Section 1: 10-K (10-K)
167
Table of Contents UNITED STATES SECURITIES AND EXCHANGE COMMISSION Washington, D.C. 20549 FORM 10-K For the Fiscal Year Ended December 31, 2019 OR For the transition period from to Commission File Number: 1-12252 (Equity Residential) Commission File Number: 0-24920 (ERP Operating Limited Partnership) EQUITY RESIDENTIAL ERP OPERATING LIMITED PARTNERSHIP (Exact name of registrant as specified in its charter) Securities registered pursuant to Section 12(b) of the Act: Securities registered pursuant to Section 12(g) of the Act: None (Equity Residential) Units of Limited Partnership Interest (ERP Operating Limited Partnership) (Title of each class) Indicate by check mark if the registrant is a well-known seasoned issuer, as defined in Rule 405 of the Securities Act. Indicate by check mark if the registrant is not required to file reports pursuant to Section 13 or Section 15(d) of the Act. Indicate by check mark whether the registrant (1) has filed all reports required to be filed by Section 13 or 15(d) of the Securities Exchange Act of 1934 during the preceding 12 months (or for such shorter period that the registrant was required to file such reports), and (2) has been subject to such filing requirements for the past 90 days. Indicate by check mark whether the registrant has submitted electronically every Interactive Data File required to be submitted pursuant to Rule 405 of Regulation S-T (§ 232.405 of this chapter) during the preceding 12 months (or for such shorter period that the registrant was required to submit such files). Indicate by check mark whether the registrant is a large accelerated filer, an accelerated filer, a non-accelerated filer, a smaller reporting company, or an emerging growth company. See the definitions of “ large accelerated filer,” “ accelerated filer,” “ smaller reporting company,” and “ emerging growth company” in Rule 12b-2 of the Exchange Act. If an emerging growth company, indicate by check mark if the registrant has elected not to use the extended transition period for complying with any new or revised financial accounting standards provided pursuant to Section 13(a) of the Exchange Act. Equity Residential ☐ ERP Operating Limited Partnership ☐ Section 1: 10-K (10-K) ☒ ANNUAL REPORT PURSUANT TO SECTION 13 OR 15(d) OF THE SECURITIES EXCHANGE ACT OF 1934 TRANSITION REPORT PURSUANT TO SECTION 13 OR 15(d) OF THE SECURITIES EXCHANGE ACT OF 1934 Maryland (Equity Residential) 13-3675988 (Equity Residential) Illinois (ERP Operating Limited Partnership) 36-3894853 (ERP Operating Limited Partnership) (State or other jurisdiction of incorporation or organization) (I.R.S. Employer Identification No.) Two North Riverside Plaza, Chicago, Illinois 60606 (312) 474-1300 (Address of principal executive offices) (Zip Code) (Registrant’s telephone number, including area code) Title of each class Trading Symbol(s) Name of each exchange on which registered Common Shares of Beneficial Interest, $0.01 Par Value (Equity Residential) EQR New York Stock Exchange 7.57% Notes due August 15, 2026 (ERP Operating Limited Partnership) N/A New York Stock Exchange Equity Residential Yes ☒ No ☐ ERP Operating Limited Partnership Yes ☒ No ☐ Equity Residential Yes ☐ No ☒ ERP Operating Limited Partnership Yes ☐ No ☒ Equity Residential Yes ☒ No ☐ ERP Operating Limited Partnership Yes ☒ No ☐ Equity Residential Yes ☒ No ☐ ERP Operating Limited Partnership Yes ☒ No ☐ Equity Residential: Large accelerated filer ☒ Accelerated filer ☐ Non-accelerated filer ☐ Smaller reporting company ☐ Emerging growth company ☐ ERP Operating Limited Partnership: Large accelerated filer ☐ Accelerated filer ☐ Non-accelerated filer ☒ Smaller reporting company ☐ Emerging growth company ☐
-
Upload
khangminh22 -
Category
Documents
-
view
0 -
download
0
Transcript of Section 1: 10-K (10-K)

Table of Contents
UNITED STATES SECURITIES AND EXCHANGE COMMISSION
Washington, D.C. 20549
FORM 10-K
For the Fiscal Year Ended December 31, 2019
O R
For the transition period from to
Commission File Number: 1-12252 (Equity Residential)
Commission File Number: 0-24920 (ERP Operating Limited Partnership)
EQUITY RESIDENTIAL ERP OPERATING LIMITED PARTNERSHIP
(Exact name of registrant as specified in its charter)
Securities registered pursuant to Section 12(b) of the Act:
Securities registered pursuant to Section 12(g) of the Act:
None (Equity Residential) Units of Limited Partnership Interest (ERP Operating Limited Partnership)
(Title of each class)
Indicate by check mark if the registrant is a well-known seasoned issuer, as defined in Rule 405 of the Securities Act.
Indicate by check mark if the registrant is not required to file reports pursuant to Section 13 or Section 15(d) of the Act.
Indicate by check mark whether the registrant (1) has filed all reports required to be filed by Section 13 or 15(d) of the Securities Exchange Act of 1934 during the preceding 12 months (or for such shorter period that the registrant was required to file such reports), and (2) has been subject to such filing requirements for the past 90 days.
Indicate by check mark whether the registrant has submitted electronically every Interactive Data File required to be submitted pursuant to Rule 405 of Regulation S-T (§ 232.405 of this chapter) during the preceding 12 months (or for such shorter period that the registrant was required to submit such files).
Indicate by check mark whether the registrant is a large accelerated filer, an accelerated filer, a non-accelerated filer, a smaller reporting company, or an emerging growth company. See the definitions of “ large accelerated filer,” “ accelerated filer,” “ smaller reporting company,” and “ emerging growth company” in Rule 12b-2 of the Exchange Act.
If an emerging growth company, indicate by check mark if the registrant has elected not to use the extended transition period for complying with any new or revised financial accounting standards provided pursuant to Section 13(a) of the Exchange Act.
Equity Residential ☐ ERP Operating Limited Partnership ☐
Section 1: 10-K (10-K)
☒☒☒☒ ANNUAL REPORT PURSUANT TO SECTION 13 OR 15(d) OF THE SECURITIES EXCHANGE ACT OF 1934
☐☐☐☐ TRANSITION REPORT PURSUANT TO SECTION 13 OR 15(d) OF THE SECURITIES EXCHANGE ACT OF 1934
Maryland (Equity Residential) 13-3675988 (Equity Residential) Illinois (ERP Operating Limited Partnership) 36-3894853 (ERP Operating Limited Partnership)
(State or other jurisdiction of incorporation or organization) (I.R.S. Employer Identification No.)
Two North Riverside Plaza, Chicago, Illinois 60606 (312) 474-1300 (Address of principal executive offices) (Zip Code) (Registrant’s telephone number, including area code)
Title of each class Trading Symbol(s) Name of each exchange on which registered Common Shares of Beneficial Interest, $0.01 Par Value (Equity Residential)
EQR New York Stock Exchange
7.57% Notes due August 15, 2026 (ERP Operating Limited Partnership)
N/A New York Stock Exchange
Equity Residential Yes ☒ No ☐ ERP Operating Limited Partnership Yes ☒ No ☐
Equity Residential Yes ☐ No ☒ ERP Operating Limited Partnership Yes ☐ No ☒
Equity Residential Yes ☒ No ☐ ERP Operating Limited Partnership Yes ☒ No ☐
Equity Residential Yes ☒ No ☐ ERP Operating Limited Partnership Yes ☒ No ☐
Equity Residential:
Large accelerated filer ☒ Accelerated filer ☐
Non-accelerated filer ☐ Smaller reporting company ☐
Emerging growth company ☐
ERP Operating Limited Partnership:
Large accelerated filer ☐ Accelerated filer ☐
Non-accelerated filer ☒ Smaller reporting company ☐
Emerging growth company ☐

Indicate by check mark whether the registrant is a shell company (as defined in Rule 12b-2 of the Act).
The aggregate market value of Common Shares held by non-affiliates of the Registrant was approximately $27.9 billion based upon the closing price on June 30, 2019 of $75.92 using beneficial ownership of shares rules adopted pursuant to Section 13 of the Securities Exchange Act of 1934 to exclude voting shares owned by Trustees and Executive Officers, some of whom may not be held to be affiliates upon judicial determination.
The number of Common Shares of Beneficial Interest, $0.01 par value, outstanding on February 14, 2020 was 371,978,449.
Equity Residential Yes ☐ No ☒ ERP Operating Limited Partnership Yes ☐ No ☒

Table of Contents
DOCUMENTS INCORPORATED BY REFERENCE
Part III incorporates by reference certain information that will be contained in Equity Residential’s Proxy Statement relating to its 2020 Annual Meeting of Shareholders, which Equity Residential intends to file no later than 120 days after the end of its fiscal year ended December 31, 2019, and thus these items have been omitted in accordance with General Instruction G(3) to Form 10-K. Equity Residential is the general partner and 96.4% owner of ERP Operating Limited Partnership.
2

Table of Contents
EXPLANATORY NOTE
This report combines the annual reports on Form 10-K for the year ended December 31, 2019 of Equity Residential and ERP Operating Limited Partnership. Unless stated otherwise or the context otherwise requires, references to “EQR” mean Equity Residential, a Maryland real estate investment trust (“REIT”), and references to “ERPOP” mean ERP Operating Limited Partnership, an Illinois limited partnership. References to the “Company,” “we,” “us” or “our” mean collectively EQR, ERPOP and those entities/subsidiaries owned or controlled by EQR and/or ERPOP. References to the “Operating Partnership” mean collectively ERPOP and those entities/subsidiaries owned or controlled by ERPOP. The following chart illustrates the Company’s and the Operating Partnership’s corporate structure:
EQR is the general partner of, and as of December 31, 2019 owned an approximate 96.4% ownership interest in, ERPOP. The remaining 3.6% interest is owned by limited partners. As the sole general partner of ERPOP, EQR has exclusive control of ERPOP’s day-to-day management. Management operates the Company and the Operating Partnership as one business. The management of EQR consists of the same members as the management of ERPOP.
The Company is structured as an umbrella partnership REIT (“UPREIT”) and EQR contributes all net proceeds from its various equity offerings to ERPOP. In return for those contributions, EQR receives a number of OP Units (see definition below) in ERPOP equal to the number of Common Shares it has issued in the equity offering. The Company may acquire properties in transactions that include the issuance of OP Units as consideration for the acquired properties. Such transactions may, in certain circumstances, enable the sellers to defer in whole or in part, the recognition of taxable income or gain that might otherwise result from the sales. This is one of the reasons why the Company is structured in the manner shown above. Based on the terms of ERPOP’s partnership agreement, OP Units can be exchanged with Common Shares on a one-for-one basis because the Company maintains a one-for-one relationship between the OP Units of ERPOP issued to EQR and the outstanding Common Shares.
The Company believes that combining the reports on Form 10-K of EQR and ERPOP into this single report provides the following benefits:
3
• enhances investors’ understanding of the Company and the Operating Partnership by enabling investors to view the business as a whole in the same manner as management views and operates the business;
• eliminates duplicative disclosure and provides a more streamlined and readable presentation since a substantial portion of the disclosure applies to both the Company and the Operating Partnership; and
• creates time and cost efficiencies through the preparation of one combined report instead of two separate reports.
Table of Contents
The Company believes it is important to understand the few differences between EQR and ERPOP in the context of how EQR and ERPOP operate as a consolidated company. All of the Company’s property ownership, development and related business operations are conducted through the Operating Partnership and EQR has no material assets or liabilities other than its investment in ERPOP. EQR’s primary function is acting as the general partner of ERPOP. EQR also issues equity from time to time, the net proceeds of which it is obligated to contribute to ERPOP. EQR does not have any indebtedness as all debt is incurred by the Operating Partnership. The Operating Partnership holds substantially all of the assets of the Company, including the Company’s ownership interests in its joint ventures. The Operating Partnership conducts the operations of the business and is structured as a partnership with no publicly traded equity. Except for the net proceeds from equity offerings by EQR (which are contributed to the capital of ERPOP in exchange for additional partnership interests in ERPOP (“OP Units”) (on a one-for-one Common Share per OP Unit basis) or additional preference units in ERPOP (on a one-for-one preferred share per preference unit basis)), the Operating Partnership generates all remaining capital required by the Company’s business. These sources include the Operating Partnership’s working capital, net cash provided by operating activities, borrowings under its revolving credit facility and/or commercial paper program, the issuance of secured and unsecured debt and partnership interests, and proceeds received from disposition of certain properties and joint venture interests.
Shareholders’ equity, partners’ capital and noncontrolling interests are the main areas of difference between the consolidated financial statements of the Company and those of the Operating Partnership. The limited partners of the Operating Partnership are accounted for as partners’ capital in the Operating Partnership’s financial statements and as noncontrolling interests in the Company’s financial statements. The noncontrolling interests in the Operating Partnership’s financial statements include the interests of unaffiliated partners in various consolidated partnerships. The noncontrolling interests in the Company’s financial statements include the same noncontrolling interests at the Operating Partnership level and limited partner OP Unit holders of the Operating Partnership. The differences between shareholders’ equity and partners’ capital result from differences in the equity issued at the Company and Operating Partnership levels.
To help investors understand the differences between the Company and the Operating Partnership, this report provides separate consolidated financial statements for the Company and the Operating Partnership; a single set of consolidated notes to such financial statements that includes separate discussions of each entity’s debt, noncontrolling interests and shareholders’ equity or partners’ capital, as applicable; and a combined Management’s Discussion and Analysis of Financial Condition and Results of Operations section that includes discrete information related to each entity.
This report also includes separate Part II, Item 9A, Controls and Procedures, sections and separate Exhibits 31 and 32 certifications for each of the Company and the Operating Partnership in order to establish that the requisite certifications have been made and that the Company and the Operating Partnership are compliant with Rule 13a-15 or Rule 15d-15 of the Securities Exchange Act of 1934, as amended (the “Exchange Act”), and 18 U.S.C. §1350.
In order to highlight the differences between the Company and the Operating Partnership, the separate sections in this report for the Company and the Operating Partnership specifically refer to the Company and the Operating Partnership. In the sections that combine disclosure of the Company and the Operating Partnership, this report refers to actions or holdings as being actions or holdings of the Company. Although the Operating Partnership is generally the entity that directly or indirectly enters into contracts and joint ventures and holds assets and debt, reference to the Company is appropriate because the Company is one business and the Company operates that business through the Operating Partnership.
As general partner with control of ERPOP, EQR consolidates ERPOP for financial reporting purposes, and EQR essentially has no assets or liabilities other than its investment in ERPOP. Therefore, the assets and liabilities of the Company and the Operating Partnership are the same on their respective financial statements. The separate discussions of the Company and the Operating Partnership in this report should be read in conjunction with each other to understand the results of the Company on a consolidated basis and how management operates the Company.
4

Table of Contents
EQUITY RESIDENTIAL ERP OPERATING LIMITED PARTNERSHIP
TABLE OF CONTENTS
5
PAGE PART I.
Item 1. Business 6
Item 1A. Risk Factors 9
Item 1B. Unresolved Staff Comments 17
Item 2. Properties 17
Item 3. Legal Proceedings 19
Item 4. Mine Safety Disclosures 19
PART II.
Item 5. Market for Registrant’s Common Equity, Related Stockholder Matters and Issuer Purchases of Equity Securities 20
Item 6. Selected Financial Data 21
Item 7. Management’s Discussion and Analysis of Financial Condition and Results of Operations 23
Item 7A. Quantitative and Qualitative Disclosures about Market Risk 42
Item 8. Financial Statements and Supplementary Data 43
Item 9. Changes in and Disagreements with Accountants on Accounting and Financial Disclosure 43
Item 9A. Controls and Procedures 43
Item 9B. Other Information 44
PART III.
Item 10. Trustees, Executive Officers and Corporate Governance 45
Item 11. Executive Compensation 45
Item 12. Security Ownership of Certain Beneficial Owners and Management and Related Stockholder Matters 45
Item 13. Certain Relationships and Related Transactions, and Trustee Independence 45
Item 14. Principal Accounting Fees and Services 45
PART IV.
Item 15. Exhibits, Financial Statement Schedules 46
Item 16. Form 10-K Summary 46
EX-4.1
EX-4.2
EX-4.3
EX-21
EX-23.1
EX-23.2
EX-31.1
EX-31.2
EX-31.3
EX 31.4
EX-32.1
EX-32.2
EX-32.3
EX-32.4
EX-101 INSTANCE DOCUMENT
EX-101 SCHEMA DOCUMENT
EX-101 CALCULATION LINKBASE DOCUMENT
EX-101 LABELS LINKBASE DOCUMENT
EX-101 PRESENTATION LINKBASE DOCUMENT
EX-101 DEFINITION LINKBASE DOCUMENT

Table of Contents
PART I
Item 1. Business
General
Equity Residential (“EQR”) is committed to creating communities where people thrive. The Company, a member of the S&P 500, is focused on the acquisition, development and management of rental apartment properties located in urban and high-density suburban communities where today’s renters want to live, work and play. ERP Operating Limited Partnership (“ERPOP”) is focused on conducting the multifamily property business of EQR. EQR is a Maryland real estate investment trust (“REIT”) formed in March 1993 and ERPOP is an Illinois limited partnership formed in May 1993. References to the “Company,” “we,” “us” or “our” mean collectively EQR, ERPOP and those entities/subsidiaries owned or controlled by EQR and/or ERPOP. References to the “Operating Partnership” mean collectively ERPOP and those entities/subsidiaries owned or controlled by ERPOP. Unless otherwise indicated, the notes to consolidated financial statements apply to both the Company and the Operating Partnership.
EQR is the general partner of, and as of December 31, 2019 owned an approximate 96.4% ownership interest in, ERPOP. All of the Company’s property ownership, development and related business operations are conducted through the Operating Partnership and EQR has no material assets or liabilities other than its investment in ERPOP. EQR issues equity from time to time, the net proceeds of which it is obligated to contribute to ERPOP, but does not have any indebtedness as all debt is incurred by the Operating Partnership. The Operating Partnership holds substantially all of the assets of the Company, including the Company’s ownership interests in its joint ventures. The Operating Partnership conducts the operations of the business and is structured as a partnership with no publicly traded equity.
The Company’s corporate headquarters is located in Chicago, Illinois and the Company also operates regional property management offices in each of its markets. As of December 31, 2019, the Company had approximately 2,700 employees who provided real estate operations, leasing, legal, financial, accounting, acquisition, disposition, development and other support functions.
Certain capitalized terms used herein are defined in the Notes to Consolidated Financial Statements. See also Note 17 in the Notes to Consolidated Financial Statements for additional discussion regarding the Company’s segment disclosures.
Available Information
You may access our Annual Report on Form 10-K, our Quarterly Reports on Form 10-Q, our Current Reports on Form 8-K and any amendments to any of those reports we file with the Securities and Exchange Commission (“SEC”) free of charge on our website, www.equityapartments.com. These reports are made available on our website as soon as reasonably practicable after we file them with the SEC. The information contained on our website, including any information referred to in this report as being available on our website, is not a part of or incorporated into this report.
Business Objectives and Operating and Investing Strategies
Overview
The Company is one of the largest U.S. publicly-traded owners of rental apartments with a portfolio of properties primarily located in Boston, New York, Washington, D.C., Seattle, San Francisco, Southern California (including Los Angeles, Orange County and San Diego) and Denver. Continued high wage job and income growth, positive demographics and a consumer preference for a rental lifestyle in our highly desirable markets has created a supportive backdrop for our business. Our markets continue to draw skilled knowledge workers that drive economic growth in the United States. This, in turn, attracts employers to our markets seeking to locate and expand their businesses and employ this talented pool of workers, resulting in strong demand for our product.
We believe we have created a best-in-class operating platform to run our properties. Our employees are focused on delivering remarkable customer service to our residents so they will stay with us longer, be willing to pay higher rent for a great experience and will tell their friends about how much they love living in an Equity Residential property. Increasingly, we are using technology to improve this resident experience and to operate our business more efficiently. Our disciplined balance sheet management enhances returns and value creation while maintaining capacity to take advantage of future opportunities. We are committed to sustainability, diversity and inclusion, the total well-being of our employees and being a responsible corporate citizen in the communities in which we operate. These “Equity Values” are deeply embedded in our culture. We believe that our stakeholders value stability, liquidity, predictability and accountability and that is the mission to which we remain unwaveringly committed.
6

Table of Contents
Investment Strategy
The Company invests in apartment communities located in strategically targeted markets (primarily urban and high-density suburban locations) with the goal of maximizing our risk-adjusted total returns by balancing current cash flow generation with long-term capital appreciation. We seek to meet this goal by investing in markets that are characterized by conditions favorable to multifamily property operations over the long-term. These markets generally feature one or more of the following characteristics that allow us to drive performance:
We believe our strategy capitalizes on the increasing preference of renters of all ages to live in the urban core of cities or dense suburban locations near transit, entertainment and cultural amenities. Currently demand for rental housing is driven primarily by household formations from the Millennial segment of our population, also known as the Echo Boom Generation, that now comprises the largest segment of the U.S. population. These young adults, born between 1981 and 2000, currently total approximately 78 million people and are disproportionately renters. We also expect this demographic to remain renters longer due to societal trends favoring delays in marriage and having children. We believe we will continue to see demand from this group, as the largest sub-segment of this cohort is now turning 29 years old while the median age of our resident is 33 years old. Following the Millenials is Generation Z, which comprises the more than 70 million people born between 2001 and 2014. Reports also show a growing trend among aging Baby Boomers, a demographic of more than 76 million people born between 1946 and 1964, toward apartment rentals. We believe we are extremely well positioned to benefit for many years to come as a result of the significant impact these generations will have on rental housing.
Over the past several years, the Company has done an extensive repositioning of its portfolio into urban and highly walkable, close-in suburban assets. While we continue to look for opportunities to expand our portfolio in these locations, we also have been exploring other markets that share these same characteristics, such as Denver. These markets feature strong high wage job growth, high single family home prices and a very attractive lifestyle for our target demographic, which we believe will lead to long-term outperformance for a rental market.
Operations and Innovation
We balance occupancy and rental rates to maximize our revenue while exercising tight cost control to generate the highest possible return to our shareholders. Revenue is maximized through our customized pricing system that uses market data on current and projected demand and availability to create both current and forward pricing daily for each apartment unit we manage. We believe our great success with renewal rate growth is due to our motivation to retain our residents with a relentless focus on customer service. Highly satisfied residents stay longer and say great things about us. We also use a standardized purchasing system to control our operating expenses and a business intelligence platform that allows all our team members to quickly identify and address issues and opportunities.
The technology driving the rental industry continues to evolve at a rapid pace, and we have long been a leader in deploying and investing in property technology to serve our customers better and operate more efficiently. As a first mover in such important areas as revenue management, online leasing, centralized procurement and internet listing services, we are focused on technology that improves our operating margin and customer experience. Currently, we are focused on areas such as self-guided tours enabled by technology; automated responses to customer inquiries; data analytics to drive expense savings and revenue improvements; and “smart home” technology. We believe these areas will provide the foundation for current and future improvements to how we do business.
7
• High single family housing prices;
• Strong economic growth as centers of the knowledge-based economy, leading to high wage job growth and household formation, which in turn leads to high demand for our apartments;
• Highly walkable urban and high-density suburban areas in what we believe are some of the best locations in the public apartment REIT sector with an attractive quality of life, leading to high resident demand and retention;
• Favorable demographics contributing to a larger pool of target residents with a high propensity or greater preference to rent apartments;
• Higher barriers to entry where, because of land scarcity or government regulation, it is typically more difficult or costly to build new apartment properties, creating limits on new supply; and
• Strong demand drivers.
Table of Contents
Focus on Our Employees
The Company has a strong, rich culture with a commitment to our “Equity Values” of Diversity & Inclusion, “Total Well-Being” (which brings together physical, financial, career, social and community well-being into a cohesive whole), Sustainability and Social Responsibility. We actively elevate and support these values when employees’ voices are heard and we embrace each other regardless of our differences; when we give back to our communities; when we care for and preserve our environment; and when we encourage and enable our employees and their families to thrive in all areas of well-being. Our employee-led Equity Values Council leads our efforts on these values by acting as change agents to drive initiatives and create awareness. We engage our stakeholders for feedback on key issues, and environmental, social and governance (“ESG”) factors help guide our investment and operating strategy. Additionally, executive compensation is based in part on meeting these important Equity Values goals, and our Board of Trustees takes an active role in overseeing these matters.
Our goal is to create and sustain an inclusive environment where diversity will thrive, employees will want to work and residents will want to live. The Equity Values Council drives new, diversity-focused initiatives for recruitment, career development and education. We actively promote from within, and many senior corporate and property leaders have risen from entry level or junior positions. We survey our employees annually to identify strengths and opportunities in employee satisfaction. We continue to maintain high engagement scores in these surveys and find our employees say they are proud to work at the Company, value one another as colleagues, believe in our mission and values and feel their skills meet their job requirements. The Company was honored with a Glassdoor Employees’ Choice Award, recognizing the Company as one of the 100 Best Places to Work in 2019 among all United States large companies, was in the Top 50 on the overall list and was the highest rated real estate company in this survey. Indeed also recognized the Company as a top-rated workplace in many of our markets.
Our Commitment to ESG
Our purpose is creating communities where people thrive. This needs to be a sustainable endeavor, in which we provide properties that will stand the test of time and remain attractive to our customers and the community without negatively impacting the environment. We have a dedicated in-house team that initiates and applies sustainable practices in all aspects of our business, including investment activities, development, property operations and property management activities. Multifamily housing is one of the most environmentally-friendly uses of real estate, as each property provides homes for hundreds of families in a denser shared environment. We invest in locations that are highly walkable and transit-friendly, enabling a low carbon footprint lifestyle for our residents to live, work and play.
Our sustainability goals help us focus efforts and track progress. We are especially focusing on energy consumption, water consumption and greenhouse gas emissions. We invest in developing and renovating our properties, with a focus on reducing waste, energy and water use by investing in energy-saving technology, such as those for irrigation, lighting, HVAC and renewable energy, while positively impacting the experience of our residents and the value of our assets.
For additional information regarding our ESG efforts, see our October 2019 Environmental, Social and Governance Report at our website, www.equityapartments.com. This report was reviewed and approved by the Corporate Governance Committee of our Board of Trustees, which monitors the Company’s ongoing ESG efforts. We continue to enhance our ESG disclosure efforts, including auditing the results outlined in the above report. In addition, the Company issued $400.0 million of ten-year 4.15% unsecured notes in 2018 as "green" bonds, and as a result, the Company allocated an amount equal to the net proceeds to eligible green/sustainable projects. This was the first "green" bond issuance from an apartment REIT.
Please refer to Item 7, Management’s Discussion and Analysis of Financial Condition and Results of Operations, for the Company’s Results of Operations and Liquidity.
Competition
All of the Company’s properties are located in developed areas that include other multifamily properties. The number of competitive multifamily properties in a particular area could have a material effect on the Company’s ability to lease apartment units at its properties and on the rents charged. The Company may be competing with other entities that have greater resources than the Company and whose managers have more experience than the Company’s managers. In addition, other forms of rental properties and single family housing provide housing alternatives to potential residents of multifamily properties. See Item 1A, Risk Factors, for additional information with respect to competition.
Environmental Considerations
See Item 1A, Risk Factors, for information concerning the potential effects of environmental regulations on our operations.
8

Table of Contents Item 1A. Risk Factors
General
This Item 1A includes forward-looking statements. You should refer to our discussion of the qualifications and limitations on forward-looking statements included in Item 7, Management’s Discussion and Analysis of Financial Condition and Results of Operations.
The occurrence of the events discussed in the following risk factors could adversely affect, possibly in a material manner, our business, financial condition or results of operations, which could affect the value of our common shares of beneficial interest or preferred shares of beneficial interest (which we refer to collectively as “Shares”), Preference Units, OP Units, restricted units and our public unsecured debt. In this section, we refer to the Shares, Preference Units, OP Units, restricted units and public unsecured debt together as our “securities” and the investors who own such securities as our “security holders.”
Risks Related to our Business Strategy
Investing in real estate is inherently subject to risks that could negatively impact our business.
Investing in real estate is subject to varying degrees and types of risk. While we seek to mitigate these risks through various strategies, including geographic diversification, market research and proactive asset management, among other techniques, these risks cannot be eliminated. Factors that may impact cash flows and real estate values include, but are not limited to:
Competition in multifamily housing may negatively affect operations and demand for the Company’s properties or residents.
Our properties face competition for residents from other existing or new multifamily properties, condominiums, single family homes and other living arrangements, whether owned or rental, that may attract residents from our properties or prospective residents that would otherwise choose to live with us. As a result, we may not be able to renew existing resident leases or enter into new resident leases, or if we are able to renew or enter into new leases, they may be at rates or terms that are less favorable than our current rates or terms, resulting in a material impact on our results of operations.
Failure to generate sufficient revenue could limit our ability to make financing payments or distributions to security holders.
A decrease in cash flows due to declines in rental revenue could negatively affect our ability to make financing payments and distributions to our security holders. Significant expenditures associated with each property, such as real estate taxes, insurance, utilities, maintenance costs and employee wages and benefits, may also negatively impact cash flows and not decline as quickly or at the same rate as revenues when circumstances might cause a reduction at our properties.
The short-term nature of apartment leases expose us more quickly to the effects of declining market rents, potentially making our revenue more volatile.
Generally our residential apartment leases are for twelve months or less. If the terms of the renewal or reletting are less favorable than current terms, then the Company’s results of operations and financial condition could be negatively affected. Given our generally shorter term lease structure, our rental revenues are impacted by declines in market rents more quickly than if our leases were for longer terms.
9
• Local economic conditions, particularly oversupply or reductions in demand;
• National, regional and local political climates and governmental policies;
• The inability or unwillingness of residents to pay rent increases;
• Increases in our operating expenses;
• Cost of labor and materials required to maintain our properties at acceptable standards;
• Availability of attractive financing opportunities;
• Changes in social preferences; and
• Additional risks that are discussed below.

Table of Contents
The geographic concentration of our properties could have an adverse effect on our operations.
The Company’s properties are highly concentrated in our primarily coastal markets. If one or more of our markets is unfavorably impacted by specific economic conditions, local real estate conditions, increases in real estate and other taxes, rent control or stabilization laws or localized environmental issues or natural/man-made disasters, the impact of such conditions may have a more negative impact on our results of operations than if our properties were more geographically diverse.
Additionally within its primarily coastal markets, the Company is highly concentrated in certain dense urban and suburban submarkets. To the extent that these particular submarkets become less desirable to operate in, including changes in multifamily housing supply and demand, our results of operations could be more negatively impacted than if we were more diversified within our markets.
Operations from new acquisitions, development projects and renovations may fail to perform as expected.
We intend to actively acquire, develop and renovate multifamily operating properties as part of our business strategy. Newly acquired, developed or renovated properties may not perform as we expect. We may also overestimate the revenue (or underestimate the expenses) that a new or repositioned project may generate. The occupancy rates and rents at these properties may fail to meet the expectations underlying our investment. Development and renovations, in particular, are subject to greater uncertainties and risks due to complexities and lead time in estimating costs. We may underestimate the costs necessary to operate an acquired property to the standards established for its intended market position. We may also underestimate the costs to complete a development property or to complete a renovation.
Competition for acquisitions may prevent us from acquiring properties on favorable terms.
We may not be successful in pursuing acquisition and development opportunities. We expect that other real estate investors will compete with us for attractive investment opportunities or may also develop properties in markets where we focus our development and acquisition efforts. We may not be in a position or have the opportunity in the future to make suitable property acquisitions on favorable terms.
Because real estate investments are illiquid, we may not be able to sell properties when appropriate.
Real estate investments generally cannot be sold quickly. We may not be able to reconfigure our portfolio promptly in response to economic or other conditions. We may be unable to consummate such dispositions in a timely manner, on attractive terms, or at all. In some cases, we may also determine that we will not recover the carrying amount of the property upon disposition. This inability to reallocate our capital promptly could negatively affect our financial condition, including our ability to make distributions to our security holders.
The Company’s real estate assets may be subject to impairment charges.
A decline in the fair value of our assets may require us to recognize an impairment against such assets under accounting principles generally accepted in the United States (“GAAP”) if we were to determine that, with respect to any assets in unrealized loss positions, we do not have the ability and intent to hold such assets for a period of time sufficient to allow for recovery of the amortized cost of such assets. If such a determination were to be made, we would recognize unrealized losses through earnings and write-down the amortized cost of such assets to a new cost basis, based on the fair value of such assets on the date they are considered to be impaired. Such impairment charges reflect non-cash losses at the time of recognition; subsequent disposition or sale of such assets could further affect our future losses or gains, as they are based on the difference between the sale price received and adjusted amortized cost of such assets at the time of sale. If we are required to recognize material asset impairment charges in the future, these charges could adversely affect our financial condition and results of operations.
Construction risks on our development projects could affect our profitability.
We intend to continue to develop multifamily properties as part of our business strategy. Development often includes long planning and entitlement timelines, subjecting the project to changes in market conditions. It can involve complex and costly activities, including significant environmental remediation or construction work in our markets. We may also experience an increase in costs due to general disruptions that affect the cost of labor and/or materials such as trade disputes, tariffs, labor unrest and/or geopolitical conflicts. We may abandon opportunities that we have already begun to explore for a number of reasons, and as a result, we may fail to recover expenses or option payments already incurred in exploring those opportunities. We may also be unable to obtain, or experience delays in obtaining, necessary zoning, occupancy, or other required governmental or third party permits and
10

Table of Contents
authorizations. These and other risks inherent in development projects could result in increased costs or the delay or abandonment of opportunities.
We are subject to risks involved in real estate activity through joint ventures.
We currently and may continue to in the future develop and acquire properties in joint ventures with other persons or entities. Joint ventures create risks including the following:
At times we have entered into agreements providing for joint and several liability with our partners. We also have in the past and could choose in the future to guarantee part of or all of certain joint venture debt. We and our respective joint venture partners may each have the right to trigger a buy-sell arrangement that could cause us to sell our interest, or acquire our partner's interest, at a time when we otherwise would not have initiated such a transaction. In some instances, joint venture partners may also have competing interests or objectives that could create conflicts of interest similar to those noted above. These objectives may be contrary to our compliance with the REIT requirements, and our REIT status could be jeopardized if any of our joint ventures do not operate in compliance with those requirements. To the extent our partners do not meet their obligations to us or our joint ventures, or they take actions inconsistent with the interests of the joint venture, it could have a negative effect on our results of operations and financial condition, including distributions to our security holders.
Risks Related to our Financing Strategy and Capital Structure
Disruptions in the financial markets could hinder our ability to obtain debt and equity financing and impact our acquisitions and dispositions.
Dislocations and disruptions in capital markets could result in increased costs or lack of availability of debt financing (including under our $1.0 billion commercial paper program) and equity financing. Such events may affect our ability to refinance existing debt, require us to utilize higher cost alternatives and/or impair our ability to adjust to changing economic and business conditions. Capital market disruptions could negatively impact our ability to make acquisitions or make it more difficult or not possible for us to sell properties or may unfavorably affect the price we receive for properties that we do sell. Such disruptions could cause the price of our securities to decline.
Our financial counterparties may not perform their obligations.
Although we have not experienced any material counterparty non-performance, disruptions in financial and credit markets or other events could impair the ability of our counterparties to perform under their contractual obligations to us. There are multiple financial institutions that are individually committed to provide borrowings under our revolving credit facility. Should any of these institutions fail to perform their obligations when contractually required, our financial condition could be adversely affected.
Rising interest rates can increase costs.
The Company is exposed to market risk from financial instruments primarily from changes in market interest rates. Such risks derive from the refinancing of debt, exposure to interest rate fluctuations in floating rate debt and from derivative instruments utilized to swap fixed rate debt to floating rates or to hedge rates in anticipation of future debt issuances. Increases in interest rates would increase our interest expense and the costs of refinancing existing debt.
Insufficient cash flow could affect our ability to service existing debt and create refinancing risk.
We are subject to risks normally associated with debt financing, including the risk that our cash flow will be insufficient to meet required payments. We may not be able to refinance existing debt and if we can, the terms of such refinancing may be less favorable than the terms of existing indebtedness. Our inability to refinance, extend or repay debt with proceeds from other capital market transactions would negatively impact our financial condition. If the debt is secured, the mortgage holder may also foreclose on the property.
11
• The possibility that our partners might refuse to make capital contributions when due and therefore we may be forced to make contributions to protect our investments;
• We may be responsible to our partners for indemnifiable losses;
• Our partners might at any time have business or economic goals that are inconsistent with ours; and
• Our partners may be in a position to take action or withhold consent contrary to our recommendations, instructions or requests.

Table of Contents
A significant downgrade in our credit ratings could adversely affect our performance.
A significant downgrade in our credit ratings, while not affecting our ability to draw proceeds under the Company’s revolving credit facility, would cause the corresponding borrowing costs to increase, impact our ability to borrow secured and unsecured debt, and potentially impair our ability to access the commercial paper market or otherwise limit our access to capital. In addition, a downgrade below investment grade would require us to post cash collateral and/or letters of credit in favor of some of our secured lenders to cover our self-insured property and liability insurance deductibles or to obtain lower deductible insurance compliant with the lenders’ requirements at the lower ratings level.
Financial covenants could limit operational flexibility and affect our overall financial position.
The terms of our credit agreements, including our revolving credit facility and the indentures under which a substantial portion of our unsecured debt was issued, require us to comply with a number of financial covenants. These covenants may limit our flexibility to run our business and breaches of these covenants could result in defaults under the instruments governing the applicable indebtedness and trigger a cross default of other debt.
Some of our properties are financed with tax-exempt bonds or otherwise contain restrictive covenants or deed restrictions, including affordability requirements, which limit income from certain properties. The Company monitors compliance with the restrictive covenants and deed restrictions that affect these properties. While we generally believe that the interest rate benefit from financing properties with tax-exempt bonds more than outweighs any loss of income due to restrictive covenants or deed restrictions, this may not always be the case. Some of these requirements are complex, and our failure to comply with them may subject us to material fines or liabilities.
We may change the dividend policy for our securities in the future.
The decision to declare and pay dividends on our securities, as well as the timing, amount and composition of any such future dividends, is at the discretion of the Board of Trustees and will depend on actual and projected financial conditions, the Company’s actual and projected liquidity and operating results, the Company’s projected cash needs for capital expenditures and other investment activities and such other factors as the Company’s Board of Trustees deems relevant. The Board of Trustees may modify our dividend policy from time to time and any change in our dividend policy could negatively impact the market price of our securities.
Changes in market conditions and volatility of share prices could decrease the market price of our Common Shares.
The stock markets, including the New York Stock Exchange on which we list our Common Shares, have experienced significant price and volume fluctuations over time. As a result, the market price of our Common Shares could be similarly volatile. Investors in our Common Shares consequently may experience a decrease in the value of their shares, including decreases due to this volatility and not necessarily related to our operating performance or prospects. Additionally, the market price of our Common Shares may decline or fluctuate significantly in response to the sale of substantial amounts of our Common Shares, or the anticipation of the sale of such shares, by large holders of our securities. The issuance of additional Common Shares by the Company, or the perception that such issuances might occur, could also cause significant volatility and decreases in the value of our shares.
Issuances or sales of our Common Shares or Units may be dilutive.
Any potential additional issuance of Common Shares or OP Units would reduce the percentage of our Common Shares and OP Units owned by investors. In most circumstances, shareholders and unitholders will not be entitled to vote on whether or not we issue additional Common Shares or Units. In addition, depending on the terms and pricing of additional offerings of our Common Shares or Units along with the value of our properties, our shareholders and unitholders could experience dilution in both book value and fair value of their Common Shares or Units, as well as dilution in our actual and expected earnings per share, funds from operations (“FFO”) per share and Normalized FFO per share.
General Risks
We depend on our key personnel.
We depend on the efforts of our trustees and executive officers. If one or more of them resign or otherwise cease to be employed by us, our business and results of operations and financial condition could be adversely affected.
12

Table of Contents
The occurrence of cyber incidents, or a deficiency in our cybersecurity, could negatively impact our business by causing a disruption to our operations, a compromise or corruption of our confidential information, and/or damage to our reputation and business relationships, all of which could negatively impact our financial results.
A cyber incident is an intentional attack or an unintentional event that can include gaining unauthorized access to systems to disrupt payment collections and operations, corrupt data or steal confidential information, including information regarding our residents, prospective residents, employees and employees’ dependents.
Despite system redundancy, the implementation of security measures, required employee awareness training and the existence of a disaster recovery plan for our internal information technology systems, our systems and systems maintained by third party vendors with which we do business are vulnerable to damage from any number of sources. We face risks associated with security breaches, whether through cyber attacks or cyber intrusions over the Internet, malware, computer viruses, attachments to emails, phishing attempts or other scams, persons inside our organization or persons/vendors with access to our systems and other significant disruptions of our information technology networks and related systems, including property infrastructure. Our information technology networks and related systems are essential to the operation of our business and our ability to perform day-to-day operations. Even the most well-protected information, networks, systems and facilities remain potentially vulnerable because the techniques used in such attempted security breaches evolve and generally are not recognized until launched against a target, and in some cases are designed not to be detected and, in fact, may not be detected. Accordingly, we may be unable to anticipate these techniques or to implement adequate security barriers or other preventative measures, and thus it is impossible for us to entirely mitigate this risk.
We collect and hold personally identifiable information of our residents and prospective residents in connection with our leasing activities, and we collect and hold personally identifiable information of our employees and their dependents. In addition, we engage third party service providers that may have access to such personally identifiable information in connection with providing necessary information technology, security and other business services to us. The systems of our third party service providers may contain defects in design or other problems that could unexpectedly compromise personally identifiable information. Although we make efforts to maintain the security and integrity of our information technology networks and those of our third party providers and we have implemented various measures to manage the risk of a security breach or disruption, there can be no assurance that our security efforts and measures will be effective or that attempted security breaches or disruptions would not be successful or damaging.
We address potential breaches or disclosure of this confidential personally identifiable information by implementing a variety of security measures intended to protect the confidentiality and security of this information including (among others): (a) engaging reputable, recognized firms to help us design and maintain our information technology and data security systems; (b) conducting periodic testing and verification of information and data security systems, including performing ethical hacks of our systems to discover where any vulnerabilities may exist; and (c) providing periodic employee awareness training around phishing and other scams, malware and other cyber risks. The Company also has a cyber liability insurance policy to provide some coverage for certain risks arising out of data and network breaches and data privacy regulations which provides a policy aggregate limit and a per occurrence deductible. Cyber liability insurance generally covers, among other things, costs associated with the wrongful release, through inadvertent breach or network attack, of personally identifiable information. However, there can be no assurance that these measures will prevent a cyber incident or that our cyber liability insurance coverage will be sufficient in the event of a cyber incident.
A breach or significant and extended disruption in the function of our systems, including our primary website, could damage our reputation and cause us to lose residents and revenues, result in a violation of applicable privacy and other laws, generate third party claims, result in the unintended and/or unauthorized public disclosure or the misappropriation of proprietary, personally identifiable and confidential information and require us to incur significant expenses to address and remediate or otherwise resolve these kinds of issues. We may not be able to recover these expenses in whole or in any part from our service providers, our insurers or any other responsible parties. As a result, there can be no assurance that our financial results would not be negatively impacted.
Litigation risk could affect our business.
We may become involved in legal proceedings, claims, actions, inquiries and investigations in the ordinary course of business. These legal proceedings may include, but are not limited to, proceedings related to consumer, shareholder, securities, employment, environmental, development, condominium conversion, tort, eviction and commercial legal issues. Litigation can be lengthy and expensive, and it can divert management's attention and resources. Results cannot be predicted with certainty, and an unfavorable outcome in litigation could result in liability material to our financial condition or results of operations.
13

Table of Contents
Insurance policies can be costly and may not cover all losses, which may adversely affect our financial condition or results of operations.
The Company’s property, general liability and workers compensation insurance policies provide coverage with substantial per occurrence deductibles and/or self-insured retentions. These self-insurance retentions can be a material portion of insurance losses in excess of the base deductibles. While the Company has previously purchased incremental insurance coverage in the event of multiple non-catastrophic occurrences within the same policy year, these substantial deductible and self-insured retention amounts do expose the Company to greater potential for uninsured losses and this additional multiple occurrences coverage may not be available at all or on commercially reasonable terms in the future. We believe the policy specifications and insured limits of these policies are adequate and appropriate; however, there are certain types of extraordinary losses which may not be adequately covered under our insurance program. As a result, our financial results could be adversely affected and may vary significantly from period to period.
The Company relies on third party insurance providers for its property, general liability, workers compensation and other insurance, and should any of them experience liquidity issues or other financial distress, it could negatively impact their ability to pay claims under the Company’s policies.
Earthquake risk: Our policies insuring against earthquake losses have substantial deductibles which are applied to the values of the buildings involved in the loss. With the geographic concentration of our properties, a single earthquake affecting a market may have a significant negative effect on our financial condition and results of operations. We cannot assure that an earthquake would not cause damage or losses greater than insured levels. In the event of a loss in excess of insured limits, we could lose our capital invested in the affected property or market, as well as anticipated future revenue.
Terrorism risk: The Company has terrorism insurance coverage which excludes losses from nuclear, biological and chemical attacks. In the event of a terrorist attack impacting one or more of our properties, we could lose the revenues from the property, our capital investment in the property and possibly face liability claims from residents or others suffering injuries or losses.
Catastrophic weather risk: Our properties may be located in areas that could experience catastrophic weather and other natural disasters from time to time, including wildfires, snow or ice storms, windstorms or hurricanes, flooding or other severe weather. This severe weather and natural disasters could cause substantial damages or losses to our properties which may not be covered or could exceed our insurance coverage. Exposure to this risk could also result in a decrease in demand for properties located in these areas or affected by these conditions.
Climate change risk: To the extent that significant changes in the climate occur in areas where our properties are located, we may experience severe weather, which may result in physical damage to or decrease the demand for properties located in these areas or affected by these conditions. Should the impact of climate change be material in nature, significant property damage or destruction of our properties could result. In addition, climate change could cause a significant increase in insurance premiums and deductibles or a decrease in the availability of coverage, either of which could expose the Company to even greater uninsured losses. Our financial condition or results of operations may be adversely affected. In addition, changes in federal, state and local legislation and regulation based on concerns about climate change could result in increased capital expenditures on our existing properties and our new development properties.
Provisions of our Declaration of Trust and Bylaws could inhibit changes in control.
Certain provisions of our Declaration of Trust and Bylaws may delay or prevent a change in control of the Company or other transactions that could provide the security holders with a premium over the then-prevailing market price of their securities or which might otherwise be in the best interest of our security holders. This includes the Ownership Limit described below in this Item 1A. While our existing preferred shares/preference units do not have all of these provisions, any future series of preferred shares/preference units may have certain voting provisions that could delay or prevent a change in control or other transactions that might otherwise be in the interest of our security holders. Our Bylaws require certain information to be provided by any security holder, or persons acting in concert with such security holder, who proposes business or a nominee at an annual meeting of shareholders, including disclosure of information related to hedging activities and investment strategies with respect to our securities. These requirements could delay or prevent a change in control or other transactions that might otherwise be in the interest of our security holders. The Board of Trustees may use its powers to issue preferred shares and to set the terms of such securities to delay or prevent a change in control of the Company even if a change in control were in the interest of the security holders.
Regulatory and Tax Risks
The adoption of, or changes, in rent control or rent stabilization laws and regulations and eviction laws and regulations in our markets could have an adverse effect on our operations and property values.
Various state and local governments have enacted and may continue to enact rent control or rent stabilization laws and regulations which could limit our ability to raise rents or charge certain fees, either of which could have a retroactive effect. We continue to see increases in governments considering or being urged by advocacy groups to consider rent control or rent stabilization
14

Table of Contents
laws and regulations. These regulations may also make changes to eviction and other tenants’ rights laws and regulations that could have an adverse impact on our operations and property values. In June 2019, the State of New York enacted rent control regulations known as the Housing Stability and Tenant Protection Act of 2019. In October 2019, the State of California enacted rent control regulations known as the Tenant Protection Act of 2019.
Compliance or failure to comply with regulatory requirements could result in substantial costs.
Our properties are subject to various federal, state and local regulatory requirements, such as state and local fire and life safety requirements and federal, state and local accessibility requirements, including and in addition to those imposed by the Americans with Disabilities Act and the Fair Housing Act. Noncompliance could result in fines, subject us to lawsuits and require us to remediate or repair the noncompliance. Existing requirements could change and compliance with future requirements may require significant unanticipated expenditures that could adversely affect our financial condition or results of operations.
Environmental problems are possible and can be costly.
Federal, state and local laws and regulations relating to the protection of the environment may require current or previous owners or operators of real estate to investigate and clean up hazardous or toxic substances at such properties. The owner or operator may have to pay a governmental entity or third parties for property damage and for investigation and clean-up costs incurred by such parties in connection with the contamination. These laws typically impose clean-up responsibility and liability without regard to whether the owner or operator knew of or caused the presence of the contaminants. Even if more than one person may have been responsible for the contamination, each person covered by the environmental laws may be held responsible for all of the clean-up costs incurred. Third parties may also sue the owner or operator of a site for damages and costs resulting from environmental contamination emanating from that site. We cannot be assured that existing environmental assessments of our properties reveal all environmental liabilities, that any prior owner of any of our properties did not create a material environmental condition not known to us, or that a material environmental condition does not otherwise exist as to any of our properties.
Changes in U.S. accounting standards may materially and adversely affect the reporting of our operations.
The Company follows GAAP, which is established by the Financial Accounting Standards Board (“FASB”), an independent body whose standards are recognized by the Securities and Exchange Commission (“SEC”) as authoritative for publicly held companies. The FASB and the SEC create and interpret accounting standards and may issue new accounting pronouncements or change the interpretation and application of these standards that govern the preparation of our financial statements. These changes could have a material impact on our reported consolidated results of operations and financial position.
Any weaknesses identified in our internal control over financial reporting could result in a decrease of our share price.
Section 404 of the Sarbanes-Oxley Act of 2002 requires us to evaluate and report on our internal control over financial reporting. If we identify one or more material weaknesses in our internal control over financial reporting, we could lose investor confidence in the accuracy and completeness of our financial reports, which in turn could have a negative impact on our share price.
Our failure to qualify as a REIT would have serious adverse consequences to our security holders.
We plan to continue to meet the requirements for taxation as a REIT. Many of these requirements, for which there is limited judicial and administrative interpretation, however, are highly technical and complex. Therefore, we cannot guarantee that we have qualified or will qualify as a REIT in the future. The determination that we are a REIT requires an analysis of various factual matters that may not be totally within our control. To qualify as a REIT, our assets must be substantially comprised of real estate assets as defined in the Internal Revenue Code of 1986, as amended (the “Code”), and related guidance and our gross income must generally come from rental and other real estate or passive related sources that are itemized in the REIT tax laws. We are also required to distribute to security holders at least 90% of our REIT taxable income excluding net capital gains.
If we fail to qualify as a REIT, we would be subject to federal income tax at regular corporate rates (including, for years prior to 2018, any alternative minimum tax) and would have to pay significant income taxes unless the Internal Revenue Service (“IRS”) granted us relief under certain statutory provisions. In addition, we would remain disqualified from taxation as a REIT for four years following the year in which we failed to qualify as a REIT. We would therefore have less money available for investments or for distributions to security holders and would no longer be required to make distributions to security holders. This would likely have a significant negative impact on the value of our securities.
In addition, certain of our subsidiary entities have elected to be taxed as REITs. As such, each must separately satisfy all of the requirements to qualify for REIT status. If a subsidiary REIT did not satisfy such requirements, and certain relief provisions did not apply, it would be taxed as a regular corporation and its income would be subject to U.S. federal income taxation. Failure to comply with these complex REIT rules at the subsidiary REIT level can have a material and detrimental impact to EQR’s REIT status.
15

Table of Contents
Gain on disposition of assets held for sale in the ordinary course of business is subject to 100% tax.
Any gain resulting from transfers of properties we hold as inventory or primarily for sale to customers in the ordinary course of business is treated as income from a prohibited transaction subject to a 100% penalty tax. We do not believe that our transfers or disposals of property are prohibited transactions. However, whether property is held for investment purposes is a question that depends on all the facts and circumstances surrounding the particular transaction. The IRS may contend that certain transfers or dispositions of properties by us or contributions of properties are prohibited transactions. While we believe the IRS would not prevail in any such dispute, if the IRS were to argue successfully that a transfer or disposition of property constituted a prohibited transaction, we would be required to pay a 100% penalty tax on any gain allocable to us from the prohibited transaction. In addition, income from a prohibited transaction might adversely affect our ability to satisfy the income tests for qualification as a REIT.
We may be subject to legislative or regulatory tax changes that could negatively impact our financial condition.
At any time, U.S. federal income tax laws governing REITs or the administrative interpretations of those laws may be enacted or amended. We cannot predict if or when any new U.S. federal income tax law, regulation or administrative interpretation, or any amendment to any existing U.S. federal income tax law, IRS and U.S. Department of Treasury regulations or administrative guidance, will be adopted or become effective and any such law, regulation or interpretation may take effect retroactively. The Company and our shareholders could be negatively impacted by any such change in, or any new, U.S. federal income tax law, regulations or administrative guidance.
Distribution requirements may limit our flexibility to manage our portfolio.
In order to maintain qualification as a REIT under the Code, a REIT must annually distribute to its shareholders at least 90% of its REIT taxable income, excluding the dividends paid deduction and net capital gains. In addition, we will be subject to a 4% nondeductible excise tax on amounts, if any, by which distributions we pay in any calendar year are less than the sum of 85% of our ordinary income, 95% of our net capital gains and 100% of our undistributed income from prior years. We may not have sufficient cash or other liquid assets to meet the 90% distribution requirement. We may be required from time to time, under certain circumstances, to accrue as income for tax purposes interest and rent earned but not yet received. We may incur a reduction in tax depreciation without a reduction in capital expenditures. Difficulties in meeting the 90% distribution requirement might arise due to competing demands for our funds or due to timing differences between tax reporting and cash distributions, because deductions may be disallowed, income may be reported before cash is received, expenses may have to be paid before a deduction is allowed or because the IRS may make a determination that adjusts reported income. In addition, gain from the sale of property may exceed the amount of cash received on a leverage-neutral basis. A substantial increase to our taxable income may reduce the flexibility of the Company to manage its portfolio through dispositions of properties other than through tax deferred transactions or cause the Company to borrow funds or liquidate investments on unfavorable terms in order to meet these distribution requirements. If we fail to satisfy the 90% distribution requirement, we would cease to be taxed as a REIT, resulting in substantial tax-related liabilities.
We have a share ownership limit for REIT tax purposes.
To remain qualified as a REIT for federal income tax purposes, not more than 50% in value of our outstanding Shares may be owned, directly or indirectly, by five or fewer individuals at any time during the last half of any year. To facilitate maintenance of our REIT qualification, our Declaration of Trust, subject to certain exceptions, prohibits ownership by any single shareholder of more than five percent of the lesser of the number or value of any outstanding class of common or preferred shares (the “Ownership Limit”). Absent an exemption or waiver granted by our Board of Trustees, securities acquired or held in violation of the Ownership Limit will be transferred to a trust for the exclusive benefit of a designated charitable beneficiary, and the security holder’s rights to distributions and to vote would terminate. A transfer of Shares may be void if it causes a person to violate the Ownership Limit. The Ownership Limit could delay or prevent a change in control and, therefore, could affect our security holders’ ability to realize a premium over the then-prevailing market price for their Shares. To reduce the ability of the Board to use the Ownership Limit as an anti-takeover device, the Company’s Ownership Limit requires, rather than permits, the Board to grant a waiver of the Ownership Limit if the individual seeking a waiver demonstrates that such ownership would not jeopardize the Company’s status as a REIT.
Tax elections regarding distributions may impact future liquidity of the Company or our shareholders.
Under certain circumstances we have made and/or may consider making in the future, a tax election to treat future distributions to shareholders as distributions in the current year. This election, which is provided for in the Code, may allow us to avoid increasing our dividends or paying additional income taxes in the current year. However, this could result in a constraint on our ability to decrease our dividends in future years without creating risk of either violating the REIT distribution requirements or generating additional income tax liability.
In order to retain liquidity and continue to satisfy the REIT distribution requirements, the Company could issue shares rather than pay a dividend entirely in cash to shareholders. The IRS has published several rulings which have allowed REITs to offer shareholders the choice between shares or cash as a form of payment of a dividend (an “elective stock dividend”). However, REITs
16

Table of Contents
are also permitted to limit the amount of cash paid to all shareholders to 20% of the total dividend paid. Therefore, it is possible that the total tax burden to shareholders resulting from an elective stock dividend may exceed the amount of cash received by the shareholder.
Inapplicability of Maryland law limiting certain changes in control.
Certain provisions of Maryland law applicable to REITs prohibit “business combinations” (including certain issuances of equity securities) with any person who beneficially owns ten percent or more of the voting power of outstanding securities, or with an affiliate who, at any time within the two-year period prior to the date in question, was the beneficial owner of ten percent or more of the voting power of the Company’s outstanding voting securities (an “Interested Shareholder”), or with an affiliate of an Interested Shareholder. These prohibitions last for five years after the most recent date on which the Interested Shareholder became an Interested Shareholder. After the five-year period, a business combination with an Interested Shareholder must be approved by two super-majority shareholder votes unless, among other conditions, holders of common shares receive a minimum price for their shares and the consideration is received in cash or in the same form as previously paid by the Interested Shareholder for its common shares. As permitted by Maryland law, however, the Board of Trustees of the Company has opted out of these restrictions with respect to any business combination involving Sam Zell and certain of his affiliates and persons acting in concert with them. Consequently, the five-year prohibition and the super-majority vote requirements will not apply to a business combination involving us and/or any of them. Such business combinations may not be in the best interest of our security holders.
Item 1B. Unresolved Staff Comments
None.
Item 2. Properties
As of December 31, 2019, the Company, directly or indirectly through investments in title holding entities, owned all or a portion of 309 properties located in 10 states and the District of Columbia consisting of 79,962 apartment units. See Item 1, Business, for additional information regarding the Company’s properties and the markets/metro areas upon which we are focused. The Company’s properties are summarized by building type in the following table:
The Company’s properties are summarized by ownership type in the following table:
17
Type Properties Apartment Units Average
Apartment Units
Garden 105 26,688 254 Mid/High-Rise 204 53,274 261
309 79,962 259
Properties Apartment Units
Wholly Owned Properties 291 76,265 Master-Leased Property – Consolidated 1 162 Partially Owned Properties – Consolidated 17 3,535
309 79,962

Table of Contents
The following table sets forth certain information by market relating to the Company’s properties at December 31, 2019:
Note: Projects under development are not included in the Portfolio Summary until construction has been completed.
As of December 31, 2019, the Company’s same store occupancy was 96.1% and its total portfolio-wide occupancy, which includes completed development properties in various stages of lease-up, was 95.8%. Certain of the Company’s properties are encumbered by mortgages and additional detail can be found on Schedule III – Real Estate and Accumulated Depreciation. Resident leases are generally for twelve months in length. Garden-style are generally defined as properties with two and/or three story buildings while mid-rise/high-rise are defined as properties with greater than three story buildings. These two property types typically provide residents with amenities, such as rooftop decks and swimming pools, fitness centers and community rooms. In addition, many of our urban properties have parking garages and/or retail components.
18
Portfolio Summary
Markets/Metro Areas Properties Apartment
Units
% of Stabilized Budgeted NOI (A)
Average Rental
Rate (B)
Los Angeles 72 16,603 18.7 % $ 2,634 Orange County 13 4,028 4.3 % 2,271 San Diego 12 3,385 3.8 % 2,437
Subtotal – Southern California 97 24,016 26.8 % 2,545 San Francisco 51 13,606 20.6 % 3,320 Washington D.C. 48 15,248 16.2 % 2,466 New York 37 9,606 14.4 % 3,937 Seattle 45 9,296 10.7 % 2,459 Boston 25 6,430 9.9 % 3,179 Denver 5 1,624 1.4 % 2,053 Other Markets 1 136 — % 1,323
Total 309 79,962 100.0 % $ 2,858
(A) % of Stabilized Budgeted NOI - Represents budgeted 2020 NOI for stabilized properties and projected annual NOI at stabilization (defined as having achieved 90% occupancy for three consecutive months) for properties that are in lease-up.
(B) Average Rental Rate - Total residential rental revenues reflected on a straight-line basis in accordance with GAAP divided by the weighted average occupied apartment units for the reporting period presented.

Table of Contents
The consolidated properties currently in various stages of development and lease-up at December 31, 2019 are included in the following table:
Item 3. Legal Proceedings
As of December 31, 2019, the Company does not believe there is any litigation pending or threatened against it that, individually or in the aggregate, may reasonably be expected to have a material adverse effect on the Company.
Item 4. Mine Safety Disclosures
Not applicable.
19
Development and Lease-Up Projects as of December 31, 2019 (Amounts in thousands except for project and apartment unit amounts)
Total Total Total Book No. of Budgeted Book Value Not Estimated/Actual Apartment Capital Value Placed in Total Percentage Initial Completion Stabilization Percentage Percentage
Projects Location Units Cost (1) to Date Service Debt Completed Occupancy Date Date Leased Occupied Projects Under Development - Wholly Owned: Alcott Apartments (fka West End Tower) Boston, MA 470 $ 409,749 $ 139,310 $ 139,310 $ — 32 % Q2 2021 Q3 2021 Q1 2023 — — 4885 Edgemoor Lane (2) Bethesda, MD 154 75,271 10,865 10,865 — 4 % Q3 2021 Q3 2021 Q3 2022 — —
Projects Under Development Wholly Owned 624 485,020 150,175 150,175 —
Projects Under Development - Partially Owned: Aero Apartments (3) Alameda, CA 200 117,794 31,455 31,455 7,050 11 % Q4 2020 Q2 2021 Q2 2022 — —
Projects Under Development Partially Owned 200 117,794 31,455 31,455 7,050
Projects Under Development 824 602,814 181,630 181,630 7,050
Completed Not Stabilized (4): Lofts at Kendall Square II (fka 249 Third Street) Cambridge, MA 84 51,447 47,259 — — Q3 2019 Q3 2019 Q2 2020 81 % 79 % Chloe on Madison (fka 1401 E. Madison) Seattle, WA 137 65,341 62,995 — — Q3 2019 Q3 2019 Q2 2020 81 % 75 %
Projects Completed Not Stabilized 221 116,788 110,254 — —
Completed and Stabilized During the Quarter: 100K Apartments Washington D.C. 222 85,273 85,262 — — Q3 2018 Q4 2018 Q4 2019 96 % 96 %
Projects Completed and Stabilized During the Quarter 222 85,273 85,262 — —
Total Development Projects 1,267 $ 804,875 $ 377,146 $ 181,630 $ 7,050
Land Held for Development N/A N/A $ 96,688 $ 96,688 $ —
(1) Total Budgeted Capital Cost – Estimated remaining cost for projects under development and/or developed plus all capitalized costs incurred to date, including land acquisition costs, construction costs, capitalized real estate taxes and insurance, capitalized interest and loan fees, permits, professional fees, allocated development overhead and other regulatory fees, plus any estimates of costs remaining to be funded for all projects, all in accordance with GAAP.
(2) 4885 Edgemoor Lane – The land under this project is subject to a long-term ground lease. This project is adjacent to an existing apartment property owned by the Company.
(3) Aero Apartments – This development project is owned 90% by the Company and 10% by a third party partner in a joint venture consolidated by the Company. Construction is being partially funded with a construction loan that is non-recourse to the Company. The joint venture partner has funded $4.6 million for its allocated share of the project equity and serves as the developer of the project.
(4) Properties included here are substantially complete. However, they may still require additional exterior and interior work for all apartment units to be available for leasing. Both of these properties are wholly owned by the Company.

Table of Contents
PART II Item 5. Market for Registrant’s Common Equity, Related Stockholder Matters and Issuer Purchases of Equity Securities
Common Share/Unit Dividends/Distributions (Equity Residential and ERP Operating Limited Partnership)
The Company’s Common Shares trade on the New York Stock Exchange under the trading symbol EQR. There is no established public market for the Operating Partnership’s Units (OP Units and restricted units). At February 14, 2020, the number of record holders of Common Shares was approximately 2,030 and 371,978,449 Common Shares were outstanding. At February 14, 2020, the number of record holders of Units in the Operating Partnership was approximately 485 and 385,928,364 Units were outstanding.
The following table sets forth, for the years indicated, the dividends/distributions declared on the Company’s Common Shares/Operating Partnership’s Units.
Unregistered Common Shares Issued in the Quarter Ended December 31, 2019 (Equity Residential)
During the quarter ended December 31, 2019, EQR issued 19,540 Common Shares in exchange for 19,540 OP Units held by various limited partners of ERPOP. OP Units are generally exchangeable into Common Shares on a one-for-one basis or, at the option of ERPOP, the cash equivalent thereof, at any time one year after the date of issuance. These shares were either registered under the Securities Act of 1933, as amended (the “Securities Act”), or issued in reliance on an exemption from registration under Section 4(a)(2) of the Securities Act and the rules and regulations promulgated thereunder, as these were transactions by an issuer not involving a public offering. In light of the manner of the sale and information obtained by EQR from the limited partners in connection with these transactions, EQR believes it may rely on these exemptions.
Equity Compensation Plan Information
The following table provides information as of December 31, 2019 with respect to the Company’s Common Shares that may be issued under its existing equity compensation plans.
On June 27, 2019, the shareholders of EQR approved the Company's 2019 Plan and the Company has filed a Form S-8 registration statement to register 11,331,958 Common Shares under this plan. As of December 31, 2019, 11,328,266 shares were available for future issuance. In conjunction with the approval of the 2019 Plan, no further awards may be granted under the 2011 Plan. The 2019 Plan expires on June 27, 2029.
Any Common Shares issued pursuant to EQR’s incentive equity compensation and employee share purchase plans will result in ERPOP issuing OP Units to EQR on a one-for-one basis, with ERPOP receiving the net cash proceeds of such issuances.
20
Dividends/Distributions 2019 2018
Fourth Quarter Ended December 31, $ 0.5675 $ 0.54 Third Quarter Ended September 30, $ 0.5675 $ 0.54 Second Quarter Ended June 30, $ 0.5675 $ 0.54 First Quarter Ended March 31, $ 0.5675 $ 0.54
Plan Category
Number of securities to be issued upon
exercise of outstanding options, warrants and rights
Weighted-average exercise price of
outstanding options, warrants
and rights
Number of securities remaining available for future issuance
under equity compensation plans
(excluding securities in column (a))
(a) (1) (b) (1) (c) (2) Equity compensation plans approved by shareholders 5,567,544 $ 55.52 14,042,598 Equity compensation plans not approved by shareholders N/A N/A N/A
(1) The amounts shown in columns (a) and (b) of the above table do not include 306,706 outstanding Common Shares (all of which are restricted and subject to vesting requirements) that were granted under the Company’s 2011 Share Incentive Plan, as amended (the “2011 Plan”), and 2019 Share Incentive Plan, as amended (the “2019 Plan”), and outstanding Common Shares that have been purchased by employees and trustees under the Company’s ESPP.
(2) Includes 11,328,266 Common Shares that may be issued under the 2019 Plan and 2,714,332 Common Shares that may be sold to employees and trustees under the ESPP.

Table of Contents
Item 6. Selected Financial Data
The following tables set forth selected financial and operating information on a historical basis for the Company and the Operating Partnership. The following information should be read in conjunction with all of the financial statements and notes thereto included elsewhere in this Form 10-K. The historical operating and balance sheet data have been derived from the historical financial statements of the Company and the Operating Partnership. Certain capitalized terms as used herein are defined in the Notes to Consolidated Financial Statements. As a result of the adoption of new lease accounting guidance on January 1, 2019, prior period amounts were not adjusted and continue to be reported in accordance with our historic accounting policies (see Note 2 in the Notes to Consolidated Financial Statements for further discussion).
EQUITY RESIDENTIAL CONSOLIDATED HISTORICAL FINANCIAL INFORMATION
(Financial information in thousands except for per share and property data)
21
Year Ended December 31, 2019 2018 2017 2016 2015
OPERATING DATA: Total revenues from continuing operations $ 2,701,075 $ 2,578,434 $ 2,471,406 $ 2,425,800 $ 2,744,965
Net gain (loss) on sales of real estate properties $ 447,637 $ 256,810 $ 157,057 $ 4,044,055 $ 335,134
Interest and other income $ 2,817 $ 15,317 $ 6,136 $ 65,773 $ 7,372
Income from continuing operations $ 1,009,708 $ 685,192 $ 628,381 $ 4,479,586 $ 907,621
Discontinued operations, net $ — $ — $ — $ 518 $ 397
Net income $ 1,009,708 $ 685,192 $ 628,381 $ 4,480,104 $ 908,018
Net income available to Common Shares $ 967,287 $ 654,445 $ 600,363 $ 4,289,072 $ 863,277
Earnings per share – basic: Income from continuing operations available to Common Shares $ 2.61 $ 1.78 $ 1.64 $ 11.75 $ 2.37
Net income available to Common Shares $ 2.61 $ 1.78 $ 1.64 $ 11.75 $ 2.37
Weighted average Common Shares outstanding 370,461 368,052 366,968 365,002 363,498
Earnings per share – diluted: Income from continuing operations available to Common Shares $ 2.60 $ 1.77 $ 1.63 $ 11.68 $ 2.36
Net income available to Common Shares $ 2.60 $ 1.77 $ 1.63 $ 11.68 $ 2.36
Weighted average Common Shares outstanding 386,333 383,695 382,678 381,992 380,620
Distributions declared per Common Share outstanding $ 2.27 $ 2.16 $ 2.015 $ 13.015 $ 2.21
BALANCE SHEET DATA (at end of period): Real estate, before accumulated depreciation $ 27,533,607 $ 26,511,022 $ 26,026,896 $ 25,386,425 $ 25,182,352 Real estate, after accumulated depreciation $ 20,256,821 $ 19,814,741 $ 19,986,518 $ 20,026,036 $ 20,276,946 Real estate held for sale $ — $ — $ — $ — $ 2,181,135 Total assets $ 21,172,769 $ 20,394,209 $ 20,570,599 $ 20,704,148 $ 23,110,196 Total debt $ 9,036,956 $ 8,817,939 $ 8,957,291 $ 8,987,258 $ 10,921,366 Redeemable Noncontrolling Interests – Operating Partnership $ 463,400 $ 379,106 $ 366,955 $ 442,092 $ 566,783 Total shareholders' equity $ 10,315,506 $ 10,173,204 $ 10,242,464 $ 10,229,078 $ 10,470,368 Total Noncontrolling Interests $ 229,020 $ 226,445 $ 231,399 $ 231,906 $ 225,987 OTHER DATA: Total properties (at end of period) 309 307 305 302 394 Total apartment units (at end of period) 79,962 79,482 78,611 77,458 109,652 Funds from operations available to Common Shares and Units – basic (1) $ 1,311,058 $ 1,204,867 $ 1,204,904 $ 1,123,530 $ 1,323,786 Normalized funds from operations available to Common Shares and Units – basic (1) $ 1,348,068 $ 1,248,710 $ 1,199,237 $ 1,179,650 $ 1,317,802 Cash flow provided by (used for):
Operating activities $ 1,456,984 $ 1,356,295 $ 1,265,788 $ 1,214,123 $ 1,356,628 Investing activities $ (771,824 ) $ (376,834 ) $ (594,296 ) $ 5,903,942 $ (695,814 ) Financing activities $ (684,474 ) $ (963,910 ) $ (789,818 ) $ (7,054,092 ) $ (666,167 )

Table of Contents
ERP OPERATING LIMITED PARTNERSHIP CONSOLIDATED HISTORICAL FINANCIAL INFORMATION
(Financial information in thousands except for per Unit and property data)
22
Year Ended December 31, 2019 2018 2017 2016 2015
OPERATING DATA: Total revenues from continuing operations $ 2,701,075 $ 2,578,434 $ 2,471,406 $ 2,425,800 $ 2,744,965
Net gain (loss) on sales of real estate properties $ 447,637 $ 256,810 $ 157,057 $ 4,044,055 $ 335,134
Interest and other income $ 2,817 $ 15,317 $ 6,136 $ 65,773 $ 7,372
Income from continuing operations $ 1,009,708 $ 685,192 $ 628,381 $ 4,479,586 $ 907,621
Discontinued operations, net $ — $ — $ — $ 518 $ 397
Net income $ 1,009,708 $ 685,192 $ 628,381 $ 4,480,104 $ 908,018
Net income available to Units $ 1,003,321 $ 679,384 $ 622,967 $ 4,460,583 $ 897,518
Earnings per Unit – basic: Income from continuing operations available to Units $ 2.61 $ 1.78 $ 1.64 $ 11.75 $ 2.37
Net income available to Units $ 2.61 $ 1.78 $ 1.64 $ 11.75 $ 2.37
Weighted average Units outstanding 383,368 380,921 379,869 378,829 377,074
Earnings per Unit – diluted: Income from continuing operations available to Units $ 2.60 $ 1.77 $ 1.63 $ 11.68 $ 2.36
Net income available to Units $ 2.60 $ 1.77 $ 1.63 $ 11.68 $ 2.36
Weighted average Units outstanding 386,333 383,695 382,678 381,992 380,620
Distributions declared per Unit outstanding $ 2.27 $ 2.16 $ 2.015 $ 13.015 $ 2.21
BALANCE SHEET DATA (at end of period): Real estate, before accumulated depreciation $ 27,533,607 $ 26,511,022 $ 26,026,896 $ 25,386,425 $ 25,182,352 Real estate, after accumulated depreciation $ 20,256,821 $ 19,814,741 $ 19,986,518 $ 20,026,036 $ 20,276,946 Real estate held for sale $ — $ — $ — $ — $ 2,181,135 Total assets $ 21,172,769 $ 20,394,209 $ 20,570,599 $ 20,704,148 $ 23,110,196 Total debt $ 9,036,956 $ 8,817,939 $ 8,957,291 $ 8,987,258 $ 10,921,366 Redeemable Limited Partners $ 463,400 $ 379,106 $ 366,955 $ 442,092 $ 566,783 Total partners’ capital $ 10,543,343 $ 10,401,942 $ 10,469,155 $ 10,450,375 $ 10,691,747 Noncontrolling Interests – Partially Owned Properties $ 1,183 $ (2,293 ) $ 4,708 $ 10,609 $ 4,608
OTHER DATA: Total properties (at end of period) 309 307 305 302 394 Total apartment units (at end of period) 79,962 79,482 78,611 77,458 109,652 Funds from operations available to Units – basic (1) $ 1,311,058 $ 1,204,867 $ 1,204,904 $ 1,123,530 $ 1,323,786 Normalized funds from operations available to Units – basic (1) $ 1,348,068 $ 1,248,710 $ 1,199,237 $ 1,179,650 $ 1,317,802 Cash flow provided by (used for):
Operating activities $ 1,456,984 $ 1,356,295 $ 1,265,788 $ 1,214,123 $ 1,356,628 Investing activities $ (771,824 ) $ (376,834 ) $ (594,296 ) $ 5,903,942 $ (695,814 ) Financing activities $ (684,474 ) $ (963,910 ) $ (789,818 ) $ (7,054,092 ) $ (666,167 )
(1) See Item 7, Management’s Discussion and Analysis of Financial Condition and Results of Operations, for a reconciliation of net income to FFO, FFO available to Common Shares and Units / Units, Normalized FFO and Normalized FFO available to Common Shares and Units / Units and the definitions of these non-GAAP financial measures.

Table of Contents Item 7. Management’s Discussion and Analysis of Financial Condition and Results of Operations
The following discussion and analysis of the results of operations and financial condition of the Company and the Operating Partnership should be read in connection with the Consolidated Financial Statements and Notes thereto. Due to the Company’s ability to control the Operating Partnership and its subsidiaries, the Operating Partnership and each such subsidiary entity has been consolidated with the Company for financial reporting purposes, except for any unconsolidated properties/entities. Capitalized terms used herein and not defined are as defined elsewhere in this Annual Report on Form 10-K.
Forward-Looking Statements
Forward-looking statements in this Item 7 as well as elsewhere in this Annual Report on Form 10-K are intended to be made pursuant to the safe harbor provisions of the Private Securities Litigation Reform Act of 1995. These statements are based on current expectations, estimates, projections and assumptions made by management. While the Company’s management believes the assumptions underlying its forward-looking statements are reasonable, such information is inherently subject to uncertainties and may involve certain risks, which could cause actual results, performance or achievements of the Company to differ materially from anticipated future results, performance or achievements expressed or implied by such forward-looking statements. Many of these uncertainties and risks are difficult to predict and beyond management’s control. Forward-looking statements are not guarantees of future performance, results or events. The forward-looking statements contained herein are made as of the date hereof and the Company undertakes no obligation to update or supplement these forward-looking statements. Factors that might cause such differences are discussed in Part I of this Annual Report on Form 10-K, particularly those under Item 1A, Risk Factors.
Forward-looking statements and related uncertainties are also included in the Notes to Consolidated Financial Statements in this report. The 2020 guidance assumptions disclosed throughout this Item 7 are based on current expectations and are forward-looking.
Overview
See Item 1, Business, for discussion regarding the Company’s overview.
Business Objectives and Operating and Investing Strategies
See Item 1, Business, for discussion regarding the Company’s business objectives and operating and investing strategies.
23

Table of Contents
Results of Operations
2019 and 2018 Transactions
In conjunction with our business objectives and operating strategy, the Company continued to invest in apartment properties located primarily in our urban and high-density suburban communities and sell apartment properties that we believe will have inferior long-term returns. The following tables provide a rollforward of the transactions that occurred during the years ended December 31, 2019 and 2018:
Portfolio Rollforward
($ in thousands)
24
Properties Apartment
Units Purchase
Price Acquisition
Cap Rate 12/31/2018 307 79,482
Acquisitions: Consolidated:
Rental Properties 9 2,412 $ 1,039,830 4.6 % Rental Properties – Not Stabilized (1) 4 1,128 $ 454,859 4.9 % Land Parcels — — $ 19,832
Sales Price Disposition
Yield Dispositions:
Consolidated: Rental Properties (11 ) (2,361 ) $ (1,080,675 ) (4.6 )% Land Parcels — — $ (2,100 )
Unconsolidated: Rental Properties (2) (2 ) (945 ) $ (394,500 ) (4.7 )%
Completed Developments – Consolidated 2 221 Configuration Changes — 25
12/31/2019 309 79,962
(1) The Company acquired four properties during the year ended December 31, 2019, consisting of two properties in the Denver market and two properties in the Seattle market, all of which are in the final stages of completing lease-up and are expected to stabilize in the second year of ownership at the Acquisition
Cap Rate listed above. (2) The Company owned a 20% interest in unconsolidated rental properties located in San Jose, CA and South Florida. Sales price listed is the gross sales
price. The Company received net sales proceeds of approximately $78.3 million and recognized a GAAP gain on sale of approximately $69.5 million.

Table of Contents
The consolidated properties acquired were located in the New York, Seattle, Washington D.C., San Francisco, Los Angeles and Denver markets. The consolidated properties disposed of were located in the New York, Washington D.C., San Francisco and Boston markets and the sales generated an Unlevered IRR of 7.8%. The consolidated properties development completions were located in the Boston and Seattle markets. Finally, the Company started construction on two consolidated projects, located in the San Francisco and Washington D.C. markets, consisting of 354 apartment units totaling approximately $193.1 million of expected development costs.
Portfolio Rollforward ($ in thousands)
The consolidated properties acquired were located in the Seattle, New York, Denver and Boston markets. The consolidated properties
disposed of were located in the Seattle, Los Angeles and New York markets and the sales generated an Unlevered IRR of 8.7%. The consolidated properties development completions were located in the San Francisco and Washington D.C. markets. Finally, the Company started construction on one consolidated project, located in the Boston market, consisting of 469 apartment units totaling approximately $409.7 million of expected development costs.
See the Definitions section below for the definition of Acquisition Cap Rate, Development Yield, Disposition Yield and Unlevered IRR. See also Note 4 in the Notes to Consolidated Financial Statements for additional discussion regarding the Company’s real estate transactions.
The Company’s guidance assumes consolidated rental acquisitions of $1.25 billion and consolidated rental dispositions of $1.0 billion, and the Company expects that the Acquisition Cap Rate will be 0.25% lower than the Disposition Yield for the full year ending December 31, 2020. We currently budget spending approximately $365.0 million on development costs during the year ending December 31, 2020 (inclusive of approximately $50.0 million of construction mortgage and joint venture partner obligations), primarily for properties currently under construction.
Same Store Results
Properties that the Company owned and were stabilized (see definition below) for all of both 2019 and 2018 (the “2019 Same Store Properties”), which represented 71,830 apartment units, impacted the Company’s results of operations. The 2019 Same Store Properties are discussed in the following paragraphs.
The Company’s primary financial measure for evaluating each of its apartment communities is net operating income (“NOI”). NOI represents rental income less direct property operating expenses (including real estate taxes and insurance). The Company believes that NOI is helpful to investors as a supplemental measure of its operating performance because it is a direct measure of the actual operating results of the Company’s apartment properties.
25
Properties Apartment
Units Purchase
Price Acquisition
Cap Rate 12/31/2017 305 78,611
Acquisitions: Consolidated:
Rental Properties 5 1,478 $ 707,005 4.4 %
Sales Price Disposition
Yield Dispositions:
Consolidated: Rental Properties (5 ) (1,292 ) $ (706,120 ) (4.1 )% Land Parcels — — $ (2,700 )
Completed Developments – Consolidated 2 671 Configuration Changes — 14
12/31/2018 307 79,482
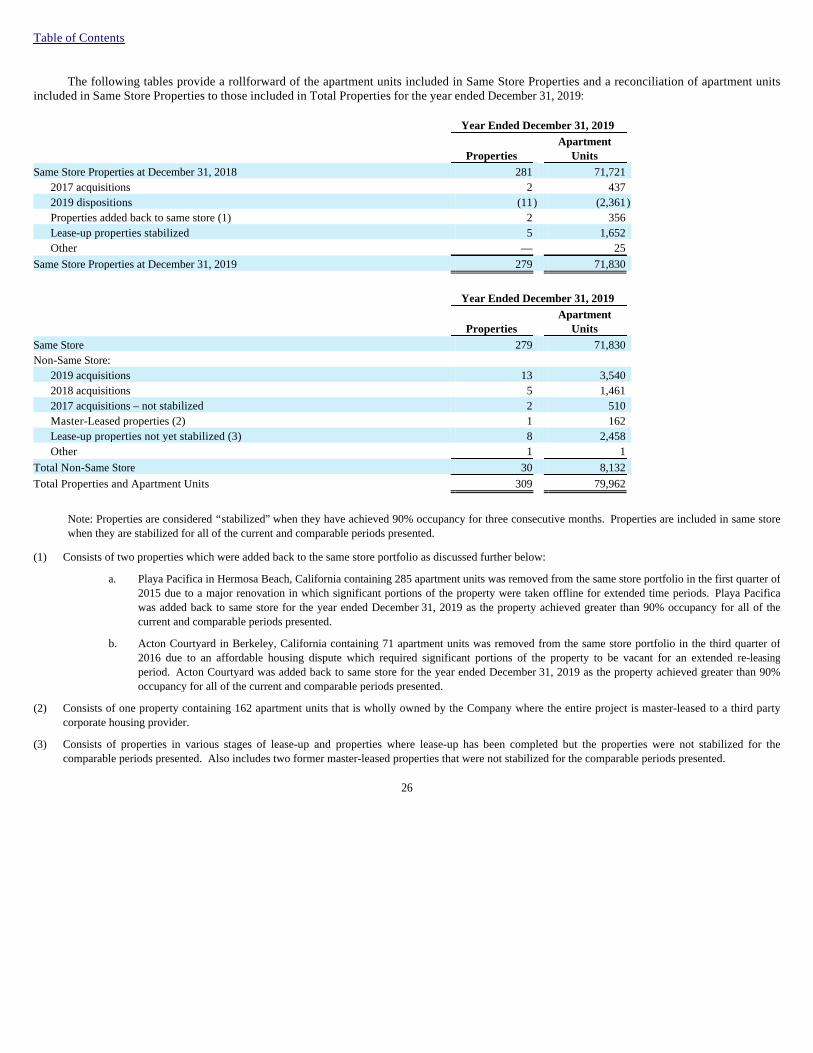
Table of Contents
The following tables provide a rollforward of the apartment units included in Same Store Properties and a reconciliation of apartment units included in Same Store Properties to those included in Total Properties for the year ended December 31, 2019:
Note: Properties are considered “stabilized” when they have achieved 90% occupancy for three consecutive months. Properties are included in same store when they are stabilized for all of the current and comparable periods presented.
26
Year Ended December 31, 2019
Properties Apartment
Units Same Store Properties at December 31, 2018 281 71,721
2017 acquisitions 2 437 2019 dispositions (11 ) (2,361 ) Properties added back to same store (1) 2 356 Lease-up properties stabilized 5 1,652 Other — 25
Same Store Properties at December 31, 2019 279 71,830
Year Ended December 31, 2019
Properties Apartment
Units Same Store 279 71,830 Non-Same Store:
2019 acquisitions 13 3,540 2018 acquisitions 5 1,461 2017 acquisitions – not stabilized 2 510 Master-Leased properties (2) 1 162 Lease-up properties not yet stabilized (3) 8 2,458 Other 1 1
Total Non-Same Store 30 8,132
Total Properties and Apartment Units 309 79,962
(1) Consists of two properties which were added back to the same store portfolio as discussed further below:
a. Playa Pacifica in Hermosa Beach, California containing 285 apartment units was removed from the same store portfolio in the first quarter of 2015 due to a major renovation in which significant portions of the property were taken offline for extended time periods. Playa Pacifica was added back to same store for the year ended December 31, 2019 as the property achieved greater than 90% occupancy for all of the current and comparable periods presented.
b. Acton Courtyard in Berkeley, California containing 71 apartment units was removed from the same store portfolio in the third quarter of 2016 due to an affordable housing dispute which required significant portions of the property to be vacant for an extended re-leasing period. Acton Courtyard was added back to same store for the year ended December 31, 2019 as the property achieved greater than 90% occupancy for all of the current and comparable periods presented.
(2) Consists of one property containing 162 apartment units that is wholly owned by the Company where the entire project is master-leased to a third party corporate housing provider.
(3) Consists of properties in various stages of lease-up and properties where lease-up has been completed but the properties were not stabilized for the comparable periods presented. Also includes two former master-leased properties that were not stabilized for the comparable periods presented.

Table of Contents
The following table provides comparative same store results and statistics for the 2019 Same Store Properties:
2019 vs. 2018 Same Store Results/Statistics for 71,830 Same Store Apartment Units
$ in thousands (except for Average Rental Rate)
Note: Same store revenues for all leases are reflected on a straight line basis in accordance with GAAP for the current and comparable periods.
The following tables present reconciliations of operating income per the consolidated statements of operations to NOI, along with rental
income, operating expenses and NOI per the consolidated statements of operations allocated between same store and non-same store results for the 2019 Same Store Properties (amounts in thousands):
The Company anticipates the following same store results for the full year ending December 31, 2020, which assumptions are based on
current expectations and are forward-looking:
27
Results Statistics
Description Revenues Expenses NOI
Average Rental
Rate (1) Physical
Occupancy (2) Turnover (3) 2019 $ 2,453,259 $ 734,553 $ 1,718,706 $ 2,843 96.4 % 49.5 % 2018 $ 2,377,066 $ 708,616 $ 1,668,450 $ 2,762 96.2 % 51.4 %
Change $ 76,193 $ 25,937 $ 50,256 $ 81 0.2 % (1.9 %)
Change 3.2 % 3.7 % 3.0 % 2.9 %
(1) Average Rental Rate – Total residential rental revenues reflected on a straight-line basis in accordance with GAAP divided by the weighted average occupied apartment units for the reporting period presented.
(2) Physical Occupancy – The weighted average occupied apartment units for the reporting period divided by the average of total apartment units available for rent for the reporting period.
(3) Turnover – Total residential move-outs (including inter-property and intra-property transfers) divided by total residential apartment units.
Year Ended December 31, 2019 2018
Operating income $ 1,356,544 $ 1,115,370 Adjustments:
Fee and asset management revenue (384 ) (753 ) Property management 95,344 92,485 General and administrative 52,757 53,813 Depreciation 831,083 785,725 Net (gain) loss on sales of real estate properties (447,637 ) (256,810 ) Impairment — 702
Total NOI $ 1,887,707 $ 1,790,532
Rental income: Same store $ 2,453,259 $ 2,377,066 Non-same store/other 247,432 200,615
Total rental income 2,700,691 2,577,681 Operating expenses:
Same store 734,553 708,616 Non-same store/other 78,431 78,533
Total operating expenses 812,984 787,149 NOI:
Same store 1,718,706 1,668,450 Non-same store/other 169,001 122,082
Total NOI $ 1,887,707 $ 1,790,532
2020 Same Store Assumptions Physical Occupancy 96.4% Revenue change 2.3% to 3.3% Expense change 3.0% to 4.0% NOI change 1.5% to 3.5%


Table of Contents
The following table provides the actual same store revenue growth during the year ended December 31, 2019 as compared to the same period in 2018 and our expected full year same store revenue growth for 2020:
Same store revenues for the full year of 2019 were slightly lower than our most recent expectations but still performed at the high end of our
expectations from the beginning of the year. Revenue increased due to record low turnover, strong occupancy and favorable overall demand. The Company’s primary focus in 2019 was on providing remarkable experiences for our residents which resulted in record levels of customer satisfaction and resident retention. The Company’s primary goals for 2020 will be to continue the 2019 trends while accelerating the deployment of various operating initiatives such as smart home technology and other sales and service related innovation improvements. We expect consistent demand that should help with the absorption of the continued elevated supply that we expect in many of our markets.
New rent control regulations enacted in both the New York and California markets during 2019 are expected to negatively impact our overall same store revenue results by approximately 20 basis points for 2020. Of the approximately 9,600 apartment units located in our New York market, approximately 3,100 apartment units are "rent stabilized" (primarily as a result of the 421(a) real estate tax abatement program) and therefore more directly impacted by these new regulations. Once the abatement expires, the apartment units can be brought to market rents and will no longer be subject to the rent control regulations. We estimate that the new regulations will have a negative impact on renewal rates for some of these 3,100 apartment units and will impact our ability to charge certain fees at all of our New York City properties (approximately 6,600 apartment units). California’s new rent control regulations, which became effective on January 1, 2020, among other things limits the ability to raise rents on renewals to the local California consumer price index + 5% on properties fifteen years or older. It does not, however, impose such a cap upon vacancy of an apartment unit. Of our approximately 37,600 apartment units located in California, approximately 24,400 are subject to these new regulations.
Boston performed better than expected with strong demand across the market. Strong occupancy, new lease and renewal pricing increases drove our improved performance in 2019. However, with competitive new supply pressures increasing in 2020, we anticipate consistent occupancy but less growth from renewals and new leases that will lead to lower anticipated overall same store revenue growth levels in 2020.
Strong occupancy and pricing power continued to improve in New York as 2019 progressed. This market, however, experienced some
seasonal softness near year-end, resulting in a concessionary environment that was greater than expected. For 2020, while we continue to believe the new rent control regulations will have a modestly negative impact on our New York market results, we expect overall same store revenue growth to improve from 2019 as pricing power returns to the market given the anticipated almost complete lack of competitive new supply. Additionally, we expect slightly higher occupancy and renewal rates, favorable market conditions and new lease growth in 2020.
Washington D.C. continued to demonstrate strength in demand with strong occupancy, renewal rates achieved and new lease change
despite elevated supply in 2019. The economy, particularly in Northern Virginia, remains strong with gains in the professional and business services sector which are aiding in the absorption of new supply being delivered. In 2020, we anticipate improved results mostly driven by stronger embedded growth starting the year and similar operating outcomes for occupancy, new lease change and achieved renewal increase.
The Seattle market performed better than expected due to stronger than anticipated demand despite elevated new supply. Job growth
continued to be very strong and we experienced the highest occupancy gains, renewal rates achieved and new lease pricing of any of our markets in 2019. We expect to produce better same store revenue growth in 2020 with similar occupancy, slight improvement to achieved renewal rates and the majority of growth coming from gains in new leases as we look to capitalize on the current and near-term pricing power in the portfolio.
28
Markets/Metro Areas Actual Full Year 2019
Same Store Revenue Growth Projected Full Year 2020
Same Store Revenue Growth Boston 4.0% 2.6% to 3.6% New York 2.3% 2.1% to 3.1% Washington D.C. 2.3% 2.1% to 3.1% Seattle 3.4% 3.5% to 4.5% San Francisco 3.7% 2.6% to 3.6% Los Angeles 3.7% 1.8% to 2.8% Orange County 3.8% 2.7% to 3.7% San Diego 3.3% 2.3% to 3.3% Overall 3.2% 2.3% to 3.3%

Table of Contents
San Francisco performed slightly below our most recent expectations due to lower occupancy and elevated supply, especially in the East Bay, impacting performance towards the end of 2019. While these trends are consistent with normal seasonal declines, they were modestly more pronounced. In 2020, we expect similar new supply levels with the concentration of competitive supply impacting the downtown and South Bay areas the most. Expected revenue growth in 2020 is lower compared to 2019 due to the impact of this new supply and the new rent control regulations. While we expect some softness when new supply is concentrated around us, this market has a critical mass of technology talent and growth drivers for strong long-term performance.
While the Los Angeles market continued to maintain steady occupancy and solid renewal rates, the market performed slightly below our expectations due to pricing power declines and negative new lease changes as new supply was delivered during the second half of 2019. We expect Los Angeles to be our most challenged market in 2020 due to elevated new supply, implementation of the new rent control regulations and restrictions on short-term lease pricing. Therefore, we expect slightly lower occupancy, modest gains in new lease change and a decline in renewal rate achieved growth.
In Orange County, results continued to be strong and in line with our expectations primarily due to high occupancy levels and in-line renewal rate achieved and new lease change. Our properties performed well against competitive new supply during 2019. For 2020, we expect to deliver similar occupancy, slight gains in new lease change and a decline in renewal rate achieved growth due to the impact of the new rent control regulations, leading to expected 2020 results below 2019. With strong occupancy, we believe that we are well-positioned heading into a competitive environment.
In San Diego, occupancy was better than expected but renewal rate achieved and new lease pricing were both lower than anticipated,
resulting in same store revenue slightly below our expectations. Overall, military spending in this market remains strong but supply pressure limits our pricing power. We expect to deliver strong but lower same store revenue growth in 2020 with similar occupancy, slight gains in new lease change and a decline in renewal rate achieved growth based on the impact of the new rent control regulations. With strong occupancy, we believe that we are well-positioned heading into a competitive environment.
The following table provides comparative same store operating expenses for the 2019 Same Store Properties:
2019 vs. 2018 Same Store Operating Expenses for 71,830 Same Store Apartment Units
$ in thousands
29
% of Actual 2019 Actual Actual $ % Operating 2019 2018 Change (5) Change Expenses
Real estate taxes $ 315,033 $ 301,969 $ 13,064 4.3 % 42.9 % On-site payroll (1) 157,120 155,901 1,219 0.8 % 21.4 % Utilities (2) 98,015 94,949 3,066 3.2 % 13.4 % Repairs and maintenance (3) 92,361 90,050 2,311 2.6 % 12.6 % Insurance 20,869 18,973 1,896 10.0 % 2.8 % Leasing and advertising 9,774 9,883 (109 ) (1.1 )% 1.3 % Other on-site operating expenses (4) 41,381 36,891 4,490 12.2 % 5.6 %
Same store operating expenses $ 734,553 $ 708,616 $ 25,937 3.7 % 100.0 %
(1) On-site payroll – Includes payroll and related expenses for on-site personnel including property managers, leasing consultants and maintenance staff.
(2) Utilities – Represents gross expenses prior to any recoveries under the Resident Utility Billing System (“RUBS”). Recoveries are reflected in rental income.
(3) Repairs and maintenance – Includes general maintenance costs, apartment unit turnover costs including interior painting, routine landscaping, security, exterminating, fire protection, snow removal, elevator, roof and parking lot repairs and other miscellaneous building repair and maintenance costs.
(4) Other on-site operating expenses – Includes ground lease costs and administrative costs such as office supplies, telephone and data charges and association and business licensing fees.
(5) The changes are due primarily to:
• Real estate taxes – Increase above expectations due primarily to fewer recoveries from appeals activity.
• On-site payroll – Increase below expectations. Payroll pressures continue but were offset by lower than expected employee benefit-related costs.
• Utilities – Growth generally in line with expectations for the year.

Table of Contents
Same store expenses increased 3.7% during the year ended December 31, 2019 as compared to the same period in 2018, which was towards
the low end of our original expectations (3.5% to 4.5%) and slightly lower than our most recent guidance provided in October 2019 (3.8%). We anticipate same store expenses to increase between 3.0% to 4.0% for 2020 as compared to 2019 primarily due to the following items:
Same store NOI increased 3.0% for the full year 2019 as compared to the same period in 2018, which was at the high end of our original
expectations (1.5% to 3.0%) and slightly lower than our most recent guidance provided in October 2019 (3.1%). The Company anticipates same store NOI growth for the full year 2020 of approximately 1.5% to 3.5% as a result of the same store revenue and expense expectations discussed above.
See also Note 17 in the Notes to Consolidated Financial Statements for additional discussion regarding the Company’s segment disclosures.
Non-Same Store/Other Results
Non-same store/other NOI results for the year ended December 31, 2019 increased approximately $46.9 million compared to the same period of 2018 and consist primarily of properties acquired in calendar years 2018 and 2019, operations from the Company’s development properties and operations prior to disposition from 2018 and 2019 sold properties. This difference is due primarily to:
30
• Insurance – Increase due to higher premiums on property insurance renewal as a result of challenging conditions in the insurance market.
• Other on-site operating expenses – Increase primarily driven by higher ground lease costs due to a contractual revaluation at one property along with higher association fees.
• Real estate taxes are estimated to remain elevated with an increase between 3.75% and 4.75% primarily due to the 421-a tax abatement benefits continuing to burn-off in New York, a slight decline in forecasted year-over-year appeals activity and anticipated rate pressure in Seattle;
• Payroll costs are estimated to increase approximately 2.25% to 3.25% primarily due to continued pressures from a tight labor market and anticipated increases in medical insurance and other employee benefits due to these costs being lower than expected in 2019. Excluding these anticipated medical expense/benefit pressures, we would expect growth to be very modest;
• Utilities are estimated to increase between 2.5% and 3.5% primarily due to continued modest commodity cost pressures along with increases in trash and sewer costs; and
• Repairs and maintenance costs are estimated to increase between 2.5% and 3.5% primarily due to significant pressure from increases in minimum wages for contract labor and additional cost from our operating initiatives offset by forecasted better utilization of our internal workforce.
• A positive impact of higher NOI from development and newly stabilized development properties in lease-up of $13.4 million;
• A positive impact of higher NOI from properties mainly acquired in 2018 and 2019 of $53.2 million;
• A positive impact of higher NOI from other non-same store properties (including one current and two former master leased properties) of $0.8 million; and
• A negative impact of lost NOI from 2018 and 2019 dispositions of $31.7 million.

Table of Contents
Comparison of the year ended December 31, 2019 to the year ended December 31, 2018.
The following table presents a reconciliation of diluted earnings per share/unit for the year ended December 31, 2019 as compared to the same period in 2018:
The increase in consolidated NOI is primarily a result of the Company’s improved NOI from same store and lease-up properties along with
NOI from the Company’s recent transaction activity. The following table presents the changes in the components of consolidated NOI for the year ended December 31, 2019 as compared to the same period in 2018:
Property management expenses include off-site expenses associated with the self-management of the Company’s properties as well as management fees paid to any third party management companies. These expenses increased approximately $2.9 million or 3.1% during the year ended December 31, 2019 as compared to 2018. These increases are primarily attributable to increases in legal and professional fees, computer operations and education/conferences cost. The Company anticipates that property management expenses will approximate $100.0 million to $102.0 million for the year ending December 31, 2020, inclusive of $1.5 million of additional expenses for various operating initiatives such as sales-focused improvements and service enhancements along with personnel costs to support these initiatives.
General and administrative expenses, which include corporate operating expenses, decreased approximately $1.1 million or 2.0% during the year ended December 31, 2019 as compared to 2018, primarily due to decreases in payroll-related costs, partially offset by increases in office rent. The Company anticipates that general and administrative expenses will approximate $50.0 million to $52.0 million for the year ending December 31, 2020.
Depreciation expense, which includes depreciation on non-real estate assets, increased approximately $45.4 million or 5.8% during the year ended December 31, 2019 as compared to 2018, primarily as a result of additional depreciation expense on properties acquired in 2018 and 2019 and development properties placed in service during 2018 and 2019, offset by lower depreciation from properties sold in 2018 and 2019.
Net gain on sales of real estate properties increased approximately $190.8 million or 74.3% during the year ended December 31, 2019 as compared to 2018, primarily as a result of a higher sales volume with the sale of eleven consolidated apartment properties in 2019 as compared to five consolidated apartment properties in 2018.
Interest and other income decreased approximately $12.5 million or 81.6% during the year ended December 31, 2019 as compared to 2018, primarily due to a decline in insurance/litigation settlement proceeds received during 2019 as compared to 2018. The Company anticipates that interest and other income will approximate $1.5 million to $2.0 million for the year ending December 31, 2020, excluding certain non-comparable insurance/litigation settlement proceeds.
Other expenses increased approximately $0.9 million or 5.3% during the year ended December 31, 2019 as compared to 2018, primarily due to an increase in expenses related to litigation settlements, pursuit costs and various consulting costs related to a data analytics project, partially offset by a decrease in advocacy contributions in 2019 as compared to 2018.
Interest expense, including amortization of deferred financing costs, decreased approximately $22.9 million or 5.4% during the year ended December 31, 2019 as compared to 2018. The decrease is due primarily to $17.3 million in lower debt extinguishment costs in 2019 as compared to 2018. The effective interest cost on all indebtedness, excluding debt extinguishment costs/prepayment
31
Year Ended
December 31
Diluted earnings per share/unit for full year 2018 $ 1.77 Property NOI 0.25 Debt extinguishment costs 0.05 Depreciation expense (0.09 ) Net gain/loss on property/unconsolidated sales 0.67 Other (0.05 ) Diluted earnings per share/unit for full year 2019 $ 2.60
Year Ended
December 31, 2019
Consolidated rental income 4.8 % Consolidated operating expenses (1) 3.3 % Consolidated NOI 5.4 %
(1) Consolidated operating expenses are comprised of property and maintenance and real estate taxes and insurance.

Table of Contents
penalties, for the year ended December 31, 2019 was 4.20% as compared to 4.32% in 2018. The Company capitalized interest of approximately $6.9 million and $6.3 million during the years ended December 31, 2019 and 2018, respectively. The Company anticipates that interest expense, excluding debt extinguishment costs/prepayment penalties, will approximate $340.0 million to $348.0 million and capitalized interest will approximate $12.0 million to $14.0 million for the year ending December 31, 2020.
Income and other tax benefit increased approximately $3.2 million during the year ended December 31, 2019 as compared to 2018, primarily due to various alternative minimum tax credit refunds recognized in 2019 that did not occur in 2018. The Company anticipates that income and other tax expense will approximate $0.7 million to $1.2 million for the year ending December 31, 2020.
Income from investments in unconsolidated entities increased approximately $69.6 million during the year ended December 31, 2019 as compared to 2018, primarily as a result of a $69.5 million gain on the sale of two unconsolidated properties in 2019 that did not occur in 2018.
Net gain on sales of land parcels increased approximately $1.1 million during the year ended December 31, 2019 as compared to 2018, primarily due to a higher gain on the sale of two land parcels in 2019 as compared to one land parcel sale in 2018.
For comparison of the year ended December 31, 2018 to the year ended December 31, 2017, refer to Item 7, Management’s Discussion and Analysis of Financial Condition and Results of Operations, included in the Company’s and the Operating Partnership’s Annual Report on Form 10-K for the year ended December 31, 2018.
Liquidity and Capital Resources
Short-Term Liquidity and Cash Proceeds
The Company generally expects to meet its short-term liquidity requirements, including capital expenditures related to maintaining its existing properties and scheduled unsecured note and mortgage note repayments, through its working capital, net cash provided by operating activities and borrowings under the Company’s revolving credit facility and commercial paper program. Under normal operating conditions, the Company considers its cash provided by operating activities to be adequate to meet operating requirements and payments of distributions.
As of January 1, 2019, the Company had approximately $47.4 million of cash and cash equivalents and approximately $68.9 million of restricted deposits, and the available borrowing capacity on its revolving credit facility was $1.40 billion. After the effect of the various transactions discussed in the following paragraphs and the net cash provided by operating activities, at December 31, 2019, the Company’s cash and cash equivalents balance was approximately $45.8 million, the restricted deposits balance was approximately $71.2 million and the available borrowing capacity on its revolving credit facility was $1.38 billion. See Note 9 in the Notes to Consolidated Financial Statements for further discussion of the availability on the Company’s revolving credit facility.
During the year ended December 31, 2019, the Company generated proceeds from various transactions, which included the following:
During the year ended December 31, 2019, the above proceeds along with net cash flow from operations and borrowings from the Company’s revolving line of credit and commercial paper program were primarily utilized to:
32
• Disposed of eleven consolidated rental properties, two unconsolidated rental properties and two land parcels, receiving combined net proceeds of approximately $1.1 billion;
• Obtained $295.8 million of mortgage loan proceeds;
• Issued $600.0 million of ten-year 3.00% unsecured notes, receiving net proceeds of approximately $597.5 million before underwriting fees, hedge termination costs and other expenses;
• Issued $600.0 million of ten-year 2.50% unsecured notes, receiving net proceeds of approximately $597.0 million before underwriting fees and other expenses; and
• Issued Common Shares related to share option exercises and ESPP purchases and received net proceeds of $80.9 million, which were contributed to the capital of the Operating Partnership in exchange for additional OP Units (on a one-for-one Common Share per OP Unit basis).
• Acquire thirteen consolidated rental properties and four land parcels for approximately $1.5 billion in cash;
• Invest $195.7 million primarily in development projects;
• Repay $749.8 million of mortgage loans (inclusive of scheduled principal repayments) and incur prepayment penalties of approximately $3.4 million; and
• Repay $1.1 billion of unsecured notes and incur prepayment penalties of approximately $10.3 million.

Table of Contents
Credit Facility and Commercial Paper Program
The Company has a $2.5 billion unsecured revolving credit facility maturing November 1, 2024. The Company has the ability to increase available borrowings by an additional $750.0 million by adding lenders to the facility, obtaining the agreement of existing lenders to increase their commitments or incurring one or more term loans. The interest rate on advances under the facility will generally be LIBOR plus a spread (currently 0.775%), or based on bids received from the lending group, and the Company pays a quarterly facility fee (currently 0.125%). Both the spread and the facility fee are dependent on the Company’s senior unsecured credit rating.
The unsecured revolving credit agreement contains provisions that establish a process for entering into an amendment to replace LIBOR under certain circumstances, such as the anticipated phase-out of LIBOR by the end of 2021. At this time, it cannot be determined what interest rate(s) may succeed LIBOR, if any, and how any successor or alternative rates for LIBOR may affect borrowing costs or the availability of variable interest rate borrowings.
The Company has an unsecured commercial paper note program in the United States. The Company may borrow up to a maximum of $1.0 billion under this program subject to market conditions. The notes will be sold under customary terms in the United States commercial paper note market and will rank pari passu with all of the Company’s other unsecured senior indebtedness.
The Company limits its utilization of the revolving credit facility in order to maintain liquidity to support its $1.0 billion commercial paper program along with certain other obligations. The following table presents the availability on the Company’s unsecured revolving credit facility as of February 14, 2020 (amounts in thousands):
Dividend Policy
The Company determines its dividends/distributions based on actual and projected financial conditions, the Company’s actual and projected liquidity and operating results, the Company’s projected cash needs for capital expenditures and other investment activities and such other factors as the Company’s Board of Trustees deems relevant. The Company declared a dividend/distribution for each quarter in 2019 of $0.5675 per share/unit, an annualized increase of 5.1% over the amount paid in 2018. This increase is supported by the Company’s strong growth in property operations and a significant reduction in its development activity resulting in a material increase in available cash flow. The Company’s 2019 operating cash flow was sufficient to cover capital expenditures and regular dividends/distributions.
The Company expects to declare a dividend/distribution of $0.6025 per share/unit for the first quarter of 2020, an annualized increase of 6.2% over the amount paid in 2019. This increase is driven by the Company’s continued strong cash flow performance, solid balance sheet and modest payout ratio. The Company believes that its expected 2020 operating cash flow will be sufficient to cover capital expenditures and regular dividends/distributions. All future dividends/distributions remain subject to the discretion of the Company’s Board of Trustees.
Total dividends/distributions paid in January 2020 amounted to $218.3 million (excluding distributions on Partially Owned Properties), which consisted of certain distributions declared during the fourth quarter ended December 31, 2019.
Long-Term Financing and Capital Needs
The Company expects to meet its long-term liquidity requirements, such as lump sum unsecured note and mortgage debt maturities, property acquisitions and financing of development activities, through the issuance of secured and unsecured debt and equity securities, including additional OP Units, proceeds received from the disposition of certain properties and joint ventures and cash generated from operations after all distributions. In addition, the Company has a significant number of unencumbered properties available to secure additional mortgage borrowings in the event that unsecured capital is unavailable or the cost of alternative sources of capital is too high. The value of and cash flow from these unencumbered properties are in excess of the requirements the Company must maintain in order to comply with covenants under its unsecured notes and line of credit. Of the $27.5 billion in investment in real estate on the Company’s balance sheet at December 31, 2019, $23.9 billion or 86.9% was unencumbered. However, there can be no assurances that these sources of capital will be available to the Company in the future on acceptable terms or otherwise.
33
February 14, 2020
Unsecured revolving credit facility commitment $ 2,500,000 Commercial paper balance outstanding (1,000,000 ) Unsecured revolving credit facility balance outstanding (10,000 ) Other restricted amounts (100,949 )
Unsecured revolving credit facility availability $ 1,389,051

Table of Contents
EQR issues public equity and guarantees certain debt of the Operating Partnership from time to time. EQR does not have any indebtedness as all debt is incurred by the Operating Partnership.
The Company’s total debt summary and debt maturity schedules as of December 31, 2019 are as follows:
Debt Summary as of December 31, 2019 ($ in thousands)
34
Amounts % of Total
Weighted Average Rates
Weighted Average
Maturities (years)
Secured $ 1,941,610 21.5 % 3.84 % 6.5 Unsecured 7,095,346 78.5 % 4.07 % 9.2
Total $ 9,036,956 100.0 % 4.02 % 8.6
Fixed Rate Debt: Secured – Conventional $ 1,574,699 17.4 % 4.28 % 4.3 Unsecured – Public 6,077,513 67.3 % 4.24 % 10.8
Fixed Rate Debt 7,652,212 84.7 % 4.25 % 9.5
Floating Rate Debt: Secured – Conventional 7,050 0.1 % 3.28 % 2.5 Secured – Tax Exempt 359,861 4.0 % 1.94 % 16.0 Unsecured – Public — — 3.34 % — Unsecured – Revolving Credit Facility 20,000 0.2 % 3.12 % 4.8 Unsecured – Commercial Paper Program 997,833 11.0 % 2.42 % —
Floating Rate Debt 1,384,744 15.3 % 2.49 % 4.3
Total $ 9,036,956 100.0 % 4.02 % 8.6

Table of Contents
Debt Maturity Schedule as of December 31, 2019 ($ in thousands)
See the Definitions section below for the definition of Weighted Average Coupons and Weighted Average Rates. See also Note 9 in the Notes to Consolidated Financial Statements for additional discussion of debt at December 31, 2019.
The Company’s “Consolidated Debt-to-Total Market Capitalization Ratio” as of December 31, 2019 is presented in the following table. The Company calculates the equity component of its market capitalization as the sum of (i) the total outstanding Common Shares and assumed conversion of all Units at the equivalent market value of the closing price of the Company’s Common Shares on the New York Stock Exchange and (ii) the liquidation value of all perpetual preferred shares outstanding.
Equity Residential Capital Structure as of December 31, 2019
(Amounts in thousands except for share/unit and per share amounts)
The Operating Partnership’s “Consolidated Debt-to-Total Market Capitalization Ratio” as of December 31, 2019 is presented in the following
table. The Operating Partnership calculates the equity component of its market capitalization as the sum of (i) the total outstanding Units at the equivalent market value of the closing price of the Company’s Common Shares on the New York Stock Exchange and (ii) the liquidation value of all perpetual preference units outstanding.
35
Year Fixed Rate
Floating Rate Total % of Total
Weighted Average Coupons on
Fixed Rate Debt
Weighted Average Coupons on Total Debt
2020 $ 27,542 $ 1,000,000 (1) $ 1,027,542 11.3 % 4.56 % 2.07 % 2021 926,404 — 926,404 10.1 % 4.64 % 4.64 % 2022 264,185 7,650 271,835 3.0 % 3.25 % 3.23 % 2023 1,325,588 3,500 1,329,088 14.5 % 3.74 % 3.73 % 2024 — 26,100 (2) 26,100 0.3 % N/A 2.37 % 2025 450,000 8,200 458,200 5.0 % 3.38 % 3.34 % 2026 592,025 9,000 601,025 6.6 % 3.58 % 3.56 % 2027 400,000 9,800 409,800 4.5 % 3.25 % 3.21 % 2028 900,000 42,380 942,380 10.3 % 3.79 % 3.70 % 2029 888,120 11,500 899,620 9.9 % 3.30 % 3.28 % 2030+ 1,950,850 288,135 2,238,985 24.5 % 3.81 % 3.53 %
Subtotal 7,724,714 1,406,265 9,130,979 100.0 % 3.75 % 3.47 % Deferred Financing Costs and Unamortized (Discount) (72,502 ) (21,521 ) (94,023 ) N/A N/A N/A
Total $ 7,652,212 $ 1,384,744 $ 9,036,956 100.0 % 3.75 % 3.47 %
(1) Represents principal outstanding on the Company’s commercial paper program.
(2) Includes $20.0 million in principal outstanding on the Company’s revolving credit facility.
Secured Debt $ 1,941,610 21.5 % Unsecured Debt 7,095,346 78.5 %
Total Debt 9,036,956 100.0 % 22.4 % Common Shares (includes Restricted Shares) 371,670,884 96.4 % Units (includes OP Units and Restricted Units) 13,731,315 3.6 %
Total Shares and Units 385,402,199 100.0 % Common Share Price at December 31, 2019 $ 80.92
31,186,746 99.9 % Perpetual Preferred Equity 37,280 0.1 %
Total Equity 31,224,026 100.0 % 77.6 % Total Market Capitalization $ 40,260,982 100.0 %

Table of Contents
ERP Operating Limited Partnership Capital Structure as of December 31, 2019
(Amounts in thousands except for unit and per unit amounts)
EQR and ERPOP currently have an active universal shelf registration statement for the issuance of equity and debt securities that
automatically became effective upon filing with the SEC in June 2019 and expires in June 2022. Per the terms of ERPOP’s partnership agreement, EQR contributes the net proceeds of all equity offerings to the capital of ERPOP in exchange for additional OP Units (on a one-for-one Common Share per OP Unit basis) or preference units (on a one-for-one preferred share per preference unit basis).
The Company has an At-The-Market (“ATM”) share offering program which allows EQR to sell Common Shares from time to time into the existing trading market at current market prices as well as through negotiated transactions. In June 2019, the Company extended the program maturity to June 2022. In connection with the extension, the Company may now also sell Common Shares under forward sale agreements. The use of a forward sale agreement would allow the Company to lock in a price on the sale of Common Shares at the time the agreement is executed, but defer receiving the proceeds from the sale until a later date. EQR has the authority to issue 13.0 million shares but has not issued any shares under this program since September 2012. EQR may, but shall have no obligation to, sell Common Shares through the ATM share offering program in amounts and at times to be determined by EQR. Actual sales will depend on a variety of factors, including (among others) market conditions, the trading price of EQR’s Common Shares and determinations of the appropriate sources of funding for EQR. Through February 14, 2020, EQR has cumulatively issued approximately 16.7 million Common Shares at an average price of $48.53 per share for total consideration of approximately $809.9 million.
The Company may repurchase up to 13.0 million Common Shares under its share repurchase program. No open market repurchases have occurred since 2008, and no repurchases of any kind have occurred since February 2014. EQR may, but shall have no obligation to, repurchase Common Shares through the share repurchase program in amounts and at times to be determined by EQR. Actual repurchases will depend on a variety of factors, including (among others) market conditions, the trading price of EQR’s Common Shares and other opportunities for the investment of available capital. As of February 14, 2020, EQR has remaining authorization to repurchase up to 13.0 million of its shares.
ERPOP’s long-term senior debt ratings and short-term commercial paper ratings as well as EQR’s long-term preferred equity ratings, which all have a stable outlook, as of February 14, 2020 are as follows:
See Note 18 in the Notes to Consolidated Financial Statements for discussion of the events, if any, which occurred subsequent to
December 31, 2019.
Capitalization of Fixed Assets and Improvements to Real Estate
Our policy with respect to capital expenditures is generally to capitalize expenditures that improve the value of the property or extend the useful life of the component asset of the property. We track improvements to real estate in three major categories and several subcategories:
36
Secured Debt $ 1,941,610 21.5 % Unsecured Debt 7,095,346 78.5 %
Total Debt 9,036,956 100.0 % 22.4 % Total Outstanding Units 385,402,199 Common Share Price at December 31, 2019 $ 80.92
31,186,746 99.9 % Perpetual Preference Units 37,280 0.1 %
Total Equity 31,224,026 100.0 % 77.6 % Total Market Capitalization $ 40,260,982 100.0 %
Standard &
Poor’s Moody’s Fitch
ERPOP’s long-term senior debt rating A- A3 A ERPOP’s short-term commercial paper rating A-2 P-2 F-1 EQR’s long-term preferred equity rating BBB Baa1 BBB+
▪ Replacements (inside the apartment unit). These include:
• flooring such as carpets, hardwood, vinyl or tile;

Table of Contents
All replacements are depreciated over a five to ten-year estimated useful life. We expense as incurred all make-ready maintenance and turnover costs such as cleaning, interior painting of individual apartment units and the repair of any replacement item noted above.
All building improvements are depreciated over a five to fifteen-year estimated useful life. We capitalize building improvements and upgrades only if the item: (i) exceeds $2,500 (selected projects may be restricted by other thresholds); (ii) extends the useful life of the asset; and (iii) improves the value of the asset.
The third major category is renovations, which primarily consists of expenditures for kitchens and baths designed to reposition the apartment units/properties for higher rental levels in their respective markets. All renovation expenditures are depreciated over a ten-year estimated useful life.
For the year ended December 31, 2019, our actual capital expenditures to real estate included the following (amounts in thousands except for apartment unit and per apartment unit amounts):
Capital Expenditures to Real Estate For the Year Ended December 31, 2019
37
• appliances;
• mechanical equipment such as individual furnace/air units, hot water heaters, smoke/carbon monoxide/water alarms, etc.;
• furniture and fixtures such as kitchen/bath cabinets, light fixtures, ceiling fans, sinks, tubs, toilets, mirrors, countertops, etc.; and
• blinds and window coverings.
▪ Building improvements (outside the apartment unit). These include:
• roof replacement and major repairs;
• paving or major resurfacing of parking lots, curbs and sidewalks;
• amenities and common areas such as pools, exterior sports and playground equipment, lobbies, clubhouses, laundry rooms, alarm and security systems and offices;
• major building mechanical equipment systems;
• interior and exterior structural repair and exterior painting and siding;
• major landscaping and grounds improvement; and
• vehicles and office and maintenance equipment.
Same Store
Properties (4) Non-Same Store
Properties/Other (5) Total Same Store Avg. Per
Apartment Unit
Total Apartment Units 71,830 8,132 79,962
Building Improvements (1) $ 91,256 $ 7,469 $ 98,725 $ 1,270 Renovation Expenditures (2) 37,466 2,607 40,073 522 Replacements (3) 37,063 2,562 39,625 516
Total Capital Expenditures to Real Estate $ 165,785 $ 12,638 $ 178,423 $ 2,308
(1) Building Improvements – Includes roof replacement, paving, building mechanical equipment systems, exterior siding and painting, major landscaping, furniture, fixtures and equipment for amenities and common areas, vehicles and office and maintenance equipment.
(2) Renovation Expenditures – Apartment unit renovation costs (primarily kitchens and baths) designed to reposition these units for higher rental levels in their respective markets. Amounts for 2,415 same store apartment units approximated $15,515 per apartment unit renovated.
(3) Replacements – Includes appliances, mechanical equipment, fixtures and flooring (including hardwood and carpeting).
(4) Same Store Properties – Primarily includes all properties acquired or completed that are stabilized prior to January 1, 2018, less properties subsequently sold.
(5) Non-Same Store Properties/Other – Primarily includes all properties acquired during 2018 and 2019, plus any properties in lease-up and not stabilized as of January 1, 2018. Also includes capital expenditures for properties sold.

Table of Contents
For the year ended December 31, 2018, our actual capital expenditures to real estate included the following (amounts in thousands except for apartment unit and per apartment unit amounts):
Capital Expenditures to Real Estate For the Year Ended December 31, 2018
The Company estimates that during 2020 it will spend approximately $2,600 per same store apartment unit or $195.0 million of total capital expenditures to real estate for same store properties. Included in these total expected expenditures are approximately $50.0 million for apartment unit renovation expenditures on approximately 2,500 same store apartment units at an average cost of approximately $20,000 per apartment unit renovated and approximately $10.0 million on smart home technology upgrades on approximately 10,000 same store apartment units at an average cost of approximately $1,000 per apartment unit. The anticipated total capital expenditures to real estate for same store properties represent a higher absolute and per unit dollar amount and percentage of same store revenues as compared to 2019, primarily due to the higher expected renovation expenditures and smart home technology upgrades.
During the year ended December 31, 2019, the Company’s total non-real estate capital additions, such as computer software, computer equipment, and furniture and fixtures and leasehold improvements to the Company’s property management offices and its corporate offices, were approximately $5.0 million. The Company expects to fund approximately $22.7 million in total non-real estate capital additions in 2020. These anticipated fundings are significantly higher than 2019 and are primarily driven by corporate office renovations during 2020.
Derivative Instruments
In the normal course of business, the Company is exposed to the effect of interest rate changes. The Company may seek to manage these risks by following established risk management policies and procedures including the use of derivatives to hedge interest rate risk on debt instruments. The Company may also use derivatives to manage commodity prices in the daily operations of the business.
The Company has a policy of only entering into derivative contracts with major financial institutions based upon their credit ratings and other factors. When viewed in conjunction with the underlying and offsetting exposure that the derivatives are designed to hedge, the Company has not sustained a material loss from these instruments nor does it anticipate any material adverse effect on its net income or financial position in the future from the use of derivatives it currently has in place.
See Note 10 in the Notes to Consolidated Financial Statements for additional discussion of derivative instruments at December 31, 2019.
38
Same Stores
Properties (5) Non-Same Store
Properties/Other (6) Total
Same Store Avg. Per
Apartment Unit
Total Apartment Units (1) 71,721 6,816 78,537
Building Improvements (2) $ 100,382 $ 3,830 $ 104,212 $ 1,399 Renovation Expenditures (3) 39,431 1,922 41,353 550 Replacements (4) 41,746 1,190 42,936 582
Total Capital Expenditures to Real Estate $ 181,559 $ 6,942 $ 188,501 $ 2,531
(1) Total Apartment Units – Excludes 945 unconsolidated apartment units for which capital expenditures to real estate are self-funded and do not consolidate into the Company’s results.
(2) Building Improvements – Includes roof replacement, paving, building mechanical equipment systems, exterior siding and painting, major landscaping, furniture, fixtures and equipment for amenities and common areas, vehicles and office and maintenance equipment.
(3) Renovation Expenditures – Apartment unit renovation costs (primarily kitchens and baths) designed to reposition these units for higher rental levels in their respective markets. Amounts for 2,850 same store apartment units approximated $13,800 per apartment unit renovated.
(4) Replacements – Includes appliances, mechanical equipment, fixtures and flooring (including hardwood and carpeting).
(5) Same Store Properties – Primarily includes all properties acquired or completed that are stabilized prior to January 1, 2017, less properties subsequently sold.
(6) Non-Same Store Properties/Other – Primarily includes all properties acquired during 2017 and 2018, plus any properties in lease-up and not stabilized as of January 1, 2017. Also includes capital expenditures for properties sold.

Table of Contents
Definitions
The definition of certain terms described above or below are as follows:
Off-Balance Sheet Arrangements and Contractual Obligations
The Company has various unconsolidated interests in certain joint ventures. The Company does not believe that these unconsolidated investments have a materially different impact on its liquidity, cash flows, capital resources, credit or market risk than its consolidated operating and/or other activities. See also Note 6 in the Notes to Consolidated Financial Statements for additional discussion regarding the Company’s investments in partially owned entities. See also Note 16 in the Notes to Consolidated Financial Statements for discussion regarding the Company’s development projects.
39
• Acquisition Cap Rate – NOI that the Company anticipates receiving in the next 12 months (or the year two or three stabilized NOI for properties that are in lease-up at acquisition) less an estimate of property management costs/management fees allocated to the project (generally ranging from 2.0% to 4.0% of revenues depending on the size and income streams of the asset) and less an estimate for in-the-unit replacement capital expenditures (generally ranging from $100-$450 per apartment unit depending on the age and condition of the asset) divided by the gross purchase price of the asset. The weighted average Acquisition Cap Rate for acquired properties is weighted based on the projected NOI streams and the relative purchase price for each respective property.
• Development Yield – NOI that the Company anticipates receiving in the next 12 months following stabilization less an estimate of property management costs/management fees allocated to the project (generally ranging from 2.0% to 4.0% of revenues depending on the size and income streams of the asset) and less an estimate for in-the-unit replacement capital expenditures (generally ranging from $50-$150 per apartment unit depending on the type of asset) divided by the Total Budgeted Capital Cost of the asset. The weighted average Development Yield for development properties is weighted based on the projected NOI streams and the relative Total Budgeted Capital Cost for each respective property.
• Disposition Yield – NOI that the Company anticipates giving up in the next 12 months less an estimate of property management costs/management fees allocated to the project (generally ranging from 2.0% to 4.0% of revenues depending on the size and income streams of the asset) and less an estimate for in-the-unit replacement capital expenditures (generally ranging from $100-$450 per apartment unit depending on the age and condition of the asset) divided by the gross sales price of the asset. The weighted average Disposition Yield for sold properties is weighted based on the projected NOI streams and the relative sales price for each respective property.
• Unlevered Internal Rate of Return (“IRR”) – The Unlevered IRR on sold properties is the compound annual rate of return calculated by the Company based on the timing and amount of: (i) the gross purchase price of the property plus any direct acquisition costs incurred by the Company; (ii) total revenues earned during the Company’s ownership period; (iii) total direct property operating expenses (including real estate taxes and insurance) incurred during the Company’s ownership period; (iv) capital expenditures incurred during the Company’s ownership period; and (v) the gross sales price of the property net of selling costs.
• Weighted Average Coupons – Contractual interest rate for each debt instrument weighted by principal balances as of December 31, 2019. In case of debt for which fair value hedges are in place, the rate payable under the corresponding derivatives is used in lieu of the contractual interest rate.
• Weighted Average Rates – Interest expense for each debt instrument for the year ended December 31, 2019 weighted by its average principal balance for the same period. Interest expense includes amortization of premiums, discounts and other comprehensive income on debt and related derivative instruments. In case of debt for which derivatives are in place, the income or expense recognized under the corresponding derivatives is included in the total interest expense for the period.
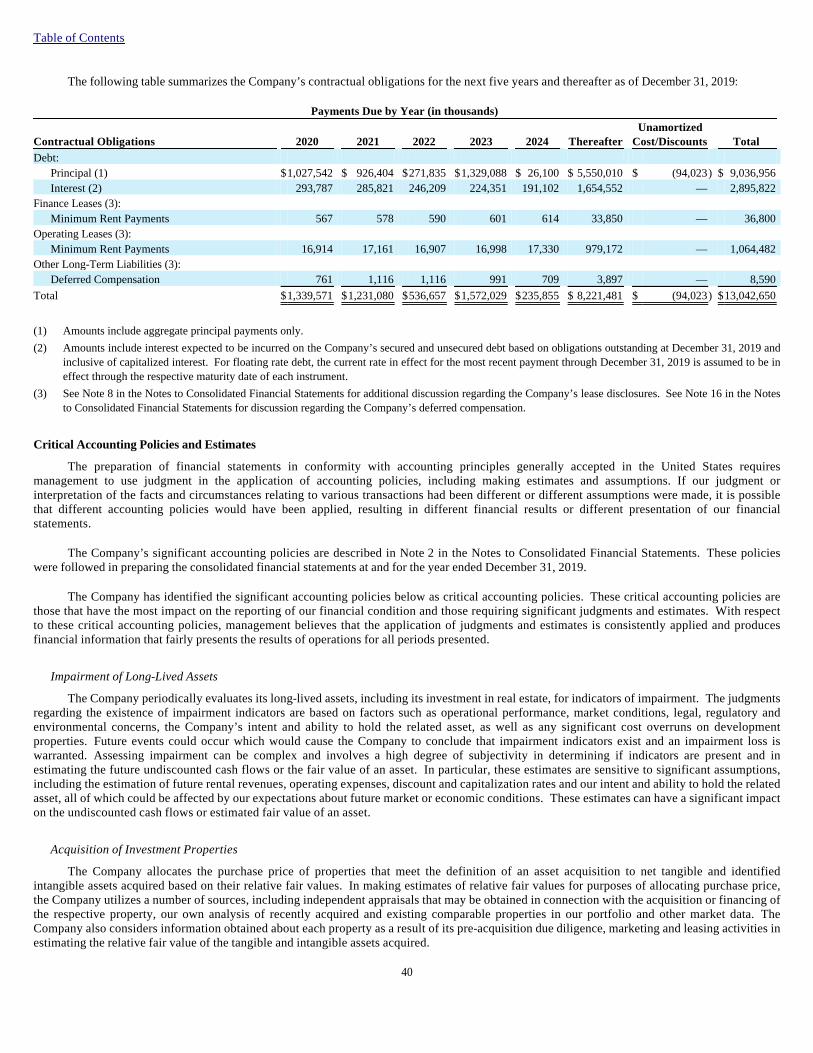
Table of Contents
The following table summarizes the Company’s contractual obligations for the next five years and thereafter as of December 31, 2019:
Critical Accounting Policies and Estimates
The preparation of financial statements in conformity with accounting principles generally accepted in the United States requires management to use judgment in the application of accounting policies, including making estimates and assumptions. If our judgment or interpretation of the facts and circumstances relating to various transactions had been different or different assumptions were made, it is possible that different accounting policies would have been applied, resulting in different financial results or different presentation of our financial statements.
The Company’s significant accounting policies are described in Note 2 in the Notes to Consolidated Financial Statements. These policies were followed in preparing the consolidated financial statements at and for the year ended December 31, 2019.
The Company has identified the significant accounting policies below as critical accounting policies. These critical accounting policies are those that have the most impact on the reporting of our financial condition and those requiring significant judgments and estimates. With respect to these critical accounting policies, management believes that the application of judgments and estimates is consistently applied and produces financial information that fairly presents the results of operations for all periods presented.
Impairment of Long-Lived Assets
The Company periodically evaluates its long-lived assets, including its investment in real estate, for indicators of impairment. The judgments regarding the existence of impairment indicators are based on factors such as operational performance, market conditions, legal, regulatory and environmental concerns, the Company’s intent and ability to hold the related asset, as well as any significant cost overruns on development properties. Future events could occur which would cause the Company to conclude that impairment indicators exist and an impairment loss is warranted. Assessing impairment can be complex and involves a high degree of subjectivity in determining if indicators are present and in estimating the future undiscounted cash flows or the fair value of an asset. In particular, these estimates are sensitive to significant assumptions, including the estimation of future rental revenues, operating expenses, discount and capitalization rates and our intent and ability to hold the related asset, all of which could be affected by our expectations about future market or economic conditions. These estimates can have a significant impact on the undiscounted cash flows or estimated fair value of an asset.
Acquisition of Investment Properties
The Company allocates the purchase price of properties that meet the definition of an asset acquisition to net tangible and identified intangible assets acquired based on their relative fair values. In making estimates of relative fair values for purposes of allocating purchase price, the Company utilizes a number of sources, including independent appraisals that may be obtained in connection with the acquisition or financing of the respective property, our own analysis of recently acquired and existing comparable properties in our portfolio and other market data. The Company also considers information obtained about each property as a result of its pre-acquisition due diligence, marketing and leasing activities in estimating the relative fair value of the tangible and intangible assets acquired.
40
Payments Due by Year (in thousands)
Contractual Obligations 2020 2021 2022 2023 2024 Thereafter Unamortized
Cost/Discounts Total Debt:
Principal (1) $ 1,027,542 $ 926,404 $ 271,835 $ 1,329,088 $ 26,100 $ 5,550,010 $ (94,023 ) $ 9,036,956 Interest (2) 293,787 285,821 246,209 224,351 191,102 1,654,552 — 2,895,822
Finance Leases (3): Minimum Rent Payments 567 578 590 601 614 33,850 — 36,800
Operating Leases (3): Minimum Rent Payments 16,914 17,161 16,907 16,998 17,330 979,172 — 1,064,482
Other Long-Term Liabilities (3): Deferred Compensation 761 1,116 1,116 991 709 3,897 — 8,590
Total $ 1,339,571 $ 1,231,080 $ 536,657 $ 1,572,029 $ 235,855 $ 8,221,481 $ (94,023 ) $ 13,042,650
(1) Amounts include aggregate principal payments only.
(2) Amounts include interest expected to be incurred on the Company’s secured and unsecured debt based on obligations outstanding at December 31, 2019 and inclusive of capitalized interest. For floating rate debt, the current rate in effect for the most recent payment through December 31, 2019 is assumed to be in effect through the respective maturity date of each instrument.
(3) See Note 8 in the Notes to Consolidated Financial Statements for additional discussion regarding the Company’s lease disclosures. See Note 16 in the Notes to Consolidated Financial Statements for discussion regarding the Company’s deferred compensation.
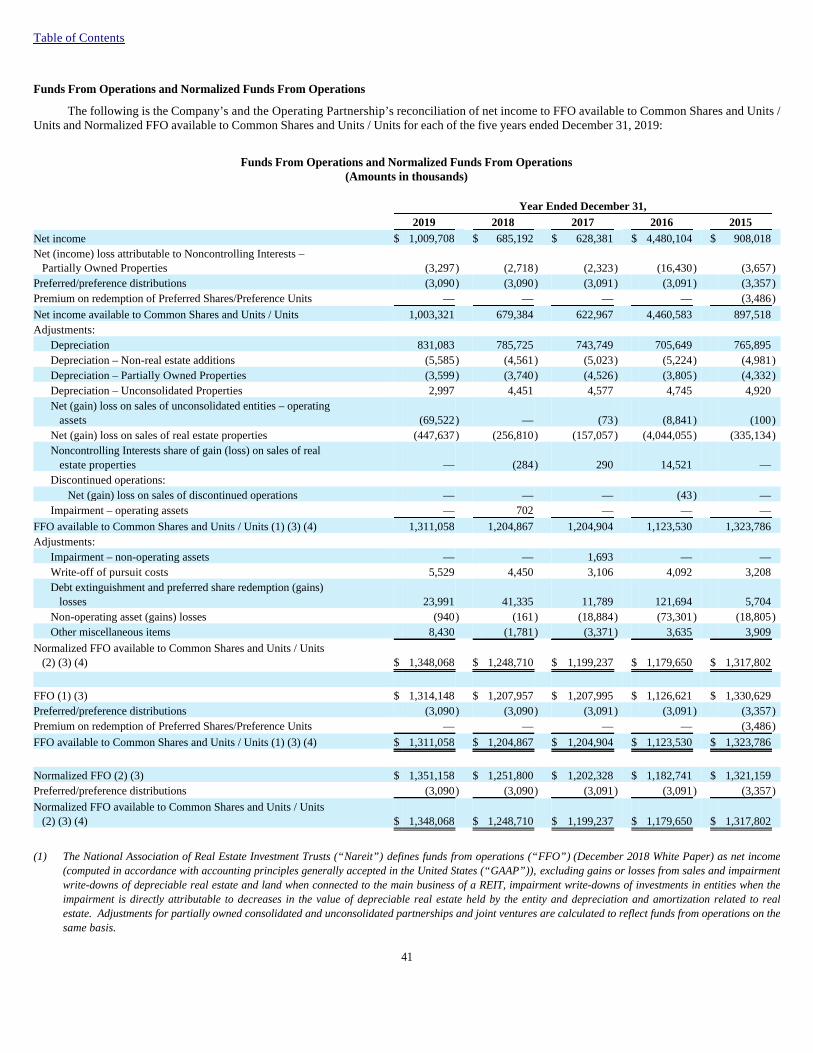
Table of Contents
Funds From Operations and Normalized Funds From Operations
The following is the Company’s and the Operating Partnership’s reconciliation of net income to FFO available to Common Shares and Units / Units and Normalized FFO available to Common Shares and Units / Units for each of the five years ended December 31, 2019:
Funds From Operations and Normalized Funds From Operations (Amounts in thousands)
41
Year Ended December 31, 2019 2018 2017 2016 2015
Net income $ 1,009,708 $ 685,192 $ 628,381 $ 4,480,104 $ 908,018 Net (income) loss attributable to Noncontrolling Interests – Partially Owned Properties (3,297 ) (2,718 ) (2,323 ) (16,430 ) (3,657 ) Preferred/preference distributions (3,090 ) (3,090 ) (3,091 ) (3,091 ) (3,357 ) Premium on redemption of Preferred Shares/Preference Units — — — — (3,486 )
Net income available to Common Shares and Units / Units 1,003,321 679,384 622,967 4,460,583 897,518 Adjustments:
Depreciation 831,083 785,725 743,749 705,649 765,895 Depreciation – Non-real estate additions (5,585 ) (4,561 ) (5,023 ) (5,224 ) (4,981 ) Depreciation – Partially Owned Properties (3,599 ) (3,740 ) (4,526 ) (3,805 ) (4,332 ) Depreciation – Unconsolidated Properties 2,997 4,451 4,577 4,745 4,920 Net (gain) loss on sales of unconsolidated entities – operating assets (69,522 ) — (73 ) (8,841 ) (100 ) Net (gain) loss on sales of real estate properties (447,637 ) (256,810 ) (157,057 ) (4,044,055 ) (335,134 ) Noncontrolling Interests share of gain (loss) on sales of real estate properties — (284 ) 290 14,521 — Discontinued operations:
Net (gain) loss on sales of discontinued operations — — — (43 ) — Impairment – operating assets — 702 — — —
FFO available to Common Shares and Units / Units (1) (3) (4) 1,311,058 1,204,867 1,204,904 1,123,530 1,323,786 Adjustments:
Impairment – non-operating assets — — 1,693 — — Write-off of pursuit costs 5,529 4,450 3,106 4,092 3,208 Debt extinguishment and preferred share redemption (gains) losses 23,991 41,335 11,789 121,694 5,704 Non-operating asset (gains) losses (940 ) (161 ) (18,884 ) (73,301 ) (18,805 ) Other miscellaneous items 8,430 (1,781 ) (3,371 ) 3,635 3,909
Normalized FFO available to Common Shares and Units / Units (2) (3) (4) $ 1,348,068 $ 1,248,710 $ 1,199,237 $ 1,179,650 $ 1,317,802
FFO (1) (3) $ 1,314,148 $ 1,207,957 $ 1,207,995 $ 1,126,621 $ 1,330,629 Preferred/preference distributions (3,090 ) (3,090 ) (3,091 ) (3,091 ) (3,357 ) Premium on redemption of Preferred Shares/Preference Units — — — — (3,486 )
FFO available to Common Shares and Units / Units (1) (3) (4) $ 1,311,058 $ 1,204,867 $ 1,204,904 $ 1,123,530 $ 1,323,786
Normalized FFO (2) (3) $ 1,351,158 $ 1,251,800 $ 1,202,328 $ 1,182,741 $ 1,321,159 Preferred/preference distributions (3,090 ) (3,090 ) (3,091 ) (3,091 ) (3,357 )
Normalized FFO available to Common Shares and Units / Units (2) (3) (4) $ 1,348,068 $ 1,248,710 $ 1,199,237 $ 1,179,650 $ 1,317,802
(1) The National Association of Real Estate Investment Trusts (“Nareit”) defines funds from operations (“FFO”) (December 2018 White Paper) as net income (computed in accordance with accounting principles generally accepted in the United States (“GAAP”)), excluding gains or losses from sales and impairment write-downs of depreciable real estate and land when connected to the main business of a REIT, impairment write-downs of investments in entities when the impairment is directly attributable to decreases in the value of depreciable real estate held by the entity and depreciation and amortization related to real estate. Adjustments for partially owned consolidated and unconsolidated partnerships and joint ventures are calculated to reflect funds from operations on the same basis.

Table of Contents
Item 7A. Quantitative and Qualitative Disclosures about Market Risk
The Company is exposed to market risk from financial instruments primarily from changes in interest rates. Such risks derive from the refinancing of debt maturities, from exposure to interest rate fluctuations on floating rate debt and from derivative instruments utilized to swap fixed rate debt to floating or to hedge rates in anticipation of future debt issuances. Our operating results are, therefore, affected by changes in short-term interest rates, primarily London interbank offered rate (“LIBOR”) and Securities Industry and Financial Markets Association (“SIFMA”) indices, which directly impact borrowings under our revolving credit facility and interest on secured and unsecured borrowings contractually tied to such rates. Short-term interest rates also indirectly affect the discount on notes issued under our commercial paper program. Additionally, we have exposure to long-term interest rates, particularly U.S. Treasuries as they are utilized to price our long term borrowings and therefore affect the cost of refinancing existing debt or incurring additional debt.
The Company monitors and manages interest rates as part of its risk management process, by targeting adequate levels of floating rate exposure and an appropriate debt maturity profile. From time to time, we may utilize derivative instruments to manage interest rate exposure and to comply with the requirements of certain lenders, but not for trading or speculative purposes. See also Note 10 in the Notes to Consolidated Financial Statements for additional discussion of derivative instruments.
The Company had total variable rate debt of $1.4 billion, representing 15.3% of total debt, and $1.4 billion, representing 16.4% of total debt as of December 31, 2019 and 2018, respectively. If interest rates had been 100 basis points higher in 2019 and 2018 and average balances coincided with year end balances, our annual interest expense would have been $13.8 million and $14.5 million higher, respectively. Unsecured notes issued under the Company’s commercial paper program are treated as variable rate debt for the purposes of this calculation even though they do not have a stated interest rate, given their short-term nature. The effect of derivatives, if applicable, is also considered when computing the total amount of variable rate debt.
Changes in interest rates also affect the estimated fair market value of our fixed rate debt, computed using a discounted cash flow model. As of December 31, 2019, the Company had total outstanding fixed rate debt of $7.7 billion, or 84.7% of total debt, with an estimated fair market value of $8.2 billion. If interest rates had been 100 basis points lower as of December 31, 2019, the estimated fair market value would have increased by approximately $664.4 million. As of December 31, 2018, the Company had total outstanding fixed rate debt of $7.4 billion, or 83.6% of total debt, with an estimated fair market value of $7.4 billion. If interest rates had been 100 basis points lower as of December 31, 2018, the estimated fair market value would have increased by approximately $514.3 million.
42
(2) Normalized funds from operations (“Normalized FFO”) begins with FFO and excludes:
• the impact of any expenses relating to non-operating asset impairment;
• pursuit cost write-offs;
• gains and losses from early debt extinguishment and preferred share redemptions;
• gains and losses from non-operating assets; and
• other miscellaneous items.
(3) The Company believes that FFO and FFO available to Common Shares and Units / Units are helpful to investors as supplemental measures of the operating performance of a real estate company, because they are recognized measures of performance by the real estate industry and by excluding gains or losses from sales and impairment write-downs of depreciable real estate and excluding depreciation related to real estate (which can vary among owners of identical assets in similar condition based on historical cost accounting and useful life estimates), FFO and FFO available to Common Shares and Units / Units can help compare the operating performance of a company’s real estate between periods or as compared to different companies. The Company also believes that Normalized FFO and Normalized FFO available to Common Shares and Units / Units are helpful to investors as supplemental measures of the operating performance of a real estate company because they allow investors to compare the Company’s operating performance to its performance in prior reporting periods and to the operating performance of other real estate companies without the effect of items that by their nature are not comparable from period to period and tend to obscure the Company’s actual operating results. FFO, FFO available to Common Shares and Units / Units, Normalized FFO and Normalized FFO available to Common Shares and Units / Units do not represent net income, net income available to Common Shares / Units or net cash flows from operating activities in accordance with GAAP. Therefore, FFO, FFO available to Common Shares and Units / Units, Normalized FFO and Normalized FFO available to Common Shares and Units / Units should not be exclusively considered as alternatives to net income, net income available to Common Shares / Units or net cash flows from operating activities as determined by GAAP or as a measure of liquidity. The Company’s calculation of FFO, FFO available to Common Shares and Units / Units, Normalized FFO and Normalized FFO available to Common Shares and Units / Units may differ from other real estate companies due to, among other items, variations in cost capitalization policies for capital expenditures and, accordingly, may not be comparable to such other real estate companies.
(4) FFO available to Common Shares and Units / Units and Normalized FFO available to Common Shares and Units / Units are calculated on a basis consistent with net income available to Common Shares / Units and reflects adjustments to net income for preferred distributions and premiums on redemption of preferred shares/preference units in accordance with GAAP. The equity positions of various individuals and entities that contributed their properties to the Operating Partnership in exchange for OP Units are collectively referred to as the “Noncontrolling Interests – Operating Partnership”. Subject to certain restrictions, the Noncontrolling Interests – Operating Partnership may exchange their OP Units for Common Shares on a one-for-one basis.

Table of Contents
The Company had no outstanding derivative instruments as of December 31, 2019 and had derivative instruments with a net liability fair value of approximately $10.1 million as of December 31, 2018. If interest rates had been 27 basis points (representing 10% of the weighted average of the then prevailing market rates) lower on December 31, 2018, the liability would have increased by approximately $11.3 million.
These amounts were determined by considering the impact of hypothetical interest rates on the Company’s financial instruments. These analyses do not consider the effects of the changes in overall economic activity that could exist in such an environment. Further, in the event of changes of such magnitude, management would likely take actions to further mitigate its exposure to these changes. However, due to the uncertainty of the specific actions that would be taken and their possible effects, this analysis assumes no changes in the Company’s financial structure or results.
The Company cannot predict the effect of adverse changes in interest rates on its debt and derivative instruments and, therefore, its exposure to market risk, nor can there be any assurance that long-term debt will be available at advantageous pricing. Consequently, future results may differ materially from the estimated adverse changes discussed above.
Item 8. Financial Statements and Supplementary Data
See Index to Consolidated Financial Statements and Schedule on page F-1 of this Form 10-K.
Item 9. Changes in and Disagreements with Accountants on Accounting and Financial Disclosure
None.
Item 9A. Controls and Procedures
Equity Residential
(a) Evaluation of Disclosure Controls and Procedures:
Effective as of December 31, 2019, the Company carried out an evaluation, under the supervision and with the participation of the Company’s management, including the Chief Executive Officer and Chief Financial Officer, of the effectiveness of the Company’s disclosure controls and procedures pursuant to Exchange Act Rules 13a-15 and 15d-15. Based on that evaluation, the Chief Executive Officer and Chief Financial Officer concluded that the disclosure controls and procedures are effective to ensure that information required to be disclosed by the Company in its Exchange Act filings is recorded, processed, summarized and reported within the time periods specified in the SEC’s rules and forms.
(b) Management’s Report on Internal Control over Financial Reporting:
Equity Residential’s management is responsible for establishing and maintaining adequate internal control over financial reporting, as such term is defined in Rule 13a-15(f) under the Exchange Act. Under the supervision and with the participation of management, including the Company’s Chief Executive Officer and Chief Financial Officer, management conducted an evaluation of the effectiveness of internal control over financial reporting based on the framework in Internal Control – Integrated Framework issued by the Committee of Sponsoring Organizations of the Treadway Commission (2013 framework).
Because of its inherent limitations, internal control over financial reporting may not prevent or detect misstatements. Therefore, even those systems determined to be effective can only provide reasonable assurance with respect to financial statement preparation and presentation.
Based on the Company’s evaluation under the framework in Internal Control – Integrated Framework, management concluded that its internal control over financial reporting was effective as of December 31, 2019. Our internal control over financial reporting has been audited as of December 31, 2019 by Ernst & Young LLP, an independent registered public accounting firm, as stated in their report which is included herein.
(c) Changes in Internal Control over Financial Reporting:
There were no changes to the internal control over financial reporting of the Company identified in connection with the Company’s evaluation referred to above that occurred during the fourth quarter of 2019 that have materially affected, or are reasonably likely to materially affect, the Company’s internal control over financial reporting.
43

Table of Contents
ERP Operating Limited Partnership
(a) Evaluation of Disclosure Controls and Procedures:
Effective as of December 31, 2019, the Operating Partnership carried out an evaluation, under the supervision and with the participation of the Operating Partnership’s management, including the Chief Executive Officer and Chief Financial Officer of EQR, of the effectiveness of the Operating Partnership’s disclosure controls and procedures pursuant to Exchange Act Rules 13a-15 and 15d-15. Based on that evaluation, the Chief Executive Officer and Chief Financial Officer concluded that the disclosure controls and procedures are effective to ensure that information required to be disclosed by the Operating Partnership in its Exchange Act filings is recorded, processed, summarized and reported within the time periods specified in the SEC’s rules and forms.
(b) Management’s Report on Internal Control over Financial Reporting:
ERP Operating Limited Partnership’s management is responsible for establishing and maintaining adequate internal control over financial reporting, as such term is defined in Rule 13a-15(f) under the Exchange Act. Under the supervision and with the participation of management, including the Chief Executive Officer and Chief Financial Officer of EQR, management conducted an evaluation of the effectiveness of internal control over financial reporting based on the framework in Internal Control – Integrated Framework issued by the Committee of Sponsoring Organizations of the Treadway Commission (2013 framework).
Because of its inherent limitations, internal control over financial reporting may not prevent or detect misstatements. Therefore, even those systems determined to be effective can only provide reasonable assurance with respect to financial statement preparation and presentation.
Based on the Operating Partnership’s evaluation under the framework in Internal Control – Integrated Framework, management concluded that its internal control over financial reporting was effective as of December 31, 2019. Our internal control over financial reporting has been audited as of December 31, 2019 by Ernst & Young LLP, an independent registered public accounting firm, as stated in their report which is included herein.
(c) Changes in Internal Control over Financial Reporting:
There were no changes to the internal control over financial reporting of the Operating Partnership identified in connection with the Operating Partnership’s evaluation referred to above that occurred during the fourth quarter of 2019 that have materially affected, or are reasonably likely to materially affect, the Operating Partnership’s internal control over financial reporting.
Item 9B. Other Information
None.
44

Table of Contents
PART III
Items 10, 11, 12, 13 and 14.
Trustees, Executive Officers and Corporate Governance; Executive Compensation; Security Ownership of Certain Beneficial Owners and Management and Related Stockholder Matters; Certain Relationships and Related Transactions, and Trustee Independence; and Principal Accounting Fees and Services
The information required by Item 10, Item 11, Item 12, Item 13 and Item 14 is incorporated by reference to, and will be contained in, Equity Residential’s Proxy Statement, which the Company intends to file no later than 120 days after the end of its fiscal year ended December 31, 2019, and thus these items have been omitted in accordance with General Instruction G(3) to Form 10-K. Equity Residential is the general partner and 96.4% owner of ERP Operating Limited Partnership.
45

Table of Contents
PART IV
Item 15. Exhibits, Financial Statement Schedules
(a) The following documents are filed as part of this Report:
Item 16. Form 10-K Summary
None.
46
(1) Financial Statements: See Index to Consolidated Financial Statements and Schedule on page F-1 of this Form 10-K.
(2) Exhibits: See the Exhibit Index.
(3) Financial Statement Schedules: See Index to Consolidated Financial Statements and Schedule on page F-1 of this Form 10-K.

Table of Contents
EXHIBIT INDEX
The exhibits listed below are filed as part of this report. References to exhibits or other filings under the caption “Location” indicate that the exhibit or other filing has been filed, that the indexed exhibit and the exhibit referred to are the same and that the exhibit referred to is incorporated by reference. The Commission file numbers for our Exchange Act filings referenced below are 1-12252 (Equity Residential) and 0-24920 (ERP Operating Limited Partnership).
47
Exhibit Description Location
3.1 Articles of Restatement of Declaration of Trust of Equity Residential dated December 9, 2004.
Included as Exhibit 3.1 to Equity Residential’s Form 10-K for the year ended December 31, 2004.
3.2 Eighth Amended and Restated Bylaws of Equity Residential, effective as of October 1, 2015.
Included as Exhibit 3.1 to Equity Residential's Form 8-K dated and filed on October 1, 2015.
3.3
First Amendment to Eighth Amended and Restated Bylaws of Equity Residential, dated November 20, 2017.
Included as Exhibit 3.1 to Equity Residential's Form 8-K dated and filed on November 20, 2017.
3.4 Sixth Amended and Restated Agreement of Limited Partnership for ERP Operating Limited Partnership dated as of March 12, 2009.
Included as Exhibit 10.1 to Equity Residential's and ERP Operating Limited Partnership's Form 8-K dated March 12, 2009, filed on March 18, 2009.
4.1 Description of Equity Residential Common Shares Registered Under Section 12 of the Securities Exchange Act of 1934.
Attached herein.
4.2 Description of ERP Operating Limited Partnership Notes Registered Under Section 12 of the Securities Exchange Act of 1934.
Attached herein.
4.3 Description of ERP Operating Limited Partnership OP Units Registered Under Section 12 of the Securities Exchange Act of 1934.
Attached herein.
4.4 Indenture, dated October 1, 1994, between the Operating Partnership and The Bank of New York Mellon Trust Company, N.A., as successor trustee (“Indenture”).
Included as Exhibit 4(a) to ERP Operating Limited Partnership’s Form S-3 filed on October 7, 1994. **
4.5 First Supplemental Indenture to Indenture, dated as of September 9, 2004.
Included as Exhibit 4.2 to ERP Operating Limited Partnership’s Form 8-K, filed on September 10, 2004.
4.6 Second Supplemental Indenture to Indenture, dated as of August 23, 2006.
Included as Exhibit 4.1 to ERP Operating Limited Partnership’s Form 8-K dated August 16, 2006, filed on August 23, 2006.
4.7 Third Supplemental Indenture to Indenture, dated as of June 4, 2007. Included as Exhibit 4.1 to ERP Operating Limited Partnership’s Form 8-K dated May 30, 2007, filed on June 1, 2007.
4.8 Fourth Supplemental Indenture to Indenture, dated as of December 12, 2011.
Included as Exhibit 4.2 to ERP Operating Limited Partnership's Form 8-K dated December 7, 2011, filed on December 9, 2011.
4.9 Fifth Supplemental Indenture to Indenture, dated as of February 1, 2016.
Included as Exhibit 4.6 to Equity Residential's and ERP Operating Limited Partnership's Form 10-K for the year ended December 31, 2015.
4.10 Form of 4.625% Note due December 15, 2021. Included as Exhibit 4.1 to ERP Operating Limited Partnership's Form 8-K dated December 7, 2011, filed on December 9, 2011.
4.11 Form of 3.00% Note due April 15, 2023. Included as Exhibit 4.1 to ERP Operating Limited Partnership's Form 8-K dated April 3, 2013, filed on April 8, 2013.
4.12 Form of 3.375% Note due June 1, 2025. Included as Exhibit 4.1 to ERP Operating Limited Partnership's Form 8-K dated May 11, 2015, filed on May 13, 2015.
4.13 Terms Agreement regarding 7.57% Notes due August 15, 2026. Included as Exhibit 1 to ERP Operating Limited Partnership’s Form 8-K, filed on August 13, 1996.
4.14 Form of 2.850% Note due November 1, 2026. Included as Exhibit 4.1 to ERP Operating Limited Partnership's Form 8-K dated October 4, 2016, filed on October 7, 2016.
4.15 Form of 3.250% Note due August 1, 2027. Included as Exhibit 4.1 to Equity Residential's and ERP Operating Limited Partnership's Form 8-K dated July 31, 2017, filed on August 2, 2017.
4.16 Form of 3.500% Note due March 1, 2028. Included as Exhibit 4.1 to Equity Residential's and ERP Operating Limited Partnership's Form 8-K dated February 1, 2018, filed on February 6, 2018.

Table of Contents
48
4.17 Form of 4.150% Note due December 1, 2028.
Included as Exhibit 4.1 to Equity Residential's and ERP Operating Limited Partnership's Form 8-K dated November 28, 2018, filed on November 29, 2018.
4.18 Form of 3.000% Note due July 1, 2029. Included as Exhibit 4.1 to Equity Residential's and ERP Operating Limited Partnership's Form 8-K dated June 17, 2019, filed on June 20, 2019.
4.19 Form of 2.500% Note due February 15, 2030.
Included as Exhibit 4.1 to Equity Residential's and ERP Operating Limited Partnership's Form 8-K dated August 20, 2019, filed on August 22, 2019.
4.20 Form of 4.500% Note due July 1, 2044. Included as Exhibit 4.2 to ERP Operating Limited Partnership's Form 8-K dated June 16, 2014, filed on June 18, 2014.
4.21 Form of 4.500% Note due June 1, 2045. Included as Exhibit 4.2 to ERP Operating Limited Partnership's Form 8-K dated May 11, 2015, filed on May 13, 2015.
4.22 Form of 4.000% Note due August 1, 2047. Included as Exhibit 4.2 to Equity Residential's and ERP Operating Limited Partnership's Form 8-K dated July 31, 2017, filed on August 2, 2017.
10.1 * Noncompetition Agreement (Zell). Included as an exhibit to Equity Residential's Form S-11 Registration Statement, File No. 33-63158. **
10.2 * Noncompetition Agreement (Spector). Included as an exhibit to Equity Residential's Form S-11 Registration Statement, File No. 33-63158. **
10.3 * Form of Noncompetition Agreement (other officers). Included as an exhibit to Equity Residential's Form S-11 Registration Statement, File No. 33-63158. **
10.4 Revolving Credit Agreement, dated as of November 1, 2019, among ERP Operating Limited Partnership, Bank of America, N.A., as Administrative Agent, and the financial institutions party thereto.
Included as Exhibit 10.1 to Equity Residential's and ERP Operating Limited Partnership's Form 8-K dated November 1, 2019, filed on November 4, 2019.
10.5 Amended and Restated Limited Partnership Agreement of Lexford Properties, L.P.
Included as Exhibit 10.16 to Equity Residential's Form 10-K for the year ended December 31, 1999.
10.6 * Equity Residential 2019 Share Incentive Plan. Included as Exhibit 99.1 to Equity Residential's and ERP Operating Limited Partnership's Form 8-K dated June 27, 2019, filed on July 1, 2019.
10.7 * Equity Residential 2011 Share Incentive Plan. Included as Exhibit 99.1 to Equity Residential's and ERP Operating Limited Partnership's Form 8-K dated June 16, 2011, filed on June 22, 2011.
10.8 * First Amendment to 2011 Share Incentive Plan. Included as Exhibit 10.1 to Equity Residential's and ERP Operating Limited Partnership's Form 10-Q for the quarterly period ended June 30, 2012.
10.9 * Second Amendment to 2011 Share Incentive Plan. Included as Exhibit 10.1 to Equity Residential's and ERP Operating Limited Partnership's Form 10-Q for the quarterly period ended September 30, 2013.
10.10 * Third Amendment to 2011 Share Incentive Plan. Included as Exhibit 10.1 to Equity Residential's and ERP Operating Limited Partnership's Form 10-Q for the quarterly period ended March 31, 2014.
10.11 * Fourth Amendment to 2011 Share Incentive Plan. Included as Exhibit 10.1 to Equity Residential's and ERP Operating Limited Partnership's Form 10-Q for the quarterly period ended September 30, 2014.
10.12 * Fifth Amendment to 2011 Share Incentive Plan. Included as Exhibit 10.1 to Equity Residential's and ERP Operating Limited Partnership's Form 10-Q for the quarterly period ended June 30, 2016.
10.13 * Sixth Amendment to 2011 Share Incentive Plan. Included as Exhibit 10.18 to Equity Residential's and ERP Operating Limited Partnership's Form 10-K for the year ended December 31, 2016.
10.14 * Seventh Amendment to 2011 Share Incentive Plan. Included as Exhibit 10.1 to Equity Residential's and ERP Operating Limited Partnership's Form 10-Q for the quarterly period ended September 30, 2017.
10.15 * Equity Residential Second Restated 2002 Share Incentive Plan dated December 10, 2008.
Included as Exhibit 10.15 to Equity Residential's Form 10-K for the year ended December 31, 2008.

Table of Contents
49
10.16 * First Amendment to Second Restated 2002 Share Incentive Plan. Included as Exhibit 10.1 to Equity Residential's Form 10-Q for the quarterly period ended September 30, 2010.
10.17 * Second Amendment to Second Restated 2002 Share Incentive Plan. Included as Exhibit 10.3 to Equity Residential's Form 10-Q for the quarterly period ended June 30, 2011.
10.18 * Third Amendment to Second Restated 2002 Share Incentive Plan. Included as Exhibit 10.2 to Equity Residential's and ERP Operating Limited Partnership's Form 10-Q for the quarterly period ended June 30, 2012.
10.19 * Fourth Amendment to Second Restated 2002 Share Incentive Plan. Included as Exhibit 10.2 to Equity Residential's and ERP Operating Limited Partnership's Form 10-Q for the quarterly period ended September 30, 2013.
10.20 * Form of 2018 Long-Term Incentive Plan Award Agreement.
Included as Exhibit 10.1 to Equity Residential's and ERP Operating Limited Partnership's Form 10-Q for the quarterly period ended March 31, 2018.
10.21 * Form of Change in Control/Severance Agreement between the Company and other executive officers.
Included as Exhibit 10.13 to Equity Residential's Form 10-K for the year ended December 31, 2001.
10.22 * Form of First Amendment to Amended and Restated Change in Control/Severance Agreement with each executive officer.
Included as Exhibit 10.1 to Equity Residential's Form 10-Q for the quarterly period ended March 31, 2009.
10.23 * Form of Indemnification Agreement between the Company and each trustee and executive officer.
Included as Exhibit 10.18 to Equity Residential's Form 10-K for the year ended December 31, 2003.
10.24 * Form of Letter Agreement between Equity Residential and Alan W. George.
Included as Exhibit 10.3 to Equity Residential's Form 10-Q for the quarterly period ended September 30, 2008.
10.25 * Form of Executive Retirement Benefits Agreement. Included as Exhibit 10.24 to Equity Residential's Form 10-K for the year ended December 31, 2006.
10.26 * Retirement Benefits Agreement between Samuel Zell and the Company dated October 18, 2001.
Included as Exhibit 10.18 to Equity Residential's Form 10-K for the year ended December 31, 2001.
10.27 * Rule of 70 Retirement Agreement, dated February 28, 2018, by and between Equity Residential and David S. Santee.
Included as Exhibit 10.2 to Equity Residential's and ERP Operating Limited Partnership's Form 10-Q for the quarterly period ended March 31, 2018.
10.28 * Age 62 Retirement Agreement, dated September 4, 2018, by and between Equity Residential and David J. Neithercut.
Included as Exhibit 10.1 to Equity Residential's and ERP Operating Limited Partnership's Form 10-Q for the quarterly period ended September 30, 2018.
10.29 * The Equity Residential Supplemental Executive Retirement Plan as Amended and Restated effective April 1, 2017.
Included as Exhibit 10.2 to Equity Residential's and ERP Operating Limited Partnership's Form 10-Q for the quarterly period ended June 30, 2017.
10.30 * The Equity Residential Grandfathered Supplemental Executive Retirement Plan as Amended and Restated effective January 1, 2005.
Included as Exhibit 10.2 to Equity Residential's Form 10-Q for the quarterly period ended March 31, 2008.
10.31 Distribution Agreement, dated June 6, 2019, among the Company, the Operating Partnership, JPMorgan Chase Bank, National Association, London Branch, J.P. Morgan Securities LLC, Barclays Bank PLC, Barclays Capital Inc., Bank of America, N.A., BofA Securities, Inc., The Bank of New York Mellon, BNY Mellon Capital Markets, LLC, Morgan Stanley & Co. LLC, MUFG Securities EMEA plc, MUFG Securities Americas Inc., The Bank of Nova Scotia, Scotia Capital (USA) Inc., UBS AG, London Branch and UBS Securities LLC.
Included as Exhibit 1.1 to Equity Residential's and ERP Operating Limited Partnership's Form 8-K dated and filed on June 6, 2019.
10.32 Form of Master Forward Sale Confirmation. Included as Exhibit 1.2 to Equity Residential's and ERP Operating Limited Partnership's Form 8-K dated and filed on June 6, 2019.
10.33 Archstone Residual JV, LLC Limited Liability Company Agreement. Included as Exhibit 10.3 to Equity Residential's and ERP Operating Limited Partnership's Form 8-K dated February 27, 2013, filed on February 28, 2013.
10.34 Archstone Parallel Residual JV, LLC Limited Liability Company Agreement.
Included as Exhibit 10.4 to Equity Residential's and ERP Operating Limited Partnership's Form 8-K dated February 27, 2013, filed on February 28, 2013.
10.35 Archstone Parallel Residual JV 2, LLC Limited Liability Company Agreement.
Included as Exhibit 10.5 to Equity Residential's and ERP Operating Limited Partnership's Form 8-K dated February 27, 2013, filed on February 28, 2013.

Table of Contents
*Management contracts and compensatory plans or arrangements filed as exhibits to this report are identified by an asterisk.
**Filed on paper – hyperlink is not required pursuant to Rule 105 of Regulation S-T.
50
10.36 Legacy Holdings JV, LLC Limited Liability Company Agreement. Included as Exhibit 10.6 to Equity Residential's and ERP Operating Limited Partnership's Form 8-K dated February 27, 2013, filed on February 28, 2013.
21 List of Subsidiaries of Equity Residential and ERP Operating Limited Partnership.
Attached herein.
23.1 Consent of Ernst & Young LLP - Equity Residential. Attached herein.
23.2 Consent of Ernst & Young LLP - ERP Operating Limited Partnership. Attached herein.
24 Power of Attorney. See the signature page to this report.
31.1 Equity Residential - Certification of Mark J. Parrell, Chief Executive Officer.
Attached herein.
31.2 Equity Residential - Certification of Robert A. Garechana, Chief Financial Officer.
Attached herein.
31.3 ERP Operating Limited Partnership - Certification of Mark J. Parrell, Chief Executive Officer of Registrant's General Partner.
Attached herein.
31.4 ERP Operating Limited Partnership - Certification of Robert A. Garechana, Chief Financial Officer of Registrant's General Partner.
Attached herein.
32.1 Equity Residential - Certification Pursuant to 18 U.S.C. Section 1350, as adopted pursuant to Section 906 of the Sarbanes-Oxley Act of 2002, of Mark J. Parrell, Chief Executive Officer of the Company.
Attached herein.
32.2 Equity Residential - Certification Pursuant to 18 U.S.C. Section 1350, as adopted pursuant to Section 906 of the Sarbanes-Oxley Act of 2002, of Robert A. Garechana, Chief Financial Officer of the Company.
Attached herein.
32.3 ERP Operating Limited Partnership - Certification Pursuant to 18 U.S.C. Section 1350, as adopted pursuant to Section 906 of the Sarbanes-Oxley Act of 2002, of Mark J. Parrell, Chief Executive Officer of Registrant's General Partner.
Attached herein.
32.4 ERP Operating Limited Partnership - Certification Pursuant to 18 U.S.C. Section 1350, as adopted pursuant to Section 906 of the Sarbanes-Oxley Act of 2002, of Robert A. Garechana, Chief Financial Officer of Registrant's General Partner.
Attached herein.
101.INS Inline XBRL Instance Document – the instance document does not appear in the Interactive Data File because XBRL tags are embedded within the Inline XBRL document.
101.SCH Inline XBRL Taxonomy Extension Schema Document.
101.CAL Inline XBRL Taxonomy Extension Calculation Linkbase Document.
101.DEF Inline XBRL Taxonomy Extension Definition Linkbase Document.
101.LAB Inline XBRL Taxonomy Extension Label Linkbase Document.
101.PRE Inline XBRL Taxonomy Extension Presentation Linkbase Document.
104 Cover Page Interactive Data File (embedded within the Inline XBRL document).

Table of Contents
SIGNATURES
Pursuant to the requirements of Section 13 or 15(d) of the Securities Exchange Act of 1934, each registrant has duly caused this report to be signed on its behalf by the undersigned thereunto duly authorized.
EQUITY RESIDENTIAL By: /s/ Mark J. Parrell
Mark J. Parrell President and Chief Executive Officer (Principal Executive Officer)
Date: February 20, 2020
ERP OPERATING LIMITED PARTNERSHIP BY: EQUITY RESIDENTIAL ITS GENERAL PARTNER
By: /s/ Mark J. Parrell
Mark J. Parrell President and Chief Executive Officer (Principal Executive Officer)
Date: February 20, 2020

Table of Contents
EQUITY RESIDENTIAL ERP OPERATING LIMITED PARTNERSHIP
POWER OF ATTORNEY
KNOW ALL MEN/WOMEN BY THESE PRESENTS, that each person whose signature appears below, hereby constitutes and appoints Mark J. Parrell, Robert A. Garechana and Ian S. Kaufman, or any of them, his or her attorneys-in-fact and agents, with full power of substitution and resubstitution for him or her in any and all capacities, to do all acts and things which said attorneys and agents, or any of them, deem advisable to enable the company to comply with the Securities Exchange Act of 1934, as amended, and any requirements or regulations of the Securities and Exchange Commission in respect thereof, in connection with the company’s filing of an annual report on Form 10-K for the company’s fiscal year 2019, including specifically, but without limitation of the general authority hereby granted, the power and authority to sign his or her name as a trustee or officer, or both, of the company, as indicated below opposite his or her signature, to the Form 10-K, and any amendment thereto; and each of the undersigned does hereby fully ratify and confirm all that said attorneys and agents, or any of them, or the substitute of any of them, shall do or cause to be done by virtue hereof.
Pursuant to the requirements of the Securities Exchange Act of 1934, this report has been signed below by the following persons on behalf of each registrant and in the capacities set forth below and on the dates indicated:
Name Title Date
/s/ Mark J. Parrell President, Chief Executive Officer and Trustee February 20, 2020 Mark J. Parrell (Principal Executive Officer)
/s/ Robert A. Garechana Executive Vice President and Chief Financial Officer February 20, 2020 Robert A. Garechana (Principal Financial Officer)
/s/ Ian S. Kaufman Senior Vice President and Chief Accounting Officer February 20, 2020 Ian S. Kaufman (Principal Accounting Officer)
/s/ Charles L. Atwood Trustee February 20, 2020 Charles L. Atwood
/s/ Raymond Bennett Trustee February 20, 2020 Raymond Bennett
/s/ Linda Walker Bynoe Trustee February 20, 2020 Linda Walker Bynoe
/s/ Connie K. Duckworth Trustee February 20, 2020 Connie K. Duckworth
/s/ Mary Kay Haben Trustee February 20, 2020 Mary Kay Haben
/s/ T. Zia Huque Trustee February 20, 2020 T. Zia Huque
/s/ Bradley A. Keywell Trustee February 20, 2020 Bradley A. Keywell
/s/ John E. Neal Trustee February 20, 2020 John E. Neal
/s/ David J. Neithercut Trustee February 20, 2020 David J. Neithercut
/s/ Mark S. Shapiro Trustee February 20, 2020 Mark S. Shapiro
/s/ Stephen E. Sterrett Trustee February 20, 2020 Stephen E. Sterrett
/s/ Samuel Zell Chairman of the Board of Trustees February 20, 2020 Samuel Zell

Table of Contents
INDEX TO CONSOLIDATED FINANCIAL STATEMENTS AND SCHEDULE
EQUITY RESIDENTIAL ERP OPERATING LIMITED PARTNERSHIP
All other schedules have been omitted because they are inapplicable, not required or the information is included elsewhere in the consolidated financial statements or notes thereto.
PAGE
FINANCIAL STATEMENTS FILED AS PART OF THIS REPORT
Report of Independent Registered Public Accounting Firm on the Financial Statements (Equity Residential) F-2 to F-3
Report of Independent Registered Public Accounting Firm on the Financial Statements (ERP Operating Limited Partnership)
F-4
Report of Independent Registered Public Accounting Firm on Internal Control Over Financial Reporting (Equity Residential)
F-5
Report of Independent Registered Public Accounting Firm on Internal Control Over Financial Reporting (ERP Operating Limited Partnership)
F-6
Financial Statements of Equity Residential:
Consolidated Balance Sheets as of December 31, 2019 and 2018 F-7
Consolidated Statements of Operations and Comprehensive Income for the years ended December 31, 2019, 2018 and 2017
F-8 to F-9
Consolidated Statements of Cash Flows for the years ended December 31, 2019, 2018 and 2017 F-10 to F-12
Consolidated Statements of Changes in Equity for the years ended December 31, 2019, 2018 and 2017 F-13 to F-14
Financial Statements of ERP Operating Limited Partnership:
Consolidated Balance Sheets as of December 31, 2019 and 2018 F-15
Consolidated Statements of Operations and Comprehensive Income for the years ended December 31, 2019, 2018 and 2017
F-16 to F-17
Consolidated Statements of Cash Flows for the years ended December 31, 2019, 2018 and 2017 F-18 to F-20
Consolidated Statements of Changes in Capital for the years ended December 31, 2019, 2018 and 2017 F-21 to F-22
Notes to Consolidated Financial Statements of Equity Residential and ERP Operating Limited Partnership F-23 to F-56
SCHEDULE FILED AS PART OF THIS REPORT
Schedule III – Real Estate and Accumulated Depreciation of Equity Residential and ERP Operating Limited Partnership
S-1 to S-12

Table of Contents
REPORT OF INDEPENDENT REGISTERED PUBLIC ACCOUNTING FIRM To the Shareholders and Board of Trustees Equity Residential Opinion on the Financial Statements We have audited the accompanying consolidated balance sheets of Equity Residential (the Company) as of December 31, 2019 and 2018, the related consolidated statements of operations and comprehensive income, changes in equity and cash flows for each of the three years in the period ended December 31, 2019, and the related notes and financial statement schedule listed in the Index at Item 15(a) (collectively referred to as the “consolidated financial statements”). In our opinion, the consolidated financial statements present fairly, in all material respects, the financial position of the Company at December 31, 2019 and 2018, and the results of its operations and its cash flows for each of the three years in the period ended December 31, 2019, in conformity with U.S. generally accepted accounting principles. We also have audited, in accordance with the standards of the Public Company Accounting Oversight Board (United States) (PCAOB), the Company's internal control over financial reporting as of December 31, 2019, based on criteria established in Internal Control – Integrated Framework issued by the Committee of Sponsoring Organizations of the Treadway Commission (2013 framework) and our report dated February 20, 2020 expressed an unqualified opinion thereon. Adoption of New Accounting Standard As discussed in Note 2 to the consolidated financial statements, the Company changed its method of accounting for leases effective January 1, 2019. Basis for Opinion These financial statements are the responsibility of the Company's management. Our responsibility is to express an opinion on the Company’s financial statements based on our audits. We are a public accounting firm registered with the PCAOB and are required to be independent with respect to the Company in accordance with the U.S. federal securities laws and the applicable rules and regulations of the Securities and Exchange Commission and the PCAOB. We conducted our audits in accordance with the standards of the PCAOB. Those standards require that we plan and perform the audit to obtain reasonable assurance about whether the financial statements are free of material misstatement, whether due to error or fraud. Our audits included performing procedures to assess the risks of material misstatement of the financial statements, whether due to error or fraud, and performing procedures that respond to those risks. Such procedures included examining, on a test basis, evidence regarding the amounts and disclosures in the financial statements. Our audits also included evaluating the accounting principles used and significant estimates made by management, as well as evaluating the overall presentation of the financial statements. We believe that our audits provide a reasonable basis for our opinion. Critical Audit Matter The critical audit matter communicated below is a matter arising from the current period audit of the financial statements that was communicated or required to be communicated to the audit committee and that: (1) relates to accounts or disclosures that are material to the consolidated financial statements and (2) involved our especially challenging, subjective or complex judgments. The communication of the critical audit matter does not alter in any way our opinion on the consolidated financial statements, taken as a whole, and we are not, by communicating the critical audit matter below, providing a separate opinion on the critical audit matter or on the account or disclosure to which it relates.
F-2

Table of Contents
F-3
Impairment of Long-Lived Assets Description of the Matter
At December 31, 2019, the Company’s net investment in real estate was approximately $20.3 billion. As more fully described in Note 2 to the consolidated financial statements, the Company periodically evaluates its long-lived assets, including its investment in real estate, for impairment. The judgments regarding the existence of impairment indicators are based on factors such as operational performance, market conditions, legal and environmental concerns, the Company’s intent and ability to hold the related asset, as well as any significant cost overruns on development properties. If the expected future undiscounted cash flows are less than the carrying amount of the long-lived asset, an impairment loss is recognized for the difference between the estimated fair value and the carrying amount.
Auditing the Company's process to evaluate long-lived assets for impairment was complex due to a high degree of subjectivity in determining whether indicators of impairment were present, and in determining the future undiscounted cash flows and estimated fair values, if necessary, of long-lived assets where impairment indicators were determined to be present. In particular, these estimates were sensitive to significant assumptions, including the estimation of future rental revenues, operating expenses and capitalization rates, which are affected by expectations about future market or economic conditions.
How We Addressed the Matter in Our Audit
We obtained an understanding, evaluated the design and tested the operating effectiveness of controls over the Company’s long-lived asset impairment evaluation and measurement process, including controls over management’s determination and review of the significant assumptions used in the analyses and described above.
To test the Company’s evaluation of long-lived assets for impairment, we performed audit procedures that included, among others, evaluating the indicators of impairment identified by management and testing the significant assumptions and completeness and accuracy of operating data used by the Company in its analyses. We compared the significant assumptions used by management to current market data and performed sensitivity analyses of certain significant assumptions as discussed above. We also involved our valuation specialist to assist in evaluating certain assumptions used, including future rental revenues and operating expenses, and capitalization rates.
/s/ ERNST & YOUNG LLP ERNST & YOUNG LLP We have served as the Company’s auditor since 1996.
Chicago, Illinois
February 20, 2020

Table of Contents
REPORT OF INDEPENDENT REGISTERED PUBLIC ACCOUNTING FIRM To the Partners ERP Operating Limited Partnership Opinion on the Financial Statements We have audited the accompanying consolidated balance sheets of ERP Operating Limited Partnership (the Operating Partnership) as of December 31, 2019 and 2018, the related consolidated statements of operations and comprehensive income, changes in capital and cash flows for each of the three years in the period ended December 31, 2019, and the related notes and financial statement schedule listed in the Index at Item 15(a) (collectively referred to as the “consolidated financial statements”). In our opinion, the consolidated financial statements present fairly, in all material respects, the financial position of the Operating Partnership at December 31, 2019 and 2018, and the results of its operations and its cash flows for each of the three years in the period ended December 31, 2019, in conformity with U.S. generally accepted accounting principles. We also have audited, in accordance with the standards of the Public Company Accounting Oversight Board (United States) (PCAOB), the Operating Partnership’s internal control over financial reporting as of December 31, 2019, based on criteria established in Internal Control – Integrated Framework issued by the Committee of Sponsoring Organizations of the Treadway Commission (2013 framework) and our report dated February 20, 2020 expressed an unqualified opinion thereon. Adoption of New Accounting Standard As discussed in Note 2 to the consolidated financial statements, the Operating Partnership changed its method of accounting for leases effective January 1, 2019. Basis for Opinion These financial statements are the responsibility of the Operating Partnership’s management. Our responsibility is to express an opinion on the Operating Partnership’s financial statements based on our audits. We are a public accounting firm registered with the PCAOB and are required to be independent with respect to the Operating Partnership in accordance with the U.S. federal securities laws and the applicable rules and regulations of the Securities and Exchange Commission and the PCAOB. We conducted our audits in accordance with the standards of the PCAOB. Those standards require that we plan and perform the audit to obtain reasonable assurance about whether the financial statements are free of material misstatement, whether due to error or fraud. Our audits included performing procedures to assess the risks of material misstatement of the financial statements, whether due to error or fraud, and performing procedures that respond to those risks. Such procedures included examining, on a test basis, evidence regarding the amounts and disclosures in the financial statements. Our audits also included evaluating the accounting principles used and significant estimates made by management, as well as evaluating the overall presentation of the financial statements. We believe that our audits provide a reasonable basis for our opinion.
F-4
/s/ ERNST & YOUNG LLP ERNST & YOUNG LLP We have served as the Operating Partnership’s auditor since 1996.
Chicago, Illinois
February 20, 2020

Table of Contents
REPORT OF INDEPENDENT REGISTERED PUBLIC ACCOUNTING FIRM To the Shareholders and Board of Trustees Equity Residential Opinion on Internal Control over Financial Reporting We have audited Equity Residential’s internal control over financial reporting as of December 31, 2019, based on criteria established in Internal Control – Integrated Framework issued by the Committee of Sponsoring Organizations of the Treadway Commission (2013 framework) (the COSO criteria). In our opinion, Equity Residential (the Company) maintained, in all material respects, effective internal control over financial reporting as of December 31, 2019, based on the COSO criteria. We also have audited, in accordance with the standards of the Public Company Accounting Oversight Board (United States) (PCAOB), the consolidated balance sheets of the Company as of December 31, 2019 and 2018, the related consolidated statements of operations and comprehensive income, changes in equity and cash flows for each of the three years in the period ended December 31, 2019, and the related notes and financial statement schedule listed in the Index at Item 15(a) and our report dated February 20, 2020 expressed an unqualified opinion thereon. Basis for Opinion The Company’s management is responsible for maintaining effective internal control over financial reporting, and for its assessment of the effectiveness of internal control over financial reporting included in the accompanying Management's Report on Internal Control over Financial Reporting. Our responsibility is to express an opinion on the Company’s internal control over financial reporting based on our audit. We are a public accounting firm registered with the PCAOB and are required to be independent with respect to the Company in accordance with the U.S. federal securities laws and the applicable rules and regulations of the Securities and Exchange Commission and the PCAOB. We conducted our audit in accordance with the standards of the PCAOB. Those standards require that we plan and perform the audit to obtain reasonable assurance about whether effective internal control over financial reporting was maintained in all material respects. Our audit included obtaining an understanding of internal control over financial reporting, assessing the risk that a material weakness exists, testing and evaluating the design and operating effectiveness of internal control based on the assessed risk, and performing such other procedures as we considered necessary in the circumstances. We believe that our audit provides a reasonable basis for our opinion. Definition and Limitations of Internal Control over Financial Reporting A company’s internal control over financial reporting is a process designed to provide reasonable assurance regarding the reliability of financial reporting and the preparation of financial statements for external purposes in accordance with generally accepted accounting principles. A company’s internal control over financial reporting includes those policies and procedures that (1) pertain to the maintenance of records that, in reasonable detail, accurately and fairly reflect the transactions and dispositions of the assets of the company; (2) provide reasonable assurance that transactions are recorded as necessary to permit preparation of financial statements in accordance with generally accepted accounting principles, and that receipts and expenditures of the company are being made only in accordance with authorizations of management and trustees of the company; and (3) provide reasonable assurance regarding prevention or timely detection of unauthorized acquisition, use, or disposition of the company’s assets that could have a material effect on the financial statements. Because of its inherent limitations, internal control over financial reporting may not prevent or detect misstatements. Also, projections of any evaluation of effectiveness to future periods are subject to the risk that controls may become inadequate because of changes in conditions, or that the degree of compliance with the policies or procedures may deteriorate.
F-5
/s/ ERNST & YOUNG LLP ERNST & YOUNG LLP Chicago, Illinois February 20, 2020
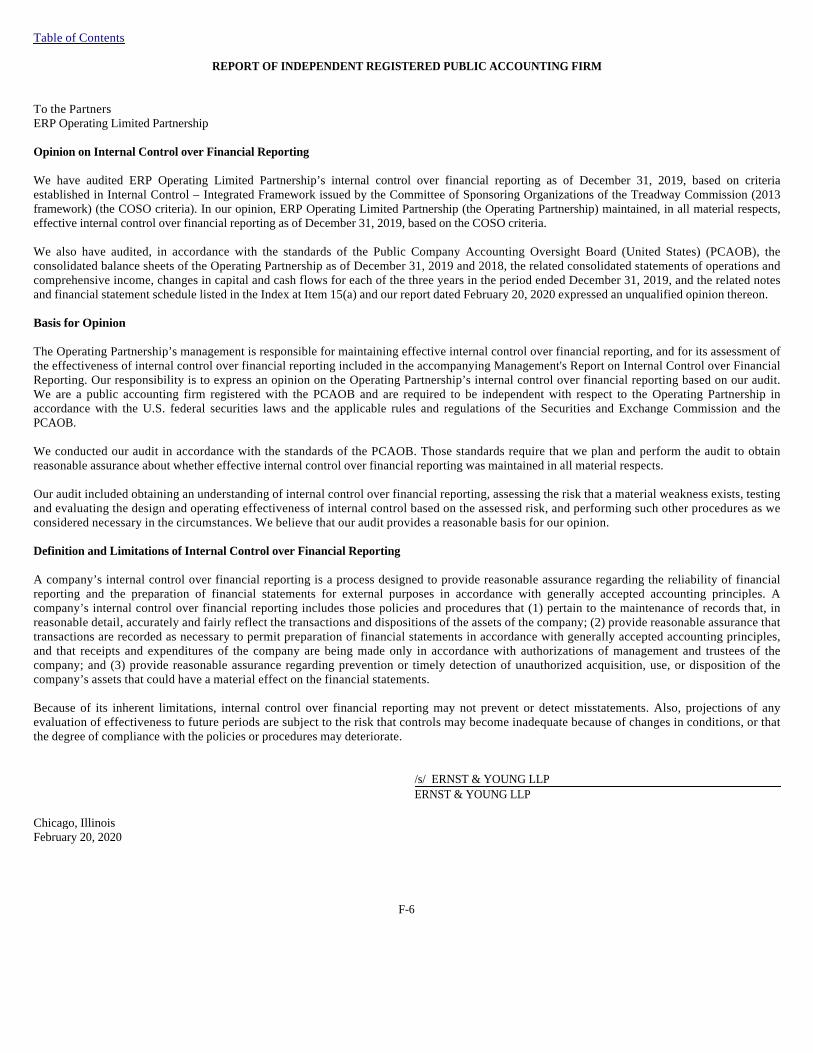
Table of Contents
REPORT OF INDEPENDENT REGISTERED PUBLIC ACCOUNTING FIRM To the Partners ERP Operating Limited Partnership Opinion on Internal Control over Financial Reporting We have audited ERP Operating Limited Partnership’s internal control over financial reporting as of December 31, 2019, based on criteria established in Internal Control – Integrated Framework issued by the Committee of Sponsoring Organizations of the Treadway Commission (2013 framework) (the COSO criteria). In our opinion, ERP Operating Limited Partnership (the Operating Partnership) maintained, in all material respects, effective internal control over financial reporting as of December 31, 2019, based on the COSO criteria. We also have audited, in accordance with the standards of the Public Company Accounting Oversight Board (United States) (PCAOB), the consolidated balance sheets of the Operating Partnership as of December 31, 2019 and 2018, the related consolidated statements of operations and comprehensive income, changes in capital and cash flows for each of the three years in the period ended December 31, 2019, and the related notes and financial statement schedule listed in the Index at Item 15(a) and our report dated February 20, 2020 expressed an unqualified opinion thereon. Basis for Opinion The Operating Partnership’s management is responsible for maintaining effective internal control over financial reporting, and for its assessment of the effectiveness of internal control over financial reporting included in the accompanying Management's Report on Internal Control over Financial Reporting. Our responsibility is to express an opinion on the Operating Partnership’s internal control over financial reporting based on our audit. We are a public accounting firm registered with the PCAOB and are required to be independent with respect to the Operating Partnership in accordance with the U.S. federal securities laws and the applicable rules and regulations of the Securities and Exchange Commission and the PCAOB. We conducted our audit in accordance with the standards of the PCAOB. Those standards require that we plan and perform the audit to obtain reasonable assurance about whether effective internal control over financial reporting was maintained in all material respects. Our audit included obtaining an understanding of internal control over financial reporting, assessing the risk that a material weakness exists, testing and evaluating the design and operating effectiveness of internal control based on the assessed risk, and performing such other procedures as we considered necessary in the circumstances. We believe that our audit provides a reasonable basis for our opinion. Definition and Limitations of Internal Control over Financial Reporting A company’s internal control over financial reporting is a process designed to provide reasonable assurance regarding the reliability of financial reporting and the preparation of financial statements for external purposes in accordance with generally accepted accounting principles. A company’s internal control over financial reporting includes those policies and procedures that (1) pertain to the maintenance of records that, in reasonable detail, accurately and fairly reflect the transactions and dispositions of the assets of the company; (2) provide reasonable assurance that transactions are recorded as necessary to permit preparation of financial statements in accordance with generally accepted accounting principles, and that receipts and expenditures of the company are being made only in accordance with authorizations of management and trustees of the company; and (3) provide reasonable assurance regarding prevention or timely detection of unauthorized acquisition, use, or disposition of the company’s assets that could have a material effect on the financial statements. Because of its inherent limitations, internal control over financial reporting may not prevent or detect misstatements. Also, projections of any evaluation of effectiveness to future periods are subject to the risk that controls may become inadequate because of changes in conditions, or that the degree of compliance with the policies or procedures may deteriorate.
F-6
/s/ ERNST & YOUNG LLP ERNST & YOUNG LLP Chicago, Illinois February 20, 2020

Table of Contents
EQUITY RESIDENTIAL CONSOLIDATED BALANCE SHEETS
(Amounts in thousands except for share amounts)
See accompanying notes
F-7
December 31, December 31, 2019 2018
ASSETS Land $ 5,936,188 $ 5,875,803 Depreciable property 21,319,101 20,435,901 Projects under development 181,630 109,409 Land held for development 96,688 89,909
Investment in real estate 27,533,607 26,511,022 Accumulated depreciation (7,276,786 ) (6,696,281 )
Investment in real estate, net 20,256,821 19,814,741 Investments in unconsolidated entities 52,238 58,349 Cash and cash equivalents 45,753 47,442 Restricted deposits 71,246 68,871 Right-of-use assets 512,774 — Other assets 233,937 404,806
Total assets $ 21,172,769 $ 20,394,209
LIABILITIES AND EQUITY Liabilities:
Mortgage notes payable, net $ 1,941,610 $ 2,385,470 Notes, net 6,077,513 5,933,286 Line of credit and commercial paper 1,017,833 499,183 Accounts payable and accrued expenses 94,350 102,471 Accrued interest payable 66,852 62,622 Lease liabilities 331,334 — Other liabilities 346,963 358,563 Security deposits 70,062 67,258 Distributions payable 218,326 206,601
Total liabilities 10,164,843 9,615,454
Commitments and contingencies Redeemable Noncontrolling Interests – Operating Partnership 463,400 379,106 Equity:
Shareholders' equity: Preferred Shares of beneficial interest, $0.01 par value; 100,000,000 shares authorized; 745,600 shares issued and outstanding as of December 31, 2019 and December 31, 2018 37,280 37,280 Common Shares of beneficial interest, $0.01 par value; 1,000,000,000 shares authorized; 371,670,884 shares issued and outstanding as of December 31, 2019 and 369,405,161 shares issued and outstanding as of December 31, 2018 3,717 3,694 Paid in capital 8,965,577 8,935,453 Retained earnings 1,386,495 1,261,763 Accumulated other comprehensive income (loss) (77,563 ) (64,986 )
Total shareholders’ equity 10,315,506 10,173,204 Noncontrolling Interests:
Operating Partnership 227,837 228,738 Partially Owned Properties 1,183 (2,293 )
Total Noncontrolling Interests 229,020 226,445
Total equity 10,544,526 10,399,649 Total liabilities and equity $ 21,172,769 $ 20,394,209

Table of Contents
EQUITY RESIDENTIAL CONSOLIDATED STATEMENTS OF OPERATIONS AND COMPREHENSIVE INCOME
(Amounts in thousands except per share data)
See accompanying notes
F-8
Year Ended December 31, 2019 2018 2017
REVENUES Rental income $ 2,700,691 $ 2,577,681 $ 2,470,689 Fee and asset management 384 753 717
Total revenues 2,701,075 2,578,434 2,471,406
EXPENSES
Property and maintenance 446,845 429,335 405,281 Real estate taxes and insurance 366,139 357,814 335,495 Property management 95,344 92,485 85,493 General and administrative 52,757 53,813 52,224 Depreciation 831,083 785,725 743,749
Total expenses 1,792,168 1,719,172 1,622,242
Net gain (loss) on sales of real estate properties 447,637 256,810 157,057 Impairment — (702 ) (1,693 )
Operating income 1,356,544 1,115,370 1,004,528
Interest and other income 2,817 15,317 6,136 Other expenses (18,177 ) (17,267 ) (5,186 ) Interest:
Expense incurred, net (390,076 ) (413,360 ) (383,890 ) Amortization of deferred financing costs (11,670 ) (11,310 ) (8,526 )
Income before income and other taxes, income (loss) from investments in unconsolidated entities and net gain (loss) on sales of land parcels 939,438 688,750 613,062 Income and other tax (expense) benefit 2,281 (878 ) (478 ) Income (loss) from investments in unconsolidated entities 65,945 (3,667 ) (3,370 ) Net gain (loss) on sales of land parcels 2,044 987 19,167
Net income 1,009,708 685,192 628,381 Net (income) loss attributable to Noncontrolling Interests:
Operating Partnership (36,034 ) (24,939 ) (22,604 ) Partially Owned Properties (3,297 ) (2,718 ) (2,323 )
Net income attributable to controlling interests 970,377 657,535 603,454 Preferred distributions (3,090 ) (3,090 ) (3,091 )
Net income available to Common Shares $ 967,287 $ 654,445 $ 600,363
Earnings per share – basic: Net income available to Common Shares $ 2.61 $ 1.78 $ 1.64
Weighted average Common Shares outstanding 370,461 368,052 366,968
Earnings per share – diluted: Net income available to Common Shares $ 2.60 $ 1.77 $ 1.63
Weighted average Common Shares outstanding 386,333 383,695 382,678

Table of Contents
EQUITY RESIDENTIAL CONSOLIDATED STATEMENTS OF OPERATIONS AND COMPREHENSIVE INCOME (Continued)
(Amounts in thousands except per share data)
See accompanying notes
F-9
Year Ended December 31, 2019 2018 2017
Comprehensive income: Net income $ 1,009,708 $ 685,192 $ 628,381 Other comprehensive income (loss):
Other comprehensive income (loss) – derivative instruments: Unrealized holding gains (losses) arising during the year (33,765 ) 5,174 6,439 Losses reclassified into earnings from other comprehensive income 21,188 18,452 18,858
Other comprehensive income (loss) (12,577 ) 23,626 25,297
Comprehensive income 997,131 708,818 653,678 Comprehensive (income) attributable to Noncontrolling Interests (38,872 ) (28,526 ) (25,845 )
Comprehensive income attributable to controlling interests $ 958,259 $ 680,292 $ 627,833
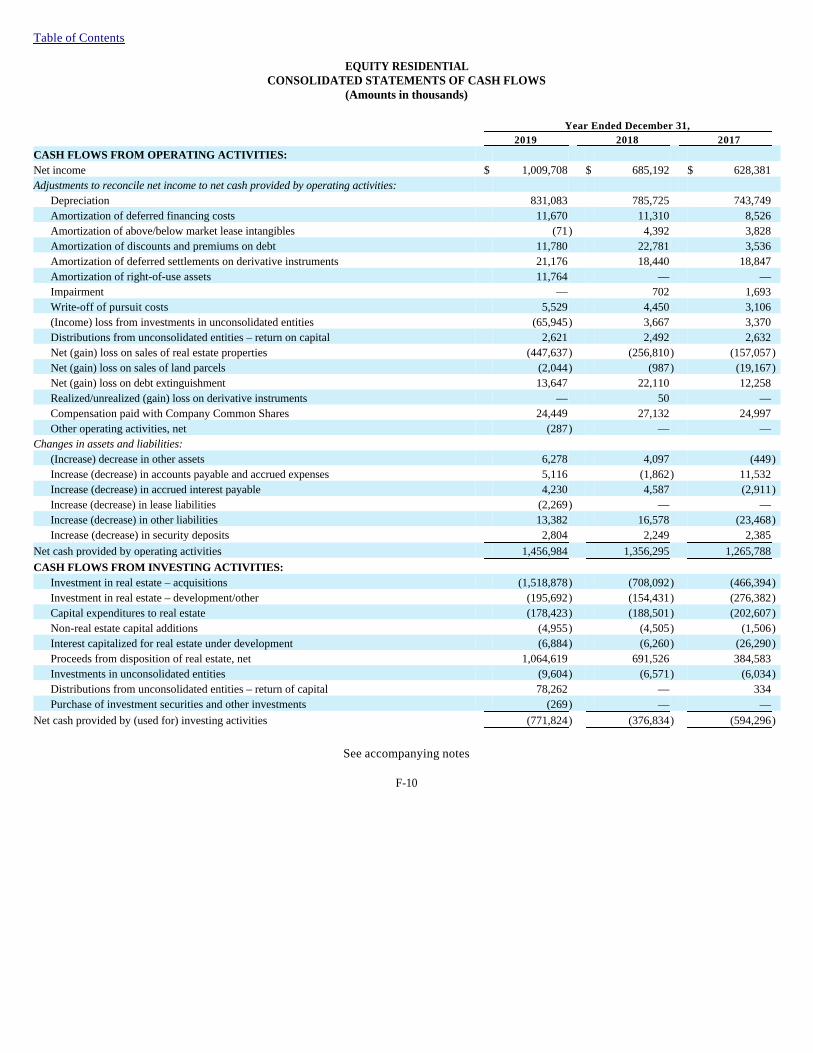
Table of Contents
EQUITY RESIDENTIAL CONSOLIDATED STATEMENTS OF CASH FLOWS
(Amounts in thousands)
See accompanying notes
F-10
Year Ended December 31, 2019 2018 2017
CASH FLOWS FROM OPERATING ACTIVITIES: Net income $ 1,009,708 $ 685,192 $ 628,381 Adjustments to reconcile net income to net cash provided by operating activities:
Depreciation 831,083 785,725 743,749 Amortization of deferred financing costs 11,670 11,310 8,526 Amortization of above/below market lease intangibles (71 ) 4,392 3,828 Amortization of discounts and premiums on debt 11,780 22,781 3,536 Amortization of deferred settlements on derivative instruments 21,176 18,440 18,847 Amortization of right-of-use assets 11,764 — — Impairment — 702 1,693 Write-off of pursuit costs 5,529 4,450 3,106 (Income) loss from investments in unconsolidated entities (65,945 ) 3,667 3,370 Distributions from unconsolidated entities – return on capital 2,621 2,492 2,632 Net (gain) loss on sales of real estate properties (447,637 ) (256,810 ) (157,057 ) Net (gain) loss on sales of land parcels (2,044 ) (987 ) (19,167 ) Net (gain) loss on debt extinguishment 13,647 22,110 12,258 Realized/unrealized (gain) loss on derivative instruments — 50 — Compensation paid with Company Common Shares 24,449 27,132 24,997 Other operating activities, net (287 ) — —
Changes in assets and liabilities: (Increase) decrease in other assets 6,278 4,097 (449 ) Increase (decrease) in accounts payable and accrued expenses 5,116 (1,862 ) 11,532 Increase (decrease) in accrued interest payable 4,230 4,587 (2,911 ) Increase (decrease) in lease liabilities (2,269 ) — — Increase (decrease) in other liabilities 13,382 16,578 (23,468 ) Increase (decrease) in security deposits 2,804 2,249 2,385
Net cash provided by operating activities 1,456,984 1,356,295 1,265,788
CASH FLOWS FROM INVESTING ACTIVITIES: Investment in real estate – acquisitions (1,518,878 ) (708,092 ) (466,394 ) Investment in real estate – development/other (195,692 ) (154,431 ) (276,382 ) Capital expenditures to real estate (178,423 ) (188,501 ) (202,607 ) Non-real estate capital additions (4,955 ) (4,505 ) (1,506 ) Interest capitalized for real estate under development (6,884 ) (6,260 ) (26,290 ) Proceeds from disposition of real estate, net 1,064,619 691,526 384,583 Investments in unconsolidated entities (9,604 ) (6,571 ) (6,034 ) Distributions from unconsolidated entities – return of capital 78,262 — 334 Purchase of investment securities and other investments (269 ) — —
Net cash provided by (used for) investing activities (771,824 ) (376,834 ) (594,296 )

Table of Contents
EQUITY RESIDENTIAL CONSOLIDATED STATEMENTS OF CASH FLOWS (Continued)
(Amounts in thousands)
See accompanying notes
F-11
Year Ended December 31, 2019 2018 2017
CASH FLOWS FROM FINANCING ACTIVITIES: Debt financing costs $ (19,812 ) $ (8,583 ) $ (6,289 ) Mortgage notes payable, net:
Proceeds 295,771 96,935 — Lump sum payoffs (743,021 ) (1,347,939 ) (493,420 ) Scheduled principal repayments (6,808 ) (6,629 ) (10,704 ) Net gain (loss) on debt extinguishment (3,381 ) (22,110 ) (12,258 )
Notes, net: Proceeds 1,194,468 896,294 692,466 Lump sum payoffs (1,050,000 ) — (497,975 ) Net gain (loss) on debt extinguishment (10,266 ) — —
Line of credit and commercial paper: Line of credit proceeds 6,010,000 3,805,000 1,845,000 Line of credit repayments (5,990,000 ) (3,805,000 ) (1,845,000 ) Commercial paper proceeds 15,944,800 14,030,926 5,066,509 Commercial paper repayments (15,446,150 ) (13,831,500 ) (4,786,750 )
Proceeds from (payments on) settlement of derivative instruments (41,616 ) 18,118 1,295 Prepaid finance ground lease (34,734 ) — — Proceeds from Employee Share Purchase Plan (ESPP) 3,116 3,879 3,744 Proceeds from exercise of options 77,785 30,655 31,596 Payment of offering costs (991 ) (27 ) (51 ) Other financing activities, net (80 ) (78 ) (63 ) Acquisition of Noncontrolling Interests – Partially Owned Properties — (13 ) — Contributions – Noncontrolling Interests – Partially Owned Properties 7,337 125 125 Contributions – Noncontrolling Interests – Operating Partnership 2 1 — Distributions:
Common Shares (831,111 ) (782,122 ) (739,375 ) Preferred Shares (3,090 ) (3,863 ) (3,091 ) Noncontrolling Interests – Operating Partnership (29,615 ) (28,226 ) (27,291 ) Noncontrolling Interests – Partially Owned Properties (7,078 ) (9,753 ) (8,286 )
Net cash provided by (used for) financing activities (684,474 ) (963,910 ) (789,818 )
Net increase (decrease) in cash and cash equivalents and restricted deposits 686 15,551 (118,326 ) Cash and cash equivalents and restricted deposits, beginning of year 116,313 100,762 219,088
Cash and cash equivalents and restricted deposits, end of year $ 116,999 $ 116,313 $ 100,762
Cash and cash equivalents and restricted deposits, end of year
Cash and cash equivalents $ 45,753 $ 47,442 $ 50,647 Restricted deposits 71,246 68,871 50,115
Total cash and cash equivalents and restricted deposits, end of year $ 116,999 $ 116,313 $ 100,762

Table of Contents
EQUITY RESIDENTIAL CONSOLIDATED STATEMENTS OF CASH FLOWS (Continued)
(Amounts in thousands)
See accompanying notes
F-12
Year Ended December 31, 2019 2018 2017
SUPPLEMENTAL INFORMATION: Cash paid for interest, net of amounts capitalized $ 342,048 $ 358,156 $ 360,273
Net cash paid (received) for income and other taxes $ (585 ) $ 853 $ 640
Amortization of deferred financing costs: Investment in real estate, net $ (120 ) $ — $ —
Other assets $ 2,987 $ 2,412 $ 2,412
Mortgage notes payable, net $ 3,934 $ 4,792 $ 2,493
Notes, net $ 4,869 $ 4,106 $ 3,621
Amortization of discounts and premiums on debt: Mortgage notes payable, net $ 8,618 $ 20,144 $ 1,172
Notes, net $ 3,162 $ 2,637 $ 2,364
Amortization of deferred settlements on derivative instruments: Other liabilities $ (12 ) $ (12 ) $ (11 )
Accumulated other comprehensive income $ 21,188 $ 18,452 $ 18,858
Write-off of pursuit costs: Investment in real estate, net $ 5,451 $ 4,364 $ 2,965
Other assets $ 62 $ 53 $ 17
Accounts payable and accrued expenses $ 16 $ 33 $ 124
(Income) loss from investments in unconsolidated entities: Investments in unconsolidated entities $ (67,268 ) $ 2,304 $ 1,955
Other liabilities $ 1,323 $ 1,363 $ 1,415
Realized/unrealized (gain) loss on derivative instruments: Other assets $ 2,002 $ (14,977 ) $ (4,582 )
Notes, net $ 2,277 $ (680 ) $ (3,454 )
Other liabilities $ 29,486 $ 10,533 $ 1,597
Accumulated other comprehensive income $ (33,765 ) $ 5,174 $ 6,439
Investments in unconsolidated entities: Investments in unconsolidated entities $ (7,504 ) $ (4,891 ) $ (3,034 )
Other liabilities $ (2,100 ) $ (1,680 ) $ (3,000 )
Debt financing costs: Other assets $ (6,909 ) $ (145 ) $ —
Mortgage notes payable, net $ (2,354 ) $ (555 ) $ —
Notes, net $ (10,549 ) $ (7,883 ) $ (6,289 )
Right-of-use assets and lease liabilities initial measurement and reclassifications: Right-of-use assets $ (489,517 ) $ — $ —
Other assets $ 184,116 $ — $ —
Lease liabilities $ 333,603 $ — $ —
Other liabilities $ (28,202 ) $ — $ —
Proceeds from (payments on) settlement of derivative instruments: Other assets $ — $ 18,118 $ 1,295
Other liabilities $ (41,616 ) $ — $ —

Table of Contents
EQUITY RESIDENTIAL CONSOLIDATED STATEMENTS OF CHANGES IN EQUITY
(Amounts in thousands)
See accompanying notes
F-13
Year Ended December 31, 2019 2018 2017
SHAREHOLDERS’ EQUITY PREFERRED SHARES Balance, beginning of year $ 37,280 $ 37,280 $ 37,280
Balance, end of year $ 37,280 $ 37,280 $ 37,280
COMMON SHARES, $0.01 PAR VALUE Balance, beginning of year $ 3,694 $ 3,680 $ 3,659
Conversion of OP Units into Common Shares 3 1 11 Exercise of share options 17 11 8 Employee Share Purchase Plan (ESPP) 1 1 1 Share-based employee compensation expense:
Restricted shares 2 1 1
Balance, end of year $ 3,717 $ 3,694 $ 3,680
PAID IN CAPITAL Balance, beginning of year $ 8,935,453 $ 8,886,586 $ 8,758,422
Common Share Issuance: Conversion of OP Units into Common Shares 10,407 4,097 15,889 Exercise of share options 77,768 30,644 31,588 Employee Share Purchase Plan (ESPP) 3,115 3,878 3,743
Share-based employee compensation expense: Restricted shares 12,436 8,257 9,776 Share options 2,675 9,734 6,835 ESPP discount 642 767 747
Offering costs (991 ) (27 ) (51 ) Supplemental Executive Retirement Plan (SERP) (1,675 ) (454 ) (594 ) Change in market value of Redeemable Noncontrolling Interests – Operating Partnership (82,283 ) (13,922 ) 41,916 Adjustment for Noncontrolling Interests ownership in Operating Partnership 8,030 5,893 18,315
Balance, end of year $ 8,965,577 $ 8,935,453 $ 8,886,586
RETAINED EARNINGS Balance, beginning of year $ 1,261,763 $ 1,403,530 $ 1,543,626
Net income attributable to controlling interests 970,377 657,535 603,454 Common Share distributions (842,555 ) (796,212 ) (740,459 ) Preferred Share distributions (3,090 ) (3,090 ) (3,091 )
Balance, end of year $ 1,386,495 $ 1,261,763 $ 1,403,530
ACCUMULATED OTHER COMPREHENSIVE INCOME (LOSS) Balance, beginning of year $ (64,986 ) $ (88,612 ) $ (113,909 )
Accumulated other comprehensive income (loss) – derivative instruments: Unrealized holding gains (losses) arising during the year (33,765 ) 5,174 6,439 Losses reclassified into earnings from other comprehensive income 21,188 18,452 18,858
Balance, end of year $ (77,563 ) $ (64,986 ) $ (88,612 )
DISTRIBUTIONS Distributions declared per Common Share outstanding $ 2.27 $ 2.16 $ 2.015

Table of Contents
EQUITY RESIDENTIAL CONSOLIDATED STATEMENTS OF CHANGES IN EQUITY (Continued)
(Amounts in thousands)
See accompanying notes
F-14
Year Ended December 31, 2019 2018 2017
NONCONTROLLING INTERESTS OPERATING PARTNERSHIP Balance, beginning of year $ 228,738 $ 226,691 $ 221,297
Issuance of restricted units to Noncontrolling Interests 2 1 — Conversion of OP Units held by Noncontrolling Interests into OP Units held by General Partner (10,410 ) (4,098 ) (15,900 ) Equity compensation associated with Noncontrolling Interests 13,410 14,009 10,523 Net income attributable to Noncontrolling Interests 36,034 24,939 22,604 Distributions to Noncontrolling Interests (29,896 ) (28,682 ) (26,739 ) Change in carrying value of Redeemable Noncontrolling Interests – Operating Partnership (2,011 ) 1,771 33,221 Adjustment for Noncontrolling Interests ownership in Operating Partnership (8,030 ) (5,893 ) (18,315 )
Balance, end of year $ 227,837 $ 228,738 $ 226,691
PARTIALLY OWNED PROPERTIES Balance, beginning of year $ (2,293 ) $ 4,708 $ 10,609
Net income attributable to Noncontrolling Interests 3,297 2,718 2,323 Acquisitions of Noncontrolling Interests – Partially Owned Properties — (13 ) — Contributions by Noncontrolling Interests 7,337 125 125 Distributions to Noncontrolling Interests (7,158 ) (9,831 ) (8,349 )
Balance, end of year $ 1,183 $ (2,293 ) $ 4,708

Table of Contents
ERP OPERATING LIMITED PARTNERSHIP CONSOLIDATED BALANCE SHEETS
(Amounts in thousands)
See accompanying notes
F-15
December 31, December 31, 2019 2018
ASSETS Land $ 5,936,188 $ 5,875,803 Depreciable property 21,319,101 20,435,901 Projects under development 181,630 109,409 Land held for development 96,688 89,909
Investment in real estate 27,533,607 26,511,022 Accumulated depreciation (7,276,786 ) (6,696,281 )
Investment in real estate, net 20,256,821 19,814,741 Investments in unconsolidated entities 52,238 58,349 Cash and cash equivalents 45,753 47,442 Restricted deposits 71,246 68,871 Right-of-use assets 512,774 — Other assets 233,937 404,806
Total assets $ 21,172,769 $ 20,394,209
LIABILITIES AND CAPITAL Liabilities:
Mortgage notes payable, net $ 1,941,610 $ 2,385,470 Notes, net 6,077,513 5,933,286 Line of credit and commercial paper 1,017,833 499,183 Accounts payable and accrued expenses 94,350 102,471 Accrued interest payable 66,852 62,622 Lease liabilities 331,334 — Other liabilities 346,963 358,563 Security deposits 70,062 67,258 Distributions payable 218,326 206,601
Total liabilities 10,164,843 9,615,454
Commitments and contingencies Redeemable Limited Partners 463,400 379,106 Capital:
Partners’ Capital: Preference Units 37,280 37,280 General Partner 10,355,789 10,200,910 Limited Partners 227,837 228,738 Accumulated other comprehensive income (loss) (77,563 ) (64,986 )
Total partners’ capital 10,543,343 10,401,942 Noncontrolling Interests – Partially Owned Properties 1,183 (2,293 )
Total capital 10,544,526 10,399,649 Total liabilities and capital $ 21,172,769 $ 20,394,209

Table of Contents
ERP OPERATING LIMITED PARTNERSHIP CONSOLIDATED STATEMENTS OF OPERATIONS AND COMPREHENSIVE INCOME
(Amounts in thousands except per Unit data)
See accompanying notes
F-16
Year Ended December 31, 2019 2018 2017
REVENUES Rental income $ 2,700,691 $ 2,577,681 $ 2,470,689 Fee and asset management 384 753 717
Total revenues 2,701,075 2,578,434 2,471,406
EXPENSES
Property and maintenance 446,845 429,335 405,281 Real estate taxes and insurance 366,139 357,814 335,495 Property management 95,344 92,485 85,493 General and administrative 52,757 53,813 52,224 Depreciation 831,083 785,725 743,749
Total expenses 1,792,168 1,719,172 1,622,242
Net gain (loss) on sales of real estate properties 447,637 256,810 157,057 Impairment — (702 ) (1,693 )
Operating income 1,356,544 1,115,370 1,004,528
Interest and other income 2,817 15,317 6,136 Other expenses (18,177 ) (17,267 ) (5,186 ) Interest:
Expense incurred, net (390,076 ) (413,360 ) (383,890 ) Amortization of deferred financing costs (11,670 ) (11,310 ) (8,526 )
Income before income and other taxes, income (loss) from investments in unconsolidated entities and net gain (loss) on sales of land parcels 939,438 688,750 613,062 Income and other tax (expense) benefit 2,281 (878 ) (478 ) Income (loss) from investments in unconsolidated entities 65,945 (3,667 ) (3,370 ) Net gain (loss) on sales of land parcels 2,044 987 19,167
Net income 1,009,708 685,192 628,381 Net (income) loss attributable to Noncontrolling Interests - Partially Owned Properties (3,297 ) (2,718 ) (2,323 )
Net income attributable to controlling interests $ 1,006,411 $ 682,474 $ 626,058
ALLOCATION OF NET INCOME: Preference Units $ 3,090 $ 3,090 $ 3,091
General Partner $ 967,287 $ 654,445 $ 600,363 Limited Partners 36,034 24,939 22,604
Net income available to Units $ 1,003,321 $ 679,384 $ 622,967
Earnings per Unit – basic: Net income available to Units $ 2.61 $ 1.78 $ 1.64
Weighted average Units outstanding 383,368 380,921 379,869
Earnings per Unit – diluted: Net income available to Units $ 2.60 $ 1.77 $ 1.63
Weighted average Units outstanding 386,333 383,695 382,678

Table of Contents
ERP OPERATING LIMITED PARTNERSHIP CONSOLIDATED STATEMENTS OF OPERATIONS AND COMPREHENSIVE INCOME (Continued)
(Amounts in thousands except per Unit data)
See accompanying notes
F-17
Year Ended December 31, 2019 2018 2017
Comprehensive income: Net income $ 1,009,708 $ 685,192 $ 628,381 Other comprehensive income (loss):
Other comprehensive income (loss) – derivative instruments: Unrealized holding gains (losses) arising during the year (33,765 ) 5,174 6,439 Losses reclassified into earnings from other comprehensive income 21,188 18,452 18,858
Other comprehensive income (loss) (12,577 ) 23,626 25,297
Comprehensive income 997,131 708,818 653,678 Comprehensive (income) attributable to Noncontrolling Interests – Partially Owned Properties (3,297 ) (2,718 ) (2,323 )
Comprehensive income attributable to controlling interests $ 993,834 $ 706,100 $ 651,355

Table of Contents
ERP OPERATING LIMITED PARTNERSHIP CONSOLIDATED STATEMENTS OF CASH FLOWS
(Amounts in thousands)
See accompanying notes
F-18
Year Ended December 31, 2019 2018 2017
CASH FLOWS FROM OPERATING ACTIVITIES: Net income $ 1,009,708 $ 685,192 $ 628,381 Adjustments to reconcile net income to net cash provided by operating activities:
Depreciation 831,083 785,725 743,749 Amortization of deferred financing costs 11,670 11,310 8,526 Amortization of above/below market lease intangibles (71 ) 4,392 3,828 Amortization of discounts and premiums on debt 11,780 22,781 3,536 Amortization of deferred settlements on derivative instruments 21,176 18,440 18,847 Amortization of right-of-use assets 11,764 — — Impairment — 702 1,693 Write-off of pursuit costs 5,529 4,450 3,106 (Income) loss from investments in unconsolidated entities (65,945 ) 3,667 3,370 Distributions from unconsolidated entities – return on capital 2,621 2,492 2,632 Net (gain) loss on sales of real estate properties (447,637 ) (256,810 ) (157,057 ) Net (gain) loss on sales of land parcels (2,044 ) (987 ) (19,167 ) Net (gain) loss on debt extinguishment 13,647 22,110 12,258 Realized/unrealized (gain) loss on derivative instruments — 50 — Compensation paid with Company Common Shares 24,449 27,132 24,997 Other operating activities, net (287 ) — —
Changes in assets and liabilities: (Increase) decrease in other assets 6,278 4,097 (449 ) Increase (decrease) in accounts payable and accrued expenses 5,116 (1,862 ) 11,532 Increase (decrease) in accrued interest payable 4,230 4,587 (2,911 ) Increase (decrease) in lease liabilities (2,269 ) — — Increase (decrease) in other liabilities 13,382 16,578 (23,468 ) Increase (decrease) in security deposits 2,804 2,249 2,385
Net cash provided by operating activities 1,456,984 1,356,295 1,265,788
CASH FLOWS FROM INVESTING ACTIVITIES: Investment in real estate – acquisitions (1,518,878 ) (708,092 ) (466,394 ) Investment in real estate – development/other (195,692 ) (154,431 ) (276,382 ) Capital expenditures to real estate (178,423 ) (188,501 ) (202,607 ) Non-real estate capital additions (4,955 ) (4,505 ) (1,506 ) Interest capitalized for real estate under development (6,884 ) (6,260 ) (26,290 ) Proceeds from disposition of real estate, net 1,064,619 691,526 384,583 Investments in unconsolidated entities (9,604 ) (6,571 ) (6,034 ) Distributions from unconsolidated entities – return of capital 78,262 — 334 Purchase of investment securities and other investments (269 ) — —
Net cash provided by (used for) investing activities (771,824 ) (376,834 ) (594,296 )

Table of Contents
ERP OPERATING LIMITED PARTNERSHIP CONSOLIDATED STATEMENTS OF CASH FLOWS (Continued)
(Amounts in thousands)
See accompanying notes
F-19
Year Ended December 31, 2019 2018 2017
CASH FLOWS FROM FINANCING ACTIVITIES: Debt financing costs $ (19,812 ) $ (8,583 ) $ (6,289 ) Mortgage notes payable, net:
Proceeds 295,771 96,935 — Lump sum payoffs (743,021 ) (1,347,939 ) (493,420 ) Scheduled principal repayments (6,808 ) (6,629 ) (10,704 ) Net gain (loss) on debt extinguishment (3,381 ) (22,110 ) (12,258 )
Notes, net: Proceeds 1,194,468 896,294 692,466 Lump sum payoffs (1,050,000 ) — (497,975 ) Net gain (loss) on debt extinguishment (10,266 ) — —
Line of credit and commercial paper: Line of credit proceeds 6,010,000 3,805,000 1,845,000 Line of credit repayments (5,990,000 ) (3,805,000 ) (1,845,000 ) Commercial paper proceeds 15,944,800 14,030,926 5,066,509 Commercial paper repayments (15,446,150 ) (13,831,500 ) (4,786,750 )
Proceeds from (payments on) settlement of derivative instruments (41,616 ) 18,118 1,295 Prepaid finance ground lease (34,734 ) — — Proceeds from EQR’s Employee Share Purchase Plan (ESPP) 3,116 3,879 3,744 Proceeds from exercise of EQR options 77,785 30,655 31,596 Payment of offering costs (991 ) (27 ) (51 ) Other financing activities, net (80 ) (78 ) (63 ) Acquisition of Noncontrolling Interests – Partially Owned Properties — (13 ) — Contributions – Noncontrolling Interests – Partially Owned Properties 7,337 125 125 Contributions – Limited Partners 2 1 — Distributions:
OP Units – General Partner (831,111 ) (782,122 ) (739,375 ) Preference Units (3,090 ) (3,863 ) (3,091 ) OP Units – Limited Partners (29,615 ) (28,226 ) (27,291 ) Noncontrolling Interests – Partially Owned Properties (7,078 ) (9,753 ) (8,286 )
Net cash provided by (used for) financing activities (684,474 ) (963,910 ) (789,818 )
Net increase (decrease) in cash and cash equivalents and restricted deposits 686 15,551 (118,326 ) Cash and cash equivalents and restricted deposits, beginning of year 116,313 100,762 219,088
Cash and cash equivalents and restricted deposits, end of year $ 116,999 $ 116,313 $ 100,762
Cash and cash equivalents and restricted deposits, end of year
Cash and cash equivalents $ 45,753 $ 47,442 $ 50,647 Restricted deposits 71,246 68,871 50,115
Total cash and cash equivalents and restricted deposits, end of year $ 116,999 $ 116,313 $ 100,762

Table of Contents
ERP OPERATING LIMITED PARTNERSHIP CONSOLIDATED STATEMENTS OF CASH FLOWS (Continued)
(Amounts in thousands)
See accompanying notes
F-20
Year Ended December 31, 2019 2018 2017
SUPPLEMENTAL INFORMATION: Cash paid for interest, net of amounts capitalized $ 342,048 $ 358,156 $ 360,273
Net cash paid (received) for income and other taxes $ (585 ) $ 853 $ 640
Amortization of deferred financing costs: Investment in real estate, net $ (120 ) $ — $ —
Other assets $ 2,987 $ 2,412 $ 2,412
Mortgage notes payable, net $ 3,934 $ 4,792 $ 2,493
Notes, net $ 4,869 $ 4,106 $ 3,621
Amortization of discounts and premiums on debt: Mortgage notes payable, net $ 8,618 $ 20,144 $ 1,172
Notes, net $ 3,162 $ 2,637 $ 2,364
Amortization of deferred settlements on derivative instruments: Other liabilities $ (12 ) $ (12 ) $ (11 )
Accumulated other comprehensive income $ 21,188 $ 18,452 $ 18,858
Write-off of pursuit costs: Investment in real estate, net $ 5,451 $ 4,364 $ 2,965
Other assets $ 62 $ 53 $ 17
Accounts payable and accrued expenses $ 16 $ 33 $ 124
(Income) loss from investments in unconsolidated entities: Investments in unconsolidated entities $ (67,268 ) $ 2,304 $ 1,955
Other liabilities $ 1,323 $ 1,363 $ 1,415
Realized/unrealized (gain) loss on derivative instruments: Other assets $ 2,002 $ (14,977 ) $ (4,582 )
Notes, net $ 2,277 $ (680 ) $ (3,454 )
Other liabilities $ 29,486 $ 10,533 $ 1,597
Accumulated other comprehensive income $ (33,765 ) $ 5,174 $ 6,439
Investments in unconsolidated entities: Investments in unconsolidated entities $ (7,504 ) $ (4,891 ) $ (3,034 )
Other liabilities $ (2,100 ) $ (1,680 ) $ (3,000 )
Debt financing costs: Other assets $ (6,909 ) $ (145 ) $ —
Mortgage notes payable, net $ (2,354 ) $ (555 ) $ —
Notes, net $ (10,549 ) $ (7,883 ) $ (6,289 )
Right-of-use assets and lease liabilities initial measurement and reclassifications: Right-of-use assets $ (489,517 ) $ — $ —
Other assets $ 184,116 $ — $ —
Lease liabilities $ 333,603 $ — $ —
Other liabilities $ (28,202 ) $ — $ —
Proceeds from (payments on) settlement of derivative instruments: Other assets $ — $ 18,118 $ 1,295
Other liabilities $ (41,616 ) $ — $ —

Table of Contents
ERP OPERATING LIMITED PARTNERSHIP CONSOLIDATED STATEMENTS OF CHANGES IN CAPITAL
(Amounts in thousands)
See accompanying notes
F-21
Year Ended December 31, 2019 2018 2017
PARTNERS’ CAPITAL PREFERENCE UNITS Balance, beginning of year $ 37,280 $ 37,280 $ 37,280
Balance, end of year $ 37,280 $ 37,280 $ 37,280
GENERAL PARTNER Balance, beginning of year $ 10,200,910 $ 10,293,796 $ 10,305,707
OP Unit Issuance: Conversion of OP Units held by Limited Partners into OP Units held by General Partner 10,410 4,098 15,900 Exercise of EQR share options 77,785 30,655 31,596 EQR’s Employee Share Purchase Plan (ESPP) 3,116 3,879 3,744
Share-based employee compensation expense: EQR restricted shares 12,438 8,258 9,777 EQR share options 2,675 9,734 6,835 EQR ESPP discount 642 767 747
Net income available to Units – General Partner 967,287 654,445 600,363 OP Units – General Partner distributions (842,555 ) (796,212 ) (740,459 ) Offering costs (991 ) (27 ) (51 ) Supplemental Executive Retirement Plan (SERP) (1,675 ) (454 ) (594 ) Change in market value of Redeemable Limited Partners (82,283 ) (13,922 ) 41,916 Adjustment for Limited Partners ownership in Operating Partnership 8,030 5,893 18,315
Balance, end of year $ 10,355,789 $ 10,200,910 $ 10,293,796
LIMITED PARTNERS Balance, beginning of year $ 228,738 $ 226,691 $ 221,297
Issuance of restricted units to Limited Partners 2 1 — Conversion of OP Units held by Limited Partners into OP Units held by General Partner (10,410 ) (4,098 ) (15,900 ) Equity compensation associated with Units – Limited Partners 13,410 14,009 10,523 Net income available to Units – Limited Partners 36,034 24,939 22,604 Units – Limited Partners distributions (29,896 ) (28,682 ) (26,739 ) Change in carrying value of Redeemable Limited Partners (2,011 ) 1,771 33,221 Adjustment for Limited Partners ownership in Operating Partnership (8,030 ) (5,893 ) (18,315 )
Balance, end of year $ 227,837 $ 228,738 $ 226,691
ACCUMULATED OTHER COMPREHENSIVE INCOME (LOSS) Balance, beginning of year $ (64,986 ) $ (88,612 ) $ (113,909 )
Accumulated other comprehensive income (loss) – derivative instruments: Unrealized holding gains (losses) arising during the year (33,765 ) 5,174 6,439 Losses reclassified into earnings from other comprehensive income 21,188 18,452 18,858
Balance, end of year $ (77,563 ) $ (64,986 ) $ (88,612 )
DISTRIBUTIONS Distributions declared per Unit outstanding $ 2.27 $ 2.16 $ 2.015

Table of Contents
ERP OPERATING LIMITED PARTNERSHIP CONSOLIDATED STATEMENTS OF CHANGES IN CAPITAL (Continued)
(Amounts in thousands)
See accompanying notes
F-22
Year Ended December 31, 2019 2018 2017
NONCONTROLLING INTERESTS NONCONTROLLING INTERESTS – PARTIALLY OWNED PROPERTIES Balance, beginning of year $ (2,293 ) $ 4,708 $ 10,609
Net income attributable to Noncontrolling Interests 3,297 2,718 2,323 Acquisitions of Noncontrolling Interests – Partially Owned Properties — (13 ) — Contributions by Noncontrolling Interests 7,337 125 125 Distributions to Noncontrolling Interests (7,158 ) (9,831 ) (8,349 )
Balance, end of year $ 1,183 $ (2,293 ) $ 4,708

Table of Contents
EQUITY RESIDENTIAL ERP OPERATING LIMITED PARTNERSHIP
NOTES TO CONSOLIDATED FINANCIAL STATEMENTS
Equity Residential (“EQR”) is an S&P 500 company focused on the acquisition, development and management of rental apartment properties located in urban and high-density suburban communities, a business that is conducted on its behalf by ERP Operating Limited Partnership (“ERPOP”). EQR is a Maryland real estate investment trust (“REIT”) formed in March 1993 and ERPOP is an Illinois limited partnership formed in May 1993. References to the “Company,” “we,” “us” or “our” mean collectively EQR, ERPOP and those entities/subsidiaries owned or controlled by EQR and/or ERPOP. References to the “Operating Partnership” mean collectively ERPOP and those entities/subsidiaries owned or controlled by ERPOP. Unless otherwise indicated, the notes to consolidated financial statements apply to both the Company and the Operating Partnership.
EQR is the general partner of, and as of December 31, 2019 owned an approximate 96.4% ownership interest in, ERPOP. All of the Company’s property ownership, development and related business operations are conducted through the Operating Partnership and EQR has no material assets or liabilities other than its investment in ERPOP. EQR issues equity from time to time, the net proceeds of which it is obligated to contribute to ERPOP, but does not have any indebtedness as all debt is incurred by the Operating Partnership. The Operating Partnership holds substantially all of the assets of the Company, including the Company’s ownership interests in its joint ventures. The Operating Partnership conducts the operations of the business and is structured as a partnership with no publicly traded equity.
As of December 31, 2019, the Company, directly or indirectly through investments in title holding entities, owned all or a portion of 309 properties located in 10 states and the District of Columbia consisting of 79,962 apartment units. The ownership breakdown includes (table does not include various uncompleted development properties):
The “Wholly Owned Properties” are accounted for under the consolidation method of accounting. The “Master-Leased Property –
Consolidated” is wholly owned by the Company but the entire project is leased to a third party corporate housing provider. This property is consolidated and reflected as a real estate asset while the master lease is accounted for as an operating lease. The “Partially Owned Properties – Consolidated” are controlled by the Company, but have partners with noncontrolling interests and are accounted for under the consolidation method of accounting and qualify as variable interest entities.
Basis of Presentation
Due to the Company’s ability as general partner to control either through ownership or by contract the Operating Partnership and its subsidiaries, the Operating Partnership and each such subsidiary has been consolidated with the Company for financial reporting purposes, except for any unconsolidated properties/entities.
Real Estate Assets and Depreciation of Investment in Real Estate
The Company expects that substantially all of its transactions will be accounted for as asset acquisitions. In an asset acquisition, the Company is required to capitalize transaction costs and allocate the purchase price on a relative fair value basis. For the years ended December 31, 2019 and 2018, all acquisitions were considered asset acquisitions.
F-23
1. Business
Properties Apartment Units
Wholly Owned Properties 291 76,265 Master-Leased Property – Consolidated 1 162 Partially Owned Properties – Consolidated 17 3,535 309 79,962
2. Summary of Significant Accounting Policies

Table of Contents
For asset acquisitions, the Company allocates the purchase price of the net tangible and identified intangible assets on a relative fair value basis. In making estimates of relative fair values for purposes of allocating purchase price, the Company utilizes a number of sources, including independent appraisals that may be obtained in connection with the acquisition or financing of the respective property, our own analysis of recently acquired and existing comparable properties in our portfolio and other market data. The Company also considers information obtained about each property as a result of its pre-acquisition due diligence, marketing and leasing activities in estimating the relative fair value of the tangible and intangible assets/liabilities acquired. The Company allocates the purchase price of acquired real estate to various components as follows:
Replacements inside an apartment unit such as appliances and carpeting are depreciated over an estimated useful life of five to ten years. Renovation expenditures for ordinary maintenance and repairs are expensed to operations as incurred and significant renovations and improvements that improve and/or extend the useful life of the asset are capitalized over their estimated useful life, generally five to fifteen years. Initial direct leasing costs are expensed as incurred as such expense approximates the deferral and amortization of initial direct leasing costs over the lease terms.
Property dispositions are recorded when control transfers to unrelated third parties, contingencies have been removed and sufficient cash consideration has been received by the Company. Upon disposition, the related costs and accumulated depreciation are removed from the respective accounts. Any gain or loss on sale is recognized in accordance with accounting principles generally accepted in the United States.
The Company classifies real estate assets as real estate held for sale when it is probable a property will be disposed of. The Company classifies properties under development and/or expansion and properties in the lease-up phase (including land) as construction-in-progress until construction has been completed and certificates of occupancy permits have been obtained.
Impairment of Long-Lived Assets
The Company periodically evaluates its long-lived assets, including its investment in real estate, for indicators of impairment. The judgments regarding the existence of impairment indicators are based on factors such as operational performance, market conditions, legal, regulatory and environmental concerns, the Company’s intent and ability to hold the related asset, as well as any significant cost overruns on development properties. Future events could occur which would cause the Company to conclude that impairment indicators exist and an impairment loss is warranted. If impairment indicators exist, the Company performs the following:
F-24
• Land – Based on actual purchase price adjusted to an allocation of the relative fair value (as necessary) if acquired separately or market research/comparables if acquired with an operating property.
• Furniture, Fixtures and Equipment – Ranges between $10,000 and $35,000 per apartment unit acquired as an estimate of the allocation of the relative fair value of the appliances and fixtures inside an apartment unit. The per-apartment unit amount applied depends on the economic age of the apartment units acquired. Depreciation is calculated on the straight-line method over an estimated useful life of five to ten years.
• Lease Intangibles – The Company considers the value of acquired in-place leases and above/below market leases and the amortization period is the average remaining term of each respective acquired lease. In-place residential leases’ average term at acquisition approximates six months. In-place retail leases’ term at acquisition approximates the average remaining term of all acquired retail leases. See Note 8 for more information on ground lease intangibles.
• Other Intangible Assets – The Company considers whether it has acquired other intangible assets, including any customer relationship intangibles and the amortization period is the estimated useful life of the acquired intangible asset.
• Building – Based on the allocation of the relative fair value determined on an “as-if vacant” basis. Depreciation is calculated on the straight-line method over an estimated useful life of thirty years.
• Long-Term Debt – The Company calculates the allocation of the relative fair value by discounting the remaining contractual cash flows on each instrument at the current market rate for those borrowings.
• For long-lived operating assets to be held and used, the Company compares the expected future undiscounted cash flows for the long-lived asset against the carrying amount of that asset. If the sum of the estimated undiscounted cash flows is less than the carrying amount of the asset, the Company would make an estimate of the fair value for the particular asset and would record an impairment loss for the difference between the estimated fair value and the carrying amount of the asset. In determining the future undiscounted cash flows or the estimated fair value of an asset there is judgment in estimating the expected future rental revenues, operating expenses and discount and capitalization rates.

Table of Contents
Cost Capitalization
See the Real Estate Assets and Depreciation of Investment in Real Estate section for a discussion of the Company’s policy with respect to capitalization vs. expensing of fixed asset/repair and maintenance costs. In addition, the Company capitalizes an allocation of the payroll and associated costs of employees directly responsible for and who spend their time on the execution and supervision of major capital and/or renovation projects. These costs are reflected on the balance sheets as increases to depreciable property.
For all development projects, the Company uses its professional judgment in determining whether such costs meet the criteria for capitalization or must be expensed as incurred. The Company capitalizes interest, real estate taxes and insurance and payroll and associated costs for those individuals directly responsible for and who spend their time on development activities, with capitalization ceasing no later than 90 days following issuance of the certificate of occupancy. These costs are reflected on the balance sheets as construction-in-progress for each specific property. The Company expenses as incurred all payroll costs of on-site employees working directly at our properties, except as noted above on our development properties prior to certificate of occupancy issuance and on specific major renovations at selected properties when additional incremental employees are hired.
During the years ended December 31, 2019, 2018 and 2017, the Company capitalized $14.2 million, $13.2 million and $14.7 million, respectively, of payroll and associated costs of employees directly responsible for and who spend their time on the execution and supervision of development activities as well as major capital and/or renovation projects.
Cash and Cash Equivalents
The Company considers all demand deposits, money market accounts and investments in certificates of deposit with a maturity of three months or less at the date of purchase to be cash equivalents. The Company maintains its cash and cash equivalents at financial institutions. The combined account balances at one or more institutions typically exceed the Federal Deposit Insurance Corporation (“FDIC”) insurance coverage, and, as a result, there is a concentration of credit risk related to amounts on deposit in excess of FDIC insurance coverage. The Company believes that the risk is not significant, as the Company does not anticipate the financial institutions’ non-performance.
Fair Value of Financial Instruments, Including Derivative Instruments
The valuation of financial instruments requires the Company to make estimates and judgments that affect the fair value of the instruments. The Company, where possible, bases the fair values of its financial instruments, including its derivative instruments, on listed market prices and third party quotes. Where these are not available, the Company bases its estimates on current instruments with similar terms and maturities or on other factors relevant to the financial instruments.
In the normal course of business, the Company is exposed to the effect of interest rate changes. The Company may seek to manage these risks by following established risk management policies and procedures including the use of derivatives to hedge interest rate risk on debt instruments. The Company may also use derivatives to manage commodity prices in the daily operations of the business.
The Company has a policy of only entering into derivative contracts with major financial institutions based upon their credit ratings and other factors. When viewed in conjunction with the underlying and offsetting exposure that the derivatives are designed to hedge, the Company has not sustained a material loss from these instruments nor does it anticipate any material adverse effect on its net income or financial position in the future from the use of derivatives it currently has in place.
F-25
• For long-lived non-operating assets (projects under development and land held for development), management evaluates major cost overruns, market conditions that could affect lease-up projections, intent and ability to hold the asset and any other indicators of impairment. If any of the indicators were to suggest impairment was present, the carrying value of the asset would be adjusted accordingly to fair value.
• For long-lived assets to be disposed of, an impairment loss is recognized when the estimated fair value of the asset, less the estimated cost to sell, is less than the carrying amount of the asset measured at the time that the Company has determined it will sell the asset. Long-lived assets held for sale and the related liabilities are separately reported, with the long-lived assets reported at the lower of their carrying amounts or their estimated fair values, less their costs to sell, and are not depreciated after reclassification to real estate held for sale.

Table of Contents
The Company recognizes all derivatives as either assets or liabilities in the consolidated balance sheets and measures those instruments at fair value. In addition, fair value adjustments will affect either shareholders’ equity/partners’ capital or net income depending on whether the derivative instruments qualify as a hedge for accounting purposes and, if so, the nature of the hedging activity. When the terms of an underlying transaction are modified, or when the underlying transaction is terminated or completed, all changes in the fair value of the instrument are marked-to-market with changes in value included in net income each period until the instrument matures. Any derivative instrument used for risk management that does not meet the hedging criteria is marked-to-market each period. The Company does not use derivatives for trading or speculative purposes.
Leases and Revenue Recognition
Rental income attributable to residential leases is recorded on a straight-line basis, which is not materially different than if it were recorded when due from residents and recognized monthly as it was earned. Leases entered into between a resident and a property for the rental of an apartment unit are generally year-to-year, renewable upon consent of both parties on an annual or monthly basis. Rental income attributable to retail leases (including commercial leases) is also recorded on a straight-line basis. Retail leases generally have five to ten year lease terms with market based renewal options. Fee and asset management revenue and interest income are recorded on an accrual basis.
The majority of the Company’s revenue is derived from residential, retail and other lease income, which are accounted for under the new leasing standard effective January 1, 2019 (discussed below in Recently Adopted Accounting Pronouncements). Our revenue streams have the same timing and pattern of revenue recognition across our reportable segments, with consistent allocations between the leasing and revenue recognition standards.
The Company is a lessor for its residential and retail leases and is a lessee for its corporate headquarters and regional offices and ground leases for land underlying current operating properties or projects under development. If applicable, lease agreements must be evaluated to determine the accounting treatment as a finance or operating lease in accordance with the new leasing standard. A lease is classified as a finance lease if it meets any of the following criteria: (a) Ownership of the underlying asset is transferred to the lessee by the end of the lease term; (b) the lessee has and is reasonably certain to exercise an option to purchase the underlying asset; (c) the lease term is for the major part of the remaining economic life of the underlying asset; (d) the present value of future minimum lease payments is equal to substantially all of the fair value of the underlying asset; and (e) the underlying asset is expected to have no alternative use to the lessor at the end of the lease term due to its specialized nature.
The new leasing standard also requires the recognition on the balance sheet of: (a) a liability for the lease obligation (initially measured at the present value of the future lease payments not yet paid over the lease term); and (b) an asset for its right to use the underlying asset (initially equal to the lease liability). See Recently Adopted Accounting Pronouncements below for additional details regarding the adoption of this standard. Rental revenues are recognized on a straight-line basis over the term of the lease when reasonably assured they are collectible. The Company uses estimates and judgments on the incremental borrowing rate used to calculate the present value of the future lease payments. See Note 8 for additional discussion.
The Company’s revenue streams that are not accounted for under the new leasing standard include:
F-26
• Parking revenue – The Company’s parking revenue, not related to leasing, is derived primarily from monthly and transient daily parking and is accounted for at the point in time when control of the goods or services transfers to the customer and our performance obligation is satisfied.
• Other rental and non-rental related revenue – The Company receives other income, including, but not limited to: (a) ancillary income, such as laundry, renters insurance and cable income; (b) net settlement income or collections; and (c) miscellaneous fee income.
• Fee and asset management revenue – The Company received management fee revenue as the property manager for two unconsolidated joint ventures for which it had an ownership interest during part of the year but no longer owns as of December 31, 2019.
• Gains or losses on sales of real estate properties – The Company accounts for the sale of real estate properties and any related gain recognition in accordance with the accounting guidance applicable to sales of real estate, which establishes standards for recognition of profit on all real estate sales transactions. The Company recognizes the sale, and associated gain or loss from the disposition, provided that the earnings process is complete and the Company does not have significant continuing involvement. A gain or loss is recognized when the criteria for an asset to be derecognized are met, which include when a contract exists and the buyer obtained control of the nonfinancial asset that was sold.

Table of Contents
The Company’s rental income detail by leasing and revenue recognition standards along with the percentages of rental income are disclosed in the table below for the years ended December 31, 2019 and 2018 (amounts in thousands).
Share-Based Compensation
The Company expenses share-based compensation such as restricted shares, restricted units and share options. Any common share of beneficial interest, $0.01 par value per share (the “Common Shares”), issued pursuant to EQR’s incentive equity compensation and employee share purchase plans will result in ERPOP issuing units of partnership interest (“OP Units”) to EQR on a one-for-one basis, with ERPOP receiving the net cash proceeds of such issuances. See Note 12 for further discussion.
The fair value of the option grants is recognized over the requisite service/vesting period of the options. The fair value for the Company’s share options was estimated at the time the share options were granted using the Black-Scholes option pricing model with the primary grant in each year having the following weighted average assumptions:
The valuation method and assumptions are the same as those the Company used in accounting for option expense in its consolidated financial statements. The Black-Scholes option valuation model was developed for use in estimating the fair value of traded options that have no vesting restrictions and are fully transferable. This model is only one method of valuing options. Because the Company’s share options have characteristics significantly different from those of traded options, and because changes in the subjective input assumptions can materially affect the fair value estimate, the actual value of the options to the recipient may be significantly different.
Income and Other Taxes
EQR has elected to be taxed as a REIT. This, along with the nature of the operations of its operating properties, resulted in no provision for federal income taxes being made at the EQR level. In addition, ERPOP generally is not liable for federal income taxes as the partners recognize their proportionate share of income or loss in their tax returns; therefore no provision for federal income taxes has been made at the ERPOP level. Historically, the Company has generally only incurred certain state and local income, excise and franchise taxes. The Company has elected taxable REIT subsidiary (“TRS”) status for certain of its corporate subsidiaries and as a result, these entities will incur both federal and state income taxes on any taxable income of such entities after consideration of any net operating losses.
F-27
Year Ended December 31, 2019 Year Ended December 31, 2018 Income Type $ Rental Income % of Rental Income $ Rental Income % of Rental Income
Residential and retail rent $ 2,486,189 $ 2,369,552 Utility recoveries ("RUBS") 68,576 63,218 Parking rent 37,905 33,757 Storage rent 3,816 3,674 Pet rent 11,617 11,185
Leasing standard (1) 2,608,103 96.6 % 2,481,386 96.3 % Parking revenue 28,272 26,743 Other revenue 64,316 69,552
Revenue recognition standard 92,588 3.4 % 96,295 3.7 % Rental income $ 2,700,691 100.0 % $ 2,577,681 100.0 %
(1) See Note 8 for additional details on leasing revenue.
2019 2018 2017
Expected volatility (1) 16.3 % 14.8 % 15.3 % Expected life (2) 5 years 5 years 5 years Expected dividend yield (3) 3.10 % 3.09 % 3.08 % Risk-free interest rate (4) 2.43 % 2.52 % 1.93 % Option valuation per share $ 8.06 $ 6.15 $ 5.86
(1) Expected volatility – Estimated based on the historical five-year volatility (the period matching the expected life) of EQR’s share price measured on a monthly basis.
(2) Expected life – Approximates the actual weighted average life of all share options granted since the Company went public in 1993.
(3) Expected dividend yield – Calculated by averaging the historical annual yield on EQR shares for a period matching the expected life of each grant, with the annual yield calculated by dividing actual regular dividends (excluding any special dividends) by the average price of EQR’s shares in a given year.
(4) Risk-free interest rate – The most current U.S. Treasury rate available at the grant date for a period matching the expected life of each grant.

Table of Contents
The Company’s provision for income and other tax expense (benefit) was as follows for the years ended December 31, 2019, 2018 and 2017 (amounts in thousands):
During the years ended December 31, 2019, 2018 and 2017, the tax character of the Company’s dividends and distributions were as follows (unaudited):
The unaudited cost of land and depreciable property, net of accumulated depreciation, for federal income tax purposes as of December 31,
2019 and 2018 was approximately $13.7 billion and $14.0 billion, respectively.
Principles of Consolidation
The Company may hold an interest in subsidiaries, partnerships, joint ventures and other similar entities and accounts for these interests in accordance with the consolidation guidance. The Company first determines whether to consolidate the entity as a variable interest entity (“VIE”) or account for the interest under the equity method of accounting. Equity investors of VIEs do not have sufficient equity at risk to finance their activities without additional subordinated financial support or do not have substantive participating rights. The Company consolidates an entity when it is considered to be the primary beneficiary or when it controls the entity through ownership of a majority voting interest. A primary beneficiary has the power to direct the activities that most significantly impact the VIE’s performance and has the obligation to absorb the expected losses or the right to receive the expected residual returns that could potentially be significant to the VIE. In evaluating whether the entity is a VIE, the Company considers several factors, including, but not limited to, funding and financing sources, business purpose of the entity, related parties, developer and property management fees and agreement terms regarding major decisions, participating and voting rights, contributions and distributions.
F-28
Year Ended December 31, 2019 2018 2017
State and local income, franchise and excise tax (benefit) $ 963 $ 878 $ 478 Alternative minimum tax credit (benefit) (1) (3,244 ) — —
Income and other tax expense (benefit) (2) $ (2,281 ) $ 878 $ 478
(1) As provided in recent tax legislation which repealed the alternative minimum tax on corporations, in 2019 the Company claimed/received $1.6 million of refunds of various alternative minimum tax credit carryovers generated in prior tax years. The provision allows for carryover amounts to be refunded over four years, with 50% available in the first year. The remaining $1.6 million, which will be claimed over three years, was accrued in 2019, for a total expected benefit of $3.2 million.
(2) All provisions for income tax amounts are current and none are deferred.
Year Ended December 31, 2019 (1) 2018 (2) 2017 (3)
Tax character of dividends and distributions: Ordinary dividends $ 1.39604 $ 1.84454 $ 1.22126 Long-term capital gain 0.61243 0.21423 0.18959 Unrecaptured section 1250 gain 0.23403 0.06498 0.10040
Dividends and distributions per Common Share/Unit outstanding $ 2.24250 $ 2.12375 $ 1.51125
(1) The Company’s fourth quarter 2019 dividends and distributions of $0.5675 per Common Share/Unit outstanding will be included as taxable income in calendar year 2020.
(2) The Company’s fourth quarter 2018 dividends and distributions of $0.54 per Common Share/Unit outstanding was included as taxable income in calendar year 2019.
(3) The Company’s fourth quarter 2017 dividends and distributions of $0.50375 per Common Share/Unit outstanding was included as taxable income in calendar year 2018.

Table of Contents
Noncontrolling Interests
A noncontrolling interest in a subsidiary (minority interest) is an ownership interest in the consolidated entity that should be reported as equity in the consolidated financial statements and separate from the parent company’s equity. In addition, consolidated net income is required to be reported at amounts that include the amounts attributable to both the parent and the noncontrolling interest and the amount of consolidated net income attributable to the parent and the noncontrolling interest are required to be disclosed on the face of the consolidated statements of operations and comprehensive income. See Note 3 for further discussion.
Operating Partnership: Net income is allocated to noncontrolling interests based on their respective ownership percentage of the Operating Partnership. The ownership percentage is calculated by dividing the number of OP Units held by the noncontrolling interests by the total OP Units held by the noncontrolling interests and EQR. Issuance of additional Common Shares and OP Units changes the ownership interests of both the noncontrolling interests and EQR. Such transactions and the related proceeds are treated as capital transactions.
Partially Owned Properties: The Company reflects noncontrolling interests in partially owned properties on the balance sheet for the portion of properties consolidated by the Company that are not wholly owned by the Company. The earnings or losses from those properties attributable to the noncontrolling interests are generally based on ownership percentage and are reflected as noncontrolling interests in partially owned properties in the consolidated statements of operations and comprehensive income.
Partners’ Capital
The “Limited Partners” of ERPOP include various individuals and entities that contributed their properties to ERPOP in exchange for OP Units. The “General Partner” of ERPOP is EQR. Net income is allocated to the Limited Partners based on their respective ownership percentage of ERPOP. The ownership percentage is calculated by dividing the number of OP Units held by the Limited Partners by the total OP Units held by the Limited Partners and the General Partner. Issuance of additional Common Shares and OP Units changes the ownership interests of both the Limited Partners and EQR. Such transactions and the related proceeds are treated as capital transactions.
Redeemable Noncontrolling Interests – Operating Partnership / Redeemable Limited Partners
The Company classifies Redeemable Noncontrolling Interests – Operating Partnership / Redeemable Limited Partners in the mezzanine section of the consolidated balance sheets for the portion of OP Units that EQR is required, either by contract or securities law, to deliver registered Common Shares to the exchanging OP Unit holder. The redeemable noncontrolling interest units / redeemable limited partner units are adjusted to the greater of carrying value or fair market value based on the Common Share price of EQR at the end of each respective reporting period. See Note 3 for further discussion.
Use of Estimates
In preparation of the Company’s financial statements in conformity with accounting principles generally accepted in the United States, management makes estimates and assumptions that affect the reported amounts of assets and liabilities and disclosure of contingent assets and liabilities at the date of the financial statements as well as the reported amounts of revenues and expenses during the reporting period. Actual results could differ from these estimates.
Reclassifications
Certain reclassifications considered necessary for a fair presentation have been made to the prior period financial statements in order to conform to the current year presentation. These reclassifications have not changed the results of operations or equity/capital.
Recently Issued Accounting Pronouncements
In June 2016, the Financial Accounting Standards Board (“FASB”) issued a new standard which requires companies to adopt a new approach for estimating credit losses on certain types of financial instruments, such as trade and other receivables and loans. The standard requires entities to estimate a lifetime expected credit loss for most financial instruments, including trade receivables. In November 2018, the FASB issued an amendment excluding operating lease receivables accounted for under the new leases standard from the scope of the new credit losses standard. The new standard was effective for the Company beginning on January 1, 2020 and it did not have a material effect on its consolidated results of operations or financial position.
F-29

Table of Contents
Recently Adopted Accounting Pronouncements
In May 2014, the FASB issued a comprehensive revenue recognition standard entitled Revenue from Contracts with Customers that superseded nearly all existing revenue recognition guidance. The standard specifically excludes lease revenue. The standard may be applied retrospectively to each prior period presented or prospectively with the cumulative effect, if any, recognized as of the date of adoption. The Company selected the modified retrospective transition method as of the date of adoption as required effective January 1, 2018. The majority of rental income consists of revenue from leasing arrangements, which is specifically excluded from the standard. The Company analyzed its remaining revenue streams, inclusive of fee and asset management and gains and losses on sales, and concluded these revenue streams have the same timing and pattern of revenue recognition under the new guidance, and therefore the Company had no changes in revenue recognition with the adoption of the standard. As such, adoption of the standard did not result in a cumulative adjustment recognized as of January 1, 2018, and the standard did not have a material impact on the Company’s consolidated financial position, results of operations, equity/capital or cash flows.
Additionally, as part of the revenue recognition standard, the FASB issued amendments related to partial sales of real estate. Adoption of
the partial sales standard did not result in a change of accounting for the Company related to its disposition process. We concluded that the Company’s typical dispositions will continue to meet the criteria for sale and associated profit recognition under both standards.
In February 2016, the FASB issued a leases standard which sets out principles for the recognition, measurement, presentation and disclosure of leases for both parties to a contract (i.e. lessors and lessees). The standard requires the following:
The Company adopted this standard as required effective January 1, 2019 using a modified retrospective method and the Company applied the guidance as of the adoption date and elected certain practical expedients, as described below. The standard impacted our consolidated balance sheets but did not impact our consolidated statements of operations. Right-of-use (“ROU”) assets and lease liabilities where the Company is the lessee were recognized for various corporate office leases and ground leases. The Company recorded ROU assets and related lease liabilities to its opening balance sheet upon adoption on January 1, 2019 of $434.2 million and $278.3 million, respectively. The Company calculated the net present value of the lease liabilities on January 1, 2019 and reclassed the following amounts from other assets and other liabilities to record our initial ROU assets (amounts in thousands):
The Company elected the practical expedient to not reassess the classification of existing operating leases. As of January 1, 2019, any new
or modified ground leases may be classified as financing leases unless they meet certain conditions. When there is a material lease modification, the Company is required to reassess the classification and remeasure the lease liability.
F-30
• Lessors – Leases are accounted for using an approach that is substantially equivalent to existing guidance for operating, sales-type and financing leases, but aligned with the revenue recognition standard. Lessors are required to allocate lease payments to separate lease and non-lease components of each lease agreement, with the non-lease components evaluated under the revenue recognition standard.
• Lessees – Leases are accounted for using a dual approach, classifying leases as either operating or finance based on the principle of whether or not the lease is effectively a financed purchase of the leased asset by the lessee. This classification determines whether the lease expense is recognized on a straight-line basis over the term of the lease (for operating leases) or based on an effective interest method (for finance leases). A lessee is also required to record a right-of-use asset and a lease liability on its balance sheet for all leases with a term of greater than 12 months regardless of their classification as operating or finance leases. Leases with a term of 12 months or less are accounted for similar to existing guidance for operating leases.
January 1, 2019 Balance Sheet Reclass:
Initial lease liabilities $ 278,287 Reclassifications:
Prepaid ground leases 17,886 Other Assets Ground lease intangibles – below market, net 166,230 Other Assets Ground lease intangibles – above market, net (2,110 ) Other Liabilities Straight-line rent liabilities (1) (26,092 ) Other Liabilities
Initial right-of-use assets $ 434,201
(1) Straight-line rent liabilities relate to corporate office leases and certain ground leases.

Table of Contents
In July 2018, the FASB issued an amendment to the leases standard, which includes a practical expedient that provides lessors an option not to separate lease and non-lease components when certain criteria are met and instead account for those components as a single component under the leases standard. The amendment also provides a transition option that permits the application of the new guidance as of the adoption date rather than to all periods presented. The Company elected the practical expedient to account for both its lease and non-lease components as a single component under the leases standard and elected the new transition option as of the date of adoption effective January 1, 2019. See Note 8 for additional discussion regarding the new lease standard.
In August 2017, the FASB issued a final standard which makes changes to the hedge accounting model to enable entities to better portray their risk management activities in the financial statements. The standard expands an entity’s ability to hedge nonfinancial and financial risk components, reduces complexity in fair value hedges of interest rate risk and eases certain documentation and assessment requirements. The standard also eliminates the requirement to separately measure and report hedge ineffectiveness and generally requires the entire change in the fair value of any hedging instrument to be presented in the same income statement line as the hedged instrument. The Company adopted this standard as required effective January 1, 2019 and it did not have a material effect on its consolidated results of operations or financial position.
Other
The Company is the controlling partner in various consolidated partnerships owning 17 properties consisting of 3,535 apartment units having a noncontrolling interest balance of $1.2 million at December 31, 2019. The Company is required to make certain disclosures regarding noncontrolling interests in consolidated limited-life subsidiaries. Of the consolidated entities described above, the Company is the controlling partner in limited-life partnerships owning four properties having a noncontrolling interest deficit balance of $10.2 million. These four partnership agreements contain provisions that require the partnerships to be liquidated through the sale of their assets upon reaching a date specified in each respective partnership agreement. The Company, as controlling partner, has an obligation to cause the property owning partnerships to distribute the proceeds of liquidation to the Noncontrolling Interests in these Partially Owned Properties only to the extent that the net proceeds received by the partnerships from the sale of their assets warrant a distribution based on the partnership agreements. As of December 31, 2019 the Company estimates the value of Noncontrolling Interest distributions for these four properties would have been approximately $78.9 million (“Settlement Value”) had the partnerships been liquidated. This Settlement Value is based on estimated third party consideration realized by the partnerships upon disposition of the four Partially Owned Properties and is net of all other assets and liabilities, including yield maintenance on the mortgages encumbering the properties, that would have been due on December 31, 2019 had those mortgages been prepaid. Due to, among other things, the inherent uncertainty in the sale of real estate assets, the amount of any potential distribution to the Noncontrolling Interests in the Company’s Partially Owned Properties is subject to change. To the extent that the partnerships’ underlying assets are worth less than the underlying liabilities, the Company has no obligation to remit any consideration to the Noncontrolling Interests in these Partially Owned Properties.
The Company refers to “Common Shares” and “Units” (which refer to both OP Units and restricted units) as equity securities for EQR and “General Partner Units” and “Limited Partner Units” as equity securities for ERPOP. To provide a streamlined and more readable presentation of the disclosures for the Company and the Operating Partnership, several sections below refer to the respective terminology for each with the same financial information and separate sections are provided, where needed, to further distinguish any differences in financial information and terminology.
F-31
3. Equity, Capital and Other Interests

Table of Contents
The following table presents the changes in the Company’s issued and outstanding Common Shares and Units for the years ended December 31, 2019, 2018 and 2017:
The following table presents the changes in the Operating Partnership’s issued and outstanding General Partner Units and Limited Partner
Units for the years ended December 31, 2019, 2018 and 2017:
The equity positions of various individuals and entities that contributed their properties to the Operating Partnership in exchange for
OP Units, as well as the equity positions of the holders of restricted units, are collectively referred to as the “Noncontrolling Interests – Operating Partnership” and “Limited Partners Capital,” respectively, for the Company and the Operating Partnership. Subject to certain exceptions (including the “book-up” requirements of restricted units), the Noncontrolling Interests – Operating Partnership/Limited Partners Capital may exchange their Units with EQR for Common Shares on a one-for-one basis. The carrying value of the Noncontrolling Interests – Operating Partnership/Limited Partners Capital (including redeemable interests) is allocated based on the number of Noncontrolling Interests – Operating Partnership/Limited Partners Capital in total in proportion to the number of Noncontrolling Interests – Operating Partnership/Limited Partners Capital in total plus the total number of Common Shares/General Partner Units. Net income is allocated to the Noncontrolling Interests – Operating Partnership/Limited Partners Capital based on the weighted average ownership percentage during the period.
F-32
2019 2018 2017
Common Shares Common Shares outstanding at January 1, 369,405,161 368,018,082 365,870,924 Common Shares Issued: Conversion of OP Units 313,940 131,477 1,149,284 Exercise of share options 1,745,050 1,056,388 846,137 Employee Share Purchase Plan (ESPP) 48,131 75,414 68,286 Restricted share grants, net 158,602 123,800 83,451
Common Shares outstanding at December 31, 371,670,884 369,405,161 368,018,082
Units Units outstanding at January 1, 13,904,035 13,768,438 14,626,075 Restricted unit grants, net 141,220 267,074 291,647 Conversion of OP Units to Common Shares (313,940 ) (131,477 ) (1,149,284 )
Units outstanding at December 31, 13,731,315 13,904,035 13,768,438 Total Common Shares and Units outstanding at December 31, 385,402,199 383,309,196 381,786,520
Units Ownership Interest in Operating Partnership 3.6 % 3.6 % 3.6 %
2019 2018 2017
General and Limited Partner Units General and Limited Partner Units outstanding at January 1, 383,309,196 381,786,520 380,496,999 Issued to General Partner: Exercise of EQR share options 1,745,050 1,056,388 846,137 EQR’s Employee Share Purchase Plan (ESPP) 48,131 75,414 68,286 EQR’s restricted share grants, net 158,602 123,800 83,451 Issued to Limited Partners: Restricted unit grants, net 141,220 267,074 291,647
General and Limited Partner Units outstanding at December 31, 385,402,199 383,309,196 381,786,520
Limited Partner Units Limited Partner Units outstanding at January 1, 13,904,035 13,768,438 14,626,075 Limited Partner restricted unit grants, net 141,220 267,074 291,647 Conversion of Limited Partner OP Units to EQR Common Shares (313,940 ) (131,477 ) (1,149,284 )
Limited Partner Units outstanding at December 31, 13,731,315 13,904,035 13,768,438
Limited Partner Units Ownership Interest in Operating Partnership 3.6 % 3.6 % 3.6 %

Table of Contents
The Operating Partnership has the right but not the obligation to make a cash payment instead of issuing Common Shares to any and all holders of Noncontrolling Interests – Operating Partnership/Limited Partners Capital requesting an exchange of their Noncontrolling Interests – Operating Partnership/Limited Partners Capital with EQR. Once the Operating Partnership elects not to redeem the Noncontrolling Interests – Operating Partnership/Limited Partners Capital for cash, EQR is obligated to deliver Common Shares to the exchanging holder of the Noncontrolling Interests – Operating Partnership/Limited Partners Capital.
The Noncontrolling Interests – Operating Partnership/Limited Partners Capital are classified as either mezzanine equity or permanent equity. If EQR is required, either by contract or securities law, to deliver registered Common Shares, such Noncontrolling Interests – Operating Partnership/Limited Partners Capital are differentiated and referred to as “Redeemable Noncontrolling Interests – Operating Partnership” and “Redeemable Limited Partners,” respectively. Instruments that require settlement in registered shares cannot be classified in permanent equity as it is not always completely within an issuer’s control to deliver registered shares. Therefore, settlement in cash is assumed and that responsibility for settlement in cash is deemed to fall to the Operating Partnership as the primary source of cash for EQR, resulting in presentation in the mezzanine section of the balance sheet. The Redeemable Noncontrolling Interests – Operating Partnership/Redeemable Limited Partners are adjusted to the greater of carrying value or fair market value based on the Common Share price of EQR at the end of each respective reporting period. EQR has the ability to deliver unregistered Common Shares for the remaining portion of the Noncontrolling Interests – Operating Partnership/Limited Partners Capital that are classified in permanent equity at December 31, 2019 and 2018.
The carrying value of the Redeemable Noncontrolling Interests – Operating Partnership/Redeemable Limited Partners is allocated based on the number of Redeemable Noncontrolling Interests – Operating Partnership/Redeemable Limited Partners in proportion to the number of Noncontrolling Interests – Operating Partnership/Limited Partners Capital in total. Such percentage of the total carrying value of Units/Limited Partner Units which is ascribed to the Redeemable Noncontrolling Interests – Operating Partnership/Redeemable Limited Partners is then adjusted to the greater of carrying value or fair market value as described above. As of December 31, 2019 and 2018, the Redeemable Noncontrolling Interests – Operating Partnership/Redeemable Limited Partners have a redemption value of approximately $463.4 million and $379.1 million, respectively, which represents the value of Common Shares that would be issued in exchange for the Redeemable Noncontrolling Interests – Operating Partnership/Redeemable Limited Partners.
The following table presents the changes in the redemption value of the Redeemable Noncontrolling Interests – Operating Partnership/Redeemable Limited Partners for the years ended December 31, 2019, 2018 and 2017, respectively (amounts in thousands):
Net proceeds from EQR Common Share and Preferred Share (see definition below) offerings and proceeds from exercise of options for
Common Shares are contributed by EQR to ERPOP. In return for those contributions, EQR receives a number of OP Units in ERPOP equal to the number of Common Shares it has issued in the equity offering (or in the case of a preferred equity offering, a number of preference units in ERPOP equal in number and having the same terms as the Preferred Shares issued in the equity offering). As a result, the net proceeds from Common Shares and Preferred Shares are allocated for the Company between shareholders’ equity and Noncontrolling Interests – Operating Partnership and for the Operating Partnership between General Partner’s Capital and Limited Partners Capital to account for the change in their respective percentage ownership of the underlying equity.
The Company’s declaration of trust authorizes it to issue up to 100,000,000 preferred shares of beneficial interest, $0.01 par value per share (the “Preferred Shares”), with specific rights, preferences and other attributes as the Board of Trustees may determine, which may include preferences, powers and rights that are senior to the rights of holders of the Company’s Common Shares.
F-33
2019 2018 2017
Balance at January 1, $ 379,106 $ 366,955 $ 442,092 Change in market value 82,283 13,922 (41,916 ) Change in carrying value 2,011 (1,771 ) (33,221 )
Balance at December 31, $ 463,400 $ 379,106 $ 366,955

Table of Contents
The following table presents the Company’s issued and outstanding Preferred Shares/Preference Units as of December 31, 2019 and 2018:
Other
EQR and ERPOP currently have an active universal shelf registration statement for the issuance of equity and debt securities that automatically became effective upon filing with the SEC in June 2019 and expires in June 2022. Per the terms of ERPOP’s partnership agreement, EQR contributes the net proceeds of all equity offerings to the capital of ERPOP in exchange for additional OP Units (on a one-for-one Common Share per OP Unit basis) or preference units (on a one-for-one preferred share per preference unit basis).
The Company has an At-The-Market (“ATM”) share offering program which allows EQR to sell Common Shares from time to time into the existing trading market at current market prices as well as through negotiated transactions. In June 2019, the Company extended the program maturity to June 2022. In connection with the extension, the Company may now also sell Common Shares under forward sale agreements. The use of a forward sale agreement would allow the Company to lock in a price on the sale of Common Shares at the time the agreement is executed, but defer receiving the proceeds from the sale until a later date. EQR has the authority to issue 13.0 million shares but has not issued any shares under this program since September 2012.
The Company may repurchase up to 13.0 million Common Shares under its share repurchase program. No open market repurchases have occurred since 2008 and no repurchases of any kind have occurred since February 2014. As of December 31, 2019, EQR has remaining authorization to repurchase up to 13.0 million of its shares.
The following table summarizes the carrying amounts for the Company’s investment in real estate (at cost) as of December 31, 2019 and 2018 (amounts in thousands):
F-34
Amounts in thousands
Annual Call Dividend Per December 31, December 31, Date (1) Share/Unit (2) 2019 2018
Preferred Shares/Preference Units of beneficial interest, $0.01 par value; 100,000,000 shares authorized: 8.29% Series K Cumulative Redeemable Preferred Shares/Preference Units; liquidation value $50 per share/unit; 745,600 shares/units issued and outstanding as of December 31, 2019 and 2018 12/10/26 $ 4.145 $ 37,280 $ 37,280
$ 37,280 $ 37,280
(1) On or after the call date, redeemable Preferred Shares/Preference Units may be redeemed for cash at the option of the Company or the Operating Partnership, respectively, in whole or in part, at a redemption price equal to the liquidation price per share/unit, plus accrued and unpaid distributions, if any.
(2) Dividends on Preferred Shares/Preference Units are payable quarterly.
4. Real Estate
2019 2018
Land $ 5,936,188 $ 5,875,803 Depreciable property:
Buildings and improvements 18,904,686 18,232,625 Furniture, fixtures and equipment 1,916,458 1,722,231 In-Place lease intangibles 497,957 481,045
Projects under development: Land 23,531 25,429 Construction-in-progress 158,099 83,980
Land held for development: Land 64,460 61,038 Construction-in-progress 32,228 28,871
Investment in real estate 27,533,607 26,511,022 Accumulated depreciation (7,276,786 ) (6,696,281 )
Investment in real estate, net $ 20,256,821 $ 19,814,741

Table of Contents
Acquisitions and Dispositions
During the year ended December 31, 2019, the Company acquired the following from unaffiliated parties (purchase price in thousands):
During the year ended December 31, 2018, the Company acquired the following from unaffiliated parties (purchase price in thousands):
During the year ended December 31, 2019, the Company disposed of the following to unaffiliated parties (sales price in thousands):
The Company recognized a net gain on sales of real estate properties of approximately $447.6 million, a net gain on sales of unconsolidated
entities of approximately $69.5 million and a net gain on sales of land parcels of approximately $2.0 million on the above sales.
During the year ended December 31, 2018, the Company disposed of the following to unaffiliated parties (sales price in thousands):
The Company recognized a net gain on sales of real estate properties of approximately $256.8 million and a net gain on sales of land parcels
of approximately $1.0 million on the above sales.
Impairment
During the year ended December 31, 2018, the Company recorded an approximate $0.7 million non-cash asset impairment charge on a property located in the San Francisco market due to physical property damage as a result of a fire at one of the buildings at the property.
F-35
Properties Apartment Units Purchase Price
Rental Properties – Consolidated (1) 13 3,540 $ 1,494,689 Land Parcels (four) (2) — — 19,832
Total 13 3,540 $ 1,514,521
(1) Purchase price includes an allocation of approximately $268.3 million to land and $1.229 billion to depreciable property (inclusive of capitalized closing costs).
(2) Purchase price includes an allocation of approximately $16.7 million to vacant land and $4.9 million to construction-in-progress (inclusive of capitalized closing costs). Land parcels include entry into two long-term ground leases for land projects under development in the Washington D.C. market, of which one land parcel is subject to a fully prepaid ground lease. See Notes 6 and 8 for additional discussion.
Properties Apartment Units Purchase Price
Rental Properties – Consolidated (1) 5 1,478 $ 707,005
Total 5 1,478 $ 707,005
(1) Purchase price includes an allocation of approximately $113.7 million to land and $594.4 million to depreciable property (inclusive of capitalized closing costs).
Properties Apartment Units Sales Price
Rental Properties – Consolidated 11 2,361 $ 1,080,675 Rental Properties – Unconsolidated (1) 2 945 394,500 Land Parcels (two) — — 2,100
Total 13 3,306 $ 1,477,275
(1) The Company owned a 20% interest in both unconsolidated rental properties. Sales price listed is the gross sales price. The Company received net sales proceeds of approximately $78.3 million.
Properties Apartment Units Sales Price
Rental Properties – Consolidated 5 1,292 $ 706,120 Land Parcels (one) — — 2,700
Total 5 1,292 $ 708,820

Table of Contents
During the year ended December 31, 2017, the Company recorded an approximate $1.7 million non-cash asset impairment charge on a land parcel that was being marketed for sale, which is included in land held for development on the consolidated balance sheets and included in the non-same store/other segment discussed in Note 17. The charge was the result of an analysis of the parcel’s estimated fair value (determined using internally developed models based on market assumptions and potential sales data from the marketing process) compared to its current capitalized carrying value. The parcel was sold in 2019.
The Company has not entered into any agreements to acquire rental properties or land parcels as of the date of filing.
The Company has entered into separate agreements to dispose of the following (sales price in thousands):
The closing of pending transactions is subject to certain conditions and restrictions; therefore, there can be no assurance that the
transactions will be consummated or that the final terms will not differ in material respects from any agreements summarized above. See Note 18 for discussion of the properties acquired or disposed of, if any, subsequent to December 31, 2019.
The Company has co-invested in various properties with unrelated third parties which are either consolidated or accounted for under the equity method of accounting (unconsolidated).
Consolidated VIEs
In accordance with accounting standards for consolidation of VIEs, the Company consolidates ERPOP on EQR’s financial statements. As the sole general partner of ERPOP, EQR has exclusive control of ERPOP’s day-to-day management. The limited partners are not able to exercise substantive kick-out or participating rights. As a result, ERPOP qualifies as a VIE. EQR has a controlling financial interest in ERPOP and, thus, is ERPOP’s primary beneficiary. EQR has the power to direct the activities of ERPOP that most significantly impact ERPOP’s economic performance as well as the obligation to absorb losses or the right to receive benefits from ERPOP that could potentially be significant to ERPOP.
The Company has various equity interests in certain joint ventures owning 17 properties containing 3,535 apartment units. The Company is the general partner or managing member of these joint ventures and is responsible for managing the operations and affairs of the joint ventures as well as making all decisions regarding the businesses of the joint ventures. The limited partners or non-managing members are not able to exercise substantive kick-out or participating rights. As a result, the joint ventures qualify as VIEs. The Company has a controlling financial interest in the VIEs and, thus, is the VIEs’ primary beneficiary. The Company has both the power to direct the activities of the VIEs that most significantly impact the VIEs’ economic performance as well as the obligation to absorb losses or the right to receive benefits from the VIEs that could potentially be significant to the VIEs. As a result, the joint ventures are required to be consolidated on the Company’s financial statements.
During the year ended December 31, 2019, the Company entered into two consolidated joint ventures, both of which have been deemed to be VIEs and are consolidated due to the Company being the primary beneficiary. The joint ventures own two separate land parcels which they are currently developing into multifamily rental properties.
The consolidated assets and liabilities related to the VIEs discussed above were approximately $754.7 million and $323.1 million, respectively, at December 31, 2019 and approximately $713.6 million and $313.9 million, respectively, at December 31, 2018.
F-36
5. Commitments to Acquire/Dispose of Real Estate
Properties Apartment Units Sales Price
Rental Properties – Consolidated 4 1,416 $ 723,500 Land Parcels (two) — — 55,150
Total 4 1,416 $ 778,650
6. Investments in Partially Owned Entities

Table of Contents
Investments in Unconsolidated Entities
The following table and information summarizes the Company’s investments in unconsolidated entities, which are accounted for under the equity method of accounting as the requirements for consolidation are not met, as of December 31, 2019 and December 31, 2018 (amounts in thousands except for ownership percentage):
The following table presents the Company’s restricted deposits as of December 31, 2019 and 2018 (amounts in thousands):
Lessor Accounting
The Company is the lessor for its residential and retail leases (including commercial leases) and these leases will continue to be accounted for as operating leases under the new standard as described in Note 2. Therefore, the Company did not have significant changes in the accounting for its lease revenues.
For the year ended December 31, 2019, approximately 97% of the Company’s total lease revenue is generated from residential apartment leases that are generally twelve months or less in length. The residential apartment leases may include lease income related to such items as RUBS income, parking, storage and pet rent that the Company treats as a single lease component because the amenities cannot be leased on their own and the timing and pattern of revenue recognition are the same. The collection of lease payments at lease commencement is probable and therefore the Company subsequently recognizes lease income over the lease term on a straight-line basis. Residential leases are renewable upon consent of both parties on an annual or monthly basis.
F-37
December 31, 2019 December 31, 2018 Ownership Percentage
Investments in Unconsolidated Entities: Operating Property (VIE) (1) $ 40,361 $ 42,365 33.3% Operating Properties (Non-VIE) (2) — 10,494 20.0% Real Estate Technology/Other 11,877 5,490 Varies
Investments in Unconsolidated Entities $ 52,238 $ 58,349
(1) Represents an unconsolidated interest in an entity that owns the land underlying one of the consolidated joint venture properties noted above and owns and operates a related parking facility. The joint venture, as a limited partner, does not have substantive kick-out or participating rights in the entity. As a result, the entity qualifies as a VIE. The joint venture does not have a controlling financial interest in the VIE and is not the VIE’s primary beneficiary. The joint venture does not have the power to direct the activities of the VIE that most significantly impact the VIE’s economic performance or the obligation to absorb losses or the right to receive benefits from the VIE that could potentially be significant to the VIE. As a result, the entity that owns the land and owns and operates the parking facility is unconsolidated and recorded using the equity method of accounting.
(2) Includes two joint ventures under separate agreements with the same partner totaling 945 apartment units as of December 31, 2018. During the year ended December 31, 2019, the Company and its joint venture partner sold both properties under separate agreements to unaffiliated parties. See Note 4 for additional discussion.
7. Restricted Deposits
December 31, 2019 December 31, 2018
Mortgage escrow deposits: Real estate taxes and insurance $ — $ 876 Replacement reserves 8,543 8,641 Mortgage principal reserves/sinking funds 9,689 9,754 Other — 852
Mortgage escrow deposits 18,232 20,123
Restricted cash: Tax-deferred (1031) exchange proceeds 14,232 — Earnest money on pending acquisitions — 5,000 Restricted deposits on real estate investments 658 540 Resident security and utility deposits 37,140 35,659 Other 984 7,549
Restricted cash 53,014 48,748
Restricted deposits $ 71,246 $ 68,871
8. Leases

Table of Contents
For the year ended December 31, 2019, approximately 3% of the Company’s total lease revenue is generated by retail leases that are generally for terms ranging between five to ten years. The retail leases generally consist of ground floor retail spaces and master-leased parking garages that serve as additional amenities for our residents. The retail leases may include lease income related to such items as RUBS income, parking rent and storage rent that the Company treats as a single lease component because the amenities cannot be leased on their own and the timing and pattern of revenue recognition are the same. The collection of lease payments at lease commencement is probable and therefore the Company subsequently recognizes lease income over the lease term on a straight-line basis. Retail leases are renewable with market-based renewal options.
The Company elected the practical expedient to account for both its lease and non-lease components (specifically common area maintenance charges) as a single lease component under the leases standard.
The following table presents the lease income types relating to lease payments for residential and retail leases for the year ended December 31, 2019 (amounts in thousands):
Lessee Accounting
The Company is the lessee under various corporate office and ground leases for which the Company recognized ROU assets and related lease liabilities effective January 1, 2019. The following table presents the Company’s ROU assets and related lease liabilities as of December 31, 2019 (amounts in thousands):
As the standard requires the recognition of a liability for the lease obligation, discount rates are used to determine the net present value of
the lease payments. The discount rate for the lease is the rate implicit in the lease or, if that rate cannot be readily determined, the incremental borrowing rate. As the Company does not know the amount of the lessors’ initial direct costs, it cannot readily determine the rate implicit in the lease and instead must apply the incremental borrowing rate. The Company has estimated the discount rate ranges of 3.3% to 3.9% for corporate office leases and 4.4% to 5.5% for ground leases at adoption. Since the Company’s credit backs the corporate office lease obligations and the lease terms are generally ten years or less, the discount rate range was estimated by using the Company’s borrowing rates for actual pricing data. The discount rate range for ground leases takes into account various factors, including the longer life of the ground leases, and was estimated by using the Company’s borrowing rates for actual pricing data through 30 years and other long-term market rates.
Corporate office leases
The Company leases nine corporate offices with lease expiration dates ranging from 2021 through 2042 (inclusive of applicable extension options). The Company’s corporate office leases continue to be accounted for as operating leases under the new standard. During the year ended December 31, 2019, the Company modified four office leases that continue to be classified as operating leases
F-38
Year Ended December 31, 2019 Lease Income Type Residential Leases Retail Leases Total
Residential and retail rent $ 2,414,201 $ 71,988 $ 2,486,189 Utility recoveries (RUBS income) (1) 67,659 917 68,576 Parking rent 37,557 348 37,905 Storage rent 3,745 71 3,816 Pet rent 11,617 — 11,617
Total lease revenue (2) $ 2,534,779 $ 73,324 $ 2,608,103
(1) RUBS income primarily consists of variable payments representing the recovery of utility costs from residents.
(2) Excludes other rental income of $92.6 million for the year ended December 31, 2019, which is accounted for under the revenue recognition standard discussed in Note 2.
2019
Right-of-use assets: Corporate office leases $ 41,596 Ground leases (finance) 57,982 Ground leases (operating) 413,196
Right-of-use assets $ 512,774
Lease liabilities: Corporate office leases $ 43,105 Ground leases (finance) 23,239 Ground leases (operating) 264,990
Lease liabilities $ 331,334

Table of Contents
and recorded an additional lease liability and ROU asset at initial remeasurement of approximately $32.1 million. See Note 15 for details on a corporate office lease with a related party.
Ground leases
The Company maintains long-term ground leases for 14 operating properties and two projects under development with lease expiration dates ranging from 2042 through 2118 (inclusive of applicable purchase options). The Company owns the building and improvements. Based on its election of the package of practical expedients, the Company was not required to reassess the classification of existing ground leases at adoption and therefore the 14 operating property leases continue to be accounted for as operating leases. During the year ended December 31, 2019, the Company entered into two new ground leases, one of which is a fully prepaid ground lease, for projects under development that are being accounted for as finance leases and recorded initial ROU assets of approximately $57.9 million and lease liabilities of approximately $23.2 million.
Ground Lease Intangibles
Effective on January 1, 2019 with the adoption of the new leasing standard, ground lease intangibles, net of accumulated amortization were reclassed from other assets and other liabilities and are reported within the ROU assets on the consolidated balance sheets. See Note 2 for discussion of the opening balance of ROU assets. The following table summarizes the Company’s ground lease intangibles as of December 31, 2019 and 2018 (amounts in thousands):
The following table provides a summary of the effect of the amortization for ground lease intangibles on the Company’s accompanying
consolidated statements of operations and comprehensive income for the years ended December 31, 2019, 2018 and 2017 (amounts in thousands):
The following table provides a summary of the aggregate amortization for ground lease intangibles for each of the next five years (amounts in
thousands):
F-39
Description 2019 2018
Assets
Ground lease intangibles $ 189,518 $ 191,918 Accumulated amortization (29,861 ) (25,688 )
Ground lease intangible assets, net (1) $ 159,657 $ 166,230
Liabilities
Ground lease intangibles $ — $ 2,400 Accumulated amortization — (290 )
Ground lease intangible liabilities, net (1) $ — $ 2,110
(1) As of December 31, 2019, ground lease intangibles, net of accumulated amortization are included within the ROU assets on the consolidated balance sheets. As of December 31, 2018, the ground lease intangibles were included within other assets and other liabilities on the consolidated balance sheets.
Description Income Statement Location 2019 2018 2017
Ground lease intangible amortization Property and Maintenance $ (4,463 ) $ (4,463 ) $ (4,369 )
2020 2021 2022 2023 2024
Ground lease intangibles $ (4,463 ) $ (4,463 ) $ (4,463 ) $ (4,463 ) $ (4,463 )

Table of Contents
Additional disclosures
The following tables illustrate the quantitative disclosures for lessees as of and for the year ended December 31, 2019 (amounts in thousands):
The following table summarizes the Company’s undiscounted cash flows for contractual obligations for minimum rent payments/receipts
under operating and financing leases for the next five years and thereafter as of December 31, 2019:
F-40
Year Ended
December 31, 2019
Lease cost: Finance lease cost:
Amortization of right-of-use assets $ — Interest on lease liabilities (capitalized) 225
Operating lease cost: Corporate office leases 3,937 Ground leases 22,198
Variable lease cost: Corporate office leases 1,489 Ground leases 3,700
Total lease cost $ 31,549
December 31, 2019
Other information: Cash paid for amounts included in the measurement of lease liabilities:
Investing cash flows from finance leases (capitalized) $ 34,922 Operating cash flows from operating leases:
Corporate office leases $ 5,494 Ground leases $ 16,837
ROU assets obtained in exchange for new finance lease liabilities $ 23,201 ROU assets obtained in exchange for new operating lease liabilities:
Corporate office leases $ 44,298 Ground leases $ 422,018
Weighted-average remaining lease term – finance leases (1) 19.7 years Weighted-average remaining lease term – operating leases:
Corporate office leases 18.1 years Ground leases 56.2 years
Weighted-average discount rate – finance leases 3.0 % Weighted-average discount rate – operating leases:
Corporate office leases 3.2 % Ground leases 5.0 %
(1) The weighted-average remaining lease term – finance leases does not include the remaining term of a fully prepaid finance lease entered into during the year ended December 31, 2019.
(Payments)/Receipts Due by Year (in thousands) 2020 2021 2022 2023 2024 Thereafter Total
Finance Leases: Minimum Rent Payments (a) $ (567 ) $ (578 ) $ (590 ) $ (601 ) $ (614 ) $ (33,850 ) $ (36,800 )
Operating Leases: Minimum Rent Payments (a) $ (16,914 ) $ (17,161 ) $ (16,907 ) $ (16,998 ) $ (17,330 ) $ (979,172 ) $ (1,064,482 ) Minimum Rent Receipts (b) $ 64,527 $ 61,817 $ 58,204 $ 50,906 $ 43,784 $ 154,898 $ 434,136
(a) Minimum basic rent due for corporate office leases and base rent due on ground leases where the Company is the lessee.
(b) Minimum basic rent receipts due for various retail space where the Company is the lessor. Excludes residential leases due to their short-term nature.

Table of Contents
The following table provides a reconciliation of lease liabilities from our undiscounted cash flows for minimum rent payments as of December 31, 2019 (amounts in thousands):
EQR does not have any indebtedness as all debt is incurred by the Operating Partnership. Weighted average interest rates noted below for the years ended December 31, 2019 and 2018 include the effect of any derivative instruments and amortization of premiums/discounts/OCI (other comprehensive income) on debt and derivatives.
Mortgage Notes Payable
The following tables summarize the Company’s mortgage notes payable activity for the years ended December 31, 2019 and 2018, respectively (amounts in thousands):
The following table summarizes the Company’s debt extinguishment costs on mortgages recorded as additional interest expense during the years ended December 31, 2019 and 2018, respectively (amounts in thousands):
F-41
2019
Total minimum rent payments $ 1,101,282 Less: Lease discount 769,948
Lease liabilities $ 331,334
9. Debt
Mortgage notes payable, net as of
December 31, 2018 Proceeds
Lump sum
payoffs
Scheduled principal
repayments
Amortization of premiums/
discounts
Amortization of deferred financing
costs, net (1)
Mortgage notes payable, net as of
December 31, 2019
Fixed Rate Debt: Secured – Conventional $ 1,885,407 $ 288,120 (2) $ (584,536 ) $ (6,308 ) $ (7,999 ) $ 15 $ 1,574,699
Floating Rate Debt: Secured – Conventional 6,357 7,651 (3) (5,920 ) (500 ) — (538 ) 7,050 Secured – Tax Exempt 493,706 — (152,565 ) — 16,617 2,103 359,861
Floating Rate Debt 500,063 7,651 (158,485 ) (500 ) 16,617 1,565 366,911
Total $ 2,385,470 $ 295,771 $ (743,021 ) $ (6,808 ) $ 8,618 $ 1,580 $ 1,941,610
(1) Represents amortization of deferred financing costs, net of debt financing costs.
(2) Obtained 3.94% fixed rate mortgage debt held in a Fannie Mae loan pool maturing on March 1, 2029.
(3) Obtained variable rate construction mortgage debt that is non-recourse to the Company maturing on June 25, 2022 (total commitment of $67.6 million).
Mortgage notes payable, net as of
December 31, 2017 Proceeds Lump sum
payoffs
Scheduled principal
repayments
Amortization of premiums/
discounts
Amortization of deferred financing
costs, net (1)
Mortgage notes payable, net as of
December 31, 2018
Fixed Rate Debt: Secured – Conventional $ 2,982,344 $ — $ (1,093,705 ) $ (6,029 ) $ 719 $ 2,078 $ 1,885,407
Floating Rate Debt: Secured – Conventional 6,948 — — (600 ) — 9 6,357 Secured – Tax Exempt 629,430 96,935 (2) (254,234 ) — 19,425 2,150 493,706
Floating Rate Debt 636,378 96,935 (254,234 ) (600 ) 19,425 2,159 500,063
Total $ 3,618,722 $ 96,935 $ (1,347,939 ) $ (6,629 ) $ 20,144 $ 4,237 $ 2,385,470
(1) Represents amortization of deferred financing costs, net of debt financing costs.
(2) Reissued floating rate tax-exempt mortgage bonds which mature on April 1, 2042, remarket weekly and are guaranteed by ERPOP.
Description 2019 2018 Prepayment premiums/penalties $ 3,381 $ 22,110
Write-offs of unamortized deferred financing costs 2,273 2,957 Write-offs of unamortized (premiums)/discounts/OCI 6,153 16,268
Total $ 11,807 $ 41,335

Table of Contents
The following table summarizes certain interest rate and maturity date information as of and for the years ended December 31, 2019 and 2018, respectively:
As of December 31, 2019 and 2018, the Company had $281.7 million and $440.7 million, respectively, of secured debt (primarily tax-exempt
bonds) subject to third party credit enhancement.
The historical cost, net of accumulated depreciation, of encumbered properties was $2.7 billion and $3.2 billion at December 31, 2019 and 2018, respectively.
Notes
The following tables summarize the Company’s notes activity for the years ended December 31, 2019 and 2018, respectively (amounts in thousands):
The following table summarizes the Company’s debt extinguishment costs on notes recorded as additional interest expense during the years
ended December 31, 2019 and 2018, respectively (amounts in thousands):
F-42
December 31, 2019 December 31, 2018 Interest Rate Ranges 0.10% - 5.29% 0.10% - 6.90% Weighted Average Interest Rate 3.84% 4.15% Maturity Date Ranges 2020-2061 2019-2061
Notes, net as of December 31,
2018 Proceeds Lump sum
payoffs
Realized/unrealized (gain) loss on
derivative instruments
Amortization of premiums/
discounts
Amortization of deferred financing
costs, net (1)
Notes, net as of December 31,
2019
Fixed Rate Debt: Unsecured – Public $ 5,485,884 $ 1,194,468 (2) $ (600,000 ) $ — $ 3,117 $ (5,956 ) $ 6,077,513
Floating Rate Debt: Unsecured – Public 447,402 — (450,000 ) 2,277 45 276 —
Total $ 5,933,286 $ 1,194,468 $ (1,050,000 ) $ 2,277 $ 3,162 $ (5,680 ) $ 6,077,513
(1) Represents amortization of deferred financing costs, net of debt financing costs.
(2) Issued $600.0 million of ten-year 3.00% unsecured notes, receiving net proceeds of approximately $597.5 million before underwriting fees, hedge termination costs and other expenses. Additionally, issued $600.0 million of ten-year 2.50% unsecured notes, receiving net proceeds of approximately $597.0 million before underwriting fees and other expenses.
Notes, net as of
December 31, 2017 Proceeds
Realized/unrealized (gain) loss on
derivative instruments
Amortization of premiums/
discounts
Amortization of deferred financing
costs, net (1) Notes, net as of
December 31, 2018
Fixed Rate Debt:
Unsecured – Public $ 4,591,373 $ 896,294 (2) $ — $ 2,547 $ (4,330 ) $ 5,485,884 Floating Rate Debt:
Unsecured – Public (3) 447,439 — (680 ) 90 553 447,402
Total $ 5,038,812 $ 896,294 $ (680 ) $ 2,637 $ (3,777 ) $ 5,933,286
(1) Represents amortization of deferred financing costs, net of debt financing costs.
(2) Issued $500.0 million of ten-year 3.50% unsecured notes, receiving net proceeds of approximately $497.0 million before underwriting fees, hedge termination costs and other expenses. Additionally, issued $400.0 million of ten-year 4.15% unsecured notes, receiving net proceeds of approximately $399.3 million before underwriting fees, hedge termination costs and other expenses.
(3) Fair value interest rate swaps converted the $450.0 million 2.375% notes due July 1, 2019 to a floating interest rate of 90-Day LIBOR plus 0.61%.
Description 2019 2018 Prepayment premiums/penalties $ 10,266 $ — Write-offs of unamortized deferred financing costs 287 — Write-offs of unamortized (premiums)/discounts/OCI 1,043 —
Total $ 11,596 $ —

Table of Contents
The following table summarizes certain interest rate and maturity date information as of and for the years ended December 31, 2019 and 2018, respectively:
The Company’s unsecured public notes contain certain financial and operating covenants including, among other things, maintenance of
certain financial ratios. The Company was in compliance with its unsecured public debt covenants for both the years ended December 31, 2019 and 2018.
EQR and ERPOP currently have an active universal shelf registration statement for the issuance of equity and debt securities that automatically became effective upon filing with the SEC in June 2019 and expires in June 2022.
Line of Credit and Commercial Paper
On November 1, 2019, the Company replaced its existing $2.0 billion facility with a $2.5 billion unsecured revolving credit facility maturing November 1, 2024. The Company has the ability to increase available borrowings by an additional $750.0 million by adding lenders to the facility, obtaining the agreement of existing lenders to increase their commitments or incurring one or more term loans. The interest rate on advances under the facility will generally be LIBOR plus a spread (currently 0.775%), or based on bids received from the lending group, and the Company pays a quarterly facility fee (currently 0.125%). Both the spread and the facility fee are dependent on the Company’s senior unsecured credit rating. Weighted average interest rates on the revolving credit facility were 3.12% and 2.97% for the years ended December 31, 2019 and 2018, respectively.
The Company has an unsecured commercial paper note program in the United States. On November 4, 2019, the Company increased the maximum aggregate amount outstanding for the commercial paper program from $500.0 million to $1.0 billion. The notes will be sold under customary terms in the United States commercial paper note market subject to market conditions and will rank pari passu with all of the Company’s other unsecured senior indebtedness. The notes bear interest at various floating rates with a weighted average interest rate of 2.42% and 2.35% for the years ended December 31, 2019 and 2018, respectively, and a weighted average maturity of 40 days and 22 days as of December 31, 2019 and 2018, respectively. The weighted average amount outstanding for the years ended December 31, 2019 and 2018 was approximately $434.4 million and $397.3 respectively.
The Company limits its utilization of the revolving credit facility in order to maintain liquidity to support its $1.0 billion commercial paper program ($500.0 million at December 31, 2018) along with certain other obligations. The following table presents the availability on the Company’s unsecured revolving credit facility as of December 31, 2019 and 2018 (amounts in thousands):
The following table summarizes the Company’s debt extinguishment costs on the line of credit recorded as additional interest expense during
the years ended December 31, 2019 and 2018, respectively (amounts in thousands):
F-43
December 31, 2019 December 31, 2018 Interest Rate Ranges 2.50% - 7.57% 2.85% - 7.57% Weighted Average Interest Rate 4.21% 4.25% Maturity Date Ranges 2021-2047 2019-2047
December 31, 2019 December 31, 2018 Unsecured revolving credit facility commitment $ 2,500,000 $ 2,000,000 Commercial paper balance outstanding (1,000,000 ) (500,000 ) Unsecured revolving credit facility balance outstanding (20,000 ) — Other restricted amounts (100,929 ) (103,622 )
Unsecured revolving credit facility availability $ 1,379,071 $ 1,396,378
Description 2019 2018 Write-offs of unamortized deferred financing costs $ 588 $ —
Total $ 588 $ —

Table of Contents
Debt Maturity Table
The following table provides a summary of the aggregate payments of principal on all debt for each of the next five years and thereafter as of December 31, 2019 (amounts in thousands):
The valuation of financial instruments requires the Company to make estimates and judgments that affect the fair value of the instruments. The Company, where possible, bases the fair values of its financial instruments, including its derivative instruments, on listed market prices and third party quotes. Where these are not available, the Company bases its estimates on current instruments with similar terms and maturities or on other factors relevant to the financial instruments.
In the normal course of business, the Company is exposed to the effect of interest rate changes. The Company may seek to manage these risks by following established risk management policies and procedures including the use of derivatives to hedge interest rate risk on debt instruments. The Company may also use derivatives to manage commodity prices in the daily operations of the business.
A three-level valuation hierarchy exists for disclosure of fair value measurements. The valuation hierarchy is based upon the transparency of inputs to the valuation of an asset or liability as of the measurement date. A financial instrument’s categorization within the valuation hierarchy is based upon the lowest level of input that is significant to the fair value measurement. The three levels are defined as follows:
The Company’s derivative positions are valued using models developed by the respective counterparty as well as models applied internally by the Company that use as their inputs readily observable market parameters (such as forward yield curves and credit default swap data). Employee holdings other than Common Shares within the supplemental executive retirement plan (the “SERP”) are valued using quoted market prices for identical assets and are included in other assets and other liabilities on the consolidated balance sheets. Redeemable Noncontrolling Interests – Operating Partnership/Redeemable Limited Partners are valued using the quoted market price of Common Shares. The fair values disclosed for mortgage notes payable and unsecured debt (including its commercial paper and line of credit, if applicable) were calculated using indicative rates provided by lenders of similar loans in the case of mortgage notes payable and the private unsecured debt (including its commercial paper and line of credit, if applicable) and quoted market prices for each underlying issuance in the case of the public unsecured notes.
F-44
Year Total 2020 (1) $ 1,027,542
2021 926,404 2022 271,835 2023 1,329,088 2024 26,100
Thereafter 5,550,010
Subtotal 9,130,979 Deferred Financing Costs and Unamortized (Discount) (94,023 )
Total $ 9,036,956
(1) Includes $1.0 billion in principal outstanding on the Company’s commercial paper program.
10. Derivative and Other Fair Value Instruments
• Level 1 – Inputs to the valuation methodology are quoted prices (unadjusted) for identical assets or liabilities in active markets.
• Level 2 – Inputs to the valuation methodology include quoted prices for similar assets and liabilities in active markets, and inputs that are observable for the asset or liability, either directly or indirectly, for substantially the full term of the financial instrument.
• Level 3 – Inputs to the valuation methodology are unobservable and significant to the fair value measurement.

Table of Contents
The fair values of the Company’s financial instruments (other than mortgage notes payable, unsecured notes, commercial paper, line of credit and derivative instruments), including cash and cash equivalents and other financial instruments, approximate their carrying or contract value. The following table provides a summary of the carrying and fair values for the Company’s mortgage notes payable and unsecured debt (including its commercial paper and line of credit, if applicable) at December 31, 2019 and 2018, respectively (amounts in thousands):
The following tables provide a summary of the fair value measurements for each major category of assets and liabilities measured at fair value
on a recurring basis and the location within the accompanying consolidated balance sheets at December 31, 2019 and 2018, respectively (amounts in thousands):
F-45
December 31, 2019 December 31, 2018
Carrying Value Estimated Fair Value (Level 2) Carrying Value
Estimated Fair Value (Level 2)
Mortgage notes payable, net $ 1,941,610 $ 1,930,710 $ 2,385,470 $ 2,352,502 Unsecured debt, net 7,095,346 7,677,289 6,432,469 6,481,426
Total debt, net $ 9,036,956 $ 9,607,999 $ 8,817,939 $ 8,833,928
Fair Value Measurements at Reporting Date Using
Description Balance Sheet
Location 12/31/2019
Quoted Prices in Active Markets for
Identical Assets/Liabilities (Level 1)
Significant Other Observable Inputs
(Level 2)
Significant Unobservable
Inputs (Level 3)
Assets
Supplemental Executive Retirement Plan Other Assets $ 151,889 $ 151,889 $ — $ — Liabilities
Supplemental Executive Retirement Plan Other Liabilities $ 151,889 $ 151,889 $ — $ — Redeemable Noncontrolling Interests –
Operating Partnership/Redeemable Limited Partners Mezzanine $ 463,400 $ — $ 463,400 $ —
Fair Value Measurements at Reporting Date Using
Description Balance Sheet
Location 12/31/2018
Quoted Prices in Active Markets for
Identical Assets/Liabilities (Level 1)
Significant Other Observable Inputs
(Level 2)
Significant Unobservable
Inputs (Level 3)
Assets
Derivatives designated as hedging instruments:
Interest Rate Contracts: Forward Starting Swaps Other Assets $ 2,000 $ — $ 2,000 $ —
Supplemental Executive Retirement Plan Other Assets 134,088 134,088 — —
Total $ 136,088 $ 134,088 $ 2,000 $ —
Liabilities
Derivatives designated as hedging instruments:
Interest Rate Contracts: Fair Value Hedges Other Liabilities $ 2,277 $ — $ 2,277 $ — Forward Starting Swaps Other Liabilities 9,851 — 9,851 —
Supplemental Executive Retirement Plan Other Liabilities 134,088 134,088 — —
Total $ 146,216 $ 134,088 $ 12,128 $ —
Redeemable Noncontrolling Interests –
Operating Partnership/Redeemable Limited Partners Mezzanine $ 379,106 $ — $ 379,106 $ —

Table of Contents
The following tables provide a summary of the effect of fair value hedges on the Company’s accompanying consolidated statements of operations and comprehensive income for the years ended December 31, 2019, 2018 and 2017, respectively (amounts in thousands):
The following tables provide a summary of the effect of cash flow hedges on the Company’s accompanying consolidated statements of
operations and comprehensive income for the years ended December 31, 2019, 2018 and 2017, respectively (amounts in thousands):
F-46
December 31, 2019 Type of Fair Value Hedge
Location of Gain/(Loss)
Recognized in Income on Derivative
Amount of Gain/(Loss)
Recognized in Income on Derivative Hedged Item
Income Statement Location of
Hedged Item Gain/(Loss)
Amount of Gain/(Loss)
Recognized in Income
on Hedged Item
Derivatives designated as hedging instruments: Interest Rate Contracts:
Interest Rate Swaps Interest expense $ 2,277 Fixed rate debt Interest expense $ (2,277 )
Total $ 2,277 $ (2,277 )
December 31, 2018 Type of Fair Value Hedge
Location of Gain/(Loss)
Recognized in Income on Derivative
Amount of Gain/(Loss)
Recognized in Income on Derivative Hedged Item
Income Statement Location of
Hedged Item Gain/(Loss)
Amount of Gain/(Loss)
Recognized in Income
on Hedged Item
Derivatives designated as hedging instruments: Interest Rate Contracts:
Interest Rate Swaps Interest expense $ (680 ) Fixed rate debt Interest expense $ 680
Total $ (680 ) $ 680
December 31, 2017 Type of Fair Value Hedge
Location of Gain/(Loss)
Recognized in Income on Derivative
Amount of Gain/(Loss)
Recognized in Income on Derivative Hedged Item
Income Statement Location of
Hedged Item Gain/(Loss)
Amount of Gain/(Loss)
Recognized in Income
on Hedged Item
Derivatives designated as hedging instruments: Interest Rate Contracts:
Interest Rate Swaps Interest expense $ (3,454 ) Fixed rate debt Interest expense $ 3,454
Total $ (3,454 ) $ 3,454
Effective Portion
December 31, 2019 Type of Cash Flow Hedge
Amount of Gain/(Loss)
Recognized in OCI on Derivative
Location of Gain/(Loss)
Reclassified from Accumulated OCI
into Income
Amount of Gain/(Loss)
Reclassified from Accumulated
OCI into Income
Derivatives designated as hedging instruments: Interest Rate Contracts:
Forward Starting Swaps $ (33,765 ) Interest expense $ (21,188 )
Total $ (33,765 ) $ (21,188 )
Effective Portion Ineffective Portion
December 31, 2018 Type of Cash Flow Hedge
Amount of Gain/(Loss)
Recognized in OCI on Derivative
Location of Gain/(Loss)
Reclassified from Accumulated OCI
into Income
Amount of Gain/(Loss)
Reclassified from Accumulated
OCI into Income
Location of Gain/(Loss)
Recognized in Income on Derivative
Amount of Gain/(Loss)
Reclassified from Accumulated
OCI into Income
Derivatives designated as hedging instruments: Interest Rate Contracts:
Forward Starting Swaps $ 5,124 Interest expense $ (18,452 ) N/A $ —
Total $ 5,124 $ (18,452 ) $ —

Table of Contents
As of December 31, 2019 and 2018, there were approximately $77.6 million and $65.0 million in deferred losses, net, included in accumulated
other comprehensive income (loss), respectively, related to derivative instruments, of which an estimated $24.9 million may be recognized as additional interest expense during the twelve months ending December 31, 2020.
In July 2019, six fair value interest rate swaps matured in conjunction with the maturity of $450.0 million of 2.375% unsecured notes.
In June 2019, the Company paid approximately $41.8 million to settle ten forward starting swaps in conjunction with the issuance of $600.0 million of ten-year unsecured public notes. The accrued interest of approximately $0.2 million was recorded as an increase to interest expense. The remaining $41.6 million will be deferred as a component of accumulated other comprehensive income (loss) and will be recognized as an increase to interest expense over the first nine years and eleven months of the notes.
In November 2018, the Company received approximately $16.4 million to settle six forward starting swaps in conjunction with the issuance of $400.0 million of ten-year unsecured public notes. The accrued interest of approximately $120,000 was recorded as an increase to interest expense. The remaining $16.5 million will be deferred as a component of accumulated other comprehensive income (loss) and will be recognized as a decrease to interest expense over the first nine years and nine months of the notes.
In February 2018, the Company received approximately $1.6 million to settle two forward starting swaps in conjunction with the issuance of $500.0 million of ten-year unsecured public notes. The entire $1.6 million was initially deferred as a component of accumulated other comprehensive income (loss) and will be recognized as a decrease to interest expense over the ten-year term of the notes.
In August 2017, the Company received $1.3 million to settle four forward starting swaps in conjunction with the issuance of $400.0 million of ten-year fixed rate public notes. The entire $1.3 million was initially deferred as a component of accumulated other comprehensive income (loss) and will be recognized as a decrease to interest expense over the ten-year term of the notes.
F-47
Effective Portion Ineffective Portion
December 31, 2017 Type of Cash Flow Hedge
Amount of Gain/(Loss)
Recognized in OCI on Derivative
Location of Gain/(Loss)
Reclassified from Accumulated OCI
into Income
Amount of Gain/(Loss)
Reclassified from Accumulated
OCI into Income
Location of Gain/(Loss)
Recognized in Income on Derivative
Amount of Gain/(Loss)
Reclassified from Accumulated
OCI into Income
Derivatives designated as hedging instruments: Interest Rate Contracts:
Forward Starting Swaps $ 6,439 Interest expense $ (18,858 ) N/A $ —
Total $ 6,439 $ (18,858 ) $ —

Table of Contents
Equity Residential
The following tables set forth the computation of net income per share – basic and net income per share – diluted for the Company (amounts in thousands except per share amounts):
ERP Operating Limited Partnership
The following tables set forth the computation of net income per Unit – basic and net income per Unit – diluted for the Operating Partnership (amounts in thousands except per Unit amounts):
Any Common Shares issued pursuant to EQR’s incentive equity compensation and employee share purchase plans will result in ERPOP issuing OP Units to EQR on a one-for-one basis with ERPOP receiving the net cash proceeds of such issuances. See Note 2 for additional information regarding the Company’s share-based compensation.
F-48
11. Earnings Per Share and Earnings Per Unit
Year Ended December 31, 2019 2018 2017
Numerator for net income per share – basic: Net income $ 1,009,708 $ 685,192 $ 628,381 Allocation to Noncontrolling Interests – Operating Partnership (36,034 ) (24,939 ) (22,604 ) Net (income) loss attributable to Noncontrolling Interests – Partially Owned Properties (3,297 ) (2,718 ) (2,323 ) Preferred distributions (3,090 ) (3,090 ) (3,091 )
Numerator for net income per share – basic $ 967,287 $ 654,445 $ 600,363
Numerator for net income per share – diluted: Net income $ 1,009,708 $ 685,192 $ 628,381 Net (income) loss attributable to Noncontrolling Interests – Partially Owned Properties (3,297 ) (2,718 ) (2,323 ) Preferred distributions (3,090 ) (3,090 ) (3,091 )
Numerator for net income per share – diluted $ 1,003,321 $ 679,384 $ 622,967
Denominator for net income per share – basic and diluted: Denominator for net income per share – basic 370,461 368,052 366,968 Effect of dilutive securities:
OP Units 12,907 12,869 12,901 Long-term compensation shares/units 2,965 2,774 2,809
Denominator for net income per share – diluted 386,333 383,695 382,678
Net income per share – basic $ 2.61 $ 1.78 $ 1.64
Net income per share – diluted $ 2.60 $ 1.77 $ 1.63
Year Ended December 31, 2019 2018 2017
Numerator for net income per Unit – basic and diluted: Net income $ 1,009,708 $ 685,192 $ 628,381 Net (income) loss attributable to Noncontrolling Interests – Partially Owned Properties (3,297 ) (2,718 ) (2,323 ) Allocation to Preference Units (3,090 ) (3,090 ) (3,091 )
Numerator for net income per Unit – basic and diluted $ 1,003,321 $ 679,384 $ 622,967
Denominator for net income per Unit – basic and diluted: Denominator for net income per Unit – basic 383,368 380,921 379,869 Effect of dilutive securities:
Dilution for Units issuable upon assumed exercise/vesting of the Company’s long-term compensation shares/units 2,965 2,774 2,809
Denominator for net income per Unit – diluted 386,333 383,695 382,678
Net income per Unit – basic $ 2.61 $ 1.78 $ 1.64
Net income per Unit – diluted $ 2.60 $ 1.77 $ 1.63
12. Share Incentive Plans

Table of Contents
Overview of Share Incentive Plans
The 2019 Share Incentive Plan (the “2019 Plan”), as approved by the Company’s shareholders on June 27, 2019, expires on June 27, 2029 and reserves 11,331,958 Common Shares for issuance. All future awards will be granted under the 2019 Plan. As of December 31, 2019, 11,328,266 shares were available for future issuance.
Pursuant to the 2019 Plan, the 2011 Share Incentive Plan (the “2011 Plan”) and the 2002 Share Incentive Plan (the “2002 Plan”), as restated and amended (collectively the “Share Incentive Plans”), officers, trustees, key employees and consultants of the Company and its subsidiaries may be granted share options to acquire Common Shares (“Options”), including non-qualified share options (“NQSOs”), incentive share options (“ISOs”) and share appreciation rights (“SARs”), or may be granted restricted or non-restricted shares/units (including long-term incentive plan awards), subject to conditions and restrictions. Options, SARs, restricted shares and restricted units are sometimes collectively referred to herein as “Awards”.
The 2011 Plan and the 2002 Plan, as restated and amended, will both terminate when all outstanding Awards have expired or have been exercised/vested. The Board of Trustees may at any time amend or terminate the Share Incentive Plans, but termination will not affect Awards previously granted, absent immediate vesting and cash settlement. Any Options which had vested prior to such a termination would remain exercisable by the holder.
Employee Long-Term Compensation Awards
The following table summarizes the terms of Awards generally granted to employees:
F-49
Options Restricted Shares Restricted Units Overview Options exercised after vesting result in
issuance of new Common Shares. Restricted shareholders generally have the
same voting rights and receive quarterly dividend payments on their shares at the same rate and on the same date as any other Common Share holder (1).
When certain conditions are met, restricted units convert into an equal number of OP Units, which the holder may exchange for Common Shares on a one-for-one basis or at the option of the Company the cash value of such shares. Restricted unitholders receive quarterly distribution payments on their restricted units at the same rate and on the same date as any other OP Unit holder (1).
Grant/Exercise Price
Granted at the fair market value of Common Shares as of the grant date.
Granted at the fair market value of Common Shares as of the grant date.
Granted at varying discount rates to the fair market value of Common Shares as of the grant date (2).
Vesting Period In three equal installments over a three-year period from the grant date.
Three years from the grant date. Three years from the grant date.
Expiration Ten years from the grant date. Not applicable. Ten years from the grant date (2). Upon Employee Termination
Unvested options are canceled. Unvested restricted shares are canceled. Unvested restricted units are canceled.
(1) Dividends/distributions paid on unvested restricted shares and units are included as a component of retained earnings and Noncontrolling Interest – Operating Partnership/Limited Partners Capital, respectively, and have not been considered in reducing net income available to Common Shares/Units in a manner similar to the Company’s preferred share/preference unit dividends for the earnings per share/Unit calculation.
(2) A restricted unit will automatically convert to an OP Unit when the capital account of each restricted unit increases (“books-up”) to a specified target. The probability of a book-up occurring within the ten-year contractual life along with the liquidity risk associated with various hold period restrictions are both reflected in the discount. If the capital target is not attained within ten years following the date of issuance, the restricted unit will automatically be canceled and no compensation will be payable to the holder of such canceled restricted unit. If the capital target is attained and the restricted unit is converted to an OP Unit, it will not expire.

Table of Contents
Long Term Incentive Plan
The Company’s executive compensation program allows the Chairman, Chief Executive Officer and certain other Executive Officers to earn from 0% to 200% of the target number of long-term incentive (“LTI”) awards, payable in the form of restricted shares and/or restricted units. The Company’s Total Shareholder Return (“TSR”) and Normalized Funds from Operations (“FFO”) results over a forward-looking three-year performance period determine the restricted shares and/or restricted units awarded and are compared to pre-established quantitative performance metrics. The grant date fair value of the awards is estimated using a Monte Carlo model for the TSR portion of the awards and the resulting expense is recorded over the service period regardless of whether the TSR performance measures are achieved and the Normalized FFO portion of the awards is adjusted based on the final achievement obtained. If the executive is retirement-eligible, the grant date fair value is amortized into expense over the first year. All other awards are amortized into expense over the three year performance and vesting period.
The LTI participants receive distributions on only restricted units awarded equal to 10% of the quarterly distributions paid on OP Units
during the performance period. At the end of the performance period, LTI participants receive dividends/distributions actually earned on restricted shares or restricted units awarded during the performance period, less any distributions already paid on the restricted units. No payout would be made for any return below 50% of the target performance metric. If employment is terminated prior to vesting, the restricted shares and restricted units are generally canceled.
Trustees
All Trustees, with the exception of the Company’s Chairman and employee Trustees, are granted Options, restricted shares and/or restricted units that vest one-year from the grant date that corresponds to the term for which he or she has been elected to serve. Since 2016, the Chairman has only received awards under the LTI plan (see further discussion above).
Retirement Benefits
The Company’s Share Incentive Plans provide for certain benefits upon retirement. The following table summarizes the terms of each retirement eligibility category.
Under the Company’s definitions of retirement, some of its executive officers and its Chairman are retirement eligible.
F-50
Age 62 for Employees Rule of 70 for Employees Age 72 for Trustees Eligibility
For employees hired prior to January 1, 2009 and who were age 59 or older as of February 1, 2019.
All employees (1). All non-employee Trustees.
Effect on unvested restricted shares, restricted units and Options
Awards immediately vest and Options continue to be exercisable for the balance of the applicable ten-year option period.
Awards continue to vest per the original vesting schedule, subject to certain conditions, and Options continue to be exercisable for the balance of the applicable ten-year option period.
Awards immediately vest and Options continue to be exercisable for the balance of the applicable ten-year option period.
Effect on LTI Plan
Awards are prorated in proportion to the number of days worked in the first year of the three-year performance period and the individual does not receive any payout of shares or units until the final payout is determined at the end of the three-year performance period.
(1) The Rule of 70 is met when an employee’s years of service with the Company (which must be at least 15 years) plus his or her age (which must be at least 55 years) on the date of termination equals or exceeds 70 years. In addition, the employee must give the Company at least six months’ advance written notice of his or her intention to retire along with agreeing to certain other conditions.

Table of Contents
Compensation Expense and Award Activity
The following tables summarize compensation information regarding the restricted shares, restricted units, Options and Employee Share Purchase Plan (“ESPP”) for the three years ended December 31, 2019, 2018 and 2017.
Compensation expense is generally recognized for Awards as follows:
The Company accelerates the recognition of compensation expense for all Awards for those individuals approaching or meeting the retirement age criteria discussed above. The total compensation expense related to Awards not yet vested at December 31, 2019 is $8.9 million (including the accelerated expenses for individuals approaching or meeting the retirement age criteria discussed above), which is expected to be recognized over a weighted average term of 1.35 years.
F-51
Year Ended December 31, 2019
Compensation
Expense Compensation
Capitalized Restricted Units/Options
In-Lieu of Bonus (1) Compensation
Equity Dividends Incurred
Restricted shares (2) $ 11,522 $ 916 $ — $ 12,438 $ 979 Restricted units (2) 9,905 240 3,265 13,410 825 Options 2,420 254 1 2,675 — ESPP discount 602 40 — 642 —
Total $ 24,449 $ 1,450 $ 3,266 $ 29,165 $ 1,804
Year Ended December 31, 2018
Compensation
Expense Compensation
Capitalized Restricted Units/Options
In-Lieu of Bonus (1) Compensation
Equity Dividends Incurred
Restricted shares (2) $ 7,406 $ 852 $ — $ 8,258 $ 754 Restricted units (2) 12,310 36 1,663 14,009 963 Options 6,683 296 2,755 9,734 — ESPP discount 733 34 — 767 —
Total $ 27,132 $ 1,218 $ 4,418 $ 32,768 $ 1,717
Year Ended December 31, 2017
Compensation
Expense Compensation
Capitalized Restricted Units/Options
In-Lieu of Bonus (1) Compensation
Equity Dividends Incurred
Restricted shares (2) $ 9,209 $ 568 $ — $ 9,777 $ 761 Restricted units (2) 10,214 119 190 10,523 741 Options 4,893 323 1,619 6,835 — ESPP discount 681 66 — 747 —
Total $ 24,997 $ 1,076 $ 1,809 $ 27,882 $ 1,502
(1) The Company allows eligible officers the ability to receive immediately vested restricted units (subject to the book-up provisions described above and a two-year hold restriction) or immediately vested Options in-lieu of any percentage of their annual cash bonus.
(2) Includes LTI plan awards granted under the executive compensation program.
• Restricted shares, restricted units and Options – Straight-line method over the vesting period of the Options, shares or units regardless of cliff or ratable vesting distinctions.
• LTI plan awards – Target amount is recognized under the straight-line method over the vesting period of the shares or units regardless of cliff or ratable vesting distinctions.
• ESPP discount – Immediately upon the purchase of Common Shares each quarter.

Table of Contents
The tables below summarize the Award activity of the Share Incentive Plans for the three years ended December 31, 2019, 2018 and 2017:
The following table summarizes information regarding Options outstanding and exercisable at December 31, 2019 (aggregate intrinsic value is in thousands):
As of December 31, 2018 and 2017, 5,328,020 Options (with a weighted average exercise price of $49.57) and 5,336,043 Options (with a weighted average exercise price of $43.24) were exercisable, respectively.
F-52
Common Shares Subject
to Options
Weighted Average
Exercise Price per Option
Restricted Shares
Weighted Average Fair
Value per Restricted Share
Restricted Units
Weighted Average Fair
Value per Restricted Unit
Balance at December 31, 2016 6,023,101 $ 42.05 452,034 $ 70.35 802,257 $ 75.26 Awards granted (1) (5) 1,337,898 $ 60.88 93,867 $ 61.94 291,921 $ 68.57 Awards exercised/vested (2) (3) (4) (846,137 ) $ 37.26 (165,744 ) $ 58.04 (192,644 ) $ 54.16 Awards forfeited (27,547 ) $ 61.85 (10,416 ) $ 72.44 (274 ) $ 75.50 Awards expired (3,483 ) $ 65.91 — — — —
Balance at December 31, 2017 6,483,832 $ 46.46 369,741 $ 73.67 901,260 $ 77.61 Awards granted (1) (5) 1,730,942 $ 60.40 129,303 $ 62.25 267,074 $ 61.60 Awards exercised/vested (2) (3) (4) (1,056,388 ) $ 29.05 (194,116 ) $ 77.32 (28,486 ) $ 55.50 Awards forfeited (38,133 ) $ 60.74 (5,503 ) $ 65.77 — $ — Awards expired (8,018 ) $ 59.70 — — — —
Balance at December 31, 2018 7,112,235 $ 52.35 299,425 $ 66.52 1,139,848 $ 71.07 Awards granted (1) (5) 234,147 $ 72.10 163,799 $ 73.96 141,772 $ 67.22 Awards exercised/vested (2) (3) (4) (1,745,050 ) $ 44.72 (151,321 ) $ 75.41 (422,784 ) $ 70.77 Awards forfeited (30,489 ) $ 61.92 (5,197 ) $ 65.35 (552 ) $ 69.43 Awards expired (3,299 ) $ 40.39 — — — —
Balance at December 31, 2019 5,567,544 $ 55.52 306,706 $ 66.15 858,284 $ 64.95
(1) The weighted average grant date fair value for Options granted during the years ended December 31, 2019, 2018 and 2017 was $8.05 per share, $6.17 per share and $5.86 per share, respectively.
(2) The aggregate intrinsic value of Options exercised during the years ended December 31, 2019, 2018 and 2017 was $58.1 million, $42.9 million and $25.6million, respectively. These values were calculated as the difference between the strike price of the underlying awards and the per share price at which each respective award was exercised.
(3) The fair value of restricted shares vested during the years ended December 31, 2019, 2018 and 2017 was $11.1 million, $11.5 million and $10.2 million, respectively.
(4) The fair value of restricted units vested during the years ended December 31, 2019, 2018 and 2017 was $29.1 million, $1.8 million and $11.7 million, respectively.
(5) Includes LTI plan awards granted under the executive compensation program.
Options
Weighted Average
Remaining Contractual
Life in Years
Weighted Average
Exercise Price
Aggregate Intrinsic Value (1)
Options Outstanding 5,567,544 5.30 $ 55.52 $ 141,395 Options Exercisable 4,750,481 4.81 $ 54.13 $ 127,277 Vested and expected to vest 808,646 8.13 $ 63.60 $ 14,005
(1) The aggregate intrinsic values were calculated as the excess, if any, between the Company’s closing share price of $80.92 per share on December 31, 2019 and the strike price of the underlying awards.

Table of Contents
The Company established an Employee Share Purchase Plan to provide each employee and trustee the ability to annually acquire up to $100,000 of Common Shares of EQR. The Company registered 7,000,000 Common Shares under the ESPP, of which 2,714,332 Common Shares remained available for purchase at December 31, 2019. The Common Shares may be purchased quarterly at a price equal to 85% of the lesser of: (a) the closing price for a share on the last day of such quarter; and (b) the greater of: (i) the closing price for a share on the first day of such quarter, and (ii) the average closing price for a share for all the business days in the quarter. The following table summarizes information regarding the Common Shares issued under the ESPP with the net proceeds noted below being contributed to ERPOP in exchange for OP Units (amounts in thousands except share and per share amounts):
The Company established a defined contribution plan (the “401(k) Plan”) to provide retirement benefits for employees that meet minimum
employment criteria. The Company matches dollar for dollar up to the first 4% of eligible compensation that a participant contributes to the 401(k) Plan for all employees except those defined as highly compensated employees, whose match is 3%. Participants are vested in the Company’s contributions over five years. The Company recognized an expense in the amount of $5.0 million, $4.9 million and $4.6 million for the years ended December 31, 2019, 2018 and 2017, respectively.
The Company established the SERP to provide certain officers and trustees an opportunity to defer a portion of their eligible compensation in order to save for retirement. The SERP is restricted to investments in Common Shares, certain marketable securities that have been specifically approved and cash equivalents. The deferred compensation liability represented in the SERP and the securities issued to fund such deferred compensation liability are consolidated by the Company and carried on the Company’s balance sheets, and the Company’s Common Shares held in the SERP are accounted for as a reduction to paid in capital (included in general partner’s capital in the Operating Partnership’s financial statements).
On September 30, 2014, the Company filed with the SEC a Form S-3 Registration Statement to register 4,790,000 Common Shares pursuant to a Distribution Reinvestment Plan (the “2014 DRIP”), which included the remaining shares available for issuance under a previous registration. The registration was automatically declared effective the same day and will expire when all 4,790,000 shares have been issued. The Company has 4,664,977 Common Shares available for issuance under the 2014 DRIP at December 31, 2019.
The 2014 DRIP provides holders of record and beneficial owners of Common Shares and Preferred Shares with a simple and convenient method of reinvesting cash dividends/distributions in additional Common Shares. Common Shares purchased under the 2014 DRIP may, at the option of EQR, be directly issued by EQR or purchased by EQR’s transfer agent in the open market using participants’ funds. The net proceeds from any Common Share issuances are contributed to ERPOP in exchange for OP Units.
The Company leases its corporate headquarters from an entity affiliated with EQR’s Chairman of the Board of Trustees. The lease term expires on November 30, 2032 and contains two five-year extension options. The amount incurred for such office space for the years ended December 31, 2019, 2018 and 2017 were approximately $2.6 million, $2.5 million and $2.8 million, respectively. The Company believes these amounts approximate market rates for such rental space.
The Company, as an owner of real estate, is subject to various Federal, state and local environmental laws. Compliance by the Company with existing laws has not had a material adverse effect on the Company. However, the Company cannot predict the impact of new or changed laws or regulations on its current properties or on properties that it may acquire in the future.
The Company does not believe there is any litigation pending or threatened against it that, individually or in the aggregate, may reasonably be expected to have a material adverse effect on the Company.
As of December 31, 2019, the Company has two wholly owned projects and one partially owned project totaling 824 apartment units in various stages of development with remaining commitments to fund of approximately $421.2 million (inclusive of applicable construction mortgage and joint venture partner obligations) and estimated completion dates ranging through September 30, 2021, as well as other completed development projects that are in various stages of lease-up or are stabilized.
F-53
13. Employee Plans
Year Ended December 31, 2019 2018 2017
Shares issued 48,131 75,414 68,286 Issuance price ranges $59.56 – $72.91 $47.80 – $57.09 $52.79 – $58.06 Issuance proceeds $3,116 $3,879 $3,744
14. Distribution Reinvestment Plan
15. Transactions with Related Parties
16. Commitments and Contingencies

Table of Contents
As of December 31, 2019, the Company has two joint venture agreements with third party partners for the consolidated development of multifamily rental properties. The development commitment to fund the project under construction is included in the development funding totals above for one of the joint ventures. The joint venture agreements with each partner include a buy-sell provision that provides the right, but not the obligation, for the Company to acquire each respective partner’s interests or sell its interests at any time following the occurrence of certain pre-defined events described in the joint venture agreements. See Note 6 for additional discussion.
The Company has entered into a retirement benefits agreement with its Chairman and deferred compensation agreements with other former executive officers. During the years ended December 31, 2019, 2018 and 2017, the Company recognized compensation expense of $0.4 million, $0.3 million and $0.4 million, respectively, related to these agreements.
The following table summarizes the Company’s contractual obligations for deferred compensation for the next five years and thereafter as of December 31, 2019:
Operating segments are defined as components of an enterprise that engage in business activities from which they may earn revenues and incur expenses and about which discrete financial information is available that is evaluated regularly by the chief operating decision maker. The chief operating decision maker decides how resources are allocated and assesses performance on a recurring basis at least quarterly.
The Company’s primary business is the acquisition, development and management of multifamily residential properties, which includes the generation of rental and other related income through the leasing of apartment units to residents. The chief operating decision maker evaluates the Company’s operating performance geographically by market and both on a same store and non-same store basis. The Company’s geographic same store operating segments located in urban and high-density suburban communities represent its reportable segments (the recently acquired Denver properties owned by the Company were included in non–same store through 2019). The Company’s operating segments located in its other markets (Phoenix) that are not material have also been included in the tables presented below.
The Company’s fee and asset management and development activities are other business activities that do not constitute an operating segment and as such, have been aggregated in the “Other” category in the tables presented below.
All revenues are from external customers and there is no customer who contributed 10% or more of the Company’s total revenues during the three years ended December 31, 2019, 2018 and 2017, respectively.
The primary financial measure for the Company’s rental real estate segment is net operating income (“NOI”), which represents rental income less: 1) property and maintenance expense and 2) real estate taxes and insurance expense (all as reflected in the accompanying consolidated statements of operations and comprehensive income). The Company believes that NOI is helpful to investors as a supplemental measure of its operating performance because it is a direct measure of the actual operating results of the Company’s apartment properties. Revenues for all leases are reflected on a straight-line basis in accordance with GAAP for the current and comparable periods.
The following table presents a reconciliation of NOI from our rental real estate for the years ended December 31, 2019, 2018 and 2017, respectively (amounts in thousands):
F-54
(Payments)/Receipts Due by Year (in thousands) 2020 2021 2022 2023 2024 Thereafter Total
Other Long-Term Liabilities: Deferred Compensation (1) $ (761 ) $ (1,116 ) $ (1,116 ) $ (991 ) $ (709 ) $ (3,897 ) $ (8,590 )
(1) Estimated payments to the Company’s Chairman and one former executive officer based on actual and estimated retirement dates.
17. Reportable Segments
Year Ended December 31, 2019 2018 2017
Rental income $ 2,700,691 $ 2,577,681 $ 2,470,689 Property and maintenance expense (446,845 ) (429,335 ) (405,281 ) Real estate taxes and insurance expense (366,139 ) (357,814 ) (335,495 )
Total operating expenses (812,984 ) (787,149 ) (740,776 )
Net operating income $ 1,887,707 $ 1,790,532 $ 1,729,913

Table of Contents
The following tables present NOI for each segment from our rental real estate for the years ended December 31, 2019, 2018 and 2017, respectively, as well as total assets and capital expenditures at December 31, 2019 and 2018, respectively (amounts in thousands):
Subsequent to December 31, 2019, the Company:
Year Ended December 31, 2019 Year Ended December 31, 2018 Year Ended December 31, 2017
Rental Income
Operating Expenses NOI
Rental Income
Operating Expenses NOI
Rental Income
Operating Expenses NOI
Same store (1)
Los Angeles $ 468,517 $ 136,096 $ 332,421 $ 451,592 $ 129,455 $ 322,137 $ 402,192 $ 114,055 $ 288,137
Orange County 105,087 24,407 80,680 101,198 24,468 76,730 88,527 21,544 66,983
San Diego 95,042 24,636 70,406 91,971 24,024 67,947 88,507 23,073 65,434
Subtotal - Southern California 668,646 185,139 483,507 644,761 177,947 466,814 579,226 158,672 420,554
San Francisco 480,499 116,036 364,463 463,492 112,331 351,161 430,501 108,689 321,812
Washington D.C. 413,006 125,688 287,318 403,761 123,345 280,416 430,060 129,720 300,340
New York 454,448 188,784 265,664 444,112 178,055 266,057 454,945 170,064 284,881
Boston 227,547 62,176 165,371 218,778 60,409 158,369 223,595 60,931 162,664
Seattle 207,019 56,016 151,003 200,222 55,871 144,351 191,074 52,470 138,604
Other Markets 2,094 714 1,380 1,940 658 1,282 1,839 652 1,187
Total same store 2,453,259 734,553 1,718,706 2,377,066 708,616 1,668,450 2,311,240 681,198 1,630,042
Non-same store/other (2) (3)
Non-same store 196,476 62,591 133,885 103,688 36,874 66,814 95,016 30,742 64,274
Other (3) 50,956 15,840 35,116 96,927 41,659 55,268 64,433 28,836 35,597
Total non-same store/other 247,432 78,431 169,001 200,615 78,533 122,082 159,449 59,578 99,871
Totals $ 2,700,691 $ 812,984 $ 1,887,707 $ 2,577,681 $ 787,149 $ 1,790,532 $ 2,470,689 $ 740,776 $ 1,729,913
(1) For the years ended December 31, 2019 and 2018, same store primarily includes all properties acquired or completed that were stabilized prior to January 1, 2018, less properties subsequently sold, which represented 71,830 apartment units. For the year ended December 31, 2017, same store primarily includes all properties acquired or completed that were stabilized prior to January 1, 2017, less properties subsequently sold, which represented 71,721 apartment units.
(2) For the years ended December 31, 2019 and 2018, non-same store primarily includes properties acquired after January 1, 2018, plus any properties in lease-up and not stabilized as of January 1, 2018. For the year ended December 31, 2017, non-same store primarily includes properties acquired after January 1, 2017, plus any properties in lease-up and not stabilized as of January 1, 2017.
(3) Other includes development, other corporate operations and operations prior to disposition for properties sold.
Year Ended December 31, 2019 Year Ended December 31, 2018
Total Assets Capital Expenditures Total Assets Capital Expenditures
Same store (1) Los Angeles $ 2,975,420 $ 31,738 $ 2,958,361 $ 28,574 Orange County 404,545 9,276 418,041 8,214 San Diego 389,537 4,464 405,449 4,525
Subtotal - Southern California 3,769,502 45,478 3,781,851 41,313 San Francisco 3,238,884 28,153 3,325,595 42,497 Washington D.C. 3,370,750 23,015 3,484,045 26,981 New York 3,866,500 25,132 3,878,580 23,126 Boston 1,464,196 23,823 1,514,814 24,000 Seattle 1,292,609 19,990 1,330,959 18,065 Other Markets 12,931 194 12,781 163
Total same store 17,015,372 165,785 17,328,625 176,145 Non-same store/other (2) (3)
Non-same store 3,447,497 10,788 1,990,102 5,934 Other (3) 709,900 1,850 1,075,482 6,422
Total non-same store/other 4,157,397 12,638 3,065,584 12,356
Totals $ 21,172,769 $ 178,423 $ 20,394,209 $ 188,501
(1) Same store primarily includes all properties acquired or completed that were stabilized prior to January 1, 2018, less properties subsequently sold, which represented 71,830 apartment units.
(2) Non-same store primarily includes properties acquired after January 1, 2018, plus any properties in lease-up and not stabilized as of January 1, 2018.
(3) Other includes development, other corporate operations and capital expenditures for properties sold.
18. Subsequent Events
• Sold one partially owned property consisting of 136 apartment units for $31.2 million.

F-55

Table of Contents
Equity Residential
The following unaudited quarterly data has been prepared on the basis of a December 31 year-end. Amounts are in thousands, except for per share amounts.
* The Company did not have any discontinued operations, extraordinary items or cumulative effect of change in accounting principle during the periods presented. Therefore, income from continuing operations and income before extraordinary items and cumulative effect of change in accounting principle are not shown as they were both equal to the net income amounts disclosed above.
ERP Operating Limited Partnership
The following unaudited quarterly data has been prepared on the basis of a December 31 year-end. Amounts are in thousands, except for per Unit amounts.
* The Operating Partnership did not have any discontinued operations, extraordinary items or cumulative effect of change in accounting principle during the periods presented. Therefore, income from continuing operations and income before extraordinary items and cumulative effect of change in accounting principle are not shown as they were both equal to the net income amounts disclosed above.
19. Quarterly Financial Data (Unaudited)
First Quarter Second Quarter Third Quarter Fourth Quarter 2019 (1) 3/31 6/30 9/30 12/31
Total revenues $ 662,494 $ 669,517 $ 685,145 $ 683,919 Operating income 209,969 369,260 368,363 408,952 Net income * 109,257 321,299 277,846 301,306 Net income available to Common Shares 103,766 308,196 266,333 288,992 Earnings per share: Net income available to Common Shares - basic $ 0.28 $ 0.83 $ 0.72 $ 0.78 Net income available to Common Shares - diluted $ 0.28 $ 0.83 $ 0.71 $ 0.77
First Quarter Second Quarter Third Quarter Fourth Quarter 2018 (1) 3/31 6/30 9/30 12/31
Total revenues $ 633,016 $ 639,808 $ 652,867 $ 652,743 Operating income 339,082 217,603 339,403 219,282 Net income * 220,548 118,410 223,846 122,388 Net income available to Common Shares 211,036 112,830 214,164 116,415 Earnings per share: Net income available to Common Shares - basic $ 0.57 $ 0.31 $ 0.58 $ 0.32 Net income available to Common Shares - diluted $ 0.57 $ 0.31 $ 0.58 $ 0.31
(1) Amounts may not equal full year results due to rounding.
First Quarter Second Quarter Third Quarter Fourth Quarter 2019 (1) 3/31 6/30 9/30 12/31
Total revenues $ 662,494 $ 669,517 $ 685,145 $ 683,919 Operating income 209,969 369,260 368,363 408,952 Net income * 109,257 321,299 277,846 301,306 Net income available to Units 107,685 319,706 276,243 299,687 Earnings per Unit: Net income available to Units - basic $ 0.28 $ 0.83 $ 0.72 $ 0.78 Net income available to Units - diluted $ 0.28 $ 0.83 $ 0.71 $ 0.77
First Quarter Second Quarter Third Quarter Fourth Quarter 2018 (1) 3/31 6/30 9/30 12/31
Total revenues $ 633,016 $ 639,808 $ 652,867 $ 652,743 Operating income 339,082 217,603 339,403 219,282 Net income * 220,548 118,410 223,846 122,388 Net income available to Units 219,095 117,129 222,323 120,837 Earnings per Unit: Net income available to Units - basic $ 0.57 $ 0.31 $ 0.58 $ 0.32 Net income available to Units - diluted $ 0.57 $ 0.31 $ 0.58 $ 0.31
(1) Amounts may not equal full year results due to rounding.

F-56

Table of Contents
EQUITY RESIDENTIAL ERP OPERATING LIMITED PARTNERSHIP
Schedule III - Real Estate and Accumulated Depreciation Overall Summary
December 31, 2019
S-1
Properties Apartment
Units
Investment in Real
Estate, Gross Accumulated Depreciation
Investment in Real
Estate, Net Encumbrances (1)
Wholly Owned Unencumbered 257 68,002 $ 23,408,268,350 $ (6,199,955,243 ) $ 17,208,313,107 $ —
Wholly Owned Encumbered 35 8,425 3,204,805,398 (792,348,079 ) 2,412,457,319 1,630,731,451
Wholly Owned Properties 292 76,427 26,613,073,748 (6,992,303,322 ) 19,620,770,426 1,630,731,451
Partially Owned Unencumbered 9 1,847 524,897,809 (133,111,488 ) 391,786,321 —
Partially Owned Encumbered 8 1,688 395,635,869 (151,371,564 ) 244,264,305 310,878,101
Partially Owned Properties 17 3,535 920,533,678 (284,483,052 ) 636,050,626 310,878,101
Total Unencumbered Properties 266 69,849 23,933,166,159 (6,333,066,731 ) 17,600,099,428 —
Total Encumbered Properties 43 10,113 3,600,441,267 (943,719,643 ) 2,656,721,624 1,941,609,552
Total Consolidated Investment in Real Estate 309 79,962 $ 27,533,607,426 $ (7,276,786,374 ) $ 20,256,821,052 $ 1,941,609,552
(1) See attached Encumbrances Reconciliation.

Table of Contents
EQUITY RESIDENTIAL ERP OPERATING LIMITED PARTNERSHIP
Schedule III - Real Estate and Accumulated Depreciation Encumbrances Reconciliation
December 31, 2019
S-2
Portfolio/Entity Encumbrances
Number of Properties
Encumbered by See Properties
With Note: Amount
Archstone Master Property Holdings LLC 13 H $ 798,230,171
Portfolio/Entity Encumbrances 13 798,230,171
Individual Property Encumbrances 1,143,379,381
Total Encumbrances per Financial Statements $ 1,941,609,552

Table of Contents
EQUITY RESIDENTIAL ERP OPERATING LIMITED PARTNERSHIP
Schedule III – Real Estate and Accumulated Depreciation (Amounts in thousands)
The changes in total real estate for the years ended December 31, 2019, 2018 and 2017 are as follows:
The changes in accumulated depreciation for the years ended December 31, 2019, 2018 and 2017 are as follows:
S-3
2019 2018 2017
Balance, beginning of year $ 26,511,022 $ 26,026,896 $ 25,386,425
Acquisitions and development 1,704,320 855,254 710,960
Improvements 180,944 192,661 204,113
Dispositions and other (862,679 ) (563,789 ) (274,602 )
Balance, end of year $ 27,533,607 $ 26,511,022 $ 26,026,896
2019 2018 2017
Balance, beginning of year $ 6,696,281 $ 6,040,378 $ 5,360,389
Depreciation 831,083 785,725 743,749
Dispositions and other (250,578 ) (129,822 ) (63,760 )
Balance, end of year $ 7,276,786 $ 6,696,281 $ 6,040,378

Table of Contents
EQUITY RESIDENTIAL ERP OPERATING LIMITED PARTNERSHIP
Schedule III - Real Estate and Accumulated Depreciation December 31, 2019
S-4
Description Initial Cost to
Company
Cost Capitalized
Subsequent to Acquisition
(Improvements, net) (E)
Gross Amount Carried at Close of Period 12/31/19
Apartment Name Location
Retail/ Commercial
Space Date of
Construction Apartment
Units Land Building &
Fixtures Building &
Fixtures Land Building & Fixtures (A) Total (B)
Accumulated Depreciation (C)
Investment in Real
Estate, Net at 12/31/19 Encumbrances
Wholly Owned Unencumbered:
100 K Apartments (fka 100K Street) Washington, D.C.
— 2018 222 $ 15,600,000 $ 69,662,369 $ 2,484 $ 15,600,000 $ 69,664,853 $ 85,264,853 $ (3,157,965 ) $ 82,106,888 $ —
140 Riverside Boulevard New York, NY G 2003 354 103,539,100 94,082,725 10,160,746 103,539,100 104,243,471 207,782,571 (52,510,393 ) 155,272,178 —
160 Riverside Boulevard New York, NY G 2001 455 139,933,500 190,964,745 17,198,947 139,933,500 208,163,692 348,097,192 (104,423,480 ) 243,673,712 —
170 Amsterdam New York, NY G 2015 236 — 112,096,955 439,194 — 112,536,149 112,536,149 (20,556,743 ) 91,979,406 —
175 Kent Brooklyn, NY G 2011 113 22,037,831 53,962,169 2,003,647 22,037,831 55,965,816 78,003,647 (18,206,594 ) 59,797,053 —
180 Montague (fka Brooklyn Heights) Brooklyn, NY G 2000 193 32,400,000 92,675,228 4,764,589 32,400,000 97,439,817 129,839,817 (27,077,371 ) 102,762,446 —
180 Riverside Boulevard New York, NY G 1998 516 144,968,250 138,346,681 14,692,592 144,968,250 153,039,273 298,007,523 (78,364,843 ) 219,642,680 —
1111 Belle Pre (fka The Madison) Alexandria, VA G 2014 360 18,937,702 94,758,679 399,141 18,937,702 95,157,820 114,095,522 (25,780,466 ) 88,315,056 —
1210 Mass Washington, D.C.
G 2004 144 9,213,512 36,559,189 2,770,003 9,213,512 39,329,192 48,542,704 (20,032,298 ) 28,510,406 —
1401 Joyce on Pentagon Row Arlington, VA — 2004 326 9,780,000 89,668,165 5,482,703 9,780,000 95,150,868 104,930,868 (38,110,856 ) 66,820,012 —
1500 Mass Ave Washington, D.C.
G 1951 556 54,638,298 40,361,702 15,851,496 54,638,298 56,213,198 110,851,496 (29,241,959 ) 81,609,537 —
1800 Oak (fka Rosslyn) Arlington, VA G 2003 314 31,400,000 109,005,734 7,759,305 31,400,000 116,765,039 148,165,039 (32,605,736 ) 115,559,303 —
2201 Pershing Drive Arlington, VA G 2012 188 11,321,198 49,674,175 2,653,163 11,321,198 52,327,338 63,648,536 (15,332,930 ) 48,315,606 —
2201 Wilson Arlington, VA G 2000 219 21,900,000 78,724,663 4,621,475 21,900,000 83,346,138 105,246,138 (23,254,386 ) 81,991,752 —
2400 M St Washington, D.C.
G 2006 359 30,006,593 114,013,785 4,706,151 30,006,593 118,719,936 148,726,529 (57,645,397 ) 91,081,132 —
315 on A Boston, MA G 2013 202 14,450,070 115,824,930 1,261,179 14,450,070 117,086,109 131,536,179 (22,891,380 ) 108,644,799 —
340 Fremont (fka Rincon Hill) San Francisco, CA
— 2016 348 42,000,000 248,609,655 179,247 42,000,000 248,788,902 290,788,902 (33,388,938 ) 257,399,964 —
341 Nevins Brooklyn, NY — (F) — 3,621,830 189,222 — 3,621,830 189,222 3,811,052 — 3,811,052 —
3003 Van Ness (fka Van Ness) Washington, D.C.
— 1970 625 56,300,000 141,191,580 7,157,154 56,300,000 148,348,734 204,648,734 (43,856,738 ) 160,791,996 —
425 Mass Washington, D.C.
G 2009 559 28,150,000 138,600,000 4,759,357 28,150,000 143,359,357 171,509,357 (53,491,733 ) 118,017,624 —
455 Eye Street Washington, D.C.
G 2017 174 11,941,407 61,418,274 40,682 11,941,407 61,458,956 73,400,363 (6,002,916 ) 67,397,447 —
4701 Willard Chevy Chase, MD
G 1966 517 76,921,130 153,947,682 31,235,663 76,921,130 185,183,345 262,104,475 (67,153,478 ) 194,950,997 —
4885 Edgemoor Lane Bethesda, MD — (F) — — 10,864,626 — — 10,864,626 10,864,626 — 10,864,626 —
4th and Hill Los Angeles, CA
— (F) — 13,131,456 16,680,349 — 13,131,456 16,680,349 29,811,805 — 29,811,805 —
600 Washington New York, NY G 2004 135 32,852,000 43,140,551 1,548,076 32,852,000 44,688,627 77,540,627 (22,331,625 ) 55,209,002 —
660 Washington (fka Boston Common) Boston, MA G 2006 420 106,100,000 166,311,679 4,730,410 106,100,000 171,042,089 277,142,089 (46,949,010 ) 230,193,079 —
70 Greene Jersey City, NJ G 2010 480 28,108,899 236,763,553 2,932,277 28,108,899 239,695,830 267,804,729 (81,879,133 ) 185,925,596 —
71 Broadway New York, NY G 1997 238 22,611,600 77,492,171 17,054,425 22,611,600 94,546,596 117,158,196 (51,104,697 ) 66,053,499 —
77 Bluxome San Francisco, CA
— 2007 102 5,249,124 18,609,876 479,898 5,249,124 19,089,774 24,338,898 (6,408,288 ) 17,930,610 —
77 Park Avenue (fka Hoboken) Hoboken, NJ G 2000 301 27,900,000 168,992,440 7,688,560 27,900,000 176,681,000 204,581,000 (47,768,422 ) 156,812,578 —
777 Sixth New York, NY G 2002 294 65,352,706 65,747,294 4,999,856 65,352,706 70,747,150 136,099,856 (30,672,075 ) 105,427,781 —
88 Hillside Daly City, CA G 2011 95 7,786,800 31,587,325 3,225,899 7,786,800 34,813,224 42,600,024 (11,434,181 ) 31,165,843 —
855 Brannan San Francisco, CA
G 2018 449 41,363,921 282,107,685 62,476 41,363,921 282,170,161 323,534,082 (23,429,467 ) 300,104,615 —
929 Mass (fka 929 House) Cambridge, MA G 1975 127 3,252,993 21,745,595 7,695,575 3,252,993 29,441,170 32,694,163 (19,893,418 ) 12,800,745 —
Academy Village North Hollywood, CA
— 1989 248 25,000,000 23,593,194 9,821,339 25,000,000 33,414,533 58,414,533 (20,345,297 ) 38,069,236 —
Acappella Pasadena, CA — 2002 143 5,839,548 29,360,452 2,301,628 5,839,548 31,662,080 37,501,628 (12,293,107 ) 25,208,521 —
Acton Courtyard Berkeley, CA G 2003 71 5,550,000 15,785,509 396,492 5,550,000 16,182,001 21,732,001 (7,612,133 ) 14,119,868 —
Alban Towers Washington, D.C.
— 1934 229 18,900,000 89,794,201 6,474,195 18,900,000 96,268,396 115,168,396 (25,786,581 ) 89,381,815 —
Alborada Fremont, CA — 1999 442 24,310,000 59,214,129 9,528,299 24,310,000 68,742,428 93,052,428 (44,468,172 ) 48,584,256 —
Alcott Apartments (fka West End Tower) Boston, MA G (F) — 10,424,000 128,885,729 — 10,424,000 128,885,729 139,309,729 — 139,309,729 —
Altitude (fka Village at Howard Hughes, The (Lots 1 & 2))
Los Angeles, CA
— 2016 545 43,783,485 150,235,905 493,024 43,783,485 150,728,929 194,512,414 (20,615,169 ) 173,897,245 —
Alton, The (fka Millikan) Irvine, CA — 2017 344 11,049,027 96,526,323 150,438 11,049,027 96,676,761 107,725,788 (11,346,591 ) 96,379,197 —
Arbor Terrace Sunnyvale, CA — 1979 175 9,057,300 18,483,642 11,357,865 9,057,300 29,841,507 38,898,807 (17,937,496 ) 20,961,311 —
Arches, The Sunnyvale, CA — 1974 410 26,650,000 62,850,000 2,623,168 26,650,000 65,473,168 92,123,168 (24,870,049 ) 67,253,119 —

Table of Contents
EQUITY RESIDENTIAL ERP OPERATING LIMITED PARTNERSHIP
Schedule III - Real Estate and Accumulated Depreciation December 31, 2019
S-5
Description Initial Cost to
Company
Cost Capitalized
Subsequent to Acquisition
(Improvements, net) (E)
Gross Amount Carried at Close of Period 12/31/19
Apartment Name Location
Retail/ Commercial
Space Date of
Construction Apartment
Units Land Building &
Fixtures Building &
Fixtures Land Building & Fixtures (A) Total (B)
Accumulated Depreciation (C)
Investment in Real
Estate, Net at 12/31/19 Encumbrances
Artisan on Second Los Angeles, CA — 2008 118 8,000,400 36,074,600 1,173,462 8,000,400 37,248,062 45,248,462 (12,924,017 ) 32,324,445 —
Artisan Square Northridge, CA — 2002 140 7,000,000 20,537,359 1,889,100 7,000,000 22,426,459 29,426,459 (13,116,756 ) 16,309,703 —
Artistry Emeryville (fka Emeryville) Emeryville, CA — 1994 267 12,300,000 61,466,267 7,189,056 12,300,000 68,655,323 80,955,323 (20,908,096 ) 60,047,227 —
Atelier Brooklyn, NY G 2015 120 32,401,680 47,135,432 432,778 32,401,680 47,568,210 79,969,890 (8,426,826 ) 71,543,064 —
Avenue Two Redwood City, CA
— 1972 123 7,995,000 18,005,000 2,417,128 7,995,000 20,422,128 28,417,128 (7,587,499 ) 20,829,629 —
Axis at Shady Grove Rockville, MD — 2016 366 14,745,774 90,503,831 123,658 14,745,774 90,627,489 105,373,263 (6,627,790 ) 98,745,473 —
Azure (fka Mission Bay-Block 13) San Francisco, CA — 2015 273 32,855,115 153,569,655 385,653 32,855,115 153,955,308 186,810,423 (25,110,173 ) 161,700,250 —
Bay Hill Long Beach, CA — 2002 160 7,600,000 27,437,239 3,648,128 7,600,000 31,085,367 38,685,367 (16,705,166 ) 21,980,201 —
Beatrice, The New York, NY — 2010 302 114,351,405 165,648,595 1,852,511 114,351,405 167,501,106 281,852,511 (51,586,536 ) 230,265,975 —
Bella Vista I, II, III Combined Woodland Hills, CA
— 2003-2007 579 31,682,754 121,095,786 10,564,320 31,682,754 131,660,106 163,342,860 (63,397,900 ) 99,944,960 —
Belle Arts Condominium Homes, LLC Bellevue, WA — 2000 1 63,158 236,157 2,098 63,158 238,255 301,413 (91,640 ) 209,773 —
Belle Fontaine Marina Del Rey, CA
— 2003 102 9,098,808 28,701,192 2,077,210 9,098,808 30,778,402 39,877,210 (9,929,838 ) 29,947,372 —
Breakwater at Marina Del Rey Marina Del Rey, CA
— 1964-1969 224 — 73,189,262 2,301,977 — 75,491,239 75,491,239 (22,556,033 ) 52,935,206 —
Briarwood (CA) Sunnyvale, CA — 1985 192 9,991,500 22,247,278 4,223,652 9,991,500 26,470,930 36,462,430 (19,003,418 ) 17,459,012 —
Brodie, The Westminster, CO — 2016 312 8,639,904 79,254,009 338,241 8,639,904 79,592,250 88,232,154 (4,390,121 ) 83,842,033 —
Brooklyner, The (fka 111 Lawrence) Brooklyn, NY G 2010 490 40,099,922 221,438,631 4,272,230 40,099,922 225,710,861 265,810,783 (69,755,616 ) 196,055,167 —
C on Pico Los Angeles, CA — 2014 94 17,125,766 28,074,234 468,094 17,125,766 28,542,328 45,668,094 (4,917,365 ) 40,750,729 —
Carlyle Mill Alexandria, VA — 2002 317 10,000,000 51,367,913 9,043,657 10,000,000 60,411,570 70,411,570 (34,997,308 ) 35,414,262 —
Carmel Terrace San Diego, CA — 1988-1989 384 2,288,300 20,596,281 12,519,325 2,288,300 33,115,606 35,403,906 (28,576,803 ) 6,827,103 —
Cascade Seattle, WA G 2017 477 23,751,564 149,388,658 10,060 23,751,564 149,398,718 173,150,282 (14,329,011 ) 158,821,271 —
Centennial (fka Centennial Court & Centennial Tower) Seattle, WA G 1991/2001 408 9,700,000 70,080,378 13,065,205 9,700,000 83,145,583 92,845,583 (43,852,523 ) 48,993,060 —
Centre Club Combined Ontario, CA — 1994 &
2002 412 7,436,000 33,014,789 9,490,814 7,436,000 42,505,603 49,941,603 (26,716,928 ) 23,224,675 —
Chloe on Madison (fka 1401 E. Madison) Seattle, WA G 2019 137 10,401,958 52,593,395 — 10,401,958 52,593,395 62,995,353 (497,660 ) 62,497,693 —
Chloe on Union (fka Chloe) Seattle, WA G 2010 117 14,835,571 39,359,650 2,516,557 14,835,571 41,876,207 56,711,778 (4,541,342 ) 52,170,436 —
Church Corner Cambridge, MA G 1987 85 5,220,000 16,744,643 3,270,549 5,220,000 20,015,192 25,235,192 (10,988,447 ) 14,246,745 —
City Gate at Cupertino (fka Cupertino) Cupertino, CA — 1998 311 40,400,000 95,937,046 7,548,015 40,400,000 103,485,061 143,885,061 (29,361,079 ) 114,523,982 —
City Pointe Fullerton, CA G 2004 183 6,863,792 36,476,208 3,588,233 6,863,792 40,064,441 46,928,233 (15,519,206 ) 31,409,027 —
City Square Bellevue (fka Bellevue) Bellevue, WA G 1998 191 15,100,000 41,876,257 3,873,050 15,100,000 45,749,307 60,849,307 (13,419,667 ) 47,429,640 —
Clarendon, The Arlington, VA G 2005 292 30,400,340 103,824,660 2,674,009 30,400,340 106,498,669 136,899,009 (36,985,746 ) 99,913,263 —
Cleo, The Los Angeles, CA — 1989 92 6,615,467 14,829,335 4,079,934 6,615,467 18,909,269 25,524,736 (9,776,697 ) 15,748,039 —
Connecticut Heights Washington, D.C. — 1974 518 27,600,000 114,002,295 10,060,643 27,600,000 124,062,938 151,662,938 (33,971,504 ) 117,691,434 —
Corcoran House at DuPont Circle (fka DuPont Circle) Washington, D.C. G 1961 138 13,500,000 26,913,113 2,637,933 13,500,000 29,551,046 43,051,046 (9,012,285 ) 34,038,761 —
Courthouse Plaza Arlington, VA G 1990 396 — 87,386,024 6,316,702 — 93,702,726 93,702,726 (28,408,921 ) 65,293,805 —
Creekside (San Mateo) San Mateo, CA — 1985 192 9,606,600 21,193,232 4,951,801 9,606,600 26,145,033 35,751,633 (18,907,735 ) 16,843,898 —
Cronins Landing Waltham, MA G 1998 281 32,300,000 85,119,324 11,972,290 32,300,000 97,091,614 129,391,614 (27,201,943 ) 102,189,671 —
Crystal Place Arlington, VA — 1986 181 17,200,000 47,918,975 3,946,812 17,200,000 51,865,787 69,065,787 (15,614,718 ) 53,451,069 —
Dalton, The Alexandria, VA G 2018 270 22,947,777 95,292,515 (6 ) 22,947,777 95,292,509 118,240,286 — 118,240,286 —
Deerwood (SD) San Diego, CA — 1990 316 2,082,095 18,739,815 15,675,022 2,082,095 34,414,837 36,496,932 (30,453,714 ) 6,043,218 —
Del Mar Ridge San Diego, CA — 1998 181 7,801,824 36,948,176 4,246,225 7,801,824 41,194,401 48,996,225 (17,680,819 ) 31,315,406 —
Eagle Canyon Chino Hills, CA — 1985 252 1,808,900 16,274,361 10,865,978 1,808,900 27,140,339 28,949,239 (20,747,510 ) 8,201,729 —
Edgemont at Bethesda Metro Bethesda, MD — 1989 122 13,092,552 43,907,448 1,674,370 13,092,552 45,581,818 58,674,370 (15,155,907 ) 43,518,463 —
Emerson Place Boston, MA G 1962 444 14,855,000 57,566,636 35,014,249 14,855,000 92,580,885 107,435,885 (63,325,270 ) 44,110,615 —
Encore at Sherman Oaks, The Sherman Oaks, CA — 1988 174 8,700,000 25,446,003 3,847,449 8,700,000 29,293,452 37,993,452 (10,801,336 ) 27,192,116 —
Eviva on Cherokee Denver, CO — 2017 274 10,507,626 100,037,204 151,235 10,507,626 100,188,439 110,696,065 (6,553,585 ) 104,142,480 —

Table of Contents
EQUITY RESIDENTIAL ERP OPERATING LIMITED PARTNERSHIP
Schedule III - Real Estate and Accumulated Depreciation December 31, 2019
S-6
Description Initial Cost to
Company
Cost Capitalized
Subsequent to Acquisition
(Improvements, net) (E)
Gross Amount Carried at Close of Period 12/31/19
Apartment Name Location
Retail/ Commercial
Space Date of
Construction Apartment
Units Land Building &
Fixtures Building &
Fixtures Land Building & Fixtures (A) Total (B)
Accumulated Depreciation (C)
Investment in Real
Estate, Net at 12/31/19 Encumbrances
Fountains at Emerald Park (fka Emerald Park) Dublin, CA — 2000 324 25,900,000 83,986,217 3,935,049 25,900,000 87,921,266 113,821,266 (25,270,333 ) 88,550,933 —
Fremont Center Fremont, CA G 2002 322 25,800,000 78,753,114 4,490,634 25,800,000 83,243,748 109,043,748 (24,471,382 ) 84,572,366 —
Gaithersburg Station Gaithersburg, MD G 2013 400 17,500,000 74,678,917 3,537,268 17,500,000 78,216,185 95,716,185 (20,628,153 ) 75,088,032 —
Gallery, The Hermosa Beach, CA
— 1971 169 18,144,000 46,567,941 2,995,980 18,144,000 49,563,921 67,707,921 (24,741,834 ) 42,966,087 —
Gateway at Malden Center Malden, MA G 1988 203 9,209,780 25,722,666 16,463,954 9,209,780 42,186,620 51,396,400 (26,861,288 ) 24,535,112 —
Geary Court Yard San Francisco, CA — 1990 165 1,722,400 15,471,429 6,197,853 1,722,400 21,669,282 23,391,682 (15,406,560 ) 7,985,122 —
Girard Boston, MA G 2016 160 — 102,450,328 865,330 — 103,315,658 103,315,658 (11,248,402 ) 92,067,256 —
Hampshire Place Los Angeles, CA — 1989 259 10,806,000 30,335,330 8,125,571 10,806,000 38,460,901 49,266,901 (19,841,849 ) 29,425,052 —
Harbor Steps Seattle, WA G 2000 761 59,403,601 158,829,432 40,880,428 59,403,601 199,709,860 259,113,461 (97,046,373 ) 162,067,088 —
Hathaway Long Beach, CA — 1987 385 2,512,500 22,611,912 13,674,471 2,512,500 36,286,383 38,798,883 (27,001,675 ) 11,797,208 —
Helios (fka 2nd+Pine) Seattle, WA G 2017 398 18,061,674 206,628,093 110,524 18,061,674 206,738,617 224,800,291 (20,125,380 ) 204,674,911 —
Heritage at Stone Ridge Burlington, MA — 2005 180 10,800,000 31,808,335 2,849,652 10,800,000 34,657,987 45,457,987 (17,798,543 ) 27,659,444 —
Heritage Ridge Lynwood, WA — 1999 197 6,895,000 18,983,597 4,605,503 6,895,000 23,589,100 30,484,100 (11,968,336 ) 18,515,764 —
Hesby North Hollywood, CA
— 2013 308 23,299,892 102,700,108 1,653,931 23,299,892 104,354,039 127,653,931 (25,277,554 ) 102,376,377 —
Highlands at South Plainfield South Plainfield, NJ
— 2000 252 10,080,000 37,526,912 2,592,223 10,080,000 40,119,135 50,199,135 (20,191,766 ) 30,007,369 —
Hikari Los Angeles, CA G 2007 128 9,435,760 32,564,240 965,477 9,435,760 33,529,717 42,965,477 (11,609,215 ) 31,356,262 —
Hudson Crossing New York, NY G 2003 259 23,420,000 69,977,699 3,000,297 23,420,000 72,977,996 96,397,996 (38,482,671 ) 57,915,325 —
Hudson Pointe Jersey City, NJ — 2003 182 5,350,000 41,114,074 6,902,664 5,350,000 48,016,738 53,366,738 (26,064,218 ) 27,302,520 —
Hunt Club II Charlotte, NC — (F) — 100,000 — — 100,000 — 100,000 — 100,000 —
Huxley, The Redwood City, CA
— 2018 137 18,775,028 89,335,476 5,577 18,775,028 89,341,053 108,116,081 (2,362,663 ) 105,753,418 —
Ivory Wood Bothell, WA — 2000 144 2,732,800 13,888,282 1,716,006 2,732,800 15,604,288 18,337,088 (8,531,839 ) 9,805,249 —
Jia (fka Chinatown Gateway) Los Angeles, CA G 2014 280 14,791,831 77,752,457 816,097 14,791,831 78,568,554 93,360,385 (22,410,277 ) 70,950,108 —
Junction 47 (fka West Seattle) Seattle, WA G 2015 206 11,726,305 56,576,329 139,678 11,726,305 56,716,007 68,442,312 (9,832,830 ) 58,609,482 —
Kelvin, The (fka Modera) Irvine, CA — 2015 194 15,521,552 64,853,448 593,826 15,521,552 65,447,274 80,968,826 (12,644,037 ) 68,324,789 —
Kenwood Mews Burbank, CA — 1991 141 14,100,000 24,662,883 4,164,875 14,100,000 28,827,758 42,927,758 (14,951,144 ) 27,976,614 —
Laguna Clara Santa Clara, CA — 1972 264 13,642,420 29,597,400 5,500,048 13,642,420 35,097,448 48,739,868 (19,856,605 ) 28,883,263 —
Landings at Port Imperial W. New York, NJ — 1999 276 27,246,045 37,741,050 14,471,631 27,246,045 52,212,681 79,458,726 (33,207,884 ) 46,250,842 —
Lane Seattle, WA G 2019 217 13,142,946 71,853,083 (1 ) 13,142,946 71,853,082 84,996,028 — 84,996,028 —
Lex, The San Jose, CA — 2017 387 21,817,512 158,778,598 77,511 21,817,512 158,856,109 180,673,621 (8,972,354 ) 171,701,267 —
Liberty Park Braintree, MA — 2000 202 5,977,504 26,749,111 6,951,551 5,977,504 33,700,662 39,678,166 (19,975,624 ) 19,702,542 —
Liberty Tower Arlington, VA G 2008 235 16,382,822 83,817,078 2,551,120 16,382,822 86,368,198 102,751,020 (31,785,187 ) 70,965,833 —
Lincoln Heights Quincy, MA — 1991 336 5,928,400 33,595,262 15,019,958 5,928,400 48,615,220 54,543,620 (37,746,289 ) 16,797,331 —
Lindley Apartments Encino, CA — 2004 129 5,805,000 25,705,000 2,055,111 5,805,000 27,760,111 33,565,111 (10,259,804 ) 23,305,307 —
Lofts at Kendall Square (fka Kendall Square) Cambridge, MA — 1998 186 18,696,674 78,445,657 6,941,386 18,696,674 85,387,043 104,083,717 (24,300,285 ) 79,783,432 —
Lofts at Kendall Square ll (fka 249 Third Street) Cambridge, MA G 2019 84 4,603,326 42,655,411 — 4,603,326 42,655,411 47,258,737 (388,231 ) 46,870,506 —
Longacre House New York, NY G 2000 293 73,170,045 53,962,510 4,562,899 73,170,045 58,525,409 131,695,454 (26,269,075 ) 105,426,379 —
Longfellow Place Boston, MA G 1975 710 38,264,917 132,175,915 86,857,633 38,264,917 219,033,548 257,298,465 (153,930,179 ) 103,368,286 —
Madox Jersey City, NJ G 2013 131 9,679,635 64,594,205 456,215 9,679,635 65,050,420 74,730,055 (4,991,342 ) 69,738,713 —
Mantena New York, NY G 2012 98 22,346,513 61,501,158 1,159,451 22,346,513 62,660,609 85,007,122 (18,028,047 ) 66,979,075 —
Marina 41 (fka Marina Del Rey) Marina Del Rey, CA
— 1973 623 — 168,842,442 9,214,698 — 178,057,140 178,057,140 (53,401,243 ) 124,655,897 —
Mariposa at Playa Del Rey (fka Playa Del Rey) Playa Del Rey, CA — 2004 354 60,900,000 89,311,482 6,259,009 60,900,000 95,570,491 156,470,491 (28,260,197 ) 128,210,294 —
Mark on 8th Seattle, WA G 2016 174 23,004,387 51,148,861 132,254 23,004,387 51,281,115 74,285,502 (4,399,467 ) 69,886,035 —
Market Street Village San Diego, CA — 2006 229 13,740,000 40,757,301 2,433,811 13,740,000 43,191,112 56,931,112 (21,071,334 ) 35,859,778 —
Milano Lofts Los Angeles, CA G 1925/2006 99 8,125,216 27,378,784 4,128,987 8,125,216 31,507,771 39,632,987 (9,253,714 ) 30,379,273 —
Mill Creek Milpitas, CA — 1991 516 12,858,693 57,168,503 17,604,121 12,858,693 74,772,624 87,631,317 (39,853,420 ) 47,777,897 —
Montierra (CA) San Diego, CA — 1990 272 8,160,000 29,360,938 8,510,123 8,160,000 37,871,061 46,031,061 (26,472,405 ) 19,558,656 —

Table of Contents
EQUITY RESIDENTIAL ERP OPERATING LIMITED PARTNERSHIP
Schedule III - Real Estate and Accumulated Depreciation December 31, 2019
S-7
Description Initial Cost to
Company
Cost Capitalized
Subsequent to Acquisition
(Improvements, net) (E)
Gross Amount Carried at Close of Period 12/31/19
Apartment Name Location
Retail/ Commercial
Space Date of
Construction Apartment
Units Land Building &
Fixtures Building &
Fixtures Land Building & Fixtures (A) Total (B)
Accumulated Depreciation (C)
Investment in Real
Estate, Net at 12/31/19 Encumbrances
Mosaic at Metro Hyattsville, MD — 2008 260 — 59,580,898 1,537,111 — 61,118,009 61,118,009 (23,624,406 ) 37,493,603 —
Mountain View Redevelopment Mountain View, CA
— (F) — — 882,046 — — 882,046 882,046 — 882,046 —
Mozaic at Union Station Los Angeles, CA — 2007 272 8,500,000 52,529,446 2,472,824 8,500,000 55,002,270 63,502,270 (26,004,162 ) 37,498,108 —
Murray Hill Tower (fka Murray Hill) New York, NY G 1974 270 75,800,000 102,705,401 10,547,453 75,800,000 113,252,854 189,052,854 (34,480,104 ) 154,572,750 —
Next on Sixth Los Angeles, CA G 2017 398 52,509,906 136,635,362 52,028 52,509,906 136,687,390 189,197,296 (6,067,150 ) 183,130,146 —
North Pier at Harborside Jersey City, NJ — 2003 297 4,000,159 94,290,590 5,767,779 4,000,159 100,058,369 104,058,528 (53,298,183 ) 50,760,345 —
Northglen Valencia, CA — 1988 234 9,360,000 20,778,553 6,828,841 9,360,000 27,607,394 36,967,394 (16,473,980 ) 20,493,414 —
Northpark Burlingame, CA — 1972 510 38,607,000 77,472,217 15,236,070 38,607,000 92,708,287 131,315,287 (40,034,278 ) 91,281,009 —
Northridge Pleasant Hill, CA — 1974 221 5,524,000 14,691,705 11,618,255 5,524,000 26,309,960 31,833,960 (20,784,027 ) 11,049,933 —
Oak Park Combined Agoura Hills, CA — 1989 &
1990 444 3,390,700 30,517,274 11,129,906 3,390,700 41,647,180 45,037,880 (33,598,181 ) 11,439,699 —
Oaks Santa Clarita, CA — 2000 520 23,400,000 61,020,438 7,150,916 23,400,000 68,171,354 91,571,354 (38,896,036 ) 52,675,318 —
Oakwood Crystal City Arlington, VA — 1987 162 15,400,000 35,474,336 4,164,931 15,400,000 39,639,267 55,039,267 (11,715,439 ) 43,323,828 —
Ocean Crest Solana Beach, CA — 1986 146 5,111,200 11,910,438 4,831,677 5,111,200 16,742,115 21,853,315 (11,831,439 ) 10,021,876 —
Odin (fka Tallman) Seattle, WA — 2015 301 16,807,519 64,519,515 70,389 16,807,519 64,589,904 81,397,423 (11,050,157 ) 70,347,266 —
Old Town Lofts Redmond, WA G 2014 149 7,740,467 44,146,181 821,523 7,740,467 44,967,704 52,708,171 (8,666,808 ) 44,041,363 —
Olympus Towers Seattle, WA G 2000 328 14,752,034 73,335,425 10,370,617 14,752,034 83,706,042 98,458,076 (46,375,373 ) 52,082,703 —
One Henry Adams San Francisco, CA G 2016 241 30,224,393 139,558,692 22,022 30,224,393 139,580,714 169,805,107 (16,605,628 ) 153,199,479 —
One India Street (fka Oakwood Boston) Boston, MA G 1901 94 22,200,000 28,672,979 6,249,693 22,200,000 34,922,672 57,122,672 (9,689,007 ) 47,433,665 —
Pacific Place Los Angeles, CA — 2008 430 32,250,000 110,750,000 2,028,500 32,250,000 112,778,500 145,028,500 (31,554,841 ) 113,473,659 —
Packard Building Seattle, WA G 2010 61 5,911,041 19,954,959 1,112,353 5,911,041 21,067,312 26,978,353 (3,941,611 ) 23,036,742 —
Parc 77 New York, NY G 1903 137 40,504,000 18,025,679 6,560,029 40,504,000 24,585,708 65,089,708 (14,088,276 ) 51,001,432 —
Parc Cameron New York, NY G 1927 166 37,600,000 9,855,597 7,590,854 37,600,000 17,446,451 55,046,451 (11,702,099 ) 43,344,352 —
Parc Coliseum New York, NY G 1910 177 52,654,000 23,045,751 9,553,310 52,654,000 32,599,061 85,253,061 (19,280,179 ) 65,972,882 —
Parc East Towers New York, NY G 1977 324 102,163,000 108,989,402 12,219,604 102,163,000 121,209,006 223,372,006 (56,644,803 ) 166,727,203 —
Parc on Powell (fka Parkside at Emeryville) Emeryville, CA G 2015 173 16,667,059 65,073,509 419,037 16,667,059 65,492,546 82,159,605 (12,009,148 ) 70,150,457 —
Park Connecticut Washington, D.C. — 2000 142 13,700,000 59,087,519 1,863,350 13,700,000 60,950,869 74,650,869 (16,566,168 ) 58,084,701 —
Park Hacienda (fka Hacienda) Pleasanton, CA — 2000 540 43,200,000 128,753,359 6,614,073 43,200,000 135,367,432 178,567,432 (39,974,119 ) 138,593,313 —
Park West (CA) Los Angeles, CA — 1987/1990 444 3,033,500 27,302,383 12,126,113 3,033,500 39,428,496 42,461,996 (30,924,343 ) 11,537,653 —
Parkside Union City, CA — 1979 208 6,246,700 11,827,453 8,185,992 6,246,700 20,013,445 26,260,145 (13,217,770 ) 13,042,375 —
Pearl, The (WA) Seattle, WA G 2008 80 6,972,585 26,527,415 1,051,124 6,972,585 27,578,539 34,551,124 (5,151,187 ) 29,399,937 —
Pearl MDR (fka Oakwood Marina Del Rey) Marina Del Rey, CA
G 1969 597 — 120,795,359 5,726,479 — 126,521,838 126,521,838 (38,784,120 ) 87,737,718 —
Pegasus Los Angeles, CA G 1949/2003 322 18,094,052 81,905,948 6,904,081 18,094,052 88,810,029 106,904,081 (32,523,925 ) 74,380,156 —
Playa Pacifica Hermosa Beach, CA
— 1972 285 35,100,000 33,473,822 23,756,377 35,100,000 57,230,199 92,330,199 (31,171,766 ) 61,158,433 —
Portofino Chino Hills, CA — 1989 176 3,572,400 14,660,994 3,874,242 3,572,400 18,535,236 22,107,636 (14,171,043 ) 7,936,593 —
Portofino (Val) Valencia, CA — 1989 216 8,640,000 21,487,126 5,837,031 8,640,000 27,324,157 35,964,157 (17,518,529 ) 18,445,628 —
Portside Towers Jersey City, NJ G 1992-1997 527 22,487,006 96,842,913 24,128,821 22,487,006 120,971,734 143,458,740 (89,422,204 ) 54,036,536 —
Potrero 1010 San Francisco, CA G 2016 453 40,830,011 181,812,933 518,975 40,830,011 182,331,908 223,161,919 (26,294,704 ) 196,867,215 —
Prado (fka Glendale) Glendale, CA — 1988 264 — 67,977,313 5,928,659 — 73,905,972 73,905,972 (21,102,334 ) 52,803,638 —
Prime, The Arlington, VA — 2002 281 34,625,000 77,879,740 2,669,467 34,625,000 80,549,207 115,174,207 (32,656,903 ) 82,517,304 —
Prism at Park Avenue South (fka 400 Park Avenue South) New York, NY G 2015 269 76,292,169 171,649,131 208,922 76,292,169 171,858,053 248,150,222 (32,299,311 ) 215,850,911 —
Promenade at Town Center I & II Valencia, CA — 2001 564 28,200,000 69,795,915 10,883,962 28,200,000 80,679,877 108,879,877 (44,391,535 ) 64,488,342 —
Providence Bothell, WA — 2000 200 3,573,621 19,055,505 4,537,035 3,573,621 23,592,540 27,166,161 (12,025,867 ) 15,140,294 —
Quarry Hills Quincy, MA — 2006 316 26,900,000 84,411,162 4,202,638 26,900,000 88,613,800 115,513,800 (25,515,603 ) 89,998,197 —
Radius Uptown Denver, CO — 2017 372 13,644,960 121,899,084 640,652 13,644,960 122,539,736 136,184,696 (9,914,578 ) 126,270,118 —
Red 160 (fka Redmond Way) Redmond, WA G 2011 250 15,546,376 65,320,010 1,448,098 15,546,376 66,768,108 82,314,484 (20,622,372 ) 61,692,112 —
Redmond Court Bellevue, WA — 1977 206 10,300,000 33,488,745 1,211,705 10,300,000 34,700,450 45,000,450 (11,274,160 ) 33,726,290 —
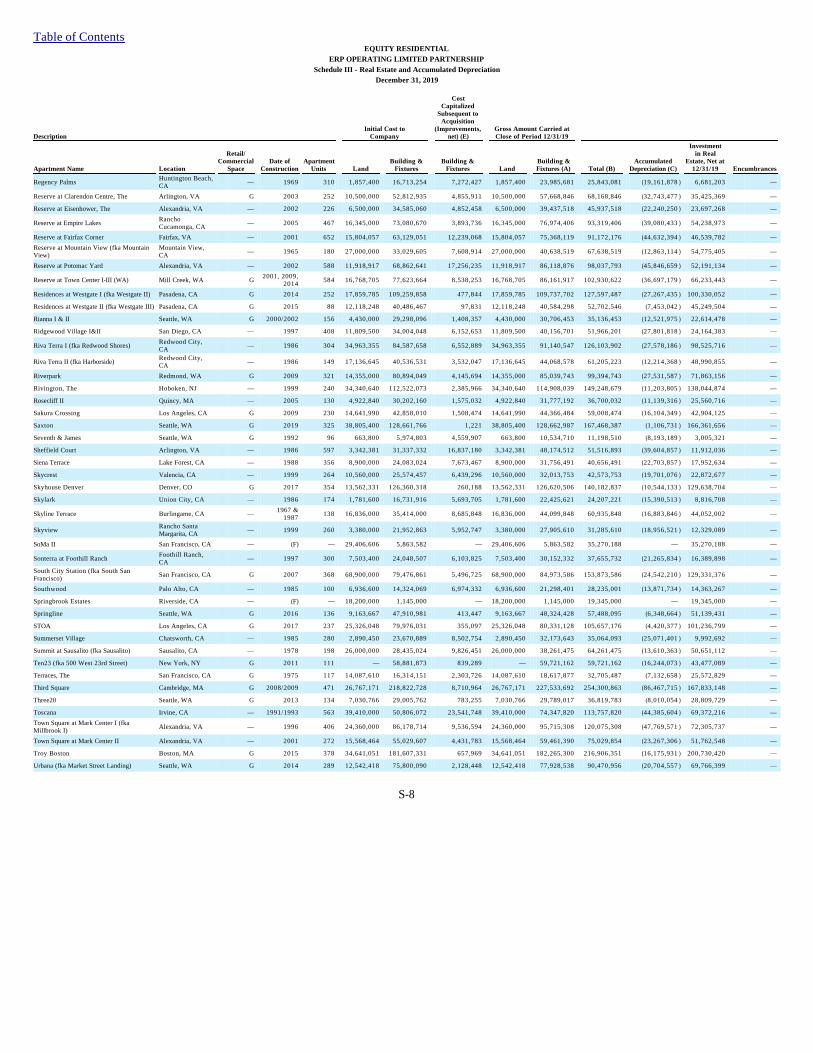
Table of Contents EQUITY RESIDENTIAL
ERP OPERATING LIMITED PARTNERSHIP Schedule III - Real Estate and Accumulated Depreciation
December 31, 2019
S-8
Description Initial Cost to
Company
Cost Capitalized
Subsequent to Acquisition
(Improvements, net) (E)
Gross Amount Carried at Close of Period 12/31/19
Apartment Name Location
Retail/ Commercial
Space Date of
Construction Apartment
Units Land Building &
Fixtures Building &
Fixtures Land Building & Fixtures (A) Total (B)
Accumulated Depreciation (C)
Investment in Real
Estate, Net at 12/31/19 Encumbrances
Regency Palms Huntington Beach, CA
— 1969 310 1,857,400 16,713,254 7,272,427 1,857,400 23,985,681 25,843,081 (19,161,878 ) 6,681,203 —
Reserve at Clarendon Centre, The Arlington, VA G 2003 252 10,500,000 52,812,935 4,855,911 10,500,000 57,668,846 68,168,846 (32,743,477 ) 35,425,369 —
Reserve at Eisenhower, The Alexandria, VA — 2002 226 6,500,000 34,585,060 4,852,458 6,500,000 39,437,518 45,937,518 (22,240,250 ) 23,697,268 —
Reserve at Empire Lakes Rancho Cucamonga, CA
— 2005 467 16,345,000 73,080,670 3,893,736 16,345,000 76,974,406 93,319,406 (39,080,433 ) 54,238,973 —
Reserve at Fairfax Corner Fairfax, VA — 2001 652 15,804,057 63,129,051 12,239,068 15,804,057 75,368,119 91,172,176 (44,632,394 ) 46,539,782 —
Reserve at Mountain View (fka Mountain View)
Mountain View, CA
— 1965 180 27,000,000 33,029,605 7,608,914 27,000,000 40,638,519 67,638,519 (12,863,114 ) 54,775,405 —
Reserve at Potomac Yard Alexandria, VA — 2002 588 11,918,917 68,862,641 17,256,235 11,918,917 86,118,876 98,037,793 (45,846,659 ) 52,191,134 —
Reserve at Town Center I-III (WA) Mill Creek, WA G 2001, 2009,
2014 584 16,768,705 77,623,664 8,538,253 16,768,705 86,161,917 102,930,622 (36,697,179 ) 66,233,443 —
Residences at Westgate I (fka Westgate II) Pasadena, CA G 2014 252 17,859,785 109,259,858 477,844 17,859,785 109,737,702 127,597,487 (27,267,435 ) 100,330,052 —
Residences at Westgate II (fka Westgate III) Pasadena, CA G 2015 88 12,118,248 40,486,467 97,831 12,118,248 40,584,298 52,702,546 (7,453,042 ) 45,249,504 —
Rianna I & II Seattle, WA G 2000/2002 156 4,430,000 29,298,096 1,408,357 4,430,000 30,706,453 35,136,453 (12,521,975 ) 22,614,478 —
Ridgewood Village I&II San Diego, CA — 1997 408 11,809,500 34,004,048 6,152,653 11,809,500 40,156,701 51,966,201 (27,801,818 ) 24,164,383 —
Riva Terra I (fka Redwood Shores) Redwood City, CA
— 1986 304 34,963,355 84,587,658 6,552,889 34,963,355 91,140,547 126,103,902 (27,578,186 ) 98,525,716 —
Riva Terra II (fka Harborside) Redwood City, CA
— 1986 149 17,136,645 40,536,531 3,532,047 17,136,645 44,068,578 61,205,223 (12,214,368 ) 48,990,855 —
Riverpark Redmond, WA G 2009 321 14,355,000 80,894,049 4,145,694 14,355,000 85,039,743 99,394,743 (27,531,587 ) 71,863,156 —
Rivington, The Hoboken, NJ — 1999 240 34,340,640 112,522,073 2,385,966 34,340,640 114,908,039 149,248,679 (11,203,805 ) 138,044,874 —
Rosecliff II Quincy, MA — 2005 130 4,922,840 30,202,160 1,575,032 4,922,840 31,777,192 36,700,032 (11,139,316 ) 25,560,716 —
Sakura Crossing Los Angeles, CA G 2009 230 14,641,990 42,858,010 1,508,474 14,641,990 44,366,484 59,008,474 (16,104,349 ) 42,904,125 —
Saxton Seattle, WA G 2019 325 38,805,400 128,661,766 1,221 38,805,400 128,662,987 167,468,387 (1,106,731 ) 166,361,656 —
Seventh & James Seattle, WA G 1992 96 663,800 5,974,803 4,559,907 663,800 10,534,710 11,198,510 (8,193,189 ) 3,005,321 —
Sheffield Court Arlington, VA — 1986 597 3,342,381 31,337,332 16,837,180 3,342,381 48,174,512 51,516,893 (39,604,857 ) 11,912,036 —
Siena Terrace Lake Forest, CA — 1988 356 8,900,000 24,083,024 7,673,467 8,900,000 31,756,491 40,656,491 (22,703,857 ) 17,952,634 —
Skycrest Valencia, CA — 1999 264 10,560,000 25,574,457 6,439,296 10,560,000 32,013,753 42,573,753 (19,701,076 ) 22,872,677 —
Skyhouse Denver Denver, CO G 2017 354 13,562,331 126,360,318 260,188 13,562,331 126,620,506 140,182,837 (10,544,133 ) 129,638,704 —
Skylark Union City, CA — 1986 174 1,781,600 16,731,916 5,693,705 1,781,600 22,425,621 24,207,221 (15,390,513 ) 8,816,708 —
Skyline Terrace Burlingame, CA — 1967 &
1987 138 16,836,000 35,414,000 8,685,848 16,836,000 44,099,848 60,935,848 (16,883,846 ) 44,052,002 —
Skyview Rancho Santa Margarita, CA
— 1999 260 3,380,000 21,952,863 5,952,747 3,380,000 27,905,610 31,285,610 (18,956,521 ) 12,329,089 —
SoMa II San Francisco, CA — (F) — 29,406,606 5,863,582 — 29,406,606 5,863,582 35,270,188 — 35,270,188 —
Sonterra at Foothill Ranch Foothill Ranch, CA
— 1997 300 7,503,400 24,048,507 6,103,825 7,503,400 30,152,332 37,655,732 (21,265,834 ) 16,389,898 —
South City Station (fka South San Francisco) San Francisco, CA G 2007 368 68,900,000 79,476,861 5,496,725 68,900,000 84,973,586 153,873,586 (24,542,210 ) 129,331,376 —
Southwood Palo Alto, CA — 1985 100 6,936,600 14,324,069 6,974,332 6,936,600 21,298,401 28,235,001 (13,871,734 ) 14,363,267 —
Springbrook Estates Riverside, CA — (F) — 18,200,000 1,145,000 — 18,200,000 1,145,000 19,345,000 — 19,345,000 —
Springline Seattle, WA G 2016 136 9,163,667 47,910,981 413,447 9,163,667 48,324,428 57,488,095 (6,348,664 ) 51,139,431 —
STOA Los Angeles, CA G 2017 237 25,326,048 79,976,031 355,097 25,326,048 80,331,128 105,657,176 (4,420,377 ) 101,236,799 —
Summerset Village Chatsworth, CA — 1985 280 2,890,450 23,670,889 8,502,754 2,890,450 32,173,643 35,064,093 (25,071,401 ) 9,992,692 —
Summit at Sausalito (fka Sausalito) Sausalito, CA — 1978 198 26,000,000 28,435,024 9,826,451 26,000,000 38,261,475 64,261,475 (13,610,363 ) 50,651,112 —
Ten23 (fka 500 West 23rd Street) New York, NY G 2011 111 — 58,881,873 839,289 — 59,721,162 59,721,162 (16,244,073 ) 43,477,089 —
Terraces, The San Francisco, CA G 1975 117 14,087,610 16,314,151 2,303,726 14,087,610 18,617,877 32,705,487 (7,132,658 ) 25,572,829 —
Third Square Cambridge, MA G 2008/2009 471 26,767,171 218,822,728 8,710,964 26,767,171 227,533,692 254,300,863 (86,467,715 ) 167,833,148 —
Three20 Seattle, WA G 2013 134 7,030,766 29,005,762 783,255 7,030,766 29,789,017 36,819,783 (8,010,054 ) 28,809,729 —
Toscana Irvine, CA — 1991/1993 563 39,410,000 50,806,072 23,541,748 39,410,000 74,347,820 113,757,820 (44,385,604 ) 69,372,216 —
Town Square at Mark Center I (fka Millbrook I) Alexandria, VA — 1996 406 24,360,000 86,178,714 9,536,594 24,360,000 95,715,308 120,075,308 (47,769,571 ) 72,305,737 —
Town Square at Mark Center II Alexandria, VA — 2001 272 15,568,464 55,029,607 4,431,783 15,568,464 59,461,390 75,029,854 (23,267,306 ) 51,762,548 —
Troy Boston Boston, MA G 2015 378 34,641,051 181,607,331 657,969 34,641,051 182,265,300 216,906,351 (16,175,931 ) 200,730,420 —
Urbana (fka Market Street Landing) Seattle, WA G 2014 289 12,542,418 75,800,090 2,128,448 12,542,418 77,928,538 90,470,956 (20,704,557 ) 69,766,399 —

Table of Contents EQUITY RESIDENTIAL
ERP OPERATING LIMITED PARTNERSHIP Schedule III - Real Estate and Accumulated Depreciation
December 31, 2019
S-9
Description Initial Cost to
Company
Cost Capitalized
Subsequent to Acquisition
(Improvements, net) (E)
Gross Amount Carried at Close of Period 12/31/19
Apartment Name Location
Retail/ Commercial
Space Date of
Construction Apartment
Units Land Building &
Fixtures Building &
Fixtures Land Building & Fixtures (A) Total (B)
Accumulated Depreciation (C)
Investment in Real
Estate, Net at 12/31/19 Encumbrances
Uwajimaya Village Seattle, WA — 2002 176 8,800,000 22,188,288 4,603,487 8,800,000 26,791,775 35,591,775 (12,717,581 ) 22,874,194 —
Vantage Pointe San Diego, CA
G 2009 679 9,403,960 190,596,040 10,700,900 9,403,960 201,296,940 210,700,900 (73,412,146 ) 137,288,754 —
Veloce Redmond, WA
G 2009 322 15,322,724 76,176,594 1,876,091 15,322,724 78,052,685 93,375,409 (23,071,740 ) 70,303,669 —
Venue at the Promenade Castle Rock, CO
— 2017 312 8,355,048 83,752,689 89,298 8,355,048 83,841,987 92,197,035 (4,260,814 ) 87,936,221 —
Verde Condominium Homes (fka Mission Verde, LLC)
San Jose, CA
— 1986 108 5,190,700 9,679,109 4,541,057 5,190,700 14,220,166 19,410,866 (10,817,710 ) 8,593,156 —
Veridian (fka Silver Spring) Silver Spring, MD
G 2009 457 18,539,817 130,407,365 3,911,967 18,539,817 134,319,332 152,859,149 (48,528,051 ) 104,331,098 —
Versailles Woodland Hills, CA
— 1991 253 12,650,000 33,656,292 8,301,520 12,650,000 41,957,812 54,607,812 (24,444,631 ) 30,163,181 —
Versailles (K-Town) Los Angeles, CA
— 2008 225 10,590,975 44,409,025 1,768,461 10,590,975 46,177,486 56,768,461 (18,704,272 ) 38,064,189 —
Victor on Venice Los Angeles, CA
G 2006 115 10,350,000 35,433,437 1,455,531 10,350,000 36,888,968 47,238,968 (17,138,982 ) 30,099,986 —
Villa Solana Laguna Hills, CA
— 1984 272 1,665,100 14,985,677 11,916,441 1,665,100 26,902,118 28,567,218 (21,819,381 ) 6,747,837 —
Village at Del Mar Heights, The (fka Del Mar Heights)
San Diego, CA
— 1986 168 15,100,000 40,859,396 3,059,227 15,100,000 43,918,623 59,018,623 (13,135,144 ) 45,883,479 —
Virginia Square Arlington, VA
G 2002 231 — 85,940,003 6,071,125 — 92,011,128 92,011,128 (25,981,773 ) 66,029,355 —
Vista 99 (fka Tasman) San Jose, CA
— 2016 554 27,709,329 177,551,020 530,009 27,709,329 178,081,029 205,790,358 (26,777,048 ) 179,013,310 —
Vista Del Lago Mission Viejo, CA
— 1986-1988 608 4,525,800 40,736,293 18,471,821 4,525,800 59,208,114 63,733,914 (50,585,532 ) 13,148,382 —
Walden Park Cambridge, MA
— 1966 232 12,448,888 52,044,448 4,534,927 12,448,888 56,579,375 69,028,263 (21,419,276 ) 47,608,987 —
Water Park Towers Arlington, VA
— 1989 362 34,400,000 108,485,859 10,352,960 34,400,000 118,838,819 153,238,819 (34,973,941 ) 118,264,878 —
Watertown Square Watertown, MA
G 2005 134 16,800,000 34,074,056 1,780,526 16,800,000 35,854,582 52,654,582 (10,288,446 ) 42,366,136 —
West 96th New York, NY
G 1987 207 84,800,000 67,055,501 6,032,361 84,800,000 73,087,862 157,887,862 (23,339,208 ) 134,548,654 —
West End Apartments (fka Emerson Place/CRP II) Boston, MA G 2008 310 469,546 163,123,022 4,644,170 469,546 167,767,192 168,236,738 (67,233,339 ) 101,003,399 —
Westchester at Rockville Rockville, MD
— 2009 192 10,600,000 44,135,207 1,115,325 10,600,000 45,250,532 55,850,532 (12,723,620 ) 43,126,912 —
Westmont New York, NY
G 1986 163 64,900,000 61,143,259 5,556,773 64,900,000 66,700,032 131,600,032 (19,263,749 ) 112,336,283 —
Westside Los Angeles, CA
— 2004 204 34,200,000 56,962,630 3,224,934 34,200,000 60,187,564 94,387,564 (17,012,037 ) 77,375,527 —
Westside Barrington (fka Westside Villas III)
Los Angeles, CA
— 1999 36 3,060,000 5,538,871 1,138,171 3,060,000 6,677,042 9,737,042 (4,172,543 ) 5,564,499 —
Westside Barry (Westside Villas VI)
Los Angeles, CA
— 1989 18 1,530,000 3,023,523 731,986 1,530,000 3,755,509 5,285,509 (2,345,294 ) 2,940,215 —
Westside Beloit (fka Westside Villas I)
Los Angeles, CA
— 1999 21 1,785,000 3,233,254 748,943 1,785,000 3,982,197 5,767,197 (2,551,527 ) 3,215,670 —
Westside Bundy (fka Westside Villas II)
Los Angeles, CA
— 1999 23 1,955,000 3,541,435 760,287 1,955,000 4,301,722 6,256,722 (2,680,002 ) 3,576,720 —
Westside Butler (fka Westside Villas IV)
Los Angeles, CA
— 1999 36 3,060,000 5,539,390 1,169,833 3,060,000 6,709,223 9,769,223 (4,174,963 ) 5,594,260 —
Westside Villas (fka Westside Villas V &VII)
Los Angeles, CA
— 1999 &
2001 113 9,605,000 19,983,385 2,834,458 9,605,000 22,817,843 32,422,843 (14,084,170 ) 18,338,673 —
Windridge (CA) Laguna Niguel, CA
— 1989 344 2,662,900 23,985,497 12,894,049 2,662,900 36,879,546 39,542,446 (29,263,863 ) 10,278,583 —
Wood Creek I Pleasant Hill, CA
— 1987 256 9,729,900 23,009,768 10,186,943 9,729,900 33,196,711 42,926,611 (24,464,128 ) 18,462,483 —
Woodleaf Campbell, CA
— 1984 178 8,550,600 16,988,183 5,276,931 8,550,600 22,265,114 30,815,714 (16,233,694 ) 14,582,020 —
Management Business Chicago, IL — (D) — — — 120,063,148 — 120,063,148 120,063,148 (100,043,672 ) 20,019,476 —
Operating Partnership Chicago, IL — (F) — — 3,342,110 — — 3,342,110 3,342,110 — 3,342,110 —
Other N/A — — — — — 99,015 — 99,015 99,015 (46,097 ) 52,918 —
Wholly Owned Unencumbered 68,002 5,112,513,000 16,729,302,793 1,566,452,557 5,112,513,000 18,295,755,350 23,408,268,350 (6,199,955,243 ) 17,208,313,107 —
Wholly Owned Encumbered:
2501 Porter Washington, D.C.
— 1988 202 13,000,000 75,271,179 6,881,392 13,000,000 82,152,571 95,152,571 (23,752,603 ) 71,399,968 (H)
300 East 39th (fka East 39th) New York, NY
G 2001 254 48,900,000 96,174,639 5,454,780 48,900,000 101,629,419 150,529,419 (29,129,896 ) 121,399,523 61,827,655
303 East 83rd (fka Camargue) New York, NY
G 1976 261 79,400,000 79,122,624 9,514,116 79,400,000 88,636,740 168,036,740 (25,938,650 ) 142,098,090 (H)
425 Broadway Santa Monica, CA
G 2001 101 12,600,000 34,394,772 3,743,997 12,600,000 38,138,769 50,738,769 (11,169,257 ) 39,569,512 (H)
55 West Fifth I & II (fka Townhouse Plaza and Gardens)
San Mateo, CA
— 1964/1972 241 21,041,710 71,931,323 13,813,466 21,041,710 85,744,789 106,786,499 (29,022,401 ) 77,764,098 24,527,815
Alcyone Seattle, WA G 2004 162 11,379,497 49,360,503 1,521,001 11,379,497 50,881,504 62,261,001 (11,900,832 ) 50,360,169 27,246,175
Avanti Anaheim, CA
— 1987 162 12,960,000 18,497,683 4,104,266 12,960,000 22,601,949 35,561,949 (11,252,625 ) 24,309,324 28,015,078
Avenir Apartments Boston, MA G 2009 241 — 114,321,619 5,726,350 — 120,047,969 120,047,969 (32,447,760 ) 87,600,209 85,443,736
Calvert Woodley Washington, D.C.
— 1962 136 12,600,000 43,527,379 2,412,100 12,600,000 45,939,479 58,539,479 (13,266,223 ) 45,273,256 (H)

Table of Contents EQUITY RESIDENTIAL
ERP OPERATING LIMITED PARTNERSHIP Schedule III - Real Estate and Accumulated Depreciation
December 31, 2019
S-10
Description Initial Cost to
Company
Cost Capitalized
Subsequent to Acquisition
(Improvements, net) (E)
Gross Amount Carried at Close of Period 12/31/19
Apartment Name Location
Retail/ Commercial
Space Date of
Construction Apartment
Units Land Building &
Fixtures Building &
Fixtures Land Building & Fixtures (A) Total (B)
Accumulated Depreciation (C)
Investment in Real
Estate, Net at 12/31/19 Encumbrances
Chelsea Square Redmond, WA
— 1991 113 3,397,100 9,289,074 2,960,815 3,397,100 12,249,889 15,646,989 (8,780,971 ) 6,866,018 9,248,429
Citrus Suites Santa Monica, CA
— 1978 70 9,000,000 16,950,326 2,141,605 9,000,000 19,091,931 28,091,931 (5,582,509 ) 22,509,422 (H)
Cleveland House Washington, D.C.
— 1953 214 18,300,000 66,392,414 5,509,932 18,300,000 71,902,346 90,202,346 (20,430,345 ) 69,772,001 (H)
Columbia Crossing Arlington, VA
— 1991 247 23,500,000 53,045,073 3,113,933 23,500,000 56,159,006 79,659,006 (16,792,580 ) 62,866,426 (H)
Elevé Glendale, CA
G 2013 208 14,080,560 56,419,440 1,010,321 14,080,560 57,429,761 71,510,321 (14,460,258 ) 57,050,063 38,356,888
Estancia at Santa Clara (fka Santa Clara)
Santa Clara, CA
— 2000 450 — 123,759,804 1,914,108 — 125,673,912 125,673,912 (36,538,855 ) 89,135,057 (H)
Fairchase Fairfax, VA — 2007 392 23,500,000 87,722,321 1,576,897 23,500,000 89,299,218 112,799,218 (24,613,974 ) 88,185,244 (H)
Fairfield Stamford, CT G 1996 263 6,510,200 39,690,120 9,165,718 6,510,200 48,855,838 55,366,038 (36,158,521 ) 19,207,517 31,381,614
Flats at DuPont Circle Washington, D.C.
— 1967 306 35,200,000 108,768,198 4,181,605 35,200,000 112,949,803 148,149,803 (29,876,521 ) 118,273,282 (H)
Glo Los Angeles, CA
G 2008 201 16,047,023 48,650,963 3,529,222 16,047,023 52,180,185 68,227,208 (17,906,742 ) 50,320,466 32,367,606
Heights on Capitol Hill Seattle, WA G 2006 104 5,425,000 21,138,028 1,887,584 5,425,000 23,025,612 28,450,612 (10,762,358 ) 17,688,254 22,562,286
Kelvin Court (fka Alta Pacific) Irvine, CA — 2008 132 10,752,145 34,628,115 851,673 10,752,145 35,479,788 46,231,933 (14,415,041 ) 31,816,892 26,242,091
La Terrazza at Colma Station Colma, CA G 2005 155 — 41,251,044 3,207,542 — 44,458,586 44,458,586 (19,788,954 ) 24,669,632 25,008,472
Lofts 590 Arlington, VA
— 2005 212 20,100,000 67,909,023 785,733 20,100,000 68,694,756 88,794,756 (18,393,776 ) 70,400,980 42,942,461
Longview Place Waltham, MA
— 2004 348 20,880,000 90,255,509 10,395,783 20,880,000 100,651,292 121,531,292 (49,137,968 ) 72,393,324 84,192,433
Metro on First Seattle, WA G 2002 102 8,540,000 12,209,981 2,455,932 8,540,000 14,665,913 23,205,913 (7,193,891 ) 16,012,022 21,468,471
Moda Seattle, WA G 2009 251 12,649,228 36,842,012 1,903,142 12,649,228 38,745,154 51,394,382 (14,892,031 ) 36,502,351 (I)
Park Place at San Mateo (fka San Mateo)
San Mateo, CA
G 2001 575 71,900,000 211,907,141 13,628,927 71,900,000 225,536,068 297,436,068 (64,679,195 ) 232,756,873 (H)
SoMa Square Apartments (fka South Market)
San Francisco, CA
G 1986 410 79,900,000 177,316,977 15,704,742 79,900,000 193,021,719 272,921,719 (52,889,334 ) 220,032,385 (H)
Square One Seattle, WA — 2014 112 7,222,544 26,277,456 99,319 7,222,544 26,376,775 33,599,319 (6,486,674 ) 27,112,645 (I)
Teresina Chula Vista, CA
— 2000 440 28,600,000 61,916,670 7,609,660 28,600,000 69,526,330 98,126,330 (34,235,450 ) 63,890,880 37,940,000
Vantage Hollywood Los Angeles, CA
— 1987 298 42,580,326 56,014,674 2,850,265 42,580,326 58,864,939 101,445,265 (13,149,796 ) 88,295,469 39,550,471
Vintage Ontario, CA — 2005-2007 300 7,059,230 47,677,762 1,742,159 7,059,230 49,419,921 56,479,151 (23,528,467 ) 32,950,684 49,085,671
Vintage at 425 Broadway (fka Promenade)
Santa Monica, CA
G 1934/2001 60 9,000,000 13,961,523 1,918,439 9,000,000 15,879,962 24,879,962 (4,816,090 ) 20,063,872 (H)
West 54th New York, NY
G 2001 222 60,900,000 48,193,837 4,230,586 60,900,000 52,424,423 113,324,423 (16,852,716 ) 96,471,707 48,684,032
Westgate (fka Westgate I) Pasadena, CA
— 2010 480 22,898,848 133,467,158 3,178,513 22,898,848 136,645,671 159,544,519 (42,104,815 ) 117,439,704 96,409,896
Portfolio/Entity Encumbrances (1) — — — — — — — — — 798,230,171
Wholly Owned Encumbered 8,425 769,823,411 2,274,256,364 160,725,623 769,823,411 2,434,981,987 3,204,805,398 (792,348,079 ) 2,412,457,319 1,630,731,451
Partially Owned Unencumbered:
2300 Elliott Seattle, WA G 1992 92 796,800 7,173,725 7,612,428 796,800 14,786,153 15,582,953 (11,840,195 ) 3,742,758 —
9th & W Washington, DC
G (F) — — 3,566,064 — — 3,566,064 3,566,064 — 3,566,064 —
Canyon Ridge San Diego, CA
— 1989 162 4,869,448 11,955,064 4,156,380 4,869,448 16,111,444 20,980,892 (11,815,991 ) 9,164,901 —
Country Oaks Agoura Hills, CA
— 1985 256 6,105,000 29,561,865 7,265,339 6,105,000 36,827,204 42,932,204 (22,480,257 ) 20,451,947 —
Harrison Square (fka Elliot Bay) Seattle, WA G 1992 166 7,600,000 35,844,345 5,653,924 7,600,000 41,498,269 49,098,269 (12,916,108 ) 36,182,161 —
Radius Koreatown Los Angeles, CA
— 2014/2016 301 32,494,154 84,645,202 276,918 32,494,154 84,922,120 117,416,274 (11,662,625 ) 105,753,649 —
Rosecliff Quincy, MA — 1990 156 5,460,000 15,721,570 4,373,677 5,460,000 20,095,247 25,555,247 (13,904,866 ) 11,650,381 —
Strayhorse at Arrowhead Ranch Glendale, AZ — 1998 136 4,400,000 12,968,001 1,162,489 4,400,000 14,130,490 18,530,490 (7,106,675 ) 11,423,815 —
Venn at Main Bellevue, WA
G 2016 350 26,626,497 151,652,048 226,783 26,626,497 151,878,831 178,505,328 (15,894,448 ) 162,610,880 —
Wood Creek II (fka Willow Brook (CA))
Pleasant Hill, CA
— 1985 228 5,055,000 38,388,672 9,286,416 5,055,000 47,675,088 52,730,088 (25,490,323 ) 27,239,765 —
Partially Owned Unencumbered 1,847 93,406,899 391,476,556 40,014,354 93,406,899 431,490,910 524,897,809 (133,111,488 ) 391,786,321 —
Partially Owned Encumbered:
Aero Apartments Alameda, CA G (F) — 13,107,242 18,347,948 — 13,107,242 18,347,948 31,455,190 — 31,455,190 7,049,636
Bellevue Meadows Bellevue, WA
— 1983 180 4,507,100 12,574,814 5,863,119 4,507,100 18,437,933 22,945,033 (13,949,169 ) 8,995,864 16,526,976

Table of Contents EQUITY RESIDENTIAL
ERP OPERATING LIMITED PARTNERSHIP Schedule III - Real Estate and Accumulated Depreciation
December 31, 2019
(1) See attached Encumbrances Reconciliation.
S-11
Description Initial Cost to
Company
Cost Capitalized
Subsequent to Acquisition
(Improvements, net) (E)
Gross Amount Carried at Close of Period 12/31/19
Apartment Name Location
Retail/ Commercial
Space Date of
Construction Apartment
Units Land Building &
Fixtures Building &
Fixtures Land Building & Fixtures (A) Total (B)
Accumulated Depreciation (C)
Investment in Real
Estate, Net at 12/31/19 Encumbrances
Canyon Creek (CA) San Ramon, CA
— 1984 268 5,425,000 18,812,120 7,911,730 5,425,000 26,723,850 32,148,850 (18,327,786 ) 13,821,064 28,171,906
Lantern Cove Foster City, CA
— 1985 232 6,945,000 23,064,976 7,320,624 6,945,000 30,385,600 37,330,600 (19,807,488 ) 17,523,112 36,439,783
Schooner Bay I Foster City, CA
— 1985 168 5,345,000 20,390,618 5,854,156 5,345,000 26,244,774 31,589,774 (17,054,268 ) 14,535,506 28,854,243
Schooner Bay II Foster City, CA
— 1985 144 4,550,000 18,064,764 5,376,714 4,550,000 23,441,478 27,991,478 (15,168,558 ) 12,822,920 26,159,132
Surrey Downs Bellevue, WA
— 1986 122 3,057,100 7,848,618 3,532,712 3,057,100 11,381,330 14,438,430 (8,356,388 ) 6,082,042 9,829,000
Virgil Square Los Angeles, CA
— 1979 142 5,500,000 15,216,613 3,380,225 5,500,000 18,596,838 24,096,838 (10,021,205 ) 14,075,633 9,893,916
Wisconsin Place Chevy Chase, MD
— 2009 432 — 172,089,355 1,550,321 — 173,639,676 173,639,676 (48,686,702 ) 124,952,974 147,953,509
Partially Owned Encumbered 1,688 48,436,442 306,409,826 40,789,601 48,436,442 347,199,427 395,635,869 (151,371,564 ) 244,264,305 310,878,101
Total Consolidated Investment in Real Estate 79,962 $ 6,024,179,752 $ 19,701,445,539 $ 1,807,982,135 $ 6,024,179,752 $ 21,509,427,674 $ 27,533,607,426 $ (7,276,786,374 ) $ 20,256,821,052 $ 1,941,609,552

Table of Contents
EQUITY RESIDENTIAL ERP OPERATING LIMITED PARTNERSHIP
Schedule III - Real Estate and Accumulated Depreciation December 31, 2019
NOTES:
S-12 (Back To Top)
Exhibit 4.1
Description of Equity Residential Common Shares Registered Under Section 12 of the Securities Exchange Act of 1934
Please note that in this exhibit, references to “the Company,” “we,” “our” and “us” refer to Equity Residential, as the issuer of the Common Shares, unless the context requires otherwise.
The description of the Common Shares of Beneficial Interest, $0.01 par value (the “Common Shares”), of the Company set forth below does not purport to be complete and is subject to and qualified in its entirety by reference to the Articles of Restatement of Declaration of Trust of the Company dated December 9, 2004 (“Declaration of Trust”), as amended and/or restated from time to time, and the Eighth Amended and Restated Bylaws of the Company, as adopted on October 1, 2015 (“Bylaws”), as amended, supplemented and/or restated from time to time, each of which is incorporated by reference as an exhibit to the Annual Report on Form 10-K of which this Exhibit 4.1 is a part. We encourage you to read our Declaration of Trust, our Bylaws, and the applicable provisions of the Maryland REIT Law (as defined below) for additional information.
Our Declaration of Trust provides that we may issue up to 1,000,000,000 Common Shares.
Both Title 8 of the Corporations and Associations Article of the Annotated Code of Maryland (the “Maryland REIT Law”) and our Declaration of Trust provide that no shareholder of the Company will be liable for any debt or obligation of the Company solely as a result of his or her status as a shareholder of the Company. Our Declaration of Trust further provides that the Company has the power to indemnify each shareholder against any claim or liability to which the shareholder may become subject by reason of his or her being or having been a shareholder and to reimburse each shareholder for all reasonable expenses incurred by him or her in connection with any such claim or liability.
The Common Shares are traded on The New York Stock Exchange under the trading symbol of “EQR.”
Distributions
Subject to the preferential rights of any other class of shares of beneficial interest (none of which are currently outstanding other than Series K Cumulative Redeemable Preferred Shares) and to the provisions of our Declaration of Trust regarding excess shares (as defined herein), holders of Common Shares are entitled to receive distributions if, as and when authorized and declared by the Board of Trustees of the Company (the “Board of Trustees”) out of assets legally available therefor and to share ratably in the assets of the Company legally available for distribution to its shareholders in the event of its liquidation, dissolution or winding-up after payment of, or adequate provision for, all known debts and
(A) The balance of furniture & fixtures included in the total investment in real estate amount was $1,916,458,010 as of December 31, 2019.
(B) The cost, net of accumulated depreciation, for Federal Income Tax purposes as of December 31, 2019 was approximately $13.7 billion (unaudited).
(C) The life to compute depreciation for building is 30 years, for building improvements ranges from 5 to 15 years, for furniture & fixtures, replacements and renovations is 5 to 10 years and for lease intangibles is the average remaining term of each respective lease.
(D) This asset consists of various acquisition dates and largely represents furniture, fixtures and equipment, leasehold improvements and computer equipment and software costs owned by the Management Business, which are generally depreciated over periods ranging from 3 to 7 years.
(E) Primarily represents capital expenditures for building improvements, replacements and renovations incurred subsequent to each property’s acquisition date.
(F) Primarily represents land and/or construction-in-progress on projects either held for future development or projects currently under development.
(G) A portion of these properties includes and/or will include retail/commercial space (including parking garages).
(H) See Encumbrances Reconciliation schedule.
(I) Boot property for Bond Partnership mortgage pool.
Section 2: EX-4.1 (EX-4.1)

liabilities of the Company. Holders of Common Shares have no right to any dividend or distribution unless and until authorized and declared by the Board of Trustees.
Voting Rights
Subject to the provisions of our Declaration of Trust regarding excess shares, each outstanding Common Share entitles the holder to one vote on the following matters: (a) the election or removal of Trustees; (b) the amendment of our Declaration of Trust; (c) the voluntary dissolution or termination of Equity Residential; (d) the merger of Equity Residential, provided, however, that the shareholders shall not be entitled to vote on a merger of Equity Residential which may be approved pursuant to the provisions of the Maryland REIT Law by a majority of the entire Board of Trustees without a vote of the shareholders and, further provided, that if a shareholder vote is required pursuant to the provisions of the Maryland REIT Law, such merger shall be approved by the affirmative vote of the holders of not less than a majority of all of the shares then outstanding and entitled to vote thereon; (e) the sale or other disposition of all or substantially all of Equity Residential’s assets, provided, however, that the sale or other disposition of all or substantially all of Equity Residential’s assets shall be approved by the affirmative vote of the holders of not less than a majority of all the shares then outstanding and entitled to vote thereon; and (f) such other matters with respect to which the Board of Trustees has adopted a resolution declaring advisable or recommending a proposal and directing that the matter be submitted to the shareholders for consideration. Except as otherwise required by law or except as provided with respect to any other class or series of shares of beneficial

interest, the holders of the Common Shares will possess the exclusive voting power. There is no cumulative voting in the election of Trustees, which means that the holders of a majority of the outstanding Common Shares can elect all of the Trustees then standing for election and the holders of the remaining shares of beneficial interest, if any, will not be able to elect any Trustees.
Under the Maryland REIT Law, a declaration of trust may permit the trustees by a two-thirds vote to amend the declaration of trust from time to time to enable it to qualify as a real estate investment trust (“REIT”) under the Internal Revenue Code of 1986, as amended (the “Internal Revenue Code”), or the Maryland REIT Law without the affirmative vote or written consent of the shareholders. Our Declaration of Trust permits such action by the Board of Trustees.
Conversion, Redemption, Liquidation Rights
Holders of Common Shares have no conversion, sinking fund, redemption or preemptive rights to subscribe for any securities of the Company. Subject to the provisions of our Declaration of Trust regarding excess shares, Common Shares have equal distribution, liquidation and other rights, and have no preference, exchange or, except as expressly required by the Maryland REIT Law, appraisal rights.
Restriction on Ownership and Transfer
For the Company to qualify as a REIT under the Internal Revenue Code, no more than 50% in value of its outstanding shares of beneficial interest may be owned, actually or constructively, by five or fewer individuals (as defined in the Internal Revenue Code to include certain entities) during the last half of a taxable year (other than the first year for which an election to be treated as a REIT has been made) or during a proportionate part of a shorter taxable year. A REIT’s shares also must be beneficially owned by 100 or more persons during at least 335 days of a taxable year of twelve months or during a proportionate part of a shorter taxable year (other than the first year for which an election to be treated as a REIT has been made). To facilitate maintenance of its qualification as a REIT for federal income tax purposes, we generally will prohibit ownership, directly or by virtue of the attribution provisions of the Internal Revenue Code, by any single shareholder of more than 5% (in value or number of shares, whichever is more restrictive) of the issued and outstanding Common Shares (the “Ownership Limit”).
Because the Board of Trustees believes it is desirable for the Company to qualify as a REIT, the Declaration of Trust, subject to certain exceptions, provides that no holder may own, or be deemed to own by virtue of the attribution provisions of the Internal Revenue Code, more than the Ownership Limit. The ownership attribution rules under the Internal Revenue Code are complex and may cause Common Shares owned actually or constructively by a group of related individuals and/or entities to be owned constructively by one individual or entity. As a result, the acquisition of less than 5% of the Common Shares (or the acquisition of an interest in an entity that owns, actually or constructively, Common Shares) by an individual or entity could nevertheless cause that individual or entity, or another individual or entity, to own constructively in excess of 5% of the outstanding Common Shares and thus subject such Common Shares to the Ownership Limit. To reduce the ability of the Board of Trustees to use the Ownership Limit as an anti-takeover device, the Declaration of Trust requires, rather than permits, the Board of Trustees to grant a waiver of the Ownership Limit if the shareholder seeking a waiver demonstrates that such ownership would not jeopardize the Company’s status as a REIT. We have issued several of these waivers in the past. As a condition of such a waiver, the Board of Trustees may require undertakings or representations from the shareholder seeking a waiver with respect to preserving the REIT status of the Company.
The Board of Trustees will have the authority to increase the Ownership Limit from time to time, but will not have the authority to do so to the extent that after giving effect to such increase, five persons who would be treated as “individuals” for purposes of the Internal Revenue Code could beneficially own in the aggregate more than 49.5% of the outstanding Common Shares.
The Declaration of Trust further prohibits (a) any person from actually or constructively owning shares of beneficial interest of the Company that would result in the Company being “closely held” under Section 856(h) of the Internal Revenue Code or otherwise cause the Company to fail to qualify as a REIT and (b) any person from

transferring shares of beneficial interest of the Company if such transfer would result in shares of beneficial interest of the Company being owned by fewer than 100 persons.
Any person who acquires or attempts or intends to acquire actual or constructive ownership of shares of beneficial interest of the Company that will or may violate any of the foregoing restrictions on transferability and ownership is required to give at least 15 days’ prior written notice to the Company and provide the Company with such other information as the Company may request in order to determine the effect of such transfer on the Company’s status as a REIT.
If any purported transfer of shares of beneficial interest of the Company or any other event would otherwise result in any person violating the Ownership Limit or the other restrictions in the Declaration of Trust, then any such purported transfer will be void and of no force or effect with respect to the purported transferee (the “Prohibited Transferee”) as to that number of shares that exceeds the Ownership Limit (referred to as “excess shares”) and the Prohibited Transferee shall acquire no right or interest (or, in the case of any event other than a purported transfer, the person or entity holding record title to any such shares in excess of the Ownership Limit (the “Prohibited Owner”) shall cease to own any right or interest) in such excess shares. Any such excess shares described above will be transferred automatically, by operation of law, to a trust, the beneficiary of which will be a qualified charitable organization selected by the Company (the “Beneficiary”). Such automatic transfer shall be deemed to be effective as of the close of business on the Business Day (as defined in the Declaration of Trust) prior to the date of such violating transfer. Within 20 days of receiving notice from the Company of the transfer of shares to the trust, the trustee of the trust (who shall be designated by the Company and be unaffiliated with the Company and any Prohibited Transferee or Prohibited Owner) will be required to sell such excess shares to a person or entity who could own such shares without violating the Ownership Limit, and distribute to the Prohibited Transferee an amount equal to the lesser of the price paid by the Prohibited Transferee for such excess shares or the sales proceeds received by the trust for such excess shares. In the case of any excess shares resulting from any event other than a transfer, or from a transfer for no consideration (such as a gift), the trustee will be required to sell such excess shares to a qualified person or entity and distribute to the Prohibited Owner an amount equal to the lesser of the fair market value of such excess shares as of the date of such event or the sales proceeds received by the trust for such excess shares. In either case, any proceeds in excess of the amount distributable to the Prohibited Transferee or Prohibited Owner, as applicable, will be distributed to the Beneficiary. Prior to a sale of any such excess shares by the trust, the trustee will be entitled to receive, in trust for the Beneficiary, all dividends and other distributions paid by the Company with respect to such excess shares, and also will be entitled to exercise all voting rights with respect to such excess shares. Subject to Maryland law, effective as of the date that such shares have been transferred to the trust, the trustee shall have the authority (at the trustee’s sole discretion and subject to applicable law) (i) to rescind as void any vote cast by a Prohibited Transferee prior to the discovery by the Company that such shares have been transferred to the trust and (ii) to recast such vote in accordance with the desires of the trustee acting for the benefit of the Beneficiary. However, if the Company has already taken irreversible corporate action, then the trustee shall not have the authority to rescind and recast such vote. Any dividend or other distribution paid to the Prohibited Transferee or Prohibited Owner (prior to the discovery by the Company that such shares had been automatically transferred to a trust as described above) will be required to be repaid to the trustee upon demand for distribution to the Beneficiary. If the transfer to the trust as described above is not automatically effective (for any reason) to prevent violation of the Ownership Limit, then the Declaration of Trust provides that the transfer of the excess shares will be void.
In addition, shares of beneficial interest of the Company held in the trust shall be deemed to have been offered for sale to the Company, or its designee, at a price per share equal to the lesser of (i) the price per share in the transaction that resulted in such transfer to the trust (or, in the case of a devise or gift, the market value at the time of such devise or gift) and (ii) the market value of such shares on the date the Company, or its designee, accepts such offer. The Company shall have the right to accept such offer until the trustee has sold the shares of beneficial interest held in the trust. Upon such a sale to the Company, the interest of the Beneficiary in the shares sold shall terminate and the trustee shall distribute the net proceeds of the sale to the Prohibited Owner.
The foregoing restrictions on transferability and ownership will not apply if the Board of Trustees determines that it is no longer in the best interests of the Company to attempt to qualify, or to continue to qualify, as a REIT.

All persons who own, directly or by virtue of the attribution provisions of the Internal Revenue Code, more than 5% (or such lower percentage as provided in the rules and regulations promulgated under the Internal Revenue Code) of the outstanding shares of beneficial interest of the Company must give a written notice to the Company within 30 days after the end of each taxable year stating such person’s name and address, the number of shares owned by such person and a description of the manner in which such shares are held. Any record holder who holds shares as nominee for another person who is required to include in gross income the distributions received on such shares must give notice stating the name and address of such other person and the number of shares of such other person with respect to which such record holder is nominee. In addition, each shareholder will, upon demand, be required to disclose to the Company in writing such information with respect to the direct, indirect and constructive ownership of shares of beneficial interest as the Board of Trustees deems reasonably necessary to comply with the provisions of the Internal Revenue Code applicable to a REIT or to ensure compliance with the ownership limitations described above.
These ownership limitations could have the effect of delaying, deferring or preventing a takeover or other transaction in which holders of some, or a majority, of Common Shares might receive a premium for their Common Shares over the then prevailing market price or which such holders might believe to be otherwise in their best interest.
Registrar and Transfer Agent
The registrar and transfer agent for the Common Shares is Computershare Trust Company, N.A.
Possible Anti-Takeover Effects of Maryland Law and our Declaration of Trust and Bylaws
The business combination provisions of Maryland law (with the exception that such provisions do not apply to transactions involving Samuel Zell, the Chairman of the Board of Trustees, and certain of his affiliates and persons acting in concert with them), the control share acquisition provisions of Maryland law (if the applicable provision in our Bylaws is rescinded), the exclusive power of the Trustees to fill vacancies on the Board of Trustees and the provision that any Trustee so appointed will serve for the remaining term of that trusteeship, the limitations on removal of Trustees, the power of the Board of Trustees to issue Preferred Shares (and the power to classify any unissued Preferred Shares and reclassify any previously classified but unissued Preferred Shares), the shareholders’ limited ability to call a special meeting, the advance notice provisions of our Bylaws (to the extent not mitigated by the proxy access provision) and the restrictions on the acquisition of our shares could have the effect of delaying, deterring or preventing a transaction or a change in control of our Company that might involve a premium price for holders of Common Shares or that shareholders otherwise believe may be in their best interest. The “unsolicited takeovers” provisions of Maryland law permit the Board of Trustees, without shareholder approval and regardless of what is provided in our Declaration of Trust or Bylaws, to implement takeover defenses that we may not yet have.
(Back To Top)
Exhibit 4.2
Description of ERP Operating Limited Partnership Notes Registered Under Section 12 of the Securities Exchange Act of 1934
Please note that in this exhibit, references to “the Operating Partnership,” “we,” “our” and “us” refer to ERP Operating Limited Partnership, as the issuer of the Notes, and references to “the Company” refer to Equity Residential, the general partner of the Operating Partnership, unless the context requires otherwise.
The Operating Partnership may offer unsecured senior or subordinated debt securities under the Indenture (as defined below) (the “ERP Debt Securities”).
The Operating Partnership’s 7.57% Notes due August 15, 2026 (the “Notes”), traded on The New York Stock Exchange, constitute a
separate series of ERP Debt Securities issued pursuant to an indenture, dated as of October 1, 1994 (the “Original Indenture”), as supplemented by the first supplemental indenture thereto, dated as of September 9, 2004, the second supplemental indenture thereto, dated as of August 23, 2006, the third supplemental indenture thereto, dated as of June 4, 2007 (the “Third Supplemental Indenture”), the fourth supplemental indenture thereto, dated December 12, 2011 (the “Fourth Supplemental Indenture”), and the fifth supplemental indenture thereto, dated as of February 1, 2016, between us and The Bank of New York Mellon Trust Company, N.A. (formerly known as The Bank of New York Trust Company, N.A.) (as successor to J.P. Morgan Trust Company, National Association, as successor to Bank One Trust Company, NA, as successor to The First National Bank of Chicago) (the “Trustee”), as trustee (collectively, the “Indenture”). The Indenture is incorporated by reference as an exhibit to the Annual Report on Form 10-K of which this Exhibit 4.2 is a part, is available for inspection at the corporate trust office of the Trustee at 2 N. LaSalle Street, 7th Floor, Chicago, Illinois 60602, and is subject to, and governed by, the Trust Indenture Act of 1939, as amended (the “Trust Indenture Act”). The terms of the Notes include those provisions contained in the Indenture and those made part of the Indenture by reference to the Trust Indenture Act. Unless otherwise specified herein, the Notes are subject to the terms of the Original Indenture and not the provisions set forth in the supplemental indentures to the Original Indenture. The statements made hereunder relating to the Indenture and the Notes issued thereunder are summaries of certain provisions thereof and do not purport to be complete and are subject to, and are qualified in their entirety by reference to, all provisions of
Section 3: EX-4.2 (EX-4.2)

the Indenture and the Notes. Capitalized terms used herein that are not defined herein have the meanings set forth in the Indenture. All section references appearing below refer to sections of the Original Indenture. In addition to its services as trustee, the Trustee and its affiliates may perform various commercial banking and investment banking services for the Company and/or its subsidiaries from time to time in the ordinary course of business.
General
The following is a description of certain of the specific terms and conditions of the Notes. The Notes were initially issued in a $150,000,000 aggregate principal amount. We are permitted to issue additional notes of this series
without the consent of the holders of that series of notes. As of February 14, 2020, no such additional notes of this series have been issued, and the total amount outstanding is $92,025,000.
The Notes were issued in denominations of $1,000 and integral multiples of $1,000, bear interest from August 13, 1996 at the annual rate
of 7.57%, and will mature on August 15, 2026 (the “Maturity Date”). Interest is payable semi-annually in arrears on February 15 and August 15, commencing February 15, 1997 (each, an “Interest Payment Date”), to the persons in whose names the Notes are registered at the close of business on the preceding February 1 or August 1, respectively, regardless of whether such day is a Business Day. If any Interest Payment Date or the Maturity Date falls on a day that is not a Business Day, the required payment shall be made on the next Business Day as if it were made on the date such payment was due and no interest shall accrue on the amount so payable for the period from and after such Interest Payment Date or the Maturity Date, as the case may be. “Business Day” means any day, other than a Saturday or Sunday, on which banking institutions in The City of New York are open for business.
The principal of (and premium, if any) and interest on the Notes are payable at the corporate trust office of the Trustee, located at 2 N. LaSalle Street, 7th Floor, Chicago, Illinois 60602; provided that, at our option, payment

of interest may be made by check mailed to the address of the person entitled thereto as it appears in the security register or by wire transfer of funds to such person at an account maintained within the United States (Sections 301, 305, 306, 307 and 1002).
Any interest not punctually paid or duly provided for on any interest payment date with respect to the Notes will forthwith cease to be payable to the holder on the applicable regular record date and may either be paid to the person in whose name the Notes are registered at the close of business on a special record date for the payment of the defaulted interest to be fixed by the Trustee, notice whereof shall be given to the holder of the Notes not less than ten days prior to the special record date, or may be paid at any time in any other lawful manner, all as more completely described in the Indenture (Section 307).
The Notes are direct, unsecured obligations of the Operating Partnership and rank equally with all other unsecured and unsubordinated
indebtedness of the Operating Partnership from time to time outstanding. The Notes were issued only in fully registered, book-entry form. The Notes are not subject to a sinking fund.
Redemption or Repayment Repayment at the Option of Holders. The Notes could have been repaid on August 15, 2006 (the “Option Payment Date”), at the option
of the registered holders at 100% of their principal amount together with accrued interest to August 15, 2006; however, only $10.0 million of the Notes were so repaid.
Option Redemption by the Operating Partnership. The Operating Partnership may redeem the Notes, at any time after the Option Payment Date, in whole or from time to time in part, at the election of the Operating Partnership, at a redemption price equal to the sum of (i) the principal amount of the Notes being redeemed plus accrued interest thereon to the redemption date and (ii) the Make-Whole Amount (as defined below), if any, with respect to such Notes (the “Redemption Price”). Notice of any optional redemption of any Notes will be given to holders at their addresses, as shown in the security register, not more than 60 nor less than 30 days prior to the date fixed for redemption. The notice of redemption will specify, among other items, the Redemption Price and the principal amount of the Notes held by such holder to be redeemed.
From and after notice has been given as provided in the Indenture, if funds for the redemption of any Notes called for redemption shall have been made available on the redemption date, such Notes will cease to bear interest on the date fixed for such redemption specified in such notice and the only right of the holders of the Notes will be to receive payment of the redemption price (Section 1106).
If we elect to redeem the Notes, we will notify the Trustee at least 45 days prior to the redemption date (or such shorter period as satisfactory to the Trustee) of the aggregate principal amount of the Notes to be redeemed and the redemption date (Section 1102). If less than all the Notes are to be redeemed, the Trustee shall select the particular Notes to be redeemed in such manner as it shall deem fair and appropriate (Section 1103), including in accordance with the procedure of The Depository Trust Company. Additional Indenture Provisions Applicable to the Notes
Governing Law. The Indenture and the Notes are governed by, and construed in accordance with, the laws of the State of New York.
Merger, Consolidation or Sale. We may consolidate with, or sell, lease or convey all or substantially all of our assets to, or merge with or into any other entity, provided that:
(1) we will be the continuing entity, or the successor entity will be an entity organized and existing under the laws of the United States or a state thereof and will expressly assume payment of the principal of and premium (if any) and any interest (including all Additional Amounts, if any, payable pursuant to Section 1012) on all of the

ERP Debt Securities and the due and punctual performance and observance of all of the covenants and conditions contained in the Indenture;
(2) immediately after giving effect to the transaction and treating any indebtedness which becomes our obligation or the obligation of any of our subsidiaries as a result thereof as having been incurred by us, or our subsidiary at the time of such transaction, no event of default under the Indenture, and no event which after notice or the lapse of time, or both, would become an event of default, shall have occurred and be continuing; and
(3) an officers’ certificate of Equity Residential, as our general partner, and a legal opinion covering these conditions shall have been delivered to the Trustee (Sections 801 and 803).
Certain Covenants.
Limitations on Incurrence of Debt. The Operating Partnership will not, and will not permit any Subsidiary (as defined below) to incur any Debt (as defined below), other than intercompany Debt (representing Debt to which the only parties are the Company, the Operating Partnership and any of its Subsidiaries (but only so long as such Debt is held solely by any of the Company, the Operating Partnership and any Subsidiary)) that is subordinate in right of payment of the ERP Debt Securities, if, immediately after giving effect to the incurrence of such additional Debt, the aggregate principal amount of all outstanding Debt of the Operating Partnership and its Subsidiaries on a consolidated basis determined in accordance with generally accepted accounting principles is greater than 60% of the sum of (i) the Operating Partnership's Total Assets (as defined below) as of the end of the calendar quarter covered in the Operating Partnership's Annual Report on Form 10-K or Quarterly Report on Form 10-Q, as the case may be, most recently filed with the Securities and Exchange Commission (the “Commission”) (or, if such filing is not permitted under the Securities Exchange Act of 1934, as amended (the “Exchange Act”), with the Trustee) prior to the incurrence of such additional Debt and (ii) the increase in Total Assets from the end of such quarter including, without limitation, any increase in Total Assets caused by the incurrence of such additional Debt (such increase together with the Company's Total Assets shall be referred to as the “Adjusted Total Assets”) (Section 1004).
In addition to the foregoing limitation on the incurrence of Debt, the Operating Partnership will not and will not permit any Subsidiary to incur any Debt if the ratio of Consolidated Income Available for Debt Service (as defined below) to the Maximum Annual Service Charge (as defined below) for the four consecutive fiscal quarters most recently ended prior to the date on which such additional Debt is to be incurred shall have been less than 1.5 to 1, on a pro forma basis after giving effect to the incurrence of such Debt and to the application of the proceeds therefrom, and calculated on the assumption that (i) such Debt and any other Debt incurred by the Operating Partnership or its Subsidiaries since the first day of such four-quarter period and the application of the proceeds therefrom, including to refinance other Debt, had occurred at the beginning of such period, (ii) the repayment or retirement of any other Debt by the Operating Partnership or its Subsidiaries since the first day of such four-quarter period had been incurred, repaid or retired at the beginning of such period (except that, in making such computation, the amount of Debt under any revolving credit facility shall be computed based upon the average daily balance of such Debt during such period), (iii) the income earned on any increase in Adjusted Total Assets since the end of such four-quarter period had been earned, on an annualized basis, during such period; and (iv) in the case of any acquisition or disposition by the Operating Partnership or any Subsidiary of any asset or group of assets since the first day of such four-quarter period, including, without limitation, by merger, stock purchase or sale, or asset purchase or sale, such acquisition or disposition or any related repayment of Debt had occurred as of the first day of such period with the appropriate adjustments with respect to such acquisition or disposition being included in such pro forma calculation (Section 1004).
In addition to the foregoing limitations on the incurrence of Debt, the Operating Partnership will not, and will not permit any Subsidiary to incur any Debt secured by any mortgage, lien, charge, pledge, encumbrance or security interest of any kind upon any of the property of the Operating Partnership or any Subsidiary (“Secured Debt”), whether owned at the date of the Indenture or thereafter acquired, if, immediately after giving effect to the incurrence of such additional Secured Debt, the aggregate principal

amount of all outstanding Secured Debt of the Operating Partnership and its Subsidiaries on a consolidated basis is greater than 40% of the Adjusted Total Assets (Section 1004).
Notwithstanding the limitation set forth in the preceding paragraph, the Indenture provides that the Operating Partnership and its Subsidiaries may incur Secured Debt, provided that such Secured Debt is incurred under the Acquisition Lines of Credit (as defined below), and provided further that after the increase of such Secured Debt under the Acquisition Lines of Credit, the aggregate principal amount of all outstanding Secured Debt, including debt under the Acquisition Lines of Credit of the Operating Partnership or any Subsidiary does not exceed 45% of the Adjusted Total Assets; provided, however, that the aggregate principal amount of all outstanding Secured Debt of the Operating Partnership and its Subsidiaries on a consolidated basis may exceed 40% of the Adjusted Total Assets for not more than 270 days of any consecutive 360 day period.
In addition to the debt covenants in the Original Indenture, the Operating Partnership is required to maintain Total Unencumbered Assets (as defined below) of not less than 150% of the aggregate outstanding principal amount of the Unsecured Debt (as defined below) of the Operating Partnership.
For purposes of the foregoing provisions regarding the limitation on the incurrence of Debt, Debt shall be deemed to be “incurred” by the Operating Partnership and its Subsidiaries on a consolidated basis whenever the Operating Partnership and its Subsidiaries on a consolidated basis shall create, assume, guarantee or otherwise become liable in respect thereof.
Restrictions on Distributions. The Operating Partnership will not make any distribution, by reduction of capital or otherwise (other than distributions payable in securities evidencing interests in the Operating Partnership's capital for the purpose of acquiring interests in real property or otherwise) if, immediately after such distribution the aggregate of all such distributions made since March 31, 1993 shall exceed Funds from Operations (as defined below) of the Operating Partnership and its Subsidiaries from March 31, 1993 until the end of the calendar quarter covered in the Operating Partnership's Annual Report on Form 10-K or Quarterly Report on Form 10-Q, as the case may be, most recently filed with the Commission (or, if such filing is not permitted under the Exchange Act, with the Trustee) prior to such distribution; provided, however, that the foregoing limitation shall not apply to any distribution which is necessary to maintain the Company's status as a REIT under the Internal Revenue Code of 1986, as amended (the “Code”), if the aggregate principal amount of all outstanding Debt of the Operating Partnership and its Subsidiaries on a consolidated basis at such time is less than 60% of Adjusted Total Assets (Section 1005).
Notwithstanding the foregoing, the Operating Partnership will not be prohibited from making the payment of any distribution within 30 days of the declaration thereof if at such date of declaration such payment would have complied with the provisions of the immediately preceding paragraph (Section 1005).
Events of Default, Notice and Waiver. The Indenture provides that the following events are “events of default” with respect to the ERP
Debt Securities issued thereunder:
(1) default in the payment of any interest on or any Additional Amounts payable in respect of any debt security of such series when due and payable and continuance of such default for a period of 30 days;
(2) default in the payment of the principal of (or premium, if any, on) any debt security of such series at its maturity;
(3) default in the performance, or breach, of any other covenant or warranty of ours contained in the Indenture (other than a covenant or warranty added to the Indenture solely for the benefit of a series of ERP Debt Securities issued thereunder other than such series), continued for 60 days after written notice as provided in the Indenture;

(4) a default under any bond, debenture, note or other evidence of indebtedness of ours, or under any mortgage, indenture or other instrument of ours under which there may be issued or by which there may be secured any indebtedness of ours (or by any subsidiary, the repayment of which we have guaranteed or for which we are directly responsible or liable as obligor or guarantor on a full recourse basis) whether such indebtedness now exists or shall hereafter be created, which default shall constitute a failure to pay an aggregate principal amount exceeding $10,000,000 of such indebtedness when due and payable after the expiration of any applicable grace period with respect thereto and shall have resulted in such indebtedness in an aggregate principal amount exceeding $10,000,000 becoming or being declared due and payable prior to the date on which it would otherwise have become due and payable, without such indebtedness having been discharged, or such acceleration having been rescinded or annulled, within a period of 10 days after there shall have been given to us by the trustee or by the holders of at least 10% in principal amount of the outstanding ERP Debt Securities of that series a written notice specifying such default and requiring us to cause such indebtedness to be discharged or cause such acceleration to be rescinded or annulled;
(5) certain events of bankruptcy, insolvency or reorganization, or court appointment of a receiver, liquidator or trustee of ours, any Significant Subsidiary (as defined below) or all or substantially all of our or their property; and
(6) any other event of default provided with respect to the ERP Debt Securities of a particular series (Section 501). (The Notes have no other events of default.)
If an event of default under the Indenture with respect to ERP Debt Securities of any series at the time outstanding occurs and is continuing, then in every such case the Trustee or the holders of not less than 25% of the principal amount of the outstanding ERP Debt Securities of that series will have the right to declare the principal of (or, if the ERP Debt Securities of that series are original issue discount securities or indexed securities, such portion of the principal amount as may be specified in the terms thereof) and premium (if any) on all of the ERP Debt Securities of that series to be due and payable immediately by written notice thereof to us (and to the Trustee if given by the holders). However, at any time after such a declaration of acceleration with respect to ERP Debt Securities of any series has been made, but before a judgment or decree for payment of the money due has been obtained by the Trustee, the holders of not less than a majority in principal amount of outstanding ERP Debt Securities of that series may rescind and annul such declaration and its consequences if:
(1) we shall have paid or deposited with the Trustee all required payments of the principal of and premium (if any) and interest on the outstanding ERP Debt Securities of such series that have become due otherwise than by such declaration of acceleration, plus certain fees, expenses, disbursements and advances of the Trustee, and
(2) all events of default, other than the non-payment of accelerated principal or interest, with respect to the ERP Debt Securities of such
series have been cured or waived as provided in the Indenture (Section 502).
The Indenture also provides that the holders of not less than a majority in principal amount of the outstanding ERP Debt Securities of any series may waive any past default with respect to such series and its consequences, except a default (x) in the payment of the principal of and premium (if any) or interest payable in respect of any debt security of such series or (y) in respect of a covenant or provision contained in the Indenture that cannot be modified or amended without the consent of the holder of each outstanding debt security of such series affected thereby (Section 513).
The Trustee will be required to give notice to the holders of ERP Debt Securities within 90 days of a default under the Indenture, unless the default shall have been cured or waived; provided, however, that the Trustee may withhold notice to the holders of any series of ERP Debt Securities of any default with respect to that series (except a default in the payment of the principal of and premium (if any) or interest on with respect to any debt security) if and so long as the responsible officers of the Trustee consider such withholding to be in the interest of those holders (Section 601).
The Indenture provides that no holders of ERP Debt Securities of any series may institute any proceedings, judicial or otherwise, with respect to the Indenture or for any remedy thereunder, except in the case of failure of the Trustee, for 60 days, to act after it has received a written request to institute proceedings in respect of an event of

default from the holders of not less than 25% in principal amount of the outstanding ERP Debt Securities of such series, as well as an offer of indemnity reasonably satisfactory to it (Section 507). This provision will not prevent, however, any holder of ERP Debt Securities from instituting suit for the enforcement of payment of the principal of and premium (if any) and interest on such ERP Debt Securities at the respective due dates thereof (Section 508).
Subject to provisions in the Indenture relating to its duties in case of default, the Trustee is under no obligation to exercise any of its rights or powers under the Indenture at the request or direction of any holders of any series of ERP Debt Securities then outstanding under the Indenture, unless such holders shall have offered to the Trustee reasonable security or indemnity (Section 602). The holders of not less than a majority in principal amount of the outstanding ERP Debt Securities of any series shall have the right to direct the time, method and place of conducting any proceeding for any remedy available to the Trustee, or of exercising any trust or power conferred upon the Trustee. However, the Trustee may refuse to follow any direction which is in conflict with any law or the Indenture, which may involve the Trustee in personal liability or which may be unduly prejudicial to the holders of ERP Debt Securities of such series not joining therein (Section 512).
Within 120 days after the end of each fiscal year, we must deliver to the Trustee a certificate, signed by one of several specified officers of Equity Residential, as to the officer’s knowledge of our compliance with all conditions and covenants under the Indenture and, in the event of any noncompliance, specifying each instance of noncompliance and the nature and status thereof (Section 1011).
Modification of the Indenture. Modifications and amendments of the Indenture may be made only with the consent of the holders of not less than a majority in principal amount of all outstanding ERP Debt Securities issued under the Indenture which are affected by the modification or amendment; provided, however, that no such modification or amendment may, without the consent of the holder of each outstanding debt security affected thereby:
(1) change the stated maturity of the principal of (or premium, if any, on), or any installment of principal of or interest on, any debt security;
(2) reduce the principal amount of, or the rate or amount of interest on, or premium payable upon the redemption of, any debt security; (3) adversely affect any right of repayment at the option of the holder of any debt security;
(4) change the place of payment, or the currency, for payment of principal of any debt security or any premium or interest on any debt security;
(5) impair the right to institute suit for the enforcement of any payment on or with respect to any debt security on or after the stated maturity thereof (or in the case of redemption or repayment at the option of the holder, on or after the redemption date or repayment date);
(6) reduce the above-stated percentage of outstanding ERP Debt Securities of any series necessary to modify or amend the Indenture, to waive compliance with certain provisions thereof or certain defaults and consequences thereunder or to reduce the quorum or voting requirements set forth in the Indenture; or
(7) modify any of the foregoing provisions or any of the provisions relating to the waiver of certain past defaults or certain covenants, except to increase the required percentage to effect such action or to provide that certain other provisions may not be modified or waived without the consent of the holder of each outstanding debt security affected thereby (Section 902).
The holders of not less than a majority in principal amount of outstanding ERP Debt Securities of each series affected thereby have the right to waive our compliance with certain covenants in the Indenture (Section 1013).
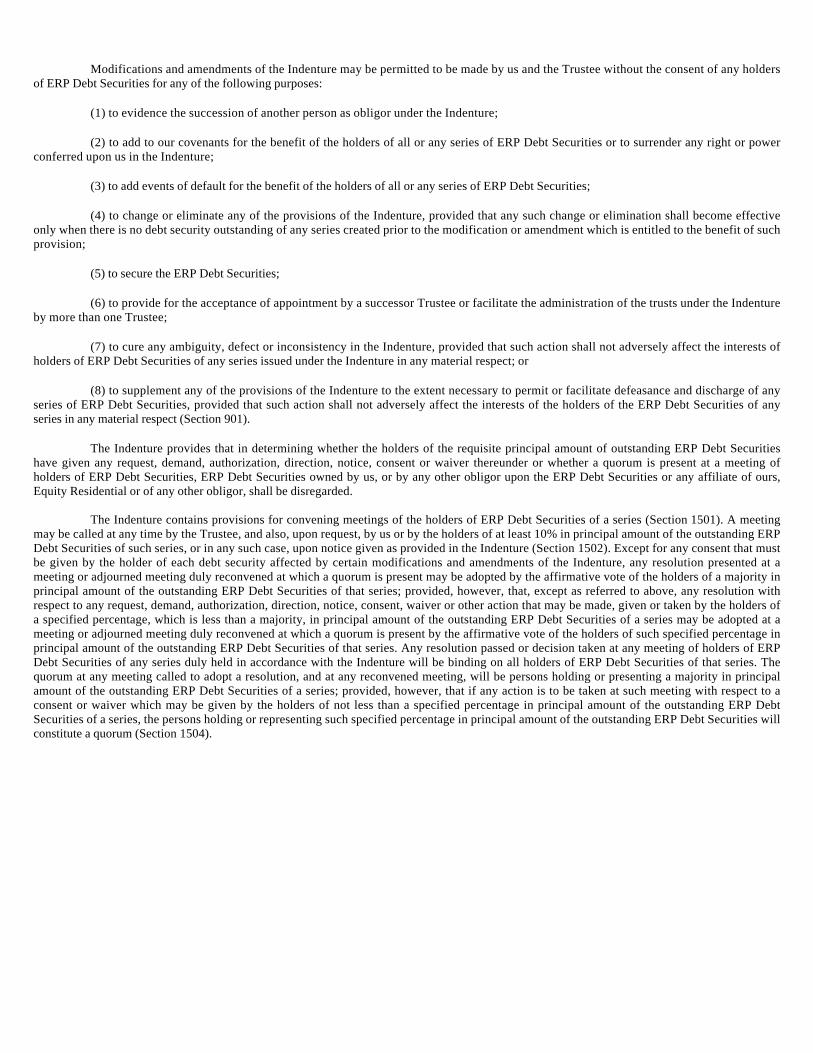
Modifications and amendments of the Indenture may be permitted to be made by us and the Trustee without the consent of any holders of ERP Debt Securities for any of the following purposes:
(1) to evidence the succession of another person as obligor under the Indenture;
(2) to add to our covenants for the benefit of the holders of all or any series of ERP Debt Securities or to surrender any right or power conferred upon us in the Indenture;
(3) to add events of default for the benefit of the holders of all or any series of ERP Debt Securities;
(4) to change or eliminate any of the provisions of the Indenture, provided that any such change or elimination shall become effective only when there is no debt security outstanding of any series created prior to the modification or amendment which is entitled to the benefit of such provision;
(5) to secure the ERP Debt Securities;
(6) to provide for the acceptance of appointment by a successor Trustee or facilitate the administration of the trusts under the Indenture by more than one Trustee;
(7) to cure any ambiguity, defect or inconsistency in the Indenture, provided that such action shall not adversely affect the interests of holders of ERP Debt Securities of any series issued under the Indenture in any material respect; or
(8) to supplement any of the provisions of the Indenture to the extent necessary to permit or facilitate defeasance and discharge of any series of ERP Debt Securities, provided that such action shall not adversely affect the interests of the holders of the ERP Debt Securities of any series in any material respect (Section 901).
The Indenture provides that in determining whether the holders of the requisite principal amount of outstanding ERP Debt Securities have given any request, demand, authorization, direction, notice, consent or waiver thereunder or whether a quorum is present at a meeting of holders of ERP Debt Securities, ERP Debt Securities owned by us, or by any other obligor upon the ERP Debt Securities or any affiliate of ours, Equity Residential or of any other obligor, shall be disregarded.
The Indenture contains provisions for convening meetings of the holders of ERP Debt Securities of a series (Section 1501). A meeting
may be called at any time by the Trustee, and also, upon request, by us or by the holders of at least 10% in principal amount of the outstanding ERP Debt Securities of such series, or in any such case, upon notice given as provided in the Indenture (Section 1502). Except for any consent that must be given by the holder of each debt security affected by certain modifications and amendments of the Indenture, any resolution presented at a meeting or adjourned meeting duly reconvened at which a quorum is present may be adopted by the affirmative vote of the holders of a majority in principal amount of the outstanding ERP Debt Securities of that series; provided, however, that, except as referred to above, any resolution with respect to any request, demand, authorization, direction, notice, consent, waiver or other action that may be made, given or taken by the holders of a specified percentage, which is less than a majority, in principal amount of the outstanding ERP Debt Securities of a series may be adopted at a meeting or adjourned meeting duly reconvened at which a quorum is present by the affirmative vote of the holders of such specified percentage in principal amount of the outstanding ERP Debt Securities of that series. Any resolution passed or decision taken at any meeting of holders of ERP Debt Securities of any series duly held in accordance with the Indenture will be binding on all holders of ERP Debt Securities of that series. The quorum at any meeting called to adopt a resolution, and at any reconvened meeting, will be persons holding or presenting a majority in principal amount of the outstanding ERP Debt Securities of a series; provided, however, that if any action is to be taken at such meeting with respect to a consent or waiver which may be given by the holders of not less than a specified percentage in principal amount of the outstanding ERP Debt Securities of a series, the persons holding or representing such specified percentage in principal amount of the outstanding ERP Debt Securities will constitute a quorum (Section 1504).

Notwithstanding the foregoing provisions, if any action is to be taken at a meeting of holders of ERP Debt Securities of any series with respect to any request, demand, authorization, direction, notice, consent, waiver or other action that the Indenture expressly provides may be made, given or taken by the holders of a specified percentage in principal amount of all outstanding ERP Debt Securities affected thereby, or of the holders of any series and one or more additional series:
(1) there shall be no minimum quorum requirement for the meeting; and
(2) the principal amount of the outstanding ERP Debt Securities of the series that vote in favor of the request, demand, authorization, direction, notice, consent, waiver or other action shall be taken into account in determining whether such request, demand, authorization, direction, notice, consent, waiver or other action has been made, given or taken under the Indenture (Section 1504).
Discharge, Defeasance and Covenant Defeasance. We may discharge certain obligations to holders of any series of ERP Debt Securities that either have become due and payable or will become due and payable within one year (or scheduled for redemption within one year) by irrevocably depositing with the Trustee, in trust, funds in an amount sufficient to pay and discharge the entire indebtedness on such ERP Debt Securities in respect of principal and premium (if any) and interest to the date of such deposit (if such ERP Debt Securities have become due and payable) or to the stated maturity or redemption date, as the case may be (Section 401).
The provisions of Article Fourteen of the Indenture are applicable to the Notes, and pursuant to Article Fourteen of the Indenture, we may elect either:
(1) to defease and be discharged from any and all obligations with respect to such ERP Debt Securities (except for the obligations to register the transfer or exchange of such ERP Debt Securities, to replace temporary or mutilated, destroyed, lost or stolen ERP Debt Securities, to maintain an office or agency in respect of such ERP Debt Securities and to hold moneys for payment in trust) (referred to herein as “defeasance”) (Section 1402); or
(2) to be released from our obligations with respect to such ERP Debt Securities under Sections 1004 to 1010, inclusive, of the Indenture (being the restrictions described under “Certain Covenants”) and any omission to comply with such obligations shall not constitute a default or an event of default with respect to such ERP Debt Securities (referred to herein as “covenant defeasance”) (Section 1403),
in either case upon the irrevocable deposit by us with the Trustee, in trust, of an amount, in cash or Government Obligations (as defined below), or both, which through the scheduled payment of principal and interest in accordance with their terms will provide money in an amount sufficient without reinvestment to pay the principal of and premium (if any) and interest on such ERP Debt Securities on the scheduled due dates therefor.
Such a trust may only be established if, among other things, we have delivered to the applicable Trustee an opinion of counsel (as specified in the Indenture) to the effect that the holders will not recognize income, gain or loss for U.S. federal income tax purposes as a result of defeasance or covenant defeasance and will be subject to U.S. federal income tax on the same amounts, in the same manner and at the same times as would have been the case if the defeasance or covenant defeasance had not occurred, and the opinion of counsel, in the case of defeasance, must refer to and be based upon a ruling of the Internal Revenue Service or a change in applicable U.S. federal income tax law occurring after the date of the Indenture (Section 1404).
In the event we effect covenant defeasance with respect to any ERP Debt Securities, and those ERP Debt Securities are declared due and payable because of the occurrence of any event of default other than the event of default described in clause (3) under “Events of Default, Notice and Waiver” with respect to Sections 1004 to 1010, inclusive, of the Indenture (which Sections would no longer be applicable to such ERP Debt Securities), the amount of Government Obligations on deposit with the Trustee will be sufficient to pay amounts due on such ERP Debt Securities at the time of their stated maturity but may not be sufficient to pay amounts due on such ERP Debt Securities at the time of the acceleration resulting from the event of default. However, we would remain liable to make payment of such amounts due at the time of acceleration.

Definitions
As used herein,
“Acquisition Lines of Credit” means, collectively, any secured lines of credit of the Operating Partnership and its Subsidiaries, the proceeds of which shall be used to, among other things, acquire interests, directly or indirectly, in real estate.
“Consolidated Income Available for Debt Service” for any period means Consolidated Net Income (as defined below) of the Operating Partnership and its Subsidiaries plus amounts which have been deducted for (a) interest on Debt of the Operating Partnership and its Subsidiaries, (b) provision for taxes of the Operating Partnership and its Subsidiaries based on income, (c) amortization of debt discount, (d) provisions for gains and losses on properties, (e) depreciation and amortization, (f) the effect of any non-cash charge resulting from a change in accounting principles in determining Consolidated Net Income for such period and (g) amortization of deferred charges.
“Consolidated Net Income” for any period means the amount of consolidated net income (or loss) of the Operating Partnership and its Subsidiaries for such period determined on a consolidated basis in accordance with generally accepted accounting principles.
“Debt” of the Operating Partnership or any Subsidiary means any indebtedness of the Operating Partnership and its Subsidiaries, whether or not contingent, in respect of (i) borrowed money evidenced by bonds, notes, debentures or similar instruments, (ii) indebtedness secured by any mortgage, pledge, lien, charge, encumbrance or any security interest existing on property owned by the Operating Partnership and its Subsidiaries, (iii) the reimbursement obligations, contingent or otherwise, in connection with any letters of credit actually issued or amounts representing the balance deferred and unpaid of the purchase price of any property except any such balance that constitutes an accrued expense or trade payable or (iv) any lease of property by the Operating Partnership and its Subsidiaries as lessee which is reflected on the Operating Partnership's consolidated balance sheet as a capitalized lease in accordance with generally accepted accounting principles, in the case of items of indebtedness incurred under (i) through (iii) above to the extent that any such items (other than letters of credit) would appear as a liability on the Operating Partnership's consolidated balance sheet in accordance with generally accepted accounting principles, and also includes, to the extent not otherwise included, any obligation of the Operating Partnership or any Subsidiary to be liable for, or to pay, as obligor, guarantor or otherwise (other than for purposes of collection in the ordinary course of business), indebtedness of another person (other than the Operating Partnership or any Subsidiary) (it being understood that Debt shall be deemed to be incurred by the Operating Partnership and its Subsidiaries on a consolidated basis whenever the Operating Partnership and its Subsidiaries on a consolidated basis shall create, assume, guarantee or otherwise become liable in respect thereof).
“Funds from Operations” for any period means the Consolidated Net Income of the Operating Partnership and its Subsidiaries for such period without giving effect to depreciation and amortization, gains or losses from extraordinary items, gains or losses on sales of real estate, gains or losses on investments in marketable securities and any provision/benefit for income taxes for such period, plus funds from operations of unconsolidated joint ventures, all determined on a consistent basis in accordance with generally accepted accounting principles.
“Government Obligations” means securities that are (1) direct obligations of the United States of America, for the payment of which its full faith and credit is pledged or (2) obligations of a Person (as defined below) controlled or supervised by and acting as an agency or instrumentality of the United States of America, the payment of which is unconditionally guaranteed as a full faith and credit obligation by the United States of America, that are not callable or redeemable at the option of the issuer thereof, and shall also include a depository receipt issued by a bank or trust company as custodian with respect to any Government Obligation or specific payment of interest on or principal of any Government Obligation held by the custodian for the account of the holder of a depository receipt, provided that (except as required by law) the custodian is not authorized to make any deduction from the amount payable to the holder of the depository receipt from any amount received by the custodian in respect of the Government Obligation or the specific payment of interest on or principal of the Government Obligation evidenced by the depository receipt.

“Make-Whole Amount” means, in connection with any optional redemption or accelerated payment of any Notes, the excess, if any, of (i) the aggregate present value as of the date of such redemption or accelerated payment of each dollar of principal being redeemed or paid and the amount of interest (exclusive of interest accrued to the date of redemption or accelerated payment) that would have been payable in respect of such dollar if such redemption or accelerated payment had not been made, determined by discounting, on a semiannual basis, such principal and interest at the Reinvestment Rate (as defined below) (determined on the third Business Day preceding the date such notice of redemption is given or declaration of acceleration is made) from the respective dates on which such principal and interest would have been payable if such redemption or accelerated payment had not been made, over (ii) the aggregate principal amount of the Notes being redeemed or paid.
“Maximum Annual Service Charge” as of any date means the maximum amount which is payable in any 12 month period for interest on
Debt. “Person” means any individual, corporation, partnership, joint venture, association, joint-stock company, trust, unincorporated
organization or government or any agency or political subdivision thereof. “Reinvestment Rate” means .25% (one-fourth of one percent) plus the arithmetic mean of the yields under the respective heading “Week
Ending” published in the most recent Statistical Release (as defined below) under the caption “Treasury Constant Maturities” for the maturity (rounded to the nearest month) corresponding to the remaining life to maturity, as of the payment date of the principal being redeemed or paid. If no maturity exactly corresponds to such maturity, yields for the two published maturities most closely corresponding to such maturity shall be calculated pursuant to the immediately preceding sentence and the Reinvestment Rate shall be interpolated or extrapolated from such yields on a straight-line basis, rounding in each of such relevant periods to the nearest month. For the purposes of calculating the Reinvestment Rate, the most recent Statistical Release published prior to the date of determination of the Make-Whole Amount shall be used.
“Statistical Release” means the statistical release designated “H.15(519)” or any successor publication which is published weekly by the
Federal Reserve System and which establishes yields on actively traded United States government securities adjusted to constant maturities, or, if such statistical release is not published at the time of any determination under the Indenture, then such other reasonably comparable index which shall be designated by the Operating Partnership.
“Significant Subsidiary” means any Subsidiary of ours which is a “Significant Subsidiary” (within the meaning of Regulation S-X,
promulgated under the Securities Act). “Subsidiary” means a corporation, a limited liability company or a partnership, a majority of the outstanding voting stock, limited liability
company interests or partnership interests, as the case may be, of which is owned, directly or indirectly, by the Operating Partnership or by one or more other Subsidiaries of the Operating Partnership. For the purposes of this definition, “voting stock” means stock having voting power for the election of directors, managing members or trustees, whether at all times or only so long as no senior class of stock has such voting power by reason of any contingency.
“Total Assets” as of any date means the sum of (i) the Operating Partnership's and its Subsidiaries' Undepreciated Real Estate Assets
(as defined below) and (ii) all other assets of the Operating Partnership and its Subsidiaries on a consolidated basis determined in accordance with generally accepted accounting principles (but excluding intangibles and accounts receivable).
“Total Unencumbered Assets” means the sum of (i) those Undepreciated Real Estate Assets not subject to an encumbrance and (ii) all
other assets of the Operating Partnership and its Subsidiaries not subject to an encumbrance determined in accordance with GAAP (but excluding accounts receivable and intangibles).
“Undepreciated Real Estate Assets” as of any date means the cost (original cost plus capital improvements) of real estate assets of the
Operating Partnership and its Subsidiaries on such date, before depreciation and amortization determined on a consolidated basis in accordance with generally accepted accounting principles.

“Unsecured Debt” means Debt of the Operating Partnership or any Subsidiary which is not secured by any mortgage, lien, charge,
pledge or security interest of any kind upon any of the Properties.
(Back To Top)
Exhibit 4.3
Description of ERP Operating Limited Partnership OP Units Registered Under Section 12 of the Securities Exchange Act of 1934
Please note that in this exhibit, references to “the Operating Partnership,” “we,” “our” and “us” refer to ERP Operating Limited Partnership, as the issuer of the units of limited partnership interest, and references to “the Company” refer to Equity Residential, the general partner of the Operating Partnership, unless the context requires otherwise.
The description of the units of limited partnership interest (the “OP Units”) of the Operating Partnership set forth below does not purport to be complete and is subject to and qualified in its entirety by reference to the Sixth Amended and Restated Agreement of Limited Partnership of the Operating Partnership (“Partnership Agreement”), as amended and/or restated from time to time, which is incorporated by reference as an exhibit to the Annual Report on Form 10-K of which this Exhibit 4.3 is a part. We encourage you to read our Partnership Agreement, and the applicable provisions of Illinois law, including the Partnership Act (as defined below), for additional information. Capitalized terms used herein that are not defined herein have the meanings set forth in the Partnership Agreement. General
The Company, as general partner of the Operating Partnership, is the sole manager of the business of the Operating Partnership and has the right to make all decisions and take all actions with respect thereto. No limited partner of the Operating Partnership (a “Limited Partner”) may take part in the conduct or control of the business or affairs of the Operating Partnership by virtue of being a holder of OP Units. All of the Company’s property ownership, development and related business operations are conducted through the Operating Partnership, and the Company has no material assets or liabilities other than its investment in the Operating Partnership.
Holders of OP Units (other than the Company in its capacity as general partner) hold limited partnership interests in the Operating Partnership, and all holders of OP Units (including the Company in its capacity as general partner) are entitled to share in cash distributions from, and in the profits and losses of, the Operating Partnership. Each OP Unit generally receives distributions in the same amount paid on each Common Share of Beneficial Interest, $0.01 par value (a “Common Share”), of the Company. The OP Units are registered under the Securities Exchange Act of 1934, as amended, which registration does not affect their restricted nature. The OP Units are not listed on The New York Stock Exchange or any other exchange or quoted on any national market system.
The Operating Partnership was formed as a limited partnership under the Illinois Revised Uniform Limited Partnership Act (the “Partnership Act”). Holders of OP Units (other than the Company in its capacity as general partner) have the rights to which limited partners are entitled under the Partnership Agreement and the Partnership Act, including the right to exchange their OP Units for Common Shares, to receive distributions from the cash flow of the Operating Partnership, and to receive distributions upon liquidation of the Operating Partnership, each as described herein. The Partnership Agreement imposes certain restrictions on the transfer of OP Units, as described herein.
Distributions
The Partnership Agreement provides for the distribution of Operating Cash Flow and Capital Cash Flow to the partners not less frequently than annually. “Operating Cash Flow” is generally defined as cash receipts for the period in question (excluding capital contributions and proceeds of sales, financing and proceeds of insurance and condemnation and other items of Capital Cash Flow as hereinafter described) in excess of Operating Partnership expenses (excluding depreciation and other non-cash expenses) and cash needs, including debt service, capital expenditures and any reserves (as determined by the Company and which may include cash held for future acquisitions). “Capital Cash Flow” includes proceeds from the sale of assets of the Operating Partnership, gross financing or refinancing proceeds, gross condemnation or insurance proceeds (excluding such proceeds to be applied to restoration) less the sum of closing costs, the cost to discharge any partnership financing encumbering or otherwise associated with the asset in question, the establishment of reserves (as determined by the Company, and
Section 4: EX-4.3 (EX-4.3)

which may include cash held for future acquisitions) and other expenses of the Operating Partnership. Distributions of Operating Cash Flow and Capital Cash Flow shall be distributed first to partners holding Preference Units (as defined below), none of which are currently outstanding other than Series K Cumulative Redeemable Preference Units, to the extent of any applicable priorities, and then the balance among the partners holding OP Units and LTIP Units (as defined below) (on the basis of the OP Unit Value set forth in the terms of such LTIP Unit) and the partners holding Preference Units that are entitled to participate in such distributions on a pari passu basis with holders of OP Units and LTIP Units based on the quotient arrived at by dividing (i) the aggregate value of the units held by such partner by (ii) the aggregate value of all Preference Units, OP Units and LTIP Units issued and outstanding.
Liability of the Limited Partners
No partner of the Operating Partnership will be required to make additional capital contributions to the Operating Partnership, except that the Company is generally required to contribute net proceeds of the sale of shares of beneficial interest of the Company to the Operating Partnership. No limited or general partner will be required to pay to the Operating Partnership any deficit or negative balance which may exist in his or its account unless separately agreed to between the Limited Partner and the Operating Partnership. Assuming that a Limited Partner (in his or its capacity as limited partner) does not take part in the control of the business of the Operating Partnership, and otherwise acts in conformity with the provisions of the Partnership Agreement, the liability of the Limited Partner for obligations of the Operating Partnership under the Partnership Agreement and the Partnership Act will generally be limited, subject to certain possible exceptions, to the loss of the Limited Partner's investment in the Operating Partnership represented by his or its OP Units. Under the Partnership Act, the Operating Partnership may not make a distribution to a partner if, at the time of the distribution, after giving effect thereto, the liabilities of the Operating Partnership, other than liabilities to partners on account of their partnership interest, exceed the fair value of the Operating Partnership's assets, except that the fair value of any property subject to nonrecourse liabilities of the Operating Partnership will be included in the assets of the Operating Partnership to the extent that the fair value of such property exceeds such liability. The Partnership Act provides that a Limited Partner who receives a distribution in violation of the foregoing prohibition is liable to the Operating Partnership for the amount of the distribution.
Restrictions on Transfer of OP Units by Limited Partners
The Partnership Agreement provides that no Limited Partner shall, without the prior written consent of the Company (which may be withheld in the sole discretion of the Company), sell, assign, distribute or otherwise transfer all or any part of his or its interest in the Operating Partnership except (i) by operation of law, gift (outright or in trust) or by sale, in each case to or for the benefit of his parents, spouse or descendants, (ii) pledges or other collateral transfers effected by a Limited Partner to secure the repayment of a bona fide loan, (iii) the exchange of OP Units for Common Shares in accordance with the Partnership Agreement and (iv) the distribution of OP Units by a Limited Partner to any of its partners in compliance with any lock-up restrictions and/or applicable securities laws.
An assignee, legatee, distributee or other transferee (“Transferee”) of all or any portion of a partner's interest in the Operating Partnership shall be entitled to receive net profits, net losses and distributions under the Partnership Agreement attributable to such interest, from and after the effective date of the transfer of such interest, and Assignees shall have the ability to exercise the rights granted to Limited Partners under Section 3.2(C) of the Partnership Agreement (right to exchange OP Units for Common Shares), but shall not have any consent rights with respect to any matter presented to Limited Partners for approval; provided, however, (i) no transfer by a Limited Partner shall be effective until such transfer has been consented to by the Company, (ii) no Transferee shall be considered a substituted Limited Partner, and (iii) the Operating Partnership and the Company shall be entitled to treat the transferor of such interest as the absolute owner thereof in all respects, and shall incur no liability for the allocation of net profits, net losses or distributions which are made to such transferor until such time as the written instrument of transfer has been received by the Company and the effective date of the transfer has passed. The Company shall have the right to require any such transferor to exchange the OP Units to which such interest relates into Common Shares pursuant to the Partnership Agreement, excluding pledges of OP Units. The “effective date” of any transfer shall be the last day of the month set forth on the written instrument of transfer or such other date consented to in writing by the Company as the “effective date.” Notwithstanding the foregoing, (x) in the event a

Limited Partner dissolves and liquidates, the partners receiving any portion of the Limited Partner's interest in the Operating Partnership will become substitute Limited Partners and shall succeed to the rights and obligations of such Limited Partner in the Operating Partnership in proportion to their respective interests in the dissolving or liquidating Limited Partner and (y) no transfer shall be effective to the extent it would, by treating the OP Units so transferred as if they had been exchanged for Common Shares, violate the limitations on ownership set forth in the Company's declaration of trust in order to protect and preserve the Company's status as a REIT or violate any securities laws. Notwithstanding any provision of the Partnership Agreement to the contrary, no sale, exchange, assignment, or other transfer or issuance of a Partnership Interest by or to any Partner shall be effective if the effect of such transaction would be to cause the Company’s Percentage Interest to decrease to a level of fifty percent (50%) or less.
Exchange of OP Units
Subject to the limitations described herein, Limited Partners may exchange any or all of their OP Units for Common Shares, with one OP Unit being exchangeable for one Common Share, by notifying the Operating Partnership at least 10 days prior to the date of exchange. Upon receipt of such a request, the Operating Partnership may, in its discretion, in lieu of the Company issuing Common Shares, pay to such Limited Partner cash in an amount equal to the product arrived at by multiplying (i) the number of OP Units requested to be exchanged by such Limited Partner, multiplied by (ii) the market price per Common Share as determined in accordance with the Partnership Agreement. The Company will at all times reserve and keep available out of its authorized but unissued Common Shares, solely for the purpose of effecting the exchange of OP Units for Common Shares, such number of Common Shares as shall from time to time be sufficient for the conversion of all outstanding OP Units not owned by the Company, OP Units that may become issuable upon the automatic conversion of LTIP Units (as defined below) and any Preference Units (as defined below) not owned by the Company that are convertible into OP Units. No Limited Partner, by virtue of being the holder of one or more OP Units, will be deemed to be a shareholder of or have any other interest in the Company. In the event of any change in the outstanding Common Shares by reason of any share dividend, split, recapitalization, merger, consolidation, combination, exchange of shares or other similar change, the number of OP Units held by each partner shall be proportionately adjusted so that one OP Unit remains exchangeable for one share without dilution. A Limited Partner shall not have the right to request an exchange of OP Units for Common Shares if (1) in the opinion of counsel for the Company, the Company would, as a result thereof, no longer qualify (or it would be likely that the Company no longer would qualify) as a REIT under the Code; or (ii) such exchange would, in the opinion of counsel for the Company, constitute or be likely to constitute a violation of applicable securities laws.
No Withdrawal by Limited Partners
No Limited Partner has the right to withdraw from or reduce his or its capital contribution to the Operating Partnership, except as a result of the transfer of OP Units in accordance with the Partnership Agreement.
Issuance of Additional OP Units, Preference Units and/or LTIP Units
The Company is authorized at any time, without the consent of the Limited Partners, to cause the Operating Partnership to issue additional OP Units to (i) existing or newly admitted partners (including itself) in exchange for additional capital contributions by a partner (“Capital Contributions”) to the Operating Partnership, (ii) the Company in connection with the issuance by the Company of additional Common Shares in exchange for OP Units as provided in the Partnership Agreement or (iii) to the Company upon the issuance by the Company of additional Common Shares not in connection with the exchange of OP Units as provided in the Partnership Agreement, provided that any net proceeds received by the Company as a result of the issuance of additional shares are contributed to the Operating Partnership as additional Capital Contributions in accordance with the Partnership Agreement (except that the Company may issue Common Shares in connection with any Company share option plan, dividend reinvestment plan, restricted share plan or other benefit or compensation plan without receiving any proceeds and that the issuance of such shares shall nonetheless entitle the Company to additional OP Units). Upon the issuance of additional OP Units, the percentage interest of all the partners in the Operating Partnership would be diluted so that the percentage interest of each partner will equal the quotient (expressed as a percentage) arrived at by dividing the number of OP Units held by a partner by the total number of OP Units then outstanding. In addition,

the Partnership Agreement provides that the Operating Partnership may also issue (i) preferred units (“Preference Units”) having such rights, preferences and other privileges, variations and designations as may be determined by the Company; and (ii) long-term incentive plan interests in the Operating Partnership issued for services provided to the Operating Partnership (“LTIP Units”), which have the right to share in distributions with the OP Units based on an assigned OP Unit Value and have such privileges, variations and designations as may be determined by the Company. Any such Preference Units may have terms, provisions and rights which are preferential to the terms, provisions and rights of the OP Units. Any such LTIP Units shall automatically convert into an OP Unit at such time as the Capital Account maintained with respect to such LTIP Unit reaches a target amount designated by the Company upon issuance of such LTIP Unit or will be automatically canceled if such target amount is not achieved within ten years of issuance. In no event may the Operating Partnership issue additional Preference Units, OP Units, or LTIP Units to the extent such issuance would result in the Company’s Percentage Interest being fifty percent (50%) or less.
Amendment of the Partnership Agreement
Each Partner, by execution of the Partnership Agreement, irrevocably appoints the Chairman of the Board of Trustees of the Company, with power of substitution, as his or its true and lawful attorney coupled with an interest, in his or its name, place and stead to amend the Partnership Agreement in any respect other than: (i) to enlarge the obligation of any partner to make contributions to the capital of the Operating Partnership, (ii) except as otherwise provided for in the Partnership Agreement or as required by law, to modify the allocation of net profits or net losses or distributions among the partners as provided for in the Partnership Agreement, (iii) to amend certain provisions of the Partnership Agreement dealing with issuance and conversion of OP Units, powers and authorities of partners and transfers of partnership interests or (iv) to amend the provisions of the Partnership Agreement relating to amending the Partnership Agreement. With respect to the foregoing exceptions (ii) and (iii), the Partnership Agreement may be amended with the consent of each of certain limited partners who became limited partners in connection with the formation of the Operating Partnership (including certain affiliates of Samuel Zell, currently Chairman of the Board of Trustees of the Company (the “Original Owners”)) so long as such Original Owners remain Limited Partners, and the consent of those Limited Partners holding not less than 67% of the aggregate of Percentage Interests held by all Limited Partners; provided that certain changes to the terms of the Preference Units require the consent of holders of at least 67% of the Preference Units. With respect to the foregoing exceptions (i) and (iv), the Partnership Agreement may be amended only with the written consent of all Partners.
Dissolution, Winding Up and Termination
The Operating Partnership will be dissolved and its affairs wound up upon the earliest of (i) the agreement of partners holding at least ninety percent (90%) of the percentage interests of all of the partners (excluding percentage interests attributable to LTIP Units) that the Operating Partnership should be dissolved; or (ii) the entry of a final judgment, order or decree of a court of competent jurisdiction adjudicating as bankrupt either the Operating Partnership or the Company, and the expiration without appeal of the period, if any, allowed by applicable law to appeal therefrom. Any proceeds from liquidation of the Operating Partnership shall be applied in the following order of priority: (a) to pay debts of the Operating Partnership, including repayment of principal and interest on loans and advances made by the Company; (b) to the establishment of any reserves deemed necessary or appropriate by the Company, or by the person winding up the affairs of the Operating Partnership in the event there is no remaining general partner of the Operating Partnership, for any contingent or unforeseen liabilities or obligations of the Operating Partnership; and then (c) to the partners of the Operating Partnership, including holders of LTIP Units, in accordance with their respective capital account balances, after giving effect to all contributions, distributions and allocations for all periods. The Operating Partnership shall be terminated when all notes received in connection with such disposition have been paid and all of the cash or property available for application and distribution under the Partnership Agreement have been applied and distributed in accordance with the Partnership Agreement.
(Back To Top)
Exhibit 21
List of Subsidiaries of Equity Residential and ERP Operating Limited Partnership
Section 5: EX-21 (EX-21)
Entity Formation State 1 1145 Acquisition, L.L.C. Delaware 2 303 Third SPE LLC Delaware 3 303 Third Street Developer LLC Delaware 4 303 Third Street Venture I LLC Delaware 5 303 Third Venture I SPE LLC Delaware 6 340 Fremont Owners Association California 7 777 Sixth Avenue Owner LLC Delaware 8 88 Hillside Homeowners Association California 9 Alban Towers LLC District of Columbia 10 Amberton Apartments, L.L.C. Virginia 11 ANE Associates, L.L.C. Delaware

12 API Emeryville Parkside LLC Delaware 13 API Town Center III (Borrower) GP LLC Delaware 14 API Town Center III (Borrower) LP Delaware 15 Archstone Maryland 16 Archstone 101 West End Avenue GP LLC Delaware 17 Archstone 101 West End Avenue LP Delaware 18 Archstone 180 Montague GP LLC Delaware 19 Archstone 180 Montague LP Delaware 20 Archstone 5 Holdings LP Delaware 21 Archstone 5 LLC Delaware 22 Archstone 6 Holdings LP Delaware 23 Archstone 6 LLC Delaware 24 Archstone Alban Towers LLC Delaware 25 Archstone Arlington Courthouse Plaza LLC Delaware 26 Archstone Avenir GP LLC Delaware 27 Archstone Avenir LP Delaware 28 Archstone Camargue LLC Delaware 29 Archstone Camargue Mezz LLC Delaware 30 Archstone CCP LLC Delaware 31 Archstone Chelsea GP LLC Delaware 32 Archstone Chelsea LP Delaware 33 Archstone Columbia Crossing LLC Delaware 34 Archstone Columbia Crossing Mezz LLC Delaware 35 Archstone Communities LLC Delaware 36 Archstone Concourse LLC Delaware 37 Archstone Cronin's Landing LLC Delaware 38 Archstone Crystal Place LLC Delaware 39 Archstone Daggett Place LLC Delaware 40 Archstone DC 3 Holdings LLC Delaware 41 Archstone DC 5 Holdings LLC Delaware 42 Archstone DC 6 Holdings LLC Delaware 43 Archstone DC 7 Holdings LLC Delaware 44 Archstone DC Holdings LLC Delaware 45 Archstone DC Investments 3-I LP Delaware 46 Archstone DC Investments 3-II LP Delaware 47 Archstone DC Investments 5-I LP Delaware

48 Archstone DC Investments 5-II LP Delaware 49 Archstone DC Investments 6-I LP Delaware 50 Archstone DC Investments 6-II LP Delaware 51 Archstone DC Investments 7 LLC Delaware 52 Archstone DC Master Holdings LLC Delaware 53 Archstone DC Property Holdings LP Delaware 54 Archstone Del Mar Heights GP LLC Delaware 55 Archstone Del Mar Heights LP Delaware 56 Archstone Developer LLC Delaware 57 Archstone East 39th Street (Nominee) GP LLC Delaware 58 Archstone East 39th Street (Nominee) LP Delaware 59 Archstone East 39th Street GP LLC Delaware 60 Archstone East 39th Street Holdings GP LLC Delaware 61 Archstone East 39th Street Holdings LP Delaware 62 Archstone East 39th Street Land LLC Delaware 63 Archstone East 39th Street LP Delaware 64 Archstone East 39th Street Principal GP LLC Delaware 65 Archstone East 39th Street Principal LP Delaware 66 Archstone Gallery at Rosslyn LLC Delaware 67 Archstone Gateway Place LLC Delaware 68 Archstone HoldCo CM LLC Delaware 69 Archstone Inc. Maryland 70 Archstone Investments 7-I LP Delaware 71 Archstone Investments 7-II LP Delaware 72 Archstone Long Beach GP LLC Delaware 73 Archstone Long Beach LP Delaware 74 Archstone Master Holdings GP LLC Delaware 75 Archstone Master Holdings LLC Delaware 76 Archstone Master Property Holdings GP, LLC Delaware 77 Archstone Master Property Holdings LLC Delaware 78 Archstone Multifamily Series I Trust Delaware 79 Archstone Multifamily Series II LLC Delaware 80 Archstone Multifamily Series III LLC Delaware 81 Archstone Multifamily Series IV LLC Delaware 82 Archstone Near Northeast LLC Delaware 83 Archstone Northcreek LLC Delaware 84 Archstone Oakwood Boston LLC Delaware 85 Archstone Palmetto Park LLC Delaware 86 Archstone Palmetto Park Member LLC Delaware 87 Archstone Parallel Residual JV 2, LLC Delaware 88 Archstone Parallel Residual JV, LLC Delaware 89 Archstone Presidio View Member LLC Delaware 90 Archstone Property Holdings GP LLC Delaware 91 Archstone Property Holdings LLC Delaware 92 Archstone Redmond Court LLC Delaware 93 Archstone Residual JV, LLC Delaware 94 Archstone Rincon Hill GP LLC Delaware 95 Archstone Rincon Hill LP Delaware 96 Archstone San Mateo Holdings LP Delaware 97 Archstone Sausalito GP LLC Delaware 98 Archstone Sausalito LP Delaware 99 Archstone Showplace Square LLC Delaware

100 Archstone Smith Corporate Holdings LLC Delaware 101 Archstone South Market GP LLC Delaware 102 Archstone South Market LP Delaware 103 Archstone South Market Mezz GP LLC Delaware 104 Archstone South Market Mezz LP Delaware 105 Archstone Tenside Member LLC Delaware 106 Archstone Texas Land Holdings LLC Delaware 107 Archstone Trademark JV, LLC Delaware 108 Archstone Westchester at Old Town GP LLC Delaware 109 Archstone Westchester at Old Town LP Delaware 110 Archstone-Smith Unitholder Services LLC Delaware 111 Arrington Place Condominium Association Washington 112 Artery Northampton Limited Partnership Maryland 113 ASN Bellevue LLC Delaware 114 ASN Dupont Circle LLC Delaware 115 ASN Fairchase LLC Delaware 116 ASN Fairchase Mezz LLC Delaware 117 ASN Foundry LLC Delaware 118 ASN Kendall Square LLC Delaware 119 ASN Key West LLC Delaware 120 ASN Lake Mendota Investments LLC Delaware 121 ASN Monument Park LLC Delaware 122 ASN Murray Hill LLC Delaware 123 ASN Northgate, LLC Delaware 124 ASN Park Essex LLC Delaware 125 ASN Quarry Hills LLC Delaware 126 ASN Redmond Park LLC Delaware 127 ASN San Mateo GP LLC Delaware 128 ASN San Mateo Holdings GP LLC Delaware 129 ASN San Mateo LP Delaware 130 ASN Santa Clara GP LLC Delaware 131 ASN Santa Clara LP Delaware 132 ASN Santa Clara Mezz GP LLC Delaware 133 ASN Santa Clara Mezz LP Delaware 134 ASN Santa Monica GP LLC Delaware 135 ASN Santa Monica LP Delaware 136 ASN Santa Monica Mezz GP LLC Delaware 137 ASN Santa Monica Mezz LP Delaware 138 ASN Seattle LLC Delaware 139 ASN Warner Center LLC Delaware 140 ASN Watertown LLC Delaware 141 ASN Westmont LLC Delaware 142 ASN Wisconsin Place (Residential) LLC Delaware 143 ASN Wisconsin Place (Retail) LLC Delaware 144 Azure Mission Bay Owners Association California 145 BEL Residential Properties Trust Maryland 146 BEL-EQR II Limited Partnership Illinois 147 BEL-EQR II, L.L.C. Delaware 148 Brookside Place Associates, L.P. California 149 Brookside Place G.P. Corp. Delaware 150 Buena Vista Place Associates Florida 151 Canyon Creek Village Associates, L.P. California

152 Canyon Creek Village G.P. Corp. Delaware 153 CAPREIT Garden Lake Limited Partnership Georgia 154 CAPREIT Highland Grove Limited Partnership Georgia 155 CAPREIT Mariner's Wharf Limited Partnership Florida 156 CAPREIT Silver Springs Limited Partnership Florida 157 CAPREIT Westwood Pines Limited Partnership Florida 158 CAPREIT Woodcrest Villa Limited Partnership Michigan 159 Carrollwood Place Limited Partnership Texas 160 Cedar Crest General Partnership Illinois 161 Charles River Park "D" Company Massachusetts 162 Cobblestone Village Community Rentals, L.P. California 163 Cobblestone Village G.P. Corp. Delaware 164 Country Club Associates Limited Partnership Maryland 165 Country Oaks Associates, L.P. California 166 Country Oaks G.P. Corp. Delaware 167 Country Ridge General Partnership Illinois 168 CRICO of Fountain Place Limited Partnership Minnesota 169 CRICO of Ocean Walk Limited Partnership Florida 170 Crowntree Lee Vista, L.L.C. Delaware 171 CRP Service Company, L.L.C. Delaware 172 CRSI SPV 103, Inc. Delaware 173 CRSI SPV 30130, Inc. Delaware 174 CRSI SPV 30150, Inc. Delaware 175 CRSI SPV 30197, Inc. Delaware 176 DB Master Accommodation LLC Delaware 177 Deerfield Associates, L.P. California 178 Deerfield G.P. Corp. Delaware 179 Duxford Insurance Company, LLC Vermont 180 Duxford LLC Delaware 181 EC-Alexandria, LLC Delaware 182 EC-Belle Arts, L.L.C. Delaware 183 ECH-GFR, Inc. Ohio 184 EC-Mission Verde, LLC Delaware 185 EC-Mission Verde, LP Delaware 186 Edgewater Community Rentals, L.P. California 187 Edgewater G.P. Corp. Delaware 188 E-Lodge Associates Limited Partnership Illinois 189 EQR - Briarwood Limited Partnership California 190 EQR (1999) Master Limited Liability Company Delaware 191 EQR (1999) Towers LLC Delaware 192 EQR Chase Knolls Lender LLC Delaware 193 EQR Ironwood, L.L.C. Delaware 194 EQR Marks A, L.L.C. Delaware 195 EQR No. One Master Limited Partnership Delaware 196 EQR No. Two Master Limited Partnership Delaware 197 EQR/KB California RCI LLC Delaware 198 EQR/Lincoln Fort Lewis Communities LLC Delaware 199 EQR/Lincoln Guaranty Credit Limited Partnership Delaware 200 EQR/Lincoln RCI Southeast LLC Delaware 201 EQR-1250 Cherokee LLC Delaware 202 EQR-12th & Massachusetts, LLC Delaware 203 EQR-140 Riverside, LLC Delaware

204 EQR-1500 Mass, LLC Delaware 205 EQR-160 Riverside, LLC Delaware 206 EQR-175 Kent Avenue A, LLC Delaware 207 EQR-175 Kent Avenue B, LLC Delaware 208 EQR-1776 Broadway LLC Delaware 209 EQR-180 Riverside, LLC Delaware 210 EQR-228 West 71st, LLC Delaware 211 EQR-2300 Elliott, LLC Delaware 212 EQR-2400 Residential, L.L.C. Delaware 213 EQR-249 Third Street LLC Delaware 214 EQR-2850 Kelvin GP LLC Delaware 215 EQR-2850 Kelvin LP Delaware 216 EQR-315 on A Apartments LLC Delaware 217 EQR-320 Pine, LLC Delaware 218 EQR-400 PAS, LLC Delaware 219 EQR-401 Massachusetts, LLC Delaware 220 EQR-41 West 86th, LLC Delaware 221 EQR-4111 South Via Marina GP LLC Delaware 222 EQR-4111 South Via Marina LP Delaware 223 EQR-425 Massachusetts, LLC Delaware 224 EQR-4th & Hill GP LLC Delaware 225 EQR-4th & Hill LP Delaware 226 EQR-50 West 77th, LLC Delaware 227 EQR-600 Washington, L.L.C. Delaware 228 EQR-680 Berendo GP LLC Delaware 229 EQR-680 Berendo LP Delaware 230 EQR-680 Berenedo A LP Delaware 231 EQR-680 Berenedo GP A LLC Delaware 232 EQR-688 Berendo GP LLC Delaware 233 EQR-688 Berendo LP Delaware 234 EQR-71 Broadway, LLC Delaware 235 EQR-77 Park Avenue LLC Delaware 236 EQR-9th & W Member LLC Delaware 237 EQR-Academy Village SPE, L.L.C. Delaware 238 EQR-Academy Village, L.L.C. Delaware 239 EQR-Acapella Pasadena GP, LLC Delaware 240 EQR-Acapella Pasadena Limited Partnership Delaware 241 EQR-Acheson Commons, LLC Delaware 242 EQR-Acquisitions GP, LLC Delaware 243 EQR-Acquisitions, LP Delaware 244 EQR-Acton Berkeley Limited Partnership Delaware 245 EQR-Acton Berkeley, LLC Delaware 246 EQR-Alameda Block 9 GP LLC Delaware 247 EQR-Alameda Block 9 LP Delaware 248 EQR-Alcyone Apartments, LLC Delaware 249 EQR-Alexandria Orlando, L.L.C. Delaware 250 EQR-Alexandria, L.L.C. Delaware 251 EQR-Apartment Holding Co., Inc. New York 252 EQR-Apartment Holding LLC Delaware 253 EQR-Arboretum, L.L.C. Delaware 254 EQR-Arches Limited Partnership Delaware 255 EQR-Arches, LLC Delaware

256 EQR-Archstone TM Holder, LLC Delaware 257 EQR-Arden Villas, L.L.C. Delaware 258 EQR-ArtBHolder, L.L.C. Delaware 259 EQR-ArtCapLoan, L.L.C. Delaware 260 EQR-Artech Berkeley Limited Partnership Delaware 261 EQR-Artech Berkeley LLC Delaware 262 EQR-Artisan on Second Limited Partnership Delaware 263 EQR-Artisan on Second, LLC Delaware 264 EQR-Avanti, L.L.C. Delaware 265 EQR-Avanti, L.P. Delaware 266 EQR-Azure Creek, LLC Delaware 267 EQR-Back Bay Manor, LLC Delaware 268 EQR-Barrington, L.L.C. Delaware 269 EQR-Bay Hill Conversion, LLC Delaware 270 EQR-Bay Hill, LP Delaware 271 EQR-Beatrice, LLC Delaware 272 EQR-Bella Vista California GP, LLC Delaware 273 EQR-Bella Vista California, LP Delaware 274 EQR-Bella Vista, LLC Delaware 275 EQR-Bellagio, L.L.C. Delaware 276 EQR-Belle Fontaine Limited Partnership Delaware 277 EQR-Belle Fontaine, LLC Delaware 278 EQR-Bellevue Meadow GP Limited Partnership Washington 279 EQR-Bellevue Meadow Limited Partnership Washington 280 EQR-Bellevue Meadow, LLC Delaware 281 EQR-Berkeleyan Berkeley Limited Partnership Delaware 282 EQR-Berkeleyan Berkeley, LLC Delaware 283 EQR-Bond Partnership Georgia 284 EQR-Bradley Park, L.L.C. Delaware 285 EQR-Braintree, L.L.C. Delaware 286 EQR-Breakwater Marina GP LLC Delaware 287 EQR-Breakwater Marina LP Delaware 288 EQR-Breton Hammocks Financing Limited Partnership Illinois 289 EQR-Briarwood GP Limited Partnership California 290 EQR-Briarwood GP, LLC Delaware 291 EQR-Broadway Towers, LLC Delaware 292 EQR-Broadway Towers, LP Delaware 293 EQR-Brodie LLC Delaware 294 EQR-Brookdale Village, L.L.C. Delaware 295 EQR-BS Financing Limited Partnership Illinois 296 EQR-C on Pico GP, LLC Delaware 297 EQR-C on Pico, LP Delaware 298 EQR-Camellero Financing Limited Partnership Illinois 299 EQR-Cape House I, LLC Delaware 300 EQR-Cape House I, LP Delaware 301 EQR-Cape House II, LLC Delaware 302 EQR-Carmel Terrace Vistas, Inc. Illinois 303 EQR-Cascade II, LLC Delaware 304 EQR-Cascade, LLC Delaware 305 EQR-Cedar Ridge GP, L.L.C. Delaware 306 EQR-Cedar Ridge Limited Partnership Illinois 307 EQR-Cedar Springs, LP Delaware

308 EQR-Centennial Court, L.L.C. Delaware 309 EQR-Centennial Tower, L.L.C. Delaware 310 EQR-Chardonnay Park, L.L.C. Delaware 311 EQR-Chase, LLC Delaware 312 EQR-Chelsea Square GP Limited Partnership Washington 313 EQR-Chelsea Square Limited Partnership Washington 314 EQR-Chelsea, LLC Delaware 315 EQR-Chickasaw Crossing, Inc. Illinois 316 EQR-Chickasaw Crossing, L.L.C. Delaware 317 EQR-Chinatown Gateway LP Delaware 318 EQR-Chinatown Gateway, L.L.C. Delaware 319 EQR-Chloe LLC Delaware 320 EQR-Church Corner, L.L.C. Delaware 321 EQR-City Pointe Limited Partnership Delaware 322 EQR-City Pointe, LLC Delaware 323 EQR-Clarendon, LLC Delaware 324 EQR-Cliffwalk, LLC Delaware 325 EQR-Coachman Trails, L.L.C. Delaware 326 EQR-Continental Villas Financing Limited Partnership Illinois 327 EQR-Country Club Lakes, L.L.C. Delaware 328 EQR-Cupertino GP LLC Delaware 329 EQR-Cupertino LP Delaware 330 EQR-Cypress Lake, L.L.C. Delaware 331 EQR-Dalton LLC Delaware 332 EQR-Dartmouth Woods General Partnership Illinois 333 EQR-Deerwood Vistas, Inc. Illinois 334 EQR-Del Lago Vistas, Inc. Illinois 335 EQR-Del Mar Ridge GP, LLC Delaware 336 EQR-Del Mar Ridge, LP Delaware 337 EQR-District Holding, LLC Delaware 338 EQR-Doral Financing Limited Partnership Illinois 339 EQR-Dulles, LLC Delaware 340 EQR-Dupont Corcoran, LLC Delaware 341 EQR-East 27th Street Apartments, LLC Delaware 342 EQR-Edgemoor LLC Delaware 343 EQR-Element, LLC Delaware 344 EQR-Eleve GP, LLC Delaware 345 EQR-Eleve, LP Delaware 346 EQR-Elise Holding LLC Delaware 347 EQR-Ellipse, LLC Delaware 348 EQR-Emerald Park GP LLC Delaware 349 EQR-Emerald Park LP Delaware 350 EQR-Emerald Place Financing Limited Partnership Illinois 351 EQR-Emeryville GP LLC Delaware 352 EQR-Emeryville LP Delaware 353 EQR-Encore Limited Partnership Delaware 354 EQR-Encore, LLC Delaware 355 EQR-Enterprise Holdings, LLC Delaware 356 EQR-EOI Financing Limited Partnership Illinois 357 EQR-Essex Place Financing Limited Partnership Illinois 358 EQR-EWR Holding, LP Delaware 359 EQR-Exchange, LLC Delaware

360 EQR-Eye Street, LLC Delaware 361 EQR-Fairfax Corner, L.L.C. Delaware 362 EQR-Fairfield Member LLC Delaware 363 EQR-Fairfield, L.L.C. Delaware 364 EQR-Fancap 2000A Limited Partnership Illinois 365 EQR-Fancap 2000A, L.L.C. Delaware 366 EQR-Fankey 2004 Limited Partnership Illinois 367 EQR-Fankey 2004, L.L.C. Delaware 368 EQR-Fanwell 2007 GP, LLC Delaware 369 EQR-Fanwell 2007 Limited Partnership Delaware 370 EQR-Fielders Crossing GP, L.L.C. Delaware 371 EQR-Fielders Crossing Limited Partnership Illinois 372 EQR-Fifth Wall LLC Delaware 373 EQR-Fine Arts Berkeley Limited Partnership Delaware 374 EQR-Fine Arts Berkeley, LLC Delaware 375 EQR-Flatlands, L.L.C. Delaware 376 EQR-Foundry Member, LLC Delaware 377 EQR-Fremont GP LLC Delaware 378 EQR-Fremont LP Delaware 379 EQR-Fresca 2009 GP, LLC Delaware 380 EQR-Fresca 2009 Limited Partnership Delaware 381 EQR-Frewac 2008 Limited Partnership Delaware 382 EQR-FW Holding II LLC Delaware 383 EQR-Gaia Berkeley Limited Partnership Delaware 384 EQR-Gaia Berkeley, LLC Delaware 385 EQR-Gallery Apartments Limited Partnership Illinois 386 EQR-Gallery, L.L.C. Delaware 387 EQR-Gateway at Malden Center, LLC Delaware 388 EQR-Georgian Woods, L.L.C. Delaware 389 EQR-Girard LLC Delaware 390 EQR-GLO Apartments Limited Partnership Delaware 391 EQR-GLO Apartments, LLC Delaware 392 EQR-GLO Low Income Limited Partnership Delaware 393 EQR-Governor's Place Financing Limited Partnership Illinois 394 EQR-Gowanus Development LLC Delaware 395 EQR-Hacienda GP LLC Delaware 396 EQR-Hacienda LP Delaware 397 EQR-Hampshire Place Conversion, LLC Delaware 398 EQR-Hampshire Place, LP Delaware 399 EQR-Harbor Steps Member, L.L.C. Delaware 400 EQR-Harbor Steps, L.L.C. Delaware 401 EQR-Heights on Capitol Hill LLC Delaware 402 EQR-Heritage Ridge, L.L.C. Delaware 403 EQR-Heritage Ridge, L.P. Delaware 404 EQR-Herndon, L.L.C. Delaware 405 EQR-HHC 1&2 GP, LLC Delaware 406 EQR-HHC 1&2, LP Delaware 407 EQR-Highlands, LLC Delaware 408 EQR-Hikari Apartments, LP California 409 EQR-Hikari GP, LLC Delaware 410 EQR-Hikari Landlord, LP California 411 EQR-Hikari Low-Income, LP Delaware

412 EQR-Hillside Limited Partnership Delaware 413 EQR-Hillside, LLC Delaware 414 EQR-Hillside II GP LLC Delaware 415 EQR-Hillside II LP Delaware 416 EQR-Holding, LLC Delaware 417 EQR-Holding, LLC2 Delaware 418 EQR-Hudson Crossing, LLC Delaware 419 EQR-Hudson Pointe, L.L.C. Delaware 420 EQR-Huxley GP LLC Delaware 421 EQR-Huxley LP Delaware 422 EQR-Hyattsville, LLC Delaware 423 EQR-Ivory Wood, L.L.C. Delaware 424 EQR-Joyce on Pentagon Row, LLC Delaware 425 EQR-Kelvin Court, LLC Delaware 426 EQR-Kenwood Mews GP LLC Delaware 427 EQR-Kenwood Mews LP Delaware 428 EQR-La Terrazza at Colma Station GP, LLC Delaware 429 EQR-La Terrazza at Colma Station Limited Partnership Delaware 430 EQR-Lakeshore at Preston, LLC Illinois 431 EQR-Lane LLC Delaware 432 EQR-Lawrence, L.L.C. Delaware 433 EQR-Ledges LLC Delaware 434 EQR-Legacy Holdings JV Member, LLC Delaware 435 EQR-LEX A LP Delaware 436 EQR-LEX B LP Delaware 437 EQR-LEX C LP Delaware 438 EQR-LEX D LP Delaware 439 EQR-LEX GP A LLC Delaware 440 EQR-LEX GP B LLC Delaware 441 EQR-LEX GP C LLC Delaware 442 EQR-LEX GP D LLC Delaware 443 EQR-LEX GP LLC Delaware 444 EQR-LEX LP Delaware 445 EQR-Lexford Lender, L.L.C. Delaware 446 EQR-Liberty Tower, LLC Delaware 447 EQR-Lincoln Braintree, L.L.C. Delaware 448 EQR-Lincoln Fairfax, L.L.C. Delaware 449 EQR-Lincoln Laguna Clara L.P. Delaware 450 EQR-Lincoln Santa Clara L.L.C. Delaware 451 EQR-Lindley Limited Partnership Delaware 452 EQR-Lindley, LLC Delaware 453 EQR-Lodge (OK) GP Limited Partnership Illinois 454 EQR-Lombard, L.L.C. Delaware 455 EQR-Loudoun, L.L.C. Delaware 456 EQR-LPC Urban Renewal North Pier, L.L.C. New Jersey 457 EQR-Madison & Henry, L.L.C. Delaware 458 EQR-Madison LLC Delaware 459 EQR-Madox LLC Delaware 460 EQR-Mantena, LLC Delaware 461 EQR-Marina Bay, L.L.C. Delaware 462 EQR-Marina Del Rey-I GP LLC Delaware 463 EQR-Marina Del Rey-I Limited Partnership Delaware

464 EQR-Marina Del Rey-II GP LLC Delaware 465 EQR-Marina Del Rey-II Limited Partnership Delaware 466 EQR-Mark on 8th LLC Delaware 467 EQR-Market Street Landing, LLC Delaware 468 EQR-Market Village Conversion, LLC Delaware 469 EQR-Market Village, LP Delaware 470 EQR-Melrose, LLC Delaware 471 EQR-Melrose, LP Delaware 472 EQR-MET CA Financing Limited Partnership Illinois 473 EQR-Metro on First LLC Delaware 474 EQR-MHL McCaslin Hidden Lakes, LLC Texas 475 EQR-Mill Creek, L.L.C. Delaware 476 EQR-Millikan Avenue GP, LLC Delaware 477 EQR-Millikan Avenue, LP Delaware 478 EQR-Mission Bay Block 13 Limited Partnership Delaware 479 EQR-Mission Bay Block 13, LLC Delaware 480 EQR-Missouri, L.L.C. Delaware 481 EQR-MLP 1, L.L.C. Delaware 482 EQR-MLP 2, L.L.C. Delaware 483 EQR-Moda, LLC Delaware 484 EQR-Montclair Reserve, LLC Delaware 485 EQR-Montclair, LLC Delaware 486 EQR-Monte Viejo, L.L.C. Delaware 487 EQR-Mountain Park Ranch, LLC Delaware 488 EQR-Mountain View GP LLC Delaware 489 EQR-Mountain View LP Delaware 490 EQR-MR McCaslin Riverhill, LLC Texas 491 EQR-Navitas LLC Delaware 492 EQR-Navitas III LLC Delaware 493 EQR-New Carlyle, LP Delaware 494 EQR-NEW LLC Delaware 495 EQR-NEW LLC3 Maryland 496 EQR-Next on Sixth GP LLC Delaware 497 EQR-Next on Sixth LP Delaware 498 EQR-North Ninth II LLC Delaware 499 EQR-North Ninth LLC Delaware 500 EQR-North Pier, L.L.C. Delaware 501 EQR-Northpark Limited Partnership Delaware 502 EQR-Northpark, LLC Delaware 503 EQR-Oak Park Limited Partnership Delaware 504 EQR-Old Town Lofts LLC Delaware 505 EQR-Oregon, L.L.C. Delaware 506 EQR-Overlook Manor II, L.L.C. Delaware 507 EQR-Pacific Place, LLC Delaware 508 EQR-Pacific Place, LP Delaware 509 EQR-Packard LLC Delaware 510 EQR-Palm Harbor, L.L.C. Delaware 511 EQR-Parallel Residual JV 2 Member, LLC Delaware 512 EQR-Parc on Powell GP LLC Delaware 513 EQR-Parc on Powell LP Delaware 514 EQR-Parc Vue, L.L.C. Delaware 515 EQR-Park Place I General Partnership Illinois

516 EQR-Park Place II General Partnership Illinois 517 EQR-Park West (CA) Vistas, Inc. Illinois 518 EQR-Parkside Limited Partnership Texas 519 EQR-Pearl LLC Delaware 520 EQR-Pegasus Apartments, LP Delaware 521 EQR-Pershing, LLC Delaware 522 EQR-Plantation Financing Limited Partnership Illinois 523 EQR-Playa Del Rey GP LLC Delaware 524 EQR-Playa Del Rey LP Delaware 525 EQR-Portland Center, L.L.C. Delaware 526 EQR-Prado GP LLC Delaware 527 EQR-Prado LP Delaware 528 EQR-Prime, L.L.C. Delaware 529 EQR-Prospect Towers Phase II LLC Delaware 530 EQR-QRS Highline Oaks, Inc. Illinois 531 EQR-Radius Uptown LLC Delaware 532 EQR-Ranch at Fossil Creek, L.L.C. Delaware 533 EQR-Ranch at Fossil Creek, L.P. Texas 534 EQR-Redmond Way, LLC Delaware 535 EQR-Regency Park, LLC Delaware 536 EQR-Rehab Master GP, L.L.C. Delaware 537 EQR-Rehab Master Limited Partnership Delaware 538 EQR-Renaissance Villas Limited Partnership Delaware 539 EQR-Renaissance Villas, LLC Delaware 540 EQR-Reserve Square Limited Partnership Illinois 541 EQR-Residual JV Member, LLC Delaware 542 EQR-Rianna, LLC Delaware 543 EQR-RID SP, L.L.C. Delaware 544 EQR-Ridgewood Village GP LLC Delaware 545 EQR-Ridgewood Village LP Delaware 546 EQR-Riva Terra I GP LLC Delaware 547 EQR-Riva Terra I LP Delaware 548 EQR-Riva Terra II GP LLC Delaware 549 EQR-Riva Terra II LP Delaware 550 EQR-River Park Limited Partnership Illinois 551 EQR-Riverpark, LLC Delaware 552 EQR-Riverside Corp. Delaware 553 EQR-Rivertower A, LLC Delaware 554 EQR-Rivertower B, LLC Delaware 555 EQR-Rivertower C, LLC Delaware 556 EQR-Rivertower D, LLC Delaware 557 EQR-Rivertower E, LLC Delaware 558 EQR-Rivertower, LLC Delaware 559 EQR-Rivington A LLC Delaware 560 EQR-Rivington LLC Delaware 561 EQR-Sakura Apartments, LP California 562 EQR-Sakura GP, LLC Delaware 563 EQR-Sakura Landlord, LP California 564 EQR-Sakura Low-Income, LP Delaware 565 EQR-Saxton LLC Delaware 566 EQR-Seattle Member LLC Delaware 567 EQR-Second and Pine II, LLC Delaware

568 EQR-Second and Pine, LLC Delaware 569 EQR-Shadow Creek, L.L.C. Delaware 570 EQR-Shady Grove, LLC Delaware 571 EQR-Siena Terrace, LP Delaware 572 EQR-Silver Spring Gateway Residential, LLC Delaware 573 EQR-Silver Spring Gateway, LLC Delaware 574 EQR-Silver Spring Residential Associates, LLC Delaware 575 EQR-Skylark Limited Partnership Delaware 576 EQR-Skyline Terrace Limited Partnership Delaware 577 EQR-Skyline Terrace, LLC Delaware 578 EQR-Skyline Towers Member, LLC Delaware 579 EQR-Skyline Towers, L.L.C. Delaware 580 EQR-Skyview GP, LLC Delaware 581 EQR-Skyview, LP Delaware 582 EQR-SLP LLC Delaware 583 EQR-Smoketree, LLC Delaware 584 EQR-Soma II GP LLC Delaware 585 EQR-Soma II LP Delaware 586 EQR-Sombra 2008 GP, LLC Delaware 587 EQR-Sombra 2008 Limited Partnership Delaware 588 EQR-South City Station GP LLC Delaware 589 EQR-South City Station LP Delaware 590 EQR-South Plainfield I, L.P. Delaware 591 EQR-South Plainfield, L.L.C. Delaware 592 EQR-Southwood GP Limited Partnership California 593 EQR-Southwood Limited Partnership California 594 EQR-Southwood LP I Limited Partnership California 595 EQR-Southwood LP II Limited Partnership California 596 EQR-Springline LLC Delaware 597 EQR-Square One LLC Delaware 598 EQR-Square One Member LLC Delaware 599 EQR-STOA GP LLC Delaware 600 EQR-STOA LP Delaware 601 EQR-Stonelake GP, L.L.C. Delaware 602 EQR-Stonelake Limited Partnership Illinois 603 EQR-Stoney Ridge SPE, L.L.C. Delaware 604 EQR-Stonybrook, L.L.C. Delaware 605 EQR-Summer Creek, L.L.C. Delaware 606 EQR-Sunrise Developer, LLC Delaware 607 EQR-Sunrise Member, LLC Delaware 608 EQR-Surrey Downs GP Limited Partnership Washington 609 EQR-Surrey Downs, LLC Delaware 610 EQR-SWN Line Financing Limited Partnership Illinois 611 EQR-Talleyrand, L.L.C. Delaware 612 EQR-Tallman, LLC Delaware 613 EQR-Tanasbourne Terrace Financing Limited Partnership Illinois 614 EQR-Teresina Limited Partnership Delaware 615 EQR-Teresina, LLC Delaware 616 EQR-Terraces Limited Partnership Delaware 617 EQR-Terraces, LLC Delaware 618 EQR-The Carlyle, L.L.C. Delaware 619 EQR-The Hesby LLC Delaware

620 EQR-The Hesby LP Delaware 621 EQR-The Oaks GP LLC Delaware 622 EQR-The Oaks LP Delaware 623 EQR-The Palms, L.L.C. Delaware 624 EQR-The Retreat, L.L.C. Delaware 625 EQR-The Ridge, L.L.C. Delaware 626 EQR-Timberwood GP Limited Partnership Colorado 627 EQR-Timberwood Limited Partnership Colorado 628 EQR-Toscana Apartments, LP Delaware 629 EQR-Touriel Berkeley Limited Partnership Delaware 630 EQR-Touriel Berkeley, LLC Delaware 631 EQR-Town Square at Millbrook, LLC Delaware 632 EQR-Townhouse Gardens, LLC Delaware 633 EQR-Townhouse Gardens, LP Delaware 634 EQR-Townhouse Plaza, LLC Delaware 635 EQR-Townhouse Plaza, LP Delaware 636 EQR-Troy LLC Delaware 637 EQR-Urban Renewal 77 Hudson Street, L.L.C. New Jersey 638 EQR-Urban Renewal Jersey City, L.L.C. New Jersey 639 EQR-Uwajimaya Village, L.L.C. Delaware 640 EQR-Valencia GP LLC Delaware 641 EQR-Valencia Limited Partnership Delaware 642 EQR-Valley Park South Financing Limited Partnership Illinois 643 EQR-Vantage GP LLC Delaware 644 EQR-Vantage LP Delaware 645 EQR-Vantage Pointe Limited Partnership Delaware 646 EQR-Vantage Pointe, LLC Delaware 647 EQR-Veloce, LLC Delaware 648 EQR-Venn at Main A LLC Delaware 649 EQR-Venn at Main B LLC Delaware 650 EQR-Venn at Main LLC Delaware 651 EQR-Versailles Limited Partnership Delaware 652 EQR-Versailles, LLC Delaware 653 EQR-Victor, L.L.C. Delaware 654 EQR-Victor, L.P. Delaware 655 EQR-Villa Serenas Successor Borrower, L.L.C. Delaware 656 EQR-Villa Solana Vistas, Inc. Illinois 657 EQR-Village at Lakewood, LLC Delaware 658 EQR-Villas of Josey Ranch GP, L.L.C. Delaware 659 EQR-Vintage I, L.P. Delaware 660 EQR-Vintage II, L.L.C. Delaware 661 EQR-Virginia Square LLC Delaware 662 EQR-Virginia, L.L.C. Delaware 663 EQR-Vista del Lago, LLC Delaware 664 EQR-Vista Developer, LP Delaware 665 EQR-Vista Member, LLC Delaware 666 EQR-Vistas Courthouse, LLC Delaware 667 EQR-Walden Park, LLC Delaware 668 EQR-Warwick, L.L.C. Delaware 669 EQR-Washington, L.L.C. Delaware 670 EQR-Waterfall, L.L.C. Delaware 671 EQR-Waterford Place, L.L.C. Delaware

672 EQR-Watermarke I, LLC Delaware 673 EQR-Watermarke II, LLC Delaware 674 EQR-Waterside, L.L.C. Delaware 675 EQR-Watson General Partnership Illinois 676 EQR-Wellfan 2008 GP, LLC Delaware 677 EQR-Wellfan 2008 Limited Partnership Delaware 678 EQR-Wellington Hill Financing Limited Partnership Illinois 679 EQR-Wellington, L.L.C. Delaware 680 EQR-West Coast Portfolio GP, LLC Delaware 681 EQR-West Seattle, LLC Delaware 682 EQR-Westfield Village, L.L.C. Delaware 683 EQR-Westgate Pasadena II, LP Delaware 684 EQR-Westport, L.L.C. Delaware 685 EQR-Westside GP LLC Delaware 686 EQR-Westside LP Delaware 687 EQR-Whisper Creek, L.L.C. Delaware 688 EQR-Willard, LLC Delaware 689 EQR-Windsor at Fair Lakes, L.L.C. Delaware 690 EQR-Woodland Park A Limited Partnership Delaware 691 EQR-Woodland Park A, LLC Delaware 692 EQR-Woodland Park B Limited Partnership Delaware 693 EQR-Woodland Park B, LLC Delaware 694 EQR-Woodland Park C Limited Partnership Delaware 695 EQR-Woodland Park C, LLC Delaware 696 EQR-Woodland Park Limited Partnership Delaware 697 EQR-Woodland Park, LLC Delaware 698 EQR-Woodleaf Apartments GP, LLC Delaware 699 EQR-Woodleaf Apartments, LP Delaware 700 EQR-Woodridge I GP Limited Partnership Colorado 701 EQR-Woodridge I Limited Partnership Colorado 702 EQR-Woodridge II GP Limited Partnership Colorado 703 EQR-Woodridge II Limited Partnership Colorado 704 EQR-Woodridge III Limited Partnership Colorado 705 EQR-Worldgate, LLC Delaware 706 EQR-Yorktowne Financing Limited Partnership Illinois 707 Equity Corporate Housing, Inc. Ohio 708 Equity Marina Bay Phase II, L.L.C. Delaware 709 Equity Residential Foundation Illinois 710 Equity Residential Management, L.L.C. Delaware 711 Equity Residential Properties Management Corp. Delaware 712 Equity Residential Properties Management Corp. II Delaware 713 Equity Residential Properties Management Corp. Protective Trust II Delaware 714 Equity Residential REIT Services II, Inc. Delaware 715 Equity Residential REIT Services Inc. Delaware 716 Equity Residential Services II, LLC Illinois 717 Equity Residential Services, L.L.C. Delaware 718 Equity-Lodge Venture Limited Partnership Illinois 719 Equity-Tasman Apartments LLC Delaware 720 ERP Holding Co., Inc. Delaware 721 ERP Operating Limited Partnership Illinois 722 ERP-New England Program, L.L.C. Delaware 723 ERP-QRS Arbors, Inc. Illinois

724 ERP-QRS BS, Inc. Illinois 725 ERP-QRS Cedar Ridge, Inc. Illinois 726 ERP-QRS Country Club I, Inc. Illinois 727 ERP-QRS Country Club II, Inc. Illinois 728 ERP-QRS Country Ridge, Inc. Illinois 729 ERP-QRS CPRT II, Inc. Illinois 730 ERP-QRS Emerald Place, Inc. Illinois 731 ERP-QRS Essex Place, Inc. Illinois 732 ERP-QRS Fairfield, Inc. Illinois 733 ERP-QRS Flatlands, Inc. Illinois 734 ERP-QRS Georgian Woods Annex, Inc. Illinois 735 ERP-QRS Glenlake Club, Inc. Illinois 736 ERP-QRS Grove L.P., Inc. Illinois 737 ERP-QRS Lincoln, Inc. Delaware 738 ERP-QRS Lodge (OK), Inc. Illinois 739 ERP-QRS Magnum, Inc. Illinois 740 ERP-QRS MET CA, Inc. Illinois 741 ERP-QRS Northampton I, Inc. Illinois 742 ERP-QRS Sonterra at Foothills Ranch, Inc. Illinois 743 ERP-QRS SWN Line, Inc. Illinois 744 ERP-QRS Towne Centre III, Inc. Illinois 745 ERP-QRS Towne Centre IV, Inc. Illinois 746 ERP-Southeast Properties, L.L.C. Georgia 747 ET 400 PAS, LLC Delaware 748 Evans Withycombe Finance Partnership, L.P. Delaware 749 Evans Withycombe Residential, L.P. Delaware 750 Feather River Community Rentals, L.P. California 751 Feather River G.P. Corp. Delaware 752 Florida Partners G.P. Illinois 753 Fort Lewis SPE, Inc. Delaware 754 Geary Courtyard Associates California 755 Georgian Woods Annex Associates Maryland 756 Governor's Green I Trust Delaware 757 Governor's Green II Trust Delaware 758 Governor's Green III Trust Delaware 759 GPT-929 House, LLC Delaware 760 GPT-Abington Glen, LLC Delaware 761 GPT-Abington Land, LLC Delaware 762 GPT-Acton, LLC Delaware 763 GPT-CC, LLC Delaware 764 GPT-Cedar Glen, LLC Delaware 765 GPT-CG, LLC Delaware 766 GPT-Chestnut Glen, LLC Delaware 767 GPT-Conway Court, LLC Delaware 768 GPT-East Providence, LLC Delaware 769 GPT-Glen Grove, LLC Delaware 770 GPT-Glen Meadow, LLC Delaware 771 GPT-GOF II, LLC Delaware 772 GPT-Gosnold Grove, LLC Delaware 773 GPT-Heritage Green, LLC Delaware 774 GPT-HG, LLC Delaware 775 GPT-Highland Glen, LLC Delaware

776 GPT-Jaclen Tower, LLC Delaware 777 GPT-Longfellow Glen, LLC Delaware 778 GPT-Nehoiden Glen, LLC Delaware 779 GPT-Noonan Glen, LLC Delaware 780 GPT-Norton Glen, LLC Delaware 781 GPT-Old Mill Glen, LLC Delaware 782 GPT-RG Amherst, LLC Delaware 783 GPT-RG Fall River, LLC Delaware 784 GPT-RG, LLC Delaware 785 GPT-Rockingham Glen, LLC Delaware 786 GPT-SHG, LLC Delaware 787 GPT-Sturbridge, LLC Delaware 788 GPT-Summer Hill Glen, LLC Delaware 789 GPT-West Springfield, LLC Delaware 790 GPT-Westfield, LLC Delaware 791 GPT-Westwood Glen, LLC Delaware 792 GPT-WG, LLC Delaware 793 GPT-WILG, LLC Delaware 794 GPT-Wilkens Glen, LLC Delaware 795 GPT-Windsor, LLC Delaware 796 GR-Cedar Glen, LP Delaware 797 GR-Conway Court, L.P. Delaware 798 Greentree Apartments Limited Partnership Maryland 799 Greenwich Woods Associates Limited Partnership Maryland 800 Greenworks Renewable Energy, LLC Delaware 801 GR-Highland Glen, L.P. Delaware 802 GR-Northeast Apartments Associates, LLC Delaware 803 Grove Development LLC Delaware 804 Grove Operating, L.P. Delaware 805 Grove Rocky Hill, L.L.C. Delaware 806 GR-Rockingham Glen, L.P. Delaware 807 GR-Summer Hill Glen, L.P. Delaware 808 GR-Westwood Glen, L.P. Delaware 809 GR-Wilkens Glen, L.P. Delaware 810 Guilford Company, Inc. Alabama 811 HEW-RAD Realty Corp. New York 812 Hidden Lake Associates, L.P. California 813 Hidden Lake G.P. Corp. Delaware 814 Hunter's Glen General Partnership Illinois 815 Kelvin Court Limited Partnership Delaware 816 Kingsport Apartments, L.L.C. Virginia 817 Lake Mendota Investments LLC Delaware 818 Lakeview Community Rentals, L.P. California 819 Lakeview G.P. Corp. Delaware 820 Lakewood Community Rentals G.P. Corp. Delaware 821 Lakewood Community Rentals, L.P. California 822 Landon Legacy Partners Limited Texas 823 Landon Prairie Creek Partners Limited Texas 824 Lantern Cove Associates, L.P. California 825 Lantern Cove G.P. Corp. Delaware 826 Lawrence Downtown Holdings, LLC Delaware 827 Lawrence Street Borrower, LLC Delaware

828 Lawrence Street Partners, LLC Delaware 829 Legacy Holdings JV, LLC Delaware 830 Lenox Place Limited Partnership Texas 831 Lexford GP III, LLC Florida 832 Lexford Guilford GP, LLC Ohio 833 Lexford Guilford, Inc. Ohio 834 Lexford Partners, L.L.C. Ohio 835 Lexford Properties, L.P. Ohio 836 Lincoln Herndon Residential LLC Delaware 837 Lincoln Maples Associates LLC Delaware 838 Linear Park, Inc. California 839 LMI Cheshire Bridge LLC Delaware 840 LMI Pembroke Landings LLC Delaware 841 LMI Preston Park LLC Delaware 842 LMI Riverbend LLC Delaware 843 LMI Rosemont LLC Delaware 844 LMI Windward Park LLC Delaware 845 Lofts 590 LLC Delaware 846 Longview Place, LLC Delaware 847 Merry Land DownREIT I LP Georgia 848 Mesa del Oso Associates, L.P. California 849 Mesa del Oso G.P. Corp. Delaware 850 Mission Verde Condominium Homeowners Association California 851 ML North Carolina Apartments LP Georgia 852 ML Tennessee Apartments LP Georgia 853 Move, Inc. Delaware 854 Mozaic Loan Acquisition, LP Delaware 855 Multifamily Portfolio LP Limited Partnership Delaware 856 Multifamily Portfolio Partners, Inc. Delaware 857 North Pier L.L.C. Delaware 858 Oaks at Baymeadows Associates Florida 859 OEC Holdings LLC Delaware 860 Old Redwoods LLC Delaware 861 One Henry Adams Owners Association California 862 Pines Whisper, LLC Florida 863 Port Royale Holdings, LLC Delaware 864 Potrero 1010 Owners Association California 865 Prince George's Metro Apartments, LLC Delaware 866 PSH Realty Corp. New York 867 Purcel Woodward and Ames, L.L.C. New York 868 QRS-Arboretum, Inc. Illinois 869 QRS-ArtCapLoan, Inc. Illinois 870 QRS-Bond, Inc. Illinois 871 QRS-Codelle, Inc. Illinois 872 QRS-Connor, Inc. Illinois 873 QRS-Cove, Inc. Illinois 874 QRS-Employer, Inc. Delaware 875 QRS-Fancap 2000A, Inc. Illinois 876 QRS-Greentree I, Inc. Illinois 877 QRS-LLC, Inc. Illinois 878 QRS-Marks A, Inc. Illinois 879 QRS-Marks B, Inc. Illinois

880 QRS-RWE, Inc. Texas 881 QRS-Scarborough, Inc. Illinois 882 QRS-Siena Terrace, Inc. Illinois 883 QRS-Summit Center, Inc. Illinois 884 QRS-Towers at Portside, Inc. Illinois 885 QRS-Vinings at Ashley Lake, Inc. Illinois 886 QRS-Warwick, Inc. Illinois 887 QRS-Waterfall, Inc. Illinois 888 Redwood Shores Owners Association California 889 Residential Insurance Agency, LLC Delaware 890 Residential Insurance Agency, LLC Ohio 891 Riverpark Redmond Condominium Association Washington 892 Rosehill Pointe General Partnership Illinois 893 San Norterra Apartments LLC Delaware 894 Sarasota Beneva Place Associates, Ltd. Florida 895 Schooner Bay I Associates, L.P. California 896 Schooner Bay I G.P. Corp. Delaware 897 Schooner Bay II Associates, L.P. California 898 Schooner Bay II G.P. Corp. Delaware 899 Seagull Drive Joint Venture Florida 900 Second and Pine Owners Association Washington 901 Second Country Club Associates Limited Partnership Maryland 902 Second Georgian Woods Limited Partnership Maryland 903 Sheffield Apartments, L.L.C. Virginia 904 Smith Property Holdings 4411 Connecticut LLC Delaware 905 Smith Property Holdings Alban Towers LLC Delaware 906 Smith Property Holdings Columbia Road LP Delaware 907 Smith Property Holdings Parc Vista LLC Delaware 908 Smith Property Holdings Six (D.C.) LP Delaware 909 Smith Property Holdings Three (D.C.) LP Delaware 910 Smith Property Holdings Three LP Delaware 911 Smith Property Holdings Van Ness LP Delaware 912 Smith Property Holdings Water Park Towers LLC Delaware 913 Smith Property Holdings Wilson LLC Delaware 914 Smith Realty Company Delaware 915 Songbird General Partnership Illinois 916 South Shore Associates, L.P. California 917 South Shore G.P. Corp. Delaware 918 Summit Center, LLC Florida 919 Sunny Oak Village General Partnership Illinois 920 Sunrise Village Development, LLC Delaware 921 Sunrise Village Joint Venture, LLC Delaware 922 Tanglewood Apartments, L.L.C. Virginia 923 The Cleo Homeowners' Association California 924 The Crossings Associates Florida 925 The Gates of Redmond, L.L.C. Washington 926 The Landings Holding Company, L.L.C. New Jersey 927 The Landings Urban Renewal Company, L.L.C. New Jersey 928 The Veridian at Silver Spring Metro Owners Association, Inc. Maryland 929 Third Greentree Associates Limited Partnership Maryland 930 Tierra Antigua Associates, L.P. California 931 Tierra Antigua G.P. Corp. Delaware

(Back To Top)
Exhibit 23.1
Consent of Independent Registered Public Accounting Firm
We consent to the incorporation by reference in the Registration Statements (Forms S-3 No. 333-231967, No. 333-199036, No. 333-204573, No. 333-178040, No. 333-175242, No. 333-151588, No. 333-142723, No. 333-141261, No. 333-135503, No. 333-100631, No. 333-63176, No. 333-80835, No. 333-72961, No. 333-12983, No. 333-06873, No. 33-97680 and No. 33-84974; Forms S-8 No. 333-107244, No. 333-102609, No. 333-175173 and No. 333-232630; and Forms S-4 No. 333-44576 and No. 333-35873) of Equity Residential and in the related Prospectuses of our reports dated February 20, 2020 with respect to the consolidated financial statements and schedule of Equity Residential and the effectiveness of internal control over financial reporting of Equity Residential, included in this Annual Report (Form 10-K) for the year ended December 31, 2019.
(Back To Top)
Exhibit 23.2
932 Towers at Portside Urban Renewal Company, L.L.C. New Jersey 933 Vinings Club at Metrowest Limited Partnership Texas 934 Vista Montana Park Apartments Holdings, LLC Delaware 935 Vista Montana Park Homes LLC Delaware 936 Wadlington Investments General Partnership Illinois 937 Wadlington, Inc. Illinois 938 Waterfield Square Associates, L.P. California 939 Waterfield Square I G.P. Corp. Delaware 940 Waterfield Square II G.P. Corp. Delaware 941 Watermarke Associates Delaware 942 Waterton Tenside Holdings LLC Delaware 943 Wellsford San Tropez Corporation Arizona 944 Wellsford Warwick Corp. Colorado 945 Westchester at Town Center (Borrower) GP LLC Delaware 946 Westchester at Town Center (Borrower) LP Delaware 947 Westchester at Town Center GP LLC Delaware 948 Westchester at Town Center LP Delaware 949 Western Hill Condominium Association Washington 950 Westgate Pasadena Apartments GP, LLC Delaware 951 Westgate Pasadena Apartments, L.P. Delaware 952 Westgate Pasadena, LLC Delaware 953 WHRP, Inc. Maryland 954 Willow Brook Associates, L.P. California 955 Willow Brook G.P. Corp. Delaware 956 Willow Creek Community Rentals, L.P. California 957 Willow Creek G.P. Corp. Delaware 958 Wisconsin Place Residential LLC Delaware 959 Wisconsin Place Retail LLC Delaware 960 WNY Parkland Holdings, LLC Delaware 961 Woodbine Properties Missouri 962 Woolbright Place Master Association, Inc. Florida 963 WP Project Developer LLC Delaware
Section 6: EX-23.1 (EX-23.1)
/s/ ERNST & YOUNG LLP
ERNST & YOUNG LLP Chicago, Illinois February 20, 2020
Section 7: EX-23.2 (EX-23.2)

Consent of Independent Registered Public Accounting Firm
We consent to the incorporation by reference in the Registration Statements (Form S-3 No. 333-231967 and Forms S-4 No. 333-44576 and No. 333-36053) of ERP Operating Limited Partnership and in the related Prospectuses of our reports dated February 20, 2020 with respect to the consolidated financial statements and schedule of ERP Operating Limited Partnership and the effectiveness of internal control over financial reporting of ERP Operating Limited Partnership, included in this Annual Report (Form 10-K) for the year ended December 31, 2019.
(Back To Top)
Exhibit 31.1
Equity Residential CERTIFICATIONS
I, Mark J. Parrell, certify that:
Date: February 20, 2020
/s/ ERNST & YOUNG LLP
ERNST & YOUNG LLP Chicago, Illinois February 20, 2020
Section 8: EX-31.1 (EX-31.1)
1. I have reviewed this annual report on Form 10-K of Equity Residential;
2. Based on my knowledge, this report does not contain any untrue statement of a material fact or omit to state a material fact necessary to makethe statements made, in light of the circumstances under which such statements were made, not misleading with respect to the period covered by this report;
3. Based on my knowledge, the financial statements, and other financial information included in this report, fairly present in all material respects the financial condition, results of operations and cash flows of the registrant as of, and for, the periods presented in this report;
4. The registrant’s other certifying officer(s) and I are responsible for establishing and maintaining disclosure controls and procedures (as defined in Exchange Act Rules 13a-15(e) and 15d-15(e)) and internal control over financial reporting (as defined in Exchange Act Rules 13a-15(f) and 15d-15(f)) for the registrant and have:
a) Designed such disclosure controls and procedures, or caused such disclosure controls and procedures to be designed under our supervision, to ensure that material information relating to the registrant, including its consolidated subsidiaries, is made known to us by others within those entities, particularly during the period in which this report is being prepared;
b) Designed such internal control over financial reporting, or caused such internal control over financial reporting to be designed under our supervision, to provide reasonable assurance regarding the reliability of financial reporting and the preparation of financial statements for external purposes in accordance with generally accepted accounting principles;
c) Evaluated the effectiveness of the registrant’s disclosure controls and procedures and presented in this report our conclusions about the effectiveness of the disclosure controls and procedures, as of the end of the period covered by this report based on such evaluation; and
d) Disclosed in this report any change in the registrant’s internal control over financial reporting that occurred during the registrant’s most recent fiscal quarter (the registrant’s fourth fiscal quarter in the case of an annual report) that has materially affected, or is reasonably likely to materially affect, the registrant’s internal control over financial reporting; and
5. The registrant’s other certifying officer(s) and I have disclosed, based on our most recent evaluation of internal control over financial reporting, to the registrant’s auditors and the audit committee of the registrant’s board of directors (or persons performing the equivalentfunctions):
a) All significant deficiencies and material weaknesses in the design or operation of internal control over financial reporting which are reasonably likely to adversely affect the registrant’s ability to record, process, summarize and report financial information; and
b) Any fraud, whether or not material, that involves management or other employees who have a significant role in the registrant’s internal control over financial reporting.
/s/ Mark J. Parrell

(Back To Top)
Exhibit 31.2
Equity Residential CERTIFICATIONS
I, Robert A. Garechana, certify that:
Date: February 20, 2020
(Back To Top)
Mark J. Parrell Chief Executive Officer
Section 9: EX-31.2 (EX-31.2)
1. I have reviewed this annual report on Form 10-K of Equity Residential;
2. Based on my knowledge, this report does not contain any untrue statement of a material fact or omit to state a material fact necessary to makethe statements made, in light of the circumstances under which such statements were made, not misleading with respect to the period covered by this report;
3. Based on my knowledge, the financial statements, and other financial information included in this report, fairly present in all material respects the financial condition, results of operations and cash flows of the registrant as of, and for, the periods presented in this report;
4. The registrant’s other certifying officer(s) and I are responsible for establishing and maintaining disclosure controls and procedures (as defined in Exchange Act Rules 13a-15(e) and 15d-15(e)) and internal control over financial reporting (as defined in Exchange Act Rules 13a-15(f) and 15d-15(f)) for the registrant and have:
a) Designed such disclosure controls and procedures, or caused such disclosure controls and procedures to be designed under our supervision, to ensure that material information relating to the registrant, including its consolidated subsidiaries, is made known to us by others within those entities, particularly during the period in which this report is being prepared;
b) Designed such internal control over financial reporting, or caused such internal control over financial reporting to be designed under our supervision, to provide reasonable assurance regarding the reliability of financial reporting and the preparation of financial statements for external purposes in accordance with generally accepted accounting principles;
c) Evaluated the effectiveness of the registrant’s disclosure controls and procedures and presented in this report our conclusions about the effectiveness of the disclosure controls and procedures, as of the end of the period covered by this report based on such evaluation; and
d) Disclosed in this report any change in the registrant’s internal control over financial reporting that occurred during the registrant’s most recent fiscal quarter (the registrant’s fourth fiscal quarter in the case of an annual report) that has materially affected, or is reasonably likely to materially affect, the registrant’s internal control over financial reporting; and
5. The registrant’s other certifying officer(s) and I have disclosed, based on our most recent evaluation of internal control over financial reporting, to the registrant’s auditors and the audit committee of the registrant’s board of directors (or persons performing the equivalent functions):
a) All significant deficiencies and material weaknesses in the design or operation of internal control over financial reporting which are reasonably likely to adversely affect the registrant’s ability to record, process, summarize and report financial information; and
b) Any fraud, whether or not material, that involves management or other employees who have a significant role in the registrant’s internal control over financial reporting.
/s/ Robert A. Garechana Robert A. Garechana Chief Financial Officer

Exhibit 31.3
ERP Operating Limited Partnership CERTIFICATIONS
I, Mark J. Parrell, certify that:
Date: February 20, 2020
(Back To Top)
Exhibit 31.4
ERP Operating Limited Partnership
Section 10: EX-31.3 (EX-31.3)
1. I have reviewed this annual report on Form 10-K of ERP Operating Limited Partnership;
2. Based on my knowledge, this report does not contain any untrue statement of a material fact or omit to state a material fact necessary to make the statements made, in light of the circumstances under which such statements were made, not misleading with respect to the period covered by this report;
3. Based on my knowledge, the financial statements, and other financial information included in this report, fairly present in all material respects the financial condition, results of operations and cash flows of the registrant as of, and for, the periods presented in this report;
4. The registrant’s other certifying officer(s) and I are responsible for establishing and maintaining disclosure controls and procedures (as defined in Exchange Act Rules 13a-15(e) and 15d-15(e)) and internal control over financial reporting (as defined in Exchange Act Rules 13a-15(f) and 15d-15(f)) for the registrant and have:
a) Designed such disclosure controls and procedures, or caused such disclosure controls and procedures to be designed under our supervision, to ensure that material information relating to the registrant, including its consolidated subsidiaries, is made known to us by others within those entities, particularly during the period in which this report is being prepared;
b) Designed such internal control over financial reporting, or caused such internal control over financial reporting to be designed under our supervision, to provide reasonable assurance regarding the reliability of financial reporting and the preparation of financial statements for external purposes in accordance with generally accepted accounting principles;
c) Evaluated the effectiveness of the registrant’s disclosure controls and procedures and presented in this report our conclusions about the effectiveness of the disclosure controls and procedures, as of the end of the period covered by this report based on such evaluation; and
d) Disclosed in this report any change in the registrant’s internal control over financial reporting that occurred during the registrant’s most recent fiscal quarter (the registrant’s fourth fiscal quarter in the case of an annual report) that has materially affected, or is reasonably likely to materially affect, the registrant’s internal control over financial reporting; and
5. The registrant’s other certifying officer(s) and I have disclosed, based on our most recent evaluation of internal control over financial reporting, to the registrant’s auditors and the audit committee of the registrant’s board of directors (or persons performing the equivalent functions):
a) All significant deficiencies and material weaknesses in the design or operation of internal control over financial reporting which are reasonably likely to adversely affect the registrant’s ability to record, process, summarize and report financial information; and
b) Any fraud, whether or not material, that involves management or other employees who have a significant role in the registrant’s internal control over financial reporting.
/s/ Mark J. Parrell Mark J. Parrell Chief Executive Officer of Registrant’s General Partner
Section 11: EX-31.4 (EX-31.4)

CERTIFICATIONS
I, Robert A. Garechana, certify that:
Date: February 20, 2020
(Back To Top)
Exhibit 32.1
Equity Residential CERTIFICATION PURSUANT TO
18 U.S.C. SECTION 1350, AS ADOPTED PURSUANT TO
SECTION 906 OF THE SARBANES-OXLEY ACT OF 2002
In connection with the Annual Report of Equity Residential (the “Company”) on Form 10-K for the period ending December 31, 2019 as filed with the Securities and Exchange Commission on the date hereof (the “Report”), I, Mark J. Parrell, Chief Executive Officer of the Company, certify, pursuant to 18 U.S.C. § 1350, as adopted pursuant to § 906 of the Sarbanes-Oxley Act of 2002, that, to the best of my knowledge:
1. I have reviewed this annual report on Form 10-K of ERP Operating Limited Partnership;
2. Based on my knowledge, this report does not contain any untrue statement of a material fact or omit to state a material fact necessary to makethe statements made, in light of the circumstances under which such statements were made, not misleading with respect to the period covered by this report;
3. Based on my knowledge, the financial statements, and other financial information included in this report, fairly present in all material respects the financial condition, results of operations and cash flows of the registrant as of, and for, the periods presented in this report;
4. The registrant’s other certifying officer(s) and I are responsible for establishing and maintaining disclosure controls and procedures (as defined in Exchange Act Rules 13a-15(e) and 15d-15(e)) and internal control over financial reporting (as defined in Exchange Act Rules 13a-15(f) and 15d-15(f)) for the registrant and have:
a) Designed such disclosure controls and procedures, or caused such disclosure controls and procedures to be designed under our supervision, to ensure that material information relating to the registrant, including its consolidated subsidiaries, is made known to us by others within those entities, particularly during the period in which this report is being prepared;
b) Designed such internal control over financial reporting, or caused such internal control over financial reporting to be designed under our supervision, to provide reasonable assurance regarding the reliability of financial reporting and the preparation of financial statements for external purposes in accordance with generally accepted accounting principles;
c) Evaluated the effectiveness of the registrant’s disclosure controls and procedures and presented in this report our conclusions about the effectiveness of the disclosure controls and procedures, as of the end of the period covered by this report based on such evaluation; and
d) Disclosed in this report any change in the registrant’s internal control over financial reporting that occurred during the registrant’s most recent fiscal quarter (the registrant’s fourth fiscal quarter in the case of an annual report) that has materially affected, or is reasonably likely to materially affect, the registrant’s internal control over financial reporting; and
5. The registrant’s other certifying officer(s) and I have disclosed, based on our most recent evaluation of internal control over financial reporting, to the registrant’s auditors and the audit committee of the registrant’s board of directors (or persons performing the equivalent functions):
a) All significant deficiencies and material weaknesses in the design or operation of internal control over financial reporting which are reasonably likely to adversely affect the registrant’s ability to record, process, summarize and report financial information; and
b) Any fraud, whether or not material, that involves management or other employees who have a significant role in the registrant’s internal control over financial reporting.
/s/ Robert A. Garechana Robert A. Garechana Chief Financial Officer of Registrant’s General Partner
Section 12: EX-32.1 (EX-32.1)

(Back To Top)
Exhibit 32.2
Equity Residential CERTIFICATION PURSUANT TO
18 U.S.C. SECTION 1350, AS ADOPTED PURSUANT TO
SECTION 906 OF THE SARBANES-OXLEY ACT OF 2002
In connection with the Annual Report of Equity Residential (the “Company”) on Form 10-K for the period ending December 31, 2019 as filed with the Securities and Exchange Commission on the date hereof (the “Report”), I, Robert A. Garechana, Chief Financial Officer of the Company, certify, pursuant to 18 U.S.C. § 1350, as adopted pursuant to § 906 of the Sarbanes-Oxley Act of 2002, that, to the best of my knowledge:
(Back To Top)
Exhibit 32.3
ERP Operating Limited Partnership CERTIFICATION PURSUANT TO
18 U.S.C. SECTION 1350, AS ADOPTED PURSUANT TO
SECTION 906 OF THE SARBANES-OXLEY ACT OF 2002
In connection with the Annual Report of ERP Operating Limited Partnership (the “Operating Partnership”) on Form 10-K for the period ending December 31, 2019 as filed with the Securities and Exchange Commission on the date hereof (the “Report”), I, Mark J. Parrell, Chief Executive Officer of Equity Residential, general partner of the Operating Partnership, certify, pursuant to 18 U.S.C. § 1350, as adopted pursuant to § 906 of the Sarbanes-Oxley Act of 2002, that, to the best of my knowledge:
(1) The Report fully complies with the requirements of section 13(a) or 15(d) of the Securities Exchange Act of 1934; and
(2) The information contained in the Report fairly presents, in all material respects, the financial condition and results of operations of the Company.
/s/ Mark J. Parrell Mark J. Parrell Chief Executive Officer February 20, 2020
Section 13: EX-32.2 (EX-32.2)
(1) The Report fully complies with the requirements of section 13(a) or 15(d) of the Securities Exchange Act of 1934; and
(2) The information contained in the Report fairly presents, in all material respects, the financial condition and results of operations of the Company.
/s/ Robert A. Garechana Robert A. Garechana Chief Financial Officer February 20, 2020
Section 14: EX-32.3 (EX-32.3)

(Back To Top)
Exhibit 32.4
ERP Operating Limited Partnership CERTIFICATION PURSUANT TO
18 U.S.C. SECTION 1350, AS ADOPTED PURSUANT TO
SECTION 906 OF THE SARBANES-OXLEY ACT OF 2002
In connection with the Annual Report of ERP Operating Limited Partnership (the “Operating Partnership”) on Form 10-K for the period ending December 31, 2019 as filed with the Securities and Exchange Commission on the date hereof (the “Report”), I, Robert A. Garechana, Chief Financial Officer of Equity Residential, general partner of the Operating Partnership, certify, pursuant to 18 U.S.C. § 1350, as adopted pursuant to § 906 of the Sarbanes-Oxley Act of 2002, that, to the best of my knowledge:
(Back To Top)
(1) The Report fully complies with the requirements of section 13(a) or 15(d) of the Securities Exchange Act of 1934; and
(2) The information contained in the Report fairly presents, in all material respects, the financial condition and results of operations of the Operating Partnership.
/s/ Mark J. Parrell Mark J. Parrell Chief Executive Officer of Registrant’s General Partner February 20, 2020
Section 15: EX-32.4 (EX-32.4)
(1) The Report fully complies with the requirements of section 13(a) or 15(d) of the Securities Exchange Act of 1934; and
(2) The information contained in the Report fairly presents, in all material respects, the financial condition and results of operations of the Operating Partnership.
/s/ Robert A. Garechana Robert A. Garechana Chief Financial Officer of Registrant’s General Partner February 20, 2020