
Form 10-K - FLOWSERVE CORPORATION
138
UNITED STATES SECURITIES AND EXCHANGE COMMISSION Washington, D.C. 20549 Form 10-K ☑ ANNUAL REPORT PURSUANT TO SECTION 13 OR 15(d) OF THE SECURITIES EXCHANGE ACT OF 1934 FOR THE FISCAL YEAR ENDED DECEMBER 31, 2019 OR ☐ TRANSITION REPORT PURSUANT TO SECTION 13 OR 15(d) OF THE SECURITIES EXCHANGE ACT OF 1934 Commission file number 1-13179 FLOWSERVE CORPORATION (Exact name of registrant as specified in its charter) New York 31-0267900 (State or other jurisdiction of incorporation or organization) (I.R.S. Employer Identification No.) 5215 N. O'Connor Boulevard Suite 2300, Irving, Texas 75039 (Address of principal executive offices) (Zip Code) (972) 443-6500 (Registrant’s telephone number, including area code) Securities registered pursuant to Section 12(b) of the Act: Title of Each Class Trading Symbol Name of Each Exchange on Which Registered Common Stock, $1.25 Par Value FLS New York Stock Exchange 1.25% Senior Notes due 2022 FLS22A New York Stock Exchange Securities registered pursuant to Section 12(g) of the Act: None Indicate by check mark if the registrant is a well-known seasoned issuer, as defined in Rule 405 of the Securities Act. Yes ☑ No ☐ Indicate by check mark if the registrant is not required to file reports pursuant to Section 13 or Section 15(d) of the Act. Yes ☐ No ☑ Indicate by check mark whether the registrant (1) has filed all reports required to be filed by Section 13 or 15(d) of the Securities Exchange Act of 1934 during the preceding 12 months (or for such shorter period that the registrant was required to file such reports), and (2) has been subject to such filing requirements for the past 90 days. Yes ☑ No ☐ Indicate by check mark whether the registrant has submitted electronically every Interactive Data File required to be submitted pursuant to Rule 405 of Regulation S-T (§ 232.405 of this chapter) during the preceding 12 months (or for such shorter period that the registrant was required to submit such files). Yes ☑ No ☐ Indicate by check mark whether the registrant is a large accelerated filer, an accelerated filer, a non-accelerated filer, a smaller reporting company, or an emerging growth company. See the definitions of “large accelerated filer,” “accelerated filer”, “smaller reporting company” and “emerging growth company” in Rule 12b-2 of the Exchange Act. Large accelerated filer ☑ Accelerated filer ☐ Non-accelerated filer ☐ Smaller reporting company ☐ Emerging growth company ☐ If an emerging growth company, indicate by check mark if the registrant has elected not to use the extended transition period for complying with any new or revised financial accounting standards provided pursuant to Section 13(a) of the Exchange Act. ☐ Indicate by check mark whether the registrant is a shell company (as defined in Rule 12b-2 of the Act). Yes ☐ No ☑ The aggregate market value of the common stock held by non-affiliates of the registrant, computed by reference to the closing price of the registrant’s common stock as reported on June 28, 2019 (the last business day of the registrant’s most recently completed second fiscal quarter), was approximately $3,069,855,077. For purposes of the foregoing calculation only, all directors, executive officers and known 5% beneficial owners have been deemed affiliates. Number of the registrant’s common shares outstanding as of February 12, 2020 was 130,901,014. DOCUMENTS INCORPORATED BY REFERENCE Certain information contained in the definitive proxy statement for the registrant’s 2020 Annual Meeting of Shareholders scheduled to be held on May 21, 2020 is incorporated by reference into Part III hereof.
-
Upload
khangminh22 -
Category
Documents
-
view
3 -
download
0
Transcript of Form 10-K - FLOWSERVE CORPORATION
UNITED STATES SECURITIES AND EXCHANGE COMMISSIONWashington, D.C. 20549
Form 10-K
☑ ANNUAL REPORT PURSUANT TO SECTION 13 OR 15(d) OF THE SECURITIES EXCHANGE ACT OF 1934 FOR THE FISCAL YEAR ENDED DECEMBER 31, 2019
OR
☐ TRANSITION REPORT PURSUANT TO SECTION 13 OR 15(d) OF THE SECURITIES EXCHANGE ACT OF 1934Commission file number 1-13179
FLOWSERVE CORPORATION(Exact name of registrant as specified in its charter)
New York 31-0267900
(State or other jurisdiction of incorporation or organization) (I.R.S. Employer Identification No.)
5215 N. O'Connor Boulevard Suite 2300, Irving, Texas 75039
(Address of principal executive offices) (Zip Code)(972) 443-6500
(Registrant’s telephone number, including area code)
Securities registered pursuant to Section 12(b) of the Act:
Title of Each Class Trading Symbol Name of Each Exchange on Which Registered
Common Stock, $1.25 Par Value FLS New York Stock Exchange1.25% Senior Notes due 2022 FLS22A New York Stock Exchange
Securities registered pursuant to Section 12(g) of the Act:None
Indicate by check mark if the registrant is a well-known seasoned issuer, as defined in Rule 405 of the Securities Act. Yes ☑ No ☐Indicate by check mark if the registrant is not required to file reports pursuant to Section 13 or Section 15(d) of the Act. Yes ☐ No ☑
Indicate by check mark whether the registrant (1) has filed all reports required to be filed by Section 13 or 15(d) of the Securities Exchange Act of 1934 during the preceding 12 months (orfor such shorter period that the registrant was required to file such reports), and (2) has been subject to such filing requirements for the past 90 days. Yes ☑ No ☐
Indicate by check mark whether the registrant has submitted electronically every Interactive Data File required to be submitted pursuant to Rule 405 of Regulation S-T (§ 232.405 of thischapter) during the preceding 12 months (or for such shorter period that the registrant was required to submit such files). Yes ☑ No ☐
Indicate by check mark whether the registrant is a large accelerated filer, an accelerated filer, a non-accelerated filer, a smaller reporting company, or an emerging growth company. See thedefinitions of “large accelerated filer,” “accelerated filer”, “smaller reporting company” and “emerging growth company” in Rule 12b-2 of the Exchange Act.
Large accelerated filer ☑ Accelerated filer ☐ Non-accelerated filer ☐ Smaller reporting company ☐
Emerging growth company ☐ If an emerging growth company, indicate by check mark if the registrant has elected not to use the extended transition period for complying with any new or
revised financial accounting standards provided pursuant to Section 13(a) of the Exchange Act. ☐ Indicate by check mark whether the registrant is a shell company (as defined in Rule 12b-2 of the Act). Yes ☐ No ☑The aggregate market value of the common stock held by non-affiliates of the registrant, computed by reference to the closing price of the registrant’s common stock as reported on June 28,
2019 (the last business day of the registrant’s most recently completed second fiscal quarter), was approximately $3,069,855,077. For purposes of the foregoing calculation only, all directors,executive officers and known 5% beneficial owners have been deemed affiliates.
Number of the registrant’s common shares outstanding as of February 12, 2020 was 130,901,014.
DOCUMENTS INCORPORATED BY REFERENCECertain information contained in the definitive proxy statement for the registrant’s 2020 Annual Meeting of Shareholders scheduled to be held on May 21, 2020 is incorporated by reference
into Part III hereof.
FLOWSERVE CORPORATIONFORM 10-K
TABLE OF CONTENTS
Page
PART IItem 1. Business 1Item 1A. Risk Factors 11Item 1B. Unresolved Staff Comments 21Item 2. Properties 21Item 3. Legal Proceedings 22Item 4. Mine Safety Disclosures 22
PART IIItem 5. Market for the Registrant’s Common Equity, Related Stockholder Matters and Issuer Purchases of Equity Securities 22Item 6. Selected Financial Data 25Item 7. Management’s Discussion and Analysis of Financial Condition and Results of Operations 26Item 7A. Quantitative and Qualitative Disclosures About Market Risk 48Item 8. Financial Statements and Supplementary Data 49Item 9. Changes in and Disagreements with Accountants on Accounting and Financial Disclosure 107Item 9A. Controls and Procedures 107Item 9B. Other Information 108
PART IIIItem 10. Directors, Executive Officers and Corporate Governance 108Item 11. Executive Compensation 109Item 12. Security Ownership of Certain Beneficial Owners and Management and Related Stockholder Matters 109Item 13. Certain Relationships and Related Transactions, and Director Independence 109Item 14. Principal Accounting Fees and Services 109
PART IVItem 15. Exhibits, Financial Statement Schedules 109Item 16. *Form 10-K Summary 112Signatures 113
i
PART IITEM 1. BUSINESS
OVERVIEW
Flowserve Corporation is a world leading manufacturer and aftermarket service provider of comprehensive flow control systems. FlowserveCorporation as it exists today was created in 1997 through the merger of two leading fluid motion and control companies — BW/IP and Durco International.Under the name of a predecessor entity, we were incorporated in the State of New York on May 1, 1912, but some of our heritage product brand names dateback to our founding in 1790. Over the years, we have evolved through organic growth and strategic acquisitions, and our over 225-year history of Flowserveheritage brands serves as the foundation for the breadth and depth of our products and services today. Unless the context otherwise indicates, references to"Flowserve," "the Company" and such words as "we," "our" and "us" include Flowserve Corporation and its subsidiaries.
We develop and manufacture precision-engineered flow control equipment integral to the movement, control and protection of the flow of materials inour customers’ critical processes. Our product portfolio of pumps, valves, seals, automation and aftermarket services supports global infrastructure industries,including oil and gas, chemical, power generation (including nuclear, fossil and renewable) and water management, as well as certain general industrialmarkets where our products and services add value. Through our manufacturing platform and global network of Quick Response Centers ("QRCs"), we offera broad array of aftermarket equipment services, such as installation, advanced diagnostics, repair and retrofitting.
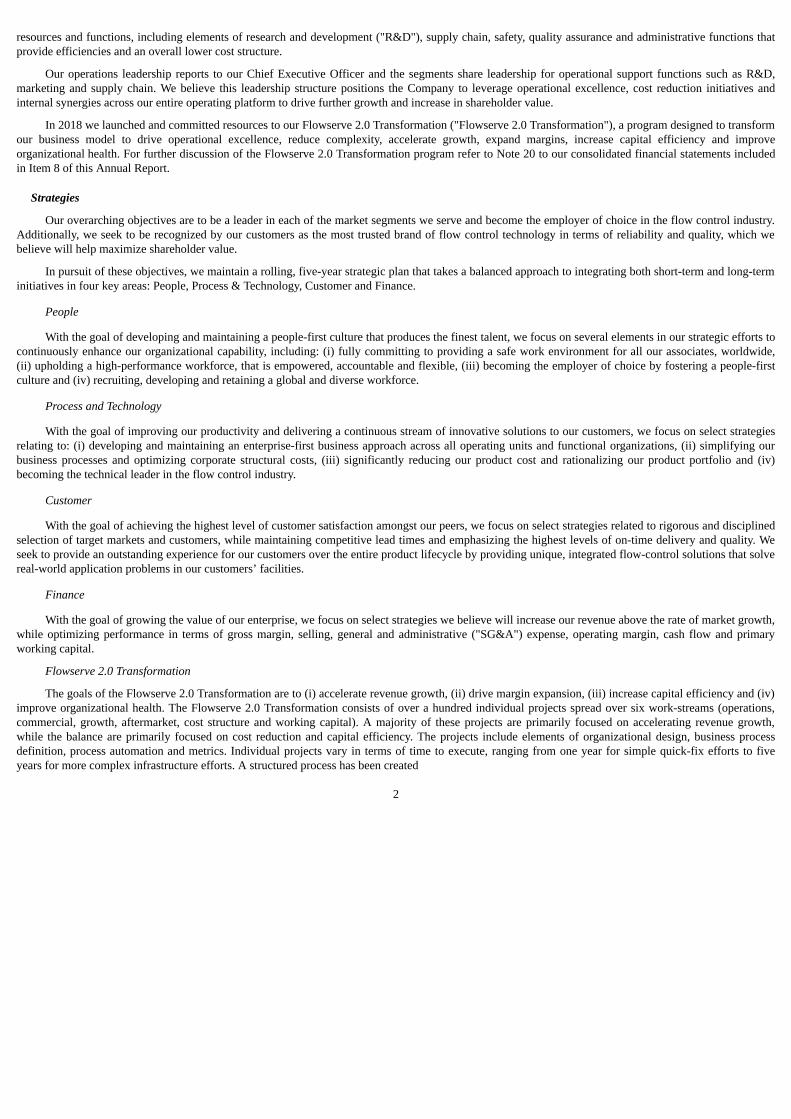
We sell our products and services to more than 10,000 companies, including some of the world’s leading engineering, procurement and constructionfirms ("EPC"), original equipment manufacturers, distributors and end users. Our products and services are used in several distinct industries having a broadgeographic reach. Our bookings mix by industry in 2019 and 2018 consisted of:
2019 2018
• oil and gas 41% 38%• general industries(1) 22% 25%• chemical(2) 22% 22%• power generation 11% 11%• water management 4% 4%
(1) General industries include mining and ore processing, pulp and paper, food and beverage and other smaller applications, as well as sales todistributors whose end customers typically operate in the industries we primarily serve.
(2)Chemical industry is comprised of chemical-based and pharmaceutical products.
We have pursued a strategy of industry diversity and geographic breadth to mitigate the impact on our business of normal economic downturns in anyone of the industries or in any particular part of the world we serve. For events that may occur and adversely impact our business, financial condition, resultsof operations and cash flows, refer to "Item 1A. Risk Factors" of this Annual Report on Form 10-K for the year ended December 31, 2019 ("Annual Report").For information on our sales and long-lived assets by geographic areas, see Note 18 to our consolidated financial statements included in "Item 8. FinancialStatements and Supplementary Data" ("Item 8") of this Annual Report.
During the first quarter of 2019, we determined that there were meaningful operational synergies and benefits to combining our previously reportedEngineered Product Division ("EPD") and Industrial Product Division ("IPD") segments into one reportable segment, Flowserve Pump Division ("FPD"). Asa result, we implemented a reorganization of our operating segments and report our financial information reflecting two segments: FPD and Flow ControlDivision ("FCD"). The reorganization of the segments reflects how our chief operating decision maker (Chief Executive Officer) regularly reviews financialinformation to allocate resources and assess performance. Prior periods' financial information was retrospectively adjusted to reflect the new reportablesegment structure. Sales to external customers, intersegment sales, operating profit and the presentation of certain other financial information by segment arereported in Note 18 to our consolidated financial statements included in Item 8 of this Annual Report and in the Management’s Discussion and Analysis ofFinancial Condition and Results of Operations.
Our segments share a focus on industrial flow control technology and benefit from our global footprint and our economies of scale in reducingadministrative and overhead costs to serve customers more cost effectively. All segments share certain
1
resources and functions, including elements of research and development ("R&D"), supply chain, safety, quality assurance and administrative functions thatprovide efficiencies and an overall lower cost structure.
Our operations leadership reports to our Chief Executive Officer and the segments share leadership for operational support functions such as R&D,marketing and supply chain. We believe this leadership structure positions the Company to leverage operational excellence, cost reduction initiatives andinternal synergies across our entire operating platform to drive further growth and increase in shareholder value.
In 2018 we launched and committed resources to our Flowserve 2.0 Transformation ("Flowserve 2.0 Transformation"), a program designed to transformour business model to drive operational excellence, reduce complexity, accelerate growth, expand margins, increase capital efficiency and improveorganizational health. For further discussion of the Flowserve 2.0 Transformation program refer to Note 20 to our consolidated financial statements includedin Item 8 of this Annual Report.
Strategies
Our overarching objectives are to be a leader in each of the market segments we serve and become the employer of choice in the flow control industry.Additionally, we seek to be recognized by our customers as the most trusted brand of flow control technology in terms of reliability and quality, which webelieve will help maximize shareholder value.
In pursuit of these objectives, we maintain a rolling, five-year strategic plan that takes a balanced approach to integrating both short-term and long-terminitiatives in four key areas: People, Process & Technology, Customer and Finance.
People
With the goal of developing and maintaining a people-first culture that produces the finest talent, we focus on several elements in our strategic efforts tocontinuously enhance our organizational capability, including: (i) fully committing to providing a safe work environment for all our associates, worldwide,(ii) upholding a high-performance workforce, that is empowered, accountable and flexible, (iii) becoming the employer of choice by fostering a people-firstculture and (iv) recruiting, developing and retaining a global and diverse workforce.
Process and Technology
With the goal of improving our productivity and delivering a continuous stream of innovative solutions to our customers, we focus on select strategiesrelating to: (i) developing and maintaining an enterprise-first business approach across all operating units and functional organizations, (ii) simplifying ourbusiness processes and optimizing corporate structural costs, (iii) significantly reducing our product cost and rationalizing our product portfolio and (iv)becoming the technical leader in the flow control industry.
Customer
With the goal of achieving the highest level of customer satisfaction amongst our peers, we focus on select strategies related to rigorous and disciplinedselection of target markets and customers, while maintaining competitive lead times and emphasizing the highest levels of on-time delivery and quality. Weseek to provide an outstanding experience for our customers over the entire product lifecycle by providing unique, integrated flow-control solutions that solvereal-world application problems in our customers’ facilities.
Finance
With the goal of growing the value of our enterprise, we focus on select strategies we believe will increase our revenue above the rate of market growth,while optimizing performance in terms of gross margin, selling, general and administrative ("SG&A") expense, operating margin, cash flow and primaryworking capital.
Flowserve 2.0 Transformation
The goals of the Flowserve 2.0 Transformation are to (i) accelerate revenue growth, (ii) drive margin expansion, (iii) increase capital efficiency and (iv)improve organizational health. The Flowserve 2.0 Transformation consists of over a hundred individual projects spread over six work-streams (operations,commercial, growth, aftermarket, cost structure and working capital). A majority of these projects are primarily focused on accelerating revenue growth,while the balance are primarily focused on cost reduction and capital efficiency. The projects include elements of organizational design, business processdefinition, process automation and metrics. Individual projects vary in terms of time to execute, ranging from one year for simple quick-fix efforts to fiveyears for more complex infrastructure efforts. A structured process has been created
2
to ensure that each project follows common milestones and delivers value over its lifecycle, with a governance process that oversees the portfolio to ensurethat time-phased trade-offs between cost and benefits are proactively managed. The project portfolio is actively covered by a dedicated transformation officeto ensure that projects are managed from inception to execution to protect the long-term value of the transformation.
Competition
Despite consolidation activities in past years, the markets for our products remain highly competitive, with primary competitive drivers being price,reputation, project management, timeliness of delivery, quality, proximity to service centers and technical expertise, as well as contractual terms and previousinstallation history. In the pursuit of large capital projects, competitive drivers and competition vary depending on the industry and products involved.Industries experiencing slow growth generally tend to have a competitive environment more heavily influenced by price due to supply outweighing demandand price competition tends to be more significant for original equipment orders than aftermarket services. Considering the current forecasts for 2020, pricingfor original equipment orders may continue to be a particularly influential competitive factor. The unique competitive environments in our business segmentsare discussed in more detail under the “Business Segments” heading below.
In the aftermarket portion of our business, we compete against large, well-established national and global competitors and, in some markets, againstregional and local companies. In the oil and gas and chemical industries, the primary competitors for aftermarket services tend to be customers’ own in-housecapabilities. In the nuclear power generation industry, we possess certain competitive advantages due to our "N Stamp" certification, which is a prerequisite toserve customers in that industry, as well as our considerable base of proprietary knowledge. Aftermarket competition for standardized products is aggressivedue to the existence of common standards allowing for easier replacement or repair of the installed products.
In the sale of aftermarket products and services, we benefit from our large installed base of pumps, valves and seals, which continually requiremaintenance, repair and replacement parts due to the nature of the products and the conditions under which they operate. Timeliness of delivery, quality andthe proximity of service centers are important customer considerations when selecting a provider for aftermarket products and services. In geographic regionswhere we are locally positioned to provide a quick response, customers have traditionally relied on us, rather than our competitors, for aftermarket productsrelating to our highly-engineered and customized products, although we are seeing increased competition in this area.
Generally, our customers attempt to reduce the number of vendors from which they purchase, thereby reducing the size and diversity of their supplychain. Although vendor reduction programs could adversely affect our business, we have been successful in establishing long-term supply agreements with anumber of customers. While the majority of these agreements do not provide us with exclusive rights, they can provide us a "preferred" status with ourcustomers and thereby increase opportunities to win future business. We also utilize our LifeCycle Advantage program to establish fee-based contracts tomanage customers’ aftermarket requirements. These programs provide an opportunity to manage the customer’s installed base and expand the businessrelationship with the customer.
Our ability to use our portfolio of products, solutions and services to meet customer needs is a competitive strength. Our market approach is to createvalue for our customers throughout the life cycle of their investments in flow control management. We continue to explore and develop potential newofferings in conjunction with our customers. In the early phases of project design, we endeavor to create value in optimizing the selection of equipment forthe customer’s specific application, as we are capable of providing technical expertise on product and system capabilities even outside the scope of ourspecific products, solutions and services. After the equipment is constructed and delivered to the customer’s site, we continue to create value through ouraftermarket capabilities by optimizing the performance of the equipment over its operational life. Our skilled service personnel can provide these aftermarketservices for our products, as well as many competitors’ products, within the installed base. This value is further enhanced by the global reach of our QRCsand, when combined with our other solutions for our customers’ flow control management needs, allows us to create value for our customers during allphases of the capital and operating expenditure cycles.
Customers
We sell to a wide variety of customers globally including leading EPC firms, original equipment manufacturers, distributors and end users in severaldistinct industries: oil and gas, chemical, power generation, water management and general industries. We do not have sales to any individual customer thatrepresent 10% or more of consolidated 2019 revenues. Customer information relating to each of our business segments is discussed in more detail under the"Business Segments" heading below.
3
We are not normally required to carry unusually high amounts of inventory to meet customer delivery requirements, although higher backlog levels andlonger lead times generally require higher amounts of inventory. We typically require advance cash payments from customers on longer lead time projects tohelp offset our investment in inventory. We have initiated programs targeted at improving our operational effectiveness to reduce our overall working capitalneeds. While we do provide cancellation policies through our contractual relationships, we generally do not provide rights of product return for ourcustomers.
Selling and Distribution
We primarily distribute our products through direct sales by employees assigned to specific regions, industries or products. In addition, we usedistributors and sales representatives to supplement our direct sales force in countries where it is more appropriate due to business practices or customs, orwhenever the use of direct sales staff is not economically efficient. We generate a majority of our sales leads through existing relationships with vendors,customers and prospects or through referrals.
Intellectual Property
We own a number of trademarks and patents relating to the names and designs of our products. We consider our trademarks and patents to be valuableassets of our business. In addition, our pool of proprietary information, consisting of know-how and trade secrets related to the design, manufacture andoperation of our products, is considered particularly valuable. Accordingly, we take proactive measures to protect such proprietary information. We generallyown the rights to the products that we manufacture and sell and are unencumbered by licensing or franchise agreements. Our trademarks can typically berenewed indefinitely as long as they remain in use, whereas our existing patents generally expire 10 to 20 years from the dates they were filed, which hasoccurred at various times in the past. We do not believe that the expiration of any individual patent will have a material adverse impact on our business,financial condition or results of operations.
Raw Materials
The principal raw materials used in manufacturing our products are readily available and include ferrous and non-ferrous metals in the form of barstock, machined castings, fasteners, forgings and motors, as well as silicon, carbon faces, gaskets and fluoropolymer components. A substantial volume of ourraw materials is purchased from outside sources, and we have been able to develop a robust supply chain and anticipate no significant shortages of suchmaterials in the future. We continually monitor the business conditions of our suppliers to manage competitive market conditions and to avoid potentialsupply disruptions. We continue to expand global sourcing to capitalize on localization in emerging markets and low-cost sources of purchased goodsbalanced with efficient consolidated and compliant logistics.
Metal castings used in the manufacture of our pump, valve, and mechanical seals are purchased from qualified and approved foundry sources. Weremain vertically integrated with metal castings in certain strategic product families.
Concerning the products we supply to customers in the nuclear power generation industry, suppliers of raw materials for nuclear power generationmarkets must be qualified to meet the requirements of nuclear industry standards and governmental regulations. Supply channels for these materials arecurrently adequate, and we do not anticipate difficulty in obtaining such materials in the future.
Employees and Labor Relations
We have approximately 17,000 employees globally as of December 31, 2019. In the United States ("U.S."), a portion of the hourly employees at ourpump manufacturing plant located in Vernon, California, our valve manufacturing plant located in Lynchburg, Virginia and our pattern storage facility locatedin Dayton, Ohio, are represented by unions. Additionally, some employees at select facilities in the following countries are unionized or have employee workscouncils: Argentina, Australia, Austria, Brazil, Finland, France, Germany, India, Italy, Japan, Mexico, The Netherlands, South Africa, Spain, Sweden and theUnited Kingdom ("U.K."). We believe relations with our employees throughout our operations are generally satisfactory, including those employeesrepresented by unions and employee works councils. No unionized facility accounted for more than 10% of our consolidated 2019 revenues.
Environmental Regulations and Proceedings
We are subject to environmental laws and regulations in all jurisdictions in which we have operating facilities. These requirements primarily relate tothe generation and disposal of waste, air emissions and waste water discharges. We periodically
4
make capital expenditures to enhance our compliance with environmental requirements, as well as to abate and control pollution. At present, we have noplans for any material capital expenditures for environmental control equipment at any of our facilities. However, we have incurred and continue to incuroperating costs relating to ongoing environmental compliance matters. Based on existing and proposed environmental requirements and our anticipatedproduction schedule, we believe that future environmental compliance expenditures will not have a material adverse effect on our financial condition, resultsof operations or cash flows.
We use hazardous substances and generate hazardous wastes in many of our manufacturing and foundry operations. Most of our current and formerproperties are or have been used for industrial purposes and some may require clean-up of historical contamination. During the due diligence phase of ouracquisitions, we conduct environmental site assessments to identify potential environmental liabilities and required clean-up measures. We are currentlyconducting follow-up investigation and/or remediation activities at those locations where we have known environmental concerns. We have cleaned up amajority of the sites with known historical contamination and are addressing the remaining identified issues.
Over the years, we have been involved as one of many potentially responsible parties ("PRP") at former public waste disposal sites that are or weresubject to investigation and remediation. We are currently involved as a PRP at five Superfund sites. The sites are in various stages of evaluation bygovernment authorities. Our total projected "fair share" cost allocation at these five sites is expected to be immaterial. See "Item 3. Legal Proceedings"included in this Annual Report for more information.
We have established reserves that we currently believe to be adequate to cover our currently identified on-site and off-site environmental liabilities.
Exports
Our export sales from the U.S. to foreign unaffiliated customers were $300.9 million in 2019, $234.3 million in 2018 and $258.3 million in 2017.
Licenses are required from U.S. and other government agencies to export certain products. In particular, products with nuclear power generation and/ormilitary applications are restricted, as are certain other pump, valve and seal products.
BUSINESS SEGMENTS
In addition to the business segment information presented below, Note 18 to our consolidated financial statements in Item 8 of this Annual Reportcontains additional financial information about our business segments and geographic areas in which we have conducted business in 2019, 2018 and 2017.
FLOWSERVE PUMP DIVISION
Our largest business segment is FPD, through which we design, manufacture, pre-test, distribute and service specialty and highly-engineered customand pre-configured pumps and pump systems, mechanical seals, auxiliary systems, replacement parts and upgrades and related aftermarket services. FPD alsomanufactures replacement pumps and upgrades and provides a full array of replacement parts, repair and support services (collectively referred to as"aftermarket"). FPD products and services are primarily used by companies that operate in the oil and gas, petrochemical, chemical, power generation, watermanagement and general industries. We market our pump and mechanical seal products through our global sales force and our regional QRCs and service andrepair centers or through independent distributors and sales representatives. A portion of our mechanical seal products are sold directly to other originalequipment manufacturers for incorporation into their rotating equipment requiring mechanical seals.
Our pump products are manufactured in a wide range of metal alloys and with a variety of configurations to reliably meet the operating requirements ofour customers. Mechanical seals are critical to the reliable operation of rotating equipment in that they prevent leakage and emissions of hazardous substancesfrom the rotating equipment and reduce shaft wear on the equipment caused by the use of non-mechanical seals. We also manufacture a gas-lubricatedmechanical seal that is used in high-speed compressors for gas pipelines and in the oil and gas production and process markets. Our products are currentlymanufactured in 39 manufacturing facilities worldwide, 13 of which are located in Europe, 12 in North America, eight in Asia Pacific and six in LatinAmerica, and we have 144 QRCs, including those co-located in manufacturing facilities and/or shared with FCD.
We also conduct business through strategic foreign joint ventures. We have six unconsolidated joint ventures that are located in Chile, China, India,Saudi Arabia, South Korea and the United Arab Emirates, where a portion of our products are
5
manufactured, assembled or serviced in these territories. These relationships provide numerous strategic opportunities, including increased access to ourcurrent and new markets, access to additional manufacturing capacity and expansion of our operational platform to support best-cost sourcing initiatives andbalance capacity demands for other markets.
FPD Products
We manufacture more than 40 different active types of pumps and approximately 185 different models of mechanical seals and sealing systems. Thefollowing is a summary list of our FPD product types and globally recognized brands:
FPD Product Types
Single and Multistage Between Bearings Pumps Single Stage Overhung Pumps• Single Case — Axially Split • API Process• Single Case — Radially Split • Double Case
Overhung Pumps Between Bearings Pumps• Chemical Process ASME and ISO • Single Case — Radially Split• Industrial Process • Side Channel Multistage• Slurry and Solids Handling • Split Case — Axially Split• Metallic & Lined Magnetic Drive Process • Split Case — Radially Split
Positive Displacement Pumps Mechanical Seals and Seal Support Systems• Rotary Multiphase • Dry-Running Seals• Rotary Screw • Barrier Fluids and Lubricants • Bearing IsolatorsVertical Pumps • Compressor Seals• Deepwell Submersible • Gas Barrier Seals• Slurry and Solids Handling • Mixer Seals• Sump & Cantilever • Standard Cartridge Seals• Vertical Inline • Seal Support Systems• Vertical Line Shaft • Vertical Canned Shaft Vacuum Systems• Wet Pit, Double Case API & Double • Liquid Ring • LR SystemsPositive Displacement Pumps • Dry Systems• Gear
Specialty Products • Ag Chem • Submersible Pumps• Barge Pumps • Solids Handling Submersible• Cryogenic Pumps • Wireless Transmitters• Concrete Volute Pumps • Power Recovery — DWEER• Ebullator Recycle Pumps • Power Recovery — Hydro Turbine• Geothermal Deepwell Pumps • Energy Recovery Devices• Molten Salt Pumps • Hydraulic Decoking Systems• Nuclear Pumps • API Slurry Pumps• Nuclear Seals
6
FPD Brand Names
• BW Seals • Meregalli• Byron Jackson • Niigata Worthington• Calder Energy Recovery Devices • QRC™• Durametallic • Pacific• Durco • Pacific Weitz• Five Star Seal • Pac-Seal• Flowserve • ReadySeal• GASPAC™ • Scienco• Halberg • SIHI• IDP • TKL• Innomag • United Centrifugal• Interseal • Western Land Roller• Lawrence • Worthington• LifeCycle Advantage • Worthington-Simpson• Labour
FPD Services
We market our pump products through our worldwide sales force, regional service and repair centers, independent distributors and sales representatives.We also provide engineered aftermarket services through our global network of 144 QRCs, some of which are co-located in manufacturing facilities, in 44countries. Our FPD service personnel provide a comprehensive set of equipment services for flow management control systems, including installation,commissioning services, seal systems spare parts, repairs, advanced diagnostics, re-rate and upgrade solutions and retrofit programs, machining andcomprehensive asset management solutions. We provide asset management services and condition monitoring for rotating equipment through specialcontracts with many of our customers that reduce maintenance costs. A large portion of FPD’s service work is performed on a quick response basis, and weoffer 24-hour service in all of our major markets.
FPD New Product Development
Our investments in new product R&D continue to focus on increasing the capability of our products as customer applications become more advanced,demanding greater levels of production (i.e., flow and power) and under more extreme conditions (i.e., erosive, corrosive and temperature) beyond the levelof traditional technology. We will invest in our product platform to expand and enhance our products offered to the global chemical industry. We continue todevelop innovations that improve our competitive position in the engineered equipment industry, specifically upstream, offshore and downstream applicationsfor the oil and gas market. Continued engagement with our end users is exemplified through completion of advancements that significantly improve energyefficiency, reduce total cost-of-ownership and enhance safety.
As new sources of energy generation are explored, we continue to develop new product designs to support the most critical applications in the powergeneration market. New designs and qualification test programs continue to support the critical services found in the coal fired, combined cycle, smallmodular nuclear and concentrated solar power generation plant.
We continue to address our core products with design enhancements that improve performance, reduce costs, extend operating life between requiredmaintenance periods and reduce the lead times in which we can deliver our products. Our engineering teams continue to apply and develop sophisticateddesign technology and methods supporting continuous improvement of our proven technology. Additionally, we are incentivizing our operations and trackingthe R&D projects more closely, which is leading to broader engagement in developing new products.
We continue to advance our Intelligent Performance Solutions ("IPS") Insight platform. This platform utilizes a combination of our developedtechnologies and leading edge technology partners to increase our remote monitoring, diagnostics, asset management and service capabilities for our end-usercustomers. These technologies include intelligent devices, advanced communication and security protocols, wireless and satellite communications and web-enabled data convergence. Additionally, we have been exploring additive manufacturing opportunities in our products and auxiliary systems.
None of these newly developed products or services required the investment of a material amount of our assets or was otherwise material to ourbusiness.
7
FPD Customers
Our customer mix is diversified and includes leading EPC firms, major national oil companies, international oil companies, equipment end users in ourserved markets, other original equipment manufacturers, distributors and end users. Our sales mix of original equipment products and aftermarket productsand services diversifies our business and helps mitigate the impact of normal economic cycles on our business. Our sales are diversified among severalindustries, including oil and gas, petrochemical, chemical, power generation, water management and general industries.
FPD Competition
The pump and mechanical seal industry is highly fragmented, with thousands of competitors globally. We compete, however, primarily with a limitednumber of large companies operating on a global scale. There are also a number of smaller, newer entrants in some of our emerging markets. Competitionamong our closest competitors is generally driven by delivery times, application knowledge, experience, expertise, price, breadth of product offerings,contractual terms, previous installation history and reputation for quality. Some of our largest industry competitors include: Sulzer Pumps; Ebara Corp.; SPXFLOW, Inc.; Eagle Burgmann, which is a joint venture of two traditional global seal manufacturers, A. W. Chesterton Co. and AES Corp.; John Crane Inc., aunit of Smiths Group Plc; Weir Group Plc.; ITT Industries; and KSB SE & Co. KGaA.
The pump and mechanical seal industry continues to undergo considerable consolidation, which is primarily driven by (i) the need to lower coststhrough reduction of excess capacity and (ii) customers’ preference to align with global full service suppliers to simplify their supplier base. Despite theconsolidation activity, the market remains highly competitive.
We believe that our strongest sources of competitive advantage rest with our extensive range of pumps for the oil and gas, petrochemical, chemical andpower generation industries, our large installed base of products, our strong customer relationships, our high technology, our more than 225 years ofexperience in manufacturing and servicing pumping equipment, our reputation for providing quality engineering solutions and our ability to deliverengineered new seal product orders within 72 hours from the customer’s request.
FPD Backlog
FPD’s backlog of orders as of December 31, 2019 was $1,560.9 million, compared with $1,286.2 million as of December 31, 2018. We expect torecognize revenue on approximately 88% of December 31, 2019 backlog during 2020.
FLOW CONTROL DIVISION
FCD designs, manufactures, distributes and services a broad portfolio of engineered and industrial valve and automation solutions, including isolationand control valves, actuation, controls and related equipment. FCD leverages its experience and application know-how by offering a complete menu ofengineering and project management services to complement its expansive product portfolio. FCD products are used to control, direct and manage the flow ofliquids and gases and are an integral part of any flow control system. Our valve products are most often customized or engineered to perform specificfunctions within each customer’s unique flow control environment.
Our flow control products are primarily used by companies operating in the chemical, power generation, oil and gas, water management and generalindustries. Our products are currently manufactured in 21 principal manufacturing facilities, five of which are located in the U.S., 10 located in Europe, fivelocated in Asia Pacific and one located in Latin America. FCD operates 28 QRCs worldwide, including seven sites in Europe, nine in North America,10 inAsia Pacific and two in Latin America, including those co-located in manufacturing facilities.
FCD Products
Our valve, automation and controls product and solutions portfolio represent one of the most comprehensive in the flow control industry. Our productsare used in a wide variety of applications, from general service to the most severe and demanding services, including those involving high levels of corrosion,extreme temperatures and/or pressures, zero fugitive emissions and emergency shutdown.
Our “smart” valve and diagnostic technologies integrate sensors, microprocessor controls and software into high performance integrated control valves,digital positioners and switchboxes for automated on/off valve assemblies and electric actuators. These technologies permit real-time system analysis, systemwarnings and remote indication of asset health. These technologies have been developed in response to the growing demand for reduced maintenance,improved process control
8
efficiency and digital communications at the plant level. We are committed to further enhancing the quality of our product portfolio by continuing to upgradeour existing offerings with cutting-edge technologies.
Our valve automation products encompass a broad range of pneumatic, electric, hydraulic and stored energy actuation designs to take advantage ofwhatever power source the customer has available. FCD’s actuation products can utilize the process fluid flowing through the pipeline as a source of power toactuate the valve. Our actuation products also cover one of the widest ranges of output torques in the industry, providing the ability to automate anything fromthe smallest linear globe valve to the largest multi-turn gate valve. Most importantly, FCD combines best-in-class mechanical designs with the latest in digitalcontrols in order to provide complete integrated automation solutions that optimize the combined valve-actuator-controls package.
The following is a summary list of our valve and automation products and globally recognized brands:
FCD Product Types
• Valve Automation Systems • Electro Pneumatic Positioners• Control Valves • Digital Positioners• Ball Valves • Pneumatic Positioners• Gate Valves • Intelligent Positioners• Globe Valves • Electric/Electronic Actuators• Check Valves • Pneumatic Actuators• Butterfly Valves • Hydraulic Actuators• Lined Plug Valves • Diaphragm Actuators• Lined Ball Valves • Direct Gas and Gas-over-Oil Actuators• Lubricated Plug Valves • Limit Switches• Non-Lubricated Plug Valves • Digital Communications• Integrated Valve Controllers • Valve and Automation Repair Services• Diagnostic Software
FCD Brand Names
• Accord • NAF• Anchor/Darling • Noble Alloy• Argus • Norbro• Atomac • Nordstrom• Automax • PMV• Durco • Serck Audco• Edward • Schmidt Armaturen• Flowserve • Valbart• Kammer • Valtek• Limitorque • Worcester Controls• McCANNA/MARPAC
FCD Services
Our service personnel provide comprehensive equipment maintenance services for flow control systems, including advanced diagnostics, repair,installation, commissioning, retrofit programs and field machining capabilities. A large portion of our service work is performed on a quick response basis,which includes 24-hour service in all of our major markets. We also provide in-house repair and return manufacturing services worldwide through ourmanufacturing facilities. We believe our ability to offer comprehensive, quick turnaround services provides us with a unique competitive advantage andunparalleled access to our customers’ installed base of flow control products.
9
FCD New Product Development
Our R&D investment is focused on areas that will advance our technological leadership and further differentiate our competitive advantage from aproduct perspective. Investment has been focused on significantly enhancing the digital integration and interoperability of valve top-works (e.g., positioners,actuators, limit switches and associated accessories) with Distributed Control Systems ("DCS"). We continue to pursue the development and deployment ofnext-generation hardware and software for valve diagnostics and the integration of the resulting device intelligence through the DCS to provide a practicaland effective asset management capability for the end user. In addition to developing these new capabilities and value-added services, our investments alsoinclude product portfolio expansion in the areas of higher tier offering and severe service applications such as noise and cavitation reduction. Theseinvestments are made by adding new resources and talent to the organization, as well as leveraging the experience of FPD and increasing our collaborationwith third parties. We expect to continue our R&D investments in the areas discussed above.
None of these newly developed valve products or services required the investment of a material amount of our assets or was otherwise material.
FCD Customers
Our customer mix spans several markets, including the chemical, power generation, oil and gas, water management, pulp and paper, mining and othergeneral industries. Our product mix includes original equipment and aftermarket parts and services. FCD contracts with a variety of customers, ranging fromEPC firms, to distributors, end users and other original equipment manufacturers.
FCD Competition
While in recent years the valve market has undergone a significant amount of consolidation, the market remains highly fragmented. Some of the largestvalve industry competitors include Emerson Electric Co., Cameron International Corp. (a Schlumberger company), Baker Hughes, Rotork plc and Crane Co.
Our market research and assessments indicate that the top 10 global valve manufacturers collectively comprise less than 15% of the total valve market.Based on independent industry sources, we believe that FCD is the second largest industrial valve supplier in the world. We believe that our strongest sourcesof competitive advantage rest with our comprehensive portfolio of valve products and services, our ability to provide complementary pump and aftermarketproducts and services, our focus on execution and our expertise in severe corrosion and erosion applications.
FCD Backlog
FCD’s backlog of orders as of December 31, 2019 was $600.1 million, compared with $608.4 million as of December 31, 2018. We expect to recognizerevenue on approximately 90% of December 31, 2019 backlog during 2020.
AVAILABLE INFORMATION
We maintain an Internet web site at www.flowserve.com. Our Annual Reports on Form 10-K, Quarterly Reports on Form 10-Q, Current Reports onForm 8-K and any amendments to those reports filed or furnished pursuant to Section 13(a) of the Securities Exchange Act of 1934 are made available free ofcharge through the “Investor Relations” section of our Internet web site as soon as reasonably practicable after we electronically file the reports with, orfurnish the reports to, the U.S. Securities and Exchange Commission ("SEC"). Reports, proxy statements and other information filed or furnished with theSEC are also available at www.sec.gov.
Also available on our Internet web site are our Corporate Governance Guidelines for our Board of Directors and Code of Ethics and Business Conduct,as well as the charters of the Audit, Finance and Risk, Organization and Compensation and Corporate Governance and Nominating Committees of our Boardof Directors and other important governance documents. All of the foregoing documents may be obtained through our Internet web site as noted above andare available in print without charge to shareholders who request them. Information contained on or available through our Internet web site is not incorporatedinto this Annual Report or any other document we file with, or furnish to, the SEC.
10
ITEM 1A. RISK FACTORS
When the factors, events, and contingencies discussed below or elsewhere in this Annual Report materialize, our business, financial condition, results ofoperations, cash flows, reputation or prospects could be materially adversely affected. While we believe all known material risks are disclosed, additionalrisks and uncertainties not presently known to us, or that we currently deem immaterial, may also materially adversely affect our business, financial condition,results of operations, cash flows, reputation or prospects. Because of the risk factors discussed below and elsewhere in this Annual Report and in other filingswe make with the SEC, as well as other variables affecting our operating results, past financial performance may not be a reliable indicator of futureperformance, historical trends should not be used to anticipate results or trends in future periods and actual results could differ materially from those projectedin the forward-looking statements contained in this Annual Report.
Our business depends on our customers’ levels of capital investment and maintenance expenditures, which in turn are affected by numerous factors,including changes in the state of domestic and global economies, global energy demand and the liquidity cyclicality and condition of global credit andcapital markets, any of which could impact the ability or willingness of our customers to invest in our products and services and adversely affect ourfinancial condition, results of operations and cash flow.
Demand for most of our products and services depends on the level of new capital investment and planned maintenance expenditures by our customers.The level of capital expenditures by our customers depends, in turn, on general economic conditions, availability of credit, economic conditions within theirrespective industries and expectations of future market behavior. Additionally, volatility in commodity prices can negatively affect the level of these activitiesand can result in postponement of capital spending decisions or the delay or cancellation of existing orders. The ability of our customers to finance capitalinvestment and maintenance is also affected by factors independent of the conditions in their industry, such as the condition of global credit and capitalmarkets.
The businesses of many of our customers, particularly oil and gas companies, chemical companies and general industrial companies, are to varyingdegrees cyclical and have experienced periodic downturns. Our customers in these industries, particularly those whose demand for our products and servicesis primarily profit-driven, historically have tended to delay large capital projects, including expensive maintenance and upgrades, during economicdownturns. For example, our chemical customers generally tend to reduce their spending on capital investments and operate their facilities at lower levels in asoft economic environment, which reduces demand for our products and services. Additionally, fluctuating energy demand forecasts and lingering uncertaintyconcerning commodity pricing, specifically the price of oil, can cause our customers to be more conservative in their capital planning, which reduces demandfor our products and services. Reduced demand for our products and services could result in the delay or cancellation of existing orders or lead to excessmanufacturing capacity, which unfavorably impacts our absorption of fixed manufacturing costs. This reduced demand may also erode average selling pricesin our industry. Any of these results could adversely affect our business, financial condition, results of operations and cash flows.
Additionally, our customers sometimes delay capital investment and maintenance even during favorable conditions in their industries or markets.Despite these favorable conditions, the general health of global credit and capital markets and our customers' ability to access such markets impactsinvestments in large capital projects, including necessary maintenance and upgrades. In addition, the liquidity and financial position of our customers impactscapital investment decisions and their ability to pay in full and/or on a timely basis. Any of these factors, whether individually or in the aggregate, could havea material adverse effect on our customers and, in turn, our business, financial condition, results of operations and cash flows.
Volatility in commodity prices, effects from credit and capital market conditions and global economic growth forecasts has in the past and may in thefuture prompt customers to delay or cancel existing orders, which could adversely affect the viability of our backlog and could impede our ability torealize revenues on our backlog.
Our backlog represents the value of uncompleted customer orders. While we cannot be certain that reported backlog will be indicative of future results,our ability to accurately value our backlog can be adversely affected by numerous factors, including the health of our customers' businesses and their access tocapital, volatility in commodity prices (e.g., copper, nickel, stainless steel) and economic uncertainty. While we attempt to mitigate the financial consequencesof order delays and cancellations through contractual provisions and other means, if we were to experience a significant increase in order delays orcancellations that can result from the aforementioned economic conditions or other factors beyond our control, it could impede or delay our ability to realizeanticipated revenues on our backlog. Such a loss of anticipated revenues could have a material adverse effect on our business, financial condition, results ofoperations and cash flows.
11
Our inability to deliver our backlog on time could affect our revenues, future sales and profitability and our relationships with customers.
At December 31, 2019, our backlog was $2.2 billion. In 2020, our ability to meet customer delivery schedules for backlog is dependent on a number offactors including, but not limited to, sufficient manufacturing plant capacity, adequate supply channel access to the raw materials and other inventory requiredfor production, an adequately trained and capable workforce, project engineering expertise for certain large projects and appropriate planning and schedulingof manufacturing resources. Our manufacturing plant operations, capacity and supply chain are subject to disruption as a result of equipment failure, severeweather conditions and other natural or manmade disasters, including power outages, fires, explosions, terrorism, cyber-based attacks, conflicts or unrest,epidemics (including the ongoing coronavirus outbreak emanating from China) or pandemics, labor disputes, acts of God, or other reasons. We may alsoencounter capacity limitations due to changes in demand despite our forecasting efforts. Many of the contracts we enter into with our customers require longmanufacturing lead times and contain penalty clauses related to late delivery. Failure to deliver in accordance with contract terms and customer expectationscould subject us to financial penalties, damage existing customer relationships, increase our costs, reduce our sales and have a material adverse effect on ourbusiness, financial condition, results of operations and cash flows.
Failure to successfully execute and realize the expected financial benefits from our transformation and strategic realignment and other cost-savinginitiatives could adversely affect our business.
In the second quarter of 2018, we launched and committed resources to our Flowserve 2.0 Transformation, a program designed to transform ourbusiness model to drive operational excellence, reduce complexity, accelerate growth, improve organizational health and better leverage our existing globalplatform.
While we have experienced significant financial benefits from our Flowserve 2.0 Transformation, we may not realize the full benefits that we currentlyexpect within the anticipated time frame or at all. Adverse effects from our execution of transformation and realignment activities could interfere with ourrealization of anticipated synergies, customer service improvements and cost savings from these strategic initiatives. Additionally, our ability to fully realizethe benefits and implement the transformation and realignment programs is limited by the terms of our credit facilities and other contractual commitments.Moreover, because such expenses are difficult to predict and are necessarily inexact, we may incur substantial expenses in connection with the execution ofour transformation and realignment plans in excess of what is currently anticipated. Further, transformation and realignment activities are a complex andtime-consuming process that can place substantial demands on management, which could divert attention from other business priorities or disrupt our dailyoperations. Any of these failures could, in turn, materially adversely affect our business, financial condition, results of operations and cash flows, which couldconstrain our liquidity.
If these measures are not successful or sustainable, we may undertake additional realignment and cost reduction efforts, which could result in futurecharges. Moreover, our ability to achieve our other strategic goals and business plans may be adversely affected, and we could experience businessdisruptions with customers and elsewhere if our transformation and realignment efforts prove ineffective.
We sell our products in highly competitive markets, which results in pressure on our profit margins and limits our ability to maintain or increase themarket share of our products.
The markets for our products and services are geographically diverse and highly competitive. We compete against large and well-established nationaland global companies, as well as regional and local companies, low-cost replicators of spare parts and in-house maintenance departments of our end-usercustomers. We compete based on price, technical expertise, timeliness of delivery, contractual terms, project management, proximity to service centers,previous installation history and reputation for quality and reliability. Competitive environments in slow-growth industries and for original equipment ordershave been inherently more influenced by pricing and domestic and global economic conditions and current economic forecasts suggest that the competitiveinfluence of pricing has broadened. Additionally, some of our customers have been attempting to reduce the number of vendors from which they purchase inorder to reduce the size and diversity of their supply chain. To remain competitive, we must invest in manufacturing, technology, marketing, customer serviceand support and our distribution networks. No assurances can be made that we will have sufficient resources to continue to make the investment required tomaintain or increase our market share or that our investments will be successful. In addition, negative publicity or other organized campaigns critical of us,through social media or otherwise, could negatively affect our reputation. If we do not compete successfully, our business, financial condition, results ofoperations and cash flows could be materially adversely affected.
12
Failure to successfully develop and introduce new products could limit our ability to grow and maintain our competitive position and adversely affectour financial condition, results of operations and cash flow.
The success of new and improved products and services depends on their initial and continued acceptance by our customers. Our businesses are affectedby varying degrees of technological change and corresponding shifts in customer demand, which result in unpredictable product transitions, shortened lifecycles and increased importance of being first to market with new products and services. Difficulties or delays in the research, development, productionand/or marketing of new products and services may negatively impact our operating results and prevent us from recouping or realizing a return on theinvestments required to continue to bring these products and services to market.
Our inability to obtain raw materials at favorable prices may adversely affect our operating margins and results of operations.
We purchase substantially all electric power and other raw materials we use in the manufacturing of our products from outside sources. The costs ofthese raw materials have been volatile historically and are influenced by factors that are outside our control. In recent years, the prices for energy, metalalloys, nickel and certain other of our raw materials have been volatile. While we strive to offset our increased costs through supply chain management,contractual provisions and our Continuous Improvement Process initiative, where gains are achieved in operational efficiencies, our operating margins andresults of operations and cash flows may be adversely affected if we are unable to pass increases in the costs of our raw materials on to our customers oroperational efficiencies are not achieved.
Economic, political and other risks associated with international operations could adversely affect our business.
A substantial portion of our operations is conducted and located outside the U.S. We have manufacturing, sales or service facilities in more than 50countries and sell to customers in over 90 countries, in addition to the U.S. Moreover, we primarily source certain of our manufacturing and engineeringfunctions, raw materials and components from China, Eastern Europe, India and Latin America. Accordingly, our business and results of operations aresubject to risks associated with doing business internationally, including:
• instability in a specific country's or region's political or economic conditions, particularly economic conditions in Europe and Latin America, andpolitical conditions in Russia, the Middle East, Asia, North Africa, Latin America and other emerging markets;
• trade protection measures, such as tariff increases, and import and export licensing and control requirements;
• political, financial market or economic instability relating to Brexit;
• political, financial market or economic instability relating to epidemics (including the ongoing coronavirus outbreak emanating from China) orpandemics;
• uncertainties related to any geopolitical, economic and regulatory effects or changes due to recent or upcoming domestic and international elections;
• the imposition of governmental economic sanctions on countries in which we do business, including Russia and Venezuela;
• potentially negative consequences from changes in tax laws or tax examinations;
• difficulty in staffing and managing widespread operations;
• increased aging and slower collection of receivables, particularly in Latin America and other emerging markets;
• difficulty of enforcing agreements and collecting receivables through some foreign legal systems;
• differing and, in some cases, more stringent labor regulations;
• potentially negative consequences from fluctuations in foreign currency exchange rates;
• partial or total expropriation;
• differing protection of intellectual property;
• inability to repatriate income or capital; and
13
• difficulty in administering and enforcing corporate policies, which may be different than the customary business practices of local cultures.
For example, political unrest or work stoppages negatively impact the demand for our products from customers in affected countries and othercustomers, such as U.S. oil refineries, that are affected by the resulting disruption in the supply of crude oil. Similarly, military conflicts in Russia, the MiddleEast, Asia and North Africa could soften the level of capital investment and demand for our products and services.
In order to manage our day-to-day operations, we must overcome cultural and language barriers and assimilate different business practices. In addition,we are required to create compensation programs, employment policies and other administrative programs that comply with laws of multiple countries. Wealso must communicate and monitor standards and directives across our global network. In addition, emerging markets pose other uncertainties, includingchallenges to our ability to protect our intellectual property, pressure on the pricing of our products and increased risk of political instability, and may preferlocal suppliers because of existing relationships, local restrictions or incentives. Our failure to successfully manage our geographically diverse operationscould impair our ability to react quickly to changing business and market conditions and to enforce compliance with standards and procedures.
Our future success will depend, in large part, on our ability to anticipate and effectively manage these and other risks associated with our internationaloperations. Any of these factors could, however, materially adversely affect our international operations and, consequently, our financial condition, results ofoperations and cash flows.
Our operations may be impacted by the United Kingdom’s exit from the European Union.
The United Kingdom’s June 2016 referendum in which voters approved an exit from the European Union (commonly referred to as “Brexit”) andsubsequent developments related to the referendum have caused and may continue to cause volatility in the global stock markets, currency exchange ratefluctuations and global economic uncertainty, which could adversely affect our customers’ ability to invest in capital expenditures, which may in turn reducedemand for our products and services.
In addition, the withdrawal from the European Union may result on other potential outcomes, adversely affecting the tax, tax treaty, currency,operational, legal and regulatory regimes to which our businesses in the region are subject. The withdrawal could also, among other potential outcomes,disrupt the free movement of goods, services and people between the United Kingdom and the European Union, significantly disrupt trade between theUnited Kingdom and the European Union and other parties, and result in greater restrictions on imports and exports between the U.K. and other EuropeanUnion countries, among other regulatory complexities. These potential and unknown outcomes and uncertainties related to Brexit and its impact on the globaleconomic climate could have a material adverse effect on our operations, financial condition, results of operations and cash flows.
Our operations are subject to a variety of complex and continually changing laws, regulations and policies, both internationally and domestically,which could adversely affect our business.
Due to the international scope of our operations, the system of laws, regulations and policies to which we are subject is complex and includes, withoutlimitation, regulations issued by the U.S. Customs and Border Protection, the U.S. Department of Commerce's Bureau of Industry and Security, theU.S. Treasury Department's Office of Foreign Assets Control and various foreign governmental agencies, including applicable export controls, customs,currency exchange control and transfer pricing regulations, as applicable. No assurances can be made that we will continue to be found to be operating incompliance with, or be able to detect violations of, any such laws, regulations or policies. In addition, we cannot predict the nature, scope or effect of futureregulatory requirements to which our international operations might be subject or the manner in which existing laws might be administered or interpreted.Compliance with laws and any new laws or regulations may increase our operations costs or require significant capital expenditures. Any failure to complywith applicable laws, regulations or policies in the U.S. or in any other country in which we operate could result in substantial fines and penalties, whichcould adversely affect our business.
In particular, there is uncertainty related to the current U.S. administration’s support or plans for new or existing treaty and trade relationships with othercountries, such as the January 2017 U.S. withdrawal from the Trans-Pacific Partnership, which may affect restrictions or tariffs imposed on products we buyor sell. These factors, together with other key global events during 2019 (such as the continuing uncertainty arising from the Brexit transition, as well asongoing terrorist activity), may adversely impact the ability or willingness of non-U.S. companies to transact business in the U.S. This uncertainty may alsoaffect regulations and trade agreements affecting U.S. companies, global stock markets (including the NYSE, on which
14
our common shares are traded), currency exchange rates, and general global economic conditions. All of these factors are outside of our control, but maynonetheless cause us to adjust our strategy in order to compete effectively in global markets.
Implementation of new tariffs and changes to or uncertainties related to tariffs and trade agreements could adversely affect our business.
The U.S. has recently announced the implementation of certain new tariffs on steel and aluminum imported into the country, and is reportedly alsoconsidering additional tariffs. In response, certain foreign governments have implemented or are reportedly considering implementing additional tariffs onU.S. goods. In addition, there have been recent changes to trade agreements, like the U.S. withdrawal from the Trans-Pacific Partnership and the replacementof the North American Free Trade Agreement with the United States-Mexico-Canada Agreement. Uncertainties with respect to tariffs, trade agreements, orany potential trade wars negatively impact the global economic markets and could affect our customers’ ability to invest in capital expenditures, which may inturn result in reduced demand for our products and services, and could have a material adverse effect on our financial condition, results of operations and cashflows. Changes in tariffs could also result in changes in supply and demand of our raw material needs, affect our manufacturing capabilities and lead toincreased prices that we may not be able to effectively pass on to customers, each of which could materially adversely affect our operating margins, results ofoperations and cash flows.
Our international operations expose us to fluctuations in foreign currency exchange rates which could adversely affect our business.
A significant portion of our revenue and certain of our costs, assets and liabilities, are denominated in currencies other than the U.S. dollar. The primarycurrencies to which we have exposure are the Euro, British pound, Mexican peso, Brazilian real, Indian rupee, Japanese yen, Singapore dollar, Argentinepeso, Canadian dollar, Australian dollar, Chinese yuan, Colombian peso, Chilean peso and South African rand. Certain of the foreign currencies to which wehave exposure, such as the Venezuelan bolivar and Argentine peso, have undergone significant devaluation in the past, which reduce the value of our localmonetary assets, reduce the U.S. dollar value of our local cash flow, generate local currency losses that may impact our ability to pay future dividends fromour subsidiary to the parent company and potentially reduce the U.S. dollar value of future local net income. Although we enter into forward exchangecontracts to economically hedge some of our risks associated with transactions denominated in certain foreign currencies, no assurances can be made thatexchange rate fluctuations will not adversely affect our financial condition, results of operations and cash flows.
We could be adversely affected by violations of the U.S. Foreign Corrupt Practices Act and similar worldwide anti-bribery laws and regulations.
The U.S. Foreign Corrupt Practices Act ("FCPA") and similar anti-bribery laws and regulations in other jurisdictions, such as the UK Bribery Act,generally prohibit companies and their intermediaries from making improper payments to government officials for the purpose of obtaining or retainingbusiness or securing an improper advantage. Because we operate in many parts of the world and sell to industries that have experienced corruption to somedegree, our policies mandate compliance with applicable anti-bribery laws worldwide. Violation of the FCPA or other similar anti-bribery laws or regulations,whether due to our or others' actions or inadvertence, could subject us to civil and criminal penalties or other sanctions that could have a material adverseimpact on our business, financial condition, results of operations and cash flows. In addition, actual or alleged violations could damage our reputation orability to do business.
Terrorist acts, conflicts, wars, natural or manmade disasters, epidemics or pandemics, acts of God and other such events around the world maymaterially adversely affect our business, financial condition and results of operations and the market for our common stock.
As a global company with a large international footprint, we are subject to increased risk of damage or disruption to us, our employees, facilities,partners, suppliers, distributors, resellers or customers due to, among other things, terrorist acts, conflicts, wars, severe weather conditions and other natural ormanmade disasters, including power outages, fires, explosions, cyber-based attacks, epidemics (including the ongoing coronavirus outbreak emanating fromChina) or pandemics, labor disputes, and acts of God wherever located around the world. The potential for future such events, the national and internationalresponses to such events or perceived threats to national security, and other actual or potential conflicts or wars, such as the Israeli-Hamas conflict andongoing instability in Syria and Egypt, have created many economic and political uncertainties. In addition, as a global company with headquarters andsignificant operations located in the U.S., actions against or by the U.S. may impact our business or employees. Although it is impossible to predict theoccurrences or consequences of any such events, they could result in a decrease in demand for our products, make it difficult or impossible to deliver productsto our
15
customers or to receive components from our suppliers, create delays and inefficiencies in our supply chain and pose risks to our employees, resulting in theneed to impose travel restrictions, any of which could adversely affect our business, financial condition, results of operations and cash flows.
Environmental compliance costs and liabilities could adversely affect our financial condition, results of operations and cash flows.
Our operations and properties are subject to regulation under environmental laws, which can impose substantial sanctions for violations. We mustconform our operations to applicable regulatory requirements and adapt to changes in such requirements in all countries in which we operate.
We use hazardous substances and generate hazardous wastes in many of our manufacturing and foundry operations. Most of our current and formerproperties are or have been used for industrial purposes, and some may require clean-up of historical contamination. We are currently conductinginvestigation and/or remediation activities at a number of locations where we have known environmental concerns. In addition, we have been identified asone of many PRPs at five Superfund sites. The projected cost of remediation at these sites, as well as our alleged "fair share" allocation, while not anticipatedto be material, has been reserved. However, until all studies have been completed and the parties have either negotiated an amicable resolution or the matterhas been judicially resolved, some degree of uncertainty remains.
We have incurred, and expect to continue to incur, operating and capital costs to comply with environmental requirements. In addition, new laws andregulations, stricter enforcement of existing requirements, the discovery of previously unknown contamination or the imposition of new clean-uprequirements could require us to incur costs or become the basis for new or increased liabilities. Moreover, environmental and sustainability initiatives,practices, rules and regulations are under increasing scrutiny of both governmental and non-governmental bodies, which can cause rapid change inoperational practices, standards and expectations and, in turn, increase our compliance costs. Any of these factors could have a material adverse effect on ourfinancial condition, results of operations and cash flows.
We are exposed to certain regulatory and financial risks related to climate change which could adversely affect our financial condition, results ofoperations and cash flows.
Climate change is receiving ever increasing attention worldwide. Many scientists, legislators and others attribute global warming to increased levels ofgreenhouse gases, including carbon dioxide, which has led to significant legislative and regulatory efforts to limit greenhouse gas emissions. The U.S.Congress, state and foreign legislatures and federal, state, local and foreign governmental agencies have been considering legislation and regulatory proposalsthat would regulate and limit greenhouse gas emissions. It is uncertain whether, when and in what form mandatory carbon dioxide emissions reductionprograms may be adopted. Similarly, certain countries have adopted the Kyoto Protocol and/or the Paris Climate Agreement and these and other existinginternational initiatives or those under consideration affect our international operations. When our customers, particularly those involved in the oil and gas,power generation, petrochemical processing or petroleum refining industries, are subject to any of these or other similar proposed or newly enacted laws andregulations, we are exposed to risks that the additional costs by customers to comply with such laws and regulations could impact their ability or desire tocontinue to operate at similar levels in certain jurisdictions as historically seen or as currently anticipated, which could negatively impact their demand for ourproducts and services. In addition, new laws and regulations that might favor the increased use of non-fossil fuels, including nuclear, wind, solar and bio-fuelsor that are designed to increase energy efficiency, could dampen demand for oil and gas production or power generation resulting in lower spending bycustomers for our products and services. These actions could also increase costs associated with our operations, including costs for raw materials andtransportation. Additionally, even without such laws and regulations, increased awareness and adverse publicity in the global marketplace about the levels ofgreenhouse gas emissions by companies in the manufacturing and energy industry could reduce customer demand for our products and services or harm ourreputation. Because it is uncertain what laws will be enacted, we cannot predict the potential impact of such laws on our future financial condition, results ofoperations and cash flows.
We are party to asbestos-containing product litigation that could adversely affect our financial condition, results of operations and cash flows.
We are a defendant in a substantial number of lawsuits that seek to recover damages for personal injury allegedly resulting from exposure to asbestos-containing products formerly manufactured and/or distributed by us. Such products were used as internal components of process equipment, and we do notbelieve that there was any significant emission of asbestos-containing fibers during the use of this equipment. Although we are defending these allegationsvigorously and believe that a high percentage of these lawsuits are covered by insurance or indemnities from other companies, there can be no assurance thatwe will prevail or that coverage or payments made by insurance or such other companies would be adequate. Unfavorable
16
rulings, judgments or settlement terms could have a material adverse impact on our business, financial condition, results of operations and cash flows.
Our business may be adversely impacted by work stoppages and other labor matters.
As of December 31, 2019, we had approximately 17,000 employees, of which approximately 5,000 were located in the U.S. Approximately 5% of ourU.S. employees are represented by unions. We also have unionized employees or employee work councils in Argentina, Australia, Austria, Brazil, Finland,France, Germany, India, Italy, Japan, Mexico, The Netherlands, South Africa, Spain, Sweden and the U.K. No individual unionized facility produces morethan 10% of our revenues. Although we believe that our relations with our employees are generally satisfactory and we have not experienced any materialstrikes or work stoppages recently, no assurances can be made that we will not in the future experience these and other types of conflicts with labor unions,works councils, other groups representing employees or our employees generally, or that any future negotiations with our labor unions will not result insignificant increases in our cost of labor. Our ability to successfully negotiate new and acceptable agreements when the existing agreements with employeescovered by collective bargaining expire could result in business disruptions or increased costs.
Our ability to implement our business strategy and serve our customers is dependent upon the continuing ability to employ talented professionals andattract, train, develop and retain a skilled workforce. We are subject to the risk that we will not be able to effectively replace the knowledge and expertise ofan aging workforce as workers retire. Without a properly skilled and experienced workforce, our costs, including productivity costs and costs to replaceemployees may increase, and this could negatively impact our earnings.
In addition, our policies prohibit harassment or discrimination in the workplace. Notwithstanding our conducting training and taking disciplinary actionor other actions against or in response to alleged violations, we may encounter additional costs from claims made and/or legal proceedings brought against us,and we could suffer reputational harm.
We depend on key personnel, the loss of whom would harm our business.
Our future success will depend in part on the continued service of key executive officers and personnel. The loss of the services of any key individualcould harm our business. Our future success also depends on our ability to recruit, retain and engage our personnel sufficiently, both to maintain our currentbusiness and to execute our strategic initiatives. Competition for officers and employees in our industry is intense and we may not be successful in attractingand retaining such personnel.
Inability to protect our intellectual property could negatively affect our competitive position.
We rely on a combination of patents, copyrights, trademarks, trade secrets, confidentiality provisions and licensing arrangements to establish andprotect our proprietary rights. We cannot guarantee, however, that the steps we have taken to protect our intellectual property will be adequate to preventinfringement of our rights or misappropriation of our technology. For example, effective patent, trademark, copyright and trade secret protection areunavailable or limited in some of the foreign countries in which we operate. In addition, while we generally enter into confidentiality agreements with ouremployees and third parties to protect our intellectual property, such confidentiality agreements could be breached or otherwise may not provide meaningfulprotection for our trade secrets and know-how related to the design, manufacture or operation of our products. Resorting to litigation to protect our intellectualproperty rights is burdensome and costly, and we may not always prevail. Further, adequate remedies are not always available in the event of an unauthorizeduse or disclosure of our trade secrets and manufacturing expertise. Failure to successfully enforce our intellectual property rights could harm our competitiveposition, business, financial condition, results of operations and cash flows.
Significant changes in pension fund investment performance or assumptions changes may have a material effect on the valuation of our obligationsunder our defined benefit pension plans, the funded status of these plans and our pension expense.
We maintain defined benefit pension plans that are required to be funded in the U.S., Belgium, Canada, India, Mexico, The Netherlands, Switzerlandand the U.K., and defined benefit plans that are not required to be funded in Austria, France, Germany, Italy, Japan and Sweden. Our pension liability ismaterially affected by the discount rate used to measure our pension obligations and, in the case of the plans that are required to be funded, the level of planassets available to fund those obligations and the expected long-term rate of return on plan assets. A change in the discount rate can result in a significantincrease or decrease in the valuation of pension obligations, affecting the reported status of our pension plans and our pension expense. Significant changes ininvestment performance or a change in the portfolio mix of invested assets can result in increases and decreases in the valuation of plan assets or in a changeof the expected rate of return on plan assets. This impact may be
17

particularly prevalent where we maintain significant concentrations of specified investments, such as the U.K. equity and fixed income securities in our non-U.S. defined benefit plans. Changes in the expected return on plan assets assumption can result in significant changes in our pension expense and futurefunding requirements.
We continually review our funding policy related to our U.S. pension plan in accordance with applicable laws and regulations. U.S. regulations haveincreased the minimum level of funding for U.S pension plans in prior years, which has at times required significant contributions to our pension plans.Contributions to our pension plans reduce the availability of our cash flows to fund working capital, capital expenditures, R&D efforts and other generalcorporate purposes.
Increased costs as a result of product liability and warranty claims could adversely affect our financial condition, results of operations and cash flows.
From time to time, we are exposed to product liability and warranty claims when the use of one of our products results in, or is alleged to result in,bodily injury and/or property damage or our products actually or allegedly fail to perform as expected. Some of our products are designed to support the mostcritical, severe service applications in the markets that we serve and any failure of such products could result in significant product liability and warrantyclaims, as well as damage to our reputation in the marketplace. While we maintain insurance coverage with respect to certain product liability claims, we maynot be able to obtain such insurance on acceptable terms in the future, and any such insurance may not provide adequate coverage against product liabilityclaims. In addition, product liability claims can be expensive to defend and can divert the attention of management and other personnel for significant periodsof time, regardless of the ultimate outcome. An unsuccessful defense of a product liability claim could have an adverse effect on our business, financialcondition, results of operations and cash flows. Even if we are successful in defending against a claim relating to our products, claims of this nature couldcause our customers to lose confidence in our products and our company. Warranty claims are not generally covered by insurance, and we may incursignificant warranty costs that are not reimbursable.
The recording of increased deferred tax asset valuation allowances in the future or the impact of tax law changes on such deferred tax assets couldaffect our operating results.
We currently have significant net deferred tax assets resulting from tax credit carryforwards, net operating losses and other deductible temporarydifferences that are available to reduce taxable income in future periods. Based on our assessment of our deferred tax assets, we determined, based onprojected future income and certain available tax planning strategies, that approximately $113 million of our deferred tax assets will more likely than not berealized in the future, and no valuation allowance is currently required for this portion of our deferred tax assets. Should we determine in the future that theseassets will not be realized we will be required to record an additional valuation allowance in connection with these deferred tax assets and our operatingresults would be adversely affected in the period such determination is made. In addition, tax law changes could negatively impact our deferred tax assets.
Our outstanding indebtedness and the restrictive covenants in the agreements governing our indebtedness limit our operating and financial flexibility.
We are required to make scheduled repayments and, under certain events of default, mandatory repayments on our outstanding indebtedness, whichrequires us to dedicate a substantial portion of our cash flows from operations to payments on our indebtedness, thereby reducing the availability of our cashflows to fund working capital, capital expenditures, R&D efforts and other general corporate purposes, such as dividend payments and share repurchases, andcould generally limit our flexibility in planning for, or reacting to, changes in our business and industry. In addition, we may need new or additional financingin the future to expand our business or refinance our existing indebtedness. Our current senior credit facility matures on July 16, 2024 and our senior notes aredue in 2022 and 2023. For additional information regarding our current indebtedness refer to Note 12 to our consolidated financial statements included inItem 8 of this Annual Report. Our inability to timely access capital on satisfactory terms, including as a result of market disruptions, could limit our ability toexpand our business as desired and refinance our indebtedness.
In addition, the agreements governing our indebtedness impose certain operating and financial restrictions on us and somewhat limit management'sdiscretion in operating our businesses. These agreements limit or restrict our ability, among other things, to: incur additional debt; fully utilize the capacityunder the senior credit facility; pay dividends and make other distributions; prepay subordinated debt; make investments and other restricted payments; createliens; sell assets; and enter into transactions with affiliates.
We are also required to maintain certain debt ratings, comply with leverage and interest coverage financial covenants and deliver to our lenders auditedannual and unaudited quarterly financial statements. Our ability to comply with these
18
covenants may be affected by events beyond our control. Failure to comply with these covenants could result in an event of default which, if not cured orwaived, may have a material adverse effect on our business, financial condition, results of operations and cash flows.
Our growth strategy depends on our ability to continue to expand our market presence through acquisitions, and any future acquisitions may presentunforeseen integration difficulties or costs which could materially affect our business.
Since 1997, we have expanded through a number of acquisitions, and we may pursue strategic acquisitions of businesses in the future. Our ability toimplement this growth strategy will be limited by our ability to identify appropriate acquisition candidates, covenants in our credit agreement and other debtagreements and our financial resources, including available cash and borrowing capacity. Acquisitions may require additional debt financing, resulting inhigher leverage and an increase in interest expense or may require equity financing, resulting in ownership dilution to existing shareholders. In addition,acquisitions sometimes require large one-time charges and can result in the incurrence of contingent liabilities, adverse tax consequences, substantialdepreciation or deferred compensation charges, the amortization of identifiable purchased intangible assets or impairment of goodwill, any of which couldhave a material adverse effect on our business, financial condition, results of operations and cash flows.
When we acquire another business, the process of integrating acquired operations into our existing operations creates operating challenges and requiressignificant financial and managerial resources that would otherwise be available for the ongoing development or expansion of existing operations. Some ofthe more common challenges associated with acquisitions that we may experience, and have experienced in the past, include:
• loss of key employees or customers of the acquired company;
• conforming the acquired company's standards, processes, procedures and controls, including accounting systems and controls, with our operations,which could cause deficiencies related to our internal control over financial reporting;
• coordinating operations that are increased in scope, geographic diversity and complexity;
• retooling and reprogramming of equipment;
• hiring additional management and other critical personnel; and
• the diversion of management's attention from our day-to-day operations.
Further, no guarantees can be made that we would realize the cost savings, synergies or revenue enhancements that we may anticipate from anyacquisition, or that we will realize such benefits within the time frame that we expect. If we are not able to timely address the challenges associated withacquisitions and successfully integrate acquired businesses, or if our integrated product and service offerings fail to achieve market acceptance, our businesscould be adversely affected.
Goodwill impairment could negatively impact our net income and shareholders' equity.
Goodwill is not amortized, but is tested for impairment at the reporting unit level, which is an operating segment or one level below an operatingsegment. Goodwill is required to be tested for impairment annually and between annual tests if events or circumstances indicate that it is more likely than notthat the fair value of a reporting unit is less than its carrying value. Reductions in or impairment of the value of our goodwill or other intangible assets willresult in charges against our earnings, which could have a material adverse effect on our reported results of operations and financial position in future periods.
There are numerous risks that may cause the fair value of a reporting unit to fall below its carrying amount, which could lead to the measurement andrecognition of goodwill impairment. These risks include, but are not limited to, lowered expectations of future financial results, adverse changes in thebusiness climate, increase in the discount rate, an adverse action or assessment by a regulator, the loss of key personnel, a more-likely-than-not expectationthat all or a significant portion of a reporting unit may be disposed of, failure to realize anticipated synergies from acquisitions, a sustained decline in theCompany’s market capitalization, and significant, prolonged negative variances between actual and expected financial results. In recent years, the estimatedfair value of our Pump reporting unit has fluctuated, partially due to broad-based capital spending declines and heightened pricing pressures experienced inthe oil and gas markets. Although we have concluded that there is no impairment on the goodwill associated with our Pump reporting unit as of December 31,2019, we will continue to monitor their performance and related market conditions for future indicators of potential impairment. For additional information,see the discussion in Item 7 of this Annual Report and under Note 1 to our consolidated financial statements included in Item 8 of this Annual Report.
19
A significant data breach or disruption to our information technology infrastructure could adversely affect our business operations.
Our information technology networks and related systems and devices and those technology systems under control of third parties with whom we dobusiness are critical to the operation of our business and essential to our ability to successfully perform day-to-day operations. These information technologynetworks and related systems and devices may be susceptible to damage, disruptions or shutdowns due to programming errors, defects or othervulnerabilities, power outages, hardware failures, computer viruses, cyber-attacks, malware attacks, ransomware attacks, theft, misconduct by employees orother insiders, misuse, human errors or other events. If any of the aforementioned breaches or disruptions occur and our business continuity plans do noteffectively resolve the issues in a timely manner, our business, financial condition, results of operations, and liquidity could be materially adversely affected.
In addition, any of the aforementioned breaches or disruptions could expose us to a risk of loss, disclosure, misuse, corruption, or interruption ofsensitive and critical data, information and functions, including our proprietary and confidential information and information related to our customers,suppliers and employees. It is also possible a security breach could result in theft of trade secret or other intellectual property. While we devote substantialresources to maintaining adequate levels of cybersecurity, there can be no assurance that we will be able to prevent all of the rapidly evolving forms ofincreasingly sophisticated and frequent cyberattacks, or avoid or limit a material adverse impact on our systems after such incidents or attacks occur. Thepotential consequences of a material cybersecurity incident include reputational damage, loss of customers, litigation with third parties, regulatory actions andfines, theft of intellectual property, disruption of manufacturing plant operations and increased cybersecurity protection and remediation costs. If we areunable to prevent, anticipate, detect or adequately respond to security breaches, our operations could be disrupted and our business could be materially andadversely affected.
Recent legal developments in Europe could result in changes to our business practices, penalties, increased cost of operations, or otherwise harm ourbusiness. To conduct our operations, we regularly move data across national borders and must comply with increasingly complex and rigorous regulatorystandards enacted to protect business and personal data in the U.S. and elsewhere. For example, the E.U. recently adopted the General Data ProtectionRegulation (the “GDPR”). The GDPR imposes additional obligations on companies regarding the handling of personal data and provides certain individualprivacy rights to persons whose data is stored. Compliance with existing, proposed and recently enacted laws and regulations can be costly; any failure tocomply with these regulatory standards could subject us to legal and reputational risks, including proceedings against the Company by governmental entitiesor others, fines and penalties, damage to our reputation and credibility and could have a negative impact on our business and results of operations.
Ineffective internal controls could impact the accuracy and timely reporting of our business and financial results.
Our internal control over financial reporting has not always prevented or detected misstatements because of its inherent limitations, including thepossibility of human error, the circumvention or overriding of controls or fraud. Even effective internal controls can provide only reasonable assurance withrespect to the preparation and fair presentation of financial statements. Failure to maintain the adequacy of our internal controls, including any failure toimplement required new or improved controls, or difficulties in their implementation, could harm our business and financial results and we could fail to meetour financial reporting obligations. For example, during its evaluation of the effectiveness of our internal control over financial reporting as of December 31,2016 management concluded that a deficiency in our internal controls related to the control environment primarily related to the operation of certaininventory controls or recording of unsupported manual journal entries at one of the non-U.S. sites and the design and maintenance of effective businessperformance reviews represented material weaknesses in our internal control over financial reporting and, therefore, that we did not maintain effectiveinternal control over financial reporting as of December 31, 2016. Management actively engaged in the planning and implementation of remediation efforts toaddress these material weaknesses and to strengthen the overall internal control related to the control environment at the one non-U.S. site and the businessreview controls and believes that such remediation efforts have effectively remediated the material weaknesses.
Changes in accounting principles and guidance could result in unfavorable accounting charges or effects.
We prepare our consolidated financial statements in conformity with accounting principles generally accepted in the U.S. A change in these principlescan have a significant effect on our reported financial position and financial results. The adoption of new or revised accounting principles may require us tomake changes to our systems, processes and internal controls, which could have a significant effect on our reported financial results and internal controls,cause unexpected financial reporting fluctuations, retroactively affect previously reported results or require us to make costly changes to our operationalprocesses and accounting systems upon our following the adoption of these standards.
20
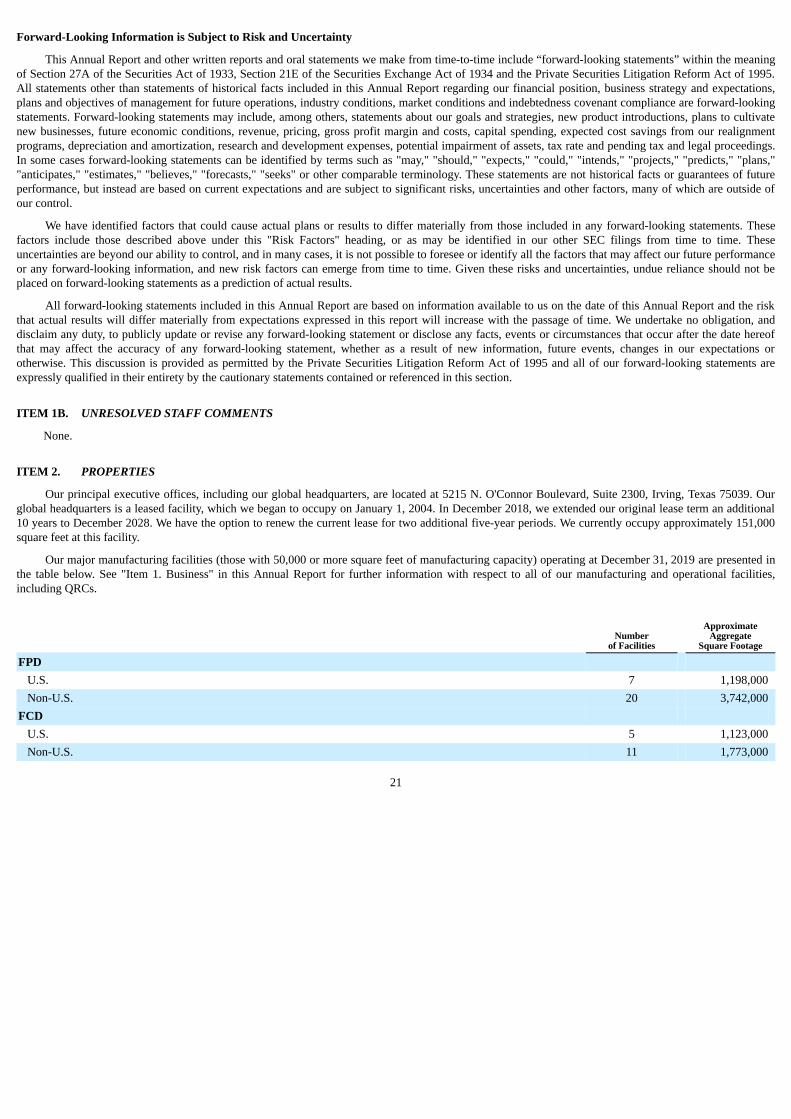
Forward-Looking Information is Subject to Risk and Uncertainty
This Annual Report and other written reports and oral statements we make from time-to-time include “forward-looking statements” within the meaningof Section 27A of the Securities Act of 1933, Section 21E of the Securities Exchange Act of 1934 and the Private Securities Litigation Reform Act of 1995.All statements other than statements of historical facts included in this Annual Report regarding our financial position, business strategy and expectations,plans and objectives of management for future operations, industry conditions, market conditions and indebtedness covenant compliance are forward-lookingstatements. Forward-looking statements may include, among others, statements about our goals and strategies, new product introductions, plans to cultivatenew businesses, future economic conditions, revenue, pricing, gross profit margin and costs, capital spending, expected cost savings from our realignmentprograms, depreciation and amortization, research and development expenses, potential impairment of assets, tax rate and pending tax and legal proceedings.In some cases forward-looking statements can be identified by terms such as "may," "should," "expects," "could," "intends," "projects," "predicts," "plans,""anticipates," "estimates," "believes," "forecasts," "seeks" or other comparable terminology. These statements are not historical facts or guarantees of futureperformance, but instead are based on current expectations and are subject to significant risks, uncertainties and other factors, many of which are outside ofour control.
We have identified factors that could cause actual plans or results to differ materially from those included in any forward-looking statements. Thesefactors include those described above under this "Risk Factors" heading, or as may be identified in our other SEC filings from time to time. Theseuncertainties are beyond our ability to control, and in many cases, it is not possible to foresee or identify all the factors that may affect our future performanceor any forward-looking information, and new risk factors can emerge from time to time. Given these risks and uncertainties, undue reliance should not beplaced on forward-looking statements as a prediction of actual results.
All forward-looking statements included in this Annual Report are based on information available to us on the date of this Annual Report and the riskthat actual results will differ materially from expectations expressed in this report will increase with the passage of time. We undertake no obligation, anddisclaim any duty, to publicly update or revise any forward-looking statement or disclose any facts, events or circumstances that occur after the date hereofthat may affect the accuracy of any forward-looking statement, whether as a result of new information, future events, changes in our expectations orotherwise. This discussion is provided as permitted by the Private Securities Litigation Reform Act of 1995 and all of our forward-looking statements areexpressly qualified in their entirety by the cautionary statements contained or referenced in this section.
ITEM 1B. UNRESOLVED STAFF COMMENTS
None.
ITEM 2. PROPERTIES
Our principal executive offices, including our global headquarters, are located at 5215 N. O'Connor Boulevard, Suite 2300, Irving, Texas 75039. Ourglobal headquarters is a leased facility, which we began to occupy on January 1, 2004. In December 2018, we extended our original lease term an additional10 years to December 2028. We have the option to renew the current lease for two additional five-year periods. We currently occupy approximately 151,000square feet at this facility.
Our major manufacturing facilities (those with 50,000 or more square feet of manufacturing capacity) operating at December 31, 2019 are presented inthe table below. See "Item 1. Business" in this Annual Report for further information with respect to all of our manufacturing and operational facilities,including QRCs.
Number
of Facilities Approximate
AggregateSquare Footage
FPD U.S. 7 1,198,000Non-U.S. 20 3,742,000
FCD U.S. 5 1,123,000Non-U.S. 11 1,773,000
21
We own the majority of our manufacturing facilities, and those manufacturing facilities we do not own are leased. We also maintain a substantialnetwork of U.S. and foreign service centers and sales offices, most of which are leased. The majority of our manufacturing leased facilities are covered bylease agreements with terms ranging from two to seven years, with individual lease terms generally varying based on the facilities’ primary usage. We believewe will be able to extend leases on our various facilities as necessary, as they expire.
We believe that our current facilities are adequate to meet the requirements of our present and foreseeable future operations. We continue to review ourcapacity requirements as part of our strategy to optimize our global manufacturing efficiency. See Note 4 to our consolidated financial statements included inItem 8 of this Annual Report for additional information regarding our lease obligations.
ITEM 3. LEGAL PROCEEDINGS
We are party to the legal proceedings that are described in Note 14 to our consolidated financial statements included in Item 8 of this Annual Report,and such disclosure is incorporated by reference into this Item 3. In addition to the foregoing, we and our subsidiaries are named defendants in certain otherroutine lawsuits incidental to our business and are involved from time to time as parties to governmental proceedings, all arising in the ordinary course ofbusiness. Although the outcome of lawsuits or other proceedings involving us, and our subsidiaries cannot be predicted with certainty, and the amount of anyliability that could arise with respect to such lawsuits or other proceedings cannot be predicted accurately, management does not currently expect thesematters, either individually or in the aggregate, to have a material effect on our financial position, results of operations or cash flows. We have establishedreserves covering exposures relating to contingencies to the extent believed to be reasonably estimable and probable based on past experience and availablefacts.
ITEM 4. MINE SAFETY DISCLOSURES
Not applicable.
PART II
ITEM 5. MARKET FOR THE REGISTRANT'S COMMON EQUITY, RELATED STOCKHOLDER MATTERS AND ISSUER PURCHASES OFEQUITY SECURITIES
Market Information
Our common stock is traded on the New York Stock Exchange ("NYSE") under the symbol "FLS" and our CUSIP number is number is 34354P105. OnFebruary 13, 2020, our records showed 952 shareholders of record.
22
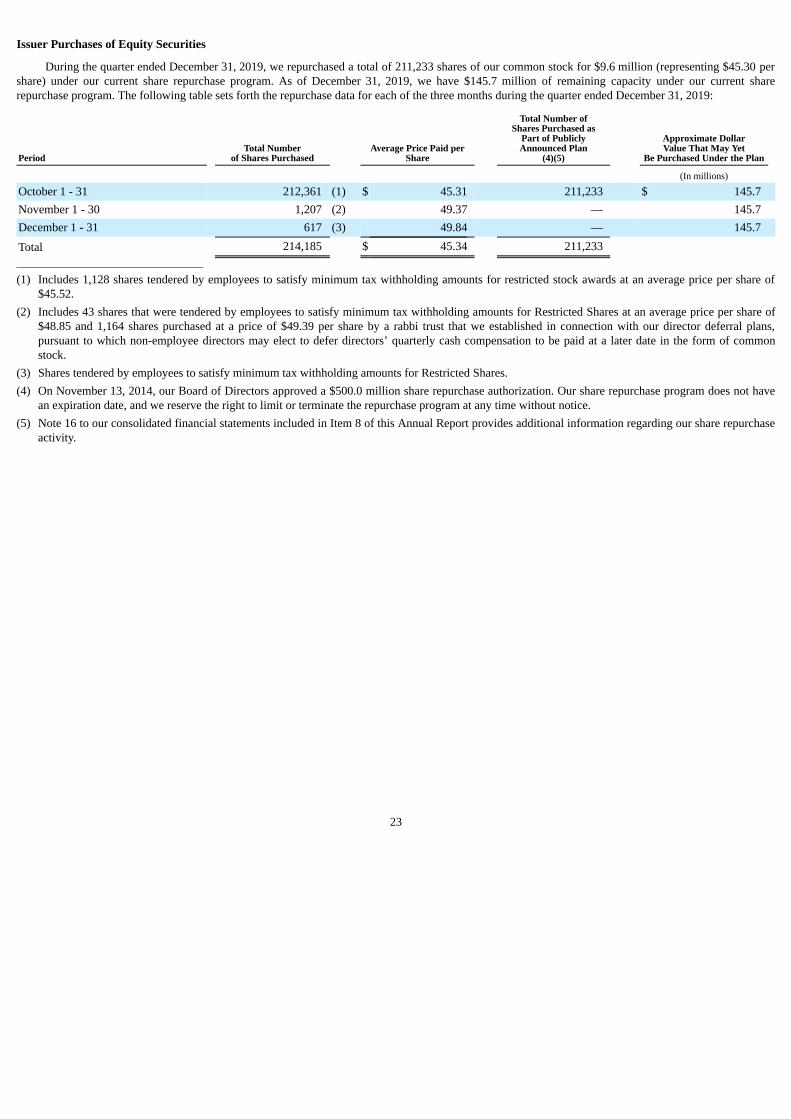
Issuer Purchases of Equity Securities
During the quarter ended December 31, 2019, we repurchased a total of 211,233 shares of our common stock for $9.6 million (representing $45.30 pershare) under our current share repurchase program. As of December 31, 2019, we have $145.7 million of remaining capacity under our current sharerepurchase program. The following table sets forth the repurchase data for each of the three months during the quarter ended December 31, 2019:
Period
Total Number
of Shares Purchased
Average Price Paid per
Share
Total Number of
Shares Purchased asPart of PubliclyAnnounced Plan
(4)(5)
Approximate DollarValue That May Yet
Be Purchased Under the Plan
(In millions) October 1 - 31 212,361 (1) $ 45.31 211,233 $ 145.7 November 1 - 30 1,207 (2) 49.37 — 145.7 December 1 - 31 617 (3) 49.84 — 145.7
Total 214,185 $ 45.34 211,233 _______________________________________
(1) Includes 1,128 shares tendered by employees to satisfy minimum tax withholding amounts for restricted stock awards at an average price per share of$45.52.
(2) Includes 43 shares that were tendered by employees to satisfy minimum tax withholding amounts for Restricted Shares at an average price per share of$48.85 and 1,164 shares purchased at a price of $49.39 per share by a rabbi trust that we established in connection with our director deferral plans,pursuant to which non-employee directors may elect to defer directors’ quarterly cash compensation to be paid at a later date in the form of commonstock.
(3) Shares tendered by employees to satisfy minimum tax withholding amounts for Restricted Shares.(4) On November 13, 2014, our Board of Directors approved a $500.0 million share repurchase authorization. Our share repurchase program does not have
an expiration date, and we reserve the right to limit or terminate the repurchase program at any time without notice.(5) Note 16 to our consolidated financial statements included in Item 8 of this Annual Report provides additional information regarding our share repurchase
activity.
23
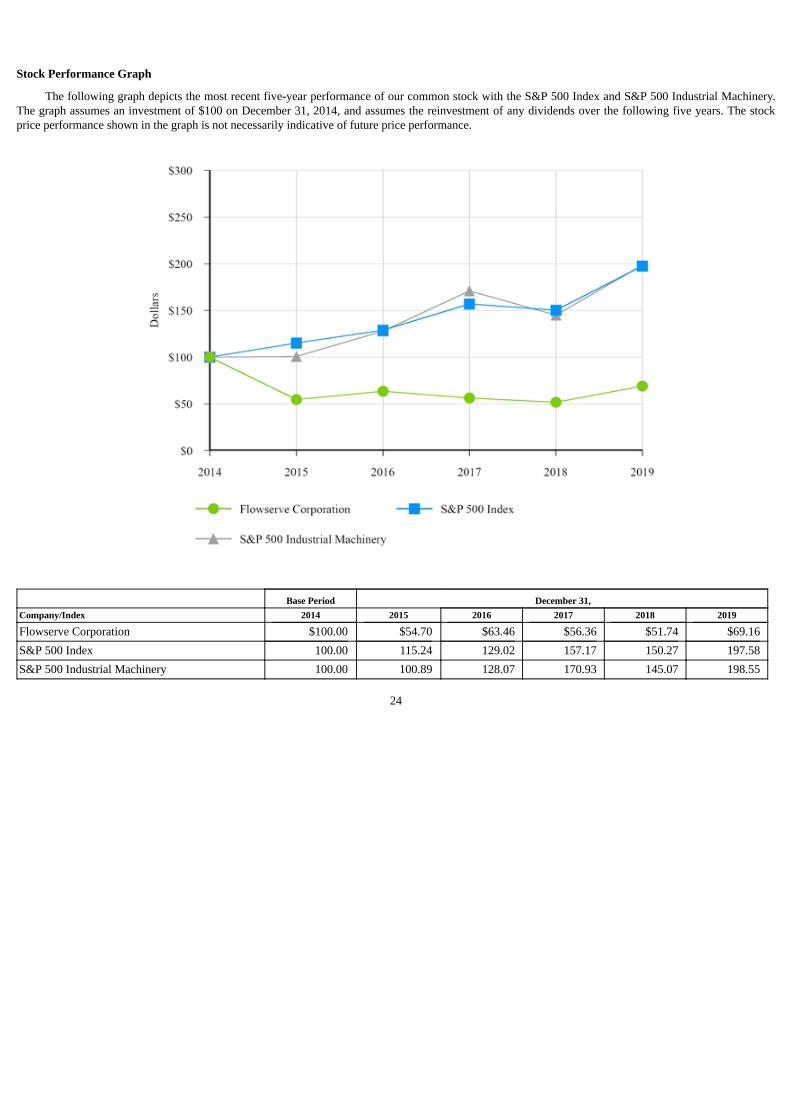
Stock Performance Graph
The following graph depicts the most recent five-year performance of our common stock with the S&P 500 Index and S&P 500 Industrial Machinery.The graph assumes an investment of $100 on December 31, 2014, and assumes the reinvestment of any dividends over the following five years. The stockprice performance shown in the graph is not necessarily indicative of future price performance.
Base Period December 31,Company/Index 2014 2015 2016 2017 2018 2019
Flowserve Corporation $100.00 $54.70 $63.46 $56.36 $51.74 $69.16S&P 500 Index 100.00 115.24 129.02 157.17 150.27 197.58S&P 500 Industrial Machinery 100.00 100.89 128.07 170.93 145.07 198.55
24
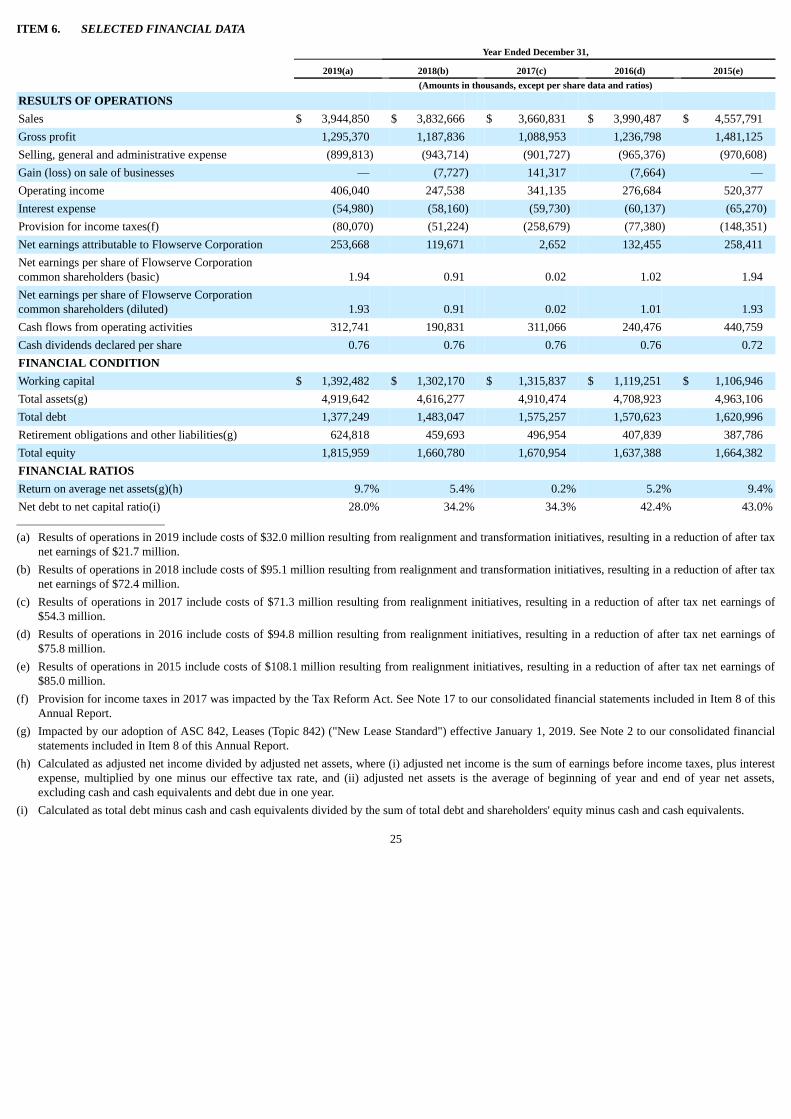
ITEM 6. SELECTED FINANCIAL DATA
Year Ended December 31,
2019(a) 2018(b) 2017(c) 2016(d) 2015(e) (Amounts in thousands, except per share data and ratios)
RESULTS OF OPERATIONS Sales $ 3,944,850 $ 3,832,666 $ 3,660,831 $ 3,990,487 $ 4,557,791Gross profit 1,295,370 1,187,836 1,088,953 1,236,798 1,481,125Selling, general and administrative expense (899,813) (943,714) (901,727) (965,376) (970,608)Gain (loss) on sale of businesses — (7,727) 141,317 (7,664) —Operating income 406,040 247,538 341,135 276,684 520,377Interest expense (54,980) (58,160) (59,730) (60,137) (65,270)Provision for income taxes(f) (80,070) (51,224) (258,679) (77,380) (148,351)Net earnings attributable to Flowserve Corporation 253,668 119,671 2,652 132,455 258,411Net earnings per share of Flowserve Corporationcommon shareholders (basic) 1.94 0.91 0.02 1.02 1.94Net earnings per share of Flowserve Corporationcommon shareholders (diluted) 1.93 0.91 0.02 1.01 1.93Cash flows from operating activities 312,741 190,831 311,066 240,476 440,759Cash dividends declared per share 0.76 0.76 0.76 0.76 0.72FINANCIAL CONDITION Working capital $ 1,392,482 $ 1,302,170 $ 1,315,837 $ 1,119,251 $ 1,106,946Total assets(g) 4,919,642 4,616,277 4,910,474 4,708,923 4,963,106Total debt 1,377,249 1,483,047 1,575,257 1,570,623 1,620,996Retirement obligations and other liabilities(g) 624,818 459,693 496,954 407,839 387,786Total equity 1,815,959 1,660,780 1,670,954 1,637,388 1,664,382FINANCIAL RATIOS Return on average net assets(g)(h) 9.7% 5.4% 0.2% 5.2% 9.4%Net debt to net capital ratio(i) 28.0% 34.2% 34.3% 42.4% 43.0%_______________________________
(a) Results of operations in 2019 include costs of $32.0 million resulting from realignment and transformation initiatives, resulting in a reduction of after taxnet earnings of $21.7 million.
(b) Results of operations in 2018 include costs of $95.1 million resulting from realignment and transformation initiatives, resulting in a reduction of after taxnet earnings of $72.4 million.
(c) Results of operations in 2017 include costs of $71.3 million resulting from realignment initiatives, resulting in a reduction of after tax net earnings of$54.3 million.
(d) Results of operations in 2016 include costs of $94.8 million resulting from realignment initiatives, resulting in a reduction of after tax net earnings of$75.8 million.
(e) Results of operations in 2015 include costs of $108.1 million resulting from realignment initiatives, resulting in a reduction of after tax net earnings of$85.0 million.
(f) Provision for income taxes in 2017 was impacted by the Tax Reform Act. See Note 17 to our consolidated financial statements included in Item 8 of thisAnnual Report.
(g) Impacted by our adoption of ASC 842, Leases (Topic 842) ("New Lease Standard") effective January 1, 2019. See Note 2 to our consolidated financialstatements included in Item 8 of this Annual Report.
(h) Calculated as adjusted net income divided by adjusted net assets, where (i) adjusted net income is the sum of earnings before income taxes, plus interestexpense, multiplied by one minus our effective tax rate, and (ii) adjusted net assets is the average of beginning of year and end of year net assets,excluding cash and cash equivalents and debt due in one year.
(i) Calculated as total debt minus cash and cash equivalents divided by the sum of total debt and shareholders' equity minus cash and cash equivalents.
25
ITEM 7. MANAGEMENT'S DISCUSSION AND ANALYSIS OF FINANCIAL CONDITION AND RESULTS OF OPERATIONS
The following discussion and analysis is provided to increase the understanding of, and should be read in conjunction with, the accompanyingconsolidated financial statements and notes. See “Item 1A. Risk Factors” and the section titled “Forward-Looking Information is Subject to Risk andUncertainty” included in this Annual Report on Form 10-K for the year ended December 31, 2019 ("Annual Report") for a discussion of the risks,uncertainties and assumptions associated with these statements. Unless otherwise noted, all amounts discussed herein are consolidated.
EXECUTIVE OVERVIEW
Our Company
We believe that we are a world-leading manufacturer and aftermarket service provider of comprehensive flow control systems. We develop andmanufacture precision-engineered flow control equipment integral to the movement, control and protection of the flow of materials in our customers’ criticalprocesses. Our product portfolio of pumps, valves, seals, automation and aftermarket services supports global infrastructure industries, including oil and gas,chemical, power generation and water management, as well as general industrial markets where our products and services add value. Through ourmanufacturing platform and global network of Quick Response Centers ("QRCs"), we offer a broad array of aftermarket equipment services, such asinstallation, advanced diagnostics, repair and retrofitting. We employ approximately 17,000 employees in more than 50 countries as of December 31, 2019.
Our business model is significantly influenced by the capital spending of global infrastructure industries for the placement of new products into serviceand maintenance spending for aftermarket services for existing operations. The worldwide installed base of our products is an important source of aftermarketrevenue, where products are expected to ensure the maximum operating time of many key industrial processes. Over the past several years, we havesignificantly invested in our aftermarket strategy to provide local support to drive customer investments in our offerings and use of our services to replace orrepair installed products. The aftermarket portion of our business also helps provide business stability during various economic periods. The aftermarketbusiness, which is primarily served by our network of 171 QRCs located around the globe, provides a variety of service offerings for our customers includingspare parts, service solutions, product life cycle solutions and other value-added services. It is generally a higher margin business compared to our originalequipment business and a key component of our profitable growth strategy.
Our operations are conducted through two business segments that are referenced throughout this Management’s Discussion and Analysis of FinancialCondition and Results of Operations ("MD&A"):
• FPD for custom, highly-engineered pumps, pre-configured industrial pumps, pump systems, mechanical seals, auxiliary systems and replacementparts and related services; and
• FCD for engineered and industrial valves, control valves, actuators and controls and related services.
Our business segments share a focus on industrial flow control technology and have a high number of common customers. These segments also havecomplementary product offerings and technologies that are often combined in applications that provide us a net competitive advantage. Our segments alsobenefit from our global footprint, our economies of scale in reducing administrative and overhead costs to serve customers more cost effectively and sharedleadership for operational support functions, such as research and development, marketing and supply chain.
The reputation of our product portfolio is built on more than 50 well-respected brand names such as Worthington, IDP, Valtek, Limitorque, Durco, Argus,Edward, Valbart and Durametallic, which we believe to be one of the most comprehensive in the industry. Our products and services are sold either directly orthrough designated channels to more than 10,000 companies, including some of the world’s leading engineering, procurement and construction ("EPC")firms, original equipment manufacturers, distributors and end users.
We continue to leverage our QRC network to be positioned as near to customers as possible for service and support in order to capture valuableaftermarket business. Along with ensuring that we have the local capability to sell, install and service our equipment in remote regions, we continuouslyimprove our global operations. We also continue to expand our global supply chain capability to meet global customer demands and ensure the quality andtimely delivery of our products. We are focusing on our ongoing low-cost sourcing, including greater use of third-party suppliers and increasing our lower-cost, emerging market capabilities. Additionally, we continue to devote resources to improving the supply chain processes across our business segments tofind areas of synergy and cost reduction and to improve our supply chain management capability
26
to ensure it can meet global customer demands. We also remain focused on improving on-time delivery and quality, while managing warranty costs as apercentage of sales across our global operations, through the assistance of a focused Continuous Improvement Process ("CIP") initiative. The goal of the CIPinitiative, which includes lean manufacturing, six sigma business management strategy and value engineering, is to maximize service fulfillment to customersthrough on-time delivery, reduced cycle time and quality at the highest internal productivity.
Over the past year we have experienced continued stabilization in business and improved conditions in certain of our key markets. With continuedstability in oil prices at improved levels through the middle of 2018 and 2019, our large-project business is showing continued signs of recovery and weanticipate that customers will continue to invest in maintenance and short cycle equipment during 2020.
In the second quarter of 2018, we launched and committed resources to our Flowserve 2.0 Transformation, a program designed to transform our businessmodel to drive operational excellence, reduce complexity, accelerate growth, expand margins, increase capital efficiency and improve organizational health.For further information regarding our Flowserve 2.0 Transformation, see “Our Results of Operations” below and Note 20 to our consolidated financialstatements included in Item 8 of this Annual Report.
Our Markets
The following discussion should be read in conjunction with the "Outlook for 2020" section included below in this MD&A.
Our products and services are used in several distinct industries: oil and gas, chemical, power generation, water management, and several otherindustries, such as mining, steel and paper, that are collectively referred to as "general industries."
Demand for most of our products depends on the level of new capital investment as well as planned and unplanned maintenance expenditures by ourcustomers. The level of new capital investment depends, in turn, on capital infrastructure projects driven by the need for products that rely on oil and gas,chemicals, power generation and water resource management, as well as general economic conditions. These drivers are generally related to the phase of thebusiness cycle in their respective industries and the expectations of future market behavior. The levels of maintenance expenditures are additionally driven bythe reliability of equipment, planned and unplanned downtime for maintenance and the required capacity utilization of the process.
Sales to EPC firms and original equipment manufacturers are typically for large project orders and critical applications, as are certain sales todistributors. Project orders are typically procured for customers either directly from us or indirectly through contractors for new construction projects orfacility enhancement projects.
The quick turnaround business, which we also refer to as "short-cycle," is defined as orders that are received from the customer (booked) and shippedgenerally within six months of receipt. These orders are typically for more standardized, general purpose products, parts or services. Each of our two businesssegments generate certain levels of this type of business.
In the sale of aftermarket products and services, we benefit from a large installed base of our original equipment, which requires periodic maintenance,repair and replacement parts. We use our manufacturing platform and global network of QRCs to offer a broad array of aftermarket equipment services, suchas installation, advanced diagnostics, repair and retrofitting. In geographic regions where we are positioned to provide quick response, we believe customershave traditionally relied on us, rather than our competitors, for aftermarket products due to our highly engineered and customized products. However, theaftermarket for standard products is competitive, as the existence of common standards allows for easier replacement of the installed products. As proximityof service centers, timeliness of delivery and quality are important considerations for all aftermarket products and services, we continue to selectively expandour global QRC capabilities to improve our ability to capture this important aftermarket business.
Oil and Gas
The oil and gas industry, which represented approximately 41% and 38% of our bookings in 2019 and 2018, respectively, experienced an increase incapital spending in 2019 compared to the previous year. The increase was primarily due to increased project activity and short cycle investment. Aftermarketopportunities in this industry remained stable throughout 2019 following increased spending in 2018 due to catch up of deferred spending on our customers'repair and maintenance budgets from previous years.
27
The outlook for the oil and gas industry is heavily dependent on the demand growth from both mature markets and developing geographies as well aschanges in the regulatory environment. In the short-term, we believe that stable oil prices will support oil and gas upstream and mid-stream investment andwe further expect continued investment in later cycle downstream oil and gas and petrochemical projects due to emerging market growth and certainregulatory requirements, such as IMO 2020. We also believe stable oil prices support increased demand for our aftermarket products and services. We believethe medium and long-term fundamentals for this industry remain attractive and see a stabilized environment as the industry works through current excesssupply. In addition, we believe projected depletion rates of existing fields and forecasted long-term demand growth will require additional investments. Withour long-standing reputation in providing successful solutions for upstream, mid-stream and downstream applications, along with the advancements in ourportfolio of offerings, we believe that we continue to be well-positioned to assist our customers in this improving environment.
Chemical
The chemical industry represented approximately 22% of our bookings in both 2019 and 2018. The chemical industry is comprised of chemical-basedand pharmaceutical products. Capital spending in 2019 increased primarily due to global economic growth and forecasted demand for chemical-basedproducts. The aftermarket opportunities remained stable throughout 2019 following increased spending in 2018 due to catch up of deferred spending of ourcustomers' repair and maintenance budgets from previous years.
The outlook for the chemical industry remains heavily dependent on global economic conditions. As global economies and unemployment conditionsimprove, a rise in consumer spending should follow. An increase in spending would drive greater demand for chemical-based products supporting improvedlevels of capital investment. We believe the chemical industry in the near-term will continue to invest in North America and Middle East capacity additions,maintenance and upgrades for optimization of existing assets and that developing regions will selectively invest in capital infrastructure to meet current andfuture indigenous demand. We believe our global presence and our localized aftermarket capabilities are well-positioned to serve the potential growthopportunities in this industry.
Power Generation
The power generation industry represented approximately 11% of our bookings in both 2019 and 2018. In 2019, the power generation industrycontinued to experience softness in thermal power generation capital spending in the mature and key developing markets. China continued to curtail theconstruction of new coal-fired power generation over the last year, while in India and southeast Asia capital investment remained in place driven by increaseddemand forecasts.
Natural gas-fired combined cycle (“NGCC”) plants increased their share of the energy mix, driven by market prices for gas remaining low and stable(partially due to the increasing global availability of liquefied natural gas (“LNG”)), low capital expenditures, and the ability of NGCC to stabilizeunpredictable renewable sources. With the potential of unconventional sources of gas, the global power generation industry is forecasting an increased use ofthis form of fuel for power generation plants.
Despite fewer new nuclear plants being constructed, nuclear power remains an important contributor to the global energy mix. We continue to supportour significant installed base in the global nuclear fleet by providing aftermarket and life extension products and services. Due to our extensive history, webelieve we are well positioned to take advantage of this ongoing source of aftermarket and new construction opportunities.
Political efforts to limit the emissions of carbon dioxide may have some adverse effect on thermal power investment plans depending on the potentialrequirements imposed and the timing of compliance by country. However, many proposed methods of capturing and limiting carbon dioxide emissions offerbusiness opportunities for our products and services. At the same time, we continue to take advantage of new investments in concentrated solar powergenerating capacity, where our pumps, valves, and seals are uniquely positioned for both molten salt applications as well as the traditional steam cycle.
We believe the long-term fundamentals for the power generation industry remain solid based on projected increases in demand for electricity driven byglobal population growth, growth of urbanization in developing markets and the increased use of electricity driven transportation. We also believe that ourlong-standing reputation in the power generation industry, our portfolio of offerings for the various generating methods, our advancements in serving therenewable energy market and carbon capture methodologies, as well as our global service and support structure, position us well for the future opportunitiesin this important industry.
28
Water Management
The water management industry represented approximately 4% our bookings in both 2019 and 2018. Water management industry activity levelsincreased in 2019 as worldwide demand for fresh water, water treatment and re-use, desalination and flood control continued to create requirements for newfacilities or for upgrades of existing systems, many of which require products that we offer, particularly pumps. Capital and aftermarket spending are on therise in developed and emerging markets with governments and private industry providing funding for critical projects.
The proportion of people living in regions that find it difficult to meet water requirements is expected to double by 2025. We believe that the persistentdemand for fresh water during all economic cycles supports continued investments, especially in North America and developing regions.
General Industries
General industries represented, in the aggregate, approximately 22% and 25% of our bookings in 2019 and 2018, respectively. General industriescomprise a variety of different businesses, including mining and ore processing, pulp and paper, food and beverage and other smaller applications, none ofwhich individually represented more than 5% of total bookings in 2019 and 2018. General industries also include sales to distributors, whose end customersoperate in the industries we primarily serve. Sales to distributors in 2019 were negatively impacted by decreased upstream oil and gas activity in NorthAmerica.
The outlook for this group of industries is heavily dependent upon the condition of global economies and consumer confidence levels. The long-termfundamentals of many of these industries remain sound, as many of the products produced by these industries are common staples of industrialized andurbanized economies. We believe that our specialty product offerings designed for these industries and our aftermarket service capabilities will providecontinued business opportunities.
OUR RESULTS OF OPERATIONS
Throughout this discussion of our results of operations, we discuss the impact of fluctuations in foreign currency exchange rates. We have calculatedcurrency effects on operations by translating current year results on a monthly basis at prior year exchange rates for the same periods.
In the second quarter of 2018, we launched and committed resources to our Flowserve 2.0 Transformation, a program designed to transform ourbusiness model to drive operational excellence, reduce complexity, accelerate growth, improve organizational health and better leverage our existing globalplatform, which is further discussed in Note 20 to our consolidated financial statements included in Item 8 of this Annual Report. For the year endedDecember 31, 2019 and 2018, we incurred Flowserve 2.0 Transformation related expenses of $28.0 million and $41.2 million, respectively. The Flowserve2.0 Transformation expenses incurred primarily consist of professional services, project management and related travel costs recorded in SG&A.
29
In 2015, we initiated Realignment Programs that consist of both restructuring and non-restructuring charges that are further discussed in Note 20 to ourconsolidated financial statements included in Item 8 of this Annual Report. As of December 31, 2019, the Realignment Programs are substantially completeand we have incurred charges of $351.7 million to date. The total charges for Realignment Programs and Flowserve 2.0 Transformation by segment aredetailed below for the years ended December 31, 2019 and 2018:
December 31, 2019
(Amounts in thousands) FPD FCD
Subtotal–ReportableSegments
Eliminationsand All Other
ConsolidatedTotal
Total Realignment and Transformation ProgramCharges COS $ 12,587 $ 4,395 $ 16,982 $ 255 $ 17,237 SG&A(1) (14,506) 774 (13,732) 32,467 18,735 Income tax expense(2) (4,000) — (4,000) — (4,000)
Total $ (5,919) $ 5,169 $ (750) $ 32,722 $ 31,972_________________________(1) Includes gains from the sales of non-strategic manufacturing facilities that are included in our Realignment Programs.(2) Income tax expense (benefit) includes exit taxes.
December 31, 2018
(Amounts in thousands) FPD FCD
Subtotal–ReportableSegments
Eliminationsand All Other
ConsolidatedTotal
Total Realignment and Transformation ProgramCharges COS $ 39,477 $ 3,221 $ 42,698 $ — $ 42,698 SG&A 5,910 (294) 5,616 46,786 52,402 Income tax expense(1) (1,000) — (1,000) — (1,000)
Total $ 44,387 $ 2,927 $ 47,314 $ 46,786 $ 94,100_________________________(1) Income tax expense (benefit) includes exit taxes.
Bookings and Backlog
2019 2018 2017 (Amounts in millions)
Bookings $ 4,238.3 $ 4,019.8 $ 3,803.9Backlog (at period end) 2,157.0 1,891.6 2,033.4
We define a booking as the receipt of a customer order that contractually engages us to perform activities on behalf of our customer in regard to themanufacture, delivery, and/or support of products or the delivery of service. Bookings recorded and subsequently canceled within the same fiscal period areexcluded from reported bookings. Bookings of $4.2 billion in 2019 increased by $218.5 million, or 5.4%, as compared with 2018. The increase includednegative currency effects of approximately $108 million. The increase was primarily driven by customer original equipment bookings. The increase wasdriven by higher bookings in the oil and gas, power generation, chemical and water management industries, partially offset by decreased bookings in thegeneral industries. Bookings in 2018 included approximately $31 million related to the two FPD locations and associated product lines that were divested inthe third quarter of 2018.
Bookings of $4.0 billion in 2018 increased by $215.9 million, or 5.7%, as compared with 2017. The increase included currency benefits of
approximately $30 million. The increase was primarily driven by the oil and gas, general and chemical industries, partially offset by a decrease in the powergeneration industry. The increase was more heavily-weighted towards customer aftermarket bookings.
30
Backlog represents the aggregate value of booked but uncompleted customer orders and is influenced primarily by bookings, sales, cancellations andcurrency effects. Backlog of $2.2 billion at December 31, 2019 increased by $265.4 million, or 14.0%, as compared with December 31, 2018. Currencyeffects provided an increase of less than $1 million (currency effects on backlog are calculated using the change in period end exchange rates). Backlogrelated to aftermarket orders was approximately 33% and 36% of the backlog at December 31, 2019 and 2018, respectively. We expect to recognize revenueon approximately 88% of December 31, 2019 backlog during 2020. Backlog includes our unsatisfied (or partially unsatisfied) performance obligations relatedto contracts having an original expected duration in excess of one year of approximately $709 million as discussed in Note 2 to our consolidated financialstatements included in Item 8 of this Annual Report.
Backlog of $1.9 billion at December 31, 2018 decreased by $141.8 million, or 7.0%, as compared with December 31, 2017. Currency effects provided adecrease of approximately $83 million. Backlog related to aftermarket orders was approximately 36% and 31% of the backlog at December 31,2018 and 2017, respectively. We expected to recognize revenue on approximately 89% of December 31, 2018 backlog during 2019.
Sales
2019 2018 2017 (Amounts in millions)
Sales $ 3,944.9 $ 3,832.7 $ 3,660.8
Sales in 2019 increased by $112.2 million, or 2.9%, as compared with 2018. The increase included negative currency effects of approximately $94million. The increase was more heavily-weighted to aftermarket sales, with increased sales into North America, Europe and Asia Pacific, partially offset bydecreased sales into Latin America, Africa and the Middle East. Sales in 2018 included approximately $30 million related to the two FPD locations andassociated product lines that were divested in the third quarter of 2018.
Sales in 2018 increased by $171.9 million, or 4.7%, as compared with 2017. The increase included currency benefits of approximately $31 million.The increase was more heavily-weighted to aftermarket sales, with increased sales into North America, Asia Pacific and Africa, partially offset by decreasedsales in the Middle East and Europe.
Sales to international customers, including export sales from the U.S., were approximately 63% of total sales in both 2019 and 2018 and 64% for 2017.Sales into Europe, the Middle East and Africa ("EMA") were approximately 32% of total sales in both 2019 and 2018 and 36% in 2017. Sales into AsiaPacific were approximately 21% of total sales for 2019, 20% for 2018 and 19% for 2017. Sales into Latin America were approximately 6% of total sales in2019, 2018 and 2017.
Gross Profit and Gross Profit Margin
2019 2018 2017 (Amounts in millions, except percentages)
Gross profit $ 1,295.4 $ 1,187.8 $ 1,089.0Gross profit margin 32.8% 31.0% 29.7%
Gross profit in 2019 increased by $107.6 million, or 9.1%, as compared with 2018. Gross profit margin in 2019 of 32.8% increased from 31.0% in2018. The increase in gross profit margin was primarily attributed to the favorable impact of revenue recognized on higher margin projects, lower realignmentcharges associated with our Realignment Programs, improvements in operational efficiency and a $7.7 million charge related to the write-down of inventoryin the second quarter of 2018 that did not recur. Aftermarket sales represent approximately 50% of total sales in both 2019 and 2018.
Gross profit in 2018 increased by $98.8 million, or 9.1%, as compared with 2017. Gross profit margin in 2018 of 31.0% increased from 29.7% in 2017.The increase in gross profit margin was primarily attributable to a $16.9 million charge for costs related to a contract to supply oil and gas platform equipmentto an end user in Latin America in 2017 that did not recur, revenue recognized on higher margin projects, a mix shift to higher margin aftermarket sales,favorable impact of increased sales on our absorption of fixed manufacturing costs and increased savings related to our Realignment Programs, partiallyoffset by a $7.7 million charge for cost incurred related to the write-down of inventory associated with the divestiture of two FPD locations and relatedproduct lines in the second quarter of 2018. Aftermarket sales increased to approximately 50% of total sales, as compared with approximately 48% of totalsales in 2017.
31
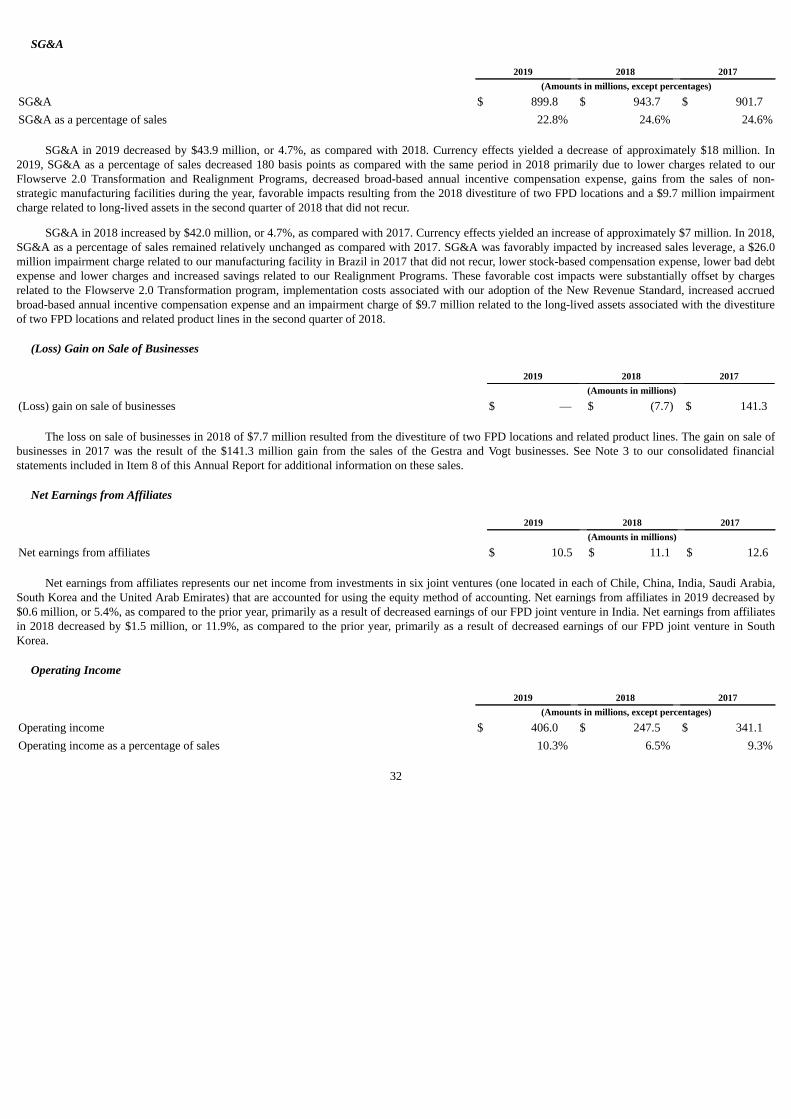
SG&A
2019 2018 2017 (Amounts in millions, except percentages)
SG&A $ 899.8 $ 943.7 $ 901.7SG&A as a percentage of sales 22.8% 24.6% 24.6%
SG&A in 2019 decreased by $43.9 million, or 4.7%, as compared with 2018. Currency effects yielded a decrease of approximately $18 million. In2019, SG&A as a percentage of sales decreased 180 basis points as compared with the same period in 2018 primarily due to lower charges related to ourFlowserve 2.0 Transformation and Realignment Programs, decreased broad-based annual incentive compensation expense, gains from the sales of non-strategic manufacturing facilities during the year, favorable impacts resulting from the 2018 divestiture of two FPD locations and a $9.7 million impairmentcharge related to long-lived assets in the second quarter of 2018 that did not recur.
SG&A in 2018 increased by $42.0 million, or 4.7%, as compared with 2017. Currency effects yielded an increase of approximately $7 million. In 2018,SG&A as a percentage of sales remained relatively unchanged as compared with 2017. SG&A was favorably impacted by increased sales leverage, a $26.0million impairment charge related to our manufacturing facility in Brazil in 2017 that did not recur, lower stock-based compensation expense, lower bad debtexpense and lower charges and increased savings related to our Realignment Programs. These favorable cost impacts were substantially offset by chargesrelated to the Flowserve 2.0 Transformation program, implementation costs associated with our adoption of the New Revenue Standard, increased accruedbroad-based annual incentive compensation expense and an impairment charge of $9.7 million related to the long-lived assets associated with the divestitureof two FPD locations and related product lines in the second quarter of 2018.
(Loss) Gain on Sale of Businesses
2019 2018 2017 (Amounts in millions)
(Loss) gain on sale of businesses $ — $ (7.7) $ 141.3
The loss on sale of businesses in 2018 of $7.7 million resulted from the divestiture of two FPD locations and related product lines. The gain on sale ofbusinesses in 2017 was the result of the $141.3 million gain from the sales of the Gestra and Vogt businesses. See Note 3 to our consolidated financialstatements included in Item 8 of this Annual Report for additional information on these sales.
Net Earnings from Affiliates
2019 2018 2017 (Amounts in millions)
Net earnings from affiliates $ 10.5 $ 11.1 $ 12.6
Net earnings from affiliates represents our net income from investments in six joint ventures (one located in each of Chile, China, India, Saudi Arabia,South Korea and the United Arab Emirates) that are accounted for using the equity method of accounting. Net earnings from affiliates in 2019 decreased by$0.6 million, or 5.4%, as compared to the prior year, primarily as a result of decreased earnings of our FPD joint venture in India. Net earnings from affiliatesin 2018 decreased by $1.5 million, or 11.9%, as compared to the prior year, primarily as a result of decreased earnings of our FPD joint venture in SouthKorea.
Operating Income
2019 2018 2017 (Amounts in millions, except percentages)
Operating income $ 406.0 $ 247.5 $ 341.1Operating income as a percentage of sales 10.3% 6.5% 9.3%
32
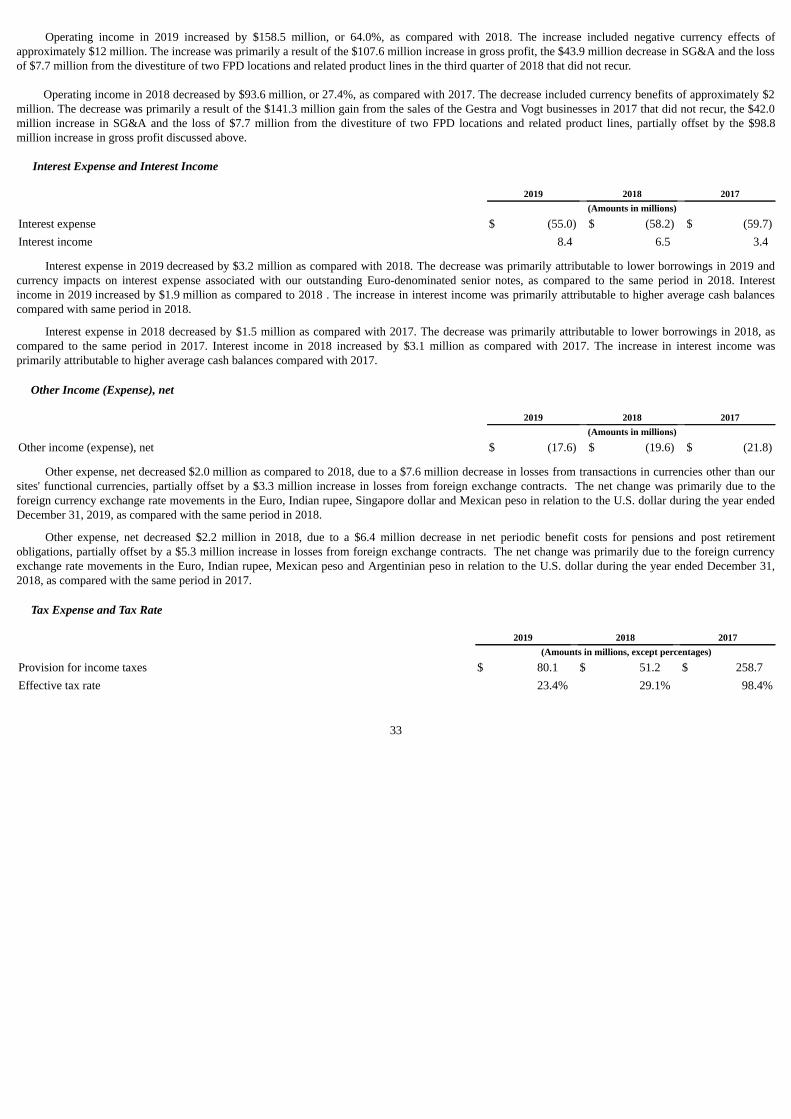
Operating income in 2019 increased by $158.5 million, or 64.0%, as compared with 2018. The increase included negative currency effects ofapproximately $12 million. The increase was primarily a result of the $107.6 million increase in gross profit, the $43.9 million decrease in SG&A and the lossof $7.7 million from the divestiture of two FPD locations and related product lines in the third quarter of 2018 that did not recur.
Operating income in 2018 decreased by $93.6 million, or 27.4%, as compared with 2017. The decrease included currency benefits of approximately $2million. The decrease was primarily a result of the $141.3 million gain from the sales of the Gestra and Vogt businesses in 2017 that did not recur, the $42.0million increase in SG&A and the loss of $7.7 million from the divestiture of two FPD locations and related product lines, partially offset by the $98.8million increase in gross profit discussed above.
Interest Expense and Interest Income
2019 2018 2017 (Amounts in millions)
Interest expense $ (55.0) $ (58.2) $ (59.7)Interest income 8.4 6.5 3.4
Interest expense in 2019 decreased by $3.2 million as compared with 2018. The decrease was primarily attributable to lower borrowings in 2019 andcurrency impacts on interest expense associated with our outstanding Euro-denominated senior notes, as compared to the same period in 2018. Interestincome in 2019 increased by $1.9 million as compared to 2018 . The increase in interest income was primarily attributable to higher average cash balancescompared with same period in 2018.
Interest expense in 2018 decreased by $1.5 million as compared with 2017. The decrease was primarily attributable to lower borrowings in 2018, ascompared to the same period in 2017. Interest income in 2018 increased by $3.1 million as compared with 2017. The increase in interest income wasprimarily attributable to higher average cash balances compared with 2017.
Other Income (Expense), net
2019 2018 2017 (Amounts in millions)
Other income (expense), net $ (17.6) $ (19.6) $ (21.8)
Other expense, net decreased $2.0 million as compared to 2018, due to a $7.6 million decrease in losses from transactions in currencies other than oursites' functional currencies, partially offset by a $3.3 million increase in losses from foreign exchange contracts. The net change was primarily due to theforeign currency exchange rate movements in the Euro, Indian rupee, Singapore dollar and Mexican peso in relation to the U.S. dollar during the year endedDecember 31, 2019, as compared with the same period in 2018.
Other expense, net decreased $2.2 million in 2018, due to a $6.4 million decrease in net periodic benefit costs for pensions and post retirementobligations, partially offset by a $5.3 million increase in losses from foreign exchange contracts. The net change was primarily due to the foreign currencyexchange rate movements in the Euro, Indian rupee, Mexican peso and Argentinian peso in relation to the U.S. dollar during the year ended December 31,2018, as compared with the same period in 2017.
Tax Expense and Tax Rate
2019 2018 2017 (Amounts in millions, except percentages)
Provision for income taxes $ 80.1 $ 51.2 $ 258.7Effective tax rate 23.4% 29.1% 98.4%
33
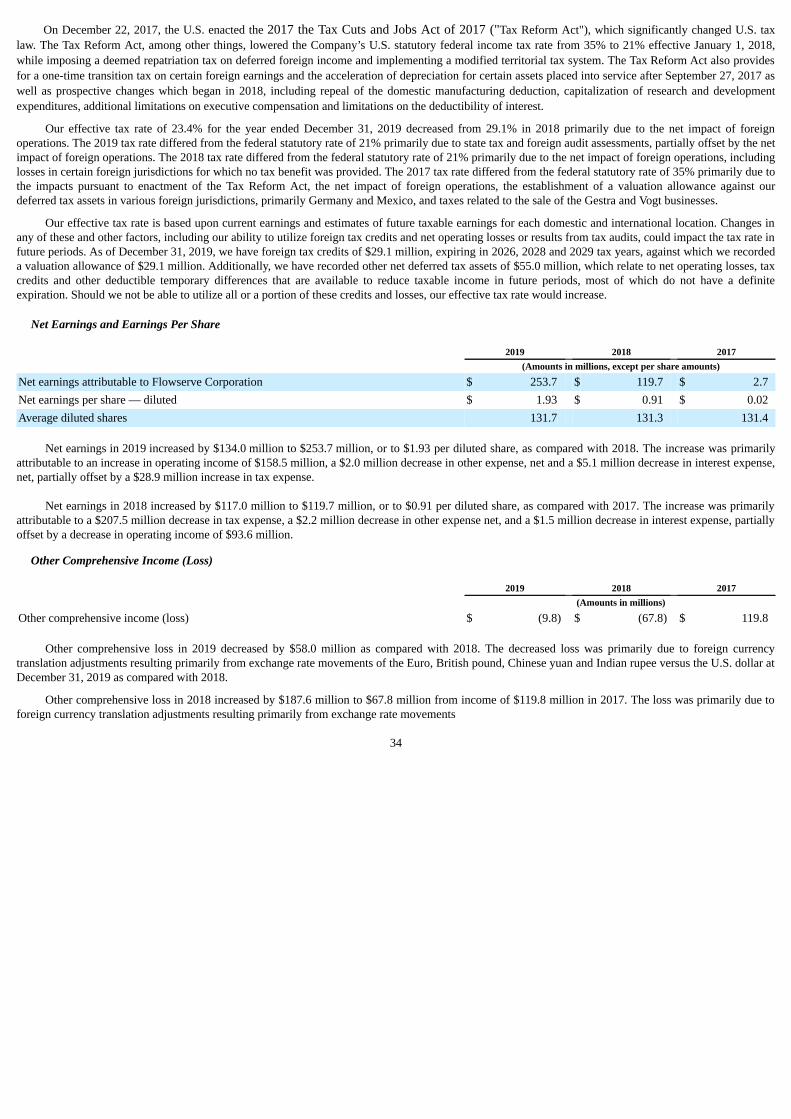
On December 22, 2017, the U.S. enacted the 2017 the Tax Cuts and Jobs Act of 2017 ("Tax Reform Act"), which significantly changed U.S. taxlaw. The Tax Reform Act, among other things, lowered the Company’s U.S. statutory federal income tax rate from 35% to 21% effective January 1, 2018,while imposing a deemed repatriation tax on deferred foreign income and implementing a modified territorial tax system. The Tax Reform Act also providesfor a one-time transition tax on certain foreign earnings and the acceleration of depreciation for certain assets placed into service after September 27, 2017 aswell as prospective changes which began in 2018, including repeal of the domestic manufacturing deduction, capitalization of research and developmentexpenditures, additional limitations on executive compensation and limitations on the deductibility of interest.
Our effective tax rate of 23.4% for the year ended December 31, 2019 decreased from 29.1% in 2018 primarily due to the net impact of foreignoperations. The 2019 tax rate differed from the federal statutory rate of 21% primarily due to state tax and foreign audit assessments, partially offset by the netimpact of foreign operations. The 2018 tax rate differed from the federal statutory rate of 21% primarily due to the net impact of foreign operations, includinglosses in certain foreign jurisdictions for which no tax benefit was provided. The 2017 tax rate differed from the federal statutory rate of 35% primarily due tothe impacts pursuant to enactment of the Tax Reform Act, the net impact of foreign operations, the establishment of a valuation allowance against ourdeferred tax assets in various foreign jurisdictions, primarily Germany and Mexico, and taxes related to the sale of the Gestra and Vogt businesses.
Our effective tax rate is based upon current earnings and estimates of future taxable earnings for each domestic and international location. Changes inany of these and other factors, including our ability to utilize foreign tax credits and net operating losses or results from tax audits, could impact the tax rate infuture periods. As of December 31, 2019, we have foreign tax credits of $29.1 million, expiring in 2026, 2028 and 2029 tax years, against which we recordeda valuation allowance of $29.1 million. Additionally, we have recorded other net deferred tax assets of $55.0 million, which relate to net operating losses, taxcredits and other deductible temporary differences that are available to reduce taxable income in future periods, most of which do not have a definiteexpiration. Should we not be able to utilize all or a portion of these credits and losses, our effective tax rate would increase.
Net Earnings and Earnings Per Share
2019 2018 2017 (Amounts in millions, except per share amounts)
Net earnings attributable to Flowserve Corporation $ 253.7 $ 119.7 $ 2.7Net earnings per share — diluted $ 1.93 $ 0.91 $ 0.02Average diluted shares 131.7 131.3 131.4
Net earnings in 2019 increased by $134.0 million to $253.7 million, or to $1.93 per diluted share, as compared with 2018. The increase was primarilyattributable to an increase in operating income of $158.5 million, a $2.0 million decrease in other expense, net and a $5.1 million decrease in interest expense,net, partially offset by a $28.9 million increase in tax expense.
Net earnings in 2018 increased by $117.0 million to $119.7 million, or to $0.91 per diluted share, as compared with 2017. The increase was primarilyattributable to a $207.5 million decrease in tax expense, a $2.2 million decrease in other expense net, and a $1.5 million decrease in interest expense, partiallyoffset by a decrease in operating income of $93.6 million.
Other Comprehensive Income (Loss)
2019 2018 2017 (Amounts in millions)
Other comprehensive income (loss) $ (9.8) $ (67.8) $ 119.8
Other comprehensive loss in 2019 decreased by $58.0 million as compared with 2018. The decreased loss was primarily due to foreign currencytranslation adjustments resulting primarily from exchange rate movements of the Euro, British pound, Chinese yuan and Indian rupee versus the U.S. dollar atDecember 31, 2019 as compared with 2018.
Other comprehensive loss in 2018 increased by $187.6 million to $67.8 million from income of $119.8 million in 2017. The loss was primarily due toforeign currency translation adjustments resulting primarily from exchange rate movements
34
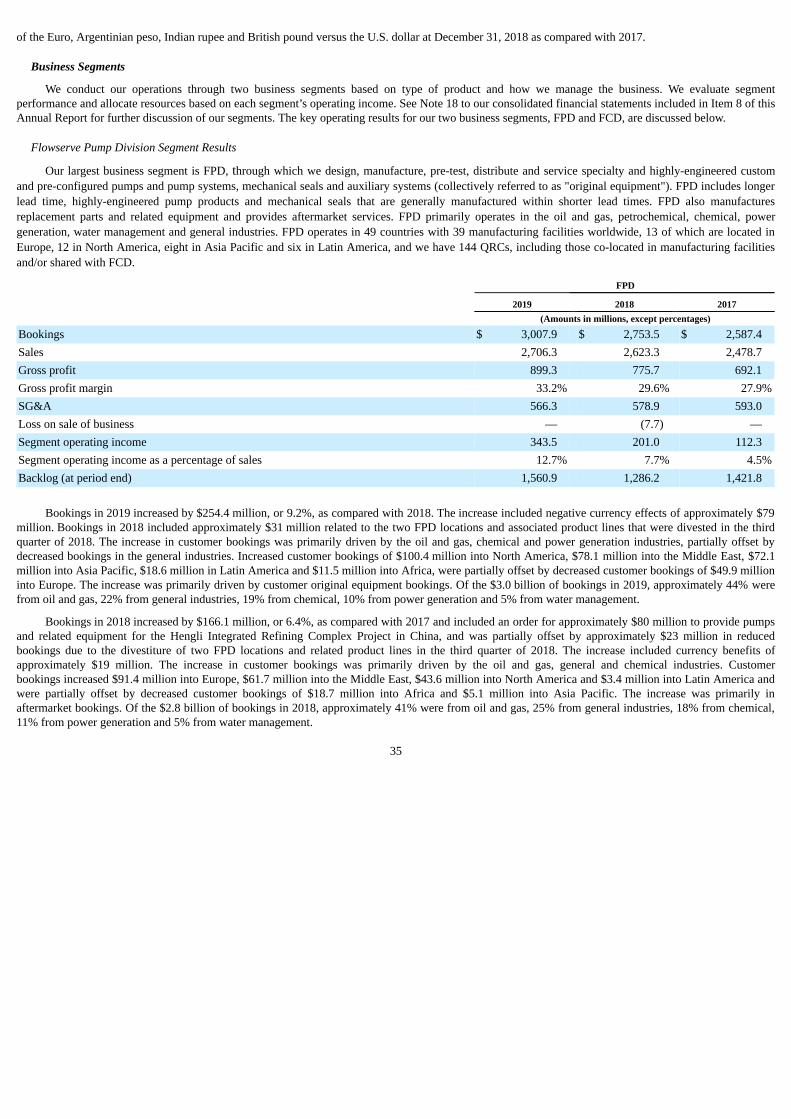
of the Euro, Argentinian peso, Indian rupee and British pound versus the U.S. dollar at December 31, 2018 as compared with 2017.
Business Segments
We conduct our operations through two business segments based on type of product and how we manage the business. We evaluate segmentperformance and allocate resources based on each segment’s operating income. See Note 18 to our consolidated financial statements included in Item 8 of thisAnnual Report for further discussion of our segments. The key operating results for our two business segments, FPD and FCD, are discussed below.
Flowserve Pump Division Segment Results
Our largest business segment is FPD, through which we design, manufacture, pre-test, distribute and service specialty and highly-engineered customand pre-configured pumps and pump systems, mechanical seals and auxiliary systems (collectively referred to as "original equipment"). FPD includes longerlead time, highly-engineered pump products and mechanical seals that are generally manufactured within shorter lead times. FPD also manufacturesreplacement parts and related equipment and provides aftermarket services. FPD primarily operates in the oil and gas, petrochemical, chemical, powergeneration, water management and general industries. FPD operates in 49 countries with 39 manufacturing facilities worldwide, 13 of which are located inEurope, 12 in North America, eight in Asia Pacific and six in Latin America, and we have 144 QRCs, including those co-located in manufacturing facilitiesand/or shared with FCD.
FPD
2019 2018 2017 (Amounts in millions, except percentages)
Bookings $ 3,007.9 $ 2,753.5 $ 2,587.4Sales 2,706.3 2,623.3 2,478.7Gross profit 899.3 775.7 692.1Gross profit margin 33.2% 29.6% 27.9%SG&A 566.3 578.9 593.0Loss on sale of business — (7.7) —Segment operating income 343.5 201.0 112.3Segment operating income as a percentage of sales 12.7% 7.7% 4.5%Backlog (at period end) 1,560.9 1,286.2 1,421.8
Bookings in 2019 increased by $254.4 million, or 9.2%, as compared with 2018. The increase included negative currency effects of approximately $79million. Bookings in 2018 included approximately $31 million related to the two FPD locations and associated product lines that were divested in the thirdquarter of 2018. The increase in customer bookings was primarily driven by the oil and gas, chemical and power generation industries, partially offset bydecreased bookings in the general industries. Increased customer bookings of $100.4 million into North America, $78.1 million into the Middle East, $72.1million into Asia Pacific, $18.6 million in Latin America and $11.5 million into Africa, were partially offset by decreased customer bookings of $49.9 millioninto Europe. The increase was primarily driven by customer original equipment bookings. Of the $3.0 billion of bookings in 2019, approximately 44% werefrom oil and gas, 22% from general industries, 19% from chemical, 10% from power generation and 5% from water management.
Bookings in 2018 increased by $166.1 million, or 6.4%, as compared with 2017 and included an order for approximately $80 million to provide pumpsand related equipment for the Hengli Integrated Refining Complex Project in China, and was partially offset by approximately $23 million in reducedbookings due to the divestiture of two FPD locations and related product lines in the third quarter of 2018. The increase included currency benefits ofapproximately $19 million. The increase in customer bookings was primarily driven by the oil and gas, general and chemical industries. Customerbookings increased $91.4 million into Europe, $61.7 million into the Middle East, $43.6 million into North America and $3.4 million into Latin America andwere partially offset by decreased customer bookings of $18.7 million into Africa and $5.1 million into Asia Pacific. The increase was primarily inaftermarket bookings. Of the $2.8 billion of bookings in 2018, approximately 41% were from oil and gas, 25% from general industries, 18% from chemical,11% from power generation and 5% from water management.
35
Sales in 2019 increased $83.0 million, or 3.2%, as compared with 2018. The increase included negative currency effects of approximately $66 million.Sales in 2018 included approximately $30 million related to the two FPD locations and associated product lines that were divested in the third quarterof 2018. The increase was primarily driven by aftermarket sales, resulting from increased customer sales of $45.3 million into North America, $28.6 millioninto Europe, $16.8 million into the Middle East and $8.8 million into Africa, partially offset by decreased sales of $17.8 million into Latin America and $4.0million into Asia Pacific.
Sales in 2018 increased $144.6 million, or 5.8%, as compared with 2017. The increase included currency benefits of approximately $23 million and waspartially offset by approximately $19 million in reduced sales due to the divestiture of two FPD locations and related product lines in the third quarter of2018. The increase was more heavily-weighted towards aftermarket sales, resulting from increased customer sales of $69.9 million into North America, $58.4million into Asia Pacific, $55.8 million into Africa and $50.9 million into Latin America, partially offset by decreased sales of $82.4 million into the MiddleEast and $2.6 million into Europe.
Gross profit in 2019 increased by $123.6 million, or 15.9%, as compared with 2018. Gross profit margin in 2019 of 33.2% increased from 29.6% in2018. The increase in gross profit margin was primarily attributable to revenue recognized on higher margin projects, lower realignment charges associatedwith our Realignment Programs, sales mix shift to higher margin aftermarket sales, improvements in operational efficiency and a $7.7 million charge relatedto the write-down of inventory in the second quarter of 2018 that did not recur.
Gross profit in 2018 increased by $83.6 million, or 12.1%, as compared with 2017. Gross profit margin in 2018 of 29.6% increasedfrom 27.9% in 2017. The increase in gross profit margin was primarily attributable to the favorable impact of increased sales on our absorption of fixedmanufacturing costs, a $16.9 million charge for costs related to a contract to supply oil and gas platform equipment to an end user in Latin America in 2017that did not recur, lower charges and increased savings related to our Realignment Programs and revenue recognized on higher margin projects, partiallyoffset by a $7.7 million charge for cost incurred related to the write-down of inventory associated with the divestiture of two FPD locations and relatedproduct lines.
SG&A in 2019 decreased by $12.6 million, or 2.2%, as compared with 2018. Currency effects provided a decrease of approximately $13 million.The decrease in SG&A, including currency, was due to favorable impacts on SG&A due to gains from the sales of non-strategic manufacturing facilitiesduring the year, the 2018 divestiture of two FPD locations and a $9.7 million impairment charge related to the long-lived assets in the second quarter of2018 that did not recur, substantially offset by an increase in selling-related expenses and collections of previously reserved bad debts in 2018 that did notrecur.
SG&A in 2018 decreased by $14.1 million, or 2.4%, as compared with 2017. Currency effects provided an increase of approximately $5 million.The decrease in SG&A was primarily attributable to a $26.0 million impairment charge related to our manufacturing facility in Brazil in 2017 that did notrecur, lower bad debt expense and decreased charges related to our Realignment Programs, partially offset by higher selling and administrative relatedexpenses and an impairment charge on long-lived assets related to the divestiture of two FPD locations and related product lines of $9.7 million.
The loss on sale of businesses in 2018 of $7.7 million resulted from the divestiture of two FPD locations and related product lines. Refer to Note 3 toour consolidated financial statements included in Item 8 of this Annual Report for additional information on this divestiture.
Operating income in 2019 increased by $142.5 million, or 70.9%, as compared with 2018. The increase included negative currency effects ofapproximately $10 million. The increase was due to the $123.6 million increase in gross profit, the $12.6 million decrease in SG&A and the $7.7 million lossfrom the divestiture of two FPD locations and related product lines in the third quarter of 2018 that did not recur.
Operating income in 2018 increased by $88.7 million, or 79.0%, as compared with 2017. The increase included negative currency effects ofapproximately $1 million. The increase was due to the $83.6 million increase in gross profit and the $14.1 million decrease in SG&A, partially offset bythe $7.7 million loss from the divestiture of two FPD locations and related product lines in the third quarter of 2018 that did not recur.
Backlog of $1.6 billion at December 31, 2019 increased by $274.7 million, or 21.4%, as compared with December 31, 2018. Currency effects providedan increase of approximately $5 million. Backlog of $1.3 billion at December 31, 2018 decreased by $135.6 million, or 9.5%, as compared withDecember 31, 2017. Currency effects provided a decrease of approximately $66 million.
36
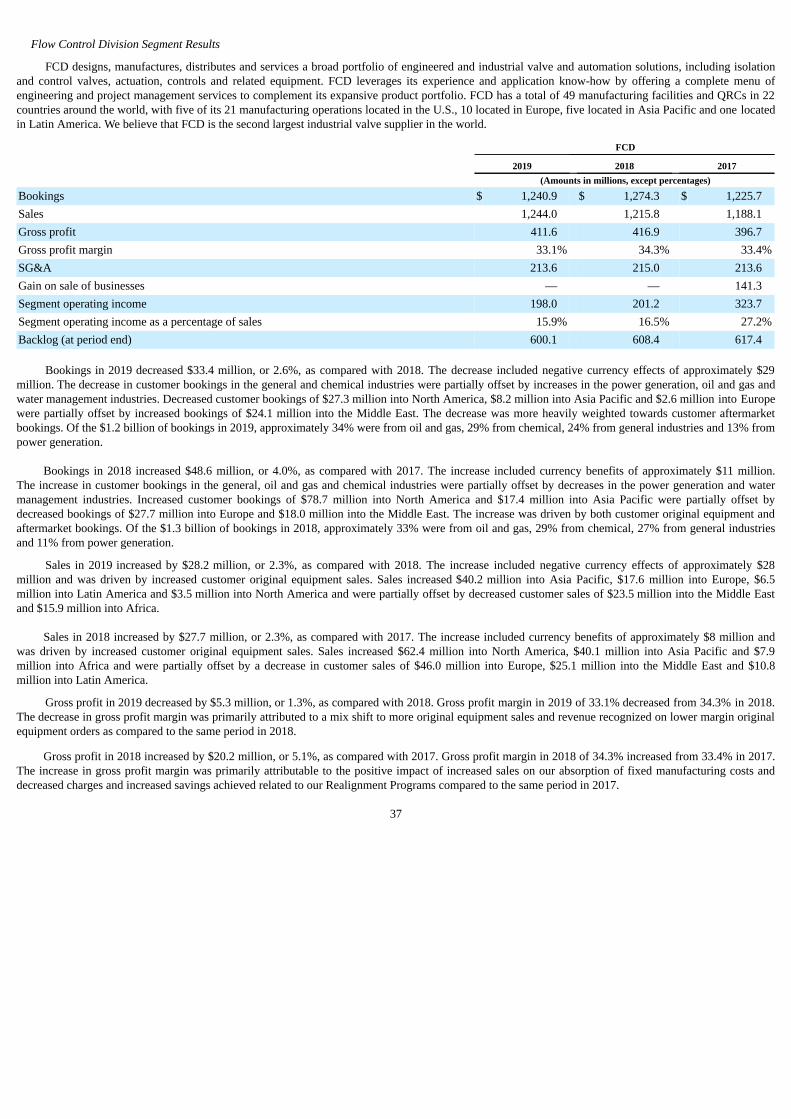
Flow Control Division Segment Results
FCD designs, manufactures, distributes and services a broad portfolio of engineered and industrial valve and automation solutions, including isolationand control valves, actuation, controls and related equipment. FCD leverages its experience and application know-how by offering a complete menu ofengineering and project management services to complement its expansive product portfolio. FCD has a total of 49 manufacturing facilities and QRCs in 22countries around the world, with five of its 21 manufacturing operations located in the U.S., 10 located in Europe, five located in Asia Pacific and one locatedin Latin America. We believe that FCD is the second largest industrial valve supplier in the world.
FCD
2019 2018 2017 (Amounts in millions, except percentages)
Bookings $ 1,240.9 $ 1,274.3 $ 1,225.7Sales 1,244.0 1,215.8 1,188.1Gross profit 411.6 416.9 396.7Gross profit margin 33.1% 34.3% 33.4%SG&A 213.6 215.0 213.6Gain on sale of businesses — — 141.3Segment operating income 198.0 201.2 323.7Segment operating income as a percentage of sales 15.9% 16.5% 27.2%Backlog (at period end) 600.1 608.4 617.4
Bookings in 2019 decreased $33.4 million, or 2.6%, as compared with 2018. The decrease included negative currency effects of approximately $29million. The decrease in customer bookings in the general and chemical industries were partially offset by increases in the power generation, oil and gas andwater management industries. Decreased customer bookings of $27.3 million into North America, $8.2 million into Asia Pacific and $2.6 million into Europewere partially offset by increased bookings of $24.1 million into the Middle East. The decrease was more heavily weighted towards customer aftermarketbookings. Of the $1.2 billion of bookings in 2019, approximately 34% were from oil and gas, 29% from chemical, 24% from general industries and 13% frompower generation.
Bookings in 2018 increased $48.6 million, or 4.0%, as compared with 2017. The increase included currency benefits of approximately $11 million.The increase in customer bookings in the general, oil and gas and chemical industries were partially offset by decreases in the power generation and watermanagement industries. Increased customer bookings of $78.7 million into North America and $17.4 million into Asia Pacific were partially offset bydecreased bookings of $27.7 million into Europe and $18.0 million into the Middle East. The increase was driven by both customer original equipment andaftermarket bookings. Of the $1.3 billion of bookings in 2018, approximately 33% were from oil and gas, 29% from chemical, 27% from general industriesand 11% from power generation.
Sales in 2019 increased by $28.2 million, or 2.3%, as compared with 2018. The increase included negative currency effects of approximately $28million and was driven by increased customer original equipment sales. Sales increased $40.2 million into Asia Pacific, $17.6 million into Europe, $6.5million into Latin America and $3.5 million into North America and were partially offset by decreased customer sales of $23.5 million into the Middle Eastand $15.9 million into Africa.
Sales in 2018 increased by $27.7 million, or 2.3%, as compared with 2017. The increase included currency benefits of approximately $8 million andwas driven by increased customer original equipment sales. Sales increased $62.4 million into North America, $40.1 million into Asia Pacific and $7.9million into Africa and were partially offset by a decrease in customer sales of $46.0 million into Europe, $25.1 million into the Middle East and $10.8million into Latin America.
Gross profit in 2019 decreased by $5.3 million, or 1.3%, as compared with 2018. Gross profit margin in 2019 of 33.1% decreased from 34.3% in 2018.The decrease in gross profit margin was primarily attributed to a mix shift to more original equipment sales and revenue recognized on lower margin originalequipment orders as compared to the same period in 2018.
Gross profit in 2018 increased by $20.2 million, or 5.1%, as compared with 2017. Gross profit margin in 2018 of 34.3% increased from 33.4% in 2017.The increase in gross profit margin was primarily attributable to the positive impact of increased sales on our absorption of fixed manufacturing costs anddecreased charges and increased savings achieved related to our Realignment Programs compared to the same period in 2017.
37
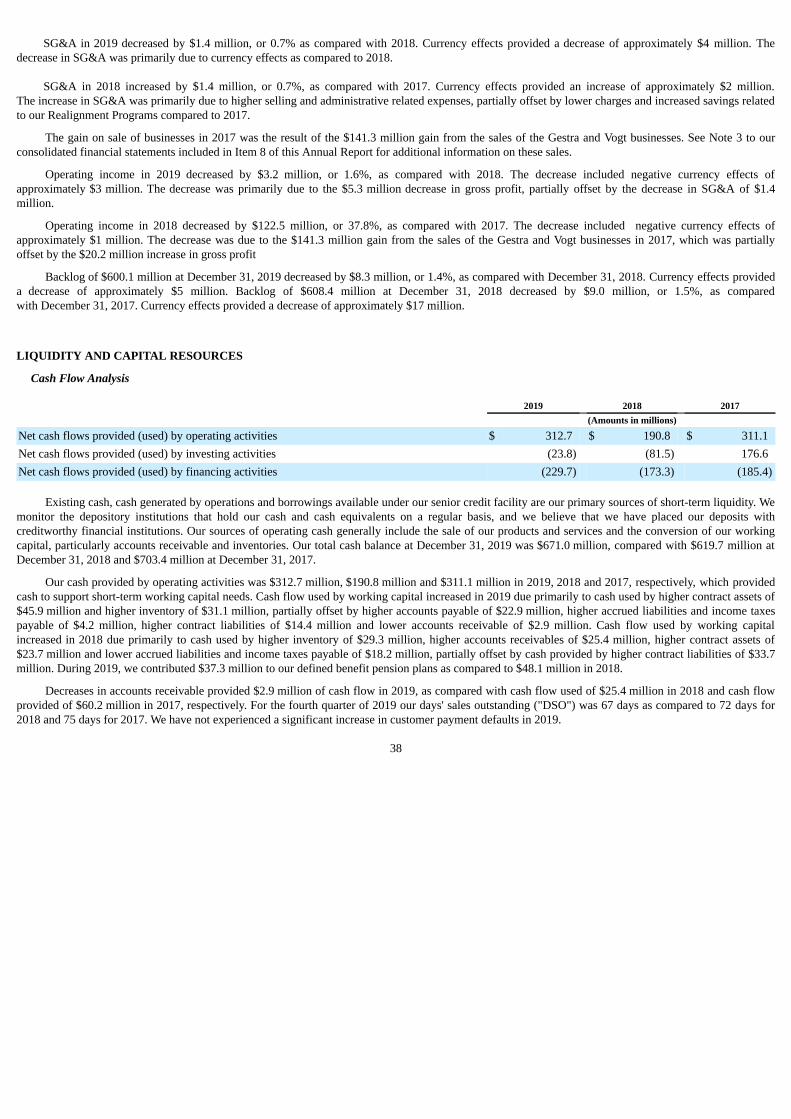
SG&A in 2019 decreased by $1.4 million, or 0.7% as compared with 2018. Currency effects provided a decrease of approximately $4 million. Thedecrease in SG&A was primarily due to currency effects as compared to 2018.
SG&A in 2018 increased by $1.4 million, or 0.7%, as compared with 2017. Currency effects provided an increase of approximately $2 million.The increase in SG&A was primarily due to higher selling and administrative related expenses, partially offset by lower charges and increased savings relatedto our Realignment Programs compared to 2017.
The gain on sale of businesses in 2017 was the result of the $141.3 million gain from the sales of the Gestra and Vogt businesses. See Note 3 to ourconsolidated financial statements included in Item 8 of this Annual Report for additional information on these sales.
Operating income in 2019 decreased by $3.2 million, or 1.6%, as compared with 2018. The decrease included negative currency effects ofapproximately $3 million. The decrease was primarily due to the $5.3 million decrease in gross profit, partially offset by the decrease in SG&A of $1.4million.
Operating income in 2018 decreased by $122.5 million, or 37.8%, as compared with 2017. The decrease included negative currency effects ofapproximately $1 million. The decrease was due to the $141.3 million gain from the sales of the Gestra and Vogt businesses in 2017, which was partiallyoffset by the $20.2 million increase in gross profit
Backlog of $600.1 million at December 31, 2019 decreased by $8.3 million, or 1.4%, as compared with December 31, 2018. Currency effects provideda decrease of approximately $5 million. Backlog of $608.4 million at December 31, 2018 decreased by $9.0 million, or 1.5%, as comparedwith December 31, 2017. Currency effects provided a decrease of approximately $17 million.
LIQUIDITY AND CAPITAL RESOURCES
Cash Flow Analysis
2019 2018 2017 (Amounts in millions)
Net cash flows provided (used) by operating activities $ 312.7 $ 190.8 $ 311.1Net cash flows provided (used) by investing activities (23.8) (81.5) 176.6Net cash flows provided (used) by financing activities (229.7) (173.3) (185.4)
Existing cash, cash generated by operations and borrowings available under our senior credit facility are our primary sources of short-term liquidity. Wemonitor the depository institutions that hold our cash and cash equivalents on a regular basis, and we believe that we have placed our deposits withcreditworthy financial institutions. Our sources of operating cash generally include the sale of our products and services and the conversion of our workingcapital, particularly accounts receivable and inventories. Our total cash balance at December 31, 2019 was $671.0 million, compared with $619.7 million atDecember 31, 2018 and $703.4 million at December 31, 2017.
Our cash provided by operating activities was $312.7 million, $190.8 million and $311.1 million in 2019, 2018 and 2017, respectively, which providedcash to support short-term working capital needs. Cash flow used by working capital increased in 2019 due primarily to cash used by higher contract assets of$45.9 million and higher inventory of $31.1 million, partially offset by higher accounts payable of $22.9 million, higher accrued liabilities and income taxespayable of $4.2 million, higher contract liabilities of $14.4 million and lower accounts receivable of $2.9 million. Cash flow used by working capitalincreased in 2018 due primarily to cash used by higher inventory of $29.3 million, higher accounts receivables of $25.4 million, higher contract assets of$23.7 million and lower accrued liabilities and income taxes payable of $18.2 million, partially offset by cash provided by higher contract liabilities of $33.7million. During 2019, we contributed $37.3 million to our defined benefit pension plans as compared to $48.1 million in 2018.
Decreases in accounts receivable provided $2.9 million of cash flow in 2019, as compared with cash flow used of $25.4 million in 2018 and cash flowprovided of $60.2 million in 2017, respectively. For the fourth quarter of 2019 our days' sales outstanding ("DSO") was 67 days as compared to 72 days for2018 and 75 days for 2017. We have not experienced a significant increase in customer payment defaults in 2019.
38
Increases in inventory used $31.1 million of cash flow in 2019 as compared with $29.3 million in 2018 and cash provided of $48.6 million in 2017. Theuse of cash from inventory in 2019 was primarily due to an increase in raw materials and work in process and in 2018 the cash used was due to decreasedprogress billings. Inventory turns were 4.3 times at December 31, 2019, as compared with 4.2 times for 2018 and 3.3 times for 2017. Our calculation ofinventory turns does not reflect the impact of advanced cash received from our customers.
Increases in contract assets used $45.9 million of cash flow and increases in contact liabilities provided $14.4 million of cash flow in 2019. Increases incontract assets used $23.7 million of cash flow and increases in contact liabilities provided $33.7 million of cash flow in 2018.
Increases in accounts payable provided $22.9 million of cash flow in 2019 compared with cash used of $4.8 million in 2018 and cash provided of $12.4million in 2017. Increases in accrued liabilities and income taxes payable provided $4.2 million of cash flow in 2019 compared with cash used of $18.2million and $3.4 million in 2018 and 2017, respectively.
Cash used by investing activities were $23.8 million in 2019, as compared to $81.5 million in 2018 and cash provided of $176.6 million in 2017. Thedecrease of cash used in 2019 was primarily due to a decrease in capital expenditures and proceeds from the disposal of assets during the year whichprovided $42.3 million, primarily from the sale of non-strategic manufacturing facilities that are included in our Realignment Programs. Capital expenditureswere $66.2 million, $84.0 million and $61.6 million in 2019, 2018 and 2017, respectively. In 2020, we currently estimate capital expenditures to be between$90 million and $100 million before consideration of any acquisition activity.
Cash used by financing activities were $229.7 million in 2019 compared to $173.3 million and $185.4 million in 2018 and 2017, respectively. Cashoutflows during 2019 resulted primarily from the $105.0 million in payments on long-term debt, $99.6 million of dividend payments and the repurchase of$15.0 million of our common stock. Cash outflows during 2018 resulted primarily from $99.4 million of dividend payments and $60.0 million in payments onlong-term debt. Cash outflows during 2017 resulted primarily from $99.2 million of dividend payments and $60.0 million in payments on long-term debt.
In 2019 we repurchased 324,889 shares of our outstanding common stock for $15.0 million. As of December 31, 2019, we had $145.7 million ofremaining capacity under our share repurchase plan previously approved by the Board of Directors.
Our cash needs for the next 12 months are expected to be lower than those of 2019 due to our Realignment Programs being substantially completed andanticipated benefits from working capital reductions. We believe cash flows from operating activities, combined with availability under our senior creditfacility and our existing cash balances, will be sufficient to enable us to meet our cash flow needs for the next 12 months. However, cash flows fromoperations could be adversely affected by a decrease in the rate of general global economic growth and an extended decrease in capital spending of ourcustomers, as well as economic, political and other risks associated with sales of our products, operational factors, competition, regulatory actions,fluctuations in foreign currency exchange rates and fluctuations in interest rates, among other factors. We believe that cash flows from operating activities andour expectation of continuing availability to draw upon our credit agreements are also sufficient to meet our cash flow needs for periods beyond the next12 months.
Acquisitions and Dispositions
We regularly evaluate acquisition opportunities of various sizes. The cost and terms of any financing to be raised in conjunction with any acquisition,including our ability to raise economical capital, is a critical consideration in any such evaluation.
Note 3 to our consolidated financial statements included in Item 8 of this Annual Report contains a discussion of our disposition activity.
Financing
Our credit agreement provides for a $800.0 million unsecured senior credit facility with a maturity date of July 16, 2024 (“Senior Credit Facility”). TheSenior Credit Facility includes a $750.0 million sublimit for the issuance of letters of credit and a $30.0 million sublimit for swing line loans. We have theright to increase the amount of the Senior Credit Facility by an aggregate amount not to exceed $400.0 million, subject to certain conditions, including eachLender's approval providing any increase.
The interest rates per annum applicable to the Senior Credit Facility (other than with respect to swing line loans) are LIBOR plus between 1.000% to1.750%, depending on our debt rating by either Moody’s Investors Service, Inc. or Standard & Poor’s ("S&P") Ratings, or, at our option, the Base Rate (asdefined in the Senior Credit Agreement) plus between 0.000% to 0.750% depending on our debt rating by either Moody’s Investors Service, Inc. or S&PGlobal Ratings. At December 31,
39
2019 the interest rate on the Senior Credit Facility was LIBOR plus 1.375% in the case of LIBOR loans and the Base Rate plus 0.375% in the case of BaseRate loans. In addition, a commitment fee is payable quarterly in arrears on the daily unused portions of the Senior Credit Facility. The commitment fee willbe between 0.090% and 0.300% of unused amounts under the Senior Credit Facility depending on our debt rating by either Moody’s Investors Service, Inc. orS&P’s Ratings. Certain financing arrangements contain provisions that may result in an event of default if there was a failure under other financingarrangements to meet payment terms. Such provisions are referred to as "cross default" provisions. A discussion of our debt and related covenants is includedin Note 12 to our consolidated financial statements included in Item 8 of this Annual Report. We were in compliance with the covenants as of December 31,2019.
Liquidity Analysis
Our cash balance increased by $51.3 million to $671.0 million as of December 31, 2019 as compared with December 31, 2018. The cash increaseincluded $312.7 million in operating cash inflows and $42.3 million from the sale of non-strategic manufacturing facilities that are included in ourRealignment Programs, partially offset by $105.0 million in payments on long-term debt, $99.6 million in dividend payments, $66.2 million in capitalexpenditures and the repurchase of $15.0 million of our common stock.
At December 31, 2019 and 2018, as a result of the values of the plan’s assets and our contributions to the plan, our U.S. pension plan was fully-fundedas defined by applicable law. After consideration of our intent to maintain fully funded status, we contributed $20.0 million to our U.S. pension plan in 2019,excluding direct benefits paid of $0.6 million. We continue to maintain an asset allocation consistent with our strategy to maximize total return, whilereducing portfolio risks through asset class diversification.
OUTLOOK FOR 2020
Our future results of operations and other forward-looking statements contained in this Annual Report, including this MD&A, involve a number of risksand uncertainties — in particular, the statements regarding our goals and strategies, new product introductions, plans to cultivate new businesses, futureeconomic conditions, revenue, pricing, gross profit margin and costs, capital spending, expected cost savings from our transformation and realignmentprograms, global economic and political risk, depreciation and amortization, research and development expenses, potential impairment of assets, tax rate andpending tax and legal proceedings. Our future results of operations may also be affected by employee incentive compensation including our annual programand the amount, type and valuation of share-based awards granted, as well as the amount of awards forfeited due to employee turnover. In addition to thevarious important factors discussed above, a number of other factors could cause actual results to differ materially from our expectations. See the risksdescribed in "Item 1A. Risk Factors" as well as the section titled “Forward-Looking Information is Subject to Risk and Uncertainty” of this Annual Report.
Our bookings were $4,238.3 million during 2019. Because a booking represents a contract that can be, in certain circumstances, modified or canceled,and can include varying lengths between the time of booking and the time of revenue recognition, there is no guarantee that bookings will result incomparable revenues or otherwise be indicative of future results.
We expect a continued competitive economic environment in 2020. We anticipate benefits from the continuation of our Flowserve 2.0 Transformationefforts, end-user strategies, the strength of our high margin aftermarket business, continued disciplined cost management, our diverse customer base, ourbroad product portfolio and our unified operating platform. Similar to prior years, we expect our results will be weighted towards the second half of the year. While we believe that our primary markets continue to provide opportunities, we remain cautious in our outlook for 2020 given the continuing uncertainty ofcapital spending in many of our markets as well as economic and political risk associated with our international operations which could have a negative effecton global economic conditions.
On December 31, 2019, we had $1,354.1 million of fixed-rate Senior Notes outstanding. We expect our interest expense in 2020 will be modestlylower compared with amounts incurred in 2019. Our results of operations may also be impacted by unfavorable foreign currency exchange rate movements.See “Item 7A. Quantitative and Qualitative Disclosures about Market Risk” of this Annual Report.
We expect to generate sufficient cash from operations and have sufficient capacity under our Senior Credit Facility to fund our working capital, capitalexpenditures, dividend payments, share repurchases, debt payments and pension plan contributions in 2020. The amount of cash generated or consumed byworking capital is dependent on our level of revenues, customer cash advances, backlog, customer-driven delays and other factors. We will seek to improveour working capital utilization, with a particular focus on improving the management of accounts receivable and inventory. In 2020, our cash flows forinvesting activities will be focused on strategic initiatives, information technology infrastructure, general upgrades
40
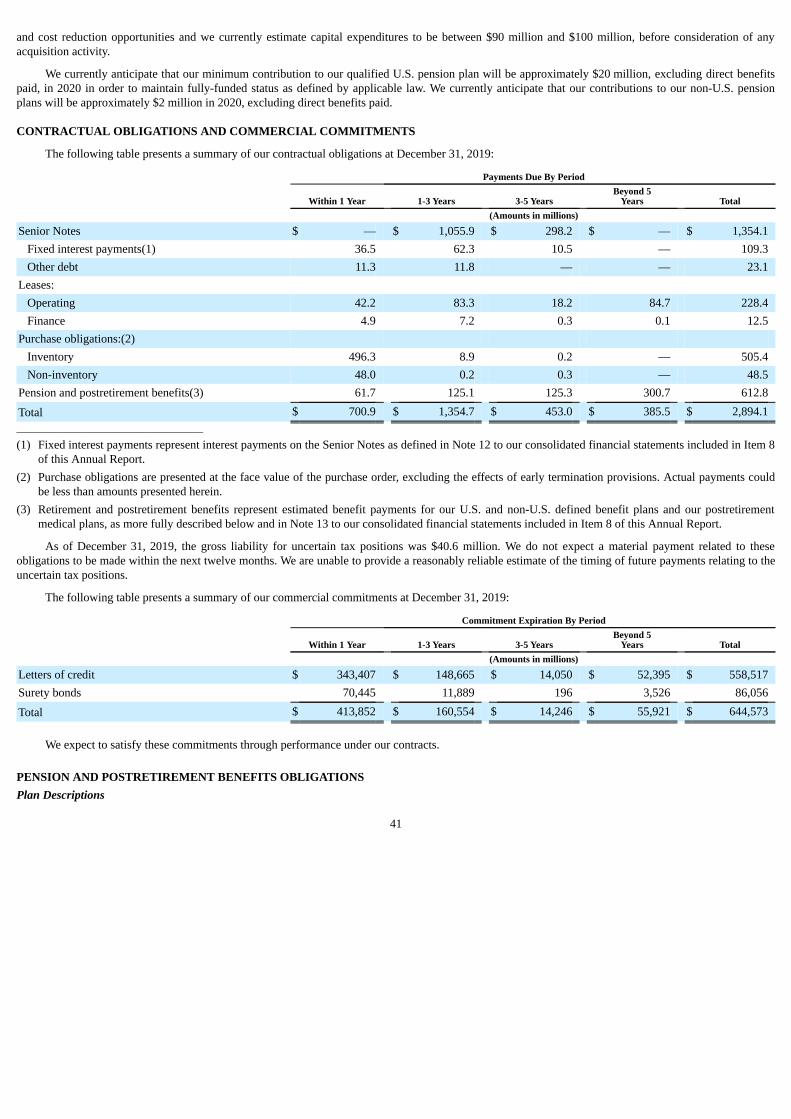
and cost reduction opportunities and we currently estimate capital expenditures to be between $90 million and $100 million, before consideration of anyacquisition activity.
We currently anticipate that our minimum contribution to our qualified U.S. pension plan will be approximately $20 million, excluding direct benefitspaid, in 2020 in order to maintain fully-funded status as defined by applicable law. We currently anticipate that our contributions to our non-U.S. pensionplans will be approximately $2 million in 2020, excluding direct benefits paid.
CONTRACTUAL OBLIGATIONS AND COMMERCIAL COMMITMENTS
The following table presents a summary of our contractual obligations at December 31, 2019:
Payments Due By Period
Within 1 Year 1-3 Years 3-5 Years Beyond 5
Years Total (Amounts in millions)
Senior Notes $ — $ 1,055.9 $ 298.2 $ — $ 1,354.1Fixed interest payments(1) 36.5 62.3 10.5 — 109.3Other debt 11.3 11.8 — — 23.1
Leases: Operating 42.2 83.3 18.2 84.7 228.4Finance 4.9 7.2 0.3 0.1 12.5
Purchase obligations:(2) Inventory 496.3 8.9 0.2 — 505.4Non-inventory 48.0 0.2 0.3 — 48.5
Pension and postretirement benefits(3) 61.7 125.1 125.3 300.7 612.8
Total $ 700.9 $ 1,354.7 $ 453.0 $ 385.5 $ 2,894.1_______________________________________
(1) Fixed interest payments represent interest payments on the Senior Notes as defined in Note 12 to our consolidated financial statements included in Item 8of this Annual Report.
(2) Purchase obligations are presented at the face value of the purchase order, excluding the effects of early termination provisions. Actual payments couldbe less than amounts presented herein.
(3) Retirement and postretirement benefits represent estimated benefit payments for our U.S. and non-U.S. defined benefit plans and our postretirementmedical plans, as more fully described below and in Note 13 to our consolidated financial statements included in Item 8 of this Annual Report.
As of December 31, 2019, the gross liability for uncertain tax positions was $40.6 million. We do not expect a material payment related to theseobligations to be made within the next twelve months. We are unable to provide a reasonably reliable estimate of the timing of future payments relating to theuncertain tax positions.
The following table presents a summary of our commercial commitments at December 31, 2019:
Commitment Expiration By Period
Within 1 Year 1-3 Years 3-5 Years Beyond 5
Years Total (Amounts in millions)
Letters of credit $ 343,407 $ 148,665 $ 14,050 $ 52,395 $ 558,517Surety bonds 70,445 11,889 196 3,526 86,056
Total $ 413,852 $ 160,554 $ 14,246 $ 55,921 $ 644,573
We expect to satisfy these commitments through performance under our contracts.
PENSION AND POSTRETIREMENT BENEFITS OBLIGATIONSPlan Descriptions
41
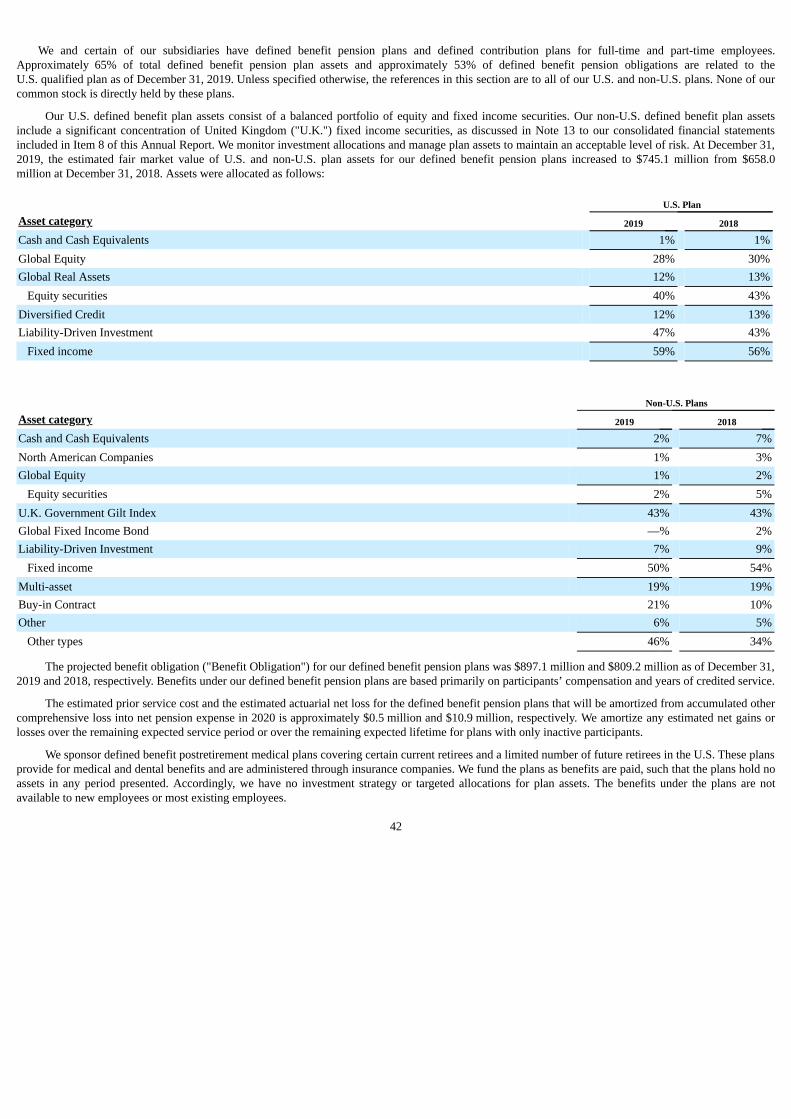
We and certain of our subsidiaries have defined benefit pension plans and defined contribution plans for full-time and part-time employees.Approximately 65% of total defined benefit pension plan assets and approximately 53% of defined benefit pension obligations are related to theU.S. qualified plan as of December 31, 2019. Unless specified otherwise, the references in this section are to all of our U.S. and non-U.S. plans. None of ourcommon stock is directly held by these plans.
Our U.S. defined benefit plan assets consist of a balanced portfolio of equity and fixed income securities. Our non-U.S. defined benefit plan assetsinclude a significant concentration of United Kingdom ("U.K.") fixed income securities, as discussed in Note 13 to our consolidated financial statementsincluded in Item 8 of this Annual Report. We monitor investment allocations and manage plan assets to maintain an acceptable level of risk. At December 31,2019, the estimated fair market value of U.S. and non-U.S. plan assets for our defined benefit pension plans increased to $745.1 million from $658.0million at December 31, 2018. Assets were allocated as follows:
U.S. Plan
Asset category 2019 2018
Cash and Cash Equivalents 1% 1%Global Equity 28% 30%Global Real Assets 12% 13%
Equity securities 40% 43%Diversified Credit 12% 13%Liability-Driven Investment 47% 43%
Fixed income 59% 56%
Non-U.S. Plans
Asset category 2019 2018
Cash and Cash Equivalents 2% 7%North American Companies 1% 3%Global Equity 1% 2%
Equity securities 2% 5%U.K. Government Gilt Index 43% 43%Global Fixed Income Bond —% 2%Liability-Driven Investment 7% 9%
Fixed income 50% 54%Multi-asset 19% 19%Buy-in Contract 21% 10%Other 6% 5%
Other types 46% 34%
The projected benefit obligation ("Benefit Obligation") for our defined benefit pension plans was $897.1 million and $809.2 million as of December 31,2019 and 2018, respectively. Benefits under our defined benefit pension plans are based primarily on participants’ compensation and years of credited service.
The estimated prior service cost and the estimated actuarial net loss for the defined benefit pension plans that will be amortized from accumulated othercomprehensive loss into net pension expense in 2020 is approximately $0.5 million and $10.9 million, respectively. We amortize any estimated net gains orlosses over the remaining expected service period or over the remaining expected lifetime for plans with only inactive participants.
We sponsor defined benefit postretirement medical plans covering certain current retirees and a limited number of future retirees in the U.S. These plansprovide for medical and dental benefits and are administered through insurance companies. We fund the plans as benefits are paid, such that the plans hold noassets in any period presented. Accordingly, we have no investment strategy or targeted allocations for plan assets. The benefits under the plans are notavailable to new employees or most existing employees.
42
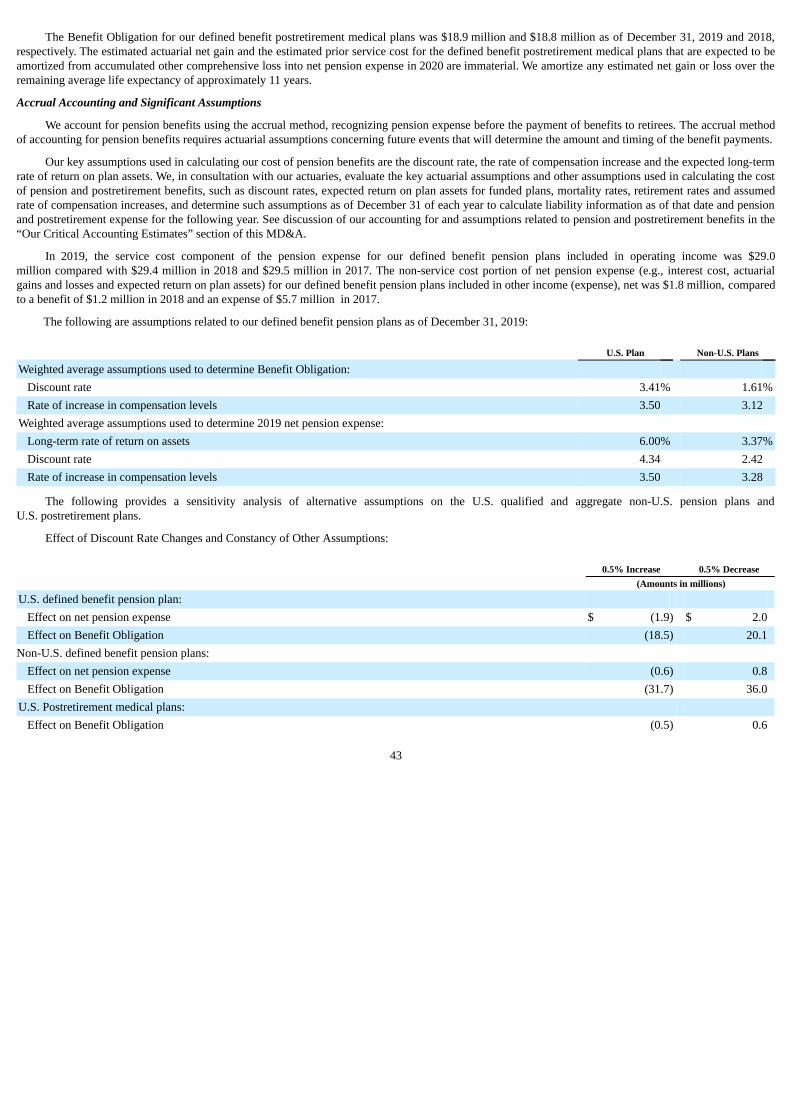
The Benefit Obligation for our defined benefit postretirement medical plans was $18.9 million and $18.8 million as of December 31, 2019 and 2018,respectively. The estimated actuarial net gain and the estimated prior service cost for the defined benefit postretirement medical plans that are expected to beamortized from accumulated other comprehensive loss into net pension expense in 2020 are immaterial. We amortize any estimated net gain or loss over theremaining average life expectancy of approximately 11 years.
Accrual Accounting and Significant Assumptions
We account for pension benefits using the accrual method, recognizing pension expense before the payment of benefits to retirees. The accrual methodof accounting for pension benefits requires actuarial assumptions concerning future events that will determine the amount and timing of the benefit payments.
Our key assumptions used in calculating our cost of pension benefits are the discount rate, the rate of compensation increase and the expected long-termrate of return on plan assets. We, in consultation with our actuaries, evaluate the key actuarial assumptions and other assumptions used in calculating the costof pension and postretirement benefits, such as discount rates, expected return on plan assets for funded plans, mortality rates, retirement rates and assumedrate of compensation increases, and determine such assumptions as of December 31 of each year to calculate liability information as of that date and pensionand postretirement expense for the following year. See discussion of our accounting for and assumptions related to pension and postretirement benefits in the“Our Critical Accounting Estimates” section of this MD&A.
In 2019, the service cost component of the pension expense for our defined benefit pension plans included in operating income was $29.0million compared with $29.4 million in 2018 and $29.5 million in 2017. The non-service cost portion of net pension expense (e.g., interest cost, actuarialgains and losses and expected return on plan assets) for our defined benefit pension plans included in other income (expense), net was $1.8 million, comparedto a benefit of $1.2 million in 2018 and an expense of $5.7 million in 2017.
The following are assumptions related to our defined benefit pension plans as of December 31, 2019:
U.S. Plan Non-U.S. Plans
Weighted average assumptions used to determine Benefit Obligation: Discount rate 3.41% 1.61%Rate of increase in compensation levels 3.50 3.12
Weighted average assumptions used to determine 2019 net pension expense: Long-term rate of return on assets 6.00% 3.37%Discount rate 4.34 2.42Rate of increase in compensation levels 3.50 3.28
The following provides a sensitivity analysis of alternative assumptions on the U.S. qualified and aggregate non-U.S. pension plans andU.S. postretirement plans.
Effect of Discount Rate Changes and Constancy of Other Assumptions:
0.5% Increase 0.5% Decrease (Amounts in millions)
U.S. defined benefit pension plan: Effect on net pension expense $ (1.9) $ 2.0Effect on Benefit Obligation (18.5) 20.1
Non-U.S. defined benefit pension plans: Effect on net pension expense (0.6) 0.8Effect on Benefit Obligation (31.7) 36.0
U.S. Postretirement medical plans: Effect on Benefit Obligation (0.5) 0.6
43
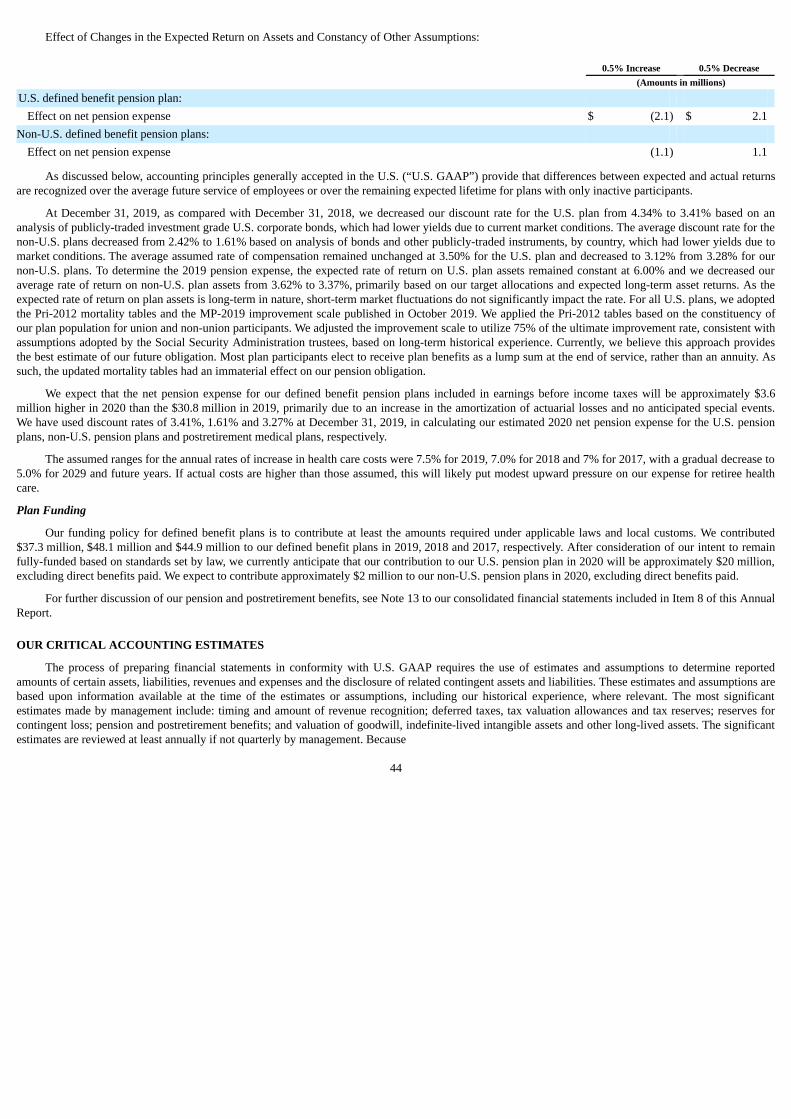
Effect of Changes in the Expected Return on Assets and Constancy of Other Assumptions:
0.5% Increase 0.5% Decrease (Amounts in millions)
U.S. defined benefit pension plan: Effect on net pension expense $ (2.1) $ 2.1
Non-U.S. defined benefit pension plans: Effect on net pension expense (1.1) 1.1
As discussed below, accounting principles generally accepted in the U.S. (“U.S. GAAP”) provide that differences between expected and actual returnsare recognized over the average future service of employees or over the remaining expected lifetime for plans with only inactive participants.
At December 31, 2019, as compared with December 31, 2018, we decreased our discount rate for the U.S. plan from 4.34% to 3.41% based on ananalysis of publicly-traded investment grade U.S. corporate bonds, which had lower yields due to current market conditions. The average discount rate for thenon-U.S. plans decreased from 2.42% to 1.61% based on analysis of bonds and other publicly-traded instruments, by country, which had lower yields due tomarket conditions. The average assumed rate of compensation remained unchanged at 3.50% for the U.S. plan and decreased to 3.12% from 3.28% for ournon-U.S. plans. To determine the 2019 pension expense, the expected rate of return on U.S. plan assets remained constant at 6.00% and we decreased ouraverage rate of return on non-U.S. plan assets from 3.62% to 3.37%, primarily based on our target allocations and expected long-term asset returns. As theexpected rate of return on plan assets is long-term in nature, short-term market fluctuations do not significantly impact the rate. For all U.S. plans, we adoptedthe Pri-2012 mortality tables and the MP-2019 improvement scale published in October 2019. We applied the Pri-2012 tables based on the constituency ofour plan population for union and non-union participants. We adjusted the improvement scale to utilize 75% of the ultimate improvement rate, consistent withassumptions adopted by the Social Security Administration trustees, based on long-term historical experience. Currently, we believe this approach providesthe best estimate of our future obligation. Most plan participants elect to receive plan benefits as a lump sum at the end of service, rather than an annuity. Assuch, the updated mortality tables had an immaterial effect on our pension obligation.
We expect that the net pension expense for our defined benefit pension plans included in earnings before income taxes will be approximately $3.6million higher in 2020 than the $30.8 million in 2019, primarily due to an increase in the amortization of actuarial losses and no anticipated special events.We have used discount rates of 3.41%, 1.61% and 3.27% at December 31, 2019, in calculating our estimated 2020 net pension expense for the U.S. pensionplans, non-U.S. pension plans and postretirement medical plans, respectively.
The assumed ranges for the annual rates of increase in health care costs were 7.5% for 2019, 7.0% for 2018 and 7% for 2017, with a gradual decrease to5.0% for 2029 and future years. If actual costs are higher than those assumed, this will likely put modest upward pressure on our expense for retiree healthcare.
Plan Funding
Our funding policy for defined benefit plans is to contribute at least the amounts required under applicable laws and local customs. We contributed$37.3 million, $48.1 million and $44.9 million to our defined benefit plans in 2019, 2018 and 2017, respectively. After consideration of our intent to remainfully-funded based on standards set by law, we currently anticipate that our contribution to our U.S. pension plan in 2020 will be approximately $20 million,excluding direct benefits paid. We expect to contribute approximately $2 million to our non-U.S. pension plans in 2020, excluding direct benefits paid.
For further discussion of our pension and postretirement benefits, see Note 13 to our consolidated financial statements included in Item 8 of this AnnualReport.
OUR CRITICAL ACCOUNTING ESTIMATES
The process of preparing financial statements in conformity with U.S. GAAP requires the use of estimates and assumptions to determine reportedamounts of certain assets, liabilities, revenues and expenses and the disclosure of related contingent assets and liabilities. These estimates and assumptions arebased upon information available at the time of the estimates or assumptions, including our historical experience, where relevant. The most significantestimates made by management include: timing and amount of revenue recognition; deferred taxes, tax valuation allowances and tax reserves; reserves forcontingent loss; pension and postretirement benefits; and valuation of goodwill, indefinite-lived intangible assets and other long-lived assets. The significantestimates are reviewed at least annually if not quarterly by management. Because
44
of the uncertainty of factors surrounding the estimates, assumptions and judgments used in the preparation of our financial statements, actual results maydiffer from the estimates, and the difference may be material.
Our critical accounting policies are those policies that are both most important to our financial condition and results of operations and require the mostdifficult, subjective or complex judgments on the part of management in their application, often as a result of the need to make estimates about the effect ofmatters that are inherently uncertain. We believe that the following represent our critical accounting policies. For a summary of all of our significantaccounting policies, see Note 1 to our consolidated financial statements included in Item 8 of this Annual Report. Management and our external auditors havediscussed our critical accounting estimates and policies with the Audit Committee of our Board of Directors.
Revenue Recognition
We recognize revenue when (or as) we satisfy a performance obligation by transferring control to a customer. Transfer of control is evaluated based onthe customer’s ability to direct the use of and obtain substantially all of the benefits of a performance obligation. Revenue is recognized either over time or ata point in time, depending on the specific facts and circumstances for each contract, including the terms and conditions of the contract as agreed with thecustomer and the nature of the products or services to be provided.
Our primary method for recognizing revenue over time is the percentage of completion (“POC”) method, whereby progress towards completion ismeasured by applying an input measure based on costs incurred to date relative to total estimated costs at completion. If control of the products and/orservices does not transfer over time, then control transfers at a point in time. We determine the point in time that control transfers to a customer based on theevaluation of specific indicators, such as title transfer, risk of loss transfer, customer acceptance and physical possession. For a discussion related to revenuerecognition refer to Note 2 included in Item 8 of this Annual Report.
Deferred Taxes, Tax Valuation Allowances and Tax Reserves
We recognize valuation allowances to reduce the carrying value of deferred tax assets to amounts that we expect are more likely than not to be realized.Our valuation allowances primarily relate to the deferred tax assets established for certain tax credit carryforwards and net operating loss carryforwards fornon-U.S. subsidiaries, and we evaluate the realizability of our deferred tax assets by assessing the related valuation allowance and by adjusting the amount ofthese allowances, if necessary. We assess such factors as our forecast of future taxable income and available tax planning strategies that could be implementedto realize the net deferred tax assets in determining the sufficiency of our valuation allowances. Failure to achieve forecasted taxable income in the applicabletax jurisdictions could affect the ultimate realization of deferred tax assets and could result in an increase in our effective tax rate on future earnings.Implementation of different tax structures in certain jurisdictions could, if successful, result in future reductions of certain valuation allowances.
The amount of income taxes we pay is subject to ongoing audits by federal, state and foreign tax authorities, which often result in proposedassessments. Significant judgment is required in determining income tax provisions and evaluating tax positions. We establish reserves for open tax years foruncertain tax positions that may be subject to challenge by various tax authorities. The consolidated tax provision and related accruals include the impact ofsuch reasonably estimable losses and related interest and penalties as deemed appropriate. Tax benefits recognized in the financial statements from uncertaintax positions are measured based on the largest benefit that has a greater than fifty percent likelihood of being realized upon ultimate settlement.
While we believe we have adequately provided for any reasonably foreseeable outcome related to these matters, our future results may includefavorable or unfavorable adjustments to our estimated tax liabilities. To the extent that the expected tax outcome of these matters changes, such changes inestimate will impact the income tax provision in the period in which such determination is made.
Reserves for Contingent Loss
Liabilities are recorded for various contingencies arising in the normal course of business when it is both probable that a loss has been incurred andsuch loss is reasonably estimable. Assessments of reserves are based on information obtained from our independent and in-house experts, including recentlegal decisions and loss experience in similar situations. The recorded legal reserves are susceptible to changes due to new developments regarding the factsand circumstances of each matter, changes in political environments, legal venue and other factors. Recorded environmental reserves could change based onfurther analysis of our properties, technological innovation and regulatory environment changes.
45
Estimates of liabilities for unsettled asbestos-related claims are based on known claims and on our experience during the preceding two years for claimsfiled, settled and dismissed, with adjustments for events deemed unusual and unlikely to recur. A substantial majority of our asbestos-related claims arecovered by insurance or indemnities. Estimated indemnities and receivables from insurance carriers for unsettled claims and receivables for settlements andlegal fees paid by us for asbestos-related claims are estimated using our historical experience with insurance recovery rates and estimates of future recoveries,which include estimates of coverage and financial viability of our insurance carriers. We have claims pending against certain insurers that, if resolved morefavorably than estimated future recoveries, would result in discrete gains in the applicable quarter. We are currently unable to estimate the impact, if any, ofunasserted asbestos-related claims, although future claims would also be subject to existing indemnities and insurance coverage. Changes in claims filed,settled and dismissed and differences between actual and estimated settlement costs and insurance or indemnity recoveries could impact future expense.
Pension and Postretirement Benefits
We provide pension and postretirement benefits to certain of our employees, including former employees, and their beneficiaries. The assets, liabilitiesand expenses we recognize and disclosures we make about plan actuarial and financial information are dependent on the assumptions and estimates used incalculating such amounts. The assumptions include factors such as discount rates, health care cost trend rates, inflation, expected rates of return on planassets, retirement rates, mortality rates, turnover, rates of compensation increases and other factors.
The assumptions utilized to compute expense and benefit obligations are shown in Note 13 to our consolidated financial statements included in Item 8of this Annual Report. These assumptions are assessed annually in consultation with independent actuaries and investment advisors as of December 31 andadjustments are made as needed. We evaluate prevailing market conditions and local laws and requirements in countries where plans are maintained,including appropriate rates of return, interest rates and medical inflation (health care cost trend) rates. We ensure that our significant assumptions are withinthe reasonable range relative to market data. The methodology to set our significant assumptions includes:
• Discount rates are estimated using high quality debt securities based on corporate or government bond yields with a duration matching the expectedbenefit payments. For the U.S. the discount rate is obtained from an analysis of publicly-traded investment-grade corporate bonds to establish aweighted average discount rate. For plans in the U.K. and the Eurozone we use the discount rate obtained from an analysis of AA-graded corporatebonds used to generate a yield curve. For other countries or regions without a corporate AA bond market, government bond rates are used. Ourdiscount rate assumptions are impacted by changes in general economic and market conditions that affect interest rates on long-term high-qualitydebt securities, as well as the duration of our plans’ liabilities.
• The expected rates of return on plan assets are derived from reviews of asset allocation strategies, expected long-term performance of asset classes,risks and other factors adjusted for our specific investment strategy. These rates are impacted by changes in general market conditions, but becausethey are long-term in nature, short-term market changes do not significantly impact the rates. Changes to our target asset allocation also impactthese rates.
• The expected rates of compensation increase reflect estimates of the change in future compensation levels due to general price levels, seniority, ageand other factors.
Depending on the assumptions used, the pension and postretirement expense could vary within a range of outcomes and have a material effect onreported earnings. In addition, the assumptions can materially affect benefit obligations and future cash funding. Actual results in any given year may differfrom those estimated because of economic and other factors.
We evaluate the funded status of each retirement plan using current assumptions and determine the appropriate funding level considering applicableregulatory requirements, tax deductibility, reporting considerations, cash flow requirements and other factors. We discuss our funding assumptions with theFinance Committee of our Board of Directors.
Valuation of Goodwill, Indefinite-Lived Intangible Assets and Other Long-Lived Assets
The initial recording of goodwill and intangible assets requires subjective judgments concerning estimates of the fair value of the acquired assets. Wetest the value of goodwill and indefinite-lived intangible assets for impairment as of December 31 each year or whenever events or circumstances indicatesuch assets may be impaired.
The test for goodwill impairment involves significant judgment in estimating projections of fair value generated through future performance of each ofthe reporting units. The identification of our reporting units began at the operating segment level and considered whether components one level below theoperating segment levels should be identified as reporting units for purpose of testing goodwill for impairment based on certain conditions. These conditionsincluded, among other factors,
46
(i) the extent to which a component represents a business and (ii) the aggregation of economically similar components within the operating segments andresulted in four reporting units. Other factors that were considered in determining whether the aggregation of components was appropriate included thesimilarity of the nature of the products and services, the nature of the production processes, the methods of distribution and the types of industries served.
An impairment loss for goodwill is recognized if the implied fair value of goodwill is less than the carrying value. We estimate the fair value of ourreporting units based on an income approach, whereby we calculate the fair value of a reporting unit based on the present value of estimated future cashflows. A discounted cash flow analysis requires us to make various judgmental assumptions about future sales, operating margins, growth rates and discountrates, which are based on our budgets, business plans, economic projections, anticipated future cash flows and market participants. We did not record animpairment of goodwill in 2019, 2018 or 2017.
We also considered our market capitalization in our evaluation of the fair value of our goodwill. Our market capitalization increased as compared with2018 and did not indicate a potential impairment of our goodwill as of December 31, 2019.
Impairment losses for indefinite-lived intangible assets are recognized whenever the estimated fair value is less than the carrying value. Fair values arecalculated for trademarks using a "relief from royalty" method, which estimates the fair value of a trademark by determining the present value of estimatedroyalty payments that are avoided as a result of owning the trademark. This method includes judgmental assumptions about sales growth and discount ratesthat have a significant impact on the fair value and are substantially consistent with the assumptions used to determine the fair value of our reporting unitdiscussed above. We did not record a material impairment of our trademarks in 2019, 2018 or 2017.
The recoverable value of other long-lived assets, including property, plant and equipment and finite-lived intangible assets, is reviewed when indicatorsof potential impairments are present. The recoverable value is based upon an assessment of the estimated future cash flows related to those assets, utilizingassumptions similar to those for goodwill. Additional considerations related to our long-lived assets include expected maintenance and improvements,changes in expected uses and ongoing operating performance and utilization.
Due to uncertain market conditions and potential changes in strategy and product portfolio, it is possible that forecasts used to support asset carryingvalues may change in the future, which could result in non-cash charges that would adversely affect our financial condition and results of operations.
ACCOUNTING DEVELOPMENTS
We have presented the information about accounting pronouncements not yet implemented in Note 1 to our consolidated financial statements includedin Item 8 of this Annual Report.
47
ITEM 7A. QUANTITATIVE AND QUALITATIVE DISCLOSURES ABOUT MARKET RISK
We have market risk exposure arising from changes in foreign currency exchange rate movements. We are exposed to credit-related losses in the eventof non-performance by counterparties to financial instruments, but we currently expect all counterparties will continue to meet their obligations given theircurrent creditworthiness.
Foreign Currency Exchange Rate Risk
A substantial portion of our operations are conducted by our subsidiaries outside of the U.S. in currencies other than the U.S. dollar. The primarycurrencies in which we operate, in addition to the U.S. dollar, are the Argentine peso, Australian dollar, Brazilian real, British pound, Canadian dollar,Chinese yuan, Colombian peso, Euro, Hungarian forint, Indian rupee, Japanese yen, Mexican peso, Singapore dollar, Swedish krona, Russian ruble,Malaysian ringgit and Venezuelan bolivar. Almost all of our non-U.S. subsidiaries conduct their business primarily in their local currencies, which are alsotheir functional currencies. Foreign currency exposures arise from translation of foreign-denominated assets and liabilities into U.S. dollars and fromtransactions, including firm commitments and anticipated transactions, denominated in a currency other than a non-U.S. subsidiary’s functional currency. InMarch 2015, we designated €255.7 million of our €500.0 million 2022 EUR Senior Notes as a net investment hedge of our investments in certain of ourinternational subsidiaries that use the Euro as their functional currency. Generally, we view our investments in foreign subsidiaries from a long-termperspective and use capital structuring techniques to manage our investment in foreign subsidiaries as deemed necessary. We realized net gains (losses)associated with foreign currency translation of $6.6 million, $(63.1) million and $98.8 million for the years ended December 31, 2019, 2018 and 2017,respectively, which are included in other comprehensive income (loss). The net gain in 2019 was primarily driven by the weakening of the Euro, Britishpound, Chinese yuan and Indian rupee versus the U.S. dollar at December 31, 2019 as compared with December 31, 2018.
We employ a foreign currency risk management strategy to minimize potential changes in cash flows from unfavorable foreign currency exchange ratemovements. Where available, the use of forward exchange contracts allows us to mitigate transactional exposure to exchange rate fluctuations as the gains orlosses incurred on the forward exchange contracts will offset, in whole or in part, losses or gains on the underlying foreign currency exposure. Our policyallows foreign currency coverage only for identifiable foreign currency exposures. As of December 31, 2019, we had a U.S. dollar equivalent of $398.5million in aggregate notional amount outstanding in foreign exchange contracts with third parties, compared with $280.9 million at December 31, 2018.Transactional currency gains and losses arising from transactions outside of our sites’ functional currencies and changes in fair value of foreign exchangecontracts are included in our consolidated results of operations. We recognized foreign currency net losses of $14.5 million, $18.7 million and $14.0 millionfor the years ended December 31, 2019, 2018 and 2017, respectively, which are included in other income (expense), net in the accompanying consolidatedstatements of income.
Based on a sensitivity analysis at December 31, 2019, a 10% change in the foreign currency exchange rates for the year ended December 31, 2019would have impacted our net earnings by approximately $17 million. At December 31, 2018, a 10% change in the foreign currency exchange rates for theyear ended December 31, 2018 would have impacted our net earnings by approximately $3 million. This calculation assumes that all currencies change in thesame direction and proportion relative to the U.S. dollar and that there are no indirect effects, such as changes in non-U.S. dollar sales volumes or prices. Thiscalculation does not take into account the impact of the foreign currency forward exchange contracts discussed above.
48
ITEM 8. FINANCIAL STATEMENTS AND SUPPLEMENTARY DATA
REPORT OF INDEPENDENT REGISTERED PUBLIC ACCOUNTING FIRM
To the Board of Directors and Shareholders of Flowserve Corporation
Opinions on the Financial Statements and Internal Control over Financial Reporting
We have audited the accompanying consolidated balance sheets of Flowserve Corporation and its subsidiaries (the “Company”) as of December 31, 2019 and2018, and the related consolidated statements of income, of comprehensive income, of shareholders' equity and of cash flows for each of the three years in theperiod ended December 31, 2019, including the related notes and schedule of valuation and qualifying accounts for each of the three years in the period endedDecember 31, 2019 listed in the index appearing under Item 15(a)(2) (collectively referred to as the “consolidated financial statements”). We also haveaudited the Company's internal control over financial reporting as of December 31, 2019, based on criteria established in Internal Control - IntegratedFramework (2013) issued by the Committee of Sponsoring Organizations of the Treadway Commission (COSO).
In our opinion, the consolidated financial statements referred to above present fairly, in all material respects, the financial position of the Company as ofDecember 31, 2019 and 2018, and the results of its operations and its cash flows for each of the three years in the period ended December 31, 2019 inconformity with accounting principles generally accepted in the United States of America. Also in our opinion, the Company maintained, in all materialrespects, effective internal control over financial reporting as of December 31, 2019, based on criteria established in Internal Control - Integrated Framework(2013) issued by the COSO.
Change in Accounting Principle
As discussed in Notes 1 and 2 to the consolidated financial statements, the Company changed the manner in which it accounts for sales from contracts withcustomers in 2018.
Basis for Opinions
The Company's management is responsible for these consolidated financial statements, for maintaining effective internal control over financial reporting, andfor its assessment of the effectiveness of internal control over financial reporting, included in Management’s Report on Internal Control Over FinancialReporting appearing under Item 9A. Our responsibility is to express opinions on the Company’s consolidated financial statements and on the Company'sinternal control over financial reporting based on our audits. We are a public accounting firm registered with the Public Company Accounting OversightBoard (United States) (PCAOB) and are required to be independent with respect to the Company in accordance with the U.S. federal securities laws and theapplicable rules and regulations of the Securities and Exchange Commission and the PCAOB.
We conducted our audits in accordance with the standards of the PCAOB. Those standards require that we plan and perform the audits to obtain reasonableassurance about whether the consolidated financial statements are free of material misstatement, whether due to error or fraud, and whether effective internalcontrol over financial reporting was maintained in all material respects.
Our audits of the consolidated financial statements included performing procedures to assess the risks of material misstatement of the consolidated financialstatements, whether due to error or fraud, and performing procedures that respond to those risks. Such procedures included examining, on a test basis,evidence regarding the amounts and disclosures in the consolidated financial statements. Our audits also included evaluating the accounting principles usedand significant estimates made by management, as well as evaluating the overall presentation of the consolidated financial statements. Our audit of internalcontrol over financial reporting included obtaining an understanding of internal control over financial reporting, assessing the risk that a material weaknessexists, and testing and evaluating the design and operating effectiveness of internal control
49
based on the assessed risk. Our audits also included performing such other procedures as we considered necessary in the circumstances. We believe that ouraudits provide a reasonable basis for our opinions.
Definition and Limitations of Internal Control over Financial Reporting
A company’s internal control over financial reporting is a process designed to provide reasonable assurance regarding the reliability of financial reporting andthe preparation of financial statements for external purposes in accordance with generally accepted accounting principles. A company’s internal control overfinancial reporting includes those policies and procedures that (i) pertain to the maintenance of records that, in reasonable detail, accurately and fairly reflectthe transactions and dispositions of the assets of the company; (ii) provide reasonable assurance that transactions are recorded as necessary to permitpreparation of financial statements in accordance with generally accepted accounting principles, and that receipts and expenditures of the company are beingmade only in accordance with authorizations of management and directors of the company; and (iii) provide reasonable assurance regarding prevention ortimely detection of unauthorized acquisition, use, or disposition of the company’s assets that could have a material effect on the financial statements.
Because of its inherent limitations, internal control over financial reporting may not prevent or detect misstatements. Also, projections of any evaluation ofeffectiveness to future periods are subject to the risk that controls may become inadequate because of changes in conditions, or that the degree of compliancewith the policies or procedures may deteriorate.
Critical Audit Matters
The critical audit matters communicated below are matters arising from the current period audit of the consolidated financial statements that werecommunicated or required to be communicated to the audit committee and that (i) relate to accounts or disclosures that are material to the consolidatedfinancial statements and (ii) involved our especially challenging, subjective, or complex judgments. The communication of critical audit matters does not alterin any way our opinion on the consolidated financial statements, taken as a whole, and we are not, by communicating the critical audit matters below,providing separate opinions on the critical audit matters or on the accounts or disclosures to which they relate.
Goodwill Impairment Test
As described in Notes 1 and 5 to the consolidated financial statements, the Company’s consolidated goodwill balance was $1,193.0 million as ofDecember 31, 2019. The Company conducts an impairment test as of December 31 each year or whenever events or circumstances indicate goodwill may beimpaired. An impairment loss for goodwill is recognized if the implied fair value of goodwill is less than the carrying value. Fair value is estimated using adiscounted cash flow analysis, which requires management to make various judgmental assumptions about future sales, operating margins, growth rates anddiscount rates.
The principal considerations for our determination that performing procedures relating to the goodwill impairment test is a critical audit matter are there wassignificant judgment by management when determining the fair value of the reporting units using a discounted cash flow analysis. This in turn led to a highdegree of auditor judgment, subjectivity and effort in performing procedures and in evaluating management’s discounted cash flow analysis, includingsignificant assumptions about future sales, operating margins, growth rates and discount rates. In addition, the audit effort included the involvement ofprofessionals with specialized skill and knowledge to assist in performing these procedures and evaluating audit evidence obtained.
Addressing the matter involved performing procedures and evaluating audit evidence in connection with forming our overall opinion on the consolidatedfinancial statements. These procedures included testing the effectiveness of controls relating to management’s goodwill impairment test, including controlsover the determination of the fair value of the Company’s reporting units. These procedures also included, among others, (i) testing management’s process fordeveloping the fair value estimate, (ii) evaluating the appropriateness of the discounted cash flow analysis, (iii) testing the completeness, accuracy andrelevance of underlying data used in the analysis, and (iv) evaluating the significant assumptions used in the discounted cash flow analysis by management indeveloping the fair value estimate, including future sales, operating margins, growth rates and discount rates. Evaluating management’s assumptions related tofuture sales, operating margins and growth rates involved evaluating whether the assumptions used by management were reasonable considering current andpast performance of the reporting units and whether these assumptions were consistent with evidence obtained in other areas of the audit. Professionals withspecialized skill and knowledge were used to assist in evaluating the reasonableness of the discount rates.
50
Income Tax - Valuation Allowances on Deferred Tax Assets
As described in Notes 1 and 17 to the consolidated financial statements, the Company’s consolidated net deferred tax assets of $113 million includesvaluation allowances of $266 million, primarily related to the deferred tax assets established for U.S. foreign tax credit carryforwards of $29.1 million,foreign capital loss carryforwards of $102.6 million, and other foreign deferred tax assets of $134.7 million. Management records valuation allowances toreduce the carrying value of deferred tax assets to amounts that are more likely than not to be realized. Management assesses existing deferred tax assets, netoperating losses and tax credits by jurisdiction and expectations of the Company’s ability to utilize these tax attributes through a review of past, current andestimated future taxable income and establishment of tax planning strategies.
The principal considerations for our determination that performing procedures relating to the income tax valuation allowances on deferred tax assets is acritical audit matter are there was significant judgment by management when estimating future taxable income, including tax planning strategies. This in turnled to a high degree of auditor judgment, subjectivity and effort in performing procedures and in evaluating audit evidence relating to future taxable income,including tax planning strategies and application of foreign tax regulations. In addition, the audit effort involved the use of professionals with specialized skilland knowledge to assist in performing these procedures and evaluating the audit evidence obtained.
Addressing the matter involved performing procedures and evaluating audit evidence in connection with forming our overall opinion on the consolidatedfinancial statements. These procedures included testing the effectiveness of controls relating to the valuation allowances on deferred tax assets, includingcontrols over the review of management’s analysis by jurisdiction of cumulative taxable income (loss) and controls over management’s estimate byjurisdiction of future taxable income. Our procedures also included, among others, (i) testing underlying historical data used in calculating the cumulativetaxable income (loss), (ii) assessing the effect of other events, such as past Company transactions, and (iii) testing management’s estimate of future taxableincome, which included evaluating the reasonableness of significant assumptions and appropriateness of available tax planning strategies. Professionals withspecialized skill and knowledge were used to assist in evaluating management’s analysis, including cumulative taxable income (loss) as well as thereasonableness of management’s judgments and estimates, including management’s application of foreign tax regulations.
/s/ PricewaterhouseCoopers LLP
PricewaterhouseCoopers LLPDallas, TexasFebruary 17, 2020
We have served as the Company’s auditor since 2000.
51
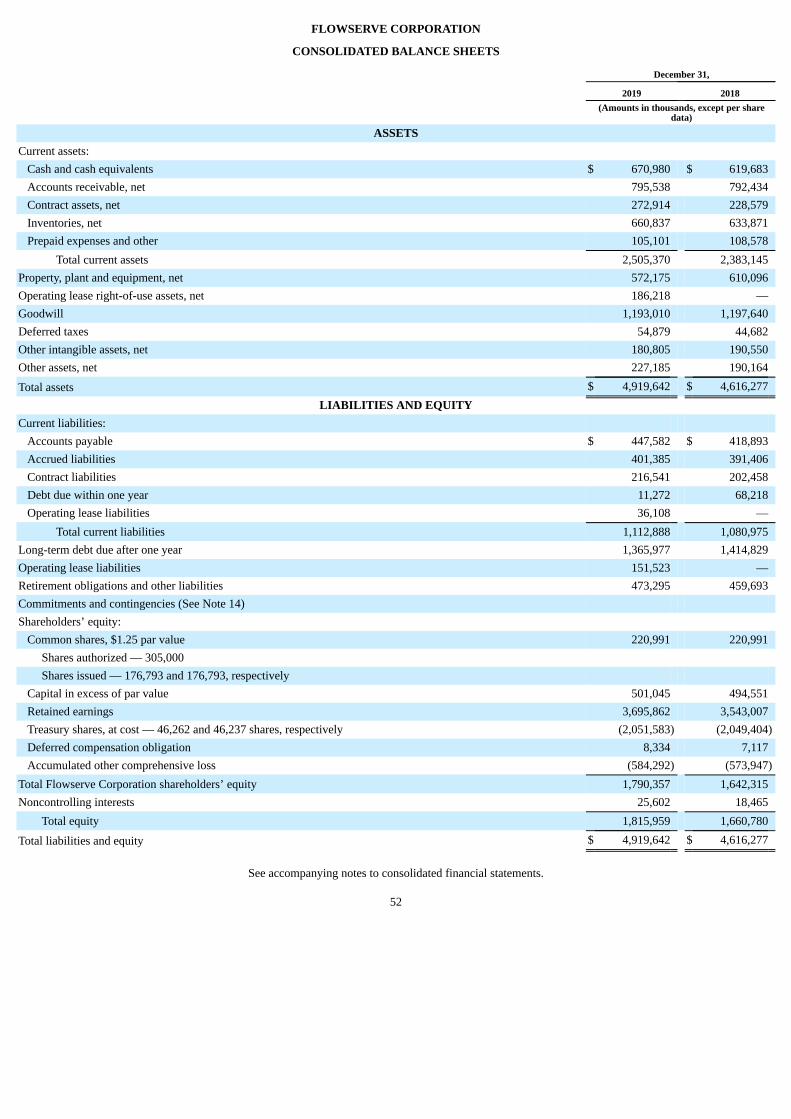
FLOWSERVE CORPORATION
CONSOLIDATED BALANCE SHEETS
December 31,
2019 2018
(Amounts in thousands, except per share
data)
ASSETSCurrent assets:
Cash and cash equivalents $ 670,980 $ 619,683Accounts receivable, net 795,538 792,434Contract assets, net 272,914 228,579Inventories, net 660,837 633,871Prepaid expenses and other 105,101 108,578
Total current assets 2,505,370 2,383,145Property, plant and equipment, net 572,175 610,096Operating lease right-of-use assets, net 186,218 —Goodwill 1,193,010 1,197,640Deferred taxes 54,879 44,682Other intangible assets, net 180,805 190,550Other assets, net 227,185 190,164
Total assets $ 4,919,642 $ 4,616,277LIABILITIES AND EQUITY
Current liabilities: Accounts payable $ 447,582 $ 418,893Accrued liabilities 401,385 391,406Contract liabilities 216,541 202,458Debt due within one year 11,272 68,218Operating lease liabilities 36,108 —
Total current liabilities 1,112,888 1,080,975Long-term debt due after one year 1,365,977 1,414,829Operating lease liabilities 151,523 —Retirement obligations and other liabilities 473,295 459,693Commitments and contingencies (See Note 14) Shareholders’ equity:
Common shares, $1.25 par value 220,991 220,991Shares authorized — 305,000 Shares issued — 176,793 and 176,793, respectively
Capital in excess of par value 501,045 494,551Retained earnings 3,695,862 3,543,007Treasury shares, at cost — 46,262 and 46,237 shares, respectively (2,051,583) (2,049,404)Deferred compensation obligation 8,334 7,117Accumulated other comprehensive loss (584,292) (573,947)
Total Flowserve Corporation shareholders’ equity 1,790,357 1,642,315Noncontrolling interests 25,602 18,465
Total equity 1,815,959 1,660,780
Total liabilities and equity $ 4,919,642 $ 4,616,277
See accompanying notes to consolidated financial statements.
52
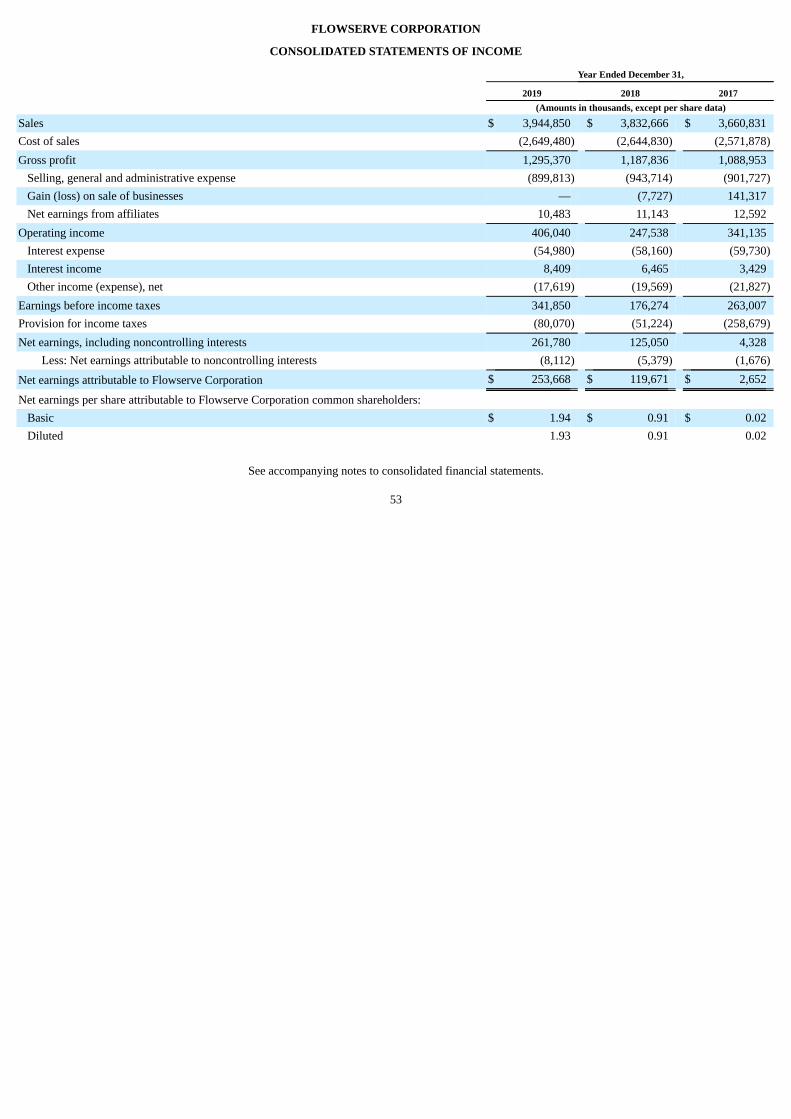
FLOWSERVE CORPORATION
CONSOLIDATED STATEMENTS OF INCOME
Year Ended December 31,
2019 2018 2017 (Amounts in thousands, except per share data)
Sales $ 3,944,850 $ 3,832,666 $ 3,660,831Cost of sales (2,649,480) (2,644,830) (2,571,878)Gross profit 1,295,370 1,187,836 1,088,953
Selling, general and administrative expense (899,813) (943,714) (901,727)Gain (loss) on sale of businesses — (7,727) 141,317Net earnings from affiliates 10,483 11,143 12,592
Operating income 406,040 247,538 341,135Interest expense (54,980) (58,160) (59,730)Interest income 8,409 6,465 3,429Other income (expense), net (17,619) (19,569) (21,827)
Earnings before income taxes 341,850 176,274 263,007Provision for income taxes (80,070) (51,224) (258,679)Net earnings, including noncontrolling interests 261,780 125,050 4,328
Less: Net earnings attributable to noncontrolling interests (8,112) (5,379) (1,676)
Net earnings attributable to Flowserve Corporation $ 253,668 $ 119,671 $ 2,652
Net earnings per share attributable to Flowserve Corporation common shareholders: Basic $ 1.94 $ 0.91 $ 0.02Diluted 1.93 0.91 0.02
See accompanying notes to consolidated financial statements.
53
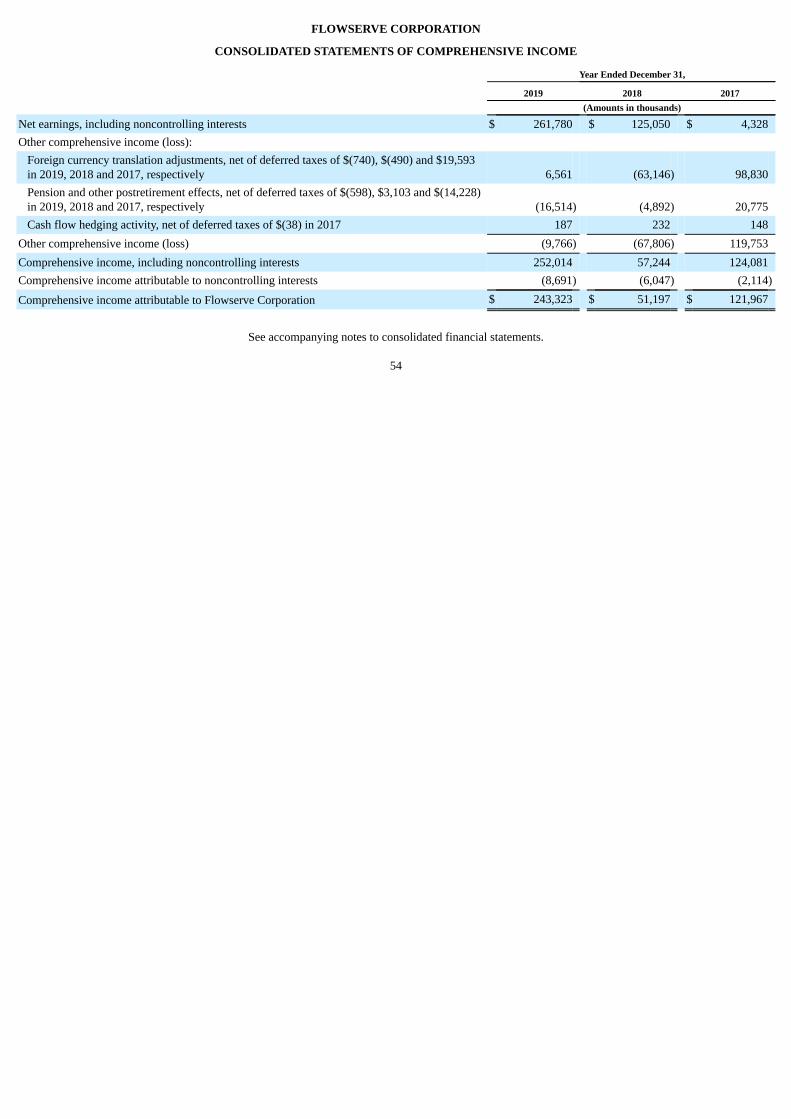
FLOWSERVE CORPORATION
CONSOLIDATED STATEMENTS OF COMPREHENSIVE INCOME
Year Ended December 31,
2019 2018 2017 (Amounts in thousands)
Net earnings, including noncontrolling interests $ 261,780 $ 125,050 $ 4,328Other comprehensive income (loss):
Foreign currency translation adjustments, net of deferred taxes of $(740), $(490) and $19,593in 2019, 2018 and 2017, respectively 6,561 (63,146) 98,830Pension and other postretirement effects, net of deferred taxes of $(598), $3,103 and $(14,228)in 2019, 2018 and 2017, respectively (16,514) (4,892) 20,775Cash flow hedging activity, net of deferred taxes of $(38) in 2017 187 232 148
Other comprehensive income (loss) (9,766) (67,806) 119,753Comprehensive income, including noncontrolling interests 252,014 57,244 124,081Comprehensive income attributable to noncontrolling interests (8,691) (6,047) (2,114)
Comprehensive income attributable to Flowserve Corporation $ 243,323 $ 51,197 $ 121,967
See accompanying notes to consolidated financial statements.
54
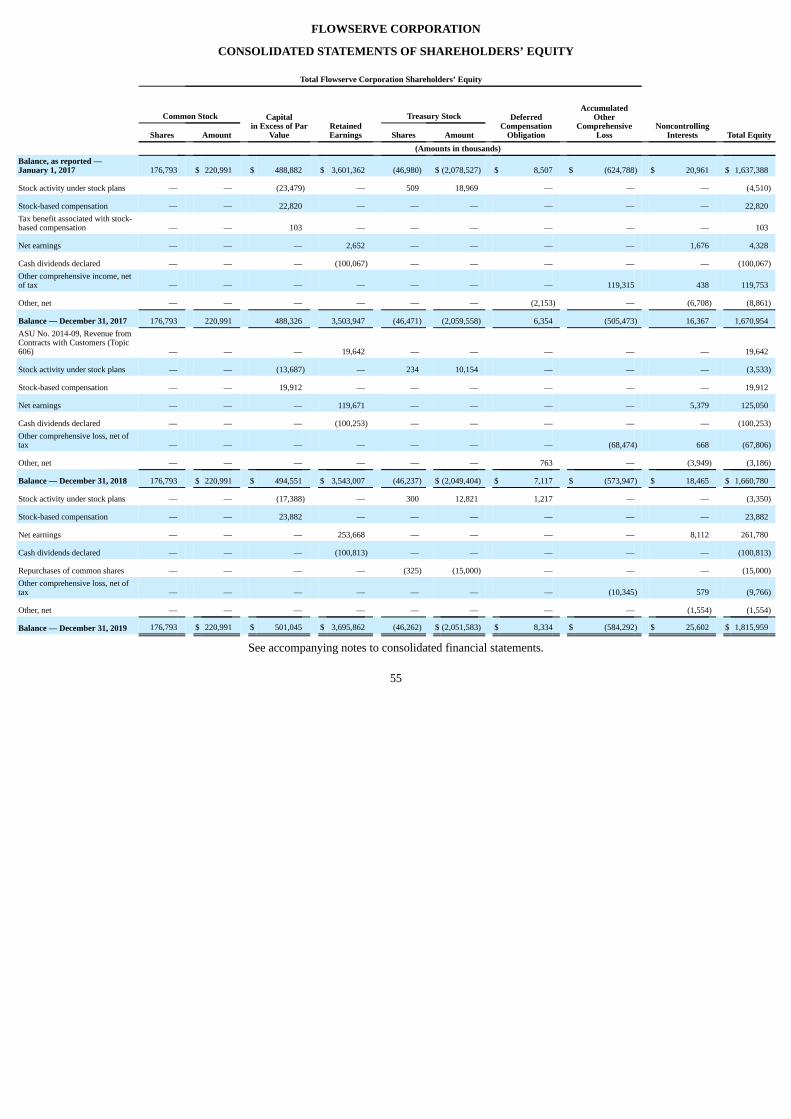
FLOWSERVE CORPORATION
CONSOLIDATED STATEMENTS OF SHAREHOLDERS’ EQUITY
Total Flowserve Corporation Shareholders’ Equity
Capitalin Excess of Par
Value
RetainedEarnings
DeferredCompensation
Obligation
Accumulated
OtherComprehensive
Loss
Total Equity
Common Stock Treasury Stock Noncontrolling
Interests
Shares Amount Shares Amount (Amounts in thousands)
Balance, as reported —January 1, 2017 176,793 $ 220,991 $ 488,882 $ 3,601,362 (46,980) $ (2,078,527) $ 8,507 $ (624,788) $ 20,961 $ 1,637,388
Stock activity under stock plans — — (23,479) — 509 18,969 — — — (4,510)
Stock-based compensation — — 22,820 — — — — — — 22,820Tax benefit associated with stock-based compensation — — 103 — — — — — — 103
Net earnings — — — 2,652 — — — — 1,676 4,328
Cash dividends declared — — — (100,067) — — — — — (100,067)Other comprehensive income, netof tax — — — — — — — 119,315 438 119,753
Other, net — — — — — — (2,153) — (6,708) (8,861)
Balance — December 31, 2017 176,793 220,991 488,326 3,503,947 (46,471) (2,059,558) 6,354 (505,473) 16,367 1,670,954ASU No. 2014-09, Revenue fromContracts with Customers (Topic606) — — — 19,642 — — — — — 19,642
Stock activity under stock plans — — (13,687) — 234 10,154 — — — (3,533)
Stock-based compensation — — 19,912 — — — — — — 19,912
Net earnings — — — 119,671 — — — — 5,379 125,050
Cash dividends declared — — — (100,253) — — — — — (100,253)Other comprehensive loss, net oftax — — — — — — — (68,474) 668 (67,806)
Other, net — — — — — — 763 — (3,949) (3,186)
Balance — December 31, 2018 176,793 $ 220,991 $ 494,551 $ 3,543,007 (46,237) $ (2,049,404) $ 7,117 $ (573,947) $ 18,465 $ 1,660,780
Stock activity under stock plans — — (17,388) — 300 12,821 1,217 — — (3,350)
Stock-based compensation — — 23,882 — — — — — — 23,882
Net earnings — — — 253,668 — — — — 8,112 261,780
Cash dividends declared — — — (100,813) — — — — — (100,813)
Repurchases of common shares — — — — (325) (15,000) — — — (15,000)Other comprehensive loss, net oftax — — — — — — — (10,345) 579 (9,766)
Other, net — — — — — — — — (1,554) (1,554)
Balance — December 31, 2019 176,793 $ 220,991 $ 501,045 $ 3,695,862 (46,262) $ (2,051,583) $ 8,334 $ (584,292) $ 25,602 $ 1,815,959
See accompanying notes to consolidated financial statements.
55
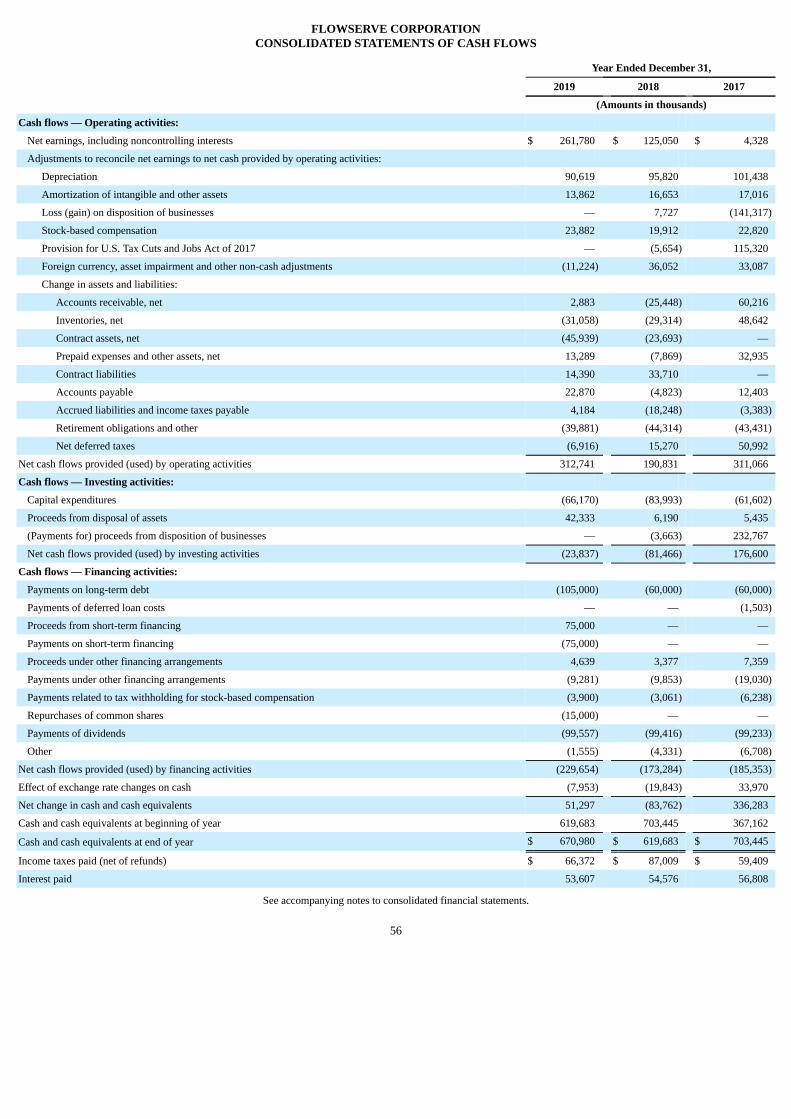
FLOWSERVE CORPORATIONCONSOLIDATED STATEMENTS OF CASH FLOWS
Year Ended December 31,
2019 2018 2017
(Amounts in thousands)
Cash flows — Operating activities:
Net earnings, including noncontrolling interests $ 261,780 $ 125,050 $ 4,328
Adjustments to reconcile net earnings to net cash provided by operating activities:
Depreciation 90,619 95,820 101,438
Amortization of intangible and other assets 13,862 16,653 17,016
Loss (gain) on disposition of businesses — 7,727 (141,317)
Stock-based compensation 23,882 19,912 22,820
Provision for U.S. Tax Cuts and Jobs Act of 2017 — (5,654) 115,320
Foreign currency, asset impairment and other non-cash adjustments (11,224) 36,052 33,087
Change in assets and liabilities:
Accounts receivable, net 2,883 (25,448) 60,216
Inventories, net (31,058) (29,314) 48,642
Contract assets, net (45,939) (23,693) —
Prepaid expenses and other assets, net 13,289 (7,869) 32,935
Contract liabilities 14,390 33,710 —
Accounts payable 22,870 (4,823) 12,403
Accrued liabilities and income taxes payable 4,184 (18,248) (3,383)
Retirement obligations and other (39,881) (44,314) (43,431)
Net deferred taxes (6,916) 15,270 50,992
Net cash flows provided (used) by operating activities 312,741 190,831 311,066
Cash flows — Investing activities:
Capital expenditures (66,170) (83,993) (61,602)
Proceeds from disposal of assets 42,333 6,190 5,435
(Payments for) proceeds from disposition of businesses — (3,663) 232,767
Net cash flows provided (used) by investing activities (23,837) (81,466) 176,600
Cash flows — Financing activities:
Payments on long-term debt (105,000) (60,000) (60,000)
Payments of deferred loan costs — — (1,503)
Proceeds from short-term financing 75,000 — —
Payments on short-term financing (75,000) — —
Proceeds under other financing arrangements 4,639 3,377 7,359
Payments under other financing arrangements (9,281) (9,853) (19,030)
Payments related to tax withholding for stock-based compensation (3,900) (3,061) (6,238)
Repurchases of common shares (15,000) — —
Payments of dividends (99,557) (99,416) (99,233)
Other (1,555) (4,331) (6,708)
Net cash flows provided (used) by financing activities (229,654) (173,284) (185,353)
Effect of exchange rate changes on cash (7,953) (19,843) 33,970
Net change in cash and cash equivalents 51,297 (83,762) 336,283
Cash and cash equivalents at beginning of year 619,683 703,445 367,162
Cash and cash equivalents at end of year $ 670,980 $ 619,683 $ 703,445
Income taxes paid (net of refunds) $ 66,372 $ 87,009 $ 59,409
Interest paid 53,607 54,576 56,808
See accompanying notes to consolidated financial statements.
56
FLOWSERVE CORPORATION
NOTES TO CONSOLIDATED FINANCIAL STATEMENTSAS OF DECEMBER 31, 2019 AND 2018 AND FOR THE
THREE YEARS ENDED DECEMBER 31, 2019
1. SIGNIFICANT ACCOUNTING POLICIES AND ACCOUNTING DEVELOPMENTS
We are principally engaged in the worldwide design, manufacture, distribution and service of industrial flow management equipment. We provide longlead time, custom and other highly-engineered pumps; standardized, general-purpose pumps; mechanical seals; engineered and industrial valves; relatedautomation products; and services and solutions primarily for oil and gas, chemical, power generation, water management and other general industriesrequiring flow management products and services. Equipment manufactured and serviced by us is predominantly used in industries that deal with difficult-to-handle and corrosive fluids, as well as environments with extreme temperatures, pressure, horsepower and speed. Our business is affected by economicconditions in the United States ("U.S.") and other countries where our products are sold and serviced, by the cyclical nature and competitive environment ofour industries served, by the relationship of the U.S. dollar to other currencies and by the demand for and pricing of our customers’ end products.
Resegmentation — We have determined that there are meaningful operational synergies and benefits to combining our previously reported EngineeredProduct Division ("EPD") and Industrial Product Division ("IPD") segments into one reportable segment, Flowserve Pump Division ("FPD"). During the firstquarter of 2019, we implemented a reorganization of our operating segments and as a result we report our financial information reflecting two operatingsegments, FPD and Flow Control Division ("FCD"). The reorganization of the segments reflects how our chief operating decision maker (Chief ExecutiveOfficer) regularly reviews financial information to allocate resources and assess performance. Prior periods' financial information were retrospectivelyadjusted to conform to the new reportable segment composition.
Principles of Consolidation — The consolidated financial statements include the accounts of our company and our wholly and majority-ownedsubsidiaries. In addition, we would consolidate any variable interest entities for which we are deemed to be the primary beneficiary. Noncontrolling interestsof non-affiliated parties have been recognized for all majority-owned consolidated subsidiaries. Intercompany profits/losses, transactions and balances amongconsolidated entities have been eliminated from our consolidated financial statements. Investments in unconsolidated affiliated companies, which representnoncontrolling ownership interests between 20% and 50%, are accounted for using the equity method, which approximates our equity interest in theirunderlying equivalent net book value under accounting principles generally accepted in the U.S. ("U.S. GAAP"). Investments in interests where we own lessthan 20% of the investee are accounted for by the cost method, whereby income is only recognized in the event of dividend receipt. Investments accounted forby the cost method are tested for impairment if an impairment indicator is present.
Use of Estimates — The process of preparing financial statements in conformity with U.S. GAAP requires us to make estimates and assumptions thataffect reported amounts of certain assets, liabilities, revenues and expenses. We believe our estimates and assumptions are reasonable; however, actual resultsmay differ materially from such estimates. The most significant estimates and assumptions are used in determining:
• Timing and amount of revenue recognition;
• Deferred taxes, tax valuation allowances and tax reserves;
• Reserves for contingent loss;
• Pension and postretirement benefits; and
• Valuation of goodwill, indefinite-lived intangible assets and other long-lived assets.
Argentina Highly Inflationary — Effective July 1, 2018, Argentina was designated as hyperinflationary, and as a result, we began using the U.S. dollaras our functional currency in Argentina. Our Argentinian subsidiary's sales for the year ended December 31, 2019 represented approximately 1% ofconsolidated sales and its assets at December 31, 2019 represented approximately 2% of total consolidated assets. Assets primarily consisted of U.S. dollar-denominated monetary assets and Argentinian peso-denominated non-monetary assets at December 31, 2019. In addition, certain of our operations in othercountries sell equipment and parts that are typically denominated in U.S. dollars directly to Argentinian customers.
57
Revenue Recognition — We adopted Accounting Standards Update ("ASU") No. 2014-09, "Revenue from Contracts with Customers (Topic 606)"("New Revenue Standard") on January 1, 2018, using the modified retrospective method for transition; periods prior to January 1, 2018, are presented inaccordance with "Revenue Recognition (Topic 605)" ("Topic 605"). The majority of our revenues relate to customer orders that typically contain a singlecommitment of goods or services which have lead times under a year. Longer lead time, more complex contracts with our customers typically have multiplecommitments of goods and services, including any combination of designing, developing, manufacturing, modifying, installing and commissioning of flowmanagement equipment and providing services and parts related to the performance of such products. We recognize revenue when (or as) we satisfy aperformance obligation by transferring control to a customer. Transfer of control is evaluated based on the customer’s ability to direct the use of and obtainsubstantially all of the benefits of a performance obligation. Revenue is recognized either over time or at a point in time, depending on the specific facts andcircumstances for each contract, including the terms and conditions of the contract as agreed with the customer and the nature of the products or services to beprovided.
Our primary method for recognizing revenue over time is the percentage of completion (“POC”) method, whereby progress towards completion ismeasured by applying an input measure based on costs incurred to date relative to total estimated costs at completion. If control of the products and/orservices does not transfer over time, then control transfers at a point in time. We determine the point in time that control transfers to a customer based on theevaluation of specific indicators, such as title transfer, risk of loss transfer, customer acceptance and physical possession. For a detailed discussion related torevenue recognition refer to Note 2.
Cash and Cash Equivalents — We place temporary cash investments with financial institutions and, by policy, invest in those institutions andinstruments that have minimal credit risk and market risk. These investments, with an original maturity of three months or less when purchased, are classifiedas cash equivalents. They are highly liquid and principal values are not subject to significant risk of change due to interest rate fluctuations.
Allowance for Doubtful Accounts and Credit Risk — The allowance for doubtful accounts is established based on estimates of the amount ofuncollectible accounts receivable, which is determined principally based upon the aging of the accounts receivable, but also customer credit history, industryand market segment information, economic trends and conditions and credit reports. Customer credit issues, customer bankruptcies or general economicconditions may also impact our estimates.
Credit risks are mitigated by the diversity of our customer base across many different geographic regions and industries and by performingcreditworthiness analyses on our customers. Additionally, we mitigate credit risk through letters of credit and advance payments received from our customers.We do not believe that we have any other significant concentrations of credit risk.
Inventories and Related Reserves — Inventories are stated at the lower of cost and net realizable value. Cost is determined by the first-in, first-outmethod. Reserves for excess and obsolete inventories are based upon our assessment of market conditions for our products determined by historical usage andestimated future demand. Due to the long life cycles of our products, we carry spare parts inventories that have historically low usage rates and providereserves for such inventory based on demonstrated usage and aging criteria.
Income Taxes, Deferred Taxes, Tax Valuation Allowances and Tax Reserves — We account for income taxes under the asset and liability method.Deferred tax assets and liabilities are recognized for the future tax consequences attributable to differences between the financial statement carrying amountsof existing assets and liabilities and their respective tax bases and operating loss and tax credit carryforwards. Deferred tax assets and liabilities are calculatedusing enacted tax rates expected to apply to taxable income in the years in which those temporary differences are expected to be recovered or settled. Theeffect on deferred tax assets and liabilities of a change in tax rates is recognized in the period that includes the enactment date. We record valuationallowances to reduce the carrying value of deferred tax assets to amounts that we expect are more likely than not to be realized. We assess existing deferredtax assets, net operating losses and tax credits by jurisdiction and expectations of our ability to utilize these tax attributes through a review of past, current andestimated future taxable income and establishment of tax planning strategies.
We provide deferred taxes for the temporary differences associated with our investment in foreign subsidiaries that have a financial reporting basis thatexceeds tax basis, unless we can assert permanent reinvestment in foreign jurisdictions. Financial reporting basis and tax basis differences in investments inforeign subsidiaries consist of both unremitted earnings and losses, as well as foreign currency translation adjustments.
58
The amount of income taxes we pay is subject to ongoing audits by federal, state, and foreign tax authorities, which often result in proposedassessments. We establish reserves for open tax years for uncertain tax positions that may be subject to challenge by various tax authorities. The consolidatedtax provision and related accruals include the impact of such reasonably estimable losses and related interest and penalties as deemed appropriate.
We recognize the tax benefit from an uncertain tax position only if it is more likely than not that the tax position will be sustained on examination by thetaxing authorities. The determination is based on the technical merits of the position and presumes that each uncertain tax position will be examined by therelevant taxing authority that has full knowledge of all relevant information. The tax benefits recognized in the financial statements from such a position aremeasured based on the largest benefit that has a greater than fifty percent likelihood of being realized upon ultimate settlement.
Legal and Environmental Contingencies — Legal and environmental reserves are recorded based upon a case-by-case analysis of the relevant facts andcircumstances and an assessment of potential legal obligations and costs. Amounts relating to legal and environmental liabilities are recorded when it isprobable that a loss has been incurred and such loss is reasonably estimable. Assessments of legal and environmental costs are based on information obtainedfrom our independent and in-house experts and our loss experience in similar situations. Estimates are updated as applicable when new information regardingthe facts and circumstances of each matter becomes available. Legal fees associated with legal and environmental liabilities are expensed as incurred.
Estimates of liabilities for unsettled asbestos-related claims are based on known claims and on our experience during the preceding two years for claimsfiled, settled and dismissed, with adjustments for events deemed unusual and unlikely to recur, and are included in retirement obligations and other liabilitiesin our consolidated balance sheets. A substantial majority of our asbestos-related claims are covered by insurance or indemnities. Estimated indemnities andreceivables from insurance carriers for unsettled claims and receivables for settlements and legal fees paid by us for asbestos-related claims are estimatedusing our historical experience with insurance recovery rates and estimates of future recoveries, which include estimates of coverage and financial viability ofour insurance carriers. Estimated receivables are included in other assets, net in our consolidated balance sheets. We have claims pending against certaininsurers that, if resolved more favorably than estimated future recoveries, would result in discrete gains in the applicable quarter. We are currently unable toestimate the impact, if any, of unasserted asbestos-related claims, although future claims would also be subject to existing indemnities and insurancecoverage.
Warranty Accruals — Warranty obligations are based upon product failure rates, materials usage, service delivery costs, an analysis of all identified orexpected claims and an estimate of the cost to resolve such claims. The estimates of expected claims are generally a factor of historical claims and knownproduct issues. Warranty obligations based on these factors are adjusted based on historical sales trends for the preceding 24 months.
Insurance Accruals — Insurance accruals are recorded for wholly or partially self-insured risks such as medical benefits and workers’ compensationand are based upon an analysis of our claim loss history, insurance deductibles, policy limits and other relevant factors that are updated annually and areincluded in accrued liabilities in our consolidated balance sheets. The estimates are based upon information received from actuaries, insurance companyadjusters, independent claims administrators or other independent sources. Receivables from insurance carriers are estimated using our historical experiencewith insurance recovery rates and estimates of future recoveries, which include estimates of coverage and financial viability of our insurance carriers.Estimated receivables are included in accounts receivable, net and other assets, net, as applicable, in our consolidated balance sheets.
Pension and Postretirement Obligations — Determination of pension and postretirement benefits obligations is based on estimates made bymanagement in consultation with independent actuaries and investment advisors. Inherent in these valuations are assumptions including discount rates,expected rates of return on plan assets, retirement rates, mortality rates and rates of compensation increase and other factors all of which are reviewedannually and updated if necessary. Current market conditions, including changes in rates of return, interest rates and medical inflation rates, are considered inselecting these assumptions.
Actuarial gains and losses and prior service costs are recognized in accumulated other comprehensive loss as they arise and we amortize these costs intonet pension expense over the remaining expected service period.
Property, Plant and Equipment and Depreciation — Property, plant and equipment are stated at historical cost, less accumulated depreciation. If assetretirement obligations exist, they are capitalized as part of the carrying amount of the asset and depreciated over the remaining useful life of the asset. Theuseful lives of leasehold improvements are the lesser of the
59
remaining lease term or the useful life of the improvement. When assets are retired or otherwise disposed of, their costs and related accumulated depreciationare removed from the accounts and any resulting gains or losses are included in income from operations for the period. Depreciation is computed by thestraight-line method based on the estimated useful lives of the depreciable assets, or in the case of assets under finance leases, over the related lease term.Generally, the estimated useful lives of the assets are:
Buildings and improvements 10 to 40 yearsMachinery, equipment and tooling 3 to 14 yearsSoftware, furniture and fixtures and other 3 to 7 years
Costs related to routine repairs and maintenance are expensed as incurred.
Leases — We have operating and finance leases for certain manufacturing facilities, offices, service and quick response centers, machinery, equipmentand automobiles. Our leases have remaining lease terms of up to 34 years. The terms and conditions of our leases may include options to extend or terminatethe lease which are considered and included in the lease term when these options are reasonably certain of exercise.
We determine if a contract is (or contains) a lease at inception by evaluating whether the contract conveys the right to control the use of an identifiedasset. For all classes of leased assets, we account for any non-lease components in the contract together with the related lease component in the same unit ofaccount. For lease contracts containing more than one lease component, we allocate the contract consideration to each of the lease components on the basis ofrelative standalone prices in order to identify the lease payments for each lease component.
ROU assets and lease liabilities are recognized in our consolidated balance sheets at the commencement date based on the present value of remaininglease payments over the lease term. Additionally, ROU assets include any lease payments made at or before the commencement date, as well as any initialdirect costs incurred, and are reduced by any lease incentives received. For a detailed discussion related to leases refer to Note 4.
Internally Developed Software — We capitalize certain costs associated with the development of internal-use software. Generally, these costs are relatedto significant software development projects and are amortized over their estimated useful life, typically three to five years, upon implementation of thesoftware.
Intangible Assets — Intangible assets, excluding trademarks (which are considered to have an indefinite life), consist primarily of engineeringdrawings, patents, existing customer relationships, software, distribution networks and other items that are being amortized over their estimated useful livesgenerally ranging from four to 40 years. These assets are reviewed for impairment whenever events and circumstances indicate impairment may haveoccurred.
Valuation of Goodwill, Indefinite-Lived Intangible Assets and Other Long-Lived Assets — The value of goodwill and indefinite-lived intangible assets istested for impairment as of December 31 each year or whenever events or circumstances indicate such assets may be impaired. The identification of ourreporting units began at the operating segment level and considered whether components one level below the operating segment levels should be identified asreporting units for purpose of testing goodwill for impairment based on certain conditions. These conditions included, among other factors, (i) the extent towhich a component represents a business and (ii) the aggregation of economically similar components within the operating segments and resulted in fourreporting units. Other factors that were considered in determining whether the aggregation of components was appropriate included the similarity of thenature of the products and services, the nature of the production processes, the methods of distribution and the types of industries served.
An impairment loss for goodwill is recognized if the implied fair value of goodwill is less than the carrying value. We estimate the fair value of ourreporting units based on an income approach, whereby we calculate the fair value of a reporting unit based on the present value of estimated future cashflows. A discounted cash flow analysis requires us to make various judgmental assumptions about future sales, operating margins, growth rates and discountrates, which are based on our budgets, business plans, economic projections, anticipated future cash flows and market participants. We did not record animpairment of goodwill in 2019, 2018 or 2017.
60
We also considered our market capitalization in our evaluation of the fair value of our goodwill. Our market capitalization increased as compared with2018 and did not indicate a potential impairment of our goodwill as of December 31, 2019.
Impairment losses for indefinite-lived intangible assets are recognized whenever the estimated fair value is less than the carrying value. Fair values arecalculated for trademarks using a "relief from royalty" method, which estimates the fair value of a trademark by determining the present value of estimatedroyalty payments that are avoided as a result of owning the trademark. This method includes judgmental assumptions about sales growth and discount ratesthat have a significant impact on the fair value and are substantially consistent with the assumptions used to determine the fair value of our reporting unitdiscussed above. We did not record a material impairment of our trademarks in 2019, 2018 or 2017.
The recoverable value of other long-lived assets, including property, plant and equipment and finite-lived intangible assets, is reviewed when indicatorsof potential impairments are present. The recoverable value is based upon an assessment of the estimated future cash flows related to those assets, utilizingassumptions similar to those for goodwill. Additional considerations related to our long-lived assets include expected maintenance and improvements,changes in expected uses and ongoing operating performance and utilization.
Deferred Loan Costs — Deferred loan costs, consisting of fees and other expenses associated with debt financing, are amortized over the term of theassociated debt using the effective interest method. Additional amortization is recorded in periods where optional prepayments on debt are made.
Fair Values of Financial Instruments — Our financial instruments are presented at fair value in our consolidated balance sheets, with the exception ofour long-term debt. Fair value is defined as the price that would be received to sell an asset or paid to transfer a liability in an orderly transaction betweenmarket participants at the measurement date. Where available, fair value is based on observable market prices or parameters or derived from such prices orparameters. Where observable prices or inputs are not available, valuation models may be applied.
Assets and liabilities recorded at fair value in our consolidated balance sheets are categorized based upon the level of judgment associated with theinputs used to measure their fair values. Hierarchical levels, as defined by Accounting Standards Codification ("ASC") 820, "Fair Value Measurements andDisclosures," are directly related to the amount of subjectivity associated with the inputs to fair valuation of these assets and liabilities. An asset or a liability’scategorization within the fair value hierarchy is based on the lowest level of significant input to its valuation. Hierarchical levels are as follows:
Level I — Inputs are unadjusted, quoted prices in active markets for identical assets or liabilities at the measurement date.
Level II — Inputs (other than quoted prices included in Level I) are either directly or indirectly observable for the asset or liability throughcorrelation with market data at the measurement date and for the duration of the instrument’s anticipated life.
Level III — Inputs reflect management’s best estimate of what market participants would use in pricing the asset or liability at the measurementdate. Consideration is given to the risk inherent in the valuation technique and the risk inherent in the inputs to the model.
Recurring fair value measurements are limited to investments in derivative instruments and certain equity securities. The fair value measurements of ourderivative instruments are determined using models that maximize the use of the observable market inputs including interest rate curves and both forward andspot prices for currencies, and are classified as Level II under the fair value hierarchy. The fair values of our derivative instruments are included in Note 8.The fair value measurements of our investments in equity securities are determined using quoted market prices and are classified as Level I. The fair values ofour investments in equity securities, and changes thereto, are immaterial to our consolidated financial position and results of operations.
Derivatives and Hedging Activities — We have a foreign currency derivatives and hedging policy outlining the conditions under which we can enterinto financial derivative transactions. We do not use derivative instruments for trading or speculative purposes. All derivative instruments are recognized onthe balance sheet at their fair values.
We employ a foreign currency economic hedging strategy to mitigate certain financial risks resulting from foreign currency exchange rate movementsthat impact foreign currency denominated receivables and payables, firm committed transactions and forecasted sales and purchases. The changes in the fairvalues are recognized immediately in other income (expense), net in the consolidated statements of income. See Note 8 for further discussion of forwardexchange contracts.
61
We are exposed to risk from credit-related losses resulting from nonperformance by counterparties to our financial instruments. We perform creditevaluations of our counterparties under forward exchange contracts and expect all counterparties to meet their obligations. If necessary, we would adjust thevalues of our derivative contracts for our or our counterparties’ credit risks.
Foreign Currency Translation — Assets and liabilities of our foreign subsidiaries are translated to U.S. dollars at exchange rates prevailing at thebalance sheet date, while income and expenses are translated at average rates for each month. Translation gains and losses are reported as a component ofaccumulated other comprehensive loss. Transactional currency gains and losses arising from transactions in currencies other than our sites’ functionalcurrencies are included in our consolidated results of operations.
Transaction and translation gains and losses arising from intercompany balances are reported as a component of accumulated other comprehensive losswhen the underlying transaction stems from a long-term equity investment or from debt designated as not due in the foreseeable future. Otherwise, werecognize transaction gains and losses arising from intercompany transactions as a component of income. Where intercompany balances are not long-terminvestment related or not designated as due beyond the foreseeable future, we may mitigate risk associated with foreign currency fluctuations by entering intoforward exchange contracts.
Stock-Based Compensation — Stock-based compensation is measured at the grant-date fair value. The exercise price of stock option awards and thevalue of restricted share, restricted share unit and performance-based unit awards (collectively referred to as "Restricted Shares") are set at the closing price ofour common stock on the New York Stock Exchange on the date of grant, which is the date such grants are authorized by our Board of Directors. Restrictedshare units and performance-based units refer to restricted awards that do not have voting rights and accrue dividends, and are forfeited if vesting does notoccur.
The intrinsic value of Restricted Shares, which is typically the product of share price at the date of grant and the number of Restricted Shares granted, isamortized on a straight-line basis to compensation expense over the periods in which the restrictions lapse based on the expected number of shares that willvest. We account for forfeitures as they occur resulting in the reversal of cumulative expense previously recognized.
Earnings Per Share — We use the two-class method of calculating Earnings Per Share ("EPS"), which determines earnings per share for each class ofcommon stock and participating security as if all earnings for the period had been distributed. Unvested restricted share awards that earn non-forfeitabledividend rights qualify as participating securities and, accordingly, are included in the basic computation as such. Our unvested Restricted Shares participateon an equal basis with common shares; therefore, there is no difference in undistributed earnings allocated to each participating security. Accordingly, thepresentation below is prepared on a combined basis and is presented as earnings per common share.
62
The following is a reconciliation of net earnings of Flowserve Corporation and weighted average shares for calculating net earnings per common share:
Year Ended December 31,
2019 2018 2017 (Amounts in thousands, except per share data)
Net earnings of Flowserve Corporation $ 253,668 $ 119,671 $ 2,652Dividends on restricted shares not expected to vest — — —
Earnings attributable to common and participating shareholders $ 253,668 $ 119,671 $ 2,652
Weighted average shares: Common stock 131,012 130,794 130,600Participating securities 22 29 103Denominator for basic earnings per common share 131,034 130,823 130,703Effect of potentially dilutive securities 685 448 655
Denominator for diluted earnings per common share 131,719 131,271 131,358
Net earnings per share attributable to Flowserve Corporation common shareholders: Basic $ 1.94 $ 0.91 $ 0.02Diluted 1.93 0.91 0.02
Diluted earnings per share is based upon the weighted average number of shares as determined for basic earnings per share plus shares potentiallyissuable in conjunction with stock options, restricted shares, restricted share units and performance share units.
Research and Development Expense — Research and development costs are charged to expense when incurred. Aggregate research and developmentcosts included in SG&A were $42.0 million, $39.6 million and $38.6 million in 2019, 2018 and 2017, respectively. Costs incurred for research anddevelopment primarily include salaries and benefits and consumable supplies, as well as rent, professional fees, utilities and the depreciation of property andequipment used in research and development activities.
Accounting Developments
Pronouncements Implemented
In February 2016, the Financial Accounting Standards Board ("FASB") issued Accounting Standards Update ("ASU") No. 2016-02, Leases (Topic 842)("New Lease Standard"). The New Lease Standard increases transparency and comparability by requiring lessees to recognize right-of-use (“ROU”) assetsand lease liabilities for operating leases on their consolidated balance sheets. Additionally, expanded disclosures are required to enable users of financialstatements to understand the amount, timing and uncertainty of cash flows arising from leases.
We adopted the New Lease Standard effective January 1, 2019, utilizing the modified retrospective approach and elected an initial application date ofJanuary 1, 2019. The adoption resulted in an increase to total assets and liabilities due to the recording of lease ROU assets and lease liabilities ofapproximately $225 million as of January 1, 2019. The adoption did not materially impact our consolidated results of operations or cash flows. Refer to Note4 for further discussion of our adoption of the New Lease Standard.
On July 13, 2017, the FASB issued ASU No. 2017-11, “Earnings Per Share (Topic 260); Distinguishing Liabilities from Equity (Topic 480); Derivativesand Hedging (Topic 815): (Part I) Accounting for Certain Financial Instruments with Down Round Features, (Part II) Replacement of the Indefinite Deferralfor Mandatory Redeemable Financial Instruments of Certain Nonpublic Entities and Certain Mandatory Redeemable Noncontrolling Interests with a ScopeException.” The ASU amends guidance in FASB Accounting Standards Codification ("ASC") 260, Earnings Per Share, FASB ASC 480, DistinguishingLiabilities from Equity, and FASB ASC 815, Derivatives and Hedging. The amendments in Part I of this ASU change the classification analysis of certainequity-linked financial instruments (or embedded features) with down round features. The amendments in this ASU must be applied to annual reportingperiods beginning after December 15, 2018. Our adoption of
63
ASU No. 2017-11 effective January 1, 2019 did not have an impact on our consolidated financial condition and results of operations.
On August 28, 2017, the FASB issued ASU No. 2017-12, "Derivatives and Hedging (Topic 815): Targeted improvements of Accounting for HedgingActivities." The purpose of this ASU is to better align a company’s risk management activities and financial reporting for hedging relationships. Additionally,the ASU simplifies the hedge accounting requirements and improve the disclosures of hedging arrangements. The amendments in this ASU must be appliedto annual reporting periods beginning after December 15, 2019. Early adoption is permitted. Our adoption of ASU No. 2017-12 effective January 1, 2019 didnot have an impact on our consolidated financial condition and results of operations.
In February 2018, the FASB issued ASU No. 2018-02, "Income Statement - Reporting Comprehensive Income (Topic 220): Reclassification of CertainTax Effects from Accumulated Comprehensive Income (“AOCI”)." The ASU and its amendments were issued as a result of the enactment of the U.S. TaxCuts and Jobs Act of 2017. The amendments of this ASU address the available options to reclassify stranded tax effects within AOCI to retained earnings ineach period in which the effect of the change (or portion thereof) is recorded. Additionally, the ASU outlines the disclosure requirements for releasing incometax effects from AOCI. The ASU is effective for fiscal years beginning after December 15, 2018. The ASU should be applied either in the period of adoptionor retrospectively to each period (or periods) in which the effect of the change in the U.S. federal corporate income tax rate in the Tax Cuts and Jobs Act isrecognized. We adopted this ASU effective January 1, 2019 and elected not to reclassify the income tax effects of the Tax Cuts and Jobs Act fromaccumulated comprehensive income to retained earnings.
In July 2018, the FASB issued ASU No. 2018-07, "Compensation - Stock Compensation (Topic 718) - Improvements to Non-employee Share-basedPayment Accounting." The amendments of this ASU apply to all share-based payment transactions to non-employees, in which a grantor acquires goods orservices to be used or consumed in a grantor’s own operations, accounted under ASC 505-50, Equity-Based Payments to Non-Employees. Under theamendments of ASU 2018-07, most of the guidance on compensation to non-employees would be aligned with the requirements for shared based paymentsgranted to employees, Topic 718. The ASU is effective for fiscal years beginning after December 15, 2018. Our adoption of ASU No. 2018-07-12 effectiveJanuary 1, 2019 did not have an impact on our consolidated financial condition and results of operations.
Pronouncements Not Yet Implemented
In June 2016, the FASB issued ASU No. 2016-13, "Financial Instruments-Credit Losses (Topic 326), Measurement of Credit Losses on FinancialInstruments." The ASU requires, among other things, the use of a new current expected credit loss ("CECL") model in order to determine our allowances fordoubtful accounts with respect to accounts receivable, contract assets, leased assets and guarantees. The CECL model requires that we estimate our lifetimeexpected credit loss with respect to our receivables and contract assets and record allowances that, when deducted from the balance of the receivables,represent the net amounts expected to be collected. During our evaluation of ASU No. 2016-13 and all related ASUs, we formed a project team to assess therequirements of the new guidance, which included a review of our financial assets measured at amortized cost basis and the associated methodology fordevelopment of reserves. To support the requirements of the new standard and all related ASUs, we modified our accounting policies and processes, andadopted the new standard on a prospective basis as of January 1, 2020. The adoption of ASU No. 2016-13 is not expected to have a material impact on ourconsolidated financial condition and results of operations.
In January 2017, the FASB issued ASU No. 2017-04, "Intangibles - Goodwill and Other (Topic 350): Simplifying the Test for Goodwill Impairment."The amendments in this ASU allow companies to apply a one-step quantitative test and record the amount of goodwill impairment as the excess of a reportingunit’s carrying amount over its fair value, not to exceed the total amount of goodwill allocated to the reporting unit. The amendments of the ASU are effectivefor annual or interim goodwill impairment tests in fiscal years beginning after December 15, 2019. Early adoption is permitted for interim or annual goodwillimpairment tests performed on testing dates after January 1, 2017. The adoption of ASU No. 2017-04 is not expected to have a material impact on ourconsolidated financial condition and results of operations.
In August 2018, the FASB issued ASU No. 2018-13, "Fair Value Measurement (Topic 820): Disclosure Framework—Changes to the DisclosureRequirements for Fair Value Measurement." The amendments of the ASU modify the disclosure requirements for fair value measurements by removing,modifying, or adding certain disclosure information requirements for assets and liabilities measured at fair value in the statement of financial position ordisclosed in the notes to financial statements. The ASU is effective for fiscal years, and interim periods within those fiscal years, beginning after December15, 2019, with early adoption permitted for the removed disclosures and delayed adoption until fiscal year 2020 permitted for the new disclosures. Theremoved and modified disclosures will be adopted on a retrospective basis and the new disclosures will be
64
adopted on a prospective basis. The adoption of ASU No. 2018-13 is not expected to have a material impact on our consolidated financial condition andresults of operations.
In August 2018, the FASB issued ASU No. 2018-14, "Compensation-Retirement Benefits-Defined Benefit Plans-General (Subtopic 715-20): DisclosureFramework-Changes to the Disclosure Requirements for Defined Benefit Plans." The ASU amends the disclosure requirements by adding, clarifying, orremoving certain disclosures for sponsor defined benefit pension or other postretirement plans. The amendments are effective for fiscal years ending afterDecember 15, 2020 and the amendments should be applied retrospectively to all periods presented. The adoption of ASU No. 2018-14 is not expected to havea material impact on our consolidated financial condition and results of operations.
In August 2018, the FASB issued ASU No. 2018-15, "Intangibles-Goodwill and Other-Internal-Use Software (Subtopic 350-40): Customer’s Accountingfor Implementation Costs Incurred in a Cloud Computing Arrangement That Is a Service Contract." The ASU addresses how entities should account for costsassociated with implementing a cloud computing arrangement that is considered a service contract. Per the amendments of the ASU, implementation costsincurred in a cloud computing arrangement that is a service contract should be accounted for in the same manner as implementation costs incurred to developor obtain software for internal use as prescribed by guidance in ASC350-40. The ASU requires that implementation costs incurred in a cloud computingarrangement be capitalized rather than expensed. Further, the ASU specifies the method for the amortization of costs incurred during implementation, and themanner in which the unamortized portion of these capitalized implementation costs should be evaluated for impairment. The ASU also provides guidance onhow to present such implementation costs in the financial statements and also creates additional disclosure requirements. The amendments are effective forfiscal years beginning after December 15, 2019, including interim periods. The amendments in this ASU should be applied either retrospectively orprospectively to all implementation costs incurred after the date of adoption. The adoption of ASU No. 2018-15 is not expected to have a material impact onour consolidated financial condition and results of operations.
In October 2018, the FASB issued ASU No. 2018-17, "Consolidation (Topic 810): Targeted Improvements to Related Party Guidance for VariableInterest Entities ("VIEs")." The standard reduces the cost and complexity of financial reporting associated with VIEs. The new standard amends the guidancefor determining whether a decision-making fee is a VIE. The amendments require organizations to consider indirect interests held through related partiesunder common control on a proportional basis rather than as the equivalent of a direct interest in its entirety as currently required in GAAP. The amendmentsof this ASU are effective for fiscal years beginning after December 15, 2019, and interim periods within those fiscal years. The adoption of ASU No. 2018-17is not expected to have a material impact on our consolidated financial condition and results of operations.
In November 2018, the FASB issued ASU No. 2018-18, "Collaborative Arrangements (Topic 808): Clarifying the Interaction Between Topic 808 andTopic 606" ("New Revenue Standard"). The ASU clarifies the interaction between the guidance for certain collaborative arrangements and the New RevenueStandard. The amendments of the ASU provide guidance on how to assess whether certain transactions between collaborative arrangement participantsshould be accounted for within the New Revenue Standard. The ASU also provides more comparability in the presentation of revenue for certain transactionsbetween collaborative arrangement participants. Parts of the collaborative arrangement that are not in the purview of the revenue recognition standard shouldbe presented separately. The amendments are effective for fiscal years beginning after December 15, 2019, and interim periods within those fiscal years. Earlyadoption is permitted. The adoption of ASU No. 2018-18 is not expected to have a material impact on our consolidated financial condition and results ofoperations.
In December 2019, the FASB issued ASU No. 2019-12, “Income Taxes (Topic 740): Simplifying the Accounting for Income Taxes,” (Topic 740). TheASU intends to simplify various aspects related to accounting for income taxes and removes certain exceptions to the general principles in the standard.Additionally, the ASU clarifies and amends existing guidance to improve consistent application of its requirements. The amendments of the ASU are effectivefor fiscal years beginning after December 15, 2020, and interim periods within those fiscal years. Early adoption is permitted. The adoption of ASU No.2019-12 is not expected to have a material impact on our consolidated financial condition and results of operations.
65
2. REVENUE RECOGNITION
We enter into contracts with customers often having multiple commitments of goods and services including any combination of designing, developing,manufacturing, modifying, installing and commissioning of flow management equipment and providing services and parts related to the performance of suchproducts. We evaluate the commitments in our contracts with customers to determine if the commitments are both capable of being distinct and distinct in thecontext of the contract in order to identify performance obligations.
We recognize revenue when (or as) we satisfy a performance obligation by transferring control of the performance obligation to a customer. Control of aperformance obligation may transfer to the customer either over time or at a point in time depending on an evaluation of the specific facts and circumstancesfor each contract, including the terms and conditions of the contract as agreed with the customer, as well as the nature of the products or services to beprovided. Our larger contracts are typically completed within a one to three-year period, while many other contracts, such as “short cycle” contracts, have ashorter timeframe for revenue recognition.
Control transfers over time when the customer is able to direct the use of and obtain substantially all of the benefits of our work as we perform. Thistypically occurs when products have no alternative use and we have a right to payment for performance completed to date, including a reasonable profitmargin. Our contracts often include cancellation provisions that require the customer to reimburse us for costs incurred up to the date of cancellation, andsome contracts also provide for reimbursement of profit upon cancellation in addition to costs incurred to date.
Our primary method for recognizing revenue over time is the POC method. We measure progress towards completion by applying an input measurebased on costs incurred to date relative to total estimated costs at completion (i.e., the cost-to-cost method). This method provides a reasonable depiction ofthe transfer of control of products and services to customers as it ensures our efforts towards satisfying a performance obligation, as reflected by costsincurred, are included in the measure of progress used for recognition of revenue. Costs generally include direct labor, direct material and manufacturingoverhead. Costs that do not contribute towards control transfer are generally immaterial, but are excluded from the measure of progress in the event they aresignificant.
Prior to the adoption of the New Revenue Standard effective January 1, 2018, revenue recognized under the POC method had been 4% to 10% of ourconsolidated sales. Under the New Revenue Standard, we have experienced an increase in the amount of revenue recognized over time. This increase isprimarily due to the application of the new “transfer of control” model for revenue recognition. Under this model, revenue for performance obligationssubject to contractual transfer of control during the manufacturing process are recognized over time. This includes contracts with cancellation provisions thatrequire reimbursement for costs incurred plus a reasonable margin and for which the performance obligation has no alternative use. Revenue from productsand services transferred to customers over time accounted for approximately 19%, 22% and 4% of total revenue for the years ended December 31, 2019, 2018and 2017, respectively.
If control does not transfer over time, then control transfers at a point in time. We recognize revenue at a point in time at the level of each performanceobligation based on the evaluation of certain indicators of control transfer, such as title transfer, risk of loss transfer, customer acceptance and physicalpossession. Revenue from products and services transferred to customers at a point in time accounted for approximately 81%, 78% and 96% of total revenuefor the years ended December 31, 2019, 2018 and 2017, respectively.
A contract modification, or “change order,” occurs when the existing enforceable rights and obligations of a contract change, such as a change in thescope, price or terms and conditions. We account for a change order as a new accounting contract when the change order is limited to adding new, distinctproducts and services that are priced in an amount consistent with standalone selling price. Other change orders are accounted for as a modification of theexisting accounting contract. When a change order occurs for a contract having in-process over time performance obligations, the effect of the change orderon the transaction price and the measure of progress for the performance obligations to which it relates is recognized as an adjustment to revenue (either as anincrease in or a reduction of revenue) on a cumulative catch-up basis.
Freight charges billed to customers are included in sales and the related shipping costs are included in cost of sales ("COS") in our consolidatedstatements of income. If shipping activities are performed after a customer obtains control of a product, we apply a policy election to account for shipping asan activity to fulfill the promise to transfer the product to the customer.
We apply a policy election to exclude transaction taxes collected from customers from sales when the tax is both imposed on and concurrent with aspecific revenue-producing transaction.
In certain instances, we provide guaranteed completion dates under the terms of our contracts. Failure to meet contractual delivery dates can result in latedelivery penalties or liquidated damages. In the event that the transaction price of such a contract is probable of experiencing a significant reversal due to apenalty, we constrain a portion of the transaction price.
66
This reduction to the transaction price could potentially cause estimated total contract costs to exceed the transaction price, in which case we record aprovision for the estimated loss in the period the loss is first projected. In circumstances where the transaction price still exceeds total projected costs, theestimated penalty generally reduces profitability of the contract at the time of subsequent revenue recognition.
Our incremental costs to obtain a contract are limited to sales commissions. We apply the practical expedient to expense commissions as incurred forcontracts having a duration of one year or less. Sales commissions related to contracts with a duration of greater than one year are immaterial to our financialstatements and are also expensed as incurred.
Performance Obligations
A performance obligation is a promise in a contract to transfer a distinct good or service to the customer, and is the unit of account for recognition ofrevenue. Many of our contracts have multiple performance obligations as the promise to transfer the individual goods or services, or certain groups of goodsand services, is separately identifiable from other promises in the contract.
We allocate the transaction price of each contract to the performance obligations on the basis of standalone selling price and recognize revenue when, oras, control of each performance obligation transfers to the customer. For standard products, we identify the standalone selling price based on directlyobservable information. For customized or unique products and services, we apply the cost plus margin approach to estimate the standalone selling price.Under this method, we forecast our expected costs of satisfying a performance obligation and then add an appropriate standalone market margin for thatdistinct good or service.
We have elected to use the practical expedient to not adjust the transaction price of a contract for the effects of a significant financing component if, at theinception of the contract, we expect that the period between when we transfer a promised good or service to a customer and when the customer pays for thatgood or service will be one year or less.
On December 31, 2019, the aggregate transaction price allocated to unsatisfied (or partially unsatisfied) performance obligations related to contractshaving an original expected duration in excess of one year was approximately $709 million. We estimate recognition of approximately $593 million of thisamount as revenue in 2020 and an additional $116 million in 2021 and thereafter.
Disaggregated Revenue
We conduct our operations through two business segments based on the type of product and how we manage the business:
• Flowserve Pump Division ("FPD") for custom, highly-engineered pumps, pre-configured industrial pumps, pump systems, mechanical seals,auxiliary systems and replacement parts and related services; and
• Flow Control Division ("FCD") for engineered and industrial valves, control valves, actuators and controls and related services.
67
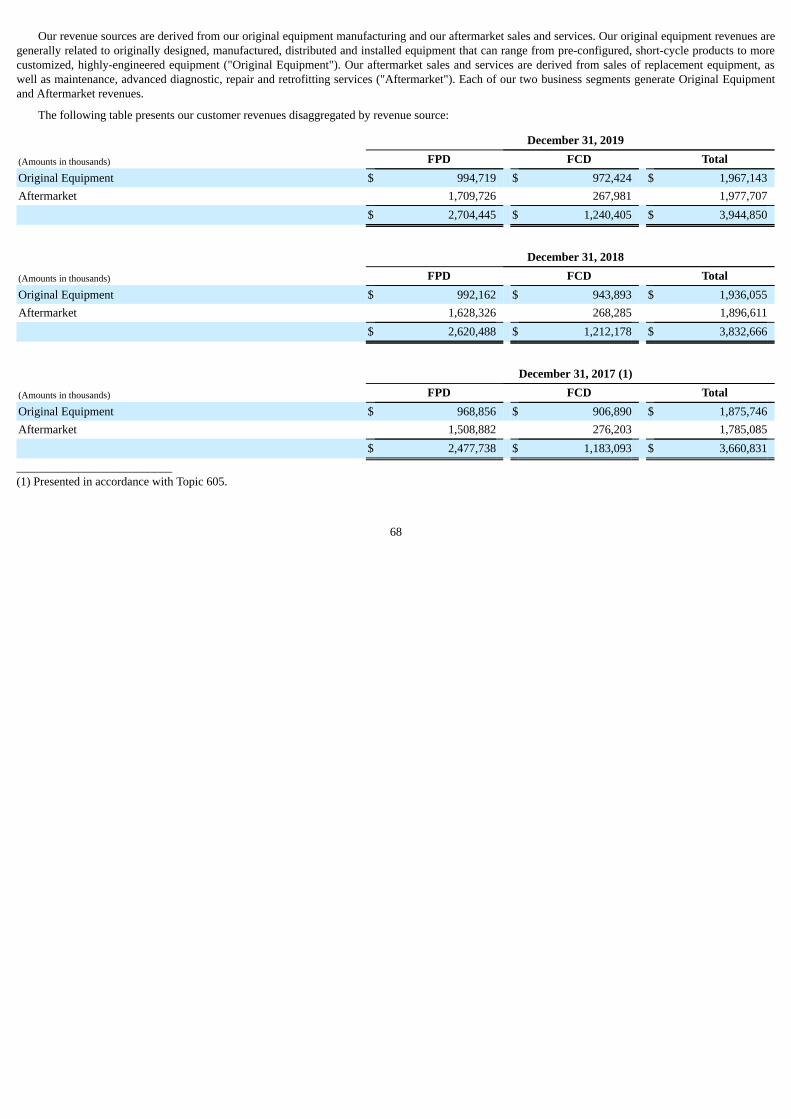
Our revenue sources are derived from our original equipment manufacturing and our aftermarket sales and services. Our original equipment revenues aregenerally related to originally designed, manufactured, distributed and installed equipment that can range from pre-configured, short-cycle products to morecustomized, highly-engineered equipment ("Original Equipment"). Our aftermarket sales and services are derived from sales of replacement equipment, aswell as maintenance, advanced diagnostic, repair and retrofitting services ("Aftermarket"). Each of our two business segments generate Original Equipmentand Aftermarket revenues.
The following table presents our customer revenues disaggregated by revenue source:
December 31, 2019
(Amounts in thousands) FPD FCD TotalOriginal Equipment $ 994,719 $ 972,424 $ 1,967,143Aftermarket 1,709,726 267,981 1,977,707
$ 2,704,445 $ 1,240,405 $ 3,944,850
December 31, 2018
(Amounts in thousands) FPD FCD TotalOriginal Equipment $ 992,162 $ 943,893 $ 1,936,055Aftermarket 1,628,326 268,285 1,896,611
$ 2,620,488 $ 1,212,178 $ 3,832,666
December 31, 2017 (1)
(Amounts in thousands) FPD FCD TotalOriginal Equipment $ 968,856 $ 906,890 $ 1,875,746Aftermarket 1,508,882 276,203 1,785,085
$ 2,477,738 $ 1,183,093 $ 3,660,831__________________________(1) Presented in accordance with Topic 605.
68
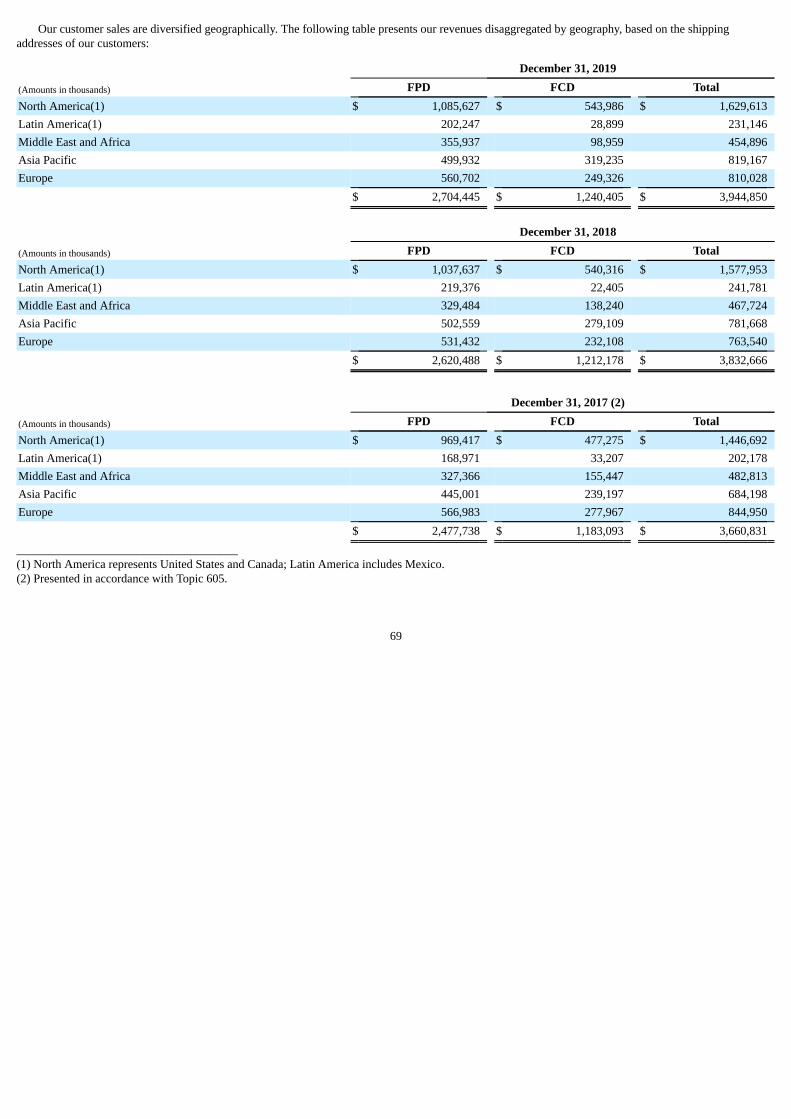
Our customer sales are diversified geographically. The following table presents our revenues disaggregated by geography, based on the shippingaddresses of our customers:
December 31, 2019
(Amounts in thousands) FPD FCD TotalNorth America(1) $ 1,085,627 $ 543,986 $ 1,629,613Latin America(1) 202,247 28,899 231,146Middle East and Africa 355,937 98,959 454,896Asia Pacific 499,932 319,235 819,167Europe 560,702 249,326 810,028
$ 2,704,445 $ 1,240,405 $ 3,944,850
December 31, 2018
(Amounts in thousands) FPD FCD TotalNorth America(1) $ 1,037,637 $ 540,316 $ 1,577,953Latin America(1) 219,376 22,405 241,781Middle East and Africa 329,484 138,240 467,724Asia Pacific 502,559 279,109 781,668Europe 531,432 232,108 763,540
$ 2,620,488 $ 1,212,178 $ 3,832,666
December 31, 2017 (2)
(Amounts in thousands) FPD FCD TotalNorth America(1) $ 969,417 $ 477,275 $ 1,446,692Latin America(1) 168,971 33,207 202,178Middle East and Africa 327,366 155,447 482,813Asia Pacific 445,001 239,197 684,198Europe 566,983 277,967 844,950
$ 2,477,738 $ 1,183,093 $ 3,660,831_____________________________________(1) North America represents United States and Canada; Latin America includes Mexico.(2) Presented in accordance with Topic 605.
69
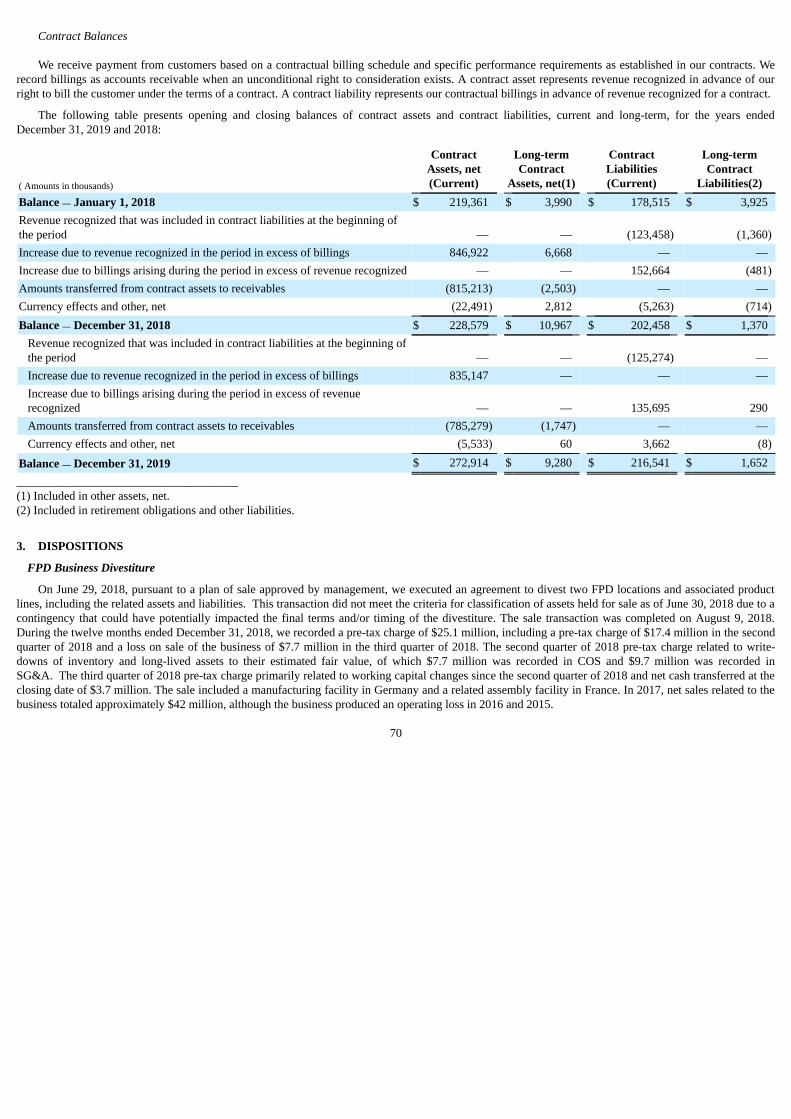
Contract Balances
We receive payment from customers based on a contractual billing schedule and specific performance requirements as established in our contracts. Werecord billings as accounts receivable when an unconditional right to consideration exists. A contract asset represents revenue recognized in advance of ourright to bill the customer under the terms of a contract. A contract liability represents our contractual billings in advance of revenue recognized for a contract.
The following table presents opening and closing balances of contract assets and contract liabilities, current and long-term, for the years endedDecember 31, 2019 and 2018:
( Amounts in thousands)
ContractAssets, net(Current)
Long-termContract
Assets, net(1)
ContractLiabilities(Current)
Long-termContract
Liabilities(2)Balance — January 1, 2018 $ 219,361 $ 3,990 $ 178,515 $ 3,925Revenue recognized that was included in contract liabilities at the beginning ofthe period — — (123,458) (1,360)Increase due to revenue recognized in the period in excess of billings 846,922 6,668 — —Increase due to billings arising during the period in excess of revenue recognized — — 152,664 (481)Amounts transferred from contract assets to receivables (815,213) (2,503) — —Currency effects and other, net (22,491) 2,812 (5,263) (714)Balance — December 31, 2018 $ 228,579 $ 10,967 $ 202,458 $ 1,370
Revenue recognized that was included in contract liabilities at the beginning ofthe period — — (125,274) —Increase due to revenue recognized in the period in excess of billings 835,147 — — —Increase due to billings arising during the period in excess of revenuerecognized — — 135,695 290Amounts transferred from contract assets to receivables (785,279) (1,747) — —Currency effects and other, net (5,533) 60 3,662 (8)
Balance — December 31, 2019 $ 272,914 $ 9,280 $ 216,541 $ 1,652_____________________________________(1) Included in other assets, net.(2) Included in retirement obligations and other liabilities.
3. DISPOSITIONS
FPD Business Divestiture
On June 29, 2018, pursuant to a plan of sale approved by management, we executed an agreement to divest two FPD locations and associated productlines, including the related assets and liabilities. This transaction did not meet the criteria for classification of assets held for sale as of June 30, 2018 due to acontingency that could have potentially impacted the final terms and/or timing of the divestiture. The sale transaction was completed on August 9, 2018.During the twelve months ended December 31, 2018, we recorded a pre-tax charge of $25.1 million, including a pre-tax charge of $17.4 million in the secondquarter of 2018 and a loss on sale of the business of $7.7 million in the third quarter of 2018. The second quarter of 2018 pre-tax charge related to write-downs of inventory and long-lived assets to their estimated fair value, of which $7.7 million was recorded in COS and $9.7 million was recorded inSG&A. The third quarter of 2018 pre-tax charge primarily related to working capital changes since the second quarter of 2018 and net cash transferred at theclosing date of $3.7 million. The sale included a manufacturing facility in Germany and a related assembly facility in France. In 2017, net sales related to thebusiness totaled approximately $42 million, although the business produced an operating loss in 2016 and 2015.
70
Vogt
Effective July 6, 2017, we sold our FCD's Vogt product line and related assets and liabilities to a privately held company for $28.0 million of cashreceived at closing. The sale resulted in a pre-tax gain of $11.1 million recorded in gain on sale of business in the consolidated statements of income. In 2016,net sales related to the Vogt business totaled approximately $17 million, with earnings before interest and taxes of approximately $4 million.
Gestra AG
Effective May 2, 2017, we sold our FCD's Gestra AG ("Gestra") business to a leading provider of steam system solutions for $203.6 million (€178.3million) of cash received in 2017. The sale resulted in a pre-tax gain of $130.2 million ($79.4 million after-tax) recorded in gain on sale of business in theconsolidated statements of income. The sale included Gestra’s manufacturing facility in Germany as well as related operations in the U.S., the UnitedKingdom ("U.K."), Spain, Poland, Italy, Singapore and Portugal. In 2016, Gestra recorded revenues of approximately $101 million (€92 million) withearnings before interest and taxes of approximately $17 million (€15 million).
4. LEASES
We adopted the New Lease Standard effective January 1, 2019 utilizing the modified retrospective approach and have elected an initial application dateof January 1, 2019. Adoption of the New Lease Standard resulted in an increase to total assets and liabilities due to the recording of lease ROU assets andlease liabilities of approximately $225 million as of January 1, 2019. Our adoption of the New Lease Standard included modification of certain accountingpolicies and practices, business processes, systems and controls in order to support compliance with the requirements.
We elected the package of three practical expedients for transition, which include the carry forward of our leases without reassessing whether anycontracts are leases or contain leases, lease classification and initial direct costs. We elected the transition practical expedient to apply hindsight whendetermining the lease term and when assessing impairment of ROU assets at the adoption date, which allows us to update our assessments according to newinformation and changes in facts and circumstances that have occurred since lease inception. We have certain land easements that have historically beenaccounted for as finite-lived intangible assets. We elected the practical expedient related to land easements, allowing us to carry forward our accountingtreatment for land easements on existing agreements as intangible assets. Any new or modified land easements will be accounted for as leases under the NewLease Standard.
Presentation of Leases
We have operating and finance leases for certain manufacturing facilities, offices, service and quick response centers, machinery, equipment andautomobiles. Our leases have remaining lease terms of up to 34 years. The terms and conditions of our leases may include options to extend or terminate thelease which are considered and included in the lease term when these options are reasonably certain of exercise.
We determine if a contract is (or contains) a lease at inception by evaluating whether the contract conveys the right to control the use of an identifiedasset. For all classes of leased assets, we have elected the practical expedient to account for any non-lease components in the contract together with the relatedlease component in the same unit of account. For lease contracts containing more than one lease component, we allocate the contract consideration to each ofthe lease components on the basis of relative standalone prices in order to identify the lease payments for each lease component.
ROU assets and lease liabilities are recognized in our consolidated balance sheets at the commencement date based on the present value of remaininglease payments over the lease term. Additionally, ROU assets include any lease payments made at or before the commencement date, as well as any initialdirect costs incurred, and are reduced by any lease incentives received. As most of our operating leases do not provide an implicit rate, we apply ourincremental country-specific borrowing rate to determine the present value of remaining lease payments. Our incremental borrowing country-specific rate isdetermined based on information available at the commencement date of the lease.
Operating leases are included in operating lease right-of-use assets, net and operating lease liabilities in our consolidated balance sheets. Finance leasesare included in property plant and equipment, debt due within one year and long-term debt due after one year in our consolidated balance sheets.
For all classes of leased assets, we have applied an accounting policy election to exclude short-term leases from recognition in our consolidated balancesheets. A short-term lease has a lease term of 12 months or less at the commencement date and
71
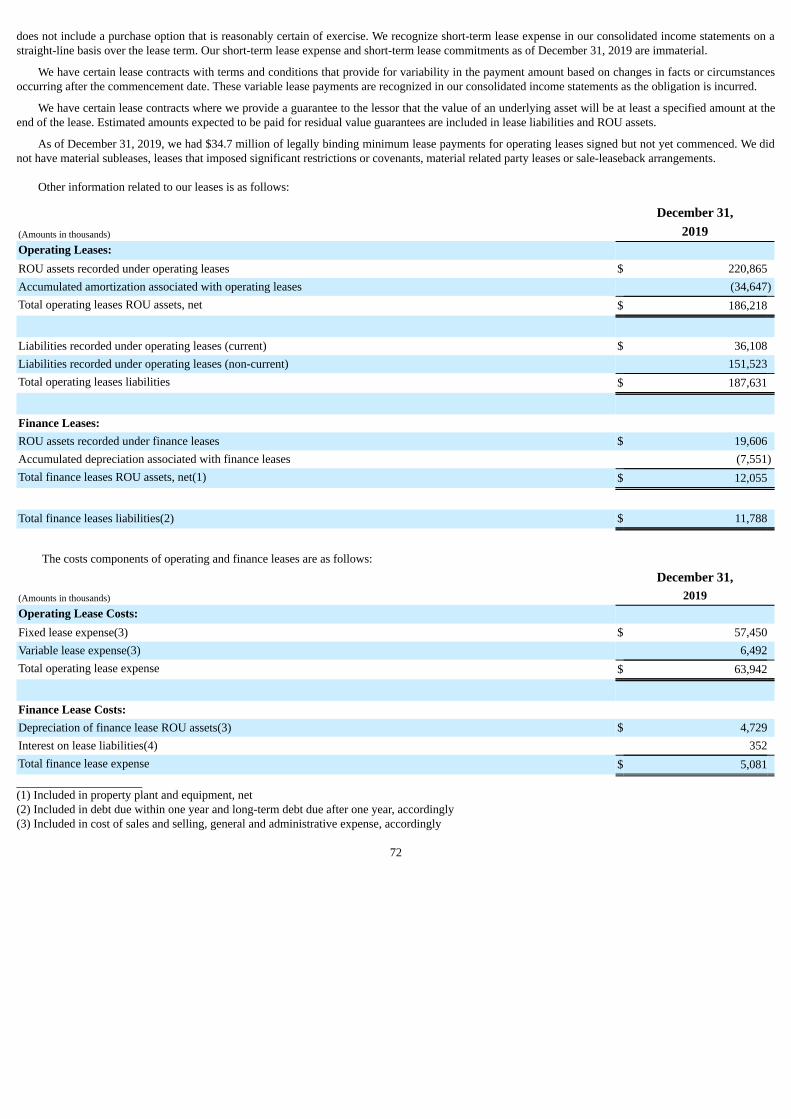
does not include a purchase option that is reasonably certain of exercise. We recognize short-term lease expense in our consolidated income statements on astraight-line basis over the lease term. Our short-term lease expense and short-term lease commitments as of December 31, 2019 are immaterial.
We have certain lease contracts with terms and conditions that provide for variability in the payment amount based on changes in facts or circumstancesoccurring after the commencement date. These variable lease payments are recognized in our consolidated income statements as the obligation is incurred.
We have certain lease contracts where we provide a guarantee to the lessor that the value of an underlying asset will be at least a specified amount at theend of the lease. Estimated amounts expected to be paid for residual value guarantees are included in lease liabilities and ROU assets.
As of December 31, 2019, we had $34.7 million of legally binding minimum lease payments for operating leases signed but not yet commenced. We didnot have material subleases, leases that imposed significant restrictions or covenants, material related party leases or sale-leaseback arrangements.
Other information related to our leases is as follows:
December 31,(Amounts in thousands) 2019Operating Leases: ROU assets recorded under operating leases $ 220,865Accumulated amortization associated with operating leases (34,647)Total operating leases ROU assets, net $ 186,218
Liabilities recorded under operating leases (current) $ 36,108Liabilities recorded under operating leases (non-current) 151,523Total operating leases liabilities $ 187,631
Finance Leases: ROU assets recorded under finance leases $ 19,606Accumulated depreciation associated with finance leases (7,551)Total finance leases ROU assets, net(1) $ 12,055
Total finance leases liabilities(2) $ 11,788
The costs components of operating and finance leases are as follows: December 31,(Amounts in thousands) 2019Operating Lease Costs: Fixed lease expense(3) $ 57,450Variable lease expense(3) 6,492Total operating lease expense $ 63,942
Finance Lease Costs: Depreciation of finance lease ROU assets(3) $ 4,729Interest on lease liabilities(4) 352Total finance lease expense $ 5,081_____________________(1) Included in property plant and equipment, net(2) Included in debt due within one year and long-term debt due after one year, accordingly(3) Included in cost of sales and selling, general and administrative expense, accordingly
72
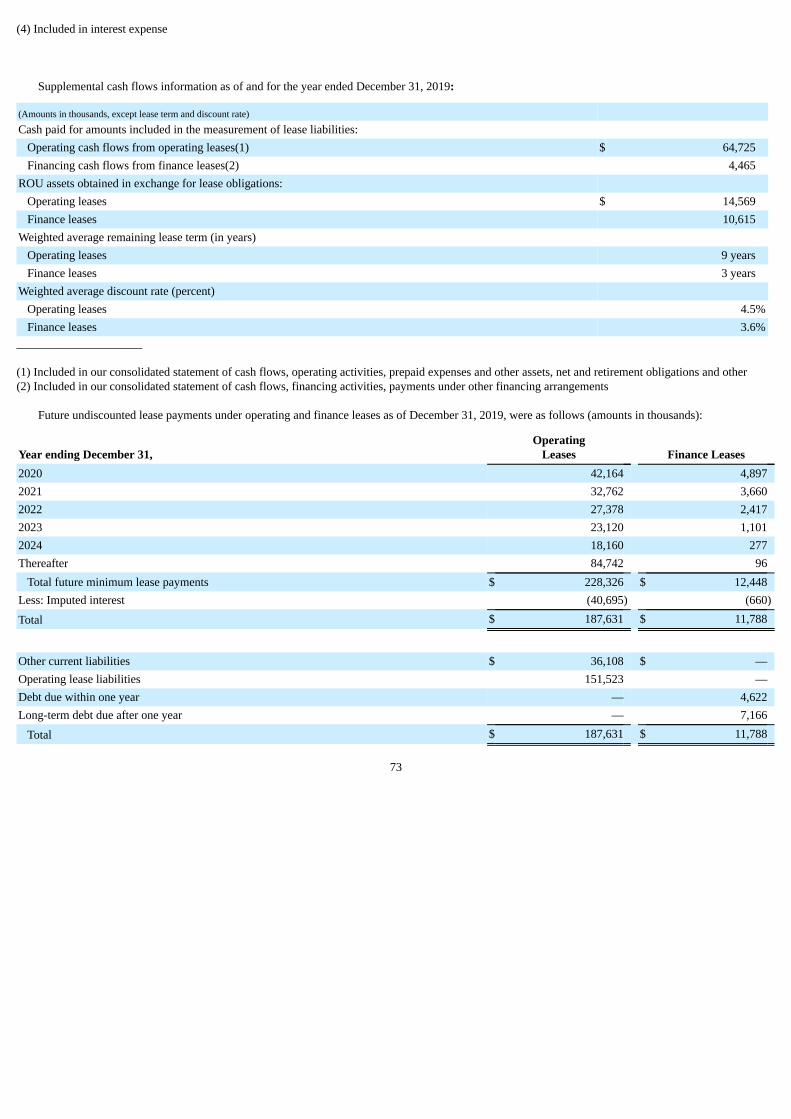
(4) Included in interest expense
Supplemental cash flows information as of and for the year ended December 31, 2019:
(Amounts in thousands, except lease term and discount rate) Cash paid for amounts included in the measurement of lease liabilities:
Operating cash flows from operating leases(1) $ 64,725Financing cash flows from finance leases(2) 4,465
ROU assets obtained in exchange for lease obligations: Operating leases $ 14,569Finance leases 10,615
Weighted average remaining lease term (in years) Operating leases 9 yearsFinance leases 3 years
Weighted average discount rate (percent) Operating leases 4.5%Finance leases 3.6%
_____________________
(1) Included in our consolidated statement of cash flows, operating activities, prepaid expenses and other assets, net and retirement obligations and other(2) Included in our consolidated statement of cash flows, financing activities, payments under other financing arrangements
Future undiscounted lease payments under operating and finance leases as of December 31, 2019, were as follows (amounts in thousands):
Year ending December 31,Operating
Leases Finance Leases2020 42,164 4,8972021 32,762 3,6602022 27,378 2,4172023 23,120 1,1012024 18,160 277Thereafter 84,742 96
Total future minimum lease payments $ 228,326 $ 12,448Less: Imputed interest (40,695) (660)
Total $ 187,631 $ 11,788
Other current liabilities $ 36,108 $ —Operating lease liabilities 151,523 —Debt due within one year — 4,622Long-term debt due after one year — 7,166
Total $ 187,631 $ 11,788
73
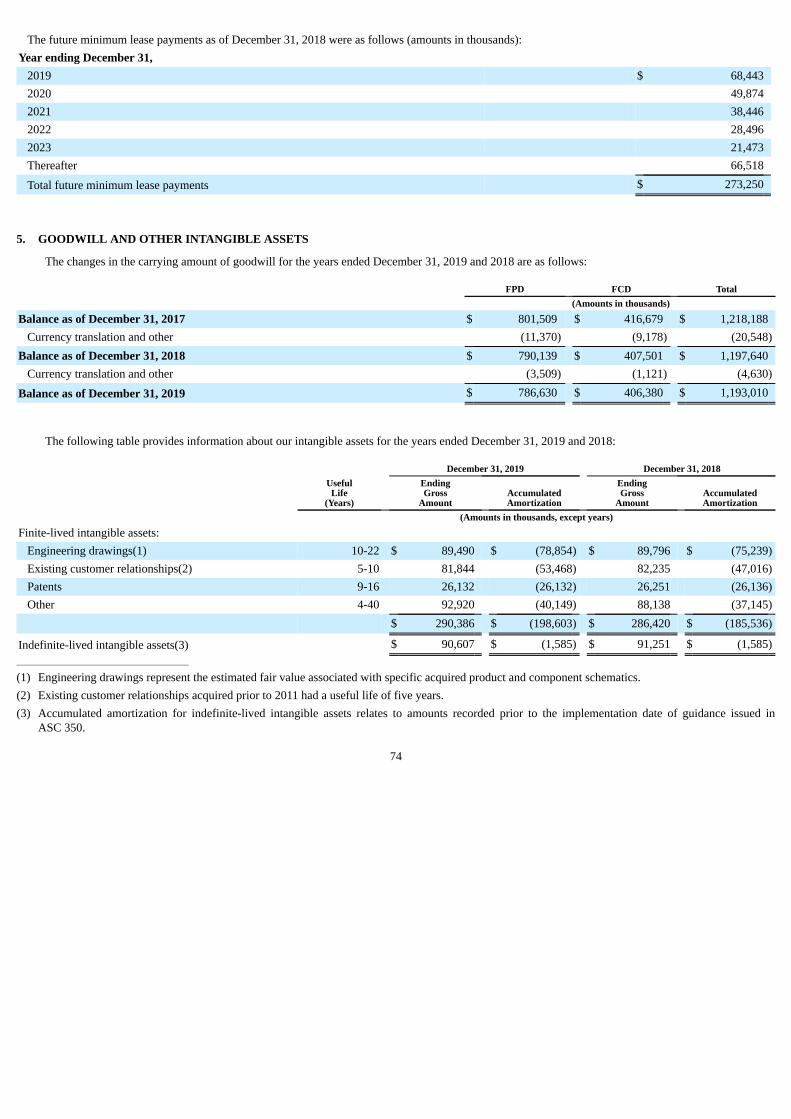
The future minimum lease payments as of December 31, 2018 were as follows (amounts in thousands):Year ending December 31,
2019 $ 68,4432020 49,8742021 38,4462022 28,4962023 21,473Thereafter 66,518
Total future minimum lease payments $ 273,250
5. GOODWILL AND OTHER INTANGIBLE ASSETS
The changes in the carrying amount of goodwill for the years ended December 31, 2019 and 2018 are as follows:
FPD FCD Total (Amounts in thousands)
Balance as of December 31, 2017 $ 801,509 $ 416,679 $ 1,218,188Currency translation and other (11,370) (9,178) (20,548)
Balance as of December 31, 2018 $ 790,139 $ 407,501 $ 1,197,640Currency translation and other (3,509) (1,121) (4,630)
Balance as of December 31, 2019 $ 786,630 $ 406,380 $ 1,193,010
The following table provides information about our intangible assets for the years ended December 31, 2019 and 2018:
December 31, 2019 December 31, 2018
UsefulLife
(Years) EndingGross
Amount AccumulatedAmortization
EndingGross
Amount AccumulatedAmortization
(Amounts in thousands, except years)
Finite-lived intangible assets: Engineering drawings(1) 10-22 $ 89,490 $ (78,854) $ 89,796 $ (75,239)Existing customer relationships(2) 5-10 81,844 (53,468) 82,235 (47,016)Patents 9-16 26,132 (26,132) 26,251 (26,136)Other 4-40 92,920 (40,149) 88,138 (37,145)
$ 290,386 $ (198,603) $ 286,420 $ (185,536)
Indefinite-lived intangible assets(3) $ 90,607 $ (1,585) $ 91,251 $ (1,585)____________________________________
(1) Engineering drawings represent the estimated fair value associated with specific acquired product and component schematics.(2) Existing customer relationships acquired prior to 2011 had a useful life of five years.(3) Accumulated amortization for indefinite-lived intangible assets relates to amounts recorded prior to the implementation date of guidance issued in
ASC 350.
74
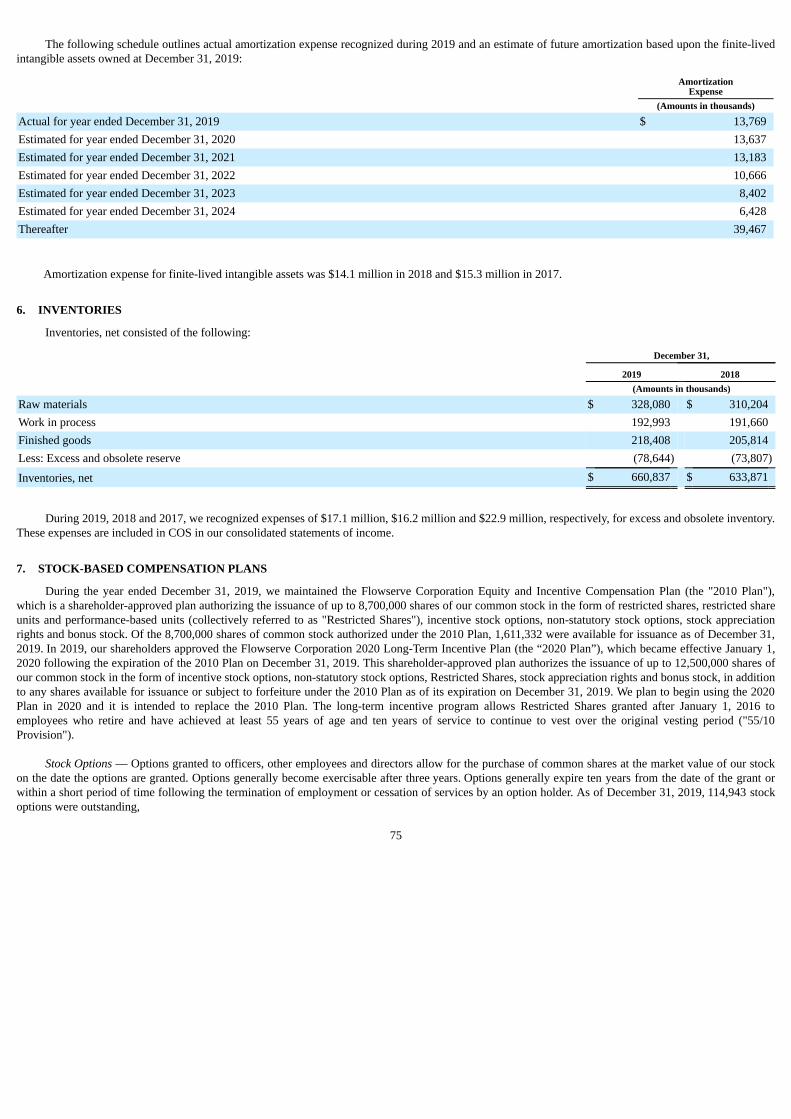
The following schedule outlines actual amortization expense recognized during 2019 and an estimate of future amortization based upon the finite-livedintangible assets owned at December 31, 2019:
Amortization
Expense (Amounts in thousands)
Actual for year ended December 31, 2019 $ 13,769Estimated for year ended December 31, 2020 13,637Estimated for year ended December 31, 2021 13,183Estimated for year ended December 31, 2022 10,666Estimated for year ended December 31, 2023 8,402Estimated for year ended December 31, 2024 6,428Thereafter 39,467
Amortization expense for finite-lived intangible assets was $14.1 million in 2018 and $15.3 million in 2017.
6. INVENTORIES
Inventories, net consisted of the following:
December 31,
2019 2018 (Amounts in thousands)
Raw materials $ 328,080 $ 310,204Work in process 192,993 191,660Finished goods 218,408 205,814Less: Excess and obsolete reserve (78,644) (73,807)
Inventories, net $ 660,837 $ 633,871
During 2019, 2018 and 2017, we recognized expenses of $17.1 million, $16.2 million and $22.9 million, respectively, for excess and obsolete inventory.These expenses are included in COS in our consolidated statements of income.
7. STOCK-BASED COMPENSATION PLANS
During the year ended December 31, 2019, we maintained the Flowserve Corporation Equity and Incentive Compensation Plan (the "2010 Plan"),which is a shareholder-approved plan authorizing the issuance of up to 8,700,000 shares of our common stock in the form of restricted shares, restricted shareunits and performance-based units (collectively referred to as "Restricted Shares"), incentive stock options, non-statutory stock options, stock appreciationrights and bonus stock. Of the 8,700,000 shares of common stock authorized under the 2010 Plan, 1,611,332 were available for issuance as of December 31,2019. In 2019, our shareholders approved the Flowserve Corporation 2020 Long-Term Incentive Plan (the “2020 Plan”), which became effective January 1,2020 following the expiration of the 2010 Plan on December 31, 2019. This shareholder-approved plan authorizes the issuance of up to 12,500,000 shares ofour common stock in the form of incentive stock options, non-statutory stock options, Restricted Shares, stock appreciation rights and bonus stock, in additionto any shares available for issuance or subject to forfeiture under the 2010 Plan as of its expiration on December 31, 2019. We plan to begin using the 2020Plan in 2020 and it is intended to replace the 2010 Plan. The long-term incentive program allows Restricted Shares granted after January 1, 2016 toemployees who retire and have achieved at least 55 years of age and ten years of service to continue to vest over the original vesting period ("55/10Provision").
Stock Options — Options granted to officers, other employees and directors allow for the purchase of common shares at the market value of our stockon the date the options are granted. Options generally become exercisable after three years. Options generally expire ten years from the date of the grant orwithin a short period of time following the termination of employment or cessation of services by an option holder. As of December 31, 2019, 114,943 stockoptions were outstanding,
75
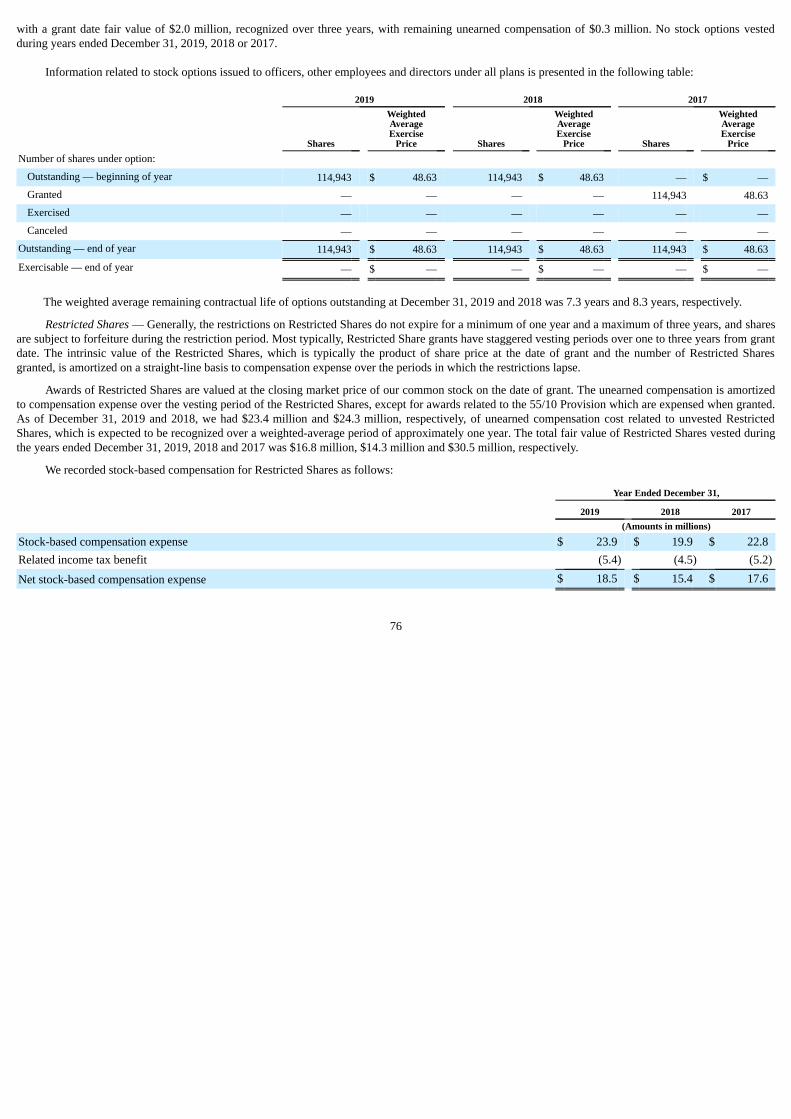
with a grant date fair value of $2.0 million, recognized over three years, with remaining unearned compensation of $0.3 million. No stock options vestedduring years ended December 31, 2019, 2018 or 2017.
Information related to stock options issued to officers, other employees and directors under all plans is presented in the following table:
2019 2018 2017
Shares
WeightedAverageExercise
Price Shares
WeightedAverageExercise
Price Shares
WeightedAverageExercise
PriceNumber of shares under option:
Outstanding — beginning of year 114,943 $ 48.63 114,943 $ 48.63 — $ —Granted — — — — 114,943 48.63Exercised — — — — — —Canceled — — — — — —
Outstanding — end of year 114,943 $ 48.63 114,943 $ 48.63 114,943 $ 48.63
Exercisable — end of year — $ — — $ — — $ —
The weighted average remaining contractual life of options outstanding at December 31, 2019 and 2018 was 7.3 years and 8.3 years, respectively.
Restricted Shares — Generally, the restrictions on Restricted Shares do not expire for a minimum of one year and a maximum of three years, and sharesare subject to forfeiture during the restriction period. Most typically, Restricted Share grants have staggered vesting periods over one to three years from grantdate. The intrinsic value of the Restricted Shares, which is typically the product of share price at the date of grant and the number of Restricted Sharesgranted, is amortized on a straight-line basis to compensation expense over the periods in which the restrictions lapse.
Awards of Restricted Shares are valued at the closing market price of our common stock on the date of grant. The unearned compensation is amortizedto compensation expense over the vesting period of the Restricted Shares, except for awards related to the 55/10 Provision which are expensed when granted.As of December 31, 2019 and 2018, we had $23.4 million and $24.3 million, respectively, of unearned compensation cost related to unvested RestrictedShares, which is expected to be recognized over a weighted-average period of approximately one year. The total fair value of Restricted Shares vested duringthe years ended December 31, 2019, 2018 and 2017 was $16.8 million, $14.3 million and $30.5 million, respectively.
We recorded stock-based compensation for Restricted Shares as follows:
Year Ended December 31,
2019 2018 2017 (Amounts in millions)
Stock-based compensation expense $ 23.9 $ 19.9 $ 22.8Related income tax benefit (5.4) (4.5) (5.2)
Net stock-based compensation expense $ 18.5 $ 15.4 $ 17.6
76
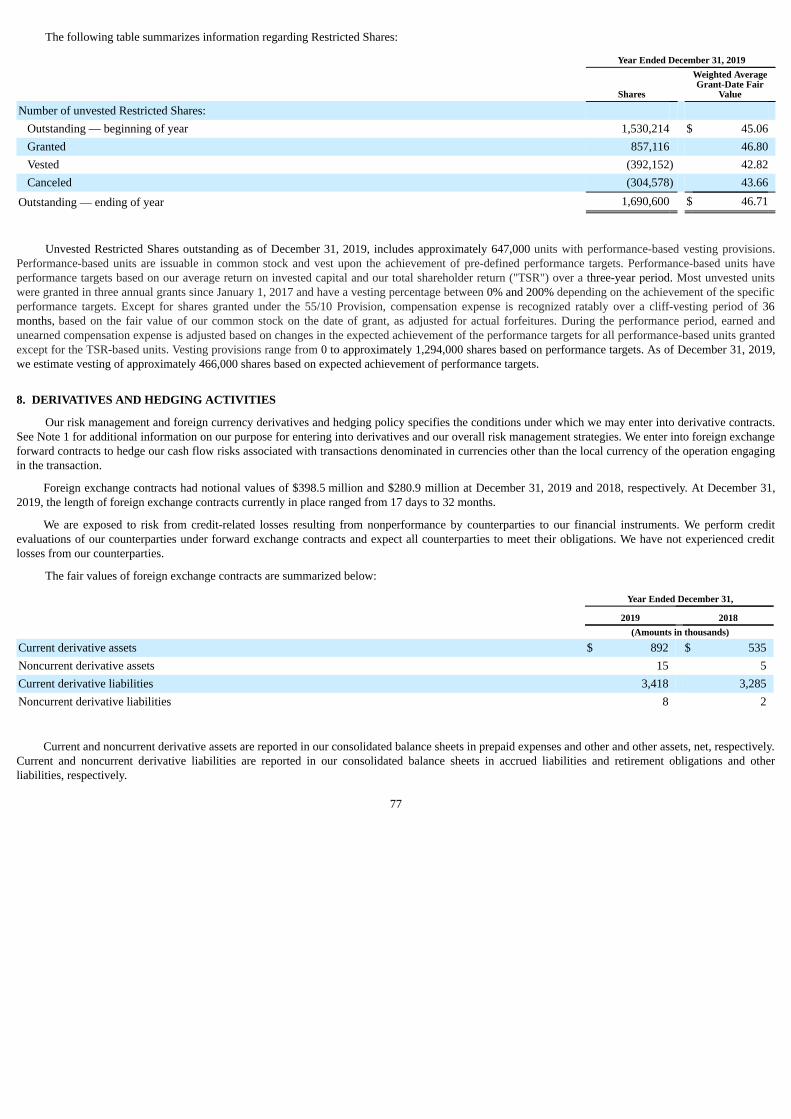
The following table summarizes information regarding Restricted Shares:
Year Ended December 31, 2019
Shares Weighted AverageGrant-Date Fair
Value
Number of unvested Restricted Shares: Outstanding — beginning of year 1,530,214 $ 45.06Granted 857,116 46.80Vested (392,152) 42.82Canceled (304,578) 43.66
Outstanding — ending of year 1,690,600 $ 46.71
Unvested Restricted Shares outstanding as of December 31, 2019, includes approximately 647,000 units with performance-based vesting provisions.Performance-based units are issuable in common stock and vest upon the achievement of pre-defined performance targets. Performance-based units haveperformance targets based on our average return on invested capital and our total shareholder return ("TSR") over a three-year period. Most unvested unitswere granted in three annual grants since January 1, 2017 and have a vesting percentage between 0% and 200% depending on the achievement of the specificperformance targets. Except for shares granted under the 55/10 Provision, compensation expense is recognized ratably over a cliff-vesting period of 36months, based on the fair value of our common stock on the date of grant, as adjusted for actual forfeitures. During the performance period, earned andunearned compensation expense is adjusted based on changes in the expected achievement of the performance targets for all performance-based units grantedexcept for the TSR-based units. Vesting provisions range from 0 to approximately 1,294,000 shares based on performance targets. As of December 31, 2019,we estimate vesting of approximately 466,000 shares based on expected achievement of performance targets.
8. DERIVATIVES AND HEDGING ACTIVITIES
Our risk management and foreign currency derivatives and hedging policy specifies the conditions under which we may enter into derivative contracts.See Note 1 for additional information on our purpose for entering into derivatives and our overall risk management strategies. We enter into foreign exchangeforward contracts to hedge our cash flow risks associated with transactions denominated in currencies other than the local currency of the operation engagingin the transaction.
Foreign exchange contracts had notional values of $398.5 million and $280.9 million at December 31, 2019 and 2018, respectively. At December 31,2019, the length of foreign exchange contracts currently in place ranged from 17 days to 32 months.
We are exposed to risk from credit-related losses resulting from nonperformance by counterparties to our financial instruments. We perform creditevaluations of our counterparties under forward exchange contracts and expect all counterparties to meet their obligations. We have not experienced creditlosses from our counterparties.
The fair values of foreign exchange contracts are summarized below:
Year Ended December 31,
2019 2018 (Amounts in thousands)
Current derivative assets $ 892 $ 535Noncurrent derivative assets 15 5Current derivative liabilities 3,418 3,285Noncurrent derivative liabilities 8 2
Current and noncurrent derivative assets are reported in our consolidated balance sheets in prepaid expenses and other and other assets, net, respectively.Current and noncurrent derivative liabilities are reported in our consolidated balance sheets in accrued liabilities and retirement obligations and otherliabilities, respectively.
77
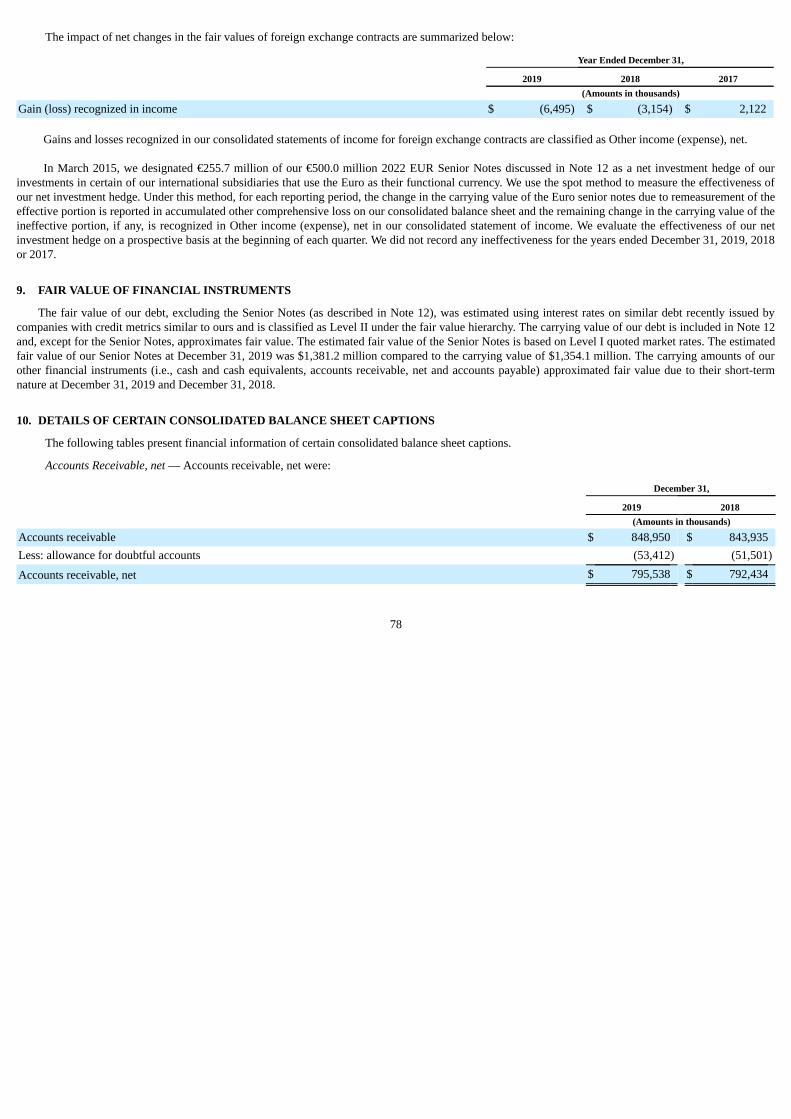
The impact of net changes in the fair values of foreign exchange contracts are summarized below:
Year Ended December 31,
2019 2018 2017 (Amounts in thousands)
Gain (loss) recognized in income $ (6,495) $ (3,154) $ 2,122
Gains and losses recognized in our consolidated statements of income for foreign exchange contracts are classified as Other income (expense), net.
In March 2015, we designated €255.7 million of our €500.0 million 2022 EUR Senior Notes discussed in Note 12 as a net investment hedge of ourinvestments in certain of our international subsidiaries that use the Euro as their functional currency. We use the spot method to measure the effectiveness ofour net investment hedge. Under this method, for each reporting period, the change in the carrying value of the Euro senior notes due to remeasurement of theeffective portion is reported in accumulated other comprehensive loss on our consolidated balance sheet and the remaining change in the carrying value of theineffective portion, if any, is recognized in Other income (expense), net in our consolidated statement of income. We evaluate the effectiveness of our netinvestment hedge on a prospective basis at the beginning of each quarter. We did not record any ineffectiveness for the years ended December 31, 2019, 2018or 2017.
9. FAIR VALUE OF FINANCIAL INSTRUMENTS
The fair value of our debt, excluding the Senior Notes (as described in Note 12), was estimated using interest rates on similar debt recently issued bycompanies with credit metrics similar to ours and is classified as Level II under the fair value hierarchy. The carrying value of our debt is included in Note 12and, except for the Senior Notes, approximates fair value. The estimated fair value of the Senior Notes is based on Level I quoted market rates. The estimatedfair value of our Senior Notes at December 31, 2019 was $1,381.2 million compared to the carrying value of $1,354.1 million. The carrying amounts of ourother financial instruments (i.e., cash and cash equivalents, accounts receivable, net and accounts payable) approximated fair value due to their short-termnature at December 31, 2019 and December 31, 2018.
10. DETAILS OF CERTAIN CONSOLIDATED BALANCE SHEET CAPTIONS
The following tables present financial information of certain consolidated balance sheet captions.
Accounts Receivable, net — Accounts receivable, net were:
December 31,
2019 2018 (Amounts in thousands)
Accounts receivable $ 848,950 $ 843,935Less: allowance for doubtful accounts (53,412) (51,501)
Accounts receivable, net $ 795,538 $ 792,434
78
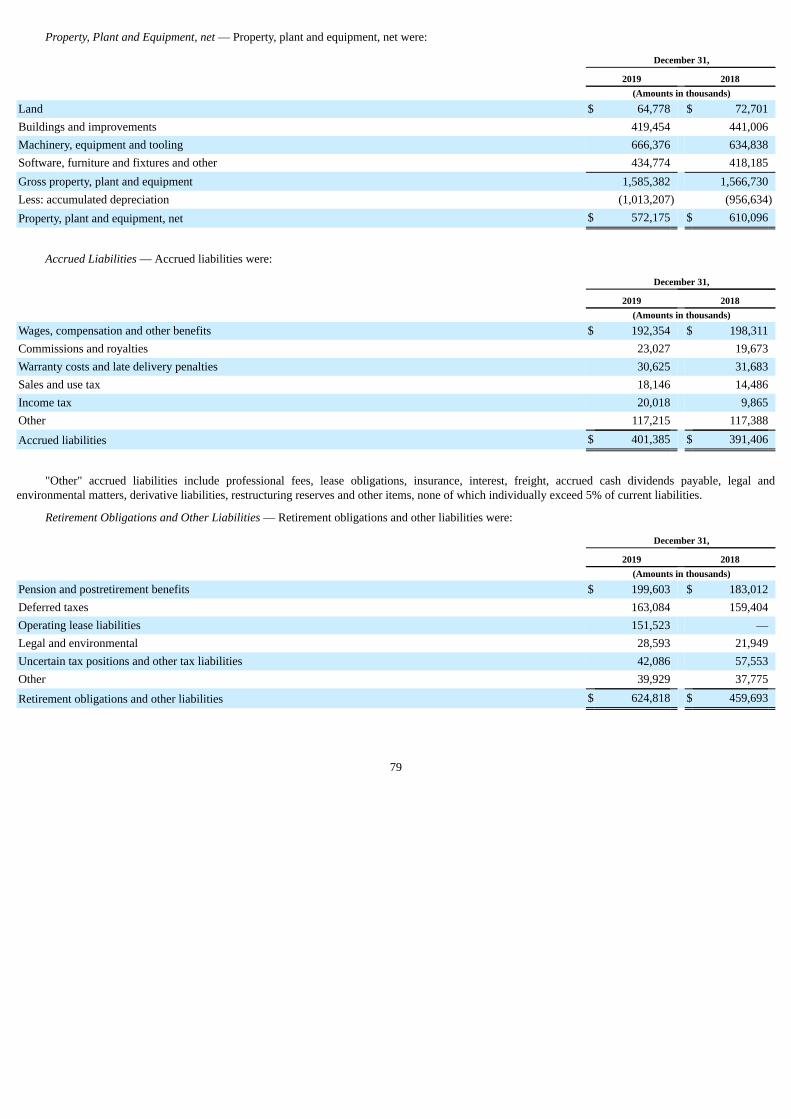
Property, Plant and Equipment, net — Property, plant and equipment, net were:
December 31,
2019 2018 (Amounts in thousands)
Land $ 64,778 $ 72,701Buildings and improvements 419,454 441,006Machinery, equipment and tooling 666,376 634,838Software, furniture and fixtures and other 434,774 418,185Gross property, plant and equipment 1,585,382 1,566,730Less: accumulated depreciation (1,013,207) (956,634)Property, plant and equipment, net $ 572,175 $ 610,096
Accrued Liabilities — Accrued liabilities were:
December 31,
2019 2018 (Amounts in thousands)
Wages, compensation and other benefits $ 192,354 $ 198,311Commissions and royalties 23,027 19,673Warranty costs and late delivery penalties 30,625 31,683Sales and use tax 18,146 14,486Income tax 20,018 9,865Other 117,215 117,388
Accrued liabilities $ 401,385 $ 391,406
"Other" accrued liabilities include professional fees, lease obligations, insurance, interest, freight, accrued cash dividends payable, legal andenvironmental matters, derivative liabilities, restructuring reserves and other items, none of which individually exceed 5% of current liabilities.
Retirement Obligations and Other Liabilities — Retirement obligations and other liabilities were:
December 31,
2019 2018 (Amounts in thousands)
Pension and postretirement benefits $ 199,603 $ 183,012Deferred taxes 163,084 159,404Operating lease liabilities 151,523 —Legal and environmental 28,593 21,949Uncertain tax positions and other tax liabilities 42,086 57,553Other 39,929 37,775
Retirement obligations and other liabilities $ 624,818 $ 459,693
79
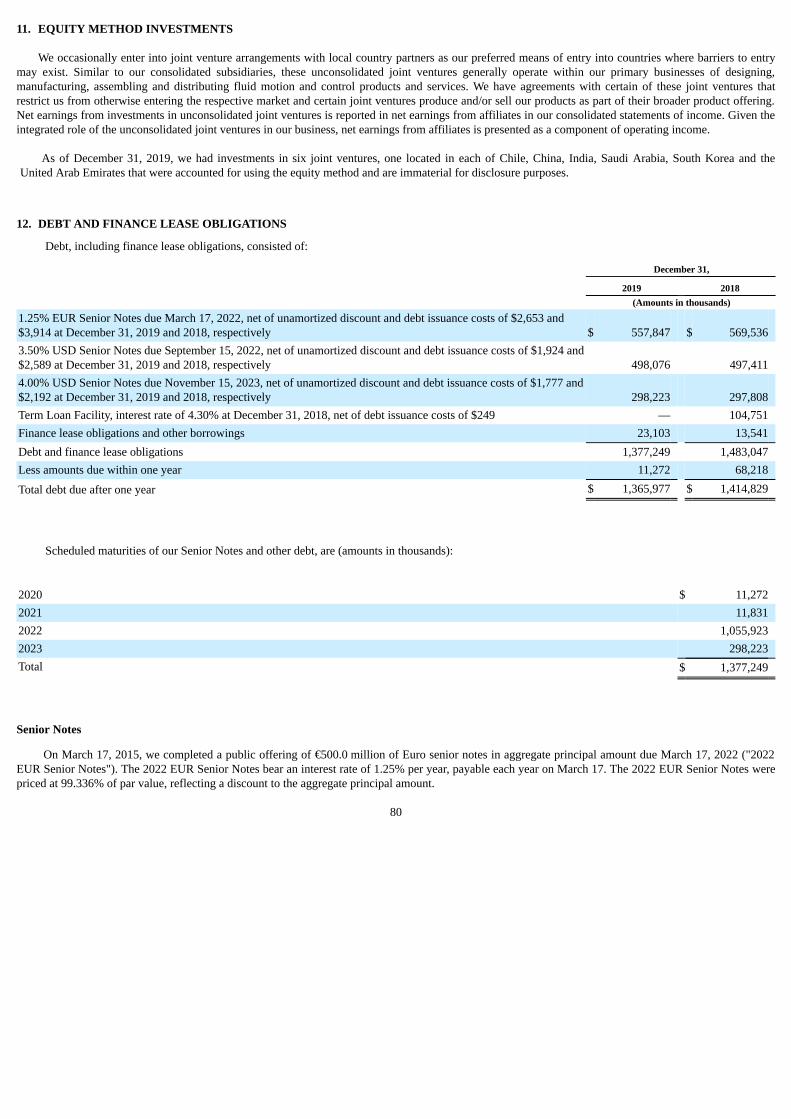
11. EQUITY METHOD INVESTMENTS
We occasionally enter into joint venture arrangements with local country partners as our preferred means of entry into countries where barriers to entrymay exist. Similar to our consolidated subsidiaries, these unconsolidated joint ventures generally operate within our primary businesses of designing,manufacturing, assembling and distributing fluid motion and control products and services. We have agreements with certain of these joint ventures thatrestrict us from otherwise entering the respective market and certain joint ventures produce and/or sell our products as part of their broader product offering.Net earnings from investments in unconsolidated joint ventures is reported in net earnings from affiliates in our consolidated statements of income. Given theintegrated role of the unconsolidated joint ventures in our business, net earnings from affiliates is presented as a component of operating income.
As of December 31, 2019, we had investments in six joint ventures, one located in each of Chile, China, India, Saudi Arabia, South Korea and theUnited Arab Emirates that were accounted for using the equity method and are immaterial for disclosure purposes.
12. DEBT AND FINANCE LEASE OBLIGATIONS
Debt, including finance lease obligations, consisted of:
December 31,
2019 2018 (Amounts in thousands)
1.25% EUR Senior Notes due March 17, 2022, net of unamortized discount and debt issuance costs of $2,653 and$3,914 at December 31, 2019 and 2018, respectively $ 557,847 $ 569,5363.50% USD Senior Notes due September 15, 2022, net of unamortized discount and debt issuance costs of $1,924 and$2,589 at December 31, 2019 and 2018, respectively 498,076 497,4114.00% USD Senior Notes due November 15, 2023, net of unamortized discount and debt issuance costs of $1,777 and$2,192 at December 31, 2019 and 2018, respectively 298,223 297,808Term Loan Facility, interest rate of 4.30% at December 31, 2018, net of debt issuance costs of $249 — 104,751Finance lease obligations and other borrowings 23,103 13,541Debt and finance lease obligations 1,377,249 1,483,047Less amounts due within one year 11,272 68,218
Total debt due after one year $ 1,365,977 $ 1,414,829
Scheduled maturities of our Senior Notes and other debt, are (amounts in thousands):
2020 $ 11,2722021 11,8312022 1,055,9232023 298,223Total $ 1,377,249
Senior Notes
On March 17, 2015, we completed a public offering of €500.0 million of Euro senior notes in aggregate principal amount due March 17, 2022 ("2022EUR Senior Notes"). The 2022 EUR Senior Notes bear an interest rate of 1.25% per year, payable each year on March 17. The 2022 EUR Senior Notes werepriced at 99.336% of par value, reflecting a discount to the aggregate principal amount.
80
On November 1, 2013 we completed the public offering of $300.0 million in aggregate principal amount of senior notes due November 15, 2023 ("2023Senior Notes"). The 2023 Senior Notes bear an interest rate of 4.00% per year, payable on May 15 and November 15 of each year. The 2023 Senior Noteswere priced at 99.532% of par value, reflecting a discount to the aggregate principal amount.
On September 11, 2012, we completed the public offering of $500.0 million in aggregate principal amount of senior notes due September 15, 2022("2022 Senior Notes"). The 2022 Senior Notes bear an interest rate of 3.50% per year, payable on March 15 and September 15 of each year. The 2022 SeniorNotes were priced at 99.615% of par value, reflecting a discount to the aggregate principal amount.
We have the right to redeem the 2022 Senior Notes and 2023 Senior Notes at any time prior to June 15, 2022 and August 15, 2023, respectively, inwhole or in part, at our option, at a redemption price equal to the greater of: (1) 100% of the principal amount of the senior notes being redeemed; or (2) thesum of the present values of the remaining scheduled payments of principal and interest in respect of the Senior Notes being redeemed discounted to theredemption date on a semi-annual basis, at the applicable Treasury Rate plus 30 basis points for the 2022 Senior Notes and plus 25 basis points for the 2023Senior Notes. In addition, at any time on or after June 15, 2022 for the 2022 Senior Notes and August 15, 2023 for the 2023 Senior Notes, we may redeem theSenior Notes at a redemption price equal to 100% of the principal amount of the Senior Notes being redeemed. In each case, we will also pay the accrued andunpaid interest on the principal amount being redeemed to the redemption date. Similarly, we have the right to redeem the 2022 EUR Senior Notes at anytime prior to December 17, 2021, in whole or in part, at our option, at a redemption price equal to the greater of: (1) 100% of the principal amount of thesenior notes being redeemed; or (2) the sum of the present values of the remaining scheduled payments of principal and interest in respect of the Senior Notesbeing redeemed (exclusive of interest accrued to, but excluding, the date of redemption) discounted to the redemption date on an annual basis, at theComparable German Government Bond Rate plus 25 basis points. At any time on or after December 17, 2021, we may redeem the 2022 EUR Senior Notes,in whole or in part from time to time, at our option, at a redemption price equal to 100% of the principal amount of the notes to be redeemed. In each case,we will also pay the accrued and unpaid interest on the principal amount being redeemed to the redemption date.
Senior Credit Facility
On July 16, 2019, we entered into a new credit agreement ("Credit Agreement”) with Bank of America, N.A., as administrative agent, and the otherlenders party thereto. The Credit Agreement provides for a $800.0 million unsecured senior credit facility with a maturity date of July 16, 2024 (“SeniorCredit Facility”). The Senior Credit Facility includes a $750.0 million sublimit for the issuance of letters of credit and a $30.0 million sublimit for swing lineloans. We have the right to increase the amount of the Senior Credit Facility by an aggregate amount not to exceed $400.0 million, subject to certainconditions, including each Lender's approval providing any increase. On July 16, 2019, approximately $75.0 million was borrowed under the Senior CreditFacility to repay all outstanding indebtedness under the previous senior credit facility. In connection with this repayment, our outstanding letters of creditunder the previous senior credit facility were transferred to the Senior Credit Facility, and we terminated the previous senior credit facility. On September 16,2019, the $75.0 million borrowed under the Senior Credit Facility was paid in full.
The interest rates per annum applicable to the Senior Credit Facility (other than with respect to swing line loans) are LIBOR plus between 1.000% to1.750%, depending on our debt rating by either Moody’s Investors Service, Inc. or Standard & Poor’s Financial Services LLC ("S&P") Ratings, or, at ouroption, the Base Rate (as defined in the Senior Credit Agreement) plus between 0.000% to 0.750% depending on our debt rating by either Moody’s InvestorsService, Inc. or S&P Global Ratings. As of December 31, 2019, the interest rate on the Senior Credit Facility was LIBOR plus 1.375% in the case of LIBORloans and the Base Rate plus 0.375% in the case of Base Rate loans. In addition, a commitment fee is payable quarterly in arrears on the daily unused portionsof the Senior Credit Facility. The commitment fee will be between 0.090% and 0.300% of unused amounts under the Senior Credit Facility depending on ourdebt rating by either Moody’s Investors Service, Inc. or S&P’s Ratings. The commitment fee was 0.20% (per annum) during the period ended December 31,2019.
As of December 31, 2019, and December 31, 2018, we had no revolving loans outstanding under the Senior Credit Facility. We had outstanding lettersof credit of $88.5 million and $92.9 million at December 31, 2019, and December 31, 2018, respectively. The amount available for borrowings under ourSenior Credit Facility was $711.5 million at December 31, 2019. As of December 31, 2018, due to a financial covenant in the previous senior credit facility,the amount available for borrowings under that facility was effectively limited to $513.7 million.
81
Repayment of Obligations — During the year ended December 31, 2019, we paid the $105.0 million outstanding principal balance on our previoussenior credit facility, including $30.0 million of scheduled principal repayments. During both 2018 and 2017, we paid $60.0 million of scheduled principalrepayments on the previous senior credit facility.
Financial Covenants — Our compliance with the financial covenants under the Senior Notes and Senior Credit Facility are tested quarterly. We were incompliance with all covenants as of December 31, 2019.
13. PENSION AND POSTRETIREMENT BENEFITS
We sponsor several noncontributory defined benefit pension plans, covering substantially all U.S. employees and certain non-U.S. employees, whichprovide benefits based on years of service, age, job grade levels and type of compensation. Retirement benefits for all other covered employees are providedthrough contributory pension plans, cash balance pension plans and government-sponsored retirement programs. All funded defined benefit pension plansreceive funding based on independent actuarial valuations to provide for current service and an amount sufficient to amortize unfunded prior service overperiods not to exceed 30 years, with funding falling within the legal limits prescribed by prevailing regulation. We also maintain unfunded defined benefitplans that, as permitted by local regulations, receive funding only when benefits become due.
Our defined benefit plan strategy is to ensure that current and future benefit obligations are adequately funded in a cost-effective manner. Additionally,our investing objective is to achieve the highest level of investment performance that is compatible with our risk tolerance and prudent investment practices.Because of the long-term nature of our defined benefit plan liabilities, our funding strategy is based on a long-term perspective for formulating andimplementing investment policies and evaluating their investment performance.
The asset allocation of our defined benefit plans reflects our decision about the proportion of the investment in equity and fixed income securities, and,where appropriate, the various sub-asset classes of each. At least annually, we complete a comprehensive review of our asset allocation policy and theunderlying assumptions, which includes our long-term capital markets rate of return assumptions and our risk tolerances relative to our defined benefit planliabilities.
The expected rates of return on defined benefit plan assets are derived from review of the asset allocation strategy, expected long-term performance ofasset classes, risks and other factors adjusted for our specific investment strategy. These rates are impacted by changes in general market conditions, butbecause they are long-term in nature, short-term market changes do not significantly impact the rates.
Our U.S. defined benefit plan assets consist of a balanced portfolio of equity and fixed income securities. Our non-U.S. defined benefit plan assetsinclude a significant concentration of United Kingdom ("U.K.") fixed income securities. We monitor investment allocations and manage plan assets tomaintain acceptable levels of risk.
For all periods presented, we used a measurement date of December 31 for each of our U.S. pension plans, non-U.S. pension plans and postretirementmedical plans.
U.S. Defined Benefit Plans
We maintain qualified and non-qualified defined benefit pension plans in the U.S. The qualified plan provides coverage for substantially all full-timeU.S. employees who receive benefits, up to an earnings threshold specified by the U.S. Department of Labor. The non-qualified plans primarily cover a smallnumber of employees including current and former members of senior management, providing them with benefit levels equivalent to other participants, butthat are otherwise limited by U.S. Department of Labor rules. The U.S. plans are designed to operate as "cash balance" arrangements, under which theemployee has the option to take a lump sum payment at the end of their service. The difference between total accumulated benefit obligation and totalprojected benefit obligation ("Benefit Obligation") is immaterial.
82
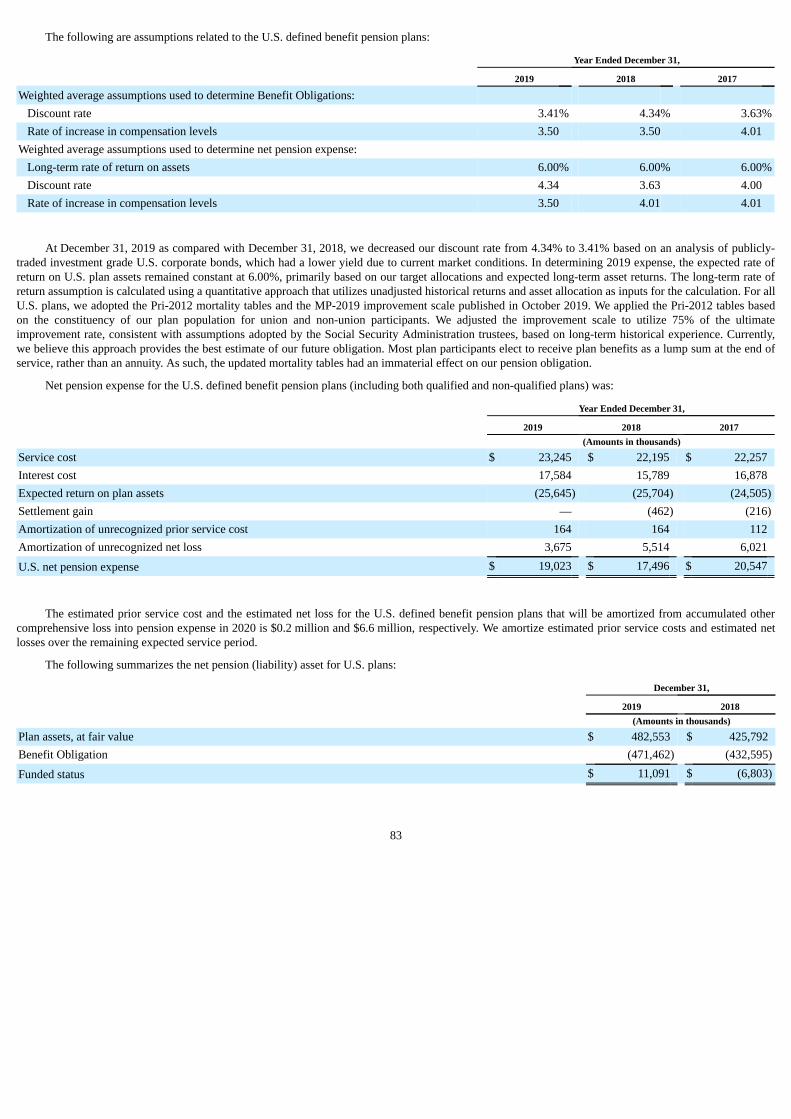
The following are assumptions related to the U.S. defined benefit pension plans:
Year Ended December 31,
2019 2018 2017
Weighted average assumptions used to determine Benefit Obligations: Discount rate 3.41% 4.34% 3.63%Rate of increase in compensation levels 3.50 3.50 4.01
Weighted average assumptions used to determine net pension expense: Long-term rate of return on assets 6.00% 6.00% 6.00%Discount rate 4.34 3.63 4.00Rate of increase in compensation levels 3.50 4.01 4.01
At December 31, 2019 as compared with December 31, 2018, we decreased our discount rate from 4.34% to 3.41% based on an analysis of publicly-traded investment grade U.S. corporate bonds, which had a lower yield due to current market conditions. In determining 2019 expense, the expected rate ofreturn on U.S. plan assets remained constant at 6.00%, primarily based on our target allocations and expected long-term asset returns. The long-term rate ofreturn assumption is calculated using a quantitative approach that utilizes unadjusted historical returns and asset allocation as inputs for the calculation. For allU.S. plans, we adopted the Pri-2012 mortality tables and the MP-2019 improvement scale published in October 2019. We applied the Pri-2012 tables basedon the constituency of our plan population for union and non-union participants. We adjusted the improvement scale to utilize 75% of the ultimateimprovement rate, consistent with assumptions adopted by the Social Security Administration trustees, based on long-term historical experience. Currently,we believe this approach provides the best estimate of our future obligation. Most plan participants elect to receive plan benefits as a lump sum at the end ofservice, rather than an annuity. As such, the updated mortality tables had an immaterial effect on our pension obligation.
Net pension expense for the U.S. defined benefit pension plans (including both qualified and non-qualified plans) was:
Year Ended December 31,
2019 2018 2017 (Amounts in thousands)
Service cost $ 23,245 $ 22,195 $ 22,257Interest cost 17,584 15,789 16,878Expected return on plan assets (25,645) (25,704) (24,505)Settlement gain — (462) (216)Amortization of unrecognized prior service cost 164 164 112Amortization of unrecognized net loss 3,675 5,514 6,021
U.S. net pension expense $ 19,023 $ 17,496 $ 20,547
The estimated prior service cost and the estimated net loss for the U.S. defined benefit pension plans that will be amortized from accumulated othercomprehensive loss into pension expense in 2020 is $0.2 million and $6.6 million, respectively. We amortize estimated prior service costs and estimated netlosses over the remaining expected service period.
The following summarizes the net pension (liability) asset for U.S. plans:
December 31,
2019 2018 (Amounts in thousands)
Plan assets, at fair value $ 482,553 $ 425,792Benefit Obligation (471,462) (432,595)
Funded status $ 11,091 $ (6,803)
83
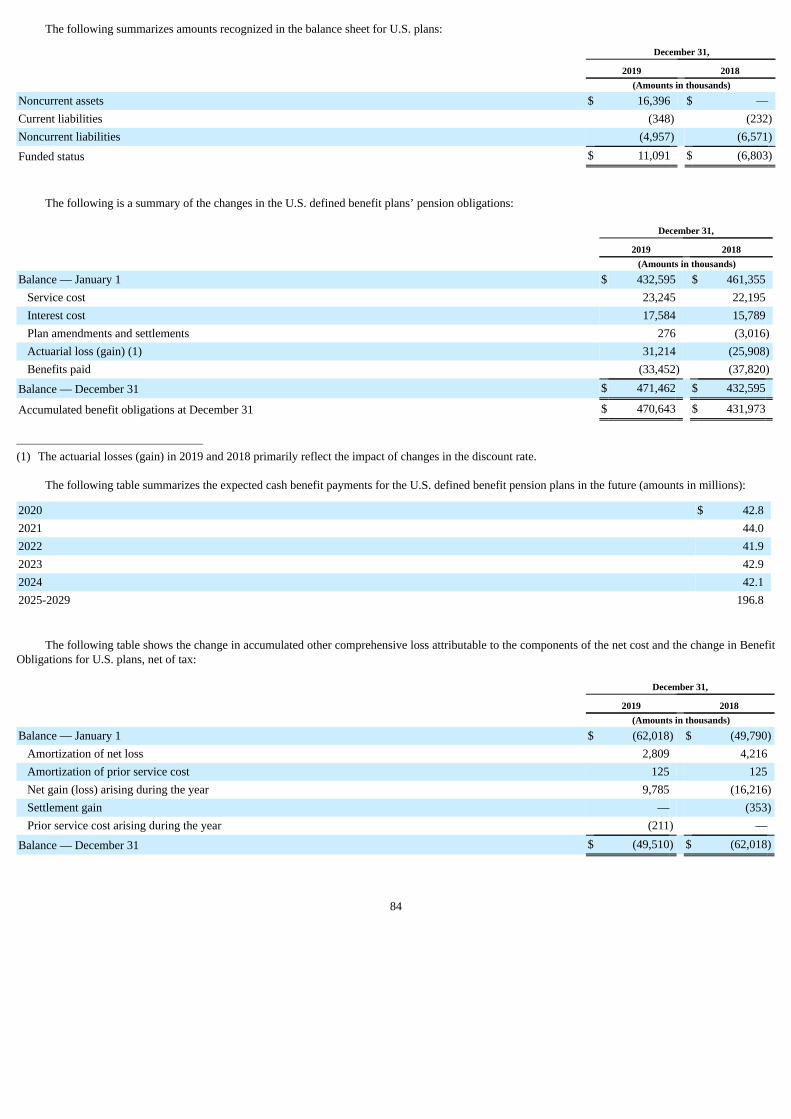
The following summarizes amounts recognized in the balance sheet for U.S. plans:
December 31,
2019 2018 (Amounts in thousands)
Noncurrent assets $ 16,396 $ —Current liabilities (348) (232)Noncurrent liabilities (4,957) (6,571)
Funded status $ 11,091 $ (6,803)
The following is a summary of the changes in the U.S. defined benefit plans’ pension obligations:
December 31,
2019 2018 (Amounts in thousands)
Balance — January 1 $ 432,595 $ 461,355Service cost 23,245 22,195Interest cost 17,584 15,789Plan amendments and settlements 276 (3,016)Actuarial loss (gain) (1) 31,214 (25,908)Benefits paid (33,452) (37,820)
Balance — December 31 $ 471,462 $ 432,595
Accumulated benefit obligations at December 31 $ 470,643 $ 431,973
_______________________________________
(1) The actuarial losses (gain) in 2019 and 2018 primarily reflect the impact of changes in the discount rate.
The following table summarizes the expected cash benefit payments for the U.S. defined benefit pension plans in the future (amounts in millions):
2020 $ 42.82021 44.02022 41.92023 42.92024 42.12025-2029 196.8
The following table shows the change in accumulated other comprehensive loss attributable to the components of the net cost and the change in BenefitObligations for U.S. plans, net of tax:
December 31,
2019 2018 (Amounts in thousands)
Balance — January 1 $ (62,018) $ (49,790)Amortization of net loss 2,809 4,216Amortization of prior service cost 125 125Net gain (loss) arising during the year 9,785 (16,216)Settlement gain — (353)Prior service cost arising during the year (211) —
Balance — December 31 $ (49,510) $ (62,018)
84
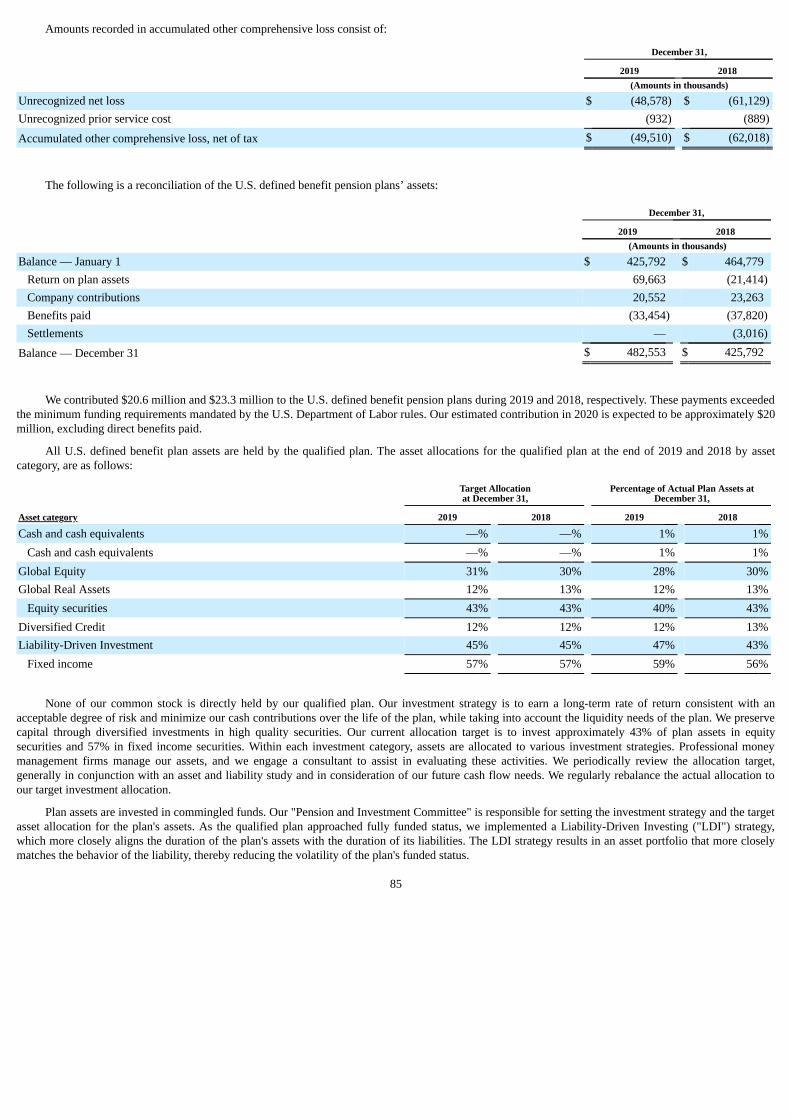
Amounts recorded in accumulated other comprehensive loss consist of:
December 31,
2019 2018 (Amounts in thousands)
Unrecognized net loss $ (48,578) $ (61,129)Unrecognized prior service cost (932) (889)
Accumulated other comprehensive loss, net of tax $ (49,510) $ (62,018)
The following is a reconciliation of the U.S. defined benefit pension plans’ assets:
December 31,
2019 2018 (Amounts in thousands)
Balance — January 1 $ 425,792 $ 464,779Return on plan assets 69,663 (21,414)Company contributions 20,552 23,263Benefits paid (33,454) (37,820)Settlements — (3,016)
Balance — December 31 $ 482,553 $ 425,792
We contributed $20.6 million and $23.3 million to the U.S. defined benefit pension plans during 2019 and 2018, respectively. These payments exceededthe minimum funding requirements mandated by the U.S. Department of Labor rules. Our estimated contribution in 2020 is expected to be approximately $20million, excluding direct benefits paid.
All U.S. defined benefit plan assets are held by the qualified plan. The asset allocations for the qualified plan at the end of 2019 and 2018 by assetcategory, are as follows:
Target Allocationat December 31,
Percentage of Actual Plan Assets atDecember 31,
Asset category 2019 2018 2019 2018
Cash and cash equivalents —% —% 1% 1%Cash and cash equivalents —% —% 1% 1%
Global Equity 31% 30% 28% 30%Global Real Assets 12% 13% 12% 13%
Equity securities 43% 43% 40% 43%Diversified Credit 12% 12% 12% 13%Liability-Driven Investment 45% 45% 47% 43%
Fixed income 57% 57% 59% 56%
None of our common stock is directly held by our qualified plan. Our investment strategy is to earn a long-term rate of return consistent with anacceptable degree of risk and minimize our cash contributions over the life of the plan, while taking into account the liquidity needs of the plan. We preservecapital through diversified investments in high quality securities. Our current allocation target is to invest approximately 43% of plan assets in equitysecurities and 57% in fixed income securities. Within each investment category, assets are allocated to various investment strategies. Professional moneymanagement firms manage our assets, and we engage a consultant to assist in evaluating these activities. We periodically review the allocation target,generally in conjunction with an asset and liability study and in consideration of our future cash flow needs. We regularly rebalance the actual allocation toour target investment allocation.
Plan assets are invested in commingled funds. Our "Pension and Investment Committee" is responsible for setting the investment strategy and the targetasset allocation for the plan's assets. As the qualified plan approached fully funded status, we implemented a Liability-Driven Investing ("LDI") strategy,which more closely aligns the duration of the plan's assets with the duration of its liabilities. The LDI strategy results in an asset portfolio that more closelymatches the behavior of the liability, thereby reducing the volatility of the plan's funded status.
85
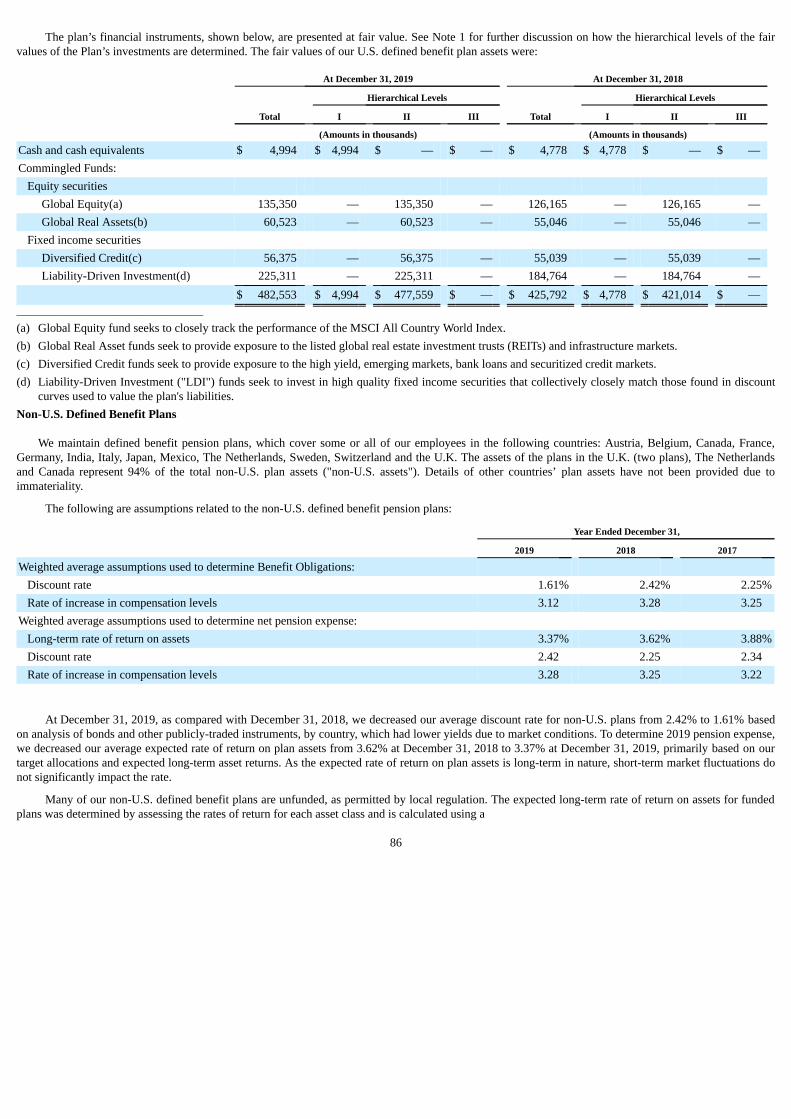
The plan’s financial instruments, shown below, are presented at fair value. See Note 1 for further discussion on how the hierarchical levels of the fairvalues of the Plan’s investments are determined. The fair values of our U.S. defined benefit plan assets were:
At December 31, 2019 At December 31, 2018
Hierarchical Levels Hierarchical Levels
Total I II III Total I II III
(Amounts in thousands) (Amounts in thousands)
Cash and cash equivalents $ 4,994 $ 4,994 $ — $ — $ 4,778 $ 4,778 $ — $ —Commingled Funds:
Equity securities Global Equity(a) 135,350 — 135,350 — 126,165 — 126,165 —Global Real Assets(b) 60,523 — 60,523 — 55,046 — 55,046 —
Fixed income securities Diversified Credit(c) 56,375 — 56,375 — 55,039 — 55,039 —Liability-Driven Investment(d) 225,311 — 225,311 — 184,764 — 184,764 —
$ 482,553 $ 4,994 $ 477,559 $ — $ 425,792 $ 4,778 $ 421,014 $ —_______________________________________
(a) Global Equity fund seeks to closely track the performance of the MSCI All Country World Index.(b) Global Real Asset funds seek to provide exposure to the listed global real estate investment trusts (REITs) and infrastructure markets.(c) Diversified Credit funds seek to provide exposure to the high yield, emerging markets, bank loans and securitized credit markets.(d) Liability-Driven Investment ("LDI") funds seek to invest in high quality fixed income securities that collectively closely match those found in discount
curves used to value the plan's liabilities.Non-U.S. Defined Benefit Plans
We maintain defined benefit pension plans, which cover some or all of our employees in the following countries: Austria, Belgium, Canada, France,Germany, India, Italy, Japan, Mexico, The Netherlands, Sweden, Switzerland and the U.K. The assets of the plans in the U.K. (two plans), The Netherlandsand Canada represent 94% of the total non-U.S. plan assets ("non-U.S. assets"). Details of other countries’ plan assets have not been provided due toimmateriality.
The following are assumptions related to the non-U.S. defined benefit pension plans:
Year Ended December 31,
2019 2018 2017
Weighted average assumptions used to determine Benefit Obligations: Discount rate 1.61% 2.42% 2.25%Rate of increase in compensation levels 3.12 3.28 3.25
Weighted average assumptions used to determine net pension expense: Long-term rate of return on assets 3.37% 3.62% 3.88%Discount rate 2.42 2.25 2.34Rate of increase in compensation levels 3.28 3.25 3.22
At December 31, 2019, as compared with December 31, 2018, we decreased our average discount rate for non-U.S. plans from 2.42% to 1.61% basedon analysis of bonds and other publicly-traded instruments, by country, which had lower yields due to market conditions. To determine 2019 pension expense,we decreased our average expected rate of return on plan assets from 3.62% at December 31, 2018 to 3.37% at December 31, 2019, primarily based on ourtarget allocations and expected long-term asset returns. As the expected rate of return on plan assets is long-term in nature, short-term market fluctuations donot significantly impact the rate.
Many of our non-U.S. defined benefit plans are unfunded, as permitted by local regulation. The expected long-term rate of return on assets for fundedplans was determined by assessing the rates of return for each asset class and is calculated using a
86
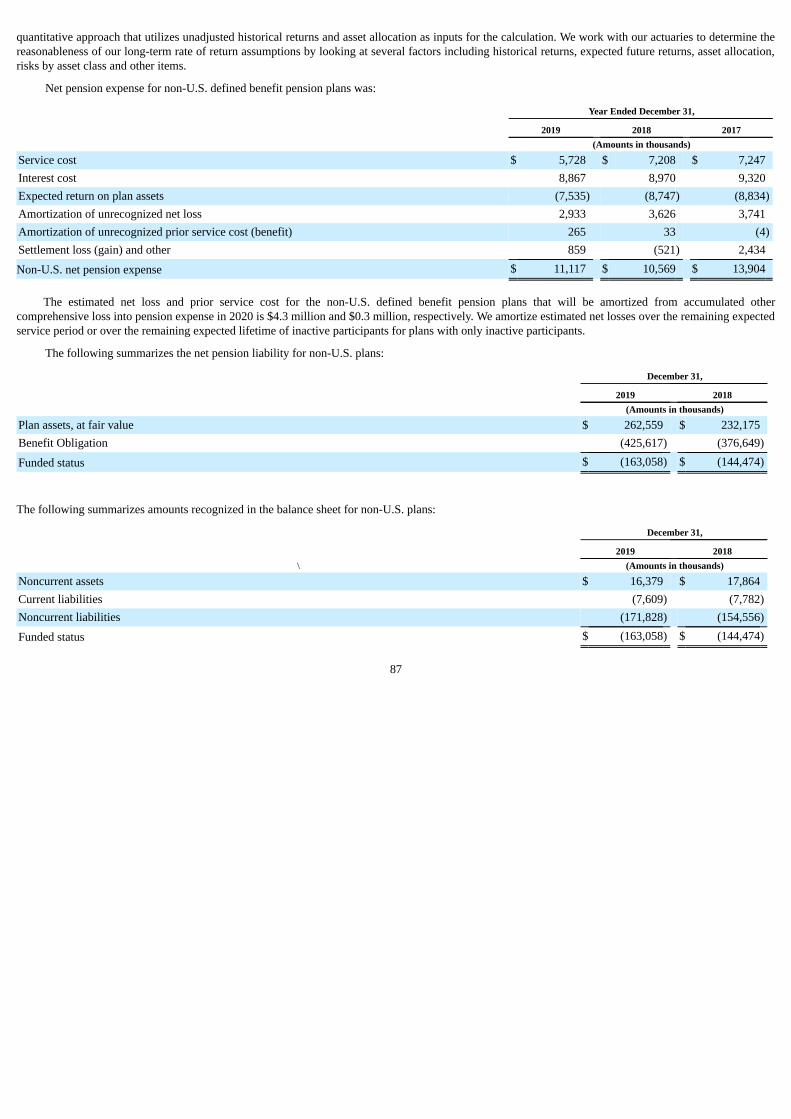
quantitative approach that utilizes unadjusted historical returns and asset allocation as inputs for the calculation. We work with our actuaries to determine thereasonableness of our long-term rate of return assumptions by looking at several factors including historical returns, expected future returns, asset allocation,risks by asset class and other items.
Net pension expense for non-U.S. defined benefit pension plans was:
Year Ended December 31,
2019 2018 2017 (Amounts in thousands)
Service cost $ 5,728 $ 7,208 $ 7,247Interest cost 8,867 8,970 9,320Expected return on plan assets (7,535) (8,747) (8,834)Amortization of unrecognized net loss 2,933 3,626 3,741Amortization of unrecognized prior service cost (benefit) 265 33 (4)Settlement loss (gain) and other 859 (521) 2,434
Non-U.S. net pension expense $ 11,117 $ 10,569 $ 13,904
The estimated net loss and prior service cost for the non-U.S. defined benefit pension plans that will be amortized from accumulated othercomprehensive loss into pension expense in 2020 is $4.3 million and $0.3 million, respectively. We amortize estimated net losses over the remaining expectedservice period or over the remaining expected lifetime of inactive participants for plans with only inactive participants.
The following summarizes the net pension liability for non-U.S. plans:
December 31,
2019 2018 (Amounts in thousands)
Plan assets, at fair value $ 262,559 $ 232,175Benefit Obligation (425,617) (376,649)
Funded status $ (163,058) $ (144,474)
The following summarizes amounts recognized in the balance sheet for non-U.S. plans:
December 31,
2019 2018\ (Amounts in thousands)
Noncurrent assets $ 16,379 $ 17,864Current liabilities (7,609) (7,782)Noncurrent liabilities (171,828) (154,556)
Funded status $ (163,058) $ (144,474)
87
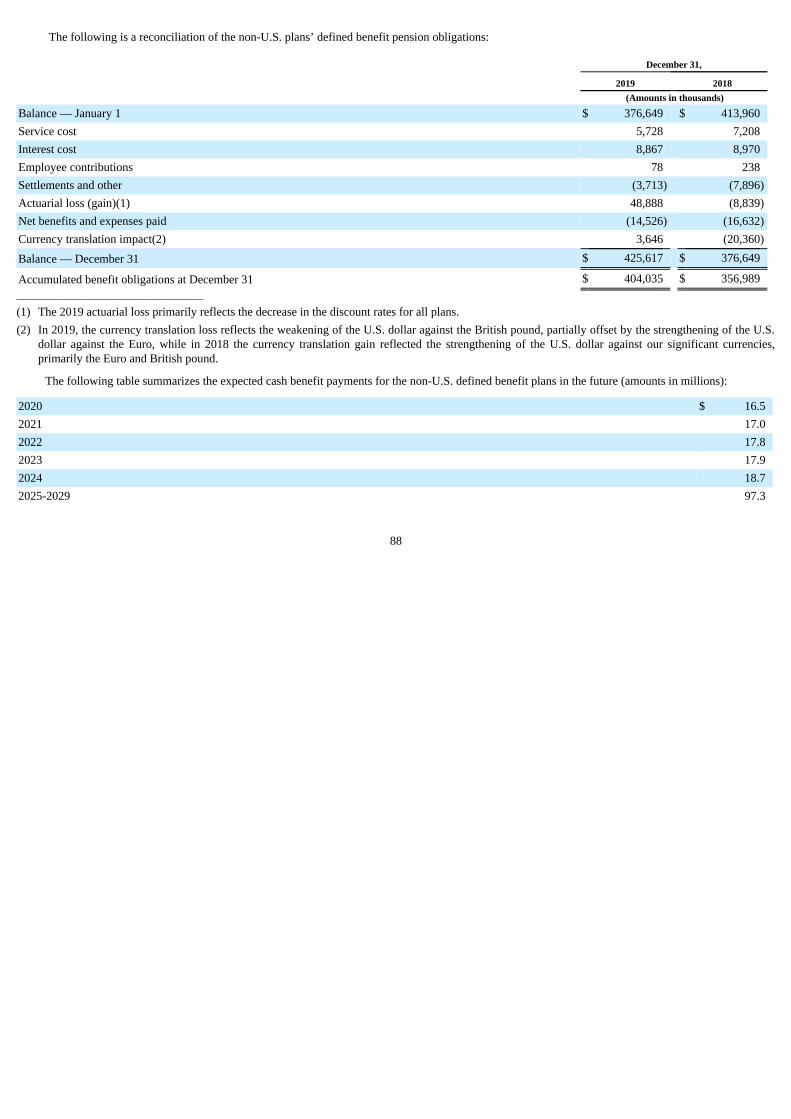
The following is a reconciliation of the non-U.S. plans’ defined benefit pension obligations:
December 31,
2019 2018 (Amounts in thousands)
Balance — January 1 $ 376,649 $ 413,960Service cost 5,728 7,208Interest cost 8,867 8,970Employee contributions 78 238Settlements and other (3,713) (7,896)Actuarial loss (gain)(1) 48,888 (8,839)Net benefits and expenses paid (14,526) (16,632)Currency translation impact(2) 3,646 (20,360)
Balance — December 31 $ 425,617 $ 376,649
Accumulated benefit obligations at December 31 $ 404,035 $ 356,989_______________________________________
(1) The 2019 actuarial loss primarily reflects the decrease in the discount rates for all plans.(2) In 2019, the currency translation loss reflects the weakening of the U.S. dollar against the British pound, partially offset by the strengthening of the U.S.
dollar against the Euro, while in 2018 the currency translation gain reflected the strengthening of the U.S. dollar against our significant currencies,primarily the Euro and British pound.
The following table summarizes the expected cash benefit payments for the non-U.S. defined benefit plans in the future (amounts in millions):
2020 $ 16.52021 17.02022 17.82023 17.92024 18.72025-2029 97.3
88
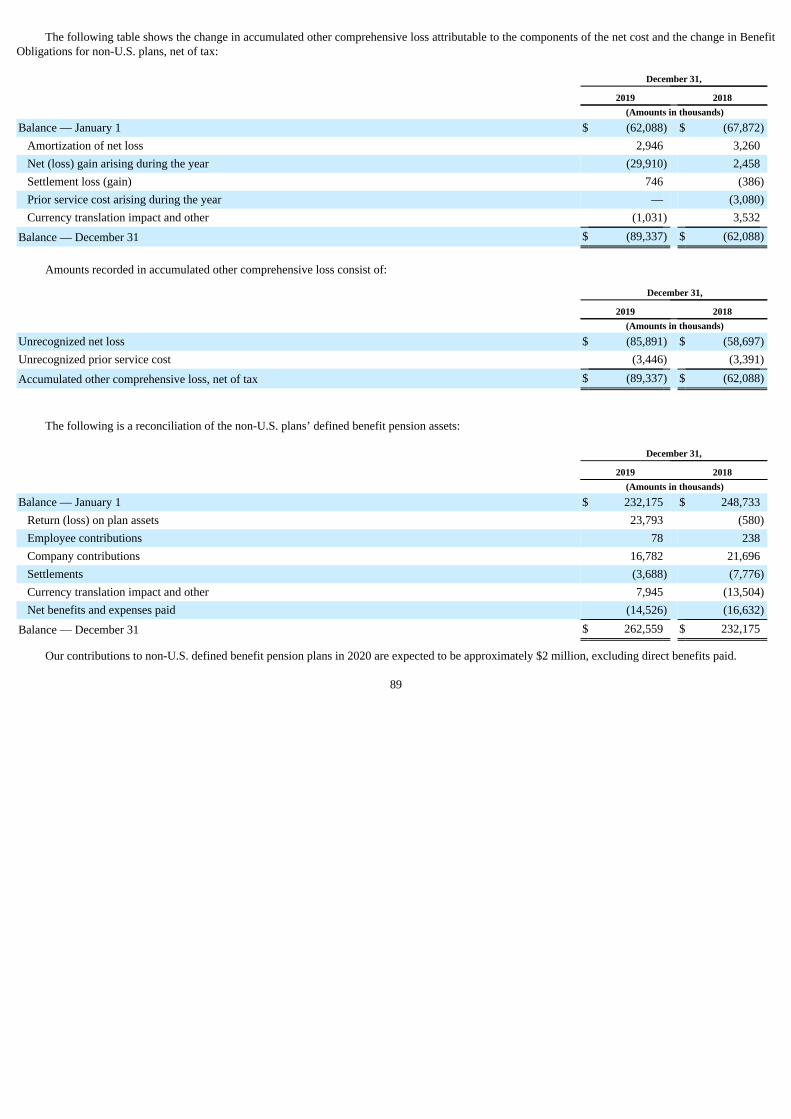
The following table shows the change in accumulated other comprehensive loss attributable to the components of the net cost and the change in BenefitObligations for non-U.S. plans, net of tax:
December 31,
2019 2018 (Amounts in thousands)
Balance — January 1 $ (62,088) $ (67,872)Amortization of net loss 2,946 3,260Net (loss) gain arising during the year (29,910) 2,458Settlement loss (gain) 746 (386)Prior service cost arising during the year — (3,080)Currency translation impact and other (1,031) 3,532
Balance — December 31 $ (89,337) $ (62,088)
Amounts recorded in accumulated other comprehensive loss consist of:
December 31,
2019 2018 (Amounts in thousands)
Unrecognized net loss $ (85,891) $ (58,697)Unrecognized prior service cost (3,446) (3,391)
Accumulated other comprehensive loss, net of tax $ (89,337) $ (62,088)
The following is a reconciliation of the non-U.S. plans’ defined benefit pension assets:
December 31,
2019 2018 (Amounts in thousands)
Balance — January 1 $ 232,175 $ 248,733Return (loss) on plan assets 23,793 (580)Employee contributions 78 238Company contributions 16,782 21,696Settlements (3,688) (7,776)Currency translation impact and other 7,945 (13,504)Net benefits and expenses paid (14,526) (16,632)
Balance — December 31 $ 262,559 $ 232,175
Our contributions to non-U.S. defined benefit pension plans in 2020 are expected to be approximately $2 million, excluding direct benefits paid.
89
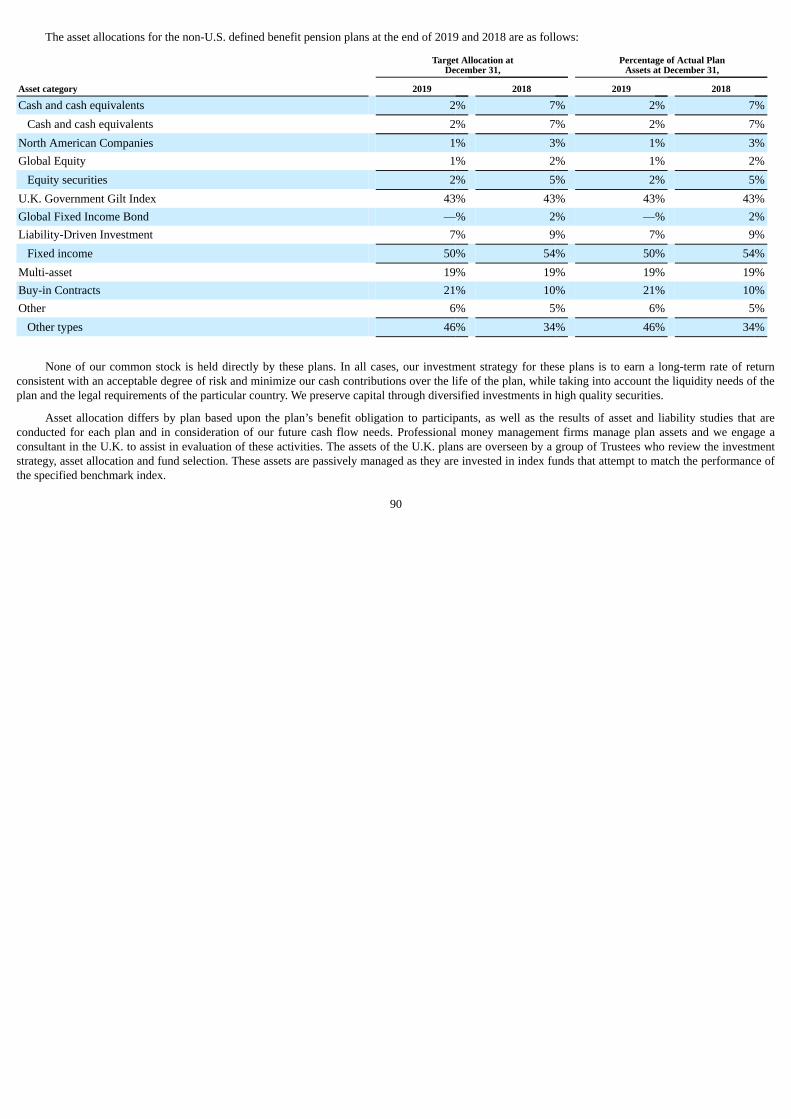
The asset allocations for the non-U.S. defined benefit pension plans at the end of 2019 and 2018 are as follows:
Target Allocation at
December 31, Percentage of Actual Plan
Assets at December 31,
Asset category 2019 2018 2019 2018
Cash and cash equivalents 2% 7% 2% 7%Cash and cash equivalents 2% 7% 2% 7%
North American Companies 1% 3% 1% 3%Global Equity 1% 2% 1% 2%
Equity securities 2% 5% 2% 5%U.K. Government Gilt Index 43% 43% 43% 43%Global Fixed Income Bond —% 2% —% 2%Liability-Driven Investment 7% 9% 7% 9%
Fixed income 50% 54% 50% 54%Multi-asset 19% 19% 19% 19%Buy-in Contracts 21% 10% 21% 10%Other 6% 5% 6% 5%
Other types 46% 34% 46% 34%
None of our common stock is held directly by these plans. In all cases, our investment strategy for these plans is to earn a long-term rate of returnconsistent with an acceptable degree of risk and minimize our cash contributions over the life of the plan, while taking into account the liquidity needs of theplan and the legal requirements of the particular country. We preserve capital through diversified investments in high quality securities.
Asset allocation differs by plan based upon the plan’s benefit obligation to participants, as well as the results of asset and liability studies that areconducted for each plan and in consideration of our future cash flow needs. Professional money management firms manage plan assets and we engage aconsultant in the U.K. to assist in evaluation of these activities. The assets of the U.K. plans are overseen by a group of Trustees who review the investmentstrategy, asset allocation and fund selection. These assets are passively managed as they are invested in index funds that attempt to match the performance ofthe specified benchmark index.
90
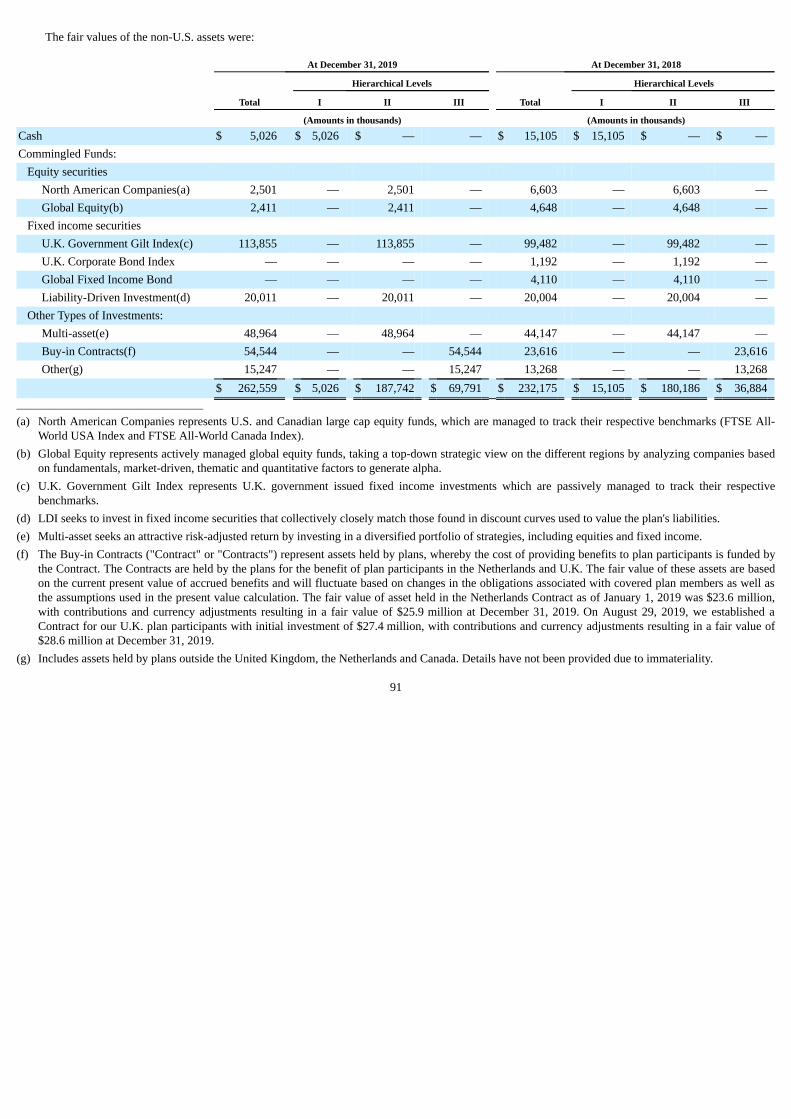
The fair values of the non-U.S. assets were:
At December 31, 2019 At December 31, 2018
Hierarchical Levels Hierarchical Levels
Total I II III Total I II III
(Amounts in thousands) (Amounts in thousands)
Cash $ 5,026 $ 5,026 $ — — $ 15,105 $ 15,105 $ — $ —Commingled Funds:
Equity securities North American Companies(a) 2,501 — 2,501 — 6,603 — 6,603 —Global Equity(b) 2,411 — 2,411 — 4,648 — 4,648 —
Fixed income securities U.K. Government Gilt Index(c) 113,855 — 113,855 — 99,482 — 99,482 —U.K. Corporate Bond Index — — — — 1,192 — 1,192 —Global Fixed Income Bond — — — — 4,110 — 4,110 —Liability-Driven Investment(d) 20,011 — 20,011 — 20,004 — 20,004 —
Other Types of Investments: Multi-asset(e) 48,964 — 48,964 — 44,147 — 44,147 —Buy-in Contracts(f) 54,544 — — 54,544 23,616 — — 23,616Other(g) 15,247 — — 15,247 13,268 — — 13,268
$ 262,559 $ 5,026 $ 187,742 $ 69,791 $ 232,175 $ 15,105 $ 180,186 $ 36,884_______________________________________
(a) North American Companies represents U.S. and Canadian large cap equity funds, which are managed to track their respective benchmarks (FTSE All-World USA Index and FTSE All-World Canada Index).
(b) Global Equity represents actively managed global equity funds, taking a top-down strategic view on the different regions by analyzing companies basedon fundamentals, market-driven, thematic and quantitative factors to generate alpha.
(c) U.K. Government Gilt Index represents U.K. government issued fixed income investments which are passively managed to track their respectivebenchmarks.
(d) LDI seeks to invest in fixed income securities that collectively closely match those found in discount curves used to value the plan's liabilities.(e) Multi-asset seeks an attractive risk-adjusted return by investing in a diversified portfolio of strategies, including equities and fixed income.(f) The Buy-in Contracts ("Contract" or "Contracts") represent assets held by plans, whereby the cost of providing benefits to plan participants is funded by
the Contract. The Contracts are held by the plans for the benefit of plan participants in the Netherlands and U.K. The fair value of these assets are basedon the current present value of accrued benefits and will fluctuate based on changes in the obligations associated with covered plan members as well asthe assumptions used in the present value calculation. The fair value of asset held in the Netherlands Contract as of January 1, 2019 was $23.6 million,with contributions and currency adjustments resulting in a fair value of $25.9 million at December 31, 2019. On August 29, 2019, we established aContract for our U.K. plan participants with initial investment of $27.4 million, with contributions and currency adjustments resulting in a fair value of$28.6 million at December 31, 2019.
(g) Includes assets held by plans outside the United Kingdom, the Netherlands and Canada. Details have not been provided due to immateriality.
91
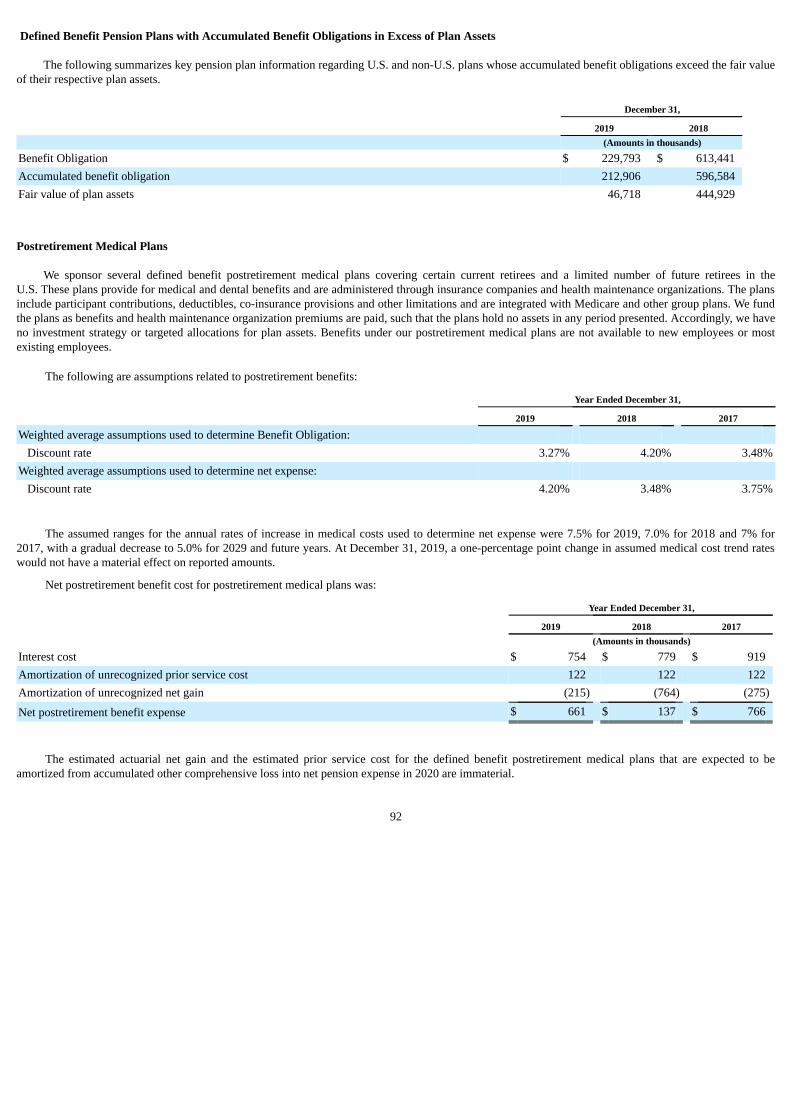
Defined Benefit Pension Plans with Accumulated Benefit Obligations in Excess of Plan Assets
The following summarizes key pension plan information regarding U.S. and non-U.S. plans whose accumulated benefit obligations exceed the fair valueof their respective plan assets.
December 31,
2019 2018 (Amounts in thousands)
Benefit Obligation $ 229,793 $ 613,441Accumulated benefit obligation 212,906 596,584Fair value of plan assets 46,718 444,929
Postretirement Medical Plans
We sponsor several defined benefit postretirement medical plans covering certain current retirees and a limited number of future retirees in theU.S. These plans provide for medical and dental benefits and are administered through insurance companies and health maintenance organizations. The plansinclude participant contributions, deductibles, co-insurance provisions and other limitations and are integrated with Medicare and other group plans. We fundthe plans as benefits and health maintenance organization premiums are paid, such that the plans hold no assets in any period presented. Accordingly, we haveno investment strategy or targeted allocations for plan assets. Benefits under our postretirement medical plans are not available to new employees or mostexisting employees.
The following are assumptions related to postretirement benefits:
Year Ended December 31,
2019 2018 2017
Weighted average assumptions used to determine Benefit Obligation: Discount rate 3.27% 4.20% 3.48%
Weighted average assumptions used to determine net expense: Discount rate 4.20% 3.48% 3.75%
The assumed ranges for the annual rates of increase in medical costs used to determine net expense were 7.5% for 2019, 7.0% for 2018 and 7% for2017, with a gradual decrease to 5.0% for 2029 and future years. At December 31, 2019, a one-percentage point change in assumed medical cost trend rateswould not have a material effect on reported amounts.
Net postretirement benefit cost for postretirement medical plans was:
Year Ended December 31,
2019 2018 2017 (Amounts in thousands)
Interest cost $ 754 $ 779 $ 919Amortization of unrecognized prior service cost 122 122 122Amortization of unrecognized net gain (215) (764) (275)
Net postretirement benefit expense $ 661 $ 137 $ 766
The estimated actuarial net gain and the estimated prior service cost for the defined benefit postretirement medical plans that are expected to beamortized from accumulated other comprehensive loss into net pension expense in 2020 are immaterial.
92
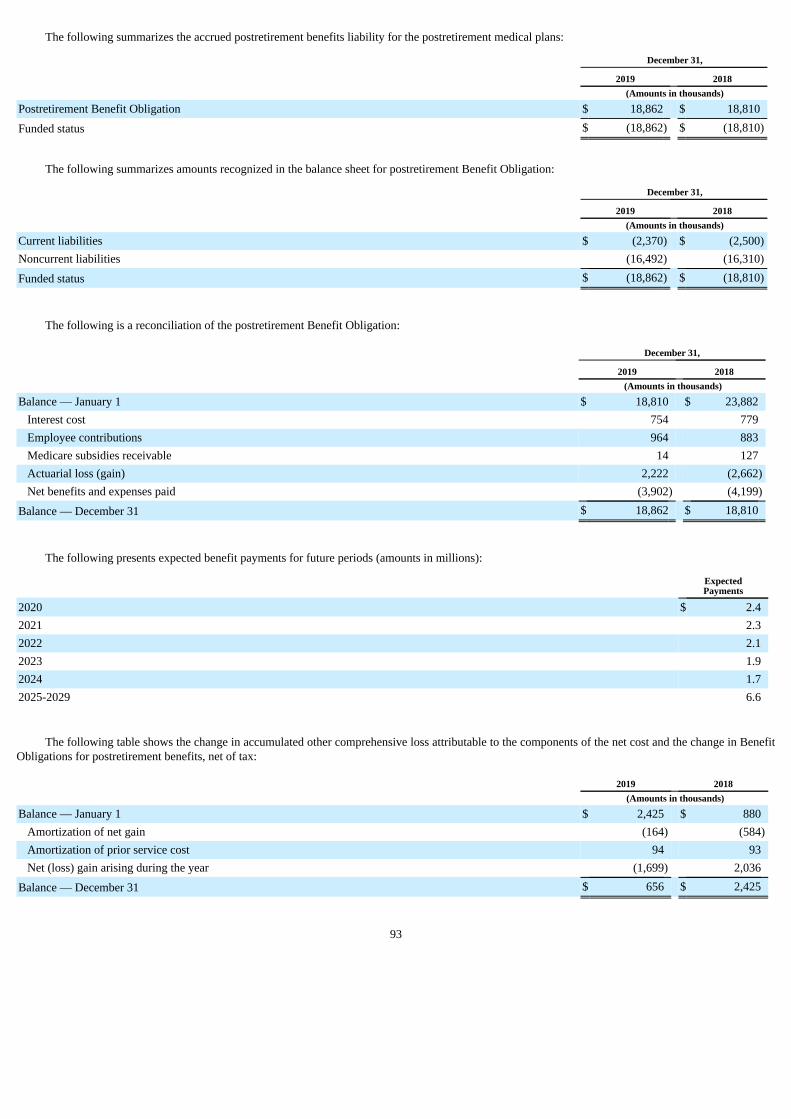
The following summarizes the accrued postretirement benefits liability for the postretirement medical plans:
December 31,
2019 2018 (Amounts in thousands)
Postretirement Benefit Obligation $ 18,862 $ 18,810
Funded status $ (18,862) $ (18,810)
The following summarizes amounts recognized in the balance sheet for postretirement Benefit Obligation:
December 31,
2019 2018 (Amounts in thousands)
Current liabilities $ (2,370) $ (2,500)Noncurrent liabilities (16,492) (16,310)
Funded status $ (18,862) $ (18,810)
The following is a reconciliation of the postretirement Benefit Obligation:
December 31,
2019 2018 (Amounts in thousands)
Balance — January 1 $ 18,810 $ 23,882Interest cost 754 779Employee contributions 964 883Medicare subsidies receivable 14 127Actuarial loss (gain) 2,222 (2,662)Net benefits and expenses paid (3,902) (4,199)
Balance — December 31 $ 18,862 $ 18,810
The following presents expected benefit payments for future periods (amounts in millions):
ExpectedPayments
2020 $ 2.42021 2.32022 2.12023 1.92024 1.72025-2029 6.6
The following table shows the change in accumulated other comprehensive loss attributable to the components of the net cost and the change in BenefitObligations for postretirement benefits, net of tax:
2019 2018 (Amounts in thousands)
Balance — January 1 $ 2,425 $ 880Amortization of net gain (164) (584)Amortization of prior service cost 94 93Net (loss) gain arising during the year (1,699) 2,036
Balance — December 31 $ 656 $ 2,425
93
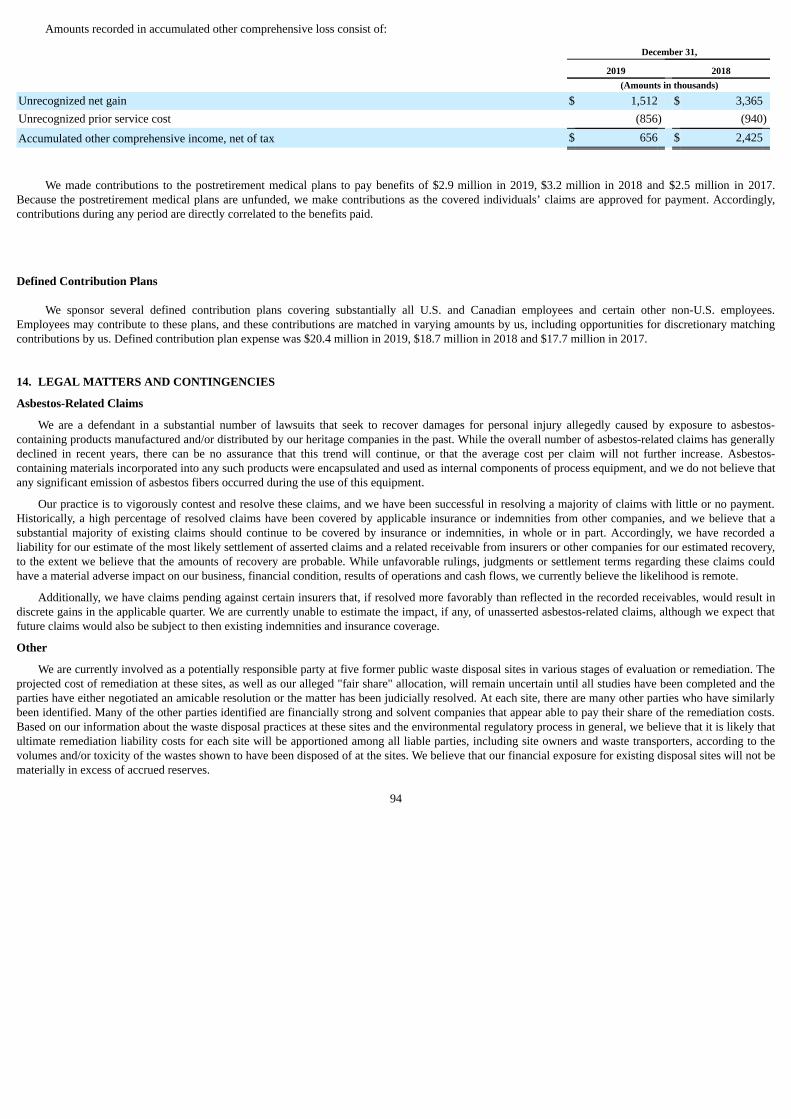
Amounts recorded in accumulated other comprehensive loss consist of:
December 31,
2019 2018 (Amounts in thousands)
Unrecognized net gain $ 1,512 $ 3,365Unrecognized prior service cost (856) (940)
Accumulated other comprehensive income, net of tax $ 656 $ 2,425
We made contributions to the postretirement medical plans to pay benefits of $2.9 million in 2019, $3.2 million in 2018 and $2.5 million in 2017.Because the postretirement medical plans are unfunded, we make contributions as the covered individuals’ claims are approved for payment. Accordingly,contributions during any period are directly correlated to the benefits paid.
Defined Contribution Plans
We sponsor several defined contribution plans covering substantially all U.S. and Canadian employees and certain other non-U.S. employees.Employees may contribute to these plans, and these contributions are matched in varying amounts by us, including opportunities for discretionary matchingcontributions by us. Defined contribution plan expense was $20.4 million in 2019, $18.7 million in 2018 and $17.7 million in 2017.
14. LEGAL MATTERS AND CONTINGENCIES
Asbestos-Related Claims
We are a defendant in a substantial number of lawsuits that seek to recover damages for personal injury allegedly caused by exposure to asbestos-containing products manufactured and/or distributed by our heritage companies in the past. While the overall number of asbestos-related claims has generallydeclined in recent years, there can be no assurance that this trend will continue, or that the average cost per claim will not further increase. Asbestos-containing materials incorporated into any such products were encapsulated and used as internal components of process equipment, and we do not believe thatany significant emission of asbestos fibers occurred during the use of this equipment.
Our practice is to vigorously contest and resolve these claims, and we have been successful in resolving a majority of claims with little or no payment.Historically, a high percentage of resolved claims have been covered by applicable insurance or indemnities from other companies, and we believe that asubstantial majority of existing claims should continue to be covered by insurance or indemnities, in whole or in part. Accordingly, we have recorded aliability for our estimate of the most likely settlement of asserted claims and a related receivable from insurers or other companies for our estimated recovery,to the extent we believe that the amounts of recovery are probable. While unfavorable rulings, judgments or settlement terms regarding these claims couldhave a material adverse impact on our business, financial condition, results of operations and cash flows, we currently believe the likelihood is remote.
Additionally, we have claims pending against certain insurers that, if resolved more favorably than reflected in the recorded receivables, would result indiscrete gains in the applicable quarter. We are currently unable to estimate the impact, if any, of unasserted asbestos-related claims, although we expect thatfuture claims would also be subject to then existing indemnities and insurance coverage.
Other
We are currently involved as a potentially responsible party at five former public waste disposal sites in various stages of evaluation or remediation. Theprojected cost of remediation at these sites, as well as our alleged "fair share" allocation, will remain uncertain until all studies have been completed and theparties have either negotiated an amicable resolution or the matter has been judicially resolved. At each site, there are many other parties who have similarlybeen identified. Many of the other parties identified are financially strong and solvent companies that appear able to pay their share of the remediation costs.Based on our information about the waste disposal practices at these sites and the environmental regulatory process in general, we believe that it is likely thatultimate remediation liability costs for each site will be apportioned among all liable parties, including site owners and waste transporters, according to thevolumes and/or toxicity of the wastes shown to have been disposed of at the sites. We believe that our financial exposure for existing disposal sites will not bematerially in excess of accrued reserves.
94
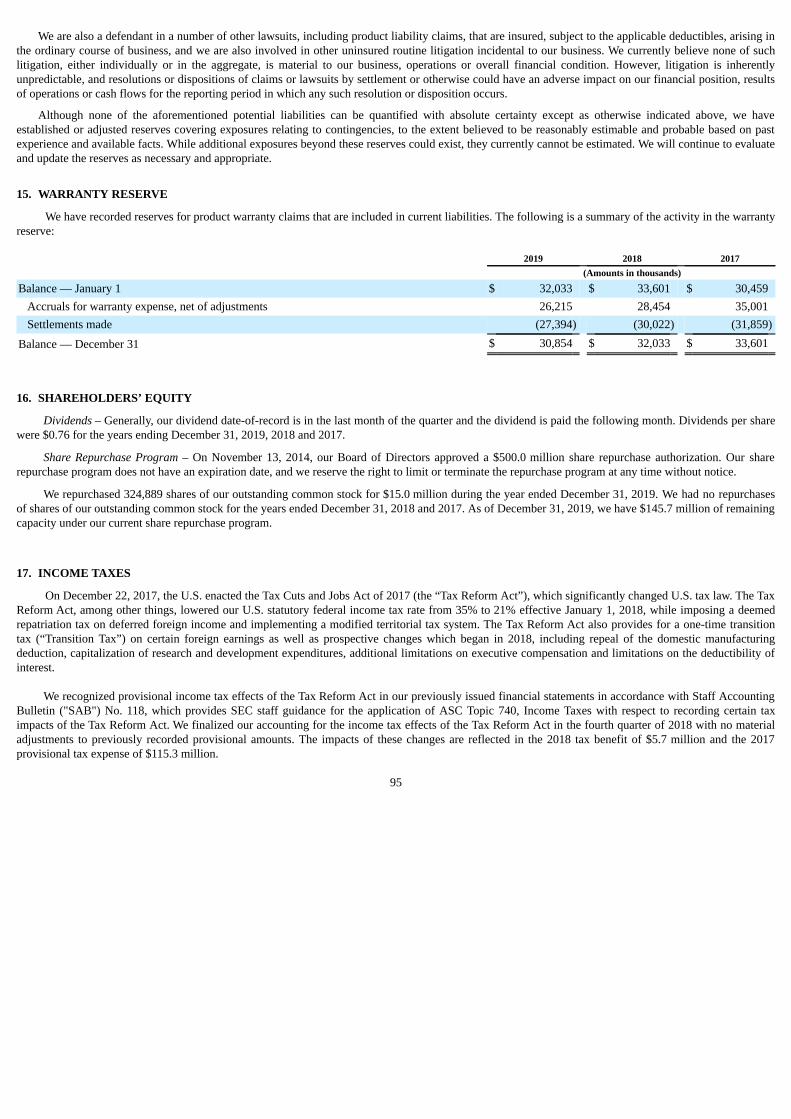
We are also a defendant in a number of other lawsuits, including product liability claims, that are insured, subject to the applicable deductibles, arising inthe ordinary course of business, and we are also involved in other uninsured routine litigation incidental to our business. We currently believe none of suchlitigation, either individually or in the aggregate, is material to our business, operations or overall financial condition. However, litigation is inherentlyunpredictable, and resolutions or dispositions of claims or lawsuits by settlement or otherwise could have an adverse impact on our financial position, resultsof operations or cash flows for the reporting period in which any such resolution or disposition occurs.
Although none of the aforementioned potential liabilities can be quantified with absolute certainty except as otherwise indicated above, we haveestablished or adjusted reserves covering exposures relating to contingencies, to the extent believed to be reasonably estimable and probable based on pastexperience and available facts. While additional exposures beyond these reserves could exist, they currently cannot be estimated. We will continue to evaluateand update the reserves as necessary and appropriate.
15. WARRANTY RESERVE
We have recorded reserves for product warranty claims that are included in current liabilities. The following is a summary of the activity in the warrantyreserve:
2019 2018 2017 (Amounts in thousands)
Balance — January 1 $ 32,033 $ 33,601 $ 30,459Accruals for warranty expense, net of adjustments 26,215 28,454 35,001Settlements made (27,394) (30,022) (31,859)
Balance — December 31 $ 30,854 $ 32,033 $ 33,601
16. SHAREHOLDERS’ EQUITY
Dividends – Generally, our dividend date-of-record is in the last month of the quarter and the dividend is paid the following month. Dividends per sharewere $0.76 for the years ending December 31, 2019, 2018 and 2017.
Share Repurchase Program – On November 13, 2014, our Board of Directors approved a $500.0 million share repurchase authorization. Our sharerepurchase program does not have an expiration date, and we reserve the right to limit or terminate the repurchase program at any time without notice.
We repurchased 324,889 shares of our outstanding common stock for $15.0 million during the year ended December 31, 2019. We had no repurchasesof shares of our outstanding common stock for the years ended December 31, 2018 and 2017. As of December 31, 2019, we have $145.7 million of remainingcapacity under our current share repurchase program.
17. INCOME TAXES
On December 22, 2017, the U.S. enacted the Tax Cuts and Jobs Act of 2017 (the “Tax Reform Act”), which significantly changed U.S. tax law. The TaxReform Act, among other things, lowered our U.S. statutory federal income tax rate from 35% to 21% effective January 1, 2018, while imposing a deemedrepatriation tax on deferred foreign income and implementing a modified territorial tax system. The Tax Reform Act also provides for a one-time transitiontax (“Transition Tax”) on certain foreign earnings as well as prospective changes which began in 2018, including repeal of the domestic manufacturingdeduction, capitalization of research and development expenditures, additional limitations on executive compensation and limitations on the deductibility ofinterest.
We recognized provisional income tax effects of the Tax Reform Act in our previously issued financial statements in accordance with Staff AccountingBulletin ("SAB") No. 118, which provides SEC staff guidance for the application of ASC Topic 740, Income Taxes with respect to recording certain taximpacts of the Tax Reform Act. We finalized our accounting for the income tax effects of the Tax Reform Act in the fourth quarter of 2018 with no materialadjustments to previously recorded provisional amounts. The impacts of these changes are reflected in the 2018 tax benefit of $5.7 million and the 2017provisional tax expense of $115.3 million.
95
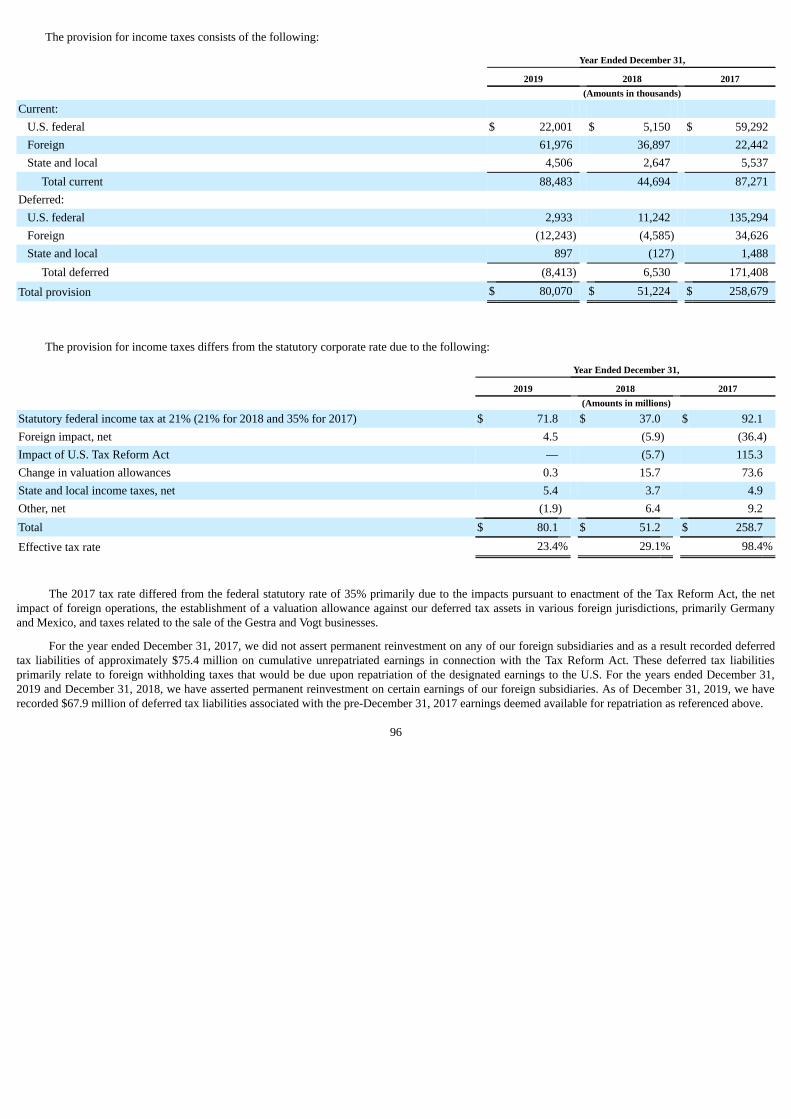
The provision for income taxes consists of the following:
Year Ended December 31,
2019 2018 2017 (Amounts in thousands)
Current: U.S. federal $ 22,001 $ 5,150 $ 59,292Foreign 61,976 36,897 22,442State and local 4,506 2,647 5,537
Total current 88,483 44,694 87,271Deferred:
U.S. federal 2,933 11,242 135,294Foreign (12,243) (4,585) 34,626State and local 897 (127) 1,488
Total deferred (8,413) 6,530 171,408
Total provision $ 80,070 $ 51,224 $ 258,679
The provision for income taxes differs from the statutory corporate rate due to the following:
Year Ended December 31,
2019 2018 2017 (Amounts in millions)
Statutory federal income tax at 21% (21% for 2018 and 35% for 2017) $ 71.8 $ 37.0 $ 92.1Foreign impact, net 4.5 (5.9) (36.4)Impact of U.S. Tax Reform Act — (5.7) 115.3Change in valuation allowances 0.3 15.7 73.6State and local income taxes, net 5.4 3.7 4.9Other, net (1.9) 6.4 9.2Total $ 80.1 $ 51.2 $ 258.7
Effective tax rate 23.4% 29.1% 98.4%
The 2017 tax rate differed from the federal statutory rate of 35% primarily due to the impacts pursuant to enactment of the Tax Reform Act, the netimpact of foreign operations, the establishment of a valuation allowance against our deferred tax assets in various foreign jurisdictions, primarily Germanyand Mexico, and taxes related to the sale of the Gestra and Vogt businesses.
For the year ended December 31, 2017, we did not assert permanent reinvestment on any of our foreign subsidiaries and as a result recorded deferredtax liabilities of approximately $75.4 million on cumulative unrepatriated earnings in connection with the Tax Reform Act. These deferred tax liabilitiesprimarily relate to foreign withholding taxes that would be due upon repatriation of the designated earnings to the U.S. For the years ended December 31,2019 and December 31, 2018, we have asserted permanent reinvestment on certain earnings of our foreign subsidiaries. As of December 31, 2019, we haverecorded $67.9 million of deferred tax liabilities associated with the pre-December 31, 2017 earnings deemed available for repatriation as referenced above.
96
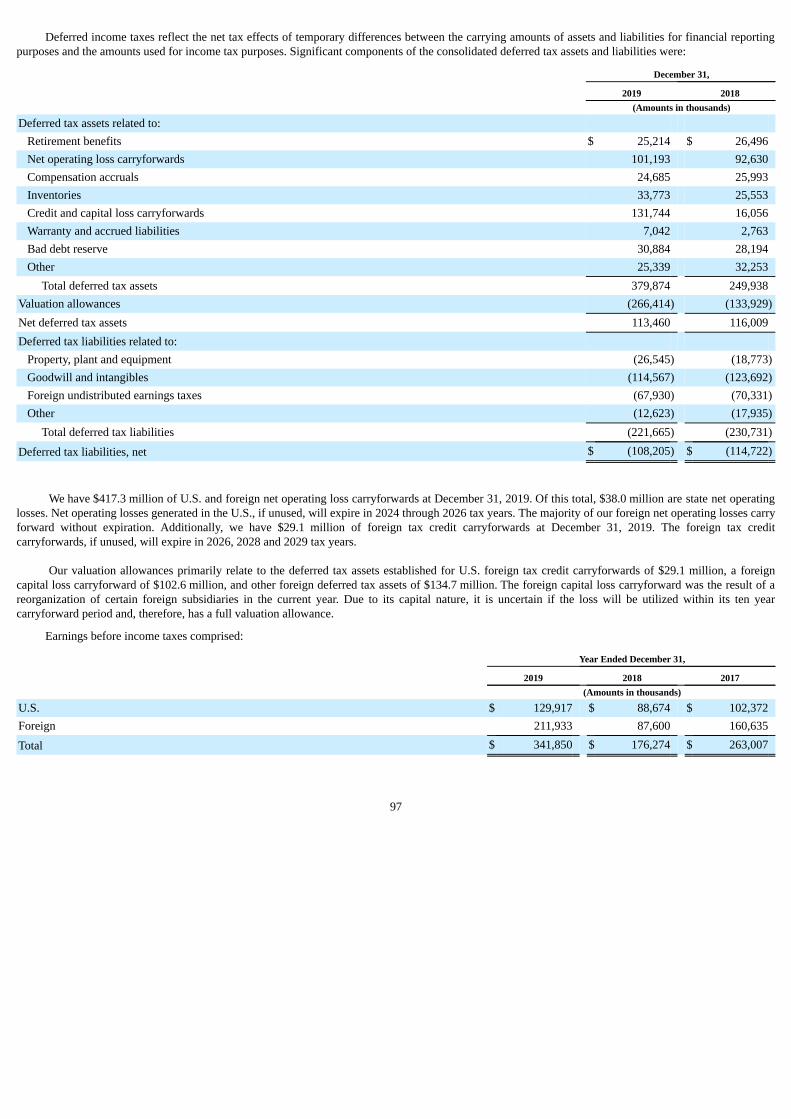
Deferred income taxes reflect the net tax effects of temporary differences between the carrying amounts of assets and liabilities for financial reportingpurposes and the amounts used for income tax purposes. Significant components of the consolidated deferred tax assets and liabilities were:
December 31,
2019 2018 (Amounts in thousands)
Deferred tax assets related to: Retirement benefits $ 25,214 $ 26,496Net operating loss carryforwards 101,193 92,630Compensation accruals 24,685 25,993Inventories 33,773 25,553Credit and capital loss carryforwards 131,744 16,056Warranty and accrued liabilities 7,042 2,763Bad debt reserve 30,884 28,194Other 25,339 32,253
Total deferred tax assets 379,874 249,938Valuation allowances (266,414) (133,929)Net deferred tax assets 113,460 116,009Deferred tax liabilities related to:
Property, plant and equipment (26,545) (18,773)Goodwill and intangibles (114,567) (123,692)Foreign undistributed earnings taxes (67,930) (70,331)Other (12,623) (17,935)
Total deferred tax liabilities (221,665) (230,731)
Deferred tax liabilities, net $ (108,205) $ (114,722)
We have $417.3 million of U.S. and foreign net operating loss carryforwards at December 31, 2019. Of this total, $38.0 million are state net operatinglosses. Net operating losses generated in the U.S., if unused, will expire in 2024 through 2026 tax years. The majority of our foreign net operating losses carryforward without expiration. Additionally, we have $29.1 million of foreign tax credit carryforwards at December 31, 2019. The foreign tax creditcarryforwards, if unused, will expire in 2026, 2028 and 2029 tax years.
Our valuation allowances primarily relate to the deferred tax assets established for U.S. foreign tax credit carryforwards of $29.1 million, a foreigncapital loss carryforward of $102.6 million, and other foreign deferred tax assets of $134.7 million. The foreign capital loss carryforward was the result of areorganization of certain foreign subsidiaries in the current year. Due to its capital nature, it is uncertain if the loss will be utilized within its ten yearcarryforward period and, therefore, has a full valuation allowance.
Earnings before income taxes comprised:
Year Ended December 31,
2019 2018 2017 (Amounts in thousands)
U.S. $ 129,917 $ 88,674 $ 102,372Foreign 211,933 87,600 160,635
Total $ 341,850 $ 176,274 $ 263,007
97
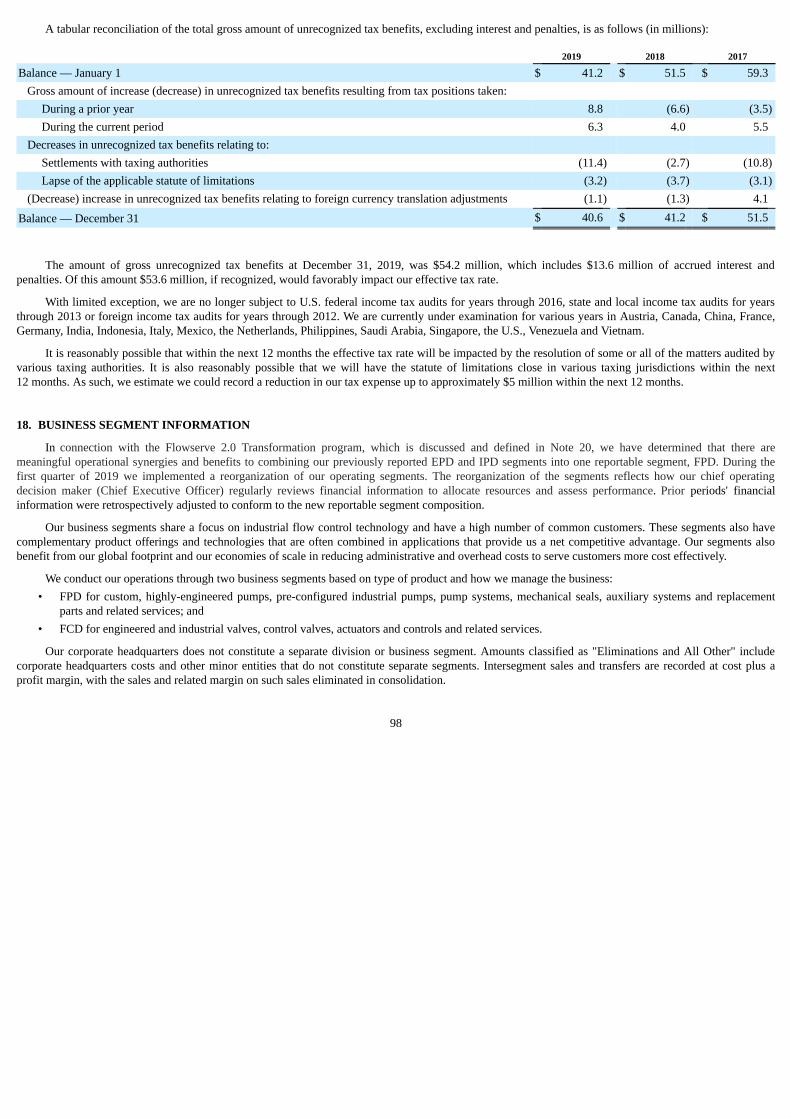
A tabular reconciliation of the total gross amount of unrecognized tax benefits, excluding interest and penalties, is as follows (in millions):
2019 2018 2017
Balance — January 1 $ 41.2 $ 51.5 $ 59.3Gross amount of increase (decrease) in unrecognized tax benefits resulting from tax positions taken:
During a prior year 8.8 (6.6) (3.5)During the current period 6.3 4.0 5.5
Decreases in unrecognized tax benefits relating to: Settlements with taxing authorities (11.4) (2.7) (10.8)Lapse of the applicable statute of limitations (3.2) (3.7) (3.1)
(Decrease) increase in unrecognized tax benefits relating to foreign currency translation adjustments (1.1) (1.3) 4.1
Balance — December 31 $ 40.6 $ 41.2 $ 51.5
The amount of gross unrecognized tax benefits at December 31, 2019, was $54.2 million, which includes $13.6 million of accrued interest andpenalties. Of this amount $53.6 million, if recognized, would favorably impact our effective tax rate.
With limited exception, we are no longer subject to U.S. federal income tax audits for years through 2016, state and local income tax audits for yearsthrough 2013 or foreign income tax audits for years through 2012. We are currently under examination for various years in Austria, Canada, China, France,Germany, India, Indonesia, Italy, Mexico, the Netherlands, Philippines, Saudi Arabia, Singapore, the U.S., Venezuela and Vietnam.
It is reasonably possible that within the next 12 months the effective tax rate will be impacted by the resolution of some or all of the matters audited byvarious taxing authorities. It is also reasonably possible that we will have the statute of limitations close in various taxing jurisdictions within the next12 months. As such, we estimate we could record a reduction in our tax expense up to approximately $5 million within the next 12 months.
18. BUSINESS SEGMENT INFORMATION
In connection with the Flowserve 2.0 Transformation program, which is discussed and defined in Note 20, we have determined that there aremeaningful operational synergies and benefits to combining our previously reported EPD and IPD segments into one reportable segment, FPD. During thefirst quarter of 2019 we implemented a reorganization of our operating segments. The reorganization of the segments reflects how our chief operatingdecision maker (Chief Executive Officer) regularly reviews financial information to allocate resources and assess performance. Prior periods' financialinformation were retrospectively adjusted to conform to the new reportable segment composition.
Our business segments share a focus on industrial flow control technology and have a high number of common customers. These segments also havecomplementary product offerings and technologies that are often combined in applications that provide us a net competitive advantage. Our segments alsobenefit from our global footprint and our economies of scale in reducing administrative and overhead costs to serve customers more cost effectively.
We conduct our operations through two business segments based on type of product and how we manage the business:• FPD for custom, highly-engineered pumps, pre-configured industrial pumps, pump systems, mechanical seals, auxiliary systems and replacement
parts and related services; and• FCD for engineered and industrial valves, control valves, actuators and controls and related services.
Our corporate headquarters does not constitute a separate division or business segment. Amounts classified as "Eliminations and All Other" includecorporate headquarters costs and other minor entities that do not constitute separate segments. Intersegment sales and transfers are recorded at cost plus aprofit margin, with the sales and related margin on such sales eliminated in consolidation.
98
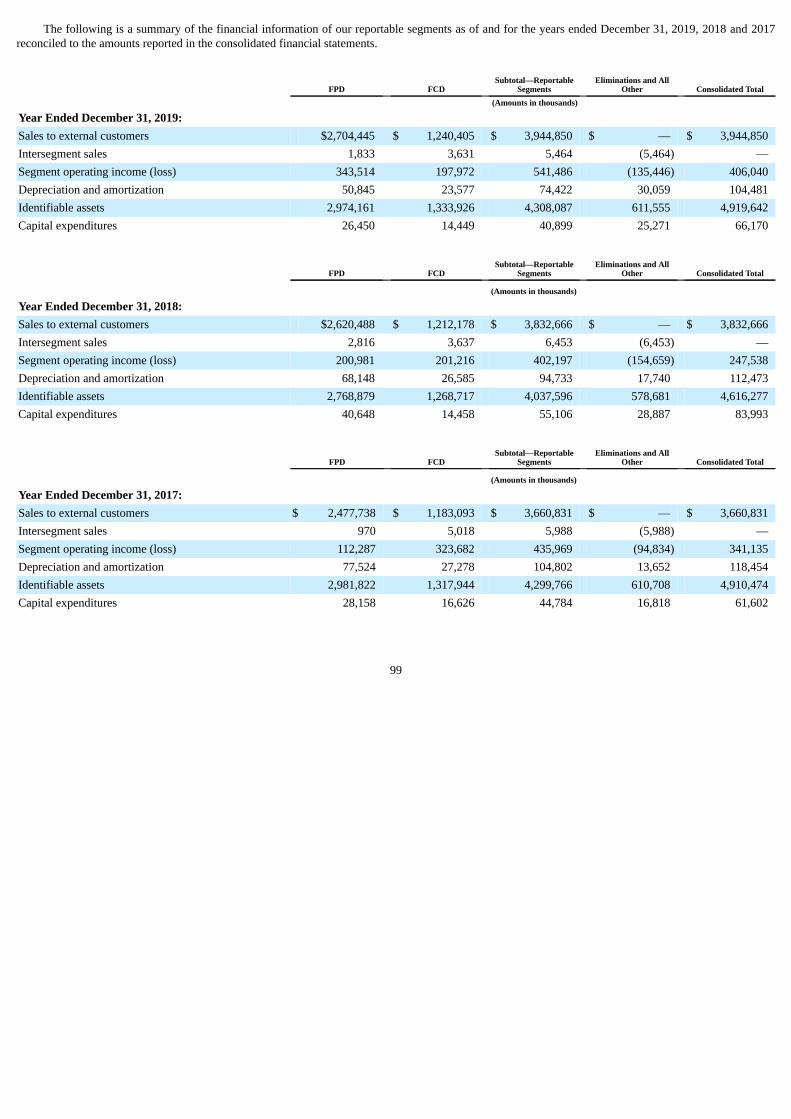
The following is a summary of the financial information of our reportable segments as of and for the years ended December 31, 2019, 2018 and 2017reconciled to the amounts reported in the consolidated financial statements.
Subtotal—Reportable
Segments
Eliminations and All
Other
Consolidated Total FPD FCD (Amounts in thousands)
Year Ended December 31, 2019: Sales to external customers $2,704,445 $ 1,240,405 $ 3,944,850 $ — $ 3,944,850Intersegment sales 1,833 3,631 5,464 (5,464) —Segment operating income (loss) 343,514 197,972 541,486 (135,446) 406,040Depreciation and amortization 50,845 23,577 74,422 30,059 104,481Identifiable assets 2,974,161 1,333,926 4,308,087 611,555 4,919,642Capital expenditures 26,450 14,449 40,899 25,271 66,170
Subtotal—Reportable
Segments
Eliminations and All
Other
Consolidated Total FPD FCD (Amounts in thousands)
Year Ended December 31, 2018: Sales to external customers $2,620,488 $ 1,212,178 $ 3,832,666 $ — $ 3,832,666Intersegment sales 2,816 3,637 6,453 (6,453) —Segment operating income (loss) 200,981 201,216 402,197 (154,659) 247,538Depreciation and amortization 68,148 26,585 94,733 17,740 112,473Identifiable assets 2,768,879 1,268,717 4,037,596 578,681 4,616,277Capital expenditures 40,648 14,458 55,106 28,887 83,993
Subtotal—Reportable
Segments
Eliminations and All
Other
Consolidated Total FPD FCD (Amounts in thousands)
Year Ended December 31, 2017: Sales to external customers $ 2,477,738 $ 1,183,093 $ 3,660,831 $ — $ 3,660,831Intersegment sales 970 5,018 5,988 (5,988) —Segment operating income (loss) 112,287 323,682 435,969 (94,834) 341,135Depreciation and amortization 77,524 27,278 104,802 13,652 118,454Identifiable assets 2,981,822 1,317,944 4,299,766 610,708 4,910,474Capital expenditures 28,158 16,626 44,784 16,818 61,602
99
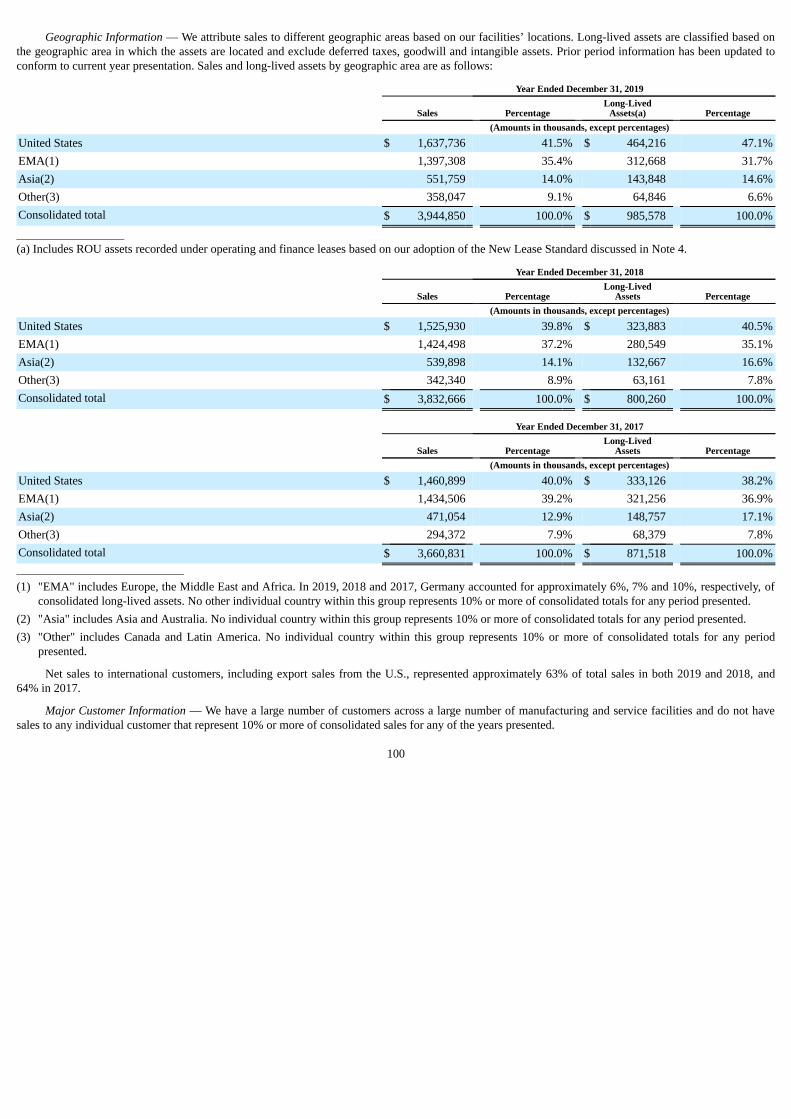
Geographic Information — We attribute sales to different geographic areas based on our facilities’ locations. Long-lived assets are classified based onthe geographic area in which the assets are located and exclude deferred taxes, goodwill and intangible assets. Prior period information has been updated toconform to current year presentation. Sales and long-lived assets by geographic area are as follows:
Year Ended December 31, 2019
Sales Percentage Long-Lived
Assets(a) Percentage (Amounts in thousands, except percentages)
United States $ 1,637,736 41.5% $ 464,216 47.1%EMA(1) 1,397,308 35.4% 312,668 31.7%Asia(2) 551,759 14.0% 143,848 14.6%Other(3) 358,047 9.1% 64,846 6.6%Consolidated total $ 3,944,850 100.0% $ 985,578 100.0%__________________(a) Includes ROU assets recorded under operating and finance leases based on our adoption of the New Lease Standard discussed in Note 4.
Year Ended December 31, 2018
Sales Percentage Long-Lived
Assets Percentage (Amounts in thousands, except percentages)
United States $ 1,525,930 39.8% $ 323,883 40.5%EMA(1) 1,424,498 37.2% 280,549 35.1%Asia(2) 539,898 14.1% 132,667 16.6%Other(3) 342,340 8.9% 63,161 7.8%Consolidated total $ 3,832,666 100.0% $ 800,260 100.0%
Year Ended December 31, 2017
Sales Percentage Long-Lived
Assets Percentage (Amounts in thousands, except percentages)
United States $ 1,460,899 40.0% $ 333,126 38.2%EMA(1) 1,434,506 39.2% 321,256 36.9%Asia(2) 471,054 12.9% 148,757 17.1%Other(3) 294,372 7.9% 68,379 7.8%Consolidated total $ 3,660,831 100.0% $ 871,518 100.0%___________________________________
(1) "EMA" includes Europe, the Middle East and Africa. In 2019, 2018 and 2017, Germany accounted for approximately 6%, 7% and 10%, respectively, ofconsolidated long-lived assets. No other individual country within this group represents 10% or more of consolidated totals for any period presented.
(2) "Asia" includes Asia and Australia. No individual country within this group represents 10% or more of consolidated totals for any period presented.(3) "Other" includes Canada and Latin America. No individual country within this group represents 10% or more of consolidated totals for any period
presented.
Net sales to international customers, including export sales from the U.S., represented approximately 63% of total sales in both 2019 and 2018, and64% in 2017.
Major Customer Information — We have a large number of customers across a large number of manufacturing and service facilities and do not havesales to any individual customer that represent 10% or more of consolidated sales for any of the years presented.
100
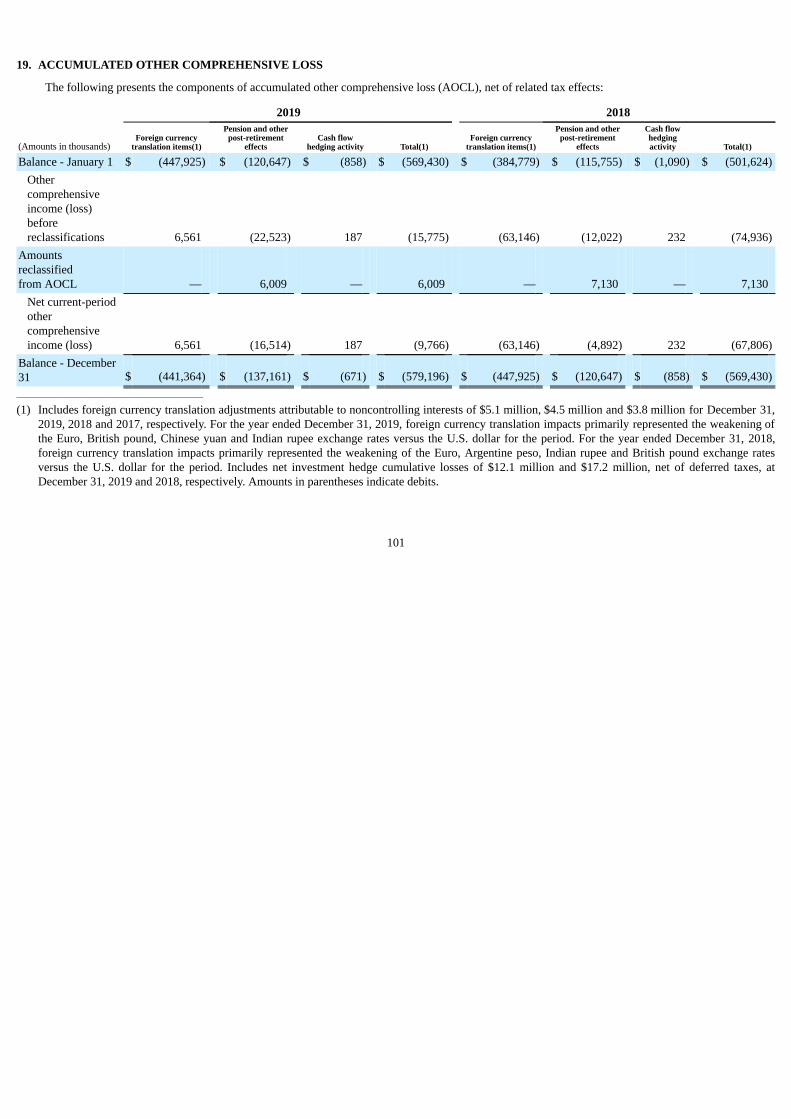
19. ACCUMULATED OTHER COMPREHENSIVE LOSS
The following presents the components of accumulated other comprehensive loss (AOCL), net of related tax effects:
2019 2018
(Amounts in thousands)Foreign currency
translation items(1) Pension and other
post-retirementeffects Cash flow
hedging activity Total(1) Foreign currencytranslation items(1)
Pension and otherpost-retirement
effects Cash flowhedgingactivity Total(1)
Balance - January 1 $ (447,925) $ (120,647) $ (858) $ (569,430) $ (384,779) $ (115,755) $ (1,090) $ (501,624)Othercomprehensiveincome (loss)beforereclassifications 6,561 (22,523) 187 (15,775) (63,146) (12,022) 232 (74,936)
Amountsreclassifiedfrom AOCL — 6,009 — 6,009 — 7,130 — 7,130
Net current-periodothercomprehensiveincome (loss) 6,561 (16,514) 187 (9,766) (63,146) (4,892) 232 (67,806)
Balance - December31 $ (441,364) $ (137,161) $ (671) $ (579,196) $ (447,925) $ (120,647) $ (858) $ (569,430)_______________________________________
(1) Includes foreign currency translation adjustments attributable to noncontrolling interests of $5.1 million, $4.5 million and $3.8 million for December 31,2019, 2018 and 2017, respectively. For the year ended December 31, 2019, foreign currency translation impacts primarily represented the weakening ofthe Euro, British pound, Chinese yuan and Indian rupee exchange rates versus the U.S. dollar for the period. For the year ended December 31, 2018,foreign currency translation impacts primarily represented the weakening of the Euro, Argentine peso, Indian rupee and British pound exchange ratesversus the U.S. dollar for the period. Includes net investment hedge cumulative losses of $12.1 million and $17.2 million, net of deferred taxes, atDecember 31, 2019 and 2018, respectively. Amounts in parentheses indicate debits.
101
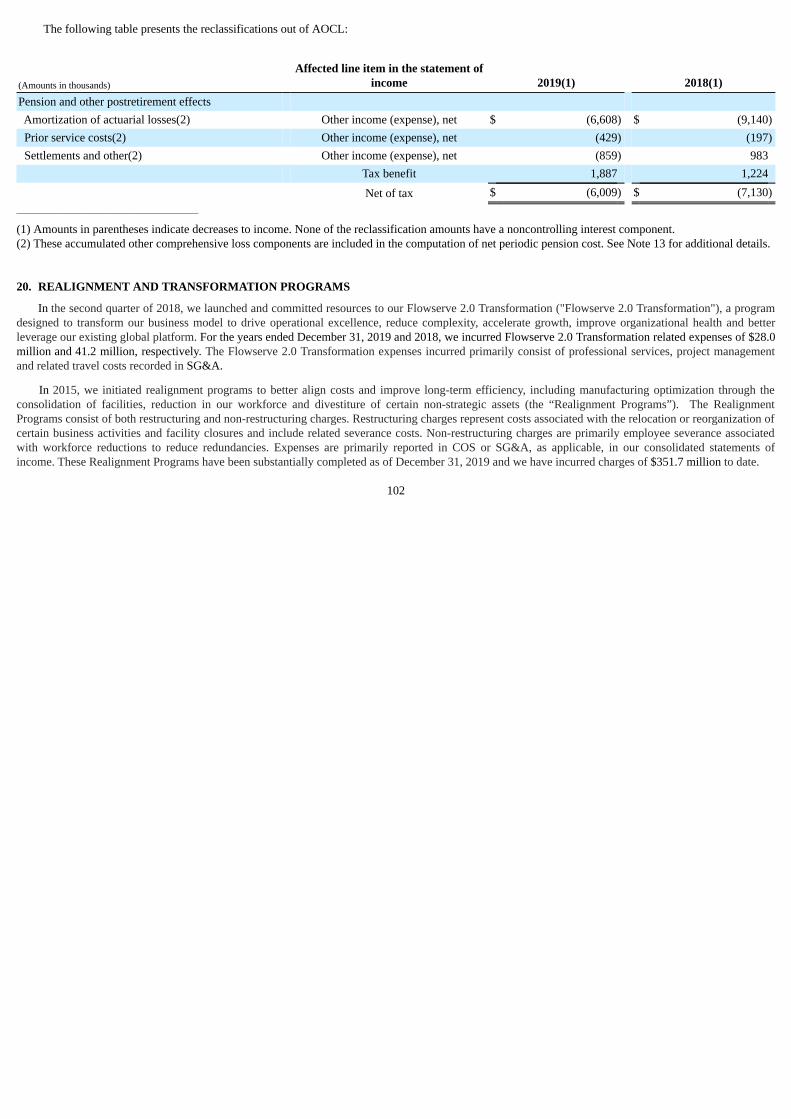
The following table presents the reclassifications out of AOCL:
(Amounts in thousands) Affected line item in the statement of
income 2019(1) 2018(1)Pension and other postretirement effects Amortization of actuarial losses(2) Other income (expense), net $ (6,608) $ (9,140) Prior service costs(2) Other income (expense), net (429) (197) Settlements and other(2) Other income (expense), net (859) 983 Tax benefit 1,887 1,224
Net of tax $ (6,009) $ (7,130)______________________________________
(1) Amounts in parentheses indicate decreases to income. None of the reclassification amounts have a noncontrolling interest component.(2) These accumulated other comprehensive loss components are included in the computation of net periodic pension cost. See Note 13 for additional details.
20. REALIGNMENT AND TRANSFORMATION PROGRAMS
In the second quarter of 2018, we launched and committed resources to our Flowserve 2.0 Transformation ("Flowserve 2.0 Transformation"), a programdesigned to transform our business model to drive operational excellence, reduce complexity, accelerate growth, improve organizational health and betterleverage our existing global platform. For the years ended December 31, 2019 and 2018, we incurred Flowserve 2.0 Transformation related expenses of $28.0million and 41.2 million, respectively. The Flowserve 2.0 Transformation expenses incurred primarily consist of professional services, project managementand related travel costs recorded in SG&A.
In 2015, we initiated realignment programs to better align costs and improve long-term efficiency, including manufacturing optimization through theconsolidation of facilities, reduction in our workforce and divestiture of certain non-strategic assets (the “Realignment Programs”). The RealignmentPrograms consist of both restructuring and non-restructuring charges. Restructuring charges represent costs associated with the relocation or reorganization ofcertain business activities and facility closures and include related severance costs. Non-restructuring charges are primarily employee severance associatedwith workforce reductions to reduce redundancies. Expenses are primarily reported in COS or SG&A, as applicable, in our consolidated statements ofincome. These Realignment Programs have been substantially completed as of December 31, 2019 and we have incurred charges of $351.7 million to date.
102
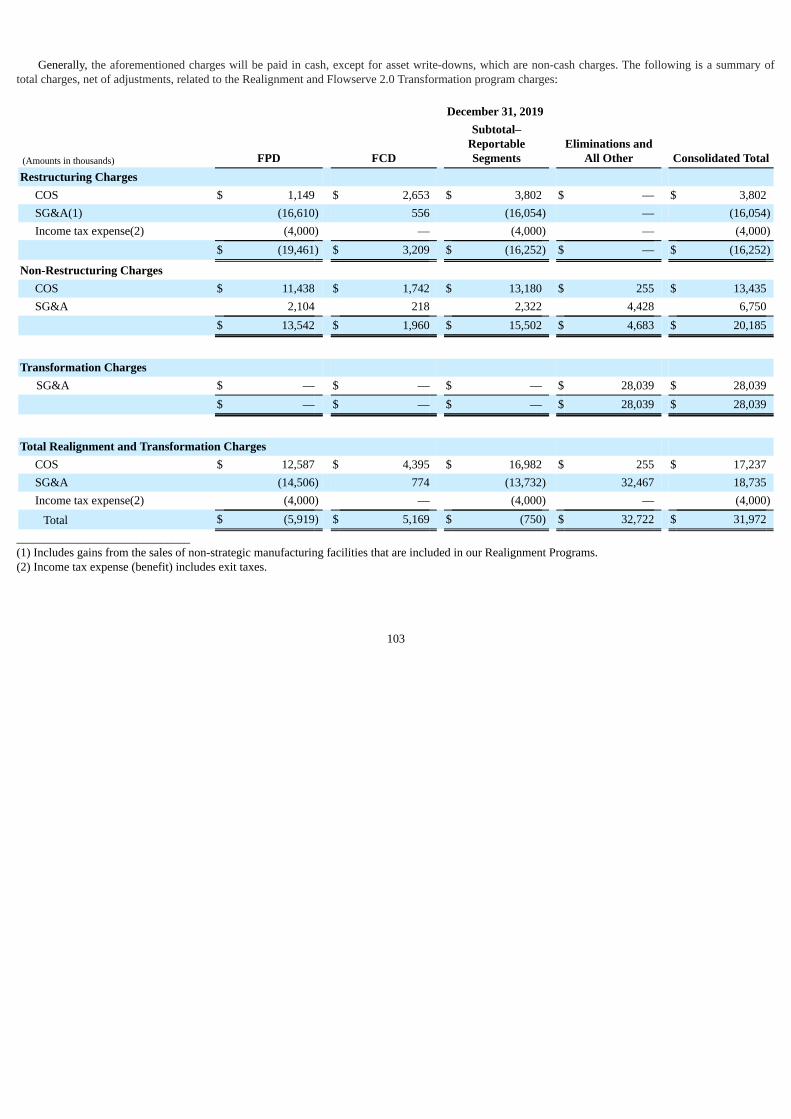
Generally, the aforementioned charges will be paid in cash, except for asset write-downs, which are non-cash charges. The following is a summary oftotal charges, net of adjustments, related to the Realignment and Flowserve 2.0 Transformation program charges:
December 31, 2019
(Amounts in thousands) FPD FCD
Subtotal–ReportableSegments
Eliminations andAll Other Consolidated Total
Restructuring Charges COS $ 1,149 $ 2,653 $ 3,802 $ — $ 3,802 SG&A(1) (16,610) 556 (16,054) — (16,054) Income tax expense(2) (4,000) — (4,000) — (4,000)
$ (19,461) $ 3,209 $ (16,252) $ — $ (16,252)
Non-Restructuring Charges COS $ 11,438 $ 1,742 $ 13,180 $ 255 $ 13,435 SG&A 2,104 218 2,322 4,428 6,750
$ 13,542 $ 1,960 $ 15,502 $ 4,683 $ 20,185
Transformation Charges SG&A $ — $ — $ — $ 28,039 $ 28,039
$ — $ — $ — $ 28,039 $ 28,039
Total Realignment and Transformation Charges COS $ 12,587 $ 4,395 $ 16,982 $ 255 $ 17,237 SG&A (14,506) 774 (13,732) 32,467 18,735 Income tax expense(2) (4,000) — (4,000) — (4,000)
Total $ (5,919) $ 5,169 $ (750) $ 32,722 $ 31,972_____________________________(1) Includes gains from the sales of non-strategic manufacturing facilities that are included in our Realignment Programs.(2) Income tax expense (benefit) includes exit taxes.
103
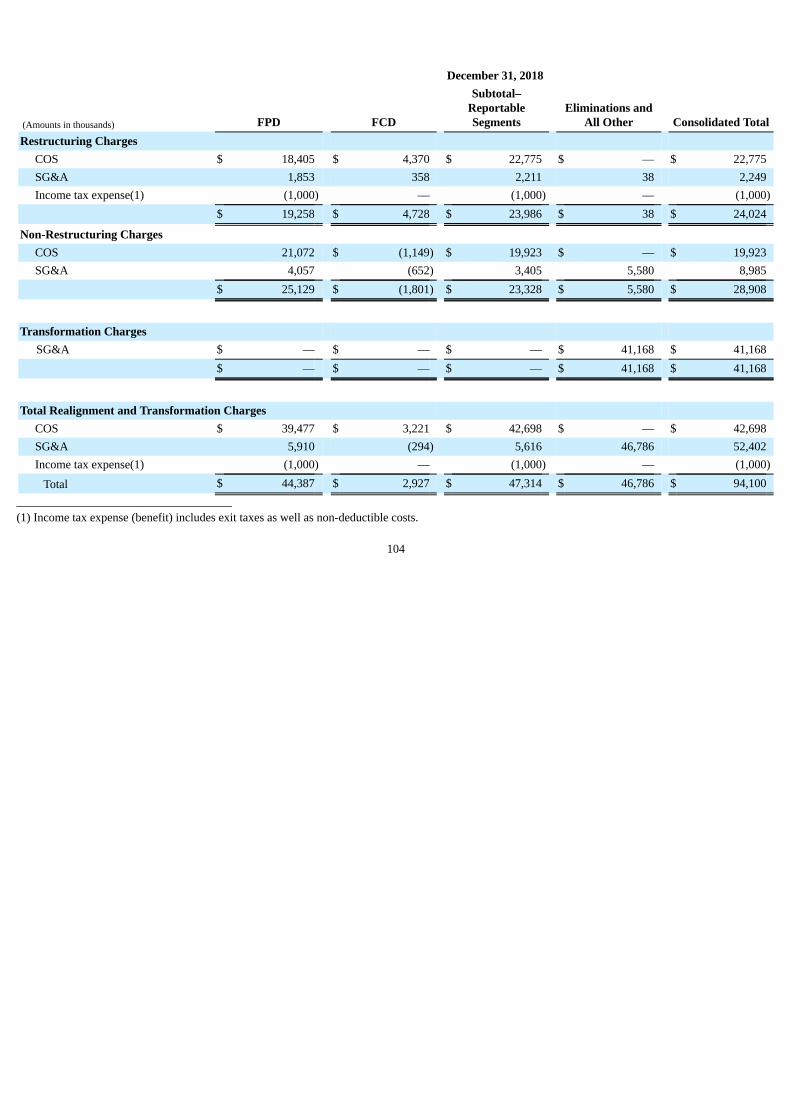
December 31, 2018
(Amounts in thousands) FPD FCD
Subtotal–ReportableSegments
Eliminations andAll Other Consolidated Total
Restructuring Charges COS $ 18,405 $ 4,370 $ 22,775 $ — $ 22,775 SG&A 1,853 358 2,211 38 2,249 Income tax expense(1) (1,000) — (1,000) — (1,000)
$ 19,258 $ 4,728 $ 23,986 $ 38 $ 24,024
Non-Restructuring Charges COS 21,072 $ (1,149) $ 19,923 $ — $ 19,923 SG&A 4,057 (652) 3,405 5,580 8,985
$ 25,129 $ (1,801) $ 23,328 $ 5,580 $ 28,908
Transformation Charges SG&A $ — $ — $ — $ 41,168 $ 41,168
$ — $ — $ — $ 41,168 $ 41,168
Total Realignment and Transformation Charges COS $ 39,477 $ 3,221 $ 42,698 $ — $ 42,698 SG&A 5,910 (294) 5,616 46,786 52,402 Income tax expense(1) (1,000) — (1,000) — (1,000)
Total $ 44,387 $ 2,927 $ 47,314 $ 46,786 $ 94,100____________________________________(1) Income tax expense (benefit) includes exit taxes as well as non-deductible costs.
104
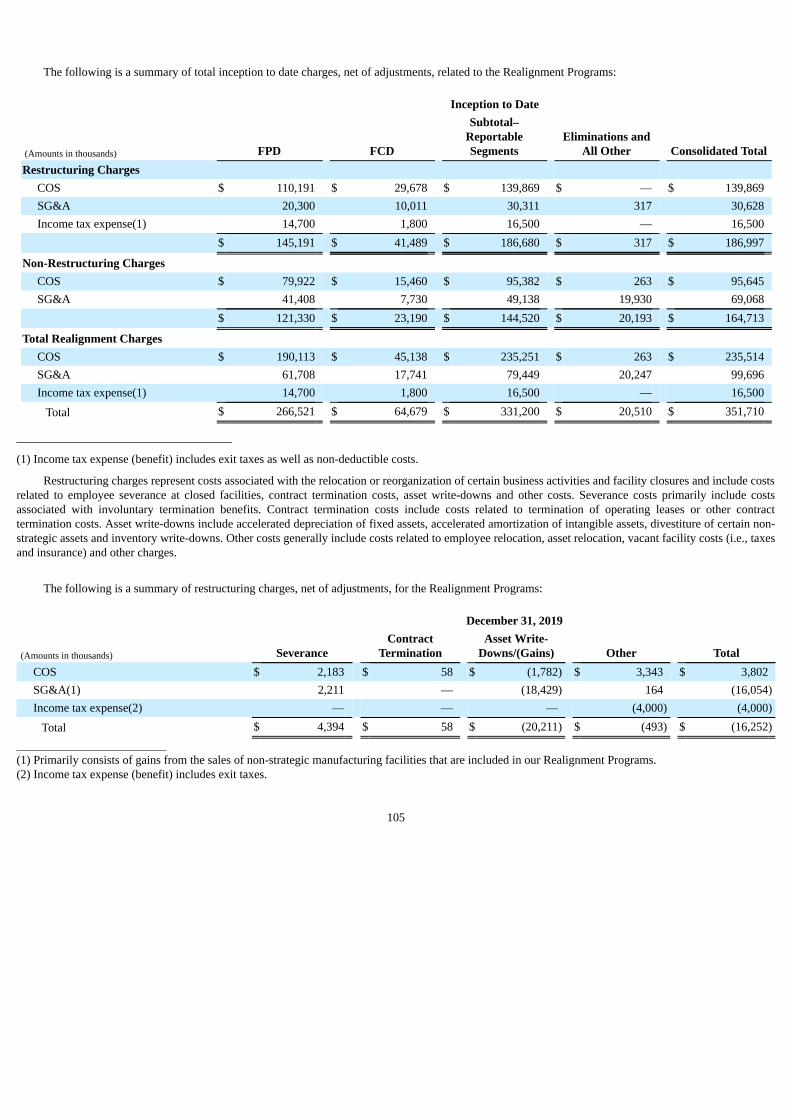
The following is a summary of total inception to date charges, net of adjustments, related to the Realignment Programs:
Inception to Date
(Amounts in thousands) FPD FCD
Subtotal–ReportableSegments
Eliminations andAll Other Consolidated Total
Restructuring Charges COS $ 110,191 $ 29,678 $ 139,869 $ — $ 139,869 SG&A 20,300 10,011 30,311 317 30,628 Income tax expense(1) 14,700 1,800 16,500 — 16,500
$ 145,191 $ 41,489 $ 186,680 $ 317 $ 186,997
Non-Restructuring Charges COS $ 79,922 $ 15,460 $ 95,382 $ 263 $ 95,645 SG&A 41,408 7,730 49,138 19,930 69,068
$ 121,330 $ 23,190 $ 144,520 $ 20,193 $ 164,713
Total Realignment Charges COS $ 190,113 $ 45,138 $ 235,251 $ 263 $ 235,514 SG&A 61,708 17,741 79,449 20,247 99,696 Income tax expense(1) 14,700 1,800 16,500 — 16,500
Total $ 266,521 $ 64,679 $ 331,200 $ 20,510 $ 351,710
____________________________________
(1) Income tax expense (benefit) includes exit taxes as well as non-deductible costs.
Restructuring charges represent costs associated with the relocation or reorganization of certain business activities and facility closures and include costsrelated to employee severance at closed facilities, contract termination costs, asset write-downs and other costs. Severance costs primarily include costsassociated with involuntary termination benefits. Contract termination costs include costs related to termination of operating leases or other contracttermination costs. Asset write-downs include accelerated depreciation of fixed assets, accelerated amortization of intangible assets, divestiture of certain non-strategic assets and inventory write-downs. Other costs generally include costs related to employee relocation, asset relocation, vacant facility costs (i.e., taxesand insurance) and other charges.
The following is a summary of restructuring charges, net of adjustments, for the Realignment Programs:
December 31, 2019
(Amounts in thousands) Severance Contract
Termination Asset Write-
Downs/(Gains) Other Total COS $ 2,183 $ 58 $ (1,782) $ 3,343 $ 3,802 SG&A(1) 2,211 — (18,429) 164 (16,054) Income tax expense(2) — — — (4,000) (4,000)
Total $ 4,394 $ 58 $ (20,211) $ (493) $ (16,252)_________________________(1) Primarily consists of gains from the sales of non-strategic manufacturing facilities that are included in our Realignment Programs.(2) Income tax expense (benefit) includes exit taxes.
105
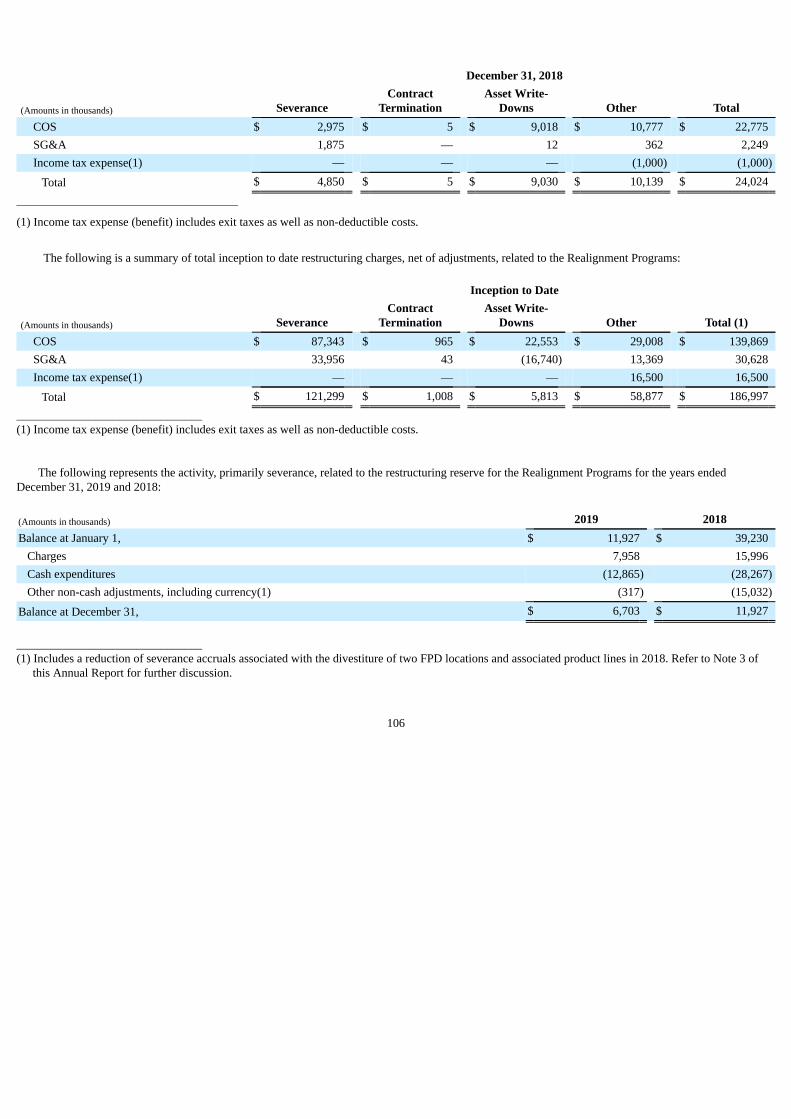
December 31, 2018
(Amounts in thousands) Severance Contract
Termination Asset Write-
Downs Other Total COS $ 2,975 $ 5 $ 9,018 $ 10,777 $ 22,775 SG&A 1,875 — 12 362 2,249 Income tax expense(1) — — — (1,000) (1,000)
Total $ 4,850 $ 5 $ 9,030 $ 10,139 $ 24,024_____________________________________
(1) Income tax expense (benefit) includes exit taxes as well as non-deductible costs.
The following is a summary of total inception to date restructuring charges, net of adjustments, related to the Realignment Programs:
Inception to Date
(Amounts in thousands) Severance Contract
Termination Asset Write-
Downs Other Total (1) COS $ 87,343 $ 965 $ 22,553 $ 29,008 $ 139,869 SG&A 33,956 43 (16,740) 13,369 30,628 Income tax expense(1) — — — 16,500 16,500
Total $ 121,299 $ 1,008 $ 5,813 $ 58,877 $ 186,997_______________________________(1) Income tax expense (benefit) includes exit taxes as well as non-deductible costs.
The following represents the activity, primarily severance, related to the restructuring reserve for the Realignment Programs for the years endedDecember 31, 2019 and 2018:
(Amounts in thousands) 2019 2018Balance at January 1, $ 11,927 $ 39,230
Charges 7,958 15,996Cash expenditures (12,865) (28,267)Other non-cash adjustments, including currency(1) (317) (15,032)
Balance at December 31, $ 6,703 $ 11,927
_______________________________(1) Includes a reduction of severance accruals associated with the divestiture of two FPD locations and associated product lines in 2018. Refer to Note 3 of
this Annual Report for further discussion.
106
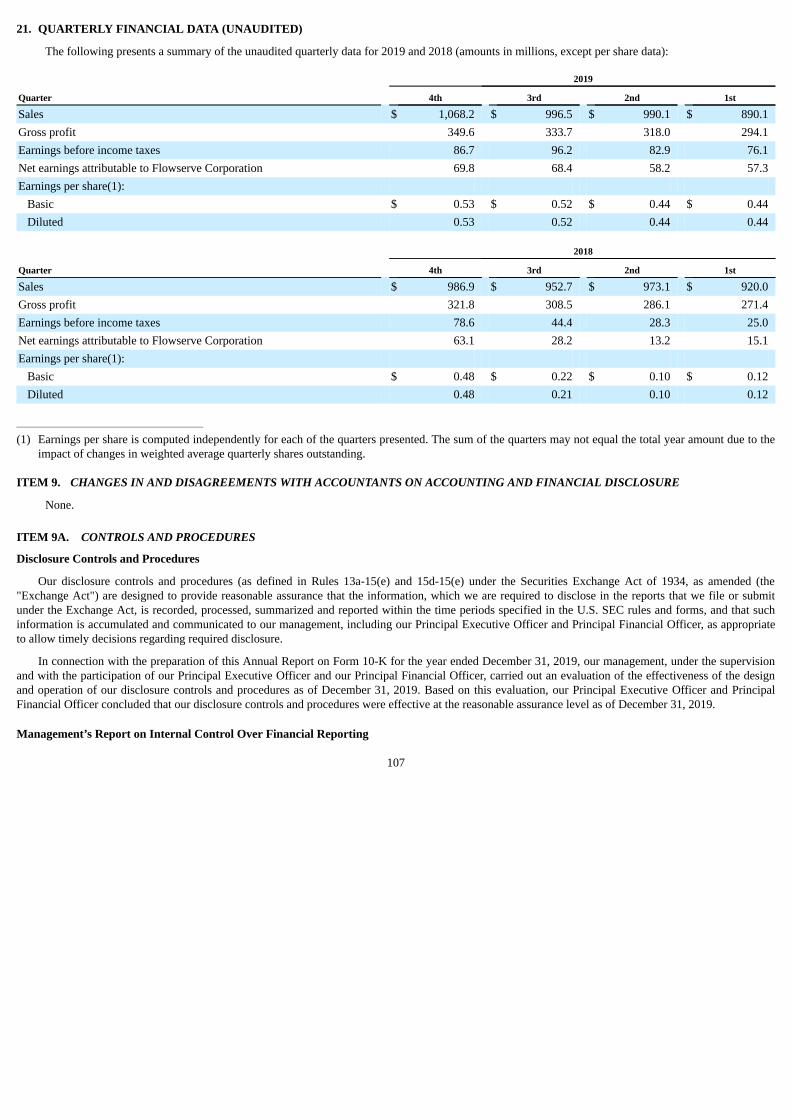
21. QUARTERLY FINANCIAL DATA (UNAUDITED)
The following presents a summary of the unaudited quarterly data for 2019 and 2018 (amounts in millions, except per share data):
2019
Quarter 4th 3rd 2nd 1st
Sales $ 1,068.2 $ 996.5 $ 990.1 $ 890.1Gross profit 349.6 333.7 318.0 294.1Earnings before income taxes 86.7 96.2 82.9 76.1Net earnings attributable to Flowserve Corporation 69.8 68.4 58.2 57.3Earnings per share(1):
Basic $ 0.53 $ 0.52 $ 0.44 $ 0.44Diluted 0.53 0.52 0.44 0.44
2018
Quarter 4th 3rd 2nd 1st
Sales $ 986.9 $ 952.7 $ 973.1 $ 920.0Gross profit 321.8 308.5 286.1 271.4Earnings before income taxes 78.6 44.4 28.3 25.0Net earnings attributable to Flowserve Corporation 63.1 28.2 13.2 15.1Earnings per share(1):
Basic $ 0.48 $ 0.22 $ 0.10 $ 0.12Diluted 0.48 0.21 0.10 0.12
_______________________________________
(1) Earnings per share is computed independently for each of the quarters presented. The sum of the quarters may not equal the total year amount due to theimpact of changes in weighted average quarterly shares outstanding.
ITEM 9. CHANGES IN AND DISAGREEMENTS WITH ACCOUNTANTS ON ACCOUNTING AND FINANCIAL DISCLOSURE
None.
ITEM 9A. CONTROLS AND PROCEDURES
Disclosure Controls and Procedures
Our disclosure controls and procedures (as defined in Rules 13a-15(e) and 15d-15(e) under the Securities Exchange Act of 1934, as amended (the"Exchange Act") are designed to provide reasonable assurance that the information, which we are required to disclose in the reports that we file or submitunder the Exchange Act, is recorded, processed, summarized and reported within the time periods specified in the U.S. SEC rules and forms, and that suchinformation is accumulated and communicated to our management, including our Principal Executive Officer and Principal Financial Officer, as appropriateto allow timely decisions regarding required disclosure.
In connection with the preparation of this Annual Report on Form 10-K for the year ended December 31, 2019, our management, under the supervisionand with the participation of our Principal Executive Officer and our Principal Financial Officer, carried out an evaluation of the effectiveness of the designand operation of our disclosure controls and procedures as of December 31, 2019. Based on this evaluation, our Principal Executive Officer and PrincipalFinancial Officer concluded that our disclosure controls and procedures were effective at the reasonable assurance level as of December 31, 2019.
Management’s Report on Internal Control Over Financial Reporting
107
Our management, under the supervision and with the participation of our Principal Executive Officer and Principal Financial Officer, is responsible forestablishing and maintaining adequate internal control over financial reporting, as such term is defined in Rules 13a-15(f) and 15d-15(f) under the ExchangeAct. Internal control over financial reporting is a process designed to provide reasonable assurance regarding the reliability of financial reporting and thepreparation of financial statements for external purposes in accordance with generally accepted accounting principles in the United States ("U.S. GAAP").Internal control over financial reporting includes policies and procedures that: (i) pertain to the maintenance of records that, in reasonable detail, accuratelyand fairly reflect the transactions and dispositions of our assets; (ii) provide reasonable assurance that transactions are recorded as necessary to permitpreparation of financial statements in accordance with U.S. GAAP, and that our receipts and expenditures are being made only in accordance withauthorizations of our management and directors; and (iii) provide reasonable assurance regarding prevention or timely detection of unauthorized acquisition,use or disposition of our assets that could have a material effect on the financial statements.
Under the supervision and with the participation of our Principal Executive Officer and Principal Financial Officer, our management conducted anassessment of our internal control over financial reporting as of December 31, 2019, based on the criteria established in Internal Control - IntegratedFramework (2013), issued by the Committee of Sponsoring Organizations of the Treadway Commission (COSO). Based on this evaluation, our managementconcluded our internal control over financial reporting was effective as of December 31, 2019, based on criteria in Internal Control - Integrated Framework(2013) issued by the COSO.
The effectiveness of our internal control over financial reporting as of December 31, 2019, has been audited by PricewaterhouseCoopers LLP, ourindependent registered public accounting firm, as stated in their report, which is included herein.
Changes in Internal Control Over Financial Reporting
There were no changes in our internal control over financial reporting (as defined in Rules 13a-15(f) and 15d-15(f) of the Exchange Act) during thequarter ended December 31, 2019 that have materially affected, or are reasonably likely to materially affect our internal control over financial reporting.
Other
Because of its inherent limitations, internal control over financial reporting may not prevent or detect misstatements. Also, projections of any evaluationof effectiveness to future periods are subject to the risk that controls may become inadequate because of changes in conditions, or that the degree ofcompliance with existing policies or procedures may deteriorate.
ITEM 9B. OTHER INFORMATION
None.
PART III
ITEM 10. DIRECTORS, EXECUTIVE OFFICERS AND CORPORATE GOVERNANCE
The information required in this Item 10 is incorporated by reference to all information under the captions “Security Ownership of Directors and CertainExecutive Officers,” “Security Ownership of Certain Beneficial Owners,” “Proposal One: Election of Directors,” “Executive Officers,” “ShareholderProposals and Nominations,” “Delinquent Section 16(a) Reports,” to the extent applicable, and “Certain Relationships and Related Transactions" in ourdefinitive Proxy Statement relating to our 2020 annual meeting of shareholders to be held on May 21, 2020. The Proxy Statement will be filed with the SECno later than April 10, 2020.
We have adopted a Code of Conduct that applies to all of our directors, officers and employees, including our Principal Executive, Principal Financialand Principal Accounting Officers, or persons performing similar functions. Our Code of Conduct is available on the Company’s website atwww.flowserve.com under the “Investors - Corporate Governance” caption. We intend to disclose future amendments to certain provisions of the Code ofConduct, and waivers of the Code of Conduct granted to executive officers and directors, on the website within four business days following the date of theamendment or waiver.
108
ITEM 11. EXECUTIVE COMPENSATION
The information required in this Item 11 is incorporated by reference to all information under the captions “Executive Compensation,” “Proposal Two:Advisory Vote on Executive Compensation,” “Delinquent Section 16(a) Reports,” to the extent applicable, “Security Ownership of Directors and CertainExecutive Officers,” “Compensation Committee Interlocks and Insider Participation” and “Certain Relationships and Related Transactions” in our definitiveProxy Statement relating to our 2020 annual meeting of shareholders to be held on May 21, 2020. The Proxy Statement will be filed with the SEC no laterthan April 10, 2020.
ITEM 12. SECURITY OWNERSHIP OF CERTAIN BENEFICIAL OWNERS AND MANAGEMENT AND RELATED STOCKHOLDER MATTERS
The information required in this Item 12 is incorporated by reference to all information under the captions “Security Ownership of Directors and CertainExecutive Officers,” “Security Ownership of Certain Beneficial Owners,” “Equity Compensation Plan Information” and “Executive Compensation” in ourdefinitive Proxy Statement relating to our 2020 annual meeting of shareholders to be held on May 21, 2020. The Proxy Statement will be filed with the SECno later than April 10, 2020.
ITEM 13. CERTAIN RELATIONSHIPS AND RELATED TRANSACTIONS, AND DIRECTOR INDEPENDENCE
The information required in this Item 13 is incorporated by reference to all information under the captions “Role of the Board; Corporate GovernanceMatters,” “Committees of the Board” and “Certain Relationships and Related Transactions” in our definitive Proxy Statement relating to our 2020 annualmeeting of shareholders to be held on May 21, 2020. The Proxy Statement will be filed with the SEC no later than April 10, 2020.
ITEM 14. PRINCIPAL ACCOUNTING FEES AND SERVICES
The information required in this Item 14 is incorporated by reference to all information under the caption “Other Audit Information” in our definitiveProxy Statement relating to our 2020 annual meeting of shareholders to be held on May 21, 2020. The Proxy Statement will be filed with the SEC no laterthan April 10, 2020.
PART IV
ITEM 15. EXHIBITS, FINANCIAL STATEMENT SCHEDULES
(a) Documents filed as a part of this Annual Report:
1. Consolidated Financial Statements
The following consolidated financial statements and notes thereto are filed as part of this Annual Report:
Report of Independent Registered Public Accounting Firm
Flowserve Corporation Consolidated Financial Statements:
Consolidated Balance Sheets at December 31, 2019 and 2018:
For each of the three years in the period ended December 31, 2019:
Consolidated Statements of Income
Consolidated Statements of Comprehensive Income
Consolidated Statements of Shareholders’ Equity
Consolidated Statements of Cash Flows
Notes to Consolidated Financial Statements
109
2. Consolidated Financial Statement Schedules
The following consolidated financial statement schedule is filed as part of this Annual Report:
Schedule II — Valuation and Qualifying Accounts........................................................................................................... 114
Financial statement schedules not included in this Annual Report have been omitted because they are not applicable or the required information isshown in the consolidated financial statements or notes thereto.
3. Exhibits
ExhibitNo. Description
3.1
Restated Certificate of Incorporation of Flowserve Corporation (incorporated by reference to Exhibit 3.1 to the Registrant's Quarterly Reporton Form 10-Q (File No. 001-13179) for the quarter ended June 30, 2013).
3.2
Flowserve Corporation By-Laws, as amended and restated effective December 12, 2019 (incorporated by reference to Exhibit 3.1 to theRegistrant's Current Report on Form 8-K (File No. 001-13179) dated December 12, 2019).
4.1
Senior Indenture, dated September 11, 2012, by and between Flowserve Corporation and U.S. Bank National Association, as trustee(incorporated by reference to Exhibit 4.1 to the Registrant's Current Report on Form 8-K (File No. 001-13179) dated September 11, 2012).
4.2
First Supplemental Indenture, dated September 11, 2012, by and among Flowserve Corporation, certain of its subsidiaries and U.S. BankNational Association, as trustee (incorporated by reference to Exhibit 4.2 to the Registrant's Current Report on Form 8-K (File No. 001-13179) dated September 11, 2012).
4.3
Second Supplemental Indenture, dated November 1, 2013, by and among Flowserve Corporation, certain of its subsidiaries and U.S. BankNational Association, as trustee (incorporated by reference to Exhibit 4.2 to the Registrant's Current Report on Form 8-K (File No. 001-13179) dated November 1, 2013).
4.4
Third Supplemental Indenture, dated March 17, 2015, by and among Flowserve Corporation, certain of its subsidiaries and U.S. BankNational Association, as trustee (incorporated by reference to Exhibit 4.2 to the Registrant's Current Report on Form 8-K (File No. 001-13179) dated March 17, 2015).
4.5+ Description of Registrant’s Securities.10.1
Credit Agreement, dated July 16, 2019, among Flowserve Corporation, Bank of America, N.A., as swingline lender, letter of credit issuerand administrative agent and the other lenders referred to therein (incorporated by reference to Exhibit 10.1 to the Registrant's CurrentReport on Form 8-K (File No. 001-13179) dated July 16, 2019).
10.2
Amended and Restated Flowserve Corporation Director Cash Deferral Plan, effective January 1, 2009 (incorporated by reference to Exhibit10.7 to the Registrant's Annual Report on Form 10-K (File No. 001-13179) for the year ended December 31, 2008).*
10.3
Amended and Restated Flowserve Corporation Director Stock Deferral Plan, dated effective January 1, 2009 (incorporated by reference toExhibit 10.8 to the Registrant's Annual Report on Form 10-K (File No. 001-13179) for the year ended December 31, 2008).*
10.4
Trust for Non-Qualified Deferred Compensation Benefit Plans, dated February 11, 2011 (incorporated by reference to Exhibit 10.8 to theRegistrant’s Annual Report on Form 10-K (File No. 001-13179) for the year ended December 31, 2010).*
10.5
Flowserve Corporation Deferred Compensation Plan (incorporated by reference to Exhibit 10.23 to the Registrant's Annual Report on Form10-K (File No. 001-13179) for the year ended December 31, 2000).*
10.6
Amendment No. 1 to the Flowserve Corporation Deferred Compensation Plan, as amended and restated, effective June 1, 2000 (incorporatedby reference to Exhibit 10.50 to the Registrant's Annual Report on Form 10-K (File No. 001-13179) for the year ended December 31, 2002).*
10.7
Amendment to the Flowserve Corporation Deferred Compensation Plan, dated December 14, 2005 (incorporated by reference to Exhibit10.70 to the Registrant's Annual Report on Form 10-K (File No. 001-13179) for the year ended December 31, 2004).*
10.8
Amendment No. 3 to the Flowserve Corporation Deferred Compensation Plan, as amended and restated effective June 1, 2000 (incorporatedby reference to Exhibit 10.22 to the Registrant's Annual Report on Form 10-K (File No. 001-13179) for the year ended December 31, 2007).*
10.9
Flowserve Corporation Senior Management Retirement Plan, amended and restated effective November 2, 2018 (incorporated by referenceto Exhibit 10.13 to the Registrant's Annual Report on Form 10-K (File No. 001-13179) for the year ended December 31, 2018).*
110
ExhibitNo. Description
10.10
Flowserve Corporation Supplemental Executive Retirement Plan, amended and restated effective November 2, 2018 (incorporated byreference to Exhibit 10.14 to the Registrant's Annual Report on Form 10-K (File No. 001-13179) for the year ended December 31, 2018).*
10.11
Flowserve Corporation Equity and Incentive Compensation Plan (incorporated by reference to Appendix A to the Registrant's ProxyStatement on Schedule 14A (File No. 001-13179) dated April 3, 2009).*
10.12
Flowserve Corporation 2020 Long-Term Incentive Plan (incorporated by reference to Appendix A to the Registrant's Proxy Statement onSchedule 14A (File No. 001-13179) dated April 11, 2019).*
10.13
Form of Restrictive Covenants Agreement for Officers (incorporated by reference to Exhibit 10.1 to the Registrant's Current Report on Form8-K (File No. 001-13179) dated as of March 9, 2006).*
10.14
Form of Indemnification Agreement for all Directors and Officers (incorporated by reference to Exhibit 10.47 to the Registrant’s AnnualReport on Form 10-K (File No. 001-13179) for the year ended December 31, 2015).
10.15
Offer Letter, dated as of February 6, 2017, by and between Flowserve Corporation and R. Scott Rowe (incorporated by reference to Exhibit10.1 to the Registrant’s Current Report on Form 8-K (File No. 001-13179) dated as of February 8, 2017).*
10.16
Flowserve Corporation Change In Control Severance Plan, amended and restated effective November 2, 2018 (incorporated by reference toExhibit 10.1 to the Registrant’s Quarterly Report on Form 10-Q (File No. 001-13179) for the quarter ended September 30, 2018).*
10.17
Flowserve Corporation Executive Officer Severance Plan, as amended and restated effective November 2, 2018 (incorporated by referenceto Exhibit 10.20 to the Registrant's Annual Report on Form 10-K (File No. 001-13179) for the year ended December 31, 2018).*
10.18
Flowserve Corporation Annual Incentive Plan, as amended and restated effective February 14, 2017 (incorporated by reference to Exhibit10.44 to the Registrant’s Annual Report on Form 10-K (File No. 001-13179) for the year ended December 31, 2016).*
14.1
Flowserve Corporation Employee Code of Conduct (incorporated by reference to Exhibit 14.1 to the Registrant’s Current Report on Form 8-K (File No. 001-13179) dated as of August 15, 2019).
21.1+ Subsidiaries of the Registrant.23.1+ Consent of PricewaterhouseCoopers LLP.31.1+
Certification of Principal Executive Officer pursuant to Exchange Act Rules 13a-14(a) and 15d-14(a), as adopted pursuant to Section 302 ofthe Sarbanes-Oxley Act of 2002.
31.2+
Certification of Principal Financial Officer pursuant to Exchange Act Rules 13a-14(a) and 15d-14(a), as adopted pursuant to Section 302 ofthe Sarbanes-Oxley Act of 2002.
32.1++
Certification of Principal Executive Officer pursuant to 18 U.S.C. Section 1350, as adopted pursuant to Section 906 of the Sarbanes-OxleyAct of 2002.
32.2++
Certification of Principal Financial Officer pursuant to 18 U.S.C. Section 1350, as adopted pursuant to Section 906 of the Sarbanes-Oxley Actof 2002.
101.INS
XBRL Instance Document - the instance document does not appear in the Interactive Data File because its XBRL tags are embedded withinthe Inline XBRL document.
101.SCH XBRL Taxonomy Extension Schema Document101.CAL XBRL Taxonomy Extension Calculation Linkbase Document101.DEF XBRL Taxonomy Extension Definition Linkbase Document101.LAB XBRL Taxonomy Extension Label Linkbase Document101.PRE XBRL Taxonomy Extension Presentation Linkbase Document
104
The cover page from the Company’s Annual Report on Form 10-K for the year ended December 31, 2019, formatted in Inline XBRL(included as Exhibit 101).
_______________________________________
* Management contracts and compensatory plans and arrangements required to be filed as exhibits to this Annual Report on Form 10-K.+ Filed herewith.++ Furnished herewith.
111

ITEM 16. FORM 10-K SUMMARY
None
112
SIGNATURES
Pursuant to the requirements of Section 13 or 15(d) of the Securities Exchange Act of 1934, the registrant has duly caused this report to be signed on itsbehalf by the undersigned, thereunto duly authorized.
FLOWSERVE CORPORATION
By: /s/ R. Scott Rowe
R. Scott RowePresident and Chief Executive Officer
Date: February 17, 2020
Pursuant to the requirements of the Securities Exchange Act of 1934, this report has been signed below by the following persons on behalf of theregistrant and in the capacities and on the date indicated.
Signature Title Date
/s/ Roger L. Fix Non-Executive Chairman of the Board February 17, 2020
Roger L. Fix
/s/ R. Scott Rowe President, Chief Executive Officer and Director(Principal Executive Officer)
February 17, 2020R. Scott Rowe
/s/ John E. Roueche, III Vice President and Interim Chief Financial Officer
(Principal Financial and Accounting Officer) February 17, 2020
John E. Roueche, III
/s/ Sujeet Chand Director February 17, 2020
Sujeet Chand
/s/ Ruby R. Chandy Director February 17, 2020 Ruby R. Chandy
/s/ Gayla J. Delly Director February 17, 2020
Gayla J. Delly
/s/ John R. Friedery Director February 17, 2020John R. Friedery
/s/ John L. Garrison Director February 17, 2020
John L. Garrison
/s/ Joseph E. Harlan Director February 17, 2020Joseph E. Harlan
/s/ Michael C. McMurray Director February 17, 2020
Michael C. McMurray
/s/ Rick J. Mills Director February 17, 2020Rick J. Mills
/s/ David E. Roberts Director February 17, 2020
David E. Roberts
113
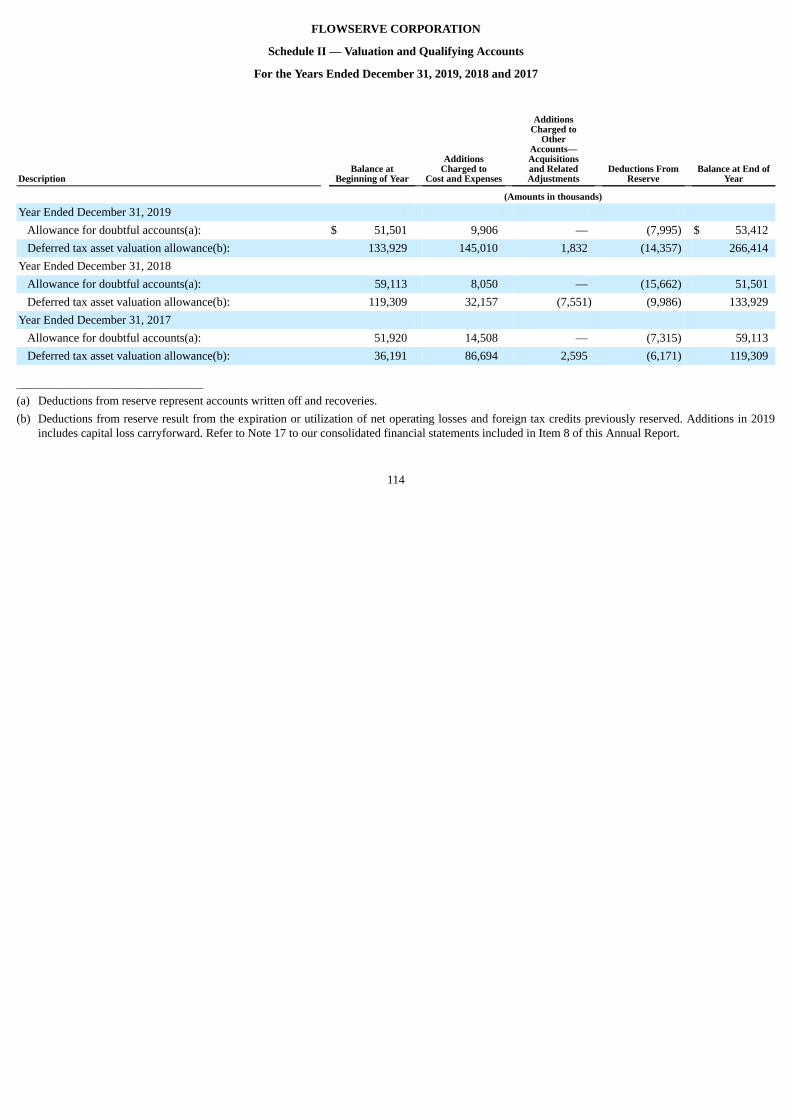
FLOWSERVE CORPORATION
Schedule II — Valuation and Qualifying Accounts
For the Years Ended December 31, 2019, 2018 and 2017
Description Balance at
Beginning of Year Additions
Charged toCost and Expenses
AdditionsCharged to
OtherAccounts—Acquisitionsand RelatedAdjustments
Deductions FromReserve
Balance at End ofYear
(Amounts in thousands)
Year Ended December 31, 2019 Allowance for doubtful accounts(a): $ 51,501 9,906 — (7,995) $ 53,412Deferred tax asset valuation allowance(b): 133,929 145,010 1,832 (14,357) 266,414
Year Ended December 31, 2018 Allowance for doubtful accounts(a): 59,113 8,050 — (15,662) 51,501Deferred tax asset valuation allowance(b): 119,309 32,157 (7,551) (9,986) 133,929
Year Ended December 31, 2017 Allowance for doubtful accounts(a): 51,920 14,508 — (7,315) 59,113Deferred tax asset valuation allowance(b): 36,191 86,694 2,595 (6,171) 119,309
_______________________________________
(a) Deductions from reserve represent accounts written off and recoveries.(b) Deductions from reserve result from the expiration or utilization of net operating losses and foreign tax credits previously reserved. Additions in 2019
includes capital loss carryforward. Refer to Note 17 to our consolidated financial statements included in Item 8 of this Annual Report.
114
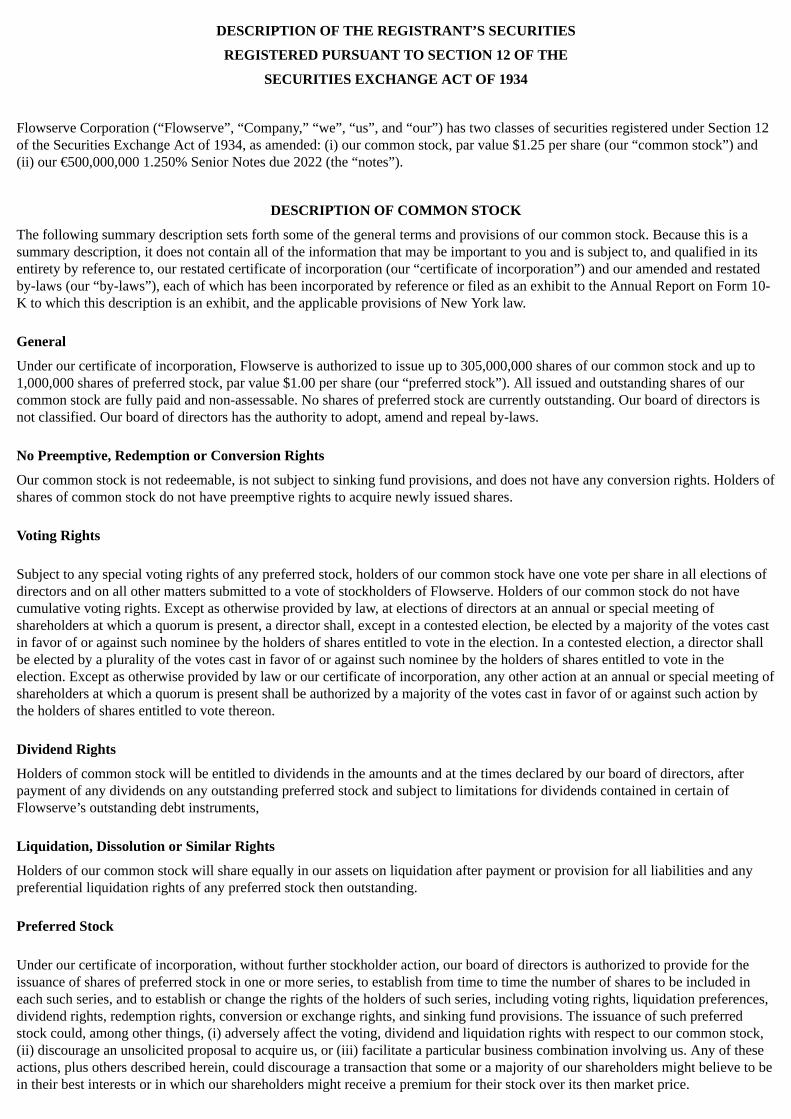
DESCRIPTION OF THE REGISTRANT’S SECURITIES
REGISTERED PURSUANT TO SECTION 12 OF THE
SECURITIES EXCHANGE ACT OF 1934
Flowserve Corporation (“Flowserve”, “Company,” “we”, “us”, and “our”) has two classes of securities registered under Section 12of the Securities Exchange Act of 1934, as amended: (i) our common stock, par value $1.25 per share (our “common stock”) and(ii) our €500,000,000 1.250% Senior Notes due 2022 (the “notes”).
DESCRIPTION OF COMMON STOCK
The following summary description sets forth some of the general terms and provisions of our common stock. Because this is asummary description, it does not contain all of the information that may be important to you and is subject to, and qualified in itsentirety by reference to, our restated certificate of incorporation (our “certificate of incorporation”) and our amended and restatedby-laws (our “by-laws”), each of which has been incorporated by reference or filed as an exhibit to the Annual Report on Form 10-K to which this description is an exhibit, and the applicable provisions of New York law.
General
Under our certificate of incorporation, Flowserve is authorized to issue up to 305,000,000 shares of our common stock and up to1,000,000 shares of preferred stock, par value $1.00 per share (our “preferred stock”). All issued and outstanding shares of ourcommon stock are fully paid and non-assessable. No shares of preferred stock are currently outstanding. Our board of directors isnot classified. Our board of directors has the authority to adopt, amend and repeal by-laws.
No Preemptive, Redemption or Conversion Rights
Our common stock is not redeemable, is not subject to sinking fund provisions, and does not have any conversion rights. Holders ofshares of common stock do not have preemptive rights to acquire newly issued shares.
Voting Rights
Subject to any special voting rights of any preferred stock, holders of our common stock have one vote per share in all elections ofdirectors and on all other matters submitted to a vote of stockholders of Flowserve. Holders of our common stock do not havecumulative voting rights. Except as otherwise provided by law, at elections of directors at an annual or special meeting ofshareholders at which a quorum is present, a director shall, except in a contested election, be elected by a majority of the votes castin favor of or against such nominee by the holders of shares entitled to vote in the election. In a contested election, a director shallbe elected by a plurality of the votes cast in favor of or against such nominee by the holders of shares entitled to vote in theelection. Except as otherwise provided by law or our certificate of incorporation, any other action at an annual or special meeting ofshareholders at which a quorum is present shall be authorized by a majority of the votes cast in favor of or against such action bythe holders of shares entitled to vote thereon.
Dividend Rights
Holders of common stock will be entitled to dividends in the amounts and at the times declared by our board of directors, afterpayment of any dividends on any outstanding preferred stock and subject to limitations for dividends contained in certain ofFlowserve’s outstanding debt instruments,
Liquidation, Dissolution or Similar Rights
Holders of our common stock will share equally in our assets on liquidation after payment or provision for all liabilities and anypreferential liquidation rights of any preferred stock then outstanding.
Preferred Stock
Under our certificate of incorporation, without further stockholder action, our board of directors is authorized to provide for theissuance of shares of preferred stock in one or more series, to establish from time to time the number of shares to be included ineach such series, and to establish or change the rights of the holders of such series, including voting rights, liquidation preferences,dividend rights, redemption rights, conversion or exchange rights, and sinking fund provisions. The issuance of such preferredstock could, among other things, (i) adversely affect the voting, dividend and liquidation rights with respect to our common stock,(ii) discourage an unsolicited proposal to acquire us, or (iii) facilitate a particular business combination involving us. Any of theseactions, plus others described herein, could discourage a transaction that some or a majority of our shareholders might believe to bein their best interests or in which our shareholders might receive a premium for their stock over its then market price.
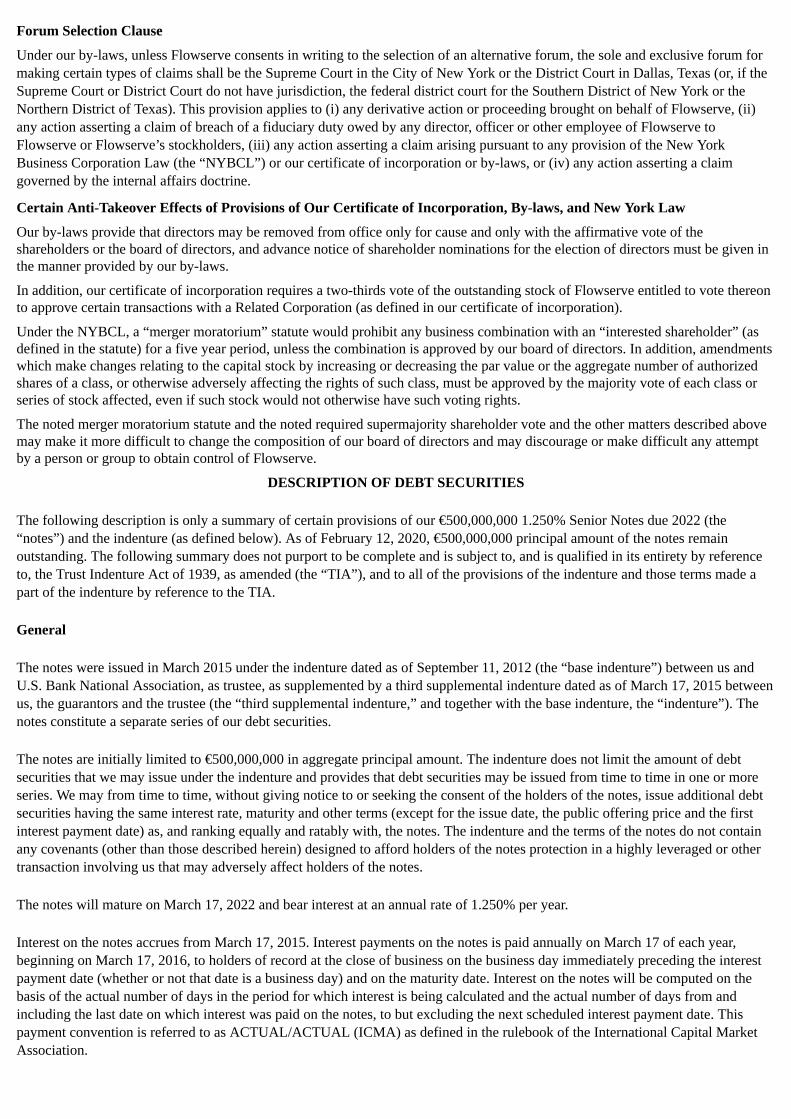
Forum Selection Clause
Under our by-laws, unless Flowserve consents in writing to the selection of an alternative forum, the sole and exclusive forum formaking certain types of claims shall be the Supreme Court in the City of New York or the District Court in Dallas, Texas (or, if theSupreme Court or District Court do not have jurisdiction, the federal district court for the Southern District of New York or theNorthern District of Texas). This provision applies to (i) any derivative action or proceeding brought on behalf of Flowserve, (ii)any action asserting a claim of breach of a fiduciary duty owed by any director, officer or other employee of Flowserve toFlowserve or Flowserve’s stockholders, (iii) any action asserting a claim arising pursuant to any provision of the New YorkBusiness Corporation Law (the “NYBCL”) or our certificate of incorporation or by-laws, or (iv) any action asserting a claimgoverned by the internal affairs doctrine.
Certain Anti-Takeover Effects of Provisions of Our Certificate of Incorporation, By-laws, and New York Law
Our by-laws provide that directors may be removed from office only for cause and only with the affirmative vote of theshareholders or the board of directors, and advance notice of shareholder nominations for the election of directors must be given inthe manner provided by our by-laws.
In addition, our certificate of incorporation requires a two-thirds vote of the outstanding stock of Flowserve entitled to vote thereonto approve certain transactions with a Related Corporation (as defined in our certificate of incorporation).
Under the NYBCL, a “merger moratorium” statute would prohibit any business combination with an “interested shareholder” (asdefined in the statute) for a five year period, unless the combination is approved by our board of directors. In addition, amendmentswhich make changes relating to the capital stock by increasing or decreasing the par value or the aggregate number of authorizedshares of a class, or otherwise adversely affecting the rights of such class, must be approved by the majority vote of each class orseries of stock affected, even if such stock would not otherwise have such voting rights.
The noted merger moratorium statute and the noted required supermajority shareholder vote and the other matters described abovemay make it more difficult to change the composition of our board of directors and may discourage or make difficult any attemptby a person or group to obtain control of Flowserve.
DESCRIPTION OF DEBT SECURITIES
The following description is only a summary of certain provisions of our €500,000,000 1.250% Senior Notes due 2022 (the“notes”) and the indenture (as defined below). As of February 12, 2020, €500,000,000 principal amount of the notes remainoutstanding. The following summary does not purport to be complete and is subject to, and is qualified in its entirety by referenceto, the Trust Indenture Act of 1939, as amended (the “TIA”), and to all of the provisions of the indenture and those terms made apart of the indenture by reference to the TIA.
General
The notes were issued in March 2015 under the indenture dated as of September 11, 2012 (the “base indenture”) between us andU.S. Bank National Association, as trustee, as supplemented by a third supplemental indenture dated as of March 17, 2015 betweenus, the guarantors and the trustee (the “third supplemental indenture,” and together with the base indenture, the “indenture”). Thenotes constitute a separate series of our debt securities.
The notes are initially limited to €500,000,000 in aggregate principal amount. The indenture does not limit the amount of debtsecurities that we may issue under the indenture and provides that debt securities may be issued from time to time in one or moreseries. We may from time to time, without giving notice to or seeking the consent of the holders of the notes, issue additional debtsecurities having the same interest rate, maturity and other terms (except for the issue date, the public offering price and the firstinterest payment date) as, and ranking equally and ratably with, the notes. The indenture and the terms of the notes do not containany covenants (other than those described herein) designed to afford holders of the notes protection in a highly leveraged or othertransaction involving us that may adversely affect holders of the notes.
The notes will mature on March 17, 2022 and bear interest at an annual rate of 1.250% per year.
Interest on the notes accrues from March 17, 2015. Interest payments on the notes is paid annually on March 17 of each year,beginning on March 17, 2016, to holders of record at the close of business on the business day immediately preceding the interestpayment date (whether or not that date is a business day) and on the maturity date. Interest on the notes will be computed on thebasis of the actual number of days in the period for which interest is being calculated and the actual number of days from andincluding the last date on which interest was paid on the notes, to but excluding the next scheduled interest payment date. Thispayment convention is referred to as ACTUAL/ACTUAL (ICMA) as defined in the rulebook of the International Capital MarketAssociation.
If any interest payment date would otherwise be a day that is not a business day, that interest payment date will be postponed to thenext date that is a business day. If the maturity date of the notes falls on a day that is not a business day, the related payment ofprincipal and interest will be made on the next business day as if it were made on the date such payment was due, and no interestwill accrue on the amounts so payable for the period from and after such date to the next business day. For purposes of the notes,“business day” shall mean a day on which commercial banks and foreign exchange markets are open for business in New York,London and in the place where any note is presented for payment (if presentation is applicable), and which is a day on which theTrans-European Automated Real-Time Gross Settlement Express Transfer System (TARGET2), or any successor thereto, isoperating.
The notes will not be entitled to the benefit of any sinking fund.
The notes will be issued only in fully registered form without coupons and in minimum denominations of €100,000 and integralmultiples of €1,000 in excess thereof. The notes will be represented by one or more global securities. Each global security will bedeposited with, or on behalf of, a common depositary, and registered in the name of the nominee of the common depositary for theaccounts of Clearstream Banking, société anonyme or its successor (“Clearstream”) and Euroclear Bank, S.A./N.V. or its successor(“Euroclear”). Except as described under “Global notes, book-entry form,” the notes will not be issuable in certificated form.
Issuance in euro
All payments of interest and principal, including payments made upon any redemption of the notes, will be made in euros; providedthat if the euro is unavailable to us due to the imposition of exchange controls or other circumstances beyond our control or if theeuro is no longer being used by the then member states of the European Monetary Union that have adopted the euro as theircurrency or for the settlement of transactions by public institutions of or within the international banking community, then allpayments in respect of the notes will be made in U.S. dollars until the euro is again available to us or so used. If the euro isunavailable to us, the amount payable on any date in euro will be converted into U.S. dollars at the rate mandated by the U.S.Federal Reserve Board as of the close of business on the second business day prior to the relevant payment date or, if the U.S.Federal Reserve Board has not mandated a rate of conversion, the rate will be determined in our sole discretion on the basis of themost recently available market exchange rate for the euro. Any payment in respect of the notes so made in U.S. dollars will notconstitute an event of default under the notes or the indenture. Neither the trustee nor the paying agent shall have any responsibilityfor any calculation or conversion in connection with the forgoing.
Guarantees
Subject to the limitations described in the base indenture, each of our subsidiaries that from time to time is a guarantor under ourprimary bank credit facility (the “guarantors”) jointly and severally, fully, unconditionally and irrevocably guarantee (the“guarantees”) the full and punctual payment when due, whether at maturity, by acceleration, by redemption or otherwise, of theprincipal of and interest on the notes and our obligations under the indenture.
The guarantee of a guarantor will be automatically and unconditionally released and discharged, without the consent of the holdersof the notes, and no further action by us, any guarantor or the trustee shall be required for such release (unless we shall notify thetrustee that no release and discharge shall occur as a result thereof) upon:
—
the sale or other disposition (including by way of consolidation or merger) of such guarantor to a person or entity otherthan us or any of our subsidiaries in a transaction or series of transactions not prohibited by the indenture;
—
the sale or other disposition of all or substantially all the assets of such guarantor to a person or entity other than us or anyof our subsidiaries in a transaction or series of transactions not prohibited by the indenture;
—
our exercise of our legal or covenant defeasance option under the indenture or the discharge of our obligations under theindenture in accordance with the terms of the indenture; or
—
the delivery of an officer’s certificate to the trustee that such guarantor does not guarantee our obligations under ourprimary bank credit facility.
At any time after the issuance of the notes, including following any release of a guarantor from its guarantee, we will cause any ofour subsidiaries that is a guarantor under our primary bank credit facility to execute and deliver to the trustee a supplementalindenture pursuant to which such subsidiary will guarantee payment of the notes on the same terms and conditions as those set forthin the indenture. Thereafter, such subsidiary shall be a guarantor for all purposes of the notes unless and until such guarantee isreleased in accordance with the provisions of the indenture.
Ranking
The notes and the guarantees are our and the guarantors’ respective senior unsecured obligations and rank equally in right ofpayment with all our and the guarantors’ respective existing and future senior unsecured indebtedness.
The notes and the guarantees rank senior in right of payment to all of our and the guarantors’ existing and future subordinatedindebtedness.
The notes and the guarantees effectively rank junior to any future secured indebtedness incurred by us or any of the guarantors, tothe extent of the value of the assets securing such indebtedness.
In addition, the notes and the guarantees effectively rank junior to all liabilities of our subsidiaries that are not guaranteeing thenotes (excluding any amounts owed by such subsidiaries to us or any guarantor). We derive a portion of our operating income andcash flow from our investments in our subsidiaries that will not become guarantors. Claims of creditors of our subsidiaries that arenot guaranteeing the notes generally will have priority with respect to the assets and earnings of such subsidiaries over the claims ofour and the guarantors’ respective creditors, including holders of the notes. Accordingly, the notes and the guarantees will bestructurally subordinated to creditors, including trade creditors and preferred stockholders, if any, other than us or any guarantor, ofour subsidiaries that are not guaranteeing the notes.
Further issues
We may from time to time, without giving notice to or seeking the consent of the holders of the notes, issue additional debtsecurities having the same interest rate, maturity and other terms (except for the issue date, the public offering price and the firstinterest payment date) as, and ranking equally and ratably with, the notes. Any additional debt securities having such similar terms,together with the notes, will constitute a single series of securities under the indenture, including for purposes of voting andredemptions, and any additional debt securities issued as part of the same series as the notes will be fungible with the notes forUnited States federal income tax purposes. No such additional debt securities may be issued if an event of default has occurred andis continuing with respect to the notes.
Optional redemption
At any time prior to December 17, 2021 (the date that is three months prior to the maturity date of the notes), we will have the rightto redeem the notes, in whole or in part from time to time, at our option, on at least 30 days’ but no more than 60 days’ prior writtennotice. We will not be responsible for giving notice to anyone other than the registered holder of the notes to be redeemed. Uponredemption of the notes, we will pay a redemption price equal to the greater of:
— 100% of the principal amount of the notes to be redeemed; and
—
the sum of the present values of the Remaining Scheduled Payments (as defined below) of the notes to be redeemed,discounted to the date of redemption on an annual basis (ACTUAL/ACTUAL ICMA) at the Comparable GovernmentBond Rate (as defined below) plus 25 basis points.
At any time on or after December 17, 2021 (the date that is three months prior to the maturity date of the notes), we may redeemthe notes, in whole or in part from time to time, at our option, at a redemption price equal to 100% of the principal amount of thenotes to be redeemed.
In each case, we will also pay the accrued and unpaid interest on the principal amount being redeemed to, but excluding, theredemption date.
“Comparable Government Bond” means, in relation to any Comparable Government Bond Rate calculation, at the discretion of anindependent investment bank selected by us, a German government bond whose maturity is closest to the maturity of the notes tobe redeemed, or if such independent investment bank in its discretion determines that such similar bond is not in issue, such otherGerman government bond as such independent investment bank may, with the advice of three brokers of, and/or market makers in,German government bonds selected by us, determine to be appropriate for determining the Comparable Government Bond Rate.
“Comparable Government Bond Rate” means the price, expressed as a percentage (rounded to three decimal places, with 0.0005being rounded upwards), at which the gross redemption yield on the notes to be redeemed, if they were to be purchased at suchprice on the third business day prior to the date fixed for redemption, would be equal to the gross redemption yield on suchbusiness day of the Comparable Government Bond (as defined below) on the basis of the middle market price of the ComparableGovernment Bond prevailing at 11:00 a.m. (London time) on such business day as determined by an independent investment bank.
“Remaining Scheduled Payments” means, with respect to each note to be redeemed, the remaining scheduled payments of theprincipal thereof and interest thereon that would be due after the related redemption date for such redemption; provided, however,that, if such redemption date is not an interest payment date with respect to such note, the amount of the next succeeding scheduledinterest payment thereon will be reduced by the amount of interest accrued thereon to such redemption date.
If less than all of the notes are to be redeemed, and the notes are global notes, the notes to be redeemed will be selected byEuroclear or Clearsteam in accordance with their standard procedures. If the notes to be redeemed are not global notes then held byEuroclear or Clearstream, the trustee will select notes to be redeemed on a pro rata basis, by lot, or by any other method the trusteedeems fair and appropriate. If the notes are listed on any national securities exchange, Euroclear or Clearstream or the trustee, asapplicable, will select notes in compliance with the requirements of the principal national securities exchange on which the notesare listed. Unless we default in payment of the redemption price, on and after the redemption date, interest will cease to accrue onthe notes or portions thereof called for redemption.
We or our affiliates may purchase notes from investors who are willing to sell from time to time, either in the open market atprevailing prices or in private transactions at negotiated prices. Notes that we or they purchase may, at our discretion, be held,resold or canceled.
The notes are also subject to redemption prior to maturity if certain events occur involving U.S. taxation. If any of these special taxevents do occur, the notes will be redeemed at a redemption price of 100% of their principal amount plus accrued and unpaidinterest to, but excluding, the redemption date. See “Redemption for tax reasons.” Before the redemption date, we will deposit withthe paying agent money sufficient to pay the redemption price of and (unless the redemption date shall be an interest payment date)accrued and unpaid interest to the redemption date on the notes to be redeemed on such date.
Payment of additional amounts
All payments of principal and interest on the notes by us will be made free and clear of and without withholding or deduction for oron account of any present or future tax, assessment or other governmental charge imposed by the United States (or any politicalsubdivision or taxing authority thereof or therein having power to tax), unless the withholding or deduction of such taxes,assessment or other government charge is required by law or the official interpretation or administration thereof. We will, subject tothe exceptions and limitations set forth below, pay as additional interest on the notes such additional amounts as are necessary inorder that the net payment by us of the principal of and interest on the notes to a holder who is not a United States person (asdefined below), after withholding or deduction for any present or future tax, assessment or other governmental charge imposed bythe United States (or any political subdivision or taxing authority thereof or therein having power to tax), will not be less than theamount provided in the notes to be then due and payable; provided, however, that the foregoing obligation to pay additionalamounts shall not apply:
(1) to the extent any tax, assessment or other governmental charge is imposed by reason of the holder (or the beneficialowner for whose benefit such holder holds such note), or a fiduciary, settlor, beneficiary, member or shareholder of theholder if the holder is an estate, trust, partnership or corporation, or a person holding a power over an estate or trustadministered by a fiduciary holder, being considered as:
(a) being or having been engaged in a trade or business in the United States or having or having had a permanent
establishment in the United States;
(b) having a current or former connection with the United States (other than a connection arising solely as a result ofthe ownership of the notes, the receipt of any payment or the enforcement of any rights hereunder), includingbeing or having been a citizen or resident of the United States;
(c) being or having been a personal holding company, a passive foreign investment company or a controlled foreigncorporation for United States income tax purposes, a private foundation or other tax-exempt organization or acorporation that has accumulated earnings to avoid U.S. federal income tax; or
(d) being or having been a “10-percent shareholder” of the Company as defined in section 871(h)(3) of the United
States Internal Revenue Code of 1986, as amended (the “Code”) or any successor provision;
(2) to any holder that is not the sole beneficial owner of the notes, or a portion of the notes, or that is a fiduciary, partnershipor limited liability company, but only to the extent that a beneficial owner with respect to the holder, a beneficiary orsettlor with respect to the fiduciary, or a beneficial owner or member of the partnership or limited liability company
would not have been entitled to the payment of an additional amount had the beneficiary, settlor, beneficial owner ormember received directly its beneficial or distributive share of the payment;
(3) to the extent any tax, assessment or other governmental charge that would not have been imposed but for the failure ofthe holder or any other person to comply with certification, identification or information reporting requirementsconcerning the nationality, residence, identity or connection with the United States of the holder or beneficial owner ofthe notes, if compliance is required by statute, by regulation of the United States or any taxing authority therein or by anapplicable income tax treaty to which the United States is a party as a precondition to exemption from such tax,assessment or other governmental charge;
(4) to any tax, assessment or other governmental charge that is imposed otherwise than by withholding by us or a paying
agent from the payment;
(5) to any estate, inheritance, gift, sales, transfer, wealth, capital gains or personal property tax or similar tax, assessment or
other governmental charge, or excise tax imposed on the transfer of notes;
(6) to any withholding or deduction that is imposed on a payment to an individual and that is required to be made pursuantto European Council Directive 2003/48/EC or any other directive implementing the conclusions of the ECOFIN Councilmeeting of November 26 and 27, 2000 on the taxation of savings income, or any law implementing or complying withor introduced in order to conform to, such directive;
(7) to any tax, assessment or other governmental charge required to be withheld by any paying agent from any payment ofprincipal of or interest on any note as a result of the presentation of any note for payment (where presentation isrequired) by or on behalf of a holder of notes, if such payment could have been made without such withholding bypresenting the relevant note to at least one other paying agent in a member state of the European Union;
(8) to the extent any tax, assessment or other governmental charge would not have been imposed but for the presentation bythe holder of any note, where presentation is required, for payment on a date more than 30 days after the date on whichpayment became due and payable or the date on which payment thereof is duly provided for, whichever occurs later;
(9) to any tax, assessment or other governmental charge imposed under Sections 1471 through 1474 of the Code (or anyamended or successor provisions), any current or future regulations or official interpretations thereof, any agreemententered into pursuant to Section 1471(b) of the Code or any fiscal or regulatory legislation, rules or practices adoptedpursuant to any intergovernmental agreement entered into in connection with the implementation of such sections of theCode; or
(10) in the case of any combination of items (1), (2), (3), (4), (5), (6), (7), (8), and (9).
The notes are subject in all cases to any tax, fiscal or other law or regulation or administrative or judicial interpretation applicableto the notes. Except as specifically provided under this heading “Payment of additional amounts,” we will not be required to makeany payment for any tax, assessment or other governmental charge imposed by any government or a political subdivision or taxingauthority of or in any government or political subdivision.
As used under this heading “Payment of additional amounts” and under the heading “Redemption for tax reasons”, the term“United States” means the United States of America, the states of the United States, and the District of Columbia, and the term“United States person” means any individual who is a citizen or resident of the United States for U.S. federal income tax purposes,a corporation, partnership or other entity created or organized in or under the laws of the United States, any state of the UnitedStates or the District of Columbia, or any estate or trust the income of which is subject to U.S. federal income taxation regardless ofits source.
Redemption for tax reasons
If, as a result of any change in, or amendment to, the laws (or any regulations or rulings promulgated under the laws) of the UnitedStates (or any taxing authority in the United States), or any change in, or amendments to, an official position regarding theapplication or interpretation of such laws, regulations or rulings, which change or amendment is announced or becomes effective onor after the date of the issuance of the notes, we become or, based upon a written opinion of independent counsel selected by us,will become obligated to pay additional amounts as described herein under the heading “Payment of additional amounts” withrespect to the notes, then we may at any time at our option redeem, in whole, but not in part, the notes on not less than 30 nor more
than 60 days prior notice, at a redemption price equal to 100% of their principal amount, together with accrued and unpaid intereston those notes to, but excluding, the redemption date.
Certain covenants
Limitation on liens
We will not, and will not permit any Material Subsidiary to, create, assume or permit to exist, any Lien, other than Permitted Liens,on any Principal Property, now owned or hereafter acquired by us or any Subsidiary, to secure Debt, without effectively providingconcurrently that the notes are secured equally and ratably with such Debt, for so long as such Debt shall be so secured.
“Permitted Liens” means:
(1) Liens existing on the date of the Indenture, or any Lien in favor of the trustee for the benefit of holders of the notes;
(2) Liens in favor of us or any guarantor;
(3) Liens on any property existing at the time we or a Material Subsidiary acquired or leased such property, including
property acquired by us or a Material Subsidiary through a merger or similar transaction;
(4) Liens on any Principal Property to secure all or part of the cost of acquisition, construction, development orimprovement of such Principal Property, or to secure Debt incurred to provide funds for any such purposes, provided,that the commitment of the creditor to extend the credit secured by any such Lien shall have been obtained not later than12 months after the later of (A) the completion of the acquisition, construction, development or improvement of suchPrincipal Property and (B) the placing in operation of such Principal Property or of such Principal Property as soconstructed, developed or improved;
(5) Liens on property of any Person existing at the time such Person becomes a Material Subsidiary;
(6) Liens imposed by law for taxes, assessments or charges of any governmental authority for claims which are not overduefor a period of more than 60 days, or to the extent that such Lien is being contested in good faith by appropriate actionsand adequate reserves in accordance with GAAP are being maintained therefor;
(7) statutory Liens of landlords and Liens of carriers, warehousemen, mechanics, materialmen and other Liens imposed bylaw or created in the ordinary course of business which are not delinquent or remain payable without penalty or whichare being contested in good faith by appropriate actions;
(8) Liens securing (i) the non-delinquent performance of bids, trade contracts (other than for borrowed money), leases orstatutory obligations, (ii) surety bonds (excluding appeal bonds and other bonds posted in connection with courtproceedings or judgments) and (iii) other non-delinquent obligations of a like nature (including those to secure health,safety and environmental obligations) in each case incurred in the ordinary course of business;
(9) Liens created by or resulting from any litigation or other proceeding that is being contested in good faith by appropriateproceedings, including Liens arising out of judgments or awards against the Company or our Subsidiaries with respectto which we or our Subsidiaries are in good faith prosecuting an appeal or proceedings for review or for which the timeto make an appeal has not yet expired, and Liens relating to final unappealable judgment liens which are satisfied within60 days of the date of judgment or Liens incurred by the Company or any of our Subsidiaries for the purpose ofobtaining a stay or discharge in the course of any litigation or proceeding to which we or any of our Subsidiaries is aparty;
(10) easements, rights-of-way, zoning or any other restrictions, encroachments, protrusions and other similar encumbranceson real property which in the aggregate do not materially detract from the value of such property or materially interferewith the ordinary conduct of our businesses or the businesses of our Subsidiaries, taken as a whole;
(11) Liens securing obligations in respect of Capital Leases on assets subject to such leases, provided that such leases are
not otherwise prohibited;
(12) any Lien renewing, extending or replacing any Lien referred to above, to the extent that (a) the principal amount of theindebtedness secured by such Lien is not increased and (b) no assets encumbered by any such Lien other than the assetspermitted to be encumbered immediately prior to such renewal, extension, refinance or refund are encumbered thereby;or
(13) any other Lien on any of our or our subsidiaries’ assets or properties that secure indebtedness, liabilities and obligationsof us or our subsidiaries in an aggregate amount at the time of the creation of such Lien that, together with the amountof such indebtedness, liabilities and obligations secured by other Liens pursuant to this clause at such time, does notexceed an amount equal to 15% of our Consolidated Tangible Assets (determined as of the most recently ended fiscalquarter for which financial statements are available).
Limitation on sale and leaseback transactions
The indenture provides that we will not, and will not permit any Material Subsidiary to, enter into any Sale and LeasebackTransaction covering any Principal Property owned by us or such Material Subsidiary. However, a Sale and Leaseback Transactionwill not be prohibited if:
(1) the transaction is permitted pursuant to the exception described in the last clause under “Limitation on liens;”
(2) the proceeds of the Sale and Leaseback Transaction are at least equal to the fair value (as determined by our Board ofDirectors in good faith) of the Principal Property leased pursuant to such transaction and an amount equal to the greaterof (i) the net proceeds of the sale or transfer and (ii) the Attributable Debt of the Principal Property sold (as determinedby us) is applied within 180 days of the Sale and Leaseback Transaction to either (x) the purchase or acquisition of, or,in the case of real property, the commencement of construction on or improvement of, property or assets, or (y) thevoluntary retirement or repayment (other than at maturity or pursuant to a mandatory sinking fund or mandatoryredemption provision) of Funded Debt of ours (other than indebtedness subordinated to the notes) or a MaterialSubsidiary, for money borrowed, maturing more than 12 months after the voluntary retirement;
(3) the lease is for a period not exceeding three years and by the end of which it is intended that the use of such Principal
Property by the lessee will be discontinued; or
(4) the lease is with us or another Material Subsidiary.
Certain definitions
The following are the meanings of terms that are important in understanding the covenants previously described:
“Attributable Debt” with regard to a Sale and Leaseback Transaction with respect to any Principal Property means, at the time ofdetermination, the present value of the total net amount of rent required to be paid under the lease during the remaining termthereof (including any period for which the lease has been extended), discounted at the rate of interest set forth or implicit in theterms of the lease (or, if not practicable to determine the rate, the weighted average interest rate per annum borne by the notes thenoutstanding under the indenture) compounded semi-annually. In the case of any lease that is terminable by the lessee upon thepayment of a penalty, the net amount of rent will be the lesser of (x) the net amount determined assuming termination upon the firstdate the lease may be terminated (in which case the net amount will also include the amount of the penalty, but will not include anyrent that would be required to be paid under the lease subsequent to the first date upon which it may be so terminated) or (y) the netamount determined assuming no such termination.
“Capital Lease” means a lease with respect to which the lessee is required concurrently to recognize the acquisition of an asset andthe incurrence of a liability in accordance with generally accepted accounting principles in effect in the United States as of the dateof the indenture.
“Consolidated Tangible Assets” means, as of any date, total assets (excluding treasury stock, unamortized debt discount andexpense, goodwill, trademarks, trade names, patents, deferred charges and other intangible assets) of the Company and itsSubsidiaries on a consolidated basis, as determined in accordance with GAAP.
“Debt” means with respect to a Person all obligations of such Person for borrowed money and all such obligations of any otherPerson for borrowed money guaranteed by such Person.
“Funded Debt” means, on the date of determination, any Debt maturing by its terms more than 12 months from such date(notwithstanding that any portion of such Debt is included in current liabilities), including any Debt renewable to extendible at theoption of the borrower to a date later than 12 months from such date of determination.
“GAAP” means generally accepted accounting principles as in effect from time to time in the United States.
“Liens” means, with respect to any Person, any mortgage, lien, pledge, charge, security interest or other similar encumbrance, orany interest or title of any vendor, lessor, lender or other secured party to or of such Person under any conditional sale or other titleretention agreement or Capital Lease, upon or with respect to any property or asset of such Person.
“Material Subsidiary” means each guarantor and any other Subsidiary of ours which owns a Principal Property.
“Person” means an individual, limited liability company, partnership, corporation, trust, unincorporated organization, association,joint venture or other entity or a government or agency or political subdivision thereof.
“Principal Property” means any manufacturing plant, warehouse, office building or parcel of real property, including fixtures butexcluding leases and other contract rights which might otherwise be deemed real property, owned by us or any of our Subsidiaries,whether owned on the date of the indenture or thereafter acquired, that has a gross book value (determined in accordance withGAAP) in excess of 1.0% of the Consolidated Tangible Assets of us and our consolidated subsidiaries. Any plant, warehouse,office building or parcel of real property or portion thereof will not be a Principal Property if our board of directors in good faithdetermines it is not of material importance to the business conducted by us and our Subsidiaries taken as a whole.
“Sale and Leaseback Transaction” means any arrangement with any Person relating to property now owned or hereafter acquiredwhereby the Company or any Subsidiary transfers such property to another Person and the Company or the Subsidiary leases orrents it from such Person.
“Subsidiary” means any corporation, partnership or other legal entity (a) the accounts of which are consolidated with ours inaccordance with GAAP and (b) of which, in the case of a corporation, more than 50% of the outstanding Voting Stock is owned,directly or indirectly, by us or by one or more other subsidiaries, or by us and one or more other subsidiaries or, in the case of anypartnership or other legal entity, more than 50% of the ordinary equity capital interests is, at the time, directly or indirectly ownedor controlled by us or by one or more of the subsidiaries or by us and one or more of the subsidiaries.
“Voting Stock” of any specified Person as of any date means the capital stock of such Person that is at the time entitled to votegenerally in the election of the board of directors of such Person.
Offer to repurchase upon a change of control triggering event
Upon the occurrence of a Change of Control Triggering Event (as defined below), unless we have given written notice with respectto a redemption of the notes as described under “Optional redemption” or “Redemption for tax reasons,” each holder of notes willhave the right to require us to purchase all or a portion of such holder’s notes pursuant to the offer described below (the “Change ofControl Offer”), at a purchase price equal to 101% of the principal amount thereof plus accrued and unpaid interest, if any, to , butexcluding, the date of purchase (a “Change of Control Payment”).
Within 30 days following the date upon which the Change of Control Triggering Event occurred, or at our option, prior to anyChange of Control but after the public announcement of the transaction that constitutes or may constitute the Change of Control,we will send, by first class mail, a notice to each holder of notes, with a copy to the trustee, which notice will govern the terms ofthe Change of Control Offer. Such notice will state, among other things, the purchase date, which must be no earlier than 30 daysnor later than 60 days from the date such notice is mailed, other than as may be required by law (the “Change of Control PaymentDate”). The notice, if mailed prior to the date of consummation of the Change of Control, will state that the Change of ControlOffer is conditioned on the Change of Control being consummated on or prior to the Change of Control Payment Date. Holders ofnotes electing to have notes purchased pursuant to a Change of Control Offer will be required to surrender their notes, with theform entitled “Option of Holder to Elect Purchase” on the reverse of the note completed, to the paying agent at the addressspecified in the notice, or transfer their notes to the paying agent by book-entry transfer pursuant to the applicable procedures of thepaying agent, prior to the close of business on the third business day prior to the Change of Control Payment Date.
On each Change of Control Payment Date, we will, to the extent lawful:
—
accept for payment all notes or portions of notes properly tendered pursuant to the applicable Change of Control Offer;and
— deposit with the paying agent an amount equal to the Change of Control Payment in respect of all notes or portions ofnotes properly tendered pursuant to the applicable Change of Control Offer; and deliver or cause to be delivered to the
trustee the notes properly accepted together with an officers’ certificate stating the aggregate principal amount of notes orportions of notes being repurchased.
We will not be required to make a Change of Control Offer upon the occurrence of a Change of Control Triggering Event if a thirdparty makes such an offer in the manner, at the times and otherwise in compliance with the requirements for such an offer made byus and such third party purchases all notes properly tendered and not withdrawn under its offer.
The Change of Control Triggering Event feature of the notes may in certain circumstances make more difficult or discourage a saleor takeover of us and, thus, the removal of incumbent management. We have no present intention to engage in a transactioninvolving a Change of Control, although it is possible that the Company could decide to do so in the future. Subject to thelimitations discussed above under “Certain covenants,” the Company could, in the future, enter into certain transactions, includingacquisitions, refinancings or other recapitalizations, that would not constitute a Change of Control under the indenture, but thatcould increase the amount of indebtedness outstanding at such time or otherwise affect the Company’s capital structure or creditratings.
We will comply with the requirements of Rule 14e-1 under the Exchange Act, and any other securities laws and regulationsthereunder to the extent those laws and regulations are applicable in connection with the repurchase of the notes as a result of aChange of Control Triggering Event. To the extent that the provisions of any such securities laws or regulations conflict with theChange of Control Offer provisions of the notes, we will comply with the applicable securities laws and regulations and will not bedeemed to have breached our obligations under the Change of Control Offer provisions of the notes by virtue of such conflicts.
“Change of Control” means the occurrence of any one of the following:
(1) the direct or indirect sale, lease, transfer, conveyance or other disposition (other than by way of merger orconsolidation), in one or a series of related transactions, of all or substantially all of the assets of the Company and itsSubsidiaries, taken as a whole, to any “person” or “group” (as those terms are used in Section 13(d)(3) of the ExchangeAct) other than to the Company and/or one or more of its Subsidiaries;
(2) the consummation of any transaction (including without limitation, any merger or consolidation) the result of which isthat any “person” or “group” (as those terms are used in Section 13(d)(3) of the Exchange Act) becomes the “beneficialowner” (as defined in Rules 13d-3 and 13d-5 under the Exchange Act), directly or indirectly, of more than 50% of theoutstanding Voting Stock of the Company, measured by voting power rather than number of shares;
(3) the Company consolidates with, or merges with or into, any Person, or any Person consolidates with, or merges with orinto, the Company, in any such event pursuant to a transaction in which any of the outstanding Voting Stock of theCompany or the Voting Stock of such other Person is converted into or exchanged for cash, securities or other property,other than any such transaction where the shares of Voting Stock of the Company outstanding immediately prior to suchtransaction constitute, or are converted into or exchanged for, at least a majority of the Voting Stock of the survivingPerson immediately after giving effect to such transaction;
(4) the first day on which the majority of the members of the board of directors of the Company cease to be ContinuingDirectors; or the approval by the holders of the Voting Stock of the Company of any plan for the liquidation ordissolution of the Company.
“Change of Control Triggering Event” means the notes cease to be rated Investment Grade by each of the three Rating Agencies onany date during the period (the “Trigger Period”) commencing on the date of our first public announcement of any Change ofControl (or pending Change of Control) and ending 60 days following consummation of such Change of Control or, if earlier, uponabandonment of the Change of Control (which Trigger Period will be extended following consummation of a Change of Control forso long as any of the Rating Agencies has publicly announced that it is considering a possible ratings downgrade). Unless at leasttwo of the three Rating Agencies are providing a rating for the notes at the commencement of any Trigger Period, the notes will bedeemed to have ceased to be rated Investment Grade by each of the three Rating Agencies during that Trigger Period.Notwithstanding the foregoing, no Change of Control Triggering Event will be deemed to have occurred in connection with anyparticular Change of Control unless and until such Change of Control has actually been consummated.
“Continuing Director” means, as of any date of determination, any member of the Company’s board of directors who:
(1) was a member of such board of directors on the date of the issuance of the notes; or
(2) was nominated for election or elected or appointed to the Company’s board of directors with the approval of a majorityof the Continuing Directors who were members of the Company’s board of directors at the time of such nomination,
election or appointment (either by a specific vote or by approval of our proxy statement in which such member wasnamed as a nominee for election as a director, without objection to such nomination).
“Fitch” means Fitch Inc., and its successors.
“Investment Grade” means a rating of Baa3 or better by Moody’s (or its equivalent under any successor rating category ofMoody’s); a rating of BBB- or better by S&P (or its equivalent under any successor rating category of S&P); and a rating of BBB-or better by Fitch (or its equivalent under any successor rating category of Fitch).
“Moody’s” means Moody’s Investors Service, Inc., a subsidiary of Moody’s Corporation, and its successors.
“Rating Agency” means each of Moody’s, S&P and Fitch; provided, that if any of Moody’s, S&P and Fitch ceases to rate the notesor fails to make a rating of the notes publicly available for reasons outside of our control, a “nationally recognized statistical ratingorganization” within the meaning of Section 3(a)(62) of the Exchange Act, selected by us as a replacement agency for Moody’s,S&P or Fitch, or all of them, as the case may be.
“S&P” means Standard & Poor’s Ratings Services, a division of The McGraw-Hill Companies, Inc., and its successors.
Events of default
The notes are subject to the following events of default:
• default for 30 days in payment of any interest due and payable on the notes;
• default in payment of principal of the notes when due and payable, whether at maturity or upon acceleration, redemption,required repurchase or otherwise;
• our failure to comply with the covenant described under “Consolidation, Merger and Sale of Assets,” in the base indenture, orour failure, for 180 days after written notice to us by the trustee or holders of at least 25% in aggregate principle amount of theoutstanding securities in that series to comply with the reporting requirements under the indenture;
• default in our performance of any other covenants or agreements in respect of the indenture or the notes for 90 days afterwritten notice is received by us from the trustee, or received by us and the trustee from the holders of at least 25% in aggregateprincipal amount of the notes then outstanding;
• our failure to deposit any sinking fund payment, if any, when due, in respect of the notes;
• the guarantee of any such guarantor is held to be unenforceable or invalid or ceases for any reason to be in full force and effect(other than in accordance with the terms of the indenture) or any guarantor of the notes or any person acting on behalf of anyguarantor denies or disaffirms such guarantor’s obligations under its guarantee (other than by reason of a release or terminationof such guarantor from its guarantee in accordance with the terms of the indenture);
• certain events of bankruptcy, insolvency and reorganization of us or our Significant Subsidiaries (as defined in the baseindenture);
• an event of default (i) under the terms of any indenture or instrument for borrowed money under which we or any of oursubsidiaries has outstanding an aggregate principal amount of at least $60,000,000 or (ii) under the terms of our primaryrevolving bank facility, in each case, which event of default results in an acceleration of the payment of all or a portion of suchindebtedness for money borrowed (which acceleration is not rescinded or annulled within 30 days after notice of suchacceleration); and
• the entry against the Company, any Material Subsidiary or any Significant Subsidiary (as defined in the base indenture) of oneor more final judgments or orders for the payment of money in an aggregate amount (as to all such judgments or orders) inexcess of $60,000,000 (to the extent not covered by independent third-party insurance as to which the insurer has been notifiedof the claim and does not dispute coverage) and (A) enforcement proceedings are commenced by any creditor upon suchjudgment or order or (B) there is a period of 30 consecutive days during which a stay of enforcement of such judgment, byreason of a pending appeal or otherwise, is not in effect.
Discharge and defeasance

The discharge and defeasance provisions of the base indenture will apply to the notes. If we discharge or defease our obligationsunder the indenture, the Company and the Guarantors will be released from their obligations in the provisions described under theheadings “Certain covenants—Limitation on liens,” “Certain covenants—Limitation on sale and leaseback transactions,” and“Offer to repurchase upon a change of control triggering event.”
Governing law
The indenture, the notes and the guarantees are governed by and construed in accordance with the laws of the State of New Yorkwithout regard to conflicts of laws.
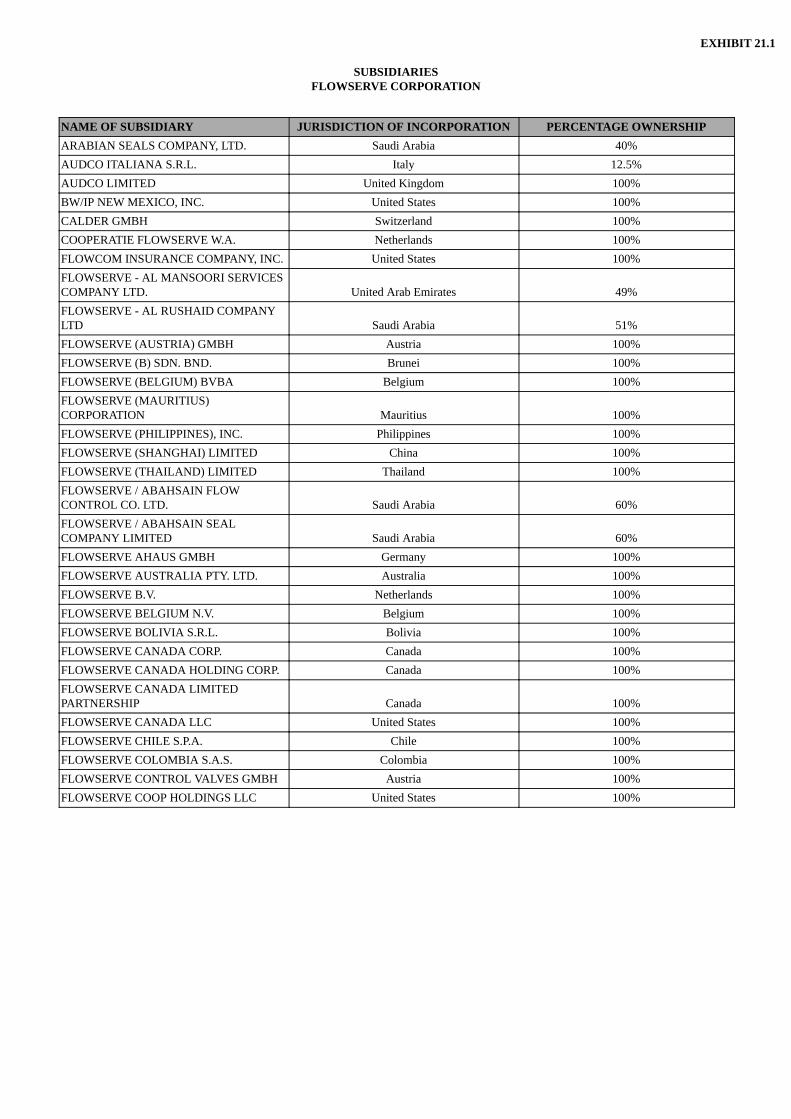
EXHIBIT 21.1
SUBSIDIARIESFLOWSERVE CORPORATION
NAME OF SUBSIDIARY JURISDICTION OF INCORPORATION PERCENTAGE OWNERSHIPARABIAN SEALS COMPANY, LTD. Saudi Arabia 40%AUDCO ITALIANA S.R.L. Italy 12.5%AUDCO LIMITED United Kingdom 100%BW/IP NEW MEXICO, INC. United States 100%CALDER GMBH Switzerland 100%COOPERATIE FLOWSERVE W.A. Netherlands 100%FLOWCOM INSURANCE COMPANY, INC. United States 100%FLOWSERVE - AL MANSOORI SERVICESCOMPANY LTD. United Arab Emirates 49%FLOWSERVE - AL RUSHAID COMPANYLTD Saudi Arabia 51%FLOWSERVE (AUSTRIA) GMBH Austria 100%FLOWSERVE (B) SDN. BND. Brunei 100%FLOWSERVE (BELGIUM) BVBA Belgium 100%FLOWSERVE (MAURITIUS)CORPORATION Mauritius 100%FLOWSERVE (PHILIPPINES), INC. Philippines 100%FLOWSERVE (SHANGHAI) LIMITED China 100%FLOWSERVE (THAILAND) LIMITED Thailand 100%FLOWSERVE / ABAHSAIN FLOWCONTROL CO. LTD. Saudi Arabia 60%FLOWSERVE / ABAHSAIN SEALCOMPANY LIMITED Saudi Arabia 60%FLOWSERVE AHAUS GMBH Germany 100%FLOWSERVE AUSTRALIA PTY. LTD. Australia 100%FLOWSERVE B.V. Netherlands 100%FLOWSERVE BELGIUM N.V. Belgium 100%FLOWSERVE BOLIVIA S.R.L. Bolivia 100%FLOWSERVE CANADA CORP. Canada 100%FLOWSERVE CANADA HOLDING CORP. Canada 100%FLOWSERVE CANADA LIMITEDPARTNERSHIP Canada 100%FLOWSERVE CANADA LLC United States 100%FLOWSERVE CHILE S.P.A. Chile 100%FLOWSERVE COLOMBIA S.A.S. Colombia 100%FLOWSERVE CONTROL VALVES GMBH Austria 100%FLOWSERVE COOP HOLDINGS LLC United States 100%
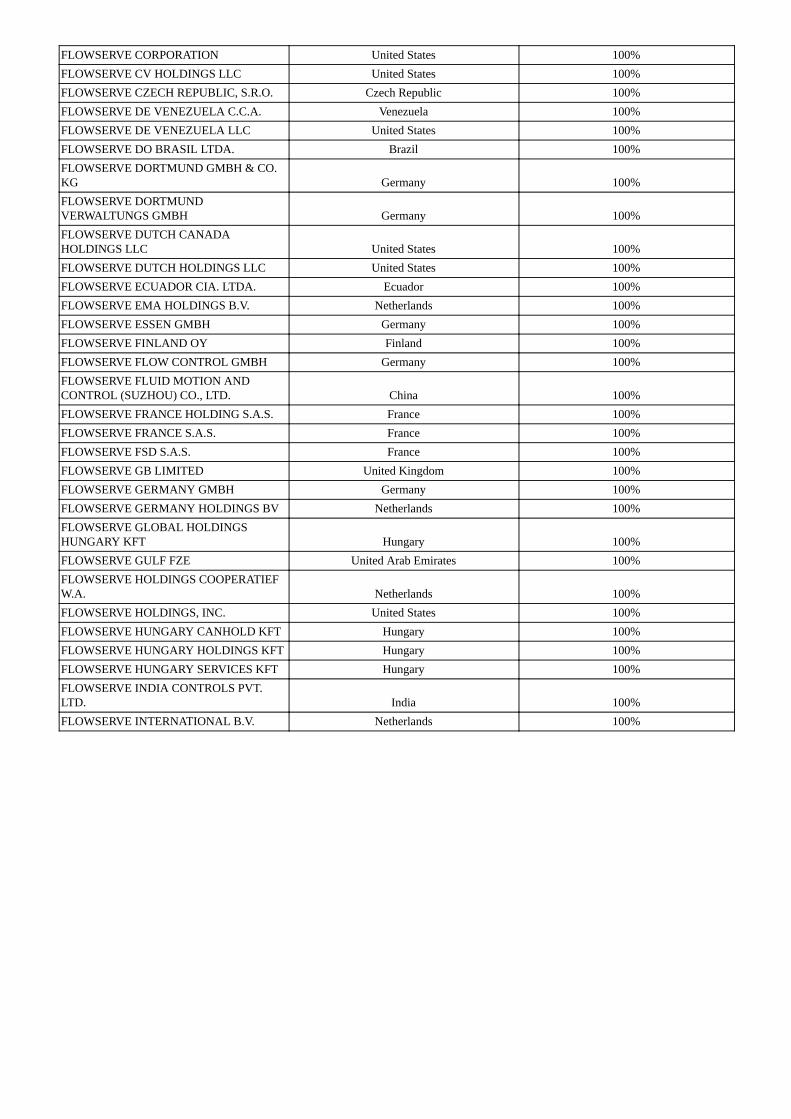
FLOWSERVE CORPORATION United States 100%FLOWSERVE CV HOLDINGS LLC United States 100%FLOWSERVE CZECH REPUBLIC, S.R.O. Czech Republic 100%FLOWSERVE DE VENEZUELA C.C.A. Venezuela 100%FLOWSERVE DE VENEZUELA LLC United States 100%FLOWSERVE DO BRASIL LTDA. Brazil 100%FLOWSERVE DORTMUND GMBH & CO.KG Germany 100%FLOWSERVE DORTMUNDVERWALTUNGS GMBH Germany 100%FLOWSERVE DUTCH CANADAHOLDINGS LLC United States 100%FLOWSERVE DUTCH HOLDINGS LLC United States 100%FLOWSERVE ECUADOR CIA. LTDA. Ecuador 100%FLOWSERVE EMA HOLDINGS B.V. Netherlands 100%FLOWSERVE ESSEN GMBH Germany 100%FLOWSERVE FINLAND OY Finland 100%FLOWSERVE FLOW CONTROL GMBH Germany 100%FLOWSERVE FLUID MOTION ANDCONTROL (SUZHOU) CO., LTD. China 100%FLOWSERVE FRANCE HOLDING S.A.S. France 100%FLOWSERVE FRANCE S.A.S. France 100%FLOWSERVE FSD S.A.S. France 100%FLOWSERVE GB LIMITED United Kingdom 100%FLOWSERVE GERMANY GMBH Germany 100%FLOWSERVE GERMANY HOLDINGS BV Netherlands 100%FLOWSERVE GLOBAL HOLDINGSHUNGARY KFT Hungary 100%FLOWSERVE GULF FZE United Arab Emirates 100%FLOWSERVE HOLDINGS COOPERATIEFW.A. Netherlands 100%FLOWSERVE HOLDINGS, INC. United States 100%FLOWSERVE HUNGARY CANHOLD KFT Hungary 100%FLOWSERVE HUNGARY HOLDINGS KFT Hungary 100%FLOWSERVE HUNGARY SERVICES KFT Hungary 100%FLOWSERVE INDIA CONTROLS PVT.LTD. India 100%FLOWSERVE INTERNATIONAL B.V. Netherlands 100%
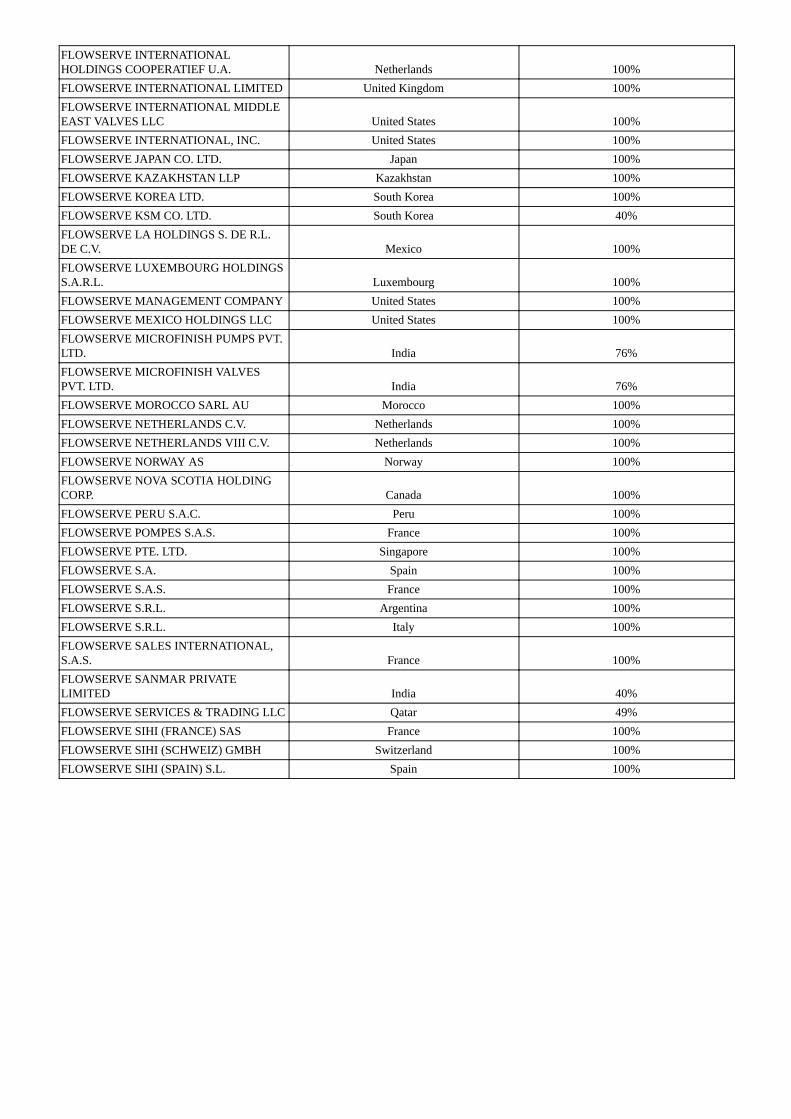
FLOWSERVE INTERNATIONALHOLDINGS COOPERATIEF U.A. Netherlands 100%FLOWSERVE INTERNATIONAL LIMITED United Kingdom 100%FLOWSERVE INTERNATIONAL MIDDLEEAST VALVES LLC United States 100%FLOWSERVE INTERNATIONAL, INC. United States 100%FLOWSERVE JAPAN CO. LTD. Japan 100%FLOWSERVE KAZAKHSTAN LLP Kazakhstan 100%FLOWSERVE KOREA LTD. South Korea 100%FLOWSERVE KSM CO. LTD. South Korea 40%FLOWSERVE LA HOLDINGS S. DE R.L.DE C.V. Mexico 100%FLOWSERVE LUXEMBOURG HOLDINGSS.A.R.L. Luxembourg 100%FLOWSERVE MANAGEMENT COMPANY United States 100%FLOWSERVE MEXICO HOLDINGS LLC United States 100%FLOWSERVE MICROFINISH PUMPS PVT.LTD. India 76%FLOWSERVE MICROFINISH VALVESPVT. LTD. India 76%FLOWSERVE MOROCCO SARL AU Morocco 100%FLOWSERVE NETHERLANDS C.V. Netherlands 100%FLOWSERVE NETHERLANDS VIII C.V. Netherlands 100%FLOWSERVE NORWAY AS Norway 100%FLOWSERVE NOVA SCOTIA HOLDINGCORP. Canada 100%FLOWSERVE PERU S.A.C. Peru 100%FLOWSERVE POMPES S.A.S. France 100%FLOWSERVE PTE. LTD. Singapore 100%FLOWSERVE S.A. Spain 100%FLOWSERVE S.A.S. France 100%FLOWSERVE S.R.L. Argentina 100%FLOWSERVE S.R.L. Italy 100%FLOWSERVE SALES INTERNATIONAL,S.A.S. France 100%FLOWSERVE SANMAR PRIVATELIMITED India 40%FLOWSERVE SERVICES & TRADING LLC Qatar 49%FLOWSERVE SIHI (FRANCE) SAS France 100%FLOWSERVE SIHI (SCHWEIZ) GMBH Switzerland 100%FLOWSERVE SIHI (SPAIN) S.L. Spain 100%
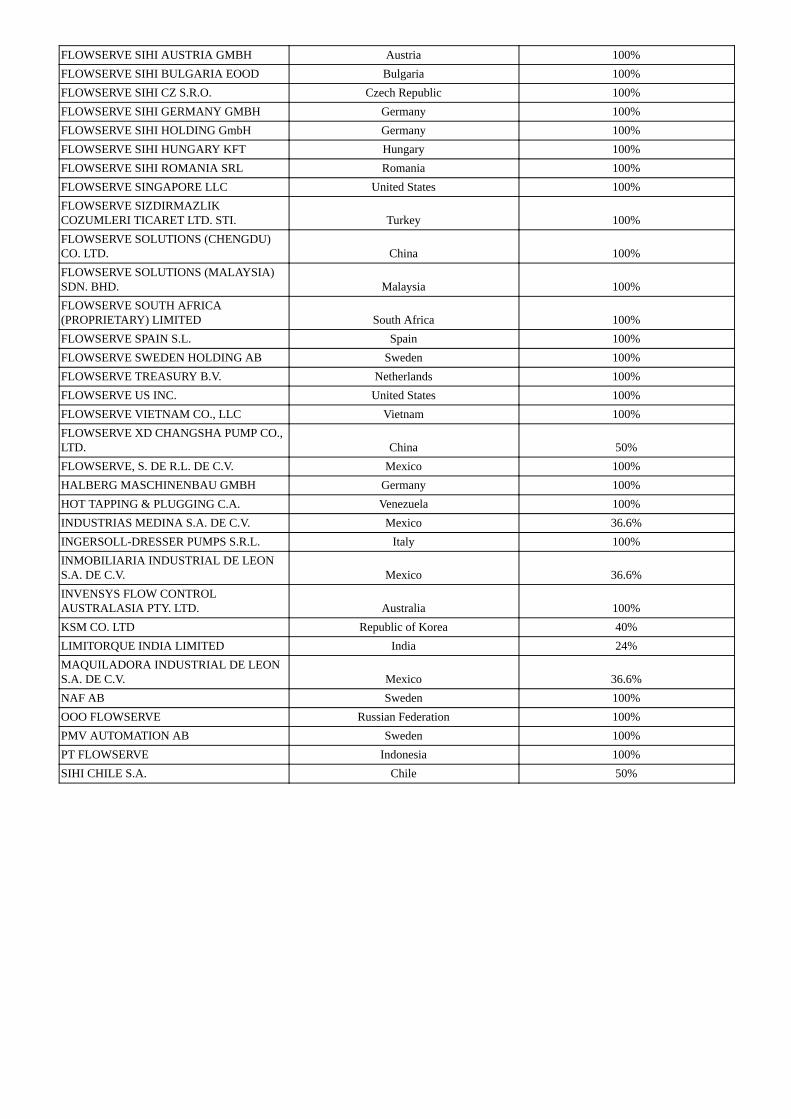
FLOWSERVE SIHI AUSTRIA GMBH Austria 100%FLOWSERVE SIHI BULGARIA EOOD Bulgaria 100%FLOWSERVE SIHI CZ S.R.O. Czech Republic 100%FLOWSERVE SIHI GERMANY GMBH Germany 100%FLOWSERVE SIHI HOLDING GmbH Germany 100%FLOWSERVE SIHI HUNGARY KFT Hungary 100%FLOWSERVE SIHI ROMANIA SRL Romania 100%FLOWSERVE SINGAPORE LLC United States 100%FLOWSERVE SIZDIRMAZLIKCOZUMLERI TICARET LTD. STI. Turkey 100%FLOWSERVE SOLUTIONS (CHENGDU)CO. LTD. China 100%FLOWSERVE SOLUTIONS (MALAYSIA)SDN. BHD. Malaysia 100%FLOWSERVE SOUTH AFRICA(PROPRIETARY) LIMITED South Africa 100%FLOWSERVE SPAIN S.L. Spain 100%FLOWSERVE SWEDEN HOLDING AB Sweden 100%FLOWSERVE TREASURY B.V. Netherlands 100%FLOWSERVE US INC. United States 100%FLOWSERVE VIETNAM CO., LLC Vietnam 100%FLOWSERVE XD CHANGSHA PUMP CO.,LTD. China 50%FLOWSERVE, S. DE R.L. DE C.V. Mexico 100%HALBERG MASCHINENBAU GMBH Germany 100%HOT TAPPING & PLUGGING C.A. Venezuela 100%INDUSTRIAS MEDINA S.A. DE C.V. Mexico 36.6%INGERSOLL-DRESSER PUMPS S.R.L. Italy 100%INMOBILIARIA INDUSTRIAL DE LEONS.A. DE C.V. Mexico 36.6%INVENSYS FLOW CONTROLAUSTRALASIA PTY. LTD. Australia 100%KSM CO. LTD Republic of Korea 40%LIMITORQUE INDIA LIMITED India 24%MAQUILADORA INDUSTRIAL DE LEONS.A. DE C.V. Mexico 36.6%NAF AB Sweden 100%OOO FLOWSERVE Russian Federation 100%PMV AUTOMATION AB Sweden 100%PT FLOWSERVE Indonesia 100%SIHI CHILE S.A. Chile 50%

SIHI GROUP B.V. Netherlands 100%SIHI PUMPS & SERVICES (THAILAND)LTD. Thailand 100%SIHI PUMPS (MALAYSIA) SDN. BHD. Malaysia 100%SIHI PUMPS (TAIWAN) CO. LTD. Taiwan 100%SIHI PUMPS (THAILAND) LTD. Thailand 100%STERLING FLUID SYSTEMS (POLSKA)SP.ZO.O. Poland 100%STERLING INDUSTRY CONSULT GMBH Germany 100%STERLING SIHI (NETHERLANDS) B.V. Netherlands 100%THOMPSONS, KELLY & LEWIS PTY.LIMITED Australia 100%WORTHINGTON S.R.L. Italy 100%YKV CORPORATION Japan 15%

EXHIBIT 23.1CONSENT OF INDEPENDENT REGISTERED PUBLIC ACCOUNTING FIRM
We hereby consent to the incorporation by reference in the Registration Statements on Form S-3 (No. 333-230796) and Form S-8 (Nos. 333-234407, 333-137706, 333-163251, and 333-82081) of Flowserve Corporation of our report dated February 17, 2020 relating to the financial statements and financialstatement schedule and the effectiveness of internal control over financial reporting, which appears in this Form 10‑K.
/s/ PricewaterhouseCoopers LLPPricewaterhouseCoopers LLP Dallas, Texas February 17, 2020
EXHIBIT 31.1
CERTIFICATION OF PRINCIPAL EXECUTIVE OFFICERPURSUANT TO SECTION 302
OF THE SARBANES-OXLEY ACT OF 2002
I, R. Scott Rowe, certify that:
1. I have reviewed this Annual Report on Form 10-K for the fiscal year ended December 31, 2019 of Flowserve Corporation;
2. Based on my knowledge, this report does not contain any untrue statement of a material fact or omit to state a material fact necessary to make thestatements made, in light of the circumstances under which such statements were made, not misleading with respect to the period covered by this report;
3. Based on my knowledge, the financial statements, and other financial information included in this report, fairly present in all material respects theconsolidated financial condition, results of operations and cash flows of the registrant as of, and for, the periods presented in this report;
4. The registrant’s other certifying officer and I are responsible for establishing and maintaining disclosure controls and procedures (as defined inExchange Act Rules 13a-15(e) and 15d-15(e)) and internal control over financial reporting (as defined in Exchange Act Rules 13a-15(f) and 15d-15(f))for the registrant and have:
(a) Designed such disclosure controls and procedures, or caused such disclosure controls and procedures to be designed under our supervision, toensure that material information relating to the registrant, including its consolidated subsidiaries, is made known to us by others within those entities,particularly during the period in which this report is being prepared;
(b) Designed such internal control over financial reporting, or caused such internal control over financial reporting to be designed under oursupervision, to provide reasonable assurance regarding the reliability of financial reporting and the preparation of financial statements for externalpurposes in accordance with generally accepted accounting principles;
(c) Evaluated the effectiveness of the registrant’s disclosure controls and procedures and presented in this report our conclusions about theeffectiveness of the disclosure controls and procedures, as of the end of the period covered by this report based on such evaluation; and
(d) Disclosed in this report any change in the registrant’s internal control over financial reporting that occurred during the registrant’s most recentfiscal quarter (the registrant’s fourth fiscal quarter in the case of an annual report) that has materially affected, or is reasonably likely to materiallyaffect, the registrant’s internal control over financial reporting; and
5. The registrant’s other certifying officer and I have disclosed, based on our most recent evaluation of internal control over financial reporting, to theregistrant’s auditors and the audit committee of the registrant’s board of directors (or persons performing the equivalent functions):
(a) All significant deficiencies and material weaknesses in the design or operation of internal control over financial reporting which arereasonably likely to adversely affect the registrant’s ability to record, process, summarize and report financial information; and
(b) Any fraud, whether or not material, that involves management or other employees who have a significant role in the registrant’s internalcontrol over financial reporting.
/s/ R. Scott RoweR. Scott RowePresident and Chief Executive Officer(Principal Executive Officer)
Date: February 17, 2020
EXHIBIT 31.2
CERTIFICATION OF PRINCIPAL FINANCIAL OFFICERPURSUANT TO SECTION 302
OF THE SARBANES-OXLEY ACT OF 2002
I, John E. Roueche, III, certify that:
1. I have reviewed this Annual Report on Form 10-K for the fiscal year ended December 31, 2019 of Flowserve Corporation;
2. Based on my knowledge, this report does not contain any untrue statement of a material fact or omit to state a material fact necessary to make thestatements made, in light of the circumstances under which such statements were made, not misleading with respect to the period covered by this report;
3. Based on my knowledge, the financial statements, and other financial information included in this report, fairly present in all material respects theconsolidated financial condition, results of operations and cash flows of the registrant as of, and for, the periods presented in this report;
4. The registrant’s other certifying officer and I are responsible for establishing and maintaining disclosure controls and procedures (as defined inExchange Act Rules 13a-15(e) and 15d-15(e)) and internal control over financial reporting (as defined in Exchange Act Rules 13a-15(f) and 15d-15(f))for the registrant and have:
(a) Designed such disclosure controls and procedures, or caused such disclosure controls and procedures to be designed under our supervision, toensure that material information relating to the registrant, including its consolidated subsidiaries, is made known to us by others within those entities,particularly during the period in which this report is being prepared;
(b) Designed such internal control over financial reporting, or caused such internal control over financial reporting to be designed under oursupervision, to provide reasonable assurance regarding the reliability of financial reporting and the preparation of financial statements for externalpurposes in accordance with generally accepted accounting principles;
(c) Evaluated the effectiveness of the registrant’s disclosure controls and procedures and presented in this report our conclusions about theeffectiveness of the disclosure controls and procedures, as of the end of the period covered by this report based on such evaluation; and
(d) Disclosed in this report any change in the registrant’s internal control over financial reporting that occurred during the registrant’s most recentfiscal quarter (the registrant’s fourth fiscal quarter in the case of an annual report) that has materially affected, or is reasonably likely to materiallyaffect, the registrant’s internal control over financial reporting; and
5. The registrant’s other certifying officer and I have disclosed, based on our most recent evaluation of internal control over financial reporting, to theregistrant’s auditors and the audit committee of the registrant’s board of directors (or persons performing the equivalent functions):
(a) All significant deficiencies and material weaknesses in the design or operation of internal control over financial reporting which arereasonably likely to adversely affect the registrant’s ability to record, process, summarize and report financial information; and
(b) Any fraud, whether or not material, that involves management or other employees who have a significant role in the registrant’s internalcontrol over financial reporting.
/s/ John E. Roueche, III
John E. Roueche, IIIVice President and Interim Chief Financial Officer(Principal Financial and Accounting Officer)
Date: February 17, 2020
EXHIBIT 32.1
CERTIFICATION PURSUANT TO18 U.S.C. SECTION 1350
AS ADOPTED PURSUANT TOSECTION 906 OF THE SARBANES-OXLEY ACT OF 2002
I, R. Scott Rowe, President and Chief Executive Officer of Flowserve Corporation (the “Company”), certify, pursuant to 18 U.S.C. Section 1350, as adoptedpursuant to Section 906 of the Sarbanes-Oxley Act of 2002, that to my knowledge:
(1) the Annual Report on Form 10-K of the Company for the period ended December 31, 2019, as filed with the Securities and ExchangeCommission on the date hereof (the “Annual Report”), fully complies with the requirements of Section 13(a) or 15(d) of the Securities Exchange Act of1934; and
(2) the information contained in the Annual Report fairly presents, in all material respects, the consolidated financial condition and results ofoperations of the Company.
/s/ R. Scott RoweR. Scott RowePresident and Chief Executive Officer(Principal Executive Officer)
Date: February 17, 2020
EXHIBIT 32.2
CERTIFICATION PURSUANT TO18 U.S.C. SECTION 1350
AS ADOPTED PURSUANT TOSECTION 906 OF THE SARBANES-OXLEY ACT OF 2002
I, John E. Roueche, III, Vice President and Interim Chief Financial Officer of Flowserve Corporation (the “Company”), certify, pursuant to 18 U.S.C.Section 1350, as adopted pursuant to Section 906 of the Sarbanes-Oxley Act of 2002, that to my knowledge:
(1) the Annual Report on Form 10-K of the Company for the period ended December 31, 2019, as filed with the Securities and ExchangeCommission on the date hereof (the “Annual Report”), fully complies with the requirements of Section 13(a) or 15(d) of the Securities Exchange Act of1934; and
(2) the information contained in the Annual Report fairly presents, in all material respects, the consolidated financial condition and results ofoperations of the Company.
/s/ John E. Roueche, IIIJohn E. Roueche, III
Vice President and Interim Chief Financial Officer(Principal Financial and Accounting Officer)
Date: February 17, 2020