
QLogic Corporation Notice of Annual Meeting, Proxy Statement and Annual Report on Form 10-K 2014
156
QLogic Corporation Notice of Annual Meeting, Proxy Statement and Annual Report on Form 10-K 2014 ANNUAL REPORT FOR THE MOST ADVANCED NETWORKS ON THE PLANET
Transcript of QLogic Corporation Notice of Annual Meeting, Proxy Statement and Annual Report on Form 10-K 2014

QLogic CorporationNotice of Annual Meeting, Proxy Statement and Annual Report on Form 10-K2014
A N N U A L R E P O R T
FOR THE MOST ADVANCED NETWORKS ON THE PLANET

Letter to Stockholders 2014
A N N U A L R E P O R T
Prasad L. Rampalli President and Chief Executive Officer
Dear Fellow Stockholder,
Fiscal 2014 was a year of sharpened focus and investment in market expansion opportunities in the server and storage connectivity markets, while continuing our disciplined financial management and leadership in served markets.
The highlight of fiscal 2014 was our acquisition of the 10/40/100Gb Ethernet controller assets related to Broadcom’s NetXtreme II Ethernet controller family. The acquired business consists of world-class controller technology, products currently shipping, a design win pipeline, and an outstanding engineering team. Strategically, this acquisition accelerates our time to market for 40Gb and 100Gb Ethernet products by almost two years, and it positions us to become the #2 player in the fast growing server Ethernet connectivity market. In addition, it provides significant revenue growth opportunities and is expected to be accretive to non-GAAP earnings immediately in fiscal 2015.
There is also a great deal of qualification activity in progress for next generation NetXtreme II product designs. The three leading server manufacturers — HP, Dell and IBM — account for well over 20 active qualification programs for NetXtreme II products. We are very excited about the program activity and prospects for future revenue growth from the new designs. We foresee solid demand across a variety of markets, including both Enterprise and Cloud, and are confident that we can expand our market share in the fast growing server Ethernet connectivity market.
During fiscal 2014, we continued our design-win success in the market for high performance I/O connectivity ASICs for storage systems. We currently have nearly 60 design wins in this important growth market, which spans traditional storage arrays, fast growing all-flash arrays and backup and recovery systems and builds off of our core Fibre Channel, Ethernet and Converged networking technologies. As data usage increases, expanded storage capacities are required, resulting in additional growth for the storage connectivity market. With the incumbent market share leader exiting this field in connection with the next generation technology transition, we believe we are well positioned to significantly increase our market share and grow revenues in this exciting new market.
Beyond these important growth markets, we continue to experience very good success with our traditional Fibre Channel products for the server connectivity market, where we have been the market leader for ten consecutive years. In calendar 2013, QLogic held a total revenue share of over 54% according to market share data from the Dell’Oro Group. In addition, QLogic led its nearest competitor by more than 12 percentage points and was the only company to show year-over-year market share gains based on reports from both Dell’Oro and Crehan Research. Further, the above figures do not account for our acquisition of Brocade’s Fibre Channel and converged network adapter business, which was completed in January 2014, and we believe will further add to our growing market share lead.
In our ongoing effort to improve our business and drive enhanced financial performance, we implemented in June 2013 a restructuring plan designed to focus our investments in markets where we have been and continue to be the most successful and to streamline our business operations with the goal of driving long-term profitable growth. This restructuring plan included a workforce reduction, the consolidation of several engineering activities, and enhanced product development focus. These restructuring activities were part of an overall plan designed to deliver greater value to customers and shareholders, while accelerating innovation. In addition, as a result of the acquisition of the NetXtreme II Ethernet business, we consolidated our Ethernet roadmap and undertook further restructuring activities in March 2014.
During fiscal 2014, the server market for some of our largest OEM customers and the overall enterprise spending environment continued to be challenged. Despite these conditions, we delivered net revenues of $460.9 million. In addition, we generated $56.8 million in cash from operations and used $157.4 million for the acquisition of businesses and $47.8 million of cash to repurchase shares of our common stock. At the end of the fiscal year, our cash and marketable securities totaled $278.0 million. Our strong cash position combined with the fact that we have no debt reflect a continued position of financial strength that provides us with considerable flexibility.
In summary, fiscal 2014 was an important year of transition and refocus. Going forward we intend to drive the following objectives:
• Maintain our revenue and profit performance in the mature Fibre Channel market by delivering superior products, gaining market share and capitalizing on new storage connectivity market opportunities.
• Grow our revenue and profit through participation in the fast growing Ethernet market by capitalizing on time to market and differentiated function.
• Develop new offerings that capitalize on our unique position in the server and storage connectivity markets.
• Continue our focus on fiscal discipline and shareholder returns.
With our improved product and technology portfolio resulting from the acquisition of the NetXtreme II Ethernet business and new streamlined business structure and organization, we believe that QLogic is well positioned for continued success.
We thank you for your continued support of QLogic.


QLOGIC CORPORATION26650 Aliso Viejo Parkway
Aliso Viejo, CA 92656(949) 389-6000
NOTICE OF ANNUALMEETING OF STOCKHOLDERSTo Be Held on August 25, 2014
To the Stockholders of QLogic Corporation:
You are cordially invited to attend the Annual Meeting of Stockholders of QLogic Corporation, a Delawarecorporation, which will be held at QLogic’s corporate headquarters, located at 26650 Aliso Viejo Parkway, AlisoViejo, California 92656, at 8:30 a.m., Pacific Daylight Time, on Monday, August 25, 2014, to consider and actupon the following matters, all as more fully described in the accompanying Proxy Statement:
1. To elect seven directors to the Board of Directors to serve until our next Annual Meeting or untiltheir successors have been elected and qualified;
2. To approve certain amendments to the QLogic Corporation 2005 Performance Incentive Plan, asamended, including, without limitation, an amendment to extend the term of the plan by 10 years;
3. An advisory vote to approve executive compensation;
4. To ratify the appointment of KPMG LLP as our independent registered public accounting firm forthe fiscal year ending March 29, 2015; and
5. To transact such other business as may properly come before the meeting or any postponements oradjournments thereof.
Stockholders of record of our common stock at the close of business on July 1, 2014, the record date fixedby the Board of Directors, are entitled to notice of, and to vote at, the meeting and at any postponements oradjournments thereof.
Important Notice Regarding the Availability of Proxy Materials for the Stockholder Meeting to BeHeld on August 25, 2014. The Proxy Statement and our Annual Report on Form 10-K for the fiscal year endedMarch 30, 2014 are available electronically at http://ir.qlogic.com.
By Order of the Board of Directors
MICHAEL L. HAWKINS
Secretary
Aliso Viejo, CaliforniaJuly 22, 2014
YOUR VOTE IS IMPORTANT
Please vote by using the Internet, by telephone or by signing and returning the enclosed proxy card assoon as possible to ensure your representation at the Annual Meeting. Your proxy card containsinstructions for each of these voting options.


QLOGIC CORPORATION26650 Aliso Viejo Parkway
Aliso Viejo, CA 92656(949) 389-6000
PROXY STATEMENT
APPROXIMATE DATE PROXYMATERIALS FIRST SENT TO STOCKHOLDERSJuly 22, 2014
These proxy materials are provided in connection with the solicitation of proxies by the Board ofDirectors of QLogic Corporation, a Delaware corporation, for the Annual Meeting of Stockholders to beheld at QLogic’s corporate headquarters, located at 26650 Aliso Viejo Parkway, Aliso Viejo, California92656, at 8:30 a.m., Pacific Daylight Time, on Monday, August 25, 2014, and at any postponements oradjournments thereof, for the purposes stated in the Notice of Annual Meeting of Stockholders precedingthis Proxy Statement. Unless the context otherwise requires, the terms “us,” “we,” “our,” “QLogic” andthe “Company” include QLogic Corporation and its consolidated subsidiaries.
QUESTIONS AND ANSWERS ABOUT THE PROXYMATERIALS AND THE MEETING
Q: What information is included in these materials?
A: This Proxy Statement includes information on the nominees for directors and the other matters to be votedon at the meeting. This Proxy Statement also includes information on the voting process and requirements,the compensation of directors and some of our executive officers, and certain other required information.
Q: What am I being asked to vote on at the meeting?
A: There are four matters scheduled to be voted on at the meeting:
(1) The election of seven directors to the Board of Directors, each of whom will serve until our next AnnualMeeting or until their successors are elected and qualified.
(2) The approval of certain amendments to the QLogic Corporation 2005 Performance Incentive Plan, asamended, including, without limitation, an amendment to extend the term of the plan by 10 years.
(3) An advisory vote to approve executive compensation.
(4) The ratification of the appointment of KPMG LLP as our independent registered public accounting firmfor fiscal year 2015.
Q: How does the Board recommend that I vote on each of these matters?
A: Our Board of Directors recommends that you vote your shares:
‰ “FOR” each of the director nominees (PROPOSAL NO. 1);
‰ “FOR” the approval of the amendments to the QLogic Corporation 2005 Performance Incentive Plan, asamended (PROPOSAL NO. 2);
‰ “FOR” the proposal regarding an advisory vote to approve executive compensation (PROPOSAL NO. 3);and
‰ “FOR” ratification of the appointment of KPMG LLP as our independent registered public accounting firmfor fiscal year 2015 (PROPOSAL NO. 4).

Q: What classes of shares are entitled to vote?
A: Each share of our common stock outstanding on July 1, 2014 (the “Record Date”) is entitled to one vote oneach item being voted on at the Annual Meeting. On the Record Date, we had 87,809,533 shares of commonstock outstanding.
Q: What shares can I vote?
A: You can vote all of the shares that you owned on the Record Date. These shares include (1) shares helddirectly in your name as the stockholder of record, and (2) shares held for you as the beneficial ownerthrough a stockbroker, bank or other nominee.
Q: What is the difference between holding shares as a stockholder of record and as a beneficial owner?
A: Most of our stockholders hold their shares through a stockbroker, bank or other nominee rather than directlyin their own name. As summarized below, there are some distinctions between shares held of record andthose owned beneficially:
Stockholder of Record — If your shares are registered in your name with our transfer agent, ComputershareInvestor Services, you are considered a stockholder of record with respect to those shares, and you arereceiving these proxy materials directly from us. As the stockholder of record, you have the right to grantyour voting proxy directly to us or to vote in person at the meeting. We have enclosed a proxy card for youto use.
Beneficial Owner — If your shares are held in a stock brokerage account, by a bank or other nominee(commonly referred to as being held in “street name”), you are considered to be the beneficial owner ofthose shares, and these proxy materials are being forwarded to you by your broker, bank or nominee as thestockholder of record. As the beneficial owner, you have the right to direct your broker, bank or nomineehow to vote your shares and are also invited to attend the Annual Meeting. However, since you are not thestockholder of record, you may not vote your shares in person at the Annual Meeting unless you obtain asigned proxy from the record holder giving you the right to vote the shares. Your broker, bank or nomineehas enclosed or provided voting instructions for you to use in directing the broker, bank or nominee how tovote your shares.
Q: How do I vote?
A: If you are a stockholder of record, you may vote by one of the following methods:
‰ via the Internet,
‰ by telephone,
‰ by mail, or
‰ in person at the Annual Meeting.
If you own your shares in “street name,” that is, through a brokerage or bank account or in another nomineeform, you must provide instructions to the broker, bank or nominee as to how your shares should be voted.Your broker, bank or nominee will usually provide you instructions at the time you receive this ProxyStatement. If you own your shares in this manner, you cannot vote in person at the Annual Meeting unlessyou receive a proxy to do so from the broker, bank or nominee.
Q: Can I revoke my proxy?
A: Yes. If you are a stockholder of record, to revoke your proxy you must do one of the following before thevotes are cast at the meeting: (1) deliver a written notice of your revocation to our Corporate Secretary at ourprincipal executive office, 26650 Aliso Viejo Parkway, Aliso Viejo, California 92656, or (2) execute anddeliver a later-dated proxy. Alternatively, you can attend the meeting and vote in person.
2

For shares you hold in street name, you may change your vote by submitting new voting instructions to yourbroker, bank or nominee or, if you have obtained a proxy from your broker, bank or nominee giving you theright to vote your shares at the Annual Meeting, by attending the meeting and voting in person.
Q: What does it mean if I get more than one proxy card?
A: It means that you hold shares registered in more than one account. Sign and return each proxy card that youget (or otherwise vote the shares in each account) in order to ensure that all of your shares are voted.
Q: What is the quorum requirement for the meeting?
A: For a “quorum” to exist at the Annual Meeting, stockholders holding a majority of the votes entitled to be castby the stockholders entitled to vote generally must be present in person or represented by proxy at the AnnualMeeting. There must be a quorum for any action to be taken at the Annual Meeting (other than postponementsor adjournments of the meeting). If you submit a properly executed proxy card or otherwise complete yourproxy via the internet, even if you abstain from voting, then your shares will be counted for purposes ofdetermining the presence of a quorum. If a broker indicates on a proxy that it lacks discretionary authority as tocertain shares to vote on a particular matter, commonly referred to as “broker non-votes,” those shares will stillbe counted for purposes of determining the presence of a quorum at the Annual Meeting.
Q: What is the voting requirement for each of the above matters?
A: QLogic has a majority voting standard for Proposal No. 1, the election of directors. Directors are elected ateach annual meeting by a majority of votes cast, meaning that the number of votes “for” a director mustexceed the number of votes “against” that director. In the event that a nominee for director receives more“against” votes for his or her election than “for” votes, the Board must consider that director’s resignationfollowing a recommendation by the Nominating and Governance Committee. The majority voting standarddoes not apply, however, in a contested election. In such circumstances, directors will instead be elected by aplurality of the votes cast, meaning that the seven nominees receiving the most votes will be elected.
With regard to the election to take place at the Annual Meeting, the Board intends to nominate the sevenpersons identified as its nominees in this Proxy Statement. Each of the directors will be elected by a majorityof the votes cast.
For each other proposal to be submitted for a vote of stockholders at the Annual Meeting, our bylaws requirethat the proposal receives the affirmative vote of a majority of the shares of common stock present or repre-sented by proxy at the meeting and entitled to vote on the proposal to be approved. Please be advised, how-ever, that Proposal No. 3 (an advisory vote to approve executive compensation) and Proposal No. 4(ratification of the appointment of KPMG LLP as our independent registered public accounting firm for fis-cal year 2015) are advisory only and are not binding on us. The Board of Directors (or a committee of theBoard of Directors, as applicable) will consider the outcome of the vote on each of these proposals inconsidering what action, if any, should be taken in response to these advisory votes by stockholders.
Q: How are abstentions and broker non-votes treated?
A: In all matters other than the election of directors (Proposal No. 1), abstentions have the same effect as votes“AGAINST” a matter. With respect to the election of directors, abstentions with respect to a director nomi-nee will not be counted as a vote cast on the election of the director nominee and therefore will not becounted in determining the outcome of the directors’ election. Abstentions will be counted as present andentitled to vote for purposes of determining the presence of a quorum at the Annual Meeting.
A broker is entitled to vote shares held for a beneficial holder on “routine” matters, such as the ratification ofthe appointment of KPMG LLP as our independent registered public accounting firm for fiscal year 2015(Proposal No. 4), without voting instructions from the beneficial holder of those shares. On the other hand, abroker is not entitled to vote shares held for a beneficial holder on certain “non-routine” items, absent votinginstructions from the beneficial holder of such shares. The election of directors (Proposal No. 1), the
3

amendments to the QLogic Corporation 2005 Performance Incentive Plan (Proposal No. 2), and the advisoryvote to approve executive compensation (Proposal No. 3) are considered non-routine matters. Consequently,if you do not give your broker specific instructions by way of a broker voting instruction card or an internetproxy, your shares will constitute broker non-votes and will not be voted with respect to Proposal No. 1,No. 2, or No. 3 and will have no effect on the outcome of these proposals, although they will count for pur-poses of determining whether a quorum exists.
Q: How will the votes be counted?
A: Your shares of common stock will be voted according to the instructions you provide on the proxy card, onthe broker voting instruction card or on your internet proxy. If you properly submit your proxy card, brokervoting instruction card or internet proxy without providing specific instructions, your shares will be voted inaccordance with the recommendations of the Board of Directors (“FOR” all director nominees named in theProxy Statement (Proposal No. 1), “FOR” the approval of the amendments to the QLogic Corporation 2005Performance Incentive Plan, as amended (Proposal No. 2), “FOR” the proposal regarding an advisory vote toapprove executive compensation (Proposal No. 3), and “FOR” ratification of the appointment of KPMG LLPas our independent registered public accounting firm for fiscal year 2015 (Proposal No. 4)).
Q: Who will count the votes?
A: We have appointed Broadridge Financial Solutions, Inc. (“Broadridge”) to act as the inspector of election forthe meeting. We believe Broadridge will use procedures that are consistent with Delaware law and ourbylaws concerning the voting of shares, the determination of the presence of a quorum and the determinationof the outcome of each matter submitted for a vote.
Q: How will voting on any other business be conducted?
A: We do not expect any matters to be presented for a vote at the meeting, other than the matters described inthis Proxy Statement. If you grant a proxy, the officers named as proxy holders, Prasad L. Rampalli and JeanHu, or their nominees or substitutes, will each have the discretion to vote your shares on any additional mat-ters that are properly presented at the meeting. If, for any unforeseen reason, any of our nominees is notavailable as a candidate for director, the person named as the proxy holder will vote your proxy for anothercandidate or other candidates nominated by the Board of Directors.
Q: Where can I find the voting results of the Annual Meeting?
A: The preliminary voting results will be announced at the Annual Meeting. The final voting results will be tal-lied by the inspector of election and published in a Current Report on Form 8-K, which the Company isrequired to file with the Securities and Exchange Commission (“SEC”) within four business days followingthe Annual Meeting. If final voting results are not known when such report is filed, they will be announcedin an amendment to such report within four business days after the final results become known.
Q: Who is paying for this proxy solicitation?
A: We will pay the cost of soliciting the proxies. The solicitation of proxies may be made in person, by tele-phone, or by electronic communication by officers, directors and regular employees, who will not be paidadditional compensation for these activities. We will send copies of the solicitation material to brokers, fidu-ciaries and custodians who will forward the material to the beneficial owners of our shares. On request, wewill reimburse brokers and other persons representing beneficial owners of shares for their reasonableexpenses in forwarding solicitation material to the beneficial owners.
Q: Are these proxy materials available electronically?
A: Yes, this is an Important Notice Regarding the Availability of Proxy Materials for the Stockholder Meetingto Be Held on August 25, 2014. This Proxy Statement and our Annual Report on Form 10-K for the fiscalyear ended March 30, 2014 are available electronically at http://ir.qlogic.com.
4

If you received your Annual Meeting materials by mail, we encourage you to help us to conserve naturalresources, as well as significantly reduce QLogic’s printing and mailing costs, by signing up to receive yourstockholder communications via e-mail. With electronic delivery, you will be notified via e-mail as soon asthe Annual Report and the Proxy Statement are available on the Internet, and you will be able to reviewthose materials and submit your stockholder vote online. Electronic delivery can also help reduce the numberof bulky documents in your personal files and eliminate duplicate mailings. To sign up for electronic deliv-ery, visit https://www.icsdelivery.com/qlogic/index.asp. Your electronic delivery enrollment will be effectiveuntil you cancel it. If you have questions about electronic delivery, please contact Investor Relations, QLogicCorporation, 26650 Aliso Viejo Parkway, Aliso Viejo, California 92656.
STOCK OWNERSHIP OF CERTAIN BENEFICIAL OWNERS ANDMANAGEMENT
The following table sets forth information as of July 1, 2014 concerning beneficial ownership by:
‰ holders of more than 5% of QLogic’s common stock,
‰ directors and nominees,
‰ each of the named executive officers listed in the Summary Compensation Table — Fiscal Years 2012,2013 and 2014 (“Summary Compensation Table”) below, and
‰ all directors and executive officers as a group.
The information provided in the table is based on QLogic’s records, information filed with the SEC andinformation provided to QLogic, except where otherwise noted.
Name
Amount andNature of Beneficial
Ownership Percent(1)
BlackRock, Inc.(2) . . . . . . . . . . . . . . . . . . . . . . . . . . . . . . . . . . . . . . . . . . 7,746,969 8.8%The Vanguard Group, Inc.(3) . . . . . . . . . . . . . . . . . . . . . . . . . . . . . . . . . 5,327,375 6.1%John T. Dickson(4) . . . . . . . . . . . . . . . . . . . . . . . . . . . . . . . . . . . . . . . . . — *Balakrishnan S. Iyer(5) . . . . . . . . . . . . . . . . . . . . . . . . . . . . . . . . . . . . . . 204,442 *Christine King(6) . . . . . . . . . . . . . . . . . . . . . . . . . . . . . . . . . . . . . . . . . . . 16,207 *Kathryn B. Lewis(7) . . . . . . . . . . . . . . . . . . . . . . . . . . . . . . . . . . . . . . . . 136,442 *D. Scott Mercer(8) . . . . . . . . . . . . . . . . . . . . . . . . . . . . . . . . . . . . . . . . . . 97,856 *Prasad L. Rampalli(9) . . . . . . . . . . . . . . . . . . . . . . . . . . . . . . . . . . . . . . . 10,000 *George D. Wells(10) . . . . . . . . . . . . . . . . . . . . . . . . . . . . . . . . . . . . . . . . 172,070 *William M. Zeitler(11) . . . . . . . . . . . . . . . . . . . . . . . . . . . . . . . . . . . . . . 107,856 *Jean Hu(12) . . . . . . . . . . . . . . . . . . . . . . . . . . . . . . . . . . . . . . . . . . . . . . . 127,174 *Roger J. Klein(13) . . . . . . . . . . . . . . . . . . . . . . . . . . . . . . . . . . . . . . . . . . 355,775 *H.K. Desai(14) . . . . . . . . . . . . . . . . . . . . . . . . . . . . . . . . . . . . . . . . . . . . . 2,158,234 2.4%Simon Biddiscombe(15) . . . . . . . . . . . . . . . . . . . . . . . . . . . . . . . . . . . . . 102,140 *Robert B. Crawford(16) . . . . . . . . . . . . . . . . . . . . . . . . . . . . . . . . . . . . . . 110,903 *All Directors and Executive Officers as a group (10 persons)(17) . . . . . 1,227,822 1.4%
* Less than 1% of the outstanding shares of our common stock.
(1) Based upon 87,809,533 shares of common stock outstanding on July 1, 2014. The number of shares benefi-cially owned by each person or entity is determined under the rules of the SEC, and the information is notnecessarily indicative of beneficial ownership for any other purpose. Under such rules, each person or entityis considered the beneficial owner of any shares as to which the person or entity has the sole or shared vot-ing power or investment power and also any shares that the entity or individual has the right to acquire on orbefore August 30, 2014 (60 days after July 1, 2014) through the exercise of any stock options, through thevesting of restricted stock units (“RSUs”) payable in shares, or upon the exercise of other rights. Unlessotherwise indicated, each person has sole voting and investment power with respect to the shares set forth inthe table.
5

(2) Number of shares owned is based on information contained in a report on Schedule 13G/A that BlackRock,Inc. (“BlackRock”) filed with the SEC on January 30, 2014. Such filing indicates that BlackRock has solevoting power with respect to 7,451,496 shares and sole dispositive power with respect to all shares. TheSchedule 13G/A contained information as of December 31, 2013 and may not reflect current holdings ofQLogic common stock. The address for BlackRock is 40 East 52nd Street, New York, New York 10022.
(3) Number of shares owned is based on information contained in a report on Schedule 13G/A that The VanguardGroup, Inc. (“Vanguard”) filed with the SEC on February 12, 2014. Such filing indicates that Vanguard hassole voting power with respect to 140,129 shares and sole dispositive power with respect to 5,192,346 shares.The Schedule 13G/A contained information as of December 31, 2013 and may not reflect current holdings ofQLogic common stock. The address for Vanguard is 100 Vanguard Blvd., Malvern, Pennsylvania 19355.
(4) Mr. Dickson joined the Board of Directors on June 20, 2014.
(5) Includes 174,662 shares which may be purchased pursuant to stock options that are exercisable on or beforeAugust 30, 2014 and 7,149 shares issuable pursuant to RSUs that will vest on or before August 30, 2014.
(6) Includes 10,801 shares which may be purchased pursuant to stock options that are exercisable on or beforeAugust 30, 2014 and 2,259 shares issuable pursuant to RSUs that will vest on or before August 30, 2014.
(7) Includes 112,662 shares which may be purchased pursuant to stock options that are exercisable on or beforeAugust 30, 2014 and 7,149 shares issuable pursuant to RSUs that will vest on or before August 30, 2014.
(8) Includes 71,076 shares which may be purchased pursuant to stock options that are exercisable on or beforeAugust 30, 2014 and 7,149 shares issuable pursuant to RSUs that will vest on or before August 30, 2014.
(9) Mr. Rampalli joined QLogic in February 2014 as a member of the Board of Directors and as President andChief Executive Officer.
(10) Includes 134,662 shares which may be purchased pursuant to stock options that are exercisable on or beforeAugust 30, 2014 and 7,149 shares issuable pursuant to RSUs that will vest on or before August 30, 2014.
(11) Includes 71,076 shares which may be purchased pursuant to stock options that are exercisable on or beforeAugust 30, 2014 and 7,149 shares issuable pursuant to RSUs that will vest on or before August 30, 2014.
(12) Includes 106,450 shares which may be purchased pursuant to stock options that are exercisable on or beforeAugust 30, 2014.
(13) Includes 350,775 shares which may be purchased pursuant to stock options that are exercisable on or beforeAugust 30, 2014.
(14) Mr. Desai passed away on June 8, 2014 and the shares listed are owned or acquirable by his estate. Benefi-cial ownership information includes 1,887,250 shares which may be purchased pursuant to stock optionsthat are exercisable on or before August 30, 2014. Under the QLogic Corporation 2005 PerformanceIncentive Plan, Mr. Desai’s beneficiaries have 12 months from the date of his death to exercise any vestedstock options.
(15) Beneficial ownership information is as of May 17, 2013 (except with respect to options), Mr. Biddiscombe’slast day of employment with the Company, and includes 46,644 shares (which represents the net differencebetween the 94,899 RSUs granted less 48,255 shares that were withheld to satisfy tax withholding obliga-tions) that were issued pursuant to RSUs for which vesting was accelerated. Stock options held byMr. Biddiscombe on his last day of employment expired in accordance with their terms prior to the recorddate.
(16) Beneficial ownership information is as of June 16, 2014, Mr. Crawford’s last day of employment with theCompany, and includes 86,150 shares which may be purchased pursuant to stock options that areexercisable on or before August 30, 2014.
(17) Includes 1,032,164 shares which may be purchased pursuant to stock options that are exercisable on orbefore August 30, 2014 and 38,004 shares issuable pursuant to RSUs that vest on or before August 30, 2014.Mr. Carrozza joined us on July 3, 2014 and is therefore not included in this table.
6

PROPOSAL NO. 1
ELECTION OF DIRECTORS
Our Board of Directors has nominated the following seven persons to serve as our directors: (1) John T.Dickson, (2) Balakrishnan S. Iyer, (3) Christine King, (4) D. Scott Mercer, (5) Prasad L. Rampalli, (6) George D.Wells, and (7) William M. Zeitler. If elected, each nominee will continue in office until our next Annual Meetingor until the director’s successor has been duly elected and qualified, or until the earlier of the director’s death,resignation, removal or retirement. Kathryn B. Lewis, a current director, is not standing for reelection.
The authorized number of directors on our Board at the time of the Annual Meeting will be seven. Biograph-ical information about our nominees for director and the experience, qualifications, attributes and skills consid-ered by our Nominating and Governance Committee and Board in determining that the nominee should serve as adirector appear below. For additional information about how we identify and evaluate nominees for director, see“Board of Directors — Committees — The Nominating and Governance Committee” below.
THE BOARD OF DIRECTORS RECOMMENDS THAT YOU VOTE “FOR” THE ELECTION OFEACH OF THE NOMINEES.
Each nominee receiving more votes for his or her election than votes against his or her election will beelected to our Board of Directors to serve until our next Annual Meeting or until their successors are elected andqualified, or until the earlier of the director’s death, resignation, removal or retirement. This required vote isdescribed in the following section entitled “Voting Standard.” Proxies cannot be voted for more than sevennominees for director. Unless authority to vote for directors has been withheld in the proxy, the persons named inthe enclosed proxy, or their nominee or substitute, intend to vote at the meeting for the election of the sevendirector nominees.
Voting Standard
Each of the nominees for director named above has consented to be named as a nominee in our Proxy State-ment, and we expect that each of the nominees will be able to serve if elected. In the event that any of the nomi-nees for director should become unable to serve if elected, it is intended that the persons named in the enclosedproxy, or their nominee or substitute, will vote your shares FOR the election of a substitute nominee as may berecommended by the Board of Directors.
Our Bylaws require that, in an uncontested election, each director will be elected by a majority of votes cast.A “majority of votes cast” means the number of shares voted “for” a director exceeds the number of shares voted“against” that director. In the case of an uncontested election, if a nominee who is serving as a director is notelected at the Annual Meeting by the requisite majority of votes cast, under Delaware law, the director wouldcontinue to serve on the Board as a “holdover director.” However, our Bylaws require each director nominee,prior to each election of directors at an annual meeting, to submit to the Board an irrevocable letter of resignationfrom the Board and all committees thereof, which will become effective if that director does not receive amajority of votes cast and the Board determines to accept such resignation. In such circumstances, the Nominat-ing and Governance Committee, composed entirely of independent directors (as detailed below in “Board ofDirectors — Committees — The Nominating and Governance Committee”), will evaluate and make a recom-mendation to the Board with respect to the submitted resignation. The Board must take action on the recom-mendation within 90 days following certification of the stockholder vote. QLogic will publicly disclose theBoard’s decision including, if applicable, the reasons for rejecting a resignation.
The majority voting standard does not apply, however, in a contested election. An election shall be deemedto be contested if, as of the 10th day preceding the date the notice of the meeting is first mailed for such meetingto the stockholders of the corporation, the number of nominees exceeds the number of directors to be elected. Insuch circumstances, directors will instead be elected by a plurality of the votes cast, meaning that the sevennominees receiving the most votes will be elected.
With regard to the election to take place at the 2014 Annual Meeting, the Board intends to nominate theseven persons identified as its nominees in this Proxy Statement.
7

The following table and paragraphs below set forth the names and certain information concerning the sevennominees for election to our Board of Directors. This information includes the principal occupation of and direc-torships held by each nominee for at least the past five years, as well as the specific experience, qualifications,attributes and skills that led to the conclusion that each nominee should serve as a member of the Board of Direc-tors.
Nominee(1) Position with QLogic Age
John T. Dickson . . . . . . . . . . . . . . . . . . . . Director 68Balakrishnan S. Iyer(3)(4) . . . . . . . . . . . . Director 58Christine King(4) . . . . . . . . . . . . . . . . . . . Director 65D. Scott Mercer(2)(3) . . . . . . . . . . . . . . . . Director 63Prasad L. Rampalli . . . . . . . . . . . . . . . . . . Director, President and Chief Executive Officer 60George D. Wells(2)(3) . . . . . . . . . . . . . . . Chairman of the Board 79William M. Zeitler(2)(4) . . . . . . . . . . . . . . Director 66
(1) The Nominating and Governance Committee identifies candidates and recommends to the Board of Direc-tors nominees for membership on the Board. Following the recommendation of the Nominating and Gover-nance Committee, the Board of Directors selects the nominees for election as directors at the AnnualMeeting.
(2) Member of the Nominating and Governance Committee.
(3) Member of the Audit Committee.
(4) Member of the Compensation Committee.
Mr. Dickson has served as a director since June 2014. Mr. Dickson served as Executive Vice President andhead of Operations of Alcatel-Lucent from May 2010 to January 2012. Mr. Dickson is the former President andChief Executive Officer of Agere Systems, Inc. (“Agere”), a position he held from August 2000 to October 2005.Prior to joining Agere, Mr. Dickson held positions as the Executive Vice President and Chief Executive Officerof Lucent’s Microelectronics and Communications Technologies Group, Vice President of AT&T Corporation’sintegrated circuit business unit, and Chairman and Chief Executive Officer of SHOgraphics, Inc., as well assenior roles with ICL, plc, and Texas Instruments, Inc. Mr. Dickson also serves as a director of Avago Tech-nologies Limited and KLA-Tencor Corporation. Within the past five years, he has served on the board of direc-tors of National Semiconductor Corporation (April 2006 to September 2010), Mettler-Toledo International Inc.(March 2001 to April 2009) and Freescale Semiconductor, Ltd. (May 2012 to July 2013). Mr. Dickson’s qual-ifications to serve on the Board include his extensive experience in senior management and executive positions inthe technology industry and his experience as a director of other public and private companies.
Mr. Iyer has served as a director since June 2003. From October 1998 to June 2003, Mr. Iyer was the SeniorVice President and Chief Financial Officer of Conexant Systems, Inc. (“Conexant”). Prior to October 1998,Mr. Iyer served as the Senior Vice President and Chief Financial Officer of VLSI Technology, Inc. Mr. Iyer hasheld a number of senior finance positions at Advanced Micro Devices, Inc., a semiconductor company. Mr. Iyercurrently serves on the Board of Directors of IHS Inc., Power Integrations, Inc. and Skyworks Solutions, Inc. Healso served on the Board of Directors of Conexant from February 2002 to April 2011 and Life TechnologiesCorp. from July 2001 to February 2014. Mr. Iyer’s experience as an executive officer of companies in thetechnology industry brings to our Board leadership, strategic and financial experience. His experience as a direc-tor at the public companies listed above provides the Board with significant financial expertise with specificapplication to our industry, as well as a broad understanding of corporate governance topics.
Ms. King has served as a director since April 2013. Ms. King was a director and President and Chief Execu-tive Officer of Standard Microsystems Corporation from October 2008 until August 2012. From September 2001until March 2008, Ms. King served as President and Chief Executive Officer of AMI Semiconductor, Inc. Priorto that Ms. King spent over 23 years at International Business Machines Corporation (“IBM”) in variousmanagement roles, including her last assignment as Vice President of Semiconductor Solutions. Ms. King cur-rently serves on the Board of Directors of Idaho Power Company, Cirrus Logic, Inc. and Skyworks Solutions,Inc. She previously served on the Board of Directors of AMI Semiconductor, Inc. from 2003 until its acquisition
8
by ON Semiconductor Corporation in March 2008, ON Semiconductor Corporation from March 2008 untilOctober 2008, Analog Devices, Inc. from June 2003 to March 2008, and Atheros Communications from April2008 until its acquisition in May 2011. Ms. King’s senior management and operational experience in a number oftechnology companies, service as a director at the companies listed above, and knowledge of the semiconductorindustry provide our Board with significant financial, strategic, operational and compliance expertise. Ms. Kingalso brings research and development and management experience gained from the executive positions she heldat IBM.
Mr. Mercer has served as a director since September 2010. Mr. Mercer was Chairman of the Board ofDirectors and Chief Executive Officer of Conexant from August 2008 and April 2008, respectively, until April2011. From November 2005 until April 2008, Mr. Mercer worked as a private investor, and from May 2005 toNovember 2005, Mr. Mercer served as interim Chief Executive Officer of Adaptec, Inc. Mr. Mercer served asSenior Vice President and Advisor to the Chief Executive Officer from February 2004 through December 2004,and as Senior Vice President and Chief Financial Officer from October 2001 through January 2004, at WesternDigital Corporation. From June 2000 to September 2001, Mr. Mercer served as Vice President and Chief Finan-cial Officer of Teralogic, Inc. From June 1996 to May 2000, he held various senior operating and financial posi-tions with Dell Inc. Mr. Mercer currently serves on the Board of Directors of Polycom, Inc. and SanDiskCorporation. He also served on the Board of Directors of Net Ratings, Inc. from January 2001 to June 2007,Adaptec, Inc. from November 2003 to October 2008, SMART Modular Technologies (WWH), Inc. from June2007 to January 2009, Palm, Inc. from June 2005 to July 2010, and Conexant from May 2003 to April 2011.Mr. Mercer’s senior management and operational experience in a number of technology companies and his serv-ice as a director at the companies listed above provide our Board with significant financial, operational andcompliance expertise with specific application to our industry, as well as a broad understanding of corporategovernance and other topics.
Mr. Rampalli joined us in February 2014 as a member of the Board of Directors and as President and ChiefExecutive Officer. Prior to joining QLogic, Mr. Rampalli served as Senior Vice President, EMC SolutionsGroup, and then Senior Vice President, Cross Business Unit Engineering at EMC Corporation (“EMC”), leadingEMC’s Solutions transformation and growth enablement since joining EMC in September 2010. Prior to EMC,Mr. Rampalli spent 27 years at Intel Corporation (“Intel”), most recently serving as Vice President, Intel Archi-tecture Group. As the Company’s principal executive officer, Mr. Rampalli is responsible for developing (inconjunction with the other Board members) and executing our business strategies, and he provides the Boardwith a deep knowledge of all aspects of our business and industry.
Mr. Wells has served as a director since February 1994 and as the Chairman of the Board of Directors sinceJune 2014. Mr. Wells was President and Chief Executive Officer of Exar Corporation, a manufacturer of analogand mixed-signal integrated circuits, from June 1992 until he retired in October 1996. Before joining Exar,Mr. Wells served as President and Chief Operating Officer of LSI Corporation (formerly LSI Logic Corporation),a manufacturer of application-specific integrated circuits, for seven years. Mr. Wells’ experience as a seniorexecutive officer of two companies in the technology industry brings to our Board his leadership, strategic,operational and management experience.
Mr. Zeitler has served as a director since September 2010. Mr. Zeitler has served as a consultant in thetechnology industry since his retirement from IBM in 2008. Prior to his retirement, Mr. Zeitler spent over 35years at IBM in various roles, including his last assignment as Senior Vice President and Group Executive —Servers, Storage and Semiconductor Groups of the IBM Systems and Technology Group. Mr. Zeitler brings tothe Board leadership, strategic, research and development and management experience gained from his experi-ence in the technology industry and the executive positions held at IBM.
9

BOARD OF DIRECTORS
Meetings
The Board of Directors held seven meetings during the fiscal year ended March 30, 2014. Each of our direc-tors attended 75% or more of the aggregate of the total number of meetings of the Board of Directors and of thetotal number of meetings of each committee on which the director was a member. Our directors are encouragedto attend our Annual Meeting each year. Six of the seven directors who stood for election at our 2013 AnnualMeeting attended the Annual Meeting either in person or by telephone.
Director Independence
Our Board of Directors currently consists of eight directors, including Mr. Dickson who was appointed tothe Board of Directors on June 20, 2014 and Ms. Lewis, who is not standing for reelection. Our Board of Direc-tors has determined that all of its members (except for Mr. Rampalli and former directors Mr. Desai, who passedaway in June 2014, and Mr. Biddiscombe, who resigned as President, Chief Executive Officer and a member ofthe Company’s Board of Directors effective May 17, 2013) who held office during fiscal year 2014 areindependent under the requirements set forth in The NASDAQ Stock Market listing standards. In considering theindependence of Mr. Dickson, the Board considered that Mr. Dickson serves as a non-employee director ofAvago Technologies Limited, the parent company of one of our suppliers. Our Board of Directors determinedthat, because of the nature of Mr. Dickson’s relationship and that the aggregate payments we make to the supplierare less than 1.2% of the other company’s annual gross revenues for its most recently completed fiscal year, therelationship does not interfere with Mr. Dickson’s exercise of independent judgment in carrying out hisresponsibilities as a director of the Company.
Communications with Board of Directors
You may communicate with any director, the entire Board of Directors, or any committee of the Board, bysending a letter to the director, the Board or the committee addressed to: Board of Directors, c/o Chairman of theBoard — QLogic Corporation, 26650 Aliso Viejo Parkway, Aliso Viejo, California 92656. The Chairman of theBoard or his designee will review all letters, categorize them, and forward them to the appropriate parties.
Board Leadership Structure; Executive Sessions of Our Independent Directors
The Board believes it is important to select its Chairman of the Board and the Company’s Chief ExecutiveOfficer (“CEO”) in the manner it considers in the best interests of the Company at any given point in time. Themembers of the Board possess considerable business experience and in-depth knowledge of the issues the Com-pany faces, and are therefore in the best position to evaluate the needs of the Company and how best to organizethe Company’s leadership structure to meet those needs. Accordingly, the Chairman and CEO positions may befilled by one individual or by two different individuals, and the Chairman may be a Company insider or anindependent director.
On June 9, 2014, we announced the passing of Mr. Desai, who served as the Company’s Chairman of theBoard for the last 15 years. Following Mr. Desai’s passing, the Board appointed Mr. Wells as Chairman of theBoard. As noted above under “Director Independence,” Mr. Wells is independent under the requirements setforth in The NASDAQ Stock Market listing standards. Mr. Rampalli serves as our President and CEO.
Effective as of May 17, 2013, Mr. Biddiscombe resigned as President and CEO of the Company, and as amember of the Company’s Board of Directors. The Company then formed a search committee, led byindependent director William M. Zeitler, to pursue the hiring of a permanent CEO. During the search for apermanent CEO, Ms. Hu, QLogic’s Senior Vice President and Chief Financial Officer (“CFO”), served as CEOon an interim basis. On December 9, 2013, QLogic announced that Mr. Rampalli would join the Company as itsPresident and CEO, and would also be appointed to the Company’s Board of Directors, effective on his first dayof employment, which was February 3, 2014.
10

Committees
Our Board of Directors has established an Audit Committee, a Compensation Committee and a Nominatingand Governance Committee.
The Audit Committee. Balakrishnan S. Iyer (Chairperson), Kathryn B. Lewis, D. Scott Mercer and George D.Wells are the current members of the Audit Committee. Ms. Lewis is not standing for reelection and her service onthe Audit Committee will end at our Annual Meeting. Our Board of Directors has determined that each member ofthe Audit Committee meets the independence requirements of The NASDAQ Stock Market listing standards, andthat Messrs. Iyer, Mercer and Wells are “audit committee financial experts” as defined by rules adopted by the SEC.The Audit Committee held nine meetings during the fiscal year ended March 30, 2014. The Audit Committee oper-ates under a written charter, which is available on our website at http://ir.qlogic.com. The Audit Committee selects,engages and reviews the performance of our independent registered public accounting firm each year. In addition,the Audit Committee approves non-audit services and fees to be paid to the independent registered public account-ing firm. The Audit Committee reports to our Board of Directors with respect to auditing and accounting matters.
The Compensation Committee. Christine King (Chairperson), Balakrishnan S. Iyer, Kathryn B. Lewis andWilliam M. Zeitler are the current members of the Compensation Committee. Ms. Lewis is not standing forreelection and her service on the Compensation Committee will end at our Annual Meeting. She served as theChairperson of the Compensation Committee until March 1, 2014, at which time she was succeeded byMs. King. Our Board of Directors has determined that each member of the Compensation Committee meets theindependence requirements of The NASDAQ Stock Market listing standards. The Compensation Committee heldfifteen meetings during the fiscal year ended March 30, 2014. The Compensation Committee reviews theperformance of our executive officers, establishes the compensation of our executive officers and reviews thecompensation programs for other key employees, including salary and cash incentive payment levels and stock-based compensation awards under our equity compensation plans. The Compensation Committee operates undera written charter, which is available on our website at http://ir.qlogic.com. For a description of the CompensationCommittee’s processes and procedures for the consideration and determination of executive compensation,please see the “Compensation Discussion and Analysis” below.
The Nominating and Governance Committee. George D. Wells (Chairperson), D. Scott Mercer and William M.Zeitler are the current members of the Nominating and Governance Committee. Our Board of Directors hasdetermined that each member of the Nominating and Governance Committee meets the independence requirements ofThe NASDAQ Stock Market listing standards. The Nominating and Governance Committee held five meetings duringthe fiscal year ended March 30, 2014. The Nominating and Governance Committee’s principal functions are to identifyprospective director nominees and recommend to our Board of Directors nominees for membership on the Board ofDirectors, to develop and recommend to our Board of Directors the governance principles applicable to the Board ofDirectors, to oversee the assessment of our Board of Directors, to recommend to our Board of Directors nominees foreach committee, and to establish and periodically review compensation for non-employee directors. The Nominatingand Governance Committee evaluates the performance of each Board member individually, the Board as a whole, andeach committee on an annual basis, and reviews this information with the full Board of Directors. Following thatreview, the Nominating and Governance Committee considers the effectiveness of each Board member individually,the Board as a whole, and each committee when deciding whether to re-nominate current Board members. The Com-pany does not have a formal policy with regard to the consideration of diversity in identifying director nominees, butthe Nominating and Governance Committee strives to nominate directors with a variety of complementary skills sothat, as a group, our Board of Directors will possess the appropriate talent, skills, and expertise to oversee the Compa-ny’s business. The Nominating and Governance Committee expects normally to be able to identify from its ownresources the names of qualified director nominees, but it will accept from stockholders recommendations ofindividuals to be considered as nominees. Additionally, the Nominating and Governance Committee has in the pastused and may continue to use the services of third party search firms to assist in the identification of appropriatecandidates. Any stockholder wishing to propose a nominee for consideration by the Nominating and GovernanceCommittee should submit a recommendation in writing to the Secretary of the Company at our principal executiveoffice in accordance with the procedures set forth below. The Nominating and Governance Committee operates undera written charter, which is available on our website at http://ir.qlogic.com. In addition, the Nominating and GovernanceCommittee has adopted a Corporate Governance Policy that is also available on our website at http://ir.qlogic.com.
11

A stockholder may submit the name of a director candidate for consideration by the Nominating and Gover-nance Committee by writing to the Secretary of the Company at the address set forth on the cover of this ProxyStatement. The stockholder must submit the following information in support of the candidate: (a) the name,address and telephone number of the stockholder recommending the candidate; (b) a representation that thestockholder submitting the recommendation is a stockholder of record or beneficial owner of shares of stock ofthe Company; (c) the name and address of the candidate; (d) a description of any arrangement or understandingbetween the stockholder and the candidate and any other person or persons regarding the submission of thecandidate’s name for consideration; (e) such other information regarding the candidate as the Company would berequired to include in a proxy statement filed pursuant to the proxy rules of the SEC if the Board were to nomi-nate the candidate for election as a director; (f) the consent of the candidate to be identified to the Board as acandidate for consideration and to be identified in the proxy; and (g) the agreement of the candidate to serve onthe Board if elected. The Nominating and Governance Committee may request any additional information that itdeems relevant in evaluating the background and experience of any candidate.
In evaluating a director candidate, the Nominating and Governance Committee will consider the candidate’sindependence, character, corporate governance skills and abilities, business experience, training and education,commitment to performing the duties of a director, and other skills, abilities or attributes that fill specific needsof the Board or its committees. The Nominating and Governance Committee will use the same criteria in evaluat-ing candidates suggested by stockholders as for candidates suggested by other sources.
Risk Oversight
Management has primary responsibility for identifying and managing risks to the Company, while ourBoard of Directors has overall responsibility for oversight of such risks, with a focus on the most significant risksfacing the Company. We believe that risk is inherent in innovation and the pursuit of long-term growth oppor-tunities. With the oversight of our Board of Directors, the Company has implemented practices and programsdesigned to help manage risks and to align risk-taking appropriately with our efforts to increase stockholdervalue. At the beginning of each fiscal year, management and the Board jointly review the strategic goals of theCompany and associated risks. The risks are prioritized and response strategies for managing those risks devel-oped. The Board also reviews whether the existing risk oversight framework continues to be appropriate for theCompany. Throughout the year, the Board and the committees to which the Board has delegated responsibilitydedicate a portion of their meetings to review and discuss specific risk topics in greater detail. For example,strategic and operational risks are presented and discussed at regularly scheduled Board meetings and at pre-sentations to the Board and its committees by executive management.
Although the Board has delegated responsibility for the oversight of specific risks to Board committees, theBoard is kept informed of each committee’s risk oversight via regular reports of the committee chairs to the fullBoard. Risk oversight is delegated to Board committees as follows:
‰ The Audit Committee oversees our risks relating to financial reporting, investments, capital structure andcompliance, as well as the guidelines, policies and processes for monitoring and mitigating those risks.
‰ The Compensation Committee oversees risks associated with the Company’s annual incentive plan, thecompensation of executive management, and the effect the compensation structure may have on businessdecisions. (For more information on the Compensation Committee’s assessment of risk and ourcompensation program, please see the “Risk Considerations” section of the “Compensation Discussionand Analysis” below.)
‰ The Nominating and Governance Committee oversees risks related to the Company’s governance struc-ture and the evaluation of individual board members and committees.
The Board’s risk oversight process builds upon management’s enterprise-wide risk management processes,which include identification and on-going monitoring of various risks, including those associated with long-termstrategy and business operations, regulatory and legal compliance, information technology and security, andfinancial reporting.
12

Executive Officer and Director Stock Ownership Guidelines
The Board has adopted stock ownership guidelines to further align the interests of the Company’s namedexecutive officers and directors with the interests of its stockholders. These guidelines are described below.
The Company’s CEO is required to own shares of the Company’s common stock with a value equal to atleast three times his or her annual base salary, and each other named executive officer is required to own sharesof the Company’s common stock with a value equal to at least one times his or her annual base salary. Shares ofthe Company’s common stock subject to outstanding unexercised stock options and unvested RSUs held by anexecutive officer do not count towards satisfaction of these guidelines. This ownership guideline is initiallycalculated using the applicable base salary as of the later of the date these guidelines were adopted (May 23,2012) or the date the individual first became subject to these guidelines as a named executive officer. The stockownership guideline for each individual will be determined on an annual basis as of the first trading day of eachfiscal year, and will be based on the applicable base salary in effect on such date and the closing price of a shareof the Company’s common stock on such date. Named executive officers are required to achieve the applicablelevel of ownership within five years of the later of May 23, 2012 or the date the person was initially designated anamed executive officer of the Company.
Non-employee directors are required to own shares of the Company’s common stock with a value equal toat least three times the annual cash retainer paid to our non-employee directors for service on the Board(excluding additional committee retainers and any extra meeting fees). Shares of the Company’s common stocksubject to outstanding unexercised stock options and unvested RSUs held by a non-employee director do notcount towards satisfaction of these guidelines. This ownership guideline is initially calculated using the annualcash retainer for service as a director (but not including amounts associated with service as a Lead Director orCommittee or Chair service) on the date the individual first became subject to these guidelines as a non-employee director. The stock ownership guideline will be determined on an annual basis as of the first tradingday of each fiscal year, and will be based on the applicable annual Board cash retainer in effect on such date andthe closing price of a share of the Company’s common stock on such date. Non-employee directors are requiredto achieve this level of ownership within five years of the later of May 23, 2012 or the date the individual firstbecame a non-employee member of the Board.
In addition to the above stock ownership guidelines, we have adopted an Insider Trading Policy available onour website at http://ir.qlogic.com that restricts employees, executive officers and directors from engaging in anyof the following activities with respect to the securities of the Company:
‰ Purchases on margin (where money is borrowed to make the purchase);
‰ Short sales;
‰ Buying or selling puts or calls;
‰ Hedging or monetization transactions, such as zero-cost collars and forward sale contracts, that allow anemployee to lock in much of the value of his or her stock holdings, often in exchange for all or part of thepotential upside appreciation in the stock; or
‰ Holding Company securities in a margin account or pledging Company securities as collateral for a loanwithout adequate financial resources to prevent a forced sale.
As of March 30, 2014, no directors or named executive officers held pledged Company securities.
13

Compensation of Directors — Fiscal Year 2014
The following table presents information regarding the compensation earned for fiscal year 2014 by ourdirectors who are not employed by us or any of our subsidiaries (the “non-employee directors”). The compensa-tion paid to Mr. Rampalli and former directors Messrs. Desai and Biddiscombe, who were also employees of theCompany during fiscal year 2014, is presented in the Summary Compensation Table below and the related tables.Messrs. Rampalli, Desai and Biddiscombe did not receive any additional compensation for their services asdirectors during fiscal year 2014.
Name(a)
FeesEarned orPaid inCash ($)
(b)
StockAwards
($)(1)(2)(3)(c)
OptionAwards
($)(1)(2)(3)(d)
Non-EquityIncentive Plan
Compensation ($)(e)
Change inPension
Value andNonqualifiedDeferred
CompensationEarnings ($)
(f)
All OtherCompensation ($)
(g)Total ($)
(h)
Balakrishnan S. Iyer . . . . . 87,000 80,498 34,502 — — — 202,000Christine King(4) . . . . . . . 59,500 125,438 110,900 — — — 295,838Kathryn B. Lewis . . . . . . . 85,000 80,498 34,502 — — — 200,000D. Scott Mercer . . . . . . . . 69,000 80,498 34,502 — — — 184,000George D. Wells . . . . . . . . 94,000 80,498 34,502 — — — 209,000William M. Zeitler . . . . . . 67,000 80,498 34,502 — — — 182,000
(1) The amounts reported in Columns (c) and (d) of the table above reflect the fair value on the grant date of thestock awards and option awards, respectively, granted to our non-employee directors during fiscal year 2014as determined under the principles used to calculate the grant date fair value of equity awards for purposes ofour financial statements. For a discussion of the assumptions and methodologies used to calculate theamounts referred to above, please see the discussion of stock awards and option awards contained under thesection entitled “Stock-Based Compensation — Stock-Based Compensation Expense” on page 63 of theCompany’s Annual Report on Form 10-K for fiscal year 2014 filed with the SEC on May 23, 2014.
(2) The following table presents the number of shares of the Company’s common stock subject to outstandingunvested stock awards and outstanding and unexercised option awards held by each of our non-employeedirectors as of March 30, 2014:
Director
Number ofUnvested Restricted
Stock Units(RSUs) as of
March 30, 2014
Number ofShares Subject to
OutstandingOptions as of
March 30, 2014
Balakrishnan S. Iyer . . . . . . . . . . . . . . . . . . . . . . . . . . . . . . . . . . . . 7,149 174,662Christine King . . . . . . . . . . . . . . . . . . . . . . . . . . . . . . . . . . . . . . . . 11,702 27,343Kathryn B. Lewis . . . . . . . . . . . . . . . . . . . . . . . . . . . . . . . . . . . . . . 7,149 112,662D. Scott Mercer . . . . . . . . . . . . . . . . . . . . . . . . . . . . . . . . . . . . . . . 7,149 71,076George D. Wells . . . . . . . . . . . . . . . . . . . . . . . . . . . . . . . . . . . . . . . 7,149 134,662William M. Zeitler . . . . . . . . . . . . . . . . . . . . . . . . . . . . . . . . . . . . . 7,149 71,076
(3) As described below, we granted to each of Messrs. Iyer, Mercer, Wells and Zeitler, and to Ms. Lewis, anaward of 7,149 RSUs and an option to purchase 8,005 shares of the Company’s common stock, and toMs. King, an award of 2,259 RSUs and an option to purchase 2,529 shares of the Company’s common stock,on August 22, 2013, the date of our 2013 Annual Meeting. On the grant date, each of the RSU awardsgranted to Messrs. Iyer, Mercer, Wells and Zeitler and to Ms. Lewis had a value of $80,498 and each of thestock options granted to Messrs. Iyer, Mercer, Wells and Zeitler and to Ms. Lewis had a value of $34,502.On the grant date, the RSU award granted to Ms. King had a value of $25,436 and the stock option grantedto Ms. King had a value of $10,900. Ms. King was appointed to the Board on April 29, 2013 and was there-fore eligible for a prorated equity award at the 2013 Annual Meeting. In connection with her appointment tothe Board, Ms. King also received an award of 9,443 RSUs (with a grant date fair value of $100,001) and anoption to purchase 24,814 shares (with a grant date fair value of $100,000).
(4) Ms. King joined the Board in April 2013.
14

Director Compensation
Compensation for our non-employee directors is determined and periodically reviewed by the Nominatingand Governance Committee, and during fiscal year 2014 consisted of a cash retainer, fees for attending meetingsin excess of a specified number, and equity awards.
Annual Retainer Fees and Meeting Fees. For fiscal year 2014, each of our non-employee directorsreceived an annual retainer for serving as a member of the Board and additional annual retainer fees for servingas the chair and/or a member of one or more committees of the Board as set forth below. These annual fees werepaid in equal quarterly installments.
Board member retainer . . . . . . . . . . . . . . . . . . . . . . . . . . . . . . . . . . . . . . . . . . . . . . . . . . . . . . . . $49,000Lead Director . . . . . . . . . . . . . . . . . . . . . . . . . . . . . . . . . . . . . . . . . . . . . . . . . . . . . . . . . . . . . . . $20,000Audit Committee Chair . . . . . . . . . . . . . . . . . . . . . . . . . . . . . . . . . . . . . . . . . . . . . . . . . . . . . . . $25,000Audit Committee member . . . . . . . . . . . . . . . . . . . . . . . . . . . . . . . . . . . . . . . . . . . . . . . . . . . . . $15,000Compensation Committee Chair . . . . . . . . . . . . . . . . . . . . . . . . . . . . . . . . . . . . . . . . . . . . . . . . $18,000Compensation Committee member . . . . . . . . . . . . . . . . . . . . . . . . . . . . . . . . . . . . . . . . . . . . . . $10,000Nominating and Governance Committee Chair . . . . . . . . . . . . . . . . . . . . . . . . . . . . . . . . . . . . . $10,000Nominating and Governance Committee member . . . . . . . . . . . . . . . . . . . . . . . . . . . . . . . . . . . $ 5,000
For each meeting of the Board in excess of nine per fiscal year, the non-employee directors receive an addi-tional fee of $1,500 for attendance in person and $750 for participation by telephone. For each Audit Committeemeeting in excess of twelve per fiscal year, each Compensation Committee meeting in excess of ten per fiscalyear, and each Nominating and Governance Committee meeting in excess of six per fiscal year, committeemembers (including committee chairs) receive an additional fee of $1,000 for attendance in person and $500 forparticipation by telephone. During fiscal year 2014, there were seven meetings of the Board of Directors, ninemeetings of the Audit Committee, fifteen meetings of the Compensation Committee, and five meetings of theNominating and Governance Committee.
Directors who are employees of QLogic receive no additional compensation for serving on the Board ofDirectors. Directors are entitled to reimbursement for out-of-pocket expenses in connection with attendance at allBoard and committee meetings.
The Nominating and Governance Committee reviewed the cash compensation for our non-employee direc-tors in May and June 2014 and made the following changes. The additional annual retainer fee for serving as achair of the Compensation Committee was increased to $25,000, effective July 1, 2014. The additional annualretainer fee for a non-employee Chairman of the Board was set at $35,000. As the current Chairman of the Boardand an independent director, Mr. Wells will receive the additional annual retainer fee for serving as non-employee Chairman of the Board, but he will no longer be eligible to receive an annual retainer fee for serving asLead Director. No other changes were made to the retainers, fees or meeting thresholds set forth in the precedingparagraphs.
Stock Awards. The Board has adopted a director grant program under the QLogic Corporation 2005 Per-formance Incentive Plan, as amended (the “2005 Plan”), which provides for awards to our non-employee direc-tors to be determined by reference to the equity compensation for non-employee directors of our compensationpeer group. The Nominating and Governance Committee reviews the compensation for our non-employee direc-tors every other year and reviewed non-employee director compensation in June 2012 and again in May 2014.The peer group is the same compensation peer group used by the Compensation Committee to evaluate executivecompensation (as identified in the “Compensation Discussion and Analysis” below). The director grant programis intended to more closely align non-employee director compensation with the philosophy used in establishingcompensation for our executive officers.
15

Under the director grant program, the number of shares of the Company’s common stock granted to eachnon-employee director reelected at the 2013 Annual Meeting was generally determined as follows:
‰ The grant date value of the equity securities awarded annually to the non-employee directors of each ofthe compensation peer group companies was determined (with options being valued using a Black-Scholes model). Target grant date values from the June 2012 non-employee director compensation reviewwere then determined for our non-employee directors.
‰ The target grant date values so determined were allocated so that 70% of the grant date value was deliv-ered in the form of RSU awards and 30% of the grant date value was delivered in the form of stockoptions (valued using the Black-Scholes model used by the Company in valuing its options for financialstatement purposes).
The director grant program also provides that grants made to non-employee directors upon their initial elec-tion or appointment to the Board are determined in a similar manner, with a target grant date value generallydetermined at the same percentile of the awards made by the compensation peer group to their newly elected orappointed non-employee directors that was used to determine the most recent annual awards to our non-employeedirectors. This value is then allocated so that 50% of the grant date value is delivered in the form of RSU awardsand 50% of the grant date value is delivered in the form of stock options (instead of the allocation of 70% of thegrant date value to RSU awards and 30% to stock options in the case of the annual awards).
The per share exercise price of each stock option granted to our non-employee directors equals the fairmarket value of a share of the Company’s common stock on the grant date. For these purposes, the fair marketvalue is equal to the closing price of a share of the Company’s common stock on the applicable grant date. Thesestock options have maximum ten-year terms. RSU awards are settled in an equivalent number of shares of theCompany’s common stock upon vesting. For awards made to non-employee directors upon their initial electionor appointment to the Board, stock options and RSU awards generally vest in annual installments over a three-year period following the date the award is granted if the director is still a member of our Board on the applicablevesting date. For annual equity award grants to non-employee directors, stock options and RSU awards vest as tothe total number of shares of the Company’s common stock subject to the award upon the earlier of (i) the dayprior to the annual meeting of the Company’s stockholders that occurs in the calendar year following the calendaryear in which the award is granted or (ii) the first anniversary of the date of grant.
The Board or a designated committee of the Board has the discretion to modify the program for determiningaward grants for non-employee directors from time to time without stockholder approval.
On August 22, 2013 (the date of the 2013 Annual Meeting), in accordance with the director grant programprovisions described above, we granted an option to purchase 8,005 shares of the Company’s common stock at aper share exercise price of $11.26 and an award of 7,149 RSUs to each of Messrs. Iyer, Mercer, Wells and Zei-tler, and to Ms. Lewis, and an option to purchase 2,529 shares of the Company’s common stock at a per shareexercise price of $11.26 and an award of 2,259 RSUs to Ms. King. Ms. King was appointed to the Board onApril 29, 2013 and was therefore eligible for a prorated equity grant at the 2013 Annual Meeting. In connectionwith her appointment to the Board, Ms. King also received an option to purchase 24,814 shares of the Company’scommon stock at a per share exercise price of $10.59 and an award of 9,443 RSUs.
In May 2014, the Nominating and Governance Committee reviewed the director grant program for our non-employee directors and made the following changes. Beginning with the 2014 Annual Meeting, awards made atthe Annual Meeting will be entirely in the form of RSUs. The Nominating and Governance Committee alsoadopted a fixed cap on the number of shares of the Company’s common stock that will be issued in connectionwith this award. If the fair market value of a share of the Company’s common stock on the applicable grant dateis less than $10.00 per share, then the target grant date value will be divided by $10.00, rather than the fair mar-ket value of a share of the Company’s common stock, to determine the exact number of shares subject to eachRSU award. For example, if the Company’s closing stock price on the date of the 2014 Annual Meeting is $9.00,in order to determine the applicable number of RSUs awarded to each director we would divide the target dategrant value of $150,000 by $10.00, for an award of 15,000 RSUs. Without the fixed cap, we would have dividedthe target date grant value of $150,000 by $9.00, for an award of 16,667 RSUs. No changes were made to thevesting terms discussed above.
16
The Nominating and Governance Committee has established target grant date values under the directorgrant program for grants of RSU awards to be made to our non-employee directors who are reelected at the 2014Annual Meeting. The target grant date value for the awards to continuing non-employee directors is $150,000(which was at the 50th percentile of the compensation peer group) and will be 100% in the form of RSU awardsas noted above. The exact number of shares of the Company’s common stock to be subject to each RSU awardwill be determined based on the closing price of the Company’s common stock on the date of the 2014 AnnualMeeting, subject to the fixed cap described above.
EXECUTIVE OFFICERS
The following table and paragraphs set forth the names of and certain information concerning our currentexecutive officers:
Name Position with QLogic Age
Prasad L. Rampalli . . . . Director, President and Chief Executive Officer 60Jean Hu . . . . . . . . . . . . . Senior Vice President and Chief Financial Officer 51Anthony E. Carrozza . . . Senior Vice President, Worldwide Sales 59Roger J. Klein . . . . . . . . Senior Vice President and General Manager, Fibre Channel Products 63
For information on the business background of Mr. Rampalli, see “Proposal One — Election of Directors”above.
Ms. Hu joined us in April 2011 as Senior Vice President and Chief Financial Officer, and also served as ourinterim CEO from May 2013 to February 2014. Previously, Ms. Hu served as Chief Financial Officer and SeniorVice President, Business Development, of Conexant from December 2008 until April 2011. She served as Treas-urer of Conexant from June 2009 until April 2011. From February 2006 to December 2008, Ms. Hu served asSenior Vice President, Strategy and Business Development, and from February 2004 to February 2006, as VicePresident, Strategy and Business Development, at Conexant. Prior to February 2004, Ms. Hu held various posi-tions in financial planning, strategy and corporate development at Conexant and its predecessor company, Rock-well International Corporation.
Mr. Carrozza joined us in July 2014 as Senior Vice President, Worldwide Sales. Previously, he served asExecutive Vice President of Worldwide Sales at Silicon Graphics International Corp. (“SGI”) from May 2013 toAugust 2013. Prior to that, Mr. Carrozza served as Executive Vice President of Field Operations at SGI fromNovember 2011 to May 2013, and in various executive leadership positions overseeing SGI’s sales organizationfrom March 2008 through November 2011. Prior to joining SGI, Mr. Carrozza was with Neterion, Inc. fromDecember 2006 to February 2008 as Vice President, Sales. From June 1987 to December 2006, Mr. Carrozzawas with Quantum Corporation (“Quantum”). When Mr. Carrozza left Quantum, he held the title of Senior VicePresident, Worldwide Sales.
Mr. Klein joined us in February 2001 and has held a variety of field marketing and business unit marketingpositions. He was promoted to Vice President, General Manager, Computer Systems Group, in August 2006, toVice President, General Manager, Host Solutions Group, in February 2007, to Senior Vice President and GeneralManager, Host Solutions Group, in May 2009, to Senior Vice President and General Manager in June 2013, andto Senior Vice President and General Manager, Fibre Channel Products in June 2014. From 1997 to January2001, Mr. Klein held various positions at CMD Technology, most recently as Vice President, Marketing. Prior to1997, Mr. Klein held various positions at Unisys Corporation and Burroughs Corporation.
Code of Ethics
We have adopted and implemented a Business Ethics Policy (the “Code of Ethics”) that applies to allCompany employees, officers and directors. The Code of Ethics operates as a tool to help our employees, officersand directors understand and adhere to the high ethical standards we expect. The Code of Ethics is available onour website at http://ir.qlogic.com. Stockholders may also obtain copies at no cost by writing to the Secretary ofthe Company.
17

COMPENSATION DISCUSSION AND ANALYSIS
Introduction
This Compensation Discussion and Analysis describes our executive compensation program and key com-pensation actions and decisions for fiscal year 2014. The primary focus of this section of our proxy statement isto explain the compensation decisions that were made for fiscal year 2014 with respect to our executive officersidentified in the Summary Compensation Table below (referred to in this proxy statement as the “named execu-tive officers”).
Executive Summary
Compensation Philosophy
We believe that a significant portion of the compensation of our named executive officers should be directlytied to our performance. Incentive award payments are determined based on achievement of financial goals forthe fiscal year as well as performance objectives that we believe contribute to our longer-term success. Equityawards granted to our named executive officers align the interests of these executive officers with the interests ofour stockholders as the ultimate value of the award depends on the value of the Company’s common stock.
Highlights of Fiscal Year 2014 Compensation Program
Our executive compensation program is designed to attract, retain and motivate a highly-skilled and dedi-cated management team to execute our business objectives. Key compensation decisions for fiscal year 2014 andimportant features of our executive compensation program include the following:
‰ CEO Compensation Package. Prasad L. Rampalli joined us as our new President and CEO on Febru-ary 3, 2014. In connection with selecting Mr. Rampalli as our new CEO, the Compensation Committeenegotiated and approved a compensation package that is described below (see “Fiscal Year 2014 Execu-tive Compensation Decisions — Management Transition”). The Compensation Committee worked withits outside compensation consultant to design a competitive, market-based compensation package appro-priate for a senior executive with Mr. Rampalli’s skill and experience as described below. In determiningthe equity portion of Mr. Rampalli’s compensation package, the Compensation Committee thought it wasimportant that at least 50% of his “new hire” equity award consist of RSUs that vest based on our totalstockholder return (“TSR”) over a three-year period, measured relative to the TSR for the NASDAQComposite Index over that period as described in more detail below, to further align his interests withthose of our stockholders.
‰ Executive Chairman Employment Agreement. At the time that we announced the selection of our newCEO, we also entered into a new employment agreement with Mr. Desai, our former Executive Chairmanwho passed away in June 2014. His prior employment agreement had expired and the CompensationCommittee wanted to ensure that Mr. Desai’s services as an executive officer would continue untilMr. Rampalli joined us and for a specific transition period after his arrival. This employment agreementwould have expired on March 29, 2015 (the last day of our fiscal year 2015) and contained terms thatwere similar to his prior employment agreement. Mr. Desai also received a new equity award to providean additional retention incentive and further align his interests with those of our stockholders. For adescription of this employment agreement, see “Fiscal Year 2014 Executive Compensation Decisions —Management Transition.”
‰ Increased Emphasis on Performance-Based Equity Awards. For fiscal years 2014 and 2015, a sig-nificant portion of the equity compensation program for the senior management team consisted of RSUsthat vest based on our TSR over a multi-year period against the TSR of the NASDAQ Composite Indexfor that period. For fiscal year 2014, these grants constituted 40% of each executive’s total annual grantand covered a two-year performance period, and for fiscal year 2015, these grants constituted 50% of eachexecutive’s total annual grant and covered a three-year performance period. In addition, the CompensationCommittee determined for these two fiscal years to target equity compensation at the median of the mar-ket (as opposed to the 60th percentile of market targeted for fiscal year 2013). Beginning with the market-
18
based equity award to Mr. Rampalli in February 2014, the Compensation Committee also increased theminimum threshold below which no market-based equity awards would be earned from 50% relative TSRperformance to 70% relative TSR performance as described below. The Compensation Committeebelieves that these changes over the last two fiscal years in the equity compensation for our senior execu-tives are consistent with market trends and best practices.
‰ No Base Salary Increases. After considering the challenges faced by the Company in meeting its fiscalyear 2013 revenue and profit targets, the Compensation Committee decided not to grant any fiscal year2014 base salary increases to our senior management team, which includes the named executive officers.
‰ Annual Incentive Plan. Annual cash incentive award payments to the named executive officers are basedon multiple performance objectives and are subject to maximum amounts that may be awarded to eachexecutive officer. No bonuses are paid under the plan if threshold performance levels are not achieved.Incentive awards to named executive officers under the plan for fiscal year 2014 ranged between 74% and111% of the executive’s target award. We believe these payout levels reflect performance during the fiscalyear and are consistent with our pay-for-performance philosophy.
‰ Stock Ownership Guidelines. Under our stock ownership guidelines, our CEO is required to own threetimes his or her annual base salary in shares of the Company’s common stock, other named executiveofficers are required to own one times their annual base salary in shares of the Company’s common stockand non-employee directors are required to own three times their annual board retainer in shares of theCompany’s common stock, in each case such ownership to be achieved over a five-year period. See“Board of Directors — Executive Officer and Director Stock Ownership Guidelines” for moreinformation.
‰ Change in Control Agreements. We maintain change in control severance agreements with our namedexecutive officers (except for Messrs. Desai and Biddiscombe) which provide severance payments andbenefits only on a “double trigger” basis (i.e. the occurrence of both a change of control and involuntarytermination of the executive’s employment). The occurrence of a change in control alone does not triggerany benefits under these agreements.
‰ No Tax Gross-Ups. None of our agreements with senior executives provide for tax gross-up payments(including, but not limited to, tax liabilities for parachute payments imposed under Sections 280G and4999 of the Internal Revenue Code).
‰ Compensation Recovery Policy. We maintain a compensation recovery (“clawback”) policy applicableto senior level employees, including our named executive officers, that permits us to recoup from culpableemployees certain previously paid compensation in the event of a financial restatement.
19

Fiscal Year 2014 Executive Compensation Decisions
Management Transition
Employment Package for CEO
In connection with Mr. Rampalli becoming the Company’s CEO in February 2014, he received an employ-ment package that consisted of: (i) $600,000 annual base salary; (ii) target annual incentive opportunity equal to100% of his base salary; (iii) a $250,000 sign-on bonus; (iv) a $250,000 relocation package; and (v) an equityaward consisting of 250,000 time-based RSUs and 250,000 market-based RSUs (assuming a target level ofperformance). The time-based RSUs vest in equal annual installments over four years. The market-based RSUsare earned based on the relative performance of the Company’s TSR to the TSR for the NASDAQ CompositeIndex over a three-year period, with the percentage of the target number of units that will be credited based onperformance determined as follows:
Company TSR Relative to NasdaqComposite Index TSR
Percentage of Target Market-Based RSUs Credited
Less Than 70% 0%70% 25%100% 100%
150% or Higher 200%
None of the market-based RSUs will be eligible to vest if the Company’s relative TSR for the three-yearperiod is less than 70% of the NASDAQ Composite Index TSR for that period. These RSUs will be credited on aprorated basis for performance between the levels stated in the table above. The maximum number of RSUs thatmay vest is 200% of the target number. The market-based RSUs will be settled at the end of the three-year meas-urement period. Mr. Rampalli was not eligible for, and did not receive, an equity award during the regular annualequity award cycle in May 2014. The sign-on bonus and relocation package are both subject to repayment byMr. Rampalli if he voluntarily terminates his employment or if he is terminated by us for cause within applicableperiods. The Compensation Committee worked with its outside compensation consultant to design a competitive,market-based compensation package appropriate for a senior executive with Mr. Rampalli’s skill and experience.The consultant reviewed Mr. Rampalli’s compensation package with his former employer and provided summarybenchmarking data on technology companies with annual revenues between $211 million and $1.3 billion thathad hired a new CEO during the last three years as well as information on CEO compensation for the regularpeer group used by the Compensation Committee for executive compensation benchmarking as identified below.The Compensation Committee considered each of these data points in proposing a compensation package forMr. Rampalli and determined that the final employment package negotiated with him provided appropriateretention and performance incentives.
Executive Chairman Employment Agreement
At the time that we announced the appointment of our new CEO in December 2013, we also entered into anemployment agreement with Mr. Desai, our former Executive Chairman who passed away in June 2014. Hisprior employment agreement had expired and the Compensation Committee wanted to ensure that Mr. Desai’sservices as an executive officer would continue until Mr. Rampalli joined the Company and for a transitionperiod after his arrival. The employment agreement started on December 4, 2013 and would have expired onMarch 29, 2015 (the last day of our fiscal year 2015). The new employment agreement continued the terms ofMr. Desai’s prior employment agreement in terms of base salary and target annual incentive opportunity. Theemployment agreement also provided for an award of 136,636 RSUs that vest in four equal annual installments,subject to Mr. Desai’s continued employment or service. In connection with this equity award, the agreementprovided that Mr. Desai would not be eligible for an equity award during the regular annual equity award cycle inMay 2014. Provisions of Mr. Desai’s agreement relating to post-termination employment benefits are discussedbelow under “Potential Payments Upon Termination or Change in Control.” Pursuant to the terms of hisemployment agreement, upon his death Mr. Desai’s estate became entitled to payment of any base salary that hadaccrued but not been paid, including accrued and unpaid vacation time. Under the terms of the 2005 Plan,Mr. Desai’s beneficiaries have 12 months from the date of his death to exercise any vested stock options. Allunvested RSUs and stock options terminated as of June 8, 2014.
20

Executive Compensation Programs
Under our fiscal year 2014 executive compensation program, our named executive officers primarilyreceived a base salary and were eligible to receive annual cash incentives and equity awards.
Base Salary
Base salaries are used to attract, motivate and retain highly qualified executive officers. Base salary, whichis determined by the level of responsibility, experience in the position, expertise of the executive officer, andcompetitive market conditions, is the primary fixed cash compensation component in the executive pay program.
In May 2013, the Compensation Committee decided not to grant any fiscal year 2014 base salary increasesto the senior management team (which included the Executive Chairman, the CEO and the officers reporting tothe CEO) after consideration of the factors noted above. The base salaries paid to our named executive officersfor fiscal year 2014 are set forth in the Summary Compensation Table below.
Annual Cash Incentive
Our annual cash incentive program is a variable element of our executive compensation program designedto reward executives for achieving key operational and financial goals that we believe will provide the founda-tion for creating longer-term stockholder value. At the beginning of each year, the Compensation Committeeapproves specific performance goals for the upcoming year for purposes of our annual cash incentive plan. Inaddition to traditional financial measures of corporate performance, such as revenue and profit, the Compensa-tion Committee has emphasized other indicators of performance, including design wins, customer satisfactionand other company operational objectives, and approves associated weightings for each objective.
The Compensation Committee believes that the design of the annual cash incentive plan provides an appro-priate mix of short-term and long-term goal achievement in an industry typified by long product developmentcycles. For example, the use of design wins as a performance measure provides management with short-term,measurable goals that may lead to long-term success for the Company. In order for the Company to offer a prod-uct to an OEM customer, the product must first receive a design win from the customer. The product then goesthrough a rigorous testing and qualification process with the customer prior to the product’s commercial release.In many cases, this testing and qualification process can take up to twenty-four months following the award of adesign win. Upon commercial release of the product, the product will begin to generate revenues for the Com-pany, thereby contributing to the Company’s long-term success.
For fiscal year 2014, the Compensation Committee determined that no cash incentives would be paid underthe program unless the Company achieved a threshold revenue goal for the year. Payment of the annual cashincentive to the named executive officers was conditioned upon QLogic achieving at least $368.1 million inrevenue for fiscal year 2014. The minimum revenue target for fiscal year 2014 was achieved and, accordingly,the named executive officers were eligible to receive annual cash incentives for the fiscal year. Cash incentivesunder the program for each executive were also capped at 150% of the executive’s target incentive award. Underthe program, the total annual incentive pool for all participants in the program was also capped at 12% of non-GAAP earnings before interest and taxes. For these purposes, non-GAAP income is calculated as the Company’sincome from continuing operations as determined under generally accepted accounting principles, as adjusted toexclude certain items such as stock-based compensation expense, amortization of acquisition-related intangibleassets, special charges and certain income tax items. We believe that excluding these items is appropriate as theyare not indicative of the Company’s on-going core operating performance.
The Compensation Committee approved a target incentive level for each of the named executive officers(other than Mr. Biddiscombe) for fiscal year 2014. The target incentive for Mr. Desai was 100% of his base sal-ary, and the target incentives for Ms. Hu and Messrs. Klein and Crawford were 65% of the executive’s base sal-ary. The Compensation Committee also determined that Mr. Rampalli would be eligible for an incentive forfiscal year 2014, with his target incentive being 100% of his base salary and his incentive being prorated basedon his period of employment during the fiscal year. Mr. Biddiscombe left the Company in May 2013 and as aresult was not eligible for an award under the fiscal year 2014 annual incentive plan.
21
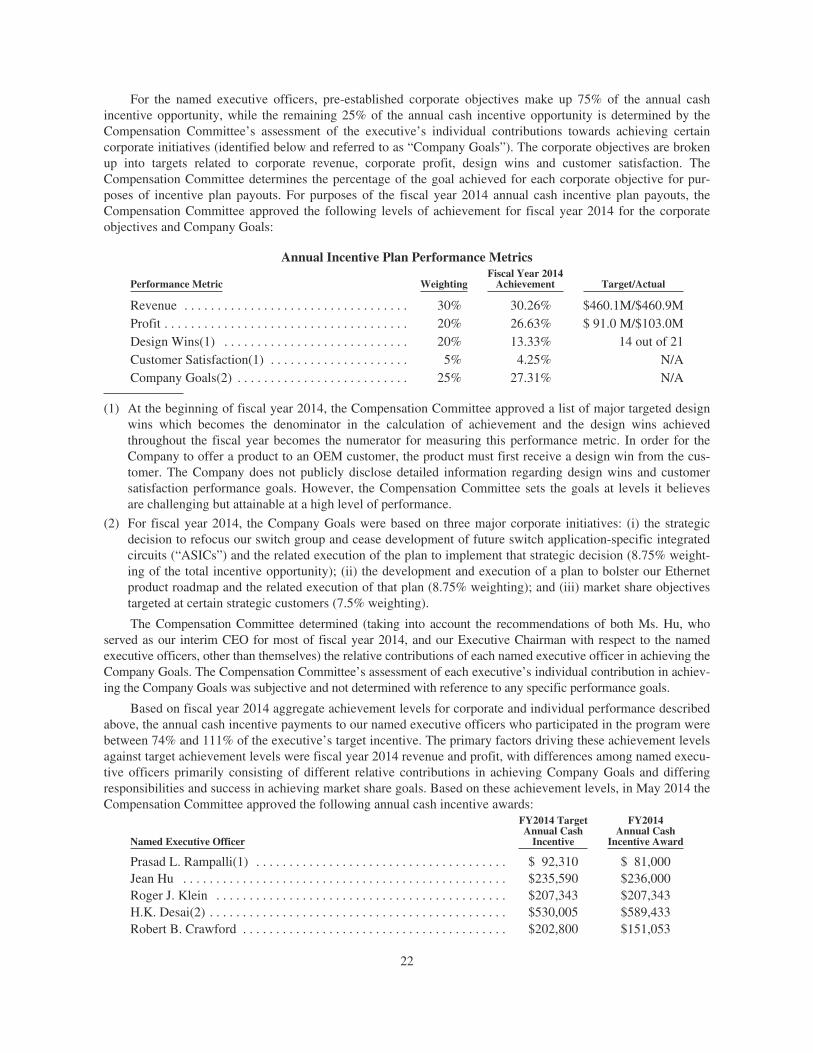
For the named executive officers, pre-established corporate objectives make up 75% of the annual cashincentive opportunity, while the remaining 25% of the annual cash incentive opportunity is determined by theCompensation Committee’s assessment of the executive’s individual contributions towards achieving certaincorporate initiatives (identified below and referred to as “Company Goals”). The corporate objectives are brokenup into targets related to corporate revenue, corporate profit, design wins and customer satisfaction. TheCompensation Committee determines the percentage of the goal achieved for each corporate objective for pur-poses of incentive plan payouts. For purposes of the fiscal year 2014 annual cash incentive plan payouts, theCompensation Committee approved the following levels of achievement for fiscal year 2014 for the corporateobjectives and Company Goals:
Annual Incentive Plan Performance Metrics
Performance Metric WeightingFiscal Year 2014Achievement Target/Actual
Revenue . . . . . . . . . . . . . . . . . . . . . . . . . . . . . . . . . . 30% 30.26% $460.1M/$460.9MProfit . . . . . . . . . . . . . . . . . . . . . . . . . . . . . . . . . . . . . 20% 26.63% $ 91.0 M/$103.0MDesign Wins(1) . . . . . . . . . . . . . . . . . . . . . . . . . . . . 20% 13.33% 14 out of 21Customer Satisfaction(1) . . . . . . . . . . . . . . . . . . . . . 5% 4.25% N/ACompany Goals(2) . . . . . . . . . . . . . . . . . . . . . . . . . . 25% 27.31% N/A
(1) At the beginning of fiscal year 2014, the Compensation Committee approved a list of major targeted designwins which becomes the denominator in the calculation of achievement and the design wins achievedthroughout the fiscal year becomes the numerator for measuring this performance metric. In order for theCompany to offer a product to an OEM customer, the product must first receive a design win from the cus-tomer. The Company does not publicly disclose detailed information regarding design wins and customersatisfaction performance goals. However, the Compensation Committee sets the goals at levels it believesare challenging but attainable at a high level of performance.
(2) For fiscal year 2014, the Company Goals were based on three major corporate initiatives: (i) the strategicdecision to refocus our switch group and cease development of future switch application-specific integratedcircuits (“ASICs”) and the related execution of the plan to implement that strategic decision (8.75% weight-ing of the total incentive opportunity); (ii) the development and execution of a plan to bolster our Ethernetproduct roadmap and the related execution of that plan (8.75% weighting); and (iii) market share objectivestargeted at certain strategic customers (7.5% weighting).
The Compensation Committee determined (taking into account the recommendations of both Ms. Hu, whoserved as our interim CEO for most of fiscal year 2014, and our Executive Chairman with respect to the namedexecutive officers, other than themselves) the relative contributions of each named executive officer in achieving theCompany Goals. The Compensation Committee’s assessment of each executive’s individual contribution in achiev-ing the Company Goals was subjective and not determined with reference to any specific performance goals.
Based on fiscal year 2014 aggregate achievement levels for corporate and individual performance describedabove, the annual cash incentive payments to our named executive officers who participated in the program werebetween 74% and 111% of the executive’s target incentive. The primary factors driving these achievement levelsagainst target achievement levels were fiscal year 2014 revenue and profit, with differences among named execu-tive officers primarily consisting of different relative contributions in achieving Company Goals and differingresponsibilities and success in achieving market share goals. Based on these achievement levels, in May 2014 theCompensation Committee approved the following annual cash incentive awards:
Named Executive Officer
FY2014 TargetAnnual CashIncentive
FY2014Annual Cash
Incentive Award
Prasad L. Rampalli(1) . . . . . . . . . . . . . . . . . . . . . . . . . . . . . . . . . . . . . . $ 92,310 $ 81,000Jean Hu . . . . . . . . . . . . . . . . . . . . . . . . . . . . . . . . . . . . . . . . . . . . . . . . . $235,590 $236,000Roger J. Klein . . . . . . . . . . . . . . . . . . . . . . . . . . . . . . . . . . . . . . . . . . . . $207,343 $207,343H.K. Desai(2) . . . . . . . . . . . . . . . . . . . . . . . . . . . . . . . . . . . . . . . . . . . . . $530,005 $589,433Robert B. Crawford . . . . . . . . . . . . . . . . . . . . . . . . . . . . . . . . . . . . . . . . $202,800 $151,053
22
(1) Mr. Rampalli joined the Company on February 3, 2014 and, as noted above, was awarded a fiscal year 2014annual incentive payment that was pro-rated based on the portion of the year he was with the Company.
(2) The Compensation Committee awarded Mr. Desai a fiscal year 2014 annual incentive payment that wasabove target in consideration of his critical contributions in negotiating and completing the acquisition of the10/40/100 Gb Ethernet controller-related assets from Broadcom Corporation.
Discretionary Incentive Awards. Our annual incentive plan includes a pool from which discretionaryincentive awards can be made. These awards can made during the year by the CEO to employees (other than tonamed executive officers) who achieve significant milestones or objectives or otherwise make critical con-tributions to the success of the Company. Any discretionary incentive awards to named executive officers aremade by the Compensation Committee. During fiscal year 2014, the Compensation Committee approved adiscretionary incentive award of $75,000 to each of Ms. Hu and Mr. Klein in recognition of their key con-tributions in negotiating and completing the acquisition of the 10/40/100 Gb Ethernet controller-related assetsfrom Broadcom Corporation in March 2014. In addition, in May 2014 the Compensation Committee reviewedMs. Hu’s performance as the Company’s interim CEO during fiscal year 2014 and awarded her a special bonusof $338,000. In arriving at the amount of this special bonus for Ms. Hu, the Compensation Committee revieweddata from its outside compensation consultant, calculated the difference between Ms. Hu’s base salary and annualcash incentive award and the average base salary and annual cash incentive award for chief executive officers ofthe regular peer group used by the Compensation Committee for executive compensation benchmarking asidentified below, and then prorated this amount for the portion of the year that she served as our interim CEO.
Equity Awards
We believe equity awards are a key element of our executive compensation program because they align theinterests of our executive officers with stockholders. For fiscal year 2014, we granted a combination of market-based RSU awards and time-based RSU awards to our executive officers, which the Compensation Committeebelieves best supports the interests of our stockholders by balancing the dual objectives of long-term value crea-tion for stockholders and retention of qualified key employees.
We use time-based RSU awards because of their greater retentive value as they generally vest over a four-year period. Our market-based RSU awards are similar to the time-based RSU awards, but are earned based onthe relative TSR of the Company’s common stock compared to the TSR of the NASDAQ Composite Index overa specified period. If shares of the Company’s common stock are earned under a market-based RSU award at theend of the two-year performance period, these shares generally vest over a four-year period from the originalaward date. Thus, the market-based RSU awards provide incentives to deliver greater return for our stockholdersand provide an additional retention incentive as to any shares that are earned. The Compensation Committeebelieves this combination of time-based and market-based RSUs provide significant motivation for our execu-tives to create value for our stockholders and opportunity to benefit from the value created. We believe this is anappropriate way to align the interests of our named executive officers with those of our stockholders in order toachieve and sustain long-term stock price growth.
In determining the annual equity grants each year, the Compensation Committee reviews equity awardmarket data presented by its outside compensation consultant. In May 2013, the Compensation Committeerevised its equity compensation philosophy for senior level executives to (i) target the 50th percentile (down fromthe 65th percentile two years earlier) of market for equity compensation awards and (ii) change the allocation ofequity awards to 40% market-based RSUs and 60% time-based RSUs. In May 2014, the Compensation Commit-tee further revised its equity compensation philosophy for senior level executives to provide for an allocation ofequity awards to 50% market-based RSUs and 50% time-based RSUs.
23
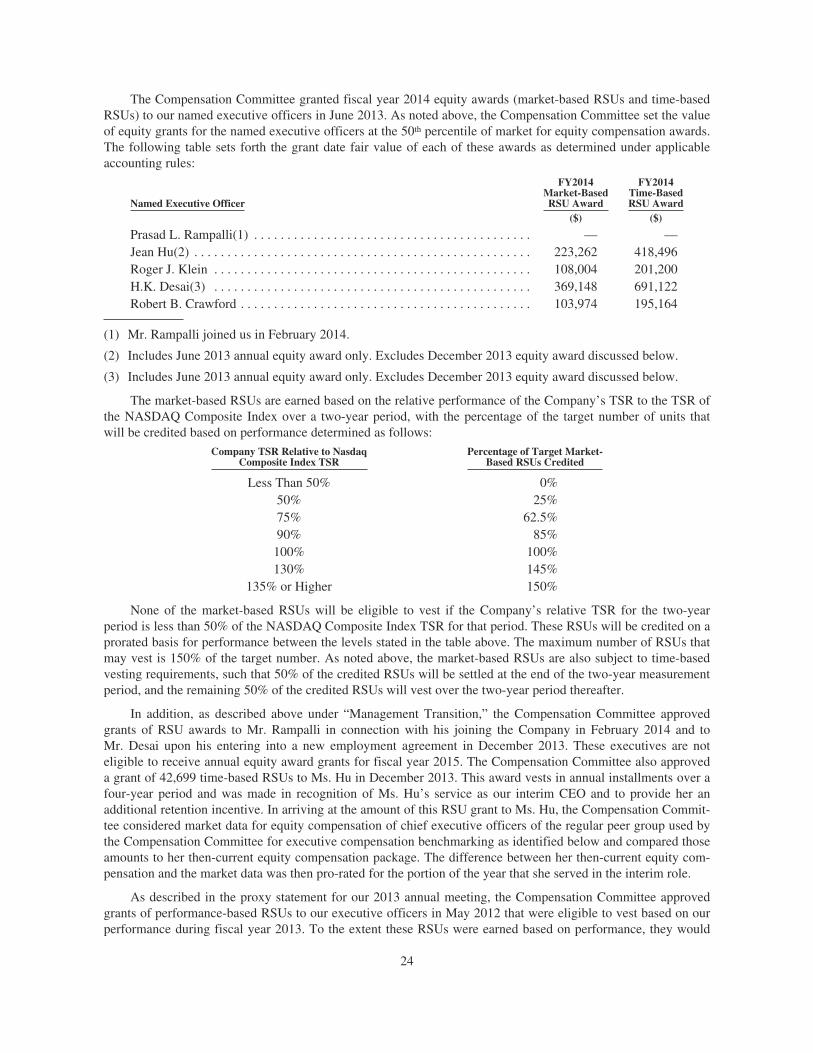
The Compensation Committee granted fiscal year 2014 equity awards (market-based RSUs and time-basedRSUs) to our named executive officers in June 2013. As noted above, the Compensation Committee set the valueof equity grants for the named executive officers at the 50th percentile of market for equity compensation awards.The following table sets forth the grant date fair value of each of these awards as determined under applicableaccounting rules:
Named Executive Officer
FY2014Market-BasedRSU Award
FY2014Time-BasedRSU Award
($) ($)
Prasad L. Rampalli(1) . . . . . . . . . . . . . . . . . . . . . . . . . . . . . . . . . . . . . . . . . . — —Jean Hu(2) . . . . . . . . . . . . . . . . . . . . . . . . . . . . . . . . . . . . . . . . . . . . . . . . . . . 223,262 418,496Roger J. Klein . . . . . . . . . . . . . . . . . . . . . . . . . . . . . . . . . . . . . . . . . . . . . . . . 108,004 201,200H.K. Desai(3) . . . . . . . . . . . . . . . . . . . . . . . . . . . . . . . . . . . . . . . . . . . . . . . . 369,148 691,122Robert B. Crawford . . . . . . . . . . . . . . . . . . . . . . . . . . . . . . . . . . . . . . . . . . . . 103,974 195,164
(1) Mr. Rampalli joined us in February 2014.
(2) Includes June 2013 annual equity award only. Excludes December 2013 equity award discussed below.
(3) Includes June 2013 annual equity award only. Excludes December 2013 equity award discussed below.
The market-based RSUs are earned based on the relative performance of the Company’s TSR to the TSR ofthe NASDAQ Composite Index over a two-year period, with the percentage of the target number of units thatwill be credited based on performance determined as follows:
Company TSR Relative to NasdaqComposite Index TSR
Percentage of Target Market-Based RSUs Credited
Less Than 50% 0%50% 25%75% 62.5%90% 85%100% 100%130% 145%
135% or Higher 150%
None of the market-based RSUs will be eligible to vest if the Company’s relative TSR for the two-yearperiod is less than 50% of the NASDAQ Composite Index TSR for that period. These RSUs will be credited on aprorated basis for performance between the levels stated in the table above. The maximum number of RSUs thatmay vest is 150% of the target number. As noted above, the market-based RSUs are also subject to time-basedvesting requirements, such that 50% of the credited RSUs will be settled at the end of the two-year measurementperiod, and the remaining 50% of the credited RSUs will vest over the two-year period thereafter.
In addition, as described above under “Management Transition,” the Compensation Committee approvedgrants of RSU awards to Mr. Rampalli in connection with his joining the Company in February 2014 and toMr. Desai upon his entering into a new employment agreement in December 2013. These executives are noteligible to receive annual equity award grants for fiscal year 2015. The Compensation Committee also approveda grant of 42,699 time-based RSUs to Ms. Hu in December 2013. This award vests in annual installments over afour-year period and was made in recognition of Ms. Hu’s service as our interim CEO and to provide her anadditional retention incentive. In arriving at the amount of this RSU grant to Ms. Hu, the Compensation Commit-tee considered market data for equity compensation of chief executive officers of the regular peer group used bythe Compensation Committee for executive compensation benchmarking as identified below and compared thoseamounts to her then-current equity compensation package. The difference between her then-current equity com-pensation and the market data was then pro-rated for the portion of the year that she served in the interim role.
As described in the proxy statement for our 2013 annual meeting, the Compensation Committee approvedgrants of performance-based RSUs to our executive officers in May 2012 that were eligible to vest based on ourperformance during fiscal year 2013. To the extent these RSUs were earned based on performance, they would
24

vest in annual installments over a four-year period after the grant date. For detailed information on the terms ofthese grants and the Compensation Committee’s determination in May 2013 of the number of RSUs that wereeligible to vest based on performance, please see our proxy statement for the 2013 annual meeting.
Equity Usage Philosophy
As part of its responsibilities, the Compensation Committee oversees our overall equity compensation pro-gram. The Compensation Committee is sensitive to stockholder concerns about stock usage and regularly reviewsequity usage and the related “burn rate” associated with equity usage against market data provided by our outsidecompensation consultant. While recent stock usage as measured by “burn rate” has been higher than theCompensation Committee would normally target, the higher “burn rate” was primarily the result of several non-routine events. As described above, we appointed a new CEO during fiscal year 2014 and granted a “new hire”equity award to him in connection with his joining the Company. In addition, in fiscal year 2014, we acquired the10/40/100 Gb Ethernet controller-related assets from Broadcom Corporation and in connection with this acquis-ition approximately 140 former Broadcom employees joined us. As part of offering competitive compensationpackages to these new employees and putting in place a retention plan for key employees, we granted RSUawards for 463,100 shares of the Company’s common stock to these new employees with vesting over a fouryear period. For more information on our Equity Usage Philosophy, see the section entitled “Potential Dilution”in Proposal 2, Amendments to the QLogic Corporation 2005 Performance Incentive Plan.
Benefits and Perquisites
Other than our 401(k) plan, we do not provide pension arrangements or post-retirement health coverage forour named executive officers. We paid the regular monthly membership dues at a country club used byMr. Desai, which was primarily used for business purposes. The benefits provided to each named executive offi-cer in fiscal year 2014 are reported in the Summary Compensation Table below in accordance with the rules ofthe Securities and Exchange Commission. Except for the membership dues referenced above, we do not providematerial perquisites or other personal benefits to our executive officers.
Post-Employment Obligations
The Company has change in control severance agreements with its named executive officers, except forMessrs. Desai, Biddiscombe and Crawford. These agreements provide severance benefits to these executivesshould their employment with us terminate in certain circumstances in connection with a change in control of theCompany.
Should the possibility of a change in control of the Company arise, the Compensation Committee believesthat certain executives may be called upon to assess the potential transaction, advise the Board as to whether thetransaction would be in the best interests of the Company and its stockholders and take such other actions as theBoard might determine to be appropriate in addition to their regular duties. We believe that it is imperative thatthe Company and the Board be able to rely upon these executive officers to continue in their positions and carryout their duties without concern that they might be distracted by the personal uncertainties and risks created bythe possibility of a change in control.
As described in more detail below under “Potential Payments Upon Termination or Change in Control,” theseverance payments and benefits under these agreements will be paid only if the executive officer’s employmentis terminated by us without cause or by the executive officer with good reason during the period beginning sixmonths before and ending 24 months after a change in control of the Company. These types of arrangements areoften referred to as “double trigger” arrangements since both a change in control and a termination of employ-ment must occur before any payment is due. We believe that it is appropriate, and serves the purpose of theseagreements, to extend the protections provided by these benefits to employment terminations that occur a shorttime before a change in control, and/or occur as a result of materially adverse changes to the terms of the execu-tive officer’s employment with the Company after a change in control.
These agreements do not entitle the executive to any tax gross-up payments from the Company. Instead,should any benefits payable to the executive in connection with a change in control of the Company be subject to
25
the excise tax imposed under Sections 280G and 4999 of the Internal Revenue Code, the executive will be entitledto either payment of the benefits in full (but no gross-up payment) or a reduction in the benefits to the extent neces-sary to avoid triggering the excise tax, whichever would result in the executive receiving the greater benefit on anafter-tax basis.
As described above, we entered into an employment agreement with Mr. Desai in December 2013 thatwould have expired March 29, 2015. As under his prior employment agreement, Mr. Desai’s new agreementprovided he would be entitled to a severance benefit if, during the term of the agreement, his employment withthe Company was terminated by the Company without cause or by Mr. Desai for good reason. Under the terms ofthe employment agreement, Mr. Desai could not receive severance payments under both the employment agree-ment and the change in control severance agreement. The Compensation Committee believed that the negotiatedseverance arrangement was appropriate in exchange for Mr. Desai’s commitment to the Company to providetransition services under the terms of his employment agreement. As noted above, Mr. Desai passed away in June2014.
On May 17, 2013, the Company accepted the resignation of Mr. Biddiscombe. In connection with his resig-nation Mr. Biddiscombe entered into an agreement with the Company that provided for him to receive certainseverance benefits and included his release of claims in favor of the Company. This agreement was negotiatedwith Mr. Biddiscombe and was determined by the Compensation Committee in consultation with its compensa-tion consultant to be consistent with market practices.
On June 16, 2014, the Company accepted the resignation of Mr. Crawford. In connection with his resig-nation Mr. Crawford entered into an agreement with the Company that provided for him to receive certain sev-erance benefits and included his release of claims in favor of the Company. This agreement was negotiated withMr. Crawford.
For additional detail on these agreements, see the section entitled “Potential Payments Upon Termination orChange in Control — Severance Agreements” below.
QLogic’s Executive Compensation Procedures and Philosophy
Role of the Compensation Committee
The Compensation Committee has overall responsibility for approving and evaluating our executive officercompensation program and related policies and practices.
The Compensation Committee has the following primary responsibilities:
‰ Review and approve on an annual basis the Company’s compensation strategy to help ensure that ourexecutive officers are appropriately incentivized and rewarded based on their performance.
‰ Review and approve on an annual basis executive compensation goals and objectives and evaluate per-formance in light of those goals and objectives.
‰ Determine on an annual basis the amount, form and terms of compensation for each of the CEO and theExecutive Chairman of the Company.
‰ Review and approve base salaries, annual incentives and other matters relating to compensation of theexecutive officers of the Company.
‰ Review and approve grants of stock options, time-based RSU awards, market-based RSU awards andother equity incentives to our executive officers.
‰ Review and approve grants of stock options, time-based RSU awards and other equity incentives to othereligible individuals in the Company’s service.
‰ Review with the Board matters related to management performance and compensation.
26

Executive Compensation Philosophy and Framework
Compensation Objectives
Our executive compensation program is designed to achieve four primary objectives:
‰ Support a strong pay-for-performance culture, which provides compensation tied directly to achievingbusiness objectives.
‰ Attract, retain and motivate highly skilled executives who contribute to our long-term success.
‰ Establish and reinforce the appropriate balance between achievement of short-term and long-term corpo-rate goals.
‰ Support long-term value creation for stockholders, by aligning the interests of our executive officers withthe long-term interests of our stockholders.
We use a combination of base salary, annual cash incentive opportunity (which is based on Company andindividual performance for the period), and participation in our equity program to achieve these objectives.
Stockholder Say-on-Pay Vote
At our last annual stockholders meeting held in August 2013, over 94% of the votes cast on the proposal toapprove the compensation of our named executive officers supported our executive compensation program.Based on this high level of support for our executive compensation programs, the Compensation Committee didnot change its general approach for fiscal year 2014, except that, as described above, the Compensation Commit-tee did revise the structure of our executive officers’ performance-based equity awards in fiscal year 2014 so thata portion of the equity awards would be earned based on the TSR of the Company’s common stock compared tothe TSR of the NASDAQ Composite Index over a two-year period and a greater portion of the executive’s totalannual equity award would be allocated to these market-based RSUs (as opposed to RSUs that vest based solelyon continued service). The Compensation Committee believes that our executive compensation program includesa number of features that further our compensation philosophy and reflect best practices in the market. TheCompensation Committee will continue to consider the outcome of our say-on-pay votes when making futurecompensation decisions for the named executive officers.
Risk Considerations
The Compensation Committee considers, in establishing and reviewing our executive compensation pro-gram, whether the program encourages unnecessary or excessive risk taking and has concluded that it does not.Our executive compensation program reflects a balanced approach using both quantitative and qualitativeassessments of performance without putting an undue emphasis on a single performance measure. Base salariesare fixed in amount and thus do not encourage risk taking. Annual cash incentive awards are based on multipleCompany and individual performance objectives as described above, including a design win component andother operational components which are considered important to the long-term success of the Company, and aresubject to maximum payout amounts. The Compensation Committee believes that the annual cash incentive planappropriately balances risk and the desire to focus employees on specific annual goals important to the Compa-ny’s success. The majority of the total compensation opportunity provided to our executive officers is in the formof equity awards. The Compensation Committee believes that these awards do not encourage unnecessary orexcessive risk taking because the ultimate value of the awards is tied to the Company’s stock price, and becausegrants are subject to long-term vesting schedules to help ensure that executive officers always have significantvalue tied to long-term stock price performance. The Company’s current practice is to grant executive officers acombination of market-based RSU awards and time-based RSU awards. The Compensation Committee believesthis mix provides an appropriate balance between the goals of increasing the price of the Company’s commonstock (as market-based RSU awards ultimate value, if any, is tied to the performance of the Company’s commonstock over a two-year period against the NASDAQ Composite index) and avoiding risks that could threaten theCompany’s growth and stability (as all of the RSU awards are exposed to decreases in the Company’s stockprice). To further discourage our executive officers from taking risks that might have a significant negativeimpact on the long-term value of our common stock, we require our named executive officers to own a minimum
27

number of shares of our common stock under our stock ownership guidelines described above (see “Board ofDirectors — Executive Officer and Director Stock Ownership Guidelines”) and have adopted a clawback policythat enables us to recoup payments under the annual cash incentive plan from senior level employees as furtherdescribed below (see “Other Compensation Considerations — Compensation Recovery (“Clawback”) Policy”).In addition, our insider trading policy prohibits our employees from engaging in hedging transactions withrespect to common stock, or other equity awards for common stock, of the Company as further described above(see “Board of Directors — Executive Officer and Director Stock Ownership Guidelines”).
Process for Evaluating Executive Officer Performance and Compensation
In general, the process for making compensation decisions for named executive officers begins prior to theend of the Company’s fiscal year, which occurs on the Sunday closest to March 31. During February or March ofeach year, the Compensation Committee will work with its independent compensation consultant to define thescope of the consultant’s engagement and to discuss any changes in information being requested by the Compen-sation Committee. During April and early May of each year, the Company finalizes financial information for thejust-completed fiscal year, and makes that information available to the Compensation Committee. During thissame time period, the Compensation Committee receives competitive market data and reviews this data with itscompensation consultant. The compensation consultant provides the Compensation Committee with a compar-ison of the current compensation (including base salary, annual cash incentives and equity) for each namedexecutive officer to the market data. The Compensation Committee typically schedules a meeting in early May toreview the Company’s actual performance against annual cash incentive plan objectives, to discuss individualexecutive performance and to discuss incentive plan payouts for the just-completed fiscal year, as well as anybase salary or target annual cash incentive adjustments for the new fiscal year. The Compensation Committeealso discusses equity awards that may be granted to named executive officers. An additional meeting is typicallyheld several weeks later at which the Compensation Committee makes final compensation decisions with respectto named executive officer compensation, including CEO and Executive Chairman compensation. None of ourexecutives has any role in establishing the compensation of our named executive officers, although the Compen-sation Committee does consider the recommendations of the CEO and Executive Chairman in setting compensa-tion levels for the named executive officers other than the CEO and the Executive Chairman.
For fiscal year 2014, the Compensation Committee retained Compensia Inc. (“Compensia”), a nationalconsulting company, to provide independent advice and information relating to executive compensation.Compensia assisted the Compensation Committee in the evaluation of base salary, annual cash incentive andequity incentive levels for the named executive officers and other senior executives. Compensia reports directlyto the Compensation Committee. From time to time, the Compensation Committee may direct its compensationconsultant to work with our Human Resources Department on matters such as: (i) reviewing and/or recommend-ing to the Compensation Committee the companies that will serve as the Company’s peer group for purposes ofevaluating the Company’s executive compensation levels (as discussed below); (ii) analyzing our executivecompensation programs and levels relative to our peer group companies; and (iii) advising on the design of cash-based incentives and equity awards for our executive officers. During fiscal year 2014, except for the consultingservices provided to the Compensation Committee, Compensia did not perform any other services for the Com-pany or its management, and the Compensation Committee has concluded that the services provided by Compen-sia did not raise any conflicts of interest.
Review of Competitive Market Data
For fiscal year 2014, the Compensation Committee examined the compensation practices of a peer group oftechnology companies identified below to assess the competitiveness of executive officer compensation practicesand levels. This compensation peer group is collectively referred to in this discussion as the “market,” and thecompensation decisions for any named executive officer based on the market are determined with reference tothe compensation levels for similar positions in the market data. The fiscal year 2014 compensation peer group of18 companies included primarily semiconductor and storage device companies that the Compensation Committeeconsidered similar to the Company in business strategy or represented business or labor market competitors,including both smaller and larger companies.
28
The peer companies used by the Compensation Committee for its comparisons in fiscal year 2014 were asfollows:
Applied Micro Circuits Corporation Aruba Networks, Inc. Electronics For Imaging, Inc.
Emulex Corporation Extreme Networks, Inc.. F5 Networks, Inc.
Fusion-IO, Inc. Harmonic, Inc. Infinera Corporation
Integrated Device Technology, Inc. Intermec Inc. Mellanox Technologies, Ltd.
Microsemi Corporation PMC-Sierra, Inc. Quantum Corporation
Riverbed Technology, Inc. Silicon Laboratories Inc. STEC, Inc.
The compensation peer group is reviewed annually by the Compensation Committee, with input from itsindependent compensation consultant, and adjustments are made as necessary to help ensure the group continuesto properly reflect the market in which we compete for business or talent. For fiscal year 2014, the CompensationCommittee updated the compensation peer group from the prior year to remove one company (Brocade Commu-nications Systems, Inc.) that had significantly higher revenues and market capitalizations than the Company. TheCompensation Committee also added seven companies (Aruba Networks, Inc., Electronics for Imaging, Inc.,Fusion-IO, Inc., Harmonic, Inc., Infinera Corporation, Intermec Inc. and Silicon Laboratories Inc.) that satisfiedthe above described selection criteria and concluded that the revised compensation peer group included a suffi-cient number of companies for comparison purposes.
The Compensation Committee believes that the companies in the compensation peer group form a reason-able basis for evaluating executive officer compensation. The following chart reflects our ranking for three keymetrics within the compensation peer group in May 2013, at the time the peer group data was reviewed by theCompensation Committee:
Comparison Metric QLogic Percentile vs. Peers
Revenue (last four quarters) . . . . . . . . . . . . . . . . . . . . . . . . . . . . . . . . . . . . . . . . 28%Net Income (last four quarters) . . . . . . . . . . . . . . . . . . . . . . . . . . . . . . . . . . . . . 78%Market Capitalization . . . . . . . . . . . . . . . . . . . . . . . . . . . . . . . . . . . . . . . . . . . . . 47%
Our strategy for executive officer compensation has been to examine market compensation practices andtarget the median of the market for base salary and for total cash compensation (base salary plus annual cashincentive). Beginning in fiscal year 2014, we changed our equity compensation philosophy to target the 50th
percentile of market for equity compensation (as opposed to the 60th percentile targeted in the prior fiscal year).
The Compensation Committee retains the discretion to approve compensation levels for individual execu-tive officers above and below the target levels identified above, based on the Compensation Committee’s sub-jective assessment of the executive officer’s individual performance, experience in the position, and consistencyof performance, as well as our financial and operational performance and internal equity considerations.
Other Compensation Considerations
Stock Ownership Guidelines
The Compensation Committee has adopted stock ownership guidelines to further align the interests of ournamed executive officers and directors with the interests of our stockholders. Under our stock ownership guide-lines, our CEO is to accumulate three times his or her annual base salary in shares of the Company’s commonstock, other named executive officers are to accumulate one times their annual base salary in shares of theCompany’s common stock and non-employee directors are to accumulate three times their annual board retainerin shares of the Company’s common stock, in each case over a five-year period. Please see “Board of Direc-tors — Executive Officer and Director Stock Ownership Guidelines” above for more information.
Compensation Recovery (“Clawback”) Policy
We maintain a compensation recovery (“clawback”) policy that enables the Company to recoup paymentsunder the annual cash incentive plan to the extent that these payments were based on incorrect financial resultsthat require a restatement of the Company’s financial statements from senior level employees whose fraud ormisconduct was a material contributing factor to the financial restatement.
29
Anti-hedging/Pledging Policy
As noted under “Board of Directors — Executive Officer and Director Stock Ownership Guidelines” above,the Company’s Insider Trading Policy restricts employees, executive officers and directors from engaging in thefollowing activities with respect to the securities of the Company:
‰ Hedging or monetization transactions, such as zero-cost collars and forward sale contracts, that allow anemployee to lock in much of the value of his or her stock holdings, often in exchange for all or part of thepotential upside appreciation in the stock; or
‰ Holding Company securities in a margin account or pledging Company securities as collateral for a loanwithout adequate financial resources to prevent a forced sale.
Tax Considerations
Federal income tax law prohibits the Company from deducting compensation paid to certain of our execu-tive officers that exceeds $1 million during the tax year unless it is based on achieving pre-established perform-ance measures that are set by the Compensation Committee pursuant to a plan approved by the Company’sstockholders (“performance-based compensation”).
While the Compensation Committee considers the deductibility of compensation paid to its named execu-tive officers, the Compensation Committee retains the flexibility necessary to provide total compensation itbelieves is in line with competitive practice, our compensation philosophy, and the interests of stockholders. Wetherefore may pay compensation to our named executive officers that may not be deductible for federal incometax purposes. The stock options and market-based RSUs granted under our stock plan are intended to meet thecriteria for performance-based compensation; however, time-based RSUs that are subject only to time-basedvesting requirements generally do not satisfy those requirements. In any case, there can be no assurance that thecompensation intended to qualify for deductibility under Section 162(m) awarded or paid by the Company willbe fully deductible.
30

COMPENSATION COMMITTEE REPORT ON EXECUTIVE COMPENSATION
The Compensation Committee has certain duties and powers as described in its charter. The CompensationCommittee is currently composed of the four non-employee directors named at the end of this report, each ofwhom is independent as defined by The NASDAQ Stock Market listing standards.
The Compensation Committee has reviewed and discussed with management the disclosures contained inthe Compensation Discussion and Analysis section of this Proxy Statement. Based upon this review and dis-cussion, the Compensation Committee recommended to our Board of Directors that the Compensation Dis-cussion and Analysis section be included in this Proxy Statement.
The Compensation Committee
Christine King, ChairBalakrishnan S. IyerKathryn B. LewisWilliam M. Zeitler
The information contained in the above report shall not be deemed to be “soliciting material” or to be filedwith the Securities and Exchange Commission, nor shall such information be incorporated by reference in anyfuture filing under the Securities Act of 1933, as amended, or under the Securities Exchange Act of 1934, asamended, except to the extent specifically incorporated by reference therein.
COMPENSATION COMMITTEE INTERLOCKS AND INSIDER PARTICIPATION
The Compensation Committee members whose names appear on the Compensation Committee Reportabove were committee members during all of fiscal year 2014, except for Ms. King, who was appointed to theCompensation Committee in May 2013. No member of the Compensation Committee is or has been an executiveofficer of the Company or had any relationships requiring disclosure by the Company under the SEC’s rulesrequiring disclosure of certain relationships and related party transactions. None of the Company’s executiveofficers served as a director or a member of a compensation committee (or other committee serving an equivalentfunction) of any other entity that has or had one or more executive officers who served as a director or member ofthe Compensation Committee during the fiscal year ended March 30, 2014.
31

SUMMARY COMPENSATION TABLE— FISCAL YEARS 2012, 2013 AND 2014
The following table presents information regarding compensation earned by or paid to our “named executiveofficers” for our fiscal years 2012, 2013 and 2014. The position set forth in the table for each person is his or hercurrent position with us unless otherwise indicated.
Name and PrincipalPosition
FiscalYear
Salary($)
Bonus($)
StockAwards($)(1)(2)
OptionAwards($)(1)
Non-EquityIncentive PlanCompensation
($)
NonqualifiedDeferred
CompensationEarnings
($)
All OtherCompensation
($)(3)Total($)
(a) (b) (c) (d) (e) (f) (g) (h) (i) (j)
Prasad L. Rampalli, . . . . . . . 2014 92,310 250,000(4) 6,202,500 — 81,000 — 14,726(5) 6,640,536President and ChiefExecutive Officer
Jean Hu, . . . . . . . . . . . . . . . . 2014 363,002 413,000(6) 1,141,763 — 236,000 — 6,005 2,159,770Senior Vice 2013 347,936 — 496,916 238,784 137,000 — 3,805 1,224,441President and 2012 327,117 30,000 232,830 693,960 177,400 — 1,501 1,462,808Chief Financial Officer*
Roger J. Klein, . . . . . . . . . . 2014 318,989 75,000(7) 309,204 — 207,343 — 8,707 919,243Senior Vice Presidentand General Manager,Fibre Channel Products
H.K. Desai, . . . . . . . . . . . . . 2014 530,005 — 2,660,278 — 589,433 — 31,278(8) 3,810,994Former Executive 2013 530,005 — 1,493,716 559,650 282,500 — 30,916 2,896,787Chairman** 2012 530,005 — 559,912 636,300 416,000 — 27,429 2,169,646
Simon Biddiscombe, . . . . . . 2014 82,186 — 944,245(9) — — — 647,019(10) 1,673,450Former President and 2013 604,067 — 1,992,545 746,200 294,261 — 15,702 3,652,775Chief Executive 2012 573,663 — 747,592 848,400 440,000 — 2,429 2,612,084Officer***
Robert B. Crawford, . . . . . . 2014 312,000 — 299,138 — 151,053 — 5,823 768,014Former Senior Vice 2013 309,466 — 489,991 238,784 116,600 — 3,323 1,158,164President, Worldwide 2012 263,094 25,000 211,320 579,981 143,000 — 223,934 1,446,329Sales****
* Ms. Hu served as our interim CEO from May 17, 2013 until February 3, 2014. On February 3, 2014,Mr. Rampalli became our President and CEO.
** Mr. Desai passed away on June 8, 2014.
*** Mr. Biddiscombe resigned effective May 17, 2013.
****Mr. Crawford resigned effective June 16, 2014.
(1) The amounts reported in Columns (e) and (f) of the table above for each fiscal year represent the fair value onthe grant date of the stock awards and option awards, respectively, granted to our named executive officersduring that fiscal year. These values have been determined under the principles used to calculate the grant datefair value of equity awards for purposes of our financial statements. For a discussion of the assumptions andmethodologies used to value the awards reported in Columns (e) and (f), please see the discussion of stockawards contained under the section entitled “Stock-Based Compensation — Stock-Based CompensationExpense” on page 63 of our Annual Report on Form 10-K for fiscal year 2014 filed with the SEC on May 23,2014 (or, for awards granted in prior fiscal years, the corresponding section of the Form 10-K for that year).
32

(2) As described in the Compensation Discussion and Analysis above, the Compensation Committee grantedRSU awards that were subject to performance-based and/or market-based vesting conditions to certainnamed executive officers during fiscal years 2013 and 2014. The amounts reported in the “Stock Awards”column of the table above include the grant date fair value of these performance-based and/or market-basedawards based on the probable outcome (determined as of the grant date in accordance with applicableaccounting rules) of the performance-based and/or market-based conditions applicable to the awards. Thefollowing tables set forth for these performance-based and/or market-based awards the amounts reported inthe “Stock Awards” column above for the applicable fiscal year and the value of these awards on the grantdate if one assumes that the highest level of performance conditions is achieved:
Name
GrantDate Fair Value
(Based onProbableOutcome)
($)
Value of Award onGrant Date Assuming
MaximumPerformance is Achieved
($)
GrantDate Fair Value
(Based onProbableOutcome)
($)
Value of Award on GrantDate Assuming
MaximumPerformance is Achieved
($)Fiscal Year 2013 Fiscal Year 2014
Prasad L. Rampalli . . . . N/A N/A 3,365,000 5,675,000Jean Hu . . . . . . . . . . . . . 215,761 317,858 223,262 417,993Roger J. Klein . . . . . . . . N/A N/A 108,004 202,206H.K. Desai . . . . . . . . . . . 503,441 741,668 369,148 691,122Simon Biddiscombe . . . . 671,255 988,890 N/A N/ARobert B. Crawford . . . . 215,761 317,858 103,974 194,661
(3) This column includes life insurance premiums and contributions to the QLogic Corporation RetirementSavings Plan (401(k) Plan) paid by the Company with respect to the named executive officer, and for fiscalyear 2014, includes: (a) life insurance premiums paid by the Company in the amount of $548 forMr. Rampalli, $864 for Ms. Hu, $2,130 for Mr. Klein, $6,858 for Mr. Desai, $125 for Mr. Biddiscombe and$723 for Mr. Crawford; and (b) 401(k) Plan contributions made by the Company in the amount of $5,200for Mr. Rampalli, $5,141 for Ms. Hu, $6,577 for Mr. Klein, $5,100 for Mr. Desai, $1,578 forMr. Biddiscombe and $5,100 for Mr. Crawford.
(4) This amount represents a sign-on bonus received by Mr. Rampalli in connection with joining the Companyin February 2014. This bonus must be repaid to the Company in the event that during Mr. Rampalli’s firstyear of employment he voluntarily terminates his employment or his employment is terminated by theCompany for cause
(5) In addition to the amounts identified in footnote (3) above, this amount includes the payment by the Com-pany of relocation expenses for Mr. Rampalli in the amount of $8,978. The relocation expenses are treatedas an advance from the Company, 1/24th of which are forgiven upon completion of each subsequentmonth’s service. The advance will be forgiven in its entirety if Mr. Rampalli’s employment is terminated bythe Company without cause; however, Mr. Rampalli will repay any remaining unforgiven amount of theadvance should his employment be terminated by the Company for cause, or he terminates his employmentvoluntarily, at any time during his first two years of employment.
(6) Consists of (i) a special award in the amount of $75,000 in recognition of Ms. Hu’s role in the successfulcompletion of the Company’s acquisition from Broadcom Corporation (“Broadcom”) of certain10/40/100Gb Ethernet controller-related assets, and (ii) a special award in the amount of $338,000 inrecognition of Ms. Hu’s service as the Company’s interim CEO from May 2013 to February 2014.
(7) This amount represents a special award in recognition of Mr. Klein’s role in the successful completion ofthe Company’s acquisition from Broadcom of certain 10/40/100Gb Ethernet controller-related assets.
(8) In addition to the amounts identified in footnote (3) above, this amount includes the payment by the Com-pany of club membership dues for Mr. Desai in the amount of $19,320.
(9) As further described below under “Potential Payments Upon Termination or Change in Control — Sev-erance Agreements,” in connection with his resignation Mr. Biddiscombe received accelerated vesting ofoutstanding and unvested RSUs granted by the Company that were otherwise scheduled to vest on or before
33

May 31, 2014 (which consisted of 94,899 RSUs). Included in the table above is the fair value of the accel-erated RSUs based on the closing price of a share of the Company’s common stock on May 17, 2013, thedate of resignation.
(10) In addition to the amounts identified in footnote (3) above, this amount includes, in connection withMr. Biddiscombe’s resignation, a severance payment in the amount of $610,500, payment for accrued butunused personal time off in the amount of $14,227, and payment by the Company of COBRA premiums inthe amount of $20,589.
Compensation of Named Executive Officers
The Summary Compensation Table above quantifies the value of the different forms of compensationearned by or awarded to our named executive officers for fiscal year 2014. The Summary Compensation Tableincludes fiscal year 2012 and 2013 information for those named executive officers who were also named execu-tive officers in fiscal years 2012 or 2013. The primary elements of each named executive officer’s total compen-sation reported in the table for fiscal year 2014 are base salary, an annual cash incentive, and long-term equityincentives consisting of RSU awards. Our named executive officers also received the other benefits listed in the“All Other Compensation” column of the Summary Compensation Table, as further described in footnotes (3),(5), (8) and (10) to the table. We do not have employment agreements with our named executive officers, exceptfor Mr. Desai. Details of Mr. Desai’s employment agreement are described below under “EmploymentAgreements.”
The Summary Compensation Table should be read in conjunction with the tables and narrative descriptionsthat follow. The “Grants of Plan-Based Awards in Fiscal Year 2014” table below, and the accompanying descrip-tion of the material terms of the RSU awards granted in fiscal year 2014, provide information regarding theequity awards granted to our named executive officers in fiscal year 2014. The “Outstanding Equity Awards atEnd of Fiscal Year 2014” and “Option Exercises and Stock Vested — Fiscal Year 2014” tables below providefurther information on the named executive officers’ potential realizable value and actual value realized withrespect to their equity awards.
Employment Agreements
In October 2010, we entered into an employment agreement with Mr. Desai in connection with his transitionfrom President and CEO to Executive Chairman. This agreement provided for a three-year term beginningNovember 15, 2010 and for Mr. Desai to receive an annual base salary of $530,000, and an annual targetincentive equal to 100% of his annual base salary. Mr. Desai was eligible for annual equity awards consistentwith the Compensation Committee’s policies on annual equity awards for executive-level employees. Mr. Desaiwas also eligible to participate in the Company’s benefit plans made available to the Company’s executive-levelemployees generally. This employment agreement expired on November 15, 2013.
In connection with announcing the appointment of Mr. Rampalli as our President and CEO, the Companyentered into a new employment agreement with Mr. Desai pursuant to which he would serve as the Company’sExecutive Chairman for a term beginning on December 4, 2013 and ending on March 29, 2015, the last day ofthe Company’s 2015 fiscal year. This agreement provided for Mr. Desai to receive an annual base salary of$530,000, and an annual target incentive equal to 100% of his annual base salary. The Compensation Committeealso approved the grant of a time-based RSU award of 136,636 shares of the Company’s common stock(effective December 4, 2013) under the Company’s 2005 Plan to Mr. Desai. This award would have vested, sub-ject to Mr. Desai’s continued employment or service, in equal annual installments over a term of four years fol-lowing the effective date of grant. Mr. Desai was also eligible to participate in the Company’s benefit plans madeavailable to the Company’s executive-level employees generally. However, he would not have been eligible toreceive further annual equity awards during the term of the Employment Agreement. Provisions of Mr. Desai’sagreement relating to post-termination employment benefits are discussed below under “Potential PaymentsUpon Termination or Change in Control” below. As noted above, Mr. Desai passed away on June 8, 2014.
34

Grants of Plan-Based Awards in Fiscal Year 2014
The following table sets forth information regarding the plan-based awards that we granted during fiscal year2014 to each of our named executive officers.
NameGrantDate
Estimated Potential PayoutsUnder Non-Equity Incentive
Plan Awards
Estimated Potential PayoutsUnder Equity Incentive Plan
Awards
AllOtherStock
Awards:Number
ofSharesof Stockor Units
(#)
All OtherOptionAwards:Number
ofSecuritiesUnderlyingOptions
(#)
Exerciseor BasePrice ofOptionAwards($/Sh)
GrantDateFairValueof Stockand
OptionAwards($)(1)
Threshold($)
Target($)
Maximum($)
Threshold(#)
Target(#)
Maximum(#)
(a) (b) (c) (d) (e) (f) (g) (h) (i) (j) (k) (l)
Prasad L. Rampalli . . . . . . . . N/A — 92,310 138,466 — — — — — — —2/3/2014 — — — — — — 250,000 — — 2,837,5002/3/2014(2) — — — 62,500 250,000 500,000 — — — 3,365,000
Jean Hu . . . . . . . . . . . . . . . . N/A — 235,951 353,927 — — — — — — —6/6/2013 — — — — — — 41,600 — — 418,4966/6/2013(2) — — — 6,925 27,700 41,550 — — — 223,26212/4/2013 — — — — — — 42,699 — — 500,005
Roger J. Klein . . . . . . . . . . . N/A — 207,343 311,014 — — — — — — —6/6/2013 — — — — — — 20,000 — — 201,2006/6/2013(2) — — — 3,350 13,400 20,100 — — — 108,004
H.K. Desai . . . . . . . . . . . . . . N/A — 530,005 795,007 — — — — — — —6/6/2013 — — — — — — 68,700 — — 691,1226/6/2013(2) — — — 11,450 45,800 68,700 — — — 369,14812/4/2013 — — — — — — 136,636 — — 1,600,008
Simon Biddiscombe(3) . . . . 5/17/2013 — — — — — — 94,899 — — 944,245Robert B. Crawford . . . . . . . N/A — 202,800 304,200 — — — — — — —
6/6/2013 — — — — — — 19,400 — — 195,1646/6/2013(2) — — — 3,225 12,900 19,350 — — — 103,974
(1) The amounts reported in Column (l) reflect the fair value of these awards on the grant date as determined underthe principles used to calculate the value of equity awards for purposes of the Company’s financial statements.For the assumptions and methodologies used to value the awards reported in Column (l), please see footnote(1) to the Summary Compensation Table.
(2) These RSU awards were subject to market-based vesting conditions and were granted by the CompensationCommittee in June 2013 and February 2014. The specific performance goals applicable to these awards wereestablished by the Compensation Committee at the time the awards were granted, and the grant date fair valueof these awards was determined for accounting purposes in June 2013 and February 2014, respectively. Underapplicable SEC rules, these awards are required to be treated as compensation for the fiscal year in which thegrant date for accounting purposes occurs. Accordingly, these awards are reported as compensation for fiscalyear 2014 in this Grants of Plan-Based Awards in Fiscal Year 2014 table, as well as in the SummaryCompensation Table above, based on the probable outcome (as determined under applicable accounting rules)of the performance conditions applicable to the awards.
(3) Mr. Biddiscombe resigned effective May 17, 2013 and therefore did not participate in the annual incentive planor receive an annual equity grant for fiscal year 2014. In connection with his resignation as CEO in May 2013,Mr. Biddiscombe received accelerated vesting of outstanding and unvested RSUs granted by the Company thatwere otherwise scheduled to vest on or before May 31, 2014 (which consisted of 94,899 RSUs). The remainderof Mr. Biddiscombe’s outstanding RSUs terminated as of his resignation date.
Description of Plan-Based Awards
Each of the equity awards reported in the “Grants of Plan-Based Awards in Fiscal Year 2014” table above wasgranted under, and is subject to, the terms of the 2005 Plan. The material terms of the non-equity incentive planawards reported in the table are described in the “Compensation Discussion and Analysis” above.
35

The Compensation Committee administers the 2005 Plan. The Compensation Committee has authority tointerpret the plan provisions and make all required determinations under the plan. This authority includes makingrequired proportionate adjustments to outstanding awards upon the occurrence of certain corporate events such asreorganizations, mergers and stock splits, and making provision to ensure that any tax withholding obligationsincurred in respect of awards are satisfied. Awards granted under the plan are generally only transferable to abeneficiary of a named executive officer upon his or her death. However, the Compensation Committee mayestablish procedures for the transfer of awards to other persons or entities, provided that such transfers complywith applicable securities laws and, with limited exceptions set forth in the plan document, are not made forvalue.
If a change in control of the Company occurs (as determined under the 2005 Plan), each named executiveofficer’s outstanding awards granted under the plan will generally only become fully vested if (i) the Companydissolves or does not survive as a public company after the change in control transaction and (ii) the Compensa-tion Committee does not provide for the substitution, assumption, exchange or other continuation of the out-standing awards. Any options that become vested in connection with a change in control of the Companygenerally must be exercised prior to the change in control, or they will be canceled in exchange for the right toreceive a cash payment in connection with the transaction. In addition, each of our named executive officers(except for Messrs. Desai, Biddiscombe and Crawford) may be eligible to receive accelerated vesting of his orher outstanding equity awards upon a termination of employment in connection with a change in control of theCompany. The terms of this accelerated vesting are described below under “Potential Payments Upon Termi-nation or Change in Control” below.
RSU Awards
Each RSU award reported in Columns (g) and (i) of the “Grants of Plan-Based Awards in Fiscal Year 2014”table above was granted to our named executive officers under the 2005 Plan. Each of the time-based RSUawards (Column (i)) is subject to a four-year vesting schedule, with 25% of the total number of shares of theCompany’s common stock subject to the RSU awards vesting on each of the first, second, third and fourth anni-versaries of the date of grant, in each case subject to the named executive officer’s continued employment with,or service to, the Company through the vesting date. The market-based RSU awards granted to Messrs. Klein,Desai and Crawford, and to Ms. Hu (Column (g)), have a four-year vesting schedule, with 50% of the totalnumber of shares of the Company’s common stock subject to the RSU awards vesting on the second anniversaryof the date of grant, and 25% of the shares of the Company’s common stock subject to the total number of RSUawards vesting on each of the third and fourth anniversaries of the award date, with vesting in each casedetermined based on the Company’s relative TSR against the TSR for the NASDAQ Composite Index for theinitial two-year performance period of the award and subject to the named executive officer’s continuedemployment with, or service to, the Company through the vesting date. The market-based RSU award granted toMr. Rampalli (Column (g)) is subject to a three-year vesting schedule, with 100% of the total number of sharesof the Company’s common stock subject to the RSU award vesting on the third anniversary of the award date,with vesting determined based on the Company’s relative TSR against the TSR for the NASDAQ CompositeIndex for the three-year performance period of the award and subject to Mr. Rampalli’s continued employment orservice with the Company through the vesting date.
Upon vesting, the Company will deliver to the named executive officer a number of shares of the Compa-ny’s common stock equal to the number of units specified in the RSU award that have vested on the applicablevesting date, less any shares of common stock that may be withheld to satisfy the related minimum tax with-holding obligations. Subject to any accelerated vesting that may apply in connection with a change in control ofthe Company, the unvested portion of any RSU award will immediately terminate upon a termination of thenamed executive officer’s employment.
36
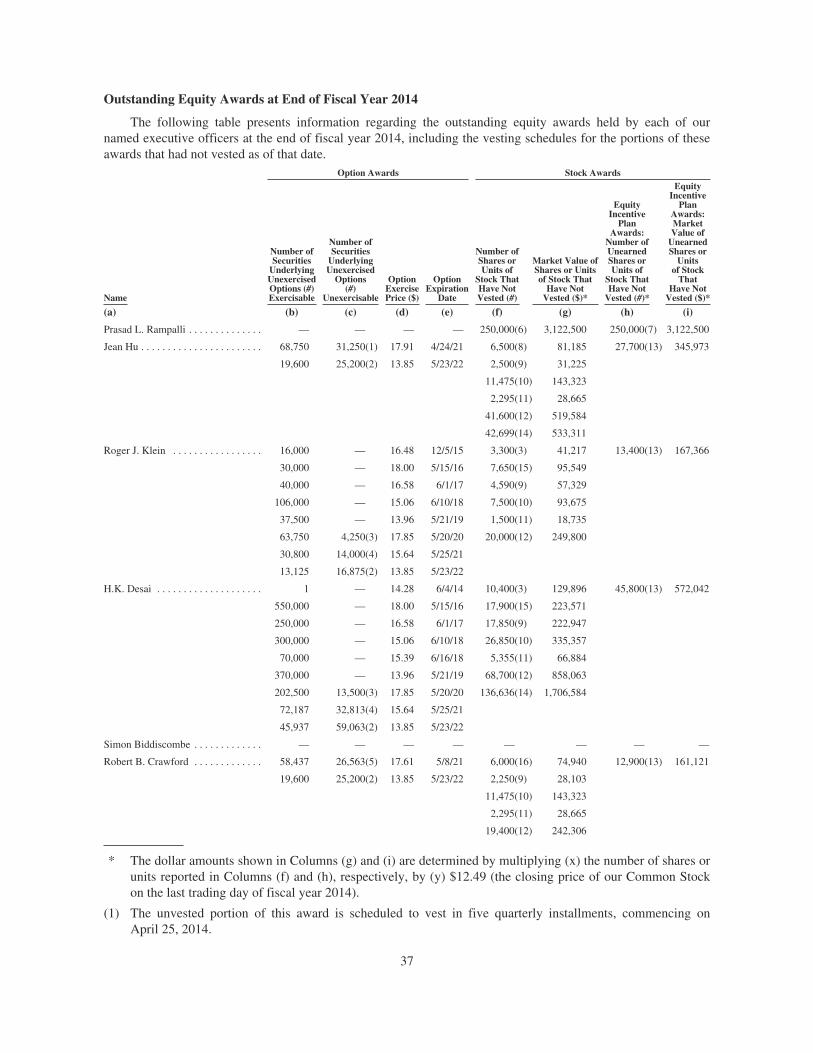
Outstanding Equity Awards at End of Fiscal Year 2014
The following table presents information regarding the outstanding equity awards held by each of ournamed executive officers at the end of fiscal year 2014, including the vesting schedules for the portions of theseawards that had not vested as of that date.
Option Awards Stock Awards
Name
Number ofSecuritiesUnderlyingUnexercisedOptions (#)Exercisable
Number ofSecuritiesUnderlyingUnexercisedOptions
(#)Unexercisable
OptionExercisePrice ($)
OptionExpiration
Date
Number ofShares orUnits of
Stock ThatHave NotVested (#)
Market Value ofShares or Unitsof Stock ThatHave NotVested ($)*
EquityIncentivePlan
Awards:Number ofUnearnedShares orUnits of
Stock ThatHave NotVested (#)*
EquityIncentivePlan
Awards:MarketValue ofUnearnedShares orUnits
of StockThat
Have NotVested ($)*
(a) (b) (c) (d) (e) (f) (g) (h) (i)
Prasad L. Rampalli . . . . . . . . . . . . . . — — — — 250,000(6) 3,122,500 250,000(7) 3,122,500
Jean Hu . . . . . . . . . . . . . . . . . . . . . . . 68,750 31,250(1) 17.91 4/24/21 6,500(8) 81,185 27,700(13) 345,973
19,600 25,200(2) 13.85 5/23/22 2,500(9) 31,225
11,475(10) 143,323
2,295(11) 28,665
41,600(12) 519,584
42,699(14) 533,311
Roger J. Klein . . . . . . . . . . . . . . . . . 16,000 — 16.48 12/5/15 3,300(3) 41,217 13,400(13) 167,366
30,000 — 18.00 5/15/16 7,650(15) 95,549
40,000 — 16.58 6/1/17 4,590(9) 57,329
106,000 — 15.06 6/10/18 7,500(10) 93,675
37,500 — 13.96 5/21/19 1,500(11) 18,735
63,750 4,250(3) 17.85 5/20/20 20,000(12) 249,800
30,800 14,000(4) 15.64 5/25/21
13,125 16,875(2) 13.85 5/23/22
H.K. Desai . . . . . . . . . . . . . . . . . . . . 1 — 14.28 6/4/14 10,400(3) 129,896 45,800(13) 572,042
550,000 — 18.00 5/15/16 17,900(15) 223,571
250,000 — 16.58 6/1/17 17,850(9) 222,947
300,000 — 15.06 6/10/18 26,850(10) 335,357
70,000 — 15.39 6/16/18 5,355(11) 66,884
370,000 — 13.96 5/21/19 68,700(12) 858,063
202,500 13,500(3) 17.85 5/20/20 136,636(14) 1,706,584
72,187 32,813(4) 15.64 5/25/21
45,937 59,063(2) 13.85 5/23/22
Simon Biddiscombe . . . . . . . . . . . . . — — — — — — — —
Robert B. Crawford . . . . . . . . . . . . . 58,437 26,563(5) 17.61 5/8/21 6,000(16) 74,940 12,900(13) 161,121
19,600 25,200(2) 13.85 5/23/22 2,250(9) 28,103
11,475(10) 143,323
2,295(11) 28,665
19,400(12) 242,306
* The dollar amounts shown in Columns (g) and (i) are determined by multiplying (x) the number of shares orunits reported in Columns (f) and (h), respectively, by (y) $12.49 (the closing price of our Common Stockon the last trading day of fiscal year 2014).
(1) The unvested portion of this award is scheduled to vest in five quarterly installments, commencing onApril 25, 2014.
37

(2) The unvested portion of these awards is scheduled to vest in nine quarterly installments, commencing onMay 24, 2014.
(3) The remaining unvested portion of these awards is scheduled to vest on May 20, 2014.
(4) The unvested portion of these awards is scheduled to vest in five quarterly installments, commencing onMay 26, 2014.
(5) The unvested portion of this award is scheduled to vest in five quarterly installments, commencing onMay 9, 2014.
(6) The unvested portion of this award is scheduled to vest in four annual installments commencing on February 3,2015.
(7) The unvested portion of this award is scheduled to vest on February 3, 2017. This RSU award is subject toperformance-based vesting requirements and was granted by the Compensation Committee on February 3,2014.
(8) The unvested portion of this award is scheduled to vest in two annual installments commencing on April 25,2014.
(9) The unvested portion of these awards is scheduled to vest in two annual installments commencing onMay 26, 2014. These RSU awards were subject to performance-based vesting requirements and weregranted by the Compensation Committee on May 26, 2011. The numbers in the table above are presentedafter giving effect to the Compensation Committee’s determination in May 2012 as to the RSUs that areeligible to vest based on the Company’s performance for the applicable period.
(10) The unvested portion of these awards is scheduled to vest in three annual installments commencing onMay 24, 2014.
(11) The unvested portion of these awards is scheduled to vest in three annual installments commencing onMay 24, 2014. These RSU awards were subject to market-based vesting requirements and were granted bythe Compensation Committee on May 24, 2012. The numbers in the table above are presented after givingeffect to the Compensation Committee’s determination in May 2013 as to the RSUs that are eligible to vestbased on the Company’s performance for the applicable period.
(12) The unvested portion of these awards is scheduled to vest in four annual installments commencing onJune 6, 2014.
(13) The unvested portion of these awards is scheduled to vest as to 50% of the award on June 6, 2015 and in twoannual installments thereafter. These RSU awards are subject to market-based vesting requirements andwere granted by the Compensation Committee on June 6, 2013.
(14) The unvested portion of these awards is scheduled to vest in four annual installments commencing onDecember 4, 2014.
(15) The unvested portion of these awards is scheduled to vest in two annual installments commencing onMay 26, 2014.
(16) The unvested portion of this award is scheduled to vest in two annual installments commencing on May 9,2014.
38

Option Exercises and Stock Vested — Fiscal Year 2014
The following table presents information regarding the exercise of stock options by named executive offi-cers during fiscal year 2014 and the vesting during fiscal year 2014 of other stock awards previously granted tothe named executive officers.
Option Awards Stock Awards
Name(a)
Number of SharesAcquired onExercise (#)
(b)
ValueRealized onExercise ($)
(c)
Number ofShares Acquiredon Vesting (#)
(d)
ValueRealized onVesting ($)(1)
(e)
Prasad L. Rampalli . . . . . . . . . . . . . . — — — —Jean Hu . . . . . . . . . . . . . . . . . . . . . . . — — 9,090 89,516Roger J. Klein . . . . . . . . . . . . . . . . . . — — 18,295 173,701H.K. Desai . . . . . . . . . . . . . . . . . . . . . — — 61,410 583,601Simon Biddiscombe(2) . . . . . . . . . . . — — 94,899 944,245Robert B. Crawford . . . . . . . . . . . . . . — — 8,715 82,838
(1) The value realized on vesting is calculated based on the closing price of the Company’s common stock onthe date that the stock awards vest (or if the markets are closed on the date that the awards vest, the closingprice of the Company’s common stock on the last day that the markets were open) multiplied by the numberof shares of the Company’s common stock that vest.
(2) As further described below under “Potential Payments Upon Termination or Change in Control — Sev-erance Agreements,” in connection with his resignation Mr. Biddiscombe received accelerated vesting ofoutstanding and unvested RSU awards that were otherwise scheduled to vest on or before May 31, 2014(which consisted of 94,899 RSUs). Included in the table above is the fair value of the accelerated RSUawards based on the closing price of a share of the Company’s common stock on May 17, 2013, the date ofresignation.
Potential Payments Upon Termination or Change in Control
The following section describes the payments and benefits that may become payable to certain named execu-tive officers in connection with a termination of their employment with QLogic or a change in control of theCompany. As prescribed by the SEC’s rules, in calculating the amount of any potential payments to the namedexecutive officer under the arrangements described below, we have assumed that the applicable triggering event(i.e., termination of employment and change in control of the Company) occurred on the last business day offiscal year 2014 and that the price per share of our common stock is equal to the closing price as of that date.
Change in Control Severance Agreements
We are party to Change in Control Severance Agreements with each of our named executive officers otherthan Messrs. Desai, Biddiscombe and Crawford (the “Change in Control Severance Agreement”). As of the endof fiscal year 2014 we were a party to Change in Control Severance Agreements with Mr. Desai, who passedaway in June 2014, and with Mr. Crawford, who resigned on June 16, 2014. Information regarding the Change inControl Severance Agreements of Messrs. Desai and Crawford is provided hereunder as required by SEC rules.
Under the Change in Control Severance Agreement, in the event that the Company terminates the executiveofficer’s employment without cause or in the event that the executive terminates his or her employment for goodreason, in either case within 6 months before or 24 months after a change in control of the Company, the execu-tive would be entitled to receive a cash lump sum payment equal to (i) the sum of the executive’s annual basesalary and the greater of the executive’s maximum annual cash bonus for the year in which the terminationoccurs or the highest annual bonus paid to the executive for any one of the three preceding fiscal years, multi-plied by (ii) a specified multiplier (for Messrs. Rampalli and Desai, the specified multiplier is two; for Ms. Hu,the specified multiplier is one and one half; and for Messrs. Klein and Crawford, the specified multiplier is one).For these purposes, the terms “cause,” “good reason” and “change in control” are defined in the Change in Con-trol Severance Agreement. In addition, the Company will pay or reimburse the executive for the cost of the pre-miums charged to continue the executive’s and his or her dependents’ health coverage pursuant to the
39

Consolidated Omnibus Budget Reconciliation Act (COBRA) for up to a specified period of time following thetermination (for Messrs. Rampalli and Desai, the specified period of time is two years; for Ms. Hu andMessrs. Klein and Crawford, the specified period of time is one year). Any stock option or other equity-basedaward granted by the Company to the executive, to the extent then outstanding and not otherwise vested, willgenerally become fully vested in connection with such termination from employment. The Change in ControlSeverance Agreement typically has a two-year term and will automatically extend for one additional year on theanniversary of the effective date of the Agreement, unless the Compensation Committee notifies the executivethat the Agreement will not be extended.
Under the Change in Control Severance Agreement, the executive is not entitled to any tax gross-up pay-ments from the Company. Instead, should any benefits payable to the executive in connection with a change incontrol of the Company be subject to the excise tax imposed under Sections 280G and 4999 of the Internal Rev-enue Code of 1986, the executive will be entitled to either payment of the benefits in full (but no gross-up pay-ment) or a reduction in the benefits to the extent necessary to avoid triggering the excise tax, whichever wouldresult in the executive receiving the greater benefit on an after-tax basis.
The following table presents the Company’s estimate of the amount of the severance payments and benefitsto which each named executive officer would be entitled under his or her Change in Control Severance Agree-ment if his or her employment terminated under the circumstances described above in connection with a changein control of the Company, and assuming for purposes of this illustration that the termination of employmentoccurred on March 30, 2014.
Name
CashSeverance
($)
Continuation ofHealth Benefits
($)
EquityAcceleration
($)(1)Total($)
Prasad L. Rampalli . . . . . . . . . . . . . . . . . . . . 1,476,968 52,590 6,245,000 7,774,558Jean Hu . . . . . . . . . . . . . . . . . . . . . . . . . . . . . 1,075,394 14,410 1,683,265 2,773,069Roger J. Klein . . . . . . . . . . . . . . . . . . . . . . . . 630,003 13,369 723,671 1,367,043H.K. Desai . . . . . . . . . . . . . . . . . . . . . . . . . . 2,650,024 37,416 4,115,343 6,802,783Robert B. Crawford . . . . . . . . . . . . . . . . . . . 616,200 22,270 678,457 1,316,927
(1) This column reports the intrinsic value of the unvested portions of each executive officer’s outstandingequity awards that would accelerate in these circumstances. For options, this value is calculated by multi-plying the amount (if any) by which the closing price of the Company’s common stock on March 28, 2014($12.49 per share) exceeds the exercise price of the option by the number of shares of the Company’scommon stock subject to the accelerated portion of the option. For RSU awards, this value is calculated bymultiplying the closing price of the Company’s common stock on March 28, 2014 by the number of unitssubject to the accelerated portion of the award.
Severance Agreements
H.K. Desai
As described above, the Company entered into an employment agreement with Mr. Desai (the “EmploymentAgreement”) beginning December 4, 2013 and ending on March 29, 2015. Under the Employment Agreement, ifMr. Desai’s employment with the Company during the term of the agreement was terminated by the Companywithout cause or by Mr. Desai for good reason (as such terms were defined in the Employment Agreement andother than in connection with a change in control as described above), Mr. Desai would have been entitled to aseverance benefit equal to his base salary in effect on the termination date calculated for the remainder of theperiod of the Employment Agreement plus his annual target incentive in effect on the termination date calculatedfor the remainder of the period of the Employment Agreement. He would have been entitled to payment for sal-ary and incentives earned during the period prior to the termination date (including any incentives for the fiscalyear in which the termination occurs). Mr. Desai’s right to receive the severance benefits described above wassubject to his execution of a general release of claims in favor of the Company as well as his compliance withcertain non-solicitation and other restrictive covenants set forth in the Employment Agreement. Under the termsof the Employment Agreement, Mr. Desai could not receive severance payments under both the Employment
40

Agreement and his Change in Control Severance Agreement. In the event that Mr. Desai’s termination of employ-ment qualified for severance benefits under both agreements, Mr. Desai would have received only the severancepayment detailed in the Change in Control Severance Agreement, as described above.
The Company estimates that the amount of the severance payments and benefits to which Mr. Desai wouldhave been entitled under the Employment Agreement if his employment terminated under the circumstancesdescribed above, and assuming for purposes of this illustration that the termination of employment occurred onMarch 30, 2014, would be $1,062,922. This amount is equal to Mr. Desai’s base salary in effect on the termi-nation date calculated for the remainder of the period of the Employment Agreement plus his annual targetincentive in effect on the termination date calculated for the remainder of the period of the Employment Agree-ment.
Simon Biddiscombe
On May 17, 2013, the Company accepted the resignation of its President and CEO, Simon Biddiscombe. Inconnection with his resignation, Mr. Biddiscombe entered into a General Release Agreement with the Company.Under the release agreement, Mr. Biddiscombe received a separation payment of $610,500 (one year’s annualsalary), and a payment of $294,261 for his earned fiscal year 2013 annual cash incentive award. He also receivedaccelerated vesting of outstanding and unvested RSUs that were otherwise scheduled to vest on or beforeMay 31, 2014; provided that in the case of performance RSUs only the earned and unvested portion of the awardwas accelerated. Vesting was accelerated for a total of 94,899 RSUs. The grant-date fair value of these accel-erated RSUs based on the closing price of a share of the Company’s common stock on May 17, 2013, the date ofaward modification for accounting purposes, was $944,245. Pursuant to the 2005 Plan, any unvested options andRSU awards held by Mr. Biddiscombe on the date of termination of his employment (after giving effect to thevesting described above) were immediately forfeited. Upon termination of his employment Mr. Biddiscombealso became entitled to payments to cover the cost of COBRA premiums for him and his dependents throughMay 31, 2014. For fiscal year 2014, QLogic’s cost to pay Mr. Biddiscombe’s COBRA premiums was $20,589.The agreement also included a release by Mr. Biddiscombe of claims against the Company.
Robert B. Crawford
On June 16, 2014, the Company accepted the resignation of its Senior Vice President, Worldwide Sales,Robert B. Crawford. In connection with his resignation, Mr. Crawford entered into a General Release Agreementwith the Company. Under the release agreement, Mr. Crawford received a lump sum payment of $156,000 and alump sum payment of $22,270 as reimbursement by the Company for 12 months of his COBRA premiums. Theagreement also included a release by Mr. Crawford of any claims against the Company.
41
PROPOSAL NO. 2
AMENDMENTS TO THE QLOGIC CORPORATION2005 PERFORMANCE INCENTIVE PLAN
General
At the Annual Meeting, stockholders will be asked to approve amendments to the QLogic Corporation 2005Performance Incentive Plan, as amended (the “2005 Plan”), which were previously adopted by the Board ofDirectors, subject to stockholder approval, on July 10, 2014.
‰ Extension of Plan Term. The 2005 Plan is currently scheduled to expire in June 2015. The proposedamendments would extend the term of the 2005 Plan until July 10, 2024.
‰ Reduction in Aggregate Share Limit. The 2005 Plan currently limits the aggregate number of sharesof the Company’s common stock that may be delivered pursuant to all awards granted under the plan to25,100,000 shares. The proposed amendments would decrease this limit by 3,158,270 shares so that thenew aggregate share limit for the 2005 Plan would be 21,941,730 shares. (This number excludes sharesthat were originally subject to awards originally granted under the Company’s Stock Awards Plan (the“Prior Plan”) and became available for grant purposes under the 2005 Plan upon termination of theaward.)
‰ Change in Share-Counting Rules. The 2005 Plan currently provides that shares that are exchanged bya participant or withheld by the Company as payment in connection with an award under the plan, as wellas any shares exchanged by a participant or withheld by the Company to satisfy the tax withholdingobligations related to any award, are not available for subsequent awards under the plan. Under the pro-posed amendments, effective as of the Annual Meeting date, any such shares that are exchanged by a par-ticipant or withheld by the Company as payment of a “full-value award” (which generally includes awardsother than stock option grants and stock appreciation rights), or to satisfy the tax withholding obligationsrelated to such an award, would be available for subsequent awards under the 2005 Plan (with any suchshares becoming available for subsequent awards taking into account the premium share-counting rule forfull-value awards described below).
‰ Extension of Performance-Based Award Feature. One element of the 2005 Plan is the flexibility togrant certain performance-based awards designed to satisfy the requirements for deductibility ofcompensation under Section 162(m) of the U.S. Internal Revenue Code. These awards are referred to as“Performance-Based Awards” and are in addition to other awards, such as stock options and stockappreciation rights, expressly authorized under the 2005 Plan which may also qualify as performance-based compensation for Section 162(m) purposes. If stockholders approve this 2005 Plan proposal, thePerformance-Based Award feature of the 2005 Plan will be extended through the first annual meeting ofstockholders that occurs in 2019 (this expiration time is earlier than the general expiration date of the 2005Plan and is required under applicable tax rules). (See “Summary Description of the 2005 PerformanceIncentive Plan — Performance-Based Awards” below.)
‰ Other Amendments. The proposed 2005 Plan includes other technical amendments to update our planterms consistent with equity plan terms typical in the industry. Such amendments are included in the fulltext of the attached amended and restated 2005 Plan, which has been filed as Exhibit A to the copy of thisProxy Statement that was filed electronically with the Securities and Exchange Commission and can bereviewed on the Securities and Exchange Commission’s Web site at http://www.sec.gov.
As of July 1, 2014, a total of 14,275,698 shares of our common stock were then subject to outstandingawards granted under the 2005 Plan, and 10,758,270 shares of the Company’s common stock were then availablefor new award grants under the 2005 Plan. As noted above, the Company is not seeking an increase in the num-ber of shares available for grant under the 2005 Plan. Rather, the Company has determined, subject to stock-holder approval of the proposed amendments, to reduce the number of shares available for grant under the plan asdescribed above. For all of the Company’s equity incentive plans (including the 2005 Plan), as of July 1, 2014, atotal of 10,487,617 shares of the Company’s common stock were subject to outstanding options (with aweighted-average exercise price of $15.87 and a weighted-average remaining term of 4.30 years), and a total of
42
4,288,147 shares of the Company’s common stock were subject to outstanding full-value awards. In each case,these numbers are calculated assuming that outstanding full-value awards subject to market-based vestingrequirements are ultimately paid out at target levels of performance. The Company’s outstanding options gen-erally may not be transferred to third parties for value and do not include dividend equivalent rights.
The Company believes that incentives and stock-based awards focus employees on the objective of creatingstockholder value and promoting the success of the Company, and that incentive compensation plans like the2005 Plan are an important attraction, retention and motivation tool for participants in the plan. The Board ofDirectors believes the foregoing amendments are important to give the Company flexibility to structure futureincentives and better attract, retain and award key employees and other participants in the plan.
If stockholders do not approve this 2005 Plan proposal, the current share limits, term and other provisions ofthe 2005 Plan will continue in effect.
Burn Rate Commitment
If stockholders approve the proposed amendments to the 2005 Plan, equity-based awards granted by theCompany during its 2015, 2016 and 2017 fiscal years will be structured such that the Company’s average annualburn rate with respect to such grants will not exceed 5.49% over this three-year period. For this purpose, the“burn rate” for any one particular fiscal year means the total number of shares of Company common stock issu-able upon exercise or payment, as the case may be, of the equity-based awards granted by the Company in thatfiscal year divided by the Company’s weighted average total number of shares of common stock issued and out-standing during that particular fiscal year. In calculating the burn rate, shares issuable upon exercise or payment,as the case may be, of equity-based awards other than options and stock appreciation rights will be counted as2.50 shares for each share actually issuable in respect of the award (as opposed to the 1.75 multiplier set forth inour 2005 Plan) and shares issued pursuant to performance-based equity awards will be allocated to the year inwhich such shares are “earned” based on performance (as opposed to the year in which the award was granted).Shares issued in respect of equity-based awards that are initially granted by other entities and that are assumed orsubstituted for by the Company in connection with mergers and acquisitions will not be counted for purposes ofcalculating the burn rate. For more information on the potential dilutive impact of the 2005 Plan proposal onstockholders and our historical grant rates, please see “Potential Dilution” below.
Summary Description of the 2005 Performance Incentive Plan
The following is a summary of the principal features of the 2005 Plan, as amended by the Board. Thissummary, however, does not purport to be a complete description of all of the provisions of the 2005 Plan and isqualified in its entirety by the full text of the attached amended and restated 2005 Plan, which has been filed asExhibit A to the copy of this Proxy Statement that was filed electronically with the Securities and ExchangeCommission and can be reviewed on the Securities and Exchange Commission’s Web site at http://www.sec.gov.A copy of the amended and restated version of the 2005 Plan document may also be obtained without charge bywriting the Secretary of the Company at our principal executive office.
Purpose. The purpose of the 2005 Plan is to promote the success of QLogic and the interests of our stock-holders by providing an additional means for us to attract, motivate, retain and reward directors, officers,employees and other eligible persons through the grant of awards and incentives for high levels of individualperformance and improved financial performance of QLogic. Equity-based awards are also intended to furtheralign the interests of award recipients and our stockholders.
Administration. Our Board of Directors or one or more committees appointed by our Board of Directorswill administer the 2005 Plan. Our Board of Directors has delegated general administrative authority for the 2005Plan to the Compensation Committee. A committee may delegate some or all of its authority with respect to the2005 Plan to another committee of directors, and certain limited authority to grant awards to employees may bedelegated to one or more of our officers. (The appropriate acting body, be it the Board of Directors, a committeewithin its delegated authority, or an officer within his or her delegated authority, is referred to in this proposal asthe “Administrator”).
43

The Administrator has broad authority under the 2005 Plan with respect to award grants including, withoutlimitation, the authority:
‰ to select participants and determine the type(s) of award(s) that they are to receive;
‰ to determine the number of shares that are to be subject to awards and the terms and conditions of awards,including the price (if any) to be paid for the shares or the award;
‰ to cancel, modify, or waive our rights with respect to, or modify, discontinue, suspend, or terminate, anyor all outstanding awards, subject to any required consents;
‰ to accelerate or extend the vesting or exercisability or extend the term of any or all outstanding awards;
‰ subject to the other provisions of the 2005 Plan, to make certain adjustments to an outstanding award andto authorize the conversion, succession or substitution of an award; and
‰ to allow the purchase price of an award or shares of our common stock to be paid for in the form of cash,check, or electronic funds transfer, by the delivery of already-owned shares of our common stock or by areduction of the number of shares deliverable pursuant to the award, by services rendered by the recipientof the award, by notice and third party payment or cashless exercise on such terms as the Administratormay authorize, or any other form permitted by law.
No Repricing. In no case (except due to an adjustment to reflect a stock split or other event referred tounder “Adjustments” below, or any repricing that may be approved by stockholders) will the Administrator(1) amend an outstanding stock option or stock appreciation right to reduce the exercise price or base price of theaward, (2) cancel, exchange, or surrender an outstanding stock option or stock appreciation right in exchange forcash or other awards for the purpose of repricing the award, or (3) cancel, exchange, or surrender an outstandingstock option or stock appreciation right in exchange for an option or stock appreciation right with an exercise orbase price that is less than the exercise or base price of the original award.
Eligibility. Persons eligible to receive awards under the 2005 Plan include our officers, employees, directors andcertain of our consultants and advisors. Currently, 782 of our officers and employees (including each of the namedexecutive officers currently employed by us) and each of our seven non-employee directors are considered eligibleunder the 2005 Plan. A summary of the material terms of the director grant program adopted by the Board under the2005 Plan can be found under the heading “Director Compensation— Stock Awards” in Proposal One above.
Authorized Shares; Limits on Awards. The maximum number of shares of our common stock that may beissued or transferred pursuant to awards under the 2005 Plan currently equals the sum of (i) 25,100,000 shares,plus (ii) the number of shares subject to stock option grants under the Prior Plan and outstanding on August 23,2005 (the date of the 2005 Annual Meeting) which expire, or for any reason are canceled or terminated, afterAugust 23, 2005 without being exercised. No additional awards will be granted under the Prior Plan. Asdescribed above, if stockholders approve the proposed amendments, the number of shares referred to in clause(i) above would be reduced to 21,941,730 shares.
Shares issued in respect of any “full-value award” granted under the 2005 Plan are counted against the sharelimit described in the preceding paragraph as 1.75 shares for every one share issued in connection with theaward. For example, if 100 shares were issued as a stock bonus under the 2005 Plan, 175 shares would becharged against the share limit with respect to that award. For this purpose, a “full-value award” generally meansany award granted under the 2005 Plan other than a stock option or stock appreciation right.
The following other limits are also contained in the 2005 Plan:
‰ The maximum number of shares that may be delivered pursuant to options qualified as incentive stockoptions granted under the 2005 Plan is 40,000,000 shares.
‰ The maximum number of shares subject to those options and stock appreciation rights that are grantedduring any calendar year to any individual under the 2005 Plan is 4,000,000 shares.
‰ “Performance-Based Awards” under Section 5.2 of the 2005 Plan granted to a participant in any one calen-dar year will not provide for payment of more than (1) in the case of awards payable only in cash and notrelated to shares, $5,000,000, and (2) in the case of awards related to shares (and in addition to optionsand stock appreciation rights which are subject to the limit referred to above), 4,000,000 shares.
44

To the extent that an award is settled in cash or a form other than shares, the shares that would have beendelivered had there been no such cash or other settlement will not be counted against the shares available forissuance under the 2005 Plan. In the event that shares are delivered in respect of a dividend equivalent right, onlythe number of shares delivered with respect to the award shall be counted against the share limits of the 2005Plan. To the extent that shares are delivered pursuant to the exercise of a stock appreciation right or stock option,the number of underlying shares as to which the exercise related shall be counted against the applicable sharelimits, as opposed to only counting the shares actually issued. (For purposes of clarity, if a stock appreciationright relates to 100,000 shares and is exercised at a time when the payment due to the participant is15,000 shares, 100,000 shares will be charged against the applicable share limits with respect to such exercise.)Shares that are subject to or underlie awards which expire or for any reason are cancelled or terminated, are for-feited, fail to vest, or for any other reason are not paid or delivered under the 2005 Plan will again be availablefor subsequent awards under the 2005 Plan. Under the current plan provisions, shares that are exchanged by aparticipant or withheld by the Company to pay the exercise price of an award granted under the 2005 Plan, aswell as any shares exchanged or withheld to satisfy the tax withholding obligations related to any award, are notavailable for subsequent awards under the 2005 Plan. If stockholders approve the proposed amendments, effec-tive as of the Annual Meeting date, shares that are exchanged by a participant or withheld by the Company as fullor partial payment in connection with any full-value award granted under the 2005 Plan, as well as any sharesexchanged by a participant or withheld by the Company to satisfy the tax withholding obligations related to anyfull-value award granted under the 2005 Plan, will be available for subsequent awards under the 2005 Plan (withany such shares becoming available for subsequent awards taking into account the premium share-counting rulediscussed above for full-value awards). Shares that are exchanged by a participant or withheld by the Companyto pay the exercise price of a stock option or stock appreciation right granted under the 2005 Plan, as well as anyshares exchanged or withheld to satisfy the tax withholding obligations related to any stock option or stockappreciation right, will not be available for subsequent awards under the 2005 Plan.
The Company may not increase the applicable share limits of the 2005 Plan by repurchasing shares ofcommon stock on the market (by using cash received through the exercise of stock options or otherwise). In addi-tion, the 2005 Plan generally provides that shares issued in connection with awards that are granted by or becomeobligations of the Company through the assumption of awards (or in substitution for awards) in connection withan acquisition of another company will not count against the shares available for issuance under the 2005 Plan.
Types of Awards. The 2005 Plan authorizes stock options, stock appreciation rights, restricted stock, stockbonuses and other forms of awards granted or denominated in our common stock or units of our common stock,as well as cash bonus awards pursuant to Section 5.2 of the 2005 Plan. The 2005 Plan retains flexibility to offercompetitive incentives and to tailor benefits to specific needs and circumstances. Any award may be paid or set-tled in cash.
A stock option is the right to purchase shares of our common stock at a future date at a specified price pershare (the “exercise price”). The per share exercise price of an option generally may not be less than the fairmarket value of a share of our common stock on the date of grant. The maximum term of an option is ten yearsfrom the date of grant. An option may either be an incentive stock option or a nonqualified stock option.Incentive stock option benefits are taxed differently from nonqualified stock options, as described under “FederalIncome Tax Consequences of Awards under the 2005 Plan” below. Incentive stock options are also subject tomore restrictive terms and are limited in amount by the Internal Revenue Code and the 2005 Plan. Incentive stockoptions may only be granted to our employees. The Company’s outstanding options and stock appreciation rightsgenerally may not be transferred to third parties for value and do not include dividend equivalent rights.
A stock appreciation right is the right to receive payment of an amount equal to the excess of the fair marketvalue of a share of our common stock on the date of exercise of the stock appreciation right over the base price ofthe stock appreciation right. The base price will be established by the Administrator at the time of grant of thestock appreciation right and generally cannot be less than the fair market value of a share of our common stockon the date of grant. Stock appreciation rights may be granted in connection with other awards or independently.The maximum term of a stock appreciation right is ten years from the date of grant.
45

The other types of awards that may be granted under the 2005 Plan include, without limitation, stockbonuses, restricted stock, performance stock, stock units, dividend equivalents, or similar rights to purchase oracquire shares, and cash awards granted consistent with Section 5.2 of the 2005 Plan as described in“Performance-Based Awards” below.
Performance-Based Awards. The Administrator may grant awards that are intended to be performance-based awards within the meaning of Section 162(m) of the Internal Revenue Code (“Performance-BasedAwards”). Performance-Based Awards are in addition to any of the other types of awards that may be grantedunder the 2005 Plan (including options and stock appreciation rights which may also qualify as performance-based awards for Section 162(m) purposes). Performance-Based Awards may be in the form of restricted stock,performance stock, stock units, other rights, or cash bonus opportunities. There can be no assurance, however,that the compensation intended to qualify for deductibility under Section 162(m) awarded or paid by the Com-pany will be fully deductible.
The vesting or payment of Performance-Based Awards (other than options or stock appreciation rights) willdepend on the absolute or relative performance of QLogic on a consolidated, subsidiary, segment, division, orbusiness unit basis. The Administrator will establish the criterion or criteria and target(s) on which performancewill be measured. The Administrator must establish criteria and targets in advance of applicable deadlines underthe Internal Revenue Code and while the attainment of the performance targets remains substantially uncertain.The criteria that the Administrator may use for this purpose will include one or more of the following: earningsper share, cash flow (which means cash and cash equivalents derived from either net cash flow from operationsor net cash flow from operations, financing and investing activities), total stockholder return, gross revenue,revenue growth, operating income (before or after taxes), net earnings (before or after interest, taxes, deprecia-tion and/or amortization), return on equity or on assets or on net investment, cost containment or reduction, thefair market value of a share of our common stock, or any combination thereof. The performance measurementperiod with respect to an award may range from three months to ten years. Performance targets will be adjustedto mitigate the unbudgeted impact of material, unusual or nonrecurring gains and losses, accounting changes orother extraordinary events not foreseen at the time the targets were set unless the Administrator provides other-wise at the time of establishing the targets.
Performance-Based Awards may be paid in stock or in cash (in either case, subject to the limits describedunder the heading “Authorized Shares; Limits on Awards” above). Before any Performance-Based Award (otherthan an option or stock appreciation right) is paid, the Administrator must certify that the performance target ortargets have been satisfied. The Administrator has discretion to determine the performance target or targets andany other restrictions or other limitations of Performance-Based Awards and may reserve discretion to reducepayments below maximum award limits.
Deferrals; Dividend Equivalents. The Administrator may provide for the deferred payment of awards, andmay determine the other terms applicable to deferrals. The Administrator may provide that awards under the2005 Plan (other than options or stock appreciation rights), and/or deferrals, earn dividends or dividend equiv-alents based on the amount of dividends paid on outstanding shares of Common Stock, provided that as to anydividend equivalent rights granted in connection with an award granted under the 2005 Plan that is subject toperformance-based vesting requirements, no dividend equivalent payment will be made unless the relatedperformance-based vesting conditions of the award are satisfied (or, in the case of a restricted stock or similaraward where the dividend must be paid as a matter of law, the dividend payment will be subject to forfeiture orrepayment, as the case may be, if the related performance-based vesting conditions are not satisfied).
Assumption and Termination of Awards. Generally, and subject to limited exceptions set forth in the 2005Plan, if the Company dissolves or undergoes certain corporate transactions such as a merger, business combina-tion, or other reorganization, or a sale of substantially all of its assets, all awards then-outstanding under the 2005Plan will become fully vested or paid, as applicable, and will terminate or be terminated in such circumstances,unless the Administrator provides for the assumption, substitution or other continuation of the award. TheAdministrator also has the discretion to establish other change in control provisions with respect to awardsgranted under the 2005 Plan. For example, the Administrator could provide for the acceleration of vesting orpayment of an award in connection with a corporate event that is not described above and provide that any suchacceleration shall be automatic upon the occurrence of any such event.
46

Transfer Restrictions. Subject to certain exceptions contained in Section 5.7 of the 2005 Plan, awardsunder the 2005 Plan generally are not transferable by the recipient other than by will or the laws of descent anddistribution and are generally exercisable, during the recipient’s lifetime, only by the recipient. Any amountspayable or shares issuable pursuant to an award generally will be paid only to the recipient or the recipient’sbeneficiary or representative. The Administrator has discretion, however, to establish written conditions andprocedures for the transfer of awards to other persons or entities, provided that such transfers comply with appli-cable federal and state securities laws and are not made for value (other than nominal consideration, settlement ofmarital property rights, or for interests in an entity in which more than 50% of the voting securities are held bythe award recipient or by the recipient’s family members).
Adjustments. As is customary in incentive plans of this nature, each share limit and the number and kind ofshares available under the 2005 Plan and any outstanding awards, as well as the exercise or purchase prices ofawards, and performance targets under certain types of performance-based awards, are subject to adjustment inthe event of certain reorganizations, mergers, combinations, recapitalizations, stock splits, stock dividends, orother similar events that change the number or kind of shares outstanding, and extraordinary dividends or dis-tributions of property to the stockholders.
No Limit on Other Authority. The 2005 Plan does not limit the authority of the Board of Directors or anycommittee to grant awards or authorize any other compensation, with or without reference to our common stock,under any other plan or authority.
Termination of or Changes to the 2005 Plan. The Board of Directors may amend or terminate the 2005Plan at any time and in any manner. Stockholder approval for an amendment will be required only to the extentthen required by applicable law or any applicable listing agency or required under Sections 162, 422 or 424 ofthe Internal Revenue Code to preserve the intended tax consequences of the 2005 Plan. For example, stockholderapproval will be required for any amendment that proposes to increase the maximum number of shares that maybe delivered with respect to awards granted under the 2005 Plan. (Adjustments as a result of stock splits or sim-ilar events will not, however, be considered an amendment requiring stockholder approval.) Currently, unlessterminated earlier by the Board of Directors, the authority to grant new awards under the 2005 Plan will termi-nate on June 8, 2015. If stockholders approve the proposed amendments, the term of the 2005 Plan will beextended until July 10, 2024. Outstanding awards, as well as the Administrator’s authority with respect thereto,generally will continue following the expiration or termination of the plan. Generally speaking, outstandingawards may be amended by the Administrator (except for a repricing), but the consent of the award holder isrequired if the amendment (or any plan amendment) materially and adversely affects the holder.
U.S. Federal Income Tax Consequences of Awards under the 2005 Plan
The U.S. federal income tax consequences of the 2005 Plan under current federal law, which is subject tochange, are summarized in the following discussion of the general tax principles applicable to the 2005 Plan.This summary is not intended to be exhaustive and, among other considerations, does not describe state, local, orinternational tax consequences.
With respect to nonqualified stock options, we are generally entitled to deduct, and the participant recog-nizes, taxable income in an amount equal to the difference between the option exercise price and the fair marketvalue of the shares at the time of exercise. With respect to incentive stock options, we are generally not entitledto a deduction nor does the participant recognize income at the time of exercise, although the participant may besubject to the U.S. federal alternative minimum tax.
The current federal income tax consequences of other awards authorized under the 2005 Plan generally fol-low certain basic patterns: nontransferable restricted stock subject to a substantial risk of forfeiture results inincome recognition equal to the excess of the fair market value over the price paid (if any) only at the time therestrictions lapse (unless the recipient elects to accelerate recognition as of the date of grant); bonuses, stockappreciation rights, cash and stock-based performance awards, dividend equivalents, stock units, and other typesof awards are generally subject to tax at the time of payment; and compensation otherwise effectively deferred istaxed when paid. In each of the foregoing cases, we will generally have a corresponding deduction at the time theparticipant recognizes income.
47
If an award is accelerated under the 2005 Plan in connection with a “change in control” (as this term is usedunder the Internal Revenue Code), we may not be permitted to deduct the portion of the compensation attribut-able to the acceleration (“parachute payments”) if it exceeds certain threshold limits under the Internal RevenueCode (and certain related excise taxes may be triggered). Furthermore, we may not be permitted in certaincircumstances to deduct the aggregate compensation in excess of $1 million attributable to awards that are not“performance-based” within the meaning of Section 162(m) of the Internal Revenue Code.
Specific Benefits under the 2005 Performance Incentive Plan
The Company has not approved any awards that are conditioned upon stockholder approval of the proposedamendments to the 2005 Plan. The Company is not currently considering any other specific award grants underthe 2005 Plan (other than the annual equity grants made to our non-employee directors as described under“Director Compensation” above). If the proposed amendments to the 2005 Plan had been in effect in fiscal year2014, the Company expects that its award grants for fiscal year 2014 would not have been substantially differentfrom those actually made in that year under the 2005 Plan. For information regarding stock-based awards grantedto the Company’s named executive officers during fiscal year 2014, see the “Grants of Plan-Based Awards inFiscal Year 2014” table above.
The closing price for a share of the Company’s common stock as of July 1, 2014 was $10.25 per share, andthe Company’s total number of outstanding shares of common stock on that date was 87,809,533.
Potential Dilution
This section includes additional information to help you assess the potential dilutive impact of the Compa-ny’s equity awards and the proposed amendments to the 2005 Plan.
The following table shows the total number of shares of our common stock that were subject to outstandingrestricted stock unit awards granted under the 2005 Plan, that were subject to outstanding stock options grantedunder the 2005 Plan, and that were then available for new award grants under the 2005 Plan as of March 30, 2014and as of July 1, 2014. (In this 2005 Plan proposal, except as expressly noted in the presentation of burn rates, thenumber of shares of the Company’s common stock subject to restricted stock unit awards granted during anyparticular period or outstanding on any particular date is presented based on the actual number of shares of theCompany’s common stock covered by those awards (without taking into account the share-counting ratio for full-value awards under the 2005 Plan described above). For awards subject to performance-based vesting require-ments, the number of shares presented is based on the target level of performance. The share numbers presentedin this section do not include shares that employees may purchase pursuant to the Company’s 1998 EmployeeStock Purchase Plan.)
As of March 30, 2014 As of July 1, 2014
Shares subject to outstanding restricted stock unit awards(excluding performance-based vesting awards) . . . . . . . . . . . . 3,611,092 3,886,922
Shares subject to outstanding performance-based vestingrestricted stock unit awards . . . . . . . . . . . . . . . . . . . . . . . . . . . 422,885 401,225
Shares subject to outstanding stock options . . . . . . . . . . . . . . . . . 10,483,106 9,987,551Shares available for new award grants . . . . . . . . . . . . . . . . . . . . . 12,556,724 10,758,270
As of March 30, 2014, a total of 15,236,985 shares of the Company’s common stock were subject to alloutstanding awards granted under the 2005 Plan, as well as the Company’s prior stock incentive plans (referredto as the Company’s “overhang”). Of these shares, 3,611,092 shares were then subject to outstanding restrictedstock unit awards (excluding performance-based vesting awards), 422,885 shares were subject to outstandingperformance-based vesting restricted stock unit awards, and 11,203,008 shares were then subject to outstandingstock options.
As of July 1, 2014, a total of 14,775,764 shares of the Company’s common stock were subject to all out-standing awards granted under the 2005 Plan, as well as the Company’s prior stock incentive plans. Of these
48
shares, 3,886,922 shares were then subject to outstanding restricted stock unit awards (excluding performance-based vesting awards), 401,225 shares were subject to outstanding performance-based vesting restricted stockunit awards, and 10,487,617 shares were then subject to outstanding stock options.
The weighted-average number of shares of the Company’s common stock issued and outstanding in each ofthe last three fiscal years was 101,766,053 shares issued and outstanding in fiscal year 2012; 93,559,547 sharesissued and outstanding in fiscal year 2013; and 87,612,042 shares issued and outstanding in fiscal year 2014. Thenumber of shares of the Company’s common stock issued and outstanding as of March 30, 2014 and July 1, 2014was 87,169,802 shares and 87,809,533 shares, respectively.
The total number of shares of the Company’s common stock subject to awards that the Company grantedunder the 2005 Plan over the last three fiscal years, and to date (as of July 1, 2014) for fiscal year 2015, are asfollows:
‰ 3,448,856 shares in fiscal year 2012 (which was 3.4% of the weighted-average number of shares of theCompany’s common stock issued and outstanding in fiscal year 2012), of which 1,655,899 shares weresubject to restricted stock unit awards (excluding performance-based vesting awards), 163,400 shareswere subject to performance-based vesting restricted stock unit awards, and 1,629,557 shares were subjectto stock options;
‰ 3,319,699 shares in fiscal year 2013 (which was 3.5% of the weighted-average number of shares of theCompany’s common stock issued and outstanding in fiscal year 2013), of which 1,753,323 shares weresubject to restricted stock unit awards (excluding performance-based vesting awards), 179,200 shareswere subject to performance-based vesting restricted stock unit awards, and 1,387,176 shares were subjectto stock options;
‰ 2,656,098 shares in fiscal year 2014 (which was 3.0% of the weighted-average number of shares of theCompany’s common stock issued and outstanding in fiscal year 2014), of which 2,207,130 shares weresubject to restricted stock unit awards (excluding performance-based vesting awards), 373,500 shareswere subject to performance-based vesting restricted stock unit awards, and 75,468 shares were subject tostock options; and
‰ 1,717,305 shares through July 1, 2014 in fiscal year 2015 (which was 2.0% of the number of shares of theCompany’s common stock issued and outstanding as of July 1, 2014), of which 1,593,519 shares weresubject to restricted stock unit awards (excluding performance-based vesting awards), 91,700 shares weresubject to performance-based vesting restricted stock unit awards, and 32,086 shares were subject to stockoptions.
As noted above, if stockholders approve the proposed amendments to the 2005 Plan, equity-based awardsgranted by the Company during its 2015, 2016 and 2017 fiscal years will be structured such that the Company’saverage annual burn rate with respect to such grants will not exceed 5.49% over this three-year period, with theburn rate for these purposes being determined in accordance with the methodology described above on page 43.Using this methodology (including the counting of shares issuable pursuant to equity-based awards other thanoptions and stock appreciation rights as 2.50 shares for each share actually issuable in respect of the award), ourburn rates for fiscal years 2012, 2013 and 2014 would have been 5.67%, 6.63% and 6.50%, respectively, for athree-year average burn rate of 6.27%.
The Compensation Committee is sensitive to stockholder concerns about stock usage. As a consequence,management and the Compensation Committee continually monitor the dilutive impact of grants made under theCompany’s equity compensation program and the following points should be taken into account in assessing ourhistorical burn rates:
‰ Our fiscal year 2014 burn rate was affected by several non-routine events during the year. On February 3,2014, Prasad L. Rampalli joined us as our new CEO. As part of his employment package he was granted atime-based RSU award of 250,000 shares of the Company’s common stock and a market-based RSUaward of 250,000 shares of the Company’s common stock. In addition, we entered into a new employmentagreement with Mr. Desai in December 2013 to help with the transition to a new CEO, and in connectionwith his new employment agreement, Mr. Desai was granted a time-based RSU award of 136,636 shares
49
of the Company’s common stock. Mr. Rampalli’s and Mr. Desai’s time-based RSUs are counted as part ofour fiscal year 2014 burn rate; however, Mr. Rampalli and Mr. Desai did not receive an additional equityaward in May 2014 when we made our regular company-wide equity awards for fiscal year 2015.
‰ In fiscal year 2014, we acquired the 10/40/100 Gb Ethernet controller-related assets from Broadcom andin connection with this acquisition approximately 140 employees joined the Company. As part of offeringcompetitive compensation packages to these new employees and putting in place a retention plan for keyemployees, we granted time-based RSU awards for 463,100 shares of the Company’s common stock tothese new employees with vesting over a four-year period. If we exclude this acquisition-related equityfrom our calculation we have a burn rate of 5.18% for fiscal year 2014.
‰ The Company’s capital allocation policy has been to use free cash flow for opportunities to expand ourbusiness and, to the extent there is excess cash flow, to use free cash flow to fund our stock repurchaseprograms. During the last three fiscal years, the Company has repurchased over 23,000,000 shares of ourcommon stock, or approximately 22% of the shares outstanding as of the end of fiscal year 2011. Sincethe burn rate is calculated by dividing share usage by weighted average shares outstanding, our stockrepurchase program has increased our three-year average burn rate by 0.82%.
‰ The Compensation Committee has taken several steps to limit share usage under our equity compensationprograms. As explained in the “Compensation Discussion and Analysis” above, the Compensation Com-mittee has gradually reduced the target equity for named executive officers from the 65th percentile ofmarket in fiscal 2012, to the 60th percentile of market in fiscal 2013, to the 50th percentile of market forfiscal year 2014. Similar reductions of target equity grant levels were made for all participants in theCompany’s equity plans. In addition, equity grants are being made to fewer positions within the Companyto further reduce share usage under our equity compensation plans.
The Compensation Committee anticipates that the number of shares that would be available for new awardgrants under the 2005 Plan after the Annual Meeting (assuming that stockholders approve the proposed amend-ments to the 2005 Plan and after giving effect to the proposed reduction in the 2005 Plan share limit describedabove, and assuming usual levels of shares becoming available for new awards as a result of forfeitures of out-standing awards) will provide the Company with flexibility to continue to grant equity awards under the 2005Plan through approximately the end of fiscal year 2016. However, this is only an estimate, in the Company’sjudgment, based on current circumstances. The total number of shares that are subject to the Company’s awardgrants in any one year or from year-to-year may change based on any number of variables, including, withoutlimitation, the value of the Company’s common stock (since higher stock prices generally require that fewershares be issued to produce awards of the same grant date fair value), changes in competitors’ compensationpractices or changes in compensation practices in the market generally, changes in the number of employees,changes in the number of directors and officers, whether and the extent to which vesting conditions applicable toequity-based awards are satisfied, acquisition activity and the need to grant awards to new employees in con-nection with acquisitions, the need to attract, retain and incentivize key talent, the type of awards the Companygrants and how the Company chooses to balance total compensation between cash and equity-based awards.
50

Aggregate Past Grants Under the 2005 Plan
As of July 1, 2014, awards covering 38,282,494 shares of our common stock had been granted under the2005 Plan, which includes 436,371 shares related to certain performance-based awards issued in connection withour previous acquisitions. (This number of shares includes shares subject to awards that expired or terminatedwithout having been exercised and paid and became available for new award grants under the 2005 Plan.) Thefollowing table shows information regarding the distribution of those awards, excluding the performance-basedawards, among the persons and groups identified below, option exercises and RSU vesting prior to and optionand unvested RSU holdings as of that date.
Stock Options Restricted Stock Units
Number ofShares
Subject toPast Option
Grants
Number ofShares
Acquiredon Exercise
Number of SharesUnderlying Options as of
July 1, 2014
Number ofRSUs
Subject toPast Grants
Numberof RSUsVested asof July 1,2014
Number ofRSUs
Outstandingand
Unvested asof July 1,2014Name and Position Exercisable Unexercisable
Executive Group:
Prasad L. Rampalli . . . . . . . . . . . . . . . . . . . . . . . . . — — — 500,000 — 500,000Director, Presidentand Chief Executive Officer
Jean Hu . . . . . . . . . . . . . . . . . . . . . . . . . . . . . . . . . 144,800 — 97,400 47,400 217,399 33,080 172,079Senior Vice President andChief Financial Officer
Roger J. Klein . . . . . . . . . . . . . . . . . . . . . . . . . . . . 434,800 62,500 346,100 26,200 188,600 101,560 72,920Senior Vice President andGeneral Manager, Fibre ChannelProducts
H.K. Desai . . . . . . . . . . . . . . . . . . . . . . . . . . . . . . . 2,191,000 225,000 1,887,250 — 795,336 493,470 —Former Chairman of the Boardand Executive Chairman*
Simon Biddiscombe . . . . . . . . . . . . . . . . . . . . . . . . 659,588 — — — 271,756 175,277 —Former President andChief Executive Officer**
Robert B. Crawford . . . . . . . . . . . . . . . . . . . . . . . . 129,800 — 86,150 — 104,300 26,405 —Former Senior Vice President,Worldwide Sales***
All current Executive Officers, as a Group(3 persons)****: . . . . . . . . . . . . . . . . . . . . . . . . 579,600 62,500 443,500 73,600 905,999 134,640 744,999
Non-Executive Director Group:John T. Dickson . . . . . . . . . . . . . . . . . . . . . . . . . . . 32,086 — — 32,086 12,012 — 12,012Balakrishnan S. Iyer . . . . . . . . . . . . . . . . . . . . . . . . 134,662 — 126,657 8,005 29,780 22,631 7,149Christine King . . . . . . . . . . . . . . . . . . . . . . . . . . . . 27,343 — 8,272 19,071 11,702 3,147 8,555Kathryn B. Lewis . . . . . . . . . . . . . . . . . . . . . . . . . . 112,662 — 104,657 8,005 23,780 16,631 7,149D. Scott Mercer . . . . . . . . . . . . . . . . . . . . . . . . . . . 71,076 — 63,071 8,005 16,780 9,631 7,149George D. Wells . . . . . . . . . . . . . . . . . . . . . . . . . . 134,662 — 126,657 8,005 29,780 22,631 7,149William M. Zeitler . . . . . . . . . . . . . . . . . . . . . . . . . 71,076 — 63,071 8,005 16,780 9,631 7,149Total for Non-Executive Director Group: . . . . . 583,567 — 492,385 91,182 140,614 84,302 56,312Each other person who has received 5% ormore of the options, warrants or rightsunder the 2005 Plan . . . . . . . . . . . . . . . . . . . . . N/A N/A N/A N/A N/A N/A N/A
All employees, including all current officerswho are not executive officers or directors,as a group . . . . . . . . . . . . . . . . . . . . . . . . . . . . . 23,507,184 3,816,844 8,459,615 427,269 12,129,159 5,785,967 3,486,836
Total . . . . . . . . . . . . . . . . . . . . . . . . . . . . . . . . . . . 24,670,351 3,879,344 9,395,500 592,051 13,175,772 6,004,909 4,288,147
* Mr. Desai passed away on June 8, 2014.
** Mr. Biddiscombe resigned effective May 17, 2013.
*** Mr. Crawford resigned effective June 16, 2014.
****Mr. Carrozza joined us on July 3, 2014 and is therefore not included in this table.
Mr. Rampalli and each of the non-executive directors identified above (except for Ms. Lewis) is a nomineefor re-election as a director at the 2014 Annual Meeting.
51

Equity Compensation Plan Information
For more information on our equity compensation plans, please see “Equity Compensation PlanInformation” on page 56 below.
Vote Required for Approval of the Amendments to the 2005 Performance Incentive Plan
The Board of Directors believes that the approval of the amendments to the 2005 Plan will promote the inter-ests of QLogic and its stockholders and will help us continue to be able to attract, retain and reward personsimportant to our success.
All members of the Board of Directors and all of the Company’s executive officers are eligible for awardsunder the 2005 Plan and thus have a personal interest in the 2005 Plan.
Approval of the amendments to the 2005 Plan requires the affirmative vote of a majority of the commonstock present in person or represented by proxy and entitled to vote at the Annual Meeting.
THE BOARD OF DIRECTORS RECOMMENDS THAT YOU VOTE “FOR” APPROVAL OF THEAMENDMENTS TO THE 2005 PERFORMANCE INCENTIVE PLAN AS DESCRIBED ABOVE ANDSET FORTH IN THE AMENDED AND RESTATED QLOGIC CORPORATION 2005 PERFORMANCEINCENTIVE PLAN (WHICH IS AVAILABLE AS DESCRIBED IN THE FIRST PARAGRAPH UNDER
“SUMMARY DESCRIPTION OF THE 2005 PERFORMANCE INCENTIVE PLAN” ABOVE).
52

PROPOSAL NO. 3
ADVISORY VOTE TO APPROVE EXECUTIVE COMPENSATION
Pay that reflects performance and alignment of pay with the long-term interests of our stockholders are keyprinciples that underlie our executive compensation program. For a detailed description of the compensation weprovide to our named executive officers, please see the “Compensation Discussion and Analysis” beginning onpage 18 of this proxy statement and the compensation tables and narratives that follow that discussion.
In accordance with the Dodd-Frank Wall Street Reform and Consumer Protection Act (the “Dodd-FrankAct”), stockholders have the opportunity to vote, on an advisory basis, on the compensation of our named execu-tive officers. This is often referred to as a “say on pay,” and provides you, as a stockholder, with the ability tocast an advisory vote with respect to our fiscal year 2014 executive compensation programs and policies and thecompensation paid to the named executive officers as disclosed in this proxy statement through the followingresolution:
“RESOLVED, that the stockholders approve the compensation of the named executive officers, asdescribed in the Compensation Discussion and Analysis section and in the compensation tables and accom-panying narrative disclosure in this proxy statement.”
As an advisory vote, this proposal is not binding upon the Company, the Board of Directors or the Compen-sation Committee, and will not be construed as overruling a decision by, or creating or implying any additionalfiduciary duty for, the Board of Directors or the Compensation Committee. However, the CompensationCommittee, which is responsible for designing and administering the Company’s executive compensation pro-gram, values the opinions expressed by stockholders by means of their vote on this proposal and will consider theoutcome of the vote when making future compensation decisions for named executive officers.
The Company’s current policy is to provide stockholders with an opportunity to approve the compensationof the named executive officers each year at the annual meeting of stockholders. It is expected that the next suchvote will occur at the 2015 Annual Meeting of Stockholders.
THE BOARD OF DIRECTORS RECOMMENDS THAT YOU VOTE “FOR”THE ADVISORY VOTE TO APPROVE EXECUTIVE COMPENSATION.
53
PROPOSAL NO. 4
RATIFICATION OF APPOINTMENT OF INDEPENDENT REGISTEREDPUBLIC ACCOUNTING FIRM
The Audit Committee of the Board of Directors has appointed KPMG LLP to serve as our independent regis-tered public accounting firm for fiscal year 2015. KPMG LLP has served as our independent registered publicaccounting firm since our inception. One or more representatives of KPMG LLP are expected to be present at theAnnual Meeting, will have an opportunity to make a statement if they desire to do so, and are expected to beavailable to respond to appropriate questions.
This matter is not required to be submitted for stockholder approval, but the Board of Directors, as a matterof good corporate practice, has elected to seek ratification of the appointment of KPMG LLP as our independentregistered public accounting firm for fiscal year 2015 by seeking the affirmative vote of the holders of a majorityof the shares of our common stock present in person or represented by proxy and entitled to vote at the AnnualMeeting.
THE BOARD OF DIRECTORS RECOMMENDS THAT YOU VOTE “FOR”THE RATIFICATION OF THE APPOINTMENT OF KPMG LLP AS OUR
INDEPENDENT REGISTERED PUBLIC ACCOUNTING FIRM FOR FISCAL YEAR 2015.
If the appointment is not ratified, the Audit Committee will consider whether it should select anotherindependent registered public accounting firm.
54
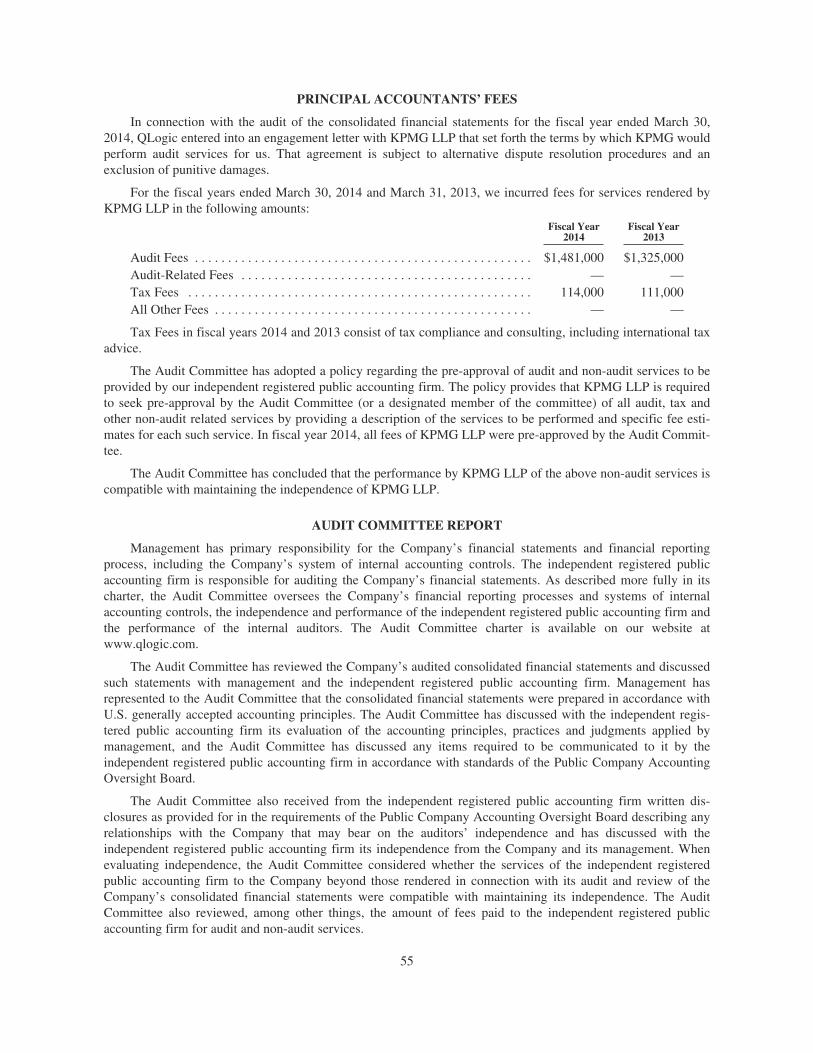
PRINCIPAL ACCOUNTANTS’ FEES
In connection with the audit of the consolidated financial statements for the fiscal year ended March 30,2014, QLogic entered into an engagement letter with KPMG LLP that set forth the terms by which KPMG wouldperform audit services for us. That agreement is subject to alternative dispute resolution procedures and anexclusion of punitive damages.
For the fiscal years ended March 30, 2014 and March 31, 2013, we incurred fees for services rendered byKPMG LLP in the following amounts:
Fiscal Year2014
Fiscal Year2013
Audit Fees . . . . . . . . . . . . . . . . . . . . . . . . . . . . . . . . . . . . . . . . . . . . . . . . . . . $1,481,000 $1,325,000Audit-Related Fees . . . . . . . . . . . . . . . . . . . . . . . . . . . . . . . . . . . . . . . . . . . . — —Tax Fees . . . . . . . . . . . . . . . . . . . . . . . . . . . . . . . . . . . . . . . . . . . . . . . . . . . . 114,000 111,000All Other Fees . . . . . . . . . . . . . . . . . . . . . . . . . . . . . . . . . . . . . . . . . . . . . . . . — —
Tax Fees in fiscal years 2014 and 2013 consist of tax compliance and consulting, including international taxadvice.
The Audit Committee has adopted a policy regarding the pre-approval of audit and non-audit services to beprovided by our independent registered public accounting firm. The policy provides that KPMG LLP is requiredto seek pre-approval by the Audit Committee (or a designated member of the committee) of all audit, tax andother non-audit related services by providing a description of the services to be performed and specific fee esti-mates for each such service. In fiscal year 2014, all fees of KPMG LLP were pre-approved by the Audit Commit-tee.
The Audit Committee has concluded that the performance by KPMG LLP of the above non-audit services iscompatible with maintaining the independence of KPMG LLP.
AUDIT COMMITTEE REPORT
Management has primary responsibility for the Company’s financial statements and financial reportingprocess, including the Company’s system of internal accounting controls. The independent registered publicaccounting firm is responsible for auditing the Company’s financial statements. As described more fully in itscharter, the Audit Committee oversees the Company’s financial reporting processes and systems of internalaccounting controls, the independence and performance of the independent registered public accounting firm andthe performance of the internal auditors. The Audit Committee charter is available on our website atwww.qlogic.com.
The Audit Committee has reviewed the Company’s audited consolidated financial statements and discussedsuch statements with management and the independent registered public accounting firm. Management hasrepresented to the Audit Committee that the consolidated financial statements were prepared in accordance withU.S. generally accepted accounting principles. The Audit Committee has discussed with the independent regis-tered public accounting firm its evaluation of the accounting principles, practices and judgments applied bymanagement, and the Audit Committee has discussed any items required to be communicated to it by theindependent registered public accounting firm in accordance with standards of the Public Company AccountingOversight Board.
The Audit Committee also received from the independent registered public accounting firm written dis-closures as provided for in the requirements of the Public Company Accounting Oversight Board describing anyrelationships with the Company that may bear on the auditors’ independence and has discussed with theindependent registered public accounting firm its independence from the Company and its management. Whenevaluating independence, the Audit Committee considered whether the services of the independent registeredpublic accounting firm to the Company beyond those rendered in connection with its audit and review of theCompany’s consolidated financial statements were compatible with maintaining its independence. The AuditCommittee also reviewed, among other things, the amount of fees paid to the independent registered publicaccounting firm for audit and non-audit services.
55
Based on the review and discussions noted above, and the report of the independent registered publicaccounting firm, the Audit Committee recommended to the Board of Directors that the Company’s audited con-solidated financial statements be included in the Annual Report on Form 10-K for the fiscal year endedMarch 30, 2014, for filing with the Securities and Exchange Commission.
Each member of the Audit Committee meets the independence requirements of The NASDAQ Stock Mar-ket, and Messrs. Iyer, Mercer and Wells are “audit committee financial experts” as defined by rules adopted bythe Securities and Exchange Commission.
The Audit Committee
Balakrishnan S. Iyer, ChairKathryn B. LewisD. Scott MercerGeorge D. Wells
The information contained in the above report shall not be deemed to be “soliciting material” or to be filedwith the Securities and Exchange Commission, nor shall such information be incorporated by reference in anyfuture filing under the Securities Act of 1933, as amended, or under the Securities Exchange Act of 1934, asamended, except to the extent specifically incorporated by reference therein.
RELATED PERSON TRANSACTIONS AND PROCEDURES
Pursuant to its written charter, the Audit Committee of the Board has the responsibility to review and dis-cuss with management and approve any transactions or courses of dealing with related parties, which includesany transaction in which (i) the amount exceeds $120,000, (ii) the Company is, was or is proposed to be a partic-ipant and (iii) such person or such person’s immediate family members has, had or may have a direct or indirectmaterial interest (a “Related Person Transaction”). During this process, Related Person Transactions are dis-closed to all Board members. The Audit Committee intends to approve only those Related Person Transactionsthat are in the best interests of the Company and our stockholders. During fiscal year 2014, there were no trans-actions or series of related transactions to which the Company was or is a party involving an amount in excess of$120,000 and in which any director, executive officer, holder of more than five percent (5%) of any class of ourvoting securities, or any member of the immediate family of any of the foregoing persons, had or will have adirect or indirect material interest as defined by SEC rules and regulations.
SECTION 16(a) BENEFICIAL OWNERSHIP REPORTING COMPLIANCE
Section 16(a) of the Securities Exchange Act of 1934, as amended, requires our directors, executive officersand beneficial owners of more than 10% of our common stock to file various reports with the SEC concerningtheir ownership and changes in ownership of our securities. Copies of these filings must be furnished to us. Toour knowledge, based solely on review of the copies of such reports furnished to us and written representationsthat no other reports were required, during our fiscal year 2014, our directors, executive officers and 10% benefi-cial owners have complied with all Section 16(a) filing requirements.
EQUITY COMPENSATION PLAN INFORMATION
We currently maintain the following equity compensation plans:
‰ QLogic Corporation 2005 Performance Incentive Plan
‰ QLogic Corporation 1998 Employee Stock Purchase Plan
‰ QLogic Corporation Stock Awards Plan
‰ QLogic Corporation Non-Employee Director Stock Option Plan
Each of the plans identified above was approved by our stockholders. Although there are outstandingequity-based awards under the QLogic Corporation Stock Awards Plan and the QLogic Corporation Non-Employee Director Stock Option Plan, we are no longer authorized to issue new equity-based awards undereither of these plans.
56
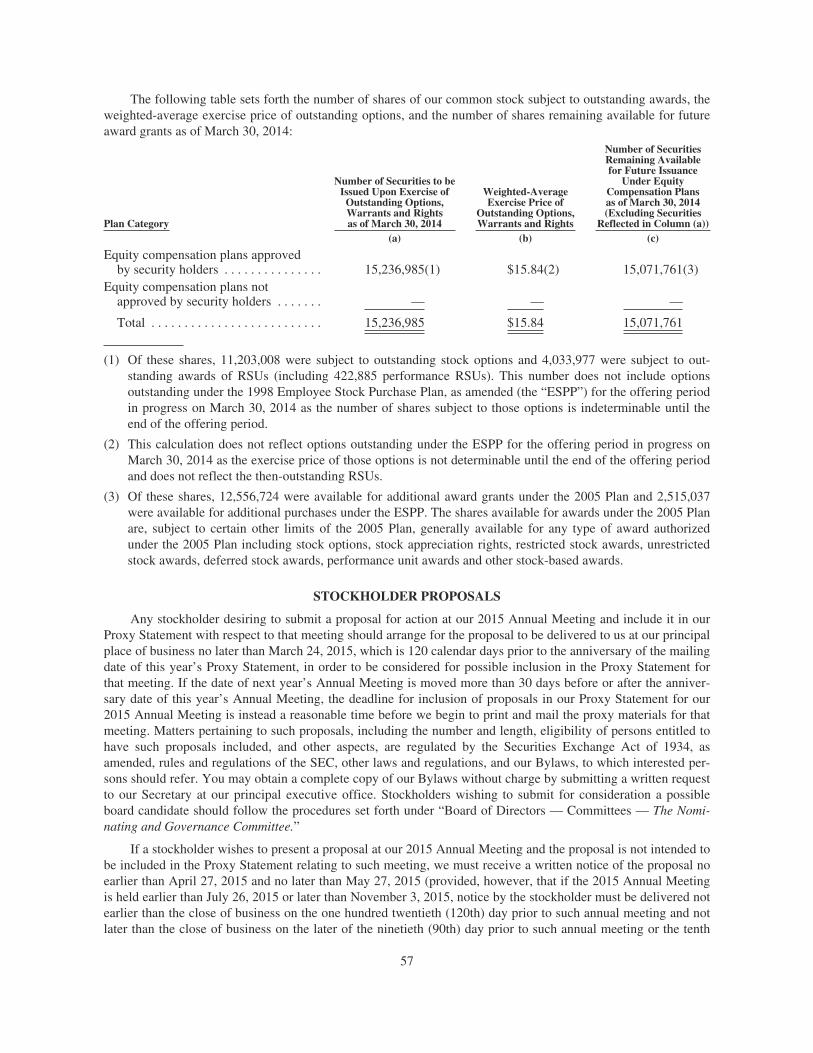
The following table sets forth the number of shares of our common stock subject to outstanding awards, theweighted-average exercise price of outstanding options, and the number of shares remaining available for futureaward grants as of March 30, 2014:
Plan Category
Number of Securities to beIssued Upon Exercise ofOutstanding Options,Warrants and Rightsas of March 30, 2014
Weighted-AverageExercise Price of
Outstanding Options,Warrants and Rights
Number of SecuritiesRemaining Availablefor Future Issuance
Under EquityCompensation Plansas of March 30, 2014(Excluding Securities
Reflected in Column (a))(a) (b) (c)
Equity compensation plans approvedby security holders . . . . . . . . . . . . . . . 15,236,985(1) $15.84(2) 15,071,761(3)
Equity compensation plans notapproved by security holders . . . . . . . — — —
Total . . . . . . . . . . . . . . . . . . . . . . . . . . 15,236,985 $15.84 15,071,761
(1) Of these shares, 11,203,008 were subject to outstanding stock options and 4,033,977 were subject to out-standing awards of RSUs (including 422,885 performance RSUs). This number does not include optionsoutstanding under the 1998 Employee Stock Purchase Plan, as amended (the “ESPP”) for the offering periodin progress on March 30, 2014 as the number of shares subject to those options is indeterminable until theend of the offering period.
(2) This calculation does not reflect options outstanding under the ESPP for the offering period in progress onMarch 30, 2014 as the exercise price of those options is not determinable until the end of the offering periodand does not reflect the then-outstanding RSUs.
(3) Of these shares, 12,556,724 were available for additional award grants under the 2005 Plan and 2,515,037were available for additional purchases under the ESPP. The shares available for awards under the 2005 Planare, subject to certain other limits of the 2005 Plan, generally available for any type of award authorizedunder the 2005 Plan including stock options, stock appreciation rights, restricted stock awards, unrestrictedstock awards, deferred stock awards, performance unit awards and other stock-based awards.
STOCKHOLDER PROPOSALS
Any stockholder desiring to submit a proposal for action at our 2015 Annual Meeting and include it in ourProxy Statement with respect to that meeting should arrange for the proposal to be delivered to us at our principalplace of business no later than March 24, 2015, which is 120 calendar days prior to the anniversary of the mailingdate of this year’s Proxy Statement, in order to be considered for possible inclusion in the Proxy Statement forthat meeting. If the date of next year’s Annual Meeting is moved more than 30 days before or after the anniver-sary date of this year’s Annual Meeting, the deadline for inclusion of proposals in our Proxy Statement for our2015 Annual Meeting is instead a reasonable time before we begin to print and mail the proxy materials for thatmeeting. Matters pertaining to such proposals, including the number and length, eligibility of persons entitled tohave such proposals included, and other aspects, are regulated by the Securities Exchange Act of 1934, asamended, rules and regulations of the SEC, other laws and regulations, and our Bylaws, to which interested per-sons should refer. You may obtain a complete copy of our Bylaws without charge by submitting a written requestto our Secretary at our principal executive office. Stockholders wishing to submit for consideration a possibleboard candidate should follow the procedures set forth under “Board of Directors — Committees — The Nomi-nating and Governance Committee.”
If a stockholder wishes to present a proposal at our 2015 Annual Meeting and the proposal is not intended tobe included in the Proxy Statement relating to such meeting, we must receive a written notice of the proposal noearlier than April 27, 2015 and no later than May 27, 2015 (provided, however, that if the 2015 Annual Meetingis held earlier than July 26, 2015 or later than November 3, 2015, notice by the stockholder must be delivered notearlier than the close of business on the one hundred twentieth (120th) day prior to such annual meeting and notlater than the close of business on the later of the ninetieth (90th) day prior to such annual meeting or the tenth
57
(10th) day following the day on which public announcement of the date of such meeting is first made by theCompany) (the “Bylaw Deadline”). The written notice must contain the additional information required by ourBylaws. If you give notice of such a proposal after the Bylaw Deadline, you may not be permitted to present theproposal to the stockholders for a vote at the meeting.
Rules of the SEC also establish a different deadline for submission of stockholder proposals that are notintended to be included in our Proxy Statement with respect to discretionary voting, which is June 7, 2015 for our2015 Annual Meeting (the “Discretionary Vote Deadline”). If you give notice of such a proposal after June 7,2015, the proxy holders will be allowed to use their discretionary voting authority to vote against the stockholderproposal when and if the proposal is raised at our 2015 Annual Meeting. Because the Bylaw Deadline is notcapable of being determined until we publicly announce the date for our 2015 Annual Meeting, it is possible thatthe Bylaw Deadline may occur after the Discretionary Vote Deadline. In such a case, a proposal received afterthe Discretionary Vote Deadline but before the Bylaw Deadline would be eligible to be presented at our 2015Annual Meeting, and we believe that the proxy holders would be allowed to use the discretionary authoritygranted by the proxy card to vote against the proposal at the meeting without including any disclosure of theproposal in the Proxy Statement relating to such meeting.
ANNUAL REPORT TO STOCKHOLDERS
Our Annual Report on Form 10-K for the fiscal year ended March 30, 2014, including our audited con-solidated financial statements and financial statement schedule, was mailed or otherwise provided to our stock-holders with this Proxy Statement. Upon request, we will provide you with an additional copy of our AnnualReport on Form 10-K for fiscal year 2014 or this Proxy Statement. You should send your written requests to ourSecretary, at QLogic Corporation, 26650 Aliso Viejo Parkway, Aliso Viejo, California 92656. This Proxy State-ment and the Company’s Annual Report on Form 10-K for the year ended March 30, 2014 are also available atthe Company’s website at http://ir.qlogic.com and from the SEC website at http://www.sec.gov.
The SEC has adopted rules that permit companies and intermediaries, such as brokers, to satisfy deliveryrequirements for proxy statements with respect to two or more stockholders sharing the same address by deliver-ing a single Proxy Statement addressed to those stockholders. This process, which is commonly referred to as“householding,” potentially provides extra convenience for stockholders and cost savings for companies. TheCompany and some brokers household proxy materials, delivering a single Proxy Statement to multiple stock-holders sharing an address unless contrary instructions have been received from the affected stockholders. Onceyou have received notice from your broker or the Company that the broker or the Company will be householdingmaterials to your address, householding will continue until you are notified otherwise or until you revoke yourconsent. If, at any time, you no longer wish to participate in householding and would prefer to receive a separateProxy Statement, or if you are receiving multiple copies of the Proxy Statement and wish to receive only one,please notify your broker if your shares are held in a brokerage account or the Company’s agent, Broadridge, ifyou hold registered shares. You can notify Broadridge by sending a written request to: Broadridge, HouseholdingDepartment, 51 Mercedes Way, Edgewood, New York 11717, or by calling Broadridge at (800) 542-1061.
58

OTHERMATTERS
We have not received notice of and do not expect any matters to be presented for a vote at the meeting,other than the proposals described in this Proxy Statement. If you grant a proxy, the person(s) named as proxyholder, or their nominee or substitute, will have the discretion to vote your shares on any additional mattersproperly presented for a vote at the meeting. If for any unforeseen reason, any of our nominees for director arenot available, the proxy holder will vote your proxy for such other candidate or candidates nominated by theBoard of Directors.
By Order of the Board of Directors
Michael L. HawkinsSecretary
Aliso Viejo, CaliforniaJuly 22, 2014
STOCKHOLDERS ARE URGED TO VOTE BY INTERNET, BY TELEPHONE OR BY SIGNINGAND RETURNING THE ENCLOSED PROXY IN THE ENCLOSED ENVELOPE.
59

[THIS PAGE INTENTIONALLY LEFT BLANK]

Annual Report on Form 10-K for the Fiscal Year Ended March 30, 2014

[THIS PAGE INTENTIONALLY LEFT BLANK]

UNITED STATES SECURITIES AND EXCHANGE COMMISSIONWashington, D.C. 20549
Form 10-KANNUAL REPORT PURSUANT TO SECTION 13 OR 15(d) OF THE
SECURITIES EXCHANGE ACT OF 1934For the fiscal year ended March 30, 2014
Commission File No. 0-23298
QLogic Corporation(Exact name of registrant as specified in its charter)
Delaware 33-0537669(State of incorporation) (I.R.S. Employer Identification No.)
26650 Aliso Viejo ParkwayAliso Viejo, California 92656
(Address of principal executive offices) (Zip Code)
(949) 389-6000(Registrant’s telephone number, including area code)
Securities registered pursuant to Section 12(b) of the Act:Title of Each Class Name of Each Exchange on Which Registered
Common Stock, $0.001 Par Value The NASDAQ Stock Market LLC(NASDAQ Global Select Market)
Securities registered pursuant to Section 12(g) of the Act:None
(Title of class)
Indicate by check mark if the Registrant is a well-known seasoned issuer, as defined in Rule 405 of the SecuritiesAct. Yes Í No ‘
Indicate by check mark if the Registrant is not required to file reports pursuant to Section 13 or Section 15(d) ofthe Act. Yes ‘ No Í
Indicate by check mark whether the Registrant (1) has filed all reports required to be filed by Section 13 or 15(d)of the Securities Exchange Act of 1934 during the preceding 12 months (or for such shorter period that the Registrantwas required to file such reports), and (2) has been subject to such filing requirements for the past 90days. Yes Í No ‘
Indicate by check mark whether the Registrant has submitted electronically and posted on its corporate Web site,if any, every Interactive Data File required to be submitted and posted pursuant to Rule 405 of Regulation S-T (§232.405 of this chapter) during the preceding 12 months (or for such shorter period that the Registrant was required tosubmit and post such files). Yes Í No ‘
Indicate by check mark if disclosure of delinquent filers pursuant to Item 405 of Regulation S-K (§ 229.405 of thischapter) is not contained herein, and will not be contained, to the best of Registrant’s knowledge, in definitive proxy orinformation statements incorporated by reference in Part III of this Form 10-K or any amendment to this Form 10-K. Í
Indicate by check mark whether the Registrant is a large accelerated filer, an accelerated filer, a non-acceleratedfiler, or a smaller reporting company. See the definitions of “large accelerated filer,” “accelerated filer” and “smallerreporting company” in Rule 12b-2 of the Exchange Act.
Large accelerated filer Í Accelerated filer ‘ Non-accelerated filer ‘ Smaller reporting company ‘(Do not check if a smaller reporting company)
Indicate by check mark whether the Registrant is a shell company (as defined in Rule 12b-2 of the ExchangeAct). Yes ‘ No Í
The aggregate market value of the voting stock held by non-affiliates of the Registrant on September 27, 2013 was$955,102,000 (based on the closing price for shares of the Registrant’s common stock as reported by the NASDAQGlobal Select Market on such date).
As of May 14, 2014, 87,201,000 shares of the Registrant’s common stock were outstanding.DOCUMENTS INCORPORATED BY REFERENCE
Portions of the Registrant’s Proxy Statement relating to the Registrant’s 2014 Annual Meeting of Stockholders areincorporated by reference into Part III of this Form 10-K where indicated.
QLOGIC CORPORATIONTABLE OF CONTENTS
Page
PART IItem 1. Business . . . . . . . . . . . . . . . . . . . . . . . . . . . . . . . . . . . . . . . . . . . . . . . . . . . . . . . . . . . . . . . . . . . . 1Item 1A. Risk Factors . . . . . . . . . . . . . . . . . . . . . . . . . . . . . . . . . . . . . . . . . . . . . . . . . . . . . . . . . . . . . . . . . 7Item 1B. Unresolved Staff Comments . . . . . . . . . . . . . . . . . . . . . . . . . . . . . . . . . . . . . . . . . . . . . . . . . . . . . 20Item 2. Properties . . . . . . . . . . . . . . . . . . . . . . . . . . . . . . . . . . . . . . . . . . . . . . . . . . . . . . . . . . . . . . . . . . . 21Item 3. Legal Proceedings . . . . . . . . . . . . . . . . . . . . . . . . . . . . . . . . . . . . . . . . . . . . . . . . . . . . . . . . . . . . . 21Item 4. Mine Safety Disclosures . . . . . . . . . . . . . . . . . . . . . . . . . . . . . . . . . . . . . . . . . . . . . . . . . . . . . . . . 21
PART IIItem 5. Market for Registrant’s Common Equity, Related Stockholder Matters and Issuer Purchases of
Equity Security . . . . . . . . . . . . . . . . . . . . . . . . . . . . . . . . . . . . . . . . . . . . . . . . . . . . . . . . . . . . . . . 22Item 6. Selected Financial Data . . . . . . . . . . . . . . . . . . . . . . . . . . . . . . . . . . . . . . . . . . . . . . . . . . . . . . . . 24Item 7. Management’s Discussion and Analysis of Financial Condition and Results of Operations . . . 26Item 7a. Quantitative and Qualitative Disclosures About Market Risk . . . . . . . . . . . . . . . . . . . . . . . . . . . 39Item 8. Financial Statements and Supplementary Data . . . . . . . . . . . . . . . . . . . . . . . . . . . . . . . . . . . . . . 40Item 9. Changes in and Disagreements with Accountants on Accounting and Financial Disclosure . . . 74Item 9A. Controls and Procedures . . . . . . . . . . . . . . . . . . . . . . . . . . . . . . . . . . . . . . . . . . . . . . . . . . . . . . . . 74Item 9B. Other Information . . . . . . . . . . . . . . . . . . . . . . . . . . . . . . . . . . . . . . . . . . . . . . . . . . . . . . . . . . . . . 74
PART IIIItem 10. Directors, Executive Officers and Corporate Governance . . . . . . . . . . . . . . . . . . . . . . . . . . . . . . 75Item 11. Executive Compensation . . . . . . . . . . . . . . . . . . . . . . . . . . . . . . . . . . . . . . . . . . . . . . . . . . . . . . . 75Item 12. Security Ownership of Certain Beneficial Owners and Management and Related Stockholder
Matters . . . . . . . . . . . . . . . . . . . . . . . . . . . . . . . . . . . . . . . . . . . . . . . . . . . . . . . . . . . . . . . . . . . . . 75Item 13. Certain Relationships and Related Transactions, and Director Independence . . . . . . . . . . . . . . . 75Item 14. Principal Accountant Fees and Services . . . . . . . . . . . . . . . . . . . . . . . . . . . . . . . . . . . . . . . . . . . . 75
PART IVItem 15. Exhibits and Financial Statement Schedules . . . . . . . . . . . . . . . . . . . . . . . . . . . . . . . . . . . . . . . . 76Signatures . . . . . . . . . . . . . . . . . . . . . . . . . . . . . . . . . . . . . . . . . . . . . . . . . . . . . . . . . . . . . . . . . . . . . . . . . . . . . 77Exhibit Index . . . . . . . . . . . . . . . . . . . . . . . . . . . . . . . . . . . . . . . . . . . . . . . . . . . . . . . . . . . . . . . . . . . . . . . . . . 79
PART I
Item 1. Business
Introduction
QLogic Corporation was organized as a Delaware corporation in 1992. Our principal executive offices arelocated at 26650 Aliso Viejo Parkway, Aliso Viejo, California 92656, and our telephone number at that locationis (949) 389-6000. Our website address is www.qlogic.com. The Company’s Annual Reports on Form 10-K,Quarterly Reports on Form 10-Q and Current Reports on Form 8-K, and any amendment to these reports, that wefile with or furnish to the Securities and Exchange Commission (SEC) are available free of charge on our websiteas soon as reasonably practicable after those reports are filed with the SEC.
On February 29, 2012, we completed the sale of our InfiniBand business. As a result of this divestiture, ourresults of operations for this divested business are presented as discontinued operations for all periods included inthis report.
On January 17, 2014, we completed the acquisition from Brocade Communications Systems, Inc. of itsFibre Channel and converged network adapter business. On March 13, 2014, we completed the acquisition fromBroadcom Corporation of its 10/40/100Gb Ethernet controller-related assets.
Unless the context indicates otherwise, “we,” “our,” “us,” “QLogic” and the “Company” each refer toQLogic Corporation and its subsidiaries.
All references to years refer to our fiscal years ended March 30, 2014, March 31, 2013 and April 1, 2012, asapplicable, unless calendar years are specified.
Our Networking Products
We design and supply high performance server and storage networking connectivity products that provide,enhance and manage computer data communication. These products facilitate the rapid transfer of data andenable efficient resource sharing between servers, networks and storage. Our products are used in enterprise datacenters, cloud computing, Web 2.0 and other environments dependent on high performance, reliable datanetworking.
Our products are based primarily on Fibre Channel and Ethernet technologies and are used in connectionwith storage networks, local area networks, and converged networks. Storage networks are used to provide dataacross enterprise environments. Fibre Channel is currently the dominant technology for enterprise storagenetworking. Local area networks (LANs) are used to provide workstation-to-server, server-to-server, and server-to-storage connectivity using Ethernet. Converged networks are designed to address the evolving data center byconsolidating and unifying various classes of connectivity and networks, such as storage area networks andLANs, using Ethernet speeds of 10Gb per second and greater. Fibre Channel over Ethernet (FCoE) is aconverged networking technology that uses an Ethernet LAN for both storage and local area data transmission,thus combining the benefits of Fibre Channel technology with the pervasiveness of Ethernet-based networks.Similarly, Internet Small Computer System Interface (iSCSI) is an alternative to FCoE and provides storage overEthernet capabilities. Our converged network products can operate individually as 10Gb Ethernet networkproducts, FCoE products, iSCSI products, or in combination as multi-protocol products.
Our products are sold worldwide, primarily to original equipment manufacturers (OEMs) anddistributors. Our customers rely on our various server and storage connectivity products to deliver solutions toinformation technology professionals in virtually every business sector. Our products are found primarily inserver and storage subsystem solutions that are used by enterprises with critical business data requirements. Thedata center and business applications that drive requirements for our networking connectivity products include:
• General business information technology requirements;
1

• Cloud computing, Web 2.0, data warehousing, data mining and online transaction processing;
• Media-rich environments such as film and video, broadcast, medical imaging, computer-aided design andcomputer-aided manufacturing; and
• Server clustering, server and storage virtualization, disaster recovery, high-speed backup, data replicationand data migration.
Our products consist primarily of connectivity products such as adapters and application-specific integratedcircuits (ASICs). Adapters reside in a server and provide for high performance connectivity of host computerservers to data and storage networks. The ASICs that we sell are used in servers, storage systems and switches.ASICs used in servers in certain embedded applications are typically referred to as converged LAN onMotherboard (cLOMs).
We provide Fibre Channel, iSCSI, FCoE and 10Gb Ethernet standard adapters and ASICs for rack andtower servers, as well as custom mezzanine adapters and ASICs for bladed servers. Our adapters and ASICs arealso used in a variety of storage systems. All of these adapters and ASICs provide single or multi-protocolnetwork connectivity. We also sell switches that manage the transmission and routing of data between serversand storage, as well as servers to servers. However, in connection with our June 2013 restructuring plan, weannounced that we were ceasing development of future switch ASICs.
We classify our products into two categories – Advanced Connectivity Platforms and Legacy ConnectivityProducts. Advanced Connectivity Platforms are comprised primarily of adapters and ASICs for server andstorage connectivity applications. Legacy Connectivity Products are comprised primarily of Fibre Channelswitch products and 1Gb iSCSI products.
Advanced Connectivity Platforms accounted for 84%, 82% and 84% of our net revenues for fiscal 2014,2013 and 2012, respectively. Legacy Connectivity Products accounted for 16%, 18% and 16% of our netrevenues for fiscal 2014, 2013 and 2012, respectively. For a summary of our net revenues by product category,see Management’s Discussion and Analysis of Financial Condition and Results of Operations, included in Part II,Item 7 of this report.
Customers
Our products are incorporated in solutions from a number of server and storage system OEM customers,including Cisco Systems, Inc., Dell Inc., EMC Corporation, Fujitsu Ltd., Hewlett-Packard Company, HuaweiTechnologies Co., Ltd., Inspur Worldwide Services Ltd., International Business Machines Corporation, LenovoGroup Ltd., NetApp, Inc., and Oracle Corporation. A small number of these customers account for a substantialportion of our net revenues, and we expect that a small number of customers will continue to represent asubstantial portion of our net revenues for the foreseeable future. Our top ten customers accounted for 83%, 84%and 86% of net revenues during fiscal 2014, 2013 and 2012, respectively.
A summary of our customers, including their manufacturing subcontractors, that represent 10% or more ofour net revenues is as follows:
2014 2013 2012
Hewlett-Packard . . . . . . . . . . . . . . . . . . . . . . . . . . . . . . . . . . . . . . . . . . . . . . . . . . . 24% 24% 27%IBM . . . . . . . . . . . . . . . . . . . . . . . . . . . . . . . . . . . . . . . . . . . . . . . . . . . . . . . . . . . . 17% 20% 18%Dell . . . . . . . . . . . . . . . . . . . . . . . . . . . . . . . . . . . . . . . . . . . . . . . . . . . . . . . . . . . . . 15% 12% 11%
We believe that our relationships with our customers are good. However, we believe our major customerscontinually evaluate whether or not to purchase products from alternative or additional sources. Accordingly,there can be no assurance that a major customer will not reduce, delay or eliminate its purchases from us. Any
2
such reduction, delay or loss of purchases could have a material adverse effect on our business, financialcondition or results of operations.
Some of our OEM customers experience seasonality and uneven sales patterns in their businesses. As aresult, we experience similar seasonality and uneven sales patterns. The seasonality is primarily due to theclosing of a disproportionate percentage of sales transactions in the last month, weeks and days of each quarterand spikes in sales during the fourth quarter of each calendar year. Although we do not consider our business tobe highly seasonal, we believe that seasonality has impacted and may impact our business. To the extent that weexperience seasonality in our business, it would most likely have a negative impact on the sequential growth rateof our net revenues during the fourth quarter of our fiscal year.
International revenues accounted for 58%, 57% and 57% of our net revenues for fiscal 2014, 2013 and2012, respectively. For additional information on our international sales and operations, see Management’sDiscussion and Analysis of Financial Condition and Results of Operations, included in Part II, Item 7 of thisreport. For a discussion of risks related to our foreign operations, see Risk Factors, included in Part I, Item 1A ofthis report.
Sales and Marketing
Our products are marketed and sold primarily to OEMs by our internal sales team supported by field salesand systems engineering personnel. In addition, we sell our products through a network of domestic andinternational distributors. We also sell our products to original design manufacturers (ODMs) both as anextension of our OEM design organizations and as direct sales transactions.
In domestic and in certain international markets, we maintain both a sales force to serve our OEM customersand distributors that are focused on medium-sized and emerging accounts. We maintain a focused businessdevelopment and outbound marketing organization to assist, train and equip the sales organizations of our OEMcustomers and their respective reseller organizations and partners. We maintain sales offices in the United Statesand various international locations. For information regarding revenue by geographic area, see Management’sDiscussion and Analysis of Financial Condition and Results of Operations, included in Part II, Item 7 of thisreport.
We work with our server and storage system OEM customers during their design cycles. We provide thesecustomers with pre-sales system design support and services, as well as training classes and seminars conductedboth in the field and from our worldwide offices.
Our sales and marketing efforts are focused on establishing and developing long-term relationships with ourOEM customers and distribution partners, as well as brand preference activities. The sales cycle for OEMstypically begins with the identification of a requirement that could be potentially fulfilled with an existingQLogic product or a product based on a new technology. The cycle continues with technical and salescollaboration with the OEM and, if successful, leads to one of our product designs being selected as a componentin a customer’s server or storage system. We then work closely with the customer to integrate our products withthe customer’s current and future generations of products or platforms. This cycle, from opportunityidentification to initial production shipment, typically ranges from six to twenty-four months. Following initialproduction shipment, our sales efforts are focused on educating the OEM’s sales and marketing teams on theapplications and benefits of our products to drive brand preference. The brand preference phase of the salesactivities can last for the duration of the OEM program.
In addition to sales and marketing efforts, we actively participate with industry organizations relating to thedevelopment and acceptance of industry standards. We collaborate with peer companies through open standardsbodies, cooperative testing and certifications. To ensure and promote multi-vendor heterogeneous operation, wemaintain interoperability certification programs and testing laboratories.
3
Engineering and Development
Our industry is subject to rapid, regular and sometimes unpredictable technological change. Our ability tocompete depends upon our ability to continually design, develop and introduce new products that take advantageof market opportunities and address emerging standards. Our strategy is to leverage our substantial base ofarchitectural, systems and engineering expertise to address a broad range of server and storage networkingsolutions.
We are engaged in the design and development of ASICs and adapters based on one or more of FibreChannel, iSCSI, FCoE and Ethernet technologies.
We continue to invest in engineering and development to expand our capabilities to address the emergingtechnologies in the rapid evolution of storage, local area and converged networks. During fiscal 2014, 2013 and2012, we incurred engineering and development expenses of $147.0 million, $156.1 million and $138.8 million,respectively.
Backlog
A substantial portion of our sales to OEM customers are transacted through hub arrangements whereby ourproducts are purchased on a just-in-time basis and fulfilled from warehouse facilities, or hubs, in proximity to thefacilities of our customers or their contract manufacturers. Our sales are made primarily pursuant to purchaseorders, including blanket purchase orders for hub arrangements. Because the hub arrangements with ourcustomers and industry practice allow customers to cancel or change orders with limited advance notice, webelieve that backlog at any particular date is not a reliable indicator of our future revenue levels and is notmaterial to understanding our business.
Competition
The markets for networking connectivity products are highly competitive and characterized by short productlife cycles, price erosion, rapidly changing technology, frequent product performance improvements andevolving industry standards. We believe the principal competitive factors in our industry include:
• time-to-market;
• features and functionality;
• product quality, reliability and performance;
• price;
• product innovation;
• customer relationships;
• design capabilities;
• customer service and technical support; and
• interoperability of components in storage, local area and converged networks.
Due to the diversity of products required in storage, local area and converged networking, we compete withmany companies. In the traditional enterprise storage Fibre Channel adapter and ASIC markets, our primarycompetitor is Emulex Corporation. In the 10Gb Ethernet adapter and ASIC markets, which include convergednetworking products such as FCoE and iSCSI, we primarily compete with Emulex Corporation, MellanoxTechnologies, Ltd., Chelsio Communications, Inc. and Intel Corporation. We may also compete with some of ourserver and storage systems customers, some of which have the capability to develop products comparable tothose we offer.
4

Manufacturing
We use ASIC industry suppliers to access foundries for the manufacture of ASICs, which we sell asstandalone products or integrate into our adapter and switch products. This approach allows us to avoid the highcosts of owning, operating, maintaining and upgrading wafer fabrication and assembly facilities. As a result, wefocus our resources on product design and development, quality assurance, sales and marketing, and supply chainmanagement. Prior to the sale of our adapter and switch products, final tests are performed to ensure quality.Product test, customer-specific configuration and product localization are completed by third-party serviceproviders or by us. We also provide fabrication process reliability tests, as required, and conduct failure analysisto confirm the integrity of our quality assurance procedures.
Our semiconductors are currently manufactured by a number of foundries. Most of the ASICs used in ourproducts are manufactured using 90, 65, 40 or 28 nanometer process technology. In addition, we continuallyevaluate smaller geometries. In the past, we have experienced some difficulties in shifting to smaller geometryprocess technologies or new manufacturing processes, which resulted in reduced manufacturing yields, delays inproduct deliveries and increased expenses. We may face similar difficulties, delays and expenses as we continueto transition our products to smaller geometry processes.
We depend on our ASIC suppliers to work with their wafer foundries to allocate a portion of their capacitysufficient to meet our needs and to produce products of acceptable quality and with satisfactory manufacturingyields in a timely manner. These foundries fabricate products for other companies and, in certain cases,manufacture products of their own design. We do not have long-term supply agreements directly with any ofthese foundries; we purchase both wafers and finished chips from our ASIC suppliers on a discrete purchaseorder basis. Therefore, the foundries, through our ASIC suppliers, generally are not obligated to supply productsto us for any specific period, in any specific quantity or at any specific price, except as may be provided in aparticular purchase order. We work with our existing ASIC suppliers, and may qualify new ASIC suppliers, asneeded, to obtain additional manufacturing capacity. However, there can be no assurance that we will be able tomaintain our current relationships or obtain additional capacity.
We currently purchase our semiconductor products through our ASIC suppliers either in finished or waferform. We use subcontractors to assemble our semiconductor products purchased in wafer form. In the assemblyprocess for our semiconductor products, the silicon wafers are separated into individual die, which are thenassembled into packaged ASICs and tested by our ASIC suppliers, third party ASIC test partners or by us.
For our adapter, switch and other products, we use third-party contract manufacturers for materialprocurement, assembly, test and inspection in a turnkey model, prior to shipment to our customers. Thesecontract manufacturers are primarily located outside the United States. To the extent that we rely on thesecontract manufacturers, we are not able to directly control product delivery schedules and quality assurance. Theloss of one of our major contract manufacturers could significantly impact our ability to produce products for anindefinite period of time. Qualifying a new contract manufacturer and commencing volume production is alengthy and expensive process. While we believe that our relationships with our contract manufacturers are good,if we are required to change a contract manufacturer or if a contract manufacturer experiences delays,disruptions, capacity constraints, component part shortages or quality control problems in its manufacturingoperations, shipment of our products to our customers could be delayed, resulting in loss or postponement ofrevenue and potential harm to our competitive position and relationships with customers.
Certain key components used in the manufacture of our products are purchased from single or limitedsources. ASICs are purchased from single sources. For example, in connection with our acquisition of10/40/100Gb Ethernet controller-related assets, we entered into a development and supply agreement whichrequires us to purchase the ASICs used in the related products exclusively from Broadcom. Other keycomponents such as microprocessors, logic chips, power supplies and programmable logic devices are purchasedfrom limited sources. If one of these suppliers experiences an interruption in its ability to supply our needs, orchooses to sever its relationship with us, we may be unable to produce certain of our products until alternativesuppliers are identified and qualified.
5

Many of the component parts used in our adapter, switch and other products are standard off-the-shelf items,which are, or can be, obtained from more than one source. We select suppliers on the basis of technology,manufacturing capacity, financial viability, quality and cost. Our reliance on third-party manufacturers involvesrisks, including possible limitations on availability of products due to market abnormalities, geopoliticalinstability, natural disasters, labor shortages and labor strikes, unavailability of or delays in obtaining access tocertain product technologies, and the absence of complete control over delivery schedules, manufacturing yieldsand total production costs. The inability of our suppliers to deliver products of acceptable quality and in a timelymanner or our inability to procure adequate supplies of our products could have a material adverse effect on ourbusiness, financial condition or results of operations.
Intellectual Property
While we have a number of patents issued and additional patent applications pending in the United States,Canada, Europe and Asia, we rely primarily on our trade secrets, trademarks, copyrights and contractualprovisions to protect our intellectual property. We attempt to protect our proprietary information throughconfidentiality agreements and contractual provisions with our customers, suppliers, employees and consultants,and through other security measures. However, the laws of certain countries in which our products are or may bedeveloped, manufactured or sold, including various countries in Asia, may not protect our products andintellectual property rights to the same extent as the laws of the United States, or at all.
Our ability to compete may be affected by our ability to protect our intellectual property. We protect ourrights vigorously; however there can be no assurance that these measures will be successful. We may be requiredto assert claims of infringement of intellectual property rights against others. In the event of such a dispute, wemay be required to expend significant resources and there can be no assurance that we would be successful. If thedispute led to litigation, it could result in significant expense to us, and divert the efforts of our technical andmanagement personnel, whether or not such litigation is determined in our favor.
We have in the past received notices of claimed infringement of intellectual property rights and beeninvolved in intellectual property litigation. There can be no assurance that third parties will not assert additionalclaims of infringement of intellectual property rights against us, or against customers or others whom we arecontractually obligated to indemnify, with respect to existing and future products. In the event of a patent or otherintellectual property dispute, we may be required to expend significant resources to defend such claims, developnon-infringing technology or to obtain licenses to the technology that is the subject of the claim. There can be noassurance that we would be successful in such development or that any such license would be available oncommercially reasonable terms, if at all. In the event of litigation to determine the validity of any third party’sclaims, such litigation could result in significant expense to us, and divert the efforts of our technical andmanagement personnel, whether or not such litigation is determined in our favor.
Some of our products are designed to include software or other intellectual property licensed from thirdparties. None of these licenses relate to core QLogic-developed technology, are material to our business, orrequire payment of amounts that are material.
Environment
Our operations are subject to regulation under various federal, state, local and foreign laws concerning theenvironment, including laws addressing the discharge of pollutants into the environment, the management anddisposal of hazardous substances and wastes, and the cleanup of contaminated sites. We could incur substantialcosts, including cleanup costs, fines and civil or criminal sanctions, and third-party damage or personal injuryclaims, if we violate or become liable under environmental laws.
Most of our products are also subject to various laws governing chemical substances in products, includingthose regulating the manufacture and distribution of chemical substances and those restricting the presence of
6

certain substances in electronic products. We could incur substantial costs, or our products could be restrictedfrom entering certain countries, if our products become non-compliant with environmental laws. We also faceincreasing complexity in our product design and procurement operations as we adjust to new and futurerequirements relating to the materials composition of our products. For example, the European Union adopted theWaste Electrical and Electronic Equipment (WEEE) Directive, pursuant to which European Union countries haveenacted legislation making producers of electrical goods financially responsible for specified collection,recycling, treatment and disposal of past and future covered products. These and similar laws adopted in othercountries could impose a significant cost of doing business in those countries.
Environmental costs are presently not material to our results of operations or financial position, and we donot currently anticipate material capital expenditures for environmental control facilities.
Working Capital
Our working capital was $314.3 million as of March 30, 2014, which includes $278.0 million of cash, cashequivalents and marketable securities. For additional information, see Management’s Discussion and Analysis ofFinancial Condition and Results of Operations – Liquidity and Capital Resources, included in Part II, Item 7 ofthis report.
Employees
We had 1,044 employees as of May 14, 2014. We believe our future prospects will depend, in part, on ourability to continue to attract, train, motivate, retain and manage skilled engineering, sales, marketing andexecutive personnel. Our employees are not represented by a labor union. We believe that our relations with ouremployees are good.
Item 1A. Risk Factors
Set forth below and elsewhere in this report and in other documents we file with the Securities andExchange Commission are risks and uncertainties that could cause our actual results of operations to differmaterially from the results contemplated by the forward-looking statements contained in this report or otherwisepublicly disclosed by the Company.
Our operating results may fluctuate in future periods, which could cause our stock price to decline.
We have experienced, are currently experiencing, and expect to experience in future periods, fluctuations insales and operating results from quarter to quarter. For example, the market for our Fibre Channel products ismature and has declined during recent periods. This market decline may be the result of a shift in the informationtechnology (IT) data center deployment model, as more enterprise data centers are using private or public cloudsto provide a portion of their requirements. This shift has adversely impacted the enterprise server market. To theextent the Fibre Channel market continues to decline, our quarterly operating results would be negativelyimpacted.
A significant portion of our net revenues in each fiscal quarter results from orders booked in that quarter.Orders placed by major customers are typically based on their forecasted sales and inventory levels for ourproducts. Accordingly, it is extremely difficult for us to forecast future sales levels and historical informationmay not be indicative of future trends. In addition, there can be no assurance that we will maintain our currentgross margins or profitability in the future.
Fluctuations in our quarterly operating results may also be the result of:
• the timing, size and mix of orders from customers;
• gain or loss of significant customers;
7

• industry consolidation among our competitors, our customers or our suppliers;
• customer policies pertaining to desired inventory levels of our products;
• sales discounts and customer incentives;
• the availability and sale of new products;
• changes in our average selling prices;
• the timing of server refresh cycles;
• variations in manufacturing capacities, efficiencies and costs;
• the availability and cost of components, including silicon chips;
• variations in product development costs, especially related to advanced technologies;
• variations in operating expenses;
• changes in effective income tax rates, including those resulting from changes in tax laws;
• our ability to timely produce products that comply with new environmental restrictions or relatedrequirements of our original equipment manufacturer (OEM) customers;
• actual events, circumstances, outcomes and amounts differing from judgments, assumptions and estimatesused in determining the value of certain assets (including the amounts of related valuation allowances),liabilities and other items reflected in our consolidated financial statements;
• the timing of revenue recognition and revenue deferrals;
• gains or losses related to our marketable securities; or
• changes in accounting rules or our accounting policies.
In addition, our quarterly results of operations are influenced by competitive factors, including the pricingand availability of our products and our competitors’ products. Furthermore, communications regarding newproducts and technologies could cause our customers to defer or cancel purchases of our products. Orderdeferrals by our customers, delays in our introduction of new products, and longer than anticipated design-incycles for our products have in the past adversely affected our quarterly results of operations. Due to thesefactors, as well as other unanticipated factors, it is likely that in some future quarter or quarters our operatingresults will be below the expectations of public market analysts or investors, and as a result, the price of ourcommon stock could significantly decrease.
We expect gross margin to vary over time and our recent level of gross margin may not be sustainable.
Our recent level of gross margin may not be sustainable and may be adversely affected by numerous factors,including:
• as a result of our acquisition of the 10/40/100Gb Ethernet controller-related assets from Broadcom in thefourth quarter of fiscal 2014, we expect that our Ethernet products will represent a higher percentage ofour future revenues and these products have a lower gross margin percentage than our historical corporateaverage;
• other changes in product mix;
• transitions to products based on emerging technologies, which may have lower gross margins;
• changes in manufacturing volumes over which fixed costs are absorbed;
• increased price competition;
8

• introduction of new products by us or our competitors, including products with advantages in price,performance or features;
• our inability to reduce manufacturing-related or component costs;
• entry into new markets;
• amortization and impairments of purchased intangible assets;
• sales discounts and customer incentives;
• increases in material, labor or overhead costs;
• excess inventory and inventory holding charges;
• changes in distribution channels;
• increased warranty costs; and
• acquisitions and dispositions of businesses, technologies or product lines.
A decrease in our gross margin could adversely affect the market price of our common stock.
Our operating results have been, are being, and may in the future be, adversely affected by unfavorableeconomic conditions.
The United States and other countries around the world have experienced, and are continuing to experience,economic weakness and uncertainty. Political instability in certain regions of the world is significantlycontributing to this economic uncertainty. Economic uncertainty is adversely affecting, and in the future maycontinue to adversely affect, IT spending rates. For example, certain of our large OEM customers are reportingsignificant weakness in particular markets and geographies. Reductions in IT spending rates have resulted inreduced sales volumes, and could result in lower prices for our products, longer sales cycles, increased inventoryprovisions and increased production costs, all of which could negatively impact our results of operations.
As a result of worldwide economic weakness and uncertainty, it is extremely difficult for us and ourcustomers to forecast future revenue levels based on historical information and trends. In addition, U.S. federalgovernment spending cuts might reduce demand for our products from organizations that receive funding fromthe U.S. government and could negatively affect macroeconomic conditions in the United States, which couldfurther reduce demand for our products. To the extent that we do not achieve our anticipated level of revenue, ouroperating results could be adversely affected.
Our stock price may be volatile.
The market price of our common stock has fluctuated substantially, and there can be no assurance that suchvolatility will not continue. Several factors could impact our stock price including, but not limited to:
• differences between our actual revenues and operating results and the published expectations of publicmarket analysts;
• quarterly fluctuations in our revenues and operating results;
• introduction of new products or changes in product pricing policies by our competitors or us;
• conditions in the markets in which we operate;
• changes in market projections by industry forecasters;
• changes in estimates of our earnings or rating upgrades or downgrades of our stock by public marketanalysts;
9

• operating results or forecasts of our major customers or competitors;
• rumors or dissemination of false information; and
• general economic and geopolitical conditions.
In addition, stock markets have experienced extreme price and volume volatility in recent years and stockprices of technology companies have been especially volatile. This volatility has had a substantial effect on themarket prices of securities of many public companies for reasons frequently unrelated to the operatingperformance of the specific companies. These broad market fluctuations could adversely affect the market priceof our common stock, which could have a material adverse impact on investor confidence and employeeretention.
Our business is dependent, in large part, on the continued growth of the networking markets that we serveand if these markets do not continue to develop, our business will suffer.
Our products are used in storage, local area and converged networks, and therefore our business isdependent on these markets. Our success in generating revenue in these markets will depend on, among otherthings, our ability to:
• educate potential OEM customers, distributors, resellers, system integrators, storage system providers andend-user organizations about the benefits of our products;
• maintain and enhance our relationships with OEM customers, distributors, resellers, system integratorsand storage system providers;
• predict and base our products on standards that ultimately become industry standards; and
• achieve and maintain interoperability between our products and other equipment and components fromdiverse vendors.
If we are not successful in any or all of these items, our business and results of operations could bematerially and adversely affected.
Our financial condition will be materially harmed if we do not maintain and gain market acceptance ofour products.
The markets in which we compete involve rapidly changing technologies, evolving industry standards andcontinuing improvements in products and services. Examples of these changing technologies include system-on-chip products and both software-defined-networking and software-defined-storage products. Our future successdepends, in part, on our ability to:
• enhance our current products and develop and introduce, in a timely manner, new products that keep pacewith technological developments and industry standards;
• compete effectively on the basis of price and performance; and
• adequately address OEM and end-user customer requirements and achieve market acceptance.
We believe that to remain competitive, we will need to continue to develop new products and enter newmarkets, which will require significant investment. Some new markets may require engagement with customerswith whom we have limited or no prior experience. Our competitors may be developing alternative technologies,or entering into exclusive strategic alliances with our major customers, either of which may adversely affect themarket acceptance of our products, our ability to enter new markets, or our ability to secure customer designwins. Although we continue to explore and develop products based on new technologies, a substantial portion ofour revenues is generated today from Fibre Channel technology. If alternative technologies are adopted by theindustry, we may not be able to develop products for these technologies in a timely manner. Further, even if
10
alternative technologies do augment Fibre Channel revenues, our products may not be fully developed in time tobe accepted by our customers. Even if our new products are developed in time, we may not be able tomanufacture them at competitive prices or in sufficient volumes.
Some of our products are based on Fibre Channel over Ethernet (FCoE) or 10Gb Ethernet technologies.FCoE is a converged networking technology that provides a unified storage and data network over EnhancedEthernet, while preserving the investment by end users in their existing Fibre Channel infrastructure and storage.As with many emerging technologies, it is expected that the market for FCoE will take a number of years to fullydevelop and mature. We expect products based on FCoE to supplement, and perhaps replace, certain productsbased on Fibre Channel technology. 10Gb Ethernet is a technology for use in enterprise data centers. The marketfor 10Gb Ethernet products includes well-established participants who have significantly more engineering, salesand marketing resources to dedicate to developing and penetrating the market than we do. An inability tomaintain, or build on, our market share in the Fibre Channel, converged or 10Gb Ethernet markets, or the failureof these markets to expand, could have a material adverse effect on our business or results of operations.
We depend on a small number of customers and any decrease in revenues from any one of our majorcustomers could adversely affect our results of operations and cause our stock price to decline.
A small number of customers account for a substantial portion of our net revenues, and we expect that asmall number of customers will continue to represent a substantial portion of our net revenues in the foreseeablefuture. Our top ten customers accounted for 83%, 84% and 86% of net revenues during fiscal 2014, 2013 and2012, respectively. Total revenue from our two largest customers, Hewlett-Packard Company and InternationalBusiness Machines Corporation, together accounted for 40% or more of net revenues during fiscal 2014, 2013and 2012. We are also subject to credit risk associated with the concentration of our accounts receivable.
A significant portion of the products we sell are incorporated into servers manufactured by our majorcustomers. Certain of our large OEM customers are reporting weakness in this market. If server sales by ourmajor customers continue to be adversely affected by the IT spending environment or server market factors,demand for our products could decrease further, which could have a material adverse effect on our business,financial condition or results of operations.
Our customers generally order products through written purchase orders instead of long-term supplycontracts and, therefore, are generally not obligated to purchase products from us for any extended period.Customers typically incorporate our products into complex devices and systems, which creates supply chaincross-dependencies. Accordingly, supply chain disruptions affecting components of our customers’ devices and/or systems could negatively impact the demand for our products, even if the supply of our products is not directlyaffected. Major customers also have significant leverage over us and may attempt to change the sales terms,including pricing, customer incentives and payment terms, or insist that we undertake or fund significant aspectsof the design, qualification and testing that our customers have typically been responsible for, either of whichcould have a material adverse effect on our business, financial condition or results of operations. As our OEMcustomers are pressured to reduce prices as a result of competitive factors, we may be required to contractuallycommit to price reductions for our products before we know how, or if, cost reductions can be achieved. If we areunable to achieve these cost reductions, our gross margins could decline and such a decline could have a materialadverse effect on our business, financial condition or results of operations.
The ongoing consolidation in the technology industry could adversely impact our business. There is thepotential for some of our customers to merge with or acquire one or more of our other customers. For example,International Business Machines Corporation recently announced an agreement to sell its x86 server business toLenovo Group Ltd. There is also a potential that one of our large customers could acquire one of our currentcompetitors. As a result of such transactions, demand for our products could decrease, which could have amaterial adverse effect on our business, financial condition or results of operations.
11
Competition within the markets for products such as ours is intense and includes various establishedcompetitors.
The markets for networking connectivity products are highly competitive and are characterized by shortproduct life cycles, price erosion, rapidly changing technology, frequent product performance improvements andevolving industry standards. Due to the diversity of products required in storage, local area and convergednetworking, we compete with many companies. In the traditional enterprise storage Fibre Channel adapter andapplication-specific integrated circuit (ASIC) markets, our primary competitor is Emulex Corporation. In the10Gb Ethernet adapter and ASIC markets, which include converged networking products such as FCoE andInternet Small Computer Systems Interface (iSCSI) we compete primarily with Emulex Corporation, MellanoxTechnologies, Ltd., Chelsio Communications, Inc. and Intel Corporation. We may also compete with some of ourserver and storage systems customers, some of which have the capability to develop products comparable tothose we offer.
We need to continue to develop products appropriate to our markets to remain competitive as ourcompetitors continue to introduce products with improved features. While we continue to devote significantresources to engineering and development, these efforts may not be successful or competitive products may notbe developed and introduced in a timely manner. In addition, while relatively few competitors offer a full rangeof storage, local area and converged networking connectivity products, additional domestic and foreignmanufacturers may increase their presence in these markets either through the development of new products orthrough industry consolidation. We may not be able to compete successfully against these or other competitors. Ifwe are unable to design, develop or introduce competitive new products on a timely basis, or if our competitorsintroduce new products that are more successful than ours in the marketplace, our future operating results may bematerially and adversely affected.
We may engage in mergers, acquisitions, divestitures and strategic investments and these activities couldadversely affect our results of operations and stock price.
Our future growth may depend in part on our ability to identify and acquire businesses, technologies orproduct lines. For example, we completed two acquisitions in fiscal 2014, including the acquisition of10/40/100Gb Ethernet controller-related assets from Broadcom Corporation. Mergers and acquisitions involvenumerous risks, including:
• the failure of markets for the products of acquired businesses, technologies or product lines to develop asexpected;
• uncertainties in identifying and pursuing acquisition targets;
• the challenges in achieving strategic objectives, cost savings and other benefits expected fromacquisitions;
• the risk that the financial returns on acquisitions will not support the expenditures incurred to acquiresuch businesses or the capital expenditures needed to develop such businesses;
• difficulties in assimilating the acquired businesses, technologies or product lines;
• the failure to successfully manage additional business locations, including the additional infrastructureand resources necessary to support and integrate such locations;
• the existence of unknown product defects related to acquired businesses, technologies or product linesthat may not be identified due to the inherent limitations involved in the due diligence process of anacquisition;
• the diversion of management’s attention from other business concerns;
• risks associated with entering markets or conducting operations with which we have no or limited directprior experience;
• risks associated with assuming the legal obligations of acquired businesses, technologies or product lines;
12
• risks related to the effect that internal control processes of acquired businesses might have on ourfinancial reporting and management’s report on our internal control over financial reporting;
• the potential loss of, or impairment of our relationships with, current customers or failure to retain thecustomers of acquired businesses;
• the inability to qualify the acquired products with OEM partners on a timely basis, or at all;
• the potential loss of key employees related to acquired businesses, technologies or product lines; and
• the incurrence of significant exit charges if products or technologies acquired in business combinationsare unsuccessful.
Further, we may never realize the perceived benefits of a business combination or divestiture. Acquisitionsby us could negatively impact gross margins or dilute stockholders’ investment and cause us to incur debt,contingent liabilities and amortization/impairment charges related to intangible assets, all of which couldmaterially and adversely affect our financial condition or results of operations. Divestitures involve risks, such asdifficulty splitting up businesses, distracting employees, potential loss of revenue and negatively impactingmargins, and potentially disrupting customer relationships. In addition, our effective tax rate for future periodscould be negatively impacted by acquisitions or divestitures.
We have made, and could make in the future, investments in technology companies, including privately-held companies in a development stage. Many of these private equity investments are inherently risky becausethe companies’ businesses may never develop, and we may incur losses related to these investments. In addition,we may be required to write down the carrying value of these investments to reflect other-than-temporarydeclines in their value, which could have a material adverse effect on our financial condition and results ofoperations.
If we are unable to attract and retain key personnel, we may not be able to sustain or grow our business.
Our future success largely depends on our key engineering, sales, marketing and executive personnel,including highly skilled semiconductor design personnel and software developers. In December 2013, weannounced the appointment of Prasad Rampalli to the position of President and Chief Executive Officer with aneffective date of February 3, 2014. During our leadership transition, it is especially important that we retain keypersonnel. If we lose the services of key personnel, or do not hire or retain other personnel for key positions, ourbusiness could be adversely affected.
We believe that the market for key personnel in the industries in which we compete is highly competitive. Inparticular, we have periodically experienced difficulty in attracting and retaining qualified engineers and othertechnical personnel and anticipate that competition for such personnel will increase in the future. For example,the market for qualified technical personnel within India has become extremely competitive, resulting insignificant wage inflation. As a result, we may not be able to attract and retain key personnel with the skills andexpertise necessary to develop new products in the future or to manage our business, both in the United Statesand abroad.
We have historically used equity awards and our employee stock purchase program as key components ofour total employee compensation program in order to align employees’ interests with the interests of ourstockholders, encourage retention of key personnel, and provide competitive compensation packages. However,the guidelines of proxy advisory firms relating to stockholder approval of shares available under equitycompensation plans and share usage could make it more difficult for us to obtain such approval and thereforegrant stock-based awards to employees in the future, which may result in changes in our stock-basedcompensation strategy. These and other developments relating to the provision of stock-based compensation toemployees could make it more difficult to attract, retain and motivate key personnel.
13

Our products are complex and may contain undetected software or hardware errors that could lead to anincrease in our costs, reduce our net revenues or damage our reputation.
Our products are complex and may contain undetected software or hardware errors when first introduced oras newer versions are released. We are also exposed to risks associated with latent defects in existing productsand to risks that components purchased from third-party subcontractors and incorporated into our products maynot meet our specifications or may otherwise fail prematurely. From time to time, we have found errors inexisting, new or enhanced products. In addition, our products are frequently combined with other products,including software, from other vendors, and these products often need to interface with existing networks, eachof which have different specifications and utilize multiple protocol standards. As a result, when problems occur,it may be difficult to identify the source of the problem. The occurrence of hardware or software errors couldadversely affect the sales of our products, cause us to incur significant warranty and repair costs, divert theattention of our engineering personnel from our product development efforts and cause significant customerrelations problems, any of which could materially and adversely affect our operating results.
We expect the pricing of our products to continue to decline, which could reduce our revenues, grossmargins and profitability.
We expect the average unit prices of our products (on a like-for-like product comparison basis) to decline inthe future as a result of competitive pricing pressures, increased sales discounts and customer incentives, newproduct introductions by us or our competitors, or other factors. If we are unable to offset these factors byincreasing sales volumes or reducing product manufacturing costs, our total revenues and gross margins maydecline. Moreover, most of our expenses are fixed in the short-term or incurred in advance of receipt ofcorresponding revenues. As a result, we may not be able to decrease our spending to offset any unexpectedshortfall in revenues. If this occurs, our revenues, gross margins and profitability could decline.
We are dependent on sole source and limited source suppliers for certain key components.
Certain key components used in the manufacture of our products are purchased from single or limitedsources. ASICs are purchased from single sources. For example, in connection with our acquisition of10/40/100Gb Ethernet controller-related assets, we entered into a development and supply agreement whichrequires us to purchase the ASICs used in the related products exclusively from Broadcom. Other keycomponents such as microprocessors, logic chips, power supplies and programmable logic devices are purchasedfrom limited sources. If one of these suppliers experiences an interruption in its ability to supply our needs, orchooses to sever or significantly change its relationship with us, we may be unable to produce certain of ourproducts, which could result in the loss of customers and have a material adverse effect on our results ofoperations.
We are dependent on worldwide third-party subcontractors and contract manufacturers.
Third-party subcontractors located outside the United States assemble and test certain products for us. Tothe extent that we rely on third-party subcontractors to perform these functions, we will not be able to directlycontrol product delivery schedules and quality assurance. This lack of control may result in product shortages orquality assurance problems that could delay shipments of products or increase manufacturing, assembly, testingor other costs. If a subcontractor experiences capacity constraints or financial difficulties, suffers damage to itsfacilities, experiences power outages, natural disasters, labor shortages or labor strikes, or any other disruption ofassembly or testing capacity, we may not be able to obtain alternative assembly and testing services in a timelymanner.
In addition, the loss of any of our major third-party contract manufacturers could significantly impact ourability to produce products for an indefinite period of time. Qualifying a new contract manufacturer andcommencing volume production is a lengthy and expensive process. Some customers will not purchase anyproducts, other than a limited number of evaluation units, until they qualify the manufacturing line for the
14

product. If we are required to change a contract manufacturer or if a contract manufacturer experiences delays,disruptions, capacity constraints, component part shortages or quality control problems in its manufacturingoperations, shipment of our products to our customers could be delayed, resulting in loss or postponement ofrevenues and potential harm to our competitive position and relationships with customers.
The migration of our customers toward new products could adversely affect our results of operations.
As new or enhanced products are introduced, we must successfully manage the transition from olderproducts in order to minimize the effects of product inventories that may become excess and obsolete, as well asensure that sufficient supplies of new products can be delivered to meet customer demand. Our failure to managethe transition to newer products in the future or to develop and successfully introduce new products and productenhancements could adversely affect our business or results of operations. In addition, our customers aredemanding a higher level of customization for new products, which prevents us from fully leveraging our productdesign work and adds to our new product development costs. When we introduce new products and productenhancements, we face additional risks relating to product transitions, including risks relating to forecastingdemand and longer lead times associated with smaller product geometries and more complex productionoperations. Any such adverse event or increased costs could have a material adverse effect on our business,financial condition or results of operations.
Historically, the technology industry has developed higher performance ASICs, which create chip-levelsolutions that replace selected board-level or box-level solutions at a significantly lower average selling price.We have previously offered ASICs to customers for certain applications that have effectively resulted in a lower-priced solution when compared to an adapter solution. This transition to ASICs may also occur with respect toother current and future products. The result of this transition may have an adverse effect on our business,financial condition or results of operations. In the future, a similar adverse effect to our business could occur ifthere were rapid shifts in customer purchases from our midrange networking connectivity products to lower-costproducts.
Our business is subject to seasonal fluctuations and uneven sales patterns.
A large percentage of our products are sold to customers who experience seasonality and uneven salespatterns in their businesses. As a result, we experience similar seasonality and uneven sales patterns. We believethis uneven sales pattern is a result of many factors including:
• the tendency of our customers to close a disproportionate percentage of their sales transactions in the lastmonth, weeks and days of each quarter;
• spikes in sales during the fourth quarter of each calendar year that some of our customers experience; and
• differences between our quarterly fiscal periods and the fiscal periods of our customers.
In addition, because our customers require us to maintain products at hub locations near their facilities ornear the facilities of their contract manufacturers, it is difficult for us to predict sales trends. Our uneven salespattern also makes it extremely difficult to predict the demand of our customers and adjust manufacturingcapacity accordingly. If we predict demand that is substantially greater than actual customer orders, we will haveexcess inventory. Alternatively, if customer orders substantially exceed predicted demand, the ability toassemble, test and ship orders received in the last weeks and days of each quarter may be limited, or at anincreased cost, which could have a material adverse effect on our quarterly revenues and earnings.
Unanticipated changes in our tax provisions or adverse outcomes resulting from examination of ourincome tax returns could adversely affect our results of operations.
We are subject to income taxes in the United States and various foreign jurisdictions. Our effective tax ratehas been and could in the future be adversely affected by changes in tax laws or interpretations of those tax laws,
15

by changes in the mix of earnings in countries with differing statutory tax rates, or by changes in the valuation ofour deferred tax assets and liabilities. Our effective tax rate is also affected by intercompany transactions forlicenses, services, funding and other items. Given the global scope of our operations, and the complexity ofglobal tax and transfer pricing rules and regulations, it is difficult to estimate earnings within each taxjurisdiction. If actual earnings within a tax jurisdiction differ materially from our estimates, we may not achieveour expected effective tax rate.
Additionally, our effective tax rate may be impacted by the tax effects of acquisitions, dispositions, changesto tax laws or regulations, examinations by tax authorities, stock-based compensation, uncertain tax positions,and changes in our ability to realize deferred tax assets. Significant judgment and estimates are required indetermining the impact on our effective tax rate related to these items, including whether it is more likely thannot that some or all of our deferred tax assets will be realized. Such estimates are subject to uncertainty due tovarious factors, including the economic environment, industry and market conditions, and the length of time ofthe projections included in the analyses. If our actual results are less favorable than current estimates, or werevise our estimates downward in future analyses, a valuation allowance may be required related to our deferredtax assets with a corresponding adjustment to earnings in the period in which such determination is made, whichcould have a material effect on our results of operations. In addition, the Organisation for Economic Co-operation and Development (OECD), an international association of 34 countries including the United States, iscontemplating changes to numerous long-standing tax principles. These contemplated changes, if finalized andadopted by countries, will increase tax uncertainty and may adversely affect our provision for income taxes.
Finally, we are subject to examination of our income tax returns by the United States Internal RevenueService (IRS) and other tax authorities, which may result in the assessment of additional income taxes. Forexample, our federal consolidated income tax returns for fiscal years 2010, 2011 and 2012 are currently underexamination by the IRS. We regularly assess the likelihood of adverse outcomes resulting from examinations todetermine the adequacy of our provisions for income taxes. However, unanticipated outcomes from examinationscould have a material adverse effect on our financial condition or results of operations.
Because we have operations in foreign countries and depend on foreign customers and suppliers, we aresubject to international economic, currency, regulatory, political and other risks that could harm ourbusiness, financial condition and results of operations.
International revenues accounted for 58%, 57% and 57% of our net revenues for fiscal 2014, 2013 and2012, respectively. We expect that international revenues will continue to account for a significant percentage ofour net revenues for the foreseeable future. In addition, we maintain operations in foreign countries and asignificant portion of our inventory purchases are from suppliers that are located outside the United States. As aresult, we are subject to several risks, which include:
• a greater difficulty of administering and managing our business globally;
• compliance with multiple, and potentially conflicting, regulatory requirements, such as import or exportrequirements, tariffs and other barriers;
• less effective intellectual property protections outside of the United States;
• currency fluctuations;
• overlapping or differing tax structures;
• political and economic instability, including terrorism and war; and
• general trade restrictions.
As of March 30, 2014, our international subsidiaries held $232.8 million of our total cash, cash equivalentsand marketable securities. These holdings by our international subsidiaries consist primarily of debt securities
16
due from U.S. issuers, including the U.S. government and related agencies, and U.S. dollar denominated cash andmoney market funds. Certain foreign regulations could impact our ability to transfer funds to the United States.Additionally, should we decide to repatriate cash held outside of the United States, we may incur a significant taxobligation.
Our international sales are invoiced in U.S. dollars and, accordingly, if the relative value of the U.S. dollarin comparison to the currency of our foreign customers should increase, the resulting effective price increase ofour products to such foreign customers could result in decreased sales. In addition, a significant portion of ourinventory is purchased from international suppliers, who invoice us in U.S. dollars. If the relative value of theU.S. dollar in comparison to the currency of our foreign suppliers should decrease, our suppliers may increaseprices, which could result in a decline of our gross margin. Any of the foregoing factors could have a materialadverse effect on our business, financial condition or results of operations.
Our facilities and the facilities of our suppliers and customers are located in regions that are subject tonatural disasters.
Our California facilities, including our principal executive offices, our principal design facilities and ourcritical business operations, are located near major earthquake faults. We are not specifically insured forearthquakes or other natural disasters. Any personal injury at, or damages to, the facilities as a result of suchoccurrences could have a material adverse effect on our business, results of operations or financial condition.Additionally, we have operations, suppliers and customers in regions that have historically experienced naturaldisasters. Any earthquake or other natural disaster, including a hurricane, flood, volcanic eruption, tsunami orfire, affecting any of these regions could adversely affect our business, results of operations and financialcondition.
In addition, as a result of a natural disaster, our major customers may face shortages of components thatcould negatively impact their ability to build the servers and data center devices into which our products areintegrated, thereby negatively impacting the demand for our products even if the supply of our products is notdirectly affected by the natural disaster. For example, the earthquake, tsunami and related events that occurred inJapan in March 2011, and the extensive flooding that occurred in Thailand beginning in October 2011, causedwidespread destruction in regions that include suppliers of components for many technology companies.
Our proprietary rights may be inadequately protected and difficult to enforce.
In some jurisdictions, we have patent protection on certain aspects of our technology. However, we relyprimarily on trade secrets, trademarks, copyrights and contractual provisions to protect our proprietary rights.There can be no assurance that these protections will be adequate to protect our proprietary rights, that others willnot independently develop or otherwise acquire equivalent or superior technology, or that we can maintain suchtechnology as trade secrets. There also can be no assurance that any patents we possess will not be invalidated,circumvented or challenged. We have taken steps in several jurisdictions to enforce our trademarks against thirdparties. No assurances can be given that we will ultimately be successful in protecting our trademarks. The lawsof certain countries in which our products are or may be developed, manufactured or sold, including variouscountries in Asia, may not protect our products and intellectual property rights to the same extent as the laws ofthe United States, or at all. If we fail to protect our intellectual property rights, our business could be negativelyimpacted.
Disputes relating to claimed infringement of intellectual property rights may adversely affect our business.
We have in the past received notices of claimed infringement of intellectual property rights and beeninvolved in intellectual property litigation. There can be no assurance that third parties will not assert futureclaims of infringement of intellectual property rights against us, or against customers who we are contractually
17
obligated to indemnify, with respect to existing and future products. In addition, our supply of silicon chips andother components can also be interrupted by intellectual property infringement claims against our suppliers.
Individuals and groups are purchasing intellectual property assets for the sole purpose of making claims ofinfringement and attempting to extract settlements from companies such as ours. Although patent and intellectualproperty disputes may be settled through licensing or similar arrangements, costs associated with thesearrangements may be substantial and the necessary licenses or similar arrangements may not be available to uson satisfactory terms, or at all. As a result, we could be prevented from manufacturing and selling some of ourproducts. In addition, if we litigate these kinds of claims, the litigation could be expensive, time consuming andcould divert management’s attention from other matters and there is no guarantee we would prevail. Our businesscould suffer regardless of the outcome of the litigation.
Our distributors may not effectively sell our products and their reseller customers may purchase productsfrom our competitors, which could negatively affect our results of operations.
Our distributors, which currently account for less than 15% of our net revenues, generally offer a diversearray of products from several different manufacturers and suppliers. Accordingly, we are at risk that thesedistributors may give higher priority to selling products from other suppliers, thus reducing their efforts to sellour products. A reduction in sales efforts by our current distributors could materially and adversely impact ourbusiness or results of operations. In addition, if we decrease our distributor-incentive programs (i.e., competitivepricing and rebates), our distributors may decrease the amount of product purchased from us. This could result ina change of business behavior, and distributors may decide to decrease their inventory levels, which could impactavailability of our products to their customers.
As a result of these factors regarding our distributors or other unrelated factors, the reseller customers of ourdistributors could decide to purchase products developed and manufactured by our competitors. Any loss ofdemand for our products by value-added resellers and system integrators could have a material adverse effect onour business or results of operations.
Our portfolio of marketable securities could experience a decline in market value, which could materiallyand adversely affect our financial results.
As of March 30, 2014, we held short-term marketable securities totaling $186.8 million. We invest in debtsecurities, the majority of which are high investment grade, and we limit the exposure to credit risk throughdiversification and investment in highly-rated securities. However, investing in highly-rated securities does notentirely mitigate the risk of potential declines in market value. For example, in the past we have recordedimpairment charges related to investment securities, including securities issued by companies in the financialservices sector, that had previously been rated AA or higher. A deterioration in the economy, includingtightening of credit markets or significant volatility in interest rates, could cause declines in value of ourmarketable securities or could impact the liquidity of the portfolio. If market conditions deteriorate significantly,our results of operations or financial condition could be materially and adversely affected.
Changes in and compliance with regulations could materially and adversely affect us.
Our business, results of operations or financial condition could be materially and adversely affected if newlaws, regulations or standards relating to us or our products are implemented or existing ones are changed. Inaddition, our compliance with existing regulations may have a material adverse impact on us. For example, inJuly 2010, the Dodd-Frank Wall Street Reform and Consumer Protection Act (the Dodd-Frank Act), wasenacted. There are significant corporate governance and executive compensation related provisions in the Dodd-Frank Act that require the U.S. Securities and Exchange Commission to adopt additional rules and regulations inthese areas. The U.S. Securities and Exchange Commission has also finalized new disclosure requirementsrelating to the sourcing of so-called conflict minerals from the Democratic Republic of Congo and certain other
18

adjoining countries. Our disclosure will be predicated upon the timely receipt of accurate information fromsuppliers, who may be unwilling or unable to provide us with the relevant information. As a result, these newrequirements could adversely affect our costs, the availability of minerals used in our products and ourrelationships with customers and suppliers.
We and our customers are subject to various import and export regulations of the United States governmentand other countries. Certain government export regulations apply to the encryption or other features contained insome of our products. Changes in or violations of any such import or export regulations could materially andadversely affect our business, financial condition or results of operations.
In many foreign countries, particularly in those with developing economies, it is common to engage inbusiness practices that are prohibited by regulations applicable to us, such as the Foreign Corrupt Practices Actand other anti-bribery laws. Although we have policies and procedures designed to ensure compliance with theselaws, our employees, contractors and agents, as well as those companies to which we outsource certain of ourbusiness operations, may take actions in violation of our policies. Any such violation, even if prohibited by ourpolicies, could have a material adverse effect on our business, financial condition or results of operations.
We face increasing complexity in our product design and procurement operations as we adjust to new andfuture requirements relating to the chemical and material composition of our products, their safe use, the energyconsumption associated with those products and product take-back legislation (i.e., legislation that makesproducers of electrical goods financially responsible for specified collection, recycling, treatment and disposal ofpast and future covered products). We could incur substantial costs, our products could be restricted fromentering certain jurisdictions, and we could face other sanctions, if we were to violate or become liable underenvironmental laws or if our products become non-compliant with environmental laws.
We continually seek ways to increase the energy efficiency of our products. Recent analyses have estimatedthe amount of global carbon emissions that are due to information technology products. As a result,governmental and non-governmental organizations have turned their attention to development of regulations andstandards to drive technological improvements and reduce the amount of carbon emissions. There is a risk thatthese regulations or standards, once developed, will not fully address the complexity of the technology developedby the IT industry or will favor certain technological approaches that we do not currently utilize. Depending onthe regulations or standards that are ultimately adopted, compliance could adversely affect our business, resultsof operations or financial condition.
We may experience difficulties in transitioning to smaller geometry process technologies.
We expect to continue to transition our semiconductor products to increasingly smaller line widthgeometries. This transition requires us to modify the manufacturing processes for our products and to redesignsome products, as well as standard cells and other integrated circuit designs that we may use in multiple products.We periodically evaluate the benefits, on a product-by-product basis, of migrating to smaller geometry processtechnologies. In the past, we have experienced some difficulties in shifting to smaller geometry processtechnologies or new manufacturing processes, which resulted in reduced manufacturing yields, delays in productdeliveries and increased expenses. We may face similar difficulties, delays and expenses as we continue totransition our products to smaller geometry processes.
If we fail to carefully manage the use of “open source” software in our products, we may be required tolicense key portions of our products on a royalty-free basis or expose key parts of our source code.
Certain of our software may be derived from “open source” software that is generally made available to thepublic by its authors and/or other third parties. Such open source software is often made available to us underlicenses, such as the GNU General Public License, that impose certain obligations on us in the event we were todistribute derivative works of the open source software. These obligations may require us to make source code
19

for the derivative works available to the public and license such derivative works under a particular type oflicense, rather than the forms of licenses customarily used to protect our intellectual property. In the event thecopyright holder of any open source software were to successfully establish in court that we had not compliedwith the terms of a license for a particular work, we could be required to release the source code of that work tothe public or stop distributing that work.
System security risks, data protection breaches and cyber-attacks could disrupt our internal operations,and any such disruption could reduce our expected revenues, increase our expenses, damage ourreputation and adversely affect our stock price.
Experienced computer programmers and hackers may be able to penetrate our network and misappropriateor compromise our confidential information or that of third parties, create system disruptions or causeshutdowns. Computer programmers and hackers also may be able to develop and deploy viruses, worms, andother malicious software programs that attack our products or otherwise exploit any security vulnerabilities ofour products. In addition, sophisticated hardware and operating system software and applications that we produceor procure from third parties may contain defects in design or manufacture, including “bugs” and other problemsthat could unexpectedly interfere with the operation of the system. The costs to us to eliminate or alleviate cyberor other security problems, bugs, viruses, worms, malicious software programs and security vulnerabilities couldbe significant and, if our efforts to address these problems are not successful, this could result in interruptions,delays, cessation of service and loss of existing or potential customers that may impede our sales, manufacturing,distribution or other critical functions.
We manage and store various proprietary information and sensitive or confidential data relating to ourbusiness. We have also outsourced a number of our business functions to third party contractors. Breaches of ouror our third party contractors’ security measures or the accidental loss, inadvertent disclosure or unapproveddissemination of proprietary information or sensitive or confidential data about us or our customers, including thepotential loss or disclosure of such information or data as a result of fraud, trickery or other forms of deception,could expose us or our customers to a risk of loss or misuse of this information, result in litigation and potentialliability for us, damage our brand and reputation or otherwise harm our business. In addition, the cost andoperational consequences of implementing further data protection measures could be significant.
Our ability to borrow and maintain outstanding borrowings under our credit agreement is subject tocertain covenants.
We have a credit agreement that provides us with a $125.0 million unsecured revolving credit facility thatmatures in March 2018. Borrowings under the credit agreement may be used for general corporate purposes,including permitted share repurchases and acquisitions. Under the credit agreement, we may increase therevolving commitments or obtain incremental term loans in an aggregate amount up to an additional $100.0million, subject to certain conditions. Our ability to borrow under the credit agreement is subject to continuedcompliance with certain financial and non-financial covenants. In addition, a breach of any of the covenants orother provisions in the credit agreement could result in an event of default, which if not cured or waived, couldresult in outstanding borrowings becoming immediately due and payable. We may be unable to maintaincompliance with these covenants and, if we fail to do so, we may be unable to obtain waivers or amend thecovenants. In the event that some or all of our outstanding borrowings are accelerated and become immediatelydue and payable, we may not have the funds to repay, or the ability to refinance, our borrowings. There were noborrowings outstanding under the credit agreement as of March 30, 2014.
Item 1B. Unresolved Staff Comments
None.
20

Item 2. Properties
Our principal product development, operations, sales and corporate offices are located in four buildingscomprising approximately 195,000 square feet in Aliso Viejo, California. We own each of these buildings. Wealso lease one building comprising approximately 100,000 square feet in Shakopee, Minnesota, that housesproduct development and operations teams for many of our Legacy Connectivity Products. We lease anoperations, sales and fulfillment facility located in Dublin, Ireland. In addition, we lease facilities in MountainView and Roseville, California; Pune and Bangalore, India; Ramat Gan, Israel; and Taipei City, Taiwan. We alsomaintain sales offices at various locations in the United States, Europe and Asia. We believe that our existingproperties, including both owned and leased sites, are in good condition and suitable for the conduct of ourbusiness.
Item 3. Legal Proceedings
Various lawsuits, claims and proceedings have been or may be instituted against us. The outcome oflitigation cannot be predicted with certainty and some lawsuits, claims and proceedings may be disposed ofunfavorably to us. Many intellectual property disputes have a risk of injunctive relief and there can be noassurance that a license will be granted. Injunctive relief could have a material adverse effect on our financialcondition or results of operations. Based on an evaluation of matters that are pending or asserted, we believe thedisposition of such matters will not have a material adverse effect on our financial condition or results ofoperations.
Item 4. Mine Safety Disclosures
Not applicable.
21

PART II
Item 5. Market for Registrant’s Common Equity, Related Stockholder Matters and Issuer Purchases ofEquity Securities
Principal Market and Prices
Shares of our common stock are traded and quoted on the NASDAQ Global Select Market under the symbolQLGC. The following table sets forth the range of high and low sales prices per share of our common stock foreach quarterly period of the two most recent fiscal years as reported on the NASDAQ Global Select Market.
2014 2013
High Low High Low
Fourth Quarter . . . . . . . . . . . . . . . . . . . . . . . . . . . . . . . . . . . . . . . . . . . . . . . . . $12.90 $10.82 $12.90 $ 9.50Third Quarter . . . . . . . . . . . . . . . . . . . . . . . . . . . . . . . . . . . . . . . . . . . . . . . . . . 12.67 10.32 11.61 8.63Second Quarter . . . . . . . . . . . . . . . . . . . . . . . . . . . . . . . . . . . . . . . . . . . . . . . . 11.73 9.57 14.07 9.56First Quarter . . . . . . . . . . . . . . . . . . . . . . . . . . . . . . . . . . . . . . . . . . . . . . . . . . 11.67 9.29 17.85 13.14
Number of Common Stockholders
The number of record holders of our common stock was 413 as of May 14, 2014.
Dividends
We have never paid cash dividends on our common stock. We currently anticipate that we will retain all ofour future earnings for use in the development and expansion of our business and for general corporate purposes,including repurchases of our common stock. Any determination to pay dividends in the future will be at thediscretion of our board of directors and will depend upon our operating results, financial condition and otherfactors as the board of directors deems relevant.
Recent Sales of Unregistered Securities
We did not issue any unregistered securities during fiscal 2014.
Issuer Purchases of Equity Securities
Our most recent stock repurchase program expired during fiscal 2014. We did not make any stockrepurchases during the fourth quarter of fiscal 2014.
22

Stockholder Return Performance
The performance graph below shall not be deemed filed for purposes of Section 18 of the SecuritiesExchange Act of 1934, as amended (Exchange Act), or otherwise subject to the liabilities under that Section andshall not be deemed to be incorporated by reference into any of our filings under the Securities Act of 1933, asamended, or the Exchange Act, except to the extent that we specifically incorporate this information byreference, and will not otherwise be deemed filed under the Acts.
The following graph compares, for the five-year period ended March 30, 2014, the cumulative totalstockholder return for our common stock, the Standard & Poor’s Midcap 400 Index (S&P Midcap 400 Index) andthe NASDAQ Computer Index. Measurement points are the last trading day of each of our fiscal years endedMarch 29, 2009, March 28, 2010, April 3, 2011, April 1, 2012, March 31, 2013 and March 30, 2014. The graphassumes that $100 was invested on March 29, 2009 in our common stock, the S&P Midcap 400 Index and theNASDAQ Computer Index and assumes reinvestment of dividends. The stock price performance on thefollowing graph is not necessarily indicative of future stock price performance.
COMPARISON OF 5 YEAR CUMULATIVE TOTAL RETURN*Among QLogic Corporation,the S&P Midcap 400 Index,
and the NASDAQ Computer Index
DOLLARS
0
50
100
150
200
250
350
300
QLogic Corporation S&P Midcap 400 NASDAQ Computer
3/30/143/31/134/1/124/3/113/28/103/29/09
Cumulative Total Return3/29/09 3/28/10 4/3/11 4/1/12 3/31/13 3/30/14
QLogic Corporation $100.00 $172.01 $154.95 $151.54 $ 98.98 $106.57
S&P Midcap 400 Index 100.00 164.07 208.29 212.42 250.30 303.47
NASDAQ Computer Index 100.00 166.95 201.35 249.06 234.04 314.41
* $100 invested on 3/29/09 in stock or 3/31/09 in index, including reinvestment of dividends. Indexes calculatedon month-end basis.
23

Item 6. Selected Financial Data
The following selected financial data should be read in conjunction with Management’s Discussion andAnalysis of Financial Condition and Results of Operations and the consolidated financial statements and notesthereto appearing elsewhere in this report.
Year Ended (1)
March 30,2014 (2) (3)
March 31,2013 (4)
April 1,2012
April 3,2011
March 28,2010
(In thousands, except per share amounts)Statement of Operations DataNet revenues . . . . . . . . . . . . . . . . . . . . . . . . . . . . . . . . $460,907 $484,538 $558,608 $558,375 $518,471Cost of revenues . . . . . . . . . . . . . . . . . . . . . . . . . . . . . . 150,800 159,180 177,704 176,959 167,107
Gross profit . . . . . . . . . . . . . . . . . . . . . . . . . . . . . 310,107 325,358 380,904 381,416 351,364
Operating expenses:Engineering and development . . . . . . . . . . . . . . . . . 147,010 156,097 138,768 125,219 116,789Sales and marketing . . . . . . . . . . . . . . . . . . . . . . . . . 68,367 78,512 77,370 73,965 68,881General and administrative . . . . . . . . . . . . . . . . . . . 32,097 32,899 35,299 34,148 34,242Special charges . . . . . . . . . . . . . . . . . . . . . . . . . . . . 74,853 — — 373 5,163
Total operating expenses . . . . . . . . . . . . . . . . . . . 322,327 267,508 251,437 233,705 225,075
Operating income (loss) . . . . . . . . . . . . . . . . . . . . . . . . (12,220) 57,850 129,467 147,711 126,289Interest and other income, net . . . . . . . . . . . . . . . . . . . 3,260 4,007 3,959 5,187 10,601
Income (loss) from continuing operations beforeincome taxes . . . . . . . . . . . . . . . . . . . . . . . . . . . . . . (8,960) 61,857 133,426 152,898 136,890
Income tax expense (benefit) . . . . . . . . . . . . . . . . . . . . 9,306 (11,704) 13,983 11,552 69,345
Income (loss) from continuing operations . . . . . . . . . . (18,266) 73,561 119,443 141,346 67,545
Discontinued operations:Income (loss) from operations, net of incometaxes . . . . . . . . . . . . . . . . . . . . . . . . . . . . . . . . . — (425) 910 (2,256) (12,597)
Gain on sale, net of income taxes . . . . . . . . . . . . — — 109,083 — —
Income (loss) from discontinued operations . . . . . . . . — (425) 109,993 (2,256) (12,597)
Net income (loss) . . . . . . . . . . . . . . . . . . . . . . . . . . . . . $ (18,266) $ 73,136 $229,436 $139,090 $ 54,948
Income (loss) from continuing operations per share:Basic . . . . . . . . . . . . . . . . . . . . . . . . . . . . . . . . . . . . . $ (0.21) $ 0.79 $ 1.17 $ 1.31 $ 0.58
Diluted . . . . . . . . . . . . . . . . . . . . . . . . . . . . . . . . . . . $ (0.21) $ 0.78 $ 1.16 $ 1.29 $ 0.58
Income (loss) from discontinued operations per share:Basic . . . . . . . . . . . . . . . . . . . . . . . . . . . . . . . . . . . . . $ — $ (0.01) $ 1.08 $ (0.02) $ (0.11)
Diluted . . . . . . . . . . . . . . . . . . . . . . . . . . . . . . . . . . . $ — $ — $ 1.07 $ (0.02) $ (0.11)
Net income (loss) per share:Basic . . . . . . . . . . . . . . . . . . . . . . . . . . . . . . . . . . . . . $ (0.21) $ 0.78 $ 2.25 $ 1.29 $ 0.47
Diluted . . . . . . . . . . . . . . . . . . . . . . . . . . . . . . . . . . . $ (0.21) $ 0.78 $ 2.23 $ 1.27 $ 0.47
Balance Sheet DataCash and cash equivalents and investmentsecurities . . . . . . . . . . . . . . . . . . . . . . . . . . . . . . . . . $278,041 $455,506 $537,955 $384,076 $375,673
Total assets . . . . . . . . . . . . . . . . . . . . . . . . . . . . . . . . . . 798,263 825,163 913,418 757,207 750,737Total stockholders’ equity . . . . . . . . . . . . . . . . . . . . . . 693,426 734,277 759,843 601,164 583,339
(1) The statement of operations data for all periods reflects the operating results of the InfiniBand business asdiscontinued operations.
24

(2) During the fourth quarter of fiscal 2014, we completed the acquisition of (i) Broadcom’s 10/40/100GbEthernet controller-related assets, and (ii) Brocade’s Fibre Channel and converged network adapterbusiness.
(3) In fiscal 2014, we recorded special charges of $74.9 million consisting of $41.0 million for the portion of alicense payment we attributed to the use of the related technology in periods prior to the date of the licenseagreement, $26.5 million of exit costs and $7.3 million of asset impairment charges primarily related toproperty and equipment. During fiscal 2014, we also recorded incremental income tax charges of $16.5million for valuation allowances against deferred tax assets related to certain state tax credits and netoperating loss carryforwards.
(4) In fiscal 2013, we recorded $14.3 million of income tax benefits associated with adjustments to certain taxpositions subject to an IRS examination.
25
Item 7. Management’s Discussion and Analysis of Financial Condition and Results of Operations
This Management’s Discussion and Analysis of Financial Condition and Results of Operations should beread in conjunction with our audited consolidated financial statements and related notes. In this discussion andelsewhere in this report, we make forward-looking statements. These forward-looking statements are made inreliance upon safe harbor provisions of the Private Securities Litigation Reform Act of 1995. Such forward-looking statements include, without limitation, descriptions of our expectations regarding future trends affectingour business and other statements regarding future events or our objectives, goals, strategies, beliefs andunderlying assumptions that are other than statements of historical fact. When used in this report, the words“anticipates,” “believes,” “can,” “continue,” “could,” “estimates,” “expects,” “intends,” “may,” “plans,”“potential,” “predicts,” “should,” “will” and similar expressions, or the negative of such expressions, areintended to identify these forward-looking statements. Statements concerning current conditions may also beforward-looking if they imply a continuation of current conditions. Our actual results could differ materiallyfrom those anticipated in these forward-looking statements as a result of several factors, including, but notlimited to those factors set forth and discussed in Part I, Item 1A “Risk Factors” and elsewhere in this report. Inlight of the significant uncertainties inherent in the forward-looking information included in this report, theinclusion of this information should not be regarded as a representation by us or any other person that ourobjectives or plans will be achieved. You are cautioned, therefore, not to place undue reliance on these forward-looking statements, which are made only as of the date of this report. We undertake no obligation to update orrevise these forward-looking statements, whether as a result of new information, future events or otherwise.
Overview
We design and supply high performance server and storage networking connectivity products that provide,enhance and manage computer data communication. These products facilitate the rapid transfer of data andenable efficient resource sharing between servers, networks and storage. Our products are used in enterprise datacenters, cloud computing, Web 2.0 and other environments dependent on high performance, reliable datanetworking.
Our products are based primarily on Fibre Channel and Ethernet technologies and are used in connectionwith storage networks, local area networks, and converged networks. Storage networks are used to provide dataacross enterprise environments. Fibre Channel is currently the dominant technology for enterprise storagenetworking. Local area networks (LANs) are used to provide workstation-to-server, server-to-server, and server-to-storage connectivity using Ethernet. Converged networks are designed to address the evolving data center byconsolidating and unifying various classes of connectivity and networks, such as storage area networks andLANs, using Ethernet speeds of 10Gb per second and greater. Fibre Channel over Ethernet (FCoE) is aconverged networking technology that uses an Ethernet LAN for both storage and local area data transmission,thus combining the benefits of Fibre Channel technology with the pervasiveness of Ethernet-based networks.Similarly, Internet Small Computer System Interface (iSCSI) is an alternative to FCoE and provides storage overEthernet capabilities. Our converged network products can operate individually as 10Gb Ethernet products, FCoEproducts, iSCSI products, or in combination as multi-protocol products.
We classify our products into two categories – Advanced Connectivity Platforms and Legacy ConnectivityProducts. Advanced Connectivity Platforms are comprised primarily of adapters and application-specificintegrated circuits (ASICs) for server and storage connectivity applications. Legacy Connectivity Products arecomprised primarily of Fibre Channel switch products and 1Gb iSCSI products.
Our products are sold worldwide, primarily to original equipment manufacturers (OEMs) anddistributors. Our customers rely on our various server and storage connectivity products to deliver solutions toinformation technology professionals in virtually every business sector. Our products are found primarily inserver and storage subsystem solutions that are used by enterprises with critical business data requirements.These products are incorporated in solutions from a number of server and storage system OEM customers,including Cisco Systems, Inc., Dell Inc., EMC Corporation, Fujitsu Ltd., Hewlett-Packard Company, Huawei
26
Technologies Co. Ltd., Inspur Worldwide Services Ltd., International Business Machines Corporation, LenovoGroup Ltd., NetApp, Inc. and Oracle Corporation.
We use a fifty-two/fifty-three week fiscal year ending on the Sunday nearest March 31. Fiscal years 2014,2013 and 2012 each comprised fifty-two weeks and ended on March 30, 2014, March 31, 2013 and April 1,2012, respectively.
Business Acquisitions
On March 13, 2014, we acquired certain 10/40/100Gb Ethernet controller-related assets from BroadcomCorporation (Broadcom) primarily relating to Broadcom’s NetXtreme® II Ethernet controller family and licensedcertain related intellectual property under non-exclusive licenses for total cash consideration of $147.8 millionand the assumption of certain liabilities. This business acquisition expands our product portfolio and is expectedto accelerate our time to market for next generation products in the server Ethernet connectivity market.
On January 17, 2014, we acquired the assets of the Fibre Channel and converged network adapter businessfrom Brocade Communications Systems, Inc. (Brocade) for cash consideration of $9.6 million and theassumption of certain liabilities. We completed this acquisition to expand our product portfolio and marketposition in the Fibre Channel and converged network adapter market.
License Agreement
On March 13, 2014, we entered into a non-exclusive patent license agreement with Broadcom and paid aone-time fee of $62.0 million as specified in the agreement. The license covers all of our Fibre Channel products.We attributed $41.0 million to the use of the related technology in periods prior to the date of the licenseagreement and recorded such amount in special charges in fiscal 2014. The portion of the fee attributed to thefuture use of the related technology is $21.0 million and was recorded as a prepaid license that will be amortizedover the ten-year term of the license agreement.
Restructuring Plans
In March 2014, we implemented a restructuring plan primarily designed to consolidate our Ethernet productroadmap following the acquisition of the Ethernet controller-related assets from Broadcom. This restructuringplan primarily includes a workforce reduction and the consolidation and elimination of certain engineeringactivities. During the fourth quarter of fiscal 2014, we recorded special charges of $14.0 million in connectionwith this plan, which consisted of $9.1 million of exit costs and $4.9 million of asset impairment chargesprimarily related to property and equipment. We expect to incur approximately $1 million of additional exitcosts, primarily related to severance costs for workforce reductions. We expect to substantially complete theserestructuring activities during the first quarter of fiscal 2015.
In June 2013, we commenced a restructuring plan designed to enhance product focus and streamlinebusiness operations. This restructuring plan includes a workforce reduction and the consolidation and eliminationof certain engineering activities. In connection with this plan, we ceased development of future ASICs for switchproducts. We recorded special charges of $19.8 million related to this restructuring plan during fiscal 2014,which consisted of $17.4 million of exit costs and $2.4 million of asset impairment charges primarily related toproperty and equipment. We expect to incur between $1 million and $2 million of additional severance costs inconnection with employees required to provide services for varying periods in excess of statutory notice periods.The additional severance costs will be recognized over the requisite service period.
Disposition of Business
In February 2012, we completed the sale of the product lines and certain assets associated with ourInfiniBand business (the IB Business). As a result of this divestiture, our consolidated statements of operations
27

for all periods present the operations of this business as discontinued operations. The following discussion andanalysis is based on our continuing operations and excludes any results or discussion of our discontinuedoperations.
Fiscal Year and Fourth Quarter Financial Highlights and Other Information
Net revenues for fiscal 2014 were $460.9 million compared to $484.5 million in fiscal 2013. Loss fromcontinuing operations for fiscal 2014 was $18.3 million, or $0.21 per diluted share, compared to income fromcontinuing operations of $73.6 million, or $0.78 per diluted share, in fiscal 2013. During fiscal 2014, wegenerated $56.8 million of cash from operations and used $47.8 million of cash to purchase common stock underour stock repurchase program.
A summary of our financial performance during the fourth quarter of fiscal 2014 is as follows:
• Net revenues for the fourth quarter of fiscal 2014 were $115.7 million compared to $116.9 million in thefourth quarter of fiscal 2013. Revenue from Advanced Connectivity Platforms increased to $101.1 millionin the fourth quarter of fiscal 2014 from $97.0 million in the same quarter of fiscal 2013. Revenue fromLegacy Connectivity Products was $14.6 million in the fourth quarter of fiscal 2014 compared to $19.9million in the same quarter of fiscal 2013.
• Gross profit as a percentage of net revenues for the fourth quarter of fiscal 2014 was 65.9% compared to67.7% in the fourth quarter of fiscal 2013. Gross profit for the fourth quarter of fiscal 2014 included $2.0million of incremental costs related to our acquisitions in the fourth quarter of fiscal 2014.
• Operating loss was $42.6 million in the fourth quarter of fiscal 2014 compared to operating income of$10.4 million in the fourth quarter of fiscal 2013. We recorded special charges of $56.5 million during thefourth quarter of fiscal 2014, comprised of $41.0 million related to the non-exclusive patent licenseagreement with Broadcom and $15.5 million related to our restructuring plans.
• Loss from continuing operations was $46.8 million, or $0.54 per diluted share, in the fourth quarter offiscal 2014 compared to income from continuing operations of $29.6 million, or $0.33 per diluted share,in the fourth quarter of fiscal 2013. Loss from continuing operations in the fourth quarter of fiscal 2014included special charges of $56.5 million and incremental tax charges of $14.7 million for valuationallowances related to deferred tax assets for certain state tax credits and net operating loss carryforwards.
• Cash, cash equivalents and marketable securities were $278.0 million as of March 30, 2014 compared to$455.5 million as of March 31, 2013.
• Accounts receivable was $65.2 million as of March 30, 2014 compared to $66.1 million as of March 31,2013. Days sales outstanding in receivables was 51 days as of March 30, 2014.
• Inventories decreased to $18.0 million as of March 30, 2014 from $20.2 million as of March 31, 2013.Our annualized inventory turns were 8.7 turns in the fourth quarter of fiscal 2014.
28
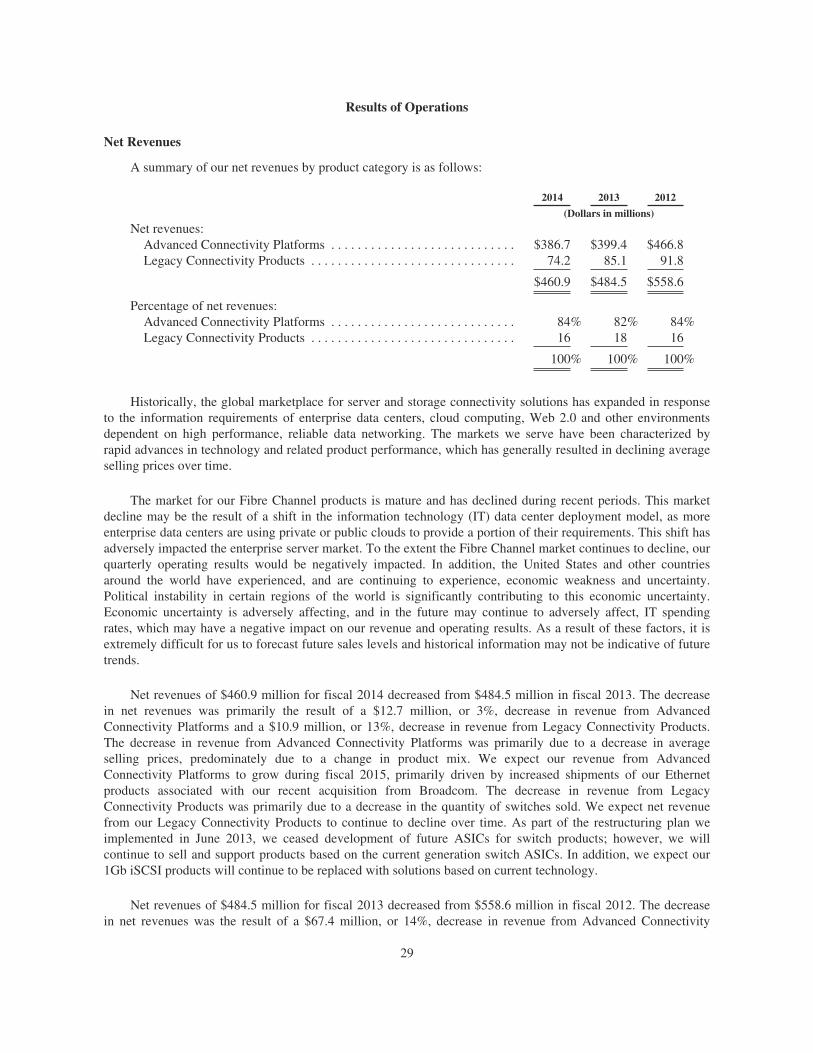
Results of Operations
Net Revenues
A summary of our net revenues by product category is as follows:
2014 2013 2012
(Dollars in millions)
Net revenues:Advanced Connectivity Platforms . . . . . . . . . . . . . . . . . . . . . . . . . . . . $386.7 $399.4 $466.8Legacy Connectivity Products . . . . . . . . . . . . . . . . . . . . . . . . . . . . . . . 74.2 85.1 91.8
$460.9 $484.5 $558.6
Percentage of net revenues:Advanced Connectivity Platforms . . . . . . . . . . . . . . . . . . . . . . . . . . . . 84% 82% 84%Legacy Connectivity Products . . . . . . . . . . . . . . . . . . . . . . . . . . . . . . . 16 18 16
100% 100% 100%
Historically, the global marketplace for server and storage connectivity solutions has expanded in responseto the information requirements of enterprise data centers, cloud computing, Web 2.0 and other environmentsdependent on high performance, reliable data networking. The markets we serve have been characterized byrapid advances in technology and related product performance, which has generally resulted in declining averageselling prices over time.
The market for our Fibre Channel products is mature and has declined during recent periods. This marketdecline may be the result of a shift in the information technology (IT) data center deployment model, as moreenterprise data centers are using private or public clouds to provide a portion of their requirements. This shift hasadversely impacted the enterprise server market. To the extent the Fibre Channel market continues to decline, ourquarterly operating results would be negatively impacted. In addition, the United States and other countriesaround the world have experienced, and are continuing to experience, economic weakness and uncertainty.Political instability in certain regions of the world is significantly contributing to this economic uncertainty.Economic uncertainty is adversely affecting, and in the future may continue to adversely affect, IT spendingrates, which may have a negative impact on our revenue and operating results. As a result of these factors, it isextremely difficult for us to forecast future sales levels and historical information may not be indicative of futuretrends.
Net revenues of $460.9 million for fiscal 2014 decreased from $484.5 million in fiscal 2013. The decreasein net revenues was primarily the result of a $12.7 million, or 3%, decrease in revenue from AdvancedConnectivity Platforms and a $10.9 million, or 13%, decrease in revenue from Legacy Connectivity Products.The decrease in revenue from Advanced Connectivity Platforms was primarily due to a decrease in averageselling prices, predominately due to a change in product mix. We expect our revenue from AdvancedConnectivity Platforms to grow during fiscal 2015, primarily driven by increased shipments of our Ethernetproducts associated with our recent acquisition from Broadcom. The decrease in revenue from LegacyConnectivity Products was primarily due to a decrease in the quantity of switches sold. We expect net revenuefrom our Legacy Connectivity Products to continue to decline over time. As part of the restructuring plan weimplemented in June 2013, we ceased development of future ASICs for switch products; however, we willcontinue to sell and support products based on the current generation switch ASICs. In addition, we expect our1Gb iSCSI products will continue to be replaced with solutions based on current technology.
Net revenues of $484.5 million for fiscal 2013 decreased from $558.6 million in fiscal 2012. The decreasein net revenues was the result of a $67.4 million, or 14%, decrease in revenue from Advanced Connectivity
29

Platforms and a $6.7 million, or 7%, decrease in revenue from Legacy Connectivity Products. The decrease inrevenue from Advanced Connectivity Platforms and Legacy Connectivity Products were each primarily due to adecrease in units sold.
A small number of our customers account for a substantial portion of our net revenues, and we expect that asmall number of customers will continue to represent a substantial portion of our net revenues for the foreseeablefuture. Our top ten customers accounted for 83%, 84% and 86% of net revenues during fiscal 2014, 2013 and2012, respectively.
A summary of our customers, including their manufacturing subcontractors, that represent 10% or more ofour net revenues is as follows:
2014 2013 2012
Hewlett-Packard . . . . . . . . . . . . . . . . . . . . . . . . . . . . . . . . . . . . . . . . . . . . . . . . . . . 24% 24% 27%IBM . . . . . . . . . . . . . . . . . . . . . . . . . . . . . . . . . . . . . . . . . . . . . . . . . . . . . . . . . . . . 17% 20% 18%Dell . . . . . . . . . . . . . . . . . . . . . . . . . . . . . . . . . . . . . . . . . . . . . . . . . . . . . . . . . . . . . 15% 12% 11%
We believe our major customers continually evaluate whether or not to purchase products from alternativeor additional sources. Accordingly, there can be no assurance that a major customer will not reduce, delay oreliminate its purchases from us. Any such reduction, delay or loss of purchases could have a material adverseeffect on our business, financial condition or results of operations.
Net revenues by geographic area are as follows:
2014 2013 2012
(In millions)
United States . . . . . . . . . . . . . . . . . . . . . . . . . . . . . . . . . . . . . . . . . . . . . . $191.5 $209.6 $239.2Asia-Pacific and Japan . . . . . . . . . . . . . . . . . . . . . . . . . . . . . . . . . . . . . . . 166.5 158.0 178.7Europe, Middle East and Africa . . . . . . . . . . . . . . . . . . . . . . . . . . . . . . . . 85.6 92.7 113.9Rest of world . . . . . . . . . . . . . . . . . . . . . . . . . . . . . . . . . . . . . . . . . . . . . . 17.3 24.2 26.8
$460.9 $484.5 $558.6
Revenues by geographic area are presented based upon the ship-to location of the customer, which is notnecessarily indicative of the location of the ultimate end-user of our products. The United States and China arethe only countries that represented 10% or more of net revenues for the years presented. Net revenues fromcustomers in China were $56.0 million, $65.0 million and $72.6 million for fiscal 2014, 2013 and 2012,respectively.
Gross Profit
Gross profit represents net revenues less cost of revenues. Cost of revenues consists primarily of the cost ofpurchased products, assembly and test services; costs associated with product procurement, inventorymanagement, logistics and product quality; and the amortization of purchased intangible assets and other assets.A summary of our gross profit and related percentage of net revenues is as follows:
2014 2013 2012
(Dollars in millions)
Gross profit . . . . . . . . . . . . . . . . . . . . . . . . . . . . . . . . . . . . . . . . . . . . . . . . $310.1 $325.4 $380.9Percentage of net revenues . . . . . . . . . . . . . . . . . . . . . . . . . . . . . . . . . . . . 67.3% 67.1% 68.2%
Gross profit for fiscal 2014 decreased $15.3 million, or 4.7%, from gross profit for fiscal 2013, primarilydue to the decrease in revenue and incremental acquisition-related costs of $1.2 million for intangible assetamortization and $0.8 million for acquired inventory valuation step-up amortization. The gross profit percentage
30
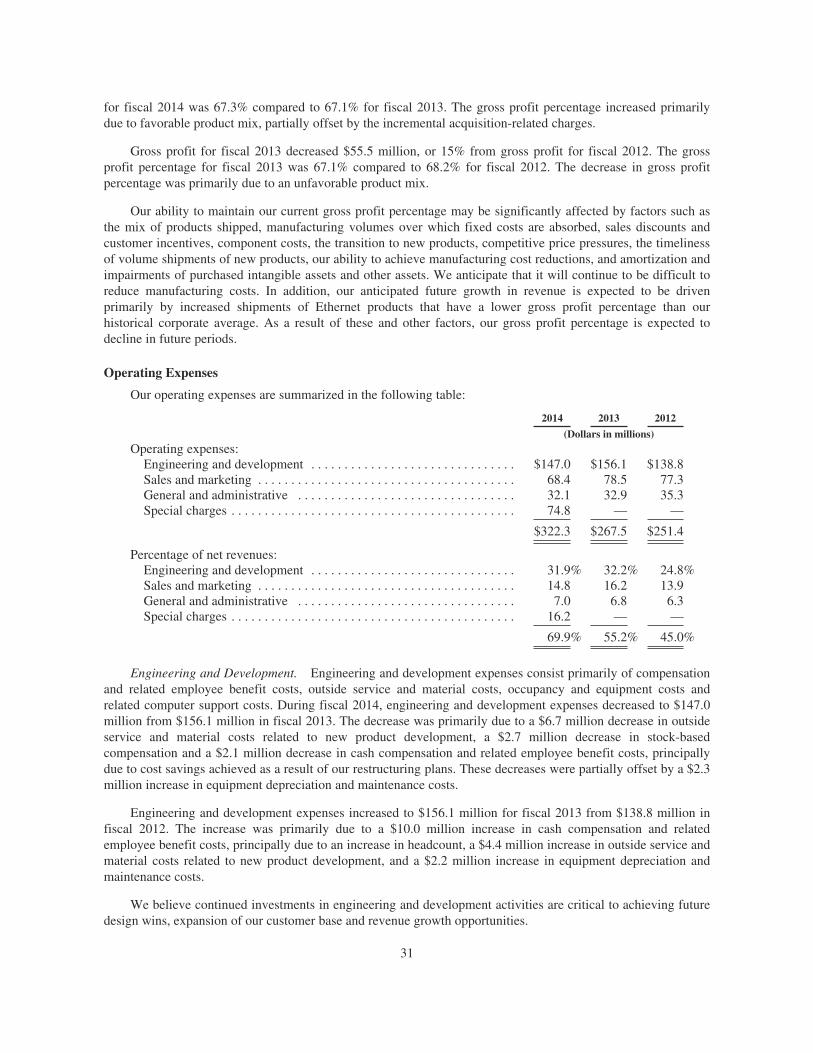
for fiscal 2014 was 67.3% compared to 67.1% for fiscal 2013. The gross profit percentage increased primarilydue to favorable product mix, partially offset by the incremental acquisition-related charges.
Gross profit for fiscal 2013 decreased $55.5 million, or 15% from gross profit for fiscal 2012. The grossprofit percentage for fiscal 2013 was 67.1% compared to 68.2% for fiscal 2012. The decrease in gross profitpercentage was primarily due to an unfavorable product mix.
Our ability to maintain our current gross profit percentage may be significantly affected by factors such asthe mix of products shipped, manufacturing volumes over which fixed costs are absorbed, sales discounts andcustomer incentives, component costs, the transition to new products, competitive price pressures, the timelinessof volume shipments of new products, our ability to achieve manufacturing cost reductions, and amortization andimpairments of purchased intangible assets and other assets. We anticipate that it will continue to be difficult toreduce manufacturing costs. In addition, our anticipated future growth in revenue is expected to be drivenprimarily by increased shipments of Ethernet products that have a lower gross profit percentage than ourhistorical corporate average. As a result of these and other factors, our gross profit percentage is expected todecline in future periods.
Operating Expenses
Our operating expenses are summarized in the following table:
2014 2013 2012
(Dollars in millions)
Operating expenses:Engineering and development . . . . . . . . . . . . . . . . . . . . . . . . . . . . . . . $147.0 $156.1 $138.8Sales and marketing . . . . . . . . . . . . . . . . . . . . . . . . . . . . . . . . . . . . . . . 68.4 78.5 77.3General and administrative . . . . . . . . . . . . . . . . . . . . . . . . . . . . . . . . . 32.1 32.9 35.3Special charges . . . . . . . . . . . . . . . . . . . . . . . . . . . . . . . . . . . . . . . . . . . 74.8 — —
$322.3 $267.5 $251.4
Percentage of net revenues:Engineering and development . . . . . . . . . . . . . . . . . . . . . . . . . . . . . . . 31.9% 32.2% 24.8%Sales and marketing . . . . . . . . . . . . . . . . . . . . . . . . . . . . . . . . . . . . . . . 14.8 16.2 13.9General and administrative . . . . . . . . . . . . . . . . . . . . . . . . . . . . . . . . . 7.0 6.8 6.3Special charges . . . . . . . . . . . . . . . . . . . . . . . . . . . . . . . . . . . . . . . . . . . 16.2 — —
69.9% 55.2% 45.0%
Engineering and Development. Engineering and development expenses consist primarily of compensationand related employee benefit costs, outside service and material costs, occupancy and equipment costs andrelated computer support costs. During fiscal 2014, engineering and development expenses decreased to $147.0million from $156.1 million in fiscal 2013. The decrease was primarily due to a $6.7 million decrease in outsideservice and material costs related to new product development, a $2.7 million decrease in stock-basedcompensation and a $2.1 million decrease in cash compensation and related employee benefit costs, principallydue to cost savings achieved as a result of our restructuring plans. These decreases were partially offset by a $2.3million increase in equipment depreciation and maintenance costs.
Engineering and development expenses increased to $156.1 million for fiscal 2013 from $138.8 million infiscal 2012. The increase was primarily due to a $10.0 million increase in cash compensation and relatedemployee benefit costs, principally due to an increase in headcount, a $4.4 million increase in outside service andmaterial costs related to new product development, and a $2.2 million increase in equipment depreciation andmaintenance costs.
We believe continued investments in engineering and development activities are critical to achieving futuredesign wins, expansion of our customer base and revenue growth opportunities.
31

Sales and Marketing. Sales and marketing expenses consist primarily of compensation and relatedemployee benefit costs, sales commissions, promotional activities and travel for sales and marketing personnel.Sales and marketing expenses decreased to $68.4 million for fiscal 2014 from $78.5 million for fiscal 2013. Thedecrease was primarily due to a $4.8 million decrease in cash compensation and related employee benefit costsand a $1.5 million decrease in stock-based compensation, principally due to a reduction in headcount resultingfrom our restructuring plans. The decrease in sales and marketing expenses also included a $2.9 million decreasein promotional expenses.
Sales and marketing expenses increased to $78.5 million for fiscal 2013 from $77.3 million for fiscal 2012.The increase was primarily due to an increase in cash compensation and related employee benefit costs,principally due to an increase in headcount.
General and Administrative. General and administrative expenses consist primarily of compensation andrelated employee benefit costs for executive, finance, accounting, human resources, legal and informationtechnology personnel. Non-compensation components of general and administrative expenses includeaccounting, legal and other professional fees, facilities expenses and other corporate expenses. General andadministrative expenses decreased to $32.1 million for fiscal 2014 from $32.9 million for fiscal 2013 primarilydue to a $2.5 million decrease in stock-based compensation, partially offset by a $1.7 million increase in outsideservices and other corporate expenses.
General and administrative expenses decreased to $32.9 million for fiscal 2013 from $35.3 million for fiscal2012 primarily due to a $1.2 million decrease in cash compensation and related employee benefit costs and a$0.8 million decrease in stock-based compensation.
Special Charges. During fiscal 2014, we recorded special charges of $74.8 million, consisting of $41.0million for the portion of a license payment attributed to the use of the related technology in periods prior to thedate of our license agreement with Broadcom, $26.5 million of exit costs and $7.3 million of asset impairmentcharges primarily related to property and equipment. The exit costs include severance and related costsassociated with involuntarily terminated employees. Certain employees that were notified of their termination arerequired to provide services for varying periods in excess of statutory notice periods. Severance costs related tothese services are recognized ratably over the estimated requisite service period. Exit costs also include the costsassociated with the cancellation of certain contracts and the estimated costs associated with the portion of afacility under a non-cancelable lease that we ceased using. We expect to incur between $2 million and $3 millionof additional exit costs associated with both of our current restructuring activities, primarily related to severancecosts for terminated employees that are required to provide services beyond the statutory notice period.
The total unpaid exit costs of $15.6 million as of March 30, 2014 are expected to be paid over the terms ofthe related agreements through fiscal 2018, including $10.0 million during the next twelve months.
Income Taxes
Our income tax expense (benefit) from continuing operations was $9.3 million, $(11.7) million and $14.0million for fiscal 2014, 2013 and 2012, respectively.
Income tax expense for fiscal 2014 included $16.5 million of valuation allowances we recorded againstdeferred tax assets related to certain state tax credits and net operating loss carryforwards. Based upon ourcurrent projections of future taxable income in the respective states, we are no longer able to assert that it is morelikely than not that we would realize the full benefit of these deferred tax assets. The current projections reflectchanges in our forecasted taxable income, including the impact of acquisitions and restructuring activities whichoccurred during the fourth quarter of fiscal 2014. Income tax expense for fiscal 2014 was also impacted by theeffect of a discrete tax-related item associated with the difference between stock-based compensation expenseand the deduction related to stock-based awards on income tax returns.
32
Our income tax benefit for fiscal 2013 was primarily the result of adjustments to certain tax positionssubject to an Internal Revenue Service (IRS) examination. These adjustments primarily consist of the settlementof a significant matter in the IRS examination of our income tax returns for fiscal years 2008 and 2009 for anamount less than we had previously accrued related to this tax position. During fiscal 2014, we settled allremaining matters relating to this IRS examination without material adjustment and are no longer subject tofederal income tax examinations for years prior to fiscal 2010.
Our federal consolidated income tax returns for fiscal years 2010, 2011 and 2012 are currently underexamination by the IRS. We do not believe that the results of these examinations will have a material impact onour financial condition or results of operations.
Given the global scope of our operations and the complexity of global tax and transfer pricing rules andregulations, it is difficult to estimate earnings within each tax jurisdiction. If actual earnings within each taxjurisdiction differ materially from our estimates, we may not achieve our expected effective tax rate.Additionally, our effective tax rate may be impacted by other items, including the tax effects of acquisitions anddispositions, changes to tax laws or regulations, examinations by tax authorities, stock-based compensation,uncertain tax positions and changes in our ability to realize deferred tax assets.
Liquidity and Capital Resources
Our combined balances of cash, cash equivalents and marketable securities was $278.0 million as ofMarch 30, 2014 compared to $455.5 million as of March 31, 2013. As of March 30, 2014 and March 31, 2013,our international subsidiaries held $232.8 million and $317.1 million, respectively, of our total cash, cashequivalents and marketable securities. These holdings by our international subsidiaries consisted primarily ofdebt securities due from U.S. issuers, including the U.S. government and related agencies, and U.S. dollardenominated cash and money market funds. Certain foreign regulations could impact our ability to transfer fundsto the United States. We currently intend to invest the funds held outside of the United States in our internationaloperations and, as a result, do not intend to repatriate these funds. Should we decide to repatriate funds heldoutside of the United States, we may incur a significant tax obligation.
We believe that existing cash, cash equivalents, marketable securities and expected cash flow fromoperations will provide sufficient funds to finance our operations for at least the next twelve months. However, itis possible that we may need to supplement our existing sources of liquidity to finance our activities beyond thenext twelve months or for the future acquisition of businesses, products or technologies and there can be noassurance that sources of liquidity will be available to us at that time.
Revolving Credit Facility
We have a credit agreement that provides us with a $125.0 million unsecured revolving credit facility thatmatures in March 2018. Borrowings under the credit agreement may be used for general corporate purposes,including permitted share repurchases and acquisitions. Under the credit agreement, we may increase therevolving commitments or obtain incremental term loans in an aggregate amount up to an additional $100.0million, subject to certain conditions. There were no borrowings outstanding under the credit agreement as ofMarch 30, 2014.
Operating, Investing and Financing Activities
Cash provided by operating activities was $56.8 million for fiscal 2014 compared to $97.2 million for fiscal2013. Operating cash flow for fiscal 2014 included the payment of $62.0 related to the non-exclusive patentlicense agreement with Broadcom, of which $41.0 million was attributed to the use of the related technology inperiods prior to the date of the license agreement and charged to operations in fiscal 2014 and $21.0 million wasattributed to the future use of the related technology over the term of the agreement and recorded as a prepaidlicense. Cash provided by operating activities for fiscal 2014 consisted of our net loss of $18.3 million, includingthe $41.0 million related to the license agreement, net non-cash expenses of $62.3 million and net cash provided
33
as a result of changes in operating assets and liabilities of $12.8 million. Net non-cash expenses include $32.5million of depreciation and amortization, $22.6 million of stock-based compensation, and $8.0 million of assetimpairments which were primarily related to our restructuring plans. The changes in operating assets andliabilities included an $11.5 million increase in other liabilities, a $9.9 million increase in accrued taxes, net, anda $6.7 million decrease in inventories (excluding the impact of our acquisitions in fiscal 2014), partially offset bya $19.0 million increase in other assets. The increase in other liabilities was primarily due to accrued exit costsassociated with our restructuring plans. The increase in accrued taxes, net, was primarily due to lower taxpayments remitted during fiscal 2014. The decrease in inventories was primarily due to sales of products thatincluded ASICs that were purchased in the prior year due to long lead times. The increase in other assets isprimarily related to the $21.0 million of the amount paid under the patent license agreement with Broadcom thatwe attributed to future periods.
Cash provided by operating activities was $97.2 million for fiscal 2013 compared to $166.2 million forfiscal 2012. Operating cash flow for fiscal 2013 consisted of our net income of $73.1 million and net non-cashexpenses of $62.9 million, partially offset by net cash used as a result of changes in operating assets andliabilities of $38.8 million. The changes in operating assets and liabilities included a $37.3 million decrease inaccrued taxes, net, and a $10.6 million decrease in accounts receivable. The decrease in accrued taxes, net, wasprimarily due to tax payments associated with the settlement of a significant matter in the IRS examination. Thedecrease in accounts receivable was primarily due to the timing of cash collections and a decrease in netrevenues.
Operating cash flow for fiscal 2012 consisted of our net income of $229.4 million, including a $103.5million gain on sale of the IB Business, and net non-cash expenses of $65.4 million, partially offset by net cashused as a result of changes in operating assets and liabilities of $25.1 million. The changes in operating assetsand liabilities included a $16.3 million use of cash for accrued taxes, primarily due to estimated tax paymentsremitted during the fiscal year.
Cash used in investing activities was $17.0 million for fiscal 2014 and consisted of $157.4 million for theacquisition of businesses and $27.5 million of purchases of property and equipment, partially offset by $167.9million of net proceeds from sales and maturities of available-for-sale securities. Cash used in investing activitieswas $36.4 million for fiscal 2013 and consisted of $46.8 million of purchases of property and equipment,partially offset by $10.4 million of net proceeds from sales and maturities of available-for-sale securities. Cashused in investing activities was $47.8 million for fiscal 2012 and consisted of $140.0 million of net purchases ofavailable-for-sale securities and $32.8 million of purchases of property and equipment, partially offset by $125.0million of proceeds from the sale of the IB Business.
We expect capital expenditures to remain significant in the future as we continue to invest in more costlyengineering and production tools for new technologies, machinery and equipment, and enhancements to ourcorporate information technology infrastructure.
Cash used in financing activities was $44.1 million for fiscal 2014 and consisted primarily of our purchaseof $47.8 million of common stock under our stock repurchase program, $4.7 million for minimum taxwithholdings paid on behalf of employees for restricted stock units that vested during the year, partially offset by$8.7 million of proceeds from the issuance of common stock under stock-based awards. Cash used in financingactivities was $129.7 million for fiscal 2013 and consisted primarily of our purchase of $131.4 million ofcommon stock under our stock repurchase program, $5.6 million for minimum tax withholdings paid on behalf ofemployees for restricted stock units that vested during the year, partially offset by $8.3 million of proceeds fromthe issuance of common stock under stock-based awards. Cash used in financing activities was $101.7 million forfiscal 2012 and consisted primarily of our purchase of $126.9 million of common stock under our stockrepurchase programs and $5.5 million for minimum tax withholdings paid on behalf of employees for restrictedstock units that vested during the year, partially offset by $30.0 million of proceeds from the issuance of commonstock under stock-based awards.
34

Since fiscal 2003, we have had various stock repurchase programs that authorized the purchase of up to$1.95 billion of our outstanding common stock. As of March 30, 2014, we had repurchased a total of126.6 million shares of common stock under our stock repurchase programs for an aggregate purchase price of$1.94 billion. Our most recent stock repurchase program expired during fiscal 2014.
Contractual Obligations and Commitments
We have certain contractual obligations and commitments to make future payments in the form of non-cancelable purchase orders to our suppliers and commitments under operating lease arrangements. A summary ofour contractual obligations as of March 30, 2014, and their impact on our cash flows in future fiscal years, is asfollows:
2015 2016 2017 2018 2019 Total
(In millions)
Operating leases . . . . . . . . . . . . . . . . . . . . . . . . . $ 8.2 $ 4.4 $ 2.5 $ 1.9 $ 0.2 $ 17.2Non-cancelable purchase obligations . . . . . . . . . 39.5 — — — — 39.5
$ 47.7 $ 4.4 $ 2.5 $ 1.9 $ 0.2 $ 56.7
The amount of unrecognized tax benefits, including related accrued interest and penalties, was $17.1 millionas of March 30, 2014. We are not able to provide a reasonable estimate of the timing of future tax paymentsrelated to these obligations.
Critical Accounting Policies and Estimates
The preparation of financial statements in accordance with U.S. generally accepted accounting principlesrequires us to make estimates and judgments that affect the reported amounts of assets and liabilities at the dateof the financial statements and the reported amounts of net revenues and expenses during the reporting period.We base our estimates on historical experience and on various other factors that we believe to be reasonableunder the circumstances, including the current economic environment, in making judgments about the carryingvalues of assets and liabilities. We believe the accounting policies described below to be our most criticalaccounting policies. These accounting policies are affected significantly by judgments, assumptions andestimates used in the preparation of the financial statements and actual results could differ materially from theamounts reported based on these policies.
Revenue Recognition
We recognize revenue from product sales when all of the following fundamental criteria are met:(i) persuasive evidence of an arrangement exists, (ii) delivery has occurred, (iii) the price to the customer is fixedor determinable and (iv) collection of the resulting accounts receivable is reasonably assured.
For all sales, we use a binding purchase order or a signed agreement as evidence of an arrangement.Delivery occurs when goods are shipped and title and risk of loss transfer to the customer, in accordance with theterms specified in the arrangement with the customer. The customer’s obligation to pay and the payment termsare set at the time of delivery and are not dependent on the subsequent resale of the product. However, certain ofour sales are made to distributors under agreements that contain a limited right to return unsold product and priceprotection provisions. These return rights and price protection provisions limit our ability to reasonably estimateproduct returns and the final price of the inventory sold to distributors. As a result, the price to the customer isnot fixed or determinable at the time products are delivered to distributors. Accordingly, we recognize revenuefrom these distributors based on the sell-through method using inventory information provided by the distributor.At times, we provide standard incentive programs to our customers. We account for our competitive pricingincentives and rebates as a reduction of revenue in the period the related revenue is recorded based on thespecific program criteria and historical experience. In addition, we record provisions against revenue and cost ofrevenue for estimated product returns in the same period that revenue is recognized. These provisions are based
35
on historical experience as well as specifically identified product returns. Service and other revenue is recognizedwhen earned and receipt is reasonably assured.
For those sales that include multiple deliverables, we allocate revenue based on the relative selling price ofthe individual components. When more than one element, such as hardware and services, are contained in asingle arrangement, we allocate revenue between the elements based on each element’s relative selling price,provided that each element meets the criteria for treatment as a separate unit of accounting. When applying therelative selling price method, we determine the selling price for each deliverable using vendor-specific objectiveevidence (VSOE) of the selling price, if it exists. In order to establish VSOE of the selling price, we mustregularly sell the product and/or service on a standalone basis with a substantial majority of the sales pricedwithin a relatively narrow range. If VSOE of the selling price cannot be determined, we then consider third partyevidence (TPE) of the selling price. Generally, we are not able to determine TPE due to the lack of similarproducts and services sold by other companies within the industry. If neither VSOE nor TPE exists, we determinethe estimated selling price based on multiple factors including, but not limited to, cost, gross margin, marketconditions and pricing practices. Revenue allocated to each element is then recognized when the basic revenuerecognition criteria is met for each deliverable.
We sell certain software products and related post-contract customer support. We recognize revenue fromsoftware products when all of the following fundamental criteria are met: (i) persuasive evidence of anarrangement exists, (ii) delivery has occurred, (iii) the price to the customer is fixed or determinable and(iv) collection of the resulting accounts receivable is probable. Revenue is allocated to undelivered elementsbased upon VSOE of the fair value of the element. VSOE of the fair value is based upon the price charged whenthe element is sold separately. Revenue allocated to each element is then recognized when the basic revenuerecognition criteria are met for each element. If we are unable to determine VSOE of fair value for anundelivered element, the entire amount of revenue from the arrangement is deferred and recognized over theservice period or when all elements have been delivered.
Stock-Based Compensation
We recognize compensation expense for all stock-based awards made to employees and non-employeedirectors, including stock options, restricted stock units and stock purchases under our Employee Stock PurchasePlan (the ESPP), based on estimated fair values on the measurement date, which is generally the date of grant.Stock-based compensation is recognized for the portion of the award that is ultimately expected to vest.Forfeitures are estimated at the time of grant based on historical trends and revised, if necessary, in subsequentperiods if actual forfeitures differ from those estimates. We recognize stock-based compensation expense forawards that are subject to only a service condition on a straight-line basis over the requisite service period for theentire award, which is the vesting period for stock options and restricted stock units, and the offering period forthe ESPP. For all other stock-based awards, stock-based compensation is recognized on a straight-line basis overthe requisite service period for each separately vesting portion of the award. The determination of fair value ofstock-based awards on the date of grant using an option-pricing model is affected by our stock price, as well asassumptions regarding a number of highly complex and subjective variables. These variables include, but are notlimited to, our expected stock price volatility over the term of the awards and actual and projected employeestock option exercise behaviors. In estimating expected stock price volatility, we use a combination of(i) historical volatility, calculated based on the daily closing prices of our common stock over a period equal tothe expected term of the option, and (ii) implied volatility, utilizing market data of actively traded options on ourcommon stock. We believe that the historical volatility of the price of our common stock over the expected termof the option is a strong indicator of the expected future volatility. We also believe that implied volatility takesinto consideration market expectations of how future volatility will differ from historical volatility. Accordingly,we believe a combination of both historical and implied volatility provides the best estimate of the futurevolatility of the market price of our common stock. Changes in the subjective assumptions can materially affectthe estimated fair value of stock-based awards.
36
Income Taxes
We utilize the asset and liability method of accounting for income taxes. Income tax positions taken orexpected to be taken in a tax return are recognized in the first reporting period that it is more likely than not thetax position will be sustained upon examination. A tax position that meets the more-likely-than-not recognitionthreshold is initially and subsequently measured as the largest amount of tax benefit that is greater than 50%likely of being realized upon settlement with a taxing authority that has full knowledge of all relevantinformation. Previously recognized income tax positions that fail to meet the recognition threshold in asubsequent period are derecognized in that period. Differences between actual results and our assumptions, orchanges in our assumptions in future periods, are recorded in the period they become known. We record potentialaccrued interest and penalties related to unrecognized tax benefits in income tax expense.
Deferred income taxes are recognized for the future tax consequences of temporary differences usingenacted statutory tax rates expected to apply to taxable income in the years in which those temporary differencesare expected to be recovered or settled. Temporary differences include the difference between the financialstatement carrying amounts and the tax bases of existing assets and liabilities and operating loss and tax creditcarryforwards. The effect on deferred taxes of a change in tax rates is recognized in earnings in the period thatincludes the enactment date.
A valuation allowance is recorded when it is more likely than not that some or all of a deferred tax asset willnot be realized. Significant judgment and estimates are required in determining whether a valuation allowance isrecorded. In assessing the need for a valuation allowance, we consider all available evidence, including pastoperating results, estimates of future taxable income, and the feasibility of tax planning strategies. Our estimatesand projections require significant judgment and are subject to uncertainty due to various factors, including theeconomic environment, industry and market conditions, and the length of time of the projections included in theanalyses. If our actual results are less favorable than current estimates, or we revise our estimates downward infuture analyses, a valuation allowance may be required with a corresponding adjustment to earnings in the periodin which such determination is made.
As a multinational corporation, we are subject to complex tax laws and regulations in various jurisdictions.The application of tax laws and regulations is subject to legal and factual interpretation, judgment anduncertainty. Tax laws themselves are subject to change as a result of changes in fiscal policy, changes inlegislation, evolution of regulations and court rulings. Therefore, the actual liability for U.S. or foreign taxes maybe materially different from our estimates, which could result in the need to record additional liabilities orpotentially to reverse previously recorded tax liabilities. Differences between actual results and our assumptions,or changes in our assumptions in future periods, are recorded in the period they become known.
Marketable Securities
Marketable securities consist of available-for-sale securities and are classified in the consolidated balancesheets based on the nature of the security and the availability for use in current operations. Available-for-salesecurities are recorded at fair value based on quoted market prices or other observable inputs. Unrealized gainsand losses, net of related income taxes, on available-for-sale securities are excluded from earnings and reportedas a separate component of accumulated other comprehensive income until realized.
We recognize an impairment charge on available-for-sale securities when the decline in the fair value of aninvestment below its cost basis is judged to be other-than-temporary. If we intend to sell the security or it is morelikely than not that we will be required to sell the security before recovery of its amortized cost basis less anycurrent-period credit loss, we would recognize the entire impairment in earnings. If we do not intend to sell thesecurity and it is not more likely than not that we will be required to sell the security before recovery of itsamortized cost basis less any current-period credit loss, the other-than-temporary impairment is separated into(a) the amount representing the credit loss and (b) the amount related to all other factors. The amount of theother-than-temporary impairment related to the credit loss is recognized in earnings. The amount of the other-than-temporary impairment related to other factors is recognized in other comprehensive income, net of
37
applicable taxes. Significant judgment is required in determining the fair value of investment securities ininactive markets as well as determining when declines in fair value constitute an other-than-temporaryimpairment and the portion of any impairment that is due to a credit loss. We consider various factors indetermining whether to recognize an impairment charge, including the current financial and credit marketenvironment, the financial condition and near-term prospects of the issuer of the security, the magnitude of theunrealized loss compared to the cost of the investment, the length of time the investment has been in a lossposition and our intent and ability to hold the investment for a period of time sufficient to allow for anyanticipated recovery of market value.
Realized gains or losses are determined on a specific identification basis and reported in interest and otherincome, net, as incurred.
Inventories
Inventories are stated at the lower of cost (first-in, first-out) or market. We write down the carrying value ofour inventory to estimated net realizable value for estimated excess and obsolete inventory based uponassumptions about future demand and market conditions. These assumptions are based on economic conditionsand trends (both current and projected), anticipated customer demand and acceptance of our current products,expected future products and other assumptions. If actual market conditions are less favorable than thoseprojected by management, additional write-downs may be required. Once we write down the carrying value ofinventory, a new cost basis is established. Subsequent changes in facts and circumstances do not result in anincrease in the newly established cost basis.
Inventories acquired through business combinations are recorded at their acquisition date fair value, whichis generally estimated selling price less the costs of disposal and a normal profit allowance.
Goodwill and Other Intangible Assets
Goodwill is recorded as the difference, if any, between the aggregate consideration paid for an acquisitionand the fair value of the net tangible and intangible assets acquired. The amounts and useful lives assigned tointangible assets acquired, other than goodwill, impact the amount and timing of future amortization. The amountassigned to in-process research and development is capitalized and accounted for as an indefinite-lived intangibleasset until the underlying projects are completed or abandoned.
Goodwill is not amortized but instead is tested at least annually for impairment, or more frequently whenevents or changes in circumstances indicate a potential impairment, by comparing the carrying value to the fairvalue of the reporting unit to which the goodwill is assigned. A two-step test is used to identify the potentialimpairment and to measure the amount of impairment, if any. The first step is to compare the fair value of thereporting unit with its carrying amount, including goodwill. If the fair value of the reporting unit is less than itscarrying amount, goodwill is considered impaired and the loss is measured by performing step two. Under steptwo, the impairment loss is measured by comparing the implied fair value of the reporting unit goodwill with thecarrying amount of that goodwill. We perform the annual test for impairment as of the first day of our fourthfiscal quarter. During the annual goodwill impairment test in fiscal 2014, we completed step one and determinedthat there was no impairment of goodwill since the fair value (based on quoted market price) of the reporting unitexceeded its carrying value. Based on this impairment test, we believe that we have no at-risk goodwill.
The initial recording and subsequent evaluation for impairment of goodwill and purchased intangible assetsrequires the use of significant management judgment regarding the forecasts of future operating results. It ispossible that our business plans may change and our estimates used may prove to be inaccurate. If our actualresults or estimates used in future impairment analyses are lower than current estimates, we could incurimpairment charges.
38
Long-Lived Assets
Long-lived assets, including property and equipment and purchased intangible assets, are reviewed forimpairment whenever events or changes in circumstances indicate that the carrying amount of an asset or assetgroup may not be recoverable. Significant judgment is required in determining whether a potential indicator ofimpairment of our long-lived assets exists. Recoverability of assets to be held and used is measured by thecomparison of the carrying amount of an asset or asset group to future undiscounted net cash flows expected tobe generated by the asset or asset group. If such an asset or asset group is considered to be impaired, theimpairment to be recognized is measured as the amount by which the carrying amount of the asset or asset groupexceeds the fair value of the asset or asset group. Assets to be disposed of are reported at the lower of theircarrying amount or fair value less costs to sell. Estimating future net cash flows and determining proper assetgroupings for the purpose of this impairment test requires the use of significant management judgment. If ouractual results, or estimates used in future impairment analyses, are lower than our current estimates, we couldincur impairment charges.
Recently Issued Accounting Standards Not Yet Effective
In July 2013, the Financial Accounting Standards Board issued an accounting standard update that requirescertain unrecognized tax benefits to be presented as a reduction to deferred tax assets rather than as liabilitieswhen a net operating loss carryforward, a similar tax loss, or a tax credit carryforward exists. This standard maybe applied prospectively or retrospectively. We will adopt this standard in the first quarter of fiscal 2015 and itsadoption is not expected to have a material effect on our consolidated financial statements.
Off-Balance Sheet Arrangements
During the periods presented, we did not have any off-balance sheet arrangements other than operatingleases. Information related to our off-balance sheet arrangements is included in Note 17 of the Notes toConsolidated Financial Statements in this Form 10-K. Such information is hereby incorporated by reference.
Item 7a. Quantitative and Qualitative Disclosures About Market Risk
Our cash and cash equivalents are not subject to significant interest rate risk due to the short maturities ofthese instruments. As of March 30, 2014, the carrying value of our cash and cash equivalents approximates fairvalue.
We maintain a portfolio of marketable securities consisting primarily of U.S. government and agencysecurities, corporate debt obligations, mortgage-backed securities and municipal bonds, the majority of whichhave remaining terms of three years or less. We are exposed to fluctuations in interest rates as movements ininterest rates can result in changes in the market value of our investments in debt securities. However, due to theshort-term expected duration of our portfolio of marketable securities, we do not believe that we are subject tomaterial interest rate risk.
In accordance with our investment guidelines, we only invest in instruments with high credit quality ratingsand we limit our exposure to any one issuer or type of investment. Our portfolio of marketable securities as ofMarch 30, 2014 consists of $186.8 million of securities that are classified as available-for-sale. As of March 30,2014, we had gross unrealized losses associated with our available-for-sale securities of $0.3 million that weredetermined by management to be temporary in nature.
We do not use derivative financial instruments.
39

Item 8. Financial Statements and Supplementary Data
REPORT OF INDEPENDENT REGISTERED PUBLIC ACCOUNTING FIRM
The Board of Directors and StockholdersQLogic Corporation:
We have audited the accompanying consolidated balance sheets of QLogic Corporation and subsidiaries asof March 30, 2014 and March 31, 2013, and the related consolidated statements of operations, comprehensiveincome (loss), stockholders’ equity and cash flows for each of the years in the three-year period ended March 30,2014. In connection with our audits of the consolidated financial statements, we also have audited the financialstatement schedule of valuation and qualifying accounts as listed in the index under Item 15(a) (2). Theseconsolidated financial statements and financial statement schedule are the responsibility of the Company’smanagement. Our responsibility is to express an opinion on these consolidated financial statements and financialstatement schedule based on our audits.
We conducted our audits in accordance with the standards of the Public Company Accounting OversightBoard (United States). Those standards require that we plan and perform the audit to obtain reasonable assuranceabout whether the financial statements are free of material misstatement. An audit includes examining, on a testbasis, evidence supporting the amounts and disclosures in the financial statements. An audit also includesassessing the accounting principles used and significant estimates made by management, as well as evaluatingthe overall financial statement presentation. We believe that our audits provide a reasonable basis for ouropinion.
In our opinion, the consolidated financial statements referred to above present fairly, in all material respects,the financial position of QLogic Corporation and subsidiaries as of March 30, 2014 and March 31, 2013, and theresults of their operations and their cash flows for each of the years in the three-year period ended March 30,2014, in conformity with U.S. generally accepted accounting principles. Also in our opinion, the related financialstatement schedule, when considered in relation to the basic consolidated financial statements taken as a whole,presents fairly, in all material respects, the information set forth therein.
We also have audited, in accordance with the standards of the Public Company Accounting Oversight Board(United States), QLogic Corporation’s internal control over financial reporting as of March 30, 2014, based oncriteria established in Internal Control — Integrated Framework (1992) issued by the Committee of SponsoringOrganizations of the Treadway Commission (COSO), and our report dated May 22, 2014, expressed anunqualified opinion on the effectiveness of the Company’s internal control over financial reporting.
/s/ KPMG LLP
Irvine, CaliforniaMay 22, 2014
40

REPORT OF INDEPENDENT REGISTERED PUBLIC ACCOUNTING FIRM
The Board of Directors and StockholdersQLogic Corporation:
We have audited QLogic Corporation’s internal control over financial reporting as of March 30, 2014, basedon criteria established in Internal Control — Integrated Framework (1992) issued by the Committee ofSponsoring Organizations of the Treadway Commission (COSO). QLogic Corporation’s management isresponsible for maintaining effective internal control over financial reporting and for its assessment of theeffectiveness of internal control over financial reporting, included in the accompanying Management’s Report onInternal Control Over Financial Reporting appearing under Item 9A. Our responsibility is to express an opinionon the Company’s internal control over financial reporting based on our audit.
We conducted our audit in accordance with the standards of the Public Company Accounting OversightBoard (United States). Those standards require that we plan and perform the audit to obtain reasonable assuranceabout whether effective internal control over financial reporting was maintained in all material respects. Ouraudit included obtaining an understanding of internal control over financial reporting, assessing the risk that amaterial weakness exists, and testing and evaluating the design and operating effectiveness of internal controlbased on the assessed risk. Our audit also included performing such other procedures as we considered necessaryin the circumstances. We believe that our audit provides a reasonable basis for our opinion.
A company’s internal control over financial reporting is a process designed to provide reasonable assuranceregarding the reliability of financial reporting and the preparation of financial statements for external purposes inaccordance with generally accepted accounting principles. A company’s internal control over financial reportingincludes those policies and procedures that (1) pertain to the maintenance of records that, in reasonable detail,accurately and fairly reflect the transactions and dispositions of the assets of the company; (2) provide reasonableassurance that transactions are recorded as necessary to permit preparation of financial statements in accordancewith generally accepted accounting principles, and that receipts and expenditures of the company are being madeonly in accordance with authorizations of management and directors of the company; and (3) provide reasonableassurance regarding prevention or timely detection of unauthorized acquisition, use, or disposition of thecompany’s assets that could have a material effect on the financial statements.
Because of its inherent limitations, internal control over financial reporting may not prevent or detectmisstatements. Also, projections of any evaluation of effectiveness to future periods are subject to the risk thatcontrols may become inadequate because of changes in conditions, or that the degree of compliance with thepolicies or procedures may deteriorate.
In our opinion, QLogic Corporation maintained, in all material respects, effective internal control overfinancial reporting as of March 30, 2014, based on criteria established in Internal Control — IntegratedFramework (1992) issued by the Committee of Sponsoring Organizations of the Treadway Commission.
We also have audited, in accordance with the standards of the Public Company Accounting Oversight Board(United States), the consolidated balance sheets of QLogic Corporation and subsidiaries as of March 30, 2014and March 31, 2013, and the related consolidated statements of operations, comprehensive income (loss),stockholders’ equity and cash flows for each of the years in the three-year period ended March 30, 2014, and ourreport dated May 22, 2014, expressed an unqualified opinion on those consolidated financial statements.
/s/ KPMG LLP
Irvine, CaliforniaMay 22, 2014
41

QLOGIC CORPORATION
CONSOLIDATED BALANCE SHEETSMarch 30, 2014 and March 31, 2013
2014 2013
(In thousands, except shareand per share amounts)
ASSETSCurrent assets:Cash and cash equivalents . . . . . . . . . . . . . . . . . . . . . . . . . . . . . . . . . . . . . . . . . . . . $ 91,258 $ 95,532Marketable securities . . . . . . . . . . . . . . . . . . . . . . . . . . . . . . . . . . . . . . . . . . . . . . . . 186,783 359,974Accounts receivable, less allowance for doubtful accounts of $1,186 and $1,196as of March 30, 2014 and March 31, 2013, respectively . . . . . . . . . . . . . . . . . . . 65,213 66,135
Inventories . . . . . . . . . . . . . . . . . . . . . . . . . . . . . . . . . . . . . . . . . . . . . . . . . . . . . . . . 18,036 20,160Deferred tax assets . . . . . . . . . . . . . . . . . . . . . . . . . . . . . . . . . . . . . . . . . . . . . . . . . . 15,080 13,036Other current assets . . . . . . . . . . . . . . . . . . . . . . . . . . . . . . . . . . . . . . . . . . . . . . . . . 16,590 24,381
Total current assets . . . . . . . . . . . . . . . . . . . . . . . . . . . . . . . . . . . . . . . . . . . . . . . . 392,960 579,218Property and equipment, net . . . . . . . . . . . . . . . . . . . . . . . . . . . . . . . . . . . . . . . . . . . . . 84,912 96,336Goodwill . . . . . . . . . . . . . . . . . . . . . . . . . . . . . . . . . . . . . . . . . . . . . . . . . . . . . . . . . . . . 194,107 110,976Purchased intangible assets, net . . . . . . . . . . . . . . . . . . . . . . . . . . . . . . . . . . . . . . . . . . 69,903 4,054Deferred tax assets . . . . . . . . . . . . . . . . . . . . . . . . . . . . . . . . . . . . . . . . . . . . . . . . . . . . 32,827 31,992Other assets . . . . . . . . . . . . . . . . . . . . . . . . . . . . . . . . . . . . . . . . . . . . . . . . . . . . . . . . . . 23,554 2,587
$ 798,263 $ 825,163
LIABILITIES AND STOCKHOLDERS’ EQUITYCurrent liabilities:Accounts payable . . . . . . . . . . . . . . . . . . . . . . . . . . . . . . . . . . . . . . . . . . . . . . . . . . . $ 30,657 $ 29,668Accrued compensation . . . . . . . . . . . . . . . . . . . . . . . . . . . . . . . . . . . . . . . . . . . . . . . 26,956 27,453Accrued taxes . . . . . . . . . . . . . . . . . . . . . . . . . . . . . . . . . . . . . . . . . . . . . . . . . . . . . . 981 4,559Deferred revenue . . . . . . . . . . . . . . . . . . . . . . . . . . . . . . . . . . . . . . . . . . . . . . . . . . . 3,954 4,676Other current liabilities . . . . . . . . . . . . . . . . . . . . . . . . . . . . . . . . . . . . . . . . . . . . . . . 16,123 7,651
Total current liabilities . . . . . . . . . . . . . . . . . . . . . . . . . . . . . . . . . . . . . . . . . . . . . 78,671 74,007Accrued taxes . . . . . . . . . . . . . . . . . . . . . . . . . . . . . . . . . . . . . . . . . . . . . . . . . . . . . . . . 17,095 10,772Other liabilities . . . . . . . . . . . . . . . . . . . . . . . . . . . . . . . . . . . . . . . . . . . . . . . . . . . . . . . 9,071 6,107
Total liabilities . . . . . . . . . . . . . . . . . . . . . . . . . . . . . . . . . . . . . . . . . . . . . . . . . . . 104,837 90,886
Commitments and contingenciesStockholders’ equity:Preferred stock, $0.001 par value; 1,000,000 shares authorized; no shares issuedand outstanding . . . . . . . . . . . . . . . . . . . . . . . . . . . . . . . . . . . . . . . . . . . . . . . . . . . — —
Common stock, $0.001 par value; 500,000,000 shares authorized; 213,786,000and 212,145,000 shares issued as of March 30, 2014 and March 31, 2013,respectively . . . . . . . . . . . . . . . . . . . . . . . . . . . . . . . . . . . . . . . . . . . . . . . . . . . . . . 214 212
Additional paid-in capital . . . . . . . . . . . . . . . . . . . . . . . . . . . . . . . . . . . . . . . . . . . . . 958,008 932,557Retained earnings . . . . . . . . . . . . . . . . . . . . . . . . . . . . . . . . . . . . . . . . . . . . . . . . . . . 1,672,071 1,690,337Accumulated other comprehensive income . . . . . . . . . . . . . . . . . . . . . . . . . . . . . . . 435 1,887Treasury stock, at cost: 126,616,000 and 122,185,000 shares as of March 30,2014 and March 31, 2013, respectively . . . . . . . . . . . . . . . . . . . . . . . . . . . . . . . . (1,937,302) (1,890,716)
Total stockholders’ equity . . . . . . . . . . . . . . . . . . . . . . . . . . . . . . . . . . . . . . . . . . 693,426 734,277
$ 798,263 $ 825,163
See accompanying notes to consolidated financial statements.
42

QLOGIC CORPORATION
CONSOLIDATED STATEMENTS OF OPERATIONSYears Ended March 30, 2014, March 31, 2013 and April 1, 2012
2014 2013 2012
(In thousands, except pershare amounts)
Net revenues . . . . . . . . . . . . . . . . . . . . . . . . . . . . . . . . . . . . . . . . . . . . . . . . . . . . $460,907 $484,538 $558,608Cost of revenues . . . . . . . . . . . . . . . . . . . . . . . . . . . . . . . . . . . . . . . . . . . . . . . . . 150,800 159,180 177,704
Gross profit . . . . . . . . . . . . . . . . . . . . . . . . . . . . . . . . . . . . . . . . . . . . . . . . . . . 310,107 325,358 380,904
Operating expenses:Engineering and development . . . . . . . . . . . . . . . . . . . . . . . . . . . . . . . . . . . . 147,010 156,097 138,768Sales and marketing . . . . . . . . . . . . . . . . . . . . . . . . . . . . . . . . . . . . . . . . . . . . 68,367 78,512 77,370General and administrative . . . . . . . . . . . . . . . . . . . . . . . . . . . . . . . . . . . . . . 32,097 32,899 35,299Special charges . . . . . . . . . . . . . . . . . . . . . . . . . . . . . . . . . . . . . . . . . . . . . . . . 74,853 — —
Total operating expenses . . . . . . . . . . . . . . . . . . . . . . . . . . . . . . . . . . . . . . 322,327 267,508 251,437
Operating income (loss) . . . . . . . . . . . . . . . . . . . . . . . . . . . . . . . . . . . . . . . . . . . (12,220) 57,850 129,467Interest and other income, net . . . . . . . . . . . . . . . . . . . . . . . . . . . . . . . . . . . . . . 3,260 4,007 3,959
Income (loss) from continuing operations before income taxes . . . . . . . . . . . . (8,960) 61,857 133,426Income tax expense (benefit) . . . . . . . . . . . . . . . . . . . . . . . . . . . . . . . . . . . . . . . 9,306 (11,704) 13,983
Income (loss) from continuing operations . . . . . . . . . . . . . . . . . . . . . . . . . . . . . (18,266) 73,561 119,443
Discontinued operations:Income (loss) from operations, net of income taxes . . . . . . . . . . . . . . . . . . . — (425) 910Gain on sale, net of income taxes . . . . . . . . . . . . . . . . . . . . . . . . . . . . . . . . . . — — 109,083
Income (loss) from discontinued operations . . . . . . . . . . . . . . . . . . . . . . . . . . . — (425) 109,993
Net income (loss) . . . . . . . . . . . . . . . . . . . . . . . . . . . . . . . . . . . . . . . . . . . . . . . . $ (18,266) $ 73,136 $229,436
Income (loss) from continuing operations per share:Basic . . . . . . . . . . . . . . . . . . . . . . . . . . . . . . . . . . . . . . . . . . . . . . . . . . . . . . . . $ (0.21) $ 0.79 $ 1.17
Diluted . . . . . . . . . . . . . . . . . . . . . . . . . . . . . . . . . . . . . . . . . . . . . . . . . . . . . . $ (0.21) $ 0.78 $ 1.16
Income (loss) from discontinued operations per share:Basic . . . . . . . . . . . . . . . . . . . . . . . . . . . . . . . . . . . . . . . . . . . . . . . . . . . . . . . . $ — $ (0.01) $ 1.08
Diluted . . . . . . . . . . . . . . . . . . . . . . . . . . . . . . . . . . . . . . . . . . . . . . . . . . . . . . $ — $ — $ 1.07
Net income (loss) per share:Basic . . . . . . . . . . . . . . . . . . . . . . . . . . . . . . . . . . . . . . . . . . . . . . . . . . . . . . . . $ (0.21) $ 0.78 $ 2.25
Diluted . . . . . . . . . . . . . . . . . . . . . . . . . . . . . . . . . . . . . . . . . . . . . . . . . . . . . . $ (0.21) $ 0.78 $ 2.23
Number of shares used in per share calculations:Basic . . . . . . . . . . . . . . . . . . . . . . . . . . . . . . . . . . . . . . . . . . . . . . . . . . . . . . . . 87,612 93,560 101,766
Diluted . . . . . . . . . . . . . . . . . . . . . . . . . . . . . . . . . . . . . . . . . . . . . . . . . . . . . . 87,612 93,998 102,711
See accompanying notes to consolidated financial statements.
43
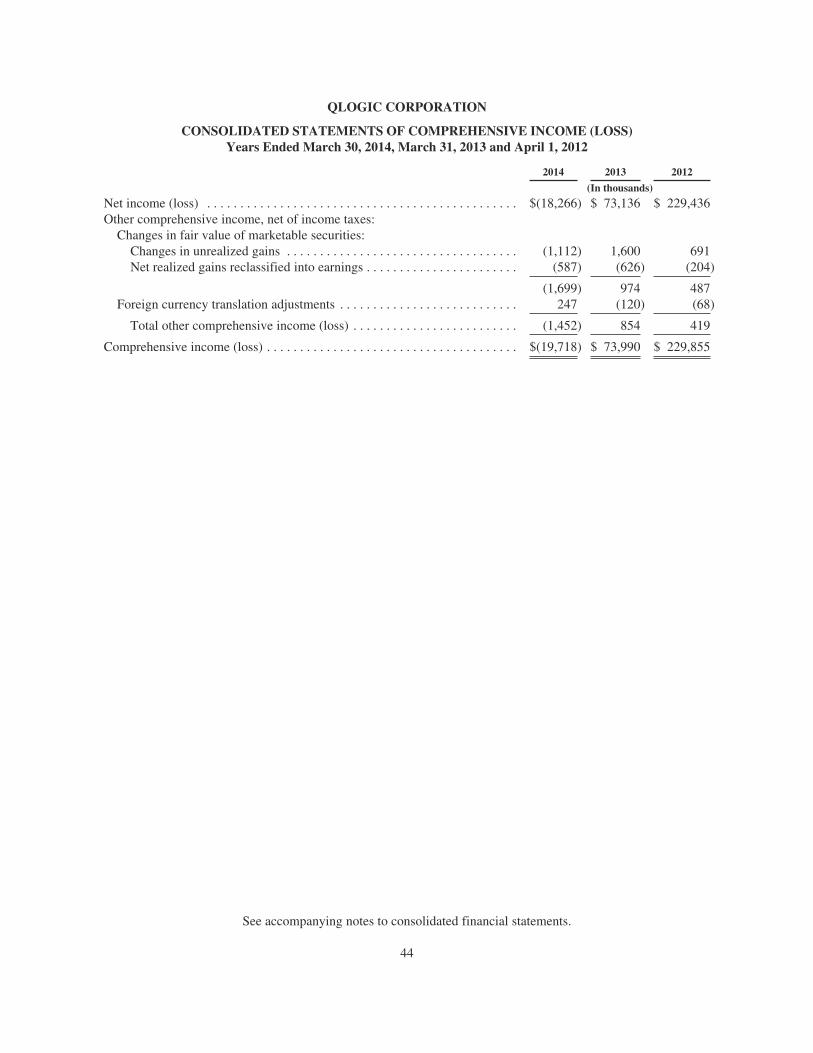
QLOGIC CORPORATION
CONSOLIDATED STATEMENTS OF COMPREHENSIVE INCOME (LOSS)Years Ended March 30, 2014, March 31, 2013 and April 1, 2012
2014 2013 2012
(In thousands)
Net income (loss) . . . . . . . . . . . . . . . . . . . . . . . . . . . . . . . . . . . . . . . . . . . . . . . $(18,266) $ 73,136 $ 229,436Other comprehensive income, net of income taxes:Changes in fair value of marketable securities:Changes in unrealized gains . . . . . . . . . . . . . . . . . . . . . . . . . . . . . . . . . . . (1,112) 1,600 691Net realized gains reclassified into earnings . . . . . . . . . . . . . . . . . . . . . . . (587) (626) (204)
(1,699) 974 487Foreign currency translation adjustments . . . . . . . . . . . . . . . . . . . . . . . . . . . 247 (120) (68)
Total other comprehensive income (loss) . . . . . . . . . . . . . . . . . . . . . . . . . (1,452) 854 419
Comprehensive income (loss) . . . . . . . . . . . . . . . . . . . . . . . . . . . . . . . . . . . . . . $(19,718) $ 73,990 $ 229,855
See accompanying notes to consolidated financial statements.
44
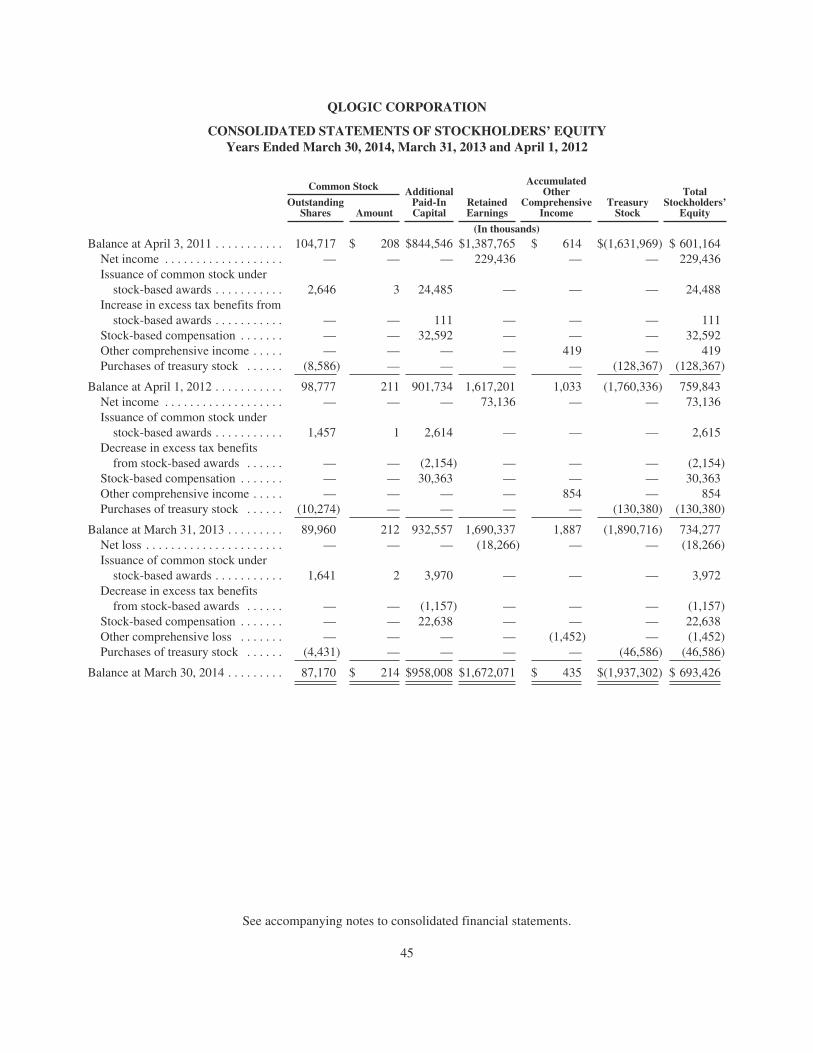
QLOGIC CORPORATION
CONSOLIDATED STATEMENTS OF STOCKHOLDERS’ EQUITYYears Ended March 30, 2014, March 31, 2013 and April 1, 2012
AccumulatedOther
ComprehensiveIncome
TreasuryStock
TotalStockholders’
Equity
Common Stock AdditionalPaid-InCapital
RetainedEarnings
OutstandingShares Amount
(In thousands)Balance at April 3, 2011 . . . . . . . . . . . 104,717 $ 208 $844,546 $1,387,765 $ 614 $(1,631,969) $ 601,164
Net income . . . . . . . . . . . . . . . . . . . — — — 229,436 — — 229,436Issuance of common stock understock-based awards . . . . . . . . . . . 2,646 3 24,485 — — — 24,488
Increase in excess tax benefits fromstock-based awards . . . . . . . . . . . — — 111 — — — 111
Stock-based compensation . . . . . . . — — 32,592 — — — 32,592Other comprehensive income . . . . . — — — — 419 — 419Purchases of treasury stock . . . . . . (8,586) — — — — (128,367) (128,367)
Balance at April 1, 2012 . . . . . . . . . . . 98,777 211 901,734 1,617,201 1,033 (1,760,336) 759,843Net income . . . . . . . . . . . . . . . . . . . — — — 73,136 — — 73,136Issuance of common stock understock-based awards . . . . . . . . . . . 1,457 1 2,614 — — — 2,615
Decrease in excess tax benefitsfrom stock-based awards . . . . . . — — (2,154) — — — (2,154)
Stock-based compensation . . . . . . . — — 30,363 — — — 30,363Other comprehensive income . . . . . — — — — 854 — 854Purchases of treasury stock . . . . . . (10,274) — — — — (130,380) (130,380)
Balance at March 31, 2013 . . . . . . . . . 89,960 212 932,557 1,690,337 1,887 (1,890,716) 734,277Net loss . . . . . . . . . . . . . . . . . . . . . . — — — (18,266) — — (18,266)Issuance of common stock understock-based awards . . . . . . . . . . . 1,641 2 3,970 — — — 3,972
Decrease in excess tax benefitsfrom stock-based awards . . . . . . — — (1,157) — — — (1,157)
Stock-based compensation . . . . . . . — — 22,638 — — — 22,638Other comprehensive loss . . . . . . . — — — — (1,452) — (1,452)Purchases of treasury stock . . . . . . (4,431) — — — — (46,586) (46,586)
Balance at March 30, 2014 . . . . . . . . . 87,170 $ 214 $958,008 $1,672,071 $ 435 $(1,937,302) $ 693,426
See accompanying notes to consolidated financial statements.
45

QLOGIC CORPORATION
CONSOLIDATED STATEMENTS OF CASH FLOWSYears Ended March 30, 2014, March 31, 2013 and April 1, 2012
2014 2013 2012
(In thousands)
Cash flows from operating activities:Net income (loss) . . . . . . . . . . . . . . . . . . . . . . . . . . . . . . . . . . . . . . . . . . . . $ (18,266) $ 73,136 $ 229,436Adjustments to reconcile net income (loss) to net cash provided byoperating activities:Depreciation and amortization . . . . . . . . . . . . . . . . . . . . . . . . . . . . . . . . 32,523 28,630 31,641Stock-based compensation . . . . . . . . . . . . . . . . . . . . . . . . . . . . . . . . . . . 22,638 30,363 32,592Deferred income taxes . . . . . . . . . . . . . . . . . . . . . . . . . . . . . . . . . . . . . . (3,637) (110) (4,813)Gain on sale of business . . . . . . . . . . . . . . . . . . . . . . . . . . . . . . . . . . . . . — — (103,509)Asset impairments . . . . . . . . . . . . . . . . . . . . . . . . . . . . . . . . . . . . . . . . . 8,022 — —Other non-cash items . . . . . . . . . . . . . . . . . . . . . . . . . . . . . . . . . . . . . . . 2,729 3,954 5,946Changes in operating assets and liabilities, net of acquisitions anddisposition:Accounts receivable . . . . . . . . . . . . . . . . . . . . . . . . . . . . . . . . . . . . . . 899 10,635 (6,533)Inventories . . . . . . . . . . . . . . . . . . . . . . . . . . . . . . . . . . . . . . . . . . . . . 6,660 (436) (843)Other assets . . . . . . . . . . . . . . . . . . . . . . . . . . . . . . . . . . . . . . . . . . . . (19,013) (3,346) 361Accounts payable . . . . . . . . . . . . . . . . . . . . . . . . . . . . . . . . . . . . . . . . 4,376 (3,555) (4,908)Accrued compensation . . . . . . . . . . . . . . . . . . . . . . . . . . . . . . . . . . . . (1,511) (873) 2,468Accrued taxes, net . . . . . . . . . . . . . . . . . . . . . . . . . . . . . . . . . . . . . . . 9,855 (37,314) (16,265)Other liabilities . . . . . . . . . . . . . . . . . . . . . . . . . . . . . . . . . . . . . . . . . . 11,516 (3,919) 590
Net cash provided by operating activities . . . . . . . . . . . . . . . . . . . 56,791 97,165 166,163
Cash flows from investing activities:Purchases of available-for-sale securities . . . . . . . . . . . . . . . . . . . . . . . . . (342,921) (298,621) (573,635)Proceeds from sales and maturities of available-for-sale securities . . . . . 510,816 308,947 433,644Purchases of property and equipment . . . . . . . . . . . . . . . . . . . . . . . . . . . . (27,550) (46,765) (32,731)Acquisition of businesses . . . . . . . . . . . . . . . . . . . . . . . . . . . . . . . . . . . . . . (157,352) — —Proceeds from sale of business . . . . . . . . . . . . . . . . . . . . . . . . . . . . . . . . . — — 124,969
Net cash used in investing activities . . . . . . . . . . . . . . . . . . . . . . . . . (17,007) (36,439) (47,753)
Cash flows from financing activities:Proceeds from issuance of common stock under stock-based awards . . . . 8,711 8,250 29,961Minimum tax withholding paid on behalf of employees for restrictedstock units . . . . . . . . . . . . . . . . . . . . . . . . . . . . . . . . . . . . . . . . . . . . . . . . (4,739) (5,635) (5,473)
Purchases of treasury stock . . . . . . . . . . . . . . . . . . . . . . . . . . . . . . . . . . . . (47,785) (131,426) (126,870)Other financing activities . . . . . . . . . . . . . . . . . . . . . . . . . . . . . . . . . . . . . . (245) (899) 708
Net cash used in financing activities . . . . . . . . . . . . . . . . . . . . . . . . . (44,058) (129,710) (101,674)
Net increase (decrease) in cash and cash equivalents . . . . . . . . . . . . . . . . . . (4,274) (68,984) 16,736Cash and cash equivalents at beginning of year . . . . . . . . . . . . . . . . . . . . . . . 95,532 164,516 147,780
Cash and cash equivalents at end of year . . . . . . . . . . . . . . . . . . . . . . . . . . . . $ 91,258 $ 95,532 $ 164,516
Supplemental disclosure of cash flow information:Cash paid during the year for income taxes, net of refunds received . . . . $ 2,508 $ 23,434 $ 25,311
See accompanying notes to consolidated financial statements.
46

QLOGIC CORPORATION
NOTES TO CONSOLIDATED FINANCIAL STATEMENTS
Note 1. Description of Business and Summary of Significant Accounting Policies
General Business Information
QLogic Corporation (QLogic or the Company) designs and supplies high performance server and storagenetworking connectivity products that provide, enhance and manage computer data communication. TheCompany’s products are used in enterprise data centers, cloud computing, Web 2.0 and other environmentsdependent on high performance, reliable data networking. The Company’s products are based primarily on FibreChannel and Ethernet technologies and are used in connection with storage networks, local area networks, andconverged networks. The Company’s products consist primarily of connectivity products such as adapters andapplication-specific integrated circuits (ASICs) and are sold worldwide, primarily to original equipmentmanufacturers (OEMs) and distributors.
The Company classifies its products into two categories – Advanced Connectivity Platforms and LegacyConnectivity Products. Advanced Connectivity Platforms are comprised primarily of adapters and ASICs forserver and storage connectivity applications. Legacy Connectivity Products are comprised primarily of FibreChannel switch products and 1Gb Internet Small Computer System Interface (iSCSI) products.
Principles of Consolidation
The consolidated financial statements include the financial statements of QLogic Corporation and itswholly-owned subsidiaries. Intercompany balances and transactions have been eliminated in consolidation.
Financial Reporting Period
The Company uses a fifty-two/fifty-three week fiscal year ending on the Sunday nearest March 31. Fiscalyears 2014, 2013 and 2012 each comprised fifty-two weeks and ended on March 30, 2014, March 31, 2013 andApril 1, 2012, respectively.
Basis of Presentation
In February 2012, the Company completed the sale of the product lines and certain assets associated with itsInfiniBand business (the IB Business). The IB Business meets the criteria to be presented as discontinuedoperations. As a result of this divestiture, the Company’s consolidated financial statements for all periods presentthe operations of the IB Business as discontinued operations.
Certain immaterial reclassifications have been made to prior year amounts to conform to the current yearpresentation.
Use of Estimates
The preparation of financial statements in accordance with U.S. generally accepted accounting principlesrequires management to make estimates and judgments that affect the amounts reported in the Company’sconsolidated financial statements and accompanying notes. Among the significant estimates affecting theconsolidated financial statements are those related to revenue recognition, stock-based compensation, incometaxes, marketable securities, inventories, goodwill and long-lived assets.
The Company evaluates its estimates on an ongoing basis using historical experience and other factors,including the current economic environment. Significant judgment is required in determining (i) the fair value ofassets acquired and liabilities assumed in a business combination, including the fair value of identifiableintangible assets, (ii) the fair value of a patent license and the portion of the fair value attributable to past and
47

QLOGIC CORPORATION
NOTES TO CONSOLIDATED FINANCIAL STATEMENTS— (Continued)
future periods, (iii) the Company’s tax filing positions and the related assessment of recognition andmeasurement of uncertain tax positions, (iv) whether a valuation allowance related to a deferred tax asset shouldbe recorded, (v) whether a potential indicator of impairment of the Company’s long-lived assets exists and inestimating future cash flows for the purpose of any necessary impairment tests, and (vi) whether a group of assetsdisposed or to be disposed of meets the criteria for presentation as discontinued operations and in identifying theappropriate amounts to present as discontinued operations. If management’s estimates differ materially fromactual results, the Company’s future results of operations will be affected.
Revenue Recognition
The Company recognizes revenue from product sales when all of the following fundamental criteria are met:(i) persuasive evidence of an arrangement exists, (ii) delivery has occurred, (iii) the price to the customer is fixedor determinable and (iv) collection of the resulting accounts receivable is reasonably assured.
For all sales, the Company uses a binding purchase order or a signed agreement as evidence of anarrangement. Delivery occurs when goods are shipped and title and risk of loss transfer to the customer, inaccordance with the terms specified in the arrangement with the customer. The customer’s obligation to pay andthe payment terms are set at the time of delivery and are not dependent on the subsequent resale of the product.However, certain of the Company’s sales are made to distributors under agreements that contain a limited right toreturn unsold product and price protection provisions. These return rights and price protection provisions limitthe Company’s ability to reasonably estimate product returns and the final price of the inventory sold todistributors. As a result, the price to the customer is not fixed or determinable at the time products are deliveredto distributors. Accordingly, the Company recognizes revenue from these distributors based on the sell-throughmethod using inventory information provided by the distributor. At times, the Company provides standardincentive programs to its customers. The Company accounts for its competitive pricing incentives and rebates asa reduction of revenue in the period the related revenue is recorded based on the specific program criteria andhistorical experience. In addition, the Company records provisions against revenue and cost of revenue forestimated product returns in the same period that revenue is recognized. These provisions are based on historicalexperience as well as specifically identified product returns. Service and other revenue is recognized whenearned and receipt is reasonably assured.
For those sales that include multiple deliverables, the Company allocates revenue based on the relativeselling price of the individual components. When more than one element, such as hardware and services, arecontained in a single arrangement, the Company allocates revenue between the elements based on each element’srelative selling price, provided that each element meets the criteria for treatment as a separate unit of accounting.When applying the relative selling price method, the Company determines the selling price for each deliverableusing vendor-specific objective evidence (VSOE) of the selling price, if it exists. In order to establish VSOE ofthe selling price, the Company must regularly sell the product and/or service on a standalone basis with asubstantial majority of the sales priced within a relatively narrow range. If VSOE of the selling price cannot bedetermined, the Company then considers third party evidence (TPE) of the selling price. Generally, the Companyis not able to determine TPE due to the lack of similar products and services sold by other companies within theindustry. If neither VSOE nor TPE exists, the Company determines the estimated selling price based on multiplefactors including, but not limited to, cost, gross margin, market conditions and pricing practices. Revenueallocated to each element is then recognized when the basic revenue recognition criteria is met for eachdeliverable.
The Company sells certain software products and related post-contract customer support. The Companyrecognizes revenue from software products when all of the following fundamental criteria are met: (i) persuasiveevidence of an arrangement exists, (ii) delivery has occurred, (iii) the price to the customer is fixed ordeterminable and (iv) collection of the resulting accounts receivable is probable. Revenue is allocated to
48

QLOGIC CORPORATION
NOTES TO CONSOLIDATED FINANCIAL STATEMENTS— (Continued)
undelivered elements based upon VSOE of the fair value of the element. VSOE of the fair value is based uponthe price charged when the element is sold separately. Revenue allocated to each element is then recognizedwhen the basic revenue recognition criteria are met for each element. If the Company is unable to determineVSOE of fair value for an undelivered element, the entire amount of revenue from the arrangement is deferredand recognized over the service period or when all elements have been delivered.
Stock-Based Compensation
The Company recognizes compensation expense for all stock-based awards made to employees and non-employee directors, including stock options, restricted stock units and stock purchases under its Employee StockPurchase Plan (the ESPP), based on estimated fair values on the measurement date, which is generally the date ofgrant. Stock-based compensation is recognized for the portion of the award that is ultimately expected to vest.Forfeitures are estimated at the time of grant based on historical trends and revised, if necessary, in subsequentperiods if actual forfeitures differ from those estimates. The Company recognizes stock-based compensationexpense for awards that are subject to only a service condition on a straight-line basis over the requisite serviceperiod for the entire award, which is the vesting period for stock options and restricted stock units, and theoffering period for the ESPP. For all other stock-based awards, stock-based compensation is recognized on astraight-line basis over the requisite service period for each separately vesting portion of the award. Thedetermination of fair value of stock-based awards on the date of grant using an option-pricing model is affectedby the Company’s stock price, as well as assumptions regarding a number of highly complex and subjectivevariables. These variables include, but are not limited to, the Company’s expected stock price volatility over theterm of the awards and actual and projected employee stock option exercise behaviors. In estimating expectedstock price volatility, the Company uses a combination of (i) historical volatility, calculated based on the dailyclosing prices of its common stock over a period equal to the expected term of the option, and (ii) impliedvolatility, utilizing market data of actively traded options on its common stock.
Research and Development
Research and development costs, including costs related to the development of new products and processtechnology, are expensed as incurred.
Advertising Costs
The Company expenses all advertising costs as incurred and such costs were not material to the consolidatedstatements of operations for all periods presented.
Income Taxes
The Company utilizes the asset and liability method of accounting for income taxes. Income tax positionstaken or expected to be taken in a tax return are recognized in the first reporting period that it is more likely thannot the tax position will be sustained upon examination. A tax position that meets the more-likely-than-notrecognition threshold is initially and subsequently measured as the largest amount of tax benefit that is greaterthan 50% likely of being realized upon settlement with a taxing authority that has full knowledge of all relevantinformation. Previously recognized income tax positions that fail to meet the recognition threshold in asubsequent period are derecognized in that period. Differences between actual results and the Company’sassumptions, or changes in its assumptions in future periods, are recorded in the period they become known. TheCompany records potential accrued interest and penalties related to unrecognized tax benefits in income taxexpense.
Deferred income taxes are recognized for the future tax consequences of temporary differences usingenacted statutory tax rates expected to apply to taxable income in the years in which those temporary differences
49
QLOGIC CORPORATION
NOTES TO CONSOLIDATED FINANCIAL STATEMENTS— (Continued)
are expected to be recovered or settled. Temporary differences include the difference between the financialstatement carrying amounts and the tax bases of existing assets and liabilities and operating loss and tax creditcarryforwards. The effect on deferred taxes of a change in tax rates is recognized in earnings in the period thatincludes the enactment date.
A valuation allowance is recorded when it is more likely than not that some or all of a deferred tax asset willnot be realized. In assessing the need for a valuation allowance, the Company considers all available evidence,including past operating results, estimates of future taxable income, and the feasibility of tax planning strategies.The Company’s estimates and projections require significant judgment and are subject to uncertainty due tovarious factors, including the economic environment, industry and market conditions, and the length of time ofthe projections included in the analyses.
Income from Continuing Operations per Share
The Company computes basic income (loss) from continuing operations per share based on the weighted-average number of common shares outstanding during the periods presented. Diluted income (loss) fromcontinuing operations per share is computed based on the weighted-average number of common and any dilutivepotential common shares outstanding using the treasury stock method. The Company has granted stock options,restricted stock units and other stock-based awards, which have been treated as dilutive potential common sharesin computing diluted income from continuing operations per share.
Concentration of Credit Risk
Financial instruments that potentially subject the Company to significant concentrations of credit riskconsist principally of cash equivalents, marketable securities and trade accounts receivable. Cash and cashequivalents are maintained with several financial institutions. Deposits held with banks may exceed the amountof insurance provided on such deposits.
The Company invests primarily in debt securities, the majority of which are high investment grade. Inaccordance with the Company’s investment policy, exposure to credit risk is limited by the diversification andinvestment in highly-rated securities.
The Company sells its products to OEMs and distributors throughout the world. As of March 30, 2014, andMarch 31, 2013 the Company had four customers that each individually accounted for 10% or more of theCompany’s accounts receivable. These customers, all of which were OEMs or manufacturing subcontractors ofservers and workstations, accounted for an aggregate of 71% and 74% of the Company’s accounts receivable asof March 30, 2014 and March 31, 2013, respectively. The Company performs ongoing credit evaluations of itscustomers’ financial condition and, generally, requires no collateral from its customers. Sales to customers aredenominated in U.S. dollars. As a result, the Company believes its foreign currency risk related to trade accountsreceivable is minimal.
Fair Value Measurements
Fair value is the exchange price that would be received for an asset or paid to transfer a liability (an exitprice) in the principal or most advantageous market for the asset or liability in an orderly transaction betweenmarket participants on the measurement date. Valuation techniques used to measure fair value must maximize theuse of observable inputs and minimize the use of unobservable inputs. The fair value hierarchy is based on threelevels of inputs that may be used to measure fair value. The first two levels of inputs are considered observableand the last unobservable. A description of the three levels of inputs is as follows:
• Level 1 — Quoted prices in active markets for identical assets or liabilities.
50

QLOGIC CORPORATION
NOTES TO CONSOLIDATED FINANCIAL STATEMENTS— (Continued)
• Level 2 — Inputs other than Level 1 that are observable, either directly or indirectly, such as quotedprices for similar assets or liabilities; quoted prices in markets that are not active; or other inputs thatare observable or can be corroborated by observable market data for substantially the full term of theassets or liabilities.
• Level 3 — Unobservable inputs that are supported by little or no market activity and that aresignificant to the fair value of the assets or liabilities.
Cash and Cash Equivalents
The Company considers all highly liquid investments purchased with original maturities of three months orless on their acquisition date to be cash equivalents. The carrying amounts of cash and cash equivalentsapproximate their fair values.
Marketable Securities
Marketable securities consist of available-for-sale securities and are classified in the consolidated balancesheets based on the nature of the security and the availability for use in current operations. Available-for-salesecurities are recorded at fair value based on quoted market prices or other observable inputs. Unrealized gainsand losses, net of related income taxes, on available-for-sale securities are excluded from earnings and reportedas a separate component of accumulated other comprehensive income until realized.
The Company recognizes an impairment charge on available-for-sale securities when the decline in the fairvalue of an investment below its cost basis is judged to be other-than-temporary. If the Company intends to sellthe security or it is more likely than not that it will be required to sell the security before recovery of itsamortized cost basis less any current-period credit loss, the Company would recognize the entire impairment inearnings. If the Company does not intend to sell the security and it is not more likely than not that it will berequired to sell the security before recovery of its amortized cost basis less any current-period credit loss, theother-than-temporary impairment is separated into (a) the amount representing the credit loss and (b) the amountrelated to all other factors. The amount of the other-than-temporary impairment related to the credit loss isrecognized in earnings. The amount of the other-than-temporary impairment related to other factors is recognizedin other comprehensive income, net of applicable taxes. The Company considers various factors in determiningwhether to recognize an impairment charge, including the current financial and credit market environment, thefinancial condition and near-term prospects of the issuer of the security, the magnitude of the unrealized losscompared to the cost of the investment, the length of time the investment has been in a loss position and theCompany’s intent and ability to hold the investment for a period of time sufficient to allow for any anticipatedrecovery of market value.
Realized gains or losses are determined on a specific identification basis and reported in interest and otherincome, net, as incurred.
Allowance for Doubtful Accounts
An allowance for doubtful accounts is maintained for estimated losses resulting from the inability of theCompany’s customers to make required payments. This reserve is determined by analyzing specific customeraccounts, applying estimated loss rates to the aging of remaining accounts receivable balances, and consideringthe impact of the current economic environment where appropriate.
Inventories
Inventories are stated at the lower of cost (first-in, first-out) or market. The Company writes down thecarrying value of inventory to estimated net realizable value for estimated excess and obsolete inventory based
51

QLOGIC CORPORATION
NOTES TO CONSOLIDATED FINANCIAL STATEMENTS— (Continued)
upon assumptions about future demand and market conditions. These assumptions are based on economicconditions and trends (both current and projected), anticipated customer demand and acceptance of theCompany’s current products, expected future products and other assumptions. Once the Company writes downthe carrying value of inventory, a new cost basis is established. Subsequent changes in facts and circumstancesdo not result in an increase in the newly-established cost basis.
Inventories acquired through business combinations are recorded at their acquisition date fair value, whichis generally estimated selling price less the costs of disposal and a normal profit allowance.
Property and Equipment
Property and equipment are stated at cost. Depreciation is calculated using the straight-line method overestimated useful lives of 39.5 years for buildings, five to fifteen years for building and land improvements, andtwo to five years for other property and equipment. Leasehold improvements are amortized on a straight-linebasis over the shorter of the lease term or the estimated useful life of the related asset.
Goodwill and Other Intangible Assets
Goodwill is recorded as the difference, if any, between the aggregate consideration paid for an acquisitionand the fair value of the net tangible and intangible assets acquired. The amounts and useful lives assigned tointangible assets acquired, other than goodwill, impact the amount and timing of future amortization. The amountassigned to in-process research and development is capitalized and accounted for as an indefinite-lived intangibleasset until the underlying projects are completed or abandoned.
Goodwill is not amortized but instead is tested at least annually for impairment, or more frequently whenevents or changes in circumstances indicate a potential impairment, by comparing the carrying value to the fairvalue of the reporting unit to which the goodwill is assigned. A two-step test is used to identify the potentialimpairment and to measure the amount of impairment, if any. The first step is to compare the fair value of thereporting unit with its carrying amount, including goodwill. If the fair value of the reporting unit is less than itscarrying amount, goodwill is considered impaired and the loss is measured by performing step two. Under steptwo, the impairment loss is measured by comparing the implied fair value of the reporting unit goodwill with thecarrying amount of that goodwill. Management determined that the Company has a single reporting unit for thepurpose of testing goodwill for impairment. The Company performs the annual test for impairment as of the firstday of its fourth fiscal quarter.
During the annual goodwill impairment test, the Company completed step one and determined that therewas no impairment of goodwill since the fair value (based on quoted market price) of the reporting unit exceededits carrying value.
Long-Lived Assets
Long-lived assets, including property and equipment and purchased intangible assets, are reviewed forimpairment whenever events or changes in circumstances indicate that the carrying amount of an asset or assetgroup may not be recoverable. Recoverability of assets to be held and used is measured by the comparison of thecarrying amount of an asset or asset group to future undiscounted net cash flows expected to be generated by theasset or asset group. If such an asset or asset group is considered to be impaired, the impairment to be recognizedis measured as the amount by which the carrying amount of the asset or asset group exceeds the fair value of theasset or asset group. Assets to be disposed of are reported at the lower of their carrying amount or fair value lesscosts to sell.
52

QLOGIC CORPORATION
NOTES TO CONSOLIDATED FINANCIAL STATEMENTS— (Continued)
Purchased intangible assets consist primarily of technology acquired in business acquisitions. Purchasedintangible assets that have definite lives are amortized using a method that reflects the pattern in which theeconomic benefits of the intangible assets are realized or, if that pattern cannot be reliably determined, using astraight-line method over the estimated useful lives of the related assets, generally ranging from three to sevenyears.
Debt Issuance Costs
Costs incurred in connection with the issuance of revolving credit facilities are capitalized and amortized tointerest expense on a straight-line basis over the term of the related agreement.
Warranty
The Company’s products typically carry a warranty for periods of up to five years. The Company records aliability for product warranty obligations in the period the related revenue is recorded based on historicalwarranty experience. Warranty expense and the corresponding liability were not material to the consolidatedfinancial statements for all periods presented.
Comprehensive Income
Comprehensive income (loss) includes all changes in equity other than transactions with stockholders. TheCompany’s accumulated other comprehensive income consists of unrealized gains and losses on available-for-sale securities, net of income taxes, and foreign currency translation adjustments.
Foreign Currency Translation
Certain of the Company’s foreign subsidiaries utilize a functional currency other than U.S. dollars. Assetsand liabilities of these subsidiaries are translated to U.S. dollars at exchange rates in effect at the balance sheetdate, and income and expenses are translated at average exchange rates during the period. The resultingtranslation adjustments are recorded as a component of accumulated other comprehensive income. Gains andlosses resulting from transactions denominated in currencies other than the functional currency are included ininterest and other income, net, and were not material to the consolidated statements of operations for all periodspresented.
Note 2. Business Acquisitions and License Agreement
Broadcom Corporation
On March 13, 2014, the Company acquired certain 10/40/100Gb Ethernet controller-related assets fromBroadcom Corporation (Broadcom) primarily relating to the NetXtreme® II Ethernet controller family andlicensed certain related intellectual property under non-exclusive licenses for total cash consideration of $147.8million and the assumption of certain liabilities. The transfer of certain property and equipment in a foreignjurisdiction is subject to local compliance requirements and is expected to be completed in fiscal 2015. Thisbusiness acquisition expands the Company’s product portfolio and is expected to accelerate its time to market fornext generation products in the server Ethernet connectivity market. In connection with this acquisition, theCompany entered into a development and supply agreement under which the Company will purchase servicesand ASICs from Broadcom related to this business.
The Company preliminarily estimated the fair value of the assets acquired and liabilities assumed andallocated a portion of the total purchase consideration to tangible and identifiable intangible assets acquired andliabilities assumed based on their respective estimated fair values at the acquisition date. The excess of the total
53
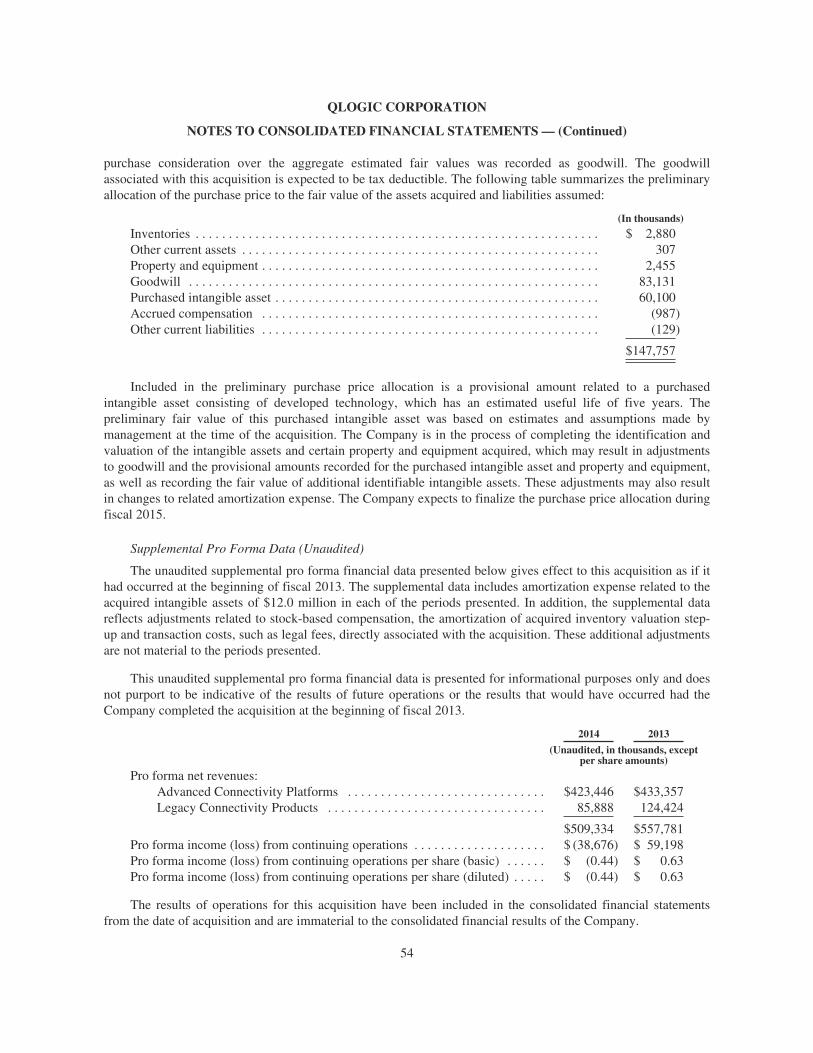
QLOGIC CORPORATION
NOTES TO CONSOLIDATED FINANCIAL STATEMENTS— (Continued)
purchase consideration over the aggregate estimated fair values was recorded as goodwill. The goodwillassociated with this acquisition is expected to be tax deductible. The following table summarizes the preliminaryallocation of the purchase price to the fair value of the assets acquired and liabilities assumed:
(In thousands)
Inventories . . . . . . . . . . . . . . . . . . . . . . . . . . . . . . . . . . . . . . . . . . . . . . . . . . . . . . . . . . . . . $ 2,880Other current assets . . . . . . . . . . . . . . . . . . . . . . . . . . . . . . . . . . . . . . . . . . . . . . . . . . . . . . 307Property and equipment . . . . . . . . . . . . . . . . . . . . . . . . . . . . . . . . . . . . . . . . . . . . . . . . . . . 2,455Goodwill . . . . . . . . . . . . . . . . . . . . . . . . . . . . . . . . . . . . . . . . . . . . . . . . . . . . . . . . . . . . . . 83,131Purchased intangible asset . . . . . . . . . . . . . . . . . . . . . . . . . . . . . . . . . . . . . . . . . . . . . . . . . 60,100Accrued compensation . . . . . . . . . . . . . . . . . . . . . . . . . . . . . . . . . . . . . . . . . . . . . . . . . . . (987)Other current liabilities . . . . . . . . . . . . . . . . . . . . . . . . . . . . . . . . . . . . . . . . . . . . . . . . . . . (129)
$147,757
Included in the preliminary purchase price allocation is a provisional amount related to a purchasedintangible asset consisting of developed technology, which has an estimated useful life of five years. Thepreliminary fair value of this purchased intangible asset was based on estimates and assumptions made bymanagement at the time of the acquisition. The Company is in the process of completing the identification andvaluation of the intangible assets and certain property and equipment acquired, which may result in adjustmentsto goodwill and the provisional amounts recorded for the purchased intangible asset and property and equipment,as well as recording the fair value of additional identifiable intangible assets. These adjustments may also resultin changes to related amortization expense. The Company expects to finalize the purchase price allocation duringfiscal 2015.
Supplemental Pro Forma Data (Unaudited)
The unaudited supplemental pro forma financial data presented below gives effect to this acquisition as if ithad occurred at the beginning of fiscal 2013. The supplemental data includes amortization expense related to theacquired intangible assets of $12.0 million in each of the periods presented. In addition, the supplemental datareflects adjustments related to stock-based compensation, the amortization of acquired inventory valuation step-up and transaction costs, such as legal fees, directly associated with the acquisition. These additional adjustmentsare not material to the periods presented.
This unaudited supplemental pro forma financial data is presented for informational purposes only and doesnot purport to be indicative of the results of future operations or the results that would have occurred had theCompany completed the acquisition at the beginning of fiscal 2013.
2014 2013
(Unaudited, in thousands, exceptper share amounts)
Pro forma net revenues:Advanced Connectivity Platforms . . . . . . . . . . . . . . . . . . . . . . . . . . . . . . $423,446 $433,357Legacy Connectivity Products . . . . . . . . . . . . . . . . . . . . . . . . . . . . . . . . . 85,888 124,424
$509,334 $557,781Pro forma income (loss) from continuing operations . . . . . . . . . . . . . . . . . . . . $ (38,676) $ 59,198Pro forma income (loss) from continuing operations per share (basic) . . . . . . $ (0.44) $ 0.63Pro forma income (loss) from continuing operations per share (diluted) . . . . . $ (0.44) $ 0.63
The results of operations for this acquisition have been included in the consolidated financial statementsfrom the date of acquisition and are immaterial to the consolidated financial results of the Company.
54
QLOGIC CORPORATION
NOTES TO CONSOLIDATED FINANCIAL STATEMENTS— (Continued)
Patent License Agreement
On March 13, 2014, the Company entered into a non-exclusive patent license agreement with Broadcom andpaid a one-time fee of $62.0 million as specified in the agreement. The license covers all of the Company’s FibreChannel products. The Company determined that the $62.0 million fee represented the estimated fair value of thelicense utilizing a market approach, as well as a relief-from-royalty income approach based on the applicablehistorical revenues and projected future revenues over the ten-year term of the license. Based on the relief-from-royalty income approach, the Company attributed $41.0 million of the license fee to the use of the relatedtechnology in periods prior to the date of the license agreement and recorded this amount in special charges infiscal 2014. The portion of the fee attributed to the future use of the technology was $21.0 million and wasrecorded as a prepaid license in other assets. The prepaid license is being amortized using a method that reflectsthe pattern in which the economic benefits of the prepaid license are consumed or otherwise used over the ten-year license term. During fiscal 2014, the Company recognized $0.1 million of amortization expense related tothe prepaid license.
Multiple Element Arrangement
The Company accounted for the acquisition of the Ethernet controller-related assets (which included adevelopment and supply agreement and a transition services agreement) and the patent license agreement as amultiple element arrangement, since these agreements were entered into between the parties within a short periodof time. In a multiple element arrangement, the fair value of the individual components is determined and thetotal consideration is allocated to the components on a relative fair value basis. The Company determined that thefair value of each of the acquisition and the patent license were consistent with the consideration specified in therespective agreements.
Brocade Communications Systems, Inc.
On January 17, 2014, the Company acquired the assets of the Fibre Channel and converged network adapterbusiness from Brocade Communications Systems, Inc. (Brocade) for cash consideration of $9.6 million and theassumption of certain liabilities. The Company completed this acquisition to expand its product portfolio andmarket position in the Fibre Channel and converged network adapter market. The Company estimated the fairvalue of the assets acquired and liabilities assumed and allocated the total purchase consideration to tangible andidentifiable intangible assets acquired and liabilities assumed based on their respective estimated fair values atthe acquisition date. The primary components of the purchase price allocation are an intangible asset of $8.0million, consisting of developed technology, and inventory of $1.7 million. The intangible asset is beingamortized over an estimated useful life of three years using a method that reflects the pattern in which theeconomic benefits of the intangible asset are utilized.
The results of operations for this acquisition have been included in the consolidated financial statementsfrom the date of acquisition and are immaterial to the consolidated financial results of the Company. Pro formaresults of operations have not been presented for this acquisition as the results of operations of the acquiredbusiness are not material to the consolidated financial statements of the Company.
Note 3. Discontinued Operations
On February 29, 2012, the Company completed the sale of the product lines and certain assets associatedwith its InfiniBand business to Intel Corporation and received $125.0 million in cash. In addition, Intel agreed toassume certain liabilities related to the IB Business. The assets sold consisted primarily of intellectual property,inventories and property and equipment. The Company allocated $8.8 million of the carrying value of itsgoodwill to the IB Business and wrote off this amount as part of the sale. The allocated amount was determinedon a pro rata basis based on the consideration received from the sale of the IB Business and the fair value of the
55

QLOGIC CORPORATION
NOTES TO CONSOLIDATED FINANCIAL STATEMENTS— (Continued)
reporting unit as of the date the IB Business was sold. In connection with this divestiture, the Companyrecognized a gain on the sale of the IB Business of $103.5 million.
Income from discontinued operations consists of direct revenues and direct expenses of the IB Business,including cost of revenues, as well as other fixed and allocated costs to the extent that such costs were eliminatedas a result of the transaction. General corporate overhead costs have not been allocated to discontinuedoperations. A summary of the operating results of the IB Business included in discontinued operations in theconsolidated statements of operations is as follows:
2013 2012
(In thousands)
Net revenues . . . . . . . . . . . . . . . . . . . . . . . . . . . . . . . . . . . . . . . . . . . . . . . . . . . . . $ 421 $36,199Loss from operations before income taxes . . . . . . . . . . . . . . . . . . . . . . . . . . . . . . $ (690) $ (2,913)
Note 4. Marketable Securities
The Company’s portfolio of available-for-sale marketable securities consists of the following:
AmortizedCost
GrossUnrealized
Gains
GrossUnrealizedLosses
EstimatedFair Value
(In thousands)
March 30, 2014U.S. government and agency securities . . . . . . . . . . $ 49,237 $ 16 $ (55) $ 49,198Corporate debt obligations . . . . . . . . . . . . . . . . . . . 74,386 200 (72) 74,514Mortgage-backed securities . . . . . . . . . . . . . . . . . . . 32,778 191 (187) 32,782Municipal bonds . . . . . . . . . . . . . . . . . . . . . . . . . . . 24,989 133 (9) 25,113Other debt securities . . . . . . . . . . . . . . . . . . . . . . . . 5,178 3 (5) 5,176
$186,568 $ 543 $ (328) $186,783
March 31, 2013U.S. government and agency securities . . . . . . . . . . $113,033 $ 327 $ (1) $113,359Corporate debt obligations . . . . . . . . . . . . . . . . . . . 153,460 1,429 (30) 154,859Mortgage-backed securities . . . . . . . . . . . . . . . . . . . 50,852 473 (44) 51,281Municipal bonds . . . . . . . . . . . . . . . . . . . . . . . . . . . 39,661 211 — 39,872Other debt securities . . . . . . . . . . . . . . . . . . . . . . . . 602 1 — 603
$357,608 $ 2,441 $ (75) $359,974
The amortized cost and estimated fair value of debt securities as of March 30, 2014, by contractual maturity,are presented below. Expected maturities will differ from contractual maturities because the issuers of securitiesmay have the right to repay obligations without prepayment penalties. Certain debt instruments, althoughpossessing a contractual maturity greater than one year, are classified as short-term marketable securities basedon their ability to be traded on active markets and availability for current operations.
AmortizedCost
EstimatedFair Value
(In thousands)
Due in one year or less . . . . . . . . . . . . . . . . . . . . . . . . . . . . . . . . . . . . . . . . . . . $ 25,933 $ 25,953Due after one year through three years . . . . . . . . . . . . . . . . . . . . . . . . . . . . . . . 118,551 118,756Due after three years through five years . . . . . . . . . . . . . . . . . . . . . . . . . . . . . . 18,255 18,205Due after five years . . . . . . . . . . . . . . . . . . . . . . . . . . . . . . . . . . . . . . . . . . . . . . 23,829 23,869
$186,568 $186,783
56

QLOGIC CORPORATION
NOTES TO CONSOLIDATED FINANCIAL STATEMENTS— (Continued)
The following table presents the Company’s marketable securities with unrealized losses by investmentcategory and length of time that individual securities have been in a continuous unrealized loss position as ofMarch 30, 2014 and March 31, 2013.
Less Than 12 Months 12 Months or Greater Total
Description of SecuritiesFairValue
UnrealizedLosses
FairValue
UnrealizedLosses
FairValue
UnrealizedLosses
(In thousands)
March 30, 2014U.S. government and agency securities . . . . $26,879 $ (55) $ — $ — $26,879 $ (55)Corporate debt obligations . . . . . . . . . . . . . . 19,906 (72) — — 19,906 (72)Mortgage-backed securities . . . . . . . . . . . . . 11,261 (145) 2,838 (42) 14,099 (187)Municipal bonds . . . . . . . . . . . . . . . . . . . . . . 3,322 (9) — — 3,322 (9)Other debt securities . . . . . . . . . . . . . . . . . . . 2,955 (5) — — 2,955 (5)
$64,323 $ (286) $ 2,838 $ (42) $67,161 $ (328)
March 31, 2013U.S. government and agency securities . . . . $ 4,502 $ (1) $ — $ — $ 4,502 $ (1)Corporate debt obligations . . . . . . . . . . . . . . 24,203 (30) — — 24,203 (30)Mortgage-backed securities . . . . . . . . . . . . . 10,048 (44) — — 10,048 (44)
$38,753 $ (75) $ — $ — $38,753 $ (75)
As of March 30, 2014 and March 31, 2013, the fair value of certain of the Company’s available-for-salesecurities was less than their cost basis. Management reviewed various factors in determining whether torecognize an impairment charge related to these unrealized losses, including the current financial and creditmarket environment, the financial condition and near-term prospects of the issuer of the security, the magnitudeof the unrealized loss compared to the cost of the investment, the length of time the investment had been in a lossposition and the Company’s intent and ability to hold the investment for a period of time sufficient to allow forany anticipated recovery of market value. As of March 30, 2014 and March 31, 2013, the Company determinedthat the unrealized losses were temporary in nature and recorded them as a component of accumulated othercomprehensive income.
Realized gains and losses reclassified from accumulated other comprehensive income are included ininterest and other income, net, in the consolidated statements of operations.
Note 5. Fair Value of Financial Instruments
The Company’s financial instruments consist principally of cash and cash equivalents, marketablesecurities, accounts receivable and accounts payable. The carrying value of accounts receivable and accountspayable approximates fair value.
57
QLOGIC CORPORATION
NOTES TO CONSOLIDATED FINANCIAL STATEMENTS— (Continued)
A summary of the assets measured at fair value on a recurring basis as of March 30, 2014 and March 31,2013 is as follows:
Fair Value Measurements Using
Level 1 Level 2 Total
(In thousands)
March 30, 2014Cash and cash equivalents . . . . . . . . . . . . . . . . . . . . . . . . . . . . . . $ 91,258 $ — $ 91,258
Marketable securities:U.S. government and agency securities . . . . . . . . . . . . . . . . 49,198 — 49,198Corporate debt obligations . . . . . . . . . . . . . . . . . . . . . . . . . . — 74,514 74,514Mortgage-backed securities . . . . . . . . . . . . . . . . . . . . . . . . . — 32,782 32,782Municipal bonds . . . . . . . . . . . . . . . . . . . . . . . . . . . . . . . . . . — 25,113 25,113Other debt securities . . . . . . . . . . . . . . . . . . . . . . . . . . . . . . . — 5,176 5,176
49,198 137,585 186,783
$140,456 $137,585 $278,041
March 31, 2013Cash and cash equivalents . . . . . . . . . . . . . . . . . . . . . . . . . . . . . . $ 95,098 $ 434 $ 95,532
Marketable securities:U.S. government and agency securities . . . . . . . . . . . . . . . . 113,359 — 113,359Corporate debt obligations . . . . . . . . . . . . . . . . . . . . . . . . . . — 154,859 154,859Mortgage-backed securities . . . . . . . . . . . . . . . . . . . . . . . . . — 51,281 51,281Municipal bonds . . . . . . . . . . . . . . . . . . . . . . . . . . . . . . . . . . — 39,872 39,872Other debt securities . . . . . . . . . . . . . . . . . . . . . . . . . . . . . . . — 603 603
113,359 246,615 359,974
$208,457 $247,049 $455,506
The Company’s investments classified within Level 2 were primarily valued based on valuations obtainedfrom a third-party pricing service. To estimate fair value, the pricing service utilizes industry-standard valuationmodels, including both income and market-based approaches for which all significant inputs are observableeither directly or indirectly. The Company obtained documentation from the pricing service as to themethodology and summary of inputs used for the various types of securities. The pricing service maximizes theuse of relevant observable inputs and minimizes the use of unobservable inputs. These observable inputs includereported trades and broker/dealer quotes of the same or similar securities, issuer credit spreads, benchmarksecurities and other observable inputs. The Company compares valuation information from the pricing servicewith other pricing sources to validate the reasonableness of the valuations.
Note 6. Inventories
Components of inventories are as follows:
2014 2013
(In thousands)
Raw materials . . . . . . . . . . . . . . . . . . . . . . . . . . . . . . . . . . . . . . . . . . . . . . . . . . . . $ 2,041 $ 2,039Finished goods . . . . . . . . . . . . . . . . . . . . . . . . . . . . . . . . . . . . . . . . . . . . . . . . . . . . 15,995 18,121
$18,036 $20,160
58

QLOGIC CORPORATION
NOTES TO CONSOLIDATED FINANCIAL STATEMENTS— (Continued)
Note 7. Property and Equipment
Components of property and equipment are as follows:
2014 2013
(In thousands)
Land . . . . . . . . . . . . . . . . . . . . . . . . . . . . . . . . . . . . . . . . . . . . . . . . . . . . . . . . . . $ 14,656 $ 14,656Buildings and improvements . . . . . . . . . . . . . . . . . . . . . . . . . . . . . . . . . . . . . . . 47,629 46,462Production and test equipment . . . . . . . . . . . . . . . . . . . . . . . . . . . . . . . . . . . . . 219,416 220,130Furniture and fixtures . . . . . . . . . . . . . . . . . . . . . . . . . . . . . . . . . . . . . . . . . . . . 8,338 7,986
290,039 289,234Less accumulated depreciation and amortization . . . . . . . . . . . . . . . . . . . . . . . 205,127 192,898
$ 84,912 $ 96,336
Note 8. Purchased Intangible Assets
Purchased intangible assets consist of the following:
March 30, 2014 March 31, 2013
GrossCarryingValue
AccumulatedAmortization
NetCarryingValue
GrossCarryingValue
AccumulatedAmortization
NetCarryingValue
(In thousands)
Acquisition-related intangibles:Developed technology . . . . . . . . . . . . $73,461 $ 4,957 $68,504 $ 5,400 $ 3,021 $ 2,379Other . . . . . . . . . . . . . . . . . . . . . . . . . . 1,010 993 17 1,010 791 219
74,471 5,950 68,521 6,410 3,812 2,598Other purchased intangibles:
Technology-related . . . . . . . . . . . . . . . 2,819 1,437 1,382 2,713 1,257 1,456
$77,290 $ 7,387 $69,903 $ 9,123 $ 5,069 $ 4,054
A summary of the amortization expense, by classification, included in the consolidated statements ofoperations is as follows:
2014 2013 2012
(In thousands)
Continuing operations — cost of revenues . . . . . . . . . . . . . . . . . . . . . . . $2,387 $1,223 $1,023Discontinued operations . . . . . . . . . . . . . . . . . . . . . . . . . . . . . . . . . . . . . . — — 3,160
$2,387 $1,223 $4,183
59
QLOGIC CORPORATION
NOTES TO CONSOLIDATED FINANCIAL STATEMENTS— (Continued)
The following table presents the estimated future amortization expense of purchased intangible assets as ofMarch 30, 2014:
Fiscal
(In thousands)
2015 . . . . . . . . . . . . . . . . . . . . . . . . . . . . . . . . . . . . . . . . . . . . . . . . . . . . . . . . . . . . . . . . . . $16,4522016 . . . . . . . . . . . . . . . . . . . . . . . . . . . . . . . . . . . . . . . . . . . . . . . . . . . . . . . . . . . . . . . . . . 15,6002017 . . . . . . . . . . . . . . . . . . . . . . . . . . . . . . . . . . . . . . . . . . . . . . . . . . . . . . . . . . . . . . . . . . 13,7932018 . . . . . . . . . . . . . . . . . . . . . . . . . . . . . . . . . . . . . . . . . . . . . . . . . . . . . . . . . . . . . . . . . . 12,2792019 . . . . . . . . . . . . . . . . . . . . . . . . . . . . . . . . . . . . . . . . . . . . . . . . . . . . . . . . . . . . . . . . . . 11,779
$69,903
Note 9. Revolving Credit Facility
In March 2013, the Company entered into a credit agreement (the Credit Agreement) which provides theCompany with a $125.0 million unsecured revolving credit facility that matures in March 2018. Borrowingsunder the Credit Agreement may be used for general corporate purposes, including permitted share repurchasesand acquisitions. Under the Credit Agreement, the Company may increase the revolving commitments or obtainincremental term loans in an aggregate amount up to $100.0 million, subject to certain conditions.
Borrowings under the credit facility bear interest, at the Company’s option, at either a rate equal to (i) a baserate described in the Credit Agreement plus an applicable margin based on the Company’s leverage ratio(varying from 0.25% to 1.00%) or (ii) an adjusted LIBO rate described in the Credit Agreement plus anapplicable margin based on the Company’s leverage ratio (varying from 1.25% to 2.00%). The credit facility alsocarries a commitment fee equal to the available but unused borrowing multiplied by an applicable margin basedon the Company’s leverage ratio and the average daily used amount of the commitments (varying from 0.20% to0.35%).
The Credit Agreement includes financial covenants requiring a maximum leverage ratio, a minimum fixedcharge coverage ratio and a minimum liquidity. The Credit Agreement also contains other customary affirmativeand negative covenants and events of default.
There were no borrowings outstanding under the Credit Agreement as of March 30, 2014.
Note 10. Stockholders’ Equity
Capital Stock
The Company’s authorized capital consists of 1 million shares of preferred stock, par value $0.001 pershare, and 500 million shares of common stock, par value $0.001 per share. As of March 30, 2014 and March 31,2013, the Company had 213.8 million and 212.1 million shares of common stock issued, respectively. As ofMarch 30, 2014, 27.8 million shares of common stock were reserved for the exercise of issued and unissuedstock-based awards and 2.5 million shares were reserved for issuance in connection with the Company’sEmployee Stock Purchase Plan.
Treasury Stock
Since fiscal 2003, the Company has had various stock repurchase programs that authorized the purchase ofthe Company’s outstanding common stock. During fiscal 2014, the Company purchased 4.4 million shares of its
60
QLOGIC CORPORATION
NOTES TO CONSOLIDATED FINANCIAL STATEMENTS— (Continued)
common stock for an aggregate purchase price of $46.6 million. During fiscal 2013, the Company purchased10.3 million shares of its common stock for an aggregate purchase price of $130.4 million. As of March 30,2014, the Company had purchased a total of 126.6 million shares of common stock under these repurchaseprograms for an aggregate purchase price of $1.94 billion. The Company’s most recent stock repurchase programexpired during fiscal 2014.
Repurchased shares have been recorded as treasury shares and will be held unless and until the Company’sBoard of Directors designates that these shares be retired or used for other purposes.
Note 11. Stock-Based Compensation
Employee Stock Purchase Plan
The Company has an Employee Stock Purchase Plan (the ESPP) that operates in accordance withSection 423 of the Internal Revenue Code. The ESPP is administered by the Compensation Committee of theBoard of Directors. Under the ESPP, employees of the Company who elect to participate are granted options topurchase common stock at a 15% discount from the lower of the market value of the common stock at thebeginning or end of each offering period. The ESPP permits an enrolled employee to make contributions topurchase shares of common stock, in an amount between 1% and 10% of compensation, subject to limitsspecified in the Internal Revenue Code. The total number of shares issued under the ESPP was 836,000, 740,000and 556,000 during fiscal 2014, 2013 and 2012, respectively.
Stock Incentive Compensation Plans
The Company may grant stock-based awards to employees and directors under the QLogic 2005Performance Incentive Plan (the 2005 Plan). Shares available for future grant were 12.6 million under the 2005Plan as of March 30, 2014. Prior to the adoption of the 2005 Plan in August 2005, the Company granted optionsto purchase shares of the Company’s common stock to employees and directors under certain predecessor stockplans. No further awards can be granted under these predecessor plans.
The 2005 Plan provides for the issuance of incentive and non-qualified stock options, restricted stock unitsand other stock-based incentive awards for employees. The 2005 Plan permits the Compensation Committee ofthe Board of Directors to select eligible employees to receive awards and to determine the terms and conditionsof awards. In general, stock options granted to employees have ten-year terms and vest over four years from thedate of grant. Restricted stock units represent a right to receive a share of stock at a future vesting date with nocash payment from the holder. In general, restricted stock units granted to employees subject to only a servicecondition vest over four years from the date of grant. Restricted stock units granted to certain senior executivessubject to a service and either a performance or market condition vest over three or four years.
Under the terms of the 2005 Plan, as amended, non-employee directors receive grants of stock-based awardsupon initial election or appointment to the Board of Directors and upon annual reelection to the Board. The targetfair value of such grants is determined by reference to the equity compensation for non-employee directors of theCompany’s peer group of companies. The target value is then allocated 50% to a restricted stock unit award and50% to a non-qualified stock option grant in the case of the initial grant and allocated 70% to a restricted stockunit award and 30% to a non-qualified stock option grant in the case of the annual grant. All stock-based awardsgranted to non-employee directors have ten-year terms and vest from one to three years from the date of grant.
61
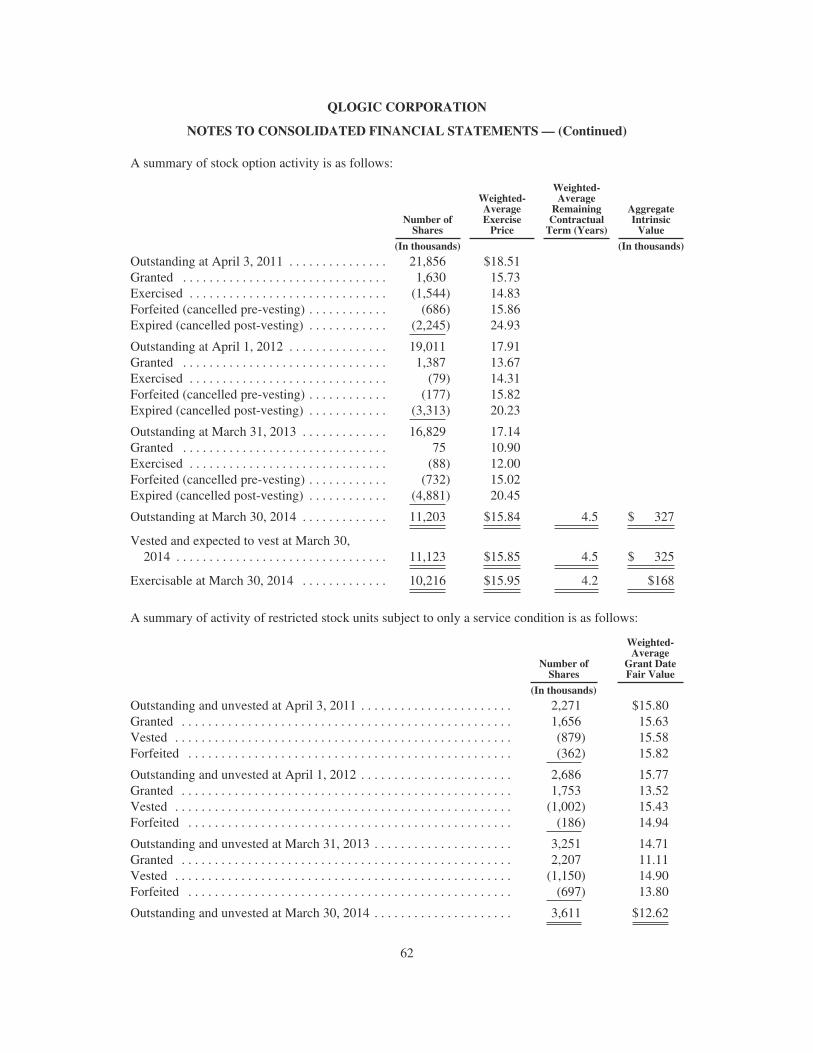
QLOGIC CORPORATION
NOTES TO CONSOLIDATED FINANCIAL STATEMENTS— (Continued)
A summary of stock option activity is as follows:
Number ofShares
Weighted-AverageExercisePrice
Weighted-Average
RemainingContractualTerm (Years)
AggregateIntrinsicValue
(In thousands) (In thousands)
Outstanding at April 3, 2011 . . . . . . . . . . . . . . . 21,856 $18.51Granted . . . . . . . . . . . . . . . . . . . . . . . . . . . . . . . 1,630 15.73Exercised . . . . . . . . . . . . . . . . . . . . . . . . . . . . . . (1,544) 14.83Forfeited (cancelled pre-vesting) . . . . . . . . . . . . (686) 15.86Expired (cancelled post-vesting) . . . . . . . . . . . . (2,245) 24.93
Outstanding at April 1, 2012 . . . . . . . . . . . . . . . 19,011 17.91Granted . . . . . . . . . . . . . . . . . . . . . . . . . . . . . . . 1,387 13.67Exercised . . . . . . . . . . . . . . . . . . . . . . . . . . . . . . (79) 14.31Forfeited (cancelled pre-vesting) . . . . . . . . . . . . (177) 15.82Expired (cancelled post-vesting) . . . . . . . . . . . . (3,313) 20.23
Outstanding at March 31, 2013 . . . . . . . . . . . . . 16,829 17.14Granted . . . . . . . . . . . . . . . . . . . . . . . . . . . . . . . 75 10.90Exercised . . . . . . . . . . . . . . . . . . . . . . . . . . . . . . (88) 12.00Forfeited (cancelled pre-vesting) . . . . . . . . . . . . (732) 15.02Expired (cancelled post-vesting) . . . . . . . . . . . . (4,881) 20.45
Outstanding at March 30, 2014 . . . . . . . . . . . . . 11,203 $15.84 4.5 $ 327
Vested and expected to vest at March 30,2014 . . . . . . . . . . . . . . . . . . . . . . . . . . . . . . . . 11,123 $15.85 4.5 $ 325
Exercisable at March 30, 2014 . . . . . . . . . . . . . 10,216 $15.95 4.2 $168
A summary of activity of restricted stock units subject to only a service condition is as follows:
Number ofShares
Weighted-Average
Grant DateFair Value
(In thousands)
Outstanding and unvested at April 3, 2011 . . . . . . . . . . . . . . . . . . . . . . . 2,271 $15.80Granted . . . . . . . . . . . . . . . . . . . . . . . . . . . . . . . . . . . . . . . . . . . . . . . . . . 1,656 15.63Vested . . . . . . . . . . . . . . . . . . . . . . . . . . . . . . . . . . . . . . . . . . . . . . . . . . . (879) 15.58Forfeited . . . . . . . . . . . . . . . . . . . . . . . . . . . . . . . . . . . . . . . . . . . . . . . . . (362) 15.82
Outstanding and unvested at April 1, 2012 . . . . . . . . . . . . . . . . . . . . . . . 2,686 15.77Granted . . . . . . . . . . . . . . . . . . . . . . . . . . . . . . . . . . . . . . . . . . . . . . . . . . 1,753 13.52Vested . . . . . . . . . . . . . . . . . . . . . . . . . . . . . . . . . . . . . . . . . . . . . . . . . . . (1,002) 15.43Forfeited . . . . . . . . . . . . . . . . . . . . . . . . . . . . . . . . . . . . . . . . . . . . . . . . . (186) 14.94
Outstanding and unvested at March 31, 2013 . . . . . . . . . . . . . . . . . . . . . 3,251 14.71Granted . . . . . . . . . . . . . . . . . . . . . . . . . . . . . . . . . . . . . . . . . . . . . . . . . . 2,207 11.11Vested . . . . . . . . . . . . . . . . . . . . . . . . . . . . . . . . . . . . . . . . . . . . . . . . . . . (1,150) 14.90Forfeited . . . . . . . . . . . . . . . . . . . . . . . . . . . . . . . . . . . . . . . . . . . . . . . . . (697) 13.80
Outstanding and unvested at March 30, 2014 . . . . . . . . . . . . . . . . . . . . . 3,611 $12.62
62

QLOGIC CORPORATION
NOTES TO CONSOLIDATED FINANCIAL STATEMENTS— (Continued)
The table above includes 477,000 restricted stock units granted to employees that joined the Company inconnection with acquisitions in fiscal 2014.
A summary of activity of restricted stock units subject to a service condition and either a performance ormarket condition is as follows:
Number ofShares
Weighted-Average
Grant DateFair Value
(In thousands)
Outstanding and unvested at April 3, 2011 . . . . . . . . . . . . . . . . . . . . . . . — $ —Granted . . . . . . . . . . . . . . . . . . . . . . . . . . . . . . . . . . . . . . . . . . . . . . . . . . 163 13.85Vested . . . . . . . . . . . . . . . . . . . . . . . . . . . . . . . . . . . . . . . . . . . . . . . . . . . — —Forfeited . . . . . . . . . . . . . . . . . . . . . . . . . . . . . . . . . . . . . . . . . . . . . . . . . (8) 13.85
Outstanding and unvested at April 1, 2012 . . . . . . . . . . . . . . . . . . . . . . . 155 13.85Granted . . . . . . . . . . . . . . . . . . . . . . . . . . . . . . . . . . . . . . . . . . . . . . . . . . 179 14.10Vested . . . . . . . . . . . . . . . . . . . . . . . . . . . . . . . . . . . . . . . . . . . . . . . . . . . (36) 13.85Forfeited . . . . . . . . . . . . . . . . . . . . . . . . . . . . . . . . . . . . . . . . . . . . . . . . . (9) 13.85
Outstanding and unvested at March 31, 2013 . . . . . . . . . . . . . . . . . . . . . 289 14.01Granted . . . . . . . . . . . . . . . . . . . . . . . . . . . . . . . . . . . . . . . . . . . . . . . . . . 374 11.67Vested . . . . . . . . . . . . . . . . . . . . . . . . . . . . . . . . . . . . . . . . . . . . . . . . . . . (60) 13.97Forfeited . . . . . . . . . . . . . . . . . . . . . . . . . . . . . . . . . . . . . . . . . . . . . . . . . (180) 13.86
Outstanding and unvested at March 30, 2014 . . . . . . . . . . . . . . . . . . . . . 423 $12.02
During fiscal 2014, 2013 and 2012, the Company issued 717,000, 638,000 and 546,000 shares of commonstock, respectively, in connection with the vesting of restricted stock units. The difference between the number ofrestricted stock units vested and the shares of common stock issued is the result of restricted stock units withheldin satisfaction of minimum tax withholding obligations associated with the vesting.
Stock-Based Compensation Expense
A summary of stock-based compensation expense, by functional line item in the consolidated statements ofoperations, is as follows:
2014 2013 2012
(In thousands)
Cost of revenues . . . . . . . . . . . . . . . . . . . . . . . . . . . . . . . . . . . . . . . . . $ 1,349 $ 2,372 $ 2,506Engineering and development . . . . . . . . . . . . . . . . . . . . . . . . . . . . . . 10,918 13,584 14,199Sales and marketing . . . . . . . . . . . . . . . . . . . . . . . . . . . . . . . . . . . . . . 5,337 6,853 6,667General and administrative . . . . . . . . . . . . . . . . . . . . . . . . . . . . . . . . 5,034 7,554 8,316
Total continuing operations . . . . . . . . . . . . . . . . . . . . . . . . . . . . 22,638 30,363 31,688Discontinued operations . . . . . . . . . . . . . . . . . . . . . . . . . . . . . . . . . . . — — 904
$22,638 $30,363 $32,592
63

QLOGIC CORPORATION
NOTES TO CONSOLIDATED FINANCIAL STATEMENTS— (Continued)
The fair value of stock options granted and shares to be purchased under the ESPP have been estimated atthe date of grant using a Black-Scholes option-pricing model. The weighted-average fair values and underlyingassumptions are as follows:
2014 2013 2012
StockOptions
Employee StockPurchase Plan
StockOptions
Employee StockPurchase Plan
StockOptions
Employee StockPurchase Plan
Fair value . . . . . . . . . . . . $4.12 $2.41 $4.97 $2.66 $5.73 $3.49Expected volatility . . . . . 36% 32% 38% 36% 36% 36%Risk-free interest rate . . . 1.6% 0.1% 0.9% 0.1% 1.8% 0.1%Expected life (years) . . . 6.2 0.3 5.5 0.25 5.5 0.25Dividend yield . . . . . . . . — — — — — —
Restricted stock units granted subject to either (i) a service condition only, or (ii) service and performanceconditions, are valued based on the closing market price on the date of grant. Restricted stock units granted withservice and market conditions are valued based on a Monte Carlo simulation model on the date of grant.
The Company recognized tax benefits related to stock-based compensation expense for fiscal 2014, 2013and 2012 of $6.2 million, $7.9 million and $7.7 million, respectively. Stock-based compensation costs capitalizedas part of the cost of assets were not material for all periods presented.
As of March 30, 2014, there was $45.3 million of total unrecognized compensation costs related tooutstanding stock-based awards. These costs are expected to be recognized over a weighted-average period of 2.5years.
During fiscal 2014, 2013 and 2012, the grant date fair value of options vested totaled $7.7 million, $12.1million and $16.5 million, respectively. The intrinsic value of options exercised during fiscal 2014, 2013 and2012 totaled $0.1 million, $0.2 million and $3.8 million, respectively. Intrinsic value of options exercised iscalculated as the difference between the market price on the date of exercise and the exercise price multiplied bythe number of options exercised.
The fair value of restricted stock units vested during fiscal 2014, 2013 and 2012 totaled $11.7 million, $14.6million and $14.4 million, respectively.
The Company currently issues new shares to deliver common stock under its stock-based award plans.
Note 12. Employee Retirement Savings Plan
The Company has established a pretax savings plan under Section 401(k) of the Internal Revenue Code forsubstantially all U.S. employees. Under the plan, eligible employees are able to contribute up to 50% of theircompensation, subject to limits specified in the Internal Revenue Code. In fiscal 2013, the Company beganmatching contributions up to 2% of a participant’s compensation. Additionally, the Company periodicallyauthorizes discretionary contributions to the plan. The Company’s matching and discretionary contributions onbehalf of its employees totaled $1.8 million, $1.2 million and $1.1 million in fiscal 2014, 2013 and 2012,respectively.
The Company also maintains retirement plans in certain non-U.S. locations. The total expense and totalobligation of the Company for these plans were not material to the consolidated financial statements for allperiods presented.
64

QLOGIC CORPORATION
NOTES TO CONSOLIDATED FINANCIAL STATEMENTS— (Continued)
Note 13. Special Charges
A summary of the special charges recorded during fiscal 2014 is as follows:
(In thousands)
Patent license (Note 2) . . . . . . . . . . . . . . . . . . . . . . . . . . . . . . . . . . . . . . . . . . . . . . . . . . . $41,040Exit costs . . . . . . . . . . . . . . . . . . . . . . . . . . . . . . . . . . . . . . . . . . . . . . . . . . . . . . . . . . . . . . 26,491Asset impairments . . . . . . . . . . . . . . . . . . . . . . . . . . . . . . . . . . . . . . . . . . . . . . . . . . . . . . . 7,322
$74,853
March 2014 Initiative
In March 2014, the Company implemented a restructuring plan (March 2014 Initiative) primarily designedto consolidate its Ethernet product roadmap following the acquisition of the Ethernet controller-related assetsfrom Broadcom (Note 2). This restructuring plan primarily includes a workforce reduction and the consolidationand elimination of certain engineering activities. The Company expects to incur approximately $1 million ofadditional exit costs, primarily related to severance costs for workforce reductions. The Company expects tosubstantially complete these restructuring activities during the first quarter of fiscal 2015.
During the fourth quarter of fiscal 2014, the Company recorded special charges of $14.0 million inconnection with the March 2014 Initiative, consisting of $9.1 million of exit costs and $4.9 million of assetimpairment charges primarily related to abandoned property and equipment. The exit costs include severance andrelated costs associated with involuntarily terminated employees and the costs associated with the cancellation ofcertain contracts.
Activity and liability balances for exit costs related to the March 2014 Initiative are as follows:
WorkforceReduction
ContractCancellationand Other Total
(In thousands)
Charged to costs and expenses . . . . . . . . . . . . . . . . . . . . . . . . . . . $ 4,789 $4,325 $ 9,114Payments . . . . . . . . . . . . . . . . . . . . . . . . . . . . . . . . . . . . . . . . . . . . (1,612) (14) (1,626)
Balance as of March 30, 2014 . . . . . . . . . . . . . . . . . . . . . . . . . . . $ 3,177 $4,311 $ 7,488
June 2013 Initiative
In June 2013, the Company commenced a restructuring plan (June 2013 Initiative) designed to enhanceproduct focus and streamline business operations. The restructuring plan includes a workforce reduction and theconsolidation and elimination of certain engineering activities. In connection with this plan, the Company ceaseddevelopment of future ASICs for switch products.
During fiscal 2014, the Company recorded special charges of $19.8 million in connection with the June2013 Initiative, consisting of $17.4 million of exit costs and $2.4 million of asset impairment charges primarilyrelated to abandoned property and equipment. The exit costs include severance and related costs associated withinvoluntarily terminated employees. Certain employees that were notified of their termination are required toprovide services for varying periods in excess of statutory notice periods. Severance costs related to theseservices are recognized ratably over the estimated requisite service period. The Company expects to incurbetween $1 million and $2 million of additional severance costs in connection with these employees over the
65
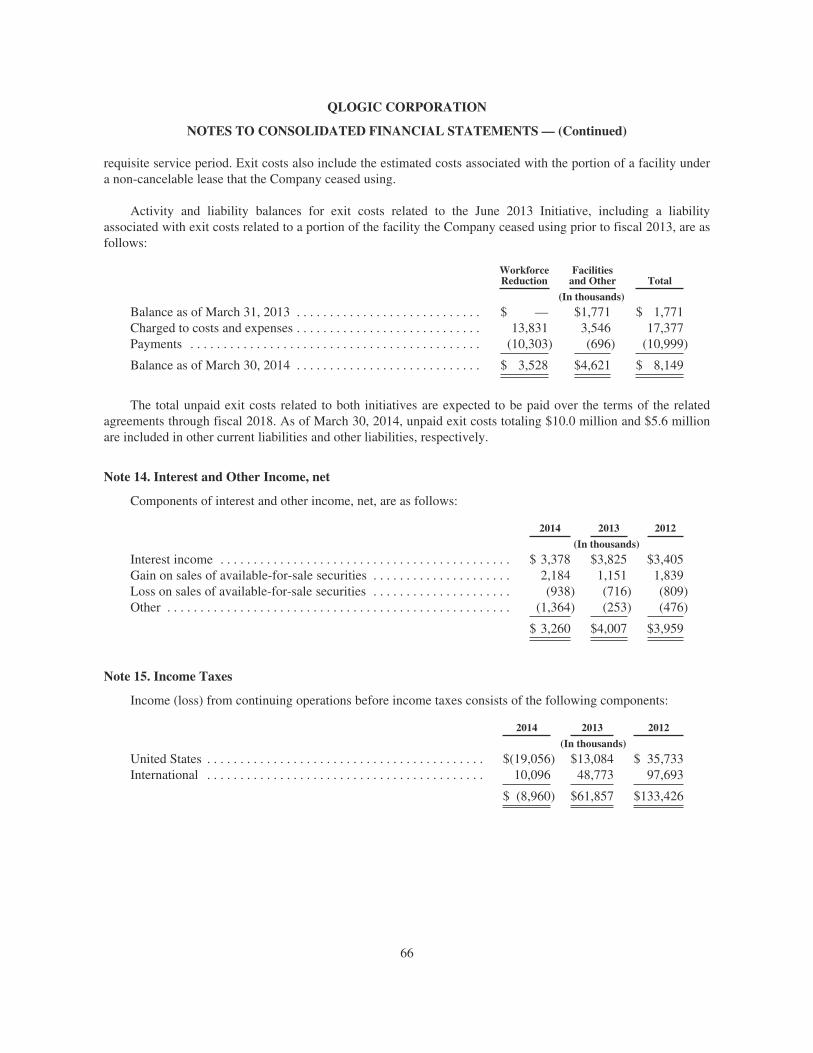
QLOGIC CORPORATION
NOTES TO CONSOLIDATED FINANCIAL STATEMENTS— (Continued)
requisite service period. Exit costs also include the estimated costs associated with the portion of a facility undera non-cancelable lease that the Company ceased using.
Activity and liability balances for exit costs related to the June 2013 Initiative, including a liabilityassociated with exit costs related to a portion of the facility the Company ceased using prior to fiscal 2013, are asfollows:
WorkforceReduction
Facilitiesand Other Total
(In thousands)
Balance as of March 31, 2013 . . . . . . . . . . . . . . . . . . . . . . . . . . . . $ — $1,771 $ 1,771Charged to costs and expenses . . . . . . . . . . . . . . . . . . . . . . . . . . . . 13,831 3,546 17,377Payments . . . . . . . . . . . . . . . . . . . . . . . . . . . . . . . . . . . . . . . . . . . . (10,303) (696) (10,999)
Balance as of March 30, 2014 . . . . . . . . . . . . . . . . . . . . . . . . . . . . $ 3,528 $4,621 $ 8,149
The total unpaid exit costs related to both initiatives are expected to be paid over the terms of the relatedagreements through fiscal 2018. As of March 30, 2014, unpaid exit costs totaling $10.0 million and $5.6 millionare included in other current liabilities and other liabilities, respectively.
Note 14. Interest and Other Income, net
Components of interest and other income, net, are as follows:
2014 2013 2012
(In thousands)
Interest income . . . . . . . . . . . . . . . . . . . . . . . . . . . . . . . . . . . . . . . . . . . . $ 3,378 $3,825 $3,405Gain on sales of available-for-sale securities . . . . . . . . . . . . . . . . . . . . . 2,184 1,151 1,839Loss on sales of available-for-sale securities . . . . . . . . . . . . . . . . . . . . . (938) (716) (809)Other . . . . . . . . . . . . . . . . . . . . . . . . . . . . . . . . . . . . . . . . . . . . . . . . . . . . (1,364) (253) (476)
$ 3,260 $4,007 $3,959
Note 15. Income Taxes
Income (loss) from continuing operations before income taxes consists of the following components:
2014 2013 2012
(In thousands)
United States . . . . . . . . . . . . . . . . . . . . . . . . . . . . . . . . . . . . . . . . . . $(19,056) $13,084 $ 35,733International . . . . . . . . . . . . . . . . . . . . . . . . . . . . . . . . . . . . . . . . . . 10,096 48,773 97,693
$ (8,960) $61,857 $133,426
66

QLOGIC CORPORATION
NOTES TO CONSOLIDATED FINANCIAL STATEMENTS— (Continued)
The components of income tax expense (benefit) from continuing operations are as follows:
2014 2013 2012
(In thousands)
Current:Federal . . . . . . . . . . . . . . . . . . . . . . . . . . . . . . . . . . . . . . . . . . . . . $ 9,206 $(13,374) $11,054State . . . . . . . . . . . . . . . . . . . . . . . . . . . . . . . . . . . . . . . . . . . . . . . 1,532 260 1,279Foreign . . . . . . . . . . . . . . . . . . . . . . . . . . . . . . . . . . . . . . . . . . . . . 2,205 1,520 1,904
Total current . . . . . . . . . . . . . . . . . . . . . . . . . . . . . . . . . . . . . . 12,943 (11,594) 14,237
Deferred:Federal . . . . . . . . . . . . . . . . . . . . . . . . . . . . . . . . . . . . . . . . . . . . . (18,883) 3,445 3,360State . . . . . . . . . . . . . . . . . . . . . . . . . . . . . . . . . . . . . . . . . . . . . . . 15,006 (3,684) (4,781)Foreign . . . . . . . . . . . . . . . . . . . . . . . . . . . . . . . . . . . . . . . . . . . . . 240 129 1,167
Total deferred . . . . . . . . . . . . . . . . . . . . . . . . . . . . . . . . . . . . . (3,637) (110) (254)
$ 9,306 $(11,704) $13,983
Income tax expense from continuing operations for fiscal 2014 includes the impact of valuation allowancesrecorded against deferred tax assets related to certain state tax credits and net operating loss carryforwards.Income tax benefit from continuing operations for fiscal 2013 was primarily the result of adjustments to certaintax positions subject to an Internal Revenue Service (IRS) examination. These adjustments primarily consist ofthe settlement of a significant matter in the IRS examination of the Company’s income tax returns for fiscal years2008 and 2009.
The income tax benefit related to discontinued operations for fiscal 2013 and 2012 was $0.3 million and$9.4 million, respectively. The income tax benefit for fiscal 2012 includes a $5.6 million net benefit associatedwith the sale of the IB Business, including the tax effect of the related liquidation of two domestic subsidiarieswhich were engaged in the IB Business. In connection with this liquidation, the Company recognized losses fortax purposes related to its investment in these subsidiaries. The tax benefit of these losses was substantially offsetby the tax related to the gain on sale of the IB Business. The $5.6 million net tax benefit is included in the gainon sale from discontinued operations, net of income taxes, in the consolidated statement of operations for fiscal2012.
The effect of deferred taxes associated with the change in unrealized gains and losses on the Company’savailable-for-sale securities was immaterial for all periods presented and was recorded in accumulated othercomprehensive income.
67
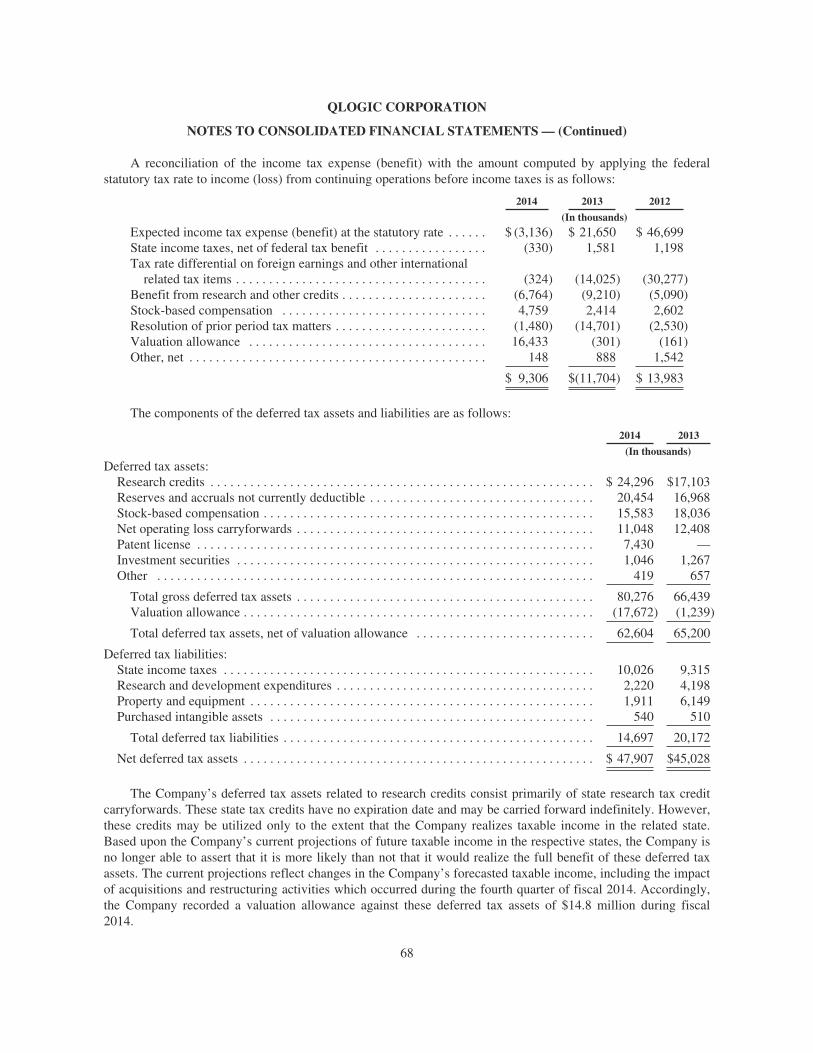
QLOGIC CORPORATION
NOTES TO CONSOLIDATED FINANCIAL STATEMENTS— (Continued)
A reconciliation of the income tax expense (benefit) with the amount computed by applying the federalstatutory tax rate to income (loss) from continuing operations before income taxes is as follows:
2014 2013 2012
(In thousands)
Expected income tax expense (benefit) at the statutory rate . . . . . . $ (3,136) $ 21,650 $ 46,699State income taxes, net of federal tax benefit . . . . . . . . . . . . . . . . . (330) 1,581 1,198Tax rate differential on foreign earnings and other internationalrelated tax items . . . . . . . . . . . . . . . . . . . . . . . . . . . . . . . . . . . . . . (324) (14,025) (30,277)
Benefit from research and other credits . . . . . . . . . . . . . . . . . . . . . . (6,764) (9,210) (5,090)Stock-based compensation . . . . . . . . . . . . . . . . . . . . . . . . . . . . . . . 4,759 2,414 2,602Resolution of prior period tax matters . . . . . . . . . . . . . . . . . . . . . . . (1,480) (14,701) (2,530)Valuation allowance . . . . . . . . . . . . . . . . . . . . . . . . . . . . . . . . . . . . 16,433 (301) (161)Other, net . . . . . . . . . . . . . . . . . . . . . . . . . . . . . . . . . . . . . . . . . . . . . 148 888 1,542
$ 9,306 $(11,704) $ 13,983
The components of the deferred tax assets and liabilities are as follows:
2014 2013
(In thousands)
Deferred tax assets:Research credits . . . . . . . . . . . . . . . . . . . . . . . . . . . . . . . . . . . . . . . . . . . . . . . . . . . . . . . . . . $ 24,296 $17,103Reserves and accruals not currently deductible . . . . . . . . . . . . . . . . . . . . . . . . . . . . . . . . . . 20,454 16,968Stock-based compensation . . . . . . . . . . . . . . . . . . . . . . . . . . . . . . . . . . . . . . . . . . . . . . . . . . 15,583 18,036Net operating loss carryforwards . . . . . . . . . . . . . . . . . . . . . . . . . . . . . . . . . . . . . . . . . . . . . 11,048 12,408Patent license . . . . . . . . . . . . . . . . . . . . . . . . . . . . . . . . . . . . . . . . . . . . . . . . . . . . . . . . . . . . 7,430 —Investment securities . . . . . . . . . . . . . . . . . . . . . . . . . . . . . . . . . . . . . . . . . . . . . . . . . . . . . . 1,046 1,267Other . . . . . . . . . . . . . . . . . . . . . . . . . . . . . . . . . . . . . . . . . . . . . . . . . . . . . . . . . . . . . . . . . . 419 657
Total gross deferred tax assets . . . . . . . . . . . . . . . . . . . . . . . . . . . . . . . . . . . . . . . . . . . . . 80,276 66,439Valuation allowance . . . . . . . . . . . . . . . . . . . . . . . . . . . . . . . . . . . . . . . . . . . . . . . . . . . . . (17,672) (1,239)
Total deferred tax assets, net of valuation allowance . . . . . . . . . . . . . . . . . . . . . . . . . . . 62,604 65,200
Deferred tax liabilities:State income taxes . . . . . . . . . . . . . . . . . . . . . . . . . . . . . . . . . . . . . . . . . . . . . . . . . . . . . . . . 10,026 9,315Research and development expenditures . . . . . . . . . . . . . . . . . . . . . . . . . . . . . . . . . . . . . . . 2,220 4,198Property and equipment . . . . . . . . . . . . . . . . . . . . . . . . . . . . . . . . . . . . . . . . . . . . . . . . . . . . 1,911 6,149Purchased intangible assets . . . . . . . . . . . . . . . . . . . . . . . . . . . . . . . . . . . . . . . . . . . . . . . . . 540 510
Total deferred tax liabilities . . . . . . . . . . . . . . . . . . . . . . . . . . . . . . . . . . . . . . . . . . . . . . . 14,697 20,172
Net deferred tax assets . . . . . . . . . . . . . . . . . . . . . . . . . . . . . . . . . . . . . . . . . . . . . . . . . . . . . $ 47,907 $45,028
The Company’s deferred tax assets related to research credits consist primarily of state research tax creditcarryforwards. These state tax credits have no expiration date and may be carried forward indefinitely. However,these credits may be utilized only to the extent that the Company realizes taxable income in the related state.Based upon the Company’s current projections of future taxable income in the respective states, the Company isno longer able to assert that it is more likely than not that it would realize the full benefit of these deferred taxassets. The current projections reflect changes in the Company’s forecasted taxable income, including the impactof acquisitions and restructuring activities which occurred during the fourth quarter of fiscal 2014. Accordingly,the Company recorded a valuation allowance against these deferred tax assets of $14.8 million during fiscal2014.
68

QLOGIC CORPORATION
NOTES TO CONSOLIDATED FINANCIAL STATEMENTS— (Continued)
The Company’s deferred tax assets related to net operating loss carryforwards include both federal and statenet operating loss carryforwards. The state net operating loss carryforwards are specific to the states in which thenet operating losses were generated and certain of these carryforwards relate to previous acquisitions, which aresubject to limitations on the timing of utilization. Based upon the Company’s current projections of futuretaxable income in the respective states, the Company is no longer able to assert that it is more likely than not thatit would realize the full benefit of these deferred tax assets. The current projections reflect changes in theCompany’s forecasted taxable income, including the impact of acquisitions and restructuring activities whichoccurred during the fourth quarter of fiscal 2014. Accordingly, the Company recorded a valuation allowanceagainst these deferred tax assets of $1.7 million during fiscal 2014.
The Company’s deferred tax assets related to investment securities and capital loss carryovers consistprimarily of temporary differences related to other-than-temporary impairments on the Company’s investmentsecurities and realized losses on dispositions of investment securities that are subject to limitations ondeductibility. As a result of limitations on the deductibility of capital losses and other factors, management iscurrently unable to assert that it is more likely than not that the Company will realize the full benefit of thesedeferred tax assets. Accordingly, the Company had previously recorded a valuation allowance against thesedeferred tax assets. The balance of this valuation allowance was $1.2 million as of March 30, 2014 andMarch 31, 2013.
Based upon the Company’s current and historical pre-tax earnings, management believes it is more likelythan not that the Company will realize the full benefit of the existing deferred tax assets as of March 30, 2014,except for the deferred tax assets discussed above. Management believes the existing net deductible temporarydifferences will reverse during periods in which the Company generates net taxable income or that there wouldbe sufficient tax carrybacks available; however, there can be no assurance that the Company will generate anyearnings or any specific level of continuing earnings in future years.
As of March 30, 2014, the Company has federal net operating loss carryforwards of $14.0 million, whichwill expire between fiscal 2027 and 2029, if not utilized, and state net operating loss carryforwards of $71.2million, which will expire between fiscal 2017 and 2032, if not utilized. The net operating loss carryforwardsrelating to acquired companies are subject to limitations on the timing of utilization. The Company also has statecapital loss carryovers of $54.4 million, which will expire between fiscal 2017 and 2029, if not utilized, and stateresearch tax credit carryforwards of $23.3 million, which have no expiration date.
The Company has made no provision for U.S. income taxes or foreign withholding taxes on the earnings ofits foreign subsidiaries, as these amounts are intended to be indefinitely reinvested in operations outside theUnited States. As of March 30, 2014, the cumulative amount of undistributed earnings of the Company’s foreignsubsidiaries was $355.2 million. Because of the availability of U.S. foreign tax credits, it is not practicable todetermine the U.S. federal income tax liability that would be payable if such earnings were not reinvestedindefinitely.
During fiscal 2013, the Company effectively settled a matter with the IRS related to the examination of theCompany’s income tax returns for fiscal years 2008 and 2009. This settlement was for an amount less than theCompany had previously accrued for this tax position. As a result, the Company recorded an income tax benefitof $9.5 million. In connection with this settlement, the Company paid federal and state income tax paymentstotaling $32.8 million in fiscal 2013.
Also during fiscal 2013, the Company obtained additional information related to other matters underexamination by the IRS. Based on this new information, the Company reassessed the largest amount of tax
69

QLOGIC CORPORATION
NOTES TO CONSOLIDATED FINANCIAL STATEMENTS— (Continued)
benefit that is greater than 50% likely of being realized related to these tax positions. As a result, the Companyreduced the related liability for unrecognized tax benefits and recorded a corresponding income tax benefit of$4.8 million.
During fiscal 2014, the Company settled all open matters relating to the IRS examination of the Company’sincome tax returns for fiscal years 2008 and 2009 without material adjustment and is no longer subject to federalincome tax examinations for years prior to fiscal 2010. The Company’s federal consolidated income tax returnsfor fiscal years 2010, 2011 and 2012 are currently under examination by the IRS. With limited exceptions, theCompany is no longer subject to state and foreign income tax examinations by taxing authorities for years priorto fiscal 2008. Management does not believe that the results of these examinations will have a material impact onthe Company’s financial condition or results of operations.
A rollforward of the activity in the gross unrecognized tax benefits is as follows:
2014 2013
(In thousands)
Balance at beginning of year . . . . . . . . . . . . . . . . . . . . . . . . . . . . . . . . . . . . . . . . $ 9,584 $ 58,384Additions based on tax positions related to the current year . . . . . . . . . . . . . . 1,140 1,470Additions for tax positions of prior years . . . . . . . . . . . . . . . . . . . . . . . . . . . . 4,494 183Reductions for tax positions of prior years . . . . . . . . . . . . . . . . . . . . . . . . . . . (1,641) (20,547)Decreases relating to settlements with taxing authorities . . . . . . . . . . . . . . . . — (29,906)
Balance at end of year . . . . . . . . . . . . . . . . . . . . . . . . . . . . . . . . . . . . . . . . . . . . . $13,577 $ 9,584
If the unrecognized tax benefits as of March 30, 2014 were recognized, $10.8 million, net of $2.8 million oftax benefits from state income taxes, would favorably affect the Company’s effective income tax rate.
In addition to the unrecognized tax benefits noted above, the Company had accrued $3.5 million and $1.2million of interest expense and penalties as of March 30, 2014 and March 31, 2013, respectively. The Companyrecognized interest expense, net of the related tax effect, and penalties aggregating $2.1 million, $1.0 million and$1.0 million during fiscal 2014, 2013 and 2012, respectively.
It is reasonably possible that the Company’s liability for uncertain tax positions may be reduced by as muchas $1.4 million as a result of either the settlement of tax positions with various tax authorities or by virtue of thestatute of limitations expiring through the end of fiscal 2015.
70

QLOGIC CORPORATION
NOTES TO CONSOLIDATED FINANCIAL STATEMENTS— (Continued)
Note 16. Income per Share
The following table sets forth the computation of basic and diluted income (loss) from continuing operationsper share:
2014 2013 2012
(In thousands, except per share amounts)
Income (loss) from continuing operations . . . . . . . . . . . . . . . . . $(18,266) $ 73,561 $119,443
Shares:Weighted-average shares outstanding — basic . . . . . . . . . . . 87,612 93,560 101,766Dilutive potential common shares, using treasury stockmethod . . . . . . . . . . . . . . . . . . . . . . . . . . . . . . . . . . . . . . . . . — 438 945
Weighted-average shares outstanding — diluted . . . . . . . . . . 87,612 93,998 102,711
Income (loss) from continuing operations per share:Basic . . . . . . . . . . . . . . . . . . . . . . . . . . . . . . . . . . . . . . . . . . . . $ (0.21) $ 0.79 $ 1.17
Diluted . . . . . . . . . . . . . . . . . . . . . . . . . . . . . . . . . . . . . . . . . . . $ (0.21) $ 0.78 $ 1.16
Stock-based awards, including stock options and restricted stock units, representing 15.2 million,18.4 million and 16.6 million shares of common stock have been excluded from the diluted per share calculationsfor fiscal 2014, 2013 and 2012, respectively. These stock-based awards have been excluded from the diluted pershare calculations because their effect would have been antidilutive.
Note 17. Commitments and Contingencies
Leases
The Company leases certain facilities, software and equipment under operating lease agreements. Asummary of the future minimum lease commitments under non-cancelable operating leases as of March 30, 2014is as follows:
Fiscal Year (In thousands)
2015 . . . . . . . . . . . . . . . . . . . . . . . . . . . . . . . . . . . . . . . . . . . . . . . . . . . . . . . . . . . . . . . . . . $ 8,1902016 . . . . . . . . . . . . . . . . . . . . . . . . . . . . . . . . . . . . . . . . . . . . . . . . . . . . . . . . . . . . . . . . . . 4,3702017 . . . . . . . . . . . . . . . . . . . . . . . . . . . . . . . . . . . . . . . . . . . . . . . . . . . . . . . . . . . . . . . . . . 2,5642018 . . . . . . . . . . . . . . . . . . . . . . . . . . . . . . . . . . . . . . . . . . . . . . . . . . . . . . . . . . . . . . . . . . 1,9282019 . . . . . . . . . . . . . . . . . . . . . . . . . . . . . . . . . . . . . . . . . . . . . . . . . . . . . . . . . . . . . . . . . . 163
Total future minimum lease payments . . . . . . . . . . . . . . . . . . . . . . . . . . . . . . . . . . . . . . . $17,215
Rent expense for fiscal 2014, 2013 and 2012 was $10.4 million, $10.6 million and $10.9 million,respectively.
Contingencies
Various lawsuits, claims and proceedings have been or may be instituted against the Company. The outcomeof litigation cannot be predicted with certainty and some lawsuits, claims and proceedings may be disposed ofunfavorably to the Company.
The Company indemnifies certain of its customers and others against claims that the Company’s productsinfringe upon a patent, copyright, trademark or trade secret of a third party. In the event of such a claim, theCompany agrees to pay all litigation costs, including attorney fees, and any settlement payments or damagesawarded directly related to the infringement.
71

QLOGIC CORPORATION
NOTES TO CONSOLIDATED FINANCIAL STATEMENTS— (Continued)
Management believes that any monetary liability or financial impact to the Company from these matters,individually and in the aggregate, would not be material to the Company’s financial condition or results ofoperations. However, there can be no assurance with respect to such result, and the monetary liability or financialimpact to the Company from these matters could differ materially from those projected.
Note 18. Revenue Components, Geographic Revenues and Significant Customers
Operating segments are components of an enterprise for which separate financial information is availableand is evaluated regularly by the chief operating decision maker in deciding how to allocate resources and inassessing performance. The Company operates in one operating segment.
Revenue Components
A summary of net revenues by product category is as follows:
2014 2013 2012
(In thousands)
Advanced Connectivity Platforms . . . . . . . . . . . . . . . . . . . . . . . . $386,738 $399,416 $466,846Legacy Connectivity Products . . . . . . . . . . . . . . . . . . . . . . . . . . . 74,169 85,122 91,762
$460,907 $484,538 $558,608
Geographic Revenues
Revenues by geographic area are presented based upon the ship-to location of the customer. Net revenues bygeographic area are as follows:
2014 2013 2012
(In thousands)
United States . . . . . . . . . . . . . . . . . . . . . . . . . . . . . . . . . . . . . . . . $191,481 $209,590 $239,198Asia-Pacific and Japan . . . . . . . . . . . . . . . . . . . . . . . . . . . . . . . . . 166,568 158,075 178,715Europe, Middle East and Africa . . . . . . . . . . . . . . . . . . . . . . . . . . 85,572 92,695 113,873Rest of world . . . . . . . . . . . . . . . . . . . . . . . . . . . . . . . . . . . . . . . . 17,286 24,178 26,822
$460,907 $484,538 $558,608
The United States and China are the only countries that represented 10% or more of net revenues for theyears presented. Net revenues from customers in China were $56.0 million, $65.0 million and $72.6 million forfiscal 2014, 2013 and 2012, respectively.
Significant Customers
A summary of the Company’s customers, including their manufacturing subcontractors, that represent 10%or more of the Company’s net revenues is as follows:
2014 2013 2012
Hewlett-Packard . . . . . . . . . . . . . . . . . . . . . . . . . . . . . . . . . . . . . . . . . . . . . . . . . . . 24% 24% 27%IBM . . . . . . . . . . . . . . . . . . . . . . . . . . . . . . . . . . . . . . . . . . . . . . . . . . . . . . . . . . . . 17% 20% 18%Dell . . . . . . . . . . . . . . . . . . . . . . . . . . . . . . . . . . . . . . . . . . . . . . . . . . . . . . . . . . . . . 15% 12% 11%
72
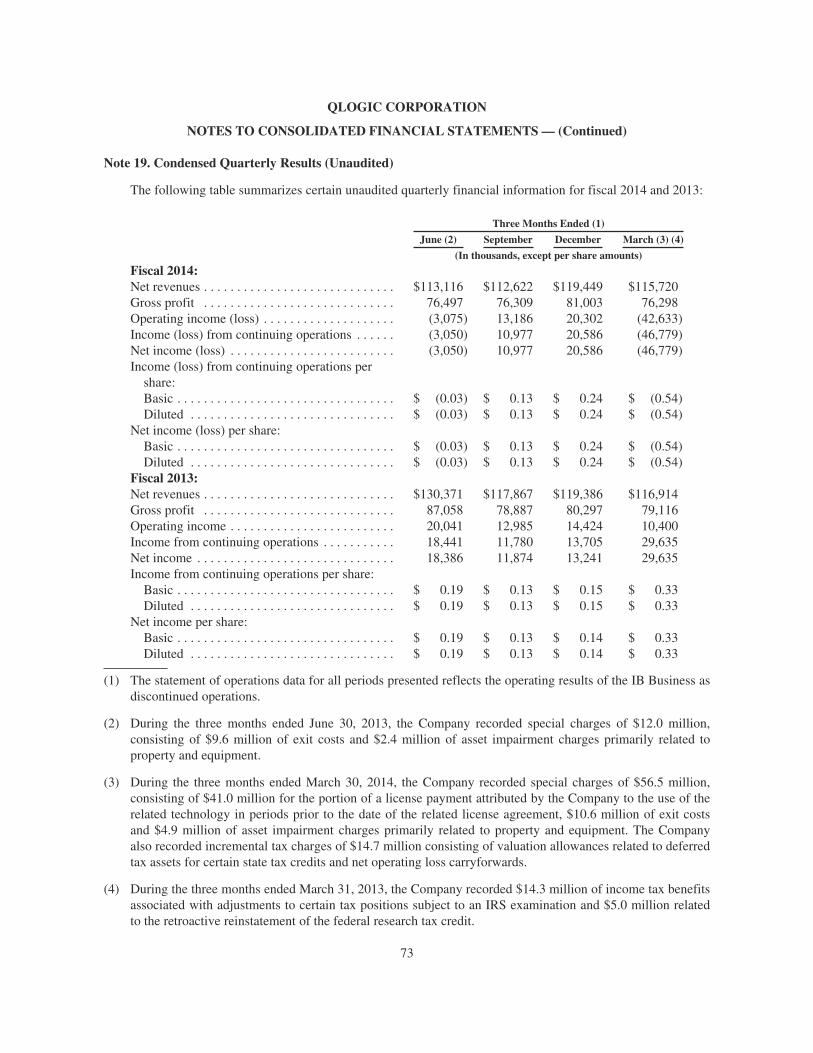
QLOGIC CORPORATION
NOTES TO CONSOLIDATED FINANCIAL STATEMENTS— (Continued)
Note 19. Condensed Quarterly Results (Unaudited)
The following table summarizes certain unaudited quarterly financial information for fiscal 2014 and 2013:
Three Months Ended (1)
June (2) September December March (3) (4)
(In thousands, except per share amounts)
Fiscal 2014:Net revenues . . . . . . . . . . . . . . . . . . . . . . . . . . . . . $113,116 $112,622 $119,449 $115,720Gross profit . . . . . . . . . . . . . . . . . . . . . . . . . . . . . 76,497 76,309 81,003 76,298Operating income (loss) . . . . . . . . . . . . . . . . . . . . (3,075) 13,186 20,302 (42,633)Income (loss) from continuing operations . . . . . . (3,050) 10,977 20,586 (46,779)Net income (loss) . . . . . . . . . . . . . . . . . . . . . . . . . (3,050) 10,977 20,586 (46,779)Income (loss) from continuing operations pershare:Basic . . . . . . . . . . . . . . . . . . . . . . . . . . . . . . . . . $ (0.03) $ 0.13 $ 0.24 $ (0.54)Diluted . . . . . . . . . . . . . . . . . . . . . . . . . . . . . . . $ (0.03) $ 0.13 $ 0.24 $ (0.54)
Net income (loss) per share:Basic . . . . . . . . . . . . . . . . . . . . . . . . . . . . . . . . . $ (0.03) $ 0.13 $ 0.24 $ (0.54)Diluted . . . . . . . . . . . . . . . . . . . . . . . . . . . . . . . $ (0.03) $ 0.13 $ 0.24 $ (0.54)
Fiscal 2013:Net revenues . . . . . . . . . . . . . . . . . . . . . . . . . . . . . $130,371 $117,867 $119,386 $116,914Gross profit . . . . . . . . . . . . . . . . . . . . . . . . . . . . . 87,058 78,887 80,297 79,116Operating income . . . . . . . . . . . . . . . . . . . . . . . . . 20,041 12,985 14,424 10,400Income from continuing operations . . . . . . . . . . . 18,441 11,780 13,705 29,635Net income . . . . . . . . . . . . . . . . . . . . . . . . . . . . . . 18,386 11,874 13,241 29,635Income from continuing operations per share:Basic . . . . . . . . . . . . . . . . . . . . . . . . . . . . . . . . . $ 0.19 $ 0.13 $ 0.15 $ 0.33Diluted . . . . . . . . . . . . . . . . . . . . . . . . . . . . . . . $ 0.19 $ 0.13 $ 0.15 $ 0.33
Net income per share:Basic . . . . . . . . . . . . . . . . . . . . . . . . . . . . . . . . . $ 0.19 $ 0.13 $ 0.14 $ 0.33Diluted . . . . . . . . . . . . . . . . . . . . . . . . . . . . . . . $ 0.19 $ 0.13 $ 0.14 $ 0.33
(1) The statement of operations data for all periods presented reflects the operating results of the IB Business asdiscontinued operations.
(2) During the three months ended June 30, 2013, the Company recorded special charges of $12.0 million,consisting of $9.6 million of exit costs and $2.4 million of asset impairment charges primarily related toproperty and equipment.
(3) During the three months ended March 30, 2014, the Company recorded special charges of $56.5 million,consisting of $41.0 million for the portion of a license payment attributed by the Company to the use of therelated technology in periods prior to the date of the related license agreement, $10.6 million of exit costsand $4.9 million of asset impairment charges primarily related to property and equipment. The Companyalso recorded incremental tax charges of $14.7 million consisting of valuation allowances related to deferredtax assets for certain state tax credits and net operating loss carryforwards.
(4) During the three months ended March 31, 2013, the Company recorded $14.3 million of income tax benefitsassociated with adjustments to certain tax positions subject to an IRS examination and $5.0 million relatedto the retroactive reinstatement of the federal research tax credit.
73

Item 9. Changes in and Disagreements with Accountants on Accounting and Financial Disclosure
None.
Item 9A. Controls and Procedures
Conclusion Regarding the Effectiveness of Disclosure Controls and Procedures
We maintain disclosure controls and procedures to ensure that information we are required to disclose inreports that we file or submit under the Exchange Act (i) is recorded, processed, summarized and reported withinthe time periods specified in Securities and Exchange Commission rules and forms and (ii) is accumulated andcommunicated to our management, including our principal executive officer and principal financial officer, toallow timely decisions regarding required disclosure. Our management evaluated, with the participation of ourprincipal executive officer and principal financial officer, the effectiveness of our disclosure controls andprocedures, as such term is defined under Rules 13a-15(e) and 15d-15(e) promulgated under the Exchange Act.Based on this evaluation, our principal executive officer and principal financial officer concluded that ourdisclosure controls and procedures were effective at a reasonable assurance level as of March 30, 2014.
Management’s Report on Internal Control Over Financial Reporting
Our management is responsible for establishing and maintaining adequate internal control over financialreporting, as defined in Rule 13a-15(f) promulgated under the Exchange Act. Internal control over financialreporting is designed to provide reasonable assurance regarding the reliability of financial reporting and thepreparation of financial statements for external purposes in accordance with generally accepted accountingprinciples. Because of its inherent limitations, internal control over financial reporting may not prevent or detectmisstatements. Also, projections of any evaluation of effectiveness to future periods are subject to the risk thatcontrols may become inadequate because of changes in conditions, or that the degree of compliance with thepolicies or procedures may deteriorate.
Our management evaluated the effectiveness of our internal control over financial reporting using thecriteria set forth by the Committee of Sponsoring Organizations of the Treadway Commission in InternalControl — Integrated Framework (1992). Based on this evaluation, our principal executive officer and principalfinancial officer concluded that the Company’s internal control over financial reporting was effective at areasonable assurance level as of March 30, 2014.
The independent registered public accounting firm that audited the consolidated financial statementsincluded in this annual report has issued an audit report on the effectiveness of the Company’s internal controlover financial reporting. See page 41 herein.
Changes in Internal Control over Financial Reporting
There was no change in our internal control over financial reporting, as defined in Rule 13a-15(f)promulgated under the Exchange Act that occurred during the fourth quarter of fiscal 2014 that has materiallyaffected, or is reasonably likely to materially affect, our internal control over financial reporting.
Item 9B. Other Information
None.
74

PART III
Item 10. Directors, Executive Officers and Corporate Governance
Reference is made to the Company’s Definitive Proxy Statement for its 2014 Annual Meeting ofStockholders, to be filed with the Securities and Exchange Commission within 120 days after the end of fiscal2014, for information required under this Item 10. Such information is incorporated herein by reference.
The Company has adopted and implemented a Business Ethics Policy (the Code of Ethics) that applies tothe Company’s officers, employees and directors. The Code of Ethics is available on our website atwww.qlogic.com.
Item 11. Executive Compensation
Reference is made to the Company’s Definitive Proxy Statement for its 2014 Annual Meeting ofStockholders, to be filed with the Securities and Exchange Commission within 120 days after the end of fiscal2014, for information required under this Item 11. Such information is incorporated herein by reference.
Item 12. Security Ownership of Certain Beneficial Owners and Management and Related StockholderMatters
Reference is made to the Company’s Definitive Proxy Statement for its 2014 Annual Meeting ofStockholders, to be filed with the Securities and Exchange Commission within 120 days after the end of fiscal2014, for information required under this Item 12. Such information is incorporated herein by reference.
There are no arrangements, known to the Company, which might at a subsequent date result in a change incontrol of the Company.
Item 13. Certain Relationships and Related Transactions, and Director Independence
Reference is made to the Company’s Definitive Proxy Statement for its 2014 Annual Meeting ofStockholders, to be filed with the Securities and Exchange Commission within 120 days after the end of fiscal2014, for information required under this Item 13. Such information is incorporated herein by reference.
Item 14. Principal Accounting Fees and Services
Reference is made to the Company’s Definitive Proxy Statement for its 2014 Annual Meeting ofStockholders, to be filed with the Securities and Exchange Commission within 120 days after the end of fiscal2014, for information required under this Item 14. Such information is incorporated herein by reference.
75

PART IV
Item 15. Exhibits and Financial Statement Schedules
(a) (1) Consolidated Financial Statements
The following consolidated financial statements of the Company for the years ended March 30,2014, March 31, 2013 and April 1, 2012 are filed as part of this report:
FINANCIAL STATEMENT INDEX
PageNumber
Reports of Independent Registered Public Accounting Firm . . . . . . . . . . . . . . . . . . . . . . . . . . . . . . . . . . . 40Consolidated Balance Sheets as of March 30, 2014 and March 31, 2013 . . . . . . . . . . . . . . . . . . . . . . . . . . 42Consolidated Statements of Operations for the years ended March 30, 2014, March 31, 2013 andApril 1, 2012 . . . . . . . . . . . . . . . . . . . . . . . . . . . . . . . . . . . . . . . . . . . . . . . . . . . . . . . . . . . . . . . . . . . . . . 43
Consolidated Statements of Comprehensive Income (Loss) for the years ended March 30,2014, March 31, 2013 and April 1, 2012 . . . . . . . . . . . . . . . . . . . . . . . . . . . . . . . . . . . . . . . . . . . . . . . . . 44
Consolidated Statements of Stockholders’ Equity for the years ended March 30, 2014, March 31, 2013and April 1, 2012 . . . . . . . . . . . . . . . . . . . . . . . . . . . . . . . . . . . . . . . . . . . . . . . . . . . . . . . . . . . . . . . . . . . 45
Consolidated Statements of Cash Flows for the years ended March 30, 2014, March 31, 2013 andApril 1, 2012 . . . . . . . . . . . . . . . . . . . . . . . . . . . . . . . . . . . . . . . . . . . . . . . . . . . . . . . . . . . . . . . . . . . . . . 46
Notes to Consolidated Financial Statements . . . . . . . . . . . . . . . . . . . . . . . . . . . . . . . . . . . . . . . . . . . . . . . . 47
(a) (2) Financial Statement Schedule
The following consolidated financial statement schedule of the Company for the years ended March 30,2014, March 31, 2013 and April 1, 2012 is filed as part of this report and is incorporated herein by reference:
Schedule II — Valuation and Qualifying Accounts
All other schedules have been omitted because the required information is presented in the financialstatements or notes thereto, the amounts involved are not significant or the schedules are not applicable.
(a) (3) Exhibits
An exhibit index has been filed as part of this report and is incorporated herein by reference.
76

SIGNATURES
Pursuant to the requirements of Section 13 or 15(d) of the Securities Exchange Act of 1934, the Registranthas duly caused this report to be signed on its behalf by the undersigned, thereunto duly authorized.
QLOGIC CORPORATION
By: /s/ PRASAD L. RAMPALLI
Prasad L. RampalliPresident and Chief Executive Officer
Date: May 22, 2014
POWER OF ATTORNEY
Each person whose signature appears below hereby authorizes Prasad L. Rampalli and/or Jean Hu, asattorney-in-fact, to sign on his or her behalf and in each capacity stated below, and to file all amendments and/orsupplements to this Annual Report on Form 10-K.
Pursuant to the requirements of the Securities Exchange Act of 1934, this report has been signed below bythe following persons on behalf of the Registrant and in the capacities and on the dates indicated.
Signature Title Date
Principal Executive Officer:
/s/ PRASAD L. RAMPALLI
Prasad L. Rampalli
President, Chief Executive Officerand Director
May 22, 2014
Principal Financial and Accounting Officer:
/s/ JEAN HU
Jean Hu
Senior Vice President and ChiefFinancial Officer
May 22, 2014
/s/ H.K. DESAI
H.K. Desai
Executive Chairman andChairman of the Board
May 22, 2014
/s/ BALAKRISHNAN S. IYER
Balakrishnan S. Iyer
Director May 22, 2014
/s/ CHRISTINE KING
Christine King
Director May 22, 2014
/s/ KATHRYN B. LEWIS
Kathryn B. Lewis
Director May 22, 2014
/s/ D. SCOTT MERCER
D. Scott Mercer
Director May 22, 2014
/s/ GEORGE D. WELLS
George D. Wells
Director May 22, 2014
/s/ WILLIAM M. ZEITLER
William M. Zeitler
Director May 22, 2014
77

SCHEDULE II
QLOGIC CORPORATIONVALUATION AND QUALIFYING ACCOUNTS
Balance atBeginning of
Year
Additions:Charged toCosts andExpenses
or Revenues
Deductions:Amounts
Written Off, Netof Recoveries
Balance atEnd ofYear
(In thousands)
Year ended March 30, 2014:Allowance for doubtful accounts . . . . . . . . . . . . . . . . . $1,196 $ 23 $ 33 $1,186Sales returns and allowances . . . . . . . . . . . . . . . . . . . . $4,747 $17,225 $18,099 $3,873
Year ended March 31, 2013:Allowance for doubtful accounts . . . . . . . . . . . . . . . . . $1,446 $ (182) $ 68 $1,196Sales returns and allowances . . . . . . . . . . . . . . . . . . . . $4,861 $31,653 $31,767 $4,747
Year ended April 1, 2012:Allowance for doubtful accounts . . . . . . . . . . . . . . . . . $1,536 $ 79 $ 169 $1,446Sales returns and allowances . . . . . . . . . . . . . . . . . . . . $7,856 $35,170 $38,165 $4,861
78

EXHIBIT INDEX
ExhibitNo. Description
2.1 Asset Purchase Agreement, by and between QLogic Corporation and Intel Corporation, dated as ofJanuary 20, 2012 (incorporated by reference to Exhibit 2.1 of the Registrant’s Current Report onForm 8-K filed on January 25, 2012).
2.2 Asset Purchase Agreement, by and between QLogic Corporation and Broadcom Corporation, datedas of February 18, 2014 (incorporated by reference to Exhibit 2.1 of the Registrant’s CurrentReport on Form 8-K filed on March 13, 2014).
3.1 Certificate of Incorporation of QLogic Corporation, as amended to date (incorporated by referenceto Exhibit 3.1 of the Registrant’s Annual Report on Form 10-K for the year ended April 1, 2012).
3.2 Amended and Restated By-Laws of QLogic Corporation, as adopted on February 9, 2012(incorporated by reference to Exhibit 3.1 of the Registrant’s Current Report on Form 8-K filed onFebruary 13, 2012).
10.1 QLogic Corporation Non-Employee Director Stock Option Plan, as amended (incorporated byreference to Exhibit 4.1 of the Registrant’s Registration Statement on Form S-8 filed on February6, 2004 (File No. 333-112572)).*
10.2 QLogic Corporation Stock Awards Plan, as amended (incorporated by reference to Exhibit 4.2 ofthe Registrant’s Registration Statement on Form S-8 filed on February 6, 2004 (FileNo. 333-112572)).*
10.3 Form of Indemnification Agreement between QLogic Corporation and Directors and ExecutiveOfficers (incorporated by reference to Exhibit 10.1 of the Registrant’s Current Report on Form 8-Kfiled on April 7, 2006).*
10.4 QLogic Corporation 1998 Employee Stock Purchase Plan, Amended and Restated Effective May23, 2013 (incorporated by reference to Exhibit 10.1 of the Registrant’s Current Report on Form 8-K filed on August 23, 2013).*
10.5 QLogic Corporation 2005 Performance Incentive Plan, Amended and Restated Effective July 16,2009 (incorporated by reference to Exhibit 10.1 of the Registrant’s Current Report on Form 8-Kfiled on August 21, 2009).*
10.6 Terms and Conditions of Nonqualified Stock Option under the QLogic Corporation 2005Performance Incentive Plan, as amended (incorporated by reference to Exhibit 10.3 of theRegistrant’s Quarterly Report on Form 10-Q for the quarter ended December 29, 2013).*
10.7 Terms and Conditions of Incentive Stock Option under the QLogic Corporation 2005 PerformanceIncentive Plan, as amended (incorporated by reference to Exhibit 10.2 of the Registrant’s QuarterlyReport on Form 10-Q for the quarter ended December 29, 2013).*
10.8 Terms and Conditions of Stock Unit Award under the QLogic Corporation 2005 PerformanceIncentive Plan, as amended (incorporated by reference to Exhibit 10.1 of the Registrant’s QuarterlyReport on Form 10-Q for the quarter ended December 29, 2013).*
10.9 Change in Control Severance Agreement, dated December 19, 2008, between QLogic Corporationand H.K. Desai (incorporated by reference to Exhibit 10.2 of the Registrant’s Quarterly Report onForm 10-Q for the quarter ended December 28, 2008).*
10.10 Change in Control Severance Agreement, dated December 19, 2008, between QLogic Corporationand Simon Biddiscombe (incorporated by reference to Exhibit 10.3 of the Registrant’s QuarterlyReport on Form 10-Q for the quarter ended December 28, 2008).*
79

ExhibitNo. Description
10.11 Non-Employee Director Equity Award Program under the QLogic Corporation 2005 PerformanceIncentive Plan Amended and Restated Effective June 4, 2012 (incorporated by reference to Exhibit10.2 of the Registrant’s Quarterly Report on Form 10-Q for the quarter ended July 1, 2012).*
10.12 Amendment to Change in Control Severance Agreement, effective November 15, 2010, by andbetween QLogic Corporation and Simon Biddiscombe (incorporated by reference to Exhibit 10.1of the Registrant’s Current Report on Form 8-K filed on October 21, 2010).*
10.13 Employment Agreement, effective December 4, 2013, by and between QLogic Corporation andH.K. Desai (incorporated by reference to Exhibit 10.1 of the Registrant’s Current Report on Form8-K filed on December 9, 2013).*
10.14 Amendment to Change in Control Severance Agreement, effective November 15, 2010, by andbetween QLogic Corporation and H.K. Desai (incorporated by reference to Exhibit 10.3 of theRegistrant’s Current Report on Form 8-K filed on October 21, 2010).*
10.15 Form of Change in Control Severance Agreement between QLogic Corporation and ExecutiveOfficers (incorporated by reference to Exhibit 10.4 of the Registrant’s Quarterly Report on Form10-Q for the quarter ended December 30, 2012).*
10.16 Terms and Conditions of FY2012 Performance Share Award under the QLogic Corporation 2005Performance Incentive Plan (incorporated by reference to Exhibit 10.2 of the Registrant’sQuarterly Report on Form 10-Q for the quarter ended July 3, 2011).*
10.17 Terms and Conditions of Performance Share Award under the QLogic Corporation 2005Performance Incentive Plan (incorporated by reference to Exhibit 10.1 of the Registrant’sQuarterly Report on Form 10-Q for the quarter ended July 1, 2012).*
10.18 Amendment No. 2 to Change in Control Severance Agreement, dated December 20, 2012, by andbetween QLogic Corporation and Simon Biddiscombe (incorporated by reference to Exhibit 10.1of the Registrant’s Quarterly Report on Form 10-Q for the quarter ended December 30, 2012).*
10.19 Amendment No. 2 to Change in Control Severance Agreement, dated December 20, 2012, by andbetween QLogic Corporation and H.K. Desai (incorporated by reference to Exhibit 10.3 of theRegistrant’s Quarterly Report on Form 10-Q for the quarter ended December 30, 2012).*
10.20 Credit Agreement, dated as of March 20, 2013, by and among QLogic Corporation, the lendersparty thereto and JPMorgan Chase Bank, N.A., as Administrative Agent (incorporated by referenceto Exhibit 10.21 of the Registrant’s Annual Report on Form 10-K filed on May 23, 2013).
10.21 General Release Agreement, dated May 17, 2013, by and between the Company and SimonBiddiscombe (incorporated by reference to Exhibit 10.1 of the Registrant’s Current Report onForm 8-K filed on May 20, 2013).*
10.22 Form of Terms and Conditions of Performance Share Award under the QLogic Corporation 2005Performance Incentive Plan, as amended (incorporated by reference to Exhibit 10.4 of theRegistrant’s Quarterly Report on Form 10-Q for the quarter ended December 29, 2013).*
10.23 Offer Letter, dated December 3, 2013, by and between QLogic Corporation and Prasad Rampalli(incorporated by reference to Exhibit 10.5 of the Registrant’s Quarterly Report on Form 10-Q forthe quarter ended December 29, 2013).*
21.1 Subsidiaries of the Registrant.
23.1 Consent of Independent Registered Public Accounting Firm.
24 Power of Attorney (included on signature page).
80
ExhibitNo. Description
31.1 Certification of Chief Executive Officer pursuant to Rule 13a-14(a) of the Securities Exchange Actof 1934, as amended, as adopted pursuant to Section 302 of the Sarbanes-Oxley Act of 2002.
31.2 Certification of Chief Financial Officer pursuant to Rule 13a-14(a) of the Securities Exchange Actof 1934, as amended, as adopted pursuant to Section 302 of the Sarbanes-Oxley Act of 2002.
32 Certification of Chief Executive Officer and Chief Financial Officer pursuant to Rule 13a-14(b) ofthe Securities Exchange Act of 1934, as amended, and 18 U.S.C. Section 1350, as adoptedpursuant to Section 906 of the Sarbanes-Oxley Act of 2002.
101.INS XBRL Instance Document
101.SCH XBRL Taxonomy Extension Schema Document
101.CAL XBRL Taxonomy Extension Calculation Linkbase Document
101.DEF XBRL Taxonomy Extension Definition Linkbase Document
101.LAB XBRL Taxonomy Extension Label Linkbase Document
101.PRE XBRL Taxonomy Extension Presentation Linkbase Document
* Compensation plan, contract or arrangement required to be filed as an exhibit pursuant to applicable rules ofthe Securities and Exchange Commission.
81

[THIS PAGE INTENTIONALLY LEFT BLANK]

[THIS PAGE INTENTIONALLY LEFT BLANK]

[THIS PAGE INTENTIONALLY LEFT BLANK]

Corporate Information
Board of Directors
John T. Dickson
Balakrishnan S. Iyer
Christine King
Kathryn B. Lewis
D. Scott Mercer
Prasad L. Rampalli
George D. Wells
William M. Zeitler
Executive Officers
Prasad L. RampalliPresident andChief Executive Officer
Anthony E. CarrozzaSenior Vice President,Worldwide Sales
Jean HuSenior Vice President andChief Financial Officer
Roger J. KleinSenior Vice President and General Manager, Fibre Channel Products
Transfer Agent and Registrar
Computershare Investor Services250 Royall StreetCanton, MA 02021Telephone: 800.962.4284 781.575.3120
Independent Registered Public Accounting Firm
KPMG LLPIrvine, CA
Legal Counsel
O’Melveny & Myers LLPNewport Beach, CA
©2014 QLogic Corporation. All rights reserved. QLogic and the QLogic Logo are registered trademarks of QLogic Corporation. All other brands and product names are trademarks or registered trademarks of their respective owners.
2014
A N N U A L R E P O R T

Corporate HeadquartersQLogic Corporation26650 Aliso Viejo ParkwayAliso Viejo, CA 92656949.389.6000
www.qlogic.com