FORM 6-K - LATAM Airlines Group SA
142
UNITED STATES SECURITIES AND EXCHANGE COMMISSION Washington, D.C. 20549 FORM 6-K REPORT OF FOREIGN PRIVATE ISSUER PURSUANT TO RULE 13a-16 OR 15d-16 UNDER THE SECURITIES EXCHANGE ACT OF 1934 March 15, 2018 Commission File Number 1-14728 LATAM Airlines Group S.A. (Translation of Registrant’s Name Into English) Presidente Riesco 5711, 20th floor Las Condes Santiago, Chile (Address of principal executive offices) Indicate by check mark whether the registrant files or will file annual reports under cover of Form 20-F or Form 40-F: Form 20-F ☒ Form 40-F ☐ Indicate by check mark if the registrant is submitting the Form 6-K in paper as permitted by Regulation S-T Rule 101(b)(1): ☐ Indicate by check mark if the registrant is submitting the Form 6-K in paper as permitted by Regulation S-T Rule 101(b)(7): ☐
-
Upload
khangminh22 -
Category
Documents
-
view
1 -
download
0
Transcript of FORM 6-K - LATAM Airlines Group SA

UNITED STATESSECURITIES AND EXCHANGE COMMISSION
Washington, D.C. 20549
FORM 6-K
REPORT OF FOREIGN PRIVATE ISSUERPURSUANT TO RULE 13a-16 OR 15d-16
UNDER THE SECURITIES EXCHANGE ACT OF 1934
March 15, 2018
Commission File Number 1-14728
LATAM Airlines Group S.A.(Translation of Registrant’s Name Into English)
Presidente Riesco 5711, 20th floor
Las CondesSantiago, Chile
(Address of principal executive offices)
Indicate by check mark whether the registrant files or will file annual reports under cover of Form 20-F or Form 40-F:
Form 20-F ☒ Form 40-F ☐ Indicate by check mark if the registrant is submitting the Form 6-K in paper as permitted by Regulation S-T Rule 101(b)(1): ☐ Indicate by check mark if the registrant is submitting the Form 6-K in paper as permitted by Regulation S-T Rule 101(b)(7): ☐

LATAM AIRLINES GROUP S.A. AND SUBSIDIARIES CONSOLIDATED FINANCIAL STATEMENTS DECEMBER 31, 2017 CONTENTS Consolidated Statement of Financial PositionConsolidated Statement of Income by FunctionConsolidated Statement of Comprehensive IncomeConsolidated Statement of Changes in EquityConsolidated Statement of Cash Flows - Direct MethodNotes to the Consolidated Financial Statements CLP - CHILEAN PESOARS - ARGENTINE PESOUS$ - UNITED STATES DOLLARTHUS$ - THOUSANDS OF UNITED STATES DOLLARSCOP - COLOMBIAN PESOBRL/R$ - BRAZILIAN REALTHR$ - THOUSANDS OF BRAZILIAN REALMXN - MEXICAN PESOVEF - STRONG BOLIVAR

Contents of the notes to the consolidated financial statements of LATAM Airlines Group S.A. and Subsidiaries. Notes Page 1 - General information 12 - Summary of significant accounting policies 5
2.1. Basis of Preparation 52.2. Basis of Consolidation 82.3. Foreign currency transactions 92.4. Property, plant and equipment 102.5. Intangible assets other than goodwill 112.6. Goodwill 112.7. Borrowing costs 122.8. Losses for impairment of non-financial assets 122.9. Financial assets 122.10. Derivative financial instruments and hedging activities 132.11. Inventories 142.12. Trade and other accounts receivable 142.13. Cash and cash equivalents 152.14. Capital 152.15. Trade and other accounts payables 152.16. Interest-bearing loans 152.17. Current and deferred taxes 152.18. Employee benefits 162.19. Provisions 162.20. Revenue recognition 172.21. Leases 172.22. Non-current assets (or disposal groups) classified as held for sale 182.23. Maintenance 182.24. Environmental costs 18
3 - Financial risk management 193.1. Financial risk factors 193.2. Capital risk management 333.3. Estimates of fair value 33
4 - Accounting estimates and judgments 355 - Segmental information 396 - Cash and cash equivalents 427 - Financial instruments 43
7.1. Financial instruments by category 437.2. Financial instruments by currency 45
8 - Trade, other accounts receivable and non-current accounts receivable 469 - Accounts receivable from/payable to related entities 4910 - Inventories 5011 - Other financial assets 5112 - Other non-financial assets 5213 - Non-current assets and disposal group classified as held for sale 5314 - Investments in subsidiaries 54

15 - Intangible assets other than goodwill 5716 - Goodwill 5817 - Property, plant and equipment 6018 - Current and deferred tax 6619 - Other financial liabilities 7120 - Trade and other accounts payables 7921 - Other provisions 8122 - Other non-financial liabilities 8323 - Employee benefits 8424 - Accounts payable, non-current 8625 - Equity 8626 - Revenue 9227 - Costs and expenses by nature 9228 - Other income, by function 9429 - Foreign currency and exchange rate differences 9430 - Earnings per share 10331 - Contingencies 10432 - Commitments 11633 - Transactions with related parties 12134 - Share based payments 12235 - Statement of cash flows 12536 - The environment 12737 - Events subsequent to the date of the financial statements 128

REPORT OF INDEPENDENT AUDITORS(Free translation from the original in Spanish) Santiago, March 14, 2018 To the Board of Directors and ShareholdersLatam Airlines Group S.A. We have audited the accompanying consolidated financial statements of Latam Airlines Group S.A. and subsidiaries, which comprise theconsolidated statement of financial position as at December 31, 2017 and 2016 and the related statements of income, comprehensive income,changes in equity and cash flows for the years then ended, and the corresponding notes to the consolidate financial statements. Management’s responsibility for the consolidated financial statements Management is responsible for the preparation and fair presentation of these consolidated financial statements in accordance with the InternationalFinancial Reporting Standards (IFRS). This responsibility includes the design, implementation and maintenance of a relevant internal control for thepreparation and fair presentation of consolidated financial statements that are free from material misstatement, whether due to fraud or error. Auditor’s responsibility Our responsibility is to express an opinion on these consolidated financial statements based on our audits. We conducted our audits in accordancewith Chilean Generally Accepted Auditing Standards. Those standards require that we plan and perform the audit to obtain reasonable assuranceabout whether the consolidated financial statements are free from material misstatement. An audit involves performing procedures to obtain audit evidence about the amounts and disclosures in the consolidated financial statements. Theprocedures selected depend on the auditor’s judgment, including the assessment of the risks of material misstatement of the consolidated financialstatements, whether due to fraud or error. In making those risk assessments, the auditor considers internal control relevant to the entity’s preparationand fair presentation of the consolidated financial statements in order to design audit procedures that are appropriate in the circumstances, but not forthe purpose of expressing an opinion on the effectiveness of the entity’s internal control. As a consequence we do not express that kind of opinion.An audit also includes evaluating the appropriateness of accounting policies used and the reasonableness of accounting estimates made bymanagement, as well as evaluating the overall presentation of the consolidated financial statements. We believe that the audit evidence we have obtained is sufficient and appropriate to provide a basis for our audit opinion. PWC Chile, Av. Andrés Bello 2711 - piso 5, Las Condes – Santiago, Chile RUT: 81.513.400-1 | Teléfono: (562) 2940 0000 | www.pwc.cl

Santiago, March 14, 2018Latam Airlines Group S.A.2 Opinion In our opinion, the consolidated financial statements present fairly, in all material respects the financial position of Latam Airlines Group S.A. andsubsidiaries as at December 31, 2017 and 2016, and the results of operations and cash flows for the years then ended in accordance with theInternational Financial Reporting Standards (IFRS).
Renzo Corona SpedaliereRUT: 6.373.028-9

LATAM AIRLINES GROUP S.A. AND SUBSIDIARIES
CONSOLIDATED STATEMENT OF FINANCIAL POSITION
ASSETS
Note
As ofDecember 31,
2017
As ofDecember 31,
2016 ThUS$ ThUS$ Current assets
Cash and cash equivalents 6 - 7 1,142,004 949,327 Other financial assets 7 - 11 559,919 712,828 Other non-financial assets 12 221,188 212,242 Trade and other accounts receivable 7 - 8 1,214,050 1,107,889 Accounts receivable from related entities 7 - 9 2,582 554 Inventories 10 236,666 241,363 Tax assets 18 77,987 65,377
Total current assets other than non-current assets (or disposal groups) classified as held for sale or as
held for distribution to owners 3,454,396 3,289,580
Non-current assets (or disposal groups) classified as held for sale or as held for distribution to owners 13 291,103 337,195
Total current assets 3,745,499 3,626,775 Non-current assets
Other financial assets 7 - 11 88,090 102,125 Other non-financial assets 12 220,807 237,344 Accounts receivable 7 - 8 6,891 8,254 Intangible assets other than goodwill 15 1,617,247 1,610,313 Goodwill 16 2,672,550 2,710,382 Property, plant and equipment 17 10,065,335 10,498,149 Tax assets 18 17,532 20,272 Deferred tax assets 18 364,021 384,580
Total non-current assets 15,052,473 15,571,419 Total assets 18,797,972 19,198,194
The accompanying Notes 1 to 37 form an integral part of these consolidated financial statements.

LATAM AIRLINES GROUP S.A. AND SUBSIDIARIES
CONSOLIDATED STATEMENT OF FINANCIAL POSITION
LIABILITIES AND EQUITY
LIABILITIES Note
As ofDecember 31,
2017
As ofDecember 31,
2016 ThUS$ ThUS$ Current liabilities
Other financial liabilities 7 - 19 1,300,949 1,839,528 Trade and other accounts payables 7 - 20 1,695,202 1,593,068 Accounts payable to related entities 7 - 9 760 269 Other provisions 21 2,783 2,643 Tax liabilities 18 3,511 14,286 Other non-financial liabilities 22 2,823,963 2,762,245
5,827,168 6,212,039
Liabilities included in disposal groups classified as held for sale 13 15,546 10,152 Total current liabilities 5,842,714 6,222,191
Non-current liabilities
Other financial liabilities 7 - 19 6,605,508 6,796,952 Accounts payable 7 - 24 498,832 359,391 Other provisions 21 374,593 422,494 Deferred tax liabilities 18 949,697 915,759 Employee benefits 23 101,087 82,322 Other non-financial liabilities 22 158,305 213,781
Total non-current liabilities 8,688,022 8,790,699 Total liabilities 14,530,736 15,012,890
EQUITY
Share capital 25 3,146,265 3,149,564 Retained earnings 25 475,118 366,404 Treasury Shares 25 (178) (178)Other reserves 554,884 580,870 Parent’s ownership interest 4,176,089 4,096,660 Non-controlling interest 14 91,147 88,644
Total equity 4,267,236 4,185,304 Total liabilities and equity 18,797,972 19,198,194
The accompanying Notes 1 to 37 form an integral part of these consolidated financial statements.

LATAM AIRLINES GROUP S.A. AND SUBSIDIARIES
CONSOLIDATED STATEMENT OF INCOME BY FUNCTION
For the period ended
December 31, Note 2017 2016
ThUS$ ThUS$ Revenue 26 9,613,907 8,988,340 Cost of sales (7,441,849) (6,967,037)Gross margin 2,172,058 2,021,303 Other income 28 549,889 538,748 Distribution costs (699,600) (747,426)Administrative expenses (938,931) (872,954)Other expenses (368,883) (373,738)Other gains/(losses) (7,754) (72,634)Income from operation activities 706,779 493,299 Financial income 78,695 74,949 Financial costs 27 (393,286) (416,336)Share of profit of investments accounted for using the equity method — — Foreign exchange gains/(losses) 29 (18,718) 121,651 Result of indexation units 748 311 Income (loss) before taxes 374,218 273,874 Income (loss) tax expense / benefit 18 (173,504) (163,204)NET INCOME (LOSS) FOR THE PERIOD 200,714 110,670 Income (loss) attributable to owners of the parent 155,304 69,220 Income (loss) attributable to non-controlling interest 14 45,410 41,450 Net income (loss) for the year 200,714 110,670 EARNINGS PER SHARE Basic earnings (losses) per share (US$) 30 0,25610 0.12665 Diluted earnings (losses) per share (US$) 30 0,25610 0.12665 The accompanying Notes 1 to 37 form an integral part of these consolidated financial statements.

LATAM AIRLINES GROUP S.A. AND SUBSIDIARIES
CONSOLIDATED STATEMENT OF COMPREHENSIVE INCOME
For the period ended
December 31, Note 2017 2016 ThUS$ ThUS$ NET INCOME (LOSS) 200,714 110,670 Components of other comprehensive income that will not be reclassified to income before taxes Other comprehensive income, before taxes, gains (losses) by new measurements on defined benefit plans 25 2,763 (3,105)Total other comprehensive income that will not be reclassified to income before taxes 2,763 (3,105)Components of other comprehensive income that will be reclassified to income before taxes
Currency translation differences Gains (losses) on currency translation, before tax 29 (47,495) 494,362 Other comprehensive income, before taxes, currency translation differences (47,495) 494,362
Cash flow hedges Gains (losses) on cash flow hedges before taxes 19 18,344 127,390 Other comprehensive income (losses), before taxes, cash flow hedges 18,344 127,390
Total other comprehensive income that will be reclassified to income before taxes (29,151) 621,752 Other components of other comprehensive income (loss), before taxes (26,388) 618,647 Income tax relating to other comprehensive income that will not be reclassified to income
Income tax relating to new measurements on defined benefit plans 18 (785) 921 Accumulate income tax relating to other comprehensive income that will not be reclassified to income (785) 921
Income tax relating to other comprehensive income that will be reclassified to income Income tax related to cash flow hedges in other comprehensive income (1,770) (34,695)
Income taxes related to components of other comprehensive income that will be reclassified to income (1,770) (34,695)Total Other comprehensive income (28,943) 584,873 Total comprehensive income (loss) 171,771 695,543 Comprehensive income (loss) attributable to owners of the parent 128,876 648,539 Comprehensive income (loss) attributable to non-controlling interests 42,895 47,004 TOTAL COMPREHENSIVE INCOME (LOSS) 171,771 695,543 The accompanying Notes 1 to 37 form an integral part of these consolidated financial statements.

LATAM AIRLINES GROUP S.A. AND SUBSIDIARIES
CONSOLIDATED STATEMENT OF CHANGES IN EQUITY
Attributable to owners of the parent Change in other reserves
Note Sharecapital
Treasuryshares
Currencytranslation
reserve
Cash flowhedgingreserve
Actuarialgains
or losseson
definedbenefitplans
reserve
Sharesbased
paymentsreserve
Othersundryreserve
Totalother
reserve Retainedearnings
Parent’sownership
interest
Non-controlling
interest Totalequity
ThUS$ ThUS$ ThUS$ ThUS$ ThUS$ ThUS$ ThUS$ ThUS$ ThUS$ ThUS$ ThUS$ ThUS$ Equity as of January 1,
2017 3,149,564 (178) (2,086,555) 1,506 (12,900) 38,538 2,640,281 580,870 366,404 4,096,660 88,644 4,185,304 Total increase
(decrease) in equityComprehensiveincome
Gain (losses) 25 — — — — — — — — 155,304 155,304 45,410 200,714 Other
comprehensiveincome — — (45,036) 16,634 1,974 — (26,428) — (26,428) (2,515) (28,943)
Total comprehensiveincome — — (45,036) 16,634 1,974 — — (26,428) 155,304 128,876 42,895 171,771
Transactions withshareholders Dividens 25 — — — — — — — — (46,590) (46,590) — (46,590)Increase (decrease)
through transfersand otherchanges, equity 25-34 (3,299) — — — — 943 (501) 442 — (2,857) (40,392) (43,249)
Total transactionswith shareholders (3,299) — — — — 943 (501) 442 (46,590) (49,447) (40,392) (89,839)
Closing balance as ofDecember 31, 2017 3,146,265 (178) (2,131,591) 18,140 (10,926) 39,481 2,639,780 554,884 475,118 4,176,089 91,147 4,267,236
The accompanying Notes 1 to 37 form an integral part of these consolidated financial statements.

LATAM AIRLINES GROUP S.A. AND SUBSIDIARIES
CONSOLIDATED STATEMENT OF CHANGES IN EQUITY
Attributable to owners of the parent Change in other reserves
Note Sharecapital Treasury
shares Currencytranslation
reserve Cash flowhedgingreserve
Actuarialgains orlosses
on definedbenefitplans reserve
Sharesbased
paymentsreserve
Othersundryreserve
Totalother
reserve Retainedearnings
Parent’sownership
interest Non-
controllinginterest Total
equity ThUS$ ThUS$ ThUS$ ThUS$ ThUS$ ThUS$ ThUS$ ThUS$ ThUS$ ThUS$ ThUS$ ThUS$
Equity as of January 1,
2016 2,545,705 (178) (2,576,041) (90,510) (10,717) 35,647 2,634,679 (6,942) 317,950 2,856,535 81,013 2,937,548 Total increase
(decrease) in equity Comprehensive
income Gain (losses) 25 — — — — — — — — 69,220 69,220 41,450 110,670 Other
comprehensiveincome — — 489,486 92,016 (2,183) — 579,319 — 579,319 5,554 584,873
Total comprehensiveincome — — 489,486 92,016 (2,183) — — 579,319 69,220 648,539 47,004 695,543
Transactions withshareholders Equity issue 25-34 608,496 — — — — — — — — 608,496 — 608,496 Dividens 25 — — — — — — — — (20,766) (20,766) — (20,766)Increase (decrease)
through transfersand otherchanges, equity 25-34 (4,637) — — — — 2,891 5,602 8,493 — 3,856 (39,373) (35,517)
Total transactions withshareholders 603,859 — — — — 2,891 5,602 8,493 (20,766) 591,586 (39,373) 552,213
Closing balance as of
December 31, 2016 3,149,564 (178) (2,086,555) 1,506 (12,900) 38,538 2,640,281 580,870 366,404 4,096,660 88,644 4,185,304
The accompanying Notes 1 to 37 form an integral part of these consolidated financial statements.

LATAM AIRLINES GROUP S.A. AND SUBSIDIARIES
CONSOLIDATED STATEMENT OF CASH FLOWS DIRECT – METHOD
For the periods ended
December 31, Note 2017 2016
ThUS$ ThUS$ Cash flows from operating activities
Cash collection from operating activities Proceeds from sales of goods and services 10,595,718 9,918,589 Other cash receipts from operating activities 73,668 70,359
Payments for operating activities Payments to suppliers for goods and services (6,722,713) (6,756,121)Payments to and on behalf of employees (1,955,310) (1,820,279)Other payments for operating activities (223,706) (162,839)
Income taxes refunded (paid) (91,986) (59,556)Other cash inflows (outflows) 35 (8,931) (209,269)
Net cash flows from operating activities 1,666,740 980,884 Cash flows used in investing activities
Cash flows from losses of control of subsidiaries or other businesses 6,503 — Other cash receipts from sales of equity or debt instruments of other entities 3,248,693 2,969,731 Other payments to acquire equity or debt instruments of other entities (3,106,411) (2,706,733)Amounts raised from sale of property, plant and equipment 51,316 76,084 Purchases of property, plant and equipment (403,666) (694,370)Amounts raised from sale of intangible assets — 1 Purchases of intangible assets (87,318) (88,587)Interest received 12,684 11,242 Other cash inflows (outflows) 35 (9,223) 843
Net cash flow from (used in) investing activities (287,422) (431,789) Cash flows from (used in) financing activities
Amounts raised from issuance of shares — 608,496 Amounts raised from long-term loans 1,305,384 1,820,016 Amounts raised from short-term loans 132,280 279,593 Loans repayments (1,829,191) (2,121,130)Payments of finance lease liabilities (344,901) (314,580)Dividends paid 35 (66,642) (41,223)Interest paid (389,724) (398,288)Other cash inflows (outflows) 35 13,706 (229,163)
Net cash flows from (used in) financing activities (1,179,088) (396,279)Net increase (decrease) in cash and cash equivalents before effect of exchanges rate change 200,230 152,816
Effects of variation in the exchange rate on cash and cash equivalents (7,553) 43,014 Net increase (decrease) in cash and cash equivalents 192,677 195,830
CASH AND CASH EQUIVALENTS AT BEGINNING OF PERIOD 6 949,327 753,497 CASH AND CASH EQUIVALENTS AT END OF PERIOD 6 1,142,004 949,327 The accompanying Notes 1 to 37 form an integral part of these consolidated financial statements.
LATAM AIRLINES GROUP S.A. AND SUBSIDIARIES
NOTES TO THE CONSOLIDATED FINANCIAL STATEMENTS
AS OF DECEMBER 31, 2017
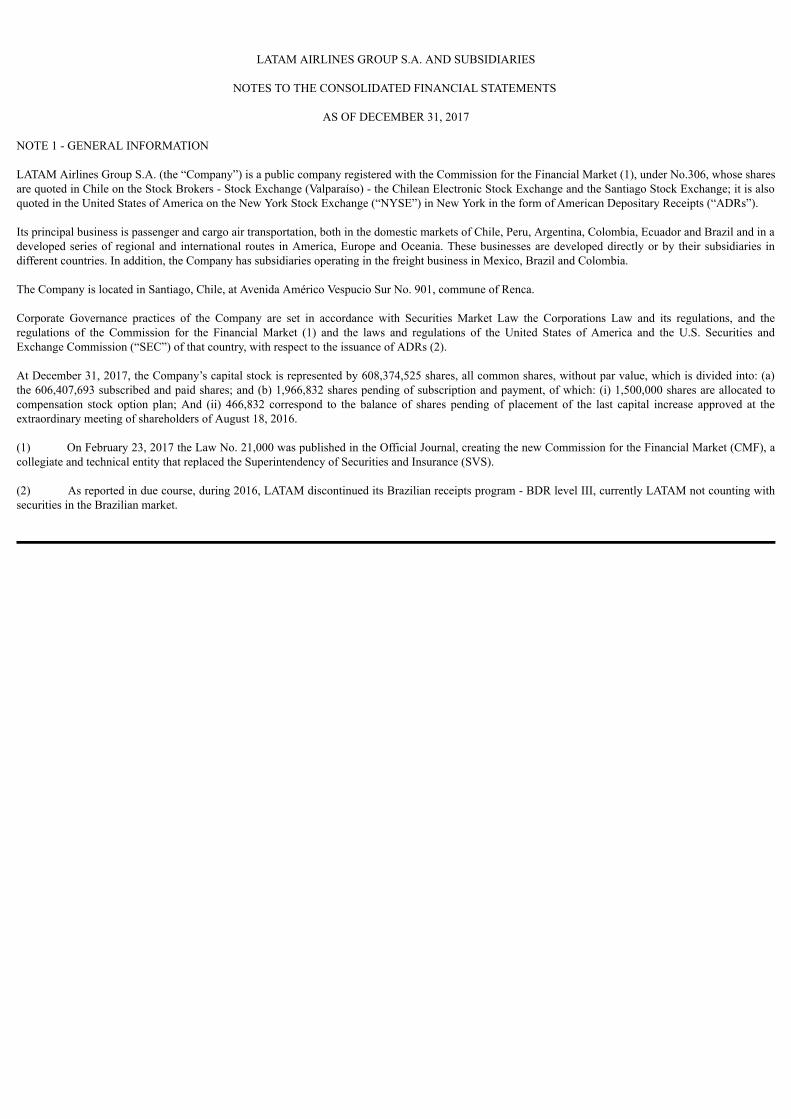
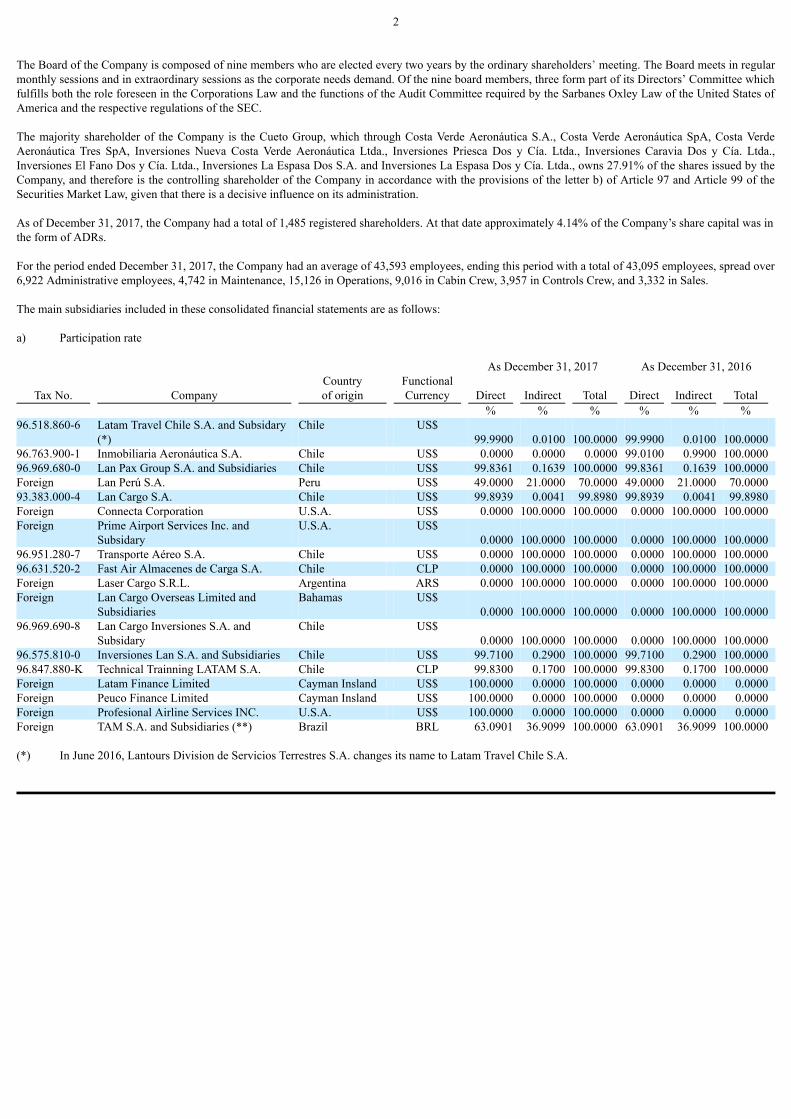
NOTE 1 - GENERAL INFORMATION LATAM Airlines Group S.A. (the “Company”) is a public company registered with the Commission for the Financial Market (1), under No.306, whose sharesare quoted in Chile on the Stock Brokers - Stock Exchange (Valparaíso) - the Chilean Electronic Stock Exchange and the Santiago Stock Exchange; it is alsoquoted in the United States of America on the New York Stock Exchange (“NYSE”) in New York in the form of American Depositary Receipts (“ADRs”). Its principal business is passenger and cargo air transportation, both in the domestic markets of Chile, Peru, Argentina, Colombia, Ecuador and Brazil and in adeveloped series of regional and international routes in America, Europe and Oceania. These businesses are developed directly or by their subsidiaries indifferent countries. In addition, the Company has subsidiaries operating in the freight business in Mexico, Brazil and Colombia. The Company is located in Santiago, Chile, at Avenida Américo Vespucio Sur No. 901, commune of Renca. Corporate Governance practices of the Company are set in accordance with Securities Market Law the Corporations Law and its regulations, and theregulations of the Commission for the Financial Market (1) and the laws and regulations of the United States of America and the U.S. Securities andExchange Commission (“SEC”) of that country, with respect to the issuance of ADRs (2). At December 31, 2017, the Company’s capital stock is represented by 608,374,525 shares, all common shares, without par value, which is divided into: (a)the 606,407,693 subscribed and paid shares; and (b) 1,966,832 shares pending of subscription and payment, of which: (i) 1,500,000 shares are allocated tocompensation stock option plan; And (ii) 466,832 correspond to the balance of shares pending of placement of the last capital increase approved at theextraordinary meeting of shareholders of August 18, 2016. (1) On February 23, 2017 the Law No. 21,000 was published in the Official Journal, creating the new Commission for the Financial Market (CMF), acollegiate and technical entity that replaced the Superintendency of Securities and Insurance (SVS). (2) As reported in due course, during 2016, LATAM discontinued its Brazilian receipts program - BDR level III, currently LATAM not counting withsecurities in the Brazilian market.
2
The Board of the Company is composed of nine members who are elected every two years by the ordinary shareholders’ meeting. The Board meets in regularmonthly sessions and in extraordinary sessions as the corporate needs demand. Of the nine board members, three form part of its Directors’ Committee whichfulfills both the role foreseen in the Corporations Law and the functions of the Audit Committee required by the Sarbanes Oxley Law of the United States ofAmerica and the respective regulations of the SEC. The majority shareholder of the Company is the Cueto Group, which through Costa Verde Aeronáutica S.A., Costa Verde Aeronáutica SpA, Costa VerdeAeronáutica Tres SpA, Inversiones Nueva Costa Verde Aeronáutica Ltda., Inversiones Priesca Dos y Cía. Ltda., Inversiones Caravia Dos y Cía. Ltda.,Inversiones El Fano Dos y Cía. Ltda., Inversiones La Espasa Dos S.A. and Inversiones La Espasa Dos y Cía. Ltda., owns 27.91% of the shares issued by theCompany, and therefore is the controlling shareholder of the Company in accordance with the provisions of the letter b) of Article 97 and Article 99 of theSecurities Market Law, given that there is a decisive influence on its administration. As of December 31, 2017, the Company had a total of 1,485 registered shareholders. At that date approximately 4.14% of the Company’s share capital was inthe form of ADRs. For the period ended December 31, 2017, the Company had an average of 43,593 employees, ending this period with a total of 43,095 employees, spread over6,922 Administrative employees, 4,742 in Maintenance, 15,126 in Operations, 9,016 in Cabin Crew, 3,957 in Controls Crew, and 3,332 in Sales. The main subsidiaries included in these consolidated financial statements are as follows: a) Participation rate As December 31, 2017 As December 31, 2016
Tax No. Company Countryof origin
FunctionalCurrency Direct Indirect Total Direct Indirect Total
% % % % % % 96.518.860-6 Latam Travel Chile S.A. and Subsidary
(*) Chile US$
99.9900
0.0100
100.0000
99.9900
0.0100
100.0000
96.763.900-1 Inmobiliaria Aeronáutica S.A. Chile US$ 0.0000 0.0000 0.0000 99.0100 0.9900 100.0000 96.969.680-0 Lan Pax Group S.A. and Subsidiaries Chile US$ 99.8361 0.1639 100.0000 99.8361 0.1639 100.0000 Foreign Lan Perú S.A. Peru US$ 49.0000 21.0000 70.0000 49.0000 21.0000 70.0000 93.383.000-4 Lan Cargo S.A. Chile US$ 99.8939 0.0041 99.8980 99.8939 0.0041 99.8980 Foreign Connecta Corporation U.S.A. US$ 0.0000 100.0000 100.0000 0.0000 100.0000 100.0000 Foreign Prime Airport Services Inc. and
Subsidary U.S.A. US$
0.0000
100.0000
100.0000
0.0000
100.0000
100.0000
96.951.280-7 Transporte Aéreo S.A. Chile US$ 0.0000 100.0000 100.0000 0.0000 100.0000 100.0000 96.631.520-2 Fast Air Almacenes de Carga S.A. Chile CLP 0.0000 100.0000 100.0000 0.0000 100.0000 100.0000 Foreign Laser Cargo S.R.L. Argentina ARS 0.0000 100.0000 100.0000 0.0000 100.0000 100.0000 Foreign Lan Cargo Overseas Limited and
Subsidiaries Bahamas US$
0.0000
100.0000
100.0000
0.0000
100.0000
100.0000
96.969.690-8 Lan Cargo Inversiones S.A. andSubsidary
Chile US$ 0.0000
100.0000
100.0000
0.0000
100.0000
100.0000
96.575.810-0 Inversiones Lan S.A. and Subsidiaries Chile US$ 99.7100 0.2900 100.0000 99.7100 0.2900 100.0000 96.847.880-K Technical Trainning LATAM S.A. Chile CLP 99.8300 0.1700 100.0000 99.8300 0.1700 100.0000 Foreign Latam Finance Limited Cayman Insland US$ 100.0000 0.0000 100.0000 0.0000 0.0000 0.0000 Foreign Peuco Finance Limited Cayman Insland US$ 100.0000 0.0000 100.0000 0.0000 0.0000 0.0000 Foreign Profesional Airline Services INC. U.S.A. US$ 100.0000 0.0000 100.0000 0.0000 0.0000 0.0000 Foreign TAM S.A. and Subsidiaries (**) Brazil BRL 63.0901 36.9099 100.0000 63.0901 36.9099 100.0000 (*) In June 2016, Lantours Division de Servicios Terrestres S.A. changes its name to Latam Travel Chile S.A.

3
(**) As of December 31, 2017, indirect ownership participation on TAM S.A and subsidiaries is from Holdco I S.A., LATAM is entitled to 99,9983% of
the economic rights and 49% of the rights politicians product of provisional measure No. 714 of the Brazilian Government implemented during 2016which allows foreign capital to have up to 49% of the property.
Thus, since April 2016, LATAM Airlines Group S.A. owns 901 voting shares of Holdco I S.A., equivalent to 49% of the total shares with votingrights of said company and TEP Chile S.A. owns 938 voting shares of Holdco I S.A., equivalent to 51% of the total voting shares of that company.
b) Financial Information
Statement of financial position Net Income
As of December 31, 2017 As of December 31, 2016 For the periods ended
December 31, 2017 2016
Tax No. Company Assets Liabilities Equity Assets Liabilities Equity Gain /(loss) ThUS$ ThUS$ ThUS$ ThUS$ ThUS$ ThUS$ ThUS$ ThUS$
96.518.860-6 Latam Travel Chile S.A. and Subsidary
(*)
6,771
2,197
4,574
5,468
2,727
2,741
1,833
2,650
96.763.900-1 Inmobiliaria Aeronáutica S.A. — — — 36,756 8,843 27,913 — 3,443 96.969.680-0 Lan Pax Group S.A. and Subsidiaries
(**)
499,345
1,101,548
(596,406)
475,763
1,045,761
(561,472)
(35,943)
(36,331)
Foreign Lan Perú S.A. 315,607 303,204 12,403 306,111 294,912 11,199 1,205 (2,164) 93.383.000-4 Lan Cargo S.A. 584,169 371,934 212,235 480,908 239,728 241,180 (30,220) (24,813) Foreign Connecta Corporation 38,735 17,248 21,487 31,981 23,525 8,456 13,013 9,684 Foreign Prime Airport Services Inc. and
Subsidary (**)
12,671
15,722
(3,051)
7,385
11,294
(3,909)
857
588
96.951.280-7 Transporte Aéreo S.A. 324,498 104,357 220,141 340,940 124,805 216,135 2,172 8,206 Foreign Aircraft International Leasing Limited — — — — 9 96.631.520-2 Fast Air Almacenes de Carga S.A. 12,931 4,863 8,068 10,023 3,645 6,378 939 1,717 Foreign Laser Cargo S.R.L. 18 27 (9) 21 32 (11) 2 (1) Foreign Lan Cargo Overseas Limited and
Subsidiaries (**)
66,039
42,271
18,808
54,092
35,178
15,737
3,438
176
96.969.690-8 Lan Cargo Inversiones S.A. andSubsidary (**)
144,884
156,005
(10,112)
80,644
95,747
(13,506)
3,389
(910)
96.575.810-0 Inversiones Lan S.A. and Subsidiaries(**)
11,681
5,201
6,377
10,971
6,452
4,452
1,561
2,549
96.847.880-K Technical Trainning LATAM S.A. 1,967 367 1,600 1,745 284 1,461 109 73 Foreign Latam Finance Limited 678,289 708,306 (30,017) — — — (30,017) — Foreign Peuco Finance Limited 608,191 608,191 — — — — — — Foreign Profesional Airline Services INC. 3,703 3,438 265 — — — 294 — Foreign TAM S.A. and Subsidiaries (**) 4,490,714 3,555,423 856,829 5,287,286 4,710,308 495,562 160,582 2,107 (*) In June 2016, Lantours Division of Terrestrial Services S.A. changed its name to Latam Travel Chile S.A. (**) The Equity reported corresponds to Equity attributable to owners of the parent, it does not include Non-controlling interest. Additionally, we have proceeded to consolidate the following special purpose entities: 1. Chercán Leasing Limited created to finance the pre-deliverypayments on aircraft; 2. Guanay Finance Limited created to issue a bond collateralized with future credit card receivables; 3. Private investment funds and 4.Avoceta Leasing Limited created to finance the pre-delivery payments on aircraft. These companies have been consolidated as required by IFRS 10. All controlled entities have been included in the consolidation.

4
Changes in the scope of consolidation between January 1, 2016 and December 31, 2017, are detailed below: (1) Incorporation or acquisition of companies - On January 2016, the increase in the share capital and statutory amendment for the purpose of creating a new class of shares of Lan Argentina SA, a
subsidiary of Lan Pax Group SA, for a total amount was registered in the Public Registry of Commerce. of 90,000,000 nominated “C” class sharesnot endorsable and without the right to vote. Lan Pax Group S.A. participated in this capital increase, modifying its ownership in 4.87%, as a resultof which, the indirect participation of LATAM Airlines Group S.A. increases to 99.8656%.
- On April 1, 2016, Multiplus Corretora de Seguros Ltda. was created, the ownership of which corresponds to 99.99% of Multiplus S.A. direct
subsidiary of TAM S.A. - On September 2016, Latam Finance Limited, a wholly-owned subsidiary of LATAM Airlines Group S.A., was created. Company operation started
on April 2017. - On November 2015, the company Peuco Finance Limited was created, whose ownership corresponds 100% to LATAM Airlines Group S.A. The
operation of this company began in December 2017. - Prismah Fidelidade Ltda. is constituted on June 29, 2012, whose ownership corresponds 99.99% to Multiplus S.A. direct subsidiary of TAM S.A.
The operation of this company began in December 2017. - On December 11, 2017, a capital increase was made in TAM S.A. for a total of MR $ 697,935 (ThUS $ 210,000), with no new shares issues. This
capital increase was paid a whole 100% by the shareholder LATAM Airlines Goup S.A.
The foregoing, in accordance with the TAM’s shareholder Holdco I S.A., who renounces to any right arisinged from this increase.
- As of December 31, 2017, Inversiones LAN S.A., subsidiary of LATAM Airlines Group S.A., acquired 4,951 shares of Aerovías de IntegraciónRegional Aires S.A. a non-controlling shareholder, equivalent to 0.09498%, consequently, the indirect participation of LATAM Airlines Group S.A.increases to 99.19414%
(2) Dissolution of companies - During the period 2016, Lan Chile Investments Limited, subsidiary of LATAM Airlines Group S.A.; and Aircraft International Leasing Limited,
subsidiary of Lan Cargo S.A., were dissolved.
- On November 20, 2017 LATAM Airlines Group S.A. acquires 100% of the shares of Inmobiliaria Aeronáutica S.A. consequently, a merger andsubsequent dissolution of said company is carried out.

5
(3) Disappropriation of companies. - On May 5, 2017 Lan Pax Group S.A. and Inversiones Lan S.A., both subsidiaries of LATAM Airlines Group S.A., sold Talma Servicios
Aeroportuarios S.A. and Inversiones Talma S.A.C. 100% of the capital stock of Rampas Andes Airport Services S.A.
The sale value of Rampas Andes Airport Services S.A. it was of ThUS $ 8,624.
NOTE 2 - SUMMARY OF SIGNIFICANT ACCOUNTING POLICIES The following describes the principal accounting policies adopted in the preparation of these consolidated financial statements. 2.1. Basis of Preparation The consolidated financial statements of LATAM Airlines Group S.A. for the period ended December 31, 2017, have been prepared in accordance withInternational Financial Reporting Standards (IFRS) issued by the International Accounting Standards Board (“IASB”) incorporated therein and with theinterpretations issued by the International Financial Reporting Standards Interpretations Committee (IFRIC). The consolidated financial statements have been prepared under the historic-cost criterion, although modified by the valuation at fair value of certainfinancial instruments. The preparation of the consolidated financial statements in accordance with IFRS requires the use of certain critical accounting estimates. It also requiresmanagement to use its judgment in applying the Company’s accounting policies. Note 4 shows the areas that imply a greater degree of judgment orcomplexity or the areas where the assumptions and estimates are significant to the consolidated financial statements. During 2016 the Company recorded out of period adjustments resulting in an aggregate net decrease of US$ 18.2 million to “Net income (loss) for theperiod” for the year ended December 31, 2016. These adjustments include US$ 39.5 million (loss) resulting from an account reconciliation process initiatedafter the Company’s afiliate TAM S.A. and its subsidiaries completed the implementation of the SAP system. A further US$ 11.0 million (loss) reflectadjustments related to foreign exchange differences, also relating to the Company’s subsidiaries in Brazil. The balance of US$ 32.3 million (gain) includesprincipally the adjustment of unclaimed fees for expired tickets for the Company and its affiliates outside Brazil. Management of TAM S.A. has concludedthat the out of period adjustments that have been identified are material to the 2015 financial statements of TAM S.A., which should therefore require arestatement in Brazil. However, Management of LATAM has evaluated the impact of all out of period adjustments, both individually and in the aggregate,and concluding that due to their relative size and to qualitative factors they are not material to the annual consolidated financial statements for 2016 of LatamAirlines Group S.A. or to any previously reported consolidated financial statements, therefore no restatement or revision is necessary. In order to facilitate comparison, some minor reclassifications have been made to the consolidated financial statements for the previous year.

6
(a) Accounting pronouncements with implementation effective from January 1, 2017:
(i) Standards and amendments Date of issue
MandatoryApplication:Annual periods
beginning on or after Amendment to IAS 7: Statement of cash flow January 2016 01/01/2017 Amendment to IAS 12: Income tax January 2016 01/01/2017 (ii) Improvements Improvements to International Financial Reporting Standards (2014-2016 cycle): IFRS 12Disclosure of interests in other entities
December 2016 01/01/2017
The application of standards, amendments, interpretations and improvements had no material impact on the consolidated financial statements of theCompany. (b) Accounting pronouncements not yet in force for financial years beginning on January 1, 2017 and which has not been effected early adoption
(i) Standards and amendments Date of issue
MandatoryApplication:
Annual periodsbeginning on or after
IFRS 9: Financial instruments. December 2009 01/01/2018 Amendment to IFRS 9: Financial instruments. November 2013 01/01/2018 IFRS 15: Revenue from contracts with customers (1). May 2014 01/01/2018 Amendment to IFRS 15: Revenue from contracts with customers. April 2016 01/01/2018 Amendment to IFRS 2: Share-based payments June 2016 01/01/2018 Amendment to IFRS 4: Insurance contracts. September 2016 01/01/2018 Amendment to IAS 40: Investment property December 2016 01/01/2018 IFRS 16: Leases (2). January 2016 01/01/2019 Amendment to IFRS 9: Financial Instruments October 2017 01/01/2019 Amendment to IAS 28: Investments in associates and joint ventures October 2017 01/01/2019 IFRS 17: Insurance contracts May 2017 01/01/2021

7
(ii) Standards and amendments Date of issue
MandatoryApplication:Annual periods
beginning on or afterAmendment to IFRS 10: Consolidated financial statements and IAS 28 Investments inassociates and joint ventures.
September 2014 To be determined
(iii) Improvements Improvements to International Financial Reporting Standards. (cycle 2014-2016) IFRS 1:First-time adoption of international financial reporting standards and IAS 28 investments inassociates and joint ventures.
December 2016 01/01/2018
Improvements to International Financial Reporting Standards. (cycle 2015-2017) IFRS 3:Business combinations, IAS 12: Income tax, IFRS 11: Joint arrangements and IAS 23:Borrowing costs
December 2017 01/01/2019
(iv) Interpretations IFRIC 22: Foreign currency transactions and advance consideration December 2016 01/01/2018 IFRIC 23: Uncertain tax positions June 2017 01/01/2019 The Company’s management believes that the adoption of the standards, amendments and interpretations described above but not yet effective would nothave a significant impact on the Company’s consolidated financial statements in the year of their first application, except for IFRS 15 and IFRS 16: (1) IFRS 15 Revenue from Contracts with Customers supersedes actual standard for revenue recognition that actually uses the Company, as IAS 18
Revenue and IFRIC 13 Customer Loyalty Programmes. The core principle of IFRS 15 is that an entity recognizes revenue to depict the transfer ofpromised goods or services to customers in an amount that reflects the consideration to which the entity expects to be entitled in exchange for thosegoods or services. This standards supersedes IFRS 15 supersedes, IAS 11 Construction Contracts, IAS 18 Revenue, IFRIC 13 Customer LoyaltyProgrammes, IFRIC 15 Agreements for the Construction of Real Estate, IFRIC 18 Transfers of Assets from Customers; and SIC-31 Revenue - BarterTransactions Involving Advertising Services.

8
The Company evaluated the possible adoption impacts that this new standard will have on the consolidated financial statements and has identifiedchanges in: i) the recognition of the income associated with the fines for changes, which were previously recognized at the time of the sale and nowwill be considered as a modification of the initial transport contract and therefore the recognition must be deferred until the rendering of the service;ii) the moment of recognition of the income from the sale of some services or products, where the Company concluded that it acted as principal, andtherefore the revenues must be deferred until the service is rendered; and iii) the presentation of the income associated with the sale of products,where the Company concluded that it acted as agent and therefore the income must be presented net of the associated costs.
As of December 31, 2017, the effect of the changes indicated above As of December 31, 2017, the effect of the changes indicated above will nothave a significant impact on the Company’s consolidated financial statements in the year of its first adoption.
(2) The IFRS 16 Leases add important changes in the accounting for lessees by introducing a similar treatment to financial leases for all operating leases
with a term of more than 12 months. This mean, in general terms, that an asset should be recognized for the right to use the underlying leased assetsand a liability representing its present value of payments associate to the agreement. Monthly leases payments will be replace by the assetdepreciation and a financial cost in the income statement.
We are evaluating the impact that the adoption of the new lease rule will have on the consolidated financial statements. Currently, we believe that theadoption of this new standard will have a significant impact on the consolidated statement of financial position due to the recording of an asset forright of use and a liability, corresponding to the recording of the leases that are currently registered as operating leases.
LATAM Airlines Group S.A. and subsidiaries are still assessing this standard to determinate the effect on their Financial Statements, covenants and otherfinancial indicators. 2.2. Basis of Consolidation (a) Subsidiaries Subsidiaries are all the entities (including special-purpose entities) over which the Company has the power to control the financial and operating policies,which are generally accompanied by a holding of more than half of the voting rights. In evaluating whether the Company controls another entity, theexistence and effect of potential voting rights that are currently exercisable or convertible at the date of the consolidated financial statements are considered.The subsidiaries are consolidated from the date on which control is passed to the Company and they are excluded from the consolidation on the date theycease to be so controlled. The results and flows are incorporated from the date of acquisition. Balances, transactions and unrealized gains on transactions between the Company’s entities are eliminated. Unrealized losses are also eliminated unless thetransaction provides evidence of an impairment loss of the asset transferred. When necessary in order to ensure uniformity with the policies adopted by theCompany, the accounting policies of the subsidiaries are modified. To account for and identify the financial information revealed when carrying out a business combination, such as the acquisition of an entity by the Company,is apply the acquisition method provided for in IFRS 3: Business combination.

9
(b) Transactions with non-controlling interests The Company applies the policy of considering transactions with non-controlling interests, when not related to loss of control, as equity transactions withoutan effect on income. (c) Sales of subsidiaries When a subsidiary is sold and a percentage of participation is not retained, the Company derecognizes assets and liabilities of the subsidiary, the non-controlling and other components of equity related to the subsidiary. Any gain or loss resulting from the loss of control is recognized in the consolidatedincome statement in Other gains (losses). If LATAM Airlines Group S.A. and Subsidiaries retain an ownership of participation in the sold subsidiary, and does not represent control, this is recognizedat fair value on the date that control is lost, the amounts previously recognized in Other comprehensive income are accounted as if the Company had disposeddirectly from the assets and related liabilities, which can cause these amounts are reclassified to profit or loss. The percentage retained valued at fair value issubsequently accounted using the equity method. (d) Investees or associates Investees or associates are all entities over which LATAM Airlines Group S.A. and Subsidiaries have significant influence but have no control. This usuallyarises from holding between 20% and 50% of the voting rights. Investments in associates are booked using the equity method and are initially recognized attheir cost. 2.3. Foreign currency transactions (a) Presentation and functional currencies The items included in the financial statements of each of the entities of LATAM Airlines Group S.A. and Subsidiaries are valued using the currency of themain economic environment in which the entity operates (the functional currency). The functional currency of LATAM Airlines Group S.A. is the UnitedStates dollar which is also the presentation currency of the consolidated financial statements of LATAM Airlines Group S.A. and Subsidiaries. (b) Transactions and balances Foreign currency transactions are translated to the functional currency using the exchange rates on the transaction dates. Foreign currency gains and lossesresulting from the liquidation of these transactions and from the translation at the closing exchange rates of the monetary assets and liabilities denominated inforeign currency are shown in the consolidated statement of income by function except when deferred in Other comprehensive income as qualifying cashflow hedges.

10
(c) Group entities The results and financial position of all the Group entities (none of which has the currency of a hyper-inflationary economy) that have a functional currencyother than the presentation currency are translated to the presentation currency as follows: (i) Assets and liabilities of each consolidated statement of financial position presented are translated at the closing exchange rate on the consolidatedstatement of financial position date; (ii) The revenues and expenses of each income statement account are translated at the exchange rates prevailing on the transaction dates, and (iii) All the resultant exchange differences by conversion are shown as a separate component in other comprehensive income. The exchange rates used correspond to those fixed in the country where the subsidiary is located, whose functional currency is different to the U.S. dollar. Adjustments to the Goodwill and fair value arising from the acquisition of a foreign entity are treated as assets and liabilities of the foreign entity and aretranslated at the closing exchange rate or period informed. 2.4. Property, plant and equipment The land of LATAM Airlines Group S.A. and Subsidiaries, are recognized at cost less any accumulated impairment loss. The rest of the Properties, plants andequipment are recorded, both in their initial recognition and in their subsequent measurement, at their historical cost less the corresponding depreciation andany loss due to deterioration. The amounts of advances paid to the aircraft manufacturers are activated by the Company under Construction in progress until they are received. Subsequent costs (replacement of components, improvements, extensions, etc.) are included in the value of the initial asset or are recognized as a separateasset, only when it is probable that the future economic benefits associated with the elements of property, plant and equipment , they will flow to theCompany and the cost of the item can be determined reliably. The value of the replaced component is written off. The rest of the repairs and maintenance arecharged to the result of the year in which they are incurred. The depreciation of the properties, plants and equipment is calculated using the linear method over their estimated technical useful lives; except in the case ofcertain technical components which are depreciated on the basis of cycles and hours flown. The residual value and the useful life of the assets are reviewed and adjusted, if necessary, once a year. When the value of an asset exceeds its estimated recoverable amount, its value is immediately reduced to its recoverable amount (Note 2.8). Losses and gains from the sale of property, plant and equipment are calculated by comparing the consideration with the book value and are included in theconsolidated statement of income.

11
2.5. Intangible assets other than goodwill (a) Airport slots and Loyalty program Airport slots and the Coalition and Loyalty program are intangible assets of indefinite useful life and are subject to impairment tests annually as an integralpart of each CGU, in accordance with the premises that are applicable, included as follows: Airport slots – Air transport CGULoyalty program – Coalition and loyalty program Multiplus CGU(See Note 16) The airport slots correspond to an administrative authorization to carry out operations of arrival and departure of aircraft at a specific airport, within aspecified period. The Loyalty program corresponds to the system of accumulation and redemption of points that has developed Multiplus S.A., subsidiary of TAM S.A. The Brands, airport Slots and Loyalty program were recognized in fair values determined in accordance with IFRS 3, as a consequence of the businesscombination with TAM and Subsidiaries. (b) Computer software Licenses for computer software acquired are capitalized on the basis of the costs incurred in acquiring them and preparing them for using the specificsoftware. These costs are amortized over their estimated useful lives, for which the Company has been defined useful lives between 3 and 10 years. Expenses related to the development or maintenance of computer software which do not qualify for capitalization, are shown as an expense when incurred.The personnel costs and others costs directly related to the production of unique and identifiable computer software controlled by the Company, are shown asintangible Assets others than Goodwill when they have met all the criteria for capitalization. (c) Brands The Brands were acquired in the business combination with TAM S.A. And Subsidiaries and recognized at fair value under IFRS. During the year 2016, theestimated useful life of the brands change from an indefinite useful life to a five-year period, the period in which the value of the brands will be amortized(See Note 15). 2.6. Goodwill Goodwill represents the excess of acquisition cost over the fair value of the Company’s participation in the net identifiable assets of the subsidiary orassociate on the acquisition date. Goodwill related to acquisition of subsidiaries is not amortized but tested for impairment annually or each time that there isevidence of impairment. Gains and losses on the sale of an entity include the book amount of the goodwill related to the entity sold.
12
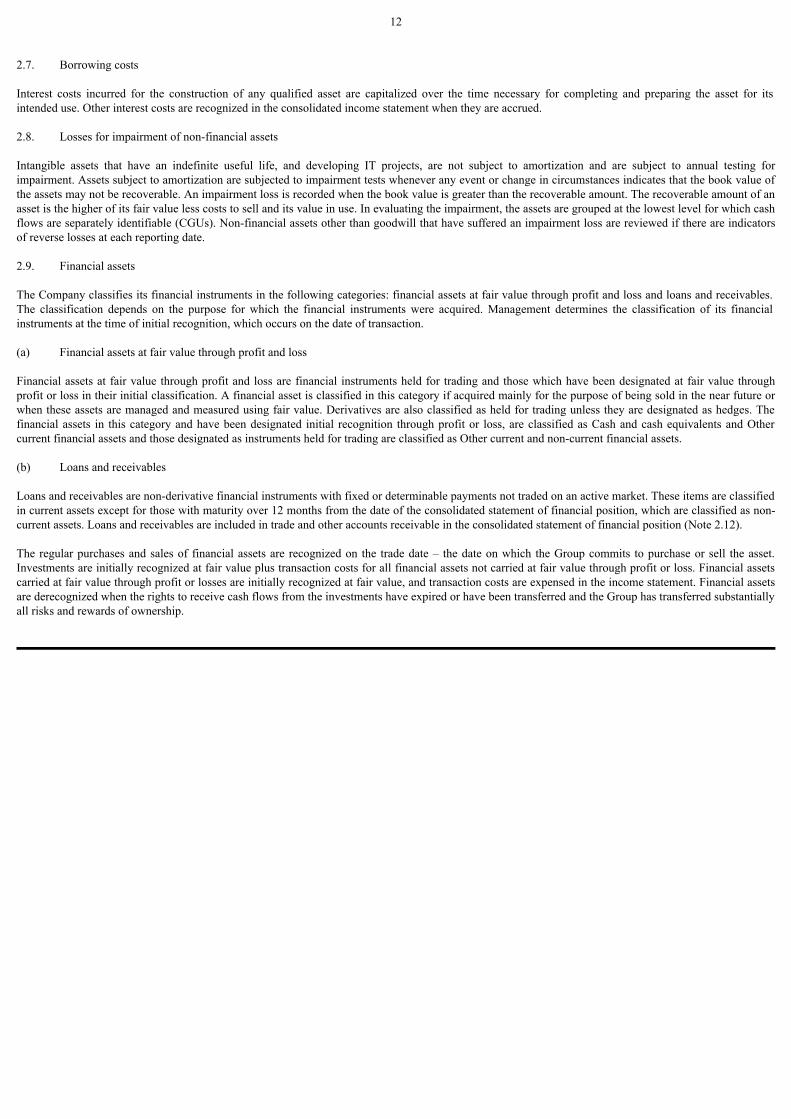
2.7. Borrowing costs Interest costs incurred for the construction of any qualified asset are capitalized over the time necessary for completing and preparing the asset for itsintended use. Other interest costs are recognized in the consolidated income statement when they are accrued. 2.8. Losses for impairment of non-financial assets Intangible assets that have an indefinite useful life, and developing IT projects, are not subject to amortization and are subject to annual testing forimpairment. Assets subject to amortization are subjected to impairment tests whenever any event or change in circumstances indicates that the book value ofthe assets may not be recoverable. An impairment loss is recorded when the book value is greater than the recoverable amount. The recoverable amount of anasset is the higher of its fair value less costs to sell and its value in use. In evaluating the impairment, the assets are grouped at the lowest level for which cashflows are separately identifiable (CGUs). Non-financial assets other than goodwill that have suffered an impairment loss are reviewed if there are indicatorsof reverse losses at each reporting date. 2.9. Financial assets The Company classifies its financial instruments in the following categories: financial assets at fair value through profit and loss and loans and receivables.The classification depends on the purpose for which the financial instruments were acquired. Management determines the classification of its financialinstruments at the time of initial recognition, which occurs on the date of transaction. (a) Financial assets at fair value through profit and loss Financial assets at fair value through profit and loss are financial instruments held for trading and those which have been designated at fair value throughprofit or loss in their initial classification. A financial asset is classified in this category if acquired mainly for the purpose of being sold in the near future orwhen these assets are managed and measured using fair value. Derivatives are also classified as held for trading unless they are designated as hedges. Thefinancial assets in this category and have been designated initial recognition through profit or loss, are classified as Cash and cash equivalents and Othercurrent financial assets and those designated as instruments held for trading are classified as Other current and non-current financial assets. (b) Loans and receivables Loans and receivables are non-derivative financial instruments with fixed or determinable payments not traded on an active market. These items are classifiedin current assets except for those with maturity over 12 months from the date of the consolidated statement of financial position, which are classified as non-current assets. Loans and receivables are included in trade and other accounts receivable in the consolidated statement of financial position (Note 2.12). The regular purchases and sales of financial assets are recognized on the trade date – the date on which the Group commits to purchase or sell the asset.Investments are initially recognized at fair value plus transaction costs for all financial assets not carried at fair value through profit or loss. Financial assetscarried at fair value through profit or losses are initially recognized at fair value, and transaction costs are expensed in the income statement. Financial assetsare derecognized when the rights to receive cash flows from the investments have expired or have been transferred and the Group has transferred substantiallyall risks and rewards of ownership.

13
The financial assets at fair value through profit or loss are subsequently carried at fair value. Loans and receivables are subsequently carried at amortized costusing the effective interest rate method. At the date of each consolidated statement of financial position, the Company assesses if there is objective evidence that a financial asset or group of financialassets may have suffered an impairment loss. 2.10. Derivative financial instruments and hedging activities Derivatives are booked initially at fair value on the date the derivative contracts are signed and later they continue to be valued at their fair value. The methodfor booking the resultant loss or gain depends on whether the derivative has been designated as a hedging instrument and if so, the nature of the item hedged.The Company designates certain derivatives as: (a) Hedge of the fair value of recognized assets (fair value hedge); (b) Hedge of an identified risk associated with a recognized liability or an expected highly- Probable transaction (cash-flow hedge), or (c) Derivatives that do not qualify for hedge accounting. The Company documents, at the inception of each transaction, the relationship between the hedging instrument and the hedged item, as well as its objectivesfor managing risk and the strategy for carrying out various hedging transactions. The Company also documents its assessment, both at the beginning and onan ongoing basis, as to whether the derivatives used in the hedging transactions are highly effective in offsetting the changes in the fair value or cash flows ofthe items being hedged. The total fair value of the hedging derivatives is booked as Other non-current financial asset or liability if the remaining maturity of the item hedged is over12 months, and as an other current financial asset or liability if the remaining term of the item hedged is less than 12 months. Derivatives not booked ashedges are classified as Other financial assets or liabilities. (a) Fair value hedges Changes in the fair value of designated derivatives that qualify as fair value hedges are shown in the consolidated statement of income, together with anychange in the fair value of the asset or liability hedged that is attributable to the risk being hedged. (b) Cash flow hedges The effective portion of changes in the fair value of derivatives that are designated and qualify as cash flow hedges is shown in the statement of othercomprehensive income. The loss or gain relating to the ineffective portion is recognized immediately in the consolidated statement of income under othergains (losses). Amounts accumulated in equity are reclassified to profit or loss in the periods when the hedged item affects profit or loss.

14
In case of variable interest-rate hedges, the amounts recognized in the statement of other comprehensive income are reclassified to results within financialcosts at the same time the associated debts accrue interest. For fuel price hedges, the amounts shown in the statement of other comprehensive income are reclassified to results under the line item Cost of sales to theextent that the fuel subject to the hedge is used. For foreign currency hedges, the amounts recognized in the statement of other comprehensive income are reclassified to income as deferred revenue resultingfrom the use of points, are recognized as Income. When hedging instruments mature or are sold or when they do not meet the requirements to be accounted for as hedges, any gain or loss accumulated in thestatement of Other comprehensive income until that moment remains in the statement of other comprehensive income and is reclassified to the consolidatedstatement of income when the hedged transaction is finally recognized. When it is expected that the hedged transaction is no longer going to occur, the gainor loss accumulated in the statement of other comprehensive income is taken immediately to the consolidated statement of income as “Other gains (losses)”. (c) Derivatives not booked as a hedge The changes in fair value of any derivative instrument that is not booked as a hedge are shown immediately in the consolidated statement of income in “Othergains (losses)”. 2.11. Inventories Inventories, detailed in Note 10, are shown at the lower of cost and their net realizable value. The cost is determined on the basis of the weighted average costmethod (WAC). The net realizable value is the estimated selling price in the normal course of business, less estimated costs necessary to make the sale. 2.12. Trade and other accounts receivable Trade accounts receivable are shown initially at their fair value and later at their amortized cost in accordance with the effective interest rate method, less theallowance for impairment losses. An allowance for impairment loss of trade accounts receivable is made when there is objective evidence that the Companywill not be able to recover all the amounts due according to the original terms of the accounts receivable. The existence of significant financial difficulties on the part of the debtor, the probability that the debtor is entering bankruptcy or financial reorganization andthe default or delay in making payments are considered indicators that the receivable has been impaired. The amount of the provision is the differencebetween the book value of the assets and the present value of the estimated future cash flows, discounted at the original effective interest rate. The book valueof the asset is reduced by the amount of the allowance and the loss is shown in the consolidated statement of income in Cost of sales. When an accountreceivable is written off, it is charged to the allowance account for accounts receivable.

15
2.13. Cash and cash equivalents Cash and cash equivalents include cash and bank balances, time deposits in financial institutions, and other short-term and highly liquid investments. 2.14. Capital The common shares are classified as net equity. Incremental costs directly attributable to the issuance of new shares or options are shown in net equity as a deduction from the proceeds received from theplacement of shares. 2.15. Trade and other accounts payables Trade payables and other accounts payable are initially recognized at fair value and subsequently at amortized cost. 2.16. Interest-bearing loans Financial liabilities are shown initially at their fair value, net of the costs incurred in the transaction. Later, these financial liabilities are valued at theiramortized cost; any difference between the proceeds obtained (net of the necessary arrangement| costs) and the repayment value, is shown in the consolidatedstatement of income during the term of the debt, according to the effective interest rate method. Financial liabilities are classified in current and non-current liabilities according to the contractual payment dates of the nominal principal. 2.17. Current and deferred taxes The expense by current tax is comprised of income and deferred taxes. The charge for current tax is calculated based on tax laws in force on the date of statement of financial position, in the countries in which the subsidiaries andassociates operate and generate taxable income. Deferred taxes are calculated using the liability method, on the temporary differences arising between the tax bases of assets and liabilities and their bookvalues. However, if the temporary differences arise from the initial recognition of a liability or an asset in a transaction different from a business combinationthat at the time of the transaction does not affect the accounting result or the tax gain or loss, they are not booked. The deferred tax is determined using the taxrates (and laws) that have been enacted or substantially enacted at the consolidated financial statements close, and are expected to apply when the relateddeferred tax asset is realized or the deferred tax liability discharged.

16
Deferred tax assets are recognized when it is probable that there will be sufficient future tax earnings with which to compensate the temporary differences. The tax (current and deferred) is recognized in income by function, unless it relates to an item recognized in other comprehensive income, directly in equityor from business combination. In that case the tax is also recognized in other comprehensive income, directly in income by function or goodwill, respectively. 2.18. Employee benefits (a) Personnel vacations The Company recognizes the expense for personnel vacations on an accrual basis. (b) Share-based compensation The compensation plans implemented based on the shares of the Company are recognized in the consolidated financial statements in accordance with IFRS 2:Share-based payments, for plans based on the granting of options, the effect of fair value is recorded in equity with a charge to remuneration in a linearmanner between the date of grant of said options and the date on which they become irrevocable, for the plans considered as cash settled award the fair value,updated as of the closing date of each reporting period, is recorded as a liability with charge to remuneration. (c) Post-employment and other long-term benefits Provisions are made for these obligations by applying the method of the projected unit credit method, and taking into account estimates of future permanence,mortality rates and future wage increases determined on the basis of actuarial calculations. The discount rates are determined by reference to market interest-rate curves. Actuarial gains or losses are shown in other comprehensive income. (d) Incentives The Company has an annual incentives plan for its personnel for compliance with objectives and individual contribution to the results. The incentiveseventually granted consist of a given number or portion of monthly remuneration and the provision is made on the basis of the amount estimated fordistribution. 2.19. Provisions Provisions are recognized when: (i) The Company has a present legal or implicit obligation as a result of past events; (ii) It is probable that payment is going to be necessary to settle an obligation; and (iii) The amount has been reliably estimated.

17
2.20. Revenue recognition Revenues include the fair value of the proceeds received or to be received on sales of goods and rendering services in the ordinary course of the Company’sbusiness. Revenues are shown net of refunds, rebates and discounts. (a) Rendering of services (i) Passenger and cargo transport The Company shows revenue from the transportation of passengers and cargo once the service has been provided. Consistent with the foregoing, the Company presents the deferred revenues, generated by anticipated sale of flight tickets and freight services, in headingother non - financial liabilities in the Consolidated Statement of Financial Position. (ii) Frequent flyer program The Company currently has a frequent flyer programs, whose objective is customer loyalty through the delivery of kilometers or points fly whenever theprograms holders make certain flights, use the services of entities registered with the program or make purchases with an associated credit card. Thekilometers or points earned can be exchanged for flight tickets or other services of associated entities. The consolidated financial statements include liabilities for this concept (deferred income), according to the estimate of the valuation established for thekilometers or points accumulated pending use at that date, in accordance with IFRIC 13: Customer loyalty programs. (iii) Other revenues The Company records revenues for other services when these have been provided. (b) Dividend income Dividend income is booked when the right to receive the payment is established. 2.21. Leases (a) When the Company is the lessee – financial lease The Company leases certain Property, plant and equipment in which it has substantially all the risk and benefits deriving from the ownership; they aretherefore classified as financial leases. Financial leases are initially recorded at the lower of the fair value of the asset leased and the present value of theminimum lease payments. Every lease payment is separated between the liability component and the financial expenses so as to obtain a constant interest rate over the outstandingamount of the debt. The corresponding leasing obligations, net of financial charges, are included in other financial liabilities. The element of interest in thefinancial cost is charged to the consolidated statement of income over the lease period so that it produces a constant periodic rate of interest on the remainingbalance of the liability for each year. The asset acquired under a financial lease is depreciated over its useful life and is included in Property, plant andequipment.

18
(b) When the Company is the lessee – operating lease Leases, in which the lessor retains an important part of the risks and benefits deriving from ownership, are classified as operating leases. Payments withrespect to operating leases (net of any incentive received from the lessor) are charged in the consolidated statement of income on a straight-line basis over theterm of the lease. 2.22. Non-current assets or disposal groups classified as held for sale Non-current assets (or disposal groups) classified as assets held for sale are shown at the lesser of their book value and the fair value less costs to sell. 2.23. Maintenance The costs incurred for scheduled heavy maintenance of the aircraft’s fuselage and engines are capitalized and depreciated until the next maintenance. Thedepreciation rate is determined on technical grounds, according to the use of the aircraft expressed in terms of cycles and flight hours. In case of own aircraft or under financial leases, these maintenance cost are capitalized as Property, plant and equipment, while in the case of aircraft underoperating leases, a liability is accrued based on the use of the main components is recognized, since a contractual obligation with the lessor to return theaircraft on agreed terms of maintenance levels exists. These are recognized as Cost of sales. Additionally, some leases establish the obligation of the lessee to make deposits to the lessor as a guarantee of compliance with the maintenance and returnconditions. These deposits, often called maintenance reserves, accumulate until a major maintenance is performed, once made, the recovery is requested to thelessor. At the end of the contract period, there is comparison between the reserves that have been paid and required return conditions, and compensationbetween the parties are made if applicable. The unscheduled maintenance of aircraft and engines, as well as minor maintenance, are charged to results as incurred. 2.24. Environmental costs Disbursements related to environmental protection are charged to results when incurred.

19
NOTE 3 - FINANCIAL RISK MANAGEMENT 3.1. Financial risk factors The Company is exposed to different financial risks: (a) market risk, (b) credit risk, and (c) liquidity risk. The program overall risk management of theCompany aims to minimize the adverse effects of financial risks affecting the company. (a) Market risk Due to the nature of its operations, the Company is exposed to market factors such as: (i) fuel-price risk, (ii) exchange -rate risk, and (iii) interest -rate risk. The Company has developed policies and procedures for managing market risk, which aim to identify, quantify, monitor and mitigate the adverse effects ofchanges in market factors mentioned above. For this, the Administration monitors the evolution of price levels, exchange rates and interest rates, and quantifies their risk exposures (Value at Risk), anddevelops and implements hedging strategies. (i) Fuel-price risk: Exposition: For the execution of its operations the Company purchases a fuel called Jet Fuel grade 54 USGC, which is subject to the fluctuations of international fuelprices. Mitigation: To cover the risk exposure fuel, the Company operates with derivative instruments (swaps and options) whose underlying assets may be different from JetFuel, being possible use West Texas Intermediate (“WTI”) crude, Brent (“BRENT”) crude and distillate Heating Oil (“HO”), which have a high correlationwith Jet Fuel and greater liquidity. Fuel Hedging Results: During the period ended December 31, 2017, the Company recognized gains of US $ 15.1 million for fuel net premium coverage. During the same period of2016, the Company recognized losses of US $ 48.0 million for the same concept. As of December 31, 2017, the market value of fuel positions amounted to US $ 10.7 million (positive). At the end of December 2016, this market value wasUS $ 8.1 million (positive).
20
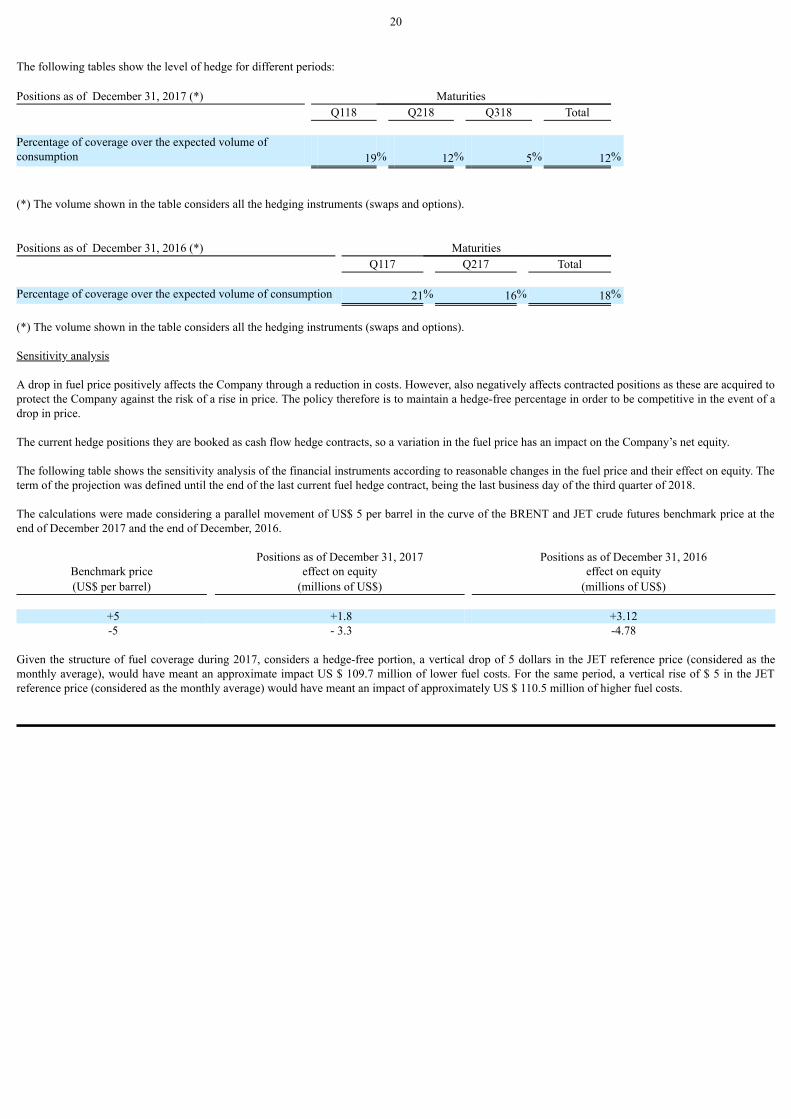
The following tables show the level of hedge for different periods: Positions as of December 31, 2017 (*) Maturities Q118 Q218 Q318 Total Percentage of coverage over the expected volume ofconsumption 19% 12% 5% 12% (*) The volume shown in the table considers all the hedging instruments (swaps and options). Positions as of December 31, 2016 (*) Maturities Q117 Q217 Total Percentage of coverage over the expected volume of consumption 21% 16% 18% (*) The volume shown in the table considers all the hedging instruments (swaps and options). Sensitivity analysis A drop in fuel price positively affects the Company through a reduction in costs. However, also negatively affects contracted positions as these are acquired toprotect the Company against the risk of a rise in price. The policy therefore is to maintain a hedge-free percentage in order to be competitive in the event of adrop in price. The current hedge positions they are booked as cash flow hedge contracts, so a variation in the fuel price has an impact on the Company’s net equity. The following table shows the sensitivity analysis of the financial instruments according to reasonable changes in the fuel price and their effect on equity. Theterm of the projection was defined until the end of the last current fuel hedge contract, being the last business day of the third quarter of 2018. The calculations were made considering a parallel movement of US$ 5 per barrel in the curve of the BRENT and JET crude futures benchmark price at theend of December 2017 and the end of December, 2016. Positions as of December 31, 2017 Positions as of December 31, 2016
Benchmark price effect on equity effect on equity(US$ per barrel) (millions of US$) (millions of US$)
+5 +1.8 +3.12 -5 - 3.3 -4.78
Given the structure of fuel coverage during 2017, considers a hedge-free portion, a vertical drop of 5 dollars in the JET reference price (considered as themonthly average), would have meant an approximate impact US $ 109.7 million of lower fuel costs. For the same period, a vertical rise of $ 5 in the JETreference price (considered as the monthly average) would have meant an impact of approximately US $ 110.5 million of higher fuel costs.

21
(ii) Foreign exchange rate risk: Exposition: The functional and presentation currency of the Financial Statements of the Parent Company is the US dollar, so that the risk of the Transactional andConversion exchange rate arises mainly from the Company’s business, strategic and accounting operating activities that are expressed in a monetary unitother than the functional currency. The subsidiaries of LATAM are also exposed to foreign exchange risk whose impact affects the Company’s Consolidated Income. The largest operational exposure to LATAM’s exchange risk comes from the concentration of businesses in Brazil, which are mostly denominated in BrazilianReal (BRL), and are actively managed by the company. At a lower concentration, the Company is also exposed to the fluctuation of other currencies, such as: euro, pound sterling, Australian dollar, Colombian peso,Chilean peso, Argentine peso, Paraguayan guarani, Mexican peso, Peruvian nuevo sol and New Zealand dollar. Mitigation: The Company mitigates currency risk exposures by contracting derivative instruments or through natural hedges or execution of internal operations. FX Hedging Results: In order to reduce the exposure to the exchange rate risk in the operational cash flows of 2017, and to ensure the operating margin, LATAM makes hedgesusing FX derivatives. As of December 31, 2017, the market value of FX derivative positions amounted to US $ 4.4 million (positive). At the end of December 2016, this marketvalue was US $ 1.1 million (negative). During the period ended December 31, 2017, the Company recognized losses of US $ 9.7 million for FX net premium coverage. During the same period of2016, the company recognized losses of US $ 40.3 million for this concept. As of December 31, 2017, the Company has contracted FX derivatives for US $ 180 million for BRL. By the end of December 2016, the company hadcontracted FX derivatives for US $ 60 million for BRL, and US $ 10 million for GBP. Sensitivity analysis: A depreciation of the R $ / US $ exchange rate, negatively affects the Company’s operating cash flows, however, also positively affects the value of thepositions of derivatives contracted. FX derivatives are recorded as cash flow hedge contracts; therefore, a variation in the exchange rate has an impact on the market value of the derivatives, thechanges of which affect the Company’s net equity.

22
The following table shows the awareness of FX derivative instruments according to reasonable changes in the exchange rate and its effect on equity. Theprojection term was defined until the end of the last contract of coverage in force, being the last business day of the second quarter of the year 2018:
Appreciation (depreciation)* Effect at December 31, 2017 Effect at December 31, 2016of R$ Millions of US$ Millions of US$
-10% -10.7 -1.02+10% +9.7 +3.44
(*)Both currencies (BRL and GBP) only apply period to the closing of 2016. During 2017, the Company contracted derivative currency swaps to hedge debt issued the same year for a notional UF 8.7 million. As of December 31, 2017,the market value of derivative positions of currency swaps amounted to US$ 30.6 million (positive). As of December 31, 2017, the Company has recorded an amount for ineffectiveness in the consolidated statement of income for this type of hedges for US $6.2 million (positive). In the case of TAM S.A, whose functional currency is the Brazilian real, a large part of its liabilities are expressed in US dollars. Therefore, when convertingfinancial assets and liabilities, from dollars to reais, they have an impact on the result of TAM S.A., which is consolidated in the Company’s IncomeStatement. With the objective of reducing the impact on the Company’s results caused by appreciations or depreciations of R$/US $, the Company has executed internaloperations to reduce the net exposure in US$ for TAM S.A. The following table shows the variation of financial performance to appreciate or depreciate 10% exchange rate R$/US$:
Appreciation (depreciation)* Effect at December 31, 2017 Effect at December 31, 2016of R$/US$ Millons of US$ Millons of US$
-10% +80.5 +119.2+10% -80.5 -119.2
(*) Appreciation (depreciation) of US$ regard to the covered currencies. Effects of exchange rate derivatives in the Financial Statements The profit or losses caused by changes in the fair value of hedging instruments are segregated between intrinsic value and temporary value. The intrinsicvalue is the actual percentage of cash flow covered, initially shown in equity and later transferred to income, while the hedge transaction is recorded inincome. The temporary value corresponds to the ineffective portion of cash flow hedge which is recognized in the financial results of the Company (Note 19).

23
Due to the functional currency of TAM S.A. and Subsidiaries is the Brazilian real, the Company presents the effects of the exchange rate fluctuations in Othercomprehensive income by converting the Statement of financial position and Income statement of TAM S.A. and Subsidiaries from their functional currencyto the U.S. dollar, which is the presentation currency of the consolidated financial statement of LATAM Airlines Group S.A. and Subsidiaries. The Goodwillgenerated in the Business combination is recognized as an asset of TAM S.A. and Subsidiaries in Brazilian real whose conversion to U.S. dollar also produceseffects in other comprehensive income. The following table shows the change in Other comprehensive income recognized in Total equity in the case of appreciate or depreciate 10% the exchangerate R$/US$:
Appreciation (depreciation) Effect at December 31, 2017 Effect at December 31, 2016of R$/US$ Millions of US$ Millions of US$
-10% +386.62 +351.04+10% -316.33 -287.22
(iii) Interest -rate risk: Exposition: The Company is exposed to fluctuations in interest rates affecting the markets future cash flows of the assets, and current and future financial liabilities. The Company is exposed in one portion to the variations of London Inter-Bank Offer Rate (“LIBOR”) and other interest rates of less relevance are BrazilianInterbank Deposit Certificate (“ILC”). Mitigation: In order to reduce the risk of an eventual rise in interest rates, the Company has signed interest-rate swap and call option contracts. Currently a 63% (63% atDecember 31, 2016) of the debt is fixed to fluctuations in interest rate. Rate Hedging Results: At December 31, 2017, the market value of the positions of interest rate derivatives amounted to US$ 6.6 million (negative). At end of December 2016 thismarket value was US$ 17.2 million (negative).

24
Sensitivity analysis: The following table shows the sensitivity of changes in financial obligations that are not hedged against interest-rate variations. These changes are consideredreasonably possible, based on current market conditions each date.
Increase (decrease) Positions as of December 31, 2017 Positions as of December 31, 2016futures curve effect on profit or loss before tax effect on profit or loss before tax
in libor 3 months (millions of US$) (millions of US$)
+100 basis points -29.26 -32.16-100 basis points +29.26 +32.16
Much of the current rate derivatives are registered for as hedges of cash flow, therefore, a variation in the exchange rate has an impact on the market value ofderivatives, whose changes impact on the Company’s net equity. The calculations were made increasing (decreasing) vertically 100 basis points of the three-month Libor futures curve, being both reasonably possiblescenarios according to historical market conditions.
Increase (decrease) Positions as of December 31, 2017 Positions as of December 31, 2016futures curve effect on equity effect on equity
in libor 3 months (millions of US$) (millions of US$)
+100 basis points +1.9 +3.93-100 basis points -1.9 -4.03
The assumptions of sensitivity calculation must assume that forward curves of interest rates do not necessarily reflect the real value of the compensationflows. Moreover, the structure of interest rates is dynamic over time. During the periods presented, the Company has no registered amounts by ineffectiveness in consolidated statement of income for this kind of hedging. (b) Credit risk Credit risk occurs when the counterparty to a financial agreement or instrument fails to discharge an obligation due or financial instrument, leading to a lossin market value of a financial instrument (only financial assets, not liabilities). The Company is exposed to credit risk due to its operative and financial activities, including deposits with banks and financial institutions, investments inother kinds of instruments, exchange-rate transactions and the contracting of derivative instruments or options. To reduce the credit risk associated with operational activities, the Company has established credit limits to abridge the exposure of their debtors which aremonitored permanently (mainly in case of operational activities in Brazil with travel agents). As a way to mitigate credit risk related to financial activities, the Company requires that the counterparty to the financial activities remain at least investmentgrade by major Risk Assessment Agencies. Additionally the Company has established maximum limits for investments which are monitored regularly.

25
(i) Financial activities Cash surpluses that remain after the financing of assets necessary for the operation are invested according to credit limits approved by the Company’s Board,mainly in time deposits with different financial institutions, private investment funds, short-term mutual funds, and easily-liquidated corporate and sovereignbonds with short remaining maturities. These investments are booked as Cash and cash equivalents and other current financial assets. In order to reduce counterparty risk and to ensure that the risk assumed is known and managed by the Company, investments are diversified among differentbanking institutions (both local and international). The Company evaluates the credit standing of each counterparty and the levels of investment, based on (i)their credit rating, (ii) the equity size of the counterparty, and (iii) investment limits according to the Company’s level of liquidity. According to these threeparameters, the Company chooses the most restrictive parameter of the previous three and based on this, establishes limits for operations with eachcounterparty. The Company has no guarantees to mitigate this exposure. (ii) Operational activities The Company has four large sales “clusters”: travel agencies, cargo agents, airlines and credit-card administrators. The first three are governed byInternational Air Transport Association, international (“IATA”) organization comprising most of the airlines that represent over 90% of scheduled commercialtraffic and one of its main objectives is to regulate the financial transactions between airlines and travel agents and cargo. When an agency or airline does notpay their debt, they are excluded from operating with IATA’s member airlines. In the case of credit-card administrators, they are fully guaranteed by 100% bythe issuing institutions. The exposure consists of the term granted, which fluctuates between 1 and 45 days. One of the tools the Company uses for reducing credit risk is to participate in global entities related to the industry, such as IATA, Business Sales Processing(“BSP”), Cargo Account Settlement Systems (“CASS”), IATA Clearing House (“ICH”) and banks (credit cards). These institutions fulfill the role ofcollectors and distributors between airlines and travel and cargo agencies. In the case of the Clearing House, it acts as an offsetting entity between airlines forthe services provided between them. A reduction in term and implementation of guarantees has been achieved through these entities. Currently the salesinvoicing of TAM Linhas Aéreas S.A. related with travel agents and cargo agents for domestic transportation in Brazil is done directly by TAM LinhasAéreas S.A. Credit quality of financial assets The external credit evaluation system used by the Company is provided by IATA. Internal systems are also used for particular evaluations or specific marketsbased on trade reports available on the local market. The internal classification system is complementary to the external one, i.e. for agencies or airlines notmembers of IATA, the internal demands are greater.

26
To reduce the credit risk associated with operational activities, the Company has established credit limits to abridge the exposure of their debtors which aremonitored permanently (mainly in case of operational activities of TAM Linhas Aéreas S.A. with travel agents).The bad-debt rate in the principal countrieswhere the Company has a presence is insignificant. (c) Liquidity risk Liquidity risk represents the risk that the Company has no sufficient funds to meet its obligations. Because of the cyclical nature of the business, the operation, and its investment and financing needs related to the acquisition of new aircraft and renewal ofits fleet, plus the financing needs, the Company requires liquid funds, defined as cash and cash equivalents plus other short term financial assets, to meet itspayment obligations. The liquid funds, the future cash generation and the capacity to obtain additional funding, through bond issuance and banking loans, will allow the Companyto obtain sufficient alternatives to face its investment and financing future commitments. At December 31, 2017 is US$ 1,614 million (US$ 1,486 million at December 31, 2016), invested in short term instruments through financial high creditrating levels entities. In addition to the liquid funds, the Company has access to short term credit line. As of December 31, 2017, LATAM has working capital credit lines withmultiple banks and additionally has a US$ 450 million undrawn committed credit line (US$ 325 million at December 31, 2016) subject to borrowing baseavailability.
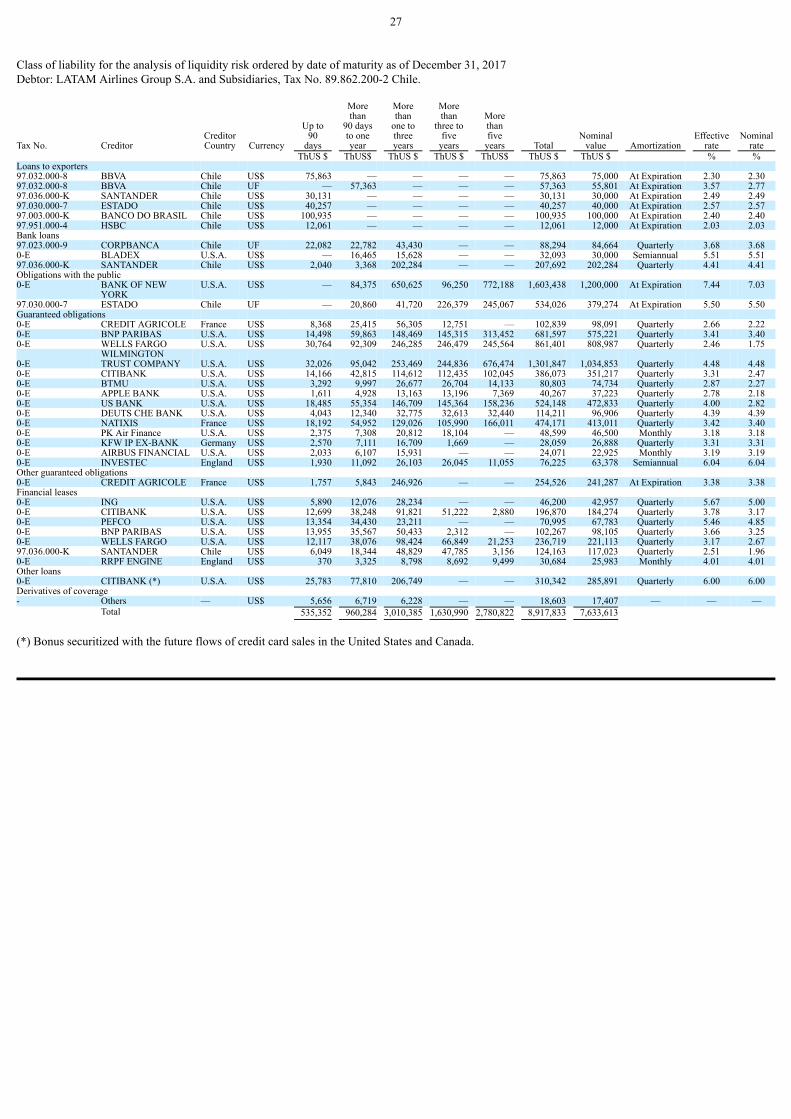
27
Class of liability for the analysis of liquidity risk ordered by date of maturity as of December 31, 2017Debtor: LATAM Airlines Group S.A. and Subsidiaries, Tax No. 89.862.200-2 Chile.
Tax No. Creditor CreditorCountry Currency
Up to90
days
Morethan
90 daysto oneyear
Morethan
one tothreeyears
Morethan
three tofive
years
Morethanfive
years Total Nominal
value Amortization Effective
rate Nominal
rate ThUS $ ThUS$ ThUS $ ThUS $ ThUS$ ThUS $ ThUS $ % %Loans to exporters 97.032.000-8 BBVA Chile US$ 75,863 — — — — 75,863 75,000 At Expiration 2.30 2.3097.032.000-8 BBVA Chile UF — 57,363 — — — 57,363 55,801 At Expiration 3.57 2.7797.036.000-K SANTANDER Chile US$ 30,131 — — — — 30,131 30,000 At Expiration 2.49 2.4997.030.000-7 ESTADO Chile US$ 40,257 — — — — 40,257 40,000 At Expiration 2.57 2.5797.003.000-K BANCO DO BRASIL Chile US$ 100,935 — — — — 100,935 100,000 At Expiration 2.40 2.4097.951.000-4 HSBC Chile US$ 12,061 — — — — 12,061 12,000 At Expiration 2.03 2.03Bank loans 97.023.000-9 CORPBANCA Chile UF 22,082 22,782 43,430 — — 88,294 84,664 Quarterly 3.68 3.680-E BLADEX U.S.A. US$ — 16,465 15,628 — — 32,093 30,000 Semiannual 5.51 5.5197.036.000-K SANTANDER Chile US$ 2,040 3,368 202,284 — — 207,692 202,284 Quarterly 4.41 4.41Obligations with the public 0-E BANK OF NEW
YORK U.S.A. US$ — 84,375 650,625 96,250 772,188 1,603,438 1,200,000 At Expiration 7.44 7.03
97.030.000-7 ESTADO Chile UF — 20,860 41,720 226,379 245,067 534,026 379,274 At Expiration 5.50 5.50Guaranteed obligations 0-E CREDIT AGRICOLE France US$ 8,368 25,415 56,305 12,751 — 102,839 98,091 Quarterly 2.66 2.220-E BNP PARIBAS U.S.A. US$ 14,498 59,863 148,469 145,315 313,452 681,597 575,221 Quarterly 3.41 3.400-E WELLS FARGO U.S.A. US$ 30,764 92,309 246,285 246,479 245,564 861,401 808,987 Quarterly 2.46 1.75
0-E WILMINGTONTRUST COMPANY U.S.A. US$ 32,026 95,042 253,469 244,836 676,474 1,301,847 1,034,853 Quarterly 4.48 4.48
0-E CITIBANK U.S.A. US$ 14,166 42,815 114,612 112,435 102,045 386,073 351,217 Quarterly 3.31 2.470-E BTMU U.S.A. US$ 3,292 9,997 26,677 26,704 14,133 80,803 74,734 Quarterly 2.87 2.270-E APPLE BANK U.S.A. US$ 1,611 4,928 13,163 13,196 7,369 40,267 37,223 Quarterly 2.78 2.180-E US BANK U.S.A. US$ 18,485 55,354 146,709 145,364 158,236 524,148 472,833 Quarterly 4.00 2.820-E DEUTS CHE BANK U.S.A. US$ 4,043 12,340 32,775 32,613 32,440 114,211 96,906 Quarterly 4.39 4.390-E NATIXIS France US$ 18,192 54,952 129,026 105,990 166,011 474,171 413,011 Quarterly 3.42 3.400-E PK Air Finance U.S.A. US$ 2,375 7,308 20,812 18,104 — 48,599 46,500 Monthly 3.18 3.180-E KFW IP EX-BANK Germany US$ 2,570 7,111 16,709 1,669 — 28,059 26,888 Quarterly 3.31 3.310-E AIRBUS FINANCIAL U.S.A. US$ 2,033 6,107 15,931 — — 24,071 22,925 Monthly 3.19 3.190-E INVESTEC England US$ 1,930 11,092 26,103 26,045 11,055 76,225 63,378 Semiannual 6.04 6.04Other guaranteed obligations 0-E CREDIT AGRICOLE France US$ 1,757 5,843 246,926 — — 254,526 241,287 At Expiration 3.38 3.38Financial leases 0-E ING U.S.A. US$ 5,890 12,076 28,234 — — 46,200 42,957 Quarterly 5.67 5.000-E CITIBANK U.S.A. US$ 12,699 38,248 91,821 51,222 2,880 196,870 184,274 Quarterly 3.78 3.170-E PEFCO U.S.A. US$ 13,354 34,430 23,211 — — 70,995 67,783 Quarterly 5.46 4.850-E BNP PARIBAS U.S.A. US$ 13,955 35,567 50,433 2,312 — 102,267 98,105 Quarterly 3.66 3.250-E WELLS FARGO U.S.A. US$ 12,117 38,076 98,424 66,849 21,253 236,719 221,113 Quarterly 3.17 2.6797.036.000-K SANTANDER Chile US$ 6,049 18,344 48,829 47,785 3,156 124,163 117,023 Quarterly 2.51 1.960-E RRPF ENGINE England US$ 370 3,325 8,798 8,692 9,499 30,684 25,983 Monthly 4.01 4.01Other loans 0-E CITIBANK (*) U.S.A. US$ 25,783 77,810 206,749 — — 310,342 285,891 Quarterly 6.00 6.00Derivatives of coverage - Others — US$ 5,656 6,719 6,228 — — 18,603 17,407 — — — Total 535,352 960,284 3,010,385 1,630,990 2,780,822 8,917,833 7,633,613
(*) Bonus securitized with the future flows of credit card sales in the United States and Canada.

28
Class of liability for the analysis of liquidity risk ordered by date of maturity as of December 31,2017 Debtor: TAM S.A. and Subsidiaries, Tax No. 02.012.862/0001-60, Brazil.
Tax No. Creditor Creditorcountry Currency
Up to90
days
Morethan
90 daysto oneyear
Morethan
one tothreeyears
Morethan
three tofive
years
Morethanfive
years Total Nominal
value Amortization Effective
rate Nominal
rate ThUS$ ThUS$ ThUS$ ThUS$ ThUS$ ThUS$ ThUS$ % % Bank loans 0-E NEDERLANDSCHE CREDIETVERZEKERING
MAATSCHAPPIJ
Holland
US$
176
497
1,332
722
—
2,727
2,382
Monthly
6.01
6.01Financial leases 0-E NATIXIS
France
US$
4,248
7,903
23,141
71,323
—
106,615
99,036 Quarterly /
Semiannual
5.59
5.590-E WACAPOU LEASING
S.A.
Luxembourg
US$
837
2,411
6,509
3,277
—
13,034
12,047
Quarterly
3.69
3.690-E SOCIÉTÉ GÉNÉRALE
MILAN BRANCH
Italy
US$
11,735
32,230
204,836
—
—
248,801
244,513
Quarterly
4.87
4.810-E BANCO IBM S.A Brazil BRL 34 — — — — 34 21 Monthly 6.89 6.890-E SOCIÉTÉ GÉNÉRALE France BRL 161 12 — — — 173 109 Monthly 6.89 6.89 Total 17,191 43,053 235,818 75,322 — 371,384 358,108

29
Class of liability for the analysis of liquidity risk ordered by date of maturity as of December 31, 2017Debtor: LATAM Airlines Group S.A. and Subsidiaries, Tax No. 89.862.200-2, Chile.
Tax No.
Creditor
Creditorcountry
Currency
Up to90
days
Morethan
90 daysto oneyear
Morethan
one tothreeyears
Morethan
three tofive
years
Morethanfive
years
Total
Nominalvalue
Amortization
Effectiverate
Nominalrate
ThUS$ ThUS$ ThUS$ ThUS$ ThUS$ ThUS$ ThUS$ % % Trade and other accounts payables - OTHERS OTHERS ThUS$ 566,838 — — — — 566,838 566,838 — — — CLP 165,299 — — — — 165,299 165,299 — — — BRL 315,605 — — — — 315,605 315,605 — — — Other
currencies
290,244 11,215 — — — 301,459 301,459 — — —Accounts payable to related parties currents 78.997.060-2 Viajes Falabella Ltda. Chile CLP 534 — — — — 534 534 — — —0-E Inversora Aeronáutica
Argentina
Argentina
ThUS$
4 — — — — 4 4 — — —0-E Consultoría
AdministrativaProfesional S.A. deC.V.
Mexico
MXN
210 — — — — 210 210 — — —78.591.370-1 Bethia S.A. y Filiales Chile CLP 12 — — — — 12 12 — — — Total 1,338,746 11,215 — — — 1,349,961 1,349,961 Total consolidated 1,891,289 1,014,552 3,246,203 1,706,312 2,780,822 10,639,178 9,341,682

30
Class of liability for the analysis of liquidity risk ordered by date of maturity as of December 31, 2016 Debtor: LATAM Airlines Group S.A. and Subsidiaries,Tax No. 89.862.200-2 Chile.
Tax No. Creditor Creditorcountry Currency
Up to90
days
Morethan
90 daysto oneyear
Morethan
one tothreeyears
Morethan
three tofive
years
Morethanfive
years Total Nominalvalue Amortization Effective
rate Nominalrate
ThUS$ ThUS$ ThUS$ ThUS$ ThUS$ ThUS$ ThUS$ % %Loans to exporters 97.032.000-8 BBVA Chile ThUS$ 75,212 — — — — 75,212 75,000 At Expiration 1.85 1.8597.032.000-8 BBVA Chile ThUS$ — 52,675 — — — 52,675 50,381 At Expiration 5.23 4.4397.036.000-K SANTANDER Chile ThUS$ 30,193 — — — — 30,193 30,000 At Expiration 2.39 2.3997.030.000-7 ESTADO Chile ThUS$ 40,191 — — — — 40,191 40,000 At Expiration 1.91 1.9197.003.000-K BANCO DO BRASIL Chile ThUS$ 72,151 — — — — 72,151 70,000 At Expiration 3.08 3.0897.951.000-4 HSBC Chile ThUS$ 12,054 — — — — 12,054 12,000 At Expiration 1.79 1.79Bank loans 97.023.000-9 CORPBANCA Chile UF 20,808 61,112 63,188 16,529 — 161,637 153,355 Quarterly 4.06 4.060-E BLADEX U.S.A. ThUS$ — 14,579 31,949 — — 46,528 42,500 Semiannual 5.14 5.140-E DVB BANK SE U.S.A. ThUS$ 145 199 28,911 — — 29,255 28,911 Quarterly 1.86 1.8697.036.000-K SANTANDER Chile ThUS$ 1,497 4,308 160,556 — — 166,361 158,194 Quarterly 3.55 3.55Obligations with the public 0-E BANK OF NEW
YORK U.S.A. ThUS$ — 36,250 72,500 518,125 — 626,875 500,000 At Expiration 7.77 7.25Guaranteed obligations 0-E CREDIT AGRICOLE France ThUS$ 11,728 30,916 65,008 33,062 3,760 144,474 138,417 Quarterly 2.21 1.810-E BNP PARIBAS U.S.A. ThUS$ 13,805 56,324 142,178 141,965 376,894 731,166 628,118 Quarterly 2.97 2.960-E WELLS FARGO U.S.A. ThUS$ 35,896 107,830 287,878 288,338 411,076 1,131,018 1,056,345 Quarterly 2.37 1.680-E WILMINGTON
TRUST COMPANY U.S.A. ThUS$ 25,833 79,043 206,952 200,674 733,080 1,245,582 967,336 Quarterly 4.25 4.250-E CITIBANK U.S.A. ThUS$ 20,224 61,020 164,077 166,165 184,053 595,539 548,168 Quarterly 2.72 1.9697.036.000-K SANTANDER Chile ThUS$ 5,857 17,697 47,519 48,024 26,448 145,545 138,574 Quarterly 1.98 1.440-E BTMU U.S.A. ThUS$ 3,163 9,568 25,752 26,117 27,270 91,870 85,990 Quarterly 2.31 1.720-E APPLE BANK U.S.A. ThUS$ 1,551 4,712 12,693 12,891 13,857 45,704 42,754 Quarterly 2.29 1.690-E US BANK U.S.A. ThUS$ 18,563 55,592 147,357 146,045 230,747 598,304 532,608 Quarterly 3.99 2.810-E DEUTSCHE BANK U.S.A. ThUS$ 6,147 18,599 31,640 31,833 48,197 136,416 117,263 Quarterly 3.86 3.860-E NATIXIS France ThUS$ 14,779 44,826 116,809 96,087 206,036 478,537 422,851 Quarterly 2.60 2.570-E PK AirFinance U.S.A. ThUS$ 2,265 6,980 19,836 25,610 3,153 57,844 54,787 Monthly 2.40 2.400-E KFW IPEX-BANK Germany ThUS$ 2,503 7,587 18,772 9,178 — 38,040 36,191 Quarterly 2.55 2.550-E AIRBUS FINANCIAL U.S.A. ThUS$ 1,982 5,972 16,056 7,766 — 31,776 30,199 Monthly 2.49 2.490-E INVESTEC England ThUS$ 1,880 10,703 25,369 25,569 23,880 87,401 72,202 Semiannual 5.67 5.67Other guaranteed obligations 0-E CREDIT AGRICOLE France ThUS$ 1,501 4,892 268,922 — — 275,315 256,860 At Expiration 2.85 2.85Financial leases 0-E ING U.S.A. ThUS$ 5,889 17,671 34,067 12,134 — 69,761 63,698 Quarterly 5.62 4.960-E CREDIT AGRICOLE France ThUS$ 1,788 5,457 — — — 7,245 7,157 Quarterly 1.85 1.850-E CITIBANK U.S.A. ThUS$ 6,083 18,250 48,667 14,262 — 87,262 78,249 Quarterly 6.40 5.670-E PEFCO U.S.A. ThUS$ 17,558 50,593 67,095 3,899 — 139,145 130,811 Quarterly 5.39 4.790-E BNP PARIBAS U.S.A. ThUS$ 13,744 41,508 79,165 22,474 — 156,891 149,119 Quarterly 3.69 3.260-E WELLS FARGO U.S.A. ThUS$ 5,591 16,751 44,615 44,514 1,880 113,351 103,326 Quarterly 3.98 3.540-E DVB BANK SE U.S.A. ThUS$ 4,773 9,541 — — — 14,314 14,127 Quarterly 2.57 2.570-E RRPF ENGINE England ThUS$ — — 8,248 8,248 12,716 29,212 25,274 Monthly 2.35 2.35Other loans 0-E BOEING U.S.A. ThUS$ 163 320 26,214 — — 26,697 26,214 At Expiration 2.35 2.350-E CITIBANK (*) U.S.A. ThUS$ 25,802 77,795 207,001 103,341 — 413,939 370,389 Quarterly 6.00 6.00Hedging derivative - OTROS — ThUS$ 7,364 15,479 7,846 — — 30,689 — — — —- Total 508,683 944,749 2,476,840 2,002,850 2,303,047 8,236,169 7,257,368
(*) Securitized bond with the future flows from the sales with credit card in United States and Canada.

31
Clases de pasivo para el análisis del riesgo de liquidez agrupado por vencimiento al 31 de diciembre de 2016 Nombre empresa deudora: TAM S.A. y Filiales,Rut 02.012.862/0001-60, Brasil.
Rut empresaacreedora Nombre empresa acreedora
País deempresa
acreedora
Descripciónde la
moneda
Hasta90
días
Más de90 días
a unaño
Más deuno atresaños
Más detres acincoaños
Más decincoaños
TotalValor
TotalValor
nominal Tipo de
amortización Tasa
efectiva Tasa
nominal MUS$ MUS$ MUS$ MUS$ MUS$ MUS$ MUS$ % %Préstamos bancarios 0-E NEDERLANDSCHE CREDIETVERZEKERING
MAATSCHAPPIJ Holanda US$ 179 493 1,315 1,314 54 3,355 2,882 Mensual 6.01 6.010-E CITIBANK E.E.U.U. US$ 1,528 203,150 — — — 204,678 200,000 Al Vencimiento 3.39 3.14Obligaciones con el Público 0-E THE BANK OF NEW
YORK E.E.U.U. US$ — 352,938 83,750 562,813 — 999,501 800,000 Al Vencimiento 8.17 8.00Arrendamiento Financiero 0-E AFS INVESTMENT IX
LLC E.E.U.U. US$ 2,733 7,698 20,522 8,548 — 39,501 35,448 Mensual 1.25 1.250-E DVB BANK SE E.E.U.U. US$ 120 165 — — — 285 282 Mensual 2.50 2.500-E
GENERAL ELECTRICCAPITALCORPORATION
E.E.U.U.
US$
3,852
5,098
—
—
—
8,950
8,846
Mensual
2.30
2.30
0-E KFW IPEX-BANK Alemania US$ 592 1,552 — — — 2,144 2,123 Mensual/Trimestral 2.80 2.800-E NATIXIS Francia US$ 4,290 7,837 22,834 40,968 41,834 117,763 107,443 Trimestral/Semestral 4.90 4.900-E WACAPOU LEASING
S.A. Luxemburgo US$ 833 2,385 6,457 6,542 — 16,217 14,754 Trimestral 3.00 3.000-E SOCIÉTÉ GÉNÉRALE
MILAN BRANCH Italia US$ 11,875 32,116 85,995 171,553 — 301,539 279,335 Trimestral 4.18 4.110-E BANCO IBM S.A Brasil BRL 380 1,161 35 — — 1,576 1,031 Mensual 13.63 13.630-E HP FINANCIAL SERVICE Brasil BRL 225 — — — — 225 222 Mensual 10.02 10.020-E SOCIÉTÉ GÉNÉRALE Francia BRL 146 465 176 — — 787 519 Mensual 13.63 13.63 Total 26,753 615,058 221,084 791,738 41,888 1,696,521 1,452,885

32
Class of liability for the analysis of liquidity risk ordered by date of maturity as of December 31, 2016 Debtor: LATAM Airlines Group S.A. and Subsidiaries,Tax No. 89.862.200-2, Chile.
Tax No. Creditor Creditorcountry Currency
Up to90
days
Morethan
90 daysto oneyear
Morethan
one tothreeyears
Morethan
three tofive
years
Morethanfive
years Total Nominal
value Amortization Effective
rate Nominal
rate ThUS$ ThUS$ ThUS$ ThUS$ ThUS$ ThUS$ ThUS$ % %Trade and other accounts payables - OTHERS OTHERS ThUS$ 549,897 21,215 — — — 571,112 571,112 — — — CLP 48,842 (30) — — — 48,812 48,812 — — — BRL 346,037 27 — — — 346,064 346,064 — — —
Otherscurrencies 140,471 11,467 — — — 151,938 151,938 — — —
Accounts payable to related parties currents
0-E
ConsultoríaAdministrativaProfesional S.A. deC.V. Mexico MXN 170 — — — — 170 170 — — —
78.997.060-2 Viajes Falabella Ltda. Chile CLP 46 — — — — 46 46 — — —
0-E
TAM AviaçãoExecutiva e Taxi AéreoS.A. Brazil BRL 28 — — — — 28 28 — — —
65.216.000-K Comunidad Mujer Chile CLP 13 — — — — 13 13 78.591.370-1 Bethia S.A. y Filiales Chile CLP 6 — — — — 6 6
79.773.440-3 Transportes San FelipeS.A. Chile CLP 4 — — — — 4 4 — — —
0-E Inversora AeronáuticaArgentina Argentina ThUS$ 2 — — — — 2 2 — — —
Total 1,085,516 32,679 — — — 1,118,195 1,118,195 Total consolidated 1,620,952 1,592,486 2,697,924 2,794,588 2,344,935 11,050,885 9,828,448
33
The Company has fuel, interest rate and exchange rate hedging strategies involving derivatives contracts with different financial institutions. The Companyhas margin facilities with each financial institution in order to regulate the mutual exposure produced by changes in the market valuation of the derivatives. At the end of 2016, the Company provided US$ 30.2 million in derivative margin guarantees, for cash and stand-by letters of credit. At December 31, 2017,the Company had provided US$ 16.4 million in guarantees for Cash and cash equivalent and stand-by letters of credit. The decrease was due at: i) maturity ofhedge contracts, ii) acquire of new fuel purchase contracts, and iii) changes in fuel prices, exchange rate and interest rates. 3.2. Capital risk management The Company’s objectives, with respect to the management of capital, are (i) to comply with the restrictions of minimum equity and (ii) to maintain anoptimal capital structure. The Company monitors its contractual obligations and the regulatory limitations in the different countries where the entities of the group are domiciled toassure they meet the limit of minimum net equity, where the most restrictive limitation is to maintain a positive net equity. Additionally, the Company periodically monitors the short and long term cash flow projections to assure the Company has adequate sources of funding togenerate the cash requirement to face its investment and funding future commitments. The Company international credit rating is the consequence of the Company capacity to face its long terms financing commitments. As of December 31, 2017the Company has an international long term credit rating of BB- with stable outlook by Standard & Poor’s, a B+ rating with stable outlook by Fitch Ratingsand a B1 rating with stable outlook by Moody’s. 3.3. Estimates of fair value. At December 31, 2017, the Company maintained financial instruments that should be recorded at fair value. These are grouped into two categories: 1. Hedge Instruments: This category includes the following instruments:
- Interest rate derivative contracts,
- Fuel derivative contracts,
- Currency derivative contracts.
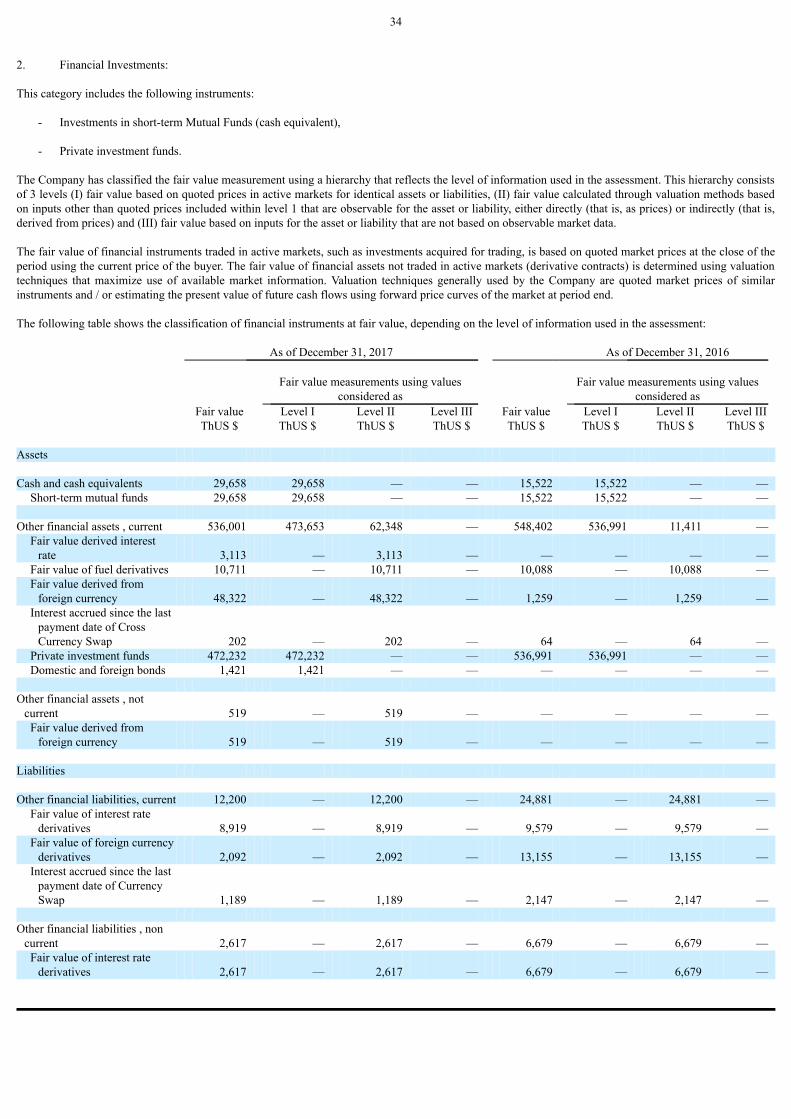
34
2. Financial Investments: This category includes the following instruments:
- Investments in short-term Mutual Funds (cash equivalent),
- Private investment funds. The Company has classified the fair value measurement using a hierarchy that reflects the level of information used in the assessment. This hierarchy consistsof 3 levels (I) fair value based on quoted prices in active markets for identical assets or liabilities, (II) fair value calculated through valuation methods basedon inputs other than quoted prices included within level 1 that are observable for the asset or liability, either directly (that is, as prices) or indirectly (that is,derived from prices) and (III) fair value based on inputs for the asset or liability that are not based on observable market data. The fair value of financial instruments traded in active markets, such as investments acquired for trading, is based on quoted market prices at the close of theperiod using the current price of the buyer. The fair value of financial assets not traded in active markets (derivative contracts) is determined using valuationtechniques that maximize use of available market information. Valuation techniques generally used by the Company are quoted market prices of similarinstruments and / or estimating the present value of future cash flows using forward price curves of the market at period end. The following table shows the classification of financial instruments at fair value, depending on the level of information used in the assessment: As of December 31, 2017 As of December 31, 2016
Fair value measurements using values
considered as Fair value measurements using values
considered as Fair value Level I Level II Level III Fair value Level I Level II Level III ThUS $ ThUS $ ThUS $ ThUS $ ThUS $ ThUS $ ThUS $ ThUS $
Assets Cash and cash equivalents 29,658 29,658 — — 15,522 15,522 — —
Short-term mutual funds 29,658 29,658 — — 15,522 15,522 — —
Other financial assets , current 536,001 473,653 62,348 — 548,402 536,991 11,411 — Fair value derived interest
rate 3,113 — 3,113 — — — — — Fair value of fuel derivatives 10,711 — 10,711 — 10,088 — 10,088 — Fair value derived from
foreign currency 48,322 — 48,322 — 1,259 — 1,259 — Interest accrued since the last
payment date of CrossCurrency Swap 202 — 202 — 64 — 64 —
Private investment funds 472,232 472,232 — — 536,991 536,991 — — Domestic and foreign bonds 1,421 1,421 — — — — — —
Other financial assets , not
current 519 — 519 — — — — — Fair value derived from
foreign currency 519 — 519 — — — — — Liabilities Other financial liabilities, current 12,200 — 12,200 — 24,881 — 24,881 —
Fair value of interest ratederivatives 8,919 — 8,919 — 9,579 — 9,579 —
Fair value of foreign currencyderivatives 2,092 — 2,092 — 13,155 — 13,155 —
Interest accrued since the lastpayment date of CurrencySwap 1,189 — 1,189 — 2,147 — 2,147 —
Other financial liabilities , non
current 2,617 — 2,617 — 6,679 — 6,679 — Fair value of interest rate
derivatives 2,617 — 2,617 — 6,679 — 6,679 —

35
Additionally, at December 31, 2017, the Company has financial instruments which are not recorded at fair value. In order to meet the disclosure requirementsof fair values, the Company has valued these instruments as shown in the table below: As of December 31, 2017 As of December 31, 2016 Book value Fair value Book value Fair value ThUS$ ThUS$ ThUS$ ThUS$ Cash and cash equivalents 1,112,346 1,112,346 933,805 933,805
Cash on hand 8,562 8,562 8,630 8,630 Bank balance 330,430 330,430 255,746 255,746 Overnight 239,292 239,292 295,060 295,060 Time deposits 534,062 534,062 374,369 374,369
Other financial assets, current 23,918 23,918 164,426 164,426 Other financial assets 23,918 23,918 164,426 164,426
Trade debtors, other accounts receivable and Current accounts receivable 1,214,050 1,214,050 1,107,889 1,107,889 Accounts receivable from entities related, current 2,582 2,582 554 554
Other financial assets, not current 87,571 87,571 102,125 102,125 Accounts receivable, non-current 6,891 6,891 8,254 8,254 Other current financial liabilities 1,288,749 1,499,495 1,814,647 2,022,290 Accounts payable for trade and other accounts payable, current 1,695,202 1,695,202 1,593,068 1,593,068 Accounts payable to entities related, current 760 760 269 269 Other financial liabilities, not current 6,602,891 6,738,872 6,790,273 6,970,375 Accounts payable, not current 498,832 498,832 359,391 359,391 The book values of accounts receivable and payable are assumed to approximate their fair values, due to their short-term nature. In the case of cash on hand,bank balances, overnight, time deposits and accounts payable, non-current, fair value approximates their carrying values. The fair value of other financial liabilities is estimated by discounting the future contractual cash flows at the current market interest rate for similar financialinstruments (Level II). In the case of Other financial assets, the valuation was performed according to market prices at period end. NOTE 4 - ACCOUNTING ESTIMATES AND JUDGMENTS The Company has used estimates to value and record certain assets, liabilities, revenue, expenditure, and commitments. Basically, these estimates relate to: (a) Evaluation of possible losses through impairment of goodwill and intangible assets with an indefinite useful life.

36
As of December 31, 2017, the capital gain amounts to ThUS $ 2,672,550 (ThUS $ 2,710,382 as of December 31, 2016), while the intangible assets comprisethe Airport Slots for ThUS $ 964,513 (ThUS $ 978,849 as of December 31, 2016) and Loyalty Program for ThUS $ 321,440 (ThUS $ 326,262 as ofDecember 31, 2016). The Company checks at least once a year whether goodwill and intangible assets with an indefinite useful life have suffered an impairment loss. For thisevaluation, the Company has identified two cash generating units (CGU), “Air transport” and “Multiplus coalition and loyalty program”. The book value ofthe surplus value assigned to each CGU as of December 31, 2017 amounted to ThUS $ 2,146,692 and ThUS $ 525,858 (ThUS $ 2,176,634 and ThUS $533,748 as of December 31, 2016), which include the following Intangible assets of indefinite useful life:
Air Transport CGU Coalition and loyalty
Program Multiplus CGU
As ofDecember
31,2017
As of December
31,2016
As of December
31,2017
As ofDecember
31,2016
ThUS$ ThUS$ ThUS$ ThUS$ Airport Slots 964,513 978,849 — — Loyalty program — — 321,440 326,262
The recoverable value of these cash-generating units (CGUs) has been determined based on calculations of their value in use. The principal assumptions usedby the management include: growth rate, exchange rate, discount rate, fuel prices, and other economic assumptions. The estimation of these assumptionsrequires significant judgment by the management, as these variables feature inherent uncertainty; however, the assumptions used are consistent withCompany’s internal planning. Therefore, management evaluates and updates the estimates on an annual basis, in light of conditions that affect these variables.The mainly assumptions used as well as, the corresponding sensitivity analyses are showed in Note 16. (b) Useful life, residual value, and impairment of property, plant, and equipment The depreciation of assets is calculated based on the linear model, except for certain technical components depreciated on cycles and hours flown. Theseuseful lives are reviewed on an annual basis according with the Company’s future economic benefits associated with them. Changes in circumstances such as: technological advances, business model, planned use of assets or capital strategy may render the useful life different to thelifespan estimated. When it is determined that the useful life of property, plant, and equipment must be reduced, as may occur in line with changes in plannedusage of assets, the difference between the net book value and estimated recoverable value is depreciated, in accordance with the revised remaining usefullife. Residual values are estimated in accordance with the market value that these assets will have at the end of their useful life. The assets’ residual values anduseful lives are reviewed, and adjusted if appropriate, once a year. An asset’s carrying amount is written down immediately to its recoverable amount if theasset’s carrying amount is greater than its estimated recoverable amount (note 2.8).

37
(c) Recoverability of deferred tax assets Deferred taxes are calculated according to the liability method, on the temporary differences that arise between the tax bases of assets and liabilities and theircarrying amounts. Deferred tax assets on tax losses are recognized to the extent that it is probable that future tax benefits will be available with which tooffset the temporary differences. The Company makes financial and fiscal projections to evaluate the realization in time of this deferred tax asset.Additionally, it ensures that these projections are consistent with those used to measure other long-lived assets. As of December 31, 2017, the Company hasrecognized deferred tax assets of ThUS $ 364,021 (ThUS $ 384,580 as of December 31, 2016) and has ceased to recognize deferred tax assets on tax lossesof ThUS $ 81,155 (ThUS $ 115,801). December 31, 2016) (Note 18). (d) Air tickets sold that are not actually used. The Company register advance sales of tickets as deferred revenue. Revenue from ticket sales is recognized in the income statement when the service isprovided or when the tickets expires unused, reducing the corresponding deferred revenue. The Company evaluates monthly the probability that ticketsexpiry unused, based on the history of used tickets. Changes in the exchange probability would have an impact our revenue in the year in which the changeoccurs and in future years. As of December 31, 2017, deferred revenue associated with air tickets sold amounted to ThUS$ 1,550,447 (ThUS$ 1,535,229 asof December 31, 2016). An hypothetical change of 1% in passenger behavior regarding to the ticket usage, that is, if during the next six months after sellsprobability of used were 89% rather than 90%, as we consider, it would lead to a change in the expiry period from six to seven months, which, would have animpact of up to ThUS$ 20,000 in the results of 2017. (e) Valuation of loyalty points and kilometers granted to loyalty program members, pending usage. As of December 31, 2017 and 2016 the Company operated the following loyalty programs: LATAM Pass, LATAM Fidelidade and Multiplus, with theobjective of enhancing customer loyalty by offering points or kilometers (see Note 22). The members of these programs accumulate kilometers when they fly with LATAM Airlines Group or any other airline member of the onewordl® program,as well as use the services of the associated entities. When kilometers and points are redeemed for products and services other than the services provided by the Company, revenue is recognized immediately;when they are redeemed for air tickets on airlines from to LATAM Airlines Group S.A. and subsidiaries, revenue is deferred until the transport service isprovided or the corresponding tickets expired. Deferred revenue from loyalty programs at the closing date corresponds to the valuation of points and kilometers granted to loyalty program members,pending of use, weighted by the probability to be redeemed. According to IFRIC-13, kilometers and points value that the Company estimate are not likely to be redeemed (“breakage”), they recognize the associatedvalue proportionally during the period in which the remaining kilometers or points are expected to be redeemed. The Company uses statistical models toestimate the breakage, based on historical redemption patterns Changes in the breakage would have a significant impact on our revenue in the year in whichthe change occurs and in future years.

38
As of December 31, 2017, the deferred revenue associated with the LATAM Pass loyalty program amounts to ThUS $ 853,505 (ThUS $ 896,190 as ofDecember 31, 2016). A hypothetical change of one percentage point in the exchange probability would result in an impact as of December 31, 2017 of ThUS$ 25,000 (ThUS $ 30,632 as of December 31, 2016). While the deferred revenues associated with the loyalty programs LATAM Fidelidade and Multiplusamount to ThUS $ 364,866 (ThUS $ 392,107 as of December 31, 2016). A hypothetical change of two percentage points in the number of points pending tobe exchanged would result in an impact as of December 31, 2017 of ThUS $ 16,700 (ThUS $ 14,639 as of December 31, 2016). The fair value of kilometers and other associated components are determined by the Company on the basis of fair value analysis of them past. As ofDecember 31, 2017 a hypothetical change of one percentage point in the fair value of the unused kilometers would result in an impact of ThUS$ 8,000 in2017 (ThUS$ 8,400 in 2016). (f) Provisions needs, and their valuation when required Known contingencies are recognized when: the Company has a present legal or constructive obligation as a result of past events; it is probable that anoutflow of resources will be required to settle the obligation and the amount has been reliably estimated. The Company applies professional judgment,experience, and knowledge to use available information to determine these values, in light of the specific characteristics of known risks. This processfacilitates the early assessment and valuation of potential risks in individual cases or in the development of contingent eventualities. (g) Investment in subsidiary (TAM) The management has applied its judgment in determining that LATAM Airlines Group S.A. controls TAM S.A. and Subsidiaries, for accounting purposes,and has therefore consolidated the financial statements. The grounds for this decision are that LATAM issued ordinary shares in exchange for the majority of circulating ordinary and preferential shares in TAM,except for those TAM shareholders who did not accept the exchange, which were subject to a squeeze out, entitling LATAM to substantially all economicbenefits generated by the LATAM Group, and thus exposing it to substantially all risks relating to the operations of TAM. This exchange aligns the economicinterests of LATAM and all of its shareholders, including the controlling shareholders of TAM, thus insuring that the shareholders and directors of TAM shallhave no incentive to exercise their rights in a manner that would be beneficial to TAM but detrimental to LATAM. Furthermore, all significant actionsnecessary of the operation of the airlines require votes in favor by the controlling shareholders of both LATAM and TAM. Since the integration of LAN and TAM operations, the most critical airline operations in Brazil have been managed by the CEO of TAM while globalactivities have been managed by the CEO of LATAM, who is in charge of the operation of the LATAM Group as a whole and reports to the LATAM Board.

39
The CEO of LATAM also evaluates the performance of LATAM Group executives and, together with the LATAM Board, determines compensation.Although Brazilian law currently imposes restrictions on the percentages of voting rights that may be held by foreign investors, LATAM believes that theeconomic basis of these agreements meets the requirements of accounting standards in force, and that the consolidation of the operations of LAN andLATAM is appropriate. These estimates were made based on the best information available relating to the matters analyzed. In any case, it is possible that events that may take place in the future could lead to their modification in future reporting periods, which would be made in aprospective manner. NOTE 5 - SEGMENTAL INFORMATION The Company has determined that it has two operating segments: the air transportation business and the coalition and loyalty program Multiplus. The Air transport segment corresponds to the route network for air transport and it is based on the way that the business is run and managed, according to thecentralized nature of its operations, the ability to open and close routes and reallocate resources (aircraft, crew, staff, etc..) within the network, which is afunctional relationship between all of them, making them inseparable. This segment definition is the most common level used by the global airline industry. The segment of loyalty coalition called Multiplus, unlike LATAM Pass and LATAM Fidelidade, is a frequent flyer programs which operate as a unilateralsystem of loyalty that offers a flexible coalition system, interrelated among its members, with 19.4 million of members, along with being a regulated entitywith a separately business and not directly related to air transport.

40
For the periods ended
Air transportation At December 31,
Coalition andloyalty program
MultiplusAt December 31,
EliminationsAt December 31,
ConsolidatedAt December 31,
2017 2016 2017 2016 2017 2016 2017 2016 ThUS$ ThUS$ ThUS$ ThUS$ ThUS$ ThUS$ ThUS$ ThUS$ Income from ordinary activities from
external customers (*) 9,159,031 8,587,772 454,876 400,568 — — 9,613,907 8,988,340 LAN passenger 4,313,287 4,104,348 — — — — 4,313,287 4,104,348 TAM passenger 3,726,314 3,372,799 454,876 400,568 — — 4,181,190 3,773,367 Freight 1,119,430 1,110,625 — — — — 1,119,430 1,110,625
Income from ordinary activities fromtransactions with other operatingsegments 454,876 400,568 67,554 65,969 (522,430) (466,537) — —
Other operating income 308,937 364,551 240,952 174,197 — — 549,889 538,748 Interest income 28,184 27,287 50,511 58,380 — (10,718) 78,695 74,949 Interest expense (393,286) (427,054) — — — 10,718 (393,286) (416,336)Total net interest expense (365,102) (399,767) 50,511 58,380 — — (314,591) (341,387)Depreciation and amortization (994,416) (952,285) (7,209) (8,043) — — (1,001,625) (960,328)Material non-cash items other than
depreciation and amortization (75,479) 10,069 (145) (991) — — (75,624) 9,078 Disposal of fixed assets and
inventory losses (39,238) (82,734) — — — — (39,238) (82,734)Doubtful accounts (18,272) (29,674) (144) (476) — — (18,416) (30,150)Exchange differences (18,717) 122,129 (1) (478) — — (18,718) 121,651 Result of indexation units 748 348 — (37) — — 748 311
Income (loss) atributable to owners ofthe parents (3,482) (83,653) 158,783 152,873 — — 155,301 69,220
Expenses for income tax (104,376) (92,476) (69,128) (70,728) — — (173,504) (163,204)Segment profit / (loss) 41,931 (42,203) 158,783 152,873 — — 200,714 110,670 Assets of segment 17,430,937 17,805,749 1,373,049 1,400,432 (6,014) (7,987) 18,797,972 19,198,194 Segment liabilities 14,007,916 14,469,505 563,849 572,065 (41,029) (28,680) 14,530,736 15,012,890 Amount of non-current asset additions 412,846 1,481,090 — — — — 412,846 1,481,090
Property, plant and equipment 325,513 1,390,730 — — — — 325,513 1,390,730 Intangibles other than goodwill 87,333 90,360 — — — — 87,333 90,360
Purchase of non-monetary assets ofsegment 490,983 782,957 — — — — 490,983 782,957
(*) The Company does not have any interest revenue that should be recognized as income from ordinary activities by interest.

41
For the periods ended
Airtransportation
At December 31,
Coalition andloyalty program
Multiplus AtDecember 31,
Eliminations AtDecember 31,
Consolidated AtDecember 31,
2017 2016 2017 2016 2017 2016 2017 2016 ThUS$ ThUS$ ThUS$ ThUS$ ThUS$ ThUS$ ThUS$ ThUS$ Net cash flows from
Purchases of property, plant andequipment 403,282 693,581 384 789 — — 403,666 694,370 Additions associated with
maintenance 218,537 197,866 — — — — 218,537 197,866 Other additions 184,745 495,715 384 789 — — 185,129 496,504
Purchases of intangible assets (**) 79,102 84,377 8,216 4,210 — — 87,318 88,587 Net cash flows from (used in) operating
activities 1,489,797 827,108 186,367 154,411 (9,424) (635) 1,666,740 980,884 Net cash flow from (used in) investing
activities (278,790) (426,989) (8,632) (4,800) — — (287,422) (431,789)Net cash flows from (used in) financing
activities (1,010,705) (246,907) (168,383) (149,372) — — (1,179,088) (396,279) (**) The company does not have the cash flows of intangible asset acquisitions associated with maintenance.

42
The Company’s revenues by geographic area are as follows:
For the period ended
At December 31, 2017 2016 ThUS$ ThUS$ Peru 626,316 627,215 Argentina 1,113,467 1,030,973 U.S.A. 900,413 933,130 Europe 676,282 714,436 Colombia 359,276 343,001 Brazil 3,436,402 2,974,234 Ecuador 190,268 198,171 Chile 1,527,158 1,512,570 Asia Pacific and rest of Latin America 784,325 654,610
Income from ordinary activities 9,613,907 8,988,340 Other operating income 549,889 538,748 The Company allocates revenues by geographic area based on the point of sale of the passenger ticket or cargo. Assets are composed primarily of aircraft andaeronautical equipment, which are used throughout the different countries, so it is not possible to assign a geographic area. The Company has no customers that individually represent more than 10% of sales. NOTE 6 - CASH AND CASH EQUIVALENTS
As of December 31,
2017 As of December 31,
2016 ThUS$ ThUS$
Cash on hand 8,562 8,630 Bank balances 330,430 255,746 Overnight 239,292 295,060
Total Cash 578,284 559,436 Cash equivalents
Time deposits 534,062 374,369 Mutual funds 29,658 15,522
Total cash equivalents 563,720 389,891 Total cash and cash equivalents 1,142,004 949,327

43
Cash and cash equivalents are denominated in the following currencies:
Currency As of December 31,
2017 As of December 31,
2016 ThUS$ ThUS$ Argentine peso 12,135 7,871 Brazilian real 106,499 97,401 Chilean peso 81,845 30,758 Colombian peso 7,264 4,336 Euro 11,746 1,695 US Dollar 882,114 780,124 Other currencies 40,401 27,142
Total 1,142,004 949,327 NOTE 7 - FINANCIAL INSTRUMENTS 7.1. Financial instruments by category As of December 31, 2017
Assets Loans andreceivables
HedgeDerivatives Held for trading
Initial as fairvalue throughprofit and loss Total
ThUS$ ThUS$ ThUS$ ThUS$ ThUS$ Cash and cash equivalents 1,112,346 — — 29,658 1,142,004 Other financial assets, current (*) 23,918 62,348 1,421 472,232 559,919 Trade and others accounts receivable, current 1,214,050 — — — 1,214,050 Accounts receivable from related entities, current 2,582 — — — 2,582 Other financial assets, non current (*) 87,077 519 494 — 88,090 Accounts receivable, non current 6,891 — — — 6,891 Total 2,446,864 62,867 1,915 501,890 3,013,536
Liabilities Other financial
liabilities Held Hedgederivatives Total
ThUS$ ThUS$ ThUS$ Other liabilities, current 1,288,749 12,200 1,300,949 Trade and others accounts payable, current 1,695,202 — 1,695,202 Accounts payable to related entities, current 760 — 760 Other financial liabilities, non-current 6,602,891 2,617 6,605,508 Accounts payable, non-current 498,832 — 498,832 Total 10,086,434 14,817 10,101,251 (*) The value presented as initial designation as fair value through profit and loss, corresponds mainly to private investment funds; and loans and receivablescorresponds to guarantees given.

44
As of December 31, 2016
Assets
Loans and
receivables Hedge
derivatives
Held for
trading
Initialdesignation as fair value
through profit and loss Total
ThUS$ ThUS$ ThUS$ ThUS$ ThUS$ Cash and cash equivalents 933,805 — — 15,522 949,327 Other financial assets, current (*) 164,426 11,411 — 536,991 712,828 Trade and others accounts receivable, current 1,107,889 — — — 1,107,889 Accounts receivable from related entities, current 554 — — — 554 Other financial assets, non current (*) 101,603 — 522 — 102,125 Accounts receivable, non current 8,254 — — — 8,254 Total 2,316,531 11,411 522 552,513 2,880,977
Liabilities Other financial
liabilities Held Hedgederivatives Total
ThUS$ ThUS$ ThUS$ Other liabilities, current 1,814,647 24,881 1,839,528 Trade and others accounts payable, current 1,593,068 — 1,593,068 Accounts payable to related entities, current 269 — 269 Other financial liabilities, non-current 6,790,273 6,679 6,796,952 Accounts payable, non-current 359,391 — 359,391 Total 10,557,648 31,560 10,589,208 (*) The value presented as initial designation as fair value through profit and loss, corresponds mainly to private investment funds; and loans and receivablescorresponds to guarantees given.

45
7.2. Financial instruments by currency
(a) Assets As of December
31, 2017 As of December
31, 2016 ThUS$ ThUS$ Cash and cash equivalents 1,142,004 949,327
Argentine peso 12,135 7,871 Brazilian real 106,499 97,401 Chilean peso 81,845 30,758 Colombian peso 7,264 4,336 Euro 11,746 1,695 US Dollar 882,114 780,124 Other currencies 40,401 27,142
Other financial assets (current and non-current) 648,009 814,953 Argentine peso 297 337 Brazilian real 475,810 686,501 Chilean peso 26,679 668 Colombian peso 1,928 1,023 Euro 7,853 6,966 US Dollar 133,431 117,346 Other currencies 2,011 2,112
Trade and other accounts receivable, current 1,214,050 1,107,889 Argentine peso 49,958 82,770 Brazilian real 635,890 551,260 Chilean peso 83,415 92,791 Colombian peso 3,249 16,454 Euro 48,286 21,923 US Dollar 257,324 312,394 Other currencies (*) 135,928 30,297
Accounts receivable, non-current 6,891 8,254 Brazilian real 4 4 Chilean peso 6,887 8,250
Accounts receivable from related entities, current 2,582 554 Brazilian real 2 — Chilean peso 735 554 US Dollar 1,845 —
Total assets 3,013,536 2,880,977 Argentine peso 62,390 90,978 Brazilian real 1,218,205 1,335,166 Chilean peso 199,561 133,021 Colombian peso 12,441 21,813 Euro 67,885 30,584 US Dollar 1,274,714 1,209,864 Other currencies 178,340 59,551
(*) See the composition of the others currencies in Note 8 Trade, other accounts receivable and non-current accounts receivable. b) Liabilities Liabilities information is detailed in the table within Note 3 Financial risk management.

46
NOTE 8 - TRADE AND OTHER ACCOUNTS RECEIVABLE CURRENT, AND NON-CURRENT ACCOUNTS RECEIVABLE
As ofDecember 31,
2017
As ofDecember 31,
2016 ThUS$ ThUS$ Trade accounts receivable 1,175,796 1,022,933 Other accounts receivable 133,054 170,264
Total trade and other accounts receivable 1,308,850 1,193,197 Less: Allowance for impairment loss (87,909) (77,054)
Total net trade and accounts receivable 1,220,941 1,116,143 Less: non-current portion – accounts receivable (6,891) (8,254)
Trade and other accounts receivable, current 1,214,050 1,107,889 The fair value of trade and other accounts receivable does not differ significantly from the book value. The maturity of these accounts at the end of each period is as follows:
As ofDecember 31,
2017
As ofDecember 31,
2016 ThUS$ ThUS$
Fully performing 1,040,671 907,358 Matured accounts receivable, but not impaired
Expired from 1 to 90 days 34,153 27,651 Expired from 91 to 180 days 10,141 9,303 More than 180 days overdue (*) 2,922 1,567
Total matured accounts receivable, but not impaired 47,216 38,521 Matured accounts receivable and impaired Judicial, pre-judicial collection and protested documents 43,175 34,909
Debtor under pre-judicial collection process and portfolio sensitization 44,734 42,145 Total matured accounts receivable and impaired 87,909 77,054 Total 1,175,796 1,022,933
(*) Value of this segment corresponds primarily to accounts receivable that were evaluated in their ability to recover, therefore not requiring a provision.

47
Currency balances that make up the Trade and other accounts receivable and non-current accounts receivable are the following:
Currency
As ofDecember 31,
2017
As ofDecember 31,
2016 ThUS$ ThUS$ Argentine Peso 49,958 82,770 Brazilian Real 635,894 551,264 Chilean Peso 90,302 101,041 Colombian peso 3,249 16,454 Euro 48,286 21,923 US Dollar 257,324 312,394 Other currency (*) 135,928 30,297
Total 1,220,941 1,116,143 (*) Other currencies
Australian Dollar 40,303 5,487 Chinese Yuan 37 271 Danish Krone 197 151 Pound Sterling 5,068 3,904 Indian Rupee 3,277 303 Japanese Yen 18,756 2,601 Norwegian Kroner 133 184 Swiss Franc 2,430 1,512 Korean Won 18,225 4,241 New Taiwanese Dollar 2,983 662 Other currencies 44,519 10,938
Total 135,928 30,254 The Company records allowances when there is evidence of impairment of trade receivables. The criteria used to determine that there is objective evidence ofimpairment losses are the maturity of the portfolio, specific acts of damage (default) and specific market signals. Maturity Impairment Judicial and pre-judicial collection assets 100%Over 1 year 100%Between 6 and 12 months 50%

48
Movement in the allowance for impairment loss of Trade and other accounts receivables are the following:
Openingbalance Write-offs
(Increase)Decrease
Closingbalance
Periods ThUS$ ThUS$ ThUS$ ThUS$ From January 1 to December 31, 2016 (60,072) 20,910 (37,892) (77,054)From January 1 to December 31, 2017 (77,054) 8,249 (19,104) (87,909) Once pre-judicial and judicial collection efforts are exhausted, the assets are written off against the allowance. The Company only uses the allowance methodrather than direct write-off, to ensure control. Historic and current re-negotiations are not relevant and the policy is to analyze case by case in order to classify them according to the existence of risk,determining whether it is appropriate to re-classify accounts to pre-judicial recovery. If such re-classification is justified, an allowance is made for theaccount, whether overdue or falling due. The maximum credit-risk exposure at the date of presentation of the information is the fair value of each one of the categories of accounts receivableindicated above.
As of December 31, 2017 As of December 31, 2016
Gross exposureaccording to
balance
Grossimpairedexposure
Exposure netof risk
concentrations
Gross exposureaccording to
balance
GrossImpairedexposure
Exposure netof risk
concentrations ThUS$ ThUS$ ThUS$ ThUS$ ThUS$ ThUS$
Trade accounts receivable 1,175,796 (87,909) 1,087,887 1,022,933 (77,054) 945,879 Other accounts receivable 133,054 — 133,054 170,264 — 170,264 There are no relevant guarantees covering credit risk and these are valued when they are settled; no materially significant direct guarantees exist. Existingguarantees, if appropriate, are made through IATA.

49
NOTE 9 - ACCOUNTS RECEIVABLE FROM/PAYABLE TO RELATED ENTITIES (a) Accounts Receivable
Tax No. Related party Relationship Countryof origin Currency
As ofDecember 31,
2017
As ofDecember 31,
2016 ThUS$ ThUS$ Foreign Qatar Airways Indirect shareholder Qatar ThU$ 1,845 — 78.591.370-1 Bethia S.A. and Subsidiaries Related director Chile CLP 728 538 Foreign TAM Aviação Executiva e Taxi
Aéreo S.A.
Related director Brazil BRL
2
—
87.752.000-5 Granja Marina Tornagaleones S.A. Common shareholder Chile CLP 5 14 96.810.370-9 Inversiones Costa Verde Ltda. y CPA. Related director Chile CLP 2 2 Total current assets 2,582 554 (b) Accounts payable
Tax No. Related party Relationship Countryof origin Currency
As ofDecember 31,
2017
As ofDecember 31,
2016 ThUS$ ThUS$ 78.997.060-2 Viajes Falabella Ltda. Related director Chile CLP 534 46 78.591.370-1 Bethia S.A. and Subsidiaries Related director Chile CLP 12 6 Foreign Inversora Aeronáutica Argentina S.A. Related director Argentina ThUS$ 4 2 65.216.000-K Comunidad Mujer Related director Chile CLP — 13 Foreign Consultoría Administrativa
Profesional S.A. de C.V.
Related company
México MXN
210 170
Foreign TAM Aviação Executiva e TaxiAéreo S.A.
Related director
Brazil BRL
— 28
79.773.440-3 Transportes San Felipe S.A Common property Chile CLP — 4 Total current liabilities 760 269 Transactions between related parties have been carried out on free-trade conditions between interested and duly-informed parties. The transaction times arebetween 30 and 45 days, and the nature of settlement of the transactions is monetary.

50
NOTE 10 -INVENTORIES The composition of Inventories is as follows:
As ofDecember 31,
2017
As ofDecember 31,
2016 ThUS$ ThUS$ Technical stock 195,530 191,864 Non-technical stock 41,136 49,499
Total 236,666 241,363 The items included in this heading are spare parts and materials that will be used mainly in consumption in in-flight and maintenance services provided to theCompany and third parties, which are valued at average cost, net of provision for obsolescence, as per the following detail:
As ofDecember 31,
2017
As ofDecember 31,
2016 ThUS$ ThUS$ Provision for obsolescence Technical stock 21,839 31,647 Provision for obsolescence Non-technical stock 6,488 3,429
Total 28,327 35,076 The resulting amounts do not exceed the respective net realization values. As of December 31, 2017, the Company recorded ThUS$ 155,421 (ThUS$ 167,365 at December 31, 2016) within the income statement, mainly due to in-flight consumption and maintenance, which forms part of Cost of sales.

51
NOTE 11 - OTHER FINANCIAL ASSETS The composition of other financial assets is as follows:
Current Assets Non-current assets Total Assets
As ofDecember 31,
2017
As ofDecember 31,
2016
As ofDecember 31,
2017
As ofDecember 31,
2016
As ofDecember 31,
2017
As ofDecember 31,
2016 ThUS$ ThUS$ ThUS$ ThUS$ ThUS$ ThUS$
(a) Other financial assets Private investment funds 472,232 536,991 — — 472,232 536,991 Deposits in guarantee (aircraft) 15,690 16,819 41,058 56,846 56,748 73,665 Guarantees for margins of derivatives 2,197 939 — — 2,197 939 Other investments — — 494 522 494 522 Domestic and foreign bonds 1,421 — — — 1,421 — Other guarantees given 6,031 140,733 46,019 44,757 52,050 185,490 Other — 5,935 — — — 5,935
Subtotal of other financial assets 497,571 701,417 87,571 102,125 585,142 803,542 (b) Hedging assets Interest accrued since the last payment date
of Cross currency swap 202 64 — — 202 64 Fair value of interest rate derivatives 3,113 — — — 3,113 — Fair value of foreign currency derivatives 48,322 1,259 519 — 48,841 1,259 Fair value of fuel price derivatives 10,711 10,088 — — 10,711 10,088
Subtotal of hedging assets 62,348 11,411 519 — 62,867 11,411 Total Other Financial Assets 559,919 712,828 88,090 102,125 648,009 814,953 The types of derivative hedging contracts maintained by the Company at the end of each period are described in Note 19.

52
NOTE 12 - OTHER NON-FINANCIAL ASSETS The composition of other non-financial assets is as follows: Current assets Non-current assets Total Assets
As ofDecember 31,
2017
As ofDecember 31,
2016
As ofDecember 31,
2017
As ofDecember 31,
2016
As ofDecember 31,
2017
As ofDecember 31,
2016 ThUS$ ThUS$ ThUS$ ThUS$ ThUS$ ThUS$
(a) Advance payments Aircraft leases 31,322 37,560 4,718 14,065 36,040 51,625 Aircraft insurance and other 17,681 14,717 — — 17,681 14,717 Others 10,012 4,521 1,186 1,573 11,198 6,094
Subtotal advance payments 59,015 56,798 5,904 15,638 64,919 72,436
(b) Other assets Aircraft maintenance reserve (*) 21,505 51,576 51,836 90,175 73,341 141,751 Sales tax 137,866 102,351 37,959 40,232 175,825 142,583 Other taxes 2,475 500 — — 2,475 500 Contributions to Société Internationale de
Télécommunications Aéronautiques(“SITA”) 327 406 670 591 997 997
Judicial deposits — — 124,438 90,604 124,438 90,604 Others — 611 — 104 — 715
Subtotal other assets 162,173 155,444 214,903 221,706 377,076 377,150 Total Other Non - Financial Assets 221,188 212,242 220,807 237,344 441,995 449,586 (*) Aircraft maintenance reserves reflect prepayment deposits made by the group to lessors of certain aircraft under operating lease agreements in order toensure that funds are available to support the scheduled heavy maintenance of the aircraft. These amounts are calculated based on performance measures, such as flight hours or cycles, are paid periodically (usually monthly) and are contractuallyrequired to be repaid to the lessee upon the completion of the required maintenance of the leased aircraft. At the end of the lease term, any unusedmaintenance reserves are either returned to the Company in cash or used to offset amounts that we may owe the lessor as a maintenance adjustment. In some cases (five lease agreements), if the maintenance cost incurred by LATAM is less than the corresponding maintenance reserves, the lessor is entitledto retain those excess amounts at the time the heavy maintenance is performed. The Company periodically reviews its maintenance reserves for each of itsleased aircraft to ensure that they will be recovered, and recognizes an expense if any such amounts are less than probable of being returned. The cost ofaircraft maintenance in the last years has been higher than the related maintenance reserves for all aircraft. As of December 31, 2017, maintenance reserves total ThUS $ 73,341 (ThUS $ 141,751 as of December 31, 2016), corresponding to 14 aircraft that maintainremaining balances, which will be settled in the next maintenance or return. Aircraft maintenance reserves are classified as current or non-current depending on the dates when the related maintenance is expected to be performed (Note2.23)

53
NOTE 13 - NON-CURRENT ASSETS AND DISPOSAL GROUP CLASSIFIED AS HELD FOR SALE Non-current assets and in disposal groups held for sale at December 31, 2017 and December 31, 2016 are detailed below:
As ofDecember 31,
2017
As ofDecember 31,
2016 ThUS$ ThUS$ Current assets Aircraft 236,022 281,158 Engines and rotables 9,197 29,083 Other assets 45,884 26,954
Total 291,103 337,195 Current liabilities Other liabilities 15,546 10,152
Total 15,546 10,152 The balances are presented at the lower of book value and fair value less cost to sell. The fair value of these assets was determined based on quoted prices inactive markets for similar assets or liabilities. This is a level II measurement as per the fair value hierarchy set out in note 3.3 (2). There were no transfersbetween levels for recurring fair value measurements during the year. (a) Assets reclassified from Property, plant and equipment to Non-current assets or groups of assets for disposal classified as held for sale During 2016, two Airbus A319 aircraft, two Airbus A320 aircraft, six Airbus A330 aircraft, two Boeing 777 aircraft, eight A330 spare engines, A330 rotablesand two buildings under the heading Non-current assets were transferred from the Property, plant and equipment heading. or groups of assets for disposal,classified as held for sale. As a result, as of December 31, 2016, an adjustment of US $ 55 million was recorded to write down these assets to their net. During 2016, two Airbus A319 aircraft, one Airbus A320 aircraft, two Airbus A330 aircraft, one A330 spare engine and D200 rotables were sold. During 2017, an adjustment of US $ 17.4 million was recognized to record these assets at their net realizable value. In addition, during 2017 seven Airbus A330 Spare engines and two Airbus A330 aircraft were sold.

54
The detail of fleet classified as non-current assets or groups of assets for disposal classified as held for sale is the following:
As of December 31,
2017
As of December 31,
2016
Aircraft Boeing 777 Freighter 2(*) 2(*)Airbus A330-200 1 3 Airbus A320-200 1 1 ATR42-300 1 1 Total 5 7 (*) One aircraft leased to DHL. (b) Assets reclassified from Inventories to Non-current assets or groups of assets for disposal classified as held for sale During in the first quarter of 2017, stocks of the fleet Airbus A330, were reclassified from Inventories to Non-current assets or groups of assets for disposalclassified as held for sale. During 2017 an adjustment of US $ 1.3 million was recognized to record these assets at their net realizable value. In addition, during 2017 there was the partial sale of A330 inventory. NOTE 14 - INVESTMENTS IN SUBSIDIARIES (a) Investments in subsidiaries
The Company has investments in companies recognized as investments in subsidiaries. All the companies defined as subsidiaries have been consolidatedwithin the financial statements of LATAM Airlines Group S.A. and Subsidiaries. The consolidation also includes special-purpose entities. Detail of significant subsidiaries and summarized financial information: Ownership
Name of significant subsidiary Country of
incorporation Functionalcurrency
As ofDecember 31,
2017
As ofDecember 31,
2016 % % Lan Perú S.A. Peru US$ 70.00000 70.00000 Lan Cargo S.A. Chile US$ 99.89803 99.89803 Lan Argentina S.A. Argentina ARS 99.86560 99.86560 Transporte Aéreo S.A. Chile US$ 100.00000 100.00000 Aerolane Líneas Aéreas Nacionales del Ecuador S.A. Ecuador US$ 100.00000 100.00000 Aerovías de Integración Regional, AIRES S.A. Colombia COP 99.19061 99.19061 TAM S.A. Brazil BRL 99.99938 99.99938 The consolidated subsidiaries do not have significant restrictions for transferring funds to controller.

55
Summary financial information of significant subsidiaries
Statement of financial position as of December 31, 2017 Results for the period
ended December 31, 2017
Name of significant subsidiary Total Assets
Current Assets
Non-current Assets
Total Liabilities
Current Liabilities
Non-current Liabilities Revenue
Net Income
ThUS$ ThUS$ ThUS$ ThUS$ ThUS$ ThUS$ ThUS$ ThUS$ Lan Perú S.A. 315,607 294,308 21,299 303,204 301,476 1,728 1,046,423 1,205 Lan Cargo S.A. 584,169 266,836 317,333 371,934 292,529 79,405 264,544 (30,220)Lan Argentina S.A. 198,951 166,445 32,506 143,731 139,914 3,817 387,557 (41,636)Transporte Aéreo S.A. 324,498 30,909 293,589 104,357 36,901 67,456 317,436 2,172 Aerolane Líneas Aéreas Nacionales del
Ecuador S.A. 96,407 66,166 30,241 84,123 78,817 5,306 219,039 3,722 Aerovías de Integración Regional, AIRES S.A. 138,138 64,160 73,978 91,431 80,081 11,350 279,414 526 TAM S.A. (*) 4,490,714 1,843,822 2,646,892 3,555,423 2,052,633 1,502,790 4,621,338 160,582
Statement of financial position as of December 31, 2016 Results for the period
ended December 31, 2016
Name of significant subsidiary Total
Assets CurrentAssets
Non-currentAssets
TotalLiabilities
CurrentLiabilities
Non-currentLiabilities Revenue
NetIncome
ThUS$ ThUS$ ThUS$ ThUS$ ThUS$ ThUS$ ThUS$ ThUS$ Lan Perú S.A. 306,111 283,691 22,420 294,912 293,602 1,310 967,787 (2,164)Lan Cargo S.A. 480,908 144,309 336,599 239,728 211,395 28,333 266,296 (24,813)Lan Argentina S.A. 216,331 194,306 22,025 200,172 197,330 2,842 371,896 (29,572)Transporte Aéreo S.A. 340,940 36,986 303,954 124,805 59,668 65,137 297,247 8,206 Aerolane Líneas Aéreas Nacionales del
Ecuador S.A. 89,667 56,064 33,603 81,101 75,985 5,116 219,676 (1,281)Aerovías de Integración Regional,
AIRES S.A. 129,734 55,132 74,602 85,288 74,160 11,128 277,503 (13,675)TAM S.A. (*) 5,287,286 1,794,189 3,493,097 4,710,308 2,837,620 1,872,688 4,145,951 2,107

56
(b) Non-controlling interest Equity
Tax No. Countryof origin
As ofDecember 31,
2017
As of December 31,
2016
As ofDecember 31,
2017
As of December 31,
2016 % % ThUS$ ThUS$ Lan Perú S.A 0-E Peru 30.00000 30.00000 3,722 3,360
Lan Cargo S.A. and Subsidiaries 93.383.000-4 Chile 0.10196 0.10196 849 957
Promotora Aérea Latinoamericana S.A. andSubsidiaries 0-E Mexico 51.00000 51.00000 4,578 3,162
Inversora Cordillera S.A. and Subsidiaries 0-E Argentina 0,13940 0.70422 3,502 515 Lan Argentina S.A. 0-E Argentina 0,02842 0.13440 79 (311)Americonsult de Guatemala S.A. 0-E Guatemala 1.00000 1.00000 1 1 Americonsult Costa Rica S.A. 0-E Costa Rica 1.00000 1.00000 12 12 Linea Aérea Carguera de Colombiana S.A. 0-E Colombia 10.00000 10.00000 (520) (905)Aerolíneas Regionales de Integración Aires S.A. 0-E Colombia 0.80944 0.80944 461 436 Transportes Aereos del Mercosur S.A. 0-E Paraguay 5.02000 5.02000 1,324 1,104 Multiplus S.A. 0-E Brazil 27.26000 27.26000 77,139 80,313 Total 91,147 88,644
Incomes
Country As of
December 31, As of
December 31, For the period ended
December 31, Tax No. of origin 2017 2016 2017 2016 % % ThUS$ ThUS$
Lan Perú S.A 0-E Peru 30.00000 30.00000 360 (649)
Lan Cargo S.A. and Subsidiaries 93.383.000-4 Chile 0.10196 0.10196 (4) (7)
Promotora Aerea Latinoamericana S.A. andSubsidiaries 0-E Mexico 51.00000 51.00000 1,416 96
Inversora Cordillera S.A. and Subsidiaries 0-E Argentina 0,13940 0.70422 117 364 Lan Argentina S.A. 0-E Argentina 0,02842 0.13440 24 77 Americonsult de Guatemala S.A. 0-E Guatemala 1.00000 1.00000 — (4)Linea Aérea Carguera de Colombiana S.A. 0-E Colombia 10.00000 10.00000 398 (106)Aerolíneas Regionales de Integración Aires S.A. 0-E Colombia 0.80944 0.80944 4 (140)Transportes Aereos del Mercosur S.A. 0-E Paraguay 5.02000 5.02000 299 146 Multiplus S.A. 0-E Brazil 27.26000 27.26000 42,796 41,673 Total 45,410 41,450

57
NOTE 15 - INTANGIBLE ASSETS OTHER THAN GOODWILL The details of intangible assets are as follows:
Classes of intangible assets
(net) Classes of intangible assets
(gross)
As ofDecember 31,
2017
As ofDecember 31,
2016
As ofDecember 31,
2017
As ofDecember 31,
2016 ThUS$ ThUS$ ThUS$ ThUS$
Airport slots 964,513 978,849 964,513 978,849 Loyalty program 321,440 326,262 321,440 326,262 Computer software 160,970 157,016 509,377 419,652 Developing software 123,415 91,053 123,415 91,053 Trademarks (1) 46,909 57,133 62,539 63,730 Other assets — — — 808
Total 1,617,247 1,610,313 1,981,284 1,880,354 Movement in Intangible assets other than goodwill:
Computer software
Net Developing
software Airport slots (2)
Trademarks and loyalty
program (1) ( 2) Total ThUS$ ThUS$ ThUS$ ThUS$ ThUS$
Opening balance as of January 1, 2016 104,258 74,887 816,987 325,293 1,321,425 Additions 6,688 83,672 — — 90,360 Withdrawals (736) (191) — — (927)Transfer software 85,029 (74,376) — — 10,653 Foreing exchange 5,689 7,061 161,862 64,447 239,059 Amortization (43,912) — — (6,345) (50,257)Closing balance as of December 31, 2016 157,016 91,053 978,849 383,395 1,610,313 Opening balance as of January 1, 2017 157,016 91,053 978,849 383,395 1,610,313 Additions 8,453 78,880 — — 87,333 Withdrawals (244) (684) — — (928)Transfer software 45,783 (45,580) — — 203 Foreing exchange (1,215) (254) (14,336) (5,459) (21,264)Amortization (48,823) — — (9,587) (58,410)Closing balance as of December 31, 2017 160,970 123,415 964,513 368,349 1,617,247
(1) In 2016, after the extensive work of integration after the association between LAN and TAM, during which there has been solid progress in the
homologation of the optimization processes of its air connections, in addition to the restructuring and modernization of the fleet of aircraft, the Companyhas resolved adopt a unique name and identity, and announce that the brand of the group will be LATAM “, which would unite all companies under asingle image. Given the above, we have proceeded to review the brands useful life, concluding that these should go from an indefinite to defined useful life. Theestimated new useful life is 5 years, equivalent to the period for finishing all the image changes necessary.
(2) See Note 2.5

58
The amortization of the period is shown in the consolidated statement of income in administrative expenses. The accumulated amortization of computerprograms and brands as of December 31, 2017, amounts to ThUS$ 373,463 (ThUS$ 270,041 at December 31, 2016).
NOTE 16 – GOODWILL The Goodwill amount at December 31, 2017 is ThUS$ 2,672,550 (ThUS$ 2,710,382 at December 31, 2016 and ThUS$ 2,280,575 at December 31, 2015).Movement of Goodwill separated by CGU it includes the following: Movement of Goodwill, separated by CGU:
Air
Transport
Coalition and loyalty
program Multiplus Total
ThUS$ ThUS$ ThUS$ Opening balance as of January 1, 2016 1,835,088 445,487 2,280,575 Increase (decrease) due to exchange rate differences 341,813 88,261 430,074 Others (267) — (267)Closing balance as of December 31, 2016 2,176,634 533,748 2,710,382 Opening balance as of January 1, 2017 2,176,634 533,748 2,710,382 Increase (decrease) due to exchange rate differences (29,942) (7,890) (37,832)Closing balance as of December 31, 2017 2,146,692 525,858 2,672,550 The Company has two cash- generating units (CGUs), “Air transportation” and, “Coalition and loyalty program Multiplus”. The CGU “Air transport”considers the transport of passengers and cargo, both in the domestic markets of Chile, Peru, Argentina, Colombia, Ecuador and Brazil, and in a developedseries of regional and international routes in America, Europe and Oceania, while the CGU “Coalition and loyalty program Multiplus” works with anintegrated network associated companies in Brazil. The recoverable amounts of cash-generating units have been determined based on value-in-use calculations. These calculations require the use of expectedcash flows, 5 years after tax, which are based on the budget approved by the Board. Cash flows beyond the budget period are extrapolated using the estimatedgrowth rates, which do not exceed the average rates of long-term growth. Management establish rates for annual growth, discount, inflation and exchange for each cash generating, as well as fuel prices, based on their keyassumptions. The annual growth rate is based on past performance and management’s expectations over market developments in each country where itoperates. The discount rates used are in American Dollars for the CGU “Air transportation” and Brazilian Reals for CGU “Program coalition loyaltyMultiplus”, both after taxes and reflect specific risks related to each country where the Company operates. Inflation and exchange rates are based on availabledata for each country and the information provided by the Central Bank of each country, and the fuel price is determined based on estimated productionlevels, competitive environment market in which they operate and its business strategy.

59
As of December 31, 2017 the recoverable values were determined using the following assumptions presented below:
Air transportation
CGU
Coalition and loyaltyprogram Multiplus CGU
(2) Annual growth rate (Terminal) % 1.0 - 2.0 4.0 - 5.0 Exchange rate (1) R$/US$ 3.3 - 3.9 3.3 - 3.9 Discount rate based on the weighted average cost of capital (WACC) % 7.55 - 8.55 — Discount rate based on cost of equity (Ke) % — 12.4 - 13.4 Fuel Price from futures price curves commodities markets US$/barrel 73-78 — (1) In line with the expectations of the Central Bank of Brazil(2) The flow, as well as annual growth rte and discount, are denominated in real. The result of the impairment test, which includes a sensitivity analysis of the main variables, showed that the estimated recoverable amount is higher thancarrying value of the book value of net assets allocated to the cash generating unit, and therefore impairment was not detected. CGU’s are sensitive to rates for annual growth, discount and exchanges rates. The sensitivity analysis included the individual impact of changes in estimatescritical in determining the recoverable amounts, namely:
IncreaseMaximum
WACC
IncreaseMaximum
CoE
DecreaseMinimumterminal
growth rate % % %
Air transportation CGU 8.55 — 1.0 Coalition and loyalty program Multiplus CGU — 13.4 4.0 In none of the previous cases impairment in the cash- generating unit was presented. As of December 31, 2017, no signs of deterioration have been identified for the CGU Multiplus Coalition and Loyalty Program and for the UGE TransporteAéreo that require a deterioration test.

60
NOTE 17 - PROPERTY, PLANT AND EQUIPMENT The composition by category of Property, plant and equipment is as follows:
Gross Book Value Acumulated depreciation Net Book Value
As ofDecember 31,
2017
As ofDecember 31,
2016
As ofDecember 31,
2017
As ofDecember 31,
2016
As ofDecember 31,
2017
As ofDecember 31,
2016 ThUS$ ThUS$ ThUS$ ThUS$ ThUS$ ThUS$
Construction in progress (*) 556,822 470,065 — — 556,822 470,065 Land 49,780 50,148 — — 49,780 50,148 Buildings 190,552 190,771 (66,004) (60,552) 124,548 130,219 Plant and equipment 9,222,540 10,099,587 (2,390,142) (2,350,045) 6,832,398 7,749,542
Own aircraft 8,544,185 9,436,684 (2,138,612) (2,123,025) 6,405,573 7,313,659 Other (**) 678,355 662,903 (251,530) (227,020) 426,825 435,883
Machinery 39,084 39,246 (29,296) (26,821) 9,788 12,425 Information technology equipment 166,713 163,695 (136,557) (123,981) 30,156 39,714 Fixed installations and accessories 186,989 178,363 (106,212) (94,451) 80,777 83,912 Motor vehicles 70,290 96,808 (58,812) (67,855) 11,478 28,953 Leasehold improvements 186,679 192,100 (102,454) (87,559) 84,225 104,541 Other property, plants and equipment 3,640,838 3,005,981 (1,355,475) (1,177,351) 2,285,363 1,828,630
Financial leasing aircraft 3,551,041 2,905,556 (1,328,421) (1,152,190) 2,222,620 1,753,366 Other 89,797 100,425 (27,054) (25,161) 62,743 75,264
Total 14,310,287 14,486,764 (4,244,952) (3,988,615) 10,065,335 10,498,149 (*) As of December 31, 2017, includes pre-delivery payments to aircraft manufacturers for ThUS$ 543,720 (ThUS$ 434,250 as of December 31, 2016) (**) Mainly considers rotable and tools.

61
(a) Movement in the different categories of Property, plant and equipment:
Construction
in progress Land Buildings
net
Plant andequipment
net
Information technology equipment
net
Fixed installations
&accessories
net
Motorvehicles
net
Leasehold improvements
net
Other property, plant and
equipment net
Property, Plant and equipment
net ThUS$ ThUS$ ThUS$ ThUS$ ThUS$ ThUS$ ThUS$ ThUS$ ThUS$ ThUS$
Opening balance as of January 1, 2016 1,142,812 45,313 91,491 7,341,075 43,889 88,958 1,525 54,088 2,129,506 10,938,657
Additions 14,481 — 272 1,301,093 7,392 292 6 54,181 13,013 1,390,730
Disposals — — — (16,918)(1) (59) — (32) — (2,972) (19,981)
Retirements (284) — (68) (39,816) (55) (1,258) — — (2,604) (44,085)Depreciation expenses — — (6,234) (562,131) (14,909) (13,664) (293) (23,283) (124,038) (744,552)Foreing exchange 5,081 4,835 2,538 51,770 2,924 9,384 223 2,849 93,383 172,987
Other increases (decreases) (692,025) — 42,220 (285,198)(2) 532 200 (384) 16,706 (277,658) (1,195,607)
Changes, total (672,747) 4,835 38,728 448,800 (4,175) (5,046) (480) 50,453 (300,876) (440,508)Closing balance as of December 31, 2016 470,065 50,148 130,219 7,789,875 39,714 83,912 1,045 104,541 1,828,630 10,498,149 Opening balance as of January 1, 2017 470,065 50,148 130,219 7,789,875 39,714 83,912 1,045 104,541 1,828,630 10,498,149
Additions 11,145 — — 258,615 5,708 329 77 8,156 41,483 325,513 Disposals — — — (16,004) (6) (10) (43) — (27) (16,090)Retirements (127) — (6) (24,341) (473) (497) — — (1,610) (27,054)Depreciation expenses — — (7,946) (496,857) (14,587) (14,124) (187) (27,266) (204,237) (765,204)Foreing exchange 107 (368) (275) (4,603) (183) (820) (8) (243) (5,113) (11,506)Other increases (decreases) 75,632 — 2,556 (653,457) (17) 11,987 (448) (963) 626,237 61,527 Changes, total 86,757 (368) (5,671) (936,647) (9,558) (3,135) (609) (20,316) 456,733 (432,814)
Closing balance as of December 31, 2017 556,822 49,780 124,548 6,853,228 30,156 80,777 436 84,225 2,285,363 10,065,335
(1) During 2016 the sale of two Airbus A330 aircraft was materialized.(2) During 2016 the reclassification to non-current assets or groups of assets for disposal classified as held for sale (see Note 13) of two Airbus A319
aircraft, two Airbus A320 aircraft, six Airbus A330 aircraft and two Boeing 777 aircraft was materialized.

62
(b) Composition of the fleet:
Aircraft included in Property, plant
and equipment Operating leases Total fleet
Aircraft Model
As ofDecember 31,
2017
As ofDecember 31,
2016
As of December 31,
2017
As ofDecember 31,
2016
As ofDecember 31,
2017
As ofDecember 31,
2016
Boeing 767 300ER 34 34 2 3 36 37 Boeing 767 300F 8(1) 8(1) 2 3 10(1) 11(1)Boeing 777 300ER 4 4 6 6 10 10 Boeing 777 Freighter — — — 2 — 2 Boeing 787 800 6 6 4 4 10 10 Boeing 787 900 4 4 10 8 14 12 Airbus A319 100 37 36 9 12 46 48 Airbus A320 200 93(2) 93 38 53 131(2) 146 Airbus A320 NEO 1 1 3 1 4 2 Airbus A321 200 30 30 17 17 47 47 Airbus A350 900 5(3) 5 2(3) 2 7(3) 7 Total 222 221 93 111 315 332
(1) Two aircraft leased to FEDEX as of December 2017; three aircraft as of December 2016.(2) Three aircraft leased to Salam Air and one to Sundair(3) Four aircraft leased to Qatar Air. Two in operating leases and two in Properties, plant and equipment. (c) Method used for the depreciation of Property, plant and equipment: Method Useful life (years) minimum maximum Buildings Straight line without residual value 20 50 Plant and equipment
Straight line with residual value of 20% in the short-haul fleet
and 36% in the long-haul fleet. (*) 5 23 Information technology equipment Straight line without residual value 5 10 Fixed installations and accessories Straight line without residual value 10 10 Motor vehicle Straight line without residual value 10 10 Leasehold improvements Straight line without residual value 5 5 Other property, plant and equipment
Straight line with residual value of 20% in the short-haul fleet
and 36% in the long-haul fleet. (*) 10 23 (*) Except for the Boeing 767 300ER and Boeing 767 300F fleets which consider a lower residual value due to the extension of their useful life to 22 and23 years respectively. Additionally certain technical components, which are depreciated based on the basis of cycles and flight hours. The aircraft with remarketing clause (**) under modality of financial leasing, which are depreciated according to the duration of their contracts, between 12and 18 years. Its residual values are estimated according to market value at the end of such contracts. (**) Aircraft with remarketing clause are those that are required to sell at the end of the contract.

63
As of December 31, 2017, the deferred charge for the period, which is included in the consolidated statement of income, amounts to ThUS $ 765,204 (ThUS$ 744,552 as of December 31, 2016). This charge is recognized in the items of cost of sales and administrative expenses of the consolidated statement ofincome. (d) Additional information regarding Property, plant and equipment: (i) Property, plant and equipment pledged as guarantee: Description of Property, plant and equipment pledged as guarantee:
As of December 31,
2017
As ofDecember 31,
2016 Guarantee agent (*) Assets committed Fleet Existing Debt Book Value Existing Debt Book Value
ThUS$ ThUS$ ThUS$ ThUS$ Wilmington Aircraft and engines Airbus A321 / A350 637,934 721,602 596,224 722,979
Trust Company Boeing 767 593,655 888,948 811,723 1,164,364 Boeing 787 720,267 842,127 739,031 899,445 Banco Santander S.A. Aircraft and engines Airbus A319 — — 50,671 91,889 Airbus A320 199,165 291,649 462,950 709,788 Airbus A321 29,296 40,584 32,853 44,227 BNP Paribas Aircraft and engines Airbus A319 84,767 136,407 134,346 228,384 Airbus A320 110,267 175,650 128,173 181,838 Credit Agricole Aircraft and engines Airbus A319 20,874 38,826 26,014 37,389 Airbus A320 46,895 98,098 71,794 144,157 Airbus A321 30,322 85,463 40,609 93,110 Wells Fargo Aircraft and engines Airbus A320 224,786 306,660 252,428 333,419 Bank of Utah Aircraft and engines Airbus A320 / A350 614,632 666,665 670,826 709,280 Natixis Aircraft and engines Airbus A320 34,592 72,388 45,748 66,738 Airbus A321 378,418 481,397 377,104 514,625 Citibank N. A. Aircraft and engines Airbus A320 94,882 141,817 111,243 166,370 Airbus A321 36,026 72,741 42,867 70,166 KfW IPEX-Bank Aircraft and engines Airbus A319 5,592 5,505 7,494 6,360 Airbus A320 21,296 30,513 28,696 36,066 Airbus Financial Services Aircraft and engines Airbus A319 22,927 26,973 30,199 33,823 PK AirFinance US, Inc. Aircraft and engines Airbus A320 46,500 56,539 54,786 46,341 JP Morgan Aircraft and engines Boeing 777 (1) 169,674 216,000 192,671 236,400 Banco BBVA Land and buildings (2) 55,801 66,876 50,381 69,498 Total direct guarantee 4,178,568 5,463,428 4,958,831 6,606,656 (*) Due to the characteristics of a syndicated loan, the guarantee agent is the representative of the creditors. (1) These assets are classified under Non-current assets and disposal group classified as held for sale
(2) Corresponds to a debt classified in item loans to exporters (see Note 19). The amounts of existing debt are presented at nominal value. Book value corresponds to the carrying value of the goods provided as guarantees.

64
Additionally, there are indirect guarantees related to assets recorded in Property, plant and equipment whose total debt at December 31, 2017 amounted toThUS$ 1,087,052 (ThUS$ 913,494 at December 31, 2016). The book value of assets with indirect guarantees as of December 31, 2017 amounts to ThUS$2,222,620 (ThUS$ 1,740,815 as of December 31, 2016). (ii) Commitments and others Fully depreciated assets and commitments for future purchases are as follows:
As of December 31,
2017
As ofDecember 31,
2016 ThUS$ ThUS$
Gross book value of fully depreciated property, plant and equipment still in use 136,811 116,386 Commitments for the acquisition of aircraft (*) 15,400,000 15,100,000 (*) Acording to the manufacturer’s price list. Purchase commitment of aircraft
Year of delivery Manufacturer 2018 2019 2020 2021 2022 Total Airbus S.A.S. 13 11 16 21 11 72
A320-NEO 7 3 9 8 5 32 A321 — 1 — — — 1 A321-NEO 2 3 5 5 4 19 A350-1000 — — 2 8 2 12 A350-900 4 4 — — — 8
The Boeing Company — 6 2 2 — 10 Boeing 777 — 2 — — — 2 Boeing 787-9 — 4 2 2 — 8
Total 13 17 18 23 11 82 As of December 31, 2017, as a result of the different aircraft purchase agreements signed with Airbus SAS, there remain 52 Airbus aircraft of the A320family, with deliveries between 2018 and 2022, and 20 Airbus aircraft of the A350 family with dates of delivery between 2018 and 2022. The approximate amount is ThUS$ 12,600,000, according to the manufacturer’s price list. As of December 31, 2017, as a result of the different aircraft purchase agreements signed with The Boeing Company, there are 8 Boeing 787 Dreamlineraircraft remaining, with delivery dates between 2019 and 2021, and 2 Boeing 777 aircraft, with delivery scheduled for the year 2019. The approximate amount, according to the manufacturer’s list prices, is ThUS $ 2,800,000. (iii) Capitalized interest costs with respect to Property, plant and equipment.

65
For the periods ended
December 31, 2017 2016 Average rate of capitalization of capitalized interest costs % 4.21 3.54 Costs of capitalized interest ThUS$ 11,053 (696)
(iv) Financial leases
The detail of the main financial leases is as follows:
Lessor Aircraft Model
As of December 31,
2017
As ofDecember 31,
2016 Bandurria Leasing Limitd Airbus A319 100 3 — Bandurria Leasing Limitd Airbus A320 200 4 — Becacina Leasing LLC Boeing 767 300ER 1 1 Caiquen Leasing LLC Boeing 767 300F 1 1 Cernicalo Leasing LLC Boeing 767 300F — 2 Cisne Leasing LLC Boeing 767 300ER 2 2 Codorniz Leasing Limited Airbus A319 100 — 2 Conure Leasing Limited Airbus A320 200 2 2 Flamenco Leasing LLC Boeing 767 300ER 1 1 FLYAFI 1 S.R.L. Boeing 777 300ER 1 1 FLYAFI 2 S.R.L. Boeing 777 300ER 1 1 FLYAFI 3 S.R.L. Boeing 777 300ER 1 1 Garza Leasing LLC Boeing 767 300ER 1 1 General Electric Capital Corporation Airbus A330 200 — 3 Intraelo BETA Corpotation (KFW Airbus A320 200 — 1 Jilguero Leasing LLC Boing B767 300ER 3 — Loica Leasing Limited Airbus A319 100 2 2 Loica Leasing Limited Airbus A320 200 2 2 Mirlo Leasing LLC Boeing 767 300ER 1 1 NBB Rio de Janeiro Lease CO and Brasilia Lease LLC (BBAM Airbus A320 200 1 1 NBB São Paulo Lease CO. Limited (BBAM) Airbus A321 200 1 1 Osprey Leasing Limited Airbus A319 100 8 8 Patagon Leasing Limited Airbus A319 100 3 — Petrel Leasing LLC Boeing 767 300ER 1 1 Pilpilen Leasing Limited Airbus A320 200 — 4 Pochard Leasing LLC Boeing 767 300ER 2 2 Quetro Leasing LLC Boeing 767 300ER 3 3 SG Infraestructure Italia S.R.L. Boeing 777 300ER 1 1 SL Alcyone LTD (Showa) Airbus A320 200 1 1 Torcaza Leasing Limited Airbus A320 200 8 — Tricahue Leasing LLC Boeing 767 300ER 3 3 Wacapou Leasing S.A Airbus A320 200 1 1 Wells Fargo Bank North National Association Airbus A319 100 1 —
Total 60 50

66
Financial leasing contracts where the Company acts as the lessee of aircrafts establish duration between 12 and 18 year terms and semi-annual, quarterly andmonthly payments of obligations. Additionally, the lessee will have the obligation to contract and maintain active the insurance coverage for the aircrafts, perform maintenance on the aircraftsand update the airworthiness certificates at their own cost. The assets acquired under the financial leasing modality are classified under Other property, plant and equipment. As of December 31, 2017, the Companyregistered sixty aircraft under this modality (fifty aircraft as of December 31, 2016). The book value of assets under financial leases as of December 31, 2017 amounts to ThUS$ 2,107,526 (ThUS$ 1,753,366 at December 31, 2016). The minimum payments under financial leases are as follows:
As of December 31, 2017 As of December 31, 2016
GrossValue Interest
PresentValue
GrossValue Interest
PresentValue
ThUS$ ThUS$ ThUS$ ThUS$ ThUS$ ThUS$ No later than one year 303,863 (32,447) 271,416 285,168 (32,365) 252,803 Between one and five years 835,696 (30,050) 805,646 704,822 (43,146) 661,676 Over five years 36,788 (816) 35,972 43,713 (120) 43,593
Total 1,176,347 (63,313) 1,113,034 1,033,703 (75,631) 958,072 NOTE 18 - CURRENT AND DEFERRED TAXES In the period ended December 31, 2017, the income tax provision was calculated for such period, applying the rate of 25.5% for the business year 2017, inaccordance with the Law No. 20,780 published in the Official Journal of the Republic of Chile on September 29, 2014. Among the main changes is the progressive increase of the First Category Tax which will reach 27% in 2018 if the “Partially Integrated Taxation System” ischosen. Alternatively, if the Company chooses the “Attributed Income Taxation System” the top rate would reach 25% in 2017. As LATAM Airlines Group S.A. is a public company, by default it must choose the “Partially Integrated Taxation System”, unless a future ExtraordinaryMeeting of Shareholders of the Company agrees, by a minimum of 2/3 of the votes, to choose the “Attributed Income Taxation System”. This decision wastaken in the last quarter of 2016. On February 8, 2016, an amendment to the abovementioned Law was issued (as Law 20,899) stating, as its main amendments, that Companies such LatamAirlines Group S.A. had to mandatorily choose the “Partially Integrated Taxation System” and could not elect to use the other system. The Partially Integrated Taxation System is based on the taxation by the perception of profits and the Attributed Income Taxation System is based on thetaxation by the accrual of profits.
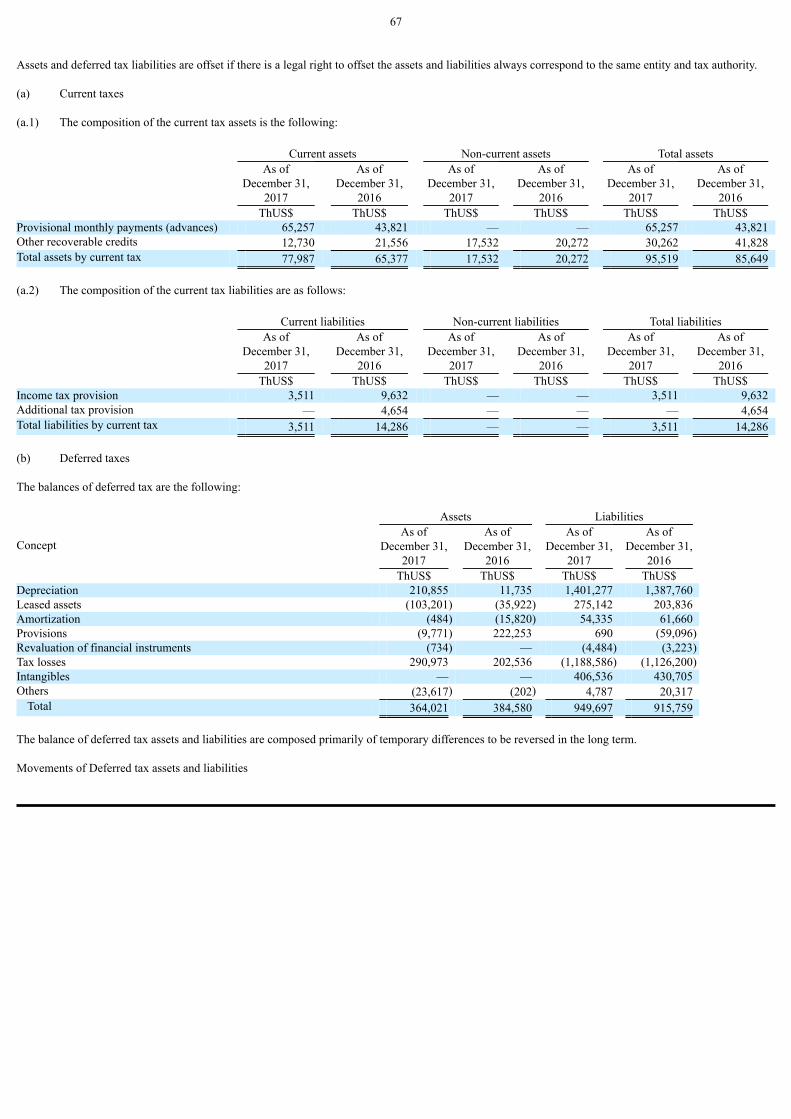
67
Assets and deferred tax liabilities are offset if there is a legal right to offset the assets and liabilities always correspond to the same entity and tax authority. (a) Current taxes
(a.1) The composition of the current tax assets is the following:
Current assets Non-current assets Total assets
As ofDecember 31,
2017
As ofDecember 31,
2016
As ofDecember 31,
2017
As ofDecember 31,
2016
As ofDecember 31,
2017
As ofDecember 31,
2016 ThUS$ ThUS$ ThUS$ ThUS$ ThUS$ ThUS$
Provisional monthly payments (advances) 65,257 43,821 — — 65,257 43,821 Other recoverable credits 12,730 21,556 17,532 20,272 30,262 41,828 Total assets by current tax 77,987 65,377 17,532 20,272 95,519 85,649 (a.2) The composition of the current tax liabilities are as follows:
Current liabilities Non-current liabilities Total liabilities
As ofDecember 31,
2017
As ofDecember 31,
2016
As ofDecember 31,
2017
As ofDecember 31,
2016
As ofDecember 31,
2017
As ofDecember 31,
2016 ThUS$ ThUS$ ThUS$ ThUS$ ThUS$ ThUS$
Income tax provision 3,511 9,632 — — 3,511 9,632 Additional tax provision — 4,654 — — — 4,654 Total liabilities by current tax 3,511 14,286 — — 3,511 14,286 (b) Deferred taxes The balances of deferred tax are the following:
Assets Liabilities
Concept
As ofDecember 31,
2017
As ofDecember 31,
2016
As ofDecember 31,
2017
As ofDecember 31,
2016 ThUS$ ThUS$ ThUS$ ThUS$
Depreciation 210,855 11,735 1,401,277 1,387,760 Leased assets (103,201) (35,922) 275,142 203,836 Amortization (484) (15,820) 54,335 61,660 Provisions (9,771) 222,253 690 (59,096)Revaluation of financial instruments (734) — (4,484) (3,223)Tax losses 290,973 202,536 (1,188,586) (1,126,200)Intangibles — — 406,536 430,705 Others (23,617) (202) 4,787 20,317
Total 364,021 384,580 949,697 915,759 The balance of deferred tax assets and liabilities are composed primarily of temporary differences to be reversed in the long term. Movements of Deferred tax assets and liabilities

68
(a) From January 1 to December 31, 2016
Openingbalance
Assets/(liabilities)
Recognized inconsolidated
income
Recognized incomprehensive
income
Exchangerate
variation Others
Endingbalance
Asset (liability) ThUS$ ThUS$ ThUS$ ThUS$ ThUS$ ThUS$
Depreciation (1,130,991) (241,435) — (3,599) — (1,376,025)Leased assets (251,302) 14,833 — (3,289) — (239,758)Amortization (71,164) (4,375) — (1,941) — (77,480)Provisions 378,537 (149,969) 921 53,448 (1,568) 281,369 Revaluation of financial instrument 8,284 28,294 (34,695) 1,340 — 3,223 Tax losses (*) 1,009,782 304,892 — 14,062 — 1,328,736 Intangibles (364,314) 4,131 — (70,522) — (430,705)Others (13,802) (30,185) — 22,234 1,214 (20,539)
Total (434,970) (73,814) (33,774) 11,733 (354) (531,179) (b) From January 1 to December 31, 2017
Openingbalance
Assets/(liabilities)
Recognizedin
consolidatedincome
Recognized incomprehensive
income
Exchangerate
variation
EndingbalanceAsset
(liability) ThUS$ ThUS$ ThUS$ ThUS$ ThUS$
Depreciation (1,376,025) 185,282 — 322 (1,190,421)Leased assets (239,758) (138,879) — 294 (378,343)Amortization (77,480) 22,486 — 174 (54,820)Provisions 281,369 (286,267) (785) (4,778) (10,461)Revaluation of financial instrument 3,223 2,417 (1,770) (120) 3,750 Tax losses (*) 1,328,736 152,081 — (1,257) 1,479,560 Intangibles (430,705) 24,436 — (267) (406,536)Others (20,539) (7,547) — (319) (28,405)
Total (531,179) (45,991) (2,555) (5,951) (585,676) Deferred tax assets not recognized:
As ofDecember 31,
2017
As ofDecember 31,
2016 ThUS$ ThUS$
Tax losses 81,155 115,801 Total Deferred tax assets not recognized 81,155 115,801 Deferred tax assets on tax loss, are recognized to the extent that it is likely probable the realization of future tax benefit By the above at December 31, 2017,the Company has not recognized deferred tax assets of ThUS$ 81,155 (ThUS$ 115,801 at December 31, 2016) according with a loss of ThUS$ 247,920(ThUS$ 340,591 at December 31, 2016).

69
Deferred tax expense and current income taxes:
For the period ended
December 31, 2017 2016 ThUS$ ThUS$
Current tax expense Current tax expense 127,024 87,307 Adjustment to previous period’s current tax 489 2,083
Total current tax expense, net 127,513 89,390
Deferred tax expense Deferred expense for taxes related to the creation and reversal of
temporary differences 45,991 73,814 Reduction (increase) in value of deferred tax assets during the evaluation
of its usefulness — — Total deferred tax expense, net 45,991 73,814 Income tax expense 173,504 163,204
Composition of income tax expense (income):
For the period ended
December 31, 2017 2016 ThUS$ ThUS$
Current tax expense, net, foreign 100,657 80,600 Current tax expense, net, Chile 26,856 8,790
Total current tax expense, net 127,513 89,390 Deferred tax expense, net, foreign 21,846 119,175 Deferred tax expense, net, Chile 24,145 (45,361)
Deferred tax expense, net, total 45,991 73,814 Income tax expense 173,504 163,204
Profit before tax by the legal tax rate in Chile (25.5% and 24.0% at December 31, 2017 and 2016, respectively)
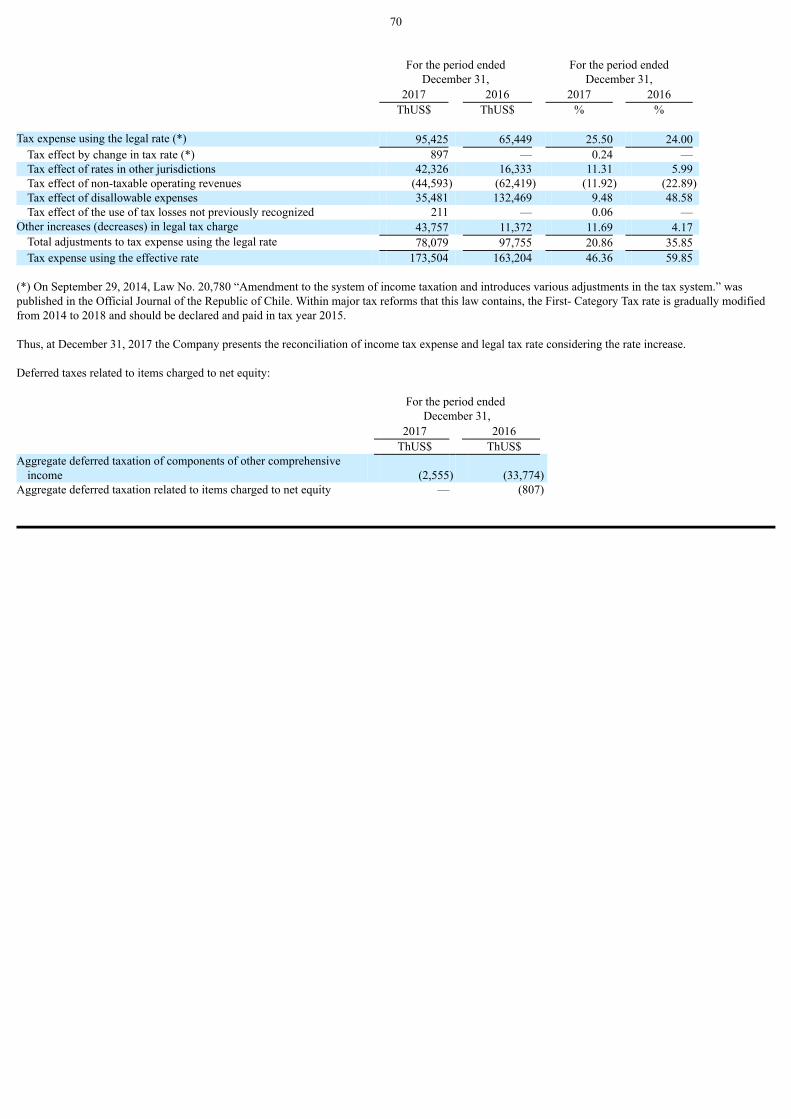
70
For the period ended
December 31, For the period ended
December 31, 2017 2016 2017 2016 ThUS$ ThUS$ % %
Tax expense using the legal rate (*) 95,425 65,449 25.50 24.00 Tax effect by change in tax rate (*) 897 — 0.24 — Tax effect of rates in other jurisdictions 42,326 16,333 11.31 5.99 Tax effect of non-taxable operating revenues (44,593) (62,419) (11.92) (22.89)Tax effect of disallowable expenses 35,481 132,469 9.48 48.58 Tax effect of the use of tax losses not previously recognized 211 — 0.06 —
Other increases (decreases) in legal tax charge 43,757 11,372 11.69 4.17 Total adjustments to tax expense using the legal rate 78,079 97,755 20.86 35.85 Tax expense using the effective rate 173,504 163,204 46.36 59.85
(*) On September 29, 2014, Law No. 20,780 “Amendment to the system of income taxation and introduces various adjustments in the tax system.” waspublished in the Official Journal of the Republic of Chile. Within major tax reforms that this law contains, the First- Category Tax rate is gradually modifiedfrom 2014 to 2018 and should be declared and paid in tax year 2015. Thus, at December 31, 2017 the Company presents the reconciliation of income tax expense and legal tax rate considering the rate increase. Deferred taxes related to items charged to net equity:
For the period ended
December 31, 2017 2016 ThUS$ ThUS$
Aggregate deferred taxation of components of other comprehensiveincome (2,555) (33,774)
Aggregate deferred taxation related to items charged to net equity — (807)

71
NOTE 19 - OTHER FINANCIAL LIABILITIES The composition of other financial liabilities is as follows:
As ofDecember 31,
2017
As ofDecember 31,
2016 ThUS$ ThUS$
Current (a) Interest bearing loans 1,288,749 1,814,647 (b) Hedge derivatives 12,200 24,881
Total current 1,300,949 1,839,528 Non-current
(a) Interest bearing loans 6,602,891 6,790,273 (b) Hedge derivatives 2,617 6,679
Total non-current 6,605,508 6,796,952 (a) Interest bearing loans Obligations with credit institutions and debt instruments:
As of December 31,
2017
As of December 31,
2016 ThUS$ ThUS$
Current Loans to exporters 314,618 278,164 Bank loans (1) 59,017 290,810 Guaranteed obligations 531,173 578,014 Other guaranteed obligations 2,170 1,908
Subtotal bank loans 906,978 1,148,896 Obligation with the public (2) 14,785 312,043 Financial leases 276,541 268,040 Other loans 90,445 85,668
Total current 1,288,749 1,814,647 Non-current
Bank loans 260,433 294,477 Guaranteed obligations (3) 3,505,669 4,180,538 Other guaranteed obligations 240,007 254,512
Subtotal bank loans 4,006,109 4,729,527 Obligation with the public (4) (5) (6) 1,569,281 997,302 Financial leases 832,964 754,321 Other loans 194,537 309,123
Total non-current 6,602,891 6,790,273 Total obligations with financial institutions 7,891,640 8,604,920

72
(1) On September 29, 2016 TAM Linhas Aéreas S.A. obtained financing for US$ 200 million, guaranteed with 18% of the shares of Multiplus S.A.,percentage adjustable depending on the shares price. Additionally, TAM obtained a hedging economic (Cross Currency Swap) for the same amount andperiod, in order to convert the commitment currency from US$ to BRL. On March 30, 2017, TAM Linhas Aéreas S.A. restructured the financing mentioned in the previous paragraph, modifying the nominal amount of thetransaction to US $ 137 million. On September 27, 2017, TAM Linhas Aéreas S.A. made the payment of capital plus interest corresponding to the last installment of the financing describedabove. Simultaneously, all the garments were lifted on the shares of Multiplus S.A. delivered as collateral. (2) On April 25, 2017, the payment of the principal plus interest on the long-term bonds issued by the company TAM Capital Inc. for an amount of US$300,000,000 at an interest rate of 7.375% annual. The payment consisted of 100% of the capital, US$ 300,000,000, and interest accrued as of the date ofpayment for ThUS $ 11,063. (3) On April 10, 2017, the issuance and private placement of debt securities in the amount of US$ 140,000,000 was made under the current structure of theEnhanced Equipment Trust Certificates (“EETC”) issued and placed the year 2015 to finance the acquisition of eleven Airbus A321-200, two Airbus A350-900 and four Boeing 787-9 with arrivals between July 2015 and April 2016. The offer is made up of Class C Certificates, which are subordinate to the CurrentClass A Certificates and Class B Certificates held by the Company. The term of the Class C Certificates is six years and expires in 2023. (4) On April 11, 2017, LATAM Finance Limited, a company incorporated in the Cayman Islands with limited liability and exclusively owned by LATAMAirlines Group SA, has issued and placed on the international market, pursuant to Rule 144 -A and Regulation S of the securities laws of the United States ofAmerica, long-term unsecured bonds in the amount of US$ 700,000,000, maturing in 2024 at an annual interest rate of 6.875%. As reported in the essential fact of April 6, 2017, the Issue and placement of the 144-A Bonds was intended to finance general corporate purposes of LATAM. (5) On August 17, 2017, LATAM made the placement in the local market (Santiago Stock Exchange) of the Series A Bonds (BLATM-A), Series B (BLATM-B), Series C (BLATM-) C) and Series D (BLATM-D), which correspond to the first issue of bonds charged to the line inscribed in the Securities Registry ofthe Commission for the Financial Market (“CMF”), under number 862 for a total of UF 9,000,000. The total amount placed of the Series A Bond was UF 2,500,000; The total amount placed of the Series B Bond was UF 2,500,000. The total amount placedof the Series C Bond was UF 1,850,000. The total amount placed of the Series D Bond was UF 1,850,000, thus totaling UF 8,700,000. The Series A Bonds have an expiration date on June 1, 2022 and an annual interest rate of 5.25%. The Series B Bonds have an expiration date on January 1,2028 and an annual interest rate of 5.75%. The Series C Bonds have an expiration date on June 1, 2022 and an annual interest rate of 5.25%. The Series DBonds have an expiration date on January 1, 2028 and an annual interest rate of 5.75%.

73
The proceeds of the placement of the Series A, Series B, Series C and Series D Bonds were allocated in full to the partial financing of the early redemption ofthe total bonds of TAM Capital 3 inc. (6) On September 1, 2017, TAM Capital 3 Inc., a company controlled indirectly by TAM S.A. through its subsidiary TAM Linhas Aéreas SA, whichconsolidates its financial statements with LATAM, made the full advance redemption of the bonds it placed abroad on June 3, 2011, for an amount of US $500 million at a 8.375% rate and with an expiration date on June 3, 2021. The total redemption was partially financed with the placement of bonds in the localmarket described in number (5) above, and the balance, with other funds available from the Company. All interest-bearing liabilities are recorded according to the effective rate method. Under IFRS, in the case of fixed rate loans, the effective rate determineddoes not vary over the duration of the loan, whereas in variable rate loans, the effective rate changes to the date of each payment of interest. Currency balances that make the interest bearing loans:
As of December 31,
2017
As of December 31,
2016 Currency ThUS$ ThUS$ Brazilian real 130 1,253 Chilean peso (U.F.) 521,122 203,194 US Dollar 7,370,388 8,400,473
Total 7,891,640 8,604,920

74
Interest-bearing loans due in installments to December 31, 2017Debtor: LATAM Airlines Group S.A. and Subsidiaries, Tax No. 89.862.200-2, Chile. Nominal values Accounting values
Morethan
Morethan
Morethan
Morethan
Morethan
Morethan
Up to 90 days one to three to
Morethan Total Up to 90 days one to three to
Morethan Total
Creditor 90 to one three five five nominal 90 to one three five five accounting Effective NominalTax No. Creditor country Currency days year years years years value days year years years years value Amortization rate rate ThUS$ ThUS$ ThUS$ ThUS$ ThUS$ ThUS$ ThUS$ ThUS$ ThUS$ ThUS$ ThUS$ ThUS$ % %Loans to exporters 97.032.000-8 BBVA Chile ThUS$ 75,000 — — — — 75,000 75,781 — — — — 75,781 At Expiration 2.30 2.3097.032.000-8 BBVA Chile UF — 55,801 — — — 55,801 — 55,934 — — — 55,934 At Expiration 3.57 2.7797.036.000-K SANTANDER Chile ThUS$ 30,000 — — — — 30,000 30,129 — — — — 30,129 At Expiration 2.49 2.4997.030.000-7 ESTADO Chile ThUS$ 40,000 — — — — 40,000 40,071 — — — — 40,071 At Expiration 2.57 2.5797.003.000-K
BANCO DOBRASIL Chile ThUS$ 100,000 — — — — 100,000 100,696 — — — — 100,696 At Expiration 2.40 2.40
97.951.000-4 HSBC Chile ThUS$ 12,000 — — — — 12,000 12,007 — — — — 12,007 At Expiration 2.03 2.03Bank loans 97.023.000-9 CORPBANCA Chile UF 21,298 21,360 42,006 — — 84,664 21,542 21,360 41,548 — — 84,450 Quarterly 3.68 3.680-E BLADEX U.S.A. ThUS$ — 15,000 15,000 — — 30,000 — 15,133 14,750 — — 29,883 Semiannual 5.51 5.5197.036.000-K SANTANDER Chile ThUS$ — — 202,284 — — 202,284 439 — 202,284 — — 202,723 Quarterly 4.41 4.41Obligations with the public 0-E
BANK OF NEWYORK U.S.A. ThUS$ — — 500,000 — 700,000 1,200,000 — 13,047 492,745 — 697,536 1,203,328 At Expiration 7.44 7.03
97.030.000-7 ESTADO Chile UF — — — 189,637 189,637 379,274 — 1,738 189,500 189,500 380,738 At Expiration 5.50 5.50Guaranteed obligations 0-E
CREDITAGRICOLE France ThUS$ 7,767 23,840 54,074 12,410 — 98,091 8,101 23,840 52,924 12,026 — 96,891 Quarterly 2.66 2.22
0-E BNP PARIBAS U.S.A. ThUS$ 10,929 44,145 114,800 119,948 285,399 575,221 13,328 44,781 111,319 117,987 282,714 570,129 Quarterly 3.41 3.400-E WELLS FARGO U.S.A. ThUS$ 27,223 82,402 225,221 233,425 240,716 808,987 30,143 82,402 203,371 224,295 236,179 776,390 Quarterly 2.46 1.750-E
WILMINGTONTRUST U.S.A. ThUS$ 20,427 61,669 175,334 183,332 594,091 1,034,853 26,614 61,669 169,506 180,520 590,723 1,029,032 Quarterly 4.48 4.48
0-E CITIBANK U.S.A. ThUS$ 11,994 36,501 101,230 104,308 97,184 351,217 13,231 36,501 95,208 101,558 94,807 341,305 Quarterly 3.31 2.470-E BTMU U.S.A. ThUS$ 2,856 8,689 24,007 25,278 13,904 74,734 3,082 8,689 22,955 24,941 13,849 73,516 Quarterly 2.87 2.270-E APPLE BANK U.S.A. ThUS$ 1,401 4,278 11,828 12,474 7,242 37,223 1,583 4,278 11,303 12,303 7,212 36,679 Quarterly 2.78 2.180-E US BANK U.S.A. ThUS$ 15,157 45,992 126,550 132,441 152,693 472,833 17,364 45,992 109,705 125,006 148,318 446,385 Quarterly 4.00 2.820-E
DEUTSCHEBANK U.S.A. ThUS$ 2,965 9,127 25,826 28,202 30,786 96,906 3,534 9,127 25,130 27,739 30,323 95,853 Quarterly 4.39 4.39
0-E NATIXIS France ThUS$ 14,645 44,627 107,068 91,823 154,848 413,011 15,642 44,627 105,056 90,823 153,124 409,272 Quarterly 3.42 3.400-E PK AIRFINANCE U.S.A. ThUS$ 2,163 6,722 19,744 17,871 — 46,500 2,225 6,722 19,744 17,871 — 46,562 Monthly 3.18 3.180-E KFW IPEX-BANK Germany ThUS$ 2,397 6,678 16,173 1,640 — 26,888 2,428 6,677 16,174 1,640 — 26,919 Quarterly 3.31 3.310-E
AIRBUSFINANCIAL U.S.A. ThUS$ 1,855 5,654 15,416 — — 22,925 1,900 5,654 15,416 — — 22,970 Monthly 3.19 3.19
0-E INVESTEC England ThUS$ 1,374 7,990 20,440 22,977 10,597 63,378 1,808 8,181 19,801 22,769 10,565 63,124 Semiannual 6.04 6.04—
SWAP Avionesllegados — ThUS$ 301 749 765 — — 1,815 301 749 765 — — 1,815 Quarterly —
Other guaranteed obligations 0-E
CREDITAGRICOLE France ThUS$ — — 241,287 — — 241,287 2,170 — 240,007 — — 242,177 At Expiration 3.38 3.38
Financial leases 0-E ING U.S.A. ThUS$ 5,347 10,779 26,831 — — 42,957 5,717 10,779 26,500 — — 42,996 Quarterly 5.67 5.000-E CITIBANK U.S.A. ThUS$ 11,206 34,267 86,085 49,853 2,863 184,274 12,013 34,267 84,104 49,516 2,859 182,759 Quarterly 3.78 3.170-E PEFCO U.S.A. ThUS$ 12,526 32,850 22,407 — — 67,783 12,956 32,850 22,088 — — 67,894 Quarterly 5.46 4.850-E BNP PARIBAS U.S.A. ThUS$ 13,146 33,840 48,823 2,296 — 98,105 13,548 33,840 48,253 2,293 — 97,934 Quarterly 3.66 3.250-E WELLS FARGO U.S.A. ThUS$ 10,630 33,866 91,162 64,471 20,984 221,113 11,460 33,866 88,674 63,860 20,903 218,763 Quarterly 3.17 2.6797.036.000-K SANTANDER Chile ThUS$ 5,459 16,542 45,416 46,472 3,134 117,023 5,813 16,542 44,010 46,153 3,128 115,646 Quarterly 2.51 1.960-E RRPF ENGINE England ThUS$ 265 2,430 6,856 7,441 8,991 25,983 265 2,430 6,856 7,441 8,991 25,983 Monthly 4.01 4.01 Other loans 0-E CITIBANK (*) U.S.A. ThUS$ 21,822 67,859 196,210 — — 285,891 22,586 67,859 194,537 — — 284,982 Quarterly 6.00 6.00 Total 482,153 713,657 2,562,843 1,346,299 2,513,069 7,618,021 508,477 729,534 2,484,733 1,318,241 2,490,731 7,531,716
(*) Bonus securitized with the future flows of credit card sales in the United States and Canada.

75
Interest-bearing loans due in installments to December 31, 2017Debtor: TAM S.A. and Subsidiaries, Tax No. 02.012.862/0001-60, Brazil.
Nominal values Accounting values More than More than More than More than More than More than Up to 90 days one to three to More than Total Up to 90 days one to three to More than Total
Creditor 90 to one three five five nominal 90 to one three five five accounting Effective NominalTax No. Creditor country Currency days year years years years value days year years years years value Amortization rate rate
ThUS$ ThUS$ ThUS$ ThUS$ ThUS$ ThUS$ ThUS$ ThUS$ ThUS$ ThUS$ ThUS$ ThUS$ % %
Bank loans 0-E NEDERLANDSCHE
CREDIETVERZEKERINGMAATSCHAPPIJ Holland ThUS$ 130 401 1,161 690 — 2,382 142 401 1,161 690 — 2,394 Monthly 6.01 6.01
Financial leases 0-E NATIXIS France ThUS$ 2,853 6,099 19,682 70,402 — 99,036 3,592 6,099 19,682 70,402 — 99,775 Quarterly/Semiannua 5.59 5.59 0-E WACAPOU LEASING S.A. Luxemburg ThUS$ 696 2,125 6,020 3,206 — 12,047 732 2,125 6,020 3,207 — 12,084 Quarterly 3.69 3.69
0-E SOCIÉTÉ GÉNÉRALE MILANBRANCH Italy ThUS$ 8,964 27,525 208,024 — — 244,513 9,992 27,525 208,024 — — 245,541 Quarterly 4.87 4.81
0-E BANCO IBM S.A Brazil BRL 21 — — — — 21 21 — — — — 21 Monthly 6.89 6.89 0-E SOCIETE GENERALE France BRL 101 8 — — — 109 101 8 — — — 109 Monthly 6.89 6.89 Total 12,765 36,158 234,887 74,298 — 358,108 14,580 36,158 234,887 74,299 — 359,924 Total consolidated 494,918 749,815 2,797,730 1,420,597 2,513,069 7,976,129 523,057 765,692 2,719,620 1,392,540 2,490,731 7,891,640

76
Interest-bearing loans due in installments to December 31, 2016 Debtor: LATAM Airlines Group S.A. and Subsidiaries, Tax No. 89.862.200-2, Chile. Nominal values Accounting values
Morethan
Morethan
Morethan
Morethan
Morethan
Morethan
Up to 90 days one to three to
Morethan Total Up to 90 days one to three to
Morethan Total
Creditor 90 to one three five five nominal 90 to one three five five accounting Effective NominalTax No. Creditor country Currency days year years years years value days year years years years value Amortization rate rate ThUS$ ThUS$ ThUS$ ThUS$ ThUS$ ThUS$ ThUS$ ThUS$ ThUS$ ThUS$ ThUS$ ThUS$ % %Loans to exporters 97.032.000-8 BBVA Chile ThUS$ 75,000 — — — — 75,000 75,234 — — — — 75,234 At Expiration 1.85 1.8597.032.000-8 BBVA Chile UF — 50,381 — — — 50,381 — 50,324 — — — 50,324 At Expiration 5.23 4.4397.036.000-K SANTANDER Chile ThUS$ 30,000 — — — — 30,000 30,183 — — — — 30,183 At Expiration 2.39 2.3997.030.000-7 ESTADO Chile ThUS$ 40,000 — — — — 40,000 40,098 — — — — 40,098 At Expiration 1.91 1.9197.003.000-K
BANCO DOBRASIL Chile ThUS$ 70,000 — — — — 70,000 70,323 — — — — 70,323 At Expiration 3.08 3.08
97.951.000-4 HSBC Chile ThUS$ 12,000 — — — — 12,000 12,002 — — — — 12,002 At Expiration 1.79 1.79Bank loans 97.023.000-9 CORPBANCA Chile UF 19,229 57,686 60,186 16,254 — 153,355 19,819 57,686 59,176 16,189 — 152,870 Quarterly 4.06 4.060-E BLADEX U.S.A. ThUS$ — 12,500 30,000 — — 42,500 — 12,667 29,625 — — 42,292 Semiannual 5.14 5.140-E DVB BANK SE U.S.A. ThUS$ — — 28,911 — — 28,911 3 — 28,911 — — 28,914 Quarterly 1.86 1.8697.036.000-K SANTANDER Chile ThUS$ — — 158,194 — — 158,194 542 — 158,194 — — 158,736 Quarterly 3.55 3.55Obligations with the public 0-E
BANK OFNEW YORK U.S.A. ThUS$ — — — 500,000 — 500,000 2,291 — — 489,885 — 492,176 At Expiration 7.77 7.25
Guaranteed obligations 0-E
CREDITAGRICOLE France ThUS$ 11,073 29,252 62,209 32,172 3,711 138,417 11,454 29,252 60,781 31,221 3,631 136,339 Quarterly 2.21 1.81
0-E BNP PARIBAS U.S.A. ThUS$ 10,496 42,401 111,962 118,181 345,078 628,118 12,792 43,023 108,271 116,067 341,481 621,634 Quarterly 2.97 2.960-E
WELLSFARGO U.S.A. ThUS$ 31,448 95,186 260,112 269,512 400,087 1,056,345 35,211 95,186 233,012 257,387 391,253 1,012,049 Quarterly 2.37 1.68
0-E
WILMINGTONTRUST U.S.A. ThUS$ 15,554 49,236 135,254 140,848 626,444 967,336 20,997 49,236 130,792 138,455 622,153 961,633 Quarterly 4.25 4.25
0-E CITIBANK U.S.A. ThUS$ 17,495 53,162 146,932 154,774 175,805 548,168 19,059 53,162 138,257 150,891 172,087 533,456 Quarterly 2.72 1.9697.036.000-K SANTANDER Chile ThUS$ 5,347 16,204 44,472 46,386 26,165 138,574 5,680 16,204 42,707 45,815 26,063 136,469 Quarterly 1.98 1.440-E BTMU U.S.A. ThUS$ 2,787 8,470 23,393 24,635 26,705 85,990 3,001 8,470 22,132 24,149 26,519 84,271 Quarterly 2.31 1.720-E APPLE BANK U.S.A. ThUS$ 1,364 4,167 11,516 12,146 13,561 42,754 1,538 4,166 10,889 11,902 13,464 41,959 Quarterly 2.29 1.690-E US BANK U.S.A. ThUS$ 14,817 44,958 123,705 129,462 219,666 532,608 17,298 44,958 104,709 120,509 211,895 499,369 Quarterly 3.99 2.810-E
DEUTSCHEBANK U.S.A. ThUS$ 4,992 15,365 24,725 26,984 45,197 117,263 5,570 15,365 24,023 26,515 44,522 115,995 Quarterly 3.86 3.86
0-E NATIXIS France ThUS$ 12,289 37,388 98,873 82,066 192,235 422,851 13,038 37,388 97,469 81,130 190,048 419,073 Quarterly 2.60 2.570-E
PKAIRFINANCE U.S.A. ThUS$ 2,018 6,268 18,413 24,944 3,144 54,787 2,071 6,269 18,412 24,944 3,144 54,840 Monthly 2.40 2.40
0-E
KFW IPEX-BANK Germany ThUS$ 2,288 7,015 17,869 9,019 — 36,191 2,319 7,015 17,869 9,019 — 36,222 Quarterly 2.55 2.55
0-E
AIRBUSFINANCIAL U.S.A. ThUS$ 1,797 5,476 15,262 7,664 — 30,199 1,841 5,477 15,261 7,664 — 30,243 Monthly 2.49 2.49
0-E INVESTEC England ThUS$ 1,298 7,526 19,290 21,667 22,421 72,202 1,771 7,733 18,533 21,368 22,309 71,714 Semiannual 5.67 5.67-
SWAP Avionesllegados — ThUS$ 403 1,067 1,658 158 — 3,286 403 1,067 1,658 158 — 3,286 Quarterly — —
Other guaranteed obligations 0-E
CREDITAGRICOLE France ThUS$ — — 256,860 — — 256,860 1,908 — 254,512 — — 256,420 Quarterly 2.85 2.85
Financial leases 0-E ING U.S.A. ThUS$ 5,089 15,653 31,151 11,805 — 63,698 5,641 15,652 30,577 11,771 — 63,641 Quarterly 5.62 4.960-E
CREDITAGRICOLE France ThUS$ 1,754 5,403 — — — 7,157 1,780 5,403 — — — 7,183 Quarterly 1.85 1.85
0-E CITIBANK U.S.A. ThUS$ 4,956 15,312 44,177 13,804 — 78,249 5,622 15,312 43,413 13,762 — 78,109 Quarterly 6.40 5.670-E PEFCO U.S.A. ThUS$ 15,979 47,048 63,957 3,827 — 130,811 16,852 47,048 63,072 3,819 — 130,791 Quarterly 5.39 4.790-E BNP PARIBAS U.S.A. ThUS$ 12,520 38,494 75,958 22,147 — 149,119 13,122 38,494 74,776 22,079 — 148,471 Quarterly 3.69 3.260-E
WELLSFARGO U.S.A. ThUS$ 4,678 14,261 39,862 42,663 1,862 103,326 5,018 14,260 38,834 42,430 1,861 102,403 Quarterly 3.98 3.54
0-E DVB BANK SE U.S.A. ThUS$ 4,680 9,447 — — — 14,127 4,713 9,448 — — — 14,161 Quarterly 2.57 2.570-E RRPF ENGINE England ThUS$ — — 6,402 6,955 11,917 25,274 — — 6,402 6,955 11,917 25,274 Monthly 2.35 2.35 Other loans 0-E BOEING U.S.A. ThUS$ — — 26,214 — — 26,214 185 — 26,214 — — 26,399 At Expiration 2.35 2.350-E CITIBANK (*) U.S.A. ThUS$ 20,555 63,942 184,866 101,026 — 370,389 21,541 63,942 182,043 100,866 — 368,392 Quarterly 6.00 6.00 Total 451,906 753,268 2,122,383 1,819,099 2,113,998 7,260,654 480,920 754,207 2,040,524 1,774,950 2,082,347 7,132,948
(*) Securitized bond with the future flows from the sales with credit card in United States and Canada.

77
Interest-bearing loans due in installments to December 31, 2016Debtor: TAM S.A. and Subsidiaries, Tax No. 02.012.862/0001-60, Brazil. Nominal values Accounting values
Morethan
Morethan
Morethan More
Morethan
Morethan
Morethan
Up to 90 days one to three to than Total Up to 90 days one to three to
Morethan Total
Creditor 90 to one three five five nominal 90 to one three five five accounting Effective NominalTax No. Creditor country Currency days year years years years value days year years years years value Amortization rate rate
ThUS $ ThUS $ ThUS $ ThUS $ ThUS $ ThUS $ ThUS $ ThUS $ ThUS $ ThUS $ ThUS $ ThUS $ % %Bank loans 0-E NEDERLANDSCHE
CREDIETVERZEKERINGMAATSCHAPPU Holland ThUS$ 122 378 1,094 1,234 54 2,882 137 378 1,094 1,233 55 2,897 Monthly 6.01 6.01
0-E CITIBANK U.S.A ThUS$ — 200,000 — — — 200,000 (151) 199,729 — — — 199,578 At Expiration 3.39 3.14Obligation with the public 0-E
THE BANK OF NEWYORK U.S.A ThUS$ — 300,000 — 500,000 — 800,000 8,173 301,579 4,119 503,298 — 817,169 At Expiration 8.17 8.00
Financial leases 0-E
AFS INVESTMENT IXLLC U.S.A ThUS$ 2,086 6,437 18,556 8,369 — 35,448 2,253 6,437 18,556 8,369 — 35,615 Monthly 1.25 1.25
0-E DVB BANK SE U.S.A ThUS$ 118 164 — — — 282 119 164 — — — 283 Monthly 2.50 2.500-E
GENERAL ELECTRICCAPITALCORPORATION U.S.A ThUS$ 3,771 5,075 — — — 8,846 3,794 5,075 — — — 8,869 Monthly 2.30 2.30
0-E KFW IPEX-BANK Germany ThUS$ 579 1,544 — — — 2,123 583 1,544 — — — 2,127 Monthly/Quarterly 2.80 2.800-E NATIXIS France ThUS$ 2,675 5,732 18,485 38,820 41,731 107,443 3,533 5,732 18,485 38,820 41,731 108,301 Quarterly/Semiannual 4.90 4.900-E
WACAPOU LEASINGS.A. Luxemburg ThUS$ 668 2,038 5,768 6,280 — 14,754 709 2,038 5,768 6,280 — 14,795 Quarterly 3.00 3.00
0-E
SOCIÉTÉ GÉNÉRALEMILAN BRANCH Italy ThUS$ 8,547 26,275 74,783 169,730 — 279,335 9,779 26,275 74,783 169,730 — 280,567 Quarterly 4.18 4.11
0-E BANCO IBM S.A Brazil BRL 260 749 22 — — 1,031 260 749 21 — — 1,030 Monthly 13.63 13.630-E
HP FINANCIALSERVICE Brazil BRL 222 — — — — 222 222 — — — — 222 Monthly 10.02 10.02
0-E SOCIETE GENERALE France BRL 102 307 110 — — 519 102 307 110 — — 519 Monthly 13.63 13.63 Total 19,150 548,699 118,818 724,433 41,785 1,452,885 29,513 550,007 122,936 727,730 41,786 1,471,972 Total consolidated 471,056 1,301,967 2,241,201 2,543,532 2,155,783 8,713,539 510,433 1,304,214 2,163,460 2,502,680 2,124,133 8,604,920
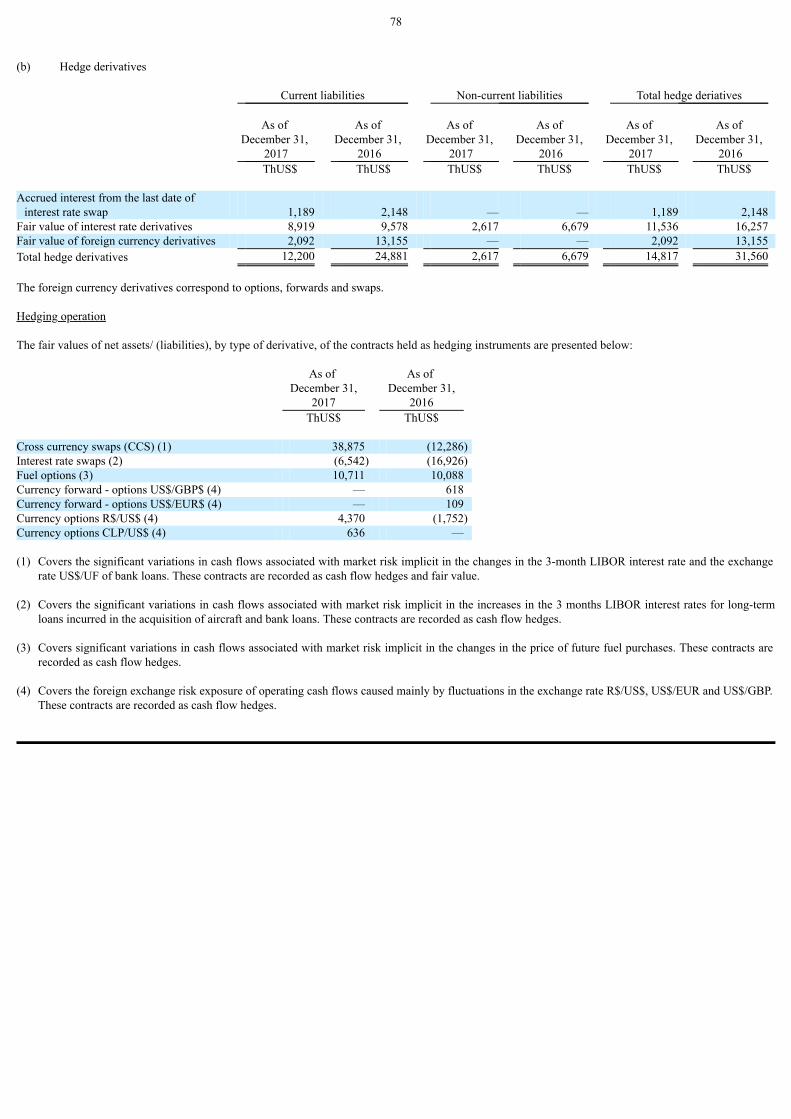
78
(b) Hedge derivatives Current liabilities Non-current liabilities Total hedge deriatives
As of December 31,
2017
As of December 31,
2016
As of December 31,
2017
As of December 31,
2016
As of December 31,
2017
As of December 31,
2016 ThUS$ ThUS$ ThUS$ ThUS$ ThUS$ ThUS$
Accrued interest from the last date of
interest rate swap 1,189 2,148 — — 1,189 2,148 Fair value of interest rate derivatives 8,919 9,578 2,617 6,679 11,536 16,257 Fair value of foreign currency derivatives 2,092 13,155 — — 2,092 13,155 Total hedge derivatives 12,200 24,881 2,617 6,679 14,817 31,560 The foreign currency derivatives correspond to options, forwards and swaps. Hedging operation The fair values of net assets/ (liabilities), by type of derivative, of the contracts held as hedging instruments are presented below:
As of December 31,
2017
As of December 31,
2016 ThUS$ ThUS$ Cross currency swaps (CCS) (1) 38,875 (12,286)Interest rate swaps (2) (6,542) (16,926)Fuel options (3) 10,711 10,088 Currency forward - options US$/GBP$ (4) — 618 Currency forward - options US$/EUR$ (4) — 109 Currency options R$/US$ (4) 4,370 (1,752)Currency options CLP/US$ (4) 636 — (1) Covers the significant variations in cash flows associated with market risk implicit in the changes in the 3-month LIBOR interest rate and the exchange
rate US$/UF of bank loans. These contracts are recorded as cash flow hedges and fair value. (2) Covers the significant variations in cash flows associated with market risk implicit in the increases in the 3 months LIBOR interest rates for long-term
loans incurred in the acquisition of aircraft and bank loans. These contracts are recorded as cash flow hedges. (3) Covers significant variations in cash flows associated with market risk implicit in the changes in the price of future fuel purchases. These contracts are
recorded as cash flow hedges. (4) Covers the foreign exchange risk exposure of operating cash flows caused mainly by fluctuations in the exchange rate R$/US$, US$/EUR and US$/GBP.
These contracts are recorded as cash flow hedges.

79
During the periods presented, the Company only has cash flow and fair value hedges (in the case of CCS). In the case of fuel hedges, the cash flows subject tosuch hedges will occur and will impact results in the next 3 months from the date of the consolidated statement of financial position, while in the case ofhedges of interest rates, these they will occur and will impact results throughout the life of the associated loans, up to their maturity. In the case of currencyhedges through a CCS, there is a group of hedging relationships, in which two types of hedge accounting are generated, one of cash flow for the US $ / UFcomponent; and another of fair value, for the floating rate component US $. The other group of hedging relationships only generates cash flow hedgeaccounting for the US $ / UF component. During the periods presented, no hedging operations of future highly probable transaction that have not been realized have occurred. Since none of the coverage resulted in the recognition of a non-financial asset, no portion of the result of the derivatives recognized in equity was transferredto the initial value of such assets. The amounts recognized in comprehensive income during the period and transferred from net equity to income are as follows:
For the period ended
December 31, 2017 2016 ThUS$ ThUS$ Debit (credit) recognized in comprehensive income during the period 18,344 127,390 Debit (credit) transferred from net equity to income during the period (15,000) (113,403) NOTE 20 - TRADE AND OTHER ACCOUNTS PAYABLES The composition of Trade and other accounts payables is as follows:
As of December 31,
2017
As of December 31,
2016 ThUS$ ThUS$
Current (a) Trade and other accounts payables 1,349,201 1,117,926 (b) Accrued liabilities at the reporting date 346,001 475,142
Total trade and other accounts payables 1,695,202 1,593,068

80
(a) Trade and other accounts payable:
As of December 31,
2017
As of December 31,
2016 ThUS$ ThUS$ Trade creditors 1,096,540 876,163 Leasing obligation 4,448 10,446 Other accounts payable 248,213 231,317
Total 1,349,201 1,117,926 The details of Trade and other accounts payables are as follows:
As of December 31,
2017
As of December 31,
2016 ThUS$ ThUS$ Boarding Fee 249,898 170,053 Aircraft Fuel 219,601 188,276 Suppliers technical purchases 114,690 40,305 Airport charges and overflight 106,534 77,484 Handling and ground handling 103,784 87,406 Other personnel expenses 89,621 81,632 Professional services and advisory 81,679 79,270 Marketing 75,220 61,053 Leases, maintenance and IT services 69,873 44,287 Services on board 68,605 44,589 Air companies 31,381 21,197 Land services 31,151 74,260 Maintenance 26,244 25,962 Crew 24,163 29,074 Achievement of goals 5,732 17,801 Communications 5,273 7,500 Aviation insurance 5,108 7,694 Aircraft and engines leasing 4,285 10,446 SEC agreement (*) — 4,719 Others 36,359 44,918
Total trade and other accounts payables 1,349,201 1,117,926 (*) Provision made for payments of fines, on July 25, 2016 LATAM reached agreements with the U.S. Department of Justice (“DOJ”) U.S. and the Securitiesand Exchange Commission (“SEC”) both authorities of the United States of America, in force as of this date, regarding the investigation on payments byLAN Airlines S.A. made in 2006-2007 to a consultant who advised on the resolution of labor matters in Argentina. The amount to the SEC agreement isThUS$ 6,744 plus interests of ThUS$ 2,694. As of December 31, 2017, the debt was paid in full.

81
(b) Liabilities accrued:
As of December 31,
2017
As of December 31,
2016 ThUS$ ThUS$ Accrued personnel expenses 125,246 113,785 Aircraft and engine maintenance 92,711 244,949 Accounts payable to personnel (*) 99,862 89,523 Others accrued liabilities 28,182 26,885
Total accrued liabilities 346,001 475,142 (*) Profits and bonds participation (Note 23 letter b) NOTE 21 - OTHER PROVISIONS Other provisions:
Current liabilities Non-current liabilities Total Liabilities
As of December 31,
2017
As of December 31,
2016
As of December 31,
2017
As of December 31,
2016
As of December 31,
2017
As of December 31,
2016 ThUS$ ThUS$ ThUS$ ThUS$ ThUS$ ThUS$
Provision for contingencies (1)
Tax contingencies 1,913 1,425 258,305 313,064 260,218 314,489 Civil contingencies 497 993 62,858 56,413 63,355 57,406 Labor contingencies 373 225 28,360 29,307 28,733 29,532 Other — — 15,187 15,046 15,187 15,046
Provision for European Commisioninvestigation (2) — — 9,883 8,664 9,883 8,664
Total other provisions (3) 2,783 2,643 374,593 422,494 377,376 425,137 (1) Provisions for contingencies:
The tax contingencies correspond to litigation and tax criteria related to the tax treatment applicable to direct and indirect taxes, which are found in bothadministrative and judicial stage. The civil contingencies correspond to different demands of civil order filed against the Company. The labor contingencies correspond to different demands of labor order filed against the Company. The Provisions are recognized in the consolidated income statement in administrative expenses or tax expenses, as appropriate.
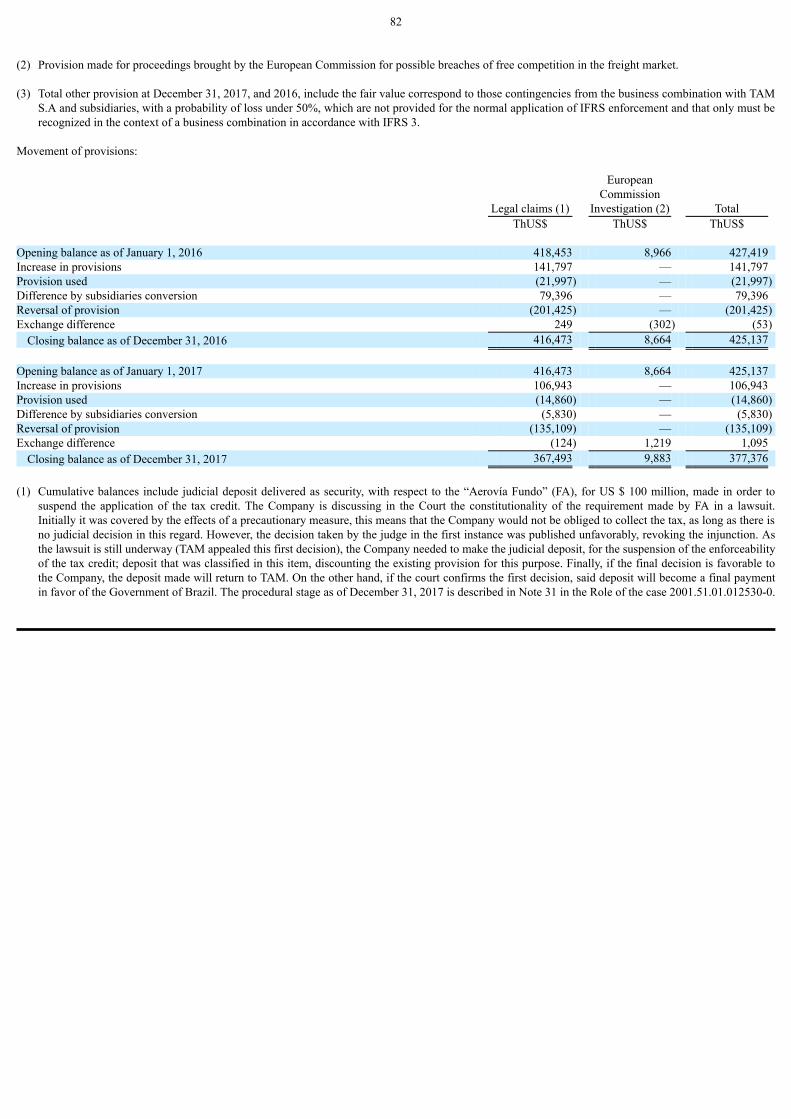
82
(2) Provision made for proceedings brought by the European Commission for possible breaches of free competition in the freight market. (3) Total other provision at December 31, 2017, and 2016, include the fair value correspond to those contingencies from the business combination with TAM
S.A and subsidiaries, with a probability of loss under 50%, which are not provided for the normal application of IFRS enforcement and that only must berecognized in the context of a business combination in accordance with IFRS 3.
Movement of provisions:
Legal claims (1)
EuropeanCommission
Investigation (2) Total ThUS$ ThUS$ ThUS$ Opening balance as of January 1, 2016 418,453 8,966 427,419 Increase in provisions 141,797 — 141,797 Provision used (21,997) — (21,997)Difference by subsidiaries conversion 79,396 — 79,396 Reversal of provision (201,425) — (201,425)Exchange difference 249 (302) (53)
Closing balance as of December 31, 2016 416,473 8,664 425,137 Opening balance as of January 1, 2017 416,473 8,664 425,137 Increase in provisions 106,943 — 106,943 Provision used (14,860) — (14,860)Difference by subsidiaries conversion (5,830) — (5,830)Reversal of provision (135,109) — (135,109)Exchange difference (124) 1,219 1,095
Closing balance as of December 31, 2017 367,493 9,883 377,376 (1) Cumulative balances include judicial deposit delivered as security, with respect to the “Aerovía Fundo” (FA), for US $ 100 million, made in order to
suspend the application of the tax credit. The Company is discussing in the Court the constitutionality of the requirement made by FA in a lawsuit.Initially it was covered by the effects of a precautionary measure, this means that the Company would not be obliged to collect the tax, as long as there isno judicial decision in this regard. However, the decision taken by the judge in the first instance was published unfavorably, revoking the injunction. Asthe lawsuit is still underway (TAM appealed this first decision), the Company needed to make the judicial deposit, for the suspension of the enforceabilityof the tax credit; deposit that was classified in this item, discounting the existing provision for this purpose. Finally, if the final decision is favorable tothe Company, the deposit made will return to TAM. On the other hand, if the court confirms the first decision, said deposit will become a final paymentin favor of the Government of Brazil. The procedural stage as of December 31, 2017 is described in Note 31 in the Role of the case 2001.51.01.012530-0.

83
(2) European Commission Provision: Provision constituted on the occasion of the process initiated in December 2007 by the General Competition Directorate of the European Commission againstmore than 25 cargo airlines, among which is Lan Cargo SA, which forms part of the global investigation initiated in 2006 for possible infractions of freecompetition in the air cargo market, which was carried out jointly by the European and United States authorities. With respect to Europe, the General Directorate of Competition imposed fines totaling € 799,445,000 (seven hundred and ninety-nine million four hundredand forty-five thousand Euros) for infractions of European Union regulations on free competition against eleven (11 ) airlines, among which are LATAMAirlines Group SA and its subsidiary Lan Cargo S.A .. For its part, LATAM Airlines Group S.A. and Lan Cargo S.A., jointly and severally, have been finedfor the amount of € 8,220,000 (eight million two hundred and twenty thousand Euros), for these infractions, an amount that was provisioned in the financialstatements of LATAM. On January 24, 2011, LATAM Airlines Group S.A. and Lan Cargo S.A. They appealed the decision before the Court of Justice of theEuropean Union. On December 16, 2015, the European Court resolved the appeal and annulled the Commission’s Decision. The European Commission didnot appeal the judgment, but on March 17, 2017, the European Commission again adopted its original decision to impose on the eleven lines original areas,the same fine previously imposed, amounting to a total of 776,465,000 Euros In the case of LAN Cargo and its parent, LATAM Airlines Group S.A. imposedthe same fine of 8.2 million Euros. The procedural stage as of December 31, 2017 is described in Note 31 in section (ii) judgments received by LATAMAirlines Group S.A. and Subsidiaries. NOTE 22 - OTHER NON-FINANCIAL LIABILITIES
Current liabilities Non-current liabilities Total Liabilities
As of December 31,
2017
As of December 31,
2016
As of December 31,
2017
As of December 31,
2016
As of December 31,
2017
As of December 31,
2016 ThUS$ ThUS$ ThUS$ ThUS$ ThUS$ ThUS$ Deferred revenues (*) 2,690,961 2,655,086 158,305 213,781 2,849,266 2,868,867 Sales tax 22,902 19,402 — — 22,902 19,402 Retentions 38,197 45,542 — — 38,197 45,542 Others taxes 8,695 7,465 — — 8,695 7,465 Dividends payable 46,590 20,766 — — 46,590 20,766 Other sundry liabilities 16,618 13,984 — — 16,618 13,984 Total other non-financial liabilities 2,823,963 2,762,245 158,305 213,781 2,982,268 2,976,026 (*) Note 2.20.

84
The balance comprises, mainly, deferred income by services not yet rendered at December 31, 2017 and 2016; and programs such as: LATAM Pass,LATAM Fidelidade y Multiplus:
LATAM Pass is the frequent passenger program created by LAN to reward the preference and loyalty of its customers with multiple benefits andprivileges, through the accumulation of kilometers that can be exchanged for free flight tickets or for a varied range of products and services. Customersaccumulate LATAM Pass kilometers every time they fly on LAN, TAM, oneworld® member companies and other airlines associated with the program,as well as buying at stores or using the services of a vast network of companies that have an agreement with the program around the world.
For its part, TAM, thinking of people who travel constantly, created the LATAM Fidelidade program, in order to improve the service and give recognitionto those who choose the company. Through the program, customers accumulate points in a wide variety of loyalty programs in a single account and canredeem them in all TAM destinations and associated airline companies, and even more, participate in the Multiplus Fidelidade Network.
Multiplus is a coalition of loyalty programs, with the objective of operating accumulation and exchange of points. This program has a network integratedby associated companies, including hotels, financial institutions, retail companies, supermarkets, vehicle leases and magazines, among many otherpartners from different segments.
NOTE 23 - EMPLOYEE BENEFITS
As ofDecember 31,
2017
As ofDecember31, 2016
ThUS$ ThUS$ Retirements payments 55,119 49,680 Resignation payments 10,124 10,097 Other obligations 35,844 22,545
Total liability for employee benefits 101,087 82,322 (a) The movement in retirements and resignation payments and other obligations:
Openingbalance
Increase(decrease)
current serviceprovision Benefits paid
Actuarial(gains) losses
Currencytranslation
Closingbalance
ThUS$ ThUS$ ThUS$ ThUS$ ThUS$ ThUS$ From January 1 to December 31, 2016 65,271 17,487 (4,536) 3,105 995 82,322 From January 1 to December 31, 2017 82,322 21,635 (5,399) (2,763) 5,292 101,087
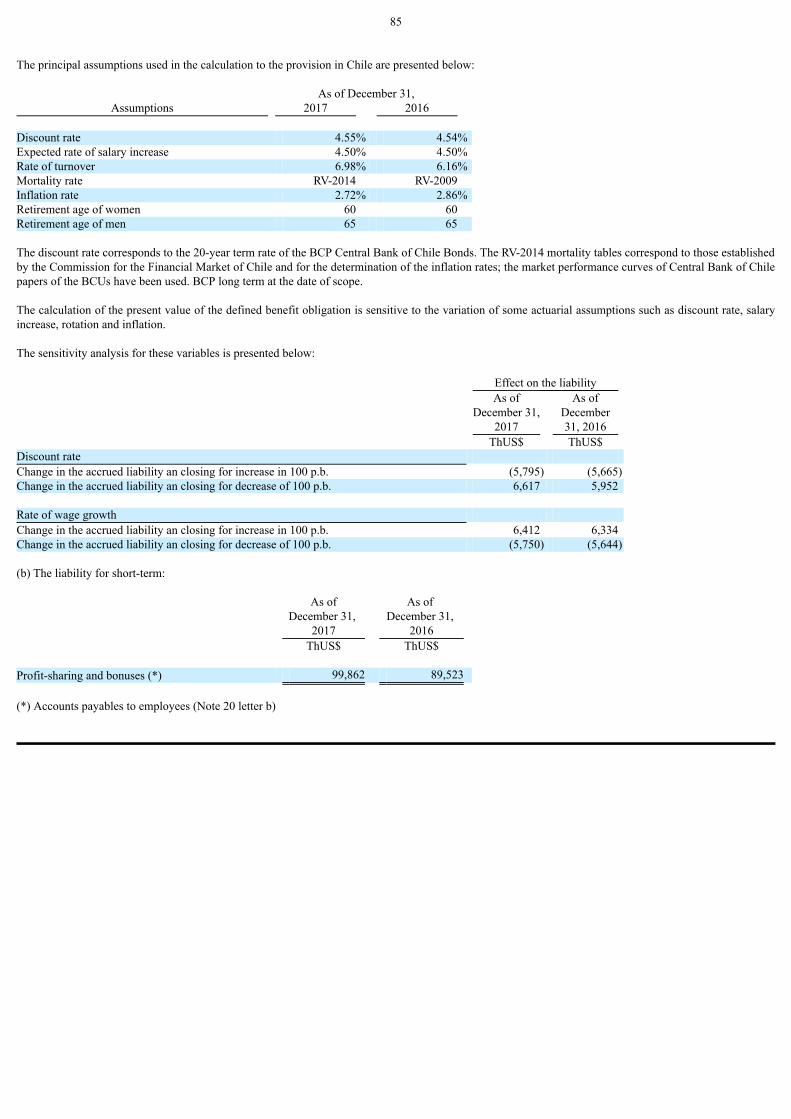
85
The principal assumptions used in the calculation to the provision in Chile are presented below: As of December 31,
Assumptions 2017 2016 Discount rate 4.55% 4.54%Expected rate of salary increase 4.50% 4.50%Rate of turnover 6.98% 6.16%Mortality rate RV-2014 RV-2009 Inflation rate 2.72% 2.86%Retirement age of women 60 60 Retirement age of men 65 65 The discount rate corresponds to the 20-year term rate of the BCP Central Bank of Chile Bonds. The RV-2014 mortality tables correspond to those establishedby the Commission for the Financial Market of Chile and for the determination of the inflation rates; the market performance curves of Central Bank of Chilepapers of the BCUs have been used. BCP long term at the date of scope. The calculation of the present value of the defined benefit obligation is sensitive to the variation of some actuarial assumptions such as discount rate, salaryincrease, rotation and inflation. The sensitivity analysis for these variables is presented below: Effect on the liability
As ofDecember 31,
2017
As ofDecember31, 2016
ThUS$ ThUS$ Discount rate Change in the accrued liability an closing for increase in 100 p.b. (5,795) (5,665)Change in the accrued liability an closing for decrease of 100 p.b. 6,617 5,952 Rate of wage growth Change in the accrued liability an closing for increase in 100 p.b. 6,412 6,334 Change in the accrued liability an closing for decrease of 100 p.b. (5,750) (5,644) (b) The liability for short-term:
As ofDecember 31,
2017
As of December 31,
2016 ThUS$ ThUS$ Profit-sharing and bonuses (*) 99,862 89,523 (*) Accounts payables to employees (Note 20 letter b)

86
The participation in profits and bonuses correspond to an annual incentives plan for achievement of objectives. (c) Employment expenses are detailed below:
For the periods ended
December 31, 2017 2016 ThUS$ ThUS$ Salaries and wages 1,604,552 1,549,402 Short-term employee benefits 145,245 132,436 Termination benefits 85,070 79,062 Other personnel expenses 188,767 190,233
Total 2,023,634 1,951,133 NOTE 24 - ACCOUNTS PAYABLE, NON-CURRENT
As ofDecember 31,
2017
As ofDecember31, 2016
ThUS$ ThUS$ Aircraft and engine maintenance 483,795 347,085 Provision for vacations and bonuses 14,725 12,080 Other sundry liabilities 312 226
Total accounts payable, non-current 498,832 359,391 NOTE 25 - EQUITY (a) Capital The Company’s objective is to maintain an appropriate level of capitalization that enables it to ensure access to the financial markets for carrying out itsmedium and long-term objectives, optimizing the return for its shareholders and maintaining a solid financial position. The paid capital of the Company at December 31, 2017 amounts to ThUS$ 3,146,265 (*) divided into 606,407,693 common stock of a same series (ThUS$3,149,564 (**) divided into 606,407,693 shares as of December 31, 2016), a single series nominative, ordinary character with no par value. There are nospecial series of shares and no privileges. The form of its stock certificates and their issuance, exchange, disablement, loss, replacement and other similarcircumstances, as well as the transfer of the shares, is governed by the provisions of Corporations Law and its regulations. (*) Includes deduction of issuance costs for ThUS $ 3,299 and adjustment for placement of 10,282 shares for ThUS $ 156, approved at the ExtraordinaryShareholders Meeting of the Company on April 27, 2017.

87
(**) Includes adjustment for placement of the aforementioned 10,282 shares for ThUS $ 156. (b) Subscribed and paid shares On August 18, 2016, the Company held an extraordinary meeting of shareholders in which it was approved to increase the capital by issuing 61,316,424shares of payment, all ordinary shares, without par value. As of December 31, 2017, 60,849,592 shares had been placed against this increase, according to thefollowing breakdown: (a) 30,499,685 shares subscribed and paid at the end of the preferred subscription period, which expired on, December 2016, raisingthe equivalent of US$ 304,996,850; and (b) 30,349,907 additional shares subscribed on December 28, 2016, earning the equivalent of US$ 303,499,070. As a result of the last placement, as of December 31, 2017, the number Company shares subscribed and paid amounts to 606,407,693. At December 31, 2017, the Company’s capital stock is represented by 608,374,525 shares, all of the same and unique series, nominative, ordinary, with no parvalue, which is divided into: (a) the 606,407,693 subscribed and paid shares mentioned above; And (b) 1,966,832 shares pending subscription and payment,of which: (i) 1,500,000 shares are allocated to compensation stock option plans; And (ii) 466,832 correspond to the balance of shares pending placement ofthe last capital increase. During 2016, the Company’s capital stock was expressed in 613,164,243 shares, all of the same and unique series, nominative, ordinary, with no par value,that is, 551,847,819 shares already authorized at the beginning of the year and 61,316,424 shares authorized in the last Capital increase dated August 18,2016. However, on December 21, 2016, the deadline for the subscription and payment of 4,789,718 shares that were destined to compensation plans forworkers expired, so that the Company’s capital stock was reduced to 608,374,525 shares. The following table shows the movement of the authorized and fully paid shares described above: Movement of authorized shares Nro. Of shares Autorized shares as of January 1, 2016 551,847,819 Increase capital approved at Extraordinary Shareholders meeting dated August 18, 2016 61,316,424 Full capital decrease due to maturity of the subscription and payment period of the compensation plan 2011, December
21, 2016 (*) (4,789,718)Authorized shares as of December 31, 2016 608,374,525 Autorized shares as of January 1, 2017 608,374,525 There is no movement of authorized shares during the period 2017 — Authorized shares as of December 31, 2017 608,374,525 (*) See Note 34 (a.1)

88
Movement fully paid shares
N° of Shares
Movement value
of shares (1)
ThUS$
Cost of issuance and placement
of shares (2)ThUS$
Paid- in Capital ThUS$
Paid shares as of January 1, 2016 545,547,819 2,552,066 (6,361) 2,545,705 Approved at Extraordinary Shereholders meeting dated August
18, 2016 60,849,592 608,496 — 608,496 Capital reserve — — (4,793) (4,793)Increase (decrease) by transfers and other changes (4) 10,282 156 — 156 Paid shares as of December 31, 2016 606,407,693 3,160,718 (11,154) 3,149,564 Paid shares as of January 1, 2017 606,407,693 3,160,718 (11,154) 3,149,564 Capital reserve — — (3,299) (3,299)Paid shares as of December 31, 2017 606,407,693(3) 3,160,718 (14,453) 3,146,265 (1) Amounts reported represent only those arising from the payment of the shares subscribed. (2) Decrease of capital by capitalization of reserves for cost of issuance and placement of shares established according to Extraordinary Shareholder´sMeetings, where such decreases were authorized. (3) At December 31, 2017, the difference between authorized shares and fully paid shares are 1,966,832 shares, of which 1,500,000 correspond tocompensation plans for executives of LATAM Airlines Group S.A. and subsidiaries (see Note 34(a.2)) and 466,832 correspond to the shares issued andunsubscribed from the capital increase approved at the Extraordinary Shareholders Meeting held on August 18, 2016. (4) These 10,282 shares were placed in January 2014 and charged to the Compensation plan 2011 (See Note 34 (a.1)) (c) Treasury stock At December 31, 2017, the Company held no treasury stock, the remaining of ThUS$ (178) corresponds to the difference between the amount paid for theshares and their book value, at the time of the full right decrease of the shares which held in its portfolio. (d) Reserve of share- based payments Movement of Reserves of share- based payments:
Periods Opening balance
Stock option
plan Deferred
tax
Netmovement
of the period Closing balance
ThUS$ ThUS$ ThUS$ ThUS$ ThUS$ From January 1 to December 31, 2016 35,647 3,698 (807) 2,891 38,538 From January 1 to December 31, 2017 38,538 943 — 943 39,481 These reserves are related to the “Share-based payments” explained in Note 34.

89
(e) Other sundry reserves Movement of Other sundry reserves:
Periods Opening balance
Legal reserves
Closing balance
ThUS$ ThUS$ ThUS$ From January 1 to December 31, 2016 2,634,679 5,602 2,640,281 From January 1 to December 31, 2017 2,640,281 (501) 2,639,780 Balance of Other sundry reserves comprises the following:
As of December 31,
2017
As of December 31,
2016 ThUS$ ThUS$ Higher value for TAM S.A. share exchange (1) 2,665,692 2,665,692 Reserve for the adjustment to the value of fixed assets (2) 2,620 2,620 Transactions with non-controlling interest (3) (25,911) (25,911)Cost of issuance and placement of shares 0 (9)Others (2,621) (2,111)
Total 2,639,780 2,640,281 (1) Corresponds to the difference in the shares value of TAM S.A. acquired (under subscriptions) by Sister Holdco S.A. and Holdco II S.A. (under the
Exchange Offer), as stipulated in the Declaration of Posting of Merger by Absorption and the fair value of these exchange shares of LATAM AirlinesGroup S.A. at June 22, 2012.
(2) Corresponds to the technical revaluation of fixed assets authorized by the Commission for the Financial Market in 1979, in Circular N° 1529. The
revaluation was optional and could be taken only once, the reserve is not distributable and can only be capitalized. (3) The balance at December 31, 2017, correspond to the loss generated by the participation of Lan Pax Group S.A. and Inversiones Lan S.A. in the
acquisition of shares of Aerovías de Integración Regional Aires of ThUS$ (3,480) and ThUS$ (20), respectively; the acquisition of TAM S.A. of theminority holding of Aerolinhas Brasileiras S.A. of ThUS$ (885) and the acquisition of minority interest of Aerolane S.A. by Lan Pax group S.A. throughHoldco Ecuador S.A. for US$ (21,526).

90
(f) Reserves with effect in other comprehensive income. Movement of Reserves with effect in other comprehensive income:
Currency translation
reserve
Cash flow hedging reserve
Actuarial gain or loss ondefined
benefit plans reserve Total
ThUS$ ThUS$ ThUS$ ThUS$ Opening balance as of January 1, 2016 (2,576,041) (90,510) (10,717) (2,677,268)Derivatives valuation gains (losses) — 126,360 — 126,360 Deferred tax — (34,344) — (34,344)Actuarial reserves by employee benefit plans — — (3,104) (3,104)Deferred tax actuarial IAS by employee benefit plans — — 921 921 Difference by subsidiaries conversion 489,486 — — 489,486 Closing balance as of December 31, 2016 (2,086,555) 1,506 (12,900) (2,097,949)Opening balance as of January 1, 2017 (2,086,555) 1,506 (12,900) (2,097,949)Derivatives valuation gains (losses) — 18,436 — 18,436 Deferred tax — (1,802) — (1,802)Actuarial reserves by employee benefit plans — — 2,758 2,758 Deferred tax actuarial IAS by employee benefit plans — — (784) (784)Difference by subsidiaries conversion (45,036) — — (45,036)Closing balance as of December 31, 2017 (2,131,591) 18,140 (10,926) (2,124,377) (f.1) Currency translation reserve These originate from exchange differences arising from the translation of any investment in foreign entities (or Chilean investment with a functional currencydifferent to that of the parent), and from loans and other instruments in foreign currency designated as hedges for such investments. When the investment (allor part) is sold or disposed and loss of control occurs, these reserves are shown in the consolidated statement of income as part of the loss or gain on the saleor disposal. If the sale does not involve loss of control, these reserves are transferred to non-controlling interests. (f.2) Cash flow hedging reserve These originate from the fair value valuation at the end of each period of the outstanding derivative contracts that have been defined as cash flow hedges.When these contracts expire, these reserves should be adjusted and the corresponding results recognized.

91
(f.3) Reserves of actuarial gains or losses on defined benefit plans Correspond to the increase or decrease in the obligation present value for defined benefit plan due to changes in actuarial assumptions, and experienceadjustments, which is the effects of differences between the previous actuarial assumptions and what has actually occurred. (g) Retained earnings Movement of Retained earnings:
Periods Opening balance
Result for the period Dividends
Closing balance
ThUS$ ThUS$ ThUS$ ThUS$ From January 1 to December 31, 2016 317,950 69,220 (20,766) 366,404 From January 1 to December 31, 2017 366,404 155,304 (46,590) 475,118 (h) Dividends per share
Description of dividend
Minimummandatory
dividend2017
Final dividenddividend
2016 Date of dividend 12/31/2017 12-31-2016 Amount of the dividend (ThUS$) 46,590 20,766(*)Number of shares among which the dividend is distributed 606,407,693 606,407,693 Dividend per share (US$) 0.0768 0.0342 (*) In accordance with the Material Fact issued on April 27, 2017, LATAM Airlines Group S.A. shareholders approved the distribution of the final dividendproposed by the board of directors in the Ordinary Session of April 4, 2017, amounting to ThUS $ 20,766, which corresponds to 30% of the profits for theyear corresponding to the year 2016.
The payment was made on May 18, 2017.

92
NOTE 26 - REVENUE The detail of revenues is as follows:
For the periods ended
December 31, 2017 2016 ThUS$ ThUS$ Passengers LAN 4,313,287 4,104,348 Passengers TAM 4,181,190 3,773,367 Cargo 1,119,430 1,110,625
Total 9,613,907 8,988,340 NOTE 27 - COSTS AND EXPENSES BY NATURE (a) Costs and operating expenses The main operating costs and administrative expenses are detailed below:
For the periods ended
December 31, 2017 2016 ThUS$ ThUS$ Aircraft fuel 2,318,816 2,056,643 Other rentals and landing fees 1,172,129 1,077,407 Aircraft rentals 579,551 568,979 Aircraft maintenance 430,825 366,153 Comissions 252,474 269,296 Passenger services 288,662 286,621 Other operating expenses 1,381,546 1,424,595
Total 6,424,003 6,049,694

93
(b) Depreciation and amortization Depreciation and amortization are detailed below:
For the period ended
December 31, 2017 2016 ThUS$ ThUS$ Depreciation (*) 943,215 910,071 Amortization 58,410 50,257
Total 1,001,625 960,328 (*) Include the depreciation of Property, plant and equipment and the maintenance cost of aircraft held under operating leases. The amount of maintenancecost included within the depreciation line item at December 31, 2017 is ThUS$ 359,940 and ThUS$ 345,651 for the same period of 2016. (c) Personnel expenses The costs for personnel expenses are disclosed in Note 23 liability for employee benefits. (d) Financial costs The detail of financial costs is as follows:
For the period ended
December 31, 2017 2016 ThUS$ ThUS$ Bank loan interest 347,551 352,405 Financial leases 37,522 32,573 Other financial instruments 8,213 31,358
Total 393,286 416,336 Costs and expenses by nature presented in this note plus the Employee expenses disclosed in Note 23, are equivalent to the sum of cost of sales, distributioncosts, administrative expenses, other expenses and financing costs presented in the consolidated statement of income by function.

94
NOTE 28 - OTHER INCOME, BY FUNCTION Other income by function is as follows:
For the period ended
December 31, 2017 2016 ThUS$ ThUS$ Coalition and loyalty program Multiplus 240,952 174,197 Tours 109,463 133,575 Aircraft leasing 103,741 65,011 Customs and warehousing 26,793 24,548 Maintenance 6,585 17,090 Duty free 8,038 11,141 Other miscellaneous income 54,317 113,186
Total 549,889 538,748 NOTE 29 - FOREIGN CURRENCY AND EXCHANGE RATE DIFFERENCES The functional currency of LATAM Airlines Group S.A. is the US dollar, also it has subsidiaries whose functional currency is different to the US dollar, suchas the chilean peso, argentine peso, colombian peso, brazilian real and guaraní. The functional currency is defined as the currency of the primary economic environment in which an entity operates and in each entity and all othercurrencies are defined as foreign currency. Considering the above, the balances by currency mentioned in this note correspond to the sum of foreign currency of each of the entities that make LATAMAirlines Group S.A. and Subsidiaries.

95
(a) Foreign currency The foreign currency detail of balances of monetary items in current and non-current assets is as follows:
Current assets As of
December 31, As of
December 31, 2017 2016 ThUS$ ThUS$ Cash and cash equivalents 260,092 201,416
Argentine peso 7,309 4,438 Brazilian real 14,242 9,705 Chilean peso 81,693 30,221 Colombian peso 1,105 1,137 Euro 11,746 1,695 U.S. dollar 108,327 128,694 Other currency 35,670 25,526
Other financial assets, current 36,484 14,573
Argentine peso 21 12 Brazilian real 17 734 Chilean peso 26,605 585 Colombian peso 150 — U.S. dollar 9,343 12,879 Other currency 348 363

96
Current assets As of
December 31, As of
December 31, 2017 2016 ThUS$ ThUS$ Other non - financial assets, current 107,170 107,789
Argentine peso 16,507 16,086 Brazilian real 19,686 20,158 Chilean peso 34,258 1,619 Colombian peso 340 713 Euro 2,722 1,563 U.S. dollar 21,907 50,157 Other currency 11,750 17,493
Trade and other accounts receivable, current 373,447 251,204
Argentine peso 49,680 54,356 Brazilian real 22,006 30,675 Chilean peso 82,369 90,482 Colombian peso 1,169 9,720 Euro 48,286 21,923 U.S. dollar 34,268 14,086 Other currency 135,669 29,962
Accounts receivable from related entities, current 958 554
Chilean peso 735 554 U.S. dollar 223 —
Tax current assets 33,575 28,198
Argentine peso 1,679 1,798 Brazilian real 3,934 2,462 Chilean peso 3,317 6,333 Colombian peso 660 1,418 Euro 179 273 U.S. dollar 327 177 Peruvian sol 21,948 14,387 Other currency 1,531 1,350
Total current assets 811,726 603,734
Argentine peso 75,196 76,690 Brazilian real 59,885 63,734 Chilean peso 228,977 129,794 Colombian peso 3,424 12,988 Euro 62,933 25,454 U.S. Dollar 174,395 205,993 Other currency 206,916 89,081

97
Non-current assets
As of December 31,
2017
As of December 31,
2016 ThUS$ ThUS$ Other financial assets, non-current 20,975 26,772
Brazilian real 3,831 2,769 Chilean peso 74 83 Colombian peso 281 285 Euro 7,853 6,966 U.S. dollar 7,273 14,920 Other currency 1,663 1,749
Other non - financial assets, non-current 9,108 19,069
Argentine peso 172 142 Brazilian real 6,368 6,029 U.S. dollar 38 8,309 Other currency 2,530 4,589
Accounts receivable, non-current 6,887 7,356
Chilean peso 6,887 7,356
Deferred tax assets 2,081 2,110 Colombian peso 86 117 Other currency 1,995 1,993
Total non-current assets 39,051 55,307
Argentine peso 172 142 Brazilian real 10,199 8,798 Chilean peso 6,961 7,439 Colombian peso 367 402 Euro 7,853 6,966 U.S. dollar 7,311 23,229 Other currency 6,188 8,331

98
The foreign currency detail of balances of monetary items in current liabilities and non-current is as follows: Up to 90 days 91 days to 1 year
Current liabilities
As ofDecember 31,
2017
As ofDecember 31,
2016
As ofDecember 31,
2017
As ofDecember 31,
2016 ThUS$ ThUS$ ThUS$ ThUS$ Other financial liabilities, current 36,000 287,175 115,182 455,086
Chilean peso 21,542 55,962 79,032 108,010 U.S. dollar 14,458 231,213 36,150 347,076
Trade and other accounts
payables, current 919,373 585,149 33,707 16,097 Argentine peso 122,452 20,838 8,636 907 Brazilian real 28,810 40,740 669 27 Chilean peso 233,202 60,701 11,311 12,255 Colombian peso 2,964 9,049 855 578 Euro 58,081 23,445 9,165 5 U.S. dollar 409,380 374,431 1,154 962 Peruvian sol 39,064 33,701 825 1,093 Mexican peso 2,732 1,535 115 — Pound sterling 5,839 1,769 199 246 Uruguayan peso 1,890 6,899 — — Other currency 14,959 12,041 778 24
Accounts payable to related entities, current 760 220 — —
Chilean peso 546 23 — — U.S. dollar 4 8 — — Other currency 210 189 — —
Other provisions, current 959 511 — — Chilean peso 30 28 — — Other currency 929 483 — —
Tax liabilities, current — (204) 174 2,501
Argentine peso — — 174 2,501 Brazilian real — (3) — — Chilean peso — (25) — — Other currency — (176) — —

99
Up to 90 days 91 days to 1 year
Current liabilities
As ofDecember 31,
2017
As ofDecember 31,
2016
As ofDecember 31,
2017
As ofDecember 31,
2016 ThUS$ ThUS$ ThUS$ ThUS$
Other non-financial
liabilities, current 25,190 33,439 — — Argentine peso 393 13,463 — — Brazilian real 542 430 — — Chilean peso 11,283 14,999 — — Colombian peso 837 578 — — Euro 5,954 168 — — U.S. dollar 3,160 684 — — Other currency 3,021 3,117 — —
Total current liabilities 982,282 906,290 149,063 473,684
Argentine peso 122,845 34,301 8,810 3,408 Brazilian real 29,352 41,167 669 27 Chilean peso 266,603 131,688 90,343 120,265 Colombian peso 3,801 9,627 855 578 Euro 64,035 23,613 9,165 5 U.S. dollar 427,002 606,336 37,304 348,038 Other currency 68,644 59,558 1,917 1,363

100
More than 1 to 3 years More than 3 to 5 years More than 5 years
Non-current liabilities
As ofDecember 31,
2017
As ofDecember 31,
2016
As ofDecember 31,
2017
As ofDecember 31,
2016
As ofDecember 31,
2017
As ofDecember 31,
2016 ThUS$ ThUS$ ThUS$ ThUS$ ThUS$ ThUS$
Other financial liabilities, non-
current 276,436 178,793 263,798 747,218 189,500 41,785 Chilean peso 41,548 59,177 189,500 16,189 189,500 — U.S. dollar 234,888 119,616 74,298 731,029 — 41,785
Accounts payable, non-current 362,964 195,629 — — — —
Chilean peso 13,251 10,474 — — — — U.S. dollar 348,329 183,904 — — — — Other currency 1,384 1,251 — — — —
Other provisions, non-current 41,514 39,513 — — — —
Argentine peso 940 635 — — — — Brazillian real 24,074 23,541 — — — — Chilean peso — 38 — — — — Colombian peso 551 569 — — — — Euro 9,883 8,664 — — — — U.S. dollar 6,066 6,066 — — — —
Provisions for employees benefits,
non-current 77,579 68,774 — — — — Brazilian real — 28 — — — — Chilean peso 73,399 68,380 — — — — U.S. dollar 4,180 366 — — — —
Other non-financial liabilities,
non-current — 3 — — — — Colombian peso — 3 — — — —
Total non-current liabilities 758,493 482,712 263,798 747,218 189,500 41,785 Argentine peso 940 635 — — — — Brazilian real 24,074 23,569 — — — — Chilean peso 128,198 138,069 189,500 16,189 189,500 — Colombian peso 551 572 — — — — Euro 9,883 8,664 — — — — U.S. dollar 593,463 309,952 74,298 731,029 — 41,785 Other currency 1,384 1,251 — — — —

101
General summary of foreign currency:
As of December 31,
2017
As of December 31,
2016 ThUS$ ThUS$
Total assets 850,777 659,041
Argentine peso 75,368 76,832 Brazilian real 70,084 72,532 Chilean peso 235,938 137,233 Colombian peso 3,791 13,390 Euro 70,786 32,420 U.S. dollar 181,706 229,222 Other currency 213,104 97,412
Total liabilities 2,343,136 2,651,689 Argentine peso 132,595 38,344 Brazilian real 54,095 64,763 Chilean peso 864,144 406,211 Colombian peso 5,207 10,777 Euro 83,083 32,282 U.S. dollar 1,132,067 2,037,140 Other currency 71,945 62,172
Net position Argentine peso (57,227) 38,488 Brazilian real 15,989 7,769 Chilean peso (628,206) (268,978)Colombian peso (1,416) 2,613 Euro (12,297) 138 U.S. dollar (950,361) (1,807,918)Other currency 141,159 35,240

102
(b) Exchange differences Exchange differences recognized in income, except for financial instruments measured at fair value through profit or loss, for the period ended December 31,2017, 2016 and 2015, generated a charge of ThUS $ 18,718, a credit of ThUS $ 121,651 and a charge of ThUS $ 467,896, respectively. Exchange differences recognized in equity as reserves for exchange differences for conversion, for the period ended December 31, 2017, 2016 and 2015,generated a charge of ThUS $ 47,495, a credit of ThUS $ 494,362 and a charge of ThUS $1, 409,439, respectively. The following shows the current exchange rates for the U.S. dollar, on the dates indicated: As of December 31, 2017 2016 2015 2014 Argentine peso 18.57 15.84 12.97 8.55 Brazilian real 3.31 3.25 3.98 2.66 Chilean peso 614.75 669.47 710.16 606.75 Colombian peso 2,984.77 3,000.25 3,183.00 2,389.50 Euro 0.83 0.95 0.92 0.82 Strong bolivar 3,345.00 673.76 198.70 12.00 Australian dollar 1.28 1.38 1.37 1.22 Boliviano 6.86 6.86 6.85 6.86 Mexican peso 19.66 20.63 17.34 14.74 New Zealand dollar 1.41 1.44 1.46 1.28 Peruvian Sol 3.24 3.35 3.41 2.99 Uruguayan peso 28.74 29.28 29.88 24.25

103
NOTE 30 - EARNINGS / (LOSS) PER SHARE
For the period ended
December 31, Basic earnings / (loss) per share 2017 2016 Earnings / (loss) attributable to owners of the
parent (ThUS$) 155,304 69,220 Weighted average number of shares, basic 606,407,693 546,559,599 Basic earnings / (loss) per share (US$) 0.25610 0.12665
For the period ended
December 31, Diluted earnings / (loss) per share 2017 2016 Earnings / (loss) attributable to owners of the
parent (ThUS$) 155,304 69,220 Weighted average number of shares, basic 606,407,693 546,559,599(*)Weighted average number of shares, diluted 606,407,693 546,559,599 Diluted earnings / (loss) per share (US$) 0.25610 0.12665 (*) In the calculation of diluted earnings per share have not been considered the compensation plan disclosed in Note 34 (a.1), because the average marketprice is lower than the price of options.

104
NOTE 31 – CONTINGENCIES
I. Lawsuits 1) Lawsuits filed by LATAM Airlines Group S.A. and Subsidiaries
Company
Court
Case Number
Origin
Stage of trial Amounts
Committed (*) ThUS$ AtlanticAviationInvestments LLC (AAI).
Supreme Court of theState of New YorkCounty of New York.
07-6022920 Atlantic Aviation InvestmentsLLC. (“AAI”), an indirectsubsidiary LATAM AirlinesGroup S.A., incorporated underthe laws of the State ofDelaware, sued in August 29th
, 2007 Varig Logistics S.A.(“Variglog”) for non-paymentof four documented loans incredit agreements governed byNew York law. These contractsestablish the acceleration of theloans in the event of sale of theoriginal debtor, VRG LinhasAéreas S.A.
The decision ordering Variglog to payprincipal, interest and costs to AAI is in theenforcement stage in Switzerland. A settlementfor CHF 24,541,781.45 was reached in Brazilfor the Swiss funds, and it was agreed that itwould be divided as follows: (i) 54.6% ofVariglog’s assets for the Swiss funds; and (ii)45.4% to AAI, subject to approval of theBrazilian Bankruptcy Commission. Variglogalso filed a petition in Switzerland forrecognition of the decision declaring itscondition of being in judicial recovery, andsubsequently, of being declared in bankruptcy.The Brazilian courts approved the AAIsettlement and Variglog’s bankruptcy on April11, 2016, which were confirmed by thosecourts on September 21, 2016. The finaldecision approving the agreement was certifiedSeptember 23, 2016. US$8.9 million have beenrecovered thus far to date, leaving a balance ofUS$2.08 million pending. Variglog fundsremain under embargo by AAII in Switzerland.
10,976
Plus interests
and costs

105
2) Lawsuits received by LATAM Airlines Group S.A. and Subsidiaries
Company
Court
Case Number
Origin
Stage of trial Amounts
Committed (*) ThUS$ LATAMAirlines GroupS.A. y LanCargo S.A.
European Commission. - Investigation of allegedinfringements to freecompetition of cargo airlines,especially fuel surcharge. OnDecember 26th , 2007, theGeneral Directorate forCompetition of the EuropeanCommission notified LanCargo S.A. and LATAMAirlines Group S.A. theinstruction process againsttwenty five cargo airlines,including Lan Cargo S.A., foralleged breaches ofcompetition in the air cargomarket in Europe, especiallythe alleged fixed fuel surchargeand freight.
On April 14th, 2008, the notification of theEuropean Commission was replied. The appealwas filed on January 24, 2011. On May 11, 2015, we attended a hearing atwhich we petitioned for the vacation of theDecision based on discrepancies in theDecision between the operating section, whichmentions four infringements (depending on theroutes involved) but refers to Lan in only oneof those four routes; and the ruling section(which mentions one single conjointinfraction). On November 9th, 2010, the GeneralDirectorate for Competition of the EuropeanCommission notified Lan Cargo S.A. andLATAM Airlines Group S.A. the imposition ofa fine in the amount of THUS$ 9,823.135(8.220.000 Euros)This fine is being appealed by Lan Cargo S.A.and LATAM Airlines Group S.A. OnDecember 16, 2015, the European Court ofJustice revoked the Commission’s decisionbecause of discrepancies. The EuropeanCommission did not appeal the decision, butpresented a new one on March 17, 2017reiterating the imposition of the same fine onthe eleven original airlines. The fine totals776,465,000 Euros. It imposed the same fineas before on Lan Cargo and its parent, LATAMAirlines Group S.A., totaling 8.2 millionEuros. On May 31, 2017 Lan Cargo S.A. andLATAM Airlines Group S.A. filed a petitionwith the General Court of the European Unionseeking vacation of this decision. We presentedour defense in December 2017.
9,823

106
Company
Court Case Number
Origin
Stage of trial Amounts
Committed (*) ThUS$ Lan CargoS.A. y LATAMAirlines GroupS.A.
In the High Court ofJustice ChanceryDivisión (England)Ovre RomerikeDistrict Court(Norway) y DirectieJuridische ZakenAfdeling Ceveil Recht(Netherlands) ,Cologne RegionalCourt (LandgerichKöln Germany).
- Lawsuits filed againstEuropean airlines by users offreight services in privatelawsuits as a result of theinvestigation into allegedbreaches of competition ofcargo airlines, especially fuelsurcharge. Lan Cargo S.A. andLATAM Airlines Group S.A.,have been sued in courtproceedings directly and/or inthird party, based in England,Norway, the Netherlands andGermany.
Cases are in the uncovering evidence stage. -0-
AerolinhasBrasileirasS.A.
Federal Justice. 0008285-53.2015.403.6105
An action seeking to quash adecision and petioning forearly protection in order toobgain a revocation of thepenalty imposed by theBrazilian CompetitionAuthority (CADE) in theinvestigation of cargo airlinesalleged fair trade violations, inparticular the fuel surcharge.
This action was filed by presenting a guaranty– policy – in order to suspend the effects ofthe CADE’s decision regarding the paymentof the following fines: (i) ABSA:ThUS$10,438; (ii) Norberto Jochmann:ThUS$201; (iii) Hernan Merino: ThUS$ 102;(iv) Felipe Meyer :ThUS$ 102. The actionalso deals with the affirmative obligationrequired by the CADE consisting of the dutyto publish the condemnation in a widelycirculating newspaper. This obligation hadalso been stayed by the court of federal justicein this process. Awaiting CADE’s statement.ABSA began a judicial review in search of anadditional reduction in the fine amount. Atthis time we cannot predict the final amount ofthe fine as the judicial review by the FederalCourt Judge is still pending.
11,828

107
Company
Court
Case Number
Origin
Stage of trial Amounts
Committed (*) ThUS$
AerolinhasBrasileirasS.A.
Federal Justice. 0001872-58.2014.4.03.6105
An annulment action with amotion for preliminaryinjunction was filed on28/02/2014, in order to canceltax debts of PIS, CONFINS,IPI and II, connected with theadministrative process10831.005704/2006.43.
We have been waiting since August 21, 2015for a statement by Serasa on TAM’s letter ofindemnity and a statement by the Union. Thestatement was authenticated on January 29,2016. A petition on evidence and replicationswere filed on June 20, 2016. A newinsurance policy was submitted on March 3,2016 with the change to the guaranteerequested by PGFN, which was declared onJune 3, 2016. A decision is pending.
15,811
Tam LinhasAéreas S.A.
Department ofFederal Revenueof Brazil
19515.720476/2015-83
Alleged irregularities in theSAT payments for the periods01/2011 to 12/2012
A judgment by CARF is pending since April12, 2016.
66,258
Tam LinhasAéreas S.A.
Court of the SecondRegion.
2001.51.01.012530-0
Ordinary judicial actionbrought for the purpose ofdeclaring the nonexistence oflegal relationship obligatingthe company to collect the AirFund.
Unfavorable court decision in first instance.Currently expecting the ruling on the appealfiled by the company.In order to suspend chargeability of TaxCredit a Guaranty Deposit to the Court wasdelivered for MUS$106.The court decision requesting that the Expertmake all clarifications requested by theparties in a period of 30 days was publishedon March 29, 2016. The plaintiffs’ submitteda petition on June 21, 2016 requestingacceptance of the opinion of their consultantand an urgent ruling on the dispute. Noamount additional to the deposit that hasalready been made is required if this case islost.
100,240
Tam LinhasAéreas S.A.
Internal RevenueService of Brazil.
10880.725950/2011-05
Compensation credits of theSocial Integration Program(PIS) and Contribution forSocial Security Financing(COFINS) Declared onDCOMPs.
The objection (manifestação deinconformidade) filed by the company wasrejected, which is why the voluntary appealwas filed. The case was assigned to the 1stOrdinary Group of Brazil’s AdministrativeCouncil of Tax Appeals (CARF) on June8, 2015. TAM’s appeal was included in theCARF session held August 25, 2016. Anagreement that converted the proceedingsinto a formal case was published on October7, 2016.
64,383
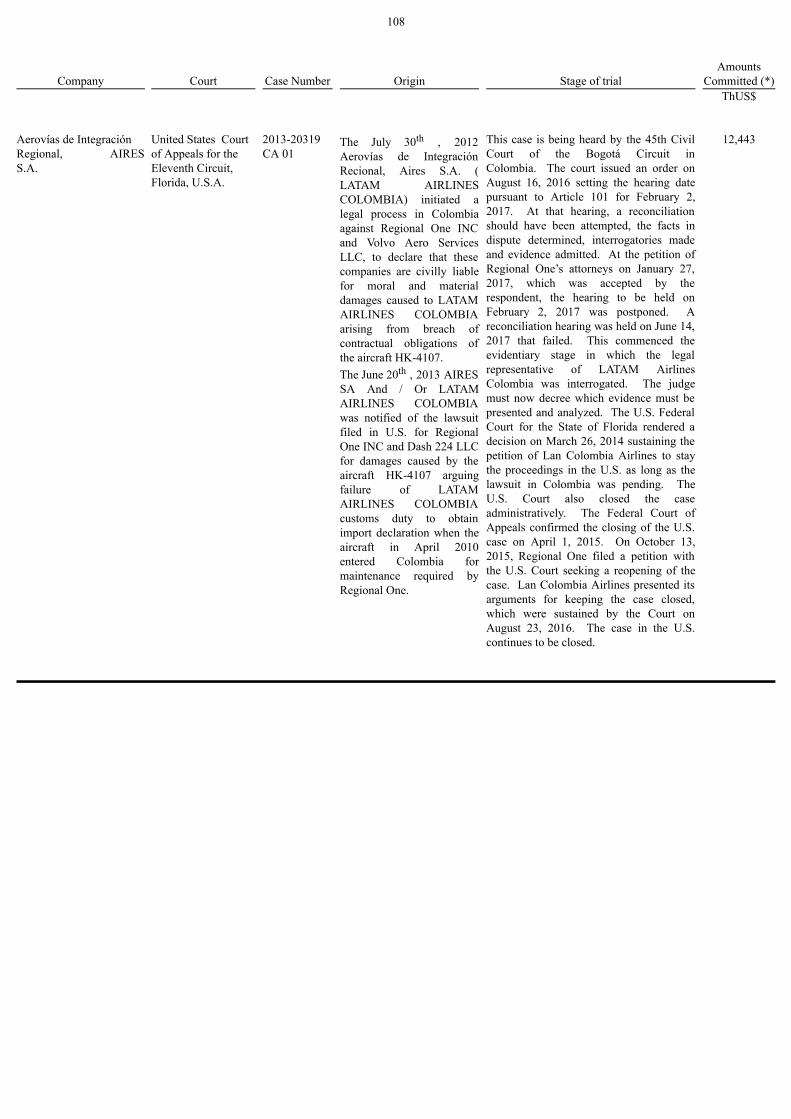
108
Company Court Case Number Origin Stage of trial Amounts
Committed (*) ThUS$ Aerovías de IntegraciónRegional, AIRESS.A.
United States Courtof Appeals for theEleventh Circuit,Florida, U.S.A.
2013-20319CA 01
The July 30th , 2012Aerovías de IntegraciónRecional, Aires S.A. (LATAM AIRLINESCOLOMBIA) initiated alegal process in Colombiaagainst Regional One INCand Volvo Aero ServicesLLC, to declare that thesecompanies are civilly liablefor moral and materialdamages caused to LATAMAIRLINES COLOMBIAarising from breach ofcontractual obligations ofthe aircraft HK-4107.The June 20th , 2013 AIRESSA And / Or LATAMAIRLINES COLOMBIAwas notified of the lawsuitfiled in U.S. for RegionalOne INC and Dash 224 LLCfor damages caused by theaircraft HK-4107 arguingfailure of LATAMAIRLINES COLOMBIAcustoms duty to obtainimport declaration when theaircraft in April 2010entered Colombia formaintenance required byRegional One.
This case is being heard by the 45th CivilCourt of the Bogotá Circuit inColombia. The court issued an order onAugust 16, 2016 setting the hearing datepursuant to Article 101 for February 2,2017. At that hearing, a reconciliationshould have been attempted, the facts indispute determined, interrogatories madeand evidence admitted. At the petition ofRegional One’s attorneys on January 27,2017, which was accepted by therespondent, the hearing to be held onFebruary 2, 2017 was postponed. Areconciliation hearing was held on June 14,2017 that failed. This commenced theevidentiary stage in which the legalrepresentative of LATAM AirlinesColombia was interrogated. The judgemust now decree which evidence must bepresented and analyzed. The U.S. FederalCourt for the State of Florida rendered adecision on March 26, 2014 sustaining thepetition of Lan Colombia Airlines to staythe proceedings in the U.S. as long as thelawsuit in Colombia was pending. TheU.S. Court also closed the caseadministratively. The Federal Court ofAppeals confirmed the closing of the U.S.case on April 1, 2015. On October 13,2015, Regional One filed a petition withthe U.S. Court seeking a reopening of thecase. Lan Colombia Airlines presented itsarguments for keeping the case closed,which were sustained by the Court onAugust 23, 2016. The case in the U.S.continues to be closed.
12,443

109
Company
Court
Case Number
Origin
Stage of trial Amounts
Committed (*) ThUS$
Tam LinhasAéreas S.A.
Internal RevenueService of Brazil
10880.722.355/2014-52
On August 19th, 2014 theFederal Tax Service issued anotice of violation stating thatcompensation credits Program(PIS) and the Contribution forthe Financing of SocialSecurity COFINS by TAMare not directly related to theactivity of air transport.
An administrative objection was filed onSeptember 17th, 2014. A first-instance rulingwas rendered on June 1, 2016 that waspartially favorable. The separate fine wasrevoked. A voluntary appeal was filed onJune 30, 2016, which is pending a decisionby CARF. On January 9, 2016, the case wasreferred to the Second Division, FourthChamber, of the Third Section of theAdministrative Council of Tax Appeals(CARF).
73,890
Tam ViagensS.A.
Department ofFinance to themunicipality of SãoPaulo.
67.168.795 /67.168.833 /67.168.884 /67.168.906 /67.168.914 /67.168.965
A claim was filed alleginginfraction and seeking a finebecause of a deficient basisfor calculation of the servicetax (ISS) because thecompany supposedly madeincorrect deductions.
We received notice of the petition onDecember 22, 2015. The objection was filedon January 19, 2016. The company wasnotified on November 23, 2016 of thedecision that partially sustained the interiminfringement ruling. An ordinary appeal wasfiled on December 19, 2016 before theMunicipal Tax Council of Sao Paulo and ajudgment is pending.
108,396
Tam LinhasAéreas S.A.
Labor Court of SãoPaulo.
0001734-78.2014.5.02.0045
Action filed by the Ministryof Labor, which requirescompliance with legislationon breaks, extra hours andothers.
This case is in the initial stages. It couldpossibly impact both operations andemployee work shift control. TAM won inthe first instance, but the Prosecutor’s Officehas appealed the trial court’s decision. Thatdecision was sustained by the appellatecourt. A petition by the Prosecutor’s Officefor clarification is now pending before thecourts. The Office of the Public Prosecutorwithdrew the petition for clarification andthe case was closed in favor ofLATAM. Now pending are the measurespertaining to lawsuit management so thattransfer to the court is declared.
16,170

110
Company
Court
Case Number
Origin
Stage of trial
AmountsCommitted (*)
ThUS$ TAM S.A. Conselho
Administrativo deRecursos Fiscais.
13855.720077/2014-02
Notice of an allegedinfringement presented bySecretaria da Receita Federaldo Brasil requiring thepayment of IRPJ and CSLL,taxes related to the incomeearned by TAM on March,2011, in relation of thereduction of the statute capitalof Multiplus S.A.
On January 12, 2014, it was filed an appealagainst the object of the notice ofinfringement. Currently, the company iswaiting for the court judgment regarding theappeal filed in the Conselho Administrativode Recursos Fiscais (CARF) The case will beput into the system again for re-assignmentfor hearing and reporting because of thedeparture of Eduardo de Andrade, a CARFcouncil member. The decision was againstTAM. The lawsuit was on August 13,2017. The administrative court’s decisionwas that TAM Linhas Aereas must payCorporate Income Tax (IRPJ) and the SocialContribution based on Net Profits(CSLL). The Company was summoned tohear a decision on December 18, 2017. TAMfiled an appeal on December 28, 2017 andmust now await the appellate decision.
149,031
TAM LinhasAéreas S.A.
Sao Paulo LaborCourt, Sao Paulo
1001531-73.2016.5.02.0710
The Ministry of Labor filedan action seeking that thecompany adapt theergonomics and comfort ofseats.
In August 2016, the Ministry of Labor filed anew lawsuit before the competent LaborCourt in Sao Paulo, in the same terms as case0000009-45.2016.5.02.090, as previouslyreported. The judgment is pending.(16/02/2018).
17,230

111
Company
Court
Case Number
Origin
Stage of trial Amounts
Committed (*) ThUS$ LATAMAirlinesGroup S.A.
22° Civil Court ofSantiago
C-29.945-2016
The Company received noticeof a civil liability claim byInversiones Ranco Tres S.A.on January 18, 2017. It isrepresented by Mr. JorgeEnrique Said Yarur. It wasfiled against LATAM AirlinesGroup S.A. for an allegedcontractual default by theCompany and against RamonEblen Kadiz, Jorge AwadMehech, Juan Jose CuetoPlaza, Enrique Cueto Plazaand Ignacio Cueto Plaza,directors and officers, foralleged breaches of theirduties. In the case of Juan JoseCueto Plaza, Enrique CuetoPlaza and Ignacio CuetoPlaza, it alleges a breach, ascontrollers of the Company, oftheir duties under theincorporation agreement.LATAM has retained legalcounsel specializing in thisarea to defend it.
The claim was answered on March 22, 2017and the plaintiff filed its replication on April4, 2017. LATAM filed its rejoinder on April13, 2017, which concluded the argumentstage of the lawsuit. A reconciliation hearingwas held on May 2, 2017, but the parties didnot reach an agreement. The Court issued theevidentiary decree on May 12, 2017. Wefiled a petition for reconsideration becausewe disagreed with certain points of evidence.That petition was partially sustained by theCourt on June 27, 2017. The evidentiarystage commenced and then concluded onJuly 20, 2017. Observations to the evidencemust now be presented. That period expiresAugust 1, 2017. We filed our observations tothe evidence on August 1, 2017. We wereserved the decision on December 13, 2017that dismissed the claim since LATAM wasin no way liable. The plaintiff filed an appealon December 26, 2017. Now pending is theadmission of the appeal by the Court ofAppeals.
21,547
TAM LinhasAéreas S.A.
10th Jurisdiction ofFederal Tax Enforcement of SaoPaulo
0020869-47.2017.4.03.6182
Tax Enforcement Lien No.0061196-68.2016.4.03.6182on Profit-Based SocialContributions from 2004 to2007.
This tax enforcement was referred to the10th Federal Jurisdiction on February 16,2017. A petition reporting our request tosubmit collateral was recorded on April 18,2017. At this time, the period is pending forthe plaintiff to respond to our petition.
42,548
TAM LinhasAéreas S.A.
Federal RevenueBureau
10880.900360/2017-55
A claim regarding thenegative Company IncomeTax (IRPJ) balance.Appraisals of compensationthat were not accepted.
The case was referred to the National ClaimsManagement Center of the Federal RevenueBureau for Sao Paulo on May 11, 2017.
15,910

112
Company
Court
Case Number
Origin
Stage of trial Amounts
Committed (*) ThUS$ TAM LinhasAéreas S.A.
Internal RevenueService of Brazil
16643.000085/2009-47
Notice of claim to recoverincome taxes and socialcontributions paid on the basisof net profits (SCL) accordingto the royalty expenses anduse of the TAM trademark.
Before the Internal Revenue Service ofBrazil. A service of process is expected inthe lawsuit on admissibility of the specialappeal, filed by the General Counsel of theNational Treasury, as well as notification ofthe decision rendered by the AdministrativeCouncil of Tax Appeals (CARF). Thedecision was made to file a lawsuit onDecember 5, 2017.
17,657
TAM LinhasAéreas S.A.
Internal RevenueService of Brazil
10831.012344/2005-55
Notice of an infringement filedby the Company to request theimport tax (II), the SocialIntegration Program (PIS) ofthe Social Security FundingContribution (COFINS) as aresult of an unidentifiedinternational cargo loss.
Before the Internal Revenue Service ofBrazil. The administrative decision wasagainst the company. The matter is pending adecision by the CARF.
17,844
TAM LinhasAéreas S.A.
Treasury Departmentof the State of SaoPaulo
3.123.785-0
Notice of an infringement todemand payment of the tax onthe circulation of merchandiseand services (ICMS)assessable on aircraft imports.
Before the Treasury Department of the Stateof Sao Paulo. A decision is now pending onthe appeal that the company has filed withthe Federal Supreme Court (STF).
14,647
TAM LinhasAéreas S.A.
Treasury Departmentof the State of SaoPaulo
4.037.054
Action brought by theTreasury Department of theState of Sao Paulo because ofnon-payment of the tax on thecirculation of merchandise andservices (ICMS) in relation totelecommunications services.
Before the Treasury Department of the Stateof Sao Paulo. Defensive arguments havebeen presented. The first-instance decisionsustained all parts of the notice. We filed anordinary appeal on which a decision ispending by the Sao Paulo Tax Court.
10,808
TAM LinhasAéreas S.A.
DERAT SPO(Delegacía de ReceitaFederal)
13808.005459/2001-45
Collection of the SocialSecurity Funding Contribution(COFINS) based on grossrevenue of the company in theperiod 1999-2000
The decision on collection was pendingthrough June 2, 2010.
27,226

113
Company
Court
Case Number
Origin
Stage of trial Amounts
Committed (*) ThUS$ PantanalLinhas AéreasS.A.
Tax EnforcementCourt
0253410-30.2012.8.26.0014
A lawsuit seekingenforcement of the fine andICMS.
A decision is pending on the appeal. 10,877
TAM LinhasAéreas S.A
Federal RevenueBureau
10880.938.664/2016-12
An administrative lawsuitabout compensation not beingproportional to the negativecorporate income tax balance.
A decision is pending by CARF on theappeal.
27,369
TAM LinhasAéreas S.A.
Vara das execucõesfiscais.
1997.0002503-9 This is a tax collection claimfor a customs fine—forfeitureof the temporary customsclearance of goods (newlawsuit).
Collateral insurance was offered in 2016 andaccepted by the Ministry of Finance in apetition made November 9, 2016. Thedefensive arguments were presented(attachments against the tax collection) andthe decision was favorable to TAM, whichmakes the payment of a fine more unlikelyfor TAM. Now pending in the lawsuit is adecision in the appeal made by the Ministryof Finance.
9,983
TAM LinhasAéreas S.A.
Delegacía de ReceitaFederal
10611.720630/2017-16
This is an administrativeclaim about a fine for theincorrectness of an importdeclaration (new lawsuit).
The administrative defensive argumentswere presented September 28, 2017.
22,253
TAM LinhasAéreas S.A.
Delegacía de ReceitaFederal
10611.720852/2016-58
An improper charge of theContribution for theFinancing of Social Security(COFINS) on an import (newlawsuit).
We are currently awaiting a decision. Thereis no predictable decision date because itdepends on the court of the governmentagency.
16,079
TAM LinhasAéreas S.A
Delegacía de ReceitaFederal
16692.721.933/2017-80
The Internal Revenue Serviceof Brazil issued a notice ofviolation because TAMapplied for credits offsettingthe contributions for theSocial Integration Program(PIS) and the Social SecurityFunding Contribution(COFINS) that do not bear adirect relationship to airtransport (new claim).
We are awaiting the presentation of anadministrative defense.
34.321

114
Company
Court
Case Number
Origin
Stage of trial Amounts
Committed (*) ThUS$ SNEA(SindicatoNacional dasempresasaeroviárias)
União Federal
0012177-54.2016.4.01.3400
A claim against the 72%increase in airport control fees(TAT-ADR) and approachcontrol fees (TAT-APP)charged by the AirspaceControl Department(“DECEA”).
A decision is now pending on the appealpresented by SNEA.
23.118
TAM LinhasAéreas S/A
União Federal
2001.51.01.020420-0
TAM and other airlines filed arecourse claim seeking afinding that there is no legal ortax basis to be released fromcollecting the AdditionalAirport Fee (“ATAERO”).
A decision by the superior court is pending.The amount is indeterminate because eventhough TAM is the plaintiff, if the ruling isagainst it, it could be ordered by the trialjudge to pay certain fees.
-0-
- In order to deal with any financial obligations arising from legal proceedings in effect at December 31, 2017, whether civil, tax, or labor, LATAM
Airlines Group S.A. and Subsidiaries, has made provisions, which are included in Other non-current provisions that are disclosed in Note 21.
- The Company has not disclosed the individual probability of success for each contingency in order to not negatively affect its outcome.
(*) The Company has reported the amounts involved only for the lawsuits for which a reliable estimation can be made of the financial impacts and of thepossibility of any recovery, pursuant to Paragraph 86 of IAS 37 Provisions, Contingent Liabilities and Contingent Assets.

115
II. Governmental Investigations. 1) On July 25, 2016, LATAM reached agreements with the U.S. Department of Justice (“DOJ”) and the U.S. Securities and Exchange Commission
(“SEC”) regarding the investigation of payments for US$1,150,000 by Lan Airlines S.A. in 2006-2007 to a consultant advising it in the resolution oflabor matters in Argentina.
The purpose of the investigation was to determine whether these payments violated the U.S. Foreign Corrupt Practices Act (“FCPA”) that: (i) forbidsbribery of foreign government authorities in order to obtain a commercial advantage; and (ii) requires the companies that must abide by the FCPA tokeep appropriate accounting records and implant an adequate internal control system. The FCPA is applicable to LATAM because of its ADR programin effect on the U.S. securities market. After an exhaustive investigation, the DOJ and SEC concluded that there was no violation of the bribery provisions of the FCPA, which is consistentwith the results of LATAM’s internal investigation. However, the DOJ and SEC consider that LAN accounted for these payments incorrectly and,consequently, infringed the part of the FCPA requiring companies to keep accurate accounting records. These authorities also consider that LAN’sinternal controls in 2006-2007 were weak, so LAN would have also violated the provisions in the FCPA requiring it to maintain an adequate internalcontrol system. The agreements signed, included the following:
a) The agreement with the DOJ involves: (i) entering into a Deferred Prosecution Agreement (“DPA”), which is a public contract under which the DOJfiles public charges alleging an infringement of the FCPA accounting regulations. LATAM is not obligated to answer these charges, the DOJ will notpursue them for a period of 3 years, and the DOJ will dismiss the charges after expiration of that 3-year period provided LATAM complies with allterms of the DPA. In exchange, LATAM must admit to the negotiated events described in the DPA and agree to pay the negotiated fine explainedbelow and abide by other terms stipulated in the agreement; (ii) clauses in which LATAM admits that the payments to the consultant in Argentina wereincorrectly accounted for and that at the time those payments were made (2006-2007), it did not have adequate internal controls in place; (iii)LATAM’s agreement to have an outside consultant monitor, evaluate and report to the DOJ on the effectiveness of LATAM’s compliance program fora period of 27 months; and LATAM’s agreement to continue evaluating and reporting directly to the DOJ on the effectiveness of its complianceprogram for a period of 9 months after the consultant’s work concludes; and (iv) LATAM paid a fine of ThUS$ 12,750.
b) The agreement with the SEC involves: (i) accepting a Cease and Desist Order, which is an administrative resolution of the SEC closing the
investigation, in which LATAM will accept certain obligations and statements of fact that are described in the document; (ii) accepting the sameobligations regarding the consultant mentioned above; and (iii) LATAM paid a fine of KUS$6,744 and interest of ThUS$ 2,694.
Nothing is owed to the SEC at this time as ThUS$ 4,719 was paid in July 2017.

116
LATAM continued to cooperate with the Chilean authorities on this matter. The investigation continues. The 7th Criminal Court set the hearing datefor October 24, 2017, at the request of the Office of the Public Prosecutor. The Prosecutor has petitioned that the investigation be closed.
2) LATAM received six Requests for Information from the Central-North Metropolitan Region Legal Division, on October 25, 2016, on November 11,2016, on March 8, 2017, on March 22, 2017, on July 7, 2017 and the last on August 28, 2017. It requested information related to the investigation ofpayments made by LAN Airlines in 2006 and 2007 to a consultant who advised it on the resolution of labor matters in Argentina. It also requested anexplanation of information provided to the market. The five requests have already been answered and the requested information has been provided.The 7th Criminal Court set the hearing date for October 24, 2017 at the request of the Public Prosecutor. A reopening of the investigation was deniedat that hearing and that denial was confirmed by the Santiago Court of Appeals on November 20, 2017.
3) The ecuatorian airline affiliate, LATAM Airlines Ecuador was given notice on August 26, 2016 of an investigation of LATAM Airlines Ecuador and
two other airlines begun, at its own initiative, by one of the Investigative Departments of the Ecuadoran Market Power Control Commission, limited toalleged signs of conscious parallelism in relation to specific fares on one domestic route in Ecuador from August 2012 to February 2013. TheInvestigative Prefecture has 180 days (through February 21, 2017) to issue a report on whether to quash the investigation or file charges against two ormore of the parties involved. That period can be extended for another 180 days. A proceeding would begin only if the decision is made to file charges.The Commission extended the term of the investigation for another 180 days (through August 18, 2017) LATAM Airlines Ecuador is cooperating withthe authority and has retained a law firm and economist expert in the subject to advise the company during this process and any additional informationrequested will be furnished. We received notice on August 23, 2017 that the Market Regulatory Commission decided to quash the investigation againstAEROLANE LÍNEAS AÉREAS NACIONALES DEL ECUADOR S.A. and two other airlines because there was insufficient information to chargethem. This decision is final.
NOTE 32 – COMMITMENTS (a) Loan covenants With respect to various loans signed by the Company for the financing of Boeing 767, 767F, 777F and 787 aircraft, which carry the guarantee of the UnitedStates Export–Import Bank, limits have been set on some of the Company’s financial indicators on a consolidated basis, for which, in any case non-compliance does not generate acceleration of the loans. Moreover, and related to these same contracts, restrictions are also in place on the Company’s management in terms of its ownership, in relation to theownership structure and the controlling group, and disposal of the assets which mainly refers to important transfers of assets. The Company and its subsidiaries do not maintain financial credit contracts with banks in Chile that indicate some limits on financial indicators of theCompany or its subsidiaries.

117
The Revolving Credit Facility (“Revolving Credit Facility”) with guaranteed aircraft, engines, spare parts and supplies for a total amount of US $ 450 millionincludes restrictions of minimum liquidity measured at the level of the Consolidated Company and measured at the individual level for the companiesLATAM Airlines Group S.A. and TAM Linhas Aéreas S.A. which remain stand by while the credit line is not used. This credit line established with aconsortium of eleven banks led by Citibank, is not used as of December 31, 2017. As of December 31, 2017, the Company is in compliance with all the indicators detailed above. (b) Commitments under operating leases as lessee Details of the main operating leases are as follows: As of As of December 31, December 31,Lessor Aircraft 2017 2016ACS Aero 1 Alpha limited Airbus A320 1 —Aircraft 76B-26329 Inc. Boeing 767 1 1Aircraft 76B-27615 Inc. Boeing 767 — 1Aircraft 76B-28206 Inc. Boeing 767 1 1Aviación Centaurus, A.I.E. Airbus A319 3 3Aviación Centaurus, A.I.E. Airbus A321 1 1Aviación Real A.I.E. Airbus A319 1 1Aviación Real A.I.E. Airbus A320 1 1Aviación Tritón A.I.E. Airbus A319 3 3Avolon Aerospace AOE 19 Limited Airbus A320 — 1Avolon Aerospace AOE 20 Limited Airbus A320 — 1Avolon Aerospace AOE 6 Limited Airbus A320 — 1Avolon Aerospace AOE 62 Limited Boeing 777 1 1Avolon Aerospace AOE 100 Limited Airbus A320 2 —AWAS 5234 T rust Airbus A320 1 1Baker & Spice Aviation Limited Airbus A320 1 1Bank of America Airbus A321 2 2Bank of Utah Boeing 787 2 —CIT Aerospace International Airbus A320 1 2ECAF I 1215 DAC Airbus A320 — 1ECAF I 2838 DAC Airbus A320 1 1ECAF I 40589 DAC Boeing 777 1 1Eden Irish Aircr Leasing MSN 1459 Airbus A320 1 1GECAS Sverige Aircraft Leasing Worldwide AB Airbus A320 — 1GFL Aircraft Leasing Netherlands B.V. Airbus A320 — 1IC Airlease One Limited Airbus A321 1 1JSA Aircraft 38484, LLC Boeing 787 1 1JSA Aircraft 7126, LLC Airbus A320 1 1JSA Aircraft 7128, LLC Airbus A321 1 1JSA Aircraft 7239, LLC Airbus A321 1 1JSA Aircraft 7298, LLC Airbus A321 1 1Macquarie Aerospace Finance 5125-2 T rust Airbus A320 1 1Macquarie Aerospace Finance 5178 Limited Airbus A320 1 1

118
As of As of December 31, December 31,Lessor Aircraft 2017 2016 Magix Airlease Limited Airbus A320 — 1MASL Sweden (8) AB Airbus A320 — 1Merlin Aviation Leasing (Ireland) 18 Limited Airbus A320 1 1Merlin Aviation Leasing (Ireland) 7 Limited Airbus A320 1 —NBB Cuckoo Co., Ltd Airbus A321 1 1NBB Grosbeak Co., Ltd Airbus A321 1 1NBB Redstart Co. Ltd Airbus A321 1 1NBB-6658 Lease Partnership Airbus A321 1 1NBB-6670 Lease Partnership Airbus A321 1 1Orix Aviation Systems Limited Airbus A320 4 5PAAL Aquila Company Limited Airbus A321 2 2PAAL Gemini Company Limited Airbus A321 1 1SASOF II (J) Aviation Ireland Limited Airbus A319 — 1Shenton Aircraft Leasing Limited Airbus A320 1 1Sky High XXIV Leasing Company Limited Airbus A320 5 5Sky High XXV Leasing Company Limited Airbus A320 2 2SMBC Aviation Capital Limited Airbus A320 4 6SMBC Aviation Capital Limited Airbus A321 2 2TC-CIT Aviation Ireland Limited Airbus A320 — 1Volito Aviation August 2007 AB Airbus A320 2 2Volito Aviation November 2006 AB Airbus A320 2 2Volito November 2006 AB Airbus A320 2 2Wells Fargo Bank North National Association Airbus A319 2 3Wells Fargo Bank North National Association Airbus A320 — 2Wells Fargo Bank Northwest National Association Airbus A320 5 7Wells Fargo Bank Northwest National Association Airbus A350 2 2Wells Fargo Bank Northwest National Association Boeing 767 2 3Wells Fargo Bank Northwest National Association Boeing 777 4 6Wells Fargo Bank Northwest National Association Boeing 787 11 11Wilmington Trust Company Airbus A319 — 1Total 93 111 The rentals are shown in results for the period for which they are incurred. The minimum future lease payments not yet payable are the following: As of As of
December 31, December 31, 2017 2016 ThUS$ ThUS$
No later than one year 462,205 533,319 Between one and five years 1,620,253 1,459,362 Over five years 1,498,064 1,262,509
Total 3,580,522 3,255,190

119
The minimum operating lease payments charged to income are the following: For the period ended December 31, 2017 2016 ThUS$ ThUS$ Minimum operating lease payments 579,551 568,979
Total 579,551 568,979 During 2017 two Airbus A320-200N were added for a period of twelve years each and two Airbus A319-100 aircraft, fifteen Airbus A320 aircraft werereturned. On the other hand, two Boeing 787-9 aircraft were added for a period of twelve year each and one Boeing 767-300ER aircraft and one Boeing 767-300 Freighter aircraft were returned. The operating lease agreements entered into by the Parent Company and its subsidiaries establish that aircraft maintenance must be carried out in accordancewith the technical provisions of the manufacturer and in the margins agreed in the contracts with the lessor, a cost assumed by the lessee. Additionally, foreach aircraft, the lessee must purchase policies that cover the associated risk and the amount of the assets involved. As for the rent payments, these areunrestricted and cannot be netted from other accounts receivable or payable by the lessor and the lessee. At December 31, 2017 the Company has existing letters of credit related to operating leasing as follows:
Value Release Creditor Guarantee Debtor Type ThUS$ date GE Capital Aviation Services
Limited Lan Cargo S.A. One letter of credit 1,100 Nov 30, 2018 ACS Aero 1 Alpha Limited LATAM Airlines Group S.A. One letter of credit 3,255 Aug 31, 2018 Bank of America LATAM Airlines Group S.A. Three letter of credit 1,043 Jul 2, 2018 Bank of Utah LATAM Airlines Group S.A. One letter of credit 2,000 Mar 24, 2019 Engine Lease Finance
Corporation LATAM Airlines Group S.A. One letter of credit 4,750 Oct 8, 2018 GE Capital Aviation Services
Ltd. LATAM Airlines Group S.A. Six letter of credit 22,105 Apr 30, 2018 International Lease Finance
Corp LATAM Airlines Group S.A. Three letter of credit 1,450 Aug 5, 2018 ORIX Aviation Systems
Limited LATAM Airlines Group S.A. Two letter of credit 7,366 Dec 11, 2018 Wells Fargo Bank LATAM Airlines Group S.A. Nine letter of credit 15,160 Mar 2, 2018 CIT Aerospace International Tam Linhas Aéreas S.A. One letter of credit 6,000 Oct 25, 2018 Wells Fargo Bank North N.A. Tam Linhas Aéreas S.A. One letter of credit 5,500 Jul 15, 2018 69,729

120
(c) Other commitments At December 31, 2017 the Company has existing letters of credit, certificates of deposits and warranty insurance policies as follows:
Creditor Guarantee Debtor Type Value ThUS$ Release
date Servicio Nacional de Aduana del Ecuador Líneas Aéreas Nacionales del Ecuador
S.A. Three letter of credit 1,705 Aug 5, 2018Corporación Peruana de Aeropuertos y Aviación
Comercial Lan Perú S.A. Twenty five letter of credit 1,897 Jan 31, 2018Lima Airport Partners S.R.L. Lan Perú S.A. Eighteen letter of credit 996 Apr 30, 2018Superintendencia Nacional de Aduanas y de
Administración Tributaria Lan Perú S.A. Ten letter of credit 80,000 Jan 21, 2018Aena Aeropuertos S.A. LATAM Airlines Group S.A. Four letter of credit 2,809 Nov 15, 2018American Alternative Insurance Corporation LATAM Airlines Group S.A. Six letter of credit 3,690 Apr 5, 2018Comisión Europea LATAM Airlines Group S.A. One letter of credit 9,868 Jun 16, 2018Deutsche Bank A.G. LATAM Airlines Group S.A. One letter of credit 15,000 Mar 31, 2018Dirección General de Aeronáutica Civil LATAM Airlines Group S.A. Fifty three letter of credit 19,759 Feb 28, 2018Empresa Pública de Hidrocarburos del Ecuador EP
Petroecuador LATAM Airlines Group S.A. One letter of credit 5,500 Jun 18, 2018Metropolitan Dade County LATAM Airlines Group S.A. Eight letter of credit 2,273 Mar 13, 20184ª Vara Mista de Bayeux Tam Linhas Aéreas S.A. One insurance policies guarantee 1,044 Mar 25, 2021Conselho Administrativo de Conselhos Federais Tam Linhas Aéreas S.A. One insurance policies guarantee 12,703 May 19, 2020Fundação de Proteão de Defesa do Consumidor Procon Tam Linhas Aéreas S.A. Two insurance policies guarantee 3,926 Apr 1, 2021União Federal Tam Linhas Aéreas S.A. One insurance policies guarantee 6,604 Oct 20, 2021União Federal -Fazenda Nacional Tam Linhas Aéreas S.A. One insurance policies guarantee 41,243 Jul 30, 2020União Federal - Procuradoira - Gral da fazenda
Nacional Tam Linhas Aéreas S.A. Four insurance policies guarantee 50,196 Jan 4, 2020União Federal Vara Comarca de DF Tam Linhas Aéreas S.A. One insurance policies guarantee 1,551 Sep 28, 2021União Federal Vara Comarca de SP Tam Linhas Aéreas S.A. One insurance policies guarantee 19,268 Feb 22, 2021 280,032

121
NOTE 33 - TRANSACTIONS WITH RELATED PARTIES (a) Details of transactions with related parties as follows:
Tax No.
Related party
Nature of
relationship withrelated parties
Countryof origin
Nature of
related partiestransactions
Currency
Transaction amountwith related partiesAs of December 31,
2017 2016 ThUS$ ThUS$ 96.810.370-9 Inversiones Costa Verde Ltda. y CPA. Related director Chile Tickets sales CLP 18 6 65.216.000-K Comunidad Mujer Related director Chile Tickets sales CLP 14 9 Services provided for advertising CLP — (12) 78.591.370-1 Bethia S.A and subsidiaries Related director Chile Services received of cargo transport CLP 1,643 (394)
Services received from National and
International Courier
CLP
(382)
(285) Services provided of cargo transport CLP (17) 192 65.216.000-K Viajes Falabella Ltda. Related director Chile Sales commissions CLP (761) (727) 79.773.440-3 Transportes San Felipe S.A Related director Chile Services received of transfer of passengers CLP — (84) Tickets sales CLP 1 3 87.752.000-5 Granja Marina Tornagaleones S.A. Common shareholder Chile Tickets sales CLP 72 76 Foreign Consultoría Administrativa Profesional
S.A. de C.V.
Associate
Mexico
Professional counseling services received
MXN
(2,357)
(2,563) Foreign Inversora Aeronáutica Argentina Related director Argentina Leases as lessor ARS (251) (264) Foreign TAM Aviação Executiva e Taxi Aéreo S/A Related director Brazil Services provided BRL 45 (120) Services received at airports BRL (39) 7 Foreign Qatar Airways Indirect shareholder Qatar Services provided by aircraft lease US$ 31,707 — Interlineal received service US$ (2,139) — Interlineal provided service US$ 5,279 — Services provided of handling US$ 1,002 — The balances of Accounts receivable and accounts payable to related parties are disclosed in Note 9. Transactions between related parties have been carried out on free-trade conditions between interested and duly-informed parties.

122
(b) Compensation of key management The Company has defined for these purposes that key management personnel are the executives who define the Company’s policies and major guidelines andwho directly affect the results of the business, considering the levels of Vice-Presidents, Chief Executives and Directors (Senior).
For the period ended December 31, 2017 2016 ThUS$ ThUS$
Remuneration 17,826 16,514 M anagement fees 468 556 Non-monetary benefits 740 778 Short-term benefits 36,970 23,459 Share-based payments 13,173 8,085
Total 69,177 49,392
NOTE 34 - SHARE-BASED PAYMENTS (a) Compensation plan for increase of capital Compensation plans implemented by providing options for the subscription and payment of shares that have been granted by LATAM Airlines Group S.A. toemployees of the Company and its subsidiaries, are recognized in the financial statements in accordance with the provisions of IFRS 2 “Share-basedPayment”, showing the effect of the fair value of the options granted under compensation in linear between the date of grant of such options and the date onwhich these irrevocable. (a.1) Compensation plan 2011 On December 21, 2016, the subscription and payment period of the 4,800,000 shares corresponding to the compensation plan approved at the ExtraordinaryShareholders’ Meeting held on December 21, 2011, expired. Of the total shares allocated to the 2011 Compensation Plan, only 10,282 shares were subscribed and paid, having been placed on the market in January 2014.In view of the above, at the expiration date, the 2011 Compensation Plan had a balance of 4,789,718 shares pending of subscription and payment, which wasdeducted from the authorized capital of the Company.
Number of Stock Options In share-based payment arrangements Options Expired Opening waived by Action Closing Periods balance executives Options Balance From January 1 to December 31, 2016 4,518,000 (4,172,000) (346,000) — From January 1 to December 31, 2017 — — — —

123
These options was valued and recorded at fair value at the grant date, determined by the “Black-Scholes-Merton”. No result has been recognized as ofDecember 2017 (ThUS$ 2,989 at December 31, 2016). (a.2) Compensation plan 2013 At the Extraordinary Shareholders’ Meeting held on June 11, 2013, the Company’s shareholders approved motions including increasing corporate equity, ofwhich 1,500,000 shares were allocated to compensation plans for employees of the Company and its subsidiaries, in conformity with the stipulationsestablished in Article 24 of the Corporations Law. With regard to this compensation, a defined date for implementation does not exist. (b) Compensation plan 2016-2018 The company implemented a retention plan long-term for executives, which lasts until December 2018, with a vesting period between October 2018 andMarch 2019, which consists of an extraordinary bonus whose calculation formula is based on the variation the value to experience the action of LATAMAirlines Group S.A. for a period of time. This benefit is recognized in accordance with the provisions of IFRS 2 “Share-based Payments” and has been considered as cash settled award and thereforerecorded at fair value as a liability, which is updated to the closing date of each financial statement with effect on profit or loss. Base Units
Opening Closing Periods balance Granted Annulled Exercised Balance From January 1 to December 31, 2016 4,719,720 — — — 4,719,720 From January 1 to December 31, 2017 4,719,720 37,359 (1,193,286) (630,897) 2,932,896 The fair value has been determined on the basis of the best estimate of the future value of the Company share multiplied by the number of units granted bases. At December 31, 2017, the carrying amount of ThUS$ 13,173, is classified under “Administrative expenses” in the Consolidated Statement of Income byFunction. (c) Subsidiaries compensation plans (c.1) Stock Options Multiplus S.A., subsidiaries of TAM S.A., have outstanding stock options at December 31, 2017, which amounted to 316,025 shares (at December 31, 2016,the distribution of outstanding stock options amounted to 394,698 for Multiplus S.A.).

124
Multiplus S.A.
4nd Extraordinary 3rd Grant 4th Grant Grant
Description 03-21-2012 04-03-2013 11-20-2013 Total Outstanding option number as December 31, 2016 84,249 173,399 137,050 394,698 Outstanding option number as December 31, 2017 84,249 163,251 68,525 316,025 For Multiplus S.A., the plan’s terms provide that the options granted to the usual prizes are divided into three equal parts and employees may exercise one-third of their two, three and four, options respectively, as long as they keep being employees of the company. The agreed term of the options is seven yearsafter the grant of the option. The first extraordinary granting was divided into two equal parts, and only half of the options may be exercised after three yearsand half after four years. The second extraordinary granting was also divided into two equal parts, which may be exercised after one and two yearsrespectively. The acquisition of the share’s rights, in both companies is as follows:
Number of shares Number of shares Accrued options Non accrued options As of As of As of As of December 31, December 31, December 31, December 31,
Company 2017 2016 2017 2016 Multiplus S.A. — — 316,025 394,698
In accordance with IFRS 2 - Payments based on shares, the fair value of the option must be recalculated and recorded in the liability of the Company, oncecash payment is made (cash-settled). The fair value of these options was calculated using the “Black-Scholes-Merton” method, where the assumptions wereupdated with information from LATAM Airlines Group S.A. As of December 31, 2017 and December 31, 2016 there is no value recorded in liabilities andresults. (c.2) Payments based on restricted stock In May of 2014 the Management Council of Multiplus S.A. approved a plan to grant restricted stock, a total of 91,103 ordinary, registered book entrysecurities with no face value, issued by the Company to beneficiaries. The quantity of restricted stock units was calculated based on employees’ expected remunerations divided by the average price of shares in Multiplus S.A.traded on the BM&F Bovespa exchange in the month prior to issue, April of 2014. This benefits plan will only grant beneficiaries the right to the restrictedstock when the following conditions have been met: a. Compliance with the performance goal defined by this Council as return on Capital Invested. b. The Beneficiary must remain as an administrator or employee of the Company for the period running from the date of issue to the following datesdescribed, in order to obtain rights over the following fractions: (i) 1/3 (one third) after the 2nd year from the issue date; (ii) 1/3 (one third) after the 3rd yearfrom the issue date; (iii) 1/3 (one third) after the 4th year from the issue date.

125
Number shares in circulation Not acquired due
Opening to breach ofemployment Closing
balance Granted Exercised retention conditions balance From January 1 to December 31, 2016 175,910 138,282 (15,811) (60,525) 237,856 From January 1 to December 31, 2017 237,856 129,218 (41,801) (15,563) 309,710 NOTE 35 - STATEMENT OF CASH FLOWS (a) The Company has done significant non-cash transactions mainly with financial leases, which are detailed in Note 17 letter (d), additional informationin numeral (iv) Financial leases.
(b) Other inflows (outflows) of cash:
For the periods ended December 31, 2017 2016 ThUS$ ThUS$
Guarantees 59,988 (51,559)Fuel hedge 19,862 (50,029)DOJ fine — (12,750)SEC agreement — (4,719)Fuel derivatives premiums (2,832) (6,840)Hedging margin guarantees (4,201) 1,184 Tax paid on bank transaction (6,635) (10,668)Bank commissions, taxes paid and other (7,738) (769)Change reservation systems (16,120) — Currency hedge (17,798) (39,534)Court deposits (33,457) (33,635)Others — 50
Total Other inflows (outflows) Operation flow (8,931) (209,269)Others deposits in guarantees 3,754 — Recovery loans convertible into shares — 8,896 Tax paid on bank transaction (2,594) (3,716)Others (10,383) (4,337)
Total Other inflows (outflows) Investment flow (9,223) 843 Loan guarantee 80,615 (74,186)Aircraft Financing advances (26,214) (125,149)Settlement of derivative contracts (40,695) (29,828)
Total Other inflows (outflows) Financing flow 13,706 (229,163)

126
(c) Dividends:
For the periods ended December 31, 2017 2016 ThUS$ ThUS$
Latam Airlines Group S.A. (20,766) — Multiplus S.A. (*) (45,876) (40,823)Lan Perú S.A. (*) — (400)
Total dividends paid (66,642) (41,223)
(*) Dividends paid to minority shareholders d) Reconciliation of liabilities arising from financing activities:
As of Cash flows Non-Flow Movements As of Obligations with December 31, Obtainment Payment Interest accrued December 31,
financial institutions 2016 Capital Capital Interest and others Reclassifications 2017 ThUS$ ThUS$ ThUS$ ThUS$ ThUS$ ThUS$ ThUS$
Loans to exporters 278,164 130,000 (99,719) (7,563) 13,737 — 314,619 Bank loans 585,287 70,357 (345,552) (21,127) 32,668 — 321,633 Guaranteed obligations 4,758,552 182,140 (486,599) (154,072) 155,907 (419,085) 4,036,843 Other guaranteed obligations 256,420 — (15,022) (8,890) 9,667 — 242,175 Obligation with the public 1,309,345 1,055,167 (797,828) (128,764) 146,146 — 1,584,066 Financial leases 1,022,361 — (344,005) (46,874) 58,937 419,085 1,109,504 Other loans 394,791 13,107 (124,688) (22,434) 22,024 — 282,800 Total Obligations with financial
institutions 8,604,920 1,450,771 (2,213,413) (389,724) 439,086 — 7,891,640
(e) Advances of aircraft Below are the cash flows associated with aircraft purchases, which are included in the statement of consolidated cash flow, in the item Purchases ofproperties, plants and equipment:
For the periods ended December 31, 2017 2016 MUS$ MUS$
Increases (payments) (205,143) (170,684)Recoveries 78,641 727,585 Total cash flows (126,502) 556,901

127
NOTE 36 - THE ENVIRONMENT LATAM Airlines Group S.A has a commitment to sustainable development seeking to generate value taking into account the governance, environmental andsocial aspects. The company manages environmental issues at a corporate level, centralized in the Sustainability Management. For the company to monitorand minimize its impact on the environment is a commitment of the highest level; where the continuous improvement and contribute to the solution of theglobal climate change problem, generating added value to the company and the region, are the pillars of its management. One of the functions of the Sustainability Management in environmental issues, together with the various areas of the Company, is to ensure environmentalcompliance, implement a management system and environmental programs that comply with the requirements every day more. demanding worldwide; inaddition to continuous improvement programs in their internal processes, which generate environmental, social and economic benefits and which are added tothose currently carried out. Within the sustainability strategy, the Environment dimension of LATAM Airlines Group S.A., is called Climate Change and is based on the goal of achievingworld leadership in this area, and for which we work on the following aspects: i. Carbon footprintii. Eco Efficiencyiii. Sustainable Alternative Energyiv. Standards and Certifications This is how, during 2017, the following initiatives have been carried out: - Implementation of an Environmental Management System for the main operations of the company. It is highlighted that the company during 2016 has
recertified its environmental management system in Miami facilities following the guidelines of the international standard ISO 14.001.- Maintenance of the Stage 2 Certification of IATA Environmental Assestment (IEnvA) whose scope is the international flights operated from Chile, the
most advanced level of this certification; being the first in the continent and one of the four airlines in the world that have this certification.- Preparation of the environmental chapter for the sustainability report of the company, which allows to measure progress in environmental issues.- Answer to the questionnaire of the DJSI.- Measurement and external verification of the Corporate Carbon Footprint.- Neutralization of land operations in the operations of Colombia and Peru with emblematic reforestation projects in the respective countries.
It is highlighted that in 2017, LATAM Airlines Group maintained its inclusion for the fourth consecutive year in the world category of the Dow JonesSustainability Index, with only 3 airlines in the world belonging to this select group.

128
NOTE 37 - EVENTS SUBSEQUENT TO THE DATE OF THE FINANCIAL STATEMENTS Subsequent to December 31, 2017 and until the date of issuance of these financial statements, there is no knowledge of other financial or other events thatsignificantly affect the balances or their interpretation. The consolidated financial statements of LATAM Airlines Group S.A. and Subsidiaries as of December 31, 2017, have been approved in an ExtraordinaryBoard Meeting on March 14, 2018.

SIGNATURES
Pursuant to the requirements of the Securities Exchange Act of 1934, the registrant has duly caused this report to be signed on its behalf by the
undersigned, thereunto duly authorized. Date: March 15, 2018 LATAM AIRLINES GROUP S.A. By: /s/ Ramiro Alfonsin Name: Ramiro Alfonsin Title: CFO at LATAM Airlines Group.


![g]kfn jfo';]jf lgud - Nepal Airlines](https://static.fdokumen.com/doc/165x107/631e912425add517740b1add/gkfn-jfojf-lgud-nepal-airlines.jpg)