SINGAPORE AIRLINES
224
Annual Report FY2016/17 SINGAPORE AIRLINES
-
Upload
khangminh22 -
Category
Documents
-
view
4 -
download
0
Transcript of SINGAPORE AIRLINES

Annual Report FY2016/17
SINGAPOREAIRLINES

MISSION STATEMENT
Singapore Airlines is a global company dedicated to providing air transportation services of the highest quality and to maximising returns for the benefit of its shareholders and employees.

CELEBRATING 70 YEARS OF EXCELLENCE: The Singapore Airlines Group’s history dates back to 1947 with the maiden flight of Malayan Airways Limited. The airline was later renamed Malaysian Airways Limited, and then Malaysia-Singapore Airlines. In 1972, Malaysia-Singapore Airlines split into Singapore Airlines and Malaysian Airline System. Initially operating a modest fleet of 10 aircraft to 22 cities in 18 countries, Singapore Airlines’ commitment to service excellence, product leadership and network connectivity quickly distinguished it as a world-class international airline group. Today, Singapore Airlines operates a modern passenger fleet of more than 100 aircraft. Together with wholly-owned subsidiaries SilkAir, Scoot, Tiger Airways (which operates as Tigerair) and SIA Cargo, the SIA Group fleet comprises nearly 180 aircraft. The combined passenger network covers 131 destinations in 35 countries. More than 31 million passengers were carried by the SIA Group’s four Singapore-based passenger airlines in the 2016/17 financial year. Singapore Airlines and its subsidiaries today employ more than 25,000 staff, with the world-famous Singapore Girl as an iconic symbol of quality customer care and service.
CONTENTS
OVERVIEW2 3-Year Financial
Highlights3 SIA Group Portfolio4 Statistical Highlights6 Significant Events
STRATEGY8 A Global Flyer 10 A Premium
Full-Service Airline12 An Innovative
Market Leader14 Celebrating 70 Years
of Excellence16 Our Strategy
for the Future18 Chairman’s
Letter to Shareholders20 Board of Directors
PERFORMANCE22 The Year in Review24 Network26 Fleet Management27 Products and Services32 People Development34 Environment35 Community
Engagement36 Subsidiaries44 Financial Review60 Awards
GOVERNANCE62 Statement on
Risk Management63 Corporate
Governance Report75 Membership
and Attendance of Singapore Airlines Limited
76 Further Information on Board of Directors
FINANCIAL80 Financial Report212 Information on
Shareholdings214 Share Price and
Turnover 215 Notice of Annual
General MeetingIBC Corporate Data
OUR JOURNEY CONTINUES...
Annual Report FY2016/17 01

3-Year Financial Highlights
$11.07
30.5 cents
20 cents
NET ASSET VALUE PER SHARE
EARNINGSPER SHARE
TOTAL DIVIDEND PER SHARE
Net asset value per share is computed by dividing equity attributable to owners of the parent by the number of ordinary shares in issue excluding treasury shares.
Earnings per share is computed by dividing profit attributable to owners of the parent by the weighted average number of ordinary shares in issue excluding treasury shares.
The final dividend of 11 cents per share will be paid on 16 August 2017 to shareholders as at 3 August 2017.Including the interim dividend of 9 cents per share paid on 24 November 2016, the total dividend for the 2016/17 financial year will be 20 cents per share.
($ million)Total Group Revenue
2016/17
2015/16
2014/15
14,869
15,239
15,566
($ million)Group Operating Profit
2016/17
2015/16
2014/15
623
681
410
($ million)Group Net Profit
2016/17
2015/16
2014/15
360
804
368
Singapore Airlines02 Singapore Airlines02
Overview

SIA Group Portfolio
During the year in review, the Singapore Airlines Group continued to expand its global network, leveraging its position as a leader in key markets around the globe.
FULL SERVICE LOW COST
Singapore Airlines SilkAir Tigerair Scoot
18,990,166passengers carried
in FY2016/17
4,105,576passengers carried
in FY2016/17
5,145,835passengers carried
in FY2016/17
3,357,174passengers carried
in FY2016/17
106 aircraft in fleet
30 aircraft in fleet
23 aircraft in fleet
12aircraft in fleet
3new destinations
introduced
3new destinations
introduced
12cities served
in China
5new destinations
introduced
70years of operation
in 2017
52destinations in
14 countries
13years of operation
in 2017
8additional Dreamliners
on firm order
Annual Report FY2016/17 03Annual Report FY2016/17 03

Statistical Highlights
Financial Statistics R1
n.m. not meaningfulR1 Singapore Airlines’ financial year is from 1 April to 31 March. Throughout this report, all figures are in Singapore Dollars, unless otherwise stated.R2 Return on equity holders’ funds is profit attributable to owners of the parent expressed as a percentage of the average equity holders’ funds. R3 Total debt : equity ratio is total debt divided by equity attributable to owners of the parent as at 31 March. R4 Earnings per share (basic) is computed by dividing profit attributable to owners of the parent by the weighted average number of ordinary shares in issue excluding treasury shares.R5 Earnings per share (diluted) is computed by dividing profit attributable to owners of the parent by the weighted average number of ordinary shares in issue excluding treasury shares,
adjusted for the dilutive effect on the exercise of all outstanding share options. R6 Net asset value per share is computed by dividing equity attributable to owners of the parent by the number of ordinary shares in issue excluding treasury shares at 31 March.R7 Dividend cover is profit attributable to owners of the parent divided by total dividends.
2016/17 2015/16 % ChangeThe GroupFinancial Results ($ million)Total revenue 14,868.5 15,238.7 - 2.4Total expenditure 14,245.7 14,557.5 - 2.1Operating profit 622.8 681.2 - 8.6Profit before taxation 518.6 972.4 - 46.7Profit attributable to owners of the parent 360.4 804.4 - 55.2
Financial Position ($ million)Share capital 1,856.1 1,856.1 –Treasury shares (194.7) (381.5) + 49.0 Capital reserve (147.6) (129.2) - 14.2 Foreign currency translation reserve (123.7) (151.3) + 18.2 Share-based compensation reserve 88.5 123.7 - 28.5 Fair value reserve (234.4) (498.6) + 53.0 General reserve 11,838.8 11,935.5 - 0.8 Equity attributable to owners of the parent 13,083.0 12,754.7 + 2.6
Return on equity holders’ funds (%) R2 2.8 6.4 - 3.6 points
Total assets 24,720.0 23,846.6 + 3.7 Total debt 1,567.8 1,347.5 + 16.3 Total debt : equity ratio (times) R3 0.12 0.11 + 0.01 times
Value added 4,843.1 5,030.9 - 3.7
Per Share DataEarnings – basic (cents) R4 30.5 69.0 - 55.8 Earnings – diluted (cents) R5 30.3 68.7 - 55.9 Net asset value ($) R6 11.07 10.96 + 1.0
DividendsInterim dividend (cents per share) 9.0 10.0 - 1.0 centsFinal dividend (cents per share) 11.0 35.0 - 24.0 centsDividend cover (times) R7 1.5 1.5 – times
The CompanyFinancial Results ($ million)Total revenue 11,094.2 11,686.1 - 5.1 Total expenditure 10,707.8 11,201.0 - 4.4 Operating profit 386.4 485.1 - 20.3 Profit before taxation 579.3 766.2 - 24.4 Profit after taxation 514.0 672.0 - 23.5
Value added 3,550.7 3,661.6 - 3.0
Singapore Airlines04 Singapore Airlines04
Overview

Singapore AirlinesRevenue passenger-km = Number of passengers carried x distance flown (in km)Available seat-km = Number of available seats x distance flown (in km)Passenger load factor = Revenue passenger-km expressed as a percentage of available seat-kmPassenger yield = Passenger revenue from scheduled services divided by revenue passenger-kmPassenger unit cost = Operating expenditure (less bellyhold revenue from SIA Cargo) divided by
available seat-kmPassenger breakeven load factor = Passenger unit cost expressed as a percentage of passenger yield. This is the
theoretical load factor at which passenger revenue equates to the operating expenditure (less bellyhold revenue from SIA Cargo)
SilkAirRevenue passenger-km = Number of passengers carried x distance flown (in km)Available seat-km = Number of available seats x distance flown (in km)Passenger load factor = Revenue passenger-km expressed as a percentage of available seat-kmPassenger yield = Passenger revenue from scheduled services divided by revenue passenger-kmPassenger unit cost = Operating expenditure (less cargo and mail revenue) divided by available seat-
kmPassenger breakeven load factor = Passenger unit cost expressed as a percentage of passenger yield. This is the theoretical load factor at which passenger revenue equates to the operating
expenditure (less cargo and mail revenue)
Budget Aviation HoldingsRevenue passenger-km = Number of passengers carried x distance flown (in km)Available seat-km = Number of available seats x distance flown (in km)Passenger load factor = Revenue passenger-km expressed as a percentage of available seat-kmRevenue per revenue seat-km = Passenger revenue from scheduled services divided by revenue passenger-kmCost per available seat-km = Operating expenditure divided by available seat-kmBreakeven load factor = Cost per available seat-km expressed as a percentage of revenue per revenue
seat-km. This is the theoretical load factor at which passenger revenue equates to the operating expenditure
SIA CargoCargo load = Cargo and mail load carried (in tonnes) x distance flown (in km)Gross capacity = Cargo capacity production (in tonnes) x distance flown (in km)Cargo load factor = Cargo and mail load (in tonne-km) expressed as a percentage of gross
capacity (in tonne-km)Cargo yield = Cargo and mail revenue from scheduled services divided by cargo load (in tonne-
km)Cargo unit cost = Operating expenditure (including bellyhold expenditure to Singapore Airlines)
divided by gross capacity (in tonne-km)Cargo breakeven load factor = Cargo unit cost expressed as a percentage of cargo yield. This is the theoretical
load factor at which cargo revenue equates to the operating expenditure (including bellyhold expenditure to Singapore Airlines)
Group Airlines (Passenger)Revenue passenger-km = Number of passengers carried x distance flown (in km)Available seat-km = Number of available seats x distance flown (in km)Passenger load factor = Revenue passenger-km expressed as a percentage of available seat-km
GLOSSARY
Operating Statistics
2016/17 2015/16 % ChangeSingapore AirlinesPassengers carried (thousand) 18,990 19,029 - 0.2 Revenue passenger-km (million) 92,913.8 94,267.4 - 1.4 Available seat-km (million) 117,662.3 118,366.5 - 0.6 Passenger load factor (%) 79.0 79.6 - 0.6 pointsPassenger yield (cents/pkm) 10.2 10.6 - 3.8 Passenger unit cost (cents/ask) 8.2 8.5 - 3.5 Passenger breakeven load factor (%) 80.4 80.2 + 0.2 points
SilkAirPassengers carried (thousand) 4,106 3,836 + 7.0 Revenue passenger-km (million) 7,138.0 6,516.2 + 9.5 Available seat-km (million) 10,086.3 9,117.8 + 10.6 Passenger load factor (%) 70.8 71.5 - 0.7 pointsPassenger yield (cents/pkm) 12.5 13.5 - 7.4 Passenger unit cost (cents/ask) 8.3 9.0 - 7.8 Passenger breakeven load factor (%) 66.4 66.7 - 0.3 points
Budget Aviation HoldingsPassengers carried (thousand) 8,503 7,540 + 12.8 Revenue passenger-km (million) 22,083.8 18,225.0 + 21.2 Available seat-km (million) 26,792.8 21,732.8 + 23.3 Passenger load factor (%) 82.4 83.9 - 1.5 pointsRevenue per revenue seat-km (cents/pkm) 5.9 6.3 - 6.3 Cost per available seat-km (cents/ask) 4.8 5.3 - 9.4 Breakeven load factor (%) 81.4 84.1 - 2.7 points
SIA CargoCargo and mail carried (million kg) 1,248.1 1,170.1 + 6.7 Cargo load (million tonne-km) 6,895.8 6,510.9 + 5.9 Gross capacity (million tonne-km) 10,912.3 10,513.3 + 3.8 Cargo load factor (%) 63.2 61.9 + 1.3 pointsCargo yield (cents/ltk) 25.9 29.0 - 10.7 Cargo unit cost (cents/ctk) 16.8 18.9 - 11.1 Cargo breakeven load factor (%) 64.9 65.2 - 0.3 points
Group Airlines (Passenger)Passengers carried (thousand) 31,599 30,405 + 3.9 Revenue passenger-km (million) 122,135.6 119,008.6 + 2.6 Available seat-km (million) 154,541.4 149,217.1 + 3.6 Passenger load factor (%) 79.0 79.8 - 0.8 points
Employee Productivity (Average) – The CompanyAverage number of employees 14,423 13,983 + 3.1 Seat capacity per employee (seat-km) 8,157,963 8,465,029 - 3.6 Passenger load per employee (tonne-km) R1 598,451 626,572 - 4.5 Revenue per employee ($) 769,202 835,736 - 8.0 Value added per employee ($) 246,183 261,861 - 6.0
Employee Productivity (Average) – The GroupAverage number of employees 25,194 24,350 + 3.5 Revenue per employee ($) 590,160 625,819 - 5.7 Value added per employee ($) 192,232 206,608 - 7.0
R1 Passenger load includes excess baggage carried.
Annual Report FY2016/17 05Annual Report FY2016/17 05

Significant Events
7 APRSingapore Airlines serves ‘Deliciously Wholesome’ meals, specially developed for an increasing number of health-conscious travellers, in SilverKris Lounges at Singapore’s Changi Airport and on flights departing from Singapore
18 APRAirbus Asia Training Centre, a joint venture between Airbus and Singapore Airlines, officially opens in Singapore
10 MAYAmsterdam becomes the first long-haul destination to receive the Singapore Airlines Airbus A350-900
17 MAYKrisFlyer programme expands to allow members to redeem their miles for travel in Premium Economy Class
18 MAYSingapore Airlines establishes Budget Aviation Holdings Pte Ltd, a holding company to own, manage and drive deep integration between budget airline subsidiaries Scoot and Tiger Airways
16 JUNSingapore Airlines announces the planned launch of non-stop services to San Francisco, and second daily Los Angeles service via Seoul, from 23 October 2016
21 JULSingapore Airlines reveals plans for a non-stop service to Manchester from 30 October 2016
22 JULDusseldorf, served with the A350-900, becomes the third German city in Singapore Airlines’ route network
18 AUGSingapore Airlines treats Metta School beneficiaries to a joyride in supercars in conjunction with the Light Up The Night Carnival, in the lead-up to the Formula 1 Singapore Airlines Singapore Grand Prix
21 SEPSingapore Airlines launches ‘Capital Express’ service to Canberra and Wellington, the first airline to operate regularly scheduled international services on this route
the 10,000thaircraft delivered
by Airbus
6th A350-900,
Delivery of SIA’s
Dusseldorf, Canberra and
Wellington services
Launch of
Q1 Q2APR MAY JUN JUL AUG SEP
2016
Singapore Airlines06 Singapore Airlines06
Overview

20 JANSingapore Airlines and French crystalmaker Lalique enter into a strategic partnership under which SIA will exclusively carry Lalique co-branded in-flight items in its Suites and First Class cabins
8 FEBSingapore Airlines’ partnership with Make-A-Wish Singapore enables KrisFlyer members to donate miles to the charity, facilitating the granting of wishes for children with life-threatening medical conditions
9 FEBSingapore Airlines signs a letter of intent with Boeing valued at US$13.8 billion for 20 777-9s and 19 787-10s, for additional growth and fleet modernisation through the next decade
14 MARSingapore Airlines and SilkAir sign an agreement to codeshare on Indian domestic flights operated by Vistara
14 OCTSingapore Airlines takes delivery of its sixth A350-900 – the 10,000th aircraft that Airbus has delivered
24 OCTSingapore Airlines launches its new non-stop Singapore–San Francisco service using A350-900 aircraft
31 OCTSingapore Airlines offers a delectable range of Singapore-style Teochew dishes to customers in all cabin classes travelling on selected flights departing from Singapore over a four-month period
15 DECSingapore Airlines announces the addition of Stockholm to its route network from 30 May 2017
Q3 Q4OCT NOV DEC JAN FEB MAR
2017
Annual Report FY2016/17 07Annual Report FY2016/17 07

GROWTH IN FLEET & NETWORK
On 1 May, Malayan Airways Limited begins services between Singapore, Kuala Lumpur, Ipoh and Penang from Singapore Kallang Airport, using twin-engined Airspeed Consuls.
Malayan Airways’ fleet grows with a large number of Douglas DC-3s, DC-4s and single-engined Beavers while the network expands to include an additional 10 destinations in six countries.
The fleet continues to expand as Malaysia-Singapore Airlines Limited purchases new Boeing 707s and 737s. Along with fleet expansion, services begin to Australia, Hong Kong, Japan, the Philippines and Taiwan.
Malaysia-Singapore Airlines separates into two airlines: Malaysian Airline System and Singapore Airlines. With the addition of services to the network, Singapore Airlines’ fleet expands to include the state-of-the-art Boeing 727, 747 and DC-10.
1947 1950s 1960s 1970s
The Singapore Airlines Group’s history dates back to 1947 with the maiden flight of Malayan Airways Limited. The airline was later renamed Malaysian Airways Limited and then Malaysia-Singapore Airlines. In 1972, Malaysia-Singapore Airlines split
into Singapore Airlines and Malaysian Airline System. The rest of the decade was devoted to growth and consolidation of
the newly-established Singapore Airlines. Since then, SIA has pursued a carefully planned fleet renewal strategy with a series
of bold aircraft orders, meeting the Airline’s short-, medium- and long-haul requirements.
4Destinations
2Countries
CLEARED FOR TAKE-OFF
Started with
Singapore Airlines08

GROWTH IN FLEET & NETWORK
Singapore Airlines purchases Airbus A300s, A310s, 747s and Boeing 757s as operations move from Paya Lebar Airport to Singapore Changi Airport. Singapore Airlines becomes the first airline to operate a commercial flight across the Pacific Ocean with the 747, from San Francisco to Singapore via Hong Kong.
The Airline extends services to South Africa with flights to Cape Town, Durban and Johannesburg. With the expansion of the route network and increase in flight frequencies, Singapore Airlines moves all its flight operations to Terminal 2 in Changi Airport as it takes delivery of the new Airbus A340 and Boeing 777 aircraft.
Singapore Airlines launches historic, non-stop flights from Singapore to New York, using the ultra-long-range Airbus A340-500, setting the record for the world’s longest non-stop commercial flight. In 2007, history is made when Singapore Airlines becomes the first to fly the Airbus A380, the world’s largest commercial aircraft, with its inaugural flight to Sydney.
Apart from two Airbus A380s in special livery to commemorate Singapore’s 50th birthday in 2015, Singapore Airlines welcomes our first A350 in 2016, a game-changer with advanced technology and superior operating efficiency. Singapore Airlines looks forward to the re-launch of non-stop flights to Los Angeles and New York with the A350-900ULR in 2018.
1980s 1990s 2000s 2010s | 2017
Today, Singapore Airlines operates a modern passenger fleet of more than 100 aircraft. Together with wholly-owned subsidiaries, SilkAir, Scoot, Tigerair and SIA Cargo, the SIA Group fleet comprises nearly 180 aircraft. The combined network covers more than 130 destinations around the world. Singapore Airlines continues to regularly review network operations, and adjust capacity to match demand for services in various markets. Apart from organic growth, SIA continues to seek opportunities to expand the route network through codeshare arrangements with other airlines. Such arrangements enable us to work with our partners to offer customers more travel options and more convenient connections. SIA has increased our weekly codeshare frequencies to around 10,000, up from about 2,000 six years ago. 61
Destinations
31Countries
A GLOBAL FLYER
Expanded to
Annual Report FY2016/17 09

GROWTH IN SERVICES
Singapore Airlines sets up the International Culinary Panel in 1998, comprising award-winning chefs from the culinary capitals of the world to create the unique selection that is available on board.
Singapore Airlines’ ‘Book the Cook’ service lets Suites, First Class, Business Class and Premium Economy Class passengers opt for a main course before their flights.
Apart from ‘Yummy!’, an in-flight meal service for children travelling in Suites, First Class and Business Class, Singapore Airlines offers a comprehensive special meal selection which includes baby and infant, religious, vegetarian and special dietary meals to suit the needs of all customers.
In-flight Services KrisFlyer Programme
700‘Book the Cook’ dishes
21Stations in 2017
More than
from THE SINGAPORE GIRLThe Singapore Girl was created in 1972, when Singapore Airlines
was formed following the division of the former Malaysia-Singapore Airlines into two carriers – Malaysian Airline System
and Singapore Airlines. In her distinctive uniform, a sarong kebaya in batik material designed by Parisian couturier Pierre
Balmain, she epitomises Singapore Airlines’ tradition of friendly service and Asian hospitality.
Singapore Airlines launches its frequent flyer programme, KrisFlyer, in 1999. Today, customers can earn and redeem miles for award flights on over 30 world-class airlines to more than 1,000 destinations in 170 countries. Miles can also be accrued through transactions with non-airline partners, and can be redeemed for upgrades and flights within the SIA Group.
Singapore Airlines10

15SilverKris Lounges
around the world in 2017
GROWTH IN SERVICES
In 2013, Singapore Airlines unveils its new-concept SilverKris Lounge in Sydney, as part of a multi-million dollar investment programme to upgrade all of the Airline’s airport lounges around the world. Lounge customers can look forward to distinct personal spaces that provide a sense of ‘being home’, as well as more personalised services from lounge staff and a delectable selection of food and beverages to complement SIA’s in-flight offerings.
Singapore Airlines launches an all-new mobile app in 2015, providing customers with a functional and seamless user experience. Features include an integrated flight schedule and booking widget, as well as a contextual homepage that displays the most relevant information about upcoming trips.
Faster check-in options are available since 2015 with the availability of kiosk check-in facilities. Other self-service check-in options include online and mobile check-in facilities to ensure an efficient and seamless travel experience for our customers at the airport.
SilverKris Lounges Ground Services
Excellence in customer service has been integral to Singapore Airlines’ success. Superb in-flight service is the cornerstone of its reputation for customer service and hospitality. Singapore Airlines continues to place emphasis on the quality of service at all touchpoints: pre-flight, on board and post-flight. Travellers on Singapore Airlines can be assured of high standards of service and efficiency both on the ground and in the air.
A PREMIUM FULL-SERVICE AIRLINE
Annual Report FY2016/17 1111Annual Report FY2016/17

44Selections
PRODUCT ENHANCEMENTS
Personal satellite-based phones enable customers to stay in touch with people on the ground while they are in the air.
Singapore Airlines is the first to introduce KrisWorld, a state-of-the-art in-flight entertainment (IFE) and communications system across all classes.
Singapore Airlines invests US$100 million to launch SpaceBed, the biggest Business Class bed in the sky. Singapore Airlines is the first to provide audio- and video-on-demand to all passengers in all classes with its new-generation entertainment system.
Singapore Airlines announces that it will be the world’s first carrier to launch the eX2™ IFE system by Panasonic Avionics Corporation as it welcomes new aircraft into its fleet.
1991 1995 2001 2006
Started with
AN INNOVATIVE MARKET LEADER
Singapore Airlines recognises the value of innovation and knows that our customers desire it too. Since its establishment,
Singapore Airlines has earned a reputation as an innovative market leader and industry trendsetter, combining quality
products with excellent service. Singapore Airlines intends to remain at the forefront of airline product innovation, with the
world’s best in-flight products in all classes of travel.
7Languages
Singapore Airlines12

1,900 Selections
PRODUCT ENHANCEMENTS
With the delivery of the new Airbus A380, Singapore Airlines unveils a comprehensive suite of new-generation cabin products, which will be introduced across all classes. The luxurious cabin interior features Singapore Airlines Suites, providing the ultimate in luxury and privacy.
On 9 July, Singapore Airlines launches its next generation of cabin products, set to be the new industry benchmark for premium air travel. Nearly US$150 million has been invested to introduce the new products on an initial eight Boeing 777-300ER aircraft. These products are the result of more than two years of working with world-renowned design firms.
Singapore Airlines unveils its new Premium Economy Class seats and in-flight offerings that customers will enjoy, following a two-year development programme and an investment of about US$80 million.
In conjunction with the arrival of Singapore Airlines’ first Airbus A350-900, Singapore Airlines raises customers’ travel experience to an exciting new level with the introduction of a first-of-its-kind ‘Companion App’.
2007 2013 2015 2016
Expanded to
A WORLD OF ENTERTAINMENT
Singapore Airlines’ KrisWorld offers more than 1,900 on-demand entertainment options in all classes, including movies, TV programmes, interactive games, audio CDs, hosted radio programmes and a variety of learning applications. Specially designed and continually adapted to suit the prevailing tastes and preferences of our customers, Singapore Airlines offers a new way to experience KrisWorld via the Singapore Airlines ‘Companion App’, through which customers have greater control over their in-flight entertainment experience, even before boarding the aircraft.
25Languages
Annual Report FY2016/17 1313Annual Report FY2016/17

IN 1965:Singapore gains independence
SIGNIFICANT EVENTS IN
SINGAPORE
IN 1981:Changi Airport Terminal 1 opens
Celebrating
70 YearsOF EXCELLENCE
We have come a long way from our early beginnings, since the first commercial flight from Kallang Airport in 1947. Since then, we have marked many ‘Firsts’ along the way, earning a reputation as an innovative market leader, combining quality products with excellent service. Today, Singapore Airlines is proud to be serving our 70th year globally and is committed to being “A Great Way To Fly”.
1947
1947The Singapore Airlines story traces back to 1947, with the birth of Malayan Airways Limited. On 1 May, a tiny Airspeed Consul took off from Singapore’s Kallang Airport, on the first of three flights a week to Kuala Lumpur, Ipoh and Penang.
1951Malayan Airways increases its fleet size to include Douglas DC-3s, and the network expands to include flights to an additional nine destinations in five countries.With the introduction of the original “female pursers” paving the way for the Singapore Girl some 20 years later, the in-flight menu expands to include a choice of hot, cold and alcoholic beverages, as well as sandwiches, biscuits and cold cuts.
1957
1963The Federation of Malaysia forms on 16 September. To commemorate this, Malayan Airways Limited becomes Malaysian Airways Limited, and later becomes Malaysia-Singapore Airlines in 1966.
1967
1968The Airline acquires new Boeing 707s, providing opportunities for network growth to more destinations. In the same year, the Airline’s annual revenue hits $100 million for the first time.
1972The Singapore Girl is created in 1972, with the formation of Singapore Airlines following the division of the former Malaysia-Singapore Airlines into two carriers. In her distinctive uniform, a sarong kebaya in batik material designed by Parisian couturier Pierre Balmain, she epitomises Singapore Airlines’ tradition of friendly service and Asian hospitality.Singapore Airlines becomes the first to give out free headsets and offer a choice of meals and drinks in Economy Class.
1981Singapore Airlines’ first Airbus A300 Superbus flies to Kuala Lumpur and Jakarta on 1 February. In addition, the Airline’s operations move from Paya Lebar Airport to the brand new Singapore Changi Airport in July.
1983Airline House, Singapore Airlines’ corporate headquarters, officially opens at the Changi Airfreight Centre.
1977
Singapore Airlines14 Singapore Airlines14
Strategy

IN 2008:Changi Airport Terminal 3 opens
IN 1991:Changi Airport Terminal 2 opens
1987 1997 2007
1989Tradewinds, a subsidiary of Singapore Airlines, is announced in February as Singapore’s second airline. It has since become SilkAir, our regional wing, and grown its route network to more than 50 destinations across Asia and Australia.Singapore Airlines becomes the first airline to operate a commercial flight across the Pacific Ocean with the Boeing 747, from San Francisco to Singapore via Hong Kong.
1991Singapore Airlines launches the world’s first global sky telephone service, enabling passengers to stay in touch with people on the ground while they are in the air.
1992Singapore Airlines announces the start of wholly-owned subsidiary SIA Engineering Company (SIAEC), allowing the company greater autonomy to pursue new business opportunities around the world. Since then, SIAEC has grown and now provides extensive maintenance, repair and overhaul of aircraft to more than 70 international airlines worldwide.
1993Madame Tussauds London unveils a waxwork of the Singapore Girl, the first commercial figure to be displayed at the museum. The Singapore Girl is chosen as it reflects the ever-growing popularity of international travel, and commemorates the 21st birthday of the Singapore Girl.
1998In September, Singapore Airlines sets up the International Culinary Panel, comprising award-winning chefs from the culinary capitals of the world to take in-flight dining to new heights.A $500 million makeover unveils a new suite of cabin products across all classes of travel, together with a wider selection of cuisine and entertainment.
1999Singapore Airlines launches its frequent flyer programme, KrisFlyer. The launch of this programme allows Singapore Airlines and SilkAir customers in all cabin classes to accumulate KrisFlyer miles and redeem tickets for travel.
2001Singapore Airlines is the first to provide audio- and video-on-demand to all passengers in all classes with KrisWorld, Singapore Airlines’ in-flight entertainment system. After being in the cargo business for over 50 years, Singapore Airlines’ Cargo division corporatises to become an independently managed subsidiary of Singapore Airlines in July.
2004Singapore Airlines, together with partners, establishes Tiger Airways, a leading Singapore-based no-frills airline that offers affordable travel options.On 28 June, Singapore Airlines launches the historic, non-stop flight from Singapore to New York using the ultra-long-range Airbus A340-500. The flight traverses a distance of close to 9,000 nautical miles (about 16,600 km) over the North Pacific, and sets a new record for the world’s longest non-stop commercial flight.
2007History is made when Singapore Airlines becomes the first to fly the Airbus A380, the world’s largest commercial aircraft. This next-generation aircraft will grow capacity on high demand routes, while delivering operational efficiency, environmental improvements and customer benefits.Singapore Airlines also unveils Singapore Airlines Suites, in conjunction with the delivery of the A380.
2008In January, Singapore Airlines becomes the first carrier to operate from Changi Airport Terminal 3, with the arrival of SQ1 at approximately 1150hrs. SQ318, bound for London, is the first flight to depart Terminal 3 at 1250hrs.
2011Singapore Airlines announces its intention to establish a low-cost subsidiary airline, Scoot, for medium- and long-haul routes. Catered to the young-at-heart and value-seeking customers, Scoot begins its first flight to Sydney, Australia in 2012.
2012The giant pandas Kai Kai and Jia Jia arrive in Singapore on 6 September, after flying in comfort on board a Singapore Airlines Cargo Boeing 747-400 freighter. Singapore Airlines becomes the Official Airline for the giant panda collaborative programme between Wildlife Reserves Singapore and the China Wildlife Conservation Association.
2013Singapore Airlines launches its next generation of cabin products, set to be the new industry benchmark for premium air travel, with new seats and new KrisWorld in-flight entertainment system.
2015Singapore Airlines unveils its new Premium Economy Class seats and in-flight offerings following a two-year development programme and an investment of about US$80 million. Entering into service in August, Premium Economy Class welcomes customers with a contemporary and stylish design, offering more space, comfort and convenience.Singapore Airlines operates its first-ever Charity Flight on the world’s largest commercial aircraft, the Airbus A380, treating more than 300 beneficiaries to a three-and- a-half-hour flight.In the same year, a second wax figure of the Singapore Girl is produced by Madame Tussauds, for display at the new Madame Tussauds Singapore.
2016Singapore Airlines welcomes the arrival of its first A350-900 in March, and later in the same year launches its new non-stop Singapore-San Francisco service using this aircraft. The launch of the new ‘Capital Express’ service to Canberra and Wellington with Boeing 777s sees Singapore Airlines being the first to operate regularly scheduled international services on this route.Budget Aviation Holdings Pte Ltd is established, a holding company to own, manage and drive deep integration between budget airline subsidiaries Scoot and Tiger Airways.
2017Singapore Airlines signs a letter of intent with Boeing valued at US$13.8 billion for 20 Boeing 777-9s and 19 787-10s, for additional growth and fleet modernisation through the next decade.
2017
Annual Report FY2016/17 15Annual Report FY2016/17 15

Our Strategy for the Future
As the SIA Group moves towards a new phase of growth across all airlines in the Group, our fleet and network continue to expand in support of our portfolio strategy. With both full-service and low-cost airline investments, we remain committed to short-, medium- and long-haul markets with our portfolio of airlines.
The SIA Group continues to place emphasis on the need to adapt nimbly and flexibly to industry changes, so as to stay relevant in the competitive environment as we step up in the next phase of our growth. During the new financial year, Scoot and Tigerair will be merging under the Scoot brand name.
1 Portfolio
STRATEGIC DEVELOPMENTS
Scoot
SilkAir
Tigerair
FULL SERVICE Singapore Airlines
LOW COST
EXTEND MARKET REACHPo
sitio
ning
Markets LONG-HAULREGIONAL
Singapore Airlines16 Singapore Airlines16
Strategy

2 Multi-Hub Strategy— With our expansion to India through Vistara and Thailand through NokScoot, the SIA Group’s investment in airlines outside of Singapore allows us to set up new hubs, create new markets, and tap into new traffic flows.
3 Strengthening Premium Positioning— Singapore Airlines remains committed to the constant enhancement of the three main pillars of our brand promise: Service Excellence, Product Leadership and Network Connectivity.
SERVICE EXCELLENCE Customer service remains a crucial differentiator for Singapore Airlines. We continue to place emphasis
on the quality of service customers receive at all Singapore Airlines touchpoints: pre-flight, on board and post-flight.
To cater to the needs of our health-conscious customers, Singapore Airlines introduced wholesome meals across all cabin classes. Healthy and nutritious, these meals were specially designed to rejuvenate the body after a flight.
Singapore Airlines also continued to offer greater convenience to passengers on the ground with new initiatives such as automated bag drops at airports.
PRODUCT LEADERSHIPIn 2016, Singapore Airlines introduced the first-of-its-kind ‘Companion App’, which allows customers to review
the video and audio content available on board before their flight and create pre-selected favourites lists. The app also allows customers to use their personal device as a remote control for the in-flight entertainment system, so that they can multi-task and maximise their KrisWorld experience.
Our practice of maintaining a modern fleet means that we are very often in the market for new aircraft. Singapore Airlines has committed to acquiring 67 Airbus A350-900s, of which 11 were in our fleet in FY2016/17. Also on order are Airbus A380-800, Boeing 777-9 and 787-10 aircraft.
NETWORK CONNECTIVITYIn FY2016/17, Singapore Airlines expanded its route network with the
launch of flights to three new destinations: Canberra, Dusseldorf and Wellington. Our existing network was further enhanced with the launch of daily non-stop flights to San Francisco, a second daily service to Los Angeles, and non-stop flights to Manchester which continue on to Houston. A new service to Stockholm was announced and will be introduced in the new financial year. We will continue to seek growth opportunities while matching capacity to demand in the current landscape.
4 New Business Initiatives— Airbus Asia Training Centre (AATC)Our joint venture with Airbus for pilot training has a client base that has grown faster than initially projected. The number of flight simulators will also expand to eight by 2019, to meet increasing training requirements for pilots in the region. We remain open to more initiatives like AATC going forward.
8simulators by 2019
Annual Report FY2016/17 17Annual Report FY2016/17 17

Chairman’s Letter to Shareholders
SIA is moving to the next phase of its
transformation, to improve efficiency
across the organisation and identify additional
revenue-generation opportunities.
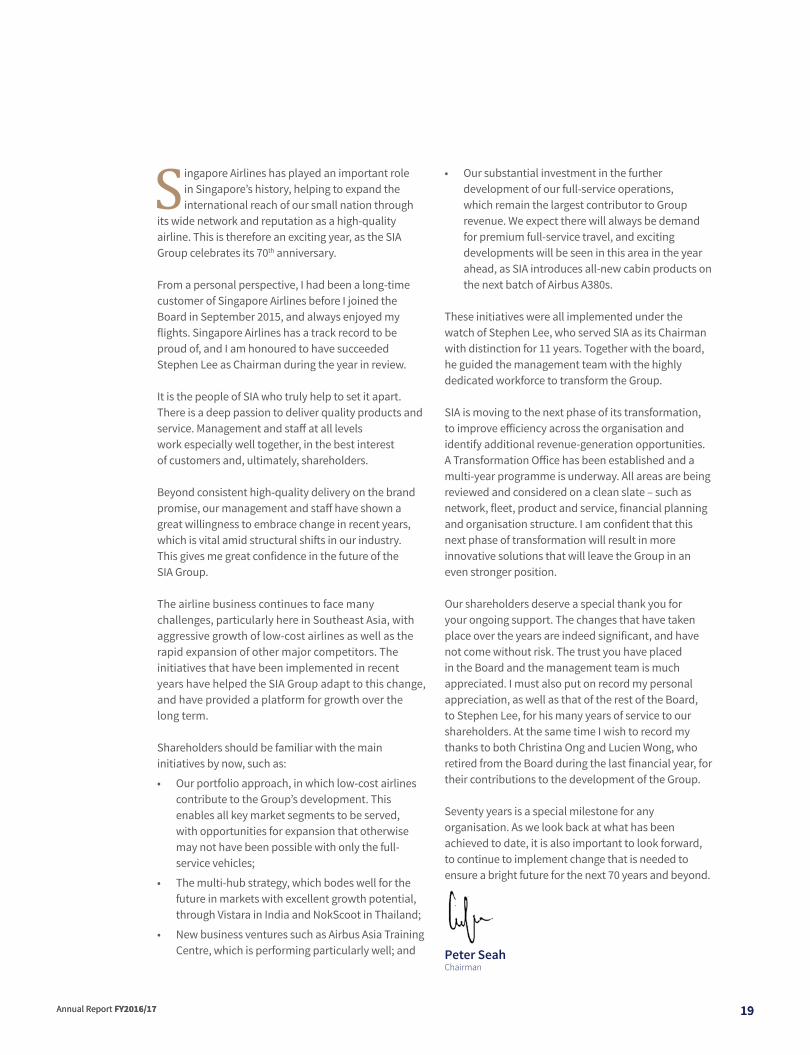
Peter SeahChairman
Singapore Airlines18 Singapore Airlines18
Strategy
Singapore Airlines has played an important role in Singapore’s history, helping to expand the international reach of our small nation through
its wide network and reputation as a high-quality airline. This is therefore an exciting year, as the SIA Group celebrates its 70th anniversary.
From a personal perspective, I had been a long-time customer of Singapore Airlines before I joined the Board in September 2015, and always enjoyed my flights. Singapore Airlines has a track record to be proud of, and I am honoured to have succeeded Stephen Lee as Chairman during the year in review.
It is the people of SIA who truly help to set it apart. There is a deep passion to deliver quality products and service. Management and staff at all levels work especially well together, in the best interest of customers and, ultimately, shareholders.
Beyond consistent high-quality delivery on the brand promise, our management and staff have shown a great willingness to embrace change in recent years, which is vital amid structural shifts in our industry. This gives me great confidence in the future of the SIA Group.
The airline business continues to face many challenges, particularly here in Southeast Asia, with aggressive growth of low-cost airlines as well as the rapid expansion of other major competitors. The initiatives that have been implemented in recent years have helped the SIA Group adapt to this change, and have provided a platform for growth over the long term.
Shareholders should be familiar with the main initiatives by now, such as:
• Our portfolio approach, in which low-cost airlines contribute to the Group’s development. This enables all key market segments to be served, with opportunities for expansion that otherwise may not have been possible with only the full-service vehicles;
• The multi-hub strategy, which bodes well for the future in markets with excellent growth potential, through Vistara in India and NokScoot in Thailand;
• New business ventures such as Airbus Asia Training Centre, which is performing particularly well; and
• Our substantial investment in the further development of our full-service operations, which remain the largest contributor to Group revenue. We expect there will always be demand for premium full-service travel, and exciting developments will be seen in this area in the year ahead, as SIA introduces all-new cabin products on the next batch of Airbus A380s.
These initiatives were all implemented under the watch of Stephen Lee, who served SIA as its Chairman with distinction for 11 years. Together with the board, he guided the management team with the highly dedicated workforce to transform the Group.
SIA is moving to the next phase of its transformation, to improve efficiency across the organisation and identify additional revenue-generation opportunities. A Transformation Office has been established and a multi-year programme is underway. All areas are being reviewed and considered on a clean slate – such as network, fleet, product and service, financial planning and organisation structure. I am confident that this next phase of transformation will result in more innovative solutions that will leave the Group in an even stronger position.
Our shareholders deserve a special thank you for your ongoing support. The changes that have taken place over the years are indeed significant, and have not come without risk. The trust you have placed in the Board and the management team is much appreciated. I must also put on record my personal appreciation, as well as that of the rest of the Board, to Stephen Lee, for his many years of service to our shareholders. At the same time I wish to record my thanks to both Christina Ong and Lucien Wong, who retired from the Board during the last financial year, for their contributions to the development of the Group.
Seventy years is a special milestone for any organisation. As we look back at what has been achieved to date, it is also important to look forward, to continue to implement change that is needed to ensure a bright future for the next 70 years and beyond.
Peter SeahChairman
Annual Report FY2016/17 19Annual Report FY2016/17 19

Board of Directors
1. Peter Seah Lim HuatChairmanMr Seah is the Chairman of DBS Bank Ltd, DBS Group Holdings Ltd, Singapore Health Services Ltd and LaSalle College of the Arts Limited. A banker for more than 30 years, Mr Seah was with former Overseas Union Bank between 1977 and 2001, retiring as Vice Chairman and CEO. Prior to that, he was with Citibank N.A. Between December 2001 and December 2004, Mr Seah served as President & CEO of Singapore Technologies Pte Ltd. Mr Seah was awarded the Distinguished Service Order in 2012 and the Public Service Star (Bintang Bakti Masyarakat) in 1999, and made a Justice of the Peace in 2003.
2. Goh Choon PhongDirector and Chief Executive OfficerMr Goh joined the Company in 1990 and has held senior management positions in various divisions in Singapore and overseas, ranging from Marketing to Information Technology to Finance and Cargo. Prior to his appointment as Chief Executive Officer, Mr Goh was Executive Vice President for Marketing and the Regions and also served as President of Singapore Airlines Cargo Pte Ltd, from 2006 to 2010, Senior Vice President Finance, from 2004 to 2006, and Senior Vice President Information Technology, from 2003 to 2004. Mr Goh’s other directorships and appointments include Chairman of Budget Aviation Holdings Pte. Ltd., which owns and manages Scoot and Tigerair, Director of SIA Engineering Company Limited, Member of the National University of Singapore Board of Trustees and Chairman of the Board of Governors of the International Air Transport Association, of which he is a Member of the Chair Committee and Strategy and Policy Committee. He was a board member of Mount Alvernia Hospital, from 2006 to 2015, and Virgin Australia Holdings Limited, from 2014 to 2015. Mr Goh was the 2015 recipient of the Centre for Aviation’s ‘Asia-Pacific Airline CEO of the Year Award’. In 2016, he received the ‘CEO Lifetime Achievement Award’ from the Airline Passenger Experience Association as well as the ‘Eisenhower Global Innovation Award’ from the Business Council for International Understanding. He was also named the ‘Outstanding Chief Executive Officer of the Year’ in the Singapore Business Awards 2017.
1.
4.
2.
5.
3.
6.
3. Gautam BanerjeeDirectorMr Banerjee is a Senior Managing Director of Blackstone Group and the Chairman of Blackstone Singapore. He was with professional services firm, PricewaterhouseCoopers (“PwC”) Singapore for over 30 years, including as its Executive Chairman for Singapore and in various leadership positions within the firm in India and the Asia Pacific region. Mr Banerjee retired from PwC Singapore on 31 December 2012. Apart from his executive role in Blackstone, he serves as Vice Chairman of the Singapore Business Federation, Chairman of raiSE and Listings Advisory Committee of the Singapore Exchange, and is a Board Member of Piramal Enterprises Limited, India, The Indian Hotels Company Limited, EDBI Pte Ltd and GIC Private Limited. He served on the Corporate Governance Council of the Monetary Authority of Singapore, Companies Act Reform Steering Committee and the Economic Strategies Committee chaired by the Finance Minister of Singapore from 2009 to 2010. Mr Banerjee was a Nominated Member of Parliament in Singapore between 2007 and 2009. In 2014, Mr Banerjee was awarded the Public Service Medal by the Singapore Government and an Honorary Doctor of Laws by the University of Warwick, England.
4. Helmut Gunter Wilhelm PankeDirectorDr Panke, a trained nuclear engineer, was with BMW AG from 1982 to 2006. During this time, he served in a number of senior positions, including Executive Chairman of the Board of Management from May 2002 through August 2006. Among other positions held, from 1993 through 1996, he served as the Chairman and CEO of BMW (US) Holding Corp, responsible for the carmaker’s North American activities. Dr Panke played a key role in the building of the first BMW plant in the USA in Spartanburg, South Carolina.
Singapore Airlines20 Singapore Airlines20
Strategy

5. William Fung Kwok LunDirectorDr Fung is the Group Chairman of Li & Fung Limited, a multinational group of companies headquartered in Hong Kong. Dr Fung has held key positions in major trade and business associations. He was the Chairman of the Hong Kong General Chamber of Commerce (1994 to 1996), Hong Kong Exporters’ Association (1989 to 1991) and Hong Kong Committee for the Pacific Economic Cooperation (1993 to 2002). Dr Fung has received numerous awards and accolades for his business contributions including the Silver Bauhinia Star by the Government of the Hong Kong Special Administrative Region in 2008. He was also conferred the Honorary Degrees of Doctor of Business Administration by the Hong Kong University of Science & Technology and by the Hong Kong Polytechnic University.
6. Hsieh Tsun-yanDirectorMr Hsieh is the Chairman and Lead Counselor of LinHart Group, a leadership advisory and counselling firm founded by Mr Hsieh in 2008. Mr Hsieh has extensive experience in international business, leadership development and corporate transformation. He was with management consulting firm, McKinsey & Company, for 28 years and held posts in Singapore, Toronto and Copenhagen. He holds joint appointment as Provost Chair Professor (Practice) at the National University of Singapore Business School and the Lee Kuan Yew School of Public Policy. He contributes to the community with board roles current and past including the Institute of Policy Studies, the Singapore International Foundation, the Singapore Symphony Orchestra, Covenant House Canada and the University Health Network Foundation in Toronto.
7. Dominic Ho Chiu FaiDirectorMr Ho is the Chairman of DBS Bank (China) Limited. He began his career as an auditor with KPMG in 1975 in the US city of Houston, covering a wide range of industries. He retired in 2007 as Co-Chairman of KPMG, China and Hong Kong. During his career with KPMG, Mr Ho was regarded as its China business specialist. He advised on China’s offshore oil industry, participated in the formation of China’s taxation system, was involved in initial public offerings (IPOs) of Chinese companies and assisted foreign companies with their investments in China. In the 1990s, he was commissioned by the Chinese Government to lead a team to perform a feasibility study of the Chinese aviation industry aimed at restructuring it ahead of the launch of airline IPOs.
Mr Ho is currently a Director of DBS Bank (Hong Kong) Limited, Hang Lung Properties Limited and Underwriters Laboratories Inc. and a past member of the Corruption Prevention Advisory Committee of Hong Kong’s Independent Commission Against Corruption, and a past member of Hong Kong’s Insurance Advisory Committee.
8. Lee Kim ShinDirectorMr Lee has 30 years of experience in the legal profession and is Managing Partner of Allen & Gledhill LLP. He first held that position between August 2012 and December 2013, returning to it in early 2015 after a one-year post as a Judicial Commissioner with the High Court of Singapore. He is a Member of the Governing Board of Duke-NUS Medical School Singapore, and a Member of the Governing Council of the Singapore Institute of Directors. Mr Lee is currently a Director of Eastern Development Holdings Pte Ltd, Eastern Development Private Limited and Epimetheus Limited. Previous directorships had been with the Accounting and Corporate Regulatory Authority, Community Cancer Fund, SIA Engineering Company, Singex Holdings and Wildlife Reserves Singapore, among others.
9. Simon Cheong Sae PengDirectorMr Cheong is the Chairman and CEO of SC Global Developments Pte Ltd, a leading luxury high-end residential developer in Singapore. He has more than 30 years of experience in real estate, banking and international finance. Mr Cheong established SC Global in 1996 as a real estate and hotel advisory and direct investment group, specialising in structuring large and complex transactions worldwide. He took SC Global Developments Ltd public in 1999 and built it into a leading high-end residential developer in Singapore with a market capitalisation of more than USD1 billion. He took it private through a general offer in 2013. Mr Cheong previously worked with Citibank (Singapore) as Head of Real Estate Finance for Singapore and with Credit Suisse First Boston as a Director and Regional Real Estate Head for Asia, excluding Japan. Mr Cheong previously served as a Board member of Republic Polytechnic, Singapore Turf Club, Singapore Dance Theatre and Raffles Girls’ Secondary School. He was also a Council Member of the Singapore Business Federation, and served two terms as President of the Real Estate Developers’ Association of Singapore.
8.7. 9.
Annual Report FY2016/17 21Annual Report FY2016/17 21

Operating ReviewThe Year in Review
The Singapore Airlines Group earned an operating profit of $623 million for the financial year ended 31 March 2017,
a 8.6 per cent decrease from last year, while profit attributable to owners of the Parent decreased 55.2 per cent to $360 million.
FINANCIAL YEAR OPERATING RESULTSThe Group saw a decrease in operating profit of $58 million to $623 million and a drop in Group revenue to $14,869 million. Passenger revenue declined over last year as yields decreased. Group expenditure fell $312 million from the last financial year, with a $780 million reduction in net fuel cost.
$623M
Group Operating Profit
79.0%
SIA Passenger Load Factor
1–2.Singapore Airlines’ sixth Airbus A350-900 is also the 10,000th aircraft delivered by Airbus.
3.Singapore Airlines welcomed the arrival of its first A350-900 aircraft on 3 March 2016.
4.Non-stop flights to San Francisco are made possible with Singapore Airlines’ new A350-900 aircraft.
1.
2.
3.
3.
During the year in review, the SIA Group leveraged its position as a leader in key markets around the globe.
Singapore Airlines22 Singapore Airlines22
Performance
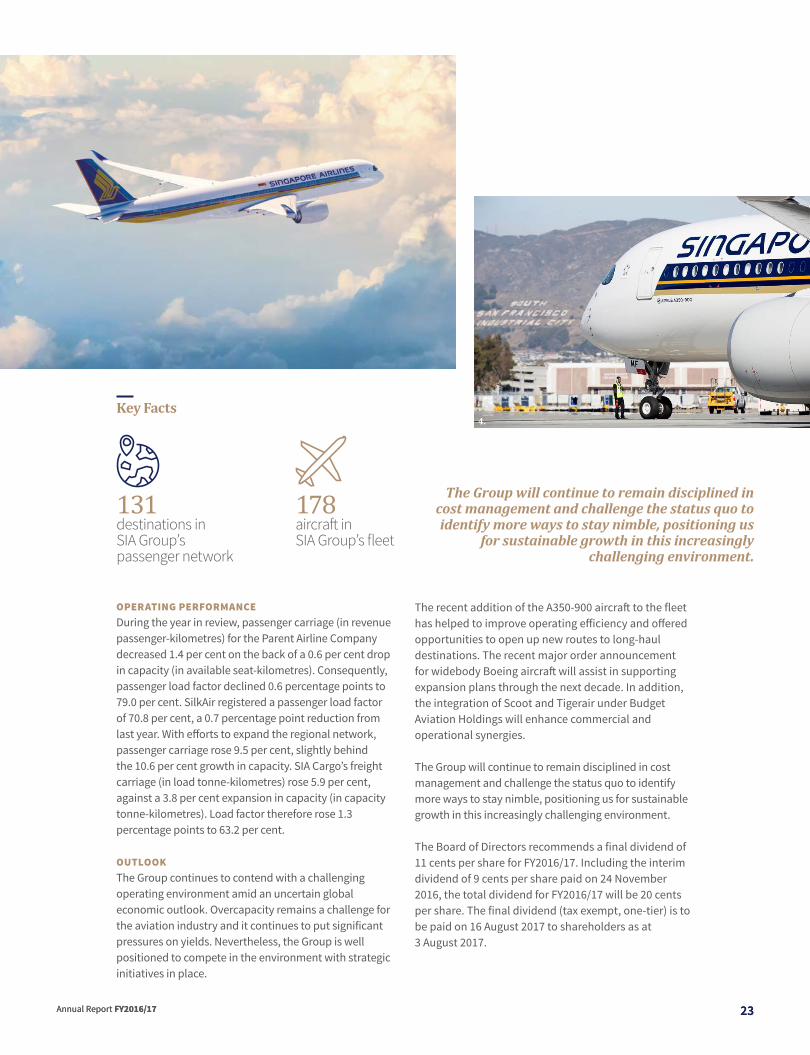
OPERATING PERFORMANCEDuring the year in review, passenger carriage (in revenue passenger-kilometres) for the Parent Airline Company decreased 1.4 per cent on the back of a 0.6 per cent drop in capacity (in available seat-kilometres). Consequently, passenger load factor declined 0.6 percentage points to 79.0 per cent. SilkAir registered a passenger load factor of 70.8 per cent, a 0.7 percentage point reduction from last year. With efforts to expand the regional network, passenger carriage rose 9.5 per cent, slightly behind the 10.6 per cent growth in capacity. SIA Cargo’s freight carriage (in load tonne-kilometres) rose 5.9 per cent, against a 3.8 per cent expansion in capacity (in capacity tonne-kilometres). Load factor therefore rose 1.3 percentage points to 63.2 per cent.
OUTLOOKThe Group continues to contend with a challenging operating environment amid an uncertain global economic outlook. Overcapacity remains a challenge for the aviation industry and it continues to put significant pressures on yields. Nevertheless, the Group is well positioned to compete in the environment with strategic initiatives in place.
The recent addition of the A350-900 aircraft to the fleet has helped to improve operating efficiency and offered opportunities to open up new routes to long-haul destinations. The recent major order announcement for widebody Boeing aircraft will assist in supporting expansion plans through the next decade. In addition, the integration of Scoot and Tigerair under Budget Aviation Holdings will enhance commercial and operational synergies.
The Group will continue to remain disciplined in cost management and challenge the status quo to identify more ways to stay nimble, positioning us for sustainable growth in this increasingly challenging environment.
The Board of Directors recommends a final dividend of 11 cents per share for FY2016/17. Including the interim dividend of 9 cents per share paid on 24 November 2016, the total dividend for FY2016/17 will be 20 cents per share. The final dividend (tax exempt, one-tier) is to be paid on 16 August 2017 to shareholders as at 3 August 2017.
The Group will continue to remain disciplined in cost management and challenge the status quo to identify more ways to stay nimble, positioning us
for sustainable growth in this increasingly challenging environment.
4.Key Facts
131destinations in SIA Group’s passenger network
178aircraft in SIA Group’s fleet
Annual Report FY2016/17 23Annual Report FY2016/17 23

Operating Review (continued)
Network
LEGEND Singapore Airlines Destinations Singapore Airlines Route Map SilkAir Destinations Scoot Destinations Tigerair Destinations
W ith the introduction of non-stop flights to San Francisco and a second daily flight to Los Angeles (via Seoul) from October 2016,
Singapore Airlines strengthened its longstanding presence in the US market. This is in addition to five weekly flights to Houston and daily flights to New York. The airline now operates 40 weekly services into the US.
In Europe, flight frequency to Germany increased with the addition of thrice-weekly Dusseldorf flights, complementing 21 weekly services into Frankfurt and Munich. In October 2016, services to Manchester via Munich were replaced by non-stop flights to Manchester, where customers can now also make onward connections to Houston.
During the year in review, Singapore Airlines and subsidiaries either launched or announced plans for 14 new destinations, leveraging the SIA Group’s position as a leader in key markets around the globe.
* Suvarnabhumi Airport (BKK) and Don Mueang International Airport (DMK)** Haneda International Airport and Narita International Airport
Qingdao
Nanjing
Dalian
Hangzhou
Shenyang
Tianjin
Kaohsiung
Sapporo
Amritsar
Shenzhen
Zhengzhou
HyderabadJaipur
Tiruchirappalli
Lucknow
Chiang Mai Haikou
NingboWuxi
MacauQuanzhou
Xi’an
Jinan
KaliboCebu
Clark
Phuket
IpohPenangLangkawiHat YaiKrabi
Dhaka
Gold Coast
Nanning
Koh SamuiSiem ReapPhnom Penh
Danang
MedanPekanbaru
Palembang
BandungYogyakarta
Lombok
Semarang
KuchingKota Kinabalu
Manado
Makassar
Balikpapan
Davao
Coimbatore
Thiruvananthapuram
Mandalay
Kathmandu
Visakhapatnam
Kunming
ChengduWuhan
Chongqing
Changsha Fuzhou
Xiamen
Cairns
Darwin
Luang PrabangVientiane
KochiAFRICA
ASIA
INDIAN OCEAN
EUROPE
SINGAPORE
To New York JFK
To Houston
ColomboMale
Bengaluru
Jeddah
Amsterdam
London
Copenhagen
Manchester
Frankfurt
Dusseldorf
Moscow
MunichParisZurich
RomeBarcelonaIstanbul
Milan
Dubai
New Delhi
Ahmedabad
Mumbai
Kolkata
Chennai
Melbourne
Cape Town
Johannesburg
Kuala Lumpur
Hanoi
Ho Chi Minh City
Sydney
Bandar Seri Begawan
Beijing
Guangzhou
Hong Kong
Shanghai
Adelaide
Brisbane
Perth
Manila
Seoul
Taipei
Bangkok*Yangon
JakartaDenpasar
Surabaya
Fukuoka
NagoyaOsaka
Tokyo**
Canberra
To San Francisco
To Los Angeles
AUSTRALIA
Singapore Airlines24 Singapore Airlines24
Performance

Our Subsidiaries
SILKAIR
52Destinations
14Countries
SCOOT
22Destinations
9Countries
TIGERAIR
41Destinations
12Countries
The South West Pacific region similarly observed strong growth with the commencement of the ‘Capital Express’ service in September 2016, linking Singapore, Canberra and Wellington four times per week. In addition, frequency to Brisbane increased to 24 weekly flights, and peak-period demand to other destinations was met with supplementary seasonal services.
Singapore Airlines also announced plans for new services to Stockholm, which will be its second Scandinavian destination after Copenhagen, with effect from 30 May 2017.
SilkAir boosted its network during the year in review with new services to Vientiane, Luang Prabang and Fuzhou. With the addition of these new services, the total number of destinations in SilkAir’s network increased to 52.
In FY2016/17, Scoot expanded its services in China, India, Japan and the Middle East, with new destinations comprising Amritsar, Chennai, Dalian, Jeddah and Sapporo. Scoot also launched services to the Indian city of Jaipur during the year in review, which were subsequently taken over by Tigerair in March 2017. Scoot also marked a significant milestone in August 2016 when it announced plans for non-stop flights between Singapore and Athens, its maiden European destination.
Tigerair continued to strengthen its market presence in China with the addition of Wuxi and Zhengzhou to the network. This brought Tigerair’s destinations to China to a total of 12 cities. With plans underway for Scoot and Tigerair to be operated under the Scoot brand name in the second half of 2017, this integration will enable passengers to travel seamlessly across Scoot and Tigerair’s combined network of 60 destinations across 16 countries.
as at 31 March 2017
61Destinations
31Countries
Singapore Airlines covers
ATLANTIC OCEAN
SOUTHAMERICA
PACIFIC OCEAN
NORTHAMERICA
To Frankfurt
To Manchester
San Francisco
Houston
Los Angeles
New York JFK
Auckland
Christchurch
Wellington
To Hong Kong
To Seoul
To Tokyo
Annual Report FY2016/17 25Annual Report FY2016/17 25

Operating Review (continued)
Fleet Management
FY2016/17 saw the delivery of 10 Airbus A350-900 aircraft to Singapore Airlines. Two A330-300s were returned to lessors.
In February 2017, a letter of intent was signed with Boeing to purchase 20 777-9s and 19 787-10s. Including these, Singapore Airlines’
total aircraft orders stood at 130 as at 31 March 2017. On order are 56 A350-900s, five A380-800s, 20 777-9s and 49 787-10s.
Singapore Airlines is committed to maintaining a modern fleet. The SIA passenger aircraft fleet in operation, as at 31 March 2017, comprised 106 aircraft, with an average age of seven years and eight months. For the four passenger airlines in the Group – Singapore Airlines, SilkAir, Scoot and Tigerair – the average age is six years and five months.
SIA Cargo’s operating fleet as at 31 March 2017 comprised seven Boeing 747-400 freighters, with an average age of 13 years and four months.
The operating fleet of SilkAir as at 31 March 2017 comprised three A319s, 10 A320s and 17 737-800NGs, with an average age of four years and three months. In August 2012, SilkAir announced firm orders for 54 aircraft – consisting of 737-800NGs and 737 MAX 8s. Deliveries are due to continue to 2022.
Scoot’s operating fleet as at 31 March 2017 comprised six 787-8s and six 787-9s, with an average age of one year and seven months. The airline has eight more aircraft on firm order, comprising four 787-8s and four 787-9s. Deliveries are due to continue to 2019.
Tigerair’s operating fleet as at 31 March 2017 comprised two A319s and 21 A320s with an average age of five years and 11 months. The airline has 39 A320neos on firm order. Deliveries will commence from 2018.
SILKAIR
4Years
3Months
SINGAPORE AIRLINES
7Years
8Months
SCOOT
1Year
7Months
TIGERAIR
5Years
11Months
SIA CARGO
13Years
4Months
Fleet Age (average age)As at 31 March 2017 Aircraft in Fleet
106
30
12
23
7
Singapore Airlines26 Singapore Airlines26
Performance

Products and Services
P rogramme improvements aimed at enhancing value to KrisFlyer members continued to be introduced during the
year in review.
KrisFlyer members now have more options to utilise their miles, with redemption for award flights and upgrades for Singapore Airlines’ Premium Economy Class, as well as for KrisShop merchandise.
For the first time, KrisFlyer members are also able to donate their miles to Make-A-Wish Singapore, which will go towards fulfilling the travel wishes of beneficiaries.
Partnerships with airline and non-airline partners were expanded to provide greater member benefits. PPS Club members and KrisFlyer Elite Gold members flying on India-based Vistara can now enjoy tier benefits, including lounge access and additional baggage allowance.
‘Infinite Journeys’, an enhanced partnership with Shangri-La, was launched in September 2016 to give greater rewards and recognition to KrisFlyer members who link their KrisFlyer and Shangri-La Golden Circle accounts. The American Express Singapore Airlines Credit Cards were also enhanced to include exclusive Singapore Airlines travel privileges, as well as improved mileage earn rates, offering card members a faster way to earn and redeem KrisFlyer rewards.
Throughout the year, members also benefitted from a series of global redemption promotions and partner privileges in the area of financial services, retail, telecommunications and travel.
KrisFlyer
Key Facts
More than 3,000,000KrisFlyer members globally
More than200 airline and non-airline partners
15SilverKris Lounges around the world
Annual Report FY2016/17 27Annual Report FY2016/17 27

Operating Review (continued)
Products and Services
Ground Services
1–3.The new SilverKris Lounge at Brisbane Airport provides customers world-class comfort and service with the ‘Home Away from Home’ concept.
4.Customers can enjoy a fuss-free check-in experience with the SingaporeAir Mobile App’s new passport scanning feature.
Singapore Airlines opened the doors to its new SilverKris Lounge at Brisbane Airport on 24 May 2016. Guests can enjoy distinct personal
space that provides a sense of ‘being home’, as well as more personalised services from lounge staff along with a delectable selection of food and beverages to complement our in-flight offerings.
Following the upgrade of the SilverKris Lounge in Brisbane, the lounge at Bangkok will complete its upgrade in the first quarter of FY2017/18. Other SilverKris Lounges modelled after the new ‘Home Away from Home’ concept are at Hong Kong, London, Manila and Sydney airports.
2.
1.
4.
3.
Singapore Airlines28 Singapore Airlines28
Performance
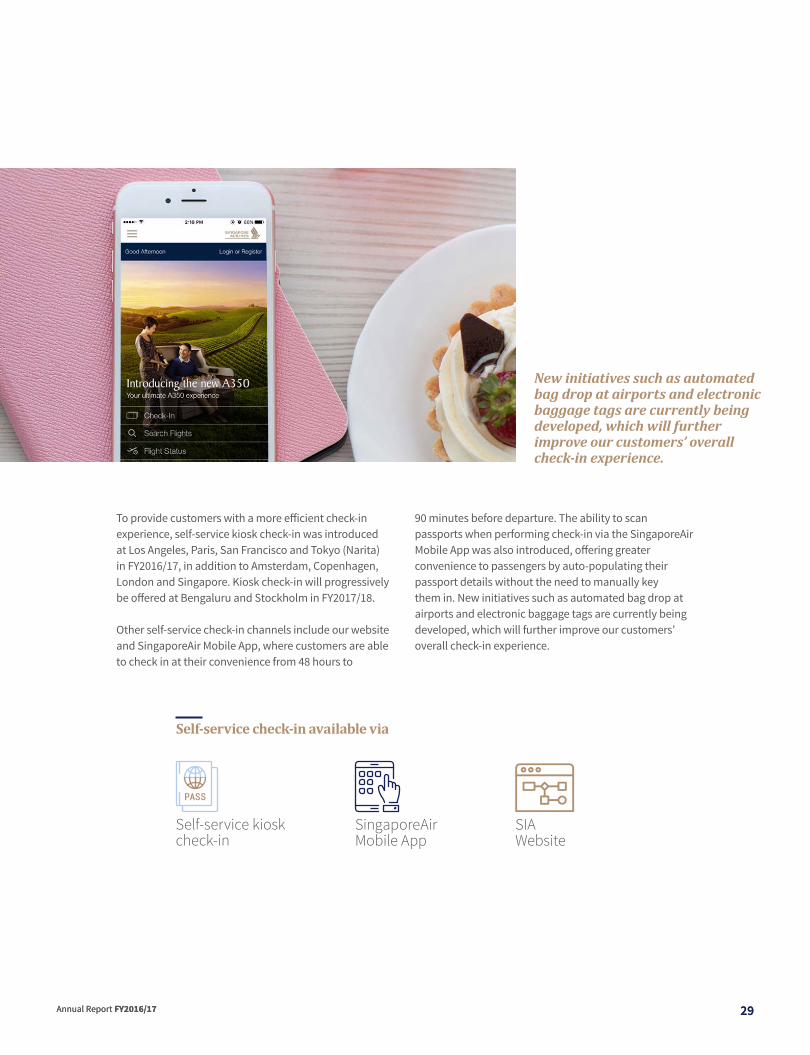
To provide customers with a more efficient check-in experience, self-service kiosk check-in was introduced at Los Angeles, Paris, San Francisco and Tokyo (Narita) in FY2016/17, in addition to Amsterdam, Copenhagen, London and Singapore. Kiosk check-in will progressively be offered at Bengaluru and Stockholm in FY2017/18.
Other self-service check-in channels include our website and SingaporeAir Mobile App, where customers are able to check in at their convenience from 48 hours to
90 minutes before departure. The ability to scan passports when performing check-in via the SingaporeAir Mobile App was also introduced, offering greater convenience to passengers by auto-populating their passport details without the need to manually key them in. New initiatives such as automated bag drop at airports and electronic baggage tags are currently being developed, which will further improve our customers’ overall check-in experience.
New initiatives such as automated bag drop at airports and electronic baggage tags are currently being developed, which will further improve our customers’ overall check-in experience.
Self-service check-in available via
SingaporeAir Mobile App
SIAWebsite
Self-service kiosk check-in
Annual Report FY2016/17 29Annual Report FY2016/17 29

Operating Review (continued)
Products and Services
Singapore Airlines introduced a new traditional Indian set meal, Ruchi Thali, for Business Class passengers travelling between India and Singapore in November 2016. Available for flights to and from Bengaluru, Delhi and Mumbai, the menu was specially curated by the renowned Chef Sanjeev Kapoor from our International Culinary Panel. The menu will be progressively introduced on other Indian sectors.
Customers can enjoy a three-course Indian meal along with quintessential accompaniments such as chutneys and yoghurt. Chef Kapoor’s Ruchi Thali is designed to replicate the plethora of taste, textures and aromas synonymous with Indian cuisine. From tenderly braised vegetables to slowly simmered meats, an exquisite selection of vegetarian and non-vegetarian dishes prepared delicately with the perfect balance of flavours will satiate the taste buds of seasoned travellers.
In-flight Services
1–3.Ruchi Thali, created by acclaimed Indian chef Sanjeev Kapoor, focuses on the perfect balance of flavours synonymous with Indian cuisine.
Customers can enjoy a three-course Indian meal along with quintessential accompaniments such as chutneys and yoghurt.
ETHNIC MEALS:
Launch of Ruchi Thali A taste of traditional Indian cuisine
Ruchi Thali Main Course and accompaniments
Ruchi Thali Appetiser
Ruchi Thali Dessert
2.
3.
1.
Singapore Airlines30 Singapore Airlines30
Performance

Hanakoireki7.
Launch of Korean Ethnic Meal An authentic taste of Hansik
Singapore Airlines introduced Hansik, a new dining concept in First Class and Business Class, from March 2017. Hansik, which means Korean cuisine, offers customers a complete Korean dining experience that includes a variety of side dishes such as soup, vegetables, meat and rice. This dining concept is a reflection of the growing popularity of Korean cuisine globally and Singapore Airlines’ constant efforts to provide new in-flight dining experiences for our customers. In Premium Economy Class and Economy Class, Singapore Airlines also introduced an enhanced menu featuring favourite Korean dishes such as bibimbap.
To celebrate the launch of Hansik, Singapore Airlines collaborated with Michelin star chef Yim Jungsik to create a special menu for all flights departing from Seoul.
New Serviceware for HanakoirekiA culinary expression of flowers through the seasons
Singapore Airlines introduced new serviceware for customers to enjoy Hanakoireki, our Japanese ethnic meal in Business Class. Derived from the Japanese word for ‘flower’, Hanakoireki was created by Chef Yoshimura Murata from Singapore Airlines’ International Culinary Panel. Hanakoireki offers customers the freshest seasonal ingredients presented in the exquisite petals of a plum blossom-shaped bento, available on selected flights to and from Japan.
4–5.Hansik, a new Korean meal dining concept available on flights departing from Seoul in First Class and Business Class, was created in collaboration with Chef Yim Jungsik.
6.Bibimbap, a signature Korean dish, is offered to customers on selected flights in Premium Economy Class and Economy Class.
7.New serviceware was introduced for Hanakoireki, the Japanese ethnic meal available on selected flights to and from Japan for Business Class customers.
This dining concept is a reflection of the growing popularity of Korean cuisine globally and Singapore Airlines’ constant efforts to provide new in-flight dining experiences for our customers.
Hansik in First Class
4.
Bibimbap in Premium Economy Class and Economy Class
6.
Hansik in Business Class
5.
Annual Report FY2016/17 31Annual Report FY2016/17 31
Operating Review (continued)
People Development
In FY2016/17, Singapore Airlines reviewed its leadership competency framework to enable sharper focus on critical competencies that are needed to
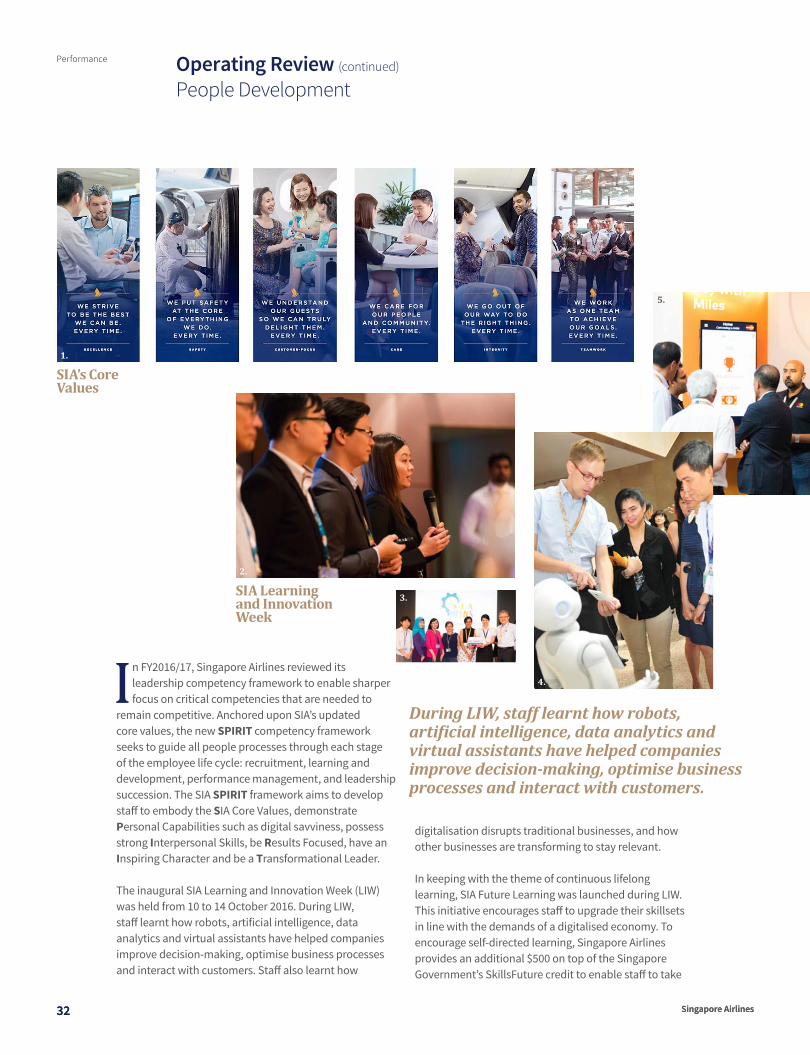
remain competitive. Anchored upon SIA’s updated core values, the new SPIRIT competency framework seeks to guide all people processes through each stage of the employee life cycle: recruitment, learning and development, performance management, and leadership succession. The SIA SPIRIT framework aims to develop staff to embody the SIA Core Values, demonstrate Personal Capabilities such as digital savviness, possess strong Interpersonal Skills, be Results Focused, have an Inspiring Character and be a Transformational Leader.
The inaugural SIA Learning and Innovation Week (LIW) was held from 10 to 14 October 2016. During LIW, staff learnt how robots, artificial intelligence, data analytics and virtual assistants have helped companies improve decision-making, optimise business processes and interact with customers. Staff also learnt how
digitalisation disrupts traditional businesses, and how other businesses are transforming to stay relevant.
In keeping with the theme of continuous lifelong learning, SIA Future Learning was launched during LIW. This initiative encourages staff to upgrade their skillsets in line with the demands of a digitalised economy. To encourage self-directed learning, Singapore Airlines provides an additional $500 on top of the Singapore Government’s SkillsFuture credit to enable staff to take
SIA’s Core Values
SIA Learning and Innovation Week
2.
5.
1.
During LIW, staff learnt how robots, artificial intelligence, data analytics and virtual assistants have helped companies improve decision-making, optimise business processes and interact with customers.
3.
4.
Singapore Airlines32 Singapore Airlines32
Performance

1.Singapore Airlines’ updated core values focus on excellence, safety, customers, integrity, care and teamwork.
2–5.The first SIA Learning and Innovation Week helped raise awareness of game-changing technologies and new business models.
6.The poster for a healthy eating workshop as part of the SIA Wellness and Health Programme.
7–8.The 35th SIA Group Athletics Meet was held over two weekends in May at ITE East Simei.
up relevant courses. Some 120 courses were curated into our internal learning management system, with a special focus on digitalisation and data analytics.
In 2016, Singapore Airlines integrated the Workplace Improvement and Innovation Scheme (WINS) together with the Staff Ideas in Action (S-I-A) scheme and introduced its first SIA-WINS Challenge. The Challenge aims to foster and sustain a culture of innovation in the SIA Group, focusing on the Group’s shared core values
SIA Wellness and Health Programme
6.
SIA Group Athletics Meet
7.
8.
More information on the staff strength of the Airline and the SIA Group can be found on pages 49 and 56.
of Excellence and Teamwork. Fourteen teams across the SIA Group competed and presented their ideas to Senior Management on process improvement, automation and how the Company can better leverage on technology.
The 35th SIA Group Athletics Meet 2016 was held over two weekends in May 2016 at ITE East Simei. The 2016 Athletics Meet saw the inclusion of Scoot and Tigerair for the first time in the traditional track and field events, as well as the two inter-divisional events. Also under the SIA Group events, the SIA Group Gamesfest was organised on 9 September 2016 at the SIA Group Sports Club to foster the spirit of camaraderie in the friendly competition of indoor and outdoor games. Staff also showcased their talents in acts ranging from songs to comedic band performances in the SIA Star Quest.
With the introduction of the SIA Wellness and Health Programme (WHP) introduced in 2011, SIA puts great emphasis on wellness programmes that keep the mind and body fit. WHP continues to promote a healthier workplace through a range of activities such as annual basic health screening, health coaching initiatives, sports and recreational activities, as well as talks and workshops covering topics on general health, healthy eating and cooking. SIA’s Wellness and Health online community was also launched to encourage the sharing of healthy living tips.
Annual Report FY2016/17 33Annual Report FY2016/17 33

Environment
During the year in review, Singapore Airlines remained dedicated to providing air transportation services of the highest quality, with a firm belief in a long-term responsibility to protect the environment.
addition to the programme. Under this programme, ASPIRE practices are observed, where the Airline makes use of favourable winds, reduces airborne holding, enables efficient ‘continuous descent’ arrivals and reduces taxiing time to save on fuel and reduce carbon emissions.
The Airline’s focus on the reduction of aircraft noise is in line with the international standards set by the International Civil Aviation Organization (ICAO). In FY2016/17, the passenger fleet for the airlines in the Group continued to meet the stringent Chapter 4 standards regulated by ICAO. In addition, SIA Group’s passenger fleet together with SIA Cargo freighters all meet the 2004 ICAO CAEP/6 Emission Standards for NOx.
While Singapore Airlines took significant steps to reduce carbon emissions from its aircraft operations in FY2016/17, the Airline continues to work towards reducing waste generation and ground emissions through environmental awareness initiatives and the observation of green practices.
More information on the Airline’s environmental activities and programmes are available in the Singapore Airlines Sustainability Report FY2016/17.
W hile sustainable practices have long been observed across the Company, Singapore Airlines continued to explore new ways
to further reduce the carbon footprint in all of our operations.
With a longstanding practice of maintaining a modern fleet, the average age of Singapore Airlines’ 106-strong aircraft fleet is seven years and eight months. For the four passenger airlines in the Group – Singapore Airlines, SilkAir, Scoot and Tigerair – the average age is six years and five months.
A comprehensive fuel productivity programme has been implemented to improve fuel efficiency through engine modification, as well as a reduction of airframe drag through performance improvement packages. The Airline also remains committed to planning the most fuel-efficient routes for our flights, in a bid to reduce emissions.
Singapore Airlines is an active member of the Sustainable Aviation Fuel Users Group (SAFUG), which works to accelerate the development and commercialisation of sustainable aviation fuel, and adopt sustainably-produced aviation biofuels that bring minimal impact on biodiversity and provide a positive socioeconomic impact.
Singapore Airlines’ participation in the Asia and Pacific Initiative to Reduce Emissions (ASPIRE) programme since 2010 highlights the unique partnership with air navigation service providers, who share the aim of reducing carbon emissions from fuel burnt in all flight phases. Singapore Airlines’ new ‘Capital Express’ service launched in September 2016 on the Canberra and Wellington route was unveiled as the latest
Singapore Airlines34 Singapore Airlines34
Performance

Community Engagement
The Airline has a longstanding commitment to help grow the arts scene in Singapore and we continued this tradition through our contributions
to the National Arts Council, Singapore Chinese Orchestra, Singapore Dance Theatre, Singapore Lyric Opera and Singapore Symphony Orchestra. In 2016, Singapore Airlines was named a ‘Friend of the Arts’ by the National Arts Council, for our ongoing contribution to Singapore’s arts scene.
SIA also continued to support educational initiatives that offer students opportunities to realise their full academic potential. Contributions from SIA provide organisations such as Room to Read opportunities to collaborate with local communities and partner organisations to develop literacy skills and reading habits among students in low-income countries.
In February 2017, KrisFlyer partnered with Make-A-Wish Singapore to enable members of the SIA Group’s frequent flyer programme to donate miles to the charity. These donated miles will go toward fulfilling the wishes of Make-A-Wish Singapore’s beneficiaries that involve overseas travel on Singapore Airlines and subsidiary SilkAir flights. The scheme is in addition to the support that SIA has provided directly to Make-A-Wish beneficiaries.
Beyond Singapore, our overseas stations are equally passionate and committed in reaching out to their local communities. Some initiatives include the SIA Mumbai team’s collaboration with Concern India Foundation to organise a Sports Day for over 200 disabled children, SIA Korea team’s partnership with Jongno Community Welfare Centre where staff volunteered their time to
bring visually-handicapped children to join a dairy farm experience programme, and SIA Philippines team’s sponsorship of Bantay Bata’s Bantay Edukasyon Program for the past 14 years, which provides financial support to over 1,400 needy children, enabling them to receive school supplies, transportation and allowances for their education needs.
The SIA Group also actively supports various charitable causes. SilkAir partnered with St. Andrew’s Autism Centre (SAAC) from December 2016 to February 2017 to launch Colours Project, an initiative that explores potential employment pathways for adults at SAAC with moderate to severe autism. Customers can purchase canvas tote bags, designed by students and clients of SAAC, on board SilkAir flights or from SilkAir’s online SkyShop, with all proceeds going to SAAC’s Colours Project. Abroad, SilkAir India helped to organise a charity event to raise funds and support Sevagram, a charitable institution established for orphans, the aged and terminally ill cancer patients, while SilkAir Indonesia organised visits to orphanages during Ramadan in June 2016, with staff staging musical performances and hosting dinners for children at the orphanages.
Since 2010, SIA has been the exclusive airline partner for the Harapan Rainforest (also known as Hutan Harapan) Initiative. This large-scale project aims to restore and protect nearly 100,000 hectares of tropical rainforest in Indonesia, one of the world’s most threatened and bio-diverse ecosystems. In 2016, some major developments of this initiative included restoration of over 4,000 hectares of the rainforest, and installation of an early warning system to better manage and extinguish forest fires.
Singapore Airlines recognises the importance of giving back to the communities we serve. For many years, we have been actively supporting charities as well as non-profit organisations through cash donations, complimentary or rebated air tickets and staff volunteerism. We firmly believe in sponsoring initiatives that promote the arts, education, sports, as well as the environment and conservation.
More details about the Airline’s community initiatives and programmes can be found in the Singapore Airlines Sustainability Report FY2016/17.
Annual Report FY2016/17 35Annual Report FY2016/17 35

SubsidiariesSIA Engineering Company
SIA Engineering Company continues to be a major player at Changi Airport, maintaining a robust revenue stream from its line maintenance business.
The SIA Engineering Company (SIAEC) Group recorded a profit attributable to owners of the parent of $332.4 million, an increase
of 90.1 per cent over the preceding year, boosted by divestment gains of $178.0 million. Revenue decreased by $9.4 million or 0.8 per cent to $1,104.1 million. Share of profits of associated and joint venture companies increased by $3.7 million or 4.0 per cent to $96.5 million.
SIAEC’s international line maintenance network covers 36 airports in seven countries, handling more than 900 flights round-the-clock daily for more than 70 airlines. At its base in Singapore, SIAEC continues to be a major player. It strengthened its line maintenance market leadership at Changi Airport by handling 141,454 flights during the year in review, an increase of 2.6 per cent compared to the preceding year. With the growing number of flights operating through Singapore, together with Changi Airport’s continued growth as a hub for full-service and low-cost carriers, SIAEC continues to pursue service offering enhancements to cater to the growing needs and expectations of airline customers.
SIAEC handlesInternational Line
Maintenance Network
900More than
flights round-the-clock
daily
36Covers
airports in seven countries
Singapore Airlines36 Singapore Airlines36
Performance

As a leading maintenance, repair and overhaul (MRO) service provider in Asia Pacific, SIAEC’s one-stop maintenance facility in Singapore offers MRO services to an international client base of airlines. The maintenance facility in Singapore comprises six hangars, and includes one of the world’s first purpose-built hangars to handle the Airbus A380, the world’s largest commercial aircraft. Another three hangars are also located in Clark, Philippines, extending the company’s outreach to airline customers in the region.
Heavy Maintenance Singapore Services Pte Ltd, the joint venture with Airbus, was incorporated during the year in review. Airbus is committed to developing the joint venture as its Centre of Excellence for Airbus A350 and A380 heavy maintenance in Asia. This will strategically bring aircraft manufacturer expertise and support directly to airlines in the region.
Staying on the course of forging collaborations with strategic partners, an agreement was signed with Moog Incorporated to establish a Singapore-based joint venture focusing on the repair and overhaul of Moog’s flight control components on new-generation aircraft such as Airbus A350s and
Boeing 787s. Another agreement was signed with Safran Aircraft Engines, which appointed SIAEC as its authorised CFM On Site Support service provider, to offer on-wing maintenance services to operators of the LEAP-1A and LEAP-1B engines in Asia Pacific.
Under its fleet management business, the company managed a fleet of 129 aircraft for nine airlines in FY2016/17, establishing it as a major fleet management service provider. An expanding pool of airlines around the world is attracted by the integrated total care services offered under SIAEC’s fleet management business, which bundles MRO services with 24/7 fleet and inventory management support.
Apart from accessing technology through collaborations with leading aircraft, engine and component manufacturers, SIAEC continues to invest in innovation initiatives and technology adoption projects in aerospace maintenance, repair and overhaul. These investments are aimed at developing innovative solutions to enhance customers’ fleet efficiency and reliability, while generating higher business productivity and process improvements.
SIAEC continues to pursue service offering enhancements
to cater to the growing needs and expectations of airline
customers.
Annual Report FY2016/17 37Annual Report FY2016/17 37

SubsidiariesSIA Cargo
SIA Cargo became the first Asia Pacific carrier to be awarded IATA’s CEIV Pharma certification, affirming SIA Cargo’s capabilities in handling pharmaceutical cargo.
SIA Cargo posted its first operating profit in six years on the back of a strong second half performance. Although the slowdown in air cargo demand growth in FY2015/16 continued into the first half of FY2016/17, a sharp
demand recovery in the second half allowed SIA Cargo to claw back all the losses incurred in the first half. Demand in key market segments such as e-commerce and aerospace saw strong growth.
Two Boeing 747-400 freighters left SIA Cargo’s operating fleet in FY2016/17 and were returned to the lessors after the end of their respective lease terms. SIA Cargo closed the financial year with seven 747-400 freighters in its operating fleet. Despite the smaller freighter fleet, SIA Cargo’s capacity (in capacity tonne-kilometres) grew by 3.8 per cent as a result of the increase in passenger aircraft bellyhold capacity, which was partly driven by the extension of the SIA Group’s route network to Canberra, Dalian, Dusseldorf, Fuzhou, Luang Prabang, Sapporo, Vientiane and Wellington. Besides its own freighters, SIA Cargo markets the bellyhold capacity of the passenger aircraft operated by Scoot, SilkAir and its parent company – Singapore Airlines.
During the year, SIA Cargo saw the renewal of its partnership with Rolls-Royce to transport Trent 1000 aircraft engines from the latter’s Seletar Assembly and Test
SIA Cargo’s Capacity
3.8%Grew by
(in capacity tonne-kilometres)due to an increase
in passenger aircraft bellyhold capacity
Singapore Airlines38 Singapore Airlines38
Performance

Unit in Singapore to Boeing’s 787 production facilities in the USA. SIA Cargo also provided charter services to carry state-of-the-art racing equipment for several global sporting events such as Formula One and MotoGP, and was privileged to be chosen as the preferred carrier to transport concert equipment for several high-profile artists such as Guns N’ Roses and Adele. Over 60 charter flights were operated during the year. In January 2017, SIA Cargo became the first carrier in Asia Pacific to be awarded IATA’s Centre of Excellence for Independent Validators in Pharmaceutical Logistics (CEIV Pharma) certification, and the first stakeholder within the Changi CEIV Community to be certified. This certification, which is recognised by the pharmaceutical industry, affirms SIA Cargo’s capabilities in handling high value, time-sensitive and temperature-controlled pharmaceutical cargo with speed, reliability and efficiency. SIA Cargo also became a Full Member of Pharma.Aero, which is an independent association comprising pharmaceutical logistics stakeholders from around the world.
Harnessing technology to better manage customer relationships, as well as improve service levels and efficiency, was a priority during the year. Among the initiatives was the launch of the Cargo Sales Force Mobility
system in November 2016 to equip SIA Cargo’s sales teams with a one-stop collaborative platform to access key customer data while on the move, and pursue sales leads and opportunities more quickly and effectively.
SIA Cargo continued to support the industry’s push towards greater digitisation, driving the implementation of electronic air waybill (e-AWB) across its network. At the end of March 2017, SIA Cargo’s e-AWB penetration rate stood at 74 per cent, well above the industry average.
As part of its corporate social responsibility programme, SIA Cargo continued to support its adopted charity, Singapore Children’s Society, through corporate funding and employee volunteering. In addition, great importance was placed on wildlife conservation, with SIA Cargo continuing to work with Wildlife Reserves Singapore vis-à-vis its global partnership programmes.
Among the accolades received in FY2016/17, SIA Cargo was again voted “Best Air Cargo Carrier in Asia” at the 2016 Asian Freight, Logistics and Supply Chain Awards, and was named “Carrier of the Year” at the Supply Chain Asia Industry Night 2016. In recognition of its steadfast contributions to the conservation of the nation’s heritage, SIA Cargo was bestowed the “Partner of Heritage Award” by the National Heritage Board of Singapore.
SIA Cargo continued to support the industry’s efforts to drive the implementation of electronic air waybill (e-AWB) across its network through the IATA eAWB360 campaign.
Annual Report FY2016/17 39Annual Report FY2016/17 39

SubsidiariesSilkAir
SilkAir was ranked 3rd in the Top 10 Airlines by Passenger Carriage in the Changi Airline Awards 2016, presented by Changi Airport Group.
During the financial year in review, SilkAir continued to grow its network, with the addition of three new destinations – Fuzhou, Luang
Prabang and Vientiane.
On 31 October 2016, SilkAir started thrice-weekly circular services to Vientiane and Luang Prabang. On 21 November 2016, SilkAir opened its eighth route to China, putting Fuzhou on the destination map. Together with the commencement of flight services to Laos, SilkAir’s network increased to 52 destinations in 14 countries.
SilkAir’s fleet size continued to grow with the delivery of three new Boeing 737-800NG aircraft. As of 31 March 2017, the fleet of 30 aircraft comprises three Airbus A319s, 10 A320s and 17 Boeing 737-800NGs.
On the product front, SilkAir launched a new All-Time Favourites menu for its Business Class customers in July 2016, offering a curated selection of 20 meal options across Asian, Western and Singaporean cuisines. The selection includes Chicken Tikka, Mee Rebus, Hainanese Chicken Rice and Blueberry Pancakes, and can be pre-booked at least 24 hours before flight departure.
Aircraft Fleet
30Comprising
aircraft in fleet
New Destinations
3Added
network points in Fuzhou, Luang
Prabang and Vientiane
Singapore Airlines40 Singapore Airlines40
Performance

In November 2016, SilkAir also launched its new mobile app, which allows even more seamless connectivity from booking to boarding. Passengers from Singapore can enjoy mobile check-in and electronic boarding passes, while tablet users will be offered an immersive experience with travel guides for all SilkAir destinations. In conjunction with the mobile app launch, exclusive deals and promotions were rolled out for all users.
A brand campaign, ‘Come Feel the Joy’, was launched during the financial year in review, highlighting SilkAir’s full-service offerings in Business Class and Economy Class such as the in-flight entertainment system SilkAir Studio and in-flight meals.
On the corporate social responsibility front, SilkAir continued to work with its adopted charity partner, Child’s Dream Foundation, on several projects. SilkAir staff participated in field trips with Child’s Dream staff as they visited provincial areas in Cambodia, Laos and Thailand to learn more about the organisation’s work. SilkAir also provided support to increase awareness of the foundation and cargo requirements for the foundation’s works.
SilkAir’s efforts to provide high standards of product and service quality continue to be recognised in the region. Australian-based airline product rating review site, Airlineratings.com, awarded SilkAir the “Regional Airline of the Year” in 2016. SilkAir was ranked 3rd in the Top 10 Airlines by Passenger Carriage in the Changi Airline Awards 2016, presented by Changi Airport Group. The airline continued to be honoured in the TTG Asia Travel Hall of Fame since 2010, following SilkAir’s 10th win at the TTG Asia Travel Awards in 2009. SilkAir was once again voted one of the Top 10 Airlines Worldwide for Cabin Service in Best in Travel Poll 2016 by Hong Kong-based online travel magazine, Smart Travel Asia.
SilkAir was named Indonesia’s Leading Regional Airline of the Year 2015/2016 at the Indonesia Travel and Tourism Awards. The airline was also named “Best International Airline” by East India Travel Awards and “Best Regional Airline” by South India Travel Awards. In addition, SilkAir received various accolades in China such as “Recommended Airlines for 2016” by Travel + Leisure China, “Xiamen Most Preferred Airlines Award” by Xiamen News Daily, and “Innovative Travel Services Award” from HN.QQ.com, a subsidiary of Tencent Inc.
SilkAir’s efforts to provide high standards of product and service quality continue to be recognised
in the region.
Annual Report FY2016/17 41Annual Report FY2016/17 41

SubsidiariesBudget Aviation Holdings
During the year in review, Budget Aviation Holdings announced plans for Scoot and Tigerair to be operated under the Scoot brand name and a single Air Operator’s Certificate.
Budget Aviation Holdings (BAH) was formed in May 2016 as Singapore Airlines’ holding company for Scoot and Tiger Airways, which operates
as Tigerair. The integration of Scoot and Tigerair under BAH has paved the way for greater commercial and operational synergies through the alignment of reservation systems, departmental functions, policies and flight schedules of both airlines. This has resulted in cost efficiencies for both Scoot and Tigerair. The integration has also made it even more convenient for passengers to travel seamlessly across Scoot and Tigerair’s combined network of 60 destinations across 16 countries.
In November 2016, BAH announced plans for Scoot and Tigerair to be operated under the Scoot brand name and a single Air Operator’s Certificate in the second half of 2017. This would encompass integrating flight scheduling and connections, as well as guest touchpoints such as website, contact centre, and check-in counters. The multi-award winning Scoot brand has demonstrated strong resonance with passengers, and the strength of the brand would help take Scoot and Tigerair’s current operations to greater heights.
Scoot and Tigerair celebrated their 50 millionth passenger across both networks in March 2017. This significant milestone was marked with celebratory activities at the Scoot and Tigerair check-in counters and flight gatehold room. Attractive travel prizes were
presented to the lucky 50 millionth passenger who was travelling from Singapore to Taipei on a Scoot flight.
In order to tap the future talent pool for upcoming business expansion, Scoot and Tigerair have worked closely with educational institutions and signed Memoranda of Understanding (MOUs) with the Institute of Technical Education in September 2016 and Ngee Ann Polytechnic in January 2017. These MOUs enable deeper collaboration with educational institutions in the areas of education curriculum as well as internship and employment opportunities with Scoot and Tigerair.
Scoot and Tigerair held their first joint pilot assessment in October 2016. This was part of the airlines’ efforts to grow their pool of pilots in preparation for upcoming fleet and network growth. Scoot and Tigerair also ramped up cabin crew hiring initiatives to complement the planned capacity expansion.
BAH recognises the importance of building partnerships with other low-cost carriers. In May 2016, Scoot co-founded the Value Alliance – the world’s first pan-regional low-cost carrier alliance. The alliance comprises eight Asia Pacific low-cost carriers, including Scoot and Tigerair. With Value Alliance, customers will benefit from the convenience of booking multi-destination itineraries across the alliance’s combined network at competitive rates.
Singapore Airlines42 Singapore Airlines42
Performance

TigerairTigerair continued to strengthen its market presence in China with the addition of Wuxi and Zhengzhou to the network. Four times weekly Singapore-Wuxi flights were launched in April 2016, and three times weekly flights to Zhengzhou commenced in June 2016. This brought Tigerair’s destinations in China to a total of 12 cities.
In December 2016, Tiger Airways Holdings entered into an agreement with China Airlines Limited to divest its 10 per cent stake in Tigerair Taiwan. As part of the divestment agreement, Tigerair Taiwan will cease to use the Tigerair website as its sales and distribution platform within 12 months of the divestment. The divestment was completed in January 2017. Along with the divestment, Tigerair renegotiated its brand franchise agreement with Tigerair Taiwan, and also held separate brand franchise negotiations with Tigerair Australia.
Tigerair was recognised for its popularity among passengers as well as its strong passenger traffic in FY2016/17. Some accolades include being voted as the Best Low Cost Carrier at the AsiaOne People’s Choice Awards 2016. Tigerair was also recognised by Changi Airport Group as one of the Top 5 Airlines by Passenger Carriage at the Changi Airline Awards 2016.
In its 13 years of operation, Tigerair has built an established network and market presence in Southeast Asia. The integration of its operations under the Scoot brand will strengthen the foundation that Tigerair has built over the years, and also take the SIA Group’s low-cost carrier arm to the next phase of growth.
ScootSince transitioning to an all-787 Dreamliner fleet in the previous financial year, Scoot continued to grow its fleet and network in FY2016/17. Scoot received two Dreamliners in FY2016/17, bringing the fleet size to a total of 12 Boeing 787s. Scoot has an additional eight 787s on firm order.
FY2016/17 also saw Scoot expanding its footprint in China, India, Japan and the Middle East with new services to Amritsar, Chennai, Dalian, Jeddah and Sapporo. The daily Chennai service operated with Scoot’s Dreamliner was introduced as a replacement for Tigerair’s service to Chennai. Scoot also launched services to the Indian city of Jaipur during the year in review, which were subsequently taken over by Tigerair in March 2017. This move complements the SIA Group network, resulting in an increase in the Group’s capacity to meet the route’s high demand.
Scoot marked yet another significant milestone in August 2016 as it announced plans for its maiden European destination in the form of direct flights between Singapore and Athens. Scoot’s inaugural long-haul flight to Athens will commence in June 2017 with a four times weekly service. Plans are underway for more long-haul routes to be introduced progressively, as Scoot takes delivery of four new aircraft fitted with crew bunks between April and October 2017.
Scoot is proud to be continually recognised for setting industry benchmarks. For the third year running, Scoot was named Best Low Cost Airline Asia/Pacific 2017 by Airlineratings.com. This is a testament to Scoot’s high standards in bringing affordable and quality travel to millions across Asia and Australia. Scoot was also recognised by the marketing community as Marketer of the Year at the Marketing Excellence Awards by Marketing Magazine.
Annual Report FY2016/17 43Annual Report FY2016/17 43

Financial ReviewHighlights of the Group’s Performance
$14,869M(-$370m, -2.4%)
$623M(-$58m, -8.6%)
$360M(-$444m, -55.2%)
Revenue
20,000
16,000
12,000
8,000
4,000
0
$ million
2012/13 2013/14 2014/15 2015/16 2016/17
Operating Profit
800
600
400
200
0
$ million
229 259
410
681623
Profit attributable to Owners of the Parent
1000
800
600
400
200
0
$ million
379 359 368
804
360
15,098 15,244 15,566 15,239 14,869
2012/13 2013/14 2014/15 2015/16 2016/17
2012/13 2013/14 2014/15 2015/16 2016/17
Singapore Airlines44 Singapore Airlines44
Performance

Performance of the Group
KEY FINANCIAL HIGHLIGHTS2016/17 2015/16 % Change
Earnings For The Year ($ million)Revenue 14,868.5 15,238.7 – 2.4Expenditure 14,245.7 14,557.5 – 2.1Operating profit 622.8 681.2 – 8.6
Profit attributable to owners of the parent 360.4 804.4 – 55.2
Per Share Data (cents)Earnings per share – basic 30.5 69.0 – 55.8Ordinary dividend per share 20.0 45.0 – 55.6
Ratios (%)Return on equity holders’ funds 2.8 6.4 – 3.6 pointsReturn on total assets 1.8 3.6 – 1.8 points
R1 BAH comprises Scoot and Tiger Airways
2016/17 2015/16 % Change$ million $ million
Singapore Airlines 10,134.2 10,633.8 – 4.7SilkAir 969.2 947.5 + 2.3BAH 1,349.1 1,193.7 + 13.0SIA Engineering 429.4 395.8 + 8.5SIA Cargo 1,950.2 2,037.1 – 4.3Others 36.4 30.8 + 18.2Total revenue 14,868.5 15,238.7 – 2.4
GROUP EARNINGSDuring the financial year, the operating landscape in the industry continued to be tough amid geopolitical uncertainties and tepid economic conditions. Intense competition and overcapacity in the market persisted, exerting pressure on yields as aggressive promotional activities were launched to bolster loads.
Group revenue fell $370 million (-2.4 per cent) year-on-year to $14,869 million. Revenue from Singapore Airlines (“the Parent Airline Company” or “the Company”) was lower, largely weighed down by softer yields (-3.8 per
cent), and coupled with the absence of income earned upon the release to Airbus of seven aircraft delivery slots last year. These were partially eased by a one-time credit upon a change in the timing of revenue recognition from unutilised tickets.
Revenue increased against prior year for Budget Aviation Holdings (“BAH”)R1 and SilkAir, boosted by passenger carriage growth from expanded operations, albeit with a dilution in yield. Cargo revenue declined largely from yield contraction (-10.7 per cent), cushioned in part by higher load carried (+5.9 per cent).
Annual Report FY2016/17 45Annual Report FY2016/17 45

Financial ReviewPerformance of the Group(continued)
GROUP EARNINGS (CONTINUED)Group expenditure decreased $312 million (-2.1 per cent) year-on-year to $14,246 million. The lower fuel hedging loss and average jet fuel price provided an $891 million saving to the Group. Nonetheless, the increase in fuel volume uplifted ($102 million) and a stronger US Dollar against the Singapore Dollar ($10 million) partially offset the aforementioned saving, resulting in a decline of $780 million in net fuel cost, or 17.2 per cent. Non-fuel costs increased $468 million (+4.7 per cent), partly attributable to double-digit capacity expansion at BAH and SilkAir.
Consequently, the Group’s operating profit was $58 million lower at $623 million (-8.6 per cent) for the financial year ended 31 March 2017. With the exception of Singapore Airlines and SIA Engineering, operating performance for all other major companies in the Group improved over last year. Singapore Airlines earned an operating profit of $386 million in the financial year, down $99 million compared to last year. SIA Cargo reported its first operating profit for six years, of $3 million. Please refer to the review of the Company and subsidiary companies for further details.
Group Expenditure
Quarterly Trend of Group Fuel Price and Fuel Cost(excluding hedging)
1,200
800
400
90
60
30
$ million USD/BBL
-2.1%to $14,246 million
Fuel Cost (excluding hedging) Fuel Price before hedging (USD/BBL)
Q1 Q1Q2 Q2
2015/16 2016/17
Q3 Q3Q4 Q4
5.7%Landing, Parking & Overflying Costs
8.4%Handling Charges
12.6%Others
17.2%Depreciation &
Lease Rentals
5.1%Passenger Costs
26.3%Fuel Costs After Hedging
18.4%Staff
Costs
6.3%Aircraft
Maintenance & Overhaul
Costs
Singapore Airlines46 Singapore Airlines46
Performance

FINANCIAL POSITIONEquity attributable to owners of the parent increased by $328 million (+2.6 per cent) to $13,083 million as at 31 March 2017, largely due to fair value movement on cash flow hedges (+$369 million), net profit for the financial year (+$360 million) and treasury shares reissued pursuant to the voluntary general offer (“VGO”) of Tiger Airways (+$287 million), partially offset by payment of dividends (-$521 million), purchase of treasury shares (-$134 million), and fair value movement in investments (-$100 million). The fair value movement on cash flow hedges of $369 million was mainly attributable to the reduction in fair value losses incurred on outstanding fuel hedges and foreign exchange hedges. The decline in fair value movement in investments was mainly due to the realisation of the gain on Hong Kong Aero Engine Services Ltd (“HAESL”), pursuant to SIA Engineering’s completion of the divestment.
Total Group assets increased by $873 million (+3.7 per cent) to $24,720 million. The increase was mainly attributable to an increase in property, plant and equipment (+$2,290 million), investment in associated companies (+$155 million) and derivative assets (+$96 million), partially offset by a reduction in cash balances (-$592 million), investments (-$496 million) and assets held for sale (-$398 million). The reduction in cash balances arose primarily from capital expenditure (-$3,945 million), payment of dividends (-$521 million), additional investment in associated companies (-$225 million), and repayment of borrowings (-$192 million). These were partially offset by cash flows generated from operations (+$2,533 million), proceeds from maturity of investments net of additional acquisition (+$532 million), issuance of bonds (+$430 million), sale of assets held for sale (+$406 million), and monies received from exercise by Tiger Airways’ shareholders of the options to subscribe for SIA shares pursuant to the VGO (+$301 million).
Total Group liabilities increased by $536 million (+5.0 per cent) to $11,250 million as at 31 March 2017, primarily arising from the increase in notes payable (+$430 million) and provision for competition related matters (+$132 million).
The Group’s net liquid assetsR2 decreased by $940 million to $2,353 million as at 31 March 2017, attributable to a reduction in cash and bank balances (-$592 million) and an increase in total debt (-$220 million) arising primarily from the issuance of bonds (-$430 million), offset by repayment of prior borrowings (+$192 million). Total debt to equity ratio increased by 0.01 times to 0.12 times as at 31 March 2017.
Group Equity Holders’ Funds, Total Assets andNet Asset Value (NAV) per Share
30,000
25,000
20,000
15,000
10,000
5,000
0
14
12
10
8
6
4
2
0
$ million Dollars
Equity Holders’ Funds ($ million) Total Assets ($ million) NAV Per Share ($)
Group Net Liquid Assets
5,000
4,000
3,000
2,000
1,000
0
5,000
4,000
3,000
2,000
1,000
0
$ million $ million
Net Liquid Assets ($ million)
R2 Net liquid assets is defined as the sum of cash and bank balances and short-term investments, net of finance lease commitments, loans and bonds issued.
2013 2014 2015 2016 2017
2013 2014 2015 2016 2017
Annual Report FY2016/17 47Annual Report FY2016/17 47

Financial ReviewPerformance of the Group(continued)
DIVIDENDSFor the financial year ended 31 March 2017, the Board recommends a final dividend of 11 cents per share. Including the interim dividend of 9 cents per share paid on 24 November 2016, the total dividend for the 2016/17 financial year will be 20 cents per share. This amounts to a payout of approximately $236 million based on the number of issued shares as at 31 March 2017. The total ordinary dividend per share of 20 cents translates to a payout ratio of 65.6 per cent, a decrease of 0.4 percentage points compared to the 2015/16 payout ratio of 66.0 per cent.
CAPITAL EXPENDITURE AND CASH FLOW OF THE GROUPCapital expenditure was $3,945 million, 35.6 per cent higher than last year. Approximately 96 per cent of the capital spending was on aircraft, spares and spare engines. Internally generated cash flow of $2,707 million (-22.7 per cent) was 0.7 times of capital expenditure. The decrease in internally generated cash flow was mainly attributable to lower cash flow from operations, as well as lower proceeds from the disposal of aircraft, spares and spare engines.
Dividend Payout
60
40
20
0
80
70
60
50
40
cents per cent
Interim Dividend (¢) Final Dividend (¢) Special Dividend (¢) Ordinary Dividend Payout Ratio (%)
2015/162013/142012/13 2014/15 2016/17
Internally Generated Cash Flow
4,500
3,000
1,500
0
4,500
3,000
1,500
0
$ million $ million
Internally Generated Cash Flow ($ million)
2012/13 2013/14 2014/15 2015/16 2016/17
Other Capital Expenditure ($ million) Capital Expenditure on Aircraft, Spares and Spare Engines ($ million)
Cash Flow: Capital Expenditure Ratio (times)
Group Capital Expenditure
4,000
3,000
2,000
1,000
2
1
0
$ million times
2012/13 2013/14 2014/15 2015/16 2016/17
Singapore Airlines48 Singapore Airlines48
Performance

GROUP STAFF STRENGTH AND PRODUCTIVITYThe Group’s staff strength as at 31 March 2017 was as follows:
31 March% Change2017 2016
Singapore Airlines 14,800 14,046 + 5.4SIA Engineering 6,482 6,177 + 4.9SilkAir 1,632 1,573 + 3.8SIA Cargo 870 886 – 1.8BAH 1,847 1,720 + 7.4Others 182 172 + 5.8
25,813 24,574 + 5.0
Average staff productivity was as follows:2016/17 2015/16 % Change
Revenue per employee ($) 590,160 625,819 – 5.7Value added per employee ($) 192,232 206,608 – 7.0
Annual Report FY2016/17 49Annual Report FY2016/17 49

Financial ReviewPerformance of the Group(continued)
STATEMENTS OF VALUE ADDED AND ITS DISTRIBUTION Value added is a measure of wealth created. The statement below shows the Group’s value added and its distribution by way of payments to employees, government, and to those who have provided capital. It also indicates the portion retained in the business for future capital requirements.
2016/17 2015/16$ million $ million
Total revenue 14,868.5 15,238.7Less: Purchase of goods and services (10,033.7) (10,519.4)
4,834.8 4,719.3Add:Interest income 73.9 70.7(Loss)/Surplus on disposal of aircraft, spares and spare engines (31.7) 52.7Dividends from long-term investments 45.0 115.3Other non-operating items (103.2) 91.1Share of profits of joint venture companies 21.1 22.9Share of profits/(losses) of associated companies 3.2 (41.1)
Total value added for distribution 4,843.1 5,030.9
Applied as follows:To employees: – Salaries and other staff cost 2,616.2 2,451.8
To government: – Corporation taxes 143.1 90.7
To suppliers of capital: – Interim and proposed dividends 236.3 531.3 – Finance charges 46.1 50.3 – Non–controlling interests 81.5 47.4
Retained for future capital requirements: – Depreciation and amortisation 1,595.8 1,586.3 – Retained profit 124.1 273.1
Total value added 4,843.1 5,030.9
Value added per $ revenue ($) 0.33 0.33Value added per $ employment cost ($) 1.85 2.05Value added per $ investment in property, plant and equipment ($) 0.17 0.19
Singapore Airlines50 Singapore Airlines50
Performance

Financial ReviewPerformance of the Company
OPERATING PERFORMANCE2016/17 2015/16 % Change
Passengers carried (thousand) 18,990 19,029 – 0.2Available seat-km (million) 117,662.3 118,366.5 – 0.6Revenue passenger-km (million) 92,913.8 94,267.4 – 1.4Passenger load factor (%) 79.0 79.6 – 0.6 pointPassenger yield (¢/pkm) 10.2 10.6 – 3.8Passenger unit cost (¢/ask) 8.2 8.5 – 3.5Passenger breakeven load factor (%) 80.4 80.2 + 0.2 point
The financial year was marked by challenging economic conditions and aggressive competition. Tactical and promotional activities initiated by the Company to boost loads placed considerable pressure on yields, which shrank 3.8 per cent year-on-year to 10.2¢/pkm.
Passenger load factor declined 0.6 percentage points over last year to 79.0 per cent as passenger carriage fell 1.4 per cent, outpacing the 0.6 per cent reduction in capacity.
A review of the Company’s operating performance by route region is as follows:By Route RegionR3 (2016/17 against 2015/16)
Passengers Carried Change (thousand)
Revenue Passenger-KM% Change
Available Seat-KM% Change
East Asia + 157 + 1.2 – 1.2Americas – 72 – 5.1 – 4.2Europe – 17 – 1.8 + 0.1South West Pacific + 31 + 0.8 + 5.1West Asia and Africa – 138 – 6.9 – 6.1Systemwide – 39 – 1.4 – 0.6
R3 Each route region comprises routes originating from Singapore to final destinations in countries within the region concerned and vice versa. For example, Singapore-Hong Kong-San Francisco-Hong Kong-Singapore route is classified under Americas region. East Asia covers Brunei, Hong Kong SAR, Indonesia, Japan, Malaysia, Myanmar, People’s Republic of China, Philippines, South Korea, Taiwan, Thailand and Vietnam. Americas comprises Brazil and USA. Europe consists of Denmark, England, France, Germany, Italy, Russia, Spain, Switzerland, The Netherlands and Turkey. South West Pacific covers Australia and New Zealand. West Asia and Africa are made up of Bangladesh, India, Maldives, Saudi Arabia, South Africa, Sri Lanka and United Arab Emirates.
Available Seat Capacity, Passenger Traffic and Load Factor
140,000
120,000
100,000
80,000
60,000
40,000
20,000
0
80
78
76
74
$ million per cent
Available Seat-km (million) Revene Passenger-km (million) Passenger Load Factor (%)
2012/13 2013/14 2014/15 2015/16 2016/17
Annual Report FY2016/17 51Annual Report FY2016/17 51

Financial ReviewPerformance of the Company(continued)
OPERATING PERFORMANCE (CONTINUED)Passenger load factor by route region was as follows:
Passenger Load Factor (%)
2016/17 2015/16% Change
points
East Asia 79.1 77.3 + 1.8 Americas 79.0 79.8 – 0.8 Europe 77.3 78.7 – 1.4 South West Pacific 83.0 86.5 – 3.5 West Asia and Africa 74.2 74.8 – 0.6 Systemwide 79.0 79.6 – 0.6
EARNINGS2016/17
$ million2015/16
$ million % Change
Revenue 11,094.2 11,686.1 – 5.1Expenditure 10,707.8 11,201.0 – 4.4Operating profit 386.4 485.1 – 20.3Finance charges (47.6) (42.0) + 13.3Interest income 99.1 87.1 + 13.8(Loss)/Surplus on disposal of aircraft, spares and spare engines (2.9) 3.7 n.m.Dividends from subsidiary and associated companies 136.6 135.2 + 1.0Dividends from long–term investments 5.2 95.2 – 94.5Other non–operating items 2.5 1.9 + 31.6Profit before taxation 579.3 766.2 – 24.4Taxation (65.3) (94.2) – 30.7Profit after taxation 514.0 672.0 – 23.5n.m. not meaningful
Operating Profit ($ million) Operating Profit Margin (%)
Operating Profit and Operating Profit Margin
600
500
400
300
200
100
0
6
4
2
0
$ million per cent
2012/13 2013/14 2014/15 2015/16 2016/172012/13 2013/14 2014/15 2015/16 2016/17
Company Revenue and Expenditure
15,000
12,000
9,000
6,000
3,000
0
15,000
12,000
9,000
6,000
3,000
0
$ million $ million
Revenue ($ million) Expenditure ($ million)
Singapore Airlines52 Singapore Airlines52
Performance

REVENUEThe Company’s revenue declined 5.1 per cent to $11,094 million as follows:
2016/17 2015/16 Change $ million $ million $ million %
Passenger revenue 7,537.9 7,893.4 – 355.5 – 4.5Bellyhold revenue from SIA Cargo 903.4 999.4 – 96.0 – 9.6Others 2,652.9 2,793.3 – 140.4 – 5.0Total operating revenue 11,094.2 11,686.1 – 591.9 – 5.1
The Company’s passenger revenue decreased in 2016/17, as a result of:$ million $ million
1.4% decrease in passenger traffic: – 113.3
3.6% decrease in passenger yield (excluding fuel surcharge):Lower local currency yields – 478.3Foreign exchange – 30.4Change in passenger mix + 266.5 – 242.2Decrease in passenger revenue – 355.5
The sensitivity of passenger revenue to a one percentage point change in passenger load factor and a one percentage change in passenger yield is as follows:
$ million
1.0% point change in passenger load factor, if yield and seat capacity remain constant 95.41.0% change in passenger yield, if passenger traffic remains constant 75.4
A breakdown of passenger revenue by route region and area of original sale is shown below:By Route Region ($ million) By Area of Original Sale R4 ($ million)
2016/17 2015/16 % Change 2016/17 2015/16 % Change
East Asia 2,686.2 2,734.3 – 1.8 4,358.0 4,507.4 – 3.3 Americas 1,160.0 1,260.7 – 8.0 501.2 553.4 – 9.4 Europe 1,672.2 1,792.6 – 6.7 1,171.3 1,242.7 – 5.7 South West Pacific 1,366.4 1,388.5 – 1.6 1,126.4 1,172.4 – 3.9 West Asia and Africa 653.1 717.3 – 9.0 381.0 417.5 – 8.7Systemwide 7,537.9 7,893.4 – 4.5 7,537.9 7,893.4 – 4.5
R4 Each area of original sale comprises countries within a region from which the sale is made.
Annual Report FY2016/17 53Annual Report FY2016/17 53

Financial ReviewPerformance of the Company(continued)
EXPENDITUREThe Company’s expenditure declined 4.4 per cent to $10,708 million in 2016/17.
2016/17 2015/16 %$ million % $ million % Change
Fuel costs 2,893.5 27.0 3,563.3 31.8 – 18.8Staff costs 1,672.7 15.6 1,596.0 14.3 + 4.8 Depreciation R5 1,251.1 11.7 1,257.4 11.2 – 0.5Handling charges 911.1 8.5 889.6 7.9 + 2.4 Aircraft maintenance and overhaul costs 784.7 7.3 750.9 6.7 + 4.5 Inflight meals and other passenger costs 669.7 6.3 669.9 6.0 –Rentals on leased aircraft 647.9 6.1 702.6 6.3 – 7.8 Airport and overflying charges 603.2 5.6 584.4 5.2 + 3.2Sales costs R6 590.3 5.5 561.7 5.0 + 5.1Communication and information technology costs R7 99.1 0.9 91.1 0.8 + 8.8 Other costs R8 584.5 5.5 534.1 4.8 + 9.4Total 10,707.8 100.0 11,201.0 100.0 – 4.4
A breakdown of fuel cost is shown below:2016/17
$ million2015/16
$ millionChange
$ million
Fuel cost (before hedging) 2,624.5 2,636.7 – 12.2Fuel hedging loss 269.0 926.6 – 657.6
2,893.5 3,563.3 – 669.8
Expenditure on fuel before hedging was $12.2 million lower because of: $ million
2.1% decrease in weighted average fuel price from 62.4 USD/BBL to 61.1 USD/BBL – 56.21.0% increase in volume uplifted from 30.6 million BBL to 30.9 million BBL + 35.2Strengthening of USD against SGD + 8.8
– 12.2
Staff costs rose $77 million (+4.8 per cent), largely attributable to service increment, higher staff strength, and revision in crew productivity allowances.
Aircraft maintenance and overhaul costs increased $34 million (+4.5 per cent) mainly due to higher provision for redelivery check costs.
Rentals on leased aircraft was $55.0 million (-7.8 per cent) lower than last year, largely due to fewer aircraft on operating lease.
Other costs rose $50 million (+9.4 per cent), mainly due to foreign exchange loss of $52 million against gain of $10 million last year (+$62 million).
R5 Depreciation included impairment of property, plant and equipment and amortisation of computer software.R6 Sales costs included commissions and incentives, frequent flyer programme cost, computer reservation system booking fees, advertising
expenses, reservation system IT cost and other sales costs.R7 Communication and information technology costs were for data transmission and contract service fees, hire of computer equipment,
maintenance/rental of software, and information technology contract and professional fees.R8 Other costs mainly comprised crew expenses, company accommodation cost, foreign exchange revaluation and hedging loss, comprehensive
aviation insurance cost, airport lounge expenses, non-information technology contract and professional fees, expenses incurred to mount non-scheduled services, aircraft licence fees and recoveries.
Singapore Airlines54 Singapore Airlines54
Performance

FUEL PRODUCTIVITY AND SENSITIVITY ANALYSISFuel productivity as measured by load tonne-km per barrel (ltk/BBL) increased marginally from 427ltk/BBL to 428ltk/BBL.
A change in fuel productivity (passenger aircraft) of 1.0 per cent would impact the Company’s annual fuel cost by about $26 million, before accounting for changes in fuel price, USD exchange rate and flying operations.
A change in the price of fuel of one US dollar per barrel affects the Company’s annual fuel cost by about $43 million, before accounting for USD exchange rate movements, and changes in volume of fuel consumed.
FINANCE CHARGESFinance charges were $6 million or 13.3 per cent higher, mainly due to issuance of the $430 million medium term notes during the financial year.
INTEREST INCOMEInterest income was $12 million or 13.8 per cent higher, mainly due to higher interest from loans extended to Virgin Australia and Scoot.
DIVIDENDS FROM LONG-TERM INVESTMENTSDividends from long-term investments were $90 million lower, primarily attributable to absence of special dividend declared by Everest Investment Holdings Limited following sale of its investment in Abacus International Pte Ltd to Sabre Technology Enterprises II Ltd last year.
TAXATIONThere was a net tax expense of $65 million, comprising current tax credit of $12 million and deferred tax charge of $77 million.
As at 31 March 2017, the Company’s deferred taxation account stood at $1,482 million.
Fuel Productivity of Passenger Fleet
440
430
420
410
440
430
420
410
LTK/BBL LTK/BBL
2012/13 2013/14 2014/15 2015/16 2016/17
Annual Report FY2016/17 55Annual Report FY2016/17 55

Financial ReviewPerformance of the Company(continued)
STAFF STRENGTH AND PRODUCTIVITY The Company’s staff strength as at 31 March 2017 was 14,800, an increase of 754 over last year. The distribution of employee strength by category and location is as follows:
31 March2017 2016 % Change
CategorySenior staff (administrative and higher ranking officers) 1,413 1,335 + 5.8Technical crew 2,087 2,056 + 1.5Cabin crew 8,356 7,741 + 7.9Other ground staff 2,944 2,914 + 1.0
14,800 14,046 + 5.4
LocationSingapore 12,782 12,035 + 6.2East Asia 863 866 – 0.3Europe 421 422 – 0.2South West Pacific 348 322 + 8.1West Asia and Africa 265 265 –Americas 121 136 – 11.0
14,800 14,046 + 5.4
The Company’s average staff productivity ratiosR9 are shown below:2016/17 2015/16 % Change
Seat capacity per employee (seat–km) 8,157,963 8,465,029 – 3.6Passenger load carried per employee (tonne–km) 598,451 626,572 – 4.5Revenue per employee ($) 769,202 835,736 – 8.0Value added per employee ($) 246,183 261,861 – 6.0
R9 The Company’s staff productivity ratios were computed based on average staff strength of 14,423 in 2016/17 (2015/16: 13,983).
Singapore Airlines56 Singapore Airlines56
Performance

Performance of the Subsidiary Companies
The major subsidiary companies are SIA Engineering, SIA Cargo, SilkAir and BAH. The following performance review includes intra–group transactions.
SIA ENGINEERING2016/17
$ million2015/16
$ million % Change
Total revenue 1,104.1 1,113.5 – 0.8Total expenditure 1,032.1 1,009.4 + 2.2Operating profit 72.0 104.1 – 30.8Net profit 332.4 174.9 + 90.1
Year-on-year, revenue declined $9 million or 0.8 per cent to $1,104 million. The decrease was mainly due to lower fleet management revenue, partially mitigated by higher line maintenance revenue. Expenditure increased $23 million or 2.2 per cent, primarily attributable to higher staff costs, partly offset by lower subcontract costs. The increase in staff costs was mainly due to a provision made for the increase in the profit-linked component of staff remuneration arising from the gain on divestment of HAESL. Salary increments and an increase in overtime as more staff are released for training on new aircraft types also contributed to the increase in staff costs.
Share of profits of associated and joint venture companies increased by $4 million to $97 million. Contributions from the engine repair and overhaul centres increased, with higher share of profits from Eagle Services Asia Pte Ltd (“ESA”) partially offset
by lower contributions from Singapore Aero Engine Services Ltd (“SAESL”), as the work content of engines shipped for the year was lower.
Profit attributable to owners of the parent was $332 million, $158 million higher compared to the same period last year. The higher net profit was largely due to a $142 million gain on divestment of HAESL and special dividend of $36 million from HAESL following divestment of its 20 per cent stake in SAESL to Rolls-Royce Singapore Pte Ltd.
As at 31 March 2017, SIAEC’s equity attributable to owners of the parent of $1,554 million was $68 million or 4.6 per cent higher than at 31 March 2016.
Basic earnings per share was 29.6 cents for the current financial year.
Annual Report FY2016/17 57Annual Report FY2016/17 57

Financial ReviewPerformance of the Subsidiary Companies (continued)
SIA CARGO2016/17
$ million2015/16
$ million % Change
Total revenue 1,955.6 2,045.0 – 4.4Total expenditure 1,952.5 2,094.7 – 6.8Operating profit/(loss) 3.1 (49.7) n.m.(Loss)/Profit after taxation (125.9) 90.3 n.m.
SIA Cargo posted its first operating profit for six years, a turnaround from a $50 million loss last year to an operating profit of $3 million. Expenditure decreased $142 million year-on-year mainly from lower fuel cost, cushioning the $89 million decline in revenue arising from a 10.7 per cent slide in yield, mitigated in part by higher freight carriage (+5.9 per cent).
Overall cargo traffic (in load tonne kilometers) increased by 5.9 per cent, outpacing the growth in capacity of 3.8 per cent. Consequently, cargo load factor increased by 1.3 percentage points to 63.2 per cent. Cargo breakeven load factor dipped by 0.3 percentage points to 64.9 per cent, as the decline in unit cost (-11.1 per cent) was more than the contraction in yield (-10.7 per cent).
Loss after taxation in the year took into account certain provisions for competition related matters, including the provision for a fine of EUR75 million ($112 million) imposed by the European Commission. The Commission had re-adopted an earlier decision in the European Union air cargo investigations involving several cargo airlines, including SIA Cargo.
In the prior year, a refund of the aforementioned competition law fine previously paid, amounting to EUR76 million ($119 million) including interest, had been recognised.
As at 31 March 2017, equity holders’ funds of SIA Cargo stood at $740 million (-12.0 per cent).
SILKAIR2016/17
$ million2015/16
$ million % Change
Total revenue 990.3 965.7 + 2.5Total expenditure 889.5 875.1 + 1.6Operating profit 100.8 90.6 + 11.3Profit after taxation 59.1 122.0 – 51.6
SilkAir’s revenue increased by $25 million (+2.5 per cent) to $990 million, as passenger revenue was lifted by a 9.5 per cent improvement in passenger carriage against a 10.6 per cent capacity growth, partially offset by a 7.4 per cent decline in passenger yield. Operating expenses rose in tandem with the expanded capacity, partially compensated for by fuel cost savings. As a result, the operating profit increased to $101 million.
Yield declined by 7.4 per cent to 12.5¢/pkm, while unit cost reduced by 7.8 per cent to 8.3¢/ask. Consequently, the passenger breakeven load factor improved by 0.3 percentage points to 66.4 per cent. Passenger load factor declined by 0.7 percentage points to 70.8 per cent.
Profit after taxation declined 51.6 per cent to $59 million, largely attributable to an absence of a gain from SilkAir’s sale and leaseback of four 737-800s reported last year.
SilkAir’s route network spanned 52 cities in 14 countries including Singapore. During the year, SilkAir launched new services to Vientiane (Laos), Luang Prabang (Laos) and Fuzhou (China).
As at 31 March 2017, equity holders’ funds of SilkAir stood at $1,015 million (+6.8 per cent).
Singapore Airlines58 Singapore Airlines58
Performance

BUDGET AVIATION HOLDINGS2016/17
$ million2015/16
$ million % Change
Total revenue 1,388.7 1,219.4 + 13.9Total expenditure 1,321.3 1,177.4 + 12.2Operating profit 67.4 42.0 + 60.5Profit after taxation 21.6 21.4 + 0.9
BAH’s operating profit rose $25 million from last year, bolstered by an increase in revenue of $169 million (+13.9 per cent). Revenue growth was driven by a higher passenger carriage (+21.2 per cent), on the back of a 23.3 per cent capacity expansion, partly discounted by a 6.3 per cent drop in yield. Expenditure increased $144 million (+12.2 per cent) attributable to the enlarged operations.
While yield was lower against last year, the decline in unit cost (-9.4 per cent) to 4.8¢/ask outstripped the reduction in yield. Consequently, breakeven load factor declined by 2.7 percentage points to 81.4 per cent. Passenger load factor fell by 1.5 percentage points to 82.4 per cent.
BAH’s route network spanned 60 cities in 16 countries, including Singapore. During the year, BAH took over Jeddah (Saudi Arabia) service from the Parent Airline Company and introduced six new services, to Amritsar (India), Jaipur (India), Qingdao-Dalian (China), Zhengzhou (China), Wuxi (China) and Sapporo (Japan).
As at 31 March 2017, equity holders’ funds of BAH stood at $816 million (+7.6 per cent).
Annual Report FY2016/17 59Annual Report FY2016/17 59

Awards
2016APR TTG China Travel Awards
Best Asian Airline Serving China (9th consecutive year)
MAY Telegraph ‘Ultras’ Travel Awards (UK)Best Asian Airline
Travel Weekly ChinaBest Airline of the Year
JUL Skytrax World Airline Awards 2016 (UK)Best Airline in AsiaBest Business Class Airline Seat
Business Traveller (Germany)Best Airline for Business Travellers International
AB Road (Japan) Airline RankingOverall Best Airline (5th consecutive year)
Best Inflight Meals, Fleet and Facilities
SEP Business Traveller (Asia Pacific) 2015Best Airline (25th consecutive year)
Best Asia-Pacific AirlineBest Airline First ClassBest Airline Business ClassBest Airline Economy ClassBest Airline Inflight Catering
OCT World Travel Awards 2016 (UK)Asia’s Leading Airline – First Class 2016Asia’s Leading Excellence Inflight Service 2016
Business Traveller (UK based) 2016Best AirlineBest Long Haul CarrierBest Asian AirlineBest Economy ClassBest Cabin StaffCondé Nast Traveler (USA) 2016 Readers’ Choice AwardsBest Airline in the World (28 out of 29 years)
Singapore Airlines is proud to be the world’s most awarded airline. Here are some of the awards won in FY2016/17:
Singapore Airlines60 Singapore Airlines60
Performance

2017FEB Fortune Magazine (USA)
Top 50 World’s Most Admired Companies (Ranked 33)
DestinAsianReaders’ Choice Awards (12th time running)
Best Airline – Overall (12th consecutive year)
Best Airline in First & Business ClassBest Airline in Economy ClassBest In-flight Entertainment – KrisWorldFavourite Frequent Flyer Programme - KrisFlyer
MAR Air Transport World Magazine (USA)Onboard Experience AwardSIA’s Companion App
TTG China Travel AwardsBest Asian Airline (10th consecutive year)
Traveller’s World Magazine (Germany)Best Airline (7th consecutive year)
NOV Condé Nast Traveler (Middle East) 2016 Readers’ Choice AwardsFavorite Airline Business Cabin (International Operator)
DEC Global Traveler (USA)Best Overall Airline in the World 2016 (12th time)
Best Airline for Business ClassBest International Business Class Champagne/SparklingBest International Business Class WinesBest International First Class WinesBest International First Class Champagne
Annual Report FY2016/17 61Annual Report FY2016/17 61

Statement on Risk Management
1.SIA Group Enterprise-Wide Risk Management FrameworkSince 2002, a formalised Risk Management Framework has been implemented across SIA Group under which risks are identified, evaluated and controlled on a coordinated and integrated basis. Details of the key elements of this Framework can be found on SIA’s Website1.
3. Board Of Directors’ Comments on the Practice of Risk Management in Singapore AirlinesHaving reviewed the risk management practices and activities of Singapore Airlines, the Board of Directors has not found anything to suggest that risks, which the Group considers relevant and material to its operations, are not being satisfactorily managed.
(a) Review of Cyber Security Risks A review of cyber security risk
exposures was carried out to look at measures and initiatives put in place to address evolving cyber security threats such as malware, ransomware, and internet hacking. Responses to cyber-related scenarios were conducted during the year through the Computer Incident Response Team drill. Disaster recovery drills were also simulated to ensure recovery readiness of critical IT systems. Such drills will continue to be conducted regularly.
(b) Simulation/Review
of Crisis Response Plan The crisis management
response plan was simulated to test the Group’s responses and capability to manage a crisis event occurring overseas. The crisis response plans of subsidiaries were also reviewed to align and integrate their processes with the Group. Coordination in procedures and communication with external stakeholders were also demonstrated during the exercise.
(c) Ongoing Risk Committee Activities and Risk Reviews
As part of the Group’s ongoing risk activities, risk management review exercises were carried out on a half-yearly basis, including a review of strategic risks. The Board Safety & Risk Committee (BSRC) reviewed top risks and corresponding controls as part of the ongoing activities, including reports on the simulation of business continuity plans. The BSRC also ensured that strategic and other risks surfaced were distributed to the other Board Committees and the full SIA Board for oversight. The SIA Group Risk & Compliance Management Committee supported the BSRC in ensuring that risks were surfaced and reviewed, and risk responses across the Group were coordinated and integrated. Correspondingly, company risk management committees ensured that risks were surfaced by the various divisions, for the BSRC’s review. Company risk management committees also reviewed risk controls and responses to ensure that they are adequate.
(d) Written Assurances on Risk Management Processes
As part of risk governance and assurance, Business Unit Heads provided written assurances on the identification and management of risks to the Company. Corresponding written assurances were also provided by CEO and Senior Vice President Finance to the BSRC.
2.Highlights of Significant Risk Management ActivitiesOver the course of the period under review, the following were the more significant risk management activities carried out:
1 https://www.singaporeair.com/saar5/pdf/corporate-info/riskmanagementframework.pdf
Singapore Airlines62 Singapore Airlines62
Governance

Corporate Governance Report
The Board and Management are committed to continually enhancing shareholder value by maintaining high standards of corporate governance, professionalism, integrity and commitment at all levels, underpinned by strong internal controls and risk management systems.
This Report sets out the Company’s corporate governance processes, with specific reference to the guidelines of the revised Code of Corporate Governance issued by the Ministry of Finance in Singapore in May 2012 (“the Code”).
Board’s Conduct of its Affairs (Principle 1) The Board oversees the business performance and affairs of the Company and provides general guidance to Management. Its principal functions include charting the Group’s strategic direction, reviewing and approving annual budgets, financial plans and monitoring the Group’s performance, approving major acquisitions and fund-raising exercises, and ensuring the Group’s compliance with all laws and regulations as may be relevant to the business.
To assist the Board in the discharge of its oversight function, five board committees have been constituted with written terms of reference. All board committees are actively engaged and play an important role in ensuring good corporate governance in the Company.
Management briefs new Directors on the Company’s business and strategic directions, as well as governance practices. The Company conducts orientation programmes and site visits for new Directors, and arranges for Directors to be updated on new laws and regulations, as well as changing commercial risks and industry developments, as deemed appropriate. Formal letters are issued to newly-appointed Directors upon their appointment, including details of their duties and obligations as Directors. The Directors are subject to the requirements of the Code.
Board Composition and Guidance (Principle 2)The Board currently comprises nine Directors as follows:
Name of DirectorPosition held on
the Board
Date of first appointment to the
Board
Date of last re-election as
DirectorNature of
Appointment
Peter Seah Lim Huat Chairman 1 September 2015 29 July 2016 Non-Executive/Independent
Goh Choon Phong Director 1 October 2010 29 July 2016 Executive/Non-Independent
Gautam Banerjee Director 1 January 2013 29 July 2016 Non-Executive/Independent
William Fung Kwok Lun Director 1 December 2009 30 July 2014 Non-Executive/Independent
Hsieh Tsun-yan Director 1 September 2012 29 July 2016 Non-Executive/Independent
Helmut Gunter Wilhelm Panke Director 1 September 2009 30 July 2015 Non-Executive/Independent
Lee Kim Shin Director 1 September 2016 – Non-Executive/Independent
Dominic Ho Chiu Fai Director 1 May 2017 – Non-Executive/Independent
Simon Cheong Sae Peng Director 1 June 2017 – Non-Executive/Independent
Notes: Mr Stephen Lee Ching Yen retired from the Board with effect from 1 January 2017.Mrs Christina Ong retired from the Board with effect from 1 September 2016.Mr Lucien Wong Yuen Kuai retired from the Board with effect from 1 September 2016.
Annual Report FY2016/17 63Annual Report FY2016/17 63

The size and composition of the Board are reviewed from time to time, taking into account the scope and nature of operations of the Company, to ensure that the size of the Board is adequate to provide for a diversity of views, facilitate effective decision-making, and that the Board has an appropriate balance of executive, independent and non-independent Directors. The Directors come from diverse backgrounds with varied expertise in finance, legal, business, marketing and management fields. Their profiles are found on pages 20 to 21 and 76 to 79.
There is a strong independent element in the Board, with the Board considering, taking into account the views of the Board Nominating Committee, eight out of nine Directors to be independent from Management and the Company’s substantial shareholder, Temasek Holdings (Private) Limited (“Temasek”). The sole non-independent Director is Mr Goh Choon Phong, who is the Chief Executive Officer (“CEO”) of the Company. All Directors have demonstrated objectivity in their deliberations in the interests of the Company.
Chairman and Chief Executive Officer (Principle 3)The Chairman, Mr Peter Seah, and the CEO, Mr Goh Choon Phong, are not related to each other. There is appropriate division of responsibilities between the Chairman and the CEO, which ensures a balance of power and authority within the Company. The Chairman leads the Board and is responsible for its workings and proceedings. He plays a crucial role in fostering constructive dialogue with shareholders at the Company’s Annual and Extraordinary General meetings. The CEO heads the Management Committee and oversees the execution of the Company’s corporate and business strategies and policies, and the conduct of its business.
Board Membership and Performance (Principles 4 and 5)A table setting out the Board Members, their memberships on the five Board Committees and attendance at Board and Committee meetings can be found on page 75. The five Board Committees formed to assist the Board in the execution of its responsibilities are:
• the Board Executive Committee;• the Board Audit Committee;• the Board Compensation and Industrial Relations
Committee;• the Board Nominating Committee; and• the Board Safety and Risk Committee.
These Committees have written mandates and operating procedures, which are reviewed periodically.
The Board held five meetings in the financial year. The Board holds separate Strategy Sessions to assist Management in developing its plans and strategies for the future. The non-executive Directors also set aside time to meet without the presence of Management to review the latter’s performance in meeting goals and objectives.
Board Executive Committee (“ExCo”)The members of the ExCo are Mr Peter Seah (Chairman), Mr Goh Choon Phong, Mr Gautam Banerjee and Mr Hsieh Tsun-yan. The ExCo oversees the execution by Management of the overall strategy, policies, directions and guidelines set by the Board for the SIA Group. The ExCo also reviews and makes recommendations to the Board on the annual operating and capital budgets and matters relating to the Group’s wholly-owned subsidiaries. The ExCo is authorised to approve transactions beyond a designated materiality threshold and to make decisions on routine financial, operational and administrative matters. The ExCo also functions as the Share Buy Back Committee of the Company.
Board Audit Committee (“AC”)The AC comprised Mr Gautam Banerjee (Chairman), Dr William Fung, Mr Hsieh Tsun-yan, and Mr Dominic Ho (with effect from 1 May 2017). All the AC members are independent Directors. The role and responsibilities of the AC are described in the section on “Audit Committee” (Principle 12) as shown on pages 71 to 73.
Board Safety and Risk Committee (“BSRC”)The members of the BSRC are Dr Helmut Panke (Chairman), Mr Peter Seah, Mr Lee Kim Shin, and Mr Dominic Ho (with effect from 1 June 2017). The functions of the BSRC include ensuring that systems and programmes in the Group comply with regulatory requirements and are in accordance with the best practices of the aviation industry; reviewing regular reports on safety performances; reviewing accident investigation findings and recommendations; and advising Management and reporting to the Board on safety issues.
The BSRC also oversees the risk governance framework and risk management system, including reviewing key risks and controls put in place by Management.
Board Nominating Committee (“NC”)The members of the NC are Mr Peter Seah (Chairman), Mr Lee Kim Shin and Mr Goh Choon Phong.
Corporate Governance Report(continued)
Singapore Airlines64 Singapore Airlines64
Governance
Under its Charter, the NC’s responsibilities and duties include considering and making recommendations to the Board concerning the appointment and re-election of Directors, and determining the independence of the Directors. The NC’s recommendations are based on a review of the range of expertise, skills and attributes of current Board members and the needs of the Board, taking into account the Company’s future business direction, the tenure of service, contribution and commitment of each Board member. Board rejuvenation is a guiding principle in determining the need for new appointees to the Board.
With regard to the selection of new Directors, the NC evaluates the balance of skills, knowledge and experience on the Board and, arising from such evaluation, determines the role and the desirable competencies for a particular appointment to enhance the existing Board composition. The NC meets with the short-listed Board candidates to assess their suitability and availability. The NC then makes recommendations to the Board for approval. Newly appointed Directors serve an initial term of three years, after which they are considered for re-nomination for another term(s). Their re-nominations are subject to the recommendations of the Chairman of the Board and the NC.
The Company’s Constitution provide that at each Annual General Meeting (“AGM”) of the Company, one-third of the Directors for the time being, or, if their number is not three or a multiple of three, then the number nearest to but not less than one-third are required to retire from office and are eligible for re-election. Retiring Directors are selected on the basis of those who have been longest in office since their last re-election, failing which they shall be selected by agreement. The CEO is also subject to retirement and re-election in accordance with the Constitution of the Company.
New Directors appointed in the year are subject to retirement and re-election by shareholders at the next AGM after their appointment. All new appointments and re-elections require the approval of the Special Member, the Minister for Finance.
For FY2016/17, the NC engaged an independent global executive search firm not affiliated to the Company or any of its Directors, to assist them in conducting a formal evaluation of the SIA Board and its Board Committees. The process involved questionnaires which provided opportunities for feedback from the Directors. The evaluation confirmed that the SIA Board and its Board
Committees were generally functioning effectively and performing well, within a highly competitive and challenging environment. The performance of individual Directors was reviewed by the Chairman and the NC, while the Chairman’s performance was reviewed by the rest of the Board.
The NC has reviewed the contribution by each Director taking into account their listed company board representations and other principal commitments. The NC and the Board are of the view that, setting a maximum number of listed company board representations a Director should have is not meaningful, as the contribution of each Director would depend on their individual circumstances, including whether they have a full-time vocation or other responsibilities. Notwithstanding the number of listed company board representations and other principal commitments which the Directors held, the NC was of the view that they were able to devote sufficient time and attention to the affairs of the Company.
The NC’s terms of reference also include the responsibility for reviewing the training and professional development programmes for the Board. For FY2016/17, Board members attended briefings on the challenges facing the airline industry, as well as other related topics conducted by global airline industry leaders and experts.
Board Compensation and Industrial Relations Committee (“BCIRC”)From 1 April 2016 to 31 December 2016, the BCIRC was chaired by Mr Stephen Lee and comprised Mr Peter Seah, Mr Gautam Banerjee, Mr Hsieh Tsun-yan and Dr Helmut Panke. Mr Stephen Lee retired with effect from 1 January 2017 and Mr Peter Seah took over the chairmanship from 1 January 2017. From 1 January 2017, in addition to the new Chairman, the BCIRC comprised Mr Hsieh Tsun-yan, Dr Helmut Panke, and Mr Simon Cheong Sae Peng (with effect from 1 June 2017). Mr Gautam Banerjee resigned from the Committee with effect from 17 August 2016. All members of the Committee are non-executive Directors.
In accordance with its responsibilities and duties under its Charter, the BCIRC reviews and recommends for the Board’s approval the general framework of remuneration for the Board and Relevant Key Management Personnel1. The BCIRC also recommends the specific remuneration packages for each Director and Relevant Key Management Personnel and administers the Company’s Profit Sharing Bonus, EVA-based Incentive Plan, Strategic Initiatives Incentive Plan, Transformational Initiatives
1 Relevant Key Management Personnel are employees holding the rank of Executive Vice President and above. For FY2016/17, they comprised the CEO and two Executive Vice Presidents.
Annual Report FY2016/17 65Annual Report FY2016/17 65

Corporate Governance Report(continued)
Incentive Plan, Performance Share Plan and Restricted Share Plan for senior executives. The award of shares to senior executives is based on organisational and individual performance. Professional advice is sought by the BCIRC, as it deems necessary, in the development and execution of the remuneration plan for the Company’s senior executives. For FY2016/17, Carrots Consulting Pte Ltd was engaged as a remuneration consultant to provide professional advice on human resource matters. The principal consultant providing such services was Mr Johan Grundlingh. Carrots Consulting only provides remuneration consulting services to the Company, and has no other relationship with the Company.
Leadership development and succession planning in the Company remains a key focus for the BCIRC. The Company has in place an annual review of high potential executives, to ensure an adequate pipeline for succession planning in key management positions. Such high potential executives will be given exposure to key jobs in the organisation, as part of their career development.
The Company continues to put much emphasis in maintaining harmonious industrial relations and the BCIRC plays an important role in providing appropriate guidance to Management in this regard. The Company’s three unions, namely, ALPA-S representing the pilots, AESU representing the Administrative Officers, and SIASU representing the General Staff (including Cabin Crew), hold regular meetings with Management and Chairman of BCIRC.
Access to Information (Principle 6)The Directors are provided with Board Papers in advance before each Board Meeting, to enable them to be properly informed of matters to be discussed and/or approved. Board Papers contain both regular items such as reports on the Company and its subsidiaries and associated companies, updates on business development, monthly management accounts, and productivity and performance indicators, as well as matters for the decision or information of the Board.
Directors have separate and independent access to Senior Management and the Company Secretary at all times. Directors can seek independent professional advice if required. Such costs will be borne by the Company.
Remuneration Matters (Principles 7, 8 and 9)
Remuneration MixSIA’s remuneration mix for Senior Management2
comprises fixed and variable components. Variable components comprise short-term and long-term incentives, which are dependent on Group, Company and individual performance. The remuneration mix aims to provide a good balance between competitiveness with the market, as well as rewards for short-term and long-term objectives.
Fixed ComponentThe fixed component comprises base salary, the Annual Wage Supplement (“AWS”) and cash allowances. The fixed components are benchmarked to comparable positions in the market, and reflect the market worth of the positions.
Variable ComponentsCash Incentive Plans for CEO and Senior ManagementThis comprises the following four components:
a. Profit-Sharing Bonus (“PSB”)The PSB targets are designed to achieve a good balance of both Group financial objectives and the Company’s operating performance. Payment of the variable bonus is based on the Group and the Company achieving the target levels set for each of the Key Performance Indicators (“KPIs”) stated below and taking into account individual performance:
• SIA Group’s Return on Shareholders’ Funds• SIA Company’s Operating Profit Margin• SIA Company’s Passenger Load Factor
Individual performance objectives aligned to the overall strategic, financial and operational goals of the Company are set at the beginning of each financial year and are cascaded down to a select group of key Senior Management staff using Individual Performance Scorecards, creating alignment between the performance of the Group, Company and the individual. While these performance objectives are different for each executive, they are assessed on the same principles across the following four broad categories of targets:
• Financial & Business• Customer & Operations• People & Organisational Development• Strategic Projects
The PSB Payout is capped at three times of monthly base salary based on SIA Group and Company Performance in respect of the CEO and Senior Management. After the assessment of the Individual
2 Senior Management are employees holding the rank of Senior Vice President and above. For FY2016/17, they comprised the CEO, two Executive Vice Presidents and 12 Senior Vice Presidents.
Singapore Airlines66 Singapore Airlines66
Governance

Performance Scorecards at the end of a performance year, an Individual Performance Rating is determined and is subsequently used to modify the PSB Payout within the range of 0-150%.
The resulting annual payout under the PSB for each incumbent was adjusted accordingly based on the BCIRC’s assessment to reflect the actual individual performance level achieved.
b. Economic Value Added (“EVA”)-based Incentive Plan (“EBIP”) The EBIP rewards for sustainable shareholder value creation over the medium term achieved by growing profits, deploying capital efficiently and managing the risk profile and risk time horizon of an airline business. A portion of the annual performance-related bonus of key Senior Management is tied to the EVA achieved by the Group in the year. Under the plan, one-third of the accumulated EBIP bonus, comprising the EBIP bonus declared in the financial year and the balance of such bonus brought forward from preceding years (which comprises multiple years of incentive dollars retained in the EVA bank), is paid out in cash each year. The remaining two-thirds are carried forward in the individual executive’s EBIP account. Amounts in the EBIP account are at risk because negative EVA will result in a retraction of EBIP bonus earned in preceding years. This mechanism encourages key Senior Management to work for sustainable EVA generation and to adopt strategies that are aligned with the long-term interests of the Group.
In determining the final EBIP payouts, the BCIRC considers overall Group performance and relevant market remuneration benchmarks.
The rules of the EBIP are subject to review by the BCIRC, which has the discretion, under authority of the Board, to amend the rules where appropriate and relevant to the business conditions.
Based on the BCIRC’s assessment that the actual performance of the Group in FY2015/16 has partially met the predetermined targets, the resulting annual payout under the EBIP was adjusted accordingly to reflect the performance level achieved.
c. Strategic Initiatives Incentive Plan (“SIP”)The SIP is an incentive scheme established with the objective of rewarding, motivating, and retaining a select group of key Senior Management staff who shoulder the responsibility for divisional-focused strategic initiatives.
Under the SIP, a target bonus is set equal to three times the monthly base salary of the respective Senior Management staff for meeting strategic initiatives set under the Individual Performance Scorecard. At the end of the financial year, the target bonus is modified by the incumbent’s performance on the execution of the strategic initiatives as assessed by the BCIRC. The resultant payout varies between 0-150% of the SIP target bonus with settlement of 50% in cash and 50% in shares under the Deferred Share Award (“DSA”).
The maximum SIP bonus payable is four and a half times the individual’s monthly base salary.
The resulting annual payout under the SIP for each incumbent was adjusted accordingly based on the BCIRC’s assessment to reflect the actual individual performance level achieved.
d. Transformational Initiatives Incentive Plan (“TIP”)The TIP was established to reward for contribution to future-oriented growth-based transformational initiatives. Under the TIP, an annual funding pool of three million Singapore Dollars is allocated to eligible Senior Management staff as a group. The group funding pool scales from 0-100% at the discretion of the BCIRC. Individual allocations are distributed based on the incumbent’s position level and performance in achieving pre-set individual contributions to the Group’s transformational initiatives, with the individual allocation ranging from 0-150%, subject to available funding and at the sole discretion of the BCIRC.
The resulting annual payout under the TIP for each incumbent was adjusted accordingly based on the BCIRC’s assessment to reflect the actual individual performance level achieved.
Share Incentive Plansi. The SIA Performance Share Plan 2014 (“PSP 2014”)
The PSP 2014 is a share-based incentive scheme established with the objective of rewarding, motivating, and retaining a select group of key Senior Management staff who shoulder the responsibility for the Group’s performance and who are able to drive the growth of the Group through innovation, creativity and superior performance. Awards under the PSP 2014 are performance-based, with stretched targets.
Under the PSP 2014, an initial award is made in the form of rights to shares, provided performance targets are met. Annual awards are made based on strategic contribution and individual performance of Senior Management staff. The final award, which
Annual Report FY2016/17 67Annual Report FY2016/17 67

can vary between 0-200% of the initial award, depends on stretched value-aligned performance targets. They are based on absolute and relative Total Shareholder Return (“TSR”), meeting targets set over the performance period of three financial years. The absolute TSR is based on outperformance against Cost of Equity. The relative TSR is based on outperformance of a selected peer group of leading full service carriers. The above performance measures are selected as key measurements of wealth creation for shareholders for the FY2016/17 PSP award.
The final award will vest in a single tranche after completion of the performance period.
The Group has attained an achievement factor which is reflective of partially meeting the pre-determined target performance level for the FY2014/15 PSP awards granted based on the performance period from FY2014/15 to FY2016/17.
ii. The SIA Restricted Share Plan 2014 (“RSP 2014”)The RSP 2014 is targeted at a broader base of senior executives and enhances the Company’s ability to recruit and retain talented senior executives, as well as to reward for Group, Company and individual performance. To retain key executives, an extended vesting period of a further two years is imposed beyond the initial one-year performance period for the FY2016/17 RSP award.
Under the RSP 2014, an initial award is made in the form of rights to shares, provided performance conditions are met in future. Annual grants are made based on position level and individual performance of the key executives selected to participate in the RSP 2014. Final awards may vary between 0-150% of the initial award, depending on the extent to which targets based on Group and Company EBITDAR Margin and Group and Company Staff Productivity are met. The performance measures are selected as they are key drivers of shareholder value and are aligned to the Group’s and the Company’s business objectives. The final award is subject to extended vesting, with one-third of the final award paid out at the end of the one-year performance period, and the rest paid out equally over the next two years.
The Group has attained an achievement factor which is reflective of outperforming the pre-determined target performance level for the FY2015/16 RSP awards granted based on the performance period from FY2015/16 to FY2016/17.
The Group has attained an achievement factor which is reflective of meeting the pre-determined target performance level for the FY2016/17 RSP awards granted based on the performance period of FY2016/17 only.
iii. The SIA Deferred Share Award (“DSA”)As part of the SIP, the DSA is a share award established with the objective of rewarding, motivating and retaining Senior Management, who are responsible for strategic initiatives. The DSA is granted as a contingent share award under the RSP 2014. The final award, which includes the Accumulated Dividend Yield (based on the sum of SIA share dividend yields declared with ex-dividend dates occurring during the vesting period), will vest in a single tranche at the end of three years after the grant date, subject to meeting a three-year service-based condition, and provided that individual performance remains satisfactory.
Under the PSP 2014 and RSP 2014, the total number of shares which may be delivered (whether in the form of shares or cash in lieu of shares) is subject to a maximum limit of 5% of the total number of issued shares (excluding treasury shares). In addition, the total number of shares under awards to be granted under the PSP 2014 and RSP 2014 from the forthcoming Annual General Meeting to the next Annual General Meeting (the “Relevant Year”) shall not exceed 0.5% of the total number of issued shares (excluding treasury shares) from time to time (the “Yearly Limit”). However, if the Yearly Limit is not fully utilised during the Relevant Year, any unutilised portion of the Yearly Limit can be used for grants of awards in subsequent years.
The SIA Employee Share Option Plan (“ESOP”) expired in 2010.
Senior Management are required to hold a portion of the shares released to them under a share ownership guideline which requires them to maintain a beneficial ownership stake in the Company, thus further aligning their interests with shareholders.
Corporate Governance Report(continued)
Singapore Airlines68 Singapore Airlines68
Governance

Details of the PSP 2014, RSP 2014, DSA and ESOP can be found on pages 83 to 87 of the Directors’ Statement.
In the event of a misstatement of financial results or of misconduct resulting in financial loss to the Company as deemed by the BCIRC, the BCIRC may, in its absolute discretion, reclaim unvested incentive components of remuneration from Senior Management.
Compensation Risk AssessmentUnder the Code, the compensation system should take into account the risk policies of the Company, be symmetric with risk outcomes and be sensitive to the time horizon of risks. The BCIRC has reviewed the various compensation risks that may arise and introduced mitigating policies to better manage risk exposures identified. The BCIRC will also undertake periodic reviews of the compensation-related risks in future.
Pay-for-Performance AlignmentIn performing the duties as required under its BCIRC Charter, the BCIRC ensures that remuneration paid to the
CEO and Relevant Key Management Personnel is strongly linked to the achievement of business and individual performance targets.
The performance targets as determined by the BCIRC are set at realistic yet stretched levels each year to motivate a high degree of business performance with emphasis on both short-term and long-term quantifiable objectives.
A pay-for-performance alignment study was conducted by the appointed external remuneration consultant and reviewed by the BCIRC. It was found that there was sufficient evidence indicating pay-for-performance alignment for the Group in both absolute and relative terms, against a peer group of large listed airline companies for the six-year period from FY2010/11 to FY2015/16.
Directors’ FeesThe Directors’ fees paid in FY2016/17 amounted to $1,945,829 [FY2015/16: $1,993,333] and were based on the following rates:
Rates ($)
Board Retainers Board Member 90,000
Chairman’s all-in-feeDeputy Chairman
750,000160,000
Committee Retainers Chairman of Executive Committee and Audit Committee 60,000
Chairman of Safety and Risk Committee and Compensation and Industrial Relations Committee 45,000
Member of Executive Committee and Audit Committee and Chairman of Nominating Committee 35,000
Member of Safety and Risk Committee and Compensation and Industrial Relations Committee 25,000
Member of Nominating Committee 20,000
Attendance Fees Home – City 5,000In – Region 10,000Out – Region 20,000Teleconference – normal hours 1,000Teleconference – odd hours 2,000
Annual Report FY2016/17 69Annual Report FY2016/17 69

Disclosure on Remuneration The following table shows the composition of the remuneration of Directors for FY2016/17.
Directors Fee$
Salary$
Bonuses1
$Shares2
$Benefits3
$Total
$
Peter Seah Lim Huat 368,500 – – – 8,150 376,650Gautam Banerjee 206,000 – – – 658 206,658William Fung Kwok Lun 166,000 – – – 772 166,772Hsieh Tsun-yan 172,329 – – – 1,298 173,627Helmut G W Panke 242,000 – – – 540 242,540Lee Kim Shin 89,750 – – – 480 90,230Stephen Lee Ching Yen 562,500 – – – 4,718 567,218Christina Ong 66,250 – – – 345 66,595Lucien Wong Yuen Kuai 72,500 – – – 1,115 73,615Goh Choon Phong4 – 1,276,000 1,945,694 1,668,606 134,088 5,024,388
1 The bonuses were paid out in FY2016/17 in respect of FY2015/16 Group and individual performance and includes EVA-based Incentive Plan (EBIP) payment, Profit-Sharing Bonus, cash component [50%] of the Strategic Incentive Plan (SIP) and Transformational Initiatives Incentive Plan (TIP). The EBIP amount paid in the reporting year is a percentage of the individual’s EVA Bank. See above for additional information on the EBIP, PSB, SIP and TIP.
2 Based on the Fair Values of RSP ($10.23), PSP ($11.30) and DSA (share component [50%] of the SIP; $9.53) granted on a contingent award basis in FY2016/17 in respect of FY2015/16 individual performance.
3 Includes transport and travel benefits provided to Directors.4 As Chief Executive Officer, Mr Goh Choon Phong does not receive any Director’s fees.
There were no employees who were immediate family members of a Director or the CEO, and whose remuneration exceeded $50,000, during FY2016/17.
The following table shows the composition of the remuneration of the Relevant Key Management Personnel (who are not Directors or the CEO) for FY2016/17.
Relevant Key Management Personnel4Fee
%Salary
%Bonuses1
%Shares2
%Benefits3
%Total
%
Between $2,250,000 to $2,500,000Mak Swee Wah 0 29 35 33 3 100Ng Chin Hwee 0 28 36 33 3 1001 The bonuses were paid out in FY2016/17 in respect of FY2015/16 Group and individual performance and includes EVA-based Incentive Plan (EBIP)
payment, Profit-Sharing Bonus, cash component [50%] of the Strategic Incentive Plan (SIP) and Transformational Initiatives Incentive Plan (TIP). The EBIP amount paid in the reporting year is a percentage of the individual’s EVA Bank. See above for additional information on the EBIP, PSB, SIP and TIP.
2 Based on the Fair Values of RSP ($10.23), PSP ($11.30) and DSA (share component [50%] of the SIP; $9.53) granted on a contingent award basis in FY2016/17 in respect of FY2015/16 individual performance.
3 Includes transport and travel benefits provided to employees.4 The above table reflects the remuneration of the employees who hold the rank of Executive Vice President and above, who are the Relevant Key
Management Personnel of the Company.
Corporate Governance Report(continued)
Singapore Airlines70 Singapore Airlines70
Governance

For FY2016/17 the aggregate total remuneration paid to the Relevant Key Management Personnel (who are not Directors or the CEO) amounted to $4,580,313.
For FY2016/17, there were no termination, retirement or post-employment benefits granted to Directors, the CEO and Relevant Key Management Personnel other than the standard contractual notice period termination payment in lieu of service, and the post-retirement travel benefits for the Directors, CEO and Relevant Key Management Personnel.
Accountability and Audit (Principle 10)The Board, through its announcements of quarterly and full-year results, aims to provide shareholders with a balanced and understandable assessment of the Company’s performance and prospects. Management provides the Board with monthly management accounts for the Board’s review.
The Company has clear policies and guidelines for dealings in securities by Directors and employees. The Company imposes a trading embargo on its Directors and employees from trading in its securities for the period of two weeks prior to the announcement of quarterly results; and a period of one month prior to the announcement of year-end results. In addition, Directors and employees are cautioned to observe the insider trading laws at all times; and to avoid dealing in the Company’s securities for short-term considerations.
Risk Management and Internal Controls (Principle 11)A dedicated Risk Management and Compliance Department looks into and manages the Group’s risk and key regulatory compliance management policies. The Statement of Risk Management can be found on page 62.
Annually, a report is submitted by the Risk Management and Compliance Department to the Board, which provides a comprehensive review of the risks faced by the Group. The review includes the identification of risks overseen by the main Board and its various Board Committees, as well as the current assessment and outlook of the various risk factors. The Department also performs risk prioritisation and ensures risk mitigation plans are reviewed by Management.
The Board had received assurance from the CEO and Senior Vice President Finance on the adequacy and effectiveness of the Company’s risk and compliance management and internal control systems, and that the financial records have been properly maintained and the financial statements give a true and fair view of the Company’s operations and finances.
Having reviewed the risk management practices and activities of Singapore Airlines, the Board, with the concurrence of the BSRC, is of the opinion that the Group’s risk management system was adequate and effective as at 31 March 2017.
Audit Committee (Principle 12)The AC’s activities for FY2016/17, in accordance with its responsibilities and duties under its Charter, included the following:
(a) Financial Reporting The AC reviewed the quarterly and annual financial
statements and financial announcements required by The Singapore Exchange Securities Trading Limited (“SGX-ST”) for recommendation to the Board for approval. The review focused on changes in accounting policies and practices, major judgemental and risk areas, significant adjustments resulting from the audit, the going concern assumption, compliance with accounting standards, compliance with SGX-ST and other legal requirements. The AC keeps itself apprised of changes in accounting policies and guidelines through scheduled regular updates by the external auditors, of such, in meeting agendas.
(b) Financial Matters In the review of the financial statements for
FY2016/17, the following significant matters impacting the financial statements were reviewed by the AC and discussed with Management and the external auditors:
Annual Report FY2016/17 71Annual Report FY2016/17 71

(c) External Audit The AC discussed with the external auditors the audit
plan, and the report on the audit of the year-end financial statements; reviewed the external auditors’ management letter and Management’s responses thereto; and reviewed the external auditors’ objectivity and independence from Management and the Company. In assessing independence, the AC reviewed the fees and expenses paid to the external auditors, including fees paid for non-audit services during the year. The AC is of the opinion that the auditors’ independence has not been compromised.
The AC considered the information provided by the external auditors under the Audit Quality Indicators Disclosure Framework issued by the Accounting and Corporate Regulatory Authority in evaluating the performance and effectiveness of the external auditors.
Other information is defined as all information in the annual report other than the financial statements and auditors’ report. With reference to the “Other Information” section in the auditors’ report on page 97, at the date of the authorisation of financial statements i.e. 18 May 2017, KPMG had not obtained certain other information (defined
as the Reports). If, after they have obtained and read the Reports, they conclude that there is a material misstatement, they will report to the Audit Committee and take appropriate actions in accordance with Singapore Standards on Auditing. KPMG has subsequently obtained and read the Reports and had nothing to report.
The Company has complied with Rules 712 and 715 of the SGX-ST Listing Manual in relation to the engagement of its auditors.
(d) Internal AuditThe AC reviewed the scope of internal audit work and its audit programmes; reviewed the major findings during the year and Management’s responses thereto; and ensured the adequacy of the independence and resource sufficiency of the internal audit function.
(e) Risk ManagementThe AC reviewed the adequacy and effectiveness of the Group’s material controls, including financial, compliance, operational and information technology controls, to safeguard shareholders’ investments and the Group’s assets.
Corporate Governance Report(continued)
Significant Matters How the AC reviewed these matters
Timing of recognition and accuracy of passenger revenue relating to tickets likely to remain unused
The AC reviewed and is satisfied with the reasonableness of Management’s judgement, assumptions and methodologies used for the recognition of revenue attributable to tickets likely to remain unused.
The AC also considered and is satisfied with the processes and controls in place for recording revenue within passenger revenue systems.
Fair value of KrisFlyer miles and the miles that will expire without use
The AC reviewed and is satisfied with the reasonableness of Management’s judgement and assumptions used in the mathematical models used to determine the fair value of frequent flyer miles and the number of miles that will expire without use.
Accounting for aircraft related assets and carrying values
The AC reviewed and is satisfied with the reasonableness of Management’s judgement and assumptions in the determination of components of aircraft and the useful life and residual values of these components.
The AC also reviewed and is satisfied with the reasonableness of Management’s assumptions and methodologies applied to determine Cash Generating Units (CGU) and the assessment of the CGU for possible impairment.
Return costs for leased aircraft
The AC reviewed and is satisfied with the reasonableness of Management’s assumptions and methodologies applied to assess the provision for aircraft return costs.
Early adoption of FRS109 Financial Instruments
The AC reviewed and is satisfied with the appropriateness of Management’s decision in the early adoption of FRS109 for the accounting of aviation fuel hedging and other financial instruments.
Provision related to the European Commission matter
The AC reviewed and is satisfied with the reasonableness of Management’s judgement and assessment of the basis of accounting for the European Commission matter. This included consideration of advice from internal counsel and external legal advisors as appropriate.
Singapore Airlines72 Singapore Airlines72
Governance

The Risk Management processes adopted are also audited periodically by Internal Audit and their adequacy and effectiveness reported to the AC accordingly.
(f) Interested Person TransactionsThe AC reviewed interested person transactions to ensure compliance with the SGX-ST Listing Manual and the Shareholders’ Mandate obtained at the last Annual General Meeting.
(g) Whistle-BlowingThe AC reviewed and is satisfied with the adequacy of the whistle-blowing programme instituted by the Company through which staff may, in confidence, raise concerns about possible improprieties in matters of financial reporting or other matters. Under the whistle-blowing programme, all staff including Management are responsible for reporting any suspected wrongdoing. In addition, they are required to comply with the Staff Regulations, which set out the code of conduct and discipline expected of them. This includes upholding professional integrity, maintaining confidentiality, reporting any conflict of interest, and whistle-blowing. All whistle-blower reports are reviewed by the AC at its quarterly meetings to ensure independent assessment, investigation and adequate resolution.
(h) OthersThe AC has full access to and co-operation of Management. The AC also has full discretion to invite any Director or executive officer to attend its meetings, and has been given adequate resources to discharge its functions. The AC meets with the internal and external auditors without the presence of non-audit Management every quarter.
Internal Audit (Principle 13) SIA’s Internal Audit is an independent department that reports directly to the Audit Committee. The department assists the Committee and the Board by performing regular evaluations on the Group’s internal controls, financial and accounting matters, compliance, business and financial risk management policies and procedures, and ensuring that internal controls are adequate to meet the Group’s requirements. SIA’s Internal Audit is a member of the Singapore Chapter of the Institute of Internal Auditors (“IIA”) and meets the Standards for the Professional Practice of Internal Auditing set by the IIA.
SIA’s Internal Audit also performs analyses of data and transactions periodically (continuous monitoring) on
selected areas that are more susceptible to fraud risk.In relation to audit activities conducted during the financial year, SIA’s Internal Audit had unfettered access to the Group’s documents, records, properties and personnel, as well as the AC.
The Control Self Assessment (“CSA”) Programme established since FY2003/04 provides a framework for Management to obtain assurance on the state of internal controls. The CSA Programme requires operating departments’ management to review and report annually on the adequacy of their respective units’ control environment to the AC. Internal Audit performed independent and random reviews during the year to validate the results of these self assessments.
Based on the internal controls established and maintained by the Group, work performed by the internal and external auditors, and reviews performed by Management and various Board Committees, the Board with the concurrence of the AC, is of the opinion that the Group’s internal controls were adequate and effective as at 31 March 2017 to address financial, operational, information technology and compliance risks, which the Group considers relevant and material to its operations.
The Board notes that the system of internal controls and risk management provides reasonable, but not absolute, assurance that the Group will not be affected by any event that could be reasonably foreseen as it strives to achieve its business objectives. In this regard, the Board also notes that no system can provide absolute assurance against the occurrence of material errors, poor judgement in decision-making, human error, fraud or other irregularities.
Shareholder Rights and Responsibilities (Principles 14 and 15)Singapore Airlines is committed to continually strengthen our relationship with the investing community and believes in timely and consistent disclosure of pertinent information to enable a transparent assessment of the Company’s value. The Company values dialogue with shareholders, and holds analyst and media briefings when announcing half-yearly and year-end results. Full transcripts of the proceedings are made available on SGXNet and our Company’s website under ‘Information for Investors’ section.
All financial results, as well as price-sensitive information, are released in a timely manner through various media, including press releases posted on the Company’s website and disclosure via SGXNet.
Annual Report FY2016/17 73Annual Report FY2016/17 73

The Company’s website is an important source of information for shareholders and the investing community. Quarterly results announcements, news releases, presentation slides, monthly operating statistics, annual reports, sustainability reports and other key facts and figures about the Company are available on the Investor Relations website.
The Investor Relations Department meets with analysts and investors on a regular basis through investor conferences and roadshows, as well as ad-hoc meetings and teleconferences. A dedicated investor relations email and hotline are maintained for the investing community to reach out to the Company for queries.
The Company’s commitment to corporate transparency and investor relations was recognised in 2012, when Singapore Airlines was inducted into the Hall of Fame in the Most Transparent Company Award Category at the 13th Investors Choice Awards presented by the Securities Investors Association of Singapore (“SIAS”).
Conduct of Shareholder Meetings (Principle 16)The Board members always endeavour to attend shareholder meetings where shareholders are given the opportunity to raise questions and clarify issues
they may have relating to the resolutions to be passed, with the Board. The Chairmen of the various Board Committees or members of the Board Committees standing in for them, as well as the external auditors, would be present and available to address questions at these meetings. Minutes of shareholders’ meetings are available on request by registered shareholders.
To enhance transparency in the voting process, the Company had, since FY2008/09, implemented full poll voting for all the resolutions tabled at its shareholders’ meetings.
Banking Transaction ProceduresLenders to SIA are to note that all bank transactions undertaken by any Group company must be properly authorised, including the opening of new bank accounts and any proposed credit facilities. Each Group company has its own approval limits and procedures for every banking transaction, having regard to the nature of the transaction concerned. These approval limits and procedures are updated from time to time and are available on request. The bankers of each Group company should always verify, in accordance with the verification process set out in the applicable procedures, that the transaction is properly authorised.
Corporate Governance Report(continued)
Singapore Airlines74 Singapore Airlines74
Governance

Membership and Attendanceof Singapore Airlines LimitedBoard of Directors and Board Committee MembersFor the Period 1 April 2016 to 31 March 2017
Notes: 1 Mr Peter Seah was appointed Chairman of the Board, Board Executive Committee, Board Compensation and Industrial Relations Committee and Board Nominating Committee, and a
member of the Board Safety and Risk Committee with effect from 1 January 2017. From 1 January 2017 to 31 March 2017, there was only one Board Safety and Risk Committee meeting and one Board Nominating Committee meeting held.
2 Mr Goh Choon Phong was appointed a member of the Board Nominating Committee with effect from 1 September 2016. From 1 September 2016 to 31 March 2017, there were only two Board Nominating Committee meetings held.
3 Mr Gautam Banerjee resigned from the Board Compensation and Industrial Relations Committee with effect from 17 August 2016. From 1 April 2016 to 16 August 2016, there were only two Board Compensation and Industrial Relations Committee meetings held.
4 Mr Hsieh Tsun-yan was appointed a member of the Board Executive Committee with effect from 20 March 2017. From 20 March 2017 to 31 March 2017, there was only one Board Executive Committee meeting held.
5 Mr Lee Kim Shin was appointed a member of the Board, Board Safety and Risk Committee and Board Nominating Committee with effect from 1 September 2016. From 1 September 2016 to 31 March 2017, there were only three Board meetings, two Board Safety and Risk Committee meetings and two Board Nominating Committee meetings held.
6 Mr Dominic Ho Chiu Fai was appointed a member of the Board, and Board Audit Committee with effect from 1 May 2017, and Board Safety and Risk Committee with effect from 1 June 2017, after the reporting period from 1 April 2016 to 31 March 2017.
7 Mr Simon Cheong Sae Peng was appointed a member of the Board, and Board Compensation and Industrial Relations Committee with effect from 1 June 2017, after the reporting period from 1 April 2016 to 31 March 2017.
8 Mr Stephen Lee retired from the Board with effect from 1 January 2017. From 1 April 2016 to 31 December 2016, there were only four Board meetings, four Board Executive Committee meetings, three Board Compensation and Industrial Relations Committee meetings, three Board Safety and Risk Committee meetings and two Board Nominating Committee meetings held.
9 Mrs Christina Ong retired from the Board with effect from 1 September 2016. From 1 April 2016 to 31 August 2016, there were only two Board meetings, two Board Safety and Risk Committee meetings and one Board Nominating Committee meeting held.
10 Mr Lucien Wong retired from the Board with effect from 1 September 2016. From 1 April 2016 to 31 August 2016, there were only two Board meetings, two Board Executive Committee meetings, two Board Safety and Risk Committee meetings and one Board Nominating Committee meeting held.
BoardBoard Executive
CommitteeBoard Audit Committee
Board Compensation and Industrial
Relations CommitteeBoard Safety and Risk Committee
Board Nominating Committee
Name of Directors
No. of meetings
held
No. of meetings attended
No. of meetings
held
No. of meetings attended
No. of meetings
held
No. of meetings attended
No. of meetings
held
No. of meetings attended
No. of meetings
held
No. of meetings attended
No. of meetings
held
No. of meetings attended
Peter Seah Lim Huat1 5 5 6 6 – – 4 4 1 1 1 1
Goh Choon Phong2 5 5 6 6 – – – – – – 2 2
Gautam Banerjee3 5 5 6 6 4 4 2 2 – – – –
William Fung Kwok Lun 5 4 – – 4 2 – – – – – –
Hsieh Tsun-yan4 5 5 1 1 4 4 4 4 – – – –
Helmut Gunter Wilhelm Panke 5 5 – – – – 4 4 4 4 – –
Lee Kim Shin5 3 3 – – – – – – 2 2 2 2
Dominic Ho Chiu Fai6 – – – – – – – – – – – –
Simon Cheong Sae Peng7 – – – – – – – – – – – –
Stephen Lee Ching Yen8 4 4 4 4 – – 3 3 3 3 2 2
Christina Ong9 2 2 – – – – – – 2 2 1 1
Lucien Wong Yuen Kuai10 2 2 2 2 – – – – 2 2 1 1
Annual Report FY2016/17 75Annual Report FY2016/17 75

Further Information on Board of Directors
Peter Seah Lim Huat aged 70
Non-executive and independent Director
Academic and Professional Qualifications:Bachelor of Business Administration (Honours), University of Singapore
Date of First Appointment as a Director:1 September 2015
Date of Appointment as Chairman: 1 January 2017
Date of Last Re-election as a Director: 29 July 2016
Board Committee(s) served on:Board Executive Committee ChairmanBoard Compensation and Industrial Relations Committee ChairmanBoard Nominating Committee ChairmanBoard Safety and Risk Committee Member
Current Directorships in Other Listed Companies Organisation/Company Title1. DBS Group Holdings Ltd Chairman2. Level 3 Communications Inc Director
Other Principal Commitments Organisation/Company Title1. DBS Bank Ltd Chairman2. DBS Bank (Hong Kong) Limited Chairman3. LaSalle College of the Arts Limited Chairman4. Singapore Health Services Pte Ltd Chairman5. STT Communications Ltd Deputy
Chairman6. Fullerton Financial Holdings Pte Ltd Deputy
Chairman7. Asia Mobile Holdings Pte Ltd Director8. GIC Private Limited Director
Principal Commitments/Directorships in the Past 3 Years Organisation/Company Title1. CapitaLand Limited Deputy
Chairman2. STATS ChipPAC Ltd Director3. StarHub Ltd Director
Gautam Banerjee aged 62
Non-executive and independent Director
Academic and Professional Qualifications:Bachelor of Science in Accounting and Financial Analysis, University of WarwickFellow of the Institute of Chartered Accountants, England and WalesFellow of the Institute of Chartered Accountants, Singapore
Board Committee(s) served on:Board Audit Committee ChairmanBoard Executive Committee MemberBoard Compensation and Industrial Relations Committee
Member (until 16 August 2016)
Current Directorships in Other Listed CompaniesOrganisation/Company Title
1. Piramal Enterprises Limited, India Director2. The Indian Hotels Company Limited Director
Other Principal CommitmentsOrganisation/Company Title
1. Blackstone Group Senior Managing Director
2. Blackstone Singapore Pte Ltd Chairman 3. Singapore Institute
of International Affairs Advisor 4. Singapore Business Federation Vice Chairman5. GIC Private Limited Director6. Singapore Centre for Social Enterprise
Ltd (raiSE) Chairman7. Listings Advisory Committee,
Singapore Exchange Chairman8. EDBI Pte Ltd Director9. Singapore Legal Service Commission Director10. Blackstone Advisors India Private
Limited Director11. Nanyang Business School Member,
Advisory Board12. Yale-NUS College Member,
Governing Board13. MAS Financial Centre Advisory Panel Member14. Council of the Board for the Teaching
and Testing of South Asian Languages Member15. Singapore Indian Development
AssociationTerm Trustee, Board of Trustees
16. The Friends of The University of Warwick, Singapore Trustee
17. The Stephen A. Schwarzman Scholars Trust Trustee
Principal Commitments/Directorships in the Past 3 YearsOrganisation/Company Title
1. Economic Development Board Director2. EDB Investments Pte Ltd Director3. Singapore International
Arbitration Centre Director4. The Blackstone Group (Australia)
Pty Limited Director5. The Blackstone Group (HK) Limited Director 6. The Straits Trading Company Limited Director7. Indian Heritage Centre Member, Steering
Committee
Date of First Appointment as a Director:1 January 2013
Date of Last Re-election as a Director:29 July 2016
Singapore Airlines76 Singapore Airlines76
Governance

Goh Choon Phong aged 53
Executive and non-independent Director
Academic and Professional Qualifications:Master of Science in Electrical Engineering and Computer Science Bachelor of Science in Computer Science & EngineeringBachelor of Science in Management ScienceBachelor of Science in Cognitive Science Massachusetts Institute of Technology
Date of First Appointment as a Director:1 October 2010
Date of Last Re-election as a Director:29 July 2016
Board Committee(s) served on:Board Executive Committee MemberBoard Nominating Committee Member
Current Directorships in Other Listed CompaniesOrganisation/Company Title
1. SIA Engineering Company Limited Director
Other Principal CommitmentsOrganisation/Company Title
1. Budget Aviation Holdings Pte. Ltd. Chairman 2. International Air Transport Association Chairman,
Board of Governors
3. National University of Singapore Member, Board of Trustees
Principal Commitments/Directorships in the Past 3 YearsOrganisation/Company Title
1. Mount Alvernia Hospital Director2. Virgin Australia Holdings Limited Director3. National Council of Social Service Member,
Care & Share@ SG50 Steering Committee
William Fung Kwok Lun aged 68
Non-executive and independent Director
Academic and Professional Qualifications:Master of Business Administration, Harvard Graduate School of Business, BostonBachelor of Science in Engineering, Princeton University, New Jersey
Board Committee(s) served on:Board Audit Committee Member
Current Directorships in Other Listed CompaniesOrganisation/Company Title
1. Li & Fung Limited Group Chairman2. Global Brands Group Holding Limited Chairman3. Trinity Limited Director4. Convenience Retail Asia Limited Director5. Shui On Land Limited Director6. Sun Hung Kai Properties Limited Director7. VTech Holdings Limited Director8. The Hongkong and Shanghai Hotels,
Limited Director
Date of First Appointment as a Director:1 December 2009
Date of Last Re-election as a Director:30 July 2014
Annual Report FY2016/17 77Annual Report FY2016/17 77

Further Information on Board of Directors(continued)
Dominic Ho Chiu Fai aged 66
Non-executive and independent Director
Academic and Professional Qualifications:Bachelor of Business Administration and Master of Science, University of Houston
Massachusetts Institute of TechnologyDate of First Appointment as a Director:1 May 2017
Date of Last Re-election as a Director:Not Applicable
Board Committee(s) served on:Board Audit Committee Member
(appointed on 1 May 2017)
Board Safety and Risk Committee Member(appointed on 1 June 2017)
Current Directorships in Other Listed CompaniesOrganisation/Company Title
1. Hang Lung Properties Limited Director
Other Principal CommitmentsOrganisation/Company Title
1. DBS Bank (China) Limited Chairman 2. DBS Bank (Hong Kong) Limited Director3. Underwriters Laboratories Inc. Director
Principal Commitments/Directorships in the Past 3 YearsOrganisation/Company Title
1. Singapore Telecommunications Limited Director
Hsieh Tsun-yan aged 64
Non-executive and independent Director
Academic and Professional Qualifications:Master of Business Administration, Harvard UniversityBachelor of Science in Mechanical Engineering, University of Alberta
Massachusetts Institute of TechnologyDate of First Appointment as a Director:1 September 2012
Date of Last Re-election as a Director:29 July 2016
Board Committee(s) served on:Board Audit Committee MemberBoard Compensation and Industrial Relations Committee MemberBoard Executive Committee Member
Current Directorships in Other Listed CompaniesOrganisation/Company Title
1. Manulife Financial Corporation, Canada Director
Other Principal CommitmentsOrganisation/Company Title
1. LinHart Group Pte Ltd Chairman 2. Manulife US Real Estate Management
Pte Ltd Chairman3. Lee Kuan Yew School of Public Policy,
SingaporeProvost Chair Professor
4. National University of Singapore Business School
Provost Chair Professor (Practice) and Member, Management Advisory Board
5. Singapore Institute of Management Pte Ltd Director
6. The Manufacturers Life Insurance Company Director
7. Institute of Policy Studies Academic Panel, Singapore Member
8. Duke-NUS Graduate Medical School, Singapore
Member,Governing Board
Principal Commitments/Directorships in the Past 3 YearsOrganisation/Company Title
1. Bharti Airtel Limited, India Director2. Singapore International Foundation Member, Board
of Governors
Singapore Airlines78 Singapore Airlines78
Governance

Lee Kim Shin aged 56
Non-executive and independent Director
Academic and Professional Qualifications:Bachelor of Laws (Honours), National University of Singapore
Massachusetts Institute of TechnologyDate of First Appointment as a Director:1 September 2016
Date of Last Re-election as a Director:Not Applicable
Board Committee(s) served on:Board Nominating Committee MemberBoard Safety and Risk Committee Member
Principal CommitmentsOrganisation/Company Title
1. Allen & Gledhill LLP Managing Partner
2. Eastern Development Holdings Pte. Ltd. Director
3. Eastern Development Private Limited Director4. Epimetheus Limited Director5. Duke-NUS Medical School Singapore Member,
Governing Board6. Singapore Institute of Directors Member,
Governing Council
Principal Commitments/Directorships in the Past 3 YearsOrganisation/Company Title
1. High Court of Singapore Judicial Commissioner
Helmut Gunter Wilhelm Panke aged 70
Non-executive and independent Director
Academic and Professional Qualifications:Doctor in Physics, University of Munich
Massachusetts Institute of TechnologyDate of First Appointment as a Director:1 September 2009
Date of Last Re-election as a Director:30 July 2015
Board Committee(s) served on:Board Safety and Risk Committee ChairmanBoard Compensation and Industrial Relations Committee Member
Current Directorships in Other Listed CompaniesOrganisation/Company Title
1. Microsoft Corporation Director
Principal Commitments/Directorships in the Past 3 YearsOrganisation/Company Title
1. Bayer AG Director2. UBS Group AG Director
Simon Cheong Sae Peng aged 60
Non-executive and independent Director
Academic and Professional Qualifications:Master of Business Administration in Finance and Investments,George Washington UniversityBachelor of Science in Civil Engineering, University of Washington
Board Committee(s) served on:Board Compensation and Industrial Relations Committee
Member (appointed on 1 June 2017)
Current Directorships in Other Listed CompaniesOrganisation/Company Title
1. AV Jennings Limited Chairman
Other Principal CommitmentsOrganisation/Company Title
1. SC Global Developments Pte. Ltd. Chairman 2. Cheong SP Holdings Pte Ltd Director3. MYK Holdings Pte. Ltd. Director
Principal Commitments/Directorships in the Past 3 YearsOrganisation/Company Title
1. Davale Pte Ltd Director2. SC Peirce (Six) Pte. Ltd. Director3. SC Peirce (Seven) Pte. Ltd. Director4. Tuscany Investments Pte. Ltd. Director5. Kairong Developments
(Shenyang) Co. Ltd Director
Date of First Appointment as a Director:1 June 2017
Date of Last Re-election as a Director:Not Applicable
Annual Report FY2016/17 79Annual Report FY2016/17 79

FINANCIAL CONTENTS
81 Directors’ Statement90 Independent Auditors’ Report99 ConsolidatedProfitandLossAccount100 Consolidated Statement
of Comprehensive Income
101 Statements of Financial Position102 Statements of Changes in Equity108 Consolidated Statement of Cash Flows110 Notes to the Financial Statements204 Additional Information Required by the
Singapore Exchange Securities
205 Quarterly Results of the Group206 Five-Year Financial Summary of the Group208 Ten-Year Statistical Record210 TheGroupFleetProfile211 Group Corporate Structure
FINANCIAL REPORT
Financial
Singapore Airlines80
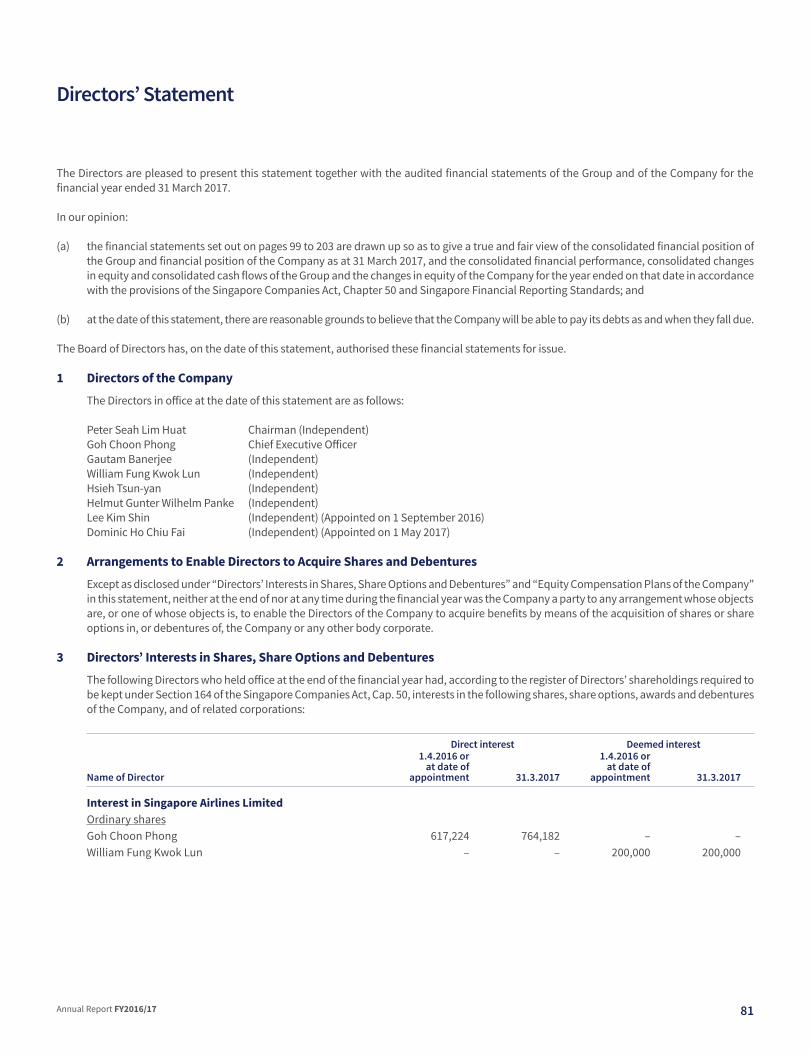
Directors’ Statement
The Directors are pleased to present this statement together with the audited financial statements of the Group and of the Company for the financial year ended 31 March 2017.
In our opinion:
(a) the financial statements set out on pages 99 to 203 are drawn up so as to give a true and fair view of the consolidated financial position of the Group and financial position of the Company as at 31 March 2017, and the consolidated financial performance, consolidated changes in equity and consolidated cash flows of the Group and the changes in equity of the Company for the year ended on that date in accordance with the provisions of the Singapore Companies Act, Chapter 50 and Singapore Financial Reporting Standards; and
(b) at the date of this statement, there are reasonable grounds to believe that the Company will be able to pay its debts as and when they fall due.
The Board of Directors has, on the date of this statement, authorised these financial statements for issue.
1 Directors of the Company
The Directors in office at the date of this statement are as follows:
Peter Seah Lim Huat Chairman (Independent)Goh Choon Phong Chief Executive Officer Gautam Banerjee (Independent)William Fung Kwok Lun (Independent)Hsieh Tsun-yan (Independent)Helmut Gunter Wilhelm Panke (Independent)Lee Kim Shin (Independent) (Appointed on 1 September 2016)Dominic Ho Chiu Fai (Independent) (Appointed on 1 May 2017)
2 Arrangements to Enable Directors to Acquire Shares and Debentures
Except as disclosed under “Directors’ Interests in Shares, Share Options and Debentures” and “Equity Compensation Plans of the Company” in this statement, neither at the end of nor at any time during the financial year was the Company a party to any arrangement whose objects are, or one of whose objects is, to enable the Directors of the Company to acquire benefits by means of the acquisition of shares or share options in, or debentures of, the Company or any other body corporate.
3 Directors’ Interests in Shares, Share Options and Debentures
The following Directors who held office at the end of the financial year had, according to the register of Directors’ shareholdings required to be kept under Section 164 of the Singapore Companies Act, Cap. 50, interests in the following shares, share options, awards and debentures of the Company, and of related corporations:
Direct interest Deemed interest
Name of Director
1.4.2016 or at date of
appointment 31.3.2017
1.4.2016 orat date of
appointment 31.3.2017
Interest in Singapore Airlines LimitedOrdinary sharesGoh Choon Phong 617,224 764,182 – –William Fung Kwok Lun – – 200,000 200,000
Annual Report FY2016/17 81

3 Directors’ Interests in Shares, Share Options and Debentures (continued)
Direct interest Deemed interest
Name of Director
1.4.2016 or at date of
appointment 31.3.2017
1.4.2016 or at date of
appointment 31.3.2017
Conditional award of restricted shares (Note 1)Goh Choon Phong – Base Awards 121,488 120,000 – – – Final Awards (Pending Release) 29,118 50,117 – –
Conditional award of performance shares (Note 2)Goh Choon Phong – Base Awards 251,592 249,546 – –
Conditional award of deferred restricted shares (Note 3)Goh Choon Phong – Base Awards 74,777 45,600 – –
Interest in Ascendas Hospitality TrustUnitsHsieh Tsun-yan 231,000 231,000 – –
Interest in Ascendas India TrustUnitsGautam Banerjee 120,000 120,000 – –
Interest in Ascendas Real Estate Investment TrustUnitsGautam Banerjee 20,000 20,000 – –William Fung Kwok Lun – – 56,000 212,600
Interest in Mapletree Global Student Accommodation Private TrustUnits in Class A (USD)Goh Choon Phong – 4,823 – –
Units in Class B (GBP)Goh Choon Phong – 4,823 – –
Interest in Mapletree Greater China Commercial TrustUnitsWilliam Fung Kwok Lun – – – 880,000
Interest in Mapletree Treasury Services LtdS$600 million 5.125% Perpetual BondsWilliam Fung Kwok Lun – – $500,000 $500,000
Interest in Singapore Technologies Engineering LimitedOrdinary sharesPeter Seah Lim Huat 545,325 545,325 – –Goh Choon Phong 6,000 6,000 – –
Directors’ Statement
Singapore Airlines82
Financial

3 Directors’ Interests in Shares, Share Options and Debentures (continued)
Direct interest Deemed interest
Name of Director
1.4.2016 or at date of
appointment 31.3.2017
1.4.2016 or at date of
appointment 31.3.2017
Interest in Singapore Telecommunications LimitedOrdinary sharesPeter Seah Lim Huat 1,667 1,667 1,550 1,550Goh Choon Phong 1,610 1,610 – –William Fung Kwok Lun – – 198,400 408,400Hsieh Tsun-yan – – 55,000 47,000Lee Kim Shin 190 190 – –
Interest in StarHub LimitedOrdinary sharesPeter Seah Lim Huat 278,092 292,092 300,000 300,000
Interest in Telechoice International LimitedOrdinary sharesPeter Seah Lim Huat 50,000 50,000 – –
Notes:1. The actual number of Final Awards of fully paid ordinary shares will range from 0% to 150% of the Base Awards and is contingent on the Achievements against
Targets over, in the case of awards granted before 2016, the two-year performance periods relating to the relevant awards and, in the case of awards granted from 2016 onwards, over the one-year performance periods relating to the relevant awards.
2. The actual number of Final Awards of fully paid ordinary shares will range from 0% to 200% of the Base Awards and is contingent on the Achievements against Targets over the three-year performance periods relating to the relevant awards.
3. The Awards of fully paid ordinary shares will vest at the end of three years from the date of the grant of the award. At the end of the vesting period, an additional number of shares equivalent to the Base Award multiplied by the accumulated dividend yield (based on the sum of SIA share dividend yields declared with ex-dividend dates occurring during the vesting period) will vest.
Except as disclosed in this statement, no other Director who held office at the end of the financial year had interests in shares, share options, awards or debentures of the Company, or of related corporations, either at the beginning of the financial year, or date of appointment if later, or at the end of the financial year.
There were no changes in any of the above-mentioned interests between the end of the financial year and 21 April 2017, except for Dr William Fung Kwok Lun, whose deemed interest in shares in Singapore Telecommunications Limited decreased from 408,400 shares as at 31 March 2017 to 178,400 shares as at 21 April 2017.
4 Equity Compensation Plans of the Company
The Company has in place (or previously had in place) the SIA Employee Share Option Plan (“ESOP”), the SIA Restricted Share Plan (“RSP”), the SIA Restricted Share Plan 2014 (“RSP 2014”), the SIA Performance Share Plan (“PSP”) and the SIA Performance Share Plan 2014 (“PSP 2014”).
At the date of this statement, the Board Compensation & Industrial Relations Committee (“BCIRC”) which administers the ESOP, RSP, RSP 2014, PSP and PSP 2014 comprises the following Directors:
Peter Seah Lim Huat – ChairmanHsieh Tsun-yanHelmut Gunter Wilhelm Panke
Annual Report FY2016/17 83

4 Equity Compensation Plans of the Company (continued)
(i) ESOP
Details of the ESOP are disclosed in Note 5 to the financial statements.
At the end of the financial year, options to take up 16,723,550 unissued shares in the Company were outstanding:
Number of options to subscribe for unissued ordinary shares Balance at Balance at Exercise
Date of grant 1.4.2016 Cancelled Exercised 31.3.2017 price* Exercisable Period
3.7.2006 3,799,229 (1,489,218) (2,310,011) – $9.34 3.7.2007 – 2.7.20162.7.2007 9,026,612 (323,760) – 8,702,852 $15.46 2.7.2008 – 1.7.20171.7.2008 8,287,356 (266,658) – 8,020,698 $12.07 1.7.2009 – 30.6.2018
21,113,197 (2,079,636) (2,310,011)** 16,723,550
* Following approval by the Company’s shareholders of the declaration of a special dividend of $0.50 per share on 31 July 2007, the BCIRC approved a reduction of $0.50 in the exercise prices of the share options outstanding on 2 August 2007. The said Committee approved another $1.71 reduction in the exercise prices of the share options outstanding on 28 August 2009 following approval by the Company’s shareholders of the dividend in specie of SATS shares on 31 July 2009. The said Committee approved another reduction of $0.80 in the exercise prices of the share options outstanding on 18 August 2011 and a further $0.25 reduction in the exercise prices outstanding on 14 August 2014 after the approvals by the Company’s shareholders of the declaration of a special dividend of $0.80 and $0.25 per share on 29 July 2011 and 30 July 2014 respectively. The exercise prices reflected here are the exercise prices after such adjustments.
** Out of these, no new shares were issued during the financial year ended 31 March 2017 as all options exercised were satisfied by way of transfer of treasury shares.
The details of options granted to and exercised by a Director of the Company are as follows:
Name of participant
Options granted during
financial year under review
Aggregate options granted since
commencement of scheme to end of
financial year under review
Aggregate options exercised since
commencement of scheme to end of
financial year under review Options lapsed
Aggregate options outstanding at end
of financial year under review
Goh Choon Phong – 444,075 444,075 – –
No options have been granted to controlling shareholders or their associates, or parent group directors or employees.
The options granted by the Company do not entitle the holders of the options, by virtue of such holding, to any rights to participate in any share issue of any other company.
No options have been granted during the financial year as the last grant of the share options under the ESOP was made in July 2008. The ESOP expired on 7 March 2010. The termination of the ESOP does not affect options which have been granted and accepted in accordance with the ESOP.
(ii) RSP/RSP 2014 and PSP/PSP 2014
Details of the RSP/RSP 2014 and PSP/PSP 2014 are disclosed in Note 5 to the financial statements.
The RSP and PSP were approved by the shareholders of the Company on 28 July 2005. The duration of the RSP and PSP was 10 years each, from 28 July 2005 to 27 July 2015.
At the Extraordinary General Meeting held on 30 July 2014, shareholders approved the adoption of the RSP 2014 and PSP 2014 to replace the RSP and PSP, which were terminated following the adoption of the RSP 2014 and PSP 2014. The termination of the RSP and PSP was without prejudice to the rights of holders of awards outstanding under the RSP and PSP as at the date of such termination. The duration of the RSP 2014 and PSP 2014 is 10 years each, commencing 30 July 2014.
Directors’ Statement
Singapore Airlines84
Financial

4 Equity Compensation Plans of the Company (continued)
Under the RSP/RSP 2014, a base number of conditional share awards (“Base Award”) was/is granted to eligible participants annually. Depending on the achievement of pre-determined targets over a two-year performance period for awards granted before 2016 and over a one-year performance period for awards granted from 2016 onwards, the BCIRC will determine an achievement factor which will then be applied to the Base Award to determine the final number of RSP/RSP 2014 shares to be awarded at the end of the respective performance periods (“Final Award”).
Under the PSP/PSP 2014, a base number of conditional share awards (“Base Award”) was/is granted to eligible participants annually. Depending on the achievement of pre-determined targets over a three-year performance period, the BCIRC will determine an achievement factor which will then be applied to the Base Award to determine the final number of PSP/PSP 2014 shares to be awarded at the end of the respective performance periods (“Final Award”).
The achievement factor could range from 0% to 150% for the RSP/RSP 2014 and from 0% to 200% for the PSP/PSP 2014.
One-third of the RSP/RSP 2014 Final Awards of fully paid ordinary shares will be released to the participants upon vesting. The balance will be released equally over the subsequent two years with fulfilment of service requirements. All the PSP/PSP 2014 Final Awards of fully paid ordinary shares will be released to the participants at the end of the three-year performance period. For the financial year under review, all RSP/RSP 2014 and PSP/PSP 2014 Final Awards released were satisfied by way of transfer of treasury shares to the participants.
No awards have been granted to controlling shareholders or their associates, or parent group directors or employees, under the RSP/RSP 2014 and PSP/PSP 2014.
No employee has received 5% or more of the total number of options or awards granted under the ESOP, RSP and PSP, or 5% or more of the total number of shares available under the RSP 2014 and PSP 2014.
The details of the shares awarded under the RSP/RSP 2014 and PSP/PSP 2014 to a Director of the Company are as follows:
1. RSP Base Awards
Name of participant
Balance as at
1 April 2016
Base Awards granted
during the financial year
Base Awards vested
during the financial year
Balance as at
31 March 2017
Aggregate Base Awards
granted since commencement of RSP to end of
financial year under review
Goh Choon Phong 61,448 – 61,488 – 280,232
2. RSP 2014 Base Awards
Name of participant
Balance as at
1 April 2016
Base Awards granted
during the financial year
Base Awards vested
during the financial year
Balance as at
31 March 2017
Aggregate Base Awards
granted since commencement of RSP 2014 to end of
financial year under review
Goh Choon Phong 60,000 60,000 – 120,000 120,000
Annual Report FY2016/17 85

4 Equity Compensation Plans of the Company (continued)
3. RSP Final Awards (Pending Release) R1
Name of participant
Balance as at
1 April 2016
Final Awards granted
during the financial year#
Final Awards released
during the financial year
Balanceas at
31 March 2017
Aggregate ordinary shares
released to participant since
commencement of RSP/RSP 2014 to end
of financial year under review
Goh Choon Phong 29,118 79,940 58,941 50,117 179,435
4. PSP Base Awards R2
Name of participant
Balance as at
1 April 2016
Base Awards granted
during the financial year
Base Awards vested
during the financial year
Balance as at
31 March 2017
Aggregate Base Awards
granted since commencement of PSP to end of
financial year under review
Aggregate ordinary shares
released to participant since commencement of PSP to end of
financial year under review
Goh Choon Phong 169,092 – 84,546 84,546 346,228 103,762
5. PSP 2014 Base Awards R2
Name of participant
Balance as at
1 April 2016
Base Awards granted
during the financial year
Base Awards vested
during the financial year
Balance as at
31 March 2017
Aggregate Base Awards
granted since commencement
of PSP 2014 to end of financial
year under review
Aggregate ordinary shares
released to participant since commencement
of PSP 2014 to end of financial
year under review
Goh Choon Phong 82,500 82,500 – 165,000 165,000 –
6. Deferred RSP/RSP 2014
Details of the deferred RSP/RSP 2014 awards of restricted shares are disclosed in Note 5 to the financial statements. The grant of deferred RSP/RSP 2014 awards granted on 4 September 2013, 28 August 2014, 10 September 2015 and 1 September 2016, were made under the authority of the BCIRC.
The details of the shares awarded under deferred RSP/RSP 2014 to a Director of the Company are as follows:
(a) Deferred RSP Awards
Name of participant
Balance as at
1 April 2016
Base Awards granted
during the financial year
Awards vested
during the financial year
Balance as at
31 March 2017
Aggregate Base Awards
granted since commencement of DSA to end of
financial year under review
Aggregate ordinary shares
released to participant since commencement of DSA to end of
financial year under review
Goh Choon Phong 42,037 – 42,037 – 42,037 45,737
Directors’ Statement
Singapore Airlines86
Financial

4 Equity Compensation Plans of the Company (continued)
6. Deferred RSP/RSP 2014 (continued)
(b) Deferred RSP 2014 Awards
Name of participant
Balance as at
1 April 2016
Base Awards granted
during the financial year
Awards vested
during the financial year
Balance as at
31 March 2017
Aggregate Base Awards
granted since commencement of DSA to end of
financial year under review
Aggregate ordinary shares
released to participant since commencement of DSA to end of
financial year under review
Goh Choon Phong 32,740 12,860 – 45,600 45,600 –
R1 The actual number of RSP Final Awards of fully paid ordinary shares will range from 0% to 150% of the Base Awards and is contingent on the Achievements against Targets over the two-year performance periods relating to the relevant awards for awards granted before 2016 and over the one-year performance periods relating to the relevant awards for awards granted from 2016 onwards.
R2 The actual number of PSP Final Awards of fully paid ordinary shares will range from 0% to 200% of the Base Awards and is contingent on the Achievements against Targets over the three-year performance periods relating to the relevant awards.
# Final Awards granted during the financial year is determined by applying the achievement factor to the Base Awards that have vested during the financial year.
5 Equity Compensation Plans of Subsidiaries
The particulars of the equity compensation plans of subsidiaries of the Company are as follows:
(i) SIA Engineering Company Limited (“SIAEC”)
The SIAEC Employee Share Option Plan (“SIAEC ESOP”) was approved by the shareholders of SIAEC on 9 February 2000. At the end of the financial year, options to take up 12,805,040 unissued shares in SIAEC were outstanding under the SIAEC ESOP.
The SIAEC Restricted Share Plan (“SIAEC RSP”) and SIAEC Performance Share Plan (“SIAEC PSP”) were approved by the shareholders of SIAEC on 25 July 2005. At the Extraordinary General Meeting of SIAEC held on 21 July 2014, shareholders of SIAEC approved the adoption of the SIAEC Restricted Share Plan 2014 (“SIAEC RSP 2014”) and the SIAEC Performance Share Plan 2014 (“SIAEC PSP 2014”) to replace the SIAEC RSP and the SIAEC PSP, which were terminated following the adoption of the SIAEC RSP 2014 and SIAEC PSP 2014. The termination of the SIAEC RSP and SIAEC PSP was without prejudice to the rights of holders of awards outstanding under the SIAEC RSP and SIAEC PSP as at the date of such termination.
Details and terms of the SIAEC ESOP, SIAEC RSP/SIAEC RSP 2014 and SIAEC PSP/SIAEC PSP 2014 have been disclosed in the Directors’ Statement of SIAEC.
(ii) Tiger Airways Holdings Limited (“Tiger Airways”)
In connection with the Company’s voluntary general offer for Tiger Airways, Tiger Airways’ Remuneration Committee during the prior financial year approved the encashment and payment of outstanding share awards under the Tiger Airways Restricted Share Plan and Tiger Airways Performance Share Plan to all participants on a deferred payment basis, subject to fulfilment of certain terms and conditions.
Annual Report FY2016/17 87

6 Audit Committee
At the date of this statement, the Audit Committee comprises the following four independent non-executive Directors:
Gautam Banerjee - ChairmanWilliam Fung Kwok LunHsieh Tsun-yan Dominic Ho Chiu Fai (Appointed on 1 May 2017)
The Audit Committee performed its functions in accordance with Section 201B(5) of the Singapore Companies Act, Cap. 50, the SGX Listing Manual and the Code of Corporate Governance, which include inter alia the review of the following:
(i) quarterly and annual financial statements of the Group and the Company prior to their submissions to the Directors of the Company for adoption;
(ii) audit scopes, plans and reports (including Key Audit Matters) of the external and internal auditors;(iii) effectiveness of material controls, including financial, compliance, information technology and risk management controls;(iv) interested person transactions (as defined in Chapter 9 of the SGX Listing Manual); (v) whistle-blowing programme instituted by the Company; and(vi) any material loss of funds, significant computer security incidents and legal cases.
The Audit Committee has held four meetings since the last Directors’ Statement. In performing its functions, the Audit Committee met with the Company’s external and internal auditors to discuss the scope of their work, the results of their examination and evaluation of the Company’s internal accounting control system. The Audit Committee has full access to management and is given the resources required for it to discharge its functions. It has full authority and the discretion to invite any Director or executive officer to attend its meetings. The Audit Committee also recommends the appointment of the external auditors and reviews the level of audit and non-audit fees.
The Audit Committee is satisfied with the independence and objectivity of the external auditors and has recommended to the Board of Directors that the auditors, KPMG LLP, be nominated for re-appointment as auditors at the forthcoming Annual General Meeting of the Company.
In appointing our auditors for the Company, subsidiaries and significant associated companies, we have complied with Rules 712 and 715 of the SGX Listing Manual.
Directors’ Statement
Singapore Airlines88
Financial

7 Auditors
The auditors, KPMG LLP, have indicated their willingness to accept re-appointment.
On behalf of the Board,
PETER SEAH LIM HUATChairman
GOH CHOON PHONGChief Executive Officer
Dated this 18th day of May 2017
Annual Report FY2016/17 89
Report on the audit of the financial statements
Opinion
We have audited the financial statements of Singapore Airlines Limited (the Company) and its subsidiaries (the Group), which comprise the consolidated statement of financial position of the Group and the statement of financial position of the Company as at 31 March 2017, the consolidated profit and loss account, consolidated statements of comprehensive income, changes in equity and cash flows of the Group, and the statement of changes in equity of the Company for the year then ended, and notes to the financial statements, including a summary of significant accounting policies as set out on pages 99 to 203.
In our opinion, the accompanying consolidated financial statements of the Group and the statements of financial position and changes in equity of the Company are properly drawn up in accordance with the provisions of the Singapore Companies Act, Chapter 50 (the Act) and Singapore Financial Reporting Standards (FRSs) so as to give a true and fair view of the consolidated financial position of the Group and the financial position of the Company as at 31 March 2017 and the consolidated financial performance, consolidated changes in equity and consolidated cash flows of the Group and the changes in equity of the Company for the year ended on that date.
Basis for opinion
We conducted our audit in accordance with Singapore Standards on Auditing (SSAs). Our responsibilities under those standards are further described in the ‘Auditors’ responsibilities for the audit of the financial statements’ section of our report. We are independent of the Group in accordance with the Accounting and Corporate Regulatory Authority ‘Code of Professional Conduct and Ethics for Public Accountants and Accounting Entities’ (ACRA Code) together with the ethical requirements that are relevant to our audit of the financial statements in Singapore, and we have fulfilled our other ethical responsibilities in accordance with these requirements and the ACRA Code. We believe that the audit evidence we have obtained is sufficient and appropriate to provide a basis for our opinion.
Key audit matters
Key audit matters are those matters that, in our professional judgement, were of most significance in our audit of the financial statements of the current period. These matters were addressed in the context of our audit of the financial statements as a whole, and in forming our opinion thereon, and we do not provide a separate opinion on these matters.
Independent Auditors’ ReportTo the members of Singapore Airlines Limited
Singapore Airlines90
Financial

Timing of recognition and accuracy of passenger revenue
Refer to note 2(t) ‘Revenue’ and note 3(c) ‘Passenger revenue recognition’ for the relevant accounting policy and a discussion of significant accounting estimates.
The key audit matter How the matter was addressed in our audit
Passenger revenue is not recorded immediately on sale but is deferred to be recorded at a later time as revenue in the profit and loss account when a passenger is flown. Such deferred revenue is presented on the balance sheet as sales in advance of carriage and is measured based on the sales price to the customer, net of discounts and rebates.
Significant judgement is required in the following aspects:
• Certain tickets may never be used – Up until 1 April 2016, the Group recognised such tickets as revenue two years after sale. Improvements to the Group’s accounting processes now allow the Group to estimate with reasonable accuracy the number of such tickets that will likely expire without being used. From 1 April 2016, the Group estimates at ticketed flight date the proportion of tickets that will likely not be used, and accounts for such tickets as revenue on that date.
The recognition of such tickets resulted in a one-off recognition of $151.2 million in revenue and is accounted for in the financial year ended 31 March 2017 (the “current year”).
• Flight tickets sold often involve multiple flight sectors and partner airlines – The determination of the amount of revenue to be recognised for each flight as it is flown relies on complex internal systems that handle large volumes of transaction data and includes the exchange of information with industry systems and partner airlines.
As a result of the judgement required in estimating revenue for tickets likely to be unused, and in the complexity of the determinations made on flight date of revenue to be recognised for flown flights, these are key focus areas in our audit.
We compared the assumptions used in estimating the revenue attributable to unused tickets to historical passenger ticket usage patterns. We checked the accuracy of the historical analysis used by testing relevant computer system controls applying data analytic technique on system data and considering its consistency with our understanding of Singapore Airlines’ ticket conditions.
To check the accuracy of the revenue recorded by the passenger revenue systems, we tested the relevant computer system controls, these being the user access, program change controls and application controls over internal passenger revenue systems. Our tests of these controls were designed to determine whether these key computer systems operated as they are designed, and are protected from tampering of data or software logic that would result in inaccurate accounting information relating to passenger revenue.
Computer system controls were tested selectively; these included those relating to the completeness of transfers of data between systems, ticket validation to identify data errors and the assignment of ticket prices to each flight. Key manual controls were also tested to assess the appropriateness of the treatment applied to exceptions and reconciliations of the Group’s records with the outputs from shared industry systems and partner airlines.
We also visited Singapore Airlines stations in Beijing, Manila and Singapore as well as SilkAir stations in Medan and Singapore to test the effectiveness of key controls in the passenger revenue accounting process at those locations.
Findings
The estimates used to determine the revenue to be recognised at ticketed flight date relating to unused tickets were cautious, however within the range of passenger usage patterns.
In assessing the accuracy of passenger revenue recorded, no significant exceptions were noted in our testing of the IT and manual controls. Our site visits found the key controls to be operating as designed.
Annual Report FY2016/17 91

Determining the fair value of KrisFlyer miles and the miles that will expire without use
Refer to note 2(t) ‘Revenue’ and note 3(d) ‘Frequent flyer programme’ for the relevant accounting policy and a discussion of significant accounting estimates.
The key audit matter How the matter was addressed in our audit
Cash is received by Singapore Airlines in return for the issuance of miles in its frequent flyer programme. A portion of unearned revenue is separately identified from the value of the ticket sales for flights on which KrisFlyer members qualify to earn frequent flyer miles used on subsequent flights. In addition, programme partners purchase such miles from Singapore Airlines to issue to their own customers.
Such unearned revenue is recognised on the balance sheet as deferred revenue.
Revenue is subsequently recognised when KrisFlyer members fly, or when it is assessed that the miles awarded will expire without use.
Significant judgement is required in the following aspects:
• The determination of the fair value of frequent flyer miles – Singapore Airlines relies on historical redemption patterns in determining these estimates; and
• The determination of the number of miles that will expire without use – This takes into account of historical expiry patterns and the anticipated impact of KrisFlyer scheme revisions.
The estimation of the fair value of miles awarded in the frequent flyer programme is complex and requires judgement to be applied. Predicting the impact of KrisFlyer scheme revisions that are anticipated to change the number of miles that will expire over time is judgemental. These are key focus areas of our audit.
We evaluated the assumptions applied in the mathematical models used to determine the fair value of expected KrisFlyer awards. This included undertaking a comparison to historical redemption patterns and testing the calculations for award values against observable inputs such as published market air fares. We tested the controls implemented over the models.
We challenged the assumptions used to estimate the number of miles that will expire without use, including a comparison to historical expiry patterns and planned changes to the programme that may affect future redemptions.
Findings
We found the estimate for the fair value of miles awards to be balanced. We found the estimate of the percentage of miles that will not be used continues to be cautious.
Independent Auditors’ ReportTo the members of Singapore Airlines Limited
Singapore Airlines92
Financial

Accounting for aircraft related assets and carrying values
Refer to note 2(h) ‘Property, plant and equipment’, note 2(f)(iv) ‘Intangible assets – goodwill’, note 3(a) ‘Impairment of property, plant and equipment – aircraft fleet’ and note 3(b) ‘Depreciation of property, plant and equipment – aircraft fleet’ for the relevant accounting policy and a discussion of significant accounting estimates.
The key audit matter How the matter was addressed in our audit
The accounting for aircraft has a material impact on Singapore Airlines due to the cumulative value of the aircraft and long-lived nature of these assets.
Significant judgement was required in the following aspects:
• The determination of components of aircraft – Major components of each aircraft require replacement at different times, leading to different periods over which those components are depreciated. As part of the introduction of the A350 aircraft into Singapore Airlines in the current year, the Group reviewed the different components that make up its aircraft. As a result of this review covering all aircraft types, the Group determined that engine overhauls (EOH) should be identified as a separate component of cost to be depreciated over its own useful life, in order to better represent the underlying economics of EOH events. This resulted in the separate component of EOH costs being depreciated over shorter useful lives, ranging from 4 to 8 years, based on the intervals between engine overhauls;
• The determination of the useful lives and residual values of the various components of the aircraft – This takes into account physical and commercial considerations;
• The determination of the cash generating units (CGU) – The integration of the operations of Tiger Airways and Scoot during the year led to a greater interdependence in revenues between the two operations. A similar continuing increase is being observed in the interdependency of revenues between passenger and cargo operations, which share aircraft, as well as within the passenger operations between Singapore Airlines and SilkAir. As a result of that interdependence, Singapore Airlines has determined that the passenger and cargo operations, previously considered to be separate CGUs, are now a single CGU. With this revision, CGU impairment tests are computed against the cash flows of the combined CGU rather than against separate and respective CGUs; and
• The assessment of CGUs for possible impairment – In testing whether asset values are impaired, these being predominantly aircraft assets and goodwill, the carrying value of all assets in the CGU are compared to the amounts expected to be recoverable from each CGU. This requires estimates to be made for each CGU of future revenues, operating costs, capital expenditure, timing of cash flows and the discount rates applicable to these cash flows.
The assessment of these judgements is a key focus area of our audit.
We assessed Singapore Airlines’ approach in determining the significant components of the cost of aircraft and compared it to our understanding of how these significant components are identified in the aviation industry. We challenged the assumptions used by the Group in the calculation of the values attributed to the identified components.
We compared the estimates of useful lives and residual values to the Singapore Airlines’ fleet plan, recent aircraft transactions, contractual rights and industry practices.
We assessed the appropriateness of the CGUs identified within Singapore Airlines, based on our understanding of the nature of Singapore Airlines’ business. This included considering how the Group Network and Fleet Planning Committee allocates aircraft to brands and routes, the redemption of KrisFlyer miles across different CGUs and the interdependence between cargo and passenger capacity. We read the plans for the integration of Tiger Airways and Scoot and interviewed key management personnel to understand the developments surrounding the Group’s portfolio strategy.
We considered the need for impairment provisions by assessing whether there were indicators of potential impairment in each CGU. Where a CGU required testing for impairment, we challenged the forecasts of its future revenues, operating costs, capital expenditure and discount rates based on our knowledge of the business and the aviation industry. We assessed the arithmetical accuracy of the discounted cash flow models by re-performing the mathematical calculations.
Annual Report FY2016/17 93

Accounting for aircraft related assets and carrying values (continued)
Findings
We found the identification of the components of the cost of aircraft to be appropriate, including the estimate of the purchase cost that is attributed to the cost of initial engine inspections. We found that the estimates of useful lives and residual values were balanced and residual values were adjusted appropriately to reflect Singapore Airlines’ fleet plans.
We found that the revised composition of the CGUs reflects the current and intended usage of the Group’s aircraft fleet assets. Where CGU testing was required to be conducted, cash flow forecasting was found to be in accordance with approved plans. The SIA Group operates in a competitive market place, which has seen multi-year reductions in yield and is subject to volatility of key input costs such as fuel and as such is inherently complex to forecast. We found management forecasts had sufficient headroom to be considered balanced overall.
Return costs for leased aircraft
Refer to note 2(p) ‘Provisions’ and note 3(f) ‘Provision for lease return costs’ for the relevant accounting policy and a discussion of significant accounting estimates.
The key audit matter How the matter was addressed in our audit
Singapore Airlines had 74 aircraft held under operating leases at 31 March 2017. Under the terms of operating lease agreements with aircraft lessors, the Group is contractually committed to meet, at the end of each lease, conditions relating to the condition of the aircraft upon return.
The work thus required on each aircraft will vary, depending on the historical utilisation and future utilisation patterns of the aircraft in the period up to its return. As a result, the estimation of the expected future cash outflows associated with these lease return costs requires significant judgement and is a key focus area for our audit.
We read the lease agreements for selected aircraft to gain an understanding of the significant terms which influence the economics of, and hence accounting for, the Group’s obligations.
We reviewed the maintenance records of these aircraft to determine their condition, and discussed with management the plans for their future utilisation.
We tested the key internal controls over the adequacy of the provisions for lease return costs.
We assessed the appropriateness of the methodologies and assumptions used in determining the estimates for these agreements, taking into account known factors, including the historical experience of how actual return costs compared to amounts previously provided.
Findings
The methodology used in the provision for aircraft return costs reflected the nature of the Group’s contractual obligations. We found the estimates of the costs to be balanced.
Independent Auditors’ ReportTo the members of Singapore Airlines Limited
Singapore Airlines94
Financial

Early adoption of FRS 109 Financial Instruments
Refer to note 2(b) ‘Changes in accounting policies’ and note 2(k) ‘Financial instruments’ for the relevant accounting policy and a discussion of significant accounting estimates.
The key audit matter How the matter was addressed in our audit
The Group chose to voluntarily adopt FRS 109 Financial Instruments on 1 October 2016, ahead of the mandatory adoption financial year ending 31 March 2019.
The implementation of this accounting standard requires significant judgement in a number of areas, principally the following:
• The Group has now applied hedge accounting to its strategies for the hedging of aviation fuel cost to the Brent index. These were previously not recognised as fully effective hedges. Assessing the effectiveness of a complex hedge strategy between these two items, and thus the appropriate accounting treatment, requires significant judgement.
• Provisions for losses on financial assets are now estimated on the basis of future expectations instead of past historical data, requiring greater application of judgement.
• Financial assets are now classified on a judgemental analysis of the substance of the originating transaction and their linkage to the business model, instead of previous accounting rule-based classification.
• Certain unquoted equity investments previously accounted for at cost are stated at estimated fair value.
The effects of these adjustments resulted in changes to the classification, measurement and presentation of financial statement captions as set out in Note 2(b).
We read Singapore Airlines’ risk management policies as they apply to aviation fuel hedging, and assessed whether the instruments accounted for as hedges operate to achieve the intent of the hedging strategy, and whether the hedging documentation appropriately sets out how this is achieved.
We challenged the assumptions used by Singapore Airlines in the estimation of future expected loss for financial assets.
We read a selected number of investment agreements to determine whether Singapore Airlines’ classification and measurement of investments is appropriate.
We assessed the appropriateness of the methodologies and assumptions used in determining the fair value of unquoted equity investments.
Findings
Singapore Airlines’ fuel hedges are appropriately documented and accounted for to be consistent with stated risk management policies. Changes in the classification of financial assets reflect the intended purpose for the arrangements. We found that the estimates used in Singapore Airlines’ FRS 109 transitional adjustments appear to be balanced.
Annual Report FY2016/17 95

Competition-related fine
Refer to note 2(p) ‘Provisions’ and note 35(a) ‘Contingent liabilities – Cargo: Investigations by Competition Authorities and Civil Class Actions’ for the relevant accounting policy and disclosures.
The key audit matter How the matter was addressed in our audit
In 2006 and thereafter, Singapore Airlines and SIA Cargo were among several airlines that received notices of investigations by competition authorities in the European Commission (EC) regarding the determination of surcharges, rates or other competitive aspects of air cargo services (air cargo matters).
On 9 November 2010, the EC issued an adverse decision against 13 airlines including Singapore Airlines and SIA Cargo. A fine of EUR74.8 million ($135.7 million at prevailing rates) was imposed on SIA Cargo and Singapore Airlines. This amount was paid and recognised as an expense in the FY2010/11 Financial Report. On appeal, the European General Court annulled the decision in December 2015. The EC refunded EUR76.4 million ($119.1 million at prevailing rates) in February 2016. This amount received was recognised as a refund in the FY2015/16 Financial Report.
In March 2017, the EC re-imposed the EUR74.8 million ($111.8 million at prevailing rates) fine requiring it to be paid by 21 June 2017.
Accounting standards require that the assessment of the obligation be made based on information available at the date of the re-imposition of the fine, and applying the judgement of the Company where such information is limited.
The Company is also required to regularly reassess the obligation. In such reassessment, the Company considers whether new information reflects new developments or an error in previous assessments.
The final outcome is however dependent on the decisions of the EC and the European Courts and may be based on facts that may not be entirely in the possession of Singapore Airlines and SIA Cargo currently.
Because of the inherent uncertainties since 2010 on the ongoing legal process, this is a key area of focus for our audit.
We reviewed the historical basis of accounting for these events considering the information we understand to have been available at the relevant reporting dates.
We obtained direct confirmation from the Group’s external solicitors on the cases.
We held discussions with the Group’s general counsel on the status of current legal actions to assess the Group’s determination of the likelihood of the liabilities that may arise.
We assessed the appropriateness of the accounting for the fines for the FY2016/17 year and the associated disclosures in the FY2016/17 Financial Report.
Findings
We consider the re-imposition of the fine to be a new development, and that the establishment of a provision at that date to be appropriate. We found the basis of provisioning for the EC matter to be reasonable.
Independent Auditors’ ReportTo the members of Singapore Airlines Limited
Singapore Airlines96
Financial

Other Information
Management is responsible for the other information contained in the annual report. Other information is defined as all information in the annual report other than the financial statements and our auditors’ report thereon. We have obtained all other information prior to the date of this auditors’ report except for the SIA Group Portfolio, Celebrating 70 Years of Excellence, Strategy, The Year in Review, Environment, Community Engagement, Subsidiaries, Corporate Governance Report, Membership and Attendance of Singapore Airlines Limited, Further Information on Board of Directors, Information on Shareholdings and Corporate Data (“the Reports”) which are expected to be made available to us after that date.
Our opinion on the financial statements does not cover the other information and we do not and will not express any form of assurance conclusion thereon.
In connection with our audit of the financial statements, our responsibility is to read the other information identified above and, in doing so, consider whether the other information is materially inconsistent with the financial statements or our knowledge obtained in the audit, or otherwise appears to be materially misstated.
If, based on the work we have performed on the other information that we obtained prior to the date of this auditors’ report, we conclude that there is a material misstatement of this other information, we are required to report that fact. We have nothing to report in this regard.
When we read the Reports, if we conclude that there is a material misstatement therein, we are required to communicate the matter to the Audit Committee and take appropriate actions in accordance with SSAs.
Responsibilities of management and directors for the financial statements
Management is responsible for the preparation of financial statements that give a true and fair view in accordance with the provisions of the Act and FRSs, and for devising and maintaining a system of internal accounting controls sufficient to provide a reasonable assurance that assets are safeguarded against loss from unauthorised use or disposition; and transactions are properly authorised and that they are recorded as necessary to permit the preparation of true and fair financial statements and to maintain accountability of assets.
In preparing the financial statements, management is responsible for assessing the Group’s ability to continue as a going concern, disclosing, as applicable, matters related to going concern and using the going concern basis of accounting unless management either intends to liquidate the Group or to cease operations, or has no realistic alternative but to do so.
The directors’ responsibilities include overseeing the Group’s financial reporting process.
Auditors’ responsibilities for the audit of the financial statements
Our objectives are to obtain reasonable assurance about whether the financial statements as a whole are free from material misstatement, whether due to fraud or error, and to issue an auditors’ report that includes our opinion. Reasonable assurance is a high level of assurance, but is not a guarantee that an audit conducted in accordance with SSAs will always detect a material misstatement when it exists. Misstatements can arise from fraud or error and are considered material if, individually or in the aggregate, they could reasonably be expected to influence the economic decisions of users taken on the basis of these financial statements.
As part of an audit in accordance with SSAs, we exercise professional judgement and maintain professional scepticism throughout the audit. We also:
• Identify and assess the risks of material misstatement of the financial statements, whether due to fraud or error, design and perform audit procedures responsive to those risks, and obtain audit evidence that is sufficient and appropriate to provide a basis for our opinion. The risk of not detecting a material misstatement resulting from fraud is higher than for one resulting from error, as fraud may involve collusion, forgery, intentional omissions, misrepresentations, or the override of internal controls.
• Obtain an understanding of internal controls relevant to the audit in order to design audit procedures that are appropriate in the circumstances, but not for the purpose of expressing an opinion on the effectiveness of the Group’s internal controls.
• Evaluate the appropriateness of accounting policies used and the reasonableness of accounting estimates and related disclosures made by management.
Annual Report FY2016/17 97

• Conclude on the appropriateness of management’s use of the going concern basis of accounting and, based on the audit evidence obtained, whether a material uncertainty exists related to events or conditions that may cast significant doubt on the Group’s ability to continue as a going concern. If we conclude that a material uncertainty exists, we are required to draw attention in our auditors’ report to the related disclosures in the financial statements or, if such disclosures are inadequate, to modify our opinion. Our conclusions are based on the audit evidence obtained up to the date of our auditors’ report. However, future events or conditions may cause the Group to cease to continue as a going concern.
• Evaluate the overall presentation, structure and content of the financial statements, including the disclosures, and whether the financial statements represent the underlying transactions and events in a manner that achieves fair presentation.
• Obtain sufficient appropriate audit evidence regarding the financial information of the entities or business activities within the Group to express an opinion on the consolidated financial statements. We are responsible for the direction, supervision and performance of the group audit. We remain solely responsible for our audit opinion.
We communicate with the Audit Committee regarding, among other matters, the planned scope and timing of the audit and significant audit findings, including any significant deficiencies in internal controls that we identify during our audit.
We also provide the Audit Committee with a statement that we have complied with relevant ethical requirements regarding independence, and communicate with them all relationships and other matters that may reasonably be thought to bear on our independence, and where applicable, related safeguards.
From the matters communicated with the Audit Committee, we determine those matters that were of most significance in the audit of the financial statements of the current period and are therefore the key audit matters. We describe these matters in our auditors’ report unless the law or regulations preclude public disclosure about the matter or when, in extremely rare circumstances, we determine that a matter should not be communicated in our report because the adverse consequences of doing so would reasonably be expected to outweigh the public interest benefits of such communication.
Report on legal and regulatory requirements
In our opinion, the accounting and other records required by the Act to be kept by the Company and by those subsidiary corporations incorporated in Singapore of which we are the auditors have been properly kept in accordance with the provisions of the Act.
The engagement partner on the audit resulting in this independent auditors’ report is Tham Sai Choy.
KPMG LLPPublic Accountants and Chartered Accountants
Dated this 18th day of May 2017Singapore
Independent Auditors’ ReportTo the members of Singapore Airlines Limited
Singapore Airlines98
Financial

The GroupNotes FY2016/17 FY2015/16
Revenue 4 14,868.5 15,238.7
ExpenditureStaff costs 5 2,616.2 2,451.8 Fuel costs 3,747.5 4,527.0 Depreciation 20 1,552.1 1,543.0 Impairment of property, plant and equipment 20 3.9 10.6 Amortisation of intangible assets 21 39.8 32.7 Aircraft maintenance and overhaul costs 898.3 804.9 Commission and incentives 387.1 365.0 Landing, parking and overflying charges 809.3 765.8 Handling charges 1,197.1 1,138.9 Rentals on leased aircraft 895.9 924.7 Material costs 63.8 67.2 Inflight meals 543.7 547.2 Advertising and sales costs 304.3 289.8 Insurance expenses 44.7 44.1 Company accommodation and utilities 115.4 119.1 Other passenger costs 176.3 180.5 Crew expenses 156.8 148.5 Other operating expenses 693.5 596.7
14,245.7 14,557.5
Operating profit 6 622.8 681.2 Finance charges 7 (46.1) (50.3)Interest income 8 73.9 70.7 (Loss)/Surplus on disposal of aircraft, spares and spare engines (31.7) 52.7 Dividends from long-term investments 5.5 115.3 Dividends from asset held for sale 39.5 – Other non-operating items 9 (103.2) 91.1 Share of profits of joint venture companies 20.9 22.8 Share of losses of associated companies (63.0) (11.1)
Profit before taxation 518.6 972.4 Taxation 10 (76.7) (120.6)Profit for the financial year 441.9 851.8
Profit attributable to:Owners of the parent 360.4 804.4 Non-controlling interests 81.5 47.4
441.9 851.8
Basic earnings per share (cents) 11 30.5 69.0 Diluted earnings per share (cents) 11 30.3 68.7
Consolidated Profit and Loss AccountFor The Financial Year Ended 31 March 2017 (in $ million)
The accompanying accounting policies and explanatory notes form an integral part of the financial statements.
Annual Report FY2016/17 99

The GroupFY2016/17 FY2015/16
Profit for the financial year 441.9 851.8
Other comprehensive income:Items that are or may be reclassified subsequently to profit or loss:Currency translation differences 27.5 (21.9)Net fair value changes on cash flow hedges 369.5 124.3 Loss on dilution of interest in an associated company due to share options exercised – (1.9)Share of other comprehensive income of associated and joint venture companies 29.6 (10.5)Net changes in fair value of cash flow hedges reclassified to carrying amount of an
associated company – (0.8) Realisation of foreign currency translation reserves on liquidation of an associated company – 4.3
Items that will not be reclassified subsequently to profit or loss:Net fair value changes on financial assets measured at fair value through other comprehensive
income (“FVOCI”) (133.2) 140.7 Actuarial loss on revaluation of defined benefit plans (5.1) (1.3)Other comprehensive income for the financial year, net of tax 288.3 232.9
Total comprehensive income for the financial year 730.2 1,084.7
Total comprehensive income attributable to:Owners of the parent 676.3 1,004.6 Non-controlling interests 53.9 80.1
730.2 1,084.7
Consolidated Statement of Comprehensive IncomeFor The Financial Year Ended 31 March 2017 (in $ million)
The accompanying accounting policies and explanatory notes form an integral part of the financial statements.
Singapore Airlines100
Financial

The Group The CompanyNotes 2017 2016 2017 2016
Equity attributable to owners of the parentShare capital 13 1,856.1 1,856.1 1,856.1 1,856.1 Treasury shares 14 (194.7) (381.5) (194.7) (381.5)Other reserves 15 11,421.6 11,280.1 10,852.2 10,533.6
13,083.0 12,754.7 12,513.6 12,008.2 Non-controlling interests 387.2 378.2 – –Total equity 13,470.2 13,132.9 12,513.6 12,008.2
Deferred account 16 234.5 255.0 214.9 222.4 Deferred taxation 17 1,890.5 1,681.7 1,482.1 1,346.5 Long-term liabilities 18, 37 1,794.7 1,283.4 1,689.4 1,110.1 Provisions 19 910.3 877.1 648.0 647.2 Defined benefit plans 131.2 129.3 122.3 121.4
18,431.4 17,359.4 16,670.3 15,455.8 Represented by:Property, plant and equipment 20 16,433.3 14,143.5 12,050.8 10,241.2 Intangible assets 21 423.5 515.8 169.5 167.0 Subsidiary companies 22 – – 4,610.1 4,460.9 Associated companies 23 1,056.9 901.9 756.8 531.5 Joint venture companies 24 160.2 156.3 – –Long-term investments 25 405.7 773.1 395.3 754.4 Other long-term assets 26, 37 479.3 496.8 397.9 398.7 Deferred account 16 61.1 65.2 49.1 50.5 Current assets
Inventories 27 178.4 181.9 106.1 108.2 Trade debtors 28 1,144.6 1,221.8 694.7 799.4 Deposits and other debtors 29 127.4 114.8 55.8 43.5 Prepayments 211.0 132.4 169.9 104.8 Deferred account 16 11.8 17.7 9.1 15.0 Amounts owing by subsidiary companies 28 – – 203.8 318.0 Loan receivable from an associated company 28 – 62.0 – 62.0 Derivative assets 37 85.0 24.9 82.1 22.3 Investments 30 539.9 668.1 469.9 601.9 Cash and bank balances 31 3,380.5 3,972.4 2,733.2 3,239.2 Other short-term assets 21.4 – 21.4 –Assets held for sale 20, 25 – 398.0 – –
5,700.0 6,794.0 4,546.0 5,314.3 Less: Current liabilities
Sales in advance of carriage 1,634.3 1,626.2 1,465.9 1,460.1 Deferred revenue 707.8 669.4 707.8 669.4 Deferred account 16 86.0 47.2 76.3 40.6 Current tax payable 80.3 191.9 30.3 131.0 Trade and other creditors 32 3,296.1 2,899.0 2,251.9 2,194.9 Amounts owing to subsidiary companies 32 – – 1,354.5 1,191.1 Borrowings 18 42.0 211.9 – –Provisions 19 322.4 218.5 298.8 180.5 Derivative liabilities 37 119.7 623.1 119.7 595.1
6,288.6 6,487.2 6,305.2 6,462.7 Net current (liabilities)/assets (588.6) 306.8 (1,759.2) (1,148.4)
18,431.4 17,359.4 16,670.3 15,455.8
Statements of Financial PositionAs At 31 March 2017 (in $ million)
The accompanying accounting policies and explanatory notes form an integral part of the financial statements.
Annual Report FY2016/17 101

Attributable to owners of the parent
NotesShare
capitalTreasury
sharesCapitalreserve
Foreign currencytranslation reserve
Share-basedcompensation
reserveFair value
reserveGeneralreserve Total
Non-controllinginterests
Totalequity
Balance at 1 April 2016 1,856.1 (381.5) (129.2) (151.3) 123.7 (498.6) 11,935.5 12,754.7 378.2 13,132.9
Effects of adopting FRS 109 2(b) – – – – – (28.4) 47.2 18.8 – 18.8
Comprehensive income
Currency translation differences 15(b) – – – 22.3 – – – 22.3 5.2 27.5
Net fair value changes on financial assets measured at FVOCI 15(d) – – – – – (100.3) – (100.3) (32.9) (133.2)
Net fair value changes on cash flow hedges 15(d) – – – – – 369.4 – 369.4 0.1 369.5
Share of other comprehensive income of associated and joint venture companies – – 6.5 – (0.5) 23.6 – 29.6 – 29.6
Actuarial loss on revaluation of defined benefit plans – – – – – – (5.1) (5.1) – (5.1)
Other comprehensive income for the financial year, net of tax – – 6.5 22.3 (0.5) 292.7 (5.1) 315.9 (27.6) 288.3
Profit for the financial year – – – – – – 360.4 360.4 81.5 441.9
Total comprehensive income for the financial year – – 6.5 22.3 (0.5) 292.7 355.3 676.3 53.9 730.2
Transactions with owners, recorded directly in equity
Contributions by and distributions to owners
Share of other changes in equity of associated companies – – (9.8) – – – – (9.8) – (9.8)
Loss on dilution of interest in a subsidiary company due to share options exercised – – – – (5.9) – (1.3) (7.2) (2.6) (9.8)
Realisation of reserves from dilution of interest in an associated company – – (8.5) 5.3 (0.5) 0.8 9.0 6.1 – 6.1
Issuance of share capital by a subsidiary company – – – – – – – – 8.2 8.2
Share-based compensation expense 5 – – – – 15.2 – – 15.2 – 15.2
Share options and share awards lapsed – – 1.7 – (16.1) – 14.4 – – –
Purchase of treasury shares 14 – (134.3) – – – – – (134.3) – (134.3)
Treasury shares reissued pursuant to equity compensation plans 14 – 34.3 3.3 – (16.0) – – 21.6 – 21.6
Treasury shares reissued pursuant to the Voluntary General Offer (“VGO”) of Tiger Airways 14 – 286.8 25.8 – (11.4) – – 301.2 – 301.2
Dividends 12 – – – – – – (521.3) (521.3) (37.6) (558.9)
Total contributions by and distributions to owners – 186.8 12.5 5.3 (34.7) 0.8 (499.2) (328.5) (32.0) (360.5)
Changes in ownership interests in a subsidiary company
Acquisition of non-controlling interests without a change in control 22(f) – – (37.4) – – (0.9) – (38.3) (12.9) (51.2)
Total changes in ownership interests in a subsidiary company – – (37.4) – – (0.9) – (38.3) (12.9) (51.2)
Total transactions with owners – 186.8 (24.9) 5.3 (34.7) (0.1) (499.2) (366.8) (44.9) (411.7)
Balance at 31 March 2017 1,856.1 (194.7) (147.6) (123.7) 88.5 (234.4) 11,838.8 13,083.0 387.2 13,470.2
Statements of Changes in EquityFor The Financial Year Ended 31 March 2017 (in $ million)
The accompanying accounting policies and explanatory notes form an integral part of the financial statements.
The Group
Singapore Airlines102
Financial

Attributable to owners of the parent
NotesShare
capitalTreasury
sharesCapitalreserve
Foreign currencytranslation reserve
Share-basedcompensation
reserveFair value
reserveGeneralreserve Total
Non-controllinginterests
Totalequity
Balance at 1 April 2016 1,856.1 (381.5) (129.2) (151.3) 123.7 (498.6) 11,935.5 12,754.7 378.2 13,132.9
Effects of adopting FRS 109 2(b) – – – – – (28.4) 47.2 18.8 – 18.8
Comprehensive income
Currency translation differences 15(b) – – – 22.3 – – – 22.3 5.2 27.5
Net fair value changes on financial assets measured at FVOCI 15(d) – – – – – (100.3) – (100.3) (32.9) (133.2)
Net fair value changes on cash flow hedges 15(d) – – – – – 369.4 – 369.4 0.1 369.5
Share of other comprehensive income of associated and joint venture companies – – 6.5 – (0.5) 23.6 – 29.6 – 29.6
Actuarial loss on revaluation of defined benefit plans – – – – – – (5.1) (5.1) – (5.1)
Other comprehensive income for the financial year, net of tax – – 6.5 22.3 (0.5) 292.7 (5.1) 315.9 (27.6) 288.3
Profit for the financial year – – – – – – 360.4 360.4 81.5 441.9
Total comprehensive income for the financial year – – 6.5 22.3 (0.5) 292.7 355.3 676.3 53.9 730.2
Transactions with owners, recorded directly in equity
Contributions by and distributions to owners
Share of other changes in equity of associated companies – – (9.8) – – – – (9.8) – (9.8)
Loss on dilution of interest in a subsidiary company due to share options exercised – – – – (5.9) – (1.3) (7.2) (2.6) (9.8)
Realisation of reserves from dilution of interest in an associated company – – (8.5) 5.3 (0.5) 0.8 9.0 6.1 – 6.1
Issuance of share capital by a subsidiary company – – – – – – – – 8.2 8.2
Share-based compensation expense 5 – – – – 15.2 – – 15.2 – 15.2
Share options and share awards lapsed – – 1.7 – (16.1) – 14.4 – – –
Purchase of treasury shares 14 – (134.3) – – – – – (134.3) – (134.3)
Treasury shares reissued pursuant to equity compensation plans 14 – 34.3 3.3 – (16.0) – – 21.6 – 21.6
Treasury shares reissued pursuant to the Voluntary General Offer (“VGO”) of Tiger Airways 14 – 286.8 25.8 – (11.4) – – 301.2 – 301.2
Dividends 12 – – – – – – (521.3) (521.3) (37.6) (558.9)
Total contributions by and distributions to owners – 186.8 12.5 5.3 (34.7) 0.8 (499.2) (328.5) (32.0) (360.5)
Changes in ownership interests in a subsidiary company
Acquisition of non-controlling interests without a change in control 22(f) – – (37.4) – – (0.9) – (38.3) (12.9) (51.2)
Total changes in ownership interests in a subsidiary company – – (37.4) – – (0.9) – (38.3) (12.9) (51.2)
Total transactions with owners – 186.8 (24.9) 5.3 (34.7) (0.1) (499.2) (366.8) (44.9) (411.7)
Balance at 31 March 2017 1,856.1 (194.7) (147.6) (123.7) 88.5 (234.4) 11,838.8 13,083.0 387.2 13,470.2
Annual Report FY2016/17 103

The accompanying accounting policies and explanatory notes form an integral part of the financial statements.
Attributable to owners of the parent
NotesShare
capitalTreasury
sharesCapitalreserve
Foreign currencytranslation reserve
Share-basedcompensation
reserveFair value
reserveGeneralreserve Total
Non-controllinginterests
Totalequity
Balance at 1 April 2015 1,856.1 (326.3) 215.9 (135.7) 113.2 (706.2) 11,446.6 12,463.6 466.5 12,930.1
Comprehensive income
Currency translation differences 15(b) – – – (19.9) – – – (19.9) (2.0) (21.9)
Net fair value changes on available-for-sale assets 15(d) – – – – – 109.0 – 109.0 31.7 140.7
Net fair value changes on cash flow hedges 15(d) – – – – – 121.3 – 121.3 3.0 124.3
Loss on dilution of interest in an associated company due to share options exercised – – – – – – (1.9) (1.9) – (1.9)
Share of other comprehensive income of associated and joint venture companies – – – – 0.3 (10.8) – (10.5) – (10.5)
Net changes in fair value of cash flow hedges reclassified to carrying amount of an associated company – – – – – (0.8) – (0.8) – (0.8)
Realisation of foreign currency translation reserves on liquidation of an associated company – – – 4.3 – – – 4.3 – 4.3
Actuarial loss on revaluation of defined benefit plans – – – – – – (1.3) (1.3) – (1.3)
Other comprehensive income for the financial year, net of tax – – – (15.6) 0.3 218.7 (3.2) 200.2 32.7 232.9
Profit for the financial year – – – – – – 804.4 804.4 47.4 851.8
Total comprehensive income for the financial year – – – (15.6) 0.3 218.7 801.2 1,004.6 80.1 1,084.7
Transactions with owners, recorded directly in equity
Contributions by and distributions to owners
Share of other changes in equity of an associated company – – (3.7) – – – – (3.7) – (3.7)
Loss on dilution of interest in subsidiary companies due to share options exercised – – – – (5.0) – (2.0) (7.0) 0.8 (6.2)
Issuance of share capital by a subsidiary company – – – – – – – – 1.5 1.5
Share-based compensation expense 5 – – – – 12.4 – – 12.4 – 12.4
Share options lapsed – – – – (5.1) – 5.1 – – –
Purchase of treasury shares 14 – (85.4) – – – – – (85.4) – (85.4)
Treasury shares reissued pursuant to equity compensation plans 14 – 30.2 1.2 – (11.3) – – 20.1 – 20.1
Dividends 12 – – – – – – (315.4) (315.4) (43.6) (359.0)
Total contributions by and distributions to owners – (55.2) (2.5) – (9.0) – (312.3) (379.0) (41.3) (420.3)
Changes in ownership interests in subsidiary companies
Disposal of a subsidiary company – – – – – – – – (3.1) (3.1)
Acquisition of non-controlling interests without a change in control 22(f) – – (342.6) – 19.2 (11.1) – (334.5) (124.0) (458.5)
Total changes in ownership interests in subsidiary companies – – (342.6) – 19.2 (11.1) – (334.5) (127.1) (461.6)
Total transactions with owners – (55.2) (345.1) – 10.2 (11.1) (312.3) (713.5) (168.4) (881.9)
Balance at 31 March 2016 1,856.1 (381.5) (129.2) (151.3) 123.7 (498.6) 11,935.5 12,754.7 378.2 13,132.9
The Group
Statements of Changes in EquityFor The Financial Year Ended 31 March 2017 (in $ million)
Singapore Airlines104
Financial

Attributable to owners of the parent
NotesShare
capitalTreasury
sharesCapitalreserve
Foreign currencytranslation reserve
Share-basedcompensation
reserveFair value
reserveGeneralreserve Total
Non-controllinginterests
Totalequity
Balance at 1 April 2015 1,856.1 (326.3) 215.9 (135.7) 113.2 (706.2) 11,446.6 12,463.6 466.5 12,930.1
Comprehensive income
Currency translation differences 15(b) – – – (19.9) – – – (19.9) (2.0) (21.9)
Net fair value changes on available-for-sale assets 15(d) – – – – – 109.0 – 109.0 31.7 140.7
Net fair value changes on cash flow hedges 15(d) – – – – – 121.3 – 121.3 3.0 124.3
Loss on dilution of interest in an associated company due to share options exercised – – – – – – (1.9) (1.9) – (1.9)
Share of other comprehensive income of associated and joint venture companies – – – – 0.3 (10.8) – (10.5) – (10.5)
Net changes in fair value of cash flow hedges reclassified to carrying amount of an associated company – – – – – (0.8) – (0.8) – (0.8)
Realisation of foreign currency translation reserves on liquidation of an associated company – – – 4.3 – – – 4.3 – 4.3
Actuarial loss on revaluation of defined benefit plans – – – – – – (1.3) (1.3) – (1.3)
Other comprehensive income for the financial year, net of tax – – – (15.6) 0.3 218.7 (3.2) 200.2 32.7 232.9
Profit for the financial year – – – – – – 804.4 804.4 47.4 851.8
Total comprehensive income for the financial year – – – (15.6) 0.3 218.7 801.2 1,004.6 80.1 1,084.7
Transactions with owners, recorded directly in equity
Contributions by and distributions to owners
Share of other changes in equity of an associated company – – (3.7) – – – – (3.7) – (3.7)
Loss on dilution of interest in subsidiary companies due to share options exercised – – – – (5.0) – (2.0) (7.0) 0.8 (6.2)
Issuance of share capital by a subsidiary company – – – – – – – – 1.5 1.5
Share-based compensation expense 5 – – – – 12.4 – – 12.4 – 12.4
Share options lapsed – – – – (5.1) – 5.1 – – –
Purchase of treasury shares 14 – (85.4) – – – – – (85.4) – (85.4)
Treasury shares reissued pursuant to equity compensation plans 14 – 30.2 1.2 – (11.3) – – 20.1 – 20.1
Dividends 12 – – – – – – (315.4) (315.4) (43.6) (359.0)
Total contributions by and distributions to owners – (55.2) (2.5) – (9.0) – (312.3) (379.0) (41.3) (420.3)
Changes in ownership interests in subsidiary companies
Disposal of a subsidiary company – – – – – – – – (3.1) (3.1)
Acquisition of non-controlling interests without a change in control 22(f) – – (342.6) – 19.2 (11.1) – (334.5) (124.0) (458.5)
Total changes in ownership interests in subsidiary companies – – (342.6) – 19.2 (11.1) – (334.5) (127.1) (461.6)
Total transactions with owners – (55.2) (345.1) – 10.2 (11.1) (312.3) (713.5) (168.4) (881.9)
Balance at 31 March 2016 1,856.1 (381.5) (129.2) (151.3) 123.7 (498.6) 11,935.5 12,754.7 378.2 13,132.9
Annual Report FY2016/17 105

NotesShare
capitalTreasury
sharesCapital reserve
Share-based compensation
reserveFair value
reserveGeneral reserve Total
Balance at 1 April 2016 1,856.1 (381.5) (5.1) 108.0 (470.9) 10,901.6 12,008.2
Effects of adopting FRS 109 2(b) – – – – (20.7) 33.0 12.3
Comprehensive income
Net fair value changes on financial assets measured at FVOCI 15(d) – – – – 5.0 – 5.0
Net fair value changes on cash flow hedges 15(d) – – – – 297.0 – 297.0
Actuarial loss on revaluation of defined benefit plans – – – – – (2.1) (2.1)
Other comprehensive income for the financial year, net of tax – – – – 302.0 (2.1) 299.9
Profit for the financial year – – – – – 514.0 514.0
Total comprehensive income for the financial year – – – – 302.0 511.9 813.9
Transactions with owners, recorded directly in equity
Contributions by and distributions to owners
Share-based compensation expense – – – 12.0 – – 12.0
Share options and share awards lapsed – – 1.7 (15.9) – 14.2 –
Purchase of treasury shares 14 – (134.3) – – – – (134.3)
Treasury shares reissued pursuant to equity compensation plans 14 – 34.3 3.3 (16.0) – – 21.6
Treasury shares reissued pursuant to the VGO of Tiger Airways 14 – 286.8 25.8 (11.4) – – 301.2
Dividends 12 – – – – – (521.3) (521.3)
Total transactions with owners – 186.8 30.8 (31.3) – (507.1) (320.8)
Balance at 31 March 2017 1,856.1 (194.7) 25.7 76.7 (189.6) 10,939.4 12,513.6
The accompanying accounting policies and explanatory notes form an integral part of the financial statements.
The Company
Statements of Changes in EquityFor The Financial Year Ended 31 March 2017 (in $ million)
Singapore Airlines106
Financial

NotesShare
capitalTreasury
sharesCapital reserve
Share-based compensation
reserveFair value
reserveGeneral reserve Total
Balance at 1 April 2015 1,856.1 (326.3) (6.3) 96.1 (581.8) 10,541.5 11,579.3
Comprehensive income
Net fair value changes on available-for-sale assets 15(d) – – – – 2.3 – 2.3
Net fair value changes on cash flow hedges 15(d) – – – – 108.6 – 108.6
Actuarial loss on revaluation of defined benefit plans – – – – – (1.6) (1.6)
Other comprehensive income for the financial year, net of tax – – – – 110.9 (1.6) 109.3
Profit for the financial year – – – – – 672.0 672.0
Total comprehensive income for the financial year – – – – 110.9 670.4 781.3
Transactions with owners, recorded directly in equity
Contributions by and distributions to owners
Share-based compensation expense – – – 9.1 – – 9.1
Share options lapsed – – – (5.1) – 5.1 –
Purchase of treasury shares 14 – (85.4) – – – – (85.4)
Treasury shares reissued pursuant to equity compensation plans 14 – 30.2 1.2 (11.3) – – 20.1
Dividends 12 – – – – – (315.4) (315.4)
Issue of share options persuant to the VGO of Tiger Airways 22(f) – – – 19.2 – – 19.2
Total transactions with owners – (55.2) 1.2 11.9 – (310.3) (352.4)
Balance at 31 March 2016 1,856.1 (381.5) (5.1) 108.0 (470.9) 10,901.6 12,008.2
The accompanying accounting policies and explanatory notes form an integral part of the financial statements.
The Company
Statements of Changes in EquityFor The Financial Year Ended 31 March 2017 (in $ million)
Annual Report FY2016/17 107

The GroupNotes FY2016/17 FY2015/16
Cash flow from operating activitiesProfit before taxation 518.6 972.4
Adjustments for:Depreciation 20 1,552.1 1,543.0 Impairment of property, plant and equipment 20 3.9 10.6 Amortisation of intangible assets 21 39.8 32.7 Writeback of impairment of trade debtors 6 (1.3) (4.7)Writedown of inventories 27 5.8 26.6 Income from short-term investments 6 (1.8) (1.8)Provisions 19 304.8 218.5 Share-based compensation expense 5 15.2 12.4 Exchange differences (47.1) 16.3 Amortisation of deferred gain on sale and operating leaseback transactions 6 (6.0) (7.6)Finance charges 7 46.1 50.3 Interest income 8 (73.9) (70.7)Loss/(Surplus) on disposal of aircraft, spares and spare engines 31.7 (52.7)Dividends from long-term investments (5.5) (115.3)Dividends from asset held for sale (39.5) - Net gain on financial assets mandatorily measured at FVTPL (1.6) - Other non-operating items 9 103.2 (91.1)Share of profits of joint venture companies (20.9) (22.8)Share of losses of associated companies 63.0 11.1
Operating cash flow before working capital changes 2,486.6 2,527.2
Increase/(Decrease) in trade and other creditors 31.7 (68.2)Increase in sales in advance of carriage 8.1 161.5 Decrease in trade debtors 82.0 295.2 Decrease/(Increase) in deposits and other debtors 17.4 (28.3)Increase in prepayments (78.5) (7.9)Increase in inventories (2.3) (6.5)Increase in deferred revenue 38.4 56.9 Cash generated from operations 2,583.4 2,929.9 Refund of fines - 116.5 Income taxes paid (50.5) (40.9)Net cash provided by operating activities 2,532.9 3,005.5
Consolidated Statement of Cash FlowsFor The Financial Year Ended 31 March 2017 (in $ million)
The accompanying accounting policies and explanatory notes form an integral part of the financial statements.
Singapore Airlines108
Financial

The GroupNotes FY2016/17 FY2015/16
Cash flow from investing activitiesCapital expenditure 33 (3,944.7) (2,909.0)Purchase of intangible assets 33 (43.6) (45.5)Proceeds from disposal of aircraft and other property, plant and equipment 45.4 492.9Purchase of long-term investments (0.6) (259.5)Proceeds from disposal of long-term investments 20.2 –Purchase of short-term investments (1,038.0) (275.5)Proceeds from disposal of short-term investments 1,570.4 166.1Dividends received from associated and joint venture companies 78.4 78.6Dividends received from investments 6.4 116.2Dividends received from asset held for sale 39.5 –Interest received from investments and deposits 76.9 77.8Proceeds from disposal of asset held for sale 405.5 –Proceeds from disposal of a subsidiary company, net of cash disposed – 0.1Loan to an associated company (54.4) (62.0)Proceeds from repayment of loan from an associated company 116.4 –Investments in associated companies (225.3) (84.8)Proceeds from partial disposal of an associated company 4.0 4.9
Net cash used in investing activities (2,943.5) (2,699.7)
Cash flow from financing activitiesDividends paid 12 (521.3) (315.4)Dividends paid by subsidiary companies to non-controlling interests 12 (37.6) (43.6)Proceeds from exercise of share options pursuant to the VGO of Tiger Airways 301.2 –Acquisition of non-controlling interests without a change in control (51.2) (458.5)Issuance of share capital by a subsidiary company 8.2 1.5Interest paid (41.1) (53.8)Proceeds from borrowings 1.8 4.9Repayment of borrowings (192.0) (41.4)Repayment of long-term lease liabilities (21.5) (54.1)Proceeds from exercise of share options 33.2 24.4Proceeds from issuance of bonds 430.0 –Repayment of bonds – (300.0)Purchase of treasury shares 14 (134.3) (85.4)
Net cash used in financing activities (224.6) (1,321.4)
Net cash outflow (635.2) (1,015.6)
Cash and cash equivalents at beginning of the financial year 3,972.4 5,042.7Effect of exchange rate changes 43.3 (54.7)
Cash and cash equivalents at end of the financial year 3,380.5 3,972.4
Analysis of cash and cash equivalentsFixed deposits 31 2,386.9 3,002.7Cash and bank 31 993.6 969.7
Cash and cash equivalents at end of the financial year 3,380.5 3,972.4
The accompanying accounting policies and explanatory notes form an integral part of the financial statements.
Annual Report FY2016/17 109

Notes to the Financial StatementsFor The Financial Year Ended 31 March 2017
1 General
Singapore Airlines Limited (“the Company”) is a limited liability company incorporated and domiciled in the Republic of Singapore. The Company is listed on the Singapore Exchange Securities Trading Limited (“SGX-ST”) and is a subsidiary company of Temasek Holdings (Private) Limited, incorporated in the Republic of Singapore.
The registered office of the Company is at Airline House, 25 Airline Road, Singapore 819829.
The financial statements of the Group as at and for the year ended 31 March 2017 comprise the Company and its subsidiary companies (together referred to as “the Group” and individually as “Group entities”) and the Group’s interest in equity-accounted investees.
The principal activities of the Group consist of passenger and cargo air transportation, engineering services, training of pilots, air charters and tour wholesaling and related activities. The principal activity of the Company consists of passenger air transportation.
The financial statements for the financial year ended 31 March 2017 were authorised for issue in accordance with a resolution of the Board of Directors on 18 May 2017.
2 Summary of Significant Accounting Policies
The accounting policies applied by the Group and the Company are consistent with those used in the previous financial year, except as explained in Note 2(b), which addresses changes in accounting policies.
(a) Basis of preparation
The consolidated financial statements of the Group and the statement of financial position and statement of changes in equity of the Company have been prepared in accordance with Singapore Financial Reporting Standards (“FRS”).
The financial statements have been prepared on the historical cost basis except as disclosed in the accounting policies below.
The financial statements are presented in Singapore Dollars (“SGD”), which is the Company’s functional currency and all values in the tables are rounded to the nearest million, unless otherwise stated.
(b) Changes in accounting policies
The accounting policies adopted are consistent with those of the previous financial year except as follows:
On 1 April 2016, the Group adopted all the new and revised standards and interpretations of FRS (“INT FRS”) that are effective for annual financial periods beginning on or after 1 April 2016. The adoption of these standards and interpretations did not have any material effect on the financial performance or position of the Group and the Company.
Singapore Airlines110
Financial

2 Summary of Significant Accounting Policies (continued)
(b) Changes in accounting policies (continued)
In addition, the Group has early adopted FRS 109: Financial Instruments with a date of initial application of 1 October 2016. The principal reason for early adoption is that FRS 109 better aligns the accounting of derivatives used for fuel hedges with the Group’s risk management strategy. FRS 109 allows the adoption from the start of a quarterly reporting period. The impact of adopting this standard on reserves on the date of initial application, 1 October 2016, is set out below.
The Group The CompanyFair value
reserveGeneral reserve
Fair value reserve
General reserve
Effects of adopting FRS 109
(Decrease)/Increase in reserves as a result of:
Classification of financial assets and liabilities (24.0) 24.0 (20.7) 20.7Expected credit loss on financial assets, certain loan
commitments and financial guarantee contracts – (5.2) – (11.7)Measurement of unquoted equity securities – 24.0 – 24.0Alignment of accounting policies of an
associated company (4.4) 4.4 – – Total (28.4) 47.2 (20.7) 33.0
(i) Classification of financial assets and liabilities
FRS 109 contains three principal classification categories for financial assets: measured at amortised cost, fair value through other comprehensive income (“FVOCI”) and fair value through profit or loss (“FVTPL”) and replaces the existing FRS 39 categories of held-to-maturity, loans and receivables and available-for-sale. Classification under FRS 109 is generally based on the business model in which a financial asset is managed and its contractual cash flows characteristics. FRS 109 largely retains the existing requirements in FRS 39 for the classification of financial liabilities.
This resulted in non-equity investments of $289.2 million for the Group and $220.7 million for the Company which were previously classified as available-for-sale to being measured at FVTPL. Correspondingly, there was a transfer of $24.0 million and $20.7 million for the Group and the Company respectively of fair value gains previously recorded in the fair value reserve, to the general reserve. Other changes in classification have not had an impact on the measurement of either financial assets or liabilities.
(ii) Expected credit loss on financial assets, certain loan commitments and financial guarantee contracts
FRS 109 replaces the ‘incurred loss’ model in FRS 39 with an ‘expected credit loss’ (“ECL”) model. The new impairment model also applies to certain loan commitments and financial guarantee contracts, but not to equity investments. This change resulted in the earlier recognition of credit losses that reduced the value of financial assets by $4.9 million and increased the value of provisions by $0.3 million for the Group, and reduced the value of financial assets by $11.6 million and increased the value of provisions by $0.1 million for the Company.
(iii) Measurement of unquoted equity securities
FRS 109 is more restrictive in the use of cost when measuring unquoted equity securities. Consequently, SIA reviewed all such investments and recognised a $24.0 million increase in long-term investments which was recorded in the general reserve.
(iv) Hedge accounting
FRS 109 permits hedge accounting of risk components of both non-financial and financial items, where they are separately identifiable and reliably measurable. Crude oil derivatives were previously designated under FRS 39 as a proxy for jet fuel derivatives resulting in hedge ineffectiveness. These hedges are now designated in qualifying cash flow hedges of the crude oil component of future jet fuel purchases. As a result, the risk of hedge ineffectiveness has been mitigated and this change better aligns the accounting of such derivatives with the Group’s risk management strategy.
Annual Report FY2016/17 111

Notes to the Financial StatementsFor The Financial Year Ended 31 March 2017
2 Summary of Significant Accounting Policies (continued)
(b) Changes in accounting policies (continued)
(v) Transition
Consistent with prescribed transitional arrangements, changes in accounting policies resulting from the adoption of FRS 109 have not been applied retrospectively, as described below.
• Comparative periods have not been restated. Differences in the carrying amounts of financial assets and financial liabilities held as at the date of initial application, are recognised in retained earnings and reserves. Accordingly, the information presented for the prior period does not reflect the requirements of FRS 109 and therefore is not comparable to the information presented in the current period under FRS 109.
• The following assessments have been made on the basis of the facts and circumstances that existed at the date of initial application:
− The determination of the business model within which a financial asset is held; and − The designation of certain investments in equity instruments not held for trading as being held at FVOCI.
(c) Standards issued but not yet effective
The Accounting Standards Council announced on 29 May 2014 that Singapore-incorporated companies listed on the Singapore Exchange will apply a new financial reporting framework identical to the International Financial Reporting Standards (referred to as SG-IFRS in these financial statements) to the Group’s financial statements for the first time from 1 April 2018.
The Group has conducted a preliminary assessment of the impact of SG-IFRS 1 First-time adoption of International Financial Reporting Standards for the transition to the new reporting framework. Based on the preliminary assessment, the Group expects that the impact on adoption of SG-IFRS 15 Revenue from Contracts with Customers under this new framework will be similar to the impact on the adoption of FRS 115 as set out in this Note.
Other than arising from the adoption of new and revised standards, the Group does not expect to change its existing accounting policies on adoption of the new framework.
The Group is currently conducting a detailed analysis of the available accounting policy choices, transitional optional exemptions and transitional mandatory exceptions under SG-IFRS 1 and the preliminary assessment may be subject to changes arising from the detailed analysis.
New standards and amendments to standards that are effective from the Group’s financial year ending 31 March 2018 are as follows:
Description Effective from
Amendments to FRS 110 and FRS 28: Sale or Contribution of Assets between an Investor and its Associate or Joint Venture
To be determined
Amendments to FRS 7: Amendment relating to disclosure of changes in liabilities arising from financing activities
1 April 2017
Amendments to FRS 12: Recognition of Deferred Tax Assets for Unrealised Losses 1 April 2017Amendments to FRS 102: Amendments relating to classification and measurement of share-based
payment transactions1 April 2018
FRS 115 Revenue from Contracts with Customers 1 April 2018FRS 116 Leases 1 April 2019
Singapore Airlines112
Financial
2 Summary of Significant Accounting Policies (continued)
(c) Standards issued but not yet effective (continued)
Except for FRS 115 and FRS 116, the Group expects that the adoption of the other standards and interpretations above will have no material impact on the financial statements in the period of initial application. The Group does not plan to adopt any of these new standards earlier than their required adoption date. The nature of the impending changes in accounting policies on adoption of FRS 115 and FRS 116 are described below.
FRS 115 Revenue from Contracts with Customers
FRS 115 was issued in November 2014 and establishes a new five-step model that will apply to revenue arising from contracts with customers. Under FRS 115, revenue is recognised at an amount that reflects the consideration to which an entity expects to be entitled in exchange for transferring goods or services to a customer. The principles in FRS 115 provide a more structured approach to measuring and recognising revenue. The new revenue standard is applicable to all entities and will supersede all current revenue recognition requirements under FRS. Either a full or modified retrospective application is required when the Group is required to adopt it on 1 April 2018. The Group’s FRS 115 project team which was set up to perform the impact assessments and implementation of this standard, is currently assessing the impact of FRS 115.
FRS 116 Leases
FRS 116 was issued in June 2016 and will supersede FRS 17 Leases. FRS 116 eliminates the lessee’s classification of leases as either operating leases or finance leases and introduces a single lease accounting model. Applying the new model, a lessee is required to recognise right-of-use (“ROU”) assets and lease liabilities for all leases, unless the term is less than 12 months or the underlying asset is of low value.
The Group has conducted a preliminary assessment of the impact of the new standard on its existing operating lease arrangements as a lessee. As at the reporting date, the Group has non-cancellable operating lease commitments amounting to $4,134.9 million (Note 34(b)). Based on the preliminary assessment, the Group expects a large proportion of these operating leases to be recognised as lease liabilities with corresponding ROU assets under the new standard. This will increase the Group’s leverage ratio and its foreign exchange volatility arising from revaluation of lease liabilities that are denominated in USD. There will also be an impact on the timing of expense recognition in the profit and loss account over the period of lease. Interest expense will be recognised using the effective interest method on outstanding lease liabilities and the ROU assets will be depreciated, rather than operating lease payments being the expense.
(d) Basis of consolidation
Business combinations are accounted for by applying the acquisition method in accordance with FRS 103 Business Combinations as at the acquisition date, which is the date on which control is transferred to the Group. Acquisition-related costs, other than those associated with the issue of debt or equity securities, are recognised as expenses as incurred.
Any excess of the total of the fair value of the consideration transferred in the business combination, the amount of non-controlling interest in the acquiree (if any), and the fair value of the Group’s previously held equity interest in the acquiree (if any), over the net fair value of the acquiree’s identifiable net assets is recorded as goodwill. The accounting policy for goodwill is set out in Note 2(f)(iv). When the amount is negative, a bargain purchase gain is recognised immediately in the profit and loss account.
The consideration transferred does not include amounts related to the settlement of pre-existing relationships. Such amounts are generally recognised in the profit and loss account.
Any contingent consideration will be recognised at fair value at the acquisition date and included in the consideration amount. If the contingent consideration is classified as equity, it is not remeasured and settled within equity. Otherwise, other contingent consideration is remeasured at fair value at each reporting date and subsequent changes to the fair value of the contingent consideration are recognised in the profit and loss account.
Annual Report FY2016/17 113

Notes to the Financial StatementsFor The Financial Year Ended 31 March 2017
2 Summary of Significant Accounting Policies (continued)
(d) Basis of consolidation (continued)
The Group elects for each separate business combination, whether the non-controlling interest in the acquiree (if any) is recognised on the acquisition date at fair value, or at the non-controlling interest’s proportionate share of the acquiree’s identifiable net assets.
Changes in the Company’s ownership interest in a subsidiary company that do not result in a loss of control are accounted for as equity transactions and therefore no adjustments are made to goodwill and no gain or loss is recognised in the profit and loss account. In such circumstances, adjustments are based on a proportionate amount of the net assets of the subsidiary companies.
Intra-group balances and transactions, and any unrealised income and expenses arising from intra-group transactions, are eliminated in the consolidated financial statements. Unrealised gains arising from transactions with associated and joint venture companies are eliminated against the investment to the extent of the Group’s interest in the investee. Unrealised losses are eliminated in the same way as unrealised gains, but only to the extent that there is no evidence of impairment.
(e) Subsidiary, associated and joint venture companies
In the Company’s separate financial statements, investments in subsidiary and associated companies are accounted for at cost less accumulated impairment losses.
A subsidiary company is an investee that is controlled by the Group. The Group controls an investee when it is exposed, or has rights, to variable returns from its involvement with the investee and has the ability to affect those returns through its power over the investee. The financial statements of subsidiary companies are included in the consolidated financial statements from the date the control commences until the date the control ceases.
The accounting policies of subsidiary companies have been changed when necessary to align them with policies adopted by the Group. Losses applicable to the non-controlling interests in a subsidiary company are allocated to the non-controlling interests even if doing so causes the non-controlling interest to have a deficit balance.
An associated company is an entity in which the Group has significant influence, but not control or joint control, over the financial and operating policies of the entity. Significant influence is presumed to exist when the Group holds 20% or more of the voting power of another entity.
A joint venture company is an arrangement in which the Group has joint control, whereby the Group has rights to the net assets of the arrangement, rather than rights to its assets and obligations for its liabilities.
The Group accounts for its investments in associated and joint venture companies using the equity method, initially at cost, including transaction costs. Subsequent to initial recognition, the consolidated financial statements include the Group’s share of profit or loss and other comprehensive income of associated and joint venture companies, until the date on which significant influence or joint control ceases. Dividends reduce the carrying amounts of the investments.
When the Group’s share of losses in an associated or joint venture company equals or exceeds its interest in the associated or joint venture company, the Group does not recognise further losses, unless it has incurred obligations or made payments on behalf of the associated or joint venture company.
The most recently available audited financial statements of the associated and joint venture companies are used by the Group in applying the equity method. Where the dates of the audited financial statements used are not coterminous with those of the Group, the share of results is arrived at from the last audited financial statements available and unaudited management financial statements to the end of the accounting period. Where necessary, adjustments are made to bring the accounting policies in line with those of the Group.
Upon the loss of significant influence or joint control over the associated or joint venture company, the Group measures the retained interest at fair value. Any difference between the fair value of the aggregate of the retained interest and proceeds from disposal and the carrying amount of the investment at the date the equity method was discontinued is recognised in profit or loss.
Singapore Airlines114
Financial

2 Summary of Significant Accounting Policies (continued)
(f) Intangible assets
(i) Computer software
Acquired computer software is stated at cost less accumulated amortisation and accumulated impairment losses.
(ii) Deferred engine development cost
The Group’s share of engine development payments, made in connection with its participation in aircraft engine development projects with other companies, is measured at cost less accumulated amortisation and accumulated impairment losses.
(iii) Brand and trademarks
The brand and trademarks were acquired in business combinations. The useful life of the brand is indefinite and is measured at cost less accumulated impairment losses. When the brand is no longer in use and the Group has no intention to sell the brand, the entire carrying amount is considered impaired. Trademarks which have finite useful lives are measured at cost less accumulated amortisation and accumulated impairment losses.
(iv) Goodwill
Goodwill acquired in a business combination is included in intangible assets. For the measurement of goodwill at initial recognition, see Note 2(d). Following initial recognition, goodwill is measured at cost less accumulated impairment losses.
Goodwill that forms part of the carrying amount of an associated company is not recognised separately, and therefore, is not tested for impairment separately. Instead, the entire amount of the investment in the associated company is tested for impairment as a single asset when there is objective evidence that the investment in associated company may be impacted.
(v) Other intangible assets
Purchased landing slots are measured at cost less accumulated impairment losses.
Licences were acquired in business combinations and are measured at cost less accumulated amortisation and accumulated impairment losses.
(vi) Subsequent expenditure
Subsequent expenditure is capitalised only when it increases the future economic benefits embodied in the specific asset to which it relates. All other expenditure is recognised in profit or loss as incurred.
(vii) Amortisation
Amortisation is calculated based on the cost of the asset, less its residual value.
Amortisation is recognised in the profit and loss account on a straight-line basis over the estimated useful lives of intangible assets from the date they are available for use. The estimated useful lives are as follows:
• Computer software 3 – 10 years• Trademarks 23 – 24 years• Licences 3 years
For deferred engine development cost, amortisation begins when the aircraft engines are available for sale. These deferred engine development costs are amortised on a straight-line basis over the period of expected sales of the aircraft engines, which is estimated to be over a period of 20 years.
Advance and progress payments are not amortised. Amortisation methods, useful lives and residual values are reviewed at the end of the reporting period and adjusted if appropriate.
Annual Report FY2016/17 115

Notes to the Financial StatementsFor The Financial Year Ended 31 March 2017
2 Summary of Significant Accounting Policies (continued)
(g) Foreign currencies
Foreign currency transactions
Foreign currency transactions are translated into SGD at the rates prevailing at the dates of those transactions.
All foreign currency monetary assets and liabilities are translated into SGD at rates prevailing at the reporting date. Non-monetary assets and liabilities that are measured in terms of historical cost in a foreign currency are translated using the exchange rates as at the dates of the initial transactions. Non-monetary assets and liabilities measured at fair value in a foreign currency are translated using the exchange rates at the date when the fair value was determined.
The foreign currency gain or loss on monetary assets and liabilities is the difference between amortised cost in the functional currency at the beginning of the year, adjusted for effective interest and payments during the year, and the amortised cost in foreign currency re-translated at the exchange rate at the end of the year.
Foreign currency differences are recognised in the profit and loss account, except for qualifying cash flow hedges which are deferred to equity.
Foreign operations
For the purpose of the consolidated financial statements, the net assets of foreign subsidiary, associated and joint venture companies are translated into SGD at rates prevailing at the reporting date. The financial results of foreign subsidiary, associated and joint venture companies are translated monthly into SGD at prevailing exchange rates. The resulting gains or losses on exchange are recognised in other comprehensive income and accumulated in the foreign currency translation reserve.
Goodwill and fair value adjustments arising from the acquisition of foreign operations are treated as assets and liabilities of the foreign operations and are recorded in the functional currency of the foreign operations, and translated into SGD at the closing rate at the end of the reporting period.
Foreign currency differences are recognised in other comprehensive income, and presented in the foreign currency translation reserve in equity, except to the extent that the foreign currency differences are allocated to non-controlling interests. When a foreign operation is disposed of such that control, significant influence or joint control is lost, the cumulative amount in the foreign currency translation reserve related to that foreign operation is reclassified to profit or loss as part of the gain or loss on disposal. When the Group disposes of only part of its interest in a subsidiary company while retaining control, the relevant proportion of the cumulative amount is reattributed to non-controlling interests. When the Group disposes of only part of its investment in an associated or a joint venture company while retaining significant influence or joint control, the relevant proportion of the cumulative amount is reclassified to profit or loss.
Singapore Airlines116
Financial

2 Summary of Significant Accounting Policies (continued)
(h) Property, plant and equipment
(i) Recognition and measurement
Property, plant and equipment are measured at cost less accumulated depreciation and accumulated impairment losses. When parts of a property, plant and equipment have different useful lives, they are accounted for as separate components. Cost includes expenditure that is directly attributable to the acquisition of the asset.
When assets are sold or retired, their costs, accumulated depreciation and accumulated impairment losses, if any, are removed from the financial statements and any gain or loss resulting from their disposal is included in the profit and loss account.
Leasehold hotel properties held by an associated company are carried at fair value, less accumulated depreciation and accumulated impairment losses. Fair values of leasehold hotel properties are determined by independent professional valuers on an annual basis. The Group’s share of the revaluation gain or loss is reflected under the share of post-acquisition capital reserve.
(ii) Depreciation of property, plant and equipment
Depreciation is based on the cost of an asset less its residual value. Operational lives, residual values and depreciation methods are reviewed annually, and adjusted prospectively, if appropriate. Significant components of individual assets are assessed and if a component has a useful life that is different from the remainder of that asset, that component is depreciated separately. Depreciation is recognised from the date the property, plant and equipment is installed and ready for use.
Freehold land, advance and progress payments are not depreciated.
The estimated useful lives and residual values are as follows:
Property, plant and equipment type Useful lives Residual values
Aircraft, spares and spare enginesPassenger aircraft, spares and spare engines 15 – 20 years 5% to 10% of costEmbedded engine overhaul costs 4 – 8 years NilNew freighter aircraft 20 years 5% of costUsed freighter aircraft 20 years less age of aircraft 5% of costMajor inspection costs relating to landing gear overhauls
and heavy maintenance visits 4 – 10 years NilTraining aircraft 5 – 15 years 10% of costFlight simulators 5 – 10 years Nil
Leasehold land and buildingsCompany owned office premises Shorter of lease period or 30 years NilCompany owned household premises Shorter of lease period or 10 years NilOther premises Shorter of lease period or 5 years NilLeasehold hotel properties held by an associated company Lease period of 99 years, up to 2081 Nil
OthersPlant and equipment, office and computer equipment 1 to 15 years Nil
Annual Report FY2016/17 117

Notes to the Financial StatementsFor The Financial Year Ended 31 March 2017
2 Summary of Significant Accounting Policies (continued)
(i) Leases
The determination of whether an arrangement is, or contains, a lease is based on the substance of the arrangement at inception date: whether fulfilment of the arrangement is dependent on the use of a specific asset and the arrangement conveys a right to use the asset.
(i) Finance lease – as lessee
Finance leases, which transfer to the Group substantially all the risks and benefits incidental to ownership of the leased asset, are capitalised at the inception of the lease at the fair value of the leased asset or, if lower, at the present value of the minimum lease payments. Any initial direct costs are also added to the amount capitalised. Lease payments are apportioned between finance charges and reduction of the lease liability so as to achieve a constant rate of interest on the remaining balance of the liability. Finance charges are charged directly against the profit and loss account.
Major improvements and modifications to leased aircraft due to operational requirements are capitalised and depreciated over the average expected life between major overhauls (estimated to be 4 to 8 years).
(ii) Operating lease
Leases where the lessor effectively retains substantially all the risks and benefits of ownership of the leased assets are classified as operating leases. Operating lease payments are recognised as an expense in the profit and loss account on a straight-line basis over the lease term. The aggregate benefit of incentives provided by the lessor is recognised as a reduction of rental expense over the lease term on a straight-line basis.
Major improvements and modifications to leased aircraft due to operational requirements are capitalised and depreciated over the remaining lease term period or, where appropriate, the average expected life between major overhauls (estimated to be 4 to 10 years).
(iii) Operating lease – as lessor
Leases where the Group retains substantially all the risks and rewards of ownership of the asset are classified as operating leases. Aircraft leased out under operating leases are included under property, plant and equipment and are stated at cost less accumulated depreciation and accumulated impairment losses, if any.
(j) Inventories
Inventories are measured at the lower of cost and net realisable value. Cost is determined on a weighted average basis and includes expenditure incurred in acquiring the inventories and other costs incurred in bringing them to their existing location and condition. Net realisable value is the estimated selling price in the ordinary course of business less estimated costs necessary to make the sale.
(k) Financial instruments – policy applicable under FRS 109
(i) Recognition and initial measurement
A financial asset or financial liability (unless it is a trade receivable without a significant financing component) is initially measured at fair value plus, in the case of the financial asset or liability not carried at fair value through profit or loss, transaction costs that are directly attributable to its acquisition or issue.
Singapore Airlines118
Financial

2 Summary of Significant Accounting Policies (continued)
(k) Financial instruments – policy applicable under FRS 109 (continued)
(ii) Classification and subsequent measurement
Financial assets
On initial recognition, a financial asset is classified as measured at: amortised cost, FVOCI or FVTPL.
For equity investments that are not held for trading, the Group may irrevocably elect on initial recognition to present subsequent changes in fair value in other comprehensive income. This election is made on an investment-by-investment basis.
a) Amortised cost: A non-equity financial asset can be measured at amortised cost if it meets both of the following conditions:
• The asset is held within a business model whose objective is to hold assets to collect contractual cash flows; and
• The contractual terms of the asset give rise on specified dates to cash flows that are solely payments of principal and interest on the principal amount outstanding.
b) FVOCI: A non-equity financial asset can be measured at FVOCI only if it meets both of the following conditions:
• The asset is held within a business model whose objective is achieved by both collecting contractual cash flows and selling financial assets; and
• The contractual terms of the asset give rise on specified dates to cash flows that are solely payments of principal and interest on the principal amount outstanding.
c) FVTPL: All other financial assets are classified as measured at FVTPL. Financial assets that are held for trading or are managed, and whose performance is evaluated on a fair value basis, are measured at FVTPL.
In addition, on initial recognition, the Group may irrevocably designate a financial asset, that otherwise meets the requirements to be measured at amortised cost or at FVOCI, as at FVTPL, if doing so eliminates or significantly reduces an accounting mismatch that would otherwise arise.
Business model assessment The Group makes an assessment of the objective of a business model in which an asset is held at a portfolio level because this best reflects the way the business is managed and information is provided to Management. The information considered includes:
• The stated policies and objectives for the portfolio and the operation of those policies in practice;
• How the performance of the portfolio is evaluated and reported to the Group’s Management;
• The risks that affect the performance of the business model and how those risks are managed;
• How managers of the portfolio are compensated; and
• The frequency, volume and timing of disposals in prior periods, the reasons for such disposals and its expectations about future activity.
Assessment of whether contractual cash flows are solely payments of principal and interest
For assessment purposes, ‘principal’ is defined as the fair value of the financial asset on initial recognition. ‘Interest’ is defined as consideration for the time value of money and for the credit risk associated with the principal amount outstanding during a particular period of time and for other basic lending risks and costs (e.g. liquidity risk and administrative costs), as well as profit margin.
Annual Report FY2016/17 119

Notes to the Financial StatementsFor The Financial Year Ended 31 March 2017
2 Summary of Significant Accounting Policies (continued)
(k) Financial instruments – policy applicable under FRS 109 (continued)
(ii) Classification and subsequent measurement (continued)
In assessing whether the contractual cash flows are solely payments of principal and interest, the Group considers contingent events, leverage features, modifications of the time value of money and other limiting terms in the contractual terms of the instrument, which could change the timing or amount of contractual cash flows such that the cash flows of the instrument would not be reflective of solely payments of principal and interest.
Reclassifications
Financial assets are not reclassified subsequent to their initial recognition, except in the period after the Group changes its business model for managing those financial assets.
Financial liabilities
The Group classifies its financial liabilities, other than financial guarantees and loan commitments, as measured at amortised cost or FVTPL.
(iii) Derecognition
Financial assets
The Group derecognises a financial asset when the contractual rights to the cash flows from the financial asset expire, or when it transfers the rights to receive the contractual cash flows in a transaction in which substantially all of the risks and rewards of ownership of the financial asset are transferred or in which the Group neither transfers nor retains substantially all of the risks and rewards of ownership and it does not retain control of the financial asset.
On derecognition of a financial asset, the difference between the carrying amount of the asset (or the carrying amount allocated to the portion of the asset derecognised), and the sum of the (i) consideration received (including any new asset obtained less any new liability assumed) and (ii) any cumulative gain or loss that has been recognised in other comprehensive income, is recognised in profit or loss.
Any cumulative gain/loss recognised in other comprehensive income, in respect of equity investment securities designated as at FVOCI, is not recognised in profit or loss on derecognition of such securities. Any interest in transferred financial assets that qualify for derecognition, that is created or retained by the Group, is recognised as a separate asset or liability.
Financial liabilities
The Group derecognises a financial liability when its contractual obligations are discharged or cancelled, or expire.
(iv) Offsetting
Financial assets and financial liabilities are offset and the net amount is presented in the balance sheets, when and only when, there is a currently enforceable legal right to set off the recognised amounts and there is an intention to settle on a net basis, or to realise the assets and settle the liabilities simultaneously.
Singapore Airlines120
Financial

2 Summary of Significant Accounting Policies (continued)
(k) Financial instruments – policy applicable under FRS 109 (continued)
(v) Impairment
Expected credit loss
The Group recognises loss allowances for ECL on non-equity financial instruments that are not measured at FVTPL.
The Group measures loss allowances at an amount equal to lifetime ECL, except for the following which are measured as 12-month ECL:
• Non-equity financial instruments that are determined to have a low credit risk at the reporting date; and
• Other non-equity financial instruments (other than trade debtors) on which credit risk has not increased significantly since their initial recognition.
Loss allowances for trade debtors are always measured at an amount equal to lifetime ECL.
The Group considers a non-equity financial instrument to have a low credit risk when its credit quality is rated to be of an investment grade by credit rating agencies.
12-month ECL is the portion of lifetime ECL that results from the default events on a financial instrument that are possible within the 12 months after the reporting date. The lifetime ECL is the expected credit loss over the term of the financial instrument, and is the shortfall of the probability weighted net present value of cash flows as compared to the carrying value of the non-equity financial asset.
Credit-impaired financial assets
At each reporting date, the Group assesses whether non-equity financial assets that are carried at amortised cost or FVOCI are credit-impaired. A financial asset is “credit-impaired” when one or more events that have a detrimental impact on the estimated future cash flows of the financial asset have occurred.
(vi) Derivative financial instruments and hedge accounting
The Group uses derivative financial instruments such as forward currency contracts, foreign currency option contracts, cross currency swap contracts, interest rate swap contracts, interest rate cap contracts, jet fuel option contracts, jet fuel, Brent and crack swap contracts and jet fuel collar contracts to hedge its risks associated with foreign currency, interest rate and jet fuel price fluctuations. Such derivative financial instruments are initially recognised at fair value on the date on which a derivative contract is entered into; any attributable transaction costs are recognised in profit or loss as incurred. Subsequent to initial recognition, derivative financial instruments are remeasured at their fair values.
Any gains or losses arising from changes in the fair value of derivatives that do not qualify for hedge accounting are taken directly to the profit and loss account.
Designation of hedges
The Group designates certain derivatives as well as non-derivative financial instruments as hedging instruments in qualifying hedging relationships. On initial designation of the hedge, the Group formally documents the relationship between the hedging instrument and the hedged item, including the risk management objective and strategy in undertaking the hedge, the economic relationship between the hedge instrument and the hedged item, the effects of credit risk on the hedge, the hedge ratio and the hedge type (cash flow or fair value).
Annual Report FY2016/17 121

Notes to the Financial StatementsFor The Financial Year Ended 31 March 2017
2 Summary of Significant Accounting Policies (continued)
(k) Financial instruments – policy applicable under FRS 109 (continued)
(vi) Derivative financial instruments and hedge accounting (continued)
Designation of a risk component of a hedged item is permitted when it is a separable identifiable component of the item, and the changes in the cash flows or the fair value of the item attributable to changes in the risk component is reliably measurable.
At the inception of the hedge relationship, the Group makes an assessment of whether the hedging instrument is expected to be highly effective in offsetting the changes in the fair value or cash flows of the respective hedged item during the period for which the hedge is designated. For a cash flow hedge of a forecast transaction, the Group also assesses whether the forecast transaction is highly probable to occur and if it presents an exposure to variations in cash flows that could ultimately affect profit or loss.
The hedge effectiveness assessment is an assessment of the economic relationship between the hedged item and the hedging instrument, and is therefore only forward looking. There is no prescribed quantitative hedge effectiveness threshold. Hedge effectiveness is the extent to which the fair value of the hedging instrument offsets changes in the fair value of the hedged item.
The time value of an option is excluded from the designation of a financial instrument and is accounted for as a cost of hedging. The fair value changes related to time value are recognised in other comprehensive income and depending on the nature of the hedged item, will either be transferred to profit and loss account in the same period that the underlying transaction affects profit or loss, or be capitalised into the initial carrying value of a hedged item.
Cash flow hedges
When a derivative is designated in a cash flow hedge, the effective portion of changes in the fair value of the derivative is recognised in other comprehensive income and presented in the fair value reserve. Any ineffective portion of changes in the fair value of the derivative (i.e. the extent to which changes in the fair value of the hedge instrument do not match the changes in fair value of the hedged item) is recognised immediately in profit or loss.
The amount accumulated in equity is retained in other comprehensive income, and depending on the nature of the hedged item, will either be transferred to the profit or loss in the same period that the underlying transaction affects the profit and loss account or be capitalised in the initial carrying amount of a hedged item.
If the hedging instrument no longer meets the criteria for hedge accounting, expires or is sold, terminated or exercised, hedge accounting is discontinued. The cumulative gain or loss previously recognised in the fair value reserve remains there until the forecast transaction occurs. If the forecast transaction is no longer expected to occur, then the amount accumulated in equity is reclassified to profit or loss.
Fair value hedges
Changes in the fair value of derivative financial instruments that are designated and qualify as fair value hedges are recorded in profit or loss, together with any changes in the fair value of the hedged asset or liability that are attributable to the hedged risk.
(l) Financial instruments – policy applicable under FRS 39
The following three areas for the accounting of financial instruments pertaining to classification and subsequent measurement, impairment and hedge accounting were accounted for under FRS 39 up to 30 September 2016, on which date FRS 109 was adopted. The differences in the accounting for financial instruments were addressed upon adoption, in the manner set out in Note 2(b).
Singapore Airlines122
Financial

2 Summary of Significant Accounting Policies (continued)
(l) Financial instruments – policy applicable under FRS 39 (continued)
(i) Classification and subsequent measurement
The Group classified its financial assets into one of the following categories:
a) Financial assets at fair value through profit or loss
Financial assets measured at fair value through profit or loss included financial assets held for trading and those designated upon initial recognition as fair value through profit or loss. Financial assets were classified as held for trading if they were acquired principally for the purpose of selling in the short-term. This category included derivative financial instruments entered into by the Group.
b) Loans and receivables
Non-derivative financial assets with fixed or determinable payments that were not quoted in an active market were classified as loans and receivables. Such assets were carried at amortised cost using the effective interest method, less impairment. Gains and losses were recognised in the profit and loss account when the loans and receivables were derecognised or impaired, as well as through the amortisation process.
c) Held-to-maturity investments
Non-derivative financial assets with fixed or determinable payments and fixed maturity were classified as held-to-maturity when the Group had the positive intention and ability to hold the investment to maturity. Subsequent to initial recognition, held-to-maturity investments were measured at amortised cost using the effective interest method, less impairment. Gains and losses were recognised in the profit and loss account when the held-to-maturity investments were derecognised or impaired, and through the amortisation process.
d) Available-for-sale investments
Available-for-sale investments were non-derivative financial assets that were either designated in this category, or not classified in other categories. After initial recognition, available-for-sale investments were measured at fair value with gains or losses being recognised in other comprehensive income, except that impairment losses and interest were recognised in the profit and loss account. The cumulative gain or loss previously recognised in other comprehensive income was reclassified from equity to the profit and loss account as a reclassification adjustment when the investment was derecognised.
(ii) Impairment
Financial assets not carried at fair value through profit or loss, including interests in associated and joint venture companies, were assessed at the end of each reporting period to determine whether there was objective evidence that it was impaired. A financial asset was impaired if objective evidence indicates that a loss event had occurred after the initial recognition of the asset, and that the loss event had an impact on the estimated future cash flows of that asset that could be estimated reliably.
a) Financial assets carried at amortised cost
For financial assets carried at amortised cost, the Group first assessed whether objective evidence of impairment existed individually for financial assets that were individually significant, or collectively for financial assets that were not individually significant.
If there was objective evidence that an impairment loss on financial assets carried at amortised cost had been incurred, the amount of the loss was measured as the difference between the asset’s carrying amount and the present value of estimated future cash flows (excluding future credit losses that had not been incurred) discounted at the financial asset’s original effective interest rate. The impairment loss was recognised in the profit and loss account.
Annual Report FY2016/17 123

Notes to the Financial StatementsFor The Financial Year Ended 31 March 2017
2 Summary of Significant Accounting Policies (continued)
(l) Financial instruments – policy applicable under FRS 39 (continued)
(ii) Impairment (continued)
b) Financial assets carried at cost
If there was objective evidence that an impairment loss on financial assets carried at cost had been incurred, the amount of the loss was measured as the difference between the asset’s carrying amount and the present value of estimated future cash flows discounted at the current market rate of return for a similar financial asset. Such impairment losses were not reversed in subsequent periods.
c) Available-for-sale financial assets
Significant or prolonged decline in the fair value below cost, significant financial difficulties of the issuer or obligor, and the disappearance of an active trading market were considered objective evidence that investment securities classified as available-for-sale financial assets were impaired.
If an available-for-sale asset was impaired, an amount comprising the difference between its cost (net of any principal repayment and amortisation) and its current fair value, less any impairment loss previously recognised in the profit and loss account, will be transferred from other comprehensive income to the profit and loss account.
In the case of non-equity investments classified as available-for-sale, impairment was assessed based on the same criteria as financial assets carried at amortised cost.
(iii) Hedge accounting
At the inception of a hedge relationship, the Group formally designated and documented the hedge relationships to which the Group wished to apply hedge accounting and the risk management objective and strategy for undertaking the hedge. The documentation included identification of the hedged item or transaction, the hedging instrument, the nature of the risk being hedged and how the Group assessed the hedging instrument’s effectiveness in offsetting the exposure to changes in the hedged item’s (or transaction’s) cash flows attributable to the hedged risk. Such hedges were expected to be highly effective in achieving offsetting changes in cash flows and were assessed on an ongoing basis to determine whether they had been highly effective throughout the financial reporting periods for which they were designated.
(m) Impairment of non-financial assets
The Group assesses at each reporting date whether there is an indication that an asset may be impaired. If any such indication exists, or when annual impairment assessment for an asset is required, the Group makes an estimate of the asset’s recoverable amount.
An asset’s recoverable amount is the higher of an asset’s or CGU’s fair value less costs to sell and its value-in-use and is determined for an individual asset, unless the asset does not generate cash inflows that are largely independent of those from other assets or groups of assets. In assessing value-in-use, the estimated future cash flows expected to be generated by the asset are discounted to their present value using a pre-tax discount rate that reflects current market assessments of the time value of money and the risks specific to the asset. Where the carrying amount of an asset or its related CGU exceeds its recoverable amount, the asset is considered impaired and is written down to its recoverable amount.
For non-financial assets excluding goodwill and those with indefinite lives, an assessment is made at each reporting date as to whether there is any indication that previously recognised impairment losses may no longer exist or may have decreased. If such indication exists, the Group estimates the asset’s or CGU’s recoverable amount. A previously recognised impairment loss is reversed only if there has been a change in the estimates used to determine the asset’s recoverable amount since the last impairment loss was recognised. If that is the case, the carrying amount of the asset is increased to its recoverable amount. That increase cannot exceed the carrying amount that would have been determined, net of depreciation, had no impairment loss been recognised previously. Such reversal is recognised in the profit and loss account unless the asset is measured at revalued amount, in which case the reversal is treated as a revaluation increase.
Singapore Airlines124
Financial

2 Summary of Significant Accounting Policies (continued)
(n) Loans, notes payable and borrowings
Loans, notes payable and other borrowings are initially recognised at the fair value of the consideration received less directly attributable transaction costs. After initial recognition, interest-bearing loans and borrowings are subsequently measured at amortised cost using the effective interest method.
Gains and losses are recognised in the profit and loss account when the liabilities are derecognised, as well as through the amortisation process.
(o) Trade and other creditors
Trade and other creditors and amounts owing to subsidiary and associated companies are initially recognised at fair value and subsequently measured at amortised cost using the effective interest method.
Gains and losses are recognised in the profit and loss account when the liabilities are derecognised, as well as through the amortisation process.
(p) Provisions
Provisions are recognised when, as a result of a past event, the Group has a present obligation (legal or constructive) that can be estimated reliably, and it is probable that an outflow of economic resources will be required to settle the obligation.
If the effect of the time value of money is material, provisions are determined by discounting the expected future cash flows at a pre-tax rate that reflects current market assessments of the time value of money and the risks specific to the liability. The unwinding of the discount is recognised as a finance cost.
Provisions for return costs to meet contractual minimum conditions for the return of aircraft, at the end of the lease terms for aircraft under operating leases, are recorded over the lease terms.
Other provisions include provisions for warranty claims, upgrade costs and end-of-lease liabilities. Provision for warranty claims is made for engine overhauls, repairs and maintenance of aircraft (excluding line maintenance), based on past experience of repairs.
(q) Share capital and share issuance expenses
Ordinary shares are classified as equity. Incremental costs directly attributable to the issuance of ordinary shares are deducted against share capital, net of any tax effect.
(r) Treasury shares
When shares are reacquired by the Company, the amount of consideration paid which includes directly attributable costs, net of any tax effect, is recognised directly in equity. Reacquired shares are classified as treasury shares and presented as a deduction from total equity. When treasury shares are subsequently sold or reissued, the cost of treasury shares is reversed from the treasury share account and the realised gain or loss on sale or reissue, net of any directly attributable incremental transaction costs, is recognised in the capital reserve. Voting rights related to treasury shares are nullified and no dividends are allocated to them.
(s) Taxation
(i) Current income tax
Tax recoverable and tax liabilities for current and prior periods are measured at the amount expected to be recovered from or paid to, respectively, the tax authorities using tax rates enacted or substantively enacted at balance sheet date. Management periodically evaluates positions taken in the tax returns with respect to situations in which applicable tax regulations are subject to interpretation and establishes provisions where appropriate.
Current income taxes are recognised in the profit and loss account except to the extent that the tax relates to a business combination, or items recognised outside profit or loss, either in other comprehensive income or directly in equity.
Annual Report FY2016/17 125

Notes to the Financial StatementsFor The Financial Year Ended 31 March 2017
2 Summary of Significant Accounting Policies (continued)
(s) Taxation (continued)
(ii) Deferred tax
Deferred tax is provided, using the balance sheet method, on all temporary differences at the end of the reporting period between the tax bases of assets and liabilities and their carrying amounts for financial reporting purposes.
Deferred tax assets and liabilities are not recognised for:
• Temporary differences on the initial recognition of goodwill or of an asset or liability in a transaction that is not a business combination and, at the time of the transaction, affects neither the accounting profit nor taxable profit or loss; and
• Temporary differences associated with investments in subsidiary, associated and joint venture companies, where the timing of the reversal of the temporary differences can be controlled and it is probable that they will not reverse in the foreseeable future.
Deferred tax assets are recognised for all deductible temporary differences, unused tax credits and unused tax losses, to the extent that it is probable that taxable profit will be available against which the deductible temporary differences, and the carry forward of unused tax credits and unused tax losses, can be utilised.
Deferred tax assets are reviewed at the end of each reporting period and reduced to the extent that it is no longer probable that sufficient taxable profit will be available to allow all or part of the deferred tax asset to be utilised.
Deferred tax assets and liabilities are measured at the tax rates that are expected to apply in the year when the asset is realised or the liability is settled, based on tax rates and tax laws that have been enacted or substantively enacted at the end of each reporting period.
Deferred tax is recognised in profit or loss except to the extent that it relates to a business combination, or items recognised directly in equity or in other comprehensive income.
Deferred tax assets and deferred tax liabilities are offset, if a legally enforceable right exists to set off current income tax assets against current income tax liabilities and the deferred taxes relate to the same taxable entity and the same tax authority.
(t) Revenue
Revenue is recognised to the extent that it is probable that the economic benefits will flow to the Group and the revenue can be reliably measured. Revenue is measured at the fair value of consideration received or receivable, net of discounts and rebates.
Revenue is principally earned from the carriage of passengers, cargo and mail, engineering services, training of pilots, air charters and tour wholesaling and related activities. Revenue for the Group excludes dividends from subsidiary companies and intra-group transactions.
Passenger and cargo sales are recognised as operating revenue when the transportation is provided. The value of unutilised tickets and airway bills is included in current liabilities as sales in advance of carriage. The value of unutilised tickets is recognised as revenue by estimating a percentage of the breakage revenue upfront at flight date based on historical trends and experience. The value of airway bills is recognised as revenue if unused after one year.
Revenue from repair and maintenance of aircraft, and engine and component overhaul is recognised based on the percentage of completion of the projects. The percentage of completion of the projects is determined based on the number of man-hours incurred to date against the estimated man-hours needed to complete the projects.
Rental income from the lease of aircraft is recognised on a straight-line basis over the lease term.
Singapore Airlines126
Financial

2 Summary of Significant Accounting Policies (continued)
(t) Revenue (continued)
The Company operates a frequent flyer programme called “KrisFlyer” that provides travel awards to programme members based on accumulated mileage. A portion of passenger revenue attributable to the award of frequent flyer benefits is deferred until they are utilised. The deferment of the revenue is estimated based on historical trends of breakage upon redemption, which is then used to project the expected utilisation of these benefits.
In addition, the Company also sells miles to programme partners for issuance to their programme members. For miles purchased by programme partners, revenue is deferred until awards are utilised. The deferrals are based on the expected utilisation of these awards.
(u) Income from investments
Dividend income from investments is recognised when the Group’s right to receive the payment is established.
Interest income from investments and fixed deposits is recognised using the effective interest method.
(v) Employee benefits
(i) Equity compensation plans
The fair value determined at the grant date of the equity-settled share-based payment awards is recognised on a straight-line basis over the vesting period. In valuing the share options and share awards, no account is taken of any performance conditions, other than conditions linked to the price of the shares of the Company and non-vesting performance conditions.
Non-market vesting performance conditions are included in the estimation of the number of shares under option that are expected to become exercisable on the vesting date. At the end of each reporting period, the Group revises its estimates of the number of shares under option that are expected to become exercisable on the vesting date and recognises the impact of the revision of the estimates in the profit and loss account, with a corresponding adjustment to the share-based compensation reserve, over the remaining vesting period.
No expense is recognised for options or awards that do not ultimately vest, except for options or awards where vesting is conditional upon a market condition, which are treated as vested irrespective of whether or not the market condition is satisfied, provided that all other performance and/or service conditions are satisfied.
The share-based compensation reserve is transferred to general reserve upon cancellation or expiry of the vested options or awards. When the options are exercised or awards are released, the share-based compensation reserve is transferred to share capital if new shares are issued.
(ii) Defined benefit plans
The net defined benefit liability is the aggregate of the present value of the defined benefit obligation at the end of the reporting period reduced by the fair value of plan assets.
The cost of providing benefits under the defined benefit plans is determined separately for each plan using the projected unit credit method.
Remeasurements comprising actuarial gains and losses, and the return on plan assets are recognised immediately in other comprehensive income in the period in which they arise. All expenses related to the defined benefit plans are recognised as an expense in profit or loss. Remeasurements are recognised in retained earnings within equity and are not reclassified to profit or loss in subsequent periods.
Plan assets are assets that are held by long-term employee benefit funds or qualifying insurance policies. Plan assets are not available to the creditors of the Group, nor can they be paid directly to the Group.
Annual Report FY2016/17 127

Notes to the Financial StatementsFor The Financial Year Ended 31 March 2017
2 Summary of Significant Accounting Policies (continued)
(v) Employee benefits (continued)
(iii) Defined contribution plans
As required by law, the companies in Singapore make contributions to the Central Provident Fund scheme in Singapore, a defined contribution scheme. Certain of the Group’s subsidiary companies and overseas stations outside Singapore make contributions to their respective countries’ defined contribution pension schemes. Such contributions are recognised as an expense in the period in which the related service is performed.
(iv) Short term employee benefits
Short-term employee benefit obligations are measured on an undiscounted basis and are expensed as the related service is provided. A liability is recognised for the amount expected to be paid under short-term cash bonus or profit-sharing plans if the Group has a present legal or constructive obligation to pay this amount as a result of past service provided by the employee, and the obligation can be estimated reliably.
(w) Aircraft maintenance and overhaul costs
The Group recognises aircraft maintenance and overhaul expenses (except heavy maintenance visits, engine overhaul and landing gear overhaul expenses) on an incurred basis. For engine overhaul costs covered by power-by-hour third-party maintenance agreements, a portion of the cost is expensed at a fixed rate per hour during the terms of the agreements. The remaining payments made are recorded as an advance payment, to the extent that it is to be utilised in the future. Upon completion of an overhaul, these amounts are transferred to property, plant and equipment and depreciated over their useful lives.
(x) Borrowing costs
Borrowing costs incurred to finance advance and progress payments for aircraft are capitalised as part of advance and progress payments until the aircraft are commissioned for operation or the projects are completed. All other borrowing costs are recognised as finance charges in the period in which they are incurred.
(y) Segment reporting
(i) Business segment
For management purposes, the Group is organised into operating segments based on the nature of the services provided which are independently managed by the respective segment managers responsible for the performance of the respective segments under their charge. The segment managers report directly to corporate management who regularly review the segment results in order to allocate resources to the segments and to assess the segment performance.
(ii) Geographical segment
The analysis of revenue by area of original sale from airline operations is derived by allocating revenue to the area in which the sale was made. Revenue from other operations, which consist principally of engineering services and cargo operations, is derived in East Asia and is therefore, not shown.
Assets, which consist principally of flight and ground equipment, support the entire worldwide transportation system, and are mainly located in Singapore. An analysis of assets and capital expenditure of the Group by geographical distribution has therefore not been included.
Singapore Airlines128
Financial

3 Significant Accounting Estimates and Critical Judgements
Estimates and assumptions concerning the future are made in the preparation of the financial statements. They affect the application of the Group’s accounting policies, reported amounts of assets, liabilities, income, expenses, and disclosures made. Actual results may differ from these estimates. They are assessed on an ongoing basis and are based on experience and relevant factors, including expectations of future events that are believed to be reasonable under the circumstances. Revisions to accounting estimates are recognised in the period in which the estimates are revised and in any future periods affected.
The key assumptions concerning the future and other key sources of estimation uncertainty at the end of the reporting period that have a significant risk of causing a material adjustment to the carrying amounts of assets and liabilities within the next financial year are discussed below.
(a) Impairment of property, plant and equipment – aircraft fleet
Impairment is recognised when events and circumstances indicate that the aircraft may be impaired and the carrying amounts of the aircraft exceed the recoverable amounts. Recoverable amount is defined as the higher of an aircraft’s fair value less costs to sell and its value-in-use. The fair value less costs to sell computation is based on available data from binding sales transactions in an arm’s length transaction of similar assets or observable market prices less incremental costs for disposing the asset. In determining the recoverable amounts of the aircraft, certain estimates regarding the current fair market value of the aircraft are made. The current fair market value is determined based on desktop valuations from an independent appraisal for aircraft with similar operational lives. When value-in-use calculations are undertaken, the Group uses discounted cash flow projections based on financial budgets approved by the Management covering a specified period.
For the purpose of impairment testing, assets that cannot be tested individually are grouped together into the smallest group of assets that generates cash inflows from continuing use that are largely independent of the cash inflows of other assets or CGU. Determination of a CGU requires judgement, as it requires identification of the lowest aggregation of assets that generate largely independent cash flows.
Management’s multi-brand strategy as well as its centralised network planning decisions have led to the integration programme involving Tiger Airways and Scoot during the year and the continued increase in the capacity interdependency among Singapore Airlines, SilkAir and SIA Cargo. As a result, the Group’s identification of CGUs has changed in the year ended 31 March 2017 from a statutory entity basis to the “Full-Service Airlines and Cargo Operations” CGU and the “Low-Cost Airlines” CGU for the Group’s wholly owned airline and cargo operations. Other CGUs remain unchanged.
(b) Depreciation of property, plant and equipment – aircraft fleet
Aircraft are depreciated on a straight-line basis at rates which are calculated to write down their cost to their estimated residual values at the end of their operational lives. Certain estimates regarding the operational lives and residual values of the fleet are made by the Group based on past experience and these are in line with the industry’s. The operational lives and residual values are reviewed on an annual basis. The carrying amount of the Group’s and the Company’s aircraft fleet at 31 March 2017 was $10,829.1 million (2016: $10,106.2 million) and $7,898.8 million (2016: $7,358.7 million) respectively.
During the financial year, the Group identified the embedded engine overhaul element within the engine as a separate component for depreciation over shorter useful lives of between four to eight years. The effect of the change is an increase in depreciation expense of approximately $25.9 million for the financial year ended 31 March 2017.
Change in estimates (in $ million) FY2016/17 FY2017/18 FY2018/19 FY2019/20 FY2020/21
Increase/(Decrease) in depreciation expense 25.9 29.2 19.3 13.3 (9.7)
Annual Report FY2016/17 129

Notes to the Financial StatementsFor The Financial Year Ended 31 March 2017
3 Significant Accounting Estimates and Critical Judgements (continued)
(c) Passenger revenue recognition
Passenger sales are recognised as operating revenue when the transportation is provided. The value of unused tickets is included as sales in advance of carriage on the statement of financial position. During the financial year, the Group revised certain estimates to recognise passenger ticket breakage revenue from expected unutilised tickets on flight date, resulting in a one-time increase in revenue of approximately $151.2 million. Effects in future periods have not been disclosed because the estimates rely on future flown revenue information.
The carrying amount of the Group’s and the Company’s sales in advance of carriage at 31 March 2017 was $1,634.3 million (2016: $1,626.2 million) and $1,465.9 million (2016: $1,460.1 million) respectively.
(d) Frequent flyer programme
The Company operates a frequent flyer programme called “KrisFlyer” that provides travel awards to programme members based on accumulated mileage. A portion of passenger revenue attributable to the award of frequent flyer benefits is deferred until they are utilised. The deferment of the revenue is estimated based on historical trends of breakage upon redemption, which is then used to project the expected utilisation of these benefits.
In addition, the Company also sells miles to programme partners for issuance to their programme members. For miles purchased by programme partners, revenue is deferred until awards are utilised. The deferrals are based on the expected utilisation of these awards.
The carrying amount of the Group’s and the Company’s deferred revenue at 31 March 2017 was $707.8 million (2016: $669.4 million).
(e) Aircraft maintenance and overhaul expenditure under power-by-hour agreements
The Group has entered into several power-by-hour (“PBH”) engine maintenance agreements with original equipment manufacturers of aircraft engines. The monthly payments are based on the number of flying hours flown. A portion of the cost is expensed at a fixed rate per hour during the term of the PBH agreement. The remaining payments made are recorded as an advance payment, to the extent that it is to be utilised through future maintenance activities, if any, or capitalised upon completion of an overhaul.
The proportion of the amount to be expensed off and capitalised is determined based on the best estimate of the proportion of day-to-day maintenance compared to maintenance which extends the useful lives of the engine. The carrying amount of the advance payment relating to PBH agreements for the Group and the Company at 31 March 2017 was $783.3 million (2016: $475.3 million) and $611.9 million (2016: $350.6 million) respectively. The maintenance and repair costs covered by PBH agreements which are expensed off during the year amounted to $70.9 million (FY2015/16: $61.4 million) for the Group and $28.1 million (FY2015/16: $35.2 million) for the Company.
(f) Provision for lease return costs
Prior to the return of aircraft leased by the Group entities to the lessor, the Group entities are required to fulfil certain lease return conditions which may include the completion of certain maintenance activities to the airframe and engines and the reconfiguration of seats within the aircraft. The provision for lease return costs for these leased aircraft is determined based on the best estimate of the costs that will be incurred to fulfil the stipulated lease return conditions. The carrying amount of the provision for the Group and the Company at 31 March 2017 was $1,137.2 million (2016: $1,002.5 million) and $886.3 million (2016: $779.6 million) respectively.
Singapore Airlines130
Financial

4 Segment Information (in $ million)
Following the Group’s multi-brand portfolio strategy and integration activities of Tiger Airways and Scoot, Management has determined that the Group has the following reportable segments:
(i) The Singapore Airlines segment provides passenger air transportation under the Singapore Airlines brand with a focus on full-service passenger segment serving short and long haul markets.
(ii) The SilkAir segment provides passenger air transportation under the SilkAir brand with a focus on full-service passenger segment serving regional markets.
(iii) The Budget Aviation segment provides passenger air transportation under the Tiger Airways and Scoot brands with a focus on the low-cost passenger segment.
(iv) SIA Engineering Company (“SIAEC”) segment is in the business of providing airframe maintenance and overhaul services, line maintenance, technical ground handling services and fleet management. It also manufactures aircraft cabin equipment, refurbishes aircraft galleys, provides technical and non-technical handling services and repair and overhaul of hydro-mechanical aircraft equipment.
(v) SIA Cargo segment is involved in air cargo transportation and related activities.
Other services provided by the Group, such as the training of pilots, air charters and tour wholesaling, have been aggregated under the segment “Others”. None of these segments meets any of the quantitative thresholds for determining reportable segments in FY2016/17 or FY2015/16.
This represents a change to the operating segments reported in the previous corresponding period. The previously reported segment results for the year ended 31 March 2016 have been restated to be comparable with the revised segmentation approach as required by FRS 108 Operating Segments.
Segment performance is evaluated based on operating profit or loss which in certain respects, as explained in the table below, is measured differently from operating profit or loss in the consolidated financial statements.
Transactions carried out between operating segments during the financial year are in the normal course of business.
Annual Report FY2016/17 131

Notes to the Financial StatementsFor The Financial Year Ended 31 March 2017
4 Segment Information (in $ million) (continued)
Business segments
The Group’s business is organised and managed separately according to the nature of the services provided. The following table presents revenue and profit information regarding business segments for the financial years ended 31 March 2017 and 2016 and certain assets and liabilities information of the business segments as at those dates.
SingaporeAirlines SilkAir
Budget Aviation SIAEC
SIA Cargo Others
Total of segments Elimination* Consolidated
FY2016/17 FY2016/17 FY2016/17 FY2016/17 FY2016/17 FY2016/17 FY2016/17 FY2016/17 FY2016/17
Total RevenueExternal revenue 10,134.2 969.2 1,349.1 429.4 1,950.2 36.4 14,868.5 – 14,868.5 Inter-segment revenue 960.0 21.1 39.6 674.7 5.4 48.1 1,748.9 (1,748.9) –
11,094.2 990.3 1,388.7 1,104.1 1,955.6 84.5 16,617.4 (1,748.9) 14,868.5 ResultsSegment result 386.4 100.8 67.4 72.0 3.1 9.6 639.3 (16.5) 622.8
Finance charges (47.6) – (28.0) (0.7) – – (76.3) 30.2 (46.1)Interest income 99.1 2.8 5.0 4.0 1.4 0.3 112.6 (38.7) 73.9 Loss on disposal of aircraft,
spares and spare engines (2.9) (25.9) (0.8) – (1.2) (0.9) (31.7) – (31.7)
Dividends from long-term investments 5.2 0.3 – – – – 5.5 – 5.5
Dividends from asset held for sale – – – 39.5 – – 39.5 – 39.5
Other non-operating items 12.1 (0.8) (127.5) 143.8 (131.9) 0.1 (104.2) 1.0 (103.2)Share of (losses)/profits
of joint venture companies – – (10.7) 31.6 – – 20.9 – 20.9
Share of (losses)/profits of associated companies (127.5) – (0.4) 64.9 – – (63.0) – (63.0)
Taxation (65.3) (18.1) 7.4 (17.9) 1.3 (1.0) (93.6) 16.9 (76.7)Profit/(Loss) for the
financial year 259.5 59.1 (87.6) 337.2 (127.3) 8.1 449.0 (7.1) 441.9
Attributable to:Owners of the parent 360.4 Non-controlling interests 81.5
441.9
* Relates to inter-segment transactions eliminated on consolidation.
Singapore Airlines132
Financial

4 Segment Information (in $ million) (continued)
Business segments (continued)
SingaporeAirlines SilkAir
Budget Aviation SIAEC
SIA Cargo Others
Total of segments Elimination* Consolidated
FY2015/16 FY2015/16 FY2015/16 FY2015/16 FY2015/16 FY2015/16 FY2015/16 FY2015/16 FY2015/16
Total RevenueExternal revenue 10,633.8 947.5 1,193.7 395.8 2,037.1 30.8 15,238.7 – 15,238.7 Inter-segment revenue 1,052.3 18.2 25.7 717.7 7.9 58.5 1,880.3 (1,880.3) –
11,686.1 965.7 1,219.4 1,113.5 2,045.0 89.3 17,119.0 (1,880.3) 15,238.7 ResultsSegment result 485.1 90.6 42.0 104.1 (49.7) (2.1) 670.0 11.2 681.2
Finance charges (42.0) – (11.7) (0.3) (1.4) – (55.4) 5.1 (50.3)Interest income 87.1 1.8 1.9 2.1 3.3 0.3 96.5 (25.8) 70.7 Surplus/(Loss) on disposal
of aircraft, spares and spare engines 3.7 39.9 (3.5) – 13.5 (0.9) 52.7 – 52.7
Dividends from long-term investments 95.2 14.0 – 6.1 – – 115.3 – 115.3
Other non-operating items (4.2) (10.8) (6.0) (4.5) 116.5 0.1 91.1 – 91.1 Share of (losses)/profits
of joint venture companies – – (21.0) 43.8 – – 22.8 – 22.8
Share of (losses)/profits of associated companies (59.9) – (0.2) 49.0 – – (11.1) – (11.1)
Taxation (94.2) (14.0) (1.3) (20.8) 5.5 5.6 (119.2) (1.4) (120.6)Profit for the financial year 470.8 121.5 0.2 179.5 87.7 3.0 862.7 (10.9) 851.8
Attributable to:Owners of the parent 804.4 Non-controlling interests 47.4
851.8
* Relates to inter-segment transactions eliminated on consolidation.
Annual Report FY2016/17 133

Notes to the Financial StatementsFor The Financial Year Ended 31 March 2017
4 Segment Information (in $ million) (continued)
Business segments (continued)
SingaporeAirlines SilkAir
BudgetAviation SIAEC
SIA Cargo Others
Total of segments Elimination* Consolidated
2017 2017 2017 2017 2017 2017 2017 2017 2017
Other information as at 31 March
Segment assets 17,213.4 1,425.4 3,198.6 1,376.3 1,426.0 193.0 24,832.7 (1,735.5) 23,097.2 Investments in associated
and joint venture companies 676.2 – (1.1) 542.0 – – 1,217.1 – 1,217.1
Long-term investments 395.3 0.6 – – – 9.8 405.7 – 405.7 Total assets 18,284.9 1,426.0 3,197.5 1,918.3 1,426.0 202.8 26,455.5 (1,735.5) 24,720.0
Segment liabilities 6,191.0 255.6 506.2 258.7 496.6 77.3 7,785.4 (1,707.0) 6,078.4 Long-term liabilities 259.4 – 9.5 – – – 268.9 – 268.9 Provisions 946.8 57.3 219.5 0.9 8.2 – 1,232.7 – 1,232.7 Defined benefit plans 122.3 0.5 – – 8.4 – 131.2 – 131.2 Borrowings 1,430.0 – 88.2 25.9 23.7 – 1,567.8 – 1,567.8 Tax liabilities 1,512.4 99.4 160.3 44.8 152.2 1.7 1,970.8 – 1,970.8 Total liabilities 10,461.9 412.8 983.7 330.3 689.1 79.0 12,956.8 (1,707.0) 11,249.8
Capital expenditure 3,120.5 314.1 471.1 38.3 84.9 1.0 4,029.9 – 4,029.9 Purchase of intangible
assets 30.4 3.2 3.6 5.2 0.8 1.3 44.5 – 44.5
Depreciation 1,219.3 57.6 100.6 47.6 125.7 1.2 1,552.0 0.1 1,552.1 Impairment of property,
plant and equipment 3.9 – 21.2 – – – 25.1 – 25.1 Amortisation of intangible
assets 27.9 2.1 3.4 5.2 0.7 0.5 39.8 – 39.8 Provision for competition-
related fines and settlement – – – – 131.9 – 131.9 – 131.9
Non-cash items other than depreciation, impairment of property, plant and equipment and amortisation of intangible assets 3.2 3.4 (1.6) (1.8) (0.4) 0.2 3.0 – 3.0
* Relates to inter-segment transactions eliminated on consolidation.
Singapore Airlines134
Financial

4 Segment Information (in $ million) (continued)
Business segments (continued)
SingaporeAirlines SilkAir
BudgetAviation SIAEC
SIA Cargo Others
Total of segments Elimination* Consolidated
2016 2016 2016 2016 2016 2016 2016 2016 2016
Other information as at 31 March
Segment assets 16,110.0 1,365.8 3,129.3 1,330.5 1,560.2 148.7 23,644.5 (1,691.2) 21,953.3 Investments in associated
and joint venture companies 556.8 – 9.9 491.5 – – 1,058.2 – 1,058.2
Loan receivable from an associated company 62.0 – – – – – 62.0 – 62.0
Long-term investments 754.4 0.6 8.3 – – 9.8 773.1 – 773.1 Total assets 17,483.2 1,366.4 3,147.5 1,822.0 1,560.2 158.5 25,537.8 (1,691.2) 23,846.6
Segment liabilities 6,373.6 281.4 402.2 229.1 461.0 51.8 7,799.1 (1,679.2) 6,119.9 Long-term liabilities 110.1 – 9.1 – 28.6 – 147.8 – 147.8 Provisions 827.7 44.1 201.3 0.2 22.3 – 1,095.6 – 1,095.6 Defined benefit plans 121.4 0.4 – – 7.5 – 129.3 – 129.3 Borrowings 1,000.0 – 269.8 33.3 44.4 – 1,347.5 – 1,347.5 Tax liabilities 1,477.5 93.7 98.9 47.5 156.0 – 1,873.6 – 1,873.6 Total liabilities 9,910.3 419.6 981.3 310.1 719.8 51.8 12,392.9 (1,679.2) 10,713.7
Capital expenditure 1,739.2 261.9 817.0 41.2 86.6 0.4 2,946.3 (22.6) 2,923.7 Purchase of intangible
assets 33.0 2.5 10.6 4.6 0.8 0.6 52.1 – 52.1
Depreciation 1,222.2 60.5 100.5 42.2 121.8 1.5 1,548.7 (5.7) 1,543.0 Impairment of property,
plant and equipment 18.7 – 2.9 – – 0.7 22.3 – 22.3 Amortisation of intangible
assets 25.4 1.7 2.8 1.6 1.1 0.1 32.7 – 32.7 Non-cash items other than
depreciation, impairment of property, plant and equipment and amortisation of intangible assets 24.8 3.4 4.1 5.0 2.5 0.1 39.9 – 39.9
* Relates to inter-segment transactions eliminated on consolidation.
Annual Report FY2016/17 135

Notes to the Financial StatementsFor The Financial Year Ended 31 March 2017
4 Segment Information (in $ million) (continued)
Geographical segments
The following table presents revenue information on airline operations by geographical areas for the financial years ended 31 March 2017 and 2016.
By area of original saleFY2016/17 FY2015/16
East Asia 5,812.7 5,862.0 Europe 1,236.1 1,303.2 South West Pacific 1,282.6 1,306.8 Americas 514.8 566.2 West Asia and Africa 625.6 657.5 Systemwide 9,471.8 9,695.7 Non-scheduled services and incidental revenue 4,001.4 4,175.5
13,473.2 13,871.2
There was no single customer who contributed to more than 10% of the Group’s revenue during the financial years ended 31 March 2017 and 2016.
5 Staff Costs (in $ million)
The GroupFY2016/17 FY2015/16
Salary, bonuses and other costs 2,409.0 2,267.5 CPF, other defined contributions and defined benefit expense 192.0 171.9 Share-based compensation expense 15.2 12.4
2,616.2 2,451.8
The Group contributes to several post-employment defined benefit plans for employees at several overseas locations. Employees may contribute in some of these plans and these contributions are matched in varying amounts by the Group. Defined benefit expense for the Group was $11.3 million for FY2016/17 (FY2015/16: $17.7 million). As this is not material to the total staff costs of the Group for FY2016/17 and FY2015/16, additional disclosures of the defined benefit plans are not shown.
Share-based compensation arrangements
As at 31 March 2017, the Group has the following share-based payment arrangements:
(a) Share option plans (equity-settled)
Singapore Airlines Limited Employee Share Option Plan (“ESOP”) which comprises the Senior Executive Share Option Scheme and the Employee Share Option Scheme for senior executives and all other employees respectively, were approved by shareholders on 8 March 2000 and modified at the Extraordinary General Meetings of the Company held on 14 July 2001, 26 July 2003 and 31 July 2009.
Following the expiry of the share option plans in March 2010, the Company ceased to grant options under ESOP.
(b) Share-based incentive plans (equity-settled)
The Singapore Airlines Limited Restricted Share Plan (“RSP”) and Performance Share Plan (“PSP”) are share-based incentive plans for senior executives and key Senior Management, which were first approved by the shareholders of the Company on 28 July 2005. On 30 July 2014, the shareholders of the Company approved the RSP 2014 and PSP 2014, to replace the RSP and PSP respectively which expired on 27 July 2015.
Singapore Airlines136
Financial

5 Staff Costs (in $ million) (continued)
Share-based compensation arrangements (continued)
(b) Share-based incentive plans (equity-settled) (continued)
The RSP/RSP 2014 awards fully paid ordinary shares of the Company, conditional on position and individual performance targets set at the start of the performance period based on medium-term Group and Company objectives.
The PSP/PSP 2014 awards fully paid ordinary shares of the Company, conditional on performance targets set at the start of a three-year overlapping performance period based on stretched long-term corporate objectives.
Key terms and conditions related to the grants under these programmes are as follows:
Plans Vesting Conditions Performance conditions^ Payout
Senior Executive Share Option Scheme@
• 25% per annum of total ordinary shares subject to the options.
None 100%
Employee Share Option Scheme@
• Two years service from grant date. None 100%
RSP/RSP 2014 Awards granted prior to FY2016/17• Based on meeting stated performance
conditions over a two-year performance period, 50% of award vests.
Awards granted in FY2016/17• Based on meeting stated performance
conditions over a one-year performance period, 33% of award vests.• Balance vests equally over the subsequent two
years with fulfilment of service requirements.
At both Company and Group level• EBITDAR# Margin• Value Added per $ Employment
Cost
0% - 150%*
PSP/PSP 2014 • Based on meeting stated performance conditions over a three-year performance period.
• Absolute Total Shareholder Return (“TSR”) outperform Cost of Equity (“COE”)
• Relative TSR against selected airline peer index companies
0% - 200%*
Time-based RSP • For employees still in service, 50% of the shares vest in 2013 and the balance vests equally in 2014 and 2015.
• For retirees, 50% of the shares vest on the retirement date and the remaining 50%
one year after the retirement date.
None 100%
Deferred share award • Awards cliff vest at the end of three years after the grant date, subject to meeting a three-year service-based condition and provided that individual performance remains satisfactory.
None 100%
@ The share options have contractual life of no longer than 10 years from grant date.# EBITDAR denotes Earnings before Interest, Taxes, Depreciation, Amortisation and Rentals on leased aircraft.
* The payout depends on the achievement of pre-set performance targets over the performance period.^ For non-market conditions, achievement factors are determined based on inputs from the Board Compensation & Industrial Relations Committee for the purpose
of accrual for the share-based incentive plans until the achievement of the targets can be accurately ascertained.
Annual Report FY2016/17 137

Notes to the Financial StatementsFor The Financial Year Ended 31 March 2017
5 Staff Costs (in $ million) (continued)
Share-based compensation arrangements (continued)
(b) Share-based incentive plans (equity-settled) (continued)
Movement of share options during the financial year
The following table illustrates the number and weighted average exercise prices of, and movements in, the ESOP during the financial year:
FY2016/17 FY2015/16
Number of options
Weightedaverage
exercise priceNumber of
options
Weightedaverage
exercise price
Balance at 1 April 21,113,197 $13.03 25,233,029 $12.42 Cancelled (2,079,636) $10.64 (1,754,354) $10.52 Exercised (2,310,011) $9.34 (2,365,478) $8.71 Balance at 31 March 16,723,550 $13.83 21,113,197 $13.03
Exercisable at 31 March 16,723,550 $13.83 21,113,197 $13.03
The range of exercise prices for options outstanding at the end of the year is $12.07 to $15.46 (FY2015/16: $9.34 to $15.46).
The weighted average share price for options exercised during the year was $10.40 (FY2015/16: $11.01). The weighted average remaining contractual life for these options is 0.73 years (FY2015/16: 1.46 years).
Movement of share awards during the financial year
Number of Restricted Shares
Date of grant
Balance at 01.04.2016/
date of grant Adjustment* Cancelled VestedBalance at 31.03.2017
RSP/RSP 201410.07.2012 102,188 – (794) (101,394) – 15.07.2013 186,175 – (640) (99,605) 85,930 03.07.2014 689,073 131,617 (2,520) (445,085) 373,085 03.07.2015 715,092 – (5,400) – 709,692 18.07.2016 794,854 – (4,158) – 790,696
2,487,382 131,617 (13,512) (646,084) 1,959,403
* Adjustment at the end of performance period upon meeting performance targets and adjustment for number of days in service for retirees.
Number of Performance Shares
Date of grant
Balance at01.04.2016/
date of grant Adjustment# VestedBalance at31.03.2017
PSP/PSP 201415.07.2013 228,425 (123,005) (105,420) – 03.07.2014 248,568 – – 248,568 03.07.2015 239,700 – – 239,700 18.07.2016 240,900 – – 240,900
957,593 (123,005) (105,420) 729,168
# Adjustment at the end of performance period upon meeting performance targets and adjustment for number of days in service for retirees.
Singapore Airlines138
Financial

5 Staff Costs (in $ million) (continued)
Share-based compensation arrangements (continued)
(b) Share-based incentive plans (equity-settled) (continued)
Time-based RSP
Movement of time-based share awards during the financial year
Number of Time-based Restricted Shares
Date of grantBalance at01.04.2016 Vested
Balance at31.03.2017
Time-based RSP07.05.2010 5,426 (5,426) –
Deferred RSP/RSP 2014 Awards (“DSA”)
Movement of deferred RSP/RSP 2014 awards during the financial year
Number of Deferred RSP/RSP 2014 Awards
Date of grant
Balance at01.04.2016/
date of grant Adjustment* VestedBalance at 31.03.2017
DSA04.09.2013 154,557 11,610 (166,167) – 28.08.2014 73,470 – – 73,470 10.09.2015 74,790 – – 74,790 01.09.2016 65,740 – – 65,740
368,557 11,610 (166,167) 214,000
Since the commencement of the RSP 2014 and PSP 2014 plans in July 2014, 2,204,546 awards have been granted.
(c) Measurement of fair values
The methods and inputs used in the measurement of fair values at grant date of the equity-settled share-based incentive plans were as follows:
FY2016/17 FY2015/16RSP 2014 PSP 2014 RSP 2014 PSP 2014
Valuation Method Monte Carlo Simulation
Expected dividend paid yield (%) Management’s forecast in line with dividend policy
Expected volatility (%) 15.53 – 17.52 16.25 14.11 – 18.34 14.11
Risk-free interest rate (%) 0.81 – 1.08 1.08 0.89 – 1.61 1.16
Expected term (years) 0.95 – 2.95 3.0 2.0 – 4.0 3.0
Share price at date of grant ($) 11.08 11.08 11.19 11.19
Estimated fair value ($) 9.82 – 10.65 11.30 9.42 – 10.34 6.58
Expected volatility has been based on an evaluation of the historical volatility of the Company’s share price, particularly over the historical period commensurating with the expected term. The expected term of the instruments has been based on historical experience and general option holder behaviour.
Annual Report FY2016/17 139

Notes to the Financial StatementsFor The Financial Year Ended 31 March 2017
6 Operating Profit (in $ million)
Operating profit for the financial year was arrived at after charging/(crediting):
The GroupFY2016/17 FY2015/16
Compensation for changes in aircraft delivery slots (36.8) (136.7)Interest income from short-term investments (0.9) (0.9)Dividend income from short-term investments (0.9) (0.9)Income from operating lease of aircraft (45.1) (46.9)Amortisation of deferred gain on sale and operating leaseback transactions (6.0) (7.6)Loss on disposal of short-term investments 0.8 5.1 Remuneration for auditors of the Company
Audit fees 1.6 1.5 Non-audit fees 0.3 0.3
Bad debts written off 1.9 1.1 Writeback of impairment of trade debtors (1.3) (4.7)Writedown of inventories 5.8 26.6 Exchange loss, net 26.9 106.2 Currency hedging loss/(gain) 36.6 (106.9)Fuel hedging loss recognised in “Fuel costs” 376.3 1,166.5 Ineffectiveness of fuel hedging contracts recognised in “Fuel Costs” (36.4) 0.2 Net gain on financial assets mandatorily measured at FVTPL (1.6) –Ineffectiveness of cross currency swaps recognised in “Rentals on leased aircraft” – 0.1
7 Finance Charges (in $ million)
The GroupFY2016/17 FY2015/16
Notes payable 38.4 36.9 Bank loans 6.6 11.4 Finance lease commitments – 0.8 Realised loss on interest rate swap contracts accounted for as cash flow hedges – 0.6 Commitment fees 1.1 0.6
46.1 50.3
8 Interest Income (in $ million)
The GroupFY2016/17 FY2015/16
Interest income from fixed deposits and investments 73.8 69.2 Amortised interest income from other receivables 0.1 1.5
73.9 70.7
Singapore Airlines140
Financial

9 Other Non-Operating Items (in $ million)
The GroupFY2016/17 FY2015/16
Impairment of aircraft (21.2) (11.7)Impairment of intangible assets (98.2) – Surplus on disposal of asset held for sale 141.6 – (Loss)/Surplus on disposal of other property, plant and equipment (0.2) 6.6 Surplus on disposal of a subsidiary company – 3.3 Surplus on partial disposal of associated companies 2.4 2.8 Loss on liquidation of an associated company – (4.3)Impairment on investment in an associated company – (2.5)Impairment on long-term investments – (9.0)Loss on disposal of a long term investment (6.1) – Net gain on financial assets mandatorily measured at FVTPL 1.5 – Writeback of provision for expected credit losses on investments and guarantees 1.8 – (Provision)/Refund of competition-related fines and settlement (131.9) 116.5 Surplus on dilution of interest in an associated company 9.7 1.9 Loss on planned disposal of aircraft – (38.0)(Provision)/Writeback of provision for onerous aircraft leases, net (2.6) 25.5
(103.2) 91.1
10 Taxation (in $ million)
The Group is subject to income taxes in numerous jurisdictions. Judgement is involved in determining the provision for income taxes. There are certain transactions and computations for which the ultimate tax determination is uncertain during the ordinary course of business. The Group recognises liabilities for expected tax issues based on estimates of whether additional taxes will be due. Where the final tax outcome of these matters is different from the amounts that were initially recognised, such differences will impact the income tax and deferred tax provisions in the period in which such determination is made.
Major components of income tax expense
The major components of income tax expense for the years ended 31 March 2017 and 2016 are:
The GroupFY2016/17 FY2015/16
Current taxationProvision for the year 36.5 145.4 Over provision in respect of prior years (15.9) (8.6)
20.6 136.8
Deferred taxationMovement in temporary differences 62.7 (16.9)Under provision in respect of prior years 0.1 0.7 Previously unrecognised tax benefits (6.7) –
56.1 (16.2) 76.7 120.6
Annual Report FY2016/17 141

Notes to the Financial StatementsFor The Financial Year Ended 31 March 2017
10 Taxation (in $ million) (continued)
Deferred taxation related to other comprehensive income:
The GroupFY2016/17 FY2015/16
Financial assets measured at FVOCI 0.9 (0.4) Cash flow hedges 70.1 37.8 Actuarial loss on revaluation of defined benefit plans (1.0) (0.3)
70.0 37.1
The Group has tax losses and deductible temporary differences (of which no deferred tax asset has been recognised) of approximately $73.9 million (2016: $103.3 million) and $36.1 million (2016: $38.6 million) respectively that are available for offset against future taxable profits of the companies. This is due to the uncertainty of the recoverability of the deferred tax asset.
A reconciliation between taxation expense and the product of accounting profit multiplied by the applicable tax rate for the years ended 31 March is as follows:
The GroupFY2016/17 FY2015/16
Profit before taxation 518.6 972.4 Less: Share of losses/(profits) of associated and joint venture companies 42.1 (11.7)
560.7 960.7
Taxation at statutory corporate tax rate of 17.0% 95.3 163.3
AdjustmentsIncome not subject to tax (36.5) (49.7) Expenses not deductible for tax purposes 33.4 12.2 Higher effective tax rates of other countries 7.3 7.4 Over provision in respect of prior years, net (15.8) (7.9) Income subject to concessionary tax rate (1.9) (1.1) Tax benefit not recognised 2.4 1.1 Previously unrecognised tax benefits (6.7) – Others (0.8) (4.7) Taxation 76.7 120.6
Singapore Airlines142
Financial

11 Earnings Per Share
The GroupFY2016/17 FY2015/16
Basic Diluted Basic Diluted
Profit attributable to owners of the parent (in $ million) 360.4 360.4 804.4 804.4 Adjustment for dilutive potential ordinary shares of
subsidiary companies (in $ million) – (0.5) – (0.3)Adjusted net profit attributable to owners of the parent (in $ million) 360.4 359.9 804.4 804.1
Weighted average number of ordinary shares in issue (in million) 1,182.6 1,182.6 1,166.0 1,166.0 Adjustment for dilutive potential ordinary shares (in million) – 4.4 – 4.9 Weighted average number of ordinary shares in issue used for
computing earnings per share (in million) 1,182.6 1,187.0 1,166.0 1,170.9
Earnings per share (cents) 30.5 30.3 69.0 68.7
Basic earnings per share is calculated by dividing the profit attributable to owners of the parent by the weighted average number of ordinary shares in issue during the financial year.
For purposes of calculating diluted earnings per share, the profit attributable to owners of the parent is adjusted to take into account effects of dilutive potential ordinary shares of subsidiary companies and the weighted average number of ordinary shares of the Company in issue is adjusted to take into account effects of dilutive options and share-based incentive plans of the Company.
17.0 million (FY2015/16: 17.6 million) of the share options granted to employees under the existing employee share option plans have not been included in the calculation of diluted earnings per share because they are anti-dilutive for the current and previous year presented.
The average market value of the Company’s shares for purposes of calculating the dilutive effect of share options was based on quoted market prices for the period during which the options were outstanding.
12 Dividends Paid and Proposed (in $ million)
The Group and the CompanyFY2016/17 FY2015/16
The following tax exempt (one-tier) dividends were declared and paid by the Group and Company to the owners of the Company:
Final dividend of 35.0 cents per share in respect of FY2015/16 (FY2015/16: 17.0 cents per share in respect of FY2014/15) 415.0 199.1
Interim dividend of 9.0 cents per share in respect of FY2016/17 (FY2015/16: 10.0 cents per share in respect of FY2015/16) 106.3 116.3
521.3 315.4
The Directors propose that a final tax exempt (one-tier) dividend of 11.0 cents per share amounting to $130.0 million be paid for the financial year ended 31 March 2017.
During the financial year, total dividends of $37.6 million (FY2015/16: $43.6 million) were paid to non-controlling interests.
Annual Report FY2016/17 143
Notes to the Financial StatementsFor The Financial Year Ended 31 March 2017
13 Share Capital (in $ million)
The Group and the CompanyNumber of shares Amount
2017 2016 2017 2016
Issued and fully paid share capitalOrdinary shares
Balance at 1 April and 31 March 1,199,851,018 1,199,851,018 1,856.1 1,856.1
Special share Balance at 1 April and 31 March 1 1 # #
# The value is $0.50
The holders of ordinary shares (except treasury shares) are entitled to receive dividends as and when declared by the Company. All ordinary shares, which have no par value, carry one vote per share without restriction. All shares rank equally with regards to the Group’s residual assets.
The Company’s ability to operate its existing route network and flight frequency is derived solely from and dependent entirely on the Air Service Agreements (“ASAs”) concluded between the Government of Singapore and the governments of other countries. ASAs are therefore critical to the Company’s operations. In almost all the ASAs, it is a condition that the Company must at all times be “effectively controlled” and “substantially owned” by Singapore nationals for the tenure of the respective ASAs.
In order to comply with the above requirement, one non-tradeable Special Share was issued to the Ministry of Finance. The Special Share enjoys all the rights attached to ordinary shares. In addition, pursuant to Article 3A of the Articles of Association, no resolution may be passed on certain matters without prior written approval of the Special Member.
The Company can also issue non-tradeable redeemable cumulative preference shares, which carry full voting rights (“ASA shares”). When issued, the ASA shares will be paid at $0.01 each and will carry equal voting rights as those of ordinary shares. These shares will be issued only when the Directors determine that the Company’s operating rights under any of the ASAs are threatened by reason of the nationality of the majority shareholders.
During the financial year, the Company did not issue any shares (FY2015/16: nil) upon exercise of options granted under the ESOP, or vesting of share-based incentive plans.
Singapore Airlines144
Financial

14 Treasury Shares (in $ million)
The Group and the Company31 March
2017 2016
Balance at 1 April (381.5) (326.3)Purchase of treasury shares (134.3) (85.4)
Treasury shares reissued pursuant to the VGO of Tiger Airways:- For cash on exercise of options 301.2 – - Transferred from share-based compensation reserve 11.4 – - Gain on reissuance of treasury shares (25.8) –
286.8 – Treasury shares reissued pursuant to equity compensation plans:
- For cash on exercise of employee share options 21.6 20.1 - Transferred from share-based compensation reserve 16.0 11.3 - Gain on reissuance of treasury shares (3.3) (1.2)
34.3 30.2 Balance at 31 March (194.7) (381.5)
Treasury shares relate to ordinary shares of the Company that are held by the Company.
During the financial year, the Company purchased 12,665,700 (FY2015/16: 8,438,700) of its ordinary shares by way of on-market purchases at share prices ranging from $10.38 to $11.06 (FY2015/16: $9.75 to $10.70). The total amount paid to purchase the shares was $134.3 million (FY2015/16: $85.4 million) and this is presented as a component within equity attributable to owners of the parent.
The Company reissued 2,310,011 (FY2015/16: 2,365,478) treasury shares pursuant to its employee share option plans at a weighted average exercise price of $9.34 (FY2015/16: $8.71) each. In addition, 646,084 (FY2015/16: 355,413) shares, 105,420 (FY2015/16: nil) shares, 5,426 (FY2015/16: 109,893) shares and 166,167 (FY2015/16: nil) shares were reissued pursuant to the RSP, PSP, time-based RSP and DSA respectively. Furthermore, 27,125,949 treasury shares were reissued pursuant to the VGO of Tiger Airways. The number of treasury shares as at 31 March 2017 was 18,377,002 (2016: 36,070,359).
Where the consideration paid by the Company for the purchase or acquisition of treasury shares is made out of revenue reserves, such consideration will correspondingly reduce the amount available for the distribution of cash dividends by the Company.
15 Other Reserves (in $ million)
The Group31 March
The Company31 March
2017 2016 2017 2016
Capital reserve (147.6) (129.2) 25.7 (5.1)Foreign currency translation reserve (123.7) (151.3) – – Share-based compensation reserve 88.5 123.7 76.7 108.0 Fair value reserve (234.4) (498.6) (189.6) (470.9)General reserve 11,838.8 11,935.5 10,939.4 10,901.6
11,421.6 11,280.1 10,852.2 10,533.6
(a) Capital reserve
Capital reserve mainly arises from the loss on the acquisition of non-controlling interests in a subsidiary company (Note 22(f)), revaluation of land and buildings owned by Ritz-Carlton, Millenia Properties Private Limited, an associated company, the share of other changes in equity of Virgin Australia Holdings Limited (“VAH”), an associated company, and the gains or losses on the reissuance of treasury shares.
Annual Report FY2016/17 145

Notes to the Financial StatementsFor The Financial Year Ended 31 March 2017
15 Other Reserves (in $ million) (continued)
(b) Foreign currency translation reserve
The foreign currency translation reserve represents exchange differences arising from the translation of the financial statements of foreign operations whose functional currencies are different from that of the Group’s presentation currency.
(c) Share-based compensation reserve
Share-based compensation reserve consists of equity-settled share options and awards granted to employees, that is made up of the cumulative value of services received from employees recorded on grant of equity-settled share options and awards, and equity-settled share options granted to the shareholders of Tiger Airways pursuant to the VGO (Note 22(f)).
(d) Fair value reserve
Fair value reserve records the cumulative fair value changes of financial assets measured at FVOCI and the portion of the fair value changes (net of tax) on derivative financial instruments designated as hedging instruments in cash flow hedges that are determined to be effective hedges.
Breakdown of the fair value reserves as follows:
The Group31 March
The Company31 March
2017 2016 2017 2016
Financial assets measured at FVOCI – 124.3 – 15.7 Derivative financial instruments designated
as hedging instruments (234.4) (622.9) (189.6) (486.6) (234.4) (498.6) (189.6) (470.9)
Fair value changes of financial assets measured at FVOCI:
The Group31 March
The Company31 March
2017 2016 2017 2016
Gain on fair value changes 8.0 103.9 5.0 2.3 Recognised in the profit and loss account on disposal
of financial assets measured at FVOCI (108.3) 5.1 – – (100.3) 109.0 5.0 2.3
Singapore Airlines146
Financial

15 Other Reserves (in $ million) (continued)
(d) Fair value reserve (continued)
Fair value changes of derivative financial instruments designated as hedging instruments in cash flow hedges:
The Group31 March
The Company31 March
2017 2016 2017 2016
Gain/(Loss) on fair value changes 29.2 (655.1) 24.3 (572.8)Recognised in the carrying value of non-financial assets on
occurrence of capital expenditure commitments (2.8) (41.4) (2.8) (31.3)Recognised in the profit and loss account on occurrence of:
Fuel hedging contracts recognised in “Fuel costs” 312.3 883.3 246.5 768.1 Foreign currency contracts recognised in
“Other operating expenses” 30.5 (77.4) 28.8 (66.7)Cross currency swap contracts recognised in
“Lease rentals” (0.1) 0.1 (0.1) 0.1 Interest rate swap contracts recognised in
“Lease rentals” 0.3 11.2 0.3 11.2Interest rate swap contracts recognised in
“Finance charges” – 0.6 – – 369.4 121.3 297.0 108.6
(e) General reserve
General reserve comprises mainly retained earnings of the Group and the Company. Movements in the Group’s and the Company’s general reserves are set out in the Statement of Changes in Equity respectively.
16 Deferred Account (in $ million)
The Group31 March
The Company31 March
2017 2016 2017 2016
Deferred (loss)/gain on sale and leaseback transactions- operating leases (4.1) 5.8 (7.3) 0.4 - finance leases 0.4 2.7 – –
(3.7) 8.5 (7.3) 0.4 Deferred credit 251.3 210.8 240.3 197.1
247.6 219.3 233.0 197.5 Presented as:
- Current assets (11.8) (17.7) (9.1) (15.0)- Non-current assets (61.1) (65.2) (49.1) (50.5)
- Current liabilities 86.0 47.2 76.3 40.6 - Non-current liabilities 234.5 255.0 214.9 222.4
247.6 219.3 233.0 197.5
Annual Report FY2016/17 147

Notes to the Financial StatementsFor The Financial Year Ended 31 March 2017
17 Deferred Taxation (in $ million)
The Group The CompanyStatement of
financial position31 March Profit and loss
Statement of financial position
31 March2017 2016 FY2016/17 FY2015/16 2017 2016
The deferred taxation arises as a result of:
Deferred tax liabilitiesDifferences in depreciation 1,958.9 1,909.9 49.0 52.9 1,547.5 1,473.8 Revaluation to fair value
- fuel hedging contracts 10.8 0.9 – – 8.9 0.9 - currency hedging contracts 7.2 3.7 – – 6.5 3.7 - cross currency swap contracts 1.2 – – – 1.2 – - interest rate cap contracts – 1.7 – – – – - financial assets measured at FVOCI 0.9 – – – – –
Fair value adjustments on acquisition of a subsidiary company – 16.8 (16.8) (0.4) – –
Other temporary differences 46.2 32.7 24.1 6.6 13.8 16.0 Gross deferred tax liabilities 2,025.2 1,965.7 56.3 59.1 1,577.9 1,494.4
Deferred tax assetsUnabsorbed capital allowances and tax losses (10.5) (81.1) (10.3) (50.6) – – Revaluation to fair value
- fuel hedging contracts (55.5) (102.5) – – (42.9) (80.3)- currency hedging contracts (10.2) (21.4) – – (9.3) (19.6)- cross currency swap contracts (1.0) – – – (1.0) – - interest rate cap contracts (0.1) (0.1) – – (0.1) (0.1)
Actuarial loss on revaluation of defined benefit plans (2.5) (1.5) – – (1.5) (1.0)
Other temporary differences (54.9) (77.4) 10.1 (24.7) (41.0) (46.9)Gross deferred tax assets (134.7) (284.0) (0.2) (75.3) (95.8) (147.9)
Net deferred tax liabilities 1,890.5 1,681.7 1,482.1 1,346.5
Deferred tax charged/(credited) to profit and loss 56.1 (16.2)
Deferred tax charged to equity 70.0 37.1 58.2 30.7
At the end of the reporting period, deferred tax liability of $0.7 million (2016: $0.7 million) has been recognised for taxes that would be payable on the undistributed earnings of one of the Group’s subsidiary companies.
For the other subsidiary companies of the Group, no deferred tax liability has been recognised as the Group has determined that undistributed earnings of these subsidiary companies will not be distributed in the foreseeable future. Such temporary differences for which no deferred tax liability has been recognised aggregate to $8.5 million (2016: $7.1 million). The deferred tax liability is estimated to be $2.6 million (2016: $2.1 million).
Singapore Airlines148
Financial

18 Borrowings and Long-Term Liabilities (in $ million)
The Group31 March
The Company31 March
2017 2016 2017 2016
Current LiabilitiesBorrowings
Loans 18.3 190.4 – – Finance lease commitments 23.7 21.5 – –
42.0 211.9 – –
Non-Current LiabilitiesBorrowings
Notes payable 1,430.0 1,000.0 1,430.0 1,000.0 Loans 95.8 112.7 – – Finance lease commitments – 22.9 – –
1,525.8 1,135.6 1,430.0 1,000.0
Long-Term LiabilitiesMaintenance reserve 9.8 5.4 9.8 5.4 Purchase option price payable to lessor – 28.6 – – Deposit received from a lessee 9.5 9.1 – – Derivative liabilities 249.6 104.7 249.6 104.7
268.9 147.8 259.4 110.1
1,794.7 1,283.4 1,689.4 1,110.1
Notes payable
Notes payable at 31 March 2017 comprised unsecured notes issued by the Company. The details are set out below.
Series Year of issuance AmountFixed interest rate
per annum Date Repayable
001 2010 500.0 3.22% 9 July 2020002 2014 200.0 3.145% 8 April 2021003 2014 300.0 3.75% 8 April 2024004 2016 430.0 3.13% 17 November 2026
Annual Report FY2016/17 149

Notes to the Financial StatementsFor The Financial Year Ended 31 March 2017
18 Borrowings and Long-Term Liabilities (in $ million) (continued)
Loans
A short-term loan of $4.1 million (2016: $8.8 million) is a revolving credit facility denominated in USD taken by a subsidiary company. The loan is unsecured and bears a fixed interest ranging from 2.50% to 2.75% (FY2015/16: 2.75% to 3.03%) per annum. The current revolving credit facility is repayable within 12 months after the reporting date.
The other short-term loans of $14.2 million (2016: $181.6 million) are European Export Credit Agency (“ECA”) aircraft financing loans denominated in SGD taken by a subsidiary company. These are in the form of credit support, where a bank or other financial institution lends money to the borrower with the loan guaranteed by the ECA. The secured bank loans are secured via assignment of the aircraft purchase agreement, assignment of engine warranty and credit agreement as well as mortgage of the aircraft. The interest rates range from 2.82% to 4.11% (FY2015/16: 1.18% to 4.11%) per annum and the loans are repayable within 12 months after the reporting date.
A long-term loan of $21.8 million (2016: $24.5 million) denominated in USD taken by a subsidiary company is unsecured and bears an average floating rate of 2.09% (FY2015/16: 1.80%) per annum, re-priced quarterly. This loan is repayable in 2022.
The other long-term loans of $74.0 million (2016: $88.2 million) are ECA aircraft financing loans denominated in SGD taken by a subsidiary company. The interest rates range from 2.82% to 4.11% per annum (FY2015/16: 1.18% to 4.11%) and the loans are repayable by 2024.
As part of the ECA financing arrangements with banks, special purpose entities (“SPEs”) (Note 22) were incorporated. As at 31 March 2017, there were ECA financing arrangements with banks to finance four aircraft (2016: 11 aircraft). Pursuant to the ECA financing, the legal ownership of the aircraft is vested in the SPEs. The subsidiary companies leased the aircraft using finance lease arrangements with Falcon Aircraft Limited and Winnie Aircraft Limited. The subsidiary companies have purchase options to acquire legal ownership of the aircraft from the SPEs at the end of the lease term at a bargain purchase option price.
Finance lease commitments
As at 31 March 2017, SIA Cargo held one (2016: two) B747-400 freighter under finance lease that matures in 2018, without any options for renewal. The lease has an option for SIA Cargo to purchase the aircraft at the end of the lease period of 12 years. Sub-leasing is allowed under the lease agreement. The interest rate on the finance lease commitment is fixed at 5.81% (FY2015/16: 5.81%) per annum.
During the financial year, SIA Cargo purchased an aircraft through the exercise of a purchase option in the finance lease. As at 31 March 2017, $35.1 million was covered by a fund placed with a financial institution under defeasance to provide for payments due at time of exercise of purchase option at the end of the 15th year of the lease period. The fund placed with a financial institution generates interest in order to meet the obligation at time of maturity. The Year-15 purchase option price is payable by instalments between March 2017 and December 2017. The carrying value of the purchase option price payable (Note 32) amounted to $34.2 million (2016: $50.8 million was recognised under trade and other creditors and $28.6 million was recognised under long-term liabilities) as at 31 March 2017.
SIA Cargo continues to remain the primary obligor under these lease agreements, and as such, there were unpaid lease commitments of $59.6 million (2016: $132.1 million) as at 31 March 2017.
Singapore Airlines150
Financial

18 Borrowings and Long-Term Liabilities (in $ million) (continued)
Finance lease commitments (continued)
Future minimum lease payments under these finance leases are as follows:
The Group31 March
2017 2016 Minimum
LeasePayments
PresentValue of
Payments
MinimumLease
Payments
PresentValue of
Payments
Not later than one year 24.5 23.7 23.8 21.5 Later than one year but not later than five years – – 23.7 22.9 Total minimum lease payments 24.5 23.7 47.5 44.4 Amounts representing interest (0.8) – (3.1) – Present value of minimum lease payments 23.7 23.7 44.4 44.4
Annual Report FY2016/17 151

Notes to the Financial StatementsFor The Financial Year Ended 31 March 2017
19 Provisions (in $ million)
Included are provisions for warranty claims, upgrade costs, return costs for leased aircraft, lease end liability and onerous leases. It is expected that the return costs will be incurred by the end of the lease terms.
An analysis of the provisions is as follows:
The Group
Return costs forleased aircraft
Onerousleases Others Total
Balance at 1 April 2015 1,006.8 88.0 43.0 1,137.8 Provision during the year 244.6 9.6 22.6 276.8 Provision written back during the year (48.7) (35.1) – (83.8)Provision utilised during the year (155.6) (20.6) (14.4) (190.6)Reclassification (44.6) – – (44.6)Balance at 31 March 2016 1,002.5 41.9 51.2 1,095.6
Current 195.1 13.2 10.2 218.5 Non-current 807.4 28.7 41.0 877.1
1,002.5 41.9 51.2 1,095.6
Balance at 1 April 2016 1,002.5 41.9 51.2 1,095.6 Provision during the year 286.4 2.6 26.6 315.6 Provision written back during the year (8.0) – (0.2) (8.2)Provision utilised during the year (151.2) (13.3) (13.3) (177.8)Reclassification 7.5 – – 7.5 Balance at 31 March 2017 1,137.2 31.2 64.3 1,232.7
Current 296.7 13.7 12.0 322.4 Non-current 840.5 17.5 52.3 910.3
1,137.2 31.2 64.3 1,232.7
Singapore Airlines152
Financial

19 Provisions (in $ million) (continued)
The Company
Return costs forleased aircraft Others Total
Balance at 1 April 2015 809.6 39.1 848.7 Provision during the year 206.0 22.2 228.2 Provision written back during the year (48.7) – (48.7)Provision utilised during the year (142.7) (13.2) (155.9)Reclassification (44.6) – (44.6)Balance at 31 March 2016 779.6 48.1 827.7
Current 171.3 9.2 180.5 Non-current 608.3 38.9 647.2
779.6 48.1 827.7
Balance at 1 April 2016 779.6 48.1 827.7 Provision during the year 246.6 25.6 272.2 Provision written back during the year (0.9) – (0.9)Provision utilised during the year (139.0) (13.2) (152.2)Balance at 31 March 2017 886.3 60.5 946.8
Current 288.3 10.5 298.8 Non-current 598.0 50.0 648.0
886.3 60.5 946.8
Annual Report FY2016/17 153

Notes to the Financial StatementsFor The Financial Year Ended 31 March 2017
20 Property, Plant and Equipment (in $ million)
The Group
AircraftAircraftspares
Aircraftspare engines
Freeholdland
Freeholdbuildings
Leasehold landand buildings
Plant andequipment
Office andcomputer
equipment
Advance andprogress
payments Total
CostAt 1 April 2015 19,218.8 527.9 201.8 15.7 147.4 611.1 870.6 276.5 3,045.9 24,915.7 Additions 714.4 67.6 53.4 – – 0.4 38.8 14.9 2,034.2 2,923.7 Transfers 1,839.7 0.2 40.0 – – – (3.4) 5.6 (1,882.1) – Reclassification to assets held for sale (266.3) – – – – – – – (19.8) (286.1)Disposals (1,434.1) (17.8) (31.2) – – – (162.9) (7.4) (9.8) (1,663.2)Disposal of a subsidiary company – – – – – – (3.5) (0.7) – (4.2)Exchange differences – (0.1) – – – (0.5) (1.0) (0.1) (0.5) (2.2)At 31 March 2016 20,072.5 577.8 264.0 15.7 147.4 611.0 738.6 288.8 3,167.9 25,883.7 Additions 91.7 21.2 33.0 – – 1.3 45.4 10.7 3,826.6 4,029.9 Transfers 2,185.3 3.8 2.1 – – 18.9 18.9 13.9 (2,242.9) – Disposals (497.3) (24.4) (28.5) – – – (44.9) (16.6) – (611.7)Exchange differences – 0.2 – – – 1.5 0.5 0.1 – 2.3 At 31 March 2017 21,852.2 578.6 270.6 15.7 147.4 632.7 758.5 296.9 4,751.6 29,304.2
Accumulated depreciation and impairment lossesAt 1 April 2015 9,586.5 300.1 104.4 – 123.0 441.8 594.4 242.3 – 11,392.5 Depreciation 1,410.8 30.1 19.7 – 3.3 11.6 49.0 18.5 – 1,543.0 Impairment losses 19.9 1.7 – – – – 0.7 – – 22.3 Transfers (21.6) – 18.9 – – – 2.7 – – – Reclassification to assets held for sale (80.5) – – – – – – – – (80.5)Disposals (948.8) (8.1) (29.4) – – – (139.2) (7.4) – (1,132.9)Disposal of a subsidiary company – – – – – – (2.6) (0.6) – (3.2)Exchange differences – (0.1) – – – (0.2) (0.6) (0.1) – (1.0)At 31 March 2016 9,966.3 323.7 113.6 – 126.3 453.2 504.4 252.7 – 11,740.2 Depreciation 1,408.6 26.1 23.9 – 3.3 12.1 59.8 18.3 – 1,552.1 Impairment losses 21.2 3.9 – – – – – – – 25.1 Transfers (13.6) (0.1) 13.6 – – – 0.1 – – – Disposals (359.4) (7.6) (21.4) – – – (43.4) (15.3) – (447.1)Exchange differences – 0.2 – – – 0.2 0.2 – – 0.6 At 31 March 2017 11,023.1 346.2 129.7 – 129.6 465.5 521.1 255.7 – 12,870.9
Net book valueAt 31 March 2016 10,106.2 254.1 150.4 15.7 21.1 157.8 234.2 36.1 3,167.9 14,143.5 At 31 March 2017 10,829.1 232.4 140.9 15.7 17.8 167.2 237.4 41.2 4,751.6 16,433.3
Singapore Airlines154
Financial

20 Property, Plant and Equipment (in $ million)
The Group
AircraftAircraftspares
Aircraftspare engines
Freeholdland
Freeholdbuildings
Leasehold landand buildings
Plant andequipment
Office andcomputer
equipment
Advance andprogress
payments Total
CostAt 1 April 2015 19,218.8 527.9 201.8 15.7 147.4 611.1 870.6 276.5 3,045.9 24,915.7 Additions 714.4 67.6 53.4 – – 0.4 38.8 14.9 2,034.2 2,923.7 Transfers 1,839.7 0.2 40.0 – – – (3.4) 5.6 (1,882.1) – Reclassification to assets held for sale (266.3) – – – – – – – (19.8) (286.1)Disposals (1,434.1) (17.8) (31.2) – – – (162.9) (7.4) (9.8) (1,663.2)Disposal of a subsidiary company – – – – – – (3.5) (0.7) – (4.2)Exchange differences – (0.1) – – – (0.5) (1.0) (0.1) (0.5) (2.2)At 31 March 2016 20,072.5 577.8 264.0 15.7 147.4 611.0 738.6 288.8 3,167.9 25,883.7 Additions 91.7 21.2 33.0 – – 1.3 45.4 10.7 3,826.6 4,029.9 Transfers 2,185.3 3.8 2.1 – – 18.9 18.9 13.9 (2,242.9) – Disposals (497.3) (24.4) (28.5) – – – (44.9) (16.6) – (611.7)Exchange differences – 0.2 – – – 1.5 0.5 0.1 – 2.3 At 31 March 2017 21,852.2 578.6 270.6 15.7 147.4 632.7 758.5 296.9 4,751.6 29,304.2
Accumulated depreciation and impairment lossesAt 1 April 2015 9,586.5 300.1 104.4 – 123.0 441.8 594.4 242.3 – 11,392.5 Depreciation 1,410.8 30.1 19.7 – 3.3 11.6 49.0 18.5 – 1,543.0 Impairment losses 19.9 1.7 – – – – 0.7 – – 22.3 Transfers (21.6) – 18.9 – – – 2.7 – – – Reclassification to assets held for sale (80.5) – – – – – – – – (80.5)Disposals (948.8) (8.1) (29.4) – – – (139.2) (7.4) – (1,132.9)Disposal of a subsidiary company – – – – – – (2.6) (0.6) – (3.2)Exchange differences – (0.1) – – – (0.2) (0.6) (0.1) – (1.0)At 31 March 2016 9,966.3 323.7 113.6 – 126.3 453.2 504.4 252.7 – 11,740.2 Depreciation 1,408.6 26.1 23.9 – 3.3 12.1 59.8 18.3 – 1,552.1 Impairment losses 21.2 3.9 – – – – – – – 25.1 Transfers (13.6) (0.1) 13.6 – – – 0.1 – – – Disposals (359.4) (7.6) (21.4) – – – (43.4) (15.3) – (447.1)Exchange differences – 0.2 – – – 0.2 0.2 – – 0.6 At 31 March 2017 11,023.1 346.2 129.7 – 129.6 465.5 521.1 255.7 – 12,870.9
Net book valueAt 31 March 2016 10,106.2 254.1 150.4 15.7 21.1 157.8 234.2 36.1 3,167.9 14,143.5 At 31 March 2017 10,829.1 232.4 140.9 15.7 17.8 167.2 237.4 41.2 4,751.6 16,433.3
Annual Report FY2016/17 155
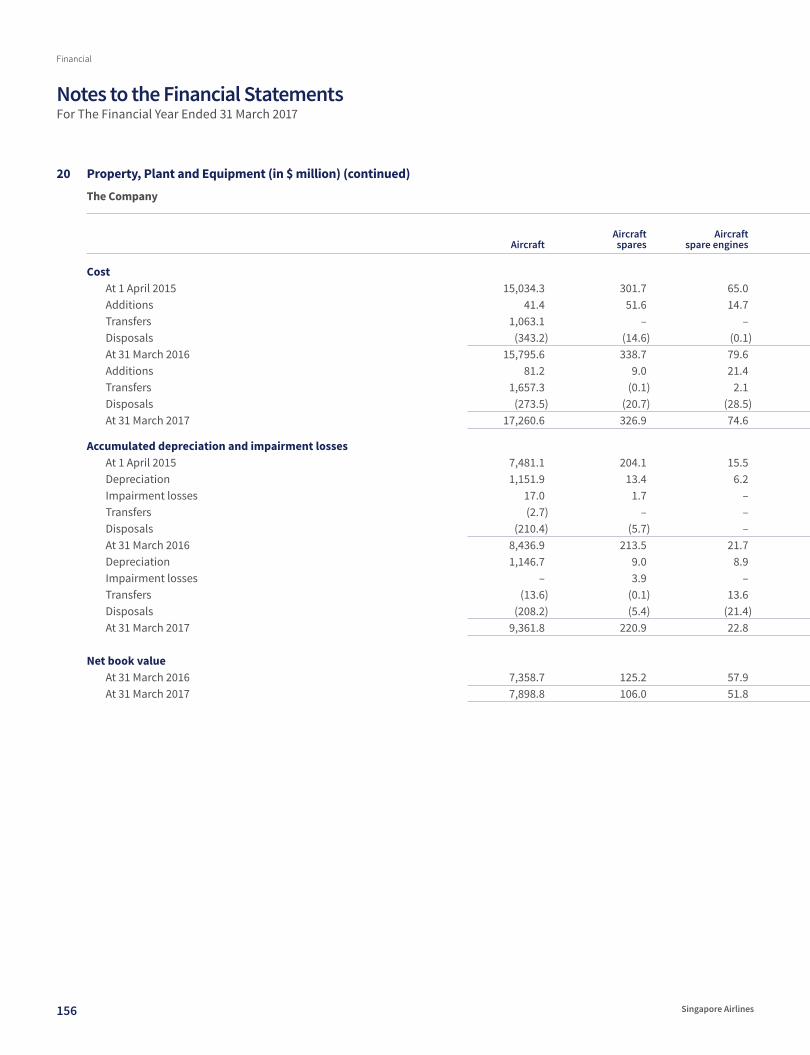
Notes to the Financial StatementsFor The Financial Year Ended 31 March 2017
20 Property, Plant and Equipment (in $ million) (continued)
The Company
AircraftAircraftspares
Aircraftspare engines
Freeholdland
Freeholdbuildings
Leasehold landand buildings
Plant andequipment
Office andcomputer
equipment
Advance andprogress
payments Total
CostAt 1 April 2015 15,034.3 301.7 65.0 15.7 147.4 332.3 540.1 217.0 1,910.3 18,563.8 Additions 41.4 51.6 14.7 – – – 23.2 13.2 1,595.1 1,739.2 Transfers 1,063.1 – – – – – – – (1,063.1) – Disposals (343.2) (14.6) (0.1) – – – (137.2) (6.8) – (501.9)At 31 March 2016 15,795.6 338.7 79.6 15.7 147.4 332.3 426.1 223.4 2,442.3 19,801.1 Additions 81.2 9.0 21.4 – – – 17.4 8.2 2,983.3 3,120.5 Transfers 1,657.3 (0.1) 2.1 – – – 0.1 – (1,659.4) – Disposals (273.5) (20.7) (28.5) – – – (19.0) (10.1) – (351.8)At 31 March 2017 17,260.6 326.9 74.6 15.7 147.4 332.3 424.6 221.5 3,766.2 22,569.8
Accumulated depreciation and impairment lossesAt 1 April 2015 7,481.1 204.1 15.5 – 123.0 312.5 323.6 197.6 – 8,657.4 Depreciation 1,151.9 13.4 6.2 – 3.3 1.9 33.2 12.3 – 1,222.2 Impairment losses 17.0 1.7 – – – – – – – 18.7 Transfers (2.7) – – – – – 2.7 – – – Disposals (210.4) (5.7) – – – – (115.5) (6.8) – (338.4)At 31 March 2016 8,436.9 213.5 21.7 – 126.3 314.4 244.0 203.1 – 9,559.9 Depreciation 1,146.7 9.0 8.9 – 3.3 1.8 40.0 9.6 – 1,219.3 Impairment losses – 3.9 – – – – – – – 3.9 Transfers (13.6) (0.1) 13.6 – – – 0.1 – – – Disposals (208.2) (5.4) (21.4) – – – (19.0) (10.1) – (264.1)At 31 March 2017 9,361.8 220.9 22.8 – 129.6 316.2 265.1 202.6 – 10,519.0
Net book valueAt 31 March 2016 7,358.7 125.2 57.9 15.7 21.1 17.9 182.1 20.3 2,442.3 10,241.2 At 31 March 2017 7,898.8 106.0 51.8 15.7 17.8 16.1 159.5 18.9 3,766.2 12,050.8
Singapore Airlines156
Financial

20 Property, Plant and Equipment (in $ million) (continued)
The Company
AircraftAircraftspares
Aircraftspare engines
Freeholdland
Freeholdbuildings
Leasehold landand buildings
Plant andequipment
Office andcomputer
equipment
Advance andprogress
payments Total
CostAt 1 April 2015 15,034.3 301.7 65.0 15.7 147.4 332.3 540.1 217.0 1,910.3 18,563.8 Additions 41.4 51.6 14.7 – – – 23.2 13.2 1,595.1 1,739.2 Transfers 1,063.1 – – – – – – – (1,063.1) – Disposals (343.2) (14.6) (0.1) – – – (137.2) (6.8) – (501.9)At 31 March 2016 15,795.6 338.7 79.6 15.7 147.4 332.3 426.1 223.4 2,442.3 19,801.1 Additions 81.2 9.0 21.4 – – – 17.4 8.2 2,983.3 3,120.5 Transfers 1,657.3 (0.1) 2.1 – – – 0.1 – (1,659.4) – Disposals (273.5) (20.7) (28.5) – – – (19.0) (10.1) – (351.8)At 31 March 2017 17,260.6 326.9 74.6 15.7 147.4 332.3 424.6 221.5 3,766.2 22,569.8
Accumulated depreciation and impairment lossesAt 1 April 2015 7,481.1 204.1 15.5 – 123.0 312.5 323.6 197.6 – 8,657.4 Depreciation 1,151.9 13.4 6.2 – 3.3 1.9 33.2 12.3 – 1,222.2 Impairment losses 17.0 1.7 – – – – – – – 18.7 Transfers (2.7) – – – – – 2.7 – – – Disposals (210.4) (5.7) – – – – (115.5) (6.8) – (338.4)At 31 March 2016 8,436.9 213.5 21.7 – 126.3 314.4 244.0 203.1 – 9,559.9 Depreciation 1,146.7 9.0 8.9 – 3.3 1.8 40.0 9.6 – 1,219.3 Impairment losses – 3.9 – – – – – – – 3.9 Transfers (13.6) (0.1) 13.6 – – – 0.1 – – – Disposals (208.2) (5.4) (21.4) – – – (19.0) (10.1) – (264.1)At 31 March 2017 9,361.8 220.9 22.8 – 129.6 316.2 265.1 202.6 – 10,519.0
Net book valueAt 31 March 2016 7,358.7 125.2 57.9 15.7 21.1 17.9 182.1 20.3 2,442.3 10,241.2 At 31 March 2017 7,898.8 106.0 51.8 15.7 17.8 16.1 159.5 18.9 3,766.2 12,050.8
Annual Report FY2016/17 157

Notes to the Financial StatementsFor The Financial Year Ended 31 March 2017
20 Property, Plant and Equipment (in $ million) (continued)
Assets held under finance leases
The Group31 March
2017 2016
Net book value of property, plant and equipment acquired under finance leases: - aircraft 265.3 613.2 - plant and equipment 0.1 0.1
265.4 613.3
Assets held as security
SilkAir (Singapore) Private Limited’s (“SilkAir”) spare engines with carrying amounts of $25.9 million (2016: $27.6 million) are pledged as security for the amounts owed to the original equipment manufacturer and service credits issued to SilkAir.
Impairment of aircraft
In the financial year ended 31 March 2017, an impairment loss of $21.2 million (FY2015/16: $11.7 million) was recognised on two Boeing 777-200 (FY2015/16: four Boeing 777-200ER) aircraft that were removed from the operating fleet. The recoverable amount was based on the estimated disposal value. This amount was recognised as a non-operating item (Note 9). The estimated disposal value was classified as Level 3 under the fair value hierarchy.
Impairment of engines
In the previous financial year, an impairment loss of $8.2 million was recognised on two engines damaged beyond economic repair.
Reclassification to assets held for sale
In the previous financial year, seven aircraft were classified as held for sale as a subsidiary company had decided to sell these aircraft. The sale was expected to be completed within one year. The Group recognised a loss on planned disposal of aircraft of $38.0 million as a non-operating item (Note 9). The estimated disposal value of the aircraft was classified as Level 3 under the fair value hierarchy. The seven aircraft were disposed during the year.
The Group31 March
2017 2016
Balance as at 1 April 241.5 71.0 Transfer from property, plant and equipment – 205.6 Loss on planned disposal of aircraft – (38.0)Disposal during the year (241.5) – Others – 2.9
– 241.5
Singapore Airlines158
Financial

21 Intangible Assets (in $ million)
The Group
Goodwill Brand Trademarks
Computer software
and others
Deferred engine
developmentcost
Advance and progress
payments Total
CostAt 1 April 2015 163.8 75.9 25.0 523.5 56.7 10.7 855.6 Additions 6.6 – – 10.4 2.6 32.5 52.1 Disposals – – – (6.4) – – (6.4)Transfers – – – 32.7 – (32.7) – Exchange differences – – – – (1.1) – (1.1)At 31 March 2016 170.4 75.9 25.0 560.2 58.2 10.5 900.2 Additions – – – 12.5 1.6 30.4 44.5 Disposals – – – (1.4) (3.1) – (4.5)Transfers – – – 27.2 – (27.2) – Exchange differences – – – – 2.1 – 2.1 At 31 March 2017 170.4 75.9 25.0 598.5 58.8 13.7 942.3
Accumulated amortisation and impairment lossesAt 1 April 2015 – – – 358.0 – – 358.0 Amortisation – – 1.6 31.1 – – 32.7 Disposals – – – (6.3) – – (6.3)At 31 March 2016 – – 1.6 382.8 – – 384.4 Amortisation – – 1.1 35.4 3.3 – 39.8 Impairment losses – 75.9 22.3 – – – 98.2 Disposals – – – (0.7) (2.9) – (3.6)At 31 March 2017 – 75.9 25.0 417.5 0.4 – 518.8
Net book valueAt 31 March 2016 170.4 75.9 23.4 177.4 58.2 10.5 515.8 At 31 March 2017 170.4 – – 181.0 58.4 13.7 423.5
Annual Report FY2016/17 159

Notes to the Financial StatementsFor The Financial Year Ended 31 March 2017
21 Intangible Assets (in $ million) (continued)
The Company
Computersoftware and
others
Advance andprogress
payments Total
CostAt 1 April 2015 437.4 8.4 445.8 Additions 8.9 24.1 33.0 Transfers 27.4 (27.4) – Disposals (5.4) – (5.4)At 31 March 2016 468.3 5.1 473.4 Additions 9.7 20.7 30.4 Transfers 17.5 (17.5) – At 31 March 2017 495.5 8.3 503.8
Accumulated amortisationAt 1 April 2015 286.4 – 286.4 Amortisation 25.4 – 25.4 Disposals (5.4) – (5.4)At 31 March 2016 306.4 – 306.4 Amortisation 27.9 – 27.9 At 31 March 2017 334.3 – 334.3
Net book valueAt 31 March 2016 161.9 5.1 167.0 At 31 March 2017 161.2 8.3 169.5
Impairment testing of goodwill, brand and trademarks
The goodwill and brand acquired through the acquisition of Tiger Airways have indefinite useful lives. During the financial year ended 31 March 2016, Tiger Airways was identified as a single CGU for impairment testing purposes. In line with Management’s multi-brand strategy, the Group embarked on plans to integrate the operations of Tiger Airways and Scoot. This has resulted in the adoption of a single brand “Scoot” by both Tiger Airways and Scoot and for both airlines to operate under a single operating licence from the second half of 2017. As a consequence of the announcement to discontinue the use of the Tiger brand, there was a $75.9 million write-down for the brand and $22.3 million write-down for trademarks.
The integration activities which have taken place during the financial year ended 31 March 2017 have resulted in an increased interdependency of revenues between the two airlines. This has led to the combination of Tiger Airways and Scoot as the “Low-Cost Airlines” CGU.
The recoverable amount of the CGU has been determined based on value-in-use calculations using cash flow projections from financial forecasts approved by Management covering a five-year period. The post-tax discount rate applied to cash flow projections is 7.0% (2016: 6.8%) and the forecast long-term growth rate used to extrapolate the cash flow projections beyond the five-year period is 3.5% (2016: 2.5%).
Singapore Airlines160
Financial

21 Intangible Assets (in $ million) (continued)
Impairment testing of goodwill, brand and trademarks (continued)
The calculation of value-in-use for the CGU is most sensitive to the following assumptions:
• Post-tax discount rates – Discount rates represent the current market assessment of the risks specific to the CGU, regarding the time value of money and individual risks of the underlying assets which have not been incorporated in the cash flow estimates.
• Growth rate – The forecast long-term growth rate is based on published industry research and does not exceed the long-term average growth rate for the industry.
A reasonable change to the assumptions used by Management to determine the impairment required, particularly the discount rate and long-term growth rate, would not significantly affect the results.
22 Subsidiary Companies (in $ million)
The Company31 March
2017 2016
Investment in subsidiary companies 3,380.9 3,331.6 Accumulated impairment losses (52.7) (52.7)
3,328.2 3,278.9 Long-term loans to a subsidiary company 1,289.5 1,182.0 Accumulated impairment loss (7.6) –
4,610.1 4,460.9
During the financial year:
1. The Company acquired the remaining 4.5% interest in Tiger Airways, resulting in Tiger Airways becoming a wholly owned subsidiary. Further details are disclosed in Note 22(f).
2. SIAEC invested approximately $3.3 million in NexGen Network (2) Holding Pte Ltd, in accordance with an agreement.
3. SIAEC extended a loan to a subsidiary company which bears an effective interest ranging from 4.05% to 4.19% (2016: 4.77% to 4.94%) per annum. The loan is non-trade related, unsecured and repayable in two tranches by 31 March 2018 and 31 March 2020 respectively.
4. SIAEC invested approximately $7.1 million in SIA Engineering (Philippines) Corporation.
5. SIAEC incorporated a subsidiary, Heavy Maintenance Singapore Services Pte Ltd (“HMSS”) with Airbus S.A.S on 28 October 2016. SIAEC invested approximately $8.1 million in HMSS.
Annual Report FY2016/17 161

Notes to the Financial StatementsFor The Financial Year Ended 31 March 2017
22 Subsidiary Companies (in $ million) (continued)
(a) Composition of the Group
The subsidiary companies at 31 March are:
Principal activities
Country of incorporation and
place of business
Percentage of equity held by the Group
2017 2016
SIA Engineering Company Limited* Engineering services Singapore 77.7 77.6 Aircraft Maintenance Services
Australia Pty Ltd (1)**Provide aircraft maintenance services,
including technical and non-technical handling at the airport
Australia 77.7 77.6
NexGen Network (1) Holding Pte Ltd (1)* Investment holding Singapore 77.7 77.6 NexGen Network (2) Holding Pte Ltd (1)* Investment holding Singapore 77.7 77.6 SIA Engineering (USA), Inc. (1)@ Provide aircraft maintenance services,
including technical and non-technical handling at the airport
United States of America
77.7 77.6
SIAEC Global Pte Ltd (1)* Investment holding Singapore 77.7 77.6 Singapore Jamco Services Pte Ltd (1)* Maintenance, repair and overhaul of
aircraft and cabin components/systemSingapore 62.1 62.0
SIA Engineering (Philippines) Corporation (1)**
Provide airframe maintenance and component overhaul services
Philippines 50.5 50.4
Heavy Maintenance Singapore Services Pte Ltd (1)@@
Provide airframe maintenance and component overhaul services
Singapore 50.5 –
Aerospace Component Engineering Services Pte Limited (1) (2)*
Repair and overhaul of hydro-mechanical equipment for Boeing and Airbus aircraft
Singapore 39.6 39.6
Aviation Partnership (Philippines) Corporation (1) (2)**
Provide aircraft maintenance services including technical and non-technical handling at the airport
Philippines 39.6 39.6
Singapore Airlines Cargo Pte Ltd* Air cargo transportation Singapore 100.0 100.0 Cargo Community Network Pte Ltd (3)* Providing and marketing of cargo
community systemsSingapore 51.0 51.0
Cargo Community (Shanghai) Co. Ltd. (4)***+
Marketing and support of portal services for the air cargo industry
People’s Republic of
China
51.0 51.0
SilkAir (Singapore) Private Limited* Air transportation Singapore 100.0 100.0 Tradewinds Tours & Travel Private
Limited (5)*Tour wholesaling Singapore 100.0 100.0
Singapore Airlines162
Financial

22 Subsidiary Companies (in $ million) (continued)
Principal activities
Country of incorporation and
place of business
Percentage of equity held by the Group
2017 2016
Budget Aviation Holdings Pte. Ltd.* Investment holding Singapore 100.0 –Scoot Pte. Ltd. (6)* Air transportation Singapore 100.0 100.0Tiger Airways Holdings Limited (6)* Investment holding Singapore 100.0 95.5Tiger Airways Singapore Pte. Ltd. (7)* Air transportation Singapore 100.0 95.5Roar Aviation Pte. Ltd. (7)* Investment holding Singapore 100.0 95.5Roar Aviation II Pte. Ltd. (7)@@ Investment holding Singapore 100.0 95.5Roar Aviation III Pte. Ltd. (7)* Investment holding Singapore 100.0 95.5Simple Holidays Pte. Ltd. (7)* Reservation service activities Singapore 100.0 95.5Singapore Aviation and General
Insurance Company (Pte) Limited*Aviation insurance Singapore 100.0 100.0
Singapore Flying College Pte Ltd* Training of pilots Singapore 100.0 100.0Sing-Bi Funds Private Limited* Investment holding Singapore 100.0 100.0Singapore Airport Duty-Free
Emporium (Private) Limited*Inactive Singapore 76.0 76.0
SIA (Mauritius) Ltd@ Inactive Mauritius 100.0 100.0
(1) Held by SIA Engineering Company(2) The company is considered a subsidiary of the Group by virtue of the management control over financial and operating policies of the company(3) Held by Singapore Airlines Cargo Pte Ltd(4) Held by Cargo Community Network Pte Ltd(5) Held by SilkAir (Singapore) Private Limited(6) Held by Budget Aviation Holdings Pte. Ltd.(7) Held by Tiger Airways Holdings Limited
* Audited by KPMG LLP, Singapore
** Audited by member firms of KPMG International in the respective countries
*** Audited by Shanghai HDDY Certified Public Accountants Co., Ltd@ Not required to be audited under the law in country of incorporation@@ Not required to be audited in the current financial year+ Financial year end 31 December
Special purpose entities
Details of the operating SPEs controlled and consolidated by the Group at the end of financial year are as follows:
Name of entity Purpose of special purpose entity Country of incorporation
Winnie Aircraft Limited Financing of aircraft MauritiusFalcon Aircraft Limited Financing of aircraft Mauritius
The SPEs are held by Tiger Airways Holdings Limited and are audited by Ernst & Young LLP, Mauritius.
Although the Group does not hold shares in these companies, they are considered subsidiary companies as the activities of the SPEs are being conducted on behalf of the Group according to its specific business needs and the Group retains the majority of the residual or ownership risks related to the assets held by these SPEs. These SPEs were incorporated for the sole purpose of financing of the Group’s aircraft (Note 18).
Annual Report FY2016/17 163

Notes to the Financial StatementsFor The Financial Year Ended 31 March 2017
22 Subsidiary Companies (in $ million) (continued)
(b) Interest in subsidiary company with material non-controlling interests (“NCI”)
The Group has the following subsidiary company that has NCI that are material to the Group:
SIA Engineering Company Group of Companies
2017 2016
Proportion of ownership interest held by NCI 22.3% 22.4%
Profit allocated to NCI during the reporting period 79.6 43.9
Accumulated NCI at the end of reporting period 381.2 359.8
Dividends paid to NCI 36.2 40.7
(c) Summarised financial information about subsidiary company with material NCI
Summarised financial information before intercompany eliminations of the subsidiary company with material non-controlling interests are as follows:
Summarised balance sheet
SIA Engineering Company Group of Companies
31 March2017 2016
CurrentAssets 979.4 926.2 Liabilities (279.4) (256.1)Net current assets 700.0 670.1
Non-currentAssets 939.0 895.8 Liabilities (51.0) (54.0)Net non-current assets 888.0 841.8
Net assets 1,588.0 1,511.9
(d) Summarised statement of comprehensive income
SIA Engineering Company Group of Companies
FY2016/17 FY2015/16
Revenue 1,104.1 1,113.5
Profit before tax 355.1 200.3 Taxation (17.9) (20.8)Profit after tax 337.2 179.5 Other comprehensive income (123.7) 148.5 Total comprehensive income 213.5 328.0
Singapore Airlines164
Financial

22 Subsidiary Companies (in $ million) (continued)
(e) Other summarised information
SIA Engineering Company Group of Companies
FY2016/17 FY2015/16
Net cash flow from operations 131.8 77.1
Acquisition of significant property, plant and equipment (38.2) (40.9)
(f) Changes in ownership interests in subsidiary companies
Acquisition of non-controlling interests without a change in control
FY2016/17
During the year, the Group acquired the remaining 4.5% interests in Tiger Airways via the following:
• 4.4% for cash consideration of $49.3 million and option to subscribe for the Company's shares; and• 0.1% for cash consideration of $1.9 million ($1.07 per Perpetual Convertible Capital Securities (“PCCS”)) held by the non-
controlling interests.
FY2015/16
The Company announced on 6 November 2015 a Voluntary Conditional General Offer (the “Offer”) for the shares in Tiger Airways that the Company did not already own for a consideration comprising $0.41 per Tiger Airways’ share (the “Offer Price”) and options to subscribe for the Company’s shares. On 4 January 2016, the Offer Price was revised to $0.45 per share (the “Final Offer Price”). On 11 January 2016, the Company declared the Offer unconditional. Shareholders who accepted the Offer were paid the Final Offer Price of $0.45 per share.
As a result of the Offer, the Group granted 44,412,941 equity-settled share-based payment options with contractual lives ranging from 38 days to 89 days from the vesting date. An amount of $19.2 million in relation to the valuation of the option to subscribe was recorded in the share-based compensation reserve (Note 15).
Financial effects
The following summarises the effect of the changes in the Group’s ownership interests in Tiger Airways on the equity attributable to owners of the Company.
31 March2017 2016
Consideration paid for acquisition of non-controlling interests 51.2 458.5 Decrease in equity attributable to non-controlling interests (12.9) (124.0)Decrease in equity attributable to owners of the Company 38.3 334.5
Annual Report FY2016/17 165

Notes to the Financial StatementsFor The Financial Year Ended 31 March 2017
23 Associated Companies (in $ million)
The Group31 March
The Company31 March
2017 2016 2017 2016
Investment in associated companies 1,068.8 913.8 766.2 540.9 Accumulated impairment losses (11.9) (11.9) (9.4) (9.4)
1,056.9 901.9 756.8 531.5
During the financial year:
1. The Company injected $40.1 million in TATA SIA Airlines Limited (“TATA-SIA”). There was no change in the Group’s 49% equity stake in TATA-SIA after the capital injection.
2. Following VAH’s share placements to HNA Aviation Group and 1:1 rights issue to all shareholders, which the Company subscribed to for $185.2 million, the Company’s ownership interest in VAH reduced from 23.1% to 20.0%. The dilution in interest resulted in a gain of $9.7 million being recognised in profit or loss.
3. Ritz-Carlton, Millenia Singapore Properties Private Limited recorded a revaluation gain of $32.6 million from its annual revaluation exercise of its land and building. The Group’s share of the revaluation gain of $6.5 million as at 31 March 2017 is included under the share of post-acquisition capital reserve.
4. Scoot Pte. Ltd. disposed 337,500 shares in Air Black Box Asia Pacific Pte. Ltd. (“Air Black Box”) to ANA Holdings, Inc. (“ANA”) and Cebu Air, Inc. (“Cebu”). Simultaneously, Air Black Box issued 1,350,000 shares to ANA and Cebu. These transactions have resulted in a reduction of equity interest in Air Black Box from 25% to 15%. The partial disposal resulted in a gain of $0.1 million being recognised in profit or loss.
5. On 1 November 2016, Component Aerospace Singapore Pte Ltd (“CAS”) acquired the business and certain assets of International Aerospace Tubes-Asia Pte Ltd (“IAT-A”) for a cash consideration of approximately US$14.3 million. Both CAS and IAT-A are joint ventures with Pratt & Whitney (“P&W”). The Group has adopted book value accounting in accounting this transaction, consistent with its policy for common control transactions. There is no financial impact to the Group.
6. SIAEC sold 2.575% of its interest in CAS to P&W for a total cash consideration of approximately $3.8 million. SIAEC’s residual interest in the shares of CAS is 46.425% with the remaining 53.575% held by P&W. The gain on sale of the investment at the Group level is approximately $2.3 million.
7. On 5 July 2016, Messier Services Asia Private Limited was renamed to Safran Landing Systems Services Singapore Private Limited.
8. On 7 December 2016, Safran Electronics Asia Pte. Ltd. was renamed to Safran Electronics & Defense Services Asia Pte. Ltd..
Singapore Airlines166
Financial

23 Associated Companies (in $ million) (continued)
The associated companies at 31 March are:
Country of incorporation and
place of business
Percentage of equity held by the Group
Principal activities 2017 2016
TATA SIA Airlines Limited (a) Domestic and international full-service scheduled passenger airlines services
India 49.0 49.0
Airbus Asia Training Centre Pte. Ltd.+++(b) Flight training services Singapore 45.0 45.0 Ritz-Carlton, Millenia Singapore
Properties Private Limited+++^Hotel ownership and management Singapore 20.0 20.0
Virgin Australia Holdings Limited +** Air transportation Australia 20.0 23.1 Eagle Services Asia Private Limited (1)+++^ Repair and overhaul of aircraft engines Singapore 38.0 38.0 Fuel Accessory Service Technologies
Pte Ltd(1)++^Repair and overhaul of engine fuel components
and accessoriesSingapore 38.0 38.0
PT JAS Aero-Engineering Services (1)+++(e) Provide aircraft maintenance services, including technical and non-technical handling at the airport
Indonesia 38.0 38.0
Southern Airports Aircraft Maintenance Services Company Limited (1)+++(a)
Provide aircraft maintenance services, including technical and non-technical handling at the airport
Vietnam 38.0 38.0
Boeing Asia Pacific Aviation Services Pte Ltd (1)+++(a)
Provide engineering, material management and fleet support solutions
Singapore 38.0 38.0
Pan Asia Pacific Aviation Services Ltd (1)(d) Provide aircraft maintenance services, including technical and non-technical handling at the airport
Hong Kong 36.6 36.5
Component Aerospace Singapore Pte Ltd (1)++^
Repair and overhaul of aircraft engine combustion chambers, guides, fuel nozzles and related parts
Singapore 36.0 38.0
JAMCO Aero Design & Engineering Pte Ltd (1)(f)
Providing turnkey solutions for aircraft interior modifications
Singapore 34.9 34.9
Panasonic Avionics Services Singapore Pte. Ltd. (1)*
IFE maintenance, repair & overhaul and ancillary services
Singapore 33.0 33.0
Safran Electronics & Defense Asia Services Pte. Ltd. (Previously known as: Safran Electronics Asia Pte Ltd) (1)+++(a)
Provide avionics maintenance, repair and overhaul services
Singapore 31.1 31.0
Goodrich Aerostructures Service Center-Asia Pte Ltd (1)+++^
Repair and overhaul of aircraft nacelles, thrust reservers and pylons
Singapore 31.1 31.0
Annual Report FY2016/17 167

Notes to the Financial StatementsFor The Financial Year Ended 31 March 2017
23 Associated Companies (in $ million) (continued)
Country of incorporation and
place of business
Percentage of equity held by the Group
Principal activities 2017 2016
Safran Landing Systems Services Singapore Private Limited (Previously known as: Messier Services Asia Private Limited) (1)+++(b)
Repair and overhaul of Boeing and Airbus series landing gears
Singapore 31.1 31.0
Asian Surface Technologies Pte Ltd (1)+++(c) Repair and overhaul of aircraft engine fan blades
Singapore 30.4 30.4
International Aerospace Tubes-Asia Pte Ltd (1)+++^
Repair of tubes, ducts and manifolds for aircraft engines and airframe application
Singapore 25.9 25.9
Asian Compressor Technology Services Co Ltd (1)+++^^@
Repair and overhaul of aircraft engine high pressure compressor stators
Taiwan 19.0 19.0
Turbine Coating Services Private Limited (1)++^@ Repair and overhaul of aircraft engine turbine airfoils
Singapore 19.0 19.0
Jamco Singapore Pte Ltd (1)(f)@ Manufacturing aircraft cabin equipment and refurbishment of aircraft galleys
Singapore 15.5 15.5
Air Black Box Asia Pacific Pte. Ltd. (2)+++(g)@@ Provision of support services to air transportation Singapore 15.0 25.0
(1) Held by SIA Engineering Company (2) Held by Scoot Pte. Ltd.
* Audited by KPMG LLP, Singapore
** Audited by member firms of KPMG International ^ Audited by Pricewaterhouse Coopers LLP, Singapore ^^ Audited by member firms of Pricewaterhouse Coopers (a) Audited by member firms of Deloitte & Touche (b) Audited by Ernst & Young LLP, Singapore (c) Audited by RSM Chio Lim, Singapore (d) Audited by BDO Limited, Hong Kong (e) Audited by RSM AAJ, Indonesia (f) Audited by Foo Kon Tan LLP (g) Audited by Wong, Lee & Associates LLP + Financial year end 30 June ++ Financial year end 30 November +++ Financial year end 31 December @ The Group has significant influence in these entities through its holdings in SIAEC @@ The Group has significant influence by virtue of the board representation
The carrying amounts of the investment in associated companies are as follows:
The Group31 March
2017 2016
Virgin Australia Holdings Limited (“VAH”) 490.1 354.2 Eagle Services Asia Private Limited (“ESA”) 164.8 146.1 Other associated companies 402.0 401.6
1,056.9 901.9
The activities of the associated companies are strategic to the Group’s activities.
Singapore Airlines168
Financial

23 Associated Companies (in $ million) (continued)
The Group has two (2016: two) associated companies that are material and a number of associated companies that are individually immaterial to the Group. All are equity accounted. The following summarises the financial information of each of the Group’s material associated companies based on their respective (consolidated) financial statements prepared in accordance with FRS, modified for fair value adjustments on acquisitions and differences in the Group’s accounting policies.
Summarised statement of financial position
VAH31 March
ESA31 March
2017 2016 2017 2016
Current assets 1,912.3 1,624.7 296.9 290.3 Non-current assets 4,813.1 4,493.1 52.4 47.8 Total assets 6,725.4 6,117.8 349.3 338.1
Current liabilities (2,205.0) (2,656.9) (10.1) (38.1)Non-current liabilities (2,692.8) (2,527.9) (2.9) (1.9)Total liabilities (4,897.8) (5,184.8) (13.0) (40.0)
Net assets 1,827.6 933.0 336.3 298.1
Summarised statement of comprehensive income
VAH ESAFY2016/17 FY2015/16 FY2016/17 FY2015/16
(Loss)/Profit after tax (373.7) (105.5) 46.6 19.8 Other comprehensive income 69.5 (75.9) – – Total comprehensive income (304.2) (181.4) 46.6 19.8
A reconciliation of the summarised financial information to the carrying amounts of VAH and ESA is as follows:
The Group31 March
2017 2016
VAHGroup's share of net assets 369.8 229.6 Goodwill on acquisition 117.1 120.8 Other adjustments 3.2 3.8
490.1 354.2
ESAGroup's share of net assets 164.8 146.1
Annual Report FY2016/17 169

Notes to the Financial StatementsFor The Financial Year Ended 31 March 2017
23 Associated Companies (in $ million) (continued)
Dividends of approximately $8.9 million (FY2015/16: $6.9 million) were received from ESA during the financial year.
The fair value of the Group’s ownership interest in VAH, which is determined based on its quoted market price and the value of other contractual arrangements exceeds its carrying amount. The fair value is classified as Level 2 under the fair value hierarchy.
Aggregate information about the Group’s share of the results of the associated companies that are not individually material is as follows:
Summarised statement of comprehensive income
Immaterial associatesFY2016/17 FY2015/16
(Loss)/Profit after tax (5.4) 3.6 Other comprehensive income 6.5 – Total comprehensive income 1.1 3.6
24 Joint Venture Companies (in $ million)
The Group31 March
2017 2016
Investment in joint venture companies 160.2 156.3
During the year, SIAEC divested its 50.0% shareholding in International Engine Component Overhaul Pte Ltd (“IECO”) to Singapore Aero Engine Services Pte Ltd (“SAESL”) on 18 July 2016. Subsequently on 2 October 2016, Rolls-Royce and SIAEC amalgamated the business and operations of IECO and SAESL into a single entity (with SAESL being the surviving entity post amalgamation), enabling them to compete more effectively for the global engine and component repair business.
The joint venture companies at 31 March are:
Country of incorporation and
place of business
Percentage of equity held by the Group
Principal activities 2017 2016
International Engine Component Overhaul Pte Ltd (1)
Repair and overhaul of aero engine components and parts
Singapore – 38.8
Singapore Aero Engine Services Pte Ltd (1) Repair and overhaul of aircraft engines Singapore 38.8 38.8 NokScoot Airlines Co., Ltd (2) Air transportation Thailand 49.0 49.0
(1) Held by SIA Engineering Company, audited by Ernst & Young LLP, Singapore, and financial year end of 31 December.(2) Held by Scoot, audited by Deloitte & Touche, Thailand, and financial year end of 31 December.
The Group jointly controls all the joint venture companies with other partners under contractual agreements that require unanimous consent for all major decisions over the relevant activities; they are all equity accounted.
Singapore Airlines170
Financial

24 Joint Venture Companies (in $ million) (continued)
The carrying amounts of the investments are as follows:
The Group31 March
2017 2016
Singapore Aero Engine Services Pte Ltd 162.0 136.0 Other joint venture companies (1.8) 20.3
160.2 156.3
The activities of SAESL are strategic to the Group’s activities.
Dividends of approximately $22.8 million (FY2015/16: $33.9 million) were received from SAESL during the financial year.
Summarised financial information in respect of SAESL, which is material to the Group, is as follows:
Summarised statement of financial position
SAESL31 March
2017 2016
Cash and short-term deposits 22.2 31.2 Other current assets 509.9 544.3 Total current assets 532.1 575.5 Non-current assets 282.7 251.3 Total assets 814.8 826.8
Current liabilities (384.6) (432.8)Non-current liabilities (106.2) (122.0)Total liabilities (490.8) (554.8)
Net assets 324.0 272.0
Summarised statement of comprehensive income
SAESLFY2016/17 FY2015/16
Revenue 1,578.5 1,326.3 Depreciation and amortisation (21.3) (12.6)Interest income 0.1 0.1 Interest expense (3.1) (1.6)
Profit before tax 62.1 82.2 Taxation (0.3) (0.2)Profit after tax 61.8 82.0 Other comprehensive income 1.7 10.7 Total comprehensive income 63.5 92.7
Annual Report FY2016/17 171

Notes to the Financial StatementsFor The Financial Year Ended 31 March 2017
24 Joint Venture Companies (in $ million) (continued)
The summarised financial information presented is extracted from the financial statements of SAESL prepared in accordance with FRS.
Aggregate information about the Group’s investment in the other joint venture companies that are not individually material is as follows:
The Group’s share of the assets and liabilities comprises:
The Group31 March
2017 2016
Assets and liabilitiesCurrent assets 54.7 43.0 Non-current assets 0.8 10.4
55.5 53.4 Current liabilities (57.0) (32.5)Non-current liabilities (0.3) (0.6)
(1.8) 20.3
The Group’s share of the results is as follows:
The GroupFY2016/17 FY2015/16
ResultsLoss after tax (10.0) (18.2)Other comprehensive income – 1.2 Total comprehensive income (10.0) (17.0)
Singapore Airlines172
Financial

25 Long-Term Investments (in $ million)
The Group31 March
The Company31 March
2017 2016 2017 2016
Quoted Non-equity investments 138.7 528.0 138.7 528.0
Unquoted Non-equity investments 221.9 215.7 221.9 215.7 Equity investments 45.1 29.4 34.7 10.7
405.7 773.1 395.3 754.4
The Group’s non-equity investments comprised investments in corporate bonds, certificates of deposits and investment funds.
The interest rates for quoted and unquoted non-equity investments range from 2.37% to 3.80% (FY2015/16: 1.30% to 3.96%) per annum and 1.00% to 4.46% (FY2015/16: 1.00% to 4.08%) per annum respectively.
Reclassification to assets held for sale
In the previous financial year, the Group entered into a conditional sale and purchase agreement with Rolls-Royce Overseas Holdings Limited and Hong Kong Aircraft Engineering Company Limited to divest its 10% stake in Hong Kong Aero Engine Services Limited (“HAESL”). The Group remeasured its investment in HAESL to its fair value of approximately $156.5 million, and recognised a gain of approximately $141.9 million in other comprehensive income. In accordance with FRS 105 Non-current Assets Held for Sale and Discontinued Operations, the Group’s equity interest in HAESL was reclassified from long-term investments to assets held for sale. The equity interest in HAESL is classified as Level 2 under the fair value hierarchy.
During the financial year, the Group completed the disposal. Proceeds of $156.6 million that were received resulted in a surplus on disposal of $141.6 million recognised in other non-operating items (Note 9) arising from the realisation of the $141.9 million gain previously recognised in other comprehensive income.
26 Other Long-Term Assets (in $ million)
The Group31 March
The Company31 March
2017 2016 2017 2016
Deposit – 28.6 – – Other receivables 435.7 460.8 354.3 391.3 Derivative assets 43.6 7.4 43.6 7.4
479.3 496.8 397.9 398.7
In the previous financial year, the deposit was held for the purpose of payment for the purchase price option payable on a finance lease (Note 18).
The Group’s other receivables are stated at amortised cost and are expected to be received over a period of two to 10 years.
Annual Report FY2016/17 173

Notes to the Financial StatementsFor The Financial Year Ended 31 March 2017
27 Inventories (in $ million)
The Group31 March
The Company31 March
2017 2016 2017 2016
Technical stocks and stores 160.1 154.2 94.6 88.6 Catering and general stocks 18.3 27.7 11.5 19.6 Total inventories at lower of cost and net realisable value 178.4 181.9 106.1 108.2
The cost of inventories recognised as an expense amounted to $109.9 million (FY2015/16: $118.8 million). In addition, the Group wrote down $5.8 million (FY2015/16: $26.6 million) of inventories, which is recognised as other operating expenses in the profit and loss account.
28 Trade Debtors (in $ million)
The Group31 March
The Company31 March
2017 2016 2017 2016
Trade debtors 1,075.0 1,137.8 694.7 798.9 Accrued receivables 43.9 61.9 – – Amounts owing by associated companies 9.0 9.1 – 0.5 Amounts owing by joint venture companies 16.7 13.0 – –
1,144.6 1,221.8 694.7 799.4
Amounts owing by subsidiary companies – – 203.8 318.0 Loan receivable from an associated company – 62.0 – 62.0
– 62.0 203.8 380.0
1,144.6 1,283.8 898.5 1,179.4
Trade debtors are non-interest bearing. The carrying amount of trade debtors impaired by credit losses is reduced through the use of an allowance account unless the Group writes off the amount ascertained to be uncollectible. In subsequent periods when a trade debtor is ascertained to be uncollectible, it is written off against the allowance account.
Significant financial difficulties of the debtor, probability that the debtor will enter bankruptcy or financial reorganisation, and default or delinquency in payments (more than 90 days aging of debtor balances) are considered indicators that the trade debtor is impaired. Individual trade debtor is written off when Management deems the amount not to be collectible.
Accrued receivables pertain to services rendered which have not been billed.
Amounts owing by subsidiary, associated and joint venture companies are unsecured, trade-related, non-interest bearing and are repayable on demand. The amounts are neither overdue nor impaired.
The interest on a short-term loan to an associated company was computed using Bank Bill Swap Bid Rate plus an agreed margin. The loan was denominated in AUD and the interest rate was 10.345% per annum. The carrying amount of the loan approximated fair value as interest rates on the loan approximated market interest rates. The short-term loan to an associated company has been repaid during the year.
Singapore Airlines174
Financial

28 Trade Debtors (in $ million) (continued)
The table below is an analysis of trade debtors as at 31 March:
The Group31 March
The Company31 March
2017 2016 2017 2016
Not past due and not impaired 1,013.3 1,186.9 868.4 1,174.1 Past due but not impaired 128.7 95.7 27.2 4.8
1,142.0 1,282.6 895.6 1,178.9
Impaired trade debtors - collectively assessed 5.2 5.3 3.4 0.4 Less: Accumulated impairment losses (2.6) (5.1) (0.5) –
2.6 0.2 2.9 0.4
Impaired trade debtors - individually assessedCustomers in bankruptcy or other financial reorganisation 2.6 5.0 – 0.1 Customers who default in payment within stipulated framework
of IATA Clearing House or Bank Settlement Plan 1.4 1.9 1.4 2.0 Less: Accumulated impairment losses (4.0) (5.9) (1.4) (2.0)
– 1.0 – 0.1
Total trade debtors, net 1,144.6 1,283.8 898.5 1,179.4
Included in trade and other debtors are amounts owing by related parties of $8.4 million (2016: $3.3 million) and $2.7 million (2016: $1.9 million) for the Group and Company respectively.
Trade debtors are stated after accumulated impairment losses. An analysis of the accumulated impairment losses is as follows:
The Group31 March
The Company31 March
2017 2016 2017 2016
Balance at 1 April 11.0 16.8 2.0 2.9 Written back during the year (1.3) (4.7) 0.5 (0.9)Written off during the year (2.7) (1.1) (0.6) – Impact of FRS 109 transferred to reserves (0.4) – – – Balance at 31 March 6.6 11.0 1.9 2.0
Bad debts written off directly to profit and loss account, net of debts recovered 0.4 1.1 0.5 0.8
As at 31 March 2017, the composition of trade debtors held in foreign currencies by the Group is as follows: USD – 13.0% (2016: 16.7%), AUD – 9.8% (2016: 13.7%), EUR – 6.5% (2016: 5.4%), GBP – 4.7% (2016: 4.1%) and JPY – 2.4% (2016: 2.0%).
Annual Report FY2016/17 175

Notes to the Financial StatementsFor The Financial Year Ended 31 March 2017
29 Deposits and Other Debtors (in $ million)
The Group31 March
The Company31 March
2017 2016 2017 2016
Deposits 50.3 66.7 8.2 8.5 Other debtors 77.1 48.1 47.6 35.0
127.4 114.8 55.8 43.5
Included in deposits is an amount of $34.2 million (2016: $50.8 million) placed with a financial institution for the purpose of payment due at the time of exercise of purchase option at the end of the 15th year of the lease period for one of the finance lease (Note 18). This deposit generates interest at a fixed rate of 5.68% (FY2015/16: 5.68%) per annum to meet the obligation at maturity of the lease in December 2017.
30 Investments (in $ million)
The Group31 March
The Company31 March
2017 2016 2017 2016
QuotedEquity investments 37.6 33.5 – – Non-equity investments 502.3 544.3 469.9 511.6
UnquotedNon-equity investments – 90.3 – 90.3
539.9 668.1 469.9 601.9
The Group’s non-equity investments comprised investments in government securities, corporate bonds, certificates of deposits and money market funds. These investments are held to manage the Group’s liquidity needs.
The interest rates for quoted non-equity investments range from 0.51% to 5.50% (FY2015/16: 1.12% to 5.25%) per annum.
Singapore Airlines176
Financial

31 Cash and Bank Balances (in $ million)
The Group31 March
The Company31 March
2017 2016 2017 2016
Fixed deposits 2,386.9 3,002.7 2,364.9 2,822.9 Cash and bank balances 993.6 969.7 368.3 416.3
3,380.5 3,972.4 2,733.2 3,239.2
As at 31 March 2017, the composition of cash and bank balances held in foreign currencies by the Group is as follows: USD – 39.4% (2016: 25.6%), EUR – 2.9% (2016: 4.3%) and AUD – 3.4% (2016: 1.6%).
Cash at bank earns interest at floating rates based on daily bank deposit rates ranging from 0.86% to 2.01% (FY2015/16: 0.43% to 2.76%) per annum. Short-term deposits are made for varying periods of between one day and one year depending on the immediate cash requirements of the Group, and earn interest at the respective short-term deposit rates. The weighted average effective interest rate for short-term deposits is 1.36% (FY2015/16: 1.45%) per annum.
32 Trade and Other Creditors (in $ million)
The Group31 March
The Company31 March
2017 2016 2017 2016
Trade creditors 3,234.1 2,844.8 2,248.6 2,192.4 Purchase option price payable to lessor 34.2 50.8 – – Amounts owing to associated companies 27.8 3.4 3.3 2.5
3,296.1 2,899.0 2,251.9 2,194.9
Funds from subsidiary companies – – 1,174.6 1,073.8 Amounts owing to subsidiary companies – – 179.9 117.3
– – 1,354.5 1,191.1
Trade and other creditors are non-interest bearing. As at 31 March 2017, 18.0% (2016: 18.7%) of trade and other creditors were held in USD by the Group. Included in trade and other creditors are amounts owing to related parties of $169.2 million (2016: $158.6 million) and $127.2 million (2016: $113.0 million) for the Group and Company respectively.
Funds from subsidiary companies are unsecured and have varying repayment terms. Interest on funds from subsidiary companies are computed using prevailing market rates which range from 0.20% to 1.20% (FY2015/16: 0.01% to 1.53%) per annum for SGD funds, and 0.87% to 1.20% (FY2015/16: 0.32% to 1.23%) per annum for USD funds.
As at 31 March 2017, 20.9% of the funds from subsidiary companies are denominated in USD (2016: USD 33.9%).
Amounts owing to related parties, subsidiary and associated companies are unsecured, trade-related, non-interest bearing and are repayable on demand.
Annual Report FY2016/17 177

Notes to the Financial StatementsFor The Financial Year Ended 31 March 2017
33 Analysis of Capital Expenditure Cash Flow (in $ million)
The GroupFY2016/17 FY2015/16
Purchase of property, plant and equipment 4,029.9 2,923.7 Property, plant and equipment acquired under credit terms (14.9) (14.7)Property, plant and equipment settled by credit notes (70.3) – Cash invested in capital expenditure 3,944.7 2,909.0
Purchase of intangible assets 44.5 52.1 Acquisition of goodwill – (6.6)Intangible assets acquired under credit terms (0.9) – Cash invested in purchase of intangible assets 43.6 45.5
34 Capital and Other Commitments (in $ million)
(a) Capital expenditure commitments
The Group and the Company have commitments for capital expenditure. Such commitments aggregated $21,021.9 million (2016: $23,688.6 million) for the Group and $15,293.5 million (2016: $16,961.0 million) for the Company. The commitments relate principally to the acquisition of aircraft fleet and related equipment.
In addition, the Group’s share of associated companies’ and joint venture companies’ commitments for capital expenditure totaled $4,137.6 million (2016: $4,367.2 million) and $6.0 million (2016: $6.2 million) respectively.
Singapore Airlines178
Financial

34 Capital and Other Commitments (in $ million) (continued)
(b) Operating lease commitments
As lessee
Aircraft
The Company has three B777-300ERs, 25 A330-300s and nine A380-800s under operating leases at fixed rental rates. In five of the A380 lease agreements, lease rentals will be adjusted if the one-month LIBOR exceeds 6.50% per annum. The original lease terms range from eight to 12 years.
For flexibility in fleet planning, most leases include extension options. The extension options provide for lease renewals up to a maximum of five years. In addition, there are 15 early termination options that allow termination of the leases up to two years prior to original lease expiry. Sub-leasing is allowed under all the lease arrangements.
SilkAir has three A319-100s, eight A320-200s, and nine B737-800s under operating leases with fixed rental rates. The original lease terms for the three A319-100s range from 6.9 to 11.5 years, and SilkAir holds options to extend the leases for up to a maximum of three years. The original lease terms for the eight A320-200s range from 6.6 to 11.8 years and SilkAir holds options to extend the leases for one to five years. The original lease terms for the nine B737-800s range from 9.8 to 10.5 years, and SilkAir holds options to extend the leases for up to a maximum of four years. Sub-leasing is allowed under all the lease arrangements.
Budget Aviation Holdings (“BAH”) Group has 31 A320-200s and two A319s under operating leases. The original lease terms on the aircraft are for 12 years. Sub-leasing is allowed under all the lease arrangements, subject to certain terms and conditions stated in the agreements.
Future minimum lease payments under non-cancellable operating leases are as follows:
The Group31 March
The Company31 March
2017 2016 2017 2016
Not later than one year 775.5 820.1 549.3 609.4 Later than one year but not later than five years 2,228.3 2,438.5 1,348.9 1,554.5 Later than five years 859.5 1,289.7 383.6 631.7
3,863.3 4,548.3 2,281.8 2,795.6
Engines
The Company has operating lease agreements for four GE90-115B engines and nine Trent 800 engines with fixed rental rates. The basic lease term for each engine varies from four to six years with extension options.
BAH Group has two spare engines under operating leases. The original lease terms on the engines are for 12 years. Sub-leasing is allowed under all the lease arrangements.
Annual Report FY2016/17 179

Notes to the Financial StatementsFor The Financial Year Ended 31 March 2017
34 Capital and Other Commitments (in $ million) (continued)
(b) Operating lease commitments (continued)
As lessee (continued)
Engines (continued)
Future minimum lease payments under non-cancellable operating leases are as follows:
The Group31 March
The Company31 March
2017 2016 2017 2016
Not later than one year 18.0 22.0 16.0 20.2 Later than one year but not later than five years 9.2 16.2 5.8 11.3 Later than five years – 0.2 – –
27.2 38.4 21.8 31.5
Property and equipment
The Group has entered into operating lease agreements for office and computer equipment, leasehold land and buildings. These non-cancellable leases have lease terms of between one and 50 years.
Future minimum lease payments under non-cancellable operating leases are as follows:
The Group31 March
The Company31 March
2017 2016 2017 2016
Not later than one year 74.0 76.4 53.9 55.5 Later than one year but not later than five years 109.2 122.1 79.6 95.1 Later than five years 61.2 63.7 12.1 12.8
244.4 262.2 145.6 163.4
The minimum lease payments recognised in the profit and loss account amounted to $69.6 million (FY2015/16: $63.9 million) and $54.3 million (FY2015/16: $53.1 million) for the Group and the Company respectively.
As lessor
Aircraft
The Company leased three B777 aircraft for a lease term of five years each to NokScoot. The lease rental is fixed throughout the lease term and is non-cancellable.
BAH Group sub-leased two A320-200 aircraft to an external party. The sub-lease term for the aircraft is between eight and nine years. BAH Group also sub-leased one A320-200 aircraft to Tigerair Australia. The sub-lease term for the aircraft is eight years. VAH has provided a guarantee to BAH Group to cover obligations for the assets leased by Tigerair Australia.
Singapore Airlines180
Financial

34 Capital and Other Commitments (in $ million) (continued)
(b) Operating lease commitments (continued)
As lessor (continued)
Aircraft (continued)
Future minimum lease receivables under non-cancellable operating leases are as follows:
The Group31 March
The Company31 March
2017 2016 2017 2016
Not later than one year 47.3 52.5 33.9 32.0 Later than one year but not later than five years 108.7 164.8 68.7 91.1 Later than five years 13.7 25.7 – –
169.7 243.0 102.6 123.1
35 Contingent Liabilities (in $ million)
(a) Cargo: Investigations by Competition Authorities and Civil Class Actions
In 2006 and thereafter, SIA Cargo and the Company were among several airlines that received notice of investigations by competition authorities in the United States, European Union, Australia, Canada, New Zealand, South Africa, South Korea and Switzerland as to whether surcharges, rates or other competitive aspects of air cargo service were lawfully determined (the “air cargo issues”).
On 9 November 2010, the European Commission issued an adverse decision against 13 air cargo airlines, including SIA Cargo and the Company, in respect of fuel surcharges, security surcharges and commissions on surcharges. A fine of EUR74.8 million ($135.7 million) was imposed on SIA Cargo and the Company. SIA Cargo paid the fine in February 2011 in accordance with European Union laws. This amount was reflected as an exceptional item in the Group’s accounts in FY2010/11. SIA Cargo and the Company filed an appeal to the European General Court seeking annulment of the decision. In December 2015, the European General Court annulled the decision of the European Commission in its entirety vis-à-vis SIA Cargo and the Company. In February 2016, EUR76.4 million ($119.1 million) comprising the fine amount and returns thereon was refunded to SIA Cargo. This refund was recognised as a non-operating item (Note 9) in the Group’s FY2015/16 accounts. In March 2017, the European Commission re-adopted a decision in respect of the same case against the air cargo airlines, imposing a fine of EUR74.8 million ($111.8 million) against SIA Cargo and the Company. This amount was recognised as a non-operating item (Note 9) in the Group’s accounts in FY2016/17.
In January 2014, the Swiss Competition Commission announced a fine against SIA Cargo and the Company of CHF1.7 million ($2.3 million) in respect of the air cargo issues. This amount was reflected as an exceptional item in the Group’s accounts in FY2013/14. SIA Cargo and the Company have filed an appeal to the Swiss Federal Administrative Tribunal seeking annulment of the decision.
The proceedings by competition authorities in the United States, South Korea, South Africa, Australia and New Zealand were resolved in previous financial periods.
After the investigations commenced, civil damage lawsuits were filed in the United States, Canada, Australia, South Korea, England, the Netherlands, Norway and Germany by private parties against several airlines, including SIA Cargo and the Company. Other lawsuits have been threatened by customers of SIA Cargo or shippers that purportedly contracted with SIA Cargo’s customers.
Annual Report FY2016/17 181

Notes to the Financial StatementsFor The Financial Year Ended 31 March 2017
35 Contingent Liabilities (in $ million) (continued)
(a) Cargo: Investigations by Competition Authorities and Civil Class Actions (continued)
The plaintiffs in the South Korea proceedings withdrew their complaint in July 2011 and the proceedings were accordingly dismissed without prejudice. In January 2014, a shipper from South Korea which purportedly contracted with SIA Cargo’s customers served a claim against SIA Cargo and other airlines. SIA Cargo is defending this proceeding.
In September 2016, one of SIA Cargo’s customers filed a claim against SIA Cargo and the Company in the United States after opting out of SIA Cargo’s and the Company’s class action settlement. SIA Cargo and the Company are defending this proceeding.
Without admitting any liabilities, SIA Cargo and the Company have settled with plaintiffs in the United States class action, Australia and Canada to resolve all liabilities of SIA Cargo and the Company as concerns the civil damage or class action lawsuits filed in the relevant jurisdictions.
In addition, without admitting any liability, in 2012, 2013 and 2015, SIA Cargo reached settlements with certain customers to resolve all pending and potential future civil damage claims regarding the air cargo issues. The settlements in 2012, 2013, 2015 and potential settlement in 2017 have been reflected in the Group’s financial statements in the respective financial years. The individual terms of all such settlements are required to be kept confidential.
Apart from Canada, the United States class action and Australia, the filed cases remain in their respective procedural stages and none have been tried thus far on their respective substantive legal merits.
Apart from the items recorded as non-operating items noted above, it is premature to make a provision in the financial statements for the other pending investigations, court proceedings, civil suits, or threatened claims as their respective outcomes are uncertain.
(b) Passengers: Civil Class Actions
The Company and several other airlines have been named in a civil class action lawsuit in Canada alleging an unlawful agreement to fix surcharges and fares on transpacific flights. The case is currently in the procedural stage and has not been tried thus far on its substantive legal merits. As the lawsuit has neither been tried nor alleged damages quantified, it is premature to make a provision in the financial statements.
In August 2014, without admitting any liability, the Company entered into a settlement agreement with the class action plaintiffs in the United States for USD9.2 million ($11.4 million) with respect to the passenger civil class action lawsuits filed in the United States. In accordance with the agreement, the Company paid the above amount into an escrow account pending court approval. Final approval of the settlement was granted by the court in June 2015. Subsequently, one of the class members filed an appeal against the court judgement approving the settlement. This appeal is currently pending.
(c) Guarantee to a Joint Venture Company
During the year, the Company provided a guarantee of THB600.0 million ($24.3 million) in respect of a revolving credit facility granted by a lender to NokScoot.
Singapore Airlines182
Financial

36 Financial Instruments (in $ million)
Classification and fair values of financial instruments
Financial assets and financial liabilities are measured on an ongoing basis either at fair value or at amortised cost. The principal accounting policies in Note 2 describe how the classes of financial instruments are measured, and how revenue and expenses, including fair value gains and losses, are recognised. The carrying amounts and fair values of financial assets and financial liabilities, including their levels in the fair value hierarchy are as per the following tables.
Financial assets and financial liabilities that are classified as measured at amortised cost with carrying amounts being a reasonable approximation of their fair values are not presented in these tables. These financial assets include trade debtors, deposits and other debtors, amounts owing by subsidiary companies and cash and bank balances. These financial liabilities include deposits received from lessee, trade and other creditors, amounts owing to subsidiary companies and loans.
Carrying amount Fair value
31 March 2017Amortised
cost FVTPL FVOCI Total Level 1 Level 2 Level 3
The GroupFinancial assetsLong-term investments
Quoted Non-equity investments 138.7 – – 138.7 140.6 – –
Unquoted Non-equity investments* – 221.9 – 221.9 – 221.9 – Equity investments – 43.7 1.4 45.1 – – 45.1
Other long-term receivables 435.7 – – 435.7 – – 432.8 Derivative assets* – 128.6 – 128.6 – 128.6 – Investments
Quoted Equity investments* – 37.6 – 37.6 37.6 – – Non-equity investments* – 32.4 – 32.4 32.4 – – Non-equity investments 469.9 – – 469.9 466.3 – –
1,044.3 464.2 1.4 1,509.9 676.9 350.5 477.9
Financial liabilitiesDerivative liabilities* – 369.3 – 369.3 – 369.3 – Notes payable 1,430.0 – – 1,430.0 1,469.2 – –
1,430.0 369.3 – 1,799.3 1,469.2 369.3 –
* Mandatorily measured at FVTPL
Annual Report FY2016/17 183

Notes to the Financial StatementsFor The Financial Year Ended 31 March 2017
36 Financial Instruments (in $ million) (continued)
Classification and fair values of financial instruments (continued)
Carrying amount Fair value
31 March 2017Amortised
cost FVTPL FVOCI Total Level 1 Level 2 Level 3
The CompanyFinancial assetsLong-term investments
Quoted Non-equity investments 138.7 – – 138.7 140.6 – –
Unquoted Non-equity investments* – 221.9 – 221.9 – 221.9 – Equity investments – 33.4 1.3 34.7 – – 34.7
Other long-term receivables 354.3 – – 354.3 – – 354.3 Derivative assets* – 125.7 – 125.7 – 125.7 – Investments
Quoted Non-equity investments 469.9 – – 469.9 466.3 – –
962.9 381.0 1.3 1,345.2 606.9 347.6 389.0
Financial liabilitiesDerivative liabilities* – 369.3 – 369.3 – 369.3 – Notes payable 1,430.0 – – 1,430.0 1,469.2 – –
1,430.0 369.3 – 1,799.3 1,469.2 369.3 –
* Mandatorily measured at FVTPL
Singapore Airlines184
Financial

36 Financial Instruments (in $ million) (continued)
Classification and fair values of financial instruments (continued)
Carrying amount Fair value
31 March 2016
Loansand
receivables
Available-for-sale
financial assets
Held-to-maturity financial
assets
Derivatives used for hedging
Financial liabilities at
amortised cost Total Level 1 Level 2 Level 3
The GroupFinancial assetsLong-term investments
Quoted Non-equity investments – – 528.0 – – 528.0 528.0 – –
Unquoted Non-equity investments – 215.7 – – – 215.7 – 215.7 – Equity investments – 29.4 – – – 29.4 – – 29.4
Deposit 79.4 – – – – 79.4 – – 84.1 Other long-term receivables 460.8 – – – – 460.8 – – 457.9 Derivative assets – – – 32.3 – 32.3 – 32.3 – Investments
Quoted Equity investments – 33.5 – – – 33.5 33.5 – – Non-equity investments – 192.9 351.4 – – 544.3 544.3 – –
Unquoted Non-equity investments – 90.3 – – – 90.3 – 90.3 –
Assets held for sale – 156.5 – – – 156.5 – 156.5 – 540.2 718.3 879.4 32.3 – 2,170.2 1,105.8 494.8 571.4
Financial liabilitiesDerivative liabilities – – – 727.8 – 727.8 – 727.8 – Notes payable – – – – 1,000.0 1,000.0 1,036.3 – –
– – – 727.8 1,000.0 1,727.8 1,036.3 727.8 –
Annual Report FY2016/17 185
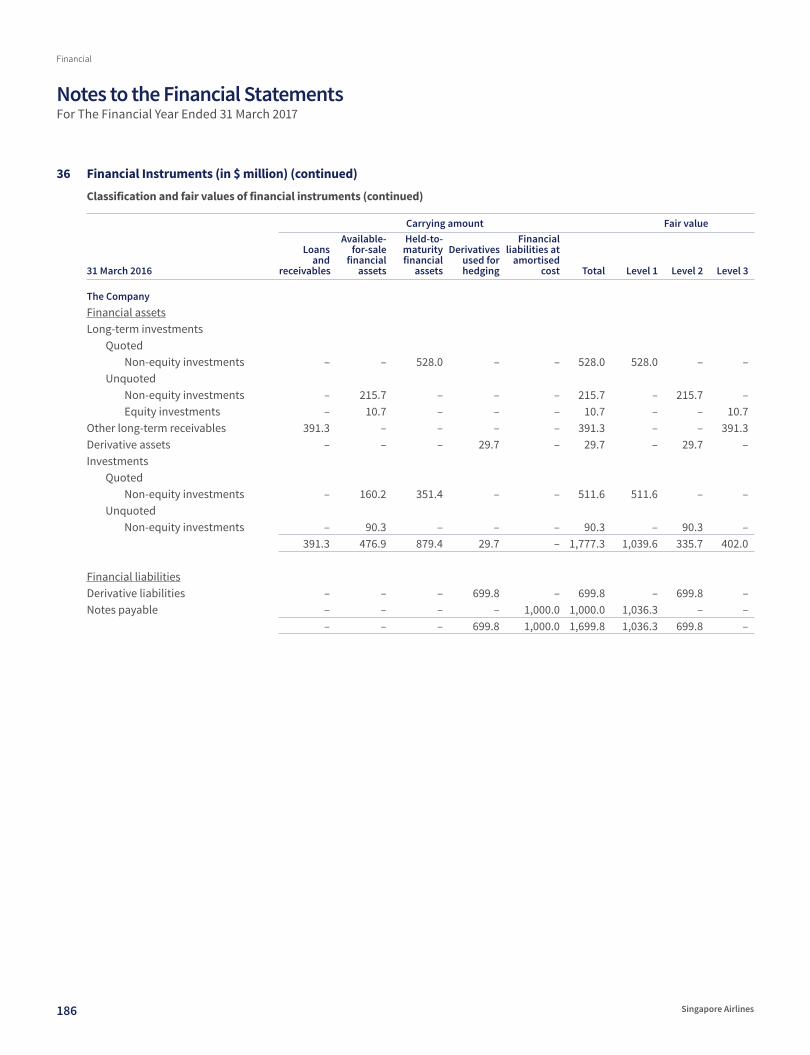
Notes to the Financial StatementsFor The Financial Year Ended 31 March 2017
36 Financial Instruments (in $ million) (continued)
Classification and fair values of financial instruments (continued)
Carrying amount Fair value
31 March 2016
Loansand
receivables
Available-for-sale
financial assets
Held-to-maturity financial
assets
Derivatives used for hedging
Financial liabilities at
amortised cost Total Level 1 Level 2 Level 3
The CompanyFinancial assetsLong-term investments
Quoted Non-equity investments – – 528.0 – – 528.0 528.0 – –
Unquoted Non-equity investments – 215.7 – – – 215.7 – 215.7 – Equity investments – 10.7 – – – 10.7 – – 10.7
Other long-term receivables 391.3 – – – – 391.3 – – 391.3 Derivative assets – – – 29.7 – 29.7 – 29.7 – Investments
Quoted Non-equity investments – 160.2 351.4 – – 511.6 511.6 – –
Unquoted Non-equity investments – 90.3 – – – 90.3 – 90.3 –
391.3 476.9 879.4 29.7 – 1,777.3 1,039.6 335.7 402.0
Financial liabilitiesDerivative liabilities – – – 699.8 – 699.8 – 699.8 – Notes payable – – – – 1,000.0 1,000.0 1,036.3 – –
– – – 699.8 1,000.0 1,699.8 1,036.3 699.8 –
Singapore Airlines186
Financial

36 Financial Instruments (in $ million) (continued)
Classification and fair values of financial instruments (continued)
Financial instruments carried at fair value
The Group classifies fair value measurement using a fair value hierarchy that reflects the significance of the inputs used in making the measurements. The fair value hierarchy has the following levels:
• Level 1 – Quoted prices (unadjusted) in active markets for identical assets or liabilities
• Level 2 – Inputs other than quoted prices included within Level 1 that are observable for the asset or liability, either directly (i.e., as prices) or indirectly (i.e., derived from prices)
• Level 3 – Unobservable inputs for the asset or liability
There has been no transfer between Level 1 and Level 2 during the financial year.
Determination of fair value
The fair values of the financial instruments are determined as follows:
• Jet fuel swap contracts – mark-to-market valuations.
• InterContinental Exchange (“ICE”) Brent swap and Brent-MOPS crack swap contracts – by reference to available market information and the marked-to-market values of these swap contracts. As the Group hedges with ICE Brent and Brent-MOPS crack contracts, the ICE Brent futures contract price and its differential relative to MOPS price are used as the mark-to-market prices.
• Forward currency contracts – by reference to current forward prices for contracts with similar maturity profiles.
• Cross currency swap contracts – by reference to market prices for existing cash flow profiles pre-agreed with counterparties at trade inception.
• Quoted investments – by reference to stock exchange quoted market bid prices at the close of the business at the end of the reporting period. For investments where there is no active market, fair value is determined using valuation techniques that are commonly used by market participants.
• Deposit – by discounting expected future cash flows at market incremental lending rate for similar types of lending at the end of the reporting period.
• Other long-term receivables – by discounting expected future cash flows at market incremental lending rate for similar types of lending at the end of the reporting period.
Annual Report FY2016/17 187

Notes to the Financial StatementsFor The Financial Year Ended 31 March 2017
36 Financial Instruments (in $ million) (continued)
Master netting or similar agreements
The Group enters into derivative transactions under International Swaps and Derivatives Association (“ISDA”) master netting agreements. In general, under such agreements the amounts owed by each counterparty on a single day in respect of all transactions outstanding in the same currency are aggregated into a single net amount that is payable by one party to the other. In certain circumstances – e.g. when a credit event such as a default occurs, all outstanding transactions under the agreement are terminated, the termination value is assessed and only a single net amount is payable in settlement of all transactions.
The above ISDA agreements do not meet the criteria for offsetting in the statement of financial position. This is because they create a right of set-off of recognised amounts that is enforceable only following an event of default, insolvency or bankruptcy of the Group or the counterparties. In addition the Group and its counterparties do not intend to settle on a net basis or to realise the assets and settle the liabilities simultaneously.
The Group also enters into netting arrangements with International Air Transport Association (“IATA”).
The following table sets out the carrying amounts of recognised financial instruments that are subject to the above agreements.
Effects of offsetting in the statements of financial position Related amounts not offset
The GroupGross
amounts
Gross amountsset-off in the
statementsof financial
position
Net amountspresented in the
statementsof financial
position
Amountssubject to
master nettingarrangements Net amount
31 March 2017Derivative assets 128.6 – 128.6 (107.5) 21.1 Trade debtors 1,155.5 (10.9) 1,144.6 – 1,144.6
1,284.1 (10.9) 1,273.2 (107.5) 1,165.7
Derivative liabilities 369.3 – 369.3 (107.5) 261.8 Trade and other creditors 3,307.0 (10.9) 3,296.1 – 3,296.1
3,676.3 (10.9) 3,665.4 (107.5) 3,557.9
31 March 2016Derivative assets 32.3 – 32.3 (27.7) 4.6 Trade debtors 1,230.4 (8.6) 1,221.8 – 1,221.8
1,262.7 (8.6) 1,254.1 (27.7) 1,226.4
Derivative liabilities 727.8 – 727.8 (27.7) 700.1 Trade and other creditors 2,907.6 (8.6) 2,899.0 – 2,899.0
3,635.4 (8.6) 3,626.8 (27.7) 3,599.1
Singapore Airlines188
Financial

36 Financial Instruments (in $ million) (continued)
Master netting or similar agreements (continued)
Effects of offsetting in the statements of financial position Related amounts not offset
The CompanyGross
amounts
Gross amountsset-off in the
statementsof financial
position
Net amountspresented in the
statementsof financial
position
Amountssubject to
master nettingarrangements Net amount
31 March 2017Derivative assets 125.7 – 125.7 (107.5) 18.2 Trade debtors 705.6 (10.9) 694.7 – 694.7 Amounts owing by subsidiary companies 363.8 (160.0) 203.8 – 203.8
1,195.1 (170.9) 1,024.2 (107.5) 916.7
Derivative liabilities 369.3 – 369.3 (107.5) 261.8 Trade and other creditors 2,262.8 (10.9) 2,251.9 – 2,251.9 Amounts owing to subsidiary companies 1,514.5 (160.0) 1,354.5 – 1,354.5
4,146.6 (170.9) 3,975.7 (107.5) 3,868.2
31 March 2016Derivative assets 29.7 – 29.7 (27.7) 2.0 Trade debtors 808.0 (8.6) 799.4 – 799.4 Amounts owing by subsidiary companies 469.5 (151.5) 318.0 – 318.0
1,307.2 (160.1) 1,147.1 (27.7) 1,119.4
Derivative liabilities 699.8 – 699.8 (27.7) 672.1 Trade and other creditors 2,203.5 (8.6) 2,194.9 – 2,194.9 Amounts owing to subsidiary companies 1,342.6 (151.5) 1,191.1 – 1,191.1
4,245.9 (160.1) 4,085.8 (27.7) 4,058.1
Annual Report FY2016/17 189
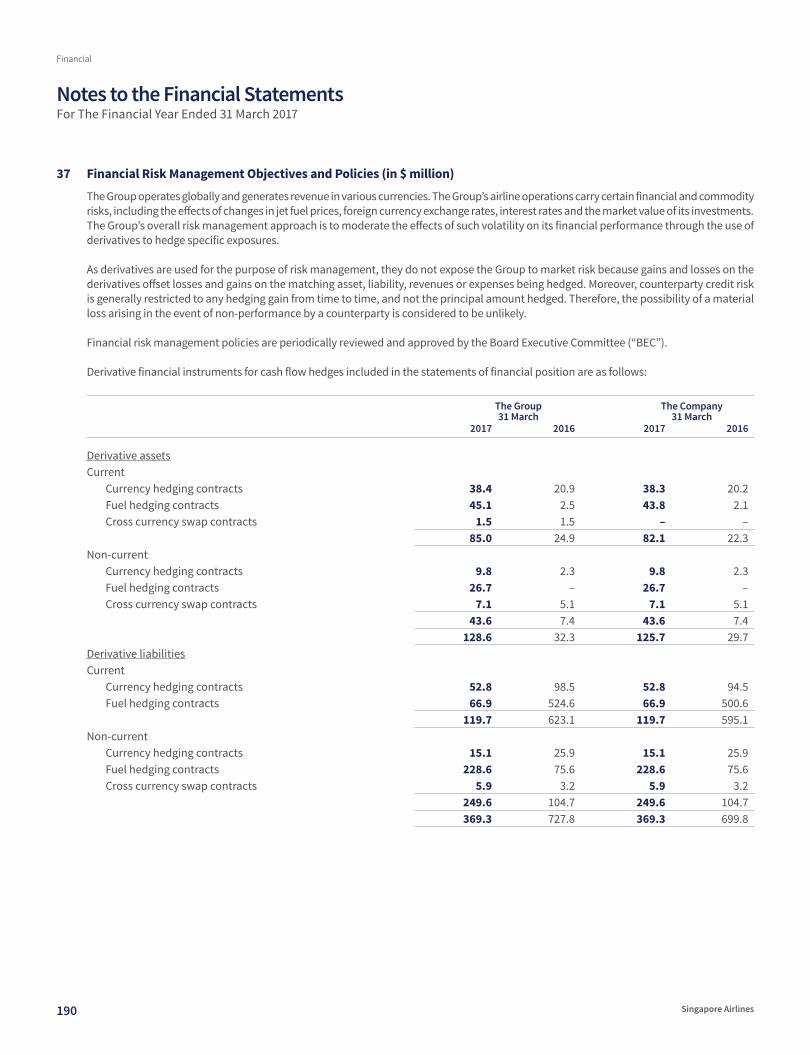
Notes to the Financial StatementsFor The Financial Year Ended 31 March 2017
37 Financial Risk Management Objectives and Policies (in $ million)
The Group operates globally and generates revenue in various currencies. The Group’s airline operations carry certain financial and commodity risks, including the effects of changes in jet fuel prices, foreign currency exchange rates, interest rates and the market value of its investments. The Group’s overall risk management approach is to moderate the effects of such volatility on its financial performance through the use of derivatives to hedge specific exposures.
As derivatives are used for the purpose of risk management, they do not expose the Group to market risk because gains and losses on the derivatives offset losses and gains on the matching asset, liability, revenues or expenses being hedged. Moreover, counterparty credit risk is generally restricted to any hedging gain from time to time, and not the principal amount hedged. Therefore, the possibility of a material loss arising in the event of non-performance by a counterparty is considered to be unlikely. Financial risk management policies are periodically reviewed and approved by the Board Executive Committee (“BEC”).
Derivative financial instruments for cash flow hedges included in the statements of financial position are as follows:
The Group31 March
The Company31 March
2017 2016 2017 2016
Derivative assetsCurrent
Currency hedging contracts 38.4 20.9 38.3 20.2 Fuel hedging contracts 45.1 2.5 43.8 2.1 Cross currency swap contracts 1.5 1.5 – –
85.0 24.9 82.1 22.3 Non-current
Currency hedging contracts 9.8 2.3 9.8 2.3 Fuel hedging contracts 26.7 – 26.7 – Cross currency swap contracts 7.1 5.1 7.1 5.1
43.6 7.4 43.6 7.4 128.6 32.3 125.7 29.7
Derivative liabilitiesCurrent
Currency hedging contracts 52.8 98.5 52.8 94.5 Fuel hedging contracts 66.9 524.6 66.9 500.6
119.7 623.1 119.7 595.1 Non-current
Currency hedging contracts 15.1 25.9 15.1 25.9 Fuel hedging contracts 228.6 75.6 228.6 75.6 Cross currency swap contracts 5.9 3.2 5.9 3.2
249.6 104.7 249.6 104.7 369.3 727.8 369.3 699.8
Singapore Airlines190
Financial

37 Financial Risk Management Objectives and Policies (in $ million) (continued)
(a) Jet fuel price risk
The Group’s earnings are affected by changes in the price of jet fuel. The Group’s strategy for managing the risk on fuel price, as defined by BEC, aims to provide the Group with protection against sudden and significant increases in jet fuel prices. In meeting these objectives, the fuel risk management programme allows for the judicious use of approved instruments such as swaps, options and collars with approved counterparties and within approved credit limits to hedge approved range of anticipated jet fuel purchases over a specified time frame.
Cash flow hedges
The Group manages this fuel price risk by using swap, option and collar contracts and hedging up to 20 quarters forward using jet fuel swap, option and collar contracts, ICE Brent swap contracts and Brent-MOPS crack swap contracts.
The Group has applied cash flow hedge accounting to these derivatives as they are considered to be highly effective hedging instruments. A net fair value loss before tax of $241.0 million (2016: loss before tax of $610.7 million), with a related deferred tax credit of $40.9 million (2016: deferred tax credit of $103.8 million), was included in the fair value reserve in respect of these contracts.
The table below sets out the movements for fuel hedges designated on 1 October 2016 when the Group voluntarily adopted FRS 109 Financial Instruments:
The Group The CompanyFY2016/17 FY2016/17
Change in fair value of hedging instrument (236.5) (239.2)Change in fair value of hedged item 236.5 239.2 Hedge ineffectiveness recognised in profit or loss – –
For the financial year ended 31 March 2017, ineffectiveness of $36.4 million related to hedge designations made under FRS 39 were de-designated on 30 September 2016.
As at 31 March 2017, the Group had entered into longer dated Brent hedges with maturity extending to 2022, covering between 40% and 45% of our projected annual fuel consumption, at average prices ranging from USD53 to USD59 per barrel.
Jet fuel price sensitivity analysis
The jet fuel price risk sensitivity analysis is based on the assumption that all other factors, such as fuel surcharge and uplifted fuel volume, remain constant. Under this assumption, and excluding the effects of hedging, an increase in price of one USD per barrel of jet fuel affects the Group’s and the Company’s annual fuel costs by $55.7 million and $43.1 million (FY2015/16: $52.4 million and $41.3 million) respectively.
The fuel hedging sensitivity analysis is based on contracts that are still outstanding as at the end of the reporting period and assumes that all jet fuel, Brent and crack hedges are highly effective. Under these assumptions, with an increase or decrease in jet fuel prices, each by one USD per barrel, the before tax effects on equity are set out in the table below.
Sensitivity analysis on outstanding fuel hedging contracts:
The Group31 March
The Company31 March
2017 2016 2017 2016Effect on equity Effect on equity
Increase in one USD per barrel 125.2 25.4 94.7 20.7
Decrease in one USD per barrel (125.2) (25.4) (94.7) (20.7)
Annual Report FY2016/17 191

Notes to the Financial StatementsFor The Financial Year Ended 31 March 2017
37 Financial Risk Management Objectives and Policies (in $ million) (continued)
(b) Foreign currency risk
The Group is exposed to the effects of foreign exchange rate fluctuations because of its foreign currency denominated operating revenues and expenses. For the financial year ended 31 March 2017, these accounted for 49.9% of total revenue (FY2015/16: 48.6%) and 53.6% of total operating expenses (FY2015/16: 58.0%). The Group’s largest exposures are from United States Dollar, Euro, UK Sterling Pound, Swiss Franc, Australian Dollar, New Zealand Dollar, Japanese Yen, Indian Rupee, Hong Kong Dollar, Chinese Yuan, Korean Won and Malaysian Ringgit. The Group generates a surplus in all of these currencies, with the exception of USD. The deficit in USD is attributable to capital expenditure, fuel costs and aircraft leasing costs – all conventionally denominated and payable in USD.
The Group manages its foreign exchange exposure by a policy of matching, as far as possible, receipts and payments in each individual currency. Surpluses of convertible currencies are sold, as soon as practicable, for USD or SGD. The Group also uses foreign currency forward and option contracts to hedge a portion of its future foreign exchange exposure. Such contracts provide for the Group to sell currencies at predetermined forward rates, buying either USD or SGD depending on forecast requirements, with settlement dates that range from one month up to one year. The Company also uses cross currency swap contracts to hedge a portion of its fixed future foreign exchange exposure in USD. The cross currency swap contracts provide for the Company to exchange surplus currency, specifically JPY and EUR into USD predetermined costs. The Group uses these currency hedging contracts purely as a hedging tool. It does not take positions in currencies with a view to making speculative gains from currency movements.
Cash flow hedges
a) Net operating and other exposures
The Group and Company hold cash flow hedges to manage net operating exposures to foreign currencies. As at 31 March 2017, the carrying amounts of these hedges consisted of $34.7 million derivative assets and $45.3 million derivative liabilities for the Group, and $33.1 million derivative assets and $45.3 million derivative liabilities for the Company. During the financial year, the amount reclassified from the cash flow hedge reserve to profit or loss (classified under ‘Other operating expenses’) is $36.6 million for the Group and $34.7 million for the Company, and no ineffectiveness has been recognised in the profit or loss for the Group or Company.
The Company holds currency swaps for the principal amounts outstanding on foreign currency denominated bonds until December 2017. As at 31 March 2017, the hedge was assessed to be highly effective on a prospective basis and a net fair value gain of $0.6 million (2016: loss of $4.3 million) was included in the fair value reserve with respect to these contracts.
The Company also holds cross currency swap contracts to hedge expected future lease commitments in USD and foreign currency risk of expected future JPY and EUR surpluses until August 2021. As at 31 March 2017, the hedges were assessed to be effective and a net fair value gain of $1.0 million (2016: gain of $2.0 million) is included in the fair value reserve with respect to these contracts.
b) Capital expenditure exposures
The Group and the Company designate cash flow hedges to manage the exposure to USD-denominated capital expenditure commitments. As at 31 March 2017, the total nominal amount of these cash flow hedges over the next two years was USD2,592.3 million with a hedged rate range of SGD/USD 1.29 – 1.45 for the Group and USD2,260.4 million with a hedged rate range of SGD/USD 1.29 – 1.45 for the Company.
As at 31 March 2017, the Company held USD756.2 million (2016: USD512.6 million) in short-term deposits to hedge against foreign currency risk for a portion of the forecast USD capital expenditure in the next 12 months. A fair value loss of $11.4 million (2016: loss of $22.5 million) was included in the fair value reserve in respect of these contracts.
During the financial year, the Company also entered into new foreign currency forward contracts to hedge against foreign currency risk for a portion of the forecast USD capital expenditure in the next 12 to 24 months. As at 31 March 2017, a fair value loss of $6.1 million (2016: loss of $50.3 million) was included in the fair value reserve in respect of these contracts.
Singapore Airlines192
Financial

37 Financial Risk Management Objectives and Policies (in $ million) (continued)
(b) Foreign currency risk (continued)
b) Capital expenditure exposures (continued)
The table below sets out the derivative positions and movements for these cash flow hedges:
The Group andthe Company
31 March2017
Fixed deposits 1,056.6 Derivative assets 22.1 Derivative liabilities (28.5)
The Group andthe Company
FY2016/17
Change in fair value of hedging instrument (17.8)Change in fair value of hedged item 17.8 Hedge ineffectiveness recognised in profit or loss –
For the financial year ended 31 March 2017, there was no realised foreign currency hedging gain/(loss) reclassified to profit or loss for the Group or Company as it had been capitalised in the carrying value of non-financial assets.
Foreign currency sensitivity analysis
The foreign currency risk sensitivity analysis is based on the assumption that all cash flow hedges are highly effective; hence there will be no impact on profit before taxation from the cash flow hedges.
The following table details the sensitivity of a 1% strengthening of SGD against the respective foreign currencies. The sensitivity analysis includes only outstanding foreign currency hedging contracts and significant outstanding foreign currency denominated monetary items and adjusts their translation at the period end for a 1% change in foreign currency rates.
Annual Report FY2016/17 193

Notes to the Financial StatementsFor The Financial Year Ended 31 March 2017
37 Financial Risk Management Objectives and Policies (in $ million) (continued)
(b) Foreign currency risk (continued)
Sensitivity analysis:
The Group31 March
2017 2016
Effect onequity R1
Effect onprofit before
taxation R2Effect onequity R1
Effect onprofit before
taxation R2
AUD 2.3 (1.5) 2.6 (2.0)EUR 1.4 – 1.0 (1.9)GBP 1.7 (0.5) 1.4 (0.7)JPY 2.4 (0.3) 0.8 (0.2)USD (51.8) 0.8 (31.8) (0.7)
The Company31 March
2017 2016
Effect onequity R1
Effect onprofit before
taxation R2Effect onequity R1
Effect onprofit before
taxation R2
AUD 1.8 (1.3) 2.3 (1.8)EUR 0.9 (0.1) 0.4 (0.1)GBP 1.4 (0.4) 1.1 (0.6)JPY 2.3 (0.2) 0.7 (0.2)USD (43.3) 3.6 (25.3) 5.2
R1 Sensitivity analysis on outstanding foreign currency hedging contracts and fuel hedging contracts denominated in foreign currency
R2 Sensitivity analysis on significant outstanding foreign currency denominated monetary items
If the relevant foreign currency strengthens by 1% against SGD, equity and profit before taxation would change by the same amounts in the opposite direction.
(c) Interest rate risk
The Group’s earnings are also affected by changes in interest rates due to the impact such changes have on interest income and expense from short-term deposits and other interest-bearing financial assets and liabilities. The Group enters into interest rate swap contracts and interest rate cap contracts to manage interest rate costs on its financial assets and liabilities, with the prior approval of the BEC or Boards of subsidiary companies.
Singapore Airlines194
Financial

37 Financial Risk Management Objectives and Policies (in $ million) (continued)
(c) Interest rate risk (continued)
Cash flow hedges
In FY2013/14, the Company entered into interest rate swap contracts to protect a portion of the future operating lease rent payments from exposure to fluctuations in interest rates. These contracts were settled in FY2014/15. The balance in the fair value reserve will be recognised in the profit and loss account over the lease term of the respective aircraft. A net fair value loss before tax of $0.3 million (2016: loss before tax of $0.7 million), with a related deferred tax credit of $0.1 million (2016: deferred tax credit of $0.1 million), was included in the fair value reserve in respect of these contracts.
Interest rate sensitivity analysis
The interest rate sensitivity analysis is based on the following assumptions:
• Changes in market interest rates affect the interest income or finance charges of variable interest financial instruments.
• Changes in market interest rates affect the fair value of derivative financial instruments designated as hedging instruments and all interest rate hedges are expected to be highly effective.
• Changes in the fair values of derivative financial instruments and other financial assets and liabilities are estimated by discounting the future cash flows to net present values using appropriate market rates prevailing at the end of the reporting period.
Under these assumptions, an increase or decrease in market interest rates of 10 basis points for all currencies in which the Group has derivative financial instruments and variable rate assets and liabilities at 31 March 2017 will have the effects as set out in the table below.
Sensitivity analysis:
The Group31 March
2017 2016
Effect onequity R1
Effect onprofit before
taxation R2Effect onequity R1
Effect onprofit before
taxation R2
Increase in 10 basis points in market interest rates – 3.3 – 3.9
Decrease in 10 basis points in market interest rates – (3.3) – (3.9)
The Company31 March
2017 2016
Effect onequity R1
Effect onprofit before
taxation R2Effect onequity R1
Effect onprofit before
taxation R2
Increase in 10 basis points in market interest rates – 1.6 – 2.4
Decrease in 10 basis points in market interest rates – (1.6) – (2.4)
R1 Sensitivity analysis on derivative financial instruments.R2 Sensitivity analysis on variable rate assets and liabilities.
Annual Report FY2016/17 195

Notes to the Financial StatementsFor The Financial Year Ended 31 March 2017
37 Financial Risk Management Objectives and Policies (in $ million) (continued)
(d) Market rate risk
At 31 March 2017, the Group and the Company own investments of $945.6 million (2016: $1,441.2 million) and $865.2 million (2016: $1,356.3 million) respectively, out of which $337.0 million (2016: $532.4 million) and $256.6 million (2016: $466.2 million) are subject to market risk, being the potential loss resulting from a decrease in market prices.
Market price sensitivity analysis
If prices for these investments increase or decrease by 1% with all other variables being held constant, the before tax effects on equity are set out in the table below.
Sensitivity analysis on investments:
The Group31 March
2017 2016
Effect onequity
Effect onprofit before
taxationEffect on
equity
Effect onprofit before
taxation
Increase in 1% of quoted prices – 3.4 5.3 –
Decrease in 1% of quoted prices – (3.4) (5.3) –
The Company31 March
2017 2016
Effect onequity
Effect onprofit before
taxationEffect on
equity
Effect onprofit before
taxation
Increase in 1% of quoted prices – 2.6 4.7 –
Decrease in 1% of quoted prices – (2.6) (4.7) –
Singapore Airlines196
Financial

37 Financial Risk Management Objectives and Policies (in $ million) (continued)
(e) Liquidity risk
At 31 March 2017, the Group has at its disposal, cash and short-term deposits amounting to $3,380.5 million (2016: $3,972.4 million). In addition, the Group has available short-term credit facilities of about $475.0 million (2016: $375.0 million). The Group also has a Medium Term Note Programme under which it may issue notes up to $2,000.0 million (2016: $2,000.0 million) and as of 31 March 2017, $570.0 million (2016: $1,000.0 million) remained unutilised. Under this Programme, notes issued by the Company may have varying maturities as contracted with the relevant financial institutions.
The Group’s holdings of cash and short-term deposits, together with committed funding facilities and net cash flow from operations, are expected to be sufficient to cover the cost of all firm aircraft deliveries due in the next financial year. It is expected that any shortfall would be met by bank borrowings or public market funding. Due to the necessity to plan aircraft orders well in advance of delivery, it is not economical for the Group to have committed funding in place at present for all outstanding orders, many of which relate to aircraft which will not be delivered for several years. The Group’s policies in this regard are in line with the funding policies of other major airlines.
The maturity profile of the financial liabilities of the Group and the Company is as follows. The amounts disclosed in the table are the contractual undiscounted cash flows. Balances due within 12 months approximate their carrying amounts as the impact of discounting is insignificant.
31 March 2017Within1 year
1 - 2years
2 - 3years
3 - 4years
4 - 5years
More than5 years Total
The GroupNotes payable 47.1 47.1 47.1 539.0 227.9 825.4 1,733.6 Loans 21.5 20.9 22.8 23.0 22.8 13.7 124.7 Finance lease commitments 24.5 – – – – – 24.5 Maintenance reserve – – 3.7 6.1 – – 9.8 Purchase option payable to lessor 35.1 – – – – – 35.1 Deposit received from a lessee – 0.1 – – – 9.4 9.5 Trade and other creditors 3,261.9 – – – – – 3,261.9 Derivative financial instruments:
Currency hedging contracts 52.8 15.1 – – – – 67.9 Fuel hedging contracts 66.9 17.7 56.7 88.2 66.1 – 295.6 Cross currency swap contracts 2.4 1.5 0.9 0.4 0.1 – 5.3
3,512.2 102.4 131.2 656.7 316.9 848.5 5,567.9
The CompanyNotes payable 47.1 47.1 47.1 539.0 227.9 825.4 1,733.6 Maintenance reserve – – 3.7 6.1 – – 9.8 Trade and other creditors 2,251.9 – – – – – 2,251.9 Amounts owing to subsidiary companies 1,354.5 – – – – – 1,354.5 Derivative financial instruments:
Currency hedging contracts 52.8 15.1 – – – – 67.9 Fuel hedging contracts 66.9 17.7 56.6 88.2 66.1 – 295.5 Cross currency swap contracts 2.4 1.5 0.9 0.4 0.1 – 5.3
3,775.6 81.4 108.3 633.7 294.1 825.4 5,718.5
Annual Report FY2016/17 197

Notes to the Financial StatementsFor The Financial Year Ended 31 March 2017
37 Financial Risk Management Objectives and Policies (in $ million) (continued)
(e) Liquidity risk (continued)
31 March 2016Within1 year
1 - 2years
2 - 3years
3 - 4years
4 - 5years
More than5 years Total
The GroupNotes payable 33.6 33.6 33.6 33.6 525.6 542.7 1,202.7 Loans 197.5 20.6 20.6 22.5 22.7 36.4 320.3 Finance lease commitments 23.8 23.7 – – – – 47.5 Maintenance reserve – – – 2.3 3.1 – 5.4 Purchase option payable to lessor 50.8 33.9 – – – – 84.7 Deposit received from a lessee – – 0.1 – – 9.0 9.1 Trade and other creditors 2,848.2 – – – – – 2,848.2 Derivative financial instruments:
Currency hedging contracts 96.3 32.8 – – – – 129.1 Fuel hedging contracts 524.6 75.6 – – – – 600.2 Cross currency swap contracts 0.5 4.8 3.0 2.0 1.0 0.2 11.5
3,775.3 225.0 57.3 60.4 552.4 588.3 5,258.7
The CompanyNotes payable 33.6 33.6 33.6 33.6 525.6 542.7 1,202.7 Maintenance reserve – – – 2.3 3.1 – 5.4 Trade and other creditors 2,194.9 – – – – – 2,194.9 Amounts owing to subsidiary companies 1,191.1 – – – – – 1,191.1 Derivative financial instruments:
Currency hedging contracts 92.3 32.8 – – – – 125.1 Fuel hedging contracts 500.6 75.6 – – – – 576.2 Cross currency swap contracts 0.5 4.8 3.0 2.0 1.0 0.2 11.5
4,013.0 146.8 36.6 37.9 529.7 542.9 5,306.9
(f) Credit risk
The Group has an independent Group Debts Review Committee to review the follow up actions on outstanding receivables monthly. On a day-to-day basis, the respective Finance divisions have the primary responsibility for measuring and managing specific risk exposures.
The maximum exposure to credit risk for the Group and the Company is represented by the carrying amount of each financial asset in the statement of financial position.
There are no significant concentrations of credit risk other than from counterparties of cash and bank balances and derivative instruments, where transactions are limited to financial institutions possessing high credit quality and hence the risk of default is low.
The sale of passenger and cargo transportation is largely achieved through IATA accredited sales agents. The credit risk of such sales agents is relatively small owing to broad diversification. In specific instances, the contract may require special collateral.
Unless expressly stated otherwise in the contract, receivables and payables among airlines are settled either bilaterally or via the IATA Clearing House. Receivables and payables are generally netted and settled at weekly intervals, which lead to a clear reduction in the risk of default.
Singapore Airlines198
Financial

37 Financial Risk Management Objectives and Policies (in $ million) (continued)
(f) Credit risk (continued)
For all other service relationships, depending on the nature and scope of the services rendered, collateral is required, credit reports or references are obtained and use is made of historical data from previous business relations, especially with regard to payment behaviour, in order to avoid non-performance.
Collateral requested from debtors include bank guarantees, cash-in-lieu of deposit and security deposits.
The Group determines concentrations of credit risk by monitoring the industry, country and credit rating of its counterparties. The table below shows an analysis of credit risk exposures of balances that exceed 5% of the financial assets of the Group and the Company as at 31 March:
The Group The CompanyOutstanding
balancePercentage of total
financial assetsOutstanding
balancePercentage of total
financial assets2017 2016 2017 2016 2017 2016 2017 2016
Counterparty profilesBy industry:Travel agencies 436.8 434.5 7.1% 5.7% 227.6 230.8 4.5% 3.6%Airlines 151.5 160.3 2.4% 2.1% 21.8 125.3 0.4% 1.9%Financial institutions 3,727.2 4,900.7 60.3% 64.3% 3,058.8 4,108.3 60.6% 64.8%Others 1,590.9 1,636.7 25.7% 21.5% 1,339.2 1,647.2 26.5% 26.0%
5,906.4 7,132.2 95.5% 93.6% 4,647.4 6,111.6 92.0% 96.3%
By region:East Asia 3,096.8 3,977.4 50.1% 52.2% 2,321.0 3,495.0 45.9% 55.1%Europe 1,449.8 1,887.0 23.4% 24.8% 1,211.3 1,545.5 24.0% 24.4%South West Pacific 1,011.1 927.5 16.4% 12.2% 961.4 864.1 19.0% 13.6%Americas 260.0 276.3 4.2% 3.6% 104.2 169.0 2.1% 2.7%West Asia and Africa 88.7 64.0 1.4% 0.8% 49.5 38.0 1.0% 0.5%
5,906.4 7,132.2 95.5% 93.6% 4,647.4 6,111.6 92.0% 96.3%
By Moody's credit ratings:Investment grade (A to Aaa) 4,125.1 5,464.2 66.7% 71.7% 3,472.4 4,666.7 68.8% 73.6%Investment grade (Baa) 19.1 8.8 0.3% 0.1% – 1.3 0.0% 0.0%Non-rated 1,762.2 1,659.2 28.5% 21.8% 1,175.0 1,443.6 23.2% 22.7%
5,906.4 7,132.2 95.5% 93.6% 4,647.4 6,111.6 92.0% 96.3%
Annual Report FY2016/17 199

Notes to the Financial StatementsFor The Financial Year Ended 31 March 2017
38 Capital Management (in $ million)
The primary objective of the management of the Company’s capital structure is to maintain an efficient mix of debt and equity in order to achieve a low cost of capital, while taking into account the desirability of retaining financial flexibility to pursue business opportunities and adequate access to liquidity to mitigate the effect of unforeseen events on cash flows.
The Directors regularly review the Company’s capital structure and make adjustments to reflect economic conditions, business strategies and future commitments.
The Group monitors capital using a gearing ratio, which is total debt divided by total capital.
Neither the Company nor any of its subsidiaries are subject to externally imposed capital requirements.
During the financial year ended 31 March 2017, no significant changes were made in the objectives, policies or processes relating to the management of the Company’s capital structure.
The Group31 March
The Company31 March
2017 2016 2017 2016
Notes payable 1,430.0 1,000.0 1,430.0 1,000.0 Finance lease commitments 23.7 44.4 – – Loans 114.1 303.1 – – Total debt 1,567.8 1,347.5 1,430.0 1,000.0
Share capital 1,856.1 1,856.1 1,856.1 1,856.1 Reserves 11,226.9 10,898.6 10,657.5 10,152.1 Total capital 13,083.0 12,754.7 12,513.6 12,008.2
Gearing ratio (times) 0.12 0.11 0.11 0.08
39 Related Party Transactions (in $ million)
For the purposes of these financial statements, parties are considered to be related to the Group if the Group has the ability, directly or indirectly, to control the party or exercise significant influence over the party in making financial and operating decisions, or vice versa, or where the Group and the party are subject to common control. Related parties may be individuals or other entities.
Key Management Personnel of the Company are those persons having the authority and responsibility for planning, directing and controlling the activities of the Company. The Group considers the Directors, Chief Executive Officer and Executive Vice Presidents of the Company to be Key Management Personnel of the Company.
In addition to the related party information disclosed elsewhere in the financial statements, the following significant related party transactions were carried out in the normal course of business during the financial year:
The GroupFY2016/17 FY2015/16
Purchases of services from associated companies 118.5 121.8 Services rendered to associated companies (59.3) (92.8)Purchases of services from joint venture companies 0.9 0.7 Services rendered to joint venture companies (44.6) (37.0)Purchases of services from related parties 1,188.6 1,187.8 Services rendered to related parties (13.9) (15.4)Professional fees paid to a firm of which a Director is a member 1.4 1.5
Singapore Airlines200
Financial

39 Related Party Transactions (in $ million) (continued)
Key Management Personnel remuneration of the Group
The GroupFY2016/17 FY2015/16
DirectorsSalary, bonuses, fee and other costs 5.3 5.3 CPF and other defined contributions * * Share-based compensation expense 1.6 1.4
6.9 6.7
Key executives (excluding executive Directors)Salary, bonuses, fee and other costs 3.1 3.0 CPF and other defined contributions * * Share-based compensation expense 1.5 1.3
4.6 4.3
* Amount less than $0.1 million
Share options granted to and exercised by a Director and key executives of the Company are as follows:
Name of participant
Aggregate options granted since
commencement of scheme up to end
of financial year under review
Aggregate options exercised since
commencement of scheme up to end
of financial year under review
Aggregate options outstanding at end
of financial year under review
Goh Choon Phong 444,075 444,075 –Mak Swee Wah 362,750 362,750 –Ng Chin Hwee 214,025 214,025 –
Conditional awards granted to a Director and key executives of the Company pursuant to the Restricted Share Plan and the Performance Share Plan are as follows:
RSP/RSP 2014 Base Awards
Name of Participant
Balance as at
1 April 2016
Base Awards granted during the
financial year
Base Awards vested during the
financial year
Balance as at
31 March 2017
Aggregate Base Awards granted since
commencement ofRSP/RSP 2014 to end
of financial year under review
Goh Choon Phong 121,488 60,000 61,488 120,000 400,232 Mak Swee Wah 60,744 30,000 30,744 60,000 235,674 Ng Chin Hwee 60,744 30,000 30,744 60,000 219,756
Annual Report FY2016/17 201

Notes to the Financial StatementsFor The Financial Year Ended 31 March 2017
39 Related Party Transactions (in $ million) (continued)
RSP/RSP 2014 Final Awards (Pending Release) R1
Name of Participant
Balance as at
1 April 2016
Final Awards granted during the
financial year#
Final Awards released during the
financial year
Balance as at
31 March 2017
Aggregate ordinary shares released to
participant since commencement of
RSP/RSP 2014 to end of financial year
under review*
Goh Choon Phong 29,118 79,940 58,941 50,117 179,435 Mak Swee Wah 14,561 39,970 29,471 25,060 123,168 Ng Chin Hwee 14,561 39,970 29,471 25,060 104,237
Deferred RSP/RSP 2014 Awards
Name of Participant
Balance as at
1 April 2016
Base Awards granted during the
financial year
Base Awards vested during the
financial year
Balance as at
31 March 2017
Aggregate ordinary shares released to
participant since commencement of DSA to end of financial year
under review
Goh Choon Phong 74,777 12,860 42,037 45,600 45,737 Mak Swee Wah 33,278 7,410 16,878 23,810 18,368 Ng Chin Hwee 35,728 7,410 16,878 26,260 18,368
PSP/PSP 2014 Base Awards R2
Name of Participant
Balance as at
1 April 2016
Base Awards granted during
the financial year
Base Awards vested during the
financial year
Balance as at
31 March 2017
Aggregate Base Awards
granted since commencement of PSP/PSP 2014
to end of financial year under review
Aggregate ordinary shares released to
participant since commencement of
PSP/PSP 2014 to end of financial year
under review*
Goh Choon Phong 251,592 82,500 84,546 249,546 511,228 103,762 Mak Swee Wah 100,636 33,000 33,818 99,818 249,178 88,793 Ng Chin Hwee 100,636 33,000 33,818 99,818 234,472 72,580
R1 The actual number of RSP Final Awards of fully paid ordinary shares will range from 0% to 150% of the Base Awards and is contingent on the Achievements against Targets over the two-year performance periods relating to the relevant awards.
R2 The actual number of PSP Final Awards of fully paid ordinary shares will range from 0% to 200% of the Base Awards and is contingent on the Achievements against Targets over the three-year performance periods relating to the relevant awards.
# Final Awards granted during the financial year is determined by applying the achievement factor to the Base Awards that have vested during the financial year.
* During the financial year, 117,883, 82,473 and 76,100 treasury shares were issued to a Director and key executives of the Company pursuant to the RSP, DSA and PSP respectively.
Singapore Airlines202
Financial

40 Comparative Information
Certain comparative figures have been reclassified to conform with current year’s presentation. The significant reclassifications are set out below:
FY2015/16As previously
reported As restated
Consolidated Profit and Loss AccountRevenue 15,228.5 15,238.7 Staff costs 2,461.0 2,451.8 Aircraft maintenance and overhaul costs 790.0 804.9 Commission and incentives 365.3 365.0 Handling charges 1,144.9 1,138.9 Advertising and sales costs 289.0 289.8 Other operating expenses 586.7 596.7
The Group The Company31 March 2016
As previouslyreported As restated
As previouslyreported As restated
Statements of Financial PositionDeferred account:
- Current assets – 17.7 – 15.0 - Non-current assets 6.0 65.2 – 50.5 - Current liabilities – 47.2 – 40.6 - Non-current liabilities 225.3 255.0 197.5 222.4
41 Subsequent Event
The Company announced on 3 April 2017 that it had increased the size of its Multicurrency Medium Term Note Programme (the “MTN Programme”). The aggregate principal amount of notes which may be issued increased from $2 billion to $5 billion. $700 million notes under the MTN Programme were issued on 11 April 2017. The $700 million notes bear fixed interest of 3.035% per annum and are repayable on 11 April 2025.
Annual Report FY2016/17 203

Additional Information Required by the Singapore Exchange Securities
1. Interested Person Transactions
The aggregate values of all Interested Person Transactions (“IPTs”) entered into during the Financial Year 2016/17 are as follows:
Aggregate value of all IPTs during the financial year under review (excluding
transactions less than $100,000 and transactions conducted
under shareholders' mandate pursuant to Rule 920)
Aggregate value of all IPTs conducted under
shareholders' mandatepursuant to Rule 920
(excluding transactions less than $100,000)
Name of Interested Person (S$) (S$)
CapitaLand Limited Group– Orchard Turn Retail Investment Pte Ltd – 4,137,790 – PT Menara Aspen Persada – 152,957
PT Bank Danamon Indonesia TBK – 590,078
SATS Ltd Group– Aerolog Express Pte Ltd – 608,654 – Air India SATS Airport Services Private Limited – 7,363,582 – Asia Airfreight Terminal Co Ltd – 7,397,024 – DFASS SATS Pte Ltd – 8,570,412 – MacroAsia Catering Services Inc. – 2,911,704 – Maldives Inflight Catering Private Limited – 2,980,494 – PT Jas Aero-Engineering Services – 347,388 – PT Jasa Angkasa Semesta Tbk – 18,658,571 – SATS Aero Laundry Pte. Ltd. – 14,872,765 – SATS HK Limited – 5,651,022 – SATS Ltd – 718,290,815 – SATS Security Services Private Limited – 23,268,943 – Taj Madras Flight Kitchen Private Limited – 765,486 – Taj SATS Air Catering Ltd – 5,138,564 – TFK Corporation – 6,638,068
Singapore GP Pte Ltd* 2,790,502 –
Singapore Technologies Engineering Ltd Group– ST Aerospace Academy Pte Ltd – 140,953
Singapore Telecommunications Limited Group– Singapore Telecommunications Limited – 1,790,477 – Optus Networks Pty Limited – 411,286
StarHub Ltd – 198,227
Temasek Holdings (Private) Limited and Associates– Ascendas Funds Management (S) Ltd – 1,598,530 – Certis Cisco Aviation Security Pte Ltd – 2,646,874 – MediaCorp Pte Ltd – 899,939 – SingEx Venues International Pte Ltd – 139,985 – Synergy FMI – 1,996,853 Total Interested Person Transactions 2,790,502 838,167,441
* Agreement for the purchase of admission and hospitality tickets in exchange for hospitality passes, marketing support and SIA tickets.
2. Material Contracts
Except as disclosed above and in the financial statements for the financial year ended 31 March 2017, there were no material contracts entered into by the Company and its subsidiary companies involving the interests of the Chief Executive Officer, Directors or controlling shareholders, which are either still subsisting at the end of the financial year or, if not then subsisting, entered into since the end of the previous financial year.
Singapore Airlines204
Financial

Quarterly Results of the Group
1st Quarter 2nd Quarter 3rd Quarter 4th Quarter Total
Total revenue
2016/17 ($ million) 3,654.4 3,650.3 3,843.8 3,720.0 14,868.5
2015/16 ($ million) 3,733.3 3,844.8 3,941.0 3,719.6 15,238.7
Total expenditure
2016/17 ($ million) 3,461.2 3,541.2 3,550.9 3,692.4 14,245.7
2015/16 ($ million) 3,621.9 3,716.2 3,653.0 3,566.4 14,557.5
Operating profit
2016/17 ($ million) 193.2 109.1 292.9 27.6 622.8
2015/16 ($ million) 111.4 128.6 288.0 153.2 681.2
Profit/(loss) before taxation
2016/17 ($ million) 341.3 82.7 226.7 (132.1) 518.6
2015/16 ($ million) 126.5 239.8 362.9 243.2 972.4
Profit/(loss) attributable to owners of the parent
2016/17 ($ million) 256.6 64.9 177.2 (138.3) 360.4
2015/16 ($ million) 91.2 213.6 274.9 224.7 804.4
Earnings/(loss) per share – Basic
2016/17 (cents) 21.7 5.5 15.0 (11.7) 30.5
2015/16 (cents) 7.8 18.3 23.6 19.3 69.0
Earnings/(loss) per share – Diluted
2016/17 (cents) 21.6 5.5 14.9 (11.7) 30.3
2015/16 (cents) 7.8 18.2 23.5 19.2 68.7
Annual Report FY2016/17 205

Five-Year Financial Summary of the Group
2016/17 2015/16 2014/15 2013/14 2012/13
Profit and loss account ($ million)Total revenue 14,868.5 15,238.7 15,565.5 15,243.9 15,098.2 Total expenditure (14,245.7) (14,557.5) (15,156.1) (14,984.6) (14,869.0)Operating profit 622.8 681.2 409.4 259.3 229.2 Finance charges (46.1) (50.3) (49.6) (37.3) (42.7)Interest income 73.9 70.7 74.9 62.7 62.5 (Loss)/Surplus on disposal of aircraft, spares and spare engines (31.7) 52.7 51.9 51.2 56.0 Dividend from long-term investments 45.0 115.3 13.2 19.6 27.3 Other non-operating items (103.2) 91.1 (14.3) 1.9 11.9 Share of profits of joint venture companies 20.9 22.8 52.0 94.0 94.9 Share of (losses)/profits of associated companies (63.0) (11.1) (129.1) (45.2) 50.4 Profit before exceptional items 518.6 972.4 408.4 406.2 489.5 Exceptional items
Remeasurement gain from consolidation of Tiger Airways – – 119.8 – – Impairment of China Cargo Airlines – – (63.6) – – Gain on divestment of an associated company – – 7.3 371.5 – Impairment of freighters – – (7.0) (293.4) – Writeback of impairment/(Impairment) of property, plant
and equipment of Singapore Flying College – – 2.1 (29.4) – Competition-related fines and settlements – – (24.1) (87.0) (19.9)
Profit before taxation 518.6 972.4 442.9 367.9 469.6
Profit attributable to owners of the parent 360.4 804.4 367.9 359.5 378.9
Statement of financial position ($ million)Share capital 1,856.1 1,856.1 1,856.1 1,856.1 1,856.1 Treasury shares (194.7) (381.5) (326.3) (262.2) (269.8)Capital reserve (147.6) (129.2) 215.9 123.7 110.3 Foreign currency translation reserve (123.7) (151.3) (135.7) (101.5) (191.8)Share-based compensation reserve 88.5 123.7 113.2 134.5 151.7 Fair value reserve (234.4) (498.6) (706.2) (40.4) (27.1)General reserve 11,838.8 11,935.5 11,446.6 11,527.0 11,460.1 Equity attributable to owners of the parent 13,083.0 12,754.7 12,463.6 13,237.2 13,089.5 Non-controlling interests 387.2 378.2 466.5 337.4 312.6 Total equity 13,470.2 13,132.9 12,930.1 13,574.6 13,402.1
Property, plant and equipment 16,433.3 14,143.5 13,523.2 13,026.7 13,098.0 Intangible assets 423.5 515.8 497.6 223.4 218.5 Associated companies 1,056.9 901.9 922.2 729.4 554.4 Joint venture companies 160.2 156.3 167.9 126.5 120.8 Long-term investments 405.7 773.1 927.6 1,125.2 706.9 Other non-current assets 540.4 562.0 630.2 100.6 230.0 Current assets 5,700.0 6,794.0 7,252.9 7,310.7 7,499.5 Total assets 24,720.0 23,846.6 23,921.6 22,642.5 22,428.1
Deferred account 234.5 255.0 141.7 226.4 146.7 Deferred taxation 1,890.5 1,681.7 1,599.6 1,788.9 1,948.2 Other non-current liabilities 2,836.2 2,289.8 2,609.8 1,661.2 1,529.5 Current liabilities 6,288.6 6,487.2 6,640.4 5,391.4 5,401.6 Total liabilities 11,249.8 10,713.7 10,991.5 9,067.9 9,026.0 Net assets 13,470.2 13,132.9 12,930.1 13,574.6 13,402.1
Singapore Airlines206
Financial

2016/17 2015/16 2014/15 2013/14 2012/13
Cash flow ($ million) Cash flow from operations 2,583.4 2,929.9 2,193.9 2,241.6 2,071.1 Internally generated cash flow R1 2,707.2 3,501.4 3,306.0 3,221.7 2,859.0 Capital expenditure 3,944.7 2,909.0 2,600.2 2,574.6 1,875.4
Per share dataEarnings – basic (cents) 30.5 69.0 31.4 30.6 32.2 Earnings – diluted (cents) 30.3 68.7 31.2 30.3 31.9 Cash earnings ($) R2 1.67 2.06 1.65 1.68 1.70 Net asset value ($) 11.07 10.96 10.66 11.26 11.14
Share price ($)High 11.67 12.24 12.91 11.45 11.35 Low 9.60 9.57 9.57 9.44 10.10 Closing 10.07 11.42 11.95 10.47 10.87
DividendsGross dividends (cents per share) 20.0 45.0 22.0 46.0 23.0 Dividend cover (times) 1.5 1.5 1.4 0.7 1.4
Profitability ratios (%)Return on equity holders’ funds R4 2.8 6.4 2.9 2.7 2.9 Return on total assets R5 1.8 3.6 1.7 1.9 2.0 Return on turnover R6 3.0 5.6 2.6 2.8 2.9
Productivity and employee dataValue added ($ million) 4,843.1 5,030.9 4,396.8 4,370.1 4,499.6 Value added per employee ($) R7 192,232 206,608 183,483 184,268 194,040 Revenue per employee ($) R7 590,160 625,819 649,564 642,769 651,093 Average staff strength 25,194 24,350 23,963 23,716 23,189
SGD per USD exchange rate as at 31 March 1.3973 1.3494 1.3752 1.2606 1.2417
R1 Internally generated cash flow comprises cash generated from operations, dividends from associated and joint venture companies, and proceeds from sale of aircraft and other property, plant and equipment.
R2 Cash earnings is defined as profit attributable to owners of the parent plus depreciation and amortisation.R3 Includes 25.0 cents per share special dividend.R4 Return on equity holders' funds is the profit attributable to owners of the parent expressed as a percentage of the average equity holders' funds.R5 Return on total assets is the profit after tax expressed as a percentage of the average total assets.R6 Return on turnover is the profit after tax expressed as a percentage of the total revenue.R7 Based on average staff strength.
R3
Annual Report FY2016/17 207

Ten-Year Statistical Record
2016/17 2015/16 2014/15 2013/14 2012/13 2011/12 2010/11 2009/10 2008/09 2007/08
Singapore Airlines
FinancialTotal revenue ($ million) 11,094.2 11,686.1 12,418.4 12,479.7 12,387.0 12,070.1 11,739.1 10,145.0 13,049.5 12,759.6 Total expenditure ($ million) 10,707.8 11,201.0 12,078.2 12,224.1 12,199.8 11,889.5 10,887.8 10,183.6 12,226.6 11,115.6 Operating profit /(loss) ($ million) 386.4 485.1 340.2 255.6 187.2 180.6 851.3 (38.6) 822.9 1,644.0 Profit/(Loss) before taxation ($ million) 579.3 766.2 563.1 536.4 (682.4) 413.3 1,194.0 233.3 1,252.4 2,077.6 Profit/(Loss) after taxation ($ million) 514.0 672.0 540.3 538.5 (694.1) 390.2 1,011.2 279.8 1,218.7 1,758.8 Capital disbursements R1 ($ million) 3,425.5 2,309.0 1,788.5 2,251.1 1,648.2 1,762.7 981.9 1,372.4 1,698.6 1,814.4
Passenger yield (cents/pkm) 10.2 10.6 11.2 11.1 11.4 11.8 11.9 10.4 12.5 12.1 Passenger unit cost (cents/ask) 8.2 8.5 8.9 9.1 9.2 9.2 8.9 8.6 9.2 8.4 Passenger breakeven load factor (%) 80.4 80.2 79.5 82.0 80.7 78.0 74.8 82.7 73.6 69.4
Operating passenger fleetAircraft (numbers) 106 102 105 103 101 100 108 108 103 98 Average age (months) 92 89 85 81 80 74 75 75 74 77
Passenger productionDestination cities (numbers) 61 60 60 62 63 63 64 68 66 65 Distance flown (million km) 388.6 382.3 384.4 392.2 386.3 374.6 354.1 342.4 379.8 365.9 Time flown (hours) 512,439 506,757 508,591 517,987 507,562 490,261 460,096 443,141 492,103 474,432 Available seat-km (million) 117,662.3 118,366.5 120,000.8 120,502.8 118,264.4 113,409.7 108,060.2 105,673.7 117,788.7 113,919.1
TrafficPassengers carried (‘000) 18,990 19,029 18,737 18,628 18,210 17,155 16,647 16,480 18,293 19,120 Revenue passenger-km (million) 92,913.8 94,267.4 94,209.2 95,064.3 93,765.6 87,824.0 84,801.3 82,882.5 90,128.1 91,485.2 Passenger load factor (%) 79.0 79.6 78.5 78.9 79.3 77.4 78.5 78.4 76.5 80.3
StaffAverage strength (numbers) 14,423 13,983 14,040 14,240 14,156 13,893 13,588 13,934 14,343 14,071 Seat capacity per employee R2 (seat-km) 8,157,963 8,465,029 8,547,066 8,462,275 8,354,366 8,163,082 7,952,620 7,583,874 8,212,278 8,096,020 Passenger load carried per employee R3 (tonne-km) 598,451 626,572 625,516 625,995 619,969 594,663 588,714 563,318 598,047 618,295 Revenue per employee ($) 769,202 835,736 884,501 876,383 875,035 868,790 863,931 728,075 909,817 906,801 Value added per employee ($) 246,183 261,861 242,970 242,184 159,593 237,472 310,480 219,678 294,666 368,382
SilkAirPassengers carried (‘000) 4,106 3,836 3,553 3,411 3,295 3,032 2,764 2,356 1,954 1,815 Revenue passenger-km (million) 7,138.0 6,516.2 5,864.9 5,516.1 5,223.1 4,469.4 4,039.6 3,466.4 3,158.6 3,094.9 Available seat-km (million) 10,086.3 9,117.8 8,355.2 7,926.9 7,096.3 5,904.8 5,285.1 4,495.9 4,355.2 4,323.0 Passenger load factor (%) 70.8 71.5 70.2 69.6 73.6 75.7 76.4 77.1 72.5 71.6 Passenger yield (cents/pkm) 12.5 13.5 13.9 13.7 14.1 14.5 14.1 13.1 15.0 14.0 Passenger unit cost (cents/ask) 8.3 9.0 9.7 9.8 9.9 10.1 9.4 9.9 10.9 9.7 Passenger breakeven load factor (%) 66.4 66.7 69.8 71.5 70.2 69.7 66.7 75.6 72.7 69.3
Budget Aviation Holdings R4
Passengers carried (‘000) 8,503 7,540 7,018 Revenue passenger-km (million) 22,083.8 18,225.0 16,415.0 Available seat-km (million) 26,792.8 21,732.8 19,983.0 Passenger load factor (%) 82.4 83.9 82.1 Revenue per revenue seat-km (cents/pkm) 5.9 6.3 6.3 Cost per available seat-km (cents/ask) 4.8 5.3 5.9 Breakeven load factor (%) 81.4 84.1 93.7
Singapore Airlines208
Financial

2016/17 2015/16 2014/15 2013/14 2012/13 2011/12 2010/11 2009/10 2008/09 2007/08
SIA CargoCargo and mail carried (million kg) 1,248.1 1,170.1 1,124.0 1,117.8 1,144.6 1,205.8 1,156.4 1,122.4 1,219.5 1,308.0 Cargo load (million tonne-km) 6,895.8 6,510.9 6,347.2 6,419.3 6,763.6 7,198.2 7,174.0 6,659.1 7,299.3 7,959.2 Gross capacity (million tonne-km) 10,912.3 10,513.3 10,024.9 10,273.6 10,661.0 11,286.5 11,208.5 10,510.1 12,292.5 12,787.8 Cargo load factor (%) 63.2 61.9 63.3 62.5 63.4 63.8 64.0 63.4 59.4 62.2 Cargo yield (cents/ltk) 25.9 29.0 32.8 32.7 33.4 34.9 36.2 32.0 38.2 38.7 Cargo unit cost (cents/ctk) 16.8 18.9 21.4 21.9 23.2 23.5 22.3 21.9 24.9 23.4 Cargo breakeven load factor (%) 64.9 65.2 65.2 67.0 69.5 67.3 61.6 68.4 65.2 60.5
Group Airlines (Passengers)Passengers carried (‘000) 31,599 30,405 29,308 22,039 21,505 20,187 19,411 18,836 20,247 20,935 Revenue passenger-km (million) 122,135.6 119,008.6 116,489.1 100,580.4 98,988.7 92,293.4 88,840.9 86,348.9 93,286.7 94,580.1 Available seat-km (million) 154,541.4 149,217.1 148,339.0 128,429.7 125,360.7 119,314.5 113,345.3 110,169.6 122,143.9 118,242.1 Passenger load factor (%) 79.0 79.8 78.5 78.3 79.0 77.4 78.4 78.4 76.4 80.0
R1 Capital disbursements comprised capital expenditure in property, plant and equipment, intangible assets, investments in subsidiary, associated and joint venture companies, and additional long-term equity investments.
R2 Seat capacity per employee is available seat capacity divided by Singapore Airlines' average staff strength.R3 Passenger load carried per employee is defined as passenger load and excess baggage carried divided by Singapore Airlines' average staff strength.R4 Operating statistics for Budget Aviation Holdings are only shown with effect from FY2014/15.
Annual Report FY2016/17 209

The Group Fleet Profile
As at 31 March 2017, Singapore Airlines Group operating fleet consisted of 178 aircraft - 171 passenger aircraft and seven freighters.
Aircraft type OwnedFinance
LeaseOperating
Lease Total
Average age in
years (y) and months (m)
On firm
orderOn
option
Singapore Airlines:777-200 11 11 13 y 11 m777-200ER 10 10 14 y 10 m777-300 5 5 13 y 4 m777-300ER 24 3 27 7 y 6 mA380-800 10 9 19 7 y 0 m 5A330-300 23 23 4 y 6 mA350-900 XWB 11 11 0 y 7 m 56787-10 30Sub-total 71 35 106 R1 7 y 8 m 91 R2
SIA Cargo:747-400F 6 1 7 13 y 4 m
SilkAir:A319 3 3 8 y 6 mA320 2 8 10 6 y 10 m737-800 8 9 17 2 y 1 m737 MAX 8 37 14 R3
Sub-total 10 20 30 4 y 3 m 37 14
Budget Aviation Holdings:787-8 6 6 1 y 3 m 4787-9 6 6 1 y 11 m 4A319 2 2 8 y 2 mA320 4 17 21 5 y 8 mA320neo 39 11Sub-total 12 4 19 35 R4 4 y 5 m 47 11
Total 99 5 74 178 6 y 8 m 175 25
R1 This excludes two 777-200ERs in storage and three 777-200s on lease to other carriers.R2 This excludes the proposed order under a Letter of Intent that Singapore Airlines had entered into with Boeing, for the purchase of 20 777-9s and 19 787-10s, plus six
options for each aircraft type.R3 These are purchase rights for Boeing model 737 MAX aircraft including 737 MAX 7, 737 MAX 8 or 737 MAX 9.R4 This excludes aircraft on lease to other carriers.
Singapore Airlines210
Financial

Group Corporate StructureAt 31 March 2017
100% Scoot Pte. Ltd.
100% Aircraft Maintenance Services Australia Pty Ltd
100% NexGen Network (1) Holding Pte Ltd
100% NexGen Network (2) Holding Pte Ltd
100% SIAEC Global Pte Ltd100% SIA Engineering (USA), Inc.80% Singapore Jamco Services
Pte Ltd65% SIA Engineering (Philippines)
Corporation65% Heavy Maintenance Singapore
Services Pte Ltd51% Aerospace Component
Engineering Services Pte Limited51% Aviation Partnership (Philippines)
Corporation50% Singapore Aero Engine Services
Pte Ltd49% Boeing Asia Pacific Aviation
Services Pte Ltd 49% Eagle Services Asia Private Limited49% Fuel Accessory Service
Technologies Pte Ltd49% PT JAS Aero-Engineering Services49% Southern Airports Aircraft
Maintenance Services Company Limited
47.1% Pan Asia Pacific Aviation Services Ltd
46.4% Component Aerospace Singapore Pte Ltd
45% JAMCO Aero Design & Engineering Pte Ltd
42.5% Panasonic Avionic Services Singapore Pte. Ltd.
40% Goodrich Aerostructures Service Center-Asia Pte Ltd
40% Safran Electronics & Defense Services Asia Pte. Ltd.
40% Safran Landing Systems Services Singapore Private Limited
39.2% Asian Surface Technologies Pte Ltd33.3% International Aerospace
Tubes-Asia Pte Ltd24.5% Asian Compressor Technology
Services Co Ltd24.5% Turbine Coating Services
Private Limited20.0% Jamco Singapore Pte Ltd
100% SilkAir (Singapore) Private Limited
45% Airbus Asia Training Centre Pte. Ltd.
100%Singapore Aviation and General Insurance Company (Pte) Limited
100% Singapore Flying College Pte Ltd
100% Sing-Bi Funds Private Limited
100% SIA (Mauritius) Ltd
76%Singapore Airport Duty-Free Emporium (Private) Limited
49% TATA SIA Airlines Limited
20%Virgin Australia Holdings Limited
Ritz-Carlton, Millenia Singapore Properties Private Limited
20%
100% Tiger Airways Holdings Limited
51% Cargo Community Network Pte Ltd
100% Cargo Community (Shanghai) Co. Ltd.
100% Budget Aviation Holdings Pte. Ltd.
77.7% SIA Engineering Company Limited
100%Tradewinds Tours & Travel Private Limited
100% Singapore Airlines Cargo Pte Ltd
100%
100%
Roar Aviation Pte. Ltd.
Roar Aviation II Pte. Ltd.
100%
100%
100%
100%
Roar Aviation III Pte. Ltd.
Simple Holidays Pte. Ltd.
Falcon Aircraft Limited
Winnie Aircraft Limited
100% Tiger Airways Singapore Pte. Ltd.
15%Air Black Box Asia Pacific Pte. Ltd.
49% NokScoot Airlines Co., Ltd
SINGAPORE AIRLINES LIMITED
Annual Report FY2016/17 211

Information on ShareholdingsAs at 2 June 2017
No. of Issued Shares: 1,199,851,019No. of Issued Shares (excluding Treasury Shares): 1,181,474,017No./ Percentage of Treasury Shares: 18,377,002 (1.53%)No./ Percentage of Subsidiary Holdings1: 0 (0%) Class of Shares: Ordinary shares One Special share held by the Minister for Finance Voting Rights (excluding Treasury shares): 1 vote for 1 share Range of shareholdings Number of shareholders % Number of shares %2
1 – 99 355 0.85 12,321 0.00100 – 1,000 16,719 40.05 13,808,477 1.171,001 – 10,000 21,790 52.20 78,224,847 6.6210,001 – 1,000,000 2,864 6.86 90,735,857 7.681,000,001 and above 14 0.04 998,692,515 84.53Total 41,742 100.00 1,181,474,017 100.00
Twenty largest shareholders Name Number of shares %2
1 Temasek Holdings (Private) Limited 657,306,600 55.632 DBS Nominees (Private) Limited 118,291,106 10.013 Citibank Nominees Singapore Pte Ltd 114,033,263 9.654 HSBC (Singapore) Nominees Pte Ltd 36,400,300 3.085 DBSN Services Pte Ltd 28,393,124 2.406 United Overseas Bank Nominees (Private) Limited 16,410,546 1.397 Raffles Nominees (Pte) Limited 12,732,758 1.088 BNP Paribas Securities Services 4,361,655 0.379 OCBC Nominees Singapore Private Limited 2,419,813 0.2110 DB Nominees (Singapore) Pte Ltd 2,419,740 0.2011 Estate of Chang Shyh Jin, Deceased 2,007,940 0.1712 UOB Kay Hian Private Limited 1,771,374 0.1513 Phillip Securities Pte Ltd 1,141,605 0.1014 OCBC Securities Private Limited 1,002,691 0.0915 Goh Kia Seng 964,100 0.0816 Tan Kim Siah 800,000 0.0717 Societe Generale Singapore Branch 795,947 0.0718 HL Bank Nominees (Singapore) Pte Ltd 795,400 0.0719 BNP Paribas Nominees Singapore Pte Ltd 743,549 0.0620 Tan Kim Han 716,000 0.06
Total 1,003,507,511 84.94
Singapore Airlines212
Financial

Substantial shareholder (as shown in the Register of Substantial Shareholders)
Number of shares
Substantial shareholder Direct Interest %2 Deemed Interest3 %2
Temasek Holdings (Private) Limited 657,306,600 55.63 295,438 0.03
1 ‘Subsidiary holdings’ is defined in the Listing Manual to mean shares referred to in Sections 21(4), 21(4B), 21(6A) and 21(6C) of the Companies Act, Chapter 50 of Singapore.2 Based on 1,181,474,016 ordinary shares issued as at 2 June 2017 (this is based on 1,199,851,018 ordinary shares issued as at 2 June 2017, excluding the 18,377,002
Treasury shares as at 2 June 2017).3 Temasek Holdings (Private) Limited is deemed interested in 295,438 ordinary shares in which its associated companies have direct or deemed interests.
Shareholdings held by the public
Based on the information available to the Company as at 2 June 2017, 44.26% of the issued ordinary shares of the Company are held by the public and, therefore, Rule 723 of the Listing Manual issued by SGX-ST is complied with.
Annual Report FY2016/17 213

Share Price and Turnover
Share Price ($) 2016/17 2015/16
High 11.67 12.24Low 9.60 9.57Closing 10.07 11.42
Market Value Ratios R1
Price/Earnings 33.02 16.55Price/Book value 0.91 1.04Price/Cash earnings R2 6.03 5.54
R1 Based on closing price on 31 March and Group numbers.R2 Cash earnings is defined as profit attributable to owners of the parent plus depreciation and amortisation.
Singapore Airlines Share Price and Turnover
Turnover Closing Price ST Index
Share Price ($)Volume (Million Stock Units) Index
60 3,400
3,200
3,000
2,800
2,600
2,400
50
40
30
20
10
0Apr 16 May 16 Jun 16 Jul 16 Aug 16 Sep 16 Oct 16 Nov 16 Dec 16 Jan 17 Feb 17 Mar 17
Singapore Airlines214
Financial

Notice of Annual General MeetingSINGAPORE AIRLINES LIMITED(Incorporated in the Republic of Singapore)Company Registration No. 197200078R
Notice is hereby given that the Forty-Fifth Annual General Meeting of Singapore Airlines Limited (“the Company”) will be held at Orchard Grand Ballroom, Level 3, Orchard Hotel Singapore, 442 Orchard Road, Singapore 238879 on Friday, 28 July 2017 at 10.00 a.m. to transact the following business:
Ordinary Business
1. To receive and adopt the Directors’ Statement and Audited Financial Statements for the year ended 31 March 2017 and the Auditors’ Report thereon.
2. To declare a final dividend of 11 cents per ordinary share for the year ended 31 March 2017.
3. To re-elect Dr Helmut Gunter Wilhelm Panke, a Director who is retiring by rotation in accordance with Article 91 of the Company’s Constitution and who, being eligible, offers himself for re-election.
Dr William Fung Kwok Lun is also due to retire by rotation under Article 91 of the Company’s Constitution but will not be offering himself for re-election.
4. To re-elect the following Directors who are retiring in accordance with Article 97 of the Company’s Constitution and who, being eligible, offer themselves for re-election:
(a) Mr Lee Kim Shin (b) Mr Dominic Ho Chiu Fai (c) Mr Simon Cheong Sae Peng
5. To approve Directors’ emoluments of up to $2,300,000 for the financial year ending 31 March 2018 (FY2016/17: up to $2,300,000).
6. To re-appoint KPMG LLP as Auditors of the Company and to authorise the Directors to fix their remuneration.
Special Business
To consider and if thought fit, to pass, with or without modifications, the following resolutions which will be proposed as Ordinary Resolutions:
7. That pursuant to Section 161 of the Companies Act, Chapter 50 of Singapore, authority be and is hereby given to the Directors of the Company to:
(a) (i) issue shares of the Company (“shares”) whether by way of rights, bonus or otherwise; and/or
(ii) make or grant offers, agreements or options (collectively, “Instruments”) that might or would require shares to be issued, including but not limited to the creation and issue of (as well as adjustments to) warrants, debentures or other instruments convertible into shares,
at any time and upon such terms and conditions and for such purposes and to such persons as the Directors may in their absolute discretion deem fit; and
(b) (notwithstanding the authority conferred by this Resolution may have ceased to be in force) issue shares in pursuance of any Instrument made or granted by the Directors while this Resolution was in force,
provided that:
(1) the aggregate number of shares to be issued pursuant to this Resolution (including shares to be issued in pursuance of Instruments made or granted pursuant to this Resolution) does not exceed 50% of the total number of issued shares (excluding treasury shares and subsidiary holdings) (as calculated in accordance with sub-paragraph (2) below), of which the aggregate number of shares to be issued other than on a pro rata basis to shareholders of the Company (including shares to be issued in pursuance of Instruments made or granted pursuant to this Resolution) does not exceed 5% of the total number of issued shares (excluding treasury shares and subsidiary holdings) (as calculated in accordance with sub-paragraph (2) below);
Annual Report FY2016/17 215

(2) (subject to such manner of calculation as may be prescribed by the Singapore Exchange Securities Trading Limited (the “SGX-ST”)) for the purpose of determining the aggregate number of shares that may be issued under sub-paragraph (1) above, the percentage of issued shares shall be based on the total number of issued shares (excluding treasury shares and subsidiary holdings) at the time this Resolution is passed, after adjusting for:
(i) new shares arising from the conversion or exercise of any convertible securities or share options or vesting of share awards which are outstanding or subsisting at the time this Resolution is passed; and
(ii) any subsequent bonus issue or consolidation or subdivision of shares,
and, in sub-paragraph (1) above and this sub-paragraph (2), “subsidiary holdings” has the meaning given to it in the Listing Manual of the SGX-ST;
(3) in exercising the authority conferred by this Resolution, the Company shall comply with the provisions of the Listing Manual of the SGX-ST for the time being in force (unless such compliance has been waived by the SGX-ST) and the Constitution for the time being of the Company; and
(4) (unless revoked or varied by the Company in general meeting) the authority conferred by this Resolution shall continue in force until the conclusion of the next Annual General Meeting of the Company or the date by which the next Annual General Meeting of the Company is required by law to be held, whichever is the earlier.
8. That the Directors of the Company be and are hereby authorised to:
(a) grant awards in accordance with the provisions of the SIA Performance Share Plan 2014 and/or the SIA Restricted Share Plan 2014; and
(b) allot and issue from time to time such number of fully paid-up ordinary shares as may be required to be delivered pursuant to the vesting of awards under the SIA Performance Share Plan 2014 and/or the SIA Restricted Share Plan 2014,
provided that:
(1) the aggregate number of (i) new ordinary shares allotted and issued and/or to be allotted and issued, (ii) existing ordinary shares (including ordinary shares held in treasury) delivered and/or to be delivered, and (iii) ordinary shares released and/or to be released in the form of cash in lieu of ordinary shares, pursuant to the SIA Performance Share Plan 2014 and the SIA Restricted Share Plan 2014, shall not exceed 5% of the total number of issued ordinary shares (excluding treasury shares and subsidiary holdings) from time to time;
(2) the aggregate number of ordinary shares under awards to be granted pursuant to the SIA Performance Share Plan 2014 and the SIA Restricted Share Plan 2014 respectively during the period (the “Relevant Year”) commencing from this Annual General Meeting and ending on the date of the next Annual General Meeting of the Company or the date by which the next Annual General Meeting of the Company is required by law to be held, whichever is the earlier, shall not exceed 0.5% of the total number of issued ordinary shares (excluding treasury shares and subsidiary holdings) from time to time (the “Yearly Limit”); and
(3) if the Yearly Limit is not fully utilised during the Relevant Year, any unutilised portion of the Yearly Limit may be used for the grant of awards under the SIA Performance Share Plan 2014 and the SIA Restricted Share Plan 2014 in subsequent years, for the duration of the SIA Performance Share Plan 2014 and the SIA Restricted Share Plan 2014 respectively,
and in this Resolution, “subsidiary holdings” has the meaning given to it in the Listing Manual of the Singapore Exchange Securities Trading Limited.
9. That:
(a) approval be and is hereby given, for the purposes of Chapter 9 of the Listing Manual (“Chapter 9”) of the Singapore Exchange Securities Trading Limited for the Company, its subsidiaries and associated companies that are “entities at risk” (as that term is used in Chapter 9), or any of them, to enter into any of the transactions falling within the types of interested person transactions described in the Appendix to the Letter to Shareholders dated 30 June 2017 (the “Letter”) with any party who is of the class of interested persons described in the Appendix to the Letter, provided that such transactions are made on normal commercial terms and in accordance with the review procedures for such interested person transactions;
Notice of Annual General MeetingSINGAPORE AIRLINES LIMITED(Incorporated in the Republic of Singapore)Company Registration No. 197200078R
Singapore Airlines216
Financial

(b) the approval given in paragraph (a) above (the “IPT Mandate”) shall, unless revoked or varied by the Company in general meeting, continue in force until the conclusion of the next Annual General Meeting of the Company; and
(c) the Directors of the Company and/or any of them be and are hereby authorised to complete and do all such acts and things (including executing all such documents as may be required) as they and/or he may consider expedient or necessary or in the interests of the Company to give effect to the IPT Mandate and/or this Resolution.
10. That:
(a) for the purposes of Sections 76C and 76E of the Companies Act, Chapter 50 of Singapore (the “Companies Act”), the exercise by the Directors of the Company of all the powers of the Company to purchase or otherwise acquire issued ordinary shares of the Company (“Shares”) not exceeding in aggregate the Maximum Limit (as hereafter defined), at such price or prices as may be determined by the Directors of the Company from time to time up to the Maximum Price (as hereafter defined), whether by way of:
(i) market purchase(s) on the Singapore Exchange Securities Trading Limited (the “SGX-ST”); and/or
(ii) off-market purchase(s) (if effected otherwise than on the SGX-ST) in accordance with any equal access scheme(s) as may be determined or formulated by the Directors as they consider fit, which scheme(s) shall satisfy all the conditions prescribed by the Companies Act,
and otherwise in accordance with all other laws and regulations and rules of the SGX-ST as may for the time being be applicable, be and is hereby authorised and approved generally and unconditionally (the “Share Buy Back Mandate”);
(b) unless varied or revoked by the Company in general meeting, the authority conferred on the Directors of the Company pursuant to the Share Buy Back Mandate may be exercised by the Directors of the Company at any time and from time to time during the period commencing from the date of the passing of this Resolution and expiring on the earliest of:
(i) the date on which the next Annual General Meeting of the Company is held;
(ii) the date by which the next Annual General Meeting of the Company is required by law to be held; and
(iii) the date on which purchases and acquisitions of Shares pursuant to the Share Buy Back Mandate are carried out to the full extent mandated;
(c) in this Resolution:
“Average Closing Price” means the average of the last dealt prices of a Share for the five consecutive trading days on which the Shares are transacted on the SGX-ST immediately preceding the date of market purchase by the Company or, as the case may be, the date of the making of the offer pursuant to the off-market purchase, and deemed to be adjusted in accordance with the listing rules of the SGX-ST for any corporate action which occurs after the relevant five-day period;
“date of the making of the offer” means the date on which the Company announces its intention to make an offer for the purchase or acquisition of Shares from holders of Shares, stating therein the purchase price (which shall not be more than the Maximum Price calculated on the foregoing basis) for each Share and the relevant terms of the equal access scheme for effecting the off-market purchase;
“Maximum Limit” means that number of issued Shares representing 5% of the total number of issued Shares as at the date of the passing of this Resolution (excluding treasury shares and subsidiary holdings (as defined in the Listing Manual of the SGX-ST)); and
“Maximum Price”, in relation to a Share to be purchased or acquired, means the purchase price (excluding brokerage, commission, applicable goods and services tax and other related expenses) which shall not exceed, whether pursuant to a market purchase or an off-market purchase, 105% of the Average Closing Price of the Shares; and
(d) the Directors of the Company and/or any of them be and are hereby authorised to complete and do all such acts and things (including executing all such documents as may be required) as they and/or he may consider expedient or necessary or in the interests of the Company to give effect to the transactions contemplated and/or authorised by this Resolution.
Annual Report FY2016/17 217

Closure of Books
Notice is hereby given that, subject to the approval of shareholders to the final dividend being obtained at the Forty-Fifth Annual General Meeting to be held on 28 July 2017, the Transfer Books and the Register of Members of the Company will be closed on 4 August 2017 for the preparation of dividend warrants.
Duly completed and stamped transfers (together with all relevant documents of or evidencing title) received by the Share Registrar, M & C Services Private Limited, 112 Robinson Road #05-01, Singapore 068902 up to 5.00 p.m. on 3 August 2017 will be registered to determine shareholders’ entitlements to the final dividend. Subject as aforesaid, shareholders whose Securities Accounts with The Central Depository (Pte) Limited are credited with ordinary shares of the Company as at 5.00 p.m. on 3 August 2017 will be entitled to the final dividend.
The final dividend, if so approved by shareholders, will be paid on 16 August 2017.
By Order of the Board
Brenton WuCompany Secretary30 June 2017Singapore
Notice of Annual General MeetingSINGAPORE AIRLINES LIMITED(Incorporated in the Republic of Singapore)Company Registration No. 197200078R
Singapore Airlines218
Financial

Explanatory notes
1. In relation to Ordinary Resolution No. 3, Dr Helmut Gunter Wilhelm Panke will, upon re-election, continue to serve as Chairman of the Board Safety and Risk Committee and a member of the Board Compensation and Industrial Relations Committee. Dr Panke is considered an independent Director. Please refer to the sections on Board of Directors and Corporate Governance in the Annual Report for further details on Dr Panke.
2. In relation to Ordinary Resolution Nos. 4(a), 4(b) and 4(c), Article 97 of the Company’s Constitution permits the Directors to appoint any person approved in writing by the Special Member to be a Director, either to fill a casual vacancy or as an addition to the existing Directors. Any Director so appointed shall hold office only until the next following Annual General Meeting, and shall then be eligible for re-election. Mr Lee Kim Shin, Mr Dominic Ho Chiu Fai and Mr Simon Cheong Sae Peng were appointed on 1 September 2016, 1 May 2017 and 1 June 2017 respectively, and are seeking re-election at the forthcoming Forty-Fifth Annual General Meeting. Mr Lee will, upon re-election, continue to serve as a member of the Board Nominating Committee and the Board Safety and Risk Committee. Mr Ho will, upon re-election, continue to serve as a member of the Board Audit Committee, and the Board Safety and Risk Committee. Mr Cheong will, upon re-election continue to serve as a member of the Board Compensation and Industrial Relations Committee. Mr Lee, Mr Ho and Mr Cheong are considered independent Directors. Please refer to the sections on Board of Directors and Corporate Governance in the Annual Report for further details on Mr Lee, Mr Ho and Mr Cheong.
3. Ordinary Resolution No. 5, if passed, will facilitate the payment of Directors’ fees during the financial year in which the fees are incurred, that is, during FY2017/18. Directors’ fees are computed based on the anticipated number of Board and Committee meetings for FY2017/18, assuming full attendance by all of the non-executive Directors. The amount also caters for any fee increases and unforeseen circumstances, for example, the appointment of additional Directors, additional unscheduled Board meetings and/or the formation of additional Board Committees. The amount also includes transport and travel benefits to be provided to the non-executive Directors. In the event that the amount proposed is insufficient, approval will be sought at the next Annual General Meeting before payments are made to Directors for the shortfall. Mr Goh Choon Phong, being the Chief Executive Officer, does not receive any Director’s fees.
4. Ordinary Resolution No. 7, if passed, will empower the Directors to issue shares, make or grant instruments convertible into shares and to issue shares pursuant to such instruments. The number of shares which the Directors may issue under this Resolution will not exceed 50% of the issued shares (excluding treasury shares and subsidiary holdings), with a sub-limit of 5% for issues other than on a pro rata basis. The 5% sub-limit for non-pro rata issues is lower than the 20% sub-limit allowed under the Listing Manual of the Singapore Exchange Securities Trading Limited (the “SGX-ST”). For the purpose of determining the aggregate number of shares which may be issued, the percentage of issued shares shall be based on the total number of issued shares (excluding treasury shares and subsidiary holdings) at the time this Ordinary Resolution is passed, after adjusting for (a) new shares arising from the conversion or exercise of any convertible instruments or share options or vesting of share awards which are outstanding at the time this Ordinary Resolution is passed and (b) any subsequent bonus issue or consolidation or subdivision of shares. For the avoidance of doubt, shareholders’ approval will be required for any consolidation or subdivision of shares. As at 2 June 2017 (the “Latest Practicable Date”), the Company had 18,377,002 treasury shares and no subsidiary holdings.
5. Ordinary Resolution No. 8, if passed, will empower the Directors to grant awards pursuant to the SIA Performance Share Plan 2014 and the SIA Restricted Share Plan 2014, and to allot and issue ordinary shares of the Company pursuant to the SIA Performance Share Plan 2014 and the SIA Restricted Share Plan 2014. The SIA Performance Share Plan 2014 and the SIA Restricted Share Plan 2014 were adopted at the Extraordinary General Meeting of the Company held on
30 July 2014. The total number of ordinary shares which may be delivered pursuant to awards granted under the SIA Performance Share Plan 2014 and the SIA Restricted Share Plan 2014 (whether in the form of ordinary shares or in the form of cash in lieu of ordinary shares) shall not exceed 5% of the total number of issued ordinary shares (excluding treasury shares and subsidiary holdings) from time to time. In addition, Ordinary Resolution No. 8 will also provide that the total number of ordinary shares under awards to be granted pursuant to the SIA Performance Share Plan 2014 and the SIA Restricted Share Plan 2014 from this Annual General Meeting to the next Annual General Meeting (the “Relevant Year”) shall not exceed 0.5% of the total number of issued ordinary shares (excluding treasury shares and subsidiary holdings) from time to time (the “Yearly Limit”), provided that if the Yearly Limit is not fully utilised during the Relevant Year, any unutilised portion of the Yearly Limit may be used by the Directors to make grants of awards under the SIA Performance Share Plan 2014 and the SIA Restricted Share Plan 2014 in subsequent years, for the duration of the SIA Performance Share Plan 2014 and the SIA Restricted Share Plan 2014 respectively.
6. Ordinary Resolution No. 9, if passed, will renew the mandate to allow the Company, its subsidiaries and associated companies that are entities at risk (as that term is used in Chapter 9 of the Listing Manual of the SGX-ST) or any of them, to enter into certain interested person transactions with certain classes of interested persons as described in the Appendix to the Letter to Shareholders dated 30 June 2017 (the “Letter”). The authority will, unless revoked or varied by the Company in general meeting, continue in force until the conclusion of the next Annual General Meeting of the Company. Please refer to the Letter for more details.
Annual Report FY2016/17 219

7. Ordinary Resolution No. 10, if passed, will renew the mandate to allow the Company to purchase or otherwise acquire its issued ordinary shares, on the terms and subject to the conditions set out in the Resolution.
The Company may use internal or external sources of funds to finance the purchase or acquisition of its ordinary shares. The amount of financing required for the Company to purchase or acquire its ordinary shares, and the impact on the Company’s financial position, cannot be ascertained as at the date of this Notice as these will depend on the number of ordinary shares purchased or acquired and the price at which such ordinary shares were purchased or acquired and whether the ordinary shares purchased or acquired are held in treasury or cancelled.
The financial effects of the purchase or acquisition of such ordinary shares by the Company pursuant to the proposed Share Buy Back Mandate on the audited financial statements of the Company and the Company and its subsidiaries for the financial year ended 31 March 2017, based on certain assumptions, are set out in paragraph 3.7 of the Letter.
Please refer to the Letter for more details.
Notes:1. (a) A member who is not a relevant intermediary is entitled to appoint not more than two proxies to attend, speak and vote at the Annual General Meeting.
Where such member’s form of proxy appoints more than one proxy, the proportion of the shareholding concerned to be represented by each proxy shall be specified in the form of proxy.
(b) A member who is a relevant intermediary is entitled to appoint more than two proxies to attend, speak and vote at the Annual General Meeting, but each proxy must be appointed to exercise the rights attached to a different share or shares held by such member. Where such member’s form of proxy appoints more than two proxies, the number and class of shares in relation to which each proxy has been appointed shall be specified in the form of proxy.
“Relevant intermediary” has the meaning ascribed to it in Section 181 of the Companies Act, Chapter 50 of Singapore.
2. A proxy need not be a member of the Company.
3. The instrument appointing a proxy or proxies must be deposited at the office of the Company’s Share Registrar, M & C Services Private Limited, 112 Robinson Road #05-01, Singapore 068902 not less than 72 hours before the time fixed for holding the Annual General Meeting.
Personal data privacy:By submitting an instrument appointing a proxy(ies) and/or representative(s) to attend, speak and vote at the Annual General Meeting and/or any adjournment thereof, a member of the Company (i) consents to the collection, use and disclosure of the member’s personal data by the Company (or its agents or service providers) for the purpose of the processing, administration and analysis by the Company (or its agents or service providers) of proxies and representatives appointed for the Annual General Meeting (including any adjournment thereof) and the preparation and compilation of the attendance lists, minutes and other documents relating to the Annual General Meeting (including any adjournment thereof), and in order for the Company (or its agents or service providers) to comply with any applicable laws, listing rules, take-over rules, regulations and/or guidelines (collectively, the “Purposes”), (ii) warrants that where the member discloses the personal data of the member’s proxy(ies) and/or representative(s) to the Company (or its agents or service providers), the member has obtained the prior consent of such proxy(ies) and/or representative(s) for the collection, use and disclosure by the Company (or its agents or service providers) of the personal data of such proxy(ies) and/or representative(s) for the Purposes, and (iii) agrees that the member will indemnify the Company in respect of any penalties, liabilities, claims, demands, losses and damages as a result of the member’s breach of warranty.
Notice of Annual General MeetingSINGAPORE AIRLINES LIMITED(Incorporated in the Republic of Singapore)Company Registration No. 197200078R
Singapore Airlines220
Financial

Corporate Data
Board of Directors CHAIRMAN Stephen Lee Ching Yen
(until 31 December 2016)Peter Seah Lim Huat(from 1 January 2017)
DEPUTY CHAIRMAN
Peter Seah Lim Huat(until 31 December 2016)
MEMBERS Gautam BanerjeeWilliam Fung Kwok LunGoh Choon PhongHsieh Tsun-yanHelmut Gunter Wilhelm PankeChristina Ong(until 31 August 2016)Lucien Wong Yuen Kuai(until 31 August 2016)Lee Kim Shin(from 1 September 2016) Dominic Ho Chiu Fai(from 1 May 2017) Simon Cheong Sae Peng(from 1 June 2017)
Board CommitteesBOARD EXECUTIVE COMMITTEECHAIRMAN Stephen Lee Ching Yen
(until 31 December 2016)Peter Seah Lim Huat(from 1 January 2017)
MEMBERS Gautam BanerjeeGoh Choon PhongLucien Wong Yuen Kuai(until 31 August 2016) Peter Seah Lim Huat(until 31 December 2016)Hsieh Tsun-yan(from 20 March 2017)
BOARD AUDIT COMMITTEECHAIRMAN Gautam BanerjeeMEMBERS William Fung Kwok Lun
Hsieh Tsun-yanDominic Ho Chiu Fai(from 1 May 2017)
BOARD COMPENSATION AND INDUSTRIAL RELATIONS COMMITTEECHAIRMAN Stephen Lee Ching Yen
(until 31 December 2016)Peter Seah Lim Huat(from 1 January 2017)
MEMBERS Hsieh Tsun-yanHelmut Gunter Wilhelm PankeGautam Banerjee(until 16 August 2016)Peter Seah Lim Huat(until 31 December 2016) Simon Cheong Sae Peng(from 1 June 2017)
BOARD NOMINATING COMMITTEECHAIRMAN Stephen Lee Ching Yen
(until 31 December 2016)Peter Seah Lim Huat(from 1 January 2017)
MEMBERS Christina Ong(until 31 August 2016)Lucien Wong Yuen Kuai(until 31 August 2016)Goh Choon Phong(from 1 September 2016)Lee Kim Shin(from 1 September 2016)
BOARD SAFETY AND RISK COMMITTEE CHAIRMAN Helmut Gunter Wilhelm PankeMEMBERS Christina Ong
(until 31 August 2016)Lucien Wong Yuen Kuai(until 31 August 2016)Stephen Lee Ching Yen(from 1 September 2016 to 31 December 2016)Lee Kim Shin(from 1 September 2016)Peter Seah Lim Huat(from 1 January 2017)Dominic Ho Chiu Fai(from 1 June 2017)
COMPANY SECRETARY
Brenton Wu Ming-Kaye
SHARE REGISTRAR
M & C Services Private Limited112 Robinson Road #05-01Singapore 068902
AUDITORS KPMG LLPPublic Accountants and Chartered Accountants16 Raffles Quay#22-00 Hong Leong BuildingSingapore 048581
AUDIT PARTNER
Tham Sai Choy (from 30 July 2015)
REGISTERED OFFICE
Airline House 25 Airline RoadSingapore 819829
Goh Choon PhongChief Executive Officer
Mak Swee WahExecutive Vice President Commercial
Ng Chin HweeExecutive Vice President Human Resources & Operations
Tan Pee TeckSenior Vice President Cabin Crew
Tan Kai PingSenior Vice President Corporate Planning(until 14 August 2016)
Lee Wen FenSenior Vice President Corporate Planning(from 15 August 2016)
Lau Hwa PengActing Senior Vice President Engineering(from 11 June 2015 to 10 June 2016)
Lau Hwa PengSenior Vice President Engineering(from 11 June 2016)
Stephen BarnesSenior Vice President Finance
Quay Chew EngActing Senior Vice President Flight Operations(from 19 October 2015 to 18 October 2016)
Quay Chew Eng Senior Vice President Flight Operations(from 19 October 2016)
Christopher Cheng Kian HaiSenior Vice President Human Resources
George Wang Wei JunSenior Vice President Information Technology
Lee Wen FenSenior Vice President Marketing Planning(until 14 August 2016)
Tan Kai PingSenior Vice President Marketing Planning(from 15 August 2016)
Marvin Tan Meng HungSenior Vice President Product & Services
Campbell David McGregor WilsonActing Senior Vice President Sales & Marketing(from 29 August 2016 to 28 February 2017)
Campbell David McGregor WilsonSenior Vice President Sales & Marketing(from 1 March 2017)
Executive Management
31 March 2017Financial Year-End
18 May 2017Announcement of FY2016/17 Annual Results
30 June 2017Publication of Annual Reportand Letter to Shareholders
27 July 2017Announcement of FY2017/18First Quarter Results
28 July 2017Annual General Meeting
16 August 2017Payment of Final Dividend for the FY2016/17(subject to shareholders’ approval at AGM)
7 November 2017Announcement of FY2017/18Second Quarter and Half-Year Results
Financial Calendar
Senior Management, Major SubsidiariesPng Kim ChiangChief Executive Officer SIA Engineering Company Limited
Lee Lik HsinChief Executive OfficerBudget Aviation Holdings Pte. Ltd.
Foo Chai WooChief Executive SilkAir (Singapore) Private Limited
Chin Yau Seng PresidentSingapore Airlines Cargo Pte Ltd
Head Office
Lee Sek EngRegional Vice President Americas
Subhas MenonRegional Vice President Europe
Lim Wee KokRegional Vice President North Asia
Philip Goh Ser MiangRegional Vice President South East Asia
Tan Tiow KorRegional Vice President South West Pacific
Joey Seow Eng WanRegional Vice President West Asia & Africa
Overseas Regions

SINGAPORE AIRLINES LIMITEDMCI (P) 130/05/2017IS20170000413Singapore Company Reg. No.: 197200078R Airline House25 Airline RoadSingapore 819829
COMPANY SECRETARYBrenton WuTel: +65 6541 5314Fax: +65 6546 7469Email: [email protected]
www.singaporeair.com
INVESTOR RELATIONSTel: +65 6541 4885Email: [email protected] PUBLIC AFFAIRSTel: +65 6541 5880Email: [email protected]