Presentación de PowerPoint - LATAM Airlines Group
13
Second Quarter 2014 Results Presentation August 2014
-
Upload
khangminh22 -
Category
Documents
-
view
1 -
download
0
Transcript of Presentación de PowerPoint - LATAM Airlines Group

00
2
05
7
12
1
21
2
05
2
05
2
02
3
15
9
21
9
21
1
21
1
21
1
00
0
09
4
16
4
25
1
20
7
04
3
14
6
14
8
15
1
Co
lor sch
eme
Second Quarter 2014 Results Presentation
August 2014

00
2
05
7
12
1
21
2
05
2
05
2
02
3
15
9
21
9
21
1
21
1
21
1
00
0
09
4
16
4
25
1
20
7
04
3
14
6
14
8
15
1
Co
lor sch
eme
2Q14 Highlights
Strong unit revenues resulting from capacity discipline, despite the weak macroeconomic
environment
Successful operations during the FIFA World Cup that took place in Brazil, but recognition
of a negative impact in results
Week seasonal seed exports in the cargo business
Positive contribution of Brazilian domestic market to our results and continued preference
from corporate passenger in that market
Significant advances in our fleet restructuring plan
2

00
2
05
7
12
1
21
2
05
2
05
2
02
3
15
9
21
9
21
1
21
1
21
1
00
0
09
4
16
4
25
1
20
7
04
3
14
6
14
8
15
1
Co
lor sch
eme
(US$ Millions) 2Q14 2Q13 Change 1H14 1H13 Change
Total Operating Revenues 3,048 3,099 -1.7% 6,225 6,508 -4.3%
Operating Income 15 39 -61.0% 128 154 -16.7%
Operating Margin 0.5% 1.3% -0.8 pp 2.1% 2.4% -0.3 pp
Net Income -59 -330 -82.1% -100 -287 -65.1%
EBITDAR 396 383 3.4% 882 895 -1.4%
EBITDAR Margin 13.0% 12.4% 0.6 pp 14.2% 13.7% 0.4 pp
2Q14 and 1H14 Financial Summary
3
00
2
05
7
12
1
21
2
05
2
05
2
02
3
15
9
21
9
21
1
21
1
21
1
00
0
09
4
16
4
25
1
20
7
04
3
14
6
14
8
15
1
Co
lor sch
eme
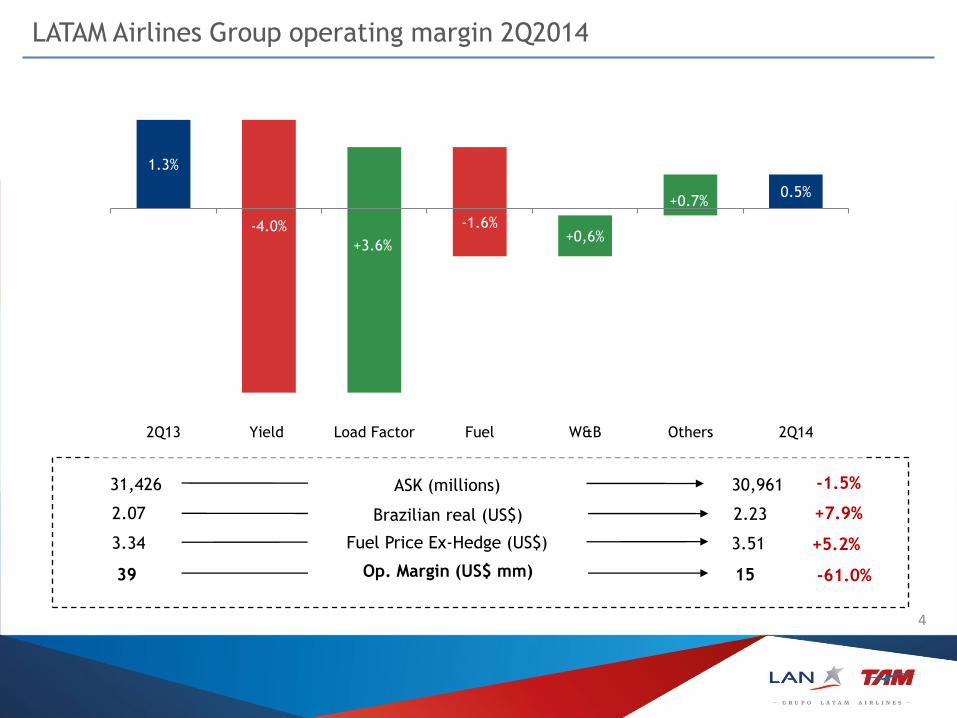
LATAM Airlines Group operating margin 2Q2014
Op. Margin (US$ mm)
Fuel Price Ex-Hedge (US$)
+5.2% 3.34 3.51
+7.9% 2.07 2.23
-61.0% 39 15
ASK (millions) -1.5% 31,426 30,961
Brazilian real (US$)
1.3%
-4.0%
+3.6%
-1.6%+0,6%
+0.7%0.5%
2Q13 Yield Load Factor Fuel W&B Others 2Q14
4
00
2
05
7
12
1
21
2
05
2
05
2
02
3
15
9
21
9
21
1
21
1
21
1
00
0
09
4
16
4
25
1
20
7
04
3
14
6
14
8
15
1
Co
lor sch
eme
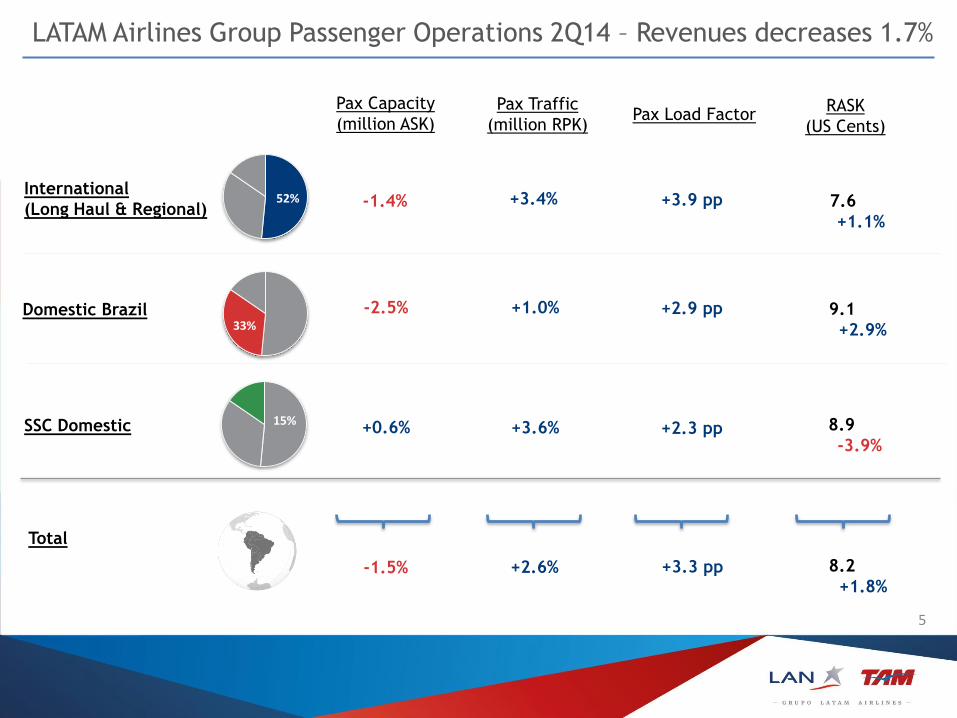
LATAM Airlines Group Passenger Operations 2Q14 – Revenues decreases 1.7%
International
(Long Haul & Regional)
Domestic Brazil
SSC Domestic
50%
16%
33%
Pax Capacity
(million ASK) Pax Load Factor
-1.4%
-2.5%
+0.6%
+3.9 pp
+2.9 pp
+2.3 pp
+3.3 pp
Pax Traffic
(million RPK)
+3.4%
+1.0%
+3.6%
+2.6%
RASK
(US Cents)
7.6
+1.1%
9.1
+ +2.9%
8.9
-3.9%
Total
-1.5% 8.2
+1.8%
52%
15%
33%
5

00
2
05
7
12
1
21
2
05
2
05
2
02
3
15
9
21
9
21
1
21
1
21
1
00
0
09
4
16
4
25
1
20
7
04
3
14
6
14
8
15
1
Co
lor sch
eme
International Passenger Business Unit
Upgraded
product with new
business class for
TAM’s B777
Additional routes
operated by the
B787
Dreamliner
Strengthening our
Hub in Guarulhos
and improving
connectivity
International context
• Increased competition
• Weaker European and Latin American markets
• Depreciation of local currencies (Argentina)
6

00
2
05
7
12
1
21
2
05
2
05
2
02
3
15
9
21
9
21
1
21
1
21
1
00
0
09
4
16
4
25
1
20
7
04
3
14
6
14
8
15
1
Co
lor sch
eme
LATAM Operation World Cup Facts
Played in 12 host cities
12 holidays in Brazil
Traffic in domestic Brazil
decreased 5.2% during June and
7.8% during in July
Focus on passenger service with 95% on-time performance
Almost 3 million passengers transported
More than 1,100 extra flights with backup aircraft
Reinforcement of our staff with special training
US$140- US$160 million impact on results mainly coming
from decreased revenues
At LATAM we are very proud of our performance during the
World Cup. Despite the negative impact on our results we
strongly believe in the long term benefits for both the airline
industry in Brazil and our passengers
Brazil World Cup
World Cup Facts LATAM Operation
7

00
2
05
7
12
1
21
2
05
2
05
2
02
3
15
9
21
9
21
1
21
1
21
1
00
0
09
4
16
4
25
1
20
7
04
3
14
6
14
8
15
1
Co
lor sch
eme
50%
Belly …
Cargo Operation
Cargo Capacity
(million ATK)
Cargo Traffic
(million RTK)
Cargo Load
Factor
-7.5% -6.2% +0.9 pp
Yield based on RTKs (US cents) 40.5
24.1
-6.9%
-5.5% Revenues per ATK (US cents)
50%
Cargo Revenues
50%
Freighter
Belly
LATAM Airlines Group Cargo Operations 2Q14 – Revenue decreases 12.7%
Weak seed exports during the 2Q14 and reduced cargo demand during the World Cup
The Company continues with a rational and disciplined approach toward freighter capacity
8

00
2
05
7
12
1
21
2
05
2
05
2
02
3
15
9
21
9
21
1
21
1
21
1
00
0
09
4
16
4
25
1
20
7
04
3
14
6
14
8
15
1
Co
lor sch
eme
Operating Costs during 2Q14
29%
Wages & Benefits
Aircraft Costs
Others
50%
US$ (mm) Variation vs. 2Q13
617
907
-3.7%
+1.8%
Operating Cost ex –fuel
Operating Cost per ASK-equivalent (US Cents)
Aircraft Fuel
Total Operating Cost
Operating Cost ASK-equivalent (US Cents)
481
-1.3%
2,005
+3.1% 5.0
-0.9%
+2.6%
-1.3%
1,027 -0.0%
3,032
5.8
20%
16%
36%
9

00
2
05
7
12
1
21
2
05
2
05
2
02
3
15
9
21
9
21
1
21
1
21
1
00
0
09
4
16
4
25
1
20
7
04
3
14
6
14
8
15
1
Co
lor sch
eme
LATAM’s fleet plan: focus on fleet renewal
239 238 242
84 74 70
16 15 14
2013 2014 2015
Narrow Body Wide Body Freighters
1.19 1.89 Fleet Commitments
US$ bn 1.94
339 327 326
+20 aircraft
-32 aircraft
+27 aircraft
-28 aircraft
Total aircraft at the end of the year
10 A31
5 B787
21 A321
10 B787
36 A321
17 B787 + 1 A350
Lower CASK
Upgraded product
10
00
2
05
7
12
1
21
2
05
2
05
2
02
3
15
9
21
9
21
1
21
1
21
1
00
0
09
4
16
4
25
1
20
7
04
3
14
6
14
8
15
1
Co
lor sch
eme
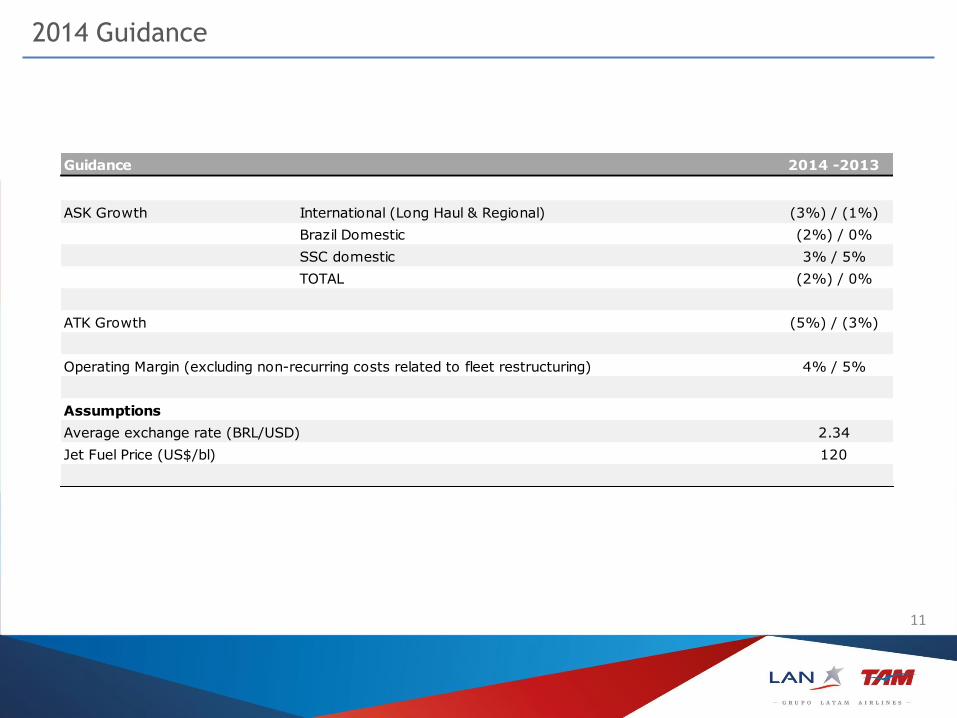
2014 Guidance
Guidance 2014 -2013
ASK Growth International (Long Haul & Regional) (3%) / (1%)
Brazil Domestic (2%) / 0%
SSC domestic 3% / 5%
TOTAL (2%) / 0%
ATK Growth (5%) / (3%)
Operating Margin (excluding non-recurring costs related to fleet restructuring) 4% / 5%
Assumptions
Average exchange rate (BRL/USD) 2.34
Jet Fuel Price (US$/bl) 120
11

00
2
05
7
12
1
21
2
05
2
05
2
02
3
15
9
21
9
21
1
21
1
21
1
00
0
09
4
16
4
25
1
20
7
04
3
14
6
14
8
15
1
Co
lor sch
eme
Solid improvement in our main financial ratios
1,183 1,242
1,696
Jun12 Jun13 Jun14
Cash & equiv. as % LTM rev.
(US$mm)
Adjusted net debt / LTM EBITDAR
(US$mm)
8.8%
6.6x 6.3x
5.0x
Jun12 Jun13 Jun14
9.3%
13.1%
12

00
2
05
7
12
1
21
2
05
2
05
2
02
3
15
9
21
9
21
1
21
1
21
1
00
0
09
4
16
4
25
1
20
7
04
3
14
6
14
8
15
1
Co
lor sch
eme
LATAM Airlines Group - Investor Relations
www.latamairlinesgroup.net
Thank you
13