FORM 10-K YOUNGEVITY INTERNATIONAL, INC.
83
UNITED STATES SECURITIES AND EXCHANGE COMMISSION WASHINGTON, D.C. 20549 FORM 10-K Annual Report Pursuant to Section 13 or 15(d) of the Securities Exchange Act of 1934 For the fiscal year ended December 31, 2013 Commission file number 000-54900 YOUNGEVITY INTERNATIONAL, INC. (Exact name of registrant as specified in its charter) Delaware 90-0890517 (State or other jurisdiction of incorporation or organization) (I.R.S. Employer Identification No.) 2400 Boswell Road, 91914 Chula Vista, CA (Zip Code) (Address of principal executive offices) (619) 934-3980 (Registrant’s telephone number, including area code) Securities registered pursuant to Section 12(b) or (g) of the Act: Title of each class Name of each exchange on which registered Common stock $0.001 par value OTCQX Market Indicate by check mark if the registrant is a well-known seasoned issuer, as defined in Rule 405 of the Securities Act. Yes [ ] No [X] Indicate by check mark if the registrant is not required to file reports pursuant to Section 13 or Section 15(d) of the Act. Yes [ ] No [X] Indicate by check mark whether the registrant (1) has filed all reports required to be filed by Section 13 or 15(d) of the Securities Exchange Act of 1934 during the preceding 12 months (or for such shorter period that the registrant was required to file such reports), and (2) has been subject to such filing requirements for the past 90 days. Yes [X] No [ ] Indicate by check mark whether the registrant has submitted electronically and posted on its corporate Web site, if any, every Interactive Data File required to be submitted and posted pursuant to Rule 405 of Regulation S-T during the preceding 12 months (or for such shorter period that the registrant was required to submit and post such files). Yes [X] No [ ] Indicate by check mark if disclosure of delinquent filers pursuant to Item 405 of Regulation S-K is not contained herein, and will not be contained, to the best of registrant's knowledge, in definitive proxy or information statements incorporated by reference in Part III of this Form 10-K or any amendment to this Form 10-K. [ ] Indicate by check mark whether the registrant is a large accelerated filer, an accelerated filer, a non-accelerated filer, or a smaller reporting company. See definition of “accelerated filer,” “ large accelerated filer,” and “smaller reporting company” in Rule 12b-2 of the Exchange Act. (Check one): Large accelerated filer [ ] Accelerated filer [ ] Non-accelerated filer [ ] Smaller reporting company [X] (Do not check if a smaller reporting company)
-
Upload
khangminh22 -
Category
Documents
-
view
0 -
download
0
Transcript of FORM 10-K YOUNGEVITY INTERNATIONAL, INC.
UNITED STATESSECURITIES AND EXCHANGE COMMISSION
WASHINGTON, D.C. 20549
FORM 10-KAnnual Report Pursuant to Section 13 or 15(d) of the Securities Exchange Act of 1934
For the fiscal year ended December 31, 2013Commission file number 000-54900
YOUNGEVITY INTERNATIONAL, INC.(Exact name of registrant as specified in its charter)
Delaware 90-0890517(State or other jurisdiction of incorporation or organization) (I.R.S. Employer Identification No.)
2400 Boswell Road, 91914Chula Vista, CA (Zip Code)
(Address of principal executive offices)
(619) 934-3980(Registrant’s telephone number, including area code)
Securities registered pursuant to Section 12(b) or (g) of the Act:
Title of each class Name of each exchange on which registeredCommon stock $0.001 par value OTCQX Market
Indicate by check mark if the registrant is a well-known seasoned issuer, as defined in Rule 405 of the Securities Act. Yes [ ] No [X]
Indicate by check mark if the registrant is not required to file reports pursuant to Section 13 or Section 15(d) of the Act. Yes [ ] No [X]
Indicate by check mark whether the registrant (1) has filed all reports required to be filed by Section 13 or 15(d) of the Securities Exchange Act of 1934during the preceding 12 months (or for such shorter period that the registrant was required to file such reports), and (2) has been subject to such filingrequirements for the past 90 days. Yes [X] No [ ]
Indicate by check mark whether the registrant has submitted electronically and posted on its corporate Web site, if any, every Interactive Data File required tobe submitted and posted pursuant to Rule 405 of Regulation S-T during the preceding 12 months (or for such shorter period that the registrant was required tosubmit and post such files). Yes [X] No [ ]
Indicate by check mark if disclosure of delinquent filers pursuant to Item 405 of Regulation S-K is not contained herein, and will not be contained, to the bestof registrant's knowledge, in definitive proxy or information statements incorporated by reference in Part III of this Form 10-K or any amendment to thisForm 10-K. [ ]
Indicate by check mark whether the registrant is a large accelerated filer, an accelerated filer, a non-accelerated filer, or a smaller reporting company. Seedefinition of “accelerated filer,” “ large accelerated filer,” and “smaller reporting company” in Rule 12b-2 of the Exchange Act. (Check one):
Large accelerated filer [ ] Accelerated filer [ ] Non-accelerated filer [ ] Smaller reporting company [X]
(Do not check if asmaller reporting company)

Table of Contents Indicate by check mark whether the registrant is a shell company (as defined in Rule 12b-2 of Act). Yes [ ] No [X]
The aggregate market value of all of the Common Stock held by non-affiliates of the registrant, based upon the closing stock price reported on the OTCQXMarket on June 28, 2013 was $ 30,488,166. Shares of common stock held by executive officers, directors and by persons who own 10% or more of theregistrant’s outstanding Common Stock have been excluded for purposes of the foregoing calculation in that such persons may be deemed to be affiliates.This does not reflect a determination that such persons are affiliates for any other purpose.
The number of shares of registrant's Common Stock outstanding on March 21, 2014 was 388,690,195.
Documents incorporated by reference: The information required in response to Part III of this Annual Report on Form 10-K is hereby incorporated byreference to the specified portions of the Registrant’s definitive proxy statement for the annual meeting of shareholders.
Table of Contents
YOUNGEVITY INTERNATIONAL, INC.FORM 10-K
FISCAL YEAR ENDED DECEMBER 31, 2013
PART I 1
ITEM 1. BUSINESS. 1ITEM 1A. RISK FACTORS. 12ITEM 1B. UNRESOLVED STAFF COMMENTS. 25ITEM 2. PROPERTIES. 26ITEM 3. LEGAL PROCEEDINGS. 26ITEM 4. MINE SAFETY DISCLOSURES. 26
PART II 27
ITEM 5. MARKET FOR REGISTRANT’S COMMON EQUITY, RELATED STOCKHOLDER MATTERS AND ISSUER PURCHASESOF EQUITY SECURITIES. 27
ITEM 6. SELECTED FINANCIAL DATA. 29ITEM 7. MANAGEMENT’S DISCUSSION AND ANALYSIS OF FINANCIAL CONDITION AND RESULTS OF OPERATIONS. 30ITEM 7A. QUANTITATIVE AND QUALITATIVE DISCLOSURES ABOUT MARKET RISK. 36ITEM 8. FINANCIAL STATEMENTS AND SUPPLEMENTARY DATA. 37ITEM 9. CHANGES IN AND DISAGREEMENTS WITH ACCOUNTANTS ON ACCOUNTING AND FINANCIAL DISCLOSURES. 67ITEM 9A. CONTROLS AND PROCEDURES. 67ITEM 9B. OTHER INFORMATION. 68
PART III 69
ITEM 10. DIRECTORS, EXECUTIVE OFFICERS AND CORPORATE GOVERNANCE. 69ITEM 11. EXECUTIVE COMPENSATION. 69ITEM 12.
SECURITY OWNERSHIP OF CERTAIN BENEFICIAL OWNERS AND MANAGEMENT AND RELATED STOCKHOLDERMATTERS. 69
ITEM 13. CERTAIN RELATIONSHIPS AND RELATED TRANSACTIONS, AND DIRECTOR INDEPENDENCE. 69ITEM 14. PRINCIPAL ACCOUNTANT FEES AND SERVICES. 69
PART IV 70
ITEM 15. EXHIBITS, FINANCIAL STATEMENT SCHEDULES. 70 SIGNATURES 72 In this report, unless the context otherwise requires, the terms “YGYI,” “Company,” “we,” “us,” and “our” refer to Youngevity International, Inc.,a Delaware corporation and its subsidiaries. Special Note Regarding Forward Looking Statements This report contains “forward-looking” statements. We intend to identify forward-looking statements in this report by using words such as“believes,” “intends,” “expects,” “may,” “will,” “should,” “plan,” “projected,” “contemplates,” “anticipates,” “estimates,” “predicts,” “potential,” “continue,”or similar terminology. These statements are based on our beliefs as well as assumptions we made using information currently available to us. We undertakeno obligation to publicly update or revise any forward-looking statements, whether as a result of new information, future events, or otherwise. Because thesestatements reflect our current views concerning future events, these statements involve risks, uncertainties, and assumptions. Actual future results may differsignificantly from the results discussed in the forward-looking statements. These risks include changes in demand for our products, changes in the level ofoperating expenses, our ability to expand our network of customers, changes in general economic conditions that impact consumer behavior and spending,product supply, the availability, amount, and cost of capital to us and our use of such capital, and other risks discussed in this report. Additional risks that mayaffect our performance are discussed below under “Risk Factors Associated with Our Business.”
-i-
Table of Contents
YOUNGEVITY INTERNATIONAL, INC.Annual Report (Form 10-K)
For Year Ended December 31, 2013
PART I ITEM 1. BUSINESS General
Youngevity International, Inc., founded in 1996, operates through the following domestic wholly-owned subsidiaries: AL Global Corporation, whichoperates our direct selling networks, CLR Roasters, LLC (“CLR Roasters”), our commercial coffee business, Financial Destinations, Inc., FDI Management,Inc., and MoneyTrax, LLC; (collectively referred to as “FDI”), MK Collaborative LLC, and the wholly owned foreign subsidiaries Youngevity Australia Pty.Ltd. and Youngevity NZ, Ltd. Effective July 23, 2013, the Company changed its name from AL International, Inc. to Youngevity International, Inc. We operate in two segments: the direct selling segment where products are offered through a global distribution network of preferred customers anddistributors and the commercial coffee segment where products are sold directly to businesses. During the year ended December 31, 2013, we derivedapproximately 90% of our revenue from our direct sales and approximately 10% of our revenue from our commercial coffee sales. Direct Selling Segment - In the direct selling segment we sell health and wellness, beauty product and skin care, scrap booking and story bookingitems and packaged food products on a global basis and offer a wide range of products through an international direct selling network. Our direct sales aremade through our network, which is a web-based global network of customers and distributors. Our multiple independent sales force markets a variety ofproducts to an array of customers, through friend-to-friend marketing and social networking. We consider our Company to be an e-commerce companywhereby personal interaction is provided to customers by our Youngevity® Essential Life Sciences independent sales network. Initially, our focus was solelyon the sale of products in the health, beauty and home care market through our marketing network; however, we have since expanded our selling efforts toinclude a variety of other products in other markets. Our Company's Youngevity® Essential Life Sciences division, founded in 1997 by Dr. Joel Wallach, BS,DVM, ND and Dr. Ma Lan, MS, MD, offers through our direct selling network more than 400 products to support a healthy lifestyle. Our product offeringsinclude:
● Nutritional products ● Gourmet coffee● Sports and energy drinks ● Skincare and cosmetics● Health and wellness-related services ● Weight loss● Lifestyle products (spa, bath, garden and pets) ● Pharmacy discount cards● Digital products including Scrap books and Memory books ● Packaged foods
Through a series of recent acquisitions of other direct selling companies and their product lines, we have substantially expanded our distributor baseby uniting the companies that we have acquired under our web-based independent distributor network, as well as providing our distributors with additionalnew products to add to their product offerings. In November of 2013, we acquired certain assets and certain liabilities of Biometics International, Inc., adeveloper and distributor of a line of liquid supplements marketed through a network of sales consultants. In October 2013, we acquired certain assets andliabilities of Go Foods Global, LLC, a developer and distributor of a complete line of packaged foods including breads and desserts, soups and entrees. Thefood products are packaged utilizing a dehydration technology that provides for long term shelf life and are sold through a network of consultants. Generallythe shelf life on the Go Global Foods line of products is in excess of 20 years. In August 2013, we acquired certain assets and certain liabilities of HeritageMarkers, LLC, a developer and distributor of a line of digital products including scrap books, memory books and greeting cards. The Heritage line ofproducts is marketed through a network of sales consultants and the product line is sold through an e-commerce platform. In July 2012, we acquired certainassets of Livinity, Inc., a developer and distributor of nutritional products through a network of distributors.
-1-
Table of Contents
In April 2012, we acquired certain assets of GLIE, LLC, a developer and distributor of nutritional supplements, including vitamins and mineralsupplements. In October 2011, we acquired all of the equity of Financial Destination, Inc. (“FDI”), a seller of financial and health and wellness-relatedservices and FDI became our wholly owned subsidiary. In August 2011, we acquired the distributor base and product line of Adaptogenix International, a SaltLake City based direct seller of botanical derived products, including a health line, wellness beverages and energy drinks. In July 2011, we acquired thedistributors and product line of R-Garden, Inc., (“R-Garden”) a Washington State based designer of nutritional supplements, including vitamin, mineral andunique plant enzyme supplements. In September 2012, we modified the terms of the agreement with R-Garden, transferring the ownership of the products toR-Garden in exchange for forgiveness of the contingent acquisition debt. In June 2011, we acquired the distributor base and product line of Bellamora, aTampa, Florida- based marketer of skin care products. In September 2010, the Company acquired the distributor base and product line of Preferred Price Plus,Inc., a direct seller of health supplement products. In June 2010, we acquired the distributor base and product line of MLM Holdings, Inc., a direct seller ofhealth brand supplements and facial products. Coffee Segment - We engage in the commercial sale of one of our products, our coffee. We own a traditional coffee roasting business that producescoffee under its own Café La Rica brand, Josies Java House Brand and Javalution brands. CLR produces a variety of private labels through major nationalsales outlets and to major customers including cruise lines and office coffee service operators, as well as through our distributor network. Our coffeemanufacturing division, CLR Roasters, was established in 2003 and is a wholly owned subsidiary. CLR Roasters produces and markets a unique line ofcoffees with health benefits under the JavaFit® brand which is sold directly to consumers. Products Direct Selling Segment - Youngevity® Through Youngevity® Essential Life Sciences, we offer more than 400 products to support a healthy lifestyle. All of these products, which are soldthrough our direct selling network, can be categorized into ten sub-product lines. (Nutritional Supplements, Sports and Energy Drinks, Health and Wellness,Weight Loss, Gourmet Coffee, Skincare and Cosmetics, Lifestyle Services, digital products including Scrap books and Memory books, Packaged Foods andPharmacy Discount Cards). Our flagship Nutritional Supplements include our Healthy Start Pak™, which includes Beyond Tangy Tangerine ® (a multivitamin/mineral/aminoacid supplement), EFA Plus™ (an essential fatty acid supplement), and Osteo-fx Plus™ (a bone and joint health supplement). This product category iscontinually evaluated, updated where and when necessary. New products are introduced to take advantage of new opportunities that may become availablebased on scientific research and or marketing trends. Beyond Tangy Tangerine 2,0 was added to the line offering a second flavor option and a non GMOoption to the company’s number one selling product. Additionally, Imortalium, an anti-aging product, was introduced on December 31, 2013. The productwas introduced with a short marketing video and its own microsite available at www.imortalium.com. Our Sports and Energy Drinks include Rebound FX™, formulated for quick, sustained energy and endorsed by former All Star Basketball playerTheo Ratliff. Our flagship Weight Management program is marketed as the Healthy Body Challenge which is a program that involves three phases includingdetoxification, transformation and the healthy lifestyle phase. Each phase includes recommended products. During the transformation phase the Companyrecommends the Slender FX™ Weight Management System, consisting of a meal replacement shake plus supplements to support healthy weight loss. OurGourmet Coffee includes JavaFit®, a line of gourmet coffees blended with nutrients to support various health aspects. Our Personal Care products includeYoungevity® Mineral Makeup™ and Youngevity® Botanical Spa™, Ancient Legacy™ Essential Oils, and Isola Luce™ Palm Oil Candles. Our Home andGarden products include Arthrydex™, a joint health supplement for pets; Hydrowash™, an environmentally safe cleaner; and Bloomin Minerals™, a line ofplant and soil revitalizers. Financial Destination, Inc. (“FDI”) and its related entities FDI Management, Inc. and MoneyTrax, LLC were acquired by Youngevity International,Inc. in October 2011 and fully intergrated into our existing direct selling businesses. FDI was a nationwide direct marketer of financial, and health andwellness-related products and services. FDI’s distributors, in addition to selling FDI products, now sell our other products such as our Youngevity® andJavaFit® products, and existing distributors of Youngevity® and JavaFit® products also sell our FDI financial services.
-2-
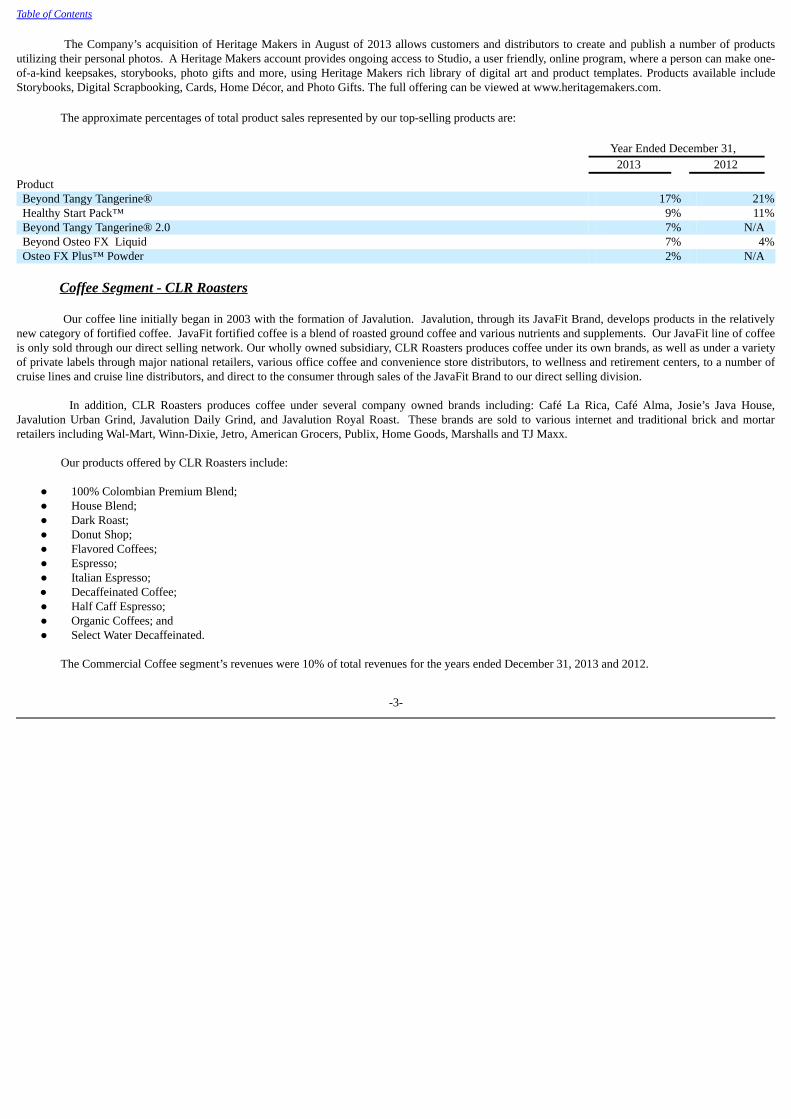
Table of Contents The Company’s acquisition of Heritage Makers in August of 2013 allows customers and distributors to create and publish a number of productsutilizing their personal photos. A Heritage Makers account provides ongoing access to Studio, a user friendly, online program, where a person can make one-of-a-kind keepsakes, storybooks, photo gifts and more, using Heritage Makers rich library of digital art and product templates. Products available includeStorybooks, Digital Scrapbooking, Cards, Home Décor, and Photo Gifts. The full offering can be viewed at www.heritagemakers.com.
The approximate percentages of total product sales represented by our top-selling products are:
Year Ended December 31, 2013 2012
Product Beyond Tangy Tangerine® 17% 21% Healthy Start Pack™ 9% 11% Beyond Tangy Tangerine® 2.0 7% N/A Beyond Osteo FX Liquid 7% 4% Osteo FX Plus™ Powder 2% N/A Coffee Segment - CLR Roasters Our coffee line initially began in 2003 with the formation of Javalution. Javalution, through its JavaFit Brand, develops products in the relativelynew category of fortified coffee. JavaFit fortified coffee is a blend of roasted ground coffee and various nutrients and supplements. Our JavaFit line of coffeeis only sold through our direct selling network. Our wholly owned subsidiary, CLR Roasters produces coffee under its own brands, as well as under a varietyof private labels through major national retailers, various office coffee and convenience store distributors, to wellness and retirement centers, to a number ofcruise lines and cruise line distributors, and direct to the consumer through sales of the JavaFit Brand to our direct selling division. In addition, CLR Roasters produces coffee under several company owned brands including: Café La Rica, Café Alma, Josie’s Java House,Javalution Urban Grind, Javalution Daily Grind, and Javalution Royal Roast. These brands are sold to various internet and traditional brick and mortarretailers including Wal-Mart, Winn-Dixie, Jetro, American Grocers, Publix, Home Goods, Marshalls and TJ Maxx. Our products offered by CLR Roasters include:
● 100% Colombian Premium Blend;● House Blend;● Dark Roast;● Donut Shop;● Flavored Coffees;● Espresso;● Italian Espresso;● Decaffeinated Coffee;● Half Caff Espresso;● Organic Coffees; and● Select Water Decaffeinated.
The Commercial Coffee segment’s revenues were 10% of total revenues for the years ended December 31, 2013 and 2012.
-3-
Table of Contents Distribution Direct Sellling Segment - We presently sell products in 63 countries and territories, including all 50 states in the U.S., with operations in the U.S. andNew Zealand. For the year ended December 31, 2013, approximately 8% of sales was derived from sales outside the U.S. We primarily sell our products tothe ultimate consumer through the direct selling channel. In 2013, approximately 121,000 unique distributors or customers made a purchase of twenty dollars($20.00) or more. Each distributor is required to pay a one-time enrollment fee of up to ten dollars ($10.00) for a welcome kit that consists of forms, policyand procedures, selling aids, and access to our distributor website, prior to commencing services for us as a distributor. Distributors are independentcontractors and not our employees. Distributors earn a profit by purchasing products directly from us at a discount from a published brochure price and sellingthem to their customers, the ultimate consumer of our products. We generally have no arrangements with end users of our products beyond the distributors,except as described below. No single distributor accounts for more than 2% of our net sales. A distributor contacts customers directly, selling primarily through our online or printed brochures, which highlight new products and specialpromotions for each of our sales campaigns. In this sense, the distributor, together with the brochure, is the “store” through which our products are sold. Abrochure introducing new sales campaigns are frequently produced and our websites and social networking activity takes place on a continuousbasis. Generally, distributors and customers forward orders using the internet, mail, telephone, or fax and payments are processed via credit card at the timean order is placed. Orders are processed and the products are assembled at our distribution center in Chula Vista, California and delivered to distributors andcustomers through a variety of local and national delivery companies. We employ certain web enabled systems to increase distributor support, which allow distributors to run their business more efficiently and also allowus to improve our order-processing accuracy. In many countries, distributors can utilize the internet to manage their business electronically, including ordersubmission, order tracking, payment and two-way communications. In addition, distributors can further build their own business through personalized webpages provided by us, enabling them to sell a complete line of our products online. Self-paced online training also is available in certain markets, as well asup-to-the-minute news, about us. In the U.S. and selected other markets, we also market our products through the following consumer websites:
● www.youngevity.com● www.90forlife.com● www.cafelarica.com● www.financialdestination.com● www.heritagemakers.com● www.YoungevityOnline.com
The recruiting of new distributors and the training are the primary responsibilities of key independent distributors supported by the Company’smarketing staff. The independent distributors are independent contractors compensated exclusively based on total sales of products achieved by their down-line distributors and customers. Although the independent distributors are not paid a fee for recruiting additional distributors, they have the incentive to recruitadditional distributors to increase their opportunities for increasing their total sales and related sales commissions. Personal contacts, includingrecommendations from current distributors, and local market advertising constitute the primary means of obtaining new distributors and customers.Distributors also have the opportunity to earn bonuses based on the net sales of products made by distributors they have recruited and trained in addition todiscounts earned on their own sales of our products. This program can be unlimited based on the level achieved in accordance with the compensation planthat can change from time to time at the discretion of the Company. The primary responsibilities of Sales Leaders are the prospecting, appointing, training anddevelopment of their down-line distributors while maintaining a certain level of their own sales.
-4-

Table of Contents
Coffee Segment – The coffee segment is operated by Youngevity International, Inc.’s wholly owned subsidiary CLR Roasters. The segmentoperates a coffee roasting plant and distribution facility located in Miami, Florida. The 39,500 square foot plant contains two commercial grade roasters andfour commercial grade grinders capable of roasting 10 million pounds of coffee annually. The plant contains a variety of packaging equipment capable ofproducing two ounce fractional packs, vacuum sealed brick packaging for espresso, various bag packaging configurations ranging from eight ounces up to afive pound bag package, as well as Super Sack packaging that holds bulk coffee up to 1,100 pounds.
The versatility of the plant supports a diverse customer base. The coffee segment is a large supplier to the hospitality market with a great focus onserving the cruise line industry. A major revenue producing area is the private label market where the company produces coffee for various retailer ownedprivate brands. The segment supplies coffee and equipment to retirement communities, services the office coffee service segment, and markets throughdistributors to the convenient store market; CLR Roasters also markets its own brands of coffee to various retailers. Company owned brands that arecurrently on retail shelves are Café La Rica, Josie’s Java House, and the Javalution stable of brands.
Seasonality and Back Orders
Our business in both the direct selling and coffee segment can experience weaker sales during the summer months; however, based on recent
experience, seasonality has not been material to our operation results. We have not experienced significant back orders.
Promotion and Marketing
Direct Selling Segment - Sales promotion and sales development activities are directed at assisting distributors through sales aids such asbrochures, product samples and demonstration products. In order to support the efforts of distributors to reach new customers, specially designed sales aids,promotional pieces, customer flyers, television and print advertising are used. In addition, we seek to motivate our distributors through the use of specialincentive programs that reward superior sales performance. Periodic sales meetings with our independent distributors are conducted by the Company’smarketing staff. The meetings are designed to keep distributors abreast of product line changes, explain sales techniques and provide recognition for salesperformance.
A number of merchandising techniques are used, including the introduction of new products, the use of combination offers, the use of trial sizesand samples, and the promotion of products packaged as gift items. In general, for each sales campaign, a distinctive brochure is published, in which newproducts are introduced and selected items are offered as special promotions or are given particular prominence in the brochure. A key current priority for ourmerchandising is to continue the use of pricing and promotional models to enable a deeper, fact-based understanding of the role and impact of pricing withinour product portfolio.
Coffee Segment – Sales promotion and sales development primarily take place via CLR Roasters in-house team, however, the Company utilizescommission only outside manufacturers’ representatives for a number of specialty accounts. CLR Roasters works diligently to be sure that the Company isinvited to participate in the request for proposal (“RFP”) process that comes up each year on major coffee contracts. CLR Roasters in-house sales teamconsists of five people that devote the majority of their time to obtaining new business. CLR has established a direct store distribution (“DSD”) route that itutilizes to market, promote and ship its Company owned Café La Rica and Josie’s Java House brands. Various promotion strategies and advertisements inretail circulars are utilized to support the brands being marketed through DSD. Suppliers
Direct Selling Segment - We purchase raw materials from numerous domestic and international suppliers. Other than the coffee products producedthrough CLR Roasters, all of our products are manufactured by independent suppliers. To achieve certain economies of scale, best pricing and uniformquality, we rely primarily on a few principal suppliers, namely: Global Health Labs, Inc., Pacific Nutritional, Inc. and Nutritional Engineering, Inc.
-5-
Table of Contents
Sufficient raw materials were available during the year ended December 31, 2013 and we believe they will continue to be. We monitor thefinancial condition of certain suppliers, their ability to supply our needs, and the market conditions for these raw materials. We believe we will be able tonegotiate similar market terms with alternative suppliers if needed.
Coffee Segment - The Company sources green coffee from various countries in Central and South America. When CLR Roasters obtains a largecontract from its customers to supply coffee it contacts its green coffee suppliers and locks in a price for the identical time period and the identical quantityrequired by CLR Roasters to supply coffee to its customers. This protects CLR Roasters and its customers from price fluctuations that take place in thecommodities market.
The Company purchases its inventory from multiple third-party suppliers at competitive prices. For the year ended December 31, 2013 the
Company made purchases from three vendors that individually comprised more than 10% of total purchases and in aggregate approximated 89% of totalpurchases. The Company does not believe it is substantially dependent upon nor exposed to any significant concentration risk related to purchases from anysingle vendor, given the availability of alternative sources from which the Company may purchase inventory. Intellectual Property
We have developed and we use registered trademarks in our business, particularly relating to our corporate and product names. We own 8trademarks that are registered with the U.S. Patent and Trademark Office and we also own trademarks in Canada, Australia, New Zealand, Singapore andMexico. Registration of a trademark enables the registered owner of the mark to bar the unauthorized use of the registered trademark in connection with asimilar product in the same channels of trade by any third-party in the respective country of registration, regardless of whether the registered owner has everused the trademark in the area where the unauthorized use occurs.
We also claim ownership and protection of certain product names, unregistered trademarks, and service marks under common law. Common lawtrademark rights do not provide the same level of protection that is afforded by the registration of a trademark. In addition, common law trademark rights arelimited to the geographic area in which the trademark is actually used. We believe these trademarks, whether registered or claimed under common law,constitute valuable assets, adding to recognition of our brands and the effective marketing of our products. We intend to maintain and keep current all of ourtrademark registrations and to pay all applicable renewal fees as they become due. The right of a trademark owner to use its trademarks, however, is based ona number of factors, including their first use in commerce, and trademark owners can lose trademark rights despite trademark registration and payment ofrenewal fees. We therefore believe that these proprietary rights have been and will continue to be important in enabling us to compete, and if for any reasonwe were unable to maintain our trademarks, our sales of the related products bearing such trademarks could be materially and negatively affected. See “RiskFactors”.
We own certain intellectual property, including trade secrets that we seek to protect, in part, through confidentiality agreements with employees
and other parties. Most of our products are not protected by patents and therefore such agreements are often our only form of protection. Even where theseagreements exist, there can be no assurance that these agreements will not be breached, that we will have adequate remedies for any breach, or that our tradesecrets will not otherwise become known to or independently developed by competitors. Our proprietary product formulations are generally considered tradesecrets, but are not otherwise protected under intellectual property laws.
We intend to protect our legal rights concerning intellectual property by all appropriate legal action. Consequently, we may become involved fromtime to time in litigation to determine the enforceability, scope, and validity of any of the foregoing proprietary rights. Any patent litigation could result insubstantial cost and divert the efforts of management and technical personnel.
Industry Overview
We are engaged in two industries, the direct selling industry and the sale of coffee industry.
-6-
Table of Contents
Direct Selling Industry
Direct selling is a business distribution model that allows a company to market its products directly to consumers by means of independentcontractors and relationship referrals. Independent, unsalaried salespeople, referred to as distributors, represent the Company and are awarded a commissionbased upon the volume of product sold through each of their independent business operations.
According to the US Direct Selling Association, it is estimated that 2012 retail sales for the direct selling channel increased 5.9% to $31.6 billionfrom $29.9 billion in 2011. The direct selling channel in the US has seen growth accelerate since the recession low of 0.8% in 2009. Driving industry growthis the increase in the number of people involved in direct selling, which increased 1.9% to nearly16 million from 15.6 million in 2011. In 2009, the number ofpeople active in direct selling reached 16.1 million stemming from the recession reflecting people losing their jobs, thus seeking to earn money as a directselling organization. The US Direct Selling Association observed that two product categories continue to gain market share, wellness and services, whilehome and family care, home durables, and personal care have experienced a gradual decline. Wellness products include weight-loss products and dietarysupplements. In 2013, IBISWorld estimates this category should account for 22.8% of total revenue or $10.8 billion, up from $10.2 billion in 2012. The keydriver for this category is increasing concerns for health and appearance. Regardless of economic conditions, consumers continue to spend on wellnessproducts in order to maintain health or proactively improve health. Another supporting factor is the aging population, who is increasingly utilizing direct-selling channels to purchase drugs and supplements for convenience.
Retailers may be noticing the success of the Direct Selling Industry as noted in a news article by Direct Selling News which pointed out that theindustry was facing new competition via e-commerce from online retailers. The article pointed out that the expansion of e-commerce has changed the sellinglandscape. It is estimated that e-commerce will top $300 billion in revenues in the United States alone in 2012. Market share is shifting from traditional formsof commerce such as retail stores to more online forms that challenge everyone engaged in the marketing of a product or service including direct sellers. It isapparent that the companies within the Direct Selling Industry will need to better integrate their selling processes with the capabilities evident in the onlineretailing space. Those that do not focus on the e-commerce opportunities will have trouble competing effectively with online retailers. More and moretraditional retailers are moving into the e-commerce space which will provide even greater competition to the Direct Selling Industry.
Coffee Business Industry
Over the last decade, the U.S. retail coffee market has seen explosive growth. As reported in a news release by the National Coffee Association’s(“NCA”) regarding 2013 Coffee Drinking Trends Market Research, coffee consumption jumped by 5% in 2013 with 83% of Americans drinkingcoffee. NCA’s 2013 Coffee Drinking Trends research revealed the following:
Past-day coffee consumption among Hispanic-Americans again outpaced that of other Americans, further affirming data identified last year when
NCA began tracking ethnic consumption. 76% of adult Hispanic-Americans said they drank coffee yesterday, 13 percentage points ahead of the totalpopulation. By comparison, 47% of African-Americans and 64% of Caucasian-Americans said they drank coffee yesterday.
In other NCDT data, the single-cup brewing format continues to grow steadily: 13% of the U.S. population drank a coffee made in a single-cup
brewer yesterday. This is up from just 4% in 2010. By contrast, past-day consumption of a coffee made in a drip coffee maker has dropped to 37% from 43%over the same period. Awareness of single-cup brewers reached 82%, up by 11 points from last year, while ownership has grown to 12% from 10% last year.
Gourmet Coffee: Consumption of gourmet coffee beverages remained strong and steady, with nearly one third (31%) of the population partaking each day. Atthe same time, consumption of traditional coffee was off by seven percentage points to 49% versus 56% in 2012.
-7-

Table of Contents Among Hispanic-Americans, past-day consumption of gourmet coffee beverages towered above that of other groups at 44% versus 30% for Caucasian-Americans and 25% among African-Americans. The differential carried through when gourmet coffee beverages were broken out into its components: forespresso-based beverages the corresponding breakout was 24% among Hispanic-Americans, 10% among Caucasian-Americans and 12% among African-Americans, while for gourmet varieties of traditional coffee, 23% among Hispanic-Americans, 20% among Caucasian-Americans and 13% among African-Americans.
Volatile Youth: Younger consumers also showed more affinity for espresso-based beverages than their elders, with 16% of those 18-39 drinkingthem in the past day compared with just 6% of those over 60. However, overall daily consumption of coffee by younger consumers appears to have dropped.Among those 18-24, daily overall coffee consumption fell to 41% from 50% last year, and for those 25-39 to 59% from 63%. However, the 2013 figures aremore consistent with levels in earlier years, suggesting that this year's decline indicates volatility in these segments rather than softening. Conversely, overalldaily consumption of coffee among those 60+ rose to 76% from 71% last year and for those 40-59 to 69% from 65% in 2012. Digging deeper, the over 60 group appears to favor gourmet varieties of traditional coffee, with daily consumption up to 24% from 19% last year.For those 25-39, conversely, the corresponding figures dropped to 18% from 26% last year. For non-gourmet traditional coffee, daily consumption remainedessentially steady for those over 60, but fell among those 18-24, moving from 27% to 17% this year. Competition
Direct Selling Segment – The diet fitness and health food industries, as well as the food and drink industries in general, are highly competitive,rapidly evolving and subject to constant change. The number of competitors in the overall diet, fitness, health food, and nutraceutical industries is virtuallyendless. We believe that existing industry competitors are likely to continue to expand their product offerings. Moreover, because there are few, if any,substantial barriers to entry, we expect that new competitors are likely to enter the “functional foods” and nutraceutical markets and attempt to market“functional food” or nutraceutical coffee products similar to our products, which would result in greater competition. We cannot be certain that we will beable to compete successfully in this extremely competitive market.
We face competition from competing products in each of our lines of business, in both the domestic and international markets. Worldwide, wecompete against products sold to consumers by other direct selling and direct-sales companies and through the Internet, and against products sold through themass market and prestige retail channels. We also face increasing competition in our developing and emerging markets.
Within the direct selling channel, we compete on a regional and often country-by-country basis, with our direct selling competitors. There are alsoa number of direct selling companies that sell product lines similar to ours, some of which also have worldwide operations and compete with us globally. Wecompete against large and well-known companies that manufacture and sell broad product lines through various types of retail establishments such as GeneralFoods and Nestle. In addition, we compete against many other companies that manufacture and sell in narrower product lines sold through retailestablishments. This industry is highly competitive, and some of our principal competitors in the industry are larger than we are and have greater resourcesthan we do. Competitive activities on their part could cause our sales to suffer. We have many competitors in the highly competitive energy drink, skin careand cosmetic, coffee, pet line and pharmacy card industries globally, including retail establishments, principally department stores, and specialty retailers, anddirect-mail companies specializing in these products. Our largest direct sales competitors are Herbalife, Amway, USANA and NuSkin. In the energy drinkmarket we compete with companies such as Red Bull, Gatorade and Rock Star. Our beauty, skin care and cosmetic products compete with Avon and BareEscentuals. From time to time, we need to reduce the prices for some of our products to respond to competitive and customer pressures or to maintain ourposition in the marketplace. Such pressures also may restrict our ability to increase prices in response to raw material and other cost increases. Any reductionin prices as a result of competitive pressures, or any failure to increase prices when raw material costs increase, would harm profit margins and, if our salesvolumes fail to grow sufficiently to offset any reduction in margins, our results of operations would suffer.
-8-
Table of Contents
We are also subject to significant competition from other network marketing organizations for the time, attention, and commitment of new andexisting distributors. Our ability to remain competitive depends, in significant part, on our success in recruiting and retaining distributors. There can be noassurance that our programs for recruiting and retaining distributors will be successful. The pool of individuals who may be interested in network marketing islimited in each market and it is reduced to the extent other network marketing companies successfully recruit these individuals into their businesses. Althoughwe believe we offer an attractive opportunity for distributors, there can be no assurance that other network marketing companies will not be able to recruit ourexisting distributors or deplete the pool of potential distributors in a given market.
Coffee Segment – With respect to our coffee products, we compete not only with other widely advertised branded products, but also with privatelabel or generic products that generally are sold at lower prices. Consumers’ willingness to purchase our products will depend upon our ability to maintainconsumer confidence that our products are of a higher quality and provide greater value than less expensive alternatives. If the difference in quality betweenour brands and private label products narrows, or if there is a perception of such a narrowing, then consumers may choose not to buy our products at pricesthat are profitable for us. If we do not succeed in effectively differentiating ourselves from our competitors in specialty coffee, including by developing andmaintaining our brands, or our competitors adopt our strategies, then our competitive position may be weakened and our sales of specialty coffee, andaccordingly our profitability, may be materially adversely affected. Government Regulations
The processing, formulation, manufacturing, packaging, labeling, advertising, and distribution of our products are subject to federal laws andregulation by one or more federal agencies, including the FDA, the FTC, the Consumer Product Safety Commission, the U.S. Department of Agriculture, andthe Environmental Protection Agency. These activities are also regulated by various state, local, and international laws and agencies of the states and localitiesin which our products are sold. Government regulations may prevent or delay the introduction or require the reformulation, of our products, which couldresult in lost revenues and increased costs to us. For instance, the FDA regulates, among other things, the composition, safety, labeling, and marketing ofdietary supplements (including vitamins, minerals, herbs, and other dietary ingredients for human use). The FDA may not accept the evidence of safety forany new dietary ingredient that we may wish to market, may determine that a particular dietary supplement or ingredient presents an unacceptable health risk,and may determine that a particular claim or statement of nutritional value that we use to support the marketing of a dietary supplement is an impermissibledrug claim, is not substantiated, or is an unauthorized version of a “health claim.” Any of these actions could prevent us from marketing particular dietarysupplement products or making certain claims or statements of nutritional support for them. The FDA could also require us to remove a particular productfrom the market. Any future recall or removal would result in additional costs to us, including lost revenues from any additional products that we are requiredto remove from the market, any of which could be material. Any product recalls or removals could also lead to liability, substantial costs, and reduced growthprospects. With respect to FTC matters, if the FTC has reason to believe the law is being violated (e.g. failure to possess adequate substantiation for productclaims), it can initiate an enforcement action. The FTC has a variety of processes and remedies available to it for enforcement, both administratively andjudicially, including compulsory process authority, cease and desist orders, and injunctions. FTC enforcement could result in orders requiring, among otherthings, limits on advertising, consumer redress, divestiture of assets, rescission of contracts, or such other relief as may be deemed necessary. Violation ofthese orders could result in substantial financial or other penalties. Any action against us by the FTC could materially and adversely affect our ability tosuccessfully market our products.
Additional or more stringent regulations of dietary supplements and other products have been considered from time to time. These developmentscould require reformulation of some products to meet new standards, recalls or discontinuance of some products not able to be reformulated, additionalrecord-keeping requirements, increased documentation of the properties of some products, additional or different labeling, additional scientific substantiation,adverse event reporting, or other new requirements. Any of these developments could increase our costs significantly. For example, the Dietary Supplementand Nonprescription Drug Consumer Protection Act (S3546), which was passed by Congress in December 2006, imposes significant regulatory requirementson dietary supplements including reporting of “serious adverse events” to FDA and recordkeeping requirements. This legislation could raise our costs andnegatively impact our business. In June 2007, the FDA adopted final regulations on GMPs in manufacturing, packaging, or holding dietary ingredients anddietary supplements, which apply to the products we manufacture and sell.
-9-
Table of Contents
These regulations require dietary supplements to be prepared, packaged, and held in compliance with certain rules. These regulations could raiseour costs and negatively impact our business. Additionally, our third-party suppliers or vendors may not be able to comply with these rules without incurringsubstantial expenses. If our third-party suppliers or vendors are not able to timely comply with these new rules, we may experience increased cost or delays inobtaining certain raw materials and third-party products. Also, the FDA has announced that it plans to publish guidance governing the notification of newdietary ingredients. Although FDA guidance is not mandatory, it is a strong indication of the FDA’s current views on the topic discussed in the guidance,including its position on enforcement.
In addition, there are an increasing number of laws and regulations being promulgated by the U.S. government, governments of individual statesand governments overseas that pertain to the Internet and doing business online. In addition, a number of legislative and regulatory proposals are underconsideration by federal, state, local, and foreign governments and agencies. Laws or regulations have been or may be adopted with respect to the Internetrelating to:
● liability for information retrieved from or transmitted over the Internet;● online content regulation;● commercial e-mail;● visitor privacy; and● taxation and quality of products and services.
Moreover, the applicability to the Internet of existing laws governing issues such as:
● intellectual property ownership and infringement;● consumer protection;● obscenity;● defamation;● employment and labor;● the protection of minors;● health information; and● personal privacy and the use of personally identifiable information.
This area is uncertain and developing. Any new legislation or regulation or the application or interpretation of existing laws may have an adverseeffect on our business. Even if our activities are not restricted by any new legislation, the cost of compliance may become burdensome, especially as differentjurisdictions adopt different approaches to regulation.
We are also subject to laws and regulations, both in the U.S. and internationally, that are directed at ensuring that product sales are made toconsumers of the products and that compensation, recognition, and advancement within the marketing organization are based on the sale of products ratherthan on investment in the sponsoring company. These laws and regulations are generally intended to prevent fraudulent or deceptive schemes, often referredto as “pyramid” schemes, which compensate participants for recruiting additional participants irrespective of product sales, use high pressure recruitingmethods and or do not involve legitimate products. Complying with these rules and regulations can be difficult and requires the devotion of significantresources on our part. Management Information, Internet and Telecommunication Systems
The ability to efficiently manage distribution, compensation, inventory control, and communication functions through the use of sophisticated anddependable information processing systems is critical to our success.
We continue to upgrade systems and introduce new technologies to facilitate our continued growth and support of independent distributoractivities. These systems include: (1) an internal network server that manages user accounts, print and file sharing, firewall management, and wide areanetwork connectivity; (2) a Microsoft SQL database server to manage sensitive transactional data, corporate accounting and sales information; (3) acentralized host computer supporting our customized order processing, fulfillment, and independent distributor management software; (4) a standardizedtelecommunication switch and system; (5) a hosted independent distributor website system designed specifically for network marketing and direct sellingcompanies; and (6) procedures to perform daily and weekly backups with both onsite and offsite storage of backups.
-10-
Table of Contents
Our technology systems provide key financial and operating data for management, timely and accurate product ordering, commission paymentprocessing, inventory management and detailed independent distributor records. Additionally, these systems deliver real-time business management, reportingand communications tools to assist in retaining and developing our sales leaders and independent distributors. We intend to continue to invest in ourtechnology systems in order to strengthen our operating platform. Product Returns
Our return policy in the direct selling segment provides that customers and distributors may return to us any products purchased within 30 days oftheir initial order for a full refund. Product damaged during shipment is replaced. Product returns as a percentage of our net sales have been approximately 1%of our monthly net sales over the last two years. Commercial coffee segment sales are only returnable if defective.
Employees As of March 14, 2014, we have 150 total employees, of which 143 are full-time employees. We believe that our current personnel are capableof meeting our operating requirements in the near term. We expect that as our business grows we may hire additional personnel to handle the increaseddemands on our operations and to handle some of the services that are currently being outsourced, such as brand management and sales efforts.
Our History
The Company is currently listed for quotation on the OTCQX Marketplace, a higher tier on the OTC Markets Group. The Company trades underthe symbol “YGYI”:
On July 11, 2011, AL Global Corporation, a privately held California corporation (“AL Global”), merged with and into a wholly owned subsidiaryof Javalution Coffee Company, a publicly traded Florida corporation (“Javalution”). After the merger, Javalution reincorporated in Delaware and changed itsname to Youngevity International, Inc. In connection with this merger, CLR Roasters, LLC (“CLR Roasters”), which had been a wholly owned subsidiary ofJavalution prior to the merger, continued to be a wholly owned subsidiary of the Company. CLR Roasters operates a traditional coffee roasting business, andthrough the merger we were provided access to additional distributors, as well as added the JavaFit® product line to our network of direct marketers.
Emerging Growth Company We are an emerging growth company under the JOBS Act. We shall continue to be deemed an emerging growth company until the earliest of: (a) the last day of the fiscal year in which we have total annual gross revenues of $1 billion or more; (b) the last day of the fiscal year of the issuer following the fifth anniversary of the date of the first sale of common equity securities of the issuer
pursuant to an effective registration statement; (c) the date on which we have issued more than $1 billion in non-convertible debt, during the previous 3-year period, issued; or.
(d) the date on which we are deemed to be a large accelerated filer. As an emerging growth company we will be subject to reduced public company reporting requirements. As an emerging growth company we areexempt from Section 404(b) of Sarbanes Oxley. Section 404(a) requires issuers to publish information in their annual reports concerning the scope andadequacy of the internal control structure and procedures for financial reporting. This statement shall also assess the effectiveness of such internal controlsand procedures. Section 404(b) requires that the registered accounting firm shall, in the same report, attest to and report on the assessment on the effectivenessof the internal control structure and procedures for financial reporting. As an emerging growth company we are also exempt from Section 14A (a) and (b) of the Securities Exchange Act of 1934 which require theshareholder approval, on an advisory basis, of executive compensation and golden parachutes.
-11-

Table of Contents We have elected to use the extended transition period for complying with new or revised accounting standards under Section 102(b)(2) of the JobsAct, that allows us to delay the adoption of new or revised accounting standards that have different effective dates for public and private companies untilthose standards apply to private companies. As a result of this election, our financial statements may not be comparable to companies that comply with publiccompany effective dates.
Our Corporate Headquarters
Our corporate headquarters are located at 2400 Boswell Road, Chula Vista, California 91914. This is also the location of our operations anddistribution center. The facility consists of a 59,000 square foot Class A single use building that is comprised 40% of office space and the balance is used fordistribution.
Our telephone number is (619) 934-3980 and our facsimile number is (619) 934-3205.
Roasting, distribution and operations for our CLR Roasters division are handled in our Miami, Florida based facility, which consists of 39,500 squarefeet of which 10% is office space. We also have a marketing office located in Windham, New Hampshire, which consists of 12,750 square feet of officespace. Available Information
Our website address is http://www.youngevity.com. We make available, free of charge through our website, our Annual Reports on Form 10-K,Quarterly Reports on Form 10-Q, Current Reports on Form 8-K, Proxy Statements, and amendments to those reports filed or furnished pursuant to Section13(a) or 15(d) of the Exchange Act as soon as reasonably practicable after such material is electronically filed with or furnished to the Securities andExchange Commission (SEC). References to our website addressed in this report are provided as a convenience and information contained on, or availablethrough, the website, is not part of this report.
Our filings may also be read and copied at the SEC's Public Reference Room at 100 F Street NE, Room 1580 Washington, DC 20549. Informationon the operation of the Public Reference Room may be obtained by calling the SEC at 1-800-SEC-0330. The SEC also maintains an Internet site that containsreports, proxy and information statements, and other information regarding issuers that file electronically with the SEC. The address of that website iswww.sec.gov.
ITEM 1A. RISK FACTORS An investment in our common stock involves a high degree of risk. You should carefully consider the risks described below and the other informationcontained in this registration statement before deciding to invest in our common stock. You should only purchase our securities if you can afford to suffer theloss of your entire investment. RISKS RELATED TO OUR BUSINESS Risks related to our Business Because we have recently acquired several businesses, it is difficult to predict if we will be able to maintain or improve our current level of profitability
Until recently, our business was comprised solely of the direct sale of Youngevity® health products. In the last three years, we completed 10business acquisitions, substantially increasing our product lines. It is too early to predict whether consumers will accept, and continue to use on a regularbasis, the products generated from these new acquisitions since we have had very limited recent operating history as a combined entity. Therefore, there canbe no assurance that we will be able to generate significant revenue or be profitable.
-12-

Table of Contents Our business is difficult to evaluate because we have recently expanded our product offering and customer base.
The Company has recently expanded its operations, engaging in the sale of new products through new distributors. There is a risk that we will beunable to successfully integrate the newly acquired businesses with our current management and structure. Although we are based in California, several ofthe businesses we acquired are based in other places such as Utah and Florida, making the integration of our newly acquired businesses difficult. Ourestimates of capital, personnel and equipment required for our newly acquired businesses are based on the historical experience of management andbusinesses they are familiar with. Our management has limited direct experience in operating a business of our current size as well as one that is publiclytraded. Our ability to generate profit will be impacted by payments we are required to make under the terms of our acquisition agreements, the extent of which isuncertain.
Since many of our acquisition agreements are based on future consideration, we could be obligated to make payments that exceed expectations.Many of our acquisition agreements require us to make future payments to the sellers based upon a percentage of sales of products.. The carrying value ofthe contingent acquisition debt, which requires remeasurement each reporting period, is based on our estimates of future sales and therefore is difficult toaccurately predict. Profits could be adversely impacted in future periods if adjustment of the carrying value of the contingent acquisition debt is required. We may have difficulty managing our future growth.
Since we initiated our network marketing sales channel in fiscal 1997, our business has grown significantly. This growth has placed substantialstrain on our management, operational, financial and other resources. If we are able to continue to expand our operations, we may experience periods of rapidgrowth, including increased resource requirements. Any such growth could place increased strain on our management, operational, financial and otherresources, and we may need to train, motivate, and manage employees, as well as attract management, sales, finance and accounting, international, technical,and other professionals. Any failure to expand these areas and implement appropriate procedures and controls in an efficient manner and at a pace consistentwith our business objectives could have a material adverse effect on our business and results of operations. In addition, the financing for any of futureacquisitions could dilute the interests of our stockholders; resulting in an increase in our indebtedness or both. Future acquisitions may entail numerous risks,including:
● difficulties in assimilating acquired operations or products, including the loss of key employees from acquired businesses and disruptionto our direct selling channel;
● diversion of management's attention from our core business; ● adverse effects on existing business relationships with suppliers and customers; and ● risks of entering markets in which we have limited or no prior experience.
Our failure to successfully complete the integration of any acquired business could have a material adverse effect on our business, financial
condition, and operating results. In addition, there can be no assurance that we will be able to identify suitable acquisition candidates or consummateacquisitions on favorable terms Our business is subject to strict government regulations.
The processing, formulation, manufacturing, packaging, labeling, advertising, and distribution of our products are subject to federal laws andregulation by one or more federal agencies, including the FDA, the FTC, the Consumer Product Safety Commission, the U.S. Department of Agriculture, andthe Environmental Protection Agency. These activities are also regulated by various state, local, and international laws and agencies of the states and localitiesin which our products are sold. Government regulations may prevent or delay the introduction, or require the reformulation, of our products, which couldresult in lost revenues and increased costs to us. For instance, the FDA regulates, among other things, the composition, safety, labeling, and marketing ofdietary supplements (including vitamins, minerals, herbs, and other dietary ingredients for human use). The FDA may not accept the evidence of safety forany new dietary ingredient that we may wish to market, may determine that a particular dietary supplement or ingredient presents an unacceptable health risk,and may determine that a particular claim or statement of nutritional value that we use to support the marketing of a dietary supplement is an impermissibledrug claim, is not substantiated, or is an unauthorized version of a “health claim.”
-13-

Table of Contents
Any of these actions could prevent us from marketing particular dietary supplement products or making certain claims or statements of nutritionalsupport for them. The FDA could also require us to remove a particular product from the market. Any future recall or removal would result in additional coststo us, including lost revenues from any additional products that we are required to remove from the market, any of which could be material. Any productrecalls or removals could also lead to liability, substantial costs, and reduced growth prospects. With respect to FTC matters, if the FTC has reason to believethe law is being violated (e.g. failure to possess adequate substantiation for product claims), it can initiate an enforcement action. The FTC has a variety ofprocesses and remedies available to it for enforcement, both administratively and judicially, including compulsory process authority, cease and desist orders,and injunctions. FTC enforcement could result in orders requiring, among other things, limits on advertising, consumer redress, divestiture of assets,rescission of contracts, or such other relief as may be deemed necessary. Violation of these orders could result in substantial financial or other penalties. Anyaction against us by the FTC could materially and adversely affect our ability to successfully market our products.
Additional or more stringent regulations of dietary supplements and other products have been considered from time to time. These developmentscould require reformulation of some products to meet new standards, recalls or discontinuance of some products not able to be reformulated, additionalrecord-keeping requirements, increased documentation of the properties of some products, additional or different labeling, additional scientific substantiation,adverse event reporting, or other new requirements. Any of these developments could increase our costs significantly. For example, the Dietary Supplementand Nonprescription Drug Consumer Protection Act (S3546), which was passed by Congress in December 2006, imposes significant regulatory requirementson dietary supplements including reporting of “serious adverse events” to FDA and recordkeeping requirements. This legislation could raise our costs andnegatively impact our business. In June 2007, the FDA adopted final regulations on GMPs in manufacturing, packaging, or holding dietary ingredients anddietary supplements, which apply to the products we manufacture and sell. These regulations require dietary supplements to be prepared, packaged, and heldin compliance with certain rules. These regulations could raise our costs and negatively impact our business. Additionally, our third-party suppliers or vendorsmay not be able to comply with these rules without incurring substantial expenses. If our third-party suppliers or vendors are not able to timely comply withthese new rules, we may experience increased cost or delays in obtaining certain raw materials and third-party products. Also, the FDA has announced that itplans to publish guidance governing the notification of new dietary ingredients. Although FDA guidance is not mandatory, it is a strong indication of theFDA’s current views on the topic discussed in the guidance, including its position on enforcement. Unfavorable publicity could materially hurt our business.
We are highly dependent upon consumers’ perceptions of the safety, quality, and efficacy of our products, as well as products distributed by othercompanies. Future scientific research or publicity may not be favorable to our industry or any particular product. Because of our dependence upon consumerperceptions, adverse publicity associated with illness or other adverse effects resulting from the consumption of our product or any similar productsdistributed by other companies could have a material adverse impact on us. Such adverse publicity could arise even if the adverse effects associated with suchproducts resulted from failure to consume such products as directed. Adverse publicity could also increase our product liability exposure, result in increasedregulatory scrutiny and lead to the initiation of private lawsuits. Product returns may adversely affect our business.
We are subject to regulation by a variety of regulatory authorities, including the Consumer Product Safety Commission and the Food and DrugAdministration. The failure of our third party manufacturer to produce merchandise that adheres to our quality control standards could damage our reputationand brands and lead to customer litigation against us. If our manufacturer is unable or unwilling to recall products failing to meet our quality standards, wemay be required to remove merchandise or issue voluntary or mandatory recalls of those products at a substantial cost to us. We may be unable to recovercosts related to product recalls. We also may incur various expenses related to product recalls, including product warranty costs, sales returns, and productliability costs, which may have a material adverse impact on our results of operations. While we maintain a reserve for our product warranty costs based oncertain estimates and our knowledge of current events and actions, our actual warranty costs may exceed our reserve, resulting in a need to increase ouraccruals for warranty costs in the future.
-14-

Table of Contents
In addition, selling products for human consumption such as coffee and energy drinks involve a number of risks. We may need to recall some ofour products if they become contaminated, are tampered with or are mislabeled. A widespread product recall could result in adverse publicity, damage to ourreputation, and a loss of consumer confidence in our products, which could have a material adverse effect on our business results and the value of our brands.We also may incur significant liability if our products or operations violate applicable laws or regulations, or in the event our products cause injury, illness ordeath. In addition, we could be the target of claims that our advertising is false or deceptive under U.S. federal and state laws as well as foreign laws,including consumer protection statutes of some states. Even if a product liability or consumer fraud claim is unsuccessful or without merit, the negativepublicity surrounding such assertions regarding our products could adversely affect our reputation and brand image.
Returns are part of our business. Our return rate since the inception of selling activities has been minimal. We replace returned products damagedduring shipment wholly at our cost, which historically has been negligible. Future return rates or costs associated with returns may increase. In addition, todate, product expiration dates have not played any role in product returns; however, it is possible they will increase in the future.
A general economic downturn, a recession globally or in one or more of our geographic regions or sudden disruption in business conditions or otherchallenges may adversely affect our business and our access to liquidity and capital.
A downturn in the economies in which we sell our products, including any recession in one or more of our geographic regions, or the currentglobal macro-economic pressures, could adversely affect our business and our access to liquidity and capital. Recent global economic events over the pastfew years, including job losses, the tightening of credit markets and failures of financial institutions and other entities, have resulted in challenges to ourbusiness and a heightened concern regarding further deterioration globally. We could experience declines in revenues, profitability and cash flow due toreduced orders, payment delays, supply chain disruptions or other factors caused by economic or operational challenges. Any or all of these factors couldpotentially have a material adverse effect on our liquidity and capital resources, including our ability to issue commercial paper, raise additional capital andmaintain credit lines and offshore cash balances. An adverse change in our credit ratings could result in an increase in our borrowing costs and have anadverse impact on our ability to access certain debt markets, including the commercial paper market.
Consumer spending is also generally affected by a number of factors, including general economic conditions, inflation, interest rates, energy costs,gasoline prices and consumer confidence generally, all of which are beyond our control. Consumer purchases of discretionary items, such as beauty andrelated products, tend to decline during recessionary periods, when disposable income is lower, and may impact sales of our products. We face continuedeconomic challenges in fiscal 2014 because customers may continue to have less money for discretionary purchases as a result of job losses, foreclosures,bankruptcies, reduced access to credit and sharply falling home prices, among other things.
In addition, sudden disruptions in business conditions as a result of a terrorist attack similar to the events of September 11, 2001, including furtherattacks, retaliation and the threat of further attacks or retaliation, war, adverse weather conditions and climate changes or other natural disasters, such asHurricane Katrina, pandemic situations or large scale power outages can have a short or, sometimes, long-term impact on consumer spending. We face significant competition.
We face competition from competing products in each of our lines of business, in both the domestic and international markets. Worldwide, wecompete against products sold to consumers by other direct selling and direct-sales companies and through the Internet, and against products sold through themass market and prestige retail channels. We also face increasing competition in our developing and emerging markets.
-15-
Table of Contents
Within the direct selling channel, we compete on a regional and often country-by-country basis, with our direct selling competitors. There are alsoa number of direct selling companies that sell product lines similar to ours, some of which also have worldwide operations and compete with us globally. Wecompete against large and well-known companies that manufacture and sell broad product lines through various types of retail establishments. In addition, wecompete against many other companies that manufacture and sell in narrower product lines sold through retail establishments. This industry is highlycompetitive and some of our principal competitors in the industry are larger than we are and have greater resources than we do. Competitive activities on theirpart could cause our sales to suffer. From time to time, we need to reduce the prices for some of our products to respond to competitive and customerpressures or to maintain our position in the marketplace. Such pressures also may restrict our ability to increase prices in response to raw material and othercost increases. Any reduction in prices as a result of competitive pressures, or any failure to increase prices when raw material costs increase, would harmprofit margins and, if our sales volumes fail to grow sufficiently to offset any reduction in margins, our results of operations would suffer.
If our advertising, promotional, merchandising, or other marketing strategies are not successful, if we are unable to deliver new products thatrepresent technological breakthroughs, if we do not successfully manage the timing of new product introductions or the profitability of these efforts, or if forother reasons our end customers perceive competitors' products as having greater appeal, then our sales and financial results may suffer.
If we do not succeed in effectively differentiating ourselves from our competitors’ products, including by developing and maintaining our brands,or our competitors adopt our strategies, then our competitive position may be weakened and our sales, and accordingly our profitability, may be materiallyadversely affected.
We are also subject to significant competition from other network marketing organizations for the time, attention, and commitment of new andexisting distributors. Our ability to remain competitive depends, in significant part, on our success in recruiting and retaining distributors. There can be noassurance that our programs for recruiting and retaining distributors will be successful. The pool of individuals who may be interested in network marketing islimited in each market, and it is reduced to the extent other network marketing companies successfully recruit these individuals into their businesses.Although we believe we offer an attractive opportunity for distributors, there can be no assurance that other network marketing companies will not be able torecruit our existing distributors or deplete the pool of potential distributors in a given market.
Our Coffee segment also faces strong competition. The coffee industry is highly competitive and coffee is widely distributed and readilyavailable. Our competition will seek to create advantages in many areas including better prices, more attractive packaging, stronger marketing, more efficientproduction processes, speed to market, and better quality verses value opportunities. Many of our competitors have stronger brand recognition and willreduce prices to keep our brands out of the market. Our competitors may have more automation built into their production lines allowing for more efficientproduction at lower costs. We compete not only with other widely advertised branded products, but also with private label or generic products that generallyare sold at lower prices. Consumers’ willingness to purchase our products will depend upon our ability to maintain consumer confidence that our products areof a higher quality and provide greater value than less expensive alternatives. If the difference in quality between our brands and private label productsnarrows, or if there is a perception of such a narrowing, then consumers may choose not to buy our products at prices that are profitable for us. Our success depends, in part, on the quality and safety of our products.
Our success depends, in part, on the quality and safety of our products, including the procedures we employ to detect the likelihood of hazard,manufacturing issues, and unforeseen product misuse. If our products are found to be, or are perceived to be, defective or unsafe, or if they otherwise fail tomeet our distributors' or end customers' standards, our relationship with our distributors or end customers could suffer, we could need to recall some of ourproducts, our reputation or the appeal of our brand could be diminished, and we could lose market share and or become subject to liability claims, any ofwhich could result in a material adverse effect on our business, results of operations, and financial condition.
-16-
Table of Contents Our ability to anticipate and respond to market trends and changes in consumer preferences could affect our financial results.
Our continued success depends on our ability to anticipate, gauge, and react in a timely and effective manner to changes in consumer spendingpatterns and preferences. We must continually work to discover and market new products, maintain and enhance the recognition of our brands, achieve afavorable mix of products, and refine our approach as to how and where we market and sell our products. While we devote considerable effort and resourcesto shape, analyze, and respond to consumer preferences, consumer spending patterns and preferences cannot be predicted with certainty and can changerapidly. If we are unable to anticipate and respond to trends in the market for beauty and related products and changing consumer demands, our financialresults will suffer.
Furthermore, material shifts or decreases in market demand for our products, including as a result of changes in consumer spending patterns andpreferences or incorrect forecasting of market demand, could result in us carrying inventory that cannot be sold at anticipated prices or increased productreturns. Failure to maintain proper inventory levels or increased product returns could result in a material adverse effect on our business, results of operationsand financial condition.
If we are unable to protect our intellectual property rights, specifically patents and trademarks, our ability to compete could be negatively impacted.
Most of our products are not protected by patents. The labeling regulations governing our nutritional supplements require that the ingredients ofsuch products be precisely and accurately indicated on product containers. Accordingly, patent protection for nutritional supplements often is impracticalgiven the large number of manufacturers who produce nutritional supplements having many active ingredients in common. Additionally, the nutritionalsupplement industry is characterized by rapid change and frequent reformulations of products, as the body of scientific research and literature refines currentunderstanding of the application and efficacy of certain substances and the interactions among various substances. In this respect, we maintain an activeresearch and development program that is devoted to developing better, purer, and more effective formulations of our products. We protect our investment inresearch, as well as the techniques we use to improve the purity and effectiveness of our products, by relying on trade secret laws. Notwithstanding ourefforts, there can be no assurance that our efforts to protect our trade secrets and trademarks will be successful. We intend to maintain and keep current all ofour trademark registrations and to pay all applicable renewal fees as they become due. The right of a trademark owner to use its trademarks, however, isbased on a number of factors, including their first use in commerce, and trademark owners can lose trademark rights despite trademark registration andpayment of renewal fees. We therefore believe that these proprietary rights have been and will continue to be important in enabling us to compete and if forany reason we were unable to maintain our trademarks, our sales of the related products bearing such trademarks could be materially and negatively affected .Nor can there be any assurance that third-parties will not assert claims against us for infringement of their intellectual proprietary rights. If an infringementclaim is asserted, we may be required to obtain a license of such rights, pay royalties on a retrospective or prospective basis, or terminate our manufacturingand marketing of our infringing products. Litigation with respect to such matters could result in substantial costs and diversion of management and otherresources and could have a material adverse effect on our business, financial condition, or operating results.
We consider our roasting methods essential to the flavor and richness of our coffee and, therefore, essential to our various brands. Because our
roasting methods cannot be patented, we would be unable to prevent competitors from copying our roasting methods, if such methods became known. If ourcompetitors copy our roasting methods, the value of our brands could be diminished and we could lose customers to our competitors. In addition, competitorscould develop roasting methods that are more advanced than ours, which could also harm our competitive position. We may become involved in the future in legal proceedings that, if adversely adjudicated or settled, could adversely affect our financial results.
We may, in the future, become party to litigation. In general, litigation claims can be expensive and time consuming to bring or defend against andcould result in settlements or damages that could significantly affect financial results. However, it is not possible to predict the final resolution of the litigationto which we may in the future become party to, and the impact of certain of these matters on our business, results of operations, and financial condition couldbe material.
-17-

Table of Contents Government reviews, inquiries, investigations, and actions could harm our business or reputation.
As we operate in various locations around the world, our operations in certain countries are subject to significant governmental scrutiny and maybe harmed by the results of such scrutiny. The regulatory environment with regard to direct selling in emerging and developing markets where we do businessis evolving and officials in such locations often exercise broad discretion in deciding how to interpret and apply applicable regulations. From time to time, wemay receive formal and informal inquiries from various government regulatory authorities about our business and compliance with local laws and regulations.Any determination that our operations or activities or the activities of our distributors, are not in compliance with existing laws or regulations could result inthe imposition of substantial fines, interruptions of business, loss of supplier, vendor or other third party relationships, termination of necessary licenses andpermits, or similar results, all of which could potentially harm our business and or reputation. Even if an inquiry does not result in these types ofdeterminations, it potentially could create negative publicity which could harm our business and or reputation.
The loss of key management personnel could adversely affect our business.
Our founder, Dr. Joel Wallach, is a highly visible spokesman for our products and our business, and our message is based in large part on hisvision and reputation, which helps distinguish us from our competitors. Any loss or limitation on Dr. Wallach as a lead spokesman for our mission, business,and products could have a material adverse effect upon our business, financial condition, or results of operations. In addition, our executive officers, includingStephan Wallach, William Andreoli, and David Briskie, are primarily responsible for our day-to-day operations, and we believe our success depends in parton our ability to retain our executive officers, to compensate our executive officers at attractive levels, and to continue to attract additional qualifiedindividuals to our management team. We cannot guarantee continued service by our key executive officers. We do not maintain key man life insurance on anyof our executive officers. The loss or limitation of the services of any of our executive officers or the inability to attract additional qualified managementpersonnel could have a material adverse effect on our business, financial condition, or results of operations. The beneficial ownership of a significant percentage of our common stock gives our officers and directors effective control, and limits the influence ofother shareholders on important policy and management issues.
Currently, our officers and directors beneficially own 76% of our outstanding common stock. By virtue of this stock ownership, they are able toexert significant influence over the election of the members of our Board of Directors and our business affairs. This concentration of ownership could alsohave the effect of delaying, deterring, or preventing a change in control that might otherwise be beneficial to shareholders. There can be no assurance thatconflicts of interest will not arise with respect to this beneficial ownership or that conflicts will be resolved in a manner favorable to other shareholders of theCompany. The inability to obtain adequate supplies of raw materials for products at favorable prices, or at all, or the inability to obtain certain products from third-party suppliers or from our manufacturers, could have a material adverse effect on our business, financial condition, or results of operations.
We contract with third-party manufacturers and suppliers for the production of some of our products, including most of our powdered drink mixesand nutrition bars, and certain of our personal care products. These third-party suppliers and manufacturers produce and, in most cases, package theseproducts according to formulations that have been developed by, or in conjunction with, our in-house product development team. There is a risk that any ofour suppliers or manufacturers could discontinue manufacturing our products or selling their products to us. Although we believe that we could establishalternate sources for most of our products, any delay in locating and establishing relationships with other sources could result in product shortages or backorders for products, with a resulting loss of net sales. In certain situations, we may be required to alter our products or to substitute different products fromanother source. We have, in the past, discontinued or temporarily stopped sales of certain products that were manufactured by third parties while thoseproducts were on back order. There can be no assurance that suppliers will provide the raw materials or manufactured products that are needed by us in thequantities that we request or at the prices that we are willing to pay. Because we do not control the actual production of certain raw materials and products, weare also subject to delays caused by any interruption in the production of these materials, based on conditions not within our control, including weather, cropconditions, transportation interruptions, strikes by supplier employees, and natural disasters or other catastrophic events.
-18-
Table of Contents Shortages of raw materials may temporarily adversely affect our margins or our profitability related to the sale of those products.
We may experience temporary shortages of the raw materials used in certain of our nutritional products. While we periodically experience priceincreases due to unexpected raw material shortages and other unanticipated events, this has historically not resulted in a material effect on our overall cost ofgoods sold. However, there is no assurance that our raw materials will not be significantly adversely affected in the future, causing our profitability to bereduced. A deterioration of our relationship with any of our suppliers, or problems experienced by these suppliers, could lead to inventory shortages. In suchcase, we may not be able to fulfill the demand of existing customers, supply new customers, or expand other channels of distribution. A raw material shortagecould result in decreased revenue or could impair our ability to maintain or expand our business.
A failure of our information technology systems would harm our business.
The global nature of our business and our seamless global compensation plan requires the development and implementation of robust andefficiently functioning information technology systems. Such systems are vulnerable to a variety of potential risks, including damage or interruption resultingfrom natural disasters, telecommunication failures, and human error or intentional acts of sabotage, vandalism, break-ins and similar acts. Although we haveadopted and implemented a business continuity and disaster recovery plan, which includes routine back-up, off-site archiving and storage, and certainredundancies, the occurrence of any of these events could result in costly interruptions or failures adversely affecting our business and the results of ouroperations.
We are dependent upon access to external sources of capital to grow our business.
Our business strategy contemplates future access to debt and equity financing to fund the expansion of our business. The inability to obtainsufficient capital to fund the expansion of our business could have a material adverse effect on us. Our business is subject to online security risks, including security breaches.
Our businesses involve the storage and transmission of users’ proprietary information, and security breaches could expose us to a risk of loss ormisuse of this information, litigation, and potential liability. An increasing number of websites, including several large companies, have recently disclosedbreaches of their security, some of which have involved sophisticated and highly targeted attacks on portions of their sites. Because the techniques used toobtain unauthorized access, disable or degrade service, or sabotage systems, change frequently and often are not recognized until launched against a target, wemay be unable to anticipate these techniques or to implement adequate preventative measures. A party that is able to circumvent our security measures couldmisappropriate our or our customers’ proprietary information, cause interruption in our operations, damage our computers or those of our customers, orotherwise damage our reputation and business. Any compromise of our security could result in a violation of applicable privacy and other laws, significantlegal and financial exposure, damage to our reputation, and a loss of confidence in our security measures, which could harm our business.
Currently, a significant number of our customers authorize us to bill their credit card accounts directly for all transaction fees charged by us. Werely on encryption and authentication technology licensed from third parties to provide the security and authentication to effectively secure transmission ofconfidential information, including customer credit card numbers. Advances in computer capabilities, new discoveries in the field of cryptography or otherdevelopments may result in the technology used by us to protect transaction data being breached or compromised. Non-technical means, for example, actionsby a suborned employee, can also result in a data breach.
Under payment card rules and our contracts with our card processors, if there is a breach of payment card information that we store, we could beliable to the payment card issuing banks for their cost of issuing new cards and related expenses. In addition, if we fail to follow payment card industrysecurity standards, even if there is no compromise of customer information, we could incur significant fines or lose our ability to give customers the option ofusing payment cards to fund their payments or pay their fees. If we were unable to accept payment cards, our business would be seriously damaged.
-19-
Table of Contents
Our servers are also vulnerable to computer viruses, physical or electronic break-ins, “denial-of-service” type attacks and similar disruptions thatcould, in certain instances, make all or portions of our websites unavailable for periods of time. We may need to expend significant resources to protectagainst security breaches or to address problems caused by breaches. These issues are likely to become more difficult as we expand the number of placeswhere we operate. Security breaches, including any breach by us or by parties with which we have commercial relationships that result in the unauthorizedrelease of our users’ personal information, could damage our reputation and expose us to a risk of loss or litigation and possible liability. Our insurancepolicies carry coverage limits, which may not be adequate to reimburse us for losses caused by security breaches.
Our web customers, as well as those of other prominent companies, may be targeted by parties using fraudulent “spoof” and “phishing” emails tomisappropriate passwords, credit card numbers, or other personal information or to introduce viruses or other malware programs to our customers’ computers.These emails appear to be legitimate emails sent by our Company, but they may direct recipients to fake websites operated by the sender of the email orrequest that the recipient send a password or other confidential information via email or download a program. Despite our efforts to mitigate “spoof” and“phishing” emails through product improvements and user education, “spoof” and “phishing” remain a serious problem that may damage our brands,discourage use of our websites, and increase our costs. Risks Related to our Direct Selling Business Independent distributor activities that violate laws could result in governmental actions against us and could otherwise harm our business.
Our independent distributors are independent contractors. They are not employees and they act independently of us. The network marketingindustry is subject to governmental regulation. We implement strict policies and procedures to try to ensure that our independent distributors comply withlaws. Any determination by the Federal Trade Commission or other governmental agency that we or our distributors are not in compliance with laws couldpotentially harm our business. Even if governmental actions do not result in rulings or orders against us, they could create negative publicity that coulddetrimentally affect our efforts to recruit or motivate independent distributors and attract customers. Network marketing is heavily regulated and subject to government scrutiny and regulation, which adds to the expense of doing business and thepossibility that changes in the law might adversely affect our ability to sell some of our products in certain markets.
Network marketing systems, such as ours, are frequently subject to laws and regulations, both in the U.S. and internationally, that are directed atensuring that product sales are made to consumers of the products and that compensation, recognition, and advancement within the marketing organizationare based on the sale of products rather than on investment in the sponsoring company. These laws and regulations are generally intended to preventfraudulent or deceptive schemes, often referred to as “pyramid” schemes, which compensate participants for recruiting additional participants irrespective ofproduct sales, use high pressure recruiting methods and or do not involve legitimate products. Complying with these rules and regulations can be difficult andrequires the devotion of significant resources on our part. Regulatory authorities, in one or more of our present or future markets, could determine that ournetwork marketing system does not comply with these laws and regulations or that it is prohibited. Failure to comply with these laws and regulations or sucha prohibition could have a material adverse effect on our business, financial condition, or results of operations. Further, we may simply be prohibited fromdistributing products through a network-marketing channel in some countries, or we may be forced to alter our compensation plan.
We are also subject to the risk that new laws or regulations might be implemented or that current laws or regulations might change, which couldrequire us to change or modify the way we conduct our business in certain markets. This could be particularly detrimental to us if we had to change or modifythe way we conduct business in markets that represent a significant percentage of our net sales. For example, the FTC released a proposed New BusinessOpportunity Rule in April 2006. As initially drafted, the proposed rule would have required pre-sale disclosures for all business opportunities, which mayhave included network marketing compensation plans such as ours. However, in March 2008 the FTC issued a revised notice of proposed rulemaking, whichindicates that the New Business Opportunity Rule as drafted will not apply to multi-level marketing companies.
-20-

Table of Contents Our principal business segment is conducted worldwide in one channel, direct selling and therefore any negative perceptive of direct selling would greatlyimpact our sales.
Our principal business segment is conducted worldwide in the direct selling channel. Sales are made to the ultimate consumer principally throughapproximately 121,000 independent distributors & customers worldwide. There is a high rate of turnover among distributors, which is a commoncharacteristic of the direct selling business. As a result, in order to maintain our business and grow our business in the future, we need to recruit, retain andservice distributors on a continuing basis and continue to innovate the direct selling model. Consumer purchasing habits, including reducing purchases ofproducts generally, or reducing purchases from distributors or buying products in channels other than in direct selling, such as retail, could reduce our sales,impact our ability to execute our global business strategy or have a material adverse effect on our business, financial condition and results of operations. If ourcompetitors establish greater market share in the direct selling channel, our business, financial condition and operating results may be adversely affected.Furthermore, if any government bans or severely restricts our business method of direct selling, our business, financial condition and operating results may beadversely affected.
Our ability to attract and retain distributors and to sustain and enhance sales through our distributors can be affected by adverse publicity ornegative public perception regarding our industry, our competition, or our business generally. Negative public perception may include negative publicityregarding the sales structure of significant, pure network marketing companies which has been the case recently with large network marketing companies, thequality or efficacy of nutritional supplement products or ingredients in general or our products or ingredients specifically, and regulatory investigations,regardless of whether those investigations involve us or our distributors or the business practices or products of our competitors or other network marketingcompanies. Any adverse publicity may also adversely impact the market price of our stock and cause insecurity among our distributors. There can be noassurance that we will not be subject to adverse publicity or negative public perception in the future or that such adverse publicity will not have a materialadverse effect on our business, financial condition, or results of operations. As a network marketing company, we are dependent upon an independent sales force and we do not have direct control over the marketing of ourproducts.
We rely on non-employee, independent distributors to market and sell our products and to generate our sales. Distributors typically market and sellour products on a part-time basis and likely will engage in other business activities, some of which may compete with us. We have a large number ofdistributors and a relatively small corporate staff to implement our marketing programs and to provide motivational support to our distributors. We relyprimarily upon our distributors to attract, train and motivate new distributors. Our sales are directly dependent upon the efforts of our distributors. Our abilityto maintain and increase sales in the future will depend in large part upon our success in increasing the number of new distributors, retaining and motivatingour existing distributors, and in improving the productivity of our distributors.
We can provide no assurances that the number of distributors will increase or remain constant or that their productivity will increase. Ourdistributors may terminate their services at any time, and, like most direct selling companies, we experience a high turnover among new distributors from yearto year. We cannot accurately predict any fluctuation in the number and productivity of distributors because we primarily rely upon existing distributors tosponsor and train new distributors and to motivate new and existing distributors. Our operating results in other markets could also be adversely affected if weand our existing distributors do not generate sufficient interest in our business to successfully retain existing distributors and attract new distributors. The loss of a significant Youngevity distributor could adversely affect our business.
We rely on the successful efforts of our distributors that become leaders. If these downline distributors in turn sponsor new distributors, additionalbusiness centers are created, with the new downline distributors becoming part of the original sponsoring distributor’s downline network. As a result of thisnetwork marketing system, distributors develop business relationships with other distributors. The loss of a key distributor or group of distributors, largeturnover or decreases in the size of the key distributors force, seasonal or other decreases in purchase volume, sales volume reduction, the costs associatedwith training new distributors, and other related expenses may adversely affect our business, financial condition, or results of operations. Moreover, ourability to continue to attract and retain distributors can be affected by a number of factors, some of which are beyond our control, including:
-21-
Table of Contents
● General business and economic conditions;
● Adverse publicity or negative misinformation about us or our products;
● Public perceptions about network marketing programs;
● High-visibility investigations or legal proceedings against network marketing companies by federal or state authorities or private citizens;
● Public perceptions about the value and efficacy of nutritional, personal care, or weight management products generally;
●
Other competing network marketing organizations entering into the marketplace that may recruit our existing distributors or reduce the potentialpool of new distributors; and
●
Changes to our compensation plan required by law or implemented for business reasons that make attracting and retaining distributors moredifficult.
There can be no assurance that we will be able to continue to attract and retain distributors in sufficient numbers to sustain future growth or to
maintain our present growth levels, which could have a material adverse effect on our business, financial condition, or results of operations. Nutritional supplement products may be supported by only limited availability of conclusive clinical studies.
Some of our products include nutritional supplements that are made from vitamins, minerals, herbs, and other substances for which there is a longhistory of human consumption. Other products contain innovative ingredients or combinations of ingredients. Although we believe that all of our products aresafe when taken as directed, there is little long-term experience with human consumption of certain of these product ingredients or combinations ofingredients in concentrated form. We conduct research and test the formulation and production of our products, but we have performed or sponsored onlylimited clinical studies. Furthermore, because we are highly dependent on consumers' perception of the efficacy, safety, and quality of our products, as well assimilar products distributed by other companies, we could be adversely affected in the event that those products prove or are asserted to be ineffective orharmful to consumers or in the event of adverse publicity associated with any illness or other adverse effects resulting from consumers' use or misuse of ourproducts or similar products of our competitors. Our manufacturers are subject to certain risks. We are dependent upon the uninterrupted and efficient operation of our manufacturers and suppliers of products. Those operations are subjectto power failures, the breakdown, failure, or substandard performance of equipment, the improper installation or operation of equipment, natural or otherdisasters, and the need to comply with the requirements or directives of government agencies, including the FDA. There can be no assurance that theoccurrence of these or any other operational problems at our facilities would not have a material adverse effect on our business, financial condition, or resultsof operations.
Risks Related to our Coffee Business Increases in the cost of high-quality arabica coffee beans or other commodities or decreases in the availability of high-quality arabica coffee beans orother commodities could have an adverse impact on our business and financial results.
We purchase, roast, and sell high-quality whole bean arabica coffee beans and related coffee products. The price of coffee is subject to significantvolatility, The high-quality arabica coffee of the quality we seek tends to trade on a negotiated basis at a premium above the “C” price. This premium dependsupon the supply and demand at the time of purchase and the amount of the premium can vary significantly. Increases in the “C” coffee commodity price doincrease the price of high-quality arabica coffee and also impact our ability to enter into fixed-price purchase commitments. We frequently enter into supplycontracts whereby the quality, quantity, delivery period, and other negotiated terms are agreed upon, but the date, and therefore price, at which the base “C”coffee commodity price component will be fixed has not yet been established.
-22-
Table of Contents
These are known as price-to-be-fixed contracts. We also enter into supply contracts whereby the quality, quantity, delivery period, and price arefixed. The supply and price of coffee we purchase can also be affected by multiple factors in the producing countries, including weather, natural disasters,crop disease, general increase in farm inputs and costs of production, inventory levels, and political and economic conditions, as well as the actions of certainorganizations and associations that have historically attempted to influence prices of green coffee through agreements establishing export quotas or byrestricting coffee supplies. Speculative trading in coffee commodities can also influence coffee prices. Because of the significance of coffee beans to ouroperations, combined with our ability to only partially mitigate future price risk through purchasing practices, increases in the cost of high-quality arabicacoffee beans could have an adverse impact on our profitability. In addition, if we are not able to purchase sufficient quantities of green coffee due to any ofthe above factors or to a worldwide or regional shortage, we may not be able to fulfill the demand for our coffee, which could have an adverse impact on ourprofitability.
Adverse public or medical opinions about the health effects of consuming our products, as well as reports of incidents involving food-borne illnesses, foodtampering, or food contamination, whether or not accurate, could harm our business.
Some of our products contain caffeine and other active compounds, the health effects of which are the subject of public scrutiny, including thesuggestion that excessive consumption of caffeine and other active compounds can lead to a variety of adverse health effects. In the U.S., there is increasingconsumer awareness of health risks, including obesity, due in part to increased publicity and attention from health organizations, as well as increasedconsumer litigation based on alleged adverse health impacts of consumption of various food products, frequently including caffeine. An unfavorable report onthe health effects of caffeine or other compounds present in our products, or negative publicity or litigation arising from certain health risks couldsignificantly reduce the demand for our products.
Similarly, instances or reports, whether true or not, of food-borne illnesses, food tampering and food contamination, either during manufacturing,packaging or preparation, have in the past severely injured the reputations of companies in the food processing, grocery and quick-service restaurant sectorsand could affect us as well. Any report linking us to the use of food tampering or food contamination could damage our brand value, severely hurt sales of ourproducts, and possibly lead to product liability claims, litigation (including class actions) or damages. If consumers become ill from food-borne illnesses,tampering or contamination, we could also be forced to temporarily stop selling our products and consequently could materially harm our business and resultsof operations.
RISKS ASSOCIATED WITH INVESTING IN OUR COMMON STOCK We are controlled by one principal stockholder who is also our Chief Executive Officer and Chairman.
Through his voting power, Mr. Stephan Wallach, our Chief Executive Officer and Chairman, has the ability to elect a majority of our directors andto control all other matters requiring the approval of our stockholders, including the election of all of our directors. Mr. Wallach owns and beneficially ownsapproximately 72% of our total equity securities (assuming exercise of the options to purchase Common Stock held by Mr. Wallach and Michelle Wallach, hiswife and Chief Operating Officer and Director). As our Chief Executive Officer, Mr. Wallach has the ability to control our business affairs.
We are an “emerging growth company,” and any decision on our part to comply with certain reduced disclosure requirements applicable to emerginggrowth companies could make our Common Stock less attractive to investors.
We are an “emerging growth company,” as defined in the Jumpstart Our Business Startups Act enacted in April 2012, and, for as long as wecontinue to be an emerging growth company, we may choose to take advantage of exemptions from various reporting requirements applicable to other publiccompanies including, but not limited to, not being required to comply with the auditor attestation requirements of Section 404 of the Sarbanes-Oxley Act of2002, not being required to comply with any new requirements adopted by the Public Company Accounting Oversight Board, or the PCAOB, requiringmandatory audit firm rotation or a supplement to the auditor's report in which the auditor would be required to provide additional information about the auditand the financial statements of the issuer, not being required to comply with any new audit rules adopted by the PCAOB after April 5, 2012 unless the SECdetermines otherwise, reduced disclosure obligations regarding executive compensation in our periodic reports and proxy statements, and exemptions fromthe requirements of holding a nonbinding advisory vote on executive compensation and stockholder approval of any golden parachute payments notpreviously approved.
-23-
Table of Contents
We could remain an emerging growth company until the earliest of : (i) the last day of the fiscal year in which we have total annual grossrevenues of $1 billion or more; (ii) the last day of our fiscal year following the fifth anniversary of the date of our first sale of common equity securitiespursuant to an effective registration statement; (iii) the date on which we have issued more than $1 billion in nonconvertible debt during the previous threeyears; or (iv) the date on which we are deemed to be a large accelerated filer. We have elected to use the extended transition period for complying with new orrevised accounting standards under Section 102(b)(2) of the Jobs Act, that allows us to delay the adoption of new or revised accounting standards that havedifferent effective dates for public and private companies until those standards apply to private companies. We cannot predict if investors will find ourCommon Stock less attractive if we choose to rely on these exemptions. If some investors find our Common Stock less attractive as a result of any choices toreduce future disclosure, there may be a less active trading market for our Common Stock and our stock price may be more volatile. Further, as a result ofthese scaled regulatory requirements, our disclosure may be more limited than that of other public companies and you may not have the same protectionsafforded to shareholders of such companies. Our financial statements may not be comparable to companies that comply with public company effective dates.
We have elected to use the extended transition period for complying with new or revised accounting standards under Section 102(b)(2) of the JobsAct, that allows us to delay the adoption of new or revised accounting standards that have different effective dates for public and private companies untilthose standards apply to private companies. As a result of this election, our financial statements may not be comparable to companies that comply with publiccompany effective dates.
Our stock has historically had a limited market. If an active trading market for our common stock does develop, trading prices may be volatile.
In the event that an active trading market develops, the market price of our shares of common stock may be based on factors that may not beindicative of future market performance. Consequently, the market price of our common stock may vary greatly. If an active market for our common stockdevelops, there is a significant risk that our stock price may fluctuate dramatically in the future in response to any of the following factors, some of which arebeyond our control:
● variations in our quarterly operating results; ● announcements that our revenue or income/loss levels are below analysts’ expectations; ● general economic slowdowns; ● changes in market valuations of similar companies; ● announcements by us or our competitors of significant contracts; or ● acquisitions, strategic partnerships, joint ventures or capital commitments.
Because our shares are deemed “penny stocks,” an investor may have difficulty selling them in the secondary trading market.
The SEC has adopted regulations which generally define a “penny stock” to be any equity security that has a market price, as therein defined, ofless than $5.00 per share or with an exercise price of less than $5.00 per share, subject to certain exceptions. Additionally, if the equity security is notregistered or authorized on a national securities exchange that makes certain reports available, the equity security may also constitute a “penny stock.” As ourcommon stock comes within the definition of penny stock, these regulations require the delivery by the broker-dealer, prior to any transaction involving ourcommon stock, of a risk disclosure schedule explaining the penny stock market and the risks associated with it. The broker-dealer also must provide thecustomer with bid and offer quotations for the penny stock, the compensation of the broker-dealer and any salesperson in the transaction, and monthlyaccount statements indicating the market value of each penny stock held in the customer’s account. In addition, the penny stock rules require that, prior to atransaction in a penny stock not otherwise exempt from those rules the broker-dealer must make a special written determination that the penny stock is asuitable investment for the purchaser and receive the purchaser’s written agreement to the transaction. These disclosure requirements may have the effect ofreducing the trading activity in the secondary market for our common stock. The ability of broker-dealers to sell our common stock and the ability ofshareholders to sell our common stock in the secondary market would be limited. As a result, the market liquidity for our common stock would be severelyand adversely affected. We can provide no assurance that trading in our common stock will not be subject to these or other regulations in the future, whichwould negatively affect the market for our common stock.
-24-
Table of Contents We are subject to the reporting requirements of Federal Securities Laws, which can be expensive.
We are subject to the information and reporting requirements under the Securities Exchange Act of 1934 and other federal securities laws, and thecompliance obligations of the Sarbanes-Oxley Act of 2002. The costs of preparing and filing annual and quarterly reports and other information with the SEChas and will continue to cause our expenses to be higher than they would be if we were a privately-held company.
Sales by our shareholders of a substantial number of shares of our common stock in the public market could adversely affect the market price of ourcommon stock.
A large number of outstanding shares of our common stock are held by several of our principal shareholders. If any of these principal shareholderswere to decide to sell large amounts of stock over a short period of time such sales could cause the market price of our common stock to decline. Our stock price has been volatile and subject to various market conditions.
There can be no assurance that an active market in our stock will be sustained. The trading price of our common stock has been subject to widefluctuations. The price of our common stock may fluctuate in the future in response to quarter-to-quarter variations in operating results, materialannouncements by us or our competitors, governmental regulatory action, conditions in the nutritional supplement industry, negative publicity, or other eventsor factors, many of which are beyond our control. In addition, the stock market has historically experienced significant price and volume fluctuations, whichhave particularly affected the market prices of many dietary and nutritional supplement companies and which have, in certain cases, not had a strongcorrelation to the operating performance of these companies. Our operating results in future quarters may be below the expectations of securities analysts andinvestors. If that were to occur, the price of our common stock would likely decline, perhaps substantially. We may issue preferred stock with rights senior to the common stock, which we may issue in order to consummate a merger or other transactionnecessary to raise capital.
Our certificate of incorporation authorizes the issuance of up to 100,000,000 shares of preferred stock, par value $0.001 per share (the “PreferredStock”) without shareholder approval and on terms established by our directors. We may issue shares of preferred stock in order to consummate a financingor other transaction, in lieu of the issuance of common stock. The rights and preferences of any such class or series of preferred stock would be establishedby our board of directors in its sole discretion and may have dividend, voting, liquidation and other rights and preferences that are senior to the rights of thecommon stock.
You should not rely on an investment in our common stock for the payment of cash dividends. We intend to retain future profits, if any, to expand our business, we have never paid cash dividends on our stock and do not anticipate paying anycash dividends in the foreseeable future. You should not make an investment in our common stock if you require dividend income. Any return on investmentin our common stock would only come from an increase in the market price of our stock, which is uncertain and unpredictable. ITEM 1B. UNRESOLVED STAFF COMMENTS
None.
-25-
Table of Contents ITEM 2. PROPERTIES Operation Properties
Our corporate headquarters are located at 2400 Boswell, Road, Chula Vista, California 91914. This is also the location of Youngevity®’s operationsand distribution center. The facility consists of a 59,000 square foot Class A single use building that is comprised 40% of office space and the balance is usedfor distribution. The building is owned by our subsidiary 2400 Boswell, LLC, a limited liability company that we acquired from the step parent of Mr.Wallach, our Chief Executive Officer. On March 15, 2013, we acquired 2400 Boswell, LLC for $248,000 in cash, $334,000 of debt forgiveness and accruedinterest, and a promissory note of approximately $393,000, payable in equal payments over 5 years and bears interest at 5.00%. Additionally, the Companyassumed a long-term mortgage of $3,625,000, payable over 25 years and has an initial interest rate of 5.75%. As of December 31, 2013 the balance on thelong-term mortgage was $3,576,000 and the balance on the promissory note was $340,000 Roasting, distribution and operations for our CLR Roasters division are handled in our Miami, Florida based facility, which consists of 39,500square feet. Our lease for this space expires in May 2023. The rent expense for the year ended December 31, 2013 was approximately $186,000.
Our marketing office is located in Windham, New Hampshire, which consists of 12,750 square feet of office space. FDI Realty is the owner andlessor of the building. The Company is the lessee and is currently one of three tenants. An officer of the Company is the single member of FDI Realty. TheCompany is a co-guarantor of FDI Realty’s mortgages on the leased building and has an agreement to purchase FDI Realty in connection with the acquisitionof FDI. This lease expires July 31, 2014 with five 3-year options to renew. The rent expense for the year ended December 31, 2013 was approximately$204,000.
Heritage Makers is located in a 9,300 square foot facility in Provo, Utah. The rent expense from August 2013 to December 2013 was approximately$34,000. Our New Zealand operations is located in a 3,570 square foot facility in Auckland. The rent expense for the year ended December 31, 2013 was$36,000.
The Company believes that the space occupied by all of its operations is adequate for its current and near-term requirements. Should additional spacebe required, the Company does not anticipate problems in securing such additional space.
ITEM 3. LEGAL PROCEEDINGS
The Company is, from time to time, the subject of claims and suits arising out of matters occurring during the operation of the Company’sbusiness. In the opinion of management, no pending claims or suits would materially affect the financial position or the results of the operations of theCompany. ITEM 4. MINE SAFETY DISCLOSURES
Not applicable.
-26-
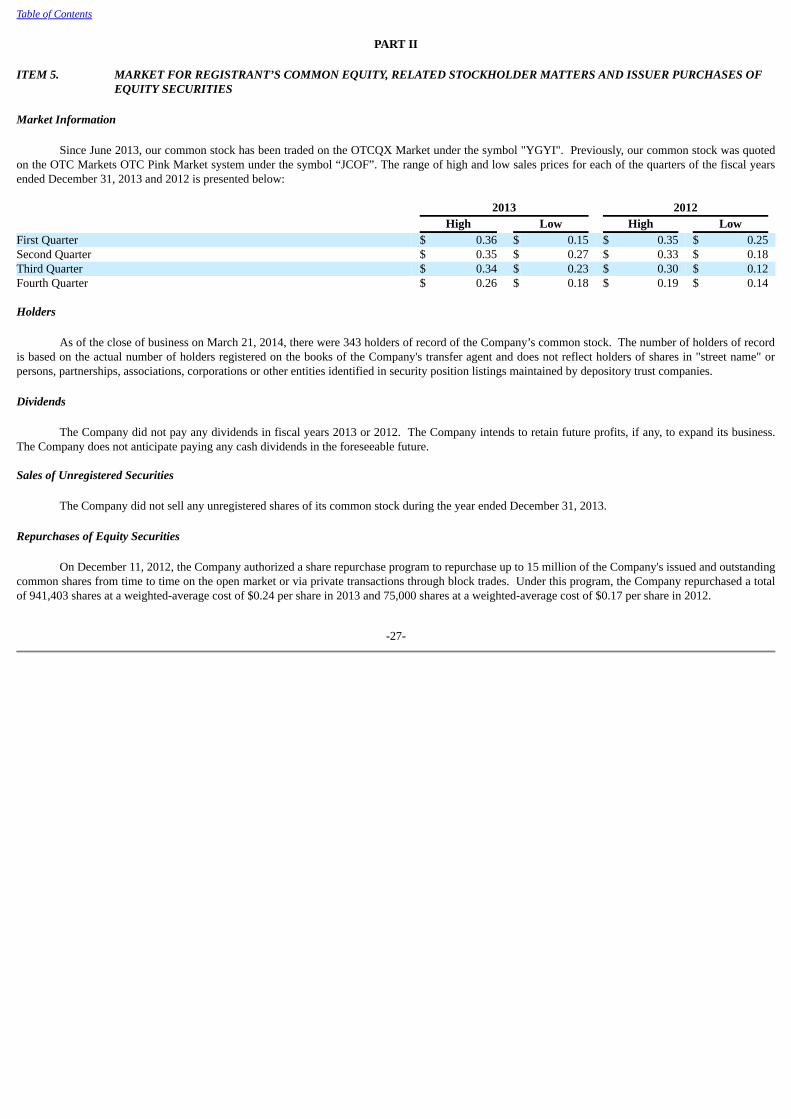
Table of Contents
PART II
ITEM 5. MARKET FOR REGISTRANT’S COMMON EQUITY, RELATED STOCKHOLDER MATTERS AND ISSUER PURCHASES OFEQUITY SECURITIES
Market Information
Since June 2013, our common stock has been traded on the OTCQX Market under the symbol "YGYI". Previously, our common stock was quotedon the OTC Markets OTC Pink Market system under the symbol “JCOF”. The range of high and low sales prices for each of the quarters of the fiscal yearsended December 31, 2013 and 2012 is presented below: 2013 2012 High Low High Low First Quarter $ 0.36 $ 0.15 $ 0.35 $ 0.25 Second Quarter $ 0.35 $ 0.27 $ 0.33 $ 0.18 Third Quarter $ 0.34 $ 0.23 $ 0.30 $ 0.12 Fourth Quarter $ 0.26 $ 0.18 $ 0.19 $ 0.14 Holders
As of the close of business on March 21, 2014, there were 343 holders of record of the Company’s common stock. The number of holders of recordis based on the actual number of holders registered on the books of the Company's transfer agent and does not reflect holders of shares in "street name" orpersons, partnerships, associations, corporations or other entities identified in security position listings maintained by depository trust companies.
Dividends
The Company did not pay any dividends in fiscal years 2013 or 2012. The Company intends to retain future profits, if any, to expand its business.The Company does not anticipate paying any cash dividends in the foreseeable future.
Sales of Unregistered Securities
The Company did not sell any unregistered shares of its common stock during the year ended December 31, 2013.
Repurchases of Equity Securities
On December 11, 2012, the Company authorized a share repurchase program to repurchase up to 15 million of the Company's issued and outstandingcommon shares from time to time on the open market or via private transactions through block trades. Under this program, the Company repurchased a totalof 941,403 shares at a weighted-average cost of $0.24 per share in 2013 and 75,000 shares at a weighted-average cost of $0.17 per share in 2012.
-27-
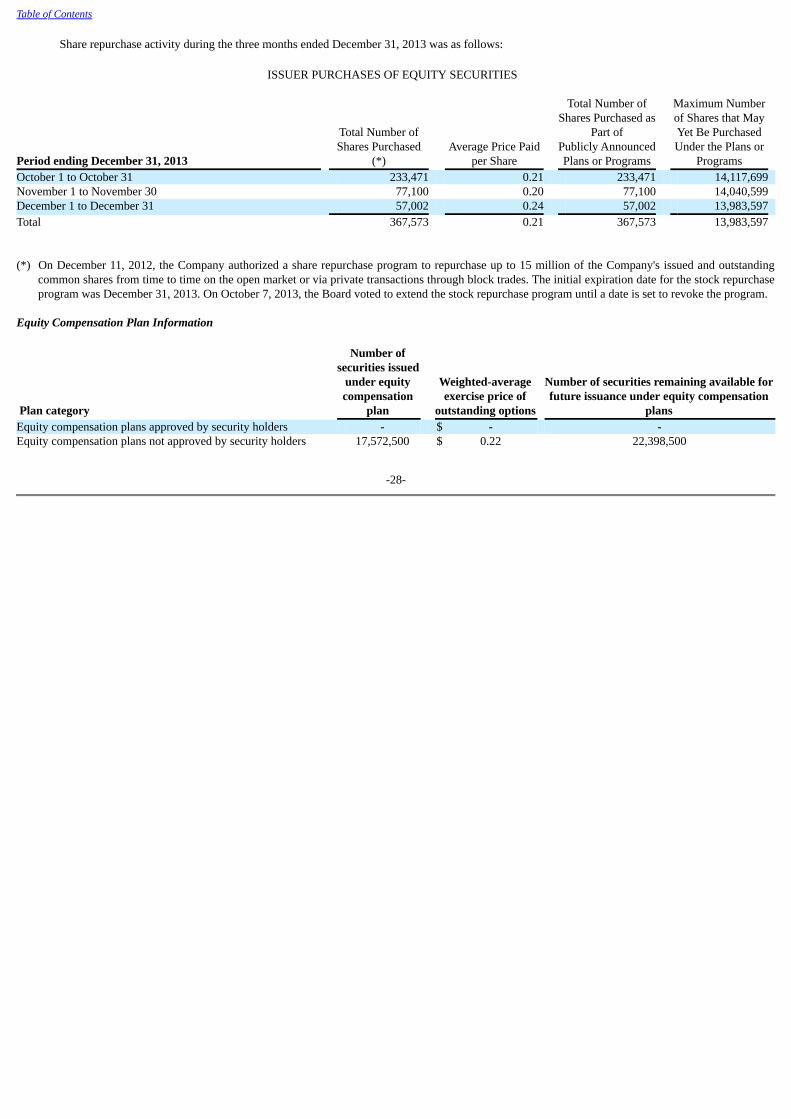
Table of Contents
Share repurchase activity during the three months ended December 31, 2013 was as follows:
ISSUER PURCHASES OF EQUITY SECURITIES
Period ending December 31, 2013
Total Number ofShares Purchased
(*) Average Price Paid
per Share
Total Number ofShares Purchased as
Part ofPublicly AnnouncedPlans or Programs
Maximum Numberof Shares that MayYet Be PurchasedUnder the Plans or
Programs October 1 to October 31 233,471 0.21 233,471 14,117,699 November 1 to November 30 77,100 0.20 77,100 14,040,599 December 1 to December 31 57,002 0.24 57,002 13,983,597 Total 367,573 0.21 367,573 13,983,597 (*) On December 11, 2012, the Company authorized a share repurchase program to repurchase up to 15 million of the Company's issued and outstanding
common shares from time to time on the open market or via private transactions through block trades. The initial expiration date for the stock repurchaseprogram was December 31, 2013. On October 7, 2013, the Board voted to extend the stock repurchase program until a date is set to revoke the program.
Equity Compensation Plan Information
Plan category
Number ofsecurities issued
under equitycompensation
plan
Weighted-averageexercise price of
outstanding options
Number of securities remaining available forfuture issuance under equity compensation
plansEquity compensation plans approved by security holders - $ - -Equity compensation plans not approved by security holders 17,572,500 $ 0.22 22,398,500
-28-
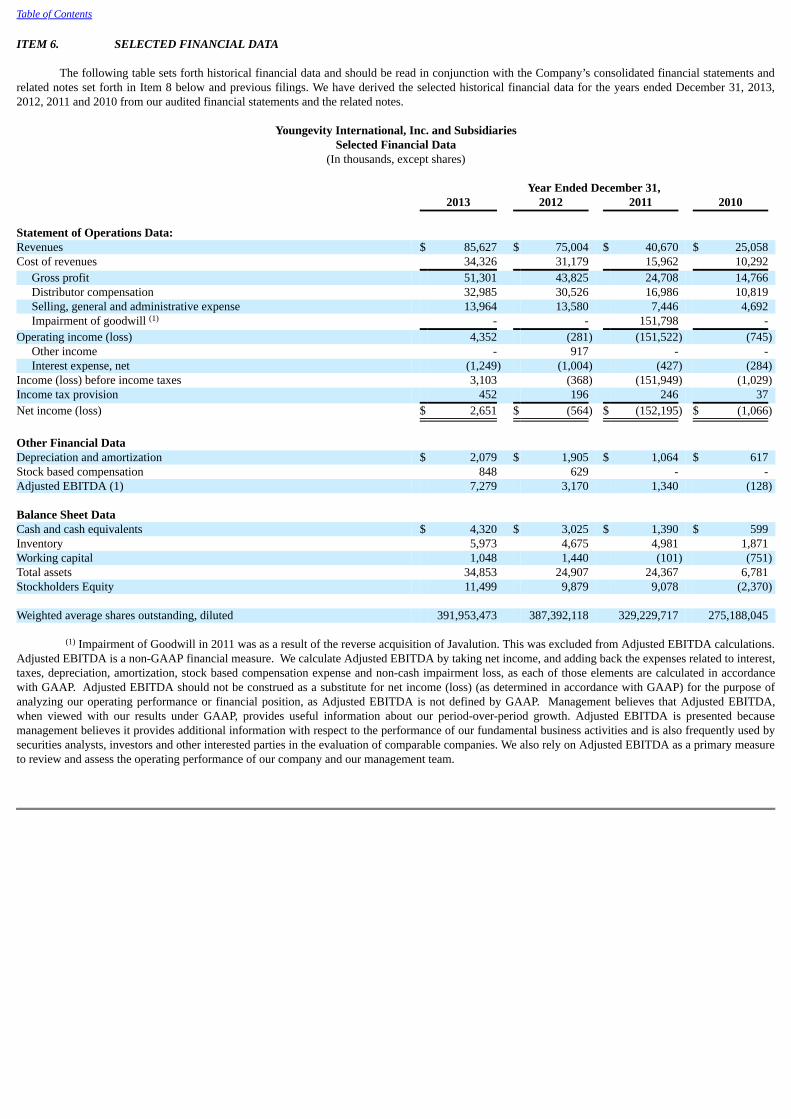
Table of Contents ITEM 6. SELECTED FINANCIAL DATA
The following table sets forth historical financial data and should be read in conjunction with the Company’s consolidated financial statements andrelated notes set forth in Item 8 below and previous filings. We have derived the selected historical financial data for the years ended December 31, 2013,2012, 2011 and 2010 from our audited financial statements and the related notes.
Youngevity International, Inc. and SubsidiariesSelected Financial Data
(In thousands, except shares) Year Ended December 31, 2013 2012 2011 2010 Statement of Operations Data: Revenues $ 85,627 $ 75,004 $ 40,670 $ 25,058 Cost of revenues 34,326 31,179 15,962 10,292
Gross profit 51,301 43,825 24,708 14,766 Distributor compensation 32,985 30,526 16,986 10,819 Selling, general and administrative expense 13,964 13,580 7,446 4,692 Impairment of goodwill (1) - - 151,798 -
Operating income (loss) 4,352 (281) (151,522) (745)Other income - 917 - - Interest expense, net (1,249) (1,004) (427) (284)
Income (loss) before income taxes 3,103 (368) (151,949) (1,029)Income tax provision 452 196 246 37 Net income (loss) $ 2,651 $ (564) $ (152,195) $ (1,066) Other Financial Data Depreciation and amortization $ 2,079 $ 1,905 $ 1,064 $ 617 Stock based compensation 848 629 - - Adjusted EBITDA (1) 7,279 3,170 1,340 (128) Balance Sheet Data Cash and cash equivalents $ 4,320 $ 3,025 $ 1,390 $ 599 Inventory 5,973 4,675 4,981 1,871 Working capital 1,048 1,440 (101) (751)Total assets 34,853 24,907 24,367 6,781 Stockholders Equity 11,499 9,879 9,078 (2,370) Weighted average shares outstanding, diluted 391,953,473 387,392,118 329,229,717 275,188,045
(1) Impairment of Goodwill in 2011 was as a result of the reverse acquisition of Javalution. This was excluded from Adjusted EBITDA calculations.Adjusted EBITDA is a non-GAAP financial measure. We calculate Adjusted EBITDA by taking net income, and adding back the expenses related to interest,taxes, depreciation, amortization, stock based compensation expense and non-cash impairment loss, as each of those elements are calculated in accordancewith GAAP. Adjusted EBITDA should not be construed as a substitute for net income (loss) (as determined in accordance with GAAP) for the purpose ofanalyzing our operating performance or financial position, as Adjusted EBITDA is not defined by GAAP. Management believes that Adjusted EBITDA,when viewed with our results under GAAP, provides useful information about our period-over-period growth. Adjusted EBITDA is presented becausemanagement believes it provides additional information with respect to the performance of our fundamental business activities and is also frequently used bysecurities analysts, investors and other interested parties in the evaluation of comparable companies. We also rely on Adjusted EBITDA as a primary measureto review and assess the operating performance of our company and our management team.

-29-
Table of Contents ITEM 7. MANAGEMENT’S DISCUSSION AND ANALYSIS OF FINANCIAL CONDITION AND RESULTS OF OPERATIONS
The following discussion of our financial condition and results of operation should be read in conjunction with the consolidated financial statementsand related notes, which are included in this Annual Report on Form 10-K.
Forward Looking Statements
A number of statements contained in this discussion and analysis are forward-looking statements that involve risks and uncertainties that couldcause actual results to differ materially from those expressed or implied in the applicable statements. You are cautioned not to place undue reliance on theseforward-looking statements. The nature of our business makes predicting the future trends of our revenues, expenses and net income difficult. The risks anduncertainties involved in our businesses could affect the matters referred to in such statements and it is possible that our actual results may differ materiallyfrom the anticipated results indicated in these forward looking statements. Important factors that could cause actual results to differ from those in theforward-looking statements include, but are not limited to:
● our ability to meet our financial obligations;● the relative success of marketing and advertising; ● the continued attractiveness of our lifestyle and diet programs;● competition, including price competition and competition with self-help weight loss and medical programs; ● our ability to obtain and continue certain relationships with the providers of popular nutrition and fitness approaches and the suppliers of our meal
delivery service;● adverse results in litigation and regulatory matters, more aggressive enforcement of existing legislation or regulations, a change in the interpretation
of existing legislation or regulations, or promulgation of new or enhanced legislation or regulations; and,● general economic and business conditions.
Overview
Youngevity International Inc. is a global direct marketer of nutritional and lifestyle products and a vertically-integrated producer of gourmetcoffees for the commercial, retail and direct sales channels. The Company operates in two segments: the direct selling segment where products are offeredthrough a global distribution network of preferred customers and distributors and the commercial coffee segment where products are sold directly tobusinesses. The direct selling segment sells health and wellness products on a global basis and offers a wide range of products through an international directselling network. Direct sales are made through a network of independent distributors, which is a web-based global network of customers anddistributors. The independent sales force sells a variety of products through friend-to-friend marketing and social networking. The Company also owns atraditional coffee roasting business that produces coffee under its own Café La Rica brand, as well as under a variety of private labels through major nationalsales outlets and major customers including cruise lines and office coffee service operators. The Company derives approximately 91% of its revenue andalmost all of its costs from within the United States.
Critical Accounting Policies and Estimates
Discussion and analysis of our financial condition and results of operations are based upon financial statements, which have been prepared inaccordance with accounting principles generally accepted in the U.S. The preparation of these financial statements requires us to make estimates andjudgments that affect the reported amounts of assets, liabilities, revenue and expenses, and related disclosure of contingent assets and liabilities. On an on-going basis, we evaluate our estimates; including those related to collection of receivables, inventory obsolescence, sales returns and non-monetarytransactions such as stock and stock options issued for services, deferred taxes and related valuation allowances, fair value of assets and liabilities acquired inbusiness combinations, asset impairments, useful lives of property, equipment and intangible assets and value of contingent acquisition debt. We base ourestimates on historical experience and on various other assumptions that are believed to be reasonable under the circumstances, the results of which form thebasis for making judgments about the carrying values of assets and liabilities that are not readily apparent from other sources. Actual results may differ fromthese estimates under different assumptions or conditions. We believe the following critical accounting policies affect our more significant judgments andestimates used in the preparation of our financial statements.
-30-
Table of Contents Emerging Growth Company
We have elected to use the extended transition period for complying with new or revised accounting standards under Section 102(b)(2) of the JobsAct, that allows us to delay the adoption of new or revised accounting standards that have different effective dates for public and private companies untilthose standards apply to private companies. As a result of this election, our financial statements may not be comparable to companies that comply with publiccompany effective dates. Revenue Recognition
The Company recognizes revenue from product sales when the following four criteria are met: persuasive evidence of an arrangement exists,delivery has occurred or services have been rendered, the selling price is fixed or determinable, and collectability is reasonably assured. Sales revenue and areserve for estimated returns are recorded when product is shipped. Revenue from product sales is recorded net of sales taxes. Inventory Valuation
Inventories are stated at the lower of cost or market on a first-in first-out basis. A reserve for inventory obsolescence is maintained and is basedupon assumptions about current and future product demand, inventory whose shelf life has expired, and prevailing market conditions. Business Combinations
The Company accounts for business combinations under the acquisition method and allocates the total purchase price for acquired businesses tothe tangible and identified intangible assets acquired and liabilities assumed, based on their estimated fair values. When a business combination includes theexchange of the Company’s common stock, the value of the common stock is determined using the closing market price as of the date such shares weretendered to the selling parties. The fair values assigned to tangible and identified intangible assets acquired and liabilities assumed are based on managementor third party estimates and assumptions that utilize established valuation techniques appropriate for the Company’s industry and each acquired business.Goodwill is recorded as the excess, if any, of the aggregate fair value of consideration exchanged for an acquired business over the fair value (measured as ofthe acquisition date) of total net tangible and identified intangible assets acquired. A liability for contingent consideration, if applicable, is recorded at fairvalue as of the acquisition date. In determining the fair value of such contingent consideration, management estimates the amount to be paid based onprobable outcomes and expectations on financial performance of the related acquired business. The fair value of contingent consideration is reassessedquarterly, with any change in the estimated value charged to operations in the period of the change. Increases or decreases in the fair value of the contingentconsideration obligations can result from changes in actual or estimated revenue streams, discount periods, discount rates, and probabilities that contingencieswill be met. Long-Lived Assets
Long-lived assets, including property and equipment and definite lived intangible assets are carried at cost less accumulated amortization. Costsincurred to renew or extend the life of a long lived asset are reviewed for capitalization. All finite-lived intangible assets are amortized on a straight-line basis,which approximates the pattern in which the estimated economic benefits of the assets are realized, over their estimated useful lives. The Company evaluateslong-lived assets for impairment whenever events or changes in circumstances indicate their net book value may not be recoverable. Impairment, if any, isbased on the excess of the carrying amount over the fair value, based on market value when available, or discounted expected cash flows, of those assets andis recorded in the period in which the determination is made. Goodwill
Goodwill is recorded as the excess, if any, of the aggregate fair value of consideration exchanged for an acquired business over the fair value(measured as of the acquisition date) of total net tangible and identified intangible assets acquired. Goodwill and other intangible assets with indefinite livesare not amortized but are tested for impairment on an annual basis or whenever events or changes in circumstances indicate that the carrying amount of theseassets may not be recoverable.
-31-

Table of Contents Stock Based Compensation
The Company accounts for stock based compensation in accordance with Financial Accounting Standards Board (“FASB”) Topic 718,Compensation – Stock Compensation, which establishes accounting for equity instruments exchanged for employee services. Under such provisions, stockbased compensation cost is measured at the grant date, based on the calculated fair value of the award, and is recognized as an expense, under the straight-linemethod, over the vesting period of the equity grant. The Company accounts for equity instruments issued to non-employees in accordance with authoritativeguidance for equity based payments to non-employees. Stock options issued to non-employees are accounted for at their estimated fair value determinedusing the Black-Scholes option-pricing model. The fair value of options granted to non-employees is re-measured as they vest, and the resulting increase invalue, if any, is recognized as expense during the period the related services are rendered.
Income Taxes
The Company accounts for income taxes under the asset and liability method which includes the recognition of deferred tax assets and liabilities forthe expected future tax consequences of events that have been included in the consolidated financial statements. Under this approach, deferred taxes arerecorded for the future tax consequences expected to occur when the reported amounts of assets and liabilities are recovered or paid. The provision for incometaxes represents income taxes paid or payable for the current year plus the change in deferred taxes during the year. Deferred taxes result from differencesbetween the financial statement and tax bases of our assets and liabilities, and are adjusted for changes in tax rates and tax laws when changes are enacted.The effects of future changes in income tax laws or rates are not anticipated. Results of Operations
The comparative financials discussed below show the condensed consolidated financial statements of Youngevity International, Inc. as of and forthe year ended December 31, 2013 and 2012.
Year ended December 31, 2013 compared to year ended December 31, 2012
Revenues
For the year ended December 31, 2013, our revenue increased 14.2% to $85,627,000 as compared to $75,004,000 for the year ended December 31,2012. The increase in revenue is attributed primarily to the increase in our product offerings and the number of distributors and customers resulting from ouracquisitions during 2012, and $2,876,000 in additional revenues derived from the acquisitions of Heritage Makers, Inc, acquired on August 14, 2013,GoFoods, acquired on October 1, 2013 and Biometics, acquired on November 19, 2013. In addition, the increase in revenues was also attributable to theorganic growth of the CLR Roasters private label business as well as the continued growth of CLR Roasters company owned Cafe La Rica brand. Thefollowing table summarizes our revenue by segment:
(numbers in thousands) For the years ended
December 31, Percentagechange
Segment 2013 2012 Direct selling $ 76,843 $ 67,324 14.1%Commercial coffee 8,784 7,680 14.4%Total $ 85,627 $ 75,004 14.2% Gross Profit
For the year ended December 31, 2013, cost of revenues increased approximately 10.1% to $34,326,000 as compared to $31,179,000 for the yearended December 31, 2012. The increase in cost of revenues is primarily attributable to the increase in revenues discussed above. Cost of revenues as apercentage of revenues decreased by 1.5% in 2013 compared with 2012. Cost of revenues includes the cost of inventory, shipping and handling costs incurredby the Company in connection with shipments to customers, royalties associated with certain products, transaction banking costs and depreciation on certainassets.
-32-
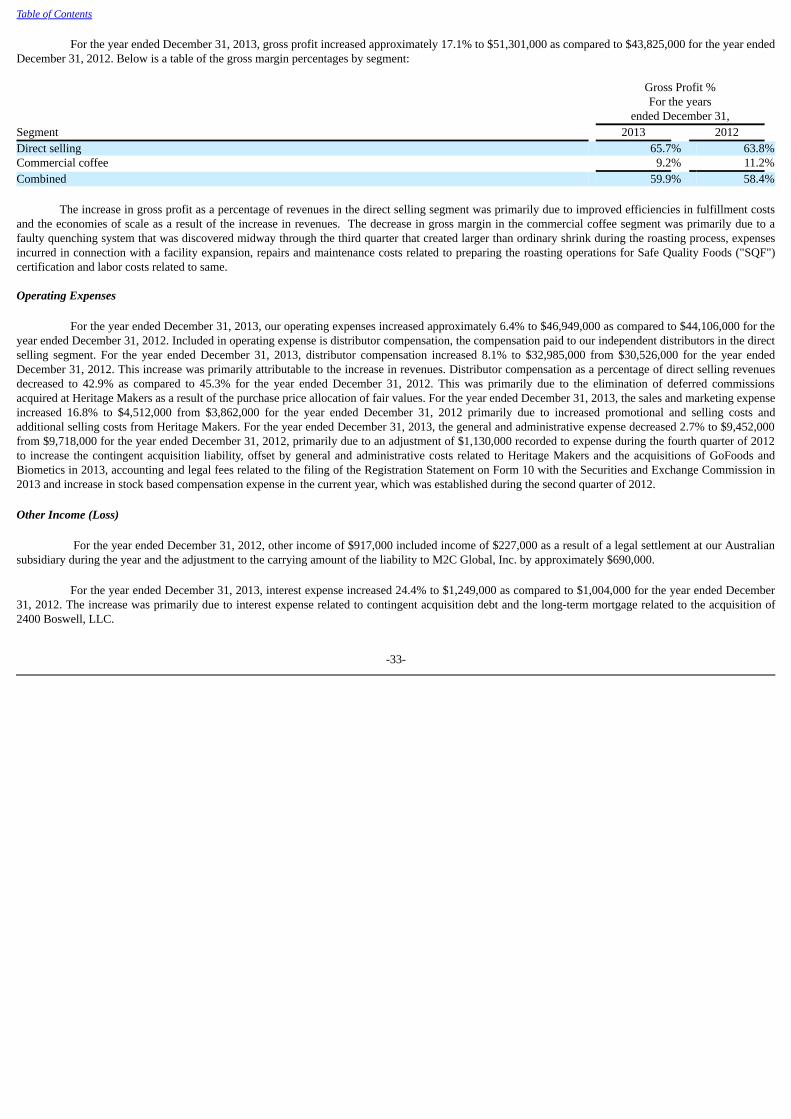
Table of Contents
For the year ended December 31, 2013, gross profit increased approximately 17.1% to $51,301,000 as compared to $43,825,000 for the year endedDecember 31, 2012. Below is a table of the gross margin percentages by segment:
Gross Profit %For the years
ended December 31, Segment 2013 2012 Direct selling 65.7% 63.8%Commercial coffee 9.2% 11.2%Combined 59.9% 58.4%
The increase in gross profit as a percentage of revenues in the direct selling segment was primarily due to improved efficiencies in fulfillment costsand the economies of scale as a result of the increase in revenues. The decrease in gross margin in the commercial coffee segment was primarily due to afaulty quenching system that was discovered midway through the third quarter that created larger than ordinary shrink during the roasting process, expensesincurred in connection with a facility expansion, repairs and maintenance costs related to preparing the roasting operations for Safe Quality Foods ("SQF")certification and labor costs related to same. Operating Expenses
For the year ended December 31, 2013, our operating expenses increased approximately 6.4% to $46,949,000 as compared to $44,106,000 for theyear ended December 31, 2012. Included in operating expense is distributor compensation, the compensation paid to our independent distributors in the directselling segment. For the year ended December 31, 2013, distributor compensation increased 8.1% to $32,985,000 from $30,526,000 for the year endedDecember 31, 2012. This increase was primarily attributable to the increase in revenues. Distributor compensation as a percentage of direct selling revenuesdecreased to 42.9% as compared to 45.3% for the year ended December 31, 2012. This was primarily due to the elimination of deferred commissionsacquired at Heritage Makers as a result of the purchase price allocation of fair values. For the year ended December 31, 2013, the sales and marketing expenseincreased 16.8% to $4,512,000 from $3,862,000 for the year ended December 31, 2012 primarily due to increased promotional and selling costs andadditional selling costs from Heritage Makers. For the year ended December 31, 2013, the general and administrative expense decreased 2.7% to $9,452,000from $9,718,000 for the year ended December 31, 2012, primarily due to an adjustment of $1,130,000 recorded to expense during the fourth quarter of 2012to increase the contingent acquisition liability, offset by general and administrative costs related to Heritage Makers and the acquisitions of GoFoods andBiometics in 2013, accounting and legal fees related to the filing of the Registration Statement on Form 10 with the Securities and Exchange Commission in2013 and increase in stock based compensation expense in the current year, which was established during the second quarter of 2012.
Other Income (Loss)
For the year ended December 31, 2012, other income of $917,000 included income of $227,000 as a result of a legal settlement at our Australiansubsidiary during the year and the adjustment to the carrying amount of the liability to M2C Global, Inc. by approximately $690,000.
For the year ended December 31, 2013, interest expense increased 24.4% to $1,249,000 as compared to $1,004,000 for the year ended December31, 2012. The increase was primarily due to interest expense related to contingent acquisition debt and the long-term mortgage related to the acquisition of2400 Boswell, LLC.
-33-
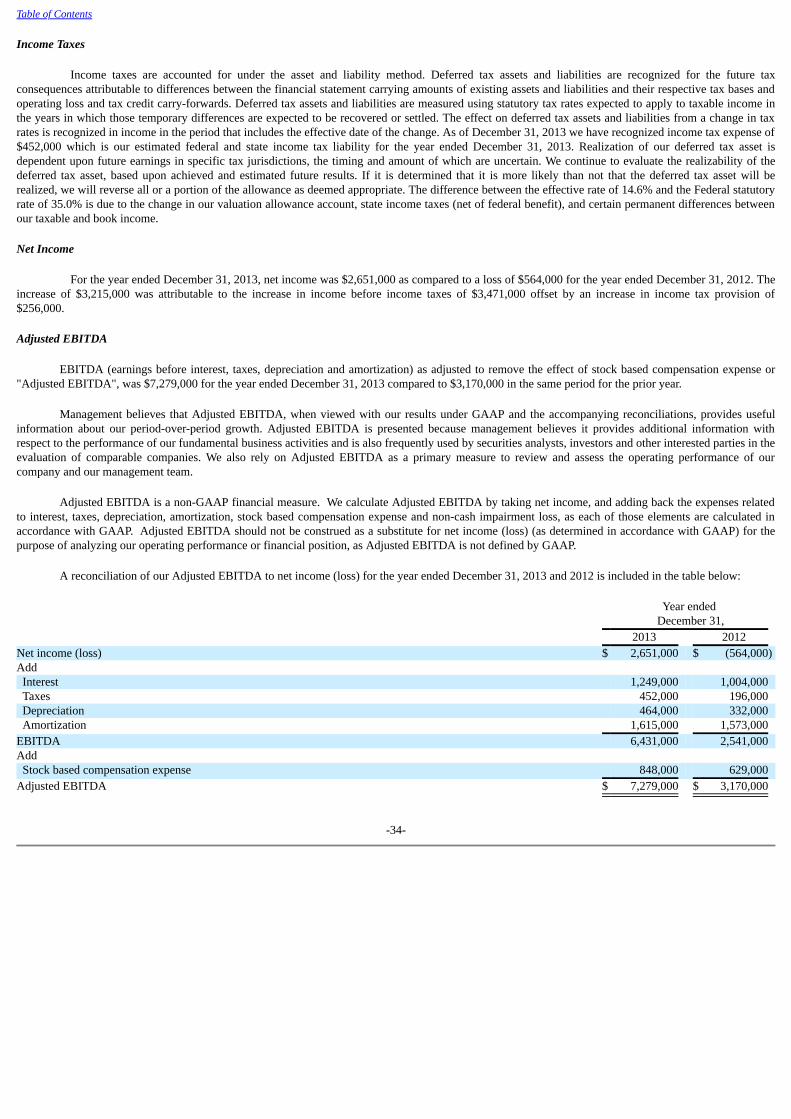
Table of Contents Income Taxes
Income taxes are accounted for under the asset and liability method. Deferred tax assets and liabilities are recognized for the future taxconsequences attributable to differences between the financial statement carrying amounts of existing assets and liabilities and their respective tax bases andoperating loss and tax credit carry-forwards. Deferred tax assets and liabilities are measured using statutory tax rates expected to apply to taxable income inthe years in which those temporary differences are expected to be recovered or settled. The effect on deferred tax assets and liabilities from a change in taxrates is recognized in income in the period that includes the effective date of the change. As of December 31, 2013 we have recognized income tax expense of$452,000 which is our estimated federal and state income tax liability for the year ended December 31, 2013. Realization of our deferred tax asset isdependent upon future earnings in specific tax jurisdictions, the timing and amount of which are uncertain. We continue to evaluate the realizability of thedeferred tax asset, based upon achieved and estimated future results. If it is determined that it is more likely than not that the deferred tax asset will berealized, we will reverse all or a portion of the allowance as deemed appropriate. The difference between the effective rate of 14.6% and the Federal statutoryrate of 35.0% is due to the change in our valuation allowance account, state income taxes (net of federal benefit), and certain permanent differences betweenour taxable and book income.
Net Income
For the year ended December 31, 2013, net income was $2,651,000 as compared to a loss of $564,000 for the year ended December 31, 2012. Theincrease of $3,215,000 was attributable to the increase in income before income taxes of $3,471,000 offset by an increase in income tax provision of$256,000.
Adjusted EBITDA
EBITDA (earnings before interest, taxes, depreciation and amortization) as adjusted to remove the effect of stock based compensation expense or"Adjusted EBITDA", was $7,279,000 for the year ended December 31, 2013 compared to $3,170,000 in the same period for the prior year.
Management believes that Adjusted EBITDA, when viewed with our results under GAAP and the accompanying reconciliations, provides usefulinformation about our period-over-period growth. Adjusted EBITDA is presented because management believes it provides additional information withrespect to the performance of our fundamental business activities and is also frequently used by securities analysts, investors and other interested parties in theevaluation of comparable companies. We also rely on Adjusted EBITDA as a primary measure to review and assess the operating performance of ourcompany and our management team.
Adjusted EBITDA is a non-GAAP financial measure. We calculate Adjusted EBITDA by taking net income, and adding back the expenses relatedto interest, taxes, depreciation, amortization, stock based compensation expense and non-cash impairment loss, as each of those elements are calculated inaccordance with GAAP. Adjusted EBITDA should not be construed as a substitute for net income (loss) (as determined in accordance with GAAP) for thepurpose of analyzing our operating performance or financial position, as Adjusted EBITDA is not defined by GAAP.
A reconciliation of our Adjusted EBITDA to net income (loss) for the year ended December 31, 2013 and 2012 is included in the table below:
Year ended
December 31, 2013 2012 Net income (loss) $ 2,651,000 $ (564,000)Add Interest 1,249,000 1,004,000 Taxes 452,000 196,000 Depreciation 464,000 332,000 Amortization 1,615,000 1,573,000 EBITDA 6,431,000 2,541,000 Add Stock based compensation expense 848,000 629,000 Adjusted EBITDA $ 7,279,000 $ 3,170,000
-34-
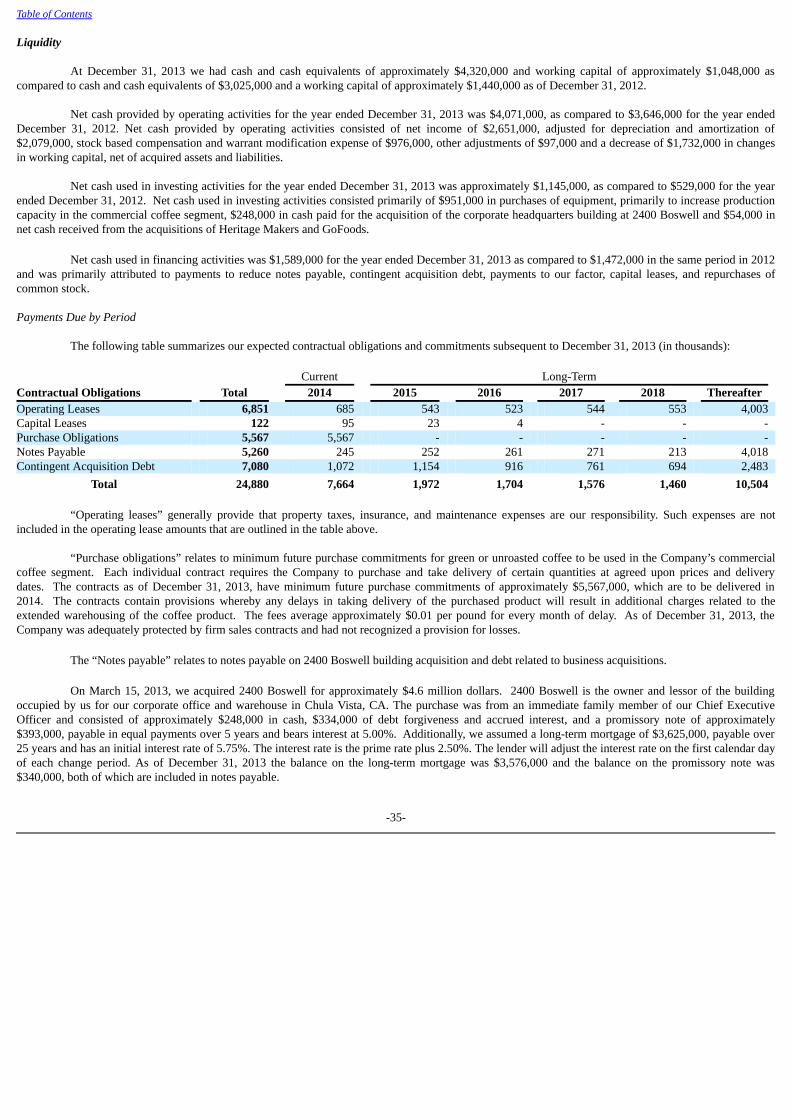
Table of Contents Liquidity
At December 31, 2013 we had cash and cash equivalents of approximately $4,320,000 and working capital of approximately $1,048,000 ascompared to cash and cash equivalents of $3,025,000 and a working capital of approximately $1,440,000 as of December 31, 2012.
Net cash provided by operating activities for the year ended December 31, 2013 was $4,071,000, as compared to $3,646,000 for the year endedDecember 31, 2012. Net cash provided by operating activities consisted of net income of $2,651,000, adjusted for depreciation and amortization of$2,079,000, stock based compensation and warrant modification expense of $976,000, other adjustments of $97,000 and a decrease of $1,732,000 in changesin working capital, net of acquired assets and liabilities.
Net cash used in investing activities for the year ended December 31, 2013 was approximately $1,145,000, as compared to $529,000 for the year
ended December 31, 2012. Net cash used in investing activities consisted primarily of $951,000 in purchases of equipment, primarily to increase productioncapacity in the commercial coffee segment, $248,000 in cash paid for the acquisition of the corporate headquarters building at 2400 Boswell and $54,000 innet cash received from the acquisitions of Heritage Makers and GoFoods.
Net cash used in financing activities was $1,589,000 for the year ended December 31, 2013 as compared to $1,472,000 in the same period in 2012and was primarily attributed to payments to reduce notes payable, contingent acquisition debt, payments to our factor, capital leases, and repurchases ofcommon stock. Payments Due by Period
The following table summarizes our expected contractual obligations and commitments subsequent to December 31, 2013 (in thousands):
Current Long-Term Contractual Obligations Total 2014 2015 2016 2017 2018 Thereafter Operating Leases 6,851 685 543 523 544 553 4,003 Capital Leases 122 95 23 4 - - - Purchase Obligations 5,567 5,567 - - - - - Notes Payable 5,260 245 252 261 271 213 4,018 Contingent Acquisition Debt 7,080 1,072 1,154 916 761 694 2,483
Total 24,880 7,664 1,972 1,704 1,576 1,460 10,504
“Operating leases” generally provide that property taxes, insurance, and maintenance expenses are our responsibility. Such expenses are not
included in the operating lease amounts that are outlined in the table above.
“Purchase obligations” relates to minimum future purchase commitments for green or unroasted coffee to be used in the Company’s commercialcoffee segment. Each individual contract requires the Company to purchase and take delivery of certain quantities at agreed upon prices and deliverydates. The contracts as of December 31, 2013, have minimum future purchase commitments of approximately $5,567,000, which are to be delivered in2014. The contracts contain provisions whereby any delays in taking delivery of the purchased product will result in additional charges related to theextended warehousing of the coffee product. The fees average approximately $0.01 per pound for every month of delay. As of December 31, 2013, theCompany was adequately protected by firm sales contracts and had not recognized a provision for losses.
The “Notes payable” relates to notes payable on 2400 Boswell building acquisition and debt related to business acquisitions.
On March 15, 2013, we acquired 2400 Boswell for approximately $4.6 million dollars. 2400 Boswell is the owner and lessor of the buildingoccupied by us for our corporate office and warehouse in Chula Vista, CA. The purchase was from an immediate family member of our Chief ExecutiveOfficer and consisted of approximately $248,000 in cash, $334,000 of debt forgiveness and accrued interest, and a promissory note of approximately$393,000, payable in equal payments over 5 years and bears interest at 5.00%. Additionally, we assumed a long-term mortgage of $3,625,000, payable over25 years and has an initial interest rate of 5.75%. The interest rate is the prime rate plus 2.50%. The lender will adjust the interest rate on the first calendar dayof each change period. As of December 31, 2013 the balance on the long-term mortgage was $3,576,000 and the balance on the promissory note was$340,000, both of which are included in notes payable.
-35-
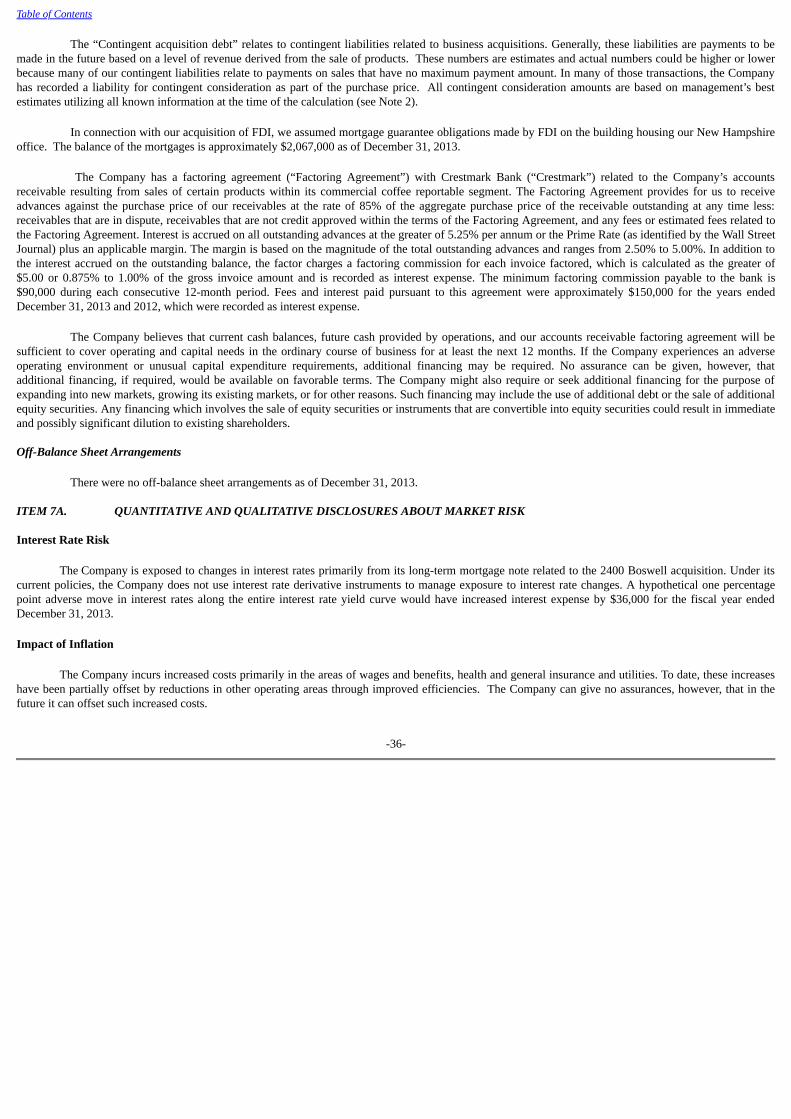
Table of Contents
The “Contingent acquisition debt” relates to contingent liabilities related to business acquisitions. Generally, these liabilities are payments to bemade in the future based on a level of revenue derived from the sale of products. These numbers are estimates and actual numbers could be higher or lowerbecause many of our contingent liabilities relate to payments on sales that have no maximum payment amount. In many of those transactions, the Companyhas recorded a liability for contingent consideration as part of the purchase price. All contingent consideration amounts are based on management’s bestestimates utilizing all known information at the time of the calculation (see Note 2).
In connection with our acquisition of FDI, we assumed mortgage guarantee obligations made by FDI on the building housing our New Hampshireoffice. The balance of the mortgages is approximately $2,067,000 as of December 31, 2013.
The Company has a factoring agreement (“Factoring Agreement”) with Crestmark Bank (“Crestmark”) related to the Company’s accountsreceivable resulting from sales of certain products within its commercial coffee reportable segment. The Factoring Agreement provides for us to receiveadvances against the purchase price of our receivables at the rate of 85% of the aggregate purchase price of the receivable outstanding at any time less:receivables that are in dispute, receivables that are not credit approved within the terms of the Factoring Agreement, and any fees or estimated fees related tothe Factoring Agreement. Interest is accrued on all outstanding advances at the greater of 5.25% per annum or the Prime Rate (as identified by the Wall StreetJournal) plus an applicable margin. The margin is based on the magnitude of the total outstanding advances and ranges from 2.50% to 5.00%. In addition tothe interest accrued on the outstanding balance, the factor charges a factoring commission for each invoice factored, which is calculated as the greater of$5.00 or 0.875% to 1.00% of the gross invoice amount and is recorded as interest expense. The minimum factoring commission payable to the bank is$90,000 during each consecutive 12-month period. Fees and interest paid pursuant to this agreement were approximately $150,000 for the years endedDecember 31, 2013 and 2012, which were recorded as interest expense.
The Company believes that current cash balances, future cash provided by operations, and our accounts receivable factoring agreement will besufficient to cover operating and capital needs in the ordinary course of business for at least the next 12 months. If the Company experiences an adverseoperating environment or unusual capital expenditure requirements, additional financing may be required. No assurance can be given, however, thatadditional financing, if required, would be available on favorable terms. The Company might also require or seek additional financing for the purpose ofexpanding into new markets, growing its existing markets, or for other reasons. Such financing may include the use of additional debt or the sale of additionalequity securities. Any financing which involves the sale of equity securities or instruments that are convertible into equity securities could result in immediateand possibly significant dilution to existing shareholders. Off-Balance Sheet Arrangements
There were no off-balance sheet arrangements as of December 31, 2013. ITEM 7A. QUANTITATIVE AND QUALITATIVE DISCLOSURES ABOUT MARKET RISK Interest Rate Risk
The Company is exposed to changes in interest rates primarily from its long-term mortgage note related to the 2400 Boswell acquisition. Under itscurrent policies, the Company does not use interest rate derivative instruments to manage exposure to interest rate changes. A hypothetical one percentagepoint adverse move in interest rates along the entire interest rate yield curve would have increased interest expense by $36,000 for the fiscal year endedDecember 31, 2013.
Impact of Inflation
The Company incurs increased costs primarily in the areas of wages and benefits, health and general insurance and utilities. To date, these increaseshave been partially offset by reductions in other operating areas through improved efficiencies. The Company can give no assurances, however, that in thefuture it can offset such increased costs.
-36-

Table of Contents ITEM 8. FINANCIAL STATEMENTS
Index to Consolidated Financial Statements
Report of Independent Registered Public Accounting Firm 38 Financial Statements:
Consolidated Balance Sheets - December 31, 2013 and 2012 39
Consolidated Statements of Operations - Years ended December 31, 2013 and 2012 40
Consolidated Statements of Comprehensive Income (Loss) - Years ended December 31, 2013 and 2012 41
Consolidated Statements of Stockholders' Equity - Years ended December 31, 2013 and 2012 42
Consolidated Statements of Cash Flows - Years ended December 31, 2013 and 2012 43 Notes to Consolidated Financial Statements 44
-37-

Table of Contents
REPORT OF INDEPENDENT REGISTERED PUBLIC ACCOUNTING FIRM
The Board of Directors and Shareholders ofYoungevity International, Inc.
We have audited the accompanying consolidated balance sheets of Youngevity International, Inc. and Subsidiaries (the “Company”) as of December 31, 2013and 2012, and the related consolidated statements of operations, comprehensive income (loss), stockholders’ equity, and cash flows for the years then ended.These financial statements are the responsibility of the Company’s management. Our responsibility is to express an opinion on these financial statementsbased on our audits. We conducted our audits in accordance with the standards of the Public Company Accounting Oversight Board (United States). Those standards require thatwe plan and perform the audit to obtain reasonable assurance about whether the financial statements are free of material misstatement. The Company is notrequired to have, nor were we engaged to perform, an audit of its internal control over financial reporting. Our audits included consideration of internalcontrol over financial reporting as a basis for designing audit procedures that are appropriate in the circumstances, but not for the purpose of expressing anopinion on the effectiveness of the Company’s internal control over financial reporting. Accordingly, we express no such opinion. An audit also includesexamining, on a test basis, evidence supporting the amounts and disclosures in the financial statements, assessing the accounting principles used andsignificant estimates made by management, as well as evaluating the overall financial statement presentation. We believe that our audits provide a reasonablebasis for our opinion. In our opinion, the consolidated financial statements referred to above present fairly, in all material respects, the financial position of YoungevityInternational, Inc. and Subsidiaries as of December 31, 2013 and 2012, and the results of their operations and their cash flows for the years then ended, inconformity with accounting principles generally accepted in the United States of America. /s/ Mayer Hoffman McCann P.C. San Diego, CaliforniaMarch 27, 2014
-38-
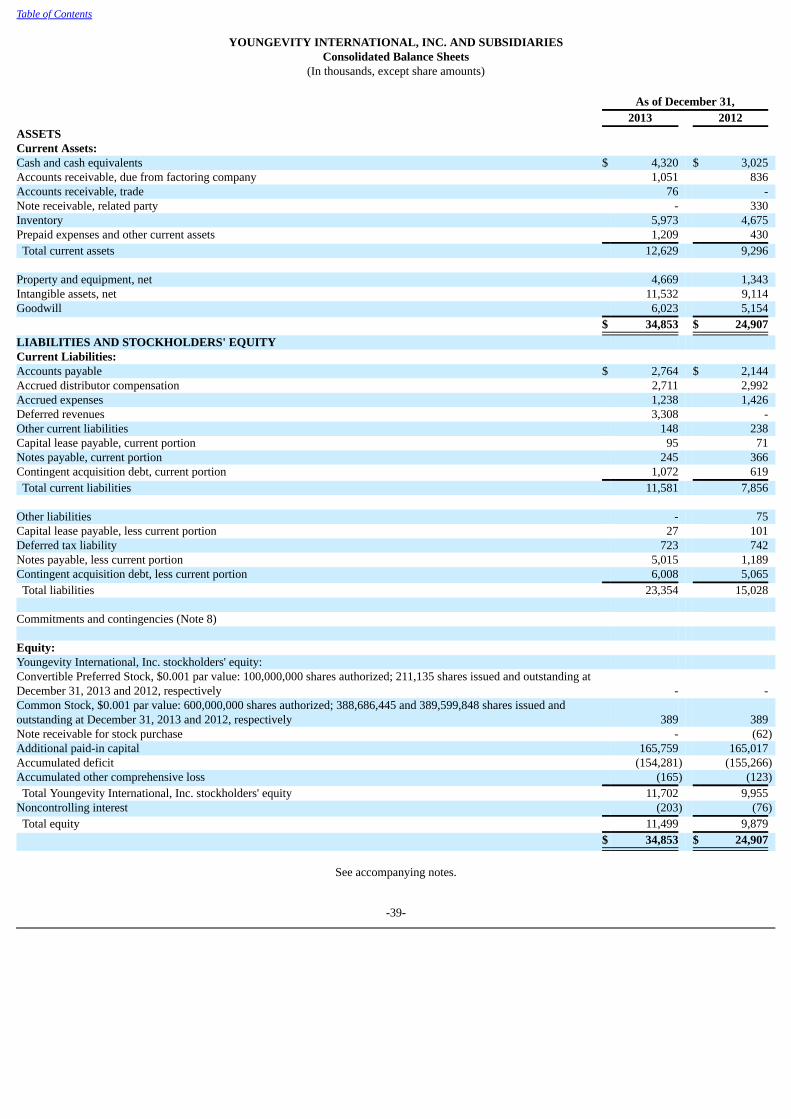
Table of Contents
YOUNGEVITY INTERNATIONAL, INC. AND SUBSIDIARIESConsolidated Balance Sheets
(In thousands, except share amounts)
As of December 31, 2013 2012 ASSETS Current Assets: Cash and cash equivalents $ 4,320 $ 3,025 Accounts receivable, due from factoring company 1,051 836 Accounts receivable, trade 76 - Note receivable, related party - 330 Inventory 5,973 4,675 Prepaid expenses and other current assets 1,209 430 Total current assets 12,629 9,296 Property and equipment, net 4,669 1,343 Intangible assets, net 11,532 9,114 Goodwill 6,023 5,154 $ 34,853 $ 24,907 LIABILITIES AND STOCKHOLDERS' EQUITY Current Liabilities: Accounts payable $ 2,764 $ 2,144 Accrued distributor compensation 2,711 2,992 Accrued expenses 1,238 1,426 Deferred revenues 3,308 - Other current liabilities 148 238 Capital lease payable, current portion 95 71 Notes payable, current portion 245 366 Contingent acquisition debt, current portion 1,072 619 Total current liabilities 11,581 7,856 Other liabilities - 75 Capital lease payable, less current portion 27 101 Deferred tax liability 723 742 Notes payable, less current portion 5,015 1,189 Contingent acquisition debt, less current portion 6,008 5,065 Total liabilities 23,354 15,028 Commitments and contingencies (Note 8) Equity: Youngevity International, Inc. stockholders' equity: Convertible Preferred Stock, $0.001 par value: 100,000,000 shares authorized; 211,135 shares issued and outstanding atDecember 31, 2013 and 2012, respectively - - Common Stock, $0.001 par value: 600,000,000 shares authorized; 388,686,445 and 389,599,848 shares issued andoutstanding at December 31, 2013 and 2012, respectively 389 389 Note receivable for stock purchase - (62)Additional paid-in capital 165,759 165,017 Accumulated deficit (154,281) (155,266)Accumulated other comprehensive loss (165) (123) Total Youngevity International, Inc. stockholders' equity 11,702 9,955 Noncontrolling interest (203) (76) Total equity 11,499 9,879 $ 34,853 $ 24,907
See accompanying notes.
-39-

Table of Contents
YOUNGEVITY INTERNATIONAL, INC. AND SUBSIDIARIESConsolidated Statements of Operations
(In thousands, except share and per share amounts)
Years Ended December 31, 2013 2012 Revenues $ 85,627 $ 75,004 Cost of revenues 34,326 31,179
Gross profit 51,301 43,825 Operating expenses
Distributor compensation 32,985 30,526 Sales and marketing 4,512 3,862 General and adminstrative 9,452 9,718 Total operating expenses 46,949 44,106
Operating income (loss) 4,352 (281)Other income - 917 Interest expense, net (1,249) (1,004) Total other expense (1,249) (87)
Income (loss) before income taxes 3,103 (368)Income tax provision 452 196 Net income (loss) 2,651 (564)
Net loss attributable to noncontrolling interest (119) (139)Net income (loss) attributable to Youngevity 2,770 (425)
Preferred stock dividends 16 17 Net income (loss) available to common stockholders $ 2,754 $ (442) Net income (loss) per share, basic $ 0.01 $ (0.00)Net income (loss) per share, diluted $ 0.01 $ (0.00) Weighted average shares outstanding, basic 389,120,351 387,392,118 Weighted average shares outstanding, diluted 391,953,473 387,392,118
See accompanying notes.
-40-

Table of Contents
YOUNGEVITY INTERNATIONAL, INC. AND SUBSIDIARIESConsolidated Statements of Comprehensive Income (Loss)
(In thousands) Years Ended December 31, 2013 2012 Net income (loss): $ 2,651 $ (564)
Foreign currency translation (42) (10)Total other comprehensive loss (42) (10)Comprehensive income (loss) $ 2,609 $ (574)
See accompanying notes.
-41-
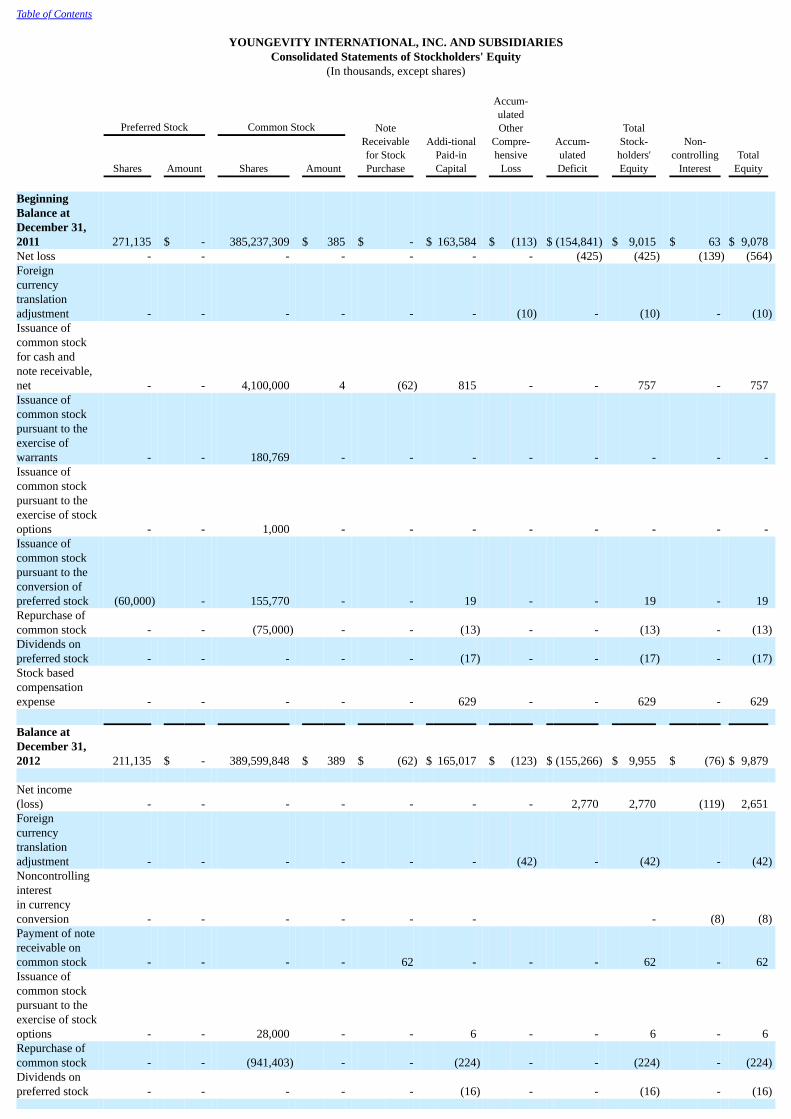
Table of Contents
YOUNGEVITY INTERNATIONAL, INC. AND SUBSIDIARIESConsolidated Statements of Stockholders' Equity
(In thousands, except shares)
Preferred Stock Common Stock NoteReceivablefor StockPurchase
Addi-tional
Paid-inCapital
Accum-ulatedOther
Compre-hensive
Loss
Accum-ulatedDeficit
TotalStock-
holders'Equity
Non-
controllingInterest
TotalEquity
Shares Amount Shares Amount BeginningBalance atDecember 31,2011 271,135 $ - 385,237,309 $ 385 $ - $ 163,584 $ (113) $ (154,841) $ 9,015 $ 63 $ 9,078 Net loss - - - - - - - (425) (425) (139) (564)Foreigncurrencytranslationadjustment - - - - - - (10) - (10) - (10)Issuance ofcommon stockfor cash andnote receivable,net - - 4,100,000 4 (62) 815 - - 757 - 757 Issuance ofcommon stockpursuant to theexercise ofwarrants - - 180,769 - - - - - - - - Issuance ofcommon stockpursuant to theexercise of stockoptions - - 1,000 - - - - - - - - Issuance ofcommon stockpursuant to theconversion ofpreferred stock (60,000) - 155,770 - - 19 - - 19 - 19 Repurchase ofcommon stock - - (75,000) - - (13) - - (13) - (13)Dividends onpreferred stock - - - - - (17) - - (17) - (17)Stock basedcompensationexpense - - - - - 629 - - 629 - 629 Balance atDecember 31,2012 211,135 $ - 389,599,848 $ 389 $ (62) $ 165,017 $ (123) $ (155,266) $ 9,955 $ (76) $ 9,879 Net income(loss) - - - - - - - 2,770 2,770 (119) 2,651 Foreigncurrencytranslationadjustment - - - - - - (42) - (42) - (42) Noncontrollinginterestin currencyconversion - - - - - - - (8) (8)Payment of notereceivable oncommon stock - - - - 62 - - - 62 - 62 Issuance ofcommon stockpursuant to theexercise of stockoptions - - 28,000 - - 6 - - 6 - 6 Repurchase ofcommon stock - - (941,403) - - (224) - - (224) - (224)Dividends onpreferred stock - - - - - (16) - - (16) - (16)

Stock basedcompensationexpense
- - - - - 848 - - 848 - 848
Warrantmodificationexpense - - - - - 128 - - 128 - 128 Deemeddividend(Boswellacquisition) - - - - - - - (1,785) (1,785) - (1,785) Balance atDecember 31,2013 211,135 - 388,686,445 $ 389 $ - $ 165,759 $ (165) $ (154,281) $ 11,702 $ (203) $11,499
See accompanying notes.
-42-

Table of Contents
YOUNGEVITY INTERNATIONAL, INC. AND SUBSIDIARIESConsolidated Statements of Cash Flows
(In thousands)
Years Ended December 31, 2013 2012 Cash Flows from Operating Activities: Net Income (loss) $ 2,651 $ (564)Adjustments to reconcile net income (loss) to net cash provided by operating activities: Depreciation and amortization 2,079 1,905 Stock based compensation expense 848 629 Warrant modification expense 128 - Increase in fair value of contingent acquisition debt 52 1,130 Amortization of debt discount 48 75 Loss on disposal of assets - 56 Interest income accrued on note receivable, related party (3) (9) Reduction of note payable - (690)Changes in operating assets and liabilities net of effect from business combinations: Accounts receivable (56) 101 Inventory (1,055) 306 Prepaid expenses and other current assets (650) 161 Accounts payable 306 (804) Accrued distributor compensation (354) 797 Deferred revenues 881 - Accrued expenses and other liabilities (785) 527 Deferred taxes (19) 26 Net Cash Provided by Operating Activities 4,071 3,646 Cash Flows from Investing Activities: Acquisitions, net of cash acquired 54 - Purchases of property and equipment (1,199) (529)Net Cash Used in Investing Activities (1,145) (529) Cash Flows from Financing Activities: Proceeds from the sale of common stock and the exercise of stock options, net 6 700 Payments to factoring company, net (215) (743) Payments of notes payable, net (363) (632) Proceeds (payments) for note receivable, related party, net 62 (263) Payments of contingent acquisition debt (805) (461) Payments of capital leases (50) (60) Repurchase of common stock (224) (13)Net Cash Used in Financing Activities (1,589) (1,472)Foreign Currency Effect on Cash (42) (10)Net increase in cash and cash equivalents 1,295 1,635 Cash and Cash Equivalents, Beginning of Year 3,025 1,390 Cash and Cash Equivalents, End of Year $ 4,320 $ 3,025 Supplemental Disclosures of Cash Flow Information Cash paid during the period for: Interest $ 1,252 $ 951 Income taxes $ 486 $ 259 Non cash financing activities Common stock issued for note receivable $ - $ 120 Capital lease for manufacturing equipment $ - $ 232 Acquisition of net assets in exchange for contingent acquisition debt $ 2,149 $ 868 Acquisition of 2400 Boswell, LLC (see Note 5 for non cash activity)
See accompanying notes.
-43-
Table of Contents
YOUNGEVITY INTERNATIONAL, INC.AND SUBSIDIARIES
Notes to Consolidated Financial StatementsDecember 31, 2013
1. THE COMPANY AND SUMMARY OF SIGNIFICANT ACCOUNTING POLICIES
Nature of Operations
Youngevity International, Inc. (the “Company”), founded in 1996, develops and distributes health and nutrition related products through its globalindependent direct selling network, also known as multi-level marketing, and manufactures coffee products which are sold to commercial customers. TheCompany operates in two business segments, its direct selling segment where products are offered through a global distribution network of preferredcustomers and distributors and its commercial coffee segment where products are sold directly to businesses. In the following text, the terms “we,” “our,” and“us” may refer, as the context requires, to the Company or collectively to the Company and its subsidiaries.
The Company operates through the following domestic wholly-owned subsidiaries: AL Global Corporation, which operates our direct sellingnetworks, CLR Roasters, LLC, our commercial coffee business, 2400 Boswell, LLC, Financial Destinations, Inc., FDI Management, Inc., and MoneyTrax,LLC; (collectively “FDI”), MK Collaborative LLC, and the wholly-owned foreign subsidiaries Youngevity Australia Pty. Ltd. and Youngevity NZ. EffectiveJuly 23, 2013, the Company changed its name from AL International, Inc. to Youngevity International, Inc.
Basis of Presentation
The Company consolidates all majority owned subsidiaries, investments in entities in which we have controlling influence, and variable interestentities where we have been determined to be the primary beneficiary. All significant intercompany accounts and transactions have been eliminated inconsolidation.
Certain reclassifications have been made to conform to the current year presentation. These reclassifications had no effect on reported results ofoperations or stockholders’ equity.
Segment Information
The Company has two reporting segments: direct selling and commercial coffee. The direct selling segment develops and distributes health andwellness products through its global independent direct selling network also known as multi-level marketing. The commercial coffee segment is a coffeeroasting and distribution company specializing in the gourmet coffee. The determination that the Company has two reportable segments is based upon theguidance set forth in Accounting Standards Codification (“ASC”) 280, “Segment Reporting”.
Use of Estimates
The preparation of financial statements in conformity with accounting principles generally accepted in the United States (“GAAP”) requires us tomake estimates and assumptions that affect the reported amounts of assets and liabilities and disclosure of contingent assets and liabilities at the date of thefinancial statements and the reported amounts of revenue and expense for each reporting period. Estimates are used in accounting for, among other things,allowances for doubtful accounts, deferred taxes and related valuation allowances, uncertain tax positions, loss contingencies, fair value of options grantedunder our stock based compensation plan, fair value of assets and liabilities acquired in business combinations, capital leases, asset impairments, estimates offuture cash flows used to evaluate impairments, useful lives of property, equipment and intangible assets, value of contingent acquisition debt, inventoryobsolescence, and sales returns.
Actual results may differ from previously estimated amounts and such differences may be material to the consolidated financialstatements. Estimates and assumptions are reviewed periodically and the effects of revisions are reflected prospectively in the period they occur.
-44-
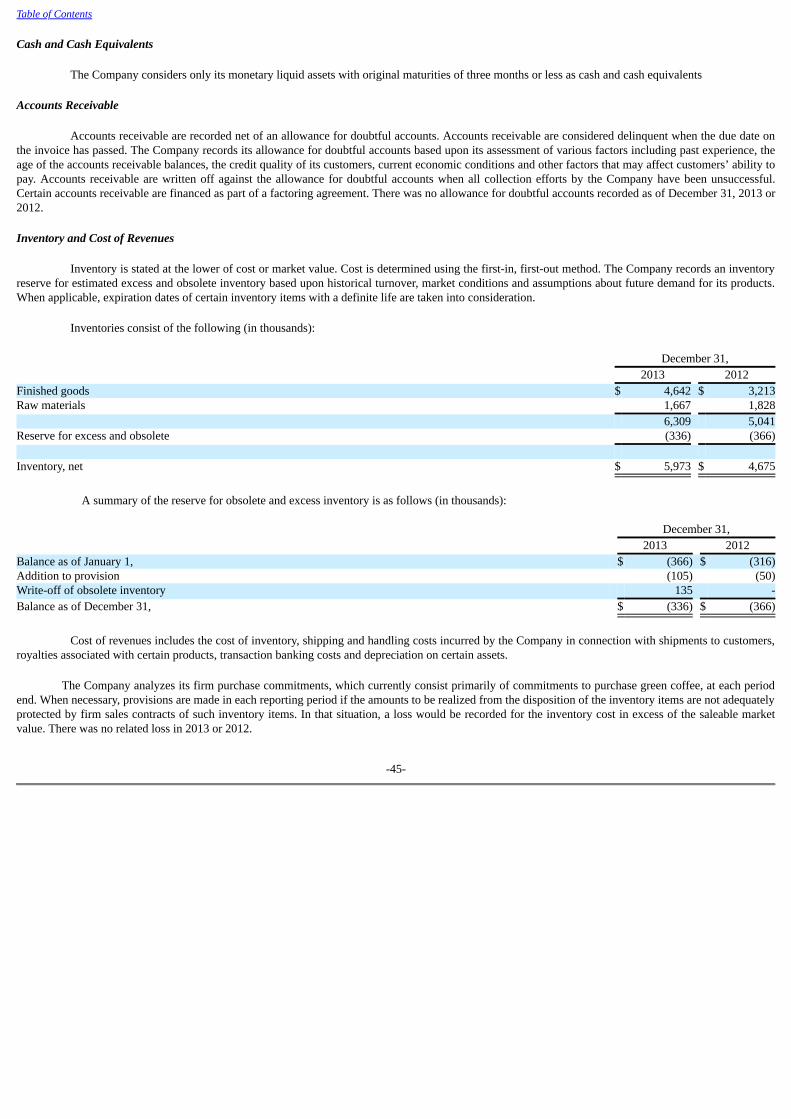
Table of Contents Cash and Cash Equivalents
The Company considers only its monetary liquid assets with original maturities of three months or less as cash and cash equivalents
Accounts Receivable
Accounts receivable are recorded net of an allowance for doubtful accounts. Accounts receivable are considered delinquent when the due date onthe invoice has passed. The Company records its allowance for doubtful accounts based upon its assessment of various factors including past experience, theage of the accounts receivable balances, the credit quality of its customers, current economic conditions and other factors that may affect customers’ ability topay. Accounts receivable are written off against the allowance for doubtful accounts when all collection efforts by the Company have been unsuccessful.Certain accounts receivable are financed as part of a factoring agreement. There was no allowance for doubtful accounts recorded as of December 31, 2013 or2012.
Inventory and Cost of Revenues
Inventory is stated at the lower of cost or market value. Cost is determined using the first-in, first-out method. The Company records an inventoryreserve for estimated excess and obsolete inventory based upon historical turnover, market conditions and assumptions about future demand for its products.When applicable, expiration dates of certain inventory items with a definite life are taken into consideration.
Inventories consist of the following (in thousands):
December 31, 2013 2012Finished goods $ 4,642 $ 3,213Raw materials 1,667 1,828 6,309 5,041Reserve for excess and obsolete (336) (366) Inventory, net $ 5,973 $ 4,675
A summary of the reserve for obsolete and excess inventory is as follows (in thousands): December 31, 2013 2012Balance as of January 1, $ (366) $ (316)Addition to provision (105) (50)Write-off of obsolete inventory 135 -Balance as of December 31, $ (336) $ (366)
Cost of revenues includes the cost of inventory, shipping and handling costs incurred by the Company in connection with shipments to customers,royalties associated with certain products, transaction banking costs and depreciation on certain assets.
The Company analyzes its firm purchase commitments, which currently consist primarily of commitments to purchase green coffee, at each periodend. When necessary, provisions are made in each reporting period if the amounts to be realized from the disposition of the inventory items are not adequatelyprotected by firm sales contracts of such inventory items. In that situation, a loss would be recorded for the inventory cost in excess of the saleable marketvalue. There was no related loss in 2013 or 2012.
-45-

Table of Contents Property and Equipment
Property and equipment are recorded at historical cost. Depreciation is provided in amounts sufficient to relate the cost of depreciable assets tooperations over the estimated useful lives of the related assets. The straight-line method of depreciation and amortization is followed for financial statementpurposes. Leasehold improvements are amortized over the shorter of the life of the respective lease or the useful life of the improvements. Estimated servicelives range from three to ten years. When such assets are sold or otherwise disposed of, the cost and accumulated depreciation are removed from the accounts,and any resulting gain or loss is reflected in operations in the period of disposal. The cost of normal maintenance and repairs is charged to expense asincurred. Significant expenditures that increase the useful life of an asset are capitalized and depreciated over the estimated useful life of the asset.
Property and equipment are considered long-lived assets and are evaluated for impairment whenever events or changes in circumstances indicatetheir net book value may not be recoverable. Management has determined that no impairment of its property and equipment occurred as of December 31,2013 or 2012.
Property and equipment consist of the following (in thousands):
December 31, 2013 2012Building $ 1,959 $ -Land 855 -Computer equipment 273 205Computer software 678 673Furniture and other equipment 876 820Manufacturing equipment 1,803 1,012Vehicles 33 33Leasehold improvements 855 835 7,332 3,578Accumulated depreciation (2,663) (2,235) Total property and equipment $ 4,669 $ 1,343
Depreciation expense totaled approximately $464,000 and $332,000 for the years ended December 31, 2013 and 2012, respectively.
Business Combinations
The Company accounts for business combinations under the acquisition method and allocates the total purchase price for acquired businesses tothe tangible and identified intangible assets acquired and liabilities assumed, based on their estimated fair values. When a business combination includes theexchange of the Company’s common stock, the value of the common stock is determined using the closing market price as of the date such shares weretendered to the selling parties. The fair values assigned to tangible and identified intangible assets acquired and liabilities assumed are based on managementor third party estimates and assumptions that utilize established valuation techniques appropriate for the Company’s industry and each acquired business.Goodwill is recorded as the excess, if any, of the aggregate fair value of consideration exchanged for an acquired business over the fair value (measured as ofthe acquisition date) of total net tangible and identified intangible assets acquired. A liability for contingent consideration, if applicable, is recorded at fairvalue as of the acquisition date. In determining the fair value of such contingent consideration, management estimates the amount to be paid based onprobable outcomes and expectations on financial performance of the related acquired business. The fair value of contingent consideration is reassessedquarterly, with any change in the estimated value charged to operations in the period of the change. Increases or decreases in the fair value of the contingentconsideration obligations can result from changes in actual or estimated revenue streams, discount periods, discount rates and probabilities that contingencieswill be met.
-46-

Table of Contents Intangible Assets and Goodwill
Intangible assets are comprised of distributor organizations, customer relationships, internally developed software and trademarks. TheCompany's acquired intangible assets, which are subject to amortization over their estimated useful lives, are reviewed for impairment whenever events orchanges in circumstances indicate that the carrying amount of an intangible asset may not be recoverable. An impairment loss is recognized when the carryingamount of an intangible asset exceeds its fair value. The Company reviewed the carrying value of its intangible assets as of the years ended December 31,2013 and 2012 and concluded that there was no impairment in 2013. An impairment loss of approximately $48,000 was recorded as amortization expense in2012 related to the impairment of certain assets acquired in connection with a 2011 business acquisition.
Intangible assets consist of the following (in thousands):
December 31, 2013 December 31, 2012
Gross Amount AccumulatedAmortization Gross Amount Accumulated
AmortizationDistributor organizations $ 8,425 $ (4,169) $ 6,825 $ (3,157)Trademarks 3,841 (113) 2,741 (66)Customer relationships 4,133 (1,248) 3,500 (729)Internally developed software 700 (37) - -Other 20 (20) 20 (20) Intangible assets, net $ 17,119 $ (5,587) $ 13,086 $ (3,972)
Amortization expense related to intangible assets was approximately $1,615,000 and $1,573,000 for the years ended December 31, 2013 and 2012,
respectively. As of December 31, 2013, future expected amortization expense related to definite lived intangible assets for the next five years is as follows (inthousands):
Years ending December 31, 2014 $ 1,658 2015 1,528 2016 1,528 2017 1,486 2018 1,128
As of December 31, 2013, the weighted-average remaining amortization period for intangibles assets was approximately 6.1 years.
Trade names, which do not have legal, regulatory, contractual, competitive, economic, or other factors that limit the useful lives are consideredindefinite lived assets and are not amortized but are tested for impairment on an annual basis or whenever events or changes in circumstances indicate that thecarrying amount of these assets may not be recoverable. Approximately $2,267,000 in trademarks from business combinations have been identified as havingindefinite lives. The Company has determined that no impairment occurred for the years ended December 31, 2013 and 2012.
Goodwill is recorded as the excess, if any, of the aggregate fair value of consideration exchanged for an acquired business over the fair value(measured as of the acquisition date) of total net tangible and identified intangible assets acquired. In accordance with ASC 350, “ Intangibles — Goodwilland Other”, goodwill and other intangible assets with indefinite lives are not amortized but are tested for impairment on an annual basis or whenever events orchanges in circumstances indicate that the carrying amount of these assets may not be recoverable. The Company conducts annual reviews for goodwill andindefinite-lived intangible assets in the fourth quarter or whenever events or changes in circumstances indicate that the carrying amounts of the assets may notbe fully recoverable.
-47-
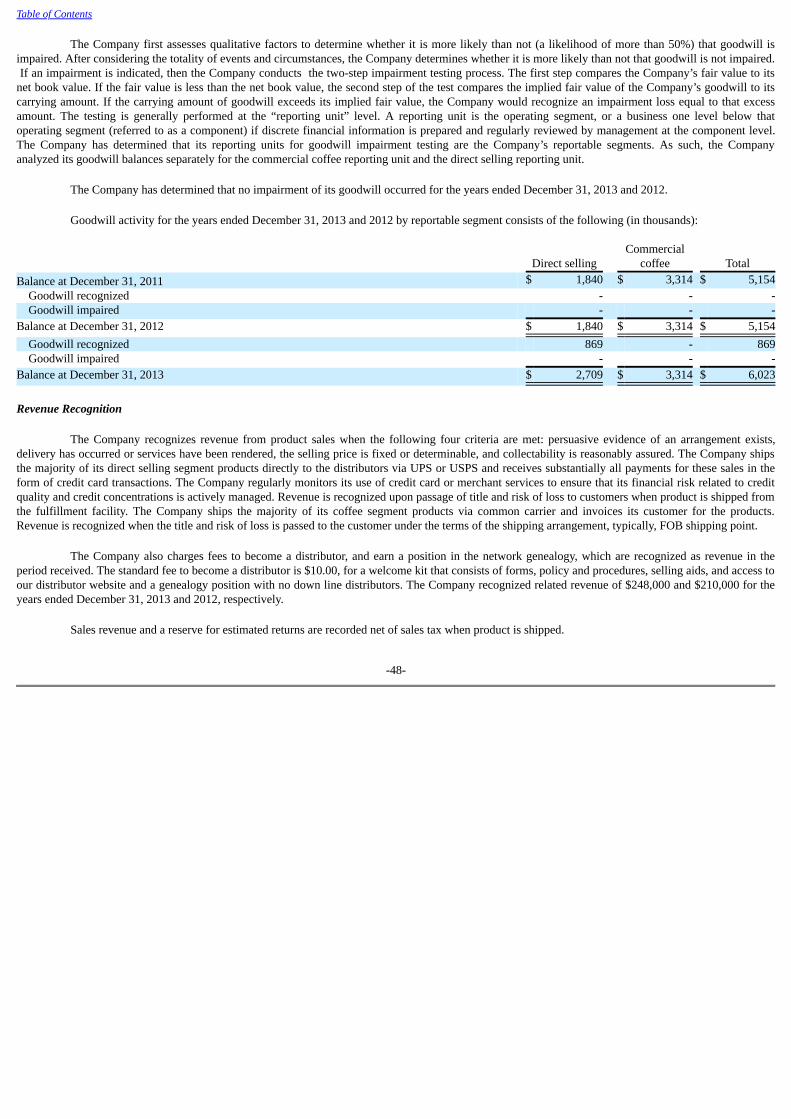
Table of Contents
The Company first assesses qualitative factors to determine whether it is more likely than not (a likelihood of more than 50%) that goodwill isimpaired. After considering the totality of events and circumstances, the Company determines whether it is more likely than not that goodwill is not impaired. If an impairment is indicated, then the Company conducts the two-step impairment testing process. The first step compares the Company’s fair value to itsnet book value. If the fair value is less than the net book value, the second step of the test compares the implied fair value of the Company’s goodwill to itscarrying amount. If the carrying amount of goodwill exceeds its implied fair value, the Company would recognize an impairment loss equal to that excessamount. The testing is generally performed at the “reporting unit” level. A reporting unit is the operating segment, or a business one level below thatoperating segment (referred to as a component) if discrete financial information is prepared and regularly reviewed by management at the component level.The Company has determined that its reporting units for goodwill impairment testing are the Company’s reportable segments. As such, the Companyanalyzed its goodwill balances separately for the commercial coffee reporting unit and the direct selling reporting unit.
The Company has determined that no impairment of its goodwill occurred for the years ended December 31, 2013 and 2012.
Goodwill activity for the years ended December 31, 2013 and 2012 by reportable segment consists of the following (in thousands):
Direct selling Commercialcoffee Total
Balance at December 31, 2011 $ 1,840 $ 3,314 $ 5,154 Goodwill recognized - - - Goodwill impaired - - -Balance at December 31, 2012 $ 1,840 $ 3,314 $ 5,154 Goodwill recognized 869 - 869 Goodwill impaired - - -Balance at December 31, 2013 $ 2,709 $ 3,314 $ 6,023
Revenue Recognition
The Company recognizes revenue from product sales when the following four criteria are met: persuasive evidence of an arrangement exists,delivery has occurred or services have been rendered, the selling price is fixed or determinable, and collectability is reasonably assured. The Company shipsthe majority of its direct selling segment products directly to the distributors via UPS or USPS and receives substantially all payments for these sales in theform of credit card transactions. The Company regularly monitors its use of credit card or merchant services to ensure that its financial risk related to creditquality and credit concentrations is actively managed. Revenue is recognized upon passage of title and risk of loss to customers when product is shipped fromthe fulfillment facility. The Company ships the majority of its coffee segment products via common carrier and invoices its customer for the products.Revenue is recognized when the title and risk of loss is passed to the customer under the terms of the shipping arrangement, typically, FOB shipping point.
The Company also charges fees to become a distributor, and earn a position in the network genealogy, which are recognized as revenue in theperiod received. The standard fee to become a distributor is $10.00, for a welcome kit that consists of forms, policy and procedures, selling aids, and access toour distributor website and a genealogy position with no down line distributors. The Company recognized related revenue of $248,000 and $210,000 for theyears ended December 31, 2013 and 2012, respectively.
Sales revenue and a reserve for estimated returns are recorded net of sales tax when product is shipped.
-48-
Table of Contents Deferred Revenues and Costs
Deferred revenues relate to the Heritage Makers product line and represent the Company’s obligation for points purchased by customers that havenot yet been redeemed for product. Cash received for points sold is recorded as deferred revenue. Revenue is recognized when customers redeem the pointsand the product is shipped. As of the acquisition date of Heritage Makers, deferred revenues acquired were recorded at their fair value of $2,427,000 (SeeNote 2). As of December 31, 2013, the balance in deferred revenues was $3,308,000.
Deferred costs relate to Heritage Makers prepaid commissions that are recognized to expense at the time the related revenue is recognized. As ofDecember 31, 2013, the balance in deferred costs was $719,000 and was included in prepaid expenses and current assets.
Product Return Policy
All products, except food products and commercial coffee products are subject to a full refund within the first 30 days of receipt by the customer,subject to an advance return authorization procedure. Returned product must be in unopened resalable condition. Product returns as a percentage of our netsales have been approximately 1% of our monthly net sales over the last two years. Commercial coffee products are returnable only if defective.
Shipping and Handling
Shipping and handling costs associated with inbound freight and freight to customers, including independent distributors, are included in cost ofsales. Shipping and handling fees charged to all customers are included in sales. Shipping expense was approximately $6,228,000 and $5,819,000 for theyears ended December 31, 2013 and 2012, respectively.
Distributor Compensation
In the direct selling segment, the Company utilizes a network of independent distributors, each of whom has signed an agreement with theCompany, enabling them to purchase products at wholesale prices, market products to customers, enroll new distributors for their down-line and earncompensation on product purchases made by those down-line distributors and customers.
The payments made and stock options issued under the compensation plans are the only form of compensation paid to the distributors. Eachproduct has a point value, which may or may not correlate to the wholesale selling price of a product. A distributor must qualify each month to participate inthe compensation plan by making a specified amount of product purchases, achieving specified point levels. Once qualified, the distributor will receivepayments based on a percentage of the point value of products sold by the distributor’s down-line. The payment percentage varies depending on thequalification level of the distributor and the number of levels of down-line distributors. There are also additional incentives paid upon achieving predefinedactivity and or down-line point value levels. There can be multiple levels of independent distributors earning incentives from the sales efforts of a singledistributor. Due to the multi-layer independent sales approach, distributor incentives are a significant component of the Company’s cost structure. TheCompany accrues all distributor compensation expense in the month earned and pays the compensation the following month.
Advertising Expense
Advertising costs are expensed in the period incurred and are not material to the results of operations in any of the periods presented. Advertisingexpense for the years ended December 31, 2013 and 2012 was approximately $52,000 and $75,000, respectively.
-49-
Table of Contents Earnings Per Share
Basic earnings (loss) per share is computed by dividing net income (loss) attributable to common stockholders by the weighted-average number ofcommon shares outstanding during the period. Diluted earnings per share is computed by dividing net income attributable to common stockholders by thesum of the weighted-average number of common shares outstanding during the period and the weighted-average number of dilutive common shareequivalents outstanding during the period, using the treasury stock method. Dilutive common share equivalents are comprised of in-the-money stock options,warrants and convertible preferred stock, based on the average stock price for each period using the treasury stock method. The incremental dilutive commonshare equivalents were 2,833,122 for the year ended December 31, 2013.
Since the Company had a net loss for the year ended December 31, 2012, 34,570,923 common stock equivalents were not included in theweighted-average calculation since their effect would have been anti-dilutive.
Foreign Currency Translation
The financial position and results of operations of the Company’s foreign subsidiaries are measured using the foreign subsidiary’s local currencyas the functional currency. Revenues and expenses of such subsidiaries have been translated into U.S. dollars at average exchange rates prevailing during theperiod. Assets and liabilities have been translated at the rates of exchange on the balance sheet date. The resulting translation gain and loss adjustments arerecorded directly as a separate component of shareholders’ equity, unless there is a sale or complete liquidation of the underlying foreign investments. TheCompany translates the foreign currencies of its Australian and New Zealand subsidiaries as well as the operations of its Philippine variable interest entity.Translation gains or losses resulting from transactions in currencies other than the respective entities functional currency are included in the determination ofincome and are not considered significant to the Company for 2013 and 2012.
Comprehensive Income (Loss)
Comprehensive income (loss) consists of net gains and losses affecting stockholders’ equity that, under generally accepted accounting principles,are excluded from net income (loss). For the Company, the only items are the cumulative foreign currency translation and net income (loss).
Income Taxes
The Company accounts for income taxes in accordance with ASC 740, "Income Taxes," under the asset and liability method which includes therecognition of deferred tax assets and liabilities for the expected future tax consequences of events that have been included in the consolidated financialstatements. Under this approach, deferred taxes are recorded for the future tax consequences expected to occur when the reported amounts of assets andliabilities are recovered or paid. The provision for income taxes represents income taxes paid or payable for the current year plus the change in deferred taxesduring the year. Deferred taxes result from differences between the financial statement and tax basis of assets and liabilities, and are adjusted for changes intax rates and tax laws when changes are enacted. The effects of future changes in income tax laws or rates are not anticipated.
The Company is subject to income taxes in the United States and certain foreign jurisdictions. The calculation of the Company’s tax provisioninvolves the application of complex tax laws and requires significant judgment and estimates. The Company evaluates the realizability of its deferred taxassets for each jurisdiction in which it operates at each reporting date and establishes a valuation allowance when it is more likely than not that all or a portionof its deferred tax assets will not be realized. The ultimate realization of deferred tax assets is dependent upon the generation of future taxable income of thesame character and in the same jurisdiction. The Company considers all available positive and negative evidence in making this assessment, including, but notlimited to, the scheduled reversal of deferred tax liabilities, projected future taxable income, and tax planning strategies. In circumstances where there issufficient negative evidence indicating that deferred tax assets are not more likely than not realizable, the Company will establish a valuation allowance.
-50-
Table of Contents
The Company applies ASC 740 in the accounting for uncertainty in income taxes recognized in its financial statements. ASC 740 requires that alltax positions be evaluated using a recognition threshold and measurement attribute for the financial statement recognition and measurement of a tax positiontaken or expected to be taken in a tax return. Differences between tax positions taken in a tax return and amounts recognized in the financial statements arerecorded as adjustments to income taxes payable or receivable, or adjustments to deferred taxes, or both. The Company believes that its accruals for uncertaintax positions are adequate for all open audit years based on its assessment of many factors including past experience and interpretation of tax law. To theextent that new information becomes available, which causes the Company to change its judgment about the adequacy of its accruals for uncertain taxpositions, such changes will impact income tax expense in the period such determination is made. The Company’s policy is to include interest and penaltiesrelated to unrecognized income tax benefits as a component of income tax expense.
Stock Based Compensation The Company accounts for stock based compensation in accordance with ASC 718, “ Compensation – Stock Compensation”, which establishes
accounting for equity instruments exchanged for employee services. Under such provisions, stock based compensation cost is measured at the grant date,based on the calculated fair value of the award, and is recognized as an expense, under the straight-line method, over the vesting period of the equity grant.
The Company accounts for equity instruments issued to non-employees in accordance with authoritative guidance for equity based payments tonon-employees. Stock options issued to non-employees are accounted for at their estimated fair value, determined using the Black-Scholes option-pricingmodel. The fair value of options granted to non-employees is re-measured as they vest, and the resulting increase in value, if any, is recognized as expenseduring the period the related services are rendered.
Other Income
In April 2012, the Company received approximately $227,000 in proceeds from a claim related to the government shutdown of a product supplierwhich occurred in 2003. During the fourth quarter of 2012, the Company reduced the carrying amount of a note payable by approximately $690,000 (seeNote 5). These are recorded as other income in the 2012 consolidated statement of operations.
Recently Issued Acounting Pronouncements
In 2013, the Financial Accounting Standards Board (“FASB”) issued new accounting guidance clarifying the accounting for the release of acumulative translation adjustment into net income when a parent either sells a part or all of its investment in a foreign entity or no longer holds a controllingfinancial interest in a subsidiary or group of assets that is a nonprofit activity or a business within a foreign entity. The new standard is effective for fiscalyears, and interim periods within those fiscal years, beginning on or after December 15, 2013. The Company does not anticipate that this adoption will have asignificant impact on its financial position, results of operations, or cash flows.
In 2013, the FASB issued a new accounting standard that will require the presentation of certain unrecognized tax benefits as reductions to deferredtax assets rather than as liabilities in the Consolidated Balance Sheets when a net operating loss carryforward, a similar tax loss, or a tax credit carryforwardexists. The new standard requires adoption on a prospective basis in the first quarter of 2015; however, early adoption is permitted. The Company does notanticipate that this adoption will have a significant impact on its financial position, results of operations, or cash flows. 2. ACQUISITIONS / BUSINESS COMBINATIONS
During 2013 and 2012, the Company entered into a number of business and asset acquisitions, which are detailed below. All of the acquisitionswere conducted in an effort to expand the Company’s distributor network, enhance and expand its product portfolio, and diversify its product mix. As such,the major purpose for all of the business combinations was to increase revenue and profitability. In most cases, the acquisitions were structured as assetpurchases which resulted in the recognition of certain intangible assets.
-51-
Table of Contents We have accounted for all of our business combinations using the acquisition method of accounting, whereby the total purchase price wasallocated to the acquired identifiable net assets based on assessments of their respective fair values, and the excess of the purchase price over the fair values ofthese identifiable net assets was allocated to goodwill.
Biometics
In November 2013, the Company acquired certain assets and assumed certain liabilities of Biometics International, Inc., a California corporation(“Biometics”). Biometics is an innovator in advanced liquid nutritional supplements. The transaction was accounted for as a business combination. Thepurchase price consisted of a maximum of $1,600,000, of which $200,000 was related to assumed liabilities and the remaining $1,400,000 is payable in cashbased on the lesser of $22,500 or 15% of gross sales revenue generated by Biometics distributor organization, plus 5% of Biometics product sales generatedoutside the Biometics distributor organization. Payments will be made monthly until the earlier of the date that is five years from the closing or until suchtime the Company has paid aggregate cash payments equal to $1,400,000, however, in no event shall the aggregate purchase price be less than $1,000,000.The contingent consideration’s estimated fair value at the date of acquisition was $1,000,000, as determined by management using a discounted cash flowmethodology. The acquisition related costs, such as legal costs and other professional fees were minimal and expensed as incurred.
The assets acquired and liabilities assumed were recorded at estimated fair values as of the date of the acquisition. The fair values of the acquiredassets have not been finalized pending further information that may impact the valuation of certain assets or liabilities. The preliminary purchase priceallocation for Biometics (in thousands) is as follows:
Inventory $ 8 Trademarks and trade name 350 Customer-related intangible 242 Distributor organization 600 Accrued expenses (200) Total purchase price $ 1,000
The preliminary fair value of intangible assets acquired was determined through the use of a discounted cash flow methodology. The trademarks andtrade name, customer-related intangible and distributor organization intangible are being amortized over their estimated useful life of ten years using thestraight-line method which is believed to approximate the time-line within which the economic benefit of the underlying intangible asset will be realized. TheCompany will be finalizing the valuation in 2014.
Revenue included in the consolidated statement of operations for the year ended December 31, 2013 was approximately
$152,000.
Go Foods
In October 2013, the Company acquired certain assets and assumed certain liabilities of Go Foods Global, LLC, a Utah limited liabilitycorporation (“GoFoods”). GoFoods is a unique direct seller of healthy and nutritious extended shelf-life food products. The transaction was accounted for as abusiness combination. The purchase price consisted of a maximum of $2,000,000, subject to adjustment as follows: If the aggregate revenue for the twelvemonths beginning with the closing date is less than $2,400,000, then the aggregate purchase price shall be reduced by the difference between $2,400,000 andthe twelve month revenue, provided, however, that in no event shall the maximum aggregate purchase price be reduced below $1,450,000.
The purchase price is payable in cash based on 5% of gross sales revenue generated by GoFoods distributor organization, plus 5% of GoFoodsproduct sales generated outside the GoFoods distributor organization. Payments will be made monthly until the total applicable purchase price is paid. Thecontingent consideration’s estimated fair value at the date of acquisition was approximately $650,000, as determined by management using a discounted cashflow methodology. The acquisition related costs, such as legal costs and other professional fees were minimal and expensed as incurred.
-52-
Table of Contents
The assets acquired and liabilities assumed were recorded at estimated fair values as of the date of the acquisition. The fair values of the acquiredassets have not been finalized pending further information that may impact the valuation of certain assets or liabilities. The preliminary purchase priceallocation for GoFoods (in thousands) is as follows:
Cash $ 75 Inventory 143 Trademarks and trade name 350 Customer-related intangible 91 Distributor organization 300 Accounts payable (258) Accrued expenses (51) Total purchase price $ 650
The preliminary fair value of intangible assets acquired was determined through the use of a discounted cash flow methodology. The trademarks andtrade name, customer-related intangible and distributor organization intangible are being amortized over their estimated useful life of ten years using thestraight-line method which is believed to approximate the time-line within which the economic benefit of the underlying intangible asset will be realized. TheCompany will be finalizing the valuation in 2014.
Revenue included in the consolidated statement of operations for the year ended December 31, 2013 was approximately
$449,000.
Heritage Makers
In August, 2013, the Company acquired certain assets and assumed certain liabilities of Heritage Makers, Inc., a direct sales personal publishingcompany based in Provo, Utah. The transaction was accounted for as a business combination. The purchase price consisted of $500,000 paid at closing, plusan amount equal to 4% of gross sales revenue generated by Heritage Makers’ distributor organization until such time a maximum of $700,000 of 4%payments are made by the Company. As a result of this acquisition, Youngevity distributors and customers will have access to Heritage Makers’ web-basedpublishing software, which allows consumers to personally design photo books, cards, calendars, posters and other printed products and Heritage Makerscustomers will gain access to all products offered by Youngevity.
The Company has estimated fair value (in thousands) at the date of acquisition of the acquired tangible and intangible assets and liabilities asfollows:
Cash paid $ 500 Estimated fair value of earn-out 500 Aggregate purchase price $ 1,000 Purchase price allocation: Cash $ 478 Accounts Receivable 20 Inventory 92 Prepaid expenses and other current assets 147 Property, plant and equipment 26 Trademarks and trade name 400 Customer-related intangible 300 Distribution network 700 Internally developed software 700 Goodwill 869 Accounts payable (56)Accrued expenses (249)Deferred revenues (2,427)
-53-
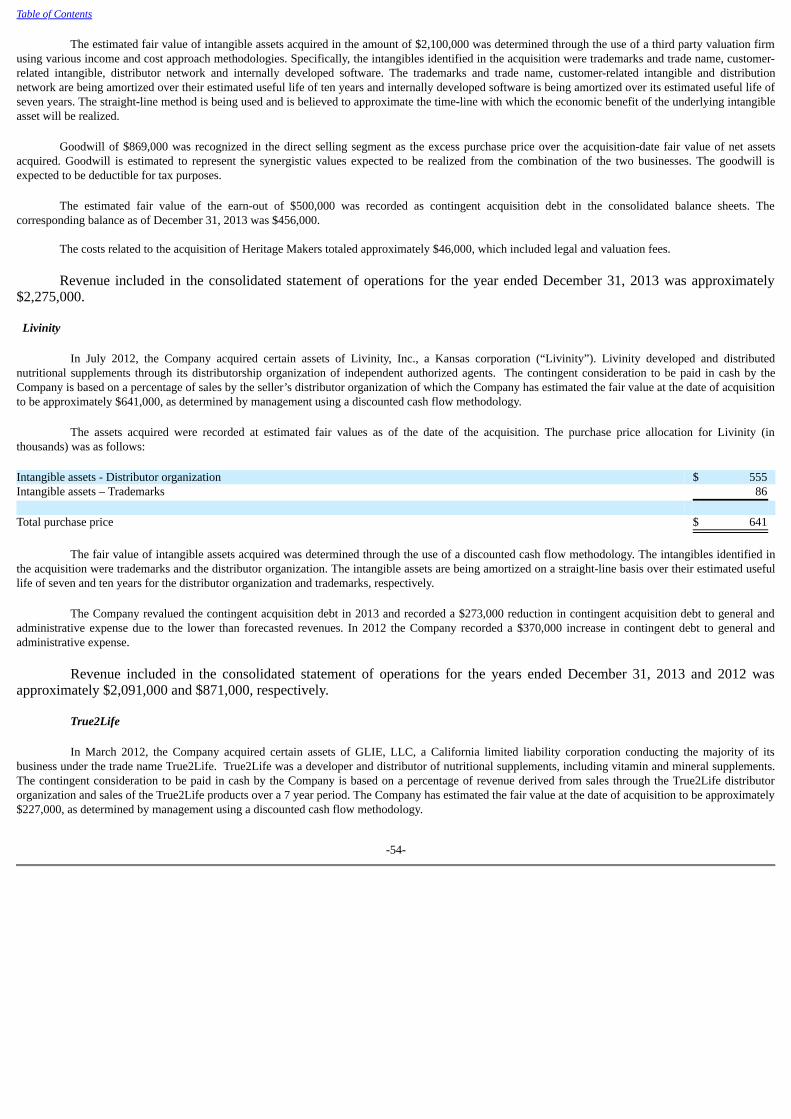
Table of Contents
The estimated fair value of intangible assets acquired in the amount of $2,100,000 was determined through the use of a third party valuation firmusing various income and cost approach methodologies. Specifically, the intangibles identified in the acquisition were trademarks and trade name, customer-related intangible, distributor network and internally developed software. The trademarks and trade name, customer-related intangible and distributionnetwork are being amortized over their estimated useful life of ten years and internally developed software is being amortized over its estimated useful life ofseven years. The straight-line method is being used and is believed to approximate the time-line with which the economic benefit of the underlying intangibleasset will be realized.
Goodwill of $869,000 was recognized in the direct selling segment as the excess purchase price over the acquisition-date fair value of net assetsacquired. Goodwill is estimated to represent the synergistic values expected to be realized from the combination of the two businesses. The goodwill isexpected to be deductible for tax purposes.
The estimated fair value of the earn-out of $500,000 was recorded as contingent acquisition debt in the consolidated balance sheets. Thecorresponding balance as of December 31, 2013 was $456,000.
The costs related to the acquisition of Heritage Makers totaled approximately $46,000, which included legal and valuation fees. Revenue included in the consolidated statement of operations for the year ended December 31, 2013 was approximately
$2,275,000.
Livinity
In July 2012, the Company acquired certain assets of Livinity, Inc., a Kansas corporation (“Livinity”). Livinity developed and distributednutritional supplements through its distributorship organization of independent authorized agents. The contingent consideration to be paid in cash by theCompany is based on a percentage of sales by the seller’s distributor organization of which the Company has estimated the fair value at the date of acquisitionto be approximately $641,000, as determined by management using a discounted cash flow methodology.
The assets acquired were recorded at estimated fair values as of the date of the acquisition. The purchase price allocation for Livinity (inthousands) was as follows:
Intangible assets - Distributor organization $ 555 Intangible assets – Trademarks 86 Total purchase price $ 641
The fair value of intangible assets acquired was determined through the use of a discounted cash flow methodology. The intangibles identified inthe acquisition were trademarks and the distributor organization. The intangible assets are being amortized on a straight-line basis over their estimated usefullife of seven and ten years for the distributor organization and trademarks, respectively.
The Company revalued the contingent acquisition debt in 2013 and recorded a $273,000 reduction in contingent acquisition debt to general andadministrative expense due to the lower than forecasted revenues. In 2012 the Company recorded a $370,000 increase in contingent debt to general andadministrative expense.
Revenue included in the consolidated statement of operations for the years ended December 31, 2013 and 2012 was
approximately $2,091,000 and $871,000, respectively.
True2Life
In March 2012, the Company acquired certain assets of GLIE, LLC, a California limited liability corporation conducting the majority of itsbusiness under the trade name True2Life. True2Life was a developer and distributor of nutritional supplements, including vitamin and mineral supplements.The contingent consideration to be paid in cash by the Company is based on a percentage of revenue derived from sales through the True2Life distributororganization and sales of the True2Life products over a 7 year period. The Company has estimated the fair value at the date of acquisition to be approximately$227,000, as determined by management using a discounted cash flow methodology.
-54-
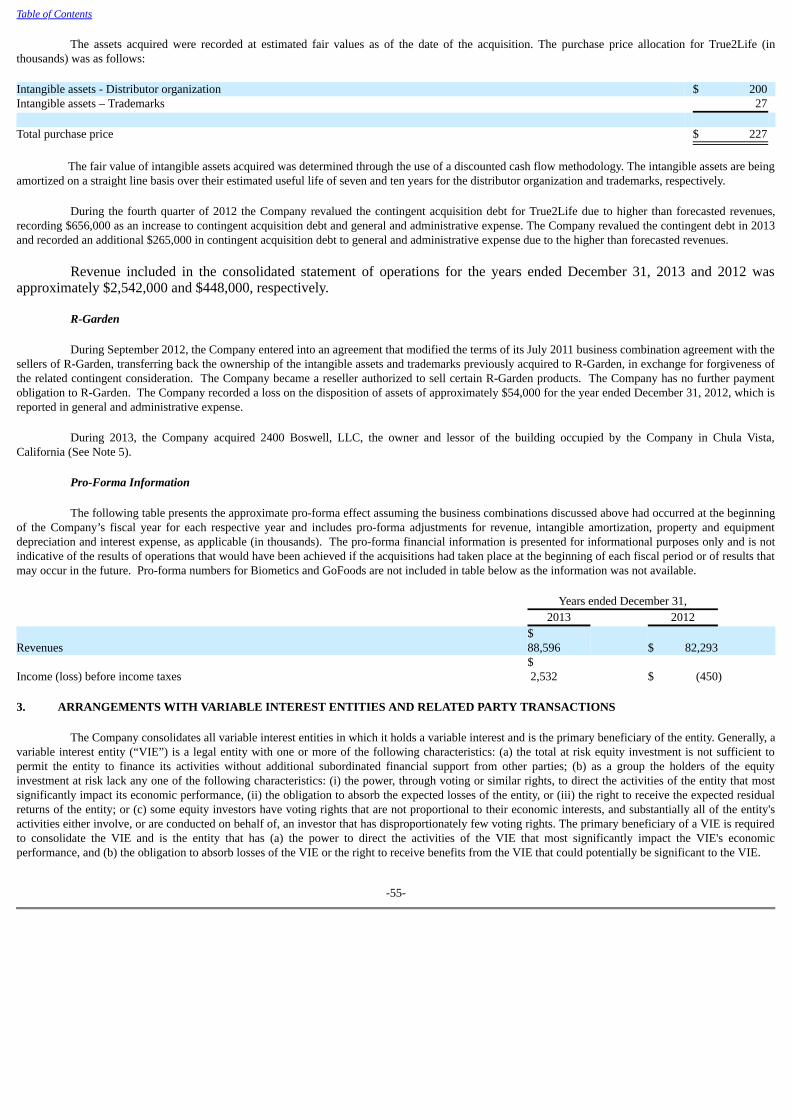
Table of Contents
The assets acquired were recorded at estimated fair values as of the date of the acquisition. The purchase price allocation for True2Life (inthousands) was as follows:
Intangible assets - Distributor organization $ 200 Intangible assets – Trademarks 27 Total purchase price $ 227 The fair value of intangible assets acquired was determined through the use of a discounted cash flow methodology. The intangible assets are beingamortized on a straight line basis over their estimated useful life of seven and ten years for the distributor organization and trademarks, respectively.
During the fourth quarter of 2012 the Company revalued the contingent acquisition debt for True2Life due to higher than forecasted revenues,recording $656,000 as an increase to contingent acquisition debt and general and administrative expense. The Company revalued the contingent debt in 2013and recorded an additional $265,000 in contingent acquisition debt to general and administrative expense due to the higher than forecasted revenues.
Revenue included in the consolidated statement of operations for the years ended December 31, 2013 and 2012 was
approximately $2,542,000 and $448,000, respectively.
R-Garden
During September 2012, the Company entered into an agreement that modified the terms of its July 2011 business combination agreement with thesellers of R-Garden, transferring back the ownership of the intangible assets and trademarks previously acquired to R-Garden, in exchange for forgiveness ofthe related contingent consideration. The Company became a reseller authorized to sell certain R-Garden products. The Company has no further paymentobligation to R-Garden. The Company recorded a loss on the disposition of assets of approximately $54,000 for the year ended December 31, 2012, which isreported in general and administrative expense.
During 2013, the Company acquired 2400 Boswell, LLC, the owner and lessor of the building occupied by the Company in Chula Vista,California (See Note 5).
Pro-Forma Information
The following table presents the approximate pro-forma effect assuming the business combinations discussed above had occurred at the beginningof the Company’s fiscal year for each respective year and includes pro-forma adjustments for revenue, intangible amortization, property and equipmentdepreciation and interest expense, as applicable (in thousands). The pro-forma financial information is presented for informational purposes only and is notindicative of the results of operations that would have been achieved if the acquisitions had taken place at the beginning of each fiscal period or of results thatmay occur in the future. Pro-forma numbers for Biometics and GoFoods are not included in table below as the information was not available.
Years ended December 31, 2013 2012
Revenues$ 88,596 $ 82,293
Income (loss) before income taxes$ 2,532 $ (450)
3. ARRANGEMENTS WITH VARIABLE INTEREST ENTITIES AND RELATED PARTY TRANSACTIONS
The Company consolidates all variable interest entities in which it holds a variable interest and is the primary beneficiary of the entity. Generally, avariable interest entity (“VIE”) is a legal entity with one or more of the following characteristics: (a) the total at risk equity investment is not sufficient topermit the entity to finance its activities without additional subordinated financial support from other parties; (b) as a group the holders of the equityinvestment at risk lack any one of the following characteristics: (i) the power, through voting or similar rights, to direct the activities of the entity that mostsignificantly impact its economic performance, (ii) the obligation to absorb the expected losses of the entity, or (iii) the right to receive the expected residualreturns of the entity; or (c) some equity investors have voting rights that are not proportional to their economic interests, and substantially all of the entity'sactivities either involve, or are conducted on behalf of, an investor that has disproportionately few voting rights. The primary beneficiary of a VIE is requiredto consolidate the VIE and is the entity that has (a) the power to direct the activities of the VIE that most significantly impact the VIE's economicperformance, and (b) the obligation to absorb losses of the VIE or the right to receive benefits from the VIE that could potentially be significant to the VIE.
-55-

Table of Contents
In determining whether it is the primary beneficiary of a VIE, the Company considers qualitative and quantitative factors, including, but notlimited to: which activities most significantly impact the VIE's economic performance and which party has the power to direct such activities; the amount andcharacteristics of Company's interests and other involvements in the VIE; the obligation or likelihood for the Company or other investors to provide financialsupport to the VIE; and the similarity with and significance to the business activities of Company and the other investors. Significant judgments related tothese determinations include estimates about the current and future fair values and performance of these VIEs and general market conditions.
FDI Realty, LLC FDI Realty is the owner and lessor of the building occupied by the Company for its sales office in Windham, NH. The Company is a lessee and
currently one of three tenants and has a lease that expires July, 2014 with five 3-year renewal options. An officer of the Company is the single member of FDIRealty. The Company is a co-guarantor of FDI Realty’s mortgages on the leased building and has an agreement to purchase FDI Realty in connection with theacquisition of FDI. The Company determined that the fair value of the guarantees is not significant and therefore did not record a related liability. The firstmortgage is due on August 13, 2018 and the second mortgage is due on August 13, 2028. The Company’s maximum exposure to loss as a result of itsinvolvement with the unconsolidated VIE is approximately $2,067,000 and $2,142,000 as of December 31, 2013 and 2012, respectively. The Company maybe subject to additional losses to the extent of any financial support that it voluntarily provides in the future. During the year ended December 31, 2012, theCompany provided financial support it was not previously contractually required to provide in the form of additional rent of approximately $58,000 to assistFDI Realty with its working capital needs. The Company did not provide financial support in 2013.
At December 31, 2013, the Company held a variable interest in FDI Realty, for which the Company is not deemed to be the primary beneficiary.The Company has concluded, based on its qualitative consideration of the lease agreement, and the role of the single member of FDI Realty, that the singlemember is the primary beneficiary of FDI Realty. In making these determinations, the Company considered that the single member conducts and manages thebusiness of FDI Realty, is authorized to borrow funds on behalf of FDI Realty, is the sole person authorized and responsible for conducting the business ofFDI Realty, and is obligated to fund the obligations of FDI Realty. As a result of this determination, the financial position and results of operations of FDIRealty have not been included in the consolidated financial statements of the Company.
2400 Boswell, LLC 2400 Boswell, LLC (“2400 Boswell”) is the owner and lessor of the building occupied by the Company for its corporate office and warehouse in
Chula Vista, CA. As of December 31, 2012, an immediate family member of a greater than 5% shareholder of the Company was the single member of 2400Boswell and the Company was a co-guarantor of the 2400 Boswell mortgage on the leased building. At December 31, 2012, the Company held a variableinterest in 2400 Boswell, for which the Company was not deemed to be the primary beneficiary. The Company had concluded, based on its qualitativeconsideration of the lease agreement, and the role of the single member of 2400 Boswell, that the single member was the primary beneficiary of 2400Boswell. As a result, the financial position and results of operations of 2400 Boswell have not been included in the consolidated financial statements of theCompany as of December 31, 2012. During 2013 the Company acquired 2400 Boswell (See Note 5).
AL Corporation Holding Pte. Ltd. and DrinkAct Southeast Asia, Inc. The Company concluded that it held variable interests in AL Corporation Holding Pte. Ltd. (“DrinkACT Singapore”) and DrinkAct Southeast
Asia, Inc. (“DrinkACT Philippines”), entities established during the year ended December 31, 2011. The VIE’s served to exclusively market and distributethe Company’s product. Although the Company does not have any legal ownership of the businesses themselves, it did exert a level of control over theactivities undertaken by each business and bore the risk of loss and the benefit of profits. The Company determined that it was the primary beneficiary in therelationship and, therefore, the results of operations and non-controlling interests are included in the consolidated financial statements. The Company endedits relationship with DrinkACT Singapore during 2012 and ended its relationship with DrinkACT Philippines in 2013.
-56-
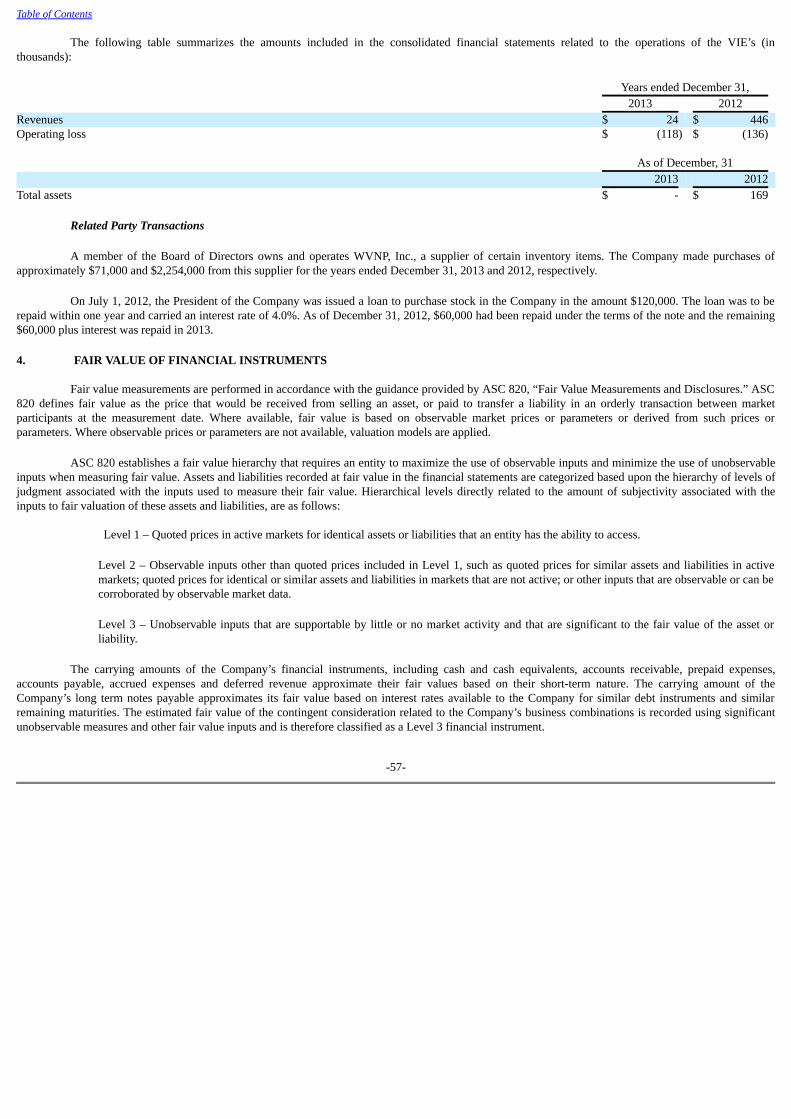
Table of Contents The following table summarizes the amounts included in the consolidated financial statements related to the operations of the VIE’s (in
thousands):
Years ended December 31, 2013 2012 Revenues $ 24 $ 446 Operating loss $ (118) $ (136) As of December, 31 2013 2012 Total assets $ - $ 169
Related Party Transactions
A member of the Board of Directors owns and operates WVNP, Inc., a supplier of certain inventory items. The Company made purchases ofapproximately $71,000 and $2,254,000 from this supplier for the years ended December 31, 2013 and 2012, respectively.
On July 1, 2012, the President of the Company was issued a loan to purchase stock in the Company in the amount $120,000. The loan was to berepaid within one year and carried an interest rate of 4.0%. As of December 31, 2012, $60,000 had been repaid under the terms of the note and the remaining$60,000 plus interest was repaid in 2013. 4. FAIR VALUE OF FINANCIAL INSTRUMENTS
Fair value measurements are performed in accordance with the guidance provided by ASC 820, “Fair Value Measurements and Disclosures.” ASC820 defines fair value as the price that would be received from selling an asset, or paid to transfer a liability in an orderly transaction between marketparticipants at the measurement date. Where available, fair value is based on observable market prices or parameters or derived from such prices orparameters. Where observable prices or parameters are not available, valuation models are applied.
ASC 820 establishes a fair value hierarchy that requires an entity to maximize the use of observable inputs and minimize the use of unobservableinputs when measuring fair value. Assets and liabilities recorded at fair value in the financial statements are categorized based upon the hierarchy of levels ofjudgment associated with the inputs used to measure their fair value. Hierarchical levels directly related to the amount of subjectivity associated with theinputs to fair valuation of these assets and liabilities, are as follows: Level 1 – Quoted prices in active markets for identical assets or liabilities that an entity has the ability to access.
Level 2 – Observable inputs other than quoted prices included in Level 1, such as quoted prices for similar assets and liabilities in activemarkets; quoted prices for identical or similar assets and liabilities in markets that are not active; or other inputs that are observable or can becorroborated by observable market data.
Level 3 – Unobservable inputs that are supportable by little or no market activity and that are significant to the fair value of the asset orliability.
The carrying amounts of the Company’s financial instruments, including cash and cash equivalents, accounts receivable, prepaid expenses,accounts payable, accrued expenses and deferred revenue approximate their fair values based on their short-term nature. The carrying amount of theCompany’s long term notes payable approximates its fair value based on interest rates available to the Company for similar debt instruments and similarremaining maturities. The estimated fair value of the contingent consideration related to the Company’s business combinations is recorded using significantunobservable measures and other fair value inputs and is therefore classified as a Level 3 financial instrument.
-57-
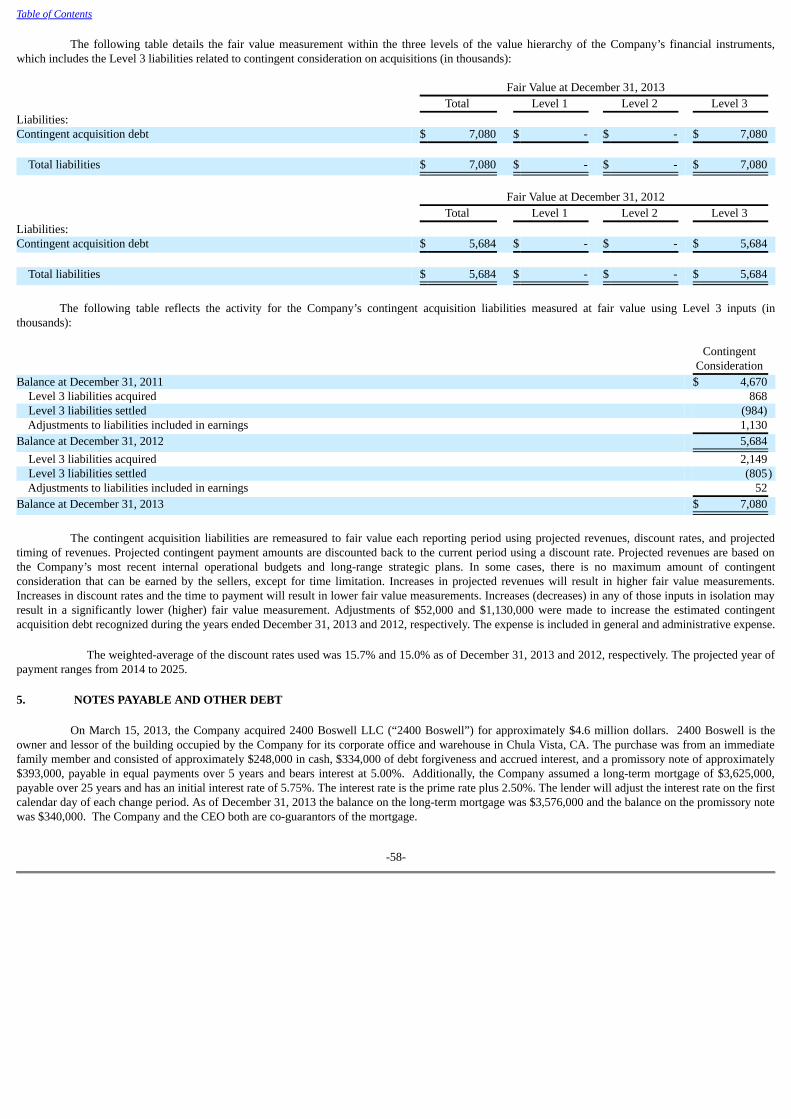
Table of Contents
The following table details the fair value measurement within the three levels of the value hierarchy of the Company’s financial instruments,which includes the Level 3 liabilities related to contingent consideration on acquisitions (in thousands): Fair Value at December 31, 2013 Total Level 1 Level 2 Level 3 Liabilities: Contingent acquisition debt $ 7,080 $ - $ - $ 7,080 Total liabilities $ 7,080 $ - $ - $ 7,080 Fair Value at December 31, 2012 Total Level 1 Level 2 Level 3 Liabilities: Contingent acquisition debt $ 5,684 $ - $ - $ 5,684 Total liabilities $ 5,684 $ - $ - $ 5,684
The following table reflects the activity for the Company’s contingent acquisition liabilities measured at fair value using Level 3 inputs (in
thousands):
Contingent
Consideration Balance at December 31, 2011 $ 4,670 Level 3 liabilities acquired 868 Level 3 liabilities settled (984) Adjustments to liabilities included in earnings 1,130 Balance at December 31, 2012 5,684 Level 3 liabilities acquired 2,149 Level 3 liabilities settled (805) Adjustments to liabilities included in earnings 52 Balance at December 31, 2013 $ 7,080
The contingent acquisition liabilities are remeasured to fair value each reporting period using projected revenues, discount rates, and projectedtiming of revenues. Projected contingent payment amounts are discounted back to the current period using a discount rate. Projected revenues are based onthe Company’s most recent internal operational budgets and long-range strategic plans. In some cases, there is no maximum amount of contingentconsideration that can be earned by the sellers, except for time limitation. Increases in projected revenues will result in higher fair value measurements.Increases in discount rates and the time to payment will result in lower fair value measurements. Increases (decreases) in any of those inputs in isolation mayresult in a significantly lower (higher) fair value measurement. Adjustments of $52,000 and $1,130,000 were made to increase the estimated contingentacquisition debt recognized during the years ended December 31, 2013 and 2012, respectively. The expense is included in general and administrative expense.
The weighted-average of the discount rates used was 15.7% and 15.0% as of December 31, 2013 and 2012, respectively. The projected year ofpayment ranges from 2014 to 2025.
5. NOTES PAYABLE AND OTHER DEBT
On March 15, 2013, the Company acquired 2400 Boswell LLC (“2400 Boswell”) for approximately $4.6 million dollars. 2400 Boswell is theowner and lessor of the building occupied by the Company for its corporate office and warehouse in Chula Vista, CA. The purchase was from an immediatefamily member and consisted of approximately $248,000 in cash, $334,000 of debt forgiveness and accrued interest, and a promissory note of approximately$393,000, payable in equal payments over 5 years and bears interest at 5.00%. Additionally, the Company assumed a long-term mortgage of $3,625,000,payable over 25 years and has an initial interest rate of 5.75%. The interest rate is the prime rate plus 2.50%. The lender will adjust the interest rate on the firstcalendar day of each change period. As of December 31, 2013 the balance on the long-term mortgage was $3,576,000 and the balance on the promissory notewas $340,000. The Company and the CEO both are co-guarantors of the mortgage.
-58-
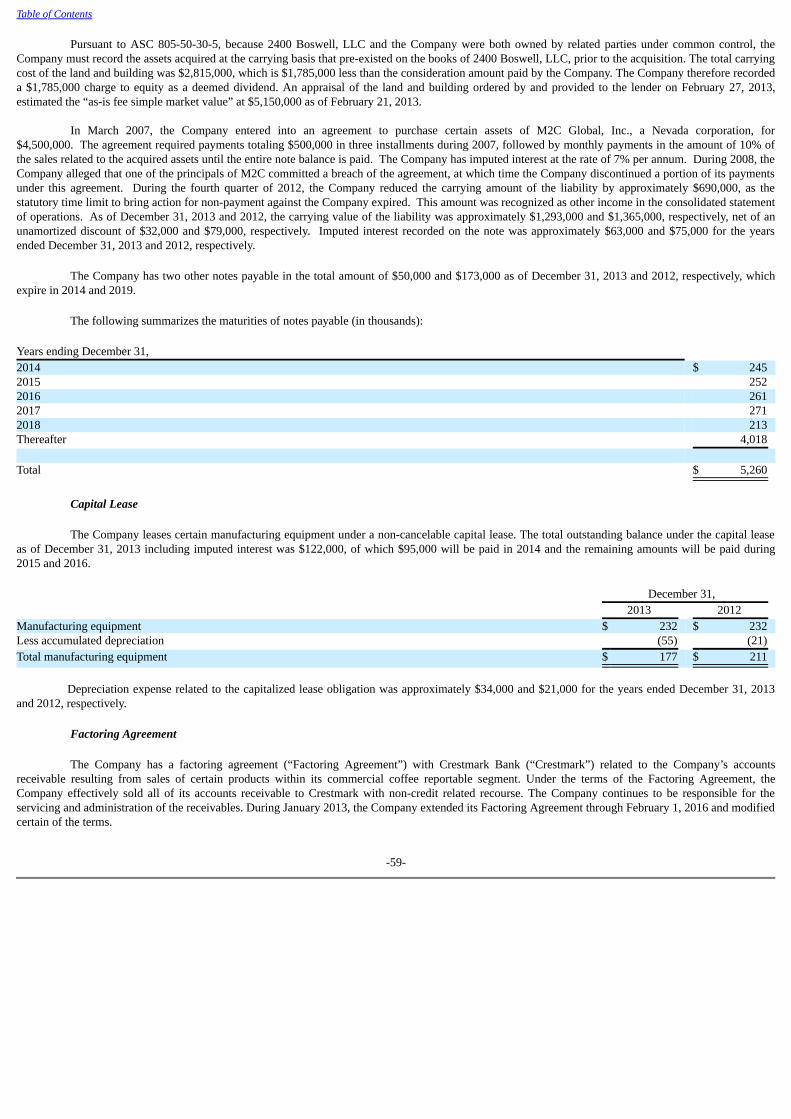
Table of Contents
Pursuant to ASC 805-50-30-5, because 2400 Boswell, LLC and the Company were both owned by related parties under common control, theCompany must record the assets acquired at the carrying basis that pre-existed on the books of 2400 Boswell, LLC, prior to the acquisition. The total carryingcost of the land and building was $2,815,000, which is $1,785,000 less than the consideration amount paid by the Company. The Company therefore recordeda $1,785,000 charge to equity as a deemed dividend. An appraisal of the land and building ordered by and provided to the lender on February 27, 2013,estimated the “as-is fee simple market value” at $5,150,000 as of February 21, 2013.
In March 2007, the Company entered into an agreement to purchase certain assets of M2C Global, Inc., a Nevada corporation, for$4,500,000. The agreement required payments totaling $500,000 in three installments during 2007, followed by monthly payments in the amount of 10% ofthe sales related to the acquired assets until the entire note balance is paid. The Company has imputed interest at the rate of 7% per annum. During 2008, theCompany alleged that one of the principals of M2C committed a breach of the agreement, at which time the Company discontinued a portion of its paymentsunder this agreement. During the fourth quarter of 2012, the Company reduced the carrying amount of the liability by approximately $690,000, as thestatutory time limit to bring action for non-payment against the Company expired. This amount was recognized as other income in the consolidated statementof operations. As of December 31, 2013 and 2012, the carrying value of the liability was approximately $1,293,000 and $1,365,000, respectively, net of anunamortized discount of $32,000 and $79,000, respectively. Imputed interest recorded on the note was approximately $63,000 and $75,000 for the yearsended December 31, 2013 and 2012, respectively.
The Company has two other notes payable in the total amount of $50,000 and $173,000 as of December 31, 2013 and 2012, respectively, whichexpire in 2014 and 2019.
The following summarizes the maturities of notes payable (in thousands):
Years ending December 31, 2014 $ 245 2015 252 2016 261 2017 271 2018 213 Thereafter 4,018 Total $ 5,260
Capital Lease
The Company leases certain manufacturing equipment under a non-cancelable capital lease. The total outstanding balance under the capital leaseas of December 31, 2013 including imputed interest was $122,000, of which $95,000 will be paid in 2014 and the remaining amounts will be paid during2015 and 2016.
December 31, 2013 2012 Manufacturing equipment $ 232 $ 232 Less accumulated depreciation (55) (21) Total manufacturing equipment $ 177 $ 211
Depreciation expense related to the capitalized lease obligation was approximately $34,000 and $21,000 for the years ended December 31, 2013
and 2012, respectively.
Factoring Agreement
The Company has a factoring agreement (“Factoring Agreement”) with Crestmark Bank (“Crestmark”) related to the Company’s accountsreceivable resulting from sales of certain products within its commercial coffee reportable segment. Under the terms of the Factoring Agreement, theCompany effectively sold all of its accounts receivable to Crestmark with non-credit related recourse. The Company continues to be responsible for theservicing and administration of the receivables. During January 2013, the Company extended its Factoring Agreement through February 1, 2016 and modifiedcertain of the terms.
-59-

Table of Contents
The Factoring Agreement provides for the Company to receive advances against the purchase price of its receivables at the rate of 85% of theaggregate purchase price of the receivable outstanding at any time less: receivables that are in dispute, receivables that are not credit approved within theterms of the Factoring Agreement, and any fees or estimated fees related to the Factoring Agreement. Interest is accrued on all outstanding advances at thegreater of 5.25% per annum or the Prime Rate (as identified by the Wall Street Journal) plus an applicable margin. The margin is based on the magnitude ofthe total outstanding advances and ranges from 2.50% to 5.00%. In addition to the interest accrued on the outstanding balance, Crestmark charges a factoringcommission for each invoice factored, which is calculated as the greater of $5.00 or 0.875% to 1.00% of the gross invoice amount and is recorded as interestexpense. The minimum factoring commission payable to the bank is $90,000 during each consecutive 12-month period. Fees and interest paid pursuant to thisagreement were approximately $150,000 for the years ended December 31, 2013 and 2012, which were recorded as interest expense.
The Company accounts for the sale of receivables under the Factoring Agreement as secured borrowing with a pledge of the subject receivables aswell as all bank deposits as collateral, in accordance with the authoritative guidance for accounting for transfers and servicing of financial assets andextinguishments of liabilities. The caption “Accounts receivable, due from factoring company” on the accompanying consolidated balance sheet in theamount of approximately $1,051,000 and $836,000 as of December 31, 2013 and 2012, respectively, reflects the related collateralized accounts. 6. SHAREHOLDERS’ EQUITY
The Company’s Articles of Incorporation, as amended, authorize the issuance of two classes of stock to be designated “Common Stock” and“Preferred Stock”.
Convertible Preferred Stock
The Company had 211,135 shares of Series A Convertible Preferred Stock ("Series A Preferred") outstanding as of December 31, 2013 and 2012. The holders of the Series A Preferred stock are entitled to receive a cumulative dividend at a rate of 8.0% per year, payable annually either in cash or sharesof the Company's common stock at the Company's election. Shares of common stock paid as accrued dividends are valued at $0.50 per share. At December31, 2013 and 2012 the Company had cumulative dividends payable of approximately $95,000 and $77,000, respectively. Each share of Series A Preferred isconvertible into two shares of the Company's common stock. The holders of Series A Preferred are entitled to receive payments upon liquidation, dissolutionor winding up of the Company before any amount is paid to the holders of common stock. The holders of Series A Preferred shall have no voting rights,except as required by law.
During 2012, there were 60,000 shares of Series A Preferred and accrued dividends of approximately $19,000 converted into 155,770 shares ofcommon stock.
Common Stock
The holders of common stock are entitled to one vote per share on matters brought before the shareholders.
On July 11, 2011, the Company issued 560,000,000 shares of common (pre-split) stock, or 280,000,000 post-split, in connection with theacquisition of AL Global with shareholders of AL Global becoming the majority shareholders of Javalution.
Effective August 8, 2011, there was a reverse split of the common stock where two shares became one share. The conversion rate of the Series APreferred was adjusted from four shares to one to two shares to one. The historical results of the Company have been retroactively adjusted to affect thereverse stock split.
During July 2012, the Company sold an aggregate of 4,100,000 shares of the Company’s common stock at a purchase price of $0.20 per share, foraggregate proceeds of $700,000 and a note receivable of $120,000. All sales were to key distributors, officers and directors of the Company, and members oftheir families. As part of this transaction, the Company also issued warrants to purchase an aggregate of 4,100,000 shares of common stock at exercise pricesranging from $0.25 to $0.40 per share. These warrants expire in 2015, three years after the closing dates. The Company determined that the warrants areequity instruments and do not represent derivative instruments. Also during 2012, the Company issued 180,769 shares of common stock as a result of thecashless exercise of 250,000 warrants to purchase common stock and issued 1,000 shares of common stock as a result of the exercise of 1,000 stock options.
During 2013, the Company repurchased 941,403 shares of its common stock. A total of 28,000 stock options were exercised during 2013.
-60-
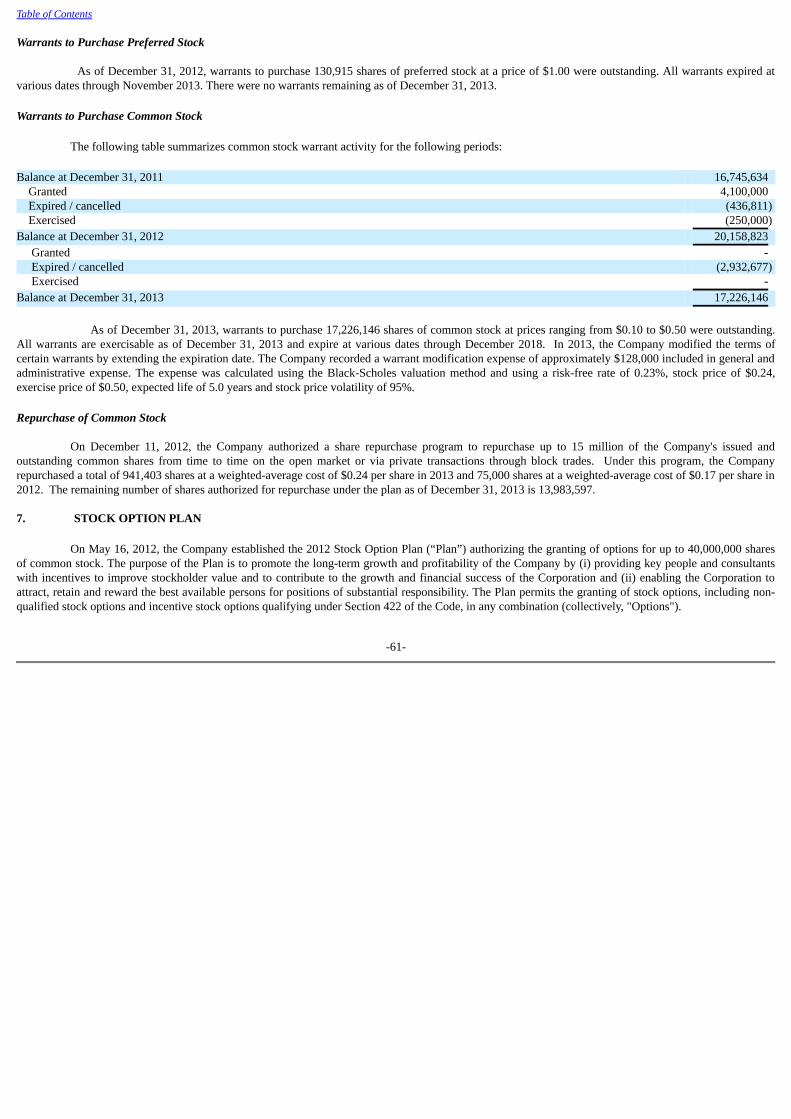
Table of Contents Warrants to Purchase Preferred Stock
As of December 31, 2012, warrants to purchase 130,915 shares of preferred stock at a price of $1.00 were outstanding. All warrants expired atvarious dates through November 2013. There were no warrants remaining as of December 31, 2013. Warrants to Purchase Common Stock
The following table summarizes common stock warrant activity for the following periods:
Balance at December 31, 2011 16,745,634 Granted 4,100,000 Expired / cancelled (436,811) Exercised (250,000)Balance at December 31, 2012 20,158,823 Granted - Expired / cancelled (2,932,677) Exercised - Balance at December 31, 2013 17,226,146
As of December 31, 2013, warrants to purchase 17,226,146 shares of common stock at prices ranging from $0.10 to $0.50 were outstanding.All warrants are exercisable as of December 31, 2013 and expire at various dates through December 2018. In 2013, the Company modified the terms ofcertain warrants by extending the expiration date. The Company recorded a warrant modification expense of approximately $128,000 included in general andadministrative expense. The expense was calculated using the Black-Scholes valuation method and using a risk-free rate of 0.23%, stock price of $0.24,exercise price of $0.50, expected life of 5.0 years and stock price volatility of 95%. Repurchase of Common Stock
On December 11, 2012, the Company authorized a share repurchase program to repurchase up to 15 million of the Company's issued andoutstanding common shares from time to time on the open market or via private transactions through block trades. Under this program, the Companyrepurchased a total of 941,403 shares at a weighted-average cost of $0.24 per share in 2013 and 75,000 shares at a weighted-average cost of $0.17 per share in2012. The remaining number of shares authorized for repurchase under the plan as of December 31, 2013 is 13,983,597.
7. STOCK OPTION PLAN
On May 16, 2012, the Company established the 2012 Stock Option Plan (“Plan”) authorizing the granting of options for up to 40,000,000 sharesof common stock. The purpose of the Plan is to promote the long-term growth and profitability of the Company by (i) providing key people and consultantswith incentives to improve stockholder value and to contribute to the growth and financial success of the Corporation and (ii) enabling the Corporation toattract, retain and reward the best available persons for positions of substantial responsibility. The Plan permits the granting of stock options, including non-qualified stock options and incentive stock options qualifying under Section 422 of the Code, in any combination (collectively, "Options").
-61-
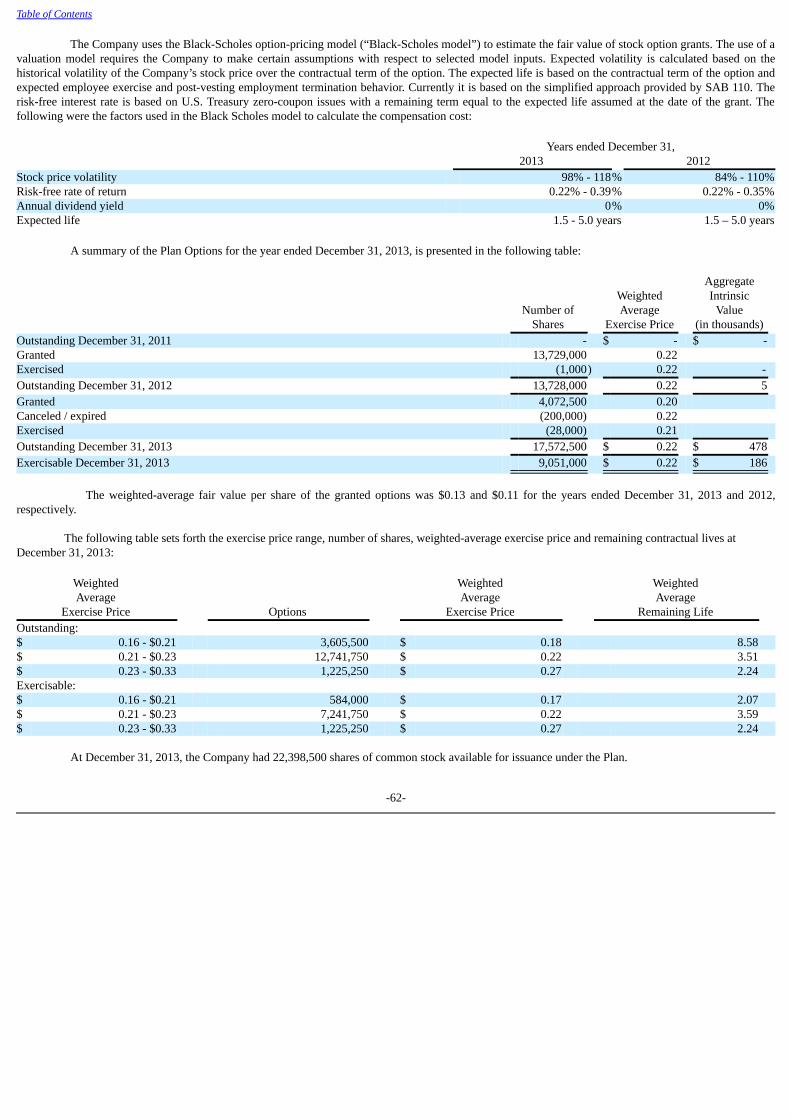
Table of Contents
The Company uses the Black-Scholes option-pricing model (“Black-Scholes model”) to estimate the fair value of stock option grants. The use of avaluation model requires the Company to make certain assumptions with respect to selected model inputs. Expected volatility is calculated based on thehistorical volatility of the Company’s stock price over the contractual term of the option. The expected life is based on the contractual term of the option andexpected employee exercise and post-vesting employment termination behavior. Currently it is based on the simplified approach provided by SAB 110. Therisk-free interest rate is based on U.S. Treasury zero-coupon issues with a remaining term equal to the expected life assumed at the date of the grant. Thefollowing were the factors used in the Black Scholes model to calculate the compensation cost:
Years ended December 31, 2013 2012Stock price volatility 98% - 118% 84% - 110%Risk-free rate of return 0.22% - 0.39% 0.22% - 0.35%Annual dividend yield 0% 0%Expected life 1.5 - 5.0 years 1.5 – 5.0 years
A summary of the Plan Options for the year ended December 31, 2013, is presented in the following table:
Number of
Shares
WeightedAverage
Exercise Price
AggregateIntrinsic
Value(in thousands)
Outstanding December 31, 2011 - $ - $ - Granted 13,729,000 0.22 Exercised (1,000) 0.22 - Outstanding December 31, 2012 13,728,000 0.22 5 Granted 4,072,500 0.20 Canceled / expired (200,000) 0.22 Exercised (28,000) 0.21 Outstanding December 31, 2013 17,572,500 $ 0.22 $ 478 Exercisable December 31, 2013 9,051,000 $ 0.22 $ 186 The weighted-average fair value per share of the granted options was $0.13 and $0.11 for the years ended December 31, 2013 and 2012,respectively.
The following table sets forth the exercise price range, number of shares, weighted-average exercise price and remaining contractual lives atDecember 31, 2013:
Weighted Weighted Weighted Average Average Average
Exercise Price Options Exercise Price Remaining Life Outstanding: $ 0.16 - $0.21 3,605,500 $ 0.18 8.58 $ 0.21 - $0.23 12,741,750 $ 0.22 3.51 $ 0.23 - $0.33 1,225,250 $ 0.27 2.24 Exercisable: $ 0.16 - $0.21 584,000 $ 0.17 2.07 $ 0.21 - $0.23 7,241,750 $ 0.22 3.59 $ 0.23 - $0.33 1,225,250 $ 0.27 2.24
At December 31, 2013, the Company had 22,398,500 shares of common stock available for issuance under the Plan.
-62-

Table of Contents Total stock based compensation expense included in the consolidated statements of operations was charged as follows in thousands:
Years ended December 31, 2013 2012 Cost of revenues $ 17 $ 4 Distributor compensation 140 165 Sales and marketing 22 9 General and administrative 669 451 $ 848 $ 629
As of December 31, 2013, there was approximately $580,000 of total unrecognized compensation expense related to unvested share-based
compensation arrangements granted under the Plan. The expense is expected to be recognized over a weighted-average period of 2.07 years. 8. COMMITMENTS, CONTINGENCIES AND CONCENTRATIONS
The Company maintains cash balances at various financial institutions primarily located in San Diego, California. Accounts at the U.S. institutionsare secured, up to certain limits, by the Federal Deposit Insurance Corporation. At times, balances may exceed federally insured limits. The Company has notexperienced any losses in such accounts. Management believes that the Company is not exposed to any significant credit risk with respect to its cash and cashequivalent balances.
The following table summarizes our expected contractual obligations and commitments subsequent to December 31, 2013 (in thousands): Current Long-Term ContractualObligations Total 2014 2015 2016 2017 2018 Thereafter Operating Leases 6,851 685 543 523 544 553 4,003
“Operating leases" generally provide that property taxes, insurance, and maintenance expenses are our responsibility. Such expenses are not
included in the operating lease amounts that are outlined in the table above. The future minimum lease payments include minimum payments that will be required if the Company elects to exercise
all renewal options of the facility leases where the Company is a co-guarantor on the morgage. Additionally, this includesapproximately $204,000 in annual lease payments to FDI Realty, related party (see Note 3). Rent expense was $635,000 and$751,000 for the years ended December 31, 2013 and 2012.
In connection with our acquisition of FDI, we assumed mortgage guarantee obligations made by FDI on the building housing our New Hampshireoffice. The balance of the mortgages is approximately $2,067,000 as of December 31, 2013 (see Note 3).
The Company purchases its inventory from multiple third-party suppliers at competitive prices. For the years ended December 31, 2013 and2012 the Company made purchases from three and four vendors, respectively, which individually comprised more than 10% of total purchases and inaggregate approximated 53% of total purchases.
The Company has purchase obligations related to minimum future purchase commitments for green or unroasted coffee to be used in the
Company’s commercial coffee segment. Each individual contract requires the Company to purchase and take delivery of certain quantities at agreed uponprices and delivery dates. The contracts as of December 31, 2013, have minimum future purchase commitments of approximately $5,567,000, which are tobe delivered in 2014. The contracts contain provisions whereby any delays in taking delivery of the purchased product will result in additional chargesrelated to the extended warehousing of the coffee product. The fees average approximately $0.01 per pound for every month of delay. As of December 31,2013, the Company was adequately protected by firm sales contracts and had not recognized a provision for losses.
The Company is, from time to time, the subject of claims and suits arising out of matters occuring during the operation of
the Company's business. In the opinion of management, no pending claims or suits would materially affect the financial position orthe results of the operations of the Company.
-63-
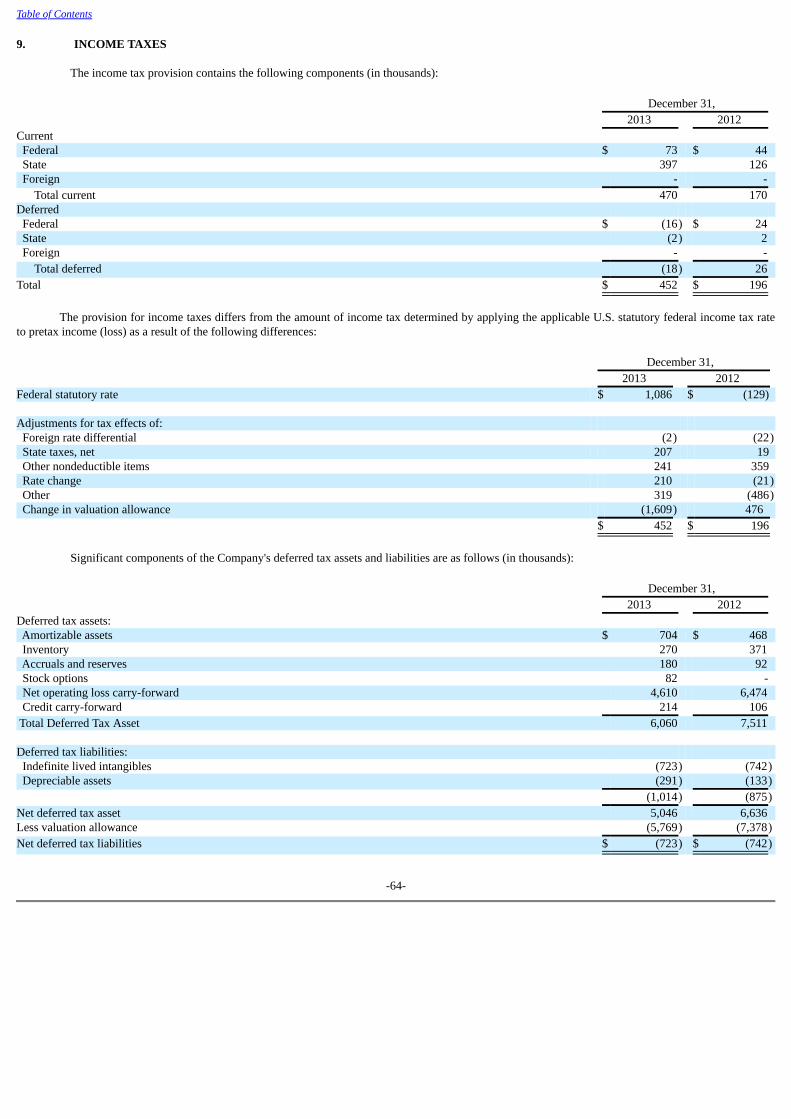
Table of Contents 9. INCOME TAXES
The income tax provision contains the following components (in thousands):
December 31, 2013 2012 Current Federal $ 73 $ 44 State 397 126 Foreign - - Total current 470 170 Deferred Federal $ (16) $ 24 State (2) 2 Foreign - - Total deferred (18) 26 Total $ 452 $ 196
The provision for income taxes differs from the amount of income tax determined by applying the applicable U.S. statutory federal income tax rate
to pretax income (loss) as a result of the following differences:
December 31, 2013 2012 Federal statutory rate $ 1,086 $ (129) Adjustments for tax effects of: Foreign rate differential (2) (22) State taxes, net 207 19 Other nondeductible items 241 359 Rate change 210 (21) Other 319 (486) Change in valuation allowance (1,609) 476 $ 452 $ 196
Significant components of the Company's deferred tax assets and liabilities are as follows (in thousands):
December 31, 2013 2012 Deferred tax assets: Amortizable assets $ 704 $ 468 Inventory 270 371 Accruals and reserves 180 92 Stock options 82 - Net operating loss carry-forward 4,610 6,474 Credit carry-forward 214 106 Total Deferred Tax Asset 6,060 7,511 Deferred tax liabilities: Indefinite lived intangibles (723) (742) Depreciable assets (291) (133) (1,014) (875)Net deferred tax asset 5,046 6,636 Less valuation allowance (5,769) (7,378)Net deferred tax liabilities $ (723) $ (742)
-64-
Table of Contents A valuation allowance has been recognized to offset the net deferred tax assets as the realization of such assets is uncertain as of December 31, 2013and 2012. The change in valuation allowance was a decrease of approximately $1,609,000 for the year ended December 31, 2013 and an increase ofapproximately $476,000 for the year ended December 31, 2012.
At December 31, 2013, the Company had approximately $9,592,000 in federal net operating loss carryforwards, which begin to expire in 2024, andapproximately $17,400,000 in net operating loss carryforwards from various states. The Company had approximately $1,598,000 in net operating losses inforeign jurisdictions.
Pursuant to Internal Revenue Code ("IRC") Section 382, use of net operating loss and credit carryforwards may be limited if the Company
experienced a cumulative change in ownership of greater than 50% in a moving three-year period. Ownership changes could impact the Company's ability toutilize the net operating loss and credit carryforwards remaining at an ownership change date. The Company has not completed a Section 382 study, butbelieves such a change occured in 2011 and therefore such a utilization in any one year will be limited.
The Company has analyzed the impact of repatriating earnings from its foreign subsidiaries and has determined that the impact is immaterial. Based upon the Company's evaluation of its tax positions, there were no significant uncertain tax positions requiring recognition in the
accompanying consolidated financial statements. The evaluation was performed for the periods from December 31, 2009 through December 31, 2013, the taxperiods that remain subject to examination by major tax jurisdictions as of December 31, 2013. The Company records interest and penalties on uncertain taxpositions in income tax expense.
10. SEGMENT AND GEOGRAPHICAL INFORMATION The Company offers a wide variety of products including; nutritional and health, sports and energy drinks, gourmet coffee, skincare and cosmetics,
lifestyle, pharmaceutical discount card and pet related. In addition, the Company offers scrap books, photo albums, memory books, health and wellnessservices. The Company’s business is classified by management into two reportable segments: direct selling and commercial coffee. Prior to the ReverseAcquisition, the Company had one operating and one reportable segment.
The Company’s segments reflect the manner in which the business is managed and how the Company allocates resources and assesses performance.
The Company’s chief operating decision maker is the Chief Executive Officer. The Company’s chief operating decision maker evaluates segmentperformance primarily based on revenue and segment operating income. The principal measures and factors the Company considered in determining thenumber of reportable segments were revenue, gross margin percentage, sales channel, customer type and competitive risks. In addition, each reportingsegment has similar products and customers, similar methods of marketing and distribution and a similar regulatory environment.
-65-
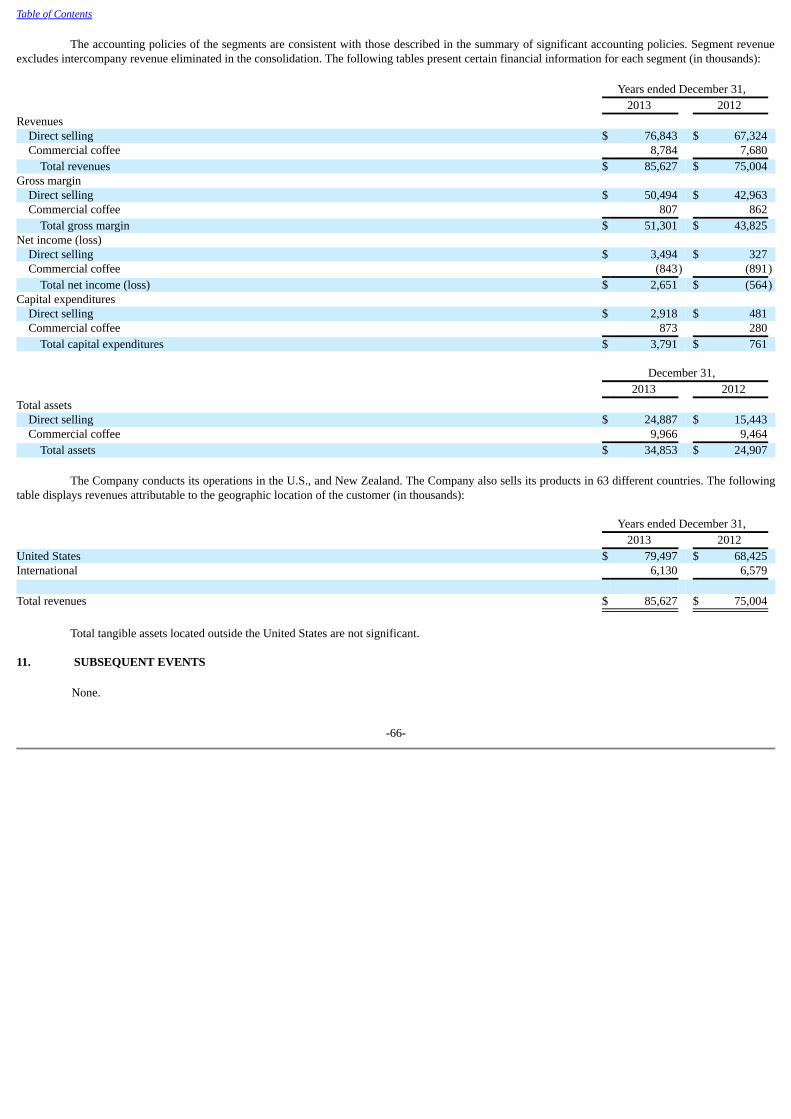
Table of Contents
The accounting policies of the segments are consistent with those described in the summary of significant accounting policies. Segment revenueexcludes intercompany revenue eliminated in the consolidation. The following tables present certain financial information for each segment (in thousands):
Years ended December 31, 2013 2012 Revenues Direct selling $ 76,843 $ 67,324 Commercial coffee 8,784 7,680 Total revenues $ 85,627 $ 75,004 Gross margin Direct selling $ 50,494 $ 42,963 Commercial coffee 807 862 Total gross margin $ 51,301 $ 43,825 Net income (loss) Direct selling $ 3,494 $ 327 Commercial coffee (843) (891) Total net income (loss) $ 2,651 $ (564)Capital expenditures Direct selling $ 2,918 $ 481 Commercial coffee 873 280 Total capital expenditures $ 3,791 $ 761 December 31, 2013 2012 Total assets Direct selling $ 24,887 $ 15,443 Commercial coffee 9,966 9,464 Total assets $ 34,853 $ 24,907
The Company conducts its operations in the U.S., and New Zealand. The Company also sells its products in 63 different countries. The followingtable displays revenues attributable to the geographic location of the customer (in thousands): Years ended December 31, 2013 2012 United States $ 79,497 $ 68,425 International 6,130 6,579 Total revenues $ 85,627 $ 75,004
Total tangible assets located outside the United States are not significant. 11. SUBSEQUENT EVENTS
None.
-66-
Table of Contents ITEM 9. CHANGES IN AND DISAGREEMENTS WITH ACCOUNTANTS ON ACCOUNTING AND FINANCIAL DISCLOSURES
None.
ITEM 9A. CONTROLS AND PROCEDURES
Disclosure Controls and Procedures
We maintain disclosure controls and procedures that are designed to provide reasonable assurances that material information related to the Companyis recorded, processed, summarized and reported within the time periods specified in the SEC rules and forms, and that such information is accumulated andcommunicated to our management, including our Chief Executive Officer and Chief Financial Officer, as appropriate, to allow timely decisions regardingrequired disclosure. The Company’s Chief Executive Officer and Chief Financial Officer carried out an evaluation of the effectiveness of the design andoperation of the Company’s disclosure controls and procedures. Based upon that evaluation, the Chief Executive Officer and Chief Financial Officerconcluded that, as of the end of the period covered by this report, the Company’s disclosure controls and procedures were effective at that “reasonableassurance” level.
Management’s Annual Report on Internal Control over Financial Reporting
Management of the Company is responsible for establishing and maintaining adequate internal control over financial reporting. The Company’sinternal control over financial reporting is designed to provide reasonable assurance regarding the reliability of financial reporting and the preparation offinancial statements for external purposes in accordance with generally accepted accounting principles in the United States.
Under the supervision and with the participation of our management, including our Chief Executive Officer and Chief Financial Officer, we
conducted an evaluation of the effectiveness of our internal control over financial reporting based on the framework in Internal Control—IntegratedFramework issued by the Committee of Sponsoring Organizations of the Treadway Commission (COSO). Based on our evaluation under that framework, ourmanagement concluded that our internal control over financial reporting was effective as of December 31, 2013.
This annual report does not include an attestation report of the company’s registered public accounting firm regarding internal control over financial
reporting. Management’s report was not subject to attestation by the company’s registered public accounting firm pursuant to SEC rules pertaining to smallerreporting companies that permit the company to provide only management’s report in this annual report. Changes in Internal Controls over Financial Reporting
There were no changes in our internal control over financial reporting (as defined in Rules 13a-15(f) under the Exchange Act) that occurred duringthe fourth quarter ended December 31, 2013 that have materially affected, or are reasonably likely to materially affect, our internal control over financialreporting.
-67-

Table of Contents Limitations of the Effectiveness
Our management, including our Chief Executive Officer and Chief Financial Officer, does not expect that our disclosure controls or internal controlsover financial reporting will prevent all errors or all instances of fraud. A control system, no matter how well designed and operated, can provide onlyreasonable, not absolute, assurance that the control system’s objectives will be met. Further, the design of a control system must reflect the fact that there areresource constraints, and the benefits of controls must be considered relative to their costs. Because of the inherent limitations in all control systems, noevaluation of controls can provide absolute assurance that all control issues and instances of fraud, if any, within our company have been detected. Theseinherent limitations include the realities that judgments in decision-making can be faulty, and that breakdowns can occur because of simple error or mistake.Controls can also be circumvented by the individual acts of some persons, by collusion of two or more people, or by management override of the controls.The design of any system of controls is based in part upon certain assumptions about the likelihood of future events, and any design may not succeed inachieving its stated goals under all potential future conditions. Over time, controls may become inadequate because of changes in conditions or deteriorationin the degree of compliance with policies or procedures. Because of the inherent limitation of a cost-effective control system, misstatements due to error orfraud may occur and not be detected.
ITEM 9B. OTHER INFORMATION
None.
-68-
Table of Contents
PART III ITEM 10. DIRECTORS, EXECUTIVE OFFICERS AND CORPORATE GOVERNANCE
The information required by this Item is incorporated herein by reference to our definitive proxy statement to be filed with the SEC with respect to ourannual meeting of shareholders. ITEM 11. EXECUTIVE COMPENSATION
The information required by this Item is incorporated herein by reference to our definitive proxy statement to be filed with the SEC with respect to ourannual meeting of shareholders. ITEM 12. SECURITY OWNERSHIP OF CERTAIN BENEFICIAL OWNERS AND MANAGEMENT AND RELATED STOCKHOLDER
MATTERS
The information required by this Item is incorporated herein by reference to our definitive proxy statement to be filed with the SEC with respect to ourannual meeting of shareholders.
ITEM 13. CERTAIN RELATIONSHIPS AND RELATED TRANSACTIONS, AND DIRECTOR INDEPENDENCE
The information required by this Item is incorporated herein by reference to our definitive proxy statement to be filed with the SEC with respect to ourannual meeting of shareholders.
ITEM 14. PRINCIPAL ACCOUNTANT FEES AND SERVICES
The information required by this Item is incorporated herein by reference to our definitive proxy statement to be filed with the SEC with respect toour annual meeting of shareholders.
-69-
Table of Contents
PART IV
ITEM 15. EXHIBITS, FINANCIAL STATEMENT SCHEDULES Consolidated Financial Statements
The following financial statements are included in Item 8 above: Consolidated Balance Sheets - December 31, 2013 and 2012
Consolidated Statements of Operations - Years ended December 31, 2013 and 2012 Consolidated Statements of Comprehensive Income (Loss) - Years ended December 31, 2013 and 2012 Consolidated Statements of Shareholders' Equity - Years ended December 31, 2013 and 2012
Consolidated Statements of Cash Flows - Years ended December 31, 2013 and 2012
Notes to Consolidated Financial Statements Financial Statement Schedules
Financial statement schedules are omitted for the reason that they are not required or are not applicable, or the required information is shown in thefinancial statements or notes thereto, or contained elsewhere in this report.
-70-
Table of Contents
LIST OF EXHIBITS
The following documents are included as exhibits to this report.
Exhibit No. Title of Document3.1 Certificate of Incorporation Dated July 15, 2011(1)3.2 Bylaws(1)4.1 Specimen Common Stock certificate. (1)4.2 Warrant for Common Stock issued to David Briskie(1)4.3 Stock Option issued to Stephan Wallach(1)4.4 Stock Option issued to Michelle Wallach(1)4.5 Stock Option issued to David Briskie(1)4.6 Stock Option issued to William Andreoli(1)4.7 Stock Option issued to Richard Renton(1)4.8 Stock Option issued to John Rochon(1)10.1 Purchase Agreement with M2C Global, Inc. dated March 9, 2007(1)10.2 First Amendment to Purchase Agreement with M2C Global, Inc. dated September 7, 2008(1)10.3 Asset Purchase Agreement with MLM Holdings, Inc. dated June 10, 2010(1)10.4 Agreement of Purchase and Sale with Price Plus, Inc. dated September 21, 2010(1)10.5 Amended and Restated Agreement and Plan of Reorganization Javalution Coffee Company, YGY Merge, Inc. dated July 11, 2011(1)10.6 Asset Purchase Agreement with R-Garden Inc. dated July 1, 2011(1)10.7 Re-Purchase Agreement with R-Garden dated September 12, 2012(1)10.8 Agreement and Plan of Reorganization with Javalution dated July 18, 2011(1)10.9 Asset Purchase Agreement with Adaptogenix, LLC dated August 22, 2011(1)10.10 Amended Asset Purchase Agreement with Adaptogenix, LLC dated January 27, 2012(1)10.11 Asset Purchase Agreement with Prosperity Group, Inc. dated October 10, 2011(1)10.12 Amended and Restated Equity Purchase Agreement with Financial Destination, Inc., FDI Management Co, Inc., FDI Realty, LLC, and
MoneyTRAX, LLC dated October 25, 2011(1)10.13 Exclusive License/Marketing Agreement with GLIE, LLC dba True2Life dated March 20, 2012(1)10.14 Bill of Sale with Livinity, Inc. dated July 10, 2012(1)10.15 Consulting Agreement with Livinity, Inc. dated July 10, 2012(1)10.16 Employment Agreement with William Andreoli dated October 25, 2011(1)10.17 Promissory Note with 2400 Boswell LLC dated July 15, 2012(1)10.18 Promissory Note with William Andreoli dated July 1, 2012(1)10.19 2012 Stock Option Plan(1)10.20 Form of Stock Option(1)10.21 Lease with 2400 Boswell LLC dated May 1, 2001(1)10.22 Lease with FDI Realty LLC dated July 29, 2008(1)10.23 First Amendment to Lease with FDI Realty LLC dated October 25, 2011(1)10.24 Lease with Perc Enterprises dated February 6, 2008(1)10.25 Lease with Perc Enterprises dated September 25, 2012(1)10.26 Factoring Agreement with Crestmark Bank dated February 12, 2010(1)10.27 First Amendment to Factoring Agreement with Crestmark Bank dated April 6, 2011(1)10.28 Second Amendment to Factoring Agreement with Crestmark Bank dated February 1, 2013(1)10.29 Lease with Perc Enterprises dated March 19, 2013(1)10.30 Purchase Agreement with Ma Lan Wallach dated March 15, 2013(1)10.31 Promissory Note with Plaza Bank dated March 14, 2013(1)21.1 Subsidiaries of Youngevity International, Inc.23.1 Consent of independent registered public accounting firm31.1 Certification of Stephan Wallach, Chief Executive Officer, pursuant to Rule 13a-14(a)/15d-14(a) *31.2 Certification of David Briskie, Chief Financial Officer pursuant to Rule 13a-14(a)/15d-14(a) *32.1 Certification of Stephan Wallach, Chief Executive Officer pursuant to Section 1350 of the Sarbanes-Oxley Act of 2002 *32.2 Certification David Briskie, Chief Financial Officer pursuant to Section 1350 of the Sarbanes-Oxley Act of 2002 *101.INS XBRL Instance Document **101.SCH XBRL Taxonomy Extension Schema Document **101.CAL XBRL Taxonomy Extension Calculation Linkbase Document **101.DEF XBRL Taxonomy Extension Definition Linkbase Document **101.LAB XBRL Taxonomy Extension Label Linkbase Document **101.PRE XBRL Taxonomy Extension Presentation Linkbase Document ** * Filed herewith ** Furnished, not filed herewith (1) Incorporated by reference to the Company’s Form 10-12G filed with the Securities and Exchange Commission on February 12, 2013
-71-
Table of Contents
SIGNATURES
Pursuant to the requirements of Section 13 or 15(d) of the Securities Exchange Act of 1934, the registrant has duly caused this report to be signed onits behalf by the undersigned, thereunto duly authorized.
YOUNGEVITY INTERNATIONAL, INC. March 27, 2014 By /s/ Stephan Wallach Stephan Wallach, Chief Executive Officer (Principal Executive Officer)
Pursuant to the requirements of the Securities Exchange Act of 1934, this report has been signed below by the following persons on behalf ofregistrant in the capacities and on the dates indicated.
Signature Title Date
/s/ Stephan Wallach Chief Executive Officer and Director (Principal Executive Officer) March 27, 2014Stephan Wallach
/s/ David Briskie Chief Financial Officer (Principal Financial and Accounting Officer) March 27, 2014David Briskie
/s/ Michelle Wallach Chief Operating Officer and Director March 27, 2014Michelle Wallach
/s/ William Thompson Director March 27, 2014William Thompson
/s/ Richard Renton Director March 27, 2014Richard Renton

Exhibit 21.1Subsidiaries of Youngevity International Inc.
Subsidiary Name(*)Names Under Which
Subsidiary Does Business(**)State or Jurisdiction of
Incorporation or Organization AL Global Corporation Youngevity® Essential Life Sciences and DrinkACT CaliforniaCLR Roasters, LLC FloridaFinancial Destinations, Inc. New HampshireFDI Management, Inc. New HampshireMoneyTrax, LLC NevadaYoungevity NZ, Ltd. New ZealandYoungevity Australia Pty. Ltd. Australia2400 Boswell, LLC CaliforniaMK Collaborative, LLC California________________________ (*) All subsidiaries are wholly-owned by the Registrant unless otherwise specified by footnote. (**) If different from the name of subsidiary.

Exhibit 23.1
CONSENT OF INDEPENDENT REGISTERED PUBLIC ACCOUNTING FIRM
We consent to the incorporation by reference in Registration Statement No. 333-189748 on Form S-8 of our report dated March 27, 2014, relating to theconsolidated financial statements of Youngevity International, Inc. and Subsidiaries, included in this Annual Report on Form 10-K for the year endedDecember 31, 2013.
/s/ Mayer Hoffman McCann P.C.San Diego, CaliforniaMarch 27, 2014

Exhibit 31.1
CERTIFICATIONS
I, Stephan Wallach, certify that:
1. I have reviewed this annual report on Form 10-K of Youngevity International, Inc.; 2. Based on my knowledge, this report does not contain any untrue statement of a material fact or omit to state a material fact necessary to make the
statements made, in light of the circumstances under which such statements were made, not misleading with respect to the period covered by thisreport;
3. Based on my knowledge, the financial statements, and other financial information included in this report, fairly present in all material respects the
financial condition, results of operations and cash flows of the registrant as of, and for, the periods presented in this report; 4. The registrant’s other certifying officer and I are responsible for establishing and maintaining disclosure controls and procedures (as defined in
Exchange Act Rules 13a-15(e) and 15d-15(e)) and internal control over financial reporting (as defined in Exchange Act Rules 13a-15(f) and 15d-15(f), for the registrant and have:
a) Designed such disclosure controls and procedures, or caused such disclosure controls and procedures to be designed under our
supervision, to ensure that material information relating to the registrant, including its consolidated subsidiaries, is made known to us byothers within those entities, particularly during the period in which this report is being prepared;
b) Designed such internal control over financial reporting, or caused such internal control over financial reporting to be designed under our
supervision, to provide reasonable assurance regarding the reliability of financial reporting and the preparation of financial statements forexternal purposes in accordance with generally accepted accounting principles;
c) Evaluated the effectiveness of the registrant’s disclosure controls and procedures and presented in this report our conclusions about the
effectiveness of the disclosure controls and procedures, as of the end of the period covered by this report based on such evaluation; and d) Disclosed in this report any change in the registrant’s internal control over financial reporting that occurred during the registrant’s most
recent fiscal quarter (the registrant’s fourth fiscal quarter in the case of an annual report) that has materially affected, or is reasonablylikely to materially affect, the registrant’s internal control over financial reporting; and
5. The registrant’s other certifying officer and I have disclosed, based on our most recent evaluation of internal control over financial reporting, to
the registrant’s auditors and the audit committee of the registrant’s board of directors (or persons performing the equivalent functions): a) All significant deficiencies and material weaknesses in the design or operation of internal control over financial reporting which are
reasonably likely to adversely affect the registrant’s ability to record, process, summarize and report financial information; and b) Any fraud, whether or not material, that involves management or other employees who have a significant role in the registrant’s internal
control over financial reporting. Dated: March 27, 2014 /s/ Stephan Wallach Stephan Wallach, Chief Executive Officer (Principal Executive Officer)

Exhibit 31.2
CERTIFICATIONS
I, David Briskie, certify that:
1. I have reviewed this annual report on Form 10-K of Youngevity International, Inc.; 2. Based on my knowledge, this report does not contain any untrue statement of a material fact or omit to state a material fact necessary to make the
statements made, in light of the circumstances under which such statements were made, not misleading with respect to the period covered by thisreport;
3. Based on my knowledge, the financial statements, and other financial information included in this report, fairly present in all material respects the
financial condition, results of operations and cash flows of the registrant as of, and for, the periods presented in this report; 4. The registrant’s other certifying officer and I are responsible for establishing and maintaining disclosure controls and procedures (as defined in
Exchange Act Rules 13a-15(e) and 15d-15(e)) and internal control over financial reporting (as defined in Exchange Act Rules 13a-15(f) and 15d-15(f), for the registrant and have:
a) Designed such disclosure controls and procedures, or caused such disclosure controls and procedures to be designed under our
supervision, to ensure that material information relating to the registrant, including its consolidated subsidiaries, is made known to us byothers within those entities, particularly during the period in which this report is being prepared;
b) Designed such internal control over financial reporting, or caused such internal control over financial reporting to be designed under our
supervision, to provide reasonable assurance regarding the reliability of financial reporting and the preparation of financial statements forexternal purposes in accordance with generally accepted accounting principles;
c) Evaluated the effectiveness of the registrant’s disclosure controls and procedures and presented in this report our conclusions about the
effectiveness of the disclosure controls and procedures, as of the end of the period covered by this report based on such evaluation; and d) Disclosed in this report any change in the registrant’s internal control over financial reporting that occurred during the registrant’s most
recent fiscal quarter (the registrant’s fourth fiscal quarter in the case of an annual report) that has materially affected, or is reasonablylikely to materially affect, the registrant’s internal control over financial reporting; and
5. The registrant’s other certifying officer and I have disclosed, based on our most recent evaluation of internal control over financial reporting, to
the registrant’s auditors and the audit committee of the registrant’s board of directors (or persons performing the equivalent functions): a) All significant deficiencies and material weaknesses in the design or operation of internal control over financial reporting which are
reasonably likely to adversely affect the registrant’s ability to record, process, summarize and report financial information; and b) Any fraud, whether or not material, that involves management or other employees who have a significant role in the registrant’s internal
control over financial reporting. Dated: March 27, 2014 /s/ David Briskie David Briskie, Chief Financial Officer (Principal Financial and Accounting Officer)

Exhibit 32.1
CERTIFICATION PURSUANT TO 18 U.S.C. SECTION 1350,AS ADOPTED PURSUANT TO SECTION 906OF THE SARBANES-OXLEY ACT OF 2002
In connection with the Annual Report of YOUNGEVITY INTERNATIONAL, INC. (the “Company”) on Form 10-K for the fiscal year endedDecember 31, 2013 as filed with the Securities and Exchange Commission on the date hereof (the Report), I, Stephan Wallach, Chief Executive Officer of theCompany, certify, pursuant to 18 U.S.C. Section 1350, as adopted pursuant to Section 906 of the Sarbanes-Oxley Act of 2002, to my knowledge:
(1) The Report fully complies with the requirements of Section 13(a) or 15(d) of the Securities Exchange Act of 1934, as amended; and
(1) The information contained in the Report fairly presents, in all material respects, the financial condition and results of operations of the Company,as of, and for, the periods presented in the Report.
Dated: March 27, 2014 /s/ Stephan Wallach Stephan Wallach, Chief Executive Officer (Principal Executive Officer)
A signed original of this written statement required by Section 906 has been provided to the Company and will be retained by the Company andfurnished to the Securities and Exchange Commission or its staff upon request.

Exhibit 32.2
CERTIFICATION PURSUANT TO 18 U.S.C. SECTION 1350,AS ADOPTED PURSUANT TO SECTION 906OF THE SARBANES-OXLEY ACT OF 2002
In connection with the Annual Report of YOUNGEVITY INTERNATIONAL, INC. (the “Company”) on Form 10-K for the fiscal year endedDecember 31, 2013 as filed with the Securities and Exchange Commission on the date hereof (the Report), I, David Briskie, Chief Financial Officer of theCompany, certify, pursuant to 18 U.S.C. Section 1350, as adopted pursuant to Section 906 of the Sarbanes-Oxley Act of 2002, to my knowledge:
(1) The Report fully complies with the requirements of Section 13(a) or 15(d) of the Securities Exchange Act of 1934, as amended; and
(1) The information contained in the Report fairly presents, in all material respects, the financial condition and results of operations of the Company,as of, and for, the periods presented in the Report.
Dated: March 27, 2014 /s/ David Briskie David Briskie, Chief Financial Officer (Principal Financial and Accounting Officer)
A signed original of this written statement required by Section 906 has been provided to the Company and will be retained by the Company andfurnished to the Securities and Exchange Commission or its staff upon request.