united states securities and exchange commission - form 10-k
Upload
khangminh22Category
view
2download
0
Patterson Companies Annual Report 2003Form 10-K (NASDAQ:PDCO)
Published: July 24th, 2003
PDF generated by stocklight.com

SECURITIES AND EXCHANGE COMMISSIONWashington, D.C. 20549
FORM 10-K (Mark One) x ANNUAL REPORT PURSUANT TO SECTION 13 OR 15(d) OF THE SECURITIES EXCHANGE ACT OF 1934
For the fiscal year ended April 26, 2003
OR ¨ TRANSITION REPORT PURSUANT TO SECTION 13 OR 15(d) OF THE SECURITIES EXCHANGE ACT OF 1934
For the transition period from to
Commission File No. 0-20572
PATTERSON DENTAL COMPANY(Exact name of registrant as specified in its charter)
Minnesota 41-0886515
(State or other jurisdiction ofincorporation or organization)
(I.R.S. Employer Identification No.)
1031 Mendota Heights RoadSt. Paul, Minnesota 55120
(Address of principal executive offices including Zip Code)
Securities registered pursuant to Section 12(b) of the Act:
None
Securities registered pursuant to Section 12(g) of the Act:
Common Stock, par value $.01
Indicate by check mark whether the registrant (1) has filed all reports required to be filed by Section 13 or 15(d) of the Securities Exchange Act of
1934 during the preceding 12 months, and (2) has been subject to such filing requirements for the past 90 days. Yes x No
Indicate by check mark if disclosure of delinquent filers pursuant to Item 405 of Regulation S-K is not contained herein, and will not be contained, tothe best of registrant’s knowledge, in definitive proxy or information statements incorporated by reference in Part III of this Form 10-K or any amendmentto this Form 10-K x
Indicate by check mark whether the registrant is an accelerated filer (as defined in Rule 12b-2 of the Act). Yes x No
The aggregate market value of voting stock held by nonaffiliates of the registrant as of October 26, 2002, was approximately $2,495,200,000.
As of July 14, 2003, there were 68,164,714 shares of Common Stock of the registrant issued and outstanding.
Documents Incorporated By Reference
Certain portions of the document listed below have been incorporated by reference into the indicated part of this Form 10-K.
Proxy Statement for 2003 Annual Meeting of Shareholders Part III
FORM 10-K INDEX
Page
PART I 2 Item 1. BUSINESS 2 Item 2. PROPERTIES 12 Item 3. LEGAL PROCEEDINGS 13 Item 4. SUBMISSION OF MATTERS TO A VOTE OF SECURITY HOLDERS 13
PART II 14 Item 5. MARKET FOR REGISTRANT’S COMMON STOCK AND RELATED STOCKHOLDER MATTERS 14 Item 6. SELECTED CONSOLIDATED FINANCIAL DATA 15
Item 7. MANAGEMENT’S DISCUSSION AND ANALYSIS OF FINANCIAL CONDITION AND RESULTS OF OPERATIONS 15 Item 7A. QUANTITATIVE AND QUALITATIVE DISCLOSURES ABOUT MARKET RISK 21 Item 8. FINANCIAL STATEMENTS AND SUPPLEMENTARY DATA 22 Item 9. CHANGES IN AND DISAGREEMENTS WITH ACCOUNTANTS ON ACCOUNTING AND FINANCIAL DISCLOSURE 40
PART III 40 Item 10. DIRECTORS AND EXECUTIVE OFFICERS OF THE REGISTRANT 40 Item 11. EXECUTIVE COMPENSATION 40 Item 12. SECURITY OWNERSHIP OF CERTAIN BENEFICIAL OWNERS AND MANAGEMENT 40 Item 13. CERTAIN RELATIONSHIPS AND RELATED TRANSACTIONS 41 Item 14. CONTROLS AND PROCEDURES 41
PART IV 41 Item 15. EXHIBITS, FINANCIAL STATEMENT SCHEDULES AND REPORTS ON FORM 8-K 41

SIGNATURES 44
SECTION 302 CERTIFICATION STATEMENTS 45
SCHEDULE II 47
INDEX TO EXHIBITS 48
i
PART I 1. BUSINESS
Certain information of a non-historical nature contained in Items 1, 2, 3 and 7 of this Form 10-K includes forward-looking statements. Reference ismade to Item 7—Management’s Discussion and Analysis of Financial Condition and Results of Operations—Factors that May Affect Future OperatingResults, for a discussion of certain factors which could cause the Company’s actual operating results to differ materially from those expressed in anyforward-looking statements. General
Patterson Dental Company (“Patterson” or the “Company”) is a value-added distributor serving the North American dental supply and companion-pet (dogs, cats and other common household pets) veterinary supply markets. Unless otherwise indicated, all references to Patterson or the Companyinclude its subsidiaries: Direct Dental Supply Co.; Patterson Dental Canada, Inc.; Patterson Dental Supply, Inc.; Webster Veterinary Supply, Inc.; PDCFunding Company, LLC; Patterson Technology Center, Inc.; Colwell Systems, Inc. and Webster Management LP.
Patterson began distributing dental supplies in 1877. The modern history of the business dates to May 1985, when the Company’s managementand certain investors purchased the Company from a subsidiary of The Beatrice Companies, Inc. Patterson became a publicly traded company inOctober 1992.
The Company historically reported under one operating segment, dental supply. In July 2001, the Company purchased the assets of J. A. Webster,Inc. The acquisition became a reportable business segment of the Company, and Patterson Dental Company began reporting two segments, dentalsupply and veterinary supply. The Company’s reportable segments are strategic business units that offer similar products and services to differentcustomer bases. Dental Supply
As Patterson’s largest business, Patterson Dental Supply is one of the two largest distributors of dental products in North America. The businesscurrently has operations in the United States and Canada. Patterson Dental Supply, a full-service, value-added supplier to dentists, dental laboratories,institutions, and other healthcare professionals, provides: consumable products (including x-ray film, restorative materials, hand instruments andsterilization products); advanced technology dental equipment; practice management and clinical software; and office forms and stationery. TheCompany offers its customers a broad selection of dental products including more than 85,000 stock keeping units (“SKU’s”) of which approximately4,000 are private-label products sold under the Patterson name. Patterson Dental Supply also offers customers a full range of related services includingdental equipment installation, maintenance and repair, dental office design and equipment financing. The Company markets its dental products andservices through over 1,200 direct sales representatives, 285 of whom are equipment specialists.
Founded in 1877, Patterson Dental Supply has over 125 years of experience providing quality service to dental professionals. Net sales of thissegment have increased from $165.8 million in fiscal 1986 to $1,471.2 million in fiscal 2003, operating margins have increased every year since fiscal1985 and profitability has increased from an operating loss in fiscal 1986 to operating income of $163.9 million in fiscal 2003.
The Company estimates the dental supply market it serves to be approximately $4.8 billion annually. The Company also believes that its share ofthis market is approximately 30%. The underlying structure of the dental supply market consists of a sizeable geographically dispersed number offragmented dental practices which is attractive for the Company’s role as a value-added, full-service distributor. According to the American DentalAssociation, there are over 150,000 dentists practicing in the United States in approximately 120,000 dental practices, representing a fragmented,geographically diverse market. There are approximately 17,000 licensed dentists in Canada according to the Canadian Dental Association. The averagegeneral practitioner generated approximately $450,000 in annual revenue in 1999, while the average specialty practitioner produced about $600,000.The Company believes that a dentist uses between 5% and 7% of annual revenue to purchase consumable supplies used in the daily operations of thepractice. This translates into between $22,000 and $42,000 of supplies being purchased by the average practice each year. However, dentists generallydo not maintain a large supply of inventory on hand. The Company believes the average dental practitioner purchases about 40% of their supplies fromtheir top supplier.
2
Total expenditures for dental services in the United States increased from $13 billion in 1980 to $68 billion in 2002. Domestic dental careexpenditures are projected by the Centers for Medicare & Medicaid Services to grow 6% annually, reaching $100 billion by the year 2010. The Companybelieves that the demand for dental services, equipment and supplies will continue to be influenced by the following factors:
• Demographics. The U.S. population grew from 235.1 million in 1980 to 280.3 million in 2002, and is expected to reach 299.9 million by 2010.
The median age of the population is also increasing and Patterson believes that older dental patients spend more on a per capita basis fordental services.
• Dental products and techniques. Technological developments in dental products have contributed to advances in dental techniques andprocedures, including cosmetic dentistry and dental implants.
• Demand for certain dental procedures. Demand is growing for preventive dentistry and periodontic (the treatment of gums), endodontic (root
canals), orthodontic (braces) and other dental procedures which enable patients to keep their natural teeth longer and improve theirappearance.
• Increased dental office productivity. The number of dentists per 100,000 U.S. population is forecasted to decline over the next two decades. As
a result, the number of patients per dental practice is expected to grow. For this reason, dentists are showing increased willingness to invest indental equipment and office infrastructure that can strengthen the productivity of their practices.
• Demand for infection control products. Greater public awareness and regulations and guidelines instituted by OSHA, the American Dental
Association and state regulatory authorities have resulted in increased use of infection control (asepsis) products such as protective clothing,gloves, facemasks and sterilization equipment to prevent the spread of communicable diseases such as AIDS, hepatitis and herpes.

• Coverage by dental plans. An increasing percentage of dental services are being funded by private dental insurance. The Centers for Medicare& Medicaid Services statistics on expenditures for dental services in the United States indicate that private dental insurance paid approximately50% of the $68 billion in total expenditures for 2002 as compared to approximately 30% of the $13 billion in total expenditures for 1980.
Veterinary Supply
Webster Veterinary Supply is the leading distributor of veterinary supplies to companion-pet (dogs, cats and other common household pets)veterinary clinics in the eastern United States and the third largest nationally. Webster provides products used for the treatment and/or prevention ofdiseases in companion pets and, to a lesser extent, equine animals. Founded in 1946 and headquartered in Sterling, Massachusetts, Webster hasdeveloped a strong regional brand identity as a value-added, full-service distributor of a virtually complete range of consumable supplies, equipment,diagnostic supplies, biologicals (vaccines) and pharmaceuticals. Webster does not distribute pet foods. Webster’s product offering, totaling more than8,000 items, is sold by over 78 field sales representatives. In addition to its core business of distributing veterinary products, Webster Veterinary Supplyhas a significant agency commission business with a few large pharmaceutical manufacturers. Under the agency relationships, the Company typicallyearns a commission for soliciting orders through its sales force representatives. In the agency relationship, the Company processes the order to themanufacturer but handles none of the product nor does the Company bill and collect from the customer. The agency commissions that WebsterVeterinary Supply earns range from 4% to 8%, a portion of which is shared with the direct sales personnel. Webster’s agency commissions accounted forapproximately 2% of net sales in fiscal 2003. Net sales by this segment in fiscal 2003 were $185.8 million. Operating income totaled $15.0 million.
The Company estimates the market for pharmaceuticals and supplies sold to companion pet veterinarians through distribution is approximately$2.4 billion on an annual basis. Based upon the estimated $2.4 billion market, the Company believes its share of this market is approximately 10%.Similar to the dental supply market, the veterinary supply market is fragmented and geographically diverse. There are approximately 60,000 veterinarianspracticing at 21,700 animal health clinics. The vast majority, approximately 65% of veterinarians, work in private animal health clinics specializing in smallanimals, predominately companion pets. The average private veterinary practice generates approximately $550,000 of annual revenue. These practicespurchase between $80,000 and $120,000 of supplies each year but similar to the dental practitioner do not maintain a large supply of inventory on hand.The typical veterinary practice purchases approximately 80% of its supplies from its top two suppliers. The average purchase of consumables by theveterinary practice is noticeably higher than that of the dental practitioner due predominately to pharmaceutical products which are administered anddispensed by veterinarians.
3
According to a market study prepared by KMPG LLP for three veterinary professional organizations in 1999, the demand for veterinary serviceshas grown significantly faster than growth in the overall economy. Total expenditures for veterinary services in the United States grew at an inflationadjusted real annual rate of 7.2% from 1980 through 1997, and are projected to grow 5% on a real basis annually, through the year 2015. The companionpet segment is the fastest growing area of the overall U.S. veterinary supply market. The Company believes this growth is sustainable due to thefollowing favorable factors:
• Number of households with companion pets. The number of households with companion pets is steadily expanding which increases the
demand for veterinary services. In 2000, 62% of U.S. households owned a companion pet compared with 56% in 1988. Overall, 47% of allhouseholds in the U.S. own more than one type of pet.
• Veterinary expenditures per household. The amount companion pet owners are willing to spend caring for their pets is increasing substantially.The American Pet Products Manufacturers Association estimates that pet owners will spend $31 billion in 2003 to care for the American petpopulation, or $460 per household. This is a 82% increase over the $17 billion spent in 1994. The greatest expense for pet owners in a 12-month period is for services related to veterinary care. The American Veterinary Medical Association estimates the veterinary expense perhousehold is between $157 and $260 per year.
• Veterinary products and techniques. Many new therapeutic and preventive products are being developed for the companion pet market.Technological developments have resulted in new innovative veterinary products and advances in veterinary services.
For further information on the Company’s operating segments and operations by geographic area, see “Management’s Discussion and Analysis of
Financial Condition and Results of Operations” in Item 7 of this document and Note 10 to the Consolidated Financial Statements. Patterson’s Strategy
Patterson’s objective is to remain a leading national distributor of supplies, equipment and related services in its markets while continuing toimprove its profitability and enhance its value to customers. To achieve this objective, Patterson has adopted a strategy of emphasizing its value-added,full-service capabilities, using technology to enhance customer service, continuing to improve operating efficiencies, and growing through internalexpansion and acquisitions.
Emphasizing Value-Added, Full-Service Capabilities. The Company believes that its customers value full service and responsive delivery of qualitysupplies and equipment, in addition to competitive prices. Customers also increasingly expect suppliers to be knowledgeable about products andservices, and generally a superior sales representative can create a special relationship with the practitioner by providing an education link to the overallindustry. The Company’s knowledgeable sales representatives assist customers in the selection and purchasing of supplies. In addition, the high qualitysales force allows Patterson to offer broader product lines. Most dentists and veterinarians are independent, sole practitioners who are unable to storeand manage large volumes of supplies in their offices. Patterson meets its customer’s requirements by delivering frequent, small quantity orders rapidlyand reliably from its strategically located distribution centers. Equipment specialists, technology representatives and service technicians also support theCompany’s value-added strategy in the dental supply market. Equipment specialists offer consultation on office design, equipment requirements andfinancing. Technology representatives provide guidance on integrating technology solutions including practice management and clinical software, digitalradiography, custom hardware and networking into the dental practice. The Company’s trained service technicians perform equipment installation,maintenance and repair services.
Using Technology to Enhance Customer Service. As part of its commitment to providing superior customer service, the Company offers itscustomers easy order placement. The Company has offered electronic ordering capability to its dental supply segment since 1987 when it first introducedRemote Order Entry (REMOSM). The Company believes that its computerized order entry systems help to establish relationships with new customers andincrease loyalty among existing customers. The remote order entry systems permit customers to place orders from their offices directly to Patterson 24hours a day, seven days a week. Over the years, the Company has continued to introduce new order entry systems designed to meet the varying needsof its customers. Today the Company offers five systems to the dental supply segment, eMAGINE®, REMOSM, PDXpress®, PassPortSM Plus andPattersondental.com. Customers as well as the Company’s sales force use these systems. Over the years, the number of orders transmittedelectronically has grown steadily to approximately 54% of Patterson’s consumable dental product volume or $448.8 million in fiscal year 2003.
In fiscal 2002, the Company introduced its newest order entry system, eMAGINE ®. eMAGINE® has become the standard platform for the salesrepresentative and includes many new features and upgrades including: up to three years of order history for the
4
customer’s reference, faster searches for products and reports, order tracking, instant information on monthly product specials, descriptions and

photographs of popular products and an electronic custom catalog, including a printable version with scanable bar codes.
For those dental customers not using eMAGINE®, the Company offers three alternative order entry products. REMO SM gives customers direct andimmediate ordering access through a personal computer to a database containing Patterson’s complete inventory. PDXpress® is a handheld order entrysystem that eliminates handwritten order forms by permitting a user to scan a product bar code from an inventory tag system or from Patterson’s bar-coded catalog. PassPortSM Plus is a smart phone which incorporates automated ordering and bar code scanning with credit card processing. Thesesystems, including eMAGINE®, are provided at no additional charge to customers who maintain certain minimum purchase requirements.
The goal of the Company’s Internet strategy is to distribute information and service related products over the Internet to enhance customers’practices and to increase sales force productivity. The Company’s Internet environment includes order entry, access to “Patterson Today” articles,manufacturers’ product information, and an office design application. Additionally, Patterson utilizes a tool, InfoSource, to provide real time customer andCompany information to the Company’s sales force, managers and vendors via the Internet.
Late in fiscal 2002, the Company introduced eMAGINE ® to the sales force calling on the veterinary supply market. During fiscal 2003, the Companybegan to offer eMAGINE® to a select number of its veterinary customers. Beta testing is underway and a complete rollout is expected to begin in latefiscal 2004. Since its introduction, approximately $34.4 million, or 15% of consumable veterinary sales have been processed using eMAGINE®.Webstervet.com, the Company’s website for the veterinary supply market, does not currently include e-commerce capabilities. Longer-term the Companyplans to implement a strategy in the veterinary market similar to the dental market with multiple order entry systems that suit a variety of customers’needs.
In addition to enhancing customer service, by offering its electronic order entry systems to customers, the Company enables its salesrepresentatives to spend more time with existing customers and to call on additional customers.
Continuing to Improve Operating Efficiencies. Patterson continues to implement programs designed to improve operating efficiencies and allow forcontinued sales growth over time. These programs include a wide variety of initiatives from investing in management information systems toconsolidating distribution centers. Recent initiatives include deploying InfoSource, upgrading the Company’s communications architecture, andimplementing a new technical service system. In fiscal 2001, the Company launched its new InfoSource program, a web-based system that disseminateskey sales information, customer purchasing trends and other administrative reports to the Company’s dental sales force and branch managers.InfoSource allows dental sales representatives to more effectively and efficiently market the Company’s broad product line while enabling branchmanagers to increase their productivity. The Company has also improved operating efficiencies by converting its communications architecture to faster,higher capacity data lines that combine voice and data transmissions while reducing overall communication costs. During fiscal 2003, the Companybegan implementing a new field service management tool for its technical service operations. This new tool will allow the Company to fundamentallychange its technical service business processes improving the Company’s ability to coordinate the actions of its service technicians and enhancingcustomer service while reducing the overall cost of operations. The Company is also in the process of developing a new order entry system for its salesoffices. The system is being developed around a customer relationship management concept and has a look and feel similar to the Company’seMAGINE® product. This system will provide customer support staff with integrated customer information on one screen. By leveraging Patterson’sexisting national distribution network, the Company has begun to implement a growth strategy in the veterinary supply market without significant newinvestments in physical infrastructure. In addition, many of the tools and capabilities available in the dental segment can be integrated into the veterinarysegment. Consequently, the Company expects to continue to improve its operating leverage and efficiencies going forward.
Growing Through Internal Expansion and Acquisitions. The Company intends to continue to grow by opening additional sales offices, hiringestablished sales representatives, hiring and training college graduates as territory sales representatives, and acquiring other distributors in order to enternew markets and expand its customer base. The Company believes that it is well positioned to take advantage of expected continued consolidation inboth the dental and veterinary distribution industries. Over the past 15 years the Company has made the following acquisitions:
Dental distribution acquisitions in the United States
• In August 1987, Patterson acquired the D.L. Saslow Co., which at the time was the third largest distributor of dental products in the United
States. Between 1989 and 2002, Patterson acquired certain assets of 24 smaller dental dealers throughout the United States. During fiscal2002, the Company acquired Thompson Dental Company of Columbia, SC, a leading value-
5
added distributor of dental supplies, equipment and services in the mid-Atlantic and southeastern U.S. Thompson ranked among the 10largest dental distributors in the country.
Dental distribution acquisitions in Canada
• In October 1993, the Company completed the acquisition of Healthco International, Inc.’s Canadian subsidiary, Healthco Canada, Inc. InAugust 1997, the Company acquired Canadian Dental Supply Ltd., which expanded the Company’s market share in British Columbia, Alberta,Saskatchewan and Ontario. In July 2002, the Company acquired Distribution Quebec Dentaire, Inc., augmenting the Company’s market sharein Quebec. As a combined operation known as Patterson Dental Canada Inc., this subsidiary, which the Company believes is one of the twolargest full-service dental products distributors in Canada, employs approximately 523 people, 141 of whom are sales representatives.
Printed office products acquisitions
• In October 1996, the Company acquired the Colwell Systems division of Deluxe Corporation. Colwell Systems produces and sells a variety of
printed office products used in medical and dental offices. In February 1999, the Company acquired Professional Business Systems, Inc.(PBS), Colwell’s largest supplier, to expand production capacity.
Software acquisitions
• In July 1997, the Company acquired EagleSoft, Inc., a developer and marketer of Windows ®-based practice management and clinical softwarefor dental offices. EagleSoft, now known as the Patterson Technology Center, is located in Effingham, Illinois. In September 2000, theCompany acquired eCheck-up.com, a web-based, value-added service that complements and expands the Company’s current productofferings to the front office of the dental practice. eCheck-up.com is an Internet service that provides on-line practice performance andbenchmarking services to subscribing dental customers through its website. In December 2001, the Company purchased Modern PracticeTechnologies, a company that provides custom computing solutions to the dental industry. This acquisition helped Patterson to position itself toprovide all of the custom hardware and networking required for interfacing the entire dental office.
Veterinary acquisitions

• In July 2001, the Company acquired the assets of J. A. Webster, Inc. the leading distributor of veterinary supplies to companion pet veterinaryclinics in the eastern United States and the third largest nationally. Webster is an excellent strategic fit with Patterson’s core competencies invalue-added distribution. Like Patterson, Webster serves a large, fragmented market with similar growth and customer characteristics and hasan ingrained sales culture that emphasizes customer relationships and unparalleled customer service. Webster will enable Patterson tocapitalize upon a significant growth opportunity in the companion pet veterinary supply market.
Products and Services
The Company has operations in two segments, dental supply and veterinary supply. Each segment provides similar products and services albeit todifferent customer bases. The following table sets forth the principal categories of products and services offered by the Company:
(1) Consists of other value-added products and services.
6
Consumable and Printed Products
Dental Supplies. Patterson offers a broad product line of consumable dental supplies such as x-ray film and solutions; impression materials;restorative materials (composites and alloys); hand instruments; sterilization products; infection control products such as protective clothing, gloves andfacemasks; paper, cotton and other disposable products; toothbrushes and a full line of dental accessories including instruments, burs, and diamonds.Patterson markets its own private label line of dental supplies including anesthetics, instruments, preventive and restorative products, and cotton andpaper products. Compared to most name brand supplies, the private label line provides lower prices for the Company’s customers and higher marginsfor the Company.
Veterinary Supplies. Webster offers its customers a broad selection of veterinary supply products including consumable supplies, pharmaceuticals,diagnostics, and biologicals. Consumable supplies distributed by Webster include lab supplies, various types and sizes of paper goods, needles andsyringes, gauze and wound dressings, sutures, latex gloves, orthopedic and casting products. Webster’s pharmaceutical products are FDA licensedproducts including anesthetics, antibotics, injectables, ointments and neutraceuticals. The diagnostics product category includes on-site testing productsfor heartworm, FIV, FELV and Parvo virus. Biological products are comprised of vaccines and injectibles.
Printed Products. The Company provides a variety of printed products, office filing supplies, and practice management systems to office-basedhealthcare providers including dental, medical and veterinary offices. Products include custom printed products, insurance and billing forms, stationery,envelopes and business cards, labels, file folders, appointment books and other stock office supply products. Products are sold through three channels: • The Company’s dental supply sales force • The Company’s veterinary supply sales force • Catalogs distributed to over 150,000 customers several times a year
All three channels are supported by a staff of telemarketing personnel located in Champaign, Illinois. Orders are received by telephone, through themail or electronically from the dental distribution order processing system.
Equipment and Software
Dental Equipment. Patterson Dental Supply is the largest supplier of dental equipment in the U.S. and Canada by a factor of more than two timeswhen compared to its next largest competitor. It offers a wide range of dental equipment products including x-ray machines, high-and low-speedhandpieces, dental chairs, dental handpiece control units, diagnostic equipment, sterilizers, dental lights and compressors. The Company also distributesnewer technology equipment that provides customers with the tools to improve productivity and patient satisfaction. Examples of such innovative andhigh-productivity products include the CEREC® product family, a chair-side restoration system; air abrasion systems; digital x-rays; and inter-oralcameras.
Veterinary Equipment. Equipment sold by Webster generally consists of machines for hospital, laboratory and general surgical use within theveterinary practice. Equipment sales accounted for about 4% of veterinary segment sales in fiscal 2003.
Software. The Company develops and markets practice management and clinical software for dental professionals. Products include software forscheduling, billing, charting and storage/retrieval of digital images. The Company also sells software products developed by third parties including Sidexisby Sirona, Dimax2 by Planmeca and VixWin by Gendex. These value-added products are designed to help achieve office productivity improvements,which translates into higher profitability for the customer.
Hardware. In fiscal 2003, the Company began to offer custom hardware and networking solutions required for integrating the entire dental office. ByJanuary 2003, this new product offering was available to all of the Company’s dental customers. This initiative marks another step in Patterson’s overallstrategy of providing customers with the convenience and cost-effectiveness of a virtually complete range of products and value-added services and isthe newest component of the Company’s single-source solution for dental offices.
7
Other
Software Services. The Company offers a variety of services to complement its software products such as service agreements, electronic claimsprocessing and billing statement processing. These services provide value to customers by allowing them to keep products current state, or receivepayments more rapidly while obtaining greater productivity.
Equipment Installation, Repair and Maintenance. To keep their practices running efficiently, dentists require reliable performance from theirequipment. All major equipment sold by Patterson includes installation and Patterson’s 90-day labor warranty at no additional charge. Patterson alsoprovides complete repair and maintenance services for all dental equipment, whether or not purchased from Patterson, including 24-hour handpiecerepair service. In addition to service technicians who provide installation and repair services on basic dental equipment, the Company also invested inpersonnel who specialize in installing and troubleshooting issues with technology solutions such as practice management software, digital imagingproducts, hardware and networking. The goal of this group, which is comprised of both local service technicians and the Patterson Technology Center, isto help customers integrate newer technology into their dental practice. The Patterson Technology Center helps the customer minimize costly downtimeby offering a single point of contact for post sale technology related issues.
Dental Office Design. Patterson provides dental office layout and design services through the use of a computer-aided design (CAD) program.Equipment specialists can create original or revised dental office designs in a fraction of the time required to produce conventional drawings. Customerspurchasing major equipment items receive dental office design services at no additional charge.

Equipment Financing. The Company provides a variety of options to fulfill its customers’ financing needs. For qualified purchasers of equipment,
the Company will arrange financing for the customer through Patterson or a third party. For non-equipment related needs, customers are referred to oneof the third party organizations. These alternatives allow the Company to offer its customers convenience while still meeting their diverse financingneeds. In fiscal 2003, the Company originated over $184.0 million of equipment finance contracts. The Company, or one of its vendor partners, financedapproximately 40% of the equipment purchased by customers during fiscal 2003.
Equipment leasing is provided by Banc of America Vendor Finance, a unit of BankAmerica, pursuant to an agreement entered into in July 1993.Applications for lease financing originated by the Company are reviewed by Banc of America Vendor Finance who, upon approval, will purchase theequipment and lease it to the customer. They will also finance the customer’s purchases on an installment sale contract with no recourse to theCompany. Since November 1998, Patterson has also maintained a finance referral agreement with an outside finance company to provide a moreextensive selection of finance opportunities to its customers. Currently this service is provided by HPSC Inc. There are no recourse provisions under thisagreement. Patterson receives referral fees under both of these agreements and these institutions service the accounts.
To meet the needs of its customers, the Company also initiates installment sale contracts which are sold to a commercial paper conduit managedby Bank One, N. A., or a group of banks led by U.S. Bank National Association.
To participate in the commercial paper conduit, the Company created a special purpose entity (“SPE”), PDC Funding Company, LLC, a wholly-owned subsidiary, and entered into a new Receivables Purchase Agreement with the commercial paper conduit. The Company transfers installment salecontracts to the SPE. In turn, the SPE sells the contracts to the commercial paper conduit administered by Bank One. This agreement was renewed inMay 2003, with a current limit of $200 million of contract purchases. There is no recourse to the Company for contracts purchased by the commercialpaper conduit but there is a holdback equal to 10% of the contracts, which is carried as a non-current asset subject to mark-to-market adjustments.
The banks, led by U.S. Bank National Assocation, also purchase the Company’s installment sale contracts secured by dental equipment, on alimited recourse basis. The contract purchase agreement with the banks allowed for a maximum capacity of $50 million, which had been fully utilized atApril 26, 2003. In May 2003, the Company extended its agreement with the banks, which now provides for sales of installment contracts up to $70million.
The Company continues to service the accounts under both of the preceding arrangements for which it receives a fee.
8
Sales and Marketing
During fiscal 2003, the Company sold products to over 127,000 customers in the U.S. and Canada who made one or more purchases of suppliesduring the year. The Company’s customers include dentists, veterinarians, laboratories, institutions and other healthcare professionals. No singlecustomer accounted for more than 1% of sales during fiscal 2003, and Patterson is not dependent on any single customer or geographic group ofcustomers. The Company’s sales and marketing efforts are designed to establish and improve customer relationships through personal interaction withits sales representatives and frequent direct marketing contact, which underscores the Company’s value-added approach.
A primary component of the Company’s value-added approach is its sales force. Due to the fragmented nature of both the dental and veterinarysupply markets, Patterson believes that a large sales force is necessary to reach potential customers and to provide full service. Sales representativesprovide an education link to the overall industry, assist practitioners in selecting and purchasing products and help customers efficiently manage theirsupply inventories. Each representative works within an assigned sales territory under the supervision of a location (branch) manager. Salesrepresentatives are all Patterson employees and are generally compensated on a commission basis, with some, less experienced, representativesreceiving a base salary and commission.
To assist its sales representatives, the Company publishes a variety of catalogs and fliers containing product and service information. TheCompany’s dental customers receive a full-line product catalog containing over 24,000 inventoried items. Veterinary customers receive a parallel catalog,which contains the approximately 8,000 SKU’s offered to the veterinary market. These catalogs include detailed descriptions and specifications ofproducts and are utilized by practitioners as a reference source. Selected consumable supplies, new products, specially priced items and high-demanditems such as infection control products are promoted through merchandise fliers printed and distributed bimonthly to the dental supply market andmonthly to the veterinary supply market. In addition, dental equipment sold by the Company is featured in the Company’s tri-yearly publication, PattersonToday, which also includes articles on dental office design, trends in dental practice, products and services offered by Patterson, and information onequipment maintenance.
To enhance the total value it brings to its customers, the Company created value-added benefit programs for its preferred customers. ThePatterson PlusSM program entitles its best dental customers to priority technical services, automated supply management systems at no charge, a varietyof product discounts and reduced rates on financial, practice management and technical services. For its preferred veterinary customers, the Companyoffers the Webstar Plus program. Membership rewards include an assortment of benefits such as reduced finance rates and deferred billing terms forequipment purchases, in-depth business reports and product discounts. Distribution
The Company believes that responsive delivery of quality supplies and equipment is a key element to providing complete customer satisfaction.
The Company ships dental consumable supplies from 10 strategically located distribution centers in the U.S. and Canada. Orders for consumabledental supplies can be placed by telephone or electronically 24 hours a day, seven days a week. Printed office products are shipped from the Company’stwo manufacturing facilities in Illinois.
Veterinary supplies are shipped from 6 distribution centers. Orders can be placed by salesperson, telephone, fax or mail. Tele-salesrepresentatives are responsible for processing approximately 70% of customers’ orders in this segment.
All orders are routed through the Company’s centralized computer ordering, shipping and inventory management systems, which are linked to eachof the Company’s strategically located distribution centers. If an item is not available in the distribution center nearest to the customer, the computersystem automatically directs shipment of the item from another center. Rapid and accurate order fulfillment is another principal component of theCompany’s value-added approach. The Company estimates that 99% of its consumable goods orders are delivered to the customer on time, which isgenerally within 24 hours.
In order to assure the availability of the Company’s broad product lines for prompt delivery to customers, the Company must maintain sufficientinventories at its distribution centers. Purchasing is centralized by segment and the purchasing departments use a real-time perpetual inventory systemto manage inventory levels. The Company’s inventory consists mostly of consumable supply items. By utilizing its computerized inventory managementand ordering systems, the Company is able to accurately predict inventory turns in order to minimize inventory levels for each item.
9

The Company’s 96 dental sales offices are generally configured with display areas where the latest dental equipment can be demonstrated. Dentalequipment inventory is generally custom ordered and is staged at the Company’s sales offices before delivery to dental offices for installation. About 50%of veterinary equipment orders are drop shipped directly to the customer, of which 15% are custom ordered from the manufacturer. The balance ofveterinary equipment is distributed in a fashion similar to consumable supplies. Sources of Supply
Effective purchasing is a key strategy the Company has adopted in order to achieve its objective of continuing to improve profitability. TheCompany has a program to effectuate electronic data interchange (EDI) with its major vendor partners. In fiscal 2003, the Company processed 58% of itsdental vendor invoices using EDI capabilities. In addition, 49% of Patterson’s dental purchase order volume was conducted employing EDI, whichrepresented 71% of dental purchase order dollars placed during the fiscal year. Utilizing EDI allows the Company to improve efficiencies and reduceadministrative costs.
The Company obtains products from approximately 1,400 vendors, including 1,100 in the dental segment and 300 in the veterinary segment. Inaddition, the Company has exclusive distribution agreements with several quality dental equipment manufacturers including Sirona for the CEREC®, andSchick Technologies for digital x-rays. The Company is the only national dealer for a-dec equipment, including chairs, units and cabinetry. A-dec is thelargest manufacturer of dental equipment in the U.S.
While the Company makes purchases from many suppliers and there is generally more than one source of supply for most of the categories ofproducts sold by the Company, the concentration of business with key suppliers is considerable. In fiscal 2003, the Company’s top 10 dental supplyvendors and single largest vendor accounted for approximately 44% and 12%, respectively, of the cost of dental products sold. Likewise, the Company’stop 10 veterinary supply manufacturers and single largest supplier comprised 74% and 23%, respectively, of the Company’s cost of veterinary supplysales. Competition
The highly competitive U.S. dental products distribution industry consists principally of national, regional and local full-service distributors and mail-order distributors. The dental supply market is extremely fragmented. In addition to Patterson and one other national, full-service firm, Henry Schein, Inc.,there are at least 19 full-service distributors which operate on a regional level, and hundreds of small local distributors. Also, some manufacturers selldirectly to end-users, and thereby eliminate the role of the Company.
Within the “companion pet” market segment, competitors range from small local distributors to large national and regional full-service companies,and to a lesser extent mail order distributors or buying groups. Webster also competes directly with pharmaceutical companies who sell certain productsdirectly to the customer.
The Company approaches its markets by emphasizing and delivering a value-added model to the practitioner. To differentiate itself from itscompetition it deploys a strategy of premium customer service, a highly qualified and motivated sales force, experienced service technicians, anextensive breadth and mix of products and services, accurate and timely delivery of product, strategic location of sales offices and distribution centers,and competitive pricing.
The Company also experiences competition in Canada in the dental supply market. Principal competitors include two national, full-service dentaldistributors, Ash Temple and Arcona, a division of Henry Schein, Inc. The Company believes it competes in Canada on essentially the same basis as inthe United States. Trademarks
Patterson has registered with the United States Patent and Trademark Office the marks “Patterson”, “PDXpress” and “eMAGINE”. The Companybelieves that the Patterson mark is well recognized in the dental products industry and by dental professionals, and is therefore a valuable asset of theCompany. Employees
As of April 26, 2003, the Company employed 4,772 people in the United States and Canada on a full-time basis. Patterson has not experienced ashortage of qualified personnel in the past, and believes that it will be able to attract such employees in the future. None of Patterson’s employees issubject to collective bargaining agreements or represented by a union. The Company considers its relations with its employees to be good.
10
Website Access to Company Reports
The Company makes available, free of charge, on or through its website, its Annual Report on Form 10-K, quarterly reports on Form 10-Q, andcurrent reports on Form 8-K, and amendments to those reports as soon as reasonably practicable after this material is electronically filed with orfurnished to the Securities and Exchange Commissions. This material may be accessed by visiting the Investor Relations section of the Company’swebsite at www.pattersondental.com. Governmental Regulation
The marketing, distribution and sale of certain products sold by the Company are subject to the requirements of various state, local and federal lawsand regulations. The Company is subject to regulation by the Food and Drug Administration, U. S. Department of Agriculture, OSHA and the DrugEnforcement Administration. Among the federal laws which impact the Company are the Federal Food, Drug and Cosmetic Act, which regulates theadvertising, record keeping, labeling, handling, storage and distribution of drugs and medical devices, and which requires the Company to be registeredwith the Federal Food and Drug Administration, and the Safe Medical Devices Act of 1990, which imposes certain reporting requirements on distributorsin the event of an incident involving serious illness, injury or death caused by a medical device. In addition, the Company is required to be licensed as adistributor of drugs and medical devices by each state in which it conducts business. Several State Boards of Pharmacy require the Company to belicensed in their state for the sale of animal health products within their jurisdiction. The Company believes that it is in substantial compliance with all ofthe foregoing laws and that it possesses all licenses required in the conduct of its business. Executive Officers of the Registrant
Set forth below are the names, ages and positions of the executive officers of the Company as of June 30, 2003.
Peter L. Frechette 65 Chief Executive Officer and Chairman of Board—Patterson Dental CompanyJames W. Wiltz 58 President and Chief Operating Officer—Patterson Dental CompanyR. Stephen Armstrong
52
Executive Vice President, Chief Financial Officer and Treasurer—Patterson DentalCompany
Scott R. Kabbes
42
President—Patterson Dental Supply, Inc., and President—Patterson Technology Center,Inc.
Jeffrey H. Webster 41 President—Webster Veterinary Supply, Inc.

Cree Z. Hanna 47 Vice President, Human Resources—Patterson Dental CompanyLynn E. Askew 41 Vice President, Management Information Systems—Patterson Dental CompanyGary D. Johnson 56 Vice President, Sales—Patterson Dental Supply, Inc.R. Reed Saunders 55 Vice President—Patterson Dental Supply, Inc. and President—Colwell Systems, Inc.Richard A. Kochmann 51 Vice President, Marketing—Patterson Dental Supply, Inc.Andre Desjardins 50 President—Patterson Dental Canada, Inc.
The officers of the Company are elected annually and serve at the discretion of the Board of Directors. None of the Company’s officers is employed
pursuant to a written employment contract. Background of Executive Officers
Peter L. Frechette has been Chief Executive Officer of the Company since September 1982. Mr. Frechette has been a director of Patterson sinceMarch 1983 and was named Chairman of Board in 1985. Mr. Frechette served as President of the Company from September 1982 to April 2003. Prior tojoining Patterson, Mr. Frechette was employed by American Hospital Supply Corporation for 18 years, the last seven of which he served as president ofits Scientific Products Division. Mr. Frechette is also a director of FinishMaster, Inc. James W. Wiltz was named the Company’s President and Chief Operating Officer in April 2003. Mr. Wiltz served as a Vice President of the Companyfrom 1986 to 2003 and as President of Patterson Dental Supply, Inc., from 1996 to 2003. He has been employed
11
by Patterson since September 1969, initially as a territory sales representative. Mr. Wiltz was appointed to the Board of Directors in March 2001.
R. Stephen Armstrong was elected Executive Vice President, Treasurer and Chief Financial Officer of the Company effective July 31, 1999. Priorto joining Patterson, Mr. Armstrong had been an Assurance Partner with Ernst & Young LLP. Ernst & Young LLP is currently the Company’s independentauditor.
Scott R. Kabbes was named President of the Company’s subsidiary Patterson Dental Supply, Inc., in April 2003 and is also President of PattersonTechnology Center, Inc. Mr. Kabbes owned EagleSoft prior to its acquisition by the Company in July 1996.
Jeffrey H. Webster has been President of Webster Veterinary Supply, Inc., since its acquisition by Patterson in July 2001. Mr. Webster heldvarious management positions with J. A. Webster, Inc. since 1984. At the time the company was acquired, Mr. Webster was President of J. A. Webster,Inc.
Cree Z. Hanna joined Patterson Dental Company in June of 2002 as Vice President, Human Resources. Prior to joining Patterson, Ms. Hannaprovided human resource consulting support to various organizations and served as Senior Vice President, Human Resources at U.S. BANCORP forapproximately 9 years.
Lynn E. Askew became Vice President, Management Information Systems, on September 1, 1999. Mr. Askew joined Patterson in 1994 asManager, Distributed Systems, and was promoted to Director, Systems and Development in 1996. Prior to joining Patterson, Mr. Askew providedadvanced technology consulting and project management services to various organizations, including Patterson.
Gary D. Johnson has been Vice President, Sales, of Patterson Dental Supply, Inc. since October 1996. Mr. Johnson has served in various salesand management positions since he joined the Company in August 1981.
R. Reed Saunders has been a Vice President of Patterson Dental Supply, Inc. since March 1997 and is President of Colwell Systems, Inc. Prior tojoining Patterson, Mr. Saunders spent 15 years with American Express Company as Senior Vice President—Chief Marketing Officer of its division,American Express Financial Advisors.
Richard A. Kochmann was promoted to Vice President, Marketing, of Patterson Dental Supply, Inc. in November 2000. Mr. Kochmann began hiscareer with Patterson in 1980 as a college representative and has held various sales and management positions within the Company.
Andre Desjardins was named President of the Company’s Canadian subsidiary Patterson Dental Canada Inc., in May 2003. Mr Desjardins wasPresident of Distribution Quebec Dentaire, Inc. prior to its acquisition by the Company in July 2002. 2. PROPERTIES
The Company owns its principal executive offices in St. Paul, Minnesota.
The Company has 10 dental and 6 veterinary distribution centers as well as two locations used to ship printed office products. Sales andadministrative personnel for the veterinary segment reside within the distribution facilities. Distribution and manufacturing facilities are located inAlabama, California, Florida, Illinois, Indiana, Iowa, Massachusetts, North Carolina, Pennsylvania, South Carolina, Texas, Washington and Quebec andAlberta, Canada. The Company owns approximately 60%, or 346,000 square feet, of the total distribution space and the balance is leased.
The Company’s dental segment also maintains sales and administrative offices inside the United States at 87 locations in 45 states and outside theUnited States at 11 locations in Canada. All of these locations, except one, are leased. The Company has two owned manufacturing facilities used toproduce the printed office products and one leased site.
In management’s opinion, all buildings, machinery and equipment are in good condition, suitable for their purposes and are maintained on a basisconsistent with sound operations. Currently, the Company does not have substantial idle facilities.
12
3. LEGAL PROCEEDINGS
The Company has been involved in various product-related and employment-related legal proceedings arising in the ordinary course of business.Some of these proceedings involve product liability claims arising out of the use of dental products manufactured by third parties and distributed by theCompany. The Company believes that if any such product liability cases are determined in favor of the claimants, the manufacturers of such productswould have primary responsibility for any damages because Patterson is a distributor of finished goods manufactured by third parties. In the event amanufacturer of a defective product is unable to pay a judgment for which the Company may be jointly liable, the Company could have liability for theentire judgment.
Among the product liability cases in which the Company is currently a defendant, seven involve claims by healthcare workers alleging damagesfrom allergic reactions from exposure to latex gloves distributed by the Company. In each of these cases the Company acted as a distributor of“Patterson” private label gloves manufactured by third parties, as well as gloves bearing the brand names of other suppliers. In each of these cases the

Company intends to seek indemnification from or assert claims against the glove manufacturers pending completion of product identification.
Since May 1985 the Company has maintained product liability insurance coverage for any potential liability for claims arising out of products soldby the Company. The Company believes that any liabilities which might result from pending cases and claims relating to events occurring after May 1985would be adequately covered by such insurance and that any unfavorable results in such cases would not have a material adverse effect on theCompany’s business or financial condition. With respect to claims relating to events occurring prior to May 1985, the agreement providing for theacquisition of Patterson from The Beatrice Companies, Inc. provides that Beatrice and its successors are obligated to indemnify the Company for lossesexceeding a litigation reserve established at the time of the acquisition plus $200,000. The successor to Beatrice has not been asked to indemnify theCompany regarding any pending cases and has not contested its obligation to indemnify the Company. Although the Company has insurance coveragefor product liability claims relating to events occurring after May 1985 and may be entitled to indemnification from third parties under certaincircumstances, any additional litigation could have a material adverse effect on the Company’s business or financial condition in the future. 4. SUBMISSION OF MATTERS TO A VOTE OF SECURITY HOLDERS
There were no matters submitted to a vote of the Company’s shareholders during the three-month period ended April 26, 2003.
13
PART II 5. MARKET FOR REGISTRANT’S COMMON STOCK AND RELATED STOCKHOLDER MATTERS
The Company’s common stock trades on the Nasdaq Stock Market ® under the symbol “PDCO”.
The following table sets forth the range of high and low sale prices for the Company’s common stock for each full quarterly period within the twomost recent fiscal years. Such quotations reflect inter-dealer prices, without retail mark-up, mark-down or commission, and may not necessarily representactual transactions.
High
Low
Fiscal 2003 First Quarter $53.47 $41.60Second Quarter $55.11 $44.25Third Quarter $54.60 $38.10Fourth Quarter $47.24 $35.41
High
Low
Fiscal 2002 First Quarter $37.24 $30.00Second Quarter $38.53 $31.00Third Quarter $42.05 $34.12Fourth Quarter $47.48 $38.86
On July 14, 2003, the number of holders of record of common stock was 4,244. The transfer agent for the Company’s common stock is Wells
Fargo Bank Minnesota, N.A., 161 North Concord Exchange, South St. Paul, Minnesota, 55075-0738, telephone: (651) 450-4064.
The Company has not paid any cash dividends on its common stock since its initial public offering in 1992 and expects that for the foreseeablefuture it will follow a policy of retaining earnings in order to finance the continued development of its business. Payment of dividends is within thediscretion of the Company’s Board of Directors and will depend upon the earnings, capital requirements and operating and financial condition of theCompany, among other factors.
14
6. SELECTED CONSOLIDATED FINANCIAL DATA(In thousands, except per share amounts)
1. Amounts are adjusted for a two-for-one stock split on June 13, 2000 and three-for-two splits on January 12, 1998 and June 17, 1994.2. Reflects the adoption of FASB Statement No. 142 “Goodwill and Other Intangible Assets”. See Note 3, “Goodwill and Other Intangible Assets”, to the consolidated Financial Statements. Had this
standard been adopted at the beginning of fiscal 1994, income in fiscal years 1994 through 2000 would have been impacted by no more than $0.02 per diluted share. 7. MANAGEMENT’S DISCUSSION AND ANALYSIS OF FINANCIAL CONDITION AND RESULTS OF OPERATIONS Introduction
The Company’s fiscal 2003 financial information is summarized in this Management’s Discussion and Analysis, the Consolidated FinancialStatements, and the related Notes. The following background is essential to fully understanding the Company’s financial information.
Historically the Company’s effective strategy for growth focused on internal growth and the acquisition of smaller dental distributors and businessesoffering dental related products and services. In fiscal 2002, the Company expanded its strategy to take advantage of a parallel growth opportunity in theveterinary supply market by acquiring the assets of J. A. Webster, Inc.
The historical operating performance of the veterinary supply business is somewhat different than the dental business. Gross margins in theveterinary business are typically in the mid 20’s compared to the mid 30’s for the dental business. The operating expense rate is also lower in theveterinary business than in the dental business. These disparities have had a notable impact on the Company’s operating ratios as is highlighted in thediscussion that follows.
15
Results of Operations
The following table summarizes the results of operations over the past three fiscal years as a percent of sales:
2003
2002
2001
Net sales 100.0% 100.0% 100.0%Cost of sales 65.3% 65.1% 64.6%

Gross margin 34.7% 34.9% 35.4%Operating expenses 23.9% 24.5% 25.4% Operating income 10.8% 10.4% 10.0%Other income 0.4% 0.3% 0.6% Income before taxes and cumulative effect of accounting change 11.2% 10.7% 10.6%Income taxes 4.2% 4.0% 4.0% Income before cumulative effect of accounting change 7.0% 6.7% 6.6%
Fiscal 2003 Compared to Fiscal 2002
Net Sales. Net sales for the year ended April 26, 2003 totaled $1,657.0 million, a 17.1% increase from $1,415.5 million reported last year.
Sales in the dental supply market increased 14.9%. Sales of dental equipment continued to be a principal sales growth driver for the dental supplysegment, increasing 22.2%. Equipment was paced by robust demand for such new-technology products as the CEREC® 3 dental restorative system anddigital radiography. Consumable supplies grew 11.1% due primarily to contributions from an expanded sales force, an increase in the number ofcustomers and acquisitions. Sales of other services and products, consisting primarily of parts, technical service, software support and insurance e-claims, grew 15.6%. During the year, the Company successfully integrated two acquisitions into its dental operation: Thompson Dental Company(“Thompson”) acquired in early April 2002 and Distribution Quebec Dentaire, Inc. acquired in July 2002. The acquisitions accounted for approximatelyfive percentage points of annual sales growth.
Canadian dental sales increased 21.4% in fiscal 2003, 19.0% excluding currency gains. The acquisition of DQD contributed about 6% to the overallsales increase in Canada.
Sales of the Webster Veterinary Supply unit increased 37.8% for the year to $185.8 million. Webster was acquired in the first quarter of fiscal 2002.Assuming this unit had been acquired at the beginning of fiscal 2002, Webster’s sales increased 10% in fiscal 2003.
Gross Margins. Gross margins increased 16.3% in fiscal 2003 due solely to higher sales volumes. The consolidated gross margin rate declined 20basis points due to the addition of the veterinary supply business in July 2001. That business has historically experienced margins in the mid 20’s. Dentalsupply gross margins were the same as last year.
Operating Expenses. Results for fiscal 2003 include the impact of the adoption of Statement of Financial Accounting Standards (SFAS) No. 142,“Goodwill and Other Intangible Assets” resulting in the cessation of goodwill amortization. Additional information regarding the adoption of SFAS No. 142is included in Note 3 to the Consolidated Financial Statements. That information is incorporated by reference into this section of this report. Afteradjusting fiscal 2002 to exclude goodwill amortization, fiscal 2003 operating expenses increased 15.2% but declined 40 basis points as a percent of sales.
Fiscal 2003 operating expenses as a percent of sales reflects twelve months of operating results for Webster Veterinary Supply compared to tenmonths in fiscal 2002. Since the operating expense rate in the veterinary business is lower than in the dental business, this disparity provides a favorableyear-over-year impact of approximately 40 basis points after the amortization of certain identifiable intangible assets.
Excluding the impact of the adoption of SFAS No. 142, the 2003 operating expense rate for the dental business was unchanged from 2002. Infiscal 2003, the Company made substantial investments in people and training to support its single-source technology solution aimed at automating andnetworking the dental office. While the Company realized sales and modest profits from
16
this program in 2003, it had a dampening effect on the Company’s operating expense rate. The implementation of new systems for managing andstrengthening the Company’s technical service operation also affected the expense ratio in fiscal 2003. In addition, the current year expense rate reflectsthe impact of the acquisition of Thompson, which contributed to operating earnings but to a lesser degree than the Company’s historical dental business.By the end of fiscal 2003 the single-source technology solution and the acquisition were contributing to earnings at a rate similar to the historic dentalbusiness. While the Company expects the technical service initiative to improve operating efficiencies and contribute sales growth over time, theCompany expects this initiative to be neutral to earnings in fiscal 2004 as the Company continues to invest in training and communication costs to roll-outthe program nationwide.
Operating Income. Operating income increased 21.6% and improved 40 basis points as a percent of sales. Higher sales volumes accounted formost of the increase. The improvement in operating income as a percent of sales is primarily the result of the veterinary supply business, which saw afavorable improvement in its operating income due to operating leverage. The discontinuation of goodwill amortization in fiscal 2003 due to adoption ofSFAS No. 142 also helped improve operating income.
Other Income. Other income, net of expenses, was $7.5 million for fiscal 2003 compared to $5.0 million for fiscal 2002. The benefit of higherfinancing income on equipment contracts was mitigated by the elimination of the amortization of deferred credits associated with the adoption of SFASNo. 142.
Income Taxes. The effective income tax rate in fiscal 2003 was 37.6%, an increase from the 37.4% rate used in fiscal 2002 reflecting the impact ofthe elimination of the amortization of the deferred credits discussed above which were non-taxable.
Earnings Per Share, Before Cumulative Effect of Accounting Change. Earnings per share increased to $1.70 versus $1.40 a year ago. Hadamortization of goodwill and the deferred credits ceased in fiscal 2002, prior year net earnings would have increased by $1.6 million or approximately$0.02 per diluted share. Fiscal 2002 Compared to Fiscal 2001
Net Sales. Net sales for the year totaled $1,415.5 million a 22.4% increase from $1,156.5 million reported in fiscal 2001. The Company’s salesgrowth reflected solid contributions from all product categories combined with $141.5 million of incremental sales from acquisitions.
Dental supply sales increased 10.7% for the fiscal year led by a 14.9% increase in equipment and software sales. The Company experienceddouble digit growth rates across most equipment product lines. Software sales were particularly robust growing 32% illustrating the success of a newmarketing strategy launched during fiscal 2002. Sales for the year were also helped by an 8.8% increase in consumable dental supplies. Consumabledental supply sales were paced by a 10.0% increase in the U. S. dental market reflecting the continued expansion of the Company’s sales force andcustomer base. Sales of other dental products and services, consisting of parts, technical service, software support and insurance e-claims, grew 10.7%during fiscal 2002. Dental acquisitions, principally Thompson, added about $6.7 million to net sales and accounted for .6 percentage points of the 10.7%sales growth. Thompson was acquired for approximately $21 million in cash and stock and is expected to contribute sales of more than $50 million on an

annualized basis, making it Patterson’s second largest dental acquisition. Thompson is expected to become accretive to earnings in the latter half fiscal2003. In fiscal 2001, dental acquisitions contributed approximately 2 percentage points to the overall sales growth rate.
Canadian sales were up almost 10% for the year in local currencies due primarily to strong equipment sales. Currency exchange rates negativelyimpacted results reducing reported sales by approximately $3.5 million.
On a proforma basis, veterinary net sales increased approximately 10% year-over-year. However, sales on a comparable basis increasedapproximately 9%. This gives effect to the conversion of a product group from distribution status to an agency arrangement at the beginning of calendaryear 2001. Comparable basis sales performance also excludes the introduction of ProHeart-6®, a new heart worm medication from Fort Dodge AnimalHealth that was introduced during fiscal 2002. Including ProHeart-6®, comparable basis sales increased 18%.
Gross Margin. The gross margin for the historical dental business was better than last year by 60 basis points benefiting from, among other things,improved point-of-sale margins in sundries, favorable changes in product mix, and improvement in the Colwell gross margins as this product grouprecognized results from its realignment efforts. Veterinary gross margins of 24.9% were consistent with management’s expectations. Gross margins onthe veterinary supply business are lower than those on the dental operations as a
17
result of pharmaceutical products, which carry lower margins. Reflecting this combination of factors, the Company’s consolidated gross margin for fiscal2002 declined to 34.9% from 35.4% in fiscal 2001.
Operating Expenses. Operating expenses for the year increased 18% to $347.0 million up from $294.0 million reported a year earlier. As a percentof sales, operating expenses declined 90 basis points year-over-year. The dental operating expense rate improved 30 basis points despite higherinsurance costs. The dental supply business achieved this reduction through a variety of cost containment initiatives and improved operating leverage.Fiscal year 2002 operating expenses as a percent of sales also reflects Webster Veterinary Supply, providing a favorable year-over-year impact ofapproximately 60 basis points after the amortization of certain intangible assets. The veterinary operation has a lower operating expense rate than thehistorical dental operation due primarily to not having the infrastructure of a technical service business.
Operating Income. Operating income increased 27.9% to $147.2 million up from $115.1 million a year ago. As a percent of sales, operating incomeincreased 40 basis points to 10.4%. Dental supply operating income increased 20.4% and as a percent of sales improved 90 basis points. Veterinarysupply operating income was $8.5 million.
Other Income. Other income, net of expenses, was $5.0 million for fiscal 2002, a $2.0 million or 28.8% decline compared to fiscal 2001. Thedecrease resulted from lower yields on investment balances and reduced average cash balances due to expenditures for acquisitions.
Income Taxes. The effective income tax rate at 37.4% remained the same as last year.
Net Income. Net income increased to $95.3 million, or 24.6% due to the factors discussed above.
Earnings Per Share. Diluted earnings per share increased to $1.40 versus $1.13 reported a year ago, a 27 cent or 23.9% increase over a year ago.The acquisition of assets of J. A. Webster, Inc. added approximately $0.04 per diluted share to the Company’s consolidated net earnings in fiscal 2002. Liquidity and Capital Resources
Patterson’s operating cash flow, which generally parallels net earnings, has been the Company’s principal source of liquidity in fiscal 2003, 2002and 2001. Cash generated from operating activities was invested in working capital, capital expenditures and acquisitions.
Operating activities generated cash of $86.7 million in fiscal 2003 compared with $89.4 million in fiscal 2002 and $79.1 million in fiscal 2001. Cashflow from operations was diminished in both fiscal 2003 and 2002 by an increase in the level of equipment finance contracts the Company carried. At theend of fiscal 2002, the Company was unable to sell a portion of its equipment finance contracts due to capacity constraints with its then current bankarrangement. This was the result of stronger than anticipated fourth quarter equipment sales. The capacity constraints were eliminated in fiscal 2003 by anew financing arrangement with a commercial paper conduit. However, the Company is now required to receive one payment from the customer before acontract is eligible for sale to the commercial paper conduit. This requirement in conjunction with increased equipment sales resulted in an increase inthe level of accounts receivable in fiscal 2003. The level of investment in working capital made in fiscal 2003 to support the financing portion of thebusiness is not anticipated to repeat in fiscal 2004.
Capital expenditures net of dispositions were $11.4, $11.1, and $10.0 million in fiscal years 2003, 2002 and 2001, respectively. The Companyexpects to invest approximately $18 to $20 million in capital in fiscal 2004 to enhance information systems and upgrade facilities. The higher level ofprojected spending for fiscal 2004 includes expenditures for a new distribution center to replace an existing facility.
The Company leases various facilities under noncancelable operating lease arrangements. Future minimum lease payments under these leasesare as follows: $8.9 in fiscal 2004; $7.1 in fiscal 2005; $5.2 in fiscal 2006; $3.5 in fiscal 2007; $2.5 in fiscal 2008 and $2.9 million in years thereafter.
In fiscal 2003, the Company used $6.5 million of cash for acquisitions, namely DQD. Acquisition costs incurred during fiscal 2003 also reflectcontingent earn-out payments from acquisitions made in prior years. In comparison, the Company invested cash of $109.3 million
18
in fiscal 2002 to acquire the assets of J. A. Webster Inc., Thompson, and Modern Practice Technologies, a company that provides custom computingsolutions to the dental industry. The Company spent $3.8 million in fiscal 2001 to acquire one dental distribution business and eCheck-Up.com, a web-based value-added service company.
The Company repurchased 321,299, 247,000 and 125,000 shares of its common stock for $13.1, $8.3 and $3.6 million during fiscal 2003, 2002and 2001, respectively. The shares repurchased minimized the dilutive effect of shares issued in conjunction with the Company’s employee benefit plansand in acquisitions.
The Company expects funds generated by operations and existing cash and cash equivalents to continue to be its most significant sources ofliquidity. The Company currently believes funds generated from the expected results of operations and available cash and cash equivalents of $217.4million will be sufficient to meet the Company’s working capital needs and finance anticipated expansion plans and strategic initiatives for the next fiscalyear. However, to increase the Company’s liquidity and flexibility, the Company entered into a $50 million credit agreement. There were no outstandingborrowings under the agreement at April 26, 2003. Should additional investment opportunities arise, management believes that the strength of theCompany’s earnings, cash flows and balance sheet will permit the Company to obtain additional debt or equity capital, if necessary.
The Company sells a significant portion of its installment sale contracts to a commercial paper funded conduit managed by a third party bank, andas a result commercial paper is indirectly an important source of liquidity for the Company. The Company is allowed to participate in the conduit due to itsfinancial strength. Cash flow could be impaired if the Company’s financial strength diminished to a level that precluded the Company from taking part in
this facility or other similar facilities. The Company’s financing business is described in further detail in Note 6 of the Notes to Consolidated FinancialStatements. That description is incorporated by reference into this section. Outlook
Over the last ten years, the Company has been able to average double-digit revenue and earnings growth through its strategy of emphasizing itsvalue-added, full-service capabilities, using technology to enhance customer service, continuing to improve operating efficiencies, and growing throughinternal expansion and acquisitions. The Company’s growth strategy will continue to focus on these key elements. Maintaining financial flexibility is also akey component of the Company’s future growth. With strong operating cash flow and available credit facility, the Company is confident that it will be ableto financially support its future growth. The strategic initiatives that the Company implemented during fiscal 2003, which have significantly strengthenedthe Company’s operational platform, are also a key ingredient to continuing future growth. Given these factors, the Company considers itself wellpositioned to continue capitalizing upon the growth opportunities in both the dental supply and companion-pet veterinary supply markets. The Companycontinues to believe that the sustainable, long-term growth rate of its North American dental operation is four percentage points in excess of the market’s7% to 9% estimated rate of growth. The Company also believes its Webster unit can continue to grow faster than the estimated 6% to 7% growth rate ofthe U.S. companion-pet veterinary supply market. Asset Management
The following table summarizes the Company’s days sales outstanding (DSO) and inventory turnover over the past three fiscal years:
(1) Reflects an increase in the level of equipment finance contracts the Company carried. At the end of fiscal 2002, the Company was unable to sell aportion of its equipment finance contracts due to capacity constraints with its then current bank arrangement. This was the result of stronger thananticipated fourth quarter equipment sales. The capacity restraints were eliminated in fiscal 2003 by a new financing arrangement. However, underthe new arrangement the Company is required to receive one payment from the customer before a contract is eligible for sale and as result the levelof contracts carried by the Company at the end of 2003 remained higher than usual.
(2) Reflects the non-annualized impact of the Webster and Thompson acquisitions during fiscal 2002.
19
(3) The inventory values used in this calculation are the LIFO inventory values for U.S. dental and veterinary inventories and the FIFO inventory valuefor Canadian and Colwell inventories.
Foreign Operations
Foreign sales are derived primarily from operations in Canada. Fluctuations in currency exchange rates have not significantly impacted earnings.However, net sales in fiscal 2003 were enhanced by changes in the exchange rate while sales in fiscal 2002 and 2001 were adversely affected by thestrengthening of the U.S. dollar. Without foreign currency effects, net sales would have been $2.3 million lower in fiscal 2003 but would have been higherby $3.5 and $2.5 million in fiscal 2002 and 2001, respectively. The Company expects the favorable US/Canadian exchange rate to continue to impact itsrate of year-over-year sales growth during the first half of fiscal 2004. Changes in currency exchange rates is a risk accompanying foreign operations, butthis risk is not considered material with respect to the net operations of the Company’s business. Critical Accounting Policies
The Company has adopted various accounting policies to prepare its consolidated financial statements in accordance with accounting principlesgenerally accepted in the United States (U.S.). Management believes that the Company’s policies are conservative and its philosophy is to adoptaccounting policies, which minimize the risk of adverse events having a material impact on recorded assets and liabilities. However, the preparation offinancial statements requires the use of estimates and judgements regarding the realization of assets and the settlements of liabilities based on theinformation available to management at the time. Changes subsequent to the preparation of the financial statements in economic, technological andcompetitive conditions may materially impact the recorded values of the Company’s assets and liabilities. Therefore, the users of the financial statementsshould read all the notes to the consolidated financial statements and be aware that conditions currently unknown to management will develop in thefuture. This may require a material adjustment to a recorded asset or liability to consistently apply the Company’s significant accounting principles andpolicies that are discussed in Note 1 to the Consolidated Financial Statements. The financial performance and condition of the Company may also bematerially impacted by transactions and events that the Company has not previously experienced and for which the Company has not been required toestablish an accounting policy or adopt a generally accepted accounting principle. Because we are a distributor, we face inventory risk due toobsolescence and customer preference. We assess our inventories continuously and value them at the lower of cost or market, and in addition, werelieve inventory cost using a last-in, first-out convention which results in an inventory carrying value that is well below the replacement cost of theinventory. Our revenue recognition processes involve establishing estimates for bad debts, returns, damaged goods and other allowances. Theseestimates are based on historical experience and the facts known at the date of preparing the financial statements but future events could cause actualresults to vary from our estimates. We have acquired other businesses in the past and this has resulted in goodwill being recorded on our financialstatements. While this asset is no longer amortized systematically over time due to changes in generally accepted accounting principles in the U.S., thisasset is subject to a periodic assessment of its continuing value to the Company. Currently, we believe the recorded value is well below the realizablevalue of this asset. New Accounting Pronouncements
A discussion of recently issued accounting pronouncements is described in Note 1 of the Notes to Consolidated Financial Statements. Thatdiscussion is incorporated by reference into this section. Factors That May Affect Future Operating Results
Certain information of a non-historical nature contained in Items 1, 2, 3 and 7 of this Form 10-K include forward-looking statements. Words such as“believes,” “expects,” “plans,” “estimates,” “intends” and variations of such words are intended to identify such forward-looking statements. Thestatements are not guaranties of future performance and are subject to certain risks, uncertainties or assumptions that are difficult to predict; therefore,the Company cautions shareholders and prospective investors that the following important factors, among others, could cause the Company’s actualoperating results to differ materially from those expressed in any forward-looking statements. The statements under this caption are intended to serve ascautionary statements within the meaning of the Private Securities Litigation Reform Act of 1995. The following information is not intended to limit in anyway the characterization of other statements or information under other captions as cautionary statements for such purpose. The order in which suchfactors appear below should not be construed to indicate their relative importance or priority.
20
• The Company’s ability to meet increased competition from national, regional and local full-service distributors and mail-order distributors of
dental and veterinary products, while maintaining current or improved profit margins. • The ability of the Company to retain its base of customers and to increase its market share.

• The ability of the Company to maintain satisfactory relationships with qualified and motivated sales personnel.
• The continued ability of the Company to maintain satisfactory relationships with key vendors and the ability of the Company to createrelationships with additional manufacturers of quality, innovative products.
• Changes in the economics of dentistry affecting dental practice growth and the demand for dental products, including the ability andwillingness of dentists to invest in high-technology diagnostic and therapeutic products.
• Reduced growth in expenditures for dental services by private dental insurance plans.
• The accuracy of the Company’s assumptions concerning future per capita expenditures for dental services, including assumptions as topopulation growth and the demand for preventive and specialty dental services such as periodontic, endodontic and orthodontic procedures.
• The rate of growth in demand for infection control products currently used for prevention of the spread of communicable diseases such asAIDS, hepatitis and herpes.
• Changes in the economics of the veterinary supply market, including reduced growth in per capita expenditures for veterinary services andreduced growth in the number of households owning pets.
7A. QUANTITATIVE AND QUALITATIVE DISCLOSURES ABOUT MARKET RISK Market Risk
The Company is subject to market risk associated with changes in interest rates and foreign currency exchange rates.
The Company’s earnings are affected by changes in short-term interest rates as a result of its investment of its cash balances in short-termcommercial paper and government securities and due to its practice of selling its equipment finance contracts. As of the end of fiscal 2003 and 2002, thefair market value of the investments approximated the carrying value. If market interest rates averaged 10 percent more or less in fiscal 2003 and 2002,the Company’s earnings would have increased or decreased by less than $0.01 per diluted share in each of the years.
The Company has operations in Canada, which it considers to be both long-term and strategic. As a result, the Company does not hedge the long-term translation exposure to its balance sheet. The Company experienced a positive translation adjustment of $2.6 million in fiscal 2003 and a negativetranslation adjustment of $0.8 million in fiscal 2002, which were reflected in the balance sheet as an adjustment to stockholders’ equity. The cumulativetranslation adjustment at the end of fiscal 2003 showed a negative translation adjustment of $0.5 million.
The Company purchases a portion of the products it sells from suppliers located in countries other than where the products are sold. The risk oftransaction gains and losses from changes in foreign exchange rates is not material as a majority of these purchases are denominated in the U.S. dollar.
21
8. FINANCIAL STATEMENTS AND SUPPLEMENTARY DATA REPORT OF INDEPENDENT AUDITORS The Board of Directors and StockholdersPatterson Dental Company
We have audited the accompanying consolidated balance sheets of Patterson Dental Company as of April 26, 2003 and April 27, 2002, and therelated consolidated statements of income, changes in stockholders’ equity and cash flows for each of the three years in the period ended April 26, 2003.These financial statements are the responsibility of the Company’s management. Our responsibility is to express an opinion on these financial statementsbased on our audits.
We conducted our audits in accordance with auditing standards generally accepted in the United States. Those standards require that we plan andperform the audit to obtain reasonable assurance about whether the financial statements are free of material misstatement. An audit includes examining,on a test basis, evidence supporting the amounts and disclosures in the financial statements. An audit also includes assessing the accounting principlesused and significant estimates made by management, as well as evaluating the overall financial statement presentation. We believe that our auditsprovide a reasonable basis for our opinion.
In our opinion, the financial statements referred to above present fairly, in all material respects, the consolidated financial position of PattersonDental Company at April 26, 2003 and April 27, 2002, and the consolidated results of its operations and its cash flows for each of the three years in theperiod ended April 26, 2003 in conformity with accounting principles generally accepted in the United States.
As discussed in Note 3 to the consolidated financial statements, the Company adopted Statement of Financial Accounting Standards No. 142,Goodwill and Other Intangible Assets , in fiscal 2003.
/s/ Ernst & Young LLP Minneapolis, MinnesotaMay 22, 2003
22
PATTERSON DENTAL COMPANY
CONSOLIDATED BALANCE SHEETS(Dollars in thousands, except per share amounts)
April 26,
April 27,
ASSETS Current assets:
Cash and cash equivalents $195,182 $125,986 Short-term investments 22,266 25,251 Receivables, net of allowance for doubtful accounts of $4,817 and $4,574 at April 26, 2003 and April 27, 2002,
respectively 248,585 222,435 Inventory 125,340 142,457 Prepaid expenses and other current assets 14,744 13,291
Total current assets 606,117 529,420

Property and equipment, net 57,254 57,140 Goodwill 125,400 115,079 Other identifiable intangibles, net 9,670 11,149 Other 25,537 5,588
Total assets $823,978 $718,376 LIABILITIES AND STOCKHOLDERS’ EQUITY Current liabilities:
Accounts payable $111,543 $133,637 Accrued payroll expense 33,693 28,311 Income taxes payable 5,153 7,815 Other accrued liabilities 33,635 28,244
Total current liabilities 184,024 198,007
Non-current liabilities 6,268 2,637
Total liabilities 190,292 200,644 Deferred credits — 3,372 Stockholders’ equity:
Preferred Stock Series A, $.01 par value, $11.20 per share liquidation value: Authorized shares—10,000,000 — —
Preferred Stock, $.01 par value: Authorized shares—20,000,000 — —
Common Stock, $.01 par value: Authorized shares—600,000,000 Issued and outstanding shares – 68,084,520 and 68,124,646 at April 26, 2003, and April 27, 2002,
respectively 681 681 Additional paid-in capital 86,703 90,777 Accumulated other comprehensive loss (519) (3,084)Retained earnings 569,353 449,661 Notes receivable from ESOP (22,532) (23,675)
Total stockholders’ equity 633,686 514,360
Total liabilities and stockholders’ equity $823,978 $718,376
See accompanying notes
23
PATTERSON DENTAL COMPANY
CONSOLIDATED STATEMENTS OF INCOME(In thousands, except per share amounts)
Fiscal Year Ended
April 26,
April 27,
April 28,
Net sales $1,656,956 $1,415,515 $1,156,455 Cost of sales 1,082,370 921,335 747,301 Gross profit 574,586 494,180 409,154 Operating expenses 395,638 347,000 294,039 Operating income 178,948 147,180 115,115 Other income and expense:
Amortization of deferred credits — 885 885 Finance income, net 7,257 4,387 6,534 Interest expense (66) (109) (123)Gain (loss) on currency exchange 263 (120) (215)
Income before income taxes and cumulative effect of accounting change 186,402 152,223 122,196 Income taxes 70,082 56,933 45,721 Income before cumulative effect of accounting change 116,320 95,290 76,475 Cumulative effect of accounting change 3,372 — — Net income $ 119,692 $ 95,290 $ 76,475 Before cumulative effect of accounting change:
Earnings per share—basic $ 1.71 $ 1.41 $ 1.13
Earnings per share—diluted $ 1.70 $ 1.40 $ 1.13 After cumulative effect of accounting change:
Earnings per share—basic $ 1.76 $ 1.41 $ 1.13
Earnings per share—diluted $ 1.75 $ 1.40 $ 1.13

Weighted average shares and potentially dilutive shares outstanding:
Basic 67,831 67,700 67,435 Diluted 68,447 68,201 67,763
See accompanying notes
24
PATTERSON DENTAL COMPANY
CONSOLIDATED STATEMENT OFCHANGES IN STOCKHOLDERS’ EQUITY
(Dollars in thousands)
Common Stock
Number
Amount
Balance at April 29, 2000 67,363,446 $ 674 $ 67,022 $(2,060) $ 277,896 $(13,062) $330,470 Change in translation adjustment — — — (256) — — (256)Net income — — — — 76,475 — 76,475 Comprehensive income 76,219 Common stock issued, net 251,020 1 4,610 — — — 4,611 Payment on ESOP note — — — — — 798 798 Share repurchases (125,000) — (3,583) — — — (3,583) Balance at April 28, 2001 67,489,466 675 68,049 (2,316) 354,371 (12,264) 408,515 Change in translation adjustment — — — (768) — — (768)Net income — — — — 95,290 — 95,290 Comprehensive income 94,522 Common stock issued,
acquisitions 655,513 7 25,589 — — — 25,596 Common stock issued, net 226,667 2 5,444 — — — 5,446 Payment on ESOP note — — — — — 1,201 1,201 Merger of acquired ESOP — — — — — (12,612) (12,612)Share repurchases (247,000) (3) (8,305) — — — (8,308) Balance at April 27, 2002 68,124,646 681 90,777 (3,084) 449,661 (23,675) 514,360
Change in translation adjustment — — — 2,565 — — 2,565 Net income — — — — 119,692 — 119,692 Comprehensive income 122,257 Common stock issued, net 281,173 3 9,054 — — — 9,057 Payment on ESOP note — — — — — 1,143 1,143 Share repurchases (321,299) (3) (13,128) — — — (13,131) Balance at April 26, 2003 68,084,520 $ 681 $ 86,703 $ (519) $ 569,353 $(22,532) $633,686
See accompanying notes
25
PATTERSON DENTAL COMPANY
CONSOLIDATED STATEMENTS OF CASH FLOWS(Dollars in thousands)
Fiscal Year Ended
April 26,
April 27,
April 28,
Operating activities:
Income before cumulative effect of accounting change $116,320 $ 95,290 $ 76,475 Adjustments to reconcile income to net cash provided by operating activities:
Depreciation 10,297 8,932 7,771 Amortization of deferred credits — (885) (885)Amortization of goodwill and intangibles 2,479 5,351 3,306 Bad debt expense 1,382 1,592 821 Deferred taxes 1,314 (2,809) (1,038)Change in assets and liabilities net of acquired:
Increase in receivables (43,822) (43,488) (13,889)Decrease (increase) in inventory 19,654 (9,310) (10,981)(Decrease) increase in accounts payable (23,244) 19,235 9,307 Increase in accrued liabilities 9,383 14,001 7,295 Other changes from operating activities, net (7,020) 1,500 934
Net cash provided by operating activities 86,743 89,409 79,116

Investing activities: Additions to property and equipment, net (11,356) (11,138) (10,014)Sale (purchase) of investments 2,985 (767) (19,764)Acquisitions (6,493) (109,253) (3,797)
Net cash used in investing activities (14,864) (121,158) (33,575)
Financing activities: Payments of long-term debt (399) (729) (683)Cash payments received on notes receivable from ESOP 1,143 1,201 798 Repurchases of common stock (13,131) (8,308) (3,583)Common stock issued, net 9,057 5,446 4,611
Net cash (used in) provided by financing activities (3,330) (2,390) 1,143 Effect of exchange rate changes on cash 647 101 (113)
Net increase (decrease) in cash and cash equivalents 69,196 (34,038) 46,571 Cash and cash equivalents at beginning of period 125,986 160,024 113,453
Cash and cash equivalents at end of period $195,182 $ 125,986 $160,024
Supplemental disclosures: Income taxes paid $ 68,495 $ 55,325 $ 42,162 Interest paid 50 112 127 Common stock issued for acquisitions — 25,596 —
Less ESOP loan — (12,612) —
Net equity impact from acquisitions — 12,984 —
See accompanying notes
26
PATTERSON DENTAL COMPANY
NOTES TO CONSOLIDATED FINANCIAL STATEMENTS
APRIL 26, 2003(Dollars in thousands, except per share amounts)
1. Summary of Significant Accounting Policies Basis of Presentation
The consolidated financial statements include the accounts of the Company’s wholly owned subsidiaries, Patterson Dental Supply, Inc., WebsterVeterinary Supply, Inc., Webster Management LP, Direct Dental Supply Co, Patterson Technology Center, Inc., Colwell Systems, Inc., Patterson DentalCanada, Inc., and PDC Funding Company, LLC. The assets of PDC Funding Company, LLC, would be available first and foremost to satisfy the claims ofits creditors. Significant inter-company transactions and balances have been eliminated in consolidation. There are no known creditors of PDC FundingCompany, LLC. Certain reclassifications of previously reported amounts have been made to conform to the current year presentation. Description of Business
Patterson Dental Company (“Patterson” or the “Company”) is a value-added distributor serving the North American dental supply and companion-pet (dogs, cats and other common household pets) veterinary supply markets. The Company has two reportable segments, dental supply and veterinarysupply. As the Company’s largest segment, dental supply provides a virtually complete range of consumable dental products, clinical and laboratoryequipment, and value-added services to dentists, dental laboratories, institutions and other healthcare providers throughout North America. TheCompany’s veterinary supply segment distributes consumable supplies, equipment, diagnostic products, biologicals (vaccines) and pharmaceuticals tocompanion pet veterinary clinics principally in the Eastern, Mid-Atlantic and Southeastern regions of the United States. Fiscal Year End
The Company utilizes a fifty-two, fifty-three week fiscal year ending on the last Saturday in April. Fiscal years 2003, 2002 and 2001 each consistedof fifty-two weeks. Use of Estimates in the Preparation of Financial Statements
The preparation of financial statements in conformity with generally accepted accounting principles requires management to make estimates andassumptions that affect the reported amounts of assets and liabilities and disclosure of contingent assets and liabilities at the date of the financialstatements and the reported amounts of revenues and expenses during the reporting period. Actual results could differ from those estimates. Cash and Cash Equivalents
Cash equivalents consist primarily of investments in money market funds, highly-rated commercial paper and government securities. Thematurities of these securities at the time of purchase is 90 days or less. Short-term investments consist of highly-rated commercial paper, corporate notesand bonds and government securities with maturities longer than 90 days at the date of purchase. All cash equivalents and short-term investments areclassified as available for sale and carried at market value, which approximates cost. Inventory
Inventory consists of merchandise held for sale and is stated at the lower of cost or market. Cost is determined using the last-in, first-out (LIFO)method for domestic dental and veterinary inventories and the first-in, first-out (FIFO) method for all other inventories. Inventories valued at LIFOrepresent 88% and 86% of total inventories at April 26, 2003, and April 27, 2002, respectively.
27
The accumulated LIFO provision was $22,260 at April 26, 2003, and $19,114 April 27, 2002. The Company believes that inventory replacementcost exceeds the inventory balance by an amount approximating the LIFO reserve.

Property and Equipment
Property and equipment are stated at cost. The Company provides depreciation on the straight-line method over estimated useful lives of up to 40years for buildings or the expected remaining life of purchased buildings, 3 to 20 years for leasehold improvements or the term of the lease, if less, 5years for data processing equipment, and 5 to 10 years for office furniture and equipment. Goodwill and Other Intangibles
In June 2001, the Financial Accounting Standards Board (FASB) approved Statement of Financial Accounting Standards (SFAS) No. 142,“Goodwill and Other Intangible Assets”. SFAS No. 142 requires companies to cease amortizing goodwill and test at least annually for impairment.Amortization of goodwill ceased on April 28, 2002, at which time it was tested for impairment. Each of the Company’s reporting units was tested forimpairment by comparing the fair value of the respective reporting unit with its carrying value. Fair value was determined primarily based on valuationstudies performed by the Company. The Company performed the second annual impairment test during the fourth quarter of fiscal 2003 using the samemethodology described above. As a result of impairment tests performed, the Company recorded no impairment loss. Revenue Recognition
Revenues recognized include product sales, billings for freight and delivery charges, and fees earned for services provided. Consumable andprinted product sales and billings for freight and delivery charges are recorded as products are shipped. Equipment and software product revenues arealso recognized upon shipment. Revenue for these products are recorded at shipment since at that time there is persuasive evidence that anarrangement exists, the price is fixed and final, and there is reasonable assurance of collection of the sales proceeds. Estimates for returns, damagedgoods, shipping terms, rebates and other revenue allowances are made at the time of sale based on the historical experience for such items. Revenuederived from post contract customer support for software is deferred and recognized ratably over the period in which the support is provided. Otherservice revenues are recorded on the date services are completed. Freight and delivery charges
Freight and delivery charges are included in cost of sales. Advertising
The Company expenses all advertising and promotional costs as incurred except for certain catalog costs which are capitalized and amortized overfuture periods based upon estimates of revenue to be generated. Total advertising and promotional expenses were $17,299, $13,748 and $11,987 forfiscal years 2003, 2002 and 2001, respectively. Deferred Credits
Negative goodwill (deferred credits) arose from the purchase of the Patterson business in fiscal 1986 and D.L. Saslow Co., Inc. in fiscal 1988. Withthe adoption of the SFAS No. 142, “Goodwill and Other Intangible Assets”, the Company recognized as the cumulative effect of a change in accountingprinciple the remaining balance of its deferred credits. The deferred credits amounted to approximately $3.4 million at the time of the adoption. Prior to theadoption of SFAS No. 142, the Company was amortizing the deferred credits on a straight-line basis over 20 years.
28
Income Taxes
The liability method is used to account for income tax expense. Under this method, deferred tax assets and liabilities are determined based ondifferences between financial reporting and tax bases of assets and liabilities and are measured using the enacted tax rates and laws that will be in effectwhen the differences are expected to reverse. Employee Stock Ownership Plan (ESOP)
Compensation expense related to the Company’s defined contribution ESOP is computed based on the shares allocated method. Stock-Based Compensation
The Company has stock based employee compensation plans, which are described more fully in Note 11 in the Notes to Consolidated FinancialStatements. The Company utilizes the intrinsic value-based method, per APB Opinion No. 25, “Accounting for Stock Issued to Employees,” for measuringthe cost of compensation paid in Company common stock. This method defines the Company’s cost as the excess of the stock’s market value at the timeof the grant over the amount that the employee is required to pay. In accordance with APB Opinion No. 25, no compensation expense was recognizedfor the stock based plans in fiscal 2003, 2002 and 2001 as the price paid was not less than 100 percent of fair market value.
The following table illustrates the effect on net earnings and net earnings per share if the Company had applied the fair value recognition provisionsof SFAS No. 123, “Accounting for Stock Based Compensation” to stock-based employee compensation:
Fiscal Year
2003
2002
2001
Income before cumulative effect of accounting change, as reported $ 116,320 $95,290 $76,475Deduct: total stock-based employee compensation expense determined under fair value based
method for all awards, net of related tax effect 1,475 1,053 627 Pro forma net earnings $ 114,845 $94,237 $75,848 Earnings per share before cumulative effect of accounting change—basic: As reported $ 1.71 $ 1.41 $ 1.13Pro forma $ 1.69 $ 1.39 $ 1.12Earnings per share before cumulative effect of accounting change—diluted: As reported $ 1.70 $ 1.40 $ 1.13Pro forma $ 1.68 $ 1.39 $ 1.12
The weighted-average fair value of options granted during fiscal 2003, 2002 and 2001 was $19.34, $11.95, and $9.64, respectively. The fair value
for these options was estimated on the date of grant using a Black-Scholes option pricing model with the following assumptions for all years: risk freeinterest rate of 2.8%, volatility factor of the expected market price of the Company’s common stock of 31.9%, assumed dividend yield of zero and aweighted-average expected life of the option of 6.2 years.
29
Earnings Per Share

Basic earnings per share is computed by dividing net earnings by the weighted average number of outstanding common shares during the period.
Diluted earnings per share is computed by dividing net earnings by the weighted average number of outstanding common shares and common shareequivalents, when dilutive, during the period. Certain director and employee stock options are not included in the April 26, 2003, April 27, 2002, and April28, 2001 calculations because they are anti-dilutive.
The following table sets forth the denominator for the computation of basic and diluted earnings per share. There were no adjustments to thenumerator.
Fiscal Year
2003
2002
2001
(in thousands)Denominator:
Denominator for basic earnings per share—weighted average shares 67,831 67,700 67,435Effect of dilutive securities:
Stock option plans 541 426 245Employee Stock Purchase Plan 10 9 10Capital Accumulation Plan 65 66 73
Dilutive potential common shares 616 501 328
Denominator for diluted earnings per share—adjusted weighted average shares 68,447 68,201 67,763
New Accounting Pronouncements
In December 2002, the FASB issued SFAS No. 148, “Accounting for Stock-Based Compensation—Transition and Disclosure”. SFAS No. 148amends SFAS No. 123, “Accounting for Stock-Based Compensation” to provide alternative methods of transition for a voluntary change to the fair valuebased method of accounting for stock-based employee compensation. SFAS No. 148 also amends the disclosure requirements of SFAS No. 123 torequire additional disclosure in both annual and interim financial statements on the method of accounting for stock-based employee compensation. TheCompany adopted the disclosure provisions of SFAS No. 148 in the fourth quarter of fiscal 2003. 2. Cash Equivalents and Short-term Investments
All cash equivalents and short-term investments are available for sale and carried at market value, which approximates cost. At April 26, 2003 andApril 27, 2002 cash equivalents and investments consisted of the following:
Fiscal Year
2003
2002
Cash on hand $ 50,115 $ 48,849Cash equivalents:
Commercial paper 5,174 5,864Corporate notes and bonds 5,939 11,930Government securities 126,587 19,493Money market funds 7,367 39,850
145,067 77,137Short-term investments:
Commercial paper 13,656 8,690Corporate notes and bonds 600 9,374Government securities and other 8,010 7,187
22,266 25,251 $ 217,448 $ 151,237
30
3. Goodwill and Other Intangible Assets
The following table reconciles reported fiscal 2002 net earnings and basic and diluted net earnings per share before the cumulative effect of anaccounting change had SFAS No. 142, “Goodwill and Other Intangible Assets,” been effective at the beginning of fiscal 2001.
April 27, 2002
April 28, 2001
Net earnings: Reported net income $ 95,290 $ 76,475 Deferred credit amortization (885) (885)Goodwill amortization, net of tax 2,448 2,287 Adjusted net earnings $ 96,853 $ 77,877 Earnings per share: Reported basic $ 1.41 $ 1.13 Deferred credit amortization (0.01) (0.01)Goodwill amortization, net of tax 0.03 0.03 Adjusted basic earnings per share $ 1.43 $ 1.15
Reported diluted $ 1.40 $ 1.13

Deferred credit amortization (0.01) (0.01)Goodwill amortization, net of tax 0.03 0.03 Adjusted diluted earnings per share $ 1.42 $ 1.15
Goodwill by operating segment is as follows:
Dental
Veterinary
Total
Balance at April 27, 2002 $57,017 $ 58,062 $ 115,079Additions from expenditures in 2003 3,750 569 4,319Purchase price adjustments from prior acquisitions 5,767 — 5,767Foreign currency translation 235 — 235 Balance at April 26, 2003 $66,769 $ 58,631 $ 125,400
The expenditures incurred during the year ended April 26, 2003 are related to contingent earn-out payments from acquisitions made in prior years
and the preliminary purchase price allocation for the acquisition of Distribution Quebec Dentaire in July 2002. Adjustments relate primarily to thefinalization of the preliminary purchase price allocation of Thompson Dental in April 2002.
The Company continues to amortize intangibles with finite lives. Identifiable intangible assets are primarily comprised of non-compete agreementsarising from previous acquisitions made by the Company. Intangible assets are amortized on a straight-line basis with estimated useful lives ranging fromthree to ten years. Accumulated amortization of other intangible assets was $4,380 and $1,901 as of April 26, 2003 and April 27, 2002, respectively.Future amortization expense will approximate $2,600, $2,000, $1,900, $1,400 and $700 for fiscal 2004, 2005, 2006, 2007 and 2008, respectively.
31
4. Acquisitions
On July 9, 2001, the Company purchased substantially all of the assets of J. A. Webster, Inc.(“Webster”) and assumed certain liabilities, for apurchase price of $95,662, consisting of $84,955 in cash and $10,707 in stock. The value of the 322,524 common shares issued was determined basedon the average market price of Patterson’s common shares on July 9, 2001. The acquisition agreement also includes an earn-out provision tied to futureproduct sales, which could result in additional cash payments over five years if certain minimum revenue milestones are achieved. The earn-outpayments are not expected to have a material impact on future cash flows.
The acquisition was accounted for under the purchase method of accounting. Accordingly, the results of J. A. Webster, Inc.’s operations areincluded in the accompanying financial statements since the date of acquisition. The purchase price plus direct acquisition costs have been allocated onthe basis of estimated fair values at the date of acquisition. The purchase price allocation is as follows:
Purchase price $ 95,662 Less: Accounts receivable 25,367 Inventory 19,758 Fixed assets 2,383 Other assets 278 Identifiable intangible assets 12,000 Accounts payable (18,839)Accrued expenses (3,347) Goodwill $ 58,062
The following pro forma summary presents the results of operations, as if the acquisition had occurred at the beginning of fiscal 2001. The pro
forma results of operations are not necessarily indicative of the results that would have been achieved had the two companies been combined.
(1) Reflects the amortization of certain intangible assets. Because the transaction was consummated following the effective date specified in SFASNo. 142 “Goodwill and Other Intangible Assets,” the Company did not amortize goodwill for this transaction.
The Company also made the following acquisitions that affect the periods covered by these financial statements:
Distribution Quebec Dentaire July 9, 2002 Cash & Earn-outThompson Dental Company April 2, 2002 Cash, Stock & Earn-outModern Practice Technologies December 4, 2001 CasheCheck-Up.com September 15 , 2000 Cash & Earn-outMicheli Dental Supply, Inc. August 1, 2000 Cash & Earn-out
32
The above acquisitions have been recorded using the purchase method of accounting. The aggregate purchase price for the acquisitions wasallocated as follows:
Fiscal Year
2003
2002
2001
Purchase price $6,493 $26,574 $3,797 Allocated to the following:
Accounts receivable 1,248 9,031 318 Inventory 1,189 9,808 420 Fixed assets 318 4,024 491

Identifiable intangibles 1,000 1,033 — Other assets (liabilities) (41) 1,752 — Accounts payable (746) (6,269) (83)Accrued expenses (794) (1,154) —
Goodwill $4,319 $ 8,349 $2,651
The operating results of each of these acquisitions are included in the Company’s consolidated statements of income from the date of eachacquisition. Pro forma results of operations have not been presented for these acquisitions since the effects of these business acquisitions were notmaterial to the Company either individually or in the aggregate. 5. Property and Equipment
April 26, 2003
April 27, 2002
Land $ 3,940 $ 3,790 Buildings 26,404 25,738 Leasehold improvements 4,693 4,477 Furniture and equipment 36,489 36,173 Data processing equipment 37,136 36,101 108,662 106,279 Accumulated depreciation (51,408) (49,139) $ 57,254 $ 57,140
6. Customer Financing
As a convenience to its customers, the Company offers several different financing alternatives including both a Company sponsored program andthird party programs. For the third party programs, the Company acts as a facilitator between the customer and the third party financing entity with no on-going involvement in the financing transaction. Under the Company sponsored program, equipment purchases for top quality credits are financed to amaximum of $200 for any one customer. The Company generally sells these customer installment sale contracts to outside financial institutions in thenormal course of its business. The Company currently has two arrangements under which it sells these contracts.
In fiscal 2003, the Company initiated an agreement to sell its equipment contracts to a commercial paper conduit managed by Bank One N. A. Toparticipate in the commercial paper conduit, the Company was required to establish a special purpose entity (“SPE”), PDC Funding Company, LLC, aconsolidated, wholly owned subsidiary. The Company transfers installment sale contracts to the SPE and in turn, the SPE sells the contracts to thecommercial paper conduit administered by Bank One. While there is no recourse to the Company by the commercial paper conduit on the sale ofcontracts, the Company receives only 90% of the principal amount of the contracts upon the sale. The remaining 10% of the proceeds is held by theconduit as security against the eventual performance of the portfolio. The holdback receivable from the conduit is recorded as a non-current asset, whichis carried at its estimated fair market value. The capacity of this arrangement with the conduit is a maximum of $200 million.
The Company also maintains an agreement with U.S. Bank National Association, as agent. This agreement allows the Company to sell, withlimited recourse on an ongoing basis, its installment sale contracts to U.S. Bank National Association and one additional bank. A capacity of $50 millionwas available under this agreement through fiscal 2003 while the capacity was increased to $70 million subsequent to year-end.
33
These financing arrangements are accounted for as a sale of assets under the provisions of SFAS No. 140, “Accounting for Transfers andServicing of Financial Assets and Extinguishments of Liabilities.” During fiscal 2003, the Company sold approximately $138.1 million of its contracts underthese arrangements. The Company retains servicing responsibilities under both agreements, for which it is paid a servicing fee. The servicing feesreceived by the Company are considered adequate compensation for services rendered. Accordingly, no servicing asset or liability has been recorded.The agreements require the Company to maintain a minimum current ratio, maximum leverage ratio and minimum net worth. The Company was incompliance with the covenants at April 26, 2003.
A total of $193.9 million of installment contracts receivable sold under the agreements were outstanding at April 26, 2003. Of this total $50.0 millionhas been sold to U. S. Bank National Association for which the Company has a 25% contingent guarantee of collection under the limited recourseprovision. The remaining balance has been sold to the commercial paper conduit. The residual receivable at April 26, 2003 was $19.8 million. Since theinternal financing program began in 1994, bad debt write-offs have amounted to less than one-percent of the loans originated. 7. Line of Credit
The Company has a $50 million credit facility that allows for multi-currency borrowings. Interest rates are determined by a pricing matrix based onthe Company’s ratio of debt to consolidated earnings before income taxes, depreciation and amortization. Facility fees are payable on the credit anddetermined in the same manner as the interest rates. Proceeds from credit extensions may be used for general corporate purposes. There were nooutstanding borrowings under the agreement at April 26, 2003. The Company’s credit agreement contains various restrictive covenants such as minimumfinancial ratios, limitations on additional liens or indebtedness and limitations on certain acquisitions and investments, all of which the Company was incompliance with at April 26, 2003. The facility expires on October 31, 2003. 8. Leases
The Company leases facilities for its branch office locations, two distribution facilities, and also certain equipment. These leases are accounted foras operating leases. Future minimum rental payments under noncancelable operating leases are as follows for the years ending in April:
2004 $ 8,8932005 7,1392006 5,2242007 3,5072008 2,542Thereafter 2,860 Total minimum payments required $30,164

Rent expense was $9,674, $8,429, and $6,839 for the years ended April 26, 2003, April 27, 2002 and April 28, 2001, respectively. 9. Income Taxes
Significant components of the provision for income taxes are as follows:
Fiscal Year
2003
2002
2001
Current: Federal $58,517 $51,466 $40,878Foreign 3,429 2,239 1,056State 6,822 6,037 4,825
Total current 68,768 59,742 46,759
34
Deferred: Federal 1,169 (2,579) (1,402)Foreign — — 481 State 145 (230) (117)
Total deferred 1,314 (2,809) (1,038)
Provision for income taxes $70,082 $56,933 $45,721
Deferred taxes assets and liabilities are included in prepaid expenses and other current assets and in non-current liabilities on the balance sheet.
Significant components of the Company’s deferred tax assets (liabilities) as of April 26, 2003 and April 27, 2002 are as follows:
Fiscal Year
2003
2002
Bad debt allowance $ 1,280 $ 1,180 LIFO reserve (1,587) (2,088)Health insurance 1,266 1,133 Capital Accumulation Plan 4,171 3,496 Inventory obsolescence 2,879 2,850 Goodwill (4,429) (1,376)Other 1,622 1,321 Total $ 5,202 $ 6,516
Income tax expense varies from the amount computed using the U.S. statutory rate. The reasons for this difference and the related tax effects are
shown below:
Fiscal Year
2003
2002
2001
Tax at U.S. statutory rate $65,240 $53,278 $42,769 State tax provision, net of federal benefit 4,455 3,775 3,060 Effect of foreign taxes 638 417 392 Amortization of deferred credit — (310) (310)Other (251) (227) (190) $70,082 $56,933 $45,721
10. Segment and Geographic Data
Patterson Dental Company is comprised of two reportable segments, dental supply and veterinary supply. The Company’s reportable segmentsare strategic business units that offer similar products and services to different customer bases. The dental supply segment provides a virtually completerange of consumable dental products, clinical and laboratory equipment and value-added services to dentists, dental laboratories, institutions and otherhealthcare providers throughout North America. The veterinary supply segment provides consumable supplies, equipment, diagnostic products,biologicals (vaccines) and pharmaceuticals to companion-pet veterinary clinics primarily in the Eastern, Mid-Atlantic and Southeastern regions of theUnited States.
The accounting policies of the segments are the same as those described in the summary of significant accounting policies. The Companyevaluates segment performance based on operating income.
35
The following table presents information about the Company’s reportable segments:
Fiscal Year
2003
2002
2001
Net sales Dental supply $ 1,471,162 $ 1,280,693 $ 1,156,455Veterinary supply 185,794 134,822 —

Consolidated net sales $ 1,656,956 $ 1,415,515 $ 1,156,455 Operating income
Dental supply $ 163,897 $ 138,647 $ 115,115Veterinary supply 15,051 8,533 —
Consolidated operating income $ 178,948 $ 147,180 $ 115,115
Total assets
Dental supply $ 692,740 $ 589,819 $ 549,180Veterinary supply 131,238 128,557 —
Consolidated total assets $ 823,978 $ 718,376 $ 549,180
Depreciation and amortization
Dental supply $ 9,770 $ 11,833 $ 11,077Veterinary supply 3,006 2,450 —
Consolidated depreciation and amortization $ 12,776 $ 14,283 $ 11,077
The following table presents sales information by product for the Company:
Fiscal Year
2003
2002
2001
Net sales Consumable and printed products $ 1,044,447 $ 908,731 $ 719,510Equipment and software 481,061 392,683 336,856Other 131,448 114,101 100,089
Total $ 1,656,956 $ 1,415,515 $ 1,156,455
The following table presents information about the Company by geographic area. There were no material sales between geographic areas.
Fiscal Year
2003
2002
2001
Net sales United States $ 1,544,604 $ 1,322,991 $ 1,068,871Canada 112,352 92,524 87,584
Total $ 1,656,956 $ 1,415,515 $ 1,156,455
Long-lived assets
United States $ 211,388 $ 185,040 $ 102,209Canada 7,918 3,916 4,210
Total $ 219,306 $ 188,956 $ 106,419
36
11. Shareholders’ Equity Share Repurchases
In September 1999, the Board of Directors authorized the repurchase of up to two million shares of the Company’s common stock. The Companyrepurchased 321,299, 247,000 and 125,000 of its common stock for $13,131, $8,308, $3,583 during fiscal 2003, 2002 and 2001, respectively. Employee Stock Ownership Plan
During 1990, the Company’s Board of Directors adopted a leveraged ESOP. During fiscal 1991, under the provisions of the plan and relatedfinancing arrangements, the Company loaned the ESOP $22,000 for the purpose of acquiring its then outstanding preferred stock which wassubsequently converted to common stock. At April 26, 2003, and April 27, 2002, indebtedness of the ESOP to the Company is shown as a deductionfrom stockholders’ equity in the consolidated balance sheets. The cost of the ESOP is borne by the Company through annual contributions to the plan inamounts determined by the Board of Directors. Shares of stock acquired by the plan are allocated to each employee who has completed 1,000 hours ofservice during the plan year.
The Company’s ESOP and an ESOP sponsored by the Thompson Dental Company (“Thompson”) were used to facilitate the acquisition andmerger of Thompson into the Company. The net result of this transaction was an additional loan of $12,612 being made to the ESOP and the ESOPacquiring 332,989 shares of common stock of Patterson Dental Company. Under current accounting standards, these shares are not consideredoutstanding for the computation of earnings per share until the shares are allocated to the participants. When the shares are allocated to the employees,the expense to the Company will be determined based on the fair market value of the shares in the year of the allocation. The loan bears interest atcurrent rates but principal does not begin to amortize until 2011. A total of 332,989 shares were issued in the transaction of which 48,905 were previouslyallocated to Thompson employees. The remaining 284,084 shares began to be allocated in fiscal 2003 but only to the extent of interest on the loan. Thenon-cash expense is not expected to materially impact the consolidated results of operations of the Company.
During fiscal 2003, 2002 and 2001, shares with a cost of $1,143, $1,201 and $798, respectively, were earned and allocated to ESOP participants.These amounts represented the Company’s contribution for each fiscal year.
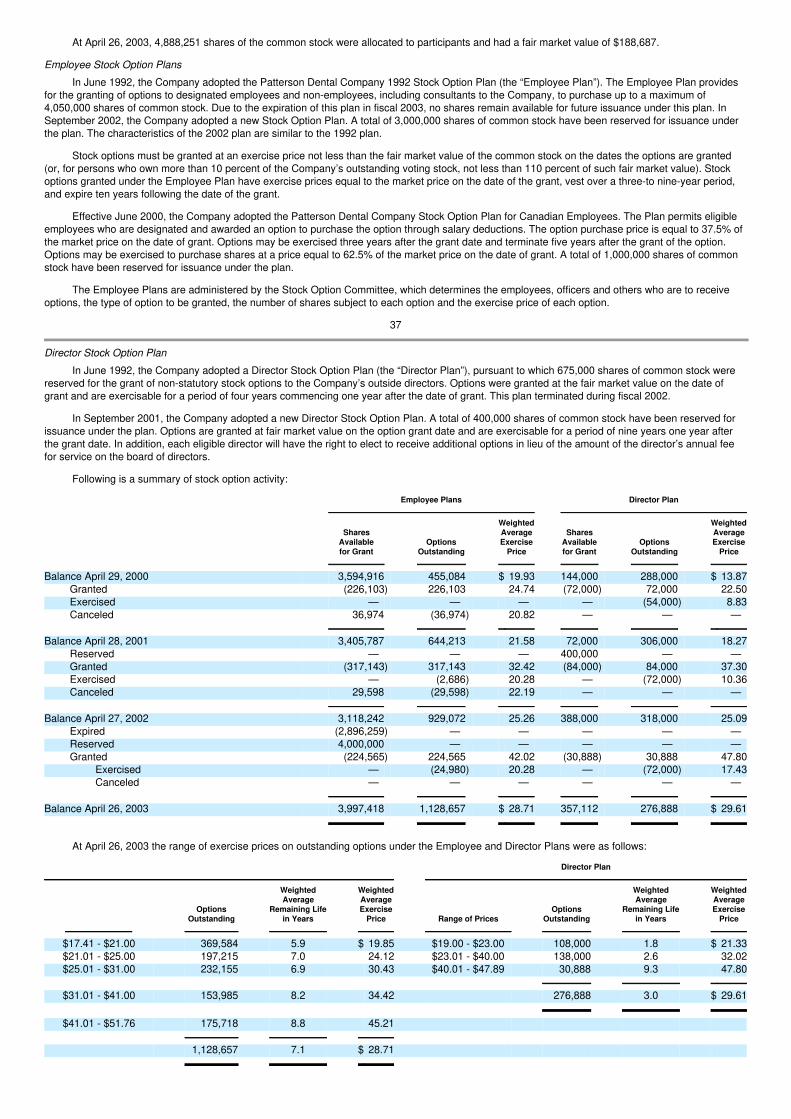
At April 26, 2003, 4,888,251 shares of the common stock were allocated to participants and had a fair market value of $188,687. Employee Stock Option Plans
In June 1992, the Company adopted the Patterson Dental Company 1992 Stock Option Plan (the “Employee Plan”). The Employee Plan providesfor the granting of options to designated employees and non-employees, including consultants to the Company, to purchase up to a maximum of4,050,000 shares of common stock. Due to the expiration of this plan in fiscal 2003, no shares remain available for future issuance under this plan. InSeptember 2002, the Company adopted a new Stock Option Plan. A total of 3,000,000 shares of common stock have been reserved for issuance underthe plan. The characteristics of the 2002 plan are similar to the 1992 plan.
Stock options must be granted at an exercise price not less than the fair market value of the common stock on the dates the options are granted(or, for persons who own more than 10 percent of the Company’s outstanding voting stock, not less than 110 percent of such fair market value). Stockoptions granted under the Employee Plan have exercise prices equal to the market price on the date of the grant, vest over a three-to nine-year period,and expire ten years following the date of the grant.
Effective June 2000, the Company adopted the Patterson Dental Company Stock Option Plan for Canadian Employees. The Plan permits eligibleemployees who are designated and awarded an option to purchase the option through salary deductions. The option purchase price is equal to 37.5% ofthe market price on the date of grant. Options may be exercised three years after the grant date and terminate five years after the grant of the option.Options may be exercised to purchase shares at a price equal to 62.5% of the market price on the date of grant. A total of 1,000,000 shares of commonstock have been reserved for issuance under the plan.
The Employee Plans are administered by the Stock Option Committee, which determines the employees, officers and others who are to receiveoptions, the type of option to be granted, the number of shares subject to each option and the exercise price of each option.
37
Director Stock Option Plan
In June 1992, the Company adopted a Director Stock Option Plan (the “Director Plan”), pursuant to which 675,000 shares of common stock werereserved for the grant of non-statutory stock options to the Company’s outside directors. Options were granted at the fair market value on the date ofgrant and are exercisable for a period of four years commencing one year after the date of grant. This plan terminated during fiscal 2002.
In September 2001, the Company adopted a new Director Stock Option Plan. A total of 400,000 shares of common stock have been reserved forissuance under the plan. Options are granted at fair market value on the option grant date and are exercisable for a period of nine years one year afterthe grant date. In addition, each eligible director will have the right to elect to receive additional options in lieu of the amount of the director’s annual feefor service on the board of directors.
Following is a summary of stock option activity:
Employee Plans
Director Plan
SharesAvailablefor Grant
OptionsOutstanding
WeightedAverageExercise
Price
SharesAvailablefor Grant
OptionsOutstanding
WeightedAverageExercise
Price
Balance April 29, 2000 3,594,916 455,084 $ 19.93 144,000 288,000 $ 13.87Granted (226,103) 226,103 24.74 (72,000) 72,000 22.50Exercised — — — — (54,000) 8.83Canceled 36,974 (36,974) 20.82 — — —
Balance April 28, 2001 3,405,787 644,213 21.58 72,000 306,000 18.27
Reserved — — — 400,000 — — Granted (317,143) 317,143 32.42 (84,000) 84,000 37.30Exercised — (2,686) 20.28 — (72,000) 10.36Canceled 29,598 (29,598) 22.19 — — —
Balance April 27, 2002 3,118,242 929,072 25.26 388,000 318,000 25.09
Expired (2,896,259) — — — — — Reserved 4,000,000 — — — — — Granted (224,565) 224,565 42.02 (30,888) 30,888 47.80
Exercised — (24,980) 20.28 — (72,000) 17.43Canceled — — — — — —
Balance April 26, 2003 3,997,418 1,128,657 $ 28.71 357,112 276,888 $ 29.61
At April 26, 2003 the range of exercise prices on outstanding options under the Employee and Director Plans were as follows:
Director Plan
OptionsOutstanding
WeightedAverage
Remaining Lifein Years
WeightedAverageExercise
Price
Range of Prices
OptionsOutstanding
WeightedAverage
Remaining Lifein Years
WeightedAverageExercise
Price
$17.41 - $21.00 369,584 5.9 $ 19.85 $19.00 - $23.00 108,000 1.8 $ 21.33$21.01 - $25.00 197,215 7.0 24.12 $23.01 - $40.00 138,000 2.6 32.02$25.01 - $31.00 232,155 6.9 30.43 $40.01 - $47.89 30,888 9.3 47.80
$31.01 - $41.00 153,985 8.2 34.42 276,888 3.0 $ 29.61
$41.01 - $51.76 175,718 8.8 45.21
1,128,657 7.1 $ 28.71

38
Employee Stock Purchase Plan
In June 1992, the Company adopted an Employee Stock Purchase Plan (the “Stock Purchase Plan”). A total of 1,375,000 shares of common stockare reserved for issuance under the Stock Purchase Plan. The Stock Purchase Plan, which is intended to qualify under Section 423 of the InternalRevenue Code, is administered by the Board of Directors of the Company or by a committee appointed by the Board of Directors. Employees are eligibleto participate after six months of employment with the Company if they are employed for at least 20 hours per week and more than five months per year.The Stock Purchase Plan permits eligible employees to purchase common stock through payroll deductions, which may not exceed 10 percent of anemployee’s compensation, at 85 percent of the lower of the fair market value of the common stock on the offering date or at the end of each three-monthperiod following the offering date during the applicable offering period. Employees may end their participation in the offering at any time during theoffering period, and participation ends automatically on termination of employment with the Company. Employees purchased 89,010, 80,678 and 99,276shares in fiscal 2003, 2002 and 2001, respectively. At April 26, 2003, there were 485,162 shares available for purchase under the Stock Purchase Plan. Capital Accumulation Plan
In 1996, the Company adopted an employee Capital Accumulation Plan (the “CAP Plan”). A total of 3,000,000 shares of common stock arereserved for issuance under the CAP Plan. Officers and other key employees of the Company or its subsidiaries are eligible to participate by purchasingcommon stock through payroll deductions, which must be between 5% and 25% of an employee’s compensation, at 75% of the price of the commonstock at the beginning of or the end of the calendar year, whichever is lower. The shares issued are restricted stock and are held in the custody of theCompany until the restrictions lapse. The restriction period is three years from the beginning of the plan year. Employees purchased 147,167, 135,046and 161,251 shares of restricted stock in fiscal 2003, 2002 and 2001, respectively. At April 26, 2003, 2,213,642 shares were available for purchaseunder the CAP Plan. 12. Litigation
In the ordinary course of business, the Company is subject to a variety of product-related and employment-related liability claims. The Company’smanagement and legal counsel believe that the loss, if any, resulting from these claims will be substantially covered by insurance or third-partyindemnification, and any uninsured losses from such claims will not have a materially adverse effect on its operations or financial position. 13. Quarterly Results (unaudited)
Quarterly results are determined in accordance with the accounting policies used for annual data and include certain items based upon estimatesfor the entire year. All fiscal quarters include results for 13 weeks. The following table summarizes results for fiscal 2003 and 2002.
Quarter Ended
Apr. 26,
Jan. 25,
Oct. 26,
July 27,
Net sales $ 447,326 $ 421,070 $ 400,821 $ 387,739Gross profit 155,872 147,765 137,774 133,175Operating income 51,150 46,477 42,458 38,863Income before cumulative effect of accounting change 33,597 30,102 27,545 25,076Net income 33,597 30,102 27,545 28,448Before cumulative effect of accounting change:
Earnings per share—basic $ 0.50 $ 0.44 $ 0.40 $ 0.37Earnings per share—diluted $ 0.49 $ 0.44 $ 0.40 $ 0.37
After cumulative effect of accounting change: Earnings per share—basic $ 0.50 $ 0.44 $ 0.40 $ 0.42Earnings per share—diluted $ 0.49 $ 0.44 $ 0.40 $ 0.42
39
Quarter Ended
Apr. 27,
Jan. 26,2002
Oct. 27,
Jul. 28,2001
Net sales $ 399,849 $ 357,394 $ 355,018 $ 303,254Gross profit 140,302 125,608 121,203 107,067Operating income 43,204 38,581 35,955 29,440Net income 27,563 24,832 23,282 19,613
Earnings per share—basic $ 0.41 $ 0.37 $ 0.34 $ 0.29Earnings per share—diluted $ 0.40 $ 0.36 $ 0.34 $ 0.29 9. CHANGES IN AND DISAGREEMENTS WITH ACCOUNTANTS ON ACCOUNTING AND FINANCIAL DISCLOSURE
None.
PART III 10. DIRECTORS AND EXECUTIVE OFFICERS OF THE REGISTRANT
Information regarding the directors of the Company is incorporated herein by reference to the descriptions set forth under the caption “Election ofDirectors” in the Company’s Proxy Statement for its Annual Meeting of Shareholders to be held September 8, 2003 (the “2003 Proxy Statement”).Information regarding executive officers of the Company is incorporated herein by reference to Item 1 of Part I of this Form 10-K under the caption“Executive Officers of the Registrant.” Information regarding compliance with Section 16(c) of the Securities Exchange Act of 1934 is incorporated hereinby reference to the information set forth under “Section 16(a) Beneficial Ownership Reporting Compliance” in the 2003 Proxy Statement. 11. EXECUTIVE COMPENSATION
Information regarding executive compensation is incorporated herein by reference to the information set forth under the caption “Compensation ofExecutive Officers” in the 2003 Proxy Statement. 12. SECURITY OWNERSHIP OF CERTAIN BENEFICIAL OWNERS AND MANAGEMENT
Some of the information called for by Item 12 is incorporated herein by reference to the information set forth under the caption “Security Ownershipof Certain Beneficial Owners and Management” in the 2003 Proxy Statement.

EQUITY COMPENSATION PLAN INFORMATION
The following table provides information as of April 26, 2003 about the Company’s common stock that may be issued under all of its existing equitycompensation plans, including the Patterson Dental Company 1992 Stock Option Plan, the Patterson Dental Company 2002 Stock Option Plan, theEmployee Stock Purchase Plan, the Capital Accumulation Plan, the 1992 Non-Employee Directors’ Stock Option Plan, the 2001 Non-EmployeeDirectors’ Director Stock Option Plan and the Stock Option Plan for Canadian Employees. All of these plans have been approved by the Company’sshareholders, except the Stock Option Plan for Canadian Employees.
40
Number of securities to beissued upon exercise of
outstanding options, warrantsand rights
Weighted-average exerciseprice of outstanding options,
warrants and rights
Number of securities remainingavailable for future issuanceunder equity compensationplans (excluding securities
reflected in column
Equity compensation plansapproved by security holders 1,350,350 $28.75 6,108,529
Equity compensation plans notapproved by security holders 55,195 $32.23 944,805
Total 1,405,545 $28.89 7,053,334
13. CERTAIN RELATIONSHIPS AND RELATED TRANSACTIONS
None. 14. CONTROLS AND PROCEDURES (a) Evaluation of disclosure controls and procedures .
Within 90 days prior to the filing date of this report (the “Evaluation Date”), the Company carried out an evaluation, under the supervision and withthe participation of the Company’s management, including the Company’s chief executive officer and its chief financial officer, of the effectiveness of thedesign and operation of the Company’s disclosure controls and procedures pursuant to Rule 13a-14 of the Securities and Exchange Act of 1934 (the“Exchange Act”). Based upon that evaluation, the chief executive officer and chief financial officer concluded that as of the Evaluation Date, theCompany’s disclosure controls and procedures (as defined in Rule 13a-14(c) under the Exchange Act) are effective to ensure that information required tobe disclosed by the Company in reports that it files or submits under the Exchange Act is recorded, processed, summarized and reported within the timeperiods specified in Securities and Exchange Commission rules and forms. (b) Changes in internal controls.
There were no significant changes in the Company’s internal controls or in other factors that could significantly affect these controls subsequent tothe date of their most recent evaluation nor were there any significant deficiencies or material weaknesses in the Company’s internal controls.
PART IV 15. EXHIBITS, FINANCIAL STATEMENT SCHEDULES AND REPORTS ON FORM 8-K (a) 1. Financial Statements.
The following consolidated financial statements and supplementary data of the Company and its subsidiaries, are included in Part II, Item 8:
Report of Independent AuditorsConsolidated Balance Sheets as of April 26, 2003 and April 27, 2002Consolidated Statements of Income for the Years Ended April 26, 2003, April 27, 2002 and April 28, 2001
41
Consolidated Statement of Changes in Stockholders’ Equity for the Years Ended April 26, 2003, April 27,2002 and April 28, 2001Consolidated Statements of Cash Flows for the Years Ended April 26, 2003, April 27, 2002 and April 28, 2001Notes to Consolidated Financial Statements
2. Financial Statement Schedules.
The following financial statement schedule is filed herewith: Schedule II—Valuation and Qualifying Accounts for the Years Ended April 26, 2003,April 27, 2002 and April 28, 2001.
Schedules other than that listed above have been omitted because they are not applicable or the required information is included in the financialstatements or notes thereto. 3. Exhibits. Exhibit
3.1 The Company’s Articles of Incorporation, as amended 1
3.2 The Company’s Bylaws, as amended 1
4.1 Specimen form of the Company’s Common Stock Certificate 1
4.2 The Company’s Articles of Incorporation, as amended (see Exhibit 3.1)
4.3 The Company’s Bylaws, as amended (see Exhibit 3.2)
10.1 Patterson Dental Company Employee Stock Ownership Plan, as amended 1
10.2 Patterson Dental Company 1992 Stock Option Plan 1
10.3 Patterson Dental Company 1992 Director Stock Option Plan 1
10.4 Patterson Dental Company Employee Stock Purchase Plan 1

10.5 Patterson Dental Company Capital Accumulation Plan 2
10.6 Incentive Compensation Program (Fiscal 1992) 1
10.8 ESOP Loan Agreement dated June 15, 1990 as amended July 13, 1992 1
10.9 Amended and Restated Term Promissory Note dated July 13, 1992 1
10.10
Second Amended and Restated Contract Purchase Agreement dated April 28, 2000 between Patterson Dental Company and U.S. BankNational Association3
10.11 Amended and Restated Credit Agreement dated April 28, 2000 between Patterson Dental Company and U.S. Bank National Association 3
10.12 Asset Purchase Agreement by and among Patterson Dental Company and J. A. Webster, Inc. 4
10.13
Third Amended and Restated Contract Purchase Agreement dated June 19, 2002 between Patterson Dental Company and U. S. BankNational Association5
10.14 Receivables Purchase Agreement dated May 10, 2002 Between Patterson Dental Company and Bank One. 5
42
1 Incorporated by reference to the Registrant’s Registration Statement on Form S-1 (No. 33-51304) filed with the Securities and ExchangeCommission August 26, 1992.
2 Incorporated by reference to the Registrant’s Form 10-K for the fiscal year ended April 27, 1996.3 Incorporated by reference to the Registrant’s Form 10-K for the fiscal year ended April 29, 2000.4 Incorporated by reference to the Registrant’s Form 10-K for the fiscal year ended April 28, 2001.5 Incorporated by reference to the Registrant’s Form 10-K for the fiscal year ended April 27, 2002.6 Incorporated by reference to the Registrant’s Form 10-Q for the quarterly period ended January 25, 2003.7 Incorporated by reference to the Registrant’s Form 10-K for the fiscal year ended April 26, 2003 (b) Reports on Form 8-K.
The Company did not file any reports on Form 8-K with the Securities and Exchange Commission during the quarter ended April 26, 2003.
43
SIGNATURES Pursuant to the requirements of section 13 or 15(d) of the Securities Exchange Act of 1934, the registrant has duly caused this report to be signed on itsbehalf by the undersigned, thereunto duly authorized. PATTERSON DENTAL COMPANYDated: July 22, 2003
By Peter L. Frechette, President and Chief Executive Officer Pursuant to the requirements of the Securities Exchange Act of 1934, this report has been signed below by the following persons on behalf of theregistrant and in the capacities and on the dates indicated.
Peter L. Frechette
Chairman and Chief Executive Officer (PrincipalExecutive Officer)
July 22, 2003
R. Stephen Armstrong
Executive Vice President, Treasurer, and ChiefFinancial Officer (Principal Financial andAccounting Officer)
July 22, 2003
Ronald E. Ezerski
Director
July 22, 2003
David K. Beecken
Director
July 22, 2003
Burt E. Swanson
Director
July 22, 2003
Andre B. Lacy
Director
July 22, 2003
James W. Wiltz
Director
July 22, 2003
Harold C. Slavkin
Director
July 22, 2003
44
SECTION 302 CERTIFICATIONS STATEMENT I, Peter L. Frechette, certify that: 1. I have reviewed this annual report on Form 10-K of Patterson Dental Company; 2. Based on my knowledge, this annual report does not contain any untrue statement of a material fact or omit to state a material fact necessary to
make the statements made, in light of the circumstances under which such statements were made, not misleading with respect to the periodcovered by this annual report;
3. Based on my knowledge, the financial statements, and other financial information included in this annual report, fairly present in all material
respects the financial condition, results of operations and cash flows of the registrant as of, and for, the periods presented in this annual report;

4. The registrant’s other certifying officers and I are responsible for establishing and maintaining disclosure controls and procedures (as defined in
Exchange Act Rules 13a-14 and 15d-14) for the registrant and we have:
a) designed such disclosure controls and procedures to ensure that material information relating to the registrant, including its consolidatedsubsidiaries, is made known to us by others within those entities, particularly during the period in which the annual report is being prepared;
b) evaluated the effectiveness of the registrant’s disclosure controls and procedures as of a date within 90 days prior to the filing date of thisannual report (the “Evaluation Date”); and
c) presented in this annual report our conclusions about the effectiveness of the disclosure controls and procedures based on our evaluation asof the Evaluation Date;
5. The registrant’s other certifying officers and I have disclosed, based on our most recent evaluation, to the registrant’s auditors and the audit
committee of registrant’s board of directors (or persons performing the equivalent function):
a) all significant deficiencies in the design or operation of internal controls which could adversely affect the registrant’s ability to record, process,summarize and report financial data and have identified for the registrant’s auditors any material weaknesses in internal controls; and
b) any fraud, whether or not material, that involves management or other employees who have a significant role in the registrant’s internalcontrols; and
6. The registrant’s other certifying officers and I have indicated in this annual report whether or not there were significant changes in internal controls
or in other factors that could significantly affect internal controls subsequent to the date of our most recent evaluation, including any correctiveactions with regard to significant deficiencies and material weaknesses.
Date: July 22, 2003 Chairman and Chief Executive Officer
45
SECTION 302 CERTIFICATIONS STATEMENT I, R. Stephen Armstrong, certify that: 1. I have reviewed this annual report on Form 10-K of Patterson Dental Company; 2. Based on my knowledge, this annual report does not contain any untrue statement of a material fact or omit to state a material fact necessary to
make the statements made, in light of the circumstances under which such statements were made, not misleading with respect to the periodcovered by this annual report;
3. Based on my knowledge, the financial statements, and other financial information included in this annual report, fairly present in all material
respects the financial condition, results of operations and cash flows of the registrant as of, and for, the periods presented in this annual report; 4. The registrant’s other certifying officers and I are responsible for establishing and maintaining disclosure controls and procedures (as defined in
Exchange Act Rules 13a-14 and 15d-14) for the registrant and we have:
a) designed such disclosure controls and procedures to ensure that material information relating to the registrant, including its consolidatedsubsidiaries, is made known to us by others within those entities, particularly during the period in which the annual report is being prepared;
c) evaluated the effectiveness of the registrant’s disclosure controls and procedures as of a date within 90 days prior to the filing date of thisannual report (the “Evaluation Date”); and
c) presented in this annual report our conclusions about the effectiveness of the disclosure controls and procedures based on our evaluation asof the Evaluation Date;
5. The registrant’s other certifying officers and I have disclosed, based on our most recent evaluation, to the registrant’s auditors and the audit
committee of registrant’s board of directors (or persons performing the equivalent function):
a) all significant deficiencies in the design or operation of internal controls which could adversely affect the registrant’s ability to record, process,summarize and report financial data and have identified for the registrant’s auditors any material weaknesses in internal controls; and
c) any fraud, whether or not material, that involves management or other employees who have a significant role in the registrant’s internalcontrols; and
6. The registrant’s other certifying officers and I have indicated in this annual report whether or not there were significant changes in internal controls
or in other factors that could significantly affect internal controls subsequent to the date of our most recent evaluation, including any correctiveactions with regard to significant deficiencies and material weaknesses.
Date: July 22, 2003 Chief Financial Officer
46
SCHEDULE IIVALUATION AND QUALIFYING ACCOUNTS
PATTERSON DENTAL COMPANY
(Dollars in thousands)
(1) Uncollectible accounts written off, net of recoveries.(2) Inventory disposed of or written off.
47
INDEX TO EXHIBITS
Exhibit 10.22 Patterson Dental Company 2002 Stock Option Plan
Exhibit 10.23 ESOP Loan Agreement dated April 1, 2002

Exhibit 10.24
Promissory Note dated April 1, 2002 between GreatBanc Trust Company, an Illinois corporation, not in its individual orcorporate capacity, but solely as trustee of the Thompson Dental Company Employee Stock Ownership Plan and Trust andThompson Dental Company
Exhibit 21 Subsidiaries
Exhibit 23 Consent of Independent Auditors
Exhibit 99.1
Certification by Chief Executive Officer Pursuant to 18 U.S.C. Section 1350, as Adopted Pursuant to Section 906 of theSarbanes-Oxley Act of 2002.
Exhibit 99.2
Certification by Chief Financial Officer Pursuant to 18 U.S.C. Section 1350, as Adopted Pursuant to Section 906 of theSarbanes-Oxley Act of 2002.
48
Copyright © 2022 FDOKUMEN