Buy Prosafe - SEB Research
32
researchonline.sebgroup.com Important. All disclosure information can be found on pages 30 – 32 of this document Rejuvenation in accommodation ● Coverage resumed with a Buy rating and target price of NOK 70 We resume our coverage of Prosafe with a Buy recommendation and a target price of NOK 70. The investment case is based on our view of an offshore accommodation market set to improve, with a supply side characterised by 25% less capacity from peak coupled with increased demand across most segments. In such a scenario we believe new relevant accommodation units can hit a mid-cycle valuation between USD 200-250m, relative to the implied value of USD 180m in the current Prosafe share price. ● Digging deeper on demand Our bottom-up analysis of accommodation demand over the past 10 years provides an important insight into how we should think of MMO – the single most important sub-segment of demand. Although some part of the maintenance is more tilted towards an oil company opex line, overall MMO demand is a levered game on oil companies’ investment strategies – which we believe are set to turn. The UK and Norway should be closer to rebound, while basins like Brazil and Mexico offer substantial upside potential. ● Make up your mind on valuation Following the refinancing, Prosafe has mechanisms capping the cash flow to equity holders over the coming years including cash sweeps and interest rate ladders. For valuation we believe asset value appreciation will trump cash flow in this period, a key pre-requisite for our conclusion on the share. Oil Services Norway Re-initiation of coverage 6 February 2017 Please note: the statement at the rear of this report contains details of investment banking services recently provided by SEB which could be considered relevant to the subject matter of this report. Buy Prosafe Share Price Performance (%) -1M -3M -12M PRSO.OL (12) 14 (97) Relative Norway (13) 1 (98) Relative sector (7) 5 (98) Key Data (2016E) Price (NOK) Target price (NOK) Recommendation - changed from Risk Reuters Bloomberg Market cap (NOKm) Market cap (USDm) Market cap (EURm) Net debt (USDm) Net gearing Net debt/EBITDA (x) 6.5 Shares fully dil. (m) Avg daily turnover (NOKm) Free float 34.10 70.00 Buy 339 Unrated High PRS NO 364 3,000 PRSO.OL 70% 1,550 200% 8,799 71.9 Share Price (12M) Absolute performance (blue) / Relative to Norway (grey). 0 200 400 600 800 1000 1200 Feb Apr Jun Aug Oct Dec Feb Financials (USD) Source for all data on this page: SEB (estimates) and SIX/Thomson Reuters (prices) Year end: Dec 2014 2015 2016E 2017E 2018E Revenues (m) 549 475 457 306 339 Operating profit (m) 248 31 133 46 90 Pre-tax profit (m) 253 31 (149) 8 53 EPS (reported) 101.6 8.89 (1.81) 0.09 0.57 EPS (adjusted) 93.7 8.89 0.51 0.09 0.57 DPS 64.0 10.0 0.00 0.00 0.00 Revenue growth (%) 4.8 (13.5) (3.8) (33.0) 10.7 Operating profit growth (%) 1.3 (87.6) 331.6 (65.3) 95.7 EPS (adjusted) growth (%) (99.5) (90.5) (94.2) (82.9) 555.5 Operating margin (%) 50.7 7.1 29.1 15.1 26.7 ROE (%) 32.2 2.8 (20.9) 1.0 6.2 ROCE (%) 16.0 1.7 6.4 2.3 4.2 PER (x) 3.3 26.8 8.1 47.2 7.2 Free cash flow yield (%) 5.1 (94.0) (88.7) 5.3 28.1 Dividend yield (%) 20.7 4.2 0.0 0.0 0.0 P/BV (x) 0.98 0.83 0.47 0.46 0.44 EV/Sales (x) 2.93 4.12 4.19 6.20 5.30 EV/EBITDA (x) 4.6 6.8 8.0 16.1 11.1 EV/EBIT (x) 5.8 57.7 14.4 41.1 19.9 Operating cash flow/EV (%) 17.3 9.7 9.0 3.4 6.8 EV/Capital employed (x) 0.91 0.89 0.86 0.84 0.79 Analyst Harald Øyen (47) 2100 8542 [email protected]
-
Upload
khangminh22 -
Category
Documents
-
view
1 -
download
0
Transcript of Buy Prosafe - SEB Research

researchonline.sebgroup.com Important. All disclosure information can be found on pages 30 – 32 of this document
Rejuvenation in accommodation ● Coverage resumed with a Buy rating and target price of NOK 70
We resume our coverage of Prosafe with a Buy recommendation and a target price of NOK 70. The investment case is based on our view of an offshore accommodation market set to improve, with a supply side characterised by 25% less capacity from peak coupled with increased demand across most segments. In such a scenario we believe new relevant accommodation units can hit a mid-cycle valuation between USD 200-250m, relative to the implied value of USD 180m in the current Prosafe share price.
● Digging deeper on demand Our bottom-up analysis of accommodation demand over the past 10 years provides an important insight into how we should think of MMO – the single most important sub-segment of demand. Although some part of the maintenance is more tilted towards an oil company opex line, overall MMO demand is a levered game on oil companies’ investment strategies – which we believe are set to turn. The UK and Norway should be closer to rebound, while basins like Brazil and Mexico offer substantial upside potential.
● Make up your mind on valuation Following the refinancing, Prosafe has mechanisms capping the cash flow to equity holders over the coming years including cash sweeps and interest rate ladders. For valuation we believe asset value appreciation will trump cash flow in this period, a key pre-requisite for our conclusion on the share.
Oil Services Norway
Re-initiation of coverage 6 February 2017
Please note: the statement at the rear of this report contains details of investment banking services recently provided by SEB which could be considered relevant to the subject matter of this report.
Buy Prosafe
Share Price Performance (%)
-1M -3M -12M PRSO.OL (12) 14 (97) Relative Norway (13) 1 (98) Relative sector (7) 5 (98)
Key Data (2016E)
Price (NOK)Target price (NOK)Recommendation - changed fromRisk
ReutersBloomberg
Market cap (NOKm)Market cap (USDm)Market cap (EURm)Net debt (USDm)Net gearingNet debt/EBITDA (x) 6.5
Shares fully dil. (m)Avg daily turnover (NOKm)Free float
34.1070.00
Buy
339
UnratedHigh
PRS NO
3643,000
PRSO.OL
70%
1,550200%
8,79971.9
Share Price (12M)
Absolute performance (blue) / Relative to Norway (grey).
0200400600800
10001200
Feb Apr Jun Aug Oct Dec Feb
Financials (USD)
Source for all data on this page: SEB (estimates) and SIX/Thomson Reuters (prices)
Year end: Dec 2014 2015 2016E 2017E 2018ERevenues (m) 549 475 457 306 339Operating profit (m) 248 31 133 46 90Pre-tax profit (m) 253 31 (149) 8 53EPS (reported) 101.6 8.89 (1.81) 0.09 0.57EPS (adjusted) 93.7 8.89 0.51 0.09 0.57DPS 64.0 10.0 0.00 0.00 0.00
Revenue growth (%) 4.8 (13.5) (3.8) (33.0) 10.7Operating profit growth (%) 1.3 (87.6) 331.6 (65.3) 95.7EPS (adjusted) growth (%) (99.5) (90.5) (94.2) (82.9) 555.5
Operating margin (%) 50.7 7.1 29.1 15.1 26.7ROE (%) 32.2 2.8 (20.9) 1.0 6.2ROCE (%) 16.0 1.7 6.4 2.3 4.2
PER (x) 3.3 26.8 8.1 47.2 7.2Free cash flow yield (%) 5.1 (94.0) (88.7) 5.3 28.1Dividend yield (%) 20.7 4.2 0.0 0.0 0.0P/BV (x) 0.98 0.83 0.47 0.46 0.44
EV/Sales (x) 2.93 4.12 4.19 6.20 5.30EV/EBITDA (x) 4.6 6.8 8.0 16.1 11.1EV/EBIT (x) 5.8 57.7 14.4 41.1 19.9Operating cash flow/EV (%) 17.3 9.7 9.0 3.4 6.8EV/Capital employed (x) 0.91 0.89 0.86 0.84 0.79
Analyst Harald Øyen (47) 2100 8542 [email protected]

SEB Equity Research
Re-initiation of coverage Prosafe
2 06 February 2017
Investment case We believe the global market for offshore accommodation units is set to improve from here and resume coverage on Prosafe with a Buy rating and target price of NOK 70.
The investment case can be summarized as follows:
● The key for conclusion on the share is that it will follow asset values, not cash flow. As of the re-financing, including the mechanisms of cash sweep and step-up interest payments, cash flow to equity holders is to some extent capped over the coming years.
● Based on a 10 year analysis of offshore accommodation demand, we believe an overall uptick in offshore spending, development spending and in the final stage maintenance, modification and operations (MMO), is due. One of our key conclusions after looking deeper into the last 10 years of accommodation demand and MMO-demand is that, although some of the MMO is opex related, this segment is likely a levered game on the overall investment strategy of the oil and gas companies.
● Further, the key regions, namely the UK and Norway, have a more promising outlook for maintenance and for Norway there is an interesting current and future pipeline of potential new offshore projects. In the UK in particular, there is also an interesting market for decommissioning that we believe is about to materialise.
● On the supply side a lot has happened over the last couple of years. Compared to the outlook three years ago, around 10 units (more than 25%) have left the fleet with a mix of cancelled newbuilds and scrapped old units. The order book comprises three units, all controlled by Prosafe.
● In sum we believe the relevant offshore accommodation market should improve from here and believe that asset values will appreciate.
● Risks to our view, beyond the usual suspects such as oil price and oil companies’ investment strategies, include a slower recovery, limited new demand from large and small subsea tie-ins, no further deflation on opex and a greater lag between asset value appreciation and Prosafe’s share price due to the capped cash flow profile to equity holders post the refinancing.

SEB Equity Research
Re-initiation of coverage Prosafe
3 06 February 2017
Market fundamentals to improve We believe the offshore accommodation market is set to trough in 2017 and show the first signs of recovery. This is based on a supply side which we believe will show a net reduction of around 25% from peak in 2015 and a bottom-up analysis of the structure and drivers of accommodation demand.
Based on the findings and conclusions of the demand analysis believe the main demand sub-segment MMO, which over the past 10 years has been around 60-70% of overall demand, is in reality a levered E&P spending derivative. As such, if one believes in a shift in oil companies’ investment strategy, one should expect a recovery in the MMO market.
We believe the global floatel market is still two to four years away from the point where dayrate levels yield excess return on capital employed, but our view is that assets prices and thus share prices are likely to move well ahead of that in tandem with a market recovery.
How the global accommodation fleet was estimated in 2013 How the global accommodation fleet looks today
Source: SEB, Infield Source: SEB
E&P development spending vs MMO accommodation demand MMO and hook-up demand vs E&P development spending
Source: SEB Source: SEB
16 17 17 17 17 17 17
20
26
32
36
0
5
10
15
20
25
30
35
40
2006 2007 2008 2009 2010 2011 2012 2013 2014E 2015E 2016E
1617 17 17 17 17 17
20
23
2928
0
5
10
15
20
25
30
35
2006 2007 2008 2009 2010 2011 2012 2013 2014 2015 2016
0
1
2
3
4
5
6
7
8
9
10
60
80
100
120
140
160
180
200
2006 2007 2008 2009 2010 2011 2012 2013 2014 2015 2016 2017E 2018EUpstream development spending, rebased Global MMO accomodation contracts
R² = 0.47
R² = 0.64
0
1
2
3
4
5
6
7
8
9
10
80 100 120 140 160 180 200
Number of contracts
pr year
Upstream development spending (100 = 2006)
MMO awards
Hook-upawards

SEB Equity Research
Re-initiation of coverage Prosafe
4 06 February 2017
According to Prosafe, the first indicators of higher demand are already present, with the number of probable tenders being up by around 10, from 25 in late 2014 to around 35 by the end of 2016. The change is mainly driven by the North Sea, including UKCS and NCS.
Number of probable tenders Number of firm tenders
Source: SEB, Prosafe Source: SEB, Prosafe
Dayrates, UK and Norway (USD ‘000 per day)
Source: SEB
1814 14
20
1
14
48
6
6
7
7
4
6
3
0
5
10
15
20
25
30
35
40
Q3/13 Q3/14 Q3/15 Q4/16North Sea Africa Americas Asia/Pac
2
6
1
1
3
2
2
3 3
1
2
1 1
1
1
0
2
4
6
8
10
12
Q3/13 Q3/14 Q3/15 Q4/16North Sea Africa Americas Asia/Pac
0
50
100
150
200
250
300
350
400
Jan-05 Jan-06 Jan-07 Jan-08 Jan-09 Jan-10 Jan-11 Jan-12 Jan-13 Jan-14 Jan-15 Jan-16 Jan-17 Jan-18UK NO
SEB Equity Research
Re-initiation of coverage Prosafe
5 06 February 2017
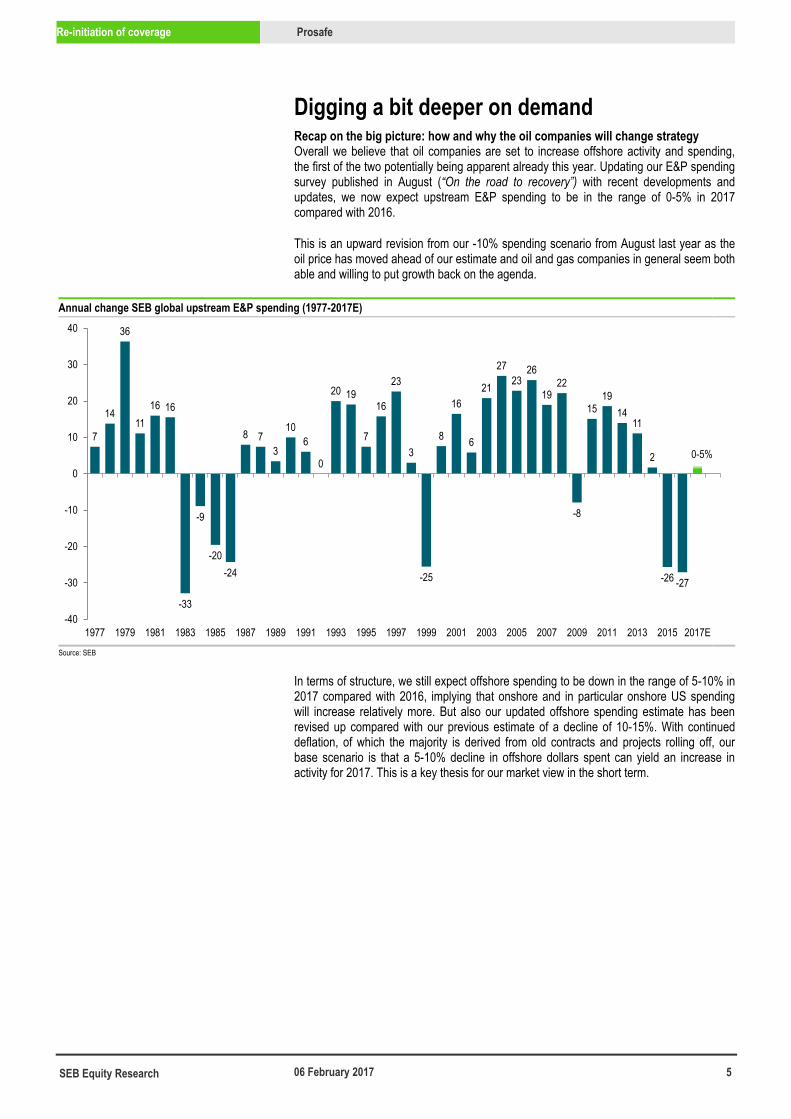
Digging a bit deeper on demand Recap on the big picture: how and why the oil companies will change strategy Overall we believe that oil companies are set to increase offshore activity and spending, the first of the two potentially being apparent already this year. Updating our E&P spending survey published in August (“On the road to recovery”) with recent developments and updates, we now expect upstream E&P spending to be in the range of 0-5% in 2017 compared with 2016.
This is an upward revision from our -10% spending scenario from August last year as the oil price has moved ahead of our estimate and oil and gas companies in general seem both able and willing to put growth back on the agenda.
Annual change SEB global upstream E&P spending (1977-2017E)
Source: SEB
In terms of structure, we still expect offshore spending to be down in the range of 5-10% in 2017 compared with 2016, implying that onshore and in particular onshore US spending will increase relatively more. But also our updated offshore spending estimate has been revised up compared with our previous estimate of a decline of 10-15%. With continued deflation, of which the majority is derived from old contracts and projects rolling off, our base scenario is that a 5-10% decline in offshore dollars spent can yield an increase in activity for 2017. This is a key thesis for our market view in the short term.
7
14
36
1116 16
-33
-9
-20-24
8 73
106
0
20 19
7
16
23
3
-25
8
16
6
21
2723
26
1922
-8
1519
1411
2
-26 -27
-40
-30
-20
-10
0
10
20
30
40
1977 1979 1981 1983 1985 1987 1989 1991 1993 1995 1997 1999 2001 2003 2005 2007 2009 2011 2013 2015 2017E
0-5%

SEB Equity Research
Re-initiation of coverage Prosafe
6 06 February 2017
2017 global upstream spending, change from 2016, by segment (SEBe Aug16 vs Jan17)
Source: SEB
We reiterate our main thesis that the oil industry is able and willing to re-start activity again following the worst industry downturn and investment cuts in the past 30 years.
Firstly, driven by underlying cost cuts, deflation (both marginal and legacy) and overall capital efficiency improvement, the global oil and gas industry is likely to generate more free cash flow at a Brent price of USD 45/bl than the average in the period 2010-14 when the oil price stayed above USD 100/bl. With SEB’s current oil price forecast (2017: USD 55/bl, 2018: USD 60/bl) the industry is estimated to generate around USD 9/bl in free cash flow – a level not seen since the period 2004 to 2007.
Oil and gas industry free cash flow per barrel: base case and USD 45/bl oil price
Source: SEB, Bloomberg
As a result of this improved cash flow, larger oil companies focus on balance sheets and dividends is set to change. Based on the long-term growth and asset depreciation, we believe the focus will again turn to reserve replacement, growth and investments.
-20%
-10%
0%
10%
20%
30%
40%
50%
Offshore US shale Other onshore
Aug-16 Jan-17
-10-15%
-0-10%
10-15%
30-40%
-10-15%
+/- 0%
3.5
5.0
2.2
-0.4
2.4
-3.9
-1.2
7.5
9.2
3.23.8
-6.0
-4.0
-2.0
0.0
2.0
4.0
6.0
8.0
10.0
2010 2011 2012 2013 2014 2015 2016E 2017E 2018E
FCF/
boe (
USD/
boe)
FCF/boe: base case FCF/boe: flat USD 45/bl

SEB Equity Research
Re-initiation of coverage Prosafe
7 06 February 2017
Organic reserve replacement ratio, 1994-2015 Reserve-life ratio, 1994-2015
Source: SEB Source: SEB
The majority of the oil and gas companies will report their reserve statement in the coming months; so far only Petrobras has published official numbers recording an organic reserve replacement for 2016 of 25%.
Petrobras organic reserve replacement ratio, 2006-2016
Source: SEB, Petrobras
102%110%
128%
152%155%
123%
110%112%103%95%
85%78%
89%
107%
91%
108%111%
126%
96%
124%114%
26%
0%
25%
50%
75%
100%
125%
150%
175%
1994 1996 1998 2000 2002 2004 2006 2008 2010 2012 2014
12.0 12.012.2
12.6
12.8 12.9
12.5 12.5
12.312.1
11.811.9
12.912.8
12.6
12.9 12.8
13.3
13.0
13.313.1
11.9
10.5
11.0
11.5
12.0
12.5
13.0
13.5
1994 1996 1998 2000 2002 2004 2006 2008 2010 2012 2014
82%
133%
36%
209%
172%
116%101%
145%117%
-183%
25%
-250%
-150%
-50%
50%
150%
250%
-250%
-150%
-50%
50%
150%
250%
2006 2007 2008 2009 2010 2011 2012 2013 2014 2015 2016
100%
SEB Equity Research
Re-initiation of coverage Prosafe
8 06 February 2017
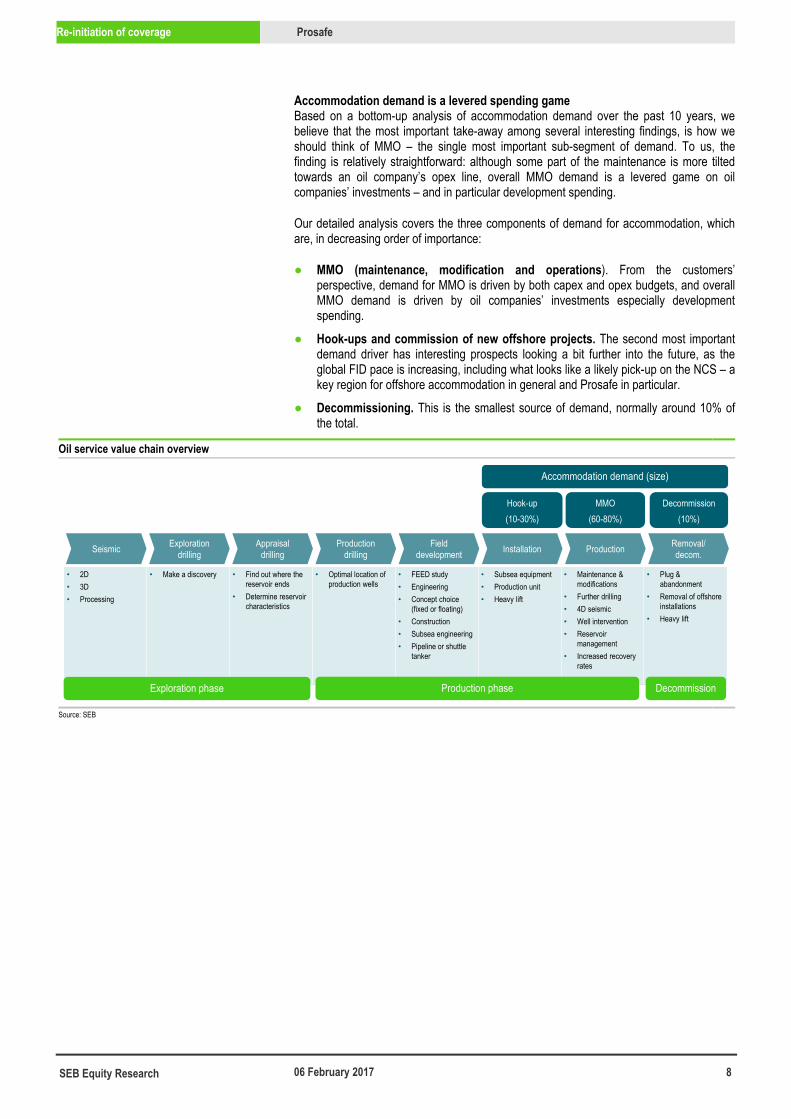
Accommodation demand is a levered spending game Based on a bottom-up analysis of accommodation demand over the past 10 years, we believe that the most important take-away among several interesting findings, is how we should think of MMO – the single most important sub-segment of demand. To us, the finding is relatively straightforward: although some part of the maintenance is more tilted towards an oil company’s opex line, overall MMO demand is a levered game on oil companies’ investments – and in particular development spending.
Our detailed analysis covers the three components of demand for accommodation, which are, in decreasing order of importance:
● MMO (maintenance, modification and operations). From the customers’ perspective, demand for MMO is driven by both capex and opex budgets, and overall MMO demand is driven by oil companies’ investments especially development spending.
● Hook-ups and commission of new offshore projects. The second most important demand driver has interesting prospects looking a bit further into the future, as the global FID pace is increasing, including what looks like a likely pick-up on the NCS – a key region for offshore accommodation in general and Prosafe in particular.
● Decommissioning. This is the smallest source of demand, normally around 10% of the total.
Oil service value chain overview
Source: SEB
• 2D• 3D• Processing
• Make a discovery • Find out where the reservoir ends
• Determine reservoir characteristics
• Optimal location of production wells
• FEED study• Engineering• Concept choice
(fixed or floating)• Construction• Subsea engineering• Pipeline or shuttle
tanker
• Subsea equipment• Production unit• Heavy lift
• Maintenance & modifications
• Further drilling• 4D seismic• Well intervention• Reservoir
management• Increased recovery
rates
• Plug &abandonment
• Removal of offshore installations
• Heavy lift
Exploration phase Production phase Decommission
Seismic Explorationdrilling
Appraisaldrilling
Productiondrilling
Fielddevelopment Installation Production Removal/
decom.
Accommodation demand (size)
Hook-up(10-30%)
MMO(60-80%)
Decommission(10%)

SEB Equity Research
Re-initiation of coverage Prosafe
9 06 February 2017
A look in the rear-view mirror, analyzing 10 years of accommodation demand, leads us to the following conclusions:
● The UK and Norway are the two most stable basins of accommodation demand. Comparing the two, the UK has had a larger share of both the total number of accommodation jobs and the number adjusted for duration – around 315 rig months contracted versus 246 in Norway. As such, the UK has been the marginally more important accommodation market driven by high MMO activity.
● Brazil has had the biggest swing. After several years with huge demand, the accommodation demand has been reduced substantially, alongside the overall slowdown in Petrobras’s investments and project execution. Should Petrobras’s financial position and overall strategy change for the better, or Brazil’s offshore and in particular pre-salt development be more diversified through stronger international ownership, this should be a substantial positive for global accommodation demand. A similar argument applies for the Mexican market in our view.
● The average accommodation contract over the past 10 years was around 11 months, but with a substantial variance. Brazil and Mexico were at the higher end at 37 months and 42 months respectively, whereas in UK and Norway the average contract duration has been around 10 months. This is interesting in more than one context, but to us helps an understanding the dynamics of dayrate levels across the regions.
Accommodation rig moths by year started, 2006-16 Number of accommodation contracts, 2006-16
Source: SEB Source: SEB
Demand by region (rig months) 2006-16 Demand by region (number of contracts) 2006-16
Source: SEB Source: SEB
22 6 12 15 23
113
6 19 11 14
2532 24 13 8
60
3746 77
296 10
95
14
22
6
12
8 3 5
13
128
96
48
12
7
14
5
0
50
100
150
200
250
300
350
2006 2007 2008 2009 2010 2011 2012 2013 2014 2015 2016WAFR NO UK Russia Mexico US GoM SE Asia Brasil Australia
4 4
10
67
11
1
6
1615
9
3
0
2
4
6
8
10
12
14
16
18
2006 2007 2008 2009 2010 2011 2012 2013 2014 2015 2016 2017
UK, 314
NO, 246
Brazil, 284
Mexico, 132
Aus, 36SE Asia, 29
US GoM, 18 Row, 38
UK, 45
NO, 22
Brazil, 7
Meixco, 6
Aus, 4
SE Asia, 4
US GoM, 3
Row, 10

SEB Equity Research
Re-initiation of coverage Prosafe
10 06 February 2017
Average contract length per region (months) Average contract length per year (months)
Source: SEB, sorted from left to right on total number of accommodation months awarded 2006-2016 Source: SEB, sorted from left to right on total number of accommodation months awarded 2006-2016
Number of accommodation contract by type, 2006-2016 Number of accommodation contracts by operator, 2006-2016
Source: SEB Source: SEB, the chart excludes operators with one accommodation contracted awarded
8
37
10
42
97
22
68
46
2
12 11
15
65
29
78
12
9
6
0
5
10
15
20
25
30
35
2006 2007 2008 2009 2010 2011 2012 2013 2014 2015 2016
Hook-up, 36
MMO, 63
Other, 2 11 11
10 10
8
7
5 5
4 4
3 3
2 2 2 2
0
2
4
6
8
10
12

SEB Equity Research
Re-initiation of coverage Prosafe
11 06 February 2017
MMO (maintenance, modification and operations) There is a clear paradox in accommodation demand in that the single most important source of demand is also the segment with the least visibility. Our conclusion is that if one believes that overall development activity and spending will rise, so will MMO.
Based on the experience of the past 10 years, MMO accommodation demand tends to be more closely linked to annual upstream E&P development spending than to hook-ups, which normally have longer lead times and thus to some extent greater visibility.
To some extent one could argue that this contradicts the thesis that MMO demand is driven by the oil companies’ opex. We see two reasons for this: modifications can often be investments and secondly, at the end of the day, there is probably not much difference in an oil company’s strategy between opex and capex.
Global upstream development spending (left) and MMO accommodation demand (right)
Source: SEB
This is further supported by the analysis below of the correlation between the number of MMO and hook-up accommodation contracts and annual upstream investments. To us the chart below and the correlations seem to support the argument that MMO activity has the higher beta to annual development investment in the oil and gas industry. With this, and given our outlook for offshore oil and gas investments and activity, we believe there is more upside to accommodation demand through increased MMO activity than the current basket of tenders implies.
0
1
2
3
4
5
6
7
8
9
10
60
80
100
120
140
160
180
200
Number of MMO
contracts
Development spending, rebased
Upstream development spending, rebased Global MMO accomodation contracts

SEB Equity Research
Re-initiation of coverage Prosafe
12 06 February 2017
Upstream development spending (rebased) and number of floatel contracts
Source: SEB
Looking closer at the modification component within the MMO segment – which in some cases can be argued to touch on the second most important demand sub-segment, hook-ups and commissioning through subsea tie-ins – we believe that one leading indicator is the magnitude and structure of the PDO project pipeline.
Based on our own bottom-up analysis of offshore projects in the pipeline, the number of projects being sanctioned globally is set to increase after being cut by around 75% from its 2007-14 average during the downturn in the past couple of years.
For 2017 and 2018 our bottom up analysis shows that around 55 projects globally are prospects for being sanctioned, up from around 20 in 2015 and 2016.
The lead time from FID to accommodation contract is normally around two to three years – but in our view FIDs are good leading indicator for demand and likely the most important inflection point for changes in asset valuation.
Annual number of global offshore FIDs
Source: SEB
R² = 0.47
R² = 0.64
0
1
2
3
4
5
6
7
8
9
80 100 120 140 160 180 200
Number of contracts
pr year
Upstream development spending (100 = 2006)
MMO awards
Hook-upawards
40
13
9
32
24
0
5
10
15
20
25
30
35
40
45
2007-2014 avg 2015 2016E 2017E 2018E

SEB Equity Research
Re-initiation of coverage Prosafe
13 06 February 2017
SEB offshore FID tracking list, 2017-18
2017
Operator
Region
Likley FID
Water depth (m)
Water depth (segment)
Size mmboe
Development type
Project Mad Dog phase 2 BP US GoM 2017 1999 UDW 472 Subsea Leviathan Noble Energy Middle East 2017 1634 UDW 3900 Subsea Coral Eni Eastern Africa 2017 2260 UDW 1096 FLNG R-Series Reliance SE Asia 2017 2260 UDW Subsea Snefrid Nord Statoil N Europe 2017 69 SW Subsea Baleia Ana Petrobras South America 2017 1480 DW 20 FPSO Utgard UK Statoil N Europe 2017 114 SW 12 Subsea Fortuna FLNG Ophir Energy West Africa 2017 1680 UDW 411 FLNG Ca Rong Do Repsol SE Asia 2017 319 SW 78 FPSO Kangaroo Karoon Brazil 2017 65 SW FPSO Kudu NAMCOR West Africa 2017 72 SW FPSO Libra Petrobras Brazil 2017 1964 UDW 5104 FPSO Sepia Petrobras Brazil 2017 2131 UDW 360 FPSO Greater Jubilee Tullow West Africa 2017 1158 DW 55 Golfinho Anadarko Eastern Africa 2017 890 DW 3456 Subsea Liza ExxonMobil South America 2017 1743 UDW 827 FPSO Rosebank Chevron N Europe 2017 1100 DW 240 FPSO ZabaZaba Eni West Africa 2017 1720 UDW 469 FPSO Etan Eni West Africa 2017 1720 UDW 469 Subsea Liwan Phase 2 Husky SE Asia 2017 1300 DW Ande Ande Lumut AWE SE Asia 2017 73 SW 75 FPSO Snorre 2040 Statoil N Europe 2017 307 SW 150 Subsea Johan Castberg Statoil N Europe 2017 373 SW 539 FPSO Apsara Kris Energy West Africa 2017 1800 UDW FPSO Snadd North Aker BP N Europe 2017 391 SW 150 Subsea Penguins Shell N Europe 2017 188 SW 38 FPSO Yme Okea/Repsol N Europe 2017 93 SW Snadd North Aker BP N Europe 2017 115 SW Subsea Itapu BP West Africa 2017 2009 UDW 399 FPSO Ubon Chevron SE Asia 2017 76 SW 122 Fixed platform Njord Future Statoil N Europe 2017 330 SW 160 Semi White Rose extension Husky 2017 Skarfjell Wintershall N Europe 2017 368 SW 139 Subsea
2018 Project Buckskin Repsol US GoM 2018 2110 UDW 127 Shenandoah (WR 52) Anadarko North America 2018 1772 UDW 500 Spar Cosmos Fields Medco Energi Northern Africa 2018 120 SW 7 FPSO Marconi Engie E&P N Europe 2018 95 SW 20 Subsea Vito (MC 984) Shell North America 2018 1231 DW 298 Semi Sirasun Energi Mega Persada SE Asia 2018 1500 UDW Cameia Cobalt West Africa 2018 1720 UDW Angelin BP West Africa 2018 1600 UDW Platina BP West Africa 2018 1700 UDW Block A KrisEnergy SE Asia 2018 73 SW 8 Fixed platform Liuhua-1 CNOOC SE Asia 2018 1339 DW FPSO Ana & Doina Carlyle Group Eastern Europe 2018 84 SW 60 Fixed platform Block 4 Shell Eastern Africa 2018 1405 DW 1073 Subsea Rossukon KrisEnergy SE Asia 2018 65 SW 11 Fixed platform Lucapa Chevron West Africa 2018 1800 UDW 300 Gendola Hub Chevron SE Asia 2018 1263 DW Nsiko Chevron West Africa 2018 1400 DW 288 Negage Chevron West Africa 2018 1444 DW 120 Hadrian North ExxonMobil US GoM 2018 2060 UDW 304 Block 18 West BP Middle Africa 2018 1500 UDW 223 Subsea Carcara Petrobras South America 2018 2027 UDW 980 FPSO West Med Deepwater BP Northern Africa 2018 998 DW 387 Subsea Buzzard Phase 2 Nexen N Europe 2018 98 SW 30 Fixed platform Tiber (KC 102) Chevron North America 2018 1259 DW 554 Spar Source: SEB
Understanding the structure of the project list is of relevance in estimating accommodation demand. The use of floatels is more common on fixed installation and spar platforms than for semis and FPSOs, as more of the commissioning activities on a floating unit can typically be done before it is towed offshore.
However, there are examples where FPSOs and semis have used floatels –recently with the Goliat FPSO hook-up where Floatel Superior was chartered in mid-2015.

SEB Equity Research
Re-initiation of coverage Prosafe
14 06 February 2017
On the other hand, we have seen fixed platform developments which have not used floatels (Gudrun, Valemon). As such one should keep in mind that there is no simple one-to-one correlation between field concept selection and the use of incremental accommodation during hook-up and commissioning.
In conclusion, the overall increase in FIDs is positive in our view; however the tendency to favour floating production units is marginally disadvantageous for overall accommodation demand.
Offshore projects by development type, 2017E-2019E
Source: SEB
Further, looking closer at the PDO pipeline on the NCS, the slowdown in new developments between 2013 and 2015 is now set to rebound with more new projects on the agenda according to our estimates. Again, there will be a lead-time from PDO submission to actual accommodation demand and contract awards, but we believe asset valuation will look more to leading indicators.
Number of PDOs (by year approved, 2Y avg) NCS
Source: SEB, Norwegian Petroleum Directorate
11
4
11
2
14
3
7
1
4
11 12
1
0
2
4
6
8
10
12
14
16
2017 2018 2019Subsea FLNG FPSO Fixed platform Semi Spar
0
1
2
3
4
5
6
7
8
9
10 This lowering currentdemand...
...this triggering higherfuture demand

SEB Equity Research
Re-initiation of coverage Prosafe
15 06 February 2017
Addressing the structure of the current and potential pipeline of new projects on the NCS, the majority of the projects are subsea tie-backs, which transferred to accommodation demand are relevant when they require substantial modification jobs at existing platforms.
PDO project list, 2013-19E
PDO year Project Operator Project type 2013 Ivar Aasen DetNor Fixed platform Gina Krog Statoil Fixed platform Aasta Hansteen Statoil Spar Oseberg Delta 2 Statoil Subsea tie-back 2014 Gullfaks Rimfaksdalen Statoil Subsea tie-back 2015 Johan Sverdup phase 1 Statoil Fixed platform Gullfaks Sør Statoil Subsea tie-back Gullfaks / Lista Statoil Subsea tie-back Maria Wintershall Subsea Oseberg Vestflanken 2 Statoil Subsea tie-back 2016 Dvalin DEA Subsea tie-back Trestakk Statoil Subsea tie-back Byrding Statoil Subsea tie-back Utgard Statoil Subsea tie-back Oda Centrica Subsea tie-back 2017 Snefrid Nord Statoil Subsea tie-back Snorre2040 Statoil Subsea tie-back Johan Castberg Statoil FPSO Snadd North AkerBP Subsea tie-back Yme Repsol Njord Future Statoil Subsea tie-back Skarfjell Wintershall Subsea tie-back/FPSO Storklakken AkerBP Subsea tie-back 2018 Mikkel South Statoil Subsea tie-back Fogelberg Centrica Subsea tie-back Pil&Bue VNG Subsea tie-back Valhall Flank West AkerBP Subsea tie-back 2019 Luno II Lundin Subsea tie-back Snilehorn Statoil Subsea tie-back Krafla/Frigg Gamme Delta Statoil/Centrica FPSO Garantiana Total Johan Sverdrup phase 2 Statoil Fixed platform Source: SEB, Norwegian Petroleum Directorate (NPD)

SEB Equity Research
Re-initiation of coverage Prosafe
16 06 February 2017
Thoughts on maintenance on NCS and UKCS For maintenance activity, the two most important regions for accommodation demand over the past 10 years have been the NCS and UKCS. The MMO market in UK has the largest share of contracts awarded (31), while Norway is second (11).
Break-down of global accommodation demand 2006-2016 (number of contracts)
Source: SEB
For maintenance, we believe looking at overall investment estimates for both NCS and UKCS should provide an insight into the overall activity level.
According to current estimates (NPD and UK Oil & Gas), it looks like we are at or close to trough levels in 2016-17. For the NCS in particular – should the current investment estimates for existing production facilities come through – we see this as supportive for an increase in maintenance work and thus accommodation activity. The relatively old average age of existing platforms on the NCS is a reason why this pocket of investments should develop positively if our base scenario for oil prices and overall investment materializes.
Total investments NCS (NOKbn) Investments in existing production installations NCS (NOKbn)
Source: SEB, Norwegian Petroleum Directorate (NPD) Source: SEB, Norwegian Petroleum Directorate (NPD)
101
35
31
11
14
10
0
20
40
60
80
100
120
Global UK NO RoW
MMO Hook-up/tie-ins
45
21
8996
103112
103
132
161
187 183
162
136
121115
124
0
50
100
150
200
2006 2007 2008 2009 2010 2011 2012 2013 2014 2015 2016 2017E 2018E 2019E
12
16 17
23
2826
32
41
32
20
1417
2123
-5
5
15
25
35
45
2006 2007 2008 2009 2010 2011 2012 2013 2014 2015 2016 2017E 2018E 2019E

SEB Equity Research
Re-initiation of coverage Prosafe
17 06 February 2017
Total investments UKCS (GBPbn) Development investments UKCS (GBPbn)
Source: SEB, UK Oil & Gas Source: SEB, UK Oil & Gas
Decommission The third and smallest sub-segment relevant for offshore accommodation demand is decommissioning. We regard the UKCS as the most relevant basin, characterised by mature fields and installed base of platforms and fields in structural decline. This is likely to drive investments in decommissioning and according to the UK regulator, decommissioning capex is set to double from 2014 (GBP 1.0bn) to 2017-18 (GBP 2.0bn).
UK Crude production (‘000 barrels/d) UK decommission investments (GBPbn)
Source: SEB, Bloomberg Source::SEB
Average age of North Sea installations
Source: SEB, OSPAR
6.6 6.6 6.2 6.37.4
10.2
13.8
16.9 16.9
13.5
11.2
10.011.0
0.00
2.00
4.00
6.00
8.00
10.00
12.00
14.00
16.00
18.00
2006 2007 2008 2009 2010 2011 2012 2013 2014 2015 2016E 2017E 2018E
5.7 5.34.8 4.9
6.0
8.5
11.4
14.4 14.8
11.6
9.0
7.38.3
0.0
2.0
4.0
6.0
8.0
10.0
12.0
14.0
16.0
2006 2007 2008 2009 2010 2011 2012 2013 2014 2015 2016E 2017E 2018E
0
500
1,000
1,500
2,000
2,500
3,000
2000 2001 2002 2003 2004 2005 2006 2007 2008 2009 2010 2011 2012 2013 2014 2015 2016 2017 2018
0.1 0.2 0.2
0.4 0.30.5
0.7
0.91.0
1.1
1.5
2.0 2.0
0.0
0.5
1.0
1.5
2.0
2.5
2006 2007 2008 2009 2010 2011 2012 2013 2014 2015 2016E 2017E 2018E
24
26 26
28
Denmark Netherlands Norway UK

SEB Equity Research
Re-initiation of coverage Prosafe
18 06 February 2017
Supply – 25% net fleet reduction from peak The global fleet of floating accommodation units is consolidating. Further, driven by scrapping and cancelled newbuilds, what was estimated in 2013 to be a fleet of 36 units is today 27. Including our estimates of future scrapping and newbuilds, the fleet will go from 27 units currently to 24 units over the next couple of years.
How the global floater fleet was estimated to in 2013 How the global floater fleet looks today
Source: SEB, Infield Source: SEB
Accommodation fleet development, SEBe 2017-2018/2020
Source: SEB
16 17 17 17 17 17 17
20
26
32
36
0
5
10
15
20
25
30
35
40
2006 2007 2008 2009 2010 2011 2012 2013 2014E 2015E 2016E
1617 17 17 17 17 17
20
23
29
26
0
5
10
15
20
25
30
35
2006 2007 2008 2009 2010 2011 2012 2013 2014 2015 2016
26 25
4 3
SEBe 2017 Scrapping Newbuilds SEBe 2018-2020

SEB Equity Research
Re-initiation of coverage Prosafe
19 06 February 2017
Global accommodation fleet
-------- Today -------- -------- 2018E-20E -------- Owner Prosafe E SEBE Scrapping Newbuilds SEBE Mkt share (%) Prosafe 10 9 2 3 10 40 Floatel 5 5 0 5 20 Cotemar 3 3 1 0 2 8 Pemex 1 1 0 1 4 COSL 1 1 0 1 4 FOE 1 0 0 0 0 OOS 2 2 0 2 8 YiuLian 1 1 1 0 0 0 POSH 2 2 0 2 8 Teekay 0 1 0 1 4 Master Marine 1 1 0 1 4 Total 27 26 4 3 25 Source: SEB
Global accommodation fleet – rig details
Source: SEB
Safe Hibernia 632 - 1977 40 ScrappedSafe Britannia 800 DP2 1980 37 ScrappedSafe Caledonia 454 DP2 x 1982 35 2017 On contract Total - Elgin-Franklin UKJasminia 535 - 1982 35 ScrappedSafe Lancia 600 DP2 1982 35 ScrappedSafe Regency 770 DP2 1982 35 2021 IdleSafe Astoria 349 - 1983 34 2017 Idle Idle, since mid-2015Safe Bristolia 316-588 - 1983 34 2021 Idle Idle, since mid.-2016Safe Scandinav ia 159 - x 1984 33 2019 TSV Statoil - TSV NorwaySafe Regalia 306 DP2 x x 1985 32 2019 Idle Idle, since late-2016Safe Concordia 390 DP2 2005 12 2020 On contract Petrobras BrasilSafe Boreas 450 DP3 x x 2015 2 2020 On contract Statoil - Mariner NorwaySafe Zephyrus 450 DP3 x x 2016 1 2020 On contract AkerBP - Ivar Aasen NorwaySafe Notos 500 DP3 x 2016 1 2021 On contract Petrobras BrasilSafe Eurus 500 DP3 x 2019 YardNova 490 DP3 x x 2018 YardVega 490 DP3 x x 2019 YardFloatel Superior 440 DP3 x x 2010 7 2020 Idle Idle, since mid-2016Floatel Reliance 500 DP2 2010 7 2020 Idle Idle, since early-2016Floatel Victory 500 DP3 x 2014 3 2019 On contract BP - Clair Ridge UKFloatel Endurance 440 DP3 x x 2015 2 2020 On contract Total - Martin Linge NorwayFloatel Triumph 500 DP3 x 2016 1 2021 On contract Inpex - Ichthys Australia
Teekay/Logitel Arendal Spirit 500 DP3 x 2015 2 2020 On contract Petrobras BrasilIolair 270 DP2 x 1982 35 N/A On contract Pemex MexicoCotemar Neptuno 744 DP3 x 2014 3 2019 On contract Pemex MexicoCotemar Atlantis 744 DP3 x 2015 2 2020 On contract Pemex Mexico
Pemex Chemul 450 DP2 1982 35 2020 On contract Pemex MexicoPOSH Xanadu 750 DP3 2014 3 2019 On contract Petrobras BrasilPOSH Arcadia 750 DP3 2015 2 2020 On contract Shell - Prelude AustraliaOOS Gretha 618 DP3 2012 5 2017 On contract Petrobras BrasilOOS Prometheus 400 2013 4 2018 On contract Petrobras Brasil
COSL COSL Rival 358 - x x 1976 41 2017 On contract ConocoPhillips - Judy UKFred Olsen Borgholm Dolphin 274 - x 1978 39 2017 Idle Idle, since mid-2015
YiuLian Jasper Cosmopolitan1 500 - 1977 40 2019 YardMaster Marine Haven 447 jack-up x x 2011 6 2021 On contract Statoil - Johan Sverdrup Norway
Prosafe
Flotel
Cotemar
POSH
OOS
Owner Name # beds SPS Rig statusDP system
NCS compliant
UK compliant
Delivery Age (yrs)
Contract Region

SEB Equity Research
Re-initiation of coverage Prosafe
20 06 February 2017
Greed is good - but only up to a certain point Looking closer at the supply of accommodation unitsont the NCS leaves us with two reflections:
● Currently there are nine units compliant for operations in Norway (six excluding newbuilds) in the hands of four operators. Together with the newly acquired Axis units, Prosafe controls five of the nine. Looking further down the road the total number could fall to seven, with Safe Regalia and COSL Rival as scrapping candidates.
● This leaves a Norwegian market close to fully controlled by Prosafe and Floatel – a relatively consolidated market in our view.
Number of NCS compliant units per owner
Source: SEB
However, we argue that further consolidation and a scenario where Prosafe and Floatel want to merge could be a long term value-destructive move. We arrive at this conclusion by asking what the real trigger was for Prosafe to lose control of its market share and financials of what used to be the sweet spot in the asset heavy part of the oilfield service market.
By having abnormal returns on capital employed (20-30%) and more importantly keeping them too high for a too long period of time, the end game was predetermined: more supply would enter this market.
In our view, on the assumption that the three main sources of resource – capital, yard capacity and people – are available over the next three to five years, striving for more consolidation in what will remain a highly consolidated market, will in our view increase the probability of trading short-term gain for long-term pain, because it would attract new players into the market.
45
2
21
11
Today 2018Prosafe Floatel Master Marine COSL

SEB Equity Research
Re-initiation of coverage Prosafe
21 06 February 2017
Valuation What is an accommodation rig worth? There are two issues in valuing an accommodation unit – what is it worth and when is it likely that this asset value will materialize?
Based on our analysis below, the mid-cycle valuation for a UK or Norwegian rig with 30 years of lifetime is in the range of USD 165m-300m in our view, while in a high-cycle the fair value range is estimated at around USD 250-350m. In a downcycle, rigs tend not to have a material value.
For the second question, we believe asset prices will move with leading indicators.
For the net present value calculations below, based on a rig operating in the UK or Norway, these are the assumptions:
● 70% utilisation (taking into account cycle, operational downtime and season)
● 30 years lifetime
● Maintenance capex: USD 5m/yr (Prosafe guides for USD 2.5m/unit in 2017)
● SPS capex: USD 10m, USD 25, USD 100, USD 50m and USD 50m
● 5% tax (Prosafe is paying around 3%)
● SG&A: USD 1m/yr
● 10% WACC
Net present value sensitivities – dayrates and opex Net present value sensitivities – dayrate and utlisation
Source: SEB Source: SEB
Further on opex, we note the following (UK and Norway average):
● 2014 actual (Prosafe): USD 70,000 per day
● 2016 guidance (Prosafe): USD 55,000 per day
● 2017-18 estimates (SEB): USD 45,000 per day
USDm, 70% utl127 50 100 150 200 250 300
80 -264 -149 -34 81 196 31070 -229 -114 0 115 230 34560 -195 -80 35 150 265 38050 -160 -45 69 184 299 41440 -126 -11 104 219 334 449
Dayrate
Opex
USDm, opex 45127 50 100 150 200 250 300
80% -144 -13 119 250 381 51370% -160 -45 69 184 299 41460% -177 -78 20 119 217 31650% -193 -111 -29 53 135 21740% -210 -144 -78 -13 53 119
Dayrate
Utl

SEB Equity Research
Re-initiation of coverage Prosafe
22 06 February 2017
Implied values At a share price of NOK 36 (close Friday 27 Jan 2017), we derive an implied value per accommodation unit of USD 182m.
The main assumptions include:
● A fleet of nine units (including three newbuilds and two more units scrapped), with an average age of 12 years. Effectively we believe the average remaining life time for this fleet is around 20-25 years.
● Remaining capex of around USD 300m, implying an effective capex per newbuild of around USD 125m. We believe Prosafe has a very solid negotiating position with the yard, including USD 60m in claim deposit secured by Bank of China in an event of no delivery of Nova and Vega.
● Safe Scandinavia value of USD 250m; the net present value of the current firm EBITDA backlog and 50% of the four year option period is around USD 175m.
Implied value per accommodation unit
USDNOK 8.31 Current SEB share price target price
Share price (NOK) 20 36 40 50 60 70 80 90 # shares (fully diluted) 88 88 88 88 88 88 88 88 Market cap (USDm) 212 381 424 529 635 741 847 953
Debt (USDm) 1,426 1,426 1,426 1,426 1,426 1,426 1,426 1,426 Cash (USDm) 183 183 183 183 183 183 183 183 NIBD (USDm) 1,243 1,243 1,243 1,243 1,243 1,243 1,243 1,243
EV (USDm) 1,455 1,624 1,666 1,772 1,878 1,984 2,090 2,196 Remaining capex (USDm) 300 300 300 300 300 300 300 300 SG&A (USDm) 150 150 150 150 150 150 150 150 Fully invested EV (USDm) 1,905 2,074 2,116 2,222 2,328 2,434 2,540 2,646
Safe Scandinavia (USDm) 250 250 250 250 250 250 250 250 Remaining EV (USDm) 1,655 1,824 1,866 1,972 2,078 2,184 2,290 2,396
Accommodation fleet Current fleet 9 9 9 9 9 9 9 9 Assumed scrapping 2 2 2 2 2 2 2 2 Newbuilds 3 3 3 3 3 3 3 3 Future fleet 10 10 10 10 10 10 10 10 Implied value per rig (USDm) 165 182 187 197 208 218 229 240
Avg age current fleet (today, yrs) 21 21 21 21 21 21 21 21 Avg age future fleet (2018, yrs) 12 12 12 12 12 12 12 12 Avg remaining effectve lifetime 20-25 20-25 20-25 20-25 20-25 20-25 20-25 20-25 Source: SEB
DCF-backed target price of NOK 70 Clearly the current spot value for an accommodation rig is well below current implied values. Based on our analysis of supply and demand, which in turn points to a tightening accommodation market, we believe asset values will appreciate. Our target price of NOK 70 is based on a DCF value of each rig on normalised rate and opex levels, applying a 10% WACC.

SEB Equity Research
Re-initiation of coverage Prosafe
23 06 February 2017
DCF rig valuation
EBITDA LT assumptions LT value Rig value Rig Delivered backlog Dayrate Opex Capex/yr Utl' (%) FCF/yr Years left Value PV (USDm) Norway Sefe Zephyrus 2016 1 225 -60 -5 70 31 24 275 171 275 Safe Boreas 2015 110 225 -60 -5 70 31 23 272 169 279 Safe Scandinavia (TSV) 1984 173 250 -130 -5 75 16 15 122 76 248 Regalia 1985 0 225 -60 -5 70 31 15 233 144 144 Nova 2018 0 225 -60 -5 70 31 30 288 179 288 Vega 2019 0 225 -60 -5 70 31 30 288 179 288
UK Safe Eurus 2019 0 200 -45 -5 70 30 30 280 174 280 Safe Caledonia 1982 4 150 -45 -5 70 17 15 129 80 84 Safe Bristolia 1983 0 150 -45 -5 70 17 15 129 80 80
International Safe Notos 2016 106 200 -50 -5 70 28 24 250 155 261 Safe Astoria 1983 0 Safe Concordia 2005 9 150 -50 -5 70 15 15 115 71 115 Safe Regency 1982 0 Total rig value 2,342 Source: SEB
DCF summary (USDm)
Gross rig value 2,342 NPV capex (2017-) (225) S&A (150) EV 1,967 NIBD (end-16) 1,223 DCF equity value (USDm) 744 No.shares (m, fully diluted) 88.0 DCF per share (USD) 8.5 USD/NOK 8.3 DCF per share (NOK) 70 Source: SEB

SEB Equity Research
Re-initiation of coverage Prosafe
24 06 February 2017
Estimates We have changed our estimates with our updated market view and we have incorporated the re-financing.
Earnings revision
(USD) 2016E 2017E 2018E Revenues (m)
Old 434 338 438 New 457 306 339 Change (%) 5 (10) (23) Operating profit (m)
Old 71 (19) 85 New 133 46 90 Change (%) 87 348 6 Pre-tax profit (m)
Old 11 (69) 39 New (149) 8 53 Change (%) (1499) 112 36 EPS (reported)
Old 0.03 (0.25) 0.14 New (0.61) 0.09 0.57 Change (%) (2114) 136 311 EPS (adjusted)
Old 0.03 (0.25) 0.14 New 0.17 0.09 0.57 Change (%) 470 136 311 Source: SEB
Prosafe estimate overview (USDm) P&L 2015 2016 2017E 2018E 2019E Estimate coverage 2015 2016 2017E 2018E 2019E Revenues 475 457 306 339 449 Backlog 285 263 128 Opex -212 -208 -148 -137 -204 Other 0 0 0 0 0 SEB revenue est 306 339 449 S&G 0 -10 -40 -40 -40 SEB est coverage (%) 93 78 29 EBITDA 263 239 118 162 205 D&A -232 -106 -72 -72 -72 Cons (Bloomberg) revenue est 316 405 552 EBIT 31 133 46 90 134 Cons (Bloomberg) est coverage (%) 90 65 23 Net interest 2 -77 -38 -38 -37 Other financials 0 -205 0 0 0 Pre-tax profit 33 -149 8 53 97 Cash flow 2015 2016 2017E 2018E 2019E Tax -11 -11 0 -2 -4 Funds from operations 237 102 65 124 168 Minorities 0 0 0 0 0 Operating cash flow 172 172 64 122 164 Net income 22 -160 8 51 93 Capex -701 -494 -45 -20 -70
Free cash flow -529 -323 19 102 94 EPS (reported) 0.14 -0.72 0.12 0.77 1.42 Dividend paid -34 0 0 0 0 EPS (adjusted, fully diluted) 0.70 0.07 0.09 0.57 1.05 Equity issue 66 127 0 0 0
Netchange in debt 474 427 15 -14 -56 DPS 0.10 0.00 0.00 0.00 0.00 Other -42 -67 0 -70 -77 Payout ratio 14% 0.00 0.00 0.00 0.00 Net change in cash -66 164 35 18 -39
Balance sheet 2015 2016 2017E 2018E 2019E Key credit metrics 2015 2016 2017E 2018E 2019E Fixed assets 1,807 2,196 2,169 2,118 2,116 TIBD 1,247 1,444 1,459 1,446 1,390 Intangibles 227 227 227 227 227 NIBD 1,190 1,223 1,204 1,172 1,154 Other current assets 91 91 91 91 91 NIBD/EBITDA (x) 4.5 5.1 10.2 7.2 5.6 Cash 57 222 257 275 236 TIBD/EBITDA (x) 4.7 6.0 12.4 8.9 6.8 Total Assets 2,187 2,757 2,780 2,804 2,828 Interest cover (x) 3.1 3.1 4.3 5.6
Equity ratio (%) 33 40 40 41 44 Long term debt 1,108 1,431 1,446 1,420 1,351 Other liabilities 59 102 102 102 102 Short term debt 140 13 13 26 39 Other short term liabilities 166 106 106 106 106 Equity 715 1,105 1,113 1,164 1,256 Total equity and liabilities 2,187 2,757 2,780 2,804 2,828 NIBD 1,190 1,223 1,204 1,172 1,154 Source: SEB

SEB Equity Research
Re-initiation of coverage Prosafe
25 06 February 2017
Overview
Investment case ● We believe the offshore accommodation market is set to trough in 2017 and show the first signs of recovery. This is based on a supply side which we believe will show a net reduction of around 25% from peak in 2015 and an overall increase in oil and gas companies investment strategies.
Company profile ● Prosafe is the world's leading owner and operator of semi-submersible accommodation/service rigs. The company owns 10 semi-submersible accommodation vessels, of which three are under construction. These units are employed to cater for increased manpower requirements at offshore facilities, typically during the hook-up and commissioning of new facilities, maintenance work or during decommissioning. The company has over 30 years’ of operational experience and is domiciled in Cyprus with offices in Singapore, Norway and the UK.
Valuation approach ● Based on DCF valuation using mid-cycle rates and opex and a WACC of 10% we derive a target price of NOK 70.
Target price risks ● Risks to target price include oil price, E&P companies investment strategies,
downtime on active rigs, overall cost inflation and capex overruns on newbuilds or maintenance work.

SEB Equity Research
Re-initiation of coverage Prosafe
26 06 February 2017
PER - 12 month forward P/BV - 12 month forward
Source: SEB Source: SEB
EV/Sales - 12 month forward EV/EBITA - 12 month forward
Source: SEB Source: SEB
Net sales & EBITDA margin EBIT & Operating margin
Source: SEB Source: SEB
Comparison with sector index - 1 year Comparison with Fred Olsen Energy - 1 year
Source: SIX Source: SIX
0.010.020.030.040.050.060.070.0
0
200
400
600
800
1,000
1,200
2013 2014 2015 2016E 2017E 2018E
(%)
(USD
m)
Net sales EBITDA margin
0
500
1,000
1,500
2,000
2,500
3,000
2013 2014 2015 2016 2017 2018
(%)
P/BV - 12 month forward
0.0
10.0
20.0
30.0
40.0
50.0
60.0
0
100
200
300
400
500
2013 2014 2015 2016E 2017E 2018E(%
)
(USD
m)
EBIT Operating margin
0
10
20
30
40
50
60
2013 2014 2015 2016 2017 2018
(x)
PER - 12 month forward
0
10
20
30
40
50
60
2013 2014 2015 2016 2017 2018
(x)
EV/EBITA - 12 month forward
0.0
5.0
10.0
15.0
20.0
2013 2014 2015 2016 2017 2018
(x)
EV/Sales - 12 month forward
0
200
400
600
800
1000
1200
Feb 16 May 16 Aug 16 Oct 16 Jan 17Prosafe Rel European Oil Services
0
200
400
600
800
1000
1200
1400
Feb 16 May 16 Aug 16 Oct 16 Jan 17Prosafe Rel Fred Olsen Energy

SEB Equity Research
Re-initiation of coverage Prosafe
27 06 February 2017
Profit & loss statement - Prosafe(USDm) 2013 2014 2015 2016E 2017E 2018ENet Sales 524 490 431 457 306 339Other revenues 0 59 44 0 0 0Total revenues 524 549 475 457 306 339
Total expenses (217) (236) (212) (218) (188) (177)Profit before depreciation 307 313 263 239 118 162
Depreciation - Fixed assets (62) (64) (232) (106) (72) (72)Depreciation - Other assets 0 0 0 0 0 0Amortisation - Goodwill 0 0 0 0 0 0Amortisation - Other intangibles 0 0 0 0 0 0Operating profit 245 248 31 133 46 90
Net interest expenses (36) 0 0 (77) (38) (38)Foreign exchange items 0 0 0 0 0 0Other financial items (9) 4 0 (205) 0 0Value changes - Fixed assets 0 0 0 0 0 0Value changes - Financial assets 0 0 0 0 0 0Value changes - Other assets 0 0 0 0 0 0Reported pre-tax profit 201 253 31 (149) 8 53
Minority interests 0 0 0 0 0 0Total taxes (6) (13) (10) (11) (0) (2)Reported profit after tax 195 240 21 (160) 8 51
Discontinued operations 0 0 0 0 0 0Extraordinary items 0 0 0 0 0 0Net Profit 195 240 21 (160) 8 51
Adjustments:Discontinued operations 0 0 0 0 0 0Interest on convertible debt 0 0 0 0 0 0Minority interests (IFRS) 0 0 0 0 0 0Value changes 0 0 0 0 0 0Goodwill/intangibles amortisations 0 0 0 0 0 0Restructuring charges 0 0 0 0 0 0Other adjustments 0 (19) 0 205 0 0Tax effect of adjustments 0 0 0 0 0 0Adjusted profit after tax 195 221 21 45 8 51
Margins, tax & returnsOperating margin 46.8 50.7 7.1 29.1 15.1 26.7Pre-tax margin 38.4 51.5 7.1 (32.5) 2.6 15.6Tax rate 2.8 5.1 31.9 (7.4) 4.0 4.0ROE 31.1 32.2 2.8 (20.9) 1.0 6.2ROCE 17.2 16.0 1.7 6.4 2.3 4.2
Growth rates y-o-y (%)Total revenues n.a. 4.8 (13.5) (3.8) (33.0) 10.7Operating profit 10.2 1.3 (87.6) 331.6 (65.3) 95.7Pre-tax profit 12.9 25.7 (87.8) n.m. n.m. 555.5EPS (adjusted) 0.0 (99.5) (90.5) (94.2) (82.9) 555.5
Cash flow(USDm) 2013 2014 2015 2016E 2017E 2018ENet profit 195 240 21 (160) 8 51Non-cash adjustments 37 77 242 117 72 74Cash flow before work cap 232 317 263 (43) 80 124
Ch. in working capital / Other 6 (69) (91) 215 (15) (2)Operating cash flow 238 248 172 172 64 122
Capital expenditures (223) (211) (701) (494) (45) (20)Asset disposals 14 0 0 0 0 0L/T financial investments 0 0 0 0 0 0Acquisitions / adjustments 0 (12) 175 (275) 0 0Free cash flow 28 26 (354) (598) 19 102
Net loan proceeds (4) 134 474 427 15 (14)Dividend paid (135) (151) (151) (26) 0 0Share issue 129 0 0 0 0 0Other 0 0 0 0 0 0Net change in cash 18 9 (32) (197) 35 88
AdjustmentsC/flow bef chng in work cap 232 317 263 (43) 80 124Adjustments 0 0 0 0 0 0Int on conv debt net of tax 0 0 0 0 0 0Cash earnings 232 317 263 (43) 80 124
Per share informationCash earnings 23,198.9 134.3 111.4 (0.49) 0.9 1.41Operating cash flow 23,788.9 105.2 72.7 1.95 0.73 1.39Free cash flow 2,848.9 10.9 (150.2) (6.8) 0.22 1.16
Investment coverCapex/sales (%) 42.7 43.1 162.7 108.3 14.7 5.9Capex/depreciation (%) 363 328 302 467 63 28
Source for all data on this page: SEB

SEB Equity Research
Re-initiation of coverage Prosafe
28 06 February 2017
Balance sheet - Prosafe(USDm) 2013 2014 2015 2016E 2017E 2018ECash and liquid assets 113 122 90 (106) (72) 17Debtors 55 0 0 0 0 0Inventories 0 0 0 0 0 0Other 24 123 91 91 91 91Current assets 193 245 182 (15) 19 108
Interest bearing fixed assets 0 0 0 0 0 0Other financial assets 0 0 0 0 0 0Capitalized development cost 0 0 0 0 0 0Goodwill 227 227 227 227 227 227Other intangibles 0 0 0 0 0 0Fixed tangible assets 1,196 1,339 1,807 2,196 2,169 2,118Other fixed assets 5 6 5 22 22 22Fixed assets 1,427 1,572 2,039 2,444 2,418 2,366
Total assets 1,620 1,817 2,221 2,429 2,437 2,474
Creditors 5 0 0 0 0 0Other trade financing 0 0 0 0 0 0S/T interest bearing debt 0 0 140 13 13 26Other 71 182 166 106 106 106Current liabilities 76 182 306 119 119 132
L/T interest bearing debt 780 830 1,108 1,431 1,446 1,420Other long-term liabilities 0 (132) (238) 36 21 19Convertible debt 0 0 0 0 0 0Pension provisions 0 0 0 0 0 0Other provisions 5 187 297 66 66 66Deferred tax 20 0 0 0 0 2Long term liabilities 805 886 1,166 1,533 1,534 1,507
Minority interests 0 0 0 0 0 0
Shareholders' equity 740 749 749 777 785 835
Total liabilities and equity 1,620 1,817 2,221 2,429 2,437 2,474
Net debt (m) 670 708 1,157 1,550 1,531 1,429Working capital (m) 4 (59) (75) (15) (15) (15)Capital employed (m) 1,523 1,579 1,996 2,221 2,244 2,281Net debt/equity (%) 91 95 155 200 195 171Net debt/EBITDA (x) 2.2 2.3 4.4 6.5 13.0 8.8Equity/total assets (%) 46 41 34 32 32 34Interest cover 6.9 0.0 0.0 1.7 1.2 2.2
Valuation(USD) 2013 2014 2015 2016E 2017E 2018E
No of shares, fully dil. (y/e) 236.0 236.0 259.6 8,799.0 8,799.0 8,799.0No of shares, fully dil. avg. 1.0 236.0 236.0 8,799.0 8,799.0 8,799.0Share price, y/e 4,680.0 2,300.0 2,100.0 34.1 34.1 34.1Share price, high 6,170.0 5,435.0 3,100.0 2,150.0Share price, low 4,235.0 1,815.0 1,900.0 25.0Share price, avg 5,323.7 4,143.7 2,442.3 375.2EPS (reported) 19548.9 101.6 8.89 (1.81) 0.09 0.57EPS (adjusted) 19548.9 93.7 8.89 0.51 0.09 0.57Cash earnings/share 23198.9 134.3 111.4 (0.49) 0.90 1.41Dividend/share 64.0 64.0 10.0 0.00 0.00 0.00Enterprise value/share 1,050 609 684 22 22 20Book value/share 313 317 288 8.8 8.9 9.5Adjusted equity/share 313 317 288 8.8 8.9 9.5PER (adjusted) 0.0 3.3 26.8 8.1 47.2 7.2CEM 0.0 2.3 2.1 (8.5) 4.6 2.9Dividend yield 8.4 20.7 4.2 0.0 0.0 0.0EV/EBITDA 8.1 4.6 6.8 8.0 16.1 11.1EV/EBITA 10.1 5.8 57.7 14.4 41.1 19.9EV/EBIT 10.1 5.8 57.7 14.4 41.1 19.9EV/Sales (x) 4.73 2.93 4.12 4.19 6.20 5.30Price/Book value 2.44 0.98 0.83 0.47 0.46 0.44Price/adjusted equity 2.44 0.98 0.83 0.47 0.46 0.44Free cash flow/Market cap (%) 189.2 5.1 (94.0) (88.7) 5.3 28.1Operating cash flow/EV (%) 9.6 17.3 9.7 9.0 3.4 6.8EV/Capital employed (x) 1.6 0.9 0.9 0.9 0.8 0.8
Main shareholders Management Company informationName (%) Votes Capital Title Name ContactState Street Bank and Trust 23.5 23.5 COB Glen Ole Rødland Internet www.prosafe.comFolketrygdefonnet 6.2 6.2 CEO Stig Harry Christiansen Phone number (47) 51 64 25 00RBC Investor Service 4.6 4.6 CFO Robin Laird
IR Cecilie Ouff
Source for all data on this page: SEB
SEB Equity Research
Re-initiation of coverage Prosafe
29 06 February 2017
Target prices and risks Target price definition and associated risks Our target price is the analyst's assessment of what total return an investor should expect over the coming six to 12 months. The target is based on fundamental equity research and other factors at the analyst's discretion.
Our current target price of NOK 70 was set today (6 Feb 2017). The main risk to our target price on Prosafe is as follows. Risks to target price include oil price, E&P companies investment strategies, downtime on active rigs, overall cost inflation and capex overruns on newbuilds or maintenance work.
Risk levels The risk level is the analyst’s view of the uncertainty in the earnings forecasts based on an assessment of the company’s business model, operating risk as well as financial risk. We use two risk levels with the following explanations:
● Normal risk: All forecasts involve uncertainty and we view companies in this risk level to have normal forecast risks
● High risk: The earnings forecasts are more uncertain than for an average instrument due to business model, operating risk, financial risk or any other reason at the analyst’s discretion. All instruments with shorter track record than 12 months as a listed company are by definition classified as high risk according to SEB.

Re-initiation of coverage Prosafe
SEB Equity Research
30 06 February 2017
Authors' statement of independence (Analyst Certification) We, the authors of this report, hereby confirm that notwithstanding the existence of any potential conflicts of interest referred to herein, the views expressed in this report accurately reflect our personal views about the companies and securities covered. We further confirm that we have not been, nor are or will be, receiving direct or indirect compensation in exchange for expressing any of the views or the specific recommendation contained in the report. We are not registered or qualified as research analysts, representatives or associated persons under the rules of any US exchange, regulatory organization or State.
This statement affects your rights This report is confidential and may not be reproduced, redistributed or republished by any recipient for any purpose or to any person.
Recipients SEB Research is approved and issued by Skandinaviska Enskilda Banken AB (publ) (“SEB”), a bank organized under the laws of the Kingdom of Sweden, on behalf of itself and its affiliates for institutional investors. SEB is not a registered Broker-Dealer under the US Securities and Exchange Act of 1934. This report must not be distributed to retail clients except those of SEB Oslo Branch and, in case of research distributed via SEB Helsinki Branch, to its retail clients located in Finland.
Use This research report is produced for the private information of recipients - if you are not a client of ours, you are not entitled to this research report, and should destroy it. The document is not, and should not be construed as, an offer to sell or solicitation of an offer to buy any securities. Opinions contained in the report represent the author's present opinion only and may be subject to change. In the event that the author's opinion should change or a new analyst with a different opinion becomes responsible for our coverage of the company concerned, we shall endeavour (but do not undertake) to disseminate any such change, within the constraints of any regulations, applicable laws, internal procedures within SEB, or other circumstances. If you are in doubt as to the meaning of the recommendation system used by SEB in its research, please refer to the "Disclaimer" section of SEB Research Online, to which our clients are granted access.
Good faith and limitations All information, including statements of fact, contained in this research report have been obtained and compiled in good faith from sources believed to be reliable. However, no representation or warranty, express or implied, is made by SEB with respect to the completeness or accuracy of its contents, and it is not to be relied upon as authoritative and should not be taken in substitution for the exercise of reasoned, independent judgement by you. Recipients are urged to base their investment decisions upon such investigations as they deem necessary. To the extent permitted by applicable law, no liability whatsoever is accepted by SEB for any direct or consequential loss arising from the use of this document or its contents.
Distribution This research report has been prepared by SEB or its affiliates and is being distributed by SEB offices in Stockholm, Copenhagen, Oslo, Helsinki, Frankfurt, London, Tallinn, Vilnius and Hong Kong. Research reports are prepared and distributed in Lithuania by AB SEB bankas and in Estonia by AS SEB Pank in accordance with the requirements of the local laws and Financial Supervision Authority’s conduct of business rules. It is being distributed in the United States by SEB Securities Inc. ('SEBSI'), a wholly owned subsidiary of SEB organized under the laws of the State of Delaware, USA. Any United States institutional investor receiving the report, who wishes to obtain further information or to effect a transaction in any security discussed in the report, should do so only through SEBSI and not its affiliates. Addresses and Phone numbers for each office can be found at the end of the report.
The SEB Group: members, memberships and regulators SEB is a member of, inter alia, Nasdaq OMX Nordic, Oslo Stock Exchange, the London Stock Exchange, NYSE Euronext, Frankfurt Stock Exchange, Tallinn Stock Exchange as well as certain European MTF’s such as BATS-Chi-X, Turquoise, Burgundy, XUBS, POSIT and Sigma-X. SEB is regulated by Finansinspektionen in Sweden and, for the conduct of investment services business, in (i) Denmark by Finanstilsynet, (ii) Norway by Finanstilsynet, (iii) Finland by Finanssivalvonta, (iv) Germany by Bundesanstalt für Finanzdienstleistungsaufsicht, (v) the UK by the Financial Conduct Authority and Prudential Regulation Authority (details about the extent of our regulation by the Financial Conduct Authority and Prudential Regulation Authority are available from us on request), (vi) Estonia by the Estonian Financial Supervision Authority, (vii) Lithuania by the Bank of Lithuania, and (viii) Hong Kong by Securities and Futures Commission. SEBSI is a U.S. broker-dealer, registered with the Financial Industry Regulatory Authority (FINRA). SEBSI is a subsidiary of SEB. SEBSI is authorized to engage in the underwriting of securities but does not make markets or otherwise engage in any proprietary trading in any securities.
SEB’s research reports are prepared in accordance with the industry standards and codes of conduct applicable to financial analysts in the countries where they are based. In Denmark, Finland, Norway and Sweden, analysts act in accordance with the rules of ethics of each country’s Society of Financial Analysts. Analysts comply with the recommendations and industry standards of the Danish, Norwegian and the Swedish Securities Dealers Associations and with those of the Federation of Finnish Financial Services. Analysts certified by the CFA Institute also comply with the Code of Ethics of the CFA Institute. The author of this report is not registered or qualified as a research analyst with FINRA and therefore may not be subject to the NASD Rule 2711 and Incorporated NYSE Rule 472 restrictions on communications with a subject company, public appearances and trading securities held by a research analyst account.

Re-initiation of coverage Prosafe
SEB Equity Research
31 06 February 2017
Prevention and avoidance of conflicts of interest All research reports are produced by SEB’s Research department, which is separated from the rest of its activities by an Information Barrier; as such, research reports are independent and based solely on publicly available information. Following standard practice, recommendations and target share prices are removed from research on companies which are the subject of public offers on which SEB is advising. The remuneration of staff within the Research department is determined exclusively by research management and senior management and may include discretionary awards based on the firm’s total earnings, including investment banking income; however, no such staff receive remuneration based upon specific investment banking transactions. SEB’s Compliance department monitors the production of research and the observance of the group's procedures designed to prevent any potential conflicts of interest from affecting the content of research; the latter are described in greater detail in the "Statement of Policies for dealing with potential conflicts of interest surrounding our Research activities" which is available on our Research Online website.
Your attention is also drawn to the fact that: The current market price of the securities shown in this report is the price prevailing at the close of the business day preceding the date of publication, save where such price was more than 5% different from the price prevailing as at the time of publication, in which case it is the latter.
Unless explicitly stated otherwise in this report, SEB expects (but does not undertake) to issue updates to this report following the publication of new figures or forecasts by the company covered, or upon the occurrence of other events which could potentially have a material effect on it.
The securities discussed in this research report may not be eligible for sale in all countries, and such securities may not be suitable for all types of investors. Offers and sales of securities discussed in this research report, and the distribution of this report, may be made only in countries where such securities are exempt from registration or qualification or have been so registered or qualified for offer and sale, and in accordance with applicable broker-dealer and agent/salesman registration or licensing requirements.
Additional recommendation history for the issuer is available at https://researchonline.sebgroup.com
Methodology Our target price is based on valuation approaches described in the Overview section of this report, unless our estimates are in the process of being updated. Final consideration as to any valuations, projections and forecasts contained in this report are based on a number of assumptions and estimates and are subject to contingencies and uncertainties, and their inclusion in this report should not be regarded as a representation or warranty by or on behalf of the Group or any person or entity within the Group that they or their underlying assumptions and estimates will be met or realized. Different assumptions could result in materially different results. Past performance is not a reliable indicator of future performance. Foreign currency rates of exchange may adversely affect the value, price or income of any security or related investment mentioned in this report. In addition, investors in securities, such as ADRs, whose values are influenced by the currency of the underlying security, effectively assume currency risk.
Company specific disclosures and potential conflicts of interest SEB advised Prosafe on its repair issue in October 2016. It also acted as Bookrunner of the Company's private placement in July 2016. This report has been produced by SEB’s Research department, which is separated from its Investment Banking division by information barriers; as such, it is independent and based solely on publicly available information. A member of, or an entity associated with, SEB or its affiliates, officers, directors, employees or shareholders of such members (a) is not, and has never been, represented on the board of directors or similar supervisory entity of Prosafe, (b) has from time to time bought or sold the securities issued by the company or options relating to the company, and (c) SEB does not hold any short / long position exceeding 0.5% of the total issued share capital of Prosafe as of 31 Jan 2017. Within the past 12 months, SEB or its affiliates acted as Lead or Co-Lead Manager in a public offering of securities of Prosafe or an affiliate. SEB or its affiliates is, or has within the last 12 months been or expects in the next 3 months to be, party to an agreement relating to the provision of investment banking services to Prosafe or an affiliate, or has received from it fees or the promise of fees in respect of such services. The analyst(s) responsible for this research report (jointly with their closely related persons) hold(s) 0 shares in Prosafe and do(es) not have holdings in other instruments related to the company. Current recommendation for Prosafe - Buy - was set on 6 Feb 2017, changed from Unrated. The dates of previous recommendation changes in relation to Prosafe can be found on our Research Online website.

SEB Equity Research Online researchonline.sebgroup.com
SEB’s standardised recommendation structure
Consolidated distribution Clients to whom SEB has provided Clients from whom SEB has received as per 31 Dec 2016 (%) material investment services, last 12M (%) investment banking income, last 12M (%) Buy 52.2 12.7 10.2 Hold 35.8 9.0 6.7 Sell 12.0 2.2 2.3 Buy Attractive risk/reward - at least 10% upside to target price. Hold Fairly valued – the security / instrument is trading close to target price. Sell Unattractive risk/reward - security / instrument is trading above target price. Unrated Company not covered, or we are not allowed to have a recommendation for compliance reasons Source: SEB
Target price and recommendation revision history
Source: Thomson Reuters / SIX / SEB
Skandinaviska Enskilda Banken AB (publ). All rights reserved.
1012
0
1000
2000
3000
4000
5000
6000
Jan 12 Jan 13 Jan 14 Jan 15 Jan 16 Jan 17
PRSO.OL Target price revisions
Please note, in the chart to the right: 1=Buy 2=Hold 3=Sell The grey spots mark the point where target prices have been changed. The price chart is not adjusted for dividends paid, whereas our recommendations are based on expected return including dividends
Copenhagen Bernstorffsgade 50 P.O. Box 100 DK-1577 Copenhagen V
Telephone: (45) 3328 2828
Frankfurt Stephanstrasse 14-16 D-60313 Frankfurt am Main
Telephone: (49) 69 9727 7740
Helsinki Unioninkatu 30 P.O. Box 630 FIN-00101 Helsinki
Telephone: (358) 9 616 28700
Hong Kong 17/F Jardine House 1 Connaught Place Central, Hong Kong Island Hong Kong
Telephone: (852) 3919 2600
London One Carter Lane London, EC4V 5AN
Telephone: (44) 20 7246 4000
New York 245 Park Avenue, 33rd Floor New York NY 10167
Telephone: (1) 212 692 4760
Oslo Filipstad Brygge 1, P.O. Box 1363 Vika NO-0113 Oslo
Telephone: (47) 2100 8500
Stockholm Kungsträdgårdsgatan 8 S-106 40 Stockholm
Telephone: (46) 8 522 29500
Tallinn Tornimäe 2 EE-Tallinn 15010
Telephone: (372) 665 7762