Investing in buy to let
16
1 Investing in buy-to-let Dave Treanor A growing number of people are investing in rental properties. Is it a good investment? How does it compare with putting the money on the stock market? Buy-to-let landlords have done well over the last fiſteen years or so. Will this continue? What are the risks? is article teases out these and other questions and explores how best to appraise the benefits and risks of an investment in residential lettings. It explains the technicalities of financial modelling in plain English, and is accompanied by a fully functioning financial appraisal system for buy-to-let which you can download free. Private rented sector (PRS) Following the Second World War the number of properties rented by private landlords declined from 8 million in 1944 to a low point of 1.9 million in 1988 when rent controls ceased to apply to new lettings. e sector has expanded steadily since then, particularly following the introduc- tion of buy-to-let mortgages in the late 1990’s, and has now overtaken social housing as the second largest tenure aſter home-ownership: ere are now almost 1.5 million landlords in the UK. Most have just one rental property. ey are sometimes described as ‘amateur’ landlords to distinguish them from those that make their main living from investment in property e government’s Private Landlord Survey in 2010 showed that almost three-quarters of them see rental investment as the safest way to make money to build up a pension, rather than as a source of income in the shorter term. ere may be a few rogue landlords, mostly at the bottom end of the market, and some tenants can also be trouble- some. But most private landlords provide a good service. According to the 2008 Rugg Report on the e Private Rented Sector three-quarters of tenants are either fairly or very satisfied with their landlords. With so many landlords the market for rented housing is very competitive. It appears to be functioning in the way a market should: responding to rising demand with an increasing supply of rented properties, rather than higher rents. is is in stark contrast to the home-ownership mar- ket, where rising prices have failed to result in increased construction. Some commentators have blamed buy-to-let for putting additional pressure on an already overheated housing mar- ket, competing with first time buyers. ey want an end to tax relief on mortgage interest since home owners no longer receive it. ey are wrong. Once operating costs are taken into account the return on investment from rents is negligible. In many cases it is less than the interest on a savings account. e profit comes from the growth in house prices on which landlords pay Capital Gains Tax, whereas home-owners do not. March 2014 Fig 1: Trends in Tenure Fig 2: Impact of buy-to-let lending on UK house prices
-
Upload
independent -
Category
Documents
-
view
2 -
download
0
Transcript of Investing in buy to let

1
Investing in buy-to-letDave Treanor
A growing number of people are investing in rental properties. Is it a good investment? How does it compare with putting the money on the stock market? Buy-to-let landlords have done well over the last fifteen years or so. Will this continue? What are the risks?This article teases out these and other questions and explores how best to appraise the benefits and risks of an investment in residential lettings. It explains the technicalities of financial modelling in plain English, and is accompanied by a fully functioning financial appraisal system for buy-to-let which you can download free.
Private rented sector (PRS)Following the Second World War the number of properties rented by private landlords declined from 8 million in 1944 to a low point of 1.9 million in 1988 when rent controls ceased to apply to new lettings. The sector has expanded steadily since then, particularly following the introduc-tion of buy-to-let mortgages in the late 1990’s, and has now overtaken social housing as the second largest tenure after home-ownership:
There are now almost 1.5 million landlords in the UK. Most have just one rental property. They are sometimes described as ‘amateur’ landlords to distinguish them from
those that make their main living from investment in propertyThe government’s Private Landlord Survey in 2010 showed that almost three-quarters of them see rental investment as the safest way to make money to build up a pension, rather than as a source of income in the shorter term.There may be a few rogue landlords, mostly at the bottom end of the market, and some tenants can also be trouble-some. But most private landlords provide a good service. According to the 2008 Rugg Report on the The Private Rented Sector three-quarters of tenants are either fairly or very satisfied with their landlords.With so many landlords the market for rented housing is very competitive. It appears to be functioning in the way a market should: responding to rising demand with an increasing supply of rented properties, rather than higher rents. This is in stark contrast to the home-ownership mar-ket, where rising prices have failed to result in increased construction.Some commentators have blamed buy-to-let for putting additional pressure on an already overheated housing mar-ket, competing with first time buyers. They want an end to tax relief on mortgage interest since home owners no longer receive it. They are wrong. Once operating costs are taken into account the return on investment from rents is negligible. In many cases it is less than the interest on a savings account. The profit comes from the growth in house prices on which landlords pay Capital Gains Tax, whereas home-owners do not.
March 2014
Fig 1: Trends in Tenure
Fig 2: Impact of buy-to-let lending on UK house prices

2
It would be surprising if buy-to-let had no impact on house prices, but a thorough study of this in 2008 by the National Housing and Planning Advice Unit concluded it was marginal (Fig 2).As Fig 1 shows, a large part of the rise in the private rental sector is matched by a fall in social housing from coun-cils and housing associations through right-to-buy sales. A large proportion of these end up being let by private land-lords at market rents, supported by Housing Benefit.Recent studies such as the government commissioned Montague Report and the Resolution Foundation’s Challenges of Build to Rent have sought ways to encour-age institutional investment into a more professionally managed private rental sector and to promote the supply of purpose-built rented housing, posing less competition to first-time buyers. The main barrier has been the poor return on investment from rental income. This is exacer-bated by rising house prices, which have not been matched in recent years by rising rents.The real problem behind house prices lies in the way plan-ning regulation restricts the supply of new housing. This is made worse by developers holding onto potential sites and watching their value increase, which can sometimes be more profitable than selling them to house builders. The growth in house prices is fully explored in Economics of Home Ownership.This report examines the economics of letting: how good an investment is it, and how can this be measured?
Financial appraisal of buy-to-letMost buy-to-let landlords invest for capital growth rather than the prospect of increasing their income. This is reflected in the way they weigh up the decision whether or not to purchase a property. A common approach is to compare rental income with the mortgage costs to see if there is sufficient margin to cover the expected running costs. Their overriding concern is how much they expect to make in profit on sale of the property perhaps ten or twenty years later, when they are ready to retire.Lenders use similarly simple criteria in judging whether it is safe to lend, having first checked the investor’s credit rat-ing, and whether they are reliable, and financially strong enough to cope with the risks involved. Banks and build-ing societies want to know the ‘loan to value’ ratio, and ‘rental cover’. Typically they will only lend up to 75% of the open market value, which does not include all the addi-tional fees and other costs in procuring the property. They usually require the rents to be at least 25% above the mort-gage repayments. It may still be possible to borrow a little below these criteria, but on less favourable terms.The housing market over the last twenty years has made almost any investment in housing profitable, with prices across the UK since the end of 1993 rising by 235%, and
in London by 389%, compared with inflation of 54%. As the market tightens it becomes increasingly important to make the right choices, and that requires a more profes-sional approach to the purchase and management of rental property.The professional way to appraise the viability of an invest-ment is to use financial modelling. At first sight a financial appraisal may appear daunting. It requires a lot of infor-mation that you cannot be sure about, and gives some very precise answers which will almost certainly be wrong, because nobody knows what the future holds.Like any business plan the point of it is to explore the potential gains and losses, and whether the set of assump-tions on which an investment would be viable are reason-able. What are the risks and can they be managed? Could it withstand a period of stagnation in house prices, or a recession? By how much would house prices have to rise to offset any initial losses on rental income?This article begins by describing a number of different measures of viability, and what they mean. It then exam-ines each of the assumptions, and what information is available on them.Mastering the techniques of financial appraisal can lead to a much deeper understanding of the risks and potential benefits of any investment, not just an investment in rental housing.Letcheck is a simpler version of the financial appraisals used by social housing provides, designed to suit the needs of a buy-to-let landlord. It can be downloaded free and used to appraise your own investments, and to explore the examples used in this paper in more depth. Click on the Letcheck logo or download it from http://treanor.co.uk/blog/LetCheck-V1.xlsx.
Cash flowRunning out of cash is what kills most business ventures. Understanding the cash flow is a crucial first step. The table below illustrates the cash flow on a hypothetical buy-to-let property over 30 years. It is already set up in Letcheck and will be used throughout this article as an example to illus-trate how a financial appraisal can be used.The property was valued at £240,000, and the total pro-curement cost including fees was £259,600. The purchase was funded with an interest-only mortgage covering 75% of the value. In addition the landlord would have put in almost £80,000 of their own money.

3
It is easier to see what is happening in a long term cash flow forecast by projecting it on a graph as illustrated below.
The red line shows rental income (net of any void losses). The dip in the first year results from a void period while the property is first prepared for letting, and thereafter income rises with inflation at 2% per annum. The colour shaded areas represent the running costs. Where the red
Table 1: Cash flow
Fig 3: Forecast cash flow
line is above them the project is in surplus. The larger the space between the red line and the shaded areas the more profitable it is. In this way the graph gives an immediate visual impression of how good an invest-ment it is.The cost of servicing the mortgage loan (in green) only rises when the interest rate goes up, which in this example happens after three years when an initial fix at 3% comes to an end. Thereafter the interest rate is expected to fluctuate around an average of 5%.The other operational costs are then added above that: management (yellow), mainte-nance (dark blue) and repairs (light blue). In this example they are projected to rise at an average rate of about ½% above inflation, allowing for some of the expected growth in wages. Once again, in practice inflation will fluctuate, but since we do not know what shape this might take it is simpler to show the long term trend.Tax (shown in brown) is due on the rental income net of allowable costs each year including interest on the mortgage. It is calculated at the higher (40%) rate. This version of the chart also includes interest (light brown) that the landlord might have expected to earn on the £80,000 deposit,
at 2%. It is omitted from subsequent charts, because it is not really a cost of the project: the initial £80,000 deposit should be treated as an equity investment, and it’s worth measured by the overall profitability of the project.Now look what happens if we vary the terms of the mort-gage loan, and the expected rate of inflation. Replacing the interest-only mortgage with one repaid over 25 years has a dramatic impact on the cash flow, which does not break even until the loan is paid off:
Fig 4: Cash flow with 25 year mortgage

4
Only the interest element can be offset against tax, and this falls as the loan gets repaid, further depressing the cash flow, and the overall profitability of the scheme.Higher inflation helps the cash flow, so long as rents rise too. It does not cause a problem, except to the extent it results in higher real rates of interest:
It is the rate of interest net of inflation that has the most impact. Lower inflation is actually a bigger risk: less so to the extent interest rates might fall to compensate:
Fig 5: Inflation 1% higher at 3% instead of 2%
Fig 6: Inflation at 3% and interest 1% higher at 6%
Over the long term, interest rates tend to rise and fall in relation to inflation, so that real rates of interest (ie net of inflation) are far less variable than the headline rate. Consequently a fixed-rate loan increases vulnerability to lower inflation, because the interest charges will not come down as inflation falls, resulting in a higher real rate of interest. Borrowing at a fixed rate becomes a gamble that inflation will rise, when rising inflation is not in itself a problem.Most buy-to-let investors would be happy to accept this level of cash flow risk. They might well be prepared to inject a little more cash into the scheme to make up for any shortfall in the early years so long as they were confident it would be profitable in the medium or longer term.The best way to quantify the cash flow risk is to calculate on the basis that all gains and losses are retained in the invest-ment, so that gains add to a cumulative balance, and losses reduce it. We can then forecast how long it will take for the investment to break even and what the peak debt will be. This should take full account of tax liabilities, but need not make any provision for interest on the landlord’s own cash invested.With a 25 year repayment mortgage the project would not break even until the loan was paid off, and the peak debt would rise to £161,000, double the initial deposit. Banks might be reluctant to lend on these terms because the rental cover would be only 115% ie the gross rent would be 15% above the loan service costs. Lenders generally want to see rental cover of 125% or more. With an interest only loan it would be 160%.Inflation 1% higher at 3% would not cause a problem in itself, although raising the long term interest rate by the same amount would begin to have an impact, resulting in three years during which additional investment would be required. Reducing inflation by 1% has a similar effect to raising the interest rate, since it increases the real rate of interest. In this example the cash flow is partially protected during the initial three years at the lower fixed rate of inter-est, so neither of these changes causes an increase in the peak debt.How crucial cash flow is to the viability of the scheme depends on how deep your pockets are. Cash flow prob-lems can accelerate very rapidly, which is why it should be the first concern of anyone contemplating a buy-to-let investment.
YieldThe most widely quoted measure of profitability is “gross yield”. This is the total rental income achievable, assuming 100 per cent occupancy, relative to the total cost of procure-ment. So in the example an initial rent of £14,400 pa on an investment of £259,600 would give a gross yield of 5.55% 14,400/259,600 = 0.0555Fig 7: Inflation down to 1% and interest back to 5%

5
The Association of Residential Lettings Agents (ARLA) publish a quarterly review and index of residential invest-ment that includes gross yields around the country. The figures for the last quarter of 2013 are illustrated here.
Gross Yield is a very crude measure. But it can be applied across a wide range of prop-erty sectors including residential lettings, offices, shops, fac-tories or almost any type of investment.Net Yield gets closer to the actual profit-ability of the invest-ment. This is the rent less the costs of man-
aging the property including void losses, maintenance, let-ting, and all other operating costs, relative to the total cost of procurement:
Gross Rent 14,400Less voids & bad debts -755Less management -1,000Less maintenance -2,000Less repairs -1,000= Net Rent 9,645
In our example the net rent is expected to be about £9,645, giving a net yield of 3.72% before taking tax into consid-eration. After tax that comes down to 3.39% for basic tax rate payers, or 3.06% for those paying at the higher 40% rate. There are no published tables of net yield on residen-tial investments, although ARLA publish net yields that take account of void losses, and ignore the other costs.Management and maintenance costs are examined later. In our example they come to 30% of the gross rent. According to a report by E C Harris in 2013 the average loss of gross to net income ranges typically from 33% to 35%, based on data from the Investment Property Databank. So the pro-vision for these in the example used here might be a little optimistic.ARLA also publish what they term ‘geared annual invest-ment yields’ which they also show net of void losses, but without taking account of the running costs such as man-agement and maintenance, or interest charges. These show the return on the property value net of the mortgage loan. Their figures are based on quarterly surveys of residential landlords and their agents which showed that in the fourth quarter of 2013 the average loan to value ratio was 41.4%. Consequently this gives much higher yields averaging 12.95%.Gearing is an important concept to understand. A simple
Table 2: Gross yields
example will illustrate the way it works. Suppose some-one buys a house for £100,000 with a £75,000 loan, and £25,000 of their own money invested. After a number of years the property doubles in value to £200,000, but the loan remains at £75,000. So even though the value of the asset rose by 100% their initial £25,000 deposit has now grown to £125,000, so it has risen by 500%. That is gear-ing. It is particularly relevant to an investment in housing, because such a high proportion is usually funded with a mortgage loan.The way ARLA assess the geared yield has the advantage of being unambiguous. But it also exaggerates the benefits: it takes no account of the costs of borrowing and other operational costs. A more realistic way of assessing the geared yield would take all the operational costs and taxa-tion into consideration. In our example property ARLA’s crude assessment of the geared yield would express the gross rent as a percentage of the cash invested to procure the property: 14,400 / 79,600 = 0.181 or 18.1%
Based on net rent it would be 9,645/79,600 = 12.12%, and after tax of £1,163 that would become 10.66%.Although slightly better than gross yield, net yield is still only based on one year’s performance, and ignores longer term changes in operating costs. The absence of any con-sensus on how it should be calculated also undermines it as a useful measure of viability. For all its faults, gross yield is universally understood. Net yield is not.
Discounted cash flowThere are a number of measures of investment perfor-mance that use discounted cash flow, in which a discount factor takes account of the costs of carrying debt. These are recognised in all sectors of finance, and can be used to compare the value of a wide range of investments.The two most important measures are Net Present Value (NPV) and Internal Rate of Return (IRR). Both are pro-vided as financial functions in Excel. They are applied to a future cash flow to indicate what it is worth today. But what do they mean?How much is a promise of £1,000 in ten years time worth today? The simple answer is to judge how much money would have to be invested today to gross up to £1,000 in ten years time at compound interest.This will depend on a judgement of interest rates over the whole of the ten year period. The rate used for this is called the ‘discount factor’. The discount factors in a buy-to-let appraisal should reflect the market view of long term inter-est rates on borrowing across the private rental sector over the period of investment, to which you might choose to add a margin for risk.

6
With a discount rate (D) of 5.0%, £1,000 (P) in ten years time (N) would be worth P /(1+ D)N = £1,000 /1.0510 = £614So the £1,000 in ten years time is worth only a little over half as much today. We can say that the ‘present value’ of a £1,000 payment due in ten years time is £614. We can also say that the ‘annual rate of return’ if we paid £614 now in exchange for a payment of £1,000 in ten years time would be 5%.If £614 was invested in a bank account that paid 5% interest (ie at 5% APR) credited to the balance each year, it would show a bank balance of £1,000 after ten years.For those unfamiliar with this kind of maths, it might be a good idea to draw up a little table of the ten year cash flow, starting with £614, and adding interest on it at 5% (ie 0.05 x £614 = £30.70), making the closing balance at the end of the first year 614 + 30.70 = 644.70. Repeat this for ten years, applying 5% interest to the closing balance of the previous year. After ten years the closing balance will be £1,000. The formula above is just a quicker way of doing the calculation.Both the NPV and the Internal Rate of Return (IRR) are based on a forecast of the cash payments and receipts on an investment over the discount period. These costs and receipts are inflated to show how they are expected to increase each year.Instead of using the NPV function in Excel to get the Net Present Value, each payment in the cash flow could be con-verted to it’s present value using the formula above, and summed, to give the same result.Calculating the IRR on a cash flow is not quite so simple. It has to be found by using ‘trial and error’, changing the discount rate to find a value that would make NPV of the cash flow equal to the money invested. It is much easier to use the IRR function in Excel.Most financial appraisals compare the investment required by a project with the net rent and any other income avail-able to repay it.Net rent is the money left from the rent each year after deducting operating costs: management, maintenance, repairs, losses on voids and bad debts, and any losses where service costs exceed charges. It is the money available from the rent to service a loan. In our example, the net rent each year is shown in the seventh column of the cash flow in Table 1 (col H in Letcheck).
Net Present ValueThe single most important method of judging viability is to compare the Net Present Value of net rent income with the investment required. This is sometimes referred to as the NPV Surplus:
NPV surplus = NPV net rents – investment required
In our example, the NPV of net rents calculated on the cash flows in column 7 using a discount factor of 5% over 30 years is £180,215. The total procurement cost was £259,600.
NPV Surplus = £180,215 - £259,600 = - £79,385
The NPV of net rent shows how much investment a buy-to-let project can repay from rental income over the dis-count period. In this case it falls £79,385 short.If we deduct income tax from the net rent, the NPV drops to £168,235 for a basic rate tax-payer, or £156,255 for someone paying tax at the higher 40% rate.There is not much of a market for buying and selling whole portfolios of private rental properties in the UK. Consequently valuers are rarely asked to make an assess-ment of what it is worth as a going concern. But in the social housing sector council and housing association properties change hands based on what is sometimes referred to as ‘tenanted value’, which is calculated using the NPV in exactly this way.
Internal Rate of ReturnThe Internal Rate of Return (IRR) is a calculation of the return on the investment over the discount period. It is the discount rate required to make the NPV of net rents and other income match the investment required.In simple terms, it is the rate of interest that would have to be earned on a savings account to make the same gain over the period as is made by the investment in the project.In our example the IRR is 2.34%, before tax is taken into consideration. The IRR of net rents after tax falls to 1.86% for a basic rate tax-payer, or 1.35% for someone on the higher 40% tax rate.Few people would want to invest in this project based on the rental returns, even though the rental income was quite sufficient to satisfy a lender that it adequately covers the interest on the mortgage. Most buy-to-let landlords invest for the capital gains from rising house prices, which we will examine in a moment.
Over how many years should viability be assessed?The government’s Private Landlords Survey 2010 showed that 69% of private landlords regarded the rental dwelling as an investment or pension.ARLA’s quarterly review of residential investment asks landlords how long they have held each property for. Bearing in mind that buy-to-let mortgages only became widely available about fifteen years ago it is quite remarka-ble that the average length of time given in the most recent survey at the end of 2013 was 13.5 years.

7
Almost twice as many landlords expected to be buying further properties during 2014 than were planning to sell (25% compared with 13%). When ARLA asked how many years from acquisition they expected to keep the properties for, the average period was 19.9 years. This might indicate a 20 year discount period. It all depends on each individ-ual landlord’s intentions.Discounted cash flow has three variables: the amount invested, the discount rate, and the discount period. NPV calcu-lates the amount that can be profitably invested. IRR calculates the discount rate at which the investment becomes profitable. The final measure is the ‘pay-back period’ which is the number of years a given investment would have to be held before it becomes profitable, ie the break-even discount period. It is much less commonly used than NPV or IRR.In practice a buy-to-let landlord would most probably expect to sell the property on the open market when they wished to withdraw their investment. To include this, we need to estimate how much it might have increased in value by the time we plan to sell up, and add that amount, net of the costs of sale, into the cash flow at the end of the final year. We can then use IRR to estimate the full rate of return on the investment. Payback then becomes a very important consideration. It tells us how long we should expect to have to hold the investment before it could be sold at an acceptable level of profit.Capital growth is considered in the next section.
Capital GrowthThe IPD UK Annual Residential Investment Index for the end of 2013 reported that the total annualised return on residential lettings over the previous ten years was 8.5%. The bulk of this (5.9%) came from capital growth.The long term trend has been for property prices to rise with earnings, fluctuating around the growth in earnings on a cycle that is typically about 10 years long – the deeper the trough the longer it takes to recover. In more recent years prices rose by significantly more than earnings, until the crash in 2008.The last property cycle was unusually long. It lasted almost 20 years from a low point in 1990 to the next low point in 2009. This was followed by one of the most dramatic collapses in property prices ever recorded. There are les-sons to be learned from what has happened over the last four or five years, but they tell us more about the impact of economic collapse than they do about long term trends in
property prices. To understand these, we should look over a much longer period of time.UK property prices nationally grew at an average rate of RPI + 2.04% per annum between 1975 and 2012. If we limit the period to 2006 before the crash then the average rate was RPI + 3.35%. The table below created using data from the Nationwide shows how this varied regionally around the country:
Many people think the increases in house prices in the years leading up to the crash were unsustainable, and that the crash was in effect a correction.Up to the year 2000 the growth in house prices (RPI + 1.6% pa) fluctuated around the rise in earnings (RPI + 1.59% pa). But since then it has grown by significantly more, implying that people were spending higher multiples of their earn-ings on buying a house. In the 1970s mortgages to home owners were typically limited to three times income, or in the case of a couple to three times the first income plus the second income. Preceding the financial crash they were being offered at as much as five times income, and even now people are commonly offered four times their income.It is only with hindsight that you can tell where in the property
Table 3: Regional growth in house prices since 1975
0
1
2
3
4
5
6
7
8
1983
1984
1985
1986
1987
1988
1989
1990
1991
1992
1993
1994
1995
1996
1997
1998
1999
2000
2001
2002
2003
2004
2005
2006
2007
2008
2009
2010
2011
2012
2013
First time buyer house price to earnings ratios
London Scotland UK
Fig 8: First time buyer house price to earnings ratios

8
cycle we are. There are those who argue that prices today are higher in relation to incomes than has ever previously been sustainable. They point to the historically low rates of interest currently available and suggest that once these return to more normal levels prices can be expected to drop.The market in London has been particularly strong, which may well be due in part to the huge influx of foreign invest-ment, much of which is in the prime properties of central London.On the other hand, there does not appear to be any pos-sibility that the supply of housing will be sufficient to meet demand in the south and east of England in the foresee-able future. Elsewhere in the country it largely depends on growth in the local economy. Some of the more depressed areas of the country have seen a collapse in their housing market, with streets full of boarded-up houses. These and other issues affecting housing prices are examined in more depth in Economics of home-ownership.Capital gains on investment property attract capital gains tax (CGT) which is currently levied at 18% for basic rate tax payers, or 28% for those at the higher rate. The first £10,600 of gain is tax free, and all the costs of purchase and sale can be offset against the gain, together with the cost of improvements. There are some additional allowances where the property has been your main residence at some point.Unless you manage to pick up a real bargain, the total cost of procurement is invariably more than the value of the property, once stamp duty, legal fees, and other incidental costs are added, even where the purchase price does not exceed the valuation. It is important to buy well, minimis-ing these additional costs. Buying at auction can be a good option, provided the property has been adequately checked beforehand. Buying from a developer ‘off-plan’ is also quite common, and the guarantees and lower repair bills that come with a new dwelling can be useful. Personal taste and preference are of less concern to the investor, than to some-one buying their own home, and value for money becomes a more important consideration.Going back to our example property, how might capital growth impact on the total rate of return? Given that on average landlords expect to keep their rental properties for about 20 years, Table 4 plots the returns over 20 years at various rates of increase in house prices. Inflation as meas-ured by the CPI remains at 2%, and management, mainte-nance, repairs and rent levels are all projected to rise at 1% above CPI. ‘Return pa before tax’ Calculates the annualised return from capital growth, ignoring any profits from rent. Capital growth is the difference between the projected sales price, net of sales costs, and the total procurement costs. It is less than the growth in house prices because of the fees and other additional costs incurred when the property was bought and when it was sold.
Table 4: Impact of growth in house prices
‘Return pa after tax’ This deducts CGT at the higher 28% rate from the increase in the property price, after deducting all eligible costs and allowances. It the property was jointly owned by two people, the personal allowance for CGT would be doubled.‘Total return on investment before tax’ This combines the profit from capital growth with any profits from rent. It is calculated as the IRR on the total cost of procurement of net rent income and the proceeds from sale of the property after 20 years.‘Total return after tax’ This is the same as the previ-ous measure, but taking income tax and CGT for a higher rate tax payer into account. It is calculated as the IRR of both the net rent income after income tax at 40% and the net receipt from the sale of the property after CGT at 28%. This and the previous measure are arguably the most useful for comparing investment in rental property with the per-formance of comparable investments in stocks and shares.‘Geared return before tax’ This is the rate of return on the cash investment by the landlord, excluding the mortgage. It is calculated as the IRR of net rent income after interest charges, and the profit from the sale of the property.‘Geared return after tax’ This is the same as the above, but deducts income tax and CGT assuming these are both at the higher rate.None of these measures is universally recognised. The most widely used measures are the Annualised capital growth (ie return pa before tax) and the Gross return on investment (total return on investment before tax). The other meas-ures may give a better indication of the overall value of the investment in practice.The table below explores how much the rate of return increases the longer the property is held before it is sold. For this purpose house price inflation is held constant at 3% per annum, and all other assumptions are unchanged.The geared return may seem like a rather complicated measure, but it is quite a useful one. It enables comparison with other ways in which the cash deposit of a little under £80,000 might have been invested, such as in a unit trust, or a cash savings account.Our example property would have to be let out for a good ten years before the investment could be considered

9
Table 5: Impact of length of time before the property is sold
worthwhile, although this period would be shorter if house prices rose faster.Getting to grips with these various measures of investment performance should help anyone contemplating a buy-to-let investment to better understand the risks and potential benefits.A financial appraisal can reveal the different profile of risk from investing in areas where the economy is strong, such as London, compared with some of the weaker areas fur-ther north, or in prime locations compared with cheaper properties that might have a higher initial yield, but pro-vide lower and riskier returns in the longer term. Those taking this more professional approach tend to invest in better quality properties, because in the long run they are more profitable.Local knowledge can be invaluable in deciding which prop-erties to invest in. Home owners often prefer houses with gardens in a suburb where the schools are good, whereas for investment purposes it might be better to choose flats close to public transport in an area showing signs of becoming increasingly attractive.Financial appraisal does not provide definitive answers. It is a tool for exploring the way events in the real world might impact on the value of the investment. It should give you a better feel for the risks and benefits, and help to focus on what matters to make it work financially. But like any tool, it is only as good as the person using it. With unreal-istic assumptions it will give unrealistic results. It is these assumptions, particularly on operating costs, that we shall explore in the next section.
Operating costsThe costs in managing and maintaining the property, including administration and loss of rent when the prop-erty is vacant or through bad debts, account for the differ-ence between the gross rent and the net rent. The net rent is the money available to service a loan, before any profit can be taken.The IPD has been tracking and publishing investment data for the UK residential investment sector for 12 years. They report that the average loss of gross to net income on resi-dential lettings ranges typically from 33% to 35%. Their
figures are based on reports by large institutional investors, not small buy-to-let landlords.There are no national statistics on the operating costs of smaller landlords in the private rented sector in the UK. The information is confidential to each buy-to-let landlord. The nearest we get to a public record are figures released by HMRC in 2013 in response to a Freedom of Information request and published by the Intergenerational Foundation:
Unfortunately they did not publish the percentage of the gross rental income which these deductions represent.Given the uncertainties, it might be wise to budget for between 30% and 35% of the gross rent to be spent meet-ing operational costs (excluding interest), until you build up sufficient experience to judge differently. Our example is at the lower end of this range.
Maintenance costsM3 Housing has run a maintenance benchmarking club for social housing providers for the last ten years, known as Checkmate. These organisations manage a wide range of properties in all parts of the UK, developed over many years. Median costs per unit pa of maintenance and repair reported for 2012 are broken down as:
Responsive maintenance (ie from repair requests £326Gas servicing £122Void repairs (ave across all units pa) £145Cyclical works (redecoration etc ave per unit) £94Planned works (ave per unit pa) £592
Totals £1,279The Resolution Foundation published a report in October 2013 on the scope for institutional investment in develop-ing a purpose-built private rental sector. This was based on financial modelling of 16 private rental sites being devel-oped by six social housing providers. The properties were all to be newly built, and designed to minimise mainte-nance costs. They included 778 units, 82% of which were 2 or three bed flats. 256 were in London, 270 in the North West, 164 in the South West, 60 in Scotland and 28 in the Midlands. Table 7 below shows the average Gross and Net Yields on these properties.The total cost of repairs and maintenance monitored by
Table 6: Tax relief claimed against rental income

10
Table 7: Operating costs & yields of 16 new build developments for market rent
M3 Checkmate is very simi-lar to the six social housing providers in the Resolution Foundation’s report.Social housing providers can achieve considerable econo-mies of scale, letting £multi-million contracts with major maintenance contractors over several years. Smaller land-lords could not hope to get repairs done at comparable prices, but many of them keep costs down just as effectively by managing the repairs and doing some of the smaller repair jobs themselves.M3 Housing also run Housecall, a website enabling
Fig 9: Which jobs attract the biggest repair costs

11
social housing tenants to identify and report repairs to their landlord. Analysis of these repair requests provides a unique insight into the repairs dealt with in response to problems reported by tenants. It excludes repairs covered by service contracts: problems with boilers accounted for almost 6% of all repair requests but these were invariably covered by a gas service contract that included provision of an annual gas safety certificate (CP12) and all boiler servic-ing and repairs. It would be surprising if most buy-to-let landlords did not make similar arrangements, although the price they would pay would typically be closer to £250 pa than £125. A search via Google revealed a number of new landlords requesting guidance on the level of costs to expect on repairs and maintenance via websites such as Landlordzone. The replies include:“I have a few 2 bed new build flats and the maintenance on them is roughly £1,000 per year” (2009).“I think if you work on 1% of the property value per annum - say, £1000 p.a. for a £100K property - that shouldn’t be too far out”.“I’d put structural maintenance costs at about 20% of the rent received and for the particular property I’m thinking of, about 0.6% of property value per annum”.“I work on a rough figure of 10% to 12% of the rental as I can get the jobs done a little cheaper as we do most work our-selves. I also keep contingency money just in case something unusual happens.”
Major repairs & improvementsLike for like replacement of worn out building components is an allowable expense against rental income for tax pur-poses, but improvements are not. In practice it can be a little hard to distinguish them, as almost any replacement would be with a modern equivalent. Your accountant may be able to advise. Costs that are allowable against rent can-not also be set off against capital gains tax when the prop-erty is sold.There are no published sources of data on the amounts spent on major repairs and improvements in the private rental sector. In social housing the average spend works out at around £225 per unit per annum. Most buy-to-let landlords spend somewhat more than that, usually between tenancies. They also have to include the replacement of white goods. Their costs are more likely to average £1,000 or more per annum, and to be spread very unevenly.
Management costsAccording to the government’s Private Landlord Survey 2010 a little more than half of all landlords (57%) handled both the letting and management of their properties them-selves. For anyone new to the game there is a lot to learn.
There is plenty of useful advice available.The Landlord Handbook published by ANUK (Accreditation Network UK) provides comprehensive advice to landlords on managing buy-to-let properties. It includes guidance on starting and ending tenancies, ten-ancy agreements, letting and managing agents, repairing obligations, gas and electrical safety, taxation, and all the regulations governing the private rental sector.There is a variety of organisations providing advice and services to landlords that can be found by a search of the internet, and anyone new to the business would be well advised to make good use of them. Examples include the Residential Landlords Association, the Association of Residential Letting Agents, Property Hawk, and Buytolet.com.Most lettings agencies also operate as estate agents. They provide a range of options for landlords:1. Letting only: This is where an agent markets the prop-
erty, advises on rent levels, finds a tenant, undertakes reference checks, provides a tenancy agreement, draws up an inventory, and moves the tenant in. The agent usually charges the landlord a one-off fee for this, often equivalent to one month’s rent. The agent may also charge the tenant an administration fee, although this is illegal in Scotland, and there are proposals to outlaw it in England & Wales.
2. Letting and Rent Collection: where the agent finds a tenant and also collects the rent. They usually charge a one-off letting fee and then a monthly fee (often a percentage of the rent - perhaps 5%) for collecting the rent.
3. Full Management: where the agent acts as a full let-ting and managing agent. The agent deals with all man-agement issues: letting and starting the tenancy, rent collection and repairs. The cost is likely to be 10% to 15% of the rent, plus VAT. The cost of repairs is not included, and you will be relying on the agent to get a good price from the repairs contractor.
4. Guaranteed rent agent: offering a guaranteed rent to landlords, irrespective of whether the property is rented out or not. The landlord assigns the property subject to the terms of the contract, to a company (or social housing provider) who pays an agreed fee for the duration of the agreement. Any tenant renting the property is the tenant of the company and not of the ‘landlord’ who becomes the superior leaseholder.
It is important to check exactly what fees will be incurred by using a lettings or management agent, and worth asking whether they also charge the tenants. Watch out for repeat fees if the tenant renews their tenancy. Do the fees they quote include VAT or is that additional?The role of agents is changing as a result of the success of companies like Zoopla, Rightmove, Findaflat, Moveflat,

12
Gumtree, and many others through which rental proper-ties can be advertised via the internet at a fraction of the cost of using an agent. Similar things are happening in the buying and selling of houses. As a result many of them have had to raise their game, and provide a much more effective service, particularly in selling or letting properties.The Association of Residential Landlord Agents provides advice on finding an agent, as well as being an excellent source of information on the rental sector through their regular newsletters.There is very little guidance available on the costs incurred in DIY management, beyond the obvious things like prop-erty insurance, and accountancy fees. You might budget around £1,000 per unit pa until you can base them on your own experience.The annual management costs of social housing providers vary enormously. According to the Global Accounts pub-lished by Socialhousing.co.uk for English social housing providers for the financial year 2011/12 they averaged £908 per unit. Going back over the previous four years it was £873, £884, £893, and £844. This excludes depreciation and impairment costs (which buy-to-let landlords would not normally take into consideration). The costs that a housing association managing several thousand properties would experience are rather different from those of a small private landlord, so may not be much use as a comparison.
Void lossesAccording to the ARLA newsletter for the last quarter of 2013, average tenancy lengths reported by landlords were 19.4 months, down slightly from 19.6 months in the previous quarter. The average void period was up from 2.9 weeks to 3 weeks. This would indicate a loss of rent through voids of around 3.5%, which is very similar to the 3.6% figure quoted by IPD. ARLA do not publish figures for losses from bad debts, but IPD quote 1.6%.So a reasonable estimate of average rent losses to expect from voids and bad debts would be between 5% and 6% of gross rent. Bad debts tend to be lower for professional tenants, than those more vulnerable to unemployment or dependent on housing benefit.
InflationInflation has a big impact on a rental investment. It affects capital growth, and drives rising rents and operating costs. The one cost it does not directly affect is interest on the mortgage loan. So as rental income rises, the portion required to cover interest on the loan falls, making the rents more profitable.In general terms higher rates of inflation make an invest-ment in rental property more profitable. Deflation could wipe out profits
The Bank of England is tasked with holding inflation as measured by the Consumer Prices Index (CPI) at around 2% and within the range 1% to 3%. In practice the Bank has been more worried by the prospects of it falling below 1%, than by it rising about 3%. The consequences of prolonged deflation can be quite devastating, as shown by stagnation in the Japanese economy which apart from a brief respite in 1998 and again in 2008 has lasted for almost twenty years. It depresses growth in the domestic economy, as it makes sense to postpone purchases if they will be cheaper tomorrow.
Inflation in rentsThe Office of National Statistics has published average regional and national rents since 2005.
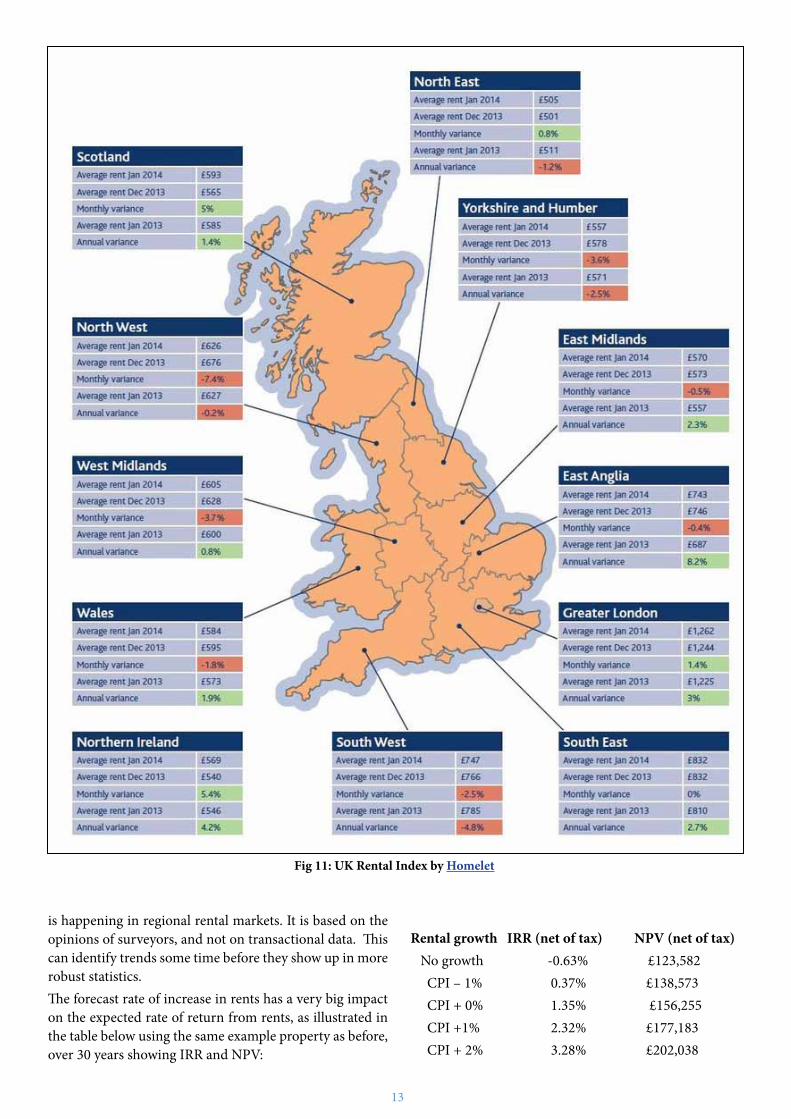
Since 2005 rents across the UK have risen by significantly less than inflation as measured by the CPI. In England as a whole they rose by 7.6% and in London by 10.6%. In that time the CPI rose by 25.8%, while average earnings rose about 15.2%.Much of the period since 2005 will have been affected by the financial crash which began in 2008. Unfortunately there is no good source of market rent data for the UK prior to 2005, so it is hard to identify longer term trends.We would expect rents to be affected by supply and demand. There has been a steady growth in the supply of rental properties over that period. The demand has also grown with many potential first time buyers finding it hard to raise the finance to make their first purchase, and remaining in rented accommodation.The UK Rental Index Map published by Homelet gives a good indication of the relative strength of the rental mar-ket in each region.The RICS publish a quarterly UK Residential Lettings Survey based on a survey of the views of surveyors in each region of the country. This provides information on changes in both demand and supply of rental properties, and in rents, together with anecdotal summaries of what
-2%
-1%
0%
1%
2%
3%
4%
5%
6%
2006
2007
2008
2009
2010
2011
2012
2013
Rent increases & CPI
CPI English Rents London Rents
Fig 10: Inflation in rents
13
Fig 11: UK Rental Index by Homelet
is happening in regional rental markets. It is based on the opinions of surveyors, and not on transactional data. This can identify trends some time before they show up in more robust statistics.The forecast rate of increase in rents has a very big impact on the expected rate of return from rents, as illustrated in the table below using the same example property as before, over 30 years showing IRR and NPV:
Rental growth IRR (net of tax) NPV (net of tax) No growth -0.63% £123,582 CPI – 1% 0.37% £138,573 CPI + 0% 1.35% £156,255 CPI +1% 2.32% £177,183 CPI + 2% 3.28% £202,038

14
It would be unwise, given these statistics, to presume that rents might rise in future by much more than the rate of inflation, although this will very much depend on local supply and demand.
Inflation in management and maintenanceManagement tends to be labour intensive, and conse-quently we might expect costs to rise with earnings. Against this there are savings to be made through efficien-cies, which in recent years have included using the internet to find tenants.In their business plans and financial appraisals, social housing providers most commonly forecast management costs rising between ½% and 1% above inflation.Maintenance costs are more variable. There was a period in the nineties where skilled labour shortages in the build-ing trades caused a rapid rise in maintenance costs, which only came to an end as a result of the influx of skilled work-ers from Eastern Europe.
In their appraisals and business plans it is quite common for social housing providers to project maintenance costs rising between ½% and 1% above CPI, just like manage-ment. But according to figures from the global accounts of housing associations published by Social Housing maga-zine, both management and maintenance have more or less kept pace with changes in the CPI since 2006. Data on tender prices from the Checkmate maintenance bench-marking club follows a very similar pattern:
Fig 13: Inflation in management and maintenance costs in social housing
Fig 14: Long term trends in house prices (Nationawide)
There are no published statistics on which to assess the way inflation impacts on the maintenance costs experi-enced by small landlords.
Inflation in house pricesThere is no shortage of statistics on the rate of growth in house prices. The Nationwide has plotted them going right back to 1952House price inflation was discussed earlier in the section looking at Capital Growth. It is examined in more detail in Economics of Home Ownership.Without expectations of capital growth few people would be interested in investing in buy-to-let. The gains to be made will be affected by capital gains tax. We know the rates at which that is charged now, but these might well change by the time the property is sold, which could be many years in the future. Government policy has sought to stabilise house prices, and reduce the speculative ele-ment in the housing market. Their efforts have been largely unsuccessful. Taxes on the speculative gains are one of the ways they might seek to influence this. Another might be the introduction of property taxes.Rather than rely on a best guess at the rate of increase in house prices, financial modelling should be used to assess the level of increase that would be necessary to make the investment profitable, and then consider how likely that was.
Monitoring the performance of your investmentHaving carried out an appraisal and bought one or more investment properties it is important to keep an eye on actual costs and incomes.The preparation of accounts for tax purposes is a good time to do a review. Actual costs should be compared with previous years, and with those forecast in the business plan, and used to review what changes to make in forecast-ing future performance. Keep copies of plans drawn up in previous years to see how your own outlook has changed.

15
How things might changeThere are risks that arise from changes in the way the rental sector is regulated and taxed. These might be favourable, or detrimental. Housing is, and always will be, a political issue. There are dozens of lobbying groups with a strong interest in housing policy.There does not appear to be any serious political opposition to the growth of a healthy private rental sector, although there has been some concern that competition particularly with first time buyers might add to the pressure on house prices.This section looks at some of the policy changes that have been proposed by lobbyists and in reports com-missioned by the government and opposition parties in recent years.
Rent ControlThere is widespread recognition that rent controls choke off investment. In the past they have driven private land-lords to exit the sector and led to under-investment in the maintenance of rented housing.There are suggestions that rent increases should be lim-ited within any existing tenancy to the rate of inflation. The Labour Party in 2012 was considering introducing measures to encourage longer tenancies of three to five years with rent indexation. In other countries longer ten-ancy terms are common, and do not appear to undermine investment.There is nothing under current housing legislation to stop landlords providing longer tenancies with indexation of rent increases. But in the UK lenders have opposed any lengthening of tenures, even where this does not affect their ability to get vacant possession following reposses-sion of a property.
Build for rentBoth the Coalition government and the Labour opposition are interested in attracting investment into a professionally managed private rented sector developing new purpose-built rented units. The Coalition government has provided a £1 billion build-to-rent fund to finance the development phase for which there was no shortage of bidders.The Montague report proposed designating a private rental sector ‘use-category’ in planning approvals, and to reduce liabilities for planning gain under S.106 on plots designated for private rent, which must then be retained for rent for at least 10 years. One of the concerns with this idea is that it might undermine an investor’s security since it would pre-vent them recovering any losses by an open-market sale of the property.
Taxes on capital and incomeA 2011 study by the LSE and another report commis-sioned by the government in 2010 made comparisons with other countries that have larger private rental sectors. They include a number of suggestions for making the tax regime more amenable. One is to permit roll-over relief on capital gains tax, so that a landlord that sold one or more proper-ties could offset the cost of buying replacement properties for letting against the tax liability. In quite a few countries capital gains tax tapers away on properties retained for more than ten years.Permitting spending on improvements, particularly for energy savings or to bring properties up to the Decent Homes Standard, could become an allowable cost against income tax. Social housing providers can offset deprecia-tion of improvements against profits, and that might be developed to suit private landlords, as it is in Germany, France, the USA and Australia.There are also suggestions that tax relief on private rent-als should be more generous on properties purpose-built for rent than on existing properties bought in competition with home-owners.In many other countries losses on rental housing can be offset against other income for tax purposes, whereas in the UK private rental is treated as an investment and losses can only be offset against profits on other rental properties.Housing policy by successive governments has failed to reduce the speculative nature of the housing market in the UK. A number of suggestions have been put forward, including the introduction of taxes on the value of prop-erty held, and a shift of taxation in the rental sector away from tax on rental income and onto tax on capital gains. The aim would be to encourage the growth of long term investment in rental housing, although in practice most landlords already take a long term view of twenty years or more.
AccreditationAs part of its ‘bonfire of regulations’ the Coalition gov-ernment abandoned Labour’s measures to bring in com-pulsory accreditation of landlords in England, similar to schemes already applying in Scotland, as proposed in the Rugg report. The intention was to eliminate rogue land-lord practices.The Office of Fair Trading has proposed controls over let-ting agents preventing them charging tenants for finding a property in addition to charging landlords for letting it, and ensuring that their charging structures are more explicit.

16
Housing BenefitExtensive changes in eligibility for housing benefit are being implemented by the Coalition government. The pro-vision of housing for the least well-off in society is already woeful in much of the UK, and is arguably the least profit-able part of the rental housing sector. Squeezing it further is likely to have a detrimental effect, and this may well be reviewed by an incoming government.Economists point out that it costs a great deal less to pro-vide capital subsidies to develop affordable housing at reduced rents than to provide rent subsidies on full mar-ket rents. The right-to-buy has resulted in a massive loss of council and social housing at affordable rents, but it is popular with the electorate and no government has had the courage to phase it out.
The AuthorDave Treanor recently retired as managing director of M3 Housing and secretary of the National Housing Maintenance Forum. He wrote Housing Investment Appraisal for the National Housing Federation, and developed financial appraisal systems widely used by housing associations. Prior to that he spent many years working with housing cooperatives.