
ITC BUY - IIFL Capital
58
CMP Rs272 Target 12m Rs350 (29%) Market cap (US$ m) 50,821 Enterprise value (US$ m) 49,466 Bloomberg ITC IN Sector FMCG 09 May 2017 52Wk High/Low (Rs) 293/209 Shares o/s (m) 12147 Daily volume (US$ m) 48 Dividend yield FY17ii (%) 1.7 Free float (%) 100.0 Shareholding pattern (%) Promoter 0.0 FII 20.0 DII 35.7 Others 44.2 Price performance (%) 1M 3M 1Y ITC (0.4) (2.2) 26.1 Absolute (US$) (1.0) 1.9 35.1 Rel. to Sensex (1.2) (7.9) 9.6 CAGR (%) 3 yrs 5 yrs EPS 8.7 13.8 Stock movement Percy Panthaki [email protected] 91 22 4646 4662 Avi Mehta [email protected] 91 22 4646 4650 Sameer Gupta [email protected] 91 22 4646 4672 www.iiflcap.com 0 100 200 300 400 0 20,000 40,000 60,000 80,000 100,000 May‐15 Jul ‐15 Sep‐15 Nov‐15 Jan‐16 Mar‐16 May‐16 Jul ‐16 Sep‐16 Nov‐16 Jan‐17 Mar‐17 May‐17 Vol('000, LHS) Price (Rs., RHS) ITC BUY 1 Growth, re-ignited Detailed report Financial summary (Rs bn) Y/e 31 Mar, Consolidated FY15A FY16A FY17ii FY18ii FY19ii Revenues (Rs bn) 384 391 413 463 519 Ebitda margins (%) 37.0 38.5 37.7 38.2 38.6 Pre‐exceptional PAT (Rs bn) 97 99 104 118 134 Reported PAT (Rs bn) 97 99 104 118 134 Pre‐exceptional EPS (Rs) 8.0 8.2 8.6 9.8 11.1 Growth (%) 8.2 2.3 5.2 13.4 13.2 IIFL vs consensus (%) (1.6) (2.1) (1.5) PER (x) 33.9 33.2 31.5 27.8 24.6 ROE (%) 32.8 30.2 29.0 29.5 29.9 Net debt/equity (x) (0.2) (0.2) (0.1) (0.1) 0.0 EV/Ebitda (x) 22.3 21.3 20.6 18.3 16.2 Price/book (x) 10.2 9.6 8.6 7.7 6.9 Source: Company, IIFL Research. Price as at close of business on 09 May 2017. Institutional Equities We expect growth to revive for ITC (FY17-19 EPS Cagr of 13% vs. 5% for FY14-17) as tax regime turns more rational, non-tax issues are in the base and consumption revives. India has one of the most favourable industry structures (virtual monopoly, FDI ban), which reduces volatility in earnings delivery. Moreover, ITC’s capital allocation has improved, with FCF conversion of ~80%. In light of these factors ITC’s 35% discount to HUL currently (vs. 12% prior to FY13) is set to contract, driving 29% upside to our price target of Rs.350. A change in incidence or structure of tax under GST regime is the main risk to our BUY rating. Growth is set to revive: In the past two budgets, average increase in excise duty has been 8% vs. 18% for the four years prior to that, possibly as the government realizes that a higher tax rate does not increase tax collections but encourages illegal trade. Non tax regulations such as pictorial warnings and ban on public smoking are already in place and others such as banning loose cigarettes are hard to implement. Moreover, revival in consumption would benefit ITC just as it would benefit other FMCG companies. Best industry structure: ITC is a virtual monopoly accounting for 86% of cigarette industry sales and 96% of profits. Moreover, FDI in cigarette manufacture is banned. Due to these factors ITC has high Ebit margins of 66% in the cigarette division vs. global average of 33%. Absence of competition gives ITC pricing power and reduces the risk of market share loss or margin erosion. Moreover, government officials have stated that GST is likely to be tax neutral – thus GST is unlikely to materially alter the industry structure. Reasonable valuation in the light of improved capital allocation: ITC generates 75-80% of its net profit as FCF, vs. an average of 55% over FY03-15. Moreover, ITC trades at a discount of 35% to HUL (with similar expected growth for FY17-19) vs. an average of 12% prior to FY13 when ITC’s EPS growth faltered due to an adverse tax regime. With growth reviving, we believe that this discount would shrink, resulting in an attractive 29% return to our TP. Our extended DCF (terminal FY39) suggests an even higher upside of 46%.
-
Upload
khangminh22 -
Category
Documents
-
view
4 -
download
0
Transcript of ITC BUY - IIFL Capital

CMP Rs272
Target 12m Rs350 (29%)
Market cap (US$ m) 50,821
Enterprise value (US$ m) 49,466
Bloomberg ITC IN
Sector FMCG
09 May 2017
52Wk High/Low (Rs) 293/209
Shares o/s (m) 12147 Daily volume (US$ m) 48
Dividend yield FY17ii (%) 1.7 Free float (%) 100.0
Shareholding pattern (%) Promoter 0.0
FII 20.0
DII 35.7
Others 44.2
Price performance (%)
1M 3M 1Y
ITC (0.4) (2.2) 26.1
Absolute (US$) (1.0) 1.9 35.1
Rel. to Sensex (1.2) (7.9) 9.6
CAGR (%) 3 yrs 5 yrs
EPS 8.7 13.8
Stock movement
Percy Panthaki [email protected] 91 22 4646 4662 Avi Mehta [email protected] 91 22 4646 4650 Sameer Gupta [email protected] 91 22 4646 4672
www.iiflcap.com
0
100
200
300
400
0
20,000
40,000
60,000
80,000
100,000
May‐1
5Ju
l‐1
5Se
p‐1
5N
ov‐
15
Jan‐1
6M
ar‐1
6M
ay‐1
6Ju
l‐1
6Se
p‐1
6N
ov‐
16
Jan‐1
7M
ar‐1
7M
ay‐1
7
Vol('000, LHS) Price (Rs., RHS)
ITC BUY
1
Growth, re-ignited
Detailed report
Financial summary (Rs bn)
Y/e 31 Mar, Consolidated FY15A FY16A FY17ii FY18ii FY19ii
Revenues (Rs bn) 384 391 413 463 519 Ebitda margins (%) 37.0 38.5 37.7 38.2 38.6 Pre‐exceptional PAT (Rs bn) 97 99 104 118 134 Reported PAT (Rs bn) 97 99 104 118 134 Pre‐exceptional EPS (Rs) 8.0 8.2 8.6 9.8 11.1 Growth (%) 8.2 2.3 5.2 13.4 13.2 IIFL vs consensus (%) (1.6) (2.1) (1.5) PER (x) 33.9 33.2 31.5 27.8 24.6 ROE (%) 32.8 30.2 29.0 29.5 29.9 Net debt/equity (x) (0.2) (0.2) (0.1) (0.1) 0.0 EV/Ebitda (x) 22.3 21.3 20.6 18.3 16.2 Price/book (x) 10.2 9.6 8.6 7.7 6.9 Source: Company, IIFL Research. Price as at close of business on 09 May 2017.
Institutional Equities
We expect growth to revive for ITC (FY17-19 EPS Cagr of 13% vs. 5% for FY14-17) as tax regime turns more rational, non-tax issues are in the base and consumption revives. India has one of the most favourable industry structures (virtual monopoly, FDI ban), which reduces volatility in earnings delivery. Moreover, ITC’s capital allocation has improved, with FCF conversion of ~80%. In light of these factors ITC’s 35% discount to HUL currently (vs. 12% prior to FY13) is set to contract, driving 29% upside to our price target of Rs.350. A change in incidence or structure of tax under GST regime is the main risk to our BUY rating.
Growth is set to revive: In the past two budgets, average increase in excise duty has been 8% vs. 18% for the four years prior to that, possibly as the government realizes that a higher tax rate does not increase tax collections but encourages illegal trade. Non tax regulations such as pictorial warnings and ban on public smoking are already in place and others such as banning loose cigarettes are hard to implement. Moreover, revival in consumption would benefit ITC just as it would benefit other FMCG companies.
Best industry structure: ITC is a virtual monopoly accounting for 86% of cigarette industry sales and 96% of profits. Moreover, FDI in cigarette manufacture is banned. Due to these factors ITC has high Ebit margins of 66% in the cigarette division vs. global average of 33%. Absence of competition gives ITC pricing power and reduces the risk of market share loss or margin erosion. Moreover, government officials have stated that GST is likely to be tax neutral – thus GST is unlikely to materially alter the industry structure.
Reasonable valuation in the light of improved capital allocation: ITC generates 75-80% of its net profit as FCF, vs. an average of 55% over FY03-15. Moreover, ITC trades at a discount of 35% to HUL (with similar expected growth for FY17-19) vs. an average of 12% prior to FY13 when ITC’s EPS growth faltered due to an adverse tax regime. With growth reviving, we believe that this discount would shrink, resulting in an attractive 29% return to our TP. Our extended DCF (terminal FY39) suggests an even higher upside of 46%.

ITC – BUY
2 percy.panthaki@iif lcap.com
Institutional Equities
Contents:
Growth is set to revive ..................................................................................... 3
Background ..................................................................................................... 3
Tax increases likely to be reasonable ................................................................... 3
Non-tax issues already in the base ...................................................................... 9
Revival in consumption ..................................................................................... 11
Price elasticity ................................................................................................. 13
Best industry structure .................................................................................. 15
Near monopoly business ................................................................................... 15
Ban on FDI in tobacco ...................................................................................... 16
GST likely to be tax neutral ............................................................................... 19
Capital allocation and valuation ..................................................................... 24
Capital allocation has improved ......................................................................... 24
Healthcare foray not a significant risk ................................................................. 27
Reasonable valuation ....................................................................................... 28
Annexure 1 – Analysis by cigarette length ..................................................... 33
Annexure 2 – FMCG business ......................................................................... 36
Annexure 3 – Hotel business ......................................................................... 40
Annexure 4 – Paperboards business .............................................................. 43
Annexure 5 - Agri business ............................................................................ 46

3
ITC – BUY
percy.panthaki@iif lcap.com
Institutional Equities
Growth is set to revive
Background As shown in figure 1, prior to FY15, ITC was on a high growth path (FY02-14 EPS growth 18%). However during FY14-17, continuous steep tax increases took a toll and EPS growth fell to 5%. We now believe that FY17-19 will post a healthy revival with an EPS Cagr of 13%. In this section we discuss in detail the reasons why we believe growth will revive. Figure 1: EPS growth expected to revive in a rational tax regime
Source: Company, IIFL Research
Tax increases likely to be reasonable We believe tax increases will be reasonable in the medium term. As we explain in this note, the sweet spot for tax increases is 8-10% per annum, since at this rate of increase the government is able to optimise the holy trinity of keeping cigarette volume growth close to zero, increasing government revenues at a handsome rate and limit proliferation of illegal cigarettes. 1. Tax rate does not impact tax collections Over FY12-16, excise duties increased aggressively. Tax rates increased at 18% Cagr over this four year period (excluding mix change impact). The decade prior to that i.e. the period of FY03-13 witnessed excise duties increase of 5.7% p.a. The recent past has therefore seen a clear steepening of the tax curve vs. history. However, higher tax rates have not necessarily translated into higher government collections; indeed in some cases steep tax increases have hurt growth in tax collections due to a combination of volume decline and down-trading to shorter cigarette lengths which have a lower excise duty per stick.
0%
5%
10%
15%
20%
25%
30%
FY0
3
FY0
4
FY0
5
FY0
6
FY0
7
FY0
8
FY0
9
FY1
0
FY1
1
FY1
2
FY1
3
FY1
4
FY1
5
FY1
6
FY1
7ii
FY1
8ii
FY1
9ii
ED rates YoY growth EPS growth
High EPS CAGR of 18%
Low EPS CAGR of 5%
Steady EPS CAGR of 13%
EPS growth has fallen to 5% p.a. for the past three years due to a continuous
tax increases; we believe it will revive to 13% p.a. over
the next two years
Excise payment by ITC FY12-16 grew 11% p.a.
despite a higher tax rate growth of 18% p.a.

ITC – BUY
4 percy.panthaki@iif lcap.com
Institutional Equities
Figure 2: Tax collections have dipped despite increase in duty rates
Source: Company, IIFL Research
During the period FY03-12, ITC’s excise payment has increased at a Cagr of 8% vs. a tax rate Cagr of 4%. However, for the period FY12-16 while the tax rate grew at a much sharper Cagr of 18%, the actual tax paid increased at a lower Cagr of 11% due to volume decline and down-trading. 2. High taxation results in proliferation of duty evaded cigarettes and non cigarette tobacco consumption A high tax burden provides arbitrage opportunities for duty-evaded cigarettes to thrive, especially in developing countries where implementation of law is lax. In India, illegal cigarettes account for 20.2% of all cigarettes sold in India in CY15. This has increased from 15.7% in CY10. Most of these cigarettes are available at less than half the price of similar cigarettes (since tax accounts for ~55% of the retail price of a cigarette) and therefore offer significant price competition to legal cigarettes. Figure 3: Illegal cigarette volumes have more than doubled since CY04
Source: Tobacco institute of India, IIFL Research
Moreover, as cigarettes are taxed much higher than bidis or other forms of consumption, an increase in cigarette taxation results in consumption shifting from cigarette to other forms.
‐5%
0%
5%
10%
15%
20%
25%
FY0
3
FY0
4
FY0
5
FY0
6
FY0
7
FY0
8
FY0
9
FY1
0
FY1
1
FY1
2
FY1
3
FY1
4
FY1
5
FY1
6
FY1
7
ED paid yoy growth ED per stick YoY growth ED rates yoy growth
11.112.5
13.514.6
16.717.5
18.319.5
20.821.8
22.8 23.9
5
7
9
11
13
15
17
19
21
23
25
CY04 CY05 CY06 CY07 CY08 CY09 CY10 CY11 CY12 CY13 CY14 CY15
(bn sticks)
Illegal cigarettes contribution to industry
volumes went up from 15.7% in CY10 to 20.2% in
CY16

5
ITC – BUY
percy.panthaki@iif lcap.com
Institutional Equities
Figure 4: Comparison of taxes paid by cigarettes and other forms
Figure 5: Contribution from legal cigarettes to overall tobacco consumption
Source: Tobacco institute of India, IIFL Research Source: Tobacco institute of India, IIFL Research
Legal cigarettes account for only 11% of tobacco consumed in India and this share has been declining over the years. Despite this, legal cigarettes account for 87% of taxation on tobacco. Figure 6: Cigarettes are a small part of tobacco consumption but a large part of tobacco taxes
Source: Tobacco institute of India, IIFL Research The problem is accentuated by the fact that the tax on bidis is low, and it does not grow as fast as the tax on cigarettes. Figure 7: Taxation on cigarettes vs. bidis
Source: IIFL Research
33 52
953
2,773
0
500
1,000
1,500
2,000
2,500
3,000
FY06 FY15
Other forms Cigarettes
Excise duty per kg of tobacco used
(Rs)
86 62
320
500
0
100
200
300
400
500
600
FY82 FY16
Legal cigarettes Other tobacco forms(mn kgs)
11%
87%85%
13%
0%
20%
40%
60%
80%
100%
Share of tobacco consumption Share of tax revenues
Legal cigarretes Other tobacco products
1,349 1,584 1,768 2,095 2,238
577 769 930
1,157 1,207
‐
5
10
15
20
25
0
500
1,000
1,500
2,000
2,500
3,000
3,500
4,000
FY13 FY14 FY15 FY16 FY17
VAT per stick paid by ITC (LHS)Excise duty per stick paid by ITC (LHS)Excise duty per stick on bidi (hand made) (RHS)
ED per 1000sticks (Rs)
ED per 1000sticks (Rs)
Excise duty on cigarettes 100x that of bidis on a per
stick basis

ITC – BUY
6 percy.panthaki@iif lcap.com
Institutional Equities
Illegal cigarettes — case study of a few countries: Malaysia Malaysia has one of the highest illicit cigarette markets in the world in terms of composition of the overall market. Illegal cigarettes comprise ~57% of industry volumes. This is because Malaysia has a tax incidence much higher than neighbouring countries such as Indonesia, resulting in an arbitrage opportunity for duty evaded imports. At USD 3.29 per pack of 20 for the most sold brand, the price of cigarettes in Malaysia is higher than in Indonesia (USD 1.48 per pack), Thailand (USD 1.13), and Vietnam (USD 0.80) in 2015
Figure 8: Malaysia – split of cigarette consumption in 2015 Figure 9: Malaysia – share of illicit cigarettes over the years
Source: IIFL Research, Oxford economics Source: IIFL Research, Oxford economics, *denotes exit 2016 share as
per BAT Malaysia annual report
As per BAT Malaysia annual report (which quoted Nielsen), contribution of illegal cigarettes exit 2016 has gone up to 57%, as the government has increased taxation by ~40%. Experts expect the illegal share to cross 60% in the next few months. In 2016 BAT announced that it would shut its factory at Petaling citing “falling sales due to the presence of illicit cigarettes in the market and high duties imposed by the government”. Pakistan While the illegal cigarettes in Malaysia are mainly imported, in Pakistan these are of domestic origin. An increase in taxes by the Pakistan government has made manufacture of duty evaded cigarettes more attractive. This has led to the share of illegal cigarettes increasing from 25.3% in 2012 to 31.3% in 2015.
Domestic ‐legal,
61.7%
Non domestic ‐legal, 1.7%
Illicit, 36.7%
34.5%35.6%
33.7%
36.7%
57.10%
30%
35%
40%
45%
50%
55%
60%
2012 2013 2014 2015 2016*
Illegal cigarettes in Malaysia outnumber legal cigarettes now as a result
of steep tax hikes

7
ITC – BUY
percy.panthaki@iif lcap.com
Institutional Equities
Figure 10: Pakistan –excise duty per stick for most sold brand Figure 11: Pakistan – share of legal and illicit cigarettes
Source: IIFL Research, Oxford economics Source: IIFL Research, Oxford economics
As per annual report of Pakistan Tobacco Company for CY16, illegal cigarettes touched 40% of industry volumes exit 2016. The share has increased every month, starting at 31.9% in January 2016 and ending with 40.6% in December 2016. In the previous year, taxes in Pakistan went up 15-20%. 3. Tax in India is already high and consumption is low Tax as a percentage of MRP in India is ~55%. This is low compared with several other countries Figure 12: Tax as % of MRP in India is lower than many other countries
Source: IIFL Research, WHO
However, this is mainly due to ITC’s virtual monopoly, (Ebit margin is nearly 70% of net sales for ITC’s cigarette division) allowing it to increase prices as required. Therefore, while tax increases have been steep, price has increased correspondingly leading to no significant change in the tax to retail price ratio. If India were a market with enough competition, then the tax to retail price ratio would definitely be higher as the retail price would have been competed down to lower levels. This is not necessarily desirable; the objective of a tax regime is to make cigarettes unaffordable and that is unlikely to be achieved by increasing competition and bringing down the price table, thereby having a higher tax to retail price ratio.
0%
10%
20%
30%
40%
0
200
400
600
800
1,000
1,200
2008 2009 2010 2011 2012 2013 2014 2015
Excise duty per 1000 sticks (LHS)
% growth (RHS)
(Pakistanrupee)
(%)
74.4% 77.1% 74.6%68.6%
21.9% 18.6% 21.1%24.2%
3.5% 4.2% 4.2% 7.1%
50%
70%
90%
2012 2013 2014 2015
Domestic ‐ legal Domestic ‐ illicitNon domestic ‐ illicit
25%
45%
65%
85%
Vie
tnam USA
Ch
ina
Sou
th A
fric
a
Ind
on
esi
a
Mal
aysi
a
Au
stra
lia
Ind
ia
Pak
ista
n
Bra
zil
Me
ixco
Arg
en
tin
a
Ge
rman
y
Thai
lan
d
Egyp
t
Sri L
anka
Ph
ilip
pin
es
Po
rtu
gal
Ban
glad
esh
Spai
n
Turk
ey
UK
Tax as % of MRP on most sold brand
Illegal cigarettes contributed 40% to
industry volumes in Dec 2016, up sharply from 31%
in CY15
Tax as a percentage of MRPin India is lower than
several countries, but that is only due to ITC’s virtual
monopoly giving it significant pricing power

ITC – BUY
8 percy.panthaki@iif lcap.com
Institutional Equities
What is relevant is the retail price or the tax in relation to per capita income of the consumer. On both these parameters we observe that cigarettes in the Indian market are highly unaffordable.
Figure 13: Tax per 100 packs on most sold brand as a percentage of GDP per capita
Figure 14: MRP of 100 packs of most sold brand as a percentage of GDP per capita
Source: IIFL Research, WHO Source: IIFL Research, WHO
India is already quite low in terms of per capita consumption of cigarettes as well as tobacco.
Figure 15: Per capita consumption of cigarettes per adult Figure 16: Per capita tobacco consumption
Source: IIFL Research, World Library Source: IIFL Research
Percentage of adults who consume tobacco in India is not very high. Here are some facts • 34.6% of adults, 47.9% of males and 20.3% of females consume
any form of tobacco • 14% of adults smoke tobacco (24.3% makes and 2.9% females)
o 5.7% of adult smoke cigarettes (10.3% males and 0.3% females)
o 9.2% of adults smoke bidis (16% males and 1.9% females) • 25.9% of adults consume smokeless tobacco (32.9% males and
18.4% females)
0%
2%
4%
6%
8%
10%
12%
USA
Ch
ina
Arg
en
tin
aG
erm
any
Au
stra
liaB
razi
lP
hili
pp
ine
sSp
ain
Vie
tnam
Mal
aysi
aP
ort
uga
lM
eix
coP
akis
tan
Sou
th A
fric
aU
KEg
ypt
Ind
on
esi
aTh
aila
nd
Turk
ey
Ban
glad
esh
Ind
iaSr
i Lan
ka0%
2%
4%
6%
8%
10%
12%
14%
16%
USA
Arg
en
tin
aG
erm
any
Ph
ilip
pin
es
Ch
ina
Spai
nB
razi
lA
ust
ralia
Po
rtu
gal
UK
Me
ixco
Egyp
tM
alay
sia
Turk
ey
Thai
lan
dP
akis
tan
Vie
tnam
Ind
on
esi
aSo
uth A
fric
aB
angl
ade
shIn
dia
Sri L
anka
0
400
800
1,200
1,600
2,000
Ind
iaB
angl
ade
shSr
i Lan
kaM
eix
coSo
uth A
fric
aP
akis
tan
Bra
zil
Mal
aysi
aTh
aila
nd
UK
Ph
ilip
pin
es
Vie
tnam USA
Au
stra
liaA
rge
nti
na
Ge
rman
yIn
do
ne
sia
Egyp
tP
ort
uga
lTu
rke
yC
hin
aSp
ain
No. of cigarettes per year
438 461 468
743
1,1451,256
0
200
400
600
800
1,000
1,200
1,400
Pakistan Nepal India World China USA
(gms per year)
Taxation and retail price of cigarettes in conjunction
with per capita income reveals India as one of the
highest taxed countries
India has one of the lowestper capita consumption of cigarettes at 96 p.a.; only
5.7% of Indian adults smoke cigarettes

Key data related to tobacco consumption
Country GDP per capita (USD)
Tobacco consumption
Sticks per adult per year
Cigarette MRP USD (20’s pack)
MRP as % of GDP per capita (%)
Tax as % of MRP (%)
Tax as % of GDP per capita (%)
Advertisement restrictions Smoking restrictions Pictorial warnings
India 1,627 96 1.76 10.8% 60.4% 6.5% All forms of advertisements including surrogate, are banned
Prohibited in public places including auditoriums, cinemas, hospitals, pub-lic transport, restaurants, hotels, bars, educational institutes and parks
Pictorial and text health warnings to cover 85% of pack
Pakistan 1,287 468 0.48 3.7% 60.7% 2.3% Advertisements banned in print and electronic media, some promotional activities allowed in PoS
Banned in public places Pictorial and text health warnings to cover 40% of pack, new regulations to increase this to 85% have been delayed
Sri Lanka 6,844 195 9.24 13.5% 73.8% 10.0% Restrictions on advertising and promo-tions, but product displays at PoS are allowed
Banned in enclosed public places Pictorial and text health warnings to cover 80% of pack
Bangladesh 2,520 154 1.93 7.7% 76.0% 5.8% Advertising prohibited in all print and electronic media, including PoS
Banned in indoor public places GHW to cover atleast 50% of main display areas of the pack
Thailand 5,546 560 2.03 3.7% 73.1% 2.7% Most forms of tobacco advertising banned.
Banned in indoor public places, indoor workplaces and public transport
GHW to cover 85% of principal dis-play areas of the pack
Malaysia 11,059 539 3.76 3.4% 55.4% 1.9% All forms of tobaco advertisement and promotion, prohibited
Banned in public transport, specified public places and workplaces
Combined GHW and text warnings to occupy 50% of front and 60% of back of the pack
Indonesia 3,398 1085 1.58 4.7% 53.4% 2.5% Tobacco advertising and promotions are allowed with certain restrictions
Prohibited in public transport and designated public places
Pictorial health warnings are required to cover 40% of main display areas of the pack
China 7,570 1711 1.62 2.1% 44.4% 1.0% Tobacco advertising prohibited in mass media, public places, means of public transport and outdoors
Banned in at least 28 indoor public places including medical facilities, restaurants, and bars
Required warnings are text only, and cover at most 35% of the pack
Vietnam 2,071 1001 0.88 4.3% 41.6% 1.8% Tobacco advertising and promotions are prohibited, PoS displays are however allowed
Banned in select public places such as health and educational facitlities
Combined picture and text warnings to cover 50% of the pack
Philippines 2,938 838 0.62 2.1% 74.3% 1.6% Tobacco advertising and promotions are prohibited, PoS displays and free distri-bution of tobacco products are however allowed
Banned in select places, transport facilities and restrictions on access to minors
Combined picture and text warnings to cover 50% of the pack
UK 44,216 750 12.69 2.9% 82.2% 2.4% Tobacco advertising and promtions are prohibited with few exceptions such as retailer incentive programmes
Banned in all closed places and public places. Smoking also prohibited in private cars carrying a child
Standardised packaging for all packs
Institutional Equities

Key data related to tobacco consumption
Country GDP per capita (USD)
Tobacco consumption
Sticks per adult per
year
Cigarette MRP USD (20’s pack)
MRP as % of GDP per capita (%)
Tax as % of MRP
(%)
Tax as % of
GDP per capita (%)
Advertisement restrictions Smoking restrictions Pictorial warnings
Germany 41,613 1045 6.45 1.6% 72.9% 1.1% Tobacco advertising prohibited in TV, radio and print. Advertising at PoS and print advertising such as posters, are allowed
Prohibited in indoor workplaces and public places
One of the two authorized text warning to occupy 30% of front of the pack, and one of 14 authorized text warning to occupy 40% of the back of the pack
Spain 31,000 1757 6.82 2.2% 78.1% 1.7% Tobacco advertising prohibited, PoS ad-vertising being the exception
Prohibited in indoor public places, work-places and public transport
One of the two authorized text warning to occupy 30% of front of the pack, and one of 14 authorized text warning to occupy 40% of the back of the pack
Portugal 21,733 1114 6.02 2.8% 74.5% 2.1% Total sponsorship and advertising ban, including PoS advertising. Electronic ciga-rettes and herbal smoking products also included
Prohibited in all enclosed public places, work places and public transport
Warnings to cover 65% of most relevant area of the pack
Turkey 10,523 1399 3.82 3.6% 82.1% 3.0% Tobacco advertising prohibited, PoS ad-vertising is also regulated
Prohibited in indoor workplaces and public places
Warnings to cover 65% of the pack
South Africa 6,360 459 2.97 4.7% 48.8% 2.3% Tobacco advertising prohibited, PoS ad-vertising is also regulated
Partially banned in indoor public areas, 25% of indoor public areas are allowed for smoking
Pictorial and text health warnings to cover 15% of the front of the pack, and 25% of the back of the pack
Egypt 3,343 1104 1.12 3.4% 73.1% 2.4% Tobacco advertising and promotions prohibited, but law does not cover spon-sorship or financial contributions by the tobacco industry
Banned in specified public places Warnings to cover 50% of of the pack
Brazil 11,092 504 2.54 2.3% 64.9% 1.5% Tobacco advertising prohibited, PoS ad-vertising is the only exception
Prohibited in all enclosed public and workplaces
GHW to cover 30% of front side of the pack, 100% of back and one side of the pack
Argentina 12,734 1042 1.77 1.4% 69.8% 1.0% Most forms of tobacco advertising banned.
Prohibited in indoor work and public places and public transport
Warnings to cover 50% of of the pack
Mexico 10,849 371 3.45 3.2% 65.9% 2.1% Most forms of tobacco advertising banned, but directed advertising to adults such as adult magazines, are al-lowed
Banned in designated public places, isolated areas in other public and work-places are allowed
Warnings to cover 30% of front, 100% of back and 100% of one side of the pack
Australia 62,846 1034 15.9 2.5% 56.8% 1.4% Most forms of tobacco advertising banned, restrictions on PoS advertising
Banned in indoor work and public places and public transport
GHW and text warnings to cover 75% of front and 90% of back. Additionally, an informational mes-sage to be included on one full side
USA 54,649 1028 6.23 1.1% 42.5% 0.5% NA NA NA
Institutional Equities

9
ITC – BUY
percy.panthaki@iif lcap.com
Institutional Equities
Figure 17: Adults smoking tobacco is relatively low in India, and smoking cigaretteseven lower
Source: WHO, IIFL Research. *The proportion of cigarette smokers is even lower at 5.7%
4. Tax increases have been benign in recent times The past two budgets have been relatively benign in terms of increase in excise duties. The budget in Feb 2016 increased excise duties by 10% and the one in Feb 2017 increased duties by 6% only. Moreover, several government officials have mentioned that GST would be tax neutral for tobacco. These developments lead us to believe that the government stance on tobacco has become less aggressive since it has realised that steep tax increases do not lead to additional revenue but they make production and sale of duty evaded cigarettes more attractive. Non-tax issues already in the base Tobacco control consists of tax as well as non-tax measures. In the previous section we argued why tax measures are likely to be manageable in the medium term. In this section we look at the possible risks on the non-tax front. We argue that most of the non-tax measures have already been implemented in India over the past several years, and that there are very few areas on which India is not already compliant. Therefore, the pressure due to non-tax regulations coming into force will be lower in the future vs. what it was in the past. The only possible issues that could come up are a ban on loose cigarettes and increasing the minimum age of a customer to whom cigarettes can be sold. Both these measures are so difficult to implement as to have no material impact. FCTC (Framework Convention for Tobacco Control) stipulates several non-tax measures to control consumption. India is compliant with most of the main measures: • Ban on public smoking – India announced a nationwide ban on
public smoking in October 2008. Places where smoking was restricted included auditoriums, cinemas, hospitals, public transport, restaurants, hotels, bars, educational institutes and parks among others, with offenders being charged a fine of Rs200.
• Pictorial warnings – In India, pictorial warnings increased from 40% to 85% of the pack in April 2016
0%
10%
20%
30%
40%
50%
Ke
nya
Me
xico
Pak
ista
n
Egyp
t
Ph
ilip
pin
es
Thai
lan
d
Ind
ia*
Ind
on
esi
a
Ru
ssia
Ban
glad
esh
Tobacco users Tobacco smokers Smokeless tobacco users
% of adults
Excise hikes in the past twobudgets have averaged 8%vs. 18% in the four budgets
before that
Most of the FCTC non tax recommendations such as
ban on public smoking, ban on advertisement and pictorial warnings are
already in place

ITC – BUY
10 percy.panthaki@iif lcap.com
Institutional Equities
Figure 18: Pictorial warnings now make up ~85% of the pack area
Source: IIFL Research
• Ban on advertising – There is almost a complete ban on
advertising of tobacco products. Even surrogate advertising is not allowed. The only form of advertisement allowed is billboards on retail shops
There are only a few areas where there could be regulatory pressure, but we believe that these are difficult to implement Ban on loose cigarettes About 70% of cigarettes in India are bought loose and therefore a ban on public smoking could theoretically affect the industry adversely. Under Section 18 of the Legal Metrology Act, “No person shall manufacture, pack, sell, import, distribute, deliver, offer, expose or possess for sale any pre-packaged commodity unless such package is in such standard quantities or number and bears thereon such declarations and particulars in such manner as may be prescribed.” Tobacco products were included in May 2015 and they came in effect from January 2016 within the purview of this section. Under section 7 of COTPA (Cigarettes and other tobacco products Act) loose cigarettes cannot be sold as the section deals with health warnings. The sale of cigarettes without pictorial and other warnings is not allowed and therefore the interpretation could be that loose cigarette sales cannot be allowed as the consumer does not get to see the pictorial warning. There is a bill to amend the COTPA to give it more teeth and make the ban on loose cigarettes more explicit. Despite these laws, there is no dearth of availability of loose cigarettes in India. Some states have enacted their own laws or issued notification based on existing laws to prevent sale of loose cigarettes. However, this has not impacted the availability of loose cigarettes. Cigarette retail is largely unorganised in India with 7.5mn retail points most of which are small mom and pop retail kiosks. Therefore it is very difficult to implement a ban on loose cigarettes. Even the ban on public smoking, which is already in place since the past eight years, has not resulted in any significant number of people being
Ban on loose cigarettes are difficult to implement; we
expect no significant impact on availability and pricing

11
ITC – BUY
percy.panthaki@iif lcap.com
Institutional Equities
fined for violating this law. While it is imposed in metros and big cities, our experience is that implementation elsewhere of the ban on public smoking is very lax. Implementation of ban on loose cigarettes is almost non-existent even in large cities such as Mumbai. We believe that even if the states and centre turn more serious on this ban, loose cigarettes will continue to be available freely, but retailers may charge a premium of about Rs.1 per stick to offset any fines or bribes they may have to pay as a result of strict implementation. Hence, in the worst case, it seems that a ban on loose cigarettes will be equivalent to a one time price increase of 5-10%. Increase in the minimum age There is a proposal to increase the minimum age of consumers to whom cigarettes can be sold from 18 years to 21 years and gradually to 25 years. We believe this provision is likely to be completely ignored in terms of implementation. Given the millions of retail points for cigarettes it is very difficult to check the age of the person buying a cigarette. Revival in consumption Slowdown in FMCG sales Over the past 3-4 years, performance of ITC’s cigarette division has deteriorated both in terms of growth in consumer spending on its products, as well as volume growth. The deceleration has coincided with the period when tax rates increased steeply. Figure 19: Sales growth has suffered in the past few years for ITC
Source: Company, IIFL Research
This has led to the belief that the deceleration in ITC’s performance has been solely due to the continuous steep tax increases. Although the tax increase certainly has had an important role to play in the deceleration, the fact is that overall FMCG spending slowed down and that is likely to have hurt cigarette consumption as well.
‐10%
‐5%
0%
5%
10%
15%
20%
25%
FY04 FY05 FY06 FY07 FY08 FY09 FY10 FY11 FY12 FY13 FY14 FY15 FY16 FY17
Volume Excise duty per stick Gross sales (including VAT)
% growth
Increase in minimum age of consumers to whom
cigarettes can be sold is even more difficult to
implement than banning loose cigarettes
Slowdown in ITC’s sales is often blamed solely on
steep tax increases as bothhave happened at the same
time; however, overall slowdown in FMCG is also a
factor which is often overlooked

ITC – BUY
12 percy.panthaki@iif lcap.com
Institutional Equities
Figure 20: Consumer slowdown has also affected ITC’s cigarettes division
Source: Company, IIFL Research
We (and indeed most analysts as well as investors) are building in an increase in sales growth for the FMCG sector, denoting a recovery for the sector. Consequently, there should be a recovery in cigarettes as well. Figure 21: Expect a recovery in FMCG as well as cigarettes going forward
Source: Company, IIFL Research
Cigarettes gross sales linked at least partially to macro indicators We plot gross sales growth for ITC’s cigarette division for the past 20 years and compare it to nominal GDP growth and rural agri wage growth
0%
5%
10%
15%
20%
25%
FY07 FY08 FY09 FY10 FY11 FY12 FY13 FY14 FY15 FY16 FY17
Growth in FMCG excl ITC Growth in ITC's gross cigarette sales
6.2%
7.7%
11.2%10.1%
0%
2%
4%
6%
8%
10%
12%
FMCG excl ITC sales growth ITC's gross cigarette sales growth
FY14‐17 FY17‐19ii
We expect cigarette sales growth to be higher in the
future compared to the past, and this is no different
from our estimates for FMCG in general

13
ITC – BUY
percy.panthaki@iif lcap.com
Institutional Equities
Figure 22: Gross sales growth has been in‐line with macro indicators
Source: Company, IIFL Research
As with other FMCG products, cigarette sales growth too has moved in line with macro indicators. Even as tax increases have hampered ITC’s sales growth in recent times, on a broad basis, ITC’s cigarettes division has registered a sales growth (gross of VAT and excise), in-line with other macro indicators such as nominal GDP growth and rural agri-wage growth. Thus, an improvement in these macro factors should also lead to revival of the growth in ITC’s cigarettes division (on a gross basis). Price elasticity We have data for ITC’s price growth (including mix changes) and volume from FY95 onwards. There is a clear negative correlation (R=-0.71) over the period FY95-FY17.
Figure 23: Volume and pricing growth trends for ITC cigarettes Figure 24: Price elasticity for cigarettes
Source: IIFL Research Source: IIFL Research
The slope of the curve over this period is -0.74 i.e. for a 100 bps increase in price, the volume drops by 74 bps. However, the slope of the curve for the past 10 years (FY08-17) is lower at -0.54. If we consider the past three years as the period of decelerating growth and exclude these from our analysis and look at the slope of the curve for the 10 year period FY05-14, it is not significantly different at -0.56.
‐5%
0%
5%
10%
15%
20%
25%
FY9
5
FY9
6
FY9
7
FY9
8
FY9
9
FY0
0
FY0
1
FY0
2
FY0
3
FY0
4
FY0
5
FY0
6
FY0
7
FY0
8
FY0
9
FY1
0
FY1
1
FY1
2
FY1
3
FY1
4
FY1
5
FY1
6
FY1
7
ITC's gross cigarette sales growth Nominal GDP growth
Rural agri wage growth
‐10%
‐5%
0%
5%
10%
15%
20%
25%
FY9
5FY
96
FY9
7FY
98
FY9
9FY
00
FY0
1FY
02
FY0
3FY
04
FY0
5FY
06
FY0
7FY
08
FY0
9FY
10
FY1
1FY
12
FY1
3FY
14
FY1
5FY
16
FY1
7
Volume growth Price growthy = ‐0.7351x + 0.0988
‐10%
‐5%
0%
5%
10%
15%
20%
25%
0% 5% 10% 15% 20% 25%
Vo
lum
e g
row
th
Price growth
ITC’s sales are at least partially impacted by macro
indicators such as GDP growth and rural agri wage
growth; the current slowdown in sales coincides
with a slowdown in these indicators

ITC – BUY
14 percy.panthaki@iif lcap.com
Institutional Equities
Alternate view of elasticity - Actual vs. projected volume Using the data of FY95-17 the regression equation is Y = -0.74X + .099. We plug this equation into all the years and project volume growth as per the equation. We ascertain the difference between the actual volume growth and the projected volume growth and plot it as below Figure 25: Actual growth tends to fall below projected growth during periods whereconsumption is weak
Source: IIFL Research
We notice that in the past three years the actual volume growth is indeed below the projected volume growth by 4-6%, implying an adverse impact on the price elasticity. This may be construed as a breakdown in price elasticity due to continuous steep increases in tax. And surely, that is certainly an important reason for the lower–than-projected volume growth. However, we notice that the other period where volume growth fell below projected levels was the period of the early 2000s. Anyone who has been tracking Indian FMCG for long enough will know that this period is well known for the collapse of FMCG growth dragged by slow rural growth and indeed lower overall GDP growth. The fact that the volume growth falls below projected only in periods when FMCG consumption is under stress seems to suggest that the consumption climate is an important factor affecting volume growth and that volume growth is not (as the popular opinion seems to be) solely a function of price elasticity having broken down or changed due to steep tax increases.
‐10%
‐5%
0%
5%
10%
15%
FY9
5
FY9
6
FY9
7
FY9
8
FY9
9
FY0
0
FY0
1
FY0
2
FY0
3
FY0
4
FY0
5
FY0
6
FY0
7
FY0
8
FY0
9
FY1
0
FY1
1
FY1
2
FY1
3
FY1
4
FY1
5
FY1
6
FY1
7
The years where projected volume (using past data
regression) has fallen below actual volume have
been years of general FMCGslowdown; the tax impact in the overall slowdown is
therefore overstated

15
ITC – BUY
percy.panthaki@iif lcap.com
Institutional Equities
Best industry structure Near monopoly business Dominant player ITC is a dominant player in the Indian tobacco business due to legacy reasons. The three listed players via ITC, GPI and VST account for ~95% of the market volumes. Taking these three as the universe, ITC accounts for 86% of net sales and 96% of profits.
Figure 26: Revenue share as on FY16 (on net sales) Figure 27: Profit share as on FY16 (on Ebit)
Source: Company, IIFL Research Source: Company, IIFL Research
High profit margins Due to its dominant market position, ITC is able to make healthy margins, which are above global peers as well as Indian competitors. The Indian competitors have been forced to compete purely on price and in the lower priced 64mm segment as ITC has superior distribution strength as well as better brand recall. Figure 28: ITC’s EBIT margin is one of the highest among Asian and global peers
Source: Company, IIFL Research
Sri Lanka has a monopoly on cigarette manufacture, and the margins of Ceylon tobacco are therefore similar to ITC.
ITC, 86%
VST, 4%
GPI, 9%ITC, 96%
VST, 2%
GPI, 2%
13% 14% 15% 16%23% 24% 26% 27%
34% 36% 38%45% 47%
66% 67%
0%
20%
40%
60%
80%
Go
dfr
ey
Ph
ilip
s
Gu
dan
g ga
ram
Ph
ilip M
orr
is
HM S
amp
oe
rna
VST In
du
stri
es
Pak to
bac
co
Swe
dis
h M
atch
BA
T M
alay
sia
Bri
tish A
me
rica
n T
ob
acco
Re
yno
lds
Am
eri
ca
Jap
an T
ob
acco
Inc
Alt
ria
Imp
eri
al B
ran
ds
ITC
Ce
ylo
n T
ob
acco
Co P
LC
Ebit margin
ITC accounts for 86% of industry sales and 96% of
industry profit
ITC has one of the highest cigarette Ebit margins
amongst peers

ITC – BUY
16 percy.panthaki@iif lcap.com
Institutional Equities
Ban on FDI in tobacco In April 2010, the government of India banned FDI in cigarette manufacturing, following pressure from the Health ministry on the grounds that being a signatory of the Framework Convention on Tobacco control, it was the government’s responsibility to reduce consumption. The new DIPB notification stated “FDI is prohibited in manufacturing of cigars, cheroots, cigarillos and cigarettes, of tobacco or of tobacco substitutes”. The earlier policy permitted FDI up to 100% with prior permission from the Foreign Investment Promotion Board (FIPB), and subject to the company obtaining an industrial license. However, this was as good as defunct as no new industrial license was issued since 1999. Further, the cabinet in November 2016 proposed to ban FDI in cigarettes in any form, including licensing for franchise, trademark, brand name and management contracts. Over the years, FDI policies have become more stringent and access to foreign capital has become increasingly difficult. The case studies of Japan Tobacco Inc and Godfrey Philips India illustrate this point. Case study - JTI (Japan Tobacco Inc) Figure 29: JTI India – timeline of events
Year Event
1993 Japan Tobacco Inc enters India through a 50:50 JV with Mumbai based Thakkar family
2008 With the JV facing losses, JTI seeks permission of FIPB to infuse equity and increase stake from 50% to 74%
2010 While the proposal stays in abeyance with FIPB, the government bans any new FDI in cigarette manufacturing
2010 JTI India issues shares to JTI at a premium while also issuing equal number of shares to Thakkar family, thus investing Rs2.9bn in the company without altering the equity structure
2010 The transaction comes under the scrutiny of the Finance ministry
2011 Unable to infuse equity, JTI exits the JV
Source: IIFL Research
JTI based its decision of exiting the JV on “accumulation of investment and an unsustainable business model in an operating environment where readymade cigarette demand has not evolved, with several foreign investment, regulatory, duty and tax related uncertainties”.
FDI ban on tobacco manufacturing builds a
strong moat for ITC
JTI exited India due to unfavourable regulatory
environment

17
ITC – BUY
percy.panthaki@iif lcap.com
Institutional Equities
Case study - GPI (Godfrey Philips India) Figure 30: Phillip Morris in India – timeline of events
Year Event
1936 Godfrey Philips India (GPI) is promoted by Godfrey Philips, London
1968 Philip Morris acquires Godfrey Philips, London
1979 Philip Morris reduces stake in GPI and K.K. Modi group enters the business
2003 Philip Morris launches its greatest selling brand "Marlboro", through an arrangement with a local distributor ‐ Barkat Foods and Tobacco, sidelining GPI. This resulted in strained relations between Philip Morris and the Modi group
2009 Both parties reconcile, resulting in GPI getting the rights of manufacturing, distribution and sales of Marlboro
2010 GPI launches a 69mm cigarette under the Marlboro brand – “Marlboro Gold Advance Compact” in Mumbai and Pune. However ITC countered it with launch of “Players Gold Leaf” at a 14% discount, after which the product failed to gain any traction
Source: IIFL Research
Phillip Morris despite being present in India in some form or the other has not been able to make any significant inroads. In October 2010, Marlboro was launched in the 69mm segment which accounted for ~80% of industry volumes at that time. Prior to this Marlboro was present only in the 84mm segment. With this new variant, it was expected that Marlboro’s market share would increase, but due to the strong competitive positioning of ITC, and the inability of Phillip Morris to compete aggressively due to stifling regulation, Marlboro was not able to garner significant market share in India. As per a Euromonitor report, Marlboro’s volume market share in India in 2015 was just 1%. In recent times, there have been talks to split the business of GPI into two entities with Philip Morris Inc controlling the marketing and distribution of brands, and the Modi group controlling manufacturing. However, such an arrangement would not be possible if the proposed ban on FDI in any form (i.e. not just on manufacturing but even on selling and distribution) goes through. Licenses required for manufacturing One might argue that since only manufacturing is banned, any foreign company could have set up a 100% subsidiary, got the manufacturing outsourced to a local party and handled the sales, distribution and marketing. However, putting up a new factory or increasing capacity requires government licensing, and therefore in practice this route does not work well. Moreover, foreign companies are not comfortable sinking in large investments in a structure where they do not have control over the whole operation. This is the reason why foreign companies have largely stayed away from the Indian market. Now with the cabinet proposal to ban FDI in tobacco in a more comprehensive manner, companies will be even more wary to enter into India given the risk that they may be asked to shut shop at any time. Advantages of FDI ban The FDI ban is therefore, a substantial competitive moat for ITC. It ensures that
Marlboro volume market share is 1% despite being present in India for over a
decade
Due to license requirementsit is difficult for foreign
companies to operate in India even via third party
manufacturing

ITC – BUY
18 percy.panthaki@iif lcap.com
Institutional Equities
• There is no risk of market share loss; market shares have been largely stable over the past few years.
Figure 31: ITC is able to maintain market shares at a high level for a long period
Source: Company, IIFL Research
In markets such as Indonesia, with 3-4 strong players, market shares tend to fluctuate. Figure 32: Fluctuations in market shares are larger in more competitive countries like Indonesia
Source: IIFL Research
• There is minimal risk of margin erosion; over the past several
years, cigarette Ebit for ITC has continuously increased as ITC can take the price increases it deems necessary without worrying about competition undercutting and taking away market share
86% 86% 85% 85% 85% 84% 85% 85% 85% 86%
5% 4% 4% 4% 4% 4% 4% 4% 4% 4%10% 10% 11% 11% 11% 11% 11% 11% 11% 9%
0%
20%
40%
60%
80%
100%
FY07 FY08 FY09 FY10 FY11 FY12 FY13 FY14 FY15 FY16
ITC VST GPI
20%
21%
21%
22%
22%
23%
23%
27%
29%
31%
33%
35%
37%
CY10 CY11 CY12 CY13 CY14 CY15 CY16
HM Sampoerna (LHS) Gudang garam (RHS)
Indonesia ‐ Market shares of top two players

19
ITC – BUY
percy.panthaki@iif lcap.com
Institutional Equities
Figure 33: Margins for ITC’s cigarette business have improved continuously over theyears
Source: Company, IIFL Research
Other companies have seen substantial gyration in margins over the years – ITC’s margins in contrast have been much more stable and moving up continuously. Figure 34: ITC’s margins have been gradually increasing vs. high volatility among other global peers
Source: Company, IIFL Research, Bloomberg
GST likely to be tax neutral India is on the cusp of implementing GST. There is uncertainty as to how this will impact ITC, but there have been multiple statements from government officials stating that GST will be tax neutral for tobacco. Initially we did not give much importance to these statements because GST implementation was far away. But now, with the government having come out with cess caps, and implementation just a few weeks away these statements have been re-iterated. The fact that these statements are being made when we are at an advanced stage of implementation give them a higher credence than the same statements made six months ago, in our view.
53% 53%55%
53%54%
55%
59%
64%66% 66%
40%
45%
50%
55%
60%
65%
70%
FY07 FY08 FY09 FY10 FY11 FY12 FY13 FY14 FY15 FY16
ITC's Ebit margin in cigarettes
30%
40%
50%
60%
70%
0%
10%
20%
30%
40%
50%
FY06 FY07 FY08 FY09 FY10 FY11 FY12 FY13 FY14 FY15 FY16 FY17
Imperial Brands (LHS) Japan Tobacco Inc (LHS) ITC (RHS)
Ebit Margin
As per government officials,GST is unlikely to change
tax incidence for ITC

ITC – BUY
20 percy.panthaki@iif lcap.com
Institutional Equities
Figure 35: Statements made by government personnel on tobacco taxation over time
Date Person Designation Excerpt of Statement
12/7/2015 Arvind Subramanian Chief Economic Advisor "Our recommendations on the demerit rate are very much based on what happens currently. De facto, some of these goods are taxed at close to what we are recommending. So, we are not changing anything,"
11/3/2016 Arvind Subramanian Chief Economic Advisor “…in all those things (i.e. goods on which cess is applicable) the current incidence will be maintained broadly and there will be no increase in incidence on that. So, that is the decision.”
3/16/2017 Krishna Byre Gowda GST Council member, Minister for agriculture, Karnataka
“Compared to the current tax structure, the GST along with the cess will only alter the composition of the taxes on tobacco products, there will be no increase in tax rates for tobacco due to GST”. Although, he added that there may be a variation in the taxation of tobacco from state to state
Source: IIFL Research
Cess caps announced: The cess cap for cigarettes is announced at Rs.4170 per thousand sticks or 290% or a combination of both. We believe that the ad valorem rate will not apply to cigarettes as the specific rate tallies exactly with the rate of excise on the Kings segment just before the budget on 1st Feb 2017. While government officials have stated that GST will be tax neutral for tobacco, the exact modus operandi is unclear. We believe that the modus operandi could be the following
• Excise duty could be made zero (although government will have the right to increase this in the future).
• Cess could be introduced at pre budget rates (i.e. at the maximum cap announced). This will result in excise duty reducing ~6% from the current level, as the increase in the budget this year was 6%.
• GST would be levied at 28% while VAT which is currently 25% (weighted average of different states) will cease to exist. Thus, there will be a 300 bps increase in the ad valorem taxes.
• The 300 bps increase in ad valorem tax is roughly equal to the 600 bps decline in specific duty, and therefore GST as an event will be tax neutral. Or in other words, FY18 will witness an increase of ~600 bps of excise duty vs. FY17 – the same that was announced in the budget in Feb 2017 – and no change in ad valorem tax.
There is a reason to believe that cess will replace excise under the GST regime. By law, cess does not have to be shared with the states and it accrues only to the centre. Excise duty has to be shared with the states and therefore depletes the central kitty. We believe that the government will want to increase its cess collections as they could help pay the states in case there is any deficit in collection. Higher ad valorem component a risk if ad valorem rate increases in future Although GST is likely to be tax neutral, the exact tax structure is not known. Therefore, it is possible that it may not pan out the way we believe as outlined above. It is possible that while the total tax paid is the same, a higher element of it is ad valorem. There is a belief that higher ad valorem taxes are less desirable than specific duties. As the company takes a price increase, the ad
Higher ad valorem component by itself is not aproblem; if it is higher and
increases from over the years, that is an issue

21
ITC – BUY
percy.panthaki@iif lcap.com
Institutional Equities
valorem tax rises automatically even without a change in the rate, unlike a specific per stick tax which does not change with price increase and therefore a higher part of the price increase may be retained at the net sales level if taxes are specific rather than ad valorem. While there is an element of truth in this, we believe that in the current environment, and the current expectations, a higher ad valorem component is not necessarily negative, unless the higher ad valorem rate once established moves up in future. If the ad valorem component is higher, or even if 100% of the tax collected is ad valorem in nature, there is no problem unless the rate goes up. The current expectation is a stable low double digit medium-long term Cagr in the cigarette Ebit. This is very different from the period of FY05-14 where cigarette Ebit grew at ~18%. Also, it would be imprudent to believe that even in the absence of GST, excise duty hikes would average mid single digits in future. A more reasonable estimate is at ~8-10% increase in excise duty with approximately flat volume growth. If we plug in these estimates, we get approximately the same net sales growth in scenario A (current i.e. pre GST duty structure) and scenario B (assuming all taxes are ad valorem). Figure 36: Net sales growth remains similar under both scenarios
Rs.per stick Scenario A Scenario B
FY17 FY18 YoY change
FY17 FY18 YoY change
Retail price 6.51 7.16 10% 6.51 7.16 10%
Trade margin 0.65 0.71 10% 0.65 0.71 10%
Gross sales 5.86 6.45 10% 5.86 6.45 10%
VAT / GST 1.17 1.29 10% 3.36 3.70 10%
Gross sales reported 4.69 5.16 10% 2.50 2.75 10%
Excise duty 2.19 2.41 10% 0.00 0.00 ‐
Net sales 2.50 2.75 10% 2.50 2.75 10%
Source: IIFL Research
As per Figure 36, in scenario A, the excise duty and VAT are separate, as is currently the case. In scenario B, excise (i.e. calculated per stick) duty is made zero and is replaced by an ad valorem regime. The total tax under both these situations remains the same in the base year i.e. FY17. Now assuming that the government wants to follow an objective tax policy, i.e. a policy that would meet the following objectives
• Limit the volume growth of the industry – i.e. volumes should not increase
• Limit growth of the illicit industry – as it is much more difficult to regulate and a shift from legal to illegal not only leads to revenue loss, but is also futile from a health point of view – an illegal cigarette is at least as harmful if not more harmful as a legal one.
• Keeping the above two objectives in mind, maximising revenue growth.
Net sales growth under scenario A (current i.e. pre
GST duty structure) and scenario B (assuming all
taxes are ad valorem) would be the same.

ITC – BUY
22 percy.panthaki@iif lcap.com
Institutional Equities
Scenario A: We believe that in the current macroeconomic environment, where GDP growth (nominal) is ~10%, it is reasonable to expect that the growth in consumer spending on the category will also be ~10%. If volume growth is to be maintained at zero, it would mean that price growth would contribute 10%. This would mean that the optimum growth in tax revenues would also be 10%, given that the company would want to maintain net sales growth at 10% in order to achieve a low double digit Ebit growth (some benefit from operating leverage). If the government decides that tax revenues need to grow at higher than optimum rate i.e. say 15%, it would result in ITC increasing price by more than 10%, resulting in volume decline. A large part of this decline would be picked up by the illegal trade; a sub-optimal outcome. So what the government will do is increase excise duty by 10%, assuming a flat ad valorem rate. The company will increase prices by 10%, resulting in zero volume growth, 10% increase in VAT revenue automatically and net sales growth of 10%. Scenario B In this scenario, we assume no specific tax, only ad valorem, but the same quantum in FY17 as scenario A. Therefore, the total tax in FY17 in both scenarios is assumed at Rs.3.36 per stick. Now assuming that the macro economic scenario remains the same, the total tax rate increase possible is 10% as demonstrated above. To achieve that 10% growth, government can keep rates unchanged. With a 10% price increase, tax revenues will automatically increase 10%, volumes will remain flat and net sales will grow 10% - which is the same outcome as scenario A. There are two reasons why things may not pan out as expected above 1. Ad valorem rate is kept unchanged by the government but ITC
decides to increase price by only 5% hoping to increase volumes by 5%, giving 10% gross sales, net sales and increase in government revenues. However, the objective of not letting volume grow is not met here.
2. The government increases its ad valorem rate itself. As per our forecasts, if ad valorem rate is increased from 134% of net sales to 140% of net sales, then with a 10% price increase, net sales will increase by 7.5% in scenario B vs. 10% in scenario A. It is very difficult to bridge this gap – if the company takes a higher price increase, volume dips and therefore total sales and total profit is adversely impacted due to lower volume. However, we believe that a scenario where all taxes will be made ad valorem is highly unlikely.
Also, note that if the overall tax remains unchanged, a higher ad valorem component by itself is not negative. It is negative only if that higher proportion is then increased again. The scenario of 100% of taxes being ad valorem however, is unrealistic in our view. It is possible that the ad valorem component goes up due to GST, but certainly the government would want to maintain a specific tax as well, to maintain a minimum price for a cigarette. With a 100% ad valorem tax, ITC would be able to slash

23
ITC – BUY
percy.panthaki@iif lcap.com
Institutional Equities
prices for certain brands way low and make them affordable to drive volume growth. GST rate may not change, but tax may go up The central government has guaranteed a 14% Cagr in tax revenues to the states for the next five years and any shortfall to this figure will be reimbursed by the centre to the states. Therefore, states are unlikely to have any incentive to have the GST rate on tobacco increased, like they do in the current VAT regime. What is likely to happen in the second year and onwards is that the central government will increase the excise duty (which we believe will be zero in year one).

ITC – BUY
24 percy.panthaki@iif lcap.com
Institutional Equities
Capital allocation and valuation Capital allocation has improved Capital employed vs. Ebit One of the main issues with ITC has been that the other businesses use up a lot of the free cash flow generated by the cigarettes business.
Figure 37: Split of capital employed across segments (FY16) Figure 38: Split of Ebit across segments (FY16)
Source: Company, IIFL Research
Source: Company, IIFL Research Note – total Ebit taken excluding unallocated cost, and segment contributions calculated on this denominator
Cigarettes account for 80% of ITC’s Ebit, but only 17% of ITC’s capital employed. On the other hand, businesses such as FMCG and hotels barely achieve breakeven but account for 15% each of the capital employed in the company. Consequently, pre tax returns on capital employed (Ebit divided by segment capital employed) is significantly different for different segments. Cigarette division, due to low fixed and working capital intensity, generates 205% pre tax ROCE, whereas FMCG and Hotels, due to depressed margins, generate only 1% ROCE. However, it must be noted that the agri business generates a decent return of 41% and paperboards too is not too bad at 17%. Figure 39: Pre tax ROCE is highest for cigarettes business, followed by agri
Source: Company, IIFL Research
Cigarettes, 16.7%
FMCG, 14.6%
Hotels, 15.2%
Agri, 7.2%
Paper, 16.1%
Unallocated/Others,
30.2%
Cigarettes, 79.7%
FMCG, 0.4% Hotels,
0.4%
Agri, 6.0%
Paper, 5.9%
Unallocated/Others,
7.6%
205%
1% 1%
41%
17%
47%
0%
50%
100%
150%
200%
250%
Cigarettes FMCG Hotels Agri Paper Overall
Segment wise ROCE ‐ FY16
Cigarette business accountsfor 80% of segmental Ebit
but only 17% of capital employed

25
ITC – BUY
percy.panthaki@iif lcap.com
Institutional Equities
Capex flat lining Over the past several years, ITC has been keeping incremental capital employed in check. Moreover, despite EPS growing 14% over the past five years (FY11-16), capex has remained flat and has even come down in FY16.
Figure 40: Incremental capital employed over the years Figure 41: Segment wise capex over the years
Source: IIFL Research Source: IIFL Research
We believe that capex will not increase materially in the future vs. the past few years’ average and will remain around Rs.24bn • Cigarette volume growth is likely to remain flat, requiring low
capex. However some capex will be required for modernisation etc
• Hotels division has seen an average of Rs.6.5bn capex in the past five years. Unlike other hotel players who have been severely impacted by the slowdown and therefore have gone slow on investments, ITC with its cigarette cash flow has been able to invest steadily in the business.
• Paperboards is to an extent linked to cigarette demand which is likely to remain flat, and FMCG demand overall is in line or below historic averages
Figure 42: Capex levels likely to remain moderate in medium term
Source: Company, IIFL Research
Working capital for the business fluctuates depending on the inventory on balance sheet date of leaf tobacco and other agri commodities. However, in the past few years, it has averaged 17%
(10)
‐
10
20
30
40
50
FY12 FY13 FY14 FY15 FY16
(Rs bn)
Unallocated/Others PaperAgri HotelsFMCG CigarettesTotal
Incremental capital employed
0
5
10
15
20
25
30
FY12 FY13 FY14 FY15 FY16
Others Paper Agri
Hotels FMCG Cigarettes
(Rs bn)
Capex
‐40%
‐30%
‐20%
‐10%
0%
10%
20%
30%
40%
5
10
15
20
25
30
FY10 FY11 FY12 FY13 FY14 FY15 FY16 FY17ii FY18ii FY19ii
Overall capex (LHS) change YoY (RHS)(Rs bn) (%)
Capex unlikely to grow materially from current
levels

ITC – BUY
26 percy.panthaki@iif lcap.com
Institutional Equities
of sales, in line with the number seen in FY16. We believe that it should continue around this number in the future. Figure 43: Working capital levels likely to remain near current levels
Source: Company, IIFL Research
FCF generation at 75-80% Free cash flow to net profit has improved and is likely to remain at 75-80%. Over the past five years FY11-16, EPS has increased at a Cagr of 14% whereas capex has been flat to negative. This has resulted in significant improvement in the free cash flow conversion of the company. Figure 44: FCF generation likely to remain in the 75‐80% band
Source: Company, IIFL Research
FCF generation for ITC compares well to other companies in our coverage universe
10%
12%
14%
16%
18%
20%
22%
20
30
40
50
60
70
80
90
FY10 FY11 FY12 FY13 FY14 FY15 FY16 FY17ii FY18ii FY19ii
Working capital (LHS) As % of sales (RHS)(Rs bn) (%)
40%
50%
60%
70%
80%
90%
20
40
60
80
100
120
FY10 FY11 FY12 FY13 FY14 FY15 FY16 FY17ii FY18ii FY19ii
FCF (LHS) FCF to net profit (RHS)(Rs bn) (%)
FCF to net profit ratio of 75-80% quite similar to other
FMCG companies

27
ITC – BUY
percy.panthaki@iif lcap.com
Institutional Equities
Figure 45: FCF generation for ITC compares well with peers
Source: Company, IIFL Research
Healthcare foray not a significant risk ITC has received shareholder approval to enter the healthcare vertical, possibly opening up multi-specialty hospitals across the country. According to the company, such an initiative would leverage the company's repertoire of knowledge and experience in the hospitality and tourism sector and can be used for medical tourism for the country using the multi-specialty world class facilities. This has caused concern among some analysts and investors in terms of capital allocation. Our view is that it is preferable that ITC does not go into a new vertical, but the fact that it has decided to do so is not a significant negative. We look at the financials of other listed hospital plays. Apollo, the largest hospital chain in India trades at a PE of over 43x on FY18 consensus estimates. Moreover, the EV/IC of most hospital chains is >1, implying that for every rupee invested in the business, the enterprise value attributed is higher – thus the business is value accretive for investors
Figure 46: FY18 P/E for major healthcare services players Figure 47: EV/IC for major healthcare services players
Source: IIFL Research Source: IIFL Research
In our SOTP valuation, hospitals would be valued at higher than the invested capital in the business. Any investment in hospitals does not worry us much. Moreover, the investments in this business even
0%
50%
100%
150%
200%
GC
PL
Bri
tan
nia
Co
lgat
e
Emam
i
Dab
ur
ITC
HU
L
Baj
aj C
orp
GSK
C
on
sum
…
Mar
ico
Jyo
thy
Lab
s
Ne
stle
FY16 FY18‐19ii average
FCF to Net profit
19 20
44 54 58
95
0
20
40
60
80
100
120
Ko
vai M
ed
ical
Ind
rap
rast
ha
Me
dic
al
Ap
ollo
Ho
spit
als
Nar
ayan
a H
rud
ayal
aya
Fort
is H
eal
thca
re
HC
G
PE on FY18 EPS
2.3 2.3 3.2
3.5
5.1 5.8
0
1
2
3
4
5
6
7
Fort
is
He
alth
care
Ind
rap
rast
ha
Me
dic
al HC
G
Ap
ollo
Ho
spit
als
Ko
vai M
ed
ical
Nar
ayan
a H
rud
ayal
aya
EV/IC (FY16)
Enterprise value of listed hospitals much higher than
invested capital; potential investments by ITC in this area therefore unlikely to
be value destructive

ITC – BUY
28 percy.panthaki@iif lcap.com
Institutional Equities
over a 10 year period are unlikely to be material from the point of view of ITC’s market cap. For example, if we assume that ITC invests Rs.5bn each year into this business, and the entire investment is a write-off, Rs.50bn attrition from ITC’s market cap would result in ITC’s stock price falling just 1.5%. Reasonable valuation We value ITC on an SOTP business, taking a separate value for each business vertical. Before providing details of the SOTP valuation, we would like to calculate DCF value of the business just for reference. DCF valuation We believe that ITC can clock 10-12% Ebit Cagr in cigarettes business for a long time even with a 0-2% volume decline p.a. The assumptions to arrive at this are as follows • Industry size (at retail price) in value terms grows at 9-10%, in
line or marginally below nominal GDP growth. Cigarette industry at MRP is Rs.60bn – as a percentage of GDP this works out to 0.5%. At such a nascent level, we believe that there is limited downside to this number. We believe that despite tax increases, Indians will continue to spend at least 0.5% of their GDP on cigarettes.
• Tax hikes by the government average 10% - as explained earlier in the report, we believe that a 10% hike is optimal in terms of maximizing government revenue, minimising volume growth of legal players and halting the growth of the illegal trade.
• This will result in 9-10% increase in net sales for the cigarettes division.
• With some operating leverage, cigarettes Ebit can grow ~100-200 bps higher than sales growth i.e. 10-12%
We believe that this kind of situation can continue for 20 years before we can give a terminal growth. This would mean that at the end of 20 years, the per capita consumption of cigarettes would drop by a third, from 96 currently to 62 by FY39 (1% volume decline Cagr and 1.2% population increase Cagr). Despite this cigarettes bottom-line can grow at 11% as explained above. Based on a 10% discounting rate, 11% earnings growth FY19-39 and a 5% terminal growth rate, and a free cash flow to net profit of 78%, we arrive at a price target of Rs.397 per share (including Rs.19 per share of cash and financial investments; our FCF does not include non operating income). Figure 48: Sensitivity analysis of ITC’s DCF
Semi explicit growth rate
Discounting
rate
9% 10% 11% 12% 13%
9.0% 393 451 518 597 690
9.5% 345 393 450 517 594
10.0% 307 348 397 453 519
10.5% 276 312 354 402 459
11.0% 250 282 318 360 409
Source: Company, IIFL Research
Assuming 78% FCF to net profit, 11% EPS growth
FY19-39, 5% terminal and 10% WACC, we get a 12
month fair value of Rs.397

29
ITC – BUY
percy.panthaki@iif lcap.com
Institutional Equities
Our assumptions for the future are very conservative vs. the past. Over the past 10 years (i.e. FY06-16) ITC’s EPS has grown at a Cagr of 15% and ITC’s FCF has grown at a Cagr of 21%. Our assumptions for the next 20 years are 11% growth in profits and free cash flow respectively. Figure 49: FCF Cagr has been healthy in the last 20 years
Source: Company, IIFL Research
Secondly, our DCF does not assume any margin improvement in hotels and FMCG post FY19, which itself builds in conservatism. We believe that over the next several years, the FMCG business can come up to an Ebit margin of ~10% vs. the barely break even number currently. This could add 7% to the overall consolidated Ebit of the company, and consequently add a similar upside to the fair value. Of course, since that margin will be reached only after several years, the current value of that 7% will be consequently lower. DCF of cigarettes business Another sense check is to calculate the DCF value of the cigarette business only. We estimate that for the cigarettes business, with a pre-tax ROCE of 205%, the FCF will be 90% of the net profit. We derive this number taking the average incremental capital over the past several years divided by the average net profit (Ebit x (1-t)) over the same period. Since the cigarettes business accounts for ~85% of company profits, 90% of that works out to 76.5% i.e. the FCF from the cigarettes business accounts for 76.5% of overall profit. This is very similar to the 78% FCF to net profit ratio we have forecast for the company overall. In other words, almost all the free cash flow generated by the company is from the cigarettes division only, and therefore the DCF value of Rs.397 per share calculated above is almost entirely attributed to the cigarettes business. Does that mean that the other businesses do not have any value at all? We do not think so. We believe that these businesses, if demerged into separate companies would have significant value on their own. The same is not visible in a DCF because of the simplistic assumptions that we make, so as to not complicate the calculation too much. The simplifying assumptions are as below • Profit growth for the company is assumed at 11%, the same rate
at which the cigarettes business is likely to grow. In reality, the growth rate could be higher as FMCG business scales up margins and hotels recovers from a cyclical downturn
22.9% 21.5%
14.7%
19.3%
14.7%13.3%
0%
5%
10%
15%
20%
25%
FY96‐16 Cagr FY06‐16 cagr FY17‐19ii Cagr
FCF EPS
Cigarettes DCF value almostequal to overall DCF value
as our simplistic assumptions do not
consider higher margins/FCF from non cigarette businesses in
future

ITC – BUY
30 percy.panthaki@iif lcap.com
Institutional Equities
• Free cash flow conversion for businesses such as hotels and paperboards is very low or even negative now, but as these businesses go into the terminal year, their entire profit will be a free cash flow in perpetuity. This is not factored into our simplistic DCF model, lest it becomes too complicated to put forth in this report in an easy to understand manner.
SOTP is therefore the correct way to value ITC Due to the issues mentioned above, we believe that SOTP valuation is the best way to arrive at a fair value for ITC. • Cigarettes – as explained above, we believe that the fair DCF
value for the cigarettes division is ~Rs.390. This works out to a target PE of 41.5x on FY19 cigarette EPS. However, investors may be hesitant to attribute this value to the cigarettes division since they may want to be conservative on the number of years of growth (terminal growth starting FY30 instead of FY39). If we shift the terminal year to FY30, the valuation for the cigarettes business comes to Rs.300, which is 32x FY19 cigarette division EPS. If we keep the terminal year at FY39 but increase the cost of capital to 11% from 10%, we arrive at a valuation of Rs.318.
• FMCG – most FMCG companies are currently trading at a price to sales ratio of 5x FY18. Given the very low margins of ITC, combined with the fact that even a few years down the line margins are likely to be lower than other food companies we believe that a multiple of 2.5x is fair. Although the margins are low we must account for the fact that several businesses such as dairy, coffee, chocolates are very small and the size of opportunity in these segments could mean that ITC could grow the overall FMCG business faster or longer than other players.
• We value hotels in line with peers. We use EV/IC as the valuation metric given that margins are significantly depressed vs. historic average. Hotels such as Indian hotels, Taj GVK and EIH trade at an EV/IC of 2.1/1.8/2.7 on FY16 respectively. We accordingly value ITC at 1.5x FY19 (equivalent to 2x FY16) capital employed.
• We ascribe agri business as well as paperboards 7x PE ratio due to the heavy capex and / or commoditised nature of the business.
• We value cash and investments separately on book value. To ensure no double counting, our EPS estimate for cigarettes or any other division does not contain any other income.
Figure 50: Our SOTP valuation yields a price target of Rs.350
Basis Business March 2019 Multiple Per Share Price
EPS Cigarettes 30.0x 9.4 282
Agribusiness 7.0x 0.6 5
Paperboards 7.0x 0.6 4
Sales FMCG ‐ Others 2.5x 11.5 29
Capital employed Hotels 1.5x 7.3 11
Cash Cash per share 19
Target Price 350
Source: IIFL Research
SOTP is the best way to value ITC as other methods
unable to value other businesses correctly

31
ITC – BUY
percy.panthaki@iif lcap.com
Institutional Equities
Figure 51: Cigarettes division contributes 81% of ITC’s share price
Source: IIFL Research
Relative valuation vs. FMCG HUL and ITC being the two large cap stocks in the FMCG space, it is interesting to study the relative valuation of these two companies over time. Figure 52: ITC’s discount vs. HUL has widened after FY13
Source: IIFL Research, Bloomberg
Prior to FY13, ITC used to trade at 12% discount to HUL. Post steep tax increases starting FY13, the valuation gap between HUL and ITC widened and it currently stands at 35%. Given that the tax environment is likely to turn more rational, we believe that the valuation gap could narrow from here on. Relative valuation vs. global tobacco players Versus other global tobacco players, ITC seems expensive. However, there are a few reasons for this 1. Higher expected growth
Growth for ITC for the next two years is expected at 13%, which is at the higher end of the band for the tobacco universe
Cigarettes, 81%
Agribusiness, 1%
Paperboards, 1%
FMCG, 8%
Hotels, 3%
Others, 6%
‐50%
‐40%
‐30%
‐20%
‐10%
0%
10%
20%
No
v‐0
8
May‐0
9
No
v‐0
9
May‐1
0
No
v‐1
0
May‐1
1
No
v‐1
1
May‐1
2
No
v‐1
2
May‐1
3
No
v‐1
3
May‐1
4
No
v‐1
4
May‐1
5
No
v‐1
5
May‐1
6
No
v‐1
6
May‐1
7
ITC's % discount vs. HUL average discount during the period
ITC’s discount to HUL has fallen to 35% currently vs.an average of 12% before
steep tax hikes; we believe there may be scope for
discount narrowing
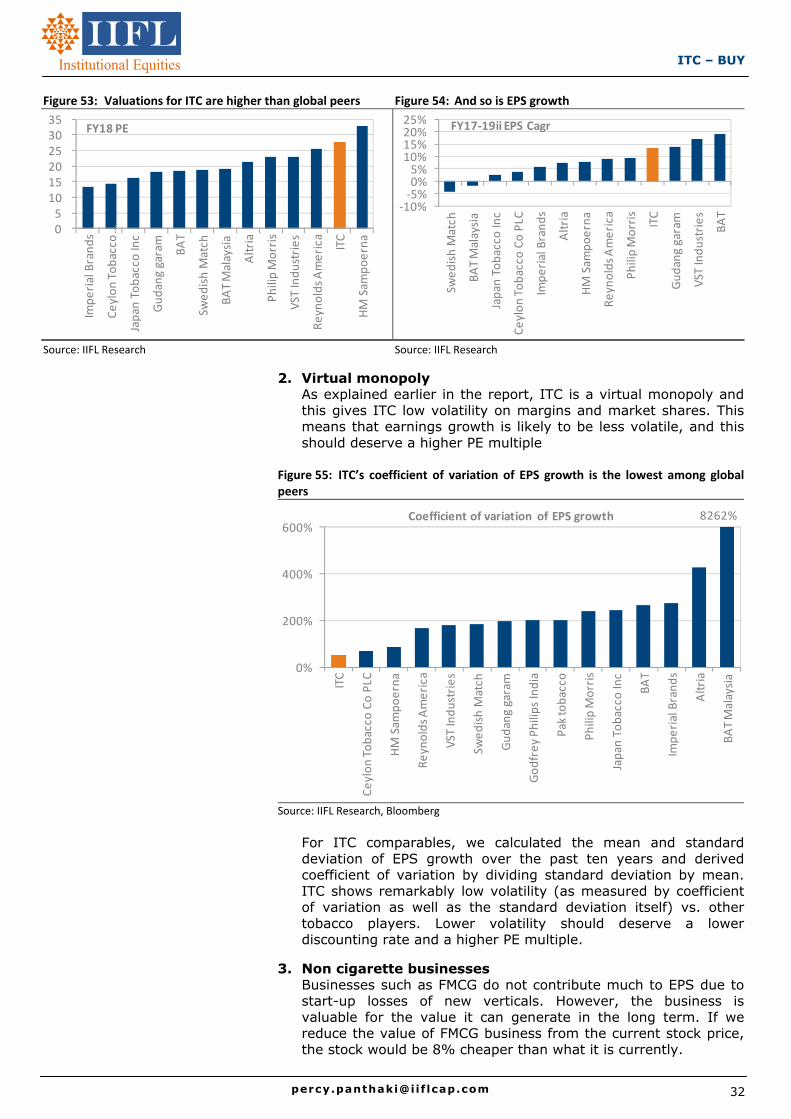
ITC – BUY
32 percy.panthaki@iif lcap.com
Institutional Equities
Figure 53: Valuations for ITC are higher than global peers Figure 54: And so is EPS growth
Source: IIFL Research Source: IIFL Research
2. Virtual monopoly
As explained earlier in the report, ITC is a virtual monopoly and this gives ITC low volatility on margins and market shares. This means that earnings growth is likely to be less volatile, and this should deserve a higher PE multiple
Figure 55: ITC’s coefficient of variation of EPS growth is the lowest among global peers
Source: IIFL Research, Bloomberg
For ITC comparables, we calculated the mean and standard deviation of EPS growth over the past ten years and derived coefficient of variation by dividing standard deviation by mean. ITC shows remarkably low volatility (as measured by coefficient of variation as well as the standard deviation itself) vs. other tobacco players. Lower volatility should deserve a lower discounting rate and a higher PE multiple.
3. Non cigarette businesses
Businesses such as FMCG do not contribute much to EPS due to start-up losses of new verticals. However, the business is valuable for the value it can generate in the long term. If we reduce the value of FMCG business from the current stock price, the stock would be 8% cheaper than what it is currently.
0 5
10 15 20 25 30 35
Imp
eri
al B
ran
ds
Ce
ylo
n T
ob
acco
…
Jap
an T
ob
acco
Inc
Gu
dan
g ga
ram
BA
T
Swe
dis
h M
atch
BA
T M
alay
sia
Alt
ria
Ph
ilip M
orr
is
VST In
du
stri
es
Re
yno
lds
Am
eri
ca ITC
HM S
amp
oe
rna
FY18 PE
‐10%‐5%0%5%
10%15%20%25%
Swe
dis
h M
atch
BA
T M
alay
sia
Jap
an T
ob
acco
Inc
Ce
ylo
n T
ob
acco
Co P
LC
Imp
eri
al B
ran
ds
Alt
ria
HM S
amp
oe
rna
Re
yno
lds
Am
eri
ca
Ph
ilip M
orr
is
ITC
Gu
dan
g ga
ram
VST In
du
stri
es
BA
T
FY17‐19ii EPS Cagr
0%
200%
400%
600%
ITC
Ce
ylo
n T
ob
acco
Co P
LC
HM S
amp
oe
rna
Re
yno
lds
Am
eri
ca
VST In
du
stri
es
Swe
dis
h M
atch
Gu
dan
g ga
ram
Go
dfr
ey
Ph
ilip
s In
dia
Pak to
bac
co
Ph
ilip M
orr
is
Jap
an T
ob
acco
Inc
BA
T
Imp
eri
al B
ran
ds
Alt
ria
BA
T M
alay
sia
Coefficient of variation of EPS growth 8262%

33
ITC – BUY
percy.panthaki@iif lcap.com
Institutional Equities
Annexure 1 – Analysis by cigarette length The tobacco industry in India is taxed according to length. The excise duties on different cigarette lengths are as below Figure 56: Excise duty per 1000 sticks in India
Cigarette length FY14 FY15 FY16 FY17 FY18
Plains
Upto 65mm 689 1,185 1,440 1,585 1,681
65 to 70mm 2,088 2,318 2,590 2,850 3,021
Filters
Upto 65mm 689 1,185 1,440 1,585 1,681
65 to 70mm 1,451 1,700 1,900 2,090 2,216
70 to 75mm 2,088 2,318 2,590 2,850 3,021
Above 75 mm 3,389 3,389 3,790 4,170 4,421
Source: Tobacco Institute of India, IIFL Research
In effect, non-filter cigarettes are not available in the legal market because their taxation (and therefore price) is the same as filter cigarettes. So there are four cigarette lengths available, all in the filter segment • 64mm called “Micro” • 69mm called “Regular” • 74mm called “Long” • 84mm called “King” 64mm filter is a recent introduction (was introduced in FY13). Currently, 64mm contributes ~35% to the volumes of ITC Figure 57: Contribution of different cigarette lengths to ITC’s volumes
Source: IIFL Research
In our estimation the average retail price of an ITC cigarette for FY17 was ~Rs.6.51 per stick.
11% 12% 13% 13% 14% 15% 16% 17%6% 6% 5% 5% 5% 5% 5% 5%
83% 82% 82% 79% 74% 68% 61%44%
0% 0% 0% 3% 8% 12% 18%35%
0%
20%
40%
60%
80%
100%
FY10 FY11 FY12 FY13 FY14 FY15 FY16 FY17
Kings Longs Regular Micro
64mm cigarettes have goneup to 35% of volumes in
the past 5 years due to lower taxes on this
segment

ITC – BUY
34 percy.panthaki@iif lcap.com
Institutional Equities
Figure 58: Breakup of ITC’s average MRP for a cigarette
Source: IIFL Research
While the gross margin for each cigarette length is not materially different, the gross profit per stick is higher for longer lengths Figure 59: Gross profit is higher for longer lengths
Source: IIFL Research
Due to the lower price, 64mm has been gaining traction at the cost of 69mm i.e. consumers are trading down from 69mm to 64mm. Recently, instead of taking a price hike, ITC has been cutting the length of cigarettes from 69mm to 64mm. This has the dual advantage of not subjecting the consumer to a price hike, while at the same time increasing net sales by reducing tax payout. To understand this, take the example of a 69mm cigarette which sells at Rs.5 and is cut to 64mm, while maintaining the price at the same level. As the excise duty on the 64mm is Rs.0.5 per stick lower than the 69mm segment, this differential filters through to the net sales and the profit per stick.
Trade margin10%
VAT18%
Excise duty34%
COGS4%
SG&A8%
Ebit26%
1.2 0.8 0.6 0.4 0.6
2.21.5 1.1 0.8 1.2
4.0
2.72.0
1.52.2
0.4
0.30.3
0.20.3
4.5
2.8
2.01.5
2.3
0
2
4
6
8
10
12
14
84mm 74mm 69mm 64mm Overall
Gross profit COGS Excise duty VAT Trade margin(Rs)
Gross margin is similar for different cigarette lengths, but gross profit per stick is
higher for longer lengths

35
ITC – BUY
percy.panthaki@iif lcap.com
Institutional Equities
Figure 60: Effect on gross profit of cutting cigarette length from 69mm to 64mmwhile keeping retail price unchanged
Source: IIFL Research
As per our calculation for such a shift, net sales for the volumes shifted increases by 31% and gross profit of the volumes shifted increases by 40%. For every 10% of ITC’s total volume which shifts from 69mm to 64mm while keeping retail price unchanged, cigarette division Ebit increases by 3.1% and ITC’s overall EPS increases by 2.5%.
0.5 0.5
0.9 0.9
2.01.5
0.30.2
1.31.9
0
1
2
3
4
5
6
69mm 64mm
Gross profit COGS Excise duty VAT Trade margin(Rs)

ITC – BUY
36 percy.panthaki@iif lcap.com
Institutional Equities
Annexure 2 – FMCG business Historic background ITC’s non-cigarette FMCG business is, to some extent, an indirect offshoot of the agri business. ITC’s agri business was set up primarily to source leaf tobacco for the cigarettes division. With a sourcing infrastructure set up, it made sense to leverage it to trade in other commodities such as wheat. The company then decided to utilize its back end strength in sourcing wheat to enter the branded wheat flour market with its brand “Aashirwad”. Following this, it made sense to enter the biscuit market, since it was a more value added use of wheat sourcing capabilities. The company decided to become a much more diversified FMCG company and now has presence across several product segments. Product portfolio The company has a fairly wide offering under the “FMCG - others” line item. While the company does not disclose the split of revenues, our estimate of the split is shown in Figure 61. Figure 61: Split of ITC’s “FMCG – others” business
Source: IIFL Research
Main products We estimate that 70% of the non-cigarette FMCG business of ITC is from the foods business.
Wheat flour, 25%
Biscuits, 23%Snacks, 7%
Noodles, 9%
Confectionery, 5%
Food ‐ others, 2%
Stationery, 10%
Personal care, 8%
Retailing, 4% Incense & matchsticks,
8%
Others, 1%
Wide range of products, with foods making up
~70% of sales and more than 100% of profits for
“FMCG – others”

37
ITC – BUY
percy.panthaki@iif lcap.com
Institutional Equities
Figure 62: ITC’s FMCG portfolio of products
Source: IIFL Research
• ITC has a dominant market share in wheat flour and we believe that the business would make healthy margins (in relation to other players).
• In the biscuit market ITC has a low double digit market share and has products across the spectrum. Its premium products such as Dark Fantasy have garnered strong market share in the premium creams segment.
• ITC forayed into snacks with its brand Bingos and garnered mid-teens market share within a short time after the launch. This is a fast growing industry and therefore ITC’s sales growth would be consequently faster
• In the noodles segment ITC’s brand Yippee benefitted due to the ban on Maggi. We believe that Yippee would be a ~Rs.10bn brand with a market share of 25-30%
• ITC has a mint and confectionary business with brands such as Candyman, Mint-o, and GumOn which works well due to its distribution reach in small pan and bidi shops.
• ITC has forayed into personal products such as soaps, body washes, shampoos, skin care etc, but has met limited success in these segments except maybe deodorants where it has established itself as the number 2 market share player albeit on the back of high A&P spends. We believe that personal products division would be loss making and will take fairly long to break even

ITC – BUY
38 percy.panthaki@iif lcap.com
Institutional Equities
• ITC is a large player in the matchstick and incense stick market and we believe that this business may be as large as personal care business.
• ITC’s brand of classmate notebook and stationery supplies is a forward integration from its paper and paperboards business. The brand would be close to Rs.10bn in turnover.
• Wills lifestyle and John Players are two brands for apparel that ITC retails though its own as well as other stores.
Profitability The segment over the years has not been profitable in any material fashion despite clocking over Rs.100bn in turnover. While this is disappointing and we believe that it should have performed better, one must account for the fact that there are at any given point of time businesses in investment mode which pull down the profitability of the segment. However, this does not mean that there aren’t several profitable businesses in the portfolio. We believe that foods as a whole is profitable, with majority of the losses attributed to personal products and retailing. The FMCG business broke even in FY14 in a small way and has remained profitable ever since. In the period FY02-13 the business clocked cumulative losses of Rs.27bn. Given that FY17 turnover crossed Rs.100bn and we value the business at Rs.350bn (2.5x FY19 sales) the cumulative losses of Rs.27bn do not seem too large, and are anyways behind us. The question now is what profit margins the business can clock. We believe that the steady state margins for the foods businesses are likely to be quite robust, if not now then surely in the next 3-4 years. However, the issue is on the losses in personal products, as the company is neither able to garner sufficient market share, nor is it willing to give up the business. Similarly in the retail business we believe that it will be difficult for ITC to make profits, and therefore if the pace of expansion is moderate, losses can be capped. Figure 63: Medium term margin estimates for ITC’s different FMCG businesses
Source: IIFL Research Assuming 8% Ebit margin on foods and a loss continuing on retailing, personal products and some new businesses, we believe that in the next 5 years i.e. by FY22, ITC will be able to make an Ebit margin of 4-5% in the “FMCG – others” segment. The margins could be higher if the losses in new launches, retailing and personal
7%
9%
10% 10%
12%
4%
5%
6%
7%
8%
9%
10%
11%
12%
13%
Wheat flour Confectionery Noodles Snacks Biscuits
Medium tern Ebitda margin
We believe that the “FMCG –others” segment can
generate high single digit Ebit margin in the medium term if investments behind
new segments moderate; realistically 4-5% by FY22

39
ITC – BUY
percy.panthaki@iif lcap.com
Institutional Equities
products are curtailed. We believe that in the long term, ITC could clock 10% Ebit margins in the non cigarette FMCG business.
Forecasts We forecast sales Cagr of 15% for the next two years as FMCG industry revives, and ITC scales up some of its nascent businesses such as dairy. We have not taken substantial Ebit margin expansion in the next two years as we believe that investments in new businesses restrict margin expansion.
Figure 64: Sales forecast for ITC’s FMCG business Figure 65: Ebit forecast for ITC’s FMCG business
Source: Company, IIFL Research Source: Company, IIFL Research
Figure 66: Split of capex and working capital addition – FMCG others
Figure 67: ROCE over the years – FMCG others
Source: Company, IIFL Research Source: Company, IIFL Research
New businesses ITC in the past few months has forayed into coffee with its brand Sunbean, dairy (ghee currently but will expand into other products in course of time) under the brand Aashirvaad and chocolates under the brand Fabelle. These three are significant in terms of opportunity size – ghee is a Rs.80bn market, coffee is Rs.25bn and chocolates is Rs100bn. ITC will build these out slowly over time, but assuming even a 5% market share in these businesses over 5 years, the top line from this could be Rs.15bn.
0%
5%
10%
15%
20%
25%
30%
20
40
60
80
100
120
140
160
FY1
0
FY1
1
FY1
2
FY1
3
FY1
4
FY1
5
FY1
6
FY1
7ii
FY1
8ii
FY1
9ii
Sales (LHS) % change (RHS)(Rs bn) (%)
‐100%
‐50%
0%
50%
100%
150%
200%
(5,000)
(4,000)
(3,000)
(2,000)
(1,000)
0
1,000
FY1
0
FY1
1
FY1
2
FY1
3
FY1
4
FY1
5
FY1
6
FY1
7ii
FY1
8ii
FY1
9ii
Ebit (LHS) % change (RHS)(Rs mn) (%)
(10)
(5)
‐
5
10
15
FY09 FY10 FY11 FY12 FY13 FY14 FY15 FY16
Capex Change in working capital(Rs bn)
‐23%
‐19%‐18%
‐11%
‐4%
0% 1% 1%
‐25%
‐20%
‐15%
‐10%
‐5%
0%
5%
FY09 FY10 FY11 FY12 FY13 FY14 FY15 FY16

ITC – BUY
40 percy.panthaki@iif lcap.com
Institutional Equities
Annexure 3 – Hotel business Historic background ITC started its hotels division in 1975. One of the reasons for getting into this business was the foreign exchange that it brought in which was in short supply during those times of currency controls. ITC needed foreign currency to buy tobacco overseas (a portion was imported). ITC’s properties ITC operates 108 hotels across India under four brands • ITC hotels – Luxury Hotels Segment • Welcom Hotel – Upper Scale Segment • Fortune Hotels – Midscale Segment • Welcom Heritage – Leisure & Heritage Segment. Figure 68: Number of hotels operated by ITC under each category
Source: Company, IIFL Research
Upcoming hotel projects are as below Figure 69: ITC’s upcoming projects
City Brand
Hyderabad ITC Kohinoor
Kolkata ITC Royal Bengal
Coimbatore My Fortune
Bhubaneswar My Fortune
Guntur My Fortune
Colombo Welcom Hotels Lanka
Source: Company, IIFL Research
Market dynamics Over the past few years hotels industry has been going through a downturn but is improving now. Occupancy rates which were in the mid-50s have now increased to 63% and are likely to head higher.
ITC Hotels, 12
Welcom Hotels, 9
Fortune Hotels, 48
Welcom Heritage, 39
Occupancy rates are inchingup

41
ITC – BUY
percy.panthaki@iif lcap.com
Institutional Equities
Figure 70: Average Hotel Occupancy (%)
Source: IIFL Research
With occupancy trending up, the fall in ARR has been arrested at least in the 5 star segment and in the five star deluxe segment there is actually some increase. Indicators such as domestic and foreign air traffic have been improving, which suggests that occupancy and consequently ARR should also improve.
Figure 71: Domestic Passenger Travel Growth Figure 72: Foreign Tourist Arrivals
Source: IIFL Research Source: IIFL Research
In the past two quarters (H2FY17), foreign passenger growth (as reported by domestic carriers) has increased by 14%, which is an uptick from H1FY17 growth of 9%. Our estimates We estimate an increase in ARR and occupancy driving better performance for ITC over the next two years. We build in sales Cagr of 18% and Ebit Cagr of 31% over FY17-19
40
45
50
55
60
65
70
75
FY0
2
FY0
3
FY0
4
FY0
5
FY0
6
FY0
7
FY0
8
FY0
9
FY1
0
FY1
1
FY1
2
FY1
3
FY1
4
FY1
5
FY1
6
‐20%
‐10%
0%
10%
20%
30%
40%
50%
20
40
60
80
100
120
FY0
7
FY0
8
FY0
9
FY1
0
FY1
1
FY1
2
FY1
3
FY1
4
FY1
5
FY1
6
FY1
7
Number of Passengers (LHS)
Growth in Number of Passengers (RHS)(mn)
0%
5%
10%
15%
20%
5
7
9
11
13
15
17
FY0
7
FY0
8
FY0
9
FY1
0
FY1
1
FY1
2
FY1
3
FY1
4
FY1
5
FY1
6
Foregin Tourist Arrival (LHS)
Growth in Foreign Tourist Arrival
(mn)
Foreign passenger growth in H2FY17 accelerated to
14% vs. 9% in H1FY17

ITC – BUY
42 percy.panthaki@iif lcap.com
Institutional Equities
Figure 73: Sales forecast for ITC’s hotel business Figure 74: Ebit forecast for ITC’s hotel business
Source: Company, IIFL Research Source: Company, IIFL Research
Figure 75: Split of capex and working capital addition – hotels Figure 76: ROCE over the years – hotels
Source: Company, IIFL Research Source: Company, IIFL Research
‐15%
‐10%
‐5%
0%
5%
10%
15%
20%
25%
5
7
9
11
13
15
17
19
21
FY1
0
FY1
1
FY1
2
FY1
3
FY1
4
FY1
5
FY1
6
FY1
7ii
FY1
8ii
FY1
9ii
Sales (LHS) % change (RHS)(Rs bn) (%)
‐80%
‐60%
‐40%
‐20%
0%
20%
40%
60%
80%
0
500
1,000
1,500
2,000
2,500
3,000
3,500
FY1
0
FY1
1
FY1
2
FY1
3
FY1
4
FY1
5
FY1
6
FY1
7ii
FY1
8ii
FY1
9ii
Ebit (LHS) % change (RHS)(Rs mn) (%)
‐4
‐2
0
2
4
6
8
10
12
FY09 FY10 FY11 FY12 FY13 FY14 FY15 FY16
Capex Change in working capital(Rs bn)15.9%
9.7%10.6%
9.5%
4.0% 3.5%
1.1% 1.2%
0%
2%
4%
6%
8%
10%
12%
14%
16%
18%
FY09 FY10 FY11 FY12 FY13 FY14 FY15 FY16

43
ITC – BUY
percy.panthaki@iif lcap.com
Institutional Equities
Annexure 4 – Paperboards business Historic background With advertising on cigarettes banned, packaging of cigarettes is a very important way to connect with consumers. Packaging design and value added features is therefore very important and several years back, ITC wanted to have this expertise in-house and therefore started this business. ITC caters to a wide variety of third party clients also and is a fairly large player in the industry, especially in the virgin paperboards segment which is the higher end of the market. Products ITC has an entire gamut of products in its portfolio. Figure 77: ITC’s products in paperboards and packaging
Source: Company, IIFL Research
Market landscape and ITC’s position
• Annual paperboards demand is 2.6m tonnes and India’s per capita consumption of 9kg pa is much lower than the world average of 58 kg.
• The paperboards market is growing at 6% p.a. Value added paperboards is the fastest growing segment at 10% due to
ITC is one of India’s leadingpaperboard companies and
the leader in value added paperboards which is the
fast growing segment of theindustry

ITC – BUY
44 percy.panthaki@iif lcap.com
Institutional Equities
increasing demand for branded packaged goods, growth in organised retail and packaging differentiation to catch consumer attention. ITC is the leader in value added paperboards.
• ITC has a total capacity of 0.7m TPA across paper and paperboard products.
• Projects underway are - Bleached Chemi Thermo Mechanical Pulp mill (0.1m TPA), Value Added Paperboard (0.14m LTPA) and Decor (200,000 TPA).
Main issues Rising Imports Import duty on Paper & Paperboard for Association of South East Asian Nations (ASEAN) countries has been reduced from 2.5% to 0% in 2013, which resulted in cheaper imports. With weak global demand and anti-dumping duty imposed by the U.S. on supplies from Indonesia & China, imports from these countries have been flooding the Indian market. For FY16, India imported 2.61 million tonnes of paper as against 2.35 million tonnes in 2014-15. Figure 78: India’s import of paper, paperboards and newsprint
Source: IIFL Research
Oversupply in China From 2010 to 2014 global paper and board demand has grown by 7.6 million tonnes. However Chinese Production grew from 65.5MT to 77.6 MT. Rest of the world fell from 300.3to 295.8 as growth in Latin America, East Europe and emerging Asia was offset by declines elsewhere. Capacity expansion in China coincided with the slowdown in the economy resulting in surplus supplies. Softening raw material prices Raw material prices have seen a decline in FY17 after an inflationary trend for the past few years. Our estimates We estimate 8-10% increase in sales growth for the paperboards division as the cigarettes business volume decline turns into volume growth and the overall FMCG demand improves. With raw material prices soft, we forecast Ebit growth slightly ahead of sales growth
1.8
2.12.0
2.3 2.4
2.6
0
1
2
3
FY11 FY12 FY13 FY14 FY15 FY16
(mn tonnes)
Increasing imports due tounfavourable duty structureand oversupply in China are
hurting Indian industry

45
ITC – BUY
percy.panthaki@iif lcap.com
Institutional Equities
Figure 79: Sales forecast for ITC’s paperboards business Figure 80: Ebit forecast for ITC’s paperboards business
Source: Company, IIFL Research Source: Company, IIFL Research
Figure 81: Split of capex and working capital addition –Paperboards
Figure 82: ROCE over the years – Paperboards
Source: Company, IIFL Research Source: Company, IIFL Research
0%
5%
10%
15%
20%
25%
20
25
30
35
40
45
FY1
0
FY1
1
FY1
2
FY1
3
FY1
4
FY1
5
FY1
6
FY1
7ii
FY1
8ii
FY1
9ii
Sales (LHS) % change (RHS)(Rs bn) (%)
‐10%‐5%0%5%10%15%20%25%30%35%40%
6
7
8
9
10
11
12
FY1
0
FY1
1
FY1
2
FY1
3
FY1
4
FY1
5
FY1
6
FY1
7ii
FY1
8ii
FY1
9ii
Ebit (LHS) % change (RHS)(Rs bn) (%)
‐4
‐2
0
2
4
6
8
FY09 FY10 FY11 FY12 FY13 FY14 FY15 FY16
Capex Change in working capital(Rs bn)
14.6%
18.3%
22.0%
23.1%
20.7%
17.4% 17.2%16.6%
10%
12%
14%
16%
18%
20%
22%
24%
FY09 FY10 FY11 FY12 FY13 FY14 FY15 FY16

ITC – BUY
46 percy.panthaki@iif lcap.com
Institutional Equities
Annexure 5 - Agri business Historic background ITC is a major consumer of leaf tobacco for its cigarette division and needs a reliable sourcing arm for procurement. This was one of the reasons why the agri business came into existence. Once the sourcing infrastructure was put in place, it made sense to leverage it to trade other commodities such as wheat, soya, coffee etc. ITC realised that it could use its sourcing prowess to forward integrate into value added products, and thus brands which use wheat as their main ingredient such as Aashirwaad Atta, Sunfeast biscuits and Yippee noodles were born. Similarly potato sourcing has helped the Bingo potato chips brand. Product portfolio Tobacco • ITC was the pioneer of tobacco cultivation in India. • ITC is the largest buyer, processor and exporter of leaf tobaccos
in India. It is the fifth largest tobacco exporter in the world. • It buys nearly 50% of the tobacco crop (cigarette type) grown in
India. • ITC exports to customers in over 50 countries. • India is the second largest producer of tobacco in the world but
its share in world trade is only 9%. • Globally, tobacco demand has been decelerating due to
regulatory and taxation measures to curb tobacco consumption. This has impacted Indian exports which have fallen to a four year low of 207mn kgs. Moreover, a pipeline correction and currency depreciation in competing origins also impacted exports adversely.
Other products ITC is the country’s second largest exporter of agri products. The main commodities are • Feed Ingredients - Soyameal • Food Grains - Wheat & Wheat Flour, Rice, Pulses, Barley & Maize • Marine Products - Shrimps and Prawns • Processed Fruits - Fruit Purees/Concentrates, IQF/Frozen Fruits,
Organic Fruit Products • Coffee E-choupals E choupal is ITC’s sourcing infrastructure and there are 6100 e-choupals today across ten states covering 35,000 villages. Each e-choupal has a computer with an internet connection which provides farmer data about prices of different agri commodities in various mandis. This creates awareness of prices with the farmer which is otherwise difficult in rural areas.
ITC is the fifth largest exporter of tobacco in the
world

47
ITC – BUY
percy.panthaki@iif lcap.com
Institutional Equities
Figure 83: The agri ecosystem
Source: Company, IIFL Research
Figure 84: Comparison of the earlier Mandi process and the E‐choupal process
Source: Company, IIFL Research
Outbound logistics
Inbound logistics
Display and Inspection
Auction
Bagging and weighing
Payment
Inbound logistics
Weighing and payment
Pricing
Hub logistics
Inspection and grading
Mandi process E-choupal

ITC – BUY
48 percy.panthaki@iif lcap.com
Institutional Equities
Our estimates We forecast sales growth of 10% and Ebit growth of 12% for the agri business for the next two years.
Figure 85: Sales forecast for ITC’s Agri business Figure 86: Ebit forecast for ITC’s Agri business
Source: Company, IIFL Research Source: Company, IIFL Research
Figure 87: Capex and working capital addition – Agri business Figure 88: Pre tax ROCE over the years – Agri business
Source: Company, IIFL Research Source: Company, IIFL Research
‐30%
‐20%
‐10%
0%
10%
20%
30%
40%
50%
20
25
30
35
40
45
50
55
60
65
FY1
0
FY1
1
FY1
2
FY1
3
FY1
4
FY1
5
FY1
6
FY1
7ii
FY1
8ii
FY1
9ii
Sales (LHS) % change (RHS)(Rs bn) (%)
0%
10%
20%
30%
40%
50%
60%
70%
80%
5
6
7
8
9
10
11
12
13
FY1
0
FY1
1
FY1
2
FY1
3
FY1
4
FY1
5
FY1
6
FY1
7ii
FY1
8ii
FY1
9ii
Ebit (LHS) % change (RHS)(Rs bn) (%)
‐6
‐4
‐2
0
2
4
6
8
10
FY09 FY10 FY11 FY12 FY13 FY14 FY15 FY16
Capex Change in working capital(Rs bn)
20.1%
33.4%34.9%
37.5%
45.5% 46.7%42.3%
40.8%
10%
15%
20%
25%
30%
35%
40%
45%
50%
FY09 FY10 FY11 FY12 FY13 FY14 FY15 FY16

49
ITC – BUY
percy.panthaki@iif lcap.com
Institutional Equities
Company snapshot
PE chart
EV/Ebitda
Background:ITC is one of India's foremost private sector companies with a market cap of US $ 43 billion.ITC has a diversified presence in FMCG, Hotels, Paperboards & Specialty Papers, Packaging, Agri-Business, and Information Technology. While ITC is an market leader in its traditional businesses of Cigarettes, Hotels, Paperboards, Packaging and Agri-Exports, it is rapidly gaining market share even in its nascent business of FMCG.ITC has a market share of 80% in cigarette and has iconic brands like “Gold Flake”,”Kings Classic” and operates hotels under “Welcome” and “Fortune” brand respectively. ITC is master in developing FMCG brands from scratch and has developed brands like Sunfeast (Biscuits), Bingo (Chips), Yippee (Noodles), Aashirvaad (Flour).
Assumptions Y/e 31 Mar, Consolidated FY15A FY16A FY17ii FY18ii FY19ii
Cigarette volume growth (% YoY)
(7.8) (7.9) 2.5 3.0 0.0
Cigarette price growth (% YoY) 16.6 18.3 4.0 6.5 10.5 Cigarette EBIT (%) 36.5 36.3 36.4 38.9 40.2 Other FMCG gross revenue growth (% YoY)
11.2 7.7 8.0 15.0 15.0
Source: Company data, IIFL Research
6.7
‐2.8
6.5
1.0
‐3.0
‐7.8 ‐7.9‐10.0
‐8.0
‐6.0
‐4.0
‐2.0
0.0
2.0
4.0
6.0
8.0
FY10 FY11 FY12 FY13 FY14 FY15 FY16
Cigarette volume growth (%)
6.0
9.0
12.0
15.0
18.0
21.0
24.0
Apr‐07 Apr‐09 Apr‐11 Apr‐13 Apr‐15 Apr‐17
12m fwd EV/EBITDA Avg +/‐ 1SD
(x)
12.0
15.0
18.0
21.0
24.0
27.0
30.0
33.0
36.0
Apr‐07 Apr‐09 Apr‐11 Apr‐13 Apr‐15 Apr‐17
12m fwd PE Avg +/‐ 1SD
(x)
Cigarettes, 48
FMCG , 25
Hotels, 3
Agri Business,
11
Paperboards, 9
Others, 4Net sales mix (%) - FY16
Management Name Designation
Y C Deveshwar Chairman
Sanjiv Puri CEO
Sandeep Kaul Head (India tobacco division

ITC – BUY
50 percy.panthaki@iif lcap.com
Institutional Equities
Income statement summary (Rs bn)
Y/e 31 Mar, Consolidated FY15A FY16A FY17ii FY18ii FY19ii
Revenues 384 391 413 463 519
Ebitda 142 151 156 177 201
Depreciation and amortisation (10) (11) (12) (13) (15)
Ebit 132 139 144 164 186
Non‐operating income 13 15 18 19 21
Financial expense (1) (1) 0 0 0
PBT 144 154 161 182 206
Exceptionals 0 0 0 0 0
Reported PBT 144 154 161 182 206
Tax expense (46) (54) (55) (62) (71)
PAT 98 101 106 120 136
Minorities, Associates etc. (1) (1) (2) (2) (2)
Attributable PAT 97 99 104 118 134
Ratio analysis
Y/e 31 Mar, Consolidated FY15A FY16A FY17ii FY18ii FY19ii
Per share data (Rs) Pre‐exceptional EPS 8.0 8.2 8.6 9.8 11.1
DPS 5.0 4.8 4.5 5.1 5.8
BVPS 26.5 28.2 31.4 35.1 39.2
Growth ratios (%) Revenues 9.9 1.6 5.8 12.1 12.1
Ebitda 8.8 6.0 3.5 13.6 13.5
EPS 8.2 2.3 5.2 13.4 13.2
Profitability ratios (%) Ebitda margin 37.0 38.5 37.7 38.2 38.6
Ebit margin 34.3 35.7 34.8 35.3 35.8
Tax rate 32.0 34.8 34.2 34.2 34.2
Net profit margin 25.4 25.8 25.6 25.9 26.2
Return ratios (%) ROE 32.8 30.2 29.0 29.5 29.9
ROCE 48.2 46.6 44.5 45.2 45.8
Solvency ratios (x)
Net debt‐equity (0.2) (0.2) (0.1) (0.1) 0.0
Net debt to Ebitda (0.5) (0.5) (0.3) (0.2) (0.1)
Interest coverage NM NM NM NM NM
Source: Company data, IIFL Research
Financial summary
EPS growth to revive in a rational tax regime

51
ITC – BUY
percy.panthaki@iif lcap.com
Institutional Equities
Balance sheet summary (Rs bn)
Y/e 31 Mar, Consolidated FY15A FY16A FY17ii FY18ii FY19ii
Cash & cash equivalents 79 70 54 40 12
Inventories 86 92 97 104 115
Receivables 20 19 20 22 24
Other current assets 28 37 43 48 54
Creditors 58 66 70 76 86
Other current liabilities 63 85 84 95 107
Net current assets 91 67 60 44 13 Fixed assets 178 183 193 204 216
Intangibles 0 0 0 0 0
Investments 69 112 150 203 275
Other long‐term assets (16) (18) (21) (24) (28)
Total net assets 322 343 382 426 476 Borrowings 3 1 1 1 1
Other long‐term liabilities 2 3 3 3 4
Shareholders’ equity 317 340 378 422 472 Total liabilities 322 343 382 426 476
Cash flow summary (Rs bn)
Y/e 31 Mar, Consolidated FY15A FY16A FY17ii FY18ii FY19ii
Ebit 132 139 144 164 186
Tax paid (43) (52) (52) (59) (67)
Depreciation and amortization 10 11 12 13 15
Net working capital change 12 15 (9) 2 3
Other operating items 0 0 0 0 0
Operating cash flow before interest
111 114 94 120 137
Financial expense (1) (1) 0 0 0
Non‐operating income 13 15 18 19 21
Operating cash flow after interest 123 129 111 139 157
Capital expenditure (31) (16) (22) (24) (27) Long‐term investments 3 (42) (38) (53) (72)
Others 0 0 0 0 0
Free cash flow 96 71 51 62 58 Equity raising 8 4 (2) (2) (2)
Borrowings 1 (1) 0 0 0
Dividend (61) (83) (66) (74) (84)
Net chg in cash and equivalents 44 (9) (16) (14) (28)
Source: Company data, IIFL Research
Free cashflow generation to remain
healthy

ITC – BUY
52 percy.panthaki@iif lcap.com
Institutional Equities
NOTES

53
ITC – BUY
percy.panthaki@iif lcap.com
Institutional Equities
NOTES

ITC – BUY
54 percy.panthaki@iif lcap.com
Institutional Equities
Disclosure : Published in 2017, © India Infoline Ltd 2017
India Infoline Group (hereinafter referred as IIFL) is engaged in diversified financial services business including equity broking, DP services, merchantbanking, portfolio management services, distribution of Mutual Fund, insurance products and other investment products and also loans and financebusiness. India Infoline Ltd (“hereinafter referred as IIL”) is a part of the IIFL and is a member of the National Stock Exchange of India Limited(“NSE”) and the BSE Limited (“BSE”). IIL is also a Depository Participant registered with NSDL & CDSL, a SEBI registered merchant banker and aSEBI registered portfolio manager. IIL is a large broking house catering to retail, HNI and institutional clients. It operates through its branches andauthorised persons and sub-brokers spread across the country and the clients are provided online trading through internet and offline trading throughbranches and Customer Care.
a) This research report (“Report”) is for the personal information of the authorized recipient(s) and is not for public distribution and should not bereproduced or redistributed to any other person or in any form without IIL’s prior permission. The information provided in the Report is frompublicly available data, which we believe, are reliable. While reasonable endeavors have been made to present reliable data in the Report so faras it relates to current and historical information, but IIL does not guarantee the accuracy or completeness of the data in the Report.Accordingly, IIL or any of its connected persons including its directors or subsidiaries or associates or employees shall not be in any wayresponsible for any loss or damage that may arise to any person from any inadvertent error in the information contained, views and opinionsexpressed in this publication.
b) Past performance should not be taken as an indication or guarantee of future performance, and no representation or warranty, express orimplied, is made regarding future performance. Information, opinions and estimates contained in this report reflect a judgment of its originaldate of publication by IIFL and are subject to change without notice. The price, value of and income from any of the securities or financialinstruments mentioned in this report can fall as well as rise. The value of securities and financial instruments is subject to exchange ratefluctuation that may have a positive or adverse effect on the price or income of such securities or financial instruments.
c) The Report also includes analysis and views of our research team. The Report is purely for information purposes and does not construe to beinvestment recommendation/advice or an offer or solicitation of an offer to buy/sell any securities. The opinions expressed in the Report are ourcurrent opinions as of the date of the Report and may be subject to change from time to time without notice. IIL or any persons connected withit do not accept any liability arising from the use of this document.
d) Investors should not solely rely on the information contained in this Report and must make investment decisions based on their own investmentobjectives, judgment, risk profile and financial position. The recipients of this Report may take professional advice before acting on thisinformation.
e) IIL has other business segments / divisions with independent research teams separated by 'Chinese walls' catering to different sets of customershaving varying objectives, risk profiles, investment horizon, etc and therefore, may at times have, different and contrary views onstocks, sectors and markets.
f) This report is not directed or intended for distribution to, or use by, any person or entity who is a citizen or resident of or located in any locality,state, country or other jurisdiction, where such distribution, publication, availability or use would be contrary to local law, regulation or whichwould subject IIL and its affiliates to any registration or licensing requirement within such jurisdiction. The securities described herein may ormay not be eligible for sale in all jurisdictions or to certain category of investors. Persons in whose possession this Report may come arerequired to inform themselves of and to observe such restrictions.
g) As IIL along with its associates, are engaged in various financial services business and so might have financial, business or other interests inother entities including the subject company(ies) mentioned in this Report. However, IIL encourages independence in preparation of researchreport and strives to minimize conflict in preparation of research report. IIL and its associates did not receive any compensation or otherbenefits from the subject company(ies) mentioned in the Report or from a third party in connection with preparation of the Report. Accordingly,IIL and its associates do not have any material conflict of interest at the time of publication of this Report.
h) As IIL and its associates are engaged in various financial services business, it might have:-
(a) received any compensation (except in connection with the preparation of this Report) from the subject company in the past twelve months;(b) managed or co-managed public offering of securities for the subject company in the past twelve months; (c) received any compensation forinvestment banking or merchant banking or brokerage services from the subject company in the past twelve months; (d) received anycompensation for products or services other than investment banking or merchant banking or brokerage services from the subject company inthe past twelve months; (e) engaged in market making activity for the subject company.
i) IIL and its associates collectively do not own (in their proprietary position) 1% or more of the equity securities of the subject companymentioned in the report as of the last day of the month preceding the publication of the research report.
j) The Research Analyst engaged in preparation of this Report or his/her relative:-
(a) does not have any financial interests in the subject company (ies) mentioned in this report; (b) does not own 1% or more of the equitysecurities of the subject company mentioned in the report as of the last day of the month preceding the publication of the research report; (c)does not have any other material conflict of interest at the time of publication of the research report.
k) The Research Analyst engaged in preparation of this Report:-
(a) has not received any compensation from the subject company in the past twelve months; (b) has not managed or co-managed publicoffering of securities for the subject company in the past twelve months; (c) has not received any compensation for investment banking ormerchant banking or brokerage services from the subject company in the past twelve months; (d) has not received any compensation forproducts or services other than investment banking or merchant banking or brokerage services from the subject company in the past twelvemonths; (e) has not received any compensation or other benefits from the subject company or third party in connection with the researchreport; (f) has not served as an officer, director or employee of the subject company; (g) is not engaged in market making activity for thesubject company.
L) IIFLCAP accepts responsibility for the contents of this research report, subject to the terms set out below, to the extent that it is delivered to aU.S. person other than a major U.S. institutional investor. The analyst whose name appears in this research report is not registered or qualifiedas a research analyst with the Financial Industry Regulatory Authority (“FINRA”) and may not be an associated person of IIFLCAP and,therefore, may not be subject to applicable restrictions under FINRA Rules on communications with a subject company, public appearances andtrading securities held by a research analyst account.
We submit that no material disciplinary action has been taken on IIL by any regulatory authority impacting Equity Research Analysis.

55
ITC – BUY
percy.panthaki@iif lcap.com
Institutional Equities
0
100
200
300
400
500
May‐1
4Ju
n‐1
4Ju
l‐1
4A
ug‐
14
Sep‐1
4O
ct‐1
4N
ov‐
14
De
c‐1
4Ja
n‐1
5Fe
b‐1
5M
ar‐1
5A
pr‐
15
May‐1
5Ju
n‐1
5Ju
l‐1
5A
ug‐
15
Sep‐1
5O
ct‐1
5N
ov‐
15
De
c‐1
5Ja
n‐1
6Fe
b‐1
6M
ar‐1
6A
pr‐
16
May‐1
6Ju
n‐1
6Ju
l‐1
6A
ug‐
16
Sep‐1
6O
ct‐1
6N
ov‐
16
De
c‐1
6Ja
n‐1
7Fe
b‐ 1
7M
ar‐1
7A
pr‐
17
May‐1
7
Price TP/Reco changed date(Rs)
ITC: 3 year price and rating history Date Close price (Rs)
Target price (Rs)
Rating
26 May 2014 343 360 BUY 11 Jul 2014 342 400 BUY 22 Jan 2015 353 380 BUY 02 Mar 2015 361 355 ADD 25 May 2015 329 360 ADD 02 Nov 2015 335 355 ADD 25 Jan 2016 309 330 ADD 23 May 2016 330 355 ADD 22 Jul 2016 251 250 ADD
26 Sep 2016 253 270 ADD 10 Oct 2016 239 260 ADD 05 Jan 2017 245 265 ADD
Date Closeprice(Rs)
Target price (Rs)
Rating
02 Feb 2017 270 285 ADD 20 Mar 2017 281 330 BUY
A graph of daily closing prices of securities is available at http://www.nseindia.com/ChartApp/install/charts/mainpage.jsp, www.bseindia.com andhttp://economictimes.indiatimes.com/markets/stocks/stock-quotes. (Choose a company from the list on the browser and select the “three years”period in the price chart).
Name, Qualification and Certification of Research Analyst: Percy Panthaki(Chartered Accountant), Avi Mehta(PGDBM), Sameer Gupta(PGPM)
India Infoline Limited (Formerly “India Infoline Distribution Company Limited”), CIN No.: U99999MH1996PLC132983, Corporate Office– IIFL Centre, Kamala City, Senapati Bapat Marg, Lower Parel, Mumbai – 400013 Tel: (91-22) 4249 9000 .Fax: (91-22) 40609049, Regd. Office –IIFL House, Sun Infotech Park, Road No. 16V, Plot No. B-23, MIDC, Thane Industrial Area, Wagle Estate, Thane – 400604 Tel: (91-22) 25806650.Fax: (91-22) 25806654 E-mail: [email protected] Website: www.indiainfoline.com, Refer www.indiainfoline.com for detail of Associates.
National Stock Exchange of India Ltd. SEBI Regn. No. : INB231097537/ INF231097537/ INE231097537, Bombay Stock Exchange Ltd. SEBIRegn. No.:INB011097533/ INF011097533/ BSE-Currency, MCX Stock Exchange Ltd. SEBI Regn. No.: INB261097530/ INF261097530/INE261097537, United Stock Exchange Ltd. SEBI Regn. No.: INE271097532, PMS SEBI Regn. No. INP000002213, IA SEBI Regn. No. INA000000623,SEBI RA Regn.:- INH000000248
Key to our recommendation structure
BUY - Absolute - Stock expected to give a positive return of over 20% over a 1-year horizon.
SELL - Absolute - Stock expected to fall by more than 10% over a 1-year horizon.
In addition, Add and Reduce recommendations are based on expected returns relative to a hurdle rate. Investment horizon for Add andReduce recommendations is up to a year. We assume the current hurdle rate at 10%, this being the average return on a debt instrument availablefor investment.
Add - Stock expected to give a return of 0-10% over the hurdle rate, i.e. a positive return of 10%+.
Reduce - Stock expected to return less than the hurdle rate, i.e. return of less than 10%.
Distribution of Ratings: Out of 205 stocks rated in the IIFL coverage universe, 114 have BUY ratings, 7 have SELL ratings, 56 have ADDratings and 28 have REDUCE ratings
Price Target: Unless otherwise stated in the text of this report, target prices in this report are based on either a discounted cash flow valuation orcomparison of valuation ratios with companies seen by the analyst as comparable or a combination of the two methods. The result of thisfundamental valuation is adjusted to reflect the analyst’s views on the likely course of investor sentiment. Whichever valuation method is used thereis a significant risk that the target price will not be achieved within the expected timeframe. Risk factors include unforeseen changes in competitivepressures or in the level of demand for the company’s products. Such demand variations may result from changes in technology, in the overall levelof economic activity or, in some cases, in fashion. Valuations may also be affected by changes in taxation, in exchange rates and, in certainindustries, in regulations. Investment in overseas markets and instruments such as ADRs can result in increased risk from factors such as exchangerates, exchange controls, taxation, and political and social conditions. This discussion of valuation methods and risk factors is not comprehensive –further information is available upon request.

www.iiflcap.comInstitutional Equities
IIFL - IndiaIndia Infoline Ltd9th Floor, IIFL Centre, Kamala City, Senapati Bapat Marg, Lower Parel (W),Mumbai - 400013Tel +91-22-4646-4600Fax +91-22-4646-4700
IIFL - USAIIFL Inc.1120 avenue of the Americas suite 1502, New York,NY 10036 Tel +1-212-221-6800Fax +1-646-417-5800
IIFL - UKIIFL Wealth (UK) Limited 45, King William Street, London - EC4R 9AN, United KingdomTel +44 (0) 20 707 87208
CMP Rs1571Target 12m Rs1800 (15%)Market cap (US$ m) 7,544Enterprise value (US$ m) 8,213Bloomberg GCPL INSector FMCG
21 June 2016
52Wk High/Low (Rs) 1584/1109Shares o/s (m) 341Daily volume (US$ m) 6Dividend yield FY17ii (%) 0.5Free float (%) 36.7
Shareholding pattern (%)Promoter 63.3FII 28.6DII 1.9Others 6.3
Price performance (%)1M 3M 1Y
GodrejConsumer
14.7 17.4 40.1
Absolute (US$) 14.6 15.9 32.5Rel. to Sensex 8.7 11.3 41.9CAGR (%) 3 yrs 5 yrsEPS 20.1 17.4
Stock movement
Percy [email protected] 22 4646 4662
Avi [email protected] 22 4646 4650
Sameer [email protected] 22 4646 4672
www.iiflcap.com
0
500
1,000
1,500
2,000
0200400600800
1,0001,2001,400
Jun
14Au
g14
Oct
14De
c14
Feb
15Ap
r15
Jun
15Au
g15
Oct
15De
c15
Feb
16Ap
r16
Jun
16
Volume (LHS)Price (RHS) (Rs)Shares (000')
Godrej Consumer BUY
1
Growth trotter
Detailedreport
Institutional Equities
Financial summary (Rs m)Y/e 31 Mar, Consolidated FY15A FY16A FY17ii FY18ii FY19iiRevenues (Rs m) 82,422 89,572 103,752 118,077 135,314Ebitda margins (%) 16.6 18.3 18.3 19.0 19.6
Pre exceptional PAT (Rs m) 8,944 11,437 13,287 16,041 19,055Reported PAT (Rs m) 9,071 11,227 13,287 16,041 19,055Pre exceptional EPS (Rs) 26.3 33.6 39.0 47.1 56.0Growth (%) 18.6 27.9 16.2 20.7 18.8
IIFL vs consensus (%) (2.3) 1.5 6.9
PER (x) 59.8 46.8 40.3 33.3 28.1ROE (%) 22.1 24.3 23.7 24.2 25.0
Net debt/equity (x) 0.4 0.4 0.3 0.1 0.0EV/Ebitda (x) 40.4 33.8 29.3 24.2 20.3Price/book (x) 12.4 10.5 8.8 7.5 6.6Source: Company, IIFL Research. Price as at close of business on 21 June 2016.
GCPL’s presence in Asia, Latin America and Africa across hair care, home care and personal care provides sufficient headroom for high growth to sustain over a long period. Our in-depth research leads us to believe that GCPL has the necessary tools to capitalize on this growth opportunity. With an addressable market of ~2.5bn consumers in low income, fast growing emerging economies, GCPL’s is a highly scalable business model that combines robust organic growth with value accretive acquisitions. We forecast 19% EPS Cagr FY16-19 spurred by innovation, cross-pollination of products, and synergies of integration. BUY.
Attractive opportunity: GCPL’s presence across Asia, Latin America and Africa provide exposure to a population of ~2.5bn with an average per capita GDP of US$5400, and a nominal GDP growth forecast of 12%. We believe that there is significant penetration led growth opportunity (e.g. per capita consumption in hair colours in India / Indonesia is 3-4x lower than Thailand). Moreover, there is enough headroom to grow in the current market (e.g. GCPL’s revenues are less than 10% of global African hair care market size).
Solid innovation track record: GCPL has been ahead of competition in innovation which has helped it to gain market share. Products such as “Hit Magic Paper”, “Expert Crème Hair colour” in sachet and “Good knight low smoke coil” have made the respective categories more accessible or attractive to consumers while being margin accretive for the company. GCPL will continue to have this edge due to its design-led thinking, R&D capabilities and multi-country presence.
Successful acquisition strategy: GCPL acquires companies in focused geographies and categories at reasonable valuations. The acquired companies are given significant autonomy to maintain their distinct culture while ensuring that the best practices of the group are followed. Exchange of learnings across geographies accelerates growth and mitigates risk. Moreover, GCPL uses its technological and marketing expertise in one region to grow organically in another. HI (Household Insecticides) in Africa and the upcoming hair care launch in Indonesia are examples of this growth via cross pollination.
India Strategy
Institutional Equities Kiss of Debt India Inc’s debt has risen at an unprecedented pace in the past six years and debt-servicing ability of companies has weakened, as reflected in falling interest coverage and dwindling cash flows. Flagging growth outlook for the Indian economy, aggravated by weakening INR and diminishing prospects of interest rate cuts in the near term, intensify the pain of high debt. This pain is almost equally shared between the borrowers and lenders. Government banks have been showing stress signs for a while and private banks too are unlikely to remain immune. ICICI, Axis, and Yes Bank are expected to be the worst impacted among private banks.
The two extremes — drowning in debt or floating in cash: Net debt for 749 companies in our universe (ex-banks and finance companies) with combined market cap of US$828bn, has risen 4.9x over the past six years (FY07-FY13) to Rs14,918bn (US$244bn). Average net debt-to-equity ratio for the leveraged companies nearly doubled to 0.98x. Further, interest coverage almost halved to 3.4x in the past six years. ROE for this group dropped from 18.9% in FY07 to 8.1% in FY13, despite higher leverage.
Highly leveraged companies cast a shadow on banks: The 176 companies with net cash have combined market cap of US$409bn or 49% of our universe. On the other hand, the 66 highly leveraged companies with net debt-to-equity>1.5x and net debt of >Rs10bn have market cap of only US$17bn or 2% of our universe. Although these companies are small in terms of market cap, they cast a shadow on the country’s banking system with their combined net debt of US$81bn.
NPLs and restructured loans to further rise: Buffeted by sharp slowdown in existing operations, delays in project execution, high interest rates, and INR depreciation, we expect many of the highly leveraged companies to slip into NPL or restructured categories over the next two years. Asset quality woes of banks are now assuming systemic proportions, which will manifest in the form of banks becoming increasingly risk averse and suffering from capital shortfall. We downgrade our recommendation on the most vulnerable private sector banks, ICICI, Axis and Yes, to REDUCE and on other private banks, HDFC Bank, Kotak and IndusInd, to ADD.
Figure 1: Companies with highest debt and net debt‐to‐equity >2.5x Figure 2: Companies with highest Net Cash(Rs bn) MCap Net DebtAdani Enterprises 186 668Jaiprakash Associates 70 613Hindustan Petroleum 64 400Adani Power 104 398Tata Power 179 355GMR Infrastructure 50 312Lanco Infratech 13 308Bhushan Steel 105 267Jaiprakash Power Ventures 32 223Essar Oil 75 199
(Rs bn) MCap Net Cash Coal India 1,733 622Hindustan Zinc 440 215NMDC 431 210Infosys 1,726 205Cairn India 576 122Oil India 288 119Wipro 1,121 90ITC 2,654 87TCS 3,550 74Sterlite Industries 264 59
Source: Bloomberg, IIFL Research. Based on closing prices of 12‐Aug‐2013 Source: Bloomberg, IIFL Research. Based on closing prices of 12‐Aug‐2013
Prabodh Agrawal [email protected] 91 22 4646 4697 Sampath Kumar [email protected] 91 22 4646 4665 Abhishek Murarka [email protected] 91 22 4646 4661 Amit Tiwari [email protected] 91 22 4646 4649
Agriculture
Corporat
e
Public Finance
Demographics
Public Secto
r
Growth
External sector
Money, Credit
Agriculture
Corporat
e
Public Finance
Demographics
Public Secto
r
Growth
External sector
Money, Credit
Agriculture
Corporat
e
Public Finance
Demographics
Public Secto
r
Growth
External sector
Money, Credit
Agriculture
Corporat
e
Public Finance
Demographics
Public Secto
r
Growth
External sector
Money, Credit
Agriculture
Corporat
e
Public Finance
Demographics
Public Secto
r
Growth
External sector
Money, Credit
Agriculture
Corporat
e
Public Finance
Demographics
Public Secto
r
Growth
External sector
Money, Credit
Agriculture
Corporat
e
Public Finance
Demographics
Public Secto
r
Growth
External sector
Money, Credit
Agriculture
Corporat
e
Public Finance
Demographics
Public Secto
r
Growth
External sector
Money, Credit
Agriculture
Corporat
e
Public Finance
Demographics
Public Secto
r
Growth
External sector
Money, Credit
Agriculture
Corporat
e
Public Finance
Demographics
Public Secto
r
Growth
External sector
Money, Credit
Agriculture
Corporat
e
Public Finance
Demographics
Public Secto
r
Growth
External sector
Money, Credit
Agriculture
Corporat
e
Public Finance
Demographics
Public Secto
r
Growth
External sector
Money, Credit
Agriculture
Corporat
e
Public Finance
Demographics
Public Secto
r
Growth
External sector
Money, Credit
Agriculture
Corporat
e
Public Finance
Demographics
Public Secto
r
Growth
External sector
Money, Credit
Agriculture
Corporat
e
Public Finance
Demographics
Public Secto
r
Growth
External sector
Money, Credit
Agriculture
Corporat
e
Public Finance
Demographics
Public Secto
r
Growth
External sector
Money, Credit
Agriculture
Corporat
e
Public Finance
Demographics
Public Secto
r
Growth
External sector
Money, Credit
Insights - IIIndia chartbook
1Q2014
Agriculture
Corporat
e
Public Finance
Demographics
Public Secto
r
Growth
External sector
Money, Credit
India - Strategy
Improving outlook for corporate profitability
Metamorphosis 2Q2014
India - PSUs
2Q2014
All the King’s Jewels
Modi Inc
CMP Rs1003 Target 12m Rs1320 (32%) Market cap (US$ m) 53,280 Enterprise value (US$ m) 66,075 Bloomberg RIL IN Sector Oil & Gas
14 August 2014
52Wk High/Low (Rs) 1145/764 Shares o/s (m) 3234 Daily volume (US$ m) 70 Dividend yield FY15ii (%) 1.0 Free float (%) 54.7
Shareholding pattern (%) Promoters 45.3 FIIs 19.9 DIIs 10.9 Public 23.9
Price performance (%) 1M 3M 1YRIL 4.3 (4.1) 15.9Absolute (US$) 3.0 (5.0) 18.2Rel. to Sensex (0.1) (13.7) (18.8)CAGR (%) 3 yrs 5 yrsEPS 10.0 4.9
Stock movement
02004006008001,0001,200
0
5,000
10,000
15,000
Aug‐
12O
ct‐1
2D
ec‐1
2Fe
b‐13
Apr‐1
3Ju
n‐13
Aug‐
13O
ct‐1
3D
ec‐1
3Fe
b‐14
Apr‐1
4Ju
n‐14
Aug‐
14
Volume (LHS)Price (RHS) (Rs)Shares (000')
Bhaskar Chakraborty [email protected] 91 22 4646 4670 Mohit Agrawal [email protected] 91 22 4646 4675
www.iiflcap.com
Reliance Industries BUY
1
Cranking Capex, Upping Margins
Detailed report
Financial summary (Rs bn)Y/e 31 Mar, Consolidated FY14A FY15ii FY16ii FY17ii FY18iiRevenues (Rs bn) 4,345 4,966 5,308 5,746 6,096
Ebitda margins (%) 8.0 8.1 8.8 10.7 10.7
Pre‐exceptional PAT (Rs bn) 225 255 280 365 417
Reported PAT (Rs bn) 225 255 280 365 417
Pre‐exceptional EPS (Rs) 69.6 79.1 86.6 112.8 129.0
Growth (%) 7.5 13.6 9.5 30.4 14.3
IIFL vs consensus (%) (2.3) (4.4) (1.5) NAPER (x) 14.4 12.7 11.6 8.9 7.8 ROE (%) 11.8 12.2 11.9 13.9 14.0 Net debt/equity (x) 0.5 0.6 0.5 0.4 0.2 EV/Ebitda (x) 10.6 10.0 8.4 6.0 5.1 Price/book (x) 1.6 1.5 1.3 1.2 1.0 Source: Company, IIFL Research. Price as at close of business on 14 August 2014.
Institutional Equities
Reliance Industries (RIL) is poised for an exciting phase of earnings growth. We believe that new capacities would improve RIL’s competitive position in refining and petrochemicals and almost double its EPS over FY14-18ii. This will help ROE recover to 14% from 11.8% currently. RIL is trading at its 10-year average one-year forward P/B indicating that the strong revival in its earnings and ROE are not factored into the current price. Our target price of Rs1,320 implies 32% upside. BUY.
Cyclical businesses on a strong wicket: RIL is undertaking capex to: 1) lower operating cost of the refinery by $1bn annually FY17 onwards; 2) double polyethylene capacity while halving cash operating cost; and 3) double polyester capacity by FY17. This core capex will add $3.2-3.5bn to RIL’s annual Ebitda by FY17ii and contribute c93% of its consolidated EBIT over FY15-17ii. Ongoing capacity rationalization and improvement in demand will help margins recover from their current lows.
Non-cyclical businesses to provide the next leg of growth: Ebit in the domestic upstream and US shale gas businesses should double over FY14-17ii. Retailing business EBIT should grow six-fold. Ebit contribution of these businesses will increase from Rs35bn in FY14 to Rs82bn in FY17ii. However, start-up losses in Reliance Jio would reduce the contribution of these non-cyclical businesses to 7% of RIL’s FY17ii Ebit. With adequate scale, these businesses should provide the next leg of growth FY18 onwards.
Risk-reward favourable, BUY: We reckon RIL would invest 30% of FY17ii consolidated balance sheet in the 4G telecom and US shale gas businesses, which would be ROE dilutive. However, FY18 consolidated EPS should nearly double over FY14 as the new capacities stabilize. This will help ROE recover to 14% from 11.8% currently. At 8.9x FY17ii EPS, RIL is attractively valued in view of the strong revival in earnings growth and return ratios. Our target price of Rs1,320 factors in normalized refining and petrochemical margins.
India - Cement
3Q2014
The Indian Cement walk of fame
Cement Stars of India
CMP Rs1262 Target 12m Rs1550 (23%) Market cap (US$ m) 4, 072 Enterprise value (US$ m) 3,648 Bloomberg CCRI IN Sector Logistics
5 September 2014 52Wk High/Low (Rs) 1410/675 Shares o/s (m) 195 Daily volume (US$ m) 2 Dividend yield FY15ii (%) 1.4 Free float (%) 38.2
Shareholding pattern (%) Govt. of India 61.8 FII 26.5 DII 6.4 Others 5.3 Price performance (%) 1M 3M 1YCCRI (1.4) 6.1 79.1Absolute (US$) (0.3) 4.6 98.6Rel. to Sensex (5.7) (1.9) 36.7CAGR (%) 3 yrs 5 yrsEPS 4.1 4.6
Stock movement
Harshvardhan Dole [email protected] 91 22 4646 4660 Devesh Agarwal, CFA [email protected] 91 22 4646 4647
www.iiflcap.com
0
500
1,000
1,500
0
500
1,000
1,500
Sep‐
12No
v‐12
Jan‐
13M
ar‐1
3M
ay‐1
3Ju
l‐13
Sep‐
13No
v‐13
Jan‐
14M
ar‐1
4M
ay‐1
4Ju
l‐14
Sep‐
14
Volume (LHS)Price (RHS) (Rs)Shares (000')
Container Corp of India BUY
1
Who moved my container?
Detailed report
Institutional Equities
Container Corporation of India (Concor) is transforming from a vanilla transportation company into an integrated logistics player by setting up 15 logistics parks along the dedicated freight corridor (DFC). Phased completion of DFC from FY17 should eliminate railway network congestion and improve competitiveness of container movement on rails vs. road. Concor’s virtual monopoly (79% share) in this market should accelerate earnings from FY17. Through FY14-17ii, earnings should grow at 15% pa vs. 5% during FY09-14, led by gradual pickup in the economy and entry into logistics parks.
Strong business franchise; set to become stronger: Armed with a vast network of 63 terminals across India, Concor enjoys a virtual monopoly (market share of 79%) in moving container cargo on rail. It plans to invest Rs30bn to set up 15 logistics parks (MMLPs) across the proposed DFCs. The MMLPs are well equipped to handle third-party cargos and offer warehousing facilities. We believe that timely diversification would only strengthen Concor’s business franchise.
Structural growth drivers falling in place: Structural headwinds such as capacity constraints in rail infra, idle capacity in surface transport, and gaps in EXIM trade adversely affected container movement by rail. The government’s plans to set up two DFCs connecting the northern region to key ports of western and eastern India should go a long way in addressing network congestion in phases from FY17. Seamless completion of DFC, gradual revival in the economy, and possible initiatives such as GST should help rail container movement to gain market share from road. We model rail container volumes to grow at 22-25% pa through FY17-25ii vs. 8-9% pa seen through FY08-14.
LT play on strong macro themes: Concor is well placed to benefit from structural growth drivers likely to play out in phases from FY17. We model its volumes to grow at 20-22% pa through FY17-25ii, with commensurate growth in EPS. Our DCF-based TP is predicated on this. Through FY14-17ii, gradual pickup in the domestic economy should help Concor’s volume to grow at 12-13% pa, leading to 15% pa EPS growth through FY14-17ii, vs. 5% pa in FY09-14. In the meanwhile, a runaway increase in haulage charges (10-15%) remains a key risk. Financial summary (Rs m)Y/e 31 Mar, Parent FY13A FY14A FY15ii FY16ii FY17iiRevenues (Rs m) 44,060 49,844 59,435 72,065 86,133 Ebitda margins (%) 23.8 22.1 22.1 22.7 22.1 Pre‐exceptional PAT (Rs m) 9,390 9,900 11,046 13,296 15,173 Reported PAT (Rs m) 9,400 9,847 11,046 13,296 15,173 Pre‐exceptional EPS (Rs) 48.2 50.8 56.7 68.2 77.8 Growth (%) 1.0 5.4 11.6 20.4 14.1 IIFL vs consensus (%) 2.6 5.7 (1.1) PER (x) 26.2 24.9 22.3 18.5 16.2ROE (%) 15.8 14.9 15.0 16.3 16.7 Net debt/equity (x) (0.5) (0.4) (0.4) (0.4) (0.4) EV/Ebitda (x) 20.6 19.6 16.4 13.0 11.1Price/book (x) 3.9 3.5 3.2 2.9 2.6Source: Company, IIFL Research. Price as at close of business on 5 September 2014.
CMP Rs2576
Target 12m Rs3100 (20%)
Market cap (US$ m) 1,741
Bloomberg BAF IN
Sector Banks
16 September 2014
52Wk High/Low (Rs) 2648/1130 Shares o/s (m) 50 Daily volume (US$ m) 1 Dividend yield FY15ii (%) 0.7 Free float (%) 38.4
Shareholding pattern (%) Promoters 61.6 FII 12.2 DII 7.1 Others 19.1
Price performance (%) 1M 3M 1YBajaj Finance 14.0 27.2 124.8Absolute (US$) 13.3 25.3 135.3Rel. to Sensex 11.2 20.9 88.9CAGR (%) 3 yrs 5 yrsEPS 29.0 73.2
Stock movement
Sampath Kumar [email protected] +91 22 4646 4665 Abhishek Murarka [email protected] 91 22 4646 4661
www.iiflcap.com
05001,0001,5002,0002,5003,000
0
500
1,000
1,500
2,000
Sep‐
12No
v‐12
Jan‐
13M
ar‐1
3M
ay‐1
3Ju
l‐13
Sep‐
13No
v‐13
Jan‐
14M
ar‐1
4M
ay‐1
4Ju
l‐14
Sep‐
14
Volume (LHS)Price (RHS) (Rs)Shares (000')
Bajaj Finance BUY
1
Indulge yourself
Detailed report
Financial summary (Rs m)Y/e 31 Mar, Parent FY13A FY14A FY15ii FY16ii FY17iiPre prov. operating inc. (Rs m) 10,534 13,490 15,649 19,790 25,457 Pre‐exceptional PAT (Rs m) 5,913 7,190 8,570 11,001 14,155 Reported PAT (Rs m) 5,913 7,190 8,570 11,001 14,155 Pre‐exceptional EPS (Rs) 118.8 144.5 170.9 219.4 282.3 Growth (%) 20.8 21.7 18.3 28.4 28.7 IIFL vs consensus (%) (1.3) 3.7 10.7 PER (x) 21.7 17.8 15.1 11.7 9.1 Book value (Rs) 676 802 952 1145 1398 PB (x) 3.8 3.2 2.7 2.2 1.8 CAR (%) 22.0 22.0 20.3 19.3 18.7 ROA (%) 3.8 3.4 3.0 2.9 3.0 ROE (%) 22.0 19.5 19.6 20.9 22.2 Source: Company, IIFL Research. Price as at close of business on 15 September 2014.
Institutional Equities
Bajaj Finance (BAF) is the only diversified NBFC in India that has scaled up its business successfully over FY09-14 to emerge as the third largest in terms of assets under management (AUM). The opportunity landscape for BAF to scale up businesses in consumer and small business finance and consolidate its leadership position in its chosen segments is immense. Hiving off home loans into a separate housing finance subsidiary is a step in that direction. We believe Bajaj Finance (BAF) is well poised to deliver 25% earnings Cagr, 3% ROA and 20%+ ROE over FY14-17ii, superior to its peers. We maintain BUY and raise 12-m TP to Rs3100 on visibility of high growth and profitability.
A unique franchise with sustainability: BAF has emerged as a diversified financial services company with well-established franchises in consumer and small business financing. A large market opportunity landscape and niche positioning of BAF in its key business segments make its high growth sustainable over the medium term. Growth is a continuum in BAF, driven by constant extensions to the existing product offerings and launch of new product designs. These drivers would anchor growth outlook for BAF over the long term too.
Strong earnings growth sustainable over FY14-17ii too: We forecast 25% earnings Cagr for BAF driven by 30% AUM Cagr, stable asset quality, and improvement in operating efficiency. BAF would be incorporating a wholly owned subsidiary and will hive off its home loan business into the subsidiary. This organisational restructuring is likely to enhance profitability of the housing finance business, as well as the value accruing from this business to BAF.
Strong earnings, capital augmentation to sustain re-rating: BAF’s stock price has significantly re-rated, aided by successful scaling up of the business, increased confidence on execution capabilities of the management, and demonstration of efficient use of capital. The company is likely to augment capital over the next 9-12 months. Growth is likely to be self-sustaining over the next five years despite rapid growth in AUM, due to strong internal accruals.
SIZING UP INDIA & CHINA 2Q2015
India - Internet
3Q2015
A deep dive into Indian Internet
Click Moved My Cheese
India - Pharma
2Q2015
US opportunity remains the best growth bet
Striking roots
Institutional EquitiesRural India
4Q2015
Migration – only solution for agri distress
Simba go to the city
India - FMCG
1Q2016
Injurious to listed FMCG health
Patanjali
Institutional EquitiesIndia - Insurance
4Q2015
New choices, more ideas
Unlocking value
Institutional Equities
CMP Rs6489 Target 12m Rs6300 (‐3%) Market cap (US$ m) 9,337 Enterprise value (US$ m) 9,265 Bloomberg NEST IN Sector FMCG
01 September 2016
52Wk High/Low (Rs) 7390/4981 Shares o/s (m) 96 Daily volume (US$ m) 4 Dividend yield FY16ii (%) 1.5 Free float (%) 37.2
Shareholding pattern (%) Promoter 62.8 FII 14.4 DII 5.7 Others 17.2
Price performance (%) 1M 3M 1Y Nestle India (6.7) 1.5 8.1 Absolute (US$) (6.9) 2.4 7.8 Rel. to Sensex (8.2) (4.9) (2.5) CAGR (%) 3 yrs 5 yrs EPS (5.6) 1.9
Stock movement
Percy Panthaki [email protected] 91 22 4646 4662 Avi Mehta [email protected] 91 22 4646 4650 Sameer Gupta [email protected] 91 22 4646 4672
www.iiflcap.com
0
2,000
4,000
6,000
8,000
0200400600800
1,000
Sep‐
14N
ov‐1
4Ja
n‐15
Mar‐1
5M
ay‐1
5Ju
l‐15
Sep‐
15N
ov‐1
5Ja
n‐16
Mar‐1
6M
ay‐1
6Ju
l‐16
Sep‐
16
Volume (LHS)Price (RHS) (Rs)Shares (000')
Nestle India REDUCE
1
Product launches may not launch growth
Detailed report
Financial summary (Rs m) Y/e 31 Dec, Parent CY14A CY15A CY16ii CY17ii CY18iiRevenues (Rs m) 98,063 81,233 95,413 110,785 126,062 Ebitda margins (%) 21.4 20.3 21.1 21.7 22.0 Pre‐exceptional PAT (Rs m) 11,800 8,988 11,476 13,925 16,293 Reported PAT (Rs m) 11,847 5,633 11,476 13,925 16,293 Pre‐exceptional EPS (Rs) 122.4 93.2 119.0 144.4 169.0 Growth (%) 6.5 (23.8) 27.7 21.3 17.0 IIFL vs consensus (%) (3.3) (4.1) (0.8) PER (x) 53.0 69.6 54.5 44.9 38.4 ROE (%) 45.3 31.8 40.7 49.4 57.8 Net debt/equity (x) (0.2) (0.2) (0.3) (0.5) (0.7) EV/Ebitda (x) 29.6 37.7 30.6 25.4 21.9 Price/book (x) 22.1 22.2 22.2 22.2 22.2 Source: Company, IIFL Research. Price as at close of business on 01 September 2016.
Institutional Equities
Nestlé’s stock price has moved up 30% in the past six months spurred by a flurry of new launches. We believe that the huge benefit of doubt Nestle enjoys is unjustified, given its track record. Moreover, we estimate that these new launches will increase CY20 sales by just 6% and the larger debate should be what the company is doing to strengthen the core, i.e. the remaining 90%+ of its business. We believe that Nestlé’s pricing policy, under-investment in brands, and narrow definition of target market will prevent it from realising its full potential. Maintain REDUCE. Poor track record of launches: At a time when the company is struggling to grow (H1CY16 LFL sales growth approximately flat) it could do well to focus its energies on fixing its core business. Nestlé’s launch track record is poor; we estimate products launched over the past 10 years have increased CY15 sales by ~5%. Our dip-stick survey of 75 respondents in our office revealed that 25 of them had not consumed even one of Nestlé's seven major innovations of the past few years. Factors holding Nestle back: Nestlé is over-earning in India with Ebitda margins higher than those of its parent. India needs to be treated as an “invest to grow” market. Launches should serve the dual objectives of premiumisation and penetration – the latter is missing due to the narrow definition of target audience which excludes 75% of the population. Investment in A&P needs to go up dramatically and price premium to competition needs to reduce. Analysis of new launches: We analyse products launched by Nestle in the past few months and estimate that they will account for 8% of CY20 sales and add 6% to the top line (the difference being cannibalisation). Hot heads would be the biggest contributor and then a long tail of products contributing small amounts. Insta-filter could be successful, but will cannibalise existing products. Nestlé is spreading itself too thin by clubbing so many launches in a short period, which could result in sub-optimal outcomes.
India - Telecom
3Q2016
Shake off the Heebie GBs
The 2016 JIO Olympics begins
Institutional Equities
Scale of operations mn sq ft Ongoing Projects 41 Upcoming Projects 51 Land Bank 390 Source: Company, IIFL Research. Largest market share in Mumbai
Source: Bloomberg, Liases Foras, Company, IIFL Research. Largest player in India by Sales FY16 Sales Value* Rs bn Lodha Developers 65 Godrej Properties 50 DLF 32 Prestige Estates 31 Source: Company, IIFL Research. * Gross Sales reported by Company.
Mohit Agrawal [email protected] 91 22 4646 4675
www.iiflcap.com
Other, 571
LDPL, 65
FY16 Sales value (Rs bn)
Mumbai Rs636 bn
Lodha Developers
1
‘Banking’ on Mumbai Market
Detailed report
Financial summary (Rs m)Y/e 31 Mar, Consolidated FY12A FY13A FY14A FY15A FY16ARevenues (Rs m) 29,626 35,102 47,127 62,699 83,198Ebitda (Rs mn) 7,232 7,373 8,990 14,212 20,112Ebitda margins (%) 24.4 21.0 19.1 22.7 24.2Pre‐exceptional PAT (Rs m) 3,771 3,728 4,206 7,249 6,313Reported PAT (Rs m) 3,819 3,948 4,205 7,249 6,318Pre‐exceptional EPS (Rs) 17.5 17.3 19.5 33.6 29.2Growth (%) 44.4 (1.1) 12.8 72.4 (12.9)ROE (%) 40.8 25.3 19.0 26.0 18.1ROCE (%) 12.8 7.7 6.3 8.3 9.0Net debt/equity (x) 4.5 6.4 5.1 4.9 4.0Source: Company, IIFL Research.
Institutional Equities (Unlisted)
Lodha Developers (LDPL), the largest real estate developer in India by sales value, is primarily focused on residential development. More than 90% of its sales, projects, and land bank are located in the Mumbai Metropolitan region (MMR). LDPL has set an aggressive target of more than doubling turnover over the next five years. Despite the challenging demand environment in the near term, we believe LDPL is well placed given the strong growth drivers in the long term.
Strong project pipeline and land bank to support long-term growth: LDPL has more than 90mn sq. ft. of projects planned. Out of this, an ongoing 41mn sq. ft. are at various stages of completion and LDPL will execute an upcoming 51mn sq. ft. over the next 5-10 years (largely in MMR). Beyond this, it has more than 390mn sq. ft. of high-quality contiguous developable area in the extended suburbs of Mumbai. LDPL’s strong brand, aggressive sales strategy, and robust execution capability should ensure strong cash flow and earnings.
Balance sheet health to improve as execution gathers pace: LDPL’s operations have been cash-neutral-to-positive over the past five years, underpinned by robust growth in customer collections. Despite this, its debt levels have tripled over the last past five years due to aggressive land buying across the premium markets of Mumbai and London. LDPL plans to deleverage by: 1) increasing focus on execution to accelerate collections; 2) monetizing completed or near-complete inventory of Rs60bn; 3) moderating its capex in land; and 4) reducing its borrowing costs. In the near term, however, demonetisation could delay deleveraging until sales momentum recovers.
Brighter days ahead for organized players; Mumbai remains the best bet: Reforms initiated by Government of India (GoI) in the real estate sector will help organized players to gain market share in the medium-to-long term and reduce competition from small unorganized players due to increased cost of compliance and financing. Mumbai, the largest real estate market in India, enjoys the highest pricing premium, given strong demand for housing amid supply constraints. LDPL is well positioned to benefit from the region, given its dominant market share in MMR and its diversified 360 degree offering from affordable to luxury housing.