Part II:From Costing to Value Analysis - ITC
47
Part II: Towards the Future through Full-Value-Cost Analysis Webinar By: David Birnbaum Date: 30 November 2020
-
Upload
khangminh22 -
Category
Documents
-
view
5 -
download
0
Transcript of Part II:From Costing to Value Analysis - ITC

Part II: Towards the Future through Full-Value-Cost AnalysisWebinar
By: David BirnbaumDate: 30 November 2020

Towards the Future
Our industry has always operated in a state of constant change. For the most part we have dealt with this through a process of incremental development• Greater efficiency• Increase productivity• More advanced technology• Increased access to dataHowever, we are now facing a special situation, where the entire industry is in the throes of disruptive innovation. The industry as we know it, is coming to an end. It will be replaced by a new very different industry.
In this situation incremental development cannot succeed because it is based on the assumption that the industry five years from now will be an extension of the industry of today.
2

Facing the Unknown
This is by no-means unique.
In secondary school we all studied the industrial revolution, which ironically, began in the textile industry. We were all forced to memorize the names James Hargreaves and his Spinning Jenny, and Samuel Compton and his mule.
We can understand the manufacturers of horsedrawn wagons and coaches, who at the end of the 19th century were working hard to make their vehicles better, more efficient and more aesthetically pleasing, never realizing that their industry was dying
How many of us, today can see that the great oil companies that were once the world’s largest corporations are already things of the past?
However, there is evidence of the change that it already upon us.
3

Introduction: The unlearning experience
Our industry faces a serious problem
The decisions we make increasingly do not provide the solutions we expect
We blame this on incompetent management, the inability to keep up with an ever-changing industry and/or the need for greater data and more sophisticated data-analysis.
The real problem lies with the way we process information.
The purpose of this study is to provide a new decision process. Ironically, this book provides no new information. Everything in this study is well-known to professionals both on the supplier and customer sides.
The real problem is that to understand the new concepts, we must first put away our current ideas of how the industry operates and how we must operate in the industry
4
The Changing Face of the Global Garment Industry: I
The competitive Model
In the early days, when products were limited to cheap basic commodities such as T-shirts, cotton casual pants, basic woven shirts and underwear, customers’ expectations were perforce extremely low: A decent garment shipped on time at a low, low price. Very quickly, supplier selection became a zero-sum game where the lowest FOB price won the order. Because there were many more factories than customers, factories became disposable tools – if low prices forced one factory to go out of business, there were two more ready to take its place.
In turn, the factory took the same position with regard to its workers. Because workers were for the most part semi-skilled, semi-literate women, they too were seen as disposable tools. If 10 workers quit, there were 20 more ready to take their places. This was the era of the zero-service factory where suppliers were equipped to do nothing more than cut & sew. Today, 65 years later, despite sophisticated modern technology, many customers still remain firmly trapped in the competitive strategy mentality.
5

The Changing Face of the Global Garment Industry: II
The Cooperative Model
In the mid-1970s, the move from commodity to fashion created an opportunity for change on both the customer and the supplier sides. Customers (retailers and brands) began to recognize that while pushing down factory manufacturing prices might bring price reductions of 50¢-70¢ per unit, transferring product development work to the factory and developing fast turn could save up to ten times that amount. Where once factories were limited to the status of product makers, they could now be upgraded to become service suppliers.
The customer and supplier recognized that to meet the needs of the industry, they had to cooperate with each other to develop the necessary services. Under this new strategy, the zero-sum competitive model slowly began to be replaced. At the top of the pyramid were the full-service transnational giants and the specialist factories able to achieve strategic-supplier status
6

The Changing Face of the Global Garment Industry: III
The Collaborative Model
This model is still in a nascent state. The new industry customers, particularly both large and smaller e-commerce companies, are the catalyst for this latest model. Under this new model, the entire supply chain is hollowed out. In the collaborative model, the role of the customer is reduced to the first and final stages only–determining what the consumer wants, providing the factory with the original design and the final sales and marketing. Everything else is ceded to the factory.
In this new model, both the customer and supplier side recognize that neither side can move forward without the other. Consequently the relationship between the customer and supplier becomes a true partnership. Where originally this concept was limited to the pure-play retail sector, we now see a growing realization that what is relevant to e-commerce is equally relevant to the industry as a whole.
7

Cost to Value Analysis
We start with some simple definitions:1. COST is what the supplier pays for materials and manufacturing2. PRICE is what buyer pays for materials and manufacturing3. Everyone is both a customer and a supplier
a. The spinner pays a price when he buys fiber, but that fiber immediately becomes a cost of the yarn he produces
b. The weaver pays a price for yarn, which becomes a cost in his fabric.This cost/price relationship moves up the supply chain until the retailer pays the price for the finished garment, which becomes the cost of the garment to the consumer
8

Cost to Value Analysis (cont)
COST, at least to some degree is calculable. We may not know, let alone calculate costs, but costs do existPRICE may not be calculable because it is based on VALUE, and value is personal. It may not even be rationalThe customer does not care about cost.You go to a pharmacy to buy toothpaste or an automobile agency to buy a car. You do not care what Colgate or Porsche paid for materials and manufacturing, you only care that
THE THING IS WORTH THE PRICE TO YOUWhat is true for you when you buy toothpaste or a car is equally true when you buy 50,000 woven shirts.
The only difference is that in cost to value analysis, COST AND VALUE MUST BE CALCULABLE
9

The problem with the Basic Cost sheet
10
Basic CostingPCT of FOB Cost
Material Fabric 60.0% $6.00Material Trim 10.0% $1.00CM Labour 6.4% $0.64CM Overhead 18.6% $1.86CM Total Cost 25.0% $2.50Total Cost 95.0% $9.50Factory Profit 5.0% $0.50Total FOB Cost $10.00

The Problem with the Basic Cost sheet (cont)
The reality is that there is no such thing as a valid cost sheet because there is no such thing as the cost of any style. The costs of any style cannot be fixed because other outside factors change the cost
• The Factory: Each factory will have its own unique costs because each factory has its own unique structure and system. Think Productivity
• The Order: Quantity directly affects cost. The cost per garment for an order of 100 pieces is greater than the cost per garment for an order of 1000 pieces, which in turn is greater than the cost per garment for an order of 5000 pieces, which in turn is greater than. . .
• Date: The cost per garment in low season is less than the cost per garment for the same style in high season when the factory faces capacity issues, availability of materials, etc.
• What you pay for an item may not be the total cost. To take the simplest case, you may pay 10¢ for a zipper, the cost of that zipper may be $10.00. This is not theory
11

The Cost-to-Value Cost Sheet
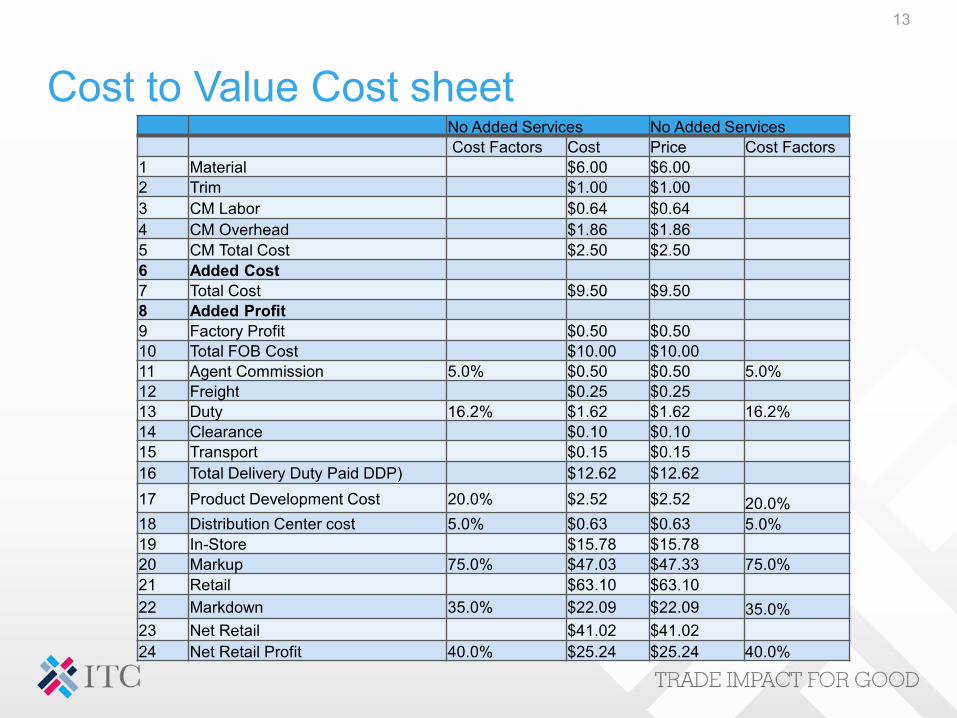
Cost to value analysis is all about change. Management wants to make an investment. To make the right decision they must compare the added cost of the investment with the added value the investment will provideThe result is a two part cost sheet: Before and AfterThe cost-to-value cost sheet must include all the costs and values. A cost incurred at an early stage may not provide value until a very later stage. To be relevant the cost sheet must include both. For example where the factory is part of a free trade agreement, buying local fabric may add material costs at the outset, but those costs will be more than offset when we include import duty on the cost sheet. Since the basic cost sheet includes only FOB, we cannot see the value of import duty savingsThe Cost sheet below does not include any services; therefore there is no before-and-after. The cost values; e.g., 5% agent commission, 20% product development costs. are arbitrary. 75% markup and 35% markdown are estimatesFinally since we will be using 100% cotton woven shirts throughout our cost analyses, we have listed 16.2% import duty (the U.S. rate for HTS 5205.20 Cotton Woven Shirts)
12
Cost to Value Cost sheet
13
No Added Services No Added ServicesCost Factors Cost Price Cost Factors
1 Material $6.00 $6.002 Trim $1.00 $1.003 CM Labor $0.64 $0.644 CM Overhead $1.86 $1.865 CM Total Cost $2.50 $2.506 Added Cost7 Total Cost $9.50 $9.508 Added Profit9 Factory Profit $0.50 $0.5010 Total FOB Cost $10.00 $10.0011 Agent Commission 5.0% $0.50 $0.50 5.0%12 Freight $0.25 $0.2513 Duty 16.2% $1.62 $1.62 16.2%14 Clearance $0.10 $0.1015 Transport $0.15 $0.1516 Total Delivery Duty Paid DDP) $12.62 $12.6217 Product Development Cost 20.0% $2.52 $2.52 20.0%18 Distribution Center cost 5.0% $0.63 $0.63 5.0%19 In-Store $15.78 $15.7820 Markup 75.0% $47.03 $47.33 75.0%21 Retail $63.10 $63.1022 Markdown 35.0% $22.09 $22.09 35.0%23 Net Retail $41.02 $41.0224 Net Retail Profit 40.0% $25.24 $25.24 40.0%

Intrinsic cost savings
Every effort on the part of management to increase profit by reducing costs can be divided into two parts:• Added Cost: the investment of time, effort, and capital• Added Value: the profit derived from the investment
When the cost of the investment is paid for by the company and the value received goes back to the same company, we define this as intrinsic cost savings
These cost savings can be based on work by either the customer or by the supplier but in the case of intrinsic costs work carried out by the factory benefits only the factory. Work carried out by the brand or retailer customer benefits only that customer.
14

Intrinsic Cost Savings (cont)
• The Customer SideCost savings may come from different areas:Expansion to new marketsAdded productsIntroduction of new technologyGarment FOB price reduction
• The Factory SideCost savings may come from different areas:Capital Investment in high-tech equipmentCapital investment in worker training
15
The Factory Side: Investment in high-Tech Machinery
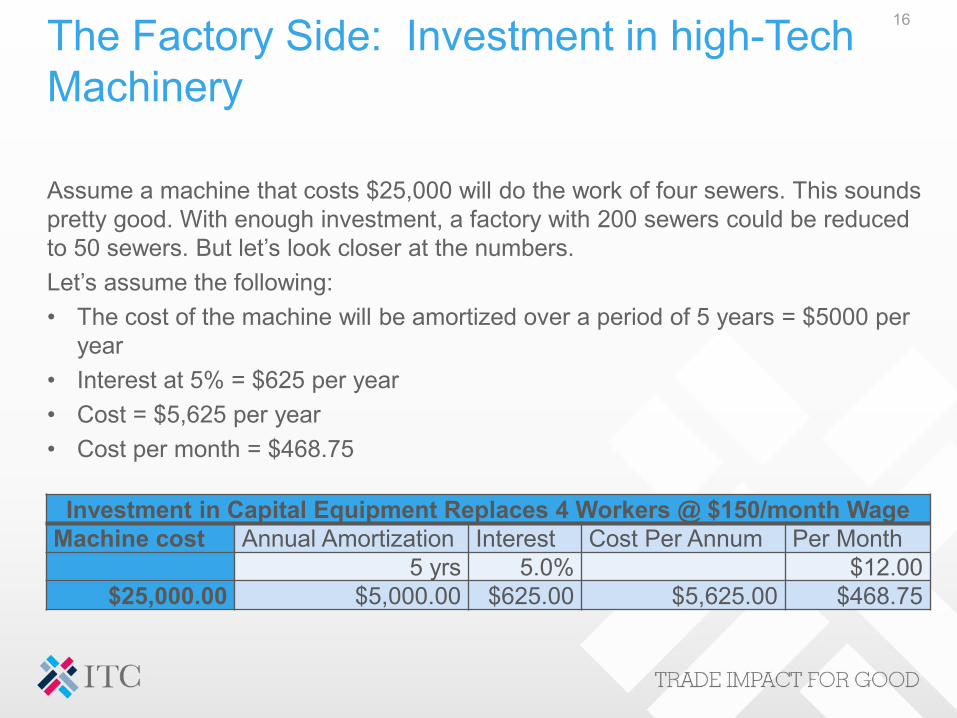
Assume a machine that costs $25,000 will do the work of four sewers. This sounds pretty good. With enough investment, a factory with 200 sewers could be reduced to 50 sewers. But let’s look closer at the numbers.Let’s assume the following:• The cost of the machine will be amortized over a period of 5 years = $5000 per
year• Interest at 5% = $625 per year• Cost = $5,625 per year• Cost per month = $468.75
16
Investment in Capital Equipment Replaces 4 Workers @ $150/month WageMachine cost Annual Amortization Interest Cost Per Annum Per Month
5 yrs 5.0% $12.00$25,000.00 $5,000.00 $625.00 $5,625.00 $468.75

Calculating Capital Cost per Minute
To calculate the capital cost per minute,we divide the total number of working minutes per month (10hrs/day x 26 days/mo= 15600 minutes). This comes to 3cts/minute. The capital cost of a 40-minute garments is therefore $1.20.
The table below shows how the investment of one machine that replaces four workers breaks even on a per-unit basis.
17
Capital Cost per Unit (40 min/pc)Per Month Per Minute Per Unit
$468.75 $0.03 $1.20

For the cost sheet, we now use material and trim costs multiplied by 4 since we are talking about the work done by four workers.Capital investment stays at $1.20 because there is only one machine.
We then have to calculate the sewing labor cost per unit. Here we go back to the 15600minutes/worker per month divided by the $150/mo wage. That works out to 0.96cts/minute or 38cts per 40-minute garment.
Sewing labor represents only part of the CM total labor, about 60%. The rest is made up of labor from other departments (cutting, pressing, packing etc) which is not affected by capital investment calculations. CM overhead remains the same because the number of units produced is unchanged, only the number of workers decreases.
18
Capital Investment 1 Machine Replaces 4 Workers Without Capital Investment After Capital Investment
Cost Factor Cost Cost Cost FactorMaterial 60% $24.00 $24.00Trim 10% $4.00 $4.00Capital Investment $0.00 $1.20CM Labor Sewing $1.54 $0.38CM Labor Other $0.77 $0.77CM Overhead* $6.69 $6.69FOB $37.00 $37.04 -$0.04

Capital Investment: Other Factors
How many factories in developing countries have access to funds for capital investment? To make matters worse, we haven’t even factored in the cost of maintenance. Furthermore, the 50 remaining workers would not be illiterate semi-skilled sewers but rather university graduates with engineering degrees. And if we are located in least developed countries LDCs), we have to ask if we can find qualified engineers in our area, and if so, how much would we have to pay them.
19

Capital Investment Developing v Developed Countries
Imagine you are H.B. Schlogvessel, a factory owner in an industrialized country. You are faced with the same problem. Wages are indeed rising. Unlike your counterpart located in a developing country who can no longer afford to pay his workers $150 a month for a 60+ hour week, you are paying $3000 a month for an eight-hour day, five days a week. You are in an altogether different position. In your case the machine is cheaper than the worker. Your investment practically pays off even if the $25,000 capital investment replaces one worker and you get real savings if it replaces two workers.
20
Capital Investment 1 Machine Replaces 2 Workers No Capital Investment With Capital Investment
Cost Factor Cost Cost Cost FactorMaterial 60% $24.00 $24.00Trim 10% $4.00 $4.00Capital Investment $0.00 $1.20CM Labor Sewing $17.79 $8.89CM Labor Other $8.89 $8.89CM Overhead $26.68 $26.68FOB $69.37 $61.66 Factory Savings $7.70

Intrinsic Cost Saving: Investment in Worker TrainingCost-to-Value Cost Sheet
21
25% Increased Productivity from 40 to 30 minutes per garment
No Worker Training With Worker TrainingFactor Cost Cost Factor
Material 60% $6.00 $6.00Trim 10% $1.00 $1.00CM Labor $0.64 $0.48 75%CM Overhead $1.86 $1.40 75%CM Total Cost $2.50 $1.88Added Training Cost $0.00 $0.21
Total Cost $9.50 $9.09Total Revenue $10.00 $10.00Profit 5% $0.50 $0.91 9.1%
The Hidden Intrinsic Costs The World’s Top 10 Garment Exporters 2019
22
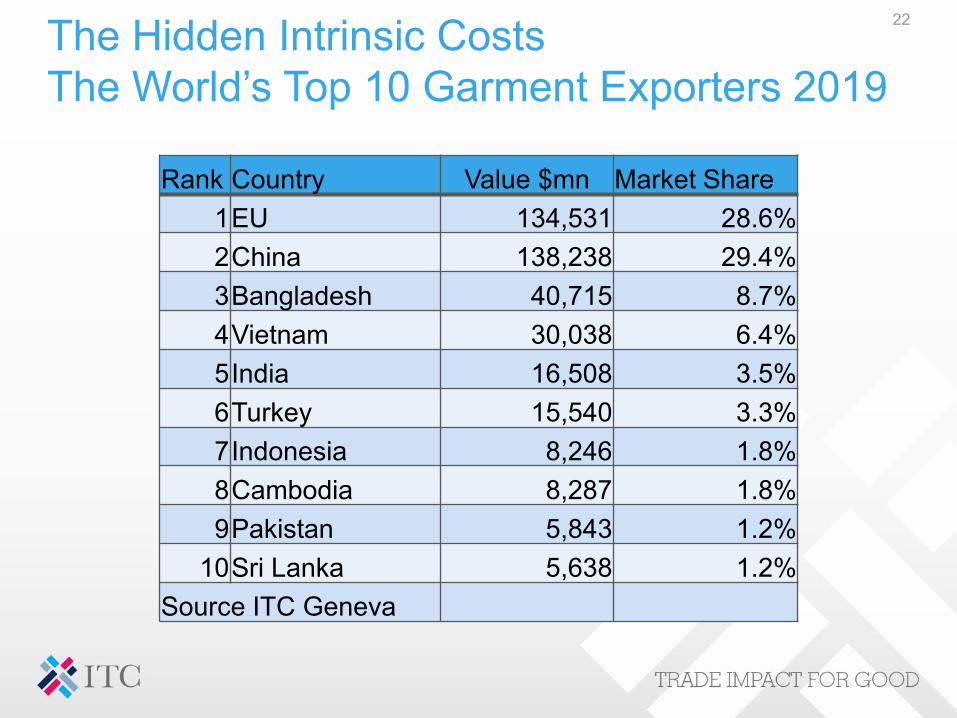
Rank Country Value $mn Market Share1EU 134,531 28.6%2China 138,238 29.4%3Bangladesh 40,715 8.7%4Vietnam 30,038 6.4%5India 16,508 3.5%6Turkey 15,540 3.3%7Indonesia 8,246 1.8%8Cambodia 8,287 1.8%9Pakistan 5,843 1.2%
10Sri Lanka 5,638 1.2%Source ITC Geneva

China and the EU have much in common
• Easy access to locally produced materials,
• Ease of doing business,
• Concentration on sophisticated fashion products,
• Educated management and technical specialists and well trained workers
• Strong domestic demand particularly for fashion clothing.
23

China and the EU have Differences
24
FOB Price Comparison EU v China (Year of Latest data)
HTS Description FOB EU FOB China Year6205.20 Men's Cotton Woven Shirts $15.11 $5.99 20156203.31 Men's wool Jacket $111.31 $47.27 20196203.41 Men's Wool Pants $40.94 $26.11 20196203.42 Men's cotton pants $16.41 $6.51 20166204.42 Women's Dresses $21.93 $6.60 20166204.61 Womens wool pants $51.39 $21.62 20196204.62 Women's cotton pants $14.29 $6.04 20186209.10 Cotton T-shirts $4.18 $2.99 20156110.11 Wool Sweaters $41.37 $14.75 20196110.20 Cotton Sweaters $11.86 $6.68 2015
Hidden Intrinsic Value
Design: The EU is home to the world’s greatest agglomeration of design centers including, Italy, France, Spain, Netherlands, Sweden, Germany, ETC. Importers placing orders in the EU generally rely on EU design. Contrast this with China where the customers placing orders provide their own designs, often of EU origin
Brand: Made-in-Italy, Made-in-France, Made-in-Spain etc. provide a cachet which allows the importing retailer and/or brand to charge a higher price. Some may claim that this brand cachet is unwarranted, but we have to accept that these EU based brands create value which Made-in-China lacks.
25

Extrinsic cost savings
Customers at the cutting edge developed engineering departments to bring skill sets to their best suppliers. Their goals were first to increase factory productivity, develop better scheduling, QA and QC. Eventually customers’ engineers went further. They worked with the selected factories to develop services such as product development, fast turn and quick response capability and eventually speed-to-market
Ironically the customers recognized that the skill-sets they were developing in the selected factories would be made available to the customers’ competitors working in those same factories. They accepted this, and in doing so created the underlying basis for the cooperative model.
The move from competitive to cooperative was not an act of charity, but rather an effective strategy to reduce costs and increase profits.
Underlying the cooperative strategy is a fundamental realization:
Benefit for everybody is better than benefit for nobody
26

Extrinsic Cost Savings (cont)
When company management decides on a specific project usually the project can be divided into two parts:a. Added Cost: the investment of time, effort, and capitalb. Added Value: the profit derived from that investment
When added cost comes from one company and the added value goes to the other company, we define this as Extrinsic Cost Savings.
These cost savings are based on a cooperative efforts between the customer and its factory supplier. Many customers and suppliers do not believe that extrinsic cost savings exist because they believe that cooperation between customer and factory is impossible. Nevertheless the cooperative model does indeed exist and can produce the greatest cost saving.
Product development (sample making, material sourcing, trim selection andMarkdowns)
27

Contrasting Competitive with Cooperative Extrinsic Cost Reduction: Reducing FOB Prices
28
Customer Reduces FOB Price From $10.00 to $9.50Original Costsheet Costsheet with $0.50 Price Reduction
Cost Factors Cost Price1Material $6.00 $6.002Trim $1.00 $1.003CM Labor $0.64 $0.644CM Overhead $1.86 $1.865CM Total Cost $2.50 $2.506Added Costs7Total Cost $9.50 $9.508Added Profit -$0.509Factory Profit $0.50 $0.00
10Total FOB Cost $10.00 $9.5011Agent Commission 5.0% $0.50 $0.48 5.0%12Freight $0.25 $0.2513Duty 16.2% $1.62 $1.54 16.2%14Clearance $0.10 $0.1015Transport $0.15 $0.1516Total DDP $12.64 $12.02 Saving $0.62

Quantifying Extrinsic Cost Saving: Fighting over FOB
• A fashion garment with an FOB price of $10.00 Would Retail for between $60.00 - $80.00
• FOB price equals 16.7% - 12.5% of retail• In today’s industry where garment sourcing has replaced garment buying, the
customer negotiates price directly with the textile mill and trim supplier, with the result that negotiations with the factory involve only CM $3.00
• CM Price equals 5.0% -3.75% of retail• Of the CM labor and overhead costs are non-negotiable in the short run, with
the result is that negotiations with factory involve only new profit $0.50• Net Profit equals 0.833% - 0.625% of retail
• Why fight over less than 1% of cost rather than the other 99+%
29

Opportunity Costs
The purpose of cost to value analysis is to provide the tools for companies to make the best decisions. When faced with a choice between A and B, the company should select the option that maximizes value relative to cost.
In some instances both A and B may be profitable, but if the company opts for A when B provides the greater profit than management has suffered what economists term an opportunity cost.
The move from the competitive model to the cooperative model is all about opportunity costs. As the supplier side has changed from simple product makers to more sophisticated service providers the factories located in cheap-labor countries that can offer lowest CM prices are unable to provide the services customers increasingly want.
30

Extrinsic Cost Savings: The Cooperative Model:Moving Product Development Product development is the first and longest step in the product cycle. Traditionally the work was carried out by the customer. Moving the process from the customer’s home country to the factory has many important advantages, provided the factory has the necessary skill sets.1. Quality Assurance (QA): All too often the design provided by the customer is
beyond the factory’s capability. When the factory carries out product development QA is assured
2. Design Integrity: The customer is assured that the sample will follow the designer’s sketch and stock will follow the sample
3. Reduced lead time. In the past product development carried out by the customer often required 20+ months. Moving the work to the factory can reduce lead times from months to days
4. Reduced Costs
31

32Full Value Costing: Providing Product DevelopmentCustomer provides product Development
Factory provides product development
Factors Cost Cost Factors1Material $6.00 $6.002Trim $1.00 $1.003CM Labor $0.64 $0.644CM Overhead $1.86 $1.865Added Cost Product Development $0.00 $0.256CM Total Cost $2.50 $2.757Total Factory Cost $9.50 $9.758Added Factory Profit $0.00 $0.259Net Factory Profit 5.0% $0.50 $0.75 7.5%
10Total FOB Cost $10.00 $10.5011Agent Commission 5.0% $0.50 $0.53 5.0%12Freight $0.25 $0.2513Duty 16.2% $1.62 $1.70 16.2%14Clearance $0.10 $0.1015Transport $0.15 $0.1516Total LDP Cost $12.12 $12.7317Product Development Loading 20.0% $2.42 $0.25 2.0%18Distribution Center Loading 5.0% $0.63 $0.66 5.0%19Total Cost In-Store $15.78 $14.1420Markup 75.0% $47.34 $48.96 78.0%21Retail $63.12 $63.1222Markdown 35.0% $22.09 $22.0923Net Retail $41.03 $41.0324Net Customer Profit $25.25 $26.89 $1.64
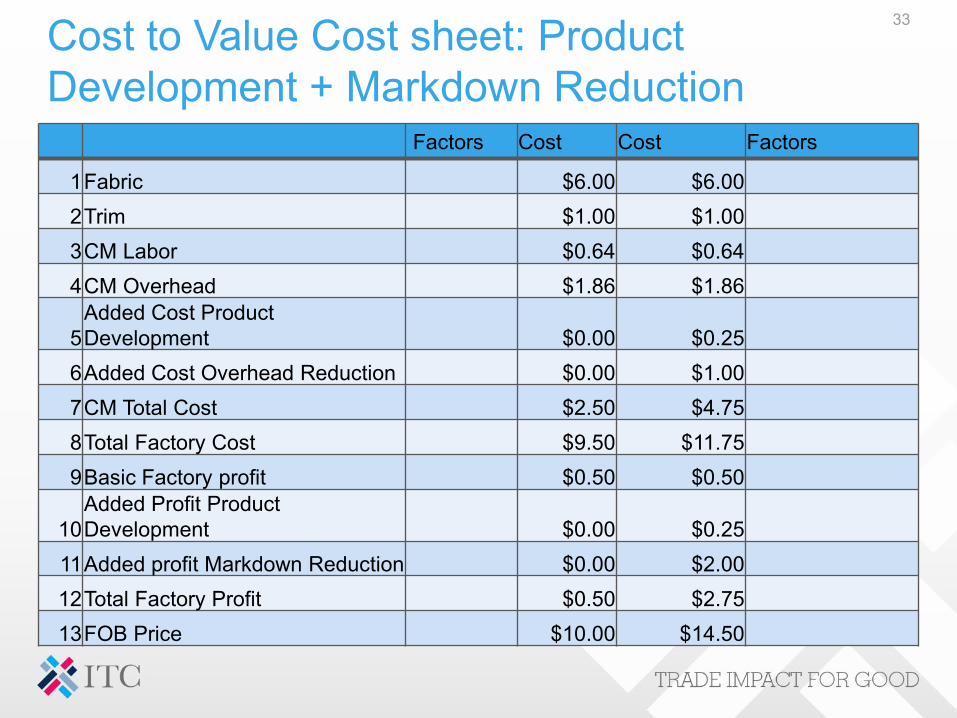
Cost to Value Cost sheet: Product Development + Markdown Reduction
33
Factors Cost Cost Factors
1Fabric $6.00 $6.002Trim $1.00 $1.003CM Labor $0.64 $0.644CM Overhead $1.86 $1.86
5Added Cost Product Development $0.00 $0.25
6Added Cost Overhead Reduction $0.00 $1.007CM Total Cost $2.50 $4.758Total Factory Cost $9.50 $11.759Basic Factory profit $0.50 $0.50
10Added Profit Product Development $0.00 $0.25
11Added profit Markdown Reduction $0.00 $2.0012Total Factory Profit $0.50 $2.7513FOB Price $10.00 $14.50

34
14Agent Commission 5.0% $0.50 $0.73 5.0%
15Freight $0.25 $2.00
16Duty 16.2% $1.62 $2.35 16.2%
17Clearance $0.10 $0.10
18Local transport $0.15 $0.15
19Total DDP $12.62 $19.82
20Product development Loading 20.0% $2.52 $0.30 1.5%
21Distribution Center $0.60 $0.60
22Total Cost Instore $15.74 $20.72
23Markup 75.0% $47.23 $42.26
24Retail Price $62.98 $62.98
25Markdown 35.0% $22.04 $6.30 10.0%
26Net Retail $40.93 $56.68
27Net Customer Profit $25.19 $36.86 $11.67
60% 78%

Competitive v Cooperative: Money in the Bank
35
Customer Benefit Factory BenefitTraditional Savings $0 Profit $0.50Competitive (Reduce FOB) Savings $0.62 Profit $0.00Cooperative (Move Product Development) Savings $1.64 Profit $0.75Cooperative (Markdown reduction) Savings $11.67 Profit $2.75

Cooperative ModelThe Strategic Supplier
There are factory suppliers that are unique. These are the big winners.There are three factors any one of which will allow a factory to become a strategic supplier:
1. Product2. Quality3. Service
36
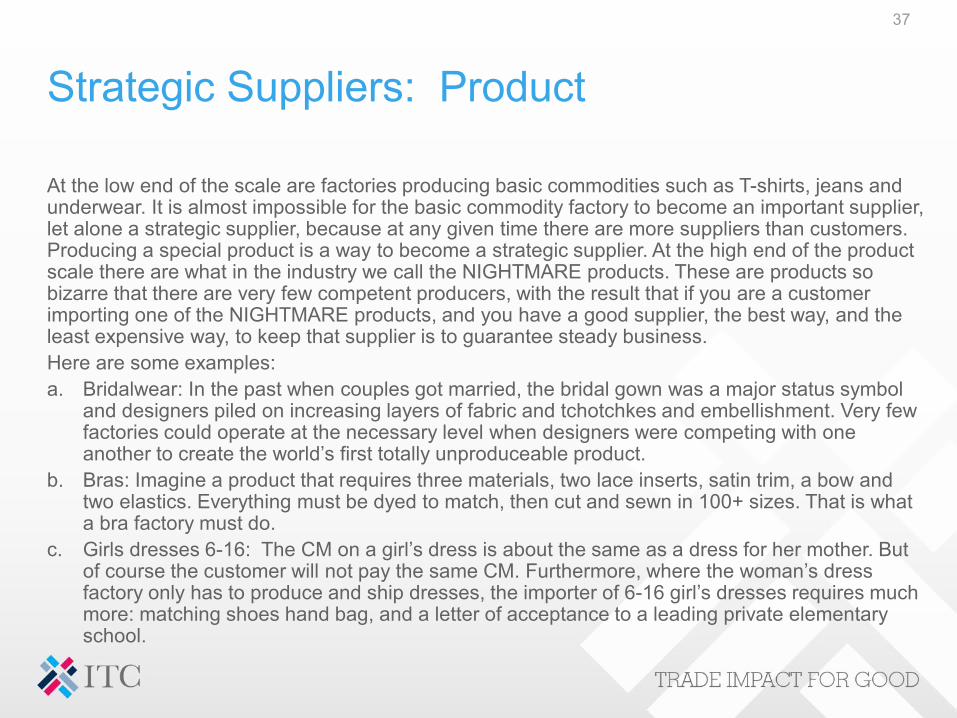
Strategic Suppliers: Product
At the low end of the scale are factories producing basic commodities such as T-shirts, jeans and underwear. It is almost impossible for the basic commodity factory to become an important supplier, let alone a strategic supplier, because at any given time there are more suppliers than customers. Producing a special product is a way to become a strategic supplier. At the high end of the product scale there are what in the industry we call the NIGHTMARE products. These are products so bizarre that there are very few competent producers, with the result that if you are a customer importing one of the NIGHTMARE products, and you have a good supplier, the best way, and the least expensive way, to keep that supplier is to guarantee steady business. Here are some examples:a. Bridalwear: In the past when couples got married, the bridal gown was a major status symbol
and designers piled on increasing layers of fabric and tchotchkes and embellishment. Very few factories could operate at the necessary level when designers were competing with one another to create the world’s first totally unproduceable product.
b. Bras: Imagine a product that requires three materials, two lace inserts, satin trim, a bow and two elastics. Everything must be dyed to match, then cut and sewn in 100+ sizes. That is what a bra factory must do.
c. Girls dresses 6-16: The CM on a girl’s dress is about the same as a dress for her mother. But of course the customer will not pay the same CM. Furthermore, where the woman’s dress factory only has to produce and ship dresses, the importer of 6-16 girl’s dresses requires much more: matching shoes hand bag, and a letter of acceptance to a leading private elementary school.
37

Strategic Supplier: Quality
Every customer says they want the best quality but most have no idea of what constitutes the best quality and even fewer are willing to pay. Those factories at the very top of the quality tree are potential strategic suppliers.
Case Study: The World’s Greatest Factory (slight exaggeration)
A small factory (80 machines) located in France produced very high-quality women’s tailored jackets, skirts and pants. Their customers were some of the best designers in the world. Accordingly, their prices were very high: a jacket averaged CM $80-$120. Unfortunately, their customers had only two seasons, meaning for the six months of high season orders, the factory did very well indeed, but for rest of the year, they pretty much lost all the profit from the high season.
Eventually the factory brought in a consultant. The consultant’s first step was to carry out cost analysis, creating job cost sheets for a certain number of styles. He recognized that in France a factory could not lay off workers. That meant that during low season, losses came from more than just overhead but also included wages and therefore wiped out all the profits from the high season
The consultant’s next step was to determine the breakeven point where CM prices charged to the customer would equal CM cost. Finally the consultant designed a workable strategy to return the factory to profit. The plan he submitted called for doubling the size of the factory from 80 to 160 machines. To the factory management and its owners, doubling the size of a money-losing factory seemed insane.
The consultant reasoned that to the right U.S. importer, the combination of ultimate high quality together with a made-in-France label would definitely define the factory as a strategic supplier. Consequently during high season when the factory had orders from their regular couture customers, the U.S. importer would provide orders for 80 machines and for low season orders for all 160 machines. After all, even 160 machines would not produce all that many high-end garments.
The only question was to determine a CM price agreeable to both parties which worked out to be $40-$50 per unit. At that level the factory was able to cover the cost of labor and about 65% of overhead. Yes, it still lost money during low season, but the losses were sharply reduced, substantially increasing net profit for the year.
38

Strategic Supplier: Services
In a sense we can understand why factories capable of dealing with the nightmare products or those providing truly exceptional quality are entitled to special consideration. But those special factories account for at best 1% of all garment suppliers. The question remains, what can the other 99% do to join the strategic supplier elite.
Where once garment factories were simply product makers, those at the cutting edge had to become service suppliers and in doing so, created increased value which entitled them to charge higher prices.
39

The Collaborative Model
The Competitive Model--- The Past: The customer is king and to survive the factory must bend to the will of the customer
Requires no special skill sets
The Cooperative Model--- The Present: The customer and the factory recognize that by working together both will benefit
Requires skill sets developed by both sides
The Collaborative Model --- The Future: The customer and the factory form a partnership type arrangement to do things never before possible
Requires skill sets neither side can provide To succeed both sides need outside support
40

The Collaborative Model: SME Factories and Customers
SMEs on both the customer and the factory sides have long been the orphans of the Global Garment Industry. The assumption was that SME factories could work together with SME customers. This proved to be illusory. In the end, professionals were forced to recognize that with some notable exceptions neither had much of a future unless they could move up from SME status.
A generation ago this move was still possible. However, in the past decade the skill sets required by both sides increased to the point that neither side could be competitive. The problem of missing skill sets still remains and we must accept that SMEs cannot become competitive without outside support.
However, in the new industry both SME customers and their potential factory suppliers can become one of the single most profitable global garment industry sectors, provided they are given necessary outside support.
This is what the Collaborative Model is all about
41

The Collaborative Model: The SME Strategy
In the new industry, the fastest growing sector is and will remain to be the Pure-Play e-commerce company. These new SME start-ups need SME factory suppliers since their volume is too small to work with the large factory groups. The collaborative model partnership ensures that the relationship of these customers and suppliers can thrive.
The most serious obstacle is the inability of e-commerce companies to work effectively with factory suppliers, just as SME factories are unable to meet the needs of the potential SME e-commerce buyers because neither side has the necessary skill sets
ANY NATIONAL INDUSTRY CAPABLE OF OVERCOMING THESE OBSTACLES WILL BECOME THE WORLD LEADER IN THÌS IMPORTANT NEW SECTOR.
The way forward is to create a national SME Center that will provide the necessary services, assistance and training to allow both the SME factories and their SME e-commerce potential customers to flourish. The following shows the steps in the supply chain where obstacles exist and how the national SME Center can provide the means to remove those obstacles.
42

SME Strategy: Fabric Sourcing
• Obstacle: The quantity of fabric required is too small to order directly from most mills. This leaves the SME e-commerce companies with only two alternatives: limit themselves to commodity fabric only or use the limited variety of fashion fabric available for which they must pay a hefty premium.
• Solution: There does exist an almost inexhaustible quantity and variety of fashion fabric available at well below market price. Every garment factory and every fabric mill has quantities of “dead” fabric, usually left over from orders previously shipped. Therefore, a market does exist, but there is no marketplace. The national SME Center would create a virtual online marketplace.
43

SME Strategy: Providing Skill Sets
Patternmaking, grading and marker makinga. Obstacle: Based on 14 styles per day (with average two cuttings for each style). No SME
factory has the in-house capacity to carry out patternmaking, grading and marker making. There are excellent high-speed computer systems that can produce the work efficiently and in large quantities, but the costs are beyond the means of any SME factory.
b. Solution: The SME Center creates a sector-wide high-tech patternmaking, grading and marker making facility which can carry out the work at a reasonable cost and send the results to each factory via internet.
Fast-turn production for small quantitiesa. Obstacle: Most SME factories are currently geared to act as subcontractors with workers
divided into lines producing relatively large quantities of a few styles. Because of the factory structure and system, factories are trapped at the very bottom. This is probably the greatest cause of sweatshop operations paying slave labor rates.
b. Solution: The national SME Center would provide engineers to move the factory from lines using single-tasked semi-skilled workers into teams employing multi-tasked sewers. Through the center’s work, the sweatshop factories can become totally compliant operations with the highest standards of sustainability and total transparency.
44

SME Strategy: Providing Skill sets
Pick & Pack consolidation and final shipment to the consumer
a. Obstacle: The logistics are extremely complex and do not work well in an SME operation.i. Pick & pack for 200-400 individual consumer orders daily is a very
expensive proposition for an SME factory.ii. Goods could be shipped from the factory directly to the consumer but the
cost would be prohibitive. To be cost-effective, shipments to individual consumers should first be consolidated and then shipped to four or five separate locations where the final pick & pack process takes place with the orders sent on to each individual consumer.
iii. An SME factory does not have the facilities necessary to carry out the process.
b. Solution: The national SME Center creates a single automated facility to service the entire sector.
45

SME Cost to Value Cost sheet
46
Pick & Pack by E-Commerce Company vs SME Factory By E-Commerce company By SME Factory
Fabric $6.00 $3.00Trim $1.00 $1.00CM Labor $7.00 $0.64CM Overhead 70% $4.90 $1.86 290%Cost of Pick & Pack Service $0.00 $0.10Total Cost $18.90 $6.60Service Charge from SME Center $1.32 20%Factory Net Profit $3.00Total FOB $18.90 $10.92Freight In $1.00 $0.00Freight Out $2.00 $2.00Pick & Pack $1.00 $1.00Cost Shipped to Consumer $22.90 $13.92 $8.98
Collaborative Model: SME Strategy Conclusion
The benefit to both sides is substantial: the customer’s cost drops from $22.90 to $13.92 per unit while the factory’s net profit increases from $0.50 to $3.00. Of course, developing the SME sector so that it can work efficiently with the new e-commerce sector customers will require some investment and substantial training in the factory suppliers’ countries.
The obstacle facing collaborative model strategies is neither technical nor financial. The required skill sets already exist. The funding is minimal and most important limited to a one-time cost after which the center becomes self supporting
Indeed the obstacle is the willingness for government and institutions to invest in the future.
Our industry is highly labor intensive. It is also the first step towards industrial development. Garments may not have the status of automobile production or IT software development, but as an investment in GDP growth it is #1.
47