
Biocon BUY - IIFL Capital
37
CMP Rs533 Target 12m Rs700 (31%) Market cap (US$ m) 4,996 Enterprise value (US$ m) 5,086 Bloomberg BIOS IN Sector Pharma 17 January 2018 52Wk High/Low (Rs) 564/295 Shares o/s (m) 600 Daily volume (US$ m) 25 Dividend yield FY18ii (%) 0.9 Free float (%) 39.3 Shareholding pattern (%) Promoter 60.7 FII 15.4 DII 3.8 Others 20.1 Price performance (%) 1M 3M 1Y Biocon 2.3 42.2 60.3 Absolute (US$) 2.3 43.7 70.9 Rel. to Sensex (1.6) 35.7 32.9 CAGR (%) 3 yrs 5 yrs EPS 14.1 12.7 Stock movement Strong earnings visibility from FY20ii Source: Company IIFL Research Dr Abhishek Sharma [email protected] 91 22 4646 4668 Rahul Jeewani [email protected] 91 22 4646 4673 www.iiflcap.com 0 200 400 600 0 20,000 40,000 60,000 Jan‐16 Mar‐16 May‐16 Jul‐16 Sep‐16 Nov‐16 Jan‐17 Mar‐17 May‐17 Jul‐17 Sep‐17 Nov‐17 Jan‐18 Vol('000, LHS) Price (Rs., RHS) 0% 5% 10% 15% 20% 25% 30% 35% 40% 0 200 400 600 800 1,000 1,200 1,400 1,600 FY17 FY18ii FY19ii FY20ii FY21ii Revenue (USD mn) (LHS) Ebitda margins (RHS) The dark horse in biosimilars Biocon BUY 1 Detailed report Institutional Equities Biocon-Mylan has established its credentials as a leading biosimilar player in the global markets, with the partnership having already received approval for Trastuzumab in US. We expect 2018 to be a year of approvals for Biocon-Mylan with 4-5 approvals coming up this year across US and EU. Addition of US/EU revenues from the first wave of biosimilars could potentially help Biocon’s profits to grow ~6x over the next five years. Biocon has also resolved its manufacturing issues, while growth in Syngene will continue to pick up. Maintain BUY with an upgraded TP of Rs700. Clear runway for bagging regulated market approvals for the first wave of biosimilars; potential to quintuple profits in five years: Biocon has continued to surprise us positively as it worked toward putting together pieces for biosimilar approvals in the US/EU. With Trastuzumab approval being the first in class, Biocon-Mylan has established its credentials as a leading biosimilar player in the global markets. With 4-5 approvals coming up this year, we expect 2018 to be a year of approvals for Biocon-Mylan. These approvals will provide further visibility to earnings and continue to de-risk the business. Addition of US/EU revenues from the first wave of biosimilars would help Biocon’s profits to grow ~6x over the next five years. Strong execution aided by tailwinds: Biocon overcame compliance challenges of USFDA inspections in April and June 2017 rather quickly. Pegfilgrastim (Neulasta) started as a competitive product. However, competition has whittled down further to only two projects looking at near-term approval. Insulin Glargine (Lantus) is also expected to remain a low-competition product in the foreseeable future, due to requirements of a dedicated manufacturing facility. Syngene back on track after an incidence of fire: About 20% of Syngene’s business suffered due to a fire at one of its facilities in late FY17. However, the company regained lost ground, reflected in strong growth in recent quarters. Syngene remains an important value driver for Biocon. We believe that foray into large-scale manufacturing, client accretion in biology, and maturing of newly added dedicated centres are long-term growth drivers for Syngene, which would help it register ~20% revenue growth over the next five years. Financial summary (Rs m) Y/e 31 Mar, Consolidated FY16A FY17A FY18ii FY19ii FY20ii Revenues (Rs m) 33,372 38,763 39,049 45,868 74,311 Ebitda margins (%) 22.3 24.5 20.0 22.0 37.5 Pre‐exceptional PAT (Rs m) 4,021 6,121 3,360 4,340 15,663 Reported PAT (Rs m) 5,504 6,121 3,360 4,340 15,663 Pre‐exceptional EPS (Rs) 6.7 10.2 5.6 7.2 26.1 Growth (%) 0.1 52.2 (45.1) 29.1 260.9 IIFL vs consensus (%) (29.4) (41.9) 63.6 PER (x) 79.6 52.3 95.2 73.7 20.4 ROE (%) 11.0 13.8 6.9 8.7 27.8 Net debt/equity (x) 0.0 0.0 0.0 0.1 0.1 EV/Ebitda (x) 43.4 34.2 41.8 32.7 11.9 Price/book (x) 7.4 6.1 5.9 5.8 4.6 Source: Company, IIFL Research. Price as at close of business on 16 January 2018.
-
Upload
khangminh22 -
Category
Documents
-
view
0 -
download
0
Transcript of Biocon BUY - IIFL Capital
CMP Rs533 Target 12m Rs700 (31%) Market cap (US$ m) 4,996 Enterprise value (US$ m) 5,086 Bloomberg BIOS IN Sector Pharma
17 January 2018
52Wk High/Low (Rs) 564/295 Shares o/s (m) 600 Daily volume (US$ m) 25 Dividend yield FY18ii (%) 0.9 Free float (%) 39.3
Shareholding pattern (%) Promoter 60.7 FII 15.4 DII 3.8 Others 20.1
Price performance (%)
1M 3M 1Y Biocon 2.3 42.2 60.3 Absolute (US$) 2.3 43.7 70.9 Rel. to Sensex (1.6) 35.7 32.9
CAGR (%) 3 yrs 5 yrs EPS 14.1 12.7
Stock movement
Strong earnings visibility from FY20ii
Source: Company IIFL Research
Dr Abhishek Sharma [email protected] 91 22 4646 4668
Rahul Jeewani [email protected] 91 22 4646 4673
www.iiflcap.com
0
200
400
600
0
20,000
40,000
60,000
Jan‐16
Mar‐16
May‐16
Jul‐16
Sep‐16
Nov‐16
Jan‐17
Mar‐17
May‐17
Jul‐17
Sep‐17
Nov‐17
Jan‐18
Vol('000, LHS) Price (Rs., RHS)
0%
5%
10%
15%
20%
25%
30%
35%
40%
0
200
400
600
800
1,000
1,200
1,400
1,600
FY17
FY18ii
FY19ii
FY20ii
FY21ii
Revenue (USD mn) (LHS)Ebitda margins (RHS)
The dark horse in biosimilars
Biocon BUY
1
Detailed report
Institutional Equities
Biocon-Mylan has established its credentials as a leading biosimilar player in the global markets, with the partnership having already received approval for Trastuzumab in US. We expect 2018 to be a year of approvals for Biocon-Mylan with 4-5 approvals coming up this year across US and EU. Addition of US/EU revenues from the first wave of biosimilars could potentially help Biocon’s profits to grow ~6x over the next five years. Biocon has also resolved its manufacturing issues, while growth in Syngene will continue to pick up. Maintain BUY with an upgraded TP of Rs700.
Clear runway for bagging regulated market approvals for the first wave of biosimilars; potential to quintuple profits in five years: Biocon has continued to surprise us positively as it worked toward putting together pieces for biosimilar approvals in the US/EU. With Trastuzumab approval being the first in class, Biocon-Mylan has established its credentials as a leading biosimilar player in the global markets. With 4-5 approvals coming up this year, we expect 2018 to be a year of approvals for Biocon-Mylan. These approvals will provide further visibility to earnings and continue to de-risk the business. Addition of US/EU revenues from the first wave of biosimilars would help Biocon’s profits to grow ~6x over the next five years.
Strong execution aided by tailwinds: Biocon overcame compliance challenges of USFDA inspections in April and June 2017 rather quickly. Pegfilgrastim (Neulasta) started as a competitive product. However, competition has whittled down further to only two projects looking at near-term approval. Insulin Glargine (Lantus) is also expected to remain a low-competition product in the foreseeable future, due to requirements of a dedicated manufacturing facility.
Syngene back on track after an incidence of fire: About 20% of Syngene’s business suffered due to a fire at one of its facilities in late FY17. However, the company regained lost ground, reflected in strong growth in recent quarters. Syngene remains an important value driver for Biocon. We believe that foray into large-scale manufacturing, client accretion in biology, and maturing of newly added dedicated centres are long-term growth drivers for Syngene, which would help it register ~20% revenue growth over the next five years.
Financial summary (Rs m)
Y/e 31 Mar, Consolidated FY16A FY17A FY18ii FY19ii FY20ii
Revenues (Rs m) 33,372 38,763 39,049 45,868 74,311 Ebitda margins (%) 22.3 24.5 20.0 22.0 37.5 Pre‐exceptional PAT (Rs m) 4,021 6,121 3,360 4,340 15,663 Reported PAT (Rs m) 5,504 6,121 3,360 4,340 15,663 Pre‐exceptional EPS (Rs) 6.7 10.2 5.6 7.2 26.1 Growth (%) 0.1 52.2 (45.1) 29.1 260.9 IIFL vs consensus (%) (29.4) (41.9) 63.6 PER (x) 79.6 52.3 95.2 73.7 20.4 ROE (%) 11.0 13.8 6.9 8.7 27.8 Net debt/equity (x) 0.0 0.0 0.0 0.1 0.1 EV/Ebitda (x) 43.4 34.2 41.8 32.7 11.9 Price/book (x) 7.4 6.1 5.9 5.8 4.6 Source: Company, IIFL Research. Price as at close of business on 16 January 2018.

Biocon – BUY
Institutional Equities
Robust progress in the biosimilars pipeline Mylan-Biocon executed their ongoing biosimilar pipeline programmes quite well, with three of the lead molecules in the pipeline (Trastuzumab, Pegfilgrastim and Insulin Glargine) achieving critical regulatory and/or litigation milestones over the past two years. Recently, the partnership received approval for its first biosimilar product in US, namely Trastuzumab (also the first approval in the category). We believe that with the Trastuzumab approval, manufacturing concerns at Biocon are laid to rest and there is high visibility for Pegfilgrastim approval coming in the next few months. Mylan-Biocon have resubmitted their Pegfilgrastim filing in the US after updating the plant requalification data. Additionally, both Trastuzumab and Pegfilgrastim filing have already been resubmitted in EU following the CAPAs (Corrective and Preventive Actions) implemented by Biocon at the Bangalore facility. Mylan-Biocon have also progressed favourably on Insulin Glargine by filing the product in the US recently. The EU filing is in the final stage of the review process with the EMA (European Medicines Agency). Some of these products, especially Pegfilgrastim and Insulin Glargine, have been tough to develop, which has put off competitors from initiating projects or has created delays. In a field dominated by big pharma players, Mylan-Biocon has been able to stay ahead of competition until now.
Figure 1: Biocon’s lead biosimilar filings for the regulated markets and status of various competitors in these filings Product Brand
(Innovator) 2017* revenue Mylan/ Biocon's
Mylan/ Biocon's biosimilar
Status of other
(USD mn) biosimilar status expected launch
date biosimilar filers
US EU US EU US EU US EU
Trastuzumab Herceptin (Roche)
2,746 2,156 Approved Re‐filed post facility remediation
Mid‐2019 Mid‐2019
Teva/Celltrion (filed) Amgen/Allergan (filed) Samsung/Biogen (P‐III) Pfizer/Hospira (P‐III)
Samsung/Merck (approved) Celltrion (filed) Amgen/Allergan (filed) Pfizer/Hospira (P‐III)
Pegfilgrastim Neulasta (Amgen)
3,949 ‐ Re‐filed post plant requalification
Re‐filed post facility remediation
Late‐2018 Late‐2018
Coherus (filed; pending CRL) Sandoz (pending CRL) Apotex (very old filing)
Coherus (filed) Sandoz (re‐filed)Gedeon Richter (filing withdrawn)
Insulin Glargine
Lantus (Sanofi)
3,048 898 Filed Filed Late‐2020 Late‐2018
Eli Lilly/BI (approved) Samsung/Merck (tentatively approved)
Eli Lilly/BI (approved) Samsung/Merck (approved)
Source: Company, IIFL Research; *2017 revenue – based on 9M‐2017 reported run‐rate
3
Biocon – BUY
Institutional Equities
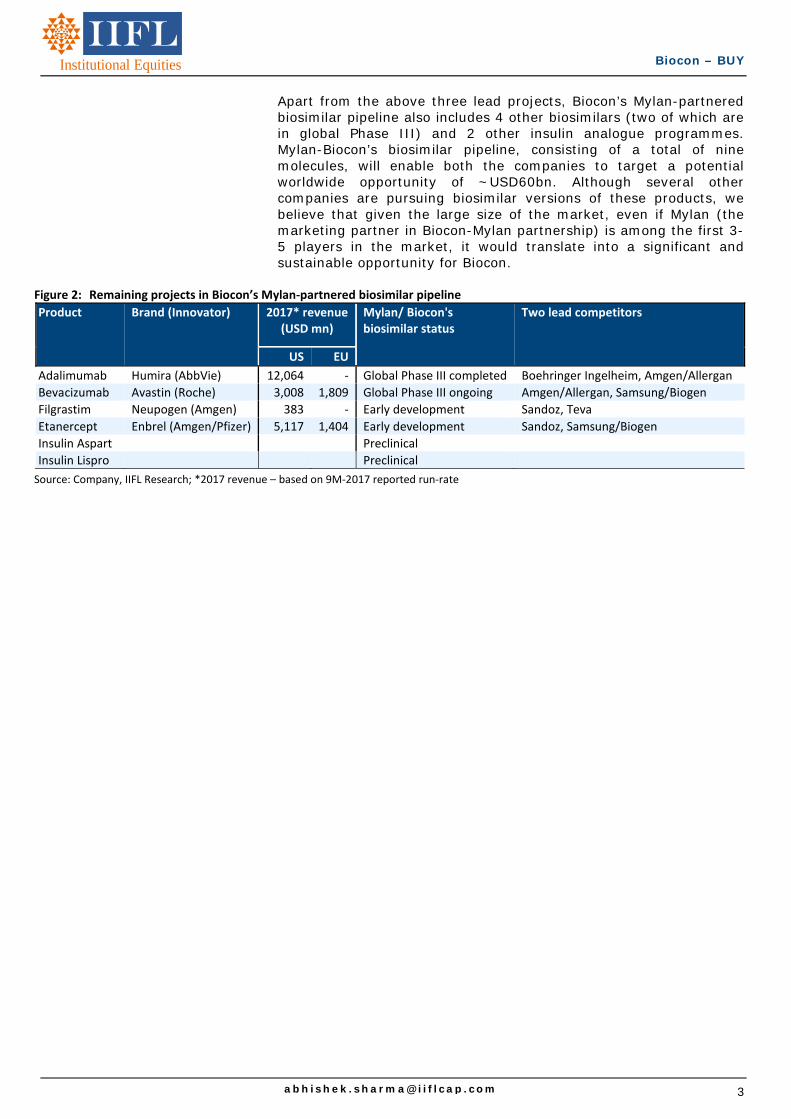
Apart from the above three lead projects, Biocon’s Mylan-partnered biosimilar pipeline also includes 4 other biosimilars (two of which are in global Phase III) and 2 other insulin analogue programmes. Mylan-Biocon’s biosimilar pipeline, consisting of a total of nine molecules, will enable both the companies to target a potential worldwide opportunity of ~USD60bn. Although several other companies are pursuing biosimilar versions of these products, we believe that given the large size of the market, even if Mylan (the marketing partner in Biocon-Mylan partnership) is among the first 3-5 players in the market, it would translate into a significant and sustainable opportunity for Biocon.
Figure 2: Remaining projects in Biocon’s Mylan‐partnered biosimilar pipeline
Product Brand (Innovator) 2017* revenue (USD mn)
Mylan/ Biocon's biosimilar status
Two lead competitors
US EU
Adalimumab Humira (AbbVie) 12,064 ‐ Global Phase III completed Boehringer Ingelheim, Amgen/Allergan
Bevacizumab Avastin (Roche) 3,008 1,809 Global Phase III ongoing Amgen/Allergan, Samsung/Biogen
Filgrastim Neupogen (Amgen) 383 ‐ Early development Sandoz, Teva
Etanercept Enbrel (Amgen/Pfizer) 5,117 1,404 Early development Sandoz, Samsung/Biogen
Insulin Aspart Preclinical
Insulin Lispro Preclinical
Source: Company, IIFL Research; *2017 revenue – based on 9M‐2017 reported run‐rate

0
5,000
10,000
15,000
20,000
25,000
30,000
Biocon's FY18ii base business PAT (Rs mn)
Biocon's 2022ii PAT from 3-lead biosimilars in US and EU (Rs mn)
Biocon's base business PAT 5 years hence (Rs mn)
Biocon’s PAT can more than quintuple in five yearsInstitutional Equities
Innovator Company Amgen Amgen Roche AbbVie Sanofi Amgen/Pfizer JNJ Roche Amgen Roche
Product Filgrastim (Neupogen) Pegfligrastim (Neulasta) Trastuzumab (Herceptin) Adalimumab (Humira) Insulin Glargine (Lantus) Etanercept (Enbrel) Infliximab (Remicade) Rituximab (Rituxan) Epoetin alfa (Epogen) Bevacizumab (Avastin)
US EU US EU US EU US EU US EU US EU US EU US EU US EU US EU2015 Mkt size (US$ mn) 793 - 3,891 - 2,476 2,088 8,405 - 4,464 996 5,099 2,130 4,453 - 3,905 1,888 1,856 - 3,176 1,8832016 Mkt size (US $ mn) 534 - 3,925 - 2,484 2,034 10,432 - 3,881 966 5,719 1,900 4,842 - 3,911 1,879 1,282 - 2,964 1,8412017ii Mkt size (US $ mn)* 383 - 3,949 - 2,746 2,156 12,064 - 3,048 898 5,117 1,404 4,603 - 4,274 1,823 1,101 - 3,008 1,809
Sandoz Approved Approved Filed (pending CRL) Refiled Phase-3 Filed Approved Approved Phase-3 Filed Filed Approved Phase-3 Approved
Mylan/Biocon Early devel-opment
Refiled post plant requali-
fication
Refiled post facility remediation
ApprovedRefiled
post facility remediation
Phase-3 Phase-3 Filed Filed Early devel-opment
Mylan has a partnership
with MabionPhase-3 Phase-3
Eli Lilly/Boehringer Ingel-heim Approved Approved Approved Approved Phase-3 Phase-3
Samsung/Biogen/Merck Phase-3 Approved Phase-3 Approved Tentatively approved Approved Phase-3 Approved Approved Approved Phase-3 Phase-3
Amgen/Allergan Filed Filed Approved Approved Phase-3 Phase-3 Phase-3 Phase-3 Approved Filed
Pfizer/Hospira/Celltrion Phase-1 Approved Phase-1 Phase-3 Phase-3 Phase-3 Phase-3 2 Approved products Approved Phase-3 Phase-3 Filed (pending
CRL) Approved Phase-3 Phase-3
Apotex/Intas Filed ApprovedFiled (very old
filing, Dec-2014)
Clinicals Phase-3 Clinicals
Teva/Celltrion Approved Approved Filed Filed Filed Approved
Coherus Filed (pending CRL) Filed Phase-3 Phase-3 Phase-3 Phase-3
Gedeon Richter Withdrawn Partnership with DM Bio
Momenta/Mylan Phase-3 Phase-3Adello Biologics LLC Filed
Source: IIFL Estimates
Source: Company, IIFL Research
Source: Company, IIFL ResearchNote: 2017* revenue - based on 9M-2017 reported run-rate
Source: IIFL Estimates
Post-tax profit contribution in US + EU 2017ii 2018ii 2019ii 2020ii 2021ii 2022ii 2023ii 2024iiTrastuzumab (USD mn) - - 95 101 77 81 85 90 Pegfilgrastim (USD mn) - 31 81 70 103 111 111 111 Insulin Glargine (USD mn) - - - 34 60 86 98 116 Total post-tax profit contribution (USD mn) - 31 176 205 240 278 295 317 Total post-tax profit contribution (Rs mn) - 1,997 11,331 13,239 15,478 17,959 19,019 20,467 EPS contribution - 3.3 18.9 22.1 25.8 29.9 31.7 34.1
FY14A FY15A FY16A FY17A FY18ii FY19ii FY20ii FY21iiEBIT Margins 17.2 14.5 14.9 17.4 10.0 11.4 29.5 30.3 Non. Op Effect 1.1 1.4 1.5 1.3 1.4 1.3 1.0 1.1 Tax Effect 0.8 0.7 0.5 0.7 0.6 0.7 0.7 0.7 Asset Turnover (based on Net Assets) 0.7 0.6 0.5 0.5 0.5 0.6 0.9 0.9 Equity Multiplier (based on Net Assets) 1.4 1.6 1.7 1.7 1.6 1.5 1.5 1.4 ROE 14.5 12.8 11.0 13.8 6.9 8.7 27.8 27.0
We expect three lead biosimilars to contribute combined profit of ~USD280mn to Biocon by 2022
Biocon’s DuPont analysis – We expect ROEs to significantly improve from FY20 onwards
Global biosimilars pipeline
Based on our estimates, Biocon’s profit can potentially grow ~6x in five years driven by the commercialization of the 3 lead biosimilars in US and EU
5
Biocon – BUY
Institutional Equities
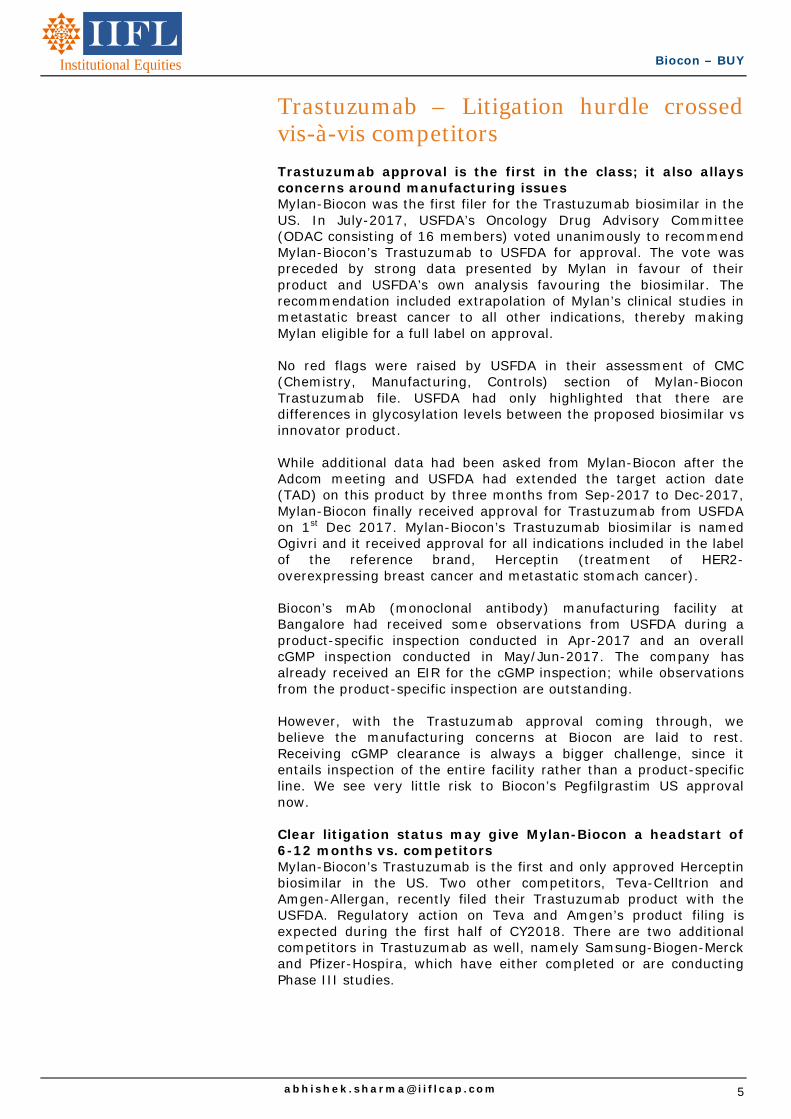
Trastuzumab – Litigation hurdle crossed vis-à-vis competitors Trastuzumab approval is the first in the class; it also allays concerns around manufacturing issues Mylan-Biocon was the first filer for the Trastuzumab biosimilar in the US. In July-2017, USFDA’s Oncology Drug Advisory Committee (ODAC consisting of 16 members) voted unanimously to recommend Mylan-Biocon’s Trastuzumab to USFDA for approval. The vote was preceded by strong data presented by Mylan in favour of their product and USFDA’s own analysis favouring the biosimilar. The recommendation included extrapolation of Mylan’s clinical studies in metastatic breast cancer to all other indications, thereby making Mylan eligible for a full label on approval. No red flags were raised by USFDA in their assessment of CMC (Chemistry, Manufacturing, Controls) section of Mylan-Biocon Trastuzumab file. USFDA had only highlighted that there are differences in glycosylation levels between the proposed biosimilar vs innovator product. While additional data had been asked from Mylan-Biocon after the Adcom meeting and USFDA had extended the target action date (TAD) on this product by three months from Sep-2017 to Dec-2017, Mylan-Biocon finally received approval for Trastuzumab from USFDA on 1st Dec 2017. Mylan-Biocon’s Trastuzumab biosimilar is named Ogivri and it received approval for all indications included in the label of the reference brand, Herceptin (treatment of HER2-overexpressing breast cancer and metastatic stomach cancer). Biocon’s mAb (monoclonal antibody) manufacturing facility at Bangalore had received some observations from USFDA during a product-specific inspection conducted in Apr-2017 and an overall cGMP inspection conducted in May/Jun-2017. The company has already received an EIR for the cGMP inspection; while observations from the product-specific inspection are outstanding. However, with the Trastuzumab approval coming through, we believe the manufacturing concerns at Biocon are laid to rest. Receiving cGMP clearance is always a bigger challenge, since it entails inspection of the entire facility rather than a product-specific line. We see very little risk to Biocon’s Pegfilgrastim US approval now. Clear litigation status may give Mylan-Biocon a headstart of 6-12 months vs. competitors Mylan-Biocon’s Trastuzumab is the first and only approved Herceptin biosimilar in the US. Two other competitors, Teva-Celltrion and Amgen-Allergan, recently filed their Trastuzumab product with the USFDA. Regulatory action on Teva and Amgen’s product filing is expected during the first half of CY2018. There are two additional competitors in Trastuzumab as well, namely Samsung-Biogen-Merck and Pfizer-Hospira, which have either completed or are conducting Phase III studies.
Biocon – BUY
Institutional Equities
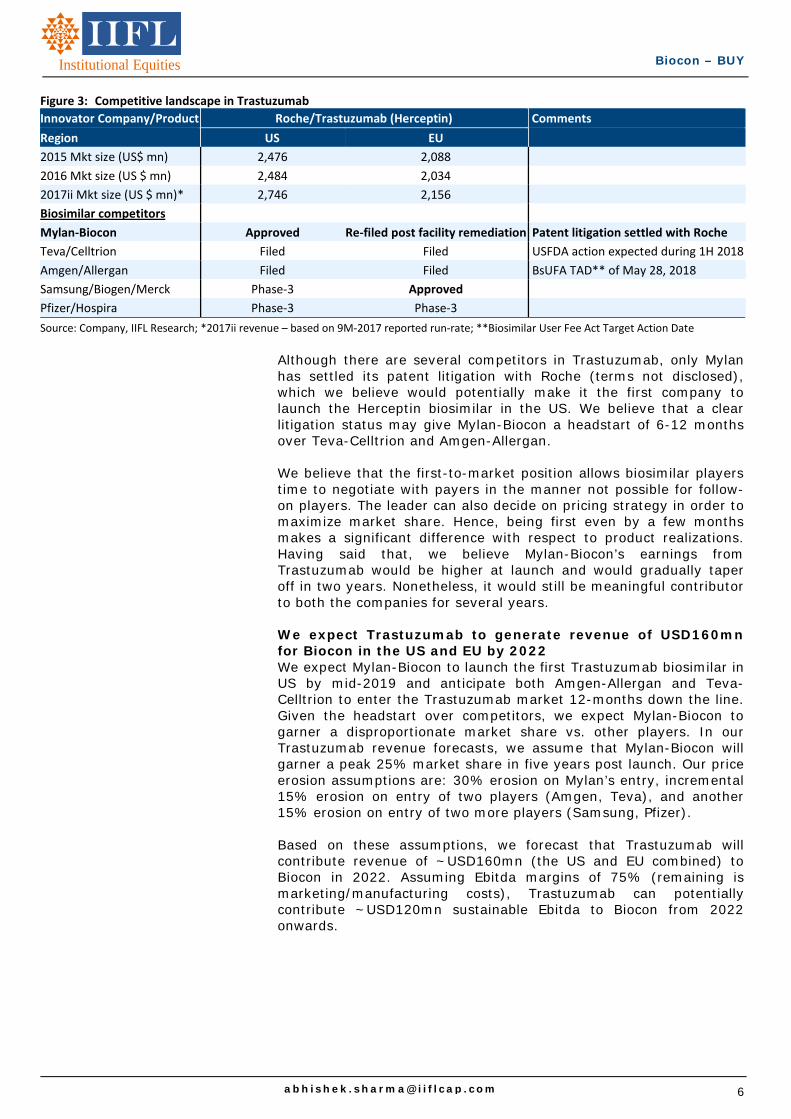
Figure 3: Competitive landscape in Trastuzumab
Innovator Company/Product Roche/Trastuzumab (Herceptin) Comments
Region US EU
2015 Mkt size (US$ mn) 2,476 2,088
2016 Mkt size (US $ mn) 2,484 2,034
2017ii Mkt size (US $ mn)* 2,746 2,156
Biosimilar competitors
Mylan‐Biocon Approved Re‐filed post facility remediation Patent litigation settled with Roche
Teva/Celltrion Filed Filed USFDA action expected during 1H 2018
Amgen/Allergan Filed Filed BsUFA TAD** of May 28, 2018
Samsung/Biogen/Merck Phase‐3 Approved
Pfizer/Hospira Phase‐3 Phase‐3
Source: Company, IIFL Research; *2017ii revenue – based on 9M‐2017 reported run‐rate; **Biosimilar User Fee Act Target Action Date
Although there are several competitors in Trastuzumab, only Mylan has settled its patent litigation with Roche (terms not disclosed), which we believe would potentially make it the first company to launch the Herceptin biosimilar in the US. We believe that a clear litigation status may give Mylan-Biocon a headstart of 6-12 months over Teva-Celltrion and Amgen-Allergan. We believe that the first-to-market position allows biosimilar players time to negotiate with payers in the manner not possible for follow-on players. The leader can also decide on pricing strategy in order to maximize market share. Hence, being first even by a few months makes a significant difference with respect to product realizations. Having said that, we believe Mylan-Biocon’s earnings from Trastuzumab would be higher at launch and would gradually taper off in two years. Nonetheless, it would still be meaningful contributor to both the companies for several years. We expect Trastuzumab to generate revenue of USD160mn for Biocon in the US and EU by 2022 We expect Mylan-Biocon to launch the first Trastuzumab biosimilar in US by mid-2019 and anticipate both Amgen-Allergan and Teva-Celltrion to enter the Trastuzumab market 12-months down the line. Given the headstart over competitors, we expect Mylan-Biocon to garner a disproportionate market share vs. other players. In our Trastuzumab revenue forecasts, we assume that Mylan-Biocon will garner a peak 25% market share in five years post launch. Our price erosion assumptions are: 30% erosion on Mylan’s entry, incremental 15% erosion on entry of two players (Amgen, Teva), and another 15% erosion on entry of two more players (Samsung, Pfizer). Based on these assumptions, we forecast that Trastuzumab will contribute revenue of ~USD160mn (the US and EU combined) to Biocon in 2022. Assuming Ebitda margins of 75% (remaining is marketing/manufacturing costs), Trastuzumab can potentially contribute ~USD120mn sustainable Ebitda to Biocon from 2022 onwards.

7
Biocon – BUY
Institutional Equities
Figure 4: Trastuzumab earnings forecast model for Biocon
USD mn 2016 2017ii 2018ii 2019ii 2020ii 2021ii 2022ii 2023ii 2024ii
No. of players (including innovator) 1 1 1 2 6 6 6 6 6
Price discount 0% 0% 0% 30% 45% 60% 60% 60% 60%
Trastuzumab market size in US (USD mn)
2,484 2,746 2,938 2,057 1,616 1,175 1,175 1,175 1,175
Market Shares
Innovator 100% 100% 100% 85% 62% 42% 29% 28% 27%
Mylan‐Biocon 15% 20% 22% 23% 24% 25%
Amgen/Allergan 6% 10% 12% 12% 12%
Teva/Celltrion 6% 10% 12% 12% 12%
Samsung/Biogen 3% 8% 12% 12% 12%
Pfizer/Hospira 3% 8% 12% 12% 12%
Revenues (USD mn)
Innovator 2,484 2,746 2,938 1,748 1,002 494 341 329 317
Mylan‐Biocon ‐ ‐ ‐ 309 323 259 270 282 294
Amgen/Allergan ‐ ‐ ‐ ‐ 97 118 141 141 141
Teva/Celltrion ‐ ‐ ‐ ‐ 97 118 141 141 141
Samsung/Biogen ‐ ‐ ‐ ‐ 48 94 141 141 141
Pfizer/Hospira ‐ ‐ ‐ ‐ 48 94 141 141 141
Biocon's economics (USD mn)
Cost of Goods 31 32 26 27 28 29
Pre‐Tax Profit to the partners 185 194 155 162 169 176
Mylan share of profits in US 111 116 93 97 102 106
Biocon share of profits in US 74 78 62 65 68 71
Biocon revenue line (US) 105 110 88 92 96 100
Biocon revenue line (EU) 82 86 69 72 75 78
Biocon's Trastuzumab revenue (US + EU)
187 196 157 164 171 178
Biocon's pre‐tax Trastuzumab profit 140 147 118 123 128 134
Biocon's post‐tax Trastuzumab profit 115 121 97 101 105 110
Incremental depreciation on USD200mn mAb facility
20 20 20 20 20 20
Biocon's post‐tax profit (US + EU) 95 101 77 81 85 90
Source: IIFL Estimates
Figure 5: Assumptions for the above earnings forecast model
Biocon's economics (USD mn) Assumptions
Cost of Goods 10%
Pre‐Tax Profit to the partners 60%
Mylan share of profits 60%
Biocon share of profits 40%
Biocon revenue line (US) Share of Profits + COGS
Biocon revenue line (EU) Proportioned based on US:EU revenue split for the brand
Ebitda margin assumed for Biocon75%
Tax‐rate assumed 18%
Source: IIFL Research
Biocon – BUY
Institutional Equities
Pegfilgrastim – Competitors have faced delays We see little risk to Biocon’s Pegfilgrastim US approval now Mylan-Biocon’s Pegfilgrastim filing was accepted by USFDA in Feb-2017. However, following the ‘483 observations on Biocon’s Bangalore facility, the USFDA issued a CRL (Complete Response Letter) for Mylan-Biocon’s Pegfilgrastim product in Oct-2017. Although the CRL has slightly delayed the approval timeline for this product, we derive comfort from the fact that the CRL did not raise any issues around clinical data (PK/PD studies i.e. pharmacokinetic/pharmacodynamic), biosimilarity, immunogenicity etc. Mylan-Biocon’s Pegfilgrastim dossier was otherwise complete and the only outstanding issue was for the company to take requalification batches post facility remediation. Mylan-Biocon has now resubmitted the Pegfilgrastim filing in the US after updating the plant requalification data, taking care of the issue. The manufacturing concerns at Biocon have been laid to rest following receipt of the cGMP clearance for the May/Jun-2017 inspection and the Trastuzumab product approval coming through in the US. We see little risk to the company’s Pegfilgrastim US approval now. Mylan-Biocon could potentially be the first-to-market in Pegfilgrastim as well Pegfilgrastim started as a relatively crowded field, with three other players (Apotex, Sandoz and Coherus) having already filed their products with the USFDA ahead of Mylan-Biocon. However, due to issues around development, several players have either dropped out or received CRL citing deficiencies in filing. The US is the primary market for Neulasta (Pegfilgrastim’s reference brand), which accounts for 87% of the product sales. Among the four biosimilar competitors, Coherus seems to be the next most advanced (after Biocon) based on the current status of the product. Coherus has a pending CRL on its Pegfilgrastim filing in US. Coherus’ CRL consists of two parts where USFDA has requested the company for: 1) reanalysis of a subset of patient samples with a revised immunogenicity assay; and 2) additional manufacturing-related process information. The CRL did not request a clinical study to be performed on oncology patients. In its Nov-2017 earnings call, Coherus stated that the company has successfully developed and completed the validation of the immunogenicity assay. These immunogenicity assay results were found to be consistent with USFDA’s expectations for higher sensitivity. Coherus also completed the analysis of additional manufacturing and process-related issues. However, the reports from these are yet to be validated, which the company intends to do with the USFDA at upcoming meetings. Resubmission of Coherus’ Pegfilgrastim filing in the US is expected by mid-1Q 2018 (USFDA has already granted a meeting to Coherus on this during middle of 1Q 2018). Coherus will announce the acceptance of the file by the USFDA, which should happen within 30

9
Biocon – BUY
Institutional Equities
days post resubmission. Coherus expects the review timeline on the product to be six months post acceptance. Sandoz received a CRL on its Pegfilgrastim filing in the US in Jul-2016, where the USFDA had asked the company to conduct an additional PK study. Sandoz had earlier expected to resubmit the dossier in 2018, but due to a change in the study design the company has had to push back its likely Pegfilgrastim filing in the US to 1H 2019. Apotex was the earliest biosimilar filer on Neulasta and has had a Pegfilgrastim filing in US since Dec-2014. However, there has been no update on the status of Apotex’s file since then. We believe that in this product Pegylation has been a challenge where some of the competition may have stumbled. Apotex had filed a Citizen Petition on Neulasta in Apr-2017 requesting USFDA not to approve any Pegfilgrastim biosimilars that rely on healthy volunteer data only. Apotex had instead asked that efficacy studies should be carried out in diseased patient populations by the filers for USFDA to consider the application. Apotex had possibly moved the Citizen Petition in order to block Coherus and keep alive its own chances. Coherus has only submitted healthy volunteer data in its application while Mylan-Biocon conducted efficacy trials in 194 patients. However, Apotex’s Citizen Petition was denied by USFDA in Sep-2017. This is in line with USFDA’s thinking where the agency had not asked Coherus in its CRL to conduct clinical studies in diseased patients.
Figure 6: Competitive landscape in Pegfilgrastim
Innovator Company/Product Amgen/Pegfligrastim (Neulasta) Comments
Region US EU
2015 Mkt size (US$ mn) 3,891 ‐
2016 Mkt size (US $ mn) 3,925 ‐
2017ii Mkt size (US $ mn)* 3,949 ‐
Biosimilar competitors
Mylan‐Biocon Re‐filed post plant requalification
Re‐filed post facility remediation
Coherus (CHS‐1701) Filed (pending CRL) Filed USFDA issued CRL in Jun‐2017; Resubmission expected mid 1Q 2018
Sandoz Filed (pending CRL) Re‐filed Sandoz announced in Jul‐2016 that the company has received a CRL on Pegfilgrastim; Resubmission planned for 1H 2019
Apotex/Intas Filed Very old filing, Dec‐2014
Pfizer/Hospira Phase‐1
Gedeon Richter Withdrawn
Source: Company, IIFL Research; *2017ii revenue – based on 9M‐2017 reported run‐rate
Given the issues faced by other Pegfilgrastim filers, we believe that Mylan-Biocon could potentially become the first or the second company to receive approval for a Neulasta biosimilar. We expect Coherus to also receive approval around the same time as Mylan-Biocon (provided Coherus is able to resolve the issues highlighted in the CRL). Given the current status of various filers, we believe Neulasta will be a two-player biosimilar market initially (Mylan-Biocon and Coherus)

Biocon – BUY
Institutional Equities
and we expect additional competition (if any) to enter only 12-18 months later. Due to lower competitive intensity, we believe that launched Pegfilgrastim biosimilars will have a relatively free run in the market. If Coherus is delayed due to any issues, then the potential opportunity for Mylan-Biocon could be higher. We expect Pegfilgrastim to generate revenue of USD180mn for Biocon in the US by 2022 Amgen has filed patent infringement lawsuits against the four advanced filers of Pegfilgrastim. While all these litigations are currently ongoing, we note that the US District Court for the Southern District of Florida had ruled in Sep-2016 that Apotex’s process of manufacturing its Filgrastim and Pegfilgrastim products does not infringe Amgen’s ’138 patent (expiring on July 29, 2031). Amgen has appealed against the US District Court’s ruling and the Federal Circuit Court heard the arguments on this case in Oct-2017. Figure 7: Amgen’s Litigation status with various Pegfilgrastim filers
Company Status
Mylan‐Biocon Lawsuit filed in Sep‐2017 for infringement of the patents 8,273,707 and 9,643,997
Coherus (CHS‐1701) Trial (for the patent 8,273,707) is scheduled to commence on September 16, 2019
Sandoz Trial is scheduled for March 26, 2018
Apotex/Intas Amgen had appealed against the US district court's decision which had found that Apotex’s process of manufacturing its Filgrastim and Pegfilgrastim products does not infringe Amgen's US patent 8,952,138. The Federal Circuit Court heard Amgen's argument on October 3, 2017
Source: Company, IIFL Research
In order to protect its Neulasta franchise from biosimilar competition, Amgen launched a lifecycle extension variant (Neulasta Onpro kit) in Mar-2015 and the company has been able to switch patients to it. After chemotherapy treatment, doctors attach the Neulasta Onpro kit (i.e. an in-body injector containing a single dose of Neulasta) to the patient’s skin. The on-body injector for Neulasta is designed to automatically deliver the patient’s dose about 27 hours after the doctor places the device on the patient’s skin. The Onpro kit has ensured that the patient does not need to visit the doctor the next day of chemo treatment just to take a Neulasta injection. As of 3Q CY2017, Neulasta Onpro kit’s share was 56% of total US Neulasta units. However, in our view, the clinical benefit of the variant does not appear significant and we are not sure if it would withstand payer pressure once biosimilar options are available in the market. We expect Mylan-Biocon to launch their Pegfilgrastim biosimilar in US by late-2018/early-2019 and anticipate Coherus to also launch around the same time. We expect Sandoz and Apotex to enter the Pegfilgrastim market 12-18 months down the line. Given the headstart over competitors, we expect Mylan-Biocon and Coherus to garner a disproportionate market share vs. other players. In our Pegfilgrastim revenue forecasts, we assume that Mylan-Biocon will garner a peak 27% market share in five years post launch. Our price erosion assumptions are: 35% erosion on Mylan’s and Coherus’
11
Biocon – BUY
Institutional Equities
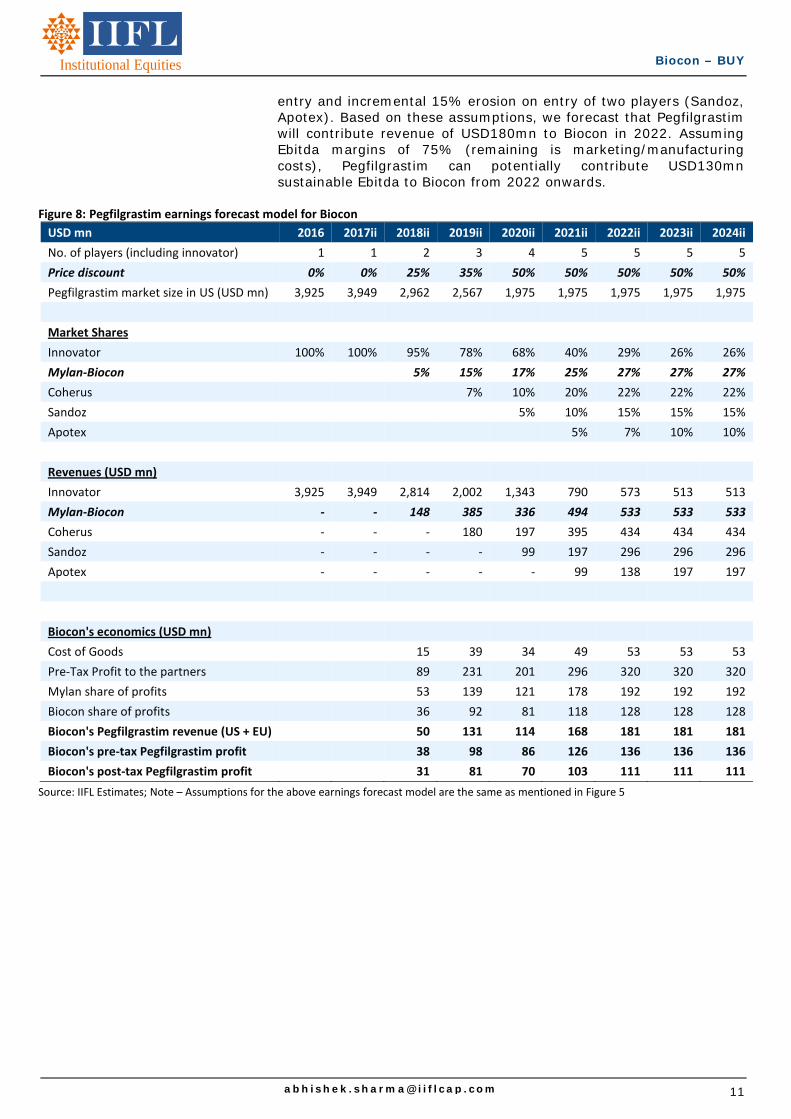
entry and incremental 15% erosion on entry of two players (Sandoz, Apotex). Based on these assumptions, we forecast that Pegfilgrastim will contribute revenue of USD180mn to Biocon in 2022. Assuming Ebitda margins of 75% (remaining is marketing/manufacturing costs), Pegfilgrastim can potentially contribute USD130mn sustainable Ebitda to Biocon from 2022 onwards.
Figure 8: Pegfilgrastim earnings forecast model for Biocon
USD mn 2016 2017ii 2018ii 2019ii 2020ii 2021ii 2022ii 2023ii 2024ii
No. of players (including innovator) 1 1 2 3 4 5 5 5 5
Price discount 0% 0% 25% 35% 50% 50% 50% 50% 50%
Pegfilgrastim market size in US (USD mn) 3,925 3,949 2,962 2,567 1,975 1,975 1,975 1,975 1,975
Market Shares
Innovator 100% 100% 95% 78% 68% 40% 29% 26% 26%
Mylan‐Biocon 5% 15% 17% 25% 27% 27% 27%
Coherus 7% 10% 20% 22% 22% 22%
Sandoz 5% 10% 15% 15% 15%
Apotex 5% 7% 10% 10%
Revenues (USD mn)
Innovator 3,925 3,949 2,814 2,002 1,343 790 573 513 513
Mylan‐Biocon ‐ ‐ 148 385 336 494 533 533 533
Coherus ‐ ‐ ‐ 180 197 395 434 434 434
Sandoz ‐ ‐ ‐ ‐ 99 197 296 296 296
Apotex ‐ ‐ ‐ ‐ ‐ 99 138 197 197
Biocon's economics (USD mn)
Cost of Goods 15 39 34 49 53 53 53
Pre‐Tax Profit to the partners 89 231 201 296 320 320 320
Mylan share of profits 53 139 121 178 192 192 192
Biocon share of profits 36 92 81 118 128 128 128
Biocon's Pegfilgrastim revenue (US + EU) 50 131 114 168 181 181 181
Biocon's pre‐tax Pegfilgrastim profit 38 98 86 126 136 136 136
Biocon's post‐tax Pegfilgrastim profit 31 81 70 103 111 111 111
Source: IIFL Estimates; Note – Assumptions for the above earnings forecast model are the same as mentioned in Figure 5

Biocon – BUY
Institutional Equities
Insulin Glargine – Mylan-Biocon lagged competitors, but this will remain a limited-competition market overall Manufacturing strategy is critical for Insulin Glargine vis-à-vis monoclonal antibodies Very few biosimilar aspirants ventured into the Insulin Glargine market and have instead focused on monoclonal antibodies (mAbs). Insulin Glargine is different because: a) it has a simpler structure; b) it is not treated as a biologic by the regulators; and c) it is prescribed by specialists and primary care physicians to a very large population of diabetics. In contrast, mAbs are largely indicated for use in oncology (cancer) and autoimmune diseases, are prescribed by oncologists or rheumatologists, and administered to a much smaller set of population. The per-unit price of Insulin Glargine vs. mAbs is much lower. Therefore a biosimilar aspirant has to focus on the manufacturing strategy as well. Eli Lilly’s Insulin Glargine biosimilar has shown strong traction in the US Eli Lilly launched its Insulin Glargine biosimilar (Basaglar) in the US market in mid-December 2016. Since then, Eli Lilly has reported a strong uptake in US sales of Basaglar, driven by payer switching in formularies and new patient uptake. Some of the payers have removed the innovator reference brand (Lantus) from the formulary. In the first nine months of 2017, Eli Lilly reported sales of USD197mn for Basaglar in the US. This would likely make Basaglar exceed USD300mn revenues in the first full year in the US. Figure 9: Eli Lilly’s Insulin Glargine biosimilar has shown strong sales traction in US
Source: Eli Lilly financial releases, IIFL Research
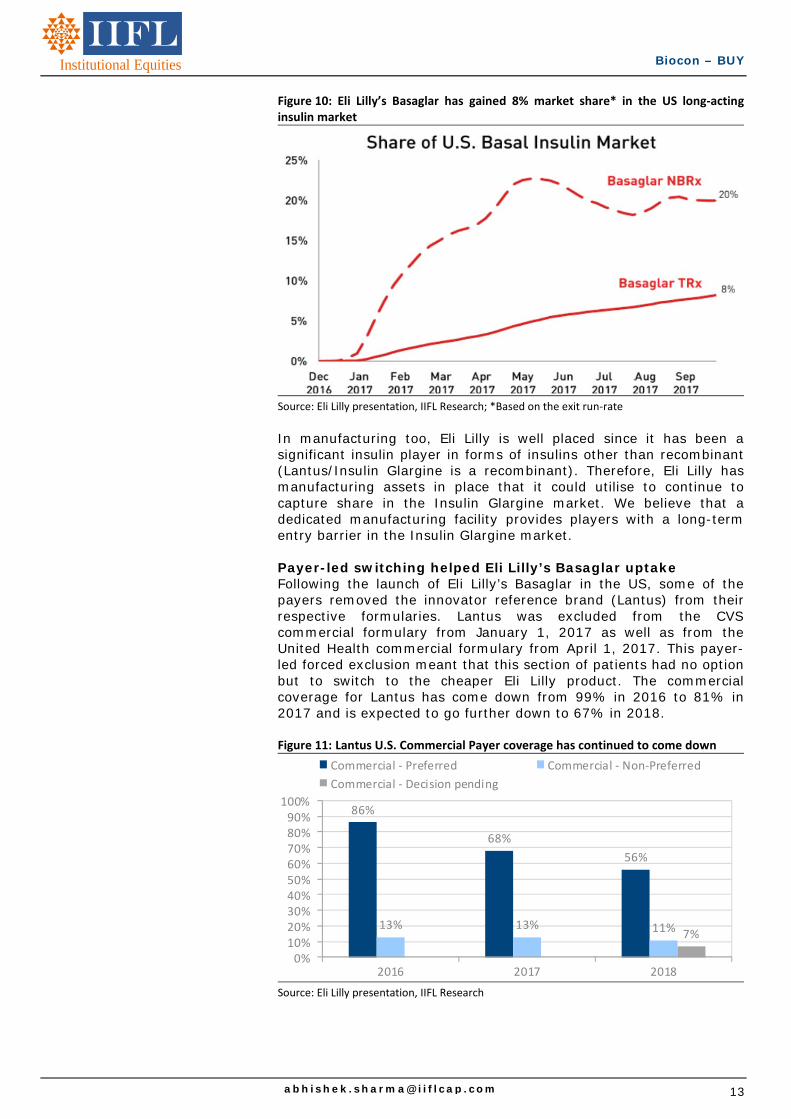
In its 3Q CY2017 presentation, Eli Lilly has also disclosed that Basaglar achieved 20% share of new patients being put on long-acting insulins, which is different from what the company would have gained through payer switch. In terms of total prescriptions (TRx), Basaglar has already garnered 8% market share in the US long-acting insulin market.
16 22
60
115
0
20
40
60
80
100
120
140
1Q 2Q 3Q 4Q 1Q 2Q 3Q
2016 2017
US RoW
Eli Lilly's Basaglar sales (USD mn)
13
Biocon – BUY
Institutional Equities
Figure 10: Eli Lilly’s Basaglar has gained 8% market share* in the US long‐acting insulin market
Source: Eli Lilly presentation, IIFL Research; *Based on the exit run‐rate
In manufacturing too, Eli Lilly is well placed since it has been a significant insulin player in forms of insulins other than recombinant (Lantus/Insulin Glargine is a recombinant). Therefore, Eli Lilly has manufacturing assets in place that it could utilise to continue to capture share in the Insulin Glargine market. We believe that a dedicated manufacturing facility provides players with a long-term entry barrier in the Insulin Glargine market. Payer-led switching helped Eli Lilly’s Basaglar uptake Following the launch of Eli Lilly’s Basaglar in the US, some of the payers removed the innovator reference brand (Lantus) from their respective formularies. Lantus was excluded from the CVS commercial formulary from January 1, 2017 as well as from the United Health commercial formulary from April 1, 2017. This payer-led forced exclusion meant that this section of patients had no option but to switch to the cheaper Eli Lilly product. The commercial coverage for Lantus has come down from 99% in 2016 to 81% in 2017 and is expected to go further down to 67% in 2018. Figure 11: Lantus U.S. Commercial Payer coverage has continued to come down
Source: Eli Lilly presentation, IIFL Research
86%
68%
56%
13% 13% 11% 7%
0%10%20%30%40%50%60%70%80%90%
100%
2016 2017 2018
Commercial ‐ Preferred Commercial ‐ Non‐Preferred
Commercial ‐ Decision pending

Biocon – BUY
Institutional Equities
Samsung-Merck’s Insulin Glargine has been tentatively approved in US Samsung-Merck’s Insulin Glargine product, Lusduna was tentatively approved by USFDA in Jul-2017. This product was filed as a 505(b)2 product and a tentative approval is due to the 30 months stay owing to Sanofi’s patent infringement lawsuit against Merck (lawsuit was filed in Sep-2016). Lusduna was approved by the EU regulator in Jan-2017. Mylan-Biocon is the third filer on Insulin Glargine; we expect Insulin Glargine to remain a low-competition market Mylan-Biocon filed their Insulin Glargine product both in the US and EU. The product was filed as a 505(b)2 application with USFDA. Biocon has recently disclosed that its Insulin Glargine filing in EU is in the last stage of the review process with the European Medicines Agency (EMA). Additionally, Biocon’s dedicated insulin manufacturing facility at Malaysia was inspected by the EMA in April-2017 and has already received the EU GMP certificate. We do not know of any other known biosimilar company that is in late-stage trials for Insulin Glargine. Because of this (only three known filers) and the need for a dedicated manufacturing facility, we believe the Insulin Glargine market will be a low-competition market over the next decade.
Figure 12: Competitive landscape in Insulin Glargine
Innovator Company/Product Sanofi/Insulin Glargine (Lantus) Comments
Region US EU
2015 Mkt size (US$ mn) 4,464 996
2016 Mkt size (US $ mn) 3,881 966
2017ii Mkt size (US $ mn)* 3,048 898
Biosimilar competitors
Eli Lilly/Boehringer Ingelheim Approved Approved Eli Lilly launched its Insulin Glargine biosimilar (Basaglar) in the US market in mid‐December 2016; Basaglar is expected to exceed USD300mn revenues in the first full year in US
Samsung/Merck Tentatively approved
Approved Samsung/Merck’s Insulin Glargine product, Lusduna was tentatively approved by USFDA in Jul‐2017
Mylan‐Biocon Filed Filed Mylan‐Biocon's Insulin Glargine was submitted to USFDA during 3Q CY2017
Source: Company, IIFL Research; *2017ii revenue – based on 9M‐2017 reported run‐rate
Sanofi is the innovator of Lantus and it has launched Toujeo, a new formulation of Insulin Glargine, which aims to switch patients from Lantus. Toujeo is formulated to administer the same number of insulin units in one-third of the injection volume compared with Lantus. Toujeo was launched in the US in Apr-2015 and the product has garnered just 15% share of Sanofi’s Insulin Glargine sales in the US so far. Based on the 9M-2017 run-rate, Toujeo’s sales in US are expected to be ~USD540mn in 2017. Both Sanofi and Novo Nordisk (another big diabetes player) have put GLP-1 analogues + long acting insulin combination products on the market recently with the expectation that they will be able to switch patients to the combination before the Lantus market goes entirely generic. However, the label for the combination product places it as a second line of treatment to be used only after patients have failed

15
Biocon – BUY
Institutional Equities
on long-acting insulin (Lantus) or GLP-1. Novo Nordisk also reported on its latest call that talks with payers indicate only a gradual uptake of its combination product in the US. We expect Insulin Glargine to generate revenue of USD150mn for Biocon in the US and EU by 2024 Eli Lilly had launched its Insulin Glargine biosimilar in the US in mid Dec-2016 as it had already settled its patent litigation with the innovator (Sanofi). However, patent litigation in the US is currently ongoing against both Merck and Mylan. The 30-month stay on USFDA approval of Insulin Glargine biosimilar for Merck and Mylan will expire in Feb-2019 and Mar-2020 respectively (or on a date earlier than this if a court decision is ruled in favour of the biosimilar aspirants). Figure 13: Sanofi’s litigation status with various Insulin Glargine filers Company Status
Eli Lilly/Boehringer Ingelheim Product launched under settlement agreement with Sanofi
Samsung/Merck
Lawsuit filed in Sep‐2016; 30‐month stay on FDA approval will expire on the earlier of February 8, 2019 or a court decision in favor of Merck. Trial is scheduled to begin on May 29, 2018
Mylan‐Biocon
Lawsuit filed in Oct‐2017 alleging infringement of Sanofi's 18 patents; 30‐month stay on FDA approval will expire on the earlier of March, 2020 or a court decision in favor of Mylan.
Source: Company, IIFL Research
Mylan had also filed a petition with the Patent Trial and Appeal Board (PTAB) for Inter Partes Review (IPR) challenging all the claims of Sanofi’s two OB-listed patents for Lantus (patent nos. 7,476,652 and 7,713,930). Once the petition is filed by the petitioner, the PTAB may institute (i.e. allow) IPR proceedings provided the agency believes that there is a reasonable likelihood that the petitioner would prevail with respect to at least one claim challenged. The PTAB instituted Mylan’s IPR proceeding against Lantus in Dec-2017. A final determination/outcome by the PTAB is usually issued within a year (extendable for good cause by six months). Hence, we may expect a decision on this IPR by Jun-2019. If Mylan prevails in the IPR and Sanofi’s Lantus patents are invalidated, then it will open up the 30-month stay on USFDA’s approval of Mylan’s Insulin Glargine and the company should be able to launch the product immediately on approval. However, we do not assume this scenario in our base-case estimates for Biocon and assume that the 30-month stay on the product remains valid. Based on the above 30-month expiry dates, we expect Merck and Mylan-Biocon to launch their Insulin Glargine biosimilars in US in 2019 and late-2020 respectively. As there are no other known filers for Insulin Glargine (or companies in Phase-III) and due to the requirement for a dedicated manufacturing facility, we believe that Insulin Glargine market will be a low-competition market over the next decade.

Biocon – BUY
Institutional Equities
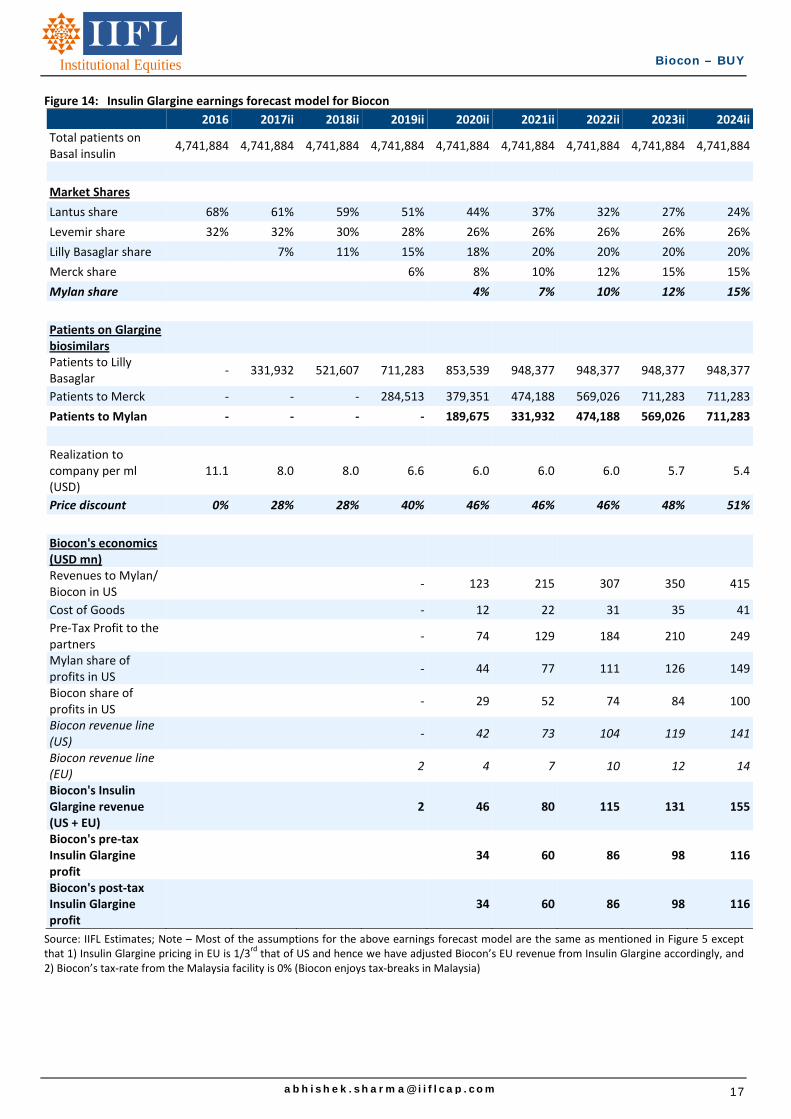
Mylan-Biocon’s Insulin Glargine filing in EU is in the last stage of the review process and we expect the product to get approved soon, given that the company’s Malaysia insulin facility has also received the EU GMP certificate for the recent inspection. We believe that Mylan-Biocon would be able to launch Insulin Glargine biosimilar in EU by late-2018. In our forecasts for Insulin Glargine revenue, we assume that Mylan-Biocon will garner a peak 15% market share in the basal insulin market in the US five years post launch. Our price erosion assumption is: 46% overall erosion in the market by the time both Merck and Mylan enter the market. Based on these assumptions, we forecast that Insulin Glargine will contribute revenue of ~USD150mn (the US and EU combined) for Biocon in 2024. Assuming Ebitda margin of 75% (remaining comprise marketing/manufacturing costs), Insulin Glargine may potentially contribute sustainable Ebitda of USD110mn to Biocon from 2024 onwards.
17
Biocon – BUY
Institutional Equities
Figure 14: Insulin Glargine earnings forecast model for Biocon
2016 2017ii 2018ii 2019ii 2020ii 2021ii 2022ii 2023ii 2024ii
Total patients on Basal insulin
4,741,884 4,741,884 4,741,884 4,741,884 4,741,884 4,741,884 4,741,884 4,741,884 4,741,884
Market Shares
Lantus share 68% 61% 59% 51% 44% 37% 32% 27% 24%
Levemir share 32% 32% 30% 28% 26% 26% 26% 26% 26%
Lilly Basaglar share 7% 11% 15% 18% 20% 20% 20% 20%
Merck share 6% 8% 10% 12% 15% 15%
Mylan share 4% 7% 10% 12% 15%
Patients on Glargine biosimilars
Patients to Lilly Basaglar
‐ 331,932 521,607 711,283 853,539 948,377 948,377 948,377 948,377
Patients to Merck ‐ ‐ ‐ 284,513 379,351 474,188 569,026 711,283 711,283
Patients to Mylan ‐ ‐ ‐ ‐ 189,675 331,932 474,188 569,026 711,283
Realization to company per ml (USD)
11.1 8.0 8.0 6.6 6.0 6.0 6.0 5.7 5.4
Price discount 0% 28% 28% 40% 46% 46% 46% 48% 51%
Biocon's economics (USD mn)
Revenues to Mylan/ Biocon in US
‐ 123 215 307 350 415
Cost of Goods ‐ 12 22 31 35 41
Pre‐Tax Profit to the partners
‐ 74 129 184 210 249
Mylan share of profits in US
‐ 44 77 111 126 149
Biocon share of profits in US
‐ 29 52 74 84 100
Biocon revenue line (US)
‐ 42 73 104 119 141
Biocon revenue line (EU)
2 4 7 10 12 14
Biocon's Insulin Glargine revenue (US + EU)
2 46 80 115 131 155
Biocon's pre‐tax Insulin Glargine profit
34 60 86 98 116
Biocon's post‐tax Insulin Glargine profit
34 60 86 98 116
Source: IIFL Estimates; Note – Most of the assumptions for the above earnings forecast model are the same as mentioned in Figure 5 except that 1) Insulin Glargine pricing in EU is 1/3
rd that of US and hence we have adjusted Biocon’s EU revenue from Insulin Glargine accordingly, and
2) Biocon’s tax‐rate from the Malaysia facility is 0% (Biocon enjoys tax‐breaks in Malaysia)

Biocon – BUY
Institutional Equities
Additional points to highlight for the biosimilars business Emerging Markets launch of Biocon’s biosimilars is already underway Although the biosimilar opportunity in the US and Europe for Biocon is expected to begin from late-2018 onwards, launches in the Emerging Markets (EM) and the Rest of the World (RoW) will drive near-term growth in the company’s biosimilars portfolio. Biocon has targeted to launch Insulin Glargine in the top 15 EMs, which together account for ~90% of Glargine’s total EM sales. Biocon has already partnered with or is in advanced discussions for partnership in 70-80% of these top 15 EMs. So far, the company has already launched Insulin Glargine in Japan (through partner Fujifilm), Mexico (through partner PiSA Farmaceutica) and Colombia, and in each of these markets, the product has seen decent uptake. Biocon also recently won a three-year contract from the Ministry of Health (MoH), Malaysia, for supply of Insulin products manufactured at the company’s Malaysia facility. This contract is worth MYR300mn (~USD70mn) and can be extended for two more years, subject to requisite approvals. Under the contract, Biocon will supply its insulin products to a local pharma company, CCM Pharmaceuticals, which in turn will distribute these products to the primary healthcare clinics and hospitals across Malaysia. This contract has started contributing to Biocon’s financials from 1QFY18 onwards. Biocon had launched Trastuzumab biosimilar in India in 2014, representing the first Trastuzumab biosimilar to be commercialized globally. For Trastuzumab as well, the company intends to target only the top-15 EMs, which account for ~96% of Trastuzumab’s total sales in EMs. The launch has already happened in some of the EMs in FY16. Figure 15: EM and RoW market for Insulin Glargine, Trastuzumab and Pegfilgrastim is also quite big
EM & RoW sales (USD mn) 2015 2016 2017ii*
Insulin Glargine (Lantus) 1,527 1,439 1,574
Trastuzumab (Herceptin) 2,227 2,196 2,279
Pegfilgrastim (Neulasta) 824 723 611
Total 4,578 4,358 4,464
Source: Company, IIFL Research; *2017ii revenue – based on 9M‐2017 reported run‐rate; the above table indicates the revenue for the reference brand reported by the innovator
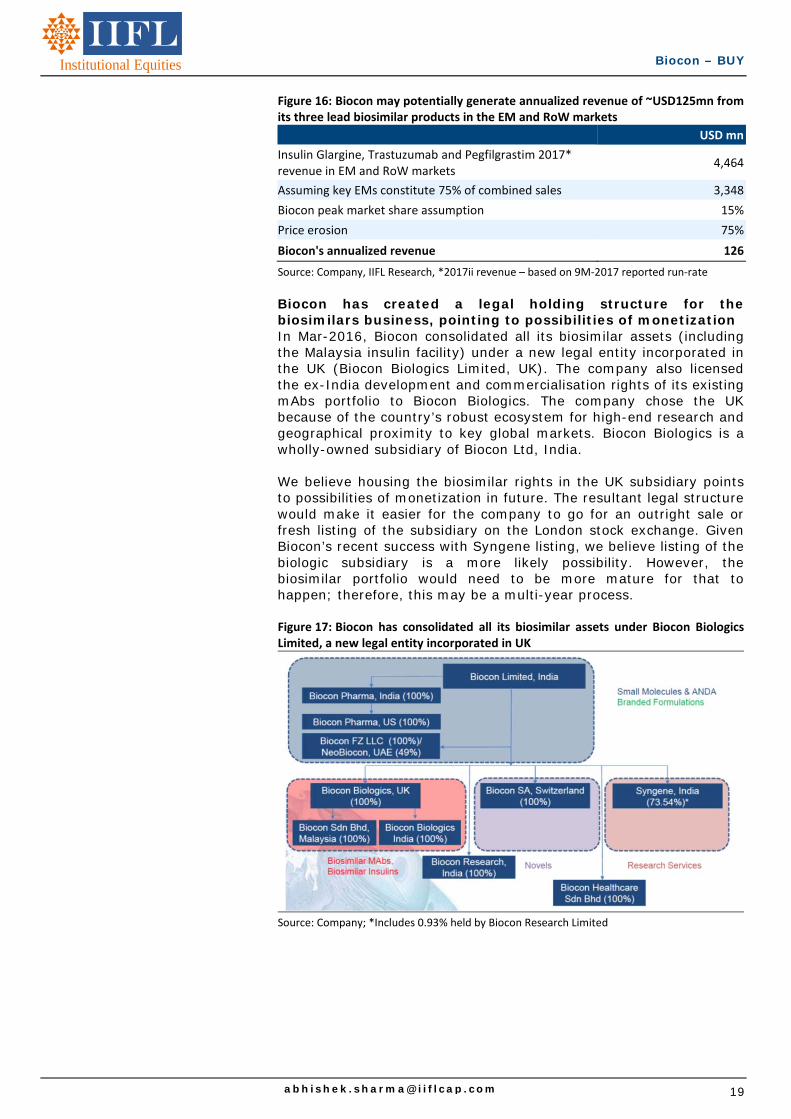
The combined revenue of Insulin Glargine, Trastuzumab and Pegfilgrastim in EM and RoW market is ~USD4.5bn. We believe Biocon can generate peak annualized revenue of ~USD125mn from these three products in the EM and RoW markets, assuming that the company garners 15% market share and price erosion is 75%.
19
Biocon – BUY
Institutional Equities
Figure 16: Biocon may potentially generate annualized revenue of ~USD125mn from its three lead biosimilar products in the EM and RoW markets
USD mn
Insulin Glargine, Trastuzumab and Pegfilgrastim 2017* revenue in EM and RoW markets
4,464
Assuming key EMs constitute 75% of combined sales 3,348
Biocon peak market share assumption 15%
Price erosion 75%
Biocon's annualized revenue 126
Source: Company, IIFL Research, *2017ii revenue – based on 9M‐2017 reported run‐rate
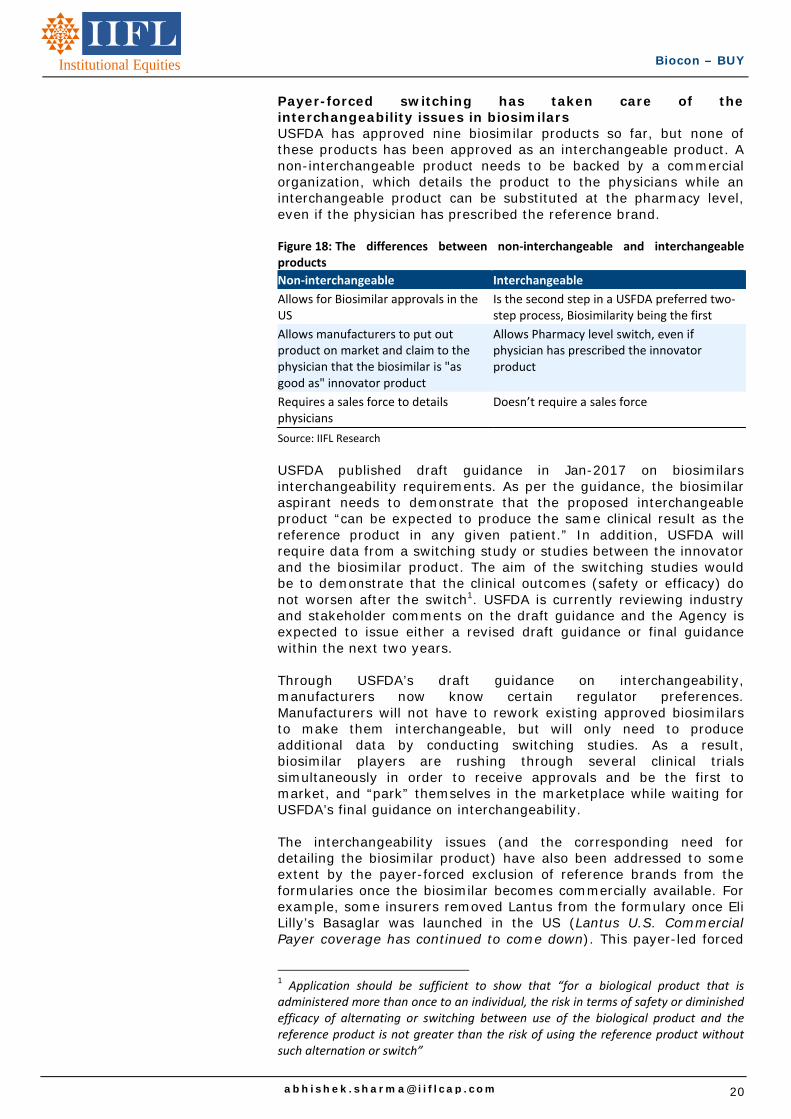
Biocon has created a legal holding structure for the biosimilars business, pointing to possibilities of monetization In Mar-2016, Biocon consolidated all its biosimilar assets (including the Malaysia insulin facility) under a new legal entity incorporated in the UK (Biocon Biologics Limited, UK). The company also licensed the ex-India development and commercialisation rights of its existing mAbs portfolio to Biocon Biologics. The company chose the UK because of the country’s robust ecosystem for high-end research and geographical proximity to key global markets. Biocon Biologics is a wholly-owned subsidiary of Biocon Ltd, India. We believe housing the biosimilar rights in the UK subsidiary points to possibilities of monetization in future. The resultant legal structure would make it easier for the company to go for an outright sale or fresh listing of the subsidiary on the London stock exchange. Given Biocon’s recent success with Syngene listing, we believe listing of the biologic subsidiary is a more likely possibility. However, the biosimilar portfolio would need to be more mature for that to happen; therefore, this may be a multi-year process. Figure 17: Biocon has consolidated all its biosimilar assets under Biocon BiologicsLimited, a new legal entity incorporated in UK
Source: Company; *Includes 0.93% held by Biocon Research Limited
Biocon – BUY
Institutional Equities
Payer-forced switching has taken care of the interchangeability issues in biosimilars USFDA has approved nine biosimilar products so far, but none of these products has been approved as an interchangeable product. A non-interchangeable product needs to be backed by a commercial organization, which details the product to the physicians while an interchangeable product can be substituted at the pharmacy level, even if the physician has prescribed the reference brand. Figure 18: The differences between non‐interchangeable and interchangeable products
Non‐interchangeable Interchangeable
Allows for Biosimilar approvals in the US
Is the second step in a USFDA preferred two‐step process, Biosimilarity being the first
Allows manufacturers to put out product on market and claim to the physician that the biosimilar is "as good as" innovator product
Allows Pharmacy level switch, even if physician has prescribed the innovator product
Requires a sales force to details physicians
Doesn’t require a sales force
Source: IIFL Research
USFDA published draft guidance in Jan-2017 on biosimilars interchangeability requirements. As per the guidance, the biosimilar aspirant needs to demonstrate that the proposed interchangeable product “can be expected to produce the same clinical result as the reference product in any given patient.” In addition, USFDA will require data from a switching study or studies between the innovator and the biosimilar product. The aim of the switching studies would be to demonstrate that the clinical outcomes (safety or efficacy) do not worsen after the switch1. USFDA is currently reviewing industry and stakeholder comments on the draft guidance and the Agency is expected to issue either a revised draft guidance or final guidance within the next two years. Through USFDA’s draft guidance on interchangeability, manufacturers now know certain regulator preferences. Manufacturers will not have to rework existing approved biosimilars to make them interchangeable, but will only need to produce additional data by conducting switching studies. As a result, biosimilar players are rushing through several clinical trials simultaneously in order to receive approvals and be the first to market, and “park” themselves in the marketplace while waiting for USFDA’s final guidance on interchangeability. The interchangeability issues (and the corresponding need for detailing the biosimilar product) have also been addressed to some extent by the payer-forced exclusion of reference brands from the formularies once the biosimilar becomes commercially available. For example, some insurers removed Lantus from the formulary once Eli Lilly’s Basaglar was launched in the US (Lantus U.S. Commercial Payer coverage has continued to come down). This payer-led forced
1 Application should be sufficient to show that “for a biological product that is administered more than once to an individual, the risk in terms of safety or diminished efficacy of alternating or switching between use of the biological product and the reference product is not greater than the risk of using the reference product without such alternation or switch”

21
Biocon – BUY
Institutional Equities
exclusion meant that this section of patients had no option but to switch to the cheaper Eli Lilly biosimilar product. We believe that similar steps by payers in other products would help biosimilars even if they do not get an interchangeable status. Because of the payer-forced switching, biosimilar companies would be in a great position to decide whether: • They should produce additional data and change their product
status from biosimilar to interchangeable; or • If the economics so allow, continue marketing their products only
as biosimilars.

Biocon – BUY
Institutional Equities
Syngene is the second most important value driver for Biocon after biosimilars Consistent track record of growth and profitability Syngene is Biocon’s contract research subsidiary in which Biocon holds a 73.54% stake (including 0.93% held by Biocon Research Limited). Syngene was established in 1994 as India’s first Contract Research Organization (CRO). Over the past 23 years, Syngene has built expertise in novel molecule discovery, development and manufacturing services. The company offers an integrated services platform across small and large molecules, antibody-drug conjugates and oligonucleotides.
Figure 19: Syngene offers an integrated services platform across discovery, development and manufacturing services
Source: Company
Contract research services provided by Syngene range from chemistry and small animal studies to bio-informatics. Syngene has consistently expanded its client base, which now comprises 293 companies, including eight of the top 10 global pharma players. Syngene’s R&D and manufacturing infrastructure spreads over 1.3mn square feet and the company boasts a talent pool of ~3,100 qualified scientists. Figure 20: Syngene has consistently added to its client base
Source: Company, IIFL Research
50
100
150
200
250
300
350
FY12A FY13A FY14A FY15A FY16A FY17A
Number of clients serviced by Syngene
23
Biocon – BUY
Institutional Equities
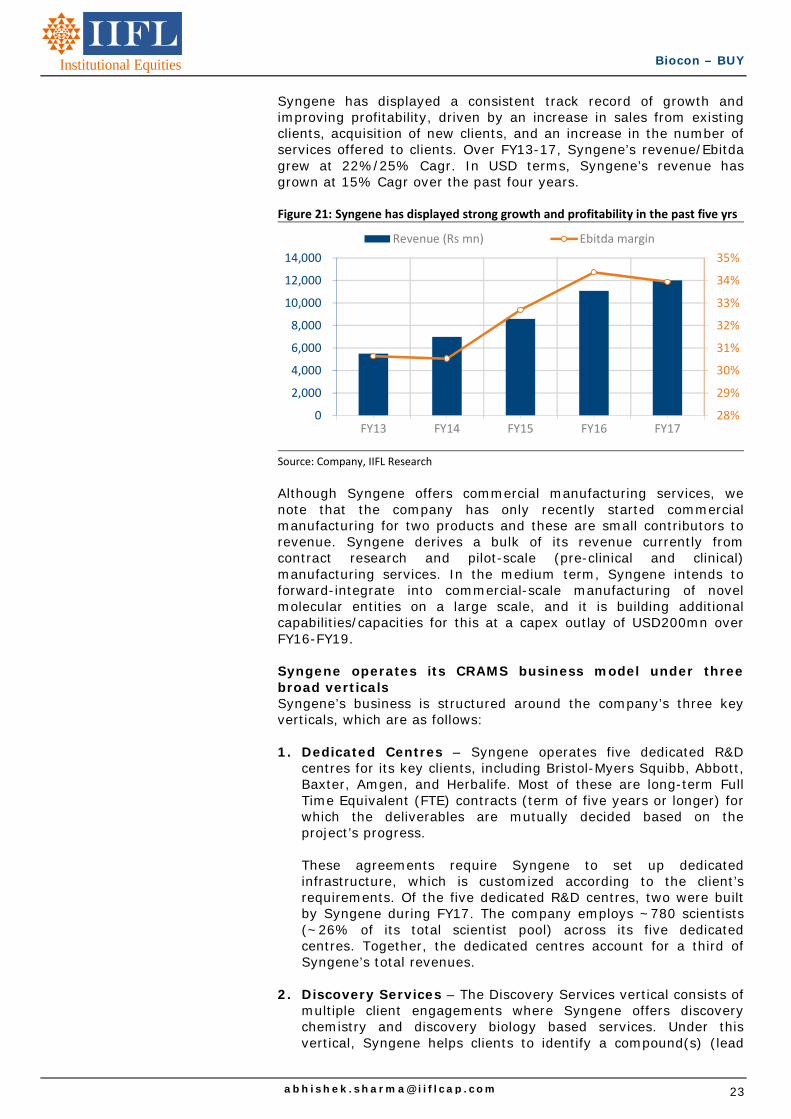
Syngene has displayed a consistent track record of growth and improving profitability, driven by an increase in sales from existing clients, acquisition of new clients, and an increase in the number of services offered to clients. Over FY13-17, Syngene’s revenue/Ebitda grew at 22%/25% Cagr. In USD terms, Syngene’s revenue has grown at 15% Cagr over the past four years. Figure 21: Syngene has displayed strong growth and profitability in the past five yrs
Source: Company, IIFL Research
Although Syngene offers commercial manufacturing services, we note that the company has only recently started commercial manufacturing for two products and these are small contributors to revenue. Syngene derives a bulk of its revenue currently from contract research and pilot-scale (pre-clinical and clinical) manufacturing services. In the medium term, Syngene intends to forward-integrate into commercial-scale manufacturing of novel molecular entities on a large scale, and it is building additional capabilities/capacities for this at a capex outlay of USD200mn over FY16-FY19. Syngene operates its CRAMS business model under three broad verticals Syngene’s business is structured around the company’s three key verticals, which are as follows: 1. Dedicated Centres – Syngene operates five dedicated R&D
centres for its key clients, including Bristol-Myers Squibb, Abbott, Baxter, Amgen, and Herbalife. Most of these are long-term Full Time Equivalent (FTE) contracts (term of five years or longer) for which the deliverables are mutually decided based on the project’s progress. These agreements require Syngene to set up dedicated infrastructure, which is customized according to the client’s requirements. Of the five dedicated R&D centres, two were built by Syngene during FY17. The company employs ~780 scientists (~26% of its total scientist pool) across its five dedicated centres. Together, the dedicated centres account for a third of Syngene’s total revenues.
2. Discovery Services – The Discovery Services vertical consists of multiple client engagements where Syngene offers discovery chemistry and discovery biology based services. Under this vertical, Syngene helps clients to identify a compound(s) (lead
28%
29%
30%
31%
32%
33%
34%
35%
0
2,000
4,000
6,000
8,000
10,000
12,000
14,000
FY13 FY14 FY15 FY16 FY17
Revenue (Rs mn) Ebitda margin

Biocon – BUY
Institutional Equities
identification to drug candidate selection), or develop a process(es) or deliver a specific report(s). Syngene’s contracts under this vertical are largely FTE based engagements which are typically renewed annually (high renewal rates). The Discovery Services vertical accounts for one-fourth of Syngene’s total revenues.
3. Development and Manufacturing Services – Under the Development services, Syngene offers activities across multiple disciplines as a molecule moves from preclinical to clinical trials. Services offered by Syngene include preclinical and clinical studies, analytical and bio-analytical evaluation, formulation development, and stability studies. These agreements are largely structured as Fee for Service (FFS) contracts (both short and long term).
In Manufacturing Services, Syngene provides manufacturing support for scale-up, pre-clinical and clinical supplies quantities mainly. Although Syngene offers commercial manufacturing services also, we note that the company has only recently started commercial manufacturing for two products and Syngene’s existing manufacturing facility at Bangalore can only support initial commercial supplies. In order to manufacture larger commercial scale batches, Syngene is setting up a new manufacturing facility in Mangalore. The Development and Manufacturing Services is Syngene’s largest vertical and it accounts for 40-42% of the company’s total revenues.
Figure 22: Syngene’s revenue break‐up across its three business verticals
Source: Company, IIFL Research
Syngene is adding service lines in biology and manufacturing for growth Syngene has committed to spend USD200mn over FY16 to FY19 in order to ramp up capabilities and expand its manufacturing infrastructure. Of the USD200mn, the company has already invested USD102mn until 2QFY18. Key facility additions by Syngene during the last two years include dedicated R&D centers for Amgen and Herbalife, Phase I of the new Formulation manufacturing facility (spread across 17,000 sq ft), Phase I of the new Syngene Research Centre (occupying 50,000 sq ft) and a Viral testing facility. Separately, Syngene has also added
Dedicated centers33%
Discovery Services25%
Development &
Manufacturing Services42%
Syngene's revenue breakup (2QFY18)
25
Biocon – BUY
Institutional Equities
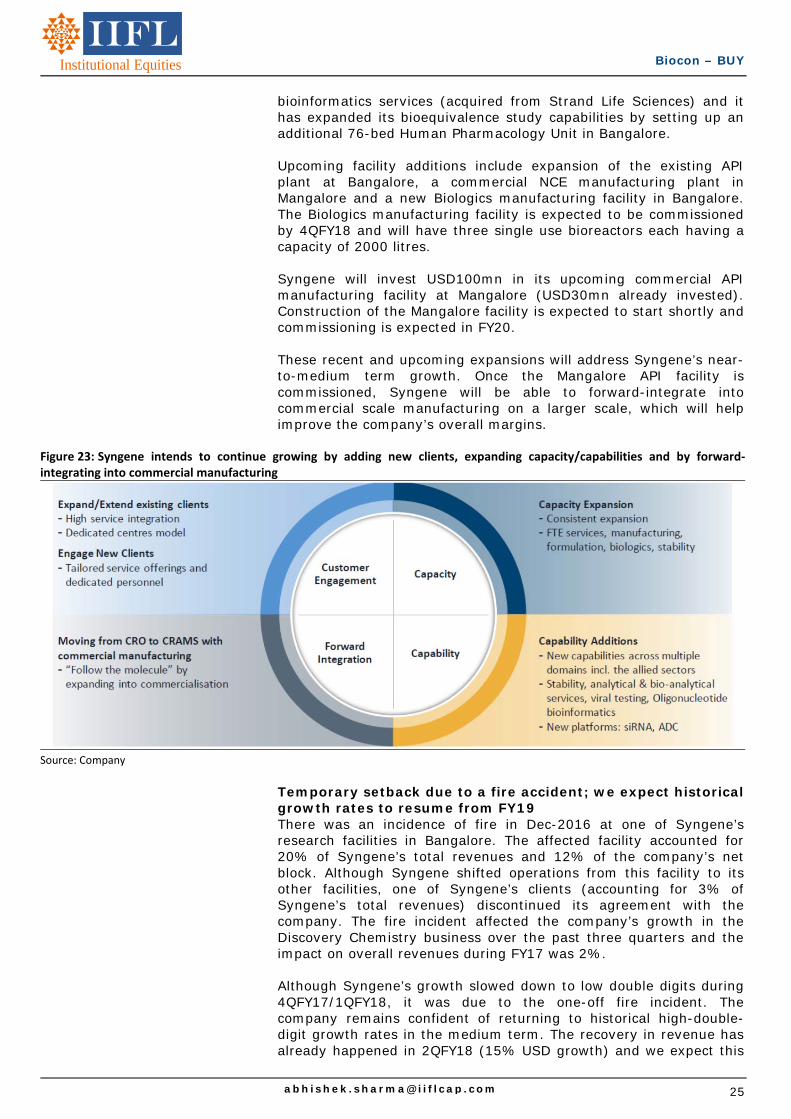
bioinformatics services (acquired from Strand Life Sciences) and it has expanded its bioequivalence study capabilities by setting up an additional 76-bed Human Pharmacology Unit in Bangalore. Upcoming facility additions include expansion of the existing API plant at Bangalore, a commercial NCE manufacturing plant in Mangalore and a new Biologics manufacturing facility in Bangalore. The Biologics manufacturing facility is expected to be commissioned by 4QFY18 and will have three single use bioreactors each having a capacity of 2000 litres. Syngene will invest USD100mn in its upcoming commercial API manufacturing facility at Mangalore (USD30mn already invested). Construction of the Mangalore facility is expected to start shortly and commissioning is expected in FY20. These recent and upcoming expansions will address Syngene’s near-to-medium term growth. Once the Mangalore API facility is commissioned, Syngene will be able to forward-integrate into commercial scale manufacturing on a larger scale, which will help improve the company’s overall margins.
Figure 23: Syngene intends to continue growing by adding new clients, expanding capacity/capabilities and by forward‐integrating into commercial manufacturing
Source: Company
Temporary setback due to a fire accident; we expect historical growth rates to resume from FY19 There was an incidence of fire in Dec-2016 at one of Syngene’s research facilities in Bangalore. The affected facility accounted for 20% of Syngene’s total revenues and 12% of the company’s net block. Although Syngene shifted operations from this facility to its other facilities, one of Syngene’s clients (accounting for 3% of Syngene’s total revenues) discontinued its agreement with the company. The fire incident affected the company’s growth in the Discovery Chemistry business over the past three quarters and the impact on overall revenues during FY17 was 2%. Although Syngene’s growth slowed down to low double digits during 4QFY17/1QFY18, it was due to the one-off fire incident. The company remains confident of returning to historical high-double-digit growth rates in the medium term. The recovery in revenue has already happened in 2QFY18 (15% USD growth) and we expect this
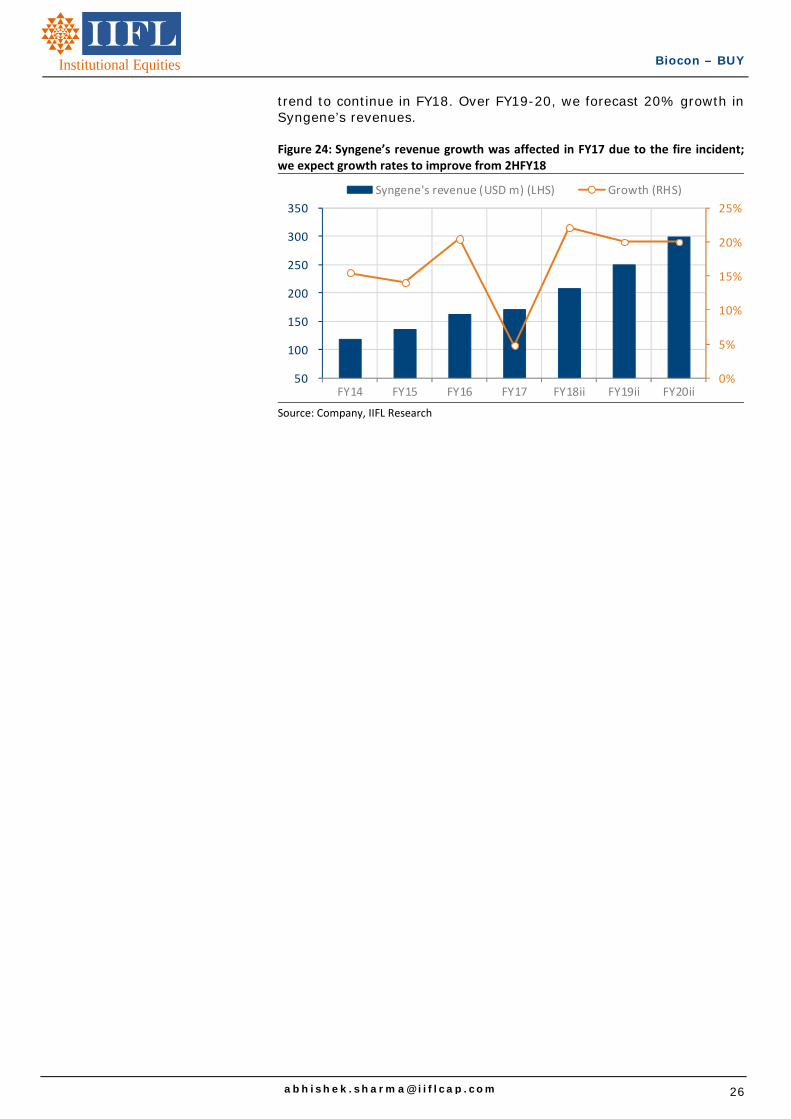
Biocon – BUY
Institutional Equities
trend to continue in FY18. Over FY19-20, we forecast 20% growth in Syngene’s revenues. Figure 24: Syngene’s revenue growth was affected in FY17 due to the fire incident;we expect growth rates to improve from 2HFY18
Source: Company, IIFL Research
0%
5%
10%
15%
20%
25%
50
100
150
200
250
300
350
FY14 FY15 FY16 FY17 FY18ii FY19ii FY20ii
Syngene's revenue (USD m) (LHS) Growth (RHS)
27
Biocon – BUY
Institutional Equities
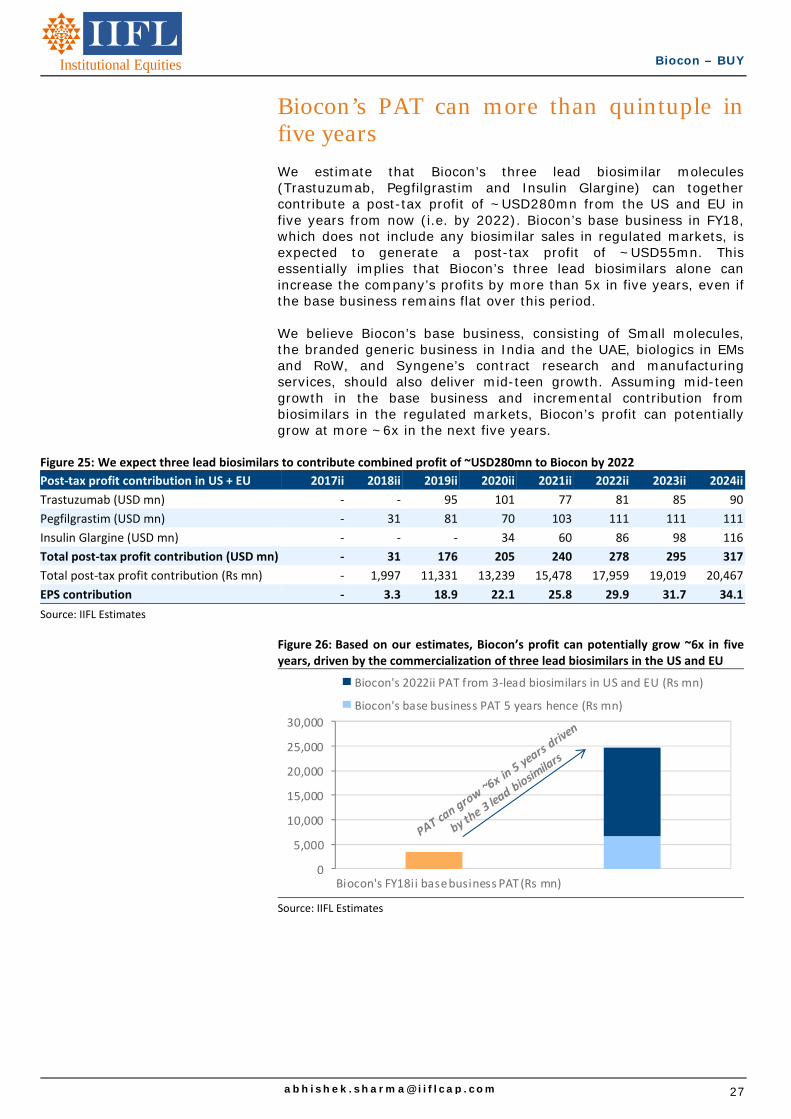
Biocon’s PAT can more than quintuple in five years We estimate that Biocon’s three lead biosimilar molecules (Trastuzumab, Pegfilgrastim and Insulin Glargine) can together contribute a post-tax profit of ~USD280mn from the US and EU in five years from now (i.e. by 2022). Biocon’s base business in FY18, which does not include any biosimilar sales in regulated markets, is expected to generate a post-tax profit of ~USD55mn. This essentially implies that Biocon’s three lead biosimilars alone can increase the company’s profits by more than 5x in five years, even if the base business remains flat over this period. We believe Biocon’s base business, consisting of Small molecules, the branded generic business in India and the UAE, biologics in EMs and RoW, and Syngene’s contract research and manufacturing services, should also deliver mid-teen growth. Assuming mid-teen growth in the base business and incremental contribution from biosimilars in the regulated markets, Biocon’s profit can potentially grow at more ~6x in the next five years.
Figure 25: We expect three lead biosimilars to contribute combined profit of ~USD280mn to Biocon by 2022
Post‐tax profit contribution in US + EU 2017ii 2018ii 2019ii 2020ii 2021ii 2022ii 2023ii 2024ii
Trastuzumab (USD mn) ‐ ‐ 95 101 77 81 85 90
Pegfilgrastim (USD mn) ‐ 31 81 70 103 111 111 111
Insulin Glargine (USD mn) ‐ ‐ ‐ 34 60 86 98 116
Total post‐tax profit contribution (USD mn) ‐ 31 176 205 240 278 295 317
Total post‐tax profit contribution (Rs mn) ‐ 1,997 11,331 13,239 15,478 17,959 19,019 20,467
EPS contribution ‐ 3.3 18.9 22.1 25.8 29.9 31.7 34.1
Source: IIFL Estimates
Figure 26: Based on our estimates, Biocon’s profit can potentially grow ~6x in five years, driven by the commercialization of three lead biosimilars in the US and EU
Source: IIFL Estimates
0
5,000
10,000
15,000
20,000
25,000
30,000
Biocon's FY18ii base business PAT (Rs mn)
Biocon's 2022ii PAT from 3‐lead biosimilars in US and EU (Rs mn)
Biocon's base business PAT 5 years hence (Rs mn)

Biocon – BUY
Institutional Equities
Biocon’s base business (ex- biosimilars in regulated markets) should deliver mid-teen growth
Figure 27: Growth expectation in Biocon’s base business (ex‐of biosimilars in regulated markets)
Business segment
1HFY18 revenue
contribution
Description Growth prospects IIFL’s growth expectation (FY17‐20ii
CAGR)
Small Molecules
38% Largely APIs and some Generic Formulations for the regulated markets. API portfolio includes fermentation‐based stations and immunosuppressants and a few other biopharma products
API business is expected to have single digit volume expansion accompanied by price pressure. Biocon has recently started filing ANDAs in US and Generic Formulations business will take time to ramp‐up. Intends to file ~10‐15 ANDAs in the next few years. Company has recently commissioned a new oral solid dosage facility at an investment of USD25mn
5%
Biologics 18% Includes Biosimilars and Novel Biologics business in EM and RoW markets
Company's Recombinant Human Insulin is approved in 55+ Emerging Markets. Trastuzumab is also approved in a number of markets. Growth going forward will be driven by launches of biosimilars in additional EM & RoW markets and the 3‐year Malaysian contract for Insulins
30%
Branded Formulations
16% Includes Branded Generics/Specialty business in India and UAE. Key products in India include rh‐insulin, Glargine, Nimotuzumab, Glimepiride+Metformin, Trastuzumab, Everolimus, Tacrolimus and Itolizumab
Growth was impacted in FY15/16 due to product rationalization, NLEM pricing impact and withdrawal of the licensing agreement for one of the key products (Abraxane). Growth is expected to pick‐up now driven by various initiatives (change in business leadership, ongoing in‐licensing talks with other companies)
10%
Syngene (Research Services)
33% Syngene is India’s leading contract research organisation (CRO) offering a full line of pharma R&D services to global clients from its India base. The company has consistently added to its client base and it now runs four dedicated R&D centres for large pharma/biotech clients.
Growth was impacted from 3QFY17 to 1QFY18 due to a fire accident at one of the facilities. However, it has started to normalize now. Future growth drivers include adding new service lines/clients and forward integrating from CRO to CRAMS with commercial manufacturing
20%
Intersegmental ‐4%
Blended base business growth 15%
Source: Company, IIFL Research
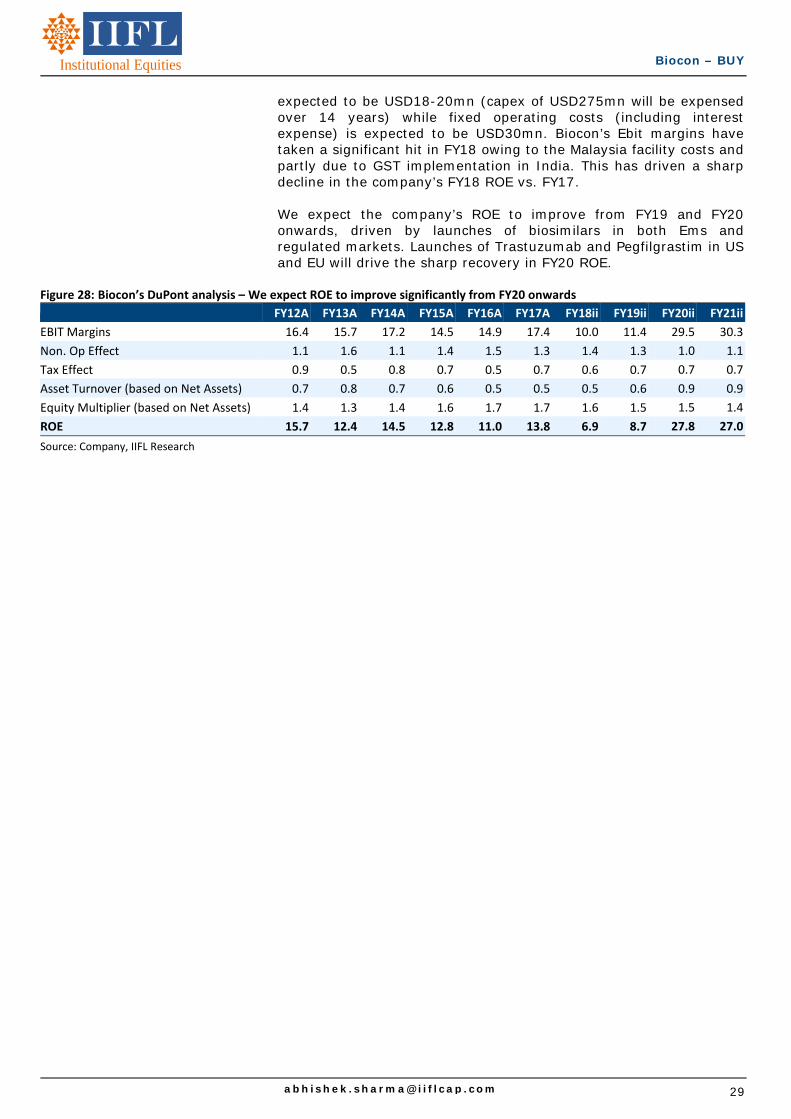
ROE should improve once biosimilar commercialization begins in the regulated markets Biocon’s ROE has been historically lower compared with peers because of the company’s significant investments in R&D and the manufacturing facilities for the biosimilar projects. R&D investments have put pressure on Ebit margins, and investments in manufacturing facilities have led to lower asset turnover. Asset turnover has been low as the company has invested ~USD275mn in its new Malaysia insulin facility, which has not started contributing meaningfully to revenues yet. Revenues from the Malaysia facility are currently small. However, the operational and fixed costs related to the facility have started affecting company’s P&L from 1QFY18 onwards. The company has previously indicated that depreciation owing to the Malaysia facility is
29
Biocon – BUY
Institutional Equities
expected to be USD18-20mn (capex of USD275mn will be expensed over 14 years) while fixed operating costs (including interest expense) is expected to be USD30mn. Biocon’s Ebit margins have taken a significant hit in FY18 owing to the Malaysia facility costs and partly due to GST implementation in India. This has driven a sharp decline in the company’s FY18 ROE vs. FY17. We expect the company’s ROE to improve from FY19 and FY20 onwards, driven by launches of biosimilars in both Ems and regulated markets. Launches of Trastuzumab and Pegfilgrastim in US and EU will drive the sharp recovery in FY20 ROE.
Figure 28: Biocon’s DuPont analysis – We expect ROE to improve significantly from FY20 onwards
FY12A FY13A FY14A FY15A FY16A FY17A FY18ii FY19ii FY20ii FY21ii
EBIT Margins 16.4 15.7 17.2 14.5 14.9 17.4 10.0 11.4 29.5 30.3
Non. Op Effect 1.1 1.6 1.1 1.4 1.5 1.3 1.4 1.3 1.0 1.1
Tax Effect 0.9 0.5 0.8 0.7 0.5 0.7 0.6 0.7 0.7 0.7
Asset Turnover (based on Net Assets) 0.7 0.8 0.7 0.6 0.5 0.5 0.5 0.6 0.9 0.9
Equity Multiplier (based on Net Assets) 1.4 1.3 1.4 1.6 1.7 1.7 1.6 1.5 1.5 1.4
ROE 15.7 12.4 14.5 12.8 11.0 13.8 6.9 8.7 27.8 27.0
Source: Company, IIFL Research
Biocon – BUY
Institutional Equities
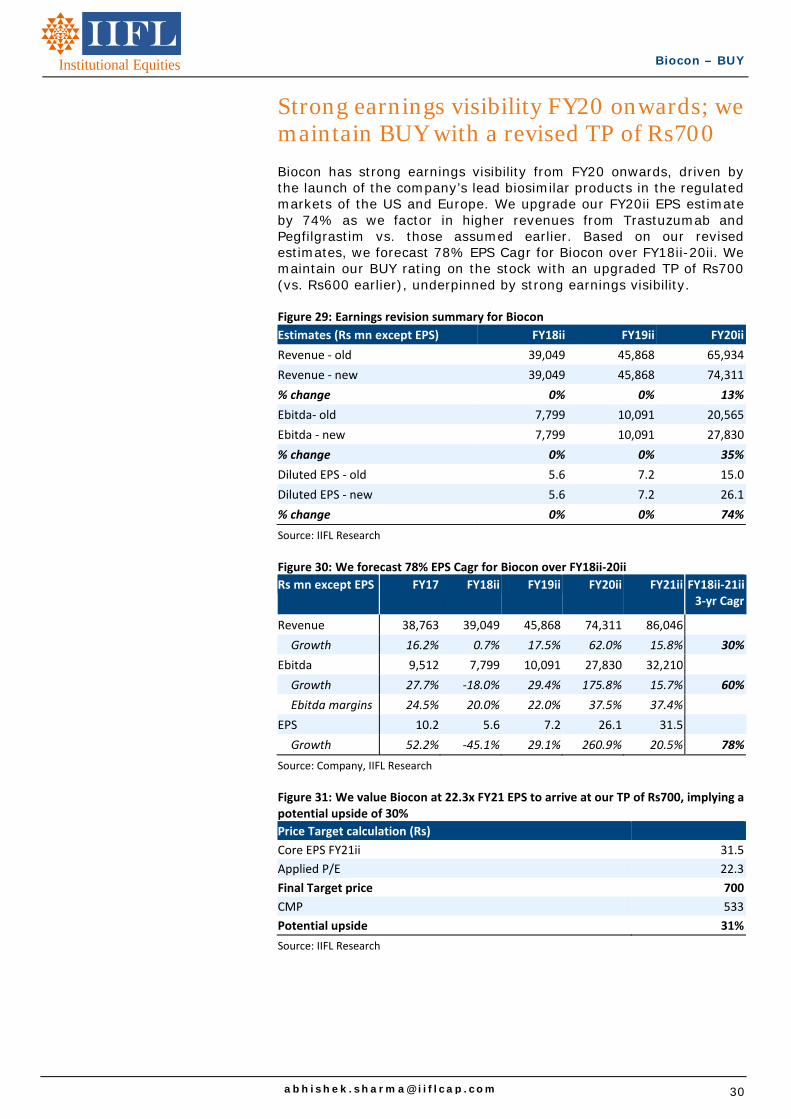
Strong earnings visibility FY20 onwards; we maintain BUY with a revised TP of Rs700 Biocon has strong earnings visibility from FY20 onwards, driven by the launch of the company’s lead biosimilar products in the regulated markets of the US and Europe. We upgrade our FY20ii EPS estimate by 74% as we factor in higher revenues from Trastuzumab and Pegfilgrastim vs. those assumed earlier. Based on our revised estimates, we forecast 78% EPS Cagr for Biocon over FY18ii-20ii. We maintain our BUY rating on the stock with an upgraded TP of Rs700 (vs. Rs600 earlier), underpinned by strong earnings visibility. Figure 29: Earnings revision summary for Biocon
Estimates (Rs mn except EPS) FY18ii FY19ii FY20ii
Revenue ‐ old 39,049 45,868 65,934
Revenue ‐ new 39,049 45,868 74,311
% change 0% 0% 13%
Ebitda‐ old 7,799 10,091 20,565
Ebitda ‐ new 7,799 10,091 27,830
% change 0% 0% 35%
Diluted EPS ‐ old 5.6 7.2 15.0
Diluted EPS ‐ new 5.6 7.2 26.1
% change 0% 0% 74%
Source: IIFL Research
Figure 30: We forecast 78% EPS Cagr for Biocon over FY18ii‐20ii
Rs mn except EPS FY17 FY18ii FY19ii FY20ii FY21ii FY18ii‐21ii 3‐yr Cagr
Revenue 38,763 39,049 45,868 74,311 86,046
Growth 16.2% 0.7% 17.5% 62.0% 15.8% 30%
Ebitda 9,512 7,799 10,091 27,830 32,210
Growth 27.7% ‐18.0% 29.4% 175.8% 15.7% 60%
Ebitda margins 24.5% 20.0% 22.0% 37.5% 37.4%
EPS 10.2 5.6 7.2 26.1 31.5
Growth 52.2% ‐45.1% 29.1% 260.9% 20.5% 78%
Source: Company, IIFL Research
Figure 31: We value Biocon at 22.3x FY21 EPS to arrive at our TP of Rs700, implying a potential upside of 30%
Price Target calculation (Rs)
Core EPS FY21ii 31.5
Applied P/E 22.3
Final Target price 700
CMP 533
Potential upside 31%
Source: IIFL Research
31
Biocon – BUY
Institutional Equities
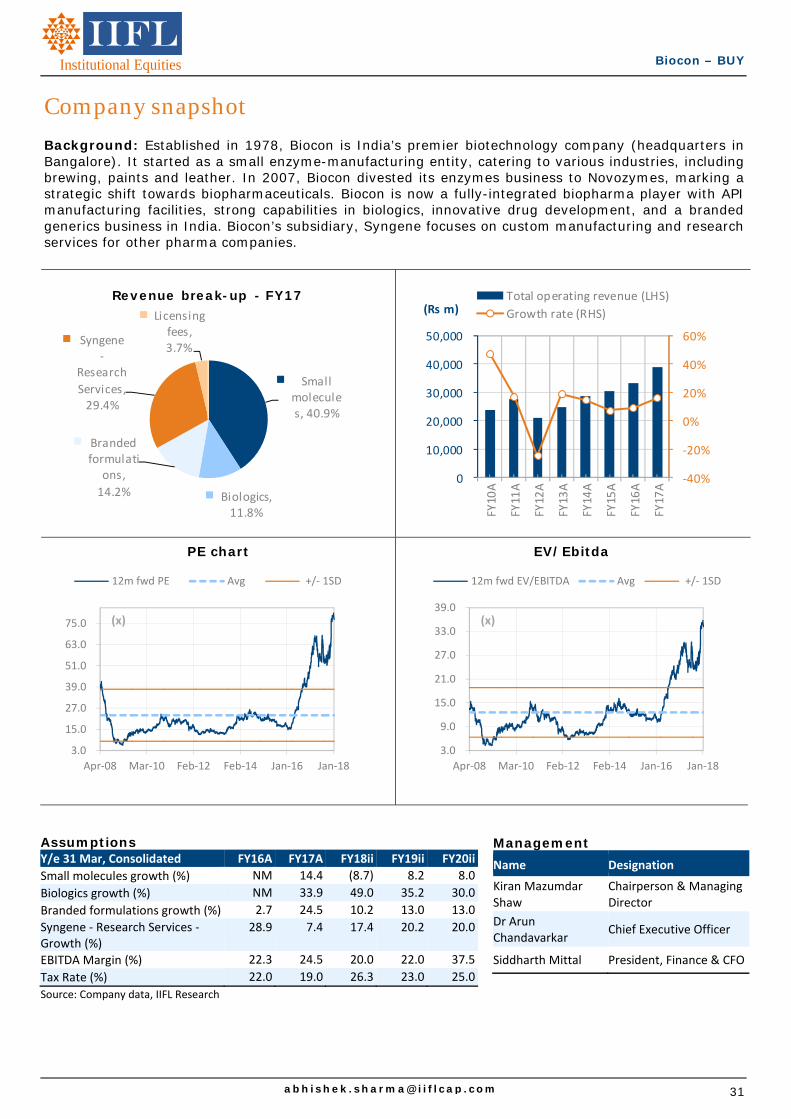
Company snapshot Background: Established in 1978, Biocon is India’s premier biotechnology company (headquarters in Bangalore). It started as a small enzyme-manufacturing entity, catering to various industries, including brewing, paints and leather. In 2007, Biocon divested its enzymes business to Novozymes, marking a strategic shift towards biopharmaceuticals. Biocon is now a fully-integrated biopharma player with API manufacturing facilities, strong capabilities in biologics, innovative drug development, and a branded generics business in India. Biocon’s subsidiary, Syngene focuses on custom manufacturing and research services for other pharma companies.
PE chart
EV/Ebitda
Assumptions Y/e 31 Mar, Consolidated FY16A FY17A FY18ii FY19ii FY20ii
Small molecules growth (%) NM 14.4 (8.7) 8.2 8.0 Biologics growth (%) NM 33.9 49.0 35.2 30.0 Branded formulations growth (%) 2.7 24.5 10.2 13.0 13.0 Syngene ‐ Research Services ‐ Growth (%)
28.9 7.4 17.4 20.2 20.0
EBITDA Margin (%) 22.3 24.5 20.0 22.0 37.5 Tax Rate (%) 22.0 19.0 26.3 23.0 25.0 Source: Company data, IIFL Research
‐40%
‐20%
0%
20%
40%
60%
0
10,000
20,000
30,000
40,000
50,000
FY10A
FY11A
FY12A
FY13A
FY14A
FY15A
FY16A
FY17A
Total operating revenue (LHS)
Growth rate (RHS)(Rs m)
3.0
9.0
15.0
21.0
27.0
33.0
39.0
Apr‐08 Mar‐10 Feb‐12 Feb‐14 Jan‐16 Jan‐18
12m fwd EV/EBITDA Avg +/‐ 1SD
(x)
3.0
15.0
27.0
39.0
51.0
63.0
75.0
Apr‐08 Mar‐10 Feb‐12 Feb‐14 Jan‐16 Jan‐18
12m fwd PE Avg +/‐ 1SD
(x)
Small molecules, 40.9%
Biologics, 11.8%
Branded formulati
ons,
14.2%
Syngene ‐
Research
Services, 29.4%
Licensing fees, 3.7%
Revenue break-up - FY17
Management Name Designation
Kiran Mazumdar Shaw
Chairperson & Managing Director
Dr Arun Chandavarkar
Chief Executive Officer
Siddharth Mittal President, Finance & CFO

Biocon – BUY
Institutional Equities
Financial summary Income statement summary (Rs m)
Y/e 31 Mar, Consolidated FY16A FY17A FY18ii FY19ii FY20ii
Revenues 33,372 38,763 39,049 45,868 74,311
Ebitda 7,450 9,512 7,799 10,091 27,830
Depreciation and amortisation (2,487) (2,772) (3,899) (4,850) (5,905)
Ebit 4,963 6,740 3,901 5,241 21,925
Non‐operating income 1,237 2,017 2,320 1,908 1,401
Financial expense (293) (260) (600) (473) (626)
PBT 5,907 8,497 5,621 6,676 22,699
Exceptionals 1,483 0 0 0 0
Reported PBT 7,390 8,497 5,621 6,676 22,699
Tax expense (1,299) (1,616) (1,480) (1,536) (5,675)
PAT 6,091 6,881 4,141 5,141 17,025
Minorities, Associates etc. (587) (760) (780) (801) (1,362)
Attributable PAT 5,504 6,121 3,360 4,340 15,663
Ratio analysis
Y/e 31 Mar, Consolidated FY16A FY17A FY18ii FY19ii FY20ii
Per share data (Rs) Pre‐exceptional EPS 6.7 10.2 5.6 7.2 26.1
DPS 5.0 3.0 5.0 5.0 5.0
BVPS 71.7 86.9 90.2 92.7 115.1
Growth ratios (%) Revenues 9.1 16.2 0.7 17.5 62.0
Ebitda 12.0 27.7 (18.0) 29.4 175.8
EPS 0.1 52.2 (45.1) 29.1 260.9
Profitability ratios (%) Ebitda margin 22.3 24.5 20.0 22.0 37.5
Ebit margin 14.9 17.4 10.0 11.4 29.5
Tax rate 17.6 19.0 26.3 23.0 25.0
Net profit margin 18.3 17.8 10.6 11.2 22.9
Return ratios (%) ROE 11.0 13.8 6.9 8.7 27.8
ROCE 10.0 11.6 8.0 9.5 28.5
Solvency ratios (x)
Net debt‐equity 0.0 0.0 0.0 0.1 0.1
Net debt to Ebitda 0.1 0.2 0.2 0.5 0.1
Interest coverage 16.9 25.9 6.5 11.1 35.0
Source: Company data, IIFL Research

33
Biocon – BUY
Institutional Equities
Balance sheet summary (Rs m)
Y/e 31 Mar, Consolidated FY16A FY17A FY18ii FY19ii FY20ii
Cash & cash equivalents 24,133 21,093 17,350 9,337 13,330
Inventories 5,424 6,353 6,248 7,339 11,890
Receivables 7,145 8,832 8,981 10,550 17,091
Other current assets 3,007 4,199 1,971 3,437 9,552
Creditors 12,087 14,309 14,813 17,529 23,952
Other current liabilities 374 468 312 358 465
Net current assets 27,248 25,700 19,424 12,775 27,447 Fixed assets 39,206 43,921 48,022 51,173 53,268
Intangibles 672 722 722 722 722
Investments 259 422 422 422 422
Other long‐term assets 4,735 8,400 8,400 8,400 8,400
Total net assets 72,120 79,165 76,990 73,491 90,259 Borrowings 24,920 23,088 18,939 13,910 17,264
Other long‐term liabilities 4,204 3,939 3,939 3,939 3,939
Shareholders’ equity 42,996 52,138 54,112 55,642 69,056 Total liabilities 72,120 79,165 76,990 73,491 90,259 Cash flow summary (Rs m)
Y/e 31 Mar, Consolidated FY16A FY17A FY18ii FY19ii FY20ii
Ebit 4,963 6,740 3,901 5,241 21,925
Tax paid (2,465) (2,030) (1,480) (1,536) (5,675)
Depreciation and amortization 2,487 2,772 3,899 4,850 5,905
Net working capital change (1,762) (2,270) 2,533 (1,364) (10,678)
Other operating items 483 1,188 0 0 0
Operating cash flow before interest
3,706 6,400 8,852 7,192 11,476
Financial expense (501) (586) 1,720 1,435 775
Non‐operating income 6,101 (46) 0 0 0
Operating cash flow after interest 9,306 5,768 10,572 8,627 12,251
Capital expenditure (8,028) (7,619) (8,000) (8,000) (8,000) Long‐term investments 0 0 0 0 0
Others 0 0 0 0 0
Free cash flow 1,278 (1,851) 2,572 627 4,251 Equity raising (51) 43 0 0 0
Borrowings 13,429 (1,232) (4,149) (5,029) 3,353
Dividend (2,201) 0 (2,166) (3,611) (3,611)
Net chg in cash and equivalents 12,455 (3,040) (3,743) (8,013) 3,994
Source: Company data, IIFL Research
Biocon – BUY
Institutional Equities
Disclosure : Published in 2018, © India Infoline Ltd 2018
India Infoline Group (hereinafter referred as IIFL) is engaged in diversified financial services business including equity broking, DP services, merchantbanking, portfolio management services, distribution of Mutual Fund, insurance products and other investment products and also loans and financebusiness. India Infoline Ltd (“hereinafter referred as IIL”) is a part of the IIFL and is a member of the National Stock Exchange of India Limited(“NSE”) and the BSE Limited (“BSE”). IIL is also a Depository Participant registered with NSDL & CDSL, a SEBI registered merchant banker and aSEBI registered portfolio manager. IIL is a large broking house catering to retail, HNI and institutional clients. It operates through its branches andauthorised persons and sub-brokers spread across the country and the clients are provided online trading through internet and offline trading throughbranches and Customer Care.
a) This research report (“Report”) is for the personal information of the authorized recipient(s) and is not for public distribution and should not bereproduced or redistributed to any other person or in any form without IIL’s prior permission. The information provided in the Report is frompublicly available data, which we believe, are reliable. While reasonable endeavors have been made to present reliable data in the Report so faras it relates to current and historical information, but IIL does not guarantee the accuracy or completeness of the data in the Report.Accordingly, IIL or any of its connected persons including its directors or subsidiaries or associates or employees shall not be in any wayresponsible for any loss or damage that may arise to any person from any inadvertent error in the information contained, views and opinionsexpressed in this publication.
b) Past performance should not be taken as an indication or guarantee of future performance, and no representation or warranty, express orimplied, is made regarding future performance. Information, opinions and estimates contained in this report reflect a judgment of its originaldate of publication by IIFL and are subject to change without notice. The price, value of and income from any of the securities or financialinstruments mentioned in this report can fall as well as rise. The value of securities and financial instruments is subject to exchange ratefluctuation that may have a positive or adverse effect on the price or income of such securities or financial instruments.
c) The Report also includes analysis and views of our research team. The Report is purely for information purposes and does not construe to beinvestment recommendation/advice or an offer or solicitation of an offer to buy/sell any securities. The opinions expressed in the Report are ourcurrent opinions as of the date of the Report and may be subject to change from time to time without notice. IIL or any persons connected withit do not accept any liability arising from the use of this document.
d) Investors should not solely rely on the information contained in this Report and must make investment decisions based on their own investmentobjectives, judgment, risk profile and financial position. The recipients of this Report may take professional advice before acting on thisinformation.
e) IIL has other business segments / divisions with independent research teams separated by 'Chinese walls' catering to different sets of customershaving varying objectives, risk profiles, investment horizon, etc and therefore, may at times have, different and contrary views onstocks, sectors and markets.
f) This report is not directed or intended for distribution to, or use by, any person or entity who is a citizen or resident of or located in any locality,state, country or other jurisdiction, where such distribution, publication, availability or use would be contrary to local law, regulation or whichwould subject IIL and its affiliates to any registration or licensing requirement within such jurisdiction. The securities described herein may ormay not be eligible for sale in all jurisdictions or to certain category of investors. Persons in whose possession this Report may come arerequired to inform themselves of and to observe such restrictions.
g) As IIL along with its associates, are engaged in various financial services business and so might have financial, business or other interests inother entities including the subject company(ies) mentioned in this Report. However, IIL encourages independence in preparation of researchreport and strives to minimize conflict in preparation of research report. IIL and its associates did not receive any compensation or otherbenefits from the subject company(ies) mentioned in the Report or from a third party in connection with preparation of the Report. Accordingly,IIL and its associates do not have any material conflict of interest at the time of publication of this Report.
h) As IIL and its associates are engaged in various financial services business, it might have:-
(a) received any compensation (except in connection with the preparation of this Report) from the subject company in the past twelve months;(b) managed or co-managed public offering of securities for the subject company in the past twelve months; (c) received any compensation forinvestment banking or merchant banking or brokerage services from the subject company in the past twelve months; (d) received anycompensation for products or services other than investment banking or merchant banking or brokerage services from the subject company inthe past twelve months; (e) engaged in market making activity for the subject company.
i) IIL and its associates collectively do not own (in their proprietary position) 1% or more of the equity securities of the subject companymentioned in the report as of the last day of the month preceding the publication of the research report.
j) The Research Analyst engaged in preparation of this Report or his/her relative:-
(a) does not have any financial interests in the subject company (ies) mentioned in this report; (b) does not own 1% or more of the equitysecurities of the subject company mentioned in the report as of the last day of the month preceding the publication of the research report; (c)does not have any other material conflict of interest at the time of publication of the research report.
k) The Research Analyst engaged in preparation of this Report:-
(a) has not received any compensation from the subject company in the past twelve months; (b) has not managed or co-managed publicoffering of securities for the subject company in the past twelve months; (c) has not received any compensation for investment banking ormerchant banking or brokerage services from the subject company in the past twelve months; (d) has not received any compensation forproducts or services other than investment banking or merchant banking or brokerage services from the subject company in the past twelvemonths; (e) has not received any compensation or other benefits from the subject company or third party in connection with the researchreport; (f) has not served as an officer, director or employee of the subject company; (g) is not engaged in market making activity for thesubject company.
L) IIFLCAP accepts responsibility for the contents of this research report, subject to the terms set out below, to the extent that it is delivered to aU.S. person other than a major U.S. institutional investor. The analyst whose name appears in this research report is not registered or qualifiedas a research analyst with the Financial Industry Regulatory Authority (“FINRA”) and may not be an associated person of IIFLCAP and,therefore, may not be subject to applicable restrictions under FINRA Rules on communications with a subject company, public appearances andtrading securities held by a research analyst account.
We submit that no material disciplinary action has been taken on IIL by any regulatory authority impacting Equity Research Analysis.

35
Biocon – BUY
Institutional Equities
0200400600800
1,0001,2001,400
Jan‐15
Feb‐15
Mar‐15
Apr‐15
May‐15
Jun‐15
Jul‐15
Aug‐15
Sep‐15
Oct‐15
Nov‐15
Dec‐15
Jan‐16
Feb‐16
Mar‐16
Apr‐16
May‐16
Jun‐16
Jul‐16
Aug‐16
Sep‐16
Oct‐16
Nov‐16
Dec‐16
Jan‐17
Feb‐17
Mar‐17
Apr‐17
May‐17
Jun‐17
Jul‐17
Aug‐17
Sep‐17
Oct‐ 17
Nov‐17
Dec‐17
Jan‐18
Price TP/Reco changed date(Rs)
Biocon: 3 year price and rating history
A graph of daily closing prices of securities is available at http://www.nseindia.com/ChartApp/install/charts/mainpage.jsp, www.bseindia.com andhttp://economictimes.indiatimes.com/markets/stocks/stock-quotes. (Choose a company from the list on the browser and select the “three years”period in the price chart).
Name, Qualification and Certification of Research Analyst: Dr Abhishek Sharma(PGDM), Rahul Jeewani(PGDM)
India Infoline Limited (Formerly “India Infoline Distribution Company Limited”), CIN No.: U99999MH1996PLC132983, Corporate Office– IIFL Centre, Kamala City, Senapati Bapat Marg, Lower Parel, Mumbai – 400013 Tel: (91-22) 4249 9000 .Fax: (91-22) 40609049, Regd. Office –IIFL House, Sun Infotech Park, Road No. 16V, Plot No. B-23, MIDC, Thane Industrial Area, Wagle Estate, Thane – 400604 Tel: (91-22) 25806650.Fax: (91-22) 25806654 E-mail: [email protected] Website: www.indiainfoline.com, Refer www.indiainfoline.com for detail of Associates.
National Stock Exchange of India Ltd. SEBI Regn. No. : INB231097537/ INF231097537/ INE231097537, Bombay Stock Exchange Ltd. SEBIRegn. No.:INB011097533/ INF011097533/ BSE-Currency, MCX Stock Exchange Ltd. SEBI Regn. No.: INB261097530/ INF261097530/INE261097537, United Stock Exchange Ltd. SEBI Regn. No.: INE271097532, PMS SEBI Regn. No. INP000002213, IA SEBI Regn. No. INA000000623,SEBI RA Regn.:- INH000000248
Key to our recommendation structure
BUY - Stock expected to give a return 10%+ more than average return on a debt instrument over a 1-year horizon.
SELL - Stock expected to give a return 10%+ below the average return on a debt instrument over a 1-year horizon.
Add - Stock expected to give a return 0-10% over the average return on a debt instrument over a 1-year horizon.
Reduce - Stock expected to give a return 0-10% below the average return on a debt instrument over a 1-year horizon.
Distribution of Ratings: Out of 211 stocks rated in the IIFL coverage universe, 109 have BUY ratings, 5 have SELL ratings, 71 have ADDratings and 26 have REDUCE ratings
Price Target: Unless otherwise stated in the text of this report, target prices in this report are based on either a discounted cash flow valuation orcomparison of valuation ratios with companies seen by the analyst as comparable or a combination of the two methods. The result of thisfundamental valuation is adjusted to reflect the analyst’s views on the likely course of investor sentiment. Whichever valuation method is used thereis a significant risk that the target price will not be achieved within the expected timeframe. Risk factors include unforeseen changes in competitivepressures or in the level of demand for the company’s products. Such demand variations may result from changes in technology, in the overall levelof economic activity or, in some cases, in fashion. Valuations may also be affected by changes in taxation, in exchange rates and, in certainindustries, in regulations. Investment in overseas markets and instruments such as ADRs can result in increased risk from factors such as exchangerates, exchange controls, taxation, and political and social conditions. This discussion of valuation methods and risk factors is not comprehensive –further information is available upon request.
Date Close price (Rs)
Targetprice(Rs)
Rating
27 Jan 2015 413 415 REDUCE 04 May 2015 453 435 REDUCE 27 Jul 2015 466 430 REDUCE
18 Apr 2016 554 654 BUY 25 Jul 2016 810 815 BUY 24 Oct 2016 1008 1037 BUY 27 Jan 2017 1023 1050 BUY 02 May 2017 1105 1075 BUY 12 Jul 2017 323 400 BUY
04 Dec 2017 447 600 BUY

www.iiflcap.comInstitutional Equities
IIFL - IndiaIIFL Holdings Ltd9th Floor, IIFL Centre, Kamala City, Senapati Bapat Marg, Lower Parel (W),Mumbai - 400013Tel +91-22-4646-4600Fax +91-22-4646-4700
IIFL - USAIIFL Inc.1120 avenue of the Americas suite 1502, New York,NY 10036 Tel +1-212-221-6800Fax +1-646-417-5800
IIFL - UKIIFL Wealth (UK) Limited 6 Bevis Marks,London - EC3A 7BA, United KingdomTel +44 (0) 20 707 87208