KTM Industries Buy CHF 90.00 - PIERER Mobility AG
70
KTM Industries (CDAX, Automobile & Parts) Analyst Franz Schall [email protected] +49 40 309537 - 230 Analyst Marc-René Tonn [email protected] +49 40 309537 - 259 F ULL N OTE Published 20.06.2019 08:15 1 RESEARCH Buy CHF 90.00 Price CHF 56.80 Upside 58.5 % Value Indicators: CHF Share data: Description: DCF: 90.05 FCF-Value Potential 21e: 77.61 Bloomberg: KTMI GR Reuters: KTMI.VI ISIN: AT0000KTMI02 Europe's largest manufacturer of sports motorcycles. Market Snapshot: CHF m Shareholders: Risk Profile (WRe): 2019e Market cap: 1,280 No. of shares (m): 23 EV: 2,282 Freefloat MC: 486 Ø Trad. Vol. (30d): 328.54 th Freefloat 38.0 % Pierer Industrie AG 62.0 % Remaining management 1.1 % Beta: 1.4 Price / Book: 3.4 x Equity Ratio: 41 % Net Fin. Debt / EBITDA: 1.4 x Net Debt / EBITDA: 1.5 x Taking a fresh look at Europe's leading motorcycle company; Initiation with Buy We initiate our coverage of KTM Industries, a leading European motorcycle manufacturer with a BUY recommendation and a PT of CHF 90. KTM Industries AG (KTMI) is a parent company with majority stakes in leading brands, including KTM, Husqvarna Motorcycles, WP Suspensions and Raymon, which, together, create a vertically integrated supply chain with which KTMI ensures production of all critical and performance-related components for motorcycles. KTMI is primarily a growth story, based on the following factors: A growth story: Historically, KTMI chalked up an incredible growth rate of ~15.6% CAGR in motorcycle unit sales for the 1993-2018 time period. We are fairly confident that the company can prolong its growth as it is maintaining its high level of innovation and has a shorter time- to-market cycle than competitors. It can generate synergies with the Husqvarna brand, boost street model sales in emerging markets via partnerships, and increase market share globally. Additionally, the new common 48-volt electric two-wheeler platform with which KTMI and Bajaj will start production in 2022e will target a new market segment with significant growth potential. We anticipate sales CAGR of ~7% 18- 21e and a CAGR of ~5% for 22e-32e. Sustained high level of growth in market share: Off-road is KTMI’s legacy business and, in Europe, it holds a market share of ~70%. The company has also delivered sustainable market share gains in the on-road segment. Today, KTM Industries is one of the market leaders in Europe and has a strong footprint in the USA (market share 12% and 9% respectively) with the clear goal of further increases. As KTMI has created a unique vertical supply chain which ensures production of all critical and performance-related components in-house, it has a clear competitive advantage over its peers. ROCE is set to improve: Our model reflects stable profitability and slower growth in capital employed. The result will be a decent improvement in returns on capital employed. Nevertheless while KTMI’s strong market position is fundamentally based on its technological leadership which continually requires heavy investment in new innovations, we also identified economies of scale and network effects resulting from a larger company with strong ties to established players in emerging markets (Bajaj & CF Moto). Investment case is based on exponential FCF generation: In the past, KTM Industries lacked FCF generation owing to high capex requirements which served as a basis for high growth. However, we expect Capex/sales to dramatically trend down from its current high level. Constant absolute capex of 150-160m in 19e-21e in connection with further revenue growth will bring FCF/sales to 3.8% in 2021e up from - 0.1% in 2018 and further improve with a larger share of licence fee income from Bajaj to >5% in the long run. Valuation requires deep analysis: Based on our DCF model, we initiate our coverage with a BUY rating and a price target of CHF 90 per share. Strong investment in growth in the past has had a massive, and distorting, influence on historical financial metrics. However we expect the magnitude of this impact to weaken as soon as in 2019e, which should cast a whole new light on the company, its FCF generation and, consequently, valuation. FY End: 31.12. in EUR m CAGR (18-21e) 2015 2016 2017 2018 2019e 2020e 2021e Sales 7.2 % 1,224 1,343 1,354 1,462 1,523 1,636 1,799 Change Sales yoy n.a. 9.8 % 0.8 % 8.0 % 4.1 % 7.4 % 10.0 % Gross profit margin 31.0 % 32.3 % 30.2 % 29.6 % 30.0 % 29.9 % 29.8 % EBITDA 10.8 % 178 198 194 211 242 262 287 Margin 14.6 % 14.8 % 14.3 % 14.4 % 15.9 % 16.0 % 16.0 % EBIT 8.7 % 113 122 122 129 134 147 166 Margin 9.2 % 9.1 % 9.0 % 8.8 % 8.8 % 9.0 % 9.2 % Net income -3.0 % 30 52 45 67 42 50 61 EPS -3.0 % 1.33 2.30 1.98 2.99 1.88 2.20 2.73 EPS adj. 14.5 % 1.33 2.30 1.77 1.82 1.88 2.20 2.73 DPS 0.0 % 0.03 0.03 0.30 0.30 0.30 0.30 0.30 Dividend Yield 0.1 % 0.1 % 0.6 % 0.5 % 0.6 % 0.6 % 0.6 % FCFPS -1.16 1.05 -0.77 -4.35 3.93 1.67 1.97 EV / Sales 1.2 x 1.3 x 1.6 x 1.6 x 1.3 x 1.3 x 1.1 x EV / EBITDA 8.5 x 8.9 x 10.9 x 10.9 x 8.5 x 7.9 x 7.2 x EV / EBIT 13.5 x 14.4 x 17.4 x 17.9 x 15.3 x 14.0 x 12.5 x P / E 18.5 x 15.7 x 26.0 x 20.8 x 27.1 x 23.1 x 18.6 x P / E adj. 18.5 x 15.7 x 29.1 x 34.1 x 27.1 x 23.1 x 18.6 x FCF Potential Yield 6.1 % 6.3 % 4.8 % 6.2 % 6.7 % 7.1 % 7.7 % Net Debt 408 388 399 348 358 341 317 ROE 30.5 % 22.0 % 15.1 % 21.9 % 13.4 % 14.0 % 15.3 % ROCE (NOPAT) 20.5 % 12.2 % 10.0 % 10.7 % 10.7 % 10.9 % 11.6 % Guidance: Revenue growth 1-5%; EBIT Margin 8-10%; FCF/sales 3-5% Rel. Performance vs CDAX: 1 month: -4.5 % 6 months: -19.7 % Year to date: -18.1 % Trailing 12 months: -12.4 % Company events: 27.06.19 Warburg Highlights 26.08.19 HY1
-
Upload
khangminh22 -
Category
Documents
-
view
0 -
download
0
Transcript of KTM Industries Buy CHF 90.00 - PIERER Mobility AG

KTM Industries
(CDAX, Automobile & Parts)
A n a l y s t
Franz Schall [email protected]
+49 40 309537-230
A n a l y s t
Marc-René [email protected]
+49 40 309537-259
FU L L NO T E Published 20.06.2019 08:15 1
RESEARCH
Buy
CHF 90.00
Price CHF 56.80
Upside 58.5 %
Value Indicators: CHF Share data: Description:
DCF: 90.05
FCF-Value Potential 21e: 77.61
Bloomberg: KTMI GR
Reuters: KTMI.VI
ISIN: AT0000KTMI02
Europe's largest manufacturer of sports motorcycles.
Market Snapshot: CHF m Shareholders: Risk Profile (WRe): 2019e
Market cap: 1,280
No. of shares (m): 23
EV: 2,282
Freefloat MC: 486
Ø Trad. Vol. (30d): 328.54 th
Freefloat 38.0 %
Pierer Industrie AG 62.0 %
Remaining management 1.1 %
Beta: 1.4
Price / Book: 3.4 x
Equity Ratio: 41 %
Net Fin. Debt / EBITDA: 1.4 x
Net Debt / EBITDA: 1.5 x
Taking a fresh look at Europe's leading motorcycle company; Initiation with Buy
We initiate our coverage of KTM Industries, a leading European motorcycle manufacturer with a BUY recommendation and a PT of CHF 90. KTM Industries AG (KTMI) is a parent company with majority stakes in leading brands, including KTM, Husqvarna Motorcycles, WP Suspensions and Raymon, which, together, create a vertically integrated supply chain with which KTMI ensures production of all critical and performance-related components for motorcycles. KTMI is primarily a growth story, based on the following factors:
� A growth story: Historically, KTMI chalked up an incredible growth rate of ~15.6% CAGR in motorcycle unit sales for the 1993-2018 time period. We are fairly confident that the company can prolong its growth as it is maintaining its high level of innovation and has a shorter time-to-market cycle than competitors. It can generate synergies with the Husqvarna brand, boost street model sales in emerging markets via partnerships, and increase market share globally. Additionally, the new common 48-volt electric two-wheeler platform with which KTMI and Bajaj will start production in 2022e will target a new market segment with significant growth potential. We anticipate sales CAGR of ~7% 18-21e and a CAGR of ~5% for 22e-32e.
� Sustained high level of growth in market share: Off-road is KTMI’s legacy business and, in Europe, it holds a market share of ~70%. The company has also delivered sustainable market share gains in the on-road segment. Today, KTM Industries is one of the market leaders in Europe and has a strong footprint in the USA (market share 12% and 9% respectively) with the clear goal of further increases. As KTMI has created a unique vertical supply chain which ensures production of all critical and performance-related components in-house, it has a clear competitive advantage over its peers.
� ROCE is set to improve: Our model reflects stable profitability and slower growth in capital employed. The result will be a decent improvement in returns on capital employed. Nevertheless while KTMI’s strong market position is fundamentally based on its technological leadership which continually requires heavy investment in new innovations, we also identified economies of scale and network effects resulting from a larger company with strong ties to established players in emerging markets (Bajaj & CF Moto).
� Investment case is based on exponential FCF generation: In the past, KTM Industries lacked FCF generation owing to high capex requirements which served as a basis for high growth. However, we expect Capex/sales to dramatically trend down from its current high level. Constant absolute capex of 150-160m in 19e-21e in connection with further revenue growth will bring FCF/sales to 3.8% in 2021e up from -0.1% in 2018 and further improve with a larger share of licence fee income from Bajaj to >5% in the long run.
� Valuation requires deep analysis: Based on our DCF model, we initiate our coverage with a BUY rating and a price target of CHF 90 per
share. Strong investment in growth in the past has had a massive, and distorting, influence on historical financial metrics. However we expect the magnitude of this impact to weaken as soon as in 2019e, which should cast a whole new light on the company, its FCF generation and, consequently, valuation.
FY End: 31.12. in EUR m
CAGR (18-21e) 2015 2016 2017 2018 2019e 2020e 2021e
Sales 7.2 % 1,224 1,343 1,354 1,462 1,523 1,636 1,799 Change Sales yoy n.a. 9.8 % 0.8 % 8.0 % 4.1 % 7.4 % 10.0 % Gross profit margin 31.0 % 32.3 % 30.2 % 29.6 % 30.0 % 29.9 % 29.8 %
EBITDA 10.8 % 178 198 194 211 242 262 287 Margin 14.6 % 14.8 % 14.3 % 14.4 % 15.9 % 16.0 % 16.0 %
EBIT 8.7 % 113 122 122 129 134 147 166 Margin 9.2 % 9.1 % 9.0 % 8.8 % 8.8 % 9.0 % 9.2 %
Net income -3.0 % 30 52 45 67 42 50 61 EPS -3.0 % 1.33 2.30 1.98 2.99 1.88 2.20 2.73 EPS adj. 14.5 % 1.33 2.30 1.77 1.82 1.88 2.20 2.73 DPS 0.0 % 0.03 0.03 0.30 0.30 0.30 0.30 0.30 Dividend Yield 0.1 % 0.1 % 0.6 % 0.5 % 0.6 % 0.6 % 0.6 % FCFPS -1.16 1.05 -0.77 -4.35 3.93 1.67 1.97 EV / Sales 1.2 x 1.3 x 1.6 x 1.6 x 1.3 x 1.3 x 1.1 x EV / EBITDA 8.5 x 8.9 x 10.9 x 10.9 x 8.5 x 7.9 x 7.2 x EV / EBIT 13.5 x 14.4 x 17.4 x 17.9 x 15.3 x 14.0 x 12.5 x P / E 18.5 x 15.7 x 26.0 x 20.8 x 27.1 x 23.1 x 18.6 x P / E adj. 18.5 x 15.7 x 29.1 x 34.1 x 27.1 x 23.1 x 18.6 x FCF Potential Yield 6.1 % 6.3 % 4.8 % 6.2 % 6.7 % 7.1 % 7.7 % Net Debt 408 388 399 348 358 341 317 ROE 30.5 % 22.0 % 15.1 % 21.9 % 13.4 % 14.0 % 15.3 % ROCE (NOPAT) 20.5 % 12.2 % 10.0 % 10.7 % 10.7 % 10.9 % 11.6 % Guidance: Revenue growth 1-5%; EBIT Margin 8-10%; FCF/sales 3-5%
Rel. Performance vs CDAX:
1 month: -4.5 %
6 months: -19.7 %
Year to date: -18.1 %
Trailing 12 months: -12.4 %
Company events:
27.06.19 Warburg Highlights
26.08.19 HY1

KTM Industries
FU L L NO T E Publ ished 20 .06 .2019 2
RESEARCH
Sales & margin development in EUR m
Source: Warburg Research
Sales by regions 2018; in %
Source: Warburg Research
Motorcycles unit sales by brand in units
Source: Warburg Research
Company Background
� KTM Industries AG, is the biggest European motorcycle manufacturer and a global leader in off-road motorcycles. The company
operates under the two brands KTM and Husqvarna Motorcycles which are marketed separately.
� Racing plays an important role in generating new sales and winning new customers in both segments. In motorcycle racing, the driver
is the hero and the brand is associated with the face of the winning driver.
� According to KTMI, wins can be translated 1-to-1 into off-road sales, while this effect is less pronounced for street motorcycles.
� Besides motorcycles, KTM Industries has set ambitious sales targets for its eBike JV (PEXCO) of more than 60K units and roughly
EUR 75-85m sales for 2019e already, while only targeting the DACH markets in a first step.
Competitive Quality
� KTM Industries is the market leader in Europe and has a strong footprint in USA (market share 12% and 9% respectively). Despite
that, off-road is KTM’s legacy business where it benefits from a 70% market share in Europe.
� Customers look for quality and brands, which KTM can offer as its products offer technically differentiated product features. A
substantial amount of time and capital is needed to achieve the technology level of KTM.
� Even stricter emission regulation disadvantages smaller players and new entrants and serve as a barrier to entry.
� KTMI is the industry leader in R&D spending, which enables it to defend its existing product offering and quickly understand new
trends.
� KTMI created a unique vertical supply chain which ensures production of all critical and performance related components in house.
eBike unit sales development in units
Source: Warburg Research
Sales share on/off-road 2018; in %
Source: Warburg Research
Net income development in EUR m
Source: Warburg Research

KTM Industries
FU L L NO T E Publ ished 20 .06 .2019 3
RESEARCH
Summary of Investment Case 5
Company Overview 6
Company Overview 7
KTM AG is the main revenues and earnings driver 8
Design and Concept development 8
PEXCO as the door-opener for eMobilityK 8
Competitive Quality 10
European market leader in sport motorcycles 10
KTMI’s strong position in Europe 11
High barriers to entry for new competitors 14
High vertical integration: key components are developed internally 14
Motorcycle substitutes vs. KTMI positioning 14
Strategy 15
Analysis of return on capital 16
Capital employed 16
High level of intangibles due to the strong KTM brand and high R&D capitalisation 16
Investment and D&A 17
Working capital management 18
Solid financial position 19
Provisions 20
Capital turn 21
Operating profitability 22
KTMI historically delivered relatively stable margins 22
Selling and racing expenses 23
Returns 25
Returns are in line with management’s target 25
Conclusion 25
Growth / Financials 26
KTMI is a worldwide growth story 26
Europe 28
North America 29
India 30
Partnership with Bajaj 31
China 34
Rest of the world 35
eBikes – a hidden value option 36
eMobility – the next chapter already started 38
Putting the parts together – our outlook 39
Non operative drivers 40
Dividend policy 42
Warburg vs. consensus 43
Short- and mid-term guidance 43

KTM Industries
FU L L NO T E Publ ished 20 .06 .2019 4
RESEARCH
Valuation 44
Fundamental valuation 44
DCF valuation 44
FCF Value Potential 47
Relative Valuation 48
Company & Group Structure 50
Ownership structure 50
Group structure in detail 51
Powered two-wheelers 51
Off-road vs street motorcycles 52
KTM Components / WP: the group’s biggest supplier 54
Design, concept development & digitalisation 54
eMobility 55
Sales & distribution 55
Company history 58
Management 59
Management remuneration 60

KTM Industries
FU L L NO T E Publ ished 20 .06 .2019 5
RESEARCH
Summary of Investment Case
Investment triggers
� The valuation for KTMI seems stretched at a first glance (>20x earnings) but a comprehensive analysis is revealing. Firstly, we
acknowledge the competitive quality and decent growth prospects. Secondly, we see strong fundamental upside potential resulting
from a normalisation of capex/sales and, as a consequence, leverage of FCF.
� We were expecting a minimum of ~10% EPS accretion following a potential share transaction of Bajaj Auto International Holdings BV.
Bajaj currently holds 48% of KTM AG (KTM Industries holds 52%) but was expected to transfer its stake to KTM Industries via the
existing authorised capital of the company (max 50% increase). However, in an ad-hoc release dated June 2, 2019, KTMI reported
that these considerations are no longer being pursued any further for the time being. Nevertheless, we take a look at the possible
implications.
Valuation
� DCF: Our DCF-based price target of CHF 90 implies a PE multiple 2021e of 30x and seems a bit high. However, historic financial
metrics are massively distorted by strong investment in growth which we expect to phase out in the next couple of years. We expect
the top line to grow at a CAGR of ~7% and the EBIT margin to remain stable at ~9% for 19e-21e. However, during the transitional
phase, sales CAGR is anticipated to be ~5% and EBIT margins are anticipated to come down to 8% in 2032.
� FCF Value Potential: Keeping maintenance capex at 5% of sales and WC constant, leaves us with a value of CHF 78 for 2021e.
� Peers: We benchmark KTMI with multiples of peer companies active in the motorcycle industry. However, comparability is limited as
most major motorcycle competitors are either part of large automotive group or conglomerates with the motorcycle business only
contributing a very small share (Honda, Suzuki, Kawasaki, BMW, Ducati). Many smaller competitors are privately-owned for which
neither historic data nor forecasts are available (Triumph). Others are focused on markets in which KTMI is not present (Hero
MotoCorp in India, Bajaj with three-wheelers in India and Africa) or, to a large extent, serve a different market segment
(Piaggio/Scooters, Polaris/Snowmobiles).
Growth
� KTMI is without doubt a successful growth story. Historically, KTMI boosted motorcycle unit sales at an incredible ~15.6% CAGR for
the 1993-2018 time period from 7k units in 1993 to 261.5k in 2018. We are pretty confident that growth will continue as the company
maintains its high rate of innovation and its shorter time-to-market cycle than competitors. It can also increase synergies with the
Husqvarna brand, boost street model sales in emerging markets via partnerships, and increase market share globally.
� More specifically, we expect the company to boost corporate KTM brand unit sales to ~200k and Husqvarna to ~80k in 2022e.
Furthermore, we anticipate unit sales to rocket on the back of the Bajaj cooperation to ~70k KTM brand and ~55k Husqvarna brand
by 2022e. Beginning in 2022e, the common 48-volt electric two-wheeler platform will provide for additional growth potential.
� Regionally, we expect stronger relative growth in emerging markets as a result of the Bajaj & CF Moto cooperation. India is expected
to be the most important future market. In absolute terms, however, most growth is still expected in Europe and North America.
Competitive quality
� KTM Industries is the market leader in Europe and it has a strong footprint in the USA (market share 12% and 9% respectively).
Despite that, off-road is KTMI’s legacy business and it benefits from a 70% market share in Europe.
� Customers are seeking quality and brand-names. KTMI can meet this demand and its products clearly offer features with technical
differentiation. Additionally, a substantial amount of time and capital is needed to reach the technology level of KTMI.
� Even stricter emission regulation puts smaller players and new entrants at a disadvantage and serves as a barrier to entry. As KTMI
is the industry leader in R&D spending, the company can defend its existing product offering and quickly adapt to new trends. KTMI
created a unique vertical supply chain which ensures production of all critical and performance-related components in-house.
Warburg versus consensus
� There is only one other sell-side analyst covering KTM Industries. We are roughly in line for 2019e-20e. However, in 2021e we are
below consensus as we assume that the other analyst modelled a full consolidation of the PEXCO JV.

KTM Industries
FU L L NO T E Publ ished 20 .06 .2019 6
RESEARCH
Company Overview
Source: KTM Industries, Warburg Research

KTM Industries
FU L L NO T E Publ ished 20 .06 .2019 7
RESEARCH
Company Overview
The focus of our note is KTM Industries AG (KTMI).
KTM Industries AG (formerly known as CROSS Industries) is a global motorcycle
manufacturer and the biggest in Europe with the well-known brands KTM, Husqvarna
Motorcycles and WP, which all are among the technology and market leaders in their
respective segments. KTMI focuses on highly innovative sport motorcycles and electro
mobility. KTM Industries is divided into the three main areas Powered Two Wheelers,
Design and Concept development and eMobility. The company, headquartered in Wels,
Austria, had more than 4,200 employees in December 2018. KTM Industries is listed on
the SIX Swiss exchange as the trading volume in Switzerland is higher than in Vienna.
The majority shareholder with 62% of the shares is Pierer Industrie AG, an Austrian
industrial investment group that is fully owned by Pierer Konzerngesellschaft mbH (Mr.
Stefan Pierer). The remaining 38.12% is in free float.
Pierer Industrie AG is also the owner of the Pankl SHW Industries Group. In 2018, KTM
Industries sold Pankl to Pierer Industrie AG Group.
� Pankl Racing Systems AG, based in Kapfenberg (Austria), is a leading international
manufacturer of high-tech mechanical systems for dynamic components in the global
niche markets of motor racing, luxury/high performance cars and aerospace.
� The German SHW AG is an automotive supplier and offers effective solutions in the
fields of pumps, engine components and lightweight composite brake discs.
� Pierer Industrie AG has further shareholdings in abatec group AG, Riser GmbH and in
METTOP GmbH.
Group structure
Source: Pierer Industrie AG, Warburg Research

KTM Industries
FU L L NO T E Publ ished 20 .06 .2019 8
RESEARCH
KTM AG is the main revenues and earnings driver
Christmas 1991: While the competition was on Christmas vacation, Stefan Pierer (35
years old at the time) bought the motorcycle business of the insolvent KTM for the
equivalent of almost EUR 4m. He focused on the off-road niche and soon sent a team to
the Paris-Dakar, a relentless desert rally, but also the ultimate endurance test for the
product. In 2001 KTM won the race for the first time and has done so every year since.
KTM introduced its first street motorcycle in the mid-1990s and acquired Husqvarna
Motorcycles in 2013. Husqvarna also originated as a pure off-road motorcycle
manufacturer under the umbrella of the BMW group. Through the acquisition the
company overtook BMW in terms of the number of units sold. At the same time Pierer &
KTM were able to copy the platform strategy of carmakers. The rally-proven engines of
KTM also migrated to the Husqvarna’s, and development costs were scaled. "KTM and
Husqvarna are competitors on the track and for customers" said Pierer in a newspaper
interview, and continued "Everything else is family".
In a next step, Husqvarna launched its urban street lines in 2017 to utilize the platform
strategy for street models. KTM has a reputation for being highly authentic. As a
manufacturer of premium products, KTM aims to manufacture products that are
innovative, in line with market requirements, safe and of high quality. A key success
factor is the development and manufacturing of the engine by KTM AG, which gives the
motorcycle an immediate association with authenticity.
Today, KTM Industries owns 51.7% of KTM AG, which is the parent company to the
KTM and Husqvarna Motorcycles brands as well as KTM Components. In 2007 Mr.
Pierer started a partnership with Bajaj Auto Limited (through the holding company Bajaj
Auto International Holdings BV). The deal was as follows: KTM shared its four stroke
knowledge, ABS and direct injection expertise with Bajaj. In exchange, KTM gained
access to the largest two-wheeler market worldwide and to production at a fraction of the
costs in Europe. Today, ~48% of KTM AG is owned by the Indian two-wheeler and three-
wheeler manufacturing company.
KTM Components (WP) a leading supplier of high performance motorcycle parts
The company is specialised in the production of lightweight and high-strength titanium,
aluminium or steel-alloy components. It mainly focuses on chassis (suspensions &
frames) and engine components (exhausts & radiators) for the motorcycle and power
sports industry. The most relevant product in terms of share of sales is suspension
(WRe: ~50%). We estimate that the associated companies, KTM and Husqvarna are
KTM Components most important customers accounting for >90% of sales. While KTM
Components currently also supplies external customers, we anticipate that it will
exclusively produce for KTM Industries in future.
Design and Concept development
In the area of Design and Concept development, KTM Industries included the
independent design studio KISKA (In 2018, KTM Industries increased its stake in KISKA
from 26% to 50%), the concept engineers from KTM Technologies (74% share) and the
innovation manager from KTM Innovations (100% share) which operate within various
technology fields such as artificial intelligence, big data, blockchain and business
modeling.
PEXCO as the door-opener for eMobilityG
In 2017, KTM Industries entered a JV agreement with the German Puello family, to
create the PEXCO JV with 40%-ownership by KTM Industries. The increased traffic and
congestion in many big cities and metropolitan areas and the more restrictive emission
(exhaust, CO2, noise) standards will trigger a gradual shift from ICE (internal combustion
engine) vehicles to EVs (electric vehicles) in the next decades. We regard the strategic
step as valuable as KTM Industries has acquired a vehicle which is able to take a
leading role in the development of electric bikes.

KTM Industries
FU L L NO T E Publ ished 20 .06 .2019 9
RESEARCH
Gbut the e-story has just started
In addition to efforts in eBikes, KTM Industries and Bajaj have already decided to initiate
a serial production project for powered two-wheeler electric vehicles in the power range
of 3 to 10 kW (48 volt) at the level of KTM AG. This platform will support different product
variants – scooters, mopeds, small mopeds, under the brands of both partners. This
opens a new market segment for KTMI as those products will be in competition with
scooters and low displacement motorcycles ranging up to 125ccm.

KTM Industries
FU L L NO T E Publ ished 20 .06 .2019 10
RESEARCH
Competitive Quality
� KTMI is the market leader in Europe and the market leader in the global off-road
segment.
� The street motorcycle market is characterised by high pricing pressure, and strong
established competitors like BMW, Harley Davidson, Honda or Kawasaki.
� Substantial amount of time and capital is required to reach the technology level of
KTMI and offer a comparably strong brand.
European market leader in sport motorcycles
Force Degree Factors to consider
Threat of
substitutes
Medium � Cars, scooters and public transport, especially in
emerging markets, are becoming a relevant substitute
with increasing disposable income.
� E-bikes are an increasing competition; however, KTMI
also addresses this market.
� Generally, KTMI is the industry leader in R&D spending,
thereby defending its existing product offering and
quickly incorporating new trends.
Rivalry Medium � KTMI is the market leader in Europe & in the off-road
segment (50% global market share).
� The street motorcycle market is characterised by high
pricing pressure, and strong established competitors like
BMW, Harley Davidson, Honda or Kawasaki.
� Globally and especially in Asia, Japanese manufacturers
have a far greater market share.
� On average, KTMI’s product innovation cycle is one year
shorter than competitors’.
Bargaining
power of
suppliers
Low � KTMI uses suppliers of raw materials (aluminium, steel,
copper, zinc, rubber and plastics) rather than for pre-
manufactured products.
� KTMI created a unique vertical supply chain which
ensures production of all critical and performance related
components in house.
Bargaining
power of buyers
High � Customers are seeking quality and brand-names. KTMI
can clearly offer product features with technical
differentiation. However, switching costs are non-existent
and product lifecycles are relatively short (3-5 years).
Threat of new
entrants
Low � Substantial amount of time and capital is required to
reach the technology level of KTMI to be able to offer
comparably strong brands.
� Even stricter emission regulation negatively affects
smaller players and new entrants.
� Key to success in the aftermarkets and the PG&A
business is a dense service & dealer network which is
expensive to establish.

KTM Industries
FU L L NO T E Publ ished 20 .06 .2019 11
RESEARCH
KTMI’s strong position in Europe
KTMI’s geographic sales distribution (2018)
Source: KTM Industries, Warburg Research
In terms of geographic sales distribution, Europe (56%) is by far the largest regional
contributor. Here, the company claims it had a market share of 11.7% at the end of
2018. Sales in Europe grew by 14.4% which compares to registration growth of
21.5% yoy. The second-largest region is North America with approximately 25% of
sales and a market share of 8.9%. Sales in NA decreased by 4.4% while
registrations in the US grew at 8.5% yoy.
The reason for the differing development of registrations and revenues is explained
by the high share of off-road vehicles sold by KTM AG (40% off-road vs. 60% on-
road) which are not mandatorily registered in Europe.
KTMI’s market share development
Source: KTM Industries, Warburg Research
According to the company, KTM Industries continued to gain market share in the US.
These gains are mainly driven by the addition of Husqvarna to the KTM platform and
are achieved despite the ongoing decline of the US market. Overall, KTM and
Husqvarna combined finished 2018 with an all-time high market share, both in
Europe and in the US.
In Q1/19 KTMI reported a strong market development and further market share gains
in its core markets. Contrary to estimates at the beginning of the year, the retail
market in Europe has developed very well. The European market as a whole grew by
around 20% in the first quarter. KTMI increased its market share to 12.3% with a
registration increase of 22%. In addition to the outstanding increase in sales in India
56%
25%
19%
Sales Europe Sales North America Sales Other

KTM Industries
FU L L NO T E Publ ished 20 .06 .2019 12
RESEARCH
(+30%), the remaining markets were in line with expectations.
In Europe, KTMI is the market leader. In the street segment, Japanese peers are the
strongest competitors for KTMI globally. However, during the last decades KTMI
clearly outperformed them and successfully gained market share. In the United
States, Harley Davidson is –in addition to Japanese peers- a major competitor in the
touring segment, making up around half of the motorcycle registrations with over
600ccm. The American motorcycle maker, however, has lost market share within its
domestic market for a few consecutive years – in contrast to KTMI.
We think the key reasons for KTMI’s massive gain in market share from 2011
onwards are:
� High investment in R&D and product development after 2008 when most peers
drastically reduced investment spending.
� KTMI focus on street models. The street to off-road ratio changed from 30/70 in
2008 to 60/40 in 2018 despite an ongoing increase in units sold in the off-road
segment.
� KTMI also introduced KTM finance (with various bank partners) which provides
consumer loans and leasing for motorcycle purchases.
� KTM Industries follows a clear B2B strategy. Unlike its peers, KTMI only sells its
bikes through dealers with which the company cultivates a longstanding
partnership. As KTMI, in a first step, only sells “standard” products, dealers have
the opportunity to earn an extra margin by selling add-on parts in the aftermarket.
Street motorcycles are becoming increasingly important for KTMI
While KTMI has its origins in off-road, the street segment is becoming increasingly
important. The focus is on design as well as an even higher share of electronics
which ensures better performance, new functionalities, more comfort and better
safety.
KTMIs models also offer features like ABS for which the company was the
development partner of Bosch. As a first mover, KTMI’s motorcycles are also
expected to be equipped with a variety of new technologies, including
interconnectivity/vehicle-to-vehicle communication, which are likely to further boost
future sales. This technology, based on sensors in vehicles or attached to a driver
vest or helmet, could improve safety and make motorcycles visible to everybody on
the road.
The higher focus on technological innovation and electronics also leads to much
higher R&D spending and the street segment generally has lower margins.
Bajaj Auto partnership at a glance
Success in emerging markets and in the street segment depends on the company’s
partnership with Bajaj Auto. While >60% of KTMI’s motorcycles are still produced in
Austria the partnership is beneficial for both parties. KTMI provided Bajaj with
technological expertise and subsequently gained access to its very efficient
production and a distribution partner for the Indian & Indonesian market. We regard
this as a smart strategic move as it enables asset light scaling of KTM & Husqvarna
Motorcycle products. The production shift to Bajaj will free up capacity in the
Mattighofen plant and will enable KTMI to increase total production without further
capacity expansion investments.
Royalty fees
The strategic partnership with Bajaj is based on a license fee model. For every USD
sales from Bajaj KTMI earns a fee. License fees for KTMI stand at 4.0% in 2018 and
will gradually be increased to 5.0% from 2019e onwards as new models are
introduced. For Husqvarna Motorcycles, the license fee also amounts to 5.0%.

KTM Industries
FU L L NO T E Publ ished 20 .06 .2019 13
RESEARCH
While the license fee is recorded under revenues (WRe: EUR 2.5-3m in 2018), it
drops straight to EBIT and is therefore supportive for profitability.
KTMI pays Swedish Husqvarna group a similar 1.5% royalty fee for using the
“Husqvarna Motorcycles” brand name which is booked in selling and racing
expenses. We note that the license agreement for the Husqvarna brand is valid until
2037.
KTMI & Bajaj relationship
Source: Warburg Research
The risk stemming from this partnership is limited in our opinion. Bajaj (Bajaj Auto
International Holdings) owns ~48% of KTM AG shares, aligning Bajaj’s efforts with
the success of KTMI. Bajaj is a tightly held family business where decisions are
mainly made by Bajaj family members, significantly streamlining the decision making
process.
KTMI’s home turf is off-road
Off-road is KTMI’s legacy business. In this area, it benefits from a global market
share of 50% and an even better 70% market share in Europe, according to the
company. Such a strong position in off-road can also help KTMI with brand
recognition when expanding even more into the street segment in Europe.
In the overall off-road segment, KTMI is among the leading motorcycle manufacturers
especially because of its pioneering role in integrating electric engine starters, its
reliable engines and its lightweight construction.
This segment is also known for shorter replacement cycles (~3 years) than for street
motorcycles (~3-5 years) which lead to more frequent purchases and steadier sales
volume.
The shorter replacement cycles (where the price has no time to decrease) have led
to higher margins in the off-road segment. For example, the enduro segment
generates the highest margins as it offers many special features for customers to
choose from and is more complex to produce.
With a greater number of models than its competitors, KTM and Husqvarna are
leading brands in the enduro segment. In this segment, it is particularly important to
be able to offer a broad range of models to the customers.
At the same time, however, KTMI’s prices are generally slightly higher than those of
its Japanese competition placing KTMI in a more premium segment.
Success in racing competitions, such as the Dakar Rally, is a crucial driver of off-road
motorcycle sales. These motorsports events have a huge reach across the world and
are an excellent marketing platform for motorcycle producers.
According to KTM Industries, winning a prestigious race has a direct impact on
motorcycle sales. Its constant success in motorsport in the past explains KTMI’s
increasing sales even in markets like Europe or the United States where sales growth
was rather flat.

KTM Industries
FU L L NO T E Publ ished 20 .06 .2019 14
RESEARCH
High barriers to entry for new competitors
To enter the motorcycle manufacturing market, a substantial amount of time and
capital is required to reach the technology level of KTMI and its comparably strong
brand offer. We think this is especially true for premium products where customers
have a high brand loyalty.
Another barrier to entry is its access to a broad dealer / distribution network. This is
mainly B2B business which takes time to develop. KTMI claims it had access to
2,078 KTM and 744 Husqvarna dealers at the end of 2018 (including India) of which
>200 were dual brand dealers.
EURO 5 will be introduced in 2020
With the introduction of the new emission standard EURO 5 in 2020, a consolidation
among manufacturers is expected as even stricter emission regulation negatively
affects smaller players and new entrants. We think that especially players with lower
unit sales (see units ranking) will struggle to cope with increasing regulatory
pressure.
KTMI’s relative position (Registrations Europe & US, >120cc)
Source: KTM Industries (Europe US)
High vertical integration: key components are developed internally
As costs for materials represent the largest cost item by far (WRe: 60%) managing
the supplier base is crucial. However, KTM Industries manages its components with
a high level of vertical integration, which limits the competitiveness of suppliers
dramatically. We estimate that the 10 largest suppliers account for approximately
50% of KTM’s AG purchase volume but roughly two-thirds is sourced from group
subsidiaries or strategic partner entities (KTM Components, Pankl, Kiska, or Bajaj).
While KTMI single-sources some components from suppliers outside the group
(Bosch, Brembo, Akrapovič, etc.) the business relationships are long-standing.
Discussion with management made clear that trust is a high priority for the company
and, as a result, we regard the risk as limited.
Motorcycle substitutes vs. KTMI positioning
In the following, we would like to highlight some considerations regarding potential
substitutes for motorcycles in the long run.
� Obviously, cars, scooters and public transport are relevant substitutes especially in

KTM Industries
FU L L NO T E Publ ished 20 .06 .2019 15
RESEARCH
emerging markets in light of a broad-based increase in disposable income and
more investments into public transportation.
� Additionally, E-bikes are increasingly meeting the need for inner-city transportation;
however, KTMI also addresses this market with the PEXCO JV and its e-mobility
strategy/product portfolio.
� Generally, KTMI is the industry leader in R&D spending, thereby defending its
existing product offering and quickly assimilating new trends.
How cyclical is the motorcycle industry?
The graph on page 11 (market share development) also highlights the cyclical pattern
of motorcycle markets which are tied to general economic development. Following
the financial crisis 2008/09 registration figures in Europe and in the US plunged for
some years. Even KTMI could not escape this harsh decline unscathed. In 2009
KTMI unit sales decreased by >30% and EBIT was negative. However, while the
market has not yet returned to pre-crisis production levels, KTMI returned to its pre-
crisis level in 2012 and has outperformed the market by far since then.
Strategy
Our impression is that KTMI and its management is highly innovative and is
constantly striving for the next technological improvement. In the following, we
highlight some key strategic advantages:
� The biggest assets of KTM Industries are its strong and widely known brands KTM
and Husqvarna Motorcycles (second-oldest motorcycle brand worldwide). The
company incorporated racing in its “DNA” and as a result it continuously strives for.
Consequently, the company is able to charge premium prices (5-10% higher than
the competition).
� The dual brand strategy is a competitive advantage as it enables the company to
capitalise on a modular platform production for KTM and Husqvarna. Both use
similar engines, frames and the majority of components (WRe: ~80% are common
parts). This could lead to up to significant cost reduction as the development of a
new engine can cost up to EUR 25-30m.
� Generally KTMI profits from its shorter time-to-market cycle (on average 1 year
faster than peers) which is a result of lean production and shorter decision-making
paths than other brands which are embedded in huge conglomerates.
� Worth mentioning is that the CEO and the rest of the management shares the boat
with minority investors and bears the same risks.
� KTM Industries claims to have an export share of ~98%. The company clearly aims
for further internationalisation through partnerships (Bajaj, CFMoto).
� As KTMI manufactures the majority of motorcycles in Mattighofen, its highly
qualified employees are another major asset. With a 23% gender quota, KTMI is
also a leading employer of women in the industry. While the average age of
employees is ~35 years, we regard this as a sign of incorporating speed and a
desire for innovation into the organisation.

KTM Industries
FU L L NO T E Publ ished 20 .06 .2019 16
RESEARCH
Analysis of return on capital
� In 2018, KTMI’s high investment ratio weighed on CF generation. However, we
anticipate the ratio will decrease based on lower investments in tangible assets
combined with increasing top-line development.
� We see the potential to improve working capital management by reducing inventory
which was extraordinarily high at the end of 2018.
� With increasing unit volume distributed by Bajaj and CFMoto and correspondingly
higher royalty fee income, the stage is set for a boost in returns.
FY 2015 & 2016 somehow distorted by the Pankl sale
Capital employed
In June 2018, KTM industries sold all its shares in Pankl Racing System for a purchase
price of EUR 130.5m to the Pierer Industrie Group. As KTMI provided the financial
details for 2018 and 2017 on the basis of the stand-alone entity excluding Pankl, we built
our (P&L) model accordingly showing the Pankl business as discontinued operations.
KTMI’s Balance Sheet
Source: KTM Industries, Warburg Research
High level of intangibles reflect capitalised R&D
High level of intangibles due to the strong KTM brand and high R&D capitalisation
KTMI has some 31.2% (EUR 326.6m) of its total assets allocated to intangibles, of which
the majority (291.9m) are customers, brand values and development costs, which also
includes the “KTM” brand worth EUR 61.1m. The remainder (30.4m) is attributable to
concession, industrial property rights as well as the resulting licenses and a small share
(4.3m) of advanced payments.
In 2018 development costs were capitalised at EUR 81.1m which compares to total
research and development costs of EUR 126.5m and results in a capitalisation ratio of
64% after 58% in FY 2017. While we acknowledge this fairly high ratio, we regard it to be
adequate as this is almost no basic research but is totally product driven and therefore
has to be capitalised. In addition, KTMI has clearly built a strong market position based
on its technological leadership.
Goodwill of EUR 96.2m is recognised which translates into 7.1% of total assets. The
company’s superior track record without write-offs on intangibles strengthens credibility
in our assumption that this will be sustained during our forecast period.
As a manufacturing company, PPE is a major item. However, it is relatively stable at
~22% of total assets for the last three years. Not surprisingly, for FY 2018, the largest
parts of the total 283.4m are attributable to buildings (144.3m) and technical plant and
Other; 6%
Cash; 7%
WC; 32%
Tangible assets; 24%
Intangible assets; 31%
Other; 13%
WC; 14%
Interest bearing debt; 30%
Provisions; 2%
Equity; 41%
0%
20%
40%
60%
80%
100%
ASSETS LIABILITIES

KTM Industries
FU L L NO T E Publ ished 20 .06 .2019 17
RESEARCH
machinery (71.5m). We estimate the production capacity in the Mattighofen plant at
approximately 200k units p.a. Given the company’s sales target of ~400k units in 2022
and a scheduled production capacity of ~200k from Bajaj and ~20k from CFMoto we do
not anticipate a need for further investment.
Capex reflects major capitalised R&D costs
Investment and D&A
KTMI spent EUR 183.6m on capex in FY 2018. Interestingly, the larger part (93.5m) was
invested in intangibles, thereof EUR 81m in customers, brand values, development
costs. This is in line with the trend in recent years as the ratio of investment in intangibles
to sales increased from 4.4% in 2015 up to 6.0% in 2018. Additionally, KTMI classifies
EUR ~25m as capex in PPE which also is an integral part of R&D investment.
KTMI’s investments
Source: KTM Industries, Warburg Research
An investment ratio of 11.8% is clearly not what investors want to see as this is
burdening FCF and the resulting high D&A will clearly weigh on margins going forward.
On the other hand, we observed lower PPE investments in 2018 (90.1m vs. 104.7m in
FY 2017 whereof ~25m are R&D tooling investments) as the intensive investment
programme in production sites has come to an end. According to KTMI, investment in
facilities totalled EUR 250m while product investments amounted to EUR 645m
respectively since 2009.
For our forecast period we estimate EUR 160m of total capex which is at the upper end
of the management guidance of EUR 150-160m. We anticipate that the larger share will
be invested in intangibles as KTMI aims to stay at the forefront of technological
leadership. In total this will reduce the investment rate from 11.8% in 2018 to ~9% in
2021e which in turn will boost FCF and serve as the basis for higher valuations. In other
words, we regard the capex cycle to be in investors’ favour.
In line with an increase in investments in intangibles we observed a stronger increase in
amortization of intangible fixed assets which we model to grow at a CAGR of ~13% from
2018 to 2021e. The spike in 2019e is also explained by IFRS 16. We want to highlight
that amortization will remain at a high level as KTMI generally amortizes its off-road
models over a 3-year horizon and its on-road models over a 3-5 year horizon.
As the investment programme in PPE came to an end in 2018, we model a slightly
slower pace (excluding IFRS 16) of growth in the depreciation of fixed assets than in the
last few years
5469 74
93 90 95 95
79
75
10590
60 60 65
0.0%
2.0%
4.0%
6.0%
8.0%
10.0%
12.0%
14.0%
00
20
40
60
80
100
120
140
160
180
200
2015 2016 2017 2018 2019e 2020e 2021e
Capex intangibles Capex PPE Capex/Revenues

KTM Industries
FU L L NO T E Publ ished 20 .06 .2019 18
RESEARCH
KTMI’s D&A
Source: KTM Industries, Warburg Research
.
WC management leaves some room for upside
Working capital management
Working capital amounted to EUR 435.9m (32.2% of total assets) as of the end of FY
2018 and thus represents the largest item on KTMI’s balance sheet. However, KTMI
mentions in a presentation that due to a parts delivery interruption, inventory was about
50-55m higher than normal per FY2018.
KTMI’s working capital management
Source: KTM Industries, Warburg Research
On the positive side WC/sales decreased from 19.8% in 2015 to 16.8% in 2018 mainly
on the back of an extension in days payable outstanding (from 33 to 46) which we mainly
attribute to the deconsolidation of Pankl. However, a further breakdown clearly highlights
that the main driver of WC was the high inventory level KTMI carried on its balance
sheet.
For the time being, our model factors in a EUR 50m improvement in inventories and a
slightly higher inventory turnover. We forecast a working capital/sales ratio of ~15% in
2019e – 2021e as the new acquisition of the Australian distributor increased the
WC/Sales ratio by ~3% according to KTMI.
Nevertheless we see potential to decrease the ratio if a larger than expected part of unit
sales will come from Bajaj as this working capital is not on KTMI’s balance sheet.
00
10
20
30
40
50
60
70
00
100
200
300
400
500
600
2015 2016 2017 2018 2019e 2020e 2021e
Intangible assets Property, plant & equipment
Depreciation of fixed assets Amortisation of intangible fixed assets
KTM-Industries- Working Capital Management 2015 2016 2017 2018 2019e 2020e 2021e
Net Working Capital 242.1 243.0 238.8 245.3 231.0 249.1 274.1
Days Inventory on Hand (DOH) 72 67 65 68 68 65 65
Days Sales Outstanding (DSO) 33 32 29 32 36 35 34
Days Payable Outstanding (DPO) 33 33 37 43 47 46 46
Cash-Conversion-Cycle 72 66 57 57 57 54 53
Note: Computed metrics are based on average balance sheet values from 2016 onwards.

KTM Industries
FU L L NO T E Publ ished 20 .06 .2019 19
RESEARCH
KTMI’s working capital management
Source: KTM Industries, Warburg Research
As the following graph shows, the seasonality of working capital also has high
implications for the free cash flow. While the build-up in the first half of the year draws
down FCF, a normalization of WC leads to stronger cash generation towards the end of
the year. This year we expect a decrease in the inventory level already in H1 2019.
KTMI’s FCF generation shows a seasonal pattern
Source: KTM Industries, Warburg Research
Financial position will further improve
Solid financial position
In 2018 KTMI undertook a raft of capital measures affecting equity:
� Repayment of a EUR 60m (hybrid) perpetual bond.
� The proper reduction of the company’s share capital from EUR 225,386,740 to EUR
22,538,674 by combining shares at a ratio of 10:1 for the purpose of transferring EUR
202,848,066 to an unappropriated reserve was resolved.
� Conservative dividend payment of EUR 6.8m (payout ratio of ~10%).
Before 2015 (not included in our model) the company had to cope with strong growth
and as a result required additional funding to finance investments, net working capital
and to increase stakes in both WP and Pankl Racing Systems. The corresponding
expansion of the balance sheet led to a temporary decrease in the equity ratio.
20%
18%
16%17%
15% 15% 15%
0.0%
5.0%
10.0%
15.0%
20.0%
25.0%
200.00
210.00
220.00
230.00
240.00
250.00
260.00
270.00
280.00
2015 2016 2017 2018 2019e 2020e 2021e
Working Capital Working Capital / Sales
-210.00
-160.00
-110.00
-60.00
-10.00
40.00
90.00
140.00
190.00
240.00
H1/16 H2/16 H1/17 H2/17 H1/18 H2/18 H1/19 H2/19 H1/20 H2/20 H1/21 H2/21
Gross Cash Flow Change in working capital
Cash flow from investing activities Free Cash Flow KTM definition

KTM Industries
FU L L NO T E Publ ished 20 .06 .2019 20
RESEARCH
In a similar fashion, gearing stood at >100% in 2015 but steadily declined thereafter to
reach a level of 58.7% in 2018. Following the Pankl sale to Pierer Industrie Group last
year which improved financial metrics, we expect the trend to resume and estimate a
gearing of ~36.5% in 2021e (also affected by IFRS 16).
KTMI’s balance sheet quality
Source: KTM Industries, Warburg Research
For net debt/EBITDA, the company is targeting 1.0-1.2x in 2019e & 2020e and <1.0x for
2021e (before IFRS 16). Solid EBITDA growth and CF generation should help to lower
the ratio to 1.1x in 2021e, in line with the target.
While we know from the footnotes that some loan agreements include financial
covenants regarding the equity ratio (min 30%) and the dynamic debt level (net financial
debt to EBITDA ratio), where non-compliance would lead to a premature repayment of
the financial liabilities, we do not think that this will become an issue for KTMI.
Based on our planning, KTMI can finance its future growth from internally generated
funds and does not require additional external financing, especially in light of the very
conservative dividend payments in the last couple of years.
KTMI follows a prudent & consistent provisioning approach
Provisions
Provisions are not a major issue for KTMI as management has been following a prudent
and consistent provisioning approach over the last four years. Net additions are on
average 0.8% of sales (mainly compromised of guarantee & warranty provisions) which
we regard as a reasonable amount and totally in line with peers.
The same is true for liabilities for employee benefits which on average amount to <2% of
sales and total assets. We have not detected any anomalies regarding volatile changes
in accounting assumptions and regard the absolute level of minor importance.
0.0%
20.0%
40.0%
60.0%
80.0%
100.0%
120.0%
.00
100.00
200.00
300.00
400.00
500.00
600.00
700.00
800.00
900.00
2015 2016 2017 2018 2019e 2020e 2021e
Net Debt Book value of Equity Net Gearing Equity ratio

KTM Industries
FU L L NO T E Publ ished 20 .06 .2019 21
RESEARCH
KTMI’s development of provisions
Source: KTM Industries, Warburg Research
Capital turn
In total, KTMI historically delivered a relatively stable cap turn in the range of 1.5x-1.7x.
We are confident that KTMI can improve this number with slightly lower growth in capital
employed for our explicit forecast horizon. Going forward, a higher production level by
Bajaj and corresponding fee income will work as leverage as capital will not be on
KTMI’s balance sheet.
KTMI’s capital intensity
Source: KTM Industries, Warburg Research
Provisions 2015 2016 2017 2018
Additions 9.7 16.0 11.6 14.2
thereof guarantee & warranty 8.4 9.7 10.7 11.8thereof for legal action 0.6 0.7 0.1 0.3thereof other provisions 0.6 5.6 0.8 2.1
in % of sales 0.8% 1.2% 0.8% 0.9%
Dissolutions -0.4 -0.5 -4.8 -0.5
Net Additions 9.3 15.5 6.8 13.7
in % of sales 0.8% 1.2% 0.5% 0.9%
Utilization 7.4 9.0 11.6 10.7
thereof guarantee & warranty 6.7 8.2 9.7 10.5thereof for legal action 0.1 0.3 0.3 0.1thereof other provisions 0.6 0.5 1.5 0.1
in % of sales 0.6% 0.7% 0.8% 0.7%
in % net Additions 79.7% 58.0% 170.7% 78.1%
Liabilities for employee benefits 2015 2016 2017 2018
Severance payments 17.8 19.8 20.3 20.1Anniversary bonuses 3.1 3.7 3.7 4.9
20.9 23.5 24.0 25.0
in % of sales 1.7% 1.8% 1.6% 1.6%
in % of total assets 1.8% 1.7% 1.6% 1.8%
Capital Intensity 2015 2016 2017 2018 2019e 2020e 2021e
Sales (incl. Pankl) 1,223.6 1,343.0 1,533.0 1,559.6 1,522.7 1,635.8 1,799.2PP&E 274.5 303.2 357.3 283.4 333.6 330.9 330.3PP&E turnover 4.5 x 4.4 x 4.3 x 5.5 x 4.6 x 4.9 x 5.4 xCapital employed 795.0 843.1 927.5 899.1 977.9 1,039.9 1,108.6Average Capital employed 795.0 819.0 885.3 913.3 938.5 1,008.9 1,074.2Capital employed turnover 1.5 x 1.6 x 1.7 x 1.7 x 1.6 x 1.6 x 1.7 x
Note: Computed metrics are based on average balance sheet values from 2016 onwards.

KTM Industries
FU L L NO T E Publ ished 20 .06 .2019 22
RESEARCH
Gross margin influenced by street models
Operating profitability
Generally, there are three distribution streams:
� Wholesale via independent dealers carefully chosen by KTMI
� “Direct” to consumer through JVs which are accounted as at-equity holdings (CFMoto
etc.)
� Royalty fees from Bajaj
KTMI historically delivered relatively stable margins
There has been a relatively stable gross margin trend over the past four years. As the
years 2017 & 2018 do not include Pankl, the effect on gross margin is visible as it is
slightly lower after the deconsolidation.
KTMI’s gross margin/pricing
Source: KTM Industries, Warburg Research
While we observed a declining trend in gross margins from 2016 to 2017, the main
cause was an extraordinary positive effect from the USD in 2016. Generally, we
anticipate the following influences on gross margin:
� We estimate that the strongest contribution to gross profit comes from off-road models
(declining share of total unit sales) and
� big motorcycles such as the Super Duke (stable share of total unit sales).
� We estimate that street motorcycles offer a lower gross margin (~30% compared to
~35% in off-road)
� However, the rising share of Husqvarna models will somewhat offset the rising share of
street motorcycles as the HVQ price is slightly higher.
� Increasing share of licence fee from Bajaj which feeds straight into EBIT.
� As sales of vehicle accessories from “KTM Power Parts” and driver equipment from
“KTM Power Wear” enjoy an exceptionally high priority in the group. We expect positive
influence of Parts, Garments & Accessories (PG&A) on the gross margin.
Considering KTMI’s meticulous approach to increasing production efficiency, we are
confident that management would be able to offset any additional unexpected headwinds
to the gross profit line. However, the rising share of street motorcycles will weigh on
gross margin and we therefore forecast a slight decline in gross margin of 30% for 2019e
to 29.8% in 2021e.
28.0%
28.5%
29.0%
29.5%
30.0%
30.5%
31.0%
31.5%
32.0%
32.5%
33.0%
.00
200.00
400.00
600.00
800.00
1000.00
1200.00
1400.00
1600.00
1800.00
2000.00
2015 2016 2017 2018 2019e 2020e 2021e
SALES GROSS MARGIN (RHS)

KTM Industries
FU L L NO T E Publ ished 20 .06 .2019 23
RESEARCH
Operating margins
KTMI’s profitability development
Source: KTM Industries, Warburg Research
The lower gross margin due to the Pankl sale was equalized by lower fixed costs which
decreased significantly (WRe: ~24m or 1.5% of sales) and boosted EBIT margins driven
by lower general and administrative expenses.
Going forward, as already mentioned, the production shift to Bajaj will free up capacity in
the Mattighofen plant and will enable KTMI to increase total production. However, for
2019e-2021e we anticipate only gradual improvements as utilization will be a bit lower
during this period. However lower utilisation in the course of the transfer of capacity will
help to reduce the overtime levels accumulated in the last few years.
Selling and racing expenses
Racing plays an important role in generating new sales and gaining new customers. In
motorcycle racing, the driver is the hero and the brand is has a stronger association with
the winner than in the automobile market. According to KTMI, wins are reflected 1-to-1 in
off-road sales. This effect can also be seen in street motorcycles but is less pronounced.
Moto GP is mandatory for brand building - particularly in Asia where off-road does not
play a role.
In off-road, the company capitalises on its exposure in racing competitions. Moto-cross
bikes in challenges and races today are next year’s production models.
KTMI’s racing spending
Source: KTM Industries, Warburg Research
The company spends some 4-4.5% of sales on sports events. While 2.5% are for off-
road (40%) activities, the remaining 60% are spent in on road-racing. For road-racing 80-
90% is marketing and just 10-20% will be included in the next series production model.
In off-road, 40% of expenses will normally be recovered through sponsorship.
in % of Sales 2015 2016 2017 2018 2019e 2020e 2021e
Sales 100.0% 100.0% 100.0% 100.0% 100.0% 100.0% 100.0%
Cost of sales 69.0% 67.7% 69.8% 70.4% 70.0% 70.1% 70.2%
Gross profit 31.0% 32.3% 30.2% 29.6% 30.0% 29.9% 29.8%
Research and development 2.4% 3.0% 2.5% 1.9% 2.0% 2.2% 2.3%
Sales and marketing 12.2% 12.6% 12.2% 11.8% 12.0% 12.0% 12.0%
General and administration 5.6% 6.0% 4.5% 4.9% 4.8% 4.8% 4.8%
Other operating income 0.3% 0.4% 0.3% 0.0% 0.5% 0.5% 0.5%
Other operating expenses 1.8% 2.1% 2.3% 2.0% 2.9% 2.5% 2.1%
EBITDA 14.6% 14.8% 14.3% 14.4% 15.9% 16.0% 16.0%
Depreciation of fixed assets 3.1% 3.2% 2.8% 3.0% 3.9% 3.8% 3.6%
EBITA 11.5% 11.6% 11.5% 11.5% 12.0% 12.2% 12.3%
Amortisation of intangible fixed assets 2.3% 2.5% 2.5% 2.7% 3.2% 3.2% 3.1%
Impairment charges and amortisation of goodwill 0.0% 0.0% 0.0% 0.0% 0.0% 0.0% 0.0%
At-equity earnings 0.0% 0.0% 0.0% -0.3% 0.0% 0.1% 0.1%
EBIT 9.2% 9.1% 9.0% 8.8% 8.8% 9.0% 9.2%
11.2%
11.4%
11.6%
11.8%
12.0%
12.2%
12.4%
12.6%
12.8%
0.00
50.00
100.00
150.00
200.00
250.00
2015 2016 2017 2018 2019e 2020e 2021e
Vertriebskosten in % vom Umsatz

KTM Industries
FU L L NO T E Publ ished 20 .06 .2019 24
RESEARCH
Consequently, the marketing budget is relatively large and grew at a CAGR of 4.8% from
2015-2018. We expect this trend to stabilise at~12% of sales from 2019e-2021e.
Peer margin benchmarking
Our predicted improvement in EBIT margins is not only backed by the Husqvarna model
rollout but also an additional peer comparison makes us confident that KTMI can close
the gap to Harley-Davidson and Honda which are also regarded as premium
manufacturers. Some things to consider when benchmarking.
� KTMI is on average 10-15% more expensive than its Japanese competitors and also
posts a higher gross margin.
� Harley is the role-model in the Parts, Garments & Accessories (PG&A) business. The
company capitalises on its PG&A sales which offers decent margins.
� Honda has a completely different product mix with a lot of small powered two wheelers
posting decent margins.
� KTMI includes the at-equity result (which was negative in 2018) and thus,
benchmarking could be slightly distorted.
KTMI’s EBIT margin vs. peers
Source: Company reports, Warburg Research
9.1% 9.0% 8.8%
11.8%12.5%
8.7%
10.1% 9.9%
13.1%
9.0% 9.1%
8.1%
3.9%
6.6%
5.3%4.7%
3.8%4.6%
00%
02%
04%
06%
08%
10%
12%
14%
2016 2017 2018
KTM Harley-Davidson Honda BMW Yamaha Kawasaki Industry Mean

KTM Industries
FU L L NO T E Publ ished 20 .06 .2019 25
RESEARCH
ROIC to remain in narrow range, in line with company target
Returns
Returns are in line with management’s target
Driven by slightly improving profitability and slower growth in capital employed, our
ROCE forecasts reflect the positive trend from last year. ROCE is anticipated to expand
from 10.7% in 2018 to 11.6% in 2021e.
KTMI’s ROCEs
Source: KTM Industries, Warburg Research
This is in line with the management ROIC target of 10-12% which is calculated as
follows.
KTMI’s ROIC
Source: KTM Industries, Warburg Research
.
Bajaj cooperation will boost returns
Conclusion
� Historically, ROCEs were at a 4Y average of 10.8%.
� We see potential to improve working capital management by reducing inventory.
However, we took a conservative modelling approach and do not factor in a major
inventory reduction in 2020e and 2021e.
� Especially a higher than expected number of motorcycles sold via the Bajaj cooperation
would significantly improve returns as no additional capital requirements are necessary
for KTM Industries.
2015 2016 2017 2018 2019e 2020e 2021e
+Equity 386.6 454.9 528.6 550.8 620.1 698.9 791.1+Pensions 20.9 23.5 24.0 25.0 25.0 27.0 29.0+Financial liabilities 522.6 648.2 544.0 412.6 474.6 466.6 458.6-Liquid assets 135.1 283.6 169.1 89.3 141.9 152.6 170.1=Capital employed 795.0 843.1 927.5 899.1 977.9 1039.9 1108.6
yoy 6% 10% -3% 9% 6% 7%
Capital turn 1.5 x 1.6 x 1.7 x 1.7 x 1.6 x 1.6 x 1.6 x
EBIT 112.9 122.32 121.9 128.73 134.0 147.22 165.5EBIT MARGIN 9.2% 9.1% 9.0% 8.8% 8.8% 9.0% 9.2%Tax Rate 27.8% 18.5% 27.6% 24.2% 25.0% 25.0% 25.0%NOPAT 81.5 99.7 88.2 97.6 100.5 110.4 124.1
avg. CE 795.0 819.0 885.3 913.3 938.5 1,008.9 1,074.2
ROCE (NOPAT) 10.3% 12.2% 10.0% 10.7% 10.7% 10.9% 11.6%
WACC 6.47% 6.47% 6.47% 6.47% 6.47% 6.47% 6.47%1.6 x 1.9 x 1.5 x 1.7 x 1.7 x 1.7 x 1.8 x
Note: Computed metrics are based on average balance sheet values from 2016 onwards.
2015 2016 2017 2018 2019e 2020e 2021e
+PPE 274.5 303.2 357.3 283.4 333.6 330.9 330.3+Goodwill 117.7 117.7 117.1 96.2 96.2 96.2 96.2+Other Intangibles 207.8 244.3 279.6 326.6 368.3 411.0 449.8+Net Working Capital 242.1 243.0 238.8 245.3 231.0 249.1 274.1=Invested Capital 842.1 908.2 992.8 951.4 1029.1 1087.2 1150.4
yoy 8% 9% -4% 8% 6% 6%
Capital turn 1.5 x 1.5 x 1.5 x 1.6 x 1.5 x 1.5 x 1.6 x
EBIT 112.9 122.3 121.9 128.7 134.0 147.2 165.5EBIT MARGIN 9.2% 9.1% 9.0% 8.8% 8.8% 9.0% 9.2%Tax Rate 27.8% 18.5% 27.6% 24.2% 25.0% 25.0% 25.0%NOPAT 81.5 99.7 88.2 97.6 100.5 110.4 124.1
avg. IC 842.1 875.2 950.5 972.1 990.3 1,058.2 1,118.8
ROIC (NOPAT) 9.7% 11.4% 9.3% 10.0% 10.1% 10.4% 11.1%
WACC 6.47% 6.47% 6.47% 6.47% 6.47% 6.47% 6.47%1.5 x 1.8 x 1.4 x 1.6 x 1.6 x 1.6 x 1.7 x
Note: Computed metrics are based on average balance sheet values from 2016 onwards.

KTM Industries
FU L L NO T E Publ ished 20 .06 .2019 26
RESEARCH
Growth / Financials
� There is no doubt that KTMI is a growth story, with the largest growth in absolute
terms, expected from Europe and North America
� India is seen as the most important future market where the Bajaj cooperation will
lead to an asset-light geographic expansion.
� Margin development will be positively affected by a larger portion of license fee
income and Husqvarna motorcycles.
A powered two-wheeler growth story
KTMI is a worldwide growth story
KTMI is without doubt a successful growth story. Historically, KTMI boosted motorcycle
unit sales at an incredible CAGR of ~15.6% for the 1993-2018 time period from 7k units
in 1993 to 261.5k in 2018.
We are pretty confident that the company will maintain its growth as it keeps its higher
innovation rate, has a shorter time-to-market cycle than competitors, lift synergies with
the Husqvarna brand, boost street model sales in emerging markets via partnerships and
increase market share globally.
KTMI’s motorcycle growth
Source: KTM Industries, Warburg Research
Brands
The KTM brand accounts for the biggest share of group revenue (WRe: ~80%). It started
as an off-road-only motorcycle manufacturer and later became an innovative
manufacturer of street motorcycles. Innovation at KTM is visible, in an expanding product
portfolio and in a high technological standard of the offered motorcycles (e.g. ABS). The
KTM brand stands for adventure and driving on the edge. “Ready to Race”
Husqvarna is the second brand and combines long tradition with performance. Acquired
from BMW in 2013, it already had success as a complementary brand to KTM. With
Husqvarna, KTM Industries targets a completely different customer group. Husqvarna
targets a more relaxed driving style than KTM. It also targets beginner motorcycle
drivers. The eMobility strategy also concentrates on the Husqvarna brand, which we
regard as a clever strategic step as there is a greater public awareness of the brand
even beyond the world of motorcycles (lawnmowers, etc.). With brand values of
“PIONEERING, PREMIUM, and SWEDISH ROOTS,” the spirit of the past is evoked, but
innovation and future-thinking are highlighted. We estimate the contribution of
Husqvarna to group revenue is less significant (WRe: ~20%), but likely to rise steadily.

KTM Industries
FU L L NO T E Publ ished 20 .06 .2019 27
RESEARCH
Global motorcycle markets
According to Yamaha, more than 57 million two-wheelers were sold globally in 2018.
Depending on the regions and age groups, two-wheelers are used as a means of
transportation or as a leisure vehicle. This section describes the regional differences in
the global two-wheeler market with a particular focus on motorcycles, which defined as
two-wheelers with more than 120ccm are in this report.
Over the course of the next six to seven years, the global motorcycle market is expected
to grow at a CAGR of around 4.40%, reaching total sales of about USD 145 billion in
2025.
Global two-wheeler demand (2018)
Source: Yamaha, Warburg Research
KTM Industries estimates the global powered two-wheeler market (~28m motorcycles
and ~28m scooters) at ~56 million units. Thereof, KTMI targets a share of ~11% or 6
million units which the company defines as motorcycles >120cc & selling at a
manufacturer suggested retail price of > EUR 2,500.
Global powered two-wheeler market vs. addressable market
Source: KTM Industries, Warburg Research
Asia (excl. Japan)81,5%
Japan0,6%
North America0,9%
Europe2,7%
RoW14,2%
57,3 Mio. worldwide demand
North America520
LATAM2,500
Europe1,100
Africa2,300
China15,800
ASEAN16,900
India16,600
Oceania100
North America
430LATAM400
Europe580
Africa11
China1,100
ASEAN1,400
India2,033
Oceania58
Global powered two-wheeler market:56 million units
KTM / Husqvarna adressable market:6 million units

KTM Industries
FU L L NO T E Publ ished 20 .06 .2019 28
RESEARCH
Europe
With slightly over a million units in two-wheeler sales in 2018, Europe accounts for about
2-3% of global annual sales. The biggest markets, are Italy, France, Spain, Germany and
the United Kingdom, representing over 80% of the European market. Illustrated by its
annual registrations, the European motorcycle market struggled in the years after the
financial crisis, reaching its trough in 2013. Since then, a slight upward trend can be seen
but the number of registrations has not yet reached pre-crisis levels. KTMI’s market
share surged in Europe in the post-crisis years. In 2018, KTM and Husqvarna together
reached a market share of 11.7%, according to KTM Industries.
Europe motorcycle registrations by country (2018)
Source: ACEM, Warburg Research
In Europe, the birthplace of motorcycles, motorcycles are firmly anchored in the culture.
Motorsports are especially popular. More than half of the MotoGP racing series, the
world’s premier championship in motorcycle racing, are held in Europe. The European
motorcycle market is characterized by the use of motorcycles by riders across all age
groups for commuting and recreation, including countryside or circuit racing and touring.
The vast majority of motorcycles sold in Europe, however, are used for recreational
purposes.
As opposed to Asian countries, motorcycles in Europe are mostly used in leisure time.
Still, the composition between off-road and street use differs in European countries. In
the UK for instance, there is almost no demand for off-road motorcycles, while they are
more popular in Southern Europe. According to company information, KTM Industries
has a market share of 70% in the off-road motorcycle market. This strong market position
and name recognition is benefitting the company in its plan to further expand the street
segment in Europe.
Europe motorcycle registrations by selected countries (2010-2018)
Source: ACEM, Warburg Research
.
Italy21,9%
France17,7%
Spain15,9%
Germany15,5%
UK10,0%
Greece3,2%
Portugal2,8%
Austria2,6% Other
10,3%
Total: 1,0 Mio

KTM Industries
FU L L NO T E Publ ished 20 .06 .2019 29
RESEARCH
North America
The image of motorcycling in North America is associated with cruisers with low-riding
seats and long bodies on long straight open roads. This picture is also reflected in the
numbers: street motorcycles make up around 75% of the U.S. motorcycle market. Within
the street segment, half of the registered motorcycles are cruisers, 27% are touring bikes
and almost 20% are sport motorcycles. Still, there is also considerable demand for off-
road motorcycles used on mountainous terrains for sports or recreational purposes,
which accounts for almost 20% of the market. The remaining part of the total U.S.
motorcycle market comprises dual bikes.
U.S. motorcycle registrations by type (2017) [in ‘000 units]
Source: IHS Markit, IIHS, Warburg Research
As a consequence of the financial crisis in 2008, motorcycle registrations plunged in the
United States. At the same time, however, KTMI’s U.S. market share rose and almost
quadrupled from 2008 until 2018. Today, KTMI claims to have a market share of about
9% in the U.S. Thanks to the strong brand recognition of both KTM and Husqvarna
in the off-road segment, the group has been able to gain market share in the street
segment – primarily from Harley Davidson which is struggling to offer attractive products
to the younger generation. KTMI’s clear goal is to gain further market share from Harley
with Husqvarna street models.
Motorcycle registrations and KTMI market share in Europe and the U.S.
Source: KTM Industries, National data providers, Warburg Research

KTM Industries
FU L L NO T E Publ ished 20 .06 .2019 30
RESEARCH
India
With about 22 million units sold in 2018, India is the world’s largest two-wheeler market.
Over the last 10 years, there has been a steady increase in sales of both motorcycles
and scooters with a higher growth rate in the scooter category. Still, motorcycle unit sales
rose from 2009 to 2018 at a CAGR of almost 10% and are expected to continue this
trend, given the growing Indian population outlook. After a slight decrease in 2016 and
small growth in 2017, motorcycle sales increased by approximately 15% in 2018.
Two-wheeler sales in India (2009-2018) [in million units] – incl. exports
Source: Bajaj, Warburg Research
While motorcycle unit sales between 2009 and 2018 increased at a CAGR of 9.3%, other
two-wheelers had a CAGR of as much as 19.1% in the same period. The share of
scooter sales in the total two-wheeler market in India increased from around a quarter to
around a third from 2009 to 2018.
However, KTMI motorcycle sales are likely to be unaffected by this trend since scooters
tend to compete with entry-level or commuting motorcycles. KTMI, on the other hand, is
more focused on high-end motorcycles at this point in time. However it also offers entry-
level KTM motorcycles. It is launching Husqvarna motorcycles in India and will grow in
the lower displacement segments by introducing e-motorcycles. Still, both brands are
placed in the premium segment, giving KTMI enough room for growth. In 2018 alone,
Indian motorcycle sales rose by 14%, which is in line with the overall two-wheeler
industry.
Sales of motorcycles and other two-wheelers in India (2009-2018) and FY 18 two-wheeler growth [%]
Source: Bajaj, SIAM, Warburg Research
6,8
8,4
10,5
11,9 12,0 12,5 13,0 12,9 13,1
15,1
1,6
2,1
2,8
3,4 3,84,4
5,5 6,06,8
7,9
0,0
5,0
10,0
15,0
20,0
25,0
2009 2010 2011 2012 2013 2014 2015 2016 2017 2018
Motorcycles Other Two-Wheelers
CAGR: +9,3 %
Other Two-Wheelers
24%
Motorcycles76%
Other Two-Wheelers
34%
Motorcycles66%
2009 2018
15,0
20,0
14,0
-3,0
Overall
Scooters
Motorcycles
Mopeds
Contrary to South East Asian countries, India’s two-wheeler market is far from its
saturation point. Two-wheeler penetration in Indian households is only at a level of 47%,
which is low compared to Thailand, Vietnam and Indonesia where around nine out of 10
households own a two-wheeler.
A similar picture is presented by the number of two-wheelers as a percentage of the
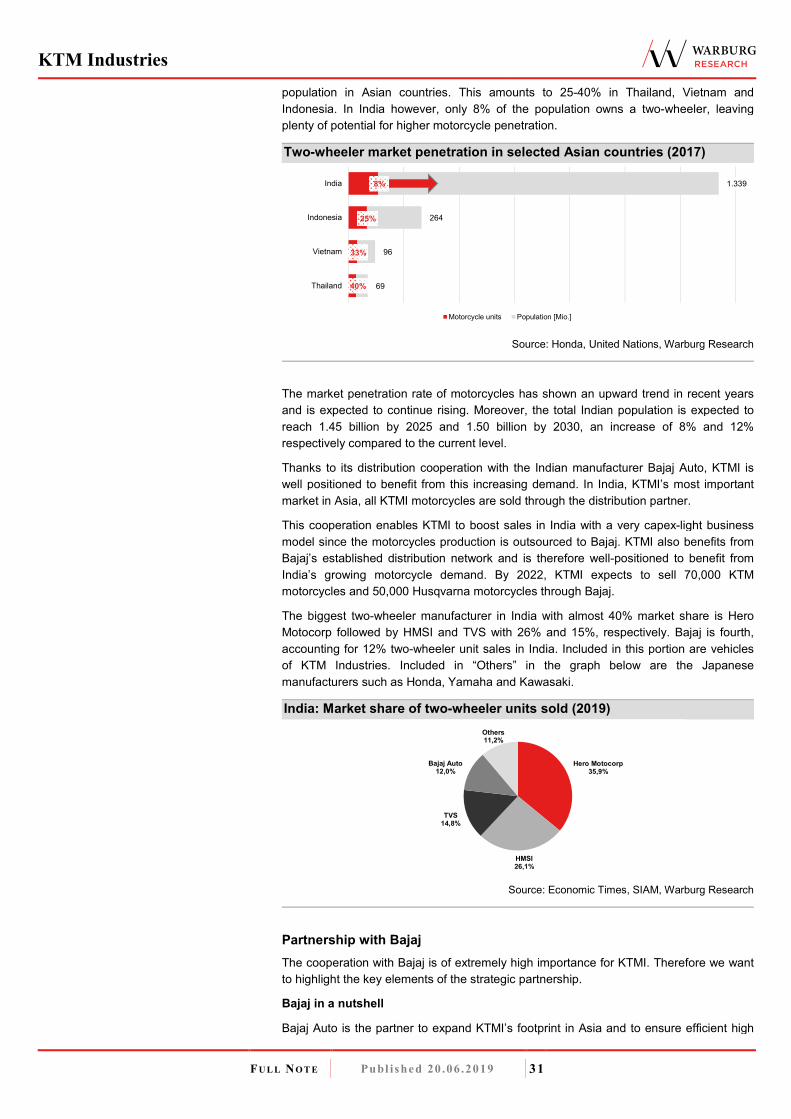
KTM Industries
FU L L NO T E Publ ished 20 .06 .2019 31
RESEARCH
population in Asian countries. This amounts to 25-40% in Thailand, Vietnam and
Indonesia. In India however, only 8% of the population owns a two-wheeler, leaving
plenty of potential for higher motorcycle penetration.
Two-wheeler market penetration in selected Asian countries (2017)
Source: Honda, United Nations, Warburg Research
The market penetration rate of motorcycles has shown an upward trend in recent years
and is expected to continue rising. Moreover, the total Indian population is expected to
reach 1.45 billion by 2025 and 1.50 billion by 2030, an increase of 8% and 12%
respectively compared to the current level.
Thanks to its distribution cooperation with the Indian manufacturer Bajaj Auto, KTMI is
well positioned to benefit from this increasing demand. In India, KTMI’s most important
market in Asia, all KTMI motorcycles are sold through the distribution partner.
This cooperation enables KTMI to boost sales in India with a very capex-light business
model since the motorcycles production is outsourced to Bajaj. KTMI also benefits from
Bajaj’s established distribution network and is therefore well-positioned to benefit from
India’s growing motorcycle demand. By 2022, KTMI expects to sell 70,000 KTM
motorcycles and 50,000 Husqvarna motorcycles through Bajaj.
The biggest two-wheeler manufacturer in India with almost 40% market share is Hero
Motocorp followed by HMSI and TVS with 26% and 15%, respectively. Bajaj is fourth,
accounting for 12% two-wheeler unit sales in India. Included in this portion are vehicles
of KTM Industries. Included in “Others” in the graph below are the Japanese
manufacturers such as Honda, Yamaha and Kawasaki.
India: Market share of two-wheeler units sold (2019)
Source: Economic Times, SIAM, Warburg Research
Partnership with Bajaj
The cooperation with Bajaj is of extremely high importance for KTMI. Therefore we want
to highlight the key elements of the strategic partnership.
Bajaj in a nutshell
Bajaj Auto is the partner to expand KTMI’s footprint in Asia and to ensure efficient high
69
96
264
1.339
Thailand
Vietnam
Indonesia
India
Motorcycle units Population [Mio.]
25%
33%
40%
8%
Hero Motocorp35,9%
HMSI26,1%
TVS14,8%
Bajaj Auto12,0%
Others11,2%

KTM Industries
FU L L NO T E Publ ished 20 .06 .2019 32
RESEARCH
volume production of its high quality motorcycles. As a result of the cooperation with
Bajaj, the partners jointly developed a completely new range of low displacement
engines (125 to 390cc) for the KTM brand. Bajaj, for instance, produces all KTM Dukes
with low displacement engines. From 2020 onwards all Husqvarna models (125 to
390cc) will join the platform. To keep costs low, the majority of parts for these
motorcycles are locally sourced from India and other Asian countries.
Bajaj, is the second-largest Indian motorcycle manufacturer with a volume >3m per year,
and therefore benefits from significant economies of scale. The 94.4k KTM motorcycles
that it produced in 2018 were only a small fraction of its total production and such volume
does not represent much of a challenge. Bajaj provides some 300 Indian workers to
assemble the KTMI motorcycles.
An important reason for the long term success of this partnership is that the companies
are cut from the same cloth. Like KTMI, the Indian manufacturer is also considered to be
a high quality player and is therefore a suitable match for KTMI’s quality & performance-
driven culture.
Efficient production plays an important role in the company’s plans for future expansion
in Asia. KTMI can leverage this relationship and use India as a stepping stone to
substantially increase its market share throughout Asia. By 2022e, KTMI expects Bajaj to
produce ~200k motorcycles up from 94.4k in 2018.
KTMI traded off technology expertise for production efficiency
The partnership started more than 10 years ago when Bajaj was seeking a technology
partner to successfully compete against the offering of Japanese companies. At the
same time, KTMI was looking for a local strategic partner in Asia to produce low
displacement motorcycles at affordable prices mainly for the developing markets.
As a consequence of the partnership, KTMI provided Bajaj with technological expertise
to produce four-stroke engines for the higher-end segment. Subsequently KTMI gained
access to its very efficient production (i.e. low cost & high capacity) and won a distributor
for KTM branded motorcycles in India and Indonesia. Bajaj benefits from substantial
economies of scale and, rather than posing a challenge, the production of additional
volumes for KTMI increases utilization.
Sales model work via a license fee
Motorcycles manufactured by Bajaj are branded KTM and Husqvarna Motorcycles. Bajaj
sells them in India & Indonesia and KTM Industries globally excl. India & Indonesia.
The royalty fee income (which was ~4% of unit revenue in 2018 and will be gradually
increased to 5% as new models are introduced) is booked in revenues. As it feeds
straight into the EBIT line, it is margin-enhancing.
Balance sheet accounting is even better for KTMI
In addition to efficient production and a license fee income, Bajaj-produced motorcycles
stay on Bajaj’s balance sheet and no net working capital or other investment is required
by KTMI.
While KTMI’s offering is mainly directed to emerging markets (e.g. Asia), around 20% of
the motorcycles find their way to Europe. All motorcycles sent to Europe are subject to
stringent quality control in Austria. All motorcycles exported to other regions are subject
to quality control in the respective CKD facility.
For vehicles distributed by KTMI, the amount owed is paid in USD to Bajaj within 45 days
after a motorcycle is sold and transactions are done through Bajaj Auto India directly.
This works out as a natural hedge for KTM Industries as it reduces the USD long position
stemming from the North America business. Bajaj charges a fair price (production costs
plus small premium) and the partners set a new pricing every six months to also share
the FX effect.
Finally, Bajaj also helps KTMI set up businesses and gain a foothold in other Asian

KTM Industries
FU L L NO T E Publ ished 20 .06 .2019 33
RESEARCH
countries.
Bajaj is one of the key drivers for our investment case
For the future, the management expects production at Bajaj to increase significantly.
Growth in Asia is expected to come mainly from Bajaj-produced motorcycles and we
therefore expect the Indian company to play a key role in KTMI’s expansion in Asia.
The partnership goes far beyond enabling KTMI’s growth in emerging markets. In India
itself, demand for mid-/high-end motorcycles is rising fast. KTM is already an established
brand in India, not least thanks to Bajaj’s substantial increase in KTM showroom
numbers in the last few years (450 KTM showrooms).
In our view, this established and growing dealer network serves as a strong base for the
planned rollout of Husqvarna street mo dels in 2020. We show our forecast until 2022e to
be consistent with KTMI’s mid-term horizon.
Warburg license fee model for Bajaj
Source: Warburg Research
Going forward, the cooperation is likely to be expanded. We think that we will see even
greater displacements being produced in India and a further deepening of the
collaboration.
2019e 2020e 2021e 2022e
License Fee KTM 4.5% 4.5% 5.0% 5.0%
License Fee HQV 4.0% 4.5% 4.5% 5.0%
KTM
KTM Unit sales India (Bajaj) 54,558 60,014 66,015 72,616
KTM unit price (Bajaj) 2300 2300 2300 2300
yoy 0.0% 0.0% 0.0%
KTM Sales (in USDm) 125.5 138.0 151.8 167.0
KTM share (KTM Sales x License Fee) 5.6 6.2 7.6 8.4
HQV
HQV Unit sales India (Bajaj) 25,000 55,000
HQV unit price (Bajaj) 2400 2400
yoy 0.0%
HQV Sales (in USDm) 60.0 132.0
KTM share (HQV Sales x License Fee) 2.7 6.6
Total Sales 125.5 138.0 211.8 299.0
Total KTM share 5.6 6.2 10.3 15.0
EUR/USD 1.14 1.14 1.14 1.14
Total Fee Income KTM (EURm) 5.0 5.4 9.0 13.1
License Fee to Husqvarna 1.5% 1.5% 1.5% 1.5%
Total License Fee Cost Husqvarna 0.0 0.0 0.8 1.7
Net License Fee KTM Industries 5.0 5.4 8.2 11.4

KTM Industries
FU L L NO T E Publ ished 20 .06 .2019 34
RESEARCH
China
After India, China is the second-largest two-wheeler market in the world counting around
16 million sales annually of which KTMI addresses around 1.1m. But despite a relatively
high household penetration of two-wheelers (60%), there is a decreasing trend in
motorcycle and overall two-wheeler sales.
The decrease in sales can be explained by the regulatory and political environment in
China which has been less favourable for motorcycles recently. In some cities
motorcycles are entirely banned. In others, no new licences have been issued. The main
concerns stated by officials were environmental and safety reasons, such as CO2 and
noise emission as well as various crimes involving motorcycles. Moreover, rising
disposable income and infrastructure quality are benefitting public transportation and
automobile manufactures.
CF Moto JV
KTM Industries established a joint venture with CF Moto in China. Starting in 2021,
middle class motorcycles will be produced in Hangzhou, China (at the moment, CF Moto
is the distributor for KTMI motorcycles in China). KTMI only contributed some intangible
assets for its 49% stake; the production capacity including machine and working capital
will all come from CF Moto. The JV focuses on the industrialisation of components in
China and the ASEAN region and the assembly of mid-range street motorcycles with
engine capacities of 500-1000 cc. The JV yields several benefits for KTMI:
� production costs of mid-range street motorcycles will be reduced,
� import duties to the Chinese market will be eliminated,
� production capacity at the Mattighofen plant will be relieved,
� the high-end motorcycle market, which is growing at ~20% p.a., will be addressed,
� components will be produced at lower cost.
For 2021, the CF Moto JV is targeting a sales volume of 15-20k motorcycles, of which
approx. 5K will be sold into the Chinese market while the remaining units (i.e. KTM 790
Duke and later also the KTM 790 Adventure) will be distributed worldwide from China.
CF Moto currently has production capacity of approx. 50k motorcycles, but is able to
expand capacity to around 100k.
While in 2018, the JV generated an at-equity result of EUR-0.97m, we forecast that the
JV will start production of mid-range motorcycles in the Chinese city of Hangzhou from
2021e onwards and break even in 2021e with further growth thereafter. Again, we show
our forecast until 2022e to be consistent with KTMI’s mid-term horizon.
Warburg assumptions for the JV with CF Moto
Source: Warburg Research
CFMOTO 2018 2019e 2020e 2021e 2022e
Total units CFMoto 10,000 15,000
yoy 50%
Unit Price 3,000 3,500 yoy 17%
Sales (in EURm) 30.0 52.5
EBIT Margin 3% 5%
EBIT 0.9 2.6
Financial Result 0.6 - 1.1 - Pretax result 0.3 1.6
Taxes 25% 0.1 0.4Net Profit -1.9 -1.0 -1.0 0.2 1.2
KTM share 49.9% 49.9% 49.9% 49.9% 49.9%KTM EBIT 0.00 0.00 0.45 1.31
KTM Profit -0.97 -0.50 -0.50 0.11 0.59

KTM Industries
FU L L NO T E Publ ished 20 .06 .2019 35
RESEARCH
Rest of the world
ASEAN 6 (Indonesia, Vietnam, Thailand, Malaysia, Singapore, Philippines)
In the ASEAN region, two-wheelers are predominantly used as means of transportation.
In many cases, a scooter or motorcycle is the primary or only vehicle for commuting to
work or school. There is also an increasing demand in commercial use of two-wheelers
(i.e. two-wheeler taxis, delivery services, etc.). For these forms of usage typically
smaller-sized two-wheelers with displacements of up to 125ccm are the preferred choice.
With the increasing wealth, there is a growing customer group resembling the ones in
developed countries with more luxurious and customized features.
Penetration of two-wheelers in private Asian households (2014) [in %]
Source: Roland Berger, Warburg Research
Unlike in India and China, the two-wheeler markets in South East Asian countries have
almost reached saturation point. In Thailand and Vietnam about nine out of ten private
households own a scooter or a motorcycle. In comparison, the percentage of households
with a two-wheeler in Germany or the U.S. is roughly 15%. Scooters account for 60-85%
in the countries of Vietnam, Thailand, Indonesia and Malaysia. With increasing
disposable income, however, motorcycles are expected to gain a greater share among
two-wheelers, which can be seen as growth potential for KTMI.
Asia: gross national income (2000-2017) and population (2000-2035e) in selected countries
Source: World Bank, United Nations, Warburg Research
The addressable market in Australia and New Zealand is estimated at ~58k p.a. and in
Africa at 11k p.a. and are therefore of rather minor importance for premium products
from KTM and Husqvarna.
87
86
85
83
60
47
32
18
16
14
Thailand
Vietnam
Indonesia
Malaysia
China
India
Philippines
Bangladesh
Germany
U.S.
0,0
1.000,0
2.000,0
3.000,0
4.000,0
5.000,0
6.000,0
7.000,0
8.000,0
9.000,0
10.000,0
2000 2001 2002 2003 2004 2005 2006 2007 2008 2009 2010 2011 2012 2013 2014 2015 2016 2017
[in USD]
CHN IND IDN PHL THA VNM
1.263 1.304 1.338 1.371 1.425 1.439 1.441 1.434
1.0531.144
1.2311.309
1.383 1.452 1.513 1.565
212227
243258
272285 296 305
2000 2005 2010 2015 2020F 2025F 2030F 2035F
[in Mio.]
CHN IND IDN PHL THA VNM

KTM Industries
FU L L NO T E Publ ished 20 .06 .2019 36
RESEARCH
eBikes – a hidden value option
The PEXCO JV as entry into the field of electric power two-wheelers
In H2/17, KTM Industries entered a JV agreement with the German Puello family (which
has 25-30 years of experience in the bicycle business). This partnership led to the
PEXCO JV with 40% ownership by KTM Industries. From our point of view, this was a
move with clear strategic rationale:
We believe the increased traffic and congestion in many big cities and metropolitan
areas and the more restrictive and emission standards (exhaust, CO2, noise) will trigger
a gradual shift from ICE (internal combustion engine) vehicles to EVs (electric vehicles)
in the next decades with electric power two-wheelers up to 11 kW (15 PS) leading the
trend. As a consequence the product categories bicycles and entry model motorcycles
will increasingly merge.
Based on KTM Industries’ broad motorcycle expertise and innovation leadership, the
strategic goal for the bicycle business is to become the technological market and
innovation leader in the global eBike market.
While currently many players are active in the market (Cube, Giant Manufacturing, Trek,
etc.) we expects a consolidation going forward.
Ambitious targets
KTM Industries has set ambitious sales targets for its eBike JV of more than 60K units
and EUR 75-85m sales for 2019e already, while only targeting the DACH market in a first
step.
The addressable DACH eBike market amounts to approx. 1.0m units p.a. but is growing
at double-digit growth rates. It is very likely that PEXCO will already launch its models in
other European countries (Scandinavia, France, etc.) in 2019e and into North America in
2020/21e.
Based on our detailed forecasts, we estimate that PEXCO will generate sales of EUR
150m at an EBIT margin of 8% by 2022e. This is in line with management’s expectation
that PEXCO will reach group margin level as soon as a critical size of units is sold.
KTMI’s stake in the PEXCO JV
Source: Warburg Research
The contract between KTM Industries and its JV partner foresees that KTM Industries
has an option to acquire the remaining 40% stake (Pierer Industries hold ~20%) in the
PEXCO JV between 2020 and 2022 at a certain EBITDA multiple (WRe: 5.5x).
In its FY 2018 presentation the company stated that KTM Industries will use its option
and acquire the remaining stake earlier than expected as the JV is growing faster than
PEXCO eBike 2018 2019e 2020e 2021e 2022e
eBikes units sold 30,000 60,000 80,000 96,000 115,000
yoy 100% 33% 20% 20%
average Unit Price 967 1,350 1,300 1,300 1,300 yoy 40% -4% 0% 0%
Sales (in EURm) 29.0 81.0 104.0 124.8 149.5
EBIT - 5.2 7.5 12.0
EBIT Margin 0% 5% 6% 8%
EBITDA 2.8 8.8 11.9 17.2
Financial Result 1.6 - 2.1 - 2.5 - 3.0 - Pretax result -1.6 3.1 5.0 9.0
Taxes 25% -0.4 0.8 1.2 2.2Net Profit -1.2 2.3 3.7 6.7
Margin -1.5% 2.3% 3.0% 4.5%
KTM share 40.0% 40.0% 40.0% 40.0% 40.0%KTM Net Profit (at-equity) -0.49 -0.49 0.94 1.50 2.69
Sales Multiple 0.3 x 0.3 x 0.3 x 0.3 xEBITDA Multiple 5.5 x 5.5 x 5.5 x 5.5 x
Target EV price based on Sales Multiple 9.72 12.48 15.56
Target EV price based on EBITDA Multiple 6.24 19.45 26.08

KTM Industries
FU L L NO T E Publ ished 20 .06 .2019 37
RESEARCH
anticipated. Full consolidation is targeted for 2020e/21e. We estimate a price of EUR
~20m if consolidated in 2021e, which would correspond to an EBITDA multiple of 5.5x.
Additionally, KTMI will have to buy the remaining 20% stake from Pierer Industrie AG
(WRe: ~EUR 3m). Important to note is that we do not incorporate a full consolidation in
our model at this stage but rather include the Pexco contribution in at-equity earnings.
Will it be successful?
Our research and discussions with industry experts make us confident that the eBike
business will be successful as a consequence of the following considerations:
� The Puello family has excellent access to bicycle dealers and profound knowledge of
the industry.
� KTMI’s Husqvarna dealers are also highly receptive to the idea of listing eBikes as they
earn a better margin than motorcycles (WRe: 30% vs. 15%)
� The eBikes reflect a lot of characteristics KTMI is known for: lightweight, design,
premium components.
� KTMI can close the gap between motorcycles and bicycles and leverage its innovative
power.
Additionally, PEXCO has a very asset-light business model and apart from the initial
investment by both partners (WRe: EUR 5-6m), the JV will be self-funded and does not
require additional financing from KTMI.
Assembly will be performed by third-party contract manufacturers with most components
sourced as standard parts, including the eMotor. For the first years, PEXCO will use off-
the-shelf eMotors from Shimano and Yamaha, two of the global leaders (the others are
Bosch and Panasonic). Going forward, PEXCO eBikes will use internally developed
eMotor specifications (motor control and applications) by KTMI (WRe: beginning in
2021e/22e), which would contribute an additional USP element and reduce dependence
on Asian suppliers.
We can also think of further synergies stemming from KTMI’s experience with entry-
model motorcycles (Freeride E 16kw, Sport Mini 2kw, etc.) and its deepened
collaboration with Bajaj in e-motorcycles.
International Roll-out Pexco 2019-2020
Source: KTM Industries, Warburg Research
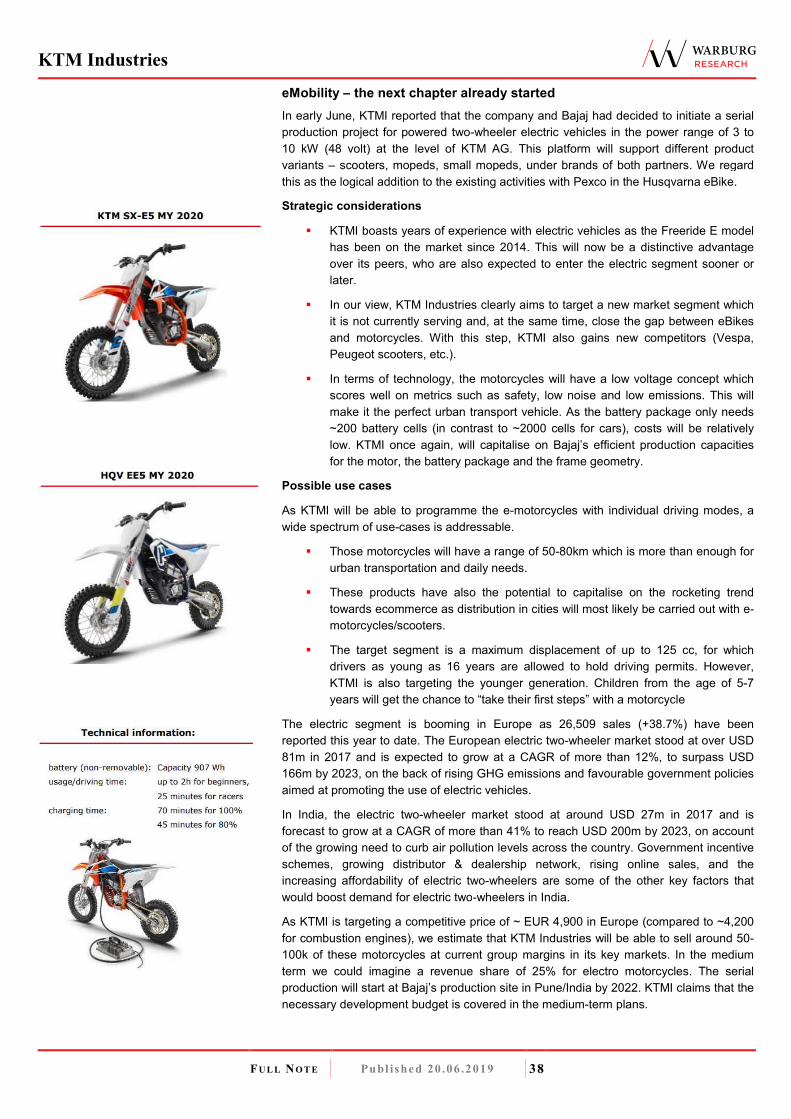
KTM Industries
FU L L NO T E Publ ished 20 .06 .2019 38
RESEARCH
eMobility – the next chapter already started
In early June, KTMI reported that the company and Bajaj had decided to initiate a serial
production project for powered two-wheeler electric vehicles in the power range of 3 to
10 kW (48 volt) at the level of KTM AG. This platform will support different product
variants – scooters, mopeds, small mopeds, under brands of both partners. We regard
this as the logical addition to the existing activities with Pexco in the Husqvarna eBike.
Strategic considerations
� KTMI boasts years of experience with electric vehicles as the Freeride E model
has been on the market since 2014. This will now be a distinctive advantage
over its peers, who are also expected to enter the electric segment sooner or
later.
� In our view, KTM Industries clearly aims to target a new market segment which
it is not currently serving and, at the same time, close the gap between eBikes
and motorcycles. With this step, KTMI also gains new competitors (Vespa,
Peugeot scooters, etc.).
� In terms of technology, the motorcycles will have a low voltage concept which
scores well on metrics such as safety, low noise and low emissions. This will
make it the perfect urban transport vehicle. As the battery package only needs
~200 battery cells (in contrast to ~2000 cells for cars), costs will be relatively
low. KTMI once again, will capitalise on Bajaj’s efficient production capacities
for the motor, the battery package and the frame geometry.
Possible use cases
As KTMI will be able to programme the e-motorcycles with individual driving modes, a
wide spectrum of use-cases is addressable.
� Those motorcycles will have a range of 50-80km which is more than enough for
urban transportation and daily needs.
� These products have also the potential to capitalise on the rocketing trend
towards ecommerce as distribution in cities will most likely be carried out with e-
motorcycles/scooters.
� The target segment is a maximum displacement of up to 125 cc, for which
drivers as young as 16 years are allowed to hold driving permits. However,
KTMI is also targeting the younger generation. Children from the age of 5-7
years will get the chance to “take their first steps” with a motorcycle
The electric segment is booming in Europe as 26,509 sales (+38.7%) have been
reported this year to date. The European electric two-wheeler market stood at over USD
81m in 2017 and is expected to grow at a CAGR of more than 12%, to surpass USD
166m by 2023, on the back of rising GHG emissions and favourable government policies
aimed at promoting the use of electric vehicles.
In India, the electric two-wheeler market stood at around USD 27m in 2017 and is
forecast to grow at a CAGR of more than 41% to reach USD 200m by 2023, on account
of the growing need to curb air pollution levels across the country. Government incentive
schemes, growing distributor & dealership network, rising online sales, and the
increasing affordability of electric two-wheelers are some of the other key factors that
would boost demand for electric two-wheelers in India.
As KTMI is targeting a competitive price of ~ EUR 4,900 in Europe (compared to ~4,200
for combustion engines), we estimate that KTM Industries will be able to sell around 50-
100k of these motorcycles at current group margins in its key markets. In the medium
term we could imagine a revenue share of 25% for electro motorcycles. The serial
production will start at Bajaj’s production site in Pune/India by 2022. KTMI claims that the
necessary development budget is covered in the medium-term plans.

KTM Industries
FU L L NO T E Publ ished 20 .06 .2019 39
RESEARCH
Putting the parts together – our outlook
As mentioned above, KTMI increased European registrations by 22% in Q1/19. However
we refrain from extrapolating this trend as we think that, April and May figures were
already lower and estimate a fair portion of Q1/19 registration were booked in FY 2018
revenues.
We still expect the largest unit sales contributions from Europe and North America in
absolute terms. However, in relative terms, emerging markets will outperform KTMI’s
main markets.
Unit sales forecast
Source: KTM Industries, Warburg Research
in EUR m 2018 2019e 2020e 2021e 2022e
KTM Unit sales Europe 83,984 86,084 88,666 91,326 94,066 7,342 2.83% 2.87%
KTM Unit sales North America 41,106 41,928 43,186 44,482 45,816 3,376 2.67% 2.75%
KTM Unit sales Asia 13,647 14,329 16,049 19,259 23,110 5,612 12.17% 14.08%
KTM Unit sales South America 12,208 13,185 15,822 18,986 22,783 6,778 15.86% 16.88%
KTM Unit sales Oceania 9,066 9,247 9,987 10,486 11,011 1,420 4.97% 4.98%
KTM Unit sales Africa / Middle East 3,291 3,390 3,559 3,915 4,307 624 5.96% 6.96%
KTM Unit sales Other 38,212 40,151 45,417 52,646 61,211 14,434 11.27% 12.50%
KTM Unit sales India (Bajaj) 49,598 54,558 60,014 66,015 72,616 16,417 10.00% 10.00%
Total 212,900 222,721 237,282 254,469 273,709 41,569 6.13% 6.48%
HQV Unit sales Europe 26,457 27,780 30,558 33,614 36,975 7,157 8.31% 8.73%
HQV Unit sales North America 14,046 14,748 15,486 16,260 19,512 2,214 5.00% 8.56%
HQV Unit sales Asia 1,886 2,075 2,490 2,987 3,585 1,101 16.57% 17.42%
HQV Unit sales South America 1,997 2,297 2,871 3,445 3,962 1,448 19.93% 18.68%
HQV Unit sales Oceania 3,368 3,536 3,890 4,668 5,602 1,300 11.49% 13.56%
HQV Unit sales Africa / Middle East 800 840 924 1,063 1,222 263 9.92% 11.17%
HQV Unit sales Other 8,051 8,748 10,174 12,163 14,370 4,112 14.74% 15.59%
HQV Unit sales India (Bajaj) 0 0 0 25,000 55,000 25,000
Total 48,554 51,276 56,218 87,037 125,857 38,483 21.48% 26.89%
KTM Unit sales India (Bajaj) 49,598 54,558 60,014 66,015 72,616 16,417 10.00% 10.00%
HQV Unit sales India (Bajaj) 0 0 0 25,000 55,000 25,000
Total Bajaj 49,598 54,558 60,014 91,015 127,616 41,417 22.43% 32.74%
Group Total 261,454 273,996 293,500 341,505 399,566 80,051 9.31% 13.40%
Group Unit sales Europe 110,441 113,863 119,224 124,940 131,041 14,499 4.20% 4.37%
Group Unit sales North America 55,152 56,676 58,672 60,742 65,328 5,590 3.27% 4.32%
Group Unit sales Other 46,263 48,899 55,591 64,809 75,581 18,546 11.89% 13.06%
Total 211,856 219,438 233,487 250,490 271,950 38,634 5.74% 6.44%
Group Unit Price Europe 7,418 7,455 7,529 7,718 7,872 1.33% 1.50%
Group Unit Price North America 6,652 6,652 6,718 6,886 7,024 1.16% 1.37%
Group Unit Price Other 5,969 5,969 6,089 6,302 6,428 1.82% 1.87%
Group Sales Europe 819.2 848.8 897.7 964.2 1,031.5 145.0 5.58% 5.93%
Group Sales North America 366.8 377.0 394.2 418.3 458.8 51.4 4.47% 5.75%
Group Sales Other 272.5 291.9 338.5 408.4 485.8 135.9 14.44% 15.55%
License Fee Income Bajaj 3.7 5.0 5.4 8.2 11.4
Total Sales 1,462.2 1,522.7 1,635.8 1,799.2 1,987.6 336.9 7.16% 7.98%
Delta 18-
21e
CAGR 18-
21e
CAGR 18-
22e

KTM Industries
FU L L NO T E Publ ished 20 .06 .2019 40
RESEARCH
Profits expected to remain stable
Profitability development
Source: KTM Industries, Warburg Research
At-equity earnings
Main drivers of the at-equity result will be the PEXCO eBike JV, the CFMoto JV as well
as Kiska. While the Australian distributor had a negative one-off in 2018, KTM Industries
announced in June 2019 that KTM Sportmotorcycle GmbH, a subsidiary of KTM AG, has
increased its stake in Motorcycle Distributors Australia Pty Ltd from 26% to 100%. With
the full takeover of the shares, the sales subsidiaries in Australia –Butmac Pty Ltd for the
brand KTM and HQVA Pty Ltd for the brand Husqvarna– as well as in New Zealand –
KTM Motorcycle Distributors NZ– become wholly-owned subsidiaries of the KTM AG.
We anticipate relatively stable earnings going forward for the other at-equity
participations which (beside the before mentioned) also include dealers, flagship stores
or the KTM Motohall museum. While we laid out our assumptions for PEXCO and
CFMoto in detail above, we expect an increasing at-equity result for Kiska as KTMI
increased its share in Kiska at the end of 2018.
KTMI’s at-equity earnings
Source: KTM Industries, Warburg Research
Non operative drivers
Financial result
KTMI’s financial result
Source: KTM Industries, Warburg Research
The financial result was historically mainly driven by interest expenses on outstanding
debt. Due to a change in presentation of expenses (from production costs to interest
expenses) in connection with a sales promotion programme in North America, the
in % of Sales 2015 2016 2017 2018 2019e 2020e 2021e
Sales 100.0% 100.0% 100.0% 100.0% 100.0% 100.0% 100.0%
Cost of sales 69.0% 67.7% 69.8% 70.4% 70.0% 70.1% 70.2%
Gross profit 31.0% 32.3% 30.2% 29.6% 30.0% 29.9% 29.8%
Research and development 2.4% 3.0% 2.5% 1.9% 2.0% 2.2% 2.3%
Sales and marketing 12.2% 12.6% 12.2% 11.8% 12.0% 12.0% 12.0%
General and administration 5.6% 6.0% 4.5% 4.9% 4.8% 4.8% 4.8%
Other operating income 0.3% 0.4% 0.3% 0.0% 0.5% 0.5% 0.5%
Other operating expenses 1.8% 2.1% 2.3% 2.0% 2.9% 2.5% 2.1%
EBITDA 14.6% 14.8% 14.3% 14.4% 15.9% 16.0% 16.0%
Depreciation of fixed assets 3.1% 3.2% 2.8% 3.0% 3.9% 3.8% 3.6%
EBITA 11.5% 11.6% 11.5% 11.5% 12.0% 12.2% 12.3%
Amortisation of intangible fixed assets 2.3% 2.5% 2.5% 2.7% 3.2% 3.2% 3.1%
Impairment charges and amortisation of goodwill 0.0% 0.0% 0.0% 0.0% 0.0% 0.0% 0.0%
At-equity earnings 0.0% 0.0% 0.0% -0.3% 0.0% 0.1% 0.1%
EBIT 9.2% 9.1% 9.0% 8.8% 8.8% 9.0% 9.2%
At-equity Earnings 2018 2019e 2020e 2021e
Kiska GmbH 0.27 0.63 0.63 0.63KTM New Zealand Ltd. 0.00KTM Asia Motorcycle Manufacturing Inc. -0.30 0.02 0.02 0.02Motorcycle Distributors Australia Pty Ltd. -3.29PEXCO GmbH -0.49 -0.49 0.94 1.50China Zhejiang CFMOTO-KTMR2R Motorcycles Co., Ltd. -0.97 -0.50 -0.50 0.11KTM Motohall GmbH -0.12 0.01 0.01 0.01Four flagship stores and miscellaneous -0.03 0.02 0.02 0.02
Total -4.93 -0.30 1.12 2.30
Financial Result 2015 2016 2017 2018 2019e 2020e 2021e
Interest Income 1.5 2.7 2.2 3.4 3.0 3.0 3.0Interest expenses -17.8 -19.5 -12.7 -18.5 -18.5 -18.2 -17.9Other financial income/expenses -6.6 3.4 -2.2 -1.4 -2.0 -2.0 -2.0
Financial Result -22.9 -13.4 -12.7 -16.4 -17.5 -17.2 -16.9
in % of sales -1.9% -1.0% -0.8% -1.1% -1.1% -1.1% -0.9%

KTM Industries
FU L L NO T E Publ ished 20 .06 .2019 41
RESEARCH
financial result decreased in 2018. As this effect is permanent, we account for the higher
expenses going forward.
Taxes
Given that the Austrian companies of KTMI are subject to a corporate income tax rate of
25%, we take this as a starting point for our explicit forecast horizon 2019e-2021e.
Minorities are substantial
Minorities are substantial at >40% of net income before minorities in 2018. Nearly all of it
is accountable to the 48% share of Bajaj in KTM AG. However, at the end of March KTM
Industries released its intention to simplify its structure.
Pierer Industrie AG and Bajaj have started discussing the possibility of transferring
Bajaj´s 48% stake in KTM AG to KTM Industries AG, with the Pierer Industrie AG
continuing to retain the controlling majority over KTM Industries AG.
If Pierer Industrie AG and Bajaj decide to execute the transaction, KTM Industries AG
plans a capital increase by contribution in kind from the existing authorised capital of the
company. The authorised capital enables a capital increase of up to 50% of the existing
share capital. If the transaction is executed, the company’s stake in KTM AG would
increase from current 51.7% to approximately 99.7%.
KTMI’s minority interest forecast
Source: KTM Industries, Warburg Research
Consequently KTM Industries’ share in profits of KTM AG would increase by
approximately two-thirds while the number of shares would only increase by maximal
50%. Thus, the transaction is highly earnings-accretive for the existing shareholders.
Bajaj’s intention is clear. First of all, the KTM AG shares are not listed and are therefore
illiquid. Secondly, as we have noted, KTM Industries comprises far more than just KTM
AG. With the transaction Bajaj also gains a fair share of the Pexco business as well as
the remaining parts of the group. Accordingly, we regard the plan as a win-win situation
for Bajaj, as well as for existing KTM Industries shareholders.
Pro forma calculation
Source: KTM Industries, Warburg Research
However, in an ad-hoc release dated June 2, 2019 KTMI reported that these
considerations are not being pursued any further for the time being. Nevertheless, we
wished to express our thoughts on this issue for the sake of presenting a comprehensive
picture.
Minorities impact 2015 2016 2017 2018 2019e 2020e 2021e
Net Income before minorities 65.0 88.8 83.9 114.2 87.4 97.5 111.5
Minority interest 35.0 36.9 39.2 46.7 45.0 48.0 50.0
Net Income 30.0 51.9 44.7 67.5 42.4 49.5 61.5
Minority interest in % of NI before minorities 54% 42% 47% 41% 52% 49% 45%
Minority interest in % of NI 117% 71% 88% 69% 106% 97% 81%
in EUR m
Net income before minorities 114.2 0%
Minority interest 46.7 -94%
Net Income 67.5 65%
Average number of shares 22.5 50%
EPS 2.99 10%
P/E ratio 17.7x
2018
actualchange
2018
post deal
16.1x
114.2
3.0
111.2
33.8
3.29

KTM Industries
FU L L NO T E Publ ished 20 .06 .2019 42
RESEARCH
Dividend policy
On the back of KTMI’s high capex needs in the last couple of years, the company has
chosen to implement a very conservative dividend policy. In the last four years, the
payout ratio amounted on average ~15% (DPS/EPS). For the explicit forecast period we
model a stable DPS @ EUR 0.30 per share which translates into a payout ratio of ~10%
in 2021e. This is in line with management’s guidance for a “stable and conservative
payout level”.
However, it is also crystal clear that KTMI will not become a dividend stock in the near
term.
KTMI’s dividend policy
Source: KTM Industries, Warburg Research
00%
05%
10%
15%
20%
25%
0.00
0.50
1.00
1.50
2.00
2.50
3.00
3.50
2015 2016 2017 2018 2019e 2020e 2021e
EPS DPS Payout ratio

KTM Industries
FU L L NO T E Publ ished 20 .06 .2019 43
RESEARCH
Warburg vs. consensus
Important to note:
� Consensus includes the estimates of only one other broker.
� While we obviously lack full transparency we are assuming that the large difference in
2021e estimates is explained by the consolidation of the PEXCO business.
� We are broadly in line with the EBIT margin assumptions.
Warburg vs. consensus
Source: Factset, Warburg Research, Data as of 20.06.2019
Short- and mid-term guidance
This compares to the management guidance as follows:
KTMI’s guidance
Source: KTM Industries, Warburg Research
KTM-Industries - Consensus
as of: 11.06.2019 2018 2019e 2020e 2021e 2019e 2020e 2021e
Sales 1,462.2 1,522.7 1,635.8 1,799.2 1,505.0 1,575.0 1,921.0
yoy 4.1% 7.4% 10.0% 2.9% 4.7% 22.0%
Delta WRe (absolut) 17.7 60.8 -121.8
Delta WRe (relative) 1.2% 3.9% -6.3%
EBIT 128.7 134.0 147.2 165.5 136.0 147.0 181.0
margin 8.8% 8.8% 9.0% 9.2% 9.0% 9.3% 9.4%
Delta WRe (absolut) -2.0 0.2 -15.5
Delta WRe (relative) -1.5% 0.1% -8.6%
Net Income 67.5 42.4 49.5 61.5 55.6 60.1 75.4
margin 4.6% 2.8% 3.0% 3.4% 3.7% 3.8% 3.9%
Delta WRe (absolut) -13.2 -10.6 -13.9
Delta WRe (relative) -23.8% -17.6% -18.5%
EPS 3.0 1.9 2.2 2.7 2.6 2.7 3.4
Delta WRe (absolut) -0.69 -0.50 -0.65
Delta WRe (relative) -26.7% -18.5% -19.3%
DPS 0.30 0.30 0.30 0.30 0.36 0.40 0.45
payout 10.0% 16.0% 13.6% 11.0% 14.0% 15.0% 13.3%
Delta WRe (absolut) -0.06 -0.10 -0.15
Delta WRe (relative) -16.4% -25.7% -33.1%
ConsensusWarburg Research

KTM Industries
FU L L NO T E Publ ished 20 .06 .2019 44
RESEARCH
Valuation
� We derive our price target of CHF 90 from our DCF model.
� To confirm our view of conservative assumptions modelled in our DCF base case we
also include a blue sky scenario.
� FCF Value Potential indicates a value of CHF 78 per share in 2021e.
Stable capex level as a driver of FCF generation
Fundamental valuation
DCF valuation
We derive an intrinsic value of EUR 80 which we convert to our target price of CHF 90
(FX-rate 1.12).
Our DCF model assumptions can be summarised as follows:
� Revenue growth: We expect top-line growth at a CAGR of ~7% during the 19e-21e
explicit forecast period. However, during the transitional phase sales CAGR is
anticipated at ~5% and will come down to 2% for the terminal value calculation. We
regard this as a conservative assumption given the extraordinary high growth prospects
outlined above.
� EBIT margin: EBIT margin decreases from 9.5% in 2022e to 8% in 2032e.
� D&A: D&A is expected to decrease from 6.5% of sales in 2022e to 5% in 2032e.
� Capex: A key pillar of our investment case is the stabilisation of capex spending and
subsequent decline in capex/sales due to the production capacity shift to Bajaj. Freeing
up capacity at the Mattighofen site will enable asset-light growth in Europe. We note
that while total capex is forecast to remain largely stable (EUR 150-160m), the two
contributing elements display opposite trends: maintenance capex in PPE is set to
decline, while capitalised R&D is set to increase due to the launch of more street
models.
� WACC: A qualitative beta of 1.4 is applied compared to an empirical beta (adjusted
Bloomberg beta) versus SMI of 0.896. We take into account the cyclical business
environment KTMI is exposed to (rated 1.5), liquidity considerations (1.3) due to only
30% free float, financial strength (1.0), transparency (1.4) and “other” (1.3). As there
are no bonds outstanding, we estimate an interest rate of 2%, which reflects the return
expected from debt investors. Corporate tax rate is 25% but increases to 30%. An
expected market return of 7% and a risk-free return of 1.5%, combined with a target
debt ratio of 33%, lead to a WACC of 6.47%.
� Minorities: Minorities are substantial as Bajaj holds a ~48% stake in KTM AG. Minority
interest stood at 41% of net income before minorities in 2018. Consequently we factor
in the minority stake in at 12x earnings.
� Market value of investments: We take EBIT before at-equity earnings as a starting
point and add the investments at book value EUR 26.1m. We regard this as extremely
conservative given the potential of PEXCO outlined above.

KTM Industries
FU L L NO T E Publ ished 20 .06 .2019 45
RESEARCH
DCF model
Detailed forecast period Transitional period Term. Value
Figures in EUR m 2019e 2020e 2021e 2022e 2023e 2024e 2025e 2026e 2027e 2028e 2029e 2030e 2031e Sales 1,523 1,636 1,799 1,979 2,148 2,303 2,445 2,574 2,689 2,791 2,882 2,961 3,031
Sales change 4.1 % 7.4 % 10.0 % 10.0 % 8.5 % 7.2 % 6.2 % 5.3 % 4.5 % 3.8 % 3.2 % 2.8 % 2.3 % 2.0 %
EBIT 134 146 163 188 201 211 221 228 234 239 243 245 247
EBIT-margin 8.8 % 8.9 % 9.1 % 9.5 % 9.3 % 9.2 % 9.0 % 8.9 % 8.7 % 8.6 % 8.4 % 8.3 % 8.1 %
Tax rate (EBT) 25.0 % 25.0 % 25.0 % 25.0 % 25.5 % 25.9 % 26.4 % 26.9 % 27.4 % 27.9 % 28.4 % 28.9 % 29.5 %
NOPAT 101 110 122 141 149 157 162 167 170 172 174 174 174 Depreciation 108 116 124 129 136 142 147 151 153 155 156 156 156
in % of Sales 7.1 % 7.1 % 6.9 % 6.5 % 6.3 % 6.2 % 6.0 % 5.9 % 5.7 % 5.6 % 5.4 % 5.3 % 5.1 %
Changes in provisions 0 2 2 3 3 2 2 2 2 2 1 1 1
Change in Liquidity from
- Working Capital -14 18 25 23 21 18 16 13 11 9 7 5 4
- Capex 150 155 160 158 165 169 172 173 173 172 171 168 165
Capex in % of Sales 9.9 % 9.5 % 8.9 % 8.0 % 7.7 % 7.3 % 7.0 % 6.7 % 6.4 % 6.2 % 5.9 % 5.7 % 5.4 %
Other 10 0 0 0 0 0 0 0 0 0 0 0 0 Free Cash Flow (WACC Model)
63 55 64 91 103 114 124 133 141 148 154 159 163 166
PV of FCF 62 51 55 75 79 82 84 85 85 83 81 79 76 1,729 share of PVs 6.22 % 29.90 % 63.88 %
Model parameter Valuation (m)
Derivation of WACC: Derivation of Beta: Present values 2031e 977
Terminal Value 1,729
Debt ratio 35.00 % Financial Strength 1.30 Financial liabilities 445
Cost of debt (after tax) 1.4 % Liquidity (share) 1.50 Pension liabilities 25
Market return 7.00 % Cyclicality 1.50 Hybrid capital 0
Risk free rate 1.50 % Transparency 1.40 Minority interest 540
Others 1.30 Market val. of investments 26
Liquidity 89 No. of shares (m) 22.5
WACC 6.47 % Beta 1.40 Equity Value 1,812 Value per share (EUR) 80.41
Sensitivity Value per Share (EUR)
Terminal Growth Delta EBIT-margin
Beta WACC 1.25 % 1.50 % 1.75 % 2.00 % 2.25 % 2.50 % 2.75 % Beta WACC -1.5 pp -1.0 pp -0.5 pp +0.0 pp +0.5 pp +1.0 pp +1.5 pp
1.68 7.5 % 50.35 52.41 54.65 57.09 59.77 62.72 65.98 1.68 7.5 % 36.70 43.50 50.29 57.09 63.89 70.69 77.49
1.54 7.0 % 59.02 61.61 64.44 67.56 71.01 74.85 79.14 1.54 7.0 % 45.10 52.58 60.07 67.56 75.05 82.54 90.03
1.47 6.7 % 63.96 66.88 70.09 73.64 77.59 82.00 86.98 1.47 6.7 % 49.97 57.86 65.75 73.64 81.53 89.42 97.31
1.40 6.5 % 69.38 72.69 76.34 80.41 84.95 90.07 95.87 1.40 6.5 % 55.40 63.74 72.07 80.41 88.74 97.07 105.41
1.33 6.2 % 75.36 79.12 83.30 87.98 93.25 99.22 106.05 1.33 6.2 % 61.48 70.31 79.15 87.98 96.81 105.65 114.48
1.26 6.0 % 81.99 86.29 91.10 96.52 102.67 109.70 117.82 1.26 6.0 % 68.34 77.73 87.13 96.52 105.91 115.31 124.70
1.12 5.5 % 97.62 103.36 109.87 117.32 125.93 135.98 147.88 1.12 5.5 % 85.04 95.80 106.56 117.32 128.08 138.84 149.60 � Sales growth slows from 10% to 2% in perpetuity.
� EBIT margin declines during transitional phase from 9% to 8%.
� EBIT used in our DCF differs from EBIT in the P&L as we exclude at-equity earningsK
� K and separately add at-equity participations at book value. We deduct minority interest at 12x minority earnings.
� "Other" is the estimated purchase price for the distributor in Australia & New Zealand.

KTM Industries
FU L L NO T E Publ ished 20 .06 .2019 46
RESEARCH
Bull Case DCF
To put our conservative base case assumptions into perspective we also include a blue-
sky scenario which would yield a value of CHF 128.
� Revenue growth: We expect top-line growth at a CAGR of ~7% during the 19e-21e
explicit forecast period. In contrast to our base case scenario, we estimate top-line
growth will continue at a high pace during the transitional phase and will come down to
2% for the terminal value calculation.
� EBIT margin: EBIT margin decreases from 9.5% in 2022e to only 9% in 2032e.
� Taxes: stable @ 25%
� Capex: Capex remains at the same absolute level; however, the FCF increases
substantially as capex to sales decreases as a result of stronger top-line growth.
� WACC: changes as implied market value changes.
Bull case DCF
Source: Warburg Research,
Detailed forecast period Transitional period Term. Value
Figures in EUR m 2019e 2020e 2021e 2022e 2023e 2024e 2025e 2026e 2027e 2028e 2029e 2030e 2031e
Sales 1522.7 1635.8 1799.2 1979.1 2162.3 2347.7 2534.0 2720.2 2905.3 3088.3 3268.5 3445.0 3617.2Sales change 4.1% 7.4 % 10.0 % 10.0 % 9.3 % 8.6 % 7.9 % 7.3 % 6.8 % 6.3 % 5.8 % 5.4 % 5.0 % 2.0 %
EBIT 134.3 146.1 163.2 188.0 204.3 220.6 236.9 252.9 268.6 284.0 299.0 313.4 327.3EBIT-margin 8.8% 8.9 % 9.1 % 9.5 % 9.4 % 9.4 % 9.3 % 9.3 % 9.2 % 9.2 % 9.1 % 9.1 % 9.0 %
Tax rate (EBT) 25.0% 25.0 % 25.0 % 25.0 % 25.0 % 25.0 % 25.0 % 25.0 % 25.0 % 25.0 % 25.0 % 25.0 % 25.0 %
NOPAT 100.7 109.6 122.4 141.0 153.2 165.5 177.6 189.7 201.5 213.0 224.2 235.1 245.5
Depreciation 107.6 116.1 124.2 128.6 136.9 144.8 152.2 159.2 165.6 171.5 176.8 181.5 185.7in % of Sales 7.1% 7.1 % 6.9 % 6.5 % 6.3 % 6.2 % 6.0 % 5.9 % 5.7 % 5.6 % 5.4 % 5.3 % 5.1 %
Change in provisions 0.0 2.0 2.0 .7 2.7 2.8 2.8 2.8 2.8 2.7 2.7 2.6 2.6
Change in liquidity from- Working Capital -14.3 18.1 25.0 3.0 23.4 23.4 23.1 22.7 22.2 21.6 20.9 20.1 19.2- Capex 150.0 155.0 160.0 158.3 164.6 169.0 171.9 173.3 173.4 172.4 170.5 167.8 164.5Capex in % of Sales 9.9% 9.5 % 8.9 % 8.0 % 7.6 % 7.2 % 6.8 % 6.4 % 6.0 % 5.6 % 5.2 % 4.9 % 4.5 %
Other 10 0 0 0 0 0 0 0 0 0 0 0 0
62.6 54.6 63.6 109.0 104.9 120.7 137.6 155.6 174.2 193.2 212.3 231.3 250.0
PV of FCF 61.9 50.4 54.9 88.0 79.1 85.0 90.6 95.7 100.1 103.8 106.6 108.5 109.6 2341.0
share of PVs 4.8% 27.82% 67.4%
Model parameter Valuation (m)
Derivation of WACC: Derivation of Beta: Present values until 2031e 1134.1Terminal Value 2341.0
Debt ratio 28.0% Financial Strength 1.30 Financial liabilities 444.6Cost of debt 2.0% Liquidity 1.50 Pension liabilities 25.0Market return 7.0% Cyclicality 1.50 Hybrid capital .0Risk free rate 1.5% Transparency 1.40 Minority interest 540.0Risk premium 5.5% Others 1.30 Market val. of investments 26.1
Cost of equity 9.2% Liquidity 89.3 No. of shares (m) 22.5
WACC 7.0% Beta 1.40 Equity Value 2581.0 114.51
Sensitivity Value per share (EUR)
Terminal Growth Delta EBIT-margin
Beta (WACC) 1.3 % 1.50% 1.75% 2.00% 2.25% 2.50% 2.75% -1.50 pp -1.00 pp -0.50 pp 0.00 pp 0.50 pp 1.00 pp 1.50 pp
1.65 8.0% 76.29 78.93 81.78 84.86 88.21 91.87 95.88 63.00 70.29 77.58 84.86 92.15 99.43 106.721.53 7.5% 87.61 90.88 94.43 98.29 102.53 107.19 112.34 74.31 82.30 90.30 98.29 106.29 114.29 122.281.46 7.3% 94.02 97.67 101.65 106.01 110.80 116.09 121.98 80.80 89.20 97.60 106.01 114.41 122.81 131.211.40 7.0% 101.00 105.10 109.58 114.51 119.96 126.01 132.77 87.96 96.81 105.66 114.51 123.36 132.21 141.071.34 6.8% 108.65 113.26 118.34 123.94 130.17 137.12 144.95 95.90 105.25 114.60 123.94 133.29 142.64 151.981.27 6.5% 117.05 122.27 128.04 134.45 141.61 149.65 158.77 104.75 114.65 124.55 134.45 144.35 154.24 164.141.15 6.0% 136.61 143.39 150.97 159.49 169.15 180.18 192.89 125.87 137.08 148.28 159.49 170.70 181.91 193.12
Value per share
(EUR)
Free Cash Flow (WACC-model)

KTM Industries
FU L L NO T E Publ ished 20 .06 .2019 47
RESEARCH
No-growth assumptions also indicate an undervaluation
FCF Value Potential
Keeping maintenance capex at 5% of sales (2019e: 77.4m) and WC constant leaves us
with a value of EUR 69 per share for 2021e which translates in CHF ~78 (FX rate of
1.12).
Free Cash Flow Value Potential Warburg Research's valuation tool "FCF Value Potential" reflects the ability of the company to generate sustainable free cash flows. It is based on the "FCF potential" - a FCF "ex growth" figure - which assumes unchanged working capital and pure maintenance capex. A value indication is derived via the perpetuity of a given year’s “FCF potential” with consideration of the weighted costs of capital. The fluctuating value indications over time add a timing element to the DCF model (our preferred valuation tool). in EUR m 2015 2016 2017 2018 2019e 2020e 2021e
Net Income before minorities 65 89 84 114 87 98 111 + Depreciation + Amortisation 66 76 72 82 108 115 122 - Net Interest Income -23 -13 -13 -16 -18 -17 -17 - Maintenance Capex 61 67 68 73 76 82 90 + Other 0 0 0 4 0 -1 -2
= Free Cash Flow Potential 92 111 101 144 137 147 159
FCF Potential Yield (on market EV) 6.1 % 6.3 % 4.8 % 6.2 % 6.7 % 7.1 % 7.7 % WACC 6.47 % 6.47 % 6.47 % 6.47 % 6.47 % 6.47 % 6.47 %
= Enterprise Value (EV) 1,525 1,765 2,120 2,308 2,044 2,064 2,064 = Fair Enterprise Value 1,426 1,713 1,559 2,219 2,116 2,274 2,450
- Net Debt (Cash) 323 323 323 323 333 314 288 - Pension Liabilities 25 25 25 25 25 27 29 - Other 0 0 0 0 0 0 0 - Market value of minorities 561 561 561 561 540 576 600 + Market value of investments 26 26 26 26 26 27 29
= Fair Market Capitalisation 543 830 676 1,336 1,244 1,384 1,562
Number of shares, average 23 23 23 23 23 23 23
= Fair value per share (EUR) 24.10 36.84 29.98 59.27 55.19 61.40 69.29
premium (-) / discount (+) in % 8.5 % 20.7 % 36.2 %
Sensitivity Fair value per Share (EUR)
9.47 % 4.06 12.76 8.08 28.08 25.45 29.44 34.85 8.47 % 9.16 18.89 13.65 36.02 33.03 37.58 43.62 7.47 % 15.63 26.66 20.73 46.09 42.63 47.89 54.74 WACC 6.47 % 24.10 36.84 29.98 59.27 55.19 61.40 69.29
5.47 % 35.67 50.73 42.62 77.26 72.36 79.84 89.17 4.47 % 52.41 70.84 60.92 103.31 97.20 106.53 117.94 3.47 % 78.80 102.55 89.76 144.37 136.36 148.61 163.29
� We expect maintenance Capex at 5% of sales.
� "Others" include the adjustments from at-equity earnings which we separately add at book value.
� Additionally, we deduct minority interest at 12x minority earnings.

KTM Industries
FU L L NO T E Publ ished 20 .06 .2019 48
RESEARCH
Relative Valuation
We benchmark KTMI with multiples of peer companies active in the motorcycle or eBike
industry. However, comparability is limited as most major motorcycle competitors are:
� Part of a large automotive group or conglomerates with the motorcycle business only
contributing a very small share (Honda, Suzuki, Kawasaki, BMW, Ducati).
� Many smaller competitors are privately-owned and neither historic data nor forecasts
are available (Triumph).
� Others focus on markets where KTMI does not compete (Hero MotoCorp in India, Bajaj
with 3-wheelers in India and Africa) or to a large extent serve a different market
segment (Piaggio/Scooters, Polaris/Snowmobiles).
� Plus we do not find a listed entity active in both motorcycles and eBikes.
We made the following observations:
� Harley-Davidson & BMW also have a finance division which distorts comparability.
� The large motorcycle OEMs (Yamaha, Honda, Piaggio) are serving different market
segments, trade at discount but also have a lower margin profile.
� eBike manufacturer can reach a comparable margin level but trade at a large premium
to KTMI. This also indicates a decent hidden value of the PEXCO JV.
Peer group key figures
Source: Factset, Warburg Research, Data as of 20.06.2019
Peer group multiples
Source: Factset, Warburg Research, Data as of 20.06.2019
Company Ticker LW Kurs MK EV
in LC in LC m in LC m 19e 20e 21e 19e 20e 21e 19e 20e 21e
Direct comparable
Harley-Davidson, Inc. HOG USD 34.98 5,564.4 12,104.3 4,701.0 4,752.3 4,787.0 985.0 1,050.5 1,021.2 654.5 782.8 764.9Yamaha Motor Co., Ltd. 7272-TKS JPY 1872.00 653,943.9 968,152.4 1,720,900.0 1,800,500.0 1,886,866.9 186,750.0 204,421.8 218,500.0 140,000.0 155,000.0 167,000.0
Indirect comparable - motorcycle OEMs
Bayerische Motoren Werke AG BMW-ETR EUR 63.61 41,829.9 141,241.1 98,877.1 101,136.0 103,357.4 12,473.6 14,195.0 14,612.0 7,486.2 8,685.5 8,619.0
Honda Motor Co., Ltd. 7267-TKS JPY 2766.00 4,866,951.0 10,014,246.6 15,800,000.0 16,165,000.0 16,545,283.0 1,229,500.0 1,327,500.0 1,394,000.0 802,500.0 858,500.0 970,049.3Piaggio & C. S.p.a. PIA-MIL EUR 2.53 903.9 1,377.0 1,506.6 1,606.2 1,661.1 228.0 243.0 254.4 110.0 129.1 144.0
Polaris Industries Inc. PII USD 93.40 5,704.0 7,743.5 6,794.3 7,032.0 7,326.1 810.7 857.0 952.7 541.0 612.0 638.5
Indirect comparable - eBike Manufacturers
Giant Manufacturing Co., Ltd. 9921-TAI TWD 248.00 93,016.1 103,056.8 64,556.8 70,876.4 75,869.0 6,177.6 6,990.5 7,337.0 4,750.0 5,457.4 5,798.0
Merida Industry Co., Ltd. 9914-TAI TWD 188.00 56,209.0 56,181.4 28,656.8 31,716.6 34,610.0 2,104.0 2,486.4 2,773.9 1,803.0 2,232.2 2,508.2Accell Group N.V. ACCEL-AMS EUR 23.55 631.1 776.4 1,147.1 1,219.6 70.4 80.2 58.5 67.7
KTM Industries AG KTMI-SWX EUR 57.20 1,289.2 2,183.4 1,522.7 1,635.8 1,799.2 241.9 262.2 287.4 134.0 147.2 165.5
Sales EBITDA EBIT
Company LC
19e 20e 21e 19e 20e 21e 19e 20e 21e 19e 20e 21e
Direct comparable
Harley-Davidson, Inc. USD 9.5 x 9.2 x 8.7 x 2.6 x 2.5 x 2.5 x 12.3 x 11.5 x 11.9 x 18.5 x 15.5 x 15.8 x
Yamaha Motor Co., Ltd. JPY 7.0 x 6.3 x 5.7 x 0.6 x 0.5 x 0.5 x 5.2 x 4.7 x 4.4 x 6.9 x 6.2 x 5.8 x
Indirect comparable - motorcycle OEMs
Bayerische Motoren Werke AG EUR 7.3 x 6.4 x 6.4 x 1.4 x 1.4 x 1.4 x 11.3 x 10.0 x 9.7 x 18.9 x 16.3 x 16.4 x
Honda Motor Co., Ltd. JPY 6.8 x 6.4 x 5.9 x 0.6 x 0.6 x 0.6 x 8.1 x 7.5 x 7.2 x 12.5 x 11.7 x 10.3 x
Piaggio & C. S.p.a. EUR 18.0 x 16.1 x 13.6 x 0.9 x 0.9 x 0.8 x 6.0 x 5.7 x 5.4 x 12.5 x 10.7 x 9.6 x
Polaris Industries Inc. USD 15.0 x 13.6 x 12.4 x 1.1 x 1.1 x 1.1 x 9.6 x 9.0 x 8.1 x 14.3 x 12.7 x 12.1 x
Indirect comparable - eBike Manufacturers
Giant Manufacturing Co., Ltd. TWD 27.7 x 23.3 x 21.5 x 1.6 x 1.5 x 1.4 x 16.7 x 14.7 x 14.0 x 21.7 x 18.9 x 17.8 x
Merida Industry Co., Ltd. TWD 23.5 x 20.0 x 17.7 x 2.0 x 1.8 x 1.6 x 26.7 x 22.6 x 20.3 x 31.2 x 25.2 x 22.4 x
Accell Group N.V. EUR 20.0 x 14.7 x n.a. 0.7 x 0.6 x n.a. 11.0 x 9.7 x n.a. 13.3 x 11.5 x n.a.
Mean 15.0 x 12.9 x 11.5 x 1.3 x 1.2 x 1.2 x 11.9 x 10.6 x 10.1 x 16.6 x 14.3 x 13.8 x
Median 15.0 x 13.6 x 10.6 x 1.1 x 1.1 x 1.2 x 11.0 x 9.7 x 8.9 x 14.3 x 12.7 x 14.0 x
KTM Industries AG EUR 30.43 x 26.00 x 20.95 x 1.43 x 1.33 x 1.21 x 9.02 x 8.33 x 7.60 x 16.29 x 14.83 x 13.19 x
Potential to mean in % -51% -50% -45% -11% -9% 2% 32% 27% 33% 2% -4% 4%
Potential to median in % -51% -48% -50% -21% -18% 0% 22% 16% 17% -12% -15% 6%
Fair value per share based on mean 28.17 28.40 31.39 46.56 48.40 58.92 87.88 83.75 89.39 59.23 53.57 61.49
Fair value per share based on median 28.28 30.00 28.81 37.32 40.25 56.73 78.70 72.95 73.77 45.42 42.97 62.97
Quelle: Warburg Research, FactSet
P/E EV/Sales EV / EBITDA EV / EBIT

KTM Industries
FU L L NO T E Publ ished 20 .06 .2019 49
RESEARCH
Peer group margins
Source: Factset, Warburg Research, Data as of 20.06.2019
Company LW
19e 20e 21e 19e 20e 21e 19e 20e 21e 19e 20e 21e
Direct comparable
Harley-Davidson, Inc. USD 4.3% 4.4% 4.7% 30.7% 32.3% 31.4% 21.0% 22.1% 21.3% 13.9% 16.7% 16.3%
Yamaha Motor Co., Ltd. JPY 4.8% 5.1% 5.3% 26.5% 27.5% 27.1% 10.9% 11.4% 11.6% 8.1% 9.0% 9.7%
Indirect comparable - motorcycle OEMs
Bayerische Motoren Werke AG EUR 5.0% 5.5% 5.5% 23.2% 23.3% 23.4% 12.6% 14.0% 14.1% 7.6% 8.8% 8.7%
Honda Motor Co., Ltd. JPY 4.3% 4.7% 5.1% 21.8% 21.9% 21.7% 7.8% 8.2% 8.4% 5.1% 5.4% 6.1%
Piaggio & C. S.p.a. EUR 3.7% 3.8% 3.7% - - - 15.1% 15.1% 15.3% 7.3% 8.6% 9.6%
Polaris Industries Inc. USD 2.6% 2.7% 3.0% 24.3% 24.9% 24.8% 11.9% 12.2% 13.0% 8.0% 9.0% 9.4%
Indirect comparable - eBike Manufacturers
Giant Manufacturing Co., Ltd. TWD 2.2% 2.6% 2.7% 21.7% 23.4% - 9.6% 9.9% 9.7% 7.4% 8.5% 9.0%
Merida Industry Co., Ltd. TWD 2.5% 3.0% 3.3% 13.3% 13.8% 12.9% 7.3% 7.8% 8.0% 6.3% 7.8% 8.8%
Accell Group N.V. EUR 2.5% 3.4% - 30.4% 30.9% - 6.1% 6.6% - 5.1% 5.9% -
Mean 3.5% 3.9% 4.2% 24.0% 24.7% 23.6% 11.4% 11.9% 12.7% 7.6% 8.8% 9.7%
Median 3.7% 3.8% 4.2% 23.7% 24.1% 24.1% 10.9% 11.4% 12.3% 7.4% 8.6% 9.2%
KTM Industries AG EUR 0.6% 0.6% 0.6% 30.0% 29.9% 29.8% 15.9% 16.0% 16.0% 8.8% 9.0% 9.2%
Delta to mean in bp -297bps -332bps -357bps 602bps 517bps 623bps 452bps 411bps 329bps 116bps 16bps -49bps
Delta to median in bp -313bps -325bps -359bps 627bps 578bps 570bps 504bps 468bps 368bps 144bps 43bps 1bps
Quelle: Warburg Research, FactSet
Div Yield Gross Margin EBITDA Margin EBIT Margin

KTM Industries
FU L L NO T E Publ ished 20 .06 .2019 50
RESEARCH
High vertical integration Company & Group Structure
KTM Industries AG (formerly known as CROSS Industries) is a global motorcycle
manufacturer with the well-known brands KTM, Husqvarna Motorcycles and WP, which
all are among the technology and market leaders in their respective segments. The
company, headquartered in Wels, Austria, had more than 4,200 employees in December
2018.
KTM industries’ operations are divided into the three segments “powered two wheelers”,
“design, concept development & digitalization” and “eMobility”. The export rate of all
business segments of the Austria-based company is higher than 95%.
Due to the disposal of the Pankl Group at the end of June 2018 and the integration of the
KTM Components Group (formerly: WP Group) into KTM AG, KTM AG now represents
the main division of the KTM Industries Group.
KTM Industries: simplified group structure (May 2019)
Source: KTM Industries, Warburg Research
Ownership structure
KTM Industries is a public company and listed at the SIX Swiss exchange under the
ticker symbol KTMI. Majority shareholder with 62% of the shares is Pierer Industries AG,
the holding company of Stefan Pierer. The remaining 38% are free floating shares
whereof approximately 1.1% of KTM Industries is held by the CFO and the CSO
KTM Industries owns 51.7% of KTM Group, which is the parent company to the KTM and
Husqvarna Motorcycles brands as well as KTM Components. 48% of KTM Group is
owned by the Indian two-wheeler and three-wheeler manufacturing company Bajaj Auto
Limited (through the holding company Bajaj Auto International Holdings BV). The
partnership with Bajaj enables KTMI to offer a broader product range including small-
engine street models (between 125ccm and 390ccm). This partnership, which is in place
since 2007, is planned to be extended as the production of the Husqvarna street bikes
should be relocated to Bajaj.
In 2018, KTM Industries increased its stake in KISKA from 26% to 50%. Simultaneously,
the company holds 74% shares in KTM Technologies and 100% in KTM Innovation.
PEXCO GmbH is a joint venture in cooperation with the Puello family, which holds 40%

KTM Industries
FU L L NO T E Publ ished 20 .06 .2019 51
RESEARCH
of the shares through Platin 1483 GmbH. 20% of PEXCO is held by Pierer Industrie AG
and the remainder by KTM Industries, which reduced the stake from 49.99% to 40% in
December 2018. KTM Industries holds PEXCO “at equity”.
Other holdings of KTM Industries are the wholly-owned PF Beteiligungsverwaltungs
GmbH and a 12.3% stake in ACstyria Mobilitätscluster GmbH.
KTM Industries: shareholder structure
Source: KTM Industries AG, Warburg Research
Group structure in detail
Powered two-wheelers
Within its powered two wheelers segment KTM Industries manufactures and distributes
street and off-road motorcycles under the brands KTM and Husqvarna Motorcycles as
well as motorcycle components under the brand WP.
KTM AG: Europe’s leading motorcycle manufacturer
KTM AG is Europe’s largest manufacturer of street and off-road motorbikes with a
market share of 11.7% in Europe and 8.9% in the United States and with revenues of
more than EUR 1 billion.
The KTM brand offers a wide range of street and off-road motorcycles, including
motocross, endure, free ride, supermoto, adventure tourers, sports tourers, supersport
and naked bikes. Moreover, the company produces and sells a lightweight, two-seater
sportscar (“X-Bow”) as well as motorcycle components and clothing (see table below).
“Ready to race” – more than just a slogan: The brand KTM is well-known for its
strong performances across various motorsport disciplines. Having won about 300 world
championships, KTM is among the most successful brands worldwide. In 2018, Red Bull-
KTM factory driver Matthias Walkner came first in the Dakar Rally in his KTM 450 RALLY
as the first Austrian. This marked the 17th win in a row for KTM of the prestigious race.
Husqvarna Motorcycles: “Pioneering since 1903”
Since 2013, the motorcycle manufacturer Husqvarna Motorcycles has been part of the
KTMI Group. The company began producing motorcycles in 1903 in Husqvarna,
Sweden, as a subsidiary of the Husqvarna armament company. This makes Husqvarna
the world's second-oldest continuously-produced motorcycle brand after Royal Enfield
and ahead of Harley-Davidson. By introducing a street bike segment with the models
Vitpilen and Svartpilen in 2014, KTMI wants to make Husqvarna Motorcycles the third-
largest European producer (see table below).
Since the 1930s, Husqvarna has been a regular participant in international off-road
Pierer Industries AG62.00%
Management1.10%
Remaining Free Float36.90%

KTM Industries
FU L L NO T E Publ ished 20 .06 .2019 52
RESEARCH
racing competitions. Husqvarna riders have won more than 80 World Championship
titles in motocross, enduro and supermoto and have won several major rally events such
as the Baja 1000 race.
Off-road vs street motorcycles
Off-road
KTM Industries’ off-road segment of both brands, KTM and Husqvarna, comprises
motocross, enduro and freeride, which are all primarily sports vehicles than means of
transportation. The motorcycles mainly differ in terms of their usage, chassis and
equipment.
� Motocross is a race of about 15 to 30 minutes driven in closed laps, usually 500m to
3km long. Races are characterised by top speed on tracks with tight curves, jumps and
washboards. Motocross bikes are usually equipped with harder chassis, narrower
gearboxes and smaller tanks and are generally lighter and less comfortable.
� Enduro races – as its name implies – are endurance races lasting for 2 hours to up to
a few days and over several hundred kilometres. Races usually take place on both
closed tracks and on public roads. Enduro motorcycles, compared to motocross bikes,
usually have harder chassis, less aggressive engines and are more comfortable. In
some cases, enduros are legally roadworthy.
� KTM’s Freeride models (including the E-Ride motorcycle) are marketed as a
combination of an enduro and a motocross motorcycle.
Street
Since the introductions of the street motorcycles, KTM’s sales have steadily increased
and are now generating the same level of revenue as the off-road models. In general,
street motorcycles have more technological features comforting regular street cycling,
such as GPS or ABS systems.
The models can be divided into tourer, urban street, supermoto, supersport and KTM’s
four-wheeler models.
� Tourers are particularly suitable for longer journeys, having large displacement fairings
and windshields for wind and weather protection, big fuel tanks as well as more elastic
engines.
� Urban street is not a traditional motorcycle segment and rather marks KTM Industries’
first move into a new market of street bikes. Husqvarna’s Vitpilen and Svartpilen do not
belong to either the off-road or street racing motorcycle categories and are more suited
to stylish and relaxed way of riding - the focus is on the driver experience.
� Supermoto is a race that combines off-road and street racing, where tracks alternate
between street, flat tracks, jumps and motocross obstacles. Motorcycles used are
usually off-road motorcycles with street racing tires.
� Super sport bikes are motorcycles with the emphasis on speed, acceleration, braking
and manoeuvrability. They are primarily built for paved race tracks, and lack features of
comfort or amenity.

KTM Industries
FU L L NO T E Publ ished 20 .06 .2019 53
RESEARCH
KTM: Product overview
Source: Company website, Warburg Research
Husqvarna: Product overview
Source: Company website, Warburg Research
Vehicle type Category Name Engine Displacement
[ccm]
Dry Weight
[kg]
Price
Motorcycle Motocross 450 SX-F 4-Stroke, 1-cyclinder 450 100 10,345 €
450 SX-F Herlings Replica 2019 4-Stroke, 1-cyclinder 450 100 11,095 €
350 SX-F 4-Stroke, 1-cyclinder 350 100 10,045 €
250 SX-F 4-Stroke, 1-cyclinder 250 99 9,745 €
250 SX 2-Stroke, 1-cyclinder 249 96 9,145 €
150 SX 2-Stroke, 1-cyclinder 144 88 8,945 €
125 SX 2-Stroke, 1-cyclinder 125 88 8,345 €
85 SX 19/16 2-Stroke, 1-cyclinder 85 68 5,995 €
85 SX 17/14 2-Stroke, 1-cyclinder 85 67 5,995 €
65 SX 2-Stroke, 1-cyclinder 65 53 4,895 €
50 SX 2-Stroke, 1-cyclinder 49 42 3,895 €
Enduro 500 EXC-F SIX DAYS 4-Stroke, 1-cyclinder 510 107 11,645 €
500 EXC-F 4-Stroke, 1-cyclinder 510 107 10,945 €
450 EXC-F SIX DAYS 4-Stroke, 1-cyclinder 449 107 11,445 €
450 EXC-F 4-Stroke, 1-cyclinder 449 106 10,745 €
350 EXC-F SIX DAYS 4-Stroke, 1-cyclinder 350 105 11,245 €
350 EXC-F 4-Stroke, 1-cyclinder 350 104 10,545 €
250 EXC-F SIX DAYS 4-Stroke, 1-cyclinder 250 104 10,995 €
250 EXC-F 4-Stroke, 1-cyclinder 250 103 10,295 €
300 EXC TPI SIX DAYS 2-Stroke, 1-cyclinder 293 104 10,595 €
300 EXC TPI ERZBERGRODEO 2-Stroke, 1-cyclinder 293 104 11,245 €
300 EXC TPI 2-Stroke, 1-cyclinder 293 103 9,995 €
250 EXC TPI SIX DAYS 2-Stroke, 1-cyclinder 249 104 10,495 €
250 EXC TPI 2-Stroke, 1-cyclinder 249 103 9,795 €
150 EXC TPI 2-Stroke, 1-cyclinder 144 97 8,795 €
Freeride Freeride 250 F 4-Stroke, 1-cyclinder 250 99 7,695 €
E-Ride Freeride E-XC n/a n/a 110 7,695 €
Travel 1090 Adventure 4-Stroke, 2-cyclinder 1,050 205 13,395 €
1290 Super Adventure R 4-Stroke, 2-cyclinder 1,301 217 17,999 €
1290 Super Adventure S 4-Stroke, 2-cyclinder 1,301 215 17,199 €
1090 Adventure R 4-Stroke, 2-cyclinder 1,050 207 14,795 €
790 Adventure R 4-Stroke, 2-cyclinder 799 189 13,399 €
790 Adventure 4-Stroke, 2-cyclinder 799 189 12,399 €
690 Enduro R 4-Stroke, 1-cyclinder 693 146 10,799 €
450 Rally 4-Stroke, 1-cyclinder 449 139 n/a
Sports Tourer 1290 Super Duke GT 4-Stroke, 2-cyclinder 1,301 209 18,999 €
Supermoto 690 SMC R 4-Stroke, 1-cyclinder 693 147 10,799 €
Naked 1290 Super Duke R 4-Stroke, 2-cyclinder 1,301 195 17,099 €
790 Duke 4-Stroke, 2-cyclinder 799 169 10,099 €
690 Duke 4-Stroke, 1-cyclinder 690 149 8,899 €
390 Duke 4-Stroke, 1-cyclinder 373 149 5,449 €
125 Duke 4-Stroke, 1-cyclinder 125 137 4,749 €
Supersport RC 390 4-Stroke, 1-cyclinder 373 147 5,859 €
RC 125 4-Stroke, 1-cyclinder 125 135 4,749 €
Sportscar X-Bow X-BOW GT4 2-liter TFSI 1,984 975 n/a
X-BOW RR 2-liter TFSI 1,984 810 n/a
X-BOW R 2-liter TFSI 1,984 790 n/a
X-BOW GT 2-liter TFSI 1,984 847 n/a
Vehicle type Category Name Engine Displacement
[ccm]
Dry Weight
[kg]
Price
Motorcycle Motocross FC 450 Rockstar Edition 4-Stroke, 1-cyclinder 450 101 11,398 €
FC 450 4-Stroke, 1-cyclinder 450 101 10,499 €
FC 350 4-Stroke, 1-cyclinder 350 100 10,299 €
FC 250 4-Stroke, 1-cyclinder 250 100 9,899 €
TC 250 2-Stroke, 1-cyclinder 249 96 9,099 €
TC 125 2-Stroke, 1-cyclinder 125 88 8,199 €
TC 85 19/16 2-Stroke, 1-cyclinder 85 68 5,699 €
TC 85 17/14 2-Stroke, 1-cyclinder 85 67 5,699 €
TC 65 2-Stroke, 1-cyclinder 65 53 4,699 €
TC 50 2-Stroke, 1-cyclinder 49 42 3,699 €
TC 50 Mini 2-Stroke, 1-cyclinder 49 40 3,699 €
Enduro 701 Enduro 4-Stroke, 1-cyclinder 693 145 11,299 €
FE 501 4-Stroke, 1-cyclinder 511 109 11,399 €
FE 450 4-Stroke, 1-cyclinder 450 109 11,099 €
FE 350 4-Stroke, 1-cyclinder 350 107 10,799 €
FE 250 4-Stroke, 1-cyclinder 250 106 10,499 €
TE 300i 2-Stroke, 1-cyclinder 293 105 10,699 €
TE 250i 2-Stroke, 1-cyclinder 249 105 10,199 €
TX 125 2-Stroke, 1-cyclinder 125 92 9,299 €
Supermoto 701 Supermoto 4-Stroke, 1-cyclinder 693 145 11,299 €
FS 450 4-Stroke, 1-cyclinder 450 103 11,498 €
Vitpilen Vitpilen 701 4-Stroke, 1-cyclinder 693 157 11,299 €
Vitpilen 401 4-Stroke, 1-cyclinder 373 148 6,699 €
Svartpilen Svartpilen 701 4-Stroke, 1-cyclinder 693 159 11,299 €
Svartpilen 401 4-Stroke, 1-cyclinder 373 150 6,699 €

KTM Industries
FU L L NO T E Publ ished 20 .06 .2019 54
RESEARCH
KTM Components / WP: the group’s biggest supplier
KTM Components develops, manufactures and markets chassis components for
motorcycles and vehicles, including suspension components, frame manufacturing and
related steel welding assemblies, exhaust systems and cooling systems.
The company was founded in 1977 as White Power Suspension B.V. in Malden,
Netherlands by Wim Peters and is currently one of the largest European manufacturers
of wheel suspensions for motorcycles. During the 1980s, the company transformed from
an aftermarket producer to an OEM for KTMI, Husaberg and BMW.
KTM Components / WP: product overview
Source: Company website, Warburg Research
During the course of the integration of WP Group “WP Performance Systems GmbH”
was renamed “KTM Components GmbH”. The brand name “WP” for motorcycle
components will remain in force. Currently, KTM Components is the most important
supplier of KTM’s motorcycle production. WP products are also installed in vehicles of
Beta, Honda, Kawasaki, Sherco, Suzuki and Yamaha.
Currently the company has more than 100 authorised centres in Europe, North America,
South Africa and Australia. In 2018, the expansion of the group's own radiator production
site in Dalian, China was largely completed and series production started successfully.
Design, concept development & digitalisation
The design, concept development and digitalisation segment comprises the companies
KTM Technologies, KTM Innovations and KISKA.
KTM Technologies
KTM Technologies is a service company for concept development, design, dimensioning
and simulation, prototype manufacturing and consulting. The company mainly focuses on
high performance composites and lightweight designs. Its core business is the concept
development of electric vehicles, such as e-bikes, e-motorcycles, electric cars and
autonomous vehicles. Within the lightweight segment, the company is involved in
numerous future-oriented projects, including drones for passenger and goods
transportation, data glasses for augmented reality and high-end sports articles.
Biggest customer of KTM Technologies is the KTM Group but among the clients are
other internationally renowned and emerging businesses from IT, aerospace, medical
engineering, energy and mechanical engineering industries.
The company, formerly known as “KTM Engineering”, emerged as a spin-off for the
development and production of KTM’s X-BOW in 2007. KTM Technologies continued to
work closely with “in-house” partners such as KISKA, enabling the company to fully
include product design into the concept development process.
KTM Innovation
KTM Innovation is KTM’s in-house centre for digital transformation and innovation. The
company consists of a diverse group of technical experts in the fields IT, internet of
things, artificial intelligence and production to enable innovation within the whole group.
KISKA
KISKA is an independent design agency with offices in Austria, Germany, the USA and
China. The agency was founded in 1990 by Gerald Kiska as a one-man business.

KTM Industries
FU L L NO T E Publ ished 20 .06 .2019 55
RESEARCH
Currently, the Salzburg headquarters employs more than 260 designers, strategists,
digital experts, engineers and modellers from 35 nations. KISKA operates an office in
Bamberg, Germany, and a subsidiary in California, US.
The company sees its unique selling point in integrated design development. Strategic
brand and design studies are the basis for target group-oriented and focused design
solutions, according to the company. Most of the designs were developed for consumer
goods, industrial goods and automotive industries.
KISKA has been working for KTM since 1991. During this cooperation the company has
designed all motorcycles since 1992 as well as four versions of the X-BOW. The agency
is responsible for the entire branding of KTM as well as advertising materials, digital
appearances, trade fair appearances and shop designs. Among the customers are
numerous other national and international companies such as Atomic, CFMoto
Gasteiner, Husqvarna Motorcycles, Magura, Ottobock, Schuberth and Zeiss.
eMobility
As one of the first manufacturers of off-road motorcycles, KTM introduced an electric-
powered version of its Freeride model in 2014. The new 2018 model includes a
powerpack allowing rides of up to 90 minutes, which is already 50% more than the
previous version. This innovative approach of introducing an off-road motorcycle
powered with an electric engine, even though it is not yet competitive to combustion
engines, was valuable in the context of government initiatives to reduce vehicle
emissions and can be seen as the starting point for the deepened cooperation with Bajaj
on a jointly developed e-platform.
In 2017, KTM Industries entered into a strategic partnership with PEXCO GmbH, an
eMobility company recently founded by the German entrepreneur family Puello. The joint
venture PEXCO focuses on the development and distribution of e-bikes and bicycles.
PEXCO sells its e-bikes and bicycles under the brands “Husqvarna Bicycles” and “R
Raymon”. Due to the successful market launch of the Husqvarna and Raymon brands,
the joint venture was able to generate sales of around EUR 29m in the first fiscal year
2018 (more than 30,000 e-bikes and bicycles). The company has set itself the goal of
becoming the technology leader in the area of zero emissions for lightweight vehicles.
Sales & distribution
Within KTM AG in 2017, street and off-road motorcycles each generated approximately
40% of revenues, while around 4% was generated with minicycles and X-Bows. The
remaining 16% were mainly generated with parts and components, clothing and
accessories.
Currently, the ratio of street to off-road motorcycles is about 60:40 but should shift
towards 70: 30 by 2022, according to KTM Industries.
KTM AG: Revenues by Segment (2017) [in €‘000]
Source: Company website, Warburg Research
Off-road motorcycles:
546.743 (41%)
Street motorcycles:515.087 (39%)
Minicycles: 55.461 (4%)
X-Bow: 5.712 (0%)
Components, gear, accessories: 208.714 (16%)

KTM Industries
FU L L NO T E Publ ished 20 .06 .2019 56
RESEARCH
With over 35 sales subsidiaries and joint ventures, KTM AG currently cooperates with
2,822 independent dealers and importers of the two brands worldwide (see map).
In 2018, the company was able to sell more than 260,000 motorcycles (+10% compared
to 2017), of which approximately 210,000 were KTM and 50,000 were Husqvarna bikes.
The company has set itself the target of an annual sales volume of 400,000 motorcycles
by 2022. KTM Industries achieved record sales of EUR 1,559.6m in 2018 (including
Pankl).
Units sold in Europe and North America account for over 60% of KTM Industries’ sales,
however, the largest growth in relative terms is expected in emerging markets. Last year,
unit sales rose by 30% in Asia and by 14% in South America.
To benefit from this growing trend in developing countries, KTM Industries plans to
extend the production volume of its strategic partner Bajaj in India. By Q4 2019, the
production of Husqvarna road motorcycles (up to 400 ccm) will be transferred to India.
The motorcycles will be distributed by Bajaj based on a license fee model as already in
place with KTM motorcycles produced by Bajaj.
In 2018, KTM Industries formed a joint venture with longstanding distribution partner CF
Moto. From 2021, mid-class motorcycles are going to be manufactured in Hangzhou,
China, and distributed worldwide from there. The 2021 target is to produce between
15,000 and 20,000 motorcycles in China, of which about 5,000 should remain in China.

KTM Industries
FU L L NO T E Publ ished 20 .06 .2019 57
RESEARCH
KTM Industries: sales & distribution network
Source: Company website, Warburg Research

KTM Industries
FU L L NO T E Publ ished 20 .06 .2019 58
RESEARCH
Company history
Long road to market leadership
1934 Hans Trunkenpolz founds a metalworking and car repair shop in Mattighofen.
1953 Ernst Kronreif joins the company as sizeable shareholder. Now, the official
company name is: KTM "Kronreif, Trunkenpolz, Mattighofen".
1978 US subsidiary KTM North America Inc. is founded in Lorain, Ohio.
1986 Despite the successes in motorsports in the decades before, the company
experiences massive financial problems for the first time. A revenue decline and
difficulties with importers in Italy, Germany and France attracts attention.
1987 Stefan Pierer founds investment company Cross Holding, which later becomes
KTM Industries-Beteiligungsgruppe.
1991 Additional losses in other operating sectors leads to the bankruptcy of KTM
Motorfahrzeugbau AG and its division into four independent successor
companies: KTM Sportmotorcycle GmbH (motorcycles division), KTM Fahrrad
GmbH (bicycles division), KTM Kühler GmbH (radiators division) and KTM
Werkzeugbau GmbH (tooling division).
1992 Stefan Pierer acquirers shares in KTM Sportmotorcycle GmbH. The newly formed
motorcycle division - KTM Sportmotorcycle GmbH - starts with a new
management (Stefan Pierer), a new Hard Enduro concept and a new motorcycle
design.
1996 Acquisition of Swedish Husaberg AB and White Power Suspension. KTM
Motorradholding AG is listed on the Vienna Stock Exchange.
1999 Opening of plant, development centre and administration building in Mattighofen.
Cross Beteiligungsverwaltungs-AG is founded, which acquires 99.77% of the
shares of KTM Sportmotorcycle AG and delists the company from the Vienna
stock exchange.
2003 Re-listing on the Vienna Stock Exchange
2005 Cross Beteiligungsverwaltungs-AG is renamed KTM Power Sports AG.
2007 Indian Bajaj Auto acquires 14.5% stake in KTM Power Sports AG (increased
stake to 48% by 2013).
2008 Introduction of KTM’s first superbike (RC8) and super sports car (X-Bow).
2012 Renaming KTM Power Sports AG “KTM AG”
2013 Acquisition of Husqvarna Motorcycles
2016 Dual Listing at SIX Swiss Exchange
2018 Joint Ventures with PEXCO and CF Moto. Full integration of WP Group.
Source: Company website, Warburg Research

KTM Industries
FU L L NO T E Publ ished 20 .06 .2019 59
RESEARCH
Management
Management & Supervisory Board
DI Stefan Pierer (*1956, Austrian), Member of the Executive Board (CEO)
After graduating from the Montan-University in Leoben, Austria (Business and Energy
Management), Stefan Pierer began his career as sales assistant at HOVAL GmbH in
Marchtrenk in 1982 and then later as sales manager for Upper Austria and authorized
signatory. In 1987 he founded the KTM Industries Group in which he acts as majority
shareholder and member of the Executive Board. He has been shareholder and member
of the Management Board of the KTM AG since 1992.
Mag. Friedrich Roithner (*1963, Austrian), Member of the Executive Board (CFO)
After graduating from the Johannes Kepler University of Linz (Business Administration),
Friedrich Roithner started his career as an auditing assistant at one of the big four
leading tax consultancy and auditing companies in Austria (focusing on tax consultancy
and auditing). In 1992 he switched to Austria Metall AG and was a member of the
Management Board from 2002 until 2006.
Since the end of 2007 Friedrich Roithner has been part of the management team at the
KTM Industries Group. In 2010 Friedrich Roithner became CFO of KTM Industries AG.
Mag. Hubert Trunkenpolz (*1962, Austrian), Member of the Executive Board (CSO)
After graduating from the Johannes Kepler University Linz (Business Administration),
Hubert Trunkenpolz started his career at ISA Audivisual Communication Corp. as
marketing manager and subsequently at TRUMAG as sales manager/managing director.
He has been at CROSS Group (now KTM Industries group) since 1992 and a member of
the Executive Board of KTM Motorrad AG since 2004. Hubert Trunkenpolz also became
a member of the Executive Board of KTM AG in 2007 and of KTM Industries AG in 2018.
Josef Blazicek (*1964, Austrian), Chairman of the Supervisory Board
Josef Blasicek began his career in the International Sales division of GIRO Credit Bank
of the Österreichischen Sparkassen AG. From 1989, he was head of the trading
department at ERSTE BANK AG, before taking up the same position at
INVESTMENTBANK AUSTRIA AG in 1991, where he served as a director of Bank
Austria Securities Ltd., among other positions. From 1997 to 2000, he was Head of
Syndications at ICE Securities Ltd. Subsequently, until 2003, he was managing
shareholder at OCEAN Equities Ltd. Since 2000 Josef Blazicek has been working in the
QINO Group / Ocean Constulting GmbH in various leadership positions and since 2008
has been a Member of the Supervisory Board of the Company as Chairman.
Source: Company website, Warburg Research

KTM Industries
FU L L NO T E Publ ished 20 .06 .2019 60
RESEARCH
Management remuneration
The remuneration of the members of the Executive Board of KTM Industries AG includes
fixed and variable components.
The variable components of the remuneration are not limited in amount and depend on
the key performance indicators EBIT, EBT and free cash flow of the KTM Industries
Group companies for the respective financial year. With regard to the various members
of the Management Board, the variable remuneration components laid down in the
individual contracts each target different performance indicators. The weighting of the
individual parameters of the variable components of the remuneration is determined
individually between the Supervisory Board and the respective Management Board
member.
The remuneration policy is reviewed annually by the Supervisory Board. There is no
external benchmarking of the remuneration or remuneration structure. The Chairman of
the Supervisory Board informs the Annual General Meeting once a year about the
principles of the remuneration system.
There are no stock option plans or similar share-based payment systems. There is a
D&O insurance policy in place which, in addition to the Executive Board and the
Supervisory Board also includes the management of the Group companies.
Executive Board remuneration
Name Fixed [€] Fixed [%] Variable [€]Variable [%] Total
Stefan Pierer 392.598 25 1.200.000 75 1.592.598
Friedrich Roithner 175.434 21 666.667 79 842.100
Hubert Trunkenpolz 348.264 27 951.000 73 1.299.264
Source: Company website, Warburg Research

KTM Industries
FU L L NO T E Publ ished 20 .06 .2019 61
RESEARCH
DCF model
Detailed forecast period Transitional period Term. Value
Figures in EUR m 2019e 2020e 2021e 2022e 2023e 2024e 2025e 2026e 2027e 2028e 2029e 2030e 2031e Sales 1,523 1,636 1,799 1,979 2,148 2,303 2,445 2,574 2,689 2,791 2,882 2,961 3,031
Sales change 4.1 % 7.4 % 10.0 % 10.0 % 8.5 % 7.2 % 6.2 % 5.3 % 4.5 % 3.8 % 3.2 % 2.8 % 2.3 % 2.0 %
EBIT 134 146 163 188 201 211 221 228 234 239 243 245 247
EBIT-margin 8.8 % 8.9 % 9.1 % 9.5 % 9.3 % 9.2 % 9.0 % 8.9 % 8.7 % 8.6 % 8.4 % 8.3 % 8.1 %
Tax rate (EBT) 25.0 % 25.0 % 25.0 % 25.0 % 25.5 % 25.9 % 26.4 % 26.9 % 27.4 % 27.9 % 28.4 % 28.9 % 29.5 %
NOPAT 101 110 122 141 149 157 162 167 170 172 174 174 174 Depreciation 108 116 124 129 136 142 147 151 153 155 156 156 156
in % of Sales 7.1 % 7.1 % 6.9 % 6.5 % 6.3 % 6.2 % 6.0 % 5.9 % 5.7 % 5.6 % 5.4 % 5.3 % 5.1 %
Changes in provisions 0 2 2 3 3 2 2 2 2 2 1 1 1
Change in Liquidity from
- Working Capital -14 18 25 23 21 18 16 13 11 9 7 5 4
- Capex 150 155 160 158 165 169 172 173 173 172 171 168 165
Capex in % of Sales 9.9 % 9.5 % 8.9 % 8.0 % 7.7 % 7.3 % 7.0 % 6.7 % 6.4 % 6.2 % 5.9 % 5.7 % 5.4 %
Other 10 0 0 0 0 0 0 0 0 0 0 0 0 Free Cash Flow (WACC Model)
63 55 64 91 103 114 124 133 141 148 154 159 163 166
PV of FCF 62 51 55 75 79 82 84 85 85 83 81 79 76 1,729 share of PVs 6.22 % 29.90 % 63.88 %
Model parameter Valuation (m)
Derivation of WACC: Derivation of Beta: Present values 2031e 977
Terminal Value 1,729
Debt ratio 35.00 % Financial Strength 1.30 Financial liabilities 445
Cost of debt (after tax) 1.4 % Liquidity (share) 1.50 Pension liabilities 25
Market return 7.00 % Cyclicality 1.50 Hybrid capital 0
Risk free rate 1.50 % Transparency 1.40 Minority interest 540
Others 1.30 Market val. of investments 26
Liquidity 89 No. of shares (m) 22.5
WACC 6.47 % Beta 1.40 Equity Value 1,812 Value per share (EUR) 80.41
Sensitivity Value per Share (EUR)
Terminal Growth Delta EBIT-margin
Beta WACC 1.25 % 1.50 % 1.75 % 2.00 % 2.25 % 2.50 % 2.75 % Beta WACC -1.5 pp -1.0 pp -0.5 pp +0.0 pp +0.5 pp +1.0 pp +1.5 pp
1.68 7.5 % 50.35 52.41 54.65 57.09 59.77 62.72 65.98 1.68 7.5 % 36.70 43.50 50.29 57.09 63.89 70.69 77.49
1.54 7.0 % 59.02 61.61 64.44 67.56 71.01 74.85 79.14 1.54 7.0 % 45.10 52.58 60.07 67.56 75.05 82.54 90.03
1.47 6.7 % 63.96 66.88 70.09 73.64 77.59 82.00 86.98 1.47 6.7 % 49.97 57.86 65.75 73.64 81.53 89.42 97.31
1.40 6.5 % 69.38 72.69 76.34 80.41 84.95 90.07 95.87 1.40 6.5 % 55.40 63.74 72.07 80.41 88.74 97.07 105.41
1.33 6.2 % 75.36 79.12 83.30 87.98 93.25 99.22 106.05 1.33 6.2 % 61.48 70.31 79.15 87.98 96.81 105.65 114.48
1.26 6.0 % 81.99 86.29 91.10 96.52 102.67 109.70 117.82 1.26 6.0 % 68.34 77.73 87.13 96.52 105.91 115.31 124.70
1.12 5.5 % 97.62 103.36 109.87 117.32 125.93 135.98 147.88 1.12 5.5 % 85.04 95.80 106.56 117.32 128.08 138.84 149.60 � Sales growth slows from 10% to 2% in perpetuity.
� EBIT margin declines during transitional phase from 9% to 8%.
� EBIT used in our DCF differs from EBIT in the P&L as we exclude at-equity earningsK
� K and separately add at-equity participations at book value. We deduct minority interest at 12x minority earnings.
� "Other" is the estimated purchase price for the distributor in Australia & New Zealand.

KTM Industries
FU L L NO T E Publ ished 20 .06 .2019 62
RESEARCH
Free Cash Flow Value Potential Warburg Research's valuation tool "FCF Value Potential" reflects the ability of the company to generate sustainable free cash flows. It is based on the "FCF potential" - a FCF "ex growth" figure - which assumes unchanged working capital and pure maintenance capex. A value indication is derived via the perpetuity of a given year’s “FCF potential” with consideration of the weighted costs of capital. The fluctuating value indications over time add a timing element to the DCF model (our preferred valuation tool). in EUR m 2015 2016 2017 2018 2019e 2020e 2021e
Net Income before minorities 65 89 84 114 87 98 111 + Depreciation + Amortisation 66 76 72 82 108 115 122 - Net Interest Income -23 -13 -13 -16 -18 -17 -17 - Maintenance Capex 61 67 68 73 76 82 90 + Other 0 0 0 4 0 -1 -2
= Free Cash Flow Potential 92 111 101 144 137 147 159
FCF Potential Yield (on market EV) 6.1 % 6.3 % 4.8 % 6.2 % 6.7 % 7.1 % 7.7 % WACC 6.47 % 6.47 % 6.47 % 6.47 % 6.47 % 6.47 % 6.47 %
= Enterprise Value (EV) 1,525 1,765 2,120 2,308 2,044 2,064 2,064 = Fair Enterprise Value 1,426 1,713 1,559 2,219 2,116 2,274 2,450
- Net Debt (Cash) 323 323 323 323 333 314 288 - Pension Liabilities 25 25 25 25 25 27 29 - Other 0 0 0 0 0 0 0 - Market value of minorities 561 561 561 561 540 576 600 + Market value of investments 26 26 26 26 26 27 29
= Fair Market Capitalisation 543 830 676 1,336 1,244 1,384 1,562
Number of shares, average 23 23 23 23 23 23 23
= Fair value per share (EUR) 24.10 36.84 29.98 59.27 55.19 61.40 69.29
premium (-) / discount (+) in % 8.5 % 20.7 % 36.2 %
Sensitivity Fair value per Share (EUR)
9.47 % 4.06 12.76 8.08 28.08 25.45 29.44 34.85 8.47 % 9.16 18.89 13.65 36.02 33.03 37.58 43.62 7.47 % 15.63 26.66 20.73 46.09 42.63 47.89 54.74 WACC 6.47 % 24.10 36.84 29.98 59.27 55.19 61.40 69.29
5.47 % 35.67 50.73 42.62 77.26 72.36 79.84 89.17 4.47 % 52.41 70.84 60.92 103.31 97.20 106.53 117.94 3.47 % 78.80 102.55 89.76 144.37 136.36 148.61 163.29
� We expect maintenance Capex at 5% of sales.
� "Others" include the adjustments from at-equity earnings which we separately add at book value.
� Additionally, we deduct minority interest at 12x minority earnings.

KTM Industries
FU L L NO T E Publ ished 20 .06 .2019 63
RESEARCH
Valuation
2015 2016 2017 2018 2019e 2020e 2021e Price / Book 2.8 x 3.0 x 3.7 x 4.7 x 3.4 x 3.1 x 2.7 x Book value per share ex intangibles -5.72 -3.89 -3.49 -5.56 -5.83 -5.83 -5.12 EV / Sales 1.2 x 1.3 x 1.6 x 1.6 x 1.3 x 1.3 x 1.1 x EV / EBITDA 8.5 x 8.9 x 10.9 x 10.9 x 8.5 x 7.9 x 7.2 x EV / EBIT 13.5 x 14.4 x 17.4 x 17.9 x 15.3 x 14.0 x 12.5 x EV / EBIT adj.* 13.5 x 14.5 x 17.4 x 17.3 x 15.2 x 14.1 x 12.6 x P / FCF n.a. 34.5 x n.a. n.a. 13.0 x 30.4 x 25.9 x P / E 18.5 x 15.7 x 26.0 x 20.8 x 27.1 x 23.1 x 18.6 x P / E adj.* 18.5 x 15.7 x 29.1 x 34.1 x 27.1 x 23.1 x 18.6 x Dividend Yield 0.1 % 0.1 % 0.6 % 0.5 % 0.6 % 0.6 % 0.6 % FCF Potential Yield (on market EV) 6.1 % 6.3 % 4.8 % 6.2 % 6.7 % 7.1 % 7.7 %
*Adjustments made for: One-offs and Pankl deconsolidation effect
Company Specific Items
2015 2016 2017 2018 2019e 2020e 2021e
Total KTM Bikes 161,613 172,636 201,451 212,898 222,721 237,282 254,469 Total Husqvarna Bikes 21,560 30,787 36,883 48,554 51,276 56,218 87,037 Sales share off-road 46.0 % 50.0 % 45.0 % 40.0 % 39.0 % 36.0 % 34.0 % Sales share on-road 54.0 % 50.0 % 55.0 % 60.0 % 61.0 % 64.0 % 66.0 % eBikes sold n.a. n.a. n.a. 30,000 60,000 80,000 96,000

KTM Industries
FU L L NO T E Publ ished 20 .06 .2019 64
RESEARCH
Consolidated profit and loss In EUR m 2015 2016 2017 2018 2019e 2020e 2021e
Sales 1,224 1,343 1,354 1,462 1,523 1,636 1,799
Change Sales yoy n.a. 9.8 % 0.8 % 8.0 % 4.1 % 7.4 % 10.0 % COGS 844 909 945 1,029 1,066 1,147 1,263 Gross profit 379 434 409 433 457 489 536
Gross margin 31.0 % 32.3 % 30.2 % 29.6 % 30.0 % 29.9 % 29.8 %
Research and development 30 40 34 27 30 36 41 Sales and marketing 149 170 165 172 183 196 216 Administration expenses 69 80 60 71 73 79 86 Other operating expenses 22 28 32 30 44 40 38 Other operating income 4 5 4 0 8 8 9 Unfrequent items 0 0 0 0 0 0 0 EBITDA 178 198 194 211 242 262 287
Margin 14.6 % 14.8 % 14.3 % 14.4 % 15.9 % 16.0 % 16.0 %
Depreciation of fixed assets 37 43 38 43 60 63 66 EBITA 141 156 156 168 182 200 222
Amortisation of intangible assets 28 33 34 39 48 52 56 Goodwill amortisation 0 0 0 0 0 0 0 EBIT 113 122 122 129 134 147 166
Margin 9.2 % 9.1 % 9.0 % 8.8 % 8.8 % 9.0 % 9.2 %
EBIT adj. 113 122 122 134 134 146 163
Interest income 2 3 2 3 3 3 3 Interest expenses 18 20 13 18 19 18 18 Other financial income (loss) -7 3 -2 -1 -2 -2 -2 EBT 90 109 109 112 116 130 149
Margin 7.4 % 8.1 % 8.1 % 7.7 % 7.7 % 7.9 % 8.3 %
Total taxes 25 20 30 27 29 33 37 Net income from continuing operations 65 89 79 85 87 98 111
Income from discontinued operations (net of tax) 0 0 5 5 0 0 0 Net income before minorities 65 89 84 114 87 98 111
Minority interest 35 37 39 47 45 48 50 Net income 30 52 45 67 42 50 61
Margin 2.5 % 3.9 % 3.3 % 4.6 % 2.8 % 3.0 % 3.4 % Number of shares, average 23 23 23 23 23 23 23 EPS 1.33 2.30 1.98 2.99 1.88 2.20 2.73
EPS adj. 1.33 2.30 1.77 1.82 1.88 2.20 2.73
*Adjustments made for: One-offs and Pankl deconsolidation effect
Guidance: Revenue growth 1-5%; EBIT Margin 8-10%; FCF/sales 3-5%
Financial Ratios 2015 2016 2017 2018 2019e 2020e 2021e
Total Operating Costs / Sales 21.8 % 23.2 % 21.2 % 20.5 % 21.2 % 21.0 % 20.7 % Operating Leverage n.a. 0.9 x -0.4 x 0.7 x 1.0 x 1.3 x 1.2 x EBITDA / Interest expenses 10.0 x 10.2 x 15.3 x 11.4 x 13.1 x 14.4 x 16.1 x Tax rate (EBT) 27.8 % 18.5 % 27.6 % 24.2 % 25.0 % 25.0 % 25.0 % Dividend Payout Ratio 1.0 % 0.8 % 8.6 % 7.9 % 7.7 % 6.9 % 6.1 % Sales per Employee 268,739 264,936 322,856 339,817 339,817 339,817 339,817
Sales, EBITDA in EUR m
Source: Warburg Research
Operating Performance in %
Source: Warburg Research
Performance per Share
Source: Warburg Research

KTM Industries
FU L L NO T E Publ ished 20 .06 .2019 65
RESEARCH
Consolidated balance sheet In EUR m 2015 2016 2017 2018 2019e 2020e 2021e
Assets
Goodwill and other intangible assets 326 362 397 423 465 507 546 thereof other intangible assets 208 244 280 327 368 411 450 thereof Goodwill 118 118 117 96 96 96 96 Property, plant and equipment 274 303 357 283 334 331 330 Financial assets 4 6 15 26 26 27 29 Other long-term assets 26 11 6 9 10 10 12 Fixed assets 630 682 775 742 834 876 917
Inventories 243 252 297 287 277 303 333 Accounts receivable 111 122 120 149 154 161 178 Liquid assets 135 284 169 89 142 153 170 Other short-term assets 57 84 104 87 91 97 107 Current assets 546 741 691 612 664 714 788
Total Assets 1,176 1,424 1,465 1,354 1,497 1,590 1,705
Liabilities and shareholders' equity
Subscribed capital 225 225 225 23 23 23 23 Capital reserve 10 10 10 10 10 10 10 Retained earnings 0 0 0 0 0 0 0 Other equity components -39 39 83 265 301 343 398 Shareholders' equity 197 274 318 297 333 376 431 Minority interest 190 181 211 253 287 323 361 Total equity 387 455 529 551 620 699 791
Provisions 33 41 50 43 43 45 47 thereof provisions for pensions and similar obligations 21 24 24 25 25 27 29 Financial liabilities (total) 523 648 544 413 475 467 459 thereof short-term financial liabilities 57 191 171 73 73 73 73 Accounts payable 111 131 178 191 200 215 237 Other liabilities 123 149 164 157 160 165 172 Liabilities 789 969 937 803 877 891 914
Total liabilities and shareholders' equity 1,176 1,424 1,465 1,354 1,497 1,590 1,705
Financial Ratios 2015 2016 2017 2018 2019e 2020e 2021e
Efficiency of Capital Employment
Operating Assets Turnover 2.4 x 2.5 x 2.3 x 2.8 x 2.7 x 2.8 x 3.0 x Capital Employed Turnover 1.5 x 1.6 x 1.5 x 1.6 x 1.6 x 1.6 x 1.6 x ROA 4.8 % 7.6 % 5.8 % 9.1 % 5.1 % 5.7 % 6.7 % Return on Capital
ROCE (NOPAT) 20.5 % 12.2 % 10.0 % 10.7 % 10.7 % 10.9 % 11.6 % ROE 30.5 % 22.0 % 15.1 % 21.9 % 13.4 % 14.0 % 15.3 % Adj. ROE 30.5 % 22.0 % 13.5 % 13.4 % 13.4 % 14.0 % 15.3 % Balance sheet quality
Net Debt 408 388 399 348 358 341 317 Net Financial Debt 387 365 375 323 333 314 288 Net Gearing 105.6 % 85.3 % 75.5 % 63.2 % 57.7 % 48.8 % 40.1 % Net Fin. Debt / EBITDA 217.1 % 183.7 % 193.3 % 153.2 % 137.5 % 119.7 % 100.4 % Book Value / Share 8.7 12.2 14.1 13.2 14.8 16.7 19.1 Book value per share ex intangibles -5.7 -3.9 -3.5 -5.6 -5.8 -5.8 -5.1
ROCE Development
Source: Warburg Research
Net debt in EUR m
Source: Warburg Research
Book Value per Share in EUR
Source: Warburg Research

KTM Industries
FU L L NO T E Publ ished 20 .06 .2019 66
RESEARCH
Consolidated cash flow statement In EUR m 2015 2016 2017 2018 2019e 2020e 2021e
Net income 65 89 84 114 87 98 111 Depreciation of fixed assets 37 43 38 43 60 63 66 Amortisation of goodwill 0 0 0 0 0 0 0 Amortisation of intangible assets 28 33 34 39 48 52 56 Increase/decrease in long-term provisions 0 3 0 1 0 2 2 Other non-cash income and expenses 14 -4 28 -29 -1 -4 -6 Cash Flow before NWC change 145 164 185 168 194 211 229
Increase / decrease in inventory -21 13 -36 -58 40 -26 -30 Increase / decrease in accounts receivable -18 -25 -44 -26 -5 -7 -16 Increase / decrease in accounts payable 0 16 56 1 10 15 22 Increase / decrease in other working capital positions 1 0 0 0 0 0 0 Increase / decrease in working capital (total) -38 4 -23 -83 44 -18 -25 Net cash provided by operating activities [1] 107 168 161 85 239 193 204
Investments in intangible assets -54 -69 -74 -93 -90 -95 -95 Investments in property, plant and equipment -79 -75 -105 -90 -60 -60 -65 Payments for acquisitions 0 0 0 0 -10 0 0 Financial investments 0 0 9 16 0 0 0 Income from asset disposals 2 7 27 70 0 0 0 Net cash provided by investing activities [2] -110 -159 -154 -102 -160 -155 -160
Change in financial liabilities 71 206 -97 -39 -8 -8 -8 Dividends paid -15 -18 -20 -19 -7 -7 -7 Purchase of own shares 0 0 0 0 0 0 0 Capital measures 0 0 0 0 0 0 0 Other -5 -49 0 -6 -11 -12 -13 Net cash provided by financing activities [3] 51 139 -118 -63 -26 -27 -27
Change in liquid funds [1]+[2]+[3] 47 148 -111 -80 53 11 18 Effects of exchange-rate changes on cash -2 0 -4 0 0 0 0 Cash and cash equivalent at end of period 46 283 169 89 142 153 170
Financial Ratios 2015 2016 2017 2018 2019e 2020e 2021e
Cash Flow
FCF -26 24 -17 -98 89 38 44 Free Cash Flow / Sales -2.1 % 1.8 % -1.3 % -6.7 % 5.8 % 2.3 % 2.5 % Free Cash Flow Potential 92 111 101 144 137 147 159 Free Cash Flow / Sales -2.1 % 1.8 % -1.3 % -6.7 % 5.8 % 2.3 % 2.5 % Free Cash Flow / Net Profit -87.0 % 45.6 % -38.7 % -145.4 % 208.9 % 76.1 % 72.1 % Interest Received / Avg. Cash 2.3 % 1.3 % 1.0 % 2.7 % 2.6 % 2.0 % 1.9 % Interest Paid / Avg. Debt 6.8 % 3.3 % 2.1 % 3.9 % 4.2 % 3.9 % 3.9 % Management of Funds
Investment ratio 10.9 % 10.7 % 13.2 % 12.6 % 9.9 % 9.5 % 8.9 % Maint. Capex / Sales 5.0 % 5.0 % 5.0 % 5.0 % 5.0 % 5.0 % 5.0 % Capex / Dep 202.8 % 189.4 % 248.0 % 223.0 % 139.0 % 134.8 % 131.3 % Avg. Working Capital / Sales 9.9 % 18.1 % 17.8 % 16.6 % 15.6 % 14.7 % 14.5 % Trade Debtors / Trade Creditors 99.5 % 93.1 % 67.4 % 78.4 % 77.1 % 75.0 % 75.0 % Inventory Turnover 3.5 x 3.6 x 3.2 x 3.6 x 3.9 x 3.8 x 3.8 x Receivables collection period (days) 33 33 32 37 37 36 36 Payables payment period (days) 48 53 69 68 69 68 68 Cash conversion cycle (Days) 90 82 78 71 63 64 64
CAPEX and Cash Flow in EUR m
Source: Warburg Research
Free Cash Flow Generation
Source: Warburg Research
Working Capital
Source: Warburg Research
KTM Industries
FU L L NO T E Publ ished 20 .06 .2019 67
RESEARCH
LEGAL DISCLAIMER
This research report (“investment recommendation”) was prepared by the Warburg Research GmbH, a fully owned subsidiary of the M.M.Warburg &
CO (AG & Co.) KGaA and is passed on by the M.M.Warburg & CO (AG & Co.) KGaA. It is intended solely for the recipient and may not be passed on
to another company without their prior consent, regardless of whether the company is part of the same corporation or not. It contains selected
information and does not purport to be complete. The investment recommendation is based on publicly available information and data ("information")
believed to be accurate and complete. Warburg Research GmbH neither examines the information for accuracy and completeness, nor guarantees its
accuracy and completeness. Possible errors or incompleteness of the information do not constitute grounds for liability of M.M.Warburg & CO (AG &
Co.) KGaA or Warburg Research GmbH for damages of any kind whatsoever, and M.M.Warburg & CO (AG & Co.) KGaA and Warburg Research
GmbH are not liable for indirect and/or direct and/or consequential damages. In particular, neither M.M.Warburg & CO (AG & Co.) KGaA nor Warburg
Research GmbH are liable for the statements, plans or other details contained in these investment recommendations concerning the examined
companies, their affiliated companies, strategies, economic situations, market and competitive situations, regulatory environment, etc. Although due
care has been taken in compiling this investment recommendation, it cannot be excluded that it is incomplete or contains errors. M.M.Warburg & CO
(AG & Co.) KGaA and Warburg Research GmbH, their shareholders and employees are not liable for the accuracy and completeness of the
statements, estimations and the conclusions derived from the information contained in this investment recommendation. Provided a investment
recommendation is being transmitted in connection with an existing contractual relationship, i.e. financial advisory or similar services, the liability of
M.M.Warburg & CO (AG & Co.) KGaA and Warburg Research GmbH shall be restricted to gross negligence and wilful misconduct. In case of failure in
essential tasks, M.M.Warburg & CO (AG & Co.) KGaA and Warburg Research GmbH are liable for normal negligence. In any case, the liability of
M.M.Warburg & CO (AG & Co.) KGaA and Warburg Research GmbH is limited to typical, expectable damages. This investment recommendation does
not constitute an offer or a solicitation of an offer for the purchase or sale of any security. Partners, directors or employees of M.M.Warburg & CO (AG
& Co.) KGaA, Warburg Research GmbH or affiliated companies may serve in a position of responsibility, i.e. on the board of directors of companies
mentioned in the report. Opinions expressed in this investment recommendation are subject to change without notice. All rights reserved.
COPYRIGHT NOTICE
This work including all its parts is protected by copyright. Any use beyond the limits provided by copyright law without permission is prohibited and
punishable. This applies, in particular, to reproductions, translations, microfilming, and storage and processing on electronic media of the entire content
or parts thereof.
DISCLOSURE ACCORDING TO §85 OF THE GERMAN SECURITIES TRADING ACT (WPHG), MAR AND MIFID II INCL. COMMISSION DELEGATED REGULATION (EU) 2016/958 AND (EU) 2017/565
The valuation underlying the investment recommendation for the company analysed here is based on generally accepted and widely used methods of
fundamental analysis, such as e.g. DCF Model, Free Cash Flow Potential, Peer Group Comparison or Sum of the Parts Model (see also
http://www.mmwarburg.de/disclaimer/disclaimer.htm#Valuation). The result of this fundamental valuation is modified to take into consideration the
analyst’s assessment as regards the expected development of investor sentiment and its impact on the share price.
Independent of the applied valuation methods, there is the risk that the price target will not be met, for instance because of unforeseen changes in
demand for the company’s products, changes in management, technology, economic development, interest rate development, operating and/or
material costs, competitive pressure, supervisory law, exchange rate, tax rate etc. For investments in foreign markets and instruments there are further
risks, generally based on exchange rate changes or changes in political and social conditions.
This commentary reflects the opinion of the relevant author at the point in time of its compilation. A change in the fundamental factors underlying the
valuation can mean that the valuation is subsequently no longer accurate. Whether, or in what time frame, an update of this commentary follows is not
determined in advance.
Additional internal and organisational arrangements to prevent or to deal with conflicts of interest have been implemented. Among these are the spatial
separation of Warburg Research GmbH from M.M.Warburg & CO (AG & Co.) KGaA and the creation of areas of confidentiality. This prevents the
exchange of information, which could form the basis of conflicts of interest for Warburg Research in terms of the analysed issuers or their financial
instruments.
The analysts of Warburg Research GmbH do not receive a gratuity – directly or indirectly – from the investment banking activities of M.M.Warburg &
CO (AG & Co.) KGaA or of any company within the Warburg-Group.
All prices of financial instruments given in this investment recommendation are the closing prices on the last stock-market trading day before the
publication date stated, unless another point in time is explicitly stated.
M.M.Warburg & CO (AG & Co.) KGaA and Warburg Research GmbH are subject to the supervision of the Federal Financial Supervisory Authority,
BaFin. M.M.Warburg & CO (AG & Co.) KGaA is additionally subject to the supervision of the European Central Bank (ECB).
SOURCES
All data and consensus estimates have been obtained from FactSet except where stated otherwise.

KTM Industries
FU L L NO T E Publ ished 20 .06 .2019 68
RESEARCH
Additional information for clients in the United States
1. This research report (the “Report”) is a product of Warburg Research GmbH, Germany, a fully owned subsidiary of M.M.Warburg & CO (AG & Co.)
KGaA, Germany (in the following collectively “Warburg”). Warburg is the employer of the research analyst(s), who have prepared the Report. The
research analyst(s) reside outside the United States and are not associated persons of any U.S. regulated broker-dealer and therefore are not subject
to the supervision of any U.S. regulated broker-dealer.
2. The Report is provided in the United States for distribution solely to "major U.S. institutional investors" under Rule 15a-6 of the U.S. Securities
Exchange Act of 1934.
3. Any recipient of the Report should effect transactions in the securities discussed in the Report only through J.P.P. Euro-Securities, Inc., Delaware.
4. J.P.P. Euro-Securities, Inc. does not accept or receive any compensation of any kind for the dissemination of the research reports from Warburg.
Reference in accordance with section 85 of the German Securities Trading Act (WpHG) and Art. 20 MAR regarding possible conflicts of interest with companies analysed:
-1-
Warburg Research, or an affiliated company, or an employee of one of these companies responsible for the compilation of the research, hold
a share of more than 5% of the equity capital of the analysed company.
-2-
Warburg Research, or an affiliated company, within the last twelve months participated in the management of a consortium for an issue in
the course of a public offering of such financial instruments, which are, or the issuer of which is, the subject of the investment
recommendation.
-3- Companies affiliated with Warburg Research manage financial instruments, which are, or the issuers of which are, subject of the
investment recommendation, in a market based on the provision of buy or sell contracts.
-4-
MMWB, Warburg Research, or an affiliated company, reached an agreement with the issuer to provide investment banking and/or
investment services and the relevant agreement was in force in the last 12 months or there arose for this period, based on the relevant
agreement, the obligation to provide or to receive a service or compensation - provided that this disclosure does not result in the disclosure of
confidential business information.
-5- The company compiling the analysis or an affiliated company had reached an agreement on the compilation of the investment
recommendation with the analysed company.
-6- Companies affiliated with Warburg Research regularly trade financial instruments of the analysed company or derivatives of these.
-6a- Warburg Research, or an affiliated company, holds a net long position of more than 0.5% of the total issued share capital of the analysed
company.
-6b- Warburg Research, or an affiliated company, holds a net short position of more than 0.5% of the total issued share capital of the analysed
company.
-6c- The issuer holds shares of more than 5% of the total issued capital of Warburg Research or an affiliated company.
-7- The company preparing the analysis as well as its affiliated companies and employees have other important interests in relation to the
analysed company, such as, for example, the exercising of mandates at analysed companies.
This report has been made accessible to the company analysed and was modified thereafter.
Company Disclosure Link to the historical price targets and rating changes (last 12 months)
KTM Industries 5 http://www.mmwarburg.com/disclaimer/disclaimer_en/AT0000KTMI02.htm

KTM Industries
FU L L NO T E Publ ished 20 .06 .2019 69
RESEARCH
INVESTMENT RECOMMENDATION
Investment recommendation: expected direction of the share price development of the financial instrument up to the given price target in the opinion of
the analyst who covers this financial instrument.
-B- Buy: The price of the analysed financial instrument is expected to rise over the next 12 months.
-H- Hold: The price of the analysed financial instrument is expected to remain mostly flat over the next 12
months.
-S- Sell: The price of the analysed financial instrument is expected to fall over the next 12 months.
“-“ Rating suspended: The available information currently does not permit an evaluation of the company.
WARBURG RESEARCH GMBH – ANALYSED RESEARCH UNIVERSE BY RATING
Rating Number of stocks % of Universe
Buy 120 60
Hold 69 35
Sell 4 2
Rating suspended 6 3
Total 199 100
WARBURG RESEARCH GMBH – ANALYSED RESEARCH UNIVERSE BY RATING G
G taking into account only those companies which were provided with major investment services in the last twelve months.
Rating Number of stocks % of Universe
Buy 34 83
Hold 5 12
Sell 0 0
Rating suspended 2 5
Total 41 100
PRICE AND RATING HISTORY KTM INDUSTRIES AS OF 20.06.2019
Markings in the chart show rating changes by Warburg Research
GmbH in the last 12 months. Every marking details the date and
closing price on the day of the rating change.

KTM Industries
FU L L NO T E Publ ished 20 .06 .2019 70
RESEARCH
EQUITIES Matthias Rode +49 40 3282-2678 Head of Equities [email protected] RESEARCH Michael Heider +49 40 309537-280 Andreas Pläsier +49 40 309537-246 Head of Research [email protected] Banks, Financial Services [email protected] Henner Rüschmeier +49 40 309537-270 Franz Schall +40 40 309537-230 Head of Research [email protected] Automobiles, Car Suppliers [email protected]
Jan Bauer +40 40 309537-155 Malte Schaumann +49 40 309537-170 Renewables [email protected] Technology [email protected] Jonas Blum +40 40 309537-240 Patrick Schmidt +49 40 309537-125 Telco, Construction [email protected] Leisure, Internet [email protected] Christian Cohrs +49 40 309537-175 Oliver Schwarz +49 40 309537-250 Industrials & Transportation [email protected] Chemicals, Agriculture [email protected] Felix Ellmann +49 40 309537-120 Cansu Tatar +49 40 309537-248 Software, IT [email protected] Cap. Goods, Engineering [email protected] Jörg Philipp Frey +49 40 309537-258 Marc-René Tonn +49 40 309537-259 Retail, Consumer Goods [email protected] Automobiles, Car Suppliers [email protected] Marius Fuhrberg +49 40 309537-185 Robert-Jan van der Horst +49 40 309537-290 Financial Services [email protected] Technology [email protected]
Ulrich Huwald +49 40 309537-255 Andreas Wolf +49 40 309537-140 Health Care, Pharma [email protected] Software, IT [email protected]
Philipp Kaiser +49 40 309537-260 Real Estate [email protected]
Thilo Kleibauer +49 40 309537-257 Retail, Consumer Goods [email protected]
Eggert Kuls +49 40 309537-256 Engineering [email protected] INSTITUTIONAL EQUITY SALES Marc Niemann +49 40 3282-2660 Matthias Fritsch +49 40 3282-2696 Head of Equity Sales, Germany [email protected] United Kingdom [email protected]
Klaus Schilling +49 40 3282-2664 Michael Kriszun +49 40 3282-2695 Head of Equity Sales, Germany [email protected] United Kingdom [email protected]
Tim Beckmann +49 40 3282-2665 United Kingdom [email protected]
Lyubka Bogdanova +49 69 5050-7411 Ireland, Poland, Australia [email protected]
Jens Buchmüller +49 69 5050-7415 Julia Fesenberg +49 69 5050-7417 Scandinavia, Austria [email protected] Roadshow/Marketing [email protected] Alexander Eschweiler +49 40 3282-2669 Juliane Niemann +49 40 3282-2694 Germany [email protected] Roadshow/Marketing [email protected] SALES TRADING Oliver Merckel +49 40 3282-2634 Bastian Quast +49 40 3282-2701 Head of Sales Trading [email protected] Sales Trading [email protected] Elyaz Dust +49 40 3282-2702 Jörg Treptow +49 40 3282-2658 Sales Trading [email protected] Sales Trading [email protected] Michael Ilgenstein +49 40 3282-2700 Jan Walter +49 40 3282-2662 Sales Trading [email protected] Sales Trading [email protected] MACRO RESEARCH Carsten Klude +49 40 3282-2572 Dr. Christian Jasperneite +49 40 3282-2439 Macro Research [email protected] Investment Strategy [email protected] Our research can be found under: Warburg Research http://research.mmwarburg.com/en/index.html Thomson Reuters www.thomsonreuters.com Bloomberg MMWA GO Capital IQ www.capitaliq.com FactSet www.factset.com For access please contact:
Andrea Schaper +49 40 3282-2632 Kerstin Muthig +49 40 3282-2703 Sales Assistance [email protected] Sales Assistance [email protected]