BUY InnoTek (INNOT SP)
18
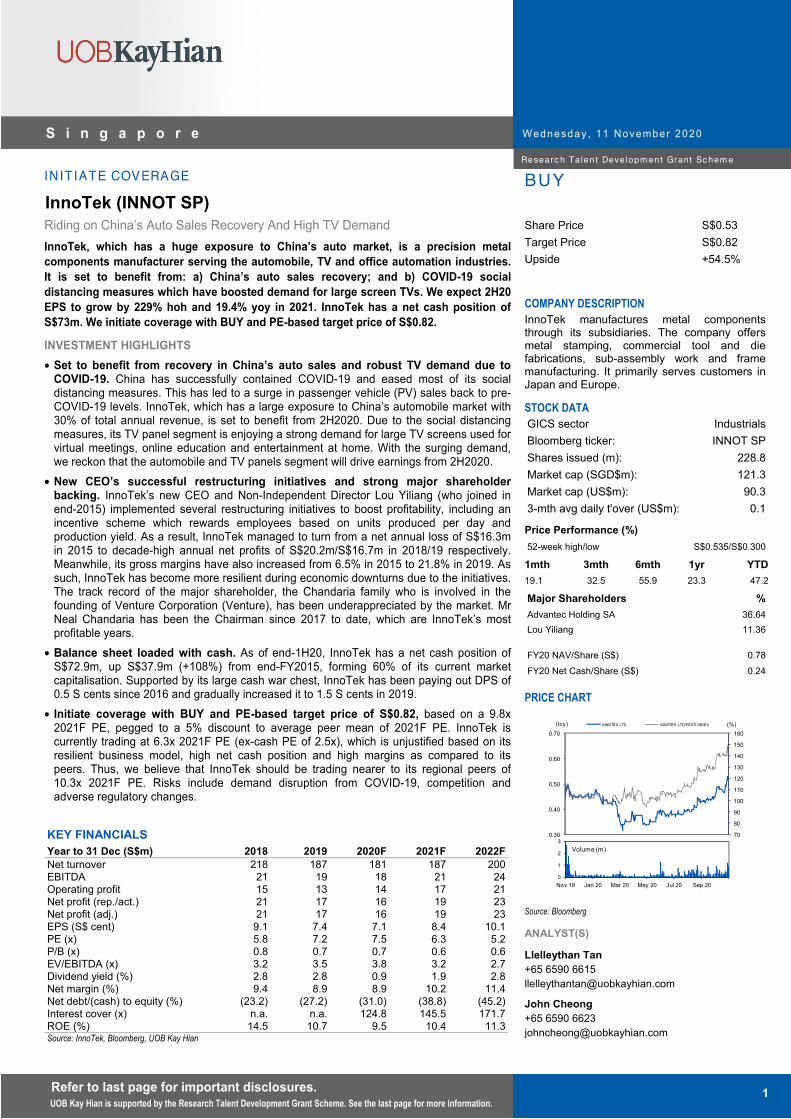
Wednesda y , 11 November 2020 Refer to last page for important disclosures. 1 S i n g a p o r e INITIATE COVERAGE BU Y Share Price S$0.53 Target Price S$0.82 Upside +54.5% COMPANY DESCRIPTION InnoTek manufactures metal components through its subsidiaries. The company offers metal stamping, commercial tool and die fabrications, sub-assembly work and frame manufacturing. It primarily serves customers in Japan and Europe. STOCK DATA GICS sector Industrials Bloomberg ticker: INNOT SP Shares issued (m): 228.8 Market cap (SGD$m): 121.3 Market cap (US$m): 90.3 3-mth avg daily t'over (US$m): 0.1 Price Performance (%) 52-week high/low S$0.535/S$0.300 1mth 3mth 6mth 1yr YTD 19.1 32.5 55.9 23.3 47.2 Major Shareholders % Advantec Holding SA 36.64 Lou Yiliang 11.36 FY20 NAV/Share (S$) 0.78 FY20 Net Cash/Share (S$) 0.24 PRICE CHART 70 80 90 100 110 120 130 140 150 160 0.30 0.40 0.50 0.60 0.70 (%) (lcy) INNOTEK LTD INNOTEK LTD/FSSTI INDEX 0 1 2 3 Nov 19 Jan 20 Mar 20 May 20 Jul 20 Sep 20 Volume (m) Source: Bloomberg ANALYST(S) Llelleythan Tan +65 6590 6615 [email protected] John Cheong +65 6590 6623 j[email protected] InnoTek (INNOT SP) Riding on China’s Auto Sales Recovery And High TV Demand InnoTek, which has a huge exposure to China’s auto market, is a precision metal components manufacturer serving the automobile, TV and office automation industries. It is set to benefit from: a) China’s auto sales recovery; and b) COVID-19 social distancing measures which have boosted demand for large screen TVs. We expect 2H20 EPS to grow by 229% hoh and 19.4% yoy in 2021. InnoTek has a net cash position of S$73m. We initiate coverage with BUY and PE-based target price of S$0.82. INVESTMENT HIGHLIGHTS • Set to benefit from recovery in China’s auto sales and robust TV demand due to COVID-19. China has successfully contained COVID-19 and eased most of its social distancing measures. This has led to a surge in passenger vehicle (PV) sales back to pre- COVID-19 levels. InnoTek, which has a large exposure to China’s automobile market with 30% of total annual revenue, is set to benefit from 2H2020. Due to the social distancing measures, its TV panel segment is enjoying a strong demand for large TV screens used for virtual meetings, online education and entertainment at home. With the surging demand, we reckon that the automobile and TV panels segment will drive earnings from 2H2020. • New CEO’s successful restructuring initiatives and strong major shareholder backing. InnoTek’s new CEO and Non-Independent Director Lou Yiliang (who joined in end-2015) implemented several restructuring initiatives to boost profitability, including an incentive scheme which rewards employees based on units produced per day and production yield. As a result, InnoTek managed to turn from a net annual loss of S$16.3m in 2015 to decade-high annual net profits of S$20.2m/S$16.7m in 2018/19 respectively. Meanwhile, its gross margins have also increased from 6.5% in 2015 to 21.8% in 2019. As such, InnoTek has become more resilient during economic downturns due to the initiatives. The track record of the major shareholder, the Chandaria family who is involved in the founding of Venture Corporation (Venture), has been underappreciated by the market. Mr Neal Chandaria has been the Chairman since 2017 to date, which are InnoTek’s most profitable years. • Balance sheet loaded with cash. As of end-1H20, InnoTek has a net cash position of S$72.9m, up S$37.9m (+108%) from end-FY2015, forming 60% of its current market capitalisation. Supported by its large cash war chest, InnoTek has been paying out DPS of 0.5 S cents since 2016 and gradually increased it to 1.5 S cents in 2019. • Initiate coverage with BUY and PE-based target price of S$0.82, based on a 9.8x 2021F PE, pegged to a 5% discount to average peer mean of 2021F PE. InnoTek is currently trading at 6.3x 2021F PE (ex-cash PE of 2.5x), which is unjustified based on its resilient business model, high net cash position and high margins as compared to its peers. Thus, we believe that InnoTek should be trading nearer to its regional peers of 10.3x 2021F PE. Risks include demand disruption from COVID-19, competition and adverse regulatory changes. KEY FINANCIALS Year to 31 Dec (S$m) 2018 2019 2020F 2021F 2022F Net turnover 218 187 181 187 200 EBITDA 21 19 18 21 24 Operating profit 15 13 14 17 21 Net profit (rep./act.) 21 17 16 19 23 Net profit (adj.) 21 17 16 19 23 EPS (S$ cent) 9.1 7.4 7.1 8.4 10.1 PE (x) 5.8 7.2 7.5 6.3 5.2 P/B (x) 0.8 0.7 0.7 0.6 0.6 EV/EBITDA (x) 3.2 3.5 3.8 3.2 2.7 Dividend yield (%) 2.8 2.8 0.9 1.9 2.8 Net margin (%) 9.4 8.9 8.9 10.2 11.4 Net debt/(cash) to equity (%) (23.2) (27.2) (31.0) (38.8) (45.2) Interest cover (x) n.a. n.a. 124.8 145.5 171.7 ROE (%) 14.5 10.7 9.5 10.4 11.3 Source: InnoTek, Bloomberg, UOB Kay Hian UOB Kay Hian is supported by the Research Talent Development Grant Scheme. See the last page for more information. Research Talent Develo p ment Grant Scheme
-
Upload
khangminh22 -
Category
Documents
-
view
2 -
download
0
Transcript of BUY InnoTek (INNOT SP)
Wednesday , 11 November 2020
Refer to last page for important disclosures. 1
S i n g a p o r e
IN IT IATE COVERAGE BUY
Share Price S$0.53Target Price S$0.82Upside +54.5%
COMPANY DESCRIPTION InnoTek manufactures metal components through its subsidiaries. The company offers metal stamping, commercial tool and die fabrications, sub-assembly work and frame manufacturing. It primarily serves customers in Japan and Europe.
STOCK DATA GICS sector IndustrialsBloomberg ticker: INNOT SPShares issued (m): 228.8 Market cap (SGD$m): 121.3 Market cap (US$m): 90.3 3-mth avg daily t'over (US$m): 0.1
Price Performance (%) 52-week high/low S$0.535/S$0.300
1mth 3mth 6mth 1yr YTD19.1 32.5 55.9 23.3 47.2
Major Shareholders %Advantec Holding SA 36.64Lou Yiliang 11.36
FY20 NAV/Share (S$) 0.78FY20 Net Cash/Share (S$) 0.24
PRICE CHART
70
80
90
100
110
120
130
140
150
160
0.30
0.40
0.50
0.60
0.70(%)(lcy) INNOTEK LTD INNOTEK LTD/FSSTI INDEX
0
1
2
3
Nov 19 Jan 20 Mar 20 May 20 Jul 20 Sep 20
Volume (m)
Source: Bloomberg
ANALYST(S) Llelleythan Tan +65 6590 6615 [email protected]
John Cheong +65 6590 6623 [email protected]
InnoTek (INNOT SP)
Riding on China’s Auto Sales Recovery And High TV Demand InnoTek, which has a huge exposure to China’s auto market, is a precision metal components manufacturer serving the automobile, TV and office automation industries. It is set to benefit from: a) China’s auto sales recovery; and b) COVID-19 social distancing measures which have boosted demand for large screen TVs. We expect 2H20 EPS to grow by 229% hoh and 19.4% yoy in 2021. InnoTek has a net cash position of S$73m. We initiate coverage with BUY and PE-based target price of S$0.82.
INVESTMENT HIGHLIGHTS • Set to benefit from recovery in China’s auto sales and robust TV demand due to
COVID-19. China has successfully contained COVID-19 and eased most of its social distancing measures. This has led to a surge in passenger vehicle (PV) sales back to pre-COVID-19 levels. InnoTek, which has a large exposure to China’s automobile market with 30% of total annual revenue, is set to benefit from 2H2020. Due to the social distancing measures, its TV panel segment is enjoying a strong demand for large TV screens used for virtual meetings, online education and entertainment at home. With the surging demand, we reckon that the automobile and TV panels segment will drive earnings from 2H2020.
• New CEO’s successful restructuring initiatives and strong major shareholder backing. InnoTek’s new CEO and Non-Independent Director Lou Yiliang (who joined in end-2015) implemented several restructuring initiatives to boost profitability, including an incentive scheme which rewards employees based on units produced per day and production yield. As a result, InnoTek managed to turn from a net annual loss of S$16.3m in 2015 to decade-high annual net profits of S$20.2m/S$16.7m in 2018/19 respectively. Meanwhile, its gross margins have also increased from 6.5% in 2015 to 21.8% in 2019. As such, InnoTek has become more resilient during economic downturns due to the initiatives. The track record of the major shareholder, the Chandaria family who is involved in the founding of Venture Corporation (Venture), has been underappreciated by the market. Mr Neal Chandaria has been the Chairman since 2017 to date, which are InnoTek’s most profitable years.
• Balance sheet loaded with cash. As of end-1H20, InnoTek has a net cash position of S$72.9m, up S$37.9m (+108%) from end-FY2015, forming 60% of its current market capitalisation. Supported by its large cash war chest, InnoTek has been paying out DPS of 0.5 S cents since 2016 and gradually increased it to 1.5 S cents in 2019.
• Initiate coverage with BUY and PE-based target price of S$0.82, based on a 9.8x2021F PE, pegged to a 5% discount to average peer mean of 2021F PE. InnoTek is currently trading at 6.3x 2021F PE (ex-cash PE of 2.5x), which is unjustified based on its resilient business model, high net cash position and high margins as compared to its peers. Thus, we believe that InnoTek should be trading nearer to its regional peers of 10.3x 2021F PE. Risks include demand disruption from COVID-19, competition and adverse regulatory changes.
KEY FINANCIALS Year to 31 Dec (S$m) 2018 2019 2020F 2021F 2022FNet turnover 218 187 181 187 200EBITDA 21 19 18 21 24Operating profit 15 13 14 17 21Net profit (rep./act.) 21 17 16 19 23Net profit (adj.) 21 17 16 19 23EPS (S$ cent) 9.1 7.4 7.1 8.4 10.1PE (x) 5.8 7.2 7.5 6.3 5.2P/B (x) 0.8 0.7 0.7 0.6 0.6EV/EBITDA (x) 3.2 3.5 3.8 3.2 2.7Dividend yield (%) 2.8 2.8 0.9 1.9 2.8Net margin (%) 9.4 8.9 8.9 10.2 11.4Net debt/(cash) to equity (%) (23.2) (27.2) (31.0) (38.8) (45.2)Interest cover (x) n.a. n.a. 124.8 145.5 171.7ROE (%) 14.5 10.7 9.5 10.4 11.3Source: InnoTek, Bloomberg, UOB Kay Hian
UOB Kay Hian is supported by the Research Talent Development Grant Scheme. See the last page for more information.
Researc h Talen t Deve lopm ent Grant Sc hem e

Wednesday , 11 November 2020
Refer to last page for important disclosures. 2
S i n g a p o r e
Contents
Investment Highlights ...................................................................................................................................... 3
Valuation .......................................................................................................................................................... 5
Peer Comparison ............................................................................................................................................. 6
Company Background ..................................................................................................................................... 7
Industry Overview ............................................................................................................................................. 8
Earnings Outlook ............................................................................................................................................. 9
Financial Statements ..................................................................................................................................... 10
Appendix I: Risk Factors ................................................................................................................................. 12
Appendix II: Company Information ................................................................................................................. 13
Appendix III: Key Management ...................................................................................................................... 14
Appendix IV: Substantial Shareholders ......................................................................................................... 16
This report uses the closing prices of 11 Nov 2020
Wednesday , 11 November 2020
Refer to last page for important disclosures. 3
S i n g a p o r e
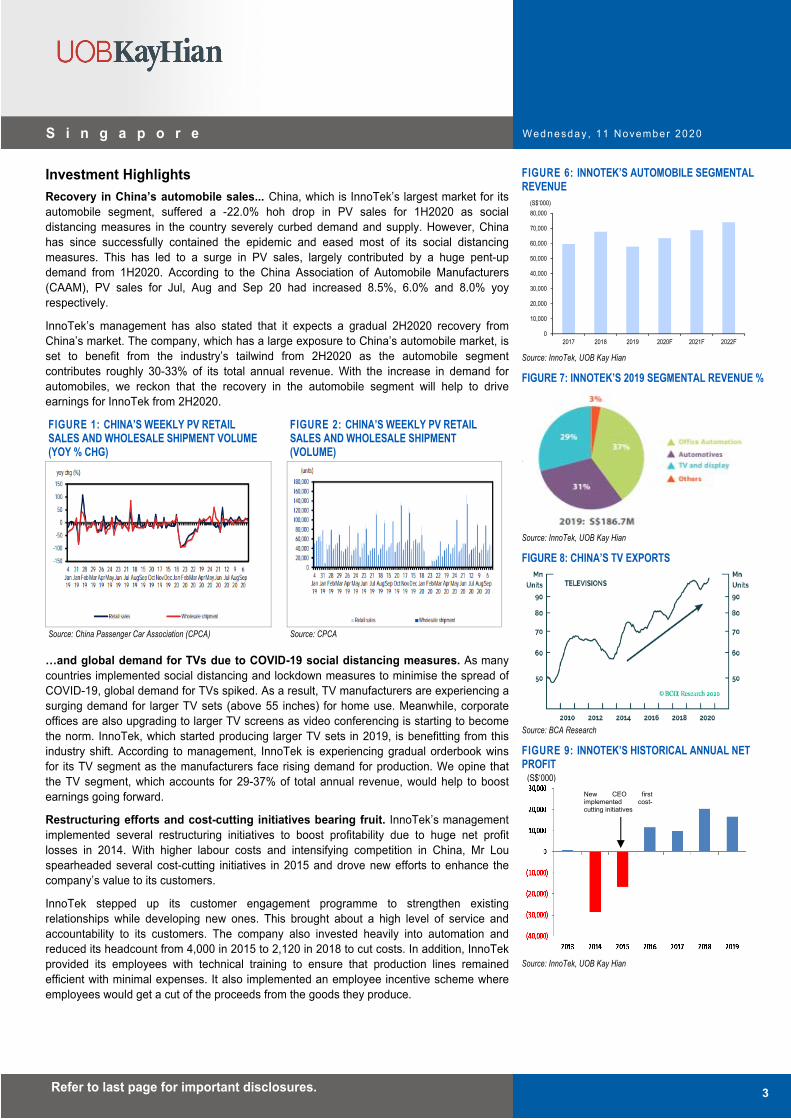
Investment Highlights Recovery in China’s automobile sales... China, which is InnoTek’s largest market for its automobile segment, suffered a -22.0% hoh drop in PV sales for 1H2020 as social distancing measures in the country severely curbed demand and supply. However, China has since successfully contained the epidemic and eased most of its social distancing measures. This has led to a surge in PV sales, largely contributed by a huge pent-up demand from 1H2020. According to the China Association of Automobile Manufacturers (CAAM), PV sales for Jul, Aug and Sep 20 had increased 8.5%, 6.0% and 8.0% yoy respectively.
InnoTek’s management has also stated that it expects a gradual 2H2020 recovery from China’s market. The company, which has a large exposure to China’s automobile market, is set to benefit from the industry’s tailwind from 2H2020 as the automobile segment contributes roughly 30-33% of its total annual revenue. With the increase in demand for automobiles, we reckon that the recovery in the automobile segment will help to drive earnings for InnoTek from 2H2020.
FIGURE 1: CHINA’S WEEKLY PV RETAILSALES AND WHOLESALE SHIPMENT VOLUME (YOY % CHG)
FIGURE 2: CHINA’S WEEKLY PV RETAIL SALES AND WHOLESALE SHIPMENT (VOLUME)
Source: China Passenger Car Association (CPCA) Source: CPCA
…and global demand for TVs due to COVID-19 social distancing measures. As many countries implemented social distancing and lockdown measures to minimise the spread of COVID-19, global demand for TVs spiked. As a result, TV manufacturers are experiencing a surging demand for larger TV sets (above 55 inches) for home use. Meanwhile, corporate offices are also upgrading to larger TV screens as video conferencing is starting to become the norm. InnoTek, which started producing larger TV sets in 2019, is benefitting from this industry shift. According to management, InnoTek is experiencing gradual orderbook wins for its TV segment as the manufacturers face rising demand for production. We opine that the TV segment, which accounts for 29-37% of total annual revenue, would help to boost earnings going forward.
Restructuring efforts and cost-cutting initiatives bearing fruit. InnoTek’s management implemented several restructuring initiatives to boost profitability due to huge net profit losses in 2014. With higher labour costs and intensifying competition in China, Mr Lou spearheaded several cost-cutting initiatives in 2015 and drove new efforts to enhance the company’s value to its customers.
InnoTek stepped up its customer engagement programme to strengthen existing relationships while developing new ones. This brought about a high level of service and accountability to its customers. The company also invested heavily into automation and reduced its headcount from 4,000 in 2015 to 2,120 in 2018 to cut costs. In addition, InnoTek provided its employees with technical training to ensure that production lines remained efficient with minimal expenses. It also implemented an employee incentive scheme where employees would get a cut of the proceeds from the goods they produce.
FIGURE 6: INNOTEK’S AUTOMOBILE SEGMENTAL REVENUE
0
10,000
20,000
30,000
40,000
50,000
60,000
70,000
80,000
2017 2018 2019 2020F 2021F 2022F
(S$‘000)
Source: InnoTek, UOB Kay Hian
FIGURE 7: INNOTEK’S 2019 SEGMENTAL REVENUE %
Source: InnoTek, UOB Kay Hian
FIGURE 8: CHINA’S TV EXPORTS
Source: BCA Research
FIGURE 9: INNOTEK’S HISTORICAL ANNUAL NET PROFIT
Source: InnoTek, UOB Kay Hian
New CEO first implemented cost-cutting initiatives
(S$‘000)

Wednesday , 11 November 2020
Refer to last page for important disclosures. 4
S i n g a p o r e
From 2015-18, the revenue per employee increased from S$58,000 to S$103,000. As a result, InnoTek managed to turn a net loss of S$16.3m in 2015 to decade-high net profits of S$20.2m and S$16.7m in 2018 and 2019 respectively. Its gross margins also increased from 6.5% in 2015 to 21.8% in 2019. We reckon that InnoTek will be able to improve margins further and drive earnings from 2H2020 with its new restructured business model and cost-cutting initiatives.
FIGURE 3: INNOTEK’S HISTORICAL ANNUAL REVENUE AND GROSS MARGINS
0.0%
5.0%
10.0%
15.0%
20.0%
25.0%
0
50,000
100,000
150,000
200,000
250,000
2015 2016 2017 2018 2019 1H20
Total Annual Revenue (LHS) Gross Margin (RHS)
(S$‘000)
Source: InnoTek, UOB Kay Hian
Chandaria family’s business track record underappreciated. The Chandaria family has a well-established business track record, which includes being involved in the founding of Singapore’s Venture Corporation (VMS SP). Venture, which is Singapore’s most successful electronics manufacturing services company in terms of growth and market cap, was a reverse takeover of two contract manufacturing businesses built by the Chandaria family. The family has taken a backseat but still remains a small shareholder in Venture. The Chandaria family is the largest shareholder of InnoTek with a 37% stake at end-2019. Mr Chandaria joined InnoTek’s board as a Non-Executive and Non-Independent Director in Nov 15 before stepping up as a Chairman in Apr 17. Under his and Mr Lou’s leadership, InnoTek has experienced four years of strong profitability from 2016-19, a strong testament to their experience and business acumen.
Balance sheet loaded with cash. Due to its cash generative business model, InnoTek has been steadily increasing its net cash position for the past five financial years. As of end-1H2020, InnoTek has a net cash position of S$72.9m, up S$37.9m (+108%) from end-FY2015, representing 60% of its current market capitalisation. Supported by its large cash war chest, InnoTek has been paying out DPS of 0.5 S cents since 2016 and gradually increased it to 1.5 S cents in 2019. With such a healthy and robust balance sheet, we believe InnoTek has the financial capacity to withstand potential business headwinds and may continue to increase dividends or seek out potential earnings-accretive M&As in the near future.
FIGURE 4: INNOTEK’S ANNUAL NET CASH FIGURE 5: INNOTEK’S DIVIDEND PER SHARE
010,00020,00030,00040,00050,00060,00070,00080,000
2015 2016 2017 2018 2019
(S$‘000)
0.0000.0020.0040.0060.0080.0100.0120.0140.016
2016 2017 2018 2019
(S$)
Source: InnoTek, UOB Kay Hian Source: InnoTek, UOB Kay Hian
Mr Lou increased his stake in InnoTek from 5.26% to 11.48%.
US-China Trade Tensions
Social lockdown measures due to COVID-19

Wednesday , 11 November 2020
Refer to last page for important disclosures. 5
S i n g a p o r e
Valuation Initiate coverage with BUY and PE-based target price of S$0.82, based on a 9.8x 2021F PE, pegged to a discounted average peer mean of 2021F PE. Taking a conservative approach, we have applied a 5% discount to InnoTek’s peer average 2021F mean PE of 10.3x. InnoTek is currently trading at 6.3x 2021F PE (2.5x ex-cash 2021F PE), which is unjustified based on its strong company fundamentals as well as its robust net cash position and recovery in its business segments.
InnoTek, which has a resilient business model that is cash-generative and is poised to benefit from beneficial tailwinds, is attractive to investors wanting to ride on China’s strong recovery. We believe strong contributions from InnoTek’s automobiles and TV panels segment would help to boost earnings growth and narrow the PE valuation gap between InnoTek and its peers. Our target price of S$0.82 represents an upside of 54.5% from thecurrent price levels.
FIGURE 10: PE BAND FIGURE 11: P/B BAND
Source: Bloomberg, UOB Kay Hian Source: Bloomberg, UOB Kay Hian
FIGURE 12: DIVIDEND YIELD (%) FIGURE 13: NET CASH (S$’000)
0
10,000
20,000
30,000
40,000
50,000
60,000
70,000
80,000
2015 2016 2017 2018 2019
Source: Bloomberg, UOB Kay Hian Source: Bloomberg, UOB Kay Hian
FIGURE 14: INNOTEK SHARE PRICE PERFORMANCE VS REGIONAL PEERS
40
90
140
190
240
290
340
390
Sep Oct Nov Dec Jan Feb Mar Apr May Jun Jul Aug
INNOT AEM FRKN FUYUHIP SUNN UMSH
2019 2020
(26-Sep-19=100)
Source: Bloomberg, UOB Kay Hian
FIGURE 15: INNOTEK VS STI INDEX
50
60
70
80
90
100
110
120
130
Sep Oct Nov Dec Jan Feb Mar Apr May Jun Jul Aug
INNOT FSSTI2019 2020
(26-Sep-19=100)
Source: Bloomberg, UOB Kay Hian
FIGURE 16: INNOTEK VS STI SMALL CAP INDEX
50
60
70
80
90
100
110
120
130
Sep Oct Nov Dec Jan Feb Mar Apr May Jun Jul Aug
INNOT FSTS2019 2020
(26-Sep-19=100)
Source: Bloomberg, UOB Kay Hian
FIGURE 17: SENSITIVITY ANALYSIS
PE M
ultip
le (x
)
FY2021F Net Profit (S$’000) 17,615 18,115 18,615 19,115 19,615 20,115 20,615
6.8x 0.52 0.54 0.55 0.57 0.58 0.60 0.61 7.8x 0.60 0.62 0.64 0.65 0.67 0.69 0.70 8.8x 0.68 0.70 0.72 0.74 0.76 0.78 0.79 9.8x 0.76 0.78 0.80 0.82 0.84 0.86 0.88 10.8x 0.83 0.86 0.88 0.90 0.93 0.95 0.98 11.8x 0.91 0.94 0.96 0.99 1.01 1.04 1.07 12.8x 0.99 1.02 1.04 1.07 1.10 1.13 1.16
Source: Bloomberg, UOB Kay Hian
Wednesday , 11 November 2020
Refer to last page for important disclosures. 6
S i n g a p o r e
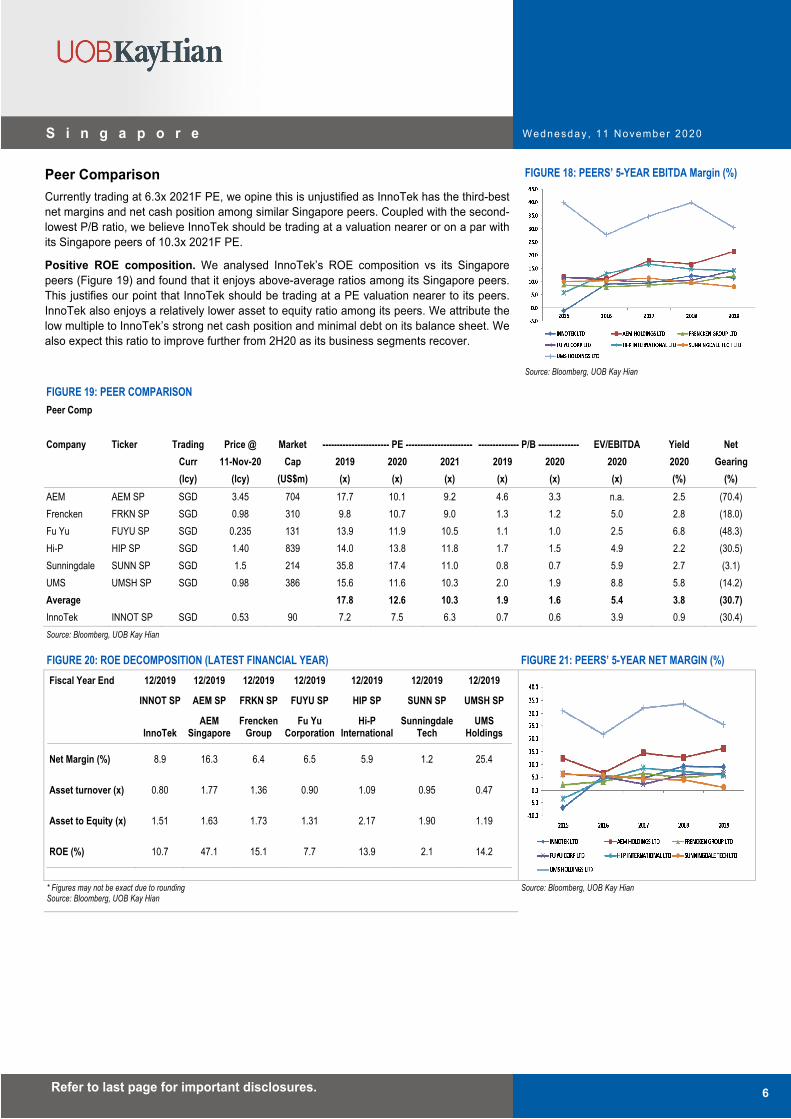
Peer Comparison Currently trading at 6.3x 2021F PE, we opine this is unjustified as InnoTek has the third-best net margins and net cash position among similar Singapore peers. Coupled with the second-lowest P/B ratio, we believe InnoTek should be trading at a valuation nearer or on a par with its Singapore peers of 10.3x 2021F PE.
Positive ROE composition. We analysed InnoTek’s ROE composition vs its Singapore peers (Figure 19) and found that it enjoys above-average ratios among its Singapore peers. This justifies our point that InnoTek should be trading at a PE valuation nearer to its peers. InnoTek also enjoys a relatively lower asset to equity ratio among its peers. We attribute the low multiple to InnoTek’s strong net cash position and minimal debt on its balance sheet. We also expect this ratio to improve further from 2H20 as its business segments recover.
FIGURE 18: PEERS’ 5-YEAR EBITDA Margin (%)
Source: Bloomberg, UOB Kay Hian
FIGURE 19: PEER COMPARISON Peer Comp Company Ticker Trading Price @ Market ----------------------- PE ----------------------- -------------- P/B -------------- EV/EBITDA Yield Net Curr 11-Nov-20 Cap 2019 2020 2021 2019 2020 2020 2020 Gearing (lcy) (lcy) (US$m) (x) (x) (x) (x) (x) (x) (%) (%) AEM AEM SP SGD 3.45 704 17.7 10.1 9.2 4.6 3.3 n.a. 2.5 (70.4) Frencken FRKN SP SGD 0.98 310 9.8 10.7 9.0 1.3 1.2 5.0 2.8 (18.0) Fu Yu FUYU SP SGD 0.235 131 13.9 11.9 10.5 1.1 1.0 2.5 6.8 (48.3) Hi-P HIP SP SGD 1.40 839 14.0 13.8 11.8 1.7 1.5 4.9 2.2 (30.5) Sunningdale SUNN SP SGD 1.5 214 35.8 17.4 11.0 0.8 0.7 5.9 2.7 (3.1) UMS UMSH SP SGD 0.98 386 15.6 11.6 10.3 2.0 1.9 8.8 5.8 (14.2) Average 17.8 12.6 10.3 1.9 1.6 5.4 3.8 (30.7) InnoTek INNOT SP SGD 0.53 90 7.2 7.5 6.3 0.7 0.6 3.9 0.9 (30.4) Source: Bloomberg, UOB Kay Hian FIGURE 20: ROE DECOMPOSITION (LATEST FINANCIAL YEAR) FIGURE 21: PEERS’ 5-YEAR NET MARGIN (%)Fiscal Year End 12/2019 12/2019 12/2019 12/2019 12/2019 12/2019 12/2019
INNOT SP AEM SP FRKN SP FUYU SP HIP SP SUNN SP UMSH SP
InnoTek AEM
Singapore Frencken
Group Fu Yu
CorporationHi-P
InternationalSunningdale
Tech UMS
Holdings
Net Margin (%) 8.9 16.3 6.4 6.5 5.9 1.2 25.4
Asset turnover (x) 0.80 1.77 1.36 0.90 1.09 0.95 0.47
Asset to Equity (x) 1.51 1.63 1.73 1.31 2.17 1.90 1.19
ROE (%) 10.7 47.1 15.1 7.7 13.9 2.1 14.2
* Figures may not be exact due to rounding Source: Bloomberg, UOB Kay Hian
Source: Bloomberg, UOB Kay Hian

Wednesday , 11 November 2020
Refer to last page for important disclosures. 7
S i n g a p o r e
Company Background InnoTek is a precision metal components manufacturer which offers electronics, office automation, as well as automobile and mobility devices through its wholly-owned Mansfield Manufacturing. InnoTek’s three business units: a) precision metal components stamping; b) Tools & Die design and fabrications; and c) integrated processes and assembly have a strong and diversified base of Japanese and European end-customers. It has built up a diversified client portfolio spanning five continents, through more than 30 years of being in the business. Some of its major end-clients include heavyweights such as Nissan, Sony, Toyota, Canon and Continental.
Corporate structure InnoTek has six manufacturing plants across China and a total manufacturing space of more than 200,000 sq ft. It has more than 700 stamping presses with capacity ranging from 25 tons to 1,100 tons, which is a significant number of computer numerical control machines, electrical discharge machines, plastic injection moulding and grinding equipment. In response to existing office automation customers shifting their production out of China to Southeast Asia, MSF founded a new plant, Mansfield (Thailand), in 2017. Located in Rayong Province, Thailand, it is InnoTek’s first manufacturing plant outside of China and is expected to ramp up production in 2020.
FIGURE 22: INNOTEK’S CORPORATE STRUCTURE
Source: InnoTek, Mansfield, UOB Kay Hian
Precision components stamping The precision components stamping segment has three production factories in China and one in Thailand. The factories are equipped with more than 700 stamping machines and produce various metal products that are used in exhaust pipes, airbags, car seat & frame structures, engine components, home appliances and office automation equipment.
Tools & Die design and fabrications The Tools & Die design and fabrications segment focuses on manufacturing die for use in auto parts, office automation facilities, home appliances, consumer electronics and metal stamping dies. This segment is supported by a lone production facility in Tangxia, China, with a total floor area of 5,000 sqm and 100 staff members.
Integrated processes and assembly
InnoTek, which is equipped with high-tech equipment, has the capabilities to meet the demand for high-precision products used in high-end smart TVs, smartphones, tablets, personal computers and consumer electronics. With TV front frames as its main product and focus, customers for this segment include industry leaders such as Sony, Panasonic and VIZIO.
FIGURE 23: INNOTEK’S GEOGRAPHICAL CLIENT DISTRIBUTION
Source: InnoTek, Mansfield, UOB Kay Hian FIGURE 24: TV COMPONENT PARTS
Source: InnoTek, Mansfield, UOB Kay Hian
FIGURE 25: CAR SEATS & FRAME STRUCTURES
Source: InnoTek, Mansfield, UOB Kay Hian FIGURE 26: OFFICE AUTOMATION EQUIPMENT
Source: InnoTek, Mansfield, UOB Kay Hian FIGURE 27: HOME APPLIANCES
Source: InnoTek, Mansfield, UOB Kay Hian FIGURE 28: METAL STAMPING DIES
Source: InnoTek, Mansfield, UOB Kay Hian
Wednesday , 11 November 2020
Refer to last page for important disclosures. 8
S i n g a p o r e
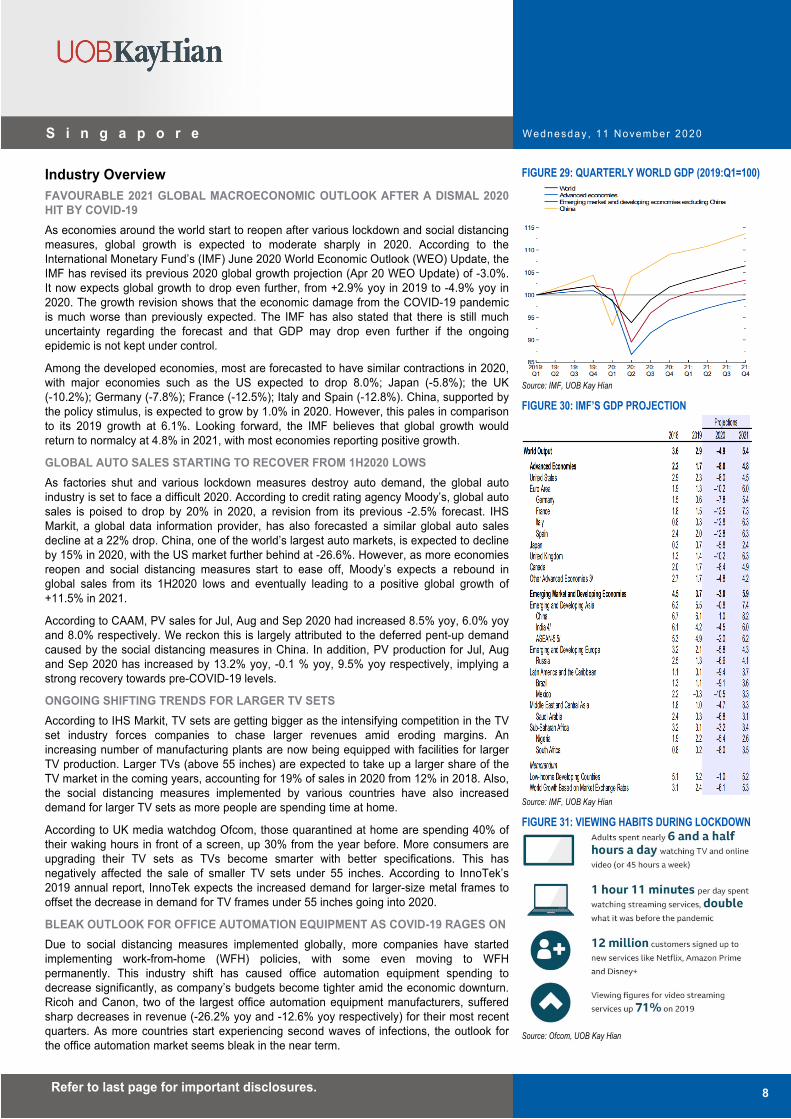
Industry Overview FAVOURABLE 2021 GLOBAL MACROECONOMIC OUTLOOK AFTER A DISMAL 2020 HIT BY COVID-19 As economies around the world start to reopen after various lockdown and social distancing measures, global growth is expected to moderate sharply in 2020. According to the International Monetary Fund’s (IMF) June 2020 World Economic Outlook (WEO) Update, the IMF has revised its previous 2020 global growth projection (Apr 20 WEO Update) of -3.0%. It now expects global growth to drop even further, from +2.9% yoy in 2019 to -4.9% yoy in 2020. The growth revision shows that the economic damage from the COVID-19 pandemic is much worse than previously expected. The IMF has also stated that there is still much uncertainty regarding the forecast and that GDP may drop even further if the ongoing epidemic is not kept under control.
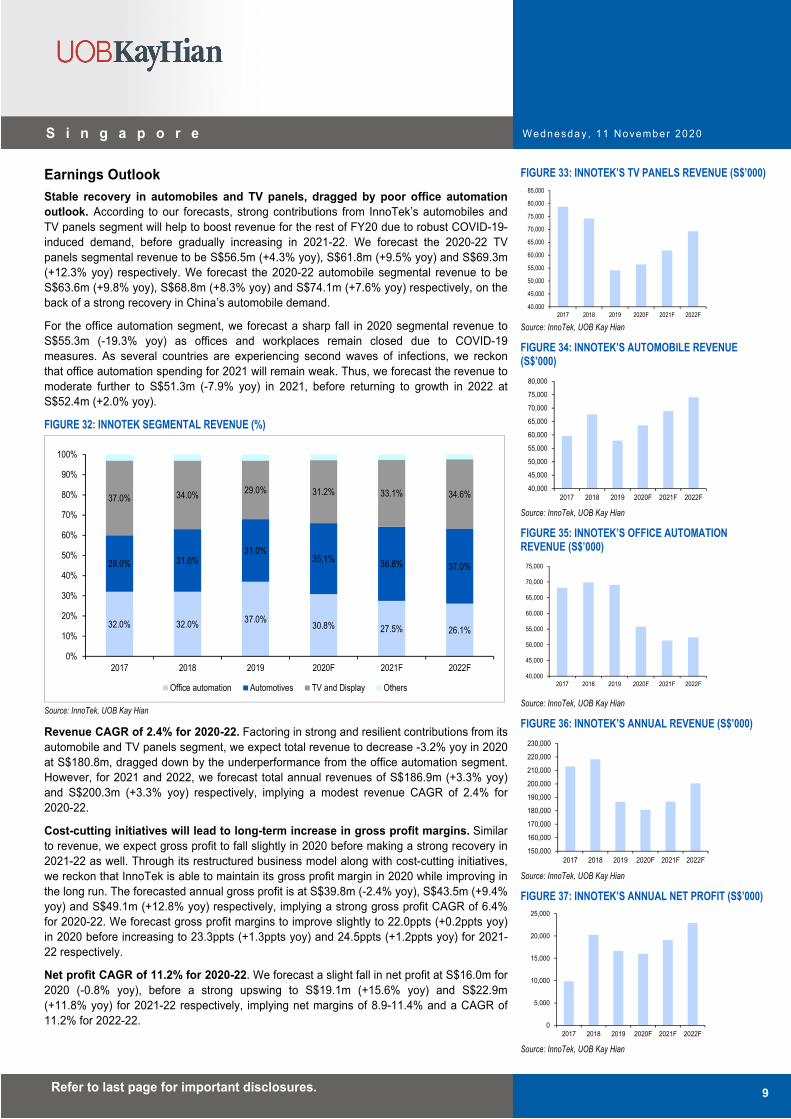
Among the developed economies, most are forecasted to have similar contractions in 2020, with major economies such as the US expected to drop 8.0%; Japan (-5.8%); the UK (-10.2%); Germany (-7.8%); France (-12.5%); Italy and Spain (-12.8%). China, supported by the policy stimulus, is expected to grow by 1.0% in 2020. However, this pales in comparison to its 2019 growth at 6.1%. Looking forward, the IMF believes that global growth would return to normalcy at 4.8% in 2021, with most economies reporting positive growth.
GLOBAL AUTO SALES STARTING TO RECOVER FROM 1H2020 LOWS As factories shut and various lockdown measures destroy auto demand, the global auto industry is set to face a difficult 2020. According to credit rating agency Moody’s, global auto sales is poised to drop by 20% in 2020, a revision from its previous -2.5% forecast. IHS Markit, a global data information provider, has also forecasted a similar global auto sales decline at a 22% drop. China, one of the world’s largest auto markets, is expected to decline by 15% in 2020, with the US market further behind at -26.6%. However, as more economies reopen and social distancing measures start to ease off, Moody’s expects a rebound in global sales from its 1H2020 lows and eventually leading to a positive global growth of +11.5% in 2021.
According to CAAM, PV sales for Jul, Aug and Sep 2020 had increased 8.5% yoy, 6.0% yoy and 8.0% respectively. We reckon this is largely attributed to the deferred pent-up demand caused by the social distancing measures in China. In addition, PV production for Jul, Aug and Sep 2020 has increased by 13.2% yoy, -0.1 % yoy, 9.5% yoy respectively, implying a strong recovery towards pre-COVID-19 levels.
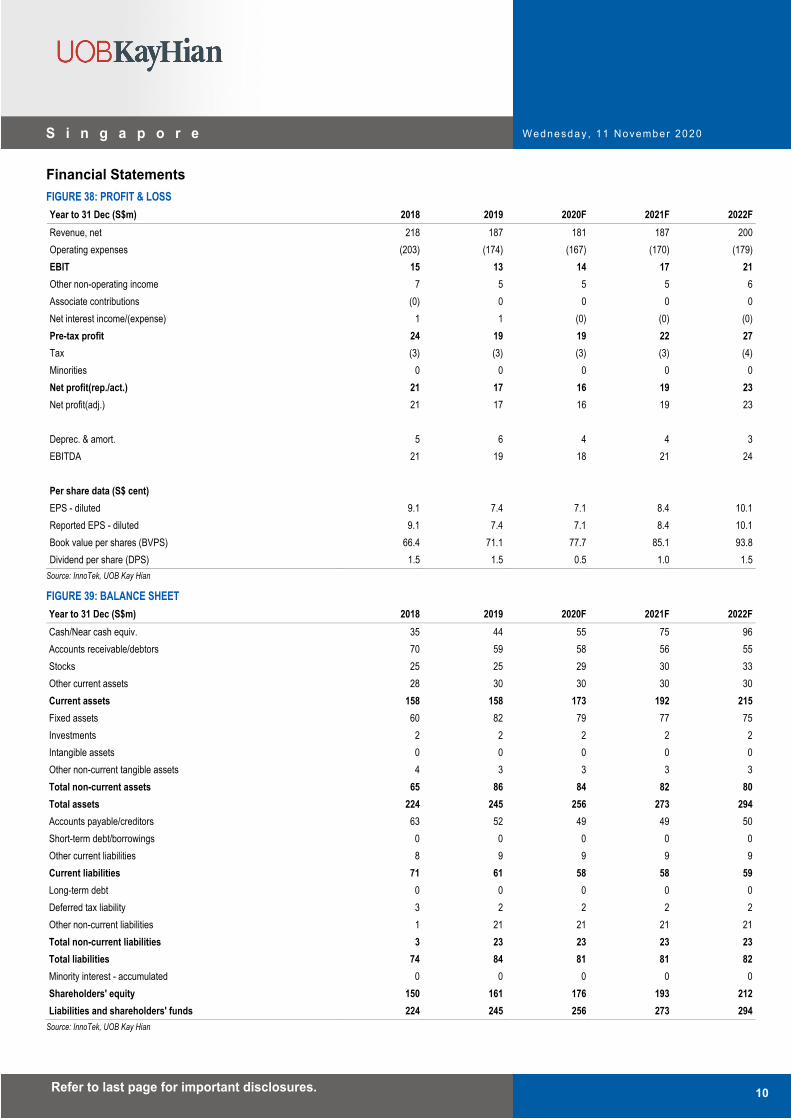
ONGOING SHIFTING TRENDS FOR LARGER TV SETS According to IHS Markit, TV sets are getting bigger as the intensifying competition in the TV set industry forces companies to chase larger revenues amid eroding margins. An increasing number of manufacturing plants are now being equipped with facilities for larger TV production. Larger TVs (above 55 inches) are expected to take up a larger share of the TV market in the coming years, accounting for 19% of sales in 2020 from 12% in 2018. Also, the social distancing measures implemented by various countries have also increased demand for larger TV sets as more people are spending time at home.
According to UK media watchdog Ofcom, those quarantined at home are spending 40% of their waking hours in front of a screen, up 30% from the year before. More consumers are upgrading their TV sets as TVs become smarter with better specifications. This has negatively affected the sale of smaller TV sets under 55 inches. According to InnoTek’s 2019 annual report, InnoTek expects the increased demand for larger-size metal frames to offset the decrease in demand for TV frames under 55 inches going into 2020.
BLEAK OUTLOOK FOR OFFICE AUTOMATION EQUIPMENT AS COVID-19 RAGES ONDue to social distancing measures implemented globally, more companies have started implementing work-from-home (WFH) policies, with some even moving to WFH permanently. This industry shift has caused office automation equipment spending to decrease significantly, as company’s budgets become tighter amid the economic downturn. Ricoh and Canon, two of the largest office automation equipment manufacturers, suffered sharp decreases in revenue (-26.2% yoy and -12.6% yoy respectively) for their most recent quarters. As more countries start experiencing second waves of infections, the outlook for the office automation market seems bleak in the near term.
FIGURE 29: QUARTERLY WORLD GDP (2019:Q1=100)
Source: IMF, UOB Kay Hian
FIGURE 30: IMF’S GDP PROJECTION
Source: IMF, UOB Kay Hian
FIGURE 31: VIEWING HABITS DURING LOCKDOWN
Source: Ofcom, UOB Kay Hian
Wednesday , 11 November 2020
Refer to last page for important disclosures. 9
S i n g a p o r e
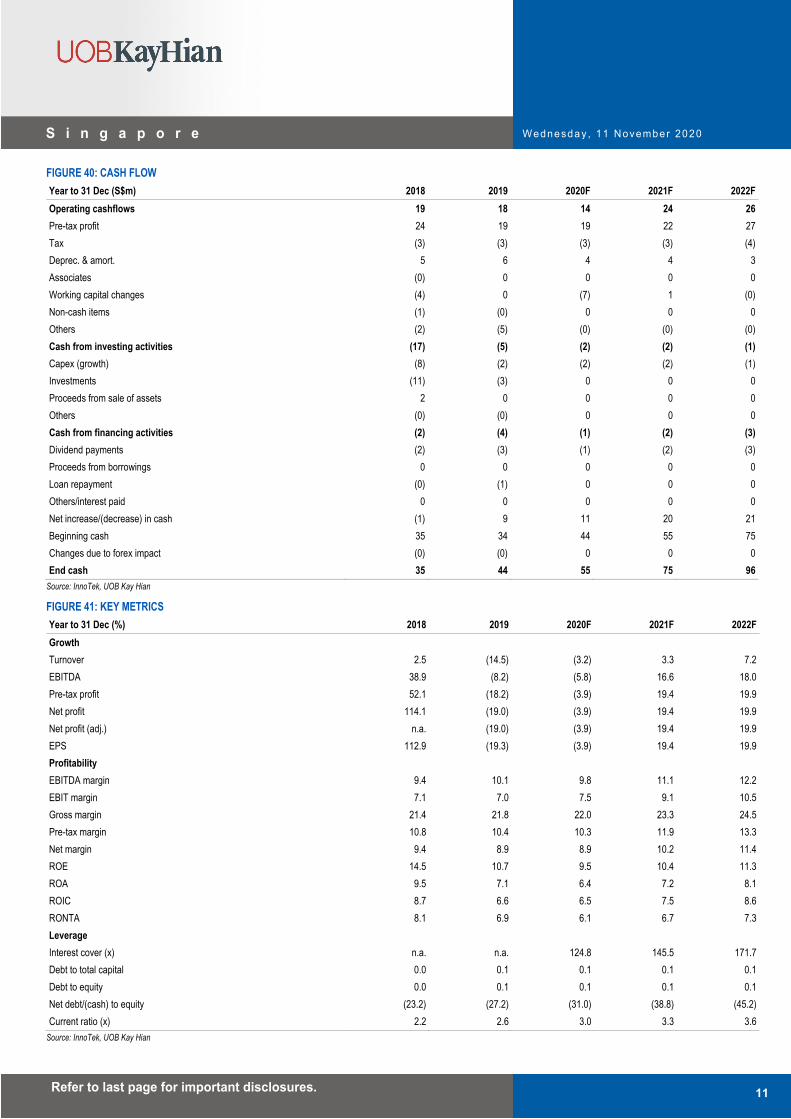
Earnings Outlook Stable recovery in automobiles and TV panels, dragged by poor office automation outlook. According to our forecasts, strong contributions from InnoTek’s automobiles and TV panels segment will help to boost revenue for the rest of FY20 due to robust COVID-19-induced demand, before gradually increasing in 2021-22. We forecast the 2020-22 TV panels segmental revenue to be S$56.5m (+4.3% yoy), S$61.8m (+9.5% yoy) and S$69.3m (+12.3% yoy) respectively. We forecast the 2020-22 automobile segmental revenue to be S$63.6m (+9.8% yoy), S$68.8m (+8.3% yoy) and S$74.1m (+7.6% yoy) respectively, on the back of a strong recovery in China’s automobile demand.
For the office automation segment, we forecast a sharp fall in 2020 segmental revenue to S$55.3m (-19.3% yoy) as offices and workplaces remain closed due to COVID-19 measures. As several countries are experiencing second waves of infections, we reckon that office automation spending for 2021 will remain weak. Thus, we forecast the revenue to moderate further to S$51.3m (-7.9% yoy) in 2021, before returning to growth in 2022 at S$52.4m (+2.0% yoy).
FIGURE 32: INNOTEK SEGMENTAL REVENUE (%)
32.0% 32.0% 37.0% 30.8% 27.5% 26.1%
28.0% 31.0%31.0%
35.1% 36.8% 37.0%
37.0% 34.0% 29.0% 31.2% 33.1% 34.6%
0%
10%
20%
30%
40%
50%
60%
70%
80%
90%
100%
2017 2018 2019 2020F 2021F 2022F
Office automation Automotives TV and Display Others
Source: InnoTek, UOB Kay Hian
Revenue CAGR of 2.4% for 2020-22. Factoring in strong and resilient contributions from its automobile and TV panels segment, we expect total revenue to decrease -3.2% yoy in 2020 at S$180.8m, dragged down by the underperformance from the office automation segment. However, for 2021 and 2022, we forecast total annual revenues of S$186.9m (+3.3% yoy) and S$200.3m (+3.3% yoy) respectively, implying a modest revenue CAGR of 2.4% for 2020-22.
Cost-cutting initiatives will lead to long-term increase in gross profit margins. Similar to revenue, we expect gross profit to fall slightly in 2020 before making a strong recovery in 2021-22 as well. Through its restructured business model along with cost-cutting initiatives, we reckon that InnoTek is able to maintain its gross profit margin in 2020 while improving in the long run. The forecasted annual gross profit is at S$39.8m (-2.4% yoy), S$43.5m (+9.4% yoy) and S$49.1m (+12.8% yoy) respectively, implying a strong gross profit CAGR of 6.4% for 2020-22. We forecast gross profit margins to improve slightly to 22.0ppts (+0.2ppts yoy) in 2020 before increasing to 23.3ppts (+1.3ppts yoy) and 24.5ppts (+1.2ppts yoy) for 2021-22 respectively.
Net profit CAGR of 11.2% for 2020-22. We forecast a slight fall in net profit at S$16.0m for 2020 (-0.8% yoy), before a strong upswing to S$19.1m (+15.6% yoy) and S$22.9m (+11.8% yoy) for 2021-22 respectively, implying net margins of 8.9-11.4% and a CAGR of 11.2% for 2022-22.
FIGURE 33: INNOTEK’S TV PANELS REVENUE (S$’000)
40,000
45,000
50,000
55,000
60,000
65,000
70,000
75,000
80,000
85,000
2017 2018 2019 2020F 2021F 2022F Source: InnoTek, UOB Kay Hian
FIGURE 34: INNOTEK’S AUTOMOBILE REVENUE (S$’000)
40,000
45,000
50,000
55,000
60,000
65,000
70,000
75,000
80,000
2017 2018 2019 2020F 2021F 2022F Source: InnoTek, UOB Kay Hian
FIGURE 35: INNOTEK’S OFFICE AUTOMATION REVENUE (S$’000)
40,000
45,000
50,000
55,000
60,000
65,000
70,000
75,000
2017 2018 2019 2020F 2021F 2022F
Source: InnoTek, UOB Kay Hian
FIGURE 36: INNOTEK’S ANNUAL REVENUE (S$’000)
150,000
160,000
170,000
180,000
190,000
200,000
210,000
220,000
230,000
2017 2018 2019 2020F 2021F 2022F
Source: InnoTek, UOB Kay Hian
FIGURE 37: INNOTEK’S ANNUAL NET PROFIT (S$’000)
0
5,000
10,000
15,000
20,000
25,000
2017 2018 2019 2020F 2021F 2022F Source: InnoTek, UOB Kay Hian
Wednesday , 11 November 2020
Refer to last page for important disclosures. 10
S i n g a p o r e
Financial Statements FIGURE 38: PROFIT & LOSS Year to 31 Dec (S$m) 2018 2019 2020F 2021F 2022FRevenue, net 218 187 181 187 200Operating expenses (203) (174) (167) (170) (179)EBIT 15 13 14 17 21Other non-operating income 7 5 5 5 6Associate contributions (0) 0 0 0 0Net interest income/(expense) 1 1 (0) (0) (0)Pre-tax profit 24 19 19 22 27Tax (3) (3) (3) (3) (4)Minorities 0 0 0 0 0Net profit(rep./act.) 21 17 16 19 23Net profit(adj.) 21 17 16 19 23
Deprec. & amort. 5 6 4 4 3EBITDA 21 19 18 21 24
Per share data (S$ cent) EPS - diluted 9.1 7.4 7.1 8.4 10.1Reported EPS - diluted 9.1 7.4 7.1 8.4 10.1Book value per shares (BVPS) 66.4 71.1 77.7 85.1 93.8Dividend per share (DPS) 1.5 1.5 0.5 1.0 1.5
Source: InnoTek, UOB Kay Hian
FIGURE 39: BALANCE SHEET Year to 31 Dec (S$m) 2018 2019 2020F 2021F 2022FCash/Near cash equiv. 35 44 55 75 96Accounts receivable/debtors 70 59 58 56 55Stocks 25 25 29 30 33Other current assets 28 30 30 30 30Current assets 158 158 173 192 215Fixed assets 60 82 79 77 75Investments 2 2 2 2 2Intangible assets 0 0 0 0 0Other non-current tangible assets 4 3 3 3 3Total non-current assets 65 86 84 82 80Total assets 224 245 256 273 294Accounts payable/creditors 63 52 49 49 50Short-term debt/borrowings 0 0 0 0 0Other current liabilities 8 9 9 9 9Current liabilities 71 61 58 58 59Long-term debt 0 0 0 0 0Deferred tax liability 3 2 2 2 2Other non-current liabilities 1 21 21 21 21Total non-current liabilities 3 23 23 23 23Total liabilities 74 84 81 81 82Minority interest - accumulated 0 0 0 0 0Shareholders' equity 150 161 176 193 212Liabilities and shareholders' funds 224 245 256 273 294
Source: InnoTek, UOB Kay Hian
Wednesday , 11 November 2020
Refer to last page for important disclosures. 11
S i n g a p o r e
FIGURE 40: CASH FLOW Year to 31 Dec (S$m) 2018 2019 2020F 2021F 2022FOperating cashflows 19 18 14 24 26Pre-tax profit 24 19 19 22 27Tax (3) (3) (3) (3) (4)Deprec. & amort. 5 6 4 4 3Associates (0) 0 0 0 0Working capital changes (4) 0 (7) 1 (0)Non-cash items (1) (0) 0 0 0Others (2) (5) (0) (0) (0)Cash from investing activities (17) (5) (2) (2) (1)Capex (growth) (8) (2) (2) (2) (1)Investments (11) (3) 0 0 0Proceeds from sale of assets 2 0 0 0 0Others (0) (0) 0 0 0Cash from financing activities (2) (4) (1) (2) (3)Dividend payments (2) (3) (1) (2) (3)Proceeds from borrowings 0 0 0 0 0Loan repayment (0) (1) 0 0 0Others/interest paid 0 0 0 0 0Net increase/(decrease) in cash (1) 9 11 20 21Beginning cash 35 34 44 55 75Changes due to forex impact (0) (0) 0 0 0End cash 35 44 55 75 96
Source: InnoTek, UOB Kay Hian
FIGURE 41: KEY METRICS Year to 31 Dec (%) 2018 2019 2020F 2021F 2022FGrowth Turnover 2.5 (14.5) (3.2) 3.3 7.2EBITDA 38.9 (8.2) (5.8) 16.6 18.0Pre-tax profit 52.1 (18.2) (3.9) 19.4 19.9Net profit 114.1 (19.0) (3.9) 19.4 19.9Net profit (adj.) n.a. (19.0) (3.9) 19.4 19.9EPS 112.9 (19.3) (3.9) 19.4 19.9Profitability EBITDA margin 9.4 10.1 9.8 11.1 12.2EBIT margin 7.1 7.0 7.5 9.1 10.5Gross margin 21.4 21.8 22.0 23.3 24.5Pre-tax margin 10.8 10.4 10.3 11.9 13.3Net margin 9.4 8.9 8.9 10.2 11.4ROE 14.5 10.7 9.5 10.4 11.3ROA 9.5 7.1 6.4 7.2 8.1ROIC 8.7 6.6 6.5 7.5 8.6RONTA 8.1 6.9 6.1 6.7 7.3Leverage Interest cover (x) n.a. n.a. 124.8 145.5 171.7Debt to total capital 0.0 0.1 0.1 0.1 0.1Debt to equity 0.0 0.1 0.1 0.1 0.1Net debt/(cash) to equity (23.2) (27.2) (31.0) (38.8) (45.2)Current ratio (x) 2.2 2.6 3.0 3.3 3.6
Source: InnoTek, UOB Kay Hian
Wednesday , 11 November 2020
Refer to last page for important disclosures. 12
S i n g a p o r e
Appendix I: Risk Factors Potential demand disruption of COVID-19 on office automation and auto segments. COVID-19 could impact the demand for Innotek’s products, especially in the office automation and auto segments. Demand for office equipment, such as printers, could reduce if more people are forced to work from home due to COVID-19. On the other hand, demand for automotive outside of China could also reduce if consumption power reduces as a result of COVID-19. If the second wave of COVID-19 is not being controlled in the US and Europe, which contribute a huge portion of global auto demand, this may impact Innotek’s auto segment.
Intense competition and low barriers of entry. InnoTek faces stiff competition where customers have the option to switch suppliers easily. Many of its larger competitors are well established and may have greater resources (ie financial and marketing). Furthermore, new competitors may enter the market, resulting in increased competition. If InnoTek is unable to compete successfully against competitors or adapt to market conditions, business and financial performances may be materially and adversely affected.
Forex pressure may erode earnings. As most of InnoTek’s business comes from China, it has a significant exposure to renminbi. If InnoTek is unable to minimise any potential material adverse impact from forex currency movements, business and financial performances may be materially and adversely affected.
Underutilisation of production capacity. InnoTek’s business is characterised by high fixed costs, including plant facilities, manufacturing equipment and machineries. If its capacity utilisation decreases due to poor demand or cancellation/delay of customer orders, the company could encounter significantly higher unit production costs, lower margins and potentially significant losses. The underutilisation of production capacity could also result in equipment write-offs, restructuring charges and employee layoffs.
Changes in political, social and economic conditions. InnoTek’s manufacturing facilities are mainly located in China. Any unfavourable changes in the political, social, legal, regulatory and economic conditions in China (such as the worsening of US-Sino trade relations) may disrupt operations and affect InnoTek’s financial performance.
Wednesday , 11 November 2020
Refer to last page for important disclosures. 13
S i n g a p o r e
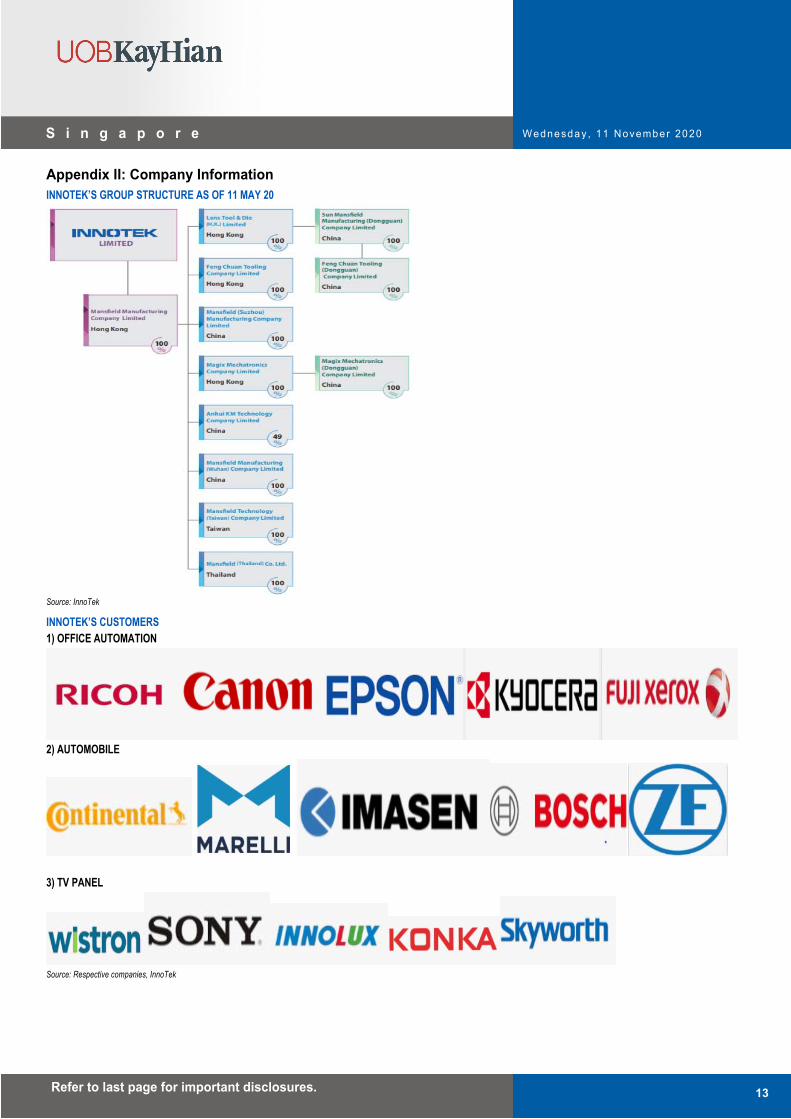
Appendix II: Company Information INNOTEK’S GROUP STRUCTURE AS OF 11 MAY 20
Source: InnoTek
INNOTEK’S CUSTOMERS 1) OFFICE AUTOMATION
2) AUTOMOBILE
3) TV PANEL
Source: Respective companies, InnoTek
Wednesday , 11 November 2020
Refer to last page for important disclosures. 14
S i n g a p o r e
Appendix III: Key Management SELECTED DIRECTORS AND MANAGEMENT
Name Position Experience
Mr Neal Manilal Chandaria
Chairman, Non-Executive and Non-Independent Director
Mr Chandaria joined as a Non-Executive and Non-Independent Director on 2 Nov 15 and is a member of the Nominating Committee. He was appointed Chairman of the Board and member of the Audit & Risk Management Committee on 27 Apr 17. He is a senior executive at Comcraft Group, which is globally active in various sectors including steel, aluminium, plastics, packaging and information technology.
Mr Chandaria, who is based in Singapore, has been helping Comcraft to develop its businesses in Asia for more than 20 years. He was previously involved in Comcraft's businesses in Africa and Europe. Mr Chandaria, who graduated from Stanford University with a degree in economics, is the Honorary Consul of the Republic of Kenya in Singapore. He was re-elected as a Director of the company at the 2019 AGM.
Mr Lou Yiliang
CEO, Executive and Non-Independent Director
Mr Lou was appointed the Executive Director of InnoTek and the Chief Executive Officer of InnoTek’s Mansfield Group on 2 Nov 15. In 2017, Mr Lou was appointed as the Chief Executive Officer of InnoTek. Mr Lou, who was born in Shanghai, has vast experience in the consumer electronics and home appliances businesses in Asia.
He started his career as an entrepreneur in the 1980s by helping to procure Toshiba consumer electronic products from Japan to China. The business helped to pave the way for the transfer of technology from Toshiba in Japan to major Chinese manufacturers of TV sets and other consumer electronics. These included Changhong, Haier, Hisense and KONKA Group (KONKA).
In 2000, Mr Lou set up Toyo Communication Technology (Shenzhen), which makes and assembles printed circuit boards and provides electronic manufacturing services. In 2006, Mr Lou formed a joint venture, Konka Precision Mould Plastic, with major TV manufacturer KONKA to develop precision moulds for TV and office automation components as well as automobile products.
Mr Lou is the Chairman of Konka Precision Mould Plastic, which has a 51:49 joint venture company, Anhui KM Technology, with Mansfield Manufacturing, a wholly-owned subsidiary of InnoTek. Mr Lou, who is proficient in Chinese and Japanese, was re-elected as a Director of the company at the 2018 AGM.
Mr Steven Chong Teck Sin
Non-Executive and Independent Director
Mr Chong, who joined InnoTek as a Director on 17 Sep 12, is the Chairman of the Audit & Risk Management Committee and a Remuneration Committee member. He has extensive experience as director of public listed companies in Singapore, particularly in the technology sector. Between 1999 and 2004 he served as the Executive Director & Group Managing Director (Commercial) of Seksun Corporation, which was then listed on the Main Board of the Singapore Exchange (SGX). He later held non-executive directorships in other SGX and Australia Stock Exchange (ASX) listed companies.
Mr Chong was also a board member of the Accounting and Corporate Regulatory Authority, a statutory board of Singapore’s Ministry of Finance from Apr 04 to Mar 10, as well as a board member of Singapore’s largest charity, the National Kidney Foundation from Oct 08 to Jul 10. He currently sits on the board of public companies listed on the SGX, the ASX and the Hong Kong Stock Exchange. Mr Chong graduated with a Bachelor of Engineering degree from the University of Tokyo in 1981 on a government scholarship and subsequently obtained a Masters of Business Administration from the National University of Singapore in 1987 through part-time study.
Mr Sunny Wong Fook Choy
Non-Executive and Independent Director
Mr Wong, who joined as a Non-Executive Independent Director on 17 Nov 14, is the Chairman of the Remuneration Committee and a Nominating Committee member. He has extensive experience as director of public listed companies in Singapore. He sits on the board of Civmec, Excelpoint Technology and Mencast Holdings.
A practising advocate and solicitor of the Supreme Court of Singapore, he has extensive experience in the legal practice. Mr Wong is a shareholder and Managing Director of Wong Tan & Molly Lim LLC. He is also a shareholder and Director of WTML Management Services. Mr Wong holds a Bachelor of Law (Honours) degree from the National University of Singapore. He was re-elected as a Director of the company at the 2017 AGM and is due for re-election at this year’s AGM.
Mr Teruo Kiriyama Non-Executive and Independent Director
Mr Kiriyama, who was appointed to the Board as an Independent Director on 2 Nov 15, is the Chairman of the Nominating Committee and a member of the Audit & Risk Management Committee and Remuneration Committee. He has held various senior management positions in Japanese conglomerate Toshiba Corporation for almost two decades. Mr Kiriyama was adviser to Toshiba Corporation from 2014-15. Before this, he was Toshiba’s Corporate Vice-President from 2011-14, during which he was also the Chairman and CEO of Toshiba China. Under his watch, Toshiba China generated annual sales of US$6 billion and boasted a 35,000-strong workforce amid a period of political sensitivity for Japanese businesses in China. Besides China, Mr Kiriyama was also involved in Toshiba’s operations in Europe, the US, Canada and several emerging markets. He graduated from Japan’s Doshisha University in Kyoto with a degree in economics. He was re-elected as a Director of the company at the 2019 AGM.
Wednesday , 11 November 2020
Refer to last page for important disclosures. 15
S i n g a p o r e
Name Position Experience
Mr Okura Ippei Director, Mansfield Group
Mr Okura was appointed as Director of Mansfield, responsible for the group sales of Mansfield Manufacturing, Hong Kong, in Dec 15. He has extensive industry experience in research, manufacturing and corporate management. Prior to joining Mansfield, Mr Okura worked in research at the National Laboratory for High Energy Physics of Japan from 1989-93. He joined Toyoichi Tsusho in 1993, where he was involved in technical cooperation and trade between China and Japan. He became the Director at Shenzhen Konka Precision Mould Plastic in 2006. In 2014, he joined Anhui KM Technology as a Managing Director. Mr. Okura holds a master’s degree in science from Tokyo Gakugei University.
Mr Ukawa Masatsugu GM, Internal Audit Department, Chief Administration Officer, Director, Mansfield Group
Mr Ukawa joined Mansfield Group as a General Manager of the Internal Audit Department in Dec 15. He has been the Chief Administration Officer for Mansfield Group Administration since Apr 18. Prior to joining Mansfield, Mr Ukawa was in investment banking at Nomura Securities from 1986 to 2010. Between 1993 and 2008, he was the resident CEO of NOMURA–CITIC International Investment Consulting, an investment consultancy in Beijing, China, which was founded by Nomura.
Over the course of his work at NOMURA–CITIC, Mr Ukawa successfully established multiple Sino-Japanese JVs in various fields. From 2010-15, he was a Director of KITO a professional crane equipment manufacturer. Mr Ukawa was responsible for managing the company’s business in China, and served as the General Manager of Jiangyin KITO Crane, a subsidiary of KITO located in Jiangyin, China.
Mr Ukawa brings to Mansfield Group more than 30 years of experience in investment banking, finance and corporate management in China and Japan. With his extensive knowledge of Chinese and Japanese corporate culture and business models, Mr Ukawa is well-positioned to lead the Mansfield Group management. He graduated from Japan’s Waseda University with a degree in economics.
Ms Quek Siew Hoon Corporate Controller
Ms Quek, who joined in 2000, has been with the Group for more than 19 years. She has over 27 years of experience in finance and accounting, and is responsible for the finance functions. In her early career, Ms Quek joined KPMG for two years and was responsible for auditing assignments, mainly for manufacturing companies. She then spent more than three years with Texas Instruments Singapore as a Financial Accountant and later as a Cost Accountant at its Singapore manufacturing plant, which was later taken over by Micron Semiconductor. Prior to joining InnoTek, Ms Quek was a Finance Director of Seagate Technology’s (Seagate) electronic assembly operations division, which had manufacturing operations in Singapore, Batam and Senai.
Ms Quek spent 11 years at Seagate, starting as a Costing and Financial Planning Manager and was subsequently promoted to a Finance Director. She handled complex inventory systems, budgeting, scrap and product cost controls, financial reporting and other accounting functions of the electronic assembly operations division. She also provided financial information to the electronic assembly operations president for his strategic planning. Ms Quek’s other responsibilities included ensuring adherence to financial policies and compliance. She holds a Bachelor of Accountancy degree from the National University of Singapore and is a member of the Institute of Singapore Chartered Accountants.
Ms Ivy Neo Finance Director, Mansfield Group
Ms Neo joined Mansfield (Suzhou) Manufacturing as a Financial Controller in May 14. After a year and a half, she was re-designated as a Finance Director of Mansfield Group, where she oversees the financial affairs and corporate functions and works closely with the core leadership team. Ms Neo has over 30 years of financial exposure with more than 10 years’ working experience in the manufacturing environment in China. Prior to joining Mansfield, Ms Neo was with various companies, including Sino-American Joint Venture, Yaguang Nypro Precision Molding (Tianjin), Celestica Holdings (HK), Thomson Multimedia, Keppel Shipyard and the Singapore Press Holdings. She graduated from Victoria University in Australia with a Master of Business Administration (Accounting) and is an associate member of the CPA Australia.
Source: InnoTek

Wednesday , 11 November 2020
Refer to last page for important disclosures. 16
S i n g a p o r e
Appendix IV: Substantial Shareholders SUBSTANTIAL SHAREHOLDERS AS OF 30 APR 20 No. Name No of Shares Held % Deemed Interest %1 Advantec Holding (1) * 22,571,000 9.97 60,811,300 26.872 Trustee of Chandaria Trust I (2) * - - 83,832,300 37.043 Lou Yiliang (3) * 14,082,700 6.22 11,902,800 5.26 (1) Advantec Holding is deemed to be interested in the 60,811,300 shares held through the following:
Raffles Nominees in respect of 40,811,300 shares UOB Bank Nominees in respect of 20,000,000 shares
(2) Trustee of Chandaria Trust I is deemed to be interested in the 83,382,300 shares held by Advantec Holding as well as a further 450,000 shares held by Metchem Engineering, both of which are wholly-owned by the Chandaria Trust I.
(3) Mr Lou Yiliang is deemed to be interested in the 11,902,800 shares held through Philip Securities.
Source: InnoTek
TWENTY LARGEST SHAREHOLDERS AS OF 30 APR 20
Source: InnoTek
Wednesday , 11 November 2020
Refer to last page for important disclosures. 17
S i n g a p o r e
Disc losures/Disc la im ers This report is prepared by UOB Kay Hian Private Limited (“UOBKH”), which is a holder of a capital markets services licence and an exempt financial adviser in Singapore. This report is provided for information only and is not an offer or a solicitation to deal in securities or to enter into any legal relations, nor an advice or a recommendation with respect to such securities. This report is prepared for general circulation. It does not have regard to the specific investment objectives, financial situation and the particular needs of any recipient hereof. Advice should be sought from a financial adviser regarding the suitability of the investment product, taking into account the specific investment objectives, financial situation or particular needs of any person in receipt of the recommendation, before the person makes a commitment to purchase the investment product. This report is confidential. This report may not be published, circulated, reproduced or distributed in whole or in part by any recipient of this report to any other person without the prior written consent of UOBKH. This report is not directed to or intended for distribution to or use by any person or any entity who is a citizen or resident of or located in any locality, state, country or any other jurisdiction as UOBKH may determine in its absolute discretion, where the distribution, publication, availability or use of this report would be contrary to applicable law or would subject UOBKH and its connected persons (as defined in the Financial Advisers Act, Chapter 110 of Singapore) to any registration, licensing or other requirements within such jurisdiction. The information or views in the report (“Information”) has been obtained or derived from sources believed by UOBKH to be reliable. However, UOBKH makes no representation as to the accuracy or completeness of such sources or the Information and UOBKH accepts no liability whatsoever for any loss or damage arising from the use of or reliance on the Information. UOBKH and its connected persons may have issued other reports expressing views different from the Information and all views expressed in all reports of UOBKH and its connected persons are subject to change without notice. UOBKH reserves the right to act upon or use the Information at any time, including before its publication herein. Except as otherwise indicated below, (1) UOBKH, its connected persons and its officers, employees and representatives may, to the extent permitted by law, transact with, perform or provide broking, underwriting, corporate finance-related or other services for or solicit business from, the subject corporation(s) referred to in this report; (2) UOBKH, its connected persons and its officers, employees and representatives may also, to the extent permitted by law, transact with, perform or provide broking or other services for or solicit business from, other persons in respect of dealings in the securities referred to in this report or other investments related thereto; (3) the officers, employees and representatives of UOBKH may also serve on the board of directors or in trustee positions with the subject corporation(s) referred to in this report. (All of the foregoing is hereafter referred to as the “Subject Business”); and (4) UOBKH may otherwise have an interest (including a proprietary interest) in the subject corporation(s) referred to in this report. As of the date of this report, no analyst responsible for any of the content in this report has any proprietary position or material interest in the securities of the corporation(s) which are referred to in the content they respectively author or are otherwise responsible for. IMPORTANT DISCLOSURES FOR U.S. PERSONS This research report was prepared by UOBKH, a company authorized, as noted above, to engage in securities activities in Singapore. UOBKH is not a registered broker-dealer in the United States and, therefore, is not subject to U.S. rules regarding the preparation of research reports and the independence of research analysts. This research report is provided for distribution by UOBKH (whether directly or through its US registered broker dealer affiliate named below) to “major U.S. institutional investors” in reliance on the exemption from registration provided by Rule 15a-6 of the U.S. Securities Exchange Act of 1934, as amended (the “Exchange Act”). All US persons that receive this document by way of distribution from or which they regard as being from UOBKH by their acceptance thereof represent and agree that they are a major institutional investor and understand the risks involved in executing transactions in securities. Any U.S. recipient of this research report wishing to effect any transaction to buy or sell securities or related financial instruments based on the information provided in this research report should do so only through UOB Kay Hian (U.S.) Inc (“UOBKHUS”), a registered broker-dealer in the United States. Under no circumstances should any recipient of this research report effect any transaction to buy or sell securities or related financial instruments through UOBKH. UOBKHUS accepts responsibility for the contents of this research report, subject to the terms set out below, to the extent that it is delivered to and intended to be received by a U.S. person other than a major U.S. institutional investor. The analyst whose name appears in this research report is not registered or qualified as a research analyst with the Financial Industry Regulatory Authority (“FINRA”) and may not be an associated person of UOBKHUS and, therefore, may not be subject to applicable restrictions under FINRA Rules on communications with a subject company, public appearances and trading securities held by a research analyst account.
Wednesday , 11 November 2020
Refer to last page for important disclosures. 18
S i n g a p o r e
Analyst Certification/Regulation AC Each research analyst of UOBKH who produced this report hereby certifies that (1) the views expressed in this report accurately reflect his/her personal views about all of the subject corporation(s) and securities in this report; (2) the report was produced independently by him/her; (3) he/she does not carry out, whether for himself/herself or on behalf of UOBKH or any other person, any of the Subject Business involving any of the subject corporation(s) or securities referred to in this report; and (4) he/she has not received and will not receive any compensation that is directly or indirectly related or linked to the recommendations or views expressed in this report or to any sales, trading, dealing or corporate finance advisory services or transaction in respect of the securities in this report. However, the compensation received by each such research analyst is based upon various factors, including UOBKH’s total revenues, a portion of which are generated from UOBKH’s business of dealing in securities. Reports are distributed in the respective countries by the respective entities and are subject to the additional restrictions listed in the following table. General This report is not intended for distribution, publication to or use by any person or entity who is a citizen or resident of or
located in any country or jurisdiction where the distribution, publication or use of this report would be contrary to applicable law or regulation.
Hong Kong This report is distributed in Hong Kong by UOB Kay Hian (Hong Kong) ted ("UOBKHHK"), which is regulated by the Securities and Futures Commission of Hong Kong. Neither the analyst(s) preparing this report nor his associate, has trading and financial interest and relevant relationship specified under Para. 16.4 of Code of Conduct in the listed corporation covered in this report. UOBKHHK does not have financial interests and business relationship specified under Para. 16.5 of Code of Conduct with the listed corporation covered in this report. Where the report is distributed in Hong Kong and contains research analyses or reports from a foreign research house, please note: (i) recipients of the analyses or reports are to contact UOBKHHK (and not the relevant foreign research house) in Hong Kong in respect of any matters arising from, or in connection with, the analysis or report; and (ii) to the extent that the analyses or reports are delivered to and intended to be received by any person in Hong Kong who is not a professional investor, or institutional investor, UOBKHHK accepts legal responsibility for the contents of the analyses or reports only to the extent required by law.
Indonesia This report is distributed in Indonesia by PT UOB Kay Hian Sekuritas, which is regulated by Financial Services Authority of Indonesia (“OJK”). Where the report is distributed in Indonesia and contains research analyses or reports from a foreign research house, please note recipients of the analyses or reports are to contact PT UOBKH (and not the relevant foreign research house) in Indonesia in respect of any matters arising from, or in connection with, the analysis or report.
Malaysia Where the report is distributed in Malaysia and contains research analyses or reports from a foreign research house, the recipients of the analyses or reports are to contact UOBKHM (and not the relevant foreign research house) in Malaysia, at +603-21471988, in respect of any matters arising from, or in connection with, the analysis or report as UOBKHM is the registered person under CMSA to distribute any research analyses in Malaysia.
Singapore This report is distributed in Singapore by UOB Kay Hian Private Limited ("UOBKH"), which is a holder of a capital markets services licence and an exempt financial adviser regulated by the Monetary Authority of Singapore.Where the report is distributed in Singapore and contains research analyses or reports from a foreign research house, please note: (i) recipients of the analyses or reports are to contact UOBKH (and not the relevant foreign research house) in Singapore in respect of any matters arising from, or in connection with, the analysis or report; and (ii) to the extent that the analyses or reports are delivered to and intended to be received by any person in Singapore who is not an accredited investor, expert investor or institutional investor, UOBKH accepts legal responsibility for the contents of the analyses or reports only to the extent required by law.
Thailand This report is distributed in Thailand by UOB Kay Hian Securities (Thailand) Public Company Limited, which is regulated by the Securities and Exchange Commission of Thailand.
United Kingdom
This report is being distributed in the UK by UOB Kay Hian (U.K.) Limited, which is an authorised person in the meaning of the Financial Services and Markets Act and is regulated by The Financial Conduct Authority. Research distributed in the UK is intended only for institutional clients.
United States of America (‘U.S.’)
This report cannot be distributed into the U.S. or to any U.S. person or entity except in compliance with applicable U.S. laws and regulations. It is being distributed in the U.S. by UOB Kay Hian (US) Inc, which accepts responsibility for its contents. Any U.S. person or entity receiving this report and wishing to effect transactions in any securities referred to in the report should contact UOB Kay Hian (US) Inc. directly.
Copyright 2020, UOB Kay Hian Pte Ltd. All rights reserved. http://research.uobkayhian.com RCB Regn. No. 197000447W Research Talent Development Grant Scheme UOB Kay Hian Pte Ltd is supported by the Research Talent Development Grant Scheme which aims to groom research talent to expand research coverage of small-mid cap SGX listed companies.