Smart Volatility Investing - Investcorp-Tages
16
Authors Berouz Fatemi, Portfolio Manager, Tages Capital Sébastien Krol, Portfolio Strategist, Tages Capital Tages Capital 39 St James’s Street, London, SW1A 1JD T: +44 (0)20 3036 6051 www.tagescapital.com [email protected] Quant Lab Smart Volatility Investing
-
Upload
khangminh22 -
Category
Documents
-
view
1 -
download
0
Transcript of Smart Volatility Investing - Investcorp-Tages

Authors
Berouz Fatemi, Portfolio Manager, Tages Capital
Sébastien Krol, Portfolio Strategist, Tages Capital
Tages Capital39 St James’s Street, London, SW1A 1JDT: +44 (0)20 3036 6051
Quant Lab
Smart Volatility Investing
The purpose of this report is to introduce the notion of ‘Smart Volatility’.
The concept is gaining ground as more investors look for strategies to
hedge against tail events which have better risk/reward profiles than
long options exposure.
Holding options can be an expensive exercise over the long run.
Investors have tried to time the purchase of volatility to minimise these
costs, but long term analysis shows that even good timing has failed to
markedly improve the performance record of such opportunistic buying.
Some of the basic characteristics of the options markets such as
momentum in volatility, rising skew in times of crisis, etc. can be utilised
to build systematic models to assist investors with the question of timing
entry and exit points.
Other relative value Smart Volatility strategies provide investors with
long volatility and convexity exposure at relatively modest costs. These
strategies should be considered as part of a diversified tail-hedge
strategy.
2
Overview
Over the years, investors and speculators have been
trading options on various underlying instruments
with the aim of realising gains when markets move
in a certain direction or profile. The trading of
volatility provides a direct way to capitalise on
uncertainty in financial markets, with volatility
increasing in line with market stress.
Before delving too far into the practical trading of
volatility, it is important to distinguish between
realised volatility and implied volatility.
Realised volatility: This is the standard deviation of
price returns; it is a backward looking measure
considering the path behaviour of the stock price
over the history of the volatility window.
Implied volatility: This is the market forecast of
future realised volatility; it is a forward looking
measure which is inferred from the Black-Scholes
equation based on the prices of traded options.
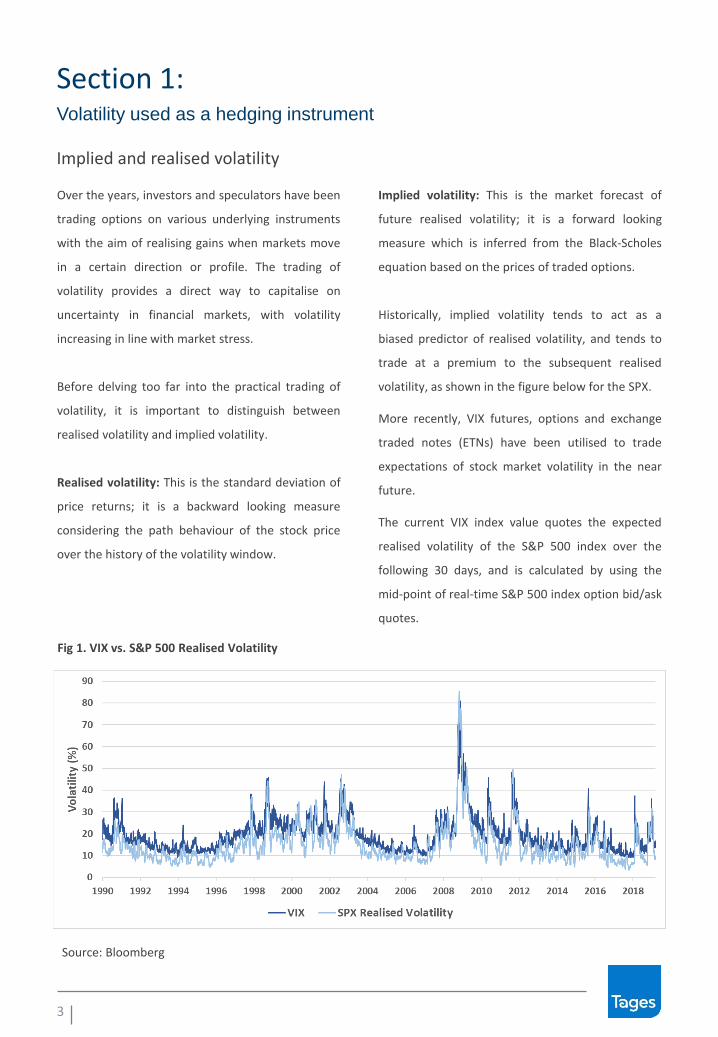
Historically, implied volatility tends to act as a
biased predictor of realised volatility, and tends to
trade at a premium to the subsequent realised
volatility, as shown in the figure below for the SPX.
More recently, VIX futures, options and exchange
traded notes (ETNs) have been utilised to trade
expectations of stock market volatility in the near
future.
The current VIX index value quotes the expected
realised volatility of the S&P 500 index over the
following 30 days, and is calculated by using the
mid-point of real-time S&P 500 index option bid/ask
quotes.
Implied and realised volatility
Volatility used as a hedging instrument
Section 1:
Fig 1. VIX vs. S&P 500 Realised Volatility
3
Source: Bloomberg
Volatility used as a hedging instrument
Section 1:
The feature that makes VIX or volatility in general
attractive to investors is its negative correlation to
equity returns. As equity markets decline, equities
tend to become more volatile. Hence, the VIX tends
to rise as the market anticipates increased future
volatility.
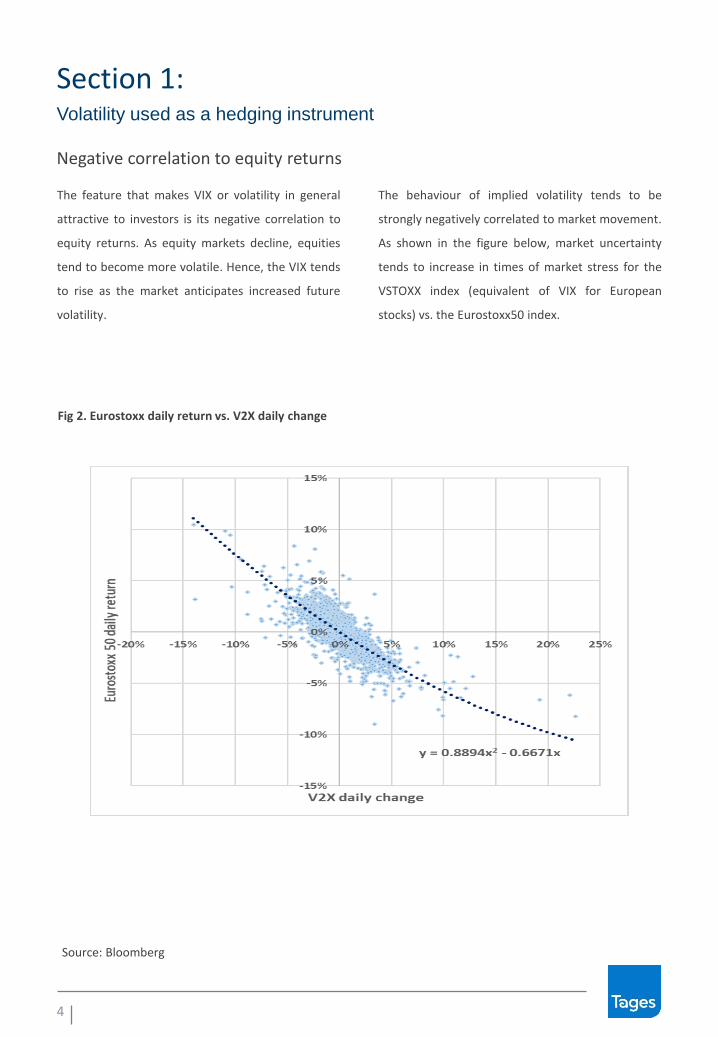
The behaviour of implied volatility tends to be
strongly negatively correlated to market movement.
As shown in the figure below, market uncertainty
tends to increase in times of market stress for the
VSTOXX index (equivalent of VIX for European
stocks) vs. the Eurostoxx50 index.
Negative correlation to equity returns
Fig 2. Eurostoxx daily return vs. V2X daily change
4
Source: Bloomberg
Volatility used as a hedging instrument
Section 1:
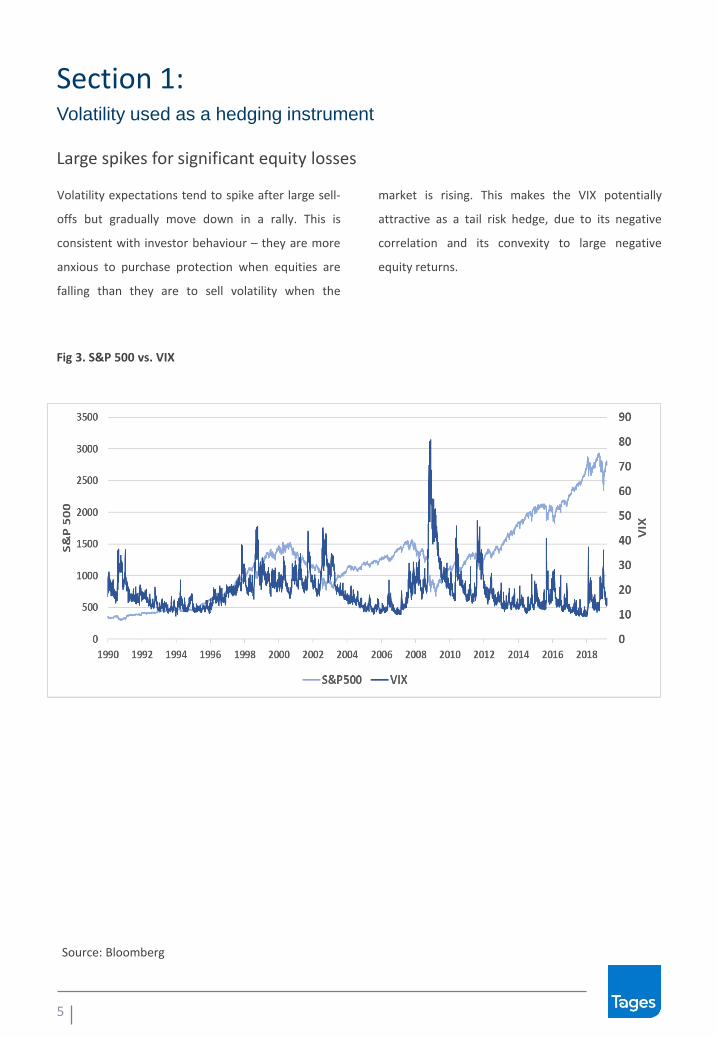
Volatility expectations tend to spike after large sell-
offs but gradually move down in a rally. This is
consistent with investor behaviour – they are more
anxious to purchase protection when equities are
falling than they are to sell volatility when the
market is rising. This makes the VIX potentially
attractive as a tail risk hedge, due to its negative
correlation and its convexity to large negative
equity returns.
Large spikes for significant equity losses
5
Fig 3. S&P 500 vs. VIX
Source: Bloomberg
Volatility used as a hedging instrument
Section 1:
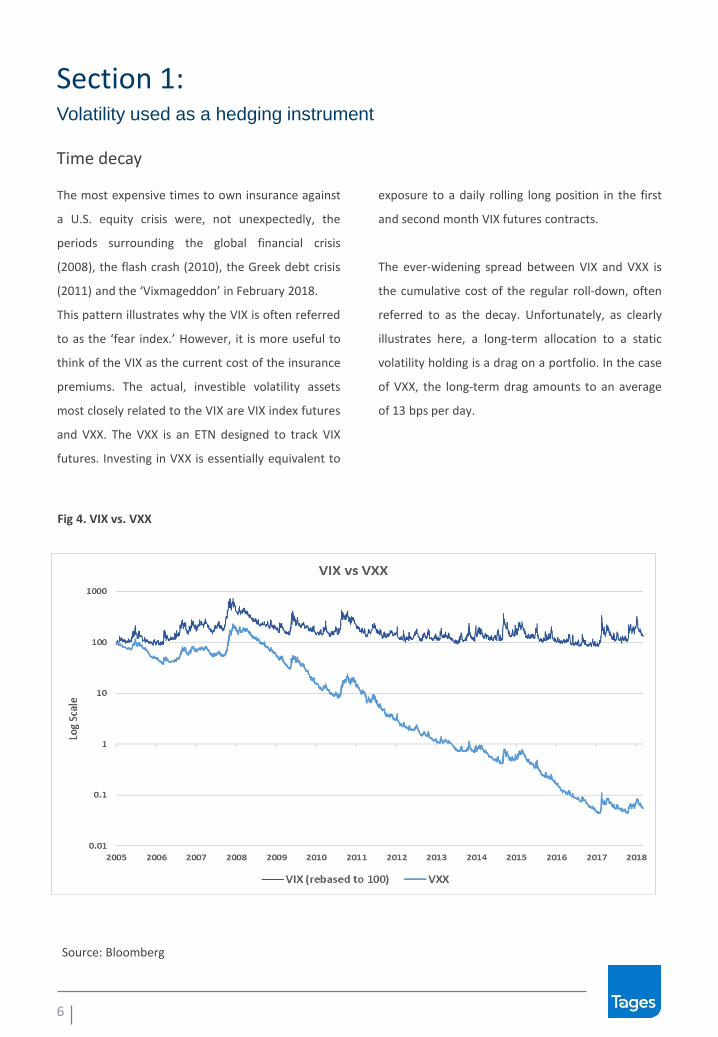
The most expensive times to own insurance against
a U.S. equity crisis were, not unexpectedly, the
periods surrounding the global financial crisis
(2008), the flash crash (2010), the Greek debt crisis
(2011) and the ‘Vixmageddon’ in February 2018.
This pattern illustrates why the VIX is often referred
to as the ‘fear index.’ However, it is more useful to
think of the VIX as the current cost of the insurance
premiums. The actual, investible volatility assets
most closely related to the VIX are VIX index futures
and VXX. The VXX is an ETN designed to track VIX
futures. Investing in VXX is essentially equivalent to
exposure to a daily rolling long position in the first
and second month VIX futures contracts.
The ever-widening spread between VIX and VXX is
the cumulative cost of the regular roll-down, often
referred to as the decay. Unfortunately, as clearly
illustrates here, a long-term allocation to a static
volatility holding is a drag on a portfolio. In the case
of VXX, the long-term drag amounts to an average
of 13 bps per day.
Time decay
6
Fig 4. VIX vs. VXX
Source: Bloomberg
Many investors use put options to hedge their
portfolios. Some investors prefer to purchase
volatility in the shape of options that they
regularly delta hedge, or by just buying VIX
futures, trying to benefit from a jump in S&P
volatility regardless of the direction.
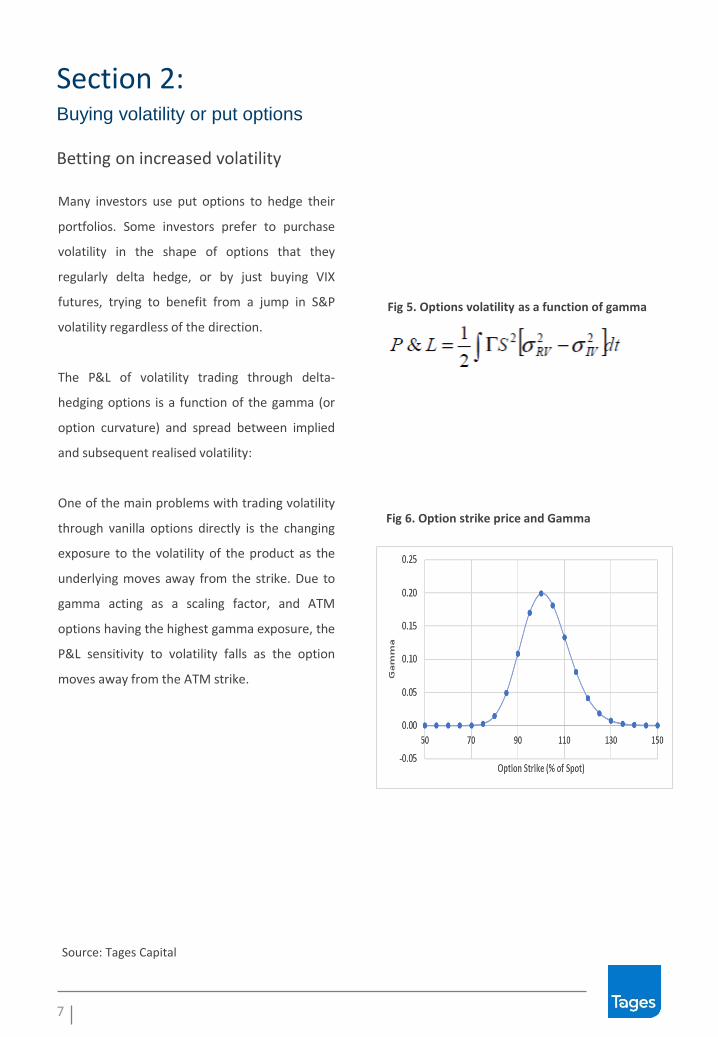
The P&L of volatility trading through delta-
hedging options is a function of the gamma (or
option curvature) and spread between implied
and subsequent realised volatility:
One of the main problems with trading volatility
through vanilla options directly is the changing
exposure to the volatility of the product as the
underlying moves away from the strike. Due to
gamma acting as a scaling factor, and ATM
options having the highest gamma exposure, the
P&L sensitivity to volatility falls as the option
moves away from the ATM strike.
Buying volatility or put options
Section 2:
Betting on increased volatility
7
Fig 5. Options volatility as a function of gamma
Fig 6. Option strike price and Gamma
Source: Tages Capital

Buying volatility or put options
Section 2:
Unfortunately, due to the difference between
implied and realised volatility, as well as the time
decay involved in owning options, the practice of
owning options ends losing money about 70% of the
time. In fact, the only time one might benefit from
owning volatility as a hedge is when volatility
increases significantly.
The below chart demonstrates the average annual
return of a long volatility strategy for different
deciles of S&P volatility increases from 1999 to
2019:
Timing volatility
8
Fig 7. Average annual return of a long volatility strategy
Even when volatility is on the rise as above, an
investor, on average, benefits only during the most
volatile decile. So not only does one need to know
when volatility is on the rise, but one must buy
volatility only when the expected rise is to be
significant. This exercise seems quite unrealistic.
Additionally, the time decay forces one to time the
entry and exit of such transaction quite accurately
as, on average, about 20 days after the first spike in
volatility, gains start diminishing quickly.
Source: Tages Capital
Smart Volatility
Section 3:
Smart Volatility strategies are essentially rule-based
trading strategies whose objectives are to capture a
specific part of the performance sought by active
volatility managers. These strategies can either be
designed to be hedging strategies or alpha
strategies, and they seek to improve performance
as it relates to the aforementioned timing
difficulties, as well as to help optimise the strategy
weightings.
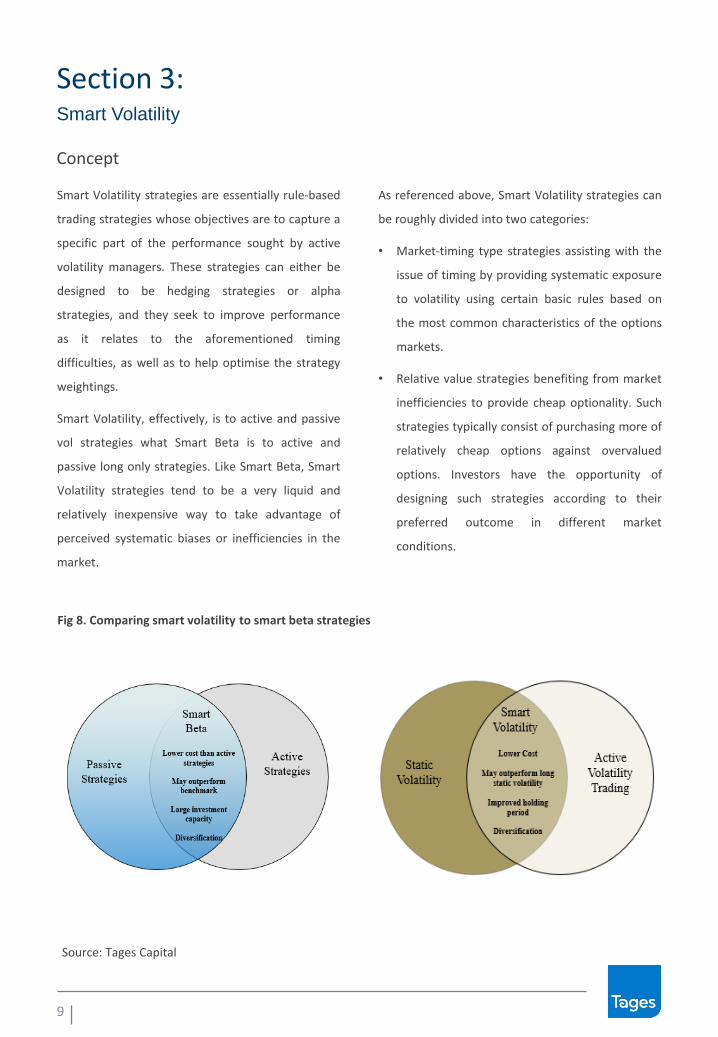
Smart Volatility, effectively, is to active and passive
vol strategies what Smart Beta is to active and
passive long only strategies. Like Smart Beta, Smart
Volatility strategies tend to be a very liquid and
relatively inexpensive way to take advantage of
perceived systematic biases or inefficiencies in the
market.
As referenced above, Smart Volatility strategies can
be roughly divided into two categories:
• Market-timing type strategies assisting with the
issue of timing by providing systematic exposure
to volatility using certain basic rules based on
the most common characteristics of the options
markets.
• Relative value strategies benefiting from market
inefficiencies to provide cheap optionality. Such
strategies typically consist of purchasing more of
relatively cheap options against overvalued
options. Investors have the opportunity of
designing such strategies according to their
preferred outcome in different market
conditions.
Concept
9
Fig 8. Comparing smart volatility to smart beta strategies
Source: Tages Capital
Smart Volatility
Section 3:
Most options markets share the below features
which can be employed in building market-timing
models to assist with the problem of timing options
transactions:
▪ The price of vol is all relative. Contrary to most
people’s initial intuition, a ‘high’ price does not
necessarily mean ‘overpriced’ and a ‘low’ price
does not necessarily indicate ‘under-priced’.
Instead, we must compare the implied volatility
(as indicated by the market price) versus its own
history, or the realised volatility of the
investment universe in question.
▪ Options exhibit a degree of momentum, or self-
correlation. Simply put, when volatility is
increasing, it has a slight tendency to continue
increasing and vice versa.
▪ Volatility is mean reverting in nature. It tends to
trend over short time horizons and reverts over
longer periods.
▪ Skew, term structure and convexity can also
have predictive characteristics. It is important to
analyse which area of the volatility surface looks
most attractive. As an example, a steeper put
skew denotes a larger demand in downside
protection.
Options markets characteristics
10
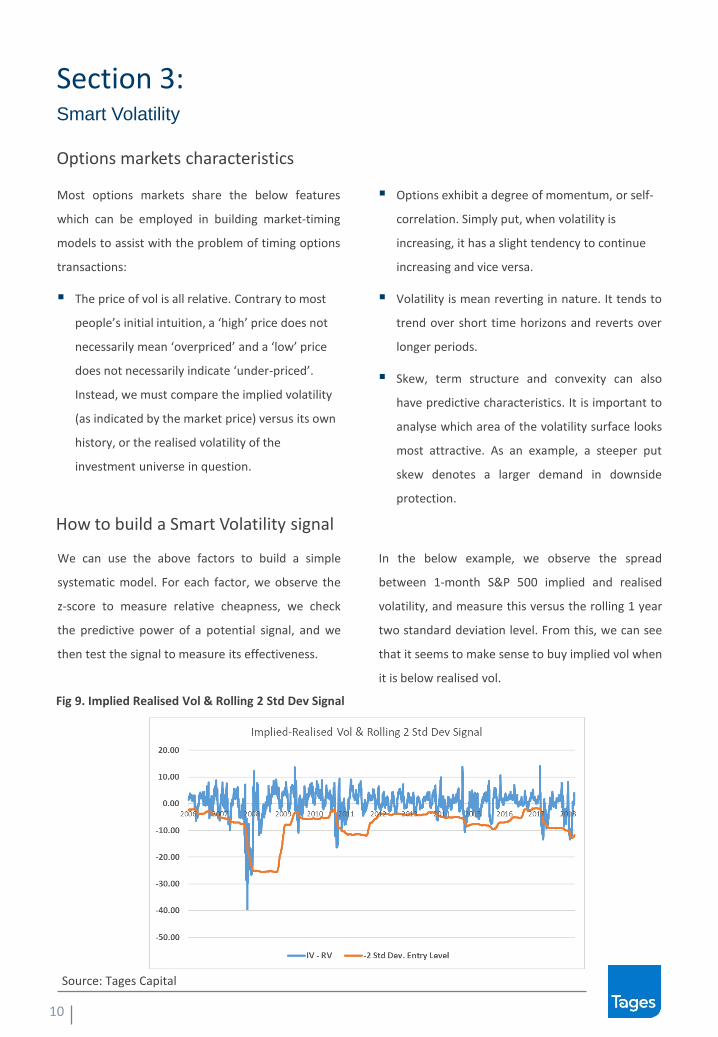
We can use the above factors to build a simple
systematic model. For each factor, we observe the
z-score to measure relative cheapness, we check
the predictive power of a potential signal, and we
then test the signal to measure its effectiveness.
In the below example, we observe the spread
between 1-month S&P 500 implied and realised
volatility, and measure this versus the rolling 1 year
two standard deviation level. From this, we can see
that it seems to make sense to buy implied vol when
it is below realised vol.
Fig 9. Implied Realised Vol & Rolling 2 Std Dev Signal
How to build a Smart Volatility signal
Source: Tages Capital
Smart Volatility
Section 3:
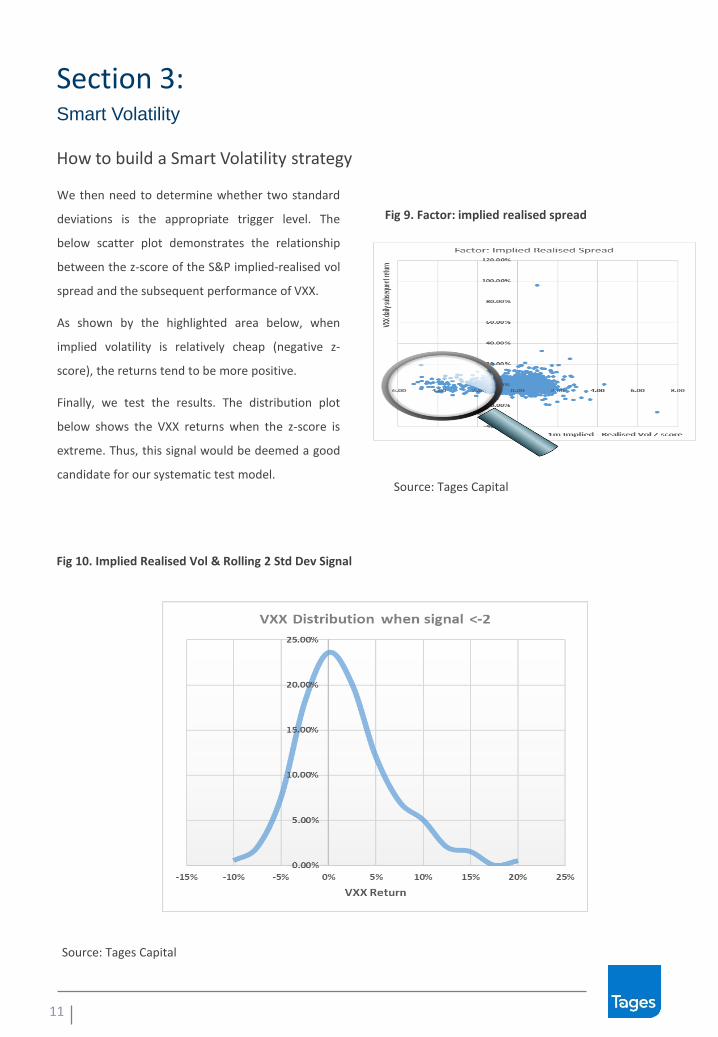
We then need to determine whether two standard
deviations is the appropriate trigger level. The
below scatter plot demonstrates the relationship
between the z-score of the S&P implied-realised vol
spread and the subsequent performance of VXX.
As shown by the highlighted area below, when
implied volatility is relatively cheap (negative z-
score), the returns tend to be more positive.
Finally, we test the results. The distribution plot
below shows the VXX returns when the z-score is
extreme. Thus, this signal would be deemed a good
candidate for our systematic test model.
How to build a Smart Volatility strategy
11
Fig 10. Implied Realised Vol & Rolling 2 Std Dev Signal
Fig 9. Factor: implied realised spread
Source: Tages Capital
Source: Tages Capital
Smart Volatility
Section 3:
We now want to show a simple example. We
apply the Smart Volatility concept to VXX using
just two signals to build a systematic model. In
our example, we will use the signal explained on
the previous page, and combine this with an
additional signal looking at skew (vol smile).
▪ The first signal is based on the cheapness of
S&P implied to realised volatility. The
indicator provides a buying signal when the
z-score hits two standard deviations.
▪ The second signal is based on the ratio of
S&P 500 At The Money volatility versus put
volatility. A VXX buy signal is produced when
downside volatility rises more than two
standard deviation relative to ATM volatility.
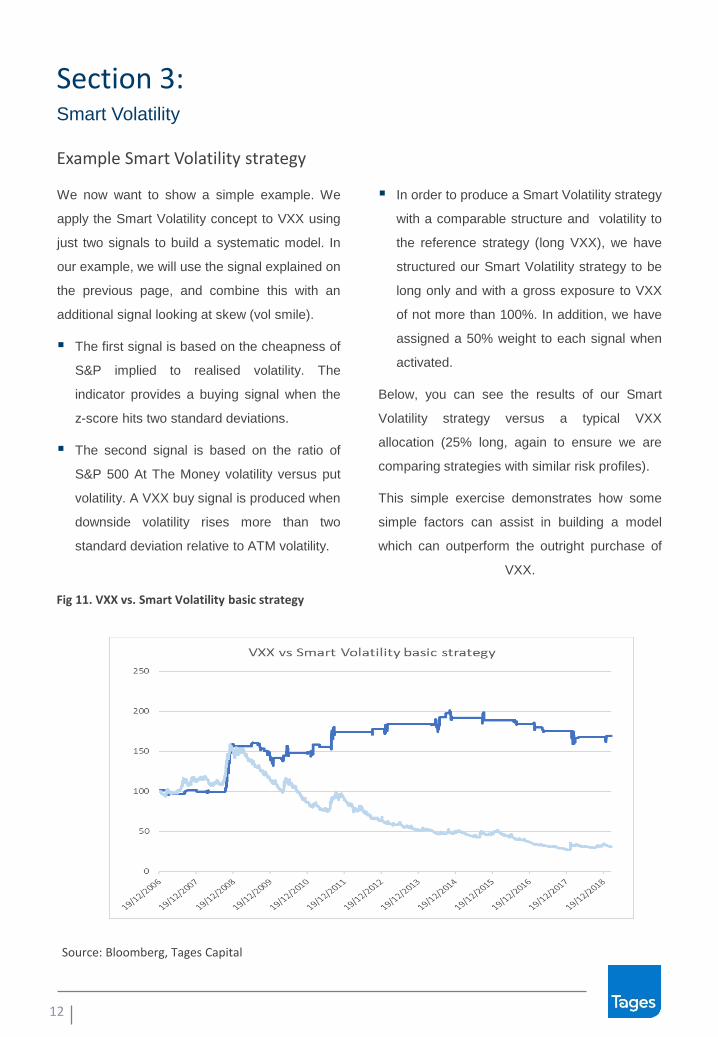
▪ In order to produce a Smart Volatility strategy
with a comparable structure and volatility to
the reference strategy (long VXX), we have
structured our Smart Volatility strategy to be
long only and with a gross exposure to VXX
of not more than 100%. In addition, we have
assigned a 50% weight to each signal when
activated.
Below, you can see the results of our Smart
Volatility strategy versus a typical VXX
allocation (25% long, again to ensure we are
comparing strategies with similar risk profiles).
This simple exercise demonstrates how some
simple factors can assist in building a model
which can outperform the outright purchase of
VXX.
Example Smart Volatility strategy
12
Fig 11. VXX vs. Smart Volatility basic strategy
Source: Bloomberg, Tages Capital
Smart Volatility
Section 3:
In addition to models structured to optimise the
timing of options strategies, there are many other
Smart Volatility strategies, which offer cheap
optionality and convexity. Here are a few examples:
▪ VIX vs S&P options
Combination long VIX and long S&P due to the
negative correlation. This strategy has produced a
positive track record with the exception of Q4 2018
when the beta of VIX futures relative to the index
itself collapsed.
▪ S&P options Vs EuroStoxx options
At times, the flow in options markets tends to
depress implied volatility in one market relative to
other markets. These anomalies can last for a few
months or years and can be a cheap source of
optionality.
▪ Skew or term-structure spreads
Flows and investor behaviour can often create
opportunities for relative value strategies across
different option tenors (three month vs one year,
for example) or across the volatility surface (ATM vs
OTM options for example). Such situations can
provide the investor with cheap protection or alpha
opportunity over prolonged periods.
▪ Dispersion trades
This strategy involves the purchase of options on a
number of single stocks against selling volatility on
the basket itself (or, as an example, buying the
options on a number of single stocks in the S&P and
selling the vol on the S&P index). With the
diversification effect, the index usually has a lower
realised volatility than a collection of single names,
the strategy acts as a long volatility strategy
especially in bear markets. This strategy could be
implemented in vega neutral, theta neutral and
other combinations, which provides the investor
with a defensive or carry profile.
Relative value strategies
13

Smart Volatility
Section 3:
The below picture includes performance of some of
the above strategies against S&P puts. It is clear that
most have demonstrated varying degrees of
positive returns during the periods of crisis. A
combination of those systematic strategies could be
a very cost effective tail-hedge solution over
medium to long term.
Relative value strategies
14
Fig 12. Relative value volatility strategies vs. S&P Puts
Source: Tages Capital

15
The concept of Smart Volatility is at the heart of our Paladin UCITS Fund. The Fund is
structured to provide a multi-asset hedge against tail type events, by combining
relatively inexpensive Smart Volatility strategies with trend, mean reversion and very
low beta carry strategies. We perform various quantitative and qualitative analysis on
each of the sub-strategies to ensure their robustness. And we diversify and update the
models we use in the portfolio on an on-going basis. This latter point should not be
under-estimated as systematic signals tend to have a limited life span. As a
consequence, we believe accessing a portfolio of such strategies is best done through
an experienced portfolio manager.
Conclusion

This document is issued by Tages Capital LLP (“Tages”) which is authorised and regulated by the UK Financial Conduct Authority. Tages isincorporated in England and Wales under registered number OC364873 with registered office 39 St James’s Street, London, SW1A 1JD. TagesCapital LLP is part of Tages Group, which also comprises Tages Capital SGR S.p.A., an Italian asset manager, registered at n. 132 of the register ofAIFMs held at the Bank of Italy.
This document is being submitted to potential investors for the purpose of review. This document does not constitute an offer to sell or thesolicitation of an offer to buy securities in any jurisdiction in which an offer, subscription or sale would be unlawful. In any event no shares shall beissued until authorisation has been obtained from the Central Bank of Ireland and any other applicable regulatory authority.
The information contained herein is preliminary, is provided for discussion purposes only, is only a summary of key information, is not completeand does not contain material information about any potential underlying investments. All opinions and estimates included herein are subject tochange without notice and Tages Capital is under no obligation to update the information contained herein. Tages Capital does not make anyrepresentations or give warranties that the information and/or material contained in this document is accurate or complete. Tages Capitalassumes no responsibility or liability for any errors or omissions with respect to the information contained herein.
The information contained herein does not take into account the particular investment objectives or financial circumstances of any specific personwho may receive it. The information contained herein is not intended to provide, and should not be relied upon for accounting, legal or taxadvice or investment recommendation. You should make an independent investigation of the investment described herein, including consultingyour tax, legal, accounting or other advisors about the matters discussed herein. Any such investment decision should be based solely on theinformation contained in the Prospectus/Supplement. In the event of any conflict between information contained herein and informationcontained in the Prospectus/Supplement, the information in such Prospectus/Supplement will control and superseded the information containedherein.
All opinions and estimates included herein are subject to change without notice and Tages Capital is under no obligation to update theinformation contained herein. Tages Capital does not make any representations or give warranties that the information and/or material containedin this document is accurate or complete. Tages Capital assumes no responsibility or liability for any errors or omissions with respect to theinformation contained herein. All information contained herein is subject to revision without notice.
This document has not been approved as a Financial Promotion. This document is intended for professional clients and eligible counterparties asdefined by the FCA.
This document is intended to be of general interest only and does not constitute legal, investment or tax advice nor is it an offer for shares orinvitation to apply for shares of any sub-funds of Tages International Funds ICAV (“the ICAV”).