The Goldman Sachs Group, Inc.
154
UNITED STATES SECURITIES AND EXCHANGE COMMISSION Washington, D.C. 20549 FORM 10-Q ≤ QUARTERLY REPORT PURSUANT TO SECTION 13 OR 15(d) OF THE SECURITIES EXCHANGE ACT OF 1934. For the quarterly period ended June 26, 2009 or n TRANSITION REPORT PURSUANT TO SECTION 13 OR 15(d) OF THE SECURITIES EXCHANGE ACT OF 1934. For the transition period from to Commission File Number: 001-14965 The Goldman Sachs Group, Inc. (Exact name of registrant as specified in its charter) Delaware 13-4019460 (State or other jurisdiction of incorporation or organization) (I.R.S. Employer Identification No.) 85 Broad Street, New York, NY 10004 (Address of principal executive offices) (Zip Code) (212) 902-1000 (Registrant’s telephone number, including area code) Indicate by check mark whether the registrant (1) has filed all reports required to be filed by Section 13 or 15(d) of the Securities Exchange Act of 1934 during the preceding 12 months (or for such shorter period that the registrant was required to file such reports), and (2) has been subject to such filing requirements for the past 90 days. ≤ Yes n No Indicate by check mark whether the registrant has submitted electronically and posted on its corporate Web site, if any, every Interactive Data File required to be submitted and posted pursuant to Rule 405 of Regulation S-T (§232.405 of this chapter) during the preceding 12 months (or for such shorter period that the registrant was required to submit and post such files). ≤ Yes n No Indicate by check mark whether the registrant is a large accelerated filer, an accelerated filer, a non-acceleratedfiler, or a smaller reporting company. See the definitions of “large accelerated filer,” “accelerated filer” and “smaller reporting company” in Rule 12b-2 of the Exchange Act. Large accelerated filer ≤ Accelerated filer n Non-accelerated filer n (Do not check if a smaller reporting company) Smaller reporting company n Indicate by check mark whether the registrant is a shell company (as defined in Rule 12b-2 of the Exchange Act). n Yes ≤ No APPLICABLE ONLY TO CORPORATE ISSUERS As of July 24, 2009, there were 511,236,761 shares of the registrant’s common stock outstanding.
-
Upload
khangminh22 -
Category
Documents
-
view
0 -
download
0
Transcript of The Goldman Sachs Group, Inc.

UNITED STATESSECURITIES AND EXCHANGE COMMISSION
Washington, D.C. 20549
FORM 10-Q≤ QUARTERLY REPORT PURSUANT TO SECTION 13 OR 15(d) OF THE
SECURITIES EXCHANGE ACT OF 1934.
For the quarterly period ended June 26, 2009
or
n TRANSITION REPORT PURSUANT TO SECTION 13 OR 15(d) OF THESECURITIES EXCHANGE ACT OF 1934.
For the transition period from to
Commission File Number: 001-14965
The Goldman Sachs Group, Inc.(Exact name of registrant as specified in its charter)
Delaware 13-4019460(State or other jurisdiction ofincorporation or organization)
(I.R.S. EmployerIdentification No.)
85 Broad Street, New York, NY 10004(Address of principal executive offices) (Zip Code)
(212) 902-1000(Registrant’s telephone number, including area code)
Indicate by check mark whether the registrant (1) has filed all reports required to be filed bySection 13 or 15(d) of the Securities Exchange Act of 1934 during the preceding 12 months (or forsuch shorter period that the registrant was required to file such reports), and (2) has been subject tosuch filing requirements for the past 90 days. ≤ Yes n No
Indicate by check mark whether the registrant has submitted electronically and posted on itscorporate Web site, if any, every Interactive Data File required to be submitted and posted pursuant toRule 405 of Regulation S-T (§232.405 of this chapter) during the preceding 12 months (or for suchshorter period that the registrant was required to submit and post such files). ≤ Yes n No
Indicate by check mark whether the registrant is a large accelerated filer, an accelerated filer, anon-accelerated filer, or a smaller reporting company. See the definitions of “large accelerated filer,”“accelerated filer” and “smaller reporting company” in Rule 12b-2 of the Exchange Act.
Large accelerated filer ≤ Accelerated filer n
Non-accelerated filer n (Do not check if a smaller reporting company) Smaller reporting company n
Indicate by check mark whether the registrant is a shell company (as defined in Rule 12b-2 of theExchange Act). n Yes ≤ No
APPLICABLE ONLY TO CORPORATE ISSUERS
As of July 24, 2009, there were 511,236,761 shares of the registrant’s common stock outstanding.

THE GOLDMAN SACHS GROUP, INC.
QUARTERLY REPORT ON FORM 10-Q FOR THE FISCAL QUARTER ENDED JUNE 26, 2009
INDEX
Form 10-Q Item Number:PageNo.
PART I: FINANCIAL INFORMATION
Item 1: Financial Statements (Unaudited)Condensed Consolidated Statements of Earnings for the three and six months
ended June 26, 2009 and May 30, 2008 . . . . . . . . . . . . . . . . . . . . . . . . . . . . . . . 2Condensed Consolidated Statements of Financial Condition as of June 26, 2009
and November 28, 2008 . . . . . . . . . . . . . . . . . . . . . . . . . . . . . . . . . . . . . . . . . . . 3Condensed Consolidated Statements of Changes in Shareholders’ Equity for the
six months ended June 26, 2009 and year ended November 28, 2008. . . . . . . . . 4Condensed Consolidated Statements of Cash Flows for the six months ended
June 26, 2009 and May 30, 2008. . . . . . . . . . . . . . . . . . . . . . . . . . . . . . . . . . . . . 5Condensed Consolidated Statements of Comprehensive Income for the three and
six months ended June 26, 2009 and May 30, 2008 . . . . . . . . . . . . . . . . . . . . . . 6Notes to Condensed Consolidated Financial Statements . . . . . . . . . . . . . . . . . . . . . 7Report of Independent Registered Public Accounting Firm . . . . . . . . . . . . . . . . . . . 76Statistical Disclosures . . . . . . . . . . . . . . . . . . . . . . . . . . . . . . . . . . . . . . . . . . . . . . . 77
Item 2: Management’s Discussion and Analysis of Financial Condition and Results ofOperations. . . . . . . . . . . . . . . . . . . . . . . . . . . . . . . . . . . . . . . . . . . . . . . . . . . . . . 81
Item 3: Quantitative and Qualitative Disclosures About Market Risk . . . . . . . . . . . . . . . . . . 139
Item 4: Controls and Procedures. . . . . . . . . . . . . . . . . . . . . . . . . . . . . . . . . . . . . . . . . . . . . 139
PART II: OTHER INFORMATION
Item 1: Legal Proceedings . . . . . . . . . . . . . . . . . . . . . . . . . . . . . . . . . . . . . . . . . . . . . . . . . 140
Item 2: Unregistered Sales of Equity Securities and Use of Proceeds . . . . . . . . . . . . . . . . . 142
Item 4: Submission of Matters to a Vote of Security Holders . . . . . . . . . . . . . . . . . . . . . . . . 143
Item 6: Exhibits . . . . . . . . . . . . . . . . . . . . . . . . . . . . . . . . . . . . . . . . . . . . . . . . . . . . . . . . . . 144
SIGNATURES. . . . . . . . . . . . . . . . . . . . . . . . . . . . . . . . . . . . . . . . . . . . . . . . . . . . . . . . . . . . . . 145
1

PART I: FINANCIAL INFORMATION
Item 1: Financial Statements (Unaudited)
THE GOLDMAN SACHS GROUP, INC. and SUBSIDIARIES
CONDENSED CONSOLIDATED STATEMENTS OF EARNINGS(UNAUDITED)
June2009
May2008
June2009
May2008
Three Months Ended Six Months Ended
(in millions, except per share amounts)
RevenuesInvestment banking . . . . . . . . . . . . . . . . . . . . . . . . . . . . . . $ 1,440 $1,685 $ 2,263 $ 2,851Trading and principal investments. . . . . . . . . . . . . . . . . . . . 9,322 5,239 15,028 10,116Asset management and securities services . . . . . . . . . . . . 957 1,221 1,946 2,562
Total non-interest revenues . . . . . . . . . . . . . . . . . . . . . . . 11,719 8,145 19,237 15,529
Interest income . . . . . . . . . . . . . . . . . . . . . . . . . . . . . . . . . 3,470 9,498 7,832 20,743Interest expense . . . . . . . . . . . . . . . . . . . . . . . . . . . . . . . . 1,428 8,221 3,883 18,515
Net interest income . . . . . . . . . . . . . . . . . . . . . . . . . . . . 2,042 1,277 3,949 2,228
Net revenues, including net interest income . . . . . . . . . . 13,761 9,422 23,186 17,757
Operating expensesCompensation and benefits . . . . . . . . . . . . . . . . . . . . . . . . 6,649 4,522 11,361 8,523
Brokerage, clearing, exchange and distribution fees . . . . . . 574 741 1,110 1,531Market development. . . . . . . . . . . . . . . . . . . . . . . . . . . . . . 82 126 150 270Communications and technology . . . . . . . . . . . . . . . . . . . . 173 192 346 379Depreciation and amortization . . . . . . . . . . . . . . . . . . . . . . 426 220 975 474Occupancy. . . . . . . . . . . . . . . . . . . . . . . . . . . . . . . . . . . . . 242 234 483 470Professional fees . . . . . . . . . . . . . . . . . . . . . . . . . . . . . . . . 145 185 280 363Other expenses . . . . . . . . . . . . . . . . . . . . . . . . . . . . . . . . . 441 370 823 772
Total non-compensation expenses . . . . . . . . . . . . . . . . . 2,083 2,068 4,167 4,259
Total operating expenses . . . . . . . . . . . . . . . . . . . . . . . . 8,732 6,590 15,528 12,782
Pre-tax earnings . . . . . . . . . . . . . . . . . . . . . . . . . . . . . . . . 5,029 2,832 7,658 4,975Provision for taxes . . . . . . . . . . . . . . . . . . . . . . . . . . . . . . . 1,594 745 2,409 1,377
Net earnings . . . . . . . . . . . . . . . . . . . . . . . . . . . . . . . . . . . 3,435 2,087 5,249 3,598Preferred stock dividends . . . . . . . . . . . . . . . . . . . . . . . . . . 717 36 872 80
Net earnings applicable to common shareholders. . . . . . . . $ 2,718 $2,051 $ 4,377 $ 3,518
Earnings per common shareBasic . . . . . . . . . . . . . . . . . . . . . . . . . . . . . . . . . . . . . . . . . $ 5.27 $ 4.80 $ 8.81 $ 8.18Diluted . . . . . . . . . . . . . . . . . . . . . . . . . . . . . . . . . . . . . . . . 4.93 4.58 8.42 7.81
Dividends declared per common share . . . . . . . . . . . . . $ 0.35 $ 0.35 $ 0.35 $ 0.70
Average common shares outstandingBasic . . . . . . . . . . . . . . . . . . . . . . . . . . . . . . . . . . . . . . . . . 514.1 427.5 495.7 430.3Diluted . . . . . . . . . . . . . . . . . . . . . . . . . . . . . . . . . . . . . . . . 551.0 447.4 520.1 450.6
The accompanying notes are an integral part of these condensed consolidated financial statements.
2
THE GOLDMAN SACHS GROUP, INC. and SUBSIDIARIES
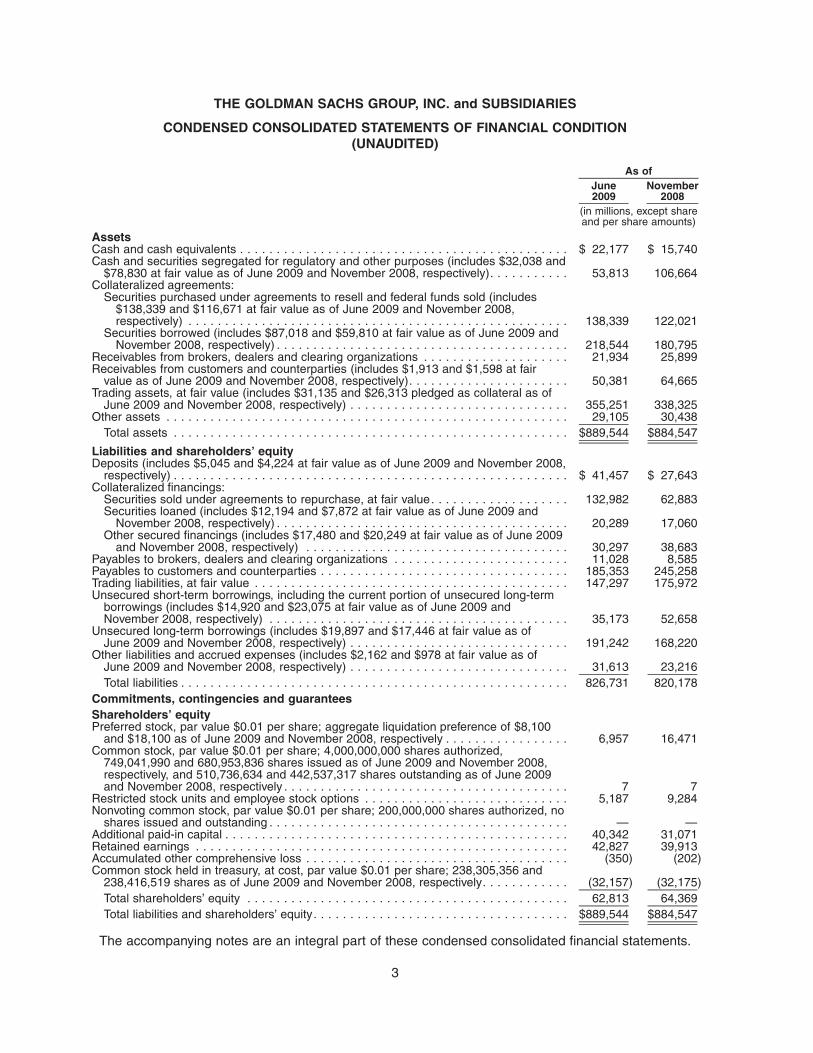
CONDENSED CONSOLIDATED STATEMENTS OF FINANCIAL CONDITION(UNAUDITED)
June2009
November2008
As of
(in millions, except shareand per share amounts)
AssetsCash and cash equivalents . . . . . . . . . . . . . . . . . . . . . . . . . . . . . . . . . . . . . . . . . . . . . $ 22,177 $ 15,740Cash and securities segregated for regulatory and other purposes (includes $32,038 and
$78,830 at fair value as of June 2009 and November 2008, respectively). . . . . . . . . . . 53,813 106,664Collateralized agreements:
Securities purchased under agreements to resell and federal funds sold (includes$138,339 and $116,671 at fair value as of June 2009 and November 2008,respectively) . . . . . . . . . . . . . . . . . . . . . . . . . . . . . . . . . . . . . . . . . . . . . . . . . . . . 138,339 122,021
Securities borrowed (includes $87,018 and $59,810 at fair value as of June 2009 andNovember 2008, respectively) . . . . . . . . . . . . . . . . . . . . . . . . . . . . . . . . . . . . . . . . 218,544 180,795
Receivables from brokers, dealers and clearing organizations . . . . . . . . . . . . . . . . . . . . 21,934 25,899Receivables from customers and counterparties (includes $1,913 and $1,598 at fair
value as of June 2009 and November 2008, respectively). . . . . . . . . . . . . . . . . . . . . . 50,381 64,665Trading assets, at fair value (includes $31,135 and $26,313 pledged as collateral as of
June 2009 and November 2008, respectively) . . . . . . . . . . . . . . . . . . . . . . . . . . . . . . 355,251 338,325Other assets . . . . . . . . . . . . . . . . . . . . . . . . . . . . . . . . . . . . . . . . . . . . . . . . . . . . . . . 29,105 30,438
Total assets . . . . . . . . . . . . . . . . . . . . . . . . . . . . . . . . . . . . . . . . . . . . . . . . . . . . . . $889,544 $884,547
Liabilities and shareholders’ equityDeposits (includes $5,045 and $4,224 at fair value as of June 2009 and November 2008,
respectively) . . . . . . . . . . . . . . . . . . . . . . . . . . . . . . . . . . . . . . . . . . . . . . . . . . . . . . $ 41,457 $ 27,643Collateralized financings:
Securities sold under agreements to repurchase, at fair value. . . . . . . . . . . . . . . . . . . 132,982 62,883Securities loaned (includes $12,194 and $7,872 at fair value as of June 2009 and
November 2008, respectively) . . . . . . . . . . . . . . . . . . . . . . . . . . . . . . . . . . . . . . . . 20,289 17,060Other secured financings (includes $17,480 and $20,249 at fair value as of June 2009
and November 2008, respectively) . . . . . . . . . . . . . . . . . . . . . . . . . . . . . . . . . . . . 30,297 38,683Payables to brokers, dealers and clearing organizations . . . . . . . . . . . . . . . . . . . . . . . . 11,028 8,585Payables to customers and counterparties . . . . . . . . . . . . . . . . . . . . . . . . . . . . . . . . . . 185,353 245,258Trading liabilities, at fair value . . . . . . . . . . . . . . . . . . . . . . . . . . . . . . . . . . . . . . . . . . . 147,297 175,972Unsecured short-term borrowings, including the current portion of unsecured long-term
borrowings (includes $14,920 and $23,075 at fair value as of June 2009 andNovember 2008, respectively) . . . . . . . . . . . . . . . . . . . . . . . . . . . . . . . . . . . . . . . . . 35,173 52,658
Unsecured long-term borrowings (includes $19,897 and $17,446 at fair value as ofJune 2009 and November 2008, respectively) . . . . . . . . . . . . . . . . . . . . . . . . . . . . . . 191,242 168,220
Other liabilities and accrued expenses (includes $2,162 and $978 at fair value as ofJune 2009 and November 2008, respectively) . . . . . . . . . . . . . . . . . . . . . . . . . . . . . . 31,613 23,216Total liabilities . . . . . . . . . . . . . . . . . . . . . . . . . . . . . . . . . . . . . . . . . . . . . . . . . . . . . 826,731 820,178
Commitments, contingencies and guaranteesShareholders’ equityPreferred stock, par value $0.01 per share; aggregate liquidation preference of $8,100
and $18,100 as of June 2009 and November 2008, respectively . . . . . . . . . . . . . . . . . 6,957 16,471Common stock, par value $0.01 per share; 4,000,000,000 shares authorized,
749,041,990 and 680,953,836 shares issued as of June 2009 and November 2008,respectively, and 510,736,634 and 442,537,317 shares outstanding as of June 2009and November 2008, respectively . . . . . . . . . . . . . . . . . . . . . . . . . . . . . . . . . . . . . . . 7 7
Restricted stock units and employee stock options . . . . . . . . . . . . . . . . . . . . . . . . . . . . 5,187 9,284Nonvoting common stock, par value $0.01 per share; 200,000,000 shares authorized, no
shares issued and outstanding . . . . . . . . . . . . . . . . . . . . . . . . . . . . . . . . . . . . . . . . . — —Additional paid-in capital . . . . . . . . . . . . . . . . . . . . . . . . . . . . . . . . . . . . . . . . . . . . . . . 40,342 31,071Retained earnings . . . . . . . . . . . . . . . . . . . . . . . . . . . . . . . . . . . . . . . . . . . . . . . . . . . 42,827 39,913Accumulated other comprehensive loss . . . . . . . . . . . . . . . . . . . . . . . . . . . . . . . . . . . . (350) (202)Common stock held in treasury, at cost, par value $0.01 per share; 238,305,356 and
238,416,519 shares as of June 2009 and November 2008, respectively. . . . . . . . . . . . (32,157) (32,175)Total shareholders’ equity . . . . . . . . . . . . . . . . . . . . . . . . . . . . . . . . . . . . . . . . . . . . 62,813 64,369Total liabilities and shareholders’ equity. . . . . . . . . . . . . . . . . . . . . . . . . . . . . . . . . . . $889,544 $884,547
The accompanying notes are an integral part of these condensed consolidated financial statements.
3

THE GOLDMAN SACHS GROUP, INC. and SUBSIDIARIES
CONDENSED CONSOLIDATED STATEMENTS OF CHANGES IN SHAREHOLDERS’ EQUITY(UNAUDITED)
June 2009 (1) November 2008
Six MonthsEnded Year Ended
(in millions)Preferred stock
Balance, beginning of period . . . . . . . . . . . . . . . . . . . . . . . . . . . . . . . . . . . . . . . $ 16,483 $ 3,100Issued . . . . . . . . . . . . . . . . . . . . . . . . . . . . . . . . . . . . . . . . . . . . . . . . . . . . . . — 13,367Accretion . . . . . . . . . . . . . . . . . . . . . . . . . . . . . . . . . . . . . . . . . . . . . . . . . . . . 48 4Repurchased . . . . . . . . . . . . . . . . . . . . . . . . . . . . . . . . . . . . . . . . . . . . . . . . . . (9,574) —Balance, end of period . . . . . . . . . . . . . . . . . . . . . . . . . . . . . . . . . . . . . . . . . . . 6,957 16,471
Common stockBalance, beginning of period . . . . . . . . . . . . . . . . . . . . . . . . . . . . . . . . . . . . . . . 7 6Issued . . . . . . . . . . . . . . . . . . . . . . . . . . . . . . . . . . . . . . . . . . . . . . . . . . . . . . — 1Balance, end of period . . . . . . . . . . . . . . . . . . . . . . . . . . . . . . . . . . . . . . . . . . . 7 7
Restricted stock units and employee stock optionsBalance, beginning of period . . . . . . . . . . . . . . . . . . . . . . . . . . . . . . . . . . . . . . . 9,463 9,302Issuance and amortization of restricted stock units and employee stock options . . . . 959 2,254Delivery of common stock underlying restricted stock units . . . . . . . . . . . . . . . . . . (5,174) (1,995)Forfeiture of restricted stock units and employee stock options . . . . . . . . . . . . . . . (60) (274)Exercise of employee stock options . . . . . . . . . . . . . . . . . . . . . . . . . . . . . . . . . . (1) (3)Balance, end of period . . . . . . . . . . . . . . . . . . . . . . . . . . . . . . . . . . . . . . . . . . . 5,187 9,284
Additional paid-in capitalBalance, beginning of period . . . . . . . . . . . . . . . . . . . . . . . . . . . . . . . . . . . . . . . 31,070 22,027Issuance of common stock . . . . . . . . . . . . . . . . . . . . . . . . . . . . . . . . . . . . . . . . 5,750 5,750Issuance of common stock warrants . . . . . . . . . . . . . . . . . . . . . . . . . . . . . . . . . . — 1,633Delivery of common stock underlying restricted stock units and proceeds from the
exercise of employee stock options . . . . . . . . . . . . . . . . . . . . . . . . . . . . . . . . . 5,303 2,331Cancellation of restricted stock units in satisfaction of withholding tax
requirements . . . . . . . . . . . . . . . . . . . . . . . . . . . . . . . . . . . . . . . . . . . . . . . . (849) (1,314)Preferred and common stock issuance costs . . . . . . . . . . . . . . . . . . . . . . . . . . . . — (1)Excess net tax benefit/(provision) related to share-based compensation . . . . . . . . . (930) 645Cash settlement of share-based compensation . . . . . . . . . . . . . . . . . . . . . . . . . . (2) —Balance, end of period . . . . . . . . . . . . . . . . . . . . . . . . . . . . . . . . . . . . . . . . . . . 40,342 31,071
Retained earningsBalance, beginning of period . . . . . . . . . . . . . . . . . . . . . . . . . . . . . . . . . . . . . . . 38,579 38,642Cumulative effect of adjustment from adoption of FIN 48. . . . . . . . . . . . . . . . . . . . — (201)Balance, beginning of period, after cumulative effect of adjustments . . . . . . . . . . . . 38,579 38,441Net earnings . . . . . . . . . . . . . . . . . . . . . . . . . . . . . . . . . . . . . . . . . . . . . . . . . . 5,249 2,322Dividends and dividend equivalents declared on common stock and restricted
stock units . . . . . . . . . . . . . . . . . . . . . . . . . . . . . . . . . . . . . . . . . . . . . . . . . . (197) (642)Dividends declared on preferred stock . . . . . . . . . . . . . . . . . . . . . . . . . . . . . . . . (756) (204)Preferred stock accretion . . . . . . . . . . . . . . . . . . . . . . . . . . . . . . . . . . . . . . . . . (48) (4)Balance, end of period . . . . . . . . . . . . . . . . . . . . . . . . . . . . . . . . . . . . . . . . . . . 42,827 39,913
Accumulated other comprehensive income/(loss)Balance, beginning of period . . . . . . . . . . . . . . . . . . . . . . . . . . . . . . . . . . . . . . . (372) (118)Currency translation adjustment, net of tax . . . . . . . . . . . . . . . . . . . . . . . . . . . . . (29) (98)Pension and postretirement liability adjustment, net of tax . . . . . . . . . . . . . . . . . . . 17 69Net unrealized gains/(losses) on available-for-sale securities, net of tax . . . . . . . . . 34 (55)Balance, end of period . . . . . . . . . . . . . . . . . . . . . . . . . . . . . . . . . . . . . . . . . . . (350) (202)
Common stock held in treasury, at costBalance, beginning of period . . . . . . . . . . . . . . . . . . . . . . . . . . . . . . . . . . . . . . . (32,176) (30,159)Repurchased . . . . . . . . . . . . . . . . . . . . . . . . . . . . . . . . . . . . . . . . . . . . . . . . . . (2) (2) (2,037)Reissued . . . . . . . . . . . . . . . . . . . . . . . . . . . . . . . . . . . . . . . . . . . . . . . . . . . . 21 21Balance, end of period . . . . . . . . . . . . . . . . . . . . . . . . . . . . . . . . . . . . . . . . . . . (32,157) (32,175)
Total shareholders’ equity . . . . . . . . . . . . . . . . . . . . . . . . . . . . . . . . . . . . . . . . . $ 62,813 $ 64,369
(1) In connection with becoming a bank holding company, the firm was required to change its fiscal year-end from November toDecember. The beginning of period for the six months ended June 2009 is December 26, 2008.
(2) Relates to repurchases of common stock by a broker-dealer subsidiary to facilitate customer transactions in the ordinarycourse of business and shares withheld to satisfy withholding tax requirements.
The accompanying notes are an integral part of these condensed consolidated financial statements.
4

THE GOLDMAN SACHS GROUP, INC. and SUBSIDIARIES
CONDENSED CONSOLIDATED STATEMENTS OF CASH FLOWS(UNAUDITED)
June2009
May2008
Six Months Ended
(in millions)
Cash flows from operating activitiesNet earnings . . . . . . . . . . . . . . . . . . . . . . . . . . . . . . . . . . . . . . . . . . . . . . . . . . . . . . $ 5,249 $ 3,598Non-cash items included in net earnings
Depreciation and amortization . . . . . . . . . . . . . . . . . . . . . . . . . . . . . . . . . . . . . . . . 1,176 654Share-based compensation. . . . . . . . . . . . . . . . . . . . . . . . . . . . . . . . . . . . . . . . . . 907 894
Changes in operating assets and liabilitiesCash and securities segregated for regulatory and other purposes. . . . . . . . . . . . . . 58,895 35,265Net receivables from brokers, dealers and clearing organizations . . . . . . . . . . . . . . . 2,715 (1,485)Net payables to customers and counterparties . . . . . . . . . . . . . . . . . . . . . . . . . . . . (37,786) 54,916Securities borrowed, net of securities loaned . . . . . . . . . . . . . . . . . . . . . . . . . . . . . (16,490) (15,196)Securities sold under agreements to repurchase, net of securities purchased under
agreements to resell and federal funds sold . . . . . . . . . . . . . . . . . . . . . . . . . . . . (136,246) (89,500)Trading assets, at fair value . . . . . . . . . . . . . . . . . . . . . . . . . . . . . . . . . . . . . . . . . 172,389 28,881Trading liabilities, at fair value . . . . . . . . . . . . . . . . . . . . . . . . . . . . . . . . . . . . . . . . (38,731) (32,154)Other, net . . . . . . . . . . . . . . . . . . . . . . . . . . . . . . . . . . . . . . . . . . . . . . . . . . . . . . 3,942 35
Net cash provided by/(used for) operating activities . . . . . . . . . . . . . . . . . . . . . . . 16,020 (14,092)Cash flows from investing activities
Purchase of property, leasehold improvements and equipment . . . . . . . . . . . . . . . . . . (653) (1,033)Proceeds from sales of property, leasehold improvements and equipment . . . . . . . . . . 50 55Business acquisitions, net of cash acquired . . . . . . . . . . . . . . . . . . . . . . . . . . . . . . . . (208) (2,199)Proceeds from sales of investments . . . . . . . . . . . . . . . . . . . . . . . . . . . . . . . . . . . . . 140 80Purchase of available-for-sale securities . . . . . . . . . . . . . . . . . . . . . . . . . . . . . . . . . . (1,904) (2,556)Proceeds from sales of available-for-sale securities . . . . . . . . . . . . . . . . . . . . . . . . . . 1,803 2,090
Net cash used for investing activities . . . . . . . . . . . . . . . . . . . . . . . . . . . . . . . . . (772) (3,563)Cash flows from financing activities
Unsecured short-term borrowings, net. . . . . . . . . . . . . . . . . . . . . . . . . . . . . . . . . . . . (10,965) (7,286)Other secured financings (short-term), net. . . . . . . . . . . . . . . . . . . . . . . . . . . . . . . . . (6,531) (8,341)Proceeds from issuance of other secured financings (long-term) . . . . . . . . . . . . . . . . . 3,400 5,014Repayment of other secured financings (long-term), including the current portion . . . . . (2,850) (3,648)Proceeds from issuance of unsecured long-term borrowings . . . . . . . . . . . . . . . . . . . . 20,875 31,790Repayment of unsecured long-term borrowings, including the current portion . . . . . . . . (16,805) (11,751)Preferred stock repurchased . . . . . . . . . . . . . . . . . . . . . . . . . . . . . . . . . . . . . . . . . . (9,574) —Derivative contracts with a financing element, net . . . . . . . . . . . . . . . . . . . . . . . . . . . 1,815 155Deposits, net . . . . . . . . . . . . . . . . . . . . . . . . . . . . . . . . . . . . . . . . . . . . . . . . . . . . . 9,327 14,148Common stock repurchased. . . . . . . . . . . . . . . . . . . . . . . . . . . . . . . . . . . . . . . . . . . (2) (1,761)Dividends and dividend equivalents paid on common stock, preferred stock and
restricted stock units . . . . . . . . . . . . . . . . . . . . . . . . . . . . . . . . . . . . . . . . . . . . . . (1,495) (393)Proceeds from issuance of common stock, including stock option exercises . . . . . . . . . 5,893 170Excess tax benefit related to share-based compensation . . . . . . . . . . . . . . . . . . . . . . 38 582Cash settlement of share-based compensation . . . . . . . . . . . . . . . . . . . . . . . . . . . . . (2) —
Net cash provided by/(used for) financing activities . . . . . . . . . . . . . . . . . . . . . . . (6,876) 18,679
Net increase in cash and cash equivalents . . . . . . . . . . . . . . . . . . . . . . . . . . . . . . . 8,372 1,024Cash and cash equivalents, beginning of period . . . . . . . . . . . . . . . . . . . . . . . . . . . . . . 13,805 10,282Cash and cash equivalents, end of period . . . . . . . . . . . . . . . . . . . . . . . . . . . . . . . . . . $ 22,177 $ 11,306
SUPPLEMENTAL DISCLOSURES:Cash payments for interest, net of capitalized interest, were $4.58 billion and $18.68 billion during the six months endedJune 2009 and May 2008, respectively.Cash payments for income taxes, net of refunds, were $1.81 billion and $1.39 billion during the six months ended June 2009and May 2008, respectively.Non-cash activities:The firm assumed $16 million and $610 million of debt in connection with business acquisitions during the six months endedJune 2009 and May 2008, respectively.
The accompanying notes are an integral part of these condensed consolidated financial statements.
5
THE GOLDMAN SACHS GROUP, INC. and SUBSIDIARIES
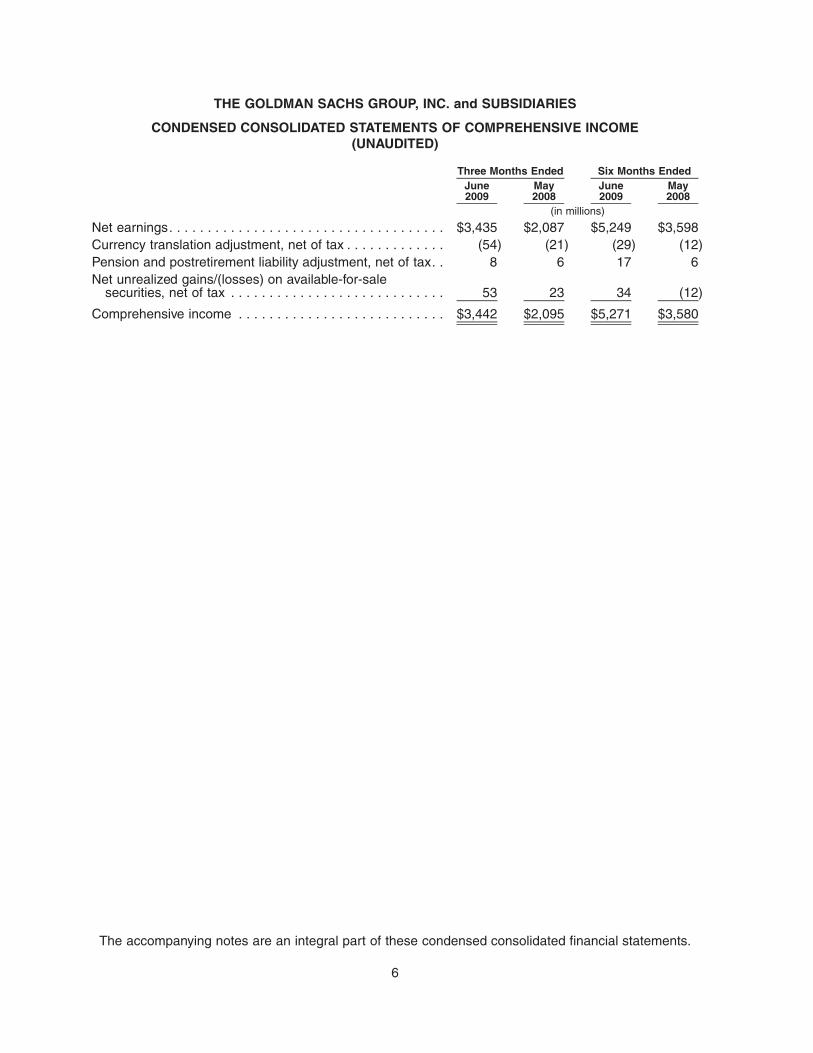
CONDENSED CONSOLIDATED STATEMENTS OF COMPREHENSIVE INCOME(UNAUDITED)
June2009
May2008
June2009
May2008
Three Months Ended Six Months Ended
(in millions)
Net earnings. . . . . . . . . . . . . . . . . . . . . . . . . . . . . . . . . . . . $3,435 $2,087 $5,249 $3,598Currency translation adjustment, net of tax . . . . . . . . . . . . . (54) (21) (29) (12)Pension and postretirement liability adjustment, net of tax. . 8 6 17 6Net unrealized gains/(losses) on available-for-sale
securities, net of tax . . . . . . . . . . . . . . . . . . . . . . . . . . . . 53 23 34 (12)
Comprehensive income . . . . . . . . . . . . . . . . . . . . . . . . . . . $3,442 $2,095 $5,271 $3,580
The accompanying notes are an integral part of these condensed consolidated financial statements.
6

THE GOLDMAN SACHS GROUP, INC. and SUBSIDIARIES
NOTES TO CONDENSED CONSOLIDATED FINANCIAL STATEMENTS(UNAUDITED)
Note 1. Description of Business
The Goldman Sachs Group, Inc. (Group Inc.), a Delaware corporation, together with itsconsolidated subsidiaries (collectively, the firm), is a leading global financial services firm providinginvestment banking, securities and investment management services to a substantial and diversifiedclient base that includes corporations, financial institutions, governments and high-net-worthindividuals. Founded in 1869, the firm is headquartered in New York and maintains offices in London,Frankfurt, Tokyo, Hong Kong and other major financial centers around the world.
The firm’s activities are divided into three segments:
• Investment Banking. The firm provides a broad range of investment banking services to adiverse group of corporations, financial institutions, investment funds, governments andindividuals.
• Trading and Principal Investments. The firm facilitates client transactions with a diversegroup of corporations, financial institutions, investment funds, governments and individuals andtakes proprietary positions through market making in, trading of and investing in fixed incomeand equity products, currencies, commodities and derivatives on these products. In addition,the firm engages in market-making and specialist activities on equities and options exchanges,and the firm clears client transactions on major stock, options and futures exchangesworldwide. In connection with the firm’s merchant banking and other investing activities, thefirm makes principal investments directly and through funds that the firm raises and manages.
• Asset Management and Securities Services. The firm provides investment advisory andfinancial planning services and offers investment products (primarily through separatelymanaged accounts and commingled vehicles, such as mutual funds and private investmentfunds) across all major asset classes to a diverse group of institutions and individualsworldwide and provides prime brokerage services, financing services and securities lendingservices to institutional clients, including hedge funds, mutual funds, pension funds andfoundations, and to high-net-worth individuals worldwide.
Note 2. Significant Accounting Policies
Basis of Presentation
These condensed consolidated financial statements include the accounts of Group Inc. and allother entities in which the firm has a controlling financial interest. All material intercompanytransactions and balances have been eliminated.
The firm determines whether it has a controlling financial interest in an entity by first evaluatingwhether the entity is a voting interest entity, a variable interest entity (VIE) or a qualifyingspecial-purpose entity (QSPE) under generally accepted accounting principles.
• Voting Interest Entities. Voting interest entities are entities in which (i) the total equityinvestment at risk is sufficient to enable the entity to finance its activities independently and(ii) the equity holders have the obligation to absorb losses, the right to receive residual returnsand the right to make decisions about the entity’s activities. Voting interest entities areconsolidated in accordance with Accounting Research Bulletin (ARB) No. 51, “ConsolidatedFinancial Statements,” as amended. The usual condition for a controlling financial interest in anentity is ownership of a majority voting interest. Accordingly, the firm consolidates votinginterest entities in which it has a majority voting interest.
7

• Variable Interest Entities. VIEs are entities that lack one or more of the characteristics of avoting interest entity. A controlling financial interest in a VIE is present when an enterprise hasa variable interest, or a combination of variable interests, that will absorb a majority of theVIE’s expected losses, receive a majority of the VIE’s expected residual returns, or both. Theenterprise with a controlling financial interest, known as the primary beneficiary, consolidatesthe VIE. In accordance with Financial Accounting Standards Board (FASB) Interpretation(FIN) 46-R, “Consolidation of Variable Interest Entities,” the firm determines whether it is theprimary beneficiary of a VIE by first performing a qualitative analysis of the VIE’s expectedlosses and expected residual returns. This analysis includes a review of, among other factors,the VIE’s capital structure, contractual terms, which interests create or absorb variability,related party relationships and the design of the VIE. Where qualitative analysis is notconclusive, the firm performs a quantitative analysis. For purposes of allocating a VIE’sexpected losses and expected residual returns to its variable interest holders, the firm utilizesthe “top down” method. Under this method, the firm calculates its share of the VIE’s expectedlosses and expected residual returns using the specific cash flows that would be allocated to it,based on contractual arrangements and/or the firm’s position in the capital structure of theVIE, under various probability-weighted scenarios. The firm reassesses its initial evaluation ofan entity as a VIE and its initial determination of whether the firm is the primary beneficiary ofa VIE upon the occurrence of certain reconsideration events as defined in FIN 46-R. See‘‘— Recent Accounting Developments” below for information regarding amendments toFIN 46-R.
• QSPEs. QSPEs are passive entities that are commonly used in mortgage and othersecuritization transactions. Statement of Financial Accounting Standards (SFAS) No. 140,“Accounting for Transfers and Servicing of Financial Assets and Extinguishments of Liabilities,”sets forth the criteria an entity must satisfy to be a QSPE. These criteria include the types ofassets a QSPE may hold, limits on asset sales, the use of derivatives and financialguarantees, and the level of discretion a servicer may exercise in attempting to collectreceivables. These criteria may require management to make judgments about complexmatters, such as whether a derivative is considered passive and the level of discretion aservicer may exercise, including, for example, determining when default is reasonablyforeseeable. In accordance with SFAS No. 140 and FIN 46-R, the firm does not consolidateQSPEs. See ‘‘— Recent Accounting Developments” below for information regardingamendments to SFAS No. 140.
• Equity-Method Investments. When the firm does not have a controlling financial interest inan entity but exerts significant influence over the entity’s operating and financial policies(generally defined as owning a voting interest of 20% to 50%) and has an investment incommon stock or in-substance common stock, the firm accounts for its investment either inaccordance with Accounting Principles Board Opinion (APB) No. 18, “The Equity Method ofAccounting for Investments in Common Stock” or at fair value in accordance withSFAS No. 159, “The Fair Value Option for Financial Assets and Financial Liabilities.” Ingeneral, the firm accounts for investments acquired subsequent to the adoption ofSFAS No. 159 at fair value. In certain cases, the firm may apply the equity method ofaccounting to new investments that are strategic in nature or closely related to the firm’sprincipal business activities, where the firm has a significant degree of involvement in the cashflows or operations of the investee, or where cost-benefit considerations are less significant.See ‘‘— Revenue Recognition — Other Financial Assets and Financial Liabilities at Fair Value”below for a discussion of the firm’s application of SFAS No. 159.
8
THE GOLDMAN SACHS GROUP, INC. and SUBSIDIARIES
NOTES TO CONDENSED CONSOLIDATED FINANCIAL STATEMENTS (Continued)(UNAUDITED)
• Other. If the firm does not consolidate an entity or apply the equity method of accounting, thefirm accounts for its investment at fair value. The firm also has formed numerousnonconsolidated investment funds with third-party investors that are typically organized aslimited partnerships. The firm acts as general partner for these funds and generally does nothold a majority of the economic interests in these funds. The firm has generally provided thethird-party investors with rights to terminate the funds or to remove the firm as the generalpartner. As a result, the firm does not consolidate these funds. These fund investments areincluded in “Trading assets, at fair value” in the condensed consolidated statements of financialcondition.
These condensed consolidated financial statements are unaudited and should be read inconjunction with the audited consolidated financial statements included in the firm’s Annual Report onForm 10-K for the fiscal year ended November 28, 2008. The condensed consolidated financialinformation as of November 28, 2008 has been derived from audited consolidated financial statementsnot included herein.
These unaudited condensed consolidated financial statements reflect all adjustments that are, inthe opinion of management, necessary for a fair statement of the results for the interim periodspresented. These adjustments are of a normal, recurring nature. Interim period operating results maynot be indicative of the operating results for a full year.
In connection with becoming a bank holding company, the firm was required to change its fiscalyear-end from November to December. This change in the firm’s fiscal year-end resulted in aone-month transition period that began on November 29, 2008 and ended on December 26, 2008.The firm’s financial information for this fiscal transition period is included in the firm’s Quarterly Reporton Form 10-Q for the quarter ended March 27, 2009. On April 13, 2009, the Board of Directors ofGroup Inc. (the Board) approved a change in the firm’s fiscal year-end from the last Friday ofDecember to December 31, beginning with fiscal 2009. Fiscal 2009 began on December 27, 2008 andwill end on December 31, 2009. The firm’s third fiscal quarter in 2009 will end on the last Friday ofSeptember. Beginning in the fourth quarter of 2009, the firm’s fiscal year will end on December 31.
In the condensed consolidated statements of earnings, cash flows and comprehensive income,the firm compares the three and six month periods, as applicable, ended June 26, 2009 with thepreviously reported three and six month periods ended May 30, 2008. Financial information for thethree and six months ended June 27, 2008 has not been included in this Form 10-Q for the followingreasons: (i) the three and six months ended May 30, 2008 provide a meaningful comparison for thethree and six months ended June 26, 2009; (ii) there are no significant factors, seasonal or other, thatwould impact the comparability of information if the results for the three and six months endedJune 27, 2008 were presented in lieu of results for the three and six months ended May 30, 2008;and (iii) it was not practicable or cost justified to prepare this information.
All references to June 2009 and May 2008, unless specifically stated otherwise, refer to thefirm’s three-month fiscal periods ended, or the dates, as the context requires, June 26, 2009 andMay 30, 2008, respectively. All references to November 2008, unless specifically stated otherwise,refer to the firm’s fiscal year ended, or the date, as the context requires, November 28, 2008. Allreferences to 2009, unless specifically stated otherwise, refer to the firm’s fiscal year ending, or thedate, as the context requires, December 31, 2009. Certain reclassifications have been made topreviously reported amounts to conform to the current presentation.
9
THE GOLDMAN SACHS GROUP, INC. and SUBSIDIARIES
NOTES TO CONDENSED CONSOLIDATED FINANCIAL STATEMENTS (Continued)(UNAUDITED)

Use of Estimates
These condensed consolidated financial statements have been prepared in accordance withgenerally accepted accounting principles that require management to make certain estimates andassumptions. The most important of these estimates and assumptions relate to fair valuemeasurements, the accounting for goodwill and identifiable intangible assets, discretionarycompensation accruals and the provision for potential losses that may arise from litigation andregulatory proceedings and tax audits. Although these and other estimates and assumptions arebased on the best available information, actual results could be materially different from theseestimates.
Revenue Recognition
Investment Banking. Underwriting revenues and fees from mergers and acquisitions andother financial advisory assignments are recognized in the condensed consolidated statements ofearnings when the services related to the underlying transaction are completed under the terms of theengagement. Expenses associated with such transactions are deferred until the related revenue isrecognized or the engagement is otherwise concluded. Underwriting revenues are presented net ofrelated expenses. Expenses associated with financial advisory transactions are recorded asnon-compensation expenses, net of client reimbursements.
Trading Assets and Trading Liabilities. Substantially all trading assets and trading liabilitiesare reflected in the condensed consolidated statements of financial condition at fair value, pursuantprincipally to:
• SFAS No. 115, “Accounting for Certain Investments in Debt and Equity Securities;”
• specialized industry accounting for broker-dealers and investment companies;
• SFAS No. 133, “Accounting for Derivative Instruments and Hedging Activities;” or
• the fair value option under either SFAS No. 155, “Accounting for Certain Hybrid FinancialInstruments — an amendment of FASB Statements No. 133 and 140,” or SFAS No. 159, “TheFair Value Option for Financial Assets and Financial Liabilities,” (i.e., the fair value option).
Related unrealized gains or losses are generally recognized in “Trading and principalinvestments” in the condensed consolidated statements of earnings.
Other Financial Assets and Financial Liabilities at Fair Value. In addition to “Tradingassets, at fair value” and “Trading liabilities, at fair value,” the firm has elected to account for certain ofits other financial assets and financial liabilities at fair value under the fair value option. The primaryreasons for electing the fair value option are to reflect economic events in earnings on a timely basis,to mitigate volatility in earnings from using different measurement attributes and to addresssimplification and cost-benefit considerations.
Such financial assets and financial liabilities accounted for at fair value include:
• certain unsecured short-term borrowings, consisting of all promissory notes and commercialpaper and certain hybrid financial instruments;
• certain other secured financings, primarily transfers accounted for as financings rather thansales under SFAS No. 140, debt raised through the firm’s William Street program and certainother nonrecourse financings;
10
THE GOLDMAN SACHS GROUP, INC. and SUBSIDIARIES
NOTES TO CONDENSED CONSOLIDATED FINANCIAL STATEMENTS (Continued)(UNAUDITED)
• certain unsecured long-term borrowings, including prepaid physical commodity transactionsand certain hybrid financial instruments;
• resale and repurchase agreements;
• securities borrowed and loaned within Trading and Principal Investments, consisting of thefirm’s matched book and certain firm financing activities;
• certain deposits issued by Goldman Sachs Bank USA (GS Bank USA), as well as securitiesheld by GS Bank USA;
• certain receivables from customers and counterparties, including certain margin loans,transfers accounted for as secured loans rather than purchases under SFAS No. 140 andprepaid variable share forwards;
• certain insurance and reinsurance contracts and certain guarantees; and
• in general, investments acquired after the adoption of SFAS No. 159 where the firm hassignificant influence over the investee and would otherwise apply the equity method ofaccounting.
Fair Value Measurements. The fair value of a financial instrument is the amount that would bereceived to sell an asset or paid to transfer a liability in an orderly transaction between marketparticipants at the measurement date (i.e., the exit price). Financial assets are marked to bid pricesand financial liabilities are marked to offer prices. Fair value measurements do not include transactioncosts.
SFAS No. 157, “Fair Value Measurements,” establishes a fair value hierarchy that prioritizes theinputs to valuation techniques used to measure fair value. The hierarchy gives the highest priority tounadjusted quoted prices in active markets for identical assets or liabilities (level 1 measurements)and the lowest priority to unobservable inputs (level 3 measurements). The three levels of the fairvalue hierarchy under SFAS No. 157 are described below:
Basis of Fair Value Measurement
Level 1 Unadjusted quoted prices in active markets that are accessible at the measurementdate for identical, unrestricted assets or liabilities;
Level 2 Quoted prices in markets that are not considered to be active or financial instrumentsfor which all significant inputs are observable, either directly or indirectly;
Level 3 Prices or valuations that require inputs that are both significant to the fair valuemeasurement and unobservable.
A financial instrument’s level within the fair value hierarchy is based on the lowest level of anyinput that is significant to the fair value measurement.
The firm defines active markets for equity instruments based on the average daily tradingvolume both in absolute terms and relative to the market capitalization for the instrument. The firmdefines active markets for debt instruments based on both the average daily trading volume and thenumber of days with trading activity.
In October 2008, the FASB issued FASB Staff Position (FSP) No. FAS 157-3, “Determining theFair Value of a Financial Asset When the Market for That Asset Is Not Active,” which specifies that itis acceptable to use inputs based on management estimates or assumptions, or for management tomake adjustments to observable inputs, to determine fair value when markets are not active and
11
THE GOLDMAN SACHS GROUP, INC. and SUBSIDIARIES
NOTES TO CONDENSED CONSOLIDATED FINANCIAL STATEMENTS (Continued)(UNAUDITED)

relevant observable inputs are not available. In April 2009, the FASB issued FSP No. FAS 157-4,“Determining Fair Value When the Volume and Level of Activity for the Asset or Liability HaveSignificantly Decreased and Identifying Transactions That Are Not Orderly,” which provides additionalguidance for estimating fair value when the volume and level of activity for an asset or liability havedecreased significantly. The firm’s fair value measurement policies are consistent with the guidance inboth FSP No. FAS 157-3 and FSP No. FAS 157-4. See ‘‘— Recent Accounting Developments” belowfor further information regarding FSP No. FAS 157-4.
Credit risk is an essential component of fair value. Cash products (e.g., bonds and loans) andderivative instruments (particularly those with significant future projected cash flows) trade in themarket at levels which reflect credit considerations. The firm calculates the fair value of derivativeassets by discounting future cash flows at a rate which incorporates counterparty credit spreads andthe fair value of derivative liabilities by discounting future cash flows at a rate which incorporates thefirm’s own credit spreads. In doing so, credit exposures are adjusted to reflect mitigants, namelycollateral agreements which reduce exposures based on triggers and contractual postingrequirements. The firm manages its exposure to credit risk as it does other market risks and will price,economically hedge, facilitate and intermediate trades which involve credit risk. The firm recordsliquidity valuation adjustments to reflect the cost of exiting concentrated risk positions, includingexposure to the firm’s own credit spreads.
In determining fair value, the firm separates its “Trading assets, at fair value” and its “Tradingliabilities, at fair value” into two categories: cash instruments and derivative contracts.
• Cash Instruments. The firm’s cash instruments are generally classified within level 1 orlevel 2 of the fair value hierarchy because they are valued using quoted market prices, brokeror dealer quotations, or alternative pricing sources with reasonable levels of pricetransparency. The types of instruments valued based on quoted market prices in activemarkets include most government obligations, active listed equities and certain money marketsecurities. Such instruments are generally classified within level 1 of the fair value hierarchy. Inaccordance with SFAS No. 157, the firm does not adjust the quoted price for such instruments,even in situations where the firm holds a large position and a sale could reasonably impact thequoted price.
The types of instruments that trade in markets that are not considered to be active, but arevalued based on quoted market prices, broker or dealer quotations, or alternative pricingsources with reasonable levels of price transparency include most government agencysecurities, investment-grade corporate bonds, certain mortgage products, certain bank loansand bridge loans, less liquid listed equities, certain state, municipal and provincial obligationsand certain money market securities and loan commitments. Such instruments are generallyclassified within level 2 of the fair value hierarchy.
Certain cash instruments are classified within level 3 of the fair value hierarchy because theytrade infrequently and therefore have little or no price transparency. Such instruments includeprivate equity and real estate fund investments, certain bank loans and bridge loans (includingcertain mezzanine financing, leveraged loans arising from capital market transactions andother corporate bank debt), less liquid corporate debt securities and other debt obligations(including less liquid high-yield corporate bonds, distressed debt instruments and collateralizeddebt obligations (CDOs) backed by corporate obligations), less liquid mortgage whole loansand securities (backed by either commercial or residential real estate), and acquired portfoliosof distressed loans. The transaction price is initially used as the best estimate of fair value.Accordingly, when a pricing model is used to value such an instrument, the model is adjusted
12
THE GOLDMAN SACHS GROUP, INC. and SUBSIDIARIES
NOTES TO CONDENSED CONSOLIDATED FINANCIAL STATEMENTS (Continued)(UNAUDITED)

so that the model value at inception equals the transaction price. This valuation is adjustedonly when changes to inputs and assumptions are corroborated by evidence such astransactions in similar instruments, completed or pending third-party transactions in theunderlying investment or comparable entities, subsequent rounds of financing, recapitalizationsand other transactions across the capital structure, offerings in the equity or debt capitalmarkets, and changes in financial ratios or cash flows.
For positions that are not traded in active markets or are subject to transfer restrictions,valuations are adjusted to reflect illiquidity and/or non-transferability. Such adjustments aregenerally based on market evidence where available. In the absence of such evidence,management’s best estimate is used.
Management’s judgment is required to determine the appropriate risk-adjusted discount ratefor cash trading instruments that are classified within level 3 of the fair value hierarchy and thathave little or no price transparency as a result of decreased volumes and lower levels oftrading activity. In such situations, the firm’s valuation is adjusted to approximate rates whichmarket participants would likely consider appropriate for relevant credit and liquidity risks.
• Derivative Contracts. Derivative contracts can be exchange-traded or over-the-counter(OTC). Exchange-traded derivatives typically fall within level 1 or level 2 of the fair valuehierarchy depending on whether they are deemed to be actively traded or not. The firmgenerally values exchange-traded derivatives using models which calibrate to market-clearinglevels and eliminate timing differences between the closing price of the exchange-tradedderivatives and their underlying instruments. In such cases, exchange-traded derivatives areclassified within level 2 of the fair value hierarchy.
OTC derivatives are valued using market transactions and other market evidence wheneverpossible, including market-based inputs to models, model calibration to market-clearingtransactions, broker or dealer quotations, or alternative pricing sources with reasonable levelsof price transparency. Where models are used, the selection of a particular model to value anOTC derivative depends upon the contractual terms of, and specific risks inherent in, theinstrument, as well as the availability of pricing information in the market. The firm generallyuses similar models to value similar instruments. Valuation models require a variety of inputs,including contractual terms, market prices, yield curves, credit curves, measures of volatility,prepayment rates and correlations of such inputs. For OTC derivatives that trade in liquidmarkets, such as generic forwards, swaps and options, model inputs can generally be verifiedand model selection does not involve significant management judgment. OTC derivatives areclassified within level 2 of the fair value hierarchy when all of the significant inputs can becorroborated to market evidence.
Certain OTC derivatives trade in less liquid markets with limited pricing information, and thedetermination of fair value for these derivatives is inherently more difficult. Such instrumentsare classified within level 3 of the fair value hierarchy. Where the firm does not havecorroborating market evidence to support significant model inputs and cannot verify the modelto market transactions, the transaction price is initially used as the best estimate of fair value.Accordingly, when a pricing model is used to value such an instrument, the model is adjustedso that the model value at inception equals the transaction price. The valuations of these lessliquid OTC derivatives are typically based on level 1 and/or level 2 inputs that can be observedin the market, as well as unobservable level 3 inputs. Subsequent to initial recognition, the firmupdates the level 1 and level 2 inputs to reflect observable market changes, with resultinggains and losses reflected within level 3. Level 3 inputs are only changed when corroborated
13
THE GOLDMAN SACHS GROUP, INC. and SUBSIDIARIES
NOTES TO CONDENSED CONSOLIDATED FINANCIAL STATEMENTS (Continued)(UNAUDITED)
by evidence such as similar market transactions, third-party pricing services and/or broker ordealer quotations, or other empirical market data. In circumstances where the firm cannotverify the model value to market transactions, it is possible that a different valuation modelcould produce a materially different estimate of fair value.
When appropriate, valuations are adjusted for various factors such as liquidity, bid/offerspreads and credit considerations. Such adjustments are generally based on market evidencewhere available. In the absence of such evidence, management’s best estimate is used.
Collateralized Agreements and Financings. Collateralized agreements consist of resaleagreements and securities borrowed. Collateralized financings consist of repurchase agreements,securities loaned and other secured financings. Interest on collateralized agreements andcollateralized financings is recognized in “Interest income” and “Interest expense,” respectively, in thecondensed consolidated statements of earnings over the life of the transaction.
• Resale and Repurchase Agreements. Securities purchased under agreements to resell andsecurities sold under agreements to repurchase, principally U.S. government, federal agencyand investment-grade sovereign obligations, represent collateralized financing transactions.The firm receives securities purchased under agreements to resell, makes delivery ofsecurities sold under agreements to repurchase, monitors the market value of these securitieson a daily basis and delivers or obtains additional collateral as appropriate. As noted above,resale and repurchase agreements are carried in the condensed consolidated statements offinancial condition at fair value under SFAS No. 159. Resale and repurchase agreements aregenerally valued based on inputs with reasonable levels of price transparency and areclassified within level 2 of the fair value hierarchy. Resale and repurchase agreements arepresented on a net-by-counterparty basis when the requirements of FIN 41, “Offsetting ofAmounts Related to Certain Repurchase and Reverse Repurchase Agreements,” or FIN 39,“Offsetting of Amounts Related to Certain Contracts,” are satisfied.
• Securities Borrowed and Loaned. Securities borrowed and loaned are generallycollateralized by cash, securities or letters of credit. The firm receives securities borrowed,makes delivery of securities loaned, monitors the market value of securities borrowed andloaned, and delivers or obtains additional collateral as appropriate. Securities borrowed andloaned within Securities Services, relating to both customer activities and, to a lesser extent,certain firm financing activities, are recorded based on the amount of cash collateral advancedor received plus accrued interest. As these arrangements generally can be terminated ondemand, they exhibit little, if any, sensitivity to changes in interest rates. As noted above,securities borrowed and loaned within Trading and Principal Investments, which are related tothe firm’s matched book and certain firm financing activities, are recorded at fair value underSFAS No. 159. These securities borrowed and loaned transactions are generally valued basedon inputs with reasonable levels of price transparency and are classified within level 2 of thefair value hierarchy.
• Other Secured Financings. In addition to repurchase agreements and securities loaned, thefirm funds assets through the use of other secured financing arrangements and pledgesfinancial instruments and other assets as collateral in these transactions. As noted above, thefirm has elected to apply SFAS No. 159 to transfers accounted for as financings rather thansales under SFAS No. 140, debt raised through the firm’s William Street program and certainother nonrecourse financings, for which the use of fair value eliminates non-economic volatilityin earnings that would arise from using different measurement attributes. These other securedfinancing transactions are generally classified within level 2 of the fair value hierarchy. Other
14
THE GOLDMAN SACHS GROUP, INC. and SUBSIDIARIES
NOTES TO CONDENSED CONSOLIDATED FINANCIAL STATEMENTS (Continued)(UNAUDITED)

secured financings that are not recorded at fair value are recorded based on the amount ofcash received plus accrued interest. See Note 3 for further information regarding othersecured financings.
Hybrid Financial Instruments. Hybrid financial instruments are instruments that containbifurcatable embedded derivatives under SFAS No. 133 and do not require settlement by physicaldelivery of non-financial assets (e.g., physical commodities). If the firm elects to bifurcate theembedded derivative, it is accounted for at fair value and the host contract is accounted for atamortized cost, adjusted for the effective portion of any fair value hedge accounting relationships. Ifthe firm does not elect to bifurcate, the entire hybrid financial instrument is accounted for at fair valueunder SFAS No. 155. See Notes 3 and 6 for further information regarding hybrid financial instruments.
Transfers of Financial Assets. In general, transfers of financial assets are accounted for assales under SFAS No. 140 when the firm has relinquished control over the transferred assets. Fortransfers accounted for as sales, any related gains or losses are recognized in net revenues.Transfers that are not accounted for as sales are accounted for as collateralized financings, with therelated interest expense recognized in net revenues over the life of the transaction.
Commissions. Commission revenues from executing and clearing client transactions on stock,options and futures markets are recognized in “Trading and principal investments” in the condensedconsolidated statements of earnings on a trade-date basis.
Insurance Activities. Certain of the firm’s insurance and reinsurance contracts are accountedfor at fair value under SFAS No. 159, with changes in fair value included in “Trading and principalinvestments” in the condensed consolidated statements of earnings.
Revenues from variable annuity and life insurance and reinsurance contracts not accounted forat fair value under SFAS No. 159 generally consist of fees assessed on contract holder accountbalances for mortality charges, policy administration fees and surrender charges, and are recognizedwithin “Trading and principal investments” in the condensed consolidated statements of earnings in theperiod that services are provided.
Interest credited to variable annuity and life insurance and reinsurance contract accountbalances and changes in reserves are recognized in “Other expenses” in the condensed consolidatedstatements of earnings.
Premiums earned for underwriting property catastrophe reinsurance are recognized within“Trading and principal investments” in the condensed consolidated statements of earnings over thecoverage period, net of premiums ceded for the cost of reinsurance. Expenses for liabilities related toproperty catastrophe reinsurance claims, including estimates of losses that have been incurred but notreported, are recognized within “Other expenses” in the condensed consolidated statements ofearnings.
Merchant Banking Overrides. The firm is entitled to receive merchant banking overrides(i.e., an increased share of a fund’s income and gains) when the return on the funds’ investmentsexceeds certain threshold returns. Overrides are based on investment performance over the life ofeach merchant banking fund, and future investment underperformance may require amounts ofoverride previously distributed to the firm to be returned to the funds. Accordingly, overrides arerecognized in the condensed consolidated statements of earnings only when all materialcontingencies have been resolved. Overrides are included in “Trading and principal investments” in thecondensed consolidated statements of earnings.
15
THE GOLDMAN SACHS GROUP, INC. and SUBSIDIARIES
NOTES TO CONDENSED CONSOLIDATED FINANCIAL STATEMENTS (Continued)(UNAUDITED)

Asset Management. Management fees are recognized over the period that the related serviceis provided based upon average net asset values. In certain circumstances, the firm is also entitled toreceive incentive fees based on a percentage of a fund’s return or when the return on assets undermanagement exceeds specified benchmark returns or other performance targets. Incentive fees aregenerally based on investment performance over a 12-month period and are subject to adjustmentprior to the end of the measurement period. Accordingly, incentive fees are recognized in thecondensed consolidated statements of earnings when the measurement period ends. Assetmanagement fees and incentive fees are included in “Asset management and securities services” inthe condensed consolidated statements of earnings.
Share-Based Compensation
The firm accounts for share-based compensation in accordance with SFAS No. 123-R,“Share-Based Payment.” The cost of employee services received in exchange for a share-basedaward is generally measured based on the grant-date fair value of the award. Share-based awardsthat do not require future service (i.e., vested awards, including awards granted to retirement-eligibleemployees) are expensed immediately. Share-based employee awards that require future service areamortized over the relevant service period. Expected forfeitures are included in determiningshare-based employee compensation expense. In the first quarter of 2006, the firm adoptedSFAS No. 123-R under the modified prospective adoption method. Under this method of adoption, theprovisions of SFAS No. 123-R are generally applied only to share-based awards granted subsequentto adoption. Share-based awards held by employees that were retirement-eligible on the date ofadoption of SFAS No. 123-R continue to be amortized over the stated service period of the award.
The firm pays cash dividend equivalents on outstanding restricted stock units. Dividendequivalents paid on restricted stock units are generally charged to retained earnings. Dividendequivalents paid on restricted stock units expected to be forfeited are included in compensationexpense. The firm adopted Emerging Issues Task Force (EITF) Issue No. 06-11, “Accounting forIncome Tax Benefits of Dividends on Share-Based Payment Awards” in the first quarter of fiscal 2009.Accordingly, the tax benefit related to dividend equivalents paid on restricted stock units is accountedfor as an increase to additional paid-in capital. Prior to the adoption of EITF Issue No. 06-11, the firmaccounted for this tax benefit as a reduction to income tax expense. See “— Recent AccountingDevelopments” below for further information on EITF Issue No. 06-11.
In certain cases, primarily related to the death of an employee or conflicted employment (asoutlined in the applicable award agreements), the firm may cash settle share-based compensationawards. For awards accounted for as equity instruments, additional paid-in capital is adjusted to theextent of the difference between the current value of the award and the grant-date value of the award.
Goodwill
Goodwill is the cost of acquired companies in excess of the fair value of identifiable net assets atacquisition date. In accordance with SFAS No. 142, “Goodwill and Other Intangible Assets,” goodwill istested at least annually for impairment. An impairment loss is recognized if the estimated fair value ofan operating segment, which is a component one level below the firm’s three business segments, isless than its estimated net book value. Such loss is calculated as the difference between theestimated fair value of goodwill and its carrying value.
16
THE GOLDMAN SACHS GROUP, INC. and SUBSIDIARIES
NOTES TO CONDENSED CONSOLIDATED FINANCIAL STATEMENTS (Continued)(UNAUDITED)

Identifiable Intangible Assets
Identifiable intangible assets, which consist primarily of customer lists, Designated Market Maker(DMM) rights and the value of business acquired (VOBA) in the firm’s insurance subsidiaries, areamortized over their estimated lives in accordance with SFAS No. 142 or, in the case of insurancecontracts, in accordance with SFAS No. 60, “Accounting and Reporting by Insurance Enterprises,” andSFAS No. 97, “Accounting and Reporting by Insurance Enterprises for Certain Long-DurationContracts and for Realized Gains and Losses from the Sale of Investments.” Identifiable intangibleassets are tested for impairment whenever events or changes in circumstances suggest that anasset’s or asset group’s carrying value may not be fully recoverable in accordance with SFAS No. 144,“Accounting for the Impairment or Disposal of Long-Lived Assets,” or SFAS No. 60 and SFAS No. 97.An impairment loss, generally calculated as the difference between the estimated fair value and thecarrying value of an asset or asset group, is recognized if the sum of the estimated undiscountedcash flows relating to the asset or asset group is less than the corresponding carrying value.
Property, Leasehold Improvements and Equipment
Property, leasehold improvements and equipment, net of accumulated depreciation andamortization, are recorded at cost and included in “Other assets” in the condensed consolidatedstatements of financial condition.
Substantially all property and equipment are depreciated on a straight-line basis over the usefullife of the asset. Leasehold improvements are amortized on a straight-line basis over the useful life ofthe improvement or the term of the lease, whichever is shorter. Certain costs of software developed orobtained for internal use are capitalized and amortized on a straight-line basis over the useful life ofthe software.
Property, leasehold improvements and equipment are tested for impairment whenever events orchanges in circumstances suggest that an asset’s or asset group’s carrying value may not be fullyrecoverable in accordance with SFAS No. 144. An impairment loss, calculated as the differencebetween the estimated fair value and the carrying value of an asset or asset group, is recognized ifthe sum of the expected undiscounted cash flows relating to the asset or asset group is less than thecorresponding carrying value.
The firm’s operating leases include office space held in excess of current requirements. Rentexpense relating to space held for growth is included in “Occupancy” in the condensed consolidatedstatements of earnings. In accordance with SFAS No. 146, “Accounting for Costs Associated with Exitor Disposal Activities,” the firm records a liability, based on the fair value of the remaining lease rentalsreduced by any potential or existing sublease rentals, for leases where the firm has ceased using thespace and management has concluded that the firm will not derive any future economic benefits.Costs to terminate a lease before the end of its term are recognized and measured at fair value upontermination.
Foreign Currency Translation
Assets and liabilities denominated in non-U.S. currencies are translated at rates of exchangeprevailing on the date of the condensed consolidated statements of financial condition, and revenuesand expenses are translated at average rates of exchange for the period. Gains or losses ontranslation of the financial statements of a non-U.S. operation, when the functional currency is otherthan the U.S. dollar, are included, net of hedges and taxes, in the condensed consolidated statementsof comprehensive income. The firm seeks to reduce its net investment exposure to fluctuations in
17
THE GOLDMAN SACHS GROUP, INC. and SUBSIDIARIES
NOTES TO CONDENSED CONSOLIDATED FINANCIAL STATEMENTS (Continued)(UNAUDITED)

foreign exchange rates through the use of foreign currency forward contracts and foreigncurrency-denominated debt. For foreign currency forward contracts, hedge effectiveness is assessedbased on changes in forward exchange rates; accordingly, forward points are reflected as acomponent of the currency translation adjustment in the condensed consolidated statements ofcomprehensive income. For foreign currency-denominated debt, hedge effectiveness is assessedbased on changes in spot rates. Foreign currency remeasurement gains or losses on transactions innonfunctional currencies are included in the condensed consolidated statements of earnings.
Income Taxes
Deferred tax assets and liabilities are recognized for temporary differences between the financialreporting and tax bases of the firm’s assets and liabilities. Valuation allowances are established toreduce deferred tax assets to the amount that more likely than not will be realized. The firm’s taxassets and liabilities are presented as a component of “Other assets” and “Other liabilities andaccrued expenses,” respectively, in the condensed consolidated statements of financial condition. Taxprovisions are computed in accordance with SFAS No. 109, “Accounting for Income Taxes.” The firmadopted the provisions of FIN 48, “Accounting for Uncertainty in Income Taxes — an Interpretation ofFASB Statement No. 109,” as of December 1, 2007, and recorded a transition adjustment resulting ina reduction of $201 million to beginning retained earnings in the first fiscal quarter of 2008. UnderFIN 48, a tax position can be recognized in the financial statements only when it is more likely thannot that the position will be sustained upon examination by the relevant taxing authority based on thetechnical merits of the position. A position that meets this standard is measured at the largest amountof benefit that will more likely than not be realized upon settlement. A liability is established fordifferences between positions taken in a tax return and amounts recognized in the financialstatements. The firm reports interest expense related to income tax matters in “Provision for taxes” inthe condensed consolidated statements of earnings and income tax penalties in “Other expenses” inthe condensed consolidated statements of earnings.
Earnings Per Common Share (EPS)
Basic EPS is calculated by dividing net earnings applicable to common shareholders by theweighted average number of common shares outstanding. Common shares outstanding includescommon stock and restricted stock units for which no future service is required as a condition to thedelivery of the underlying common stock. Diluted EPS includes the determinants of basic EPS and, inaddition, reflects the dilutive effect of the common stock deliverable pursuant to stock warrants andoptions and to restricted stock units for which future service is required as a condition to the deliveryof the underlying common stock. The firm adopted FSP No. EITF 03-6-1, “Determining WhetherInstruments Granted in Share-Based Payment Transactions Are Participating Securities,” in the firstquarter of fiscal 2009. Accordingly, the firm treats unvested share-based payment awards that havenon-forfeitable rights to dividend or dividend equivalents as a separate class of securities incalculating earnings per share. See ‘‘— Recent Accounting Developments” below for furtherinformation on FSP No. EITF 03-6-1.
Cash and Cash Equivalents
The firm defines cash equivalents as highly liquid overnight deposits held in the ordinary courseof business. As of June 2009 and November 2008, “Cash and cash equivalents” on the condensedconsolidated statements of financial condition included $6.02 billion and $5.60 billion, respectively, ofcash and due from banks and $16.16 billion and $10.14 billion, respectively, of interest-bearingdeposits with banks.
18
THE GOLDMAN SACHS GROUP, INC. and SUBSIDIARIES
NOTES TO CONDENSED CONSOLIDATED FINANCIAL STATEMENTS (Continued)(UNAUDITED)

Recent Accounting Developments
EITF Issue No. 06-11. In June 2007, the EITF reached consensus on Issue No. 06-11,“Accounting for Income Tax Benefits of Dividends on Share-Based Payment Awards.” EITF IssueNo. 06-11 requires that the tax benefit related to dividend equivalents paid on restricted stock units,which are expected to vest, be recorded as an increase to additional paid-in capital. The firmpreviously accounted for this tax benefit as a reduction to income tax expense. EITF Issue No. 06-11was applied prospectively for tax benefits on dividend equivalents declared beginning in the firstquarter of fiscal 2009. The adoption of EITF Issue No. 06-11 did not have a material effect on thefirm’s financial condition, results of operations or cash flows.
FASB Staff Position No. FAS 140-3. In February 2008, the FASB issued FASB Staff PositionNo. FAS 140-3, “Accounting for Transfers of Financial Assets and Repurchase FinancingTransactions.” FSP No. FAS 140-3 requires an initial transfer of a financial asset and a repurchasefinancing that was entered into contemporaneously or in contemplation of the initial transfer to beevaluated as a linked transaction under SFAS No. 140 unless certain criteria are met, including thatthe transferred asset must be readily obtainable in the marketplace. The firm adopted FSPNo. FAS 140-3 for new transactions entered into after November 2008. The adoption of FSPNo. FAS 140-3 did not have a material effect on the firm’s financial condition, results of operations orcash flows.
SFAS No. 161. In March 2008, the FASB issued SFAS No. 161, “Disclosures about DerivativeInstruments and Hedging Activities — an amendment of FASB Statement No. 133.” SFAS No. 161requires enhanced disclosures about an entity’s derivative and hedging activities, and was effective forthe firm beginning in the one-month transition period ended December 2008. Since SFAS No. 161requires only additional disclosures concerning derivatives and hedging activities, adoption ofSFAS No. 161 did not affect the firm’s financial condition, results of operations or cash flows.
FASB Staff Position No. EITF 03-6-1. In June 2008, the FASB issued FSP No. EITF 03-6-1,“Determining Whether Instruments Granted in Share-Based Payment Transactions Are ParticipatingSecurities.” The FSP addresses whether instruments granted in share-based payment transactionsare participating securities prior to vesting and therefore need to be included in the earnings allocationin calculating earnings per share under the two-class method described in SFAS No. 128, “Earningsper Share.” The FSP requires companies to treat unvested share-based payment awards that havenon-forfeitable rights to dividends or dividend equivalents as a separate class of securities incalculating earnings per share. The firm adopted the FSP in the first quarter of fiscal 2009. Theimpact for the three and six months ended June 2009 to basic earnings per common share was areduction of $0.02 per common share. There was no impact on diluted earnings per common share.Prior periods have not been restated due to immateriality.
SFAS No. 141(R). In December 2007, the FASB issued a revision to SFAS No. 141, “BusinessCombinations.” SFAS No. 141(R) requires changes to the accounting for transaction costs, certaincontingent assets and liabilities, and other balances in a business combination. In addition, in partialacquisitions, when control is obtained, the acquiring company must measure and record all of thetarget’s assets and liabilities, including goodwill, at fair value as if the entire target company had beenacquired. The provisions of SFAS No. 141(R) applied to the firm’s business combinations beginning inthe first quarter of fiscal 2009. Adoption of SFAS No. 141(R) did not affect the firm’s financialcondition, results of operations or cash flows, but may have an effect on accounting for futurebusiness combinations.
19
THE GOLDMAN SACHS GROUP, INC. and SUBSIDIARIES
NOTES TO CONDENSED CONSOLIDATED FINANCIAL STATEMENTS (Continued)(UNAUDITED)
SFAS No. 160. In December 2007, the FASB issued SFAS No. 160, “Noncontrolling Interestsin Consolidated Financial Statements — an amendment of ARB No. 51.” SFAS No. 160 requires thatownership interests in consolidated subsidiaries held by parties other than the parent(i.e., noncontrolling interests) be accounted for and presented as equity, rather than as a liability ormezzanine equity. SFAS No. 160 was effective for the firm beginning in the first quarter of fiscal 2009.Adoption of SFAS No. 160 did not have a material effect on the firm’s financial condition, results ofoperations or cash flows.
FASB Staff Position No. FAS 140-4 and FIN 46(R)-8. In December 2008, the FASB issuedFSP No. FAS 140-4 and FIN 46(R)-8, “Disclosures by Public Entities (Enterprises) about Transfers ofFinancial Assets and Interests in Variable Interest Entities.” FSP No. FAS 140-4 and FIN 46(R)-8requires enhanced disclosures about transfers of financial assets and interests in VIEs, and waseffective for the firm beginning in the one-month transition period ended December 2008. Since theFSP requires only additional disclosures concerning transfers of financial assets and interests in VIEs,adoption of the FSP did not affect the firm’s financial condition, results of operations or cash flows.
EITF Issue No. 07-5. In June 2008, the EITF reached consensus on Issue No. 07-5,“Determining Whether an Instrument (or Embedded Feature) Is Indexed to an Entity’s Own Stock.”EITF Issue No. 07-5 provides guidance about whether an instrument (such as the firm’s outstandingcommon stock warrants) should be classified as equity and not subsequently recorded at fair value.The firm adopted EITF Issue No. 07-5 in the first quarter of fiscal 2009. Adoption of EITF IssueNo. 07-5 did not affect the firm’s financial condition, results of operations or cash flows.
FASB Staff Position No. FAS 157-4. In April 2009, the FASB issued FSP No. FAS 157-4,“Determining Fair Value When the Volume and Level of Activity for the Asset or Liability HaveSignificantly Decreased and Identifying Transactions That Are Not Orderly.” The FSP providesguidance for estimating fair value when the volume and level of activity for an asset or liability havedecreased significantly. Specifically, the FSP lists factors which should be evaluated to determinewhether a transaction is orderly, clarifies that adjustments to transactions or quoted prices may benecessary when the volume and level of activity for an asset or liability have decreased significantly,and provides guidance for determining the concurrent weighting of the transaction price relative to fairvalue indications from other valuation techniques when estimating fair value. The firm adopted FSPNo. FAS 157-4 in the second quarter of 2009. Since the firm’s fair value methodologies wereconsistent with FSP No. FAS 157-4, adoption of the FSP did not affect the firm’s financial condition,results of operations or cash flows.
FASB Staff Position No. FAS 115-2 and FAS 124-2. In April 2009, the FASB issued FSPNo. FAS 115-2 and FAS 124-2, “Recognition and Presentation of Other-Than-TemporaryImpairments.” Under the FSP, only the portion of an other-than-temporary impairment on a debtsecurity related to credit loss is recognized in current period earnings, with the remainder recognizedin other comprehensive income, if the holder does not intend to sell the security and it is more likelythan not that the holder will not be required to sell the security prior to recovery. Previously, the entireother-than-temporary impairment was recognized in current period earnings. The firm adopted FSPNo. FAS 115-2 and FAS 124-2 in the second quarter of 2009. Adoption of the FSP did not have amaterial effect on the firm’s financial condition, results of operations or cash flows.
20
THE GOLDMAN SACHS GROUP, INC. and SUBSIDIARIES
NOTES TO CONDENSED CONSOLIDATED FINANCIAL STATEMENTS (Continued)(UNAUDITED)

FASB Staff Position No. FAS 107-1 and APB 28-1. In April 2009, the FASB issued FSPNo. FAS 107-1 and APB 28-1, “Interim Disclosures about Fair Value of Financial Instruments.” TheFSP requires that the fair value disclosures prescribed by FASB Statement No. 107, “Disclosuresabout Fair Value of Financial Instruments” be included in financial statements prepared for interimperiods. The firm adopted FSP No. FAS 107-1 and APB 28-1 in the second quarter of 2009. Theadoption of the FSP did not affect the firm’s financial condition, results of operations or cash flows.
SFAS No. 165. In May 2009, the FASB issued SFAS No. 165, “Subsequent Events,” whichcodifies the guidance regarding the disclosure of events occurring subsequent to the balance sheetdate. SFAS No. 165 does not change the definition of a subsequent event (i.e., an event ortransaction that occurs after the balance sheet date but before the financial statements are issued)but requires disclosure of the date through which subsequent events were evaluated whendetermining whether adjustment to or disclosure in the financial statements is required. SFAS No. 165was effective for the firm for the second quarter of 2009. For the second quarter of 2009, the firmevaluated subsequent events through August 4, 2009. Since SFAS No. 165 requires only additionaldisclosures concerning subsequent events, adoption of the standard did not affect the firm’s financialcondition, results of operations or cash flows.
SFAS No. 166 and 167. In June 2009, the FASB issued SFAS No. 166, “Accounting forTransfers of Financial Assets — an amendment of FASB Statement No. 140” and SFAS No. 167,“Amendments to FASB Interpretation No. 46(R),” which change the accounting for securitizations andVIEs. SFAS No. 166 will eliminate the concept of a QSPE, change the requirements for derecognizingfinancial assets, and require additional disclosures about transfers of financial assets, includingsecuritization transactions and continuing involvement with transferred financial assets. SFAS No. 167will change the determination of when a VIE should be consolidated. Under SFAS No. 167, thedetermination of whether to consolidate a VIE is based on the power to direct the activities of the VIEthat most significantly impact the VIE’s economic performance together with either the obligation toabsorb losses or the right to receive benefits that could be significant to the VIE, as well as the VIE’spurpose and design. Both Statements are effective for fiscal years beginning afterNovember 15, 2009. The firm is currently evaluating the impact of adopting SFAS No. 166 and 167 onits financial condition, results of operations and cash flows.
21
THE GOLDMAN SACHS GROUP, INC. and SUBSIDIARIES
NOTES TO CONDENSED CONSOLIDATED FINANCIAL STATEMENTS (Continued)(UNAUDITED)

Note 3. Financial Instruments
Fair Value of Financial Instruments
The following table sets forth the firm’s trading assets, at fair value, including those pledged ascollateral, and trading liabilities, at fair value. At any point in time, the firm may use cash instrumentsas well as derivatives to manage a long or short risk position.
Assets Liabilities Assets LiabilitiesJune 2009 November 2008
As of
(in millions)
Commercial paper, certificates ofdeposit, time deposits and othermoney market instruments . . . . . . . . . $ 16,965 (1) $ — $ 8,662 (1) $ —
Government and U.S. federal agencyobligations . . . . . . . . . . . . . . . . . . . . . 136,618 48,903 69,653 37,000
Mortgage and other asset-backedloans and securities . . . . . . . . . . . . . . 13,730 134 22,393 340
Bank loans and bridge loans . . . . . . . . . 18,349 2,419 (4) 21,839 3,108 (4)
Corporate debt securities andother debt obligations . . . . . . . . . . . . . 27,926 6,056 27,879 5,711
Equities and convertible debentures . . . . 50,955 21,634 57,049 12,116Physical commodities. . . . . . . . . . . . . . . 682 — 513 2Derivative contracts . . . . . . . . . . . . . . . . 90,026 (2) 68,151 (5) 130,337 (2) 117,695 (5)
Total . . . . . . . . . . . . . . . . . . . . . . . . . . . $355,251 (3) $147,297 $338,325 (3) $175,972
(1) Includes $4.56 billion and $4.40 billion as of June 2009 and November 2008, respectively, of money marketinstruments held by William Street Funding Corporation (Funding Corp.) to support the William Street credit extensionprogram. See Note 8 for further information regarding the William Street program.
(2) Net of cash received pursuant to credit support agreements of $133.34 billion and $137.16 billion as of June 2009and November 2008, respectively.
(3) Includes $3.76 billion and $1.68 billion as of June 2009 and November 2008, respectively, of securities held within thefirm’s insurance subsidiaries which are accounted for as available-for-sale under SFAS No. 115.
(4) Consists of the fair value of unfunded commitments to extend credit. The fair value of partially funded commitments isincluded in trading assets.
(5) Net of cash paid pursuant to credit support agreements of $16.31 billion and $34.01 billion as of June 2009 andNovember 2008, respectively.
22
THE GOLDMAN SACHS GROUP, INC. and SUBSIDIARIES
NOTES TO CONDENSED CONSOLIDATED FINANCIAL STATEMENTS (Continued)(UNAUDITED)

Fair Value Hierarchy
The firm’s financial assets at fair value classified within level 3 of the fair value hierarchy aresummarized below:
June2009
March2009
November2008
As of
($ in millions)
Total level 3 assets . . . . . . . . . . . . . . . . . . . . . . . . . . . . . . . $ 54,444 $ 59,062 $ 66,190Level 3 assets for which the firm bears economic
exposure (1) . . . . . . . . . . . . . . . . . . . . . . . . . . . . . . . . . . . 50,383 54,660 59,574
Total assets . . . . . . . . . . . . . . . . . . . . . . . . . . . . . . . . . . . . . 889,544 925,290 884,547Total financial assets at fair value . . . . . . . . . . . . . . . . . . . . 614,559 628,639 595,234
Total level 3 assets as a percentage of Total assets . . . . . . . 6.1% 6.4% 7.5%Level 3 assets for which the firm bears economic exposure
as a percentage of Total assets . . . . . . . . . . . . . . . . . . . . 5.7 5.9 6.7
Total level 3 assets as a percentage of Total financialassets at fair value . . . . . . . . . . . . . . . . . . . . . . . . . . . . . . 8.9 9.4 11.1
Level 3 assets for which the firm bears economic exposureas a percentage of Total financial assets at fair value . . . . 8.2 8.7 10.0
(1) Excludes assets which are financed by nonrecourse debt, attributable to minority investors or attributable to employeeinterests in certain consolidated funds.
The following tables set forth by level within the fair value hierarchy “Trading assets, at fairvalue,” “Trading liabilities, at fair value,” and other financial assets and financial liabilities accounted forat fair value under the fair value option as of June 2009 and November 2008. See Note 2 for furtherinformation on the fair value hierarchy. As required by SFAS No. 157, assets and liabilities areclassified in their entirety based on the lowest level of input that is significant to the fair valuemeasurement.
23
THE GOLDMAN SACHS GROUP, INC. and SUBSIDIARIES
NOTES TO CONDENSED CONSOLIDATED FINANCIAL STATEMENTS (Continued)(UNAUDITED)

Level 1 Level 2 Level 3Netting andCollateral Total
Financial Assets at Fair Value as of June 2009
(in millions)Commercial paper, certificates of
deposit, time deposits and othermoney market instruments. . . . . . $ 8,419 $ 8,546 $ — $ — $ 16,965
U.S. government and federalagency obligations. . . . . . . . . . . . 34,720 57,352 — — 92,072
Non-U.S. government obligations . . 41,585 2,961 — — 44,546Mortgage and other asset-backed
loans and securities:Loans and securities backed by
commercial real estate . . . . . . . — 1,170 6,839 — 8,009Loans and securities backed by
residential real estate (1) . . . . . . — 2,085 1,862 — 3,947Loan portfolios (2) . . . . . . . . . . . . — — 1,774 — 1,774
Bank loans and bridge loans . . . . . . — 8,680 9,669 — 18,349Corporate debt securities (3) . . . . . . 282 17,932 2,372 — 20,586State and municipal obligations . . . . 31 1,626 1,430 — 3,087Other debt obligations . . . . . . . . . . . — 1,450 2,803 — 4,253Equities and convertible debentures . . 20,197 18,079 12,679 (8) — 50,955Physical commodities . . . . . . . . . . . — 682 — — 682
Cash instruments . . . . . . . . . . . . . . . . 105,234 120,563 39,428 — 265,225Derivative contracts . . . . . . . . . . . . . . 333 212,185 (6) 15,016 (6) (137,508) (9) 90,026
Trading assets, at fair value . . . . . . . . . . 105,567 332,748 54,444 (137,508) 355,251Securities segregated for regulatory
and other purposes . . . . . . . . . . . . . . 14,846 (5) 17,192 (7) — — 32,038Securities purchased under agreements
to resell . . . . . . . . . . . . . . . . . . . . . . . — 138,339 — — 138,339Securities borrowed . . . . . . . . . . . . . . . . — 87,018 — — 87,018Receivables from customers and
counterparties . . . . . . . . . . . . . . . . . . — 1,913 — — 1,913Total financial assets at fair value. . . . . . $120,413 $577,210 $54,444 $(137,508) $614,559
Level 3 assets for which the firm doesnot bear economic exposure (4) . . . . . (4,061)
Level 3 assets for which the firmbears economic exposure. . . . . . . . . . $50,383
(1) Includes $5 million and $230 million of CDOs and collateralized loan obligations (CLOs) backed by real estate within level 2and level 3, respectively, of the fair value hierarchy.
(2) Consists of acquired portfolios of distressed loans, primarily backed by commercial and residential real estate collateral.(3) Includes $222 million and $518 million of CDOs and CLOs backed by corporate obligations within level 2 and level 3,
respectively, of the fair value hierarchy.(4) Consists of level 3 assets which are financed by nonrecourse debt, attributable to minority investors or attributable to
employee interests in certain consolidated funds.(5) Consists of U.S. Treasury securities and money market instruments as well as insurance separate account assets measured
at fair value under American Institute of Certified Public Accountants (AICPA) Statement of Position (SOP) 03-1, “Accountingand Reporting by Insurance Enterprises for Certain Nontraditional Long-Duration Contracts and for Separate Accounts.”
(6) Includes $46.27 billion and $9.01 billion of credit derivative assets within level 2 and level 3, respectively, of the fair valuehierarchy. These amounts exclude the effects of netting under enforceable netting agreements across other derivativeproduct types.
(7) Principally consists of securities borrowed and resale agreements. The underlying securities have been segregated to satisfycertain regulatory requirements.
(8) Consists of private equity and real estate fund investments.(9) Represents cash collateral and the impact of netting across the levels of the fair value hierarchy. Netting among positions
classified within the same level is included in that level.
24
THE GOLDMAN SACHS GROUP, INC. and SUBSIDIARIES
NOTES TO CONDENSED CONSOLIDATED FINANCIAL STATEMENTS (Continued)(UNAUDITED)

Level 1 Level 2 Level 3Netting andCollateral Total
Financial Liabilities at Fair Value as of June 2009
(in millions)
U.S. government and federal agencyobligations . . . . . . . . . . . . . . . . . . . $22,928 $ 276 $ — $ — $ 23,204
Non-U.S. government obligations . . . 25,335 364 — — 25,699Mortgage and other asset-backed
loans and securities:Loans and securities backed by
commercial real estate . . . . . . . . — 16 4 — 20Loans and securities backed by
residential real estate . . . . . . . . . — 114 — — 114Bank loans and bridge loans . . . . . . . — 1,676 743 — 2,419Corporate debt securities (1) . . . . . . . 39 5,720 260 — 6,019State and municipal obligations . . . . . — 30 — — 30Other debt obligations . . . . . . . . . . . . — — 7 — 7Equities and convertible
debentures . . . . . . . . . . . . . . . . . . 19,921 1,707 6 — 21,634
Cash instruments . . . . . . . . . . . . . . . . . 68,223 9,903 1,020 — 79,146Derivative contracts . . . . . . . . . . . . . . . 202 76,491 (2) 11,940 (2) (20,482) (4) 68,151
Trading liabilities, at fair value . . . . . . . . . 68,425 86,394 12,960 (20,482) 147,297Deposits . . . . . . . . . . . . . . . . . . . . . . . . . — 5,045 — — 5,045Securities sold under agreements to
repurchase, at fair value . . . . . . . . . . . . — 132,982 — — 132,982Securities loaned . . . . . . . . . . . . . . . . . . . — 12,194 — — 12,194Other secured financings . . . . . . . . . . . . . 287 9,126 8,067 — 17,480Unsecured short-term borrowings . . . . . . — 12,691 2,229 — 14,920Unsecured long-term borrowings . . . . . . . — 16,470 3,427 — 19,897Other liabilities and accrued expenses . . . — 518 1,644 — 2,162
Total financial liabilities at fair value . . . . . $68,712 $275,420 $28,327 (3) $(20,482) $351,977
(1) Includes $12 million and $149 million of CDOs and CLOs backed by corporate obligations within level 2 and level 3,respectively, of the fair value hierarchy.
(2) Includes $9.71 billion and $6.52 billion of credit derivative liabilities within level 2 and level 3, respectively, of the fair valuehierarchy. These amounts exclude the effects of netting under enforceable netting agreements across other derivativeproduct types.
(3) Level 3 liabilities were 8.0% of Total financial liabilities at fair value.(4) Represents cash collateral and the impact of netting across the levels of the fair value hierarchy. Netting among positions
classified within the same level is included in that level.
25
THE GOLDMAN SACHS GROUP, INC. and SUBSIDIARIES
NOTES TO CONDENSED CONSOLIDATED FINANCIAL STATEMENTS (Continued)(UNAUDITED)

Level 1 Level 2 Level 3Netting andCollateral Total
Financial Assets at Fair Value as of November 2008
(in millions)
Commercial paper, certificates ofdeposit, time deposits and othermoney market instruments . . . . . . $ 5,205 $ 3,457 $ — $ — $ 8,662
Government and U.S. federal agencyobligations . . . . . . . . . . . . . . . . . . . 35,069 34,584 — — 69,653
Mortgage and other asset-backedloans and securities. . . . . . . . . . . . — 6,886 15,507 — 22,393
Bank loans and bridge loans . . . . . . . — 9,882 11,957 — 21,839Corporate debt securities and
other debt obligations . . . . . . . . . . 14 20,269 7,596 — 27,879Equities and convertible
debentures . . . . . . . . . . . . . . . . . . 25,068 15,975 16,006 (5) — 57,049Physical commodities . . . . . . . . . . . . — 513 — — 513
Cash instruments . . . . . . . . . . . . . . . . . 65,356 91,566 51,066 — 207,988Derivative contracts . . . . . . . . . . . . . . . 24 256,412 (3) 15,124 (3) (141,223) (6) 130,337
Trading assets, at fair value . . . . . . . . . . . 65,380 347,978 66,190 (141,223) 338,325Securities segregated for regulatory
and other purposes . . . . . . . . . . . . . . . 20,030 (2) 58,800 (4) — — 78,830Securities purchased under agreements
to resell . . . . . . . . . . . . . . . . . . . . . . . . — 116,671 — — 116,671Securities borrowed . . . . . . . . . . . . . . . . . — 59,810 — — 59,810Receivables from customers and
counterparties . . . . . . . . . . . . . . . . . . . — 1,598 — — 1,598
Total financial assets at fair value. . . . . . . $85,410 $584,857 $66,190 $(141,223) $595,234
Level 3 assets for which the firm doesnot bear economic exposure (1) . . . . . . (6,616)
Level 3 assets for which the firmbears economic exposure. . . . . . . . . . . $59,574
(1) Consists of level 3 assets which are financed by nonrecourse debt, attributable to minority investors or attributable toemployee interests in certain consolidated funds.
(2) Consists of U.S. Treasury securities and money market instruments as well as insurance separate account assets measuredat fair value under AICPA SOP 03-1.
(3) Includes $66.00 billion and $8.32 billion of credit derivative assets within level 2 and level 3, respectively, of the fair valuehierarchy. These amounts exclude the effects of netting under enforceable netting agreements across other derivativeproduct types.
(4) Principally consists of securities borrowed and resale agreements. The underlying securities have been segregated to satisfycertain regulatory requirements.
(5) Consists of private equity and real estate fund investments.(6) Represents cash collateral and the impact of netting across the levels of the fair value hierarchy. Netting among positions
classified within the same level is included in that level.
26
THE GOLDMAN SACHS GROUP, INC. and SUBSIDIARIES
NOTES TO CONDENSED CONSOLIDATED FINANCIAL STATEMENTS (Continued)(UNAUDITED)

Level 1 Level 2 Level 3Netting andCollateral Total
Financial Liabilities at Fair Value as of November 2008
(in millions)
Government and U.S. federal agencyobligations . . . . . . . . . . . . . . . . . . . $36,385 $ 615 $ — $ — $ 37,000
Mortgage and other asset-backedloans and securities. . . . . . . . . . . . — 320 20 — 340
Bank loans and bridge loans . . . . . . . — 2,278 830 — 3,108Corporate debt securities and
other debt obligations . . . . . . . . . . 11 5,185 515 — 5,711Equities and convertible
debentures . . . . . . . . . . . . . . . . . . 11,928 174 14 — 12,116Physical commodities . . . . . . . . . . . . 2 — — — 2
Cash instruments . . . . . . . . . . . . . . . . . 48,326 8,572 1,379 — 58,277Derivative contracts . . . . . . . . . . . . . . . 21 145,777 (1) 9,968 (1) (38,071) (3) 117,695
Trading liabilities, at fair value . . . . . . . . . 48,347 154,349 11,347 (38,071) 175,972Deposits . . . . . . . . . . . . . . . . . . . . . . . . . — 4,224 — — 4,224Securities sold under agreements to
repurchase, at fair value . . . . . . . . . . . . — 62,883 — — 62,883Securities loaned . . . . . . . . . . . . . . . . . . . — 7,872 — — 7,872Other secured financings . . . . . . . . . . . . . — 16,429 3,820 — 20,249Unsecured short-term borrowings . . . . . . — 17,916 5,159 — 23,075Unsecured long-term borrowings . . . . . . . — 15,886 1,560 — 17,446Other liabilities and accrued expenses . . . — 978 — — 978
Total financial liabilities at fair value . . . . . $48,347 $280,537 $21,886 (2) $(38,071) $312,699
(1) Includes $31.20 billion and $4.74 billion of credit derivative liabilities within level 2 and level 3, respectively, of the fair valuehierarchy. These amounts exclude the effects of netting under enforceable netting agreements across other derivativeproduct types.
(2) Level 3 liabilities were 7.0% of Total financial liabilities at fair value.(3) Represents cash collateral and the impact of netting across the levels of the fair value hierarchy. Netting among positions
classified within the same level is included in that level.
27
THE GOLDMAN SACHS GROUP, INC. and SUBSIDIARIES
NOTES TO CONDENSED CONSOLIDATED FINANCIAL STATEMENTS (Continued)(UNAUDITED)

Level 3 Unrealized Gains/(Losses)
The table below sets forth a summary of unrealized gains/(losses) on the firm’s level 3 financialassets and financial liabilities at fair value still held at the reporting date for the three and six monthsended June 2009 and May 2008:
June2009
May2008
June2009
May2008
Three Months Ended Six Months EndedLevel 3 Unrealized Gains/(Losses)
(in millions)
Cash instruments — assets. . . . . . . . . . . . . . . . . . . . . $(1,932) $ (944) $(5,597) $(3,194)Cash instruments — liabilities . . . . . . . . . . . . . . . . . . . 289 — 280 (264)
Net unrealized losses on level 3 cash instruments. . . . (1,643) (944) (5,317) (3,458)Derivative contracts — net. . . . . . . . . . . . . . . . . . . . . . (1,403) (447) (171) 1,900Other secured financings . . . . . . . . . . . . . . . . . . . . . . (442) — (426) —Unsecured short-term borrowings . . . . . . . . . . . . . . . . (189) (18) (50) 40Unsecured long-term borrowings. . . . . . . . . . . . . . . . . (133) (71) (98) 32Other liabilities and accrued expenses . . . . . . . . . . . . 18 — 81 —
Total level 3 unrealized losses. . . . . . . . . . . . . . . . . . . $(3,792) $(1,480) $(5,981) $(1,486)
Cash Instruments
The net unrealized loss on level 3 cash instruments of $1.64 billion for the three monthsended June 2009 primarily consisted of unrealized losses on real estate fund investments, andloans and securities backed by commercial real estate, reflecting continued weakness in thecommercial real estate market. The net unrealized loss on level 3 cash instruments of$944 million for the three months ended May 2008 primarily consisted of unrealized losses oncertain bank loans and bridge loans, and corporate debt securities and other debt obligations,reflecting weakness in the credit markets. The net unrealized loss on level 3 cash instruments of$5.32 billion for the six months ended June 2009 primarily consisted of unrealized losses onprivate equity and real estate fund investments, and loans and securities backed by commercialreal estate, reflecting weakness in the global equity markets in the first quarter of 2009, as wellas weakness in the commercial real estate market. The net unrealized loss on level 3 cashinstruments of $3.46 billion for the six months ended May 2008 primarily consisted of unrealizedlosses on loans and securities backed by commercial and residential real estate, certain bankloans and bridge loans, and corporate debt securities and other debt obligations, reflectingweakness in the broader credit markets.
Level 3 cash instruments are frequently economically hedged with instruments classifiedwithin level 1 and level 2, and accordingly, gains or losses that have been reported in level 3 canbe partially offset by gains or losses attributable to instruments classified within level 1 or level 2or by gains or losses on derivative contracts classified within level 3 of the fair value hierarchy.
28
THE GOLDMAN SACHS GROUP, INC. and SUBSIDIARIES
NOTES TO CONDENSED CONSOLIDATED FINANCIAL STATEMENTS (Continued)(UNAUDITED)

Derivative Contracts
The net unrealized loss on level 3 derivative contracts of $1.40 billion for the three monthsended June 2009 was primarily driven by tighter credit spreads (which are level 2 observableinputs) on the underlying instruments. The net unrealized loss of $171 million for the six monthsended June 2009 was primarily attributable to tighter credit spreads on the underlying instrumentspartially offset by increases in commodities prices (which are level 2 observable inputs). The netunrealized loss on level 3 derivative contracts of $447 million for the three months ended May 2008and net unrealized gain of $1.90 billion for the six months ended May 2008 were primarilyattributable to observable changes in underlying credit spreads (which are level 2 inputs). Level 3gains and losses on derivative contracts should be considered in the context of the following:
• A derivative contract with level 1 and/or level 2 inputs is classified as a level 3 financialinstrument in its entirety if it has at least one significant level 3 input.
• If there is one significant level 3 input, the entire gain or loss from adjusting onlyobservable inputs (i.e., level 1 and level 2) is still classified as level 3.
• Gains or losses that have been reported in level 3 resulting from changes in level 1 orlevel 2 inputs are frequently offset by gains or losses attributable to instruments classifiedwithin level 1 or level 2 or by cash instruments reported within level 3 of the fair valuehierarchy.
The tables below set forth a summary of changes in the fair value of the firm’s level 3 financialassets and financial liabilities for the three and six months ended June 2009 and May 2008. Thetables reflect gains and losses, including gains and losses for the entire period on financial assets andfinancial liabilities that were transferred to level 3 during the period, for all financial assets andfinancial liabilities categorized as level 3 as of June 2009 and May 2008, respectively. The tables donot include gains or losses that were reported in level 3 in prior periods for instruments that were soldor transferred out of level 3 prior to the end of the period presented.
Balance,beginning of
periodNet realized
gains/(losses)
Net unrealizedgains/(losses)
relating toinstruments still
held at thereporting date
Netpurchases,issuances
andsettlements
Net transfersin and/or out
of level 3
Balance,end ofperiod
Level 3 Financial Assets and Financial Liabilities at Fair Value
(in millions)Three Months Ended June 2009Mortgage and other asset-backed
loans and securities:Loans and securities backed by
commercial real estate . . . . . . . $ 7,705 $(207) $ (637) $ (92) $ 70 $ 6,839Loans and securities backed by
residential real estate . . . . . . . . 2,088 101 (14) (301) (12) 1,862Loan portfolios . . . . . . . . . . . . . . 1,851 41 (29) (89) — 1,774
Bank loans and bridge loans . . . . . . 9,866 169 (74) (679) 387 9,669Corporate debt securities . . . . . . . . . 2,648 23 (70) (161) (68) 2,372State and municipal obligations . . . . . 1,157 3 (5) (33) 308 1,430Other debt obligations . . . . . . . . . . . 3,749 119 (166) (626) (273) 2,803Equities and convertible debentures. . 13,620 11 (937) 118 (133) 12,679Total cash instruments — assets . . . . 42,684 260 (1) (1,932) (1) (1,863) 279 39,428Cash instruments — liabilities . . . . . . (1,304) (9) (2) 289 (2) (31) 35 (1,020)Derivative contracts — net . . . . . . . . 4,116 474 (2) (1,403) (2)(3) (141) 30 (4) 3,076Other secured financings . . . . . . . . . (7,277) (15) (2) (442) (2) 90 (423) (5) (8,067)Unsecured short-term borrowings . . . (3,143) 1 (2) (189) (2) (219) 1,321 (6) (2,229)Unsecured long-term borrowings . . . . (1,916) (25) (2) (133) (2) 54 (1,407) (6) (3,427)Other liabilities and accrued
expenses . . . . . . . . . . . . . . . . . . (1,510) (11) (2) 18 (2) (141) — (1,644)
29
THE GOLDMAN SACHS GROUP, INC. and SUBSIDIARIES
NOTES TO CONDENSED CONSOLIDATED FINANCIAL STATEMENTS (Continued)(UNAUDITED)
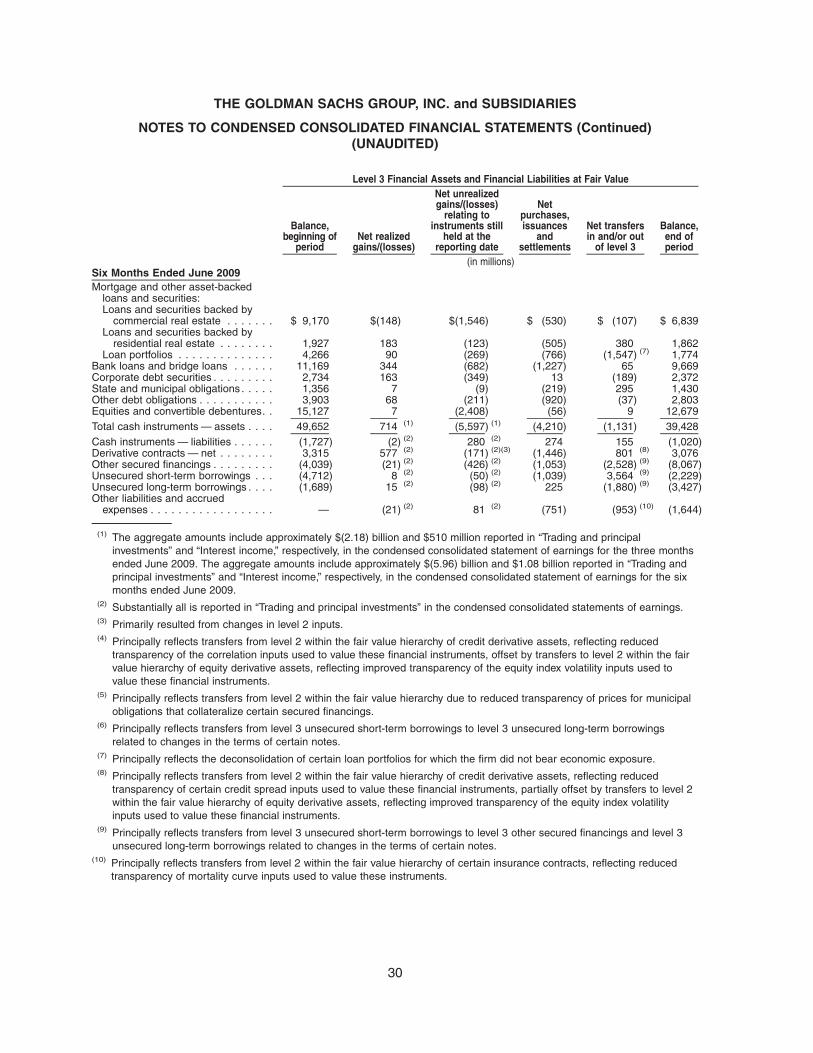
Balance,beginning of
periodNet realized
gains/(losses)
Net unrealizedgains/(losses)
relating toinstruments still
held at thereporting date
Netpurchases,issuances
andsettlements
Net transfersin and/or out
of level 3
Balance,end ofperiod
Level 3 Financial Assets and Financial Liabilities at Fair Value
(in millions)Six Months Ended June 2009Mortgage and other asset-backed
loans and securities:Loans and securities backed by
commercial real estate . . . . . . . $ 9,170 $(148) $(1,546) $ (530) $ (107) $ 6,839Loans and securities backed by
residential real estate . . . . . . . . 1,927 183 (123) (505) 380 1,862Loan portfolios . . . . . . . . . . . . . . 4,266 90 (269) (766) (1,547) (7) 1,774
Bank loans and bridge loans . . . . . . 11,169 344 (682) (1,227) 65 9,669Corporate debt securities . . . . . . . . . 2,734 163 (349) 13 (189) 2,372State and municipal obligations . . . . . 1,356 7 (9) (219) 295 1,430Other debt obligations . . . . . . . . . . . 3,903 68 (211) (920) (37) 2,803Equities and convertible debentures. . 15,127 7 (2,408) (56) 9 12,679Total cash instruments — assets . . . . 49,652 714 (1) (5,597) (1) (4,210) (1,131) 39,428Cash instruments — liabilities . . . . . . (1,727) (2) (2) 280 (2) 274 155 (1,020)Derivative contracts — net . . . . . . . . 3,315 577 (2) (171) (2)(3) (1,446) 801 (8) 3,076Other secured financings . . . . . . . . . (4,039) (21) (2) (426) (2) (1,053) (2,528) (9) (8,067)Unsecured short-term borrowings . . . (4,712) 8 (2) (50) (2) (1,039) 3,564 (9) (2,229)Unsecured long-term borrowings . . . . (1,689) 15 (2) (98) (2) 225 (1,880) (9) (3,427)Other liabilities and accrued
expenses . . . . . . . . . . . . . . . . . . — (21) (2) 81 (2) (751) (953) (10) (1,644)
(1) The aggregate amounts include approximately $(2.18) billion and $510 million reported in “Trading and principalinvestments” and “Interest income,” respectively, in the condensed consolidated statement of earnings for the three monthsended June 2009. The aggregate amounts include approximately $(5.96) billion and $1.08 billion reported in “Trading andprincipal investments” and “Interest income,” respectively, in the condensed consolidated statement of earnings for the sixmonths ended June 2009.
(2) Substantially all is reported in “Trading and principal investments” in the condensed consolidated statements of earnings.(3) Primarily resulted from changes in level 2 inputs.(4) Principally reflects transfers from level 2 within the fair value hierarchy of credit derivative assets, reflecting reduced
transparency of the correlation inputs used to value these financial instruments, offset by transfers to level 2 within the fairvalue hierarchy of equity derivative assets, reflecting improved transparency of the equity index volatility inputs used tovalue these financial instruments.
(5) Principally reflects transfers from level 2 within the fair value hierarchy due to reduced transparency of prices for municipalobligations that collateralize certain secured financings.
(6) Principally reflects transfers from level 3 unsecured short-term borrowings to level 3 unsecured long-term borrowingsrelated to changes in the terms of certain notes.
(7) Principally reflects the deconsolidation of certain loan portfolios for which the firm did not bear economic exposure.(8) Principally reflects transfers from level 2 within the fair value hierarchy of credit derivative assets, reflecting reduced
transparency of certain credit spread inputs used to value these financial instruments, partially offset by transfers to level 2within the fair value hierarchy of equity derivative assets, reflecting improved transparency of the equity index volatilityinputs used to value these financial instruments.
(9) Principally reflects transfers from level 3 unsecured short-term borrowings to level 3 other secured financings and level 3unsecured long-term borrowings related to changes in the terms of certain notes.
(10) Principally reflects transfers from level 2 within the fair value hierarchy of certain insurance contracts, reflecting reducedtransparency of mortality curve inputs used to value these instruments.
30
THE GOLDMAN SACHS GROUP, INC. and SUBSIDIARIES
NOTES TO CONDENSED CONSOLIDATED FINANCIAL STATEMENTS (Continued)(UNAUDITED)
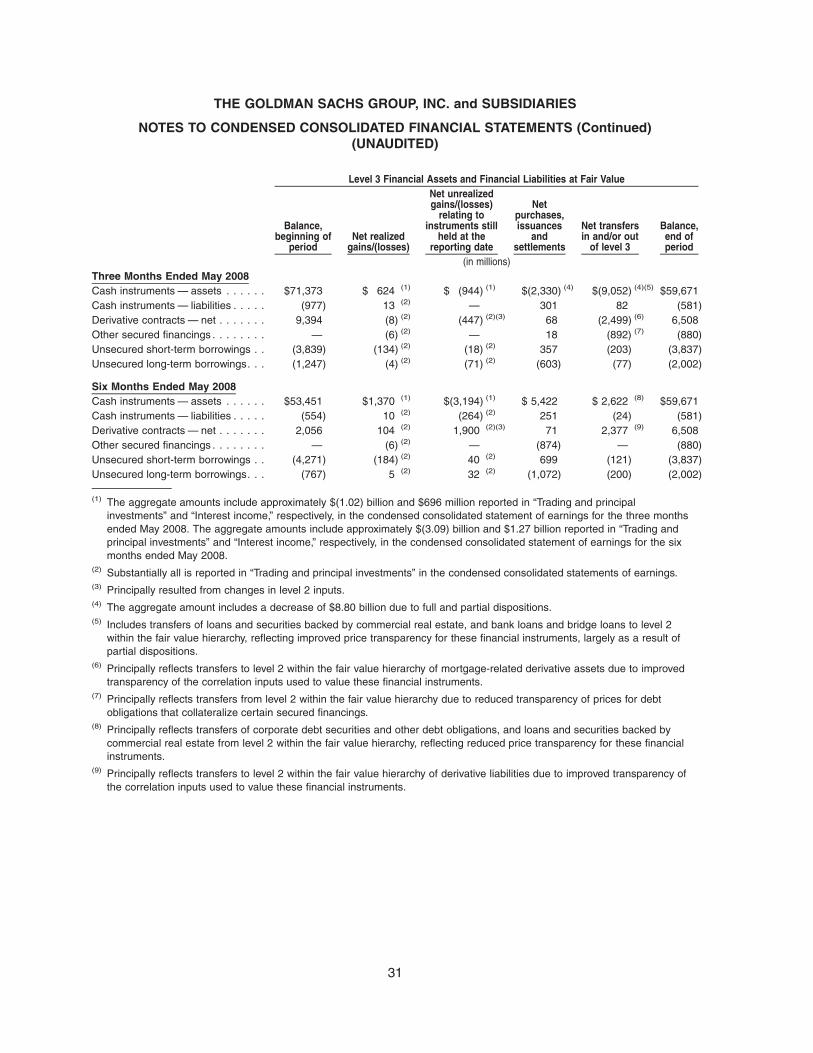
Balance,beginning of
periodNet realized
gains/(losses)
Net unrealizedgains/(losses)
relating toinstruments still
held at thereporting date
Netpurchases,issuances
andsettlements
Net transfersin and/or out
of level 3
Balance,end ofperiod
Level 3 Financial Assets and Financial Liabilities at Fair Value
(in millions)Three Months Ended May 2008Cash instruments — assets . . . . . . $71,373 $ 624 (1) $ (944) (1) $(2,330) (4) $(9,052) (4)(5) $59,671Cash instruments — liabilities . . . . . (977) 13 (2) — 301 82 (581)Derivative contracts — net . . . . . . . 9,394 (8) (2) (447) (2)(3) 68 (2,499) (6) 6,508Other secured financings . . . . . . . . — (6) (2) — 18 (892) (7) (880)Unsecured short-term borrowings . . (3,839) (134) (2) (18) (2) 357 (203) (3,837)Unsecured long-term borrowings. . . (1,247) (4) (2) (71) (2) (603) (77) (2,002)
Six Months Ended May 2008Cash instruments — assets . . . . . . $53,451 $1,370 (1) $(3,194) (1) $ 5,422 $ 2,622 (8) $59,671Cash instruments — liabilities . . . . . (554) 10 (2) (264) (2) 251 (24) (581)Derivative contracts — net . . . . . . . 2,056 104 (2) 1,900 (2)(3) 71 2,377 (9) 6,508Other secured financings . . . . . . . . — (6) (2) — (874) — (880)Unsecured short-term borrowings . . (4,271) (184) (2) 40 (2) 699 (121) (3,837)Unsecured long-term borrowings. . . (767) 5 (2) 32 (2) (1,072) (200) (2,002)
(1) The aggregate amounts include approximately $(1.02) billion and $696 million reported in “Trading and principalinvestments” and “Interest income,” respectively, in the condensed consolidated statement of earnings for the three monthsended May 2008. The aggregate amounts include approximately $(3.09) billion and $1.27 billion reported in “Trading andprincipal investments” and “Interest income,” respectively, in the condensed consolidated statement of earnings for the sixmonths ended May 2008.
(2) Substantially all is reported in “Trading and principal investments” in the condensed consolidated statements of earnings.(3) Principally resulted from changes in level 2 inputs.(4) The aggregate amount includes a decrease of $8.80 billion due to full and partial dispositions.(5) Includes transfers of loans and securities backed by commercial real estate, and bank loans and bridge loans to level 2
within the fair value hierarchy, reflecting improved price transparency for these financial instruments, largely as a result ofpartial dispositions.
(6) Principally reflects transfers to level 2 within the fair value hierarchy of mortgage-related derivative assets due to improvedtransparency of the correlation inputs used to value these financial instruments.
(7) Principally reflects transfers from level 2 within the fair value hierarchy due to reduced transparency of prices for debtobligations that collateralize certain secured financings.
(8) Principally reflects transfers of corporate debt securities and other debt obligations, and loans and securities backed bycommercial real estate from level 2 within the fair value hierarchy, reflecting reduced price transparency for these financialinstruments.
(9) Principally reflects transfers to level 2 within the fair value hierarchy of derivative liabilities due to improved transparency ofthe correlation inputs used to value these financial instruments.
31
THE GOLDMAN SACHS GROUP, INC. and SUBSIDIARIES
NOTES TO CONDENSED CONSOLIDATED FINANCIAL STATEMENTS (Continued)(UNAUDITED)

Impact of Credit Spreads
On an ongoing basis, the firm realizes gains or losses relating to changes in credit risk onderivative contracts through changes in credit mitigants or the sale or unwind of the contracts. The netgain/(loss) attributable to the impact of changes in credit exposure and credit spreads on derivativecontracts (including derivative assets and liabilities and related hedges) was $38 million and$(145) million for the three months ended June 2009 and May 2008, respectively, and $86 million and$(129) million for the six months ended June 2009 and May 2008, respectively.
The following table sets forth the net gains/(losses) attributable to the impact of changes in thefirm’s own credit spreads on unsecured borrowings for which the fair value option was elected. Thefirm calculates the fair value of unsecured borrowings by discounting future cash flows at a rate whichincorporates the firm’s observable credit spreads.
June2009
May2008
June2009
May2008
Three Months Ended Six Months Ended
(in millions)
Net gains/(losses) including hedges. . . . . . . . . . . . . . . $(348) $(178) $(545) $155Net gains/(losses) excluding hedges . . . . . . . . . . . . . . (353) (375) (545) 143
The impact of changes in instrument-specific credit spreads on loans and loan commitments forwhich the fair value option was elected was a gain of $917 million and a loss of $297 million for thethree and six months ended June 2009, respectively, and not material for the three and six monthsended May 2008. The firm attributes changes in the fair value of floating rate loans and loancommitments to changes in instrument-specific credit spreads. For fixed rate loans and loancommitments, the firm allocates changes in fair value between interest rate-related changes andcredit spread-related changes based on changes in interest rates. See below for additional detailsregarding the fair value option.
32
THE GOLDMAN SACHS GROUP, INC. and SUBSIDIARIES
NOTES TO CONDENSED CONSOLIDATED FINANCIAL STATEMENTS (Continued)(UNAUDITED)

The Fair Value Option
Gains/(Losses)
The following table sets forth the gains/(losses) included in earnings for the three and six monthsended June 2009 and May 2008 as a result of the firm electing to apply the fair value option to certainfinancial assets and financial liabilities, as described in Note 2. The table excludes gains and lossesrelated to trading assets and trading liabilities, as well as gains and losses that would have beenrecognized under other generally accepted accounting principles if the firm had not elected the fairvalue option or that are economically hedged with instruments accounted for at fair value under othergenerally accepted accounting principles.
June2009
May2008
June2009
May2008
Three Months Ended Six Months Ended
(in millions)
Unsecured long-term borrowings (1) . . . . . . . . . . . . . . . $(307) $(371) $(442) $135Other secured financings (2). . . . . . . . . . . . . . . . . . . . . (442) 124 (417) 123Unsecured short-term borrowings (3) . . . . . . . . . . . . . . (27) 25 (94) (25)Receivables from customers and counterparties (4) . . . 84 1 82 1Other liabilities and accrued expenses (5) . . . . . . . . . . (162) — (80) —Other (6) . . . . . . . . . . . . . . . . . . . . . . . . . . . . . . . . . . . 34 (28) 8 (22)
Total (7) . . . . . . . . . . . . . . . . . . . . . . . . . . . . . . . . . . . . $(820) $(249) $(943) $212
(1) Excludes losses of $2.96 billion and $1.54 billion for the three months ended June 2009 and May 2008, respectively,and $1.72 billion and $2.26 billion for the six months ended June 2009 and May 2008, respectively, related to theembedded derivative component of hybrid financial instruments. Such losses would have been recognized pursuantto SFAS No. 133 if the firm had not elected to account for the entire hybrid instrument at fair value under the fairvalue option.
(2) Excludes gains/(losses) of $(12) million and $10 million for the three months ended June 2009 and May 2008,respectively, and $7 million and $1.04 billion for the six months ended June 2009 and May 2008, respectively, relatedto financings recorded as a result of securitization-related transactions that were accounted for as secured financingsrather than sales under SFAS No. 140. Changes in the fair value of these secured financings are offset by changes inthe fair value of the related financial instruments included within the firm’s “Trading assets, at fair value” in thecondensed consolidated statements of financial condition.
(3) Excludes gains/(losses) of $(1.18) billion and $(59) million for the three months ended June 2009 and May 2008,respectively, $(1.48) billion and $253 million for the six months ended June 2009 and May 2008, respectively, relatedto the embedded derivative component of hybrid financial instruments. Such gains and losses would have beenrecognized pursuant to SFAS No. 133 if the firm had not elected to account for the entire hybrid instrument at fairvalue under the fair value option.
(4) Primarily consists of gains on certain reinsurance contracts.(5) Primarily consists of losses on certain insurance and reinsurance contracts.(6) Primarily consists of gains/(losses) on resale and repurchase agreements, and securities borrowed and loaned within
Trading and Principal Investments.(7) Reported within “Trading and principal investments” in the condensed consolidated statements of earnings. The
amounts exclude contractual interest, which is included in “Interest income” and “Interest expense” in the condensedconsolidated statements of earnings, for all instruments other than hybrid financial instruments.
33
THE GOLDMAN SACHS GROUP, INC. and SUBSIDIARIES
NOTES TO CONDENSED CONSOLIDATED FINANCIAL STATEMENTS (Continued)(UNAUDITED)

All trading assets and trading liabilities are accounted for at fair value either under the fair valueoption or as required by other accounting pronouncements. Excluding equities commissions of$1.02 billion and $1.23 billion for the three months ended June 2009 and May 2008, respectively, and$2.00 billion and $2.47 billion for the six months ended June 2009 and May 2008, respectively, andthe gains and losses on the instruments accounted for under the fair value option described above,the firm’s “Trading and principal investments” revenues in the condensed consolidated statements ofearnings primarily represent gains and losses on “Trading assets, at fair value” and “Trading liabilities,at fair value” in the condensed consolidated statements of financial condition.
Loans and Loan Commitments
As of June 2009, the aggregate contractual principal amount of loans and long-term receivablesfor which the fair value option was elected exceeded the related fair value by $45.31 billion, includinga difference of $37.53 billion related to loans with an aggregate fair value of $4.60 billion that were onnonaccrual status (including loans more than 90 days past due). As of November 2008, the aggregatecontractual principal amount of loans and long-term receivables for which the fair value option waselected exceeded the related fair value by $50.21 billion, including a difference of $37.46 billionrelated to loans with an aggregate fair value of $3.77 billion that were on nonaccrual status (includingloans more than 90 days past due). The aggregate contractual principal exceeds the related fair valueprimarily because the firm regularly purchases loans, such as distressed loans, at values significantlybelow contractual principal amounts.
As of June 2009 and November 2008, the fair value of unfunded lending commitments for whichthe fair value option was elected was a liability of $1.78 billion and $3.52 billion, respectively, and therelated total contractual amount of these lending commitments was $38.58 billion and $39.49 billion,respectively.
Long-term Debt Instruments
The aggregate contractual principal amount of long-term debt instruments (principal andnon-principal protected) for which the fair value option was elected exceeded the related fair value by$1.95 billion and $2.42 billion as of June 2009 and November 2008, respectively.
Derivative Activities
Derivative contracts are instruments, such as futures, forwards, swaps or option contracts, thatderive their value from underlying assets, indices, reference rates or a combination of these factors.Derivative instruments may be privately negotiated contracts, which are often referred to as OTCderivatives, or they may be listed and traded on an exchange. Derivatives may involve futurecommitments to purchase or sell financial instruments or commodities, or to exchange currency orinterest payment streams. The amounts exchanged are based on the specific terms of the contractwith reference to specified rates, securities, commodities, currencies or indices.
Certain cash instruments, such as mortgage-backed securities, interest-only and principal-onlyobligations, and indexed debt instruments, are not considered derivatives even though their values orcontractually required cash flows are derived from the price of some other security or index. However,certain commodity-related contracts are included in the firm’s derivatives disclosure, as thesecontracts may be settled in cash or the assets to be delivered under the contract are readilyconvertible into cash.
34
THE GOLDMAN SACHS GROUP, INC. and SUBSIDIARIES
NOTES TO CONDENSED CONSOLIDATED FINANCIAL STATEMENTS (Continued)(UNAUDITED)

The firm enters into derivative transactions to facilitate client transactions, to take proprietarypositions and as a means of risk management. Risk exposures are managed through diversification,by controlling position sizes and by entering into offsetting positions. For example, the firm maymanage the risk related to a portfolio of common stock by entering into an offsetting position in arelated equity-index futures contract.
The firm applies hedge accounting under SFAS No. 133 to certain derivative contracts. The firmuses these derivatives to manage certain interest rate and currency exposures, including the firm’s netinvestment in non-U.S. operations. The firm designates certain interest rate swap contracts as fairvalue hedges. These interest rate swap contracts hedge changes in the relevant benchmark interestrate (e.g., London Interbank Offered Rate (LIBOR)), effectively converting a substantial portion of thefirm’s unsecured long-term borrowings, certain unsecured short-term borrowings and certificates ofdeposit into floating rate obligations. See Note 2 for information regarding the firm’s accounting policyfor foreign currency forward contracts used to hedge its net investment in non-U.S. operations.
The firm applies a long-haul method to all of its hedge accounting relationships to perform anongoing assessment of the effectiveness of these relationships in achieving offsetting changes in fairvalue or offsetting cash flows attributable to the risk being hedged. The firm utilizes a dollar-offsetmethod, which compares the change in the fair value of the hedging instrument to the change in thefair value of the hedged item, excluding the effect of the passage of time, to prospectively andretrospectively assess hedge effectiveness. The firm’s prospective dollar-offset assessment utilizesscenario analyses to test hedge effectiveness via simulations of numerous parallel and slope shifts ofthe relevant yield curve. Parallel shifts change the interest rate of all maturities by identical amounts.Slope shifts change the curvature of the yield curve. For both the prospective assessment, inresponse to each of the simulated yield curve shifts, and the retrospective assessment, a hedgingrelationship is deemed to be effective if the fair value of the hedging instrument and the hedged itemchange inversely within a range of 80% to 125%.
For fair value hedges, gains or losses on derivative transactions are recognized in “Interestexpense” in the condensed consolidated statements of earnings. The change in fair value of thehedged item attributable to the risk being hedged is reported as an adjustment to its carrying valueand is subsequently amortized into interest expense over its remaining life. Gains or losses related tohedge ineffectiveness for these hedges are generally included in “Interest expense” in the condensedconsolidated statements of earnings. These gains or losses were not material for the three and sixmonths ended June 2009 and May 2008. Gains and losses on derivatives used for trading purposesare included in “Trading and principal investments” in the condensed consolidated statements ofearnings.
The fair value of the firm’s derivative contracts is reflected net of cash paid or received pursuantto credit support agreements and is reported on a net-by-counterparty basis in the firm’s condensedconsolidated statements of financial condition when management believes a legal right of setoff existsunder an enforceable netting agreement. The following table sets forth the fair value and the numberof contracts of the firm’s derivative contracts by major product type on a gross basis as of June 2009.Gross fair values in the table below exclude the effects of both netting under enforceable nettingagreements and netting of cash received or posted pursuant to credit support agreements, andtherefore are not representative of the firm’s exposure:
35
THE GOLDMAN SACHS GROUP, INC. and SUBSIDIARIES
NOTES TO CONDENSED CONSOLIDATED FINANCIAL STATEMENTS (Continued)(UNAUDITED)
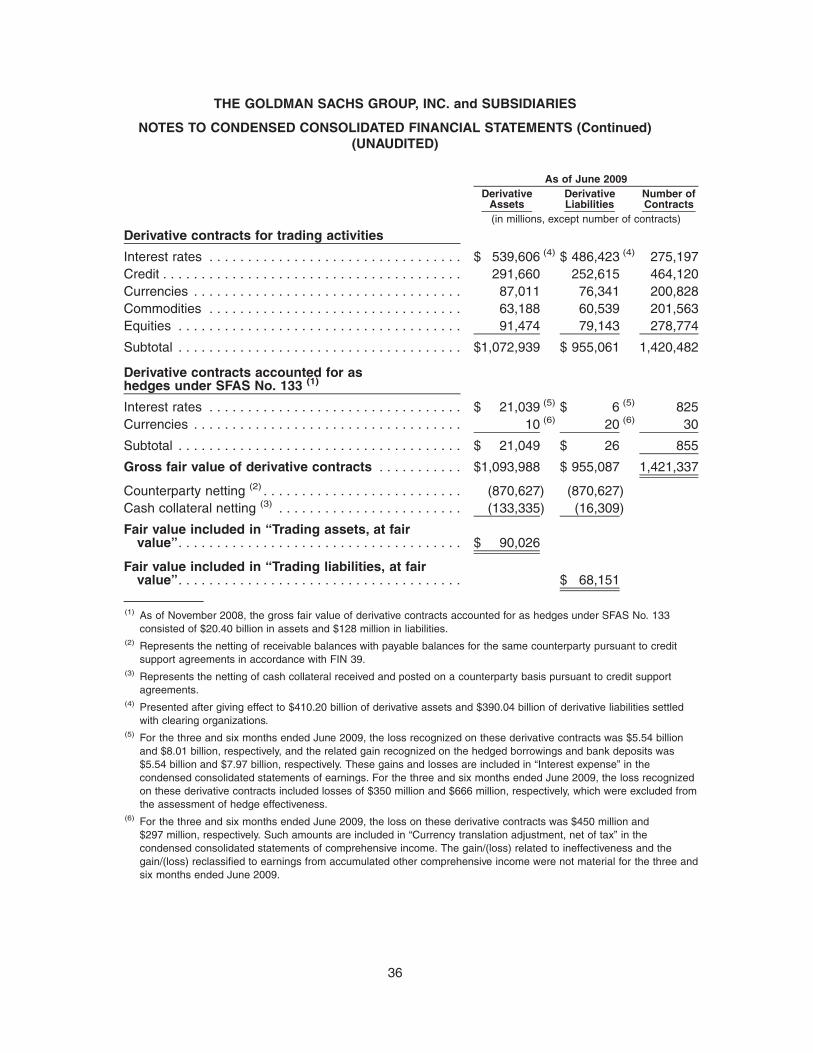
DerivativeAssets
DerivativeLiabilities
Number ofContracts
As of June 2009
(in millions, except number of contracts)
Derivative contracts for trading activities
Interest rates . . . . . . . . . . . . . . . . . . . . . . . . . . . . . . . . . $ 539,606 (4) $ 486,423 (4) 275,197Credit . . . . . . . . . . . . . . . . . . . . . . . . . . . . . . . . . . . . . . . 291,660 252,615 464,120Currencies . . . . . . . . . . . . . . . . . . . . . . . . . . . . . . . . . . . 87,011 76,341 200,828Commodities . . . . . . . . . . . . . . . . . . . . . . . . . . . . . . . . . 63,188 60,539 201,563Equities . . . . . . . . . . . . . . . . . . . . . . . . . . . . . . . . . . . . . 91,474 79,143 278,774
Subtotal . . . . . . . . . . . . . . . . . . . . . . . . . . . . . . . . . . . . . $1,072,939 $ 955,061 1,420,482
Derivative contracts accounted for ashedges under SFAS No. 133 (1)
Interest rates . . . . . . . . . . . . . . . . . . . . . . . . . . . . . . . . . $ 21,039 (5) $ 6 (5) 825Currencies . . . . . . . . . . . . . . . . . . . . . . . . . . . . . . . . . . . 10 (6) 20 (6) 30
Subtotal . . . . . . . . . . . . . . . . . . . . . . . . . . . . . . . . . . . . . $ 21,049 $ 26 855
Gross fair value of derivative contracts . . . . . . . . . . . $1,093,988 $ 955,087 1,421,337
Counterparty netting (2) . . . . . . . . . . . . . . . . . . . . . . . . . . (870,627) (870,627)Cash collateral netting (3) . . . . . . . . . . . . . . . . . . . . . . . . (133,335) (16,309)
Fair value included in “Trading assets, at fairvalue”. . . . . . . . . . . . . . . . . . . . . . . . . . . . . . . . . . . . . $ 90,026
Fair value included in “Trading liabilities, at fairvalue”. . . . . . . . . . . . . . . . . . . . . . . . . . . . . . . . . . . . . $ 68,151
(1) As of November 2008, the gross fair value of derivative contracts accounted for as hedges under SFAS No. 133consisted of $20.40 billion in assets and $128 million in liabilities.
(2) Represents the netting of receivable balances with payable balances for the same counterparty pursuant to creditsupport agreements in accordance with FIN 39.
(3) Represents the netting of cash collateral received and posted on a counterparty basis pursuant to credit supportagreements.
(4) Presented after giving effect to $410.20 billion of derivative assets and $390.04 billion of derivative liabilities settledwith clearing organizations.
(5) For the three and six months ended June 2009, the loss recognized on these derivative contracts was $5.54 billionand $8.01 billion, respectively, and the related gain recognized on the hedged borrowings and bank deposits was$5.54 billion and $7.97 billion, respectively. These gains and losses are included in “Interest expense” in thecondensed consolidated statements of earnings. For the three and six months ended June 2009, the loss recognizedon these derivative contracts included losses of $350 million and $666 million, respectively, which were excluded fromthe assessment of hedge effectiveness.
(6) For the three and six months ended June 2009, the loss on these derivative contracts was $450 million and$297 million, respectively. Such amounts are included in “Currency translation adjustment, net of tax” in thecondensed consolidated statements of comprehensive income. The gain/(loss) related to ineffectiveness and thegain/(loss) reclassified to earnings from accumulated other comprehensive income were not material for the three andsix months ended June 2009.
36
THE GOLDMAN SACHS GROUP, INC. and SUBSIDIARIES
NOTES TO CONDENSED CONSOLIDATED FINANCIAL STATEMENTS (Continued)(UNAUDITED)

The firm also has embedded derivatives that have been bifurcated from related borrowingsunder SFAS No. 133. Such derivatives, which are classified in unsecured short-term and unsecuredlong-term borrowings in the firm’s condensed consolidated statements of financial condition, had a netasset carrying value of $363 million and $774 million as of June 2009 and November 2008,respectively. The net asset as of June 2009, which represented 339 contracts, included gross assetsof $698 million (primarily comprised of equity, credit and interest rate derivatives) and gross liabilitiesof $335 million (primarily comprised of equity and interest rate derivatives). See Notes 6 and 7 forfurther information regarding the firm’s unsecured borrowings.
As of June 2009 and November 2008, respectively, the firm has designated $3.31 billion and$3.36 billion of foreign currency-denominated debt, included in unsecured long-term borrowings in thefirm’s condensed consolidated statements of financial condition, as hedges of net investments innon-U.S. subsidiaries under SFAS No. 133. For the three and six months ended June 2009, thegain/(loss) on these debt instruments was $(90) million and $179 million, respectively. Such amountsare included in “Currency translation adjustment, net of tax” in the condensed consolidated statementsof comprehensive income. The gain/(loss) related to ineffectiveness and the gain/(loss) reclassified toearnings from accumulated other comprehensive income were not material for the three and sixmonths ended June 2009.
The following table sets forth by major product type the firm’s gains/(losses) related to tradingactivities, including both derivative and nonderivative financial instruments, for the three and sixmonths ended June 2009 in accordance with SFAS No. 161. These gains/(losses) are notrepresentative of the firm’s individual business unit results because many of the firm’s tradingstrategies utilize financial instruments across various product types. Accordingly, gains or losses inone product type frequently offset gains or losses in other product types. For example, most of thefirm’s longer-term derivative contracts are sensitive to changes in interest rates and may be hedgedwith interest rate swaps. Similarly, a significant portion of the firm’s cash and derivatives tradinginventory has exposure to foreign currencies and may be hedged with foreign currency contracts. Thegains/(losses) set forth below are included in “Trading and principal investments” in the condensedconsolidated statements of earnings and exclude related interest income and interest expense.
2009 2009
Three MonthsEnded June
Six MonthsEnded June
(in millions)
Interest rates . . . . . . . . . . . . . . . . . . . . . . . . . . . . . . . . . . . . . . . . . . . $ 3,814 $ 4,386Credit . . . . . . . . . . . . . . . . . . . . . . . . . . . . . . . . . . . . . . . . . . . . . . . . 1,014 2,336Currencies . . . . . . . . . . . . . . . . . . . . . . . . . . . . . . . . . . . . . . . . . . . . . (1,398) (1) (421)Equities . . . . . . . . . . . . . . . . . . . . . . . . . . . . . . . . . . . . . . . . . . . . . . . 2,743 4,109Commodities and other . . . . . . . . . . . . . . . . . . . . . . . . . . . . . . . . . . . 1,574 3,343
Total . . . . . . . . . . . . . . . . . . . . . . . . . . . . . . . . . . . . . . . . . . . . . . . . . $ 7,747 $13,753
(1) Includes gains/(losses) on currency contracts used to hedge positions included in other product types in this table.
37
THE GOLDMAN SACHS GROUP, INC. and SUBSIDIARIES
NOTES TO CONDENSED CONSOLIDATED FINANCIAL STATEMENTS (Continued)(UNAUDITED)
Certain of the firm’s derivative instruments have been transacted pursuant to bilateralagreements with certain counterparties that may require the firm to post collateral or terminate thetransactions based on the firm’s long-term credit ratings. As of June 2009, the aggregate fair value ofsuch derivative contracts that were in a net liability position was $31.19 billion, and the aggregate fairvalue of assets posted by the firm as collateral for these derivative contracts was $14.26 billion. As ofJune 2009, additional collateral or termination payments pursuant to bilateral agreements with certaincounterparties of approximately $763 million and $1.93 billion could have been called bycounterparties in the event of a one-notch and two-notch reduction, respectively, in the firm’slong-term credit ratings.
The firm enters into various derivative transactions that are considered credit derivatives underFSP No. FAS 133-1 and FIN 45-4. The firm’s written and purchased credit derivatives include creditdefault swaps, credit spread options, credit index products and total return swaps. As individuallynegotiated contracts, credit derivatives can have numerous settlement and payment conventions. Themore common types of triggers include bankruptcy of the reference credit entity, acceleration ofindebtedness, failure to pay, restructuring, repudiation and dissolution of the entity. Substantially all ofthe firm’s purchased credit derivative transactions are with financial institutions and are subject tostringent collateral thresholds. As of June 2009, the firm’s written and purchased credit derivatives hadtotal gross notional amounts of $2.96 trillion and $3.19 trillion, respectively, for total net purchasedprotection of $227.02 billion in notional value. As of November 2008, the firm’s written and purchasedcredit derivatives had total gross notional amounts of $3.78 trillion and $4.03 trillion, respectively, fortotal net purchased protection of $255.24 billion in notional value. The decrease in notional amountsfrom November 2008 to June 2009 primarily reflects compression efforts across the industry.
38
THE GOLDMAN SACHS GROUP, INC. and SUBSIDIARIES
NOTES TO CONDENSED CONSOLIDATED FINANCIAL STATEMENTS (Continued)(UNAUDITED)

The following table sets forth certain information related to the firm’s credit derivatives. Fairvalues in the table below exclude the effects of both netting under enforceable netting agreementsand netting of cash paid pursuant to credit support agreements, and therefore are not representativeof the firm’s exposure.
0 - 12Months
1 - 5Years
5 Yearsor
Greater Total
OffsettingPurchased
CreditDerivatives (2)
OtherPurchased
CreditDerivatives (3)
Written CreditDerivatives at
Fair Value
Maximum Payout/Notional Amountof Written Credit Derivatives by Tenor (1)
Maximum Payout/NotionalAmount of Purchased
Credit Derivatives
($ in millions)As of June 2009Credit spread onunderlying (basis points) (4)
0-250 . . . . . . . . . . . . . . . . . $193,565 $1,269,520 $ 351,796 $1,814,881 $1,713,493 $179,753 $ 46,316251-500 . . . . . . . . . . . . . . . . 52,816 362,155 203,387 618,358 562,599 90,180 44,985501-1,000 . . . . . . . . . . . . . . . 24,122 174,015 43,871 242,008 228,985 89,162 24,115Greater than 1,000 . . . . . . . . . 44,752 210,653 29,516 284,921 254,360 68,654 91,411
Total . . . . . . . . . . . . . . . . . . $315,255 $2,016,343 $ 628,570 $2,960,168 $2,759,437 $427,749 $206,827 (5)
As of November 2008Credit spread onunderlying (basis points) (4)
0-250 . . . . . . . . . . . . . . . . . $108,555 $1,093,651 $ 623,944 $1,826,150 $1,632,681 $347,573 $ 77,836251-500 . . . . . . . . . . . . . . . . 51,015 551,971 186,084 789,070 784,149 26,316 94,278501-1,000 . . . . . . . . . . . . . . . 34,756 404,661 148,052 587,469 538,251 67,958 75,079Greater than 1,000 . . . . . . . . . 41,496 373,211 161,475 576,182 533,816 103,362 222,346
Total . . . . . . . . . . . . . . . . . . $235,822 $2,423,494 $1,119,555 $3,778,871 $3,488,897 $545,209 $469,539 (5)
(1) Tenor is based on expected duration for mortgage-related credit derivatives and on remaining contractual maturity for othercredit derivatives.
(2) Offsetting purchased credit derivatives represent the notional amount of purchased credit derivatives to the extent theyhedge written credit derivatives with identical underlyings.
(3) Comprised of purchased protection in excess of the amount of written protection on identical underlyings and purchasedprotection on other underlyings on which the firm has not written protection.
(4) Credit spread on the underlying, together with the tenor of the contract, are indicators of payment/performance risk. Forexample, the firm is least likely to pay or otherwise be required to perform where the credit spread on the underlying is“0-250” basis points and the tenor is “0-12 Months.” The likelihood of payment or performance is generally greater as thecredit spread on the underlying and tenor increase.
(5) This liability excludes the effects of both netting under enforceable netting agreements and netting of cash collateral paidpursuant to credit support agreements. Including the effects of netting receivable balances with payable balances for thesame counterparty pursuant to enforceable netting agreements, the firm’s net liability related to credit derivatives in the firm’scondensed consolidated statements of financial condition as of June 2009 and November 2008 was $13.46 billion and$33.76 billion, respectively. This net amount excludes the netting of cash collateral paid pursuant to credit supportagreements. The decrease in this net liability from November 2008 to June 2009 reflected tightening credit spreads.
39
THE GOLDMAN SACHS GROUP, INC. and SUBSIDIARIES
NOTES TO CONDENSED CONSOLIDATED FINANCIAL STATEMENTS (Continued)(UNAUDITED)

Collateralized Transactions
The firm receives financial instruments as collateral, primarily in connection with resaleagreements, securities borrowed, derivative transactions and customer margin loans. Such financialinstruments may include obligations of the U.S. government, federal agencies, sovereigns andcorporations, as well as equities and convertibles.
In many cases, the firm is permitted to deliver or repledge these financial instruments inconnection with entering into repurchase agreements, securities lending agreements and othersecured financings, collateralizing derivative transactions and meeting firm or customer settlementrequirements. As of June 2009 and November 2008, the fair value of financial instruments received ascollateral by the firm that it was permitted to deliver or repledge was $596.34 billion and$578.72 billion, respectively, of which the firm delivered or repledged $435.55 billion and$445.11 billion, respectively.
The firm also pledges assets that it owns to counterparties who may or may not have the right todeliver or repledge them. Trading assets pledged to counterparties that have the right to deliver orrepledge are included in “Trading assets, at fair value” in the condensed consolidated statements offinancial condition and were $31.14 billion and $26.31 billion as of June 2009 and November 2008,respectively. Trading assets, pledged in connection with repurchase agreements, securities lendingagreements and other secured financings to counterparties that did not have the right to sell orrepledge are included in “Trading assets, at fair value” in the condensed consolidated statements offinancial condition and were $122.01 billion and $80.85 billion as of June 2009 and November 2008,respectively. Other assets (primarily real estate and cash) owned and pledged in connection withother secured financings to counterparties that did not have the right to sell or repledge were$6.61 billion and $9.24 billion as of June 2009 and November 2008, respectively.
In addition to repurchase agreements and securities lending agreements, the firm obtainssecured funding through the use of other arrangements. Other secured financings includearrangements that are nonrecourse, that is, only the subsidiary that executed the arrangement or asubsidiary guaranteeing the arrangement is obligated to repay the financing. Other secured financingsconsist of liabilities related to the firm’s William Street program; consolidated VIEs; collateralizedcentral bank financings and other transfers of financial assets that are accounted for as financingsrather than sales under SFAS No. 140 (primarily pledged bank loans and mortgage whole loans); andother structured financing arrangements.
40
THE GOLDMAN SACHS GROUP, INC. and SUBSIDIARIES
NOTES TO CONDENSED CONSOLIDATED FINANCIAL STATEMENTS (Continued)(UNAUDITED)

Other secured financings by maturity are set forth in the table below:
June2009
November2008
As of
(in millions)
Other secured financings (short-term) (1)(2). . . . . . . . . . . . . . . . . . . . . . . . . $14,239 $21,225Other secured financings (long-term):
2010. . . . . . . . . . . . . . . . . . . . . . . . . . . . . . . . . . . . . . . . . . . . . . . . . . . . 3,113 2,1572011. . . . . . . . . . . . . . . . . . . . . . . . . . . . . . . . . . . . . . . . . . . . . . . . . . . . 3,766 4,5782012. . . . . . . . . . . . . . . . . . . . . . . . . . . . . . . . . . . . . . . . . . . . . . . . . . . . 3,195 3,0402013. . . . . . . . . . . . . . . . . . . . . . . . . . . . . . . . . . . . . . . . . . . . . . . . . . . . 1,558 1,3772014. . . . . . . . . . . . . . . . . . . . . . . . . . . . . . . . . . . . . . . . . . . . . . . . . . . . 1,319 1,5122015-thereafter . . . . . . . . . . . . . . . . . . . . . . . . . . . . . . . . . . . . . . . . . . . . 3,107 4,794
Total other secured financings (long-term) (3)(4) . . . . . . . . . . . . . . . . . . . . 16,058 17,458
Total other secured financings (5)(6) . . . . . . . . . . . . . . . . . . . . . . . . . . . . . . $30,297 $38,683
(1) As of June 2009 and November 2008, consists of U.S. dollar-denominated financings of $5.06 billion and$12.53 billion, respectively, with a weighted average interest rate of 1.35% and 2.98%, respectively, andnon-U.S. dollar-denominated financings of $9.18 billion and $8.70 billion, respectively, with a weighted averageinterest rate of 0.62% and 0.95%, respectively, after giving effect to hedging activities. The weighted average interestrates as of June 2009 and November 2008 excluded financial instruments accounted for at fair value underSFAS No. 159.
(2) Includes other secured financings maturing within one year of the financial statement date and other securedfinancings that are redeemable within one year of the financial statement date at the option of the holder.
(3) As of June 2009 and November 2008, consists of U.S. dollar-denominated financings of $9.41 billion and$9.55 billion, respectively, with a weighted average interest rate of 2.80% and 4.62%, respectively, andnon-U.S. dollar-denominated financings of $6.65 billion and $7.91 billion, respectively, with a weighted averageinterest rate of 2.55% and 4.39%, respectively, after giving effect to hedging activities. The weighted average interestrates as of June 2009 and November 2008 excluded financial instruments accounted for at fair value underSFAS No. 159.
(4) Secured long-term financings that are repayable prior to maturity at the option of the firm are reflected at theircontractual maturity dates. Secured long-term financings that are redeemable prior to maturity at the option of theholder are reflected at the dates such options become exercisable.
(5) As of June 2009 and November 2008, $25.83 billion and $31.54 billion, respectively, of these financings werecollateralized by trading assets and $4.47 billion and $7.14 billion, respectively, by other assets (primarily real estateand cash). Other secured financings include $11.50 billion and $13.74 billion of nonrecourse obligations as ofJune 2009 and November 2008, respectively.
(6) As of June 2009, other secured financings includes $16.13 billion, respectively, related to transfers of financial assetsaccounted for as financings rather than sales under SFAS No. 140. Such financings were collateralized by financialassets included in “Trading assets, at fair value” in the condensed consolidated statement of financial condition of$16.54 billion as of June 2009, respectively.
41
THE GOLDMAN SACHS GROUP, INC. and SUBSIDIARIES
NOTES TO CONDENSED CONSOLIDATED FINANCIAL STATEMENTS (Continued)(UNAUDITED)

Note 4. Securitization Activities and Variable Interest Entities
Securitization Activities
The firm securitizes commercial and residential mortgages, government and corporate bondsand other types of financial assets. The firm acts as underwriter of the beneficial interests that aresold to investors. The firm derecognizes financial assets transferred in securitizations, provided it hasrelinquished control over such assets. Transferred assets are accounted for at fair value prior tosecuritization. Net revenues related to these underwriting activities are recognized in connection withthe sales of the underlying beneficial interests to investors.
The firm may have continuing involvement with transferred assets, including: retaining interestsin securitized financial assets, primarily in the form of senior or subordinated securities; retainingservicing rights; and purchasing senior or subordinated securities in connection with secondarymarket-making activities. Retained interests and other interests related to the firm’s continuinginvolvement are accounted for at fair value and are included in “Trading assets, at fair value” in thecondensed consolidated statements of financial condition. See Note 2 for additional informationregarding fair value measurement.
During the three and six months ended June 2009, the firm securitized $12.91 billion and$16.47 billion, respectively, of financial assets in which the firm had continuing involvement as ofJune 2009, including $12.41 billion and $15.88 billion, respectively, of residential mortgages, primarilyin connection with government agency securitizations, and $496 million and $591 million, respectively,of other financial assets. During the three and six months ended May 2008, the firm securitized$3.97 billion and $6.54 billion, respectively, of financial assets, including $2.59 billion and $4.11 billion,respectively, of residential mortgages, $773 million and $773 million, respectively, of commercialmortgages, and $605 million and $1.65 billion, respectively, of other financial assets, primarily inconnection with CLOs. Cash flows received on retained interests were $106 million and $200 millionfor the three and six months ended June 2009, respectively, and $155 million and $271 million for thethree and six months ended May 2008, respectively.
42
THE GOLDMAN SACHS GROUP, INC. and SUBSIDIARIES
NOTES TO CONDENSED CONSOLIDATED FINANCIAL STATEMENTS (Continued)(UNAUDITED)

The following table sets forth certain information related to the firm’s continuing involvement insecuritization entities to which the firm sold assets, as well as the total outstanding principal amount oftransferred assets in which the firm has continuing involvement, as of June 2009 in accordance withFSP No. FAS 140-4 and FIN 46(R)-8. The outstanding principal amount set forth in the tables belowis presented for the purpose of providing information about the size of the securitization entities inwhich the firm has continuing involvement, and is not representative of the firm’s risk of loss. Forretained or purchased interests, the firm’s risk of loss is limited to the fair value of these interests.
Outstandingprincipalamount
Fair value ofretainedinterests
Fair value ofpurchasedinterests (2)
As of June 2009 (1)
(in millions)
Residential mortgage-backed . . . . . . . . . . . . . . . . . . . . $41,352 $1,998 (4) $134Commercial mortgage-backed . . . . . . . . . . . . . . . . . . . . 13,714 236 61Other asset-backed (3) . . . . . . . . . . . . . . . . . . . . . . . . . . 19,225 113 4
Total . . . . . . . . . . . . . . . . . . . . . . . . . . . . . . . . . . . . . . . $74,291 $2,347 $199
(1) As of June 2009, fair value of other continuing involvement excludes $334 million, of purchased interests insecuritization entities where the firm’s involvement was related to secondary market-making activities. Continuinginvolvement also excludes derivative contracts that are used by securitization entities to manage credit, interest rateor foreign exchange risk. See Note 3 for information on the firm’s derivative contracts.
(2) Comprised of senior and subordinated interests purchased in connection with secondary market-making activities inVIEs and QSPEs in which the firm also holds retained interests. In addition to these interests, the firm had othercontinuing involvement in the form of derivative transactions and guarantees with certain VIEs for which the carryingvalue was a net liability of $253 million as of June 2009. The notional amounts of these transactions are included inmaximum exposure to loss in the nonconsolidated VIE table below.
(3) Primarily consists of CDOs backed by corporate and mortgage obligations and CLOs. Outstanding principal amountand fair value of retained interests include $18.07 billion and $76 million, respectively, as of June 2009 related to VIEswhich are also included in the nonconsolidated VIE table below.
(4) Primarily consists of retained interests in government agency QSPEs.
43
THE GOLDMAN SACHS GROUP, INC. and SUBSIDIARIES
NOTES TO CONDENSED CONSOLIDATED FINANCIAL STATEMENTS (Continued)(UNAUDITED)

The following table sets forth the weighted average key economic assumptions used inmeasuring the fair value of the firm’s retained interests and the sensitivity of this fair value toimmediate adverse changes of 10% and 20% in those assumptions:
Mortgage-Backed
OtherAsset-
Backed (2)Mortgage-
Backed
OtherAsset-Backed
Type of Retained Interests (1) Type of Retained Interests (1)As of June 2009 As of November 2008
($ in millions)
Fair value of retained interests . . . . . . . . $2,234 $ 113 $1,415 $ 367 (5)
Weighted average life (years) . . . . . . . . . 5.2 3.6 6.0 5.1
Constant prepayment rate (3) . . . . . . . . . 19.1% N.M. 15.5% 4.5%Impact of 10% adverse change (3) . . . . . $ (20) N.M. $ (14) $ (6)Impact of 20% adverse change (3) . . . . . (40) N.M. (27) (12)
Discount rate (4) . . . . . . . . . . . . . . . . . . . 11.3% N.M. 21.1% 29.2%Impact of 10% adverse change. . . . . . . . $ (62) N.M. $ (46) $ (25)Impact of 20% adverse change. . . . . . . . (119) N.M. (89) (45)
(1) Includes $2.27 billion and $1.53 billion as of June 2009 and November 2008, respectively, held in QSPEs.(2) Due to the nature and current fair value of certain of these retained interests, the weighted average assumptions for
constant prepayment and discount rates and the related sensitivity to adverse changes are not meaningful as ofJune 2009. The firm’s maximum exposure to adverse changes in the value of these interests is the firm’s carryingvalue of $113 million.
(3) Constant prepayment rate is included only for positions for which constant prepayment rate is a key assumption inthe determination of fair value.
(4) The majority of the firm’s mortgage-backed retained interests are U.S. government agency-issued collateralizedmortgage obligations, for which there is no anticipated credit loss. For the remainder of the firm’s retained interests,the expected credit loss assumptions are reflected within the discount rate.
(5) Includes $192 million of retained interests related to transfers of securitized assets that were accounted for assecured financings rather than sales under SFAS No. 140.
44
THE GOLDMAN SACHS GROUP, INC. and SUBSIDIARIES
NOTES TO CONDENSED CONSOLIDATED FINANCIAL STATEMENTS (Continued)(UNAUDITED)

The preceding table does not give effect to the offsetting benefit of other financial instrumentsthat are held to mitigate risks inherent in these retained interests. Changes in fair value based on anadverse variation in assumptions generally cannot be extrapolated because the relationship of thechange in assumptions to the change in fair value is not usually linear. In addition, the impact of achange in a particular assumption is calculated independently of changes in any other assumption. Inpractice, simultaneous changes in assumptions might magnify or counteract the sensitivities disclosedabove.
As of June 2009 and November 2008, the firm held mortgage servicing rights with a fair value of$130 million and $147 million, respectively. These servicing assets represent the firm’s right to receivea future stream of cash flows, such as servicing fees, in excess of the firm’s obligation to serviceresidential mortgages. The fair value of mortgage servicing rights will fluctuate in response to changesin certain economic variables, such as discount rates and loan prepayment rates. The firm estimatesthe fair value of mortgage servicing rights by using valuation models that incorporate these variablesin quantifying anticipated cash flows related to servicing activities. Mortgage servicing rights areincluded in “Trading assets, at fair value” in the condensed consolidated statements of financialcondition and are classified within level 3 of the fair value hierarchy. The following table sets forthchanges in the firm’s mortgage servicing rights, as well as servicing fees earned:
June2009
May2008
June2009
May2008
Three Months Ended Six Months Ended
(in millions)
Balance, beginning of period . . . . . . . . . . . . . . . . . . . $139 $283 $153 $ 93Purchases . . . . . . . . . . . . . . . . . . . . . . . . . . . . . . . — — — 212 (2)
Servicing assets that resulted from transfers offinancial assets . . . . . . . . . . . . . . . . . . . . . . . . . . — — — 3
Changes in fair value due to changes in valuationinputs and assumptions . . . . . . . . . . . . . . . . . . . (9) (35) (23) (60)
Balance, end of period (1). . . . . . . . . . . . . . . . . . . . . . $130 $248 $130 $248
Contractually specified servicing fees. . . . . . . . . . . . . $ 85 $ 72 $177 $137
(1) As of June 2009, the fair value was estimated using a weighted average discount rate of approximately 16% anda weighted average prepayment rate of approximately 27%. As of May 2008, the fair value was estimated usinga weighted average discount rate of approximately 16% and a weighted average prepayment rate ofapproximately 26%.
(2) Primarily related to the acquisition of Litton Loan Servicing LP.
45
THE GOLDMAN SACHS GROUP, INC. and SUBSIDIARIES
NOTES TO CONDENSED CONSOLIDATED FINANCIAL STATEMENTS (Continued)(UNAUDITED)
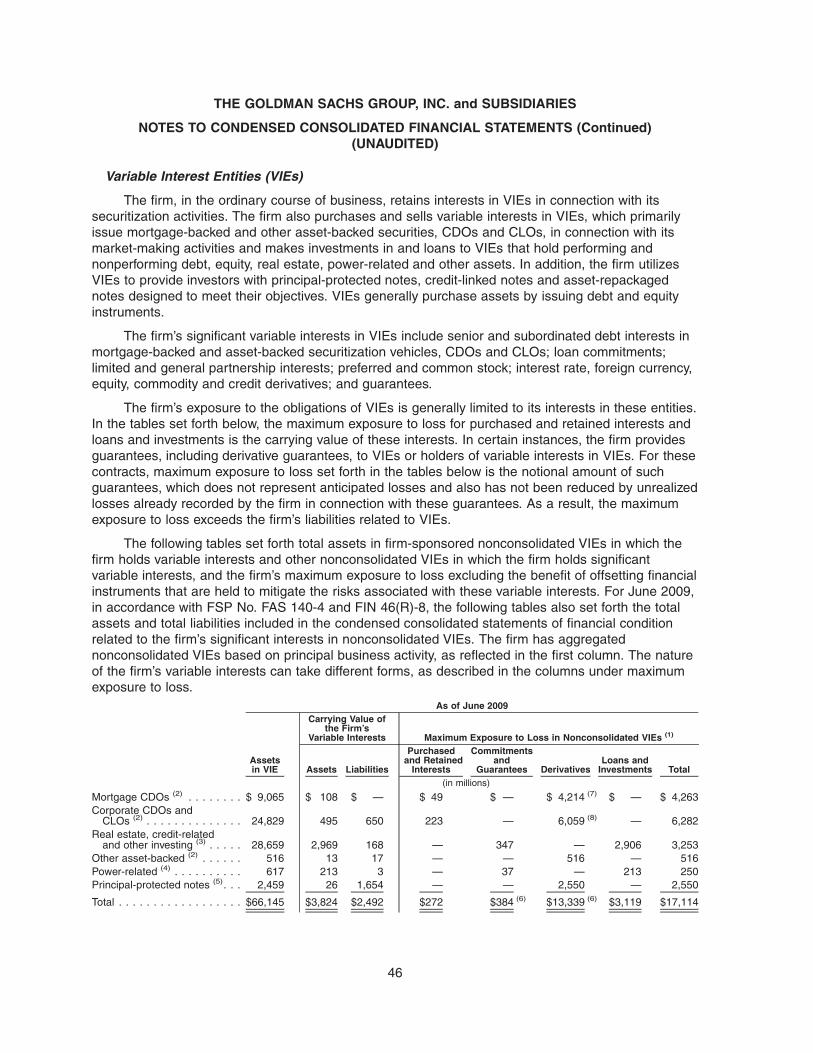
Variable Interest Entities (VIEs)
The firm, in the ordinary course of business, retains interests in VIEs in connection with itssecuritization activities. The firm also purchases and sells variable interests in VIEs, which primarilyissue mortgage-backed and other asset-backed securities, CDOs and CLOs, in connection with itsmarket-making activities and makes investments in and loans to VIEs that hold performing andnonperforming debt, equity, real estate, power-related and other assets. In addition, the firm utilizesVIEs to provide investors with principal-protected notes, credit-linked notes and asset-repackagednotes designed to meet their objectives. VIEs generally purchase assets by issuing debt and equityinstruments.
The firm’s significant variable interests in VIEs include senior and subordinated debt interests inmortgage-backed and asset-backed securitization vehicles, CDOs and CLOs; loan commitments;limited and general partnership interests; preferred and common stock; interest rate, foreign currency,equity, commodity and credit derivatives; and guarantees.
The firm’s exposure to the obligations of VIEs is generally limited to its interests in these entities.In the tables set forth below, the maximum exposure to loss for purchased and retained interests andloans and investments is the carrying value of these interests. In certain instances, the firm providesguarantees, including derivative guarantees, to VIEs or holders of variable interests in VIEs. For thesecontracts, maximum exposure to loss set forth in the tables below is the notional amount of suchguarantees, which does not represent anticipated losses and also has not been reduced by unrealizedlosses already recorded by the firm in connection with these guarantees. As a result, the maximumexposure to loss exceeds the firm’s liabilities related to VIEs.
The following tables set forth total assets in firm-sponsored nonconsolidated VIEs in which thefirm holds variable interests and other nonconsolidated VIEs in which the firm holds significantvariable interests, and the firm’s maximum exposure to loss excluding the benefit of offsetting financialinstruments that are held to mitigate the risks associated with these variable interests. For June 2009,in accordance with FSP No. FAS 140-4 and FIN 46(R)-8, the following tables also set forth the totalassets and total liabilities included in the condensed consolidated statements of financial conditionrelated to the firm’s significant interests in nonconsolidated VIEs. The firm has aggregatednonconsolidated VIEs based on principal business activity, as reflected in the first column. The natureof the firm’s variable interests can take different forms, as described in the columns under maximumexposure to loss.
Assetsin VIE Assets Liabilities
Purchasedand Retained
Interests
Commitmentsand
Guarantees DerivativesLoans and
Investments Total(in millions)
Carrying Value ofthe Firm’s
Variable Interests Maximum Exposure to Loss in Nonconsolidated VIEs (1)
As of June 2009
Mortgage CDOs (2) . . . . . . . . $ 9,065 $ 108 $ — $ 49 $ — $ 4,214 (7) $ — $ 4,263Corporate CDOs and
CLOs (2) . . . . . . . . . . . . . . 24,829 495 650 223 — 6,059 (8) — 6,282Real estate, credit-related
and other investing (3) . . . . . 28,659 2,969 168 — 347 — 2,906 3,253Other asset-backed (2) . . . . . . 516 13 17 — — 516 — 516Power-related (4) . . . . . . . . . . 617 213 3 — 37 — 213 250Principal-protected notes (5). . . 2,459 26 1,654 — — 2,550 — 2,550
Total . . . . . . . . . . . . . . . . . . $66,145 $3,824 $2,492 $272 $384 (6) $13,339 (6) $3,119 $17,114
46
THE GOLDMAN SACHS GROUP, INC. and SUBSIDIARIES
NOTES TO CONDENSED CONSOLIDATED FINANCIAL STATEMENTS (Continued)(UNAUDITED)

Assetsin VIE
Purchasedand Retained
Interests
Commitmentsand
Guarantees DerivativesLoans and
Investments Total
Maximum Exposure to Loss in Nonconsolidated VIEs (1)As of November 2008
(in millions)
Mortgage CDOs . . . . . . . . . . . . . . . . . . . . . . . . $13,061 $242 $ — $ 5,616 (7) $ — $ 5,858Corporate CDOs and CLOs . . . . . . . . . . . . . . . . 8,584 161 — 918 (8) — 1,079Real estate, credit-related and other investing (3) . . 26,898 — 143 — 3,223 3,366Municipal bond securitizations . . . . . . . . . . . . . . . 111 — 111 — — 111Other asset-backed . . . . . . . . . . . . . . . . . . . . . . 4,355 — — 1,084 — 1,084Power-related . . . . . . . . . . . . . . . . . . . . . . . . . . 844 — 37 — 213 250Principal-protected notes (5) . . . . . . . . . . . . . . . . 4,516 — — 4,353 — 4,353
Total . . . . . . . . . . . . . . . . . . . . . . . . . . . . . . . . $58,369 $403 $291 $11,971 $3,436 $16,101
(1) Such amounts do not represent the anticipated losses in connection with these transactions as they exclude the effect ofoffsetting financial instruments that are held to mitigate these risks.
(2) These VIEs are generally financed through the issuance of debt instruments collateralized by assets held by the VIE.Substantially all assets and liabilities held by the firm related to these VIEs are included in “Trading assets, at fair value” and“Trading liabilities, at fair value,” respectively, in the condensed consolidated statement of financial condition.
(3) The firm obtains interests in these VIEs in connection with making investments in real estate, distressed loans and othertypes of debt, mezzanine instruments and equities. These VIEs are generally financed through the issuance of debt andequity instruments which are either collateralized by or indexed to assets held by the VIE. Substantially all assets andliabilities held by the firm related to these VIEs are included in “Trading assets, at fair value” and “Other liabilities andaccrued expenses,” respectively, in the condensed consolidated statement of financial condition.
(4) Assets and liabilities held by the firm related to these VIEs are included in “Other assets” and “Trading liabilities, at fairvalue” in the condensed consolidated statement of financial condition.
(5) Consists of out-of-the-money written put options that provide principal protection to clients invested in various fund products,with risk to the firm mitigated through portfolio rebalancing. Assets related to these VIEs are included in “Trading assets, atfair value” and liabilities related to these VIEs are included in “Other secured financings,” “Unsecured short-term borrowings”or “Unsecured long-term borrowings” in the condensed consolidated statement of financial condition. Assets in VIE, carryingvalue of liabilities and maximum exposure to loss exclude $3.70 billion as of June 2009, associated with guarantees relatedto the firm’s performance under borrowings from the VIE, which are recorded as liabilities in the condensed consolidatedstatement of financial condition. Substantially all of the liabilities included in the table above relate to additional borrowingsfrom the VIE associated with principal protected notes guaranteed by the firm.
(6) The aggregate amounts include $4.95 billion as of June 2009, related to guarantees and derivative transactions with VIEs towhich the firm transferred assets.
(7) Primarily consists of written protection on investment-grade, short-term collateral held by VIEs that have issued CDOs.(8) Primarily consists of total return swaps on CDOs and CLOs. The firm has generally transferred the risks related to the
underlying securities through derivatives with non-VIEs.
47
THE GOLDMAN SACHS GROUP, INC. and SUBSIDIARIES
NOTES TO CONDENSED CONSOLIDATED FINANCIAL STATEMENTS (Continued)(UNAUDITED)

The following table sets forth the firm’s total assets excluding the benefit of offsetting financialinstruments that are held to mitigate the risks associated with its variable interests in consolidatedVIEs. The following table excludes VIEs in which the firm holds a majority voting interest unless theactivities of the VIE are primarily related to securitization, asset-backed financings or single-lesseeleasing arrangements. For June 2009, in accordance with FSP No. FAS 140-4 and FIN 46(R)-8, thefollowing table also sets forth the total liabilities included in the condensed consolidated statement offinancial condition related to the firm’s consolidated VIEs. The firm has aggregated consolidated VIEsbased on principal business activity, as reflected in the first column.
VIEAssets (1)
VIELiabilities (1)
VIEAssets (1)
June 2009 November 2008As of
(in millions)
Real estate, credit-related and other investing . . . . . . . . $1,154 $ 936 (2) $1,560Municipal bond securitizations . . . . . . . . . . . . . . . . . . . . 733 922 (3) 985CDOs, mortgage-backed and other asset-backed . . . . . 626 548 (4) 32Foreign exchange and commodities . . . . . . . . . . . . . . . . 298 297 (5) 652Principal-protected notes . . . . . . . . . . . . . . . . . . . . . . . . 207 207 (6) 215
Total . . . . . . . . . . . . . . . . . . . . . . . . . . . . . . . . . . . . . . . $3,018 $2,910 $3,444
(1) Consolidated VIE assets and liabilities are presented after intercompany eliminations and include assets financed ona nonrecourse basis. Substantially all VIE assets are included in “Trading assets, at fair value” in the condensedconsolidated statements of financial condition.
(2) These VIE liabilities, which are collateralized by the related VIE assets, are included in “Other secured financings” inthe condensed consolidated statement of financial condition and generally do not provide for recourse to the generalcredit of the firm.
(3) These VIE liabilities, which are partially collateralized by the related VIE assets, are included in “Other securedfinancings” in the condensed consolidated statement of financial condition.
(4) These VIE liabilities are included in “Securities sold under agreements to repurchase, at fair value” and “Othersecured financings” in the condensed consolidated statement of financial condition and generally do not provide forrecourse to the general credit of the firm.
(5) These VIE liabilities are primarily included in “Trading liabilities, at fair value” on the condensed consolidatedstatement of financial condition.
(6) These VIE liabilities are included in “Other secured financings” on the condensed consolidated statement of financialcondition.
The firm did not have off-balance-sheet commitments to purchase or finance any CDOs held bystructured investment vehicles as of June 2009 and November 2008.
48
THE GOLDMAN SACHS GROUP, INC. and SUBSIDIARIES
NOTES TO CONDENSED CONSOLIDATED FINANCIAL STATEMENTS (Continued)(UNAUDITED)

Note 5. Deposits
The following table sets forth deposits as of June 2009 and November 2008:
June2009
November2008
As of
(in millions)
U.S. offices (1) . . . . . . . . . . . . . . . . . . . . . . . . . . . . . . . . . . . . . . . . . . . . . . $35,665 $23,018Non-U.S. offices (2) . . . . . . . . . . . . . . . . . . . . . . . . . . . . . . . . . . . . . . . . . . 5,792 4,625
Total . . . . . . . . . . . . . . . . . . . . . . . . . . . . . . . . . . . . . . . . . . . . . . . . . . . . . $41,457 $27,643
(1) Substantially all U.S. deposits were interest-bearing and were held at GS Bank USA.(2) Substantially all non-U.S. deposits were interest-bearing and held at Goldman Sachs Bank (Europe) PLC (GS Bank
Europe).
Included in the above table are time deposits of $13.01 billion and $8.49 billion as of June 2009and November 2008, respectively. The following table sets forth the maturities of time deposits as ofJune 2009:
U.S. Non-U.S. TotalAs of June 2009
(in millions)
2009 . . . . . . . . . . . . . . . . . . . . . . . . . . . . . . . . . . . . . . . . . . . . . $ 3,705 $ 981 $ 4,6862010 . . . . . . . . . . . . . . . . . . . . . . . . . . . . . . . . . . . . . . . . . . . . . 1,516 14 1,5302011 . . . . . . . . . . . . . . . . . . . . . . . . . . . . . . . . . . . . . . . . . . . . . 1,593 — 1,5932012 . . . . . . . . . . . . . . . . . . . . . . . . . . . . . . . . . . . . . . . . . . . . . 839 — 8392013 . . . . . . . . . . . . . . . . . . . . . . . . . . . . . . . . . . . . . . . . . . . . . 1,783 25 1,8082014-thereafter . . . . . . . . . . . . . . . . . . . . . . . . . . . . . . . . . . . . . 2,551 — 2,551
Total. . . . . . . . . . . . . . . . . . . . . . . . . . . . . . . . . . . . . . . . . . . . . . $11,987 $1,020 $13,007
49
THE GOLDMAN SACHS GROUP, INC. and SUBSIDIARIES
NOTES TO CONDENSED CONSOLIDATED FINANCIAL STATEMENTS (Continued)(UNAUDITED)

Note 6. Short-Term Borrowings
As of June 2009 and November 2008, short-term borrowings were $49.41 billion and$73.89 billion, respectively, comprised of $14.24 billion and $21.23 billion, respectively, included in“Other secured financings” in the condensed consolidated statements of financial condition and$35.17 billion and $52.66 billion, respectively, of unsecured short-term borrowings. See Note 3 forinformation on other secured financings.
Unsecured short-term borrowings include the portion of unsecured long-term borrowingsmaturing within one year of the financial statement date and unsecured long-term borrowings that areredeemable within one year of the financial statement date at the option of the holder. The firmaccounts for promissory notes, commercial paper and certain hybrid financial instruments at fair valueunder SFAS No. 155 or SFAS No. 159. Short-term borrowings that are not recorded at fair value arerecorded based on the amount of cash received plus accrued interest, and such amounts approximatefair value due to the short-term nature of the obligations.
Unsecured short-term borrowings are set forth below:
June2009
November2008
As of
(in millions)
Current portion of unsecured long-term borrowings . . . . . . . . . . . . . . . . . . $16,062 $26,281Hybrid financial instruments . . . . . . . . . . . . . . . . . . . . . . . . . . . . . . . . . . . . 8,938 12,086Promissory notes (1) . . . . . . . . . . . . . . . . . . . . . . . . . . . . . . . . . . . . . . . . . . 3,294 6,944Commercial paper (2) . . . . . . . . . . . . . . . . . . . . . . . . . . . . . . . . . . . . . . . . . 463 1,125Other short-term borrowings (3) . . . . . . . . . . . . . . . . . . . . . . . . . . . . . . . . . 6,416 6,222
Total (4) . . . . . . . . . . . . . . . . . . . . . . . . . . . . . . . . . . . . . . . . . . . . . . . . . . . $35,173 $52,658
(1) Includes $3.28 billion and $3.42 billion as of June 2009 and November 2008, respectively, guaranteed by the FederalDeposit Insurance Corporation (FDIC) under the Temporary Liquidity Guarantee Program (TLGP).
(2) Includes $0 and $751 million as of June 2009 and November 2008, respectively, guaranteed by the FDIC under theTLGP.
(3) Includes $1.11 billion and $0 as of June 2009 and November 2008, respectively, guaranteed by the FDIC under theTLGP.
(4) The weighted average interest rates for these borrowings, after giving effect to hedging activities, were 1.70% and3.37% as of June 2009 and November 2008, respectively, and excluded financial instruments accounted for at fairvalue under SFAS No. 155 or SFAS No. 159.
50
THE GOLDMAN SACHS GROUP, INC. and SUBSIDIARIES
NOTES TO CONDENSED CONSOLIDATED FINANCIAL STATEMENTS (Continued)(UNAUDITED)

Note 7. Long-Term Borrowings
As of June 2009 and November 2008, long-term borrowings were $207.30 billion and$185.68 billion, respectively, comprised of $16.06 billion and $17.46 billion, respectively, included in“Other secured financings” in the condensed consolidated statements of financial condition and$191.24 billion and $168.22 billion, respectively, of unsecured long-term borrowings. See Note 3 forinformation regarding other secured financings.
The firm’s unsecured long-term borrowings extend through 2043 and consist principally of seniorborrowings.
Unsecured long-term borrowings are set forth below:
June2009
November2008
As of
(in millions)
Fixed rate obligations (1) . . . . . . . . . . . . . . . . . . . . . . . . . . . . . . . . . . . . . $118,723 $103,825Floating rate obligations (2) . . . . . . . . . . . . . . . . . . . . . . . . . . . . . . . . . . . 72,519 64,395
Total (3) . . . . . . . . . . . . . . . . . . . . . . . . . . . . . . . . . . . . . . . . . . . . . . . . . . $191,242 $168,220
(1) As of June 2009 and November 2008, $79.82 billion and $70.08 billion, respectively, of the firm’s fixed rate debtobligations were denominated in U.S. dollars and interest rates ranged from 1.63% to 10.04% and from 3.87% to10.04%, respectively. As of June 2009 and November 2008, $38.90 billion and $33.75 billion, respectively, of thefirm’s fixed rate debt obligations were denominated in non-U.S. dollars and interest rates ranged from 0.67% to12.65% and from 0.67% to 8.88%, respectively.
(2) As of June 2009 and November 2008, $37.77 billion and $32.41 billion, respectively, of the firm’s floating rate debtobligations were denominated in U.S. dollars. As of June 2009 and November 2008, $34.75 billion and $31.99 billion,respectively, of the firm’s floating rate debt obligations were denominated in non-U.S. dollars. Floating interest ratesgenerally are based on LIBOR or the federal funds target rate. Equity-linked and indexed instruments are included infloating rate obligations.
(3) Includes $20.75 billion and $0 as of June 2009 and November 2008, respectively, guaranteed by the FDIC under theTLGP.
Unsecured long-term borrowings by maturity date are set forth below (in millions):As of
June 2009
2010. . . . . . . . . . . . . . . . . . . . . . . . . . . . . . . . . . . . . . . . . . . . . . . . . . . . . . . . . . . . . . $ 9,3032011. . . . . . . . . . . . . . . . . . . . . . . . . . . . . . . . . . . . . . . . . . . . . . . . . . . . . . . . . . . . . . 23,7662012. . . . . . . . . . . . . . . . . . . . . . . . . . . . . . . . . . . . . . . . . . . . . . . . . . . . . . . . . . . . . . 26,4532013. . . . . . . . . . . . . . . . . . . . . . . . . . . . . . . . . . . . . . . . . . . . . . . . . . . . . . . . . . . . . . 23,0882014. . . . . . . . . . . . . . . . . . . . . . . . . . . . . . . . . . . . . . . . . . . . . . . . . . . . . . . . . . . . . . 18,0552015-thereafter . . . . . . . . . . . . . . . . . . . . . . . . . . . . . . . . . . . . . . . . . . . . . . . . . . . . . . 90,577
Total (1)(2) . . . . . . . . . . . . . . . . . . . . . . . . . . . . . . . . . . . . . . . . . . . . . . . . . . . . . . . . . . $191,242
(1) Unsecured long-term borrowings maturing within one year of the financial statement date and unsecured long-termborrowings that are redeemable within one year of the financial statement date at the option of the holder areincluded as unsecured short-term borrowings in the condensed consolidated statements of financial condition.
(2) Unsecured long-term borrowings that are repayable prior to maturity at the option of the firm are reflected at theircontractual maturity dates. Unsecured long-term borrowings that are redeemable prior to maturity at the option of theholder are reflected at the dates such options become exercisable.
51
THE GOLDMAN SACHS GROUP, INC. and SUBSIDIARIES
NOTES TO CONDENSED CONSOLIDATED FINANCIAL STATEMENTS (Continued)(UNAUDITED)

The firm enters into derivative contracts to effectively convert a substantial portion of itsunsecured long-term borrowings which are not accounted for at fair value into floating rate obligations.Accordingly, excluding the cumulative impact of changes in the firm’s credit spreads, the carryingvalue of unsecured long-term borrowings approximated fair value as of June 2009 andNovember 2008. For unsecured long-term borrowings for which the firm did not elect the fair valueoption, the cumulative impact due to the widening of the firm’s own credit spreads would be areduction in the carrying value of total unsecured long-term borrowings of approximately 3% and 9%as of June 2009 and November 2008, respectively.
The effective weighted average interest rates for unsecured long-term borrowings are set forthbelow:
Amount Rate Amount RateJune 2009 November 2008
As of
($ in millions)
Fixed rate obligations . . . . . . . . . . . . . . . . . . . . . . . . . . . $ 4,225 6.51% $ 4,015 4.97%Floating rate obligations (1) . . . . . . . . . . . . . . . . . . . . . . . 187,017 0.96 164,205 2.66
Total (2) . . . . . . . . . . . . . . . . . . . . . . . . . . . . . . . . . . . . . . $191,242 1.11 $168,220 2.73
(1) Includes fixed rate obligations that have been converted into floating rate obligations through derivative contracts.(2) The weighted average interest rates as of June 2009 and November 2008 excluded financial instruments accounted
for at fair value under SFAS No. 155 or SFAS No. 159.
Subordinated Borrowings
Unsecured long-term borrowings included subordinated borrowings with outstanding principalamounts of $19.17 billion and $19.26 billion as of June 2009 and November 2008, respectively, as setforth below.
Junior Subordinated Debt Issued to Trusts in Connection with Fixed-to-Floating andFloating Rate Normal Automatic Preferred Enhanced Capital Securities. In 2007, Group Inc.issued a total of $2.25 billion of remarketable junior subordinated debt to Goldman Sachs Capital IIand Goldman Sachs Capital III (APEX Trusts), Delaware statutory trusts that, in turn, issued$2.25 billion of guaranteed perpetual Automatic Preferred Enhanced Capital Securities (APEX) to thirdparties and a de minimis amount of common securities to Group Inc. Group Inc. also entered intocontracts with the APEX Trusts to sell $2.25 billion of perpetual non-cumulative preferred stock to beissued by Group Inc. (the stock purchase contracts). The APEX Trusts are wholly owned financesubsidiaries of the firm for regulatory and legal purposes but are not consolidated for accountingpurposes.
The firm pays interest semi-annually on $1.75 billion of junior subordinated debt issued toGoldman Sachs Capital II at a fixed annual rate of 5.59% and the debt matures on June 1, 2043. Thefirm pays interest quarterly on $500 million of junior subordinated debt issued to Goldman SachsCapital III at a rate per annum equal to three-month LIBOR plus 0.57% and the debt matures onSeptember 1, 2043. In addition, the firm makes contract payments at a rate of 0.20% per annum onthe stock purchase contracts held by the APEX Trusts. The firm has the right to defer payments onthe junior subordinated debt and the stock purchase contracts, subject to limitations, and thereforecause payment on the APEX to be deferred. During any such extension period, the firm will not bepermitted to, among other things, pay dividends on or make certain repurchases of its common orpreferred stock. The junior subordinated debt is junior in right of payment to all of Group Inc.’s seniorindebtedness and all of Group Inc.’s other subordinated borrowings.
52
THE GOLDMAN SACHS GROUP, INC. and SUBSIDIARIES
NOTES TO CONDENSED CONSOLIDATED FINANCIAL STATEMENTS (Continued)(UNAUDITED)
In connection with the APEX issuance, the firm covenanted in favor of certain of its debtholders,who are initially the holders of Group Inc.’s 6.345% Junior Subordinated Debentures dueFebruary 15, 2034, that, subject to certain exceptions, the firm would not redeem or purchase(i) Group Inc.’s junior subordinated debt issued to the APEX Trusts prior to the applicable stockpurchase date or (ii) APEX or shares of Group Inc.’s Series E or Series F Preferred Stock prior to thedate that is ten years after the applicable stock purchase date, unless the applicable redemption orpurchase price does not exceed a maximum amount determined by reference to the aggregateamount of net cash proceeds that the firm has received from the sale of qualifying equity securitiesduring the 180-day period preceding the redemption or purchase.
The firm has accounted for the stock purchase contracts as equity instruments under EITF IssueNo. 00-19, “Accounting for Derivative Financial Instruments Indexed to, and Potentially Settled in, aCompany’s Own Stock,” and, accordingly, recorded the cost of the stock purchase contracts as areduction to additional paid-in capital. See Note 9 for information on the preferred stock thatGroup Inc. will issue in connection with the stock purchase contracts.
Junior Subordinated Debt Issued to a Trust in Connection with Trust Preferred Securities.Group Inc. issued $2.84 billion of junior subordinated debentures in 2004 to Goldman Sachs Capital I(Trust), a Delaware statutory trust that, in turn, issued $2.75 billion of guaranteed preferred beneficialinterests to third parties and $85 million of common beneficial interests to Group Inc. and invested theproceeds from the sale in junior subordinated debentures issued by Group Inc. The Trust is a whollyowned finance subsidiary of the firm for regulatory and legal purposes but is not consolidated foraccounting purposes.
The firm pays interest semi-annually on these debentures at an annual rate of 6.345% and thedebentures mature on February 15, 2034. The coupon rate and the payment dates applicable to thebeneficial interests are the same as the interest rate and payment dates applicable to the debentures.The firm has the right, from time to time, to defer payment of interest on the debentures, and,therefore, cause payment on the Trust’s preferred beneficial interests to be deferred, in each case upto ten consecutive semi-annual periods. During any such extension period, the firm will not bepermitted to, among other things, pay dividends on or make certain repurchases of its common stock.The Trust is not permitted to pay any distributions on the common beneficial interests held byGroup Inc. unless all dividends payable on the preferred beneficial interests have been paid in full.These debentures are junior in right of payment to all of Group Inc.’s senior indebtedness and all ofGroup Inc.’s subordinated borrowings, other than the junior subordinated debt issued in connectionwith the Normal Automatic Preferred Enhanced Capital Securities.
Subordinated Debt. As of June 2009, the firm had $14.08 billion of other subordinated debtoutstanding with maturities ranging from fiscal 2010 to 2038. The effective weighted average interestrate on this debt was 0.53%, after giving effect to derivative contracts used to convert fixed rateobligations into floating rate obligations. As of November 2008, the firm had $14.17 billion of othersubordinated debt outstanding with maturities ranging from fiscal 2009 to 2038. The effective weightedaverage interest rate on this debt was 1.99%, after giving effect to derivative contracts used to convertfixed rate obligations into floating rate obligations. This debt is junior in right of payment to all of thefirm’s senior indebtedness.
53
THE GOLDMAN SACHS GROUP, INC. and SUBSIDIARIES
NOTES TO CONDENSED CONSOLIDATED FINANCIAL STATEMENTS (Continued)(UNAUDITED)

Note 8. Commitments, Contingencies and Guarantees
Commitments
The following table summarizes the firm’s commitments as of June 2009 and November 2008:
Remainderof 2009
2010-2011
2012-2013
2014-Thereafter
June2009
November2008
Commitment Amount by Fiscal Periodof Expiration as of June 2009 Total Commitments as of
(in millions)
Commitments to extend credit (1)
Commercial lending:Investment-grade . . . . . . . . . . . . $ 990 $ 4,675 $ 2,181 $ 75 $ 7,921 $ 8,007Non-investment-grade (2) . . . . . . 921 1,933 4,309 349 7,512 9,318
William Street program . . . . . . . . . 1,441 9,290 13,009 439 24,179 22,610Warehouse financing. . . . . . . . . . . 292 40 — — 332 1,101
Total commitments to extend credit . . 3,644 15,938 19,499 863 39,944 41,036Forward starting resale and
securities borrowing agreements . . 57,373 1,201 — — 58,574 61,455Forward starting repurchase and
securities lending agreements . . . . 12,638 — — — 12,638 6,948Underwriting commitments . . . . . . . . 1,858 — — — 1,858 241Letters of credit (3) . . . . . . . . . . . . . . 2,890 564 179 1 3,634 7,251Investment commitments (4) . . . . . . . 2,112 10,598 110 903 13,723 14,266Construction-related
commitments (5) . . . . . . . . . . . . . . 340 50 — — 390 483Other . . . . . . . . . . . . . . . . . . . . . . . . 130 97 27 24 278 260
Total commitments . . . . . . . . . . . . . . $80,985 $28,448 $19,815 $1,791 $131,039 $131,940
(1) Commitments to extend credit are presented net of amounts syndicated to third parties.(2) Included within non-investment-grade commitments as of June 2009 and November 2008 were $1.31 billion and
$2.07 billion, respectively, related to leveraged lending capital market transactions; $105 million and $164 million,respectively, related to commercial real estate transactions; and $6.09 billion and $7.09 billion, respectively, arising fromother unfunded credit facilities. Including funded loans, the total notional amount of the firm’s leveraged lending capitalmarket transactions was $5.38 billion and $7.97 billion as of June 2009 and November 2008, respectively.
(3) Consists of commitments under letters of credit issued by various banks which the firm provides to counterparties in lieu ofsecurities or cash to satisfy various collateral and margin deposit requirements.
(4) Consists of the firm’s commitments to invest in private equity, real estate and other assets directly and through funds thatthe firm raises and manages in connection with its merchant banking and other investing activities, consisting of $3.09 billionand $3.15 billion as of June 2009 and November 2008, respectively, related to real estate private investments and$10.63 billion and $11.12 billion as of June 2009 and November 2008, respectively, related to corporate and other privateinvestments. Such commitments include $12.21 billion and $12.25 billion as of June 2009 and November 2008, respectively,of commitments to invest in funds managed by the firm, which will be funded at market value on the date of investment.
(5) Includes commitments of $348 million and $388 million as of June 2009 and November 2008, respectively, related to thefirm’s new headquarters in New York City, which is expected to cost between $2.05 billion and $2.15 billion. The firm haspartially financed this construction project with $1.65 billion of tax-exempt Liberty Bonds.
54
THE GOLDMAN SACHS GROUP, INC. and SUBSIDIARIES
NOTES TO CONDENSED CONSOLIDATED FINANCIAL STATEMENTS (Continued)(UNAUDITED)

Commitments to Extend Credit. The firm’s commitments to extend credit are agreements tolend to counterparties that have fixed termination dates and are contingent on the satisfaction of allconditions to borrowing set forth in the contract. Since these commitments may expire unused or bereduced or cancelled at the counterparty’s request, the total commitment amount does not necessarilyreflect the actual future cash flow requirements. The firm accounts for these commitments at fairvalue. To the extent that the firm recognizes losses on these commitments, such losses are recordedwithin the firm’s Trading and Principal Investments segment net of any related underwriting fees.
• Commercial lending commitments. The firm’s commercial lending commitments aregenerally extended in connection with contingent acquisition financing and other types ofcorporate lending as well as commercial real estate financing. The total commitment amountdoes not necessarily reflect the actual future cash flow requirements, as the firm maysyndicate all or substantial portions of these commitments in the future, the commitments mayexpire unused, or the commitments may be cancelled or reduced at the request of thecounterparty. In addition, commitments that are extended for contingent acquisition financingare often intended to be short-term in nature, as borrowers often seek to replace them withother funding sources.
• William Street program. Substantially all of the commitments provided under the WilliamStreet credit extension program are to investment-grade corporate borrowers. Commitmentsunder the program are principally extended by William Street Commitment Corporation(Commitment Corp.), a consolidated wholly owned subsidiary of GS Bank USA, GS Bank USAand other subsidiaries of GS Bank USA. The commitments extended by Commitment Corp.are supported, in part, by funding raised by William Street Funding Corporation (FundingCorp.), another consolidated wholly owned subsidiary of GS Bank USA. The assets andliabilities of Commitment Corp. and Funding Corp. are legally separated from other assets andliabilities of the firm. The assets of Commitment Corp. and of Funding Corp. will not beavailable to their respective shareholders until the claims of their respective creditors havebeen paid. In addition, no affiliate of either Commitment Corp. or Funding Corp., except inlimited cases as expressly agreed in writing, is responsible for any obligation of either entity.With respect to most of the William Street commitments, Sumitomo Mitsui Financial Group,Inc. (SMFG) provides the firm with credit loss protection that is generally limited to 95% of thefirst loss the firm realizes on approved loan commitments, up to a maximum of $1.00 billion. Inaddition, subject to the satisfaction of certain conditions, upon the firm’s request, SMFG willprovide protection for 70% of additional losses on such commitments, up to a maximum of$1.13 billion, of which $375 million of protection has been provided as of June 2009 andNovember 2008. The firm also uses other financial instruments to mitigate credit risks relatedto certain William Street commitments not covered by SMFG.
• Warehouse financing. The firm provides financing for the warehousing of financial assets.These arrangements are secured by the warehoused assets, primarily consisting ofcommercial mortgages as of June 2009 and November 2008.
55
THE GOLDMAN SACHS GROUP, INC. and SUBSIDIARIES
NOTES TO CONDENSED CONSOLIDATED FINANCIAL STATEMENTS (Continued)(UNAUDITED)

Leases. The firm has contractual obligations under long-term noncancelable leaseagreements, principally for office space, expiring on various dates through 2069. Certain agreementsare subject to periodic escalation provisions for increases in real estate taxes and other charges.Future minimum rental payments, net of minimum sublease rentals are set forth below (in millions):
Remainder of 2009 . . . . . . . . . . . . . . . . . . . . . . . . . . . . . . . . . . . . . . . . . . . . . . . . . . . $ 2492010 . . . . . . . . . . . . . . . . . . . . . . . . . . . . . . . . . . . . . . . . . . . . . . . . . . . . . . . . . . . . . . 4662011 . . . . . . . . . . . . . . . . . . . . . . . . . . . . . . . . . . . . . . . . . . . . . . . . . . . . . . . . . . . . . . 3602012 . . . . . . . . . . . . . . . . . . . . . . . . . . . . . . . . . . . . . . . . . . . . . . . . . . . . . . . . . . . . . . 2992013 . . . . . . . . . . . . . . . . . . . . . . . . . . . . . . . . . . . . . . . . . . . . . . . . . . . . . . . . . . . . . . 2712014-thereafter . . . . . . . . . . . . . . . . . . . . . . . . . . . . . . . . . . . . . . . . . . . . . . . . . . . . . . 1,780
Total . . . . . . . . . . . . . . . . . . . . . . . . . . . . . . . . . . . . . . . . . . . . . . . . . . . . . . . . . . . . . . $3,425
Contingencies
The firm is involved in a number of judicial, regulatory and arbitration proceedings concerningmatters arising in connection with the conduct of its businesses. Management believes, based oncurrently available information, that the results of such proceedings, in the aggregate, will not have amaterial adverse effect on the firm’s financial condition, but may be material to the firm’s operatingresults for any particular period, depending, in part, upon the operating results for such period. Giventhe inherent difficulty of predicting the outcome of the firm’s litigation and regulatory matters,particularly in cases or proceedings in which substantial or indeterminate damages or fines aresought, the firm cannot estimate losses or ranges of losses for cases or proceedings where there isonly a reasonable possibility that a loss may be incurred.
In connection with its insurance business, the firm is contingently liable to provide guaranteedminimum death and income benefits to certain contract holders and has established a reserve relatedto $6.09 billion and $6.13 billion of contract holder account balances as of June 2009 andNovember 2008, respectively, for such benefits. The weighted average attained age of these contractholders was 68 years as of both June 2009 and November 2008. The net amount at risk, representingguaranteed minimum death and income benefits in excess of contract holder account balances, was$2.49 billion and $2.96 billion as of June 2009 and November 2008, respectively. See Note 12 formore information on the firm’s insurance liabilities.
Guarantees
The firm enters into various derivative contracts that meet the definition of a guarantee underFIN 45, “Guarantor’s Accounting and Disclosure Requirements for Guarantees, Including IndirectGuarantees of Indebtedness of Others,” as amended by FSP No. FAS 133-1 and FIN 45-4.
FIN 45 does not require disclosures about derivative contracts if such contracts may be cashsettled and the firm has no basis to conclude it is probable that the counterparties held, at inception,the underlying instruments related to the derivative contracts. The firm has concluded that theseconditions have been met for certain large, internationally active commercial and investment bankcounterparties and certain other counterparties. Accordingly, the firm has not included such contractsin the tables below.
The firm, in its capacity as an agency lender, indemnifies most of its securities lendingcustomers against losses incurred in the event that borrowers do not return securities and thecollateral held is insufficient to cover the market value of the securities borrowed.
56
THE GOLDMAN SACHS GROUP, INC. and SUBSIDIARIES
NOTES TO CONDENSED CONSOLIDATED FINANCIAL STATEMENTS (Continued)(UNAUDITED)
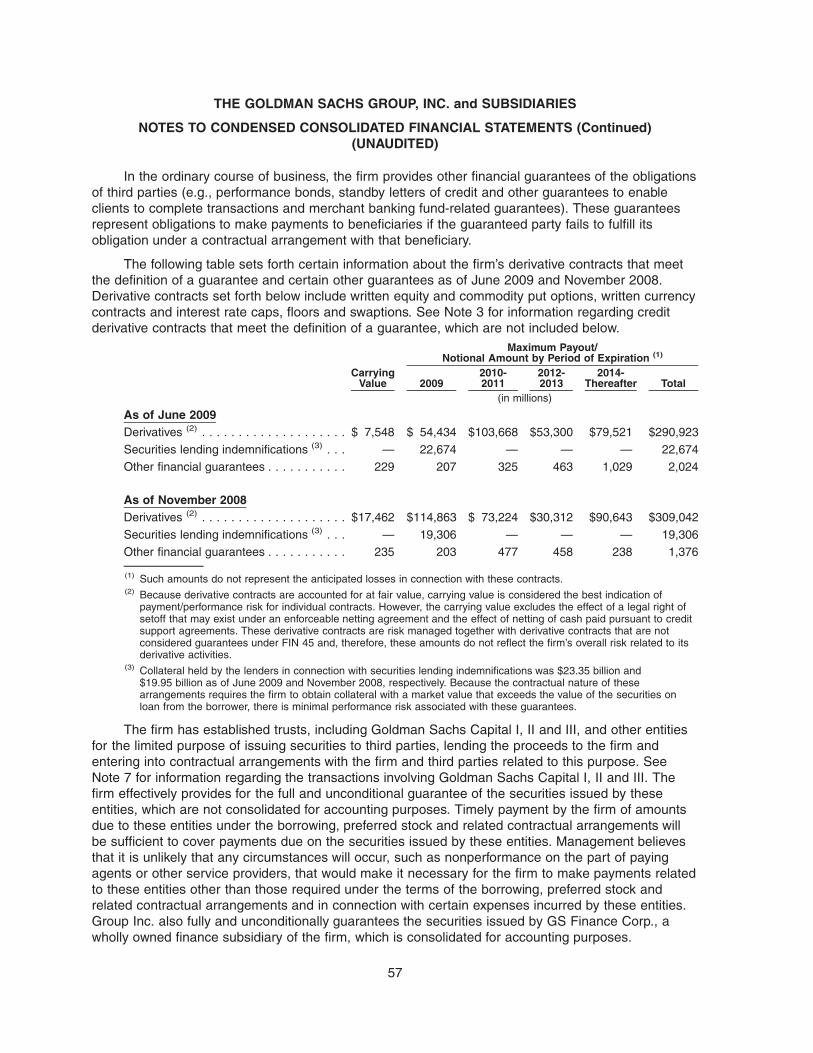
In the ordinary course of business, the firm provides other financial guarantees of the obligationsof third parties (e.g., performance bonds, standby letters of credit and other guarantees to enableclients to complete transactions and merchant banking fund-related guarantees). These guaranteesrepresent obligations to make payments to beneficiaries if the guaranteed party fails to fulfill itsobligation under a contractual arrangement with that beneficiary.
The following table sets forth certain information about the firm’s derivative contracts that meetthe definition of a guarantee and certain other guarantees as of June 2009 and November 2008.Derivative contracts set forth below include written equity and commodity put options, written currencycontracts and interest rate caps, floors and swaptions. See Note 3 for information regarding creditderivative contracts that meet the definition of a guarantee, which are not included below.
CarryingValue 2009
2010-2011
2012-2013
2014-Thereafter Total
Maximum Payout/Notional Amount by Period of Expiration (1)
(in millions)
As of June 2009Derivatives (2) . . . . . . . . . . . . . . . . . . . . $ 7,548 $ 54,434 $103,668 $53,300 $79,521 $290,923
Securities lending indemnifications (3) . . . — 22,674 — — — 22,674Other financial guarantees . . . . . . . . . . . 229 207 325 463 1,029 2,024
As of November 2008Derivatives (2) . . . . . . . . . . . . . . . . . . . . $17,462 $114,863 $ 73,224 $30,312 $90,643 $309,042
Securities lending indemnifications (3) . . . — 19,306 — — — 19,306Other financial guarantees . . . . . . . . . . . 235 203 477 458 238 1,376
(1) Such amounts do not represent the anticipated losses in connection with these contracts.(2) Because derivative contracts are accounted for at fair value, carrying value is considered the best indication of
payment/performance risk for individual contracts. However, the carrying value excludes the effect of a legal right ofsetoff that may exist under an enforceable netting agreement and the effect of netting of cash paid pursuant to creditsupport agreements. These derivative contracts are risk managed together with derivative contracts that are notconsidered guarantees under FIN 45 and, therefore, these amounts do not reflect the firm’s overall risk related to itsderivative activities.
(3) Collateral held by the lenders in connection with securities lending indemnifications was $23.35 billion and$19.95 billion as of June 2009 and November 2008, respectively. Because the contractual nature of thesearrangements requires the firm to obtain collateral with a market value that exceeds the value of the securities onloan from the borrower, there is minimal performance risk associated with these guarantees.
The firm has established trusts, including Goldman Sachs Capital I, II and III, and other entitiesfor the limited purpose of issuing securities to third parties, lending the proceeds to the firm andentering into contractual arrangements with the firm and third parties related to this purpose. SeeNote 7 for information regarding the transactions involving Goldman Sachs Capital I, II and III. Thefirm effectively provides for the full and unconditional guarantee of the securities issued by theseentities, which are not consolidated for accounting purposes. Timely payment by the firm of amountsdue to these entities under the borrowing, preferred stock and related contractual arrangements willbe sufficient to cover payments due on the securities issued by these entities. Management believesthat it is unlikely that any circumstances will occur, such as nonperformance on the part of payingagents or other service providers, that would make it necessary for the firm to make payments relatedto these entities other than those required under the terms of the borrowing, preferred stock andrelated contractual arrangements and in connection with certain expenses incurred by these entities.Group Inc. also fully and unconditionally guarantees the securities issued by GS Finance Corp., awholly owned finance subsidiary of the firm, which is consolidated for accounting purposes.
57
THE GOLDMAN SACHS GROUP, INC. and SUBSIDIARIES
NOTES TO CONDENSED CONSOLIDATED FINANCIAL STATEMENTS (Continued)(UNAUDITED)

In the ordinary course of business, the firm indemnifies and guarantees certain serviceproviders, such as clearing and custody agents, trustees and administrators, against specifiedpotential losses in connection with their acting as an agent of, or providing services to, the firm or itsaffiliates. The firm also indemnifies some clients against potential losses incurred in the eventspecified third-party service providers, including sub-custodians and third-party brokers, improperlyexecute transactions. In addition, the firm is a member of payment, clearing and settlement networksas well as securities exchanges around the world that may require the firm to meet the obligations ofsuch networks and exchanges in the event of member defaults. In connection with its prime brokerageand clearing businesses, the firm agrees to clear and settle on behalf of its clients the transactionsentered into by them with other brokerage firms. The firm’s obligations in respect of such transactionsare secured by the assets in the client’s account as well as any proceeds received from thetransactions cleared and settled by the firm on behalf of the client. In connection with joint ventureinvestments, the firm may issue loan guarantees under which it may be liable in the event of fraud,misappropriation, environmental liabilities and certain other matters involving the borrower. The firm isunable to develop an estimate of the maximum payout under these guarantees and indemnifications.However, management believes that it is unlikely the firm will have to make any material paymentsunder these arrangements, and no liabilities related to these guarantees and indemnifications havebeen recognized in the condensed consolidated statements of financial condition as of June 2009 andNovember 2008.
The firm provides representations and warranties to counterparties in connection with a varietyof commercial transactions and occasionally indemnifies them against potential losses caused by thebreach of those representations and warranties. The firm may also provide indemnifications protectingagainst changes in or adverse application of certain U.S. tax laws in connection with ordinary-coursetransactions such as securities issuances, borrowings or derivatives. In addition, the firm may provideindemnifications to some counterparties to protect them in the event additional taxes are owed orpayments are withheld, due either to a change in or an adverse application of certain non-U.S. taxlaws. These indemnifications generally are standard contractual terms and are entered into in theordinary course of business. Generally, there are no stated or notional amounts included in theseindemnifications, and the contingencies triggering the obligation to indemnify are not expected tooccur. The firm is unable to develop an estimate of the maximum payout under these guarantees andindemnifications. However, management believes that it is unlikely the firm will have to make anymaterial payments under these arrangements, and no liabilities related to these arrangements havebeen recognized in the condensed consolidated statements of financial condition as of June 2009 andNovember 2008.
Group Inc. has guaranteed the payment obligations of Goldman, Sachs & Co. (GS&Co.),GS Bank USA and GS Bank Europe, subject to certain exceptions. In November 2008, the firmcontributed subsidiaries into GS Bank USA, and Group Inc. agreed to guarantee certain losses,including credit-related losses, relating to assets held by the contributed entities. In connection withthis guarantee, Group Inc. also agreed to pledge to GS Bank USA certain collateral, includinginterests in subsidiaries and other illiquid assets. In addition, Group Inc. guarantees many of theobligations of its other consolidated subsidiaries on a transaction-by-transaction basis, as negotiatedwith counterparties. Group Inc. is unable to develop an estimate of the maximum payout under itssubsidiary guarantees; however, because these guaranteed obligations are also obligations ofconsolidated subsidiaries included in the table above, Group Inc.’s liabilities as guarantor are notseparately disclosed.
58
THE GOLDMAN SACHS GROUP, INC. and SUBSIDIARIES
NOTES TO CONDENSED CONSOLIDATED FINANCIAL STATEMENTS (Continued)(UNAUDITED)

Note 9. Shareholders’ Equity
Common and Preferred Equity
During the second quarter of 2009, Group Inc. completed a public offering of 46.7 millioncommon shares at $123.00 per share for total proceeds of $5.75 billion.
In June 2009, Group Inc. repurchased from the U.S. Department of the Treasury (U.S. Treasury)the 10.0 million shares of the Company’s Fixed Rate Cumulative Perpetual Preferred Stock, Series H(Series H Preferred Stock), that were issued to the U.S. Treasury pursuant to the U.S. Treasury’sTARP Capital Purchase Program. The aggregate purchase price paid by Group Inc. to theU.S. Treasury for the Series H Preferred Stock, including accrued dividends, was $10.04 billion. Therepurchase resulted in a one-time preferred dividend of $426 million, which is included in thecondensed consolidated statements of earnings for the three and six months ended June 2009. Thisone-time preferred dividend represented the difference between the carrying value and the redemptionvalue of the Series H Preferred Stock. In connection with the issuance of the Series H PreferredStock in October 2008, the firm issued a 10-year warrant to the U.S. Treasury to purchase up to12.2 million shares of common stock at an exercise price of $122.90 per share. See Note 18 forinformation regarding Group Inc.’s repurchase of this warrant in July 2009.
On July 13, 2009, the Board declared a dividend of $0.35 per common share to be paid onSeptember 24, 2009 to common shareholders of record on August 25, 2009.
To satisfy minimum statutory employee tax withholding requirements related to the delivery ofcommon stock underlying restricted stock units, the firm cancelled 11.1 million of restricted stock unitswith a total value of $849 million in the first half of 2009.
The firm’s share repurchase program is intended to help maintain the appropriate level ofcommon equity and to substantially offset increases in share count over time resulting from employeeshare-based compensation. The repurchase program is effected primarily through regularopen-market purchases, the amounts and timing of which are determined primarily by the firm’scurrent and projected capital positions (i.e., comparisons of the firm’s desired level of capital to itsactual level of capital) but which may also be influenced by general market conditions and theprevailing price and trading volumes of the firm’s common stock. Upon repurchase of the Series HPreferred Stock in June 2009, the Company was no longer subject to the limitations on common stockrepurchases imposed under the U.S. Treasury’s TARP Capital Purchase Program.
As of June 2009, the firm had 174,000 shares of perpetual preferred stock issued andoutstanding as set forth in the following table:
SeriesDividend
PreferenceSharesIssued
SharesAuthorized Dividend Rate
EarliestRedemption Date
RedemptionValue
(in millions)
A Non-cumulative 30,000 50,000 3 month LIBOR + 0.75%,with floor of 3.75% per annum
April 25, 2010 $ 750
B Non-cumulative 32,000 50,000 6.20% per annum October 31, 2010 800
C Non-cumulative 8,000 25,000 3 month LIBOR + 0.75%,with floor of 4.00% per annum
October 31, 2010 200
D Non-cumulative 54,000 60,000 3 month LIBOR + 0.67%,with floor of 4.00% per annum
May 24, 2011 1,350
G Cumulative 50,000 50,000 10.00% per annum Date of issuance 5,500
174,000 235,000 $8,600
59
THE GOLDMAN SACHS GROUP, INC. and SUBSIDIARIES
NOTES TO CONDENSED CONSOLIDATED FINANCIAL STATEMENTS (Continued)(UNAUDITED)
Each share of non-cumulative preferred stock issued and outstanding has a par value of $0.01,has a liquidation preference of $25,000, is represented by 1,000 depositary shares and is redeemableat the firm’s option, subject to the approval of the Board of Governors of the Federal Reserve System(Federal Reserve Board), at a redemption price equal to $25,000 plus declared and unpaid dividends.
Each share of Series G Preferred Stock issued and outstanding has a par value of $0.01, has aliquidation preference of $100,000 and is redeemable at the firm’s option, subject to the approval ofthe Federal Reserve Board, at a redemption price equal to $110,000 plus accrued and unpaiddividends. In connection with the issuance of the Series G Preferred Stock, the firm issued a five-yearwarrant to purchase up to 43.5 million shares of common stock at an exercise price of $115.00 pershare. The warrant is exercisable at any time until October 1, 2013 and the number of shares ofcommon stock underlying the warrant and the exercise price are subject to adjustment for certaindilutive events.
All series of preferred stock are pari passu and have a preference over the firm’s common stockupon liquidation. Dividends on each series of preferred stock, if declared, are payable quarterly inarrears. The firm’s ability to declare or pay dividends on, or purchase, redeem or otherwise acquire,its common stock is subject to certain restrictions in the event that the firm fails to pay or set aside fulldividends on the preferred stock for the latest completed dividend period.
In 2007, the Board authorized 17,500.1 shares of perpetual Non-Cumulative Preferred Stock,Series E, and 5,000.1 shares of perpetual Non-Cumulative Preferred Stock, Series F, in connectionwith the APEX issuance. See Note 7 for further information on the APEX issuance. Under the stockpurchase contracts, Group Inc. will issue on the relevant stock purchase dates (on or beforeJune 1, 2013 and September 1, 2013 for Series E and Series F preferred stock, respectively) oneshare of Series E and Series F preferred stock to Goldman Sachs Capital II and III, respectively, foreach $100,000 principal amount of subordinated debt held by these trusts. When issued, each shareof Series E and Series F preferred stock will have a par value of $0.01 and a liquidation preference of$100,000 per share. Dividends on Series E preferred stock, if declared, will be payable semi-annuallyat a fixed annual rate of 5.79% if the stock is issued prior to June 1, 2012 and quarterly thereafter, ata rate per annum equal to the greater of (i) three-month LIBOR plus 0.77% and (ii) 4.00%. Dividendson Series F preferred stock, if declared, will be payable quarterly at a rate per annum equal tothree-month LIBOR plus 0.77% if the stock is issued prior to September 1, 2012 and quarterlythereafter, at a rate per annum equal to the greater of (i) three-month LIBOR plus 0.77% and(ii) 4.00%. The preferred stock may be redeemed at the option of the firm on the stock purchasedates or any day thereafter, subject to regulatory approval and certain covenant restrictions governingthe firm’s ability to redeem or purchase the preferred stock without issuing common stock or otherinstruments with equity-like characteristics.
On July 13, 2009, the Board declared dividends of $236.98, $387.50, $252.78 and $252.78 pershare of Series A Preferred Stock, Series B Preferred Stock, Series C Preferred Stock and Series DPreferred Stock, respectively, to be paid on August 10, 2009 to preferred shareholders of record onJuly 26, 2009. In addition, the Board declared a dividend of $2,500 per share of Series G PreferredStock to be paid on August 10, 2009 to preferred shareholders of record on July 26, 2009.
60
THE GOLDMAN SACHS GROUP, INC. and SUBSIDIARIES
NOTES TO CONDENSED CONSOLIDATED FINANCIAL STATEMENTS (Continued)(UNAUDITED)

Other Comprehensive Income
The following table sets forth the firm’s accumulated other comprehensive income/(loss) by type:
June2009
November2008
As of
(in millions)
Adjustment from adoption of SFAS No. 158, net of tax . . . . . . . . . . . . . . . . . $(194) $(194)Currency translation adjustment, net of tax . . . . . . . . . . . . . . . . . . . . . . . . . . (91) (30)Pension and postretirement liability adjustment, net of tax . . . . . . . . . . . . . . . (89) 69Net unrealized gains/(losses) on available-for-sale securities, net of tax (1) . . . 24 (47)
Total accumulated other comprehensive loss, net of tax. . . . . . . . . . . . . . . . . $(350) $(202)
(1) Consists of net unrealized gains/(losses) of $17 million and $(55) million on available-for-sale securities held by thefirm’s insurance subsidiaries as of June 2009 and November 2008, respectively, and net unrealized gains of $7 millionand $8 million on available-for-sale securities held by investees accounted for under the equity method as ofJune 2009 and November 2008, respectively.
Note 10. Earnings Per Common Share
The computations of basic and diluted earnings per common share are set forth below:
June2009
May2008
June2009
May2008
Three Months Ended Six Months Ended
(in millions, except per share amounts)
Numerator for basic and diluted EPS — net earningsapplicable to common shareholders . . . . . . . . . . . . $2,718 $2,051 $4,377 $3,518
Denominator for basic EPS — weighted averagenumber of common shares . . . . . . . . . . . . . . . . . . . 514.1 427.5 495.7 430.3
Effect of dilutive securities (1)
Restricted stock units . . . . . . . . . . . . . . . . . . . . . . . 15.8 9.6 12.6 9.1Stock options and warrants . . . . . . . . . . . . . . . . . . . 21.1 10.3 11.8 11.2
Dilutive potential common shares . . . . . . . . . . . . . . . . 36.9 19.9 24.4 20.3
Denominator for diluted EPS — weighted averagenumber of common shares and dilutive potentialcommon shares . . . . . . . . . . . . . . . . . . . . . . . . . . . 551.0 447.4 520.1 450.6
Basic EPS (2) . . . . . . . . . . . . . . . . . . . . . . . . . . . . . . . $ 5.27 $ 4.80 $ 8.81 $ 8.18Diluted EPS (2) . . . . . . . . . . . . . . . . . . . . . . . . . . . . . . 4.93 4.58 8.42 7.81
(1) The diluted EPS computations do not include the antidilutive effect of restricted stock units (RSUs), stock options andwarrants as follows:
June2009
May2008
June2009
May2008
Three Months Ended Six Months Ended
(in millions)Number of antidilutive RSUs and common shares underlying
antidilutive stock options and warrants . . . . . . . . . . . . . . . . 14.3 6.4 53.3 7.0
(2) In accordance with FSP No. EITF 03-6-1, unvested share-based payment awards that have non-forfeitable rights todividends or dividend equivalents are to be treated as a separate class of securities in calculating earnings per share.The firm adopted the FSP in the first quarter of fiscal 2009. The impact to basic earnings per common share for thethree and six months ended June 2009 was a reduction of $0.02 per common share. There was no impact on dilutedearnings per common share. Prior periods have not been restated due to immateriality.
61
THE GOLDMAN SACHS GROUP, INC. and SUBSIDIARIES
NOTES TO CONDENSED CONSOLIDATED FINANCIAL STATEMENTS (Continued)(UNAUDITED)

Note 11. Goodwill and Identifiable Intangible Assets
Goodwill
The following table sets forth the carrying value of the firm’s goodwill by operating segment,which is included in “Other assets” in the condensed consolidated statements of financial condition:
June2009
November2008
As of
(in millions)
Investment BankingUnderwriting . . . . . . . . . . . . . . . . . . . . . . . . . . . . . . . . . . . . . . . . . . . . . . . $ 125 $ 125
Trading and Principal InvestmentsFICC . . . . . . . . . . . . . . . . . . . . . . . . . . . . . . . . . . . . . . . . . . . . . . . . . . . . 256 247Equities (1) . . . . . . . . . . . . . . . . . . . . . . . . . . . . . . . . . . . . . . . . . . . . . . . . 2,389 2,389Principal Investments . . . . . . . . . . . . . . . . . . . . . . . . . . . . . . . . . . . . . . . . 84 80
Asset Management and Securities ServicesAsset Management (2) . . . . . . . . . . . . . . . . . . . . . . . . . . . . . . . . . . . . . . . 565 565Securities Services. . . . . . . . . . . . . . . . . . . . . . . . . . . . . . . . . . . . . . . . . . 117 117
Total . . . . . . . . . . . . . . . . . . . . . . . . . . . . . . . . . . . . . . . . . . . . . . . . . . . . . . $3,536 $3,523
(1) Primarily related to SLK LLC (SLK).(2) Primarily related to The Ayco Company, L.P. (Ayco).
62
THE GOLDMAN SACHS GROUP, INC. and SUBSIDIARIES
NOTES TO CONDENSED CONSOLIDATED FINANCIAL STATEMENTS (Continued)(UNAUDITED)

Identifiable Intangible Assets
The following table sets forth the gross carrying amount, accumulated amortization and netcarrying amount of the firm’s identifiable intangible assets:
June2009
November2008
As of
(in millions)
Customer lists (1) Gross carrying amount . . . . . . . . . . . . . . . . . . . . $ 1,116 $1,160Accumulated amortization . . . . . . . . . . . . . . . . . (438) (436)
Net carrying amount . . . . . . . . . . . . . . . . . . . . . . $ 678 $ 724
New York Stock Gross carrying amount . . . . . . . . . . . . . . . . . . . . $ 714 $ 714Exchange (NYSE) Accumulated amortization . . . . . . . . . . . . . . . . . (274) (252)DMM rights Net carrying amount . . . . . . . . . . . . . . . . . . . . . . $ 440 $ 462
Insurance-related Gross carrying amount . . . . . . . . . . . . . . . . . . . . $ 292 $ 292assets (2) Accumulated amortization . . . . . . . . . . . . . . . . . (167) (137)
Net carrying amount . . . . . . . . . . . . . . . . . . . . . . $ 125 $ 155
Exchange-traded Gross carrying amount . . . . . . . . . . . . . . . . . . . . $ 138 $ 138fund (ETF) lead Accumulated amortization . . . . . . . . . . . . . . . . . (46) (43)market maker rights Net carrying amount . . . . . . . . . . . . . . . . . . . . . . $ 92 $ 95
Other (3) Gross carrying amount . . . . . . . . . . . . . . . . . . . . $ 195 $ 178Accumulated amortization . . . . . . . . . . . . . . . . . (93) (85)
Net carrying amount . . . . . . . . . . . . . . . . . . . . . . $ 102 $ 93
Total Gross carrying amount . . . . . . . . . . . . . . . . . . . . $ 2,455 $2,482Accumulated amortization . . . . . . . . . . . . . . . . . (1,018) (953)
Net carrying amount . . . . . . . . . . . . . . . . . . . . . . $ 1,437 $1,529
(1) Primarily includes the firm’s clearance and execution and NASDAQ customer lists related to SLK and financialcounseling customer lists related to Ayco.
(2) Primarily includes VOBA related to the firm’s insurance businesses.(3) Primarily includes marketing-related assets and other contractual rights.
Substantially all of the firm’s identifiable intangible assets are considered to have finite lives andare amortized over their estimated lives. The weighted average remaining life of the firm’s identifiableintangible assets is approximately 11 years.
63
THE GOLDMAN SACHS GROUP, INC. and SUBSIDIARIES
NOTES TO CONDENSED CONSOLIDATED FINANCIAL STATEMENTS (Continued)(UNAUDITED)

The estimated future amortization for existing identifiable intangible assets through 2014 is setforth below (in millions):
Remainder of 2009 . . . . . . . . . . . . . . . . . . . . . . . . . . . . . . . . . . . . . . . . . . . . . . . . . . . . . . $ 722010 . . . . . . . . . . . . . . . . . . . . . . . . . . . . . . . . . . . . . . . . . . . . . . . . . . . . . . . . . . . . . . . . . 1372011 . . . . . . . . . . . . . . . . . . . . . . . . . . . . . . . . . . . . . . . . . . . . . . . . . . . . . . . . . . . . . . . . . 1332012 . . . . . . . . . . . . . . . . . . . . . . . . . . . . . . . . . . . . . . . . . . . . . . . . . . . . . . . . . . . . . . . . . 1252013 . . . . . . . . . . . . . . . . . . . . . . . . . . . . . . . . . . . . . . . . . . . . . . . . . . . . . . . . . . . . . . . . . 1192014 . . . . . . . . . . . . . . . . . . . . . . . . . . . . . . . . . . . . . . . . . . . . . . . . . . . . . . . . . . . . . . . . . 116
Note 12. Other Assets and Other Liabilities
Other Assets
Other assets are generally less liquid, non-financial assets. The following table sets forth thefirm’s other assets by type:
June2009
November2008
As of
(in millions)
Property, leasehold improvements and equipment (1) . . . . . . . . . . . . . . . . . $10,925 $10,793Goodwill and identifiable intangible assets (2) . . . . . . . . . . . . . . . . . . . . . . . 4,973 5,052Income tax-related assets . . . . . . . . . . . . . . . . . . . . . . . . . . . . . . . . . . . . . 7,829 8,359Equity-method investments (3) . . . . . . . . . . . . . . . . . . . . . . . . . . . . . . . . . . 1,425 1,454Miscellaneous receivables and other . . . . . . . . . . . . . . . . . . . . . . . . . . . . . 3,953 4,780
Total . . . . . . . . . . . . . . . . . . . . . . . . . . . . . . . . . . . . . . . . . . . . . . . . . . . . . $29,105 $30,438
(1) Net of accumulated depreciation and amortization of $7.67 billion and $6.55 billion as of June 2009 andNovember 2008, respectively.
(2) See Note 11 for further information regarding the firm’s goodwill and identifiable intangible assets.(3) Excludes investments of $2.81 billion and $3.45 billion accounted for at fair value under SFAS No. 159 as of
June 2009 and November 2008, respectively, which are included in “Trading assets, at fair value” in the condensedconsolidated statements of financial condition.
64
THE GOLDMAN SACHS GROUP, INC. and SUBSIDIARIES
NOTES TO CONDENSED CONSOLIDATED FINANCIAL STATEMENTS (Continued)(UNAUDITED)

Other Liabilities
The following table sets forth the firm’s other liabilities and accrued expenses by type:
June2009
November2008
As of
(in millions)
Compensation and benefits . . . . . . . . . . . . . . . . . . . . . . . . . . . . . . . . . . . . $10,178 $ 4,646Insurance-related liabilities (1) . . . . . . . . . . . . . . . . . . . . . . . . . . . . . . . . . . . 11,851 9,673Noncontrolling interests (2) . . . . . . . . . . . . . . . . . . . . . . . . . . . . . . . . . . . . . 938 1,127Income tax-related liabilities . . . . . . . . . . . . . . . . . . . . . . . . . . . . . . . . . . . . 3,010 2,865Employee interests in consolidated funds . . . . . . . . . . . . . . . . . . . . . . . . . . 438 517Accrued expenses and other payables . . . . . . . . . . . . . . . . . . . . . . . . . . . . 5,198 4,388
Total . . . . . . . . . . . . . . . . . . . . . . . . . . . . . . . . . . . . . . . . . . . . . . . . . . . . . $31,613 $23,216
(1) Insurance-related liabilities are set forth in the table below:
June2009
November2008
As of
(in millions)Separate account liabilities . . . . . . . . . . . . . . . . . . . . . . . . . . . . . . . . . . . . . . . . . . . . . $ 3,808 $3,628Liabilities for future benefits and unpaid claims . . . . . . . . . . . . . . . . . . . . . . . . . . . . . . . . 6,895 4,778Contract holder account balances . . . . . . . . . . . . . . . . . . . . . . . . . . . . . . . . . . . . . . . . 812 899Reserves for guaranteed minimum death and income benefits . . . . . . . . . . . . . . . . . . . . . 336 368
Total insurance-related liabilities . . . . . . . . . . . . . . . . . . . . . . . . . . . . . . . . . . . . . . . . . . $11,851 $9,673
Separate account liabilities are supported by separate account assets, representing segregated contract holder fundsunder variable annuity and life insurance contracts. Separate account assets are included in “Cash and securitiessegregated for regulatory and other purposes” in the condensed consolidated statements of financial condition.
Liabilities for future benefits and unpaid claims include liabilities arising from reinsurance provided by the firm to otherinsurers. The firm had a receivable for $1.32 billion and $1.30 billion as of June 2009 and November 2008,respectively, related to such reinsurance contracts, which is reported in “Receivables from customers andcounterparties” in the condensed consolidated statements of financial condition. In addition, the firm has ceded risksto reinsurers related to certain of its liabilities for future benefits and unpaid claims and had a receivable of$1.35 billion and $1.20 billion as of June 2009 and November 2008, respectively, related to such reinsurancecontracts, which is reported in “Receivables from customers and counterparties” in the condensed consolidatedstatements of financial condition. Contracts to cede risks to reinsurers do not relieve the firm from its obligations tocontract holders. Liabilities for future benefits and unpaid claims include $2.10 billion and $978 million carried at fairvalue under SFAS No. 159 as of June 2009 and November 2008, respectively.
Reserves for guaranteed minimum death and income benefits represent a liability for the expected value ofguaranteed benefits in excess of projected annuity account balances. These reserves are computed in accordancewith AICPA SOP 03-1 and are based on total payments expected to be made less total fees expected to be assessedover the life of the contract.
(2) Includes $601 million and $784 million related to consolidated investment funds as of June 2009 and November 2008,respectively.
65
THE GOLDMAN SACHS GROUP, INC. and SUBSIDIARIES
NOTES TO CONDENSED CONSOLIDATED FINANCIAL STATEMENTS (Continued)(UNAUDITED)

Note 13. Transactions with Affiliated Funds
The firm has formed numerous nonconsolidated investment funds with third-party investors. Thefirm generally acts as the investment manager for these funds and, as such, is entitled to receivemanagement fees and, in certain cases, advisory fees, incentive fees or overrides from these funds.These fees amounted to $1.19 billion and $1.76 billion for the six months ended June 2009 andMay 2008, respectively. As of June 2009 and November 2008, the fees receivable from these fundswere $908 million and $861 million, respectively. Additionally, the firm may invest alongside thethird-party investors in certain funds. The aggregate carrying value of the firm’s interests in thesefunds was $12.82 billion and $14.45 billion as of June 2009 and November 2008, respectively. In theordinary course of business, the firm may also engage in other activities with these funds, including,among others, securities lending, trade execution, trading, custody, and acquisition and bridgefinancing. See Note 8 for the firm’s commitments related to these funds.
Note 14. Income Taxes
The firm is subject to examination by the U.S. Internal Revenue Service (IRS) and other taxingauthorities in jurisdictions where the firm has significant business operations, such as the UnitedKingdom, Japan, Hong Kong, Korea and various states, such as New York. The tax years underexamination vary by jurisdiction. The firm does not expect unrecognized tax benefits to changesignificantly during the twelve months subsequent to June 2009.
Below is a table of the earliest tax years that remain subject to examination by major jurisdiction:
Jurisdiction
EarliestTax Year
Subject toExamination
U.S. Federal . . . . . . . . . . . . . . . . . . . . . . . . . . . . . . . . . . . . . . . . . . . . . . . . . . . . . . 2005 (1)
New York State and City. . . . . . . . . . . . . . . . . . . . . . . . . . . . . . . . . . . . . . . . . . . . . 2004 (2)
United Kingdom . . . . . . . . . . . . . . . . . . . . . . . . . . . . . . . . . . . . . . . . . . . . . . . . . . . 2005Japan . . . . . . . . . . . . . . . . . . . . . . . . . . . . . . . . . . . . . . . . . . . . . . . . . . . . . . . . . . . 2005Hong Kong . . . . . . . . . . . . . . . . . . . . . . . . . . . . . . . . . . . . . . . . . . . . . . . . . . . . . . . 2003Korea . . . . . . . . . . . . . . . . . . . . . . . . . . . . . . . . . . . . . . . . . . . . . . . . . . . . . . . . . . . 2003
(1) IRS examination of fiscal 2005, 2006 and 2007 began during 2008. IRS examination of fiscal 2003 and 2004 hasbeen completed but the liabilities for those years are not yet final.
(2) New York State and City examination of fiscal 2004, 2005 and 2006 began in 2008. New York State examinations offiscal 1999 through 2003 have been completed but the liabilities for those years are not yet final.
All years subsequent to the above years remain open to examination by the taxing authorities.The firm believes that the liability for unrecognized tax benefits it has established is adequate inrelation to the potential for additional assessments. The resolution of tax matters is not expected tohave a material effect on the firm’s financial condition but may be material to the firm’s operatingresults for a particular period, depending, in part, upon the operating results for that period.
66
THE GOLDMAN SACHS GROUP, INC. and SUBSIDIARIES
NOTES TO CONDENSED CONSOLIDATED FINANCIAL STATEMENTS (Continued)(UNAUDITED)

Note 15. Regulation and Capital Adequacy
The Federal Reserve Board is the primary U.S. regulator of Group Inc. As a bank holdingcompany, the firm is subject to consolidated regulatory capital requirements administered by theFederal Reserve Board. The firm’s bank depository institution subsidiaries, including GS Bank USA,are subject to similar capital requirements. Under the Federal Reserve Board’s capital adequacyrequirements and the regulatory framework for prompt corrective action (PCA) that is applicable toGS Bank USA, the firm and its bank depository institution subsidiaries must meet specific capitalrequirements that involve quantitative measures of assets, liabilities and certain off-balance-sheetitems as calculated under regulatory reporting practices. The firm and its bank depository institutionsubsidiaries’ capital levels, as well as GS Bank USA’s PCA classification, are also subject toqualitative judgments by the regulators about components, risk weightings and other factors.
Many of the firm’s subsidiaries, including GS&Co. and the firm’s other broker-dealer subsidiaries,are subject to separate regulation and capital requirements as described below.
The following table sets forth information regarding Group Inc.’s capital ratios as of June 2009calculated in accordance with the Federal Reserve Board’s regulatory capital requirements currentlyapplicable to bank holding companies, which are based on the Capital Accord of the Basel Committeeon Banking Supervision (Basel I). These ratios are used by the Federal Reserve Board and otherU.S. Federal banking agencies in the supervisory review process, including the assessment of thefirm’s capital adequacy. The calculation of these ratios includes certain market risk measures that areunder review by the Federal Reserve Board, as part of Group Inc.’s transition to bank holdingcompany status. The calculation of these ratios has not been reviewed with the Federal ReserveBoard and, accordingly, these ratios may be revised in subsequent filings.
As ofJune 2009($ in millions)
Tier 1 CapitalCommon shareholders’ equity . . . . . . . . . . . . . . . . . . . . . . . . . . . . . . . . . . . . . . . . . $ 55,856Preferred stock . . . . . . . . . . . . . . . . . . . . . . . . . . . . . . . . . . . . . . . . . . . . . . . . . . . . . 6,957Junior subordinated debt issued to trusts . . . . . . . . . . . . . . . . . . . . . . . . . . . . . . . . . 5,000
Less: Goodwill . . . . . . . . . . . . . . . . . . . . . . . . . . . . . . . . . . . . . . . . . . . . . . . . . . . (3,536)Less: Disallowable intangible assets . . . . . . . . . . . . . . . . . . . . . . . . . . . . . . . . . . . (1,437)Less: Other deductions (1) . . . . . . . . . . . . . . . . . . . . . . . . . . . . . . . . . . . . . . . . . . . (6,297)
Tier 1 Capital . . . . . . . . . . . . . . . . . . . . . . . . . . . . . . . . . . . . . . . . . . . . . . . . . . . . . 56,543Tier 2 Capital
Qualifying subordinated debt (2). . . . . . . . . . . . . . . . . . . . . . . . . . . . . . . . . . . . . . . 13,989Less: Other deductions (1) . . . . . . . . . . . . . . . . . . . . . . . . . . . . . . . . . . . . . . . . . . . (160)
Tier 2 Capital . . . . . . . . . . . . . . . . . . . . . . . . . . . . . . . . . . . . . . . . . . . . . . . . . . . . . $ 13,829
Total Capital . . . . . . . . . . . . . . . . . . . . . . . . . . . . . . . . . . . . . . . . . . . . . . . . . . . . . . $ 70,372
Risk-Weighted Assets . . . . . . . . . . . . . . . . . . . . . . . . . . . . . . . . . . . . . . . . . . . . . . $409,204
Tier 1 Capital Ratio. . . . . . . . . . . . . . . . . . . . . . . . . . . . . . . . . . . . . . . . . . . . . . . . . 13.8%Total Capital Ratio . . . . . . . . . . . . . . . . . . . . . . . . . . . . . . . . . . . . . . . . . . . . . . . . . 17.2%Tier 1 Leverage Ratio . . . . . . . . . . . . . . . . . . . . . . . . . . . . . . . . . . . . . . . . . . . . . . . 6.4%
(1) Principally includes equity investments in non-financial companies and the cumulative change in the fair value of thefirm’s unsecured borrowings attributable to the impact of changes in the firm’s own credit spreads, disalloweddeferred tax assets, and investments in certain nonconsolidating entities.
(2) Substantially all of the firm’s existing subordinated debt qualifies as Tier 2 capital for Basel I purposes.
67
THE GOLDMAN SACHS GROUP, INC. and SUBSIDIARIES
NOTES TO CONDENSED CONSOLIDATED FINANCIAL STATEMENTS (Continued)(UNAUDITED)
Risk-Weighted Assets (RWAs) under the Federal Reserve Board’s risk-based capital guidelinesare comprised of requirements for market risk and credit risk. RWAs for market risk include certainmeasures that are under review by the Federal Reserve Board as part of Group Inc.’s transition tobank holding company status. Credit risk RWAs for on-balance sheet assets are based on thebalance sheet value. For off-balance sheet exposures, including OTC derivatives and commitments, acredit equivalent amount is calculated based on the notional of each trade. All such assets andamounts are then assigned a risk weight depending on whether the counterparty is a sovereign, bankor qualifying securities firm, or other entity (or where collateral is held, the risk weight will depend onthe nature of such collateral).
The firm’s Tier 1 leverage ratio is defined as Tier 1 capital under Basel I divided by adjustedaverage total assets (which includes adjustments for disallowed goodwill and certain intangibleassets).
Federal Reserve Board regulations require bank holding companies to maintain a minimumTier 1 capital ratio of 4% and a minimum total capital ratio of 8%. The required minimum Tier 1 capitalratio and total capital ratio in order to be considered a “well capitalized” bank holding company underthe Federal Reserve Board guidelines are 6% and 10%, respectively. Bank holding companies may beexpected to maintain ratios well above the minimum levels, depending upon their particular condition,risk profile and growth plans. The minimum Tier 1 leverage ratio is 3% for bank holding companiesthat have received the highest supervisory rating under Federal Reserve Board guidelines or thathave implemented the Federal Reserve Board’s capital measure for market risk. Other bank holdingcompanies must have a minimum Tier 1 leverage ratio of 4%.
The firm also continues to disclose its capital ratios in accordance with the capital guidelinesapplicable to it before it became a bank holding company in September 2008, when the firm wasregulated by the SEC as a Consolidated Supervised Entity (CSE). These guidelines were generallyconsistent with those set out in the Revised Framework for the International Convergence of CapitalMeasurement and Capital Standards issued by the Basel Committee on Banking Supervision(Basel II). Subsequent to becoming a bank holding company, the firm no longer reports the CSEcapital ratios to the SEC and Group Inc. is no longer regulated as a CSE.
68
THE GOLDMAN SACHS GROUP, INC. and SUBSIDIARIES
NOTES TO CONDENSED CONSOLIDATED FINANCIAL STATEMENTS (Continued)(UNAUDITED)

The following table sets forth information regarding Group Inc.’s capital ratios as of June 2009and November 2008 calculated in the same manner (generally consistent with Basel II) as when thefirm was regulated by the SEC as a CSE:
June2009
November2008
As of
($ in millions)
I. Tier 1 and Total Allowable CapitalCommon shareholders’ equity . . . . . . . . . . . . . . . . . . . . . . . . . . . . . . . . . $ 55,856 $ 47,898Preferred stock . . . . . . . . . . . . . . . . . . . . . . . . . . . . . . . . . . . . . . . . . . . . 6,957 16,471Junior subordinated debt issued to trusts . . . . . . . . . . . . . . . . . . . . . . . . 5,000 5,000
Less: Goodwill . . . . . . . . . . . . . . . . . . . . . . . . . . . . . . . . . . . . . . . . . . . (3,536) (3,523)Less: Disallowable intangible assets . . . . . . . . . . . . . . . . . . . . . . . . . . (1,437) (1,386)Less: Other deductions (1) . . . . . . . . . . . . . . . . . . . . . . . . . . . . . . . . . . (1,322) (1,823)
Tier 1 Capital . . . . . . . . . . . . . . . . . . . . . . . . . . . . . . . . . . . . . . . . . . . . . 61,518 62,637Other components of Total Allowable Capital
Qualifying subordinated debt (2) . . . . . . . . . . . . . . . . . . . . . . . . . . . . . . 13,989 13,703Less: Other deductions (1) . . . . . . . . . . . . . . . . . . . . . . . . . . . . . . . . . . (160) (690)
Total Allowable Capital . . . . . . . . . . . . . . . . . . . . . . . . . . . . . . . . . . . . $ 75,347 $ 75,650
II. Risk-Weighted AssetsMarket risk . . . . . . . . . . . . . . . . . . . . . . . . . . . . . . . . . . . . . . . . . . . . . . . $169,649 $176,646Credit risk . . . . . . . . . . . . . . . . . . . . . . . . . . . . . . . . . . . . . . . . . . . . . . . . 172,195 184,055Operational risk. . . . . . . . . . . . . . . . . . . . . . . . . . . . . . . . . . . . . . . . . . . . 40,000 39,675
Total Risk-Weighted Assets . . . . . . . . . . . . . . . . . . . . . . . . . . . . . . . . . $381,844 $400,376
III. Tier 1 Capital Ratio . . . . . . . . . . . . . . . . . . . . . . . . . . . . . . . . . . . . . 16.1% 15.6%IV. Total Capital Ratio . . . . . . . . . . . . . . . . . . . . . . . . . . . . . . . . . . . . . . 19.7% 18.9%
(1) Principally includes the cumulative change in the fair value of the firm’s unsecured borrowings attributable to theimpact of changes in the firm’s own credit spreads, disallowed deferred tax assets, and investments in certainnonconsolidated entities.
(2) Substantially all of the firm’s existing subordinated debt qualifies as Total Allowable Capital.
The firm’s RWAs based on the guidelines applicable to the firm when it was regulated as a CSEare driven by the amount of market risk, credit risk and operational risk associated with its businessactivities in a manner generally consistent with methodologies set out in Basel II. The methodologiesused to compute these RWAs for each of market risk, credit risk and operational risk are closelyaligned with the firm’s risk management practices.
The firm is currently working to implement the Basel II framework as applicable to it as a bankholding company (as opposed to as a CSE). U.S. banking regulators have incorporated the Basel IIframework into the existing risk-based capital requirements by requiring that internationally activebanking organizations, such as Group Inc., transition to Basel II over the next several years.
69
THE GOLDMAN SACHS GROUP, INC. and SUBSIDIARIES
NOTES TO CONDENSED CONSOLIDATED FINANCIAL STATEMENTS (Continued)(UNAUDITED)

GS Bank USA, a New York State-chartered bank and a member of the Federal Reserve Systemand the FDIC, is regulated by the Federal Reserve Board and the New York State BankingDepartment (NYSBD) and is subject to minimum capital requirements that (subject to certainexceptions) are similar to those applicable to bank holding companies. GS Bank USA computes itscapital ratios in accordance with the regulatory capital guidelines currently applicable to state memberbanks, which are based on Basel I as implemented by the Federal Reserve Board, for purposes ofassessing the adequacy of its capital. In order to be considered a “well capitalized” depositoryinstitution under the Federal Reserve Board guidelines, GS Bank USA must maintain a Tier 1 capitalratio of at least 6%, a total capital ratio of at least 10% and a Tier 1 leverage ratio of at least 5%. InNovember 2008, the firm contributed subsidiaries into GS Bank USA. In connection with thiscontribution, GS Bank USA agreed with the Federal Reserve Board to minimum capital ratios inexcess of these “well capitalized” levels. Accordingly, for a period of time, GS Bank USA is expectedto maintain a Tier 1 capital ratio of at least 8%, a total capital ratio of at least 11% and a Tier 1leverage ratio of at least 6%.
The following table sets forth information regarding GS Bank USA’s capital ratios under Basel Ias implemented by the Federal Reserve Board, as of June 2009.
As ofJune 2009
Tier 1 Capital Ratio . . . . . . . . . . . . . . . . . . . . . . . . . . . . . . . . . . . . . . . . . . . . . . . . . . . 12.9%Total Capital Ratio . . . . . . . . . . . . . . . . . . . . . . . . . . . . . . . . . . . . . . . . . . . . . . . . . . . . 17.2%Tier 1 Leverage Ratio . . . . . . . . . . . . . . . . . . . . . . . . . . . . . . . . . . . . . . . . . . . . . . . . . 9.8%
Consistent with the calculation of Group Inc.’s capital ratios, the calculation of GS Bank USA’scapital ratios includes certain market risk measures that are under review by the Federal ReserveBoard. Accordingly, these ratios may be revised in subsequent filings. GS Bank USA is currentlyworking to implement the Basel II framework. Similar to the firm’s requirement as a bank holdingcompany, GS Bank USA is required to transition to Basel II over the next several years.
The deposits of GS Bank USA are insured by the FDIC to the extent provided by law. TheFederal Reserve Board requires depository institutions to maintain cash reserves with a FederalReserve Bank. The amount deposited by the firm’s depository institution subsidiaries held at theFederal Reserve Bank was approximately $7.04 billion and $94 million as of June 2009 andNovember 2008, respectively, which exceeded required reserve amounts by $6.73 billion and$6 million as of June 2009 and November 2008, respectively. GS Bank Europe, a wholly owned creditinstitution, is regulated by the Irish Financial Services Regulatory Authority and is subject to minimumcapital requirements. As of June 2009 and November 2008, GS Bank USA and GS Bank Europewere both in compliance with all regulatory capital requirements.
Transactions between GS Bank USA and its subsidiaries and Group Inc. and its subsidiaries andaffiliates (other than, generally, subsidiaries of GS Bank USA) are regulated by the Federal ReserveBoard. These regulations generally limit the types and amounts of transactions (including loans to andborrowings from GS Bank USA) that may take place and generally require those transactions to be onan arms-length basis.
70
THE GOLDMAN SACHS GROUP, INC. and SUBSIDIARIES
NOTES TO CONDENSED CONSOLIDATED FINANCIAL STATEMENTS (Continued)(UNAUDITED)

The firm’s U.S. regulated broker-dealer subsidiaries include GS&Co. and Goldman SachsExecution & Clearing, L.P. (GSEC). GS&Co. and GSEC are registered U.S. broker-dealers and futurescommission merchants subject to Rule 15c3-1 of the SEC and Rule 1.17 of the Commodity FuturesTrading Commission, which specify uniform minimum net capital requirements, as defined, for theirregistrants, and also effectively require that a significant part of the registrants’ assets be kept inrelatively liquid form. GS&Co. and GSEC have elected to compute their minimum capital requirementsin accordance with the “Alternative Net Capital Requirement” as permitted by Rule 15c3-1. As ofJune 2009, GS&Co. had regulatory net capital, as defined by Rule 15c3-1, of $13.19 billion, whichexceeded the amount required by $11.42 billion. As of June 2009, GSEC had regulatory net capital,as defined by Rule 15c3-1, of $1.87 billion, which exceeded the amount required by $1.80 billion. Inaddition to its alternative minimum net capital requirements, GS&Co. is also required to hold tentativenet capital in excess of $1 billion and net capital in excess of $500 million in accordance with themarket and credit risk standards of Appendix E of Rule 15c3-1. GS&Co. is also required to notify theSEC in the event that its tentative net capital is less than $5 billion. As of June 2009 andNovember 2008, GS&Co. had tentative net capital and net capital in excess of both the minimum andthe notification requirements.
The firm has U.S. insurance subsidiaries that are subject to state insurance regulation andoversight in the states in which they are domiciled and in the other states in which they are licensed.In addition, certain of the firm’s insurance subsidiaries outside of the U.S. are regulated by theBermuda Monetary Authority and by Lloyd’s (which is, in turn, regulated by the U.K.’s FinancialServices Authority (FSA)). The firm’s insurance subsidiaries were in compliance with all regulatorycapital requirements as of June 2009 and November 2008.
The firm’s principal non-U.S. regulated subsidiaries include Goldman Sachs International (GSI)and Goldman Sachs Japan Co., Ltd. (GSJCL). GSI, the firm’s regulated U.K. broker-dealer, is subjectto the capital requirements of the FSA. GSJCL, the firm’s regulated Japanese broker-dealer, is subjectto the capital requirements imposed by Japan’s Financial Services Agency. As of June 2009 andNovember 2008, GSI and GSJCL were in compliance with their local capital adequacy requirements.Certain other non-U.S. subsidiaries of the firm are also subject to capital adequacy requirementspromulgated by authorities of the countries in which they operate. As of June 2009 andNovember 2008, these subsidiaries were in compliance with their local capital adequacy requirements.
The regulatory requirements referred to above restrict Group Inc.’s ability to withdraw capitalfrom its regulated subsidiaries. In addition to limitations on the payment of dividends imposed byfederal and state laws, the Federal Reserve Board, the FDIC and the NYSBD have authority toprohibit or to limit the payment of dividends by the banking organizations they supervise (includingGS Bank USA) if, in the relevant regulator’s opinion, payment of a dividend would constitute an unsafeor unsound practice in the light of the financial condition of the banking organization. As of June 2009,GS Bank USA could have declared dividends of $1.31 billion to Group Inc. without regulatoryapproval. As of November 2008, GS Bank USA would not have been able to declare dividends toGroup Inc. without regulatory approval.
Note 16. Business Segments
In reporting to management, the firm’s operating results are categorized into the following threebusiness segments: Investment Banking, Trading and Principal Investments, and Asset Managementand Securities Services. See Note 18 to the consolidated financial statements in Part II, Item 8 of thefirm’s Annual Report on Form 10-K for the fiscal year ended November 2008 for a discussion of thebasis of presentation for the firm’s business segments.
71
THE GOLDMAN SACHS GROUP, INC. and SUBSIDIARIES
NOTES TO CONDENSED CONSOLIDATED FINANCIAL STATEMENTS (Continued)(UNAUDITED)

Segment Operating Results
Management believes that the following information provides a reasonable representation ofeach segment’s contribution to consolidated pre-tax earnings and total assets:
June2009
May2008
June2009
May2008
Three Months Ended Six Months EndedAs of or for the
(in millions)
Investment Net revenues . . . . . . . . . . $ 1,440 $ 1,685 $ 2,263 $ 2,857Banking Operating expenses . . . . . 1,167 1,155 1,872 2,095
Pre-tax earnings . . . . . . . . $ 273 $ 530 $ 391 $ 762
Segment assets . . . . . . . . $ 1,473 $ 7,269 $ 1,473 $ 7,269
Trading and Net revenues . . . . . . . . . . $ 10,784 $ 5,591 $ 17,934 $ 10,715Principal Operating expenses . . . . . 6,290 3,961 11,163 7,704Investments Pre-tax earnings . . . . . . . . $ 4,494 $ 1,630 $ 6,771 $ 3,011
Segment assets . . . . . . . . $696,454 $ 724,122 $696,454 $ 724,122
Asset Management Net revenues . . . . . . . . . . $ 1,537 $ 2,146 $ 2,989 $ 4,185and Securities Operating expenses . . . . . 1,250 1,477 2,455 2,970Services Pre-tax earnings . . . . . . . . $ 287 $ 669 $ 534 $ 1,215
Segment assets . . . . . . . . $191,617 $ 356,754 $191,617 $ 356,754
Total Net revenues (1)(2) . . . . . . $ 13,761 $ 9,422 $ 23,186 $ 17,757Operating expenses (3) . . . 8,732 6,590 15,528 12,782Pre-tax earnings (4) . . . . . . $ 5,029 $ 2,832 $ 7,658 $ 4,975
Total assets . . . . . . . . . . . $889,544 $1,088,145 $889,544 $1,088,145
(1) Net revenues include net interest income as set forth in the table below:
June2009
May2008
June2009
May2008
Three Months Ended Six Months Ended
(in millions)Investment Banking . . . . . . . . . . . . . . . . . . . . . . . . . . $ — $ — $ — $ 6Trading and Principal Investments . . . . . . . . . . . . . . . . 1,462 352 2,906 599Asset Management and Securities Services . . . . . . . . . . 580 925 1,043 1,623
Total net interest . . . . . . . . . . . . . . . . . . . . . . . . . . . . $2,042 $1,277 $3,949 $2,228
(2) Net revenues include non-interest revenues as set forth in the table below:
June2009
May2008
June2009
May2008
Three Months Ended Six Months Ended
(in millions)Investment banking fees. . . . . . . . . . . . . . . . . . . . . . . $ 1,440 $1,685 $ 2,263 $ 2,851Equities commissions . . . . . . . . . . . . . . . . . . . . . . . . 1,021 1,234 1,995 2,472Asset management and other fees . . . . . . . . . . . . . . . . 957 1,221 1,946 2,562Trading and principal investments revenues . . . . . . . . . . 8,301 4,005 13,033 7,644
Total non-interest revenues . . . . . . . . . . . . . . . . . . . . . $11,719 $8,145 $19,237 $15,529
72
THE GOLDMAN SACHS GROUP, INC. and SUBSIDIARIES
NOTES TO CONDENSED CONSOLIDATED FINANCIAL STATEMENTS (Continued)(UNAUDITED)

Trading and principal investments revenues include $10 million and $(3) million for the three months ended June 2009and May 2008, respectively, and $16 million and $(2) million for the six months ended June 2009 and May 2008,respectively, of realized gains/(losses) on securities held within the firm’s insurance subsidiaries which are accountedfor as available-for-sale under SFAS No. 115.
(3) Operating expenses include net provisions for a number of litigation and regulatory proceedings of $25 million and$(3) million for the three months ended June 2009 and May 2008, respectively, and $38 million and $13 million for thesix months ended June 2009 and May 2008, respectively, that have not been allocated to the firm’s segments.
(4) Pre-tax earnings include total depreciation and amortization as set forth in the table below:
June2009
May2008
June2009
May2008
Three Months Ended Six Months Ended
(in millions)Investment Banking. . . . . . . . . . . . . . . . . . . . . . . . . . . . . . $ 39 $ 38 $ 76 $ 76Trading and Principal Investments . . . . . . . . . . . . . . . . . . . . 428 214 951 460Asset Management and Securities Services . . . . . . . . . . . . . 60 59 149 118
Total depreciation and amortization . . . . . . . . . . . . . . . . . . . $527 $311 $1,176 $654
Geographic Information
Due to the highly integrated nature of international financial markets, the firm manages itsbusinesses based on the profitability of the enterprise as a whole. Since a significant portion of thefirm’s activities require cross-border coordination in order to facilitate the needs of the firm’s clients,the methodology for allocating the firm’s profitability to geographic regions is dependent on estimatesand management judgment. Specifically, in interim periods, the firm allocates compensation andbenefits to geographic regions based upon the firmwide compensation to net revenues ratio. In thefourth quarter when compensation by employee is finalized, compensation and benefits are allocatedto the geographic regions based upon total actual compensation during the fiscal year. See Note 18 tothe consolidated financial statements in Part II, Item 8 of the firm’s Annual Report on Form 10-K forthe fiscal year ended November 2008 for a discussion of the method of allocating by geographicregion.
73
THE GOLDMAN SACHS GROUP, INC. and SUBSIDIARIES
NOTES TO CONDENSED CONSOLIDATED FINANCIAL STATEMENTS (Continued)(UNAUDITED)
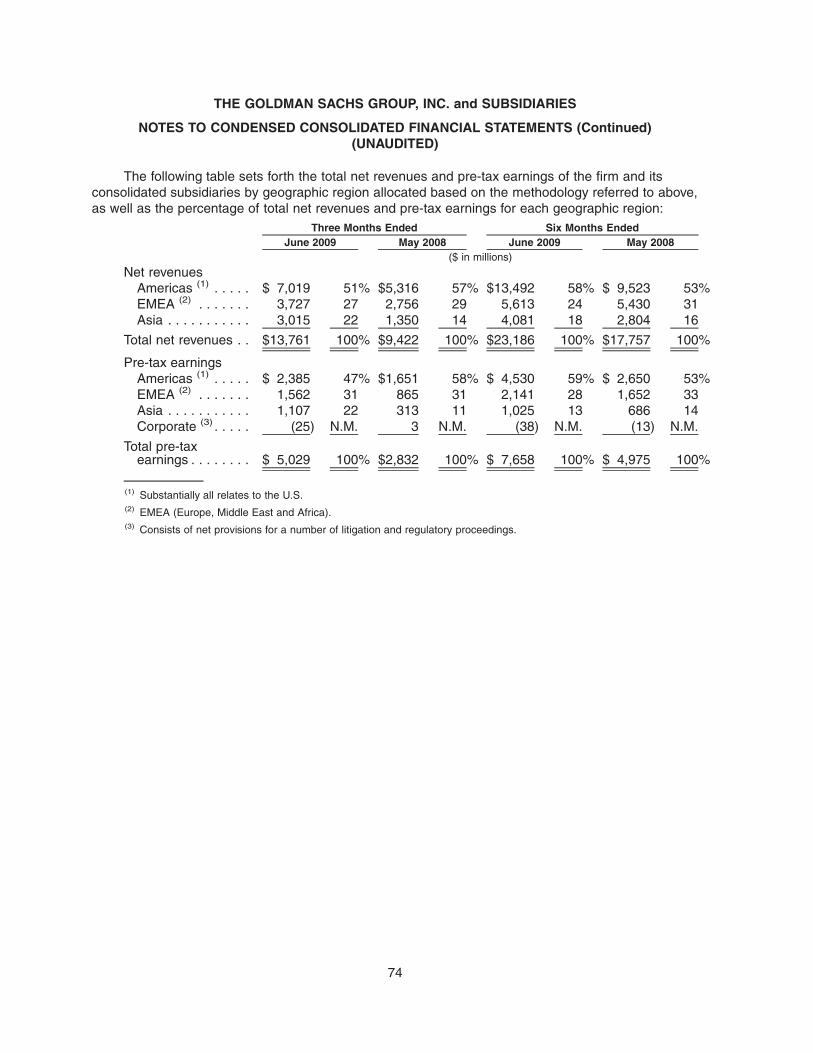
The following table sets forth the total net revenues and pre-tax earnings of the firm and itsconsolidated subsidiaries by geographic region allocated based on the methodology referred to above,as well as the percentage of total net revenues and pre-tax earnings for each geographic region:
June 2009 May 2008 June 2009 May 2008Three Months Ended Six Months Ended
($ in millions)
Net revenuesAmericas (1) . . . . . $ 7,019 51% $5,316 57% $13,492 58% $ 9,523 53%EMEA (2) . . . . . . . 3,727 27 2,756 29 5,613 24 5,430 31Asia . . . . . . . . . . . 3,015 22 1,350 14 4,081 18 2,804 16
Total net revenues . . $13,761 100% $9,422 100% $23,186 100% $17,757 100%
Pre-tax earningsAmericas (1) . . . . . $ 2,385 47% $1,651 58% $ 4,530 59% $ 2,650 53%EMEA (2) . . . . . . . 1,562 31 865 31 2,141 28 1,652 33Asia . . . . . . . . . . . 1,107 22 313 11 1,025 13 686 14Corporate (3) . . . . . (25) N.M. 3 N.M. (38) N.M. (13) N.M.
Total pre-taxearnings . . . . . . . . $ 5,029 100% $2,832 100% $ 7,658 100% $ 4,975 100%
(1) Substantially all relates to the U.S.(2) EMEA (Europe, Middle East and Africa).(3) Consists of net provisions for a number of litigation and regulatory proceedings.
74
THE GOLDMAN SACHS GROUP, INC. and SUBSIDIARIES
NOTES TO CONDENSED CONSOLIDATED FINANCIAL STATEMENTS (Continued)(UNAUDITED)

Note 17. Interest Income and Interest Expense
The following table sets forth the details of the firm’s interest income and interest expense:
June2009
May2008
June2009
May2008
Three Months Ended Six Months Ended
(in millions)
Interest income (1)
Deposits with banks . . . . . . . . . . . . . . . . . . . . . $ 18 $ 38 $ 40 $ 87Securities borrowed, securities purchased
under agreements to resell and federalfunds sold . . . . . . . . . . . . . . . . . . . . . . . . . . 176 3,184 727 7,314
Trading assets, at fair value . . . . . . . . . . . . . . . 2,881 3,426 6,039 7,143Other interest (2) . . . . . . . . . . . . . . . . . . . . . . . 395 2,850 1,026 6,199
Total interest income . . . . . . . . . . . . . . . . . . . . $3,470 $9,498 $7,832 $20,743
Interest expenseDeposits . . . . . . . . . . . . . . . . . . . . . . . . . . . . . $ 119 $ 186 $ 269 $ 386Securities loaned and securities sold under
agreements to repurchase, at fair value . . . . 366 1,875 911 4,486Trading liabilities, at fair value . . . . . . . . . . . . . 406 630 869 1,327Short-term borrowings (3) . . . . . . . . . . . . . . . . . 154 448 394 985Long-term borrowings (4) . . . . . . . . . . . . . . . . . 648 1,891 1,597 4,260Other interest (5) . . . . . . . . . . . . . . . . . . . . . . . (265) 3,191 (157) 7,071
Total interest expense . . . . . . . . . . . . . . . . . . . $1,428 $8,221 $3,883 $18,515
Net interest income . . . . . . . . . . . . . . . . . . . . . . . $2,042 $1,277 $3,949 $ 2,228
(1) Interest income is recorded on an accrual basis based on contractual interest rates.(2) Primarily includes interest income on customer debit balances and other interest-earning assets.(3) Includes interest on unsecured short-term borrowings and short-term other secured financings.(4) Includes interest on unsecured long-term borrowings and long-term other secured financings.(5) Primarily includes interest expense on customer credit balances and other interest-bearing liabilities.
Note 18. Subsequent Event
On July 22, 2009, Group Inc. repurchased in full from the U.S. Treasury the warrant to purchase12.2 million shares of common stock that was issued to the U.S. Treasury pursuant to theU.S. Treasury’s TARP Capital Purchase Program. The purchase price paid by Group Inc. to theU.S. Treasury for this warrant was $1.1 billion. This amount was recorded as a reduction toshareholders’ equity.
75
THE GOLDMAN SACHS GROUP, INC. and SUBSIDIARIES
NOTES TO CONDENSED CONSOLIDATED FINANCIAL STATEMENTS (Continued)(UNAUDITED)

Report of Independent Registered Public Accounting Firm
To the Board of Directors and the Shareholders ofThe Goldman Sachs Group, Inc.:
We have reviewed the accompanying condensed consolidated statement of financial condition ofThe Goldman Sachs Group, Inc. and its subsidiaries (the Company) as of June 26, 2009, the relatedcondensed consolidated statements of earnings for the three and six months ended June 26, 2009and May 30, 2008, the condensed consolidated statement of changes in shareholders’ equity for thesix months ended June 26, 2009, the condensed consolidated statements of cash flows for the sixmonths ended June 26, 2009 and May 30, 2008, and the condensed consolidated statements ofcomprehensive income for the three and six months ended June 26, 2009 and May 30, 2008. Thesecondensed consolidated interim financial statements are the responsibility of the Company’smanagement.
We conducted our review in accordance with the standards of the Public Company AccountingOversight Board (United States). A review of interim financial information consists principally ofapplying analytical procedures and making inquiries of persons responsible for financial andaccounting matters. It is substantially less in scope than an audit conducted in accordance with thestandards of the Public Company Accounting Oversight Board (United States), the objective of whichis the expression of an opinion regarding the financial statements taken as a whole. Accordingly, wedo not express such an opinion.
Based on our review, we are not aware of any material modifications that should be made to theaccompanying condensed consolidated interim financial statements for them to be in conformity withaccounting principles generally accepted in the United States of America.
We previously audited in accordance with the standards of the Public Company AccountingOversight Board (United States), the consolidated statement of financial condition as ofNovember 28, 2008, and the related consolidated statements of earnings, changes in shareholders’equity, cash flows and comprehensive income for the year then ended (not presented herein), and inour report dated January 22, 2009, we expressed an unqualified opinion on those consolidatedfinancial statements. In our opinion, the information set forth in the accompanying condensedconsolidated statement of financial condition as of November 28, 2008 and the condensedconsolidated statement of changes in shareholders’ equity for the year ended November 28, 2008, isfairly stated in all material respects in relation to the consolidated financial statements from which ithas been derived.
/s/ PRICEWATERHOUSECOOPERS, LLP
New York, New YorkAugust 4, 2009
76

STATISTICAL DISCLOSURES
Distribution of Assets, Liabilities and Shareholders’ Equity
The following tables set forth a summary of consolidated average balances and interest rates forthe three and six months ended June 2009 and May 2008:
Averagebalance Interest
Averagerate
(annualized)Averagebalance Interest
Averagerate
(annualized)
June 2009 May 2008Three Months Ended
(in millions, except rates)AssetsDeposits with banks . . . . . . . . . . . . . . . . . . . . . . $ 25,040 $ 18 0.29% $ 5,300 $ 38 2.88%
U.S. . . . . . . . . . . . . . . . . . . . . . . . . . . . . . 18,220 13 0.29 1,387 2 0.58Non-U.S. . . . . . . . . . . . . . . . . . . . . . . . . . . 6,820 5 0.29 3,913 36 3.70
Securities borrowed, securities purchased underagreements to resell and federal funds sold . . . . . 354,792 176 0.20 445,615 3,184 2.87
U.S. . . . . . . . . . . . . . . . . . . . . . . . . . . . . . 268,925 (109) (0.16) 354,145 2,194 2.49Non-U.S. . . . . . . . . . . . . . . . . . . . . . . . . . . 85,867 285 1.33 91,470 990 4.35
Trading assets, at fair value (1)(2) . . . . . . . . . . . . . . 267,542 2,881 4.32 362,204 3,426 3.80U.S. . . . . . . . . . . . . . . . . . . . . . . . . . . . . . 193,117 2,231 4.63 198,807 1,824 3.69Non-U.S. . . . . . . . . . . . . . . . . . . . . . . . . . . 74,425 650 3.50 163,397 1,602 3.94
Other interest-earning assets (3) . . . . . . . . . . . . . . 125,783 395 1.26 229,684 2,850 4.99U.S. . . . . . . . . . . . . . . . . . . . . . . . . . . . . . 77,381 206 1.07 135,980 1,376 4.07Non-U.S. . . . . . . . . . . . . . . . . . . . . . . . . . . 48,402 189 1.57 93,704 1,474 6.33
Total interest-earning assets . . . . . . . . . . . . . . . 773,157 3,470 1.80 1,042,803 9,498 3.66Cash and due from banks . . . . . . . . . . . . . . . . . . 9,428 7,275Other noninterest-earning assets (2) . . . . . . . . . . . . 122,478 160,248
Total assets . . . . . . . . . . . . . . . . . . . . . . . . . . . $905,063 $1,210,326
LiabilitiesDeposits . . . . . . . . . . . . . . . . . . . . . . . . . . . . . $ 42,571 $ 119 1.12% $ 29,282 $ 186 2.55%
U.S. . . . . . . . . . . . . . . . . . . . . . . . . . . . . . 36,717 107 1.17 23,063 143 2.49Non-U.S. . . . . . . . . . . . . . . . . . . . . . . . . . . 5,854 12 0.82 6,219 43 2.78
Securities loaned and securities sold underagreements to repurchase, at fair value . . . . . . . . 150,602 366 0.97 216,994 1,875 3.48
U.S. . . . . . . . . . . . . . . . . . . . . . . . . . . . . . 108,002 110 0.41 120,318 905 3.03Non-U.S. . . . . . . . . . . . . . . . . . . . . . . . . . . 42,600 256 2.41 96,676 970 4.04
Trading liabilities, at fair value (1)(2) . . . . . . . . . . . . . 67,262 406 2.42 101,166 630 2.50U.S. . . . . . . . . . . . . . . . . . . . . . . . . . . . . . 35,324 86 0.98 50,028 194 1.56Non-U.S. . . . . . . . . . . . . . . . . . . . . . . . . . . 31,938 320 4.02 51,138 436 3.43
Commercial paper . . . . . . . . . . . . . . . . . . . . . . . 381 — 0.26 4,453 24 2.17U.S. . . . . . . . . . . . . . . . . . . . . . . . . . . . . . 260 — 0.22 2,968 16 2.17Non-U.S. . . . . . . . . . . . . . . . . . . . . . . . . . . 121 — 0.36 1,485 8 2.17
Other borrowings (4)(5) . . . . . . . . . . . . . . . . . . . . . 60,017 154 1.03 104,537 424 1.63U.S. . . . . . . . . . . . . . . . . . . . . . . . . . . . . . 36,250 130 1.44 53,265 216 1.63Non-U.S. . . . . . . . . . . . . . . . . . . . . . . . . . . 23,767 24 0.41 51,272 208 1.63
Long-term borrowings (5)(6) . . . . . . . . . . . . . . . . . . 205,941 648 1.26 216,612 1,891 3.51U.S. . . . . . . . . . . . . . . . . . . . . . . . . . . . . . 194,460 596 1.23 192,750 1,683 3.51Non-U.S. . . . . . . . . . . . . . . . . . . . . . . . . . . 11,481 52 1.82 23,862 208 3.51
Other interest-bearing liabilities (7) . . . . . . . . . . . . . 210,979 (265) (0.50) 365,881 3,191 3.51U.S. . . . . . . . . . . . . . . . . . . . . . . . . . . . . . 146,049 (374) (1.03) 222,508 770 1.39Non-U.S. . . . . . . . . . . . . . . . . . . . . . . . . . . 64,930 109 0.67 143,373 2,421 6.79
Total interest-bearing liabilities . . . . . . . . . . . . . 737,753 1,428 0.78 1,038,925 8,221 3.18Noninterest-bearing deposits . . . . . . . . . . . . . . . . 83 —Other noninterest-bearing liabilities (2) . . . . . . . . . . 100,357 128,140
Total liabilities . . . . . . . . . . . . . . . . . . . . . . . . . 838,193 1,167,065Shareholders’ equityPreferred stock . . . . . . . . . . . . . . . . . . . . . . . . . 14,125 3,100Common stock . . . . . . . . . . . . . . . . . . . . . . . . . 52,745 40,161
Total shareholders’ equity . . . . . . . . . . . . . . . . . 66,870 43,261Total liabilities and shareholders’ equity . . . . . . . $905,063 $1,210,326
Interest rate spread . . . . . . . . . . . . . . . . . . . . . . 1.02% 0.48%Net interest income and net yield on interest-earning
assets . . . . . . . . . . . . . . . . . . . . . . . . . . . . . $2,042 1.06 $1,277 0.49U.S. . . . . . . . . . . . . . . . . . . . . . . . . . . . . . 1,686 1.21 1,469 0.86Non-U.S. . . . . . . . . . . . . . . . . . . . . . . . . . . 356 0.66 (192) (0.22)
Percentage of interest-earning assets andinterest-bearing liabilities attributable tonon-U.S. operations (8)
Assets . . . . . . . . . . . . . . . . . . . . . . . . . . . . . . . 27.87% 33.80%Liabilities . . . . . . . . . . . . . . . . . . . . . . . . . . . . . 24.49 36.00
77

STATISTICAL DISCLOSURES
Averagebalance Interest
Averagerate
(annualized)Averagebalance Interest
Averagerate
(annualized)
June 2009 May 2008Six Months Ended
(in millions, except rates)AssetsDeposits with banks. . . . . . . . . . . . . . . . . . . . . . $ 22,960 $ 40 0.35% $ 5,359 $ 87 3.26%
U.S. . . . . . . . . . . . . . . . . . . . . . . . . . . . . 18,321 26 0.28 1,403 12 1.72Non-U.S. . . . . . . . . . . . . . . . . . . . . . . . . . 4,639 14 0.61 3,956 75 3.81
Securities borrowed, securities purchased underagreements to resell and federal funds sold . . . . . 355,035 727 0.41 416,489 7,314 3.53
U.S. . . . . . . . . . . . . . . . . . . . . . . . . . . . . 266,682 52 0.04 330,835 5,606 3.41Non-U.S. . . . . . . . . . . . . . . . . . . . . . . . . . 88,353 675 1.53 85,654 1,708 4.01
Trading assets, at fair value (1)(2) . . . . . . . . . . . . . 281,637 6,039 4.30 372,556 7,143 3.86U.S. . . . . . . . . . . . . . . . . . . . . . . . . . . . . 205,771 4,807 4.69 204,059 4,019 3.96Non-U.S. . . . . . . . . . . . . . . . . . . . . . . . . . 75,866 1,232 3.26 168,497 3,124 3.73
Other interest-earning assets (3) . . . . . . . . . . . . . . 142,857 1,026 1.44 243,218 6,199 5.13U.S. . . . . . . . . . . . . . . . . . . . . . . . . . . . . 93,725 568 1.22 139,951 2,539 3.65Non-U.S. . . . . . . . . . . . . . . . . . . . . . . . . . 49,132 458 1.87 103,267 3,660 7.13
Total interest-earning assets . . . . . . . . . . . . . . . 802,489 7,832 1.96 1,037,622 20,743 4.02Cash and due from banks . . . . . . . . . . . . . . . . . . 6,344 7,062Other noninterest-earning assets (2) . . . . . . . . . . . 133,510 148,435
Total assets . . . . . . . . . . . . . . . . . . . . . . . . . . $942,343 $1,193,119
LiabilitiesDeposits . . . . . . . . . . . . . . . . . . . . . . . . . . . . . $ 41,049 $ 269 1.31% $ 25,090 $ 386 3.09%
U.S. . . . . . . . . . . . . . . . . . . . . . . . . . . . . 35,493 243 1.37 21,065 332 3.17Non-U.S. . . . . . . . . . . . . . . . . . . . . . . . . . 5,556 26 0.94 4,025 54 2.70
Securities loaned and securities sold underagreements to repurchase, at fair value . . . . . . . 168,946 911 1.08 219,811 4,486 4.10
U.S. . . . . . . . . . . . . . . . . . . . . . . . . . . . . 122,369 259 0.42 123,344 2,425 3.95Non-U.S. . . . . . . . . . . . . . . . . . . . . . . . . . 46,577 652 2.81 96,467 2,061 4.30
Trading liabilities, at fair value (1)(2) . . . . . . . . . . . . 65,273 869 2.67 107,146 1,327 2.49U.S. . . . . . . . . . . . . . . . . . . . . . . . . . . . . 33,166 238 1.44 55,468 448 1.62Non-U.S. . . . . . . . . . . . . . . . . . . . . . . . . . 32,107 631 3.94 51,678 879 3.42
Commercial paper . . . . . . . . . . . . . . . . . . . . . . . 525 3 1.15 6,494 98 3.03U.S. . . . . . . . . . . . . . . . . . . . . . . . . . . . . 322 3 1.87 5,226 83 3.19Non-U.S. . . . . . . . . . . . . . . . . . . . . . . . . . 203 — 0.19 1,268 15 2.38
Other borrowings (4) (5) . . . . . . . . . . . . . . . . . . . . 67,122 391 1.17 104,240 887 1.71U.S. . . . . . . . . . . . . . . . . . . . . . . . . . . . . 42,701 337 1.58 52,041 638 2.47Non-U.S. . . . . . . . . . . . . . . . . . . . . . . . . . 24,421 54 0.44 52,199 249 0.96
Long-term borrowings (5) (6) . . . . . . . . . . . . . . . . . 203,337 1,597 1.58 207,453 4,260 4.13U.S. . . . . . . . . . . . . . . . . . . . . . . . . . . . . 191,978 1,470 1.54 184,853 3,842 4.18Non-U.S. . . . . . . . . . . . . . . . . . . . . . . . . . 11,359 127 2.24 22,600 418 3.72
Other interest-bearing liabilities (7) . . . . . . . . . . . . 218,758 (157) (0.14) 350,275 7,071 4.06U.S. . . . . . . . . . . . . . . . . . . . . . . . . . . . . 152,450 (447) (0.59) 212,636 2,894 2.74Non-U.S. . . . . . . . . . . . . . . . . . . . . . . . . . 66,308 290 0.88 137,639 4,177 6.10
Total interest-bearing liabilities . . . . . . . . . . . . . 765,010 3,883 1.02 1,020,509 18,515 3.65Noninterest-bearing deposits . . . . . . . . . . . . . . . . 83 —Other noninterest-bearing liabilities (2) . . . . . . . . . . 112,083 129,534
Total liabilities . . . . . . . . . . . . . . . . . . . . . . . . 877,176 1,150,043Shareholders’ equityPreferred stock . . . . . . . . . . . . . . . . . . . . . . . . . 15,139 3,100Common stock . . . . . . . . . . . . . . . . . . . . . . . . . 50,028 39,976
Total shareholders’ equity . . . . . . . . . . . . . . . . 65,167 43,076Total liabilities and shareholders’ equity . . . . . . $942,343 $1,193,119
Interest rate spread . . . . . . . . . . . . . . . . . . . . . . 0.94% 0.37%Net interest income and net yield on interest-earning
assets . . . . . . . . . . . . . . . . . . . . . . . . . . . . . $3,949 0.99 $ 2,228 0.43U.S. . . . . . . . . . . . . . . . . . . . . . . . . . . . . 3,350 1.15 1,514 0.45Non-U.S. . . . . . . . . . . . . . . . . . . . . . . . . . 599 0.55 714 0.40
Percentage of interest-earning assets andinterest-bearing liabilities attributable tonon-U.S. operations (8)
Assets . . . . . . . . . . . . . . . . . . . . . . . . . . . . . . 27.16% 34.83%Liabilities . . . . . . . . . . . . . . . . . . . . . . . . . . . . . 24.38 35.85
78

STATISTICAL DISCLOSURES
(1) Consists of cash trading instruments, including equity securities and convertible debentures.(2) Derivative instruments are included in other noninterest-earning assets and other noninterest-bearing liabilities.(3) Primarily consists of cash and securities segregated for regulatory and other purposes and receivables from customers and
counterparties.(4) Consists of short-term other secured financings and unsecured short-term borrowings, excluding commercial paper.(5) Interest rates include the effects of hedging in accordance with SFAS No. 133.(6) Consists of long-term other secured financings and unsecured long-term borrowings.(7) Primarily consists of payables to customers and counterparties.(8) Assets, liabilities and interest are attributed to U.S. and non-U.S. based on the location of the legal entity in which the assets
and liabilities are held.
79

STATISTICAL DISCLOSURES
Ratios
The following table sets forth selected financial ratios:
June2009
May2008
June2009
May2008
Three Months Ended Six Months Ended
Annualized net earnings to average assets. . . . . . . . 1.5% 0.7% 1.1% 0.6%Annualized return on average common
shareholders’ equity (1) . . . . . . . . . . . . . . . . . . . . . 23.0 (3) 20.4 18.3 (3) 17.6Annualized return on average total shareholders’
equity (2) . . . . . . . . . . . . . . . . . . . . . . . . . . . . . . . . 20.5 19.3 16.1 16.7Total average equity to average assets . . . . . . . . . . . 7.4 3.6 6.9 3.6
(1) Based on annualized net earnings applicable to common shareholders divided by average monthly commonshareholders’ equity.
(2) Based on annualized net earnings divided by average monthly total shareholders’ equity.(3) The one-time preferred dividend of $426 million related to the repurchase of the firm’s TARP preferred stock
(calculated as the difference between the carrying value and the redemption value of the preferred stock) in thesecond quarter of 2009 was not annualized in the calculation of annualized net earnings to common shareholderssince it has no impact on other quarters in the year.
Cross-border Outstandings
Cross-border outstandings are based upon the Federal Financial Institutions ExaminationCouncil’s (FFIEC) regulatory guidelines for reporting cross-border risk. Claims include cash,receivables, securities purchased under agreements to resell, securities borrowed and cash tradinginstruments, but exclude derivative instruments and commitments. Securities purchased underagreements to resell and securities borrowed are presented based on the domicile of thecounterparty, without reduction for related securities collateral held.
The following table sets forth cross-border outstandings for each country in which cross-borderoutstandings exceed 0.75% of consolidated assets as of June 2009 in accordance with the FFIECguidelines:
Banks Governments Other Total(in millions)
CountryUnited Kingdom . . . . . . . . . . . . . . . . . . . . . . . . . $ 5,757 $6,604 $40,126 $52,487Japan . . . . . . . . . . . . . . . . . . . . . . . . . . . . . . . . . 18,301 230 4,293 22,824Germany . . . . . . . . . . . . . . . . . . . . . . . . . . . . . . 1,893 6,784 12,559 21,236Cayman Islands . . . . . . . . . . . . . . . . . . . . . . . . . 36 1 15,147 15,184France . . . . . . . . . . . . . . . . . . . . . . . . . . . . . . . . 4,103 3,246 4,878 12,227Italy . . . . . . . . . . . . . . . . . . . . . . . . . . . . . . . . . . 692 8,002 533 9,227China . . . . . . . . . . . . . . . . . . . . . . . . . . . . . . . . . 7,359 29 1,617 9,005
80

Item 2: Management’s Discussion and Analysis of Financial Condition and Results of Operations
INDEX
PageNo.
Introduction. . . . . . . . . . . . . . . . . . . . . . . . . . . . . . . . . . . . . . . . . . . . . . . . . . . . . . . . . . . . . . . . 82
Executive Overview. . . . . . . . . . . . . . . . . . . . . . . . . . . . . . . . . . . . . . . . . . . . . . . . . . . . . . . . . . 84
Business Environment . . . . . . . . . . . . . . . . . . . . . . . . . . . . . . . . . . . . . . . . . . . . . . . . . . . . . . . 87
Critical Accounting Policies . . . . . . . . . . . . . . . . . . . . . . . . . . . . . . . . . . . . . . . . . . . . . . . . . . . . 88
Fair Value . . . . . . . . . . . . . . . . . . . . . . . . . . . . . . . . . . . . . . . . . . . . . . . . . . . . . . . . . . . . . . . . . 88
Goodwill and Identifiable Intangible Assets . . . . . . . . . . . . . . . . . . . . . . . . . . . . . . . . . . . . . . . . 97
Use of Estimates . . . . . . . . . . . . . . . . . . . . . . . . . . . . . . . . . . . . . . . . . . . . . . . . . . . . . . . . . . . 99
Results of Operations . . . . . . . . . . . . . . . . . . . . . . . . . . . . . . . . . . . . . . . . . . . . . . . . . . . . . . . . 99
Financial Overview . . . . . . . . . . . . . . . . . . . . . . . . . . . . . . . . . . . . . . . . . . . . . . . . . . . . . . . . . . 100
Segment Operating Results . . . . . . . . . . . . . . . . . . . . . . . . . . . . . . . . . . . . . . . . . . . . . . . . . . . 106
Geographic Data. . . . . . . . . . . . . . . . . . . . . . . . . . . . . . . . . . . . . . . . . . . . . . . . . . . . . . . . . . . . 113
Off-Balance-Sheet Arrangements . . . . . . . . . . . . . . . . . . . . . . . . . . . . . . . . . . . . . . . . . . . . . . . 113
Equity Capital . . . . . . . . . . . . . . . . . . . . . . . . . . . . . . . . . . . . . . . . . . . . . . . . . . . . . . . . . . . . . . 114
Contractual Obligations . . . . . . . . . . . . . . . . . . . . . . . . . . . . . . . . . . . . . . . . . . . . . . . . . . . . . . . 119
Market Risk . . . . . . . . . . . . . . . . . . . . . . . . . . . . . . . . . . . . . . . . . . . . . . . . . . . . . . . . . . . . . . . 121
Credit Risk . . . . . . . . . . . . . . . . . . . . . . . . . . . . . . . . . . . . . . . . . . . . . . . . . . . . . . . . . . . . . . . . 126
Derivatives . . . . . . . . . . . . . . . . . . . . . . . . . . . . . . . . . . . . . . . . . . . . . . . . . . . . . . . . . . . . . . . . 127
Liquidity and Funding Risk . . . . . . . . . . . . . . . . . . . . . . . . . . . . . . . . . . . . . . . . . . . . . . . . . . . . 131
Recent Accounting Developments . . . . . . . . . . . . . . . . . . . . . . . . . . . . . . . . . . . . . . . . . . . . . . . 138
Cautionary Statement Pursuant to the U.S. Private Securities Litigation Reform Act of 1995 . . . 139
81

Introduction
The Goldman Sachs Group, Inc. (Group Inc.) is a leading global financial services firm providinginvestment banking, securities and investment management services to a substantial and diversifiedclient base that includes corporations, financial institutions, governments and high-net-worthindividuals. Founded in 1869, the firm is headquartered in New York and maintains offices in London,Frankfurt, Tokyo, Hong Kong and other major financial centers around the world.
Our activities are divided into three segments:
• Investment Banking. We provide a broad range of investment banking services to a diversegroup of corporations, financial institutions, investment funds, governments and individuals.
• Trading and Principal Investments. We facilitate client transactions with a diverse group ofcorporations, financial institutions, investment funds, governments and individuals and takeproprietary positions through market making in, trading of and investing in fixed income andequity products, currencies, commodities and derivatives on these products. In addition, weengage in market-making and specialist activities on equities and options exchanges, and weclear client transactions on major stock, options and futures exchanges worldwide. Inconnection with our merchant banking and other investing activities, we make principalinvestments directly and through funds that we raise and manage.
• Asset Management and Securities Services. We provide investment advisory and financialplanning services and offer investment products (primarily through separately managedaccounts and commingled vehicles, such as mutual funds and private investment funds)across all major asset classes to a diverse group of institutions and individuals worldwide andprovide prime brokerage services, financing services and securities lending services toinstitutional clients, including hedge funds, mutual funds, pension funds and foundations, andto high-net-worth individuals worldwide.
This Management’s Discussion and Analysis of Financial Condition and Results of Operationsshould be read in conjunction with our Annual Report on Form 10-K for the fiscal year endedNovember 28, 2008. References herein to our Annual Report on Form 10-K are to our Annual Reporton Form 10-K for the fiscal year ended November 28, 2008.
When we use the terms “Goldman Sachs,” “we,” “us” and “our,” we mean Group Inc., a Delawarecorporation, and its consolidated subsidiaries.
In connection with becoming a bank holding company, we were required to change our fiscalyear-end from November to December. This change in our fiscal year-end resulted in a one-monthtransition period that began on November 29, 2008 and ended on December 26, 2008. Financialinformation for this fiscal transition period is included in our Quarterly Report on Form 10-Q for thequarter ended March 27, 2009. On April 13, 2009, the Board of Directors of Group Inc. (the Board)approved a change in our fiscal year-end from the last Friday of December to December 31,beginning with fiscal 2009. Fiscal 2009 began on December 27, 2008 and will end onDecember 31, 2009. Our third fiscal quarter in 2009 will end on the last Friday of September.Beginning in the fourth quarter of 2009, our fiscal year will end on December 31.
In “Results of Operations” below, we compare the three and six month periods, as applicable,ended June 26, 2009 with the previously reported three and six month periods ended May 30, 2008.Financial information for the three and six months ended June 27, 2008 has not been included in thisForm 10-Q for the following reasons: (i) the three and six months ended May 30, 2008 provide ameaningful comparison for the three and six months ended June 26, 2009; (ii) there are no significantfactors, seasonal or other, that would impact the comparability of information if the results for thethree and six months ended June 27, 2008 were presented in lieu of results for the three and sixmonths ended May 30, 2008; and (iii) it was not practicable or cost justified to prepare thisinformation.
82

All references to June 2009 and May 2008, unless specifically stated otherwise, refer to ourthree-month fiscal periods ended, or the dates, as the context requires, June 26, 2009 andMay 30, 2008, respectively. All references to November 2008, unless specifically stated otherwise,refer to our fiscal year ended, or the date, as the context requires, November 28, 2008. All referencesto 2009, unless specifically stated otherwise, refer to our fiscal year ending, or the date, as thecontext requires, December 31, 2009.
83

Executive Overview
Three Months Ended June 2009 versus May 2008. Our diluted earnings per common sharewere $4.93 for the second quarter ended June 26, 2009 compared with $4.58 for the second quarterended May 30, 2008. Annualized return on average common shareholders’ equity (ROE) (1) was23.0% for the second quarter of 2009. During the quarter, the firm repurchased the preferred stockthat was issued to the U.S. Department of the Treasury (U.S. Treasury) pursuant to its TARP CapitalPurchase Program for an aggregate purchase price of $10.04 billion (including accrued dividends).The repurchase resulted in a one-time preferred dividend of $426 million, which is included in ourresults for the second quarter of 2009. Excluding this one-time preferred dividend, diluted earningsper common share were $5.71 (2) and annualized ROE was 23.8% (2) for the second quarter of 2009.In addition, the firm completed a public offering of common stock for proceeds of $5.75 billion. Duringthe quarter, book value per common share increased approximately 8% to $106.41 and tangible bookvalue per common share (3) increased approximately 10% to $96.94. Our Tier 1 capital ratio underBasel I (4) was 13.8% at the end of the second quarter of 2009, up from 13.7% at the end of the firstquarter of 2009. Our Tier 1 capital ratio under Basel II (4) was 16.1% at the end of the second quarterof 2009, up from 16.0% at the end of the first quarter of 2009.
Our results for the second quarter of 2009 reflected significantly higher net revenues in Tradingand Principal Investments compared with the second quarter of 2008, partially offset by significantlylower net revenues in Asset Management and Securities Services and lower net revenues inInvestment Banking. The increase in Trading and Principal Investments reflected particularly strongresults in Fixed Income, Currency and Commodities (FICC) and Equities, which were both significantlyhigher than the second quarter of 2008. The increase in FICC reflected particularly strongperformances in credit products, interest rate products and currencies, reflecting strength in the clientfranchise. In addition, net revenues in both mortgages and commodities were higher compared withthe second quarter of 2008. In the second quarter of 2009, mortgages included a loss ofapproximately $700 million on commercial mortgage loans. During the quarter, FICC operated in anenvironment characterized by strong client-driven activity, particularly in more liquid products,favorable market opportunities and tighter corporate credit spreads. The increase in Equities reflectedsignificantly higher net revenues in derivatives and, to a lesser extent, principal strategies. In addition,net revenues in shares were solid, but essentially unchanged compared with the second quarter of2008. Commissions declined compared with the second quarter of 2008. During the quarter, Equitiesoperated in an environment characterized by solid client-driven activity, favorable market opportunities,a significant increase in global equity prices and a decline in volatility levels. Results in PrincipalInvestments were also higher compared with the second quarter of 2008, and included a gain of$948 million related to our investment in the ordinary shares of Industrial and Commercial Bank ofChina Limited (ICBC), a gain of $343 million from corporate principal investments and a loss of$499 million from real estate principal investments.
The decline in Asset Management and Securities Services reflected significantly lower netrevenues in both Asset Management and Securities Services compared with the second quarter of2008. The decrease in Securities Services primarily reflected the impact of lower customer balancescompared with the second quarter of 2008. The decrease in Asset Management principally reflectedthe impact of lower assets under management, due to market depreciation since the end of thesecond quarter of 2008. During the quarter, assets under management increased $48 billion to$819 billion, due to $42 billion of market appreciation, primarily in equity and fixed income assets, and$6 billion of net inflows.
84

The decline in Investment Banking reflected significantly lower net revenues in FinancialAdvisory, partially offset by significantly higher net revenues in Underwriting compared with thesecond quarter of 2008. The decrease in Financial Advisory reflected a significant decline inindustry-wide completed mergers and acquisitions. The increase in Underwriting reflected significantlyhigher net revenues in equity underwriting, which achieved its highest quarterly performance, as wellas higher net revenues in debt underwriting. The increase in equity underwriting reflected very strongclient activity. The increase in debt underwriting primarily reflected higher net revenues frominvestment-grade and municipal activity. Our investment banking transaction backlog decreasedduring the quarter. (5)
Six Months Ended June 2009 versus May 2008. Our diluted earnings per common sharewere $8.42 for the six months ended June 26, 2009 compared with $7.81 for the six months endedMay 30, 2008. Annualized ROE (1) was 18.3% for the first half of 2009. Excluding the one-timepreferred dividend of $426 million related to the repurchase of our TARP preferred stock, dilutedearnings per common share were $9.23 (2) and annualized ROE was 19.2% (2) for the first half of2009.
Our results for the first half of 2009 reflected significantly higher net revenues in Trading andPrincipal Investments, partially offset by significantly lower net revenues in Asset Management andSecurities Services, and Investment Banking. The increase in Trading and Principal Investmentsreflected significantly higher net revenues in FICC, which were more than double the amount in thefirst half of 2008, as well as higher net revenues in Equities, partially offset by weak results inPrincipal Investments. The increase in FICC reflected particularly strong results in credit products,interest rate products and, to a lesser extent, commodities, reflecting strength in the client franchise.In addition, results in mortgages were significantly higher compared with a difficult first half of 2008,while net revenues in currencies were solid, but lower compared with the first half of 2008. In the firsthalf of 2009, mortgages included a loss of approximately $1.5 billion on commercial mortgage loans.During the first half of 2009, FICC operated in an environment characterized by strong client-drivenactivity, particularly in more liquid products, and favorable market opportunities. The increase inEquities reflected particularly strong net revenues in derivatives, as well as higher results in principalstrategies. These increases were partially offset by lower net revenues in shares compared with thefirst half of 2008. Commissions declined compared with the first half of 2008. During the first half of2009, Equities operated in an environment generally characterized by an increase in global equityprices (principally during our second quarter) and high, but declining, levels of volatility. In the first halfof 2009, results in Principal Investments reflected net losses of $1.14 billion from real estate principalinvestments and $278 million from corporate principal investments, partially offset by a gain of$797 million related to our investment in the ordinary shares of ICBC.
The decline in Asset Management and Securities Services reflected significant decreases inboth Asset Management and Securities Services. The decrease in Asset Management primarilyreflected the impact of lower assets under management, due to market depreciation during thesecond half of 2008. The decrease in Securities Services primarily reflected the impact of lowercustomer balances.
The decline in Investment Banking primarily reflected significantly lower net revenues inFinancial Advisory, due to a significant decline in industry-wide completed mergers and acquisitions.Net revenues in Underwriting were slightly lower compared with the first half of 2008, primarily due tolower net revenues in debt underwriting, reflecting a decrease in leveraged finance activity. Netrevenues in equity underwriting were essentially unchanged compared with the first half of 2008.
Our business, by its nature, does not produce predictable earnings. Our results in any givenperiod can be materially affected by conditions in global financial markets and economic conditionsgenerally. For a further discussion of the factors that may affect our future operating results, see “RiskFactors” in Part I, Item 1A of our Annual Report on Form 10-K.
85

(1) Annualized return on average common shareholders’ equity (ROE) is computed by dividing annualized net earningsapplicable to common shareholders by average monthly common shareholders’ equity. The one-time preferred dividend of$426 million related to the repurchase of our TARP preferred stock (calculated as the difference between the carrying valueand the redemption value of the preferred stock) was not annualized in the calculation of annualized net earnings applicableto common shareholders since it has no impact on other quarters in the year. See ‘‘— Results of Operations — FinancialOverview” below for further information regarding our calculation of ROE.
(2) We believe that presenting our results excluding the impact of the one-time preferred dividend of $426 million related to therepurchase of our TARP preferred stock is meaningful because it increases the comparability of period-to-period results. See“— Results of Operations — Financial Overview” below for further information regarding our calculation of diluted earningsper common share and ROE excluding the impact of this one-time dividend.
(3) Tangible common shareholders’ equity equals total shareholders’ equity less preferred stock, goodwill and identifiableintangible assets. Tangible book value per common share is computed by dividing tangible common shareholders’ equity bythe number of common shares outstanding, including restricted stock units granted to employees with no future servicerequirements. We believe that tangible common shareholders’ equity is meaningful because it is one of the measures thatwe and investors use to assess capital adequacy. See ‘‘— Equity Capital — Capital Ratios and Metrics” below for furtherinformation regarding tangible common shareholders’ equity.
(4) As a bank holding company, we are subject to consolidated regulatory capital requirements administered by the FederalReserve Board. We are reporting our Tier 1 capital ratio calculated in accordance with the regulatory capital requirementscurrently applicable to bank holding companies, which are based on the Capital Accord of the Basel Committee on BankingSupervision (Basel I). The calculation of our Tier 1 capital ratio under Basel I includes certain market risk measures that areunder review by the Federal Reserve Board, as part of our transition to bank holding company status. The calculation of ourTier 1 capital ratio has not been reviewed with the Federal Reserve Board and, accordingly, may be revised in subsequentfilings. We also continue to disclose our Tier 1 capital ratio calculated in accordance with the capital guidelines applicable tous when we were regulated by the SEC as a Consolidated Supervised Entity (CSE). These guidelines were generallyconsistent with those set out in the Revised Framework for the International Convergence of Capital Measurement andCapital Standards issued by the Basel Committee on Banking Supervision (Basel II). See ‘‘— Equity Capital” below for afurther discussion of our capital ratios.
(5) Our investment banking transaction backlog represents an estimate of our future net revenues from investment bankingtransactions where we believe that future revenue realization is more likely than not.
86

Business Environment
Global economic conditions remained weak, but showed some signs of stabilization during oursecond quarter of fiscal 2009. Although real gross domestic product (GDP) continued to decline inmost major economies, the decline was significantly less than in the first quarter of fiscal 2009, andeconomic activity in a number of emerging economies improved. Global equity markets increasedsignificantly during our second quarter, and volatility levels generally declined. In addition, corporatecredit spreads tightened during our second quarter. The price of crude oil increased, but remainedwell below the levels reached in fiscal 2008. The U.S. dollar depreciated against the British pound, theEuro and the Japanese yen. In investment banking, industry-wide mergers and acquisitions activityremained weak, while industry-wide equity and equity-related offerings increased significantly duringour second quarter, particularly in the financial sector.
In the U.S., real GDP continued to decline during our second quarter, although at a slower pacecompared with our first quarter. Residential investment continued to contract due to ongoingweakness in the housing market and the rate of unemployment continued to rise at a rapid pace.However, the fiscal stimulus package contributed to an increase in government expenditure. The rateof inflation declined during our second quarter, reflecting rising excess production capacity. TheU.S. Federal Reserve maintained its federal funds rate at a target range of zero to 0.25% during oursecond quarter. The 10-year U.S. Treasury note yield ended our second quarter 74 basis pointshigher at 3.52%. In equity markets, the NASDAQ Composite Index, the S&P 500 Index and the DowJones Industrial Average increased by 19%, 13% and 9%, respectively, during our second quarter.
In the Eurozone economies, real GDP declined during our second quarter, as businessinvestment, exports and consumer spending remained weak. Labor markets also remained weak, withthe rate of unemployment rising in the major economies. However, surveys of business and consumerconfidence recovered from the very low levels during our first quarter. In response to a continuedchallenging economic outlook and declining inflation, the European Central Bank further lowered itsmain refinancing operations rate by 50 basis points to 1.00%. The Euro appreciated by 6% againstthe U.S. dollar. In the U.K., real GDP appeared to decline during the quarter, due to weaker consumerand business investment spending, partially offset by stronger exports. The Bank of Englandmaintained its official bank rate at 0.50% during the quarter. After a period of sustained weaknessover the previous two quarters, the British pound appreciated by 15% against the U.S. dollar. Equitymarkets in both the U.K. and continental Europe increased significantly during our second quarter,while long-term government bond yields increased.
In Japan, real GDP appeared to increase during our second quarter, after a significant decline inthe first quarter. A recovery in exports and consumer spending more than offset continued weaknessin business investment. Business confidence improved slightly but remained at low levels and the rateof unemployment continued to rise. Measures of inflation declined during the quarter. The Bank ofJapan left its target overnight call rate unchanged at 0.10%, while the yield on 10-year Japanesegovernment bonds increased slightly during the quarter. The Japanese yen appreciated by 3% againstthe U.S. dollar and the Nikkei 225 Index increased 14% during our second quarter.
In China, real GDP growth accelerated during our second quarter as strong domestic demand,led by high levels of consumption and fixed investment spending, helped to offset weak exportdemand. Measures of inflation continued to decline during the quarter. The People’s Bank of Chinaleft its one-year benchmark lending rate unchanged at 5.31%. The Chinese yuan remained essentiallyunchanged against the U.S. dollar and the Shanghai Composite Index increased 23% during oursecond quarter. Equity markets in Hong Kong and Korea also ended the quarter significantly higher.In India, the pace of economic growth also accelerated due to an increase in business investment andconsumer spending. The Indian rupee appreciated by 5% against the U.S. dollar during our secondquarter and equity markets in India ended the quarter significantly higher.
87

Critical Accounting Policies
Fair Value
The use of fair value to measure financial instruments, with related unrealized gains or lossesgenerally recognized in “Trading and principal investments” in our condensed consolidated statementsof earnings, is fundamental to our financial statements and our risk management processes and is ourmost critical accounting policy. The fair value of a financial instrument is the amount that would bereceived to sell an asset or paid to transfer a liability in an orderly transaction between marketparticipants at the measurement date (i.e., the exit price) in accordance with SFAS No. 157, “FairValue Measurements.” Financial assets are marked to bid prices and financial liabilities are marked tooffer prices.
In October 2008, the Financial Accounting Standards Board (FASB) issued FASB Staff Position(FSP) No. FAS 157-3, “Determining the Fair Value of a Financial Asset When the Market for ThatAsset Is Not Active,” which specifies that it is acceptable to use inputs based on managementestimates or assumptions, or for management to make adjustments to observable inputs, to determinefair value when markets are not active and relevant observable inputs are not available. In April 2009,the FASB issued FSP No. FAS 157-4, “Determining Fair Value When the Volume and Level of Activityfor the Asset or Liability Have Significantly Decreased and Identifying Transactions That Are NotOrderly,” which provides additional guidance for estimating fair value when the volume and level ofactivity for an asset or liability have decreased significantly. Our fair value measurement policies areconsistent with the guidance in both FSP No. FAS 157-3 and FSP No. FAS 157-4. See Note 2 to thecondensed consolidated financial statements in Part I, Item 1 of this Quarterly Report on Form 10-Qfor further information regarding FSP No. FAS 157-4.
Substantially all trading assets and trading liabilities are reflected in our condensed consolidatedstatements of financial condition at fair value, pursuant principally to:
• SFAS No. 115, “Accounting for Certain Investments in Debt and Equity Securities;”
• specialized industry accounting for broker-dealers and investment companies;
• SFAS No. 133, “Accounting for Derivative Instruments and Hedging Activities;” or
• the fair value option under either SFAS No. 155, “Accounting for Certain Hybrid FinancialInstruments — an amendment of FASB Statements No. 133 and 140,” or SFAS No. 159, “TheFair Value Option for Financial Assets and Financial Liabilities,” (i.e., the fair value option).
88

In determining fair value, we separate our “Trading assets, at fair value” and “Trading liabilities,at fair value” into two categories: cash instruments and derivative contracts, as set forth in thefollowing table:
Trading Instruments by Category(in millions)
TradingAssets, atFair Value
TradingLiabilities, at
Fair Value
TradingAssets, atFair Value
TradingLiabilities, at
Fair Value
As of June 2009 As of November 2008
Cash trading instruments . . . . . . . . . . . . . . $244,617 $ 77,819 $186,231 $ 57,143ICBC . . . . . . . . . . . . . . . . . . . . . . . . . . . . 6,269 (1) — 5,496 (1) —SMFG . . . . . . . . . . . . . . . . . . . . . . . . . . . 1,330 1,327 (4) 1,135 1,134 (4)
Other principal investments . . . . . . . . . . . 13,009 (2) — 15,126 (2) —
Principal investments . . . . . . . . . . . . . . . . . 20,608 1,327 21,757 1,134
Cash instruments . . . . . . . . . . . . . . . . . . . . 265,225 79,146 207,988 58,277Exchange-traded . . . . . . . . . . . . . . . . . . . 4,709 5,573 6,164 8,347Over-the-counter . . . . . . . . . . . . . . . . . . . 85,317 62,578 124,173 109,348
Derivative contracts . . . . . . . . . . . . . . . . . . . 90,026 (3) 68,151 (5) 130,337 (3) 117,695 (5)
Total . . . . . . . . . . . . . . . . . . . . . . . . . . . . . . $355,251 $147,297 $338,325 $175,972
(1) Includes interests of $3.96 billion and $3.48 billion as of June 2009 and November 2008, respectively, held byinvestment funds managed by Goldman Sachs. The fair value of our investment in the ordinary shares of ICBC,which trade on The Stock Exchange of Hong Kong, includes the effect of foreign exchange revaluation for which wemaintain an economic currency hedge.
(2) The following table sets forth the principal investments (in addition to our investments in ICBC and Sumitomo MitsuiFinancial Group, Inc. (SMFG)) included within the Principal Investments component of our Trading and PrincipalInvestments segment:
Corporate Real Estate Total Corporate Real Estate TotalAs of June 2009 As of November 2008
(in millions)Private . . . . . . . . . . . . . . . . . . . . $ 9,407 $1,812 $11,219 $10,726 $2,935 $13,661Public . . . . . . . . . . . . . . . . . . . . . 1,747 43 1,790 1,436 29 1,465
Total . . . . . . . . . . . . . . . . . . . . . $11,154 $1,855 $13,009 $12,162 $2,964 $15,126
(3) Net of cash received pursuant to credit support agreements of $133.34 billion and $137.16 billion as of June 2009and November 2008, respectively.
(4) Represents an economic hedge on the shares of common stock underlying our investment in the convertiblepreferred stock of SMFG.
(5) Net of cash paid pursuant to credit support agreements of $16.31 billion and $34.01 billion as of June 2009 andNovember 2008, respectively.
89

Cash Instruments. Cash instruments include cash trading instruments, public principalinvestments and private principal investments.
• Cash Trading Instruments. Our cash trading instruments are generally valued using quotedmarket prices, broker or dealer quotations, or alternative pricing sources with reasonable levelsof price transparency. The types of instruments valued based on quoted market prices inactive markets include most government obligations, active listed equities and certain moneymarket securities.
The types of instruments that trade in markets that are not considered to be active, but arevalued based on quoted market prices, broker or dealer quotations, or alternative pricingsources with reasonable levels of price transparency include most government agencysecurities, investment-grade corporate bonds, certain mortgage products, certain bank loansand bridge loans, less liquid listed equities, certain state, municipal and provincial obligationsand certain money market securities and loan commitments.
Certain cash trading instruments trade infrequently and therefore have little or no pricetransparency. Such instruments include private equity and real estate fund investments, certainbank loans and bridge loans (including certain mezzanine financing, leveraged loans arisingfrom capital market transactions and other corporate bank debt), less liquid corporate debtsecurities and other debt obligations (including less liquid high-yield corporate bonds,distressed debt instruments and collateralized debt obligations (CDOs) backed by corporateobligations), less liquid mortgage whole loans and securities (backed by either commercial orresidential real estate), and acquired portfolios of distressed loans. The transaction price isinitially used as the best estimate of fair value. Accordingly, when a pricing model is used tovalue such an instrument, the model is adjusted so that the model value at inception equalsthe transaction price. This valuation is adjusted only when changes to inputs and assumptionsare corroborated by evidence such as transactions in similar instruments, completed orpending third-party transactions in the underlying investment or comparable entities,subsequent rounds of financing, recapitalizations and other transactions across the capitalstructure, offerings in the equity or debt capital markets, and changes in financial ratios orcash flows.
For positions that are not traded in active markets or are subject to transfer restrictions,valuations are adjusted to reflect illiquidity and/or non-transferability. Such adjustments aregenerally based on market evidence where available. In the absence of such evidence,management’s best estimate is used.
• Public Principal Investments. Our public principal investments held within the PrincipalInvestments component of our Trading and Principal Investments segment tend to be large,concentrated holdings resulting from initial public offerings or other corporate transactions, andare valued based on quoted market prices. For positions that are not traded in active marketsor are subject to transfer restrictions, valuations are adjusted to reflect illiquidity and/ornon-transferability. Such adjustments are generally based on market evidence where available.In the absence of such evidence, management’s best estimate is used.
Our most significant public principal investment is our investment in the ordinary shares ofICBC. Our investment in ICBC is valued using the quoted market price adjusted for transferrestrictions. During the quarter ended March 2009, we committed to supplemental transferrestrictions in relation to our investment in ICBC. Under the original transfer restrictions, theICBC shares we held would have become free from transfer restrictions in equal installmentson April 28, 2009 and October 20, 2009. Under the new supplemental transfer restrictions, onApril 28, 2009, 20% of the ICBC shares that we held became free from transfer restrictionsand we completed the disposition of these shares during the second quarter of 2009. Ourremaining ICBC shares are subject to transfer restrictions, which prohibit liquidation at anytime prior to April 28, 2010.
90

We also have an investment in the convertible preferred stock of SMFG. This investment isvalued using a model that is principally based on SMFG’s common stock price. During 2008,we converted one-third of our SMFG preferred stock investment into SMFG common stock,and delivered the common stock to close out one-third of our hedge position. As of June 2009,we remained hedged on the common stock underlying our remaining investment in SMFG.
• Private Principal Investments. Our private principal investments held within the PrincipalInvestments component of our Trading and Principal Investments segment include investmentsin private equity, debt and real estate, primarily held through investment funds. By their nature,these investments have little or no price transparency. We value such instruments initially attransaction price and adjust valuations when evidence is available to support suchadjustments. Such evidence includes transactions in similar instruments, completed or pendingthird-party transactions in the underlying investment or comparable entities, subsequent roundsof financing, recapitalizations and other transactions across the capital structure, offerings inthe equity or debt capital markets, and changes in financial ratios or cash flows.
Derivative Contracts. Derivative contracts can be exchange-traded or over-the-counter (OTC).We generally value exchange-traded derivatives using models which calibrate to market-clearinglevels and eliminate timing differences between the closing price of the exchange-traded derivativesand their underlying instruments.
OTC derivatives are valued using market transactions and other market evidence wheneverpossible, including market-based inputs to models, model calibration to market-clearing transactions,broker or dealer quotations, or alternative pricing sources with reasonable levels of price transparency.Where models are used, the selection of a particular model to value an OTC derivative depends uponthe contractual terms of, and specific risks inherent in, the instrument, as well as the availability ofpricing information in the market. We generally use similar models to value similar instruments.Valuation models require a variety of inputs, including contractual terms, market prices, yield curves,credit curves, measures of volatility, prepayment rates and correlations of such inputs. For OTCderivatives that trade in liquid markets, such as generic forwards, swaps and options, model inputscan generally be verified and model selection does not involve significant management judgment.
Certain OTC derivatives trade in less liquid markets with limited pricing information, and thedetermination of fair value for these derivatives is inherently more difficult. Where we do not havecorroborating market evidence to support significant model inputs and cannot verify the model tomarket transactions, the transaction price is initially used as the best estimate of fair value.Accordingly, when a pricing model is used to value such an instrument, the model is adjusted so thatthe model value at inception equals the transaction price. Subsequent to initial recognition, we onlyupdate valuation inputs when corroborated by evidence such as similar market transactions,third-party pricing services and/or broker or dealer quotations, or other empirical market data. Incircumstances where we cannot verify the model value to market transactions, it is possible that adifferent valuation model could produce a materially different estimate of fair value. See“— Derivatives” below for further information on our OTC derivatives.
When appropriate, valuations are adjusted for various factors such as liquidity, bid/offer spreadsand credit considerations. Such adjustments are generally based on market evidence where available.In the absence of such evidence, management’s best estimate is used.
Controls Over Valuation of Financial Instruments. A control infrastructure, independent ofthe trading and investing functions, is fundamental to ensuring that our financial instruments areappropriately valued at market-clearing levels (i.e., exit prices) and that fair value measurements arereliable and consistently determined.
91
We employ an oversight structure that includes appropriate segregation of duties. Seniormanagement, independent of the trading and investing functions, is responsible for the oversight ofcontrol and valuation policies and for reporting the results of these policies to our Audit Committee.We seek to maintain the necessary resources to ensure that control functions are performedappropriately. We employ procedures for the approval of new transaction types and markets, priceverification, review of daily profit and loss, and review of valuation models by personnel withappropriate technical knowledge of relevant products and markets. These procedures are performedby personnel independent of the trading and investing functions. For financial instruments whereprices or valuations that require inputs are less observable, we employ, where possible, proceduresthat include comparisons with similar observable positions, analysis of actual to projected cash flows,comparisons with subsequent sales, reviews of valuations used for collateral management purposesand discussions with senior business leaders. See ‘‘— Market Risk” and ‘‘— Credit Risk” below for afurther discussion of how we manage the risks inherent in our trading and principal investingbusinesses.
Fair Value Hierarchy — Level 3. SFAS No. 157 establishes a fair value hierarchy thatprioritizes the inputs to valuation techniques used to measure fair value. The objective of a fair valuemeasurement is to determine the price that would be received to sell an asset or paid to transfer aliability in an orderly transaction between market participants at the measurement date (i.e., the exitprice). The hierarchy gives the highest priority to unadjusted quoted prices in active markets foridentical assets or liabilities (level 1 measurements) and the lowest priority to unobservable inputs(level 3 measurements). Assets and liabilities are classified in their entirety based on the lowest levelof input that is significant to the fair value measurement.
Instruments that trade infrequently and therefore have little or no price transparency areclassified within level 3 of the fair value hierarchy. We determine which instruments are classifiedwithin level 3 based on the results of our price verification process. This process is performed bypersonnel independent of our trading and investing functions who corroborate valuations to externalmarket data (e.g., quoted market prices, broker or dealer quotations, third-party pricing vendors,recent trading activity and comparative analyses to similar instruments). Instruments with valuationswhich cannot be corroborated to external market data are classified within level 3 of the fair valuehierarchy.
When broker or dealer quotations or third-party pricing vendors are used for valuation or priceverification, greater priority is given to executable quotes. As part of our price verification process,valuations based on quotes are corroborated by comparison both to other quotes and to recenttrading activity in the same or similar instruments. The number of quotes obtained varies byinstrument and depends on the liquidity of the particular instrument. See Notes 2 and 3 to thecondensed consolidated financial statements in Part I, Item 1 of this Quarterly Report on Form 10-Qfor further information regarding SFAS No. 157.
Management’s judgment is required to determine the appropriate risk-adjusted discount rate forcash trading instruments that are classified within level 3 of the fair value hierarchy and that have littleor no price transparency as a result of decreased volumes and lower levels of trading activity. In suchsituations, our valuation is adjusted to approximate rates which market participants would likelyconsider appropriate for relevant credit and liquidity risks.
92

Valuation Methodologies for Level 3 Assets. Instruments classified within level 3 of the fairvalue hierarchy are initially valued at transaction price, which is considered to be the best initialestimate of fair value. As time passes, transaction price becomes less reliable as an estimate of fairvalue and accordingly, we use other methodologies to determine fair value, which vary based on thetype of instrument, as described below. Regardless of the methodology, valuation inputs andassumptions are only changed when corroborated by substantive evidence. Senior management incontrol functions, independent of the trading and investing functions, reviews all significant unrealizedgains/losses, including the primary drivers of the change in value. Valuations are further corroboratedby values realized upon sales of our level 3 assets. An overview of methodologies used to value ourlevel 3 assets subsequent to the transaction date is as follows:
• Private equity and real estate fund investments. Investments are generally held at cost forthe first year. Recent third-party investments or pending transactions are considered to be thebest evidence for any change in fair value. In the absence of such evidence, valuations arebased on third-party independent appraisals, transactions in similar instruments, discountedcash flow techniques, valuation multiples and public comparables. Such evidence includespending reorganizations (e.g., merger proposals, tender offers or debt restructurings); andsignificant changes in financial metrics (e.g., operating results as compared to previousprojections, industry multiples, credit ratings and balance sheet ratios).
• Bank loans and bridge loans and Corporate debt securities and other debt obligations.Valuations are generally based on discounted cash flow techniques, for which the key inputsare the amount and timing of expected future cash flows, market yields for such instrumentsand recovery assumptions. Inputs are generally determined based on relative value analyses,which incorporate comparisons both to credit default swaps that reference the same underlyingcredit risk and to other debt instruments for the same issuer for which observable prices orbroker quotes are available.
• Loans and securities backed by commercial real estate. Loans and securities backed bycommercial real estate are collateralized by specific assets and are generally tranched intovarying levels of subordination. Due to the nature of these instruments, valuation techniquesvary by instrument. Methodologies include relative value analyses across different tranches,comparisons to transactions in both the underlying collateral and instruments with the same orsubstantially the same underlying collateral, market indices (such as the CMBX (1)), and creditdefault swaps, as well as discounted cash flow techniques.
• Loans and securities backed by residential real estate. Valuations are based on bothproprietary and industry recognized models (including Intex and Bloomberg), discounted cashflow techniques and hypothetical securitization analyses. In the recent market environment, themost significant inputs to the valuation of these instruments are rates of delinquency, defaultand loss expectations, which are driven in part by housing prices. Inputs are determined basedon relative value analyses, which incorporate comparisons to instruments with similar collateraland risk profiles, including relevant indices such as the ABX (1).
• Loan portfolios. Valuations are based on discounted cash flow techniques, for which the keyinputs are the amount and timing of expected future cash flows and market yields for suchinstruments. Inputs are determined based on relative value analyses which incorporatecomparisons to recent auction data for other similar loan portfolios.
• Derivative contracts. Valuation models are calibrated to initial transaction price. Subsequentchanges in valuations are based on observable inputs to the valuation models (e.g., interestrates, credit spreads, volatilities, etc.). Inputs are changed only when corroborated by marketdata. Valuations of less liquid OTC derivatives are typically based on level 1 or level 2 inputsthat can be observed in the market, as well as unobservable inputs, such as correlations andvolatilities.
93
(1) The CMBX and ABX are indices that track the performance of commercial mortgage bonds and subprime residentialmortgage bonds, respectively.
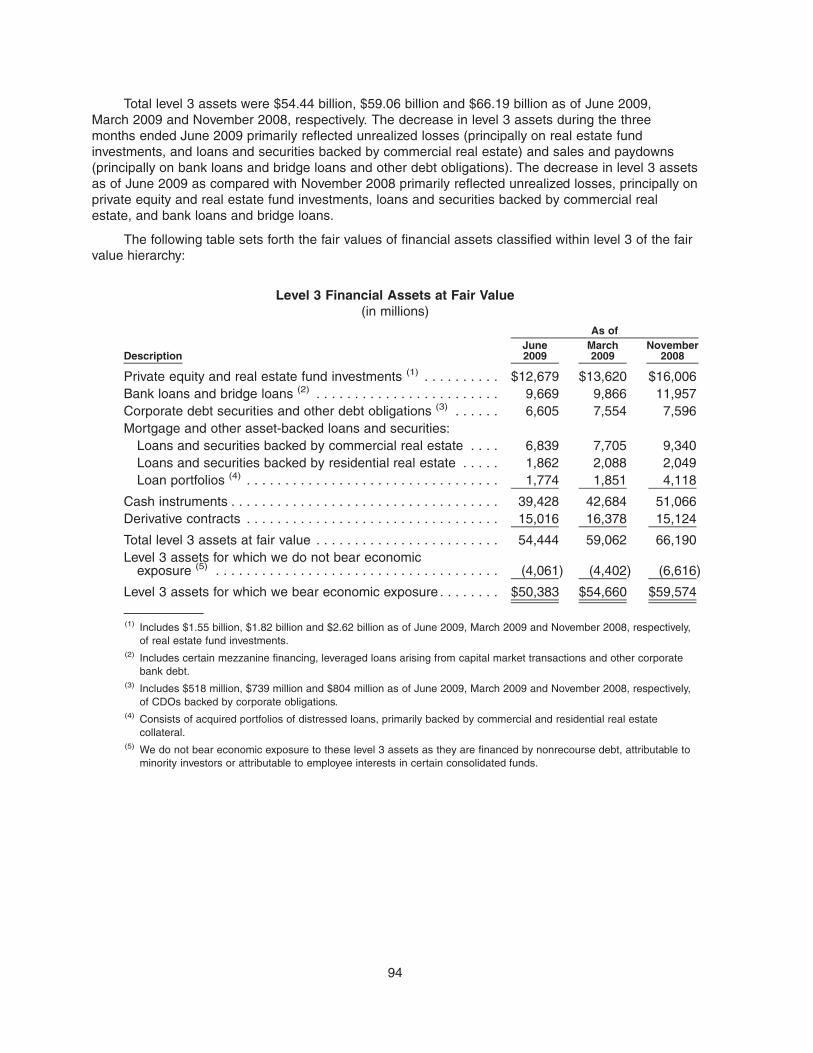
Total level 3 assets were $54.44 billion, $59.06 billion and $66.19 billion as of June 2009,March 2009 and November 2008, respectively. The decrease in level 3 assets during the threemonths ended June 2009 primarily reflected unrealized losses (principally on real estate fundinvestments, and loans and securities backed by commercial real estate) and sales and paydowns(principally on bank loans and bridge loans and other debt obligations). The decrease in level 3 assetsas of June 2009 as compared with November 2008 primarily reflected unrealized losses, principally onprivate equity and real estate fund investments, loans and securities backed by commercial realestate, and bank loans and bridge loans.
The following table sets forth the fair values of financial assets classified within level 3 of the fairvalue hierarchy:
Level 3 Financial Assets at Fair Value(in millions)
DescriptionJune2009
March2009
November2008
As of
Private equity and real estate fund investments (1) . . . . . . . . . . $12,679 $13,620 $16,006Bank loans and bridge loans (2) . . . . . . . . . . . . . . . . . . . . . . . . 9,669 9,866 11,957Corporate debt securities and other debt obligations (3) . . . . . . 6,605 7,554 7,596Mortgage and other asset-backed loans and securities:
Loans and securities backed by commercial real estate . . . . 6,839 7,705 9,340Loans and securities backed by residential real estate . . . . . 1,862 2,088 2,049Loan portfolios (4) . . . . . . . . . . . . . . . . . . . . . . . . . . . . . . . . . 1,774 1,851 4,118
Cash instruments . . . . . . . . . . . . . . . . . . . . . . . . . . . . . . . . . . . 39,428 42,684 51,066Derivative contracts . . . . . . . . . . . . . . . . . . . . . . . . . . . . . . . . . 15,016 16,378 15,124
Total level 3 assets at fair value . . . . . . . . . . . . . . . . . . . . . . . . 54,444 59,062 66,190Level 3 assets for which we do not bear economic
exposure (5) . . . . . . . . . . . . . . . . . . . . . . . . . . . . . . . . . . . . . (4,061) (4,402) (6,616)
Level 3 assets for which we bear economic exposure . . . . . . . . $50,383 $54,660 $59,574
(1) Includes $1.55 billion, $1.82 billion and $2.62 billion as of June 2009, March 2009 and November 2008, respectively,of real estate fund investments.
(2) Includes certain mezzanine financing, leveraged loans arising from capital market transactions and other corporatebank debt.
(3) Includes $518 million, $739 million and $804 million as of June 2009, March 2009 and November 2008, respectively,of CDOs backed by corporate obligations.
(4) Consists of acquired portfolios of distressed loans, primarily backed by commercial and residential real estatecollateral.
(5) We do not bear economic exposure to these level 3 assets as they are financed by nonrecourse debt, attributable tominority investors or attributable to employee interests in certain consolidated funds.
94

Loans and securities backed by residential real estate. We securitize, underwrite and makemarkets in various types of residential mortgages, including prime, Alt-A and subprime. At any point intime, we may use cash instruments as well as derivatives to manage our long or short risk position inresidential real estate. The following table sets forth the fair value of our long positions in prime, Alt-Aand subprime mortgage cash instruments:
Long Positions in Loans and Securities Backed by Residential Real Estate(in millions)
June2009
November2008
As of
Prime (1) . . . . . . . . . . . . . . . . . . . . . . . . . . . . . . . . . . . . . . . . . . . . . . . . . . . $1,511 $1,494Alt-A . . . . . . . . . . . . . . . . . . . . . . . . . . . . . . . . . . . . . . . . . . . . . . . . . . . . . . 825 1,845Subprime (2). . . . . . . . . . . . . . . . . . . . . . . . . . . . . . . . . . . . . . . . . . . . . . . . . 1,611 1,906
Total (3) . . . . . . . . . . . . . . . . . . . . . . . . . . . . . . . . . . . . . . . . . . . . . . . . . . . . $3,947 $5,245
(1) Excludes U.S. government agency-issued collateralized mortgage obligations of $7.45 billion and $4.27 billion as ofJune 2009 and November 2008, respectively. Also excludes U.S. government agency-issued mortgage pass-throughcertificates.
(2) Includes $209 million and $228 million of CDOs backed by subprime mortgages as of June 2009 andNovember 2008, respectively.
(3) Includes $1.86 billion and $2.05 billion of financial instruments (primarily loans and investment-grade securities, themajority of which were issued during 2006 and 2007) classified within level 3 of the fair value hierarchy as ofJune 2009 and November 2008, respectively.
Loans and securities backed by commercial real estate. We originate, securitize andsyndicate fixed and floating rate commercial mortgages globally. At any point in time, we may usecash instruments as well as derivatives to manage our risk position in the commercial mortgagemarket. The following table sets forth the fair value of our long positions in loans and securitiesbacked by commercial real estate by geographic region. The decrease in loans and securities backedby commercial real estate from November 2008 to June 2009 was primarily due to writedowns.
Long Positions in Loans and Securities Backed byCommercial Real Estate by Geographic Region
(in millions)
June2009
November2008
As of
Americas (1) . . . . . . . . . . . . . . . . . . . . . . . . . . . . . . . . . . . . . . . . . . . . . . . . . $6,132 $ 7,433EMEA (2) . . . . . . . . . . . . . . . . . . . . . . . . . . . . . . . . . . . . . . . . . . . . . . . . . . . 1,800 3,304Asia . . . . . . . . . . . . . . . . . . . . . . . . . . . . . . . . . . . . . . . . . . . . . . . . . . . . . . . 77 157
Total (3) . . . . . . . . . . . . . . . . . . . . . . . . . . . . . . . . . . . . . . . . . . . . . . . . . . . . $8,009 (4) $10,894 (5)
(1) Substantially all relates to the U.S.(2) EMEA (Europe, Middle East and Africa).(3) Includes $6.84 billion and $9.34 billion of financial instruments classified within level 3 of the fair value hierarchy as of
June 2009 and November 2008, respectively.(4) Comprised of loans of $6.43 billion and commercial mortgage-backed securities of $1.58 billion as of June 2009, of
which $7.39 billion was floating rate and $621 million was fixed rate.(5) Comprised of loans of $9.23 billion and commercial mortgage-backed securities of $1.66 billion as of
November 2008, of which $9.78 billion was floating rate and $1.11 billion was fixed rate.
95

Leveraged Lending Capital Market Transactions
We arrange, extend and syndicate loans and commitments related to leveraged lending capitalmarket transactions globally. The following table sets forth the notional amount of our leveragedlending capital market transactions by geographic region:
Leveraged Lending Capital Market Transactions by Geographic Region(in millions)
Funded Unfunded Total Funded Unfunded TotalAs of June 2009 As of November 2008
Americas (1). . . . . . . . . . . . . . . . . $1,692 $1,204 $2,896 $3,036 $1,735 $4,771EMEA (2) . . . . . . . . . . . . . . . . . . . 1,765 63 1,828 2,294 259 2,553Asia . . . . . . . . . . . . . . . . . . . . . . 612 40 652 568 73 641
Total . . . . . . . . . . . . . . . . . . . . . . $4,069 $1,307 $5,376 (3) $5,898 $2,067 $7,965 (3)
(1) Substantially all relates to the U.S.(2) EMEA (Europe, Middle East and Africa).(3) Represents the notional amount. We account for these transactions at fair value and our exposure was $2.75 billion
and $5.53 billion as of June 2009 and November 2008, respectively.
Other Financial Assets and Financial Liabilities at Fair Value. In addition to “Tradingassets, at fair value” and “Trading liabilities, at fair value,” we have elected to account for certain of ourother financial assets and financial liabilities at fair value under the fair value option. The primaryreasons for electing the fair value option are to reflect economic events in earnings on a timely basis,to mitigate volatility in earnings from using different measurement attributes and to addresssimplification and cost-benefit considerations.
Such financial assets and financial liabilities accounted for at fair value include:
• certain unsecured short-term borrowings, consisting of all promissory notes and commercialpaper and certain hybrid financial instruments;
• certain other secured financings, primarily transfers accounted for as financings rather thansales under SFAS No. 140, debt raised through our William Street program and certain othernonrecourse financings;
• certain unsecured long-term borrowings, including prepaid physical commodity transactionsand certain hybrid financial instruments;
• resale and repurchase agreements;
• securities borrowed and loaned within Trading and Principal Investments, consisting of ourmatched book and certain firm financing activities;
• certain deposits issued by GS Bank USA, as well as securities held by GS Bank USA;
• certain receivables from customers and counterparties, including certain margin loans,transfers accounted for as secured loans rather than purchases under SFAS No. 140 andprepaid variable share forwards;
• certain insurance and reinsurance contracts and certain guarantees; and
• in general, investments acquired after the adoption of SFAS No. 159 where we have significantinfluence over the investee and would otherwise apply the equity method of accounting. Incertain cases, we may apply the equity method of accounting to new investments that arestrategic in nature or closely related to our principal business activities, where we have asignificant degree of involvement in the cash flows or operations of the investee, or wherecost-benefit considerations are less significant.
96

Goodwill and Identifiable Intangible Assets
As a result of our acquisitions, principally SLK LLC (SLK) in 2000, The Ayco Company, L.P.(Ayco) in 2003 and our variable annuity and life insurance business in 2006, we have acquiredgoodwill and identifiable intangible assets. Goodwill is the cost of acquired companies in excess of thefair value of net assets, including identifiable intangible assets, at the acquisition date.
Goodwill. We test the goodwill in each of our operating segments, which are components onelevel below our three business segments, for impairment at least annually in accordance withSFAS No. 142, “Goodwill and Other Intangible Assets,” by comparing the estimated fair value of eachoperating segment with its estimated net book value. We derive the fair value of each of our operatingsegments based on valuation techniques we believe market participants would use for each segment(observable average price-to-earnings multiples of our competitors in these businesses andprice-to-book multiples). We derive the net book value of our operating segments by estimating theamount of shareholders’ equity required to support the activities of each operating segment. Our lastannual impairment test was performed during our 2008 fourth quarter and no impairment wasidentified.
During 2008 (particularly during the fourth quarter) and early 2009, the financial servicesindustry and the securities markets generally were materially and adversely affected by significantdeclines in the values of nearly all asset classes and by a serious lack of liquidity. If there is aprolonged period of weakness in the business environment and financial markets, our businesses maybe adversely affected, which could result in an impairment of goodwill in the future.
The following table sets forth the carrying value of our goodwill by operating segment:
Goodwill by Operating Segment(in millions)
June2009
November2008
As of
Investment BankingUnderwriting . . . . . . . . . . . . . . . . . . . . . . . . . . . . . . . . . . . . . . . . . . . . . . . $ 125 $ 125
Trading and Principal InvestmentsFICC . . . . . . . . . . . . . . . . . . . . . . . . . . . . . . . . . . . . . . . . . . . . . . . . . . . . 256 247Equities (1) . . . . . . . . . . . . . . . . . . . . . . . . . . . . . . . . . . . . . . . . . . . . . . . . 2,389 2,389Principal Investments . . . . . . . . . . . . . . . . . . . . . . . . . . . . . . . . . . . . . . . . 84 80
Asset Management and Securities ServicesAsset Management (2) . . . . . . . . . . . . . . . . . . . . . . . . . . . . . . . . . . . . . . . 565 565Securities Services. . . . . . . . . . . . . . . . . . . . . . . . . . . . . . . . . . . . . . . . . . 117 117
Total . . . . . . . . . . . . . . . . . . . . . . . . . . . . . . . . . . . . . . . . . . . . . . . . . . . . . . $3,536 $3,523
(1) Primarily related to SLK.(2) Primarily related to Ayco.
97

Identifiable Intangible Assets. We amortize our identifiable intangible assets over theirestimated lives in accordance with SFAS No. 142 or, in the case of insurance contracts, in accordancewith SFAS No. 60, “Accounting and Reporting by Insurance Enterprises,” and SFAS No. 97,“Accounting and Reporting by Insurance Enterprises for Certain Long-Duration Contracts and forRealized Gains and Losses from the Sale of Investments.” Identifiable intangible assets are tested forimpairment whenever events or changes in circumstances suggest that an asset’s or asset group’scarrying value may not be fully recoverable in accordance with SFAS No. 144, “Accounting for theImpairment or Disposal of Long-Lived Assets,” or SFAS No. 60 and SFAS No. 97. An impairment loss,generally calculated as the difference between the estimated fair value and the carrying value of anasset or asset group, is recognized if the sum of the estimated undiscounted cash flows relating to theasset or asset group is less than the corresponding carrying value.
The following table sets forth the carrying value and range of remaining lives of our identifiableintangible assets by major asset class:
Identifiable Intangible Assets by Asset Class($ in millions)
CarryingValue
Range of EstimatedRemaining Lives
(in years)Carrying
Value
As of June 2009 As of November 2008
Customer lists (1). . . . . . . . . . . . . . . . . . . . . . $ 678 2-16 $ 724New York Stock Exchange (NYSE)
Designated Market Maker (DMM) rights. . . 440 12 462Insurance-related assets (2) . . . . . . . . . . . . . . 125 6 155Exchange-traded fund (ETF) lead market
maker rights . . . . . . . . . . . . . . . . . . . . . . . 92 18 95Other (3) . . . . . . . . . . . . . . . . . . . . . . . . . . . . 102 1-17 93
Total . . . . . . . . . . . . . . . . . . . . . . . . . . . . . . . $1,437 $1,529
(1) Primarily includes our clearance and execution and NASDAQ customer lists related to SLK and financial counselingcustomer lists related to Ayco.
(2) Primarily includes the value of business acquired related to our insurance businesses.(3) Primarily includes marketing-related assets and other contractual rights.
A prolonged period of weakness in global equity markets and the trading of securities in multiplemarkets and on multiple exchanges could adversely impact our businesses and impair the value ofour identifiable intangible assets. In addition, certain events could indicate a potential impairment ofour identifiable intangible assets, including (i) changes in market structure that could adversely affectour specialist businesses (see discussion below), (ii) an adverse action or assessment by a regulatoror (iii) adverse actual experience on the contracts in our variable annuity and life insurance business.
In October 2008, the SEC approved the NYSE’s proposal to create a new market model andredefine the role of NYSE DMMs. This new rule set further aligns the NYSE’s model with investorrequirements for speed and efficiency of execution and establishes specialists as DMMs. While DMMsstill have an obligation to commit capital, they are now able to trade on parity with other marketparticipants. In addition, in June 2009 the NYSE successfully completed the rollout of new systemsarchitecture that further reduces order completion time, which enables the NYSE to offer competitiveexecution speeds, while continuing to incorporate the price discovery provided by DMMs. The newrule set, in combination with technology improvements to increase execution speed, is expected tocontinue to bolster the NYSE’s competitive position.
98

Since our last impairment test, there have been no events or changes in circumstancesindicating that NYSE DMM rights intangible asset may not be recoverable. However, we will continueto evaluate the performance of the specialist business under the new market model. There can be noassurance that these rule and system changes will result in sufficient cash flows to avoid impairmentof our NYSE DMM rights in the future. As of June 2009, the carrying value of our NYSE DMM rightswas $440 million. To the extent that there were to be an impairment in the future, it could result in asignificant writedown in the carrying value of these DMM rights.
Use of Estimates
The use of generally accepted accounting principles requires management to make certainestimates and assumptions. In addition to the estimates we make in connection with fair valuemeasurements and the accounting for goodwill and identifiable intangible assets, the use of estimatesand assumptions is also important in determining provisions for potential losses that may arise fromlitigation and regulatory proceedings and tax audits.
A substantial portion of our compensation and benefits represents discretionary compensation,which are determined at year-end. We believe the most appropriate way to allocate estimated annualdiscretionary compensation among interim periods is in proportion to the net revenues earned in suchperiods. In addition to the level of net revenues, our overall compensation expense in any given yearis also influenced by, among other factors, prevailing labor markets, business mix and the structure ofour share-based compensation programs. Our ratio of compensation and benefits to net revenueswas 49.0% for the first half of 2009.
We estimate and provide for potential losses that may arise out of litigation and regulatoryproceedings to the extent that such losses are probable and can be estimated, in accordance withSFAS No. 5, “Accounting for Contingencies.” We estimate and provide for potential liabilities that mayarise out of tax audits to the extent that uncertain tax positions fail to meet the recognition standard ofFIN 48, “Accounting for Uncertainty in Income Taxes — an Interpretation of FASB Statement No. 109.”
Significant judgment is required in making these estimates and our final liabilities may ultimatelybe materially different. Our total estimated liability in respect of litigation and regulatory proceedings isdetermined on a case-by-case basis and represents an estimate of probable losses after considering,among other factors, the progress of each case or proceeding, our experience and the experience ofothers in similar cases or proceedings, and the opinions and views of legal counsel. Given theinherent difficulty of predicting the outcome of our litigation and regulatory matters, particularly incases or proceedings in which substantial or indeterminate damages or fines are sought, we cannotestimate losses or ranges of losses for cases or proceedings where there is only a reasonablepossibility that a loss may be incurred. See ‘‘— Legal Proceedings” in Part I, Item 3 of our AnnualReport on Form 10-K, and in Part II, Item 1 of this Quarterly Report on Form 10-Q for information onour judicial, regulatory and arbitration proceedings.
Results of Operations
The composition of our net revenues has varied over time as financial markets and the scope ofour operations have changed. The composition of net revenues can also vary over the shorter termdue to fluctuations in U.S. and global economic and market conditions. See “Risk Factors” in Part I,Item 1A of our Annual Report on Form 10-K for a further discussion of the impact of economic andmarket conditions on our results of operations.
99

Financial Overview
The following table sets forth an overview of our financial results:
Financial Overview($ in millions, except per share amounts)
June2009
May2008
June2009
May2008
Three Months Ended Six Months Ended
Net revenues . . . . . . . . . . . . . . . . . . . . . . . . . . . . . . . $13,761 $9,422 $23,186 $17,757Pre-tax earnings . . . . . . . . . . . . . . . . . . . . . . . . . . . . 5,029 2,832 7,658 4,975Net earnings . . . . . . . . . . . . . . . . . . . . . . . . . . . . . . . 3,435 2,087 5,249 3,598Net earnings applicable to common shareholders . . . 2,718 2,051 4,377 3,518Diluted earnings per common share. . . . . . . . . . . . . . 4.93 4.58 8.42 7.81Annualized return on average common shareholders’
equity (1) . . . . . . . . . . . . . . . . . . . . . . . . . . . . . . . . . 23.0% 20.4% 18.3% 17.6%Diluted earnings per common share, excluding the
impact of one-time TARP preferred dividend (2) . . . . $ 5.71 N/A $ 9.23 N/AAnnualized return on average common shareholders’
equity, excluding the impact of one-time TARPpreferred dividend (2) . . . . . . . . . . . . . . . . . . . . . . . 23.8% N/A 19.2% N/A
(1) Annualized return on average common shareholders’ equity (ROE) is computed by dividing annualized net earningsapplicable to common shareholders by average monthly common shareholders’ equity. The one-time preferreddividend of $426 million related to the repurchase of our TARP preferred stock (calculated as the difference betweenthe carrying value and the redemption value of the preferred stock) was not annualized in the calculation ofannualized net earnings applicable to common shareholders since it has no impact on other quarters in the year. Thefollowing table sets forth our average common shareholders’ equity:
June2009
May2008
June2009
May2008
Three Months Ended Six Months EndedAverage for the
(in millions)Total shareholders’ equity . . . . . . . . . . . . . . . . . . . . . . . . . . . $ 66,870 $43,261 $ 65,167 $43,076Preferred stock . . . . . . . . . . . . . . . . . . . . . . . . . . . . . . . . . . (14,125) (3,100) (15,139) (3,100)Common shareholders’ equity . . . . . . . . . . . . . . . . . . . . . . . . $ 52,745 $40,161 $ 50,028 $39,976
(2) We believe that presenting our results excluding the impact of the one-time preferred dividend of $426 million relatedto the repurchase of our TARP preferred stock is meaningful because it increases the comparability ofperiod-to-period results. The following tables set forth the calculation of net earnings applicable to commonshareholders, diluted earnings per common share and average common shareholders’ equity excluding the impact ofthis one-time preferred dividend:
2009 2009
Three MonthsEnded June
Six MonthsEnded June
(in millions, exceptper share amounts)
Net earnings applicable to common shareholders . . . . . . . . . . . . . . . . . . . . . . . . $2,718 $4,377Impact of one-time TARP preferred dividend. . . . . . . . . . . . . . . . . . . . . . . . . . . . 426 426Net earnings applicable to common shareholders, excluding the impact of one-time
TARP preferred dividend . . . . . . . . . . . . . . . . . . . . . . . . . . . . . . . . . . . . . . . 3,144 4,803Divided by: average diluted common shares outstanding . . . . . . . . . . . . . . . . . . . 551.0 520.1Diluted earnings per common share, excluding the impact of one-time TARP
preferred dividend. . . . . . . . . . . . . . . . . . . . . . . . . . . . . . . . . . . . . . . . . . . . $ 5.71 $ 9.23
2009 2009
Three MonthsEnded June
Six MonthsEnded June
Average for the
(in millions)Total shareholders’ equity . . . . . . . . . . . . . . . . . . . . . . . . . . . . . . . . . . . . . . . . $ 66,870 $ 65,167Preferred stock . . . . . . . . . . . . . . . . . . . . . . . . . . . . . . . . . . . . . . . . . . . . . . . (14,125) (15,139)Common shareholders’ equity . . . . . . . . . . . . . . . . . . . . . . . . . . . . . . . . . . . . . 52,745 50,028Impact of one-time TARP preferred dividend on average common shareholders’
equity . . . . . . . . . . . . . . . . . . . . . . . . . . . . . . . . . . . . . . . . . . . . . . . . . . . . 107 61Common shareholders’ equity, excluding the impact of one-time TARP preferred
dividend on average common shareholders’ equity . . . . . . . . . . . . . . . . . . . . . . $ 52,852 $ 50,089
100

Net Revenues
Three Months Ended June 2009 versus May 2008. Our net revenues were $13.76 billion forthe second quarter of 2009, an increase of 46% compared with the second quarter of 2008, reflectingsignificantly higher net revenues in Trading and Principal Investments, partially offset by significantlylower net revenues in Asset Management and Securities Services and lower net revenues inInvestment Banking. The increase in Trading and Principal Investments reflected particularly strongresults in FICC and Equities, which were both significantly higher than the second quarter of 2008.The increase in FICC reflected particularly strong performances in credit products, interest rateproducts and currencies, reflecting strength in the client franchise. In addition, net revenues in bothmortgages and commodities were higher compared with the second quarter of 2008. In the secondquarter of 2009, mortgages included a loss of approximately $700 million on commercial mortgageloans. During the quarter, FICC operated in an environment characterized by strong client-drivenactivity, particularly in more liquid products, favorable market opportunities and tighter corporate creditspreads. The increase in Equities reflected significantly higher net revenues in derivatives and, to alesser extent, principal strategies. In addition, net revenues in shares were solid, but essentiallyunchanged compared with the second quarter of 2008. Commissions declined compared with thesecond quarter of 2008. During the quarter, Equities operated in an environment characterized bysolid client-driven activity, favorable market opportunities, a significant increase in global equity pricesand a decline in volatility levels. Results in Principal Investments were also higher compared with thesecond quarter of 2008, and included a gain of $948 million related to our investment in the ordinaryshares of ICBC, a gain of $343 million from corporate principal investments and a loss of $499 millionfrom real estate principal investments.
The decline in Asset Management and Securities Services reflected significantly lower netrevenues in both Asset Management and Securities Services compared with the second quarter of2008. The decrease in Securities Services primarily reflected the impact of lower customer balancescompared with the second quarter of 2008. The decrease in Asset Management principally reflectedthe impact of lower assets under management, due to market depreciation since the end of thesecond quarter of 2008. During the quarter, assets under management increased $48 billion to$819 billion, due to $42 billion of market appreciation, primarily in equity and fixed income assets, and$6 billion of net inflows.
The decline in Investment Banking reflected significantly lower net revenues in FinancialAdvisory, partially offset by significantly higher net revenues in Underwriting compared with thesecond quarter of 2008. The decrease in Financial Advisory reflected a significant decline inindustry-wide completed mergers and acquisitions. The increase in Underwriting reflected significantlyhigher net revenues in equity underwriting, which achieved its highest quarterly performance, as wellas higher net revenues in debt underwriting. The increase in equity underwriting reflected very strongclient activity. The increase in debt underwriting primarily reflected higher net revenues frominvestment-grade and municipal activity.
101

Six Months Ended June 2009 versus May 2008. Our net revenues were $23.19 billion for thesix months ended June 2009, an increase of 31% compared with the first half of 2008, reflectingsignificantly higher net revenues in Trading and Principal Investments, partially offset by significantlylower net revenues in Asset Management and Securities Services, and Investment Banking. Theincrease in Trading and Principal Investments reflected significantly higher net revenues in FICC,which were more than double the amount in the first half of 2008, as well as higher net revenues inEquities, partially offset by weak results in Principal Investments. The increase in FICC reflectedparticularly strong results in credit products, interest rate products and, to a lesser extent,commodities, reflecting strength in the client franchise. In addition, results in mortgages weresignificantly higher compared with a difficult first half of 2008, while net revenues in currencies weresolid, but lower compared with the first half of 2008. In the first half of 2009, mortgages included aloss of approximately $1.5 billion on commercial mortgage loans. During the first half of 2009, FICCoperated in an environment characterized by strong client-driven activity, particularly in more liquidproducts, and favorable market opportunities. The increase in Equities reflected particularly strong netrevenues in derivatives, as well as higher results in principal strategies. These increases were partiallyoffset by lower net revenues in shares compared with the first half of 2008. Commissions declinedcompared with the first half of 2008. During the first half of 2009, Equities operated in an environmentgenerally characterized by an increase in global equity prices (principally during our second quarter)and high, but declining, levels of volatility. In the first half of 2009, results in Principal Investmentsreflected net losses of $1.14 billion from real estate principal investments and $278 million fromcorporate principal investments, partially offset by a gain of $797 million related to our investment inthe ordinary shares of ICBC.
The decline in Asset Management and Securities Services reflected significant decreases inboth Asset Management and Securities Services. The decrease in Asset Management primarilyreflected the impact of lower assets under management, due to market depreciation during thesecond half of 2008. The decrease in Securities Services primarily reflected the impact of lowercustomer balances.
The decline in Investment Banking primarily reflected significantly lower net revenues inFinancial Advisory, due to a significant decline in industry-wide completed mergers and acquisitions.Net revenues in Underwriting were slightly lower compared with the first half of 2008, primarily due tolower net revenues in debt underwriting, reflecting a decrease in leveraged finance activity. Netrevenues in equity underwriting were essentially unchanged compared with the first half of 2008.
102

Operating Expenses
Our operating expenses are primarily influenced by compensation, headcount and levels ofbusiness activity. Compensation and benefits expenses includes salaries, estimated year-enddiscretionary compensation, amortization of equity awards and other items such as payroll taxes,severance costs and benefits. Discretionary compensation is significantly impacted by, among otherfactors, the level of net revenues, prevailing labor markets, business mix and the structure of ourshare-based compensation programs. Our ratio of compensation and benefits to net revenues was49.0% for the first half of 2009.
The following table sets forth our operating expenses and total staff:
Operating Expenses and Total Staff($ in millions)
June2009
May2008
June2009
May2008
Three Months Ended Six Months Ended
Compensation and benefits (1) . . . . . . . . . . . . . . . . . . . . $ 6,649 $ 4,522 $11,361 $ 8,523
Brokerage, clearing, exchange and distribution fees . . . . 574 741 1,110 1,531Market development . . . . . . . . . . . . . . . . . . . . . . . . . . . . 82 126 150 270Communications and technology. . . . . . . . . . . . . . . . . . . 173 192 346 379Depreciation and amortization (2) . . . . . . . . . . . . . . . . . . 426 220 975 474Occupancy . . . . . . . . . . . . . . . . . . . . . . . . . . . . . . . . . . . 242 234 483 470Professional fees . . . . . . . . . . . . . . . . . . . . . . . . . . . . . . 145 185 280 363Other expenses . . . . . . . . . . . . . . . . . . . . . . . . . . . . . . . 441 370 823 772
Total non-compensation expenses . . . . . . . . . . . . . . . . . 2,083 2,068 4,167 4,259
Total operating expenses . . . . . . . . . . . . . . . . . . . . . . . . $ 8,732 $ 6,590 $15,528 $12,782
Total staff at period end (3) . . . . . . . . . . . . . . . . . . . . . . . 29,400 35,000
(1) Compensation and benefits includes $66 million for both the three months ended June 2009 and May 2008 and$136 million and $129 million for the six months ended June 2009 and May 2008, respectively, attributable toconsolidated entities held for investment purposes. Consolidated entities held for investment purposes are entitiesthat are held strictly for capital appreciation, have a defined exit strategy and are engaged in activities that are notclosely related to our principal businesses.
(2) Beginning in the second quarter of 2009, “Amortization of identifiable intangible assets” is included in “Depreciationand amortization” in the condensed consolidated statements of earnings. Prior periods have been reclassified toconform to the current presentation.
(3) Includes employees, consultants and temporary staff. Excludes total staff of approximately 3,900 and 4,900 as ofJune 2009 and May 2008, respectively, of consolidated entities held for investment purposes (see footnote 1 above).
103

The following table sets forth non-compensation expenses of consolidated entities held forinvestment purposes and our remaining non-compensation expenses by line item:
Non-Compensation Expenses(in millions)
June2009
May2008
June2009
May2008
Three Months Ended Six Months Ended
Non-compensation expenses of consolidatedinvestments (1) . . . . . . . . . . . . . . . . . . . . . . . . . . . . $ 286 $ 123 $ 746 $ 248
Non-compensation expenses excluding consolidatedinvestments
Brokerage, clearing, exchange and distribution fees . . 574 741 1,110 1,531Market development . . . . . . . . . . . . . . . . . . . . . . . . . . 80 124 146 265Communications and technology . . . . . . . . . . . . . . . . 171 191 343 377Depreciation and amortization (2) . . . . . . . . . . . . . . . . 220 184 421 413Occupancy . . . . . . . . . . . . . . . . . . . . . . . . . . . . . . . . . 223 211 431 428Professional fees . . . . . . . . . . . . . . . . . . . . . . . . . . . . 143 181 276 357Other expenses . . . . . . . . . . . . . . . . . . . . . . . . . . . . . 386 313 694 640
Subtotal . . . . . . . . . . . . . . . . . . . . . . . . . . . . . . . . . . . 1,797 1,945 3,421 4,011
Total non-compensation expenses, as reported . . . . . $2,083 $2,068 $4,167 $4,259
(1) Consolidated entities held for investment purposes are entities that are held strictly for capital appreciation, have adefined exit strategy and are engaged in activities that are not closely related to our principal businesses. Forexample, these investments include consolidated entities that hold real estate assets, such as hotels, but excludeinvestments in entities that primarily hold financial assets. We believe that it is meaningful to reviewnon-compensation expenses excluding expenses related to these consolidated entities in order to evaluate trends innon-compensation expenses related to our principal business activities. Revenues related to such entities areincluded in “Trading and principal investments” in the condensed consolidated statements of earnings.
(2) Beginning in the second quarter of 2009, “Amortization of identifiable intangible assets” is included in “Depreciationand amortization” in the condensed consolidated statements of earnings. Prior periods have been reclassified toconform to the current presentation.
Three Months Ended June 2009 versus May 2008. Operating expenses of $8.73 billion forthe second quarter of 2009 increased 33% compared with the second quarter of 2008. Compensationand benefits expenses (including salaries, estimated year-end discretionary compensation,amortization of equity awards and other items such as payroll taxes, severance costs and benefits) of$6.65 billion were higher than the second quarter of 2008, primarily due to higher net revenues.During the second quarter of 2009, our ratio of compensation and benefits to net revenues was48.3%. Total staff decreased 1% during the second quarter of 2009.
104

Non-compensation expenses, excluding consolidated entities held for investment purposes, were$1.80 billion, 8% lower than the second quarter of 2008. The decrease compared with the secondquarter of 2008 was attributable to lower brokerage, clearing, exchange and distribution fees,principally reflecting lower transaction volumes in Equities. In addition, non-compensation expensesduring the second quarter of 2009 were generally lower than the second quarter of 2008 principallydue to the impact of reduced staff levels and the effect of expense reduction initiatives. Thesedecreases were partially offset by the impact of higher FDIC fees on bank deposits, including theimpact of a special assessment of approximately $50 million, and net provisions for litigation andregulatory proceedings of $25 million. The increase in non-compensation expenses related toconsolidated entities held for investment purposes reflected real estate impairment charges ofapproximately $170 million during the second quarter of 2009. This loss, which was measured basedon discounted cash flow analysis, is included in our Trading and Principal Investments segment andreflected weakness in the commercial real estate markets, particularly in Asia. Including consolidatedentities held for investment purposes, non-compensation expenses were $2.08 billion, essentiallyunchanged from the second quarter of 2008.
Six Months Ended June 2009 versus May 2008. Operating expenses of $15.53 billion for thefirst half of 2009 increased 21% compared with the first half of 2008. Compensation and benefitsexpenses (including salaries, estimated year-end discretionary compensation, amortization of equityawards and other items such as payroll taxes, severance costs and benefits) of $11.36 billion werehigher than the first half of 2008, primarily due to higher net revenues. Our ratio of compensation andbenefits to net revenues was 49.0% for the first half of 2009. Total staff decreased 7% during the firsthalf of 2009.
Non-compensation expenses, excluding consolidated entities held for investment purposes, were$3.42 billion, 15% lower than the first half of 2008. The decrease compared with the first half of 2008was primarily attributable to lower brokerage, clearing, exchange and distribution fees, principallyreflecting lower transaction volumes in Equities. The remainder of the decrease compared with thefirst half of 2008 generally reflected the impact of reduced staff levels and the effect of expensereduction initiatives. The increase in non-compensation expenses related to consolidated entities heldfor investment purposes reflected real estate impairment charges of approximately $470 million duringthe first half of 2009. These losses, which were measured based on discounted cash flow analysis,are included in our Trading and Principal Investments segment and reflected weakness in thecommercial real estate markets, particularly in Asia. Including consolidated entities held for investmentpurposes, non-compensation expenses were $4.17 billion, 2% lower than the first half of 2008.
Provision for Taxes
The effective income tax rate for the first half of 2009 was 31.5%, up slightly from 31.0% for thefirst quarter of 2009. The effective income tax rate for fiscal year 2008 was approximately 1%. Theincrease in the effective tax rate from 2008 was primarily due to changes in geographic earnings mix.During 2008, we incurred losses in various U.S. and non-U.S. entities whose income/(losses) aresubject to tax in the U.S. We also had profitable operations in certain non-U.S. entities that are taxedat their applicable local tax rates, which are generally lower than the U.S. rate. The effective tax ratefor the first half of 2009 represents a return to a geographic earnings mix that is more in line with ourhistoric earnings mix.
105

Segment Operating Results
The following table sets forth the net revenues, operating expenses and pre-tax earnings of oursegments:
Segment Operating Results(in millions)
June2009
May2008
June2009
May2008
Three Months Ended Six Months Ended
Investment Net revenues . . . . . . . . . . $ 1,440 $1,685 $ 2,263 $ 2,857Banking Operating expenses . . . . 1,167 1,155 1,872 2,095
Pre-tax earnings . . . . . . . $ 273 $ 530 $ 391 $ 762
Trading and Principal Net revenues . . . . . . . . . . $10,784 $5,591 $17,934 $10,715Investments Operating expenses . . . . 6,290 3,961 11,163 7,704
Pre-tax earnings . . . . . . . $ 4,494 $1,630 $ 6,771 $ 3,011
Asset Management and Net revenues . . . . . . . . . . $ 1,537 $2,146 $ 2,989 $ 4,185Securities Services Operating expenses . . . . 1,250 1,477 2,455 2,970
Pre-tax earnings . . . . . . . $ 287 $ 669 $ 534 $ 1,215
Total Net revenues . . . . . . . . . . $13,761 $9,422 $23,186 $17,757Operating expenses (1) . . 8,732 6,590 15,528 12,782
Pre-tax earnings . . . . . . . $ 5,029 $2,832 $ 7,658 $ 4,975
(1) Operating expenses include net provisions for a number of litigation and regulatory proceedings of $25 million and$(3) million for the three months ended June 2009 and May 2008, respectively, and $38 million and $13 million for thesix months ended June 2009 and May 2008, respectively, that have not been allocated to our segments.
Net revenues in our segments include allocations of interest income and interest expense tospecific securities, commodities and other positions in relation to the cash generated by, or fundingrequirements of, such underlying positions. See Note 16 to the condensed consolidated financialstatements in Part I, Item 1 of this Quarterly Report on Form 10-Q for further information regardingour business segments.
The cost drivers of Goldman Sachs taken as a whole — compensation, headcount and levels ofbusiness activity — are broadly similar in each of our business segments. Compensation and benefitsexpenses within our segments reflect, among other factors, the overall performance of GoldmanSachs as well as the performance of individual business units. Consequently, pre-tax margins in onesegment of our business may be significantly affected by the performance of our other businesssegments. A discussion of segment operating results follows.
106

Investment Banking
Our Investment Banking segment is divided into two components:
• Financial Advisory. Financial Advisory includes advisory assignments with respect tomergers and acquisitions, divestitures, corporate defense activities, restructurings andspin-offs.
• Underwriting. Underwriting includes public offerings and private placements of a wide rangeof securities and other financial instruments.
The following table sets forth the operating results of our Investment Banking segment:
Investment Banking Operating Results(in millions)
June2009
May2008
June2009
May2008
Three Months Ended Six Months Ended
Financial Advisory . . . . . . . . . . . . . . . . . . . . . . . . . $ 368 $ 800 $ 895 $1,463
Equity underwriting . . . . . . . . . . . . . . . . . . . . . . 736 616 784 788Debt underwriting . . . . . . . . . . . . . . . . . . . . . . . 336 269 584 606
Total Underwriting . . . . . . . . . . . . . . . . . . . . . . . . . 1,072 885 1,368 1,394
Total net revenues. . . . . . . . . . . . . . . . . . . . . . . . . 1,440 1,685 2,263 2,857Operating expenses . . . . . . . . . . . . . . . . . . . . . . . 1,167 1,155 1,872 2,095
Pre-tax earnings . . . . . . . . . . . . . . . . . . . . . . . . . . $ 273 $ 530 $ 391 $ 762
The following table sets forth our financial advisory and underwriting transaction volumes:
Goldman Sachs Global Investment Banking Volumes (1)
(in billions)
June2009
May2008
June2009
May2008
Three Months Ended Six Months Ended
Announced mergers and acquisitions . . . . . . . . . . . $183 $339 $350 $480Completed mergers and acquisitions . . . . . . . . . . . 71 257 299 400Equity and equity-related offerings (2) . . . . . . . . . . . 32 20 34 30Debt offerings (3) . . . . . . . . . . . . . . . . . . . . . . . . . . 82 68 160 129
(1) Source: Thomson Reuters. Announced and completed mergers and acquisitions volumes are based on full credit toeach of the advisors in a transaction. Equity and equity-related offerings and debt offerings are based on full credit forsingle book managers and equal credit for joint book managers. Transaction volumes may not be indicative of netrevenues in a given period. In addition, transaction volumes for prior periods may vary from amounts previouslyreported due to the subsequent withdrawal or a change in the value of a transaction.
(2) Includes Rule 144A and public common stock offerings, convertible offerings and rights offerings.(3) Includes non-convertible preferred stock, mortgage-backed securities, asset-backed securities and taxable municipal
debt. Includes publicly registered and Rule 144A issues.
107

Three Months Ended June 2009 versus May 2008. Net revenues in Investment Banking of$1.44 billion for the second quarter of 2009 decreased 15% compared with the second quarter of2008.
Net revenues in Financial Advisory of $368 million decreased 54% compared with the secondquarter of 2008, primarily reflecting a significant decline in industry-wide completed mergers andacquisitions. Net revenues in our Underwriting business of $1.07 billion increased 21% compared withthe second quarter of 2008, due to significantly higher net revenues in equity underwriting, as well ashigher net revenues in debt underwriting. The increase in equity underwriting reflected very strong clientactivity. The increase in debt underwriting primarily reflected higher net revenues from investment-gradeand municipal activity. Our investment banking transaction backlog decreased during the quarter. (1)
Operating expenses of $1.17 billion for the second quarter of 2009 were essentially unchangedcompared with the second quarter of 2008. Pre-tax earnings of $273 million in the second quarter of2009 decreased 48% compared with the second quarter of 2008.
Six Months Ended June 2009 versus May 2008. Net revenues in Investment Banking of$2.26 billion for the first half of 2009 decreased 21% compared with the first half of 2008.
Net revenues in Financial Advisory of $895 million decreased 39% compared with the first half of2008, reflecting a significant decline in industry-wide completed mergers and acquisitions. Netrevenues in our Underwriting business of $1.37 billion decreased 2% compared with the first half of2008, primarily due to lower net revenues in debt underwriting, reflecting a decrease in leveragedfinance activity. Net revenues in equity underwriting were essentially unchanged compared with thefirst half of 2008.
Operating expenses of $1.87 billion for the first half of 2009 decreased 11% compared with thefirst half of 2008, due to decreased non-compensation expenses, principally due to lower activitylevels, and decreased compensation and benefits expenses resulting from lower net revenues. Pre-taxearnings of $391 million in the first half of 2009 decreased 49% compared with the first half of 2008.
Trading and Principal Investments
Our Trading and Principal Investments segment is divided into three components:
• FICC. We make markets in and trade interest rate and credit products, mortgage-relatedsecurities and loan products and other asset-backed instruments, currencies and commodities,structure and enter into a wide variety of derivative transactions, and engage in proprietarytrading and investing.
• Equities. We make markets in and trade equities and equity-related products, structure andenter into equity derivative transactions and engage in proprietary trading. We generatecommissions from executing and clearing client transactions on major stock, options andfutures exchanges worldwide through our Equities client franchise and clearing activities. Wealso engage in specialist and insurance activities.
• Principal Investments. We make real estate and corporate principal investments, includingour investment in the ordinary shares of ICBC. We generate net revenues from returns onthese investments and from the increased share of the income and gains derived from ourmerchant banking funds when the return on a fund’s investments over the life of the fundexceeds certain threshold returns (typically referred to as an override).
108
(1) Our investment banking transaction backlog represents an estimate of our future net revenues from investment bankingtransactions where we believe that future revenue realization is more likely than not.

Substantially all of our inventory is marked-to-market daily and, therefore, its value and our netrevenues are subject to fluctuations based on market movements. In addition, net revenues derivedfrom our principal investments, including those in privately held concerns and in real estate, mayfluctuate significantly depending on the revaluation of these investments in any given period. We alsoregularly enter into large transactions as part of our trading businesses. The number and size of suchtransactions may affect our results of operations in a given period.
Net revenues from Principal Investments do not include management fees generated from ourmerchant banking funds. These management fees are included in the net revenues of the AssetManagement and Securities Services segment.
The following table sets forth the operating results of our Trading and Principal Investmentssegment:
Trading and Principal Investments Operating Results(in millions)
June2009
May2008
June2009
May2008
Three Months Ended Six Months Ended
FICC . . . . . . . . . . . . . . . . . . . . . . . . . . . . . . . . . . . . . $ 6,795 $2,379 $13,352 $ 5,521
Equities trading . . . . . . . . . . . . . . . . . . . . . . . . . . . 2,157 1,253 3,184 2,529Equities commissions . . . . . . . . . . . . . . . . . . . . . . . 1,021 1,234 1,995 2,472
Total Equities . . . . . . . . . . . . . . . . . . . . . . . . . . . . . . . 3,178 2,487 5,179 5,001
ICBC . . . . . . . . . . . . . . . . . . . . . . . . . . . . . . . . . . . 948 214 797 79
Gross gains . . . . . . . . . . . . . . . . . . . . . . . . . . . . . . 1,306 979 1,812 1,336Gross losses . . . . . . . . . . . . . . . . . . . . . . . . . . . . . (1,462) (503) (3,229) (1,270)
Net other corporate and real estate investments. . (156) 476 (1,417) 66Overrides . . . . . . . . . . . . . . . . . . . . . . . . . . . . . . . . 19 35 23 48
Total Principal Investments . . . . . . . . . . . . . . . . . . . . 811 725 (597) 193
Total net revenues . . . . . . . . . . . . . . . . . . . . . . . . . . . 10,784 5,591 17,934 10,715Operating expenses. . . . . . . . . . . . . . . . . . . . . . . . . . 6,290 3,961 11,163 7,704
Pre-tax earnings . . . . . . . . . . . . . . . . . . . . . . . . . . . . $ 4,494 $1,630 $ 6,771 $ 3,011
Three Months Ended June 2009 versus May 2008. Net revenues in Trading and PrincipalInvestments of $10.78 billion increased 93% compared with the second quarter of 2008.
Net revenues in FICC of $6.80 billion increased significantly compared with the second quarterof 2008. These results reflected particularly strong performances in credit products, interest rateproducts and currencies, reflecting strength in the client franchise. In addition, net revenues in bothmortgages and commodities were higher compared with the second quarter of 2008. In the secondquarter of 2009, mortgages included a loss of approximately $700 million on commercial mortgageloans. During the quarter, FICC operated in an environment characterized by strong client-drivenactivity, particularly in more liquid products, favorable market opportunities and tighter corporate creditspreads.
Net revenues in Equities of $3.18 billion increased 28% compared with the second quarter of2008, reflecting significantly higher net revenues in derivatives and, to a lesser extent, principalstrategies. In addition, net revenues in shares were solid, but essentially unchanged compared withthe second quarter of 2008. Commissions declined compared with the second quarter of 2008. Duringthe quarter, Equities operated in an environment characterized by solid client-driven activity, favorablemarket opportunities, a significant increase in global equity prices and a decline in volatility levels.
109
Principal Investments recorded net revenues of $811 million for the second quarter of 2009.These results included a gain of $948 million related to our investment in the ordinary shares of ICBC,a gain of $343 million from corporate principal investments and a loss of $499 million from real estateprincipal investments.
Operating expenses of $6.29 billion for the second quarter of 2009 increased 59% comparedwith the second quarter of 2008, due to increased compensation and benefits expenses resulting fromhigher net revenues, and real estate impairment charges during the second quarter of 2009 ofapproximately $170 million related to consolidated entities held for investment purposes. Theseincreases were partially offset by lower brokerage, clearing, exchange and distribution fees, principallyreflecting lower transaction volumes in Equities. Pre-tax earnings were $4.49 billion in the secondquarter of 2009 compared with $1.63 billion in the second quarter of 2008.
Six Months Ended June 2009 versus May 2008. Net revenues in Trading and PrincipalInvestments of $17.93 billion increased 67% compared with the first half of 2008.
Net revenues in FICC of $13.35 billion were more than double the amount in the first half of2008. These results reflected particularly strong results in credit products, interest rate products and,to a lesser extent, commodities, reflecting strength in the client franchise. In addition, results inmortgages were significantly higher compared with a difficult first half of 2008, while net revenues incurrencies were solid, but lower compared with the first half of 2008. In the first half of 2009,mortgages included a loss of approximately $1.5 billion on commercial mortgage loans. During thefirst half of 2009, FICC operated in an environment characterized by strong client-driven activity,particularly in more liquid products, and favorable market opportunities.
Net revenues in Equities of $5.18 billion increased 4% compared with the first half of 2008,reflecting particularly strong net revenues in derivatives, as well as higher results in principalstrategies. These increases were partially offset by lower net revenues in shares compared with thefirst half of 2008. Commissions declined compared with the first half of 2008. During the first half of2009, Equities operated in an environment generally characterized by an increase in global equityprices (principally during our second quarter) and high, but declining, levels of volatility.
Principal Investments recorded a net loss of $597 million for the first half of 2009. These resultsincluded net losses of $1.14 billion from real estate principal investments and $278 million fromcorporate principal investments, partially offset by a gain of $797 million related to our investment inthe ordinary shares of ICBC.
Operating expenses of $11.16 billion for the first half of 2009 increased 45% compared with thefirst half of 2008, due to increased compensation and benefits expenses resulting from higher netrevenues, and real estate impairment charges during the first half of 2009 of approximately$470 million related to consolidated entities held for investment purposes. These increases werepartially offset by lower brokerage, clearing, exchange and distribution fees, principally reflecting lowertransaction volumes in Equities. Pre-tax earnings were $6.77 billion in the first half of 2009 comparedwith $3.01 billion in the first half of 2008.
Asset Management and Securities Services
Our Asset Management and Securities Services segment is divided into two components:
• Asset Management. Asset Management provides investment advisory and financial planningservices and offers investment products (primarily through separately managed accounts andcommingled vehicles, such as mutual funds and private investment funds) across all majorasset classes to a diverse group of institutions and individuals worldwide and primarilygenerates revenues in the form of management and incentive fees.
• Securities Services. Securities Services provides prime brokerage services, financingservices and securities lending services to institutional clients, including hedge funds, mutualfunds, pension funds and foundations, and to high-net-worth individuals worldwide, andgenerates revenues primarily in the form of interest rate spreads or fees.
110
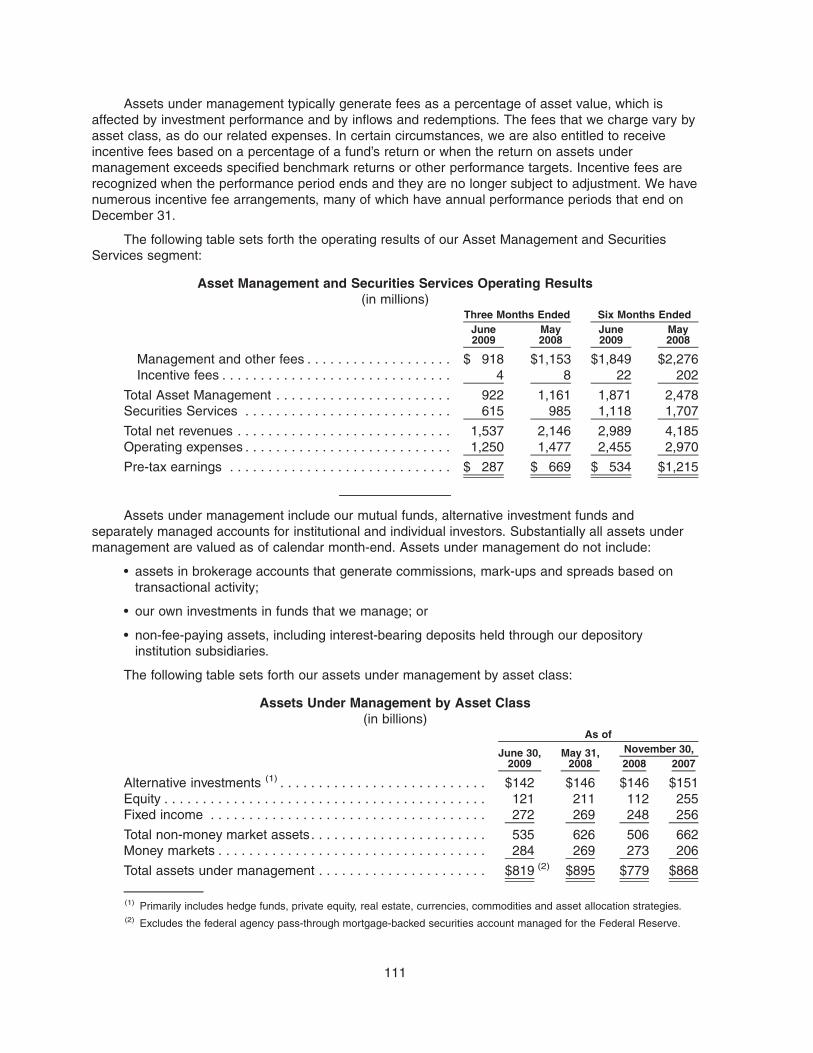
Assets under management typically generate fees as a percentage of asset value, which isaffected by investment performance and by inflows and redemptions. The fees that we charge vary byasset class, as do our related expenses. In certain circumstances, we are also entitled to receiveincentive fees based on a percentage of a fund’s return or when the return on assets undermanagement exceeds specified benchmark returns or other performance targets. Incentive fees arerecognized when the performance period ends and they are no longer subject to adjustment. We havenumerous incentive fee arrangements, many of which have annual performance periods that end onDecember 31.
The following table sets forth the operating results of our Asset Management and SecuritiesServices segment:
Asset Management and Securities Services Operating Results(in millions)
June2009
May2008
June2009
May2008
Three Months Ended Six Months Ended
Management and other fees . . . . . . . . . . . . . . . . . . . $ 918 $1,153 $1,849 $2,276Incentive fees . . . . . . . . . . . . . . . . . . . . . . . . . . . . . . 4 8 22 202
Total Asset Management . . . . . . . . . . . . . . . . . . . . . . . 922 1,161 1,871 2,478Securities Services . . . . . . . . . . . . . . . . . . . . . . . . . . . 615 985 1,118 1,707
Total net revenues . . . . . . . . . . . . . . . . . . . . . . . . . . . . 1,537 2,146 2,989 4,185Operating expenses . . . . . . . . . . . . . . . . . . . . . . . . . . . 1,250 1,477 2,455 2,970
Pre-tax earnings . . . . . . . . . . . . . . . . . . . . . . . . . . . . . $ 287 $ 669 $ 534 $1,215
Assets under management include our mutual funds, alternative investment funds andseparately managed accounts for institutional and individual investors. Substantially all assets undermanagement are valued as of calendar month-end. Assets under management do not include:
• assets in brokerage accounts that generate commissions, mark-ups and spreads based ontransactional activity;
• our own investments in funds that we manage; or
• non-fee-paying assets, including interest-bearing deposits held through our depositoryinstitution subsidiaries.
The following table sets forth our assets under management by asset class:
Assets Under Management by Asset Class(in billions)
June 30,2009
May 31,2008 2008 2007
November 30,As of
Alternative investments (1) . . . . . . . . . . . . . . . . . . . . . . . . . . . $142 $146 $146 $151Equity . . . . . . . . . . . . . . . . . . . . . . . . . . . . . . . . . . . . . . . . . . 121 211 112 255Fixed income . . . . . . . . . . . . . . . . . . . . . . . . . . . . . . . . . . . . 272 269 248 256
Total non-money market assets. . . . . . . . . . . . . . . . . . . . . . . 535 626 506 662Money markets . . . . . . . . . . . . . . . . . . . . . . . . . . . . . . . . . . . 284 269 273 206
Total assets under management . . . . . . . . . . . . . . . . . . . . . . $819 (2) $895 $779 $868
(1) Primarily includes hedge funds, private equity, real estate, currencies, commodities and asset allocation strategies.(2) Excludes the federal agency pass-through mortgage-backed securities account managed for the Federal Reserve.
111

The following table sets forth a summary of the changes in our assets under management:
Changes in Assets Under Management(in billions)
June 30,2009
May 31,2008
June 30,2009
May 31,2008
Three Months Ended Six Months Ended
Balance, beginning of period . . . . . . . . . . . . . . . . . . . . $771 $873 $798 $868
Net inflows/(outflows)Alternative investments. . . . . . . . . . . . . . . . . . . . . . . (2) (3) (4) (5)Equity . . . . . . . . . . . . . . . . . . . . . . . . . . . . . . . . . . . (1) (18) (2) (35)Fixed income . . . . . . . . . . . . . . . . . . . . . . . . . . . . . . 6 10 3 12
Total non-money market net inflows/(outflows) . . . . . . . 3 (11) (3) (28)Money markets . . . . . . . . . . . . . . . . . . . . . . . . . . . . 3 17 (2) 63
Total net inflows/(outflows) . . . . . . . . . . . . . . . . . . . . . . 6 (1) 6 (5) (1) 35
Net market appreciation/(depreciation). . . . . . . . . . . . . 42 16 26 (8)
Balance, end of period. . . . . . . . . . . . . . . . . . . . . . . . . $819 $895 $819 $895
(1) Excludes the federal agency pass-through mortgage-backed securities account managed for the Federal Reserve.
Three Months Ended June 2009 versus May 2008. Net revenues in Asset Management andSecurities Services of $1.54 billion were 28% lower compared with the second quarter of 2008.
Asset Management net revenues of $922 million were 21% lower than the second quarter of2008, primarily reflecting lower assets under management, due to market depreciation since the endof the second quarter of 2008. During the quarter, assets under management increased $48 billion to$819 billion, due to $42 billion of market appreciation, primarily in equity and fixed income assets, and$6 billion of net inflows.
Securities Services net revenues of $615 million were 38% lower than the second quarter of2008. The decrease in net revenues primarily reflected the impact of lower customer balances.
Operating expenses of $1.25 billion for the second quarter of 2009 decreased 15% comparedwith the second quarter of 2008, primarily due to decreased compensation and benefits expensesresulting from lower net revenues. Pre-tax earnings of $287 million decreased 57% compared with thesecond quarter of 2008.
Six Months Ended June 2009 versus May 2008. Net revenues in Asset Management andSecurities Services of $2.99 billion were 29% lower compared with the first half of 2008.
Asset Management net revenues of $1.87 billion were 24% lower than the first half of 2008,primarily reflecting the impact of lower assets under management, due to market depreciation duringthe second half of 2008. During the first half of 2009, assets under management increased $21 billion,reflecting $26 billion of market appreciation, primarily in fixed income and equity assets, partially offsetby $5 billion of net outflows.
Securities Services net revenues of $1.12 billion were 35% lower than the first half of 2008. Thedecrease in net revenues primarily reflected the impact of lower customer balances.
112
Operating expenses of $2.46 billion for the first half of 2009 decreased 17% compared with thefirst half of 2008. The decrease primarily reflected decreased compensation and benefits expensesresulting from lower net revenues, and lower distribution fees, primarily reflecting lower assets undermanagement, principally due to market depreciation during the second half of 2008. Pre-tax earningsof $534 million decreased 56% compared with the first half of 2008.
Geographic Data
See Note 16 to the condensed consolidated financial statements in Part I, Item 1 of thisQuarterly Report on Form 10-Q for a summary of our total net revenues and pre-tax earnings bygeographic region.
Off-Balance-Sheet Arrangements
We have various types of off-balance-sheet arrangements that we enter into in the ordinarycourse of business. Our involvement in these arrangements can take many different forms, includingpurchasing or retaining residual and other interests in mortgage-backed and other asset-backedsecuritization vehicles; holding senior and subordinated debt, interests in limited and generalpartnerships, and preferred and common stock in other nonconsolidated vehicles; entering intointerest rate, foreign currency, equity, commodity and credit derivatives, including total return swaps;entering into operating leases; and providing guarantees, indemnifications, loan commitments, lettersof credit and representations and warranties.
We enter into these arrangements for a variety of business purposes, including the securitizationof commercial and residential mortgages, government and corporate bonds, and other types offinancial assets. Other reasons for entering into these arrangements include underwriting clientsecuritization transactions; providing secondary market liquidity; making investments in performingand nonperforming debt, equity, real estate and other assets; providing investors with credit-linked andasset-repackaged notes; and receiving or providing letters of credit to satisfy margin requirements andto facilitate the clearance and settlement process.
We engage in transactions with variable interest entities (VIEs) and qualifying special-purposeentities (QSPEs). Asset-backed financing vehicles are critical to the functioning of several significantinvestor markets, including the mortgage-backed and other asset-backed securities markets, sincethey offer investors access to specific cash flows and risks created through the securitization process.Our financial interests in, and derivative transactions with, such nonconsolidated entities areaccounted for at fair value, in the same manner as our other financial instruments, except in caseswhere we apply the equity method of accounting.
We did not have off-balance-sheet commitments to purchase or finance any CDOs held bystructured investment vehicles as of June 2009 or November 2008.
In December 2007, the American Securitization Forum (ASF) issued the “StreamlinedForeclosure and Loss Avoidance Framework for Securitized Subprime Adjustable Rate MortgageLoans” (ASF Framework). The ASF Framework provides guidance for servicers to streamlineborrower evaluation procedures and to facilitate the use of foreclosure and loss prevention measuresfor securitized subprime residential mortgages that meet certain criteria. For certain eligible loans asdefined in the ASF Framework, servicers may presume default is reasonably foreseeable and apply afast-track loan modification plan, under which the loan interest rate will be kept at the then current ratefor a period up to five years following the upcoming reset date. Mortgage loan modifications of theseeligible loans will not affect our accounting treatment for QSPEs that hold the subprime loans.
113

The following table sets forth where a discussion of off-balance-sheet arrangements may befound in Part I, Items 1 and 2 of this Quarterly Report on Form 10-Q:
Type of Off-Balance-Sheet Arrangement Disclosure in Quarterly Report on Form 10-Q
Retained interests or other continuinginvolvement relating to assets transferred by usto nonconsolidated entities
See Note 4 to the condensed consolidatedfinancial statements in Part I, Item 1 of thisQuarterly Report on Form 10-Q.
Leases, letters of credit, and loans and othercommitments
See Note 8 to the condensed consolidatedfinancial statements in Part I, Item 1 of thisQuarterly Report on Form 10-Q and‘‘— Contractual Obligations” below.
Guarantees See Note 8 to the condensed consolidatedfinancial statements in Part I, Item 1 of thisQuarterly Report on Form 10-Q.
Other obligations, including contingentobligations, arising out of variable interests wehave in nonconsolidated entities
See Note 4 to the condensed consolidatedfinancial statements in Part I, Item 1 of thisQuarterly Report on Form 10-Q.
Derivative contracts See ‘‘— Critical Accounting Policies” above,and ‘‘— Risk Management” and‘‘— Derivatives” below and Notes 3 and 7 tothe condensed consolidated financialstatements in Part I, Item 1 of this QuarterlyReport on Form 10-Q.
In addition, see Note 2 to the condensed consolidated financial statements in Part I, Item 1 ofthis Quarterly Report on Form 10-Q for a discussion of our consolidation policies and for informationregarding amendments to FIN 46-R, “Consolidation of Variable Interest Entities,” and SFAS No. 140,“Accounting for Transfers and Servicing of Financial Assets and Extinguishments of Liabilities.”
Equity Capital
The level and composition of our equity capital are principally determined by our consolidatedregulatory capital requirements but may also be influenced by rating agency guidelines, subsidiarycapital requirements, the business environment, conditions in the financial markets and assessmentsof potential future losses due to extreme and adverse changes in our business and marketenvironments. As of June 2009, our total shareholders’ equity was $62.81 billion (consisting ofcommon shareholders’ equity of $55.86 billion and preferred stock of $6.96 billion). As ofNovember 2008, our total shareholders’ equity was $64.37 billion (consisting of common shareholders’equity of $47.90 billion and preferred stock of $16.47 billion). In addition to total shareholders’ equity,we consider our $5.00 billion of junior subordinated debt issued to trusts to be part of our equitycapital, as it qualifies as capital for regulatory and certain rating agency purposes.
114
Consolidated Capital Requirements
The Federal Reserve Board is the primary U.S. regulator of Group Inc. As a bank holdingcompany, we are subject to consolidated regulatory capital requirements administered by the FederalReserve Board. Our bank depository institution subsidiaries, including GS Bank USA, are subject tosimilar capital requirements. Under the Federal Reserve Board’s capital adequacy requirements andthe regulatory framework for prompt corrective action (PCA) that is applicable to GS Bank USA,Goldman Sachs and its bank depository institution subsidiaries must meet specific capitalrequirements that involve quantitative measures of assets, liabilities and certain off-balance-sheetitems as calculated under regulatory reporting practices. Goldman Sachs and its bank depositoryinstitution subsidiaries’ capital levels, as well as GS Bank USA’s PCA classification, are also subjectto qualitative judgments by the regulators about components, risk weightings and other factors.
We are reporting capital ratios in accordance with the regulatory capital requirements currentlyapplicable to bank holding companies, which are based on the Capital Accord of the Basel Committeeon Banking Supervision (Basel I). These ratios are used by the Federal Reserve Board and otherU.S. Federal banking agencies in the supervisory review process, including the assessment of ourcapital adequacy.
We also continue to disclose our capital ratios in accordance with the capital guidelinesapplicable to us before we became a bank holding company in September 2008, when we wereregulated by the SEC as a Consolidated Supervised Entity (CSE). These guidelines were generallyconsistent with those set out in the Revised Framework for the International Convergence of CapitalMeasurement and Capital Standards issued by the Basel Committee on Banking Supervision(Basel II). Subsequent to becoming a bank holding company, we no longer report the CSE capitalratios to the SEC and Group Inc. is no longer regulated as a CSE.
Our capital ratios are set forth under ‘‘— Capital Ratios and Metrics” below. See Note 15 to thecondensed consolidated financial statements in Part 1, Item 1 of this Quarterly Report on Form 10-Qfor information regarding our capital ratios calculated in accordance with the Federal Reserve Board’sregulatory capital requirements currently applicable to bank holding companies, which are based onBasel I, and our capital ratios calculated in accordance with the capital guidelines applicable to usbefore we became a bank holding company in September 2008, when we were regulated by the SECas a CSE, which were generally consistent with guidelines set out in Basel II.
Subsidiary Capital Requirements
Many of our subsidiaries are subject to separate regulation and capital requirements injurisdictions throughout the world. Goldman, Sachs & Co. (GS&Co.) and Goldman Sachs Execution &Clearing, L.P. are registered U.S. broker-dealers and futures commission merchants, and are subjectto regulatory capital requirements, including those imposed by the SEC, the Commodity FuturesTrading Commission, the Chicago Board of Trade, the Financial Industry Regulatory Authority, Inc.(FINRA) and the National Futures Association.
GS Bank USA, a New York State-chartered bank and a member of the Federal Reserve Systemand the FDIC, is regulated by the Federal Reserve Board and the New York State BankingDepartment (NYSBD) and is subject to minimum capital requirements that (subject to certainexceptions) are similar to those applicable to bank holding companies. GS Bank USA computes itscapital ratios in accordance with the regulatory capital guidelines currently applicable to state memberbanks, which are based on Basel I as implemented by the Federal Reserve Board, for purposes ofassessing the adequacy of its capital. See Note 15 to the condensed consolidated financialstatements in Part 1, Item 1 of this Quarterly Report on Form 10-Q for information regarding GS BankUSA’s capital ratios under Basel I as implemented by the Federal Reserve Board, and for furtherinformation regarding the capital requirements of our other regulated subsidiaries.
115

Subsidiaries not subject to separate regulation may hold capital to satisfy local tax guidelines,rating agency requirements (for entities with assigned credit ratings) or internal policies, includingpolicies concerning the minimum amount of capital a subsidiary should hold based on its underlyinglevel of risk. See ‘‘— Liquidity and Funding Risk — Conservative Liability Structure” below for adiscussion of our potential inability to access funds from our subsidiaries.
Group Inc. has guaranteed the payment obligations of GS&Co., GS Bank USA and GS BankEurope, subject to certain exceptions. In November 2008, we contributed subsidiaries into GS BankUSA, and Group Inc. agreed to guarantee certain losses, including credit-related losses, relating toassets held by the contributed entities. In connection with this guarantee, Group Inc. also agreed topledge to GS Bank USA certain collateral, including interests in subsidiaries and other illiquid assets.
Equity investments in subsidiaries are generally funded with parent company equity capital,commensurate with the entity’s risk of loss. As of June 2009 and November 2008, Group Inc.’s equityinvestment in subsidiaries was $58.90 billion and $51.70 billion, respectively, compared with its totalshareholders’ equity of $62.81 billion and $64.37 billion.
Our capital invested in non-U.S. subsidiaries is generally exposed to foreign exchange risk,substantially all of which is managed through a combination of derivative contracts andnon-U.S. denominated debt. In addition, we generally manage the non-trading exposure to foreignexchange risk that arises from transactions denominated in currencies other than the transactingentity’s functional currency.
Rating Agency Guidelines
The credit rating agencies assign credit ratings to the obligations of Group Inc., which directlyissues or guarantees substantially all of the firm’s senior unsecured obligations. In addition, GS BankUSA has been assigned a long-term issuer rating as well as ratings on its long-term and short-termbank deposits. The level and composition of our equity capital are among the many factors consideredin determining our credit ratings. Each agency has its own definition of eligible capital andmethodology for evaluating capital adequacy, and assessments are generally based on a combinationof factors rather than a single calculation. See ‘‘— Liquidity and Funding Risk — Credit Ratings” belowfor further information regarding our credit ratings.
Equity Capital Management
Our objective is to maintain a sufficient level and optimal composition of equity capital. Wemanage our capital through repurchases of our common stock and issuances of common andpreferred stock, junior subordinated debt issued to trusts and other subordinated debt. We manageour capital requirements principally by setting limits on balance sheet assets and/or limits on risk, ineach case at both the consolidated and business unit levels. We attribute capital usage to each of ourbusiness units based upon our regulatory capital framework and manage the levels of usage basedupon the balance sheet and risk limits established.
Stock Offering. During the second quarter of 2009, we completed a public offering of46.7 million common shares at $123.00 per share for total proceeds of $5.75 billion.
Preferred Stock. In June 2009, we repurchased from the U.S. Department of the Treasury(U.S. Treasury) the 10.0 million shares of our Fixed Rate Cumulative Perpetual Preferred Stock,Series H, that were issued to the U.S. Treasury pursuant to the U.S. Treasury’s TARP CapitalPurchase Program. The aggregate purchase price paid by us to the U.S. Treasury for the PreferredStock, including accrued dividends, was $10.04 billion. Upon repurchase of the Series H PreferredStock in June 2009, we were no longer subject to the limit on common stock repurchases imposedunder the U.S. Treasury’s TARP Capital Purchase Program.
116

Share Repurchase Program. We seek to use our share repurchase program to help maintainthe appropriate level of common equity and to substantially offset increases in share count over timeresulting from employee share-based compensation. The repurchase program is effected primarilythrough regular open-market purchases, the amounts and timing of which are determined primarily byour current and projected capital positions (i.e., comparisons of our desired level of capital to ouractual level of capital) but which may also be influenced by general market conditions and theprevailing price and trading volumes of our common stock.
As of June 2009, we were authorized to repurchase up to 60.8 million additional shares ofcommon stock pursuant to our repurchase program. See “Unregistered Sales of Equity Securities andUse of Proceeds” in Part II, Item 2 of this Quarterly Report on Form 10-Q for additional information onour repurchase program.
See Note 9 to the condensed consolidated financial statements in Part 1, Item 1 of thisQuarterly Report on Form 10-Q for further information regarding our preferred stock, juniorsubordinated debt issued to trusts and other subordinated debt.
Capital Ratios and Metrics
The following table sets forth information on our assets, shareholders’ equity, leverage ratios,capital ratios and book value per common share:
June2009
November2008
As of
($ in millions, exceptper share amounts)
Total assets. . . . . . . . . . . . . . . . . . . . . . . . . . . . . . . . . . . . . . . . . . . . . . . $889,544 $884,547Adjusted assets (1) . . . . . . . . . . . . . . . . . . . . . . . . . . . . . . . . . . . . . . . . . 553,021 528,292Total shareholders’ equity . . . . . . . . . . . . . . . . . . . . . . . . . . . . . . . . . . . . 62,813 64,369Tangible equity capital (2) . . . . . . . . . . . . . . . . . . . . . . . . . . . . . . . . . . . . . 62,840 64,317Leverage ratio (3) . . . . . . . . . . . . . . . . . . . . . . . . . . . . . . . . . . . . . . . . . . . 14.2x 13.7xAdjusted leverage ratio (4) . . . . . . . . . . . . . . . . . . . . . . . . . . . . . . . . . . . . 8.8x 8.2xDebt to equity ratio (5) . . . . . . . . . . . . . . . . . . . . . . . . . . . . . . . . . . . . . . . 3.0x 2.6xCommon shareholders’ equity . . . . . . . . . . . . . . . . . . . . . . . . . . . . . . . . . $ 55,856 $ 47,898Tangible common shareholders’ equity (6) . . . . . . . . . . . . . . . . . . . . . . . . 50,883 42,846Basel I (7)
Tier 1 capital ratio . . . . . . . . . . . . . . . . . . . . . . . . . . . . . . . . . . . . . . . . 13.8% N/ATotal capital ratio . . . . . . . . . . . . . . . . . . . . . . . . . . . . . . . . . . . . . . . . . 17.2% N/ATier 1 leverage ratio. . . . . . . . . . . . . . . . . . . . . . . . . . . . . . . . . . . . . . . 6.4% N/ATier 1 common ratio (8) . . . . . . . . . . . . . . . . . . . . . . . . . . . . . . . . . . . . 10.9% N/ATangible common shareholders’ equity to risk-weighted assets ratio. . . 12.4% N/A
Basel II (9)
Tier 1 capital ratio . . . . . . . . . . . . . . . . . . . . . . . . . . . . . . . . . . . . . . . . 16.1% 15.6%Total capital ratio . . . . . . . . . . . . . . . . . . . . . . . . . . . . . . . . . . . . . . . . . 19.7% 18.9%Tier 1 common ratio (8) . . . . . . . . . . . . . . . . . . . . . . . . . . . . . . . . . . . . 13.0% 10.3%Tangible common shareholders’ equity to risk-weighted assets ratio. . . 13.3% 10.7%
Book value per common share (10) . . . . . . . . . . . . . . . . . . . . . . . . . . . . . $ 106.41 $ 98.68Tangible book value per common share (11) . . . . . . . . . . . . . . . . . . . . . . . 96.94 88.27
(1) Adjusted assets excludes (i) low-risk collateralized assets generally associated with our matched book and securitieslending businesses and federal funds sold, (ii) cash and securities we segregate for regulatory and other purposesand (iii) goodwill and identifiable intangible assets which are deducted when calculating tangible equity capital (seefootnote 2 below).
117

The following table sets forth the reconciliation of total assets to adjusted assets:
June2009
November2008
As of
(in millions)Total assets . . . . . . . . . . . . . . . . . . . . . . . . . . . . . . . . . . . . . . . . . . . . . . . . . . . . . $ 889,544 $ 884,547Deduct: Securities borrowed. . . . . . . . . . . . . . . . . . . . . . . . . . . . . . . . . . . . . . . . . (218,544) (180,795)
Securities purchased under agreements to resell and federal funds sold. . . . . . (138,339) (122,021)Add: Trading liabilities, at fair value . . . . . . . . . . . . . . . . . . . . . . . . . . . . . . . . . . 147,297 175,972
Less derivative liabilities . . . . . . . . . . . . . . . . . . . . . . . . . . . . . . . . . . . . . . (68,151) (117,695)
Subtotal. . . . . . . . . . . . . . . . . . . . . . . . . . . . . . . . . . . . . . . . . . . . . . . . . 79,146 58,277Deduct: Cash and securities segregated for regulatory and other purposes . . . . . . . . . (53,813) (106,664)
Goodwill and identifiable intangible assets . . . . . . . . . . . . . . . . . . . . . . . . . . (4,973) (5,052)
Adjusted assets . . . . . . . . . . . . . . . . . . . . . . . . . . . . . . . . . . . . . . . . . . . . . . . . . . $ 553,021 $ 528,292
(2) Tangible equity capital equals total shareholders’ equity and junior subordinated debt issued to trusts less goodwilland identifiable intangible assets. We consider junior subordinated debt issued to trusts to be a component of ourtangible equity capital base due to certain characteristics of the debt, including its long-term nature, our ability todefer payments due on the debt and the subordinated nature of the debt in our capital structure.
The following table sets forth the reconciliation of total shareholders’ equity to tangible equity capital:
June2009
November2008
As of
(in millions)Total shareholders’ equity . . . . . . . . . . . . . . . . . . . . . . . . . . . . . . . . . . . . . . . . . . . . . $62,813 $64,369Add: Junior subordinated debt issued to trusts . . . . . . . . . . . . . . . . . . . . . . . . . . . . 5,000 5,000Deduct: Goodwill and identifiable intangible assets . . . . . . . . . . . . . . . . . . . . . . . . . . . (4,973) (5,052)
Tangible equity capital . . . . . . . . . . . . . . . . . . . . . . . . . . . . . . . . . . . . . . . . . . . . . . . $62,840 $64,317
(3) The leverage ratio equals total assets divided by total shareholders’ equity. This ratio is different from the Tier 1leverage ratios included above and is described in Note 15 to the condensed consolidated financial statements inPart 1, Item 1 of this Quarterly Report on Form 10-Q.
(4) The adjusted leverage ratio equals adjusted assets divided by tangible equity capital. We believe that the adjustedleverage ratio is a more meaningful measure of our capital adequacy than the leverage ratio because it excludescertain low-risk collateralized assets that are generally supported with little or no capital and reflects the tangibleequity capital deployed in our businesses.
(5) The debt to equity ratio equals unsecured long-term borrowings divided by total shareholders’ equity.(6) Tangible common shareholders’ equity equals total shareholders’ equity less preferred stock, goodwill and identifiable
intangible assets. We believe that tangible common shareholders’ equity is meaningful because it is one of themeasures that we and investors use to assess capital adequacy.
The following table sets forth the reconciliation of total shareholders’ equity to tangible common shareholders’ equity:
June2009
November2008
As of
(in millions)Total shareholders’ equity . . . . . . . . . . . . . . . . . . . . . . . . . . . . . . . . . . . . . . . . . . . . . $62,813 $ 64,369Deduct: Preferred stock . . . . . . . . . . . . . . . . . . . . . . . . . . . . . . . . . . . . . . . . . . . . . (6,957) (16,471)
Common shareholders’ equity . . . . . . . . . . . . . . . . . . . . . . . . . . . . . . . . . . . . . . . . . . 55,856 47,898Deduct: Goodwill and identifiable intangible assets . . . . . . . . . . . . . . . . . . . . . . . . . . . (4,973) (5,052)
Tangible common shareholders’ equity . . . . . . . . . . . . . . . . . . . . . . . . . . . . . . . . . . . . $50,883 $ 42,846
(7) Calculated in accordance with the regulatory capital requirements currently applicable to bank holding companies.Risk-weighted assets were $409.20 billion as of June 2009 under Basel I. See Note 15 to the condensedconsolidated financial statements in Part 1, Item 1 of this Quarterly Report on Form 10-Q for further informationregarding our regulatory capital ratios.
(8) The Tier 1 common ratio equals Tier 1 capital less preferred stock and junior subordinated debt issued to trusts,divided by risk-weighted assets.
(9) Calculated in accordance with the capital guidelines applicable to us when we were regulated by the SEC as a CSE.Risk-weighted assets were $381.84 billion and $400.38 billion as of June 2009 and November 2008, respectively,under Basel II. See Note 15 to the condensed consolidated financial statements in Part 1, Item 1 of this QuarterlyReport on Form 10-Q for further information regarding our regulatory capital ratios.
118

(10) Book value per common share is based on common shares outstanding, including restricted stock units granted toemployees with no future service requirements, of 524.9 million and 485.4 million and as of June 2009 andNovember 2008, respectively.
(11) Tangible book value per common share is computed by dividing tangible common shareholders’ equity by the numberof common shares outstanding, including restricted stock units granted to employees with no future servicerequirements.
Contractual Obligations
Goldman Sachs has contractual obligations to make future payments related to our unsecuredlong-term borrowings, secured long-term financings, long-term noncancelable lease agreements andpurchase obligations and has commitments under a variety of commercial arrangements.
The following table sets forth our contractual obligations by fiscal maturity date as of June 2009:
Contractual Obligations(in millions)
Remainderof 2009
2010-2011
2012-2013
2014-Thereafter Total
Unsecured long-term borrowings (1)(2)(3) . . . . $ — $33,069 $49,541 $108,632 $191,242Secured long-term financings (1)(2)(4) . . . . . . — 6,879 4,753 4,426 16,058Contractual interest payments (5) . . . . . . . . . 3,656 13,480 10,860 33,060 61,056Insurance liabilities (6) . . . . . . . . . . . . . . . . . 526 2,561 891 7,172 11,150Minimum rental payments . . . . . . . . . . . . . . 249 826 570 1,780 3,425Purchase obligations . . . . . . . . . . . . . . . . . . 470 147 27 24 668
(1) Obligations maturing within one year of our financial statement date or redeemable within one year of our financialstatement date at the option of the holder are excluded from this table and are treated as short-term obligations. SeeNote 3 to the condensed consolidated financial statements in Part I, Item 1 of this Quarterly Report on Form 10-Q forfurther information regarding our secured financings.
(2) Obligations that are repayable prior to maturity at the option of Goldman Sachs are reflected at their contractual maturitydates. Obligations that are redeemable prior to maturity at the option of the holder are reflected at the dates such optionsbecome exercisable.
(3) Includes $19.90 billion accounted for at fair value under SFAS No. 155 or SFAS No. 159, primarily consisting of hybridfinancial instruments and prepaid physical commodity transactions.
(4) These obligations are reported within “Other secured financings” in the condensed consolidated statements of financialcondition and include $10.67 billion accounted for at fair value under SFAS No. 159.
(5) Represents estimated future interest payments related to unsecured long-term borrowings and secured long-termfinancings based on applicable interest rates as of June 2009. Includes stated coupons, if any, on structured notes.
(6) Represents estimated undiscounted payments related to future benefits and unpaid claims arising from policiesassociated with our insurance activities, excluding separate accounts and estimated recoveries under reinsurancecontracts.
As of June 2009, our unsecured long-term borrowings were $191.24 billion, with maturitiesextending to 2043, and consisted principally of senior borrowings. See Note 7 to the condensedconsolidated financial statements in Part I, Item 1 of this Quarterly Report on Form 10-Q for furtherinformation regarding our unsecured long-term borrowings.
As of June 2009, our future minimum rental payments, net of minimum sublease rentals, undernoncancelable leases were $3.43 billion. These lease commitments, principally for office space, expireon various dates through 2069. Certain agreements are subject to periodic escalation provisions forincreases in real estate taxes and other charges. See Note 8 to the condensed consolidated financialstatements in Part I, Item 1 of this Quarterly Report on Form 10-Q for further information regardingour leases.
119

Our occupancy expenses include costs associated with office space held in excess of ourcurrent requirements. This excess space, the cost of which is charged to earnings as incurred, isbeing held for potential growth or to replace currently occupied space that we may exit in the future.We regularly evaluate our current and future space capacity in relation to current and projectedstaffing levels. During the three and six months ended June 2009, we incurred exit costs of$35 million and $51 million, respectively, related to our office space (included in “Occupancy” and“Depreciation and Amortization” in the condensed consolidated statements of earnings). We may incurexit costs in the future to the extent we (i) reduce our space capacity or (ii) commit to, or occupy, newproperties in the locations in which we operate and, consequently, dispose of existing space that hadbeen held for potential growth. These exit costs may be material to our results of operations in a givenperiod.
As of June 2009, included in purchase obligations was $390 million of construction-relatedobligations. As of June 2009, our construction-related obligations include commitments of$348 million, related to our new headquarters in New York City, which is expected to cost between$2.05 billion and $2.15 billion. We have partially financed this construction project with $1.65 billion oftax-exempt Liberty Bonds.
Due to the uncertainty of the timing and amounts that will ultimately be paid, our liability forunrecognized tax benefits has been excluded from the above contractual obligations table.
See Note 8 to the condensed consolidated financial statements in Part I, Item 1 of this QuarterlyReport on Form 10-Q for information regarding our commitments, contingencies and guarantees.
120

Market Risk
The potential for changes in the market value of our trading and investing positions is referred toas market risk. Such positions result from market-making, proprietary trading, underwriting, specialistand investing activities. Substantially all of our inventory positions are marked-to-market on a dailybasis and changes are recorded in net revenues.
Categories of market risk include exposures to interest rates, equity prices, currency rates andcommodity prices. A description of each market risk category is set forth below:
• Interest rate risks primarily result from exposures to changes in the level, slope and curvatureof the yield curve, the volatility of interest rates, mortgage prepayment speeds and creditspreads.
• Equity price risks result from exposures to changes in prices and volatilities of individualequities, equity baskets and equity indices.
• Currency rate risks result from exposures to changes in spot prices, forward prices andvolatilities of currency rates.
• Commodity price risks result from exposures to changes in spot prices, forward prices andvolatilities of commodities, such as electricity, natural gas, crude oil, petroleum products, andprecious and base metals.
We seek to manage these risks by diversifying exposures, controlling position sizes andestablishing economic hedges in related securities or derivatives. For example, we may seek to hedgea portfolio of common stocks by taking an offsetting position in a related equity-index futures contract.The ability to manage an exposure may, however, be limited by adverse changes in the liquidity of thesecurity or the related hedge instrument and in the correlation of price movements between thesecurity and related hedge instrument.
In addition to applying business judgment, senior management uses a number of quantitativetools to manage our exposure to market risk for “Trading assets, at fair value” and “Trading liabilities,at fair value” in the condensed consolidated statements of financial condition. These tools include:
• risk limits based on a summary measure of market risk exposure referred to as VaR;
• scenario analyses, stress tests and other analytical tools that measure the potential effects onour trading net revenues of various market events, including, but not limited to, a largewidening of credit spreads, a substantial decline in equity markets and significant moves inselected emerging markets; and
• inventory position limits for selected business units.
VaR
VaR is the potential loss in value of trading positions due to adverse market movements over adefined time horizon with a specified confidence level.
For the VaR numbers reported below, a one-day time horizon and a 95% confidence level wereused. This means that there is a 1 in 20 chance that daily trading net revenues will fall below theexpected daily trading net revenues by an amount at least as large as the reported VaR. Thus,shortfalls from expected trading net revenues on a single trading day greater than the reported VaRwould be anticipated to occur, on average, about once a month. Shortfalls on a single day can exceedreported VaR by significant amounts. Shortfalls can also occur more frequently or accumulate over alonger time horizon such as a number of consecutive trading days.
121

The modeling of the risk characteristics of our trading positions involves a number ofassumptions and approximations. While we believe that these assumptions and approximations arereasonable, there is no standard methodology for estimating VaR, and different assumptions and/orapproximations could produce materially different VaR estimates.
We use historical data to estimate our VaR and, to better reflect current asset volatilities, wegenerally weight historical data to give greater importance to more recent observations. Given itsreliance on historical data, VaR is most effective in estimating risk exposures in markets in whichthere are no sudden fundamental changes or shifts in market conditions. An inherent limitation of VaRis that the distribution of past changes in market risk factors may not produce accurate predictions offuture market risk. Different VaR methodologies and distributional assumptions could produce amaterially different VaR. Moreover, VaR calculated for a one-day time horizon does not fully capturethe market risk of positions that cannot be liquidated or offset with hedges within one day.
The following tables set forth the daily VaR:
Average Daily VaR (1)
(in millions)
Risk CategoriesJune2009
May2008
June2009
May2008
Three Months Ended Six Months EndedAverage for the
Interest rates . . . . . . . . . . . . . . . . . . . . . . . . . . . . $205 $ 144 $211 $ 125Equity prices . . . . . . . . . . . . . . . . . . . . . . . . . . . . 60 79 49 84Currency rates . . . . . . . . . . . . . . . . . . . . . . . . . . . 39 32 38 31Commodity prices . . . . . . . . . . . . . . . . . . . . . . . . 40 48 40 43Diversification effect (2) . . . . . . . . . . . . . . . . . . . . . (99) (119) (95) (112)
Total . . . . . . . . . . . . . . . . . . . . . . . . . . . . . . . . . . $245 $ 184 $243 $ 171
(1) Certain portfolios and individual positions are not included in VaR, where VaR is not the most appropriate measure ofrisk (e.g., due to transfer restrictions and/or illiquidity). See ‘‘— Other Market Risk Measures” below.
(2) Equals the difference between total VaR and the sum of the VaRs for the four risk categories. This effect arisesbecause the four market risk categories are not perfectly correlated.
Our average daily VaR increased to $245 million for the second quarter of 2009 from$184 million for the second quarter of 2008, principally due to an increase in the interest ratescategory. The increase in interest rates was primarily due to higher market volatility and wider creditspreads.
VaR excludes the impact of changes in counterparty and our own credit spreads on derivativesas well as changes in our own credit spreads on unsecured borrowings for which the fair value optionwas elected. The estimated sensitivity of our net revenues to a one basis point increase in creditspreads (counterparty and our own) on derivatives was less than a $1 million loss as of June 2009. Inaddition, the estimated sensitivity of our net revenues to a one basis point increase in our own creditspreads on unsecured borrowings for which the fair value option was elected was a $7 million gain(including hedges) as of June 2009.
122

Daily VaR (1)
(in millions)
Risk CategoriesJune2009
March2009 High Low
As of Three Months EndedJune 2009
Interest rates . . . . . . . . . . . . . . . . . . . . . . . . . . . . . . . . $176 $ 242 $242 $175Equity prices . . . . . . . . . . . . . . . . . . . . . . . . . . . . . . . . 72 40 108 33Currency rates . . . . . . . . . . . . . . . . . . . . . . . . . . . . . . . 31 43 58 21Commodity prices . . . . . . . . . . . . . . . . . . . . . . . . . . . . 29 48 59 28Diversification effect (2) . . . . . . . . . . . . . . . . . . . . . . . . . (87) (107)
Total. . . . . . . . . . . . . . . . . . . . . . . . . . . . . . . . . . . . . . . $221 $ 266 $270 $212
(1) Certain portfolios and individual positions are not included in VaR, where VaR is not the most appropriate measure ofrisk (e.g., due to transfer restrictions and/or illiquidity). See ‘‘— Other Market Risk Measures” below.
(2) Equals the difference between total VaR and the sum of the VaRs for the four risk categories. This effect arisesbecause the four market risk categories are not perfectly correlated.
Our daily VaR decreased to $221 million as of June 2009 from $266 million as of March 2009,primarily due to a decrease in the interest rates category, partially offset by an increase in the equityprices category. The decrease in interest rates was principally due to lower levels of volatility andreduced rate exposures. The increase in equity prices was principally driven by increased equityexposures.
The following chart presents our daily VaR during the last four quarters and the month ofDecember 2008:
Daily VaR($ in millions)
0
20
40
60
80
100
120
140
160
180
200
220
240
260
280
300
320
Daily T
rad
ing
VaR
Third Quarter
2008
First Quarter
2009
Second Quarter
2009
Fourth Quarter
2008
December
2008
123

Trading Net Revenues Distribution
The following chart sets forth the frequency distribution of our daily trading net revenues forsubstantially all inventory positions included in VaR for the quarter ended June 2009:
Daily Trading Net Revenues($ in millions)
(25)-0(50)-(25)<(100) 0-25 25-50 50-75 75-100 >100
30
0
35
40
45
50
5
10
15
20
25
55
Num
ber
of D
ays
Daily Trading Net Revenues
(100)-(75) (75)-(50)
0 1 10 03 2
6 6
46
As part of our overall risk control process, daily trading net revenues are compared with VaRcalculated as of the end of the prior business day. Trading losses incurred on a single day did notexceed our 95% one-day VaR during the second quarter of 2009.
Other Market Risk Measures
Certain portfolios and individual positions are not included in VaR, where VaR is not the mostappropriate measure of risk (e.g., due to transfer restrictions and/or illiquidity). The market risk relatedto our investment in the ordinary shares of ICBC, excluding interests held by investment fundsmanaged by Goldman Sachs, is measured by estimating the potential reduction in net revenuesassociated with a 10% decline in the ICBC ordinary share price. The market risk related to theremaining positions is measured by estimating the potential reduction in net revenues associated witha 10% decline in asset values.
The sensitivity analyses for equity and debt positions in our trading portfolio and equity, debt(primarily mezzanine instruments) and real estate positions in our non-trading portfolio are measuredby the impact of a decline in the asset values (including the impact of leverage in the underlyinginvestments for real estate positions in our non-trading portfolio) of such positions. The fair value ofthe underlying positions may be impacted by factors such as transactions in similar instruments,completed or pending third-party transactions in the underlying investment or comparable entities,subsequent rounds of financing, recapitalizations and other transactions across the capital structure,offerings in the equity or debt capital markets, and changes in financial ratios or cash flows.
124

The following table sets forth market risk for positions not included in VaR. These measures donot reflect diversification benefits across asset categories and, given the differing likelihood of thepotential declines in asset categories, these measures have not been aggregated:
Asset Categories 10% Sensitivity Measure June 2009 March 2009Amount as of
10% Sensitivity
(in millions)
Trading Risk (1)
Equity (2) Underlying asset value $617 $667Debt (3) Underlying asset value 523 521
Non-trading RiskICBC ICBC ordinary share price 217 212Other Equity (4) Underlying asset value 987 982Debt (5) Underlying asset value 774 689Real Estate (6) Underlying asset value 828 942
(1) In addition to the positions in these portfolios, which are accounted for at fair value, we make investments accountedfor under the equity method and we also make direct investments in real estate, both of which are included in “Otherassets” in the condensed consolidated statements of financial condition. Direct investments in real estate areaccounted for at cost less accumulated depreciation. See Note 12 to the condensed consolidated financialstatements in Part I, Item 1 of this Quarterly Report on Form 10-Q for information on “Other assets.”
(2) Relates to private and restricted public equity securities held within the FICC and Equities components of our Tradingand Principal Investments segment.
(3) Primarily relates to acquired portfolios of distressed loans (primarily backed by commercial and residential real estatecollateral), loans backed by commercial real estate, and corporate debt held within the FICC component of ourTrading and Principal Investments segment.
(4) Primarily relates to interests in our merchant banking funds that invest in corporate equities.(5) Primarily relates to interests in our merchant banking funds that invest in corporate mezzanine debt instruments.(6) Primarily relates to interests in our merchant banking funds that invest in real estate. Such funds typically employ
leverage as part of the investment strategy. This sensitivity measure is based on our percentage ownership of theunderlying asset values in the funds and unfunded commitments to the funds.
During the second quarter of 2009, the decrease in our 10% sensitivity measure for equity in ourtrading portfolio was due to dispositions and a decrease in the fair value of the portfolio. The increasein our 10% sensitivity measure for debt positions in our non-trading portfolio was due to newinvestment activity and an increase in the fair value of the portfolio. The decrease in our 10%sensitivity measure for real estate positions in our non-trading portfolio was due to a decrease in thefair value of the portfolio.
In addition to the positions included in VaR and the other risk measures described above, as ofJune 2009, we held approximately $13.71 billion of financial instruments in our bank and insurancesubsidiaries, primarily consisting of $8.29 billion of money market instruments, $1.37 billion ofgovernment and U.S. federal agency obligations, $2.51 billion of corporate debt securities and otherdebt obligations, and $1.19 billion of mortgage and other asset-backed loans and securities. As ofNovember 2008, we held approximately $10.39 billion of financial instruments in our bank andinsurance subsidiaries, primarily consisting of $2.86 billion of money market instruments, $3.08 billionof government and U.S. federal agency obligations, $2.87 billion of corporate debt securities and otherdebt obligations, and $1.22 billion of mortgage and other asset-backed loans and securities. Inaddition, as of June 2009 and November 2008, we held commitments and loans under the WilliamStreet credit extension program. See Note 8 to the condensed consolidated financial statements inPart I, Item 1 of this Quarterly Report on Form 10-Q for further information regarding our WilliamStreet credit extension program.
125

Credit Risk
Credit risk represents the loss that we would incur if a counterparty or an issuer of securities orother instruments we hold fails to perform under its contractual obligations to us, or upon adeterioration in the credit quality of third parties whose securities or other instruments, including OTCderivatives, we hold. Our exposure to credit risk principally arises through our trading, investing andfinancing activities. To reduce our credit exposures, we seek to enter into netting agreements withcounterparties that permit us to offset receivables and payables with such counterparties. In addition,we attempt to further reduce credit risk with certain counterparties by (i) entering into agreements thatenable us to obtain collateral from a counterparty on an upfront or contingent basis, (ii) seekingthird-party guarantees of the counterparty’s obligations, and/or (iii) transferring our credit risk to thirdparties using credit derivatives and/or other structures and techniques.
To measure and manage our credit exposures, we use a variety of tools, including credit limitsreferenced to both current exposure and potential exposure. Potential exposure is an estimate ofexposure, within a specified confidence level, that could be outstanding over the life of a transactionbased on market movements. In addition, as part of our market risk management process, forpositions measured by changes in credit spreads, we use VaR and other sensitivity measures. Tosupplement our primary credit exposure measures, we also use scenario analyses, such as creditspread widening scenarios, stress tests and other quantitative tools.
Our global credit management systems monitor credit exposure to individual counterparties andon an aggregate basis to counterparties and their affiliates. These systems also provide management,including the Firmwide Risk and Credit Policy Committees, with information regarding credit risk byproduct, industry sector, country and region.
While our activities expose us to many different industries and counterparties, we routinelyexecute a high volume of transactions with counterparties in the financial services industry, includingbrokers and dealers, commercial banks and investment funds, resulting in significant creditconcentration with respect to this industry. In the ordinary course of business, we may also be subjectto a concentration of credit risk to a particular counterparty, borrower or issuer.
As of June 2009 and November 2008, we held $98.43 billion (11% of total assets) and$53.98 billion (6% of total assets), respectively, of U.S. government and federal agency obligationsincluded in “Trading assets, at fair value” and “Cash and securities segregated for regulatory andother purposes” in the condensed consolidated statements of financial condition. As of June 2009 andNovember 2008, we held $44.52 billion (5% of total assets) and $21.13 billion (2% of total assets),respectively, of other sovereign obligations, principally consisting of securities issued by thegovernments of Japan and the United Kingdom. In addition, as of June 2009 and November 2008,$129.35 billion and $126.27 billion of our securities purchased under agreements to resell andsecurities borrowed (including those in “Cash and securities segregated for regulatory and otherpurposes”), respectively, were collateralized by U.S. government and federal agency obligations. As ofJune 2009 and November 2008, $62.90 billion and $65.37 billion of our securities purchased underagreements to resell and securities borrowed, respectively, were collateralized by other sovereignobligations, principally consisting of securities issued by the governments of Germany and Japan. Asof June 2009 and November 2008, we did not have credit exposure to any other counterparty thatexceeded 2% of our total assets.
126

Derivatives
Derivative contracts are instruments, such as futures, forwards, swaps or option contracts, thatderive their value from underlying assets, indices, reference rates or a combination of these factors.Derivative instruments may be privately negotiated contracts, which are often referred to as OTCderivatives, or they may be listed and traded on an exchange.
Substantially all of our derivative transactions are entered into to facilitate client transactions, totake proprietary positions or as a means of risk management. In addition to derivative transactionsentered into for trading purposes, we enter into derivative contracts to manage currency exposure onour net investment in non-U.S. operations and to manage the interest rate and currency exposure onour long-term borrowings and certain short-term borrowings.
Derivatives are used in many of our businesses, and we believe that the associated market riskcan only be understood relative to all of the underlying assets or risks being hedged, or as part of abroader trading strategy. Accordingly, the market risk of derivative positions is managed together withour nonderivative positions.
The fair value of our derivative contracts is reflected net of cash paid or received pursuant tocredit support agreements and is reported on a net-by-counterparty basis in our condensedconsolidated statements of financial condition when we believe a legal right of setoff exists under anenforceable netting agreement. For an OTC derivative, our credit exposure is directly with ourcounterparty and continues until the maturity or termination of such contract.
127

The following tables set forth the fair values of our OTC derivative assets and liabilities byproduct type and by tenor. Tenor is based on expected duration for mortgage-related credit derivativesand on remaining contractual maturity for other derivatives.
OTC Derivatives(in millions)
Product Type0 - 12
Months1 - 5
Years5 - 10Years
10 Yearsor Greater Total
Assets As of June 2009
Interest rates . . . . . . . . . . . . . . . . . . . $10,628 $42,755 $27,262 $38,214 $ 118,859Credit derivatives . . . . . . . . . . . . . . . . 10,284 26,613 15,499 8,937 61,333Currencies . . . . . . . . . . . . . . . . . . . . . 13,537 10,504 6,034 4,518 34,593Commodities . . . . . . . . . . . . . . . . . . . 10,260 9,613 603 502 20,978Equities . . . . . . . . . . . . . . . . . . . . . . . 17,674 6,975 2,975 1,270 28,894Netting across product types (1) . . . . . (4,137) (8,916) (3,319) (2,553) (18,925)
Subtotal . . . . . . . . . . . . . . . . . . . . . . . $58,246 (4) $87,544 $49,054 $50,888 $ 245,732
Cross maturity netting (2) . . . . . . . . . . (27,080)Cash collateral netting (3) . . . . . . . . . . (133,335)
Total . . . . . . . . . . . . . . . . . . . . . . . . . . $ 85,317
Product Type0 - 12
Months1 - 5
Years5 - 10Years
10 Yearsor Greater Total
Liabilities
Interest rates . . . . . . . . . . . . . . . . . . . $ 8,869 $12,222 $10,259 $13,351 $ 44,701Credit derivatives . . . . . . . . . . . . . . . . 4,559 4,858 8,561 4,310 22,288Currencies . . . . . . . . . . . . . . . . . . . . . 11,467 6,544 3,427 2,236 23,674Commodities . . . . . . . . . . . . . . . . . . . 11,089 6,180 1,047 1,169 19,485Equities . . . . . . . . . . . . . . . . . . . . . . . 9,605 2,105 2,435 599 14,744Netting across product types (1) . . . . . (4,137) (8,916) (3,319) (2,553) (18,925)
Subtotal . . . . . . . . . . . . . . . . . . . . . . . $41,452 (4) $22,993 $22,410 $19,112 $ 105,967
Cross maturity netting (2) . . . . . . . . . . (27,080)Cash collateral netting (3) . . . . . . . . . . (16,309)
Total . . . . . . . . . . . . . . . . . . . . . . . . . . $ 62,578
(1) Represents the netting of receivable balances with payable balances for the same counterparty across product typeswithin a maturity category, pursuant to credit support agreements.
(2) Represents the netting of receivable balances with payable balances for the same counterparty across maturitycategories, pursuant to credit support agreements.
(3) Represents the netting of cash collateral received and posted on a counterparty basis pursuant to credit supportagreements.
(4) Includes fair values of OTC derivative assets and liabilities, maturing within six months, of $37.29 billion and$27.44 billion, respectively.
128
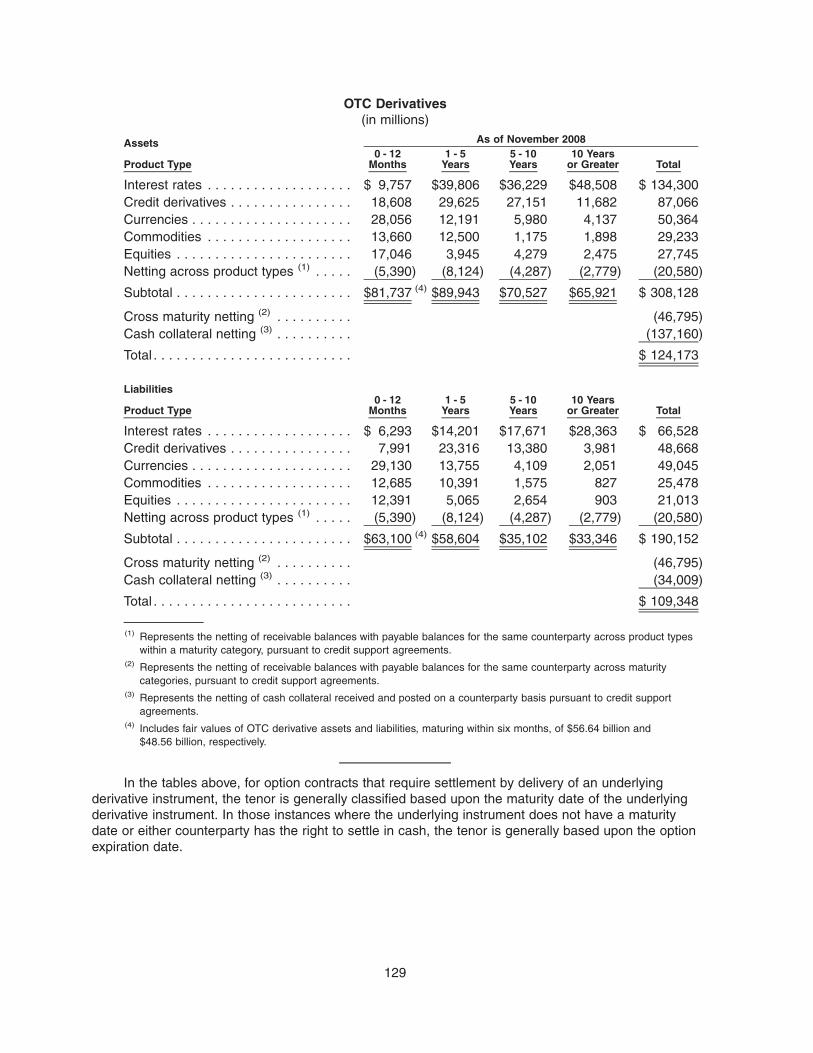
OTC Derivatives(in millions)
Product Type0 - 12
Months1 - 5
Years5 - 10Years
10 Yearsor Greater Total
As of November 2008Assets
Interest rates . . . . . . . . . . . . . . . . . . . $ 9,757 $39,806 $36,229 $48,508 $ 134,300Credit derivatives . . . . . . . . . . . . . . . . 18,608 29,625 27,151 11,682 87,066Currencies . . . . . . . . . . . . . . . . . . . . . 28,056 12,191 5,980 4,137 50,364Commodities . . . . . . . . . . . . . . . . . . . 13,660 12,500 1,175 1,898 29,233Equities . . . . . . . . . . . . . . . . . . . . . . . 17,046 3,945 4,279 2,475 27,745Netting across product types (1) . . . . . (5,390) (8,124) (4,287) (2,779) (20,580)
Subtotal . . . . . . . . . . . . . . . . . . . . . . . $81,737 (4) $89,943 $70,527 $65,921 $ 308,128
Cross maturity netting (2) . . . . . . . . . . (46,795)Cash collateral netting (3) . . . . . . . . . . (137,160)
Total . . . . . . . . . . . . . . . . . . . . . . . . . . $ 124,173
Product Type0 - 12
Months1 - 5
Years5 - 10Years
10 Yearsor Greater Total
Liabilities
Interest rates . . . . . . . . . . . . . . . . . . . $ 6,293 $14,201 $17,671 $28,363 $ 66,528Credit derivatives . . . . . . . . . . . . . . . . 7,991 23,316 13,380 3,981 48,668Currencies . . . . . . . . . . . . . . . . . . . . . 29,130 13,755 4,109 2,051 49,045Commodities . . . . . . . . . . . . . . . . . . . 12,685 10,391 1,575 827 25,478Equities . . . . . . . . . . . . . . . . . . . . . . . 12,391 5,065 2,654 903 21,013Netting across product types (1) . . . . . (5,390) (8,124) (4,287) (2,779) (20,580)
Subtotal . . . . . . . . . . . . . . . . . . . . . . . $63,100 (4) $58,604 $35,102 $33,346 $ 190,152
Cross maturity netting (2) . . . . . . . . . . (46,795)Cash collateral netting (3) . . . . . . . . . . (34,009)
Total . . . . . . . . . . . . . . . . . . . . . . . . . . $ 109,348
(1) Represents the netting of receivable balances with payable balances for the same counterparty across product typeswithin a maturity category, pursuant to credit support agreements.
(2) Represents the netting of receivable balances with payable balances for the same counterparty across maturitycategories, pursuant to credit support agreements.
(3) Represents the netting of cash collateral received and posted on a counterparty basis pursuant to credit supportagreements.
(4) Includes fair values of OTC derivative assets and liabilities, maturing within six months, of $56.64 billion and$48.56 billion, respectively.
In the tables above, for option contracts that require settlement by delivery of an underlyingderivative instrument, the tenor is generally classified based upon the maturity date of the underlyingderivative instrument. In those instances where the underlying instrument does not have a maturitydate or either counterparty has the right to settle in cash, the tenor is generally based upon the optionexpiration date.
129

The following table sets forth the distribution, by credit rating, of our exposure with respect toOTC derivatives by tenor, both before and after consideration of the effect of collateral and nettingagreements. Tenor is based on expected duration for mortgage-related credit derivatives and onremaining contractual maturity for other derivatives. The categories shown reflect our internallydetermined public rating agency equivalents:
OTC Derivative Credit Exposure(in millions)
Credit RatingEquivalent
0 - 12Months
1 - 5Years
5 - 10Years
10 Yearsor Greater Total Netting (2) Exposure
ExposureNet of
Collateral
As of June 2009
AAA/Aaa . . . . . . . $ 2,743 $ 4,524 $ 4,623 $ 3,209 $ 15,099 $ (6,221) $ 8,878 $ 8,520AA/Aa2 . . . . . . . . 6,989 20,669 9,252 9,252 46,162 (32,641) 13,521 9,759A/A2 . . . . . . . . . . 36,715 39,178 28,307 28,760 132,960 (103,597) 29,363 25,539BBB/Baa2 . . . . . . 5,091 10,211 3,435 7,238 25,975 (11,908) 14,067 8,492BB/Ba2 or lower . . 5,849 11,576 2,814 1,983 22,222 (5,965) 16,257 10,160Unrated . . . . . . . . 859 1,386 623 446 3,314 (83) 3,231 2,808
Total . . . . . . . . . . $58,246 (1) $87,544 $49,054 $50,888 $245,732 $(160,415) $ 85,317 $65,278
Credit RatingEquivalent
0 - 12Months
1 - 5Years
5 - 10Years
10 Yearsor Greater Total Netting (2) Exposure
ExposureNet of
Collateral
As of November 2008
AAA/Aaa . . . . . . . $ 5,519 $ 3,871 $ 5,853 $ 4,250 $ 19,493 $ (6,093) $ 13,400 $12,312AA/Aa2 . . . . . . . . 26,835 30,532 33,479 18,980 109,826 (76,119) 33,707 29,435A/A2 . . . . . . . . . . 25,416 27,263 17,009 24,427 94,115 (59,903) 34,212 28,614BBB/Baa2 . . . . . . 11,324 17,156 8,684 14,311 51,475 (29,229) 22,246 16,211BB/Ba2 or lower . . 11,835 10,228 4,586 3,738 30,387 (12,600) 17,787 11,204Unrated . . . . . . . . 808 893 916 215 2,832 (11) 2,821 1,550
Total . . . . . . . . . . $81,737 (1) $89,943 $70,527 $65,921 $308,128 $(183,955) $124,173 $99,326
(1) Includes fair values of OTC derivative assets, maturing within six months, of $37.29 billion and $56.64 billion as ofJune 2009 and November 2008, respectively.
(2) Represents the netting of receivable balances with payable balances for the same counterparty across maturity categoriesand the netting of cash collateral received, pursuant to credit support agreements. Receivable and payable balances with thesame counterparty in the same maturity category are netted within such maturity category, where appropriate.
Derivative transactions may also involve legal risks including the risk that they are not authorizedor appropriate for a counterparty, that documentation has not been properly executed or that executedagreements may not be enforceable against the counterparty. We attempt to minimize these risks byobtaining advice of counsel on the enforceability of agreements as well as on the authority of acounterparty to effect the derivative transaction. In addition, certain derivative transactions (e.g., creditderivative contracts) involve the risk that we may have difficulty obtaining, or be unable to obtain, theunderlying security or obligation in order to satisfy any physical settlement requirement.
130

Liquidity and Funding Risk
Liquidity is of critical importance to companies in the financial services sector. Most failures offinancial institutions have occurred in large part due to insufficient liquidity resulting from adversecircumstances. Accordingly, Goldman Sachs has in place a comprehensive set of liquidity and fundingpolicies that are intended to maintain significant flexibility to address both Goldman Sachs-specific andbroader industry or market liquidity events. Our principal objective is to be able to fund GoldmanSachs and to enable our core businesses to continue to generate revenues, even under adversecircumstances.
We have implemented a number of policies according to the following liquidity risk managementframework:
• Excess Liquidity — We maintain substantial excess liquidity to meet a broad range of potentialcash outflows in a stressed environment, including financing obligations.
• Asset-Liability Management — We seek to maintain secured and unsecured funding sourcesthat are sufficiently long-term in order to withstand a prolonged or severe liquidity-stressedenvironment without having to rely on asset sales.
• Conservative Liability Structure — We seek to access funding across a diverse range ofmarkets, products and counterparties, emphasize less credit-sensitive sources of funding andconservatively manage the distribution of funding across our entity structure.
• Crisis Planning — We base our liquidity and funding management on stress-scenario planningand maintain a crisis plan detailing our response to a liquidity-threatening event.
Excess Liquidity
Our most important liquidity policy is to pre-fund what we estimate will be our potential cashneeds during a liquidity crisis and hold such excess liquidity in the form of unencumbered, highly liquidsecurities that may be sold or pledged to provide same-day liquidity. This “Global Core Excess” isintended to allow us to meet immediate obligations without needing to sell other assets or depend onadditional funding from credit-sensitive markets. We believe that this pool of excess liquidity providesus with a resilient source of funds and gives us significant flexibility in managing through a difficultfunding environment. Our Global Core Excess reflects the following principles:
• The first days or weeks of a liquidity crisis are the most critical to a company’s survival.
• Focus must be maintained on all potential cash and collateral outflows, not just disruptions tofinancing flows. Our businesses are diverse, and our cash needs are driven by many factors,including market movements, collateral requirements and client commitments, all of which canchange dramatically in a difficult funding environment.
• During a liquidity crisis, credit-sensitive funding, including unsecured debt and some types ofsecured financing agreements, may be unavailable, and the terms or availability of other typesof secured financing may change.
• As a result of our policy to pre-fund liquidity that we estimate may be needed in a crisis, wehold more unencumbered securities and have larger unsecured debt balances than ourbusinesses would otherwise require. We believe that our liquidity is stronger with greaterbalances of highly liquid unencumbered securities, even though it increases our unsecuredliabilities and our funding costs.
131

The size of our Global Core Excess is based on an internal liquidity model together with aqualitative assessment of the condition of the financial markets and of Goldman Sachs. Our liquiditymodel identifies and estimates contractual and contingent cash and collateral outflows over ashort-term horizon in a liquidity crisis, including, but not limited to:
• upcoming maturities of unsecured debt and letters of credit;
• potential buybacks of a portion of our outstanding negotiable unsecured debt and potentialwithdrawals of client deposits;
• adverse changes in the terms or availability of secured funding;
• derivatives and other margin and collateral outflows, including those due to market moves;
• potential liquidity outflows associated with our prime brokerage business;
• additional collateral that could be called in the event of a two-notch downgrade in our creditratings;
• draws on our unfunded commitments not supported by William Street Funding Corporation (1);and
• upcoming cash outflows, such as tax and other large payments.
The following table sets forth the average loan value (the estimated amount of cash that wouldbe advanced by counterparties against these securities), as well as overnight cash deposits, of ourGlobal Core Excess:
2009 2008
Three MonthsEnded June
Year EndedNovember
(in millions)
U.S. dollar-denominated . . . . . . . . . . . . . . . . . . . . . . . . . . . . . . . . . . . $128,434 $78,048Non-U.S. dollar-denominated . . . . . . . . . . . . . . . . . . . . . . . . . . . . . . . 42,514 18,677
Total Global Core Excess . . . . . . . . . . . . . . . . . . . . . . . . . . . . . . . . . . $170,948 $96,725
The U.S. dollar-denominated excess is comprised of only unencumbered U.S. governmentsecurities, U.S. agency securities and highly liquid U.S. agency mortgage-backed securities, all ofwhich are eligible as collateral in Federal Reserve open market operations, as well as overnight cashdeposits. Our non-U.S. dollar-denominated excess is comprised of only unencumbered French,German, United Kingdom and Japanese government bonds and overnight cash deposits in highlyliquid currencies. We strictly limit our Global Core Excess to this narrowly defined list of securities andcash because we believe they are highly liquid, even in a difficult funding environment. We do notbelieve that other potential sources of excess liquidity, such as lower-quality unencumbered securitiesor committed credit facilities, are as reliable in a liquidity crisis.
We maintain our Global Core Excess to enable us to meet current and potential liquidityrequirements of our parent company, Group Inc., and all of its subsidiaries. The amount of our GlobalCore Excess is driven by our assessment of potential cash and collateral outflows, regulatoryobligations and the currency and timing requirements of our global business model. In addition, werecognize that our Global Core Excess held in a regulated entity may not be available to our parentcompany or other subsidiaries and therefore may only be available to meet the potential liquidityrequirements of that entity.
132
(1) The Global Core Excess excludes liquid assets of $4.56 billion held separately by William Street Funding Corporation. SeeNote 8 to the condensed consolidated financial statements in Part I, Item 1 of this Quarterly Report on Form 10-Q forfurther information regarding the William Street credit extension program.

In addition to our Global Core Excess, we have a significant amount of other unencumberedsecurities as a result of our business activities. These assets, which are located in the U.S., Europeand Asia, include other government bonds, high-grade money market securities, corporate bonds andmarginable equities. We do not include these securities in our Global Core Excess.
We maintain our Global Core Excess and other unencumbered assets in an amount that, ifpledged or sold, would provide the funds necessary to replace at least 110% of our unsecuredobligations that are scheduled to mature (or where holders have the option to redeem) within the next12 months. We assume conservative loan values that are based on stress-scenario borrowingcapacity and we regularly review these assumptions asset class by asset class. The estimatedaggregate loan value of our Global Core Excess, as well as overnight cash deposits, and our otherunencumbered assets averaged $220.77 billion and $163.41 billion for the three months endedJune 2009 and year ended November 2008, respectively.
Asset-Liability Management
We seek to maintain a highly liquid balance sheet and substantially all of our inventory ismarked-to-market daily. We utilize aged inventory limits for certain financial instruments as adisincentive to our businesses to hold inventory over longer periods of time. We believe that theselimits provide a complementary mechanism for ensuring appropriate balance sheet liquidity in additionto our standard position limits. Although our balance sheet fluctuates due to client activity, marketconventions and periodic market opportunities in certain of our businesses, our total assets andadjusted assets at financial statement dates are typically not materially different from those occurringwithin our reporting periods.
We seek to manage the maturity profile of our secured and unsecured funding base such thatwe should be able to liquidate our assets prior to our liabilities coming due, even in times of prolongedor severe liquidity stress. We do not rely on immediate sales of assets (other than our Global CoreExcess) to maintain liquidity in a distressed environment, although we recognize orderly asset salesmay be prudent or necessary in a severe or persistent liquidity crisis.
In order to avoid reliance on asset sales, our goal is to ensure that we have sufficient totalcapital (unsecured long-term borrowings plus total shareholders’ equity) to fund our balance sheet forat least one year. The target amount of our total capital is based on an internal liquidity model whichincorporates, among other things, the following long-term financing requirements:
• the portion of trading assets that we believe could not be funded on a secured basis in periodsof market stress, assuming conservative loan values;
• goodwill and identifiable intangible assets, property, leasehold improvements and equipment,and other illiquid assets;
• derivative and other margin and collateral requirements;
• anticipated draws on our unfunded loan commitments; and
• capital or other forms of financing in our regulated subsidiaries that are in excess of theirlong-term financing requirements. See ‘‘— Conservative Liability Structure” below for a furtherdiscussion of how we fund our subsidiaries.
133

Certain financial instruments may be more difficult to fund on a secured basis during times ofmarket stress. Accordingly, we generally hold higher levels of total capital for these assets than moreliquid types of financial instruments. The following table sets forth our aggregate holdings in thesecategories of financial instruments:
June2009
November2008
As of
(in millions)
Mortgage and other asset-backed loans and securities . . . . . . . . . . . . . . . $13,730 $22,393Bank loans and bridge loans (1) . . . . . . . . . . . . . . . . . . . . . . . . . . . . . . . . . 18,349 21,839Emerging market debt securities . . . . . . . . . . . . . . . . . . . . . . . . . . . . . . . . 1,639 2,827High-yield and other debt obligations . . . . . . . . . . . . . . . . . . . . . . . . . . . . . 10,708 9,998Private equity and real estate fund investments (2) . . . . . . . . . . . . . . . . . . . 14,380 18,171Emerging market equity securities . . . . . . . . . . . . . . . . . . . . . . . . . . . . . . . 4,554 2,665ICBC ordinary shares (3) . . . . . . . . . . . . . . . . . . . . . . . . . . . . . . . . . . . . . . 6,269 5,496SMFG convertible preferred stock . . . . . . . . . . . . . . . . . . . . . . . . . . . . . . . 1,330 1,135Other restricted public equity securities . . . . . . . . . . . . . . . . . . . . . . . . . . . 237 568Other investments in funds (4) . . . . . . . . . . . . . . . . . . . . . . . . . . . . . . . . . . 2,809 2,714
(1) Includes funded commitments and inventory held in connection with our origination and secondary trading activities.(2) Includes interests in our merchant banking funds. Such amounts exclude assets related to consolidated investment
funds of $899 million and $1.16 billion as of June 2009 and November 2008, respectively, for which Goldman Sachsdoes not bear economic exposure.
(3) Includes interests of $3.96 billion and $3.48 billion as of June 2009 and November 2008, respectively, held byinvestment funds managed by Goldman Sachs.
(4) Includes interests in other investment funds that we manage.
We focus on funding these assets with long contractual maturities to reduce refinancing risk inperiods of market stress.
See Note 3 to the condensed consolidated financial statements in Part I, Item 1 of this QuarterlyReport on Form 10-Q for further information regarding the financial instruments we hold.
Conservative Liability Structure
We seek to structure our liabilities conservatively to reduce refinancing risk and the risk that wemay be required to redeem or repurchase certain of our borrowings prior to their contractual maturity.
We fund a substantial portion of our inventory on a secured basis, which we believe providesGoldman Sachs with a more stable source of liquidity than unsecured financing, as it is less sensitiveto changes in our credit due to the underlying collateral. However, we recognize that the terms oravailability of secured funding, particularly overnight funding, can deteriorate rapidly in a difficultenvironment. To help mitigate this risk, we raise the majority of our funding for durations longer thanovernight. We seek longer terms for secured funding collateralized by lower-quality assets, as webelieve these funding transactions may pose greater refinancing risk. The weighted average life of oursecured funding, excluding funding collateralized by highly liquid securities, such as U.S., French,German, United Kingdom and Japanese government bonds, and U.S. agency securities, exceeded100 days as of June 2009.
134

Our liquidity also depends, to an important degree, on the stability of our short-term unsecuredfinancing base. Accordingly, we prefer the use of promissory notes (in which Goldman Sachs does notmake a market) over commercial paper, which we may repurchase prior to maturity through theordinary course of business as a market maker. As of June 2009, our unsecured short-termborrowings, including the current portion of unsecured long-term borrowings, were $35.17 billion. SeeNote 6 to the condensed consolidated financial statements in Part I, Item 1 of this Quarterly Reporton Form 10-Q for further information regarding our unsecured short-term borrowings.
We issue long-term borrowings as a source of total capital in order to meet our long-termfinancing requirements. The following table sets forth our quarterly unsecured long-term borrowingsmaturity profile through the second quarter of 2015:
Unsecured Long-Term Borrowings Maturity Profile($ in millions)
0
1,000
2,000
3,000
4,000
5,000
6,000
7,000
8,000
9,000
10,000
11,000
12,000
Jun 20
10
Sep
t 201
0
Dec
201
0
Mar
201
1
Jun 20
11
Sep
t 201
1
Dec
201
1
Mar
201
2
Jun 20
12
Sep
t 201
2
Dec
201
2
Mar
201
3
Jun 20
13
Sep
t 201
3
Dec
201
3
Mar
201
4
Jun 20
14
Sep
t 201
4
Dec
201
4
Mar
201
5
Jun 20
15
Calendar Quarters Ended
The weighted average maturity of our unsecured long-term borrowings as of June 2009 wasapproximately seven years. To mitigate refinancing risk, we seek to limit the principal amount of debtmaturing on any one day or during any week or year. We swap a substantial portion of our long-termborrowings into short-term floating rate obligations in order to minimize our exposure to interest rates.
We issue substantially all of our unsecured debt without provisions that would, based solelyupon an adverse change in our credit ratings, financial ratios, earnings, cash flows or stock price,trigger a requirement for an early payment, collateral support, change in terms, acceleration ofmaturity or the creation of an additional financial obligation.
135

As of June 2009, our bank depository institution subsidiaries had $41.46 billion in customerdeposits, including $28.45 billion of deposits from bank sweep programs and $13.01 billion ofcertificates of deposit and other time deposits with a weighted average maturity of three years. SinceSeptember 2008, GS Bank USA has had access to funding through the Federal Reserve Bankdiscount window. While we do not rely on funding through the Federal Reserve Bank discount windowin our liquidity modeling and stress testing, we maintain policies and procedures necessary to accessthis funding.
We seek to maintain broad and diversified funding sources globally for both secured andunsecured funding. We make extensive use of the repurchase agreement and securities lendingmarkets, as well as other secured funding markets. In addition, we issue debt through syndicatedU.S. registered offerings, U.S. registered and 144A medium-term note programs, offshoremedium-term note offerings and other bond offerings, U.S. and non-U.S. commercial paper andpromissory note issuances and other methods. We also arrange for letters of credit to be issued onour behalf.
We seek to distribute our funding products through our own sales force to a large, diverse globalcreditor base and we believe that our relationships with our creditors are critical to our liquidity. Ourcreditors include banks, governments, securities lenders, pension funds, insurance companies, mutualfunds and individuals. We access funding in a variety of markets in the Americas, Europe and Asia.We have imposed various internal guidelines on creditor concentration, including the amount of ourcommercial paper and promissory notes that can be owned and letters of credit that can be issued byany single creditor or group of creditors.
As a bank holding company, the firm has access to certain programs and facilities establishedon a temporary basis by a number of U.S. regulatory agencies, including the Temporary LiquidityGuarantee Program (TLGP). See “Liquidity and Funding Risk” in Part II, Item 7 of our Annual Reporton Form 10-K for the fiscal year ended November 2008 for a discussion of these programs. Under theTLGP, we are able to have outstanding approximately $35 billion of debt that is issued prior toOctober 31, 2009 guaranteed by the Federal Deposit Insurance Corporation (FDIC). As of June 2009,we had outstanding $25.14 billion of senior unsecured debt (comprised of $4.39 billion of short-termand $20.75 billion of long-term) under the TLGP.
See “Risk Factors” in Part I, Item 1A of our Annual Report on Form 10-K for a discussion offactors that could impair our ability to access the capital markets.
Subsidiary Funding Policies. The majority of our unsecured funding is raised by our parentcompany, Group Inc. The parent company then lends the necessary funds to its subsidiaries, some ofwhich are regulated, to meet their asset financing and capital requirements. In addition, the parentcompany provides its regulated subsidiaries with the necessary capital to meet their regulatoryrequirements. The benefits of this approach to subsidiary funding include enhanced control andgreater flexibility to meet the funding requirements of our subsidiaries. Funding is also raised at thesubsidiary level through secured funding and deposits.
Our intercompany funding policies are predicated on an assumption that, unless legally providedfor, funds or securities are not freely available from a subsidiary to its parent company or othersubsidiaries. In particular, many of our subsidiaries are subject to laws that authorize regulatorybodies to block or limit the flow of funds from those subsidiaries to Group Inc. Regulatory action ofthat kind could impede access to funds that Group Inc. needs to make payments on obligations,including debt obligations. As such, we assume that capital or other financing provided to ourregulated subsidiaries is not available to our parent company or other subsidiaries until the maturity ofsuch financing. In addition, we recognize that the Global Core Excess held in our regulated entitiesmay not be available to our parent company or other subsidiaries and therefore may only be availableto meet the potential liquidity requirements of those entities.
136

We also manage our liquidity risk by requiring senior and subordinated intercompany loans tohave maturities equal to or shorter than the maturities of the aggregate borrowings of the parentcompany. This policy ensures that the subsidiaries’ obligations to the parent company will generallymature in advance of the parent company’s third-party borrowings. In addition, many of oursubsidiaries and affiliates maintain unencumbered assets to cover their unsecured intercompanyborrowings (other than subordinated debt) in order to mitigate parent company liquidity risk.
Group Inc. has provided substantial amounts of equity and subordinated indebtedness, directlyor indirectly, to its regulated subsidiaries. For example, as of June 2009, Group Inc. had $24.75 billionof such equity and subordinated indebtedness invested in GS&Co., its principal U.S. registeredbroker-dealer; $23.71 billion invested in GSI, a regulated U.K. broker-dealer; $2.53 billion invested inGoldman Sachs Execution & Clearing, L.P., a U.S. registered broker-dealer; $3.73 billion invested inGoldman Sachs Japan Co., Ltd., a regulated Japanese broker-dealer; and $20.05 billion invested inGS Bank USA, a regulated New York State-chartered bank. Group Inc. also had $90.05 billion ofunsubordinated loans and $17.22 billion of collateral provided to these entities as of June 2009, aswell as significant amounts of capital invested in and loans to its other regulated subsidiaries.
Crisis Planning
In order to be prepared for a liquidity event, or a period of market stress, we base our liquidityrisk management framework and our resulting funding and liquidity policies on conservativestress-scenario assumptions. Our planning incorporates several market-based and operational stressscenarios. We also periodically conduct liquidity crisis drills to test our lines of communication andbackup funding procedures.
In addition, we maintain a liquidity crisis plan that specifies an approach for analyzing andresponding to a liquidity-threatening event. The plan provides the framework to estimate the likelyimpact of a liquidity event on Goldman Sachs based on some of the risks identified above andoutlines which and to what extent liquidity maintenance activities should be implemented based on theseverity of the event.
Credit Ratings
We rely upon the short-term and long-term debt capital markets to fund a significant portion ofour day-to-day operations. The cost and availability of debt financing is influenced by our creditratings. Credit ratings are important when we are competing in certain markets and when we seek toengage in longer-term transactions, including OTC derivatives. We believe our credit ratings areprimarily based on the credit rating agencies’ assessment of our liquidity, market, credit andoperational risk management practices, the level and variability of our earnings, our capital base, ourfranchise, reputation and management, our corporate governance and the external operatingenvironment, including the perceived level of government support. See “Risk Factors” in Part I,Item 1A of our Annual Report on Form 10-K for a discussion of the risks associated with a reductionin our credit ratings.
137

The following table sets forth our unsecured credit ratings (excluding debt guaranteed by theFDIC under the TLGP) as of June 2009:
Short-Term Debt Long-Term Debt Subordinated Debt Preferred Stock
Dominion Bond RatingService Limited . . . . . . R-1 (middle) A (high) A BBB
Fitch, Inc. . . . . . . . . . . . . F1+ A+ A A�Moody’s Investors
Service (1) . . . . . . . . . . P-1 A1 A2 A3Standard & Poor’s
Ratings Services . . . . . A-1 A A� BBBRating and Investment
Information, Inc. . . . . . a-1+ AA� Not Applicable Not Applicable
(1) GS Bank USA has been assigned a Long-Term Issuer rating of Aa3 as well as a rating of Aa3 for Long-Term Bank Depositsand a rating of P-1 for Short-Term Bank Deposits.
Based on our credit ratings as of June 2009, additional collateral or termination paymentspursuant to bilateral agreements with certain counterparties of approximately $763 million and$1.93 billion could have been called by counterparties in the event of a one-notch and two-notchreduction, respectively, in our long-term credit ratings. In evaluating our liquidity requirements, weconsider additional collateral or termination payments that may be required in the event of a two-notchreduction in our long-term credit ratings, as well as collateral that has not been called bycounterparties, but is available to them.
Cash Flows
As a global financial institution, our cash flows are complex and interrelated and bear littlerelation to our net earnings and net assets and, consequently, we believe that traditional cash flowanalysis is less meaningful in evaluating our liquidity position than the excess liquidity andasset-liability management policies described above. Cash flow analysis may, however, be helpful inhighlighting certain macro trends and strategic initiatives in our businesses.
Six Months Ended June 2009. Our cash and cash equivalents increased by $8.37 billion to$22.18 billion at the end of the second quarter of 2009. We generated $16.02 billion in net cash fromoperating activities. We used net cash of $7.65 billion from investing and financing activities, primarilyfor net repayments in secured and unsecured short-term borrowings and the repurchase of Series HPreferred Stock, partially offset by an increase in bank deposits and the issuance of common stock.
Six Months Ended May 2008. Our cash and cash equivalents increased by $1.02 billion to$11.31 billion at the end of the second quarter of 2008. We raised $18.68 billion in net cash fromfinancing activities, primarily in unsecured borrowings and bank deposits, partially offset byrepayments of secured financings. We used net cash of $17.66 billion in our operating and investingactivities, primarily to capitalize on trading and investing opportunities for our clients and ourselves.
Recent Accounting Developments
See Note 2 to the condensed consolidated financial statements in Part I, Item 1 of this QuarterlyReport on Form 10-Q for information regarding Recent Accounting Developments.
138

Cautionary Statement Pursuant to the U.S. Private SecuritiesLitigation Reform Act of 1995
We have included or incorporated by reference in this Quarterly Report on Form 10-Q, and fromtime to time our management may make, statements that may constitute “forward-looking statements”within the meaning of the safe harbor provisions of the U.S. Private Securities Litigation Reform Act of1995. Forward-looking statements are not historical facts but instead represent only our beliefsregarding future events, many of which, by their nature, are inherently uncertain and outside ourcontrol. It is possible that our actual results and financial condition may differ, possibly materially, fromthe anticipated results and financial condition indicated in these forward-looking statements. For adiscussion of some of the risks and important factors that could affect our future results and financialcondition, see “Risk Factors” in Part I, Item 1A of our Annual Report on Form 10-K for the fiscal yearended November 28, 2008 and “Management’s Discussion and Analysis of Financial Condition andResults of Operations” in Part II, Item 7 of our Annual Report on Form 10-K for the fiscal year endedNovember 28, 2008.
Certain of the information regarding our capital ratios, as calculated in accordance with Basel I,is based on certain market risk measures that are under review by the Federal Reserve Board. Thisinformation is subject to change as the calculation of these ratios has not been reviewed with theFederal Reserve Board, and these ratios may be revised in subsequent filings.
Statements about our investment banking transaction backlog also may constituteforward-looking statements. Such statements are subject to the risk that the terms of thesetransactions may be modified or that they may not be completed at all; therefore, the net revenues, ifany, that we actually earn from these transactions may differ, possibly materially, from those currentlyexpected. Important factors that could result in a modification of the terms of a transaction or atransaction not being completed include, in the case of underwriting transactions, a decline orcontinued weakness in general economic conditions, outbreak of hostilities, volatility in the securitiesmarkets generally or an adverse development with respect to the issuer of the securities and, in thecase of financial advisory transactions, a decline in the securities markets, an inability to obtainadequate financing, an adverse development with respect to a party to the transaction or a failure toobtain a required regulatory approval. For a discussion of other important factors that could adverselyaffect our investment banking transactions, see “Risk Factors” in Part I, Item 1A of our Annual Reporton Form 10-K for the fiscal year ended November 28, 2008 and “Management’s Discussion andAnalysis of Financial Condition and Results of Operations” in Part II, Item 7 of our Annual Report onForm 10-K for the fiscal year ended November 28, 2008.
Item 3: Quantitative and Qualitative Disclosures About Market Risk
Quantitative and qualitative disclosures about market risk are set forth under “Management’sDiscussion and Analysis of Financial Condition and Results of Operations — Market Risk” in Part I,Item 2 above.
Item 4: Controls and Procedures
As of the end of the period covered by this report, an evaluation was carried out by GoldmanSachs’ management, with the participation of our Chief Executive Officer and Chief Financial Officer,of the effectiveness of our disclosure controls and procedures (as defined in Rule 13a-15(e) under theU.S. Securities Exchange Act of 1934 (Exchange Act)). Based upon that evaluation, our ChiefExecutive Officer and Chief Financial Officer concluded that these disclosure controls and procedureswere effective as of the end of the period covered by this report. In addition, no change in our internalcontrol over financial reporting (as defined in Rule 13a-15(f) under the Exchange Act) occurred duringour most recent fiscal quarter that has materially affected, or is reasonably likely to materially affect,our internal control over financial reporting.
139

PART II: OTHER INFORMATION
Item 1: Legal Proceedings
The following supplements and amends our discussion set forth under Item 3 “LegalProceedings” in our Annual Report on Form 10-K for the fiscal year ended November 28, 2008, asupdated by our Quarterly Report on Form 10-Q for the quarter ended March 27, 2009.
Research Independence Matters
In the class action relating to coverage of RSL Communications, Inc., on April 30, 2009, plaintiffsrenewed their motion seeking class certification.
Adelphia Communications Fraudulent Conveyance Litigation
By a decision dated May 4, 2009, the district court denied GS&Co.’s motion to dismiss. GS&Co.moved for reconsideration, and by a decision dated June 15, 2009, the district court granted themotion insofar as requiring plaintiff to amend its complaint to specify the source of the marginpayments to GS&Co. By a decision dated July 30, 2009, the district court held that the sufficiency ofthe amended claim would be determined at the summary judgment stage.
Executive Compensation Matters
In the action filed in New York state court, Group Inc. removed the action to federal court, and ithas been transferred on consent to the U.S. District Court for the Eastern District of New York, wheredefendants moved to dismiss on July 8, 2009. On July 10, 2009, plaintiff moved to remand the actionto state court.
Group Inc. and certain of its affiliates have received inquiries from various governmentalagencies and self-regulatory organizations regarding the firm’s compensation processes. The firm iscooperating with the requests.
The Board has received several demand letters from shareholders relating to compensationmatters, including demands that the Board investigate compensation awards over recent years, takesteps to recoup alleged excessive compensation, and adopt certain reforms. The Board is consideringthe demand letters.
Mortgage-Related Matters
On May 11, 2009, the Massachusetts Attorney General announced that it had entered into anagreement with GS&Co. (on behalf of itself and certain affiliates) in order to conclude and resolve allissues arising from the Attorney General’s investigation of certain subprime matters. In connectionwith the settlement, GS&Co. agreed, among other things, to pay $10 million to Massachusetts andoffer to provide certain relief to Massachusetts homeowners whose mortgages are owned by GS&Co.or its affiliates.
In the action brought by the City of Cleveland, the district court granted defendants’ motion todismiss by a decision dated May 15, 2009. The City appealed on May 18, 2009.
In the purported class action relating to various mortgage pass-through and asset-backedcertificates issued by various securitization trusts in 2007, plaintiffs filed an amended complaint onMay 15, 2009.
140

Group Inc., GS&Co., Goldman Sachs Mortgage Company and GS Mortgage Securities Corp.are among the defendants in a separate putative class action commenced on February 6, 2009 in theU.S. District Court for the Southern District of New York brought on behalf of purchasers of variousmortgage pass-through certificates and asset-backed certificates issued by various securitizationtrusts in 2006 and underwritten by GS&Co. The other defendants include three current or formerGoldman Sachs employees and various rating agencies. The amended complaint generally allegesthat the registration statement and prospectus supplements for the certificates violated the federalsecurities laws. The amended complaint asserts a claim under Section 11 of the Securities Actagainst all defendants, a claim under Section 12(a)(2) of the Securities Act against Group Inc. andGS&Co. and a related “controlling person” claim under Section 15 of the Securities Act againstGroup Inc., GS&Co., Goldman Sachs Mortgage Company and the individual defendants, and seeksunspecified compensatory and rescissionary damages.
Auction Products Matters
In the shareholder derivative actions against Group Inc., its board of directors, and certain seniorofficers, on May 19, 2009, the district court granted defendants’ motion to dismiss, and onJuly 20, 2009 denied plaintiffs’ motion for reconsideration.
Washington Mutual Securities Litigation
By a decision dated May 15, 2009, the district court granted in part and denied in part theunderwriter defendants’ motion to dismiss, with leave to replead, and on June 15, 2009, plaintiffs filedan amended complaint. On July 17, 2009, the underwriters moved to dismiss certain aspects of theamended complaint.
Britannia Bulk Securities Litigation
On June 12, 2009, the underwriter defendants including GS&Co. moved to dismiss.
IndyMac Pass-Through Certificates Litigation
On May 21, 2009, plaintiffs voluntarily dismissed their California complaint. On May 14, 2009, anew plaintiff filed an action in the U.S. District Court for the Southern District of New York assertingthe same substantive claims as in the California action.
Montana Power Litigation
On July 21, 2009, the parties reached a settlement in principle, subject to, among other things,negotiation of a definitive agreement and court approval.
Credit Derivatives
Group Inc. and certain of its affiliates have received inquiries from various governmentalagencies and self-regulatory organizations regarding credit derivative instruments. The firm iscooperating with the requests.
Enron Litigation Matters
On August 3, 2009, GS&Co. entered into a definitive settlement agreement with plaintiffs in thepurported securities class action relating to the exchangeable notes. The settlement remains subjectto court approval.
141

Item 2: Unregistered Sales of Equity Securities and Use of Proceeds
The table below sets forth the information with respect to purchases made by or on behalf ofGroup Inc. or any “affiliated purchaser” (as defined in Rule 10b-18(a)(3) under the Exchange Act) ofour common stock during the three months ended June 26, 2009.
Period
Total Numberof SharesPurchased
AveragePrice
Paid perShare
Total Number ofShares Purchasedas Part of PubliclyAnnounced Plans
or Programs (1)
Maximum Numberof Shares That MayYet Be PurchasedUnder the Plans or
Programs (1)
Month #1 . . . . . . . . . . . . . . . . . . — — — 60,838,106(March 28, 2009 toApril 24, 2009)Month #2 . . . . . . . . . . . . . . . . . . — — — 60,838,106(April 25, 2009 toMay 29, 2009)Month #3 . . . . . . . . . . . . . . . . . . — — — 60,838,106(May 30, 2009 toJune 26, 2009)
Total . . . . . . . . . . . . . . . . . . . . . . — —
(1) On March 21, 2000, we announced that our board of directors had approved a repurchase program, pursuant towhich up to 15 million shares of our common stock may be repurchased. This repurchase program was increased byan aggregate of 280 million shares by resolutions of our board of directors adopted on June 18, 2001,March 18, 2002, November 20, 2002, January 30, 2004, January 25, 2005, September 16, 2005,September 11, 2006 and December 17, 2007. We use our share repurchase program to help maintain theappropriate level of common equity and to substantially offset increases in share count over time resulting fromemployee share-based compensation.
The repurchase program is effected primarily through regular open-market purchases, the amounts and timing ofwhich are determined primarily by our current and projected capital positions (i.e., comparisons of our desired level ofcapital to our actual level of capital) but which may also be influenced by general market conditions and the prevailingprice and trading volumes of our common stock, in each case subject to the limit described in the prior paragraph.The total remaining authorization under the repurchase program was 60,838,106 shares as of July 24, 2009; therepurchase program has no set expiration or termination date.
142
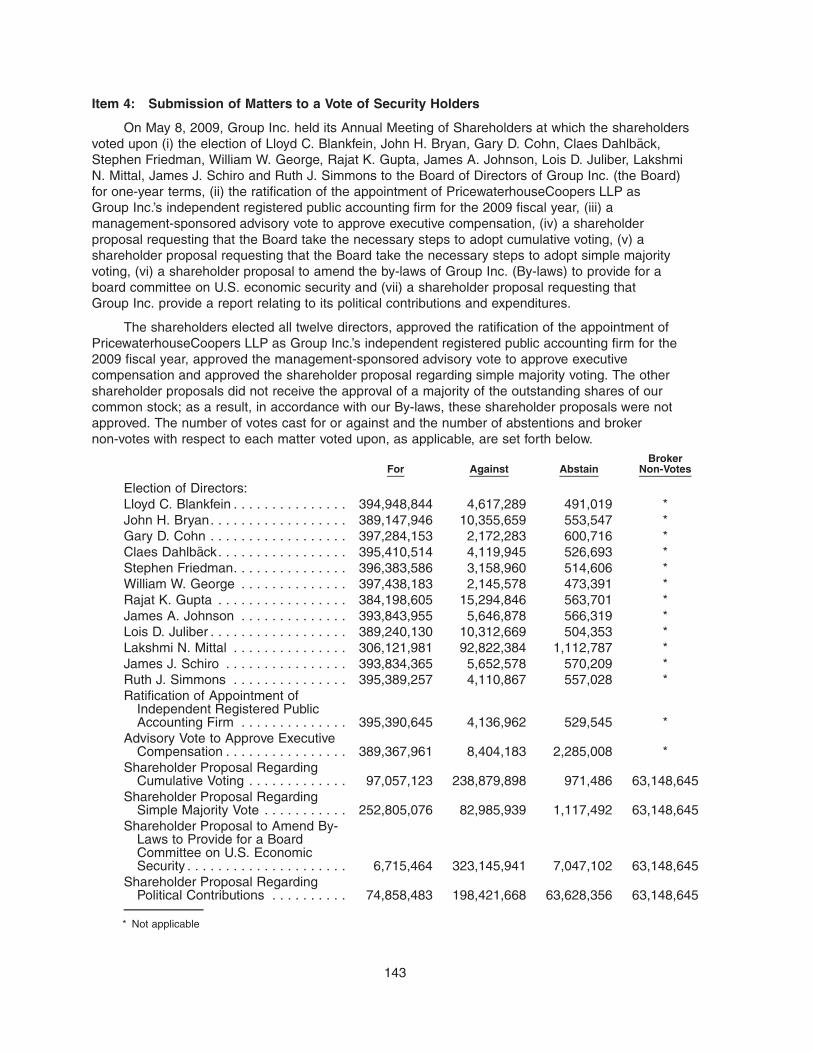
Item 4: Submission of Matters to a Vote of Security Holders
On May 8, 2009, Group Inc. held its Annual Meeting of Shareholders at which the shareholdersvoted upon (i) the election of Lloyd C. Blankfein, John H. Bryan, Gary D. Cohn, Claes Dahlback,Stephen Friedman, William W. George, Rajat K. Gupta, James A. Johnson, Lois D. Juliber, LakshmiN. Mittal, James J. Schiro and Ruth J. Simmons to the Board of Directors of Group Inc. (the Board)for one-year terms, (ii) the ratification of the appointment of PricewaterhouseCoopers LLP asGroup Inc.’s independent registered public accounting firm for the 2009 fiscal year, (iii) amanagement-sponsored advisory vote to approve executive compensation, (iv) a shareholderproposal requesting that the Board take the necessary steps to adopt cumulative voting, (v) ashareholder proposal requesting that the Board take the necessary steps to adopt simple majorityvoting, (vi) a shareholder proposal to amend the by-laws of Group Inc. (By-laws) to provide for aboard committee on U.S. economic security and (vii) a shareholder proposal requesting thatGroup Inc. provide a report relating to its political contributions and expenditures.
The shareholders elected all twelve directors, approved the ratification of the appointment ofPricewaterhouseCoopers LLP as Group Inc.’s independent registered public accounting firm for the2009 fiscal year, approved the management-sponsored advisory vote to approve executivecompensation and approved the shareholder proposal regarding simple majority voting. The othershareholder proposals did not receive the approval of a majority of the outstanding shares of ourcommon stock; as a result, in accordance with our By-laws, these shareholder proposals were notapproved. The number of votes cast for or against and the number of abstentions and brokernon-votes with respect to each matter voted upon, as applicable, are set forth below.
For Against AbstainBroker
Non-Votes
Election of Directors:Lloyd C. Blankfein . . . . . . . . . . . . . . . 394,948,844 4,617,289 491,019 *John H. Bryan. . . . . . . . . . . . . . . . . . 389,147,946 10,355,659 553,547 *Gary D. Cohn . . . . . . . . . . . . . . . . . . 397,284,153 2,172,283 600,716 *Claes Dahlback. . . . . . . . . . . . . . . . . 395,410,514 4,119,945 526,693 *Stephen Friedman. . . . . . . . . . . . . . . 396,383,586 3,158,960 514,606 *William W. George . . . . . . . . . . . . . . 397,438,183 2,145,578 473,391 *Rajat K. Gupta . . . . . . . . . . . . . . . . . 384,198,605 15,294,846 563,701 *James A. Johnson . . . . . . . . . . . . . . 393,843,955 5,646,878 566,319 *Lois D. Juliber . . . . . . . . . . . . . . . . . . 389,240,130 10,312,669 504,353 *Lakshmi N. Mittal . . . . . . . . . . . . . . . 306,121,981 92,822,384 1,112,787 *James J. Schiro . . . . . . . . . . . . . . . . 393,834,365 5,652,578 570,209 *Ruth J. Simmons . . . . . . . . . . . . . . . 395,389,257 4,110,867 557,028 *Ratification of Appointment of
Independent Registered PublicAccounting Firm . . . . . . . . . . . . . . 395,390,645 4,136,962 529,545 *
Advisory Vote to Approve ExecutiveCompensation . . . . . . . . . . . . . . . . 389,367,961 8,404,183 2,285,008 *
Shareholder Proposal RegardingCumulative Voting . . . . . . . . . . . . . 97,057,123 238,879,898 971,486 63,148,645
Shareholder Proposal RegardingSimple Majority Vote . . . . . . . . . . . 252,805,076 82,985,939 1,117,492 63,148,645
Shareholder Proposal to Amend By-Laws to Provide for a BoardCommittee on U.S. EconomicSecurity . . . . . . . . . . . . . . . . . . . . . 6,715,464 323,145,941 7,047,102 63,148,645
Shareholder Proposal RegardingPolitical Contributions . . . . . . . . . . 74,858,483 198,421,668 63,628,356 63,148,645
* Not applicable
143

Item 6: Exhibits
Exhibits:
10.1 Letter, dated May 12, 2009, from The Goldman Sachs Group, Inc. to Mr. James J. Schiro.
12.1 Statement re: Computation of Ratios of Earnings to Fixed Charges and Ratios of Earnings toCombined Fixed Charges and Preferred Stock Dividends.
15.1 Letter re: Unaudited Interim Financial Information.
31.1 Rule 13a-14(a) Certifications.
32.1 Section 1350 Certifications.
101 Interactive data files pursuant to Rule 405 of Regulation S-T: (i) the Condensed ConsolidatedStatements of Earnings for the three and six months ended June 26, 2009 and May 30, 2008,(ii) the Condensed Consolidated Statements of Financial Condition as of June 26, 2009 andNovember 28, 2008, (iii) the Condensed Consolidated Statements of Changes inShareholders’ Equity for the six months ended June 26, 2009 and year endedNovember 28, 2008, (iv) Condensed Consolidated Statements of Cash Flows for the sixmonths ended June 26, 2009 and May 30, 2008, (v) Condensed Consolidated Statements ofComprehensive Income for the three and six months ended June 26, 2009 and May 30, 2008and (vi) the notes to the Condensed Consolidated Financial Statements, tagged as blocksof text.*
* As provided in Rule 406T of Regulation S-T, this information is furnished and not filed for purposes of Sections 11 and 12 of theSecurities Act of 1933 and Section 18 of the Securities Exchange Act of 1934.
144

SIGNATURES
Pursuant to the requirements of the Securities Exchange Act of 1934, the registrant has dulycaused this report to be signed on its behalf by the undersigned thereunto duly authorized.
THE GOLDMAN SACHS GROUP, INC.
By: /s/ DAVID A. VINIAR
Name: David A. ViniarTitle: Chief Financial Officer
By: /s/ SARAH E. SMITH
Name: Sarah E. SmithTitle: Principal Accounting Officer
Date: August 4, 2009
145

EXHIBIT 10.1
May 12, 2009
James J. Schiro Zurich Financial Services Mythenquai 2 8022 Zurich Switzerland
Dear James:
We are all very pleased that you have become a member of our Board of Directors as of May 8, 2009.
This letter sets forth the terms of your compensation as a non-management director for fiscal 2009, which terms will remain in effect unless and until modified by the Board.
1. Prorated Fiscal 2009 Compensation. Your prorated fiscal 2009 compensation is as follows:
Fiscal 2009 Annual Retainer:
$50,000 (prorated from $75,000, to be converted into fully vested restricted stock units1 (“RSUs”))
Fiscal 2009 Annual Grant:
The Annual Grant amount will be determined by the Board at the end of the fiscal year. In the first year, we typically make the Annual Grant in RSUs. Thereafter, the Annual Grant typically is paid in RSUs, fully vested options, or a combination of RSUs and fully vested options at each director’s prior year election.
1 A restricted stock unit constitutes an unfunded, unsecured promise to deliver a share of The Goldman Sachs Group, Inc. (“GS Inc.”) common stock on a predetermined date.

James J. Schiro May 12, 2009 Page Two
2. Terms of RSUs. The number of RSUs granted to you for fiscal 2009 will be calculated using the same method as that used for determining grants to employees for fiscal 2009 year-end RSUs. All RSUs granted as non-management director compensation currently provide for delivery of GS Inc. shares on the last business day of May in the calendar year following the calendar year in which a director ceases to be a director of GS Inc.
3. Timing of Awards. The Annual Grant and Annual Retainer awards will be granted to you on the same date as fiscal year-end equity awards for fiscal 2009 are granted to employees of GS Inc. and its affiliates who are subject to Section 16 of the U.S. Securities Exchange Act of 1934.
Sincerely, /s/ LLOYD C. BLANKFEIN
Lloyd C. Blankfein

EXHIBIT 12.1
THE GOLDMAN SACHS GROUP, INC. and SUBSIDIARIES
COMPUTATION OF RATIOS OF EARNINGS TO FIXED CHARGES AND RATIOS OF EARNINGS TO COMBINED FIXED CHARGES AND PREFERRED STOCK DIVIDENDS
Six Months Ended June Year Ended November 2009 2008 2007 2006 2005
($ in millions) Net earnings $ 5,249 $ 2,322 $11,599 $ 9,537 $ 5,626 Add:
Provision for taxes 2,409 14 6,005 5,023 2,647 Portion of rents representative of an interest
factor 73 146 137 135 119 Interest expense on all indebtedness 3,883 31,357 41,981 31,688 18,153
Pre-tax earnings, as adjusted $11,614 $33,839 $59,722 $46,383 $26,545
Fixed charges(1):
Portion of rents representative of an interest factor $ 73 $ 146 $ 137 $ 135 $ 119
Interest expense on all indebtedness 3,921 31,444 42,051 31,755 18,161
Total fixed charges $ 3,994 $31,590 $42,188 $31,890 $18,280
Preferred stock dividend requirements 1,273 283 291 212 25
Total combined fixed charges and preferred stock
dividends $ 5,267 $31,873 $42,479 $32,102 $18,305
Ratio of earnings to fixed charges 2.91x 1.07x 1.42x 1.45x 1.45x
Ratio of earnings to combined fixed charges and
preferred stock dividends 2.21x 1.06x 1.41x 1.44x 1.45x
(1) Fixed charges include capitalized interest of $38 million, $87 million, $70 million, $67 million and $8 million as of June 2009, November 2008, November 2007, November 2006 and November 2005, respectively.

EXHIBIT 15.1
August 4, 2009
Securities and Exchange Commission 100 F Street N.E. Washington, D.C. 20549
Commissioners:
We are aware that our report dated August 4, 2009 on our review of the condensed consolidated statement of financial condition of The Goldman Sachs Group, Inc. and subsidiaries (the Company) as of June 26, 2009, the related condensed consolidated statements of earnings for the three and six months ended June 26, 2009 and May 30, 2008, the condensed consolidated statement of changes in shareholders’ equity for the six months ended June 26, 2009, the condensed consolidated statements of cash flows for the six months ended June 26, 2009 and May 30, 2008, and the condensed consolidated statements of comprehensive income for the three and six months ended June 26, 2009 and May 30, 2008 included in the Company’s quarterly report on Form 10-Q for the quarter ended June 26, 2009 is incorporated by reference in the registration statements referred to above. Pursuant to Rule 436(c) under the Securities Act of 1933, such report should not be considered a part of such registration statements, and is not a report within the meaning of Sections 7 and 11 of that Act.
Very truly yours,
/s/ PRICEWATERHOUSECOOPERS, LLP
Re: The Goldman Sachs Group, Inc. Registration Statements on Form S-8 (No. 333-80839) (No. 333-42068) (No. 333-106430) (No. 333-120802) Registration Statements on Form S-3 (No. 333-49958) (No. 333-74006) (No. 333-101093) (No. 333-110371) (No. 333-112367) (No. 333-122977) (No. 333-128461) (No. 333-130074) (No. 333-154173) (No. 333-159143)

EXHIBIT 31.1
CERTIFICATIONS
I, Lloyd C. Blankfein, certify that:
1. I have reviewed this Quarterly Report on Form 10-Q for the quarter ended June 26, 2009 of The Goldman Sachs Group, Inc.;
2. Based on my knowledge, this report does not contain any untrue statement of a material fact or omit to state a material fact necessary to make the statements made, in light of the circumstances under which such statements were made, not misleading with respect to the period covered by this report;
3. Based on my knowledge, the financial statements, and other financial information included in this report, fairly present in all material respects the financial condition, results of operations and cash flows of the registrant as of, and for, the periods presented in this report;
4. The registrant’s other certifying officer(s) and I are responsible for establishing and maintaining disclosure controls and procedures (as defined in Exchange Act Rules 13a-15(e) and 15d-15(e)) and internal control over financial reporting (as defined in Exchange Act Rules 13a-15(f) and 15d-15(f)) for the registrant and have:
(a) Designed such disclosure controls and procedures, or caused such disclosure controls and procedures to be designed under our supervision, to ensure that material information relating to the registrant, including its consolidated subsidiaries, is made known to us by others within those entities, particularly during the period in which this report is being prepared;
(b) Designed such internal control over financial reporting, or caused such internal control over financial reporting to be designed under our supervision, to provide reasonable assurance regarding the reliability of financial reporting and the preparation of financial statements for external purposes in accordance with generally accepted accounting principles;
(c) Evaluated the effectiveness of the registrant’s disclosure controls and procedures and presented in this report our conclusions about the effectiveness of the disclosure controls and procedures, as of the end of the period covered by this report based on such evaluation; and
(d) Disclosed in this report any change in the registrant’s internal control over financial reporting that occurred during the registrant’s most recent fiscal quarter (the registrant’s fourth fiscal quarter in the case of an annual report) that has materially affected, or is reasonably likely to materially affect, the registrant’s internal control over financial reporting; and
5. The registrant’s other certifying officer(s) and I have disclosed, based on our most recent evaluation of internal control over financial reporting, to the registrant’s auditors and the audit committee of the registrant’s board of directors (or persons performing the equivalent functions):
(a) All significant deficiencies and material weaknesses in the design or operation of internal control over financial reporting which are reasonably likely to adversely affect the registrant’s ability to record, process, summarize and report financial information; and
(b) Any fraud, whether or not material, that involves management or other employees who have a significant role in the registrant’s internal control over financial reporting.
Date: August 4, 2009
/s/ LLOYD C. BLANKFEIN Name: Lloyd C. Blankfein Title: Chief Executive Officer

CERTIFICATIONS
I, David A. Viniar, certify that:
1. I have reviewed this Quarterly Report on Form 10-Q for the quarter ended June 26, 2009 of The Goldman Sachs Group, Inc.;
2. Based on my knowledge, this report does not contain any untrue statement of a material fact or omit to state a material fact necessary to make the statements made, in light of the circumstances under which such statements were made, not misleading with respect to the period covered by this report;
3. Based on my knowledge, the financial statements, and other financial information included in this report, fairly present in all material respects the financial condition, results of operations and cash flows of the registrant as of, and for, the periods presented in this report;
4. The registrant’s other certifying officer(s) and I are responsible for establishing and maintaining disclosure controls and procedures (as defined in Exchange Act Rules 13a-15(e) and 15d-15(e)) and internal control over financial reporting (as defined in Exchange Act Rules 13a-15(f) and 15d-15(f)) for the registrant and have:
(a) Designed such disclosure controls and procedures, or caused such disclosure controls and procedures to be designed under our supervision, to ensure that material information relating to the registrant, including its consolidated subsidiaries, is made known to us by others within those entities, particularly during the period in which this report is being prepared;
(b) Designed such internal control over financial reporting, or caused such internal control over financial reporting to be designed under our supervision, to provide reasonable assurance regarding the reliability of financial reporting and the preparation of financial statements for external purposes in accordance with generally accepted accounting principles;
(c) Evaluated the effectiveness of the registrant’s disclosure controls and procedures and presented in this report our conclusions about the effectiveness of the disclosure controls and procedures, as of the end of the period covered by this report based on such evaluation; and
(d) Disclosed in this report any change in the registrant’s internal control over financial reporting that occurred during the registrant’s most recent fiscal quarter (the registrant’s fourth fiscal quarter in the case of an annual report) that has materially affected, or is reasonably likely to materially affect, the registrant’s internal control over financial reporting; and
5. The registrant’s other certifying officer(s) and I have disclosed, based on our most recent evaluation of internal control over financial reporting, to the registrant’s auditors and the audit committee of the registrant’s board of directors (or persons performing the equivalent functions):
(a) All significant deficiencies and material weaknesses in the design or operation of internal control over financial reporting which are reasonably likely to adversely affect the registrant’s ability to record, process, summarize and report financial information; and
(b) Any fraud, whether or not material, that involves management or other employees who have a significant role in the registrant’s internal control over financial reporting.
Date: August 4, 2009
/s/ DAVID A. VINIAR Name: David A. Viniar Title: Chief Financial Officer

EXHIBIT 32.1
Certification
Pursuant to 18 U.S.C. § 1350, the undersigned officer of The Goldman Sachs Group, Inc. (the “Company”) hereby certifies that the Company’s Quarterly Report on Form 10-Q for the quarter ended June 26, 2009 (the “Report”) fully complies with the requirements of Section 13(a) or 15(d), as applicable, of the Securities Exchange Act of 1934 and that the information contained in the Report fairly presents, in all material respects, the financial condition and results of operations of the Company.
The foregoing certification is being furnished solely pursuant to 18 U.S.C. § 1350 and is not being filed as part of the Report or as a separate disclosure document.
Dated: August 4, 2009 /s/ LLOYD C. BLANKFEIN Name: Lloyd C. Blankfein Title: Chief Executive Officer

Certification
Pursuant to 18 U.S.C. § 1350, the undersigned officer of The Goldman Sachs Group, Inc. (the “Company”) hereby certifies that the Company’s Quarterly Report on Form 10-Q for the quarter ended June 26, 2009 (the “Report”) fully complies with the requirements of Section 13(a) or 15(d), as applicable, of the Securities Exchange Act of 1934 and that the information contained in the Report fairly presents, in all material respects, the financial condition and results of operations of the Company.
The foregoing certification is being furnished solely pursuant to 18 U.S.C. § 1350 and is not being filed as part of the Report or as a separate disclosure document.
Dated: August 4, 2009 /s/ DAVID A. VINIAR Name: David A. Viniar Title: Chief Financial Officer