
report.pdf - Goldman Sachs
28
REFLATION RISK ISSUE 97| April 1, 2021| 9:10 PM EDT Global Macro Research Investors should consider this report as only a single factor in making their investment decision. For Reg AC certification and other important disclosures, see the Disclosure Appendix, or go to www.gs.com/research/hedge.html. The Goldman Sachs Group, Inc. Amid the accelerating economic recovery, the largest US fiscal stimulus outside of war times and the Fed’s commitment to keep monetary policy very easy until higher inflation is sustained have stoked concerns that the US economy is set to overheat, sending US inflation expectations and bond yields higher. Whether these concerns are warranted, and the implications for bond yields and broader markets, is Top of Mind. Given that GS growth forecasts are at the high end among forecasters, our Fed views are at the dovish end, and yet we don’t expect problematic overheating, we put our own Jan Hatzius in the hot seat. He explains that much more slack in the US economy than suggested by official estimates means that even our high growth forecasts will generate only moderate inflationary pressures, which will lessen as this year’s temporary fiscal stimulus fades. We then ask Dominic Wilson and other GS strategists what this means for bond yields (a moderate rise from here) and other assets (more upside for cyclical assets), and how to protect portfolios from reflationary risks. The market today probably still isn’t fully reflecting the above-consensus growth that we expect in the coming months… This suggests more near-term upside for cyclical assets. - Dominic Wilson “ There's no question that the amount of stimulus set to hit the US economy this year is unprecedented outside of major wars… but the economy is coming out of a deep hole and there’s still a large gap to fill between actual and potential output… so [the stimulus] should not result in substantial overheating. - Jan Hatzius “ INTERVIEWS WITH: Jan Hatzius, Head of Global Investment Research and Chief Economist, Goldman Sachs Dominic Wilson, Senior Markets Advisor in Global Investment Research, Goldman Sachs THE RISK OF OVERHEATING David Mericle, GS US Economics Research Q&A ON RECENT MOVES IN BOND YIELDS Praveen Korapaty, GS Markets Research EQUITIES AND REFLATION Peter Oppenheimer, GS Equity Strategy Research THE INEQUALITY-INFLATION TRADEOFF Jeff Currie, GS Commodities Research ASSET (RE)ALLOCATION AMID REFLATION Christian Mueller-Glissmann, GS Multi-Asset Strategy Research INFLATION: WARS VS. PANDEMICS Kevin Daly, GS CEEMEA Economics Research WHAT’S INSIDE of Allison Nathan | [email protected] ...AND MORE All major commodity bull markets and inflationary episodes have been invariably tied to redistributional, or populist, policies that have reduced income and wealth inequality. - Jeff Currie TOP MIND Jenny Grimberg | [email protected] Gabriel Lipton Galbraith | [email protected] Note: The following is a redacted version of the original report published April 1, 2021 [28 pgs].
-
Upload
khangminh22 -
Category
Documents
-
view
2 -
download
0
Transcript of report.pdf - Goldman Sachs

REFLATION RISK
ISSUE 97| April 1, 2021| 9:10 PM EDT&&&&&&S&&&&&
&&&& & & & &
Global Macro Research
Investors should consider this report as only a single factor in making their investment decision. For Reg AC certification and other important disclosures, see the Disclosure Appendix, or go to www.gs.com/research/hedge.html.
The Goldman Sachs Group, Inc.
Amid the accelerating economic recovery, the largest US fiscal stimulus outside of war times and the Fed’s commitment to keep monetary policy very easy until higher inflation is sustained have stoked concerns that the US economy is set to overheat, sending US inflation expectations and bond yields higher. Whether these concerns are warranted, and the implications for bond yields and broader markets, is Top of Mind. Given that GS growth forecasts are at the high end among forecasters, our Fed views are at the dovish end, and yet we don’t expect problematic overheating, we put our own Jan Hatzius in the hot seat. He explains that much more slack in the US economy than suggested by official estimates means that even our high
growth forecasts will generate only moderate inflationary pressures, which will lessen as this year’s temporary fiscal stimulus fades. We then ask Dominic Wilson and other GS strategists what this means for bond yields (a moderate rise from here) and other assets (more upside for cyclical assets), and how to protect portfolios from reflationary risks.
The market today probably still isn’t fully reflecting the above-consensus growth that we expect in the coming months… This suggests more near-term upside for cyclical assets.
- Dominic Wilson
“There's no question that the amount of stimulus set to hit the US economy this year is unprecedented outside of major wars… but the economy is coming out of a deep hole and there’s still a large gap to fill between actual and potential output… so [the stimulus] should not result in substantial overheating.
- Jan Hatzius
“
INTERVIEWS WITH: Jan Hatzius, Head of Global Investment Research and Chief Economist, Goldman Sachs
Dominic Wilson, Senior Markets Advisor in Global Investment Research, Goldman Sachs
THE RISK OF OVERHEATING David Mericle, GS US Economics Research
Q&A ON RECENT MOVES IN BOND YIELDS Praveen Korapaty, GS Markets Research
EQUITIES AND REFLATION Peter Oppenheimer, GS Equity Strategy Research
THE INEQUALITY-INFLATION TRADEOFF Jeff Currie, GS Commodities Research
ASSET (RE)ALLOCATION AMID REFLATION Christian Mueller-Glissmann, GS Multi-Asset Strategy Research
INFLATION: WARS VS. PANDEMICS Kevin Daly, GS CEEMEA Economics Research
WHAT’S INSIDE
of
Allison Nathan | [email protected]
...AND MORE
All major commodity bull markets and inflationary episodes have been invariably tied to redistributional, or populist, policies that have reduced income and wealth inequality.
- Jeff Currie
TOP MIND
Jenny Grimberg | [email protected] Gabriel Lipton Galbraith | [email protected]
Note: The following is a redacted version of the original report published April 1, 2021 [28 pgs].
El
Goldman Sachs Global Investment Research 2
Top of Mind Issue 97
Macro news and views
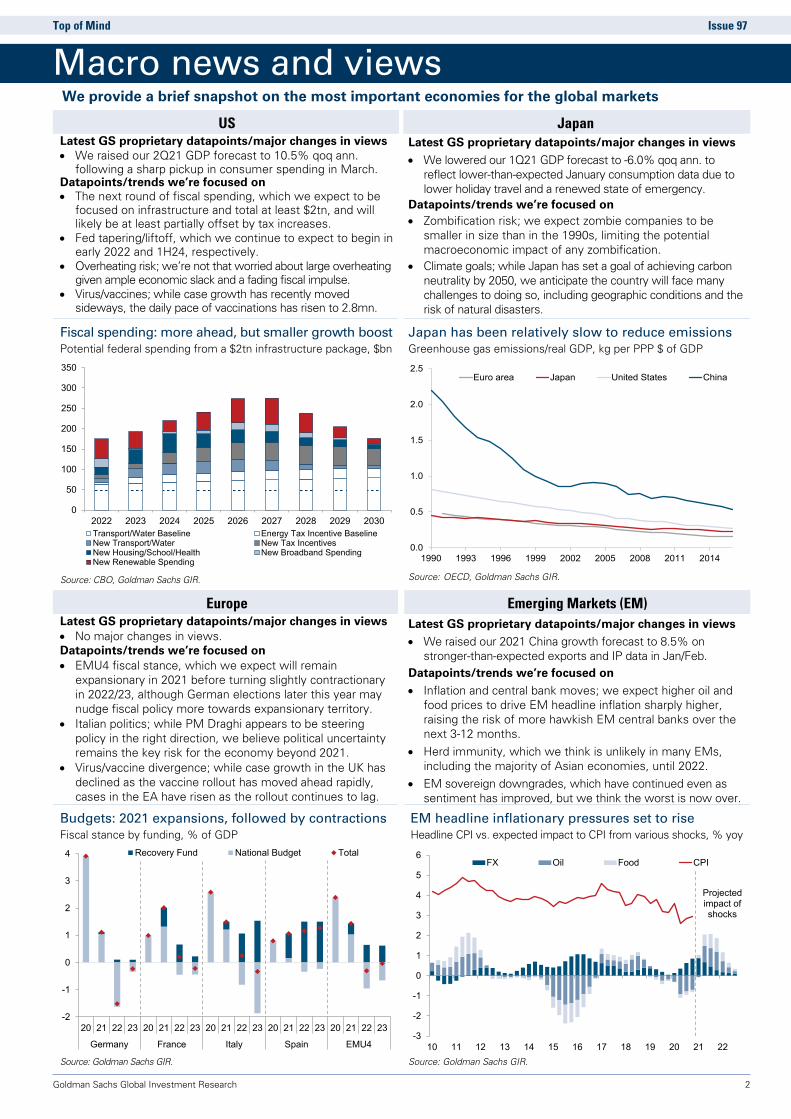
US Japan Latest GS proprietary datapoints/major changes in views • We raised our 2Q21 GDP forecast to 10.5% qoq ann.
following a sharp pickup in consumer spending in March.Datapoints/trends we’re focused on • The next round of fiscal spending, which we expect to be
focused on infrastructure and total at least $2tn, and willlikely be at least partially offset by tax increases.
• Fed tapering/liftoff, which we continue to expect to begin inearly 2022 and 1H24, respectively.
• Overheating risk; we’re not that worried about large overheating given ample economic slack and a fading fiscal impulse.
• Virus/vaccines; while case growth has recently movedsideways, the daily pace of vaccinations has risen to 2.8mn.
Latest GS proprietary datapoints/major changes in views • We lowered our 1Q21 GDP forecast to -6.0% qoq ann. to
reflect lower-than-expected January consumption data due tolower holiday travel and a renewed state of emergency.
Datapoints/trends we’re focused on • Zombification risk; we expect zombie companies to be
smaller in size than in the 1990s, limiting the potentialmacroeconomic impact of any zombification.
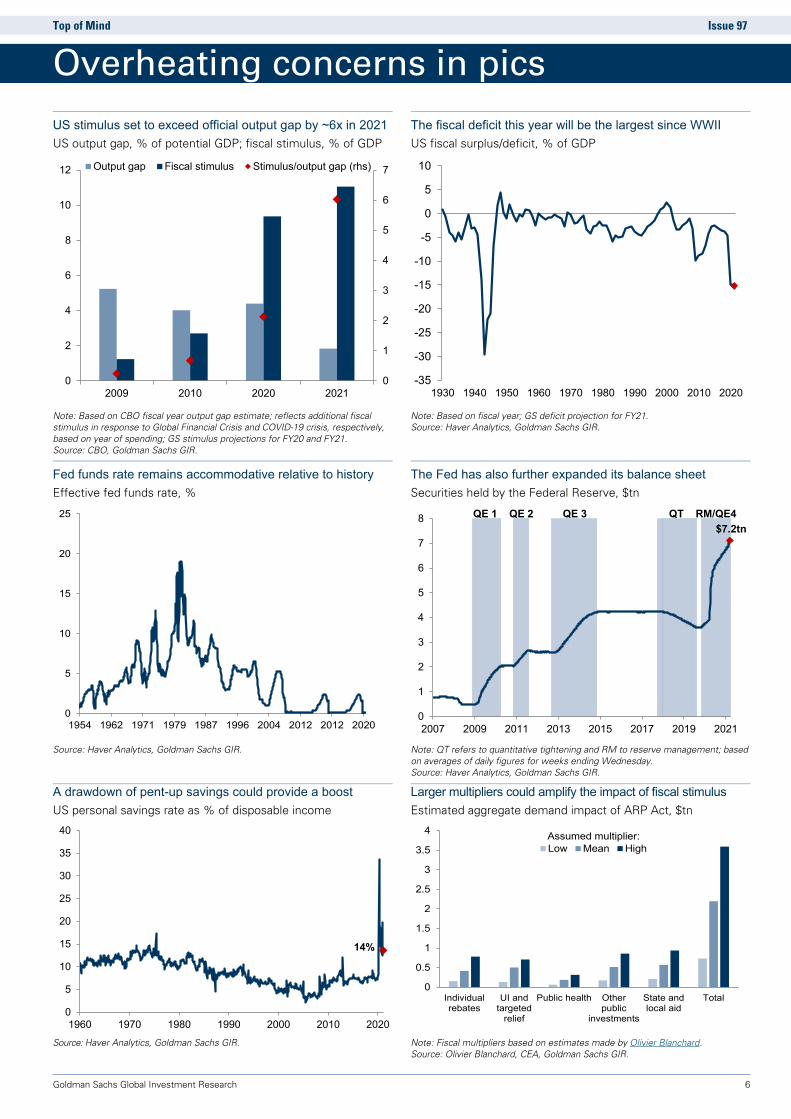
• Climate goals; while Japan has set a goal of achieving carbonneutrality by 2050, we anticipate the country will face manychallenges to doing so, including geographic conditions and therisk of natural disasters.
Fiscal spending: more ahead, but smaller growth boost Potential federal spending from a $2tn infrastructure package, $bn
Japan has been relatively slow to reduce emissions Greenhouse gas emissions/real GDP, kg per PPP $ of GDP
Source: CBO, Goldman Sachs GIR. Source: OECD, Goldman Sachs GIR.
Europe Emerging Markets (EM) Latest GS proprietary datapoints/major changes in views • No major changes in views.Datapoints/trends we’re focused on• EMU4 fiscal stance, which we expect will remain
expansionary in 2021 before turning slightly contractionaryin 2022/23, although German elections later this year maynudge fiscal policy more towards expansionary territory.
• Italian politics; while PM Draghi appears to be steeringpolicy in the right direction, we believe political uncertaintyremains the key risk for the economy beyond 2021.
• Virus/vaccine divergence; while case growth in the UK hasdeclined as the vaccine rollout has moved ahead rapidly,cases in the EA have risen as the rollout continues to lag.
Latest GS proprietary datapoints/major changes in views • We raised our 2021 China growth forecast to 8.5% on
stronger-than-expected exports and IP data in Jan/Feb.Datapoints/trends we’re focused on • Inflation and central bank moves; we expect higher oil and
food prices to drive EM headline inflation sharply higher,raising the risk of more hawkish EM central banks over thenext 3-12 months.
• Herd immunity, which we think is unlikely in many EMs,including the majority of Asian economies, until 2022.
• EM sovereign downgrades, which have continued even assentiment has improved, but we think the worst is now over.
Budgets: 2021 expansions, followed by contractions Fiscal stance by funding, % of GDP
EM headline inflationary pressures set to rise Headline CPI vs. expected impact to CPI from various shocks, % yoy
Source: Goldman Sachs GIR. Source: Goldman Sachs GIR.
0
50
100
150
200
250
300
350
2022 2023 2024 2025 2026 2027 2028 2029 2030Transport/Water Baseline Energy Tax Incentive BaselineNew Transport/Water New Tax IncentivesNew Housing/School/Health New Broadband SpendingNew Renewable Spending
0.0
0.5
1.0
1.5
2.0
2.5
1990 1993 1996 1999 2002 2005 2008 2011 2014
Euro area Japan United States China
-2
-1
0
1
2
3
4
20 21 22 23 20 21 22 23 20 21 22 23 20 21 22 23 20 21 22 23
Germany France Italy Spain EMU4
Recovery Fund National Budget Total
-3
-2
-1
0
1
2
3
4
5
6
10 11 12 13 14 15 16 17 18 19 20 21 22
FX Oil Food CPI
Projected impact of shocks
We provide a brief snapshot on the most important economies for the global markets

El
Goldman Sachs Global Investment Research 3
Top of Mind Issue 97
Amid the accelerating economic recovery from the COVID-19 recession, the largest US fiscal stimulus outside of war times as well as the Fed’s commitment under its new Average Inflation Targeting (AIT) framework to keep monetary policy very easy until higher inflation is actually sustained have stoked concerns that the US economy is set to substantially overheat. Indeed, the likes of former Treasury Secretary Larry Summers and former Chief IMF economist Olivier Blanchard have recently voiced such concerns (see pg. 6), which they and others argue, to varying degrees, could ignite inflationary pressures similar to the late 1960/70s, or force the Fed to tighten policy more quickly than it currently expects, potentially strangling growth and jeopardizing the still nascent recovery.
Partly in response to these concerns, US bond yields have jumped as inflation expectations have risen and as the market has pulled forward its expectations for Fed liftoff from 2Q24 at the beginning of the year to 1Q23 currently. And investors have begun to grapple with what the prospect of higher bond yields means for other assets. Whether the current overheating worries are warranted, and the implications for bond yields, and markets more broadly, is Top of Mind.
We first speak with Jan Hatzius, GS Head of Global Investment Research and Chief Economist, who pushes back on the view that US fiscal support far exceeds what’s needed to aid the recovery and will lead to substantial overheating. So what are those who are more worried missing? According to Hatzius, two things: one, the amount of slack in the economy is likely much higher than official estimates suggest, so even GS’s above-consensus growth forecasts will leave the economy operating only slightly above potential, and, two, fiscal stimulus, and, in turn, growth, is set to decline sharply beyond this year, even assuming another sizable investment-oriented package is enacted, which will limit any overshoot of potential output.
As a result, despite GS’s strong growth views, Hatzius expects inflation to rise only modestly above the Fed’s target over the coming months, before moderating somewhat (see pg. 7 for an overview of GS inflation views). These views, he says, are consistent with the Fed starting to taper asset purchases in early 2022, and hiking rates in 1H24—later than the market is currently pricing. And he sees risks to the timing of liftoff as balanced, or even skewed to the later side. That said, once the hiking cycle begins, risks are skewed toward a steeper hiking path, in his view.
David Mericle, GS Chief US Economist, then discusses the risks around our US growth, Fed, and inflation views that would generate more overheating than we currently expect. But if the economy did substantially overheat, he thinks the bigger worry than the Fed allowing an inflationary spiral would be the high cost of slowing things down given the historical track record of sparking recessions in these situations.
So what does this all suggest for bond yields? Praveen Korapaty, GS Chief US Interest Rates Strategist, answers the most-asked questions about the bond yield outlook. He argues that after a brief pause, yields will move higher—on the order
of an additional 20bps for UST 10y yields—to end the year at 1.9%, driven by the growth acceleration that GS economists expect. In his view, an overshoot is certainly possible, but probably unsustainable, and a further steepening in nominal, and especially, real yield curves is likely from here.
We then turn to Dominic Wilson, GS Senior Markets Advisor within Global Investment Research, to discuss how the current situation in bond markets differs from past episodes of volatility, such as the 2013 Taper Tantrum, and what that means for asset performance. He underscores that the 2013 episode resulted from a major Fed policy shock, whereas the recent (and so far much smaller) repricing has mainly stemmed from progress on the economic recovery, which risk assets have generally digested more easily. But he finds that markets today still aren’t fully reflecting the above-consensus growth that we expect in the coming months. So he recommends investors stay exposed to cyclical parts of the market in the near term, like cyclical equities and commodities, and avoid bonds, bond proxies and rate-sensitive growth assets.
Peter Oppenheimer, GS Chief Equity Portfolio Strategist, digs deeper into the differences between past reflationary cycles and the potential one ahead, which he argues suggest a broadly supportive environment for equities, but a shift in market leadership toward Value and Cyclical stocks, as well as regional markets with greater exposure to them, like Europe and Japan.
And Jeff Currie, GS Global Head of Commodities Research, explains why the current reflationary backdrop sets the stage for a commodity bull market, though perhaps not for the reasons commonly believed. He makes the case that the defining driver behind past commodity bull markets associated with reflationary episodes is expansionary policies focused on redistribution. These populist policies, he says, increase commodity-intensive spending from the large number of low-income households, substantially boosting commodity demand. In his view, it was this dynamic, generated by the War on Poverty in the 1960s—not oil supply shocks—that created the infamous inflation of the 1970s, and even the 2000s supercycle was driven by a wealth redistribution to low-income rural Chinese. Given policymakers’ focus on using expansionary policy to address high income inequality today, he sees a similar bullish period for commodities ahead, and recommends owning commodities as a hedge against broader inflationary risks.
Finally, Christian Mueller-Glissmann, GS Senior Multi-Asset Strategist, reiterates the benefit of a pro-cyclical asset allocation orientation given the moderate reflation acceleration that we expect. But he agrees with Currie that the potential for inflation to overshoot—or, conversely, disappoint rising inflation expectations—warrants hedging portfolios against these tail risks. And options still look like an attractive way to do this.
Allison Nathan, Editor
Email: [email protected] Tel: 212-357-7504 Goldman Sachs and Co. LLC
Reflation risk

El
Goldman Sachs Global Investment Research 4
Top of Mind Issue 97
Jan Hatzius is Head of Global Investment Research and Chief Economist at Goldman Sachs. Below, he argues that the risk of substantial economic overheating as the economy reopens remains limited.
Allison Nathan: Economists such as Larry Summers and Olivier Blanchard have recently raised concerns that amid an already emerging economic recovery, very expansive US fiscal policy on top of easy monetary policy risks sharply higher inflation. Our 2021 US growth forecast of 7.2% (on an annual-average basis) is one of the
highest among forecasters, so do you share these concerns?
Jan Hatzius: Not really. There's no question that the amount of stimulus set to hit the US economy this year is unprecedented outside of major wars. Together with the reopening of the economy, this is likely to produce very strong growth of about 8% on a Q4/Q4 basis in 2021. But the economy is coming out of a deep hole and there’s still a large gap to fill between actual and potential output. We estimate that US output was about 6% below potential as of late last year, which is only slightly smaller than the difference between our 8% growth forecast and our 1.75% estimate of potential growth. So even the above-consensus recovery that we expect should leave output only slightly above potential. That would suggest inflation of slightly, but not dramatically, more than 2%. Obviously, there is significant uncertainty around all of these estimates, so I think we need to be humble and willing to change our minds if the evidence changes. But at this point I agree with Treasury Secretary Janet Yellen that the American Rescue Plan Act (ARPA) should bring the economy roughly back to full employment but should not result in substantial overheating.
Allison Nathan: What accounts for the differences between your views and those who worry more about overheating?
Jan Hatzius: There are two main differences. First, Summers and Blanchard rely on the estimate of the Congressional Budget Office (CBO) that GDP was only 3% below potential in late 2020, while our estimate is twice as large. Output gaps are admittedly hard to measure, but we think there are strong reasons to believe that the CBO estimate is too small. Their figures show the economy running above potential in the two years before the pandemic, which is hard to square with the fact that inflation was, on average, below the Fed's target. Also, employment is still down 6% from the pre-pandemic level. Normally, this would indicate an output gap of significantly more than 6% because swings in output typically exceed swings in employment by a factor of about two, a relationship known as Okun’s law. While Okun’s law doesn’t hold under current circumstances because weakness is so concentrated in the economy’s most labor-intensive sectors, the 6% employment drop nevertheless makes an output gap of just 3% highly implausible.
Second, overheating concerns focus on the comparison of the output gap with the exceptionally large amount of fiscal support, which we estimate at 11% of GDP in fiscal 2021. That
is undeniably a very large and positive impulse. But much of it is temporary and concentrated in one-off payments and programs, such as longer and higher unemployment benefits that are eventually set to expire and will also scale down naturally as the labor market improves. Next year, we forecast that fiscal support will diminish to just 5% of GDP. This is despite our assumption of further fiscal packages focused on infrastructure and other spending that total over $3tn, because those packages will be spread over a ten-year period and will also be partly offset by higher taxes. We expect the implied 6pp drop in fiscal support to lead to much slower growth in 2022, especially in the second half of the year. This should limit any overshoot of potential output.
Allison Nathan: What about the argument that multiplier effects will amplify the impact of the stimulus, exacerbating overheating risks?
Jan Hatzius: I don’t find the discussion of multipliers very illuminating in the context of a one-off spending increase because the multiplier is a longer-run concept. So, for example, if we assume that an increase in transfer payments has a multiplier of one—meaning that it will prompt an increase in GDP equivalent to the initial increase in government spending—that doesn't mean we expect people to spend every extra dollar they receive. Rather, we assume that they will spend some of it, which will eventually generate more employment and wage growth, so that the boost to the level of GDP in two or three years' time ultimately reaches the size of the original stimulus. But this assumes that transfer payments are sustained at their higher level—otherwise the positive multiplier effects of the increase in transfer payments in year 1 will be offset by the negative multiplier effects of the decline in transfer payments in year 2.
Even abstracting from this issue, some parts of the ARPA are unlikely to have large effects on spending. The $350 million for state and local aid, for example, is probably bigger than what is needed to support state and local governments, whose tax receipts have come in better than expected in recent months. The state and local aid might still make sense because it will allow these governments to replenish their rainy-day funds, reducing the risk of a downturn in state and local spending in response to a future shock. But the immediate stimulative impact is unlikely to be large.
Allison Nathan: Does the shift in the Fed’s framework towards Average Inflation Targeting (AIT) increase the risk that the Fed falls behind the curve and we end up with an inflation overshoot?
Jan Hatzius: Yes, but it’s important to remember that the Fed now wants to overshoot 2% temporarily in order to ensure that inflation averages 2% over the cycle as a whole. This desire largely stems from the Fed’s discovery that treating their 2% inflation target as an effective ceiling, or at least as a symmetric target, has delivered modestly below-target inflation on average. So while 2% remains the official inflation target, in
Interview with Jan Hatzius

El
Goldman Sachs Global Investment Research 5
Top of Mind Issue 97
practice this has probably increased by roughly three to four tenths, implying modestly higher inflation outcomes over time. In line with this shift, Fed officials have stated that they want to see clear evidence of realized inflation and the achievement of maximum employment before withdrawing stimulus in this cycle.
It’s natural to worry that this shift toward greater inflation tolerance could lead to a repeat of the inflationary experience of the 1960s/70s, prior to the more pre-emptive inflation-fighting approach of Fed Chair Paul Volcker in the early 1980s. But this comparison misses the greater role that well-anchored inflation expectations play today in keeping inflation low and stable. Admittedly, we can't be 100% sure that inflation expectations will always remain anchored. But much better measurement of long-run inflation expectations today via consumer inflation surveys, forecaster inflation surveys, and inflation-linked government bonds suggest that any material shift in the market’s expectations of longer-term inflation dynamics would be quickly detected earlier and thus much less likely to sneak up on policymakers in the same way as in the 1960s/70s.
And if the economy did look like it was starting to overheat seriously—whether that is because of even stronger growth than we expect, a smaller output gap than we estimate, or other unforeseen developments—the Fed would respond. At this point, our Fed call remains relatively dovish; we expect tapering to begin in early 2022 and rate liftoff in 1H24. But we're not dug into those forecasts. If inflation surprises sharply to the upside on a sustained basis, the Fed wouldn't just sit back and watch—they would react.
Allison Nathan: At the other end of the spectrum, is there a point at which the Fed would become concerned that higher bond yields were becoming too restrictive, prompting them to act on the dovish side?
Jan Hatzius: Yes, but Chair Powell has stated that they look at broad financial conditions rather than just interest rates to assess this risk. And financial conditions as reflected by our GS Financial Conditions Index (GSFCI) remain near the all-time easiest levels ever. So that's the key metric to watch, but we're still quite far from a point that would cause the Fed concern.
Allison Nathan: So how do you view the risks around our relatively dovish Fed liftoff call?
Jan Hatzius: In terms of the timing of liftoff, I think the risks to our 1H24 forecast—which is about a year later than market pricing—are fairly balanced or perhaps even tilted to the later side. That’s because the Fed’s guidance that they will taper QE first limits the extent to which rate hikes can be pulled forward. Our baseline forecast for the start of tapering is 1Q22, and the earliest plausible date is 4Q21. The FOMC has said that the tapering process will resemble 2013-2014, which we interpret as eight $15bn steps over a year. This means that early 2023 is the first realistic point for a rate hike, even in an upside inflation scenario. This is about a year before our baseline liftoff forecast. By contrast, a disruption of the current strong
economic recovery could reasonably delay rate hikes by one, two or even more years.
In terms of the level of rates, though, risks are probably skewed to the higher side. While it's not our baseline, the Fed’s willingness to let inflation run higher for longer might require earlier and more frequent hikes than what we assume in our baseline. So this potential need for the Fed to “catch up” does introduce some risk of a significantly steeper rate hiking path than we, as well as the market, expect.
Allison Nathan: Are risks to the terminal Fed funds rate skewed to the upside, then?
Jan Hatzius: The Fed's estimate of the longer-term funds rate is 2.5%, and they’ve said they want to wait until the economy is at full employment before hiking rates, which suggests a peak rate in this cycle perhaps slightly higher than this estimate. So a 2.5-3.0% terminal funds rate seems reasonable to me, which is only modestly above current market pricing.
But I see upside risk to this 2.5-3.0% terminal rate based on the shifting attitudes toward fiscal policy. The world seems less concerned about running larger budget deficits than was the case a decade or two ago. Just as a matter of accounting, larger public sector deficits require larger private sector surpluses, and this could mean that real rates have to rise in order to entice the private sector to save more. I'm struck by the fact that even with the substantial selloff in bond markets over the past few months, 5y5y TIPS yields are still in the 0.3%-0.4% range, which is actually slightly below the average of the five years prior to the pandemic. At a minimum, it seems likely that we will get back to the pre-pandemic average, and there's some risk that we will move meaningfully higher. This all suggests a strong curve steepening bias from here; in the short-term, the market is probably overestimating how quickly the Fed moves to rate hikes, but risks are skewed to the upside at the longer-end.
Allison Nathan: Beyond the US, are any countries or regions at risk of overheating?
Jan Hatzius: I don’t think so. In fact, risks are clearly skewed in the other direction in most economies because they’re generally starting from a bigger economic hole and have enacted less stimulus than the US. Specifically, real GDP was down by 2.4% year-on-year as of late 2020 in the US, compared to 5% in Europe and 8% in the UK. And while fiscal authorities in Europe, Japan, and other advanced and emerging economies provided substantial support to their economies in 2020, the incremental fiscal impulse in 2021 is less positive than in the US. As a result, even our above-consensus growth forecasts in many of these economies suggest that they will remain relatively far away from potential output and full employment in 2022, and maybe even in 2023. So it's difficult to see any kind of overheating scenario. From a policy perspective, this suggests that while the amount of support in the US seems about right, in Europe and other places, a lot more could and should be done to support the economic recovery.
El
Goldman Sachs Global Investment Research 6
Top of Mind Issue 97
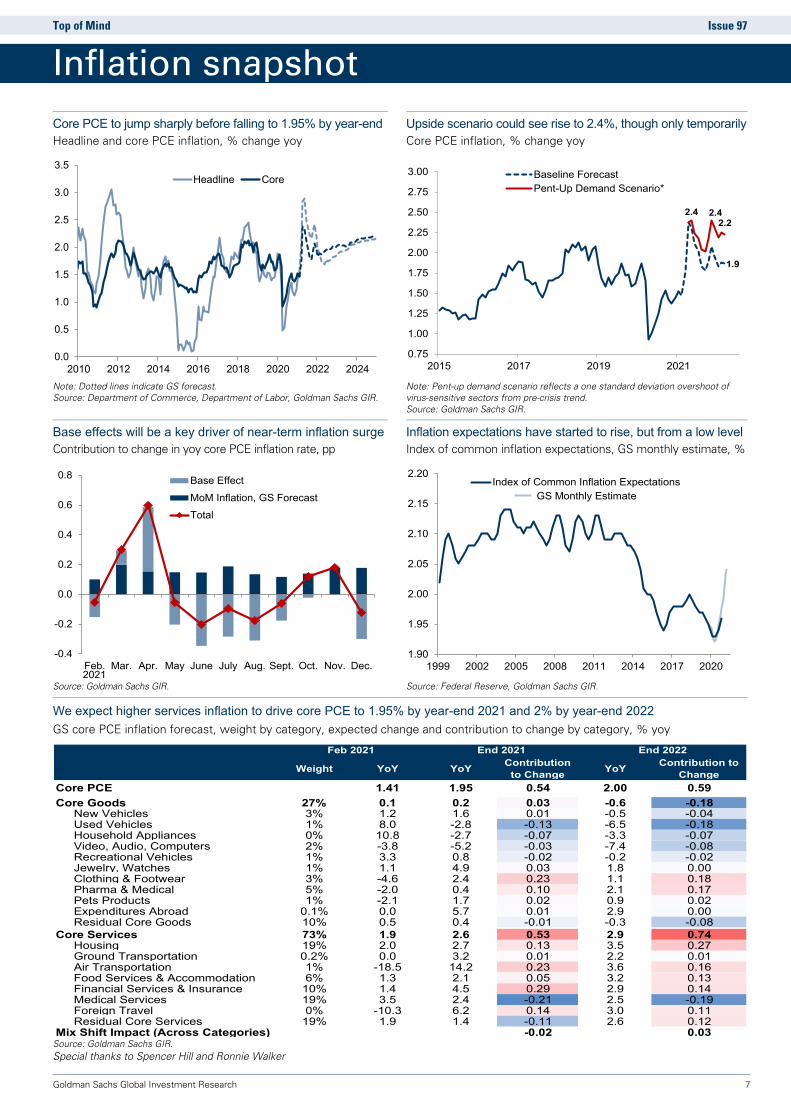
US stimulus set to exceed official output gap by ~6x in 2021 US output gap, % of potential GDP; fiscal stimulus, % of GDP
The fiscal deficit this year will be the largest since WWII US fiscal surplus/deficit, % of GDP
Note: Based on CBO fiscal year output gap estimate; reflects additional fiscal stimulus in response to Global Financial Crisis and COVID-19 crisis, respectively, based on year of spending; GS stimulus projections for FY20 and FY21. Source: CBO, Goldman Sachs GIR.
Note: Based on fiscal year; GS deficit projection for FY21. Source: Haver Analytics, Goldman Sachs GIR.
Fed funds rate remains accommodative relative to history Effective fed funds rate, %
The Fed has also further expanded its balance sheet Securities held by the Federal Reserve, $tn
Source: Haver Analytics, Goldman Sachs GIR. Note: QT refers to quantitative tightening and RM to reserve management; based
on averages of daily figures for weeks ending Wednesday. Source: Haver Analytics, Goldman Sachs GIR.
A drawdown of pent-up savings could provide a boost US personal savings rate as % of disposable income
Larger multipliers could amplify the impact of fiscal stimulus Estimated aggregate demand impact of ARP Act, $tn
Source: Haver Analytics, Goldman Sachs GIR. Note: Fiscal multipliers based on estimates made by Olivier Blanchard.
Source: Olivier Blanchard, CEA, Goldman Sachs GIR.
0
1
2
3
4
5
6
7
0
2
4
6
8
10
12
2009 2010 2020 2021
Output gap Fiscal stimulus Stimulus/output gap (rhs)
-35
-30
-25
-20
-15
-10
-5
0
5
10
1930 1940 1950 1960 1970 1980 1990 2000 2010 2020
0
5
10
15
20
25
1954 1962 1971 1979 1987 1996 2004 2012 2012 2020
$7.2tn
0
1
2
3
4
5
6
7
8
2007 2009 2011 2013 2015 2017 2019 2021
QE 1 QE 2 QE 3 QT RM/QE4
14%
0
5
10
15
20
25
30
35
40
1960 1970 1980 1990 2000 2010 2020
0
0.5
1
1.5
2
2.5
3
3.5
4
Individualrebates
UI andtargeted
relief
Public health Otherpublic
investments
State andlocal aid
Total
Low Mean HighAssumed multiplier:
Overheating concerns in pics
El
Goldman Sachs Global Investment Research 7
Top of Mind Issue 97
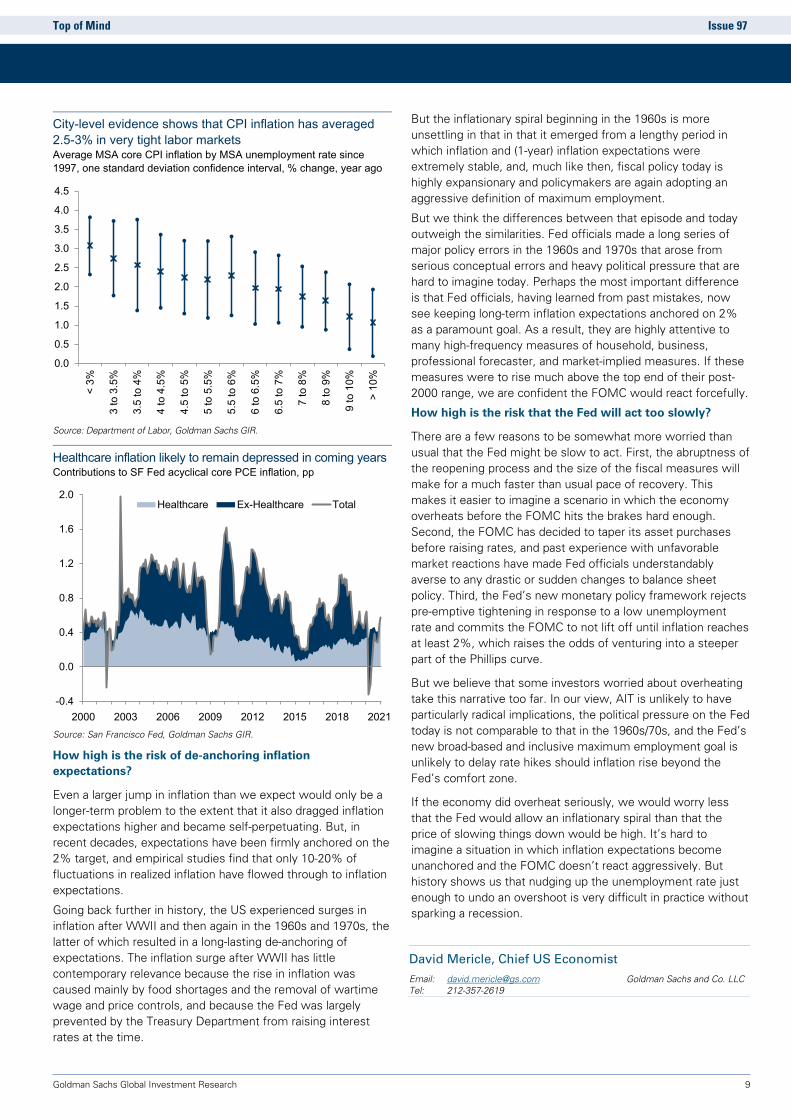
Core PCE to jump sharply before falling to 1.95% by year-end Headline and core PCE inflation, % change yoy
Upside scenario could see rise to 2.4%, though only temporarily Core PCE inflation, % change yoy
Note: Dotted lines indicate GS forecast. Source: Department of Commerce, Department of Labor, Goldman Sachs GIR.
Note: Pent-up demand scenario reflects a one standard deviation overshoot of virus-sensitive sectors from pre-crisis trend. Source: Goldman Sachs GIR.
Base effects will be a key driver of near-term inflation surge Contribution to change in yoy core PCE inflation rate, pp
Inflation expectations have started to rise, but from a low level Index of common inflation expectations, GS monthly estimate, %
Source: Goldman Sachs GIR. Source: Federal Reserve, Goldman Sachs GIR.
We expect higher services inflation to drive core PCE to 1.95% by year-end 2021 and 2% by year-end 2022 GS core PCE inflation forecast, weight by category, expected change and contribution to change by category, % yoy
Source: Goldman Sachs GIR. Special thanks to Spencer Hill and Ronnie Walker
0.0
0.5
1.0
1.5
2.0
2.5
3.0
3.5
2010 2012 2014 2016 2018 2020 2022 2024
Headline Core
1.9
2.4 2.42.2
0.75
1.00
1.25
1.50
1.75
2.00
2.25
2.50
2.75
3.00
2015 2017 2019 2021
Baseline ForecastPent-Up Demand Scenario*
-0.4
-0.2
0.0
0.2
0.4
0.6
0.8
Feb. Mar. Apr. May June July Aug. Sept. Oct. Nov. Dec.
Base EffectMoM Inflation, GS ForecastTotal
2021
1.90
1.95
2.00
2.05
2.10
2.15
2.20
1999 2002 2005 2008 2011 2014 2017 2020
Index of Common Inflation ExpectationsGS Monthly Estimate
Weight YoY YoY Contribution to Change YoY Contribution to
ChangeCore PCE 1.41 1.95 0.54 2.00 0.59Core Goods 27% 0.1 0.2 0.03 -0.6 -0.18
New Vehicles 3% 1.2 1.6 0.01 -0.5 -0.04Used Vehicles 1% 8.0 -2.8 -0.13 -6.5 -0.18Household Appliances 0% 10.8 -2.7 -0.07 -3.3 -0.07Video, Audio, Computers 2% -3.8 -5.2 -0.03 -7.4 -0.08Recreational Vehicles 1% 3.3 0.8 -0.02 -0.2 -0.02Jewelry, Watches 1% 1.1 4.9 0.03 1.8 0.00Clothing & Footwear 3% -4.6 2.4 0.23 1.1 0.18Pharma & Medical 5% -2.0 0.4 0.10 2.1 0.17Pets Products 1% -2.1 1.7 0.02 0.9 0.02Expenditures Abroad 0.1% 0.0 5.7 0.01 2.9 0.00Residual Core Goods 10% 0.5 0.4 -0.01 -0.3 -0.08
Core Services 73% 1.9 2.6 0.53 2.9 0.74Housing 19% 2.0 2.7 0.13 3.5 0.27Ground Transportation 0.2% 0.0 3.2 0.01 2.2 0.01Air Transportation 1% -18.5 14.2 0.23 3.6 0.16Food Services & Accommodation 6% 1.3 2.1 0.05 3.2 0.13Financial Services & Insurance 10% 1.4 4.5 0.29 2.9 0.14Medical Services 19% 3.5 2.4 -0.21 2.5 -0.19Foreign Travel 0% -10.3 6.2 0.14 3.0 0.11Residual Core Services 19% 1.9 1.4 -0.11 2.6 0.12
Mix Shift Impact (Across Categories) -0.02 0.03
End 2021 End 2022Feb 2021
Inflation snapshot

El
Goldman Sachs Global Investment Research 8
Top of Mind Issue 97
David Mericle discusses the risks around his US growth, Fed, and inflation views that would generate more overheating than we currently expect
Market-implied inflation expectations have drifted substantially higher in recent months amid a debate among economists and policymakers about the risk that the economy could seriously overheat and inflation could rise well beyond the moderately above 2% level that Fed officials are targeting under their new Average Inflation Targeting (AIT) framework. But we think our optimistic growth and unemployment forecasts are still consistent with relatively tame inflation over the next several years. With this in mind, we answer four key questions about the risk of overheating.
How high is the risk of overfilling the output gap?
Concerns about overheating center around the combined size of the $900bn Consolidated Appropriations Act passed in December and the $1.9tn American Rescue Plan Act (ARPA) passed in March. This legislation will provide a huge boost to household disposable income that more than fills the hole in private income during the first half of this year. This is already contributing to a surge in spending in March and will also further swell the pent-up savings that households have accumulated over the course of the pandemic.
The fiscal support this year will come at a time when the economy is also benefiting from other powerful tailwinds, including the reopening of high-contact consumer services that will largely restore normal spending opportunities, spending of pent-up savings, and the boost from easy financial conditions. We estimate that the combination of these impulses will boost the level of GDP by roughly an incremental 6% in 2021 on top of an end-2020 starting point that was already benefitting from the residual effects of the CARES Act. This boost on top of the economy’s potential growth pace implies a GDP growth rate roughly consistent with our 8% 2021 Q4/Q4 forecast. Starting in mid-2022, however, the combined impulse fades and becomes a drag on growth.
Reopening, fiscal support, pent-up savings likely to deliver a growth boost big enough to close output gap by 4Q21 Effect on level of real GDP, %
Source: Goldman Sachs GIR.
Our forecast implies an overshoot of our estimate of potential GDP of about 1% next year. But the uncertainty is greater than usual, both because of the lack of modern precedents for the reopening and pent-up savings effects, and because of uncertainty about future fiscal measures. Greater fiscal support and a higher rate of spending out of pent-up savings than we expect could each plausibly add as much as 1% to the level of GDP. If both risks materialized, the level of GDP could rise above potential by as much as 3%. We also see upside risks from a quicker pace of reopening or faster spending of stimulus money, but both would likely mean a short-term burst of spending that pulls demand forward, rather than a steady multi-year boost to the level of demand.
We expect our growth forecast to translate to a further rapid decline in the unemployment rate to 4% at end-2021, 3.5% at end-2022, 3.2% at end-2023, and 3.1% at end-2024. But these upside scenarios could push the unemployment rate below 3%, which would present upside risk to inflation.
How high is the risk of a larger inflation overshoot?
We expect this sharp decline in the unemployment rate to translate to core PCE inflation of 2.1-2.2% by 2023-2024, above the peak seen last cycle but roughly the rate that Fed officials would like to see before liftoff under their new policy framework. Our view that inflation is likely to remain fairly tame takes on board two lessons from last cycle. First, the Phillips curve that captures the inverse relationship between unemployment and inflation is alive but not very steep, and that is particularly true of the PCE index. And, second, health care legislation passed under President Obama was significantly disinflationary, and that legislation remains in place and might even expand under President Biden.
We do think that a more substantial overshoot of another 0.25-0.5pp is possible, as we’ve found that inflation is often more uncertain than intuition suggests, consensus inflation forecast errors have been surprisingly large, and local-level data show that moderately above-target inflation has actually been fairly common in extremely tight labor markets. The bottom line is that inflation is both cyclical and hard to forecast at multiyear horizons, and we would therefore not be shocked by a moderate upside surprise to our forecast.
But the much larger overshoots that some commentators have suggested are less realistic, in our view, for two reasons. First, only 40% of the core PCE index shows consistent cyclicality, meaning that cyclical categories would have to run at high levels of inflation to cause a large overshoot in the overall core measure. And second, healthcare inflation is likely to remain depressed by policy pressures over the coming years.
-5
0
5
10
15
20
Q4 Q1 Q2 Q3 Q4 Q1 Q2 Q3 Q42020 2021 2022
Reopening Fiscal SupportPent-up Savings Easy Financial ConditionsForbearance Cliff International TradeTotal
The risk of overheating
El
Goldman Sachs Global Investment Research 9
Top of Mind Issue 97
City-level evidence shows that CPI inflation has averaged 2.5-3% in very tight labor markets Average MSA core CPI inflation by MSA unemployment rate since 1997, one standard deviation confidence interval, % change, year ago
Source: Department of Labor, Goldman Sachs GIR.
Healthcare inflation likely to remain depressed in coming years Contributions to SF Fed acyclical core PCE inflation, pp
Source: San Francisco Fed, Goldman Sachs GIR.
How high is the risk of de-anchoring inflation expectations?
Even a larger jump in inflation than we expect would only be a longer-term problem to the extent that it also dragged inflation expectations higher and became self-perpetuating. But, in recent decades, expectations have been firmly anchored on the 2% target, and empirical studies find that only 10-20% of fluctuations in realized inflation have flowed through to inflation expectations.
Going back further in history, the US experienced surges in inflation after WWII and then again in the 1960s and 1970s, the latter of which resulted in a long-lasting de-anchoring of expectations. The inflation surge after WWII has little contemporary relevance because the rise in inflation was caused mainly by food shortages and the removal of wartime wage and price controls, and because the Fed was largely prevented by the Treasury Department from raising interest rates at the time.
But the inflationary spiral beginning in the 1960s is more unsettling in that in that it emerged from a lengthy period in which inflation and (1-year) inflation expectations were extremely stable, and, much like then, fiscal policy today is highly expansionary and policymakers are again adopting an aggressive definition of maximum employment.
But we think the differences between that episode and today outweigh the similarities. Fed officials made a long series of major policy errors in the 1960s and 1970s that arose from serious conceptual errors and heavy political pressure that are hard to imagine today. Perhaps the most important difference is that Fed officials, having learned from past mistakes, now see keeping long-term inflation expectations anchored on 2% as a paramount goal. As a result, they are highly attentive to many high-frequency measures of household, business, professional forecaster, and market-implied measures. If these measures were to rise much above the top end of their post-2000 range, we are confident the FOMC would react forcefully.
How high is the risk that the Fed will act too slowly?
There are a few reasons to be somewhat more worried than usual that the Fed might be slow to act. First, the abruptness of the reopening process and the size of the fiscal measures will make for a much faster than usual pace of recovery. This makes it easier to imagine a scenario in which the economy overheats before the FOMC hits the brakes hard enough. Second, the FOMC has decided to taper its asset purchases before raising rates, and past experience with unfavorable market reactions have made Fed officials understandably averse to any drastic or sudden changes to balance sheet policy. Third, the Fed’s new monetary policy framework rejects pre-emptive tightening in response to a low unemployment rate and commits the FOMC to not lift off until inflation reaches at least 2%, which raises the odds of venturing into a steeper part of the Phillips curve.
But we believe that some investors worried about overheating take this narrative too far. In our view, AIT is unlikely to have particularly radical implications, the political pressure on the Fed today is not comparable to that in the 1960s/70s, and the Fed’s new broad-based and inclusive maximum employment goal is unlikely to delay rate hikes should inflation rise beyond the Fed’s comfort zone.
If the economy did overheat seriously, we would worry less that the Fed would allow an inflationary spiral than that the price of slowing things down would be high. It’s hard to imagine a situation in which inflation expectations become unanchored and the FOMC doesn’t react aggressively. But history shows us that nudging up the unemployment rate just enough to undo an overshoot is very difficult in practice without sparking a recession.
David Mericle, Chief US Economist
Email: [email protected] Goldman Sachs and Co. LLC Tel: 212-357-2619
0.0
0.5
1.0
1.5
2.0
2.5
3.0
3.5
4.0
4.5
< 3
%
3 to
3.5
%
3.5
to 4
%
4 to
4.5
%
4.5
to 5
%
5 to
5.5
%
5.5
to 6
%
6 to
6.5
%
6.5
to 7
%
7 to
8%
8 to
9%
9 to
10%
>10
%
-0.4
0.0
0.4
0.8
1.2
1.6
2.0
2000 2003 2006 2009 2012 2015 2018 2021
Healthcare Ex-Healthcare Total
El
Goldman Sachs Global Investment Research 10
Top of Mind Issue 97
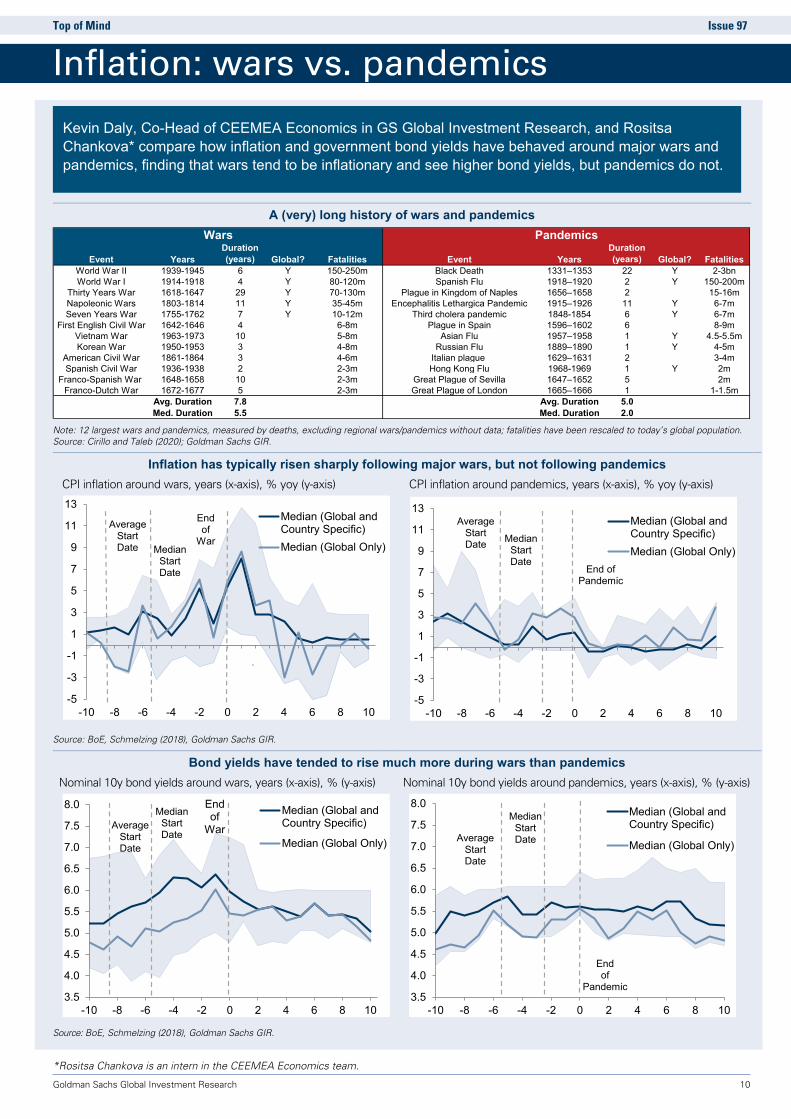
Inflation: wars vs. pandemics
A (very) long history of wars and pandemics
Note: 12 largest wars and pandemics, measured by deaths, excluding regional wars/pandemics without data; fatalities have been rescaled to today’s global population. Source: Cirillo and Taleb (2020); Goldman Sachs GIR.
Inflation has typically risen sharply following major wars, but not following pandemics CPI inflation around wars, years (x-axis), % yoy (y-axis) CPI inflation around pandemics, years (x-axis), % yoy (y-axis)
Source: BoE, Schmelzing (2018), Goldman Sachs GIR.
Bond yields have tended to rise much more during wars than pandemics Nominal 10y bond yields around wars, years (x-axis), % (y-axis) Nominal 10y bond yields around pandemics, years (x-axis), % (y-axis)
Source: BoE, Schmelzing (2018), Goldman Sachs GIR.
*Rositsa Chankova is an intern in the CEEMEA Economics team.
Event YearsDuration (years) Global? Fatalities Event Years
Duration (years) Global? Fatalities
World War II 1939-1945 6 Y 150-250m Black Death 1331–1353 22 Y 2-3bnWorld War I 1914-1918 4 Y 80-120m Spanish Flu 1918–1920 2 Y 150-200m
Thirty Years War 1618-1647 29 Y 70-130m Plague in Kingdom of Naples 1656–1658 2 15-16mNapoleonic Wars 1803-1814 11 Y 35-45m Encephalitis Lethargica Pandemic 1915–1926 11 Y 6-7mSeven Years War 1755-1762 7 Y 10-12m Third cholera pandemic 1848-1854 6 Y 6-7m
First English Civil War 1642-1646 4 6-8m Plague in Spain 1596–1602 6 8-9mVietnam War 1963-1973 10 5-8m Asian Flu 1957–1958 1 Y 4.5-5.5mKorean War 1950-1953 3 4-8m Russian Flu 1889–1890 1 Y 4-5m
American Civil War 1861-1864 3 4-6m Italian plague 1629–1631 2 3-4mSpanish Civil War 1936-1938 2 2-3m Hong Kong Flu 1968-1969 1 Y 2m
Franco-Spanish War 1648-1658 10 2-3m Great Plague of Sevilla 1647–1652 5 2mFranco-Dutch War 1672-1677 5 2-3m Great Plague of London 1665–1666 1 1-1.5m
Avg. Duration 7.8 Avg. Duration 5.0Med. Duration 5.5 Med. Duration 2.0
Wars Pandemics
-5
-3
-1
1
3
5
7
9
11
13
-10 -8 -6 -4 -2 0 2 4 6 8 10
Median (Global andCountry Specific)Median (Global Only)
End of
WarMedian
StartDate
Average Start Date
-5
-3
-1
1
3
5
7
9
11
13
-10 -8 -6 -4 -2 0 2 4 6 8 10
Median (Global andCountry Specific)Median (Global Only)
End of Pandemic
Median StartDate
Average Start Date
3.5
4.0
4.5
5.0
5.5
6.0
6.5
7.0
7.5
8.0
-10 -8 -6 -4 -2 0 2 4 6 8 10
Median (Global andCountry Specific)
Median (Global Only)
End of
WarMedian
StartDate
Average Start Date
3.5
4.0
4.5
5.0
5.5
6.0
6.5
7.0
7.5
8.0
-10 -8 -6 -4 -2 0 2 4 6 8 10
Median (Global andCountry Specific)
Median (Global Only)
End of
Pandemic
Median StartDateAverage
Start Date
Kevin Daly, Co-Head of CEEMEA Economics in GS Global Investment Research, and Rositsa Chankova* compare how inflation and government bond yields have behaved around major wars and pandemics, finding that wars tend to be inflationary and see higher bond yields, but pandemics do not.

El
Goldman Sachs Global Investment Research 11
Top of Mind Issue 97
Source: Bureau of Economic Analysis, Bureau of Labor Statistics, Federal Reserve, Goldman Sachs GIR.
All about inflation
Measuring inflation: CPI vs. PCE
Consumer price index (CPI). One of the two main inflation measures, the CPI is a monthly measure of the average change over time in the prices paid by urban consumers—who represent ~93% of the total US population—for a market basket of consumer goods and services. The market basket is developed from expenditure information provided by families and individuals on their purchases, and is updated every two years. The CPI is constructed through price data compiled by the Bureau of Labor Statistics.
Personal Consumption Expenditures (PCE) price index. The other of the two monthly main inflation measures, the PCE measures price changes for a basket of goods that evolves on a monthly basis as household expenditure patterns shift. Because consumers tend to shift their spending over time to buy products with relatively lower inflation, the PCE tends to report lower inflation than the CPI. So the PCE likely provides a closer representation of actual price changes in the economy, which is one reason the Fed prefers to use it instead of the CPI. The PCE price index is produced by the Bureau of Economic Analysis.
Pricing inflation: Survey and market-based indicators
Survey-based inflation expectations. Measures of inflation expectations based on surveys of the general public or professional forecasters and economists conducted by various institutions. Popular surveys include the New York Fed Survey of Inflation Expectations, University of Michigan’s Survey of Consumer Attitudes and Behavior, and the Survey of Professional Forecasters.
Market-based inflation expectations. Inflation expectations derived from the prices of financial securities. Two common gauges of market-based inflation expectations are the 10y breakeven inflation rate—calculated by comparing 10y nominal Treasury yields with yields on 10y TIPS—and inflation swaps. Such measures of expectations include a risk premium to compensate investors for inflation uncertainty and may be affected by factors unrelated to changes in expectations.
Treasury Inflation-Protected Securities (TIPS). A type of US government bond that provides protection against inflation. Like US Treasury bonds, TIPS pay interest twice a year at a fixed rate and repay their principal at maturity. However, while the interest rate is fixed, the principal invested in TIPS adjusts with changes in the CPI, increasing with inflation and decreasing with deflation. As a result, TIPS interest payments fluctuate with inflation. Consider an investor who buys a 30y TIPS for $1,000 with an annual coupon of 1%. If CPI inflation in the first year following the investment is 2%, the principal will adjust to $1,020 ($1,000 x 1.02), while the annual interest payment would be $10.20 ($1,020 x 1%). At maturity, the TIPS investor would receive the greater of (a) the inflation-adjusted principal and (b) the original principal.
Breakeven inflation rates. The difference in yield between US Treasury bonds and TIPS of the same maturity. Because US Treasury bonds guarantee a nominal yield and TIPS guarantee a real yield, the breakeven rate should reflect investors’ expectations of the future rate of inflation. If future inflation were to match this rate, holders of regular US Treasury bonds and TIPS would, in theory, receive the same return and therefore “break even.” In practice, however, breakeven inflation rates reflect more than just inflation expectations. They include risk premia to compensate investors for the uncertainty around the future rate of inflation and can reflect the relatively lower liquidity of the TIPS market compared to the regular Treasury market.
Inflation swaps. Contracts in which one party agrees to swap fixed payments for floating payments tied to the inflation rate, for a given notional amount and period of time. One party (the “payer”) makes a payment that varies according to the actual rate of inflation over the contract period. The other party (the “receiver”) makes a fixed payment based on the expected rate of inflation plus some inflation risk premium. The fixed rate is known as the inflation swap rate, and provides information about the expected rate of inflation at the time the contract matures. Inflation swaps are used by market participants to hedge inflation risk and to speculate on the course of inflation, and by market observers more broadly to infer inflation expectations.
Inflation forwards. Derived from breakeven inflation rates or inflation swap rates with different maturities, these are usually quoted as AyBy, reflecting expected inflation over a period of A years beginning B years from now. For example, the 3y7y forward rate—in the belly of the curve—reflects average expected inflation over a three-year period beginning seven years into the future.
The Fed’s inflation framework: A shift to AIT
Flexible average inflation targeting (AIT). Adopted by the Fed at the 2020 Jackson Hole Symposium, under AIT the FOMC will aim for inflation moderately above 2 percent following periods when inflation has run persistently below 2 percent in order to average 2 percent over time. This framework marks a departure from the previous “let bygones be bygones” approach of policy not responding to past deviations of inflation from target, though Fed Chair Powell has emphasized that the FOMC will remain flexible and will not be tied to a particular mathematical formula.

El
Goldman Sachs Global Investment Research 12
Top of Mind Issue 97
Dominic Wilson is Senior Markets Advisor in Global Investment Research at Goldman Sachs. Below, he discusses the recent repricing in US bond markets and the spillover effects on other asset classes.
Allison Nathan: What drove the initial repricing in bond markets?
Dominic Wilson: The initial bond repricing at its heart was mostly a reflection of progress in the economic recovery. Towards the end of 2020, the economy was coming out of a big hole, and vaccine announcements led the market to upgrade its growth
expectations sharply, but bond yields barely moved; Fed anchoring and the deeply distressed starting point of the economy was enough to keep a lid on yields even as growth improved. But vaccine progress has moved the economy closer to a point of substantial growth acceleration, creating dry tinder for the bond markets to finally start to reflect rising growth and inflation pressures. The spark that likely lit the tinder was the massive fiscal stimulus that was passed in December and even more so in March, which, unlike the earlier rounds of stimulus, hasn’t been implemented in the face of an immediate emergency, but rather amid an emerging economic recovery. Investors looked at the mix of all that and said, we’ve basically left the bond market alone as we’ve repriced the growth outlook in many other places, and now we’re seeing a more normal recovery profile that demands yields move higher.
Allison Nathan: What do you make of the jump in bond yields post the recent FOMC meeting? Is the market too concerned about Fed tightening?
Dominic Wilson: Relative to our expectations that temporary inflation pressures will recede as the strong pace of growth we expect in coming months slows once we’ve passed the peak fiscal impulse—and then will only build back slowly—the front-end of the curve looks like it’s pricing in too many rate hikes. But the market is grappling with two challenges regarding the Fed here. The first relates to its reaction function, meaning whether the Fed will stick to the commitment they’ve made under their new Average Inflation Targeting (AIT) regime not to tighten policy until they actually see the whites of the eyes of inflation, and see them for some time. Given the Fed’s historical track record of tightening earlier than that, the market wants reassurance that the Fed won’t walk away from that commitment in the face of economic normalization. But I don't think that will be the problem. The Fed has done a pretty careful and credible job of pushing back on that concern, and understands the risks of abandoning its commitment.
The second challenge is the more difficult one: whether the Fed’s forecasts for growth and inflation that suggest tightening is still some way off will prove correct. In other words, while the Fed can provide the market reassurance about their reaction function, they can’t provide the same reassurance about the economic outlook. The reality is that we’re probably entering a period of unprecedentedly rapid economic growth at the same time that fiscal and monetary policy remain exceptionally expansionary. This leaves the growth and inflation trajectories highly uncertain, and if growth and inflation are high
enough, the Fed will raise rates. So the Fed can communicate their forecast to markets, but the market can still worry that the Fed is not bullish enough, and as a result wants to price in the risk that the Fed hikes before they think they will based on their current forecasts. This source of pressure and concern will likely only rise until the economy is on the other side of the growth and inflation bump we expect.
Allison Nathan: Do moves in other asset classes post the bond market repricing make sense?
Dominic Wilson: Directionally, yes. Equities, commodities and the more cyclical parts of the market have moved broadly higher, the Dollar has faced some upward pressure, and EMs have struggled a bit, which is what we would have generally expected. But the magnitude has been a bit more surprising. In particular, some of the moves in parts of the rate-sensitive space, EM and the NASDAQ have been larger than we would’ve predicted. That’s likely in part a reflection of the fact that investors have built up overweight positions for a long time in areas that have benefited from the multi-decade secular downward trend in real rates, namely long-duration growth assets like tech stocks. These assets have substantially outperformed in recent years, and remain heavily subscribed, owing both to that trend as well as the favorable bottom-up fundamentals of these stocks. But the rates move is now challenging that kind of positioning, forcing rotations towards more conventional cyclical parts of the market, which has amplified moves in these assets.
Allison Nathan: Are concerns that we could be on the brink of a sharp move in bond yields, perhaps similar to the 2013 Taper Tantrum, warranted?
Dominic Wilson: It’s still early days, but we’re really only just approaching the lower limit of the real yield moves we saw in the 2013 episode, or even the more moderate bond yield volatility that occurred in 2015/16. Beyond size, I see important differences between the current episode and these historical ones. The 2013 Taper Tantrum was a major policy shock. Fed Chair Ben Bernanke surprised the market with early talk of tapering, causing the market to pull the whole Fed profile forward. That sort of Fed communication error, or surprise, has not happened today. And while the global growth backdrop was also broadly supportive in 2013, as it is now, growth in China was slowing. As a result, the China complex, EMs more broadly and commodity currencies were pummeled. There’s no China slowdown dragging EMs down today in the same way.
Allison Nathan: So are EMs less vulnerable to rising rates today?
Dominic Wilson: 2013 was a particularly bad year for EMs because they were coming off a long period of outperformance, and then the slowdown in China and a real rate shock added to that fragility. Today, the structural backdrop for EMs looks better; they aren’t suffering from similar levels of overvaluation or balance sheet issues, China growth is quite solid, and the commodity outlook is more positive. That said,
Interview with Dominic Wilson

El
Goldman Sachs Global Investment Research 13
Top of Mind Issue 97
rising rates and the prospect of Fed hawkishness still pose a greater challenge for the EM complex than for many other places, so there’s still somewhat of a tug-of-war between these positive and negative forces, even if EMs look less vulnerable now than they did in past periods of rising rates.
One way that EMs are more vulnerable today is that the carry cushion in EM assets, and particularly in EM currencies, is lower than in the past. Historically, rates in traditionally high-yielding countries like Brazil were much higher than in the US, so even if US rates were rising, EM yields still looked attractive. Given that most EM central banks have also cut rates deeply during the pandemic, this isn’t the case today. However, partly as a result of that, as well as of rising inflationary pressures, EM central banks seem more inclined to move early to withdraw some of the extraordinary recent stimulus. Brazil, Turkey and Russia have already done so, and more EMs are likely to follow. Proactively hiking rates into these pressures should act as a stabilizing force for EM bond markets and currencies, especially as central banks raise policy rates from levels that could be viewed as inappropriately stimulative. And, in any case, it’s better to tighten earlier than to wait until market pressure forces a more dramatic central bank response, though recent developments in Turkey show that it can be tough for central banks to stick to this course of action.
Allison Nathan: How should investors be positioned today?
Dominic Wilson: It depends on the time horizon. The market has already priced a decent amount of growth improvement ahead. But if we map how the market has priced cyclical recoveries relative to growth views historically, the market today probably still isn’t fully reflecting the above-consensus growth that we expect in the coming months, and it likely won’t fully reflect it until the much stronger growth actually prints. This suggests more upside for cyclical assets in the near term, so we recommend remaining long cyclical equities, as well as commodities outside of gold. At the same time, we expect rates to continue to move moderately higher—consistent with our strong growth views (see pgs. 14-15). So investors should stay away from assets that are sensitive to higher rates, like the growth-sensitive NASDAQ, and should avoid exposure to bond and bond proxies, if not outright short them. From a global perspective, non-US DMs like Japan and Europe that have more exposure to the areas we expect to do well in this environment generally look more appealing than EMs and perhaps also the broad US market.
But beyond the next few months, the investing environment may shift. Again, we forecast that after a very strong near-term bump in growth, the overall pace of growth will remain high but slow down steadily over time and that inflation pressures will prove transient. If that plays out, it will be interesting to see whether the market anchors on the level of growth or on the momentum of growth. It often does the latter, in which case some of the heavily-cyclical trades could lose some luster and some of the rate-sensitive areas that have been underperforming—EM assets, growth stocks and perhaps bonds themselves—may move back into favor.
Allison Nathan: What would make you more concerned about the impact of rates moves on asset performance?
Dominic Wilson: Either a faster or larger move in rates to the upside than we expect would likely prove disruptive to our pro-cyclical views, but over different time horizons. Near term, no matter the driver, any rapid rise in rates—10bp+ in one day or 30bp+ in a month—would likely lead to a patch of wobbliness in the equity market, as we’ve already seen. But past experience suggests that the market only needs rates to stop rising—rather than to reverse—to recover from these episodes. A sustained material increase in rates would likely erode the attractiveness of equities on a more durable basis. While we’re still a long way away from credit and fixed income instruments looking appealing relative to the cash flow yields on equities, a 40-50bp move higher in real yields could start to present an obstacle to equities, both in terms of relative attractiveness to other assets and via the removal of the support to equity valuations that negative real yields have provided.
Allison Nathan: What’s the most underappreciated risk in markets today?
Dominic Wilson: The market seems to be quite concerned about the prospect of higher inflation and the associated implications for portfolios. I worry less about this because if inflation seems at risk of moving too high for too long, the Fed will likely just head this off by raising rates more and earlier.
The risk that the market seems too complacent about is that real rates don’t stay this low forever, and that the terminal rate is actually higher than the 0.5% real rate that prevailed at the end of the last cycle. Many of the factors in the last cycle that made us willing to accept that real rates would remain low are no longer in place. Recall that the last cycle began with a massive private sector deleveraging out of a huge balance sheet problem, followed by public sector austerity within 18 months of recovery. On top of that, Chinese growth shifted downward, the commodity market collapsed, and Europe and then the UK had problems of their own. The Fed then basically began to hike alone, precipitating a large Dollar appreciation. And, amid that challenging environment, a trade war began.
Conditions today look very different. The recovery is much more synchronized, the private sector will likely want to run down the significant savings it’s accumulated over the pandemic once the recovery takes off, the public sector is committed to expansionary policy for longer, and commodities have entered a bull market. The market is slowly waking up to this risk, but to the extent that portfolios are deeply structured around the notion that real rates are going to remain at low levels forever, the potential need to adjust to a materially higher terminal real rate could prove to be a more persistent challenge.

El
Goldman Sachs Global Investment Research 14
Top of Mind Issue 97
Praveen Korapaty expects the US bond selloff to continue after a brief pause, as well as further steepening of the yield curve
Q: The fierce selloff in global bond markets over the past two months appears to be slowing. Is this just a pause amid the onset of a bond bear market, a new period of stability, or the start of a reversal?
A: Since the start of the year, benchmark yields in every major bond market have moved higher. Among G10 economies, countries fall into two groups—one that includes the US, Canada, the UK, Australia and New Zealand, where 10y yields have risen by 60-90bp, and another group that mostly includes countries in continental Europe as well as Japan, where 10y yields have risen by a more modest ~25bp. While these are large moves over a short period of time, they fall well short of the spikes seen during the 2013 US Taper Tantrum or the 2015 German Bund Tantrum. And, unlike those episodes, where the selloff was the result of perceived monetary policy tightening and stretched positioning, we think the current repricing is reflationary in nature, and reflects the strong ongoing economic recovery. While yields have risen well off their lows, it’s worth keeping in mind that, in most cases, those were all-time lows.
G10 yields have moved higher since the beginning of 2021 Year-to-date move in 10y benchmark yields, bp
Source: BBG, Goldman Sachs GIR.
Going forward, after a brief pause, we expect the selloff to continue given our expectation for a strong acceleration in growth, which we believe markets have not yet fully priced in. We forecast year-end yields for 10y US Treasurys and Bunds of 1.9% and 0%, respectively, roughly 20bp and 30bp above current levels, respectively. So how brief a pause do we expect? We believe that most of the repricing will occur in 2Q and 3Q, coinciding with the broader opening of economies. During these two quarters, it is possible that yields exceed our forecasts given the difficulty markets may have in distinguishing between transient and permanent aspects of the economic data, but we would not expect a sizable overshoot to be sustainable.
Q: What caused the initial selloff?
A: In many cases, the exceptionally low level of bond yields following the COVID-19 shock last year suggested the market
was expecting a deep and prolonged recession. As it became clear that was unlikely to be the case, yields readjusted higher. In our view, a few specific factors drove this shift in the market’s outlook. First, despite some hiccups in mass vaccination drives, market and analyst expectations about when a critical herd immunity threshold would be reached in many advanced economies have been brought forward relative to last year. Second, data have generally held up better than feared through the winter months. Third, the twin Democratic wins in Georgia—which gave the party unified control of the federal government—greatly expanded what was possible on the US fiscal front. Expansionary budget proposals also emerged in other regions like the UK. Finally, the starting point for yields in many economies, particularly in Europe, was too low, and so just pricing in a cyclical bounce led to higher yields.
Recent yield repricing reflects the strong economic recovery Year-to-date decomposition of 10y UST yields by macro factor, %
Source: Goldman Sachs GIR.
Q: Along with higher yields, markets also appear to havepulled forward policy rate normalization. Does this makesense given that central banks have indicated that they arelikely to be on hold for a while?
A: If we use 1, 2, or 3y interest rate forwards to gauge howmuch policy rate tightening is priced, across G10 economies,markets do indeed appear to be ahead of our expectations forliftoff. Because most central banks are currently close to theirrespective effective lower bounds, and because forward pricesare expectations over a distribution of outcomes that includescenarios with higher inflation than our base case, we wouldexpect average market prices to reflect some tightening.However, even accounting for this, some hike pricing appearsstretched to us. In the US, for instance, markets are pricingbetween two and three hikes by year-end 2023. The Fed’sMarch dot plot, which shows participants’ expectations of theoptimal policy rate, shows no change in the median of theseexpectations through 2023. And our economists expect liftoff ismost likely to occur in 1H24.
That said, while aggressive, we don’t think market pricing isnecessarily inconsistent with Fed guidance. Fed members haverepeatedly noted that their guidance is outcome-based ratherthan calendar-based, and markets appear to be optimistic aboutachieving persistent above-target inflation in 2023. In otherwords, market hike pricing is internally consistent with market
0
10
20
30
40
50
60
70
80
90
CAD USD NZD AUD GBP NOK SEK DEM CHF JPY
-0.1
0.1
0.3
0.5
0.7
0.9
12/31 1/8 1/18 1/26 2/3 2/11 2/19 3/1 3/9 3/17 3/25
GrowthMonetary PolicyInflationActualResidual
Q&A on recent moves in bond yields
El
Goldman Sachs Global Investment Research 15
Top of Mind Issue 97
inflation expectations, though we should note that these inflation expectations are higher than what our economists, or the Fed, expects.
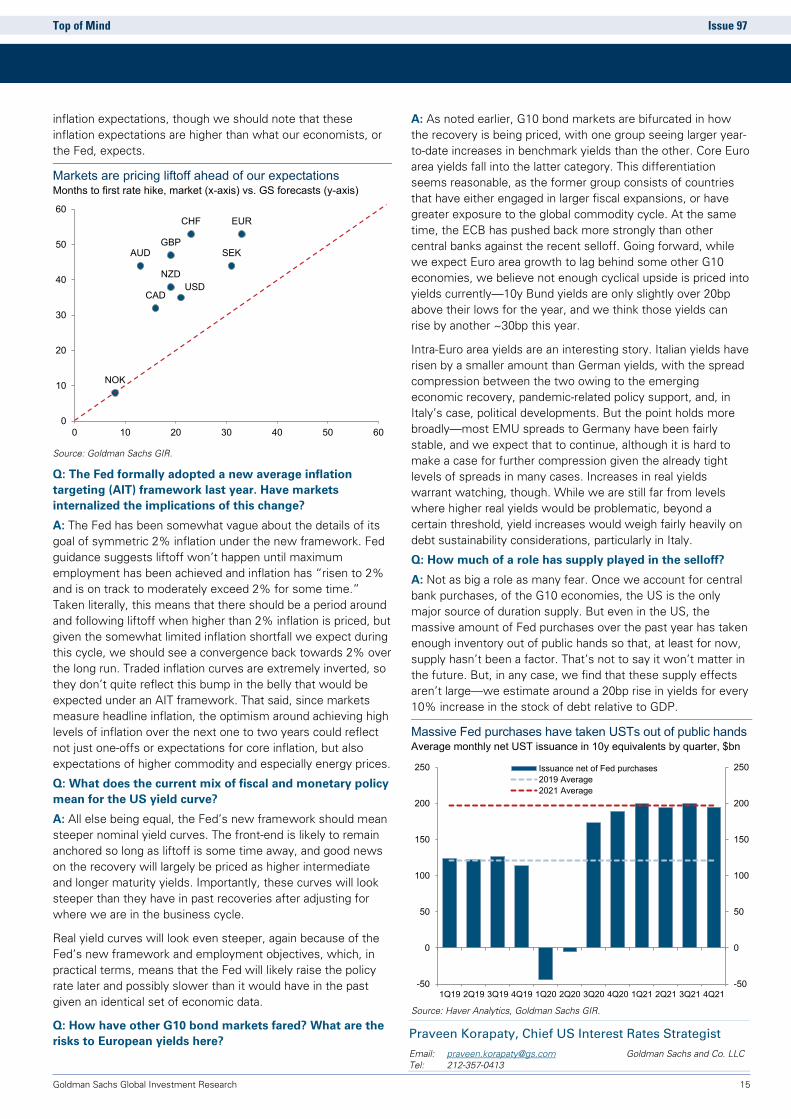
Markets are pricing liftoff ahead of our expectations Months to first rate hike, market (x-axis) vs. GS forecasts (y-axis)
Source: Goldman Sachs GIR.
Q: The Fed formally adopted a new average inflation targeting (AIT) framework last year. Have markets internalized the implications of this change?
A: The Fed has been somewhat vague about the details of its goal of symmetric 2% inflation under the new framework. Fed guidance suggests liftoff won’t happen until maximum employment has been achieved and inflation has “risen to 2% and is on track to moderately exceed 2% for some time.” Taken literally, this means that there should be a period around and following liftoff when higher than 2% inflation is priced, but given the somewhat limited inflation shortfall we expect during this cycle, we should see a convergence back towards 2% over the long run. Traded inflation curves are extremely inverted, so they don’t quite reflect this bump in the belly that would be expected under an AIT framework. That said, since markets measure headline inflation, the optimism around achieving high levels of inflation over the next one to two years could reflect not just one-offs or expectations for core inflation, but also expectations of higher commodity and especially energy prices.
Q: What does the current mix of fiscal and monetary policy mean for the US yield curve?
A: All else being equal, the Fed’s new framework should mean steeper nominal yield curves. The front-end is likely to remain anchored so long as liftoff is some time away, and good news on the recovery will largely be priced as higher intermediate and longer maturity yields. Importantly, these curves will look steeper than they have in past recoveries after adjusting for where we are in the business cycle.
Real yield curves will look even steeper, again because of the Fed’s new framework and employment objectives, which, in practical terms, means that the Fed will likely raise the policy rate later and possibly slower than it would have in the past given an identical set of economic data.
Q: How have other G10 bond markets fared? What are the risks to European yields here?
A: As noted earlier, G10 bond markets are bifurcated in how the recovery is being priced, with one group seeing larger year-to-date increases in benchmark yields than the other. Core Euro area yields fall into the latter category. This differentiation seems reasonable, as the former group consists of countries that have either engaged in larger fiscal expansions, or have greater exposure to the global commodity cycle. At the same time, the ECB has pushed back more strongly than other central banks against the recent selloff. Going forward, while we expect Euro area growth to lag behind some other G10 economies, we believe not enough cyclical upside is priced into yields currently—10y Bund yields are only slightly over 20bp above their lows for the year, and we think those yields can rise by another ~30bp this year.
Intra-Euro area yields are an interesting story. Italian yields have risen by a smaller amount than German yields, with the spread compression between the two owing to the emerging economic recovery, pandemic-related policy support, and, in Italy’s case, political developments. But the point holds more broadly—most EMU spreads to Germany have been fairly stable, and we expect that to continue, although it is hard to make a case for further compression given the already tight levels of spreads in many cases. Increases in real yields warrant watching, though. While we are still far from levels where higher real yields would be problematic, beyond a certain threshold, yield increases would weigh fairly heavily on debt sustainability considerations, particularly in Italy.
Q: How much of a role has supply played in the selloff?
A: Not as big a role as many fear. Once we account for central bank purchases, of the G10 economies, the US is the only major source of duration supply. But even in the US, the massive amount of Fed purchases over the past year has taken enough inventory out of public hands so that, at least for now, supply hasn’t been a factor. That’s not to say it won’t matter in the future. But, in any case, we find that these supply effects aren’t large—we estimate around a 20bp rise in yields for every 10% increase in the stock of debt relative to GDP.
Massive Fed purchases have taken USTs out of public hands Average monthly net UST issuance in 10y equivalents by quarter, $bn
Source: Haver Analytics, Goldman Sachs GIR.
Praveen Korapaty, Chief US Interest Rates Strategist
Email: [email protected] Goldman Sachs and Co. LLC Tel: 212-357-0413
USD
EUR
GBP
CAD
AUD
NZD
CHF
SEK
NOK
0
10
20
30
40
50
60
0 10 20 30 40 50 60
-50
0
50
100
150
200
250
-50
0
50
100
150
200
250
1Q19 2Q19 3Q19 4Q19 1Q20 2Q20 3Q20 4Q20 1Q21 2Q21 3Q21 4Q21
Issuance net of Fed purchases2019 Average2021 Average

El
Goldman Sachs Global Investment Research 16
Top of Mind Issue 97
Peter Oppenheimer argues that the coming reflationary cycle should support equities and Value and Cyclical sectors in particular
The recent swift move higher in US yields alongside rising market inflation expectations has raised the prospect of a paradigm shift in equity markets after a decade of subdued inflation following the Global Financial Crisis (GFC). In contrast to the last equity bull market, the combination of significant monetary support and fiscal expansion prompted by the pandemic—a kind of practical application of modern monetary theory—coupled with a very strong synchronized economic rebound from a record deep recession, points to a far more reflationary environment ahead. The expected drivers, magnitude and speed of this reflation should be positive for equities, in our view, and support a continued rotation toward more Cyclical and Value-oriented leadership within the equity market. But this reflationary backdrop also suggests a greater risk that higher inflation expectations in time push up bond yields and slow asset price inflation.
From disinflation to reflation
The current cycle is likely to be distinct from the cycle that prevailed after the GFC (2009-2020) in several ways. The 2020 bear market was "event-driven," triggered by the global COVID-19 pandemic and associated government policies that abruptly closed down large parts of economies to slow its spread. The recession it produced was therefore unusual in that it wasn't the result of economic or financial triggers, such as unwinding imbalances or rising interest rates, leaving less likelihood of structural overhangs in coming years, particularly in light of the aggressive monetary and fiscal policy response. In comparison, the bull market cycle that emerged out of the financial crisis came in the wake of a "structural" bear market plagued by major imbalances and a banking crisis that took time to unwind.
The period following the GFC was also associated with sharply declining inflation expectations, slowing long-term nominal GDP expectations, and lower revenue growth in the corporate sector, except for a small area of the market, specifically, Technology. This led to a deflationary economic and financial cycle from 2009-2020, at least in the real economy. But because this coincided with significant declines in interest rates and increased credit creation—via QE and related policies—this period also saw a significant and broad-based rise in asset prices. Since 2009, most prices in the real economy have been very subdued, while asset markets have experienced significant inflation. Within asset markets, the highest inflation has been in the longest duration growth assets—the Nasdaq and "Global Growth" stocks—and the weakest in the markets more levered to growth—such as Europe and Japan—and also in shorter duration "Global Value" stocks.
Looking ahead, the different drivers and changing mix of policy support in the current cycle suggest greater risk of a reflationary cycle that could see rising inflation expectations leading to rising bond yields, which, in turn, slow asset price inflation. On a relative basis, however, equities should protect investors against higher inflation expectations to some degree, while bonds will suffer from higher term premia. This is particularly
likely in the current environment when years of falling inflation expectations and perceived downside growth risks have resulted in rising equity risk premia (ERP) and a coincident increase in equity valuations. As global growth expectations accelerate from the COVID-led recession, and policy rates remain at the zero lower bound—forcing real rates to be negative—the ERP will likely narrow, supporting equities.
Asset prices outpaced "real economy" prices in last cycle Total return performance in local currency since January 2009, %
Source: Datastream, Haver Analytics, FRED, STOXX, Goldman Sachs GIR.
Dissecting the impact of inflation on equities
While starting valuations and the ERP will likely be significant determinants of equity performance amid the current reflationary backdrop, the impact of any change in inflation on the broader stock market will depend on three main factors: the level of inflation, the speed of any change in inflation and the drivers of the change.
Low but rising inflation is best macro backdrop for equities Annualized real total return (data since 1910), %
Source: Robert Shiller, Goldman Sachs GIR.
The level and direction. Equities tend to perform best either when inflation is rising from very low levels and the risks of deflation are falling, or when inflation is moderating from high levels. Higher levels of inflation, above the 3% threshold and rising, have historically produced the worst outcomes for equities, bonds, and balanced funds. For equities in particular, the best returns tend to be when inflation is below 1% but rising; this is often associated with a recovery from a recession and also a diminishing risk of deflation, and it is therefore not
-100%0%
100%200%300%400%500%600%700%800%900%
Nas
daq
Wor
ld G
row
thS&
P 50
0M
SCI W
orld
Euro
pean
HY
US
HY
MSC
I EM
SXXP
Wor
ld V
alue
Topi
xU
S IG
Gol
dG
erm
. Bon
dEu
rope
an IG
US
Bond
Japa
n Bo
ndU
S N
omin
al G
DP
US
Hou
se P
rice
US
wag
esEU
Nom
inal
GD
PU
S C
PIEA
Hou
se P
rice
Euro
pean
wag
esEu
rope
an C
PIC
omm
odity
Real economy prices
Asset prices
-10%
-5%
0%
5%
10%
15%
20%
25%
30%
Inflation>3%
& falling
Inflation>3%
& rising
Inflation1-3%
& rising
Inflation1-3%
& falling
Inflationbelow 1%& falling
Inflationbelow 1%& rising
S&P 500
60/40 portfolio
US 10-yearbonds
Inflation in-line(between 1-3%)
High Inflation(above 3%)
Deflation/ lowflation(below 1%)
Equities and reflation
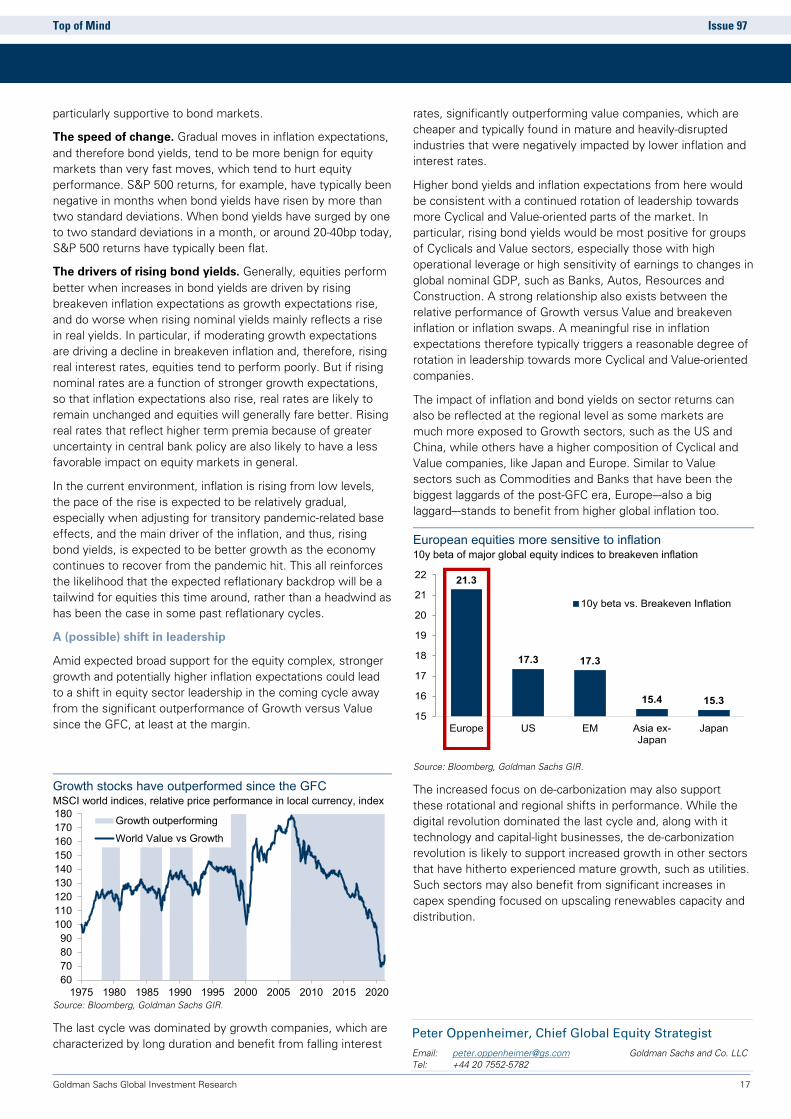
El
Goldman Sachs Global Investment Research 17
Top of Mind Issue 97
particularly supportive to bond markets.
The speed of change. Gradual moves in inflation expectations, and therefore bond yields, tend to be more benign for equity markets than very fast moves, which tend to hurt equity performance. S&P 500 returns, for example, have typically been negative in months when bond yields have risen by more than two standard deviations. When bond yields have surged by one to two standard deviations in a month, or around 20-40bp today, S&P 500 returns have typically been flat.
The drivers of rising bond yields. Generally, equities perform better when increases in bond yields are driven by rising breakeven inflation expectations as growth expectations rise, and do worse when rising nominal yields mainly reflects a rise in real yields. In particular, if moderating growth expectations are driving a decline in breakeven inflation and, therefore, rising real interest rates, equities tend to perform poorly. But if rising nominal rates are a function of stronger growth expectations, so that inflation expectations also rise, real rates are likely to remain unchanged and equities will generally fare better. Rising real rates that reflect higher term premia because of greater uncertainty in central bank policy are also likely to have a less favorable impact on equity markets in general.
In the current environment, inflation is rising from low levels, the pace of the rise is expected to be relatively gradual, especially when adjusting for transitory pandemic-related base effects, and the main driver of the inflation, and thus, rising bond yields, is expected to be better growth as the economy continues to recover from the pandemic hit. This all reinforces the likelihood that the expected reflationary backdrop will be a tailwind for equities this time around, rather than a headwind as has been the case in some past reflationary cycles.
A (possible) shift in leadership
Amid expected broad support for the equity complex, stronger growth and potentially higher inflation expectations could lead to a shift in equity sector leadership in the coming cycle away from the significant outperformance of Growth versus Value since the GFC, at least at the margin.
Growth stocks have outperformed since the GFC MSCI world indices, relative price performance in local currency, index
Source: Bloomberg, Goldman Sachs GIR.
The last cycle was dominated by growth companies, which are characterized by long duration and benefit from falling interest
rates, significantly outperforming value companies, which are cheaper and typically found in mature and heavily-disrupted industries that were negatively impacted by lower inflation and interest rates.
Higher bond yields and inflation expectations from here would be consistent with a continued rotation of leadership towards more Cyclical and Value-oriented parts of the market. In particular, rising bond yields would be most positive for groups of Cyclicals and Value sectors, especially those with high operational leverage or high sensitivity of earnings to changes in global nominal GDP, such as Banks, Autos, Resources and Construction. A strong relationship also exists between the relative performance of Growth versus Value and breakeven inflation or inflation swaps. A meaningful rise in inflation expectations therefore typically triggers a reasonable degree of rotation in leadership towards more Cyclical and Value-oriented companies.
The impact of inflation and bond yields on sector returns can also be reflected at the regional level as some markets are much more exposed to Growth sectors, such as the US and China, while others have a higher composition of Cyclical and Value companies, like Japan and Europe. Similar to Value sectors such as Commodities and Banks that have been the biggest laggards of the post-GFC era, Europe–-also a big laggard–-stands to benefit from higher global inflation too.
European equities more sensitive to inflation 10y beta of major global equity indices to breakeven inflation
Source: Bloomberg, Goldman Sachs GIR.
The increased focus on de-carbonization may also support these rotational and regional shifts in performance. While the digital revolution dominated the last cycle and, along with it technology and capital-light businesses, the de-carbonization revolution is likely to support increased growth in other sectors that have hitherto experienced mature growth, such as utilities. Such sectors may also benefit from significant increases in capex spending focused on upscaling renewables capacity and distribution.
60708090
100110120130140150160170180
1975 1980 1985 1990 1995 2000 2005 2010 2015 2020
Growth outperformingWorld Value vs Growth
21.3
17.3 17.3
15.4 15.315
16
17
18
19
20
21
22
Europe US EM Asia ex-Japan
Japan
10y beta vs. Breakeven Inflation
Peter Oppenheimer, Chief Global Equity Strategist
Email: [email protected] Goldman Sachs and Co. LLC Tel: +44 20 7552-5782
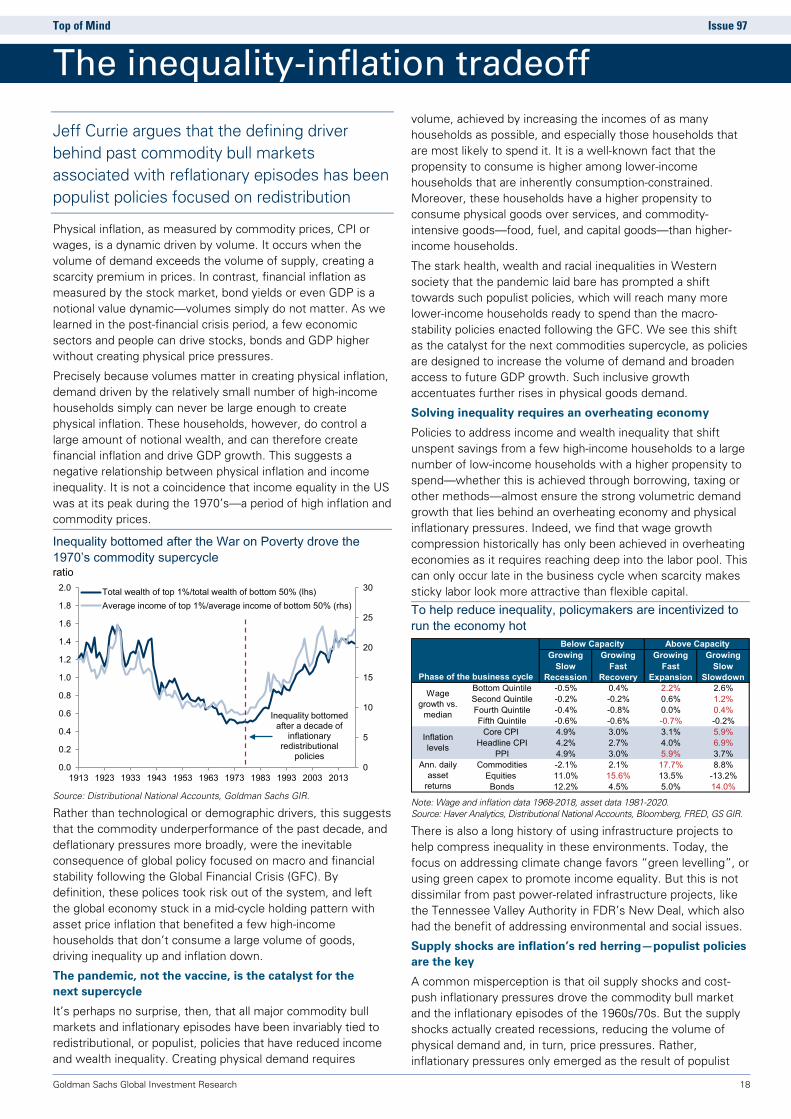
El
Goldman Sachs Global Investment Research 18
Top of Mind Issue 97
Jeff Currie argues that the defining driver behind past commodity bull markets associated with reflationary episodes has been populist policies focused on redistribution
Physical inflation, as measured by commodity prices, CPI or wages, is a dynamic driven by volume. It occurs when the volume of demand exceeds the volume of supply, creating a scarcity premium in prices. In contrast, financial inflation as measured by the stock market, bond yields or even GDP is a notional value dynamic—volumes simply do not matter. As we learned in the post-financial crisis period, a few economic sectors and people can drive stocks, bonds and GDP higher without creating physical price pressures.
Precisely because volumes matter in creating physical inflation, demand driven by the relatively small number of high-income households simply can never be large enough to create physical inflation. These households, however, do control a large amount of notional wealth, and can therefore create financial inflation and drive GDP growth. This suggests a negative relationship between physical inflation and income inequality. It is not a coincidence that income equality in the US was at its peak during the 1970’s—a period of high inflation and commodity prices.
Inequality bottomed after the War on Poverty drove the 1970’s commodity supercycle ratio
Source: Distributional National Accounts, Goldman Sachs GIR.
Rather than technological or demographic drivers, this suggests that the commodity underperformance of the past decade, and deflationary pressures more broadly, were the inevitable consequence of global policy focused on macro and financial stability following the Global Financial Crisis (GFC). By definition, these polices took risk out of the system, and left the global economy stuck in a mid-cycle holding pattern with asset price inflation that benefited a few high-income households that don’t consume a large volume of goods, driving inequality up and inflation down.
The pandemic, not the vaccine, is the catalyst for the next supercycle
It’s perhaps no surprise, then, that all major commodity bull markets and inflationary episodes have been invariably tied to redistributional, or populist, policies that have reduced income and wealth inequality. Creating physical demand requires
volume, achieved by increasing the incomes of as many households as possible, and especially those households that are most likely to spend it. It is a well-known fact that the propensity to consume is higher among lower-income households that are inherently consumption-constrained. Moreover, these households have a higher propensity to consume physical goods over services, and commodity-intensive goods—food, fuel, and capital goods—than higher-income households.
The stark health, wealth and racial inequalities in Western society that the pandemic laid bare has prompted a shift towards such populist policies, which will reach many more lower-income households ready to spend than the macro-stability policies enacted following the GFC. We see this shift as the catalyst for the next commodities supercycle, as policies are designed to increase the volume of demand and broaden access to future GDP growth. Such inclusive growth accentuates further rises in physical goods demand.
Solving inequality requires an overheating economy
Policies to address income and wealth inequality that shift unspent savings from a few high-income households to a large number of low-income households with a higher propensity to spend—whether this is achieved through borrowing, taxing or other methods—almost ensure the strong volumetric demand growth that lies behind an overheating economy and physical inflationary pressures. Indeed, we find that wage growth compression historically has only been achieved in overheating economies as it requires reaching deep into the labor pool. This can only occur late in the business cycle when scarcity makes sticky labor look more attractive than flexible capital.
To help reduce inequality, policymakers are incentivized to run the economy hot
Note: Wage and inflation data 1968-2018, asset data 1981-2020. Source: Haver Analytics, Distributional National Accounts, Bloomberg, FRED, GS GIR.
There is also a long history of using infrastructure projects to help compress inequality in these environments. Today, the focus on addressing climate change favors “green levelling”, or using green capex to promote income equality. But this is not dissimilar from past power-related infrastructure projects, like the Tennessee Valley Authority in FDR’s New Deal, which also had the benefit of addressing environmental and social issues.
Supply shocks are inflation’s red herring—populist policies are the key
A common misperception is that oil supply shocks and cost-push inflationary pressures drove the commodity bull market and the inflationary episodes of the 1960s/70s. But the supply shocks actually created recessions, reducing the volume of physical demand and, in turn, price pressures. Rather, inflationary pressures only emerged as the result of populist
0
5
10
15
20
25
30
0.0
0.2
0.4
0.6
0.8
1.0
1.2
1.4
1.6
1.8
2.0
1913 1923 1933 1943 1953 1963 1973 1983 1993 2003 2013
Total wealth of top 1%/total wealth of bottom 50% (lhs)Average income of top 1%/average income of bottom 50% (rhs)
Inequality bottomed after a decade of
inflationary redistributional
policies
Growing Slow
Growing Fast
Growing Fast
Growing Slow
Recession Recovery Expansion SlowdownBottom Quintile -0.5% 0.4% 2.2% 2.6%Second Quintile -0.2% -0.2% 0.6% 1.2%Fourth Quintile -0.4% -0.8% 0.0% 0.4%Fifth Quintile -0.6% -0.6% -0.7% -0.2%
Core CPI 4.9% 3.0% 3.1% 5.9%Headline CPI 4.2% 2.7% 4.0% 6.9%
PPI 4.9% 3.0% 5.9% 3.7%Commodities -2.1% 2.1% 17.7% 8.8%
Equities 11.0% 15.6% 13.5% -13.2%Bonds 12.2% 4.5% 5.0% 14.0%
Ann. daily asset
returns
Phase of the business cycle
Below Capacity Above Capacity
Inflation levels
Wage growth vs.
median
The inequality-inflation tradeoff
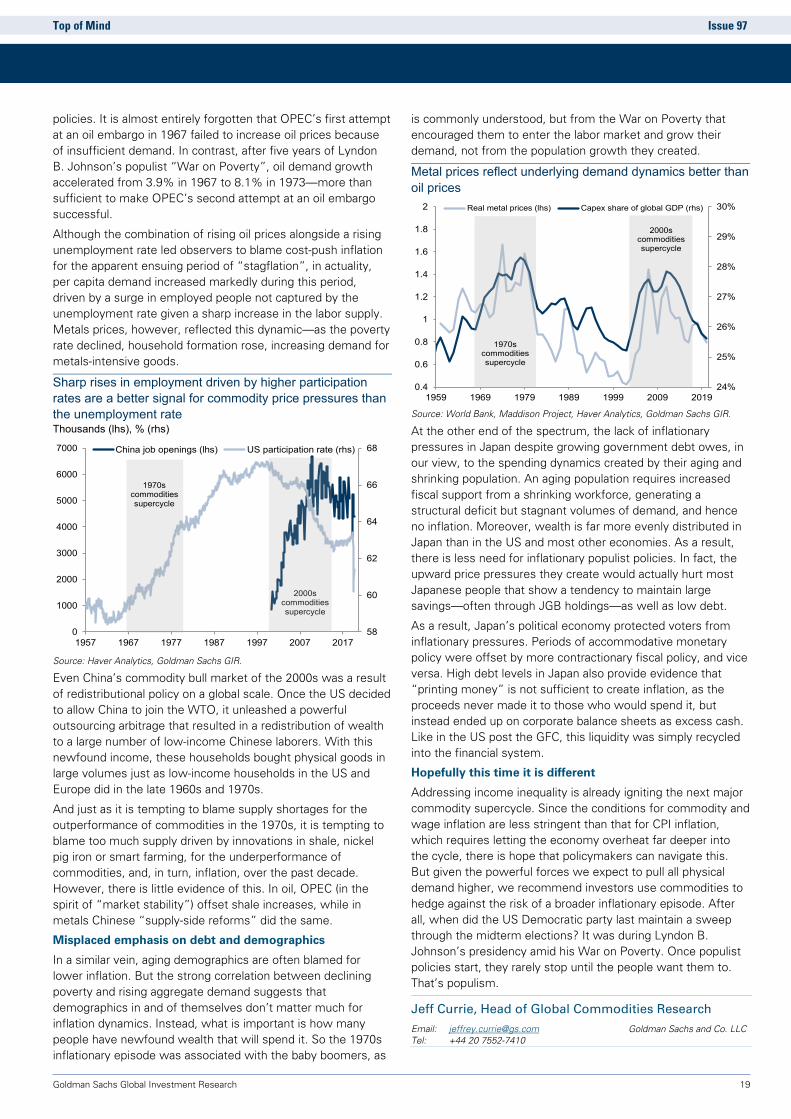
El
Goldman Sachs Global Investment Research 19
Top of Mind Issue 97
policies. It is almost entirely forgotten that OPEC’s first attempt at an oil embargo in 1967 failed to increase oil prices because of insufficient demand. In contrast, after five years of Lyndon B. Johnson’s populist “War on Poverty”, oil demand growthaccelerated from 3.9% in 1967 to 8.1% in 1973—more than sufficient to make OPEC’s second attempt at an oil embargo successful.
Although the combination of rising oil prices alongside a rising unemployment rate led observers to blame cost-push inflation for the apparent ensuing period of “stagflation”, in actuality, per capita demand increased markedly during this period, driven by a surge in employed people not captured by the unemployment rate given a sharp increase in the labor supply. Metals prices, however, reflected this dynamic—as the poverty rate declined, household formation rose, increasing demand for metals-intensive goods.
Sharp rises in employment driven by higher participation rates are a better signal for commodity price pressures than the unemployment rate Thousands (lhs), % (rhs)
Source: Haver Analytics, Goldman Sachs GIR.
Even China’s commodity bull market of the 2000s was a result of redistributional policy on a global scale. Once the US decided to allow China to join the WTO, it unleashed a powerful outsourcing arbitrage that resulted in a redistribution of wealth to a large number of low-income Chinese laborers. With this newfound income, these households bought physical goods in large volumes just as low-income households in the US and Europe did in the late 1960s and 1970s.
And just as it is tempting to blame supply shortages for the outperformance of commodities in the 1970s, it is tempting to blame too much supply driven by innovations in shale, nickel pig iron or smart farming, for the underperformance of commodities, and, in turn, inflation, over the past decade. However, there is little evidence of this. In oil, OPEC (in the spirit of “market stability”) offset shale increases, while in metals Chinese “supply-side reforms” did the same.
Misplaced emphasis on debt and demographics
In a similar vein, aging demographics are often blamed for lower inflation. But the strong correlation between declining poverty and rising aggregate demand suggests that demographics in and of themselves don’t matter much for inflation dynamics. Instead, what is important is how many people have newfound wealth that will spend it. So the 1970s inflationary episode was associated with the baby boomers, as
is commonly understood, but from the War on Poverty that encouraged them to enter the labor market and grow their demand, not from the population growth they created.
Metal prices reflect underlying demand dynamics better than oil prices
Source: World Bank, Maddison Project, Haver Analytics, Goldman Sachs GIR.
At the other end of the spectrum, the lack of inflationary pressures in Japan despite growing government debt owes, in our view, to the spending dynamics created by their aging and shrinking population. An aging population requires increased fiscal support from a shrinking workforce, generating a structural deficit but stagnant volumes of demand, and hence no inflation. Moreover, wealth is far more evenly distributed in Japan than in the US and most other economies. As a result, there is less need for inflationary populist policies. In fact, the upward price pressures they create would actually hurt most Japanese people that show a tendency to maintain large savings—often through JGB holdings—as well as low debt.
As a result, Japan’s political economy protected voters from inflationary pressures. Periods of accommodative monetary policy were offset by more contractionary fiscal policy, and vice versa. High debt levels in Japan also provide evidence that “printing money” is not sufficient to create inflation, as the proceeds never made it to those who would spend it, but instead ended up on corporate balance sheets as excess cash. Like in the US post the GFC, this liquidity was simply recycled into the financial system.
Hopefully this time it is different
Addressing income inequality is already igniting the next major commodity supercycle. Since the conditions for commodity and wage inflation are less stringent than that for CPI inflation, which requires letting the economy overheat far deeper into the cycle, there is hope that policymakers can navigate this. But given the powerful forces we expect to pull all physical demand higher, we recommend investors use commodities to hedge against the risk of a broader inflationary episode. After all, when did the US Democratic party last maintain a sweep through the midterm elections? It was during Lyndon B. Johnson’s presidency amid his War on Poverty. Once populist policies start, they rarely stop until the people want them to. That’s populism.
Jeff Currie, Head of Global Commodities Research
Email: [email protected] Goldman Sachs and Co. LLC Tel: +44 20 7552-7410
58
60
62
64
66
68
0
1000
2000
3000
4000
5000
6000
7000
1957 1967 1977 1987 1997 2007 2017
China job openings (lhs) US participation rate (rhs)
1970s commodities supercycle
2000s commodities supercycle
24%
25%
26%
27%
28%
29%
30%
0.4
0.6
0.8
1
1.2
1.4
1.6
1.8
2
1959 1969 1979 1989 1999 2009 2019
Real metal prices (lhs) Capex share of global GDP (rhs)
1970scommodities supercycle
2000s commodities supercycle

El
Goldman Sachs Global Investment Research 20
Top of Mind Issue 97
Christian Mueller-Glissmann discusses the optimal asset allocation for portfolios in the current reflationary environment
With investors moving from fading deflation risks to pricing an inflation overshoot, and as realized inflation starts to pick up, the optimal asset allocation is changing. In particular, the beneficial role of bonds in balanced portfolios will likely diminish further as reflationary pressures rise. Reflation favors greater equity exposure, which is also consistent with our current pro-risk asset allocation given expectations of a strong growth acceleration out of the COVID-19 crisis. But if inflationary pressures run too far, equities and bonds could decline together. During periods of high and rising inflation, commodities, as well non-US, short duration equities tend to outperform, suggesting portfolio tilts in these directions could prove beneficial. But as reflation optimism increases, so does the potential for disappointment. Relatively low FX and rates volatility today—which may rise should inflation-related risks increase—suggests value in hedging these risks via options.
Low inflationary pressures have benefitted 60/40 portfolios in recent decades…
Since the early 1980s, inflation and macro volatility have declined as central bank inflation targeting ushered in the Great Moderation and as disinflationary pressures from globalization, technological disruption and demographic headwinds took hold. The growth and inflation mix during this period has been generally favorable for simple 60/40 portfolios, which have delivered strong real returns. And equity/bond correlations have been mostly negative due to low and anchored inflation, resulting in robust risk-adjusted returns. As a result, bonds have not only been in a 40-year bull market, but have also offered protection during equity drawdowns.
…but new reflationary pressures favor greater equity exposure…
The beneficial role of bonds in balanced portfolios has more recently been in doubt given that bond yields close to the zero lower bound offer a diminished returns buffer during "risk-off" periods. These doubts have only increased alongside concerns that an accelerating economic recovery from the pandemic-induced recession, amplified by historically large US fiscal stimulus, could lead to a strong rise in inflation and, in turn, the start of a prolonged bond bear market. During most historical bond bear markets, equities have outperformed bonds and have delivered positive real returns. This has been especially the case over the last 20 years, during which bond bear markets tended to be short and shallow.
…although not if inflation moves too high
But higher equity allocations present their own risks. Increased exposure to equities leaves portfolios more vulnerable to deflation or negative growth shocks.
And, importantly, equities often suffer if inflation and bond yields rise too much. Prior to the late 1990s, several bond bear markets saw bonds and equities falling together. During these periods, the rise in real rates often outpaced the increase in breakeven inflation, or inflation accelerated to surprisingly high levels. Large inflation surprises can put upward pressure on equity risk premia alongside bond premia. And high and rising inflation can also eventually force central bank tightening and broader deleveraging, which increases recession risk and macro volatility, weighing on equity returns. As a result, equities, bonds and 60/40 portfolios performed poorly during past periods of high and rising inflation.
What’s outperformed in rising/high inflation environments?
In these past periods of high and rising inflation, the broad Dollar index (DXY) tended to decline, providing opportunities for investors to protect against inflation risk by diversifying regionally within assets, and particularly by increasing allocations to non-US assets. Commodities—especially oil—have performed the best in periods of rising inflation and the worst in periods with falling inflation, irrespective of inflation levels, in large part because commodity shortages have driven many of the historical episodes of sharply higher realized inflation. Non-US equities, TIPS and gold have also helped portfolios in periods with high and rising inflation. And within equities, short duration value stocks have tended to outperform long duration growth stocks. Portfolio tilts in these directions are therefore likely to help reduce risk stemming from reflationary pressures today.
Maintain pro-risk orientation, but hedge against risks from reflation acceleration
We continue to recommend a pro-risk asset allocation (OW equities and commodities, N credit, UW bonds) given our expectations for a strong recovery from the pandemic hit and relatively benign Fed views. The potential for reflation acceleration suggests higher equity allocations remain beneficial given the relatively moderate rise in inflation and yields that we expect (see pgs. 14-15).
That said, the combination of a strong recovery and expansionary fiscal policy raises the potential for inflation to overshoot. As a result, we favor commodities and cyclical or value parts of equities. Of course, as inflation and growth expectations continue to increase, so does the potential for disappointments. Investors therefore need to balance inflation and deflation tail risks in their portfolios.
Christian Mueller-Glissmann, Sr. Multi-Asset Strategist
Email: [email protected] Goldman Sachs and Co. LLC Tel: 44-20-7774-1714
Asset (re)allocation amid reflation
El
Goldman Sachs Global Investment Research 21
Top of Mind Issue 97
In recent bond bear markets, equities outperformed bonds and delivered positive real returns
Start End Duration (months)
US 10y drawdown Annualized real return
Real Nominal S&P 500 US 10y bond US 60/40
Apr-1941 Sep-1959 224 -39 24 12 -3 6 Mar-1967 May-1970 39 -22 -8 -9 -7 -8Mar-1971 Sep-1981 128 -47 23 -2 -6 -3May-1983 May-1984 13 -14 -9 -7 -13 -9Jan-1987 Oct-1987 9 -17 -14 5 -23 -7Oct-1993 Nov-1994 13 -15 -13 -1 -14 -7Oct-1998 Jan-2000 16 -15 -12 32 -12 13Jun-2003 Jun-2004 12 -13 -10 12 -12 2Jun-2005 Jun-2006 12 -10 -6 3 -10 -2Mar-2008 Jun-2008 3 -9 -7 20 -31 -4Dec-2008 Jun-2009 5 -16 -14 11 -31 -8Oct-2010 Apr-2011 6 -10 -8 26 -20 6Jul-2012 Sep-2013 14 -13 -11 21 -12 7Jan-2015 Jul-2015 5 -8 -6 9 -16 -2Jul-2016 Mar-2017 8 -11 -9 18 -15 3Sep-2017 May-2018 8 -11 -7 10 -16 -1Aug-2020 Mar-2021 8 -13 -10 25 -20 5
Average -18 -5 5 -15 -1Median -13 -8 9 -13 -2
Source: Haver Analytics, Datastream, Goldman Sachs GIR.
60/40 portfolios have often suffered during or after periods of high (3%) and rising inflation
Note: Chart shows US 60/40 portfolio real returns (yoy, monthly); grey shading indicates US CPI inflation above 3% and rising. Source: Robert Shiller, Goldman Sachs GIR.
Rising inflation points to pro-risk asset allocations, up to a certain level
Note: Average monthly real total returns since 1950; gold/oil have little movement during Bretton Woods and Texas Railroad Commission; 10y TIPS history since 1959. Source: Haver Analytics, Robert Shiller, Goldman Sachs GIR.
-40%
-30%
-20%
-10%
0%
10%
20%
30%
40%
50%
1900 1910 1920 1930 1940 1950 1960 1970 1980 1990 2000 2010 2020
Bankers'panic
WWI
Great Depression
PrematureFed
tightening
WWII
Cold war/ price
controls
Suez crisis
1962 flash crash/ Cuban missile crisis
Vietnam war &
inflation
Collapse of Bretton Woods/ Nixon price shock
Stagflation/oil price shocks
Volcker tightening
Black Monday
Gulf war
1994bond
bubble Tech bubble
GFC
Fed tightening
S&P 500 1.5% Oil 1.6% Oil 1.5%Oil 1.1% MSCI EM 1.3% S&P GSCI 1.4%
60/40 0.9% TOPIX 1.0% Gold 1.2%TOPIX 0.8% S&P 500 0.8% MSCI EM 0.6%
STOXX 600 0.7% S&P GSCI 0.8% TIPS 10Y 0.2%Japan 10Y 0.4% STOXX 600 0.6% TOPIX 0.1%MSCI EM 0.4% 60/40 0.5% T-Bills -0.1%
Gold 0.4% Gold 0.3% Germany 10Y -0.2%DJ Corp 0.3% Japan 10Y 0.3% US 10Y -0.3%TIPS 10Y 0.3% TIPS 10Y 0.2% US 30Y -0.3%
Germany 10Y 0.3% DJ Corp 0.2% DJ Corp -0.3%T-Bills 0.1% Germany 10Y 0.1% Japan 10Y -0.3%US 30Y 0.0% T-Bills 0.0% 60/40 -0.4%US 10Y 0.0% US 10Y 0.0% STOXX 600 -0.4%
DXY -0.6% US 30Y 0.0% S&P 500 -0.4%S&P GSCI -0.8% DXY -0.4% DXY -0.8%
High inflation (>3%) and risingLow inflation (<1%) and rising In-line inflation (1-3%) and risingTotal years: 4.7 Total years: 15.2Total years: 16.9
El
Goldman Sachs Global Investment Research 22
Top of Mind Issue 97
The long history of US rates 10
-yea
r U
S T
reas
ury
yie
ld
024681012141618
Pani
c of
183
7fo
llow
ed b
y de
pres
sion
(1
837-
1843
); ke
y ca
uses
w
ere
rest
rictiv
e le
ndin
g po
licie
s in
G
reat
Brit
ain,
de
clin
e in
co
tton
pric
es,
spec
ulat
ive
lend
ing
1842
:6.
6%
1792
:4.
7%
1798
:8.
1%
1821
:4.
6%18
35:
4.0%
1861
:6.
6%
Pani
c of
185
7fo
llow
ed b
y de
pres
sion
(1
857-
1860
); ke
y ca
uses
w
ere
dec
linin
g in
tern
atio
nal
econ
omy,
fa
ilure
of a
la
rge
US b
ank,
an
d do
wnt
urn
in th
e ra
ilroa
d in
dust
ry
US
Civi
lWar
(186
0-18
65);
US fo
rced
off
of
the
gold
st
anda
rd1864
:5.
3%
Gol
dcr
ash
1869
:4.
2%
1932
:4.
3%Gre
at
Depr
essi
on(1
929-
1941
)
WW
II (1
939-
1945
)
1945
:1.
7%
WW
I(1
914-
1918
)
1915
:3.
7%
US
abro
gatio
n of
Bre
tton
Woo
ds
1971
:5.
5%
1981
:15
.8%
Fed
Chai
rman
Vol
cker
incr
ease
d th
e fe
d fu
nds
rate
to a
pea
k of
20%
in 1
981
to g
et d
oubl
e -di
git i
nfla
tion
unde
r co
ntro
l
1984
:13
.9%
Volc
ker h
iked
rate
s to
re
stra
in th
eec
onom
ic
reco
very
and
ens
ure
infla
tion
wou
ld re
mai
n lo
w
2nd
oil s
hock
and
Iran
ho
stag
e cr
isis
(197
9-19
80)
1sto
il sh
ock
(197
3-19
74) Lo
win
pol
icy
rate
cyc
le
1986
:7.
0% Low
in p
olic
y-ra
te c
ycle
fo
llow
ing
1991
re
cess
ion
1993
:5.
5%
Unex
pect
ed ra
te-h
ikin
g cy
cle
as e
cono
mic
gro
wth
im
prov
ed fo
llow
ing
1991
rece
ssio
n19
947.
9%
Low
in p
olic
y-ra
te
cycl
e fo
llow
ing
tech
bu
bble
bur
stin
g
2003
:3.
4%
Star
tof a
rate
hi
king
cyc
le a
s in
flatio
n cr
ept u
p w
ith e
cono
my
reco
verin
gfr
om
2001
rece
ssio
n20
044.
7%
QE3
2012
:1.
6%QE2
2010
:2.
5%
GFC
; Q
E1
2008
:2.
3%
Pani
c of
179
6-17
97;U
S re
al
esta
te c
olla
pse
and
ensu
ing
depr
essi
on17
90:
8.7%
Pani
c of
181
9 fo
llow
ing
the
end
of th
e W
ar o
f 18
12an
d m
is-
man
agem
ento
f the
Se
cond
Ban
k of
the
Unite
d St
ates
US
econ
omic
bo
om
Rece
ssio
n fo
llow
ing
oil s
hock
1900
:2.
9%
1920
:5.
6%
Depr
essi
on
of 1
920-
1921
; Fe
d hi
ked
rate
s to
co
ntro
l pos
t-w
ar in
flatio
n;
retu
rnin
gso
ldie
rs
wei
ghed
on
wag
es
1969
:7.
9%
Fed
hike
das
ec
onom
y he
ated
up
Viet
nam
war
; US
com
bat
invo
lvem
ent
(196
5-19
73)
Firs
t Ba
nk o
f th
eUn
ited
Stat
es
(179
1)
1913
: Fed
eral
Rese
rve
Syst
em
crea
ted
The
Gre
at
Railr
oad
Strik
e
1877
:4.
5%19
07:
3.3%
Pani
c of
190
7;fa
iled
atte
mpt
to
cor
ner t
he
mar
ket o
n th
e st
ock
of a
la
rge
com
pany
ge
nera
ted
bank
loss
es, a
cr
isis
in
conf
iden
ce in
ba
nks,
and
ba
nk ru
ns
Fed
tape
ring;
ra
tehi
king
cy
cle
Sour
ce: G
loba
l Fin
anci
al D
ata,
Inc.
, Fed
eral
Res
erve
Boa
rd, H
aver
Ana
lytic
s, G
oldm
anSa
chs
GIR
.
Econ
omic
reco
very
fro
m
COVI
Dun
derw
ay

El
Goldman Sachs Global Investment Research 23
Top of Mind Issue 97
Summary of our key forecasts G
SG
IR: M
acro
at a
gla
nce
Wat
chin
g•G
loba
lly, w
e ex
pect
abo
ve-c
onse
nsus
glo
bal g
row
th o
f 6.8
% in
202
1. O
ur o
ptim
ism
refle
cts
the
view
that
pos
t-vac
cina
tion
reop
enin
g, a
ccom
mod
ativ
e m
onet
ary
and
fisca
l pol
icy,
pen
t-up
savi
ngs,
an
d lim
ited
scar
ring
effe
cts
will
supp
ort a
con
tinue
d re
cove
ry in
eco
nom
ic a
ctiv
ity, t
houg
h th
e sp
read
of m
ore
infe
ctio
us v
irus
stra
ins
pose
s ris
ks.
•In
the
US,
we
expe
ct a
bove
-con
sens
us fu
ll-ye
ar g
row
th o
f 7.2
% in
202
1 on
the
back
of s
igni
fican
t fis
cal s
timul
us a
nd w
ides
prea
d im
mun
izat
ion—
with
50%
of t
he p
opul
atio
n ex
pect
ed to
be
vacc
inat
ed b
y M
ay. W
e ex
pect
the
unem
ploy
men
t rat
e to
fall
to 4
% a
nd c
ore
PCE
infla
tion
to re
ach
1.95
% b
y ye
ar-e
nd 2
021.
•The
Fed
has
ado
pted
flex
ible
ave
rage
infla
tion
targ
etin
g an
d ou
tcom
e-ba
sed
forw
ard
guid
ance
, whi
ch w
e vi
ew a
s co
nsis
tent
with
our
exp
ecta
tion
of li
ftoff
in 1
H24
. The
Fed
has
als
o ad
opte
d ou
tcom
e-ba
sed
forw
ard
guid
ance
for a
sset
pur
chas
es, a
nd w
e ex
pect
tape
ring
to b
egin
in e
arly
202
2, th
ough
sub
stan
tial f
urth
er p
rogr
ess
on e
mpl
oym
ent a
nd in
flatio
n co
uld
brin
g fo
rwar
d th
e st
art
to 4
Q21
. On
the
fisca
l pol
icy
front
, the
Bid
en a
dmin
istra
tion
has
prop
osed
a p
acka
ge fo
cuse
d on
infra
stru
ctur
e an
d ot
her b
enef
its to
talin
g $2
.2tn
ove
r 10
year
s, w
hich
we
expe
ct w
ill be
par
tially
of
fset
via
hig
her t
axes
, inc
ludi
ng a
n in
crea
se in
cor
pora
te ta
xes.
•I
n th
e Eu
ro a
rea,
we
expe
ct 1
.9%
qoq
non
ann
. gro
wth
in Q
2 on
the
back
of a
n ex
pect
ed a
ccel
erat
ion
in th
e va
ccin
e ro
llout
, tho
ugh
rece
nt v
irus
resu
rgen
ce a
nd e
xten
ded
lock
dow
ns p
rese
nt
dow
nsid
e ris
ks. W
e ex
pect
abo
ve-c
onse
nsus
gro
wth
of 5
.1%
in 2
021,
and
look
for u
nder
lyin
g se
quen
tial i
nfla
tion
to in
crea
se fr
om th
e se
cond
hal
f of t
he y
ear,
but e
xpec
t onl
y a
grad
ual i
ncre
ase
in
unde
rlyin
g co
re in
flatio
n to
1.5
% in
late
202
4.•W
e ex
pect
the
ECB
will
mai
ntai
n a
pace
of P
EPP
purc
hase
s of
aro
und
EUR
20b
n pe
r wee
k th
roug
h Q
2 an
d ex
haus
t the
full
PEPP
env
elop
e by
mid
-202
2, b
ut b
elie
ve it
will
keep
rate
s on
hol
d un
til 2
025.
We
expe
ct th
e EC
B to
ado
pt a
sym
met
ric 2
% in
flatio
n ai
m b
ut in
clud
e "s
oft"
elem
ents
of A
vera
ge In
flatio
n Ta
rget
ing
(AIT
) by
plac
ing
som
e em
phas
is o
n pe
rsis
tent
infla
tion
mis
ses
whe
n th
e st
rate
gy re
view
con
clud
es in
Sep
tem
ber.
On
the
fisca
l sid
e, w
e ex
pect
the
EUR
750
bn R
ecov
ery
Fund
, whi
ch w
ill pr
ovid
e fis
cal s
uppo
rt to
the
coun
tries
mos
t affe
cted
by
the
viru
s, to
be
ratif
ied
and
disb
urse
men
t to
begi
n in
Q3.
•In
Chi
na, w
e ex
pect
202
1 re
al G
DP
grow
th o
f 8.5
% a
nd v
iew
the
risks
to th
is fo
reca
st a
s br
oadl
y ba
lanc
ed, w
ith th
e po
tent
ial f
or s
trong
er-th
an-e
xpec
ted
expo
rts p
osin
g up
side
risk
and
the
rece
nt
tight
enin
g of
fina
ncia
l con
ditio
ns a
nd e
mis
sion
-rela
ted
indu
stria
l out
put c
urbs
pos
ing
dow
nsid
e ris
ks.
•WAT
CH
CO
RO
NAV
IRU
S. W
hile
the
traje
ctor
y of
the
coro
navi
rus
rem
ains
hig
hly
unce
rtain
, our
bas
e ca
se a
ssum
es th
at d
eclin
ing
hosp
italiz
atio
ns w
ill dr
ive
a co
ntin
ued
reco
very
in g
loba
l ec
onom
ic a
ctiv
ity th
is y
ear.
We
expe
ct a
maj
ority
of t
he p
opul
atio
n in
mos
t DM
s to
rece
ive
thei
r firs
t vac
cine
dos
e by
mid
-yea
r,bu
t don
't se
e 50
% v
acci
natio
n be
ing
achi
eved
in m
ost E
Ms
befo
re
late
202
1.
Gol
dman
Sac
hs G
loba
l Inv
estm
ent R
esea
rch.
Gro
wth
Sou
rce:
Hav
er A
naly
tics
and
Gol
dman
Sac
hs G
loba
l Inv
estm
ent R
esea
rch.
Not
e: G
S C
AI i
s a
mea
sure
of c
urre
nt g
row
th. W
e ha
ve re
cent
ly re
vise
d ou
r met
hodo
logy
for c
alcu
latin
g th
is m
easu
re. F
or m
ore
info
rmat
ion
on th
e m
etho
dolo
gy o
f the
CA
I ple
ase
see
“Les
sons
Lea
rned
: Re-
engi
neer
ing
Our
CA
Is in
Lig
ht o
f the
Pan
dem
ic
Rec
essi
on,”
Glo
bal E
cono
mic
s A
naly
st, S
ep. 2
9, 2
020.
Fore
cast
s
Sou
rce:
Blo
ombe
rg, G
oldm
an S
achs
Glo
bal I
nves
tmen
t Res
earc
h. F
or im
porta
nt d
iscl
osur
es, s
ee th
e D
iscl
osur
e A
ppen
dix
or g
o to
ww
w.g
s.co
m/re
sear
ch/h
edge
.htm
l.M
arke
t pric
ing
as o
f Mar
ch 3
1, 2
021.

El
Goldman Sachs Global Investment Research 24
Top of Mind Issue 97
Current Activity Indicator (CAI) GS CAIs measure the growth signal in a broad range of weekly and monthly indicators, offering an alternative to Gross Domestic Product (GDP). GDP is an imperfect guide to current activity: In most countries, it is only available quarterly and is released with a substantial delay, and its initial estimates are often heavily revised. GDP also ignores important measures of real activity, such as employment and the purchasing managers’ indexes (PMIs). All of these problems reduce the effectiveness of GDP for investment and policy decisions. Our CAIs aim to address GDP’s shortcomings and provide a timelier read on the pace of growth.
For more, see our CAI page and Global Economics Analyst: Trackin’ All Over the World – Our New Global CAI, 25 February 2017.
Dynamic Equilibrium Exchange Rates (DEER) The GSDEER framework establishes an equilibrium (or “fair”) value of the real exchange rate based on relative productivity and terms-of-trade differentials.
For more, see our GSDEER page, Global Economics Paper No. 227: Finding Fair Value in EM FX, 26 January 2016, and Global Markets Analyst: A Look at Valuation Across G10 FX, 29 June 2017.
Financial Conditions Index (FCI) GS FCIs gauge the “looseness” or “tightness” of financial conditions across the world’s major economies, incorporating variables that directly affect spending on domestically produced goods and services. FCIs can provide valuable information about the economic growth outlook and the direct and indirect effects of monetary policy on real economic activity.
FCIs for the G10 economies are calculated as a weighted average of a policy rate, a long-term risk-free bond yield, a corporate credit spread, an equity price variable, and a trade-weighted exchange rate; the Euro area FCI also includes a sovereign credit spread. The weights mirror the effects of the financial variables on real GDP growth in our models over a one-year horizon. FCIs for emerging markets are calculated as a weighted average of a short-term interest rate, a long-term swap rate, a CDS spread, an equity price variable, a trade-weighted exchange rate, and—in economies with large foreign-currency-denominated debt stocks—a debt-weighted exchange rate index.
For more, see our FCI page, Global Economics Analyst: Our New G10 Financial Conditions Indices, 20 April 2017, and Global Economics Analyst: Tracking EM Financial Conditions – Our New FCIs, 6 October 2017.
Goldman Sachs Analyst Index (GSAI) The US GSAI is based on a monthly survey of GS equity analysts to obtain their assessments of business conditions in the industries they follow. The results provide timely “bottom-up” information about US economic activity to supplement and cross-check our analysis of “top-down” data. Based on analysts’ responses, we create a diffusion index for economic activity comparable to the ISM’s indexes for activity in the manufacturing and nonmanufacturing sectors.
Macro-Data Assessment Platform (MAP) GS MAP scores facilitate rapid interpretation of new data releases for economic indicators worldwide. MAP summarizes the importance of a specific data release (i.e., its historical correlation with GDP) and the degree of surprise relative to the consensus forecast. The sign on the degree of surprise characterizes underperformance with a negative number and outperformance with a positive number. Each of these two components is ranked on a scale from 0 to 5, with the MAP score being the product of the two, i.e., from -25 to +25. For example, a MAP score of +20 (5;+4) would indicate that the data has a very high correlation to GDP (5) and that it came out well above consensus expectations (+4), for a total MAP value of +20.
Glossary of GS proprietary indices

Goldman Sachs Global Investment Research 25
Top of Mind Issue 97
Issue 96 The Short and Long of Recent Volatility February 25, 2021
Issue 81 Central Bank Independence August 8, 2019
Issue 95 The IPO SPAC-tacle January 28, 2021
Issue 80 Dissecting the Market Disconnect July 11, 2019
Special Issue 2020 Update, and a Peek at 2021 December 17, 2020
Issue 79 Trade Wars 3.0 June 6, 2019
Issue 94 What's In Store For the Dollar October 29, 2020
Issue 78 EU Elections: What’s at Stake? May 9, 2019
Issue 93 Beyond 2020: Post-Election Policies October 1, 2020
Issue 77 Buyback Realities April 11, 2019
Issue 92 COVID-19: Where We Go From Here August 13, 2020
Issue 76 The Fed’s Dovish Pivot March 5, 2019
Issue 91 Investing in Racial Economic Equality July 16, 2020
Issue 75 Where Are We in the Market Cycle? February 4, 2019
Issue 90 Daunting Debt Dynamics May 28, 2020
Issue 74 What’s Next for China? December 7, 2018
Issue 89 Reopening the Economy
April 28, 2020
Issue 73 Making Sense of Midterms October 29, 2018
Issue 88 Oil’s Seismic Shock March 31, 2020
Issue 72 Recession Risk October 16, 2018
Issue 87 Roaring into Recession March 24, 2020
Issue 71 Fiscal Folly September 13, 2018
Issue 86 2020’s Black swan: COVID-19 February 28, 2020
Issue 70 Deal or No Deal: Brexit and the Future of Europe August 13, 2018
Issue 85 Investing in Climate Change January 30, 2020
Issue 69 Emerging Markets: Invest or Avoid? July 10, 2018
Special Issue 2019 Update, and a Peek at 2020 December 17, 2019
Issue 68 Liquidity, Volatility, Fragility June 12, 2018
Issue 84 Fiscal Focus November 26, 2019
Issue 67 Regulating Big Tech April 26, 2018
Issue 83 Growth and Geopolitical Risk October 10, 2019
Issue 66 Trade Wars 2.0 March 28, 2018
Issue 82 Currency Wars September 12, 2019
Issue 65 Has a Bond Bear Market Begun? February 28, 2018
Source of photos: www.istockphoto.com, www.shutterstock.com, US Department of State/Wikimedia Commons/Public Domain.
Top of Mind archive

El
Goldman Sachs Global Investment Research 26
Top of Mind Issue 97
Disclosure Appendix Reg AC We, Allison Nathan, Jenny Grimberg, Gabe Lipton Galbraith, Jeffrey Currie, Kevin Daly, Jan Hatzius, Praveen Korapaty, David Mericle, Christian Mueller-Glissmann, Peter Oppenheimer, and Dominic Wilson hereby certify that all of the views expressed in this report accurately reflect our personal views, which have not been influenced by considerations of the firm’s business or client relationships. Unless otherwise stated, the individuals listed on the cover page of this report are analysts in Goldman Sachs’ Global Investment Research division. Equity baskets disclosure The ability to trade the basket(s) in this report will depend upon market conditions, including liquidity and borrow constraints at the time of trade. Marquee disclosure: Marquee is a product of the Goldman Sachs Global Markets Division. Any Marquee content linked in this report is not necessarily representative of GS Research views.
Regulatory disclosures Disclosures required by United States laws and regulations See company-specific regulatory disclosures above for any of the following disclosures required as to companies referred to in this report: manager or co-manager in a pending transaction; 1% or other ownership; compensation for certain services; types of client relationships; managed/co-managed public offerings in prior periods; directorships; for equity securities, market making and/or specialist role. Goldman Sachs trades or may trade as a principal in debt securities (or in related derivatives) of issuers discussed in this report. The following are additional required disclosures: Ownership and material conflicts of interest: Goldman Sachs policy prohibits its analysts, professionals reporting to analysts and members of their households from owning securities of any company in the analyst's area of coverage. Analyst compensation: Analysts are paid in part based on the profitability of Goldman Sachs, which includes investment banking revenues. Analyst as officer or director: Goldman Sachs policy generally prohibits its analysts, persons reporting to analysts or members of their households from serving as an officer, director or advisor of any company in the analyst's area of coverage. Non-U.S. Analysts: Non-U.S. analysts may not be associated persons of Goldman Sachs & Co. LLC and therefore may not be subject to FINRA Rule 2241 or FINRA Rule 2242 restrictions on communications with subject company, public appearances and trading securities held by the analysts. Additional disclosures required under the laws and regulations of jurisdictions other than the United States The following disclosures are those required by the jurisdiction indicated, except to the extent already made above pursuant to United States laws and regulations. Australia: Goldman Sachs Australia Pty Ltd and its affiliates are not authorised deposit-taking institutions (as that term is defined in the Banking Act 1959 (Cth)) in Australia and do not provide banking services, nor carry on a banking business, in Australia. This research, and any access to it, is intended only for "wholesale clients" within the meaning of the Australian Corporations Act, unless otherwise agreed by Goldman Sachs. In producing research reports, members of the Global Investment Research Division of Goldman Sachs Australia may attend site visits and other meetings hosted by the companies and other entities which are the subject of its research reports. In some instances the costs of such site visits or meetings may be met in part or in whole by the issuers concerned if Goldman Sachs Australia considers it is appropriate and reasonable in the specific circumstances relating to the site visit or meeting. To the extent that the contents of this document contains any financial product advice, it is general advice only and has been prepared by Goldman Sachs without taking into account a client's objectives, financial situation or needs. A client should, before acting on any such advice, consider the appropriateness of the advice having regard to the client's own objectives, financial situation and needs. A copy of certain Goldman Sachs Australia and New Zealand disclosure of interests and a copy of Goldman Sachs’ Australian Sell-Side Research Independence Policy Statement are available at: https://www.goldmansachs.com/disclosures/australia-new-zealand/index.html. Brazil: Disclosure information in relation to CVM Instruction 598 is available at https://www.gs.com/worldwide/brazil/area/gir/index.html. Where applicable, the Brazil-registered analyst primarily responsible for the content of this research report, as defined in Article 20 of CVM Instruction 598, is the first author named at the beginning of this report, unless indicated otherwise at the end of the text. Canada: Goldman Sachs Canada Inc. is an affiliate of The Goldman Sachs Group Inc. and therefore is included in the company specific disclosures relating to Goldman Sachs (as defined above). Goldman Sachs Canada Inc. has approved of, and agreed to take responsibility for, this research report in Canada if and to the extent that Goldman Sachs Canada Inc. disseminates this research report to its clients. Hong Kong: Further information on the securities of covered companies referred to in this research may be obtained on request from Goldman Sachs (Asia) L.L.C. India: Further information on the subject company or companies referred to in this research may be obtained from Goldman Sachs (India) Securities Private Limited, Research Analyst - SEBI Registration Number INH000001493, 951-A, Rational House, Appasaheb Marathe Marg, Prabhadevi, Mumbai 400 025, India, Corporate Identity Number U74140MH2006FTC160634, Phone +91 22 6616 9000, Fax +91 22 6616 9001. Goldman Sachs may beneficially own 1% or more of the securities (as such term is defined in clause 2 (h) the Indian Securities Contracts (Regulation) Act, 1956) of the subject company or companies referred to in this research report. Japan: See below. Korea: This research, and any access to it, is intended only for "professional investors" within the meaning of the Financial Services and Capital Markets Act, unless otherwise agreed by Goldman Sachs. Further information on the subject company or companies referred to in this research may be obtained from Goldman Sachs (Asia) L.L.C., Seoul Branch. New Zealand: Goldman Sachs New Zealand Limited and its affiliates are neither "registered banks" nor "deposit takers" (as defined in the Reserve Bank of New Zealand Act 1989) in New Zealand. This research, and any access to it, is intended for "wholesale clients" (as defined in the Financial Advisers Act 2008) unless otherwise agreed by Goldman Sachs. A copy of certain Goldman Sachs Australia and New Zealand disclosure of interests is available at: https://www.goldmansachs.com/disclosures/australia-new-zealand/index.html. Russia: Research reports distributed in the Russian Federation are not advertising as defined in the Russian legislation, but are information and analysis not having product promotion as their main purpose and do not provide appraisal within the meaning of the Russian legislation on appraisal activity. Research reports do not constitute a personalized investment recommendation as defined in Russian laws and regulations, are not addressed to a specific client, and are prepared without analyzing the financial circumstances, investment profiles or risk profiles of clients. Goldman Sachs assumes no responsibility for any investment decisions that may be taken by a client or any other person based on this research report. Singapore: Goldman Sachs (Singapore) Pte. (Company Number: 198602165W), which is regulated by the Monetary Authority of Singapore, accepts legal responsibility for this research, and should be contacted with respect to any matters arising from, or in connection with, this research. Taiwan: This material is for reference only and must not be reprinted without permission. Investors should carefully consider their own investment risk. Investment results are the responsibility of the individual investor. United Kingdom: Persons who would be categorized as retail clients in the United Kingdom, as such term is defined in the rules of the Financial Conduct Authority, should read this research in conjunction with prior Goldman Sachs research on the covered companies referred to herein and should refer to the risk warnings that have been sent to them by Goldman Sachs International. A copy of these risks warnings, and a glossary of certain financial terms used in this report, are available from Goldman Sachs International on request. European Union and United Kingdom: Disclosure information in relation to Article 6 (2) of the European Commission Delegated Regulation (EU) (2016/958) supplementing Regulation (EU) No 596/2014 of the European Parliament and of the Council (including as that Delegated Regulation is implemented into United Kingdom domestic law and regulation following the United Kingdom’s departure from the European Union and the European Economic Area) with regard to regulatory technical standards for the technical arrangements for objective presentation of investment recommendations

El
Goldman Sachs Global Investment Research 27
Top of Mind Issue 97
or other information recommending or suggesting an investment strategy and for disclosure of particular interests or indications of conflicts of interest is available at https://www.gs.com/disclosures/europeanpolicy.html which states the European Policy for Managing Conflicts of Interest in Connection with Investment Research. Japan: Goldman Sachs Japan Co., Ltd. is a Financial Instrument Dealer registered with the Kanto Financial Bureau under registration number Kinsho 69, and a member of Japan Securities Dealers Association, Financial Futures Association of Japan and Type II Financial Instruments Firms Association. Sales and purchase of equities are subject to commission pre-determined with clients plus consumption tax. See company-specific disclosures as to any applicable disclosures required by Japanese stock exchanges, the Japanese Securities Dealers Association or the Japanese Securities Finance Company. Global product; distributing entities The Global Investment Research Division of Goldman Sachs produces and distributes research products for clients of Goldman Sachs on a global basis. Analysts based in Goldman Sachs offices around the world produce research on industries and companies, and research on macroeconomics, currencies, commodities and portfolio strategy. This research is disseminated in Australia by Goldman Sachs Australia Pty Ltd (ABN 21 006 797 897); in Brazil by Goldman Sachs do Brasil Corretora de Títulos e Valores Mobiliários S.A.; Ombudsman Goldman Sachs Brazil: 0800 727 5764 and / or [email protected]. Available Weekdays (except holidays), from 9am to 6pm. Ouvidoria Goldman Sachs Brasil: 0800 727 5764 e/ou [email protected]. Horário de funcionamento: segunda-feira à sexta-feira (exceto feriados), das 9h às 18h; in Canada by either Goldman Sachs Canada Inc. or Goldman Sachs & Co. LLC; in Hong Kong by Goldman Sachs (Asia) L.L.C.; in India by Goldman Sachs (India) Securities Private Ltd.; in Japan by Goldman Sachs Japan Co., Ltd.; in the Republic of Korea by Goldman Sachs (Asia) L.L.C., Seoul Branch; in New Zealand by Goldman Sachs New Zealand Limited; in Russia by OOO Goldman Sachs; in Singapore by Goldman Sachs (Singapore) Pte. (Company Number: 198602165W); and in the United States of America by Goldman Sachs & Co. LLC. Goldman Sachs International has approved this research in connection with its distribution in the United Kingdom and European Union. European Union: Goldman Sachs International authorised by the Prudential Regulation Authority and regulated by the Financial Conduct Authority and the Prudential Regulation Authority, has approved this research in connection with its distribution in the European Union and United Kingdom. Effective from the date of the United Kingdom’s departure from the European Union and the European Economic Area (“Brexit Day”) the following information with respect to distributing entities will apply: Goldman Sachs International (“GSI”), authorised by the Prudential Regulation Authority (“PRA”) and regulated by the Financial Conduct Authority (“FCA”) and the PRA, has approved this research in connection with its distribution in the United Kingdom. European Economic Area: GSI, authorised by the PRA and regulated by the FCA and the PRA, disseminates research in the following jurisdictions within the European Economic Area: the Grand Duchy of Luxembourg, Italy, the Kingdom of Belgium, the Kingdom of Denmark, the Kingdom of Norway, the Republic of Finland, Portugal, the Republic of Cyprus and the Republic of Ireland; GS -Succursale de Paris (Paris branch) which, from Brexit Day, will be authorised by the French Autorité de contrôle prudentiel et de resolution (“ACPR”) and regulated by the Autorité de contrôle prudentiel et de resolution and the Autorité des marches financiers (“AMF”) disseminates research in France; GSI - Sucursal en España (Madrid branch) authorized in Spain by the Comisión Nacional del Mercado de Valores disseminates research in the Kingdom of Spain; GSI - Sweden Bankfilial (Stockholm branch) is authorized by the SFSA as a “third country branch” in accordance with Chapter 4, Section 4 of the Swedish Securities and Market Act (Sw. lag (2007:528) om värdepappersmarknaden) disseminates research in the Kingdom of Sweden; Goldman Sachs Bank Europe SE (“GSBE”) is a credit institution incorporated in Germany and, within the Single Supervisory Mechanism, subject to direct prudential supervision by the European Central Bank and in other respects supervised by German Federal Financial Supervisory Authority (Bundesanstalt für Finanzdienstleistungsaufsicht, BaFin) and Deutsche Bundesbank and disseminates research in the Federal Republic of Germany and those jurisdictions within the European Economic Area where GSI is not authorised to disseminate research and additionally, GSBE, Copenhagen Branch filial af GSBE, Tyskland, supervised by the Danish Financial Authority disseminates research in the Kingdom of Denmark; GSBE - Sucursal en España (Madrid branch) subject (to a limited extent) to local supervision by the Bank of Spain disseminates research in the Kingdom of Spain; GSBE - Succursale Italia (Milan branch) to the relevant applicable extent, subject to local supervision by the Bank of Italy (Banca d’Italia) and the Italian Companies and Exchange Commission (Commissione Nazionale per le Società e la Borsa “Consob”) disseminates research in Italy; GSBE - Succursale de Paris (Paris branch), supervised by the AMF and by the ACPR disseminates research in France; and GSBE - Sweden Bankfilial (Stockholm branch), to a limited extent, subject to local supervision by the Swedish Financial Supervisory Authority (Finansinpektionen) disseminates research in the Kingdom of Sweden. General disclosures This research is for our clients only. Other than disclosures relating to Goldman Sachs, this research is based on current public information that we consider reliable, but we do not represent it is accurate or complete, and it should not be relied on as such. The information, opinions, estimates and forecasts contained herein are as of the date hereof and are subject to change without prior notification. We seek to update our research as appropriate, but various regulations may prevent us from doing so. Other than certain industry reports published on a periodic basis, the large majority of reports are published at irregular intervals as appropriate in the analyst's judgment. Goldman Sachs conducts a global full-service, integrated investment banking, investment management, and brokerage business. We have investment banking and other business relationships with a substantial percentage of the companies covered by our Global Investment Research Division. Goldman Sachs & Co. LLC, the United States broker dealer, is a member of SIPC (https://www.sipc.org). Our salespeople, traders, and other professionals may provide oral or written market commentary or trading strategies to our clients and principal trading desks that reflect opinions that are contrary to the opinions expressed in this research. Our asset management area, principal trading desks and investing businesses may make investment decisions that are inconsistent with the recommendations or views expressed in this research. We and our affiliates, officers, directors, and employees, will from time to time have long or short positions in, act as principal in, and buy or sell, the securities or derivatives, if any, referred to in this research, unless otherwise prohibited by regulation or Goldman Sachs policy. The views attributed to third party presenters at Goldman Sachs arranged conferences, including individuals from other parts of Goldman Sachs, do not necessarily reflect those of Global Investment Research and are not an official view of Goldman Sachs. Any third party referenced herein, including any salespeople, traders and other professionals or members of their household, may have positions in the products mentioned that are inconsistent with the views expressed by analysts named in this report. This research is focused on investment themes across markets, industries and sectors. It does not attempt to distinguish between the prospects or performance of, or provide analysis of, individual companies within any industry or sector we describe. Any trading recommendation in this research relating to an equity or credit security or securities within an industry or sector is reflective of the investment theme being discussed and is not a recommendation of any such security in isolation. This research is not an offer to sell or the solicitation of an offer to buy any security in any jurisdiction where such an offer or solicitation would be illegal. It does not constitute a personal recommendation or take into account the particular investment objectives, financial situations, or needs of individual clients. Clients should consider whether any advice or recommendation in this research is suitable for their particular circumstances and, if appropriate, seek professional advice, including tax advice. The price and value of investments referred to in this research and the income from them

El
Goldman Sachs Global Investment Research 28
Top of Mind Issue 97
may fluctuate. Past performance is not a guide to future performance, future returns are not guaranteed, and a loss of original capital may occur. Fluctuations in exchange rates could have adverse effects on the value or price of, or income derived from, certain investments. Certain transactions, including those involving futures, options, and other derivatives, give rise to substantial risk and are not suitable for all investors. Investors should review current options and futures disclosure documents which are available from Goldman Sachs sales representatives or at https://www.theocc.com/about/publications/character-risks.jsp and https://www.fiadocumentation.org/fia/regulatory-disclosures_1/fia-uniform-futures-and-options-on-futures-risk-disclosures-booklet-pdf-version-2018. Transaction costs may be significant in option strategies calling for multiple purchase and sales of options such as spreads. Supporting documentation will be supplied upon request. Differing Levels of Service provided by Global Investment Research: The level and types of services provided to you by the Global Investment Research division of GS may vary as compared to that provided to internal and other external clients of GS, depending on various factors including your individual preferences as to the frequency and manner of receiving communication, your risk profile and investment focus and perspective (e.g., marketwide, sector specific, long term, short term), the size and scope of your overall client relationship with GS, and legal and regulatory constraints. As an example, certain clients may request to receive notifications when research on specific securities is published, and certain clients may request that specific data underlying analysts’ fundamental analysis available on our internal client websites be delivered to them electronically through data feeds or otherwise. No change to an analyst’s fundamental research views (e.g., ratings, price targets, or material changes to earnings estimates for equity securities), will be communicated to any client prior to inclusion of such information in a research report broadly disseminated through electronic publication to our internal client websites or through other means, as necessary, to all clients who are entitled to receive such reports. All research reports are disseminated and available to all clients simultaneously through electronic publication to our internal client websites. Not all research content is redistributed to our clients or available to third-party aggregators, nor is Goldman Sachs responsible for the redistribution of our research by third party aggregators. For research, models or other data related to one or more securities, markets or asset classes (including related services) that may be available to you, please contact your GS representative or go to https://research.gs.com. Disclosure information is also available at https://www.gs.com/research/hedge.html or from Research Compliance, 200 West Street, New York, NY 10282. © 2021 Goldman Sachs. No part of this material may be (i) copied, photocopied or duplicated in any form by any means or (ii) redistributed without the prior written consent of The Goldman Sachs Group, Inc.