printmgr file - Goldman Sachs Asset Management
120
Goldman Sachs Funds Annual Report October 31, 2021 Strategic Multi-Asset Class Funds Multi-Manager Global Equity Multi-Manager Non-Core Fixed Income Multi-Manager Real Assets Strategy
-
Upload
khangminh22 -
Category
Documents
-
view
0 -
download
0
Transcript of printmgr file - Goldman Sachs Asset Management

Goldman Sachs Funds
Annual Report October 31, 2021
Strategic Multi-Asset Class FundsMulti-Manager Global Equity
Multi-Manager Non-Core Fixed Income
Multi-Manager Real Assets Strategy

Goldman Sachs StrategicMulti-Asset Class Funds
� MULTI-MANAGER GLOBAL EQUITY
� MULTI-MANAGER NON-CORE FIXED INCOME
� MULTI-MANAGER REAL ASSETS STRATEGY
TABLE OF CONTENTS
Market Review 1
Portfolio Management Discussions and Performance Summaries 3
Schedules of Investments 21
Financial Statements 77
Financial Highlights 81
Multi-Manager Global Equity 81
Multi-Manager Non-Core Fixed Income 82
Multi-Manager Real Assets Strategy 83
Notes to Financial Statements 84
Report of Independent Registered Public Accounting Firm 102
Other Information 103
NOT FDIC-INSURED May Lose Value No Bank Guarantee

M A R K E T R E V I E W
Goldman Sachs Strategic Multi-AssetClass Funds
Market ReviewThe capital markets produced strongly positive returns during the Reporting Period, driven by an economic rebound from the
depths of the COVID-19 pandemic as well as by continued historic fiscal stimulus and ongoing accommodative monetary policies
from central banks and governments around the world.
In the global equity markets, the Reporting Period started off on a strong note, with the MSCI All Country World Index (“MSCI
ACWI”) Investable Market Index gaining approximately 18% in November and December 2020 overall. During those two months,
global equities advanced on news that highly effective COVID-19 vaccines had been produced and would soon roll out to the
public. Also, the U.S. saw the election of a new President, removing some political uncertainty. Moving into 2021, global equity
markets continued to perform well. In the first and second calendar quarters, global equities, as represented by the MSCI ACWI
Investable Market Index, rose approximately 5% and 7%, respectively. The MSCI ACWI Investable Market Index fell back
slightly in the third quarter, declining about 1%, and then rebounded about 5% during October to finish the Reporting Period with a
gain of approximately 38% overall. Volatility was generally low during the Reporting Period as a whole, driven by the ebb and
flow of COVID-19 cases as well as by market reaction to fiscal and monetary stimulus. Fiscal stimulus remained robust, with the
U.S. federal government authorizing in March 2021 $1.9 trillion of additional COVID-19 relief spending and investors anticipating
further spending for infrastructure and social programs. As for monetary policy, the U.S. Federal Reserve (the “Fed”) kept short-
term interest rates near historic lows during the Reporting Period. Fed policymakers also signaled they might soon begin tapering
the Fed’s asset purchase program and could later raise interest rates, which led to modest short-term market volatility, mainly
among information technology stocks and other long-duration growth stocks that generally benefit from a low rate environment.
(Long-duration stocks are those that tend to deliver a higher proportion of their cash flows in the distant future.) Although growth
stocks advanced during the Reporting Period, they lagged value stocks, which did comparatively better amid the cyclical economic
recovery from the COVID-19 crisis. Energy and financials stocks were particularly strong, as demand for energy rebounded
sharply and supply constraints drove prices higher, especially in the latter part of the Reporting Period. Demand for physical goods
was robust and supply chains were strained, contributing to an annualized inflation rate of 6.2% — the highest since
November 1990. Concerns about inflation and corresponding wage increases weighed on market sentiment, as many investors
focused on the Fed’s monetary policy, but in the end, these pressures did not keep the markets from trending higher. During the
Reporting Period overall, developed markets equities were especially strong, with U.S. stock returns edging out those of developed
European and Asian equities. The performance of emerging markets stocks was also robust, though more muted than that of
developed market stocks, mainly due to a decline in the Chinese equity market. Worries about China’s economic growth, the
strength of corporate balance sheets and the increasing involvement of the Chinese government in the private sector dampened
investor sentiment.
Credit markets broadly rallied during the Reporting Period amid positive news about the effectiveness of COVID-19 vaccines and
the conclusion of U.S. elections. They were further supported by robust global economic growth, health of the consumer balance
sheet, additional fiscal and monetary stimulus, improving investor sentiment and strong company financial results. That said, credit
markets experienced some measure of volatility during the Reporting Period due to the waning effects of fiscal and monetary
stimulus, investors’ worries about inflation and disruptions to the global supply chain. High yield corporate bonds outperformed all
other fixed income sectors during the Reporting Period, driven by lower-rated credits — particularly CCC-rated bonds — and the
energy sector, which benefited from rising commodity prices. In this environment, high yield credit spreads tightened, and yields
within the broad high yield corporate bond market compressed. (Credit spreads are yield differentials between corporate bonds and
U.S. Treasury securities of comparable maturity.) Leveraged loans, especially lower-rated loans, also performed strongly, fueled
by robust investor demand for floating rate assets as well as declining default rate expectations. Within the emerging markets,
U.S. dollar-denominated debt outperformed local currency-denominated debt due to the strength of the U.S. dollar. The U.S. dollar
was supported during the Reporting Period by strong U.S. economic growth and higher U.S. interest rates. As for investment grade
corporate bonds, they lagged these fixed income sectors, primarily because of their longer duration profile as U.S. interest rates
rose. (Duration is a measure of bonds’ sensitivity to changes in interest rates.) However, investment grade credit spreads remained
near historical tights during the Reporting Period because of robust investor demand for investment grade corporate bonds.
Global real estate securities performed strongly during the Reporting Period overall and outperformed the broader global equity
markets. Following significant challenges for the asset class in early 2020 due to the COVID-19 pandemic, performance rebounded
1

M A R K E T R E V I E W
substantially during the Reporting Period, starting in November 2020, as news of promising COVID-19 vaccines drove confidence
in a near-term economic reopening. Among the best performers in the early part of the Reporting Period were property types, such
as malls, shopping centers, offices and hotels, with business models dependent on foot traffic that had been disproportionately hurt
by COVID-19 lockdown measures. Health care real estate investment trusts (“REITs”) also performed strongly, reflecting a
rebound in the senior housing segment, which had been significantly impacted by the COVID-19 health crisis. Less
COVID-19-sensitive property types, such as industrial properties, single family housing rentals, data centers and self-storage
REITs, which had experienced secular growth tailwinds even before the pandemic, notched gains but lagged the broader recovery
among global real estate securities in the early part of the Reporting Period. During the Reporting Period overall, property types
with secular growth tailwinds, including industrial, self-storage and residential REITs, outperformed. Retail REITs also did well,
outpacing other cyclically-sensitive property types. Conversely, hotel, diversified, office and health care REITs performed the
worst during the Reporting Period as a whole. Regionally, North American real estate securities performed the strongest, while
Asia Pacific real estate securities performed the weakest.
Global infrastructure securities performed strongly during the Reporting Period but trailed the broader global equity market. Sector
and industry-level dispersion remained elevated, as positive COVID-19 vaccine news in November 2020 drove a rebound in the
more cyclically-sensitive areas of the global infrastructure market, such as North American midstream energy and certain
industrials (e.g., airports, marine ports, and construction and engineering). (The midstream component of the energy industry is
usually defined as those companies providing products or services that help link the supply side, i.e., energy producers, and the
demand side, i.e., energy end-users, for any type of energy commodity. Such midstream businesses can include, but are not limited
to, those that process, store, market and transport various energy commodities.) Meanwhile, more traditionally defensive sectors,
notably utilities, underperformed the broader global infrastructure market during the Reporting Period. Digitally-oriented
infrastructure sectors (e.g., cell towers and U.S. and European data centers) also lagged but continued to exhibit strong returns on
an absolute basis because of secular industry tailwinds. Within midstream energy, companies that performed particularly well
during the Reporting Period overall were generally those with business models sensitive to commodity prices or those focused on
natural gas transportation or export activities. The latter group benefited from a spike in natural gas prices due to significant global
demand and constrained supply in Europe and Asia heading into winter. Regionally, North American infrastructure securities,
which constitute the majority of the investable opportunity set among listed infrastructure securities, and Latin American
infrastructure securities were the strongest performing market segments during the Reporting Period overall. Asia (ex-Japan) and
the U.K. lagged but still experienced strong absolute performance. Europe (ex-U.K.) performed roughly in line with the broad
global infrastructure market during the Reporting Period, while Japan experienced negative absolute performance.
Looking AheadAt the end of the Reporting Period, we believed inflation, its effects on central bank monetary policy and the potential for
additional fiscal stimulus were major items to watch in the short to medium term. The debate over whether recent higher inflation
would be transitory or more structural was likely to continue, in our view, with important ramifications for Fed monetary policy
and interest rates. Additionally, key initiatives for physical infrastructure and social programs were pending in the U.S. Congress,
with the potential for historic levels of additional stimulative spending. (In November 2021, after the end of the Reporting Period,
a $1 trillion bipartisan infrastructure bill was passed by Congress and signed into law by the President.) Although such spending
was likely to affect the U.S. deficit and national debt, we believed the capital markets would digest the impact. Lastly, while
COVID-19 cases were broadly trending lower at the end of the Reporting Period amid higher vaccination rates, we expected the
market to remain mindful of the pandemic, especially the potential for new variants, which, among other factors, could cause
medical caseloads to grow once again.
2

P O R T F O L I O R E S U L T S
Goldman Sachs Multi-ManagerGlobal Equity Fund
Investment Objective
The Fund seeks to provide long-term capital growth.
Portfolio Management Discussion and AnalysisBelow, the Goldman Sachs Multi-Asset Solutions (“MAS”) Group (formerly, the Goldman Sachs Global Portfolio
Solutions Group) and the Goldman Sachs Alternative Investments & Manager Selection (“AIMS”) Group discuss the
Goldman Sachs Multi-Manager Global Equity Fund’s (the “Fund”) performance and positioning for 12-month period
ended October 31, 2021 (the “Reporting Period”).
Q How did the Fund perform during the ReportingPeriod?
A During the Reporting Period, the Fund’s Class R6 Shares
generated an average annual total return of 42.93%. This
return compares to the 38.33% average annual total return of
the Fund’s benchmark, the MSCI All Country World Index
Investable Market Index (“MSCI ACWI IMI”) (Net, USD,
50% Non-U.S. Developed Hedged to USD) (the “Index”),
during the same time period.
Q What key factors were responsible for the Fund’sperformance during the Reporting Period?
A The Fund uses a multi-manager approach and generally seeks
to achieve its investment objective by dynamically allocating
its assets among unaffiliated investment managers
(“Underlying Managers”) that employ a mix of international,
global and U.S.-focused equity investment strategies. The
MAS Group is responsible for the Fund’s asset allocation,
wherein it applies a risk-based approach that draws from
both fundamental and quantitative disciplines with the
intention of dynamically accessing a diversified set of risks
and returns in a market cycle aware manner. The AIMS
Group is responsible for making recommendations with
respect to hiring, terminating or replacing the Fund’s
Underlying Managers and applying a multifaceted process
for manager due diligence, portfolio construction and risk
management. The MAS Group also provides certain risk
management services to the Fund.
During the Reporting Period, the Fund generated a positive
absolute return and outperformed the Index. The Fund’s
relative outperformance can be attributed to the performance
of the Fund’s Underlying Managers overall. Strategic asset
allocation also outperformed the Index during the Reporting
Period.
At various points during the Reporting Period, the Fund had
capital allocated to 12 Underlying Managers — Axiom
International Investors LLC (“Axiom”); Boston Partners
Global Investors, Inc. (“Boston Partners”), Causeway Capital
Management LLC (“Causeway”), DWS Investment
Management Americas, Inc. (“DIMA”), GW&K Investment
Management, LLC (“GW&K”), Massachusetts Financial
Services Company, doing business as MFS Investment
Management, (“MFS”), Principal Global Investors, LLC
(“Principal”); Vaughan Nelson Investment Management,
L.P. (“Vaughan Nelson”), Vulcan Value Partners, LLC
(“Vulcan”), WCM Investment Management (“WCM”) and
Wellington Management Company LLP (“Wellington”).
These 11 Underlying Managers represented five market
segments across global equity as part of the Fund’s top-level
strategy allocation — U.S. large cap (QMA, Vaughan Nelson
and Vulcan); Europe, Australasia and Far East (“EAFE”)
large cap (Causeway, MFS and WCM); U.S. small cap
(Boston Partners and GW&K); EAFE small cap (Principal);
and emerging markets (Axiom and Wellington). DIMA
managed a diversified beta strategy for the Fund throughout
the Reporting Period.
Of the 11 Underlying Managers with allocated capital for the
entire Reporting Period, nine generated positive absolute
returns and two generated negative absolute returns during
the Reporting Period. QMA generated a positive absolute
return from the beginning of the Reporting Period until
September 24, 2021, when it was removed as an Underlying
Manager of the Fund.
On a relative basis, seven Underlying Managers
outperformed their respective benchmark indices and four
underperformed their respective benchmark indices during
the Reporting Period. QMA modestly outperformed its
benchmark index between the beginning of the Reporting
3

P O R T F O L I O R E S U L T S
Period and September 24, 2021, when it was removed as an
Underlying Manager for the Fund.
During the Reporting Period, the MAS Group managed a
passive currency overlay, which is designed to hedge
exposure to non-U.S. currencies by selling the currencies in
which the Fund’s equity securities are traded and investing in
the U.S. dollar. The currency overlay seeks to minimize
unintended currency exposures for the Fund. Also, in
connection with the risk management services it provides,
the MAS Group maintained passive equity exposure to the
Fund in order to keep the Fund’s beta closer to that of the
Index. (Beta refers to the component of the returns that is
attributable market risk exposure, rather than manager skill.)
The Fund’s performance relative to the Index was aided by
manager selection, which contributed positively to returns
overall during the Reporting Period. The most significant
outperformance during the Reporting Period came from
Underlying Managers with an international focus, including
EAFE large-cap value manager Causeway and EAFE
large-cap core-oriented manager MFS, both of which
outperformed the MSCI EAFE Index, in addition to EAFE
large-cap growth manager WCM, which outperformed the
MSCI ACWI ex USA Index. Also adding to the Fund’s
relative outperformance were Underlying Mangers with a
dynamic approach, including U.S. large-cap managers
Vaughan Nelson and Vulcan, both of which outpaced the
S&P 500® Index. These positive results were partially offset
by Underlying Managers with a small-cap focus, including
EAFE small-cap manager Principal, which underperformed
the MSCI World ex USA Small Cap Index, and U.S.
small-cap value manager Boston Partners, which
underperformed the Russell 2000® Value Index, during the
Reporting Period.
Strategic asset allocation, which reflects a longer-term
perspective to diversify and invest across global equity
markets, outperformed the Index during the Reporting Period.
This outperformance was due to the Fund’s overweight
positions relative to the Index in U.S. and EAFE small-cap
equities versus its underweight in U.S. large-cap equities.
U.S. and EAFE small-cap equities outpaced their large-cap
counterparts during the Reporting Period, benefiting from
news in late 2020 of effective COVID-19 vaccines and the
increasing number of vaccinations throughout the first ten
months of 2021. (Small-cap companies had been more
severely affected by the spread of COVID-19 than large-cap
companies during 2020.) These positive results were offset
somewhat by the Fund’s overweight in EAFE large-cap
equities versus its underweight in U.S. large-cap equities,
which detracted from performance. During the Reporting
Period, U.S. large-cap equities outperformed EAFE large-cap
equities, as the U.S. economy staged a strong recovery from
the effects of the COVID-19 pandemic, even as variants
emerged in winter 2020 and summer 2021. Additional factors
supporting U.S. large-cap equities were the U.S. Federal
Reserve’s continued accommodative monetary policy,
ongoing fiscal support from global governments and a strong
rally in U.S. large-cap cyclical stocks.
Q Which global equity asset classes mostsignificantly affected Fund performance?
A In U.S. large cap, which we measure relative to the
S&P 500® Index, Underlying Manager Vulcan outperformed
the benchmark index because of strong stock selection within
the financials and health care sectors. Underlying Manager
Vaughan Nelson also outperformed the benchmark index,
largely due to strong stock selection in health care and
information technology. As for Underlying Manager QMA,
it modestly outperformed the benchmark index between the
beginning of the Reporting Period through September 24,
2021, when it was removed as an Underlying Manager of the
Fund. QMA’s relative outperformance was driven by
exposure to the value factor, with exposure to the quality and
growth factors also contributing positively.
In U.S. small cap, Boston Partners, the value-oriented
Underlying Manager, underperformed the Russell 2000®
Value Index because of weak stock selection in the consumer
discretionary and energy sectors. Underlying Manager
GW&K outperformed the Russell 2000® Index due to strong
stock selection in the health care and information technology
sectors.
In EAFE large cap, Underlying Manager WCM
outperformed its benchmark index, the MSCI ACWI ex USA
Index, due to strong security selection within the information
technology and health care sectors. Underlying Manager
MFS outperformed its benchmark index, the MSCI EAFE
Index, because of effective stock selection in the consumer
discretionary sector. Regionally, an underweight allocation to
and stock selection in Japan added to relative returns.
Underlying Manager Causeway outperformed its benchmark
index, the MSCI EAFE Index, as a result of strong stock
selection in the financials and industrials sectors. These
positive results were offset slightly by weak stock selection
in the information technology sector, which detracted from
relative performance.
4

P O R T F O L I O R E S U L T S
In EAFE small cap, Underlying Manager Principal
underperformed its benchmark index, the MSCI World ex
USA Small Cap Index, because of weak stock selection
within the consumer discretionary and industrials sectors. On
a regional basis, stock selection in continental Europe and
developed Asia (ex-Japan) also detracted from relative
returns.
In emerging markets, which we measure relative to the MSCI
Emerging Markets Index, Underlying Manager Wellington
outperformed, with positive contributions from the
momentum factor, including both short-term and long-term
signals, and the value factor, including both the pure value
and fair value signals. Conversely, the quality theme
detracted from results. Underlying Manager Axiom
underperformed the benchmark index due to an underweight
position and weak stock selection in the financials and
materials sectors. These negative results were partially offset
by an overweight position and strong stock selection in
information technology and industrials, which added value.
Regionally, stock selection in Latin America detracted from
relative performance, while effective stock selection in
emerging Asia contributed positively.
Diversified beta manager DIMA underperformed its
benchmark index, the MSCI World Index, as a result of
exposure to both momentum and low volatility factors, both
of which struggled in the 2021 calendar year to date through
October 31. These negative results were offset somewhat by
exposure to the value factor, which performed strongly
during the Reporting Period.
Q How did the Fund use derivatives and similarinstruments during the Reporting Period?
A During the Reporting Period, the MAS Group managed a
passive currency overlay that sought to minimize unintended
currency exposures for the Fund. As part of this currency
overlay, the MAS Group used forward foreign currency
exchange contracts, which had a positive impact on
performance. The MAS Group also used equity futures
within the Fund’s U.S. large-cap equity allocation in an
effort to maintain target exposure relative to the Index and to
facilitate the capital required for the currency overlay. This
had a positive impact on the Fund’s performance. In
addition, during the Reporting Period, the Fund employed
equity futures to equitize its cash holdings and manage
investment inflows. The use of equity futures for this purpose
did not have a meaningful impact of the Fund’s performance.
Underlying Manager QMA used equity index futures to
manage exposure and tracking error relative to its respective
benchmark indices during certain market events, such as
dividend accrual periods or small corporate actions. QMA’s
use of equity index futures had a neutral impact on the
Fund’s performance. Other Underlying Managers employed
rights and warrants to implement their strategies. The use of
rights and warrants did not have a material impact on the
Fund’s performance during the Reporting Period overall.
Q Were there any notable changes in the Fund’sallocations during the Reporting Period?
A In January 2021, we increased the Fund’s equity beta by
increasing its allocations to U.S. large-cap equities and U.S.
and EAFE small-cap equities.
During September 2021, QMA was removed as an
Underlying Manager of the Fund because of our concerns
about senior personnel turnover, the potential of business
distractions and whether QMA would be able to meet our
return expectations going forward. Also in September, we
added a Fund position in the Vanguard S&P 500 ETF. This
passive ETF seeks to track the investment results of the
S&P 500® Index, which measures the performance of
large-cap stocks.
Regarding the Fund’s strategic asset allocation, the Fund’s
assets were allocated at the beginning of the Reporting
Period 46.2% to U.S. large cap, 29.6% to EAFE large cap,
6.4% to U.S. small cap, 4.8% to EAFE small cap and 12.7%
to emerging markets, with the remainder in cash and cash
equivalents. At the end of the Reporting Period, the Fund’s
assets were allocated 50.7% to U.S. large cap, 28.1% to
EAFE large cap, 7.5% to U.S. small cap, 5.1% to EAFE
small cap, 11.9% to emerging markets and 0.4% to cash and
cash equivalents. This sector breakout is inclusive of
derivative exposure across all asset classes.
Q Were there any changes to the Fund’s portfoliomanagement team during the Reporting Period?
A Effective February 3, 2021, Kate El-Hillow no longer served
as a portfolio manager for the Fund, and Siwen Wu became a
portfolio manager for the Fund. By design, all investment
decisions for the Fund are performed within a team structure,
with multiple subject matter experts. This strategic decision
making has been the cornerstone of our approach and ensures
continuity in the Fund. At the end of the Reporting Period,
Neill Nuttall, Betsy Gorton and Siwen Wu were portfolio
managers for the Fund.
5

P O R T F O L I O R E S U L T S
Q What is the Fund’s tactical view and strategy forthe months ahead?
A Overall, we intend to continue to position the Fund in
alignment with our longer-term strategic views within the
equity complex as a complement to additional strategic
market exposures. We further intend to continue to monitor
allocations and Underlying Manager performance as we seek
to generate long-term capital growth.
6

F U N D B A S I C S
Multi-Manager Global Equity Fundas of October 31, 2021
T O P T E N H O L D I N G S A S O F 1 0 / 3 1 / 2 1 1 , 2
Holding % of Net Assets Line of Business
Vanguard S&P 500 ETF 10.1% Exchange Traded FundsiShares MSCI USA Multifactor ETF 4.0 Exchange Traded FundsiShares MSCI International Multifactor ETF 2.0 Exchange Traded FundsMicrosoft Corp. 1.7 SoftwareAmazon.com, Inc. 1.4 Internet & Direct Marketing RetailNVIDIA Corp. 1.4 Semiconductors & Semiconductor EquipmentMastercard, Inc. Class A 1.3 IT ServicesMeta Platforms, Inc. Class-A 1.3 Interactive Media & ServicesAlphabet, Inc. Class A 1.1 Interactive Media & ServicesApple, Inc. 1.1 Technology Hardware, Storage & Peripherals
1 The top 10 holdings may not be representative of the Fund’s future investments.2 The Fund’s overall top 10 holdings differ from the table above due to the exclusion of the Goldman Sachs Financial Square
Government Fund, which represents approximately 6.5% of the Fund’s net assets as of 10/31/21.
F U N D C O M P O S I T I O N 3
as of 10/31/20as of 10/31/21
0.5%
0.3%
Com
mon
Sto
cks
85.0
%
77.5
%
Exch
ange
Trad
ed F
unds
16.4
%
5.9%
Inve
stm
ent C
ompa
nies
0.0%
0.1%
Pref
erre
d St
ocks
0%
10%
20%
100%
80%
90%
70%
60%
50%
40%
30%Ri
ghts
7.4%
6.5%
3 The percentage shown for each investment category reflects the value of investments in that category as a percentage of net assets.Figures in the graph may not sum to 100% due to the exclusion of other assets and liabilities. Underlying compositions ofexchange traded funds and investment companies held by the Fund are not reflected in the graph above. The graph depicts theFund’s investments but may not represent the Fund’s market exposure due to the exclusion of certain derivatives, if any, as listedin the Additional Investment Information section of the Schedule of Investments.
For more information about your Fund, please refer to www.GSAMFUNDS.com. There, you can learn more about your Fund’s
investment strategies, holdings, and performance.
7

G O L D M A N S A C H S M U L T I - M A N A G E R G L O B A L E Q U I T Y F U N D
Performance SummaryOctober 31, 2021
The following graph shows the value, as of October 31, 2021, of a $1,000,000 investment made on June 24, 2015 (commencement
of operations) in Class R6 Shares at NAV. For comparative purposes, the performance of the Fund’s benchmark, the MSCI ACWI
IMI (Net, USD, 50% Non-U.S. Developed Hedged to USD) is shown. Performance reflects applicable fee waivers and/or expense
limitations in effect during the periods shown and in their absence, performance would be reduced. Returns do not reflect the
deduction of taxes that a shareholder would pay on Fund distributions or the redemption of Fund shares. The returns set forth
below represent past performance. Past performance does not guarantee future results. The Fund’s investment return and principal
value will fluctuate so that an investor’s shares, when redeemed, may be worth more or less than their original cost. Current
performance may be lower or higher than the performance quoted below. Please visit our web site at www.GSAMFUNDS.com to
obtain the most recent month-end returns.
Goldman Sachs Multi-Manager Global Equity Fund’s Lifetime Performance
Performance of a $1,000,000 Investment, with distributions reinvested, from June 24, 2015 through October 31, 2021.
$1,200,000
$1,400,000
$1,600,000
$1,000,000
10/174/1710/164/16 10/184/1810/15$800,000
$2,000,000
$1,800,000 $1,828,518
$1,944,781
6/24/15
Class R6 Shares
MSCI ACWI IMI (Net,USD, 50% Non-U.S.Developed Hedged to USD)
10/2110/19 10/204/19 4/20 4/21
Average Annual Total Return through October 31, 2021 One Year Five Years Since Inception
Class R6 (Commenced June 24, 2015)* 42.93% 13.91% 9.95%
* Effective January 16, 2018, Institutional Shares were redesignated as Class R6 Shares. These returns assume reinvestment of all distributions atNAV. Because Class R6 Shares do not involve a sales charge, such a charge is not applied to their Average Annual Total Returns.
8

P O R T F O L I O R E S U L T S
Goldman Sachs Multi-Manager Non-CoreFixed Income Fund
Investment Objective
The Fund seeks a total return consisting of income and capital appreciation.
Portfolio Management Discussion and AnalysisBelow, the Goldman Sachs Multi-Asset Solutions (“MAS”) Group (formerly, the Goldman Sachs Global Portfolio
Solutions Group) and the Goldman Sachs Alternative Investments & Manager Selection (“AIMS”) Group discuss the
Goldman Sachs Multi-Manager Non-Core Fixed Income Fund’s (the “Fund”) performance and positioning for 12-month
period ended October 31, 2021 (the “Reporting Period”).
Q How did the Fund perform during the ReportingPeriod?
A During the Reporting Period, the Fund’s Class R6 Shares
generated an average annual total return of 7.47%. This
return compares to the 6.09% average annual total return of
the Fund’s benchmark, the Multi-Manager Non-Core Fixed
Income Composite Dynamic Index (the “Index”), during the
same time period.
The Index is comprised of the Bloomberg Global High Yield
Corporate Index (Gross, USD, Unhedged) (the “Bloomberg
Index”), the Credit Suisse Leveraged Loan Index (Gross,
USD, Unhedged) (the “Credit Suisse Index”), the J.P.
Morgan Emerging Market Bond Index (“EMBISM”) Global
Diversified Index (Gross, USD, Unhedged) (the “J.P.
Morgan EMBISM Index”) and the J.P. Morgan Government
Bond Index — Emerging Markets (“GBI-EMSM”) Global
Diversified Index (Gross, USD, Unhedged) (the “J.P.
Morgan GBI-EMSM Index”), which are weighted in
accordance with the relative market capitalizations of each
constituent index (as determined by the constituent index
providers) as of the last business day of the previous calendar
year. During the Reporting Period, the Bloomberg Index, the
Credit Suisse Index, the J.P. Morgan EMBISM Index and the
J.P. Morgan GBI-EMSM Index returned 8.83%, 8.51%,
4.41% and 0.84%, respectively.
Q What key factors were responsible for the Fund’sperformance during the Reporting Period?
A The Fund uses a multi-manager approach and generally seeks
to achieve its investment objective by dynamically allocating
its assets among unaffiliated investment managers
(“Underlying Managers”) that employ a non-core fixed
income investment strategy. (Non-core fixed income
includes non-investment grade securities, bank loans and
emerging markets debt). The MAS Group is responsible for
the Fund’s asset allocation, wherein it applies a risk-based
approach that draws from both fundamental and quantitative
disciplines with the intention of dynamically accessing a
diversified set of risks and returns in a market cycle aware
manner. The AIMS Group is responsible for making
recommendations with respect to hiring, terminating or
replacing the Fund’s Underlying Managers and applying a
multifaceted process for manager due diligence, portfolio
construction and risk management.
During the Reporting Period, the Fund recorded a positive
absolute return and outperformed the Index. The Fund’s
relative outperformance can be attributed to the performance
of the Underlying Managers overall. Strategic asset
allocation also outperformed the Index during the Reporting
Period.
At various points during the Reporting Period, the Fund had
seven Underlying Managers, though not all were allocated
capital. The seven Underlying Managers were Ares Capital
Management II LLC (“Ares”), BlueBay Asset Management
LLP/BlueBay Asset Management USA (“BlueBay”),
Brigade Capital Management, LP (“Brigade”), Marathon
Asset Management, L.P. (“Marathon”), Nuveen Asset
Management, LLC (“Nuveen”) (formerly, Symphony Asset
Management LLC), River Canyon Fund Management LLC
(“River Canyon”), and TCW Investment Management
Company LLC (“TCW”).
These seven Underlying Managers represented five sectors
across non-core fixed income as part of the Fund’s top-level
strategy allocation — high yield (Ares, BlueBay and
Brigade), bank loans (Nuveen), external emerging markets
debt (Marathon), local emerging markets debt (TCW) and
structured credit (River Canyon).
9

P O R T F O L I O R E S U L T S
Of the six Underlying Managers with allocated capital for the
entire Reporting Period, all six generated positive absolute
returns during the Reporting Period. Underlying Manager
Ares did not have allocated capital during the Reporting
Period.
On a relative basis, four Underlying Managers outperformed
their respective benchmark indices and two underperformed
their respective benchmark indices during the Reporting
Period.
Strategic asset allocation, which reflects a longer-term
perspective to diversify and invest in non-core fixed income
sectors, outperformed the Index during the Reporting Period.
The outperformance was driven largely by an overweight
relative to the Index in high yield corporate bonds and
structured credit relative versus an underweight in emerging
markets debt broadly. (Structured credit refers to instruments
that pool debt obligations and sell the resulting cash flows,
such as collateralized mortgage obligations or collateralized
loan obligations (“CLOs”).) During the Reporting Period,
credit spreads (or yield differentials between corporate bonds
and U.S. Treasury securities of comparable maturity)
compressed during the Reporting Period, as corporate bonds
recovered from the adverse effects of the COVID-19
pandemic. In addition, strong and ongoing financial support
from governments and central banks globally helped to
dampen market volatility and drive investor interest in high
yield corporate bonds, bank loans and structured products.
Meanwhile, emerging markets debt struggled, particularly
during the first quarter of 2021, as developed economies
were able to ramp up COVID-19 vaccinations at a
comparatively faster pace. In addition, during the Reporting
Period, the Fund benefited from its underweight allocation to
local emerging markets debt, which posted negative returns
due in part to the depreciation of emerging markets
currencies.
Q Which non-core fixed income UnderlyingManagers most significantly affected Fundperformance?
A BlueBay, a high yield Underlying Manager, underperformed
the ICE BofA Global High Yield Investment Grade Country
Constrained Index during the Reporting Period. The
underperformance was driven primarily by positioning in the
emerging markets, specifically in China-based real estate
securities, though this was partly offset by positioning in
Europe, which contributed positively. Also weighing on
relative returns were investments in the transportation,
utilities and retail market segments. On the positive side,
overweight allocations to the media, banking and financial
services market segments added to relative performance.
Brigade, the other high yield Underlying Manager,
outperformed the ICE BofA Global High Yield Investment
Grade Country Constrained Index during the Reporting
Period. Strong credit selection within the real estate market
segment was the largest positive contributor to relative
returns, highlighted by a lack of exposure to Chinese real
estate companies. Another material driver of relative
outperformance was strong credit selection within the energy
market segment, primarily an investment in an independent
oil and gas company that rallied during the Reporting Period.
In addition, credit selection within the services, media and
capital goods market segments added to relative
performance. From a ratings perspective, credit selection
within B- and BB-rated credits and overweights in CCC- and
lower-rated credits bolstered performance. These positive
results were partly offset by a cash allocation and portfolio
hedging positions, which detracted.
Nuveen, the bank loans Underlying Manager, modestly
outperformed the Credit Suisse Leveraged Loan Index during
the Reporting Period. Strong issue selection within the
communication services, consumer discretionary, consumer
staples and energy market segments aided relative
performance. Within energy, a position in a large oil and gas
exploration company and a position in the bank loans of a
refined petroleum wholesaler contributed most positively. In
terms of credit quality, issue selection among CCC-rated
credits and an underweight in BB-rated credits enhanced
relative returns. Partially offsetting these positive results was
an underweight in select lower-quality issuers within the
industrials and information technology market segments,
which detracted. A moderate cash position was also a drag
on relative performance, as the bank loan market generated
gains during the Reporting Period.
TCW, the local emerging markets debt Underlying Manager,
outperformed the J.P. Morgan GBI-EMSM Global Diversified
Index during the Reporting Period. Adding most to relative
outperformance were positions in Egypt and South Africa as
well as security selection in Brazil and Poland. Currency
positions in Thailand and Turkey also contributed positively.
Conversely, security selection in Mexico and Colombia,
along with positioning in Uruguay, detracted from relative
returns as did currency positions in the Czech Republic and
Russia.
Marathon, the external emerging markets debt Underlying
Manager, underperformed the J.P. Morgan EMBISM Global
10

P O R T F O L I O R E S U L T S
Diversified Index. Relative underperformance was driven by
a long duration position in Peruvian interest rates, an
overweight in Argentina and an out-of-benchmark position in
Egypt. (Duration measures sensitivity to changes in interest
rates.) Security selection in Brazil and China detracted
further from relative performance.
River Canyon, the structured credit Underlying Manager,
outperformed the Bloomberg US CMBS Investment Grade
Total Return Index, largely because of its high quality focus
as the U.S. economy emerged from the depths of the
COVID-19 crisis. Security selection among CLOs and
commercial mortgage-backed securities also contributed
positively. A short duration position and income generation
added further to results. On the other hand, an allocation to
U.S. Treasury securities, which were used to manage
duration, detracted from performance during the Reporting
Period.
Q How did the Fund use derivatives and similarinstruments during the Reporting Period?
A During the Reporting Period, a specialized index of credit
default swaps (“CDX”) was used as a cost-efficient
instrument to help manage the Fund’s cash position. The use
of CDX had a positive impact on the Fund’s performance.
The Fund’s Underlying Managers employed credit default
swaps, warrants, U.S. Treasury futures, interest only
securities, forward foreign currency exchange contracts and
structured securities to implement their strategies. In
addition, the Fund’s Underlying Managers bought and sold
currency options during the Reporting Period. The use of
forward foreign currency exchange contracts by Underlying
Managers had a positive impact on the Fund’s performance,
while the use of U.S. Treasury futures and the purchase of
currency options each had a negative impact. The use of
credit default swaps, warrants, interest only securities and
structured securities, as well as the sale of currency options,
by Underlying Managers each had a neutral impact on the
Fund’s results during the Reporting Period.
Q Were there any notable changes in the Fund’sallocations during the Reporting Period?
A BlueBay has two legal entities — U.K.-based BlueBay Asset
Management LLC and U.S.-based BlueBay Asset
Management USA LLC. Effective August 11, 2021, the
U.S.-based entity was added as an Underlying Manager of
the Fund, allowing us to enhance BlueBay’s ability to
coordinate its management services to the Fund.
In terms of the Fund’s strategic allocation, at the start of the
Reporting Period, the Fund’s assets were allocated 42.2% to
high yield corporate bonds, 20.0% to bank loans, 17.6% to
local emerging markets debt, 13.2% to external emerging
markets debt and 5.0% to structured credit, with the
remainder in cash and cash equivalents. At the end of the
Reporting Period, the Fund’s assets were allocated 40.8% to
high yield corporate bonds, 22.0% to local emerging markets
debt, 18.2% to external emerging markets debt, 16.1% to
bank loans, 5.0% to structured credit and 0.7% to cash and
cash equivalents. This sector breakout is inclusive of
derivative exposure across all asset classes.
Q Were there any changes to the Fund’s portfoliomanagement team during the Reporting Period?
A Effective February 3, 2021, Kate El-Hillow no longer served
as a portfolio manager for the Fund, and Siwen Wu became a
portfolio manager for the Fund. By design, all investment
decisions for the Fund are performed within a team structure,
with multiple subject matter experts. This strategic decision
making has been the cornerstone of our approach and ensures
continuity in the Fund. At the end of the Reporting Period,
Neill Nuttall, Betsy Gorton and Siwen Wu were portfolio
managers for the Fund.
Q What is the Fund’s tactical view and strategy forthe months ahead?
A Overall, we intend to continue to position the Fund in
alignment with our longer-term strategic views on the
non-core fixed income market as a complement to additional
strategic market exposures. We further intend to continue to
monitor allocations and Underlying Manager performance as
we seek to generate total return consisting of income and
capital appreciation.
11

F U N D B A S I C S
Multi-Manager Non-Core Fixed Income Fundas of October 31, 2021
T O P T E N H O L D I N G S A S O F 1 0 / 3 1 / 2 1 1 , 2
Holding % of Net Assets Line of Business
iShares iBoxx High Yield Corporate Bond ETF 3.8% Exchange Traded FundsBrazil Notas do Tesouro Nacional 1.1 Foreign Debt ObligationsCanadian Government Bond 0.8 Foreign Debt ObligationsRepublic of South Africa 0.7 Foreign Debt ObligationsIntelsat Jackson Holdings SA 0.5 Bank LoansChina Government Bond 0.5 Foreign Debt ObligationsRegionalCare Hospital Partners Holdings, Inc. 0.5 Bank LoansRepublic of Chile 0.5 Foreign Debt ObligationsUnited Mexican States 0.5 Foreign Debt ObligationsChina Development Bank 0.5 Foreign Debt Obligations
1 The top 10 holdings may not be representative of the Fund’s future investments.2 The top The Fund’s overall top 10 holdings differ from the table above due to the exclusion of the Goldman Sachs Financial
Square Government Fund (a short-term investment fund), which represents approximately 9.2% of the Fund’s net assets as of10/31/21.
F U N D C O M P O S I T I O N 3
as of 10/31/20as of 10/31/21
Fore
ign
Debt
Obl
igat
ions
33.9
%
27.6
%
40.0
%
32.7
%Co
rpor
ate
Oblig
atio
ns
18.7
% 20.7
%Ba
nk L
oans
0%
10%
20%
50%
40%
30%
9.2%
7.6%
Inve
stm
ent C
ompa
nies
U.S.
Tre
asur
y Ob
ligat
ions
0.5%
0.0%
Colla
tera
lized
Mor
tgag
e Ob
ligat
ions
1.1%
0.5%
Com
mon
Sto
cks
War
rant
1.0% 1.3%
0.6%
0.2%
0.1%
0.0%
Exch
ange
Tra
ded
Fund
s0.
0%
3.8%
Com
mer
cial
Mor
tgag
e-Ba
cked
Sec
uriti
es
Asse
t-Bac
ked
Secu
ritie
s1.
9%
1.9%
3 The percentage shown for each investment category reflects the value of investments in that category as a percentage of net assets.Figures in the graph may not sum to 100% due to the exclusion of other assets and liabilities. Underlying sector allocations ofinvestment companies held by the Fund are not reflected in the graph above. The graph depicts the Fund’s investments but may notrepresent the Fund’s market exposure due to the exclusion of certain derivatives, if any, as listed in the Additional InvestmentInformation section of the Consolidated Schedule of Investments.
For more information about your Fund, please refer to www.GSAMFUNDS.com. There, you can learn more about your Fund’s
investment strategies, holdings, and performance.12

G O L D M A N S A C H S M U L T I - M A N A G E R N O N - C O R E F I X E D I N C O M E F U N D
Performance SummaryOctober 31, 2021
The following graph shows the value, as of October 31, 2021, of a $1,000,000 investment made on March 31, 2015
(commencement of operations) in Class R6 Shares at NAV. For comparative purposes, the performance of the Fund’s current
benchmark, the Multi-Manager Non-Core Fixed Income Composite Dynamic Index, which is comprised of the Bloomberg Global
High Yield Corporate Index (Gross, USD, Unhedged), the Credit Suisse Leveraged Loan Index (Gross, USD, Unhedged), the
J.P. Morgan EMBISM Global Diversified Index (Gross, USD, Unhedged) and the J.P. Morgan GBI-EMSM Global Diversified Index
(Gross, USD, Unhedged), is shown. Performance reflects applicable fee waivers and/or expense limitations in effect during the
periods shown and in their absence, performance would be reduced. Returns do not reflect the deduction of taxes that a shareholder
would pay on Fund distributions or the redemption of Fund shares. The returns set forth below represent past performance. Past
performance does not guarantee future results. The Fund’s investment return and principal value will fluctuate so that an investor’s
shares, when redeemed, may be worth more or less than their original cost. Current performance may be lower or higher than the
performance quoted below. Please visit our web site at www.GSAMFUNDS.com to obtain the most recent month-end returns.
Goldman Sachs Non-Core Fixed Income Fund’s Lifetime Performance
Performance of a $1,000,000 Investment, with distributions reinvested, from March 31, 2015 through October 31, 2021.
$1,100,000
$1,200,000
$1,300,000
$900,000
$1,000,000
10/174/1710/164/16 10/184/1810/15$800,000
$1,500,000
$1,400,000$1,436,636$1,377,794$1,353,665$1,318,546
$1,255,826
$1,132,987
3/31/15 10/2110/20 4/2110/194/19 4/20
Class R6 SharesMulti-Manager Non-Core FixedIncome Composite Dynamic Index
Bloomberg GlobalHigh-Yield Corporate Index(Gross, USD, Unhedged)
Credit Suisse Leveraged LoanIndex (Gross, USD, Unhedged)
J.P. Morgan EMBISM GlobalDiversified Index (Gross, USD,Unhedged)J.P. Morgan GBI EMSM GlobalDiversified Index (Gross, USD,Unhedged)
Average Annual Total Return through October 31, 2021 One year Five Years Since Inception
Class R6 (Commenced March 31, 2015)* 7.47% 3.96% 3.51%
* Effective January 16, 2018, Institutional Shares were redesignated as Class R6 Shares. These returns assume reinvestment of all distributions atNAV. Because Class R6 Shares do not involve a sales charge, such a charge is not applied to their Average Annual Total Returns.
13

P O R T F O L I O R E S U L T S
Goldman Sachs Multi-ManagerReal Assets Strategy Fund
Investment Objective
The Fund seeks to provide long-term capital growth through investments related to real assets.
Portfolio Management Discussion and AnalysisBelow, the Goldman Sachs Multi-Asset Solutions (“MAS”) Group (formerly, the Goldman Sachs Global Portfolio
Solutions Group) and the Goldman Sachs Alternative Investments & Manager Selection (“AIMS”) Group discuss the
Goldman Sachs Multi-Manager Real Assets Strategy Fund’s (the “Fund”) performance and positioning for 12-month
period ended October 31, 2021 (the “Reporting Period”).
Q How did the Fund perform during the ReportingPeriod?
A During the Reporting Period, the Fund’s Class R6 Shares
generated an average annual total return of 33.70%. This
return compares to the 35.83% average annual total return of
the Fund’s benchmark, the Multi-Manager Real Assets
Strategy Composite Dynamic Index (the “Index”), during the
same time period.
The Index is comprised of the FTSE EPRA/NAREIT
Developed Index (Net, USD, Unhedged) (the “FTSE Index”)
and the Dow Jones Brookfield Global Infrastructure Index
(Net, USD, Unhedged) (the “Dow Jones Brookfield Index”),
which are weighted in accordance with the relative market
capitalizations of each constituent index (as determined by
the constituent index providers) as of the last business day of
the previous calendar year. During the Reporting Period, the
FTSE Index and the Dow Jones Brookfield Index returned
42.46% and 26.63%, respectively.
Q What key factors were responsible for the Fund’sperformance during the Reporting Period?
A The Fund uses a multi-manager approach and generally seeks
to achieve its investment objective by dynamically allocating
its assets among unaffiliated investment managers
(“Underlying Managers”) that invest primarily in real assets.
(Real assets are defined broadly by the Fund and include any
assets that have physical properties or inflation sensitive
characteristics, such as energy, real estate, infrastructure,
commodities and inflation linked or floating rate fixed
income securities. Inflation is a sustained increase in prices
that erodes the purchasing power of money. Assets with
inflation sensitive characteristics are assets that benefit from
rising real cash flows in times of rising inflation.) The MAS
Group is responsible for the Fund’s asset allocation, wherein
it applies a risk-based approach that draws from both
fundamental and quantitative disciplines with the intention of
dynamically accessing a diversified set of risks and returns in
a market cycle aware manner. The AIMS Group is
responsible for making recommendations with respect to
hiring, terminating or replacing the Fund’s Underlying
Managers and applying a multifaceted process for manager
due diligence, portfolio construction and risk management.
The Fund posted a positive absolute return during the
Reporting Period but underperformed the Index in relative
terms. The Fund’s relative underperformance can be
attributed to the performance of the Underlying Managers
overall. Strategic asset allocation also underperformed the
Index during the Reporting Period.
During the Reporting Period, the Fund allocated capital to
four Underlying Managers — Cohen & Steers Capital
Management, Inc. (“Cohen & Steers”), PGIM Real Estate, a
business unit of PGIM, Inc. (“PGIM Real Estate”), Presima
Inc. (“Presima”) and RREEF America L.L.C. (“RREEF”), a
wholly-owned subsidiary of DWS Group GmbH & Co.
KGaA, an affiliate of Deutsche Bank AG. These four
Underlying Managers represented two sectors of real assets
as part of the Fund’s top-level strategy allocation — global
real estate (PGIM Real Estate and Presima) and global
infrastructure (Cohen & Steers and RREEF).
All four Underlying Managers with allocated capital during
the Reporting Period generated positive absolute returns
during the Reporting Period. On a relative basis, two of the
Underlying Managers outperformed their respective
benchmark indices and two of the Underlying Managers
underperformed their benchmark indices during the
Reporting Period.
Strategic asset allocation, which reflects a longer-term
perspective to diversify and invest across real assets,14

P O R T F O L I O R E S U L T S
underperformed the Index. During the Reporting Period, the
Fund’s strategic allocation to global real estate securities was
smaller than that of the Index, while its strategic allocation to
global infrastructure securities was larger. As a reminder, the
Index is weighted approximately 60% in real estate securities
and approximately 40% in global infrastructure securities.
During the Reporting Period, global equities broadly rallied,
driven by the robust performance of cyclically-oriented
sectors (e.g., energy, consumer discretionary and
communication services), as the development and rollout of
COVID-19 vaccines increased investor confidence in an
economic reopening and a services sector recovery. Global
real estate securities and global infrastructure securities both
participated in the rally, with global real estate securities
recording especially strong gains and outpacing global
infrastructure securities. Within global real estate, health care
real estate investment trusts (“REITs”), retail REITs and
hotel REITS were the top performers. Within global
infrastructure, the energy sector contributed most positively.
Q Which real assets asset classes most significantlyaffected Fund performance?
A In global real estate, which we measure against the FTSE
Index, Underlying Manager PGIM Real Estate
underperformed the benchmark index during the Reporting
Period. The negative results were driven by an underweight
and stock selection in retail REITs, select overweight
positions in Hong Kong property developers and stock
selection among hotel and resort REITs. On the positive side,
stock selection among specialized REITs, such as self-
storage and data centers, and health care REITs, such as
senior housing, added to relative performance.
Global real estate Underlying Manager Presima also
underperformed its benchmark index, largely because of
stock selection in European real estate operating companies,
an overweight and stock selection in industrial REITs, an
underweight in retail REITs and stock selection among office
REITs. Conversely, an overweight position and stock
selection in residential REITs and stock selection in hotel
and resort REITs contributed positively to relative
performance.
In global infrastructure, which we measure against the Dow
Jones Brookfield Index, Underlying Manager RREEF
outperformed the benchmark index. Strong stock selection
and an overweight position in North American midstream1
energy companies added to relative performance. These
positive results were offset somewhat by an underweight and
stock selection in North American communications
infrastructure companies, an overweight and stock selection
in European transport companies, out-of-benchmark
exposure to North American freight rails and stock selection
in North American and European electric utilities, all of
which detracted from relative returns.
Underlying Manager Cohen & Steers also outperformed its
benchmark index during the Reporting Period. Effective
stock selection in North American and Asia Pacific utilities,
as well as an overweight and stock selection in North
American midstream energy, bolstered relative performance.
Meanwhile, stock selection among transport companies in
Europe (ex-U.K.), Asia Pacific and Latin America were
relative detractors.
Q How did the Fund use derivatives and similarinstruments during the Reporting Period?
A Forward foreign currency exchange contracts were used by
Underlying Managers to facilitate equity transactions settling
in foreign currencies. The use of forward foreign currency
exchange contracts had a neutral impact on the Fund’s
performance during the Reporting Period. Rights were
employed to give the Fund the opportunity, but not the
obligation, to buy additional shares of a specific security at a
discount. The use of rights had a neutral impact on the
Fund’s performance. Real estate index futures were used to
equitize the Fund’s cash holdings. In other words, we put the
Fund’s cash holdings to work by using them as collateral for
the purchase of real estate index futures, which helped us
increase the Fund’s exposure to U.S. real estate securities.
The use of real estate index futures had a positive impact on
the Fund’s performance during the Reporting Period.
Q Were there any notable changes in the Fund’sallocations during the Reporting Period?
A In terms of the Fund’s strategic asset allocation, the Fund’s
assets were allocated 49.3% to global real estate and 49.3% to
global infrastructure, with the remainder in cash and cash
equivalents, at the beginning of the Reporting Period. At the
1 The midstream component of the energy industry is usually definedas those companies providing products or services that help link thesupply side, i.e., energy producers, and the demand side, i.e., energyend-users, for any type of energy commodity. Such midstreambusinesses can include, but are not limited to, those that process,store, market and transport various energy commodities.
15

P O R T F O L I O R E S U L T S
end of the Reporting Period, the Fund’s assets were allocated
54.2% to global real estate and 45.8% to global infrastructure,
with the remainder in cash and cash equivalents.
Q Were there any changes to the Fund’s portfoliomanagement team during the Reporting Period?
A Effective February 3, 2021, Kate El-Hillow no longer served
as a portfolio manager for the Fund, and Siwen Wu became a
portfolio manager for the Fund. By design, all investment
decisions for the Fund are performed within a team structure,
with multiple subject matter experts. This strategic decision
making has been the cornerstone of our approach and ensures
continuity in the Fund. At the end of the Reporting Period,
Neill Nuttall, Betsy Gorton, Yvonne Woo and Siwen Wu
were portfolio managers for the Fund.
Q What is the Fund’s tactical view and strategy forthe months ahead?
A Overall, we intend to continue to position the Fund in
alignment with our longer-term strategic views on the real
assets complex as a complement to additional strategic
market exposures. We further intend to continue to monitor
allocations and Underlying Manager performance as we seek
to generate long-term capital growth through investments
related to real assets.
16

F U N D B A S I C S
Multi-Manager Real Assets Strategy Fundas of October 31, 2021
T O P T E N E Q U I T Y H O L D I N G S A S O F 1 0 / 3 1 / 2 1 1
Holding % of Net Assets Line of Business
American Tower Corp. 3.3% Equity Real Estate Investment Trusts (REITs)Prologis, Inc. 2.8 Equity Real Estate Investment Trusts (REITs)Enbridge, Inc. 2.6 Oil, Gas & Consumable FuelsCrown Castle International Corp. 2.5 Equity Real Estate Investment Trusts (REITs)SBA Communications Corp. 2.2 Equity Real Estate Investment Trusts (REITs)Welltower, Inc. 2.0 Equity Real Estate Investment Trusts (REITs)Vinci SA 1.8 Construction & EngineeringCamden Property Trust 1.8 Equity Real Estate Investment Trusts (REITs)Cheniere Energy, Inc. 1.8 Oil, Gas & Consumable FuelsTC Energy Corp. 1.7 Oil, Gas & Consumable Fuels
1 The top 10 holdings may not be representative of the Fund’s future investments.
F U N D S E C T O R A L L O C A T I O N 2
as of 10/31/20as of 10/31/21
Real
Est
ate
61.2
%
60.0
%
Utili
ties
15.2
%
17.8
%
Com
mun
icat
ion
Serv
ices
1.8%
1.5%
8.7%11
.0%
Ener
gy
Info
rmat
ion
Tech
nolo
gy
0.2%
0.0%
0%
30%
10%
60%
20%
40%
50%
70%
80%
Indu
stria
ls7.
1%9.0%
1.7% 2.8%
Inve
stm
ent
Com
pani
es
2 The Fund is actively managed and, as such, its composition may differ over time. Consequently, the Fund’s overall sectorallocations may differ from the percentages contained in the graph above. The graph categorizes investments using the GlobalIndustry Classification Standard (“GICS”), however, the sector classifications used by the portfolio management team may differfrom GICS. The percentage shown for each investment category reflects the value of investments in that category as a percentageof market value. The graph depicts the Fund’s investments but may not represent the Fund’s market exposure due to the exclusionof certain derivatives, if any, as listed in the Additional Investment Information section of the Schedule of Investments.
For more information about your Fund, please refer to www.GSAMFUNDS.com. There, you can learn more about your Fund’s
investment strategies, holdings, and performance.
17

G O L D M A N S A C H S M U L T I - M A N A G E R R E A L A S S E T S S T R A T E G Y F U N D
Performance SummaryOctober 31, 2021
The following graph shows the value, as of October 31, 2021, of a $1,000,000 investment made on June 30, 2015 (commencement
of operations) in Class R6 Shares at NAV. For comparative purposes, the performance of the Fund’s current benchmark, the Multi-
Manager Real Assets Strategy Composite Dynamic Index, which is comprised of the FTSE EPRA/NAREIT Developed Index (Net,
USD, Unhedged) and the Dow Jones Brookfield Global Infrastructure Index (Net, USD, Unhedged), is shown. Performance
reflects applicable fee waivers and/or expense limitations in effect during the periods shown and in their absence, performance
would be reduced. Returns do not reflect the deduction of taxes that a shareholder would pay on Fund distributions or the
redemption of Fund shares. The returns set forth below represent past performance. Past performance does not guarantee future
results. The Fund’s investment return and principal value will fluctuate so that an investor’s shares, when redeemed, may be worth
more or less than their original cost. Current performance may be lower or higher than the performance quoted below. Please visit
our web site at www.GSAMFUNDS.com to obtain the most recent month-end returns.
Goldman Sachs Multi-Manager Real Assets Strategy Fund’s Lifetime Performance
Performance of a $1,000,000 Investment, with distributions reinvested, from June 30, 2015 through October 31, 2021.
$1,200,000
$1,000,000
10/1710/16 10/1810/15 4/16 4/17 4/18 4/19 4/20 4/21$800,000
$1,600,000
$1,400,000$1,492,682 $1,500,440 $1,510,771
$1,395,795
6/30/15 10/2110/2010/19
Class R6 Shares
Multi-Manager Real Assets StrategyComposite Dynamic Index
FTSE EPRA/NAREIT DevelopedIndex (Net, USD, Unhedged)
Dow Jones Brookfield GlobalInfrastructure Index(Net, USD, Unhedged)
Average Annual Total Return through October 31, 2021 One Year Five Years Since Inception
Class R6 (Commenced June 30, 2015)* 33.70% 8.30% 5.40%
* Effective January 16, 2018, Institutional Shares were redesignated as Class R6 Shares. These returns assume reinvestment of all distributions atNAV. Because Class R6 Shares do not involve a sales charge, such a charge is not applied to their Average Annual Total Returns.
18

P O R T F O L I O R E S U L T S
Index Definitions
Market Review
MSCI All Country World Index Investable Market Index captures large- and mid-cap representation across 23 developedmarkets and 27 emerging markets countries.
Multi-Manager Global Equity
MSCI All Country World Index Investable Market Index captures large- and mid-cap representation across 23 developedmarkets and 27 emerging markets countries.
MSCI Emerging Markets Index captures large-cap and mid-cap representation across 26 emerging markets countries. Theindex covers approximately 85% of the free float-adjusted market capitalization in each country.
S&P 500® Index is the Standard & Poor’s 500 composite index of 500 stocks, an unmanaged index of common stock prices.
Russell 2000® Index is an unmanaged index of common stock prices that measures the performance of the 2000 smallestcompanies in the Russell 3000® Index. The Index is constructed to provide a comprehensive and unbiased small-cap barometerand is completely reconstituted annually to ensure larger stocks do not distort the performance and characteristics of the truesmall-cap opportunity set.
Russell 2000® Value Index measures the performance of small-cap value segment of the U.S. equity universe. It includesthose Russell 2000 companies with lower price-to-book ratios and lower forecasted growth values. The Index is completelyreconstituted annually to ensure larger stocks do not distort the performance and characteristics of the true small-capopportunity set and that the represented companies continue to reflect value characteristics.
MSCI ACWI ex USA Index captures large and mid cap representation across 22 of 23 developed markets countries (excludingthe U.S.) and 27 emerging markets countries. With 2,217 constituents, the index covers approximately 85% of the global equityopportunity set outside the U.S.
MSCI EAFE Index is a stock market index that is designed to measure the equity market performance of developed markets inEurope, Australasia and the Far East, excluding the U.S. and Canada.
MSCI World ex USA Small Cap Index is an unmanaged index maintained by MSCI and considered representative of small-capstocks of global developed markets, excluding those of the U.S.
MSCI World Index is a broad global equity index that represents large and mid-cap equity performance across 23 developedmarkets countries. It covers approximately 85% of the free float-adjusted market capitalization in each country.
Multi-Manager Non-Core Fixed Income
Bloomberg Global High Yield Corporate Index is a multi-currency measure of the global high yield debt market.
ICE BofA Global High Yield Investment Grade Country Constrained Index contains all securities in the ICE BofA GlobalHigh Yield Index but caps issuer exposure at 2%. Index constituents are capitalization-weighted, based on their current amountoutstanding, provided the total allocation to an individual issuer does not exceed 2%. Issuers that exceed the limit are reducedto 2% and the face value of each of their bonds is adjusted on a pro-rata basis. Similarly, the face values of bonds of all otherissuers that fall below the 2% cap are increased on a pro-rata basis. In the event there are fewer than 50 issuers in the Index,each is equally weighted and the face values of their respective bonds are increased or decreased on a pro-rata basis.
Credit Suisse Leveraged Loan Index is designed to mirror the investable universe of the U.S. dollar-denominated leveragedloan market.
J.P. Morgan Emerging Market Bond Index (“EMBISM”) Global Diversified Index tracks total returns for U.S. dollar-denominated debt instruments issued by emerging market sovereign and quasi-sovereign entities.
J.P. Morgan Government Bond Index—Emerging Markets (“GBI-EMSM”) Global Diversified Index is a comprehensivelocal emerging markets index, consisting of regularly traded, fixed-rate, local currency government bonds.
19
P O R T F O L I O R E S U L T S
Multi-Manager Real Assets Strategy
FTSE EPRA/NAREIT Developed Index is designed to track the performance of listed real estate companies and real estateinvestment trusts (“REITs”) worldwide. The index incorporates REITs and real estate holding & development companies.
Dow Jones Brookfield Global Infrastructure Index intends to measure the stock performance of pure-play infrastructurecompanies domiciled globally. The index covers all sectors of the infrastructure market. Components are required to have morethan 70% of cash flows derived from infrastructure lines of business.
It is not possible to invest directly in an unmanaged index.
20

G O L D M A N S A C H S M U L T I - M A N A G E R G L O B A L E Q U I T Y F U N D
Schedule of InvestmentsOctober 31, 2021
Shares Description Value
Common Stocks – 77.5%
Australia – 0.6%1,000 Ampol Ltd. (Oil, Gas & Consumable
Fuels) $ 23,131342 Ansell Ltd. (Health Care Equipment &
Supplies) 8,188936 APA Group (Gas Utilities) 5,808
17,719 Charter Hall Group (Equity Real EstateInvestment Trusts (REITs)) 232,472
588 Coles Group Ltd. (Food & StaplesRetailing) 7,620
62 Commonwealth Bank of Australia(Banks) 4,914
4,026 CSL Ltd. (Biotechnology) 916,077220 Dexus (Equity Real Estate Investment
Trusts (REITs)) 1,80529,246 Downer EDI Ltd. (Commercial
Services & Supplies) 139,830430 Fortescue Metals Group Ltd. (Metals &
Mining) 4,4813,800 Goodman Group (Equity Real Estate
Investment Trusts (REITs)) 62,9164,765 IGO Ltd. (Metals & Mining) 34,893
180 JB Hi-Fi Ltd. (Specialty Retail) 6,8722,298 Medibank Pvt. Ltd. (Insurance) 5,7751,645 Mineral Resources Ltd. (Metals &
Mining) 48,36056,725 Mirvac Group (Equity Real Estate
Investment Trusts (REITs)) 121,06184,641 Nine Entertainment Co. Holdings Ltd.
(Media) 177,26055,072 NRW Holdings Ltd. (Construction &
Engineering) 76,37818,905 Orocobre Ltd.* (Metals & Mining) 127,6731,402 Orora Ltd. (Containers & Packaging) 3,5072,888 OZ Minerals Ltd. (Metals & Mining) 54,935
70,349 Perenti Global Ltd. (Metals & Mining) 54,4623,651 Pro Medicus, Ltd. (Health Care
Technology) 147,440217 Reece Ltd. (Trading Companies &
Distributors) 3,29141,142 Reliance Worldwide Corp. Ltd. (Building
Products) 180,9068,299 Seven Group Holdings Ltd. (Trading
Companies & Distributors) 135,5426,546 Shopping Centres Australasia Property
Group (Equity Real Estate InvestmentTrusts (REITs)) 13,752
192 Sonic Healthcare Ltd. (Health CareProviders & Services) 5,826
355 Suncorp Group Ltd. (Insurance) 3,14117,675 Super Retail Group Ltd. (Specialty
Retail) 173,398989 Washington H Soul Pattinson & Co. Ltd.
(Oil, Gas & Consumable Fuels) 24,35610,254 Wesfarmers Ltd. (Multiline Retail) 443,647
301 Woolworths Group Ltd. (Food & StaplesRetailing) 8,670
3,258,387
Shares Description Value
Common Stocks – (continued)
Austria – 0.1%57 ANDRITZ AG (Machinery) $ 3,238
3,221 BAWAG Group AG(a) (Banks) 202,5852,166 CA Immobilien Anlagen AG (Real Estate
Management & Development) 92,94170 OMV AG (Oil, Gas & Consumable
Fuels) 4,2384,939 S&T AG (IT Services) 118,6851,238 Telekom Austria AG (Diversified
Telecommunication Services) 10,69677 voestalpine AG (Metals & Mining) 2,925
5,446 Wienerberger AG (ConstructionMaterials) 192,791
628,099
Belgium – 0.2%14 Ageas SA (Insurance) 681
566 Cofinimmo SA (Equity Real EstateInvestment Trusts (REITs)) 91,315
39 D’ieteren Group (Distributors) 6,7255 Elia Group SA (Electric Utilities) 583
34 Groupe Bruxelles Lambert SA(Diversified Financial Services) 3,945
5,288 KBC Group NV (Banks) 492,434543 Proximus SADP (Diversified
Telecommunication Services) 10,226151 Sofina SA (Diversified Financial
Services) 66,8183,367 Warehouses De Pauw CVA (Equity Real
Estate Investment Trusts (REITs)) 153,322
826,049
Bermuda – 0.1%194 Arch Capital Group Ltd.* (Insurance) 8,113
3,850 Assured Guaranty Ltd. (Insurance) 213,9833,499 Axis Capital Holdings Ltd. (Insurance) 182,1939,182 Conduit Holdings Ltd. (Insurance) 55,291
13 Everest Re Group Ltd. (Insurance) 3,39912 RenaissanceRe Holdings Ltd. (Insurance) 1,702
464,681
Brazil – 0.3%46,128 Ambev SA ADR (Beverages) 136,53910,200 Banco Inter SA (Banks) 64,1594,200 Embraer SA* (Aerospace & Defense) 16,320
38,989 JBS SA (Food Products) 269,76915,000 Localiza Rent a Car SA (Road & Rail) 120,39797,100 Magazine Luiza SA (Multiline Retail) 185,98331,000 Marfrig Global Foods SA (Food
Products) 145,5587,700 Notre Dame Intermedica Participacoes
SA (Health Care Providers & Services) 87,56314,400 Vale SA (Metals & Mining) 182,71147,700 WEG SA (Electrical Equipment) 312,715
171 XP, Inc. Class A* (Capital Markets) 5,610
1,527,324
The accompanying notes are an integral part of these financial statements. 21

G O L D M A N S A C H S M U L T I - M A N A G E R G L O B A L E Q U I T Y F U N D
Schedule of Investments (continued)October 31, 2021
Shares Description Value
Common Stocks – (continued)
British Virgin Islands* – 0.0%2,929 National Energy Services Reunited Corp.
(Energy Equipment & Services) $ 34,2695,558 Nomad Foods Ltd. (Food Products) 151,345
185,614
Canada – 2.4%46,900 Air Canada* (Airlines) 840,91115,800 ARC Resources Ltd. (Oil, Gas &
Consumable Fuels) 151,54018,200 Argonaut Gold, Inc.* (Metals & Mining) 46,1775,500 ATS Automation Tooling Systems, Inc.*
(Machinery) 187,1402,731 BCE, Inc. (Diversified
Telecommunication Services) 140,5883,800 Boralex, Inc. Class A (Independent
Power and Renewable ElectricityProducers) 117,599
3,400 CAE, Inc.* (Aerospace & Defense) 103,1042,400 Canadian Apartment Properties REIT
(Equity Real Estate Investment Trusts(REITs)) 117,188
7,892 Canadian National Railway Co. (Road &Rail) 1,048,926
12,055 Canadian Pacific Railway Ltd. (Road &Rail) 933,057
33 Canadian Tire Corp. Ltd. Class A(Multiline Retail) 4,687
5,400 Capital Power Corp. (Independent Powerand Renewable Electricity Producers) 177,368
5,100 Capstone Mining Corp.* (Metals &Mining) 21,387
3,600 Empire Co. Ltd. Class A (Food & StaplesRetailing) 107,628
374 Enbridge, Inc. (Oil, Gas & ConsumableFuels) 15,666
8,681 Enerplus Corp. (Oil, Gas & ConsumableFuels) 82,209
9,200 First Capital Real Estate Investment Trust(Equity Real Estate Investment Trusts(REITs)) 131,429
82 Fortis, Inc. (Electric Utilities) 3,650722 George Weston Ltd. (Food & Staples
Retailing) 78,0111,820 Granite Real Estate Investment Trust
(Equity Real Estate Investment Trusts(REITs)) 147,529
282 Great-West Lifeco, Inc. (Insurance) 8,296810 Hydro One Ltd.(a) (Electric Utilities) 19,353
1,719 Intact Financial Corp. (Insurance) 230,4453,900 Interfor Corp. (Paper & Forest Products) 89,3074,400 Keyera Corp. (Oil, Gas & Consumable
Fuels) 112,773967 Loblaw Cos. Ltd. (Food & Staples
Retailing) 72,7281,265 Magna International, Inc. (Auto
Components) 102,899
Shares Description Value
Common Stocks – (continued)
Canada – (continued)149 Manulife Financial Corp. (Insurance) $ 2,903510 Masonite International Corp.* (Building
Products) 61,205200 Metro, Inc. (Food & Staples Retailing) 10,063
3,690 Northland Power, Inc. (IndependentPower and Renewable ElectricityProducers) 118,637
1,930 Novanta, Inc.* (Electronic Equipment,Instruments & Components) 333,041
453 Nuvei Corp.*(a) (IT Services) 54,4437,700 Parex Resources, Inc. (Oil, Gas &
Consumable Fuels) 149,5085,385 Power Corp. of Canada (Insurance) 179,3554,221 Ritchie Bros. Auctioneers, Inc.
(Commercial Services & Supplies) 288,505169 Rogers Communications, Inc. Class B
(Wireless Telecommunication Services) 7,860127 Royal Bank of Canada (Banks) 13,219570 Shopify, Inc. Class A* (IT Services) 836,036
9,058 SSR Mining, Inc. (Metals & Mining) 142,8673,250 Stantec, Inc. (Professional Services) 179,6228,200 Summit Industrial Income REIT (Equity
Real Estate Investment Trusts (REITs)) 156,63275 Sun Life Financial, Inc. (Insurance) 4,274
11,399 Suncor Energy, Inc. (Oil, Gas &Consumable Fuels) 299,804
791 TC Energy Corp. (Oil, Gas &Consumable Fuels) 42,790
2,221 TELUS Corp. (DiversifiedTelecommunication Services) 50,949
2,150 TFI International, Inc. (Road & Rail) 238,401217 The Bank of Nova Scotia (Banks) 14,227
6,114 The Descartes Systems Group, Inc.*(Software) 499,651
7,763 The Toronto-Dominion Bank (Banks) 563,533342 Thomson Reuters Corp. (Professional
Services) 41,1391,437 Toromont Industries Ltd. (Trading
Companies & Distributors) 127,8516,600 Tourmaline Oil Corp. (Oil, Gas &
Consumable Fuels) 238,54113,200 Wesdome Gold Mines Ltd.* (Metals &
Mining) 118,710500 West Fraser Timber Co. Ltd. (Paper &
Forest Products) 40,03372,115 Wheaton Precious Metals Corp.
(Metals & Mining) 2,914,167
12,819,561
Chile – 0.0%62,278 Cencosud SA (Food & Staples Retailing) 91,10112,792 Falabella SA (Multiline Retail) 35,374
126,475
22 The accompanying notes are an integral part of these financial statements.

G O L D M A N S A C H S M U L T I - M A N A G E R G L O B A L E Q U I T Y F U N D
Shares Description Value
Common Stocks – (continued)
China – 3.7%910,224 Agricultural Bank of China Ltd.
Class H (Banks) $ 309,3016,800 Airtac International Group
(Machinery) 203,4697,100 Alibaba Group Holding Ltd.*
(Internet & Direct Marketing Retail) 145,9957,186 Alibaba Group Holding Ltd. ADR*
(Internet & Direct Marketing Retail) 1,185,25950,000 Aluminum Corp. of China Ltd.
Class H* (Metals & Mining) 30,09046,000 Anhui Conch Cement Co. Ltd.
Class H (Construction Materials) 227,46623,000 ANTA Sports Products Ltd. (Textiles,
Apparel & Luxury Goods) 356,356944 Autohome, Inc. ADR (Interactive
Media & Services) 37,1464,049 Baidu, Inc. ADR* (Interactive
Media & Services) 656,9101,812,037 Bank of China Ltd. Class H (Banks) 641,283
492,363 Bank of Communications Co. Ltd.Class H (Banks) 292,898
454,000 Beijing Capital International AirportCo. Ltd. Class H* (TransportationInfrastructure) 295,220
7,500 BYD Co. Ltd. Class H (Automobiles) 286,85737,100 Centre Testing International Group
Co. Ltd. Class A (ProfessionalServices) 159,925
708,011 China Cinda Asset Management Co.Ltd. Class H (Capital Markets) 118,200
83,000 China CITIC Bank Corp. Ltd. SeriesH (Banks) 36,408
33,000 China Coal Energy Co. Ltd. Class H(Oil, Gas & Consumable Fuels) 20,133
175,515 China Construction Bank Corp.Class H (Banks) 119,452
216,000 China Energy Engineering Corp. Ltd.(Construction & Engineering) 31,926
49,709 China Everbright Bank Co. Ltd.Class H (Banks) 17,481
65,000 China Feihe Ltd.(a) (Food Products) 107,919248,662 China Galaxy Securities Co. Ltd.
Class H (Capital Markets) 138,44973,800 China International Capital Corp. Ltd.
Class H(a) (Capital Markets) 182,712190,000 China Longyuan Power Group Corp.
Ltd. Class H (Independent Power andRenewable Electricity Producers) 444,417
64,532 China Medical System Holdings Ltd.(Pharmaceuticals) 109,267
59,000 China Merchants Bank Co. Ltd.Class H (Banks) 494,428
150,000 China National Building Material Co.Ltd. Class H (Construction Materials) 187,994
406,000 China Petroleum & Chemical Corp.Class H (Oil, Gas & ConsumableFuels) 197,816
Shares Description Value
Common Stocks – (continued)
China – (continued)443,000 China Railway Group Ltd. Class H
(Construction & Engineering) $ 216,40341,245 China Shineway Pharmaceutical Group
Ltd. (Pharmaceuticals) 39,54293,000 China Suntien Green Energy Corp. Ltd.
Class H (Oil, Gas & Consumable Fuels) 73,91374,000 China Yongda Automobiles Services
Holdings Ltd. (Specialty Retail) 117,740102,000 Chinasoft International Ltd. (IT
Services) 170,3126,400 Chongqing Brewery Co. Ltd.*
(Beverages) 150,14130,500 CITIC Securities Co. Ltd. Class H
(Capital Markets) 77,4388,000 Contemporary Amperex Technology
Co. Ltd. Class A (Electrical Equipment) 801,37671,500 COSCO Shipping Holdings Co. Ltd.
Class H* (Marine) 110,74718,000 Country Garden Services Holdings Co.
Ltd. (Real Estate Management &Development) 138,573
1,533 Daqo New Energy Corp. ADR*(Semiconductors & SemiconductorEquipment) 119,252
130,000 Dongfeng Motor Group Co. Ltd.Class H (Automobiles) 121,076
22,000 Dongyue Group Ltd. (Chemicals) 51,1851,700 ENN Energy Holdings Ltd. (Gas
Utilities) 29,2884,779 FinVolution Group (Consumer Finance) 29,247
16,200 Ganfeng Lithium Co. Ltd. Class H(a)
(Metals & Mining) 303,51853,800 GF Securities Co. Ltd. Class H (Capital
Markets) 91,2518,500 Great Wall Motor Co. Ltd. Class H
(Automobiles) 38,246200,800 Guangzhou R&F Properties Co. Ltd.
Class H (Real Estate Management &Development) 125,611
42,800 Guotai Junan Securities Co. Ltd.Class H(a) (Capital Markets) 58,432
90,000 Haitong Securities Co. Ltd. Class H(Capital Markets) 80,066
20,800 Huatai Securities Co. Ltd. Class H(a)
(Capital Markets) 30,9328,969 HUYA, Inc. ADR* (Entertainment) 73,7251,345 JD.com, Inc. ADR* (Internet & Direct
Marketing Retail) 105,287130,000 Li Ning Co. Ltd. (Textiles, Apparel &
Luxury Goods) 1,434,55726,900 LONGi Green Energy Technology Co.
Ltd. Class A (Semiconductors &Semiconductor Equipment) 410,143
7,500 Meituan Class B*(a) (Internet & DirectMarketing Retail) 255,215
11,700 NetEase, Inc. (Entertainment) 226,953
The accompanying notes are an integral part of these financial statements. 23

G O L D M A N S A C H S M U L T I - M A N A G E R G L O B A L E Q U I T Y F U N D
Schedule of Investments (continued)October 31, 2021
Shares Description Value
Common Stocks – (continued)
China – (continued)3,384 NetEase, Inc. ADR (Entertainment) $ 330,2453,143 NIO, Inc. ADR* (Automobiles) 123,866
110,000 Orient Securities Co. Ltd. Class H(a)
(Capital Markets) 90,255490,000 PetroChina Co. Ltd. Class H (Oil, Gas &
Consumable Fuels) 236,2521,365 Pinduoduo, Inc. ADR* (Internet &
Direct Marketing Retail) 121,3769,000 Shenzhen Inovance Technology Co.
Ltd. Class A (Machinery) 91,6993,670 Shenzhen Mindray Bio-Medical
Electronics Co. Ltd. Class A (HealthCare Equipment & Supplies) 215,053
24,000 Shenzhou International Group HoldingsLtd. (Textiles, Apparel & LuxuryGoods) 517,061
2,500 Silergy Corp. (Semiconductors &Semiconductor Equipment) 413,013
57,000 Sinopec Engineering Group Co. Ltd.Class H (Construction & Engineering) 30,043
35,316 Tencent Holdings Ltd. (InteractiveMedia & Services) 2,148,265
387,000 The People’s Insurance Co. Group ofChina Ltd. Class H (Insurance) 120,714
192,000 Want Want China Holdings Ltd. (FoodProducts) 148,905
4,434 Weibo Corp. ADR* (InteractiveMedia & Services) 199,441
1,645 Wuliangye Yibin Co. Ltd. Class A(Beverages) 55,587
9,200 WuXi AppTec Co. Ltd. Class H(a) (LifeSciences Tools & Services) 196,431
77,078 Wuxi Biologics Cayman, Inc.*(a) (LifeSciences Tools & Services) 1,167,497
18,800 Wuxi Lead Intelligent Equipment Co.Ltd. Class A (Electronic Equipment,Instruments & Components) 239,539
14,600 Xiaomi Corp. Class B*(a) (TechnologyHardware, Storage & Peripherals) 39,910
103,500 Xtep International Holdings Ltd.(Textiles, Apparel & Luxury Goods) 135,357
1,867 Zai Lab, Ltd. ADR* (Biotechnology) 194,91533,500 Zhongsheng Group Holdings Ltd.
(Specialty Retail) 302,048
19,632,418
Colombia – 0.0%1,320 Bancolombia SA ADR (Banks) 47,428
Cyprus – 0.0%621 TCS Group Holding PLC GDR (Banks) 63,590
Denmark – 0.6%284 ALK-Abello A/S* (Pharmaceuticals) 123,044
6 AP Moller – Maersk A/S Class A(Marine) 16,474
2 AP Moller – Maersk A/S Class B(Marine) 5,796
Shares Description Value
Common Stocks – (continued)
Denmark – (continued)2,220 Carlsberg AS Class B (Beverages) $ 366,557
13 Coloplast A/S Class B (Health CareEquipment & Supplies) 2,123
62 Demant A/S* (Health Care Equipment &Supplies) 3,006
4,234 DSV A/S (Air Freight & Logistics) 984,05411,595 Novo Nordisk A/S Class B
(Pharmaceuticals) 1,271,448381 Rockwool International A/S Class B
(Building Products) 174,2371,454 Royal Unibrew A/S (Beverages) 180,6243,684 Vestas Wind Systems A/S (Electrical
Equipment) 159,258
3,286,621
Finland – 0.1%41 Elisa Oyj (Diversified
Telecommunication Services) 2,4742,668 Kesko Oyj Class B (Food & Staples
Retailing) 86,8295,572 Kojamo Oyj (Real Estate Management &
Development) 124,838117 Neste Oyj (Oil, Gas & Consumable
Fuels) 6,514425 QT Group Oyj* (Software) 68,762
289,417
France – 3.9%8,033 Air Liquide SA (Chemicals) 1,341,171
22,286 Alstom SA (Machinery) 794,2241,103 Arkema SA (Chemicals) 150,884
44,488 AXA SA (Insurance) 1,294,28982 BioMerieux (Health Care Equipment &
Supplies) 10,4441,990 BNP Paribas SA (Banks) 133,2051,358 Bollore SA (Entertainment) 7,893
235 Bouygues SA (Construction &Engineering) 9,521
5,285 Capgemini SE (IT Services) 1,232,2653,082 Carrefour SA (Food & Staples Retailing) 55,7963,792 Cellectis SA ADR* (Biotechnology) 40,802
121 Cie de Saint-Gobain (Building Products) 8,3502,555 Cie Generale des Etablissements
Michelin SCA (Auto Components) 401,6918,557 Constellium SE* (Metals & Mining) 157,534
13,627 Danone SA (Food Products) 888,2867,668 Dassault Systemes SE (Software) 447,791
43 Eiffage SA (Construction & Engineering) 4,42634,431 Engie SA (Multi-Utilities) 489,7863,256 EssilorLuxottica SA (Textiles, Apparel &
Luxury Goods) 673,6589,264 Eutelsat Communications SA (Media) 131,6702,916 Faurecia SE (Auto Components) 152,297
17 Gecina SA (Equity Real EstateInvestment Trusts (REITs)) 2,379
24 The accompanying notes are an integral part of these financial statements.
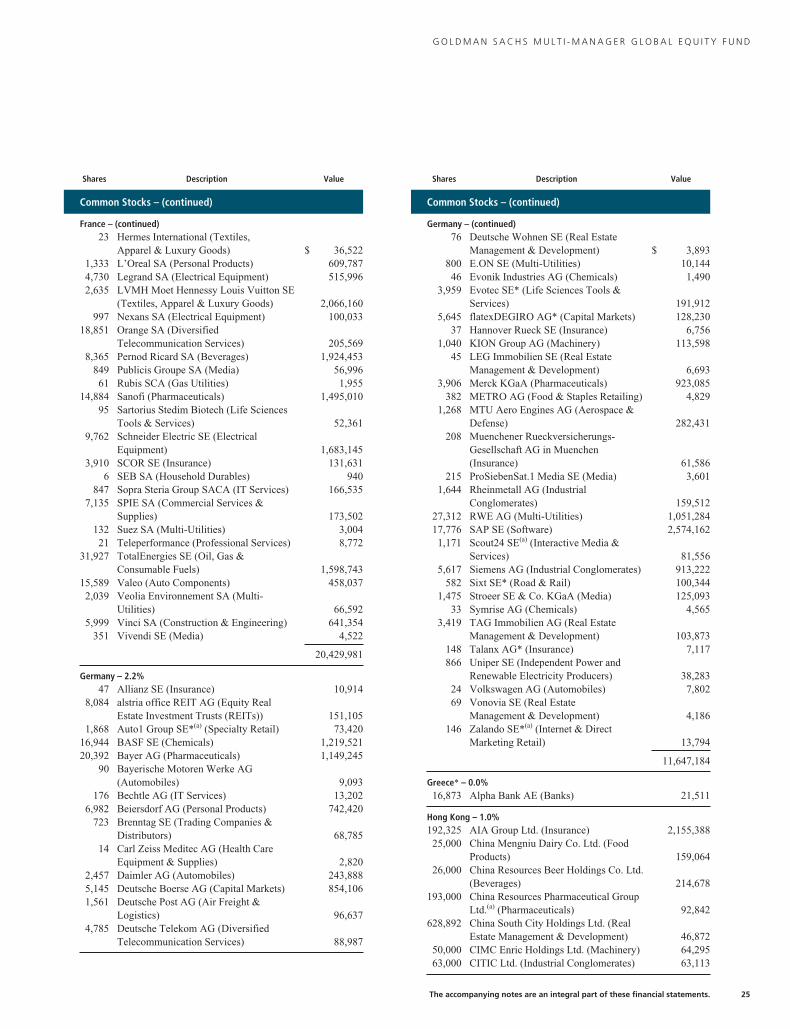
G O L D M A N S A C H S M U L T I - M A N A G E R G L O B A L E Q U I T Y F U N D
Shares Description Value
Common Stocks – (continued)
France – (continued)23 Hermes International (Textiles,
Apparel & Luxury Goods) $ 36,5221,333 L’Oreal SA (Personal Products) 609,7874,730 Legrand SA (Electrical Equipment) 515,9962,635 LVMH Moet Hennessy Louis Vuitton SE
(Textiles, Apparel & Luxury Goods) 2,066,160997 Nexans SA (Electrical Equipment) 100,033
18,851 Orange SA (DiversifiedTelecommunication Services) 205,569
8,365 Pernod Ricard SA (Beverages) 1,924,453849 Publicis Groupe SA (Media) 56,99661 Rubis SCA (Gas Utilities) 1,955
14,884 Sanofi (Pharmaceuticals) 1,495,01095 Sartorius Stedim Biotech (Life Sciences
Tools & Services) 52,3619,762 Schneider Electric SE (Electrical
Equipment) 1,683,1453,910 SCOR SE (Insurance) 131,631
6 SEB SA (Household Durables) 940847 Sopra Steria Group SACA (IT Services) 166,535
7,135 SPIE SA (Commercial Services &Supplies) 173,502
132 Suez SA (Multi-Utilities) 3,00421 Teleperformance (Professional Services) 8,772
31,927 TotalEnergies SE (Oil, Gas &Consumable Fuels) 1,598,743
15,589 Valeo (Auto Components) 458,0372,039 Veolia Environnement SA (Multi-
Utilities) 66,5925,999 Vinci SA (Construction & Engineering) 641,354
351 Vivendi SE (Media) 4,522
20,429,981
Germany – 2.2%47 Allianz SE (Insurance) 10,914
8,084 alstria office REIT AG (Equity RealEstate Investment Trusts (REITs)) 151,105
1,868 Auto1 Group SE*(a) (Specialty Retail) 73,42016,944 BASF SE (Chemicals) 1,219,52120,392 Bayer AG (Pharmaceuticals) 1,149,245
90 Bayerische Motoren Werke AG(Automobiles) 9,093
176 Bechtle AG (IT Services) 13,2026,982 Beiersdorf AG (Personal Products) 742,420
723 Brenntag SE (Trading Companies &Distributors) 68,785
14 Carl Zeiss Meditec AG (Health CareEquipment & Supplies) 2,820
2,457 Daimler AG (Automobiles) 243,8885,145 Deutsche Boerse AG (Capital Markets) 854,1061,561 Deutsche Post AG (Air Freight &
Logistics) 96,6374,785 Deutsche Telekom AG (Diversified
Telecommunication Services) 88,987
Shares Description Value
Common Stocks – (continued)
Germany – (continued)76 Deutsche Wohnen SE (Real Estate
Management & Development) $ 3,893800 E.ON SE (Multi-Utilities) 10,14446 Evonik Industries AG (Chemicals) 1,490
3,959 Evotec SE* (Life Sciences Tools &Services) 191,912
5,645 flatexDEGIRO AG* (Capital Markets) 128,23037 Hannover Rueck SE (Insurance) 6,756
1,040 KION Group AG (Machinery) 113,59845 LEG Immobilien SE (Real Estate
Management & Development) 6,6933,906 Merck KGaA (Pharmaceuticals) 923,085
382 METRO AG (Food & Staples Retailing) 4,8291,268 MTU Aero Engines AG (Aerospace &
Defense) 282,431208 Muenchener Rueckversicherungs-
Gesellschaft AG in Muenchen(Insurance) 61,586
215 ProSiebenSat.1 Media SE (Media) 3,6011,644 Rheinmetall AG (Industrial
Conglomerates) 159,51227,312 RWE AG (Multi-Utilities) 1,051,28417,776 SAP SE (Software) 2,574,1621,171 Scout24 SE(a) (Interactive Media &
Services) 81,5565,617 Siemens AG (Industrial Conglomerates) 913,222
582 Sixt SE* (Road & Rail) 100,3441,475 Stroeer SE & Co. KGaA (Media) 125,093
33 Symrise AG (Chemicals) 4,5653,419 TAG Immobilien AG (Real Estate
Management & Development) 103,873148 Talanx AG* (Insurance) 7,117866 Uniper SE (Independent Power and
Renewable Electricity Producers) 38,28324 Volkswagen AG (Automobiles) 7,80269 Vonovia SE (Real Estate
Management & Development) 4,186146 Zalando SE*(a) (Internet & Direct
Marketing Retail) 13,794
11,647,184
Greece* – 0.0%16,873 Alpha Bank AE (Banks) 21,511
Hong Kong – 1.0%192,325 AIA Group Ltd. (Insurance) 2,155,38825,000 China Mengniu Dairy Co. Ltd. (Food
Products) 159,06426,000 China Resources Beer Holdings Co. Ltd.
(Beverages) 214,678193,000 China Resources Pharmaceutical Group
Ltd.(a) (Pharmaceuticals) 92,842628,892 China South City Holdings Ltd. (Real
Estate Management & Development) 46,87250,000 CIMC Enric Holdings Ltd. (Machinery) 64,29563,000 CITIC Ltd. (Industrial Conglomerates) 63,113
The accompanying notes are an integral part of these financial statements. 25

G O L D M A N S A C H S M U L T I - M A N A G E R G L O B A L E Q U I T Y F U N D
Schedule of Investments (continued)October 31, 2021
Shares Description Value
Common Stocks – (continued)
Hong Kong – (continued)15,739 CK Hutchison Holdings Ltd. (Industrial
Conglomerates) $ 105,521855 CLP Holdings Ltd. (Electric Utilities) 8,371
184,000 CSPC Pharmaceutical Group Ltd.(Pharmaceuticals) 192,004
2,363 Hang Lung Group Ltd. (Real EstateManagement & Development) 5,533
4,205 Hong Kong Exchanges & Clearing Ltd.(Capital Markets) 253,316
36,740 Hopson Development Holdings Ltd.(Real Estate Management &Development) 99,696
29,000 Hysan Development Co. Ltd. (RealEstate Management & Development) 100,823
2,662 Kerry Logistics Network Ltd. (AirFreight & Logistics) 6,466
2,742 Kerry Properties Ltd. (Real EstateManagement & Development) 7,751
23,000 Kingboard Holdings Ltd. (ElectronicEquipment, Instruments & Components) 100,230
90,000 Kunlun Energy Co. Ltd. (Gas Utilities) 81,970243,723 Lenovo Group Ltd. (Technology
Hardware, Storage & Peripherals) 264,675610 Link REIT (Equity Real Estate
Investment Trusts (REITs)) 5,40416,500 LK Technology Holdings Ltd.
(Machinery) 41,17355,200 Man Wah Holdings Ltd. (Household
Durables) 85,43039,042 PCCW Ltd. (Diversified
Telecommunication Services) 20,100798 Power Assets Holdings Ltd. (Electric
Utilities) 4,87799,500 Shimao Group Holdings Ltd. (Real
Estate Management & Development) 156,084204,000 Sino Biopharmaceutical Ltd.
(Pharmaceuticals) 150,42675,715 Sinotruk Hong Kong Ltd. (Machinery) 104,5085,121 SITC International Holdings Co. Ltd.
(Marine) 17,30839,000 Sun Art Retail Group Ltd. (Food &
Staples Retailing) 22,86415,000 Swire Pacific Ltd. Class A (Real Estate
Management & Development) 94,29913,214 Techtronic Industries Co. Ltd.
(Machinery) 271,485512,000 Truly International Holdings Ltd.
(Electronic Equipment, Instruments &Components) 166,925
945 VTech Holdings Ltd. (CommunicationsEquipment) 7,277
38,000 Yue Yuen Industrial Holdings Ltd.*(Textiles, Apparel & Luxury Goods) 80,663
5,251,431
Shares Description Value
Common Stocks – (continued)
Hungary* – 0.1%7,455 OTP Bank Nyrt (Banks) $ 447,952
India – 1.8%12,682 Adani Enterprises Ltd. (Trading
Companies & Distributors) 241,43628,946 Adani Power Ltd.* (Independent Power
and Renewable Electricity Producers) 38,8425,563 Adani Total Gas Ltd. (Gas Utilities) 106,9386,190 Adani Transmission Ltd.* (Electric
Utilities) 145,8122,676 Apollo Hospitals Enterprise Ltd. (Health
Care Providers & Services) 152,6488,019 Asian Paints Ltd. (Chemicals) 332,3345,070 Bajaj Finance Ltd. (Consumer Finance) 502,786
590 Bajaj Finserv Ltd. (Diversified FinancialServices) 140,856
9,609 Balkrishna Industries Ltd. (AutoComponents) 316,536
6,341 Bharat Forge Ltd. (Auto Components) 65,1941,113 Colgate-Palmolive India Ltd. (Personal
Products) 22,959450 Deepak Nitrite Ltd. (Chemicals) 13,430
3,684 Divi’s Laboratories Ltd. (Life SciencesTools & Services) 253,490
614 Dr Lal PathLabs Ltd.(a) (Health CareProviders & Services) 28,840
12,553 Escorts Ltd. (Machinery) 263,914943 Gland Pharma Ltd.*(a) (Pharmaceuticals) 46,656
41,026 HDFC Bank Ltd. (Banks) 869,08812,219 Housing Development Finance Corp. Ltd.
(Thrifts & Mortgage Finance) 465,8709,121 ICICI Bank Ltd. (Banks) 98,2078,140 Indian Railway Catering & Tourism
Corp. Ltd. (Commercial Services &Supplies) 92,219
1,660 Info Edge India Ltd. (Interactive Media &Services) 135,087
21,613 Infosys Ltd. (IT Services) 483,67326,360 Infosys Ltd. ADR (IT Services) 587,30111,793 JSW Steel Ltd. (Metals & Mining) 105,624
756 L&T Technology Services Ltd.(a)
(Professional Services) 47,8311,542 Larsen & Toubro Infotech Ltd.(a) (IT
Services) 137,95213,056 Laurus Labs Ltd.(a) (Pharmaceuticals) 90,1742,914 Mindtree Ltd. (IT Services) 175,329
71,203 Motherson Sumi Systems Ltd. (AutoComponents) 213,376
97 MRF Ltd. (Auto Components) 100,29896 Page Industries Ltd. (Textiles, Apparel &
Luxury Goods) 48,37328,035 Power Finance Corp. Ltd. (Diversified
Financial Services) 49,96660,266 REC Ltd. (Diversified Financial Services) 119,94714,283 Reliance Industries Ltd. (Oil, Gas &
Consumable Fuels) 484,696
26 The accompanying notes are an integral part of these financial statements.

G O L D M A N S A C H S M U L T I - M A N A G E R G L O B A L E Q U I T Y F U N D
Shares Description Value
Common Stocks – (continued)
India – (continued)562 SRF Ltd. (Chemicals) $ 15,915
62,137 State Bank of India (Banks) 418,06418,939 Sun Pharmaceutical Industries Ltd.
(Pharmaceuticals) 201,39012,224 Tata Consultancy Services Ltd. (IT
Services) 555,636796 Tata Elxsi Ltd. (Software) 62,531
33,367 Tata Motors Ltd.* (Automobiles) 214,6505,979 Tata Steel Ltd. (Metals & Mining) 105,415
10,029 Tech Mahindra Ltd. (IT Services) 198,5155,036 Titan Co. Ltd. (Textiles, Apparel &
Luxury Goods) 160,6853,475 UltraTech Cement Ltd. (Construction
Materials) 354,899
9,265,382
Indonesia – 0.2%790,000 Aneka Tambang Tbk (Metals &
Mining) 130,738706,200 Bank Mandiri Persero Tbk PT (Banks) 357,035
1,142,400 Bank Rakyat Indonesia Persero TbkPT (Banks) 342,930
874,900 Multipolar Tbk PT* (Multiline Retail) 24,948237,600 Telekomunikasi Indonesia Persero
Tbk PT (DiversifiedTelecommunication Services) 63,507
919,158
Ireland – 1.8%3,030 Accenture PLC Class A (IT Services) 1,087,134
24 Allegion PLC (Building Products) 3,07914,322 Aon PLC Class A (Insurance) 4,581,89430,452 Bank of Ireland Group PLC* (Banks) 181,408
271 Eaton Corp. PLC (ElectricalEquipment) 44,650
4 Flutter Entertainment PLC* (Hotels,Restaurants & Leisure) 757
495 Glanbia PLC (Food Products) 8,08411,939 Grafton Group PLC (Trading
Companies & Distributors) 219,2902,670 ICON PLC* (Life Sciences Tools &
Services) 765,676570 Johnson Controls International PLC
(Building Products) 41,82187 Kerry Group PLC Class A (Food
Products) 11,6762,021 Linde PLC (Chemicals) 649,995
95 Medtronic PLC (Health CareEquipment & Supplies) 11,387
78 Pentair PLC (Machinery) 5,77011,966 Ryanair Holdings PLC ADR*
(Airlines) 1,358,26166 Seagate Technology Holdings PLC
(Technology Hardware, Storage &Peripherals) 5,879
2,698 STERIS PLC (Health CareEquipment & Supplies) 630,630
Shares Description Value
Common Stocks – (continued)
Ireland – (continued)172 Trane Technologies PLC (Building
Products) $ 31,120
9,638,511
Israel – 0.2%1,414 Bank Leumi Le-Israel BM (Banks) 13,510
120,377 Bezeq The Israeli TelecommunicationCorp. Ltd.* (DiversifiedTelecommunication Services) 150,996
4,404 Check Point Software TechnologiesLtd.* (Software) 526,719
811 CyberArk Software Ltd.* (Software) 146,0693,182 Israel Discount Bank Ltd. Class A*
(Banks) 19,22624 Nice Ltd.* (Software) 6,78589 Paz Oil Co. Ltd.* (Oil, Gas &
Consumable Fuels) 11,3431,257 The Phoenix Holdings Ltd. (Insurance) 15,8885,340 Tower Semiconductor Ltd.*
(Semiconductors & SemiconductorEquipment) 170,186
1,060,722
Italy – 0.9%1,500 Assicurazioni Generali SpA (Insurance) 32,663
15,281 Banca Mediolanum SpA (DiversifiedFinancial Services) 153,988
75,712 BPER Banca (Banks) 166,0044,685 Buzzi Unicem SpA (Construction
Materials) 109,270147,460 Enel SpA (Electric Utilities) 1,234,50321,738 Eni SpA (Oil, Gas & Consumable Fuels) 311,5593,700 ERG SpA (Independent Power and
Renewable Electricity Producers) 133,65932,687 Hera SpA (Multi-Utilities) 133,730
49 Interpump Group SpA (Machinery) 3,609172,615 Intesa Sanpaolo SpA (Banks) 490,60211,215 Mediobanca Banca di Credito
Finanziario SpA* (Banks) 133,826834 Poste Italiane SpA(a) (Insurance) 11,911
4,130 Prysmian SpA (Electrical Equipment) 156,15122,129 Snam SpA (Gas Utilities) 125,3341,103 Terna—Rete Elettrica Nazionale
(Electric Utilities) 8,218124,211 UniCredit SpA (Banks) 1,642,000
4,847,027
Japan – 4.3%2,100 ABC-Mart, Inc. (Specialty Retail) 100,934
1 Activia Properties, Inc. (Equity RealEstate Investment Trusts (REITs)) 4,100
2,700 ADEKA Corp (Chemicals) 60,0624 Advance Residence Investment Corp.
(Equity Real Estate Investment Trusts(REITs)) 13,126
The accompanying notes are an integral part of these financial statements. 27

G O L D M A N S A C H S M U L T I - M A N A G E R G L O B A L E Q U I T Y F U N D
Schedule of Investments (continued)October 31, 2021
Shares Description Value
Common Stocks – (continued)
Japan – (continued)3,400 Aeon Co. Ltd. (Food & Staples Retailing) $ 78,216
300 Air Water, Inc. (Chemicals) 4,590600 Aisin Corp. (Auto Components) 21,956100 Alfresa Holdings Corp. (Health Care
Providers & Services) 1,41017,000 Amada Co. Ltd. (Machinery) 167,9517,200 Anritsu Corp. (Electronic Equipment,
Instruments & Components) 119,394600 Azbil Corp. (Electronic Equipment,
Instruments & Components) 25,580100 Bridgestone Corp. (Auto Components) 4,424
4,700 Canon Marketing Japan, Inc. (ElectronicEquipment, Instruments & Components) 93,109
1,100 Canon, Inc. (Technology Hardware,Storage & Peripherals) 25,013
6,000 Casio Computer Co. Ltd. (HouseholdDurables) 84,907
2,200 Chubu Electric Power Co., Inc. (ElectricUtilities) 22,772
100 Chugai Pharmaceutical Co. Ltd.(Pharmaceuticals) 3,739
5,500 CKD Corp. (Machinery) 109,038200 Cosmo Energy Holdings Co. Ltd. (Oil,
Gas & Consumable Fuels) 4,0891,050 Cosmos Pharmaceutical Corp. (Food &
Staples Retailing) 160,4584,300 Daikin Industries Ltd. (Building
Products) 941,763500 Daio Paper Corp. (Paper & Forest
Products) 8,7989 Daiwa House REIT Investment Corp.
(Equity Real Estate Investment Trusts(REITs)) 25,827
2,600 Denka Co. Ltd (Chemicals) 85,1225,500 Denso Corp. (Auto Components) 398,723
100 Ebara Corp. (Machinery) 5,457400 Electric Power Development Co. Ltd.
(Independent Power and RenewableElectricity Producers) 5,288
29,600 ENEOS Holdings, Inc. (Oil, Gas &Consumable Fuels) 119,355
6,100 EXEO Group, Inc. (Construction &Engineering) 140,996
7,700 FANUC Corp. (Machinery) 1,521,682600 FUJIFILM Holdings Corp. (Technology
Hardware, Storage & Peripherals) 46,36650 Fujitsu Ltd. (IT Services) 8,641
5,300 Fukuoka Financial Group, Inc. (Banks) 95,21683 GLP J-REIT (Equity Real Estate
Investment Trusts (REITs)) 135,378500 GS Yuasa Corp. (Electrical Equipment) 10,885
2,700 Hanwa Co. Ltd. (Trading Companies &Distributors) 81,104
18,400 Hitachi Ltd. (Industrial Conglomerates) 1,060,291300 Honda Motor Co. Ltd. (Automobiles) 8,873
2,500 House Foods Group, Inc. (Food Products) 71,730
Shares Description Value
Common Stocks – (continued)
Japan – (continued)6,000 Hoya Corp. (Health Care Equipment &
Supplies) $ 883,251800 Iida Group Holdings Co. Ltd. (Household
Durables) 19,7242 Industrial & Infrastructure Fund
Investment Corp. (Equity Real EstateInvestment Trusts (REITs)) 3,667
4,200 Internet Initiative Japan, Inc. (DiversifiedTelecommunication Services) 146,951
11,800 ITOCHU Corp. (Trading Companies &Distributors) 336,546
1,300 Itoham Yonekyu Holdings, Inc. (FoodProducts) 7,927
500 Iwatani Corp. (Oil, Gas & ConsumableFuels) 29,533
2,100 Jafco Group Co. Ltd. (Capital Markets) 133,050189 Japan Hotel REIT Investment Corp.
(Equity Real Estate Investment Trusts(REITs)) 114,139
4 Japan Logistics Fund, Inc. (Equity RealEstate Investment Trusts (REITs)) 11,950
6 Japan Metropolitan Fund InvestmentCorp. (Equity Real Estate InvestmentTrusts (REITs)) 5,511
2,200 Japan Post Holdings Co. Ltd. (Insurance) 16,9051 Japan Real Estate Investment Corp.
(Equity Real Estate Investment Trusts(REITs)) 6,129
16,400 Japan Tobacco, Inc. (Tobacco) 321,9511,700 K’s Holdings Corp. (Specialty Retail) 17,549
400 Kajima Corp. (Construction &Engineering) 4,925
7,000 Kamigumi Co. Ltd. (TransportationInfrastructure) 140,945
700 Kandenko Co. Ltd. (Construction &Engineering) 5,426
100 Kaneka Corp. (Chemicals) 3,835100 KDDI Corp. (Wireless
Telecommunication Services) 3,05848 Kenedix Residential Next Investment
Corp. (Equity Real Estate InvestmentTrusts (REITs)) 92,315
1,320 Keyence Corp. (Electronic Equipment,Instruments & Components) 796,771
400 Kinden Corp. (Construction &Engineering) 6,564
310 Koei Tecmo Holdings Co. Ltd.(Entertainment) 14,430
6,200 Koito Manufacturing Co. Ltd. (AutoComponents) 351,777
400 KOKUYO Co. Ltd. (CommercialServices & Supplies) 6,088
300 Konami Holdings Corp. (Entertainment) 16,509600 Konica Minolta, Inc. (Technology
Hardware, Storage & Peripherals) 2,9702,800 Kose Corp. (Personal Products) 325,152
28 The accompanying notes are an integral part of these financial statements.

G O L D M A N S A C H S M U L T I - M A N A G E R G L O B A L E Q U I T Y F U N D
Shares Description Value
Common Stocks – (continued)
Japan – (continued)31,600 Kubota Corp. (Machinery) $ 673,1752,100 Kumagai Gumi Co. Ltd. (Construction &
Engineering) 51,9788,500 Kyocera Corp. (Electronic Equipment,
Instruments & Components) 497,6492,200 Kyudenko Corp. (Construction &
Engineering) 69,7844,800 Kyushu Electric Power Co., Inc. (Electric
Utilities) 33,8137 LaSalle Logiport REIT (Equity Real
Estate Investment Trusts (REITs)) 11,6453,300 Lasertec Corp. (Semiconductors &
Semiconductor Equipment) 715,821100 Lawson, Inc. (Food & Staples Retailing) 4,836100 Lixil Corp. (Building Products) 2,569
1,700 M&A Capital Partners Co, Ltd.* (CapitalMarkets) 95,888
5,100 Marubeni Corp. (Trading Companies &Distributors) 43,275
2,310 MatsukiyoCocokara & Co. (Food &Staples Retailing) 102,424
1,400 Medipal Holdings Corp. (Health CareProviders & Services) 25,329
6,400 Mirait Holdings Corp. (Construction &Engineering) 123,089
9,500 Mitsubishi Chemical Holdings Corp.(Chemicals) 78,636
1,600 Mitsubishi Corp. (Trading Companies &Distributors) 50,877
400 Mitsubishi Gas Chemical Co., Inc.(Chemicals) 8,050
19,700 Mitsubishi HC Capital Inc. (DiversifiedFinancial Services) 98,780
100 Mitsubishi Shokuhin Co. Ltd. (Food &Staples Retailing) 2,574
1,600 Mitsui & Co. Ltd. (Trading Companies &Distributors) 36,615
200 Mitsui Chemicals, Inc. (Chemicals) 5,94725 Mitsui Fudosan Logistics Park, Inc.
(Equity Real Estate Investment Trusts(REITs)) 132,924
100 Mitsui OSK Lines Ltd. (Marine) 6,3051,300 Mizuho Leasing Co. Ltd (Diversified
Financial Services) 40,1662 Mori Hills REIT Investment Corp.
(Equity Real Estate Investment Trusts(REITs)) 2,712
3,200 Morinaga Milk Industry Co. Ltd. (FoodProducts) 187,535
9,800 Murata Manufacturing Co. Ltd.(Electronic Equipment, Instruments &Components) 726,950
3,400 MUSASHI SEIMITSU INDUSTRY Co.Ltd. (Auto Components) 63,992
1,100 Nagase & Co. Ltd. (TradingCompanies & Distributors) 18,618
Shares Description Value
Common Stocks – (continued)
Japan – (continued)300 NEC Networks & System Integration
Corp. (IT Services) $ 4,8274,100 NET One Systems Co. Ltd. (IT Services) 134,453
100 NH Foods Ltd. (Food Products) 3,517550 Nidec Corp. (Electrical Equipment) 60,917100 Nifco, Inc. (Auto Components) 3,190
3,000 Nihon Unisys Ltd. (IT Services) 84,290400 Nippo Corp. (Construction &
Engineering) 14,1502,000 Nippon Express Co. Ltd. (Road & Rail) 125,189
9 Nippon Prologis REIT, Inc. (Equity RealEstate Investment Trusts (REITs)) 30,060
19 NIPPON REIT Investment Corp. (EquityReal Estate Investment Trusts (REITs)) 73,040
1,500 Nippon Shinyaku Co. Ltd.(Pharmaceuticals) 120,175
200 Nippon Steel Corp. (Metals & Mining) 3,5071,300 Nippon Telegraph & Telephone Corp.
(Diversified TelecommunicationServices) 36,425
1,500 Nippon Yusen KK (Marine) 108,0861,700 Nissan Motor Co. Ltd.* (Automobiles) 8,653
7 Nomura Real Estate Master Fund, Inc.(Equity Real Estate Investment Trusts(REITs)) 10,482
1,100 Obayashi Corp. (Construction &Engineering) 9,286
200 Oji Holdings Corp. (Paper & ForestProducts) 991
29,600 Olympus Corp. (Health CareEquipment & Supplies) 641,226
500 ORIX Corp. (Diversified FinancialServices) 9,938
500 Osaka Gas Co. Ltd. (Gas Utilities) 8,05915,000 Penta-Ocean Construction Co. Ltd.
(Construction & Engineering) 103,3646,100 Persol Holdings Co. Ltd. (Professional
Services) 163,9602,200 Rengo Co. Ltd. (Containers & Packaging) 16,683
100 Rinnai Corp. (Household Durables) 10,2675,800 Ryohin Keikaku Co. Ltd. (Multiline
Retail) 114,2963,000 Sankyu, Inc. (Road & Rail) 135,4402,400 Sato Holdings Corp. (Commercial
Services & Supplies) 55,31910,100 Sega Sammy Holdings, Inc. (Leisure
Products) 143,626200 Seiko Epson Corp. (Technology
Hardware, Storage & Peripherals) 3,5615,700 Sekisui House Ltd. (Household Durables) 118,507
10 Sekisui House Reit, Inc. (Equity RealEstate Investment Trusts (REITs)) 7,560
3,700 Seria Co. Ltd. (Multiline Retail) 122,151700 Seven & i Holdings Co. Ltd. (Food &
Staples Retailing) 29,389600 Shikoku Electric Power Co. Inc. (Electric
Utilities) 3,908
The accompanying notes are an integral part of these financial statements. 29

G O L D M A N S A C H S M U L T I - M A N A G E R G L O B A L E Q U I T Y F U N D
Schedule of Investments (continued)October 31, 2021
Shares Description Value
Common Stocks – (continued)
Japan – (continued)200 Shimizu Corp. (Construction &
Engineering) $ 1,4651,900 Shin-Etsu Chemical Co. Ltd. (Chemicals) 338,833
100 Shinko Electric Industries Co. Ltd.(Semiconductors & SemiconductorEquipment) 4,029
3,700 Ship Healthcare Holdings, Inc. (HealthCare Providers & Services) 97,186
800 SMC Corp. (Machinery) 477,4123,900 Sodick Co. Ltd. (Machinery) 30,0641,000 SoftBank Corp. (Wireless
Telecommunication Services) 13,650200 SoftBank Group Corp. (Wireless
Telecommunication Services) 10,8272,480 Sojitz Corp. (Trading Companies &
Distributors) 40,9188,100 Sompo Holdings, Inc. (Insurance) 351,2716,300 Sony Group Corp. (Household Durables) 729,517
100 Sugi Holdings Co. Ltd. (Food & StaplesRetailing) 7,160
3,400 Sumitomo Bakelite Co. Ltd. (Chemicals) 152,8053,200 Sumitomo Chemical Co. Ltd.
(Chemicals) 15,764200 Sumitomo Corp. (Trading Companies &
Distributors) 2,8509,300 Sumitomo Forestry Co. Ltd. (Household
Durables) 177,6395,200 Sumitomo Heavy Industries Ltd.
(Machinery) 133,877100 Sumitomo Metal Mining Co. Ltd.
(Metals & Mining) 3,87919,100 Sumitomo Mitsui Financial Group, Inc.
(Banks) 619,7881,900 Sumitomo Rubber Industries Ltd. (Auto
Components) 23,416100 Takashimaya Co. Ltd. (Multiline Retail) 926
44,900 Takeda Pharmaceutical Co. Ltd.(Pharmaceuticals) 1,260,155
1,700 Teijin Ltd. (Chemicals) 22,81914,900 Terumo Corp. (Health Care Equipment &
Supplies) 657,32517,200 The Chiba Bank Ltd. (Banks) 106,6093,000 The Chugoku Electric Power Co., Inc.
(Electric Utilities) 24,885300 The Kansai Electric Power Co., Inc.
(Electric Utilities) 2,7627,500 The Yokohama Rubber Co. Ltd. (Auto
Components) 126,9094,100 TIS, Inc. (IT Services) 111,696
400 Toda Corp. (Construction & Engineering) 2,5204,300 Tohoku Electric Power Co., Inc. (Electric
Utilities) 27,8997,900 Tokai Carbon Co. Ltd. (Chemicals) 103,3382,600 Tokyo Ohka Kogyo Co. Ltd. (Chemicals) 165,293
800 Tokyotokeiba Co. Ltd. (Hotels,Restaurants & Leisure) 31,697
Shares Description Value
Common Stocks – (continued)
Japan – (continued)25,500 Tokyu Fudosan Holdings Corp. (Real
Estate Management & Development) $ 147,757500 Toppan Printing Co. Ltd. (Commercial
Services & Supplies) 8,0712,900 Towa Pharmaceutical Co. Ltd.
(Pharmaceuticals) 74,5552,200 Toyo Suisan Kaisha Ltd. (Food
Products) 94,7964,200 Toyoda Gosei Co. Ltd. (Auto
Components) 85,942600 Toyota Boshoku Corp. (Auto
Components) 11,536700 Toyota Motor Corp. (Automobiles) 12,351400 Toyota Tsusho Corp. (Trading
Companies & Distributors) 17,350900 Ube Industries Ltd. (Chemicals) 16,768
3,400 Ulvac, Inc. (Semiconductors &Semiconductor Equipment) 190,757
2 United Urban Investment Corp. (EquityReal Estate Investment Trusts (REITs)) 2,493
6,100 Yamada Holdings Co. Ltd. (SpecialtyRetail) 23,310
100 Yaoko Co. Ltd. (Food & StaplesRetailing) 5,952
1,100 Z Holdings Corp. (Interactive Media &Services) 6,829
2,200 Zenkoku Hosho Co. Ltd. (DiversifiedFinancial Services) 106,314
6,100 Zeon Corp. (Chemicals) 72,370
22,886,693
Luxembourg – 0.3%4,548 Adecoagro SA* (Food Products) 39,8401,945 APERAM SA (Metals & Mining) 115,968
10,986 ArcelorMittal SA (Metals & Mining) 371,54833,770 B&M European Value Retail SA
(Multiline Retail) 292,57470 Eurofins Scientific SE (Life Sciences
Tools & Services) 8,2611,540 Globant SA* (IT Services) 491,552
934 L’Occitane International SA (PersonalProducts) 3,341
381 RTL Group SA* (Media) 22,006299 Tenaris SA (Energy Equipment &
Services) 3,330
1,348,420
Macau* – 0.1%309,600 Sands China Ltd. (Hotels, Restaurants &
Leisure) 705,632
Malaysia – 0.1%30,900 D&O Green Technologies Bhd
(Semiconductors & SemiconductorEquipment) 42,170
87,700 Hartalega Holdings Bhd (Health CareEquipment & Supplies) 124,106
30 The accompanying notes are an integral part of these financial statements.

G O L D M A N S A C H S M U L T I - M A N A G E R G L O B A L E Q U I T Y F U N D
Shares Description Value
Common Stocks – (continued)
Malaysia – (continued)176,200 Inari Amertron Bhd (Electronic
Equipment, Instruments & Components) $ 165,06150,400 Kossan Rubber Industries Bhd (Health
Care Equipment & Supplies) 28,724153,900 Supermax Corp. Bhd (Health Care
Equipment & Supplies) 71,357261,600 Top Glove Corp. Bhd (Health Care
Equipment & Supplies) 171,831
603,249
Mauritius – 0.0%19,000 Golden Agri-Resources Ltd. (Food
Products) 3,726
Mexico – 0.4%404,173 Cemex SAB de CV* (Construction
Materials) 385,340960 Controladora Vuela Cia de Aviacion
SAB de CV ADR* (Airlines) 17,37619,900 Grupo Bimbo SAB de CV Series A
(Food Products) 58,90492,824 Grupo Financiero Banorte SAB de CV
Class O (Banks) 587,70295,200 Grupo Mexico SAB de CV Series B
(Metals & Mining) 417,64410,100 Orbia Advance Corp. SAB de CV
(Chemicals) 26,251105,500 Wal-Mart de Mexico SAB de CV
(Food & Staples Retailing) 367,979
1,861,196
Netherlands – 1.7%3,578 Aalberts NV (Machinery) 198,037
230 Adyen NV*(a) (IT Services) 693,9814,393 Airbus SE* (Aerospace & Defense) 563,543
10,795 Akzo Nobel NV (Chemicals) 1,240,5291,905 Arcadis NV (Construction &
Engineering) 92,851144 ASM International NV
(Semiconductors & SemiconductorEquipment) 65,172
1,280 ASML Holding NV (Semiconductors &Semiconductor Equipment) 1,040,487
4,715 ASR Nederland NV (Insurance) 220,3991,831 Euronext NV(a) (Capital Markets) 205,996
463 EXOR NV (Diversified FinancialServices) 43,675
3,200 Ferrari NV (Automobiles) 759,3188 IMCD NV (Trading Companies &
Distributors) 1,77663,752 ING Groep NV (Banks) 967,0487,013 Koninklijke Ahold Delhaize NV
(Food & Staples Retailing) 228,15096 Koninklijke DSM NV (Chemicals) 20,974
1,322 Koninklijke KPN NV (DiversifiedTelecommunication Services) 3,950
Shares Description Value
Common Stocks – (continued)
Netherlands – (continued)15,522 Koninklijke Philips NV (Health Care
Equipment & Supplies) $ 732,2531,696 NN Group NV (Insurance) 90,663
38,444 PostNL NV (Air Freight & Logistics) 166,8527,007 QIAGEN NV* (Life Sciences Tools &
Services) 385,4836,729 Randstad NV (Professional Services) 483,461
784 Shop Apotheke Europe NV*(a) (Food &Staples Retailing) 118,894
2,739 Signify NV(a) (Electrical Equipment) 132,722351 Universal Music Group NV
(Entertainment) 10,191948 Wolters Kluwer NV (Professional
Services) 99,2732,300 Yandex NV Class A* (Interactive
Media & Services) 190,532
8,756,210
New Zealand – 0.0%144 Fisher & Paykel Healthcare Corp. Ltd.
(Health Care Equipment & Supplies) 3,2261,221 Fletcher Building Ltd. (Building
Products) 6,280980 Infratil, Ltd. (Electric Utilities) 5,815179 Mainfreight Ltd. (Air Freight &
Logistics) 11,535505 Spark New Zealand Ltd. (Diversified
Telecommunication Services) 1,653
28,509
Norway – 0.0%85 Aker ASA (Diversified Financial
Services) 7,835205 Equinor ASA (Oil, Gas & Consumable
Fuels) 5,19415,854 LINK Mobility Group Holding ASA*
(Software) 51,1304,523 Norsk Hydro ASA (Metals & Mining) 33,2241,864 Orkla ASA (Food Products) 18,130
286 Telenor ASA (DiversifiedTelecommunication Services) 4,519
102 Yara International ASA (Chemicals) 5,331
125,363
Panama* – 0.0%2,400 Copa Holdings SA Class A (Airlines) 177,504
Peru – 0.1%1,951 Credicorp Ltd. (Banks) 252,967
Poland – 0.0%3,467 Bank Polska Kasa Opieki SA (Banks) 114,550
44 KGHM Polska Miedz SA (Metals &Mining) 1,692
8 LPP SA (Textiles, Apparel & LuxuryGoods) 28,734
The accompanying notes are an integral part of these financial statements. 31
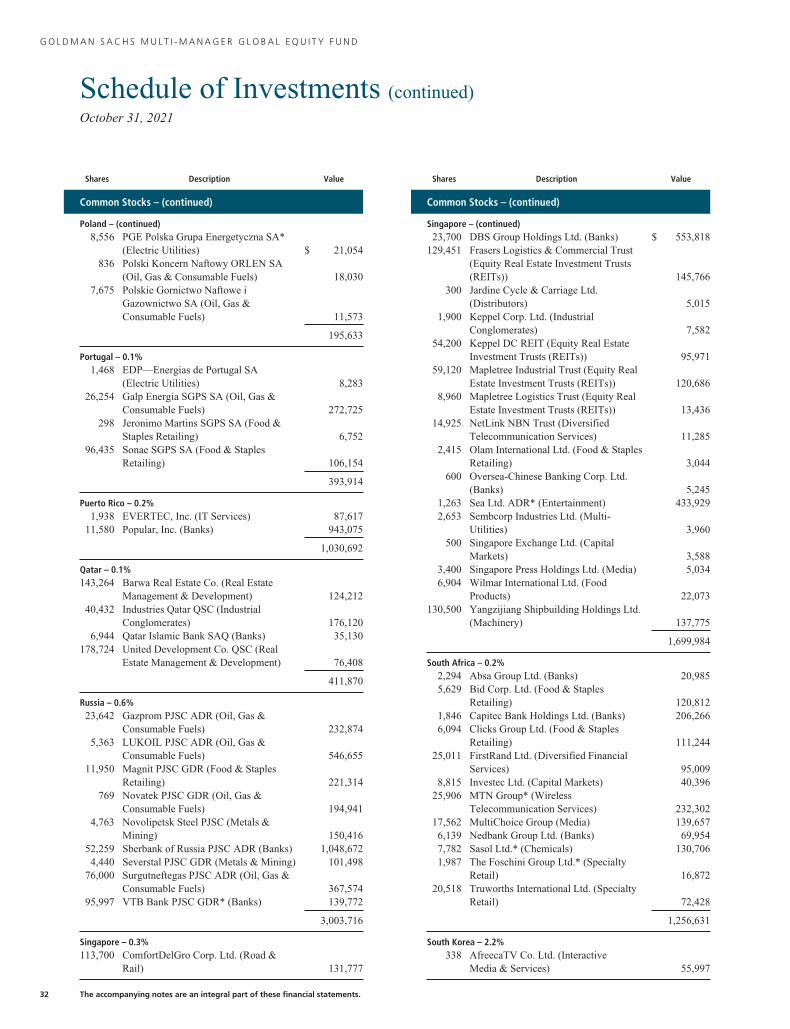
G O L D M A N S A C H S M U L T I - M A N A G E R G L O B A L E Q U I T Y F U N D
Schedule of Investments (continued)October 31, 2021
Shares Description Value
Common Stocks – (continued)
Poland – (continued)8,556 PGE Polska Grupa Energetyczna SA*
(Electric Utilities) $ 21,054836 Polski Koncern Naftowy ORLEN SA
(Oil, Gas & Consumable Fuels) 18,0307,675 Polskie Gornictwo Naftowe i
Gazownictwo SA (Oil, Gas &Consumable Fuels) 11,573
195,633
Portugal – 0.1%1,468 EDP—Energias de Portugal SA
(Electric Utilities) 8,28326,254 Galp Energia SGPS SA (Oil, Gas &
Consumable Fuels) 272,725298 Jeronimo Martins SGPS SA (Food &
Staples Retailing) 6,75296,435 Sonae SGPS SA (Food & Staples
Retailing) 106,154
393,914
Puerto Rico – 0.2%1,938 EVERTEC, Inc. (IT Services) 87,617
11,580 Popular, Inc. (Banks) 943,075
1,030,692
Qatar – 0.1%143,264 Barwa Real Estate Co. (Real Estate
Management & Development) 124,21240,432 Industries Qatar QSC (Industrial
Conglomerates) 176,1206,944 Qatar Islamic Bank SAQ (Banks) 35,130
178,724 United Development Co. QSC (RealEstate Management & Development) 76,408
411,870
Russia – 0.6%23,642 Gazprom PJSC ADR (Oil, Gas &
Consumable Fuels) 232,8745,363 LUKOIL PJSC ADR (Oil, Gas &
Consumable Fuels) 546,65511,950 Magnit PJSC GDR (Food & Staples
Retailing) 221,314769 Novatek PJSC GDR (Oil, Gas &
Consumable Fuels) 194,9414,763 Novolipetsk Steel PJSC (Metals &
Mining) 150,41652,259 Sberbank of Russia PJSC ADR (Banks) 1,048,6724,440 Severstal PJSC GDR (Metals & Mining) 101,498
76,000 Surgutneftegas PJSC ADR (Oil, Gas &Consumable Fuels) 367,574
95,997 VTB Bank PJSC GDR* (Banks) 139,772
3,003,716
Singapore – 0.3%113,700 ComfortDelGro Corp. Ltd. (Road &
Rail) 131,777
Shares Description Value
Common Stocks – (continued)
Singapore – (continued)23,700 DBS Group Holdings Ltd. (Banks) $ 553,818
129,451 Frasers Logistics & Commercial Trust(Equity Real Estate Investment Trusts(REITs)) 145,766
300 Jardine Cycle & Carriage Ltd.(Distributors) 5,015
1,900 Keppel Corp. Ltd. (IndustrialConglomerates) 7,582
54,200 Keppel DC REIT (Equity Real EstateInvestment Trusts (REITs)) 95,971
59,120 Mapletree Industrial Trust (Equity RealEstate Investment Trusts (REITs)) 120,686
8,960 Mapletree Logistics Trust (Equity RealEstate Investment Trusts (REITs)) 13,436
14,925 NetLink NBN Trust (DiversifiedTelecommunication Services) 11,285
2,415 Olam International Ltd. (Food & StaplesRetailing) 3,044
600 Oversea-Chinese Banking Corp. Ltd.(Banks) 5,245
1,263 Sea Ltd. ADR* (Entertainment) 433,9292,653 Sembcorp Industries Ltd. (Multi-
Utilities) 3,960500 Singapore Exchange Ltd. (Capital
Markets) 3,5883,400 Singapore Press Holdings Ltd. (Media) 5,0346,904 Wilmar International Ltd. (Food
Products) 22,073130,500 Yangzijiang Shipbuilding Holdings Ltd.
(Machinery) 137,775
1,699,984
South Africa – 0.2%2,294 Absa Group Ltd. (Banks) 20,9855,629 Bid Corp. Ltd. (Food & Staples
Retailing) 120,8121,846 Capitec Bank Holdings Ltd. (Banks) 206,2666,094 Clicks Group Ltd. (Food & Staples
Retailing) 111,24425,011 FirstRand Ltd. (Diversified Financial
Services) 95,0098,815 Investec Ltd. (Capital Markets) 40,396
25,906 MTN Group* (WirelessTelecommunication Services) 232,302
17,562 MultiChoice Group (Media) 139,6576,139 Nedbank Group Ltd. (Banks) 69,9547,782 Sasol Ltd.* (Chemicals) 130,7061,987 The Foschini Group Ltd.* (Specialty
Retail) 16,87220,518 Truworths International Ltd. (Specialty
Retail) 72,428
1,256,631
South Korea – 2.2%338 AfreecaTV Co. Ltd. (Interactive
Media & Services) 55,997
32 The accompanying notes are an integral part of these financial statements.

G O L D M A N S A C H S M U L T I - M A N A G E R G L O B A L E Q U I T Y F U N D
Shares Description Value
Common Stocks – (continued)
South Korea – (continued)11,298 BNK Financial Group, Inc. (Banks) $ 85,176
159 CJ CheilJedang Corp. (Food Products) 51,67675 CJ Corp. (Industrial Conglomerates) 6,166
1,875 Daewoo Engineering & Construction Co.Ltd.* (Construction & Engineering) 10,039
101 DB Insurance Co. Ltd. (Insurance) 5,1331,650 DGB Financial Group, Inc. (Banks) 14,6201,711 E-MART, Inc. (Food & Staples
Retailing) 246,302544 GS Holdings Corp. (Oil, Gas &
Consumable Fuels) 19,7017,199 Hana Financial Group, Inc. (Banks) 277,592
174 Hankook Tire & Technology Co. Ltd.(Auto Components) 6,165
280 Hanwha Corp. (Industrial Conglomerates) 8,0602,544 Hanwha Life Insurance Co. Ltd.
(Insurance) 7,580189 Hyundai Marine & Fire Insurance Co.
Ltd. (Insurance) 4,251407 Hyundai Mobis Co. Ltd. (Auto
Components) 87,9812,918 Hyundai Motor Co. (Automobiles) 521,9003,671 Industrial Bank of Korea (Banks) 34,7453,770 Kakao Corp. (Interactive Media &
Services) 405,5932,414 KakaoBank Corp.* (Banks) 130,3528,462 KB Financial Group, Inc. (Banks) 409,594
46 KCC Corp. (Chemicals) 13,15114,056 Kia Corp. (Automobiles) 1,025,699
551 Korea Investment Holdings Co. Ltd.(Capital Markets) 41,210
1,468 KT Corp. (DiversifiedTelecommunication Services) 38,328
1,903 KT Corp. ADR (DiversifiedTelecommunication Services) 24,377
70 KT&G Corp. (Tobacco) 4,862326 Kumho Petrochemical Co. Ltd.
(Chemicals) 47,9672,974 LG Display Co. Ltd.* (Electronic
Equipment, Instruments & Components) 50,2622,902 LG Electronics, Inc. (Household
Durables) 300,223124 LG Innotek Co. Ltd. (Electronic
Equipment, Instruments & Components) 22,2901,499 NAVER Corp. (Interactive Media &
Services) 521,176588 POSCO (Metals & Mining) 149,135240 Posco International Corp. (Trading
Companies & Distributors) 4,472856 S-Oil Corp. (Oil, Gas & Consumable
Fuels) 74,898598 Samsung Biologics Co. Ltd.*(a) (Life
Sciences Tools & Services) 445,50344,195 Samsung Electronics Co. Ltd.
(Technology Hardware, Storage &Peripherals) 2,646,092
Shares Description Value
Common Stocks – (continued)
South Korea – (continued)951 Samsung Electronics Co. Ltd. GDR
(Technology Hardware, Storage &Peripherals) $ 1,423,968
769 Seegene, Inc. (Biotechnology) 35,18317,200 Shinhan Financial Group Co. Ltd.
(Banks) 561,527261 SK Bioscience Co. Ltd.*
(Biotechnology) 51,37194 SK Holdings Co. Ltd. (Industrial
Conglomerates) 19,61711,792 SK Hynix, Inc. (Semiconductors &
Semiconductor Equipment) 1,039,4711,088 SK IE Technology Co. Ltd.*(a)
(Chemicals) 154,832129 SK Innovation Co. Ltd.* (Oil, Gas &
Consumable Fuels) 26,903807 SK Telecom Co. Ltd. (Wireless
Telecommunication Services) 213,6838,205 Woori Financial Group, Inc. (Banks) 93,276
11,418,099
Spain – 0.9%5,284 Aena SME SA*(a) (Transportation
Infrastructure) 867,82636,939 Amadeus IT Group SA* (IT Services) 2,471,14078,815 Banco Bilbao Vizcaya Argentaria SA
(Banks) 551,557288,854 CaixaBank SA (Banks) 830,358
42 Cellnex Telecom SA(a) (DiversifiedTelecommunication Services) 2,583
160 EDP Renovaveis SA (IndependentPower and Renewable ElectricityProducers) 4,458
2,436 Enagas SA (Gas Utilities) 54,662201 Fluidra SA (Machinery) 7,677
3,544 Iberdrola SA (Electric Utilities) 41,8491,078 Repsol SA (Oil, Gas & Consumable
Fuels) 13,808631 Siemens Gamesa Renewable Energy
SA* (Electrical Equipment) 17,12310,380 Telefonica SA (Diversified
Telecommunication Services) 45,087
4,908,128
Sweden – 0.6%7,050 AAK AB (Food Products) 154,199
84 Alfa Laval AB (Machinery) 3,60310,600 Atlas Copco AB Class A (Machinery) 682,626
146 Castellum AB (Real EstateManagement & Development) 3,891
3,565 Cint Group AB* (Software) 53,799288 Electrolux AB (Household Durables) 6,536
3,821 Essity AB Class B (HouseholdProducts) 123,769
3,300 Evolution AB(a) (Hotels, Restaurants &Leisure) 535,728
The accompanying notes are an integral part of these financial statements. 33

G O L D M A N S A C H S M U L T I - M A N A G E R G L O B A L E Q U I T Y F U N D
Schedule of Investments (continued)October 31, 2021
Shares Description Value
Common Stocks – (continued)
Sweden – (continued)34 Fastighets AB Balder* (Real Estate
Management & Development) $ 2,465148 Getinge AB Class B (Health Care
Equipment & Supplies) 6,62311,499 Husqvarna AB Class B (Household
Durables) 163,871106 Industrivarden AB Class A (Diversified
Financial Services) 3,497161 Industrivarden AB Class C (Diversified
Financial Services) 5,237732 Investor AB Class A (Diversified
Financial Services) 16,9353,288 Investor AB Class B (Diversified
Financial Services) 75,86734 Kinnevik AB Class A* (Diversified
Financial Services) 1,3722,398 Kinnevik AB Class B* (Diversified
Financial Services) 94,124154 L E Lundbergforetagen AB Class B
(Diversified Financial Services) 8,8794,755 Loomis AB (Commercial Services &
Supplies) 128,3983,994 Lundin Energy AB (Oil, Gas &
Consumable Fuels) 157,7372,681 Mycronic AB (Electronic Equipment,
Instruments & Components) 62,2155,536 Nibe Industrier AB Class B (Building
Products) 82,34118,240 Samhallsbyggnadsbolaget i Norden AB
(Real Estate Management &Development) 122,336
198 Securitas AB Class B (CommercialServices & Supplies) 3,280
173 Skanska AB Class B (Construction &Engineering) 4,399
149 Svenska Cellulosa AB SCA Class B(Paper & Forest Products) 2,328
23,108 Swedbank AB Class A (Banks) 501,1822,035 Swedish Match AB (Tobacco) 17,9438,176 Trelleborg AB Class B (Machinery) 187,129
3,212,309
Switzerland – 3.6%30 Adecco Group AG (Professional
Services) 1,5118,900 Alcon, Inc. (Health Care Equipment &
Supplies) 737,97519 Baloise Holding AG (Insurance) 3,028
129 Banque Cantonale Vaudoise (Banks) 10,386774 BKW AG (Electric Utilities) 102,545
7 Bucher Industries AG (Machinery) 3,53351 Chubb Ltd. (Insurance) 9,964
11,594 Cie Financiere Richemont SA Class A(Textiles, Apparel & Luxury Goods) 1,434,762
72,596 Credit Suisse Group AG (CapitalMarkets) 755,122
Shares Description Value
Common Stocks – (continued)
Switzerland – (continued)202 DKSH Holding AG (Professional
Services) $ 16,1914 EMS-Chemie Holding AG (Chemicals) 3,968
1,496 Garmin Ltd. (Household Durables) 214,82658 Geberit AG (Building Products) 45,29585 Georg Fischer AG (Machinery) 128,60914 Givaudan SA (Chemicals) 65,967
5,911 Julius Baer Group Ltd. (CapitalMarkets) 427,555
494 Kuehne & Nagel International AG(Marine) 155,585
800 Logitech International SA (TechnologyHardware, Storage & Peripherals) 66,922
969 Lonza Group AG (Life SciencesTools & Services) 796,325
19,721 Nestle SA (Food Products) 2,601,34126,352 Novartis AG (Pharmaceuticals) 2,179,645
789 Partners Group Holding AG (CapitalMarkets) 1,378,347
149 PSP Swiss Property AG (Real EstateManagement & Development) 18,626
7,028 Roche Holding AG (Pharmaceuticals) 2,723,20318 Schindler Holding AG (Machinery) 4,654
219 Siemens Energy AG* (ElectricalEquipment) 6,285
7,130 SIG Combibloc Group AG(Containers & Packaging) 186,469
3,903 Sika AG (Chemicals) 1,322,2572,108 Sophia Genetics SA* (Health Care
Technology) 29,9132 Straumann Holding AG (Health Care
Equipment & Supplies) 4,16310 Swiss Life Holding AG (Insurance) 5,486
707 Swiss Prime Site AG (Real EstateManagement & Development) 71,878
249 Swisscom AG (DiversifiedTelecommunication Services) 135,587
26 TE Connectivity Ltd. (ElectronicEquipment, Instruments & Components) 3,796
320 Tecan Group AG (Life SciencesTools & Services) 196,065
48,919 UBS Group AG (Capital Markets) 890,457639 VAT Group AG(a) (Machinery) 305,462416 Zur Rose Group AG* (Food & Staples
Retailing) 147,6633,773 Zurich Insurance Group AG (Insurance) 1,672,271
18,863,637
Taiwan – 1.9%10,000 Asustek Computer, Inc. (Technology
Hardware, Storage & Peripherals) 127,138183,000 Cathay Financial Holding Co. Ltd.
(Insurance) 381,4623,000 Chailease Holding Co. Ltd. (Diversified
Financial Services) 28,733143,000 China Steel Corp. (Metals & Mining) 172,409
34 The accompanying notes are an integral part of these financial statements.

G O L D M A N S A C H S M U L T I - M A N A G E R G L O B A L E Q U I T Y F U N D
Shares Description Value
Common Stocks – (continued)
Taiwan – (continued)17,800 Delta Electronics, Inc. (Electronic
Equipment, Instruments & Components) $ 157,1279,800 Eclat Textile Co. Ltd. (Textiles,
Apparel & Luxury Goods) 214,1611,000 eMemory Technology, Inc.
(Semiconductors & SemiconductorEquipment) 83,066
26,000 Evergreen Marine Corp. Taiwan Ltd.(Marine) 93,566
111,069 Fubon Financial Holding Co. Ltd.(Insurance) 293,602
5,000 Global Mixed Mode Technology, Inc.(Semiconductors & SemiconductorEquipment) 40,527
2,300 Globalwafers Co. Ltd.(Semiconductors & SemiconductorEquipment) 63,107
2,173 Himax Technologies, Inc. ADR(Semiconductors & SemiconductorEquipment) 22,947
72,000 Hon Hai Precision Industry Co. Ltd.(Electronic Equipment, Instruments &Components) 277,944
4,000 Kinsus Interconnect Technology Corp.(Semiconductors & SemiconductorEquipment) 35,202
27,367 MediaTek, Inc. (Semiconductors &Semiconductor Equipment) 900,721
4,050 momo.com, Inc. (Internet & DirectMarketing Retail) 260,983
2,000 Nan Ya Printed Circuit Board Corp.(Electronic Equipment, Instruments &Components) 35,389
3,000 Novatek Microelectronics Corp.(Semiconductors & SemiconductorEquipment) 44,997
34,488 Radiant Opto-Electronics Corp.(Semiconductors & SemiconductorEquipment) 120,836
8,896 Realtek Semiconductor Corp.(Semiconductors & SemiconductorEquipment) 160,018
25,200 Ruentex Development Co. Ltd. (RealEstate Management & Development) 64,314
165,305 Taiwan Semiconductor ManufacturingCo. Ltd. (Semiconductors &Semiconductor Equipment) 3,507,820
19,275 Taiwan Semiconductor ManufacturingCo. Ltd. ADR (Semiconductors &Semiconductor Equipment) 2,191,568
156,435 United Microelectronics Corp.(Semiconductors & SemiconductorEquipment) 324,755
20,000 Vanguard International SemiconductorCorp. (Semiconductors &Semiconductor Equipment) 104,215
Shares Description Value
Common Stocks – (continued)
Taiwan – (continued)8,800 Wan Hai Lines Ltd. (Marine) $ 50,768
19,000 Yang Ming Marine Transport Corp.*(Marine) 66,326
9,823,701
Thailand – 0.3%3,500 Bangkok Bank PCL (Banks) 12,952
126,900 Banpu PCL (Oil, Gas & ConsumableFuels) 43,581
59,200 BEC World PCL* (Media) 21,82732,000 Com7 PCL Class F (Specialty Retail) 69,33511,400 Hana Microelectronics PCL (Electronic
Equipment, Instruments & Components) 27,53915,700 Kasikornbank PCL (Banks) 66,93140,100 Kiatnakin Phatra Bank PCL (Banks) 72,647
398,800 Krung Thai Bank PCL (Banks) 138,42432,500 Precious Shipping PCL (Marine) 17,79969,600 PTT Exploration & Production PCL
(Oil, Gas & Consumable Fuels) 246,20079,900 PTT Exploration & Production PCL
NVDR (Oil, Gas & Consumable Fuels) 282,63492,900 PTT Global Chemical PCL (Chemicals) 175,81550,600 Thoresen Thai Agencies PCL (Industrial
Conglomerates) 17,73246,700 Tisco Financial Group PCL (Banks) 129,948
1,323,364
Turkey – 0.0%43,923 Haci Omer Sabanci Holding AS
(Diversified Financial Services) 51,13431,686 Turkiye Garanti Bankasi A/S (Banks) 32,46486,962 Turkiye Is Bankasi AS Class C (Banks) 51,01516,944 Turkiye Sise ve Cam Fabrikalari AS
(Industrial Conglomerates) 15,26218,136 Vestel Elektronik Sanayi ve Ticaret AS
(Household Durables) 47,802
197,677
United Arab Emirates – 0.1%57,115 Abu Dhabi Islamic Bank PJSC (Banks) 90,938
255,513 Aldar Properties PJSC (Real EstateManagement & Development) 281,139
87,147 Emirates NBD Bank PJSC (Banks) 330,969
703,046
United Kingdom – 4.8%61 3i Group PLC (Capital Markets) 1,139
1,989 Admiral Group PLC (Insurance) 78,13225,160 Alphawave IP Group PLC*
(Semiconductors & SemiconductorEquipment) 68,659
626 Antofagasta PLC (Metals & Mining) 12,21064 Ashtead Group PLC (Trading
Companies & Distributors) 5,3648,317 AstraZeneca PLC (Pharmaceuticals) 1,040,4681,410 Atlassian Corp. PLC Class A*
(Software) 645,963
The accompanying notes are an integral part of these financial statements. 35

G O L D M A N S A C H S M U L T I - M A N A G E R G L O B A L E Q U I T Y F U N D
Schedule of Investments (continued)October 31, 2021
Shares Description Value
Common Stocks – (continued)
United Kingdom – (continued)29,973 Aviva PLC (Insurance) $ 161,732
485 BAE Systems PLC (Aerospace &Defense) 3,657
75,149 Balfour Beatty PLC (Construction &Engineering) 261,264
248,104 Barclays PLC (Banks) 684,6361,125 BHP Group PLC (Metals & Mining) 29,713
45,223 Boohoo Group PLC* (Internet & DirectMarketing Retail) 112,481
337,610 BP PLC (Oil, Gas & Consumable Fuels) 1,617,45620,827 British American Tobacco PLC
(Tobacco) 724,4554,192 BT Group PLC* (Diversified
Telecommunication Services) 7,96498 Bunzl PLC (Trading Companies &
Distributors) 3,62272,177 Compass Group PLC* (Hotels,
Restaurants & Leisure) 1,531,6424,264 Computacenter PLC (IT Services) 156,7652,027 Cranswick PLC (Food Products) 95,982
619 Croda International PLC (Chemicals) 80,1184,708 CVS Group PLC* (Health Care
Providers & Services) 160,4513,668 Dechra Pharmaceuticals PLC
(Pharmaceuticals) 257,0162,438 Derwent London PLC (Equity Real
Estate Investment Trusts (REITs)) 112,77217,055 Diageo PLC (Beverages) 848,5151,199 Direct Line Insurance Group PLC
(Insurance) 4,79237,682 DS Smith PLC (Containers &
Packaging) 197,6672,012 Endava PLC ADR* (IT Services) 318,8225,132 Entain PLC* (Hotels, Restaurants &
Leisure) 143,80435,173 Experian PLC (Professional Services) 1,612,724
979 Ferguson PLC (Trading Companies &Distributors) 147,304
4,349 Future PLC (Media) 209,9802,297 Genus PLC (Biotechnology) 174,186
363 GlaxoSmithKline PLC(Pharmaceuticals) 7,536
1,254 Halma PLC (Electronic Equipment,Instruments & Components) 50,854
43,695 Hays PLC (Professional Services) 99,0243,979 Hikma Pharmaceuticals PLC
(Pharmaceuticals) 131,15532,499 Ibstock PLC(a) (Construction Materials) 88,76114,841 IG Group Holdings PLC (Capital
Markets) 161,165354 IHS Markit Ltd. (Professional Services) 46,275
7,650 IMI PLC (Machinery) 170,839150 Imperial Brands PLC (Tobacco) 3,165
7,002 Intermediate Capital Group PLC(Capital Markets) 210,025
2,397 International Game Technology PLC*(Hotels, Restaurants & Leisure) 70,688
Shares Description Value
Common Stocks – (continued)
United Kingdom – (continued)104,576 ITV PLC* (Media) $ 153,91545,649 J Sainsbury PLC (Food & Staples
Retailing) 186,9728,820 JD Sports Fashion PLC (Specialty
Retail) 131,46180 Johnson Matthey PLC (Chemicals) 2,990
4,170 Keywords Studios PLC (IT Services) 161,84619,775 Legal & General Group PLC
(Insurance) 77,988986 M&G PLC (Diversified Financial
Services) 2,69461,165 Man Group PLC (Capital Markets) 194,787
778 National Grid PLC (Multi-Utilities) 9,9617,147 Ortho Clinical Diagnostics Holdings
PLC* (Health Care Equipment &Supplies) 141,296
13,394 OSB Group PLC (Thrifts & MortgageFinance) 92,568
12,706 Paragon Banking Group PLC(Thrifts & Mortgage Finance) 95,378
624 Phoenix Group Holdings PLC(Insurance) 5,603
38,651 Prudential PLC (Insurance) 788,7886,000 Reckitt Benckiser Group PLC
(Household Products) 487,09713,904 Redrow PLC (Household Durables) 122,42145,678 RELX PLC (Professional Services) 1,416,4091,567 Rentokil Initial PLC (Commercial
Services & Supplies) 12,613477 Rightmove PLC (Interactive Media &
Services) 4,5096,479 Rio Tinto PLC (Metals & Mining) 403,975
1,416,300 Rolls-Royce Holdings PLC*(Aerospace & Defense) 2,556,194
27,853 Royal Dutch Shell PLC Class A (Oil,Gas & Consumable Fuels) 641,762
9,519 Royal Mail PLC (Air Freight &Logistics) 54,875
7,005 Safestore Holdings PLC (Equity RealEstate Investment Trusts (REITs)) 115,232
11,846 Segro PLC (Equity Real EstateInvestment Trusts (REITs)) 209,373
50 Severn Trent PLC (Water Utilities) 1,87313,324 Smiths Group PLC (Industrial
Conglomerates) 247,40160 Spirax-Sarco Engineering PLC
(Machinery) 12,8082,080 SSE PLC (Electric Utilities) 46,841
18,583 SSP Group PLC* (Hotels,Restaurants & Leisure) 65,469
6,728 St. James’s Place PLC (CapitalMarkets) 145,344
182,575 TechnipFMC PLC* (EnergyEquipment & Services) 1,345,578
136,338 Tesco PLC (Food & Staples Retailing) 503,396322 The Sage Group PLC (Software) 3,132
36 The accompanying notes are an integral part of these financial statements.

G O L D M A N S A C H S M U L T I - M A N A G E R G L O B A L E Q U I T Y F U N D
Shares Description Value
Common Stocks – (continued)
United Kingdom – (continued)480 The Weir Group PLC (Machinery) $ 11,386
22,376 Unilever PLC (Personal Products) 1,198,05312,224 Vesuvius PLC (Machinery) 78,81718,884 Victorian Plumbing Group PLC*
(Internet & Direct Marketing Retail) 46,9323,542 Vodafone Group PLC (Wireless
Telecommunication Services) 5,22029,523 WH Smith PLC* (Specialty Retail) 631,9811,162 Whitbread PLC* (Hotels, Restaurants &
Leisure) 51,985
25,017,865
United States – 34.4%18 3M Co. (Industrial Conglomerates) 3,216
901 Abbott Laboratories (Health CareEquipment & Supplies) 116,130
4,865 ABM Industries, Inc. (CommercialServices & Supplies) 214,109
7,035 ACCO Brands Corp. (CommercialServices & Supplies) 58,179
455 Adobe, Inc.* (Software) 295,9147 Advance Auto Parts, Inc. (Specialty
Retail) 1,57938 Aflac, Inc. (Insurance) 2,039
286 Agilent Technologies, Inc. (Life SciencesTools & Services) 45,042
2,545 Agree Realty Corp. (Equity Real EstateInvestment Trusts (REITs)) 180,848
202 Air Products & Chemicals, Inc.(Chemicals) 60,562
1,765 Alamo Group, Inc. (Machinery) 266,86815 Albemarle Corp. (Chemicals) 3,75761 Alexandria Real Estate Equities, Inc.
(Equity Real Estate Investment Trusts(REITs)) 12,453
4 Align Technology, Inc.* (Health CareEquipment & Supplies) 2,497
1,073 Allegiant Travel Co.* (Airlines) 188,0651,636 Allison Transmission Holdings, Inc.
(Machinery) 54,577848 Ally Financial, Inc. (Consumer Finance) 40,484
1,910 Alphabet, Inc. Class A* (InteractiveMedia & Services) 5,655,357
784 Alphabet, Inc. Class C* (InteractiveMedia & Services) 2,324,881
696 Altra Industrial Motion Corp.(Machinery) 36,296
139 Altria Group, Inc. (Tobacco) 6,1312,213 Amazon.com, Inc.* (Internet & Direct
Marketing Retail) 7,463,1881,278 Amdocs Ltd. (IT Services) 99,480
86 Ameren Corp. (Multi-Utilities) 7,24941 American Water Works Co., Inc. (Water
Utilities) 7,14117 Ameriprise Financial, Inc. (Capital
Markets) 5,136
Shares Description Value
Common Stocks – (continued)
United States – (continued)7,003 Ameris Bancorp (Banks) $ 366,8872,721 AMERISAFE, Inc. (Insurance) 161,328
324 AmerisourceBergen Corp. (Health CareProviders & Services) 39,534
76 AMETEK, Inc. (Electrical Equipment) 10,06224 Amgen, Inc. (Biotechnology) 4,967
254 Amphenol Corp. Class A (ElectronicEquipment, Instruments & Components) 19,500
308 ANSYS, Inc.* (Software) 116,911116 Anthem, Inc. (Health Care Providers &
Services) 50,47537,615 Apple, Inc. (Technology Hardware,
Storage & Peripherals) 5,634,72717,214 Applied Materials, Inc.
(Semiconductors & SemiconductorEquipment) 2,352,293
11,110 AppLovin Corp. Class A* (Software) 1,091,557118 Archer-Daniels-Midland Co. (Food
Products) 7,5802,067 Ares Commercial Real Estate Corp.
(Mortgage Real Estate Investment Trusts(REITs)) 32,287
706 Arrow Electronics, Inc.* (ElectronicEquipment, Instruments & Components) 81,720
733 Arthur J. Gallagher & Co. (Insurance) 122,9021,980 Artisan Partners Asset Management, Inc.
Class A (Capital Markets) 98,0891,505 ASGN, Inc.* (Professional Services) 180,088
473 AT&T, Inc. (DiversifiedTelecommunication Services) 11,948
3,783 AtriCure, Inc.* (Health CareEquipment & Supplies) 283,952
563 Automatic Data Processing, Inc. (ITServices) 126,388
3 AutoZone, Inc.* (Specialty Retail) 5,35569 AvalonBay Communities, Inc. (Equity
Real Estate Investment Trusts (REITs)) 16,331671 Avery Dennison Corp. (Containers &
Packaging) 146,0907,746 Avient Corp. (Chemicals) 417,3541,744 Avnet, Inc. (Electronic Equipment,
Instruments & Components) 66,4641,681 Balchem Corp. (Chemicals) 257,344
26 Ball Corp. (Containers & Packaging) 2,3782,536 BankUnited, Inc. (Banks) 102,860
233 Baxter International, Inc. (Health CareEquipment & Supplies) 18,398
2,849 Belden, Inc. (Electronic Equipment,Instruments & Components) 171,538
471 Berkshire Hathaway, Inc. Class B*(Diversified Financial Services) 135,182
413 Best Buy Co., Inc. (Specialty Retail) 50,485211 Bio-Rad Laboratories, Inc. Class A* (Life
Sciences Tools & Services) 167,677193 Bio-Techne Corp. (Life Sciences Tools &
Services) 101,064
The accompanying notes are an integral part of these financial statements. 37

G O L D M A N S A C H S M U L T I - M A N A G E R G L O B A L E Q U I T Y F U N D
Schedule of Investments (continued)October 31, 2021
Shares Description Value
Common Stocks – (continued)
United States – (continued)28 BlackRock, Inc. (Capital Markets) $ 26,417
3,794 Blackstone Mortgage Trust, Inc. Class A(Mortgage Real Estate Investment Trusts(REITs)) 124,823
195 Blackstone, Inc. (Capital Markets) 26,9922,623 Boot Barn Holdings, Inc.* (Specialty
Retail) 274,0775,409 Bright Health Group, Inc.* (Insurance) 47,3293,359 BrightView Holdings, Inc.* (Commercial
Services & Supplies) 53,274157 Broadridge Financial Solutions, Inc. (IT
Services) 28,0103,644 Brooks Automation, Inc.
(Semiconductors & SemiconductorEquipment) 424,344
2,283 Brown & Brown, Inc. (Insurance) 144,0801,846 Cactus, Inc. Class A (Energy Equipment &
Services) 80,3012,301 Cadence Design Systems, Inc.* (Software) 398,3264,967 Callaway Golf Co.* (Leisure Products) 134,357
183 Capital One Financial Corp. (ConsumerFinance) 27,638
256 Cardinal Health, Inc. (Health CareProviders & Services) 12,239
1,479 Carrier Global Corp. (Building Products) 77,248406 Carter’s, Inc. (Textiles, Apparel & Luxury
Goods) 39,9991,477 Castle Biosciences, Inc.* (Health Care
Providers & Services) 92,09128 Catalent, Inc.* (Pharmaceuticals) 3,860
6,039 Cathay General Bancorp (Banks) 254,78525 Cboe Global Markets, Inc. (Capital
Markets) 3,29950 CBRE Group, Inc. Class A* (Real Estate
Management & Development) 5,204640 CDW Corp. (Electronic Equipment,
Instruments & Components) 119,4565,681 Central Garden & Pet Co. Class A*
(Household Products) 262,4621,956 Cerence, Inc.* (Software) 205,634
77 Cerner Corp. (Health Care Technology) 5,7207,346 ChampionX Corp.* (Energy Equipment &
Services) 192,6868,481 Change Healthcare, Inc.* (Health Care
Technology) 182,5968 Charles River Laboratories International,
Inc.* (Life Sciences Tools & Services) 3,5893 Charter Communications, Inc. Class A*
(Media) 2,025320 Cheniere Energy, Inc.* (Oil, Gas &
Consumable Fuels) 33,08878 Chevron Corp. (Oil, Gas & Consumable
Fuels) 8,930132 Church & Dwight Co., Inc. (Household
Products) 11,532
Shares Description Value
Common Stocks – (continued)
United States – (continued)1,182 Churchill Downs, Inc. (Hotels,
Restaurants & Leisure) $ 271,8603,047 Chuy’s Holdings, Inc.* (Hotels,
Restaurants & Leisure) 88,851121 Cigna Corp. (Health Care Providers &
Services) 25,84739 Cincinnati Financial Corp. (Insurance) 4,73661 Cintas Corp. (Commercial Services &
Supplies) 26,4191,067 Cisco Systems, Inc. (Communications
Equipment) 59,72026 Citrix Systems, Inc. (Software) 2,46320 CMS Energy Corp. (Multi-Utilities) 1,207
32,480 Cogent Communications Holdings, Inc.(Diversified TelecommunicationServices) 2,487,643
3,013 Cohen & Steers, Inc. (Capital Markets) 285,904256 Colgate-Palmolive Co. (Household
Products) 19,5051,177 Columbia Banking System, Inc. (Banks) 40,171
105 Comcast Corp. Class A (Media) 5,4004,458 CommScope Holding Co., Inc.*
(Communications Equipment) 47,7452,018 Compass Minerals International, Inc.
(Metals & Mining) 132,3811,302 Concentrix Corp. (IT Services) 231,339
194 Copart, Inc.* (Commercial Services &Supplies) 30,126
56 Corning, Inc. (Electronic Equipment,Instruments & Components) 1,992
20,030 CoStar Group, Inc.* (ProfessionalServices) 1,723,581
572 Costco Wholesale Corp. (Food & StaplesRetailing) 281,161
3,791 Cousins Properties, Inc. (Equity RealEstate Investment Trusts (REITs)) 150,162
8,550 Covetrus, Inc.* (Health Care Providers &Services) 172,625
6,940 Crocs, Inc.* (Textiles, Apparel & LuxuryGoods) 1,120,463
9 Crown Castle International Corp. (EquityReal Estate Investment Trusts (REITs)) 1,623
6,916 CryoLife, Inc.* (Health CareEquipment & Supplies) 142,746
3,791 CryoPort, Inc.* (Health CareEquipment & Supplies) 309,118
424 Cummins, Inc. (Machinery) 101,6921,146 Curtiss-Wright Corp. (Aerospace &
Defense) 146,3211,721 CVS Health Corp. (Health Care
Providers & Services) 153,65115 D.R. Horton, Inc. (Household Durables) 1,339
16,328 Danaher Corp. (Health CareEquipment & Supplies) 5,090,581
32 Datadog, Inc. Class A* (Software) 5,346341 DaVita, Inc.* (Health Care Providers &
Services) 35,205
38 The accompanying notes are an integral part of these financial statements.

G O L D M A N S A C H S M U L T I - M A N A G E R G L O B A L E Q U I T Y F U N D
Shares Description Value
Common Stocks – (continued)
United States – (continued)240 Deere & Co. (Machinery) $ 82,154
3,453 Delek US Holdings, Inc.* (Oil, Gas &Consumable Fuels) 67,161
80 Discover Financial Services (ConsumerFinance) 9,066
123 Dollar General Corp. (Multiline Retail) 27,2477 Domino’s Pizza, Inc. (Hotels,
Restaurants & Leisure) 3,42317 Dover Corp. (Machinery) 2,87430 DTE Energy Co. (Multi-Utilities) 3,401
297 DTE Midstream LLC* (Oil, Gas &Consumable Fuels) 14,244
125 Duke Energy Corp. (Electric Utilities) 12,751514 Duke Realty Corp. (Equity Real Estate
Investment Trusts (REITs)) 28,90771 Eastman Chemical Co. (Chemicals) 7,386
1,277 eBay, Inc. (Internet & Direct MarketingRetail) 97,971
77 Ecolab, Inc. (Chemicals) 17,1113,461 Ecovyst, Inc. (Chemicals) 40,424
770 Eli Lilly & Co. (Pharmaceuticals) 196,165391 EMCOR Group, Inc. (Construction &
Engineering) 47,5032,299 Emergent BioSolutions, Inc.*
(Biotechnology) 109,59328 Emerson Electric Co. (Electrical
Equipment) 2,7161,105 Employers Holdings, Inc. (Insurance) 42,6533,977 Energizer Holdings, Inc. (Household
Products) 145,0411,188 EnerSys (Electrical Equipment) 95,088
25,720 Entegris, Inc. (Semiconductors &Semiconductor Equipment) 3,620,862
19 Entergy Corp. (Electric Utilities) 1,9573,688 Envista Holdings Corp.* (Health Care
Equipment & Supplies) 144,2011,478 EPAM Systems, Inc.* (IT Services) 995,049
12 Equifax, Inc. (Professional Services) 3,329192 Equity Residential (Equity Real Estate
Investment Trusts (REITs)) 16,5892,259 Essent Group Ltd. (Thrifts & Mortgage
Finance) 108,43215 Essex Property Trust, Inc. (Equity Real
Estate Investment Trusts (REITs)) 5,0991,471 Evercore, Inc. Class A (Capital Markets) 223,357
89 Evergy, Inc. (Electric Utilities) 5,674379 Exelon Corp. (Electric Utilities) 20,159
1,376 Expeditors International of Washington,Inc. (Air Freight & Logistics) 169,606
147 Extra Space Storage, Inc. (Equity RealEstate Investment Trusts (REITs)) 29,013
2,014 Exxon Mobil Corp. (Oil, Gas &Consumable Fuels) 129,843
16 F5 Networks, Inc.* (CommunicationsEquipment) 3,378
Shares Description Value
Common Stocks – (continued)
United States – (continued)21 FactSet Research Systems, Inc. (Capital
Markets) $ 9,322604 Fastenal Co. (Trading Companies &
Distributors) 34,476792 Federal Agricultural Mortgage Corp.
Class C (Thrifts & Mortgage Finance) 99,8631,288 First American Financial Corp.
(Insurance) 94,2045,449 First Hawaiian, Inc. (Banks) 150,3381,763 First Merchants Corp. (Banks) 73,306
25 Fiserv, Inc.* (IT Services) 2,462819 Five Below, Inc.* (Specialty Retail) 161,589
3,026 Foot Locker, Inc. (Specialty Retail) 144,24938,940 Ford Motor Co.* (Automobiles) 665,095
197 Fortinet, Inc.* (Software) 66,259233 Fortune Brands Home & Security, Inc.
(Building Products) 23,6263,108 Fresh Del Monte Produce, Inc. (Food
Products) 104,0872,272 frontdoor, Inc.* (Diversified Consumer
Services) 84,700986 FTI Consulting, Inc.* (Professional
Services) 141,905308 Gartner, Inc.* (IT Services) 102,22835 Generac Holdings, Inc.* (Electrical
Equipment) 17,45088 General Dynamics Corp. (Aerospace &
Defense) 17,84290 General Mills, Inc. (Food Products) 5,562
3,309 General Motors Co.* (Automobiles) 180,109961 Gentex Corp. (Auto Components) 34,010337 Genuine Parts Co. (Distributors) 44,184
5,423 Glacier Bancorp, Inc. (Banks) 299,838173 Globe Life, Inc. (Insurance) 15,400
4,384 Globus Medical, Inc. Class A* (HealthCare Equipment & Supplies) 338,313
4,930 GrafTech International Ltd. (ElectricalEquipment) 52,751
2,617 Grand Canyon Education, Inc.*(Diversified Consumer Services) 208,575
17,890 Graphic Packaging Holding Co.(Containers & Packaging) 356,548
2,340 Gray Television, Inc. (Media) 54,8501,385 H&R Block, Inc. (Diversified Consumer
Services) 31,952695 Haemonetics Corp.* (Health Care
Equipment & Supplies) 47,7537,850 Halozyme Therapeutics, Inc.*
(Biotechnology) 298,8504,934 Hanesbrands, Inc. (Textiles, Apparel &
Luxury Goods) 84,0754,510 Harley-Davidson, Inc. (Automobiles) 164,5704,196 Harsco Corp.* (Commercial Services &
Supplies) 71,75211 HCA Healthcare, Inc. (Health Care
Providers & Services) 2,755
The accompanying notes are an integral part of these financial statements. 39

G O L D M A N S A C H S M U L T I - M A N A G E R G L O B A L E Q U I T Y F U N D
Schedule of Investments (continued)October 31, 2021
Shares Description Value
Common Stocks – (continued)
United States – (continued)3,150 HealthEquity, Inc.* (Health Care
Providers & Services) $ 208,4674,460 Heartland Express, Inc. (Road & Rail) 72,832
12,379 HEICO Corp. Class A (Aerospace &Defense) 1,555,793
696 Helen of Troy Ltd.* (HouseholdDurables) 156,565
3,530 Helios Technologies, Inc. (Machinery) 321,4062,842 Helmerich & Payne, Inc. (Energy
Equipment & Services) 88,216465 Henry Schein, Inc.* (Health Care
Providers & Services) 35,503221 Hewlett Packard Enterprise Co.
(Technology Hardware, Storage &Peripherals) 3,238
1,292 Hillenbrand, Inc. (Machinery) 58,7343,698 HollyFrontier Corp. (Oil, Gas &
Consumable Fuels) 124,99254 Hologic, Inc.* (Health Care Equipment &
Supplies) 3,95953 Honeywell International, Inc. (Industrial
Conglomerates) 11,5875,246 Horace Mann Educators Corp.
(Insurance) 205,53820 Hormel Foods Corp. (Food Products) 846
3,000 Houlihan Lokey, Inc. (Capital Markets) 336,2401,033 HP, Inc. (Technology Hardware,
Storage & Peripherals) 31,331644 Hub Group, Inc. Class A* (Air Freight &
Logistics) 50,599194 Humana, Inc. (Health Care Providers &
Services) 89,85345 Huntington Ingalls Industries, Inc.
(Aerospace & Defense) 9,1231,613 Huntsman Corp. (Chemicals) 52,552
97 IAC/InterActiveCorp.* (InteractiveMedia & Services) 14,780
2,356 ICF International, Inc. (ProfessionalServices) 236,754
548 ICU Medical, Inc.* (Health CareEquipment & Supplies) 128,303
1,875 IDACORP, Inc. (Electric Utilities) 195,6006 IDEX Corp. (Machinery) 1,335
843 IDEXX Laboratories, Inc.* (Health CareEquipment & Supplies) 561,556
132 Illinois Tool Works, Inc. (Machinery) 30,0791,053 Ingevity Corp.* (Chemicals) 82,0392,854 Insight Enterprises, Inc.* (Electronic
Equipment, Instruments & Components) 270,2743,526 Integra LifeSciences Holdings Corp.*
(Health Care Equipment & Supplies) 234,33863 Intel Corp. (Semiconductors &
Semiconductor Equipment) 3,08715,662 Intercontinental Exchange, Inc. (Capital
Markets) 2,168,5611,992 InterDigital, Inc. (Software) 133,364
Shares Description Value
Common Stocks – (continued)
United States – (continued)60 International Business Machines Corp.
(IT Services) $ 7,50687 International Paper Co. (Containers &
Packaging) 4,321376 Intuit, Inc. (Software) 235,37224 Intuitive Surgical, Inc.* (Health Care
Equipment & Supplies) 8,6674,795 Investors Bancorp, Inc. (Banks) 73,364
104 Invitation Homes, Inc. (Equity RealEstate Investment Trusts (REITs)) 4,290
5 Iron Mountain, Inc. (Equity Real EstateInvestment Trusts (REITs)) 228
76 J.B. Hunt Transport Services, Inc.(Road & Rail) 14,986
18,060 Jack Henry & Associates, Inc. (ITServices) 3,006,629
263 Jackson Financial, Inc. Class A*(Diversified Financial Services) 7,119
36 Jacobs Engineering Group, Inc.(Professional Services) 5,055
1,141 Johnson & Johnson (Pharmaceuticals) 185,84635 Kansas City Southern (Road & Rail) 10,859
8,214 KAR Auction Services, Inc.*(Commercial Services & Supplies) 120,499
70 Keysight Technologies, Inc.*(Electronic Equipment, Instruments &Components) 12,601
166 Kimberly-Clark Corp. (HouseholdProducts) 21,495
223 Kinder Morgan, Inc. (Oil, Gas &Consumable Fuels) 3,735
25,729 KKR & Co., Inc. (Capital Markets) 2,049,829271 KLA Corp. (Semiconductors &
Semiconductor Equipment) 101,018614 Korn Ferry (Professional Services) 47,407
556,683 Kosmos Energy Ltd.* (Oil, Gas &Consumable Fuels) 2,004,059
117 Laboratory Corp. of America Holdings*(Health Care Providers & Services) 33,581
3,657 Lam Research Corp. (Semiconductors &Semiconductor Equipment) 2,060,975
208 Landstar System, Inc. (Road & Rail) 36,5681,054 LCI Industries (Auto Components) 147,181
15 Lear Corp. (Auto Components) 2,578152 Leidos Holdings, Inc. (Professional
Services) 15,197961 LHC Group, Inc.* (Health Care
Providers & Services) 129,341748 Lithia Motors, Inc. (Specialty Retail) 238,77753 Lockheed Martin Corp. (Aerospace &
Defense) 17,613165 Loews Corp. (Insurance) 9,252219 Lowe’s Cos., Inc. (Specialty Retail) 51,207
1,800 Lululemon Athletica, Inc.* (Textiles,Apparel & Luxury Goods) 838,818
44,890 Luminar Technologies, Inc.* (AutoComponents) 735,747
40 The accompanying notes are an integral part of these financial statements.

G O L D M A N S A C H S M U L T I - M A N A G E R G L O B A L E Q U I T Y F U N D
Shares Description Value
Common Stocks – (continued)
United States – (continued)5,393 MACOM Technology Solutions
Holdings, Inc.* (Semiconductors &Semiconductor Equipment) $ 376,539
17,056 Magnolia Oil & Gas Corp. Class A (Oil,Gas & Consumable Fuels) 356,129
221 Marathon Petroleum Corp. (Oil, Gas &Consumable Fuels) 14,571
2 Markel Corp.* (Insurance) 2,626339 Marsh & McLennan Cos., Inc.
(Insurance) 56,545464 Masco Corp. (Building Products) 30,415
14,605 Masimo Corp.* (Health CareEquipment & Supplies) 4,141,102
21,125 Mastercard, Inc. Class A (IT Services) 7,087,8606,400 Matador Resources Co. (Oil, Gas &
Consumable Fuels) 267,840486 MAXIMUS, Inc. (IT Services) 41,101111 McCormick & Co., Inc. (Food Products) 8,90637 McDonald’s Corp. (Hotels, Restaurants &
Leisure) 9,08572 McKesson Corp. (Health Care
Providers & Services) 14,9671,637 Medpace Holdings, Inc.* (Life Sciences
Tools & Services) 370,862696 MercadoLibre, Inc.* (Internet & Direct
Marketing Retail) 1,030,79064 Merck & Co., Inc. (Pharmaceuticals) 5,635
6,064 Meridian Bancorp, Inc. (Thrifts &Mortgage Finance) 140,685
736 Meritage Homes Corp.* (HouseholdDurables) 80,011
21,485 Meta Platforms, Inc. Class-A*(Interactive Media & Services) 6,951,901
436 MetLife, Inc. (Insurance) 27,381484 Mettler-Toledo International, Inc.* (Life
Sciences Tools & Services) 716,74626,379 Microsoft Corp. (Software) 8,747,804
185 Mid-America Apartment Communities,Inc. (Equity Real Estate InvestmentTrusts (REITs)) 37,779
3,157 Minerals Technologies, Inc. (Chemicals) 223,958470 Mondelez International, Inc. Class A
(Food Products) 28,5487,392 Monolithic Power Systems, Inc.
(Semiconductors & SemiconductorEquipment) 3,884,200
62 Monster Beverage Corp.* (Beverages) 5,27068 Moody’s Corp. (Capital Markets) 27,482
235 Morgan Stanley (Capital Markets) 24,15315,083 Motorola Solutions, Inc.
(Communications Equipment) 3,749,4832,046 Mr Cooper Group, Inc.* (Thrifts &
Mortgage Finance) 89,697739 MSCI, Inc. (Capital Markets) 491,346428 Nasdaq, Inc. (Capital Markets) 89,824
2,530 National Health Investors, Inc. (EquityReal Estate Investment Trusts (REITs)) 136,063
Shares Description Value
Common Stocks – (continued)
United States – (continued)9,793 Navient Corp. (Consumer Finance) $ 192,9224,068 NCR Corp.* (Software) 160,849
859 Nelnet, Inc. Class A (Consumer Finance) 70,979147 NetApp, Inc. (Technology Hardware,
Storage & Peripherals) 13,127104 News Corp. Class A (Media) 2,382
1,004 Nexstar Media Group, Inc. Class A(Media) 150,530
44,814 NextEra Energy, Inc. (Electric Utilities) 3,823,9797,018 NexTier Oilfield Solutions, Inc.* (Energy
Equipment & Services) 31,300505 NIKE, Inc. Class B (Textiles, Apparel &
Luxury Goods) 84,4813,678 NMI Holdings, Inc. Class A* (Thrifts &
Mortgage Finance) 89,3023,571 NorthWestern Corp. (Multi-Utilities) 203,047
548 NortonLifeLock, Inc. (Software) 13,947515 Nucor Corp. (Metals & Mining) 57,500
28,724 NVIDIA Corp. (Semiconductors &Semiconductor Equipment) 7,343,865
2 NVR, Inc.* (Household Durables) 9,79021 O’Reilly Automotive, Inc.* (Specialty
Retail) 13,0699,185 OceanFirst Financial Corp. (Banks) 203,631
175 Old Dominion Freight Line, Inc. (Road &Rail) 59,736
2,315 Ollie’s Bargain Outlet Holdings, Inc.*(Multiline Retail) 156,633
193 Omnicom Group, Inc. (Media) 13,1393,150 Open Lending Corp. Class A* (Capital
Markets) 99,288356 Oracle Corp. (Software) 34,155
1,417 Organon & Co (Pharmaceuticals) 52,07538 Otis Worldwide Corp. (Machinery) 3,052
1,863 Oxford Industries, Inc. (Textiles,Apparel & Luxury Goods) 172,737
374 PACCAR, Inc. (Machinery) 33,5186,857 Pacific Premier Bancorp, Inc. (Banks) 287,9252,193 PacWest Bancorp. (Banks) 104,1021,000 Parade Technologies Ltd.
(Semiconductors & SemiconductorEquipment) 64,420
3,667 Patrick Industries, Inc. (AutoComponents) 285,696
1,696 Paychex, Inc. (IT Services) 209,0836,000 Paycor HCM, Inc.* (Software) 194,6401,074 Paylocity Holding Corp.* (Software) 327,7201,852 PayPal Holdings, Inc.* (IT Services) 430,7571,398 PDC Energy, Inc. (Oil, Gas &
Consumable Fuels) 73,1291,125 PennyMac Financial Services, Inc.
(Thrifts & Mortgage Finance) 69,818861 PepsiCo, Inc. (Beverages) 139,138
6,034 Performance Food Group Co.* (Food &Staples Retailing) 272,918
32 PerkinElmer, Inc. (Life Sciences Tools &Services) 5,660
The accompanying notes are an integral part of these financial statements. 41

G O L D M A N S A C H S M U L T I - M A N A G E R G L O B A L E Q U I T Y F U N D
Schedule of Investments (continued)October 31, 2021
Shares Description Value
Common Stocks – (continued)
United States – (continued)3,296 PetIQ, Inc.* (Health Care Providers &
Services) $ 82,565850 Pfizer, Inc. (Pharmaceuticals) 37,17990 Philip Morris International, Inc.
(Tobacco) 8,509301 Phillips 66 (Oil, Gas & Consumable
Fuels) 22,5095,412 Phreesia, Inc.* (Health Care Technology) 381,762
378 Pool Corp. (Distributors) 194,7301,733 PRA Group, Inc.* (Consumer Finance) 74,311
656 Preferred Bank (Banks) 44,9827,324 Primoris Services Corp. (Construction &
Engineering) 197,382159 Principal Financial Group, Inc.
(Insurance) 10,6673,169 ProAssurance Corp. (Insurance) 72,6024,400 Progyny, Inc.* (Health Care Providers &
Services) 270,29239 Prologis, Inc. (Equity Real Estate
Investment Trusts (REITs)) 5,653536 Prudential Financial, Inc. (Insurance) 58,98740 PTC, Inc.* (Software) 5,094
268 Public Storage (Equity Real EstateInvestment Trusts (REITs)) 89,024
162 PulteGroup, Inc. (Household Durables) 7,78910,914 Qorvo, Inc.* (Semiconductors &
Semiconductor Equipment) 1,836,062348 Quest Diagnostics, Inc. (Health Care
Providers & Services) 51,0792,144 R1 RCM, Inc.* (Health Care Providers &
Services) 46,5251,879 Rackspace Technology, Inc.* (IT
Services) 24,9723,050 Rapid7, Inc.* (Software) 392,687
171 Raymond James Financial, Inc. (CapitalMarkets) 16,859
1,570 RBC Bearings, Inc.* (Machinery) 367,2705,113 Realogy Holdings Corp.* (Real Estate
Management & Development) 88,5578 Regeneron Pharmaceuticals, Inc.*
(Biotechnology) 5,1201,557 Republic Services, Inc. (Commercial
Services & Supplies) 209,5723,615 ResMed, Inc. (Health Care Equipment &
Supplies) 950,4201,941 Revolve Group, Inc.* (Internet & Direct
Marketing Retail) 145,653382 Robert Half International, Inc.
(Professional Services) 43,1939 Rockwell Automation, Inc. (Electrical
Equipment) 2,875984 Rollins, Inc. (Commercial Services &
Supplies) 34,66638 Roper Technologies, Inc. (Industrial
Conglomerates) 18,539
Shares Description Value
Common Stocks – (continued)
United States – (continued)2,392 Ryman Hospitality Properties, Inc.*
(Equity Real Estate Investment Trusts(REITs)) $ 204,612
143 S&P Global, Inc. (Capital Markets) 67,80516,040 Saia, Inc.* (Road & Rail) 5,014,7466,661 salesforce.com, Inc.* (Software) 1,996,2354,446 Sally Beauty Holdings, Inc.* (Specialty
Retail) 67,8462,848 Schweitzer-Mauduit International, Inc.
(Paper & Forest Products) 99,2241,672 Science Applications International Corp.
(Professional Services) 150,1128,547 Seacoast Banking Corp. of Florida
(Banks) 311,3672,741 Silgan Holdings, Inc. (Containers &
Packaging) 110,1881,698 Silicon Laboratories, Inc.*
(Semiconductors & SemiconductorEquipment) 320,514
1,801 Skechers U.S.A., Inc. Class A* (Textiles,Apparel & Luxury Goods) 83,224
7,412 Skyline Champion Corp.* (HouseholdDurables) 469,328
11,368 Skyworks Solutions, Inc.(Semiconductors & SemiconductorEquipment) 1,899,934
12,771 SLM Corp. (Consumer Finance) 234,34860 Snap-on, Inc. (Machinery) 12,194
250 Southern Copper Corp. (Metals &Mining) 14,998
510 SouthState Corp. (Banks) 39,8261,317 Spectrum Brands Holdings, Inc.
(Household Products) 123,469997 Spirit Realty Capital, Inc. (Equity Real
Estate Investment Trusts (REITs)) 48,7837,320 Splunk, Inc.* (Software) 1,206,4824,786 SPX Corp.* (Machinery) 278,0198,751 STAG Industrial, Inc. (Equity Real Estate
Investment Trusts (REITs)) 380,931724 Standard Motor Products, Inc. (Auto
Components) 34,680831 Starbucks Corp. (Hotels, Restaurants &
Leisure) 88,1444,553 Starwood Property Trust, Inc. (Mortgage
Real Estate Investment Trusts (REITs)) 115,96552 Steel Dynamics, Inc. (Metals & Mining) 3,436
2,721 Steven Madden Ltd. (Textiles, Apparel &Luxury Goods) 122,717
4,022 Stifel Financial Corp. (Capital Markets) 293,0834,976 Stride, Inc.* (Diversified Consumer
Services) 176,64859 Stryker Corp. (Health Care Equipment &
Supplies) 15,6988,722 Supernus Pharmaceuticals, Inc.*
(Pharmaceuticals) 260,35234 SVB Financial Group* (Banks) 24,392
42 The accompanying notes are an integral part of these financial statements.

G O L D M A N S A C H S M U L T I - M A N A G E R G L O B A L E Q U I T Y F U N D
Shares Description Value
Common Stocks – (continued)
United States – (continued)7 Sylvamo Corp.* (Paper & Forest
Products) $ 197128 Synchrony Financial (Consumer Finance) 5,946
6,021 Syneos Health, Inc.* (Life SciencesTools & Services) 562,000
1,600 SYNNEX Corp. (Electronic Equipment,Instruments & Components) 168,000
1,513 Synopsys, Inc.* (Software) 504,1012,890 Synovus Financial Corp. (Banks) 134,645
9 T-Mobile US, Inc.* (WirelessTelecommunication Services) 1,035
1,271 T. Rowe Price Group, Inc. (CapitalMarkets) 275,654
198 Target Corp. (Multiline Retail) 51,4056,602 TEGNA, Inc. (Media) 129,7951,823 Tempur Sealy International, Inc.
(Household Durables) 81,069161 Teradyne, Inc. (Semiconductors &
Semiconductor Equipment) 22,257885 Terex Corp. (Machinery) 39,648
1,244 Texas Instruments, Inc.(Semiconductors & SemiconductorEquipment) 233,225
4,319 Texas Roadhouse, Inc. (Hotels,Restaurants & Leisure) 383,570
45 Textron, Inc. (Aerospace & Defense) 3,3232,958 The Allstate Corp. (Insurance) 365,816
63 The Bank of New York Mellon Corp.(Capital Markets) 3,730
1,510 The Brink’s Co. (Commercial Services &Supplies) 104,009
32,478 The Carlyle Group, Inc. (CapitalMarkets) 1,823,640
46 The Charles Schwab Corp. (CapitalMarkets) 3,773
20,985 The Clorox Co. (Household Products) 3,420,765282 The Coca-Cola Co. (Beverages) 15,896225 The Estee Lauder Cos., Inc. Class A
(Personal Products) 72,9741,161 The Hanover Insurance Group, Inc.
(Insurance) 146,28648 The Hartford Financial Services Group,
Inc. (Insurance) 3,501139 The Hershey Co. (Food Products) 24,374170 The Home Depot, Inc. (Specialty Retail) 63,196
3,866 The Interpublic Group of Cos., Inc.(Media) 141,380
50 The J.M. Smucker Co. (Food Products) 6,1432,006 The Kroger Co. (Food & Staples
Retailing) 80,28016 The PNC Financial Services Group, Inc.
(Banks) 3,376782 The Procter & Gamble Co. (Household
Products) 111,8184,026 The Progressive Corp. (Insurance) 381,987
32 The Sherwin-Williams Co. (Chemicals) 10,132
Shares Description Value
Common Stocks – (continued)
United States – (continued)4,346 The Shyft Group, Inc. (Machinery) $ 179,099
247 The Southern Co. (Electric Utilities) 15,393101 The TJX Cos., Inc. (Specialty Retail) 6,61459 The Travelers Cos., Inc. (Insurance) 9,49245 The Walt Disney Co.* (Entertainment) 7,608
696 The Western Union Co. (IT Services) 12,681208 Thermo Fisher Scientific, Inc. (Life
Sciences Tools & Services) 131,679818 Toll Brothers, Inc. (Household Durables) 49,219
1,120 Tractor Supply Co. (Specialty Retail) 243,2303,973 TransDigm Group, Inc.* (Aerospace &
Defense) 2,478,437931 Travel + Leisure Co. (Hotels,
Restaurants & Leisure) 50,5911,511 TTEC Holdings, Inc. (IT Services) 142,623
729 Turning Point Brands, Inc. (Tobacco) 27,82617 Tyler Technologies, Inc.* (Software) 9,23591 UDR, Inc. (Equity Real Estate Investment
Trusts (REITs)) 5,0534,025 UFP Industries, Inc. (Building Products) 329,3662,082 Ultra Clean Holdings, Inc.*
(Semiconductors & SemiconductorEquipment) 103,205
4,268 Umpqua Holdings Corp. (Banks) 87,28120,500 Union Pacific Corp. (Road & Rail) 4,948,7004,918 Unisys Corp.* (IT Services) 125,753
32 United Parcel Service, Inc. Class B (AirFreight & Logistics) 6,831
156 UnitedHealth Group, Inc. (Health CareProviders & Services) 71,833
11,150 Unity Software, Inc.* (Software) 1,687,1061,558 Universal Corp. (Tobacco) 73,2265,501 Upstart Holdings, Inc.* (Consumer
Finance) 1,771,5423,208 US Ecology, Inc.* (Commercial
Services & Supplies) 103,266185 Valero Energy Corp. (Oil, Gas &
Consumable Fuels) 14,3067,714 Valley National Bancorp (Banks) 102,2886,962 Valvoline, Inc. (Chemicals) 236,4303,978 Veracyte, Inc.* (Biotechnology) 190,467
88 VeriSign, Inc.* (IT Services) 19,59569 Verisk Analytics, Inc. (Professional
Services) 14,509632 Verizon Communications, Inc.
(Diversified TelecommunicationServices) 33,490
94 ViacomCBS, Inc. Class B (Media) 3,40516,150 Viavi Solutions, Inc.* (Communications
Equipment) 248,710164 Vimeo, Inc.* (Interactive Media &
Services) 5,5324,337 Viper Energy Partners LP (Oil, Gas &
Consumable Fuels) 95,6317,442 Visa, Inc. Class A (IT Services) 1,575,992
245 W.R. Berkley Corp. (Insurance) 19,502
The accompanying notes are an integral part of these financial statements. 43

G O L D M A N S A C H S M U L T I - M A N A G E R G L O B A L E Q U I T Y F U N D
Schedule of Investments (continued)October 31, 2021
Shares Description Value
Common Stocks – (continued)
United States – (continued)2,735 Wabash National Corp. (Machinery) $ 42,475
97 Walgreens Boots Alliance, Inc. (Food &Staples Retailing) 4,561
1,106 Walker & Dunlop, Inc. (Thrifts &Mortgage Finance) 143,857
312 Walmart, Inc. (Food & Staples Retailing) 46,619736 Waste Management, Inc. (Commercial
Services & Supplies) 117,929409 Waters Corp.* (Life Sciences Tools &
Services) 150,3287,829 Wayfair, Inc. Class A* (Internet & Direct
Marketing Retail) 1,950,204873 Werner Enterprises, Inc. (Road & Rail) 39,564
2,483 WESCO International, Inc.* (TradingCompanies & Distributors) 321,697
730 West Pharmaceutical Services, Inc. (LifeSciences Tools & Services) 313,812
10 Weyerhaeuser Co. (Equity Real EstateInvestment Trusts (REITs)) 357
108 Whirlpool Corp. (Household Durables) 22,770131 White Mountains Insurance Group Ltd.
(Insurance) 138,204837 Whiting Petroleum Corp.* (Oil, Gas &
Consumable Fuels) 54,514509 Wintrust Financial Corp. (Banks) 45,047
5,162 Wolverine World Wide, Inc. (Textiles,Apparel & Luxury Goods) 171,224
6,222 World Fuel Services Corp. (Oil, Gas &Consumable Fuels) 189,958
122 Xcel Energy, Inc. (Electric Utilities) 7,88047 Xylem, Inc. (Machinery) 6,138
3,076 Yelp, Inc.* (Interactive Media &Services) 118,826
11,742 Yum China Holdings, Inc. (Hotels,Restaurants & Leisure) 670,233
128 Yum! Brands, Inc. (Hotels, Restaurants &Leisure) 15,992
69 Zebra Technologies Corp. Class A*(Electronic Equipment, Instruments &Components) 36,843
344 Zoetis, Inc. (Pharmaceuticals) 74,373
180,829,492
Uruguay* – 0.0%3,750 Dlocal Ltd. (IT Services) 181,912
TOTAL COMMON STOCKS(Cost $297,394,710) $407,905,662
SharesDividend
Rate Value
Preferred Stocks – 0.3%
Brazil – 0.1%Braskem SA Class A* (Chemicals)
3,600 0.000% $ 34,738Cia de Transmissao de Energia Eletrica Paulista (Electric
Utilities)9,900 18.540 42,661
Cia Paranaense de Energia (Electric Utilities)32,300 25.375 33,881
Itausa SA (Banks)109,300 3.090 198,505Petroleo Brasileiro SA (Oil, Gas & Consumable Fuels)115,700 9.200 558,635
868,420
Germany – 0.2%Bayerische Motoren Werke AG (Automobiles)
171 0.000 14,576Jungheinrich AG (Machinery)
2,605 0.951 132,106Porsche Automobil Holding SE (Automobiles)
33 2.530 3,435Sartorius AG (Health Care Equipment & Supplies)
42 0.128 27,205Volkswagen AG (Automobiles)
3,132 2.570 702,919
880,241
South Korea – 0.0%CJ CheilJedang Corp. (Food Products)
8 2.130 1,329Hanwha Corp. (Industrial Conglomerates)
81 4.630 1,139LG Electronics, Inc. (Household Durables)
177 2.006 9,742
12,210
TOTAL PREFERRED STOCKS – 0.3%(Cost $1,648,558) $ 1,760,871
Shares Description Value
Exchange Traded Funds – 16.4%
13,000 iShares Core MSCI Emerging MarketsETF $ 811,590
352,577 iShares MSCI International MultifactorETF 10,453,908
11,900 iShares MSCI Saudi Arabia ETF 514,556476,651 iShares MSCI USA Multifactor ETF 21,296,767126,510 Vanguard S&P 500 ETF 53,407,461
TOTAL EXCHANGE TRADED FUNDS(Cost $74,366,939) $ 86,484,282
44 The accompanying notes are an integral part of these financial statements.

G O L D M A N S A C H S M U L T I - M A N A G E R G L O B A L E Q U I T Y F U N D
SharesDividend
Rate Value
Investment Companies(b) – 6.5%
Goldman Sachs Financial Square Government Fund – Class R621,160,598 0.026% $ 21,160,598Goldman Sachs Financial Square Government Fund –
Institutional Shares12,999,041 0.026 12,999,041
TOTAL INVESTMENT COMPANIES – 6.5%(Cost $34,159,639) $ 34,159,639
TOTAL INVESTMENTS – 100.7%(Cost $407,569,846) $530,310,454
LIABIL IT IES IN EXCESS OFOTHER ASSETS – (0.7)% (3,912,980)
NET ASSETS – 100.0% $526,397,474
The percentage shown for each investment categoryreflects the value of investments in that category as apercentage of net assets.* Non-income producing security.
(a) Exempt from registration under Rule 144A of the SecuritiesAct of 1933.
(b) Represents an affiliated issuer.
Currency Abbreviations:AED —United Arab Emirates DirhamAUD —Australian DollarBRL —Brazilian RealCAD —Canadian DollarCHF —Swiss FrancCLP —Chilean PesoCNY —Chinese Yuan RenminbiDKK —Danish KroneEUR —EuroGBP —British PoundHKD —Hong Kong DollarIDR —Indonesian RupiahILS —Israeli ShekelINR —Indian RupeeJPY —Japanese YenKRW—South Korean WonMXN—Mexican PesoMYR—Malaysian RinggitNOK —Norwegian KroneNZD —New Zealand DollarPLN —Polish ZlotySEK —Swedish KronaSGD —Singapore DollarTHB —Thai BahtTRY —Turkish LiraTWD—Taiwan DollarUSD —U.S. DollarZAR —South African Rand
Investment Abbreviations:ADR—American Depositary ReceiptETF —Exchange Traded FundGDR—Global Depository ReceiptLLC —Limited Liability CompanyLP —Limited PartnershipPLC —Public Limited CompanyREIT—Real Estate Investment Trust
The accompanying notes are an integral part of these financial statements. 45

G O L D M A N S A C H S M U L T I - M A N A G E R G L O B A L E Q U I T Y F U N D
Schedule of Investments (continued)October 31, 2021
A D D I T I O N A L I N V E S T M E N T I N F O R M A T I O N
FORWARD FOREIGN CURRENCY EXCHANGE CONTRACTS — At October 31, 2021, the Fund had the following forward
foreign currency exchange contracts:
FORWARD FOREIGN CURRENCY EXCHANGE CONTRACTS WITH UNREALIZED GAIN
CounterpartyCurrency
PurchasedCurrency
SoldSettlement
DateUnrealized
Gain
BNP Paribas SA AUD 6,310,000 USD 4,745,621 11/02/21 $ 1,124CHF 5,670,000 USD 6,169,256 11/02/21 23,724ILS 680,000 USD 212,430 11/02/21 2,466JPY 1,877,000,000 USD 16,448,792 11/02/21 19,956SEK 19,875,000 USD 2,312,811 11/02/21 1,501USD 1,591,582 DKK 10,110,000 11/02/21 20,427USD 1,579,806 DKK 10,110,000 12/02/21 7,627USD 21,191,824 EUR 18,100,000 11/02/21 267,414USD 21,046,771 EUR 18,100,000 12/02/21 109,417USD 9,578,445 GBP 6,985,000 11/02/21 19,097USD 9,642,387 GBP 6,985,000 12/02/21 82,674USD 2,257,110 HKD 17,550,000 12/02/21 1,264USD 16,936,922 JPY 1,877,000,000 11/02/21 468,173USD 414,331 NOK 3,450,000 12/02/21 6,035USD 186,772 NZD 260,000 12/02/21 540USD 698,208 SGD 940,000 12/02/21 1,235
Brown Brothers Harriman & Co. USD 45,909 MXN 943,922 11/03/21 82JPMorgan Securities, Inc. AUD 1,780,000 USD 1,338,701 11/02/21 317
CHF 1,690,000 USD 1,838,808 11/02/21 7,071ILS 200,000 USD 62,490 11/02/21 714JPY 476,000,000 USD 4,171,351 11/02/21 5,061SEK 6,150,000 USD 715,662 11/02/21 464USD 484,874 DKK 3,080,000 11/02/21 6,223USD 481,286 DKK 3,080,000 12/02/21 2,324USD 6,076,551 EUR 5,190,000 11/02/21 76,678USD 6,034,958 EUR 5,190,000 12/02/21 31,374USD 2,639,729 GBP 1,925,000 11/02/21 5,263USD 2,657,351 GBP 1,925,000 12/02/21 22,784USD 571,082 HKD 4,440,000 12/02/21 373USD 4,295,138 JPY 476,000,000 11/02/21 118,727USD 126,101 NOK 1,050,000 12/02/21 1,837USD 43,101 NZD 60,000 12/02/21 125USD 193,119 SGD 260,000 12/02/21 339
State Street Bank and Trust USD 163,925 ZAR 2,502,725 11/04/21 151UBS AG (London) USD 13,528 ZAR 206,654 11/04/21 5
TOTAL $1,312,586
46 The accompanying notes are an integral part of these financial statements.

G O L D M A N S A C H S M U L T I - M A N A G E R G L O B A L E Q U I T Y F U N D
A D D I T I O N A L I N V E S T M E N T I N F O R M A T I O N ( c o n t i n u e d )
FORWARD FOREIGN CURRENCY EXCHANGE CONTRACTS WITH UNREALIZED LOSS
CounterpartyCurrency
PurchasedCurrency
SoldSettlement
DateUnrealized
Loss
BNP Paribas SA DKK 10,110,000 USD 1,578,848 11/02/21 $ (7,693)EUR 18,100,000 USD 21,034,644 11/02/21 (110,234)GBP 6,985,000 USD 9,642,269 11/02/21 (82,920)HKD 17,550,000 USD 2,256,925 11/02/21 (1,276)HKD 370,000 USD 47,563 12/02/21 (4)NOK 3,450,000 USD 414,420 11/02/21 (6,037)NZD 260,000 USD 186,843 11/02/21 (532)SGD 940,000 USD 698,311 11/02/21 (1,246)USD 4,571,541 AUD 6,310,000 11/02/21 (175,203)USD 5,663,983 AUD 7,530,000 12/02/21 (1,171)USD 6,125,505 CHF 5,670,000 11/02/21 (67,475)USD 7,802,385 CHF 7,160,000 12/02/21 (24,352)USD 583,033 DKK 3,750,000 12/02/21 (120)USD 5,459,317 EUR 4,720,000 12/02/21 (589)USD 1,929,561 GBP 1,410,000 12/02/21 (173)USD 2,254,793 HKD 17,550,000 11/02/21 (857)USD 212,442 ILS 680,000 11/02/21 (2,453)USD 313,592 ILS 1,000,000 12/02/21 (2,477)USD 18,022,891 JPY 2,056,000,000 12/02/21 (20,617)USD 401,371 NOK 3,450,000 11/02/21 (7,011)USD 124,255 NOK 1,050,000 12/02/21 (9)USD 182,318 NZD 260,000 11/02/21 (3,993)USD 2,286,976 SEK 19,875,000 11/02/21 (27,336)USD 3,003,344 SEK 25,800,000 12/02/21 (1,725)USD 694,570 SGD 940,000 11/02/21 (2,494)USD 133,452 SGD 180,000 12/02/21 (11)
JPMorgan Securities, Inc. DKK 3,080,000 USD 480,994 11/02/21 (2,344)EUR 5,190,000 USD 6,031,481 11/02/21 (31,609)GBP 1,925,000 USD 2,657,318 11/02/21 (22,852)HKD 4,440,000 USD 571,036 11/02/21 (376)NOK 1,050,000 USD 126,128 11/02/21 (1,837)NZD 60,000 USD 43,118 11/02/21 (123)SGD 260,000 USD 193,145 11/02/21 (340)USD 1,289,595 AUD 1,780,000 11/02/21 (49,423)USD 1,338,869 AUD 1,780,000 12/02/21 (305)USD 1,825,768 CHF 1,690,000 11/02/21 (20,111)USD 1,840,199 CHF 1,690,000 12/02/21 (7,173)USD 570,443 HKD 4,440,000 11/02/21 (217)USD 62,483 ILS 200,000 11/02/21 (721)USD 62,501 ILS 200,000 12/02/21 (713)USD 4,172,197 JPY 476,000,000 12/02/21 (5,191)USD 122,157 NOK 1,050,000 11/02/21 (2,134)USD 42,073 NZD 60,000 11/02/21 (921)USD 707,668 SEK 6,150,000 11/02/21 (8,459)USD 715,823 SEK 6,150,000 12/02/21 (501)USD 192,115 SGD 260,000 11/02/21 (690)
TOTAL $(704,048)
The accompanying notes are an integral part of these financial statements. 47

G O L D M A N S A C H S M U L T I - M A N A G E R G L O B A L E Q U I T Y F U N D
Schedule of Investments (continued)October 31, 2021
A D D I T I O N A L I N V E S T M E N T I N F O R M A T I O N ( c o n t i n u e d )
FUTURES CONTRACTS — At October 31, 2021, the Fund had the following futures contracts:
DescriptionNumber ofContracts
ExpirationDate
NotionalAmount
UnrealizedAppreciation/(Depreciation)
Long position contracts:E-Mini Russell 2000 Index 51 12/17/21 $ 5,853,015 $ 126,159S&P 500 E-Mini Index 174 12/17/21 39,993,900 989,762
TOTAL FUTURES CONTRACTS $1,115,921
48 The accompanying notes are an integral part of these financial statements.

G O L D M A N S A C H S M U L T I - M A N A G E R N O N - C O R E F I X E D I N C O M E F U N D
Schedule of InvestmentsOctober 31, 2021
PrincipalAmount
InterestRate
MaturityDate Value
Foreign Debt Obligations – 33.9%
Sovereign – 33.9%Abu Dhabi Government International Bond$ 920,000 1.625% 06/02/28 $ 905,740
1,556,000 1.875(a) 09/15/31 1,511,265454,000 3.000(a) 09/15/51 448,893
Agricultural Development Bank of ChinaCNY 39,150,000 2.250 04/22/25 5,953,181Banque Centrale de Tunisie International Bond$ 400,000 5.750 01/30/25 320,500Bonos de la Tesoreria de la Republica en PesosCLP 789,893,780 1.500 03/01/26 946,638
60,761,060 2.000 03/01/35 67,533240,000,000 2.500 03/01/25 267,907650,000,000 4.700(a) 09/01/30 730,346
1,370,000,000 5.000(a) 10/01/28 1,593,003550,000,000 5.000 03/01/35 600,542
Brazil Letras do Tesouro Nacional(b)
BRL 40,188,000 0.000 01/01/23 6,264,342Brazil Notas do Tesouro Nacional
88,245,000 10.000 01/01/23 15,285,31228,273,000 10.000 01/01/25 4,737,613
Canadian Government BondCAD 14,000,000 0.250 08/01/23 11,162,330China Development BankCNY 42,040,000 3.230 01/10/25 6,620,050
11,210,000 3.480 01/08/29 1,765,665China Government Bond$ 1,618,000 0.400 10/21/23 1,610,492
2,290,000 0.550 10/21/25 2,231,0321,733,000 1.875 12/03/22 1,758,822
CNY 15,900,000 1.990 04/09/25 2,419,38917,670,000 2.850 06/04/27 2,750,150
$ 1,387,000 3.250 10/19/23 1,457,390CNY 46,300,000 3.270 11/19/30 7,377,226
8,900,000 3.280 12/03/27 1,421,070Czech Republic Government BondCZK 27,080,000 0.950 05/15/30 1,056,456
118,390,000 1.000 06/26/26 4,906,12870,730,000 2.000 10/13/33 2,969,40026,400,000 2.400 09/17/25 1,170,79928,270,000 2.500 08/25/28 1,251,809
Dominican Republic$ 3,775,000 4.500 01/30/30 3,814,637
2,755,000 5.300 01/21/41 2,739,159Egypt Treasury Bills(b)
EGP 46,175,000 0.000 12/07/21 2,904,646El Salvador Government International Bond$ 1,603,000 5.875 01/30/25 1,267,171Export-Import Bank of India
1,232,000 2.250 01/13/31 1,157,279580,000 3.250 01/15/30 589,715
Georgia Government International Bond329,000 2.750 04/22/26 329,925
Hungary Government BondHUF 763,360,000 1.000 11/26/25 2,273,507
726,420,000 1.500 08/23/23 2,325,633$ 1,713,000 2.125(a) 09/22/31 1,674,243
PrincipalAmount
InterestRate
MaturityDate Value
Foreign Debt Obligations – (continued)
Sovereign – (continued)Hungary Government Bond – (continued)HUF 408,000,000 2.750% 12/22/26 $ 1,273,522
696,760,000 3.000 10/27/27 2,175,99394,750,000 3.000 10/27/38 257,224
$ 1,900,000 3.125(a) 09/21/51 1,846,539HUF 481,720,000 3.250 10/22/31 1,471,859$ 586,000 5.375 02/21/23 620,721HUF 369,890,000 6.000 11/24/23 1,284,282Indonesia Treasury BondIDR 27,650,000,000 6.125 05/15/28 1,995,562
28,344,000,000 6.500 06/15/25 2,103,66839,177,000,000 6.500 02/15/31 2,817,8132,559,000,000 6.625 05/15/33 180,986
19,585,000,000 7.000 09/15/30 1,452,89159,891,000,000 7.500 08/15/32 4,519,03948,720,000,000 7.500 06/15/35 3,637,5351,600,000,000 7.500 05/15/38 117,7342,287,000,000 8.125 05/15/24 175,954
33,821,000,000 8.375 03/15/24 2,602,07445,054,000,000 8.375 09/15/26 3,593,50826,296,000,000 8.375 03/15/34 2,089,94558,239,000,000 9.000 03/15/29 4,799,296
Kingdom of Bahrain$ 966,000 4.250 01/25/28 948,189
3,782,000 5.450 09/16/32 3,693,359638,000 6.250 01/25/51 594,138
Kingdom of Jordan516,000 4.950 07/07/25 536,801937,000 7.375 10/10/47 967,043
Malaysia Government BondMYR 3,927,000 3.480 03/15/23 963,447
5,250,000 3.757 05/22/40 1,191,5838,183,000 3.885 08/15/29 2,008,364
22,315,000 3.899 11/16/27 5,529,4045,250,000 3.900 11/30/26 1,307,048
13,814,000 3.955 09/15/25 3,452,2496,474,000 4.181 07/15/24 1,621,353
Malaysia Government Investment Issue6,994,000 3.465 10/15/30 1,655,607
Mongolia Government International Bond$ 543,000 3.500 07/07/27 523,995
343,000 4.450 07/07/31 331,461Morocco Government International Bond
1,018,000 2.375 12/15/27 996,686581,000 3.000 12/15/32 550,679785,000 4.000 12/15/50 705,764
Oman Government International Bond458,000 6.000 08/01/29 490,432
1,195,000 6.250 01/25/31 1,290,9733,669,000 6.750 10/28/27 4,109,280
Panama Bonos del Tesoro1,237,000 3.362 06/30/31 1,224,243
Perusahaan Penerbit SBSN Indonesia III554,000 4.325 05/28/25 610,543
Republic of Angola2,583,000 8.000 11/26/29 2,558,461
The accompanying notes are an integral part of these financial statements. 49

G O L D M A N S A C H S M U L T I - M A N A G E R N O N - C O R E F I X E D I N C O M E F U N D
Schedule of Investments (continued)October 31, 2021
PrincipalAmount
InterestRate
MaturityDate Value
Foreign Debt Obligations – (continued)
Sovereign – (continued)Republic of Argentina(c)
$ 7,309,427 1.000% 07/09/29 $ 2,646,0131,481,000 1.125(d) 07/09/35 454,667
Republic of Armenia International Bond631,000 3.600 02/02/31 591,484
Republic of Azerbaijan410,000 4.750 03/18/24 437,752835,000 5.125 09/01/29 925,441713,000 5.125 09/01/29 790,227
Republic of Belarus1,204,000 5.875 02/24/26 1,109,486
Republic of Brazil1,497,000 2.875 06/06/25 1,495,5036,242,000 3.750 09/12/31 5,702,067
Republic of Chile(c)
7,019,000 2.550 07/27/33 6,783,863253,000 3.100 05/07/41 246,422
Republic of Colombia444,000 3.250(c) 04/22/32 414,474
4,987,000 4.125(c) 02/22/42 4,508,2483,547,000 4.500(c) 03/15/29 3,750,509
COP 5,932,400,000 6.000 04/28/28 1,440,29110,025,000,000 6.250 11/26/25 2,598,85712,000,000,000 7.000 06/30/32 2,922,61721,936,400,000 7.500 08/26/26 5,888,410
Republic of Costa Rica$ 2,074,000 6.125 02/19/31 2,126,239
1,607,000 7.000 04/04/44 1,599,768Republic of Ecuador
998,729 0.000(b) 07/31/30 531,8231,425,468 0.500(d) 07/31/40 851,7173,378,668 1.000(d) 07/31/35 2,225,698
Republic of Egypt$ 2,254,000 7.300(a) 09/30/33 2,107,490
4,292,000 7.625 05/29/32 4,141,7801,497,000 7.903 02/21/48 1,309,875
EGP 55,667,000 14.060 01/12/26 3,411,28846,000,000 14.483 04/06/26 2,854,412
Republic of El Salvador(c)
$ 687,000 9.500 07/15/52 563,039Republic of Gabon
400,000 6.375 12/12/24 424,450400,000 6.375 12/12/24 424,450
Republic of Ghana1,376,000 6.375 02/11/27 1,224,6401,806,000 7.875 02/11/35 1,523,8121,282,000 8.625 04/07/34 1,121,750
Republic of Guatemala(c)
605,000 3.700(a) 10/07/33 601,975323,000 4.650(a) 10/07/41 327,946861,000 4.900 06/01/30 933,539825,000 5.375 04/24/32 922,092
Republic of Indonesia1,690,000 2.150(c) 07/28/31 1,637,3735,657,000 2.850 02/14/30 5,822,467
451,000 3.050 03/12/51 436,956
PrincipalAmount
InterestRate
MaturityDate Value
Foreign Debt Obligations – (continued)
Sovereign – (continued)Republic of Indonesia – (continued)$ 642,000 3.500% 01/11/28 $ 693,079
607,000 4.625 04/15/43 690,529Republic of Ivory Coast(c)(d)
143,890 5.750 12/31/32 143,738652,621 5.750 12/31/32 651,928
Republic of Kazakhstan1,034,000 4.875 10/14/44 1,262,514
Republic of Kenya1,034,000 6.300 01/23/34 1,002,9801,083,000 7.000 05/22/27 1,143,919
Republic of Korea624,000 1.000 09/16/30 589,374
Republic of Lebanon(e)
4,720,000 6.100 10/04/22 696,200231,000 6.600 11/27/26 34,722464,000 7.000 03/20/28 67,657
Republic of Mozambique(d)
200,000 5.000 09/15/31 170,100Republic of Nigeria
750,000 6.125(a) 09/28/28 743,438252,000 7.375(a) 09/28/33 249,480
2,216,000 7.875 02/16/32 2,248,9631,019,000 8.250(a) 09/28/51 1,001,168
738,000 8.747 01/21/31 791,182Republic of Pakistan
1,213,000 6.000 04/08/26 1,216,1661,145,000 7.375 04/08/31 1,158,007
391,000 8.875 04/08/51 392,021Republic of Panama(c)
4,911,000 2.252 09/29/32 4,621,865914,000 3.750 03/16/25 974,724
Republic of Paraguay(a)
1,598,000 2.739 01/29/33 1,532,881Republic of Peru
2,931,000 2.783(c) 01/23/31 2,926,054315,000 3.000 01/15/34 312,008
2,989,000 3.230(c)(f) 07/28/21 2,536,540225,000 3.550(c) 03/10/51 226,238
PEN 1,730,000 5.940 02/12/29 446,9197,628,000 6.150 08/12/32 1,930,9626,711,000 6.350 08/12/28 1,779,2316,741,000 6.950 08/12/31 1,823,246
Republic of Philippines$ 2,253,000 1.648 06/10/31 2,151,863
3,210,000 1.950 01/06/32 3,102,016448,000 3.000 02/01/28 475,982
1,474,000 3.200 07/06/46 1,481,532Republic of PolandPLN 19,670,000 1.250 10/25/30 4,359,432
11,253,000 2.500 07/25/26 2,845,5109,374,000 2.500 07/25/27 2,360,3177,650,000 2.750 10/25/29 1,933,6645,000,000 4.000 10/25/23 1,302,119
$ 1,996,000 5.000 03/23/22 2,029,566Republic of Qatar
2,074,000 3.750 04/16/30 2,313,547
50 The accompanying notes are an integral part of these financial statements.

G O L D M A N S A C H S M U L T I - M A N A G E R N O N - C O R E F I X E D I N C O M E F U N D
PrincipalAmount
InterestRate
MaturityDate Value
Foreign Debt Obligations – (continued)
Sovereign – (continued)Republic of Romania$ 992,000 3.000% 02/14/31 $ 997,146RON 15,675,000 3.250 04/29/24 3,596,761
6,235,000 3.250 06/24/26 1,380,018750,000 3.650 07/28/25 170,936
1,214,000 4.000 02/14/51 1,221,8155,595,000 4.250 06/28/23 1,314,6253,295,000 4.750 02/24/25 779,4183,980,000 5.000 02/12/29 935,3348,540,000 5.850 04/26/23 2,052,257
$ 642,000 6.750 02/07/22 651,951Republic of Senegal
580,000 6.750 03/13/48 575,215Republic of Serbia
400,000 2.125 12/01/30 372,325Republic of South Africa
2,371,000 4.850 09/30/29 2,428,4972,361,000 5.750 09/30/49 2,250,033
ZAR 83,614,670 6.250 03/31/36 3,759,24148,142,029 7.000 02/28/31 2,589,158
175,164,951 8.000 01/31/30 10,407,611113,108,852 8.250 03/31/32 6,487,19788,628,648 8.500 01/31/37 4,826,10313,495,150 8.875 02/28/35 778,814
Republic of Sri Lanka$ 285,000 5.750 04/18/23 195,813
3,240,000 6.750 04/18/28 2,028,645Republic of Turkey
3,075,000 4.750 01/26/26 2,945,2732,525,000 5.950 01/15/31 2,361,6642,059,000 6.500 09/20/33 1,956,050
Republic of UruguayUYU 61,317,653 3.875 07/02/40 1,567,105$ 4,538,441 4.375(c) 01/23/31 5,234,241
473,267 4.975 04/20/55 606,314Republic of Uzbekistan
200,000 3.700 11/25/30 193,300420,000 3.900 10/19/31 410,130
Republic of Venezuela(e)
85,000 6.000 12/09/20 8,500190,000 7.000 03/31/38 19,238199,000 7.650 04/21/25 20,149110,000 7.750 10/13/19 11,000175,000 8.250 10/13/24 17,500203,000 9.000 05/07/23 20,300165,000 9.250 09/15/27 16,500145,000 9.250 05/07/28 14,681152,000 9.375 01/13/34 15,390205,000 11.750 10/21/26 20,756205,000 11.950 08/05/31 20,756140,000 12.750 08/23/22 14,000
Republic of Zambia884,000 5.375 09/20/22 667,696
Russian Federation Bond5,400,000 4.375 03/21/29 6,085,800
RUB 467,786,000 4.500 07/16/25 5,817,774
PrincipalAmount
InterestRate
MaturityDate Value
Foreign Debt Obligations – (continued)
Sovereign – (continued)Russian Federation Bond – (continued)$ 400,000 5.100% 03/28/35 $ 477,700RUB 288,388,000 6.000 10/06/27 3,656,189
283,045,000 7.400 12/07/22 3,959,975231,400,000 7.650 04/10/30 3,182,074240,700,000 7.700 03/23/33 3,319,808121,770,000 7.700 03/16/39 1,674,336
Saudi Government International Bond$ 2,108,000 3.250 10/22/30 2,241,858
1,441,000 3.450 02/02/61 1,419,3851,710,000 4.000 04/17/25 1,859,625
Serbia Treasury BondsRSD 64,000,000 4.500 08/20/32 648,848Sri Lanka Government International Bond$ 565,000 6.350 06/28/24 368,415State of Israel
200,000 2.500 01/15/30 207,0001,489,000 4.500(g) 04/03/20 1,853,805
Thailand Government BondTHB 22,685,000 0.750 06/17/24 678,799
39,964,000 1.585 12/17/35 1,077,94588,535,000 1.600 12/17/29 2,634,54793,000,000 2.000 12/17/31 2,807,82029,425,000 2.125 12/17/26 922,37597,164,000 2.875 12/17/28 3,179,26193,712,000 3.300 06/17/38 3,079,314
Ukraine Government International Bond$ 3,787,000 6.876 05/21/29 3,849,485
324,000 7.750 09/01/27 348,867UAH 35,092,000 15.840 02/26/25 1,410,724United Mexican States$ 4,483,000 2.659(c) 05/24/31 4,324,134
692,000 4.350 01/15/47 715,701MXN 61,657,100 5.750 03/05/26 2,831,029
31,146,100 6.500 06/09/22 1,517,555107,439,500 7.500 06/03/27 5,243,01290,641,500 7.750 05/29/31 4,471,42989,343,000 8.500 05/31/29 4,598,58570,510,800 8.500 11/18/38 3,610,006
127,493,400 10.000 12/05/24 6,697,69214,790,000 10.000 11/20/36 864,749
TOTAL FOREIGN DEBT OBLIGATIONS(Cost $494,489,715) $ 483,333,553
Corporate Obligations – 32.7%
Advertising(c) – 0.3%Summer BC Holdco B S.a.r.l.$ 887,000 5.750% 10/31/26 $ 1,069,196Terrier Media Buyer, Inc.(a)
3,201,000 8.875 12/15/27 3,385,058
4,454,254
The accompanying notes are an integral part of these financial statements. 51

G O L D M A N S A C H S M U L T I - M A N A G E R N O N - C O R E F I X E D I N C O M E F U N D
Schedule of Investments (continued)October 31, 2021
PrincipalAmount
InterestRate
MaturityDate Value
Corporate Obligations – (continued)
Aerospace & Defense – 0.7%Bombardier, Inc.(a)(c)
$ 1,000,000 6.000% 02/15/28 $ 1,008,750410,000 7.500 12/01/24 425,888340,000 7.500 03/15/25 348,925
2,643,000 7.875 04/15/27 2,742,112Embraer Netherlands Finance B.V.(a)
1,196,000 6.950 01/17/28 1,325,168F-Brasile SpA/F-Brasile US LLC(a)(c)
1,011,000 7.375 08/15/26 1,035,001TransDigm, Inc.(a)(c)
600,000 6.250 03/15/26 627,000Triumph Group, Inc.(c)
807,479 6.250(a) 09/15/24 808,488915,000 7.750 08/15/25 928,725628,000 8.875(a) 06/01/24 691,585
9,941,642
Agriculture(a)(c) – 0.4%Turning Point Brands, Inc.
985,000 5.625 02/15/26 1,002,237Vector Group Ltd.
3,803,000 5.750 02/01/29 3,783,9851,150,000 10.500 11/01/26 1,213,250
5,999,472
Airlines – 0.2%Air Canada
265,000 4.000 07/01/25 373,605Avianca Holdings SA(a)(h)
2,154,912 9.000 03/31/22 2,157,153Delta Air Lines, Inc.(a)
599,000 7.000 05/01/25 699,332
3,230,090
Automotive – 0.6%Dealer Tire LLC/DT Issuer LLC(a)(c)
1,889,000 8.000 02/01/28 1,971,644Ford Motor Co.
650,000 8.500 04/21/23 712,5481,010,000 9.000(c) 04/22/25 1,215,229
225,000 9.625(c) 04/22/30 323,285Ford Motor Credit Co. LLC(c)
100,000 4.063 11/01/24 104,9501,260,000 4.125 08/17/27 1,334,644
IHO Verwaltungs GmbH(a)(c)(h)
(PIK 6.750%, Cash 6.000%)685,000 6.000 05/15/27 709,831
(PIK 7.125%, Cash 6.375%)535,000 6.375 05/15/29 577,800
Jaguar Land Rover Automotive PLC(a)(c)
EUR 1,100,000 4.500 07/15/28 1,270,595
8,220,526
Banks – 2.5%Banca Monte dei Paschi di Siena SpA(c)(i) (5 Year EUR Swap +
5.005%)1,724,000 5.375 01/18/28 1,442,393
PrincipalAmount
InterestRate
MaturityDate Value
Corporate Obligations – (continued)
Banks – (continued)Banco de Sabadell SA(c)(i) (-1X 5 year EUR Swap + 6.198%)$ 1,000,000 5.750% 12/31/99 $ 1,225,360Banco do Estado do Rio Grande do Sul SA(c)(i) (5 year CMT +
4.928%)1,220,000 5.375 01/28/31 1,181,341
Banco Nacional de Comercio Exterior/Cayman Islands SNC(a)(c)(i)
(5 year CMT + 2.000%)1,019,000 2.720 08/11/31 1,019,318
Banco Santander SA(c)(i) (-1x 5 Year EUR Swap + 4.534%)EUR 1,000,000 4.375 12/31/99 1,192,125Barclays PLC(c)(i)
(5 year CMT + 5.867%)$ 2,400,000 6.125 12/31/99 2,634,000(5 Year USD Swap + 4.842%)
2,255,000 7.750 12/31/99 2,449,494CaixaBank SA(c)(i) (-1X 5 year EUR Swap + 3.857%)EUR 1,000,000 3.625 12/31/99 1,098,200Commerzbank AG(c)(i)
(-1x 5 Year EUR Swap + 6.363%)600,000 6.125 03/31/99 749,955
(5 year USD Swap + 5.228%)$ 1,000,000 7.000 12/31/99 1,076,250Deutsche Bank AG(c)(i)
(-1X 5 year EUR Swap + 4.747%)EUR 800,000 4.625 12/31/99 952,544(5 Year CMT + 4.524%)$ 1,400,000 6.000 12/31/99 1,463,000Development Bank of Kazakhstan JSC
990,000 2.950 05/06/31 979,110Freedom Mortgage Corp.(a)(c)
937,750 6.625 01/15/27 888,518480,000 7.625 05/01/26 469,200
1,855,000 8.125 11/15/24 1,868,9131,225,000 8.250 04/15/25 1,237,250
Ibercaja Banco SA(c)(i) (-1X 5 year EUR Swap + 2.882%)EUR 700,000 2.750 07/23/30 814,573Intesa Sanpaolo SpA$ 1,300,000 5.710(a) 01/15/26 1,450,350(5 Year EUR Swap + 7.192%)EUR 939,000 7.750(c)(i) 12/29/49 1,310,722(5 Year USD Swap + 5.462%)$ 500,000 7.700(a)(c)(i)12/29/49 559,375Lloyds Banking Group PLC(c)(i) (5 Year USD Swap + 4.496%)
2,290,000 7.500 12/31/99 2,622,050Novo Banco SA/LuxembourgEUR 95,000 3.500 01/02/43 108,710
1,015,000 3.500 01/23/43 1,161,254UniCredit SpA(a)
$ 1,000,000 6.572 01/14/22 1,011,270(5 Year USD ICE Swap + 3.703%)
3,700,000 5.861(c)(i) 06/19/32 4,082,173
35,047,448
Biotechnology(c) – 0.1%Cidron Aida Finco SarlEUR 903,000 5.000 04/01/28 1,027,385
52 The accompanying notes are an integral part of these financial statements.
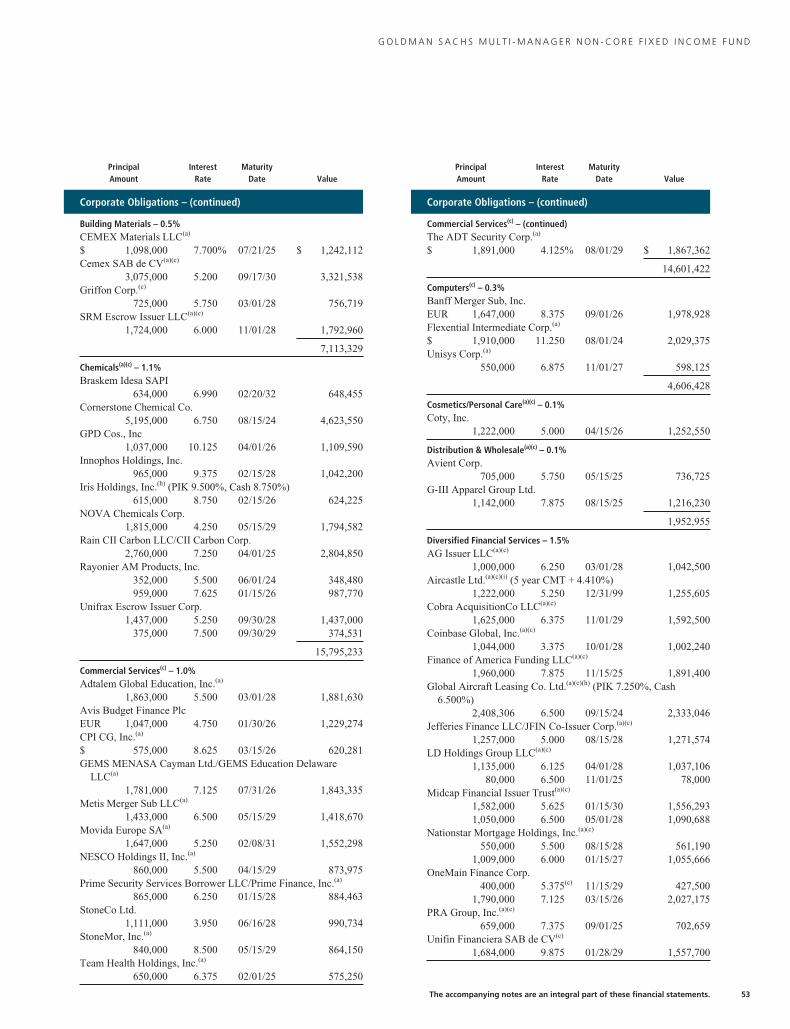
G O L D M A N S A C H S M U L T I - M A N A G E R N O N - C O R E F I X E D I N C O M E F U N D
PrincipalAmount
InterestRate
MaturityDate Value
Corporate Obligations – (continued)
Building Materials – 0.5%CEMEX Materials LLC(a)
$ 1,098,000 7.700% 07/21/25 $ 1,242,112Cemex SAB de CV(a)(c)
3,075,000 5.200 09/17/30 3,321,538Griffon Corp.(c)
725,000 5.750 03/01/28 756,719SRM Escrow Issuer LLC(a)(c)
1,724,000 6.000 11/01/28 1,792,960
7,113,329
Chemicals(a)(c) – 1.1%Braskem Idesa SAPI
634,000 6.990 02/20/32 648,455Cornerstone Chemical Co.
5,195,000 6.750 08/15/24 4,623,550GPD Cos., Inc
1,037,000 10.125 04/01/26 1,109,590Innophos Holdings, Inc.
965,000 9.375 02/15/28 1,042,200Iris Holdings, Inc.(h) (PIK 9.500%, Cash 8.750%)
615,000 8.750 02/15/26 624,225NOVA Chemicals Corp.
1,815,000 4.250 05/15/29 1,794,582Rain CII Carbon LLC/CII Carbon Corp.
2,760,000 7.250 04/01/25 2,804,850Rayonier AM Products, Inc.
352,000 5.500 06/01/24 348,480959,000 7.625 01/15/26 987,770
Unifrax Escrow Issuer Corp.1,437,000 5.250 09/30/28 1,437,000
375,000 7.500 09/30/29 374,531
15,795,233
Commercial Services(c) – 1.0%Adtalem Global Education, Inc.(a)
1,863,000 5.500 03/01/28 1,881,630Avis Budget Finance PlcEUR 1,047,000 4.750 01/30/26 1,229,274CPI CG, Inc.(a)
$ 575,000 8.625 03/15/26 620,281GEMS MENASA Cayman Ltd./GEMS Education Delaware
LLC(a)
1,781,000 7.125 07/31/26 1,843,335Metis Merger Sub LLC(a)
1,433,000 6.500 05/15/29 1,418,670Movida Europe SA(a)
1,647,000 5.250 02/08/31 1,552,298NESCO Holdings II, Inc.(a)
860,000 5.500 04/15/29 873,975Prime Security Services Borrower LLC/Prime Finance, Inc.(a)
865,000 6.250 01/15/28 884,463StoneCo Ltd.
1,111,000 3.950 06/16/28 990,734StoneMor, Inc.(a)
840,000 8.500 05/15/29 864,150Team Health Holdings, Inc.(a)
650,000 6.375 02/01/25 575,250
PrincipalAmount
InterestRate
MaturityDate Value
Corporate Obligations – (continued)
Commercial Services(c) – (continued)The ADT Security Corp.(a)
$ 1,891,000 4.125% 08/01/29 $ 1,867,362
14,601,422
Computers(c) – 0.3%Banff Merger Sub, Inc.EUR 1,647,000 8.375 09/01/26 1,978,928Flexential Intermediate Corp.(a)
$ 1,910,000 11.250 08/01/24 2,029,375Unisys Corp.(a)
550,000 6.875 11/01/27 598,125
4,606,428
Cosmetics/Personal Care(a)(c) – 0.1%Coty, Inc.
1,222,000 5.000 04/15/26 1,252,550
Distribution & Wholesale(a)(c) – 0.1%Avient Corp.
705,000 5.750 05/15/25 736,725G-III Apparel Group Ltd.
1,142,000 7.875 08/15/25 1,216,230
1,952,955
Diversified Financial Services – 1.5%AG Issuer LLC(a)(c)
1,000,000 6.250 03/01/28 1,042,500Aircastle Ltd.(a)(c)(i) (5 year CMT + 4.410%)
1,222,000 5.250 12/31/99 1,255,605Cobra AcquisitionCo LLC(a)(c)
1,625,000 6.375 11/01/29 1,592,500Coinbase Global, Inc.(a)(c)
1,044,000 3.375 10/01/28 1,002,240Finance of America Funding LLC(a)(c)
1,960,000 7.875 11/15/25 1,891,400Global Aircraft Leasing Co. Ltd.(a)(c)(h) (PIK 7.250%, Cash
6.500%)2,408,306 6.500 09/15/24 2,333,046
Jefferies Finance LLC/JFIN Co-Issuer Corp.(a)(c)
1,257,000 5.000 08/15/28 1,271,574LD Holdings Group LLC(a)(c)
1,135,000 6.125 04/01/28 1,037,10680,000 6.500 11/01/25 78,000
Midcap Financial Issuer Trust(a)(c)
1,582,000 5.625 01/15/30 1,556,2931,050,000 6.500 05/01/28 1,090,688
Nationstar Mortgage Holdings, Inc.(a)(c)
550,000 5.500 08/15/28 561,1901,009,000 6.000 01/15/27 1,055,666
OneMain Finance Corp.400,000 5.375(c) 11/15/29 427,500
1,790,000 7.125 03/15/26 2,027,175PRA Group, Inc.(a)(c)
659,000 7.375 09/01/25 702,659Unifin Financiera SAB de CV(c)
1,684,000 9.875 01/28/29 1,557,700
The accompanying notes are an integral part of these financial statements. 53

G O L D M A N S A C H S M U L T I - M A N A G E R N O N - C O R E F I X E D I N C O M E F U N D
Schedule of Investments (continued)October 31, 2021
PrincipalAmount
InterestRate
MaturityDate Value
Corporate Obligations – (continued)
Diversified Financial Services – (continued)Voyager Aviation Holdings LLC(a)(c)
$ 1,020,000 8.500% 05/09/26 $ 932,280
21,415,122
Electrical – 0.5%Eskom Holdings SOC Ltd.
645,000 4.314(j) 07/23/27 635,157742,000 6.750 08/06/23 765,327
NRG Energy, Inc.(a)(c)
1,342,000 3.875 02/15/32 1,315,160PG&E Corp.(c)
1,005,000 5.000 07/01/28 1,045,200Pike Corp.(a)(c)
971,000 5.500 09/01/28 985,565Talen Energy Supply LLC(c)
475,000 6.500 06/01/25 287,375260,000 6.625(a) 01/15/28 244,400
2,302,000 7.250(a) 05/15/27 2,198,41015,000 7.625(a) 06/01/28 14,250
705,000 10.500(a) 01/15/26 461,775
7,952,619
Electrical Components & Equipment(a)(c) – 0.1%Belden, Inc.EUR 756,000 3.375 07/15/31 899,018
Engineering & Construction – 0.6%Abertis Infraestructuras Finance BV(c)(i) (-1X 5 year EUR Swap +
3.694%)900,000 3.248 12/31/99 1,062,508
Artera Services LLC(a)(c)
$ 433,897 9.033 12/04/25 464,812Bioceanico Sovereign Certificate Ltd.(b)
1,132,000 0.000 06/05/34 840,864Global Infrastructure Solutions, Inc.(a)(c)
1,113,000 5.625 06/01/29 1,135,260Great Lakes Dredge & Dock Corp.(a)(c)
1,183,000 5.250 06/01/29 1,199,266State Agency of Roads of Ukraine(j)
1,870,000 6.250 06/24/28 1,833,184Tutor Perini Corp.(a)(c)
1,565,000 6.875 05/01/25 1,592,388
8,128,282
Entertainment(c) – 0.8%AMC Entertainment Holdings, Inc.
25,000 5.750 06/15/25 19,875235,000 6.125 05/15/27 175,075
Banijay Entertainment SASU(a)
737,000 5.375 03/01/25 754,504Banijay Group SAS
1,469,000 6.500 03/01/26 1,750,620Caesars Entertainment, Inc.(a)
$ 1,570,000 8.125 07/01/27 1,754,475Cirsa Finance International Sarl(a)
EUR 1,660,000 4.500 03/15/27 1,890,540
PrincipalAmount
InterestRate
MaturityDate Value
Corporate Obligations – (continued)
Entertainment(c) – (continued)Empire Resorts, Inc.(a)
$ 120,000 7.750% 11/01/26 $ 122,100International Game Technology PLC(a)
765,000 6.250 01/15/27 860,625Raptor Acquisition Corp./Raptor Co-Issuer LLC(a)
1,120,000 4.875 11/01/26 1,135,400Scientific Games International, Inc.(a)
1,179,000 7.000 05/15/28 1,271,846381,000 8.250 03/15/26 402,908
Wynn Resorts Finance LLC/Wynn Resorts Capital Corp.(a)
755,000 7.750 04/15/25 794,637
10,932,605
Environmental(a)(c) – 0.1%Tervita Corp.
1,020,000 11.000 12/01/25 1,173,000
Food & Drug Retailing – 0.2%Casino Guichard Perrachon SA(c)
EUR 670,000 6.625 01/15/26 769,454New Albertsons LP$ 100,000 8.000 05/01/31 122,750
1,015,000 8.700 05/01/30 1,270,019Ulker Biskuvi Sanayi AS
452,000 6.950 10/30/25 474,120
2,636,343
Forest Products&Paper(a)(c) – 0.4%Pearl Merger Sub, Inc.
2,952,000 6.750 10/01/28 2,929,860Resolute Forest Products, Inc.
1,408,000 4.875 03/01/26 1,432,640Sylvamo Corp.
1,305,000 7.000 09/01/29 1,311,525
5,674,025
Gaming(c) – 0.3%Inn of the Mountain Gods Resort & Casino(h)
978,035 9.250 11/30/23 951,892Sugarhouse HSP Gaming Prop Mezz LP/Sugarhouse HSP
Gaming Finance Corp.(a)
1,644,000 5.875 05/15/25 1,627,560Wynn Las Vegas LLC/Wynn Las Vegas Capital Corp.(a)
60,000 4.250 05/30/23 60,525325,000 5.250 05/15/27 329,469140,000 5.500 03/01/25 141,925
Wynn Macau Ltd.1,244,000 5.625 08/26/28 1,150,240
4,261,611
Healthcare Providers & Services(a)(c) – 0.7%Akumin Escrow, Inc.
685,000 7.500 08/01/28 647,325Akumin, Inc.
2,079,000 7.000 11/01/25 1,990,642CHS/Community Health Systems, Inc.
600,000 6.125 04/01/30 588,000737,000 6.875 04/15/29 756,346
54 The accompanying notes are an integral part of these financial statements.

G O L D M A N S A C H S M U L T I - M A N A G E R N O N - C O R E F I X E D I N C O M E F U N D
PrincipalAmount
InterestRate
MaturityDate Value
Corporate Obligations – (continued)
Healthcare Providers & Services(a)(c) – (continued)Envision Healthcare Corp.$ 835,000 8.750% 10/15/26 $ 561,538Lifepoint Health, Inc.
1,390,000 5.375 01/15/29 1,362,200Mozart Debt Merger Sub, Inc.
722,000 3.875 04/01/29 719,293615,000 5.250 10/01/29 624,963
RegionalCare Hospital Partners Holdings, Inc./LifePoint Health,Inc.
750,000 9.750 12/01/26 791,250Surgery Center Holdings, Inc.
1,000,000 10.000 04/15/27 1,072,500Tenet Healthcare Corp.
1,403,000 6.125 10/01/28 1,473,150
10,587,207
Home Builders(a)(c) – 0.1%Ashton Woods USA LLC/Ashton Woods Finance Co.
950,000 6.625 01/15/28 1,007,000Mattamy Group Corp.
605,000 4.625 03/01/30 613,319
1,620,319
Household Products(a)(c) – 0.1%Kronos Acquisition Holdings, Inc./KIK Custom Products, Inc.
1,000,000 7.000 12/31/27 957,500
Housewares(a)(c) – 0.1%American Greetings Corp.
1,410,000 8.750 04/15/25 1,462,875
Insurance – 0.4%Genworth Holdings, Inc.
995,000 4.800 02/15/24 1,016,144Highlands Holdings Bond Issuer Ltd./Highlands Holdings Bond
Co-Issuer, Inc.(a)(c)(h) (PIK 8.375%, Cash 7.625%)841,875 7.625 10/15/25 888,178
MGIC Investment Corp.740,000 5.250(c) 08/15/28 782,550
1,500,000 9.000(a) 04/01/63 2,002,322Sagicor Financial Co. Ltd.(c)
264,000 5.300(a) 05/13/28 273,636200,000 5.300 05/13/28 207,300
5,170,130
Internet – 0.5%Cablevision Lightpath LLC(a)(c)
1,214,000 5.625 09/15/28 1,198,825Getty Images, Inc.(a)(c)
845,000 9.750 03/01/27 895,700MercadoLibre, Inc.(c)
564,000 3.125 01/14/31 529,483Netflix, Inc.EUR 1,493,000 3.875 11/15/29 2,086,018Rakuten Group, Inc.(i)
(5 year CMT + 4.578%)$ 1,342,000 5.125 12/31/99 1,343,678
PrincipalAmount
InterestRate
MaturityDate Value
Corporate Obligations – (continued)
Internet – (continued)Rakuten Group, Inc. – (continued)(5 year CMT + 4.956%)$ 740,000 6.250% 12/31/99 $ 776,075
6,829,779
Investment Companies(c) – 0.1%Icahn Enterprises LP/Icahn Enterprises Finance Corp.
385,000 4.750 09/15/24 398,475815,000 5.250 05/15/27 847,600
1,246,075
Iron/Steel(c) – 0.7%Allegheny Technologies, Inc.
915,000 4.875 10/01/29 910,425Baffinland Iron Mines Corp./Baffinland Iron Mines LP(a)
4,890,000 8.750 07/15/26 5,146,725Mineral Resources Ltd.(a)
3,770,000 8.125 05/01/27 4,071,600
10,128,750
Leisure Time(c) – 0.4%Carnival Corp.(a)
1,000,000 9.875 08/01/27 1,151,250550,000 10.500 02/01/26 637,313
Life Time, Inc.(a)
970,000 5.750 01/15/26 999,100NCL Corp., Ltd. Class C(a)
760,000 12.250 05/15/24 893,000Pinnacle Bidco PLCEUR 891,000 5.500 02/15/25 1,049,308Royal Caribbean Cruises Ltd.(a)
$ 775,000 9.125 06/15/23 839,906
5,569,877
Machinery-Diversified(a)(c) – 0.2%GrafTech Finance, Inc.
805,000 4.625 12/15/28 813,050OT Merger Corp.
1,258,000 7.875 10/15/29 1,235,985TK Elevator Holdco GmbH
800,000 7.625 07/15/28 847,000
2,896,035
Media – 3.4%Altice Financing SA(a)(c)
1,220,000 5.750 08/15/29 1,197,125Beasley Mezzanine Holdings LLC(a)(c)
1,400,000 8.625 02/01/26 1,408,750CCO Holdings LLC/CCO Holdings Capital Corp.(a)(c)
1,525,000 4.250 01/15/34 1,475,4371,000,000 4.500 08/15/30 1,017,500
150,000 5.375 06/01/29 160,875Cengage Learning, Inc.(a)(c)
1,250,000 9.500 06/15/24 1,278,125CSC Holdings LLC(a)(c)
1,065,000 4.625 12/01/30 975,806890,000 5.750 01/15/30 874,425175,000 6.500 02/01/29 186,813
1,695,000 7.500 04/01/28 1,803,056
The accompanying notes are an integral part of these financial statements. 55

G O L D M A N S A C H S M U L T I - M A N A G E R N O N - C O R E F I X E D I N C O M E F U N D
Schedule of Investments (continued)October 31, 2021
PrincipalAmount
InterestRate
MaturityDate Value
Corporate Obligations – (continued)
Media – (continued)Cumulus Media New Holdings, Inc.(a)(c)
$ 664,000 6.750% 07/01/26 $ 690,560Diamond Sports Group LLC/Diamond Sports Finance Co.(a)(c)
1,575,000 5.375 08/15/26 889,8751,274,000 6.625 08/15/27 375,830
DIRECTV Holdings LLC/DIRECTV Financing Co, Inc.(a)(c)
885,000 5.875 08/15/27 917,081DISH DBS Corp.
615,000 5.000 03/15/23 636,5251,167,000 5.125 06/01/29 1,123,237
180,000 5.875 11/15/24 191,700677,000 7.375(c) 07/01/28 710,004275,000 7.750 07/01/26 306,281
Gray Television, Inc.(a)(c)
1,691,000 7.000 05/15/27 1,809,370Houghton Mifflin Harcourt Publishers, Inc.(a)(c)
1,810,000 9.000 02/15/25 1,914,075iHeartCommunications, Inc.(c)
137,309 8.375 05/01/27 146,234LCPR Senior Secured Financing DAC(a)(c)
2,207,000 6.750 10/15/27 2,332,068Liberty Interactive LLC
342,370 3.750(c) 02/15/30 263,6253,968,542 4.000(c) 11/15/29 3,053,793
45,000 8.250 02/01/30 49,163Mav Acquisition Corp.(a)(c)
1,650,000 5.750 08/01/28 1,621,125News Corp.(a)(c)
1,122,000 3.875 05/15/29 1,138,830Nexstar Media, Inc.(a)(c)
1,257,000 5.625 07/15/27 1,326,135Radiate Holdco LLC/Radiate Finance, Inc.(a)(c)
1,119,000 6.500 09/15/28 1,119,000Salem Media Group, Inc.(a)(c)
1,810,000 6.750 06/01/24 1,819,050Sinclair Television Group, Inc.(a)(c)
1,422,000 5.500 03/01/30 1,354,455986,000 5.875 03/15/26 1,008,185
Sirius XM Radio, Inc.(a)(c)
475,000 5.500 07/01/29 510,625Spanish Broadcasting System, Inc.(a)(c)
1,045,000 9.750 03/01/26 1,089,413TEGNA, Inc.(c)
1,890,000 4.625 03/15/28 1,899,450Telenet Finance Luxembourg Notes S.a.r.l.(a)(c)
1,800,000 5.500 03/01/28 1,876,500Univision Communications, Inc.(a)(c)
1,687,000 6.625 06/01/27 1,821,960UPC Holding B.V.(c)
EUR 939,000 3.875 06/15/29 1,102,179Urban One, Inc.(a)(c)
$ 1,835,000 7.375 02/01/28 1,919,869VTR Finance NV(a)(c)
1,200,000 6.375 07/15/28 1,276,200Ziggo B.V.(a)(c)
1,575,000 5.500 01/15/27 1,624,219
48,294,528
PrincipalAmount
InterestRate
MaturityDate Value
Corporate Obligations – (continued)
Mining(c) – 0.9%First Quantum Minerals Ltd.(a)
$ 500,000 6.875% 03/01/26 $ 519,688735,000 7.250 04/01/23 748,597
3,265,000 7.500 04/01/25 3,367,031Freeport-McMoRan, Inc.
2,100,000 5.450 03/15/43 2,619,750Hecla Mining Co.
1,650,000 7.250 02/15/28 1,769,625Mountain Province Diamonds, Inc.(a)
3,440,000 8.000 12/15/22 3,074,500New Gold, Inc.(a)
590,000 6.375 05/15/25 606,225Northwest Acquisitions ULC/Dominion Finco, Inc.(a)(e)
1,260,000 7.125 11/01/22 126Polyus Finance PLC(a)
416,000 3.250 10/14/28 411,632
13,117,174
Oil Field Services – 4.8%Antero Resources Corp.(a)(c)
543,000 8.375 07/15/26 610,196Chesapeake Engery Corp.(k)
195,000 7.000 10/01/24 5,363935,000 7.500 10/01/26 26,881
CITGO Petroleum Corp.(a)(c)
800,000 7.000 06/15/25 822,000CNX Resources Corp.(a)(c)
415,000 7.250 03/14/27 439,900Colgate Energy Partners III LLC(a)(c)
1,007,000 5.875 07/01/29 1,027,140464,000 7.750 02/15/26 494,160
Comstock Resources, Inc.(a)(c)
1,129,000 6.750 03/01/29 1,212,264Ecopetrol SA(c)
1,679,000 4.625 11/02/31 1,666,4072,437,000 5.875 11/02/51 2,418,722
EQT Corp.(c)
460,000 6.625 02/01/25 516,350800,000 7.500 02/01/30 1,022,000
Guara Norte S.a.r.l.(a)
1,581,487 5.198 06/15/34 1,550,154KazMunayGas National Co. JSC(c)
1,123,000 3.500 04/14/33 1,160,901Kosmos Energy Ltd.(a)(c)
942,000 7.750 05/01/27 946,710Matador Resources Co.(c)
1,219,000 5.875 09/15/26 1,252,523MC Brazil Downstream Trading S.a.r.l
200,000 7.250 06/30/31 194,750MEG Energy Corp.(a)(c)
3,319,000 7.125 02/01/27 3,476,652Murphy Oil Corp.(c)
1,088,000 6.375 07/15/28 1,145,120Northern Oil and Gas, Inc.(a)(c)
875,000 8.125 03/01/28 936,250NuVista Energy Ltd.(a)(c)
CAD 1,900,000 7.875 07/23/26 1,581,286
56 The accompanying notes are an integral part of these financial statements.

G O L D M A N S A C H S M U L T I - M A N A G E R N O N - C O R E F I X E D I N C O M E F U N D
PrincipalAmount
InterestRate
MaturityDate Value
Corporate Obligations – (continued)
Oil Field Services – (continued)Occidental Petroleum Corp.$ 793,000 4.500%(c) 07/15/44 $ 800,930
505,000 4.625(c) 06/15/45 520,150770,000 5.550(c) 03/15/26 849,888455,000 6.375(c) 09/01/28 528,938550,000 7.500 05/01/31 715,000
1,243,000 8.500(c) 07/15/27 1,552,196PBF Holding Co LLC/PBF Finance Corp.(c)
655,000 7.250 06/15/25 510,900865,000 9.250(a) 05/15/25 843,375
Penn Virginia Escrow LLC(a)(c)
1,219,000 9.250 08/15/26 1,267,760Petrobras Global Finance B.V.(c)
1,000,000 5.500 06/10/51 875,270Petroleos de Venezuela SA(e)
700,000 6.000 11/15/26 35,000Petroleos del Peru SA
659,000 5.625 06/19/47 666,002Petroleos Mexicanos
1,994,000 5.950(c) 01/28/31 1,957,1111,400,000 6.500 03/13/27 1,487,150
171,000 6.500 06/02/41 154,0976,316,000 6.750 09/21/47 5,565,975
633,000 6.840(c) 01/23/30 660,3771,504,000 7.690(c) 01/23/50 1,436,320
Petronas Capital Ltd.(c)
887,000 2.480 01/28/32 880,1521,772,000 3.500 04/21/30 1,910,3751,458,000 4.550 04/21/50 1,822,624
Qatar Petroleum(c)
1,800,000 2.250(a) 07/12/31 1,770,750638,000 2.250 07/12/31 627,633
1,128,000 3.125 07/12/41 1,139,2801,226,000 3.300(a) 07/12/51 1,253,968
270,000 3.300 07/12/51 276,159SA Global Sukuk Ltd.(c)
567,000 1.602 06/17/26 558,849Saudi Arabian Oil Co.(c)
1,061,000 1.625 11/24/25 1,055,165Secure Energy Services, Inc.(a)(c)
CAD 100,000 7.250 12/30/26 81,408Shelf Drilling Holdings Ltd.(a)(c)
$ 2,215,000 8.250 02/15/25 1,710,423Southwestern Energy Co.(c)
1,463,000 5.375 03/15/30 1,539,808Strathcona Resources Ltd.(a)(c)
1,670,000 6.875 08/01/26 1,657,475Tengizchevroil Finance Co International Ltd.(c)
1,198,000 2.625 08/15/25 1,214,982Transocean Pontus Ltd.(a)(c)
1,886,050 6.125 08/01/25 1,886,050Transocean, Inc.
480,000 7.500 04/15/31 314,4001,030,000 11.500(a)(c) 01/30/27 1,063,475
USA Compression Partners LP/USA Compression FinanceCorp.(c)
250,000 6.875 04/01/26 257,500
PrincipalAmount
InterestRate
MaturityDate Value
Corporate Obligations – (continued)
Oil Field Services – (continued)Vine Energy Holdings LLC(a)(c)
$ 1,699,000 6.750% 04/15/29 $ 1,822,177Viper Energy Partners LP(a)(c)
813,000 5.375 11/01/27 847,422Wintershall Dea Finance 2 BV(c)(i) (-1X 5 year EUR Swap +
3.319%)EUR 1,800,000 3.000 12/31/99 2,046,987
68,669,230
Packaging(c) – 0.4%Ardagh Packaging Finance PLC/Ardagh Holdings USA, Inc.(a)
565,000 4.125 08/15/26 575,5941,270,000 5.250 08/15/27 1,266,825
Intelligent Packaging Ltd. Finco, Inc./Intelligent Packaging Ltd.Co-Issuer LLC(a)
1,637,000 6.000 09/15/28 1,690,202LABL, Inc.(a)
1,000,000 10.500 07/15/27 1,057,500Trivium Packaging Finance BVEUR 632,000 3.750 08/15/26 733,244
5,323,365
Pharmaceuticals – 1.1%AdaptHealth LLC(a)(c)
$ 880,000 4.625 08/01/29 871,200Bausch Health Cos., Inc.(a)(c)
1,500,000 5.250 01/30/30 1,355,6253,237,000 6.250 02/15/29 3,131,797
Cheplapharm Arzneimittel GmbH(a)(c)
1,082,000 5.500 01/15/28 1,114,460Endo Dac/Endo Finance LLC/Endo Finco, Inc.(a)(c)
946,000 6.000 06/30/28 657,470638,000 9.500 07/31/27 633,215
Lannett Co, Inc.(a)(c)
2,285,000 7.750 04/15/26 2,102,200Organon & Co./Organon Foreign Debt Co.-Issuer BV(a)(c)
1,220,000 5.125 04/30/31 1,253,550Par Pharmaceutical, Inc.(a)(c)
1,405,000 7.500 04/01/27 1,415,537Teva Pharmaceutical Finance Co. B.V.
1,800,000 2.950 12/18/22 1,815,750Teva Pharmaceutical Finance Netherlands III B.V.
889,000 3.150 10/01/26 837,883
15,188,687
Pipelines – 2.0%Antero Midstream Partners LP/Antero Midstream Finance
Corp.(a)(c)
265,000 5.750 03/01/27 273,613Cheniere Energy Partners LP(c)
455,000 4.500 10/01/29 484,575CNX Midstream Partners LP(a)(c)
439,000 4.750 04/15/30 438,451CQP Holdco LP/BIP-V Chinook Holdco LLC(a)(c)
2,462,000 5.500 06/15/31 2,566,635
The accompanying notes are an integral part of these financial statements. 57

G O L D M A N S A C H S M U L T I - M A N A G E R N O N - C O R E F I X E D I N C O M E F U N D
Schedule of Investments (continued)October 31, 2021
PrincipalAmount
InterestRate
MaturityDate Value
Corporate Obligations – (continued)
Pipelines – (continued)Crestwood Midstream Partners LP/Crestwood Midstream Finance
Corp.(c)
$ 610,000 5.750% 04/01/25 $ 622,200DCP Midstream Operating LP
620,000 5.625(c) 07/15/27 705,250425,000 8.125 08/16/30 575,875
EnLink Midstream LLC(c)
425,000 5.375 06/01/29 439,875390,000 5.625(a) 01/15/28 412,425
EnLink Midstream Partners LP(c)
165,000 4.850 07/15/26 170,981Galaxy Pipeline Assets Bidco Ltd.
1,754,000 2.160 03/31/34 1,707,9573,296,000 2.940 09/30/40 3,247,590
Genesis Energy LP/Genesis Energy Finance Corp.(c)
1,650,000 7.750 02/01/28 1,625,250250,000 8.000 01/15/27 250,625
Global Partners LP/GLP Finance Corp.(c)
533,000 6.875 01/15/29 551,6551,254,000 7.000 08/01/27 1,304,160
ITT Holdings LLC(a)(c)
2,106,000 6.500 08/01/29 2,111,265KazTransGas JSC
1,240,000 4.375 09/26/27 1,363,070NGL Energy Operating LLC/NGL Energy Finance Corp.(a)(c)
1,095,000 7.500 02/01/26 1,108,687NGL Energy Partners LP/NGL Energy Finance Corp.(c)
1,480,000 6.125 03/01/25 1,265,400350,000 7.500 11/01/23 336,000725,000 7.500 04/15/26 619,875
NuStar Logistics LP(c)
725,000 6.375 10/01/30 793,875Tallgrass Energy Partners LP/Tallgrass Energy Finance Corp.(a)(c)
1,180,000 6.000 03/01/27 1,227,2001,208,000 6.000 12/31/30 1,211,020
Targa Resources Partners LP/Targa Resources Partners FinanceCorp.(c)
945,000 5.375 02/01/27 975,713Venture Global Calcasieu Pass LLC(a)(c)
750,000 3.875 08/15/29 761,2501,014,000 4.125 08/15/31 1,049,490
28,199,962
Real Estate – 0.5%ADLER Group SA(c)
EUR 500,000 2.250 01/14/29 493,520China Aoyuan Group Ltd.(c)
$ 1,276,000 7.950 02/19/23 548,680China Evergrande Group
492,000 8.250(c) 03/23/22 135,300468,000 9.500 04/11/22 119,340
Haya Real Estate SA(c)
EUR 254,000 5.250 11/15/22 241,629Saracen Development LLC(a)(c)(h)(PIK 3.000%, Cash 11.000%)$ 1,531,955 14.000 10/15/25 1,694,725
PrincipalAmount
InterestRate
MaturityDate Value
Corporate Obligations – (continued)
Real Estate – (continued)WeWork Cos., Inc.(a)
$ 1,965,000 7.875% 05/01/25 $ 1,994,475Yuzhou Group Holdings Co. Ltd.(c)
939,000 7.375 01/13/26 384,9901,073,000 8.500 02/04/23 515,040
Zhenro Properties Group Ltd.(c)
2,771,000 7.350 02/05/25 1,634,890
7,762,589
Real Estate Investment Trust(c) – 0.5%CTR Partnership LP/CareTrust Capital Corp.(a)
845,000 3.875 06/30/28 857,885Diversified Healthcare Trust
225,000 4.375 03/01/31 217,2971,000,000 9.750 06/15/25 1,089,439
Iron Mountain, Inc.(a)
620,000 4.875 09/15/29 640,150Ladder Capital Finance Holdings LLLP/Ladder Capital Finance
Corp.(a)
130,000 5.250 10/01/25 131,300New Residential Investment Corp.(a)
3,770,000 6.250 10/15/25 3,774,712
6,710,783
Retailing – 1.4%BCPE Ulysses Intermediate, Inc.(a)(c)(h)(PIK 8.500%, Cash
7.750%)925,667 7.750 04/01/27 886,326
Canwel Building Material Co.(a)(c)
CAD 2,340,0005.250 05/15/26 1,867,122Constellation Automotive Financing PLC(a)(c)
GBP 830,000 4.875 07/15/27 1,092,233Ferrellgas LP/Ferrellgas Finance Corp.(a)(c)
$ 1,617,000 5.375 04/01/26 1,572,532990,000 5.875 04/01/29 957,825
Foot Locker, Inc.(a)(c)
1,175,000 4.000 10/01/29 1,163,250KFC Holding Co./Pizza Hut Holdings LLC/Taco Bell of America
LLC(a)(c)
820,000 4.750 06/01/27 846,650LBM Acquisition LLC(a)(c)
2,217,000 6.250 01/15/29 2,150,490Neiman Marcus Group Ltd.(k)(l)
605,000 8.000 10/15/21 201,464Rite Aid Corp.
125,000 6.875(a) 12/15/28 103,750230,000 7.700 02/15/27 207,000611,000 8.000(a)(c) 11/15/26 616,346
Specialty Building Products Holdings LLC/SBP FinanceCorp.(a)(c)
1,191,000 6.375 09/30/26 1,235,663Stonegate Pub Co Financing 2019 PLC(c)
GBP 1,025,000 8.250 07/31/25 1,452,871The Gap, Inc.(a)(c)
$ 1,220,000 3.625 10/01/29 1,194,075
58 The accompanying notes are an integral part of these financial statements.
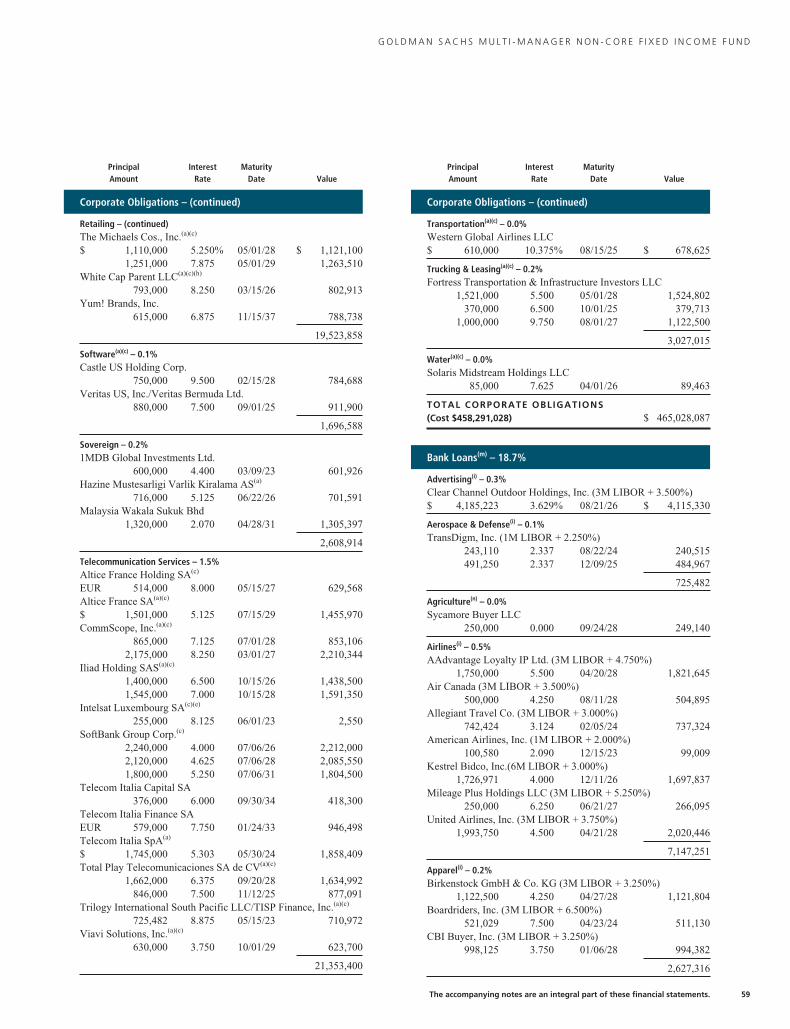
G O L D M A N S A C H S M U L T I - M A N A G E R N O N - C O R E F I X E D I N C O M E F U N D
PrincipalAmount
InterestRate
MaturityDate Value
Corporate Obligations – (continued)
Retailing – (continued)The Michaels Cos., Inc.(a)(c)
$ 1,110,000 5.250% 05/01/28 $ 1,121,1001,251,000 7.875 05/01/29 1,263,510
White Cap Parent LLC(a)(c)(h)
793,000 8.250 03/15/26 802,913Yum! Brands, Inc.
615,000 6.875 11/15/37 788,738
19,523,858
Software(a)(c) – 0.1%Castle US Holding Corp.
750,000 9.500 02/15/28 784,688Veritas US, Inc./Veritas Bermuda Ltd.
880,000 7.500 09/01/25 911,900
1,696,588
Sovereign – 0.2%1MDB Global Investments Ltd.
600,000 4.400 03/09/23 601,926Hazine Mustesarligi Varlik Kiralama AS(a)
716,000 5.125 06/22/26 701,591Malaysia Wakala Sukuk Bhd
1,320,000 2.070 04/28/31 1,305,397
2,608,914
Telecommunication Services – 1.5%Altice France Holding SA(c)
EUR 514,000 8.000 05/15/27 629,568Altice France SA(a)(c)
$ 1,501,000 5.125 07/15/29 1,455,970CommScope, Inc.(a)(c)
865,000 7.125 07/01/28 853,1062,175,000 8.250 03/01/27 2,210,344
Iliad Holding SAS(a)(c)
1,400,000 6.500 10/15/26 1,438,5001,545,000 7.000 10/15/28 1,591,350
Intelsat Luxembourg SA(c)(e)
255,000 8.125 06/01/23 2,550SoftBank Group Corp.(c)
2,240,000 4.000 07/06/26 2,212,0002,120,000 4.625 07/06/28 2,085,5501,800,000 5.250 07/06/31 1,804,500
Telecom Italia Capital SA376,000 6.000 09/30/34 418,300
Telecom Italia Finance SAEUR 579,000 7.750 01/24/33 946,498Telecom Italia SpA(a)
$ 1,745,000 5.303 05/30/24 1,858,409Total Play Telecomunicaciones SA de CV(a)(c)
1,662,000 6.375 09/20/28 1,634,992846,000 7.500 11/12/25 877,091
Trilogy International South Pacific LLC/TISP Finance, Inc.(a)(c)
725,482 8.875 05/15/23 710,972Viavi Solutions, Inc.(a)(c)
630,000 3.750 10/01/29 623,700
21,353,400
PrincipalAmount
InterestRate
MaturityDate Value
Corporate Obligations – (continued)
Transportation(a)(c) – 0.0%Western Global Airlines LLC$ 610,000 10.375% 08/15/25 $ 678,625
Trucking & Leasing(a)(c) – 0.2%Fortress Transportation & Infrastructure Investors LLC
1,521,000 5.500 05/01/28 1,524,802370,000 6.500 10/01/25 379,713
1,000,000 9.750 08/01/27 1,122,500
3,027,015
Water(a)(c) – 0.0%Solaris Midstream Holdings LLC
85,000 7.625 04/01/26 89,463
TOTAL CORPORATE OBLIGATIONS(Cost $458,291,028) $ 465,028,087
Bank Loans(m) – 18.7%
Advertising(i) – 0.3%Clear Channel Outdoor Holdings, Inc. (3M LIBOR + 3.500%)$ 4,185,223 3.629% 08/21/26 $ 4,115,330
Aerospace & Defense(i) – 0.1%TransDigm, Inc. (1M LIBOR + 2.250%)
243,110 2.337 08/22/24 240,515491,250 2.337 12/09/25 484,967
725,482
Agriculture(n) – 0.0%Sycamore Buyer LLC
250,000 0.000 09/24/28 249,140
Airlines(i) – 0.5%AAdvantage Loyalty IP Ltd. (3M LIBOR + 4.750%)
1,750,000 5.500 04/20/28 1,821,645Air Canada (3M LIBOR + 3.500%)
500,000 4.250 08/11/28 504,895Allegiant Travel Co. (3M LIBOR + 3.000%)
742,424 3.124 02/05/24 737,324American Airlines, Inc. (1M LIBOR + 2.000%)
100,580 2.090 12/15/23 99,009Kestrel Bidco, Inc.(6M LIBOR + 3.000%)
1,726,971 4.000 12/11/26 1,697,837Mileage Plus Holdings LLC (3M LIBOR + 5.250%)
250,000 6.250 06/21/27 266,095United Airlines, Inc. (3M LIBOR + 3.750%)
1,993,750 4.500 04/21/28 2,020,446
7,147,251
Apparel(i) – 0.2%Birkenstock GmbH & Co. KG (3M LIBOR + 3.250%)
1,122,500 4.250 04/27/28 1,121,804Boardriders, Inc. (3M LIBOR + 6.500%)
521,029 7.500 04/23/24 511,130CBI Buyer, Inc. (3M LIBOR + 3.250%)
998,125 3.750 01/06/28 994,382
2,627,316
The accompanying notes are an integral part of these financial statements. 59

G O L D M A N S A C H S M U L T I - M A N A G E R N O N - C O R E F I X E D I N C O M E F U N D
Schedule of Investments (continued)October 31, 2021
PrincipalAmount
InterestRate
MaturityDate Value
Bank Loans(m) – (continued)
Automotive – Parts – 0.1%Adient US LLC(i) (1M LIBOR + 3.500%)$ 498,750 3.587% 04/08/28 $ 498,660Clarios Global LP(i) (1M LIBOR + 3.250%)
482,544 3.337 04/30/26 479,326DexKo Global, Inc.(n)
210,000 0.000 10/04/28 209,775
1,187,761
Beverages(i) – 0.1%Triton Water Holdings, Inc (3M LIBOR + 3.500%)
1,247,500 4.000 03/31/28 1,245,092
Building Materials – 0.0%Ingersoll-Rand Services Co.(i) (1M LIBOR + 1.750%)
94,778 1.837 03/01/27 93,386Standard Industries, Inc.(n)
500,000 0.000 09/22/28 499,285
592,671
Chemicals – 0.2%Atotech B.V.(i) (3M LIBOR + 2.500%)
2,506,345 3.000 03/18/28 2,502,686Diamond (BC) B.V.(n)
250,000 3.500 09/29/28 249,312H.B. Fuller Co.(i) (1M LIBOR + 2.000%)
260,681 2.086 10/20/24 260,504Messer Industries GmbH(n)
250,000 0.000 03/01/26 248,203W.R. Grace & Co.-Conn.(i) (3M LIBOR + 3.750%)
250,000 4.250 09/22/28 250,562
3,511,267
Commercial Services – 1.4%CHG Healthcare Services, Inc.(n)
1,125,000 4.000 09/29/28 1,125,000EAB Global, Inc.(n)
1,000,000 0.000 08/16/28 994,380Fly Funding II S.a.r.l.(i) (3M LIBOR + 1.160%)
1,148,261 1.880 08/11/25 1,125,652Garda World Security Corp.(i) (1M LIBOR + 4.250%)
500,000 4.340 10/30/26 500,210HGIM Corp.(i) (3M LIBOR + 6.000%)
208,915 7.000 07/02/23 159,820Prime Security Services Borrower LLC(i) (LIBOR + 2.750%)
3,745,662 3.500 09/23/26 3,738,433Spin Holdco Inc.(i) (3M LIBOR + 4.000%)
497,500 4.750 03/04/28 498,798Syniverse Holdings, Inc.(i) (3M LIBOR + 5.000%)
5,011,059 6.000 03/09/23 5,005,897Team Health Holdings, Inc.(i) (1M LIBOR + 2.750%)
3,412,689 3.750 02/06/24 3,250,586The Hertz Corp.(i) (1M LIBOR + 3.500%)
1,578,485 4.000 06/30/28 1,579,938Travelport Finance (Luxembourg) S.a.r.l.(i) (3M LIBOR +
1.500%)1,418,748 6.500 02/28/25 1,467,879
PrincipalAmount
InterestRate
MaturityDate Value
Bank Loans(m) – (continued)
Commercial Services – (continued)Wand NewCo 3, Inc.(i) (1M LIBOR + 3.000%)$ 491,250 3.087% 02/05/26 $ 483,513
19,930,106
Computers – 0.7%Ahead Data Blue LLC(i) (3M LIBOR + 3.750%)
757,415 4.500 10/18/27 759,543Flexential Intermediate Corp.(i) (1M LIBOR + 3.500%)
1,126,808 3.587 08/01/24 1,082,446iQor US Inc.(i) (1M LIBOR + 7.500%)
60,438 8.500 11/19/24 61,571167,022 8.500 11/19/25 158,115
Magenta Buyer LLC(i) (3M LIBOR + 5.000%)1,250,000 5.750 07/27/28 1,240,625
McAfee LLC(i) (1M LIBOR + 3.750%)1,522,061 5.794 09/30/24 1,523,020
NCR Corp.(i) (1M LIBOR + 2.500%)1,125,294 4.150 08/28/26 1,102,788
NeuStar, Inc.(i)
(1M LIBOR + 3.500%)964,792 4.500 08/08/24 964,637
(1M LIBOR + 8.000%)223,680 9.000 08/08/25 223,320
Peraton Corp.(i) (1M LIBOR + 3.750%)398,000 4.500 02/01/28 398,434
Perforce Software, Inc.(i) (1M LIBOR + 3.750%)245,625 3.837 07/01/26 243,520
Tempo Acquisition LLC(i) (1M LIBOR + 2.750%)84,632 2.837 05/01/24 84,622
Virtusa Corp.(n)
996,250 4.500 02/11/28 1,000,295Vision Solutions, Inc.(n)
1,000,000 4.750 04/24/28 1,000,000
9,842,936
Cosmetics & Personal Care(i) – 0.2%Coty, Inc. (1M LIBOR + 2.250%)
75,597 2.337 04/07/25 74,369Journey Personal Care Corp.(l) (3M LIBOR + 4.250%)
1,122,500 5.000 03/01/28 1,116,888Revlon Consumer Products Corp.(k) (3M LIBOR + 3.500%)
2,725,291 4.250 09/07/23 1,576,117
2,767,374
Distribution & Wholesale(i) – 0.1%Core & Main LP (1M LIBOR + 2.500%)
1,246,875 2.588 07/27/28 1,236,489
Diversified Financial Services – 0.1%Astra Acquisition Corp.(n)
1,000,000 0.000 10/25/28 971,250Avolon TLB Borrower 1 (US) LLC(i) (1M LIBOR + 1.750%)
554,569 4.213 01/15/25 553,748Delos Finance S.a.r.l.(i) (3M LIBOR + 1.750%)
130,000 1.882 10/06/23 129,817Ditech Holding Corp.(i) (1M LIBOR + 6.000%)
234,152 4.985 06/30/22 46,245
1,701,060
60 The accompanying notes are an integral part of these financial statements.

G O L D M A N S A C H S M U L T I - M A N A G E R N O N - C O R E F I X E D I N C O M E F U N D
PrincipalAmount
InterestRate
MaturityDate Value
Bank Loans(m) – (continued)
Diversified Manufacturing(n) – 0.1%AI Aqua Merger Sub, Inc.$ 152,778 0.000% 07/31/28 $ 153,287
1,222,222 4.500 07/31/28 1,226,292
1,379,579
Electronics(i) – 0.1%Ingram Micro Inc. (3M LIBOR + 3.500%)
1,247,500 4.000 06/30/28 1,249,995TTM Technologies, Inc. (1M LIBOR + 2.500%)
125,912 2.582 09/28/24 125,597
1,375,592
Engineering & Construction – 0.1%Brown Group Holding LLC(i) (3M LIBOR + 2.750%)
498,666 3.250 06/07/28 497,110Centuri Group, Inc(n)
500,000 3.000 08/27/28 500,315KKR Apple Bidco LLC(n)
500,000 0.000 09/22/28 498,750
1,496,175
Entertainment – 1.1%AMC Entertainment Holdings, Inc.(i) (1M LIBOR + 3.000%)
272,439 3.086 04/22/26 250,796Crown Finance US, Inc.(i) (6M LIBOR + 2.500%)
1,163,072 3.500 02/28/25 957,208Delta 2 (LUX) S.a.r.l.(i) (1M LIBOR + 2.500%)
3,215,000 3.500 02/01/24 3,201,947East Valley Tourist Development Authority(i) (6M LIBOR +
8.000%)727,281 10.064 03/07/22 716,372
Everi Holdings, Inc.(i) (1M LIBOR + 2.500%)1,250,000 3.000 08/03/28 1,247,575
Lions Gate Capital Holdings LLC(i) (1M LIBOR + 2.250%)381,037 2.337 03/24/25 377,512
Metro-Goldwyn-Mayer, Inc.(i) (1M LIBOR + 2.500%)472,502 2.590 07/03/25 469,256
NASCAR Holdings, Inc(i) (1M LIBOR + 2.500%)1,208,095 2.587 10/19/26 1,203,565
Scientific Games International, Inc.(i) (1M LIBOR + 2.750%)1,384,273 2.863 08/14/24 1,377,822
SeaWorld Parks & Entertainment, Inc.(i) (1M LIBOR + 3.000%)500,000 3.500 08/25/28 498,125
The Stars Group Holdings B.V.(i) (3M LIBOR + 2.250%)2,093,783 2.382 07/21/26 2,085,533
Twin River Worldwide Holdings, Inc.(n)
2,125,000 0.000 08/06/28 2,122,344William Morris Endeavor Entertainment LLC(i) (1M LIBOR +
2.750%)865,684 2.840 05/18/25 847,531
15,355,586
Environmental(n) – 0.0%Madison IAQ LLC
500,000 0.000 06/21/28 498,750
PrincipalAmount
InterestRate
MaturityDate Value
Bank Loans(m) – (continued)
Food & Beverage(i) – 0.2%8th Avenue Food & Provisions, Inc. (1M LIBOR + 3.750%)$ 486,250 3.838% 10/01/25 $ 483,517US Foods, Inc. (1M LIBOR + 1.750%)
1,518,618 4.100 06/27/23 1,508,261UTZ Quality Foods, LLC (1M LIBOR + 3.000%)
259,727 3.087 01/20/28 258,969
2,250,747
Gaming(i) – 0.6%Boyd Gaming Corp.(1 Week LIBOR + 2.250%)
185,525 2.324 09/15/23 185,185Caesars Resort Collection LLC (1M LIBOR + 2.750%)
3,099,437 2.837 12/23/24 3,083,630Golden Nugget, Inc. (3M LIBOR + 2.500%)
5,984,368 3.250 10/04/23 5,951,215Station Casinos LLC (1M LIBOR + 2.250%)
96,600 2.500 02/08/27 95,591
9,315,621
Hand/Machine Tools(i) – 0.1%Alliance Laundry Systems LLC (3M LIBOR + 3.500%)
1,231,786 4.250 10/08/27 1,233,978Apex Tool Group LLC (1M LIBOR + 5.250%)
876,122 6.500 08/01/24 876,122
2,110,100
Health Care – Medical Products(i) – 0.4%Carestream Dental Equiment, Inc (3M LIBOR + 3.250%)
336,000 4.250 09/01/24 335,792Carestream Health, Inc. (3M LIBOR + 6.750%)
1,325,316 7.750 05/08/23 1,328,629Lifescan Global Corp. (3M LIBOR + 6.000%)
2,110,524 6.130 10/01/24 2,094,252Viant Medical Holdings, Inc. (1M LIBOR + 3.750%)
852,573 3.837 07/02/25 826,995Vyaire Medical, Inc. (3M LIBOR + 4.750%)
581,334 6.201 04/16/25 494,965
5,080,633
Health Care – Services – 2.6%ADMI Corp.(i) (1M LIBOR + 3.125%)
497,500 3.875 12/23/27 493,615AHP Health Partners, Inc.(i) (1M LIBOR + 3.500%)
500,000 4.000 08/04/28 501,405Air Methods Corp.(i) (3M LIBOR + 3.500%)
90,448 4.500 04/22/24 86,151BW NHHC Holdco, Inc.(i) (3M LIBOR + 5.000%)
428,725 5.125 05/15/25 377,146DaVita, Inc.(i) (1M LIBOR + 1.750%)
93,288 1.837 08/12/26 92,588Envision Healthcare Corp.(i) (1M LIBOR + 3.750%)
3,951,343 3.837 10/10/25 3,261,517Global Medical Response, Inc.(i) (3M LIBOR + 4.250%)
2,485,000 5.750 10/02/25 2,473,022ICON Luxembourg S.a.r.l.(i) (3M LIBOR + 2.500%)
2,121,250 3.000 07/03/28 2,121,017
The accompanying notes are an integral part of these financial statements. 61

G O L D M A N S A C H S M U L T I - M A N A G E R N O N - C O R E F I X E D I N C O M E F U N D
Schedule of Investments (continued)October 31, 2021
PrincipalAmount
InterestRate
MaturityDate Value
Bank Loans(m) – (continued)
Health Care – Services – (continued)MED ParentCo. LP(i) (1M LIBOR + 4.250%)$ 246,307 4.337% 08/31/26 $ 245,554Medical Solutions L.L.C.(n)
840,000 0.000 10/07/28 840,420160,000 0.000 11/01/28 160,300
Medline Industries, Inc.(n)
4,500,000 3.750 10/23/28 4,504,455Onex TSG Intermediate Corp.(i) (3M LIBOR + 4.750%)
498,750 5.500 02/28/28 497,972Parexel International Corp.(i) (1M LIBOR + 2.750%)
3,638,000 2.837 09/27/24 3,640,510Phoenix Guarantor, Inc.(i)
(1M LIBOR + 3.250%)343,875 3.338 03/05/26 341,564
(1M LIBOR + 3.500%)1,491,571 3.586 03/05/26 1,485,053
PPD, Inc.(i) (1M LIBOR + 2.000%)1,993,741 2.500 01/13/28 1,989,075
Quorum Health Corp.(i) (3M LIBOR + 7.000%)61,892 8.000 04/29/25 61,970
RegionalCare Hospital Partners Holdings, Inc.(i) (1M LIBOR +3.750%)
7,384,556 3.837 11/16/25 7,363,288Select Medical Corp.(i) (1M LIBOR + 2.250%)
1,104,077 2.340 03/06/25 1,095,796Surgery Center Holdings, Inc.(i) (1M LIBOR + 3.750%)
3,744,163 4.500 08/31/26 3,750,940Verscend Holding Corp.(i) (1M LIBOR + 4.000%)
1,496,875 4.087 08/27/25 1,498,746
36,882,104
Home Furnishings(i) – 0.1%Herman Miller, Inc (1M LIBOR + 2.000%)
1,000,000 2.063 07/19/28 998,960Weber-Stephen Products LLC (1M LIBOR + 3.250%)
563,295 4.000 10/30/27 564,236
1,563,196
Household Products – 0.1%Illuminate Merger Sub Corp.(n)
1,000,000 4.000 07/21/28 995,540Kronos Acquisition Holdings, Inc.(i) (3M LIBOR + 3.750%)
256 4.250 12/22/26 249
995,789
Insurance – 0.5%Acrisure LLC(i) (3M LIBOR + 3.500%)
492,500 3.632 02/15/27 485,605Alliant Holdings Intermediate LLC(i) (1M LIBOR + 3.250%)
1,235,743 3.337 05/09/25 1,224,548Asurion LLC(i)
(1M LIBOR + 3.125%)679,197 3.212 11/03/23 677,357
(1M LIBOR + 3.250%)248,750 3.337 07/31/27 246,262
(1M LIBOR + 5.250%)750,000 5.337 01/20/29 746,407
PrincipalAmount
InterestRate
MaturityDate Value
Bank Loans(m) – (continued)
Insurance – (continued)Broadstreet Partners, Inc.(n)
$ 1,000,000 3.087% 01/27/27 $ 986,7702,000,000 0.000 09/15/28 1,987,500
USI, Inc.(i)
(3M LIBOR + 3.000%)491,049 3.132 05/16/24 487,101
(3M LIBOR + 3.250%)248,109 3.382 12/02/26 246,300
7,087,850
Internet – 0.2%Cablevision Lightpath LLC(i) (1M LIBOR + 3.250%)
1,114,685 3.750 11/30/27 1,115,243CNT Holdings I Corp.(n)
125,000 0.000 11/08/27 125,156Eagle Broadband Investments LLC(i) (3M LIBOR + 3.000%)
1,117,500 3.750 11/12/27 1,116,807Proofpoint, Inc.(i) (3M LIBOR + 3.250%)
965,000 3.750 08/31/28 960,609
3,317,815
Leisure Time – 0.6%Alterra Mountain Co.(i) (1M LIBOR + 2.750%)
710,746 2.837 07/31/24 705,415Carnival Corp.(i)
(1M LIBOR + 3.000%)396,866 3.750 06/30/25 396,123
(6M LIBOR + 3.250%)1,125,000 4.000 10/18/28 1,123,594
ClubCorp Holdings, Inc.(i) (3M LIBOR + 2.750%)2,691,106 2.882 09/18/24 2,537,202
Equinox Holdings, Inc.(i) (3M LIBOR + 3.000%)2,257,088 4.000 03/08/24 2,145,656
Hayward Industries, Inc.(n)
498,750 0.000 05/12/28 497,089Life Time Fitness, Inc.(i) (3M LIBOR + 4.750%)
482,868 5.750 12/16/24 486,793SRAM, LLC(i) (3M LIBOR + 2.750%)
725,595 3.250 05/12/28 723,781
8,615,653
Lodging(i) – 0.0%Hilton Grand Vacations Borrower LLC (1M LIBOR + 3.000%)
500,000 3.500 08/02/28 500,875
Machinery – Construction & Mining(n) – 0.0%Vertiv Group Corp.
250,000 0.000 03/02/27 248,125
Machinery-Diversified(n) – 0.1%Ali Group S.R.L.
500,000 0.000 10/12/28 496,250Vertical US Newco, Inc.
630,420 4.000 07/30/27 631,208
1,127,458
62 The accompanying notes are an integral part of these financial statements.

G O L D M A N S A C H S M U L T I - M A N A G E R N O N - C O R E F I X E D I N C O M E F U N D
PrincipalAmount
InterestRate
MaturityDate Value
Bank Loans(m) – (continued)
Media(i) – 1.1%Altice Financing SA (3M LIBOR + 2.750%)$ 498,701 2.874% 01/31/26 $ 488,548Cengage Learning, Inc. (3M LIBOR + 4.750%)
1,108,676 5.750 06/29/26 1,113,643CSC Holdings LLC (1M LIBOR + 2.250%)
1,249,596 2.340 07/17/25 1,219,531177,716 2.340 01/15/26 173,939
Diamond Sports Group LLC (1M LIBOR + 3.250%)2,691,801 3.340 08/24/26 1,413,195
DirecTV Financing, LLC (3M LIBOR + 5.000%)2,569,000 5.750 07/22/27 2,570,233
Gray Television, Inc. (1M LIBOR + 2.500%)242,742 2.582 01/02/26 241,013
Houghton Mifflin Harcourt Publishing Co. (1M LIBOR +6.250%)
15,694 7.250 11/22/24 15,660iHeartCommunications, Inc. (1M LIBOR + 3.000%)
3,075,431 3.087 05/01/26 3,051,812LCPR Loan Financing LLC (1M LIBOR + 3.750%)
954,208 3.840 10/15/28 954,685Meredith Corp. (3M LIBOR + 4.250%)
493,750 5.250 01/31/25 503,521Nexstar Broadcasting, Inc. (1M LIBOR + 2.250%)
378,666 2.337 01/17/24 377,560Nielsen Finance LLC (1M LIBOR + 2.000%)
555,193 2.086 10/04/23 554,538Radiate Holdco LLC (1M LIBOR + 3.500%)
132,666 4.250 09/25/26 132,466Sinclair Television Group, Inc.(1M LIBOR + 2.250%)
525,911 2.340 01/03/24 519,337(1M LIBOR + 2.500%)
16,141 2.590 09/30/26 15,864The McClatchy Co.(l) (1M LIBOR + 10.000%)
715,096 10.000 07/15/26 706,158Univision Communications, Inc. (1M LIBOR + 2.750%)
179,320 3.750 03/15/24 179,133WideOpenWest Finance LLC (1M LIBOR + 3.250%)
448,978 4.250 08/18/23 448,255Ziggo Financing Partnership B.V. (1M LIBOR + 2.500%)
990,000 2.590 04/30/28 977,209
15,656,300
Metal Fabricate & Hardware – 0.0%Advanced Drainage Systems, Inc.(i) (1M LIBOR + 2.250%)
77,857 2.375 07/31/26 77,922Grinding Media, Inc.(n)
250,000 0.000 10/12/28 250,312The Hillman Group, Inc.(i)
(1M LIBOR + 2.750%)352,321 3.250 07/14/28 351,221
(3M LIBOR + 1.375%)6,751 1.375 07/14/28 6,542
685,997
PrincipalAmount
InterestRate
MaturityDate Value
Bank Loans(m) – (continued)
Mining(i)(l) – 0.1%Arctic Canadian Diamond Co.Ltd (3M LIBOR + 5.000%)$ 95,700 6.000% 12/31/24 $ 95,222
629,445 5.000 12/31/27 629,760
724,982
Miscellaneous Manufacturing(i) – 0.0%Gates Global LLC (1M LIBOR + 2.500%)
498,744 3.250 03/31/27 497,287
Oil & Gas Services(i) – 0.3%Citgo Petroleum Corp. (3M LIBOR + 6.250%)
395,750 7.250 03/28/24 395,833Delek US Holdings, Inc. (1M LIBOR + 2.250%)
487,425 2.337 03/31/25 472,305Gulf Finance LLC (1M LIBOR + 5.250%)
2,315,145 6.250 08/25/26 2,307,643QuarterNorth Energy Holding Inc. (3M LIBOR + 8.000%)
1,002,843 9.000 08/27/26 1,004,097
4,179,878
Packaging(i) – 0.2%Klockner-Pentaplast of America, Inc. (6M LIBOR + 4.750%)
1,034,430 5.250 02/12/26 1,028,285Reynolds Group Holdings, Inc. (1M LIBOR + 3.250%)
994,061 3.343 02/05/26 987,162TricorBraun Holdings, Inc.(1M LIBOR + 3.250%)
553,746 3.750 03/03/28 549,909(1M LIBOR + 3.250%)
124,759 3.750 03/03/28 123,895
2,689,251
Pharmaceuticals(i) – 1.2%Amneal Pharmaceuticals LLC (1M LIBOR + 3.500%)
244,241 3.625 05/04/25 241,901Bausch Health Cos., Inc.(1M LIBOR + 2.750%)
2,011,437 2.837 11/27/25 2,004,900(1M LIBOR + 3.000%)
2,338,487 3.158 06/02/25 2,332,501Change Healthcare Holdings LLC (3M LIBOR + 2.500%)
1,121,724 3.500 03/01/24 1,120,446Endo Finance Co.(Luxembourg) I S.a.r.l. (3M LIBOR + 5.000%)
748,747 5.750 03/27/28 728,987Gainwell Acquisition Corp. (3M LIBOR + 4.000%)
1,118,744 4.750 10/01/27 1,120,646Grifols Worldwide Operations USA, Inc.(1 Week LIBOR +
2.000%)476,364 2.074 11/15/27 469,456
Jazz Financing Lux S.a.r.l. (1M LIBOR + 3.500%)2,121,250 4.000 05/05/28 2,123,902
Mallinckrodt International Finance S.A.(1M LIBOR + 5.500%)
2,180,873 6.250 02/24/25 2,025,943(6M LIBOR + 5.250%)
1,976,699 6.000 09/24/24 1,836,413
The accompanying notes are an integral part of these financial statements. 63

G O L D M A N S A C H S M U L T I - M A N A G E R N O N - C O R E F I X E D I N C O M E F U N D
Schedule of Investments (continued)October 31, 2021
PrincipalAmount
InterestRate
MaturityDate Value
Bank Loans(m) – (continued)
Pharmaceuticals(i) – (continued)Organon & Co. (3M LIBOR + 3.000%)$ 3,617,500 3.500% 06/02/28 $ 3,624,301
17,629,396
Pipelines(i) – 0.2%Epic Y-Grade Services LP (3M LIBOR + 6.000%)
2,221,041 7.000 06/30/27 1,892,327Traverse Midstream Partners LLC (1M LIBOR + 4.250%)
672,030 5.250 09/27/24 671,049
2,563,376
Regional (state/provnc)(i) – 0.1%Mashantucket (Western) Pequot Tribe (1M LIBOR + 7.125%)
1,435,422 8.375 02/16/22 1,383,388
Retail(n) – 0.1%Restoration Hardware, Inc.
1,000,000 0.000 10/20/28 998,750
Retailing(i) – 0.6%1011778 B.C. Unlimited Liability Co. (1M LIBOR + 1.750%)
1,057,921 1.837 11/19/26 1,036,572Academy Ltd. (1M LIBOR + 3.750%)
1,244,375 4.500 11/05/27 1,245,619Belk, Inc.(3M LIBOR + 13.000%)
508,450 13.000 07/31/25 383,666(3M LIBOR + 7.500%)
112,852 8.500 07/31/25 112,663EG Group Ltd. (3M LIBOR + 4.000%)
393,878 4.132 02/07/25 392,215J.C. Penney Corp, Inc. (1M LIBOR + 8.500%)
278,376 9.500 12/07/26 276,737Park River Holdings, Inc. (3M LIBOR + 3.250%)
1,368,748 4.000 12/28/27 1,362,767PetSmart, Inc. (3M LIBOR + 3.750%)
3,094,245 4.500 02/11/28 3,095,359Serta Simmons Bedding LLC (1M LIBOR + 7.500%)
358,495 8.500 08/10/23 336,835Staples, Inc. (3M LIBOR + 5.000%)
746,183 5.126 04/16/26 716,411
8,958,844
Semiconductors(i) – 0.1%Bright Bidco B.V. (3M LIBOR + 3.500%)
1,985,761 4.500 06/30/24 1,465,492MACOM Technology Solutions Holdings, Inc. (1M LIBOR +
2.250%)89,956 2.337 05/17/24 89,371
1,554,863
Software – 2.1%Apttus Corp.(i) (3M LIBOR + 4.250%)
537,553 5.000 05/08/28 539,434Banff Merger Sub, Inc.(i) (3M LIBOR + 3.750%)
993,564 3.882 10/02/25 986,191Camelot U.S. Acquisition 1 Co.(i) (1M LIBOR + 3.000%)
998,731 3.087 10/30/26 992,739
PrincipalAmount
InterestRate
MaturityDate Value
Bank Loans(m) – (continued)
Software – (continued)CCC Intelligent Solutions, Inc.(n) (1M USD LIBOR)$ 1,125,000 0.000% 09/21/28 $ 1,121,344Ceridian HCM Holding, Inc.(i)(1 Week LIBOR + 2.500%)
1,728,442 2.574 04/30/25 1,707,148Dynatrace LLC(i) (1M LIBOR + 2.250%)
238,810 2.337 08/22/25 238,154Epicor Software Corp.(i) (1M LIBOR + 3.250%)
2,857,450 4.000 07/30/27 2,853,649Finastra USA, Inc.(i) (3M LIBOR + 3.500%)
2,858,433 4.500 06/13/24 2,841,997Greeneden U.S. Holdings II LLC(i) (1M LIBOR + 4.000%)
497,500 4.750 12/01/27 498,510Greenway Health LLC(i) (3M LIBOR + 3.750%)
124,109 4.750 02/16/24 118,958Informatica LLC(n)
1,500,000 0.000 10/27/28 1,496,250MA Finance Co. LLC(i) (1M LIBOR + 2.750%)
366,895 2.837 06/21/24 362,881Pitney Bowes Inc.(i) (1M LIBOR + 4.000%)
1,593,250 4.090 03/17/28 1,593,250Polaris Newco LLC(i) (6M LIBOR + 4.000%)
1,250,000 4.500 06/02/28 1,252,400Rackspace Technology Global, Inc.(n)
3,026,592 3.500 02/15/28 3,004,467RealPage, Inc(n)
250,000 0.000 04/24/28 249,400Riverbed Technology, Inc.(i) (1M LIBOR + 6.000%)
1,534,170 7.000 12/31/25 1,398,012Seattle SpinCo, Inc.(i) (1M LIBOR + 2.750%)
2,477,734 2.837 06/21/24 2,450,628Sophia, L.P.(i) (3M LIBOR + 3.500%)
1,240,625 4.250 10/07/27 1,240,625SS&C Holdings Europe S.a.r.l.(i) (1M LIBOR + 1.750%)
282,914 1.837 04/16/25 279,791SS&C Technologies, Inc.(i) (1M LIBOR + 1.750%)
372,324 1.837 04/16/25 368,213The Dun & Bradstreet Corp.(i) (1M LIBOR + 3.250%)
994,375 3.378 02/06/26 989,940The Ultimate Software Group, Inc.(i) (3M LIBOR + 3.250%)
2,116,234 4.000 05/04/26 2,118,626Tibco Software, Inc.(i) (1M LIBOR + 3.750%)
358,706 3.840 06/30/26 352,540Zelis Healthcare Corp.(n)
500,000 3.586 09/30/26 497,615
29,552,762
Telecommunication Services – 1.7%Altice France SA(i)
(3M LIBOR + 3.688%)1,491,271 3.811 01/31/26 1,474,121
(3M LIBOR + 4.000%)1,222,116 4.125 08/14/26 1,215,492
Avaya, Inc.1,250,000 4.340(n) 12/15/27 1,252,887
(1M LIBOR + 4.000%)2,375,000 4.090(i) 12/15/27 2,377,304
64 The accompanying notes are an integral part of these financial statements.

G O L D M A N S A C H S M U L T I - M A N A G E R N O N - C O R E F I X E D I N C O M E F U N D
PrincipalAmount
InterestRate
MaturityDate Value
Bank Loans(m) – (continued)
Telecommunication Services – (continued)CommScope, Inc.(i) (1M LIBOR + 3.250%)$ 115,974 3.337% 04/06/26 $ 114,343Delta TopCo, Inc.(i) (3M LIBOR + 3.750%)
497,500 4.500 12/01/27 496,525Frontier Communications Corp.(i) (3M LIBOR + 3.750%)
995,000 4.500 05/01/28 993,010GOGO Intermediate Holdings LLC(i) (3M LIBOR + 3.750%)
1,247,500 4.500 04/30/28 1,248,024Intelsat Jackson Holdings SA(i)
(1M LIBOR + 8.625%)500,000 8.625 01/02/24 505,535
(1M PRIME + 4.750%)7,327,000 8.000 11/27/23 7,388,034
Iridium Satellite LLC(i) (1M LIBOR + 2.500%)498,912 3.250 11/04/26 499,226
Maxar Technologies Ltd.(i) (1M LIBOR + 2.750%)2,250,737 2.840 10/04/24 2,235,072
MetroNet Systems Holdings, LLC(i) (1M LIBOR + 3.750%)498,750 4.500 05/26/28 499,219
MLN US Holding Co. LLC(i) (1M LIBOR + 4.500%)177,683 4.587 11/30/25 158,962
Plantronics, Inc.(i) (1M LIBOR + 2.500%)455,522 2.609 07/02/25 443,136
West Corp.(i)
(3M LIBOR + 3.500%)92,896 4.500 10/10/24 90,858
(3M LIBOR + 4.000%)2,706,278 5.000 10/10/24 2,657,078
23,648,826
TOTAL BANK LOANS(Cost $267,686,083) $ 266,804,823
Shares Description Value
Common Stocks – 0.6%
Automobiles(e)(k) – 0.0%65,182 Monitronics International, Inc. $ 387,833
Chemicals(e) – 0.1%42,218 Hexion Holdings Corp.
Class B 971,014
Commercial Services & Supplies(e) – 0.0%10,879 Cenveo, Inc. 76,153
Diversified Consumer Services – 0.0%7,679 Premier Brands Group
Holdings LLC 5,529
Diversified Financial Services – 0.0%20,510 Avation Capital SA(e)(l) —5,500 Copper Earnout Trust(k) 61,8751,681 Voyager Aviation Holdings
LLC(l) (Diversified FinancialServices) 144,100
205,975
Shares Description Value
Common Stocks – (continued)
Energy Equipment & Services(e) – 0.0%10,947 Noble Corp. (Energy
Equipment & Services) $ 275,42717,981 Parker Drilling Co. 80,9146,713 Valaris Ltd. 236,432
592,773
Health Care Technology(l) – 0.0%2,776 MModal, Inc. 347
Media(e) – 0.0%71,047 Clear Channel Outdoor
Holdings, Inc. 206,0363,675 Cumulus Media, Inc. Class A 45,644
251,680
Metals & Mining(e)(l) – 0.0%627 Arctic Canadian Diamond
Co.Ltd —
Multiline Retail(e) – 0.0%68 Belk, Inc. 1,224
Oil, Gas & Consumable Fuels – 0.2%2,100 California Resources Corp.(e) 96,873
14,768 Extraction Oil & Gas, Inc.(e) 983,99218,455 Fieldwood Equity 1,891,6372,295 Valaris Ltd. 80,830
3,053,332
Professional Services(e) – 0.0%17,299 Skillsoft Corp. 190,952
Real Estate – 0.1%41,250 Copper Property CTL Pass
Through Trust 876,562
Specialty Retail(l) – 0.1%7,504 Guitar Center, Inc. 1,303,520
Wireless Telecommunication Services – 0.1%5,606 iQor US Inc. 64,469
44,231 Windstream Corp. 862,504
926,973
TOTAL COMMON STOCKS(Cost $7,845,934) $ 8,843,867
PrincipalAmount
InterestRate
MaturityDate Value
Mortgage-Backed Obligations – 2.1%
Collateralized Mortgage Obligations – 1.0%Interest Only(o) – 0.6%GNMA REMIC Series 2020-104, Class HI$ 7,154,984 3.000% 07/20/50 $ 821,273GNMA REMIC Series 2020-123, Class IN
7,375,392 2.500 08/20/50 824,948
The accompanying notes are an integral part of these financial statements. 65

G O L D M A N S A C H S M U L T I - M A N A G E R N O N - C O R E F I X E D I N C O M E F U N D
Schedule of Investments (continued)October 31, 2021
PrincipalAmount
InterestRate
MaturityDate Value
Mortgage-Backed Obligations – (continued)
Collateralized Mortgage Obligations – (continued)Interest Only(o) – (continued)GNMA REMIC Series 2020-133, Class GI$ 3,728,973 2.500% 09/20/50 $ 441,132GNMA REMIC Series 2020-167, Class BI
3,931,828 2.500 11/20/50 433,956GNMA REMIC Series 2020-176, Class NI
5,127,608 2.500 11/20/50 450,648GNMA REMIC Series 2020-51, Class IO
11,803,477 3.000 04/20/50 1,494,648GNMA REMIC Series 2020-62, Class MI
1,597,741 3.000 05/20/50 145,768GNMA REMIC Series 2020-65, Class ES(i) (-1X 1M USD
LIBOR + 6.050%)4,943,276 5.964 05/20/50 938,790
GNMA REMIC Series 2020-78, Class AS(i) (-1x1M USD LIBOR+ 6.150%)
6,715,147 6.064 06/20/50 1,295,917GNMA REMIC Series 2020-78, Class SQ(i) (-1x1M USD LIBOR
+ 6.150%)1,639,141 6.064 06/20/50 310,907
GNMA REMIC Series 2021-30, Class DI12,275,545 2.500 02/20/51 1,430,058
8,588,045
Regular Floater(a)(i) – 0.4%Bellemeade Re Ltd Series 2020-4A Class M2B(1M USD LIBOR
+ 3.600%)250,000 3.689 06/25/30 251,964
CHL GMSR Issuer Trust Series 2018-GT1, Class A (1M USDLIBOR + 2.750%)
1,975,000 2.839 05/25/23 1,977,706MRA Issuance Trust Series 2021-EBO1, Class A2X(l) (1M USD
LIBOR + 1.750%)3,000,000 1.834 04/15/22 3,000,000
5,229,670
Commercial Mortgage-Backed Securities – 1.1%Interest Only(i) – 0.3%GNMA REMIC Series 2020-118 Class IO$ 8,608,388 0.911% 06/16/62 $ 672,828GNMA REMIC Series 2021-45 Class IO
12,079,531 0.835 04/16/63 939,254GNMA REMIC Series 2021-70 Class IO
12,248,545 0.722 04/16/63 959,079GNMA REMIC Series 2019-156, Class IO
11,239,511 0.541 11/16/61 654,319GNMA REMIC Series 2020-52, Class IO
4,733,879 0.872 10/16/62 378,057GNMA REMIC Series 2020-81, Class IO
2,583,633 0.885 02/16/61 184,634
3,788,171
Regular Floater(a)(i) – 0.2%Credit Suisse Mortgage Trust Series 2021- BPNY, Class A
(1M USD LIBOR + 3.714%)1,000,000 3.805 08/15/23 1,001,309
PrincipalAmount
InterestRate
MaturityDate Value
Mortgage-Backed Obligations – (continued)
Regular Floater(a)(i) – (continued)CSMC TMIC Series 2020 TMIC Class A (1M USD LIBOR +
3.000%)$ 1,000,000 3.250% 12/15/35 $ 1,010,089CSMC TMIC Series 2020 TMIC Class B (1M USD LIBOR +
5.000%)350,000 5.250 12/15/35 357,415
2,368,813
Sequential Fixed Rate – 0.3%Credit Suisse Mortgage Trust 04/23 1(a)(i) (1M USD LIBOR +
3.969%)2,746,753 4.060 04/15/23 2,745,497
Credit Suisse Mortgage Trust 05/23 12,316,000 3.800 05/15/26 2,317,037
5,062,534
Sequential Floating Rate(a)(i) – 0.3%Capital Funding Mortgage Trust Series 2021-20, Class A
(1M USD LIBOR + 3.000%)3,000,000 4.250 05/28/24 3,031,480
CSMC Trust Series 2020-LOTS, Class A(1M USD LIBOR +3.975%)
2,044,860 4.725 07/15/22 2,043,480
5,074,960
TOTAL COMMERCIAL MORTGAGE-BACKED SECURITIES $ 16,294,478
TOTAL MORTGAGE-BACKED OBLIGATIONS(Cost $29,976,460) $ 30,112,193
Asset-Backed Securities – 1.9%
Collateralized Loan Obligations(a)(i) – 1.1%Bain Capital Credit CLO Series 2021-3A, Class E (3M USD
LIBOR + 6.500%)$ 500,000 6.686% 07/24/34 $ 499,789BlueMountain CLO XXXI Ltd. Series 2021-31A, Class E
(3M USD LIBOR + 6.530%)1,000,000 6.654 04/19/34 999,972
Carlyle U.S. CLO Ltd. Series 2020-1A, Class DR (3M USDLIBOR + 6.250%)
500,000 6.382 07/20/34 499,630CBAM, Ltd. Series 2018-5A Class A(3M USD LIBOR +
1.020%)975,000 1.142 04/17/31 975,086
CIFC Funding III, Ltd. Series 2017-3A Class A1 (3M USDLIBOR + 1.220%)
305,000 1.352 07/20/30 305,266Dryden 64 CLO, Ltd. Series 2018-64A Class A (3M USD LIBOR
+ 0.970%)1,000,000 1.092 04/18/31 1,001,467
ICG U.S. CLO Ltd. Series 2020-1A, Class C (3M USD LIBOR +4.250%)
1,000,000 4.378 10/22/31 1,004,987
66 The accompanying notes are an integral part of these financial statements.

G O L D M A N S A C H S M U L T I - M A N A G E R N O N - C O R E F I X E D I N C O M E F U N D
PrincipalAmount
InterestRate
MaturityDate Value
Asset-Backed Securities – (continued)
Collateralized Loan Obligations(a)(i) – (continued)Octagon Investment Partners 48 Ltd. Series 2020-3A, Class D
(3M USD LIBOR + 4.000%)$ 1,400,000 4.132% 10/20/31 $ 1,400,000Octagon Investment Partners 48 Ltd. Series 2020-3A, Class DR
(-1X 3M USD LIBOR + 3.100%)1,400,000 1.000 10/20/34 1,400,000
Octagon Loan Funding, Ltd. Series 2014-1A Class ARR (3MUSD LIBOR + 1.180%)
2,000,000 1.305 11/18/31 2,000,162OHA Credit Funding 9 Ltd. Series 2021-9A, Class D (3M USD
LIBOR + 2.950%)1,500,000 3.134 07/19/35 1,498,662
OHA Loan Funding, Ltd. Series 2016-1A Class AR (3M USDLIBOR + 1.260%)
280,000 1.392 01/20/33 280,393Sound Point Clo XXX Ltd. Series 2021-2A, Class D (3M USD
LIBOR + 3.350%)1,000,000 3.474 07/25/34 1,001,015
Sound Point Clo XXX Ltd. Series 2021-2A, Class E (3M USDLIBOR + 6.360%)
1,000,000 6.484 07/25/34 989,392Venture 32 CLO, Ltd. Series 2018-32A Class A1 (3M USD
LIBOR + 1.100%)1,000,000 1.222 07/18/31 999,676
Voya CLO Ltd. Series 2017-1A, Class C (3M USD LIBOR +3.330%)
1,000,000 3.452 04/17/30 998,489
15,853,986
Home Equity(i) – 0.1%Countrywide Asset-Backed Certificates Series 2007-BC3,
Class 2A3 (1M USD LIBOR + 0.180%)338,615 0.269 11/25/47 341,526
Nationstar HECM Loan Trust Series 2020-1A, Class M3(a)
1,000,000 2.820 09/25/30 994,026
1,335,552
Other(a) – 0.7%AASET U.S. Ltd. Series 2018-2A, Class A
1,549,656 4.454 11/18/38 1,495,865Business Jet Securities LLC Series 2019-1, Class A
377,904 4.212 07/15/34 385,810Business Jet Securities Series 2021-1A, Class B
671,297 2.918 04/15/36 674,008Labrador Aviation Finance, Ltd. Series 2016-1A, Class A1
958,832 4.300 01/15/42 944,830M360 Ltd. Series 2021-CRE3, Class B(i)
(1M USD LIBOR + 2.250%)1,000,000 2.336 10/22/36 1,013,042
(1M USD LIBOR + 3.000%)1,200,000 3.086 10/22/36 1,199,999
(1M USD LIBOR + 3.750%)1,300,000 3.836 10/22/36 1,299,999
Oasis Securitization Funding LLC Series 2021-1A, Class A158,771 2.579 02/15/33 159,048
PrincipalAmount
InterestRate
MaturityDate Value
Asset-Backed Securities – (continued)
Other(a) – (continued)Project Silver Series 2019-1, Class A$ 3,011,038 3.967% 07/15/44 $ 2,961,804
10,134,405
TOTAL ASSET-BACKED SECURITIES(Cost $27,084,935) $ 27,323,943
SharesDividend
Rate Value
Preferred Stocks(l) – 0.0%
Specialty Retail – 0.0%Guitar Center, Inc.
104 0.000% $ 10,196(Cost $9,761)
Units DescriptionExpiration
Date Value
Warrant – 0.1%
Energy Equipment & Services(e) – 0.0%Noble Corp.
9,802 02/05/28 $ 127,426
Oil, Gas & Consumable Fuels(e) – 0.0%California Resources Corp.
670 10/27/24 10,378Fieldwood Energy LLC
6,687 08/01/29 45,919
56,297
Specialty Retail(l) – 0.1%Guitar Center, Inc.
1,825 149,4401,986 97,245
161 7,883
254,568
TOTAL WARRANT(Cost $225,495) $ 438,291
Shares Description Value
Exchange Traded Fund – 3.8%
626,948 iShares iBoxx High YieldCorporate Bond ETF $ 54,500,590
(Cost $54,851,455)
The accompanying notes are an integral part of these financial statements. 67

G O L D M A N S A C H S M U L T I - M A N A G E R N O N - C O R E F I X E D I N C O M E F U N D
Schedule of Investments (continued)October 31, 2021
SharesDividend
Rate Value
Investment Company(p) – 9.2%
Goldman Sachs Financial Square Government Fund –Institutional Shares131,055,477 0.026% $ 131,055,477
(Cost $131,055,477)
TOTAL INVESTMENTS – 103.0%(Cost $1,471,516,343) $1,467,451,020
LIABIL IT IES IN EXCESS OFOTHER ASSETS – (3.0)% (42,371,987)
NET ASSETS – 100.0% $1,425,079,033
The percentage shown for each investment categoryreflects the value of investments in that category as apercentage of net assets.(a) Exempt from registration under Rule 144A of the Securities Act of
1933.
(b) Issued with a zero coupon. Income is recognized through the accretionof discount.
(c) Security with “Call” features with resetting interest rates. Maturitydates disclosed are the final maturity dates.
(d) Coupon changes periodically based upon a predetermined schedule.Interest rate disclosed is that which is in effect on October 31, 2021.
(e) Security is currently in default and/or non-income producing.
(f) Actual maturity date is July 28, 2121.
(g) Actual maturity date is April 03, 2120.
(h) Pay-in-kind securities.
(i) Variable rate security. Except for floating rate notes (for which finalmaturity is disclosed), maturity date disclosed is the next interest resetdate. Interest rate disclosed is that which is in effect on October 31,2021.
(j) Guaranteed by a foreign government until maturity.
(k) Restricted securities are not registered under the Securities Act of 1933and are subject to legal restrictions on resale. These securitiesgenerally may be resold in transactions exempt from registration or tothe public if the securities are subsequently registered and theregistration statement is effective. Disposal of these securities mayinvolve time consuming negotiations and prompt sale at an acceptableprice may be difficult. Total market value of restricted securitiesamounts to $2,259,533, which represents approximately 0.2% of theFund’s net assets as of October 31, 2021.
Restricted SecurityAcquisition
Date Cost
Copper Earnout Trust 12/07/20 $2,487,996Revlon Consumer Products Corp. (BankLoans) 12/31/20 2,487,996Monitronics International, Inc. (CommonStocks) 04/01/20 1,069,075Neiman Marcus Group Ltd. (CorporateObligations) 10/15/21 605,000Chesapeake Engery Corp. (CorporateObligations) 06/21/19 516,788
(l) Significant unobservable inputs were used in the valuation of thisportfolio security; i.e., Level 3.
(m) Bank Loans often require prepayments from excess cash flows orpermit the borrower to repay at its election. The degree to whichborrowers repay, whether as a contractual requirement or at theirelection, cannot be predicted with accuracy. As a result, the actualremaining maturity may be substantially less than the stated maturitiesshown. As bank loan positions may involve multiple underlyingtranches for which the aggregate position is presented, the statedinterest rate represents the weighted average interest rate of allcontracts on October 31, 2021. Bank Loans typically have rates ofinterest which are predetermined either daily, monthly, quarterly orsemi-annually by reference to a base lending rate, plus a premium.These base lending rates are primarily the London-Interbank OfferedRate (“LIBOR”), and secondarily the prime rate offered by one ormore major United States banks (the “Prime Rate”) and the certificateof deposit (“CD”) rate or other base lending rates used by commerciallenders.
(n) This position represents an unsettled loan commitment at period end.Certain details associated with this purchase are not known prior to thesettlement date, including coupon rate.
(o) Security with a notional or nominal principal amount. The actualeffective yield of this security is different than the stated interest rate.
(p) Represents an affiliated issuer.
Currency Abbreviations:BRL —Brazilian RealCAD —Canadian DollarCLP —Chilean PesoCNH —Chinese Yuan Renminbi OffshoreCNY —Chinese Yuan RenminbiCOP —Colombian PesoCZK —Czech KorunaEGP —Egyptian PoundEUR —EuroGBP —British PoundHUF —Hungarian ForintIDR —Indonesian RupiahMXN —Mexican PesoMYR —Malaysian RinggitPEN —Peruvian Nuevo SolPLN —Polish ZlotyRON —New Romanian LeuRUB —Russian RubleTHB —Thai BahtTRY —Turkish LiraUAH —Ukraine HryvnaUSD —U.S. DollarUYU —Uruguayan PesoZAR —South African Rand
Investment Abbreviations:CLO —Collateralized Loan ObligationCMT —Constant Maturity Treasury IndexesCPI —Consumer Price IndexETF —Exchange Traded FundGNMA—Government National Mortgage AssociationLIBOR —London Interbank Offered RateLLC —Limited Liability CompanyLP —Limited PartnershipPLC —Public Limited CompanyREMIC—Real Estate Mortgage Investment Conduit
68 The accompanying notes are an integral part of these financial statements.

G O L D M A N S A C H S M U L T I - M A N A G E R N O N - C O R E F I X E D I N C O M E F U N D
A D D I T I O N A L I N V E S T M E N T I N F O R M A T I O N
UNFUNDED LOAN COMMITMENTS — At October 31, 2021, the Fund had unfunded loan commitments which could be
extended at the option of the borrowers, pursuant to the following loan agreements:
BorrowerPrincipalAmount
CurrentValue
UnrealizedGain (Loss)
DexKo Global, Inc., due 10/04/28 $40,000 $39,957 $ (43)The Hillman Group, due 07/14/28 77,637 77,583 (243)
TOTAL $(286)
FORWARD FOREIGN CURRENCY EXCHANGE CONTRACTS — At October 31, 2021, the Fund had the following forward
foreign currency exchange contracts:
FORWARD FOREIGN CURRENCY EXCHANGE CONTRACTS WITH UNREALIZED GAIN
CounterpartyCurrency
PurchasedCurrency
SoldSettlement
DateUnrealized
Gain
Barclays Bank PLC EUR 2,326,182 USD 2,693,401 01/04/22 $ 455IDR 9,319,700,000 USD 650,000 11/01/21 7,388MYR 33,735,082 USD 7,943,922 11/19/21 184,332RUB 119,784,530 USD 1,657,000 01/13/22 4,396THB 74,002,590 USD 2,208,432 12/01/21 21,095USD 2,700,000 EUR 2,326,182 01/04/22 6,144
BNP Paribas SA BRL 4,345,563 USD 753,000 01/03/22 6,359IDR 19,441,264,320 USD 1,345,459 11/01/21 25,879USD 430,000 BRL 2,385,882 01/03/22 13,083USD 4,637,635 PLN 18,077,477 12/01/21 109,603
BofA Securities LLC RUB 98,660,685 USD 1,357,000 01/13/22 11,411USD 325,000 BRL 1,832,653 01/03/22 4,756USD 1,466,000 TRY 14,744,295 03/29/22 44,207USD 2,408,000 ZAR 37,047,321 01/03/22 2,507
Citibank NA USD 10,938,000 CAD 13,510,131 01/25/22 20,392USD 139,759 EUR 120,000 11/01/21 1,036USD 7,300,324 EUR 6,267,749 01/25/22 38,808USD 412,343 GBP 300,000 01/25/22 1,681
JPMorgan Securities, Inc. IDR 34,724,200,000 USD 2,380,000 11/01/21 69,358Morgan Stanley & Co. CNH 11,784,351 USD 1,807,000 12/20/21 24,612
IDR 20,918,320,000 USD 1,473,225 11/01/21 2,301RUB 200,487,420 USD 2,700,000 01/13/22 80,735USD 3,516,000 BRL 19,424,142 01/03/22 121,758USD 1,480,000 IDR 20,918,320,000 11/01/21 4,474USD 379,000 ZAR 5,753,104 01/03/22 5,449
TOTAL $812,219
The accompanying notes are an integral part of these financial statements. 69

G O L D M A N S A C H S M U L T I - M A N A G E R N O N - C O R E F I X E D I N C O M E F U N D
Schedule of Investments (continued)October 31, 2021
A D D I T I O N A L I N V E S T M E N T I N F O R M A T I O N ( c o n t i n u e d )
FORWARD FOREIGN CURRENCY EXCHANGE CONTRACTS WITH UNREALIZED LOSS
CounterpartyCurrency
PurchasedCurrency
SoldSettlement
DateUnrealized
Loss
Barclays Bank PLC CZK 13,200,975 USD 615,000 11/04/21 $ (20,540)EUR 43,840,000 USD 51,607,089 11/12/21 (916,246)GBP 4,500,000 USD 6,237,068 11/12/21 (78,526)IDR 5,080,000,000 USD 360,713 11/01/21 (2,383)THB 402,887,200 USD 12,327,382 12/01/21 (189,322)TRY 28,579,853 USD 2,858,000 03/29/22 (102,043)USD 1,014,135 IDR 14,399,700,000 11/01/21 (1,584)USD 630,000 MYR 2,647,575 11/19/21 (7,916)
BNP Paribas SA HUF 617,421,079 USD 2,026,456 11/04/21 (43,200)PLN 18,888,464 USD 4,761,691 12/01/21 (30,522)RUB 21,400,000 USD 297,140 01/13/22 (325)USD 2,763,397 HUF 860,798,119 11/04/21 (1,626)USD 1,353,621 IDR 19,441,264,320 11/01/21 (17,717)ZAR 13,472,375 USD 890,000 01/03/22 (15,235)
BofA Securities LLC CLP 496,351,000 USD 610,293 01/31/22 (6,900)PLN 39,792,350 USD 10,369,329 12/01/21 (402,171)USD 1,340,678 HUF 417,942,960 11/04/21 (1,822)USD 1,947,000 RUB 142,608,015 01/13/22 (30,955)USD 2,793,354 THB 93,303,622 12/01/21 (17,668)
BofA Securities LLC TRY 7,013,690 USD 680,000 03/29/22 (3,669)Citibank NA CAD 1,536,905 USD 1,244,169 01/25/22 (2,187)
EUR 25,389,127 USD 29,556,913 01/25/22 (142,281)GBP 2,763,374 USD 3,802,177 01/25/22 (19,461)
JPMorgan Securities, Inc. BRL 3,489,063 USD 625,000 01/03/22 (15,309)HUF 661,320,000 USD 2,200,000 11/04/21 (75,733)PLN 4,150,000 USD 1,053,011 12/01/21 (13,522)TRY 16,450,755 USD 1,677,924 03/29/22 (91,576)USD 2,445,538 IDR 34,724,200,000 11/01/21 (3,820)
Morgan Stanley & Co. CLP 387,429,000 USD 475,840 01/31/22 (4,859)PLN 10,089,090 USD 2,607,000 12/01/21 (79,892)
TOTAL $(2,339,010)
FUTURES CONTRACTS — At October 31, 2021, the Fund had the following futures contracts:
TypeNumber ofContracts
ExpirationDate Value
UnrealizedGain (Loss)
Short position contracts:Ultra 10 Year U.S. Treasury Notes (75) 12/21/21 $(10,877,344) $232,716
70 The accompanying notes are an integral part of these financial statements.
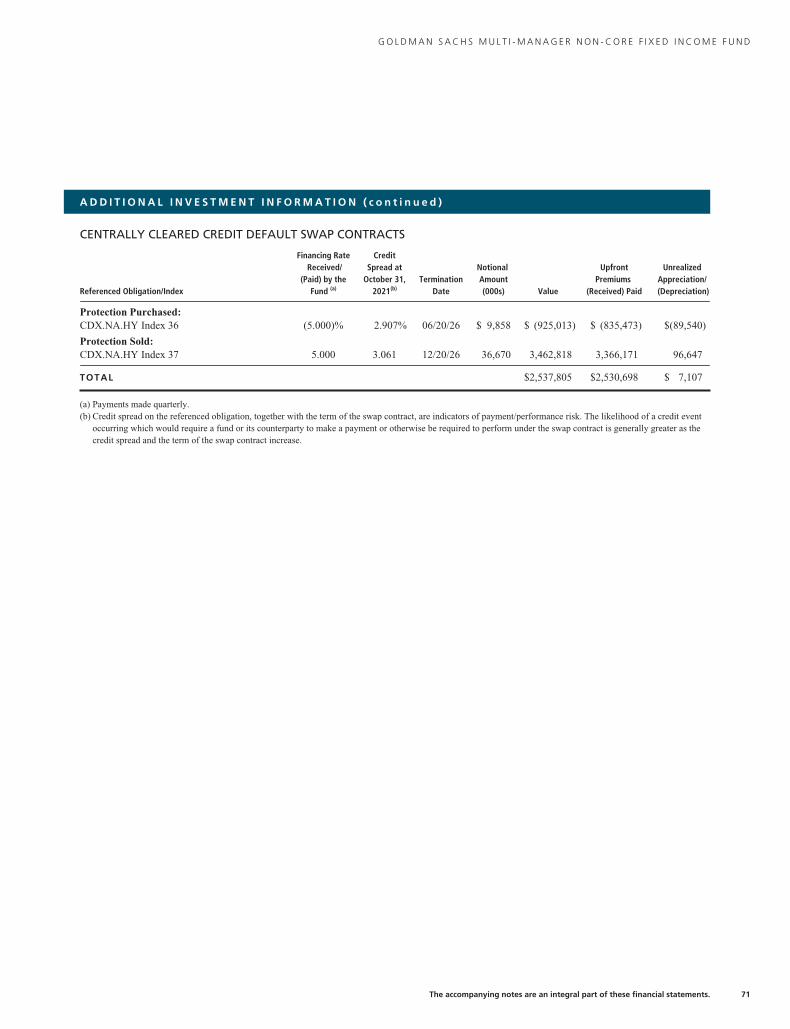
G O L D M A N S A C H S M U L T I - M A N A G E R N O N - C O R E F I X E D I N C O M E F U N D
A D D I T I O N A L I N V E S T M E N T I N F O R M A T I O N ( c o n t i n u e d )
CENTRALLY CLEARED CREDIT DEFAULT SWAP CONTRACTS
Referenced Obligation/Index
Financing RateReceived/
(Paid) by theFund (a)
CreditSpread at
October 31,2021(b)
TerminationDate
NotionalAmount(000s) Value
UpfrontPremiums
(Received) Paid
UnrealizedAppreciation/(Depreciation)
Protection Purchased:CDX.NA.HY Index 36 (5.000)% 2.907% 06/20/26 $ 9,858 $ (925,013) $ (835,473) $(89,540)
Protection Sold:CDX.NA.HY Index 37 5.000 3.061 12/20/26 36,670 3,462,818 3,366,171 96,647
TOTAL $2,537,805 $2,530,698 $ 7,107
(a) Payments made quarterly.(b) Credit spread on the referenced obligation, together with the term of the swap contract, are indicators of payment/performance risk. The likelihood of a credit event
occurring which would require a fund or its counterparty to make a payment or otherwise be required to perform under the swap contract is generally greater as thecredit spread and the term of the swap contract increase.
The accompanying notes are an integral part of these financial statements. 71

G O L D M A N S A C H S M U L T I - M A N A G E R R E A L A S S E T S S T R A T E G Y F U N D
Schedule of InvestmentsOctober 31, 2021
Shares Description Value
Common Stocks – 96.9%
Australia – 3.5%126,800 Goodman Group (Equity Real Estate
Investment Trusts (REITs)) $ 2,099,413385,521 Ingenia Communities Group (Equity
Real Estate Investment Trusts(REITs)) 1,906,091
2,288,441 Mirvac Group (Equity Real EstateInvestment Trusts (REITs)) 4,883,910
911,269 National Storage REIT (Equity RealEstate Investment Trusts (REITs)) 1,649,876
124,255 NEXTDC Ltd.* (IT Services) 1,109,203893,446 Stockland (Equity Real Estate
Investment Trusts (REITs)) 3,079,655577,220 Sydney Airport*
(Transportation Infrastructure) 3,579,593723,119 Transurban Group
(Transportation Infrastructure) 7,367,970
25,675,711
Belgium – 1.1%29,894 Aedifica SA (Equity Real Estate
Investment Trusts (REITs)) 3,986,36810,419 VGP NV (Real Estate Management &
Development) 2,697,93734,400 Warehouses De Pauw CVA (Equity
Real Estate Investment Trusts(REITs)) 1,566,456
8,250,761
Brazil* – 0.1%627,011 Santos Brasil Participacoes SA
(Transportation Infrastructure) 572,151
Canada – 8.2%52,800 Allied Properties Real Estate
Investment Trust (Equity Real EstateInvestment Trusts (REITs)) 1,824,706
33,476 Canadian Apartment Properties REIT(Equity Real Estate Investment Trusts(REITs)) 1,634,579
11,661 Canadian National Railway Co.(Road & Rail) 1,549,775
226,700 Dream Industrial Real EstateInvestment Trust (Equity Real EstateInvestment Trusts (REITs)) 3,104,852
459,986 Enbridge, Inc. (Oil, Gas &Consumable Fuels) 19,267,675
118,801 Gibson Energy, Inc. (Oil, Gas &Consumable Fuels) 2,394,066
103,712 Hydro One Ltd.(a) (Electric Utilities) 2,477,993151,005 InterRent Real Estate Investment Trust
(Equity Real Estate Investment Trusts(REITs)) 2,212,121
216,284 Pembina Pipeline Corp. (Oil, Gas &Consumable Fuels) 7,159,951
225,731 Summit Industrial Income REIT(Equity Real Estate Investment Trusts(REITs)) 4,311,798
Shares Description Value
Common Stocks – (continued)
Canada – (continued)236,124 TC Energy Corp. (Oil, Gas &
Consumable Fuels) $ 12,773,5148,950 Waste Connections, Inc. (Commercial
Services & Supplies) 1,217,289
59,928,319
China – 0.5%229,200 ENN Energy Holdings Ltd.
(Gas Utilities) 3,948,767
Denmark(a) – 0.2%13,044 Orsted A/S (Electric Utilities) 1,842,367
Finland – 0.4%115,177 Kojamo Oyj (Real Estate
Management & Development) 2,580,490
France – 3.7%15,513 Eiffage SA (Construction &
Engineering) 1,596,678155,374 Engie SA (Multi-Utilities) 2,210,21814,200 Gecina SA (Equity Real Estate
Investment Trusts (REITs)) 1,987,129260,249 Getlink SE (Transportation
Infrastructure) 4,005,52478,926 Klepierre SA (Equity Real Estate
Investment Trusts (REITs)) 1,878,93322,891 Unibail-Rodamco-Westfield*
(Equity Real Estate Investment Trusts(REITs)) 1,634,526
126,500 Vinci SA (Construction &Engineering) 13,524,140
26,837,148
Germany – 2.0%229,318 E.ON SE (Multi-Utilities) 2,907,70611,980 Fraport AG Frankfurt Airport Services
Worldwide*
(Transportation Infrastructure) 857,42615,548 LEG Immobilien SE (Real Estate
Management & Development) 2,312,65736,250 Vantage Towers AG (Diversified
Telecommunication Services) 1,246,254120,284 Vonovia SE (Real Estate
Management & Development) 7,296,764
14,620,807
Hong Kong – 3.9%300,000 China Gas Holdings Ltd. (Gas
Utilities) 748,806508,000 China Merchants Port Holdings Co.
Ltd. (Transportation Infrastructure) 846,927302,000 China Resources Gas Group Ltd.
(Gas Utilities) 1,622,466189,561 CK Asset Holdings Ltd. (Real Estate
Management & Development) 1,170,9292,010,049 COSCO SHIPPING Ports Ltd.
(Transportation Infrastructure) 1,673,136
72 The accompanying notes are an integral part of these financial statements.
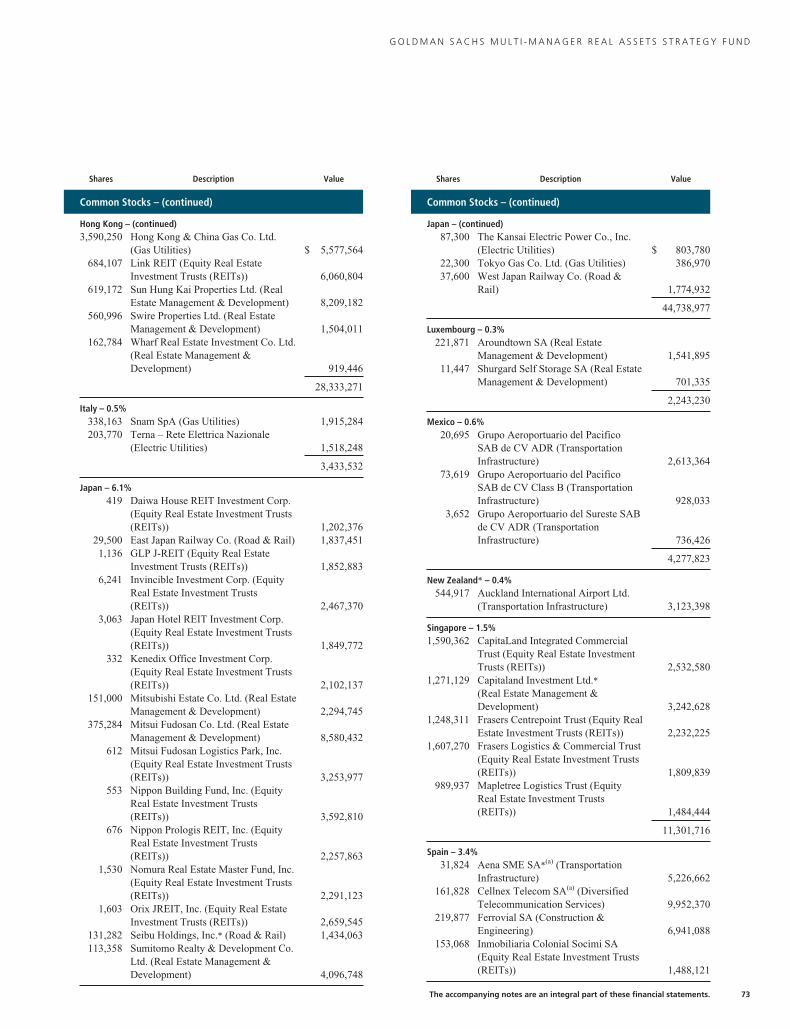
G O L D M A N S A C H S M U L T I - M A N A G E R R E A L A S S E T S S T R A T E G Y F U N D
Shares Description Value
Common Stocks – (continued)
Hong Kong – (continued)3,590,250 Hong Kong & China Gas Co. Ltd.
(Gas Utilities) $ 5,577,564684,107 Link REIT (Equity Real Estate
Investment Trusts (REITs)) 6,060,804619,172 Sun Hung Kai Properties Ltd. (Real
Estate Management & Development) 8,209,182560,996 Swire Properties Ltd. (Real Estate
Management & Development) 1,504,011162,784 Wharf Real Estate Investment Co. Ltd.
(Real Estate Management &Development) 919,446
28,333,271
Italy – 0.5%338,163 Snam SpA (Gas Utilities) 1,915,284203,770 Terna – Rete Elettrica Nazionale
(Electric Utilities) 1,518,248
3,433,532
Japan – 6.1%419 Daiwa House REIT Investment Corp.
(Equity Real Estate Investment Trusts(REITs)) 1,202,376
29,500 East Japan Railway Co. (Road & Rail) 1,837,4511,136 GLP J-REIT (Equity Real Estate
Investment Trusts (REITs)) 1,852,8836,241 Invincible Investment Corp. (Equity
Real Estate Investment Trusts(REITs)) 2,467,370
3,063 Japan Hotel REIT Investment Corp.(Equity Real Estate Investment Trusts(REITs)) 1,849,772
332 Kenedix Office Investment Corp.(Equity Real Estate Investment Trusts(REITs)) 2,102,137
151,000 Mitsubishi Estate Co. Ltd. (Real EstateManagement & Development) 2,294,745
375,284 Mitsui Fudosan Co. Ltd. (Real EstateManagement & Development) 8,580,432
612 Mitsui Fudosan Logistics Park, Inc.(Equity Real Estate Investment Trusts(REITs)) 3,253,977
553 Nippon Building Fund, Inc. (EquityReal Estate Investment Trusts(REITs)) 3,592,810
676 Nippon Prologis REIT, Inc. (EquityReal Estate Investment Trusts(REITs)) 2,257,863
1,530 Nomura Real Estate Master Fund, Inc.(Equity Real Estate Investment Trusts(REITs)) 2,291,123
1,603 Orix JREIT, Inc. (Equity Real EstateInvestment Trusts (REITs)) 2,659,545
131,282 Seibu Holdings, Inc.* (Road & Rail) 1,434,063113,358 Sumitomo Realty & Development Co.
Ltd. (Real Estate Management &Development) 4,096,748
Shares Description Value
Common Stocks – (continued)
Japan – (continued)87,300 The Kansai Electric Power Co., Inc.
(Electric Utilities) $ 803,78022,300 Tokyo Gas Co. Ltd. (Gas Utilities) 386,97037,600 West Japan Railway Co. (Road &
Rail) 1,774,932
44,738,977
Luxembourg – 0.3%221,871 Aroundtown SA (Real Estate
Management & Development) 1,541,89511,447 Shurgard Self Storage SA (Real Estate
Management & Development) 701,335
2,243,230
Mexico – 0.6%20,695 Grupo Aeroportuario del Pacifico
SAB de CV ADR (TransportationInfrastructure) 2,613,364
73,619 Grupo Aeroportuario del PacificoSAB de CV Class B (TransportationInfrastructure) 928,033
3,652 Grupo Aeroportuario del Sureste SABde CV ADR (TransportationInfrastructure) 736,426
4,277,823
New Zealand* – 0.4%544,917 Auckland International Airport Ltd.
(Transportation Infrastructure) 3,123,398
Singapore – 1.5%1,590,362 CapitaLand Integrated Commercial
Trust (Equity Real Estate InvestmentTrusts (REITs)) 2,532,580
1,271,129 Capitaland Investment Ltd.*(Real Estate Management &Development) 3,242,628
1,248,311 Frasers Centrepoint Trust (Equity RealEstate Investment Trusts (REITs)) 2,232,225
1,607,270 Frasers Logistics & Commercial Trust(Equity Real Estate Investment Trusts(REITs)) 1,809,839
989,937 Mapletree Logistics Trust (EquityReal Estate Investment Trusts(REITs)) 1,484,444
11,301,716
Spain – 3.4%31,824 Aena SME SA*(a) (Transportation
Infrastructure) 5,226,662161,828 Cellnex Telecom SA(a) (Diversified
Telecommunication Services) 9,952,370219,877 Ferrovial SA (Construction &
Engineering) 6,941,088153,068 Inmobiliaria Colonial Socimi SA
(Equity Real Estate Investment Trusts(REITs)) 1,488,121
The accompanying notes are an integral part of these financial statements. 73

G O L D M A N S A C H S M U L T I - M A N A G E R R E A L A S S E T S S T R A T E G Y F U N D
Schedule of Investments (continued)October 31, 2021
Shares Description Value
Common Stocks – (continued)
Spain – (continued)123,600 Merlin Properties Socimi SA (Equity
Real Estate Investment Trusts (REITs)) $ 1,338,548
24,946,789
Sweden – 1.2%90,103 Castellum AB (Real Estate
Management & Development) 2,401,572114,158 Fabege AB (Real Estate Management &
Development) 1,932,298156,038 Pandox AB* (Real Estate
Management & Development) 2,750,833286,273 Samhallsbyggnadsbolaget i Norden AB
(Real Estate Management &Development) 1,920,042
9,004,745
United Kingdom – 4.9%119,662 Big Yellow Group PLC (Equity Real
Estate Investment Trusts (REITs)) 2,422,062814,738 Capital & Counties Properties PLC
(Equity Real Estate Investment Trusts(REITs)) 1,837,581
681,800 Grainger PLC (Real EstateManagement & Development) 2,867,542
289,800 Great Portland Estates PLC (Equity RealEstate Investment Trusts (REITs)) 2,897,843
935,902 National Grid PLC (Multi-Utilities) 11,982,878161,813 Pennon Group PLC (Water Utilities) 2,581,006345,974 Segro PLC (Equity Real Estate
Investment Trusts (REITs)) 6,114,93341,203 Severn Trent PLC (Water Utilities) 1,543,145
216,951 The British Land Co. PLC (Equity RealEstate Investment Trusts (REITs)) 1,464,848
826,789 Tritax Big Box REIT PLC (Equity RealEstate Investment Trusts (REITs)) 2,544,389
36,256,227
United States – 54.4%124,387 Acadia Realty Trust (Equity Real Estate
Investment Trusts (REITs)) 2,659,39410,669 Alexandria Real Estate Equities, Inc.
(Equity Real Estate Investment Trusts(REITs)) 2,177,970
47,845 Ameren Corp. (Multi-Utilities) 4,032,85518,170 American Electric Power Co., Inc.
(Electric Utilities) 1,539,18174,241 American Homes 4 Rent Class A
(Equity Real Estate Investment Trusts(REITs)) 3,014,185
87,072 American Tower Corp. (Equity RealEstate Investment Trusts (REITs)) 24,551,692
61,700 American Water Works Co., Inc. (WaterUtilities) 10,746,906
82,800 Americold Realty Trust (Equity RealEstate Investment Trusts (REITs)) 2,440,116
25,745 Atmos Energy Corp. (Gas Utilities) 2,371,629
Shares Description Value
Common Stocks – (continued)
United States – (continued)20,800 AvalonBay Communities, Inc. (Equity
Real Estate Investment Trusts (REITs)) $ 4,922,94438,260 Boston Properties, Inc. (Equity Real
Estate Investment Trusts (REITs)) 4,347,866248,000 Brixmor Property Group, Inc. (Equity
Real Estate Investment Trusts (REITs)) 5,813,12082,586 Camden Property Trust (Equity Real
Estate Investment Trusts (REITs)) 13,469,777231,852 CenterPoint Energy, Inc. (Multi-
Utilities) 6,037,426125,078 Cheniere Energy, Inc.* (Oil, Gas &
Consumable Fuels) 12,933,06533,934 Clearway Energy, Inc. Class C
(Independent Power and RenewableElectricity Producers) 1,203,978
42,393 Community Healthcare Trust, Inc.(Equity Real Estate Investment Trusts(REITs)) 2,028,081
101,280 Crown Castle International Corp.(Equity Real Estate Investment Trusts(REITs)) 18,260,784
44,314 CubeSmart (Equity Real EstateInvestment Trusts (REITs)) 2,437,713
25,993 CyrusOne, Inc. (Equity Real EstateInvestment Trusts (REITs)) 2,131,946
57,211 Digital Realty Trust, Inc. (Equity RealEstate Investment Trusts (REITs)) 9,028,468
29,087 Douglas Emmett, Inc. (Equity RealEstate Investment Trusts (REITs)) 950,563
54,334 DTE Midstream LLC* (Oil, Gas &Consumable Fuels) 2,605,859
104,875 Duke Realty Corp. (Equity Real EstateInvestment Trusts (REITs)) 5,898,170
85,313 Edison International (Electric Utilities) 5,368,74768,461 EPR Properties (Equity Real Estate
Investment Trusts (REITs)) 3,437,4279,430 Equinix, Inc. (Equity Real Estate
Investment Trusts (REITs)) 7,893,57073,412 Equity Residential (Equity Real Estate
Investment Trusts (REITs)) 6,342,797144,733 Essential Properties Realty Trust, Inc.
(Equity Real Estate Investment Trusts(REITs)) 4,311,596
46,613 Essential Utilities, Inc. (Water Utilities) 2,194,07418,979 Essex Property Trust, Inc. (Equity Real
Estate Investment Trusts (REITs)) 6,451,53123,718 Evergy, Inc. (Electric Utilities) 1,512,02254,613 Eversource Energy (Electric Utilities) 4,636,64421,051 Extra Space Storage, Inc. (Equity Real
Estate Investment Trusts (REITs)) 4,154,83628,140 Federal Realty Investment Trust (Equity
Real Estate Investment Trusts (REITs)) 3,386,64933,165 First Industrial Realty Trust, Inc. (Equity
Real Estate Investment Trusts (REITs)) 1,931,198189,398 Global Medical REIT, Inc. (Equity Real
Estate Investment Trusts (REITs)) 3,140,219
74 The accompanying notes are an integral part of these financial statements.
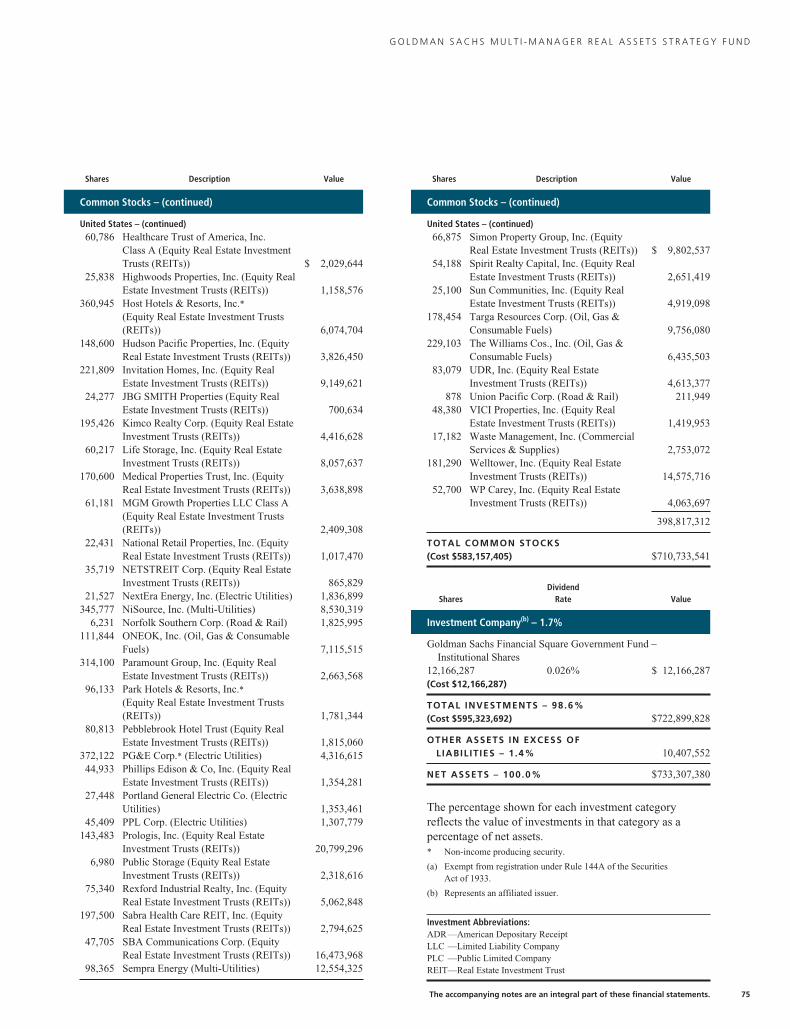
G O L D M A N S A C H S M U L T I - M A N A G E R R E A L A S S E T S S T R A T E G Y F U N D
Shares Description Value
Common Stocks – (continued)
United States – (continued)60,786 Healthcare Trust of America, Inc.
Class A (Equity Real Estate InvestmentTrusts (REITs)) $ 2,029,644
25,838 Highwoods Properties, Inc. (Equity RealEstate Investment Trusts (REITs)) 1,158,576
360,945 Host Hotels & Resorts, Inc.*(Equity Real Estate Investment Trusts(REITs)) 6,074,704
148,600 Hudson Pacific Properties, Inc. (EquityReal Estate Investment Trusts (REITs)) 3,826,450
221,809 Invitation Homes, Inc. (Equity RealEstate Investment Trusts (REITs)) 9,149,621
24,277 JBG SMITH Properties (Equity RealEstate Investment Trusts (REITs)) 700,634
195,426 Kimco Realty Corp. (Equity Real EstateInvestment Trusts (REITs)) 4,416,628
60,217 Life Storage, Inc. (Equity Real EstateInvestment Trusts (REITs)) 8,057,637
170,600 Medical Properties Trust, Inc. (EquityReal Estate Investment Trusts (REITs)) 3,638,898
61,181 MGM Growth Properties LLC Class A(Equity Real Estate Investment Trusts(REITs)) 2,409,308
22,431 National Retail Properties, Inc. (EquityReal Estate Investment Trusts (REITs)) 1,017,470
35,719 NETSTREIT Corp. (Equity Real EstateInvestment Trusts (REITs)) 865,829
21,527 NextEra Energy, Inc. (Electric Utilities) 1,836,899345,777 NiSource, Inc. (Multi-Utilities) 8,530,319
6,231 Norfolk Southern Corp. (Road & Rail) 1,825,995111,844 ONEOK, Inc. (Oil, Gas & Consumable
Fuels) 7,115,515314,100 Paramount Group, Inc. (Equity Real
Estate Investment Trusts (REITs)) 2,663,56896,133 Park Hotels & Resorts, Inc.*
(Equity Real Estate Investment Trusts(REITs)) 1,781,344
80,813 Pebblebrook Hotel Trust (Equity RealEstate Investment Trusts (REITs)) 1,815,060
372,122 PG&E Corp.* (Electric Utilities) 4,316,61544,933 Phillips Edison & Co, Inc. (Equity Real
Estate Investment Trusts (REITs)) 1,354,28127,448 Portland General Electric Co. (Electric
Utilities) 1,353,46145,409 PPL Corp. (Electric Utilities) 1,307,779
143,483 Prologis, Inc. (Equity Real EstateInvestment Trusts (REITs)) 20,799,296
6,980 Public Storage (Equity Real EstateInvestment Trusts (REITs)) 2,318,616
75,340 Rexford Industrial Realty, Inc. (EquityReal Estate Investment Trusts (REITs)) 5,062,848
197,500 Sabra Health Care REIT, Inc. (EquityReal Estate Investment Trusts (REITs)) 2,794,625
47,705 SBA Communications Corp. (EquityReal Estate Investment Trusts (REITs)) 16,473,968
98,365 Sempra Energy (Multi-Utilities) 12,554,325
Shares Description Value
Common Stocks – (continued)
United States – (continued)66,875 Simon Property Group, Inc. (Equity
Real Estate Investment Trusts (REITs)) $ 9,802,53754,188 Spirit Realty Capital, Inc. (Equity Real
Estate Investment Trusts (REITs)) 2,651,41925,100 Sun Communities, Inc. (Equity Real
Estate Investment Trusts (REITs)) 4,919,098178,454 Targa Resources Corp. (Oil, Gas &
Consumable Fuels) 9,756,080229,103 The Williams Cos., Inc. (Oil, Gas &
Consumable Fuels) 6,435,50383,079 UDR, Inc. (Equity Real Estate
Investment Trusts (REITs)) 4,613,377878 Union Pacific Corp. (Road & Rail) 211,949
48,380 VICI Properties, Inc. (Equity RealEstate Investment Trusts (REITs)) 1,419,953
17,182 Waste Management, Inc. (CommercialServices & Supplies) 2,753,072
181,290 Welltower, Inc. (Equity Real EstateInvestment Trusts (REITs)) 14,575,716
52,700 WP Carey, Inc. (Equity Real EstateInvestment Trusts (REITs)) 4,063,697
398,817,312
TOTAL COMMON STOCKS(Cost $583,157,405) $710,733,541
SharesDividend
Rate Value
Investment Company(b) – 1.7%
Goldman Sachs Financial Square Government Fund –Institutional Shares
12,166,287 0.026% $ 12,166,287(Cost $12,166,287)
TOTAL INVESTMENTS – 98.6%(Cost $595,323,692) $722,899,828
OTHER ASSETS IN EXCESS OFLIABIL IT IES – 1.4% 10,407,552
NET ASSETS – 100.0% $733,307,380
The percentage shown for each investment categoryreflects the value of investments in that category as apercentage of net assets.* Non-income producing security.
(a) Exempt from registration under Rule 144A of the SecuritiesAct of 1933.
(b) Represents an affiliated issuer.
Investment Abbreviations:ADR—American Depositary ReceiptLLC —Limited Liability CompanyPLC —Public Limited CompanyREIT—Real Estate Investment Trust
The accompanying notes are an integral part of these financial statements. 75

G O L D M A N S A C H S M U L T I - M A N A G E R R E A L A S S E T S S T R A T E G Y F U N D
Schedule of Investments (continued)October 31, 2021
A D D I T I O N A L I N V E S T M E N T I N F O R M A T I O N
FUTURES CONTRACTS — At October 31, 2021, the Fund had the following futures contracts:
DescriptionNumber ofContracts
ExpirationDate
NotionalAmount
UnrealizedAppreciation/(Depreciation)
Long position contracts:Dow Jones U.S.Real Estate Index 340 12/17/21 $14,453,400 $369,971
76 The accompanying notes are an integral part of these financial statements.

G O L D M A N S A C H S S T R A T E G I C M U L T I - A S S E T C L A S S F U N D S
Statements of Assets and LiabilitiesOctober 31, 2021
Multi-ManagerGlobal Equity
Fund
Multi-ManagerNon-Core Fixed
Income Fund
Multi-ManagerReal Assets
Strategy Fund
Assets:
Investments of unaffiliated issuers, at value (cost 373,410,207, $1,340,460,866 and $583,157,405,respectively) $496,150,815 $1,336,395,543 $710,733,541
Investments of affiliated issuers, at value (cost $34,159,639, $131,055,477 and $12,166,287, respectively) 34,159,639 131,055,477 12,166,287
Cash 169,240 13,246,063 102,315
Unrealized gain on forward foreign currency exchange contracts 1,312,586 812,219 —
Variation margin on futures contracts 573,546 99,396 —
Foreign currencies, at value (cost $301,003, $4,174,587 and $954,896, respectively) 302,244 4,172,897 954,416
Receivables:
Investments sold 25,690,510 26,676,220 759,598
Collateral on certain derivative contracts(a) 4,175,750 8,829,056 860,200
Foreign tax reclaims 607,802 218,599 139,282
Investments sold on an extended settlement basis 410,360 7,881,112 —
Dividends and interest 365,039 15,377,181 772,799
Reimbursement from investment adviser 73,114 — —Fund shares sold — 400,000 59,500,000
Other assets 15,751 156,429 45,565
Total assets 564,006,396 1,545,320,192 786,034,003
Liabilities:
Unrealized loss on forward foreign currency exchange contracts 704,048 2,339,010 —
Variation margin on futures contracts — — 166,621
Variation margin on swaps contracts — 1,268 —
Unrealized loss on unfunded loan commitment — 286 —
Payables:
Fund shares redeemed 33,300,000 19,300,000 4,900,000
Investments purchased 1,145,861 81,291,868 46,489,941
Investments purchased on an extended settlement basis 267,867 14,860,183 120,300
Management fees 169,814 477,595 303,382
Distribution and service fees and transfer agency fees 9,275 23,351 11,412
Collateral on certain derivative contracts(b) — 320,000 —
Distributions payable — 71 —
Accrued expenses and other liabilities 2,012,057 1,627,527 734,967
Total liabilities 37,608,922 120,241,159 52,726,623
Net Assets:
Paid-in capital 285,704,614 1,451,162,128 593,139,380
Total distributable earnings (loss) 240,692,860 (26,083,095) 140,168,000
NET ASSETS $526,397,474 $1,425,079,033 $733,307,380
Shares Outstanding $0.001 par value (unlimited number of shares authorized): 35,304,542 159,979,345 62,367,354
Net asset value, offering and redemption price per share: $14.91 $8.91 $11.76
(a) Segregated for initial margin and/or collateral as follows:
Fund Futures Forwards Swaps
Multi-Manager Global Equity $2,565,750 $1,610,000 $ —Multi-Manager Non-Core Fixed Income 181,500 1,020,000 7,627,556
Multi-Manager Real Assets Strategy 860,200 — —
(b) Segregated for initial margin and/or collateral for swaps contracts.
The accompanying notes are an integral part of these financial statements. 77

G O L D M A N S A C H S S T R A T E G I C M U L T I - A S S E T C L A S S F U N D S
Statements of OperationsFor the Fiscal Year Ended October 31, 2021
Multi-ManagerGlobal Equity
Fund
Multi-ManagerNon-Core Fixed
Income Fund
Multi-ManagerReal Assets
Strategy Fund
Investment income:
Dividends — unaffiliated issuers (net of foreign withholding taxes of $640,557, $1,625 and$780,834, respectively) $ 7,966,266 $ 349,360 $ 16,726,189
Dividends — affiliated issuers 8,410 23,141 4,028
Non-cash dividends — unaffiliated issuers 752,180 — —
Interest — 57,928,701 4,314
Total investment income 8,726,856 58,301,202 16,734,531
Expenses:
Management fees 5,683,454 9,445,379 6,038,877
Custody, accounting and administrative services 1,023,060 801,763 488,967
Professional fees 243,861 173,814 171,343
Transfer Agency fees 110,358 222,244 120,777
Printing and mailing costs 37,167 44,947 39,942
Trustee fees 35,822 39,790 36,387
Registration fees 28,136 113,619 49,392
Prime broker fees 6,497 994 —
Other 40,745 35,186 33,375
Total expenses 7,209,100 10,877,736 6,979,060
Less — expense reductions (4,407,896) (4,745,565) (2,794,865)
Net expenses 2,801,204 6,132,171 4,184,195
NET INVESTMENT INCOME 5,925,652 52,169,031 12,550,336
Realized and unrealized gain (loss):
Net realized gain (loss) from:
Investments — unaffiliated issuers (including commission recapture of $3,048, $0 and$2,715, respectively) 108,957,015 (2,653,953) 42,644,674
Purchased options — (71,492) —
Futures contracts 12,684,691 (290,318) 2,066,794
Written options — 10,980 —
Swap contracts — 146,922 —
Forward foreign currency exchange contracts (522,952) (1,062,461) 17,453
Foreign currency transactions 42,236 (218,553) (62,469)
Net change in unrealized gain (loss) on:
Investments — unaffiliated issuers 67,506,424 20,900,420 107,740,033
Purchased options — (4,810) —
Futures contracts 2,136,882 227,098 369,971
Unfunded loan commitments — (14,031) —
Swap contracts — 15,218 —
Forward foreign currency exchange contracts 1,224,531 (2,721) —
Foreign currency translation (15,898) (80,524) (13,643)
Net realized and unrealized gain 192,012,929 16,901,775 152,762,813
NET INCREASE IN NET ASSETS RESULTING FROM OPERATIONS $197,938,581 $69,070,806 $165,313,149
78 The accompanying notes are an integral part of these financial statements.
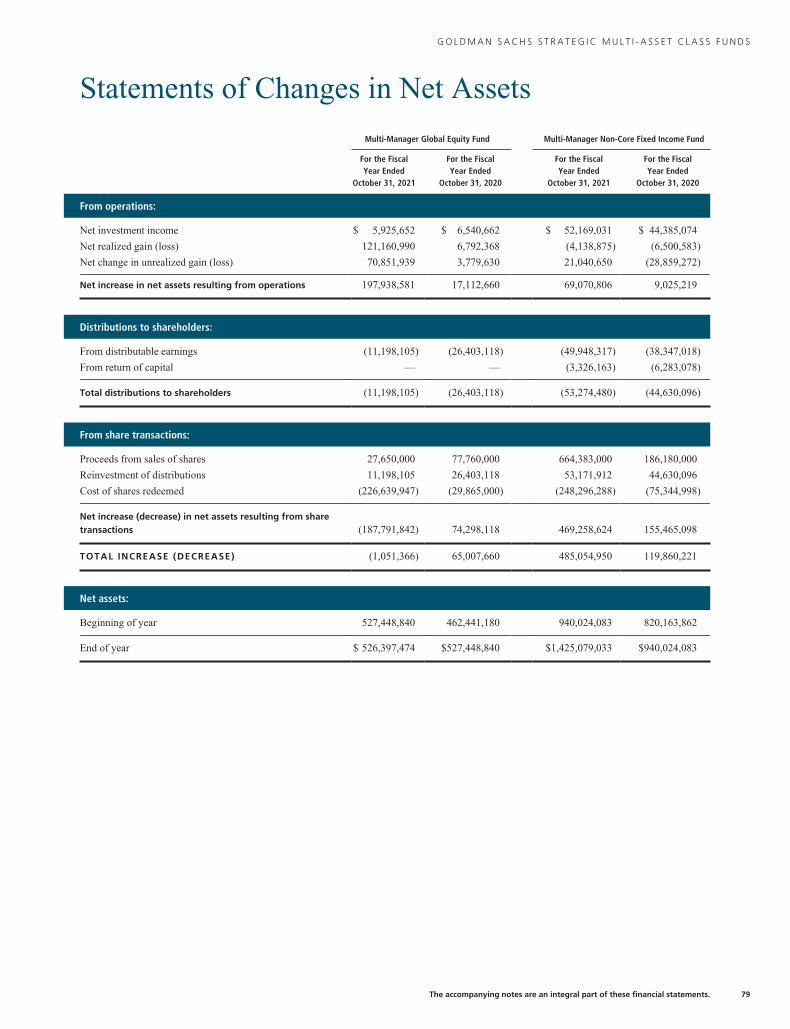
G O L D M A N S A C H S S T R A T E G I C M U L T I - A S S E T C L A S S F U N D S
Statements of Changes in Net Assets
Multi-Manager Global Equity Fund Multi-Manager Non-Core Fixed Income Fund
For the FiscalYear Ended
October 31, 2021
For the FiscalYear Ended
October 31, 2020
For the FiscalYear Ended
October 31, 2021
For the FiscalYear Ended
October 31, 2020
From operations:
Net investment income $ 5,925,652 $ 6,540,662 $ 52,169,031 $ 44,385,074
Net realized gain (loss) 121,160,990 6,792,368 (4,138,875) (6,500,583)
Net change in unrealized gain (loss) 70,851,939 3,779,630 21,040,650 (28,859,272)
Net increase in net assets resulting from operations 197,938,581 17,112,660 69,070,806 9,025,219
Distributions to shareholders:
From distributable earnings (11,198,105) (26,403,118) (49,948,317) (38,347,018)
From return of capital — — (3,326,163) (6,283,078)
Total distributions to shareholders (11,198,105) (26,403,118) (53,274,480) (44,630,096)
From share transactions:
Proceeds from sales of shares 27,650,000 77,760,000 664,383,000 186,180,000
Reinvestment of distributions 11,198,105 26,403,118 53,171,912 44,630,096
Cost of shares redeemed (226,639,947) (29,865,000) (248,296,288) (75,344,998)
Net increase (decrease) in net assets resulting from sharetransactions (187,791,842) 74,298,118 469,258,624 155,465,098
TOTAL INCREASE (DECREASE) (1,051,366) 65,007,660 485,054,950 119,860,221
Net assets:
Beginning of year 527,448,840 462,441,180 940,024,083 820,163,862
End of year $ 526,397,474 $527,448,840 $1,425,079,033 $940,024,083
The accompanying notes are an integral part of these financial statements. 79

G O L D M A N S A C H S S T R A T E G I C M U L T I - A S S E T C L A S S F U N D S
Statements of Changes in Net Assets (continued)
Multi-Manager Real Assets Strategy Fund
For the FiscalYear Ended
October 31, 2021
For the FiscalYear Ended
October 31, 2020
From operations:
Net investment income $ 12,550,336 $ 8,982,555
Net realized gain (loss) 44,666,452 (30,414,442)
Net change in unrealized gain (loss) 108,096,361 (38,525,254)
Net increase (decrease) in net assets resulting from operations 165,313,149 (59,957,141)
Distributions to shareholders:
From distributable earnings (7,892,296) (22,252,923)
From share transactions:
Proceeds from sales of shares 229,310,000 85,869,000
Reinvestment of distributions 7,892,296 22,252,923
Cost of shares redeemed (121,265,768) (15,900,000)
Net increase in net assets resulting from share transactions 115,936,528 92,221,923
TOTAL INCREASE 273,357,381 10,011,859
Net assets:
Beginning of year 459,949,999 449,938,140
End of year $ 733,307,380 $459,949,999
80 The accompanying notes are an integral part of these financial statements.

G O L D M A N S A C H S M U L T I - M A N A G E R G L O B A L E Q U I T Y F U N D
Financial HighlightsSelected Share Data for a Share Outstanding Throughout Each Year
Goldman Sachs Multi-Manager Global Equity Fund
Class R6 Shares(a)
Year Ended October 31,
2021 2020 2019 2018 2017
Per Share Data
Net asset value, beginning of year $ 10.64 $ 10.97 $ 10.62 $ 11.36 $ 9.49
Net investment income(b) 0.14 0.14 0.19 0.15 0.11
Net realized and unrealized gain (loss) 4.37 0.15 0.91 (0.52) 1.91
Total from investment operations 4.51 0.29 1.10 (0.37) 2.02
Distributions to shareholders from net investment income (0.09) (0.33) (0.19) (0.15) (0.15)
Distributions to shareholder from net realized gains (0.15) (0.29) (0.56) (0.22) —
Total distributions (0.24) (0.62) (0.75) (0.37) (0.15)
Net asset value, end of year $ 14.91 $ 10.64 $ 10.97 $ 10.62 $ 11.36
Total return(c) 42.93% 2.60% 11.39% (3.43)% 21.63%
Net assets, end of year (in 000s) $526,397 $527,449 $462,441 $633,577 $490,497
Ratio of net expenses to average net assets 0.51% 0.46% 0.72% 0.80% 0.85%
Ratio of total expenses to average net assets 1.31% 1.53% 1.42% 1.39% 1.47%
Ratio of net investment income to average net assets 1.07% 1.34% 1.81% 1.29% 1.03%
Portfolio turnover rate(d) 83% 79% 91% 76% 88%
(a) Effective January 16, 2018, the Institutional Shares were redesignated as Class R6 Shares.(b) Calculated based on the average shares outstanding methodology.(c) Assumes investment at the NAV at the beginning of the year, reinvestment of all dividends and distributions, a complete redemption of the investment at the NAV at
the end of the year and no sales or redemption charges (if any). Total returns would be reduced if a sales or redemption charge was taken into account. Returns do notreflect the impact of taxes to shareholders relating to Fund distributions or the redemption of Fund shares.
(d) The Fund’s portfolio turnover rate is calculated in accordance with regulatory requirements, without regard to transactions involving short term investments andcertain derivatives. If such transactions were included, the Fund’s portfolio turnover rate may be higher.
The accompanying notes are an integral part of these financial statements. 81
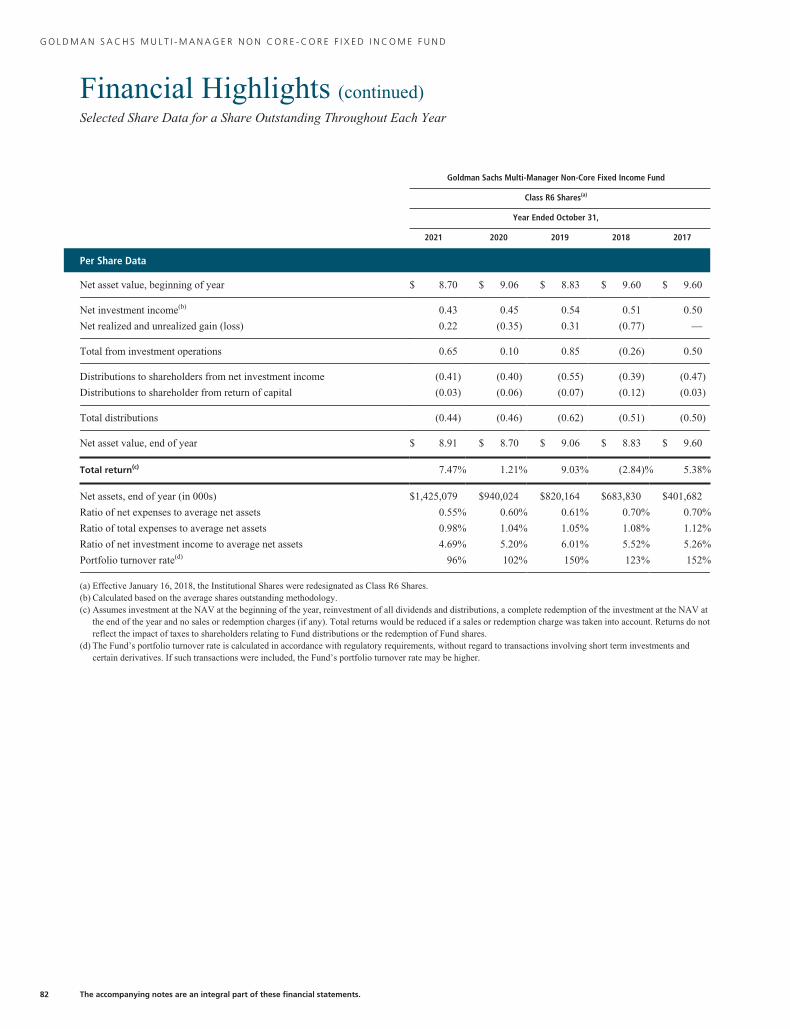
G O L D M A N S A C H S M U L T I - M A N A G E R N O N C O R E - C O R E F I X E D I N C O M E F U N D
Financial Highlights (continued)Selected Share Data for a Share Outstanding Throughout Each Year
Goldman Sachs Multi-Manager Non-Core Fixed Income Fund
Class R6 Shares(a)
Year Ended October 31,
2021 2020 2019 2018 2017
Per Share Data
Net asset value, beginning of year $ 8.70 $ 9.06 $ 8.83 $ 9.60 $ 9.60
Net investment income(b) 0.43 0.45 0.54 0.51 0.50
Net realized and unrealized gain (loss) 0.22 (0.35) 0.31 (0.77) —
Total from investment operations 0.65 0.10 0.85 (0.26) 0.50
Distributions to shareholders from net investment income (0.41) (0.40) (0.55) (0.39) (0.47)
Distributions to shareholder from return of capital (0.03) (0.06) (0.07) (0.12) (0.03)
Total distributions (0.44) (0.46) (0.62) (0.51) (0.50)
Net asset value, end of year $ 8.91 $ 8.70 $ 9.06 $ 8.83 $ 9.60
Total return(c) 7.47% 1.21% 9.03% (2.84)% 5.38%
Net assets, end of year (in 000s) $1,425,079 $940,024 $820,164 $683,830 $401,682
Ratio of net expenses to average net assets 0.55% 0.60% 0.61% 0.70% 0.70%
Ratio of total expenses to average net assets 0.98% 1.04% 1.05% 1.08% 1.12%
Ratio of net investment income to average net assets 4.69% 5.20% 6.01% 5.52% 5.26%
Portfolio turnover rate(d) 96% 102% 150% 123% 152%
(a) Effective January 16, 2018, the Institutional Shares were redesignated as Class R6 Shares.(b) Calculated based on the average shares outstanding methodology.(c) Assumes investment at the NAV at the beginning of the year, reinvestment of all dividends and distributions, a complete redemption of the investment at the NAV at
the end of the year and no sales or redemption charges (if any). Total returns would be reduced if a sales or redemption charge was taken into account. Returns do notreflect the impact of taxes to shareholders relating to Fund distributions or the redemption of Fund shares.
(d) The Fund’s portfolio turnover rate is calculated in accordance with regulatory requirements, without regard to transactions involving short term investments andcertain derivatives. If such transactions were included, the Fund’s portfolio turnover rate may be higher.
82 The accompanying notes are an integral part of these financial statements.
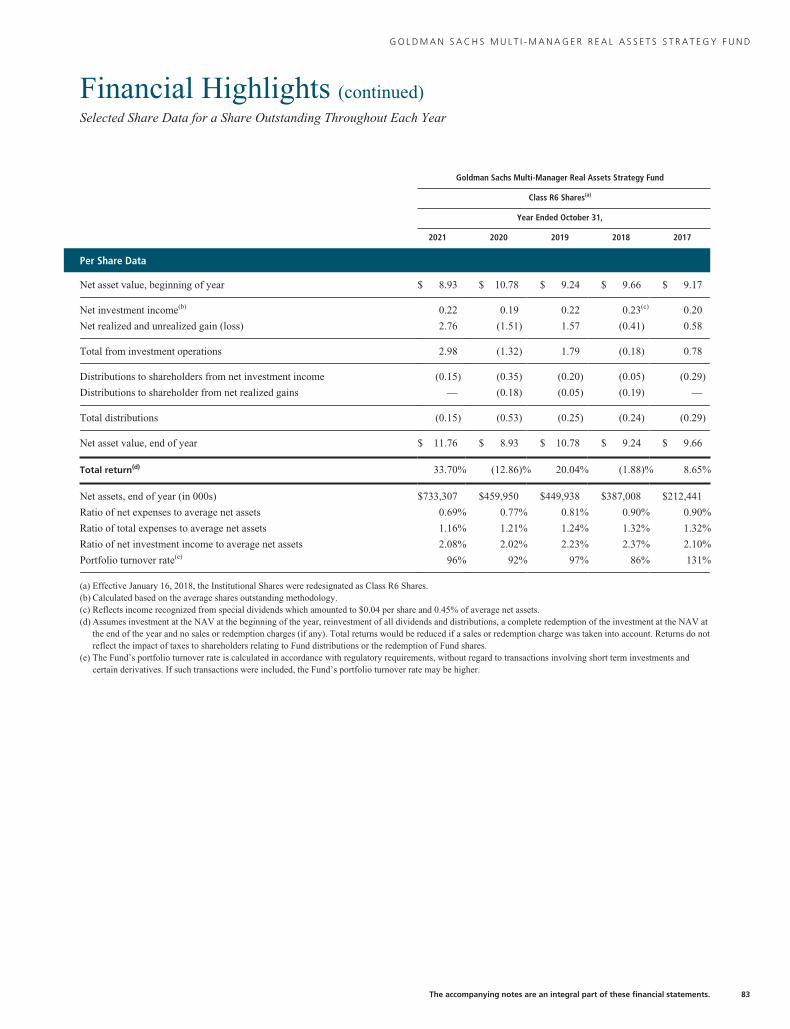
G O L D M A N S A C H S M U L T I - M A N A G E R R E A L A S S E T S S T R A T E G Y F U N D
Financial Highlights (continued)Selected Share Data for a Share Outstanding Throughout Each Year
Goldman Sachs Multi-Manager Real Assets Strategy Fund
Class R6 Shares(a)
Year Ended October 31,
2021 2020 2019 2018 2017
Per Share Data
Net asset value, beginning of year $ 8.93 $ 10.78 $ 9.24 $ 9.66 $ 9.17
Net investment income(b) 0.22 0.19 0.22 0.23(c) 0.20
Net realized and unrealized gain (loss) 2.76 (1.51) 1.57 (0.41) 0.58
Total from investment operations 2.98 (1.32) 1.79 (0.18) 0.78
Distributions to shareholders from net investment income (0.15) (0.35) (0.20) (0.05) (0.29)
Distributions to shareholder from net realized gains — (0.18) (0.05) (0.19) —
Total distributions (0.15) (0.53) (0.25) (0.24) (0.29)
Net asset value, end of year $ 11.76 $ 8.93 $ 10.78 $ 9.24 $ 9.66
Total return(d) 33.70% (12.86)% 20.04% (1.88)% 8.65%
Net assets, end of year (in 000s) $733,307 $459,950 $449,938 $387,008 $212,441
Ratio of net expenses to average net assets 0.69% 0.77% 0.81% 0.90% 0.90%
Ratio of total expenses to average net assets 1.16% 1.21% 1.24% 1.32% 1.32%
Ratio of net investment income to average net assets 2.08% 2.02% 2.23% 2.37% 2.10%
Portfolio turnover rate(e) 96% 92% 97% 86% 131%
(a) Effective January 16, 2018, the Institutional Shares were redesignated as Class R6 Shares.(b) Calculated based on the average shares outstanding methodology.(c) Reflects income recognized from special dividends which amounted to $0.04 per share and 0.45% of average net assets.(d) Assumes investment at the NAV at the beginning of the year, reinvestment of all dividends and distributions, a complete redemption of the investment at the NAV at
the end of the year and no sales or redemption charges (if any). Total returns would be reduced if a sales or redemption charge was taken into account. Returns do notreflect the impact of taxes to shareholders relating to Fund distributions or the redemption of Fund shares.
(e) The Fund’s portfolio turnover rate is calculated in accordance with regulatory requirements, without regard to transactions involving short term investments andcertain derivatives. If such transactions were included, the Fund’s portfolio turnover rate may be higher.
The accompanying notes are an integral part of these financial statements. 83

G O L D M A N S A C H S S T R A T E G I C M U L T I - A S S E T C L A S S F U N D S
Notes to Financial StatementsOctober 31, 2021
1 . O R G A N I Z A T I O N
Goldman Sachs Trust II (the “Trust”) is a Delaware statutory trust registered under the Investment Company Act of 1940, as
amended (the “Act”), as an open-end management investment company. The following table lists those series of the Trust that are
included in this report (collectively, the “Funds” or individually a “Fund”), along with their corresponding share classes and
respective diversification status under the Act:
Fund Share Classes OfferedDiversified/
Non-diversified
Multi-Manager Global Equity Fund Class R6 Diversified
Multi-Manager Non-Core Fixed Income Fund Class R6 Diversified
Mutli-Manager Real Assets Strategy Fund Class R6 Diversified
Goldman Sachs Asset Management, L.P. (“GSAM”), an affiliate of Goldman Sachs & Co. LLC (“Goldman Sachs”), serves as
investment adviser to the Funds pursuant to management agreements (each, an “Agreement”) with the Trust. As of October 31,
2021, GSAM had sub-advisory agreements (the “Sub-Advisory Agreements”) for the Multi-Manager Global Equity Fund with
Axiom Investors LLC, Boston Partners Global Investors, Inc., Causeway Capital Management LLC, DWS Investment
Management Americas, Inc., GW&K Investment Management, LLC, Massachusetts Financial Services Company, doing business
as MFS Investment Management, Principal Global Investors, LLC, Vaughan Nelson Investment Management, L.P., Vulcan Value
Partners, LLC, WCM Investment Management, LLC and Wellington Management Company LLP; for the Multi-Manager
Non-Core Fixed Income Fund with BlueBay Asset Management LLP, BlueBay Asset Management USA LLC, Brigade Capital
Management, LP, Marathon Asset Management, L.P., Nuveen Asset Management, LLC, River Canyon Fund Management, LLC,
and TCW Investment Management Company LLC; and for the Multi-Manager Real Assets Strategy Fund with Cohen & Steers
Capital Management, Inc., PGIM Real Estate, a business unit of PGIM, Inc., Presima Inc., and RREEF America L.L.C. (the
“Underlying Managers”). Pursuant to the terms of the Sub-Advisory Agreements, the Underlying Managers are responsible for
making investment decisions and managing the investments of the Fund. GSAM compensates the Underlying Managers directly in
accordance with the terms of the Sub-Advisory Agreements. The Funds are not charged any separate or additional investment
advisory fees by the Underlying Managers.
2 . S I G N I F I C A N T A C C O U N T I N G P O L I C I E S
The financial statements have been prepared in accordance with accounting principles generally accepted in the United States of
America (“GAAP”) and require management to make estimates and assumptions that may affect the reported amounts and
disclosures. Actual results may differ from those estimates and assumptions. Each Fund is an investment company under GAAP
and follows the accounting and reporting guidance applicable to investment companies.
A. Investment Valuation — The Funds’ valuation policy is to value investments at fair value.
B. Investment Income and Investments — Investment income includes interest income, dividend income and securities
lending income, if any. Interest income is accrued daily and adjusted for amortization of premiums and accretion of discounts.
Dividend income is recognized on ex-dividend date or, for certain foreign securities, as soon as such information is obtained
subsequent to the ex-dividend date. Non-cash dividends, if any, are recorded at the fair market value of the securities received.
Investment transactions are reflected on trade date. Realized gains and losses are calculated using identified cost. Investment
transactions are recorded on the following business day for daily net asset value (“NAV”) calculations. Investment income is
recorded net of any foreign withholding taxes, less any amounts reclaimable. The Funds may file withholding tax reclaims in
certain jurisdictions to recover a portion of amounts previously withheld. Any foreign capital gains tax is accrued daily based upon
net unrealized gains, and is payable upon sale of such investments. Distributions received from the Funds’ investments in U.S. real
estate investment trusts (“REITs”) may be characterized as ordinary income, net capital gain and/or a return of capital. A return of
capital is recorded by the Funds as a reduction to the cost basis of the REIT.
84

G O L D M A N S A C H S S T R A T E G I C M U L T I - A S S E T C L A S S F U N D S
2 . S I G N I F I C A N T A C C O U N T I N G P O L I C I E S ( c o n t i n u e d )
For derivative contracts, realized gains and losses are recorded upon settlement of the contract. Upfront payments, if any, are
made or received upon entering into a swap agreement and are reflected in the Statements of Assets and Liabilities. Upfront
payments are recognized over the contract’s term/event as realized gains or losses, with the exception of forward starting swap
contracts whose realized gains or losses are recognized from the effective start date.
C. Expenses — Expenses incurred directly by a Fund are charged to the Fund, and certain expenses incurred by the Trust are
allocated across the applicable Funds on a straight-line and/or pro-rata basis, depending upon the nature of the expenses, and are
accrued daily.
D. Federal Taxes and Distributions to Shareholders — It is each Fund’s policy to comply with the requirements of the
Internal Revenue Code of 1986, as amended (the “Code”), applicable to regulated investment companies and to distribute each
year substantially all of its investment company taxable income and capital gains to its shareholders. Accordingly, each Fund is not
required to make any provisions for the payment of federal income tax. Distributions to shareholders are recorded on the
ex-dividend date. Income and capital gains distributions, if any, are declared and paid according to the following schedule:
FundIncome Distributions
Declared/PaidCapital Gains Distributions
Declared/Paid
Multi-Manager Global Equity Annually Annually
Multi-Manager Non-Core Fixed Income Daily/Monthly Annually
Multi-Manager Real Assets Strategy Annually Annually
Net capital losses, if any, are carried forward to future fiscal years and may be used to the extent allowed by the Code to offset
any future capital gains. Losses that are carried forward will retain their character as either short-term or long-term capital losses.
Utilization of capital loss carryforwards will reduce the requirement of future capital gains distributions.
The characterization of distributions to shareholders for financial reporting purposes is determined in accordance with federal
income tax rules, which may differ from GAAP. The source of each Fund’s distributions may be shown in the accompanying
financial statements as either from distributable earnings or capital. Certain components of the Funds’ net assets on the Statements
of Assets and Liabilities reflect permanent GAAP/tax differences based on the appropriate tax character.
E. Foreign Currency Translation — The accounting records and reporting currency of a Fund is maintained in U.S. dollars.
Assets and liabilities denominated in foreign currencies are translated into U.S. dollars using the current exchange rates at the close
of each business day. The effect of changes in foreign currency exchange rates on investments is included within net realized and
unrealized gain (loss) on investments. Changes in the value of other assets and liabilities as a result of fluctuations in foreign
exchange rates are included in the Statements of Operations within net change in unrealized gain (loss) on foreign currency
translation. Transactions denominated in foreign currencies are translated into U.S. dollars on the date the transaction occurred, the
effects of which are included within net realized gain (loss) on foreign currency transactions.
F. Commission Recapture — GSAM, on behalf of certain Funds, may direct portfolio trades, subject to seeking best execution,
to various brokers who have agreed to rebate a portion of the commissions generated. Such rebates are made directly to a Fund as
cash payments and are included in net realized gain (loss) from investments on the Statements of Operations.
3 . I N V E S T M E N T S A N D F A I R V A L U E M E A S U R E M E N T S
U.S. GAAP defines the fair value of a financial instrument as the amount that would be received to sell an asset or paid to transfer
a liability in an orderly transaction between market participants at the measurement date (i.e., the exit price); the Funds’ policy is to
use the market approach. GAAP establishes a fair value hierarchy that prioritizes the inputs to valuation techniques used to
measure fair value. The hierarchy gives the highest priority to unadjusted quoted prices in active markets for identical assets or
85
G O L D M A N S A C H S S T R A T E G I C M U L T I - A S S E T C L A S S F U N D S
Notes to Financial Statements (continued)October 31, 2021
3 . I N V E S T M E N T S A N D F A I R V A L U E M E A S U R E M E N T S ( c o n t i n u e d )
liabilities (Level 1 measurements) and the lowest priority to unobservable inputs (Level 3 measurements). The level in the fair
value hierarchy within which the fair value measurement in its entirety falls shall be determined based on the lowest level input
that is significant to the fair value measurement in its entirety.The levels used for classifying investments are not necessarily an
indication of the risk associated with investing in these investments. The three levels of the fair value hierarchy are described
below:
Level 1 — Unadjusted quoted prices in active markets that are accessible at the measurement date for identical, unrestricted
assets or liabilities;
Level 2 — Quoted prices in markets that are not active or financial instruments for which significant inputs are observable
(including, but not limited to, quoted prices for similar investments, interest rates, foreign exchange rates, volatility and credit
spreads), either directly or indirectly;
Level 3 — Prices or valuations that require significant unobservable inputs (including GSAM’s assumptions in determining
fair value measurement).
The Board of Trustees (“Trustees”) has approved Valuation Procedures that govern the valuation of the portfolio investments held
by the Funds, including investments for which market quotations are not readily available. The Trustees have delegated to GSAM
day-to-day responsibility for implementing and maintaining internal controls and procedures related to the valuation of the Funds’
investments. To assess the continuing appropriateness of pricing sources and methodologies, GSAM regularly performs price
verification procedures and issues challenges as necessary to third party pricing vendors or brokers, and any differences are
reviewed in accordance with the Valuation Procedures.
A. Level 1 and Level 2 Fair Value Investments — The valuation techniques and significant inputs used in determining the
fair values for investments classified as Level 1 and Level 2 are as follows:
Equity Securities — Equity securities traded on a United States (“U.S.”) securities exchange or the NASDAQ system, or those
located on certain foreign exchanges, including but not limited to the Americas, are valued daily at their last sale price or official
closing price on the principal exchange or system on which they are traded. If there is no sale or official closing price or such price
is believed by GSAM to not represent fair value, equity securities will be valued at the valid closing bid price for long positions
and at the valid closing ask price for short positions (i.e. where there is sufficient volume, during normal exchange trading hours).
If no valid bid/ask price is available, the equity security will be valued pursuant to the Valuation Procedures approved by the
Trustees and consistent with applicable regulatory guidance. To the extent these investments are actively traded, they are classified
as Level 1 of the fair value hierarchy, otherwise they are generally classified as Level 2. Certain equity securities containing unique
attributes may be classified as Level 2.
Unlisted equity securities for which market quotations are available are valued at the last sale price on the valuation date, or if
no sale occurs, at the last bid price for long positions or the last ask price for short positions, and are generally classified as Level 2.
Securities traded on certain foreign securities exchanges are valued daily at fair value determined by an independent fair value
service (if available) under Fair Valuation Procedures approved by the Trustees and consistent with applicable regulatory guidance.
The independent fair value service takes into account multiple factors including, but not limited to, movements in the securities
markets, certain depositary receipts, futures contracts and foreign currency exchange rates that have occurred subsequent to the
close of the foreign securities exchange. These investments are generally classified as Level 2 of the fair value hierarchy.
Underlying Funds (including Money Market Funds) — Underlying Funds (“Underlying Funds”) include other investment
companies and exchange-traded funds (“ETFs”). Investments in the Underlying Funds (except ETFs) are valued at the NAV per
share on the day of valuation. ETFs are valued daily at the last sale price or official closing price on the principal exchange or
system on which the investment is traded. Because the Funds invest in Underlying Funds that fluctuate in value, the Funds’ shares
will correspondingly fluctuate in value. Underlying Funds are generally classified as Level 1 of the fair value hierarchy. To the
extent that underlying ETFs are actively traded, they are classified as Level 1 of the fair value hierarchy, otherwise they are
generally classified as Level 2. For information regarding an Underlying Fund’s accounting policies and investment holdings,
please see the Underlying Fund’s shareholder report.
86

G O L D M A N S A C H S S T R A T E G I C M U L T I - A S S E T C L A S S F U N D S
3 . I N V E S T M E N T S A N D F A I R V A L U E M E A S U R E M E N T S ( c o n t i n u e d )
Debt Securities — Debt securities for which market quotations are readily available are valued daily on the basis of quotations
supplied by dealers or an independent pricing service approved by the Trustees. The pricing services may use valuation models or
matrix pricing, which consider: (i) yield or price with respect to bonds that are considered comparable in characteristics such as
rating, interest rate and maturity date or (ii) quotations from securities dealers to determine current value. With the exception of
treasury securities of G7 countries, which are generally classified as Level 1, these investments are generally classified as Level 2
of the fair value hierarchy.
i. Bank Loans — Bank loans (“Loans”) are interests in amounts owed by corporate, governmental, or other borrowers to
lenders or lending syndicates. Loans are arranged through private negotiations between the borrower and one or more
financial institutions (“Lenders”) . A Fund’s investments in Loans are in the form of either participations in Loans
(“Participations”) or assignments of all or a portion of Loans from third parties (“Assignments”). With respect to
Participations, a Fund has the right to receive payments of principal, interest and any fees to which it is entitled from the
Lender selling the Participations and only upon receipt by the Lender of the payments from the borrower. A Fund generally
has no right to enforce compliance by the borrower with the terms of the loan agreement with respect to Participations.
Conversely, assignments result in a Fund having a direct contractual relationship with the borrower, and the Fund may be
permitted to enforce compliance by the borrower with the terms of the loan agreement.
The Multi-Manager Non-Core Fixed Income Fund may also enter into certain credit arrangements, all or a portion of
which may be unfunded. Unfunded loan commitments represent the remaining obligation of the Fund to the borrower. The
Fund is obligated to fund these commitments at the borrower’s discretion. The Fund may receive a commitment fee based on
the undrawn portion of the underlying line of credit of a loan. All loans and unfunded loan commitments involve interest rate
risk, liquidity risk and credit risk, including the potential default or insolvency of the borrower. Loans, including unfunded
loan commitments, are marked to market daily using pricing vendor quotations and the change in value, if any, is recorded as
an unrealized gain or loss.
Derivative Contracts — A derivative is an instrument whose value is derived from underlying assets, indices, reference rates or
a combination of these factors. A Fund enters into derivative transactions to hedge against changes in interest rates, securities
prices, and/or currency exchange rates, to increase total return, or to gain access to certain markets or attain exposure to other
underliers. For financial reporting purposes, cash collateral that has been pledged to cover obligations of a Fund and cash collateral
received, if any, is reported separately on the Statements of Assets and Liabilities as receivables/payables for collateral on certain
derivatives contracts. Non-cash collateral pledged by a Fund, if any, is noted in the Schedules of Investments.
Exchange-traded derivatives, including futures and options contracts, are generally valued at the last sale or settlement price
on the exchange where they are principally traded. Exchange-traded options without settlement prices are generally valued at the
midpoint of the bid and ask prices on the exchange where they are principally traded (or, in the absence of two-way trading, at the
last bid price for long positions and the last ask price for short positions). Exchange-traded derivatives typically fall within Level 1
of the fair value hierarchy. Over-the-counter (“OTC”) and centrally cleared derivatives are valued using market transactions and
other market evidence, including market-based inputs to models, calibration to market-clearing transactions, broker or dealer
quotations, or other alternative pricing sources. Where models are used, the selection of a particular model to value OTC and
centrally cleared derivatives depends upon the contractual terms of, and specific risks inherent in, the instrument, as well as the
availability of pricing information in the market. Valuation models require a variety of inputs, including contractual terms, market
prices, yield curves, credit curves, measures of volatility, voluntary and involuntary prepayment rates, loss severity rates and
correlations of such inputs. For OTC and centrally cleared derivatives that trade in liquid markets, model inputs can generally be
verified and model selection does not involve significant management judgment. OTC and centrally cleared derivatives are
classified within Level 2 of the fair value hierarchy when significant inputs are corroborated by market evidence.
i. Forward Contracts — A forward contract is a contract between two parties to buy or sell an asset at a specified price on a
future date. A forward contract settlement can occur on a cash or delivery basis. Forward contracts are marked-to-market daily
using independent vendor prices, and the change in value, if any, is recorded as an unrealized gain or loss. Cash and certain
investments may be used to collateralize forward contracts.
87

G O L D M A N S A C H S S T R A T E G I C M U L T I - A S S E T C L A S S F U N D S
Notes to Financial Statements (continued)October 31, 2021
3 . I N V E S T M E N T S A N D F A I R V A L U E M E A S U R E M E N T S ( c o n t i n u e d )
A forward foreign currency exchange contract is a forward contract in which a Fund agrees to receive or deliver a fixed
quantity of one currency for another, at a pre-determined price at a future date.All forward foreign currency exchange
contracts are marked to market daily by using the outright forward rates or interpolating based upon maturity dates, where
available.. Non-deliverable forward foreign currency exchange contracts are settled with the counterparty in cash without the
delivery of foreign currency.
ii. Futures Contracts — Futures contracts are contracts to buy or sell a standardized quantity of a specified commodity or
security. Upon entering into a futures contract, a Fund deposits cash or securities in an account on behalf of the broker in an
amount sufficient to meet the initial margin requirement. Subsequent payments are made or received by a Fund equal to the
daily change in the contract value and are recorded as variation margin receivable or payable with a corresponding offset to
unrealized gains or losses.
iii. Options — When a Fund writes call or put options, an amount equal to the premium received is recorded as a liability
and is subsequently marked-to-market to reflect the current value of the option written. Swaptions are options on swap
contracts.
Upon the purchase of a call option or a put option by a Fund, the premium paid is recorded as an investment and
subsequently marked-to-market to reflect the current value of the option. Certain options may be purchased with premiums to
be determined on a future date. The premiums for these options are based upon implied volatility parameters at specified
terms.
iv. Swap Contracts — Bilateral swap contracts are agreements in which a Fund and a counterparty agree to exchange
periodic payments on a specified notional amount or make a net payment upon termination. Bilateral swap transactions are
privately negotiated in the OTC market and payments are settled through direct payments between a Fund and the
counterparty By contrast, certain swap transactions are subject to mandatory central clearing. These swaps are executed
through a derivatives clearing member (“DCM”), acting in an agency capacity, and submitted to a central counterparty
(“CCP”) (“centrally cleared swaps”), in which case all payments are settled with the CCP through the DCM. Swaps are
marked-to-market daily using pricing vendor quotations, counterparty or clearinghouse prices or model prices, and the change
in value, if any, is recorded as an unrealized gain or loss. Upon entering into a swap contract, a Fund is required to satisfy an
initial margin requirement by delivering cash or securities to the counterparty (or in some cases, segregated in a triparty
account on behalf of the counterparty), which can be adjusted by any mark-to-market gains or losses pursuant to bilateral or
centrally cleared arrangements. For centrally cleared swaps the daily change in valuation, if any, is recorded as a receivable or
payable for variation margin.
A credit default swap is an agreement that involves one party (the buyer of protection) making a stream of payments to
another party (the seller of protection) in exchange for the right to receive protection on a reference security or obligation,
including a group of assets or exposure to the performance of an index. A Fund’s investment in credit default swaps may
involve greater risks than if the Fund had invested in the referenced obligation directly. Credit events are contract specific but
may include bankruptcy, failure to pay, restructuring and obligation acceleration. If a Fund buys protection through a credit
default swap and no credit event occurs, its payments are limited to the periodic payments previously made to the
counterparty. Upon the occurrence of a specified credit event, a Fund, as a buyer of credit protection, is entitled to receive an
amount equal to the notional amount of the swap and deliver to the seller the defaulted reference obligation in a physically
settled trade. A Fund may also receive a net settlement amount in the form of cash or securities equal to the notional amount
of the swap reduced by the recovery value of the reference obligation in a cash settled trade.
As a seller of protection, a Fund generally receives a payment stream throughout the term of the swap, provided that
there is no credit event. In addition, if a Fund sells protection through a credit default swap, a Fund could suffer a loss because
the value of the referenced obligation and the premium payments received may be less than the notional amount of the swap
paid to the buyer of protection. Upon the occurrence of a specified credit event, a Fund, as a seller of credit protection, may be
required to take possession of the defaulted reference obligation and pay the buyer an amount equal to the notional amount of
the swap in a physically settled trade. A Fund may also pay a net settlement amount in the form of cash or securities equal to
88

G O L D M A N S A C H S S T R A T E G I C M U L T I - A S S E T C L A S S F U N D S
3 . I N V E S T M E N T S A N D F A I R V A L U E M E A S U R E M E N T S ( c o n t i n u e d )
the notional amount of the swap reduced by the recovery value of the reference obligation in a cash settled trade. Recovery
values are at times established through the credit event auction process in which market participants are ensured that a
transparent price has been set for the defaulted security or obligation. In addition, a Fund is entitled to a return of any assets,
which have been pledged as collateral to the counterparty upon settlement. The maximum potential amount of future
payments (undiscounted) that a Fund as seller of protection could be required to make under a credit default swap would be an
amount equal to the notional amount of the agreement. These potential amounts would be partially offset by any recovery
values of the respective referenced obligations or net amounts received from a settlement of a credit default swap for the same
reference security or obligation where a Fund bought credit protection.
B. Level 3 Fair Value Investments — To the extent that significant inputs to valuation models and other alternative pricing
sources are unobservable, or if quotations are not readily available, or if GSAM believes that such quotations do not accurately
reflect fair value, the fair value of the Funds’ investments may be determined under Valuation Procedures approved by the
Trustees. GSAM, consistent with its procedures and applicable regulatory guidance, may make an adjustment to the most recent
valuation prices of either domestic or foreign securities in light of significant events to reflect what it believes to be the fair value
of the securities at the time of determining a Fund’s NAV. To the extent investments are valued using single source broker
quotations obtained directly from the broker or passed through from third party pricing vendors, such investments are classified as
Level 3 investments.
C. Fair Value Hierarchy — The following is a summary of the Funds’ investments and derivatives classified in the fair value
hierarchy as of October 31, 2021:
MULTI-MANAGER GLOBAL EQUITY
Investment Type Level 1 Level 2 Level 3
Assets
Common Stock and/or Other Equity Investments(a)
Africa $ 707,675 $ 548,956 $ —
Asia 9,149,365 76,685,244 —
Australia and Oceania 651,778 3,100,175 —
Europe 15,979,008 101,822,729 —
North America 197,292,569 180,906 —
South America 2,667,498 880,630 —
Exchange Traded Funds 86,484,282 — —
Investment Companies 34,159,639 — —
Total $347,091,814 $183,218,640 $ —
Derivative Type
Assets(b)
Forward Foreign Currency Exchange Contracts $ — $ 1,312,586 $ —
Futures Contracts 1,115,921 — —
Total $ 1,115,921 $ 1,312,586 $ —
Liabilities(b)
Forward Foreign Currency Exchange Contracts $ — $ (704,048) $ —
(a) Amounts are disclosed by continent to highlight the impact of time zone differences between local market close and the calculation of net asset value. Securityvaluations are based on the principal exchange or system on which they are traded, which may differ from country of domicile. The Funds utilize fair value modelprices provided by an independent fair value service for international equities, resulting in a Level 2 classification.
(b) Amount shown represents unrealized gain (loss) at period end.
89

G O L D M A N S A C H S S T R A T E G I C M U L T I - A S S E T C L A S S F U N D S
Notes to Financial Statements (continued)October 31, 2021
3 . I N V E S T M E N T S A N D F A I R V A L U E M E A S U R E M E N T S ( c o n t i n u e d )
MULTI-MANAGER NON-CORE FIXED INCOME
Investment Type Level 1 Level 2 Level 3
Assets
Fixed Income
Foreign Debt Obligations $ 11,162,330 $ 472,171,223 $ —
Corporate Obligations — 464,826,623 201,464
Bank Loans — 264,256,795 2,548,028
Mortgage-Backed Obligations — 27,112,193 3,000,000
Asset-Backed Securities — 27,323,943 —
Common Stock and/or Other Equity Investments(a)
North America 2,620,905 4,774,995 1,458,163
Warrants — 183,723 254,568
Exchange Traded Fund 54,500,590 — —
Investment Company 131,055,477 — —
Total $199,339,302 $1,260,649,495 $7,462,223
Liabilities(b)
Fixed Income
Unfunded Loan Committment $ — $ (286) $ —
Derivative Type
Assets(b)
Forward Foreign Currency Exchange Contracts $ — $ 812,219 $ —
Futures Contracts 232,716 — —
Credit Default Swap Contracts — 96,647 —
Total $ 232,716 $ 908,866 $ —
Liabilities(b)
Forward Foreign Currency Exchange Contracts $ — $ (2,339,010) $ —
Credit Default Swap Contracts — (89,540) —
Total $ — $ (2,428,550) $ —
(a) Amounts are disclosed by continent to highlight the impact of time zone differences between local market close and the calculation of net asset value. Securityvaluations are based on the principal exchange or system on which they are traded, which may differ from country of domicile. The Funds utilize fair value modelprices provided by an independent fair value service for international equities, resulting in a Level 2 classification.
(b) Amount shown represents unrealized gain (loss) at period end.
90

G O L D M A N S A C H S S T R A T E G I C M U L T I - A S S E T C L A S S F U N D S
3 . I N V E S T M E N T S A N D F A I R V A L U E M E A S U R E M E N T S ( c o n t i n u e d )
MULTI-MANAGER REAL ASSETS STRATEGY
Investment Type Level 1 Level 2 Level 3
Assets
Common Stock and/or Other Equity Investments(a)
Asia $ 9,971,954 $ 78,350,777 $ —
Australia and Oceania — 28,799,109 —
Europe 14,861,110 115,154,986 —
North America 463,023,454 — —
South America 572,151 — —
Investment Company 12,166,287 — —
Total $500,594,956 $222,304,872 $ —
Derivative Type
Assets(b)
Futures Contracts $ 369,971 $ — $ —
(a) Amounts are disclosed by continent to highlight the impact of time zone differences between local market close and the calculation of net asset value. Securityvaluations are based on the principal exchange or system on which they are traded, which may differ from country of domicile. The Funds utilize fair value modelprices provided by an independent fair value service for international equities, resulting in a Level 2 classification.
(b) Amount shown represents unrealized gain (loss) at period end.
For further information regarding security characteristics, see the Schedules of Investments.
4 . I N V E S T M E N T S I N D E R I V A T I V E S
The following tables set forth, by certain risk types, the gross value of derivative contracts (not considered to be hedging
instruments for accounting disclosure purposes) as of October 31, 2021. These instruments were used as part of the Funds’
investment strategies and to obtain and/or manage exposure related to the risks below. The values in the tables below exclude the
effects of cash collateral received or posted pursuant to these derivative contracts, and therefore are not representative of the
Funds’ net exposure.
Multi-Manager Global Equity
RiskStatement of Assets
and Liabilities AssetsStatement of Assets
and Liabilities Liabilities
Currency Receivable for unrealized gain on forward
foreign currency exchange contracts $1,312,586
Payable for unrealized loss on forward
foreign currency exchange contracts $(704,048)
Equity Variation margin on futures contracts 1,115,921(a) — —
Total $2,428,507 $(704,048)
(a) Includes unrealized gain (loss) on futures contracts and centrally cleared swaps described in the Additional Investment Information sections of the Schedules ofInvestments. Only current day’s variation margin is reported within the Statements of Assets and Liabilities.
91

G O L D M A N S A C H S S T R A T E G I C M U L T I - A S S E T C L A S S F U N D S
Notes to Financial Statements (continued)October 31, 2021
4 . I N V E S T M E N T S I N D E R I V A T I V E S ( c o n t i n u e d )
Multi-Manager Non-Core Fixed Income
RiskStatement of Assets
and Liabilities AssetsStatement of Assets
and Liabilities Liabilities
Interest rate Variation margin on futures contracts $ 232,716(a) — $ —
Credit Variation margin on swap contracts 96,647(a) Variation margin on swap contracts (89,540)(a)
Currency Receivable for unrealized gain on forward
foreigncurrency exchange contracts 812,219
Payable for unrealized loss on forward
foreign currency exchange contracts (2,339,010)
Total $1,141,582 $(2,428,550)
Multi-Manager Real Assets Strategy
RiskStatement of Assets
and Liabilities AssetsStatement of Assets
and Liabilities Liabilities
Equity Variation margin on futures contracts $ 369,971(a) — $ —
(a) Includes unrealized gain (loss) on futures contracts and centrally cleared swaps described in the Additional Investment Information sections of the Schedules ofInvestments. Only current day’s variation margin is reported within the Statements of Assets and Liabilities.
The following tables set forth, by certain risk types, the Funds’ gains (losses) related to these derivatives and their indicative
volumes for the fiscal year ended October 31, 2021. These gains (losses) should be considered in the context that these derivative
contracts may have been executed to create investment opportunities and/or economically hedge certain investments, and
accordingly, certain gains (losses) on such derivative contracts may offset certain (losses) gains attributable to investments. These
gains (losses) are included in “Net realized gain (loss)” or “Net change in unrealized gain (loss)” on the Statements of Operations:
Multi-Manager Global Equity
Risk Statement of OperationsNet RealizedGain (Loss)
Net Change inUnrealizedGain (Loss)
Currency Net realized gain (loss) from forward foreign currency exchange contracts/Net unrealized
gain(loss) on forward foreign currency exchange contracts $ (522,952) $1,224,531
Equity Net realized gain (loss) from futures contracts/Net change in unrealized gain (loss) on futures
contracts 12,684,691 2,136,882
Total $12,161,739 $3,361,413
Multi-Manager Non-Core Fixed Income
Risk Statement of OperationsNet RealizedGain (Loss)
Net Change inUnrealizedGain (Loss)
Interest rate Net realized gain (loss) from futures contracts / Net change in unrealized gain (loss) on futures
contracts contracts $ (290,318) $ 227,098
Credit Net realized gain (loss) from swap contracts/ Net change in unrealized gain (loss) on swap
contracts 146,922 15,218
Currency Net realized gain (loss) from purchased options and forward foreign currency exchange contracts/
Net change in unrealized gain (loss) on purchased options and forward foreign currency exchange
contracts (1,122,973) (7,531)
Total $ (1,266,369) $ 234,785
92

G O L D M A N S A C H S S T R A T E G I C M U L T I - A S S E T C L A S S F U N D S
4 . I N V E S T M E N T S I N D E R I V A T I V E S ( c o n t i n u e d )
Multi-Manager Real Assets Strategy
Risk Statement of OperationsNet RealizedGain (Loss)
Net Change inUnrealizedGain (Loss)
Currency Net realized gain (loss) from forward foreign currency exchange contracts $ 17,453 $ —
Equity Net realized gain (loss) from futures contracts/Net change in unrealized gain (loss) on futures
contracts 2,066,794 369,971
Total $2,084,247 $369,971
For the fiscal year ended October 31, 2021, the relevant values for each derivative type was as follows:
Average Number of Contracts, Notional Amounts, or Shares/Units(a)
FundFutures
contractsForwardcontracts
SwapAgreements
PurchasedOptions
WrittenOptions
Multi-Manager Global Equity $244 $281,915,721 $ — — —
Multi Manager Non-Core Fixed Income 60 182,203,952 37,418,222 7,171,667 1,800,000
Multi-Manager Real Asset Strategy 340 573,774 — — —
(a) Amounts(s) disclosed represent average number of contracts for futures contracts, notional amounts for forward contracts, swap agreements, purchased options andwritten options, based on absolute values, which is indicative of volume for this derivative type, for the months that the Fund held such derivatives for the fiscal yearended October 31, 2021.
5 . A G R E E M E N T S A N D A F F I L I A T E D T R A N S A C T I O N S
A. Management Agreement — Under the Agreement, GSAM manages the Funds, subject to the general supervision of the
Trustees.
As compensation for the services rendered pursuant to the Agreement, the assumption of the expenses related thereto and
administration of the Funds’ business affairs, including providing facilities, GSAM is entitled to a management fee, accrued daily
and paid monthly, equal to an annual percentage rate of each Fund’s average daily net assets.For the fiscal year ended October 31, 2021, contractual and effective net management fees with GSAM were at the following
rates:
FundFirst
$1 billionNext
$1 billionNext
$3 billionNext
$3 billionOver
$8 billionEffective
Rate
Effective NetManagement
Rate*^
Multi-Manager Global Equity 1.03% 0.93% 0.89% 0.87% 0.84% 1.03% 0.39%
Multi-Manager Non-Core Fixed Income 0.85 0.85 0.77 0.73 0.71 0.85 0.42
Multi-Manager Real Asset Strategy 1.00 0.90 0.86 0.84 0.82 1.00 0.54
* GSAM has agreed to waive a portion of its management fee for each Fund in order to achieve an effective net management fee rate that is equal to the actual cost offees paid to the Fund’s Underlying Managers. These arrangements will remain in effect through at least February 28, 2022, and prior to such date GSAM may notterminate the arrangements without the approval of the Board of Trustees.
^ Effective Net Management Rate includes the impact of management fee waivers of affiliated underlying funds, if any.
The Funds invest in Institutional Shares and/or Class R6 Shares of the Goldman Sachs Financial Square Government Fund,
which is an affiliated Underlying Fund. GSAM has agreed to waive a portion of its management fee payable by the Funds in an
amount equal to the management fee it earns as an investment adviser to the affiliated Underlying Fund in which the Funds invest.
93
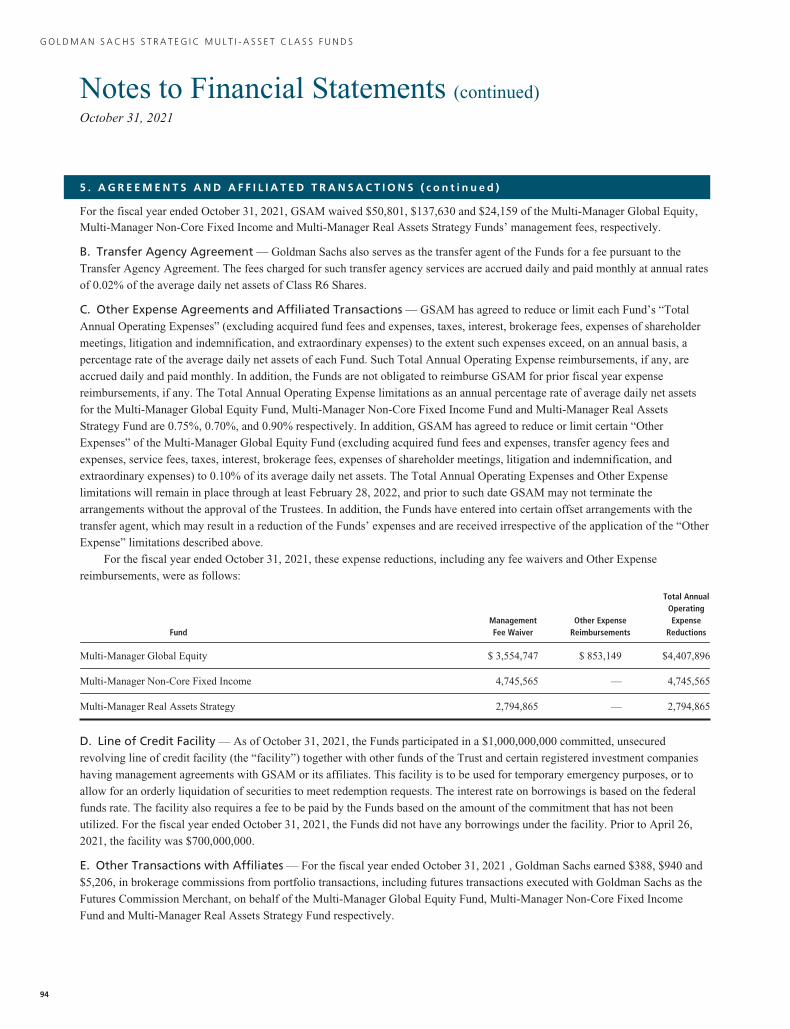
G O L D M A N S A C H S S T R A T E G I C M U L T I - A S S E T C L A S S F U N D S
Notes to Financial Statements (continued)October 31, 2021
5 . A G R E E M E N T S A N D A F F I L I A T E D T R A N S A C T I O N S ( c o n t i n u e d )
For the fiscal year ended October 31, 2021, GSAM waived $50,801, $137,630 and $24,159 of the Multi-Manager Global Equity,Multi-Manager Non-Core Fixed Income and Multi-Manager Real Assets Strategy Funds’ management fees, respectively.
B. Transfer Agency Agreement — Goldman Sachs also serves as the transfer agent of the Funds for a fee pursuant to the
Transfer Agency Agreement. The fees charged for such transfer agency services are accrued daily and paid monthly at annual rates
of 0.02% of the average daily net assets of Class R6 Shares.
C. Other Expense Agreements and Affiliated Transactions — GSAM has agreed to reduce or limit each Fund’s “Total
Annual Operating Expenses” (excluding acquired fund fees and expenses, taxes, interest, brokerage fees, expenses of shareholder
meetings, litigation and indemnification, and extraordinary expenses) to the extent such expenses exceed, on an annual basis, a
percentage rate of the average daily net assets of each Fund. Such Total Annual Operating Expense reimbursements, if any, are
accrued daily and paid monthly. In addition, the Funds are not obligated to reimburse GSAM for prior fiscal year expense
reimbursements, if any. The Total Annual Operating Expense limitations as an annual percentage rate of average daily net assets
for the Multi-Manager Global Equity Fund, Multi-Manager Non-Core Fixed Income Fund and Multi-Manager Real Assets
Strategy Fund are 0.75%, 0.70%, and 0.90% respectively. In addition, GSAM has agreed to reduce or limit certain “Other
Expenses” of the Multi-Manager Global Equity Fund (excluding acquired fund fees and expenses, transfer agency fees and
expenses, service fees, taxes, interest, brokerage fees, expenses of shareholder meetings, litigation and indemnification, and
extraordinary expenses) to 0.10% of its average daily net assets. The Total Annual Operating Expenses and Other Expense
limitations will remain in place through at least February 28, 2022, and prior to such date GSAM may not terminate the
arrangements without the approval of the Trustees. In addition, the Funds have entered into certain offset arrangements with the
transfer agent, which may result in a reduction of the Funds’ expenses and are received irrespective of the application of the “Other
Expense” limitations described above.
For the fiscal year ended October 31, 2021, these expense reductions, including any fee waivers and Other Expense
reimbursements, were as follows:
FundManagementFee Waiver
Other ExpenseReimbursements
Total AnnualOperatingExpense
Reductions
Multi-Manager Global Equity $ 3,554,747 $ 853,149 $4,407,896
Multi-Manager Non-Core Fixed Income 4,745,565 — 4,745,565
Multi-Manager Real Assets Strategy 2,794,865 — 2,794,865
D. Line of Credit Facility — As of October 31, 2021, the Funds participated in a $1,000,000,000 committed, unsecured
revolving line of credit facility (the “facility”) together with other funds of the Trust and certain registered investment companies
having management agreements with GSAM or its affiliates. This facility is to be used for temporary emergency purposes, or to
allow for an orderly liquidation of securities to meet redemption requests. The interest rate on borrowings is based on the federal
funds rate. The facility also requires a fee to be paid by the Funds based on the amount of the commitment that has not been
utilized. For the fiscal year ended October 31, 2021, the Funds did not have any borrowings under the facility. Prior to April 26,
2021, the facility was $700,000,000.
E. Other Transactions with Affiliates — For the fiscal year ended October 31, 2021 , Goldman Sachs earned $388, $940 and
$5,206, in brokerage commissions from portfolio transactions, including futures transactions executed with Goldman Sachs as the
Futures Commission Merchant, on behalf of the Multi-Manager Global Equity Fund, Multi-Manager Non-Core Fixed Income
Fund and Multi-Manager Real Assets Strategy Fund respectively.
94

G O L D M A N S A C H S S T R A T E G I C M U L T I - A S S E T C L A S S F U N D S
5 . A G R E E M E N T S A N D A F F I L I A T E D T R A N S A C T I O N S ( c o n t i n u e d )
The following table provides information about the Funds’ investments in the Goldman Sachs Financial Square Government
Fund as of and for the fiscal year ended October 31, 2021:
Fund
MarketValueas of
October 31,2020
Purchasesat Cost
Proceedsfrom Sales
MarketValueas of
October 31,2021
Sharesas of
October 31,2021
DividendIncomefrom
AffiliatedInvestmentCompanies
Multi-Manager Global Equity
Goldman Sachs Financial Square Government Fund —
Institutional Shares $ 7,928,047 $189,143,528 $(184,072,534) $ 12,999,041 12,999,041 $ 2,527
Goldman Sachs Financial Square Government Fund —
Class R6 Shares 31,021,110 107,216,223 (117,076,735) 21,160,598 21,160,598 5,883
Multi-Manager Non-Core Fixed Income
Goldman Sachs Financial Square Government Fund —
Institutional Shares 70,980,616 989,582,494 (929,507,633) 131,055,477 131,055,477 23,141
Multi-Manager Real Asset Strategy
Goldman Sachs Financial Square Government Fund —
Institutional Shares 12,797,235 289,357,454 (289,988,402) 12,166,287 12,166,287 4,028
6 . P O R T F O L I O S E C U R I T I E S T R A N S A C T I O N S
The cost of purchases and proceeds from sales and maturities of long-term securities for the fiscal year ended October 31, 2021,
were as follows:
Fund
Purchases ofGovernment
Securities
Purchases ExcludingGovernment
Securities
Sales ofGovernment
Securities
Sales ExcludingGovernment
Securities
Multi-Manager Global Equity $ — $ 417,287,827 $ — $579,353,523
Multi-Manager Non-Core Fixed Income 27,934,564 1,405,403,486 26,443,638 953,669,265
Multi-Manager Real Asset Strategy — 670,009,837 — 558,877,218
95

G O L D M A N S A C H S S T R A T E G I C M U L T I - A S S E T C L A S S F U N D S
Notes to Financial Statements (continued)October 31, 2021
7 . T A X I N F O R M A T I O N
The tax character of distributions paid during the fiscal year ended October 31, 2021 was as follows:
Multi-ManagerGlobal Equity
Multi-ManagerNon-Core
Fixed Income
Multi-ManagerReal Assets
Strategy
Distribution paid from:
Ordinary income $ 4,360,815 $ 49,948,317 $7,892,296
Net long-term capital gains 6,837,290 — —
Total taxable distributions $ 11,198,105 $ 49,948,317 $7,892,296
Tax return of capital $ — $ 3,326,163 $ —
The tax character of distributions paid during the fiscal year ended October 31, 2020 was as follows:
Multi-ManagerGlobal Equity
Multi-ManagerNon-Core
Fixed Income
Multi-ManagerReal Assets
Strategy
Distribution paid from:
Ordinary income $14,211,600 $38,347,018 $ 19,138,587
Net long-term capital gains 12,191,518 — 3,114,336
Total taxable distributions 26,403,118 $38,347,018 22,252,923
Tax return of capital $ — $ 6,283,078 $ —
As of October 31, 2021, the components of accumulated earnings (losses) on a tax basis were as follows:
Multi-ManagerGlobal Equity Fund
Multi-ManagerNon-Core
Fixed Income
Multi-ManagerReal Assets
Strategy
Undistributed ordinary income — net $ 63,958,232 $ — $ 20,785,041
Undistributed long-term capital gains 62,659,796 — 12,848,652
Total undistributed earnings $126,618,028 $ — $ 33,633,693
Capital loss carryforwards:(1)
Perpetual short-term $ — $ (2,026,460) $ —
Perpetual long-term — (14,338,065) —
Total capital loss carryforwards: $ — $(16,364,525) $ —
Timing differences (Straddle Loss Deferral/Dividend Payable) (14,548) (1,526,380) —
Unrealized gains (losses) — net 114,089,380 (8,192,190) 106,534,307
Total accumulated earnings (losses) net $240,692,860 $(26,083,095) $140,168,000
(1) Multi Manager Non-Core Fixed Income Fund and Multi-Manager Real Assets Strategy Funds utilized $78,258 and $26,832,740 of capital losses.
96

G O L D M A N S A C H S S T R A T E G I C M U L T I - A S S E T C L A S S F U N D S
7 . T A X I N F O R M A T I O N ( c o n t i n u e d )
As of October 31, 2021, the Funds’ aggregate security unrealized gains and losses based on cost for U.S. federal income tax
purposes were as follows:
Multi-ManagerGlobal Equity Fund
Multi-ManagerNon-Core Fixed
Income
Multi-ManagerReal Assets
Strategy
Tax Cost $417,788,421 $1,474,061,542 $616,726,230
Gross unrealized gain 121,967,869 31,196,279 114,520,512
Gross unrealized loss (7,878,489) (39,388,469) (7,986,205)
Net unrealized gains (losses) on securities $114,089,380 $ (8,192,190) $106,534,307
The difference between GAAP-basis and tax basis unrealized gains (losses) is attributable primarily to wash sales, net mark to
market gains (losses) on regulated futures, net mark to market gains (losses) on foreign currency contracts, and differences in the
tax treatment of swap transactions, material modification of debt securities, market discount accretion and premium amortization,
partnership investments, and passive foreign investment company investments.
In order to present certain components of the Funds’ capital accounts on a tax-basis, certain reclassifications have been
recorded to the Funds’ accounts. These reclassifications have no impact on the net asset value of the Funds’ and result primarily
from partnership investments.
GSAM has reviewed the Funds’ tax positions for all open tax years (the current and prior three years, as applicable) and has
concluded that no provision for income tax is required in the Funds’ financial statements. Such open tax years remain subject to
examination and adjustment by tax authorities.
8 . O T H E R R I S K S
The Funds’ risks include, but are not limited to, the following:
Derivatives Risk—The Funds’ use of derivatives may result in loss. Derivative instruments, which may pose risks in addition to
and greater than those associated with investing directly in securities, currencies or other instruments, may be illiquid or less liquid,
volatile, difficult to price and leveraged so that small changes in the value of the underlying instruments may produce
disproportionate losses to the Funds. Derivatives are also subject to counterparty risk, which is the risk that the other party in the
transaction will not fulfill its contractual obligation. The use of derivatives is a highly specialized activity that involves investment
techniques and risks different from those associated with investments in more traditional securities and instruments. Losses from
derivatives can also result from a lack of correlation between changes in the value of derivative instruments and the portfolio assets
(if any) being hedged.
Dividend-Paying Investments Risk — A Fund’s investments in dividend-paying securities could cause a Fund to underperform
other funds. Securities that pay dividends, as a group, can fall out of favor with the market, causing such securities to underperform
securities that do not pay dividends. Depending upon market conditions and political and legislative responses to such conditions,
dividend-paying securities that meet a Fund’s investment criteria may not be widely available and/or may be highly concentrated in
only a few market sectors. In addition, issuers that have paid regular dividends or distributions to shareholders may not continue to
do so at the same level or at all in the future. This may limit the ability of a Fund to produce current income.
Floating and Variable Rate Obligations Risk — Floating rate and variable rate obligations are debt instruments issued by
companies or other entities with interest rates that reset periodically (typically, daily, monthly, quarterly, or semiannually) in
response to changes in the market rate of interest on which the interest rate is based. For floating and variable rate obligations, there
may be a lag between an actual change in the underlying interest rate benchmark and the reset time for an interest payment of such
an obligation, which could harm or benefit the Fund, depending on the interest rate environment or other circumstances. In a rising
interest rate environment, for example, a floating or variable rate obligation that does not reset immediately would prevent the Fund
from taking full advantage of rising interest rates in a timely manner. However, in a declining interest rate environment, the Fund
may benefit from a lag due to an obligation’s interest rate payment not being immediately impacted by a decline in interest rates.97

G O L D M A N S A C H S S T R A T E G I C M U L T I - A S S E T C L A S S F U N D S
Notes to Financial Statements (continued)October 31, 2021
8 . O T H E R R I S K S ( c o n t i n u e d )
On March 5, 2021, the United Kingdom’s Financial Conduct Authority (“FCA”) and ICE Benchmark Authority formally
announced that certain LIBOR benchmarks will cease publication after December 31, 2021 while others will cease publication
after June 30, 2023. The unavailability or replacement of LIBOR may affect the value, liquidity or return on certain Fund
investments and may result in costs incurred in connection with closing out positions and entering into new trades. Any pricing
adjustments to a Fund’s investments resulting from a substitute reference rate may also adversely affect a Fund’s performance
and/or NAV.
Foreign and Emerging Countries Risk — Investing in foreign markets may involve special risks and considerations not
typically associated with investing in the U.S. Foreign securities may be subject to risk of loss because of more or less foreign
government regulation; less public information; less stringent investor protections; less stringent accounting, corporate governance,
financial reporting and disclosure standards; and less economic, political and social stability in the countries in which a Portfolio or
an Underlying Fund invests. The imposition of exchange controls (including repatriation restrictions), confiscations of assets and
property, trade restrictions (including tariffs) and other government restrictions by the U.S. or other governments, or from
problems in share registration, settlement or custody, may also result in losses. Foreign risk also involves the risk of negative
foreign currency rate fluctuations, which may cause the value of securities denominated in such foreign currency (or other
instruments through which a Portfolio or an Underlying Fund has exposure to foreign currencies) to decline in value. To the extent
that a Fund also invests in securities of issuers located in, or economically tied to, emerging markets, these risks may be more
pronounced.
Foreign Custody Risk — A Fund invests in foreign securities, and as such the Fund may hold such securities and cash with
foreign banks, agents, and securities depositories appointed by the Fund’s custodian (each a “Foreign Custodian”). Some foreign
custodians may be recently organized or new to the foreign custody business. In some countries, Foreign Custodians may be
subject to little or no regulatory oversight over, or independent evaluation of, their operations. Further, the laws of certain countries
may place limitations on a Fund’s ability to recover its assets if a Foreign Custodian enters bankruptcy. Investments in emerging
markets may be subject to even greater custody risks than investments in more developed markets. Custody services in emerging
market countries are very often undeveloped and may be considerably less well regulated than in more developed countries, and
thus may not afford the same level of investor protection as would apply in developed countries.
Industry Concentration Risk — Concentrating Fund investments in a limited number of issuers conducting business in the same
industry or group of industries will subject a Fund to a greater risk of loss as a result of adverse economic, business, political,
environmental or other developments than if its investments were diversified across different industries.
Interest Rate Risk — When interest rates increase, fixed income securities or instruments held by a Fund will generally decline
in value. Long-term fixed income securities or instruments will normally have more price volatility because of this risk than short-
term fixed income securities or instruments. The risks associated with changing interest rates may have unpredictable effects on the
markets and a Fund’s investments. Fluctuations in interest rates may also affect the liquidity of fixed income securities and
instruments held by the Funds.
Investments in Other Investment Companies Risk — As a shareholder of another investment company, including an ETF, a
Fund will indirectly bear its proportionate share of any net management fees and other expenses paid by such other investment
companies, in addition to the fees and expenses regularly borne by the Fund. ETFs are subject to risks that do not apply to
conventional mutual funds, including, but not limited, to the following: (i) the market price of the ETF’s shares may trade at a
premium or a discount to their NAV; and (ii) an active trading market for an ETF’s shares may not develop or be maintained.
Large Shareholder Transactions Risk — A Fund may experience adverse effects when certain large shareholders, such as
other funds, institutional investors (including those trading by use of non-discretionary mathematical formulas), financial
intermediaries (who may make investment decisions on behalf of underlying clients and/or include a Fund in their investment
model), individuals, accounts and Goldman Sachs affiliates, purchase or redeem large amounts of shares of a Fund. Such large
shareholder redemptions, which may occur rapidly or unexpectedly, may cause a Fund to sell portfolio securities at times when it
would not otherwise do so, which may negatively impact a Fund’s NAV and liquidity. These transactions may also accelerate the
98

G O L D M A N S A C H S S T R A T E G I C M U L T I - A S S E T C L A S S F U N D S
8 . O T H E R R I S K S ( c o n t i n u e d )
realization of taxable income to shareholders if such sales of investments resulted in gains, and may also increase transaction costs.
In addition, a large redemption could result in a Fund’s current expenses being allocated over a smaller asset base, leading to an
increase in the Fund’s expense ratio. Similarly, large Fund share purchases may adversely affect a Fund’s performance to the
extent that the Fund is delayed in investing new cash or otherwise maintains a larger cash position than it ordinarily would.
Liquidity Risk — A Fund may make investments that are illiquid or that may become less liquid in response to market
developments or adverse investor perceptions. Illiquid investments may be more difficult to value. Liquidity risk may also refer to
the risk that a Fund will not be able to pay redemption proceeds within the allowable time period or without significant dilution to
remaining investors’ interests because of unusual market conditions, an unusually high volume of redemption requests, or other
reasons. To meet redemption requests, a Fund may be forced to sell investments at an unfavorable time and/or under unfavorable
conditions. If a Fund is forced to sell securities at an unfavorable time and/or under unfavorable conditions, such sales may
adversely affect the Fund’s NAV and dilute remaining investors’ interests. Liquidity risk may be the result of, among other things,
the reduced number and capacity of traditional market participants to make a market in fixed income securities or the lack of an
active market. The potential for liquidity risk may be magnified by a rising interest rate environment or other circumstances where
investor redemptions from fixed income funds may be higher than normal, potentially causing increased supply in the market due
to selling activity. These risks may be more pronounced in connection with the Funds’ investments in securities of issuers located
in emerging market countries. Redemptions by large shareholders may have a negative impact on a Fund’s liquidity.
Loan-Related Investments Risk — In addition to risks generally associated with debt investments (e.g., interest rate risk and
default risk), loan-related investments such as loan participations and assignments are subject to other risks. Although a loan
obligation may be fully collateralized at the time of acquisition, the collateral may decline in value, be or become illiquid or less
liquid, or lose all or substantially all of its value subsequent to investment. Many loan investments are subject to legal or contractual
restrictions on resale and certain loan investments may be or become illiquid or less liquid and more difficult to value, particularly in
the event of a downgrade of the loan or the borrower. There is less readily available, reliable information about most loan
investments than is the case for many other types of securities. Substantial increases in interest rates may cause an increase in loan
obligation defaults. With respect to loan participations, a Fund may not always have direct recourse against a borrower if the
borrower fails to pay scheduled principal and/or interest; may be subject to greater delays, expenses and risks than if a Fund had
purchased a direct obligation of the borrower; and may be regarded as the creditor of the agent lender (rather than the borrower),
subjecting a Fund to the creditworthiness of that lender as well. Investors in loans, such as a Fund, may not be entitled to rely on the
anti-fraud protections of the federal securities laws, although they may be entitled to certain contractual remedies. The market for
loan obligations may be subject to irregular trading activity, wide bid/ask spreads and extended trade settlement periods. Because
transactions in many loans are subject to extended trade settlement periods, a Fund may not receive the proceeds from the sale of a
loan for a period after the sale. As a result, sale proceeds related to the sale of loans may not be available to make additional
investments or to meet a Fund’s redemption obligations for a period after the sale of the loans, and, as a result, the Fund may have to
sell other investments or engage in borrowing transactions, such as borrowing from its credit facility, if necessary to
raise cash to meet its obligations.
Senior Loans hold the most senior position in the capital structure of a business entity, and are typically secured with specific
collateral, but are nevertheless usually rated below investment grade. Because Second Lien Loans are subordinated or unsecured and
thus lower in priority of payment to Senior Loans, they are subject to the additional risk that the cash flow of the borrower and
property securing the loan or debt, if any, may be insufficient to meet scheduled payments after giving effect to the senior secured
obligations of the borrower. Second Lien Loans generally have greater price volatility than Senior Loans and may be less liquid.
Market and Credit Risks — In the normal course of business, a Fund trades financial instruments and enters into financial
transactions where risk of potential loss exists due to changes in the market (market risk). The value of the securities in which a Fund
invests may go up or down in response to the prospects of individual companies, particular sectors or governments and/or general
economic conditions throughout the world due to increasingly interconnected global economies and financial markets. Events such
as war, acts of terrorism, social unrest, natural disasters, the spread of infectious illness or other public health threats could also
99

G O L D M A N S A C H S S T R A T E G I C M U L T I - A S S E T C L A S S F U N D S
Notes to Financial Statements (continued)October 31, 2021
8 . O T H E R R I S K S ( c o n t i n u e d )
significantly impact a Fund and its investments. Additionally, the Funds may also be exposed to credit risk in the event that an issuer
or guarantor fails to perform or that an institution or entity with which the Funds has unsettled or open transactions defaults
Multi-Manager Approach Risk — The Funds’ performance depends on the ability of the Investment Adviser in selecting,
overseeing, and allocating Fund assets to the Underlying Managers. The Underlying Managers’ investment styles may not always
be complementary. The Funds’ multi-manager approach may result in the Fund investing a significant percentage of its assets in
certain types of investments, which could be beneficial or detrimental to the Funds’ performance depending on the performance of
those investments and the overall market environment. The Funds’ Underlying Managers may underperform the market generally
or underperform other investment managers that could have been selected for the Funds. Because the Funds’ Underlying Managers
may trade with counterparties, prime brokers, clearing brokers or futures commission merchants on terms that are different than
those on which the Investment Adviser would trade, and because each Underlying Manager applies its own risk analysis in
evaluating potential counterparties for the Funds, the Funds may be subject to greater counterparty risk than if they were managed
directly by the Investment Adviser.
9 . I N D E M N I F I C A T I O N S
Under the Trust’s organizational documents, its Trustees, officers, employees and agents are indemnified, to the extent permitted
by the Act and state law, against certain liabilities that may arise out of performance of their duties to the Funds. Additionally, in
the course of business, the Funds enter into contracts that contain a variety of indemnification clauses. The Funds maximum
exposure under these arrangements is unknown, as this would involve future claims that may be made against the Funds that have
not yet occurred. However, GSAM believes the risk of loss under these arrangements to be remote.
1 0 . O T H E R M A T T E R S
In March 2020, the FASB issued Accounting Standard Update (“ASU”) No. 2020-04, “Reference Rate Reform (Topic 848):
Facilitation of the Effects of Reference Rate Reform on Financial Reporting.” This ASU provides optional exceptions for applying
GAAP to contract modifications, hedging relationships and other transactions affected reference rate reform if certain criteria are
met. ASU 2020-04 is elective and is effective on March 12, 2020 through December 31, 2022. As of the financial reporting period,
GSAM is currently evaluating the impact, if any, of applying ASU 2020-04.
Pursuant to an effort to consolidate the membership of the Board of Trustees of the Trust (the “Board”) with the Board of
Trustees of each of Goldman Sachs ETF Trust, Goldman Sachs MLP and Energy Renaissance Fund and Goldman Sachs Real
Estate Diversified Income Fund, at a meeting held on August 10-11, 2021, the Board voted to nominate Steven D. Krichmar, Linda
A. Lang, Michael Latham and Lawrence W. Stranghoener (the “Nominees”) for election as Trustees of the Trust at a virtual special
joint meeting of shareholders held on December 3, 2021. Each of the Nominees (except Mr. Krichmar) currently serves as a
Trustee of Goldman Sachs ETF Trust, Goldman Sachs MLP and Energy Renaissance Fund and Goldman Sachs Real Estate
Diversified Income Fund. Mr. Krichmar currently serves as a Trustee of the Trust. If elected, the Nominees will serve as Trustees
alongside the current Trustees of the Trust. The Funds will bear a portion of the proxy solicitation, shareholder meeting and other
related costs and GSAM has agreed to reimburse each Fund if such expenses increase the Fund’s total expense ratio by more than a
specified percentage. This annual report is not a proxy statement. Information regarding the election of the Nominees is contained
in the proxy materials filed with the SEC. The proxy statement has been mailed to shareholders of record, and shareholders can
also access the proxy statement, and any other relevant documents, on the SEC’s website.
100

G O L D M A N S A C H S S T R A T E G I C M U L T I - A S S E T C L A S S F U N D S
1 1 . S U B S E Q U E N T E V E N T S
Subsequent events after the Statements of Assets and Liabilities date have been evaluated, and GSAM has concluded that there is
no impact requiring adjustment or disclosure in the financial statements.
1 2 . S U M M A R Y O F S H A R E T R A N S A C T I O N S
Share activity is as follows:
Multi-Manager Global Equity Fund
For the Fiscal Year EndedOctober 31, 2021
For the Fiscal Year EndedOctober 31, 2020
Shares Dollars Shares Dollars
Class R6 Shares
Shares sold 1,915,368 $ 27,650,000 7,760,795 $ 77,760,000
Reinvestment of distributions 926,961 11,198,105 2,381,106 26,403,118
Shares redeemed (17,114,617) (226,639,947) (2,724,576) (29,865,000)
NET INCREASE (DECREASE) (14,272,288) $(187,791,842) 7,417,325 $ 74,298,118
Multi-Manager Non-Core Fixed Income Fund
For the Fiscal Year EndedOctober 31, 2021
For the Fiscal Year EndedOctober 31, 2020
Shares Dollars Shares Dollars
Class R6 Shares
Shares sold 73,449,726 $ 664,383,000 20,983,239 $186,180,000
Reinvestment of distributions 5,845,623 53,171,912 5,146,539 44,630,096
Shares redeemed (27,333,492) (248,296,288) (8,667,847) (75,344,998)
NET INCREASE 51,961,857 $ 469,258,624 17,461,931 $155,465,098
Multi-Manager Real Assets Strategy Fund
For the Fiscal Year EndedOctober 31, 2021
For the Fiscal Year EndedOctober 31, 2020
Shares Dollars Shares Dollars
Class R6 Shares
Shares sold 21,161,423 $ 229,310,000 9,272,253 $ 85,869,000
Reinvestment of distributions 807,809 7,892,296 2,150,776 22,252,923
Shares redeemed (11,109,422) (121,265,768) (1,653,689) (15,900,000)
NET INCREASE 10,859,810 $ 115,936,528 9,769,340 $ 92,221,923
101

Report of Independent Registered PublicAccounting Firm
To the Board of Trustees of Goldman Sachs Trust II and Shareholders of Goldman Sachs Multi-Manager Global EquityFund, Goldman Sachs Multi-Manager Non-Core Fixed Income Fund, and Goldman Sachs Multi-Manager Real AssetsStrategy Fund
Opinions on the Financial Statements
We have audited the accompanying statements of assets and liabilities, including the schedules of investments, of GoldmanSachs Multi-Manager Global Equity Fund, Goldman Sachs Multi-Manager Non-Core Fixed Income Fund, and GoldmanSachs Multi-Manager Real Assets Strategy Fund (three of the funds constituting Goldman Sachs Trust II, hereaftercollectively referred to as the “Funds”) as of October 31, 2021, the related statements of operations for the year endedOctober 31, 2021, the statements of changes in net assets for each of the two years in the period ended October 31, 2021,including the related notes, and the financial highlights for each of the five years in the period ended October 31, 2021(collectively referred to as the “financial statements”). In our opinion, the financial statements present fairly, in all materialrespects, the financial position of each of the Funds as of October 31, 2021, the results of each of their operations for theyear then ended, the changes in each of their net assets for each of the two years in the period ended October 31, 2021 andeach of the financial highlights for each of the five years in the period ended October 31, 2021 in conformity withaccounting principles generally accepted in the United States of America.
Basis for Opinions
These financial statements are the responsibility of the Funds’ management. Our responsibility is to express an opinion onthe Funds’ financial statements based on our audits. We are a public accounting firm registered with the Public CompanyAccounting Oversight Board (United States) (PCAOB) and are required to be independent with respect to the Funds inaccordance with the U.S. federal securities laws and the applicable rules and regulations of the Securities and ExchangeCommission and the PCAOB.
We conducted our audits of these financial statements in accordance with the standards of the PCAOB. Those standardsrequire that we plan and perform the audit to obtain reasonable assurance about whether the financial statements are free ofmaterial misstatement, whether due to error or fraud.
Our audits included performing procedures to assess the risks of material misstatement of the financial statements, whetherdue to error or fraud, and performing procedures that respond to those risks. Such procedures included examining, on a testbasis, evidence regarding the amounts and disclosures in the financial statements. Our audits also included evaluating theaccounting principles used and significant estimates made by management, as well as evaluating the overall presentation ofthe financial statements. Our procedures included confirmation of securities owned as of October 31, 2021 bycorrespondence with the custodian, transfer agent and brokers; when replies were not received from brokers, we performedother auditing procedures. We believe that our audits provide a reasonable basis for our opinions.
/s/ PricewaterhouseCoopers LLP
Boston, MassachusettsDecember 23, 2021
We have served as the auditor of one or more investment companies in the Goldman Sachs fund complex since 2000.
102
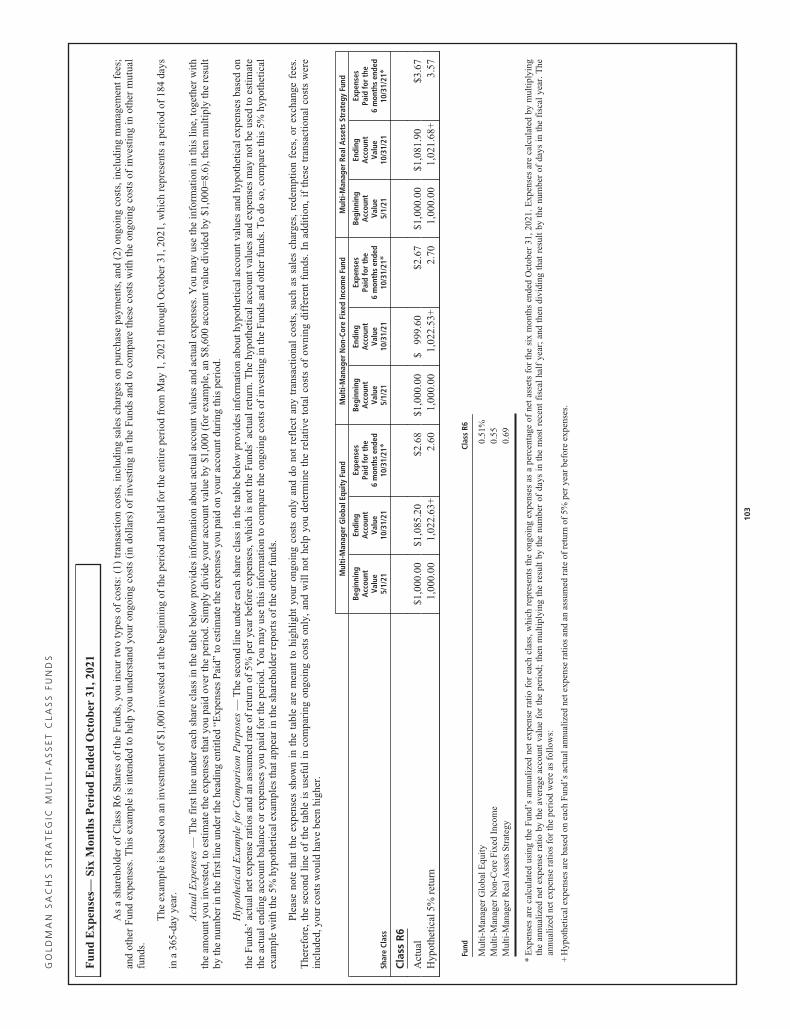
GO
LD
MA
NS
AC
HS
ST
RA
TE
GIC
MU
LT
I-A
SS
ET
CL
AS
SF
UN
DS
Fun
dE
xpen
ses—
Six
Mon
ths
Per
iod
End
edO
ctob
er31
,202
1
As
ash
areh
olde
rof
Cla
ssR
6S
hare
sof
the
Fun
ds,y
ouin
cur
two
type
sof
cost
s:(1
)tr
ansa
ctio
nco
sts,
incl
udin
gsa
les
char
ges
onpu
rcha
sepa
ymen
ts,a
nd(2
)on
goin
gco
sts,
incl
udin
gm
anag
emen
tfe
es;
and
othe
rF
und
expe
nses
.Thi
sex
ampl
eis
inte
nded
tohe
lpyo
uun
ders
tand
your
ongo
ing
cost
s(i
ndo
llar
s)of
inve
stin
gin
the
Fun
dsan
dto
com
pare
thes
eco
sts
wit
hth
eon
goin
gco
sts
ofin
vest
ing
inot
her
mut
ual
fund
s.
The
exam
ple
isba
sed
onan
inve
stm
ento
f$1
,000
inve
sted
atth
ebe
ginn
ing
ofth
epe
riod
and
held
for
the
enti
repe
riod
from
May
1,20
21th
roug
hO
ctob
er31
,202
1,w
hich
repr
esen
tsa
peri
odof
184
days
ina
365-
day
year
.
Act
ual
Exp
ense
s—
The
firs
tlin
eun
der
each
shar
ecl
ass
inth
eta
ble
belo
wpr
ovid
esin
form
atio
nab
out
actu
alac
coun
tva
lues
and
actu
alex
pens
es.Y
oum
ayus
eth
ein
form
atio
nin
this
line
,tog
ethe
rw
ith
the
amou
ntyo
uin
vest
ed,t
oes
tim
ate
the
expe
nses
that
you
paid
over
the
peri
od.S
impl
ydi
vide
your
acco
untv
alue
by$1
,000
(for
exam
ple,
an$8
,600
acco
untv
alue
divi
ded
by$1
,000
=8.
6),t
hen
mul
tipl
yth
ere
sult
byth
enu
mbe
rin
the
firs
tlin
eun
der
the
head
ing
enti
tled
“Exp
ense
sP
aid”
toes
tim
ate
the
expe
nses
you
paid
onyo
urac
coun
tdur
ing
this
peri
od.
Hyp
othe
tica
lExa
mpl
efo
rC
ompa
riso
nP
urpo
ses
—T
hese
cond
line
unde
rea
chsh
are
clas
sin
the
tabl
ebe
low
prov
ides
info
rmat
ion
abou
thyp
othe
tica
lacc
ount
valu
esan
dhy
poth
etic
alex
pens
esba
sed
onth
eF
unds
’ac
tual
net
expe
nse
rati
osan
dan
assu
med
rate
ofre
turn
of5%
per
year
befo
reex
pens
es,w
hich
isno
tth
eF
unds
’ac
tual
retu
rn.T
hehy
poth
etic
alac
coun
tva
lues
and
expe
nses
may
not
beus
edto
esti
mat
eth
eac
tual
endi
ngac
coun
tbal
ance
orex
pens
esyo
upa
idfo
rth
epe
riod
.You
may
use
this
info
rmat
ion
toco
mpa
reth
eon
goin
gco
sts
ofin
vest
ing
inth
eF
unds
and
othe
rfu
nds.
To
doso
,com
pare
this
5%hy
poth
etic
alex
ampl
ew
ith
the
5%hy
poth
etic
alex
ampl
esth
atap
pear
inth
esh
areh
olde
rre
port
sof
the
othe
rfu
nds.
Ple
ase
note
that
the
expe
nses
show
nin
the
tabl
ear
em
eant
tohi
ghli
ght
your
ongo
ing
cost
son
lyan
ddo
not
refl
ect
any
tran
sact
iona
lco
sts,
such
assa
les
char
ges,
rede
mpt
ion
fees
,or
exch
ange
fees
.T
here
fore
,th
ese
cond
line
ofth
eta
ble
isus
eful
inco
mpa
ring
ongo
ing
cost
son
ly,
and
wil
lno
the
lpyo
ude
term
ine
the
rela
tive
tota
lco
sts
ofow
ning
diff
eren
tfu
nds.
Inad
diti
on,
ifth
ese
tran
sact
iona
lco
sts
wer
ein
clud
ed,y
our
cost
sw
ould
have
been
high
er.
Mul
ti-M
anag
erG
loba
lEqu
ity
Fund
Mul
ti-M
anag
erN
on-C
ore
Fixe
dIn
com
eFu
ndM
ulti
-Man
ager
Real
Ass
ets
Stra
tegy
Fund
Shar
eCl
ass
Begi
nnin
gA
ccou
ntVa
lue
5/1/
21
Endi
ngA
ccou
ntVa
lue
10/3
1/21
Expe
nses
Paid
for
the
6m
onth
sen
ded
10/3
1/21
*
Begi
nnin
gA
ccou
ntVa
lue
5/1/
21
Endi
ngA
ccou
ntVa
lue
10/3
1/21
Expe
nses
Paid
for
the
6m
onth
sen
ded
10/3
1/21
*
Begi
nnin
gA
ccou
ntVa
lue
5/1/
21
Endi
ngA
ccou
ntVa
lue
10/3
1/21
Expe
nses
Paid
for
the
6m
onth
sen
ded
10/3
1/21
*
Cla
ssR
6
Act
ual
$1,0
00.0
0$1
,085
.20
$2.6
8$1
,000
.00
$99
9.60
$2.6
7$1
,000
.00
$1,0
81.9
0$3
.67
Hyp
othe
tica
l5%
retu
rn1,
000.
001,
022.
63+
2.60
1,00
0.00
1,02
2.53
+2.
701,
000.
001,
021.
68+
3.57
Fund
Clas
sR6
Mul
ti-M
anag
erG
loba
lEqu
ity
0.51
%M
ulti
-Man
ager
Non
-Cor
eF
ixed
Inco
me
0.55
Mul
ti-M
anag
erR
ealA
sset
sS
trat
egy
0.69
*E
xpen
ses
are
calc
ulat
edus
ing
the
Fun
d’s
annu
aliz
edne
tex
pens
era
tio
for
each
clas
s,w
hich
repr
esen
tsth
eon
goin
gex
pens
esas
ape
rcen
tage
ofne
tas
sets
for
the
six
mon
ths
ende
dO
ctob
er31
,202
1.E
xpen
ses
are
calc
ulat
edby
mul
tipl
ying
the
annu
aliz
edne
tex
pens
era
tio
byth
eav
erag
eac
coun
tva
lue
for
the
peri
od;
then
mul
tipl
ying
the
resu
ltby
the
num
ber
ofda
ysin
the
mos
tre
cent
fisc
alha
lfye
ar;
and
then
divi
ding
that
resu
ltby
the
num
ber
ofda
ysin
the
fisc
alye
ar.T
hean
nual
ized
nete
xpen
sera
tios
for
the
peri
odw
ere
asfo
llow
s:
+H
ypot
heti
cale
xpen
ses
are
base
don
each
Fun
d’s
actu
alan
nual
ized
nete
xpen
sera
tios
and
anas
sum
edra
teof
retu
rnof
5%pe
rye
arbe
fore
expe
nses
.
103

G O L D M A N S A C H S S T R A T E G I C M U L T I - A S S E T C L A S S F U N D S
Statement Regarding Basis for Approval of Management Agreement and Sub-AdvisoryAgreements (Unaudited)
BackgroundThe Goldman Sachs Multi-Manager Global Equity Fund, Goldman Sachs Multi-Manager Non-Core Fixed Income Fund, and
Goldman Sachs Multi-Manager Real Assets Strategy Fund (the “Funds”) are investment portfolios of Goldman Sachs Trust II (the
“Trust”). The Board of Trustees oversees the management of the Trust and reviews the investment performance and expenses of
the Funds at regularly scheduled meetings held throughout the year. Each Fund employs a “manager of managers” structure,
whereby Goldman Sachs Asset Management, L.P. (the “Investment Adviser”) is responsible for selecting sub-advisers (subject to
Board approval), allocating the Fund’s assets among them, and overseeing their day-to-day management of Fund assets. The Board
determines annually whether to approve the continuance of the Trust’s investment management agreement (the “Management
Agreement”) with the Investment Adviser on behalf of the Funds.
The Management Agreement was most recently approved for continuation until August 31, 2022 by the Board, including
those Trustees who are not parties to the Management Agreement or “interested persons” (as defined in the Investment Company
Act of 1940, as amended) of any party thereto (the “Independent Trustees”), at a meeting held on August 10-11, 2021 (the “Annual
Meeting”). At the Annual Meeting, the Board also considered the sub-advisory agreements (each a “Designated Sub-Advisory
Agreement” and, together with the Management Agreement, the “Agreements”) between the Investment Adviser and (i) each of
Axiom Investors LLC, Boston Partners Global Investors, Inc., Causeway Capital Management LLC, DWS Investment
Management Americas, Inc., GW&K Investment Management, LLC, Massachusetts Financial Services Company (d/b/a MFS
Investment Management), Principal Global Investors, LLC, QMA LLC, Vaughan Nelson Investment Management, L.P., Vulcan
Value Partners, LLC, WCM Investment Management, and Wellington Management Company LLP (on behalf of Goldman Sachs
Multi-Manager Global Equity Fund); (ii) each of Ares Capital Management II LLC, BlueBay Asset Management LLP, Brigade
Capital Management, LP, Marathon Asset Management, L.P., Nuveen Asset Management, LLC, River Canyon Fund Management
LLC, and TCW Investment Management Company LLC (on behalf of Goldman Sachs Multi-Manager Non-Core Fixed Income
Fund); and (iii) each of Cohen & Steers, PGIM Real Estate, a business unit of PGIM, Inc., Presima Inc., and RREEF America
L.L.C. (on behalf of Goldman Sachs Multi-Manager Real Assets Strategy Fund) (each, a “Designated Sub-Adviser” and
collectively, the “Designated Sub-Advisers”).
The review process undertaken by the Trustees spans the course of the year and culminates with the Annual Meeting. To
assist the Trustees in their deliberations, the Trustees have established a Contract Review Committee (the “Committee”),
comprised of the Independent Trustees. The Committee held four meetings over the course of the year since the Management
Agreement was last approved. At those Committee meetings, regularly scheduled Board or other committee meetings, and/or the
Annual Meeting, matters relevant to the renewal of the Management Agreement and the Designated Sub-Advisory Agreements
were considered by the Board, or the Independent Trustees, as applicable. With respect to each Fund, such matters included:
(a) the nature and quality of the advisory, administrative, and other services provided to the Fund by the Investment Adviser
and its affiliates, and the Designated Sub-Advisers, including, as applicable, information about:
(i) the structure, staff, and capabilities of the Investment Adviser and the Designated Sub-Advisers and the Designated
Sub-Advisers’ portfolio management teams;
(ii) the groups within the Investment Adviser and its affiliates that support the portfolio management teams or provide
other types of necessary services, including fund services groups (e.g., accounting and financial reporting, tax,
shareholder services, and operations); controls and risk management groups (e.g., legal, compliance, valuation
oversight, credit risk management, internal audit, compliance testing, market risk analysis, finance, and central
funding); sales and distribution support groups, and others (e.g., information technology and training);
(iii) trends in employee headcount;
(iv) the Investment Adviser’s financial resources and ability to hire and retain talented personnel and strengthen its
operations; and
(v) the parent company’s support of the Investment Adviser and its mutual fund business, as expressed by the firm’s
senior management;
(b) information on the investment performance of the Fund, including comparisons to the performance of similar mutual
funds, as provided by a third-party mutual fund data provider engaged as part of the contract review process (the
“Outside Data Provider”), benchmark performance indices, and, with respect to the Goldman Sachs Multi-Manager
Global Equity Fund, commingled investment vehicles with comparable investment strategies managed by the Investment
Adviser, as well as general investment outlooks in the markets in which the Fund invests;
(c) information provided by the Investment Adviser indicating the Investment Adviser’s views on whether the Fund’s peer
group and/or benchmark index had high, medium, or low relevance given the Fund’s particular investment strategy;
104

G O L D M A N S A C H S S T R A T E G I C M U L T I - A S S E T C L A S S F U N D S
Statement Regarding Basis for Approval of Management Agreement and Sub-AdvisoryAgreements (Unaudited) (continued)
(d) the terms of the Agreements and other agreements with affiliated service providers entered into by the Trust on behalf of
the Fund;
(e) fee and expense information for the Fund, including:
(i) the relative management fee and expense levels of the Fund as compared to those of comparable funds managed by
other advisers, as provided by the Outside Data Provider;
(ii) the Fund’s expense trends over time; and
(iii) with respect to the Goldman Sachs Multi-Manager Global Equity Fund, comparative information on the advisory
fees charged and services provided by the Investment Adviser to certain collective investment vehicles that it
manages with comparable investment strategies;
(f) with respect to the extensive investment performance and expense comparison data provided by the Outside Data
Provider, its processes in producing that data for the Fund;
(g) the undertakings of the Investment Adviser and its affiliates to implement fee waivers and/or expense limitations;
(h) information relating to the profitability of the Management Agreement and the transfer agency arrangements of the Fund
to the Investment Adviser and its affiliates;
(i) whether the Fund’s existing management fee schedule adequately addressed any economies of scale;
(j) a summary of the “fall-out” benefits derived by the Investment Adviser and its affiliates from their relationships with the
Fund, including the fees received by the Investment Adviser’s affiliates from the Fund for transfer agency, portfolio
trading, and other services;
(k) a summary of potential benefits derived by the Fund as a result of its relationship with the Investment Adviser;
(l) with respect to the Investment Adviser, portfolio manager ownership of Fund shares; the manner in which portfolio
manager compensation is determined; information on the Designated Sub-Advisers’ compensation arrangements; and the
number and types of accounts managed by the portfolio managers;
(m) the nature and quality of the services provided to the Fund by its unaffiliated service providers (as well as the Designated
Sub-Advisers), and the Investment Adviser’s general oversight and evaluation (including reports on due diligence) of
those service providers as part of the services provided under the Management Agreement; and
(n) the Investment Adviser’s and Designated Sub-Advisers’ processes and policies addressing various types of potential
conflicts of interest; their approaches to risk management; the annual review of the effectiveness of the Fund’s
compliance program; and periodic compliance reports.
The Trustees also received an overview of the Funds’ distribution arrangements. They received information regarding the
Funds’ assets and share purchase and redemption activity.
The presentations made at the Board and Committee meetings and at the Annual Meeting encompassed the Funds and other
mutual funds for which the Board of Trustees has responsibility. In evaluating the Agreements at the Annual Meeting, the Trustees
relied upon their knowledge, resulting from their meetings and other interactions throughout the year, of the Funds and the
respective services of the Investment Adviser and its affiliates, and the Designated Sub-Advisers. In conjunction with these
meetings, the Trustees received written materials and oral presentations on the topics covered, and the Investment Adviser
addressed the questions and concerns of the Trustees, including concerns regarding the investment performance of certain of the
funds they oversee. In addition, the Trustees periodically received written materials and oral presentations from the Funds’ various
sub-advisers, including the Designated Sub-Advisers. The Independent Trustees were advised by their independent legal counsel
regarding their responsibilities and other regulatory requirements related to the approval and continuation of mutual fund
investment management agreements under applicable law. In addition, the Investment Adviser and its affiliates provided the
Independent Trustees with a written response to a formal request for information sent on behalf of the Independent Trustees by
their independent legal counsel. The Trustees reviewed a written response prepared by each Designated Sub-Adviser to a similar
request for information submitted to the Designated Sub-Adviser by the Investment Adviser. During the course of their
deliberations, the Independent Trustees met in executive sessions with their independent legal counsel, without representatives of
the Investment Adviser or its affiliates present.
Nature, Extent, and Quality of the Services Provided Under the Management AgreementAs part of their review, the Trustees considered the nature, extent, and quality of the services provided to the Funds by the
Investment Adviser. In this regard, the Trustees considered both the investment advisory services and non-advisory services that
are provided by the Investment Adviser and its affiliates. The Trustees noted the transition in the leadership and changes in
personnel of various of the Investment Adviser’s portfolio management teams that had occurred in recent periods, and the ongoing
recruitment efforts aimed at bringing high quality investment talent to the Investment Adviser. They also noted the Investment105

G O L D M A N S A C H S S T R A T E G I C M U L T I - A S S E T C L A S S F U N D S
Statement Regarding Basis for Approval of Management Agreement and Sub-AdvisoryAgreements (Unaudited) (continued)
Adviser’s commitment to maintaining high quality systems and expending substantial resources to respond to ongoing changes to
the market, regulatory and control environment in which the Funds and their service providers operate, including changes
associated with the COVID-19 pandemic, as well as the efforts of the Investment Adviser and its affiliates to combat cyber security
risks. The Trustees also considered information regarding the Investment Adviser’s and the Funds’ various sub-advisers’ business
continuity planning and remote operations capabilities. The Trustees concluded that the Investment Adviser continued to commit
substantial financial and operational resources to the Funds and expressed confidence that the Investment Adviser would continue
to do so in the future. The Trustees also recognized that the Investment Adviser had made significant commitments to address
regulatory compliance requirements applicable to the Funds and the Investment Adviser and its affiliates. In addition, the Trustees
reviewed the Sub-Adviser oversight process that the Investment Adviser had employed, which included areas such as investment
analytics, risk management and compliance.
Investment PerformanceThe Trustees also considered the investment performance of the Funds. In this regard, they compared the investment
performance of each Fund to its peers using rankings and ratings compiled by the Outside Data Provider, and updated performance
information prepared by the Investment Adviser using the peer groups identified by the Outside Data Provider. The Trustees also
reviewed each Fund’s investment performance relative to its performance benchmark. As part of this review, they considered the
investment performance trends of the Funds over time, and reviewed the investment performance of each Fund in light of its
investment objective and policies and market conditions. The Trustees considered the Investment Adviser’s representations that
each Fund had significant differences from its Outside Data Provider peer group that caused them to be imperfect bases for
comparison. The Trustees also compared the investment performance of the Goldman Sachs Multi-Manager Global Equity Fund to
the performance of comparable unregistered funds for which the Investment Adviser also serves as investment adviser. They
considered that the unregistered funds provide an imperfect performance comparison because they are not subject to the
requirements of the Investment Company Act of 1940, as amended.
In addition, the Trustees considered materials prepared and presentations made by the Investment Adviser’s senior
management and the Sub-Advisers’ portfolio management personnel in which Fund performance was assessed. The Trustees also
considered the Investment Adviser’s periodic reports with respect to the Funds’ risk profiles, and how the Investment Adviser’s
approach to risk monitoring and management influences portfolio management.
The Trustees noted that the Goldman Sachs Multi-Manager Global Equity Fund had placed in the top half of its performance
peer group for the one- and three-year periods, and had outperformed its benchmark index for the one-year period and
underperformed for the three-year period ended March 31, 2021. They observed that Goldman Sachs Multi-Manager Non-Core
Fixed Income Fund had placed in the top half of its performance peer group for the one- and three-year periods and had
outperformed its composite benchmark index for the one- and three-year periods ended March 31, 2021. The Trustees considered
that the Goldman Sachs Real Assets Strategy Fund had placed in the top half of its performance peer group for the one- and three-
year periods, and had underperformed its composite benchmark index for the one-year period and outperformed for the three-year
period ended March 31, 2021.
Costs of Services Provided and Competitive InformationThe Trustees considered the contractual terms of the Management Agreement and the fee rates payable by each Fund
thereunder. In this regard, the Trustees considered information on the services rendered by the Investment Adviser to the Funds,
which included both advisory and administrative services that were directed to the needs and operations of the Funds as registered
mutual funds.
In particular, the Trustees reviewed analyses prepared by the Outside Data Provider regarding the expense rankings of the
Funds, as well as additional information provided by the Investment Adviser throughout the year. The analyses provided a
comparison of each Fund’s management fee and breakpoints to those of a relevant peer group and category universe; an expense
analysis which compared each Fund’s overall net and gross expenses to a peer group and a category universe; and data comparing
each Fund’s net expenses to the peer and category medians. The analysis also compared each Fund’s other expenses and fee
waivers/reimbursements to those of the peer group and category medians. With respect to the Goldman Sachs Multi-Manager
Global Equity Fund, the Trustees also considered comparative fee information for services provided by the Investment Adviser to
collective investment vehicles having investment objectives and policies similar to those of the Fund. The Trustees considered that
services provided to the Funds differed in various significant respects from the services provided to these collective investment
vehicles, which generally operated under less stringent regulatory and financial reporting requirements and required fewer services
106

G O L D M A N S A C H S S T R A T E G I C M U L T I - A S S E T C L A S S F U N D S
Statement Regarding Basis for Approval of Management Agreement and Sub-AdvisoryAgreements (Unaudited) (continued)
from the Investment Adviser. The Trustees concluded that the comparisons provided by the Outside Data Provider and the
Investment Adviser were useful in evaluating the reasonableness of the management fees and total expenses paid by the Funds.
The Trustees considered the Investment Adviser’s undertaking to waive a portion of the management fee payable by each
Fund. In this regard the Trustees noted that the shareholders that are invested in the Funds consist of institutional clients that have
entered into a separate management agreement with the Investment Adviser and pay a single management fee for the Investment
Adviser’s management of their accounts, and that the Investment Adviser waives a portion of the management fee with respect to
each Fund in order to achieve an effective net management fee rate that is equal to the actual cost of fees paid to the Fund’s
sub-advisers. They also considered the Investment Adviser’s undertaking to limit each Fund’s “other expenses” rate (excluding
certain expenses) to a specified level. In addition, the Trustees noted that shareholders are able to redeem their Fund shares at any
time if shareholders believe that the Fund fees and expenses are too high or if they are dissatisfied with the performance of the
Fund.
The Investment Adviser’s ProfitabilityThe Trustees reviewed each Fund’s contribution to the Investment Adviser’s revenues and pre-tax profit margins. In this
regard the Trustees noted that they had received, among other things, profitability analyses and summaries, revenue and expense
schedules by Fund and by function (i.e., investment management, transfer agency and distribution and service), and information on
the Investment Adviser’s expense allocation methodology. They observed that the profitability and expense figures are
substantially similar to those used by the Investment Adviser for many internal purposes, including compensation decisions among
various business groups, and are thus subject to a vigorous internal debate about how certain revenue and expenses should be
allocated. The Trustees also noted that the internal audit group within the Goldman Sachs organization periodically audits the
expense allocation methodology and that the internal audit group was satisfied with the reasonableness, consistency, and accuracy
of the Investment Adviser’s expense allocation methodology. Profitability data for each Fund was provided for 2020 and 2019, and
the Trustees considered this information in relation to the Investment Adviser’s overall profitability.
Economies of ScaleThe Trustees considered the information that had been provided regarding whether there have been economies of scale with
respect to the management of the Funds. The Trustees also considered that the Funds are offered to the Investment Adviser’s
institutional clients as part of an investment model whereby the Funds and other funds act as core “building blocks” with which the
client and the Investment Adviser form an investment strategy for the client’s portfolio. The Trustees considered the Investment
Adviser’s representations that its clients benefit from this investment model with increased liquidity, increased investment
oversight, access to new investment strategies, economies of scale, and reduced complexity in managing client portfolios. The
Trustees noted that, pursuant to the model, clients pay a management fee for the Investment Adviser’s management of their
accounts, and that the fund-level management fees in excess of the weighted average sub-advisory fees are waived in order to
avoid charging two layers of management fees. The Trustees also considered the breakpoints in the fee rate payable under the
Management Agreement for each of the Funds at the following annual percentage rates of the average daily net assets of the Funds:
Average DailyNet Assets
GoldmanSachs Multi-
ManagerGlobal Equity
Fund
GoldmanSachs Multi-
ManagerNon-Core
Fixed IncomeFund
GoldmanSachs Multi-
Manager RealAssets Strategy
Fund
First $1 billion 1.03% 0.85% 1.00%
Next $1 billion 0.93% 0.85% 0.90%
Next $3 billion 0.89% 0.77% 0.86%
Next $3 billion 0.87% 0.73% 0.84%
Over $8 billion 0.84% 0.71% 0.82%
The Trustees noted that the breakpoints were designed to share potential economies of scale, if any, with the Funds and their
shareholders as assets under management reach those asset levels. The Trustees considered the amounts of assets in the Funds; the
Funds’ recent share purchase and redemption activity; the information provided by the Investment Adviser relating to the costs of
the services provided by the Investment Adviser and its affiliates and their realized profits (if any); information comparing fee rates
charged by the Investment Adviser with fee rates charged to other funds in the peer groups; and the Investment Adviser’s
undertakings to waive a portion of its management fee and to limit certain expenses of the Funds that exceed specified levels. The
Trustees also considered the relationship between the advisory and sub-advisory fee rate schedules. Upon reviewing these matters107

G O L D M A N S A C H S S T R A T E G I C M U L T I - A S S E T C L A S S F U N D S
Statement Regarding Basis for Approval of Management Agreement and Sub-AdvisoryAgreements (Unaudited) (continued)
at the Annual Meeting, the Trustees concluded that the fee breakpoints represented a means of assuring that benefits of scalability,
if any, would be passed along to shareholders at the specified asset levels.
Other Benefits to the Investment Adviser and Its AffiliatesThe Trustees also considered the other benefits derived by the Investment Adviser and its affiliates from their relationships
with the Funds, including: (a) transfer agency fees received by Goldman Sachs & Co. LLC (“Goldman Sachs”); (b) brokerage and
futures commissions earned by Goldman Sachs for executing securities transactions (in its capacity as clearing broker) and futures
transactions on behalf of the Funds; (c) the Investment Adviser’s ability to leverage the infrastructure designed to service the Funds
on behalf of the Investment Adviser’s other clients; (d) the Investment Adviser’s ability to cross-market other products and
services to Fund shareholders; (e) the Investment Adviser’s ability to negotiate better pricing with the Funds’ custodian on behalf
of its other clients, as a result of the relationship with the Funds; (f) the investment of cash and cash collateral in money market
funds managed by the Investment Adviser that will result in increased assets under management for those money market funds;
(g) the investment in exchange-traded funds (“ETFs”) managed by the Investment Adviser that will result in increased assets under
management for those ETFs and may facilitate the development of the Investment Adviser’s ETF advisory business; and (h) the
possibility that the working relationship between the Investment Adviser and the Funds’ third-party service providers (including
the Sub-Advisers) may cause those service providers to be more likely to do business with other areas of Goldman Sachs. In the
course of considering the foregoing, the Independent Trustees requested and received further information quantifying certain of
these fall-out benefits.
Other Benefits to the Funds and Their ShareholdersThe Trustees also noted that the Funds receive certain other potential benefits as a result of their relationship with the
Investment Adviser, including: (a) enhanced servicing from vendors due to the volume of business generated by the Investment
Adviser and its affiliates; (b) the advantages received from the Investment Adviser’s knowledge and experience gained from
managing other accounts and products; (c) the Investment Adviser’s ability to hire and retain qualified personnel to provide
services to the Funds because of the reputation of the Goldman Sachs organization; (d) the Funds’ access, through the Investment
Adviser, to certain firm-wide resources (e.g., proprietary risk management systems and databases), subject to certain restrictions;
(e) the Funds’ ability to aggregate assets managed by certain sub-advisers with those of other clients of the Investment Adviser for
purposes of applying breakpoints in a sub-advisory agreement; and (f) access to certain affiliated distribution channels.
ConclusionIn connection with their consideration of the Management Agreement, the Trustees gave weight to various factors, but did not
identify any particular factor as controlling their decision. After deliberation and consideration of the information provided,
including the factors described above, the Trustees, including the Independent Trustees, unanimously concluded, in the exercise of
their business judgment, that the investment management fees paid by each Fund were reasonable in light of the factors considered,
and that the Management Agreement, and the terms thereof, should be approved and continued with respect to each Fund until
August 31, 2022.
Designated Sub-Advisory Agreements
Nature, Extent, and Quality of the Services Provided Under the Designated Sub-Advisory Agreements and PerformanceIn evaluating the Designated Sub-Advisory Agreements, the Trustees relied upon materials furnished and presentations made
by the Investment Adviser and the Designated Sub-Advisers. In evaluating the nature, extent, and quality of services provided by
each Designated Sub-Adviser, the Trustees considered information on the services provided to the Funds by their respective
Designated Sub-Advisers, including information about each Designated Sub-Adviser’s (a) personnel and compensation structure;
(b) track record in managing the Fund and, if applicable, other funds and/or accounts with investment strategies similar to those
employed on behalf of the Funds; (c) policies and procedures in place to address potential conflicts of interest; and (d) compliance
program and code of ethics. In this regard, they also considered assessments provided by the Investment Adviser of each
Designated Sub-Adviser, the Designated Sub-Adviser’s investment strategies and personnel, and its compliance program. The
Trustees also considered information regarding each Designated Sub-Adviser’s business continuity planning and remote operations
in the current environment. The Trustees also reviewed the operations and investment performance of each Designated
Sub-Adviser’s respective sleeve of the applicable Fund since its inception, including a comparison of each Designated Sub-Adviser
to relevant benchmark indices based on various metrics, including realized beta, excess return, alpha, and volatility.108

G O L D M A N S A C H S S T R A T E G I C M U L T I - A S S E T C L A S S F U N D S
Statement Regarding Basis for Approval of Management Agreement and Sub-AdvisoryAgreements (Unaudited) (continued)
Costs of Services ProvidedThe Trustees reviewed the terms of each Designated Sub-Advisory Agreement, including the schedule of fees payable to the
Designated Sub-Advisers. They considered any breakpoints in the sub-advisory fee rate payable under each Designated
Sub-Advisory Agreement. The Trustees noted that the compensation paid to each Designated Sub-Adviser is paid by the
Investment Adviser, not by the Funds. The Trustees considered that certain Designated Sub-Advisers had agreed to reduce their
sub-advisory fee rate, which benefited shareholders of the applicable Funds in light of the existing management fee waiver
arrangement. The Trustees reviewed the blended average of all sub-advisory fees paid by the Investment Adviser with respect to
each Fund in light of the overall management fee paid by each Fund. They also considered the Investment Adviser’s undertaking to
waive a portion of its management fee which is in excess of the weighted average of each Fund’s sub-advisory fees.
ConclusionIn connection with their consideration of the Designated Sub-Advisory Agreements, the Trustees gave weight to various
factors, but did not identify any particular factor as controlling their decision. After deliberation and consideration of the
information provided, including the factors described above, the Trustees, including the Independent Trustees, unanimously
concluded, in the exercise of their business judgment, that the sub-advisory fees paid by the Investment Adviser to each Designated
Sub-Adviser were reasonable in light of the factors considered, and that each Designated Sub-Advisory Agreement should be
approved and continued until August 31, 2022.
BackgroundThe Goldman Sachs Multi-Manager Non-Core Fixed Income Fund (the “Fund”) is an investment portfolio of Goldman Sachs
Trust II (the “Trust”). The Board of Trustees oversees the management of the Trust and reviews the investment performance and
expenses of the Fund at regularly scheduled meetings held throughout the year. The Fund employs a “manager of managers”
structure, whereby Goldman Sachs Asset Management, L.P. (the “Investment Adviser”) is responsible for selecting sub-advisers
(subject to Board approval), allocating the assets of the Fund among them, and overseeing their day-to-day management of Fund
assets.
Upon the recommendation of the Investment Adviser, at a meeting held on August 10-11, 2021, the Trustees present,
including those Trustees who are not “interested persons” as defined in the Investment Company Act of 1940, as amended (the
“Independent Trustees”), approved a sub-advisory agreement (the “Sub-Advisory Agreement”) between the Investment Adviser
and BlueBay Asset Management USA LLC (the “Sub-Adviser”) on behalf of the Fund. In connection with their evaluation of the
Sub-Advisory Agreement, the Trustees received written materials and oral presentations prepared by the Investment Adviser and
the Sub-Adviser on the topics covered, and were advised by their independent legal counsel. In addition, the Trustees received
information prepared by the Sub-Adviser in a written response to a formal request from the Investment Adviser.
Nature, Extent, and Quality of the Services to be Provided Under the Sub-Advisory AgreementIn evaluating the Sub-Advisory Agreement, the Trustees relied on the information provided by the Investment Adviser and the
Sub-Adviser. In evaluating the Sub-Advisory Agreement between the Investment Adviser and the Sub-Adviser with respect to the
Fund, the Trustees present relied on the information provided by the Investment Adviser and the Sub-Adviser. In evaluating the
nature, extent and quality of services to be provided by the Sub-Adviser, the Trustees considered information about the Sub-
Adviser’s (a) personnel and compensation structure; (b) track record in managing other funds and accounts with investment
strategies similar to those to be employed on behalf of the Fund; (c) policies and procedures in place to address potential conflicts
of interest; and (d) compliance program and code of ethics. In this regard, they considered assessments provided by the Investment
Adviser of the Sub-Adviser, the Sub-Adviser’s investment strategies and personnel, and its compliance program. The Trustees
considered that the Sub-Adviser currently manages other assets for the Investment Adviser’s clients. They also noted that the Sub-
Adviser’s affiliate, BlueBay Asset Management LLP, currently manages assets for the Fund, and BlueBay USA would be engaged
to co-manage these assets.
Costs of Services to be ProvidedThe Trustees reviewed the terms of the Sub-Advisory Agreement and the proposed fee schedule. They noted that the
compensation paid to the Sub-Adviser would be paid by the Investment Adviser, not by the Fund. They also noted that the terms of
the Sub-Advisory Agreement were the result of arms’ length negotiations between the Investment Adviser and the Sub-Adviser.
The Trustees reviewed the anticipated blended average of all sub-advisory fees to be paid by the Investment Adviser with respect
to the Fund. The Trustees considered the Investment Adviser’s undertaking to waive the portion of its management fee which is in
109

G O L D M A N S A C H S S T R A T E G I C M U L T I - A S S E T C L A S S F U N D S
Statement Regarding Basis for Approval of Management Agreement and Sub-AdvisoryAgreements (Unaudited) (continued)
excess of the weighted average of the Fund’s sub-advisory fees. They considered that the Sub-Advisory Agreement will not change
the costs incurred by the Fund.
ConclusionIn connection with their consideration of the Sub-Advisory Agreement, the Trustees gave weight to various factors, but did
not identify any particular factor as controlling their decision. After deliberation and consideration of the information provided,
including the factors described above, the Trustees present, including the Independent Trustees, unanimously concluded, in the
exercise of their business judgment, that the sub-advisory fees to be paid by the Investment Adviser to the Sub-Adviser were
reasonable in light of the factors considered, and that the Sub-Advisory Agreement, and the terms thereof, should be approved.
110

G O L D M A N S A C H S S T R A T E G I C M U L T I - A S S E T C L A S S F U N D S
Trustees and Officers (Unaudited)Independent Trustees
Name,Address and Age1
Position(s) Heldwith the Trust
Term ofOffice andLength ofTime Served2
Principal Occupation(s)During Past 5 Years
Number ofPortfolios inFund ComplexOverseen byTrustee3
OtherDirectorshipsHeld by Trustee4
Cheryl K. BeebeAge: 65
Chair of the Board ofTrustees
Since 2017(Trusteesince 2015)
Ms. Beebe is retired. She is Director, PackagingCorporation of America (2008-Present); Director,The Mosaic Company (2019-Present); Director,HanesBrands Inc. (2020-Present); and wasformerly Director, Convergys Corporation (aglobal leader in customer experienceoutsourcing) (2015-2018); and formerly held theposition of Executive Vice President, (2010-2014);and Chief Financial Officer, Ingredion, Inc.(a leading global ingredient solutions company)(2004-2014).
Chair of the Board of Trustees — Goldman SachsTrust II.
18 Packaging Corporationof America (producer ofcontainer board); TheMosaic Company(producer of phosphateand potash fertilizer);HanesBrands Inc. (amultinational clothingcompany)
Lawrence HughesAge: 63
Trustee Since 2016 Mr. Hughes is retired. Formerly, he held seniormanagement positions with BNY Mellon WealthManagement, a division of The Bank of New YorkMellon Corporation (a financial services company)(1991-2015), most recently as Chief ExecutiveOfficer (2010-2015). He serves as a Member ofthe Board of Directors, (2012-Present) andformerly served as Chairman (2012-2019), EllisMemorial and Eldredge House (a not-for-profitorganization). Previously, Mr. Hughes served asan Advisory Board Member of Goldman SachsTrust II (February 2016-April 2016).
Trustee — Goldman Sachs Trust II.
18 None
John F. KillianAge: 66
Trustee Since 2015 Mr. Killian is retired. He is Director, ConsolidatedEdison, Inc. (2007-Present); Director, HoughtonMifflin Harcourt Publishing Company (2011-Present); and formerly held senior managementpositions with Verizon Communications, Inc.,including Executive Vice President and ChiefFinancial Officer (2009-2010); and President,Verizon Business, Verizon Communications, Inc.(2005-2009).
Trustee — Goldman Sachs Trust II.
18 Consolidated Edison,Inc. (a utility holdingcompany); HoughtonMifflin HarcourtPublishing Company
Steven D. KrichmarAge: 63
Trustee Since 2018 Mr. Krichmar is retired. Formerly, he held seniormanagement and governance positions withPutnam Investments, LLC, a financial servicescompany (2001-2016). He was most recentlyChief of Operations and a member of theOperating Committee of Putnam Investments, LLCand Principal Financial Officer of The PutnamFunds. Previously, Mr. Krichmar served as anAudit Partner with PricewaterhouseCoopers LLPand its predecessor company (1990-2001).
Trustee — Goldman Sachs Trust II.
18 None
111

G O L D M A N S A C H S S T R A T E G I C M U L T I - A S S E T C L A S S F U N D S
Trustees and Officers (Unaudited) (continued)Interested Trustee*
Name,Address and Age1
Position(s) Heldwith the Trust
Term ofOffice andLength ofTime Served2
Principal Occupation(s)During Past 5 Years
Number ofPortfolios inFund ComplexOverseen byTrustee3
OtherDirectorshipsHeld by Trustee4
James A. McNamaraAge: 59
President andTrustee
Since 2012 Advisory Director, Goldman Sachs (January 2018-Present); Managing Director, Goldman Sachs(January 2000-December 2017); Director ofInstitutional Fund Sales, GSAM (April 1998-December 2000); and Senior Vice President andManager, Dreyfus Institutional ServiceCorporation (January 1993-April 1998).
President and Trustee — Goldman Sachs Trust II;Goldman Sachs Trust; Goldman Sachs VariableInsurance Trust; Goldman Sachs MLP and EnergyRenaissance Fund; Goldman Sachs ETF Trust;Goldman Sachs Credit Income Fund; and GoldmanSachs Real Estate Diversified Income Fund.
168 None
* Mr. McNamara is considered to be an “Interested Trustee” because he holds positions with Goldman Sachs and owns securities issued by The Goldman Sachs Group,Inc. He holds comparable positions with certain other companies of which Goldman Sachs, GSAM or an affiliate thereof is the investment adviser, administrator and/or distributor.
1 Each Trustee may be contacted by writing to the Trustee, c/o Goldman Sachs, 200 West Street, New York, New York, 10282, Attn: Caroline Kraus. Information isprovided as of October 31, 2021.
2 Subject to such policies as may be adopted by the Board from time-to-time, each Trustee holds office for an indefinite term, until the earliest of: (a) the election of hisor her successor; (b) the date the Trustee resigns or is removed by the Board or shareholders, in accordance with the Trust’s Declaration of Trust; or (c) thetermination of the Trust. The Board has adopted policies which provide that (a) no Trustee shall hold office for more than 15 years and (b) a Trustee shall retire as ofDecember 31st of the calendar year in which he or she reaches his or her 74th birthday, unless a waiver of such requirements shall have been adopted by a majorityof the other Trustees. These policies may be changed by the Trustees without shareholder vote.
3 The Goldman Sachs Fund Complex includes certain other companies listed above for each respective Trustee. As of October 31, 2021, Goldman Sachs Trust IIconsisted of 18 portfolios (16 of which offered shares to the public); Goldman Sachs Trust consisted of 92 portfolios (90 of which offered shares to the public);Goldman Sachs Variable Insurance Trust consisted of 17 portfolios (13 of which offered shares to the public); Goldman Sachs ETF Trust consisted of 38 portfolios(21 of which offered shares to the public); and Goldman Sachs MLP and Energy Renaissance Fund, Goldman Sachs Credit Income Fund and Goldman Sachs RealEstate Diversified Income Fund each consisted of one portfolio. Goldman Sachs Credit Income Fund did not offer shares to the public.
4 This column includes only directorships of companies required to report to the Securities and Exchange Commission under the Securities Exchange Act of 1934 (i.e.,“public companies”) or other investment companies registered under the Act.
Additional information about the Trustees is available in the Funds’ Statement of Additional Information, which can be obtained from Goldman Sachs free of charge bycalling this toll-free number (in the United States of America): 1-800-526-7384.
112
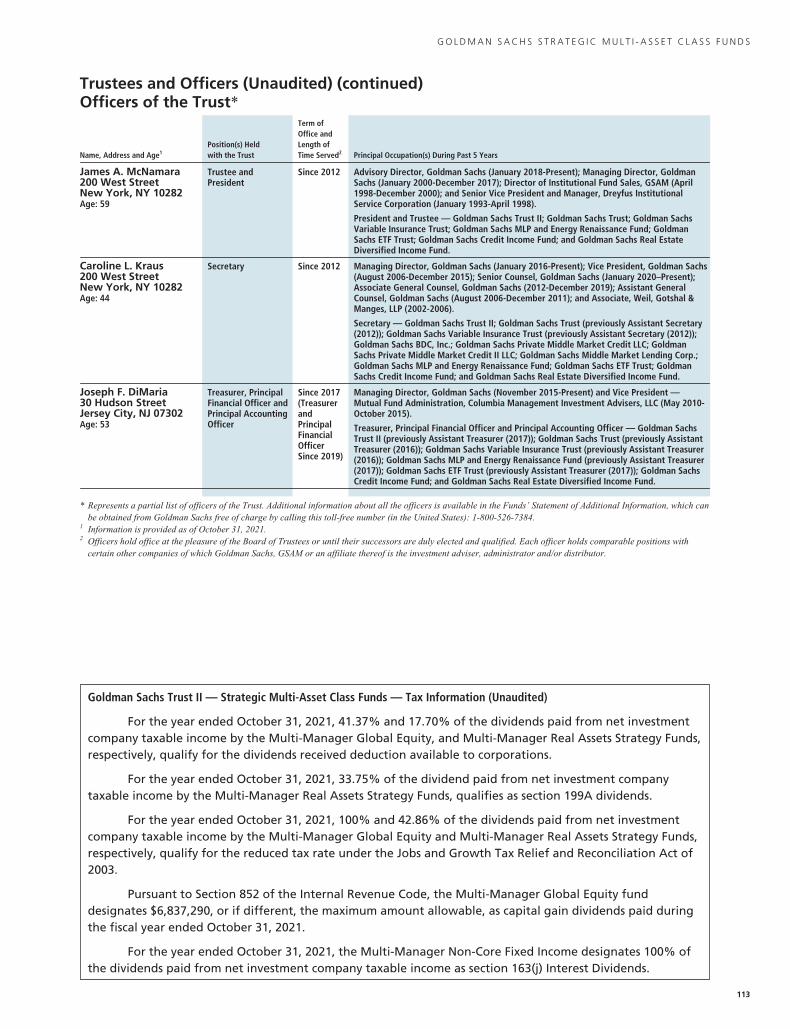
G O L D M A N S A C H S S T R A T E G I C M U L T I - A S S E T C L A S S F U N D S
Trustees and Officers (Unaudited) (continued)Officers of the Trust*
Name, Address and Age1Position(s) Heldwith the Trust
Term ofOffice andLength ofTime Served2 Principal Occupation(s) During Past 5 Years
James A. McNamara200 West StreetNew York, NY 10282Age: 59
Trustee andPresident
Since 2012 Advisory Director, Goldman Sachs (January 2018-Present); Managing Director, GoldmanSachs (January 2000-December 2017); Director of Institutional Fund Sales, GSAM (April1998-December 2000); and Senior Vice President and Manager, Dreyfus InstitutionalService Corporation (January 1993-April 1998).
President and Trustee — Goldman Sachs Trust II; Goldman Sachs Trust; Goldman SachsVariable Insurance Trust; Goldman Sachs MLP and Energy Renaissance Fund; GoldmanSachs ETF Trust; Goldman Sachs Credit Income Fund; and Goldman Sachs Real EstateDiversified Income Fund.
Caroline L. Kraus200 West StreetNew York, NY 10282Age: 44
Secretary Since 2012 Managing Director, Goldman Sachs (January 2016-Present); Vice President, Goldman Sachs(August 2006-December 2015); Senior Counsel, Goldman Sachs (January 2020–Present);Associate General Counsel, Goldman Sachs (2012-December 2019); Assistant GeneralCounsel, Goldman Sachs (August 2006-December 2011); and Associate, Weil, Gotshal &Manges, LLP (2002-2006).
Secretary — Goldman Sachs Trust II; Goldman Sachs Trust (previously Assistant Secretary(2012)); Goldman Sachs Variable Insurance Trust (previously Assistant Secretary (2012));Goldman Sachs BDC, Inc.; Goldman Sachs Private Middle Market Credit LLC; GoldmanSachs Private Middle Market Credit II LLC; Goldman Sachs Middle Market Lending Corp.;Goldman Sachs MLP and Energy Renaissance Fund; Goldman Sachs ETF Trust; GoldmanSachs Credit Income Fund; and Goldman Sachs Real Estate Diversified Income Fund.
Joseph F. DiMaria30 Hudson StreetJersey City, NJ 07302Age: 53
Treasurer, PrincipalFinancial Officer andPrincipal AccountingOfficer
Since 2017(TreasurerandPrincipalFinancialOfficerSince 2019)
Managing Director, Goldman Sachs (November 2015-Present) and Vice President —Mutual Fund Administration, Columbia Management Investment Advisers, LLC (May 2010-October 2015).
Treasurer, Principal Financial Officer and Principal Accounting Officer — Goldman SachsTrust II (previously Assistant Treasurer (2017)); Goldman Sachs Trust (previously AssistantTreasurer (2016)); Goldman Sachs Variable Insurance Trust (previously Assistant Treasurer(2016)); Goldman Sachs MLP and Energy Renaissance Fund (previously Assistant Treasurer(2017)); Goldman Sachs ETF Trust (previously Assistant Treasurer (2017)); Goldman SachsCredit Income Fund; and Goldman Sachs Real Estate Diversified Income Fund.
* Represents a partial list of officers of the Trust. Additional information about all the officers is available in the Funds’ Statement of Additional Information, which canbe obtained from Goldman Sachs free of charge by calling this toll-free number (in the United States): 1-800-526-7384.
1 Information is provided as of October 31, 2021.2 Officers hold office at the pleasure of the Board of Trustees or until their successors are duly elected and qualified. Each officer holds comparable positions with
certain other companies of which Goldman Sachs, GSAM or an affiliate thereof is the investment adviser, administrator and/or distributor.
Goldman Sachs Trust II — Strategic Multi-Asset Class Funds — Tax Information (Unaudited)
For the year ended October 31, 2021, 41.37% and 17.70% of the dividends paid from net investmentcompany taxable income by the Multi-Manager Global Equity, and Multi-Manager Real Assets Strategy Funds,respectively, qualify for the dividends received deduction available to corporations.
For the year ended October 31, 2021, 33.75% of the dividend paid from net investment companytaxable income by the Multi-Manager Real Assets Strategy Funds, qualifies as section 199A dividends.
For the year ended October 31, 2021, 100% and 42.86% of the dividends paid from net investmentcompany taxable income by the Multi-Manager Global Equity and Multi-Manager Real Assets Strategy Funds,respectively, qualify for the reduced tax rate under the Jobs and Growth Tax Relief and Reconciliation Act of2003.
Pursuant to Section 852 of the Internal Revenue Code, the Multi-Manager Global Equity funddesignates $6,837,290, or if different, the maximum amount allowable, as capital gain dividends paid duringthe fiscal year ended October 31, 2021.
For the year ended October 31, 2021, the Multi-Manager Non-Core Fixed Income designates 100% ofthe dividends paid from net investment company taxable income as section 163(j) Interest Dividends.
113

(This page intentionally left blank)

(This page intentionally left blank)

(This page intentionally left blank)

F U N D S P R O F I L E
Goldman Sachs Funds
Goldman Sachs is a premier financial services firm, known since 1869 for creating thoughtful and customized investment solutionsin complex global markets.
Today, the Asset Management Division of Goldman Sachs serves a diverse set of clients worldwide, including private institutions,public entities and individuals. With approximately $2.14 trillion in assets under supervision as of September 30, 2021, GoldmanSachs Asset Management has portfolio management teams located around the world and our investment professionals bringfirsthand knowledge of local markets to every investment decision. Assets under supervision includes assets under managementand other client assets for which Goldman Sachs does not have full discretion. Goldman Sachs Asset Management leverages theresources of Goldman Sachs & Co. LLC subject to legal, internal and regulatory restrictions.
Money MarketFinancial Square FundsSM
� Financial Square Treasury Solutions Fund1
� Financial Square Government Fund1
� Financial Square Money Market Fund2
� Financial Square Prime Obligations Fund2
� Financial Square Treasury InstrumentsFund1
� Financial Square Treasury Obligations Fund1
� Financial Square Federal Instruments Fund1
Investor FundsSM
� Investor Money Market Fund3
� Investor Tax-Exempt Money Market Fund3
Fixed IncomeShort Duration and Government� Enhanced Income Fund� High Quality Floating Rate Fund� Short-Term Conservative Income Fund� Short Duration Government Fund� Short Duration Bond Fund4
� Government Income Fund� Inflation Protected Securities FundMulti-Sector� Bond Fund� Core Fixed Income Fund� Global Core Fixed Income Fund� Strategic Income Fund� Income FundMunicipal and Tax-Free� High Yield Municipal Fund� Dynamic Municipal Income Fund� Municipal Income Completion Fund� Short Duration Tax-Free Fund
Single Sector� Investment Grade Credit Fund� U.S. Mortgages Fund� High Yield Fund� High Yield Floating Rate Fund� Emerging Markets Debt Fund� Local Emerging Markets Debt FundFixed Income Alternatives� Long Short Credit Strategies Fund
Fundamental Equity� Equity Income Fund� Small Cap Growth Fund� Small Cap Value Fund� Small/Mid Cap Value Fund� Mid Cap Value Fund� Large Cap Value Fund� Focused Value Fund� Capital Growth Fund� Strategic Growth Fund� Small/Mid Cap Growth Fund� Flexible Cap Fund� Concentrated Growth Fund� Technology Opportunities Fund� Growth Opportunities Fund� Rising Dividend Growth Fund� U.S. Equity ESG Fund� Income Builder Fund
Tax-Advantaged Equity� U.S. Tax-Managed Equity Fund� International Tax-Managed Equity Fund� U.S. Equity Dividend and Premium Fund� International Equity Dividend and
Premium Fund
Equity Insights� Small Cap Equity Insights Fund� U.S. Equity Insights Fund� Small Cap Growth Insights Fund� Large Cap Growth Insights Fund� Large Cap Value Insights Fund� Small Cap Value Insights Fund� International Small Cap Insights Fund� International Equity Insights Fund� Emerging Markets Equity Insights Fund
Fundamental Equity International� International Equity Income Fund� International Equity ESG Fund� China Equity Fund� Emerging Markets Equity Fund� ESG Emerging Markets Equity Fund
Alternative� Real Estate Securities Fund� International Real Estate Securities Fund� Commodity Strategy Fund� Global Real Estate Securities Fund� Alternative Premia Fund� Absolute Return Tracker Fund� Managed Futures Strategy Fund� MLP Energy Infrastructure Fund� Energy Infrastructure Fund� Multi-Manager Alternatives Fund� Global Infrastructure Fund� Clean Energy Income Fund� Defensive Equity Fund
Total Portfolio Solutions� Global Managed Beta Fund� Multi-Manager Non-Core Fixed Income
Fund� Multi-Manager Global Equity Fund� Multi-Manager International Equity Fund� Tactical Tilt Overlay Fund� Balanced Strategy Portfolio� Multi-Manager U.S. Small Cap Equity Fund� Multi-Manager Real Assets Strategy Fund� Growth and Income Strategy Portfolio� Growth Strategy Portfolio� Dynamic Global Equity Fund� Satellite Strategies Portfolio� Enhanced Dividend Global Equity Portfolio� Tax-Advantaged Global Equity Portfolio� Strategic Factor Allocation Fund� Strategic Volatility Premium Fund� Target Date Retirement Portfolio� Target Date 2025 Portfolio� Target Date 2030 Portfolio� Target Date 2035 Portfolio� Target Date 2040 Portfolio� Target Date 2045 Portfolio� Target Date 2050 Portfolio� Target Date 2055 Portfolio� Target Date 2060 Portfolio� GQG Partners International
Opportunities Fund
1 You could lose money by investing in the Fund. Although the Fund seeks to preserve the value of your investment at $1.00 per share, it cannotguarantee it will do so. An investment in the Fund is not a deposit of a bank and is not insured or guaranteed by the Federal Deposit InsuranceCorporation or any other government agency. The Fund’s sponsor has no legal obligation to provide financial support to the Fund, and you shouldnot expect that the sponsor will provide financial support to the Fund at any time.
2 You could lose money by investing in the Fund. Because the share price of the Fund will fluctuate, when you sell your shares they may be worthmore or less than what you originally paid for them. The Fund may impose a fee upon sale of your shares or may temporarily suspend your abilityto sell shares if the Fund’s liquidity falls below required minimums because of market conditions or other factors. An investment in the Fund is nota deposit of a bank and is not insured or guaranteed by the Federal Deposit Insurance Corporation or any other government agency. The Fund’ssponsor has no legal obligation to provide financial support to the Fund, and you should not expect that the sponsor will provide financial supportto the Fund at any time.
3 You could lose money by investing in the Fund. Although the Fund seeks to preserve the value of your investment at $1.00 per share, it cannotguarantee it will do so. The Fund may impose a fee upon sale of your shares or may temporarily suspend your ability to sell shares if the Fund’sliquidity falls below required minimums because of market conditions or other factors. An investment in the Fund is not a deposit of a bank and isnot insured or guaranteed by the Federal Deposit Insurance Corporation or any other government agency. The Fund’s sponsor has no legalobligation to provide financial support to the Fund, and you should not expect that the sponsor will provide financial support to the Fund at anytime.
4 Effective after the close of business on July 29, 2021, the Goldman Sachs Short Duration Income Fund was renamed the Goldman Sachs Short DurationBond Fund.
* This list covers open-end funds only. Please visit our website at www.GSAMFUNDS.com to learn about our closed-end funds and exchange-tradedfunds.

TRUSTEESCheryl K. Beebe, ChairLawrence HughesLinda A. Lang*Michael Latham*John F. KillianSteven D. KrichmarLawrence W. Stranghoener*James A. McNamara
*Effective December 3, 2021.
OFFICERSJames A. McNamara, PresidentJoseph F. DiMaria, Principal Financial Officer,Principal Accounting Officer and TreasurerCaroline L. Kraus, Secretary
GOLDMAN SACHS & CO. LLCDistributor and Transfer Agent
GOLDMAN SACHS ASSET MANAGEMENT, L.P.Investment Adviser
Visit our web site at www.GSAMFUNDS.com to obtain the most recent month-end returns.
Goldman Sachs Asset Management, L.P., 200 West Street, New York, New York 10282
The reports concerning the Funds included in this shareholder report may contain certain forward-looking statements about the factors that may affect theperformance of the Funds in the future. These statements are based on Fund management’s predictions and expectations concerning certain future events andtheir expected impact on the Funds, such as performance of the economy as a whole and of specific industry sectors, changes in the levels of interest rates, theimpact of developing world events, and other factors that may influence the future performance of the Funds. Management believes these forward-lookingstatements to be reasonable, although they are inherently uncertain and difficult to predict. Actual events may cause adjustments in portfolio managementstrategies from those currently expected to be employed.A description of the policies and procedures that the Funds use to determine how to vote proxies relating to portfolio securities and information regarding howFunds voted proxies relating to portfolio securities during the most recent 12-month period ended June 30 are available (I) without charge, upon request bycalling 1-800-621-2550; and (II) on the Securities and Exchange Commission (’’SEC’’) web site at http://www.sec.gov.The Funds will file portfolio holdings information for each month in a fiscal quarter within 60 days after the end of the relevant fiscal quarter on Form N-PORT.Portfolio holdings information for the third month of each fiscal quarter will be made available on the SEC’s web site at http://www.sec.gov. Portfolio holdingsinformation may be obtained upon request and without charge by calling 1-800-526-7384 (for Retail Shareholders) or 1-800-621-2550 (for InstitutionalShareholders).Goldman Sachs & Co. LLC (‘‘Goldman Sachs’’) does not provide legal, tax or accounting advice. Any statement contained in this communication (including anyattachments) concerning U.S. tax matters was not intended or written to be used, and cannot be used, for the purpose of avoiding penalties under the Internal RevenueCode, and was written to support the promotion or marketing of the transaction(s) or matter(s) addressed. Clients of Goldman Sachs should obtain their ownindependent tax advice based on their particular circumstances.Economic and market forecasts presented herein reflect our judgment as of the date of this presentation and are subject to change without notice. Theseforecasts do not take into account the specific investment objectives, restrictions, tax and financial situation or other needs of any specific client. Actual datawill vary and may not be reflected here. These forecasts are subject to high levels of uncertainty that may affect actual performance. Accordingly, theseforecasts should be viewed as merely representative of a broad range of possible outcomes. These forecasts are estimated, based on assumptions, and aresubject to significant revision and may change materially as economic and market conditions change. Goldman Sachs has no obligation to provide updates orchanges to these forecasts. Case studies and examples are for illustrative purposes only. The Global Industry Classification Standard (GICS) was developed byand is the exclusive property and a service mark of Morgan Stanley Capital International Inc. (MSCI) and Standard & Poor’s, a division of The McGraw-HillCompanies, Inc. (S&P) and is licensed for use by Goldman Sachs. Neither MSCI, S&P nor any other party involved in making or compiling the GICS or any GICSclassifications makes any express or implied warranties or representations with respect to such standard or classification (or the results to be obtained by theuse thereof), and all such parties hereby expressly disclaim all warranties of originality, accuracy, completeness, merchantability or fitness for a particularpurpose with respect to any of such standard or classification. Without limiting any of the foregoing, in no event shall MSCI, S&P, any of their affiliates or anythird party involved in making or compiling the GICS or any GICS classifications have any liability for any direct, indirect, special, punitive, consequential or anyother damages (including lost profits) even if notified of the possibility of such damages.The portfolio risk management process includes an effort to monitor and manage risk, but does not imply low risk. Diversification does not protect an investorfrom market risk and does not ensure a profit. Past correlations are not indicative of future correlations, which may vary.This material is not authorized for distribution to prospective investors unless preceded or accompanied by a current Prospectus or summaryprospectus, if applicable. Investors should consider the Funds’ objective, risks, and charges and expenses, and read the summary prospectus, ifavailable, and/or the Prospectus carefully before investing or sending money. The summary prospectus, if available, and the Prospectus contain thisand other information about each Fund and may be obtained from your authorized dealer or from Goldman Sachs & Co. LLC by calling 1-800-621-2550.© 2021 Goldman Sachs. All rights reserved. 263329-OTU-1529194 SMACAR-21