Introduction to Money Market Funds - Goldman Sachs Asset ...
Upload
khangminh22Category
view
0download
0
Goldman Sachs Funds
Annual Report August 31, 2021
Goldman Sachs MarketBeta® ETFsMarketBeta® Emerging Markets Equity ETF (GSEE)
MarketBeta® International Equity ETF (GSID)
MarketBeta® U.S. Equity ETF (GSUS)

Goldman Sachs MarketBeta® ETFs
� MarketBeta® Emerging Markets Equity ETF
� MarketBeta® International Equity ETF
� MarketBeta® U.S. Equity ETF
TABLE OF CONTENTS
Investment Process 1
Portfolio Management Discussion and Performance Summaries 3
Schedules of Investments 16
Financial Statements 55
Financial Highlights
MarketBeta® Emerging Markets Equity ETF 59
MarketBeta® International Equity ETF 60
MarketBeta® U.S. Equity ETF 61
Notes to Financial Statements 62
Report of Independent Registered Public Accounting Firm 74
Other Information 76
NOT FDIC-INSURED May Lose Value No Bank Guarantee

I N V E S T M E N T P R O C E S S
Goldman Sachs MarketBeta® Equity ETFs
Principal Investment StrategiesThe investment objective of each of the MarketBeta® Emerging Markets Equity ETF, MarketBeta® International Equity ETF and
MarketBeta® U.S. Equity ETF (each, a “Fund”), is to seek to provide investment results that closely correspond, before fees and
expenses, to the performance of its respective underlying index (each, an “Index”).
Each Fund seeks to achieve its investment objective by investing at least 80% of its assets (exclusive of collateral held from
securities lending) in securities included in its underlying index, in depositary receipts representing securities included in its
underlying index and in underlying stocks in respect of depositary receipts included in its underlying index.
MarketBeta® Emerging Markets Equity ETF
The Solactive GBS Emerging Markets Large & Mid Cap Index (the “Index”) consists of equity securities of large and
mid-capitalization issuers covering approximately the largest 85% of the free-float market capitalization in emerging markets. It is
calculated as a net total return index in U.S. dollars and weighted by free-float market capitalization.
As of August 31, 2021, the Index consisted of 1,561 securities with a market capitalization range of between approximately
$25.5 million and $1,874.3 billion from issuers in the following emerging market countries: Argentina, Brazil, Chile, China,
Colombia, the Czech Republic, Egypt, Greece, Hungary, India, Indonesia, Malaysia, Mexico, Pakistan, Peru, the Philippines,
Poland, Qatar, Russia, South Africa, South Korea, Taiwan, Thailand, Turkey and the United Arab Emirates. The components of the
Index may change over time. The percentage of the portfolio exposed to any asset class, country or geographic region will vary
from time to time as the weightings of the securities within the Index change, and the Fund may not be invested in each asset class,
country or geographic region at all times. Solactive AG (“Solactive” or the “Index Provider”) will generally deem an issuer to be
located in an emerging market country if it is organized under the laws of the emerging market country and it is primarily listed in
the emerging market country; in the event that these factors point to more than one country, the Index methodology provides for
consideration of certain additional factors. The Index is reconstituted on a semi-annual basis in May and November. New securities
from initial public offerings are also added on a semi-annual basis in February and August, subject to fulfillment of certain
eligibility criteria.
Given the Fund’s investment objective of attempting to track the Index, the Fund does not follow traditional methods ofactive investment management, which may involve buying and selling securities based upon analysis of economic andmarket factors.
MarketBeta® International Equity ETF
The Solactive GBS Developed Markets ex North America Large & Mid Cap Index (the “Index”) consists of equity securities of
large and mid-capitalization issuers covering approximately the largest 85% of the free-float market capitalization in developed
markets excluding North America. It is calculated as a net total return index in U.S. dollars and weighted by free-float market
capitalization.
As of August 31, 2021, the Index consisted of 1,018 securities with a market capitalization range of between approximately
$580.0 million and $373.5 billion from issuers in the following developed market countries: Australia, Austria, Belgium, Denmark,
Finland, France, Germany, Hong Kong, Ireland, Israel, Italy, Japan, the Netherlands, New Zealand, Norway, Portugal, Singapore,
Spain, Sweden, Switzerland and the United Kingdom. The components of the Index may change over time. The percentage of the
portfolio exposed to any asset class, country or geographic region will vary from time to time as the weightings of the securities
within the Index change, and the Fund may not be invested in each asset class, country or geographic region at all times. Solactive
AG (“Solactive” or the “Index Provider”) will generally deem an issuer to be located in a developed market country if it is
organized under the laws of the developed market country and it is primarily listed in the developed market country; in the event
that these factors point to more than one country, the Index methodology provides for consideration of certain additional factors.
The Index is reconstituted on a semi-annual basis in May and November. New securities from initial public offerings are also
added on a semi-annual basis in February and August, subject to fulfillment of certain eligibility criteria.
1

I N V E S T M E N T P R O C E S S
Given the Fund’s investment objective of attempting to track the Index, the Fund does not follow traditional methods ofactive investment management, which may involve buying and selling securities based upon analysis of economic andmarket factors.
MarketBeta® U.S. Equity ETF
The Solactive GBS United States Large & Mid Cap Index (the “Index”) consists of equity securities of large and mid-capitalization
equity issuers covering approximately the largest 85% of the free-float market capitalization in the United States. It is calculated as
a total return index in U.S. dollars and weighted by free-float market capitalization.
As of August 31, 2021, the Index consisted of 529 securities with a market capitalization range of between approximately
$4.5 billion and $2,509.8 billion. The components of the Index may change over time. The percentage of the portfolio exposed to
any asset class will vary from time to time as the weightings of the securities within the Index change, and the Fund may not be
invested in each asset class at all times. Solactive AG (“Solactive” or the “Index Provider”) will deem an issuer to be a U.S. issuer
if it is organized under the laws of the U.S. and it is primarily listed in the U.S.; in the event that these factors point to more than
one country, the Index methodology provides for consideration of certain additional factors. The Index is reconstituted on a semi-
annual basis in May and November. New securities from initial public offerings are also added on a semi-annual basis in February
and August, subject to fulfillment of certain eligibility criteria.
Given the Fund’s investment objective of attempting to track the Index, the Fund does not follow traditional methods ofactive investment management, which may involve buying and selling securities based upon analysis of economic andmarket factors.
All Above Funds
Each Fund seeks to invest in the respective Index components in approximately the same weighting that such components have
within the respective Index at the applicable time. However, under various circumstances, it may not be possible or practicable to
purchase all of the securities in the respective Index in the approximate respective Index weight. In these circumstances, the Fund
may purchase a sample of securities in the respective Index. There may also be instances in which the Investment Adviser may
choose to underweight or overweight a security in each Fund’s Index, purchase securities not in each Fund’s Index that the
Investment Adviser believes are appropriate to substitute for certain securities in such Index or utilize various combinations of
other available investment techniques.
Each Index is owned and calculated by Solactive.
Each Fund is classified as “diversified” under the Investment Company Act of 1940, as amended (the “Investment Company Act”).
However, each Fund may become “non-diversified” solely as a result of a change in the relative market capitalization or index
weighting of one or more constituents of the respective Index. A non-diversified fund may invest a larger percentage of its assets in
fewer issuers than diversified funds.
Each Fund may concentrate its investments (i.e., hold more than 25% of its total assets) in a particular industry or group of
industries to the extent that the respective Index is concentrated. The degree to which components of the respective Index represent
certain sectors or industries may change over time.
* * *
At the end of the Reporting Period, i.e. August 31, 2021, we maintained conviction in our principal investment strategies, as each
Fund continues to seek to provide efficient and diversified access to approximately 85% of the broad equity market represented by
each respective Index in one portfolio.
2

P O R T F O L I O R E S U L T S
Goldman Sachs MarketBeta® Emerging MarketsEquity ETF
Investment Objective
The Goldman Sachs MarketBeta® Emerging Markets Equity ETF (the “Fund”) seeks to provide investment results that
closely correspond, before fees and expenses, to the performance of the Solactive GBS Emerging Markets Large & Mid Cap
Index (the “Index”).
Portfolio Management Discussion and AnalysisBelow, the Goldman Sachs Quantitative Investment Strategies Team discusses the Fund’s performance and positioning
for the 12-month period ended August 31, 2021 (the “Reporting Period”).
Q How did the Fund perform during the ReportingPeriod?
A During the Reporting Period, the Fund returned 19.35% based
on net asset value (“NAV”) and 18.81% based on market
price. The Index returned 19.63% during the same period.
The Fund had an NAV of $48.15 per share on August 31,
2020 and ended the Reporting Period with an NAV of $55.68
per share. The Fund’s market price on August 31, 2021 was
$55.72 per share.
Q What key factors were responsible for the Fund’sperformance during the Reporting Period?
A The Fund seeks to provide investment results that closely
correspond, before fees and expenses, to the performance of
the Index. The Fund’s performance reflects Fund expenses,
including management fees and brokerage expenses. The
Fund’s relative performance also reflects the impact of any
cash held in the Fund as well as any other differences
between the Fund’s holdings and the constituents of the
Index. The Index is unmanaged, and Index returns do not
reflect fees and expenses, which would reduce returns.
Given the Fund’s investment objective of attempting totrack the Index, the Fund does not follow traditionalmethods of active investment management, which mayinvolve buying and selling securities based upon analysisof economic and market factors. The Fund does notfollow a strategy of seeking to outperform the Index.
Q Which sectors and countries contributed most tothe Index’s performance during the ReportingPeriod, and which contributed least?
A Index constituents in the information technology, financials
and materials sectors contributed most positively to the
Index’s results during the Reporting Period. Index
constituents in the consumer discretionary, real estate and
communication services sectors contributed least to the
Index’s results during the Reporting Period.
From a country perspective, Index constituents in Taiwan,
South Korea and India contributed most to the Index’s results
during the Reporting Period. Conversely, Index constituents
in China, Hong Kong and Peru contributed least to the
Index’s results during the Reporting Period.
Q Which individual stock positions contributed themost to the Index’s returns during the ReportingPeriod?
A Positions in Taiwan-based information technology company
Taiwan Semiconductor Manufacturing, South Korea-based
information technology company Samsung Electronics and
Brazil-based materials company Vale contributed most
positively (7.17%, 4.17% and 1.03% of Fund net assets as of
August 31, 2021, respectively). Each of these holdings
posted a robust double-digit positive return within the Index
during the Reporting Period.
Q Which individual stock positions contributed theleast to the Index’s results during the ReportingPeriod?
A Positions in China-based consumer discretionary company
Alibaba Group Holding, China-based real estate company KE
Holdings and China-based communication services company
Tencent Holdings contributed least (4.15%, 0.00%1 and
4.94% of Fund net assets as of August 31, 2021, respectively).
Alibaba Group Holding and KE Holdings each posted a
double-digit negative return within the Index during the
Reporting Period. Tencent Holdings generated a single-digit
negative return within the Index during the Reporting Period.
1 Some weights are 0.00% at August 31, 2021 either because thosepositions were eliminated during the most recent rebalance given theIndex construction methodology or were not held at all during theReporting Period as they did not meet the Fund’s investment criteria.
3

P O R T F O L I O R E S U L T S
Q How did the Fund use derivatives and similarinstruments during the Reporting Period?
A The Fund does not employ derivatives as a source of alpha
generation, although it did use index futures to equitize
excess cash. The use of futures was not material to the
performance of the Fund during the Reporting Period.
Q What was the Fund’s sector positioning relativeto the Index at the end of the Reporting Period?2
Sector Name Fund3SolactiveIndex
Information Technology 20.73% 20.46%Financials 19.72 19.86Consumer Discretionary 15.18 15.14Communication Services 11.06 10.73Materials 9.05 8.77Consumer Staples 5.86 5.85Energy 5.51 5.32Industrials 5.29 5.52Health Care 4.31 4.44Real Estate 1.21 1.73Utilities 1.99 2.18
Q What was the Fund’s country positioning relativeto the Index at the end of the Reporting Period?2
Country Name Fund3SolactiveIndex
Cayman Islands 19.99% 21.39%Taiwan 15.77 14.72Korea 12.71 12.70China 9.76 11.01India 13.18 12.42Brazil 5.40 5.21South Africa 3.35 3.18Saudi Arabia 3.53 3.24Russia 2.99 2.96Thailand 1.63 1.93Mexico 2.18 2.02Indonesia 1.41 1.39Hong Kong 0.90 0.91Malaysia 1.13 1.05Qatar 0.81 0.74United Arab Emirates 1.11 1.02Philippines 0.74 0.67Turkey 0.56 0.59Kuwait 0.61 0.57Chile 0.44 0.50Bermuda 0.19 0.31Netherlands 0.32 0.29Greece 0.26 0.26Hungary 0.29 0.26Colombia 0.19 0.17Egypt 0.10 0.10Luxembourg 0.05 0.05Czech Republic 0.13 0.12Jersey 0.09 0.10Pakistan 0.05 0.05Argentina 0.04 0.04Singapore 0.02 0.02Panama 0.00 0.01Peru 0.00 0.00Virgin Islands, British 0.00 0.01Cyprus 0.00 0.00Australia 0.00 0.00
2 Country and sector classifications for securities may differ betweenthe above listing and the Schedule of Investments due to differingclassification methodologies. The classification methodology usedfor the above listing is as set forth by Solactive. The Fund’scomposition may differ over time. Consequently, the Fund’s overallsector allocations may differ from percentages contained in the chartabove. The percentage shown for each investment category reflectsthe value of investments in that category as a percentage of marketvalue (excluding investment in the securities lending reinvestmentvehicle, if any). Underlying sector allocation of exchange-tradedfunds held by the Fund are not reflected in the chart above. Countryclassification in this listing is based on the country of incorporationrather than being based on country of domicile or country of highestrevenue. Investments in the securities lending vehicle represented1.57% of the Fund’s net assets as of August 31, 2021. Figures abovemay not sum to 100% due to rounding due to the presence of cash.
3 The Fund seeks to provide investment results that closelycorrespond, before fees and expenses, to the performance of theSolactive GBS Emerging Markets Large & Mid Cap Index.
4

F U N D B A S I C S
MarketBeta® Emerging Markets Equity ETFas of August 31, 2021
F U N D S N A P S H O T
As of August 31, 2021
Market Price1 $55.72Net Asset Value (NAV)1 $55.68
1 The Market Price is the price at which the Fund’s shares are trading on the NYSE Arca, Inc. The Market Price of the Fund’s shareswill fluctuate and, at the time of sale, shares may be worth more or less than the original investment or the Fund’s then current netasset value (“NAV”). The NAV is the market value of one share of the Fund. This amount is derived by dividing the total value ofall the securities in the Fund’s portfolio, plus other assets, less any liabilities, by the number of Fund shares outstanding. Fundshares are not individually redeemable and are issued and redeemed by the Fund at their NAV only in large, specified blocks ofshares called creation units. Shares otherwise can be bought and sold only through exchange trading at market price (not NAV).Shares may trade at a premium or discount to their NAV in the secondary market. Information regarding how often shares ofeach Fund traded on NYSE Arca at a price above (i.e., at a premium) or below (i.e., at a discount) the NAV of the Fund canbe found at www.GSAMFUNDS.com/ETFs.
T O P 1 0 H O L D I N G S A S O F 8 / 3 1 / 2 1 2
Holding % of Net Assets Line of Business Country
Taiwan Semiconductor Manufacturing Co. Ltd. 6.6% Information Technology Taiwan
Tencent Holdings Ltd. 4.5 Communication Services China
Samsung Electronics Co. Ltd. 3.8 Information Technology South Korea
Alibaba Group Holding Ltd. ADR 3.8 Consumer Discretionary China
Meituan, Class B 1.6 Consumer Discretionary China
iShares MSCI Malaysia ETF 1.0 Exchange-Traded Fund United States
Reliance Industries Ltd. 1.0 Energy India
Infosys Ltd. 1.0 Information Technology India
Vale SA 1.0 Materials BrazilNaspers Ltd., Class N 0.9 Consumer Discretionary South Africa
2 The top 10 holdings may not be representative of the Fund’s future investments.
For more information about the Fund, please refer to www.GSAMFUNDS.com/ETFs. There, you can learn more about the Fund’s
investment strategies, holdings, and performance.
5

M A R K E T B E T A® E M E R G I N G M A R K E T S E Q U I T Y E T F
Performance SummaryAugust 31, 2021
The following graph shows the value, as of August 31, 2021, of a $10,000 investment made on May 12, 2020 (commencement of
operations) in Shares at NAV. For comparative purposes, the performance of the Fund’s underlying index, the Solactive GBS
Emerging Markets Large & Mid Cap Index, is shown. Performance reflects applicable fee waivers and/or expense limitations in
effect during the periods shown and in their absence, performance would be reduced. Returns do not reflect the deduction of taxes
that a shareholder would pay on Fund distributions or the sale of Fund shares. In addition to the performance of constituents of the
underlying index, other factors may affect Fund performance. These factors include, but are not limited to, Fund operating fees and
expenses, portfolio turnover and creation and redemption in-kind transactions. The returns set forth below represent pastperformance. Past performance does not guarantee future results. The Fund’s NAV and investment return may fluctuate.These fluctuations may cause an investor’s shares to be worth more or less than their original cost. Current performancemay be lower or higher than the performance quoted below. Please visit our web site at www.GSAMFUNDS.com/ETFs toobtain the most recent month-end returns.
MarketBeta® Emerging Markets Equity ETF’s Lifetime Performance
Performance of a $10,000 Investment, with distributions reinvested, from May 12, 2020 through August 31, 2021.
$8,000
$16,000
$14,000
$12,000
$10,000
$14,602$14,506
5/12/20 2/2112/2010/206/20 8/20 8/216/214/21
Shares based on NAV
Solactive GBS Emerging Markets Large & Mid Cap Index
Average Annual Total Return through August 31, 2021* One Year Since Inception
Shares based on NAV (Commenced May 12, 2020) 19.35% 33.01%
Shares based on Market Price (Commenced May 12, 2020) 18.81% 33.03%
Solactive GBS Emerging Markets Large & Mid Cap Index 19.63% 33.68%
* Total returns are calculated assuming purchase of a share at the market price or NAV on the first day and sale of a share at the market price orNAV on the last day of each period reported. The Total Returns based on NAV and Market Price assume the reinvestment of dividends and donot reflect brokerage commissions in connection with the purchase or sale of Fund shares, which if included would lower the performanceshown above. The NAV used in the Total Return calculation assumes all management fees and operating expenses incurred by the Fund.Market Price returns are based upon the last trade as of 4:00 pm EST and do not reflect the returns you would receive if you traded shares atother times. The first day of secondary market trading is typically several days after the date on which the Fund commenced investmentoperations; therefore, the NAV of the Fund is used as a proxy for the period from inception of investment operations to the first day ofsecondary market trading to calculate the Market Price returns.
6
P O R T F O L I O R E S U L T S
Goldman Sachs MarketBeta® InternationalEquity ETF
Investment Objective
The Goldman Sachs MarketBeta® International Small Cap Equity ETF (the “Fund”) seeks to provide investment results that
closely correspond, before fees and expenses, to the performance of the Solactive GBS Developed Markets ex North America
Large & Mid Cap Index (the “Index”).
Portfolio Management Discussion and AnalysisBelow, the Goldman Sachs Quantitative Investment Strategies Team discusses the Fund’s performance and positioning
for the 12-month period ended August 31, 2021 (the “Reporting Period”).
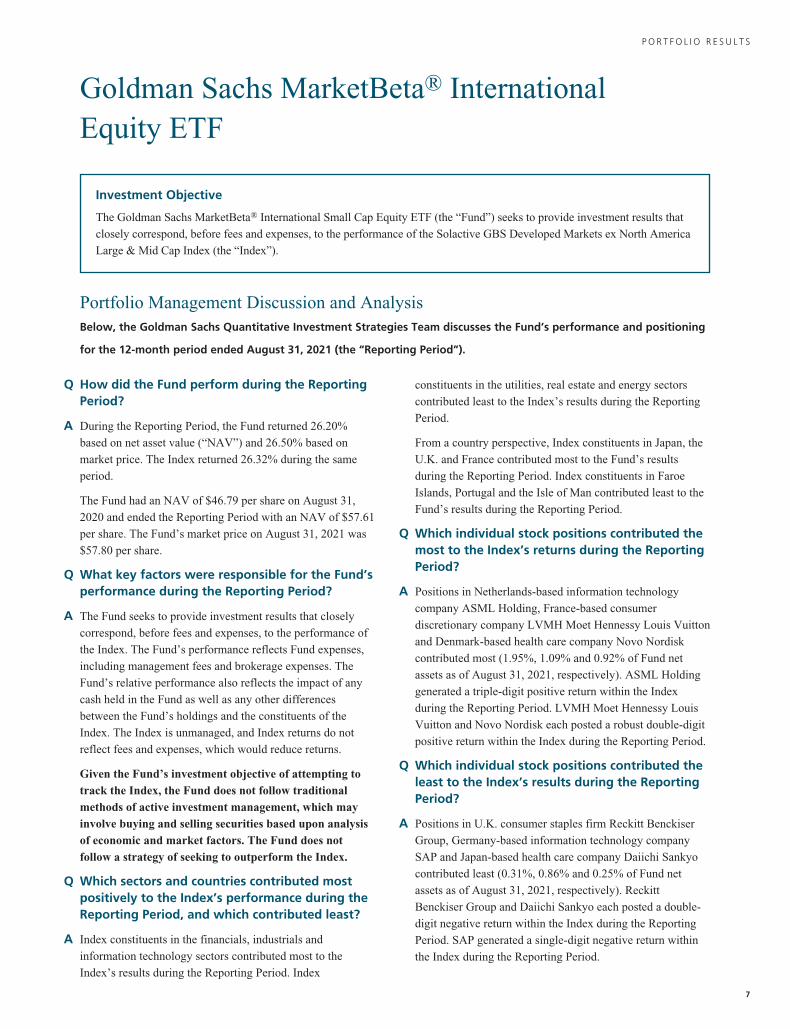
Q How did the Fund perform during the ReportingPeriod?
A During the Reporting Period, the Fund returned 26.20%
based on net asset value (“NAV”) and 26.50% based on
market price. The Index returned 26.32% during the same
period.
The Fund had an NAV of $46.79 per share on August 31,
2020 and ended the Reporting Period with an NAV of $57.61
per share. The Fund’s market price on August 31, 2021 was
$57.80 per share.
Q What key factors were responsible for the Fund’sperformance during the Reporting Period?
A The Fund seeks to provide investment results that closely
correspond, before fees and expenses, to the performance of
the Index. The Fund’s performance reflects Fund expenses,
including management fees and brokerage expenses. The
Fund’s relative performance also reflects the impact of any
cash held in the Fund as well as any other differences
between the Fund’s holdings and the constituents of the
Index. The Index is unmanaged, and Index returns do not
reflect fees and expenses, which would reduce returns.
Given the Fund’s investment objective of attempting totrack the Index, the Fund does not follow traditionalmethods of active investment management, which mayinvolve buying and selling securities based upon analysisof economic and market factors. The Fund does notfollow a strategy of seeking to outperform the Index.
Q Which sectors and countries contributed mostpositively to the Index’s performance during theReporting Period, and which contributed least?
A Index constituents in the financials, industrials and
information technology sectors contributed most to the
Index’s results during the Reporting Period. Index
constituents in the utilities, real estate and energy sectors
contributed least to the Index’s results during the Reporting
Period.
From a country perspective, Index constituents in Japan, the
U.K. and France contributed most to the Fund’s results
during the Reporting Period. Index constituents in Faroe
Islands, Portugal and the Isle of Man contributed least to the
Fund’s results during the Reporting Period.
Q Which individual stock positions contributed themost to the Index’s returns during the ReportingPeriod?
A Positions in Netherlands-based information technology
company ASML Holding, France-based consumer
discretionary company LVMH Moet Hennessy Louis Vuitton
and Denmark-based health care company Novo Nordisk
contributed most (1.95%, 1.09% and 0.92% of Fund net
assets as of August 31, 2021, respectively). ASML Holding
generated a triple-digit positive return within the Index
during the Reporting Period. LVMH Moet Hennessy Louis
Vuitton and Novo Nordisk each posted a robust double-digit
positive return within the Index during the Reporting Period.
Q Which individual stock positions contributed theleast to the Index’s results during the ReportingPeriod?
A Positions in U.K. consumer staples firm Reckitt Benckiser
Group, Germany-based information technology company
SAP and Japan-based health care company Daiichi Sankyo
contributed least (0.31%, 0.86% and 0.25% of Fund net
assets as of August 31, 2021, respectively). Reckitt
Benckiser Group and Daiichi Sankyo each posted a double-
digit negative return within the Index during the Reporting
Period. SAP generated a single-digit negative return within
the Index during the Reporting Period.
7
P O R T F O L I O R E S U L T S
Q How did the Fund use derivatives and similarinstruments during the Reporting Period?
A The Fund does not employ derivatives as a source of alpha
generation, although it did use index futures to equitize
excess cash. The use of futures was not material to the
performance of the Fund during the Reporting Period.
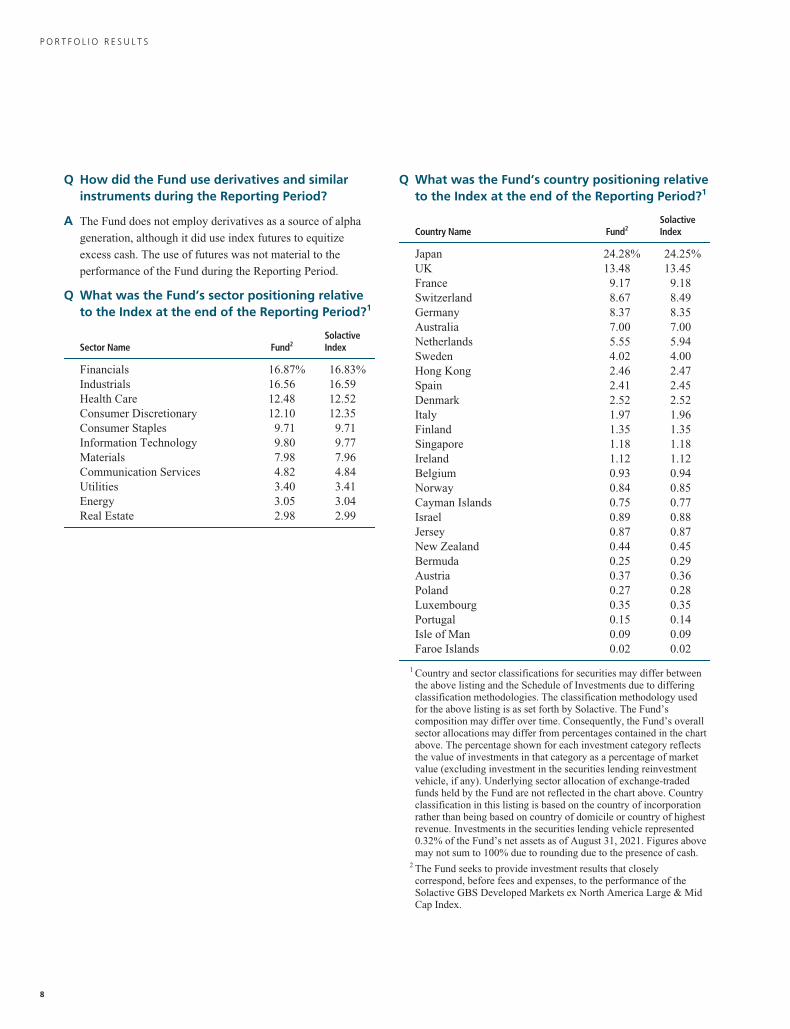
Q What was the Fund’s sector positioning relativeto the Index at the end of the Reporting Period?1
Sector Name Fund2SolactiveIndex
Financials 16.87% 16.83%Industrials 16.56 16.59Health Care 12.48 12.52Consumer Discretionary 12.10 12.35Consumer Staples 9.71 9.71Information Technology 9.80 9.77Materials 7.98 7.96Communication Services 4.82 4.84Utilities 3.40 3.41Energy 3.05 3.04Real Estate 2.98 2.99
Q What was the Fund’s country positioning relativeto the Index at the end of the Reporting Period?1
Country Name Fund2SolactiveIndex
Japan 24.28% 24.25%UK 13.48 13.45France 9.17 9.18Switzerland 8.67 8.49Germany 8.37 8.35Australia 7.00 7.00Netherlands 5.55 5.94Sweden 4.02 4.00Hong Kong 2.46 2.47Spain 2.41 2.45Denmark 2.52 2.52Italy 1.97 1.96Finland 1.35 1.35Singapore 1.18 1.18Ireland 1.12 1.12Belgium 0.93 0.94Norway 0.84 0.85Cayman Islands 0.75 0.77Israel 0.89 0.88Jersey 0.87 0.87New Zealand 0.44 0.45Bermuda 0.25 0.29Austria 0.37 0.36Poland 0.27 0.28Luxembourg 0.35 0.35Portugal 0.15 0.14Isle of Man 0.09 0.09Faroe Islands 0.02 0.02
1 Country and sector classifications for securities may differ betweenthe above listing and the Schedule of Investments due to differingclassification methodologies. The classification methodology usedfor the above listing is as set forth by Solactive. The Fund’scomposition may differ over time. Consequently, the Fund’s overallsector allocations may differ from percentages contained in the chartabove. The percentage shown for each investment category reflectsthe value of investments in that category as a percentage of marketvalue (excluding investment in the securities lending reinvestmentvehicle, if any). Underlying sector allocation of exchange-tradedfunds held by the Fund are not reflected in the chart above. Countryclassification in this listing is based on the country of incorporationrather than being based on country of domicile or country of highestrevenue. Investments in the securities lending vehicle represented0.32% of the Fund’s net assets as of August 31, 2021. Figures abovemay not sum to 100% due to rounding due to the presence of cash.
2 The Fund seeks to provide investment results that closelycorrespond, before fees and expenses, to the performance of theSolactive GBS Developed Markets ex North America Large & MidCap Index.
8

F U N D B A S I C S
MarketBeta® International Equity ETFas of August 31, 2021
F U N D S N A P S H O T
As of August 31, 2021
Market Price1 $57.80Net Asset Value (NAV)1 $57.61
1 The Market Price is the price at which the Fund’s shares are trading on the NYSE Arca, Inc. The Market Price of the Fund’s shareswill fluctuate and, at the time of sale, shares may be worth more or less than the original investment or the Fund’s then current netasset value (“NAV”). The NAV is the market value of one share of the Fund. This amount is derived by dividing the total value ofall the securities in the Fund’s portfolio, plus other assets, less any liabilities, by the number of Fund shares outstanding. Fundshares are not individually redeemable and are issued and redeemed by the Fund at their NAV only in large, specified blocks ofshares called creation units. Shares otherwise can be bought and sold only through exchange trading at market price (not NAV).Shares may trade at a premium or discount to their NAV in the secondary market. Information regarding how often shares ofeach Fund traded on NYSE Arca at a price above (i.e., at a premium) or below (i.e., at a discount) the NAV of the Fund canbe found at www.GSAMFUNDS.com/ETFs.
T O P 1 0 H O L D I N G S A S O F 8 / 3 1 / 2 1 2
Holding % of Net Assets Line of Business Country
ASML Holding NV 1.9% Information Technology NetherlandsNestle SA 1.9 Consumer Staples SwitzerlandRoche Holding AG 1.6 Health Care Switzerland
Novartis AG 1.2 Health Care SwitzerlandToyota Motor Corp. 1.1 Consumer Discretionary JapanLVMH Moet Hennessy Louis Vuitton SE 1.1 Consumer Discretionary FranceNovo Nordisk A/S, Class B 0.9 Health Care Denmark
SAP SE 0.9 Information Technology GermanyAstraZeneca PLC 0.8 Health Care United KingdomAIA Group Ltd. 0.8 Financials Hong Kong
2 The top 10 holdings may not be representative of the Fund’s future investments.
For more information about the Fund, please refer to www.GSAMFUNDS.com/ETFs. There, you can learn more about the Fund’s
investment strategies, holdings, and performance.
9
M A R K E T B E T A® I N T E R N A T I O N A L E Q U I T Y E T F
Performance SummaryAugust 31, 2021
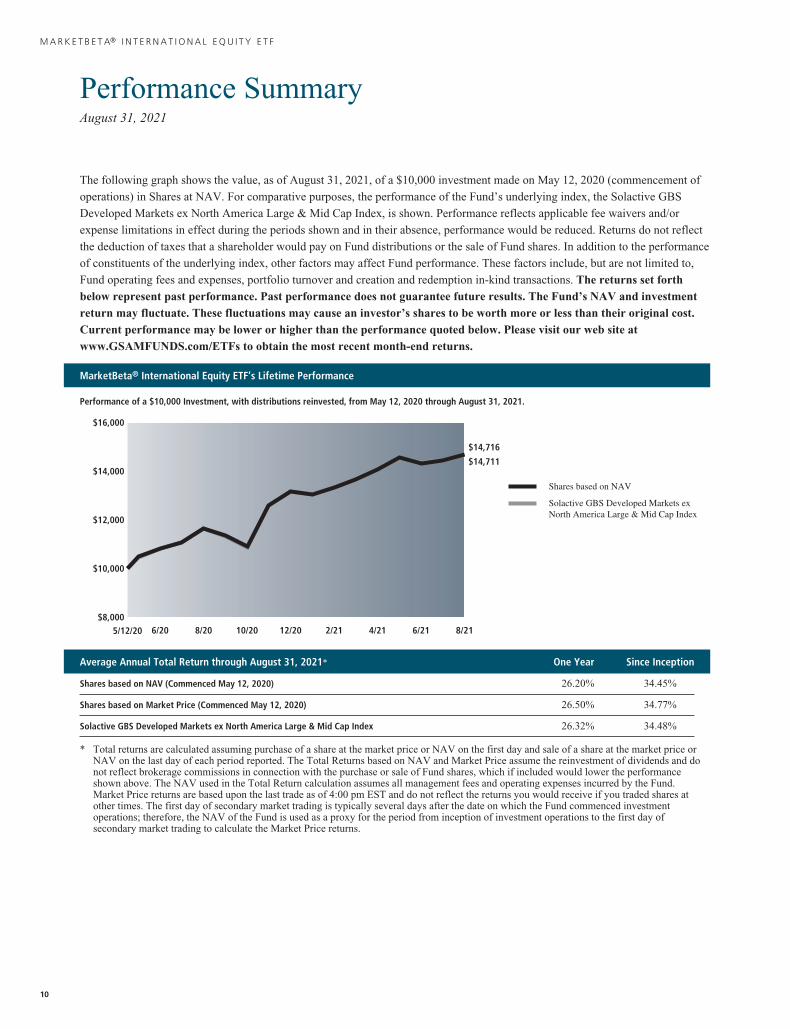
The following graph shows the value, as of August 31, 2021, of a $10,000 investment made on May 12, 2020 (commencement of
operations) in Shares at NAV. For comparative purposes, the performance of the Fund’s underlying index, the Solactive GBS
Developed Markets ex North America Large & Mid Cap Index, is shown. Performance reflects applicable fee waivers and/or
expense limitations in effect during the periods shown and in their absence, performance would be reduced. Returns do not reflect
the deduction of taxes that a shareholder would pay on Fund distributions or the sale of Fund shares. In addition to the performance
of constituents of the underlying index, other factors may affect Fund performance. These factors include, but are not limited to,
Fund operating fees and expenses, portfolio turnover and creation and redemption in-kind transactions. The returns set forthbelow represent past performance. Past performance does not guarantee future results. The Fund’s NAV and investmentreturn may fluctuate. These fluctuations may cause an investor’s shares to be worth more or less than their original cost.Current performance may be lower or higher than the performance quoted below. Please visit our web site atwww.GSAMFUNDS.com/ETFs to obtain the most recent month-end returns.
MarketBeta® International Equity ETF’s Lifetime Performance
Performance of a $10,000 Investment, with distributions reinvested, from May 12, 2020 through August 31, 2021.
$8,000
$10,000
$12,000
$14,000
$16,000
$14,716
$14,711
5/12/20 2/2112/2010/206/20 8/20 8/216/214/21
Shares based on NAV
Solactive GBS Developed Markets ex North America Large & Mid Cap Index
Average Annual Total Return through August 31, 2021* One Year Since Inception
Shares based on NAV (Commenced May 12, 2020) 26.20% 34.45%
Shares based on Market Price (Commenced May 12, 2020) 26.50% 34.77%
Solactive GBS Developed Markets ex North America Large & Mid Cap Index 26.32% 34.48%
* Total returns are calculated assuming purchase of a share at the market price or NAV on the first day and sale of a share at the market price orNAV on the last day of each period reported. The Total Returns based on NAV and Market Price assume the reinvestment of dividends and donot reflect brokerage commissions in connection with the purchase or sale of Fund shares, which if included would lower the performanceshown above. The NAV used in the Total Return calculation assumes all management fees and operating expenses incurred by the Fund.Market Price returns are based upon the last trade as of 4:00 pm EST and do not reflect the returns you would receive if you traded shares atother times. The first day of secondary market trading is typically several days after the date on which the Fund commenced investmentoperations; therefore, the NAV of the Fund is used as a proxy for the period from inception of investment operations to the first day ofsecondary market trading to calculate the Market Price returns.
10

P O R T F O L I O R E S U L T S
Goldman Sachs MarketBeta® U.S. Equity ETF
Investment Objective
The Goldman Sachs MarketBeta® U.S. Equity ETF (the “Fund”) seeks to provide investment results that closely correspond,
before fees and expenses, to the performance of the Solactive GBS United States Large & Mid Cap Index (the “Index”).
Portfolio Management Discussion and AnalysisBelow, the Goldman Sachs Quantitative Investment Strategies Team discusses the Fund’s performance and positioning
for the 12-month period ended August 31, 2021 (the “Reporting Period”).
Q How did the Fund perform during the ReportingPeriod?
A During the Reporting Period, the Fund returned 31.60%
based on net asset value (“NAV”) and 31.45% based on
market price. The Index returned 31.71% during the same
period.
The Fund had an NAV of $48.62 per share on August 31,
2020 and ended the Reporting Period with an NAV of $63.07
per share. The Fund’s market price on August 31, 2021 was
$63.09 per share.
Q What key factors were responsible for the Fund’sperformance during the Reporting Period?
A The Fund seeks to provide investment results that closely
correspond, before fees and expenses, to the performance of
the Index. The Fund’s performance reflects Fund expenses,
including management fees and brokerage expenses. The
Fund’s relative performance also reflects the impact of any
cash held in the Fund as well as any other differences
between the Fund’s holdings and the constituents of the
Index. The Index is unmanaged, and Index returns do not
reflect fees and expenses, which would reduce returns.
Given the Fund’s investment objective of attempting totrack the Index, the Fund does not follow traditionalmethods of active investment management, which mayinvolve buying and selling securities based upon analysisof economic and market factors. The Fund does notfollow a strategy of seeking to outperform the Index.
Q Which sectors contributed most positively to theIndex’s relative performance during theReporting Period, and which contributed least?
A Index constituents in the information technology, financials
and communication services sectors contributed most to the
Index’s results during the Reporting Period. Index
constituents in the utilities, materials and real estate sectors
contributed least to the Index’s results during the Reporting
Period.
Q Which individual stock positions contributed themost to the Index’s returns during the ReportingPeriod?
A Positions in communication services company Alphabet,
software leader Microsoft and information technology giant
Apple contributed most (4.23%, 5.69% and 6.42% of Fund
net assets as of August 31, 2021, respectively). Each of these
holdings posted a double-digit positive return within the
Index during the Reporting Period.
Q Which individual stock positions contributed theleast to the Index’s results during the ReportingPeriod?
A Positions in pharmaceuticals company Vertex
Pharmaceuticals, payment services provider Fidelity National
Information Services and biotechnology medicines company
Amgen contributed least (0.00%1, 0.20% and 0.33% of Fund
net assets as of August 31, 2021, respectively). Each of these
holdings generated a negative return within the Index during
the Reporting Period.
Q How did the Fund use derivatives and similarinstruments during the Reporting Period?
A The Fund does not employ derivatives as a source of alpha
generation, although it did use index futures to equitize
excess cash. The use of futures was not material to the
performance of the Fund during the Reporting Period.
1 Some weights are 0.00% at August 31, 2021 either because thosepositions were eliminated during the most recent rebalance given theIndex construction methodology or were not held at all during theReporting Period as they did not meet the Fund’s investment criteria.
11

P O R T F O L I O R E S U L T S
Q What was the Fund’s sector positioning relativeto the Index at the end of the Reporting Period?2
Sector Name Fund3SolactiveIndex
Information Technology 29.37% 29.37%Health Care 12.99 13.09Consumer Discretionary 12.11 12.13Communication Services 11.72 11.69Financials 10.69 10.66Industrials 7.91 7.89Consumer Staples 5.64 5.63Utilities 2.40 2.39Materials 2.37 2.37Real Estate 2.55 2.55Energy 2.24 2.23
2 Sector classifications for securities may differ between the abovelisting and the Schedule of Investments due to differing classificationmethodologies. The classification methodology used for the abovelisting is as set forth by Solactive. The Fund’s composition maydiffer over time. Consequently, the Fund’s overall sector allocationsmay differ from percentages contained in the chart above. Thepercentage shown for each investment category reflects the value ofinvestments in that category as a percentage of market value(excluding investment in the securities lending reinvestment vehicle,if any). Underlying sector allocation of exchange-traded funds heldby the Fund are not reflected in the chart above. Investments in thesecurities lending vehicle represented 0.12% of the Fund’s net assetsas of August 31, 2021. Figures above may not sum to 100% due torounding due to the presence of cash.
3 The Fund seeks to provide investment results that closelycorrespond, before fees and expenses, to the performance of theSolactive GBS United States Large & Mid Cap Index.
12

F U N D B A S I C S
MarketBeta® U.S. Equity ETFas of August 31, 2021
F U N D S N A P S H O T
As of August 31, 2020
Market Price1 $63.09Net Asset Value (NAV)1 $63.07
1 The Market Price is the price at which the Fund’s shares are trading on the NYSE Arca, Inc. The Market Price of the Fund’s shareswill fluctuate and, at the time of sale, shares may be worth more or less than the original investment or the Fund’s then current netasset value (“NAV”). The NAV is the market value of one share of the Fund. This amount is derived by dividing the total value ofall the securities in the Fund’s portfolio, plus other assets, less any liabilities, by the number of Fund shares outstanding. Fundshares are not individually redeemable and are issued and redeemed by the Fund at their NAV only in large, specified blocks ofshares called creation units. Shares otherwise can be bought and sold only through exchange trading at market price (not NAV).Shares may trade at a premium or discount to their NAV in the secondary market. Information regarding how often shares ofeach Fund traded on NYSE Arca at a price above (i.e., at a premium) or below (i.e., at a discount) the NAV of the Fund canbe found at www.GSAMFUNDS.com/ETFs.
T O P 1 0 H O L D I N G S A S O F 8 / 3 1 / 2 1 2
Holding % of Net Assets Line of Business Country
Apple, Inc. 6.4% Information Technology United StatesMicrosoft Corp. 5.7 Information Technology United StatesAmazon.com, Inc. 3.8 Consumer Discretionary United States
Facebook, Inc., Class A 2.3 Communication Services United StatesAlphabet, Inc., Class A 2.2 Communication Services United StatesAlphabet, Inc., Class C 2.0 Communication Services United StatesTesla, Inc. 1.4 Consumer Discretionary United States
NVIDIA Corp. 1.4 Information Technology United StatesJPMorgan Chase & Co. 1.2 Financials United StatesJohnson & Johnson 1.2 Health Care United States
2 The top 10 holdings may not be representative of the Fund’s future investments.
For more information about the Fund, please refer to www.GSAMFUNDS.com/ETFs. There, you can learn more about the Fund’s
investment strategies, holdings, and performance.
13

M A R K E T B E T A® U . S . E Q U I T Y E T F
Performance SummaryAugust 31, 2021
The following graph shows the value, as of August 31, 2021, of a $10,000 investment made on May 12, 2020 (commencement of
operations) in Shares at NAV. For comparative purposes, the performance of the Fund’s underlying index, the Solactive GBS
United States Large & Mid Cap Index, is shown. Performance reflects applicable fee waivers and/or expense limitations in effect
during the periods shown and in their absence, performance would be reduced. Returns do not reflect the deduction of taxes that a
shareholder would pay on Fund distributions or the sale of Fund shares. In addition to the performance of constituents of the
underlying index, other factors may affect Fund performance. These factors include, but are not limited to, Fund operating fees and
expenses, portfolio turnover and creation and redemption in-kind transactions. The returns set forth below represent pastperformance. Past performance does not guarantee future results. The Fund’s NAV and investment return may fluctuate.These fluctuations may cause an investor’s shares to be worth more or less than their original cost. Current performancemay be lower or higher than the performance quoted below. Please visit our web site at www.GSAMFUNDS.com/ETFs toobtain the most recent month-end returns.
MarketBeta® U.S. Equity ETF’s Lifetime Performance
Performance of a $10,000 Investment, with distributions reinvested, from May 12, 2020 through August 31, 2021.
$8,000
$10,000
$12,000
$14,000
$18,000
$16,000
$16,345
$16,323
5/12/20 2/2112/2010/206/20 8/20 8/216/214/21
Shares based on NAV
Solactive GBS United States Large & Mid Cap Index
Average Annual Total Return through August 31, 2021* One Year Since Inception
Shares based on NAV (Commenced May 12, 2020) 31.60% 45.60%
Shares based on Market Price (Commenced May 12, 2020) 31.45% 45.64%
Solactive GBS United States Large & Mid Cap Index 31.71% 45.76%
* Total returns are calculated assuming purchase of a share at the market price or NAV on the first day and sale of a share at the market price orNAV on the last day of each period reported. The Total Returns based on NAV and Market Price assume the reinvestment of dividends and donot reflect brokerage commissions in connection with the purchase or sale of Fund shares, which if included would lower the performanceshown above. The NAV used in the Total Return calculation assumes all management fees and operating expenses incurred by the Fund.Market Price returns are based upon the last trade as of 4:00 pm EST and do not reflect the returns you would receive if you traded shares atother times. The first day of secondary market trading is typically several days after the date on which the Fund commenced investmentoperations; therefore, the NAV of the Fund is used as a proxy for the period from inception of investment operations to the first day ofsecondary market trading to calculate the Market Price returns.
14

F U N D B A S I C S
Index Definitions and Industry Terms
Book Value: The total value of the company’s assets that shareholders would theoretically receive if a company were liquidated.
Free Cash Flow: A measure of financial performance calculated as operating cash flow minus capital expenditures.
Alpha: The excess returns of a fund relative to the return of a benchmark index is the fund’s alpha.
The Solactive GBS Emerging Markets Large & Mid Cap Index, Solactive GBS Developed Markets ex North America Large &
Mid Cap Index, and Solactive GBS United States Large & Mid Cap Index (the, “Solactive Indexes”) are calculated and published
by Solactive AG. Solactive AG uses its best efforts to ensure that the Solactive Indexes are calculated correctly. Irrespective of its
obligations towards the Funds, Solactive AG has no obligation to point out errors in the Solactive Indexes to third parties including
but not limited to investors and/or financial intermediaries of the Funds. Neither publication of the Solactive Indexes by Solactive
AG nor the licensing of the Solactive Indexes or Index trade mark for the purpose of use in connection with a Fund constitutes a
recommendation by Solactive AG to invest capital in said fund nor does it in any way represent an assurance or opinion of
Solactive AG with regard to any investment in this fund. Solactive AG is registered as a benchmark administrator under the
Regulation (EU) 2016/2011 (BMR). Solactive appears on the ESMA register of administrators.
15

G O L D M A N S A C H S M A R K E T B E T A® E M E R G I N G M A R K E T S E Q U I T Y E T F
Schedule of InvestmentsAugust 31, 2021
Shares Description Value
Common Stocks – 89.1%
Argentina – 0.0%328 Grupo Financiero Galicia SA ADR
(Financials) $ 3,536235 Pampa Energia SA ADR (Utilities)* 4,279918 YPF SA ADR (Energy)* 4,783
12,598
Brazil – 4.0%527 Adecoagro SA (Consumer Staples)* 4,927
19,494 Ambev SA (Consumer Staples) 65,1131,840 Atacadao SA (Consumer Staples) 6,523
26,987 B3 SA – Brasil Bolsa Balcao (Financials) 74,1686,295 Banco Bradesco SA (Financials) 24,5186,571 Banco BTG Pactual SA (Financials) 36,2723,849 Banco do Brasil SA (Financials) 22,8781,542 Banco Santander Brasil SA (Financials) 12,6323,022 BB Seguridade Participacoes SA
(Financials) 11,2512,439 BRF SA (Consumer Staples)* 11,1574,995 CCR SA (Industrials) 11,9521,812 Centrais Eletricas Brasileiras SA (Utilities) 13,3191,021 Cia Energetica de Minas Gerais (Utilities) 3,3292,877 Cia Siderurgica Nacional SA (Materials) 19,5903,778 Cosan SA (Energy) 16,272
894 CPFL Energia SA (Utilities) 5,0711,129 Energisa SA (Utilities) 9,7854,342 Eneva SA (Utilities)* 13,290
778 Engie Brasil Energia SA (Utilities) 5,7063,689 Equatorial Energia SA (Utilities) 18,3395,731 Hapvida Participacoes e Investimentos SA
(Health Care)(a) 16,4781,808 Hypera SA (Health Care) 12,5622,016 Itau Unibanco Holding SA (Financials) 11,2743,585 Klabin SA (Materials)* 18,4242,660 Localiza Rent a Car SA (Industrials) 28,8163,970 Lojas Renner SA (Consumer
Discretionary) 29,51412,005 Magazine Luiza SA (Consumer
Discretionary) 42,7721,319 Multiplan Empreendimentos Imobiliarios
SA (Real Estate) 5,4363,921 Natura & Co. Holding SA (Consumer
Staples)* 39,5351,079 Neoenergia SA (Utilities) 3,5032,420 Notre Dame Intermedica Participacoes SA
(Health Care) 37,787892 Pagseguro Digital Ltd., Class A
(Information Technology)* 53,0473,260 Petrobras Distribuidora SA (Consumer
Discretionary) 17,31416,331 Petroleo Brasileiro SA (Energy) 89,063
446 Porto Seguro SA (Financials) 4,9805,136 Raia Drogasil SA (Consumer Staples) 25,6423,427 Rede D’Or Sao Luiz SA (Health Care)(a) 46,0685,633 Rumo SA (Industrials)* 20,5973,530 Sendas Distribuidora SA (Consumer
Staples) 11,591
Shares Description Value
Common Stocks – (continued)
Brazil – (continued)920 StoneCo Ltd., Class A (Information
Technology)* $ 42,8173,522 Suzano SA (Materials)* 41,9651,977 Telefonica Brasil SA (Communication
Services) 16,8873,620 TIM SA (Communication Services) 8,8103,539 Ultrapar Participacoes SA (Energy) 9,982
17,784 Vale SA (Materials) 342,7896,712 WEG SA (Industrials) 46,621
657 XP, Inc., Class A (Financials)* 31,963
1,442,329
Chile – 0.3%193,627 Banco de Chile (Financials) 18,894
269 Banco de Credito e Inversiones SA(Financials) 11,636
276,927 Banco Santander Chile (Financials) 14,6125,992 Cencosud SA (Consumer Staples) 11,289
559 Cia Cervecerias Unidas SA (ConsumerStaples) 5,634
34,455 Colbun SA (Utilities) 5,6954,755 Empresas CMPC SA (Materials) 10,5471,764 Empresas COPEC SA (Energy) 16,3873,401 Falabella SA (Consumer Discretionary) 13,451
108,145
China – 27.7%153 51job, Inc. ADR (Industrials)* 11,750
2,920 AAC Technologies Holdings, Inc.(Information Technology) 16,276
716 AECC Aviation Power Co. Ltd., Class A(Industrials) 7,555
4,387 Agile Group Holdings Ltd. (Real Estate) 5,03220,354 Agricultural Bank of China Ltd., Class A
(Financials) 9,338126,657 Agricultural Bank of China Ltd., Class H
(Financials) 42,5051,408 Aier Eye Hospital Group Co. Ltd.,
Class A (Health Care) 9,2091,753 Air China Ltd., Class A (Industrials)* 1,9678,122 Air China Ltd., Class H (Industrials)* 5,451
506 Airtac International Group (Industrials) 15,4288,260 Alibaba Group Holding Ltd. ADR
(Consumer Discretionary)* 1,379,3374,025 Aluminum Corp. of China Ltd., Class A
(Materials)* 4,86616,858 Aluminum Corp. of China Ltd., Class H
(Materials)* 12,2251,493 Angang Steel Co. Ltd., Class A
(Materials) 1,3196,320 Angang Steel Co. Ltd., Class H
(Materials) 4,835262 Angel Yeast Co. Ltd., Class A (Consumer
Staples) 1,627264 Anhui Gujing Distillery Co. Ltd., Class A
(Consumer Staples) 8,675
16 The accompanying notes are an integral part of these financial statements.

G O L D M A N S A C H S M A R K E T B E T A® E M E R G I N G M A R K E T S E Q U I T Y E T F
Shares Description Value
Common Stocks – (continued)
China – (continued)130 Anhui Kouzi Distillery Co. Ltd., Class A
(Consumer Staples) $ 9975,005 ANTA Sports Products Ltd. (Consumer
Discretionary) 102,96665 Asymchem Laboratories Tianjin Co. Ltd.,
Class A (Health Care) 3,526341 Avary Holding Shenzhen Co. Ltd.,
Class A (Information Technology) 1,6751,056 AVIC Electromechanical Systems Co.
Ltd., Class A (Industrials) 2,2912,727 AVIC Industry-Finance Holdings Co.
Ltd., Class A (Financials) 1,6741,257 Baidu, Inc. ADR (Communication
Services)* 197,3746,042 Bank of Beijing Co. Ltd., Class A
(Financials) 4,0641,104 Bank of Chengdu Co. Ltd., Class A
(Financials) 2,0729,777 Bank of China Ltd., Class A (Financials) 4,591
370,682 Bank of China Ltd., Class H (Financials) 130,11710,544 Bank of Communications Co. Ltd.,
Class A (Financials) 7,22332,525 Bank of Communications Co. Ltd.,
Class H (Financials) 18,6941,639 Bank of Hangzhou Co. Ltd., Class A
(Financials) 3,4013,870 Bank of Jiangsu Co. Ltd., Class A
(Financials) 3,8572,840 Bank of Nanjing Co. Ltd., Class A
(Financials) 4,1291,614 Bank of Ningbo Co. Ltd., Class A
(Financials) 8,0804,060 Bank of Shanghai Co. Ltd., Class A
(Financials) 4,5371,499 Bank of Zhengzhou Co. Ltd., Class A
(Financials)* 7954,495 Baoshan Iron & Steel Co. Ltd., Class A
(Materials) 7,099325 BeiGene Ltd. ADR (Health Care)* 100,198
2,147 Beijing Enterprises Holdings Ltd.(Utilities) 7,398
18,219 Beijing Enterprises Water Group Ltd.(Utilities)* 7,520
483 Beijing New Building Materials PLC,Class A (Industrials) 2,478
390 Beijing Tiantan Biological ProductsCorp. Ltd., Class A (Health Care) 1,875
65 BGI Genomics Co. Ltd., Class A (HealthCare) 945
1,069 Bilibili, Inc. ADR (CommunicationServices)* 85,766
16,043 BOC Hong Kong Holdings Ltd.(Financials) 48,682
600 BOC International China Co. Ltd.,Class A (Financials) 1,386
11,022 BOE Technology Group Co. Ltd.,Class A (Information Technology) 9,942
Shares Description Value
Common Stocks – (continued)
China – (continued)14,036 Brilliance China Automotive Holdings
Ltd. (Consumer Discretionary)* $ 5,418487 BYD Co. Ltd., Class A (Consumer
Discretionary) 20,9083,642 BYD Co. Ltd., Class H (Consumer
Discretionary) 123,346454 By-health Co. Ltd., Class A (Consumer
Staples) 1,7701,104 Caitong Securities Co. Ltd., Class A
(Financials) 1,776341 CanSino Biologics, Inc., Class H (Health
Care)*(a) 13,4781,688 Changjiang Securities Co. Ltd., Class A
(Financials) 1,957519 Chaozhou Three-Circle Group Co. Ltd.,
Class A (Information Technology) 3,02539,215 China Cinda Asset Management Co. Ltd.,
Class H (Financials) 6,9581,428 China CITIC Bank Corp. Ltd., Class A
(Financials) 1,01642,657 China CITIC Bank Corp. Ltd., Class H
(Financials) 19,6351,039 China Coal Energy Co. Ltd., Class A
(Energy) 1,3749,972 China Coal Energy Co. Ltd., Class H
(Energy) 7,1292,922 China Construction Bank Corp., Class A
(Financials) 2,649411,210 China Construction Bank Corp., Class H
(Financials) 297,1452,532 China Eastern Airlines Corp. Ltd.,
Class A (Industrials)* 1,8447,517 China Eastern Airlines Corp. Ltd.,
Class H (Industrials)* 2,88011,173 China Everbright Bank Co. Ltd., Class A
(Financials) 5,80115,611 China Everbright Environment Group
Ltd. (Industrials) 10,7991,039 China Galaxy Securities Co. Ltd.,
Class A (Financials) 1,65716,406 China Galaxy Securities Co. Ltd.,
Class H (Financials) 9,218909 China Greatwall Technology Group Co.
Ltd., Class A (Information Technology) 2,07012,023 China Hongqiao Group Ltd. (Materials) 17,93231,929 China Huarong Asset Management Co.
Ltd., Class H (Financials)*(a)(b) 4,187300 China International Capital Corp. Ltd.,
Class A (Financials) 2,5126,203 China International Capital Corp. Ltd.,
Class H (Financials)(a) 14,420454 China International Marine Containers
Group Co. Ltd., Class A (Industrials) 1,2901,314 China International Marine Containers
Group Co. Ltd., Class H (Industrials) 2,8791,187 China Jushi Co. Ltd., Class A (Materials) 3,229
The accompanying notes are an integral part of these financial statements. 17

G O L D M A N S A C H S M A R K E T B E T A® E M E R G I N G M A R K E T S E Q U I T Y E T F
Schedule of Investments (continued)August 31, 2021
Shares Description Value
Common Stocks – (continued)
China – (continued)584 China Life Insurance Co. Ltd., Class A
(Financials) $ 2,6101,573 China Literature Ltd. (Communication
Services)*(a) 13,20714,212 China Longyuan Power Group Corp.
Ltd., Class H (Utilities) 28,98213,419 China Mengniu Dairy Co. Ltd.
(Consumer Staples)* 80,6625,441 China Merchants Bank Co. Ltd., Class A
(Financials) 41,28818,232 China Merchants Bank Co. Ltd., Class H
(Financials) 150,6185,968 China Merchants Port Holdings Co. Ltd.
(Industrials) 10,0522,094 China Merchants Securities Co. Ltd.,
Class A (Financials) 5,8942,196 China Merchants Securities Co. Ltd.,
Class H (Financials)(a) 3,3214,248 China Molybdenum Co. Ltd., Class A
(Materials) 5,14916,254 China Molybdenum Co. Ltd., Class H
(Materials) 12,70717,321 China National Building Material Co.
Ltd., Class H (Materials) 23,696976 China Northern Rare Earth Group High-
Tech Co. Ltd., Class A (Materials) 8,77821,511 China Overseas Land & Investment Ltd.
(Real Estate) 49,5091,839 China Pacific Insurance Group Co. Ltd.,
Class A (Financials) 7,49611,422 China Pacific Insurance Group Co. Ltd.,
Class H (Financials) 32,1636,483 China Petroleum & Chemical Corp.,
Class A (Energy) 4,280110,644 China Petroleum & Chemical Corp.,
Class H (Energy) 53,6345,426 China Railway Group Ltd., Class A
(Industrials) 4,7356,379 China Resources Beer Holdings Co. Ltd.
(Consumer Staples) 52,4933,991 China Resources Gas Group Ltd.
(Utilities) 24,22112,904 China Resources Land Ltd. (Real Estate) 48,0337,964 China Resources Power Holdings Co.
Ltd. (Utilities) 19,5791,634 China Shenhua Energy Co. Ltd., Class A
(Energy) 5,06515,121 China Shenhua Energy Co. Ltd., Class H
(Energy) 33,4802,207 China Southern Airlines Co. Ltd.,
Class A (Industrials)* 1,9707,341 China Southern Airlines Co. Ltd.,
Class H (Industrials)* 4,2766,414 China Taiping Insurance Holdings Co.
Ltd. (Financials) 9,369522 China Tourism Group Duty Free Corp.
Ltd., Class A (Consumer Discretionary) 18,470
Shares Description Value
Common Stocks – (continued)
China – (continued)2,612 China Vanke Co. Ltd., Class A (Real
Estate) $ 8,0168,478 China Vanke Co. Ltd., Class H (Real
Estate) 22,8924,893 China Yangtze Power Co. Ltd., Class A
(Utilities) 14,6674,397 China Zheshang Bank Co. Ltd., Class A
(Financials) 2,41981 Chongqing Brewery Co. Ltd., Class A
(Consumer Staples)* 1,7593,018 Chongqing Changan Automobile Co. Ltd.,
Class A (Consumer Discretionary) 9,645430 Chongqing Zhifei Biological Products Co.
Ltd., Class A (Health Care) 11,79616,560 CIFI Holdings Group Co. Ltd. (Real
Estate) 11,15728,484 CITIC Ltd. (Industrials) 35,452
200 Citic Pacific Special Steel Group Co. Ltd.,Class A (Materials) 790
2,860 CITIC Securities Co. Ltd., Class A(Financials) 11,383
8,473 CITIC Securities Co. Ltd., Class H(Financials) 21,462
626 Contemporary Amperex Technology Co.Ltd., Class A (Industrials) 48,014
3,341 COSCO SHIPPING Holdings Co. Ltd.,Class A (Industrials)* 10,740
15,017 COSCO SHIPPING Holdings Co. Ltd.,Class H (Industrials)*(c) 28,384
7,745 Country Garden Services Holdings Co.Ltd. (Real Estate) 59,004
4,071 CSC Financial Co. Ltd., Class H(Financials)(a) 4,460
187 DaShenLin Pharmaceutical Group Co.Ltd., Class A (Consumer Staples) 1,320
1,493 Datang International Power GenerationCo. Ltd., Class A (Utilities) 629
12,692 Datang International Power GenerationCo. Ltd., Class H (Utilities) 2,187
195 Dong-E-E-Jiao Co. Ltd., Class A (HealthCare) 1,039
844 Dongfang Electric Corp. Ltd., Class A(Industrials) 2,071
1,643 Dongfang Electric Corp. Ltd., Class H(Industrials) 2,252
12,784 Dongfeng Motor Group Co. Ltd., Class H(Consumer Discretionary) 14,005
844 Dongxing Securities Co. Ltd., Class A(Financials) 1,453
2,776 East Money Information Co. Ltd., Class A(Financials) 13,316
100 Ecovacs Robotics Co. Ltd., Class A(Consumer Discretionary) 2,274
3,369 ENN Energy Holdings Ltd. (Utilities) 66,667500 ENN Natural Gas Co. Ltd., Class A
(Utilities) 1,586
18 The accompanying notes are an integral part of these financial statements.

G O L D M A N S A C H S M A R K E T B E T A® E M E R G I N G M A R K E T S E Q U I T Y E T F
Shares Description Value
Common Stocks – (continued)
China – (continued)493 Eve Energy Co. Ltd., Class A (Industrials) $ 7,794
1,168 Everbright Securities Co. Ltd., Class A(Financials) 2,878
1,234 Everbright Securities Co. Ltd., Class H(Financials)(a) 984
1,181 Fangda Carbon New Material Co. Ltd.,Class A (Industrials) 2,367
519 FAW Jiefang Group Co. Ltd., Class A(Consumer Discretionary) 899
244 Flat Glass Group Co. Ltd., Class A(Information Technology) 2,218
1,841 Flat Glass Group Co. Ltd., Class H(Information Technology) 10,747
3,943 Focus Media Information Technology Co.Ltd., Class A (Communication Services) 4,394
537 Foshan Haitian Flavouring & Food Co.Ltd., Class A (Consumer Staples) 7,905
1,947 Founder Securities Co. Ltd., Class A(Financials) 2,574
2,252 Foxconn Industrial Internet Co. Ltd.,Class A (Information Technology) 4,007
100 Fu Jian Anjoy Foods Co. Ltd., Class A(Consumer Staples) 2,422
325 Fujian Sunner Development Co. Ltd.,Class A (Consumer Staples) 891
484 Fuyao Glass Industry Group Co. Ltd.,Class A (Consumer Discretionary) 3,593
2,568 Fuyao Glass Industry Group Co. Ltd.,Class H (Consumer Discretionary)(a) 15,816
300 Ganfeng Lithium Co. Ltd., Class A(Materials) 10,229
1,065 Ganfeng Lithium Co. Ltd., Class H(Materials)(a) 24,539
1,363 Gemdale Corp., Class A (Real Estate) 2,2051,691 GF Securities Co. Ltd., Class A
(Financials) 4,9775,913 GF Securities Co. Ltd., Class H
(Financials) 10,522182 Gigadevice Semiconductor Beijing, Inc.,
Class A (Information Technology) 4,317874 GoerTek, Inc., Class A (Information
Technology) 6,304100 Gongniu Group Co. Ltd., Class A
(Industrials) 2,733300 Gotion High-tech Co. Ltd., Class A
(Industrials)* 2,499584 Great Wall Motor Co. Ltd., Class A
(Consumer Discretionary) 5,98513,571 Great Wall Motor Co. Ltd., Class H
(Consumer Discretionary) 62,469454 Guangdong Haid Group Co. Ltd., Class A
(Consumer Staples) 4,521100 Guangdong Kinlong Hardware Products
Co. Ltd., Class A (Industrials) 2,503436 Guangzhou Automobile Group Co. Ltd.,
Class A (Consumer Discretionary) 1,249
Shares Description Value
Common Stocks – (continued)
China – (continued)12,563 Guangzhou Automobile Group Co. Ltd.,
Class H (Consumer Discretionary) $ 12,648390 Guangzhou Baiyunshan Pharmaceutical
Holdings Co. Ltd., Class A (Health Care) 1,7811,063 Guangzhou Baiyunshan Pharmaceutical
Holdings Co. Ltd., Class H (Health Care) 2,71481 Guangzhou Kingmed Diagnostics Group
Co. Ltd., Class A (Health Care) 1,324195 Guangzhou Shiyuan Electronic
Technology Co. Ltd., Class A (InformationTechnology) 2,630
200 Guangzhou Tinci Materials TechnologyCo. Ltd., Class A (Materials) 4,222
526 Guangzhou Yuexiu Financial HoldingsGroup Co. Ltd., Class A (Financials) 678
1,233 Guosen Securities Co. Ltd., Class A(Financials) 2,331
2,148 Guotai Junan Securities Co. Ltd., Class A(Financials) 5,913
3,946 Guotai Junan Securities Co. Ltd., Class H(Financials)(a) 5,520
1,201 Guoyuan Securities Co. Ltd., Class A(Financials) 1,465
1,695 Haier Smart Home Co. Ltd., Class A(Consumer Discretionary) 7,109
2,792 Haitong Securities Co. Ltd., Class A(Financials) 5,500
13,475 Haitong Securities Co. Ltd., Class H(Financials) 12,457
253 Han’s Laser Technology Industry GroupCo. Ltd., Class A (Industrials) 1,759
194 Hangzhou First Applied Material Co. Ltd.,Class A (Information Technology) 4,570
260 Hangzhou Robam Appliances Co. Ltd.,Class A (Consumer Discretionary) 1,439
215 Hangzhou Tigermed Consulting Co. Ltd.,Class A (Health Care) 4,468
546 Hangzhou Tigermed Consulting Co. Ltd.,Class H (Health Care)(a) 9,688
1,399 Hengli Petrochemical Co. Ltd., Class A(Materials) 5,681
1,097 Hengyi Petrochemical Co. Ltd., Class A(Materials) 1,993
3,246 Hesteel Co. Ltd., Class A (Materials) 1,570130 Hithink RoyalFlush Information Network
Co. Ltd., Class A (Financials) 2,3313,377 Hua Hong Semiconductor Ltd.
(Information Technology)*(a) 19,8872,467 Huadian Power International Corp. Ltd.,
Class A (Utilities) 1,4808,437 Huadian Power International Corp. Ltd.,
Class H (Utilities) 2,864419 Huadong Medicine Co. Ltd., Class A
(Health Care) 1,997800 Huafon Chemical Co. Ltd., Class A
(Materials) 1,722
The accompanying notes are an integral part of these financial statements. 19

G O L D M A N S A C H S M A R K E T B E T A® E M E R G I N G M A R K E T S E Q U I T Y E T F
Schedule of Investments (continued)August 31, 2021
Shares Description Value
Common Stocks – (continued)
China – (continued)519 Hualan Biological Engineering, Inc.,
Class A (Health Care) $ 2,3671,493 Huaneng Lancang River Hydropower,
Inc., Class A (Utilities) 1,3402,077 Huaneng Power International, Inc.,
Class A (Utilities) 1,78718,339 Huaneng Power International, Inc.,
Class H (Utilities) 8,843779 Huaxi Securities Co. Ltd., Class A
(Financials) 1,1713,059 Huaxia Bank Co. Ltd., Class A
(Financials) 2,655901 Huayu Automotive Systems Co. Ltd.,
Class A (Consumer Discretionary) 3,240651 Huazhu Group Ltd. ADR (Consumer
Discretionary)* 31,4371,800 Hunan Valin Steel Co. Ltd., Class A
(Materials) 2,176354 Hundsun Technologies, Inc., Class A
(Information Technology) 2,719598 Iflytek Co. Ltd., Class A (Information
Technology) 4,85514,818 Industrial & Commercial Bank of China
Ltd., Class A (Financials) 10,611346,338 Industrial & Commercial Bank of China
Ltd., Class H (Financials) 193,2675,580 Industrial Bank Co. Ltd., Class A
(Financials) 16,0002,077 Industrial Securities Co. Ltd., Class A
(Financials) 3,20012,246 Inner Mongolia BaoTou Steel Union Co.
Ltd., Class A (Materials)* 7,1372,467 Inner Mongolia Junzheng Energy &
Chemical Industry Group Co. Ltd.,Class A (Materials) 2,222
1,634 Inner Mongolia Yili Industrial Group Co.Ltd., Class A (Consumer Staples) 8,613
3,686 Innovent Biologics, Inc. (Health Care)*(a) 29,716100 Intco Medical Technology Co. Ltd.,
Class A (Health Care) 1,584262 JA Solar Technology Co. Ltd., Class A
(Information Technology) 3,159215 Jafron Biomedical Co. Ltd., Class A
(Health Care) 1,632200 Jason Furniture Hangzhou Co. Ltd.,
Class A (Consumer Discretionary) 2,133500 JCET Group Co. Ltd., Class A
(Information Technology) 2,6467,042 JD Logistics, Inc. (Industrials)*(a) 30,4234,069 JD.com, Inc. ADR (Consumer
Discretionary)* 319,661500 Jiangsu Eastern Shenghong Co. Ltd.,
Class A (Materials) 2,509192 Jiangsu Hengli Hydraulic Co. Ltd.,
Class A (Industrials) 2,826325 Jiangsu King’s Luck Brewery JSC Ltd.,
Class A (Consumer Staples) 2,117
Shares Description Value
Common Stocks – (continued)
China – (continued)360 Jiangsu Yanghe Brewery Joint-Stock Co.
Ltd., Class A (Consumer Staples) $ 9,348260 Jiangsu Yuyue Medical Equipment &
Supply Co. Ltd., Class A (Health Care) 1,319584 Jiangxi Copper Co. Ltd., Class A
(Materials) 2,4014,843 Jiangxi Copper Co. Ltd., Class H
(Materials) 9,851100 JiuGui Liquor Co. Ltd., Class A
(Consumer Staples) 3,24712,385 Kingdee International Software Group Co.
Ltd. (Information Technology)* 45,066568 Kuang-Chi Technologies Co. Ltd., Class A
(Consumer Discretionary)* 2,01216,445 Kunlun Energy Co. Ltd. (Utilities) 17,423
314 Kweichow Moutai Co. Ltd., Class A(Consumer Staples) 75,823
619 LB Group Co. Ltd., Class A (Materials) 3,5984,930 Legend Holdings Corp., Class H
(Information Technology)(a) 7,94927,272 Lenovo Group Ltd. (Information
Technology) 30,2271,278 Lens Technology Co. Ltd., Class A
(Information Technology) 4,6759,834 Li Ning Co. Ltd. (Consumer
Discretionary) 132,134130 Livzon Pharmaceutical Group, Inc.,
Class A (Health Care) 7947,513 Longfor Group Holdings Ltd. (Real
Estate)(a) 32,5551,454 LONGi Green Energy Technology Co.
Ltd., Class A (Information Technology) 20,1601,880 Luxshare Precision Industry Co. Ltd.,
Class A (Information Technology) 9,866393 Luzhou Laojiao Co. Ltd., Class A
(Consumer Staples) 10,355454 Mango Excellent Media Co. Ltd., Class A
(Communication Services) 3,223100 Maxscend Microelectronics Co. Ltd.,
Class A (Information Technology) 5,87417,630 Meituan, Class B (Consumer
Discretionary)*(a) 564,4435,518 Metallurgical Corp. of China Ltd., Class A
(Industrials) 4,28512,853 Metallurgical Corp. of China Ltd., Class H
(Industrials) 5,1233,173 Microport Scientific Corp. (Health Care) 19,644
900 Midea Group Co. Ltd., Class A (ConsumerDiscretionary) 9,206
1,414 Muyuan Foods Co. Ltd., Class A(Consumer Staples) 9,273
1,012 NARI Technology Co. Ltd., Class A(Industrials) 5,491
130 NAURA Technology Group Co. Ltd.,Class A (Information Technology) 7,170
1,692 NetEase, Inc. ADR (CommunicationServices) 164,835
20 The accompanying notes are an integral part of these financial statements.
G O L D M A N S A C H S M A R K E T B E T A® E M E R G I N G M A R K E T S E Q U I T Y E T F
Shares Description Value
Common Stocks – (continued)
China – (continued)419 New China Life Insurance Co. Ltd.,
Class A (Financials) $ 2,638325 Ninestar Corp., Class A (Information
Technology) 1,775244 Ningbo Tuopu Group Co. Ltd., Class A
(Consumer Discretionary) 1,3561,588 Ningbo Zhoushan Port Co. Ltd., Class A
(Industrials) 938750 Ningxia Baofeng Energy Group Co. Ltd.,
Class A (Materials) 1,8676,004 NIO, Inc. ADR (Consumer Discretionary)* 236,0177,761 Nongfu Spring Co. Ltd., Class H
(Consumer Staples)(a) 41,06391 Oppein Home Group, Inc., Class A
(Consumer Discretionary) 2,1791,817 Orient Securities Co. Ltd., Class A
(Financials) 4,2163,628 Orient Securities Co. Ltd., Class H
(Financials)(a) 3,56936,720 People’s Insurance Co. Group of China
Ltd. (The), Class H (Financials) 11,3314,672 PetroChina Co. Ltd., Class A (Energy) 3,577
93,157 PetroChina Co. Ltd., Class H (Energy) 40,845165 Pharmaron Beijing Co. Ltd., Class A
(Health Care) 4,923551 Pharmaron Beijing Co. Ltd., Class H
(Health Care)(a) 12,22830,889 PICC Property & Casualty Co. Ltd.,
Class H (Financials) 27,9211,754 Pinduoduo, Inc. ADR (Consumer
Discretionary)* 175,4355,213 Ping An Bank Co. Ltd., Class A
(Financials) 14,3827,206 Postal Savings Bank of China Co. Ltd.,
Class A (Financials) 5,74157,342 Postal Savings Bank of China Co. Ltd.,
Class H (Financials)(a) 41,3624,220 Power Construction Corp. of China Ltd.,
Class A (Industrials) 4,062286 Red Star Macalline Group Corp. Ltd.,
Class A (Real Estate)* 4491,972 Rongsheng Petrochemical Co. Ltd.,
Class A (Materials) 5,7031,503 SAIC Motor Corp. Ltd., Class A
(Consumer Discretionary) 4,5011,233 Sanan Optoelectronics Co. Ltd., Class A
(Information Technology) 6,93965 Sangfor Technologies, Inc., Class A
(Information Technology) 2,7442,279 Sany Heavy Industry Co. Ltd., Class A
(Industrials) 9,2651,381 SDIC Capital Co. Ltd., Class A
(Financials) 1,9971,806 SDIC Power Holdings Co. Ltd., Class A
(Utilities) 2,5368,768 Seazen Group Ltd. (Real Estate)* 7,779
Shares Description Value
Common Stocks – (continued)
China – (continued)534 Seazen Holdings Co. Ltd., Class A (Real
Estate) $ 2,7821,044 SF Holding Co. Ltd., Class A (Industrials) 9,3242,262 Shaanxi Coal Industry Co. Ltd., Class A
(Energy) 4,807520 Shandong Hualu Hengsheng Chemical Co.
Ltd., Class A (Materials) 2,93510,554 Shandong Weigao Group Medical Polymer
Co. Ltd., Class H (Health Care) 17,370240 Shanghai Bairun Investment Holding
Group Co. Ltd., Class A (ConsumerStaples) 2,666
846 Shanghai Baosight Software Co. Ltd.,Class A (Information Technology) 9,218
2,767 Shanghai Electric Group Co. Ltd., Class A(Industrials) 2,097
584 Shanghai Fosun Pharmaceutical Group Co.Ltd., Class A (Health Care) 5,730
2,149 Shanghai Fosun Pharmaceutical Group Co.Ltd., Class H (Health Care) 13,788
2,532 Shanghai International Port Group Co.Ltd., Class A (Industrials) 2,194
200 Shanghai Junshi Biosciences Co. Ltd.,Class A (Health Care)* 1,737
612 Shanghai Lingang Holdings Corp. Ltd.,Class A (Real Estate) 1,462
384 Shanghai Lujiazui Finance & Trade ZoneDevelopment Co. Ltd., Class A (RealEstate) 680
260 Shanghai M&G Stationery, Inc., Class A(Industrials) 2,777
584 Shanghai Pharmaceuticals Holding Co.Ltd., Class A (Health Care) 1,738
3,423 Shanghai Pharmaceuticals Holding Co.Ltd., Class H (Health Care) 6,796
7,885 Shanghai Pudong Development Bank Co.Ltd., Class A (Financials) 11,060
113 Shanghai Putailai New Energy TechnologyCo. Ltd., Class A (Materials) 2,680
1,168 Shanghai Yuyuan Tourist Mart Group Co.Ltd., Class A (Consumer Discretionary) 1,845
1,104 Shanxi Meijin Energy Co. Ltd., Class A(Energy)* 2,380
1,753 Shanxi Taigang Stainless Steel Co. Ltd.,Class A (Materials) 2,747
273 Shanxi Xinghuacun Fen Wine Factory Co.Ltd., Class A (Consumer Staples) 11,743
5,767 Shenwan Hongyuan Group Co. Ltd.,Class A (Financials) 4,201
3,457 Shenwan Hongyuan Group Co. Ltd.,Class H (Financials)(a) 840
900 Shenzhen Energy Group Co. Ltd., Class A(Utilities) 1,092
736 Shenzhen Inovance Technology Co. Ltd.,Class A (Industrials) 8,101
195 Shenzhen Kangtai Biological Products Co.Ltd., Class A (Health Care)* 3,659
The accompanying notes are an integral part of these financial statements. 21

G O L D M A N S A C H S M A R K E T B E T A® E M E R G I N G M A R K E T S E Q U I T Y E T F
Schedule of Investments (continued)August 31, 2021
Shares Description Value
Common Stocks – (continued)
China – (continued)260 Shenzhen Mindray Bio-Medical
Electronics Co. Ltd., Class A (HealthCare) $ 13,218
2,203 Shenzhen Overseas Chinese Town Co.Ltd., Class A (Consumer Discretionary) 2,301
3,512 Shenzhou International Group HoldingsLtd. (Consumer Discretionary) 76,586
794 Sichuan Chuantou Energy Co. Ltd.,Class A (Utilities) 1,400
390 Sichuan Kelun Pharmaceutical Co. Ltd.,Class A (Health Care) 1,100
909 Sinolink Securities Co. Ltd., Class A(Financials) 1,548
1,623 Sinopec Oilfield Service Corp., Class A(Energy)* 543
6,006 Sinopharm Group Co. Ltd., Class H(Health Care) 15,429
934 Sinotrans Ltd., Class A (Industrials) 7199,388 Sinotrans Ltd., Class H (Industrials) 3,8261,168 SooChow Securities Co. Ltd., Class A
(Financials) 1,713260 Spring Airlines Co. Ltd., Class A
(Industrials)* 2,143400 Sungrow Power Supply Co. Ltd., Class A
(Industrials) 9,7512,972 Sunny Optical Technology Group Co. Ltd.
(Information Technology) 89,878406 Sunwoda Electronic Co. Ltd., Class A
(Industrials) 2,474779 Suzhou Gold Mantis Construction
Decoration Co. Ltd., Class A (Industrials) 8571,104 TBEA Co. Ltd., Class A (Industrials) 4,1973,769 TCL Technology Group Corp., Class A
(Consumer Discretionary) 4,16526,531 Tencent Holdings Ltd. (Communication
Services) 1,641,525100 Thunder Software Technology Co. Ltd.,
Class A (Information Technology) 1,837844 Tianjin Zhonghuan Semiconductor Co.
Ltd., Class A (Information Technology) 7,064584 Tianma Microelectronics Co. Ltd., Class A
(Information Technology) 1,2818,219 Tingyi Cayman Islands Holding Corp.
(Consumer Staples) 14,626182 Toly Bread Co. Ltd., Class A (Consumer
Staples) 7673,318 Tongcheng-Elong Holdings Ltd.
(Consumer Discretionary)* 7,722600 Tongkun Group Co. Ltd., Class A
(Materials) 2,2231,209 Tongwei Co. Ltd., Class A (Consumer
Staples) 11,43065 Topchoice Medical Corp., Class A (Health
Care)* 2,36810,360 Topsports International Holdings Ltd.
(Consumer Discretionary)(a) 13,694
Shares Description Value
Common Stocks – (continued)
China – (continued)4,175 TravelSky Technology Ltd., Class H
(Information Technology) $ 7,8272,715 Trip.com Group Ltd. ADR (Consumer
Discretionary)* 82,780195 Tsingtao Brewery Co. Ltd., Class A
(Consumer Staples) 2,6092,411 Tsingtao Brewery Co. Ltd., Class H
(Consumer Staples) 19,747162 Unigroup Guoxin Microelectronics Co.
Ltd., Class A (Information Technology) 5,617454 Walvax Biotechnology Co. Ltd., Class A
(Health Care) 5,467843 Wanhua Chemical Group Co. Ltd.,
Class A (Materials) 13,94120,066 Want Want China Holdings Ltd.
(Consumer Staples) 13,649287 Weibo Corp. ADR (Communication
Services)* 14,4991,712 Weichai Power Co. Ltd., Class A
(Industrials) 5,3258,699 Weichai Power Co. Ltd., Class H
(Industrials) 21,9451,039 Western Securities Co. Ltd., Class A
(Financials) 1,312195 Will Semiconductor Co. Ltd., Class A
(Information Technology) 7,317325 Wingtech Technology Co. Ltd., Class A
(Information Technology) 6,012463 Wuhan Guide Infrared Co. Ltd., Class A
(Information Technology) 1,9661,043 Wuliangye Yibin Co. Ltd., Class A
(Consumer Staples) 32,604687 WuXi AppTec Co. Ltd., Class A (Health
Care) 14,1401,509 WuXi AppTec Co. Ltd., Class H (Health
Care)(a) 30,07415,475 Wuxi Biologics Cayman, Inc. (Health
Care)*(a) 239,566395 Wuxi Lead Intelligent Equipment Co. Ltd.,
Class A (Information Technology) 4,5672,402 XCMG Construction Machinery Co. Ltd.,
Class A (Industrials) 2,4271,039 Xinjiang Goldwind Science & Technology
Co. Ltd., Class A (Industrials) 2,3503,685 Xinjiang Goldwind Science & Technology
Co. Ltd., Class H (Industrials) 7,04118,719 Xinyi Solar Holdings Ltd. (Information
Technology) 45,2492,566 XPeng, Inc. ADR (Consumer
Discretionary)* 109,055649 Yanzhou Coal Mining Co. Ltd., Class A
(Energy) 2,5686,042 Yanzhou Coal Mining Co. Ltd., Class H
(Energy) 10,550195 Yealink Network Technology Corp. Ltd.,
Class A (Information Technology) 2,599
22 The accompanying notes are an integral part of these financial statements.

G O L D M A N S A C H S M A R K E T B E T A® E M E R G I N G M A R K E T S E Q U I T Y E T F
Shares Description Value
Common Stocks – (continued)
China – (continued)218 Yifeng Pharmacy Chain Co. Ltd., Class A
(Consumer Staples) $ 1,752300 Yihai Kerry Arawana Holdings Co. Ltd.,
Class A (Consumer Staples) 3,143828 Yonyou Network Technology Co. Ltd.,
Class A (Information Technology) 4,299287 Yunnan Baiyao Group Co. Ltd., Class A
(Health Care) 3,945195 Yunnan Energy New Material Co. Ltd.,
Class A (Materials) 8,535649 Yutong Bus Co. Ltd., Class A (Industrials) 1,237416 Zai Lab Ltd. ADR (Health Care)* 60,112130 Zhangzhou Pientzehuang Pharmaceutical
Co. Ltd., Class A (Health Care) 6,993549 Zhejiang Chint Electrics Co. Ltd., Class A
(Industrials) 5,356909 Zhejiang Dahua Technology Co. Ltd.,
Class A (Information Technology) 3,2436,829 Zhejiang Expressway Co. Ltd., Class H
(Industrials) 5,988325 Zhejiang Huayou Cobalt Co. Ltd., Class A
(Materials) 7,063974 Zhejiang Longsheng Group Co. Ltd.,
Class A (Materials) 2,043692 Zhejiang NHU Co. Ltd., Class A (Health
Care) 3,0861,026 Zhejiang Sanhua Intelligent Controls Co.
Ltd., Class A (Industrials) 4,015454 Zhejiang Semir Garment Co. Ltd., Class A
(Consumer Discretionary) 6661,022 Zheshang Securities Co. Ltd., Class A
(Financials)* 1,9642,434 Zhongsheng Group Holdings Ltd.
(Consumer Discretionary) 20,3422,450 Zhuzhou CRRC Times Electric Co. Ltd.,
Class H (Industrials)* 14,7595,302 Zijin Mining Group Co. Ltd., Class A
(Materials) 9,13025,595 Zijin Mining Group Co. Ltd., Class H
(Materials) 36,4641,868 Zoomlion Heavy Industry Science and
Technology Co. Ltd., Class A (Industrials) 2,2817,059 Zoomlion Heavy Industry Science and
Technology Co. Ltd., Class H (Industrials) 6,7263,382 ZTE Corp., Class H (Information
Technology) 11,893
10,021,333
Colombia – 0.1%1,015 Bancolombia SA (Financials) 8,380
16,220 Ecopetrol SA (Energy) 11,39211,978 Grupo Energia Bogota SA ESP (Utilities) 8,5781,903 Interconexion Electrica SA ESP (Utilities) 11,480
39,830
Shares Description Value
Common Stocks – (continued)
Czech Republic – 0.1%716 CEZ AS (Utilities) $ 22,565332 Komercni banka AS (Financials)* 12,761
2,157 Moneta Money Bank AS (Financials)*(a) 8,747
44,073
Egypt – 0.1%8,762 Commercial International Bank Egypt
SAE (Financials)* 26,1194,647 Eastern Co. SAE (Consumer Staples) 3,4844,876 Fawry for Banking & Payment
Technology Services SAE (InformationTechnology)* 5,059
34,662
Greece – 0.2%11,341 Eurobank Ergasias Services and Holdings
SA (Financials)* 10,804986 Hellenic Telecommunications
Organization SA (CommunicationServices) 19,397
498 JUMBO SA (Consumer Discretionary) 7,819408 LAMDA Development SA (Real Estate)* 3,995309 Motor Oil Hellas Corinth Refineries SA
(Energy)* 5,107470 Mytilineos SA (Industrials) 8,821
2,441 National Bank of Greece SA (Financials)* 7,382874 OPAP SA (Consumer Discretionary) 13,701508 Public Power Corp. SA (Utilities)* 6,015248 Terna Energy SA (Utilities) 3,548
86,589
Hong Kong – 0.0%602 Orient Overseas International Ltd.
(Industrials) 15,496
Hungary – 0.3%2,114 MOL Hungarian Oil & Gas PLC (Energy) 17,324
975 OTP Bank Nyrt (Financials)* 58,839621 Richter Gedeon Nyrt (Health Care) 18,602
94,765
India – 12.1%198 ABB India Ltd. (Industrials) 5,141371 ACC Ltd. (Materials) 12,263
1,234 Adani Enterprises Ltd. (Industrials) 26,8341,727 Adani Green Energy Ltd. (Utilities)* 25,2723,043 Adani Ports & Special Economic Zone
Ltd. (Industrials) 31,190120 Alkem Laboratories Ltd. (Health Care) 6,375
2,707 Ambuja Cements Ltd. (Materials) 15,612549 Apollo Hospitals Enterprise Ltd. (Health
Care) 37,3708,321 Ashok Leyland Ltd. (Industrials) 13,9902,702 Asian Paints Ltd. (Materials) 118,482
685 AU Small Finance Bank Ltd.(Financials)*(a) 10,609
1,197 Aurobindo Pharma Ltd. (Health Care) 11,924
The accompanying notes are an integral part of these financial statements. 23

G O L D M A N S A C H S M A R K E T B E T A® E M E R G I N G M A R K E T S E Q U I T Y E T F
Schedule of Investments (continued)August 31, 2021
Shares Description Value
Common Stocks – (continued)
India – (continued)1,072 Avenue Supermarts Ltd. (Consumer
Staples)*(a) $ 58,07010,055 Axis Bank Ltd. (Financials)* 108,321
311 Bajaj Auto Ltd. (Consumer Discretionary) 15,8801,141 Bajaj Finance Ltd. (Financials) 117,597
171 Bajaj Finserv Ltd. (Financials) 40,166127 Bajaj Holdings & Investment Ltd.
(Financials) 7,5793,300 Bandhan Bank Ltd. (Financials)(a) 12,8824,401 Bank of Baroda (Financials)* 4,6631,222 Berger Paints India Ltd. (Materials) 13,7395,075 Bharat Electronics Ltd. (Industrials) 12,9753,639 Bharat Petroleum Corp. Ltd. (Energy) 23,509
10,404 Bharti Airtel Ltd. (CommunicationServices)* 94,631
1,942 Biocon Ltd. (Health Care)* 9,54532 Bosch Ltd. (Consumer Discretionary) 6,075
531 Britannia Industries Ltd. (ConsumerStaples) 29,075
976 Cadila Healthcare Ltd. (Health Care) 7,4082,118 Cipla Ltd. (Health Care) 27,4965,982 Coal India Ltd. (Energy) 11,950
511 Colgate-Palmolive India Ltd. (ConsumerStaples) 11,852
1,045 Container Corp. Of India Ltd. (Industrials) 9,7272,525 Dabur India Ltd. (Consumer Staples) 21,495
554 Divi’s Laboratories Ltd. (Health Care) 39,2592,830 DLF Ltd. (Real Estate) 12,426
517 Dr. Reddy’s Laboratories Ltd. (HealthCare) 33,312
559 Eicher Motors Ltd. (ConsumerDiscretionary) 20,514
4,200 Embassy Office Parks REIT (Real Estate) 20,5728,108 GAIL India Ltd. (Utilities) 16,231
214 Gland Pharma Ltd. (Health Care)*(a) 11,4141,665 Godrej Consumer Products Ltd. (Consumer
Staples)* 25,070433 Godrej Properties Ltd. (Real Estate)* 8,831
1,583 Grasim Industries Ltd. (Materials) 32,533773 Gujarat Gas Ltd. (Utilities) 7,653982 Havells India Ltd. (Industrials) 17,062
4,591 HCL Technologies Ltd. (InformationTechnology) 74,348
202 HDFC Asset Management Co. Ltd.(Financials)(a) 8,506
4,109 HDFC Life Insurance Co. Ltd.(Financials)(a) 40,396
580 Hero MotoCorp Ltd. (ConsumerDiscretionary) 21,782
5,365 Hindalco Industries Ltd. (Materials) 34,413155 Hindustan Aeronautics Ltd. (Industrials) 2,921
2,614 Hindustan Petroleum Corp. Ltd. (Energy) 9,5453,606 Hindustan Unilever Ltd. (Consumer
Staples) 134,54910 Honeywell Automation India Ltd.
(Information Technology) 5,425
Shares Description Value
Common Stocks – (continued)
India – (continued)6,923 Housing Development Finance Corp. Ltd.
(Financials) $ 265,37022,716 ICICI Bank Ltd. (Financials) 223,730
974 ICICI Lombard General Insurance Co. Ltd.(Financials)(a) 21,274
2,969 ICICI Prudential Life Insurance Co. Ltd.(Financials)(a) 26,804
7,222 Indian Oil Corp. Ltd. (Energy) 10,9651,266 Indraprastha Gas Ltd. (Utilities) 9,4653,014 Indus Towers Ltd. (Communication
Services) 8,890311 Info Edge India Ltd. (Communication
Services) 26,33614,710 Infosys Ltd. (Information Technology) 343,826
440 InterGlobe Aviation Ltd. (Industrials)*(a) 11,47613,226 ITC Ltd. (Consumer Staples) 38,2794,184 JSW Steel Ltd. (Materials) 39,406
308 Jubilant Foodworks Ltd. (ConsumerDiscretionary) 16,854
616 Kansai Nerolac Paints Ltd. (Materials) 5,2274,833 Kotak Mahindra Bank Ltd. (Financials) 116,093
188 Larsen & Toubro Infotech Ltd.(Information Technology)(a) 13,680
3,051 Larsen & Toubro Ltd. (Industrials) 69,882940 Lupin Ltd. (Health Care) 12,333
4,721 Mahindra & Mahindra Ltd. (ConsumerDiscretionary) 51,298
2,091 Marico Ltd. (Consumer Staples) 15,594584 Maruti Suzuki India Ltd. (Consumer
Discretionary) 54,763233 Mindtree Ltd. (Information Technology) 11,576
5,408 Motherson Sumi Systems Ltd. (ConsumerDiscretionary)* 16,193
353 Mphasis Ltd. (Information Technology)* 14,01312 MRF Ltd. (Consumer Discretionary) 13,107
477 Muthoot Finance Ltd. (Financials) 9,892151 Nestle India Ltd. (Consumer Staples) 40,265
11,218 NHPC Ltd. (Utilities) 4,1412,394 NMDC Ltd. (Materials) 5,051
16,303 NTPC Ltd. (Utilities) 25,89210,371 Oil & Natural Gas Corp. Ltd. (Energy) 17,125
77 Oracle Financial Services Software Ltd.(Information Technology) 4,957
25 Page Industries Ltd. (ConsumerDiscretionary) 10,786
3,237 Petronet LNG Ltd. (Energy) 10,091343 PI Industries Ltd. (Materials) 15,945621 Pidilite Industries Ltd. (Materials) 19,397417 Piramal Enterprises Ltd. (Financials) 14,888
4,535 Power Finance Corp. Ltd. (Financials) 8,01611,625 Power Grid Corp. of India Ltd. (Utilities) 27,9219,039 Punjab National Bank (Financials)* 4,5383,833 REC Ltd. (Financials) 7,964
11,519 Reliance Industries Ltd. (Energy) 356,287964 SBI Cards & Payment Services Ltd.
(Financials)* 15,060
24 The accompanying notes are an integral part of these financial statements.

G O L D M A N S A C H S M A R K E T B E T A® E M E R G I N G M A R K E T S E Q U I T Y E T F
Shares Description Value
Common Stocks – (continued)
India – (continued)1,870 SBI Life Insurance Co. Ltd.
(Financials)(a) $ 30,53344 Shree Cement Ltd. (Materials) 17,048
804 Shriram Transport Finance Co. Ltd.(Financials) 14,897
276 Siemens Ltd. (Industrials) 8,591113 SRF Ltd. (Materials) 15,694
7,991 State Bank of India (Financials) 46,6334,578 Steel Authority of India Ltd. (Materials) 7,6254,672 Sun Pharmaceutical Industries Ltd.
(Health Care) 50,8143,914 Tata Consultancy Services Ltd.
(Information Technology) 202,9952,840 Tata Consumer Products Ltd. (Consumer
Staples) 33,6476,969 Tata Motors Ltd. (Consumer
Discretionary)* 27,4241,970 Tata Motors Ltd., Class A (Consumer
Discretionary)* 3,6856,482 Tata Power Co. Ltd. (The) (Utilities) 11,4582,866 Tata Steel Ltd. (Materials) 56,9312,584 Tech Mahindra Ltd. (Information
Technology) 51,2381,572 Titan Co. Ltd. (Consumer Discretionary) 41,376
217 Torrent Pharmaceuticals Ltd. (HealthCare) 9,232
483 UltraTech Cement Ltd. (Materials) 51,818313 United Breweries Ltd. (Consumer
Staples) 6,3241,336 United Spirits Ltd. (Consumer Staples)* 13,0872,172 UPL Ltd. (Materials) 22,0525,295 Vedanta Ltd. (Materials) 21,9611,002 Voltas Ltd. (Industrials) 13,6685,633 Wipro Ltd. (Information Technology) 49,453
4,379,293
Indonesia – 1.3%61,965 Adaro Energy Tbk PT (Energy) 5,47490,273 Astra International Tbk PT (Consumer
Discretionary) 33,0717,759 Bank Aladin Syariah Tbk PT
(Financials)* 1,82349,051 Bank Central Asia Tbk PT (Financials) 112,63328,307 Bank Jago Tbk PT (Financials)* 30,11879,291 Bank Mandiri Persero Tbk PT
(Financials) 33,91233,383 Bank Negara Indonesia Persero Tbk PT
(Financials) 12,639236,288 Bank Rakyat Indonesia Persero Tbk PT
(Financials) 65,109151,787 Bank Syariah Indonesia Tbk PT
(Financials)* 23,6267,349 Chandra Asri Petrochemical Tbk PT
(Materials) 4,04532,645 Charoen Pokphand Indonesia Tbk PT
(Consumer Staples) 14,649
Shares Description Value
Common Stocks – (continued)
Indonesia – (continued)80,571 Elang Mahkota Teknologi Tbk PT
(Communication Services)* $ 12,25911,449 Indah Kiat Pulp & Paper Tbk PT
(Materials) 6,3428,076 Indocement Tunggal Prakarsa Tbk PT
(Materials) 6,37019,623 Indofood Sukses Makmur Tbk PT
(Consumer Staples)* 8,49689,322 Kalbe Farma Tbk PT (Health Care) 8,42348,301 Merdeka Copper Gold Tbk PT
(Materials)* 9,550107,747 Sarana Menara Nusantara Tbk PT
(Communication Services) 10,12313,011 Semen Indonesia Persero Tbk PT
(Materials) 8,438212,471 Telkom Indonesia Persero Tbk PT
(Communication Services) 50,6506,746 United Tractors Tbk PT (Energy) 9,495
467,245
Kuwait – 0.6%4,933 Agility Public Warehousing Co. KSC
(Industrials) 16,3834,321 Boubyan Bank KSCP (Financials)* 11,248
19,146 Kuwait Finance House KSCP(Financials) 52,575
15,130 Mobile Telecommunications Co. KSCP(Communication Services) 30,733
29,784 National Bank of Kuwait SAKP(Financials) 92,679
203,618
Luxembourg – 0.0%678 Reinet Investments SCA (Financials)* 13,174
Mexico – 2.0%21,979 Alfa SAB de CV, Class A (Industrials) 15,465
132,554 America Movil SAB de CV, Series L(Communication Services) 130,771
1,975 Arca Continental SAB de CV (ConsumerStaples) 12,750
2,611 Becle SAB de CV (Consumer Staples) 6,67065,200 Cemex SAB de CV, Series CPO
(Materials)* 53,6842,214 Coca-Cola Femsa SAB de CV (Consumer
Staples) 12,846940 El Puerto de Liverpool SAB de CV
(Consumer Discretionary) 4,17713,277 Fibra Uno Administracion SA de CV
REIT (Real Estate) 15,1399,580 Fomento Economico Mexicano SAB de
CV (Consumer Staples) 83,5982,625 GMexico Transportes SAB de CV
(Industrials)(a) 4,083892 Gruma SAB de CV, Class B (Consumer
Staples) 10,210
The accompanying notes are an integral part of these financial statements. 25

G O L D M A N S A C H S M A R K E T B E T A® E M E R G I N G M A R K E T S E Q U I T Y E T F
Schedule of Investments (continued)August 31, 2021
Shares Description Value
Common Stocks – (continued)
Mexico – (continued)1,586 Grupo Aeroportuario del Pacifico SAB de
CV, Class B (Industrials)* $ 18,510545 Grupo Aeroportuario del Sureste SAB de
CV, Class B (Industrials)* 9,8026,068 Grupo Bimbo SAB de CV, Series A
(Consumer Staples) 15,3881,956 Grupo Carso SAB de CV, Series A1
(Industrials) 6,664266 Grupo Elektra SAB DE CV (Financials) 21,242
12,782 Grupo Financiero Banorte SAB de CV,Class O (Financials) 84,565
8,978 Grupo Financiero Inbursa SAB de CV,Class O (Financials)* 8,615
13,732 Grupo Mexico SAB de CV, Series B(Materials) 64,105
11,249 Grupo Televisa SAB, Series CPO(Communication Services) 29,717
555 Industrias Penoles SAB de CV(Materials)* 7,882
7,171 Kimberly-Clark de Mexico SAB de CV,Class A (Consumer Staples) 12,693
4,597 Orbia Advance Corp. SAB de CV(Materials) 13,154
22,826 Wal-Mart de Mexico SAB de CV(Consumer Staples) 81,396
723,126
Pakistan – 0.1%1,352 DG Khan Cement Co. Ltd. (Materials)* 8691,535 Engro Corp. Ltd. (Materials) 2,7131,335 Engro Polymer & Chemicals Ltd.
(Materials) 5054,801 Hub Power Co. Ltd. (The) (Utilities) 2,309
801 Lucky Cement Ltd. (Materials)* 3,9992,201 Maple Leaf Cement Factory Ltd.
(Materials)* 5731,329 Pakistan State Oil Co. Ltd. (Energy) 1,731
538 Searle Co. Ltd. (The) (Health Care) 7381,825 TRG Pakistan (Industrials) 1,7642,156 United Bank Ltd. (Financials) 1,567
16,768
Philippines – 0.7%10,083 Aboitiz Equity Ventures, Inc. (Industrials) 8,7251,124 Ayala Corp. (Industrials) 17,905
26,380 Ayala Land, Inc. (Real Estate) 17,8968,082 Bank of the Philippine Islands (Financials) 13,5167,852 BDO Unibank, Inc. (Financials) 17,345
141 Globe Telecom, Inc. (CommunicationServices) 7,709
3,661 International Container Terminal Services,Inc. (Industrials) 13,695
12,574 JG Summit Holdings, Inc. (Industrials) 16,4031,984 Jollibee Foods Corp. (Consumer
Discretionary) 8,0481,126 Manila Electric Co. (Utilities) 6,383
Shares Description Value
Common Stocks – (continued)
Philippines – (continued)8,054 Metropolitan Bank & Trust Co.
(Financials) $ 7,31731,861 Monde Nissin Corp. (Consumer
Staples)*(a) 10,785387 PLDT, Inc. (Communication Services) 11,396
2,136 SM Investments Corp. (Industrials) 43,32146,724 SM Prime Holdings, Inc. (Real Estate) 31,9323,947 Universal Robina Corp. (Consumer
Staples) 11,964
244,340
Qatar – 0.8%8,879 Commercial Bank PSQC (The)
(Financials) 14,72413,272 Industries Qatar QSC (Industrials) 46,84016,453 Masraf Al Rayan QSC (Financials) 20,56119,432 Mesaieed Petrochemical Holding Co.
(Materials) 10,6744,466 Ooredoo QPSC (Communication Services) 8,4791,880 Qatar Electricity & Water Co. QSC
(Utilities) 8,5712,181 Qatar Fuel QSC (Energy) 10,962
12,154 Qatar Gas Transport Co. Ltd. (Energy) 10,3323,321 Qatar International Islamic Bank QSC
(Financials) 8,7565,184 Qatar Islamic Bank (Financials) 26,055
19,682 Qatar National Bank QPSC (Financials) 103,627
269,581
Russia – 3.0%13,839 Alrosa PJSC (Materials) 27,548
801 Gazprom Neft PJSC (Energy) 4,66052,100 Gazprom PJSC (Energy) 217,6331,695 LUKOIL PJSC (Energy) 144,901
272 MMC Norilsk Nickel PJSC (Materials) 89,3264,966 Mobile TeleSystems PJSC
(Communication Services) 22,3063,327 Novatek PJSC (Energy) 78,7725,553 Novolipetsk Steel PJSC (Materials) 18,7151,506 Polymetal International PLC (Materials) 30,081
134 Polyus PJSC (Materials) 24,1585,475 Rosneft Oil Co. PJSC (Energy) 39,909
47,840 Sberbank of Russia PJSC (Financials) 214,8211,055 Severstal PAO (Materials) 24,7546,835 Tatneft PJSC (Energy) 45,2127,081 United Co RUSAL International PJSC
(Materials)* 5,1131,386 Yandex NV, Class A (Communication
Services)* 105,733
1,093,642
Saudi Arabia – 3.2%475 Advanced Petrochemical Co. (Materials) 9,068
5,430 Al Rajhi Bank (Financials) 175,1754,388 Alinma Bank (Financials) 26,7911,101 Almarai Co. JSC (Consumer Staples) 17,0262,496 Arab National Bank (Financials) 15,226
26 The accompanying notes are an integral part of these financial statements.

G O L D M A N S A C H S M A R K E T B E T A® E M E R G I N G M A R K E T S E Q U I T Y E T F
Shares Description Value
Common Stocks – (continued)
Saudi Arabia – (continued)780 Arabian Centres Co. Ltd. (Real Estate) $ 5,199
1,619 Bank AlBilad (Financials)* 18,4532,644 Banque Saudi Fransi (Financials) 28,550
109 BinDawood Holding Co. (ConsumerStaples) 3,139
257 Bupa Arabia for Cooperative InsuranceCo. (Financials) 11,443
2,369 Dar Al Arkan Real Estate DevelopmentCo. (Real Estate)* 6,442
380 Dr Sulaiman Al Habib Medical ServicesGroup Co. (Health Care) 18,601
1,689 Etihad Etisalat Co. (CommunicationServices) 14,410
263 Jarir Marketing Co. (ConsumerDiscretionary) 15,188
213 Mouwasat Medical Services Co. (HealthCare) 11,131
1,467 National Industrialization Co. (Materials)* 8,167538 National Petrochemical Co. (Materials) 6,813979 Rabigh Refining & Petrochemical Co.
(Energy)* 6,4266,581 Riyad Bank (Financials) 47,199
899 SABIC Agri-Nutrients Co. (Materials) 30,0571,609 Sahara International Petrochemical Co.
(Materials) 14,2851,808 Saudi Arabian Mining Co. (Materials)* 35,093
15,602 Saudi Arabian Oil Co. (Energy)(a) 146,2153,983 Saudi Basic Industries Corp. (Materials) 130,6183,924 Saudi British Bank (The) (Financials) 36,0423,503 Saudi Electricity Co. (Utilities) 25,497
987 Saudi Industrial Investment Group(Materials) 9,447
3,291 Saudi Kayan Petrochemical Co.(Materials)* 16,338
9,727 Saudi National Bank (The) (Financials) 157,6782,660 Saudi Telecom Co. (Communication
Services) 95,7421,171 Savola Group (The) (Consumer Staples) 12,5351,042 Yanbu National Petrochemical Co.
(Materials) 18,836
1,172,830
Singapore – 0.0%931 BOC Aviation Ltd. (Industrials)(a) 6,979
South Africa – 3.1%2,670 Absa Group Ltd. (Financials)* 29,173
357 African Rainbow Minerals Ltd. (Materials) 6,397184 Anglo American Platinum Ltd.
(Materials)(c) 20,9691,521 Aspen Pharmacare Holdings Ltd. (Health
Care)* 20,6211,428 Bid Corp. Ltd. (Consumer Staples)* 31,5791,474 Bidvest Group Ltd. (The) (Industrials) 20,890
272 Capitec Bank Holdings Ltd. (Financials) 35,6841,087 Clicks Group Ltd. (Consumer Staples) 22,7371,520 Discovery Ltd. (Financials)* 13,531
Shares Description Value
Common Stocks – (continued)
South Africa – (continued)1,330 Exxaro Resources Ltd. (Energy) $ 16,965
16,626 FirstRand Ltd. (Financials) 71,1363,119 Gold Fields Ltd. (Materials) 29,4283,428 Impala Platinum Holdings Ltd. (Materials) 52,824
214 Kumba Iron Ore Ltd. (Materials) 9,6617,424 MTN Group Ltd. (Communication
Services)* 68,4871,502 MultiChoice Group (Communication
Services) 11,9311,886 Naspers Ltd., Class N (Consumer
Discretionary)(c) 323,3521,786 Nedbank Group Ltd. (Financials)* 22,8421,204 Northam Platinum Ltd. (Materials)* 16,646
21,081 Old Mutual Ltd. (Financials) 22,3853,753 Pepkor Holdings Ltd. (Consumer
Discretionary)*(a) 5,9732,674 Rand Merchant Investment Holdings Ltd.
(Financials) 5,8562,106 Remgro Ltd. (Financials) 17,5897,411 Sanlam Ltd. (Financials) 33,0151,965 Sasol Ltd. (Materials)* 30,4291,872 Shoprite Holdings Ltd. (Consumer Staples) 23,793
12,354 Sibanye Stillwater Ltd. (Materials) 50,3045,737 Standard Bank Group Ltd. (Financials) 58,9802,278 Vodacom Group Ltd. (Communication
Services) 22,6234,104 Woolworths Holdings Ltd. (Consumer
Discretionary)* 18,059
1,113,859
South Korea – 11.6%114 Amorepacific Corp. (Consumer Staples) 22,368132 AMOREPACIFIC Group (Consumer
Staples) 6,58035 BGF retail Co. Ltd. (Consumer Staples) 5,388
1,035 BNK Financial Group, Inc. (Financials) 6,927370 Celltrion Healthcare Co. Ltd. (Health
Care)* 39,47573 Celltrion Pharm, Inc. (Health Care)* 10,886
362 Celltrion, Inc. (Health Care)* 91,480248 Cheil Worldwide, Inc. (Communication
Services) 4,94127 CJ CheilJedang Corp. (Consumer Staples) 10,56159 CJ Corp. (Industrials) 5,16545 CJ ENM Co. Ltd. (Consumer
Discretionary) 5,94233 CJ Logistics Corp. (Industrials)* 4,867
211 Coway Co. Ltd. (Consumer Discretionary) 14,23182 CS Wind Corp. (Industrials) 5,651
733 Daewoo Engineering & Construction Co.Ltd. (Industrials)* 4,647
212 Daewoo Shipbuilding & MarineEngineering Co. Ltd. (Industrials)* 5,129
181 DB Insurance Co. Ltd. (Financials) 9,16467 DL E&C Co. Ltd. (Industrials)* 8,148
227 Dongsuh Cos., Inc. (Consumer Staples) 5,658
The accompanying notes are an integral part of these financial statements. 27
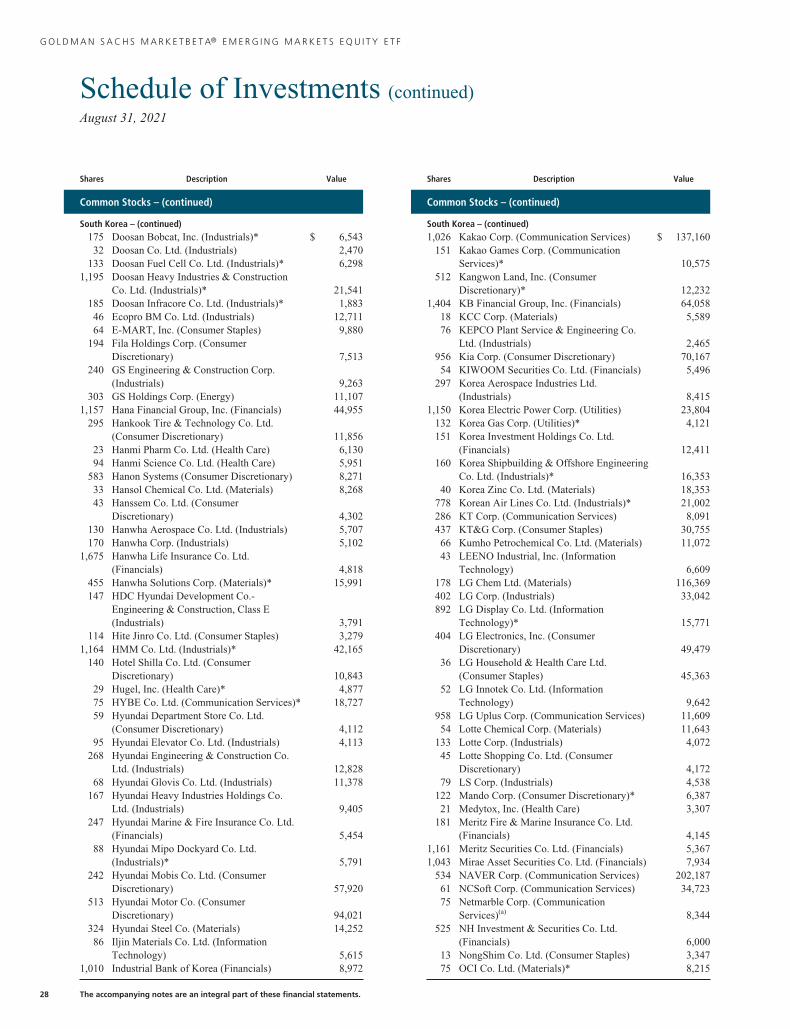
G O L D M A N S A C H S M A R K E T B E T A® E M E R G I N G M A R K E T S E Q U I T Y E T F
Schedule of Investments (continued)August 31, 2021
Shares Description Value
Common Stocks – (continued)
South Korea – (continued)175 Doosan Bobcat, Inc. (Industrials)* $ 6,54332 Doosan Co. Ltd. (Industrials) 2,470
133 Doosan Fuel Cell Co. Ltd. (Industrials)* 6,2981,195 Doosan Heavy Industries & Construction
Co. Ltd. (Industrials)* 21,541185 Doosan Infracore Co. Ltd. (Industrials)* 1,88346 Ecopro BM Co. Ltd. (Industrials) 12,71164 E-MART, Inc. (Consumer Staples) 9,880
194 Fila Holdings Corp. (ConsumerDiscretionary) 7,513
240 GS Engineering & Construction Corp.(Industrials) 9,263
303 GS Holdings Corp. (Energy) 11,1071,157 Hana Financial Group, Inc. (Financials) 44,955
295 Hankook Tire & Technology Co. Ltd.(Consumer Discretionary) 11,856
23 Hanmi Pharm Co. Ltd. (Health Care) 6,13094 Hanmi Science Co. Ltd. (Health Care) 5,951
583 Hanon Systems (Consumer Discretionary) 8,27133 Hansol Chemical Co. Ltd. (Materials) 8,26843 Hanssem Co. Ltd. (Consumer
Discretionary) 4,302130 Hanwha Aerospace Co. Ltd. (Industrials) 5,707170 Hanwha Corp. (Industrials) 5,102
1,675 Hanwha Life Insurance Co. Ltd.(Financials) 4,818
455 Hanwha Solutions Corp. (Materials)* 15,991147 HDC Hyundai Development Co.-
Engineering & Construction, Class E(Industrials) 3,791
114 Hite Jinro Co. Ltd. (Consumer Staples) 3,2791,164 HMM Co. Ltd. (Industrials)* 42,165
140 Hotel Shilla Co. Ltd. (ConsumerDiscretionary) 10,843
29 Hugel, Inc. (Health Care)* 4,87775 HYBE Co. Ltd. (Communication Services)* 18,72759 Hyundai Department Store Co. Ltd.
(Consumer Discretionary) 4,11295 Hyundai Elevator Co. Ltd. (Industrials) 4,113
268 Hyundai Engineering & Construction Co.Ltd. (Industrials) 12,828
68 Hyundai Glovis Co. Ltd. (Industrials) 11,378167 Hyundai Heavy Industries Holdings Co.
Ltd. (Industrials) 9,405247 Hyundai Marine & Fire Insurance Co. Ltd.
(Financials) 5,45488 Hyundai Mipo Dockyard Co. Ltd.
(Industrials)* 5,791242 Hyundai Mobis Co. Ltd. (Consumer
Discretionary) 57,920513 Hyundai Motor Co. (Consumer
Discretionary) 94,021324 Hyundai Steel Co. (Materials) 14,25286 Iljin Materials Co. Ltd. (Information
Technology) 5,6151,010 Industrial Bank of Korea (Financials) 8,972
Shares Description Value
Common Stocks – (continued)
South Korea – (continued)1,026 Kakao Corp. (Communication Services) $ 137,160
151 Kakao Games Corp. (CommunicationServices)* 10,575
512 Kangwon Land, Inc. (ConsumerDiscretionary)* 12,232
1,404 KB Financial Group, Inc. (Financials) 64,05818 KCC Corp. (Materials) 5,58976 KEPCO Plant Service & Engineering Co.
Ltd. (Industrials) 2,465956 Kia Corp. (Consumer Discretionary) 70,16754 KIWOOM Securities Co. Ltd. (Financials) 5,496
297 Korea Aerospace Industries Ltd.(Industrials) 8,415
1,150 Korea Electric Power Corp. (Utilities) 23,804132 Korea Gas Corp. (Utilities)* 4,121151 Korea Investment Holdings Co. Ltd.
(Financials) 12,411160 Korea Shipbuilding & Offshore Engineering
Co. Ltd. (Industrials)* 16,35340 Korea Zinc Co. Ltd. (Materials) 18,353
778 Korean Air Lines Co. Ltd. (Industrials)* 21,002286 KT Corp. (Communication Services) 8,091437 KT&G Corp. (Consumer Staples) 30,75566 Kumho Petrochemical Co. Ltd. (Materials) 11,07243 LEENO Industrial, Inc. (Information
Technology) 6,609178 LG Chem Ltd. (Materials) 116,369402 LG Corp. (Industrials) 33,042892 LG Display Co. Ltd. (Information
Technology)* 15,771404 LG Electronics, Inc. (Consumer
Discretionary) 49,47936 LG Household & Health Care Ltd.
(Consumer Staples) 45,36352 LG Innotek Co. Ltd. (Information
Technology) 9,642958 LG Uplus Corp. (Communication Services) 11,60954 Lotte Chemical Corp. (Materials) 11,643
133 Lotte Corp. (Industrials) 4,07245 Lotte Shopping Co. Ltd. (Consumer
Discretionary) 4,17279 LS Corp. (Industrials) 4,538
122 Mando Corp. (Consumer Discretionary)* 6,38721 Medytox, Inc. (Health Care) 3,307
181 Meritz Fire & Marine Insurance Co. Ltd.(Financials) 4,145
1,161 Meritz Securities Co. Ltd. (Financials) 5,3671,043 Mirae Asset Securities Co. Ltd. (Financials) 7,934
534 NAVER Corp. (Communication Services) 202,18761 NCSoft Corp. (Communication Services) 34,72375 Netmarble Corp. (Communication
Services)(a) 8,344525 NH Investment & Securities Co. Ltd.
(Financials) 6,00013 NongShim Co. Ltd. (Consumer Staples) 3,34775 OCI Co. Ltd. (Materials)* 8,215
28 The accompanying notes are an integral part of these financial statements.

G O L D M A N S A C H S M A R K E T B E T A® E M E R G I N G M A R K E T S E Q U I T Y E T F
Shares Description Value
Common Stocks – (continued)
South Korea – (continued)90 Orion Corp. (Consumer Staples) $ 9,819
926 Pan Ocean Co. Ltd. (Industrials) 6,637127 Pearl Abyss Corp. (Communication
Services)* 10,329290 POSCO (Materials) 84,290120 POSCO Chemical Co. Ltd. (Materials) 16,094185 Posco International Corp. (Industrials) 3,63083 S-1 Corp. (Industrials) 5,87758 Samsung Biologics Co. Ltd. (Health
Care)*(a) 48,273313 Samsung C&T Corp. (Industrials) 35,904111 Samsung Card Co. Ltd. (Financials) 3,265206 Samsung Electro-Mechanics Co. Ltd.
(Information Technology) 32,78020,956 Samsung Electronics Co. Ltd. (Information
Technology) 1,386,282620 Samsung Engineering Co. Ltd.
(Industrials)* 11,951125 Samsung Fire & Marine Insurance Co. Ltd.
(Financials) 24,3651,964 Samsung Heavy Industries Co. Ltd.
(Industrials)* 10,672283 Samsung Life Insurance Co. Ltd.
(Financials) 18,184200 Samsung SDI Co. Ltd. (Information
Technology) 136,789126 Samsung SDS Co. Ltd. (Information
Technology) 18,746223 Samsung Securities Co. Ltd. (Financials) 9,511175 Seegene, Inc. (Health Care) 9,931
1,963 Shinhan Financial Group Co. Ltd.(Financials) 65,775
26 Shinsegae, Inc. (Consumer Discretionary) 6,03290 SK Bioscience Co. Ltd. (Health Care)* 24,335
2,063 SK Hynix, Inc. (Information Technology) 189,49595 SK IE Technology Co. Ltd. (Materials)*(a) 17,002
185 SK Innovation Co. Ltd. (Energy)* 39,81013 SK Materials Co. Ltd. (Materials) 4,535
525 SK Networks Co. Ltd. (Industrials) 2,51876 SK Telecom Co. Ltd. (Communication
Services) 19,533121 SK, Inc. (Industrials) 27,499143 S-Oil Corp. (Energy) 11,72951 Solus Advanced Materials Co. Ltd.
(Information Technology) 2,72721 Soulbrain Co. Ltd./New (Materials) 5,131
432 SSANGYONG C&E Co. Ltd. (Materials) 3,14152 Studio Dragon Corp. (Communication
Services)* 3,9021,841 Woori Financial Group, Inc. (Financials) 17,863
166 Yuhan Corp. (Health Care) 8,948
4,192,999
Taiwan – 14.7%2,081 Accton Technology Corp. (Information
Technology) 21,06312,905 Acer, Inc. (Information Technology) 11,735
Shares Description Value
Common Stocks – (continued)
Taiwan – (continued)1,736 Advantech Co. Ltd. (Information
Technology) $ 24,17910,588 ASE Technology Holding Co. Ltd.
(Information Technology)* 49,0949,038 Asia Cement Corp. (Materials) 14,643
113 ASMedia Technology, Inc. (InformationTechnology) 8,461
2,716 Asustek Computer, Inc. (InformationTechnology) 31,753
36,312 AU Optronics Corp. (InformationTechnology) 23,061
33,162 Cathay Financial Holding Co. Ltd.(Financials) 71,317
5,712 Chailease Holding Co. Ltd. (Financials) 54,92823,616 Chang Hwa Commercial Bank Ltd.
(Financials) 14,0607,227 Cheng Shin Rubber Industry Co. Ltd.
(Consumer Discretionary) 9,7142,590 Chicony Electronics Co. Ltd. (Information
Technology) 7,33611,528 China Airlines Ltd. (Industrials)* 7,17563,635 China Development Financial Holding
Corp. (Financials) 32,6069,868 China Life Insurance Co. Ltd. (Financials) 10,290
50,516 China Steel Corp. (Materials) 69,5401,630 Chroma ATE, Inc. (Information
Technology) 10,55716,850 Chunghwa Telecom Co. Ltd.
(Communication Services) 68,09718,532 Compal Electronics, Inc. (Information
Technology) 15,31380,351 CTBC Financial Holding Co. Ltd.
(Financials) 66,6858,197 Delta Electronics, Inc. (Information
Technology) 80,008800 Eclat Textile Co. Ltd. (Consumer
Discretionary) 16,07952,595 E.Sun Financial Holding Co. Ltd.
(Financials) 50,4829,230 Eva Airways Corp. (Industrials) 6,395
11,098 Evergreen Marine Corp. Taiwan Ltd.(Industrials) 54,462
13,289 Far Eastern New Century Corp.(Industrials) 14,409
7,148 Far EasTone Telecommunications Co. Ltd.(Communication Services) 15,888
1,874 Feng TAY Enterprise Co. Ltd. (ConsumerDiscretionary) 14,606
45,059 First Financial Holding Co. Ltd.(Financials) 37,233
14,624 Formosa Chemicals & Fibre Corp.(Materials) 44,378
5,083 Formosa Petrochemical Corp. (Energy) 17,93820,645 Formosa Plastics Corp. (Materials) 76,357
325 Formosa Sumco Technology Corp.(Information Technology) 2,181
The accompanying notes are an integral part of these financial statements. 29

G O L D M A N S A C H S M A R K E T B E T A® E M E R G I N G M A R K E T S E Q U I T Y E T F
Schedule of Investments (continued)August 31, 2021
Shares Description Value
Common Stocks – (continued)
Taiwan – (continued)3,350 Formosa Taffeta Co. Ltd. (Consumer
Discretionary) $ 3,7714,062 Foxconn Technology Co. Ltd.
(Information Technology) 9,71826,200 Fubon Financial Holding Co. Ltd.
(Financials) 80,3581,009 General Interface Solution Holding Ltd.
(Information Technology) 3,9141,316 Giant Manufacturing Co. Ltd. (Consumer
Discretionary) 15,908906 Globalwafers Co. Ltd. (Information
Technology) 28,4424,287 Highwealth Construction Corp. (Real
Estate) 7,4561,116 Hiwin Technologies Corp. (Industrials) 13,128
52,377 Hon Hai Precision Industry Co. Ltd.(Information Technology) 209,784
1,281 Hotai Motor Co. Ltd. (ConsumerDiscretionary) 26,948
41,647 Hua Nan Financial Holdings Co. Ltd.(Financials)* 31,408
38,847 Innolux Corp. (Information Technology) 24,18011,202 Inventec Corp. (Information Technology) 9,8229,104 Lite-On Technology Corp. (Information
Technology) 20,1047,770 Macronix International Co. Ltd.
(Information Technology)* 11,2996,418 MediaTek, Inc. (Information Technology) 208,657
44,276 Mega Financial Holding Co. Ltd.(Financials) 52,402
894 Merida Industry Co. Ltd. (ConsumerDiscretionary) 10,290
2,983 Micro-Star International Co. Ltd.(Information Technology) 14,047
266 momo.com, Inc. (Consumer Discretionary) 16,46120,904 Nan Ya Plastics Corp. (Materials) 67,584
953 Nan Ya Printed Circuit Board Corp.(Information Technology) 14,494
4,970 Nanya Technology Corp. (InformationTechnology) 11,908
602 Nien Made Enterprise Co. Ltd. (ConsumerDiscretionary) 8,993
2,376 Novatek Microelectronics Corp.(Information Technology) 38,495
7,709 Pegatron Corp. (Information Technology) 18,025651 Phison Electronics Corp. (Information
Technology) 10,0309,982 Pou Chen Corp. (Consumer Discretionary) 11,868
15,095 Powerchip Semiconductor ManufacturingCorp. (Information Technology) 36,603
2,926 Powertech Technology, Inc. (InformationTechnology) 11,878
2,347 President Chain Store Corp. (ConsumerStaples)* 24,178
Shares Description Value
Common Stocks – (continued)
Taiwan – (continued)11,639 Quanta Computer, Inc. (Information
Technology) $ 32,9261,946 Realtek Semiconductor Corp.
(Information Technology) 38,9013,757 Ruentex Development Co. Ltd. (Real
Estate) 9,3951,656 Ruentex Industries Ltd. (Consumer
Discretionary) 6,63317,799 Shanghai Commercial & Savings Bank
Ltd. (The) (Financials) 28,90150,848 Shin Kong Financial Holding Co. Ltd.
(Financials) 17,430158 Silicon Motion Technology Corp. ADR
(Information Technology) 11,7962,262 Sino-American Silicon Products, Inc.
(Information Technology) 15,75344,510 SinoPac Financial Holdings Co. Ltd.
(Financials) 22,8875,644 Synnex Technology International Corp.
(Information Technology) 10,95747,433 Taishin Financial Holding Co. Ltd.
(Financials)* 33,11823,904 Taiwan Business Bank (Financials)* 8,35823,425 Taiwan Cement Corp. (Materials) 40,95339,546 Taiwan Cooperative Financial Holding
Co. Ltd. (Financials) 31,8933,227 Taiwan Fertilizer Co. Ltd. (Materials) 6,5799,318 Taiwan High Speed Rail Corp.
(Industrials) 10,1547,320 Taiwan Mobile Co. Ltd. (Communication
Services) 26,677107,604 Taiwan Semiconductor Manufacturing
Co. Ltd. (Information Technology) 2,383,9958,957 Tatung Co. Ltd. (Industrials)* 9,8747,513 Teco Electric and Machinery Co. Ltd.
(Industrials) 8,4582,062 Tripod Technology Corp. (Information
Technology) 8,5195,286 Unimicron Technology Corp.
(Information Technology) 28,13420,542 Uni-President Enterprises Corp.
(Consumer Staples)* 53,59149,722 United Microelectronics Corp.
(Information Technology) 113,2104,008 Vanguard International Semiconductor
Corp. (Information Technology) 21,404276 Voltronic Power Technology Corp.
(Industrials) 12,34911,924 Walsin Lihwa Corp. (Industrials) 11,5521,347 Walsin Technology Corp. (Information
Technology)* 8,7732,305 Wan Hai Lines Ltd. (Industrials)* 20,6271,390 Win Semiconductors Corp. (Information
Technology) 16,57712,105 Winbond Electronics Corp. (Information
Technology) 12,885
30 The accompanying notes are an integral part of these financial statements.
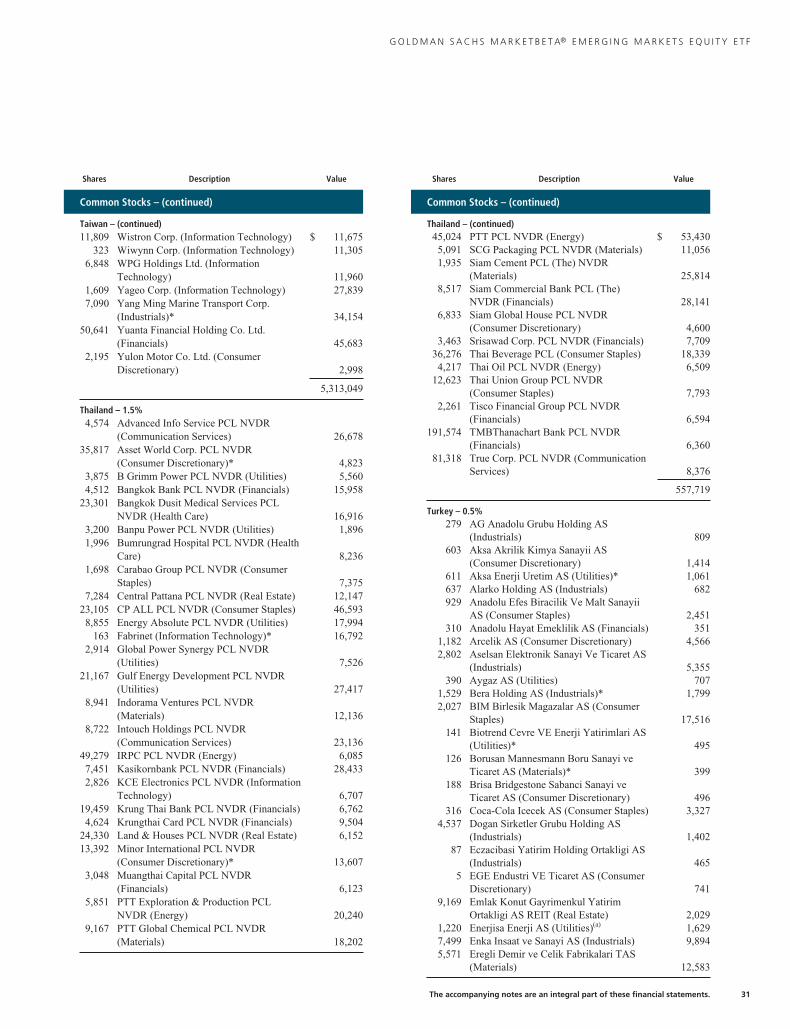
G O L D M A N S A C H S M A R K E T B E T A® E M E R G I N G M A R K E T S E Q U I T Y E T F
Shares Description Value
Common Stocks – (continued)
Taiwan – (continued)11,809 Wistron Corp. (Information Technology) $ 11,675
323 Wiwynn Corp. (Information Technology) 11,3056,848 WPG Holdings Ltd. (Information
Technology) 11,9601,609 Yageo Corp. (Information Technology) 27,8397,090 Yang Ming Marine Transport Corp.
(Industrials)* 34,15450,641 Yuanta Financial Holding Co. Ltd.
(Financials) 45,6832,195 Yulon Motor Co. Ltd. (Consumer
Discretionary) 2,998
5,313,049
Thailand – 1.5%4,574 Advanced Info Service PCL NVDR
(Communication Services) 26,67835,817 Asset World Corp. PCL NVDR
(Consumer Discretionary)* 4,8233,875 B Grimm Power PCL NVDR (Utilities) 5,5604,512 Bangkok Bank PCL NVDR (Financials) 15,958
23,301 Bangkok Dusit Medical Services PCLNVDR (Health Care) 16,916
3,200 Banpu Power PCL NVDR (Utilities) 1,8961,996 Bumrungrad Hospital PCL NVDR (Health
Care) 8,2361,698 Carabao Group PCL NVDR (Consumer
Staples) 7,3757,284 Central Pattana PCL NVDR (Real Estate) 12,147
23,105 CP ALL PCL NVDR (Consumer Staples) 46,5938,855 Energy Absolute PCL NVDR (Utilities) 17,994
163 Fabrinet (Information Technology)* 16,7922,914 Global Power Synergy PCL NVDR
(Utilities) 7,52621,167 Gulf Energy Development PCL NVDR
(Utilities) 27,4178,941 Indorama Ventures PCL NVDR
(Materials) 12,1368,722 Intouch Holdings PCL NVDR
(Communication Services) 23,13649,279 IRPC PCL NVDR (Energy) 6,0857,451 Kasikornbank PCL NVDR (Financials) 28,4332,826 KCE Electronics PCL NVDR (Information
Technology) 6,70719,459 Krung Thai Bank PCL NVDR (Financials) 6,7624,624 Krungthai Card PCL NVDR (Financials) 9,504
24,330 Land & Houses PCL NVDR (Real Estate) 6,15213,392 Minor International PCL NVDR
(Consumer Discretionary)* 13,6073,048 Muangthai Capital PCL NVDR
(Financials) 6,1235,851 PTT Exploration & Production PCL
NVDR (Energy) 20,2409,167 PTT Global Chemical PCL NVDR
(Materials) 18,202
Shares Description Value
Common Stocks – (continued)
Thailand – (continued)45,024 PTT PCL NVDR (Energy) $ 53,4305,091 SCG Packaging PCL NVDR (Materials) 11,0561,935 Siam Cement PCL (The) NVDR
(Materials) 25,8148,517 Siam Commercial Bank PCL (The)
NVDR (Financials) 28,1416,833 Siam Global House PCL NVDR
(Consumer Discretionary) 4,6003,463 Srisawad Corp. PCL NVDR (Financials) 7,709
36,276 Thai Beverage PCL (Consumer Staples) 18,3394,217 Thai Oil PCL NVDR (Energy) 6,509
12,623 Thai Union Group PCL NVDR(Consumer Staples) 7,793
2,261 Tisco Financial Group PCL NVDR(Financials) 6,594
191,574 TMBThanachart Bank PCL NVDR(Financials) 6,360
81,318 True Corp. PCL NVDR (CommunicationServices) 8,376
557,719
Turkey – 0.5%279 AG Anadolu Grubu Holding AS
(Industrials) 809603 Aksa Akrilik Kimya Sanayii AS
(Consumer Discretionary) 1,414611 Aksa Enerji Uretim AS (Utilities)* 1,061637 Alarko Holding AS (Industrials) 682929 Anadolu Efes Biracilik Ve Malt Sanayii
AS (Consumer Staples) 2,451310 Anadolu Hayat Emeklilik AS (Financials) 351
1,182 Arcelik AS (Consumer Discretionary) 4,5662,802 Aselsan Elektronik Sanayi Ve Ticaret AS
(Industrials) 5,355390 Aygaz AS (Utilities) 707
1,529 Bera Holding AS (Industrials)* 1,7992,027 BIM Birlesik Magazalar AS (Consumer
Staples) 17,516141 Biotrend Cevre VE Enerji Yatirimlari AS
(Utilities)* 495126 Borusan Mannesmann Boru Sanayi ve
Ticaret AS (Materials)* 399188 Brisa Bridgestone Sabanci Sanayi ve
Ticaret AS (Consumer Discretionary) 496316 Coca-Cola Icecek AS (Consumer Staples) 3,327
4,537 Dogan Sirketler Grubu Holding AS(Industrials) 1,402
87 Eczacibasi Yatirim Holding Ortakligi AS(Industrials) 465
5 EGE Endustri VE Ticaret AS (ConsumerDiscretionary) 741
9,169 Emlak Konut Gayrimenkul YatirimOrtakligi AS REIT (Real Estate) 2,029
1,220 Enerjisa Enerji AS (Utilities)(a) 1,6297,499 Enka Insaat ve Sanayi AS (Industrials) 9,8945,571 Eregli Demir ve Celik Fabrikalari TAS
(Materials) 12,583
The accompanying notes are an integral part of these financial statements. 31

G O L D M A N S A C H S M A R K E T B E T A® E M E R G I N G M A R K E T S E Q U I T Y E T F
Schedule of Investments (continued)August 31, 2021
Shares Description Value
Common Stocks – (continued)
Turkey – (continued)158 Fenerbahce Futbol AS (Communication
Services)* $ 650281 Ford Otomotiv Sanayi AS (Consumer
Discretionary) 5,806260 Gubre Fabrikalari TAS (Materials)* 1,621
5,922 Haci Omer Sabanci Holding AS(Financials) 7,486
1,795 Izmir Demir Celik Sanayi AS (Materials)* 572881 Kardemir Karabuk Demir Celik Sanayi ve
Ticaret AS, Class A (Materials)* 725192 Kardemir Karabuk Demir Celik Sanayi ve
Ticaret AS, Class B (Materials)* 1563,579 Kardemir Karabuk Demir Celik Sanayi ve
Ticaret AS, Class D (Materials)* 3,3494,874 KOC Holding AS (Industrials) 13,506
252 Kordsa Teknik Tekstil AS (ConsumerDiscretionary)* 710
218 Koza Altin Isletmeleri AS (Materials)* 2,711896 Koza Anadolu Metal Madencilik Isletmeleri
AS (Materials)* 1,713296 Logo Yazilim Sanayi Ve Ticaret AS
(Information Technology) 1,410303 Migros Ticaret AS (Consumer Staples)* 1,270661 MLP Saglik Hizmetleri AS (Health Care)*(a) 2,016315 Nurol Gayrimenkul Yatirim Ortakligi AS
REIT (Real Estate)* 61933 Otokar Otomotiv Ve Savunma Sanayi A.S.
(Industrials) 1,3211,207 Oyak Cimento Fabrikalari AS (Materials)* 990
185 Pegasus Hava Tasimaciligi AS(Industrials)* 1,571
5,915 Petkim Petrokimya Holding AS(Materials)* 4,410
762 Sasa Polyester Sanayi AS (Materials)* 2,5181,384 Sinpas Gayrimenkul Yatirim Ortakligi AS
REIT (Real Estate)* 7011,357 Sok Marketler Ticaret AS (Consumer
Staples) 2,016892 TAV Havalimanlari Holding AS
(Industrials)* 2,523584 Tofas Turk Otomobil Fabrikasi AS
(Consumer Discretionary) 2,951712 Torunlar Gayrimenkul Yatirim Ortakligi AS
REIT (Real Estate)* 3603,344 Turk Hava Yollari AO (Industrials)* 5,100
64 Turk Traktor ve Ziraat Makineleri AS(Industrials) 1,326
5,314 Turkcell Iletisim Hizmetleri AS(Communication Services) 10,475
9,430 Turkiye Garanti Bankasi AS (Financials) 11,2067,370 Turkiye Is Bankasi AS, Class C (Financials) 5,097
585 Turkiye Petrol Rafinerileri AS (Energy)* 7,1565,566 Turkiye Sinai Kalkinma Bankasi AS
(Financials) 8845,930 Turkiye Sise ve Cam Fabrikalari AS
(Industrials) 6,347
Shares Description Value
Common Stocks – (continued)
Turkey – (continued)356 Vestel Elektronik Sanayi ve Ticaret AS
(Consumer Discretionary) $ 1,22812,081 Yapi ve Kredi Bankasi AS (Financials) 3,8363,941 Ziraat Gayrimenkul Yatirim Ortakligi AS
(Real Estate)* 754
187,261
United Arab Emirates – 1.0%12,396 Abu Dhabi Commercial Bank PJSC
(Financials) 25,34412,783 Abu Dhabi National Oil Co. for
Distribution PJSC (ConsumerDiscretionary) 15,730
17,249 Aldar Properties PJSC (Real Estate) 19,4888,104 Dubai Islamic Bank PJSC (Financials) 11,2529,527 Emaar Malls PJSC (Real Estate)* 5,343
15,707 Emaar Properties PJSC (Real Estate) 17,9604,090 Emirates Integrated Telecommunications
Co. PJSC (Communication Services) 7,38211,005 Emirates NBD Bank PJSC (Financials) 41,4967,787 Emirates Telecommunications Group Co.
PJSC (Communication Services) 50,03219,423 First Abu Dhabi Bank PJSC (Financials) 89,8932,127 International Holding Co. PJSC
(Consumer Staples)* 85,123
369,043
United States – 0.1%4,115 JBS SA (Consumer Staples) 25,054
TOTAL COMMON STOCKS(Cost $21,571,962) $32,249,400
Shares Description Rate Value
Preferred Stocks – 1.7%
Brazil – 1.3%828 Alpargatas SA (Consumer
Discretionary)* 0.00% $ 9,69921,019 Banco Bradesco SA (Financials) 4.98 95,045
990 Bradespar SA (Materials) 9.69 12,212833 Braskem SA, Class A
(Materials)* 0.00 10,7371,088 Centrais Eletricas Brasileiras SA,
Class B (Utilities) 5.47 8,0274,908 Cia Energetica de Minas Gerais
(Utilities) 6.27 12,9525,045 Gerdau SA (Materials) 4.83 27,908
21,373 Itau Unibanco Holding SA(Financials) 2.26 129,168
20,051 Itausa SA (Financials) 2.69 45,27520,244 Petroleo Brasileiro SA (Energy) 8.89 107,516
458,539
32 The accompanying notes are an integral part of these financial statements.

G O L D M A N S A C H S M A R K E T B E T A® E M E R G I N G M A R K E T S E Q U I T Y E T F
Shares Description Rate Value
Preferred Stocks – (continued)
Chile – 0.1%1,882 Embotelladora Andina SA,
Class B (Consumer Staples) 6.22% $ 4,466627 Sociedad Quimica y Minera de
Chile SA, Class B (Materials) 1.19 32,753
37,219
Colombia – 0.1%2,004 Bancolombia SA (Financials) 2.26 16,722
17,098 Grupo Aval Acciones y ValoresSA (Financials) 5.09 5,089
21,811
Russia – 0.1%4,477 Sberbank of Russia PJSC
(Financials) 5.98 18,94834,482 Surgutneftegas PJSC (Energy) 17.44 18,207
37,155
South Korea – 0.1%50 Amorepacific Corp. (Consumer
Staples) 1.00 3,4287 CJ CheilJedang Corp.
(Consumer Staples) 2.01 1,21765 Doosan Fuel Cell Co. Ltd.
(Industrials)* 0.00 9053 Hotel Shilla Co. Ltd.
(Consumer Discretionary) 0.27 240159 Hyundai Motor Co. (Consumer
Discretionary) 4.13 13,61711 Hyundai Motor Co. (Consumer
Discretionary) 4.19 911100 Hyundai Motor Co. (Consumer
Discretionary) 4.06 8,84028 Korea Investment Holdings Co.
Ltd. (Financials) 4.33 1,72234 LG Chem Ltd. (Materials) 3.03 10,14683 LG Electronics, Inc. (Consumer
Discretionary) 1.81 5,004676 Mirae Asset Securities Co. Ltd.
(Financials) 4.22 2,76984 NH Investment & Securities Co.
Ltd. (Financials) 6.28 86214 Samsung Electro-Mechanics
Co. Ltd. (InformationTechnology) 1.43 1,226
13 Samsung Fire & MarineInsurance Co. Ltd. (Financials) 5.07 1,929
1 Samsung Heavy Industries Co.Ltd. (Industrials)* 0.00 222
7 Samsung SDI Co. Ltd.(Information Technology) 0.25 2,587
6 SK Innovation Co. Ltd. (Energy)* 0.00 8003 SK, Inc. (Industrials) 3.08 634
57,059
TOTAL PREFERRED STOCKS(Cost $371,220) $ 611,783
Units DescriptionExpiration
Month Value
Warrants – 0.0%
Thailand – 0.0%1,703 BTS Group Holdings PCL
(Industrials)* 09/21 $ —3,407 BTS Group Holdings PCL
(Industrials)* 09/21 —6,814 BTS Group Holdings PCL
(Industrials)* 11/26 —
TOTAL WARRANTS(Cost $0) $ —
Right – 0.0%
Indonesia – 0.0%1,563 Chandra Asri Petrochemical
Tbk PT (Materials)*(Cost $0) 09/21 $ 413
Shares Description Value
Exchange-Traded Fund – 1.0%
United States – 1.0%14,181 iShares MSCI Malaysia ETF(c)
(Cost $334,500) $ 376,364
TOTAL INVESTMENTS BEFORE SECURITIES LENDINGREINVESTMENT VEHICLE(Cost $22,277,682) $33,237,960
SharesDividend
Rate Value
Securities Lending Reinvestment Vehicle – 1.6%(d)
Goldman Sachs Financial Square Government Fund –Institutional Shares
568,867 0.026% $ 568,867(Cost $568,867)
TOTAL INVESTMENTS – 93.4%(Cost $22,846,549) $33,806,827
OTHER ASSETS IN EXCESS OFLIABIL IT IES – 6.6% 2,384,629
NET ASSETS – 100.0% $36,191,456
The percentage shown for each investment categoryreflects the value of investments in that category as apercentage of net assets.* Non-income producing security.
(a) Exempt from registration under Rule 144A of the Securities Act of1933.
(b) Significant unobservable inputs were used in the valuation of thisportfolio security; i.e. Level 3.
(c) All or a portion of security is on loan.
(d) Represents an affiliated issuer.
The accompanying notes are an integral part of these financial statements. 33

G O L D M A N S A C H S M A R K E T B E T A® E M E R G I N G M A R K E T S E Q U I T Y E T F
Schedule of Investments (continued)August 31, 2021
Investment Abbreviations:ADR —American Depositary ReceiptNVDR—Non-Voting Depository ReceiptPLC —Public Limited CompanyREIT —Real Estate Investment Trust
A D D I T I O N A L I N V E S T M E N T I N F O R M A T I O N
FUTURES CONTRACTS – At August 31, 2021, the Fund had the following futures contracts:
DescriptionNumber ofContracts
ExpirationDate
NotionalAmount
UnrealizedAppreciation/
(Depreciation)
MSCI Emerging Markets Index 46 09/17/21 $2,825,169 $162,991
34 The accompanying notes are an integral part of these financial statements.
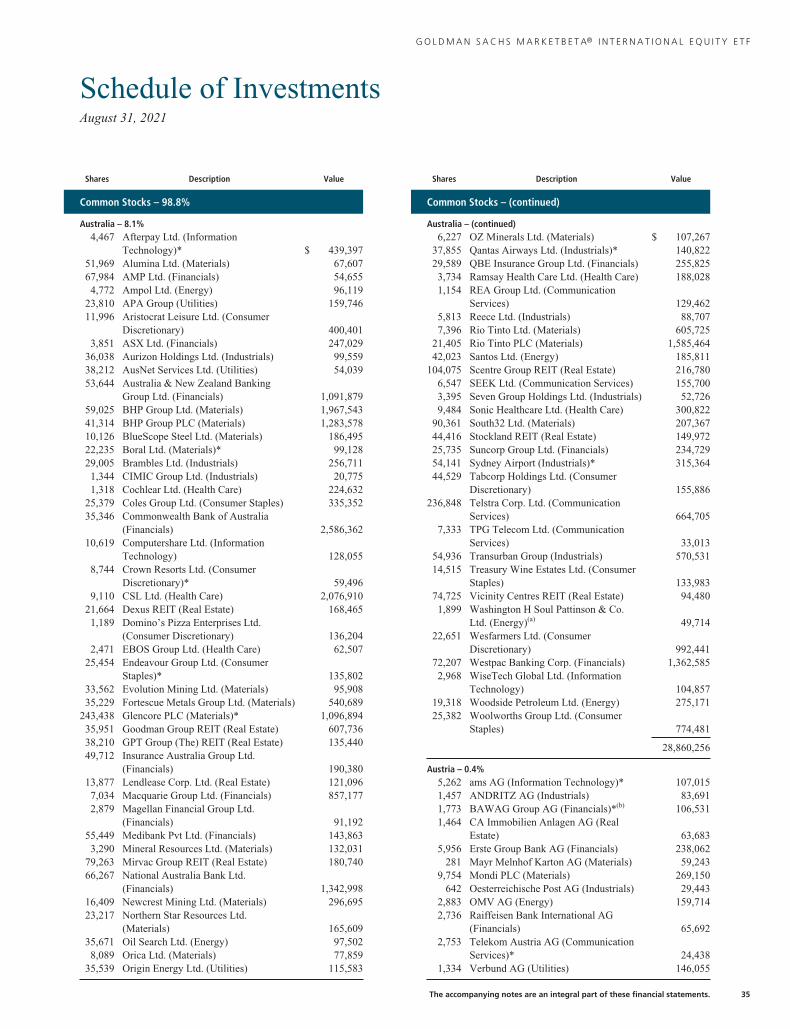
G O L D M A N S A C H S M A R K E T B E T A® I N T E R N A T I O N A L E Q U I T Y E T F
Schedule of InvestmentsAugust 31, 2021
Shares Description Value
Common Stocks – 98.8%
Australia – 8.1%4,467 Afterpay Ltd. (Information
Technology)* $ 439,39751,969 Alumina Ltd. (Materials) 67,60767,984 AMP Ltd. (Financials) 54,6554,772 Ampol Ltd. (Energy) 96,119
23,810 APA Group (Utilities) 159,74611,996 Aristocrat Leisure Ltd. (Consumer
Discretionary) 400,4013,851 ASX Ltd. (Financials) 247,029
36,038 Aurizon Holdings Ltd. (Industrials) 99,55938,212 AusNet Services Ltd. (Utilities) 54,03953,644 Australia & New Zealand Banking
Group Ltd. (Financials) 1,091,87959,025 BHP Group Ltd. (Materials) 1,967,54341,314 BHP Group PLC (Materials) 1,283,57810,126 BlueScope Steel Ltd. (Materials) 186,49522,235 Boral Ltd. (Materials)* 99,12829,005 Brambles Ltd. (Industrials) 256,7111,344 CIMIC Group Ltd. (Industrials) 20,7751,318 Cochlear Ltd. (Health Care) 224,632
25,379 Coles Group Ltd. (Consumer Staples) 335,35235,346 Commonwealth Bank of Australia
(Financials) 2,586,36210,619 Computershare Ltd. (Information
Technology) 128,0558,744 Crown Resorts Ltd. (Consumer
Discretionary)* 59,4969,110 CSL Ltd. (Health Care) 2,076,910
21,664 Dexus REIT (Real Estate) 168,4651,189 Domino’s Pizza Enterprises Ltd.
(Consumer Discretionary) 136,2042,471 EBOS Group Ltd. (Health Care) 62,507
25,454 Endeavour Group Ltd. (ConsumerStaples)* 135,802
33,562 Evolution Mining Ltd. (Materials) 95,90835,229 Fortescue Metals Group Ltd. (Materials) 540,689
243,438 Glencore PLC (Materials)* 1,096,89435,951 Goodman Group REIT (Real Estate) 607,73638,210 GPT Group (The) REIT (Real Estate) 135,44049,712 Insurance Australia Group Ltd.
(Financials) 190,38013,877 Lendlease Corp. Ltd. (Real Estate) 121,0967,034 Macquarie Group Ltd. (Financials) 857,1772,879 Magellan Financial Group Ltd.
(Financials) 91,19255,449 Medibank Pvt Ltd. (Financials) 143,8633,290 Mineral Resources Ltd. (Materials) 132,031
79,263 Mirvac Group REIT (Real Estate) 180,74066,267 National Australia Bank Ltd.
(Financials) 1,342,99816,409 Newcrest Mining Ltd. (Materials) 296,69523,217 Northern Star Resources Ltd.
(Materials) 165,60935,671 Oil Search Ltd. (Energy) 97,5028,089 Orica Ltd. (Materials) 77,859
35,539 Origin Energy Ltd. (Utilities) 115,583
Shares Description Value
Common Stocks – (continued)
Australia – (continued)6,227 OZ Minerals Ltd. (Materials) $ 107,267
37,855 Qantas Airways Ltd. (Industrials)* 140,82229,589 QBE Insurance Group Ltd. (Financials) 255,8253,734 Ramsay Health Care Ltd. (Health Care) 188,0281,154 REA Group Ltd. (Communication
Services) 129,4625,813 Reece Ltd. (Industrials) 88,7077,396 Rio Tinto Ltd. (Materials) 605,725
21,405 Rio Tinto PLC (Materials) 1,585,46442,023 Santos Ltd. (Energy) 185,811
104,075 Scentre Group REIT (Real Estate) 216,7806,547 SEEK Ltd. (Communication Services) 155,7003,395 Seven Group Holdings Ltd. (Industrials) 52,7269,484 Sonic Healthcare Ltd. (Health Care) 300,822
90,361 South32 Ltd. (Materials) 207,36744,416 Stockland REIT (Real Estate) 149,97225,735 Suncorp Group Ltd. (Financials) 234,72954,141 Sydney Airport (Industrials)* 315,36444,529 Tabcorp Holdings Ltd. (Consumer
Discretionary) 155,886236,848 Telstra Corp. Ltd. (Communication
Services) 664,7057,333 TPG Telecom Ltd. (Communication
Services) 33,01354,936 Transurban Group (Industrials) 570,53114,515 Treasury Wine Estates Ltd. (Consumer
Staples) 133,98374,725 Vicinity Centres REIT (Real Estate) 94,4801,899 Washington H Soul Pattinson & Co.
Ltd. (Energy)(a) 49,71422,651 Wesfarmers Ltd. (Consumer
Discretionary) 992,44172,207 Westpac Banking Corp. (Financials) 1,362,5852,968 WiseTech Global Ltd. (Information
Technology) 104,85719,318 Woodside Petroleum Ltd. (Energy) 275,17125,382 Woolworths Group Ltd. (Consumer
Staples) 774,481
28,860,256
Austria – 0.4%5,262 ams AG (Information Technology)* 107,0151,457 ANDRITZ AG (Industrials) 83,6911,773 BAWAG Group AG (Financials)*(b) 106,5311,464 CA Immobilien Anlagen AG (Real
Estate) 63,6835,956 Erste Group Bank AG (Financials) 238,062
281 Mayr Melnhof Karton AG (Materials) 59,2439,754 Mondi PLC (Materials) 269,150
642 Oesterreichische Post AG (Industrials) 29,4432,883 OMV AG (Energy) 159,7142,736 Raiffeisen Bank International AG
(Financials) 65,6922,753 Telekom Austria AG (Communication
Services)* 24,4381,334 Verbund AG (Utilities) 146,055
The accompanying notes are an integral part of these financial statements. 35

G O L D M A N S A C H S M A R K E T B E T A® I N T E R N A T I O N A L E Q U I T Y E T F
Schedule of Investments (continued)August 31, 2021
Shares Description Value
Common Stocks – (continued)
Austria – (continued)736 Vienna Insurance Group AG Wiener
Versicherung Gruppe (Financials) $ 21,3292,245 voestalpine AG (Materials) 101,7642,263 Wienerberger AG (Materials) 88,796
1,564,606
Belgium – 0.9%445 Ackermans & van Haaren NV
(Financials) 81,9473,559 Ageas SA/NV (Financials) 177,922
17,033 Anheuser-Busch InBev SA/NV(Consumer Staples) 1,045,342
444 D’ieteren Group (ConsumerDiscretionary) 69,394
579 Elia Group SA/NV (Utilities) 72,7221,088 Etablissements Franz Colruyt NV
(Consumer Staples) 60,8642,106 Groupe Bruxelles Lambert SA
(Financials) 241,3935,632 KBC Group NV (Financials) 474,2892,870 Proximus SADP (Communication
Services)(a) 56,256303 Sofina SA (Financials) 133,914
1,431 Solvay SA (Materials) 187,419862 Telenet Group Holding NV
(Communication Services) 32,7852,348 UCB SA (Health Care) 268,5223,923 Umicore SA (Materials) 258,1272,840 Warehouses De Pauw CVA REIT (Real
Estate) 130,545
3,291,441
Brazil – 0.1%3,266 Yara International ASA (Materials) 163,800
Chile – 0.1%6,985 Antofagasta PLC (Materials) 139,967
China – 0.9%34,155 Budweiser Brewing Co. APAC Ltd.
(Consumer Staples)(b) 85,46012,855 BYD Electronic International Co. Ltd.
(Information Technology) 58,67744,720 China Gas Holdings Ltd. (Utilities) 129,66335,278 Chow Tai Fook Jewellery Group Ltd.
(Consumer Discretionary) 71,487169,431 CSPC Pharmaceutical Group Ltd.
(Health Care) 215,02034,893 ESR Cayman Ltd. (Real Estate)*(b) 106,33046,227 Fosun International Ltd. (Industrials) 58,487
115,430 Geely Automobile Holdings Ltd.(Consumer Discretionary) 417,055
5,520 NXP Semiconductors NV (InformationTechnology) 1,187,518
8,482 Prosus NV (Consumer Discretionary)* 749,94227,256 Wharf Holdings Ltd. (The) (Real Estate) 92,16936,833 Wilmar International Ltd. (Consumer
Staples) 113,366
Shares Description Value
Common Stocks – (continued)
China – (continued)54,047 Yangzijiang Shipbuilding Holdings Ltd.
(Industrials) $ 65,896
3,351,070
Colombia – 0.0%2,046 Millicom International Cellular SA SDR
(Communication Services)* 77,187
Denmark – 2.5%3,402 Ambu A/S, Class B (Health Care) 107,517
61 AP Moller – Maersk A/S, Class A(Industrials) 165,091
69 AP Moller – Maersk A/S, Class B(Industrials) 195,724
1,916 Carlsberg AS, Class B (ConsumerStaples) 334,396
2,075 Chr Hansen Holding A/S (Materials) 191,4322,490 Coloplast A/S, Class B (Health Care) 431,215
13,608 Danske Bank A/S (Financials) 228,6411,970 Demant A/S (Health Care)* 111,6364,430 DSV PANALPINA A/S (Industrials) 1,128,6221,300 Genmab A/S (Health Care)* 615,3482,590 GN Store Nord AS (Health Care) 194,8301,245 H Lundbeck A/S (Health Care) 36,768
32,880 Novo Nordisk A/S, Class B (HealthCare) 3,276,074
4,093 Novozymes A/S, Class B (Materials) 330,5663,591 Orsted AS (Utilities)(b) 570,5849,933 Tryg A/S (Financials) 245,887
19,433 Vestas Wind Systems A/S (Industrials) 784,433
8,948,764
Faroe Islands – 0.0%1,006 Bakkafrost P/F (Consumer Staples) 88,312
Finland – 1.4%2,877 Elisa OYJ (Communication Services) 184,2078,445 Fortum OYJ (Utilities) 256,4001,822 Huhtamaki OYJ (Materials) 97,2375,312 Kesko OYJ, Class B (Consumer Staples) 219,2187,289 Kone OYJ, Class B (Industrials) 604,366
13,916 Metso Outotec OYJ (Industrials) 148,5679,291 Neste OYJ (Energy) 565,268
105,941 Nokia OYJ (Information Technology)* 635,29563,518 Nordea Bank Abp (Financials) 745,0742,011 Orion OYJ, Class B (Health Care) 81,9708,535 Sampo OYJ, Class A (Financials) 440,686
11,646 Stora Enso OYJ, Class R (Materials) 227,86510,595 UPM-Kymmene OYJ (Materials) 430,61110,874 Wartsila OYJ Abp (Industrials) 154,099
4,790,863
France – 9.1%5,548 Adevinta ASA (Communication
Services)* 111,529667 Aeroports de Paris (Industrials)* 78,295
9,515 Air Liquide SA (Materials) 1,705,239
36 The accompanying notes are an integral part of these financial statements.

G O L D M A N S A C H S M A R K E T B E T A® I N T E R N A T I O N A L E Q U I T Y E T F
Shares Description Value
Common Stocks – (continued)
France – (continued)11,693 Airbus SE (Industrials)* $ 1,597,0077,419 Alstom SA (Industrials) 318,7821,217 Amundi SA (Financials)(b) 115,144
45,348 AXA SA (Financials) 1,272,968820 BioMerieux (Health Care) 100,524
22,909 BNP Paribas SA (Financials) 1,453,01618,176 Bollore SA (Communication Services) 107,4946,026 Bouygues SA (Industrials) 252,0273,186 Capgemini SE (Information Technology) 715,137
12,522 Carrefour SA (Consumer Staples) 249,0709,616 Cie de Saint-Gobain (Industrials) 696,8503,274 Cie Generale des Etablissements
Michelin (Consumer Discretionary) 529,67029,732 Credit Agricole SA (Financials) 428,53613,215 Danone SA (Consumer Staples) 965,15013,535 Dassault Systemes SE (Information
Technology) 771,78711,238 Electricite de France SA (Utilities) 152,22635,136 Engie SA (Utilities) 503,1906,007 EssilorLuxottica SA (Consumer
Discretionary) 1,178,943666 Hermes International (Consumer
Discretionary) 978,4001,470 Kering (Consumer Discretionary) 1,169,5664,235 L’Oreal SA (Consumer Staples) 1,981,1845,280 Legrand SA (Industrials) 604,0805,238 LVMH Moet Hennessy Louis Vuitton SE
(Consumer Discretionary) 3,875,62640,085 Orange SA (Communication Services) 455,2023,532 Pernod Ricard SA (Consumer Staples) 741,9357,619 Safran SA (Industrials) 955,686
21,851 Sanofi (Health Care) 2,260,070477 Sartorius Stedim Biotech (Health Care) 289,195
16,691 Societe Generale SA (Financials) 525,0821,587 Sodexo SA (Consumer Discretionary)* 131,1741,157 Teleperformance (Industrials) 511,3482,129 Thales SA (Industrials) 215,982
53,076 TotalEnergies SE (Energy) 2,339,79610,979 Vinci SA (Industrials) 1,177,94813,658 Vivendi SE (Communication Services)(a) 521,0824,559 Worldline SA (Information
Technology)*(b) 405,078
32,441,018
Germany – 7.6%3,607 adidas AG (Consumer Discretionary) 1,279,2808,276 Allianz SE (Financials) 1,943,915
18,464 BASF SE (Materials) 1,428,06219,750 Bayer AG (Health Care) 1,099,1336,418 Bayerische Motoren Werke AG
(Consumer Discretionary) 608,8931,984 Beiersdorf AG (Consumer Staples) 240,6421,703 BioNTech SE ADR (Health Care)* 568,3132,171 Continental AG (Consumer
Discretionary)* 291,6933,765 Covestro AG (Materials)(b) 243,997
Shares Description Value
Common Stocks – (continued)
Germany – (continued)16,838 Daimler AG (Consumer Discretionary) $ 1,419,57337,936 Deutsche Bank AG (Financials)* 471,4603,686 Deutsche Boerse AG (Financials) 635,701
19,786 Deutsche Post AG (Industrials) 1,391,57365,185 Deutsche Telekom AG (Communication
Services) 1,385,6725,583 Deutsche Wohnen SE (Real Estate) 346,394
42,848 E.ON SE (Utilities) 565,3823,561 Evonik Industries AG (Materials) 120,2223,993 Fresenius Medical Care AG & Co.
KGaA (Health Care) 306,5687,860 Fresenius SE & Co. KGaA (Health
Care) 408,7111,207 Hannover Rueck SE (Financials) 222,198
490 Hapag-Lloyd AG (Industrials)(b) 111,6352,970 HeidelbergCement AG (Materials) 258,0372,036 Henkel AG & Co. KGaA (Consumer
Staples) 183,13924,154 Infineon Technologies AG (Information
Technology) 1,028,3061,336 Knorr-Bremse AG (Industrials) 160,3102,598 Merck KGaA (Health Care) 617,0421,073 MTU Aero Engines AG (Industrials) 246,1682,816 Muenchener Rueckversicherungs-
Gesellschaft AG in Muenchen(Financials) 822,560
12,566 RWE AG (Utilities) 490,84120,239 SAP SE (Information Technology) 3,045,16216,230 Siemens AG (Industrials) 2,698,3108,034 Siemens Energy AG (Industrials)* 233,1105,571 Siemens Healthineers AG (Health
Care)(b) 387,3432,498 Symrise AG (Materials) 355,6211,069 Talanx AG (Financials) 48,558
15,846 Telefonica Deutschland Holding AG(Communication Services) 44,463
577 Volkswagen AG (ConsumerDiscretionary) 192,893
11,564 Vonovia SE (Real Estate) 780,2754,497 Zalando SE (Consumer
Discretionary)*(a)(b) 497,935
27,179,090
Hong Kong – 2.7%243,006 AIA Group Ltd. (Financials) 2,904,255
6,171 ASM Pacific Technology Ltd.(Information Technology) 73,474
26,282 Bank of East Asia Ltd. (The)(Financials) 44,066
19,525 Cathay Pacific Airways Ltd.(Industrials)*(a) 16,394
39,808 CK Asset Holdings Ltd. (Real Estate) 259,50612,261 CK Infrastructure Holdings Ltd.
(Utilities) 74,49037,974 CLP Holdings Ltd. (Utilities) 379,6256,078 Dairy Farm International Holdings Ltd.
(Consumer Staples) 21,455
The accompanying notes are an integral part of these financial statements. 37

G O L D M A N S A C H S M A R K E T B E T A® I N T E R N A T I O N A L E Q U I T Y E T F
Schedule of Investments (continued)August 31, 2021
Shares Description Value
Common Stocks – (continued)
Hong Kong – (continued)36,917 Hang Lung Properties Ltd. (Real Estate) $ 88,66914,550 Hang Seng Bank Ltd. (Financials) 260,41826,522 Henderson Land Development Co. Ltd.
(Real Estate) 120,03845,724 HK Electric Investments & HK Electric
Investments Ltd. (Utilities) 45,50468,791 HKT Trust & HKT Ltd.
(Communication Services) 93,757218,177 Hong Kong & China Gas Co. Ltd.
(Utilities) 351,22225,473 Hong Kong Exchanges & Clearing Ltd.
(Financials) 1,607,50723,370 Hongkong Land Holdings Ltd. (Real
Estate) 98,1544,727 Jardine Matheson Holdings Ltd.
(Industrials) 256,77141,812 Link REIT (Real Estate) 384,6629,196 Melco Resorts & Entertainment Ltd.
ADR (Consumer Discretionary)* 126,53731,194 MTR Corp. Ltd. (Industrials) 175,67628,167 New World Development Co. Ltd. (Real
Estate) 132,55327,601 Power Assets Holdings Ltd. (Utilities) 173,364
201,552 Sino Biopharmaceutical Ltd. (HealthCare) 168,708
63,862 Sino Land Co. Ltd. (Real Estate) 94,10128,983 Sun Hung Kai Properties Ltd. (Real
Estate) 408,4349,450 Swire Pacific Ltd., Class A (Real Estate) 64,034
17,455 Swire Pacific Ltd., Class B (Real Estate) 18,96521,248 Swire Properties Ltd. (Real Estate) 57,50927,510 Techtronic Industries Co. Ltd.
(Industrials) 610,166191,190 WH Group Ltd. (Consumer Staples)(b) 165,93529,747 Wharf Real Estate Investment Co. Ltd.
(Real Estate) 147,44734,548 Xinyi Glass Holdings Ltd. (Industrials) 145,258
9,568,654
Ireland – 1.0%2,547 AerCap Holdings NV (Industrials)* 137,360
15,829 AIB Group PLC (Financials)* 47,74115,722 CRH PLC (Materials) 835,8993,483 Flutter Entertainment PLC (Consumer
Discretionary)* 677,3701,584 ICON PLC (Health Care)* 405,1403,137 Kerry Group PLC, Class A (Consumer
Staples) 459,9213,055 Kingspan Group PLC (Industrials) 349,0153,946 Ryanair Holdings PLC ADR
(Industrials)* 424,9845,174 Smurfit Kappa Group PLC (Materials) 296,709
3,634,139
Shares Description Value
Common Stocks – (continued)
Israel – 0.9%1,317 Airport City Ltd. (Real Estate)* $ 24,1392,943 Alony Hetz Properties & Investments
Ltd. (Real Estate) 43,4503,540 Amot Investments Ltd. (Real Estate) 25,149
769 Ashtrom Group Ltd. (Industrials) 16,802738 Azrieli Group Ltd. (Real Estate) 69,060
21,583 Bank Hapoalim BM (Financials) 185,86826,849 Bank Leumi Le-Israel BM (Financials) 222,08341,137 Bezeq The Israeli Telecommunication
Corp. Ltd. (Communication Services)* 48,921233 Big Shopping Centers Ltd. (Real Estate)* 34,262
1,987 Check Point Software Technologies Ltd.(Information Technology)* 249,627
420 Elbit Systems Ltd. (Industrials) 61,1564,498 Energix-Renewable Energies Ltd.
(Utilities) 18,6031,046 First International Bank Of Israel Ltd.
(The) (Financials) 37,840499 Fiverr International Ltd. (Consumer
Discretionary)* 89,576302 Global-e Online Ltd. (Consumer
Discretionary)* 23,8462,315 Harel Insurance Investments & Financial
Services Ltd. (Financials) 22,76213,623 ICL Group Ltd. (Materials) 96,483
73 Israel Corp. Ltd. (The) (Materials)* 22,18222,516 Israel Discount Bank Ltd., Class A
(Financials)* 116,454946 JFrog Ltd. (Information Technology)* 36,364931 Kornit Digital Ltd. (Industrials)* 121,374647 Matrix IT Ltd. (Information Technology) 17,683961 Maytronics Ltd. (Consumer
Discretionary) 22,062426 Melisron Ltd. (Real Estate)*(a) 34,439
13,423 Mivne Real Estate KD Ltd. (Real Estate) 45,4592,895 Mizrahi Tefahot Bank Ltd. (Financials) 96,4175,021 Nano Dimension Ltd. ADR (Information
Technology)*(a) 32,134622 Nano-X Imaging Ltd. (Health Care)*(a) 15,339
1,171 Nice Ltd. (Information Technology)* 342,044529 Nova Ltd. (Information Technology)* 53,152
1,570 OPC Energy Ltd. (Utilities)*(a) 14,5692,927 Phoenix Holdings Ltd. (The) (Financials) 31,2821,949 Plus500 Ltd. (Financials) 40,087
604 Sapiens International Corp. NV(Information Technology) 17,381
2,855 Shapir Engineering and Industry Ltd.(Industrials) 22,804
4,447 Shikun & Binui Ltd. (Industrials)* 25,9575,357 Shufersal Ltd. (Consumer Staples) 44,2441,000 Strauss Group Ltd. (Consumer Staples) 28,938
21,923 Teva Pharmaceutical Industries Ltd.(Health Care)* 210,214
2,179 Tower Semiconductor Ltd. (InformationTechnology)* 64,219
1,082 Wix.com Ltd. (Information Technology)* 240,291
38 The accompanying notes are an integral part of these financial statements.
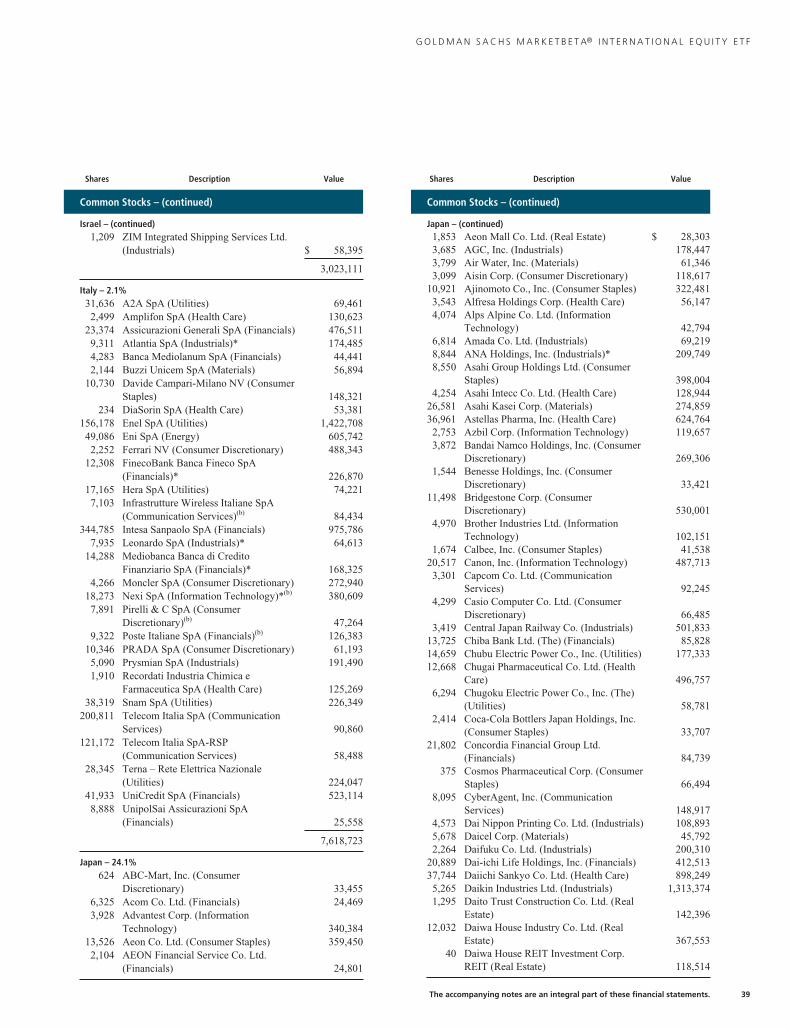
G O L D M A N S A C H S M A R K E T B E T A® I N T E R N A T I O N A L E Q U I T Y E T F
Shares Description Value
Common Stocks – (continued)
Israel – (continued)1,209 ZIM Integrated Shipping Services Ltd.
(Industrials) $ 58,395
3,023,111
Italy – 2.1%31,636 A2A SpA (Utilities) 69,4612,499 Amplifon SpA (Health Care) 130,623
23,374 Assicurazioni Generali SpA (Financials) 476,5119,311 Atlantia SpA (Industrials)* 174,4854,283 Banca Mediolanum SpA (Financials) 44,4412,144 Buzzi Unicem SpA (Materials) 56,894
10,730 Davide Campari-Milano NV (ConsumerStaples) 148,321
234 DiaSorin SpA (Health Care) 53,381156,178 Enel SpA (Utilities) 1,422,70849,086 Eni SpA (Energy) 605,7422,252 Ferrari NV (Consumer Discretionary) 488,343
12,308 FinecoBank Banca Fineco SpA(Financials)* 226,870
17,165 Hera SpA (Utilities) 74,2217,103 Infrastrutture Wireless Italiane SpA
(Communication Services)(b) 84,434344,785 Intesa Sanpaolo SpA (Financials) 975,786
7,935 Leonardo SpA (Industrials)* 64,61314,288 Mediobanca Banca di Credito
Finanziario SpA (Financials)* 168,3254,266 Moncler SpA (Consumer Discretionary) 272,940
18,273 Nexi SpA (Information Technology)*(b) 380,6097,891 Pirelli & C SpA (Consumer
Discretionary)(b) 47,2649,322 Poste Italiane SpA (Financials)(b) 126,383
10,346 PRADA SpA (Consumer Discretionary) 61,1935,090 Prysmian SpA (Industrials) 191,4901,910 Recordati Industria Chimica e
Farmaceutica SpA (Health Care) 125,26938,319 Snam SpA (Utilities) 226,349
200,811 Telecom Italia SpA (CommunicationServices) 90,860
121,172 Telecom Italia SpA-RSP(Communication Services) 58,488
28,345 Terna – Rete Elettrica Nazionale(Utilities) 224,047
41,933 UniCredit SpA (Financials) 523,1148,888 UnipolSai Assicurazioni SpA
(Financials) 25,558
7,618,723
Japan – 24.1%624 ABC-Mart, Inc. (Consumer
Discretionary) 33,4556,325 Acom Co. Ltd. (Financials) 24,4693,928 Advantest Corp. (Information
Technology) 340,38413,526 Aeon Co. Ltd. (Consumer Staples) 359,4502,104 AEON Financial Service Co. Ltd.
(Financials) 24,801
Shares Description Value
Common Stocks – (continued)
Japan – (continued)1,853 Aeon Mall Co. Ltd. (Real Estate) $ 28,3033,685 AGC, Inc. (Industrials) 178,4473,799 Air Water, Inc. (Materials) 61,3463,099 Aisin Corp. (Consumer Discretionary) 118,617
10,921 Ajinomoto Co., Inc. (Consumer Staples) 322,4813,543 Alfresa Holdings Corp. (Health Care) 56,1474,074 Alps Alpine Co. Ltd. (Information
Technology) 42,7946,814 Amada Co. Ltd. (Industrials) 69,2198,844 ANA Holdings, Inc. (Industrials)* 209,7498,550 Asahi Group Holdings Ltd. (Consumer
Staples) 398,0044,254 Asahi Intecc Co. Ltd. (Health Care) 128,944
26,581 Asahi Kasei Corp. (Materials) 274,85936,961 Astellas Pharma, Inc. (Health Care) 624,7642,753 Azbil Corp. (Information Technology) 119,6573,872 Bandai Namco Holdings, Inc. (Consumer
Discretionary) 269,3061,544 Benesse Holdings, Inc. (Consumer
Discretionary) 33,42111,498 Bridgestone Corp. (Consumer
Discretionary) 530,0014,970 Brother Industries Ltd. (Information
Technology) 102,1511,674 Calbee, Inc. (Consumer Staples) 41,538
20,517 Canon, Inc. (Information Technology) 487,7133,301 Capcom Co. Ltd. (Communication
Services) 92,2454,299 Casio Computer Co. Ltd. (Consumer
Discretionary) 66,4853,419 Central Japan Railway Co. (Industrials) 501,833
13,725 Chiba Bank Ltd. (The) (Financials) 85,82814,659 Chubu Electric Power Co., Inc. (Utilities) 177,33312,668 Chugai Pharmaceutical Co. Ltd. (Health
Care) 496,7576,294 Chugoku Electric Power Co., Inc. (The)
(Utilities) 58,7812,414 Coca-Cola Bottlers Japan Holdings, Inc.
(Consumer Staples) 33,70721,802 Concordia Financial Group Ltd.
(Financials) 84,739375 Cosmos Pharmaceutical Corp. (Consumer
Staples) 66,4948,095 CyberAgent, Inc. (Communication
Services) 148,9174,573 Dai Nippon Printing Co. Ltd. (Industrials) 108,8935,678 Daicel Corp. (Materials) 45,7922,264 Daifuku Co. Ltd. (Industrials) 200,310
20,889 Dai-ichi Life Holdings, Inc. (Financials) 412,51337,744 Daiichi Sankyo Co. Ltd. (Health Care) 898,2495,265 Daikin Industries Ltd. (Industrials) 1,313,3741,295 Daito Trust Construction Co. Ltd. (Real
Estate) 142,39612,032 Daiwa House Industry Co. Ltd. (Real
Estate) 367,55340 Daiwa House REIT Investment Corp.
REIT (Real Estate) 118,514
The accompanying notes are an integral part of these financial statements. 39
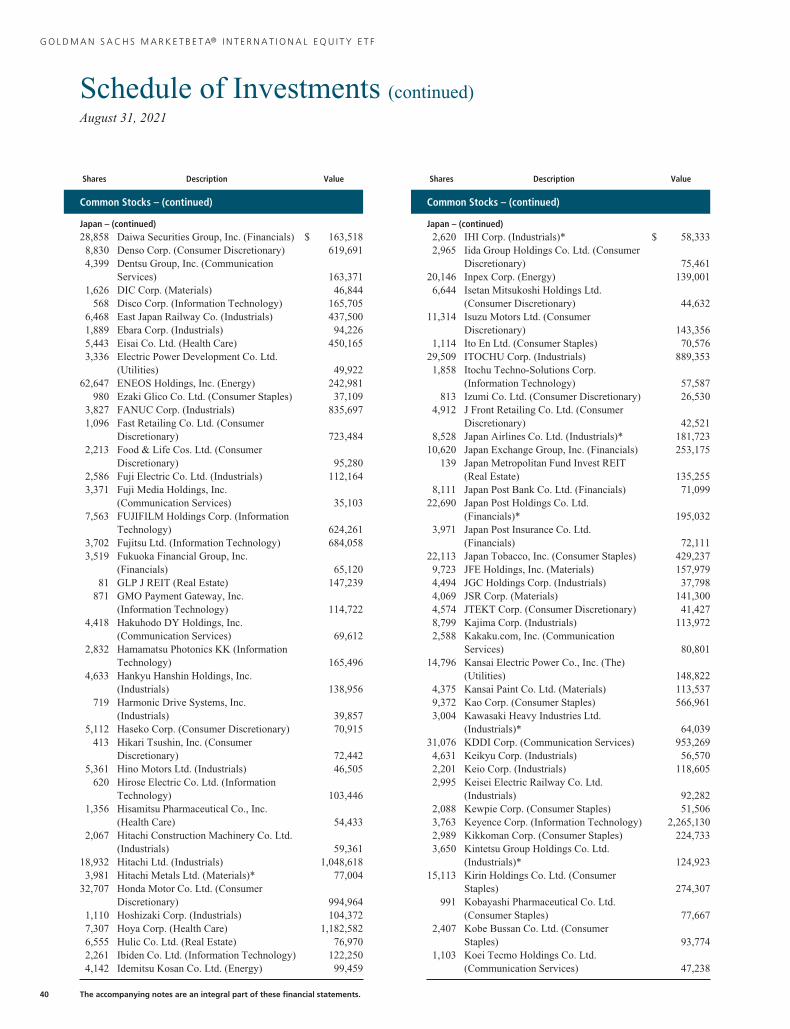
G O L D M A N S A C H S M A R K E T B E T A® I N T E R N A T I O N A L E Q U I T Y E T F
Schedule of Investments (continued)August 31, 2021
Shares Description Value
Common Stocks – (continued)
Japan – (continued)28,858 Daiwa Securities Group, Inc. (Financials) $ 163,5188,830 Denso Corp. (Consumer Discretionary) 619,6914,399 Dentsu Group, Inc. (Communication
Services) 163,3711,626 DIC Corp. (Materials) 46,844
568 Disco Corp. (Information Technology) 165,7056,468 East Japan Railway Co. (Industrials) 437,5001,889 Ebara Corp. (Industrials) 94,2265,443 Eisai Co. Ltd. (Health Care) 450,1653,336 Electric Power Development Co. Ltd.
(Utilities) 49,92262,647 ENEOS Holdings, Inc. (Energy) 242,981
980 Ezaki Glico Co. Ltd. (Consumer Staples) 37,1093,827 FANUC Corp. (Industrials) 835,6971,096 Fast Retailing Co. Ltd. (Consumer
Discretionary) 723,4842,213 Food & Life Cos. Ltd. (Consumer
Discretionary) 95,2802,586 Fuji Electric Co. Ltd. (Industrials) 112,1643,371 Fuji Media Holdings, Inc.
(Communication Services) 35,1037,563 FUJIFILM Holdings Corp. (Information
Technology) 624,2613,702 Fujitsu Ltd. (Information Technology) 684,0583,519 Fukuoka Financial Group, Inc.
(Financials) 65,12081 GLP J REIT (Real Estate) 147,239
871 GMO Payment Gateway, Inc.(Information Technology) 114,722
4,418 Hakuhodo DY Holdings, Inc.(Communication Services) 69,612
2,832 Hamamatsu Photonics KK (InformationTechnology) 165,496
4,633 Hankyu Hanshin Holdings, Inc.(Industrials) 138,956
719 Harmonic Drive Systems, Inc.(Industrials) 39,857
5,112 Haseko Corp. (Consumer Discretionary) 70,915413 Hikari Tsushin, Inc. (Consumer
Discretionary) 72,4425,361 Hino Motors Ltd. (Industrials) 46,505
620 Hirose Electric Co. Ltd. (InformationTechnology) 103,446
1,356 Hisamitsu Pharmaceutical Co., Inc.(Health Care) 54,433
2,067 Hitachi Construction Machinery Co. Ltd.(Industrials) 59,361
18,932 Hitachi Ltd. (Industrials) 1,048,6183,981 Hitachi Metals Ltd. (Materials)* 77,004
32,707 Honda Motor Co. Ltd. (ConsumerDiscretionary) 994,964
1,110 Hoshizaki Corp. (Industrials) 104,3727,307 Hoya Corp. (Health Care) 1,182,5826,555 Hulic Co. Ltd. (Real Estate) 76,9702,261 Ibiden Co. Ltd. (Information Technology) 122,2504,142 Idemitsu Kosan Co. Ltd. (Energy) 99,459
Shares Description Value
Common Stocks – (continued)
Japan – (continued)2,620 IHI Corp. (Industrials)* $ 58,3332,965 Iida Group Holdings Co. Ltd. (Consumer
Discretionary) 75,46120,146 Inpex Corp. (Energy) 139,0016,644 Isetan Mitsukoshi Holdings Ltd.
(Consumer Discretionary) 44,63211,314 Isuzu Motors Ltd. (Consumer
Discretionary) 143,3561,114 Ito En Ltd. (Consumer Staples) 70,576
29,509 ITOCHU Corp. (Industrials) 889,3531,858 Itochu Techno-Solutions Corp.
(Information Technology) 57,587813 Izumi Co. Ltd. (Consumer Discretionary) 26,530
4,912 J Front Retailing Co. Ltd. (ConsumerDiscretionary) 42,521
8,528 Japan Airlines Co. Ltd. (Industrials)* 181,72310,620 Japan Exchange Group, Inc. (Financials) 253,175
139 Japan Metropolitan Fund Invest REIT(Real Estate) 135,255
8,111 Japan Post Bank Co. Ltd. (Financials) 71,09922,690 Japan Post Holdings Co. Ltd.
(Financials)* 195,0323,971 Japan Post Insurance Co. Ltd.
(Financials) 72,11122,113 Japan Tobacco, Inc. (Consumer Staples) 429,2379,723 JFE Holdings, Inc. (Materials) 157,9794,494 JGC Holdings Corp. (Industrials) 37,7984,069 JSR Corp. (Materials) 141,3004,574 JTEKT Corp. (Consumer Discretionary) 41,4278,799 Kajima Corp. (Industrials) 113,9722,588 Kakaku.com, Inc. (Communication
Services) 80,80114,796 Kansai Electric Power Co., Inc. (The)
(Utilities) 148,8224,375 Kansai Paint Co. Ltd. (Materials) 113,5379,372 Kao Corp. (Consumer Staples) 566,9613,004 Kawasaki Heavy Industries Ltd.
(Industrials)* 64,03931,076 KDDI Corp. (Communication Services) 953,2694,631 Keikyu Corp. (Industrials) 56,5702,201 Keio Corp. (Industrials) 118,6052,995 Keisei Electric Railway Co. Ltd.
(Industrials) 92,2822,088 Kewpie Corp. (Consumer Staples) 51,5063,763 Keyence Corp. (Information Technology) 2,265,1302,989 Kikkoman Corp. (Consumer Staples) 224,7333,650 Kintetsu Group Holdings Co. Ltd.
(Industrials)* 124,92315,113 Kirin Holdings Co. Ltd. (Consumer
Staples) 274,307991 Kobayashi Pharmaceutical Co. Ltd.
(Consumer Staples) 77,6672,407 Kobe Bussan Co. Ltd. (Consumer
Staples) 93,7741,103 Koei Tecmo Holdings Co. Ltd.
(Communication Services) 47,238
40 The accompanying notes are an integral part of these financial statements.

G O L D M A N S A C H S M A R K E T B E T A® I N T E R N A T I O N A L E Q U I T Y E T F
Shares Description Value
Common Stocks – (continued)
Japan – (continued)2,456 Koito Manufacturing Co. Ltd.
(Consumer Discretionary) $ 150,45418,830 Komatsu Ltd. (Industrials) 456,3521,878 Konami Holdings Corp.
(Communication Services) 119,319645 Kose Corp. (Consumer Staples) 78,086
23,222 Kubota Corp. (Industrials) 480,7806,691 Kuraray Co. Ltd. (Materials) 63,0362,193 Kurita Water Industries Ltd.
(Industrials) 103,0036,560 Kyocera Corp. (Information
Technology) 408,7914,970 Kyowa Kirin Co. Ltd. (Health Care) 162,6369,021 Kyushu Electric Power Co., Inc.
(Utilities) 68,9752,759 Kyushu Railway Co. (Industrials) 62,5581,541 Lasertec Corp. (Information
Technology) 337,629904 Lawson, Inc. (Consumer Staples) 43,612
5,032 Lion Corp. (Consumer Staples) 85,7905,508 Lixil Corp. (Industrials) 160,6888,191 M3, Inc. (Health Care) 551,808
970 Mabuchi Motor Co. Ltd. (Industrials) 33,9934,849 Makita Corp. (Industrials) 278,952
33,790 Marubeni Corp. (Industrials) 269,3113,971 Marui Group Co. Ltd. (Consumer
Discretionary) 70,9181,643 Matsumotokiyoshi Holdings Co. Ltd.
(Consumer Staples) 76,27311,590 Mazda Motor Corp. (Consumer
Discretionary)* 100,7501,637 McDonald’s Holdings Co. Japan Ltd.
(Consumer Discretionary) 78,22920,579 Mebuki Financial Group, Inc.
(Financials) 46,0813,395 Medipal Holdings Corp. (Health Care) 64,9892,592 MEIJI Holdings Co. Ltd. (Consumer
Staples) 159,4931,896 Mercari, Inc. (Consumer
Discretionary)* 93,8857,613 MINEBEA MITSUMI, Inc. (Industrials) 196,3195,639 MISUMI Group, Inc. (Industrials) 224,051
27,776 Mitsubishi Chemical Holdings Corp.(Materials) 244,184
27,236 Mitsubishi Corp. (Industrials) 820,84839,336 Mitsubishi Electric Corp. (Industrials) 539,05323,898 Mitsubishi Estate Co. Ltd. (Real Estate) 374,3723,793 Mitsubishi Gas Chemical Co., Inc.
(Materials) 71,64113,281 Mitsubishi HC Capital, Inc. (Financials) 71,2046,079 Mitsubishi Heavy Industries Ltd.
(Industrials) 160,9672,364 Mitsubishi Materials Corp. (Materials) 48,545
12,982 Mitsubishi Motors Corp. (ConsumerDiscretionary)* 33,205
231,041 Mitsubishi UFJ Financial Group, Inc.(Financials) 1,250,052
Shares Description Value
Common Stocks – (continued)
Japan – (continued)30,236 Mitsui & Co. Ltd. (Industrials) $ 668,5173,542 Mitsui Chemicals, Inc. (Materials) 122,516
17,866 Mitsui Fudosan Co. Ltd. (Real Estate) 410,4662,278 Mitsui OSK Lines Ltd. (Industrials)(a) 176,2521,939 Miura Co. Ltd. (Industrials) 87,190
47,175 Mizuho Financial Group, Inc.(Financials) 662,580
4,889 MonotaRO Co. Ltd. (Industrials) 108,2749,355 MS&AD Insurance Group Holdings, Inc.
(Financials) 302,72212,510 Murata Manufacturing Co. Ltd.
(Information Technology) 1,038,4012,150 Nabtesco Corp. (Industrials) 85,3275,032 NEC Corp. (Information Technology) 264,7469,123 Nexon Co. Ltd. (Communication
Services) 166,9156,066 NGK Insulators Ltd. (Industrials) 100,7693,817 NGK Spark Plug Co. Ltd. (Consumer
Discretionary) 58,7872,036 NH Foods Ltd. (Consumer Staples) 79,0422,471 Nichirei Corp. (Consumer Staples) 63,068
10,112 Nidec Corp. (Industrials) 1,161,6015,924 Nihon M&A Center, Inc. (Industrials) 177,4076,417 Nikon Corp. (Consumer Discretionary) 67,6982,353 Nintendo Co. Ltd. (Communication
Services) 1,133,02170 Nippon Building Fund, Inc. REIT (Real
Estate) 455,5801,670 Nippon Express Co. Ltd. (Industrials) 113,857
19,384 Nippon Paint Holdings Co. Ltd.(Materials) 241,550
41 Nippon Prologis REIT, Inc. REIT (RealEstate) 147,975
3,532 Nippon Sanso Holdings Corp. (Materials) 85,8401,256 Nippon Shinyaku Co. Ltd. (Health Care) 102,094
17,387 Nippon Steel Corp. (Materials) 355,78045,725 Nippon Telegraph & Telephone Corp.
(Communication Services) 1,221,9972,790 Nippon Television Holdings, Inc.
(Communication Services) 29,6883,231 Nippon Yusen KK (Industrials) 260,8682,543 Nissan Chemical Corp. (Materials) 142,821
44,438 Nissan Motor Co. Ltd. (ConsumerDiscretionary)* 234,001
4,868 Nisshin Seifun Group, Inc. (ConsumerStaples) 79,937
1,368 Nissin Foods Holdings Co. Ltd.(Consumer Staples) 106,591
1,632 Nitori Holdings Co. Ltd. (ConsumerDiscretionary) 305,721
2,930 Nitto Denko Corp. (Materials) 222,96460,375 Nomura Holdings, Inc. (Financials) 293,2472,035 Nomura Real Estate Holdings, Inc. (Real
Estate) 52,14483 Nomura Real Estate Master Fund, Inc.
REIT (Real Estate) 128,210
The accompanying notes are an integral part of these financial statements. 41

G O L D M A N S A C H S M A R K E T B E T A® I N T E R N A T I O N A L E Q U I T Y E T F
Schedule of Investments (continued)August 31, 2021
Shares Description Value
Common Stocks – (continued)
Japan – (continued)7,691 Nomura Research Institute Ltd.
(Information Technology) $ 289,4809,461 NSK Ltd. (Industrials) 66,484
12,606 NTT Data Corp. (InformationTechnology) 227,312
12,542 Obayashi Corp. (Industrials) 103,432346 OBIC Business Consultants Co. Ltd.
(Information Technology) 16,2511,278 Obic Co. Ltd. (Information Technology) 243,7116,847 Odakyu Electric Railway Co. Ltd.
(Industrials) 159,80117,108 Oji Holdings Corp. (Materials) 89,69824,087 Olympus Corp. (Health Care) 506,8003,834 Omron Corp. (Information Technology) 362,2518,028 Ono Pharmaceutical Co. Ltd. (Health
Care) 193,2101,530 Open House Co. Ltd. (Consumer
Discretionary) 74,648671 Oracle Corp. Japan (Information
Technology) 55,2143,992 Oriental Land Co. Ltd. (Consumer
Discretionary) 605,37724,324 ORIX Corp. (Financials) 454,221
55 Orix JREIT, Inc. REIT (Real Estate) 98,1758,056 Osaka Gas Co. Ltd. (Utilities) 151,2792,190 Otsuka Corp. (Information Technology) 113,6268,022 Otsuka Holdings Co. Ltd. (Health Care) 341,8088,362 Pan Pacific International Holdings Corp.
(Consumer Discretionary) 159,61343,135 Panasonic Corp. (Consumer
Discretionary) 515,1392,190 Park24 Co. Ltd. (Industrials)* 42,3211,942 PeptiDream, Inc. (Health Care)* 68,5873,560 Persol Holdings Co. Ltd. (Industrials) 83,3452,315 Pigeon Corp. (Consumer Staples) 67,1151,661 Pola Orbis Holdings, Inc. (Consumer
Staples) 36,34717,519 Rakuten Group, Inc. (Consumer
Discretionary) 183,70527,596 Recruit Holdings Co. Ltd. (Industrials) 1,632,75122,412 Renesas Electronics Corp. (Information
Technology)* 242,56247,690 Resona Holdings, Inc. (Financials) 184,79513,410 Ricoh Co. Ltd. (Information Technology) 136,712
707 Rinnai Corp. (Consumer Discretionary) 76,1321,710 Rohm Co. Ltd. (Information Technology) 165,3034,885 Ryohin Keikaku Co. Ltd. (Consumer
Discretionary) 104,8507,555 Santen Pharmaceutical Co. Ltd. (Health
Care) 112,7824,815 SBI Holdings, Inc. (Financials) 117,022
866 SCREEN Holdings Co. Ltd. (InformationTechnology) 74,413
960 SCSK Corp. (Information Technology) 60,7324,215 Secom Co. Ltd. (Industrials) 320,1733,458 Sega Sammy Holdings, Inc. (Consumer
Discretionary) 46,774
Shares Description Value
Common Stocks – (continued)
Japan – (continued)4,509 Seibu Holdings, Inc. (Industrials)* $ 54,4235,757 Seiko Epson Corp. (Information
Technology) 107,4267,923 Sekisui Chemical Co. Ltd. (Consumer
Discretionary) 135,87211,858 Sekisui House Ltd. (Consumer
Discretionary) 236,70715,032 Seven & i Holdings Co. Ltd. (Consumer
Staples) 658,83012,110 Seven Bank Ltd. (Financials) 27,6688,565 SG Holdings Co. Ltd. (Industrials) 233,2655,734 Sharp Corp. (Consumer Discretionary) 75,8375,637 Shimadzu Corp. (Information
Technology) 253,219473 Shimamura Co. Ltd. (Consumer
Discretionary) 41,7631,618 Shimano, Inc. (Consumer Discretionary) 475,709
11,698 Shimizu Corp. (Industrials) 84,1208,148 Shin-Etsu Chemical Co. Ltd. (Materials) 1,350,2124,344 Shinsei Bank Ltd. (Financials) 53,9745,949 Shionogi & Co. Ltd. (Health Care) 376,4567,955 Shiseido Co. Ltd. (Consumer Staples) 528,089
10,289 Shizuoka Bank Ltd. (The) (Financials) 80,7312,869 Showa Denko KK (Materials) 63,9041,249 SMC Corp. (Industrials) 801,629
55,664 SoftBank Corp. (CommunicationServices) 746,595
22,914 SoftBank Group Corp. (CommunicationServices) 1,289,199
1,426 Sohgo Security Services Co. Ltd.(Industrials) 64,706
21,004 Sojitz Corp. (Industrials) 61,7546,469 Sompo Holdings, Inc. (Financials) 284,292
24,858 Sony Group Corp. (ConsumerDiscretionary) 2,570,425
1,792 Square Enix Holdings Co. Ltd.(Communication Services) 104,558
2,944 Stanley Electric Co. Ltd. (ConsumerDiscretionary) 73,640
12,187 Subaru Corp. (Consumer Discretionary) 225,913721 Sugi Holdings Co. Ltd. (Consumer
Staples) 55,7855,271 SUMCO Corp. (Information Technology) 111,456
32,096 Sumitomo Chemical Co. Ltd. (Materials) 163,02223,320 Sumitomo Corp. (Industrials) 329,9743,377 Sumitomo Dainippon Pharma Co. Ltd.
(Health Care) 60,61814,918 Sumitomo Electric Industries Ltd.
(Consumer Discretionary) 199,6812,312 Sumitomo Heavy Industries Ltd.
(Industrials) 60,6094,862 Sumitomo Metal Mining Co. Ltd.
(Materials) 186,93925,876 Sumitomo Mitsui Financial Group, Inc.
(Financials) 895,2735,887 Sumitomo Mitsui Trust Holdings, Inc.
(Financials) 192,804
42 The accompanying notes are an integral part of these financial statements.
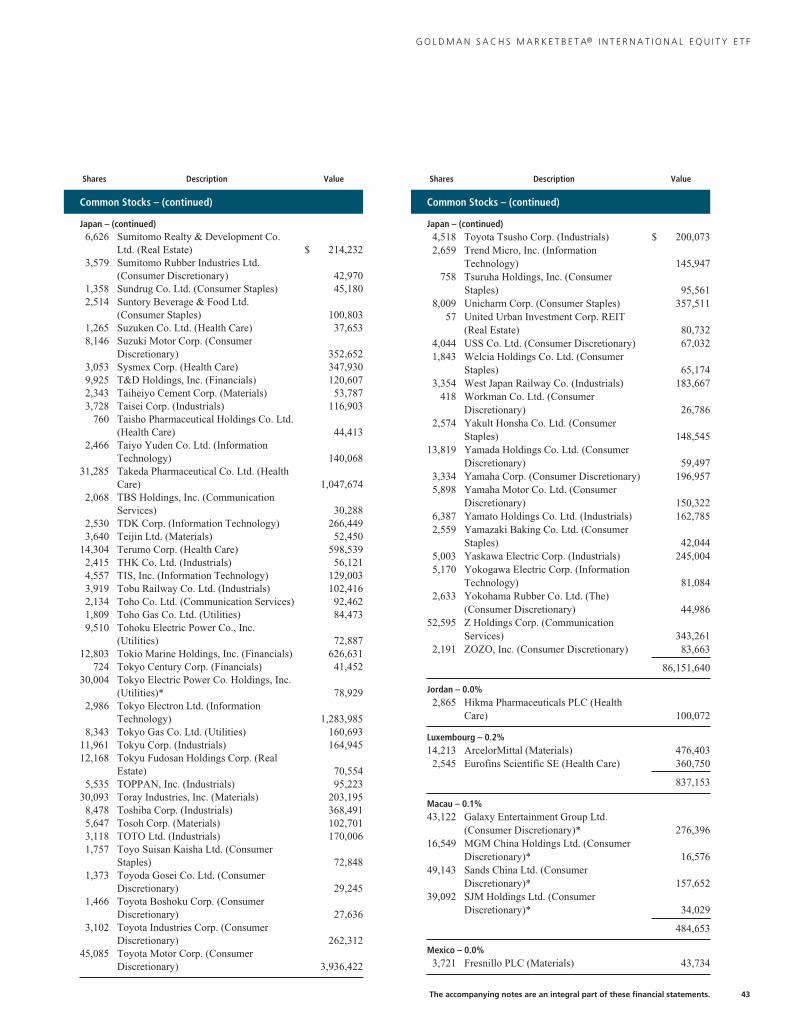
G O L D M A N S A C H S M A R K E T B E T A® I N T E R N A T I O N A L E Q U I T Y E T F
Shares Description Value
Common Stocks – (continued)
Japan – (continued)6,626 Sumitomo Realty & Development Co.
Ltd. (Real Estate) $ 214,2323,579 Sumitomo Rubber Industries Ltd.
(Consumer Discretionary) 42,9701,358 Sundrug Co. Ltd. (Consumer Staples) 45,1802,514 Suntory Beverage & Food Ltd.
(Consumer Staples) 100,8031,265 Suzuken Co. Ltd. (Health Care) 37,6538,146 Suzuki Motor Corp. (Consumer
Discretionary) 352,6523,053 Sysmex Corp. (Health Care) 347,9309,925 T&D Holdings, Inc. (Financials) 120,6072,343 Taiheiyo Cement Corp. (Materials) 53,7873,728 Taisei Corp. (Industrials) 116,903
760 Taisho Pharmaceutical Holdings Co. Ltd.(Health Care) 44,413
2,466 Taiyo Yuden Co. Ltd. (InformationTechnology) 140,068
31,285 Takeda Pharmaceutical Co. Ltd. (HealthCare) 1,047,674
2,068 TBS Holdings, Inc. (CommunicationServices) 30,288
2,530 TDK Corp. (Information Technology) 266,4493,640 Teijin Ltd. (Materials) 52,450
14,304 Terumo Corp. (Health Care) 598,5392,415 THK Co. Ltd. (Industrials) 56,1214,557 TIS, Inc. (Information Technology) 129,0033,919 Tobu Railway Co. Ltd. (Industrials) 102,4162,134 Toho Co. Ltd. (Communication Services) 92,4621,809 Toho Gas Co. Ltd. (Utilities) 84,4739,510 Tohoku Electric Power Co., Inc.
(Utilities) 72,88712,803 Tokio Marine Holdings, Inc. (Financials) 626,631
724 Tokyo Century Corp. (Financials) 41,45230,004 Tokyo Electric Power Co. Holdings, Inc.
(Utilities)* 78,9292,986 Tokyo Electron Ltd. (Information
Technology) 1,283,9858,343 Tokyo Gas Co. Ltd. (Utilities) 160,693
11,961 Tokyu Corp. (Industrials) 164,94512,168 Tokyu Fudosan Holdings Corp. (Real
Estate) 70,5545,535 TOPPAN, Inc. (Industrials) 95,223
30,093 Toray Industries, Inc. (Materials) 203,1958,478 Toshiba Corp. (Industrials) 368,4915,647 Tosoh Corp. (Materials) 102,7013,118 TOTO Ltd. (Industrials) 170,0061,757 Toyo Suisan Kaisha Ltd. (Consumer
Staples) 72,8481,373 Toyoda Gosei Co. Ltd. (Consumer
Discretionary) 29,2451,466 Toyota Boshoku Corp. (Consumer
Discretionary) 27,6363,102 Toyota Industries Corp. (Consumer
Discretionary) 262,31245,085 Toyota Motor Corp. (Consumer
Discretionary) 3,936,422
Shares Description Value
Common Stocks – (continued)
Japan – (continued)4,518 Toyota Tsusho Corp. (Industrials) $ 200,0732,659 Trend Micro, Inc. (Information
Technology) 145,947758 Tsuruha Holdings, Inc. (Consumer
Staples) 95,5618,009 Unicharm Corp. (Consumer Staples) 357,511
57 United Urban Investment Corp. REIT(Real Estate) 80,732
4,044 USS Co. Ltd. (Consumer Discretionary) 67,0321,843 Welcia Holdings Co. Ltd. (Consumer
Staples) 65,1743,354 West Japan Railway Co. (Industrials) 183,667
418 Workman Co. Ltd. (ConsumerDiscretionary) 26,786
2,574 Yakult Honsha Co. Ltd. (ConsumerStaples) 148,545
13,819 Yamada Holdings Co. Ltd. (ConsumerDiscretionary) 59,497
3,334 Yamaha Corp. (Consumer Discretionary) 196,9575,898 Yamaha Motor Co. Ltd. (Consumer
Discretionary) 150,3226,387 Yamato Holdings Co. Ltd. (Industrials) 162,7852,559 Yamazaki Baking Co. Ltd. (Consumer
Staples) 42,0445,003 Yaskawa Electric Corp. (Industrials) 245,0045,170 Yokogawa Electric Corp. (Information
Technology) 81,0842,633 Yokohama Rubber Co. Ltd. (The)
(Consumer Discretionary) 44,98652,595 Z Holdings Corp. (Communication
Services) 343,2612,191 ZOZO, Inc. (Consumer Discretionary) 83,663
86,151,640
Jordan – 0.0%2,865 Hikma Pharmaceuticals PLC (Health
Care) 100,072
Luxembourg – 0.2%14,213 ArcelorMittal (Materials) 476,4032,545 Eurofins Scientific SE (Health Care) 360,750
837,153
Macau – 0.1%43,122 Galaxy Entertainment Group Ltd.
(Consumer Discretionary)* 276,39616,549 MGM China Holdings Ltd. (Consumer
Discretionary)* 16,57649,143 Sands China Ltd. (Consumer
Discretionary)* 157,65239,092 SJM Holdings Ltd. (Consumer
Discretionary)* 34,029
484,653
Mexico – 0.0%3,721 Fresnillo PLC (Materials) 43,734
The accompanying notes are an integral part of these financial statements. 43

G O L D M A N S A C H S M A R K E T B E T A® I N T E R N A T I O N A L E Q U I T Y E T F
Schedule of Investments (continued)August 31, 2021
Shares Description Value
Common Stocks – (continued)
Netherlands – 5.1%8,906 ABN AMRO Bank NV (Financials)*(b) $ 124,286
516 Adyen NV (Information Technology)*(b) 1,665,6163,413 Akzo Nobel NV (Materials) 420,6148,306 ASML Holding NV (Information
Technology) 6,907,4912,098 EXOR NV (Financials) 174,8471,741 HAL Trust (Financials) 310,7412,042 Heineken Holding NV (Consumer
Staples) 189,2224,782 Heineken NV (Consumer Staples) 523,283
78,480 ING Groep NV (Financials) 1,083,9071,525 JDE Peet’s NV (Consumer Staples)(a) 52,385
21,021 Koninklijke Ahold Delhaize NV(Consumer Staples) 708,942
3,466 Koninklijke DSM NV (Materials) 737,48265,921 Koninklijke KPN NV (Communication
Services) 211,19418,242 Koninklijke Philips NV (Health Care) 840,6785,636 NN Group NV (Financials) 292,5332,350 Randstad NV (Industrials) 172,824
82,433 Royal Dutch Shell PLC, Class A(Energy) 1,624,128
74,503 Royal Dutch Shell PLC, Class B (Energy) 1,467,2735,305 Wolters Kluwer NV (Industrials) 610,072
18,117,518
New Zealand – 0.4%24,355 Auckland International Airport Ltd.
(Industrials)* 123,5969,015 Chorus Ltd. (Communication Services) 44,607
15,641 Contact Energy Ltd. (Utilities) 89,72311,535 Fisher & Paykel Healthcare Corp. Ltd.
(Health Care) 268,73615,391 Fletcher Building Ltd. (Industrials) 81,13910,365 Genesis Energy Ltd. (Utilities) 24,73121,132 Goodman Property Trust REIT (Real
Estate) 38,82013,930 Infratil Ltd. (Utilities) 73,2901,632 Mainfreight Ltd. (Industrials) 107,976
12,274 Mercury NZ Ltd. (Utilities) 57,45023,057 Meridian Energy Ltd. (Utilities) 85,2007,705 Ryman Healthcare Ltd. (Health Care) 83,951
37,332 Spark New Zealand Ltd. (CommunicationServices) 128,096
2,570 Xero Ltd. (Information Technology)* 285,161
1,492,476
Norway – 0.8%449 Aker ASA, Class A (Financials) 32,391
2,178 Aker BP ASA (Energy) 56,7931,747 Austevoll Seafood ASA (Consumer
Staples) 22,41617,736 DNB Bank ASA (Financials) 374,0612,074 Entra ASA (Real Estate)(b) 46,910
21,305 Equinor ASA (Energy) 452,1233,733 Gjensidige Forsikring ASA (Financials) 87,178
Shares Description Value
Common Stocks – (continued)
Norway – (continued)1,754 Kongsberg Gruppen ASA (Industrials) $ 48,8405,691 Leroy Seafood Group ASA (Consumer
Staples) 50,1819,009 Mowi ASA (Consumer Staples) 241,024
29,213 NEL ASA (Industrials)* 47,9373,318 Nordic Semiconductor ASA (Information
Technology)* 107,86426,945 Norsk Hydro ASA (Materials) 185,77514,974 Orkla ASA (Consumer Staples) 133,6171,131 Salmar ASA (Consumer Staples) 75,7172,293 Scatec ASA (Utilities)(b) 47,3601,408 Schibsted ASA, Class A (Communication
Services) 75,0471,854 Schibsted ASA, Class B (Communication
Services) 86,1693,604 SpareBank 1 SR-Bank ASA (Financials) 48,5629,190 Storebrand ASA (Financials) 81,519
12,894 Telenor ASA (Communication Services) 225,6542,340 TGS ASA (Energy) 25,9392,340 TOMRA Systems ASA (Industrials) 143,647
2,696,724
Poland – 0.3%7,795 Allegro.eu SA (Consumer
Discretionary)*(b) 144,5683,230 Bank Pekao SA (Financials)* 90,4354,001 Cyfrowy Polsat SA (Communication
Services) 38,204969 Dino Polska SA (Consumer Staples)*(b) 82,150
4,194 InPost SA (Industrials)* 81,6882,756 KGHM Polska Miedz SA (Materials) 128,342
262 mBank SA (Financials)* 25,38716,090 PGE Polska Grupa Energetyczna SA
(Utilities)* 42,4026,260 Polski Koncern Naftowy ORLEN SA
(Energy) 121,47932,816 Polskie Gornictwo Naftowe i
Gazownictwo SA (Energy) 53,99617,814 Powszechna Kasa Oszczednosci Bank
Polski SA (Financials)* 195,64311,478 Powszechny Zaklad Ubezpieczen SA
(Financials)* 121,711673 Santander Bank Polska SA (Financials)* 53,084
1,179,089
Portugal – 0.2%55,243 EDP – Energias de Portugal SA (Utilities) 303,36410,554 Galp Energia SGPS SA (Energy) 108,0654,934 Jeronimo Martins SGPS SA (Consumer
Staples) 104,547
515,976
Russia – 0.0%11,621 Evraz PLC (Materials) 94,425
44 The accompanying notes are an integral part of these financial statements.

G O L D M A N S A C H S M A R K E T B E T A® I N T E R N A T I O N A L E Q U I T Y E T F
Shares Description Value
Common Stocks – (continued)
Saudi Arabia – 0.1%3,157 Delivery Hero SE (Consumer
Discretionary)*(b) $ 456,891
Singapore – 1.1%66,546 Ascendas Real Estate Investment
Trust REIT (Real Estate) 150,39890,341 CapitaLand Integrated Commercial
Trust REIT (Real Estate) 138,35650,578 CapitaLand Ltd. (Real Estate) 150,40711,624 City Developments Ltd. (Real Estate) 59,10943,630 ComfortDelGro Corp. Ltd. (Industrials) 52,54736,122 DBS Group Holdings Ltd. (Financials) 804,83052,892 Frasers Logistics & Commercial
Trust REIT (Real Estate) 58,983114,679 Genting Singapore Ltd. (Consumer
Discretionary) 65,2211,918 Jardine Cycle & Carriage Ltd.
(Consumer Discretionary) 27,70629,024 Keppel Corp. Ltd. (Industrials) 112,20326,053 Keppel DC REIT (Real Estate) 48,42245,073 Mapletree Commercial Trust REIT
(Real Estate) 68,02341,391 Mapletree Industrial Trust REIT (Real
Estate) 89,85359,181 Mapletree Logistics Trust REIT (Real
Estate) 89,31517,657 Olam International Ltd. (Consumer
Staples) 21,00380,544 Oversea-Chinese Banking Corp. Ltd.
(Financials) 684,42313,485 SATS Ltd. (Industrials)* 40,80326,188 Singapore Airlines Ltd. (Industrials)* 98,51416,411 Singapore Exchange Ltd. (Financials) 120,78630,773 Singapore Technologies Engineering
Ltd. (Industrials) 86,478159,911 Singapore Telecommunications Ltd.
(Communication Services) 275,81132,516 Suntec Real Estate Investment
Trust REIT (Real Estate) 35,77731,419 United Overseas Bank Ltd. (Financials) 597,50110,752 UOL Group Ltd. (Real Estate) 55,9545,452 Venture Corp. Ltd. (Information
Technology) 77,660
4,010,083
South Africa – 0.3%23,323 Anglo American PLC (Materials) 985,0962,345 Thungela Resources Ltd. (Energy)* 9,795
994,891
Spain – 2.4%4,585 ACS Actividades de Construccion y
Servicios SA (Industrials)(a) 123,7271,388 Aena SME SA (Industrials)*(b) 221,5209,037 Amadeus IT Group SA (Information
Technology)* 551,735
Shares Description Value
Common Stocks – (continued)
Spain – (continued)132,797 Banco Bilbao Vizcaya Argentaria SA
(Financials)* $ 869,549344,941 Banco Santander SA (Financials)* 1,273,47287,167 CaixaBank SA (Financials) 270,82311,462 Cellnex Telecom SA (Communication
Services)*(b) 784,7584,832 EDP Renovaveis SA (Utilities) 128,4536,391 Endesa SA (Utilities) 153,6019,441 Ferrovial SA (Industrials) 273,2665,943 Grifols SA (Health Care) 145,149
122,483 Iberdrola SA (Utilities) 1,517,41922,290 Industria de Diseno Textil SA
(Consumer Discretionary) 760,68619,360 Mapfre SA (Financials) 41,7309,507 Naturgy Energy Group SA (Utilities) 244,6518,660 Red Electrica Corp. SA (Utilities) 172,661
26,392 Repsol SA (Energy) 302,3544,498 Siemens Gamesa Renewable Energy SA
(Industrials)* 133,326101,777 Telefonica SA (Communication
Services) 502,376
8,471,256
Sweden – 4.0%3,475 AAK AB (Consumer Staples) 83,0275,962 Alfa Laval AB (Industrials) 241,554
19,549 Assa Abloy AB, Class B (Industrials) 624,12712,691 Atlas Copco AB, Class A (Industrials) 870,2927,492 Atlas Copco AB, Class B (Industrials) 432,9392,167 Avanza Bank Holding AB (Financials) 83,1822,114 Axfood AB (Consumer Staples) 55,8684,427 Beijer Ref AB (Industrials) 101,5705,398 Boliden AB (Materials) 188,0224,198 Castellum AB (Real Estate) 122,1215,046 Electrolux AB, Series B (Consumer
Discretionary) 127,6887,262 Elekta AB, Class B (Health Care)(a) 90,9156,090 Embracer Group AB (Communication
Services)* 138,03312,479 Epiroc AB, Class A (Industrials) 273,5267,490 Epiroc AB, Class B (Industrials) 142,1506,344 EQT AB (Financials) 322,904
12,124 Essity AB, Class B (Consumer Staples) 388,4783,424 Evolution AB (Consumer
Discretionary)(b) 551,0965,240 Fabege AB (Real Estate) 94,8991,995 Fastighets AB Balder, Class B (Real
Estate)* 142,4433,934 Getinge AB, Class B (Health Care) 161,210
14,352 H & M Hennes & Mauritz AB, Class B(Consumer Discretionary)* 287,351
39,317 Hexagon AB, Class B (InformationTechnology) 680,418
1,817 Holmen AB, Class B (Materials) 92,2318,236 Husqvarna AB, Class B (Consumer
Discretionary) 110,355
The accompanying notes are an integral part of these financial statements. 45
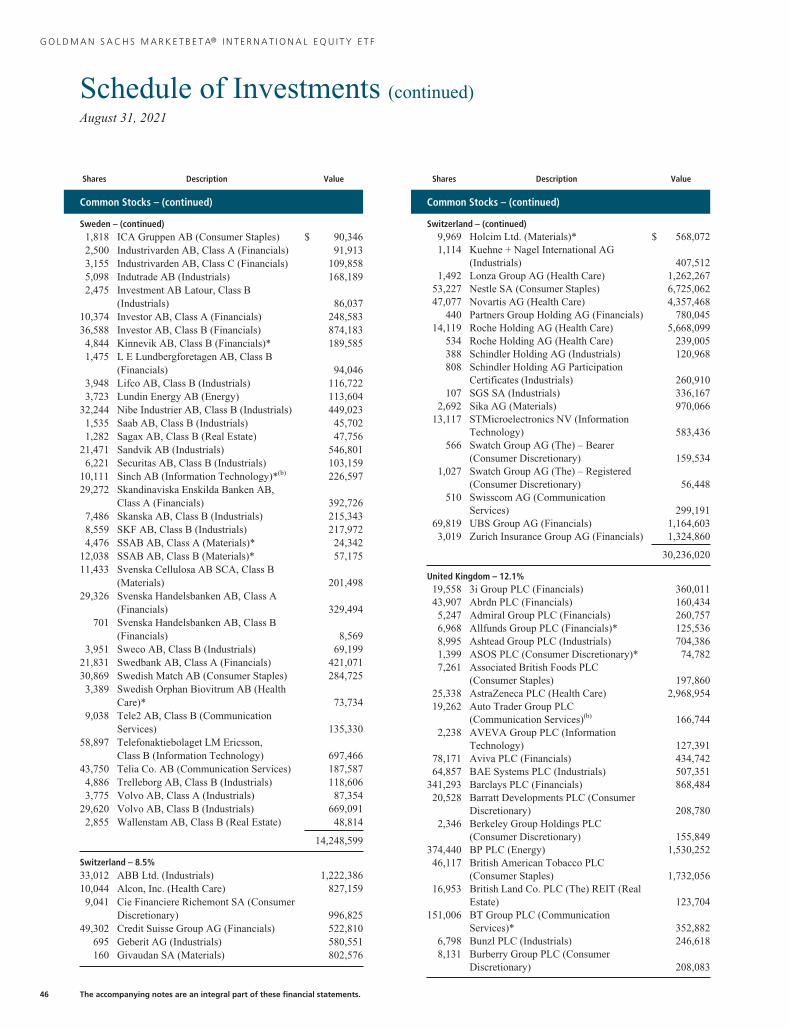
G O L D M A N S A C H S M A R K E T B E T A® I N T E R N A T I O N A L E Q U I T Y E T F
Schedule of Investments (continued)August 31, 2021
Shares Description Value
Common Stocks – (continued)
Sweden – (continued)1,818 ICA Gruppen AB (Consumer Staples) $ 90,3462,500 Industrivarden AB, Class A (Financials) 91,9133,155 Industrivarden AB, Class C (Financials) 109,8585,098 Indutrade AB (Industrials) 168,1892,475 Investment AB Latour, Class B
(Industrials) 86,03710,374 Investor AB, Class A (Financials) 248,58336,588 Investor AB, Class B (Financials) 874,1834,844 Kinnevik AB, Class B (Financials)* 189,5851,475 L E Lundbergforetagen AB, Class B
(Financials) 94,0463,948 Lifco AB, Class B (Industrials) 116,7223,723 Lundin Energy AB (Energy) 113,604
32,244 Nibe Industrier AB, Class B (Industrials) 449,0231,535 Saab AB, Class B (Industrials) 45,7021,282 Sagax AB, Class B (Real Estate) 47,756
21,471 Sandvik AB (Industrials) 546,8016,221 Securitas AB, Class B (Industrials) 103,159
10,111 Sinch AB (Information Technology)*(b) 226,59729,272 Skandinaviska Enskilda Banken AB,
Class A (Financials) 392,7267,486 Skanska AB, Class B (Industrials) 215,3438,559 SKF AB, Class B (Industrials) 217,9724,476 SSAB AB, Class A (Materials)* 24,342
12,038 SSAB AB, Class B (Materials)* 57,17511,433 Svenska Cellulosa AB SCA, Class B
(Materials) 201,49829,326 Svenska Handelsbanken AB, Class A
(Financials) 329,494701 Svenska Handelsbanken AB, Class B
(Financials) 8,5693,951 Sweco AB, Class B (Industrials) 69,199
21,831 Swedbank AB, Class A (Financials) 421,07130,869 Swedish Match AB (Consumer Staples) 284,7253,389 Swedish Orphan Biovitrum AB (Health
Care)* 73,7349,038 Tele2 AB, Class B (Communication
Services) 135,33058,897 Telefonaktiebolaget LM Ericsson,
Class B (Information Technology) 697,46643,750 Telia Co. AB (Communication Services) 187,5874,886 Trelleborg AB, Class B (Industrials) 118,6063,775 Volvo AB, Class A (Industrials) 87,354
29,620 Volvo AB, Class B (Industrials) 669,0912,855 Wallenstam AB, Class B (Real Estate) 48,814
14,248,599
Switzerland – 8.5%33,012 ABB Ltd. (Industrials) 1,222,38610,044 Alcon, Inc. (Health Care) 827,1599,041 Cie Financiere Richemont SA (Consumer
Discretionary) 996,82549,302 Credit Suisse Group AG (Financials) 522,810
695 Geberit AG (Industrials) 580,551160 Givaudan SA (Materials) 802,576
Shares Description Value
Common Stocks – (continued)
Switzerland – (continued)9,969 Holcim Ltd. (Materials)* $ 568,0721,114 Kuehne + Nagel International AG
(Industrials) 407,5121,492 Lonza Group AG (Health Care) 1,262,267
53,227 Nestle SA (Consumer Staples) 6,725,06247,077 Novartis AG (Health Care) 4,357,468
440 Partners Group Holding AG (Financials) 780,04514,119 Roche Holding AG (Health Care) 5,668,099
534 Roche Holding AG (Health Care) 239,005388 Schindler Holding AG (Industrials) 120,968808 Schindler Holding AG Participation
Certificates (Industrials) 260,910107 SGS SA (Industrials) 336,167
2,692 Sika AG (Materials) 970,06613,117 STMicroelectronics NV (Information
Technology) 583,436566 Swatch Group AG (The) – Bearer
(Consumer Discretionary) 159,5341,027 Swatch Group AG (The) – Registered
(Consumer Discretionary) 56,448510 Swisscom AG (Communication
Services) 299,19169,819 UBS Group AG (Financials) 1,164,6033,019 Zurich Insurance Group AG (Financials) 1,324,860
30,236,020
United Kingdom – 12.1%19,558 3i Group PLC (Financials) 360,01143,907 Abrdn PLC (Financials) 160,4345,247 Admiral Group PLC (Financials) 260,7576,968 Allfunds Group PLC (Financials)* 125,5368,995 Ashtead Group PLC (Industrials) 704,3861,399 ASOS PLC (Consumer Discretionary)* 74,7827,261 Associated British Foods PLC
(Consumer Staples) 197,86025,338 AstraZeneca PLC (Health Care) 2,968,95419,262 Auto Trader Group PLC
(Communication Services)(b) 166,7442,238 AVEVA Group PLC (Information
Technology) 127,39178,171 Aviva PLC (Financials) 434,74264,857 BAE Systems PLC (Industrials) 507,351
341,293 Barclays PLC (Financials) 868,48420,528 Barratt Developments PLC (Consumer
Discretionary) 208,7802,346 Berkeley Group Holdings PLC
(Consumer Discretionary) 155,849374,440 BP PLC (Energy) 1,530,25246,117 British American Tobacco PLC
(Consumer Staples) 1,732,05616,953 British Land Co. PLC (The) REIT (Real
Estate) 123,704151,006 BT Group PLC (Communication
Services)* 352,8826,798 Bunzl PLC (Industrials) 246,6188,131 Burberry Group PLC (Consumer
Discretionary) 208,083
46 The accompanying notes are an integral part of these financial statements.

G O L D M A N S A C H S M A R K E T B E T A® I N T E R N A T I O N A L E Q U I T Y E T F
Shares Description Value
Common Stocks – (continued)
United Kingdom – (continued)53,587 CK Hutchison Holdings Ltd.
(Industrials) $ 391,0158,256 Clarivate PLC (Industrials)* 207,969
19,836 CNH Industrial NV (Industrials) 327,8163,018 Coca-Cola Europacific Partners PLC
(Consumer Staples) 174,25935,838 Compass Group PLC (Consumer
Discretionary)* 740,07732,146 ConvaTec Group PLC (Health Care)(b) 99,7192,799 Croda International PLC (Materials) 352,3921,924 DCC PLC (Industrials) 163,641
46,959 Diageo PLC (Consumer Staples) 2,258,07927,097 Direct Line Insurance Group PLC
(Financials) 115,23327,335 DS Smith PLC (Materials) 166,4306,849 easyJet PLC (Industrials)* 75,030
11,667 Entain PLC (ConsumerDiscretionary)* 310,376
18,491 Experian PLC (Industrials) 815,3625,664 Farfetch Ltd., Class A (Consumer
Discretionary)* 237,095101,125 GlaxoSmithKline PLC (Health Care) 2,034,714
7,597 Halma PLC (Information Technology) 313,9757,082 Hargreaves Lansdown PLC
(Financials) 147,028410,527 HSBC Holdings PLC (Financials) 2,181,98319,016 Imperial Brands PLC (Consumer
Staples) 403,42230,300 Informa PLC (Communication
Services)* 221,4293,538 InterContinental Hotels Group PLC
(Consumer Discretionary)* 225,5895,833 Intermediate Capital Group PLC
(Financials) 176,4483,251 Intertek Group PLC (Industrials) 235,790
73,184 ITV PLC (Communication Services)* 116,63338,271 J Sainsbury PLC (Consumer Staples) 160,1189,946 JD Sports Fashion PLC (Consumer
Discretionary) 138,1823,906 Johnson Matthey PLC (Materials) 157,9903,890 Just Eat Takeaway.com NV
(Consumer Discretionary)*(b) 352,29442,623 Kingfisher PLC (Consumer
Discretionary) 205,48614,960 Land Securities Group PLC REIT
(Real Estate) 145,974119,990 Legal & General Group PLC
(Financials) 446,1983,105 Liberty Global PLC, Class A
(Communication Services)* 89,2386,881 Liberty Global PLC, Class C
(Communication Services)* 199,4111,425,502 Lloyds Banking Group PLC
(Financials) 858,7999,674 London Stock Exchange Group PLC
(Financials) 1,059,250
Shares Description Value
Common Stocks – (continued)
United Kingdom – (continued)52,496 M&G PLC (Financials) $ 148,83086,729 Melrose Industries PLC (Industrials) 200,21671,447 National Grid PLC (Utilities) 925,570
105,414 Natwest Group PLC (Financials) 309,1572,456 Next PLC (Consumer Discretionary) 267,364
10,209 Ocado Group PLC (Consumer Staples)* 282,82915,190 Pearson PLC (Communication Services) 160,4696,363 Persimmon PLC (Consumer
Discretionary) 257,45814,062 Phoenix Group Holdings PLC
(Financials) 120,64652,508 Prudential PLC (Financials) 1,094,80214,326 Reckitt Benckiser Group PLC
(Consumer Staples) 1,092,07838,839 RELX PLC (Industrials) 1,166,32737,331 Rentokil Initial PLC (Industrials) 298,19117,168 Rightmove PLC (Communication
Services) 165,723166,661 Rolls-Royce Holdings PLC
(Industrials)* 263,45121,309 Sage Group PLC (The) (Information
Technology) 217,661979 Schroders PLC (Financials) 35,031
2,724 Schroders PLC (Financials) 141,70924,076 Segro PLC REIT (Real Estate) 425,4485,012 Severn Trent PLC (Utilities) 190,516
17,660 Smith & Nephew PLC (Health Care) 339,0497,996 Smiths Group PLC (Industrials) 158,7401,477 Spirax-Sarco Engineering PLC
(Industrials) 327,47120,958 SSE PLC (Utilities) 470,86910,818 St James’s Place PLC (Financials) 239,70162,648 Standard Chartered PLC (Financials) 392,12571,613 Taylor Wimpey PLC (Consumer
Discretionary) 180,261155,410 Tesco PLC (Consumer Staples) 545,72315,649 THG PLC (Consumer Discretionary)* 132,56051,514 Unilever PLC (Consumer Staples) 2,868,45913,765 United Utilities Group PLC (Utilities) 200,334
559,917 Vodafone Group PLC (CommunicationServices) 939,807
5,234 Weir Group PLC (The) (Industrials)* 126,1664,077 Whitbread PLC (Consumer
Discretionary)* 180,00048,549 Wm Morrison Supermarkets PLC
(Consumer Staples) 193,76524,084 WPP PLC (Communication Services) 326,020
43,204,626
United States – 1.3%13,032 Avast PLC (Information Technology)(b) 107,2173,155 Carnival PLC (Consumer
Discretionary)* 68,179799 CyberArk Software Ltd. (Information
Technology)* 134,1844,470 Ferguson PLC (Industrials) 646,251
The accompanying notes are an integral part of these financial statements. 47

G O L D M A N S A C H S M A R K E T B E T A® I N T E R N A T I O N A L E Q U I T Y E T F
Schedule of Investments (continued)August 31, 2021
Shares Description Value
Common Stocks – (continued)
United States – (continued)8,442 James Hardie Industries PLC CDI
(Materials) $ 327,24813,048 JS Global Lifestyle Co. Ltd. (Consumer
Discretionary)(b) 32,74910,770 Schneider Electric SE (Industrials) 1,923,54341,731 Stellantis NV (Consumer Discretionary) 834,0935,790 Swiss Re AG (Financials) 532,5759,409 Tenaris SA (Energy) 94,808
4,700,847
TOTAL COMMON STOCKS(Cost $281,297,026) $352,777,674
Shares Description Rate Value
Preferred Stocks – 0.6%
Germany – 0.6%1,150 Bayerische Motoren Werke AG
(Consumer Discretionary) 2.77% $ 96,2483,508 Henkel AG & Co. KGaA
(Consumer Staples) 2.25 342,6283,078 Porsche Automobil Holding SE
(Consumer Discretionary) 2.55 311,602685 Sartorius AG (Health Care) 0.12 451,203
3,680 Volkswagen AG (ConsumerDiscretionary) 2.42 874,458
2,076,139
Spain – 0.0%5,278 Grifols SA, Class B (Health
Care) 4.34 76,385
TOTAL PREFERRED STOCKS(Cost $1,547,738) $ 2,152,524
TOTAL INVESTMENTS BEFORE SECURITIES LENDINGREINVESTMENT VEHICLE(Cost $282,844,764) $354,930,198
SharesDividend
Rate Value
Securities Lending Reinvestment Vehicle – 0.3%(c)
Goldman Sachs Financial Square Government Fund –Institutional Shares
1,129,562 0.026% $ 1,129,562(Cost $1,129,562)
TOTAL INVESTMENTS – 99.7%(Cost $283,974,326) $356,059,760
OTHER ASSETS IN EXCESS OFLIABIL IT IES – 0.3% 1,132,250
NET ASSETS – 100.0% $357,192,010
The percentage shown for each investment categoryreflects the value of investments in that category as apercentage of net assets.* Non-income producing security.
(a) All or a portion of security is on loan.
(b) Exempt from registration under Rule 144A of the Securities Act of1933.
(c) Represents an affiliated issuer.
Investment Abbreviations:ADR—American Depositary ReceiptPLC —Public Limited CompanyREIT—Real Estate Investment TrustSDR —Swedish Depositary Receipt
A D D I T I O N A L I N V E S T M E N T I N F O R M A T I O N
FUTURES CONTRACTS — At August 31, 2021, the Fund had the following futures contracts:
DescriptionNumber ofContracts
ExpirationDate
NotionalAmount
UnrealizedAppreciation/
(Depreciation)
MSCI EAFE Index 17 09/17/21 $1,984,295 $14,480
48 The accompanying notes are an integral part of these financial statements.

G O L D M A N S A C H S M A R K E T B E T A® U . S . E Q U I T Y E T F
Schedule of InvestmentsAugust 31, 2021
Shares Description Value
Common Stocks – 99.5%
Communication Services – 11.7%8,329 Activision Blizzard, Inc. $ 686,0603,217 Alphabet, Inc., Class A* 9,309,8373,002 Alphabet, Inc., Class C* 8,733,5382,352 Altice USA, Inc., Class A* 64,539
77,255 AT&T, Inc. 2,118,3321,332 Charter Communications, Inc., Class A* 1,087,791
49,352 Comcast Corp., Class A 2,994,6791,755 Discovery, Inc., Class A*(a) 50,6143,412 Discovery, Inc., Class C* 94,1372,722 DISH Network Corp., Class A* 118,6523,080 Electronic Arts, Inc. 447,247
25,822 Facebook, Inc., Class A* 9,796,3503,505 Fox Corp., Class A 131,2271,636 Fox Corp., Class B 56,655
838 IAC/InterActiveCorp* 110,658261 Liberty Broadband Corp., Class A* 48,486
1,640 Liberty Broadband Corp., Class C* 313,765865 Liberty Media Corp.-Liberty SiriusXM,
Class A* 42,8181,748 Liberty Media Corp.-Liberty SiriusXM,
Class C* 86,26411,866 Lumen Technologies, Inc. 145,9522,749 Match Group, Inc.* 377,8234,731 Netflix, Inc.* 2,692,8382,309 Omnicom Group, Inc. 169,0655,884 Pinterest, Inc., Class A* 326,9741,245 Roku, Inc.* 438,738
714 Sea Ltd. ADR (Taiwan)* 241,5609,443 Sirius XM Holdings, Inc. 59,208
12,202 Snap, Inc., Class A* 928,6941,251 Spotify Technology SA* 293,1591,240 Take-Two Interactive Software, Inc.* 199,9136,347 T-Mobile US, Inc.* 869,6668,418 Twitter, Inc.* 542,961
43,125 Verizon Communications, Inc. 2,371,875100 ViacomCBS, Inc., Class A 4,598
6,181 ViacomCBS, Inc., Class B 256,2021,493 Vimeo, Inc.* 56,913
19,670 Walt Disney Co. (The)* 3,566,171472 Zillow Group, Inc., Class A* 45,123
1,770 Zillow Group, Inc., Class C* 169,513
50,048,595
Consumer Discretionary – 12.1%705 Advance Auto Parts, Inc. 143,009
1,501 Airbnb, Inc., Class A* 232,6404,686 Amazon.com, Inc.* 16,264,1222,909 Aptiv PLC* 442,721
233 AutoZone, Inc.* 360,9522,434 Best Buy Co., Inc. 283,585
443 Booking Holdings, Inc.* 1,018,754716 Burlington Stores, Inc.* 214,435
1,759 CarMax, Inc.* 220,2449,174 Carnival Corp.* 221,460
865 Carvana Co.* 283,772876 Chewy, Inc., Class A* 77,193
Shares Description Value
Common Stocks – (continued)
Consumer Discretionary – (continued)300 Chipotle Mexican Grill, Inc.* $ 570,999
5,877 Coupang, Inc. (South Korea)*(a) 176,0751,412 Darden Restaurants, Inc. 212,7182,553 Dollar General Corp. 569,0892,480 Dollar Tree, Inc.* 224,539
418 Domino’s Pizza, Inc. 216,0601,399 DoorDash, Inc., Class A* 267,7693,587 D.R. Horton, Inc. 342,9893,019 DraftKings, Inc., Class A* 178,9977,103 eBay, Inc. 545,0841,368 Etsy, Inc.* 295,8441,523 Expedia Group, Inc.* 220,074
42,399 Ford Motor Co.* 552,4591,644 Garmin Ltd. 286,763
14,223 General Motors Co.* 697,0691,552 Genuine Parts Co. 189,6391,393 Hasbro, Inc. 136,9462,964 Hilton Worldwide Holdings, Inc.* 370,085
11,512 Home Depot, Inc. (The) 3,754,9842,927 Lennar Corp., Class A 314,096
170 Lennar Corp., Class B 14,8782,806 LKQ Corp.* 147,8487,631 Lowe’s Cos., Inc. 1,555,8851,298 Lululemon Athletica, Inc.* 519,4212,858 Marriott International, Inc., Class A* 386,2308,081 McDonald’s Corp. 1,918,914
516 MercadoLibre, Inc. (Argentina)* 963,6044,424 MGM Resorts International 188,551
617 Mohawk Industries, Inc.* 122,0184,108 Newell Brands, Inc. 104,384
13,632 NIKE, Inc., Class B 2,245,73637 NVR, Inc.* 191,658
745 O’Reilly Automotive, Inc.* 442,5902,839 Peloton Interactive, Inc., Class A* 284,4392,755 PulteGroup, Inc. 148,3843,797 Ross Stores, Inc. 449,5652,339 Royal Caribbean Cruises Ltd.* 193,506
12,740 Starbucks Corp. 1,496,8235,342 Target Corp. 1,319,3678,384 Tesla, Inc.* 6,168,277
12,106 TJX Cos., Inc. (The) 880,3481,241 Tractor Supply Co. 241,064
582 Ulta Beauty, Inc.* 225,414431 Vail Resorts, Inc.* 131,390
3,811 VF Corp. 291,427803 Wayfair, Inc., Class A* 225,442676 Whirlpool Corp. 149,754
1,137 Wynn Resorts Ltd.* 115,6224,354 Yum China Holdings, Inc. (China) 268,0323,222 Yum! Brands, Inc. 422,179
51,697,915
Consumer Staples – 5.6%20,023 Altria Group, Inc. 1,005,7556,019 Archer-Daniels-Midland Co. 361,140
409 Brown-Forman Corp., Class A 27,076
The accompanying notes are an integral part of these financial statements. 49
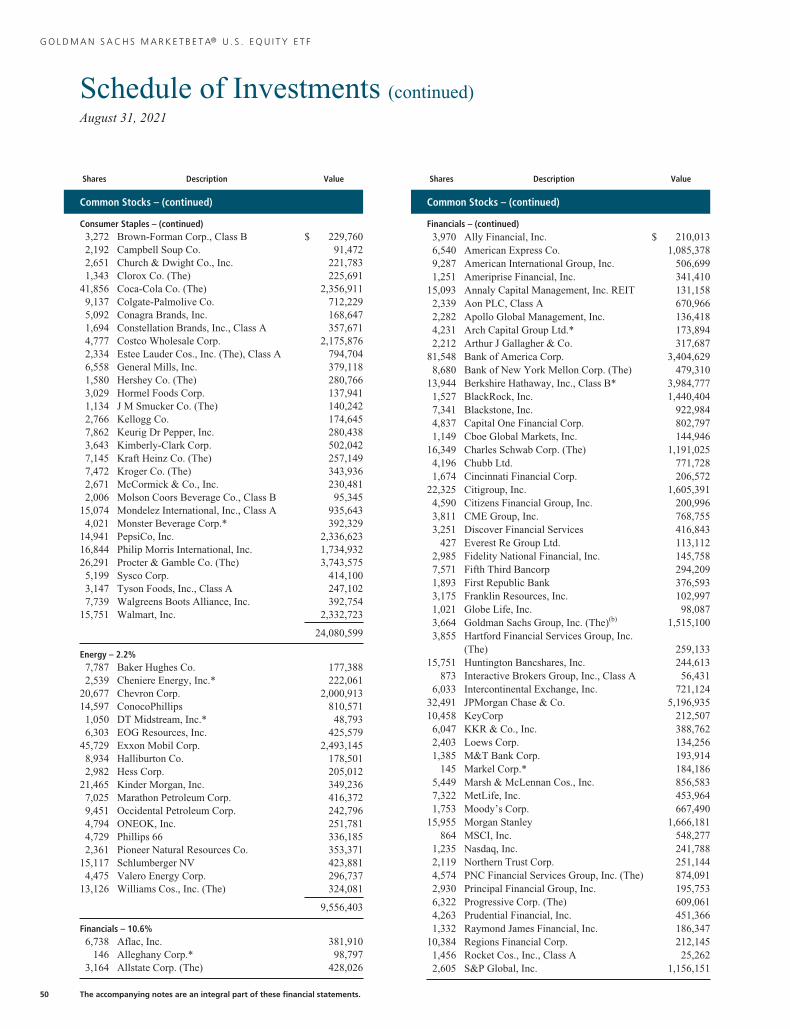
G O L D M A N S A C H S M A R K E T B E T A® U . S . E Q U I T Y E T F
Schedule of Investments (continued)August 31, 2021
Shares Description Value
Common Stocks – (continued)
Consumer Staples – (continued)3,272 Brown-Forman Corp., Class B $ 229,7602,192 Campbell Soup Co. 91,4722,651 Church & Dwight Co., Inc. 221,7831,343 Clorox Co. (The) 225,691
41,856 Coca-Cola Co. (The) 2,356,9119,137 Colgate-Palmolive Co. 712,2295,092 Conagra Brands, Inc. 168,6471,694 Constellation Brands, Inc., Class A 357,6714,777 Costco Wholesale Corp. 2,175,8762,334 Estee Lauder Cos., Inc. (The), Class A 794,7046,558 General Mills, Inc. 379,1181,580 Hershey Co. (The) 280,7663,029 Hormel Foods Corp. 137,9411,134 J M Smucker Co. (The) 140,2422,766 Kellogg Co. 174,6457,862 Keurig Dr Pepper, Inc. 280,4383,643 Kimberly-Clark Corp. 502,0427,145 Kraft Heinz Co. (The) 257,1497,472 Kroger Co. (The) 343,9362,671 McCormick & Co., Inc. 230,4812,006 Molson Coors Beverage Co., Class B 95,345
15,074 Mondelez International, Inc., Class A 935,6434,021 Monster Beverage Corp.* 392,329
14,941 PepsiCo, Inc. 2,336,62316,844 Philip Morris International, Inc. 1,734,93226,291 Procter & Gamble Co. (The) 3,743,5755,199 Sysco Corp. 414,1003,147 Tyson Foods, Inc., Class A 247,1027,739 Walgreens Boots Alliance, Inc. 392,754
15,751 Walmart, Inc. 2,332,723
24,080,599
Energy – 2.2%7,787 Baker Hughes Co. 177,3882,539 Cheniere Energy, Inc.* 222,061
20,677 Chevron Corp. 2,000,91314,597 ConocoPhillips 810,5711,050 DT Midstream, Inc.* 48,7936,303 EOG Resources, Inc. 425,579
45,729 Exxon Mobil Corp. 2,493,1458,934 Halliburton Co. 178,5012,982 Hess Corp. 205,012
21,465 Kinder Morgan, Inc. 349,2367,025 Marathon Petroleum Corp. 416,3729,451 Occidental Petroleum Corp. 242,7964,794 ONEOK, Inc. 251,7814,729 Phillips 66 336,1852,361 Pioneer Natural Resources Co. 353,371
15,117 Schlumberger NV 423,8814,475 Valero Energy Corp. 296,737
13,126 Williams Cos., Inc. (The) 324,081
9,556,403
Financials – 10.6%6,738 Aflac, Inc. 381,910
146 Alleghany Corp.* 98,7973,164 Allstate Corp. (The) 428,026
Shares Description Value
Common Stocks – (continued)
Financials – (continued)3,970 Ally Financial, Inc. $ 210,0136,540 American Express Co. 1,085,3789,287 American International Group, Inc. 506,6991,251 Ameriprise Financial, Inc. 341,410
15,093 Annaly Capital Management, Inc. REIT 131,1582,339 Aon PLC, Class A 670,9662,282 Apollo Global Management, Inc. 136,4184,231 Arch Capital Group Ltd.* 173,8942,212 Arthur J Gallagher & Co. 317,687
81,548 Bank of America Corp. 3,404,6298,680 Bank of New York Mellon Corp. (The) 479,310
13,944 Berkshire Hathaway, Inc., Class B* 3,984,7771,527 BlackRock, Inc. 1,440,4047,341 Blackstone, Inc. 922,9844,837 Capital One Financial Corp. 802,7971,149 Cboe Global Markets, Inc. 144,946
16,349 Charles Schwab Corp. (The) 1,191,0254,196 Chubb Ltd. 771,7281,674 Cincinnati Financial Corp. 206,572
22,325 Citigroup, Inc. 1,605,3914,590 Citizens Financial Group, Inc. 200,9963,811 CME Group, Inc. 768,7553,251 Discover Financial Services 416,843
427 Everest Re Group Ltd. 113,1122,985 Fidelity National Financial, Inc. 145,7587,571 Fifth Third Bancorp 294,2091,893 First Republic Bank 376,5933,175 Franklin Resources, Inc. 102,9971,021 Globe Life, Inc. 98,0873,664 Goldman Sachs Group, Inc. (The)(b) 1,515,1003,855 Hartford Financial Services Group, Inc.
(The) 259,13315,751 Huntington Bancshares, Inc. 244,613
873 Interactive Brokers Group, Inc., Class A 56,4316,033 Intercontinental Exchange, Inc. 721,124
32,491 JPMorgan Chase & Co. 5,196,93510,458 KeyCorp 212,5076,047 KKR & Co., Inc. 388,7622,403 Loews Corp. 134,2561,385 M&T Bank Corp. 193,914
145 Markel Corp.* 184,1865,449 Marsh & McLennan Cos., Inc. 856,5837,322 MetLife, Inc. 453,9641,753 Moody’s Corp. 667,490
15,955 Morgan Stanley 1,666,181864 MSCI, Inc. 548,277
1,235 Nasdaq, Inc. 241,7882,119 Northern Trust Corp. 251,1444,574 PNC Financial Services Group, Inc. (The) 874,0912,930 Principal Financial Group, Inc. 195,7536,322 Progressive Corp. (The) 609,0614,263 Prudential Financial, Inc. 451,3661,332 Raymond James Financial, Inc. 186,347
10,384 Regions Financial Corp. 212,1451,456 Rocket Cos., Inc., Class A 25,2622,605 S&P Global, Inc. 1,156,151
50 The accompanying notes are an integral part of these financial statements.

G O L D M A N S A C H S M A R K E T B E T A® U . S . E Q U I T Y E T F
Shares Description Value
Common Stocks – (continued)
Financials – (continued)1,392 SEI Investments Co. $ 87,4323,549 State Street Corp. 329,738
605 SVB Financial Group* 338,4976,274 Synchrony Financial 312,1322,418 T. Rowe Price Group, Inc. 541,3182,712 Travelers Cos., Inc. (The) 433,134
14,490 Truist Financial Corp. 826,79914,434 US Bancorp 828,3671,460 W R Berkley Corp. 109,953
44,699 Wells Fargo & Co. 2,042,7441,384 Willis Towers Watson PLC 305,476
45,612,423
Health Care – 12.9%847 10X Genomics, Inc., Class A* 149,004
19,104 Abbott Laboratories 2,414,17318,839 AbbVie, Inc. 2,275,374
479 ABIOMED, Inc.* 174,3373,274 Agilent Technologies, Inc. 574,489
799 Align Technology, Inc.* 566,4911,626 AmerisourceBergen Corp. 198,7136,212 Amgen, Inc. 1,400,9922,644 Anthem, Inc. 991,8445,437 Baxter International, Inc. 414,4083,140 Becton Dickinson and Co. 790,3381,614 Biogen, Inc.* 547,0011,964 BioMarin Pharmaceutical, Inc.* 165,388
15,350 Boston Scientific Corp.* 693,05323,836 Bristol-Myers Squibb Co. 1,593,6753,131 Cardinal Health, Inc. 164,3466,168 Centene Corp.* 388,4613,259 Cerner Corp. 248,8253,704 Cigna Corp. 783,952
530 Cooper Cos., Inc. (The) 238,87614,214 CVS Health Corp. 1,227,9476,855 Danaher Corp. 2,222,117
720 DaVita, Inc.* 94,1542,353 DENTSPLY SIRONA, Inc. 145,1801,039 Dexcom, Inc.* 550,0676,678 Edwards Lifesciences Corp.* 782,5284,807 Elanco Animal Health, Inc.* 160,4589,189 Eli Lilly & Co. 2,373,4271,845 Exact Sciences Corp.* 192,581
13,580 Gilead Sciences, Inc. 988,3522,874 HCA Healthcare, Inc. 727,0651,503 Henry Schein, Inc.* 113,6122,744 Hologic, Inc.* 217,1881,378 Humana, Inc. 558,669
915 IDEXX Laboratories, Inc.* 616,4901,577 Illumina, Inc.* 720,9412,010 Incyte Corp.* 153,7451,271 Intuitive Surgical, Inc.* 1,339,0752,029 IQVIA Holdings, Inc.* 526,992
641 Jazz Pharmaceuticals PLC* 84,42628,508 Johnson & Johnson 4,935,5901,053 Laboratory Corp. of America Holdings* 319,459
Shares Description Value
Common Stocks – (continued)
Health Care – (continued)1,674 McKesson Corp. $ 341,730
14,540 Medtronic PLC 1,940,79927,219 Merck & Co., Inc. 2,076,538
249 Mettler-Toledo International, Inc.* 386,6553,707 Moderna, Inc.* 1,396,3902,746 Organon & Co. 93,062
60,619 Pfizer, Inc. 2,792,7171,406 Quest Diagnostics, Inc. 214,8791,102 Regeneron Pharmaceuticals, Inc.* 742,0871,563 ResMed, Inc. 454,0983,408 Royalty Pharma PLC, Class A 131,7191,435 Seagen, Inc.* 240,5063,558 Stryker Corp. 985,9221,502 Teladoc Health, Inc.* 216,919
504 Teleflex, Inc. 199,3124,250 Thermo Fisher Scientific, Inc. 2,358,538
10,169 UnitedHealth Group, Inc. 4,233,050813 Universal Health Services, Inc., Class B 126,633
1,485 Veeva Systems, Inc., Class A* 492,99013,057 Viatris, Inc. 191,024
665 Waters Corp.* 275,323794 West Pharmaceutical Services, Inc. 358,586
2,256 Zimmer Biomet Holdings, Inc. 339,4155,136 Zoetis, Inc. 1,050,620
55,463,315
Industrials – 7.9%6,270 3M Co. 1,221,0201,445 A O Smith Corp. 105,0802,489 AMETEK, Inc. 338,4296,328 Boeing Co. (The)* 1,388,9969,407 Carrier Global Corp. 541,8435,923 Caterpillar, Inc. 1,248,9831,408 C.H. Robinson Worldwide, Inc. 126,804
961 Cintas Corp. 380,3352,282 Copart, Inc.* 329,3384,232 CoStar Group, Inc.* 358,620
24,554 CSX Corp. 798,7421,577 Cummins, Inc. 372,1403,052 Deere & Co. 1,153,7486,903 Delta Air Lines, Inc.* 279,1571,550 Dover Corp. 270,2584,307 Eaton Corp. PLC 725,1276,447 Emerson Electric Co. 680,1591,312 Equifax, Inc. 357,2051,819 Expeditors International of Washington,
Inc. 226,7206,201 Fastenal Co. 346,3262,655 FedEx Corp. 705,4073,563 Fortive Corp. 263,1991,492 Fortune Brands Home & Security, Inc. 145,276
671 Generac Holdings, Inc.* 293,2142,673 General Dynamics Corp. 535,429
11,719 General Electric Co. 1,235,3007,514 Honeywell International, Inc. 1,742,5723,796 IHS Markit Ltd. 457,798
The accompanying notes are an integral part of these financial statements. 51

G O L D M A N S A C H S M A R K E T B E T A® U . S . E Q U I T Y E T F
Schedule of Investments (continued)August 31, 2021
Shares Description Value
Common Stocks – (continued)
Industrials – (continued)3,092 Illinois Tool Works, Inc. $ 720,0034,200 Ingersoll Rand, Inc.* 222,684
910 J.B. Hunt Transport Services, Inc. 161,4347,741 Johnson Controls International PLC 579,027
982 Kansas City Southern 275,6182,211 L3Harris Technologies, Inc. 515,1851,517 Leidos Holdings, Inc. 148,8332,560 Lockheed Martin Corp. 921,0882,851 Lyft, Inc., Class A* 135,7362,734 Masco Corp. 166,0082,707 Norfolk Southern Corp. 686,3331,565 Northrop Grumman Corp. 575,4511,127 Old Dominion Freight Line, Inc. 325,3874,648 Otis Worldwide Corp. 428,6393,691 PACCAR, Inc. 302,1821,390 Parker-Hannifin Corp. 412,371
16,394 Raytheon Technologies Corp. 1,389,5552,272 Republic Services, Inc. 282,0231,255 Rockwell Automation, Inc. 408,4402,578 Rollins, Inc. 100,3361,134 Roper Technologies, Inc. 548,040
577 Snap-on, Inc. 129,7966,380 Southwest Airlines Co.* 317,5961,744 Stanley Black & Decker, Inc. 337,0632,433 Textron, Inc. 176,8062,578 Trane Technologies PLC 511,733
577 TransDigm Group, Inc.* 350,5102,048 TransUnion 248,893
13,860 Uber Technologies, Inc.* 542,4807,184 Union Pacific Corp. 1,557,7793,496 United Airlines Holdings, Inc.* 162,5997,833 United Parcel Service, Inc., Class B 1,532,370
780 United Rentals, Inc.* 275,0671,739 Verisk Analytics, Inc. 350,8614,566 Waste Management, Inc. 708,2321,922 Westinghouse Air Brake Technologies
Corp. 172,576471 W.W. Grainger, Inc. 204,273
1,940 Xylem, Inc. 264,441
33,774,673
Information Technology – 29.2%6,862 Accenture PLC, Class A 2,309,4755,146 Adobe, Inc.* 3,415,400
13,095 Advanced Micro Devices, Inc.* 1,449,8781,732 Akamai Technologies, Inc.* 196,1491,383 Amdocs Ltd. 106,5336,438 Amphenol Corp., Class A 493,3445,802 Analog Devices, Inc. 945,436
933 ANSYS, Inc.* 340,881180,613 Apple, Inc. 27,422,472
9,842 Applied Materials, Inc. 1,329,949328 AppLovin Corp., Class A*(a) 23,091605 Arista Networks, Inc.* 223,566
1,307 Atlassian Corp. PLC, Class A* 479,7472,380 Autodesk, Inc.* 738,014
Shares Description Value
Common Stocks – (continued)
Information Technology – (continued)4,603 Automatic Data Processing, Inc. $ 962,2114,273 Broadcom, Inc. 2,124,5781,248 Broadridge Financial Solutions, Inc. 214,9312,972 Cadence Design Systems, Inc.* 485,8631,502 CDW Corp. 301,316
42,072 Cisco Systems, Inc. 2,483,0892,431 Cloudflare, Inc., Class A* 293,5195,698 Cognizant Technology Solutions Corp.,
Class A 434,8148,331 Corning, Inc. 333,1572,108 Crowdstrike Holdings, Inc., Class A* 592,3482,381 Datadog, Inc., Class A* 328,1022,916 Dell Technologies, Inc., Class C* 284,1932,046 DocuSign, Inc.* 606,1073,245 Dropbox, Inc., Class A* 102,8991,335 Enphase Energy, Inc.* 231,930
590 EPAM Systems, Inc.* 373,358643 F5 Networks, Inc.* 130,896
6,699 Fidelity National Information Services,Inc. 855,931
6,499 Fiserv, Inc.* 765,517882 FleetCor Technologies, Inc.* 232,213
1,505 Fortinet, Inc.* 474,286906 Gartner, Inc.* 279,718
3,175 Global Payments, Inc. 516,38214,111 Hewlett Packard Enterprise Co. 218,15612,981 HP, Inc. 386,055
479 HubSpot, Inc.* 327,86143,725 Intel Corp. 2,363,7749,667 International Business Machines Corp. 1,356,6672,877 Intuit, Inc. 1,628,6981,982 Keysight Technologies, Inc.* 355,5311,652 KLA Corp. 561,6141,540 Lam Research Corp. 931,4238,843 Marvell Technology, Inc. 541,1039,411 Mastercard, Inc., Class A 3,258,3712,903 Microchip Technology, Inc. 456,816
12,174 Micron Technology, Inc.* 897,22480,420 Microsoft Corp. 24,277,1901,829 Motorola Solutions, Inc. 446,6782,409 NetApp, Inc. 214,2326,030 NortonLifeLock, Inc. 160,157
25,871 NVIDIA Corp. 5,791,2231,541 Okta, Inc.* 406,208
17,840 Oracle Corp. 1,590,07917,094 Palantir Technologies, Inc., Class A* 450,2561,029 Palo Alto Networks, Inc.* 474,4103,480 Paychex, Inc. 398,356
548 Paycom Software, Inc.* 267,91712,715 PayPal Holdings, Inc.* 3,670,3121,199 Qorvo, Inc.* 225,448
12,206 QUALCOMM, Inc. 1,790,498859 RingCentral, Inc., Class A* 216,691
10,093 salesforce.com, Inc.* 2,677,3702,280 Seagate Technology Holdings PLC 199,7052,132 ServiceNow, Inc.* 1,372,240
52 The accompanying notes are an integral part of these financial statements.

G O L D M A N S A C H S M A R K E T B E T A® U . S . E Q U I T Y E T F
Shares Description Value
Common Stocks – (continued)
Information Technology – (continued)1,782 Skyworks Solutions, Inc. $ 326,9262,814 Snowflake, Inc., Class A* 856,4411,763 Splunk, Inc.* 269,5104,218 Square, Inc., Class A* 1,130,7192,392 SS&C Technologies Holdings, Inc. 180,9791,643 Synopsys, Inc.* 545,8703,569 TE Connectivity Ltd. 536,1351,795 Teradyne, Inc. 217,9859,990 Texas Instruments, Inc. 1,907,1914,628 Trade Desk, Inc. (The), Class A* 370,4712,703 Trimble, Inc.* 254,6771,730 Twilio, Inc., Class A* 617,5412,466 UiPath, Inc., Class A*(a) 155,8511,630 Unity Software, Inc.* 206,6031,065 VeriSign, Inc.* 230,317
18,207 Visa, Inc., Class A 4,171,224856 VMware, Inc., Class A*(a) 127,433
3,231 Western Digital Corp.* 204,1994,396 Western Union Co. (The) 95,1292,021 Workday, Inc., Class A* 552,0562,659 Xilinx, Inc. 413,714
576 Zebra Technologies Corp., Class A* 338,2102,163 Zoom Video Communications, Inc.,
Class A* 626,189906 Zscaler, Inc.* 252,176
125,381,102
Materials – 2.4%2,390 Air Products and Chemicals, Inc. 644,1291,259 Albemarle Corp. 298,056
16,667 Amcor PLC 214,1713,531 Ball Corp. 338,8351,209 Celanese Corp. 191,7477,938 Corteva, Inc. 349,0348,060 Dow, Inc. 506,9745,748 DuPont de Nemours, Inc. 425,4671,471 Eastman Chemical Co. 166,4582,747 Ecolab, Inc. 619,0641,385 FMC Corp. 129,678
15,786 Freeport-McMoRan, Inc. 574,4532,693 International Flavors & Fragrances, Inc. 407,9894,228 International Paper Co. 254,0605,596 Linde PLC (United Kingdom) 1,760,4462,848 LyondellBasell Industries NV, Class A 285,797
671 Martin Marietta Materials, Inc. 255,8198,666 Newmont Corp. 502,5413,220 Nucor Corp. 378,5431,013 Packaging Corp. of America 153,6722,564 PPG Industries, Inc. 409,0862,597 Sherwin-Williams Co. (The) 788,631
920 Southern Copper Corp. (Peru) 57,5831,435 Vulcan Materials Co. 266,8102,836 Westrock Co. 147,585
10,126,628
Shares Description Value
Common Stocks – (continued)
Real Estate – 2.5%1,667 Alexandria Real Estate Equities, Inc.
REIT $ 344,0194,908 American Tower Corp. REIT 1,433,9701,507 AvalonBay Communities, Inc. REIT 345,9771,540 Boston Properties, Inc. REIT 174,0053,485 CBRE Group, Inc., Class A* 335,6054,659 Crown Castle International Corp. REIT 907,0613,045 Digital Realty Trust, Inc. REIT 499,1064,055 Duke Realty Corp. REIT 212,928
966 Equinix, Inc. REIT 814,7733,919 Equity Residential REIT 329,470
701 Essex Property Trust, Inc. REIT 231,8491,417 Extra Space Storage, Inc. REIT 264,8515,822 Healthpeak Properties, Inc. REIT 209,5927,556 Host Hotels & Resorts, Inc. REIT* 125,1276,128 Invitation Homes, Inc. REIT 252,3513,096 Iron Mountain, Inc. REIT 147,8341,232 Mid-America Apartment Communities,
Inc. REIT 237,0007,982 Prologis, Inc. REIT 1,074,8561,610 Public Storage REIT 521,0124,198 Realty Income Corp. REIT 303,1801,173 SBA Communications Corp. REIT 421,0723,540 Simon Property Group, Inc. REIT 475,9533,190 UDR, Inc. REIT 172,3244,043 Ventas, Inc. REIT 226,1654,514 Welltower, Inc. REIT 395,1108,095 Weyerhaeuser Co. REIT 291,4201,990 W.P. Carey, Inc. REIT 155,459
10,902,069
Utilities – 2.4%2,706 Alliant Energy Corp. 164,4982,748 Ameren Corp. 241,0555,409 American Electric Power Co., Inc. 484,4841,960 American Water Works Co., Inc. 357,2101,405 Atmos Energy Corp. 137,001
769 Avangrid, Inc. 42,0266,261 CenterPoint Energy, Inc. 157,0883,119 CMS Energy Corp. 200,0213,817 Consolidated Edison, Inc. 287,9938,711 Dominion Energy, Inc. 678,0642,084 DTE Energy Co. 250,7898,323 Duke Energy Corp. 871,0854,108 Edison International 237,6072,166 Entergy Corp. 239,5812,427 Evergy, Inc. 166,1283,709 Eversource Energy 336,518
10,456 Exelon Corp. 512,5535,880 FirstEnergy Corp. 228,556
21,200 NextEra Energy, Inc. 1,780,5884,227 NiSource, Inc. 104,196
16,280 PG&E Corp.* 149,2881,217 Pinnacle West Capital Corp. 93,5878,096 PPL Corp. 237,6185,463 Public Service Enterprise Group, Inc. 349,304
The accompanying notes are an integral part of these financial statements. 53
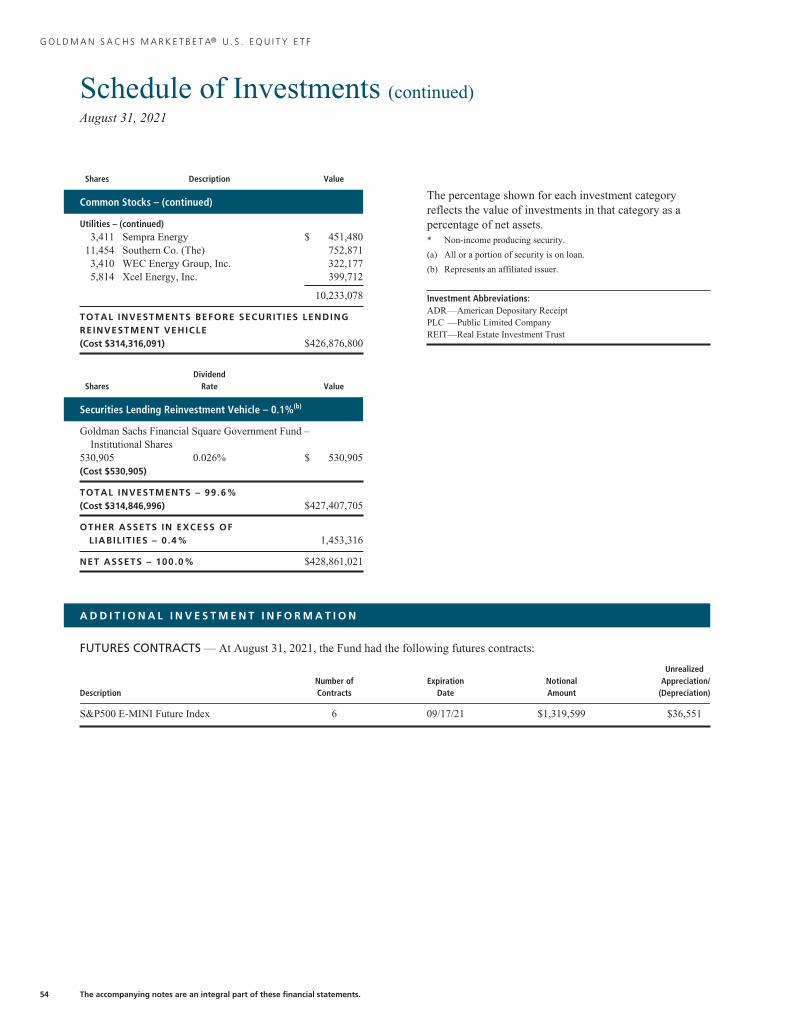
G O L D M A N S A C H S M A R K E T B E T A® U . S . E Q U I T Y E T F
Schedule of Investments (continued)August 31, 2021
Shares Description Value
Common Stocks – (continued)
Utilities – (continued)3,411 Sempra Energy $ 451,480
11,454 Southern Co. (The) 752,8713,410 WEC Energy Group, Inc. 322,1775,814 Xcel Energy, Inc. 399,712
10,233,078
TOTAL INVESTMENTS BEFORE SECURITIES LENDINGREINVESTMENT VEHICLE(Cost $314,316,091) $426,876,800
SharesDividend
Rate Value
Securities Lending Reinvestment Vehicle – 0.1%(b)
Goldman Sachs Financial Square Government Fund –Institutional Shares
530,905 0.026% $ 530,905(Cost $530,905)
TOTAL INVESTMENTS – 99.6%(Cost $314,846,996) $427,407,705
OTHER ASSETS IN EXCESS OFLIABIL IT IES – 0.4% 1,453,316
NET ASSETS – 100.0% $428,861,021
The percentage shown for each investment categoryreflects the value of investments in that category as apercentage of net assets.* Non-income producing security.
(a) All or a portion of security is on loan.
(b) Represents an affiliated issuer.
Investment Abbreviations:ADR—American Depositary ReceiptPLC —Public Limited CompanyREIT—Real Estate Investment Trust
A D D I T I O N A L I N V E S T M E N T I N F O R M A T I O N
FUTURES CONTRACTS — At August 31, 2021, the Fund had the following futures contracts:
DescriptionNumber ofContracts
ExpirationDate
NotionalAmount
UnrealizedAppreciation/
(Depreciation)
S&P500 E-MINI Future Index 6 09/17/21 $1,319,599 $36,551
54 The accompanying notes are an integral part of these financial statements.

G O L D M A N S A C H S M A R K E T B E T A® E T F S
Statements of Assets and LiabilitiesAugust 31, 2021
MarketBeta®
EmergingMarkets
Equity ETF
MarketBeta®
InternationalEquity ETF
MarketBeta®
U.S. Equity ETF
Assets:
Investments in unaffiliated issuers, at value (cost $22,277,682, $282,844,764 and$313,434,404, respectively)(a) $33,237,960 $354,930,198 $425,361,700
Investments in affiliated issuers, at value (cost $–, $– and $881,687, respectively) — — 1,515,100
Investments in securities lending reinvestment vehicle, at value which equals cost 568,867 1,129,562 530,905
Cash 2,918,546 1,097,506 1,428,529
Foreign currency, at value (cost $3,470, $17,425 and $–, respectively) 3,478 17,429 —
Variation margin on futures contracts 43,700 — —
Receivables:
Collateral on futures contracts 184,639 113,303 75,900
Dividends 40,236 880,722 512,657
Reimbursement from investment adviser 2,695 15,071 7,139
Securities lending income 418 1,780 1,968
Foreign tax reclaims — 217,155 —
Total assets 37,000,539 358,402,726 429,433,898
Liabilities:
Variation margin on futures contracts — 1,870 1,410
Payables:
Upon return of securities loaned 568,867 1,129,562 530,905
Foreign capital gains tax 225,240 — —
Management fees 13,474 75,357 32,125
Investments purchased 17 44 —
Accrued expenses 1,485 3,883 8,437
Total liabilities 809,083 1,210,716 572,877
Net Assets:
Paid-in capital 23,973,485 284,093,673 315,849,943
Total distributable earnings 12,217,971 73,098,337 113,011,078
NET ASSETS $36,191,456 $357,192,010 $428,861,021
SHARES ISSUED AND OUTSTANDING
Shares outstanding no par value (unlimited shares authorized): 650,000 6,200,000 6,800,000
Net asset value per share: $ 55.68 $ 57.61 $ 63.07
(a) Includes loaned securities having a market value of $568,407, $1,066,157 and $515,723 for MarketBeta® Emerging Markets Equity ETF, MarketBeta® InternationalEquity ETF and MarketBeta® U.S. Equity ETF, respectively.
The accompanying notes are an integral part of these financial statements. 55
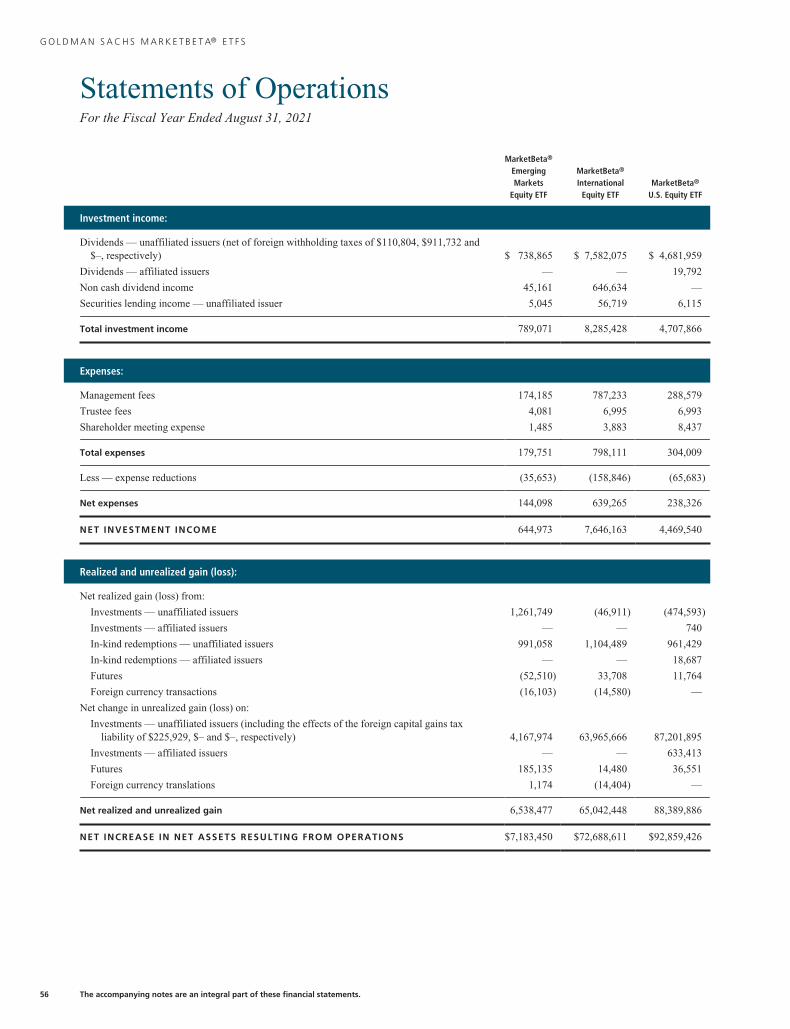
G O L D M A N S A C H S M A R K E T B E T A® E T F S
Statements of OperationsFor the Fiscal Year Ended August 31, 2021
MarketBeta®
EmergingMarkets
Equity ETF
MarketBeta®
InternationalEquity ETF
MarketBeta®
U.S. Equity ETF
Investment income:
Dividends — unaffiliated issuers (net of foreign withholding taxes of $110,804, $911,732 and$–, respectively) $ 738,865 $ 7,582,075 $ 4,681,959
Dividends — affiliated issuers — — 19,792
Non cash dividend income 45,161 646,634 —
Securities lending income — unaffiliated issuer 5,045 56,719 6,115
Total investment income 789,071 8,285,428 4,707,866
Expenses:
Management fees 174,185 787,233 288,579
Trustee fees 4,081 6,995 6,993
Shareholder meeting expense 1,485 3,883 8,437
Total expenses 179,751 798,111 304,009
Less — expense reductions (35,653) (158,846) (65,683)
Net expenses 144,098 639,265 238,326
NET INVESTMENT INCOME 644,973 7,646,163 4,469,540
Realized and unrealized gain (loss):
Net realized gain (loss) from:
Investments — unaffiliated issuers 1,261,749 (46,911) (474,593)
Investments — affiliated issuers — — 740
In-kind redemptions — unaffiliated issuers 991,058 1,104,489 961,429
In-kind redemptions — affiliated issuers — — 18,687
Futures (52,510) 33,708 11,764
Foreign currency transactions (16,103) (14,580) —
Net change in unrealized gain (loss) on:
Investments — unaffiliated issuers (including the effects of the foreign capital gains taxliability of $225,929, $– and $–, respectively) 4,167,974 63,965,666 87,201,895
Investments — affiliated issuers — — 633,413
Futures 185,135 14,480 36,551
Foreign currency translations 1,174 (14,404) —
Net realized and unrealized gain 6,538,477 65,042,448 88,389,886
NET INCREASE IN NET ASSETS RESULTING FROM OPERATIONS $7,183,450 $72,688,611 $92,859,426
56 The accompanying notes are an integral part of these financial statements.

G O L D M A N S A C H S M A R K E T B E T A® E T F S
Statements of Changes in Net Assets
MarketBeta® Emerging Markets Equity ETF MarketBeta® International Equity ETF
For the FiscalYear Ended
August 31, 2021
For the PeriodMay 12, 2020*
toAugust 31, 2020
For the FiscalYear Ended
August 31, 2021
For the PeriodMay 12, 2020*
toAugust 31, 2020
From operations:
Net investment income $ 644,973 $ 429,114 $ 7,646,163 $ 1,124,606
Net realized gain 2,184,194 675,905 1,076,706 2,955,456
Net change in unrealized gain 4,354,283 6,544,095 63,965,742 8,131,134
Net increase in net assets resulting from operations 7,183,450 7,649,114 72,688,611 12,211,196
Distributions to shareholders:
From distributable earnings (1,171,922) — (7,742,172) —
From share transactions:
Proceeds from sales of shares — 39,611,628 16,893,577 295,853,235
Cost of shares redeemed (8,337,333) (8,743,481) (5,371,302) (27,341,135)
Net increase (decrease) in net assets resulting from sharetransactions (8,337,333) 30,868,147 11,522,275 268,512,100
TOTAL INCREASE (DECREASE) (2,325,805) 38,517,261 76,468,714 280,723,296
Net assets:
Beginning of period $38,517,261 $ — $280,723,296 $ —
End of period $36,191,456 $38,517,261 $357,192,010 $280,723,296
* Commencement of operations.
The accompanying notes are an integral part of these financial statements. 57

G O L D M A N S A C H S M A R K E T B E T A® E T F S
Statements of Changes in Net Assets (continued)
MarketBeta® U.S. Equity ETF
For the FiscalYear Ended
August 31, 2021
For the PeriodMay 12, 2020*
toAugust 31, 2020
From operations:
Net investment income $ 4,469,540 $ 828,149
Net realized gain (loss) 518,027 (27,673)
Net change in unrealized gain 87,871,859 24,725,401
Net increase in net assets resulting from operations 92,859,426 25,525,877
Distributions to shareholders:
From distributable earnings (4,409,032) —
From share transactions:
Proceeds from sales of shares 85,652,201 232,137,239
Cost of shares redeemed (2,904,650) (40)
Net increase in net assets resulting from share transactions 82,747,551 232,137,199
TOTAL INCREASE 171,197,945 257,663,076
Net assets:
Beginning of period $257,663,076 $ —
End of period $428,861,021 $257,663,076
* Commencement of operations.
58 The accompanying notes are an integral part of these financial statements.

G O L D M A N S A C H S M A R K E T B E T A® E M E R G I N G M A R K E T S E Q U I T Y E T F
Financial HighlightsSelected Data for a Share Outstanding Throughout Each Period
MarketBeta® Emerging Markets Equity ETF
For the FiscalYear Ended
August 31, 2021
For the PeriodMay 12, 2020*
toAugust 31, 2020
Per Share Operating Performance:
Net asset value, beginning of period $ 48.15 $ 39.60
Net investment income(a) 0.89 0.49
Net realized and unrealized gain 8.14 8.06
Total gain from investment operations 9.03 8.55
Distributions to shareholders from net investment income (1.50) —
Net asset value, end of period $ 55.68 $ 48.15
Market price, end of period $ 55.72 $ 48.36
Total Return at Net Asset Value(b) 19.35% 21.54%
Net assets, end of period (in 000’s) $36,191 $38,517
Ratio of net expenses to average net assets 0.36% 0.36%(c)
Ratio of total expenses to average net assets 0.45% 0.45%(c)
Ratio of net investment income to average net assets 1.63% 3.60%(c)
Portfolio turnover rate(d) 21% 23%
* Commencement of operations.(a) Calculated based on the average shares outstanding methodology.(b) Assumes investment at the net asset value at the beginning of the period, reinvestment of all distributions and a complete sale of the investment at the net asset value
at the end of the period. Returns do not reflect the impact of taxes to shareholders relating to Fund distributions or the sale of Fund shares. Total returns for periodsless than one full year are not annualized.
(c) Annualized.(d) The Fund’s portfolio turnover rate is calculated in accordance with regulatory requirements and excludes portfolio securities received or delivered as a result of
in-kind transactions and short-term transactions. If such transactions were included, the Fund’s portfolio turnover rate may be higher.
The accompanying notes are an integral part of these financial statements. 59

G O L D M A N S A C H S M A R K E T B E T A® I N T E R N A T I O N A L E Q U I T Y E T F
Financial Highlights (continued)Selected Data for a Share Outstanding Throughout Each Period
MarketBeta® International Equity ETF
For the FiscalYear Ended
August 31, 2021
For the PeriodMay 12, 2020*
toAugust 31, 2020
Per Share Operating Performance:
Net asset value, beginning of period $ 46.79 $ 40.14
Net investment income(a) 1.28 0.30
Net realized and unrealized gain 10.84 6.35
Total gain from investment operations 12.12 6.65
Distributions to shareholders from net investment income (1.30) —
Net asset value, end of period $ 57.61 $ 46.79
Market price, end of period $ 57.80 $ 46.82
Total Return at Net Asset Value(b) 26.20% 16.57%
Net assets, end of period (in 000’s) $357,192 $280,723
Ratio of net expenses to average net assets 0.20% 0.20%(c)
Ratio of total expenses to average net assets 0.25% 0.25%(c)
Ratio of net investment income to average net assets 2.41% 2.15%(c)
Portfolio turnover rate(d) 5% 1%
* Commencement of operations.(a) Calculated based on the average shares outstanding methodology.(b) Assumes investment at the net asset value at the beginning of the period, reinvestment of all distributions and a complete sale of the investment at the net asset value
at the end of the period. Returns do not reflect the impact of taxes to shareholders relating to Fund distributions or the sale of Fund shares. Total returns for periodsless than one full year are not annualized.
(c) Annualized.(d) The Fund’s portfolio turnover rate is calculated in accordance with regulatory requirements and excludes portfolio securities received or delivered as a result of
in-kind transactions and short-term transactions. If such transactions were included, the Fund’s portfolio turnover rate may be higher.
60 The accompanying notes are an integral part of these financial statements.

G O L D M A N S A C H S M A R K E T B E T A® U . S . E Q U I T Y E T F
Financial Highlights (continued)Selected Data for a Share Outstanding Throughout Each Period
MarketBeta® U.S. Equity ETF
For the FiscalYear Ended
August 31, 2021
For the PeriodMay 12, 2020*
toAugust 31, 2020
Per Share Operating Performance:
Net asset value, beginning of period $ 48.62 $ 39.20
Net investment income(a) 0.74 0.22
Net realized and unrealized gain 14.46 9.20
Total gain from investment operations 15.20 9.42
Distributions to shareholders from net investment income (0.75) —
Net asset value, end of period $ 63.07 $ 48.62
Market price, end of period $ 63.09 $ 48.69
Total Return at Net Asset Value(b) 31.60% 24.03%
Net assets, end of period (in 000’s) $428,861 $257,663
Ratio of net expenses to average net assets 0.07% 0.07%(c)
Ratio of total expenses to average net assets 0.09% 0.09%(c)
Ratio of net investment income to average net assets 1.36% 1.62%(c)
Portfolio turnover rate(d) 4% 1%
* Commencement of operations.(a) Calculated based on the average shares outstanding methodology.(b) Assumes investment at the net asset value at the beginning of the period, reinvestment of all distributions and a complete sale of the investment at the net asset value
at the end of the period. Returns do not reflect the impact of taxes to shareholders relating to Fund distributions or the sale of Fund shares. Total returns for periodsless than one full year are not annualized.
(c) Annualized.(d) The Fund’s portfolio turnover rate is calculated in accordance with regulatory requirements and excludes portfolio securities received or delivered as a result of
in-kind transactions and short-term transactions. If such transactions were included, the Fund’s portfolio turnover rate may be higher.
The accompanying notes are an integral part of these financial statements. 61

G O L D M A N S A C H S M A R K E T B E T A® E T F S
Notes to Financial StatementsAugust 31, 2021
1 . O R G A N I Z A T I O N
Goldman Sachs ETF Trust (the “Trust”) is an open-end management investment company, registered under the Investment
Company Act of 1940, as amended (the “Act”), consisting of multiple series. The Trust was organized as a Delaware statutory trust
on December 16, 2009. The following table lists those series of the Trust that are included in this report (collectively, the “Funds”
or individually a “Fund”) along with their respective diversification status under the Act:
FundDiversificationClassification
Goldman Sachs MarketBeta® Emerging Markets Equity ETF (“MarketBeta® Emerging Markets Equity ETF”) Diversified
Goldman Sachs MarketBeta® International Equity ETF (“MarketBeta® International Equity ETF”) Diversified
Goldman Sachs MarketBeta® U.S. Equity ETF (“MarketBeta® U.S. Equity ETF”) Diversified
The investment objective of each Fund is to provide investment results that closely correspond, before fees and expenses, to
the performance of its respective Index.
Goldman Sachs Asset Management, L.P. (“GSAM”), an affiliate of Goldman Sachs & Co. LLC (“Goldman Sachs”), serves as
investment adviser to the Funds pursuant to a management agreement (the “Agreement”) with the Trust. Each Fund is an
exchange-traded fund (“ETF”). Shares of the Funds are listed and traded on the Cboe BZX Exchange, Inc. Market prices for the
Funds’ shares may be different from their net asset value (“NAV”). The Funds issue and redeem shares at their respective NAV
only in blocks of a specified number of shares, or multiples thereof, referred to as “Creation Units”. Creation Units are issued and
redeemed generally for a designated portfolio of securities (including any portion of such securities for which cash may be
substituted) and a specified amount of cash. Shares generally trade in the secondary market in quantities less than a Creation Unit
at market prices that change throughout the day. Only those that have entered into an authorized participant agreement with ALPS
Distributors, Inc. (the “Distributor”) may do business directly with the Funds.
2 . S I G N I F I C A N T A C C O U N T I N G P O L I C I E S
The financial statements have been prepared in accordance with accounting principles generally accepted in the United States of
America (“GAAP”) and require management to make estimates and assumptions that may affect the reported amounts and
disclosures. Actual results may differ from those estimates and assumptions. Each Fund is an investment company under GAAP
and follows the accounting and reporting guidance applicable to investment companies.
A. Investment Valuation — The Funds’ valuation policy is to value investments at fair value.
B. Investment Income and Investments — Investment income includes interest income, dividend income, and securities
lending income, if any. Interest income is accrued daily and adjusted for amortization of premiums and accretion of discounts.
Dividend income is recognized on ex-dividend date or, for certain foreign securities, as soon as such information is obtained
subsequent to the ex-dividend date. Non-cash dividends, if any, are recorded at the fair market value of the securities received.
Investment transactions are reflected on trade date. Realized gains and losses are calculated using identified cost. Investment
transactions are recorded on the following business day for daily NAV calculations. Investment income is recorded net of any
foreign withholding taxes, less any amounts reclaimable. The Funds may file withholding tax reclaims in certain jurisdictions to
recover a portion of amounts previously withheld. Any foreign capital gains tax is accrued daily based upon net unrealized gains,
and is payable upon sale of such investments. Distributions received from the Funds’ investments in U.S. real estate investment
trusts (“REITs”) may be characterized as ordinary income, net capital gain and/or a return of capital. A return of capital is recorded
by the Funds as a reduction to the cost basis of the REIT. For derivative contracts, realized gains and losses are recorded upon
settlement of the contract.
C. Expenses — Expenses incurred directly by a Fund are charged to the Fund, and certain expenses incurred by the Trust are
allocated across the applicable Funds on a straight-line and/or pro-rata basis, depending upon the nature of the expenses, and are
accrued daily.62

G O L D M A N S A C H S M A R K E T B E T A® E T F S
2 . S I G N I F I C A N T A C C O U N T I N G P O L I C I E S ( c o n t i n u e d )
D. Federal Taxes and Distributions to Shareholders — It is each Fund’s policy to comply with the requirements of the
Internal Revenue Code of 1986, as amended (the “Code”), applicable to regulated investment companies and to distribute each
year substantially all of its investment company taxable income and capital gains to its shareholders. Accordingly, each Fund is not
required to make any provisions for the payment of federal income tax. Distributions to shareholders are recorded on the
ex-dividend date. For each Fund, income distributions, if any, are declared and paid quarterly. Capital gains distributions, if any,
are declared and paid annually.
Net capital losses, if any, are carried forward to future fiscal years and may be used to the extent allowed by the Code to offset
any future capital gains. Losses that are carried forward will retain their character as either short-term or long-term capital losses.
Utilization of capital loss carryforwards will reduce the requirement of future capital gains distributions.
The characterization of distributions to shareholders for financial reporting purposes is determined in accordance with federal
income tax rules, which may differ from GAAP. The source of each Fund’s distributions may be shown in the accompanying
financial statements as either from distributable earnings or capital. Certain components of the Funds’ net assets on the Statements
of Assets and Liabilities reflect permanent GAAP/tax differences based on the appropriate tax character.
E. Foreign Currency Translation — The accounting records and reporting currency of a Fund are maintained in U.S. dollars.
Assets and liabilities denominated in foreign currencies are translated into U.S. dollars using the current exchange rates at the close
of each business day. The effect of changes in foreign currency exchange rates on investments is included within net realized and
unrealized gain (loss) on investments. Changes in the value of other assets and liabilities as a result of fluctuations in foreign
exchange rates are included in the Statements of Operations within net change in unrealized gain (loss) on foreign currency
translation. Transactions denominated in foreign currencies are translated into U.S. dollars on the date the transaction occurred, the
effects of which are included within net realized gain (loss) on foreign currency transactions.
3 . I N V E S T M E N T S A N D F A I R V A L U E M E A S U R E M E N T S
U.S. GAAP defines the fair value of a financial instrument as the amount that would be received to sell an asset or paid to transfer
a liability in an orderly transaction between market participants at the measurement date (i.e., the exit price); the Funds’ policy is to
use the market approach. GAAP establishes a fair value hierarchy that prioritizes the inputs to valuation techniques used to
measure fair value. The hierarchy gives the highest priority to unadjusted quoted prices in active markets for identical assets or
liabilities (Level 1 measurements) and the lowest priority to unobservable inputs (Level 3 measurements). The level in the fair
value hierarchy within which the fair value measurement in its entirety falls shall be determined based on the lowest level input
that is significant to the fair value measurement in its entirety. The levels used for classifying investments are not necessarily an
indication of the risk associated with investing in these investments. The three levels of the fair value hierarchy are described
below:
Level 1 — Unadjusted quoted prices in active markets that are accessible at the measurement date for identical, unrestricted
assets or liabilities;
Level 2 — Quoted prices in markets that are not active or financial instruments for which significant inputs are observable
(including, but not limited to, quoted prices for similar investments, interest rates, foreign exchange rates, volatility and credit
spreads), either directly or indirectly;
Level 3 — Prices or valuations that require significant unobservable inputs (including GSAM’s assumptions in determining
fair value measurement).
The Board of Trustees (“Trustees”) has approved Valuation Procedures that govern the valuation of the portfolio investments held
by the Funds, including investments for which market quotations are not readily available. The Trustees have delegated to GSAM
day-to-day responsibility for implementing and maintaining internal controls and procedures related to the valuation of the Funds’
investments. To assess the continuing appropriateness of pricing sources and methodologies, GSAM regularly performs price
verification procedures and issues challenges as necessary to third party pricing vendors or brokers, and any differences are
reviewed in accordance with the Valuation Procedures.
63

G O L D M A N S A C H S M A R K E T B E T A® E T F S
Notes to Financial Statements (continued)August 31, 2021
3 . I N V E S T M E N T S A N D F A I R V A L U E M E A S U R E M E N T S ( c o n t i n u e d )
A. Level 1 and Level 2 Fair Value Investments — The valuation techniques and significant inputs used in determining the
fair values for investments classified as Level 1 and Level 2 are as follows:
Equity Securities — Equity securities traded on a United States (“U.S.”) securities exchange or the NASDAQ system, or those
located on certain foreign exchanges, including but not limited to the Americas, are valued daily at their last sale price or official
closing price on the principal exchange or system on which they are traded. If there is no sale or official closing price or such price
is believed by GSAM to not represent fair value, equity securities will be valued at the valid closing bid price for long positions
and at the valid closing ask price for short positions (i.e. where there is sufficient volume, during normal exchange trading hours).
If no valid bid/ask price is available, the equity security will be valued pursuant to the Valuation Procedures approved by the
Trustees and consistent with applicable regulatory guidance. To the extent these investments are actively traded, they are classified
as Level 1 of the fair value hierarchy, otherwise they are generally classified as Level 2. Certain equity securities containing unique
attributes may be classified as Level 2.
Unlisted equity securities for which market quotations are available are valued at the last sale price on the valuation date, or if
no sale occurs, at the last bid price for long positions or the last ask price for short positions, and are generally classified as Level 2.
Derivative Contracts — A derivative is an instrument whose value is derived from underlying assets, indices, reference rates or
a combination of these factors. A Fund enters into derivative transactions to hedge against changes in interest rates, securities
prices, and/or currency exchange rates, to increase total return, or to gain access to certain markets or attain exposure to other
underliers. For financial reporting purposes, cash collateral that has been pledged to cover obligations of a Fund and cash collateral
received, if any, is reported separately on the Statements of Assets and Liabilities as receivables/payables for collateral on certain
derivatives contracts. Non-cash collateral pledged by a Fund, if any, is noted in the Schedules of Investments.
Exchange-traded derivatives, including futures and options contracts, are generally valued at the last sale or settlement price
on the exchange where they are principally traded. Exchange-traded options without settlement prices are generally valued at the
last bid price for long positions and the last ask price for short positions on the exchange where they are principally traded.
Exchange-traded derivatives typically fall within Level 1 of the fair value hierarchy.
Over-the-counter (“OTC”) and centrally cleared derivatives are valued using market transactions and other market evidence,
including market-based inputs to models, calibration to market-clearing transactions, broker or dealer quotations, or other
alternative pricing sources. Where models are used, the selection of a particular model to value OTC and centrally cleared
derivatives depends upon the contractual terms of, and specific risks inherent in, the instrument, as well as the availability of
pricing information in the market. Valuation models require a variety of inputs, including contractual terms, market prices, yield
curves, credit curves, measures of volatility, voluntary and involuntary prepayment rates, loss severity rates and correlations of
such inputs. For OTC and centrally cleared derivatives that trade in liquid markets, model inputs can generally be verified and
model selection does not involve significant management judgment. OTC and centrally cleared derivatives are classified within
Level 2 of the fair value hierarchy when significant inputs are corroborated by market evidence.
i. Futures Contracts — Futures contracts are contracts to buy or sell a standardized quantity of a specified commodity or
security. Upon entering into a futures contract, a Fund deposits cash or securities in an account on behalf of the broker in an
amount sufficient to meet the initial margin requirement. Subsequent payments are made or received by a Fund equal to the
daily change in the contract value and are recorded as variation margin receivable or payable with a corresponding offset to
unrealized gains or losses.
Underlying Funds (including Money Market Funds) — Underlying funds (“Underlying Funds”) include other investment
companies and exchange-traded funds (“ETFs”). Investments in the Underlying Funds (except ETFs) are valued at the NAV per
share on the day of valuation. ETFs are valued daily at the last sale price or official closing price on the principal exchange or
system on which the investment is traded. Because the Funds invest in Underlying Funds that fluctuate in value, the Funds’ shares
will correspondingly fluctuate in value. Underlying funds are generally classified as Level 1 of the fair value hierarchy. To the
extent that underlying ETFs are actively traded, they are classified as Level 1 of the fair value hierarchy, otherwise they are
generally classified as Level 2. For information regarding an Underlying Fund’s accounting policies and investment holdings,
please see the Underlying Fund’s shareholder report.64

G O L D M A N S A C H S M A R K E T B E T A® E T F S
3 . I N V E S T M E N T S A N D F A I R V A L U E M E A S U R E M E N T S ( c o n t i n u e d )
B. Level 3 Fair Value Investments — To the extent that significant inputs to valuation models and other alternative pricing sources are
unobservable, or if quotations are not readily available, or if GSAM believes that such quotations do not accurately reflect fair value, the fair
value of a Fund’s investments may be determined under Valuation Procedures approved by the Trustees. GSAM, consistent with its
procedures and applicable regulatory guidance, may make an adjustment to the most recent valuation prices of either domestic or foreign
securities in light of significant events to reflect what it believes to be the fair value of the securities at the time of determining a Fund’s
NAV. To the extent investments are valued using single source broker quotations obtained directly from the broker or passed through from
third party pricing vendors, such investments are classified as Level 3 investments.
C. Fair Value Hierarchy — The following is a summary of the Funds’ investments and derivatives classified in the fair value
hierarchy as of August 31, 2021:
MARKETBETA® EMERGING MARKETS EQUITY ETF
Investment Type Level 1 Level 2 Level 3
Assets
Common Stock and/or Other Equity Investments(a)
Africa $ 1,148,520 $ — $ —
Asia 27,988,406 613,232 4,187
Europe 238,601 — —
North America 1,124,543 — —
South America 1,640,744 479,727 —
Securities Lending Reinvestment Vehicle 568,867 — —
Total $ 32,709,681 $1,092,959 $ 4,187
Derivative Type
Assets(b)
Futures Contracts $ 162,991 $ — $ —
MARKETBETA® INTERNATIONAL EQUITY ETF
Investment Type Level 1 Level 2 Level 3
Assets
Common Stock and/or Other Equity Investments(a)
Africa $ 994,891 $ — $ —
Asia 107,240,600 — —
Europe 209,016,015 2,200,425 —
North America 4,417,333 327,248 —
Oceania 30,352,732 — —
South America 303,767 77,187 —
Securities Lending Reinvestment Vehicle 1,129,562 — —
Total $353,454,900 $2,604,860 $ —
Derivative Type
Assets(b)
Futures Contracts $ 14,480 $ — $ —
(a) Amounts are disclosed by continent to highlight the impact of time zone differences between local market close and the calculation of NAV. Security valuations arebased on the principal exchange or system on which they are traded, which may differ from country of domicile noted in table.
(b) Amount shown represents unrealized gain at fiscal year end.
65

G O L D M A N S A C H S M A R K E T B E T A® E T F S
Notes to Financial Statements (continued)August 31, 2021
3 . I N V E S T M E N T S A N D F A I R V A L U E M E A S U R E M E N T S ( c o n t i n u e d )
MARKETBETA® U.S. EQUITY ETF
Investment Type Level 1 Level 2 Level 3
AssetsCommon Stock and/or Other Equity Investments(a)
Asia $ 685,667 $ — $ —Europe 1,760,446 — —North America 423,409,500 — —South America 1,021,187 — —
Securities Lending Reinvestment Vehicle 530,905 — —
Total $427,407,705 $ — $ —
Derivative Type
Assets(b)
Futures Contracts $ 36,551 $ — $ —
(a) Amounts are disclosed by continent to highlight the impact of time zone differences between local market close and the calculation of NAV. Security valuations arebased on the principal exchange or system on which they are traded, which may differ from country of domicile noted in table.
(b) Amount shown represents unrealized gain at fiscal year end.
For further information regarding security characteristics, see the Schedules of Investments.
4 . I N V E S T M E N T S I N D E R I V A T I V E S
The following table sets forth, by certain risk types, the gross value of derivative contracts (not considered to be hedging instruments
for accounting disclosure purposes) as of August 31, 2021. These instruments were used as part of the Funds’ investment strategies
and to obtain and/or manage exposure related to the risks below. The values in the table below exclude the effects of cash collateral
received or posted pursuant to these derivative contracts, and therefore are not representative of the Funds’ net exposure.
Risk FundStatement of Assets
and LiabilitiesAssets
(Liabilities)(a)
Equity MarketBeta® Emerging Markets Equity ETF Variation Margin on Futures Contracts $162,991
Equity MarketBeta® International Equity ETF Variation Margin on Futures Contracts 14,480
Equity MarketBeta® U.S. Equity ETF Variation Margin on Futures Contracts 36,551
(a) Includes unrealized gain (loss) on futures contracts described in the Additional Investment Information sections of the Schedules of Investments. Only the variationmargin as of August 31, 2021 is reported within the Statements of Assets and Liabilities.
The following table sets forth, by certain risk types, the Funds’ gains (losses) related to these derivatives and their indicative
volumes for the fiscal year ended August 31, 2021. These gains (losses) should be considered in the context that these derivative
contracts may have been executed to create investment opportunities and/or economically hedge certain investments, and
accordingly, certain gains (losses) on such derivative contracts may offset certain (losses) gains attributable to investments. These
gains (losses) are included in “Net realized gain (loss)” or “Net change in unrealized gain (loss)” on the Statements of Operations:
Risk Fund
Net RealizedGain (Loss)
from FuturesContracts
Net Change inUnrealized
Gain (Loss) onFutures Contracts
Equity MarketBeta® Emerging Markets Equity ETF $(52,510) $185,135
Equity MarketBeta® International Equity ETF 33,708 14,480
Equity MarketBeta® U.S. Equity ETF 11,764 36,551
66
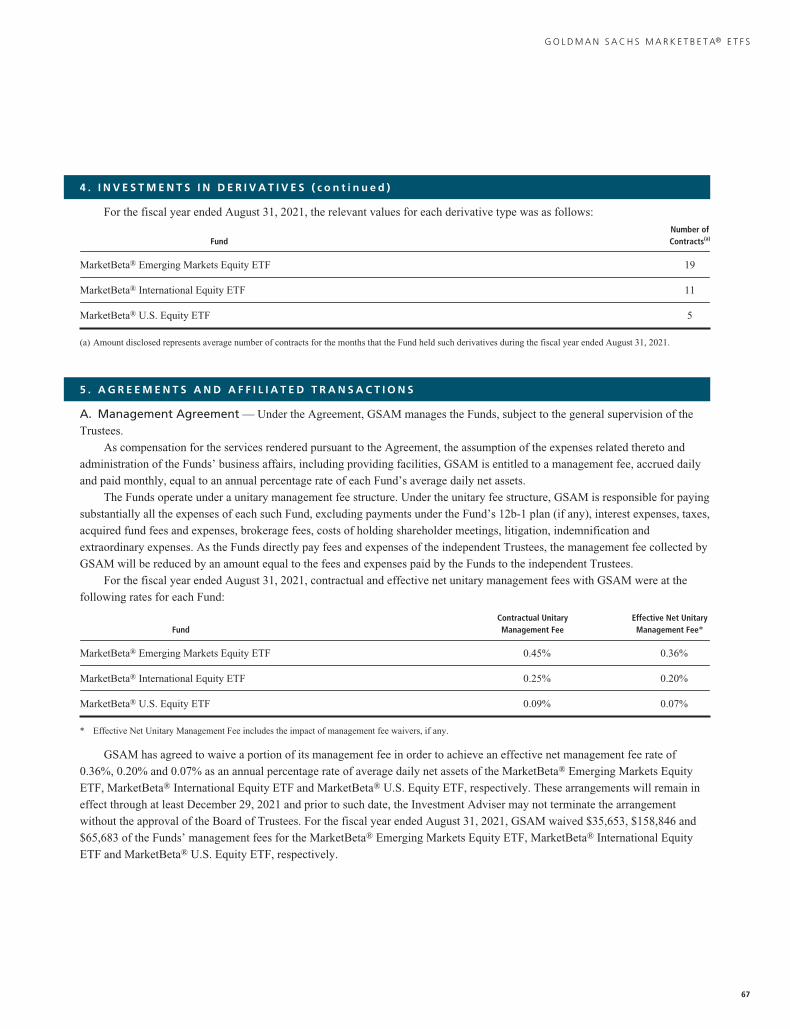
G O L D M A N S A C H S M A R K E T B E T A® E T F S
4 . I N V E S T M E N T S I N D E R I V A T I V E S ( c o n t i n u e d )
For the fiscal year ended August 31, 2021, the relevant values for each derivative type was as follows:
FundNumber ofContracts(a)
MarketBeta® Emerging Markets Equity ETF 19
MarketBeta® International Equity ETF 11
MarketBeta® U.S. Equity ETF 5
(a) Amount disclosed represents average number of contracts for the months that the Fund held such derivatives during the fiscal year ended August 31, 2021.
5 . A G R E E M E N T S A N D A F F I L I A T E D T R A N S A C T I O N S
A. Management Agreement — Under the Agreement, GSAM manages the Funds, subject to the general supervision of the
Trustees.
As compensation for the services rendered pursuant to the Agreement, the assumption of the expenses related thereto and
administration of the Funds’ business affairs, including providing facilities, GSAM is entitled to a management fee, accrued daily
and paid monthly, equal to an annual percentage rate of each Fund’s average daily net assets.
The Funds operate under a unitary management fee structure. Under the unitary fee structure, GSAM is responsible for paying
substantially all the expenses of each such Fund, excluding payments under the Fund’s 12b-1 plan (if any), interest expenses, taxes,
acquired fund fees and expenses, brokerage fees, costs of holding shareholder meetings, litigation, indemnification and
extraordinary expenses. As the Funds directly pay fees and expenses of the independent Trustees, the management fee collected by
GSAM will be reduced by an amount equal to the fees and expenses paid by the Funds to the independent Trustees.
For the fiscal year ended August 31, 2021, contractual and effective net unitary management fees with GSAM were at the
following rates for each Fund:
FundContractual UnitaryManagement Fee
Effective Net UnitaryManagement Fee*
MarketBeta® Emerging Markets Equity ETF 0.45% 0.36%
MarketBeta® International Equity ETF 0.25% 0.20%
MarketBeta® U.S. Equity ETF 0.09% 0.07%
* Effective Net Unitary Management Fee includes the impact of management fee waivers, if any.
GSAM has agreed to waive a portion of its management fee in order to achieve an effective net management fee rate of
0.36%, 0.20% and 0.07% as an annual percentage rate of average daily net assets of the MarketBeta® Emerging Markets Equity
ETF, MarketBeta® International Equity ETF and MarketBeta® U.S. Equity ETF, respectively. These arrangements will remain in
effect through at least December 29, 2021 and prior to such date, the Investment Adviser may not terminate the arrangement
without the approval of the Board of Trustees. For the fiscal year ended August 31, 2021, GSAM waived $35,653, $158,846 and
$65,683 of the Funds’ management fees for the MarketBeta® Emerging Markets Equity ETF, MarketBeta® International Equity
ETF and MarketBeta® U.S. Equity ETF, respectively.
67

G O L D M A N S A C H S M A R K E T B E T A® E T F S
Notes to Financial Statements (continued)August 31, 2021
5 . A G R E E M E N T S A N D A F F I L I A T E D T R A N S A C T I O N S ( c o n t i n u e d )
B. Other Transactions with Affiliates — The following table provides information about the MarketBeta® U.S. Equity ETF’s
investment in shares of The Goldman Sachs Group, Inc. of which the MarketBeta® U.S. Equity ETF is an affiliate as of and for the
fiscal year ended August 31, 2021:
Beginningvalue as ofAugust 31,
2020Purchases
at Cost
ProceedsfromSales
RealizedGain
Change inUnrealized
Appreciation
Endingvalue as ofAugust 31,
2021
Shares as ofAugust 31,
2021DividendIncome
$599,654 $291,846 $(57,562) $19,427 $661,735 $1,515,100 3,664 $19,792
6 . C R E A T I O N A N D R E D E M P T I O N O F C R E A T I O N U N I T S
The Trust issues and redeems shares of the Funds only in Creation Units on a continuous basis through the Distributor, without an
initial sales load, at NAV next determined after receipt, on any Business Day (as defined in the Statement of Additional
Information), of an order in proper form. Shares of the Funds may only be purchased or redeemed by certain financial institutions
(each an “Authorized Participant”). An Authorized Participant is either (1) a “Participating Party” or other participant in the
clearing process through the Continuous Net Settlement System of the National Securities Clearing Corporation; or (2) a
Depository Trust Company participant; which, in either case, must have executed an agreement with the Distributor. Retail
investors will typically not qualify as an Authorized Participant or have the resources to buy and sell whole Creation Units.
Therefore, they will be unable to purchase or redeem the shares directly from the Funds. Rather, most retail investors will
purchase shares in the secondary market at market prices with the assistance of a broker and may be subject to customary brokerage
commissions or fees. Fixed creation and redemption transaction fees are imposed in connection with creations and redemptions.
Authorized Participants transacting in Creation Units for cash may also pay a variable charge to compensate the relevant fund
for certain transaction costs (e.g. taxes on currency or other financial transactions, and brokerage costs) and market impact
expenses relating to investing in portfolio securities. Such variable charges, if any, are included in “Proceeds from sale of shares”
in the Statements of Changes in Net Assets. Share activity is as follows:
MarketBeta® Emerging Markets Equity ETF
For the Fiscal year EndedAugust 31, 2021
For the period May 12, 2020*through August 31, 2020
Shares Dollars Shares Dollars
Fund Share Activity
Shares Sold — $ — 1,000,001 $ 39,597,471
Shares Redeemed (150,000) (8,323,242) (200,001) (8,743,481)
NET INCREASE (DECREASE) IN SHARES (150,000) $ (8,323,242) 800,000 $ 30,853,990
MarketBeta® International Equity ETF
For the Fiscal Year EndedAugust 31, 2021
For the period May 12, 2020*through August 31, 2020
Shares Dollars Shares Dollars
Fund Share Activity
Shares Sold 300,000 $ 16,893,287 6,600,001 $ 295,827,537
Shares Redeemed (100,000) (5,367,710) (600,001) (27,341,135)
NET INCREASE IN SHARES 200,000 $ 11,525,577 6,000,000 $ 268,486,402
* Commencement of operations
68

G O L D M A N S A C H S M A R K E T B E T A® E T F S
6 . C R E A T I O N A N D R E D E M P T I O N O F C R E A T I O N U N I T S ( c o n t i n u e d )
MarketBeta® U.S. Equity ETF
For the Fiscal Year EndedAugust 31, 2021
For the period May 12, 2020*through August 31, 2020
Shares Dollars Shares Dollars
Fund Share Activity
Shares Sold 1,550,000 $ 85,652,200 5,300,001 $ 232,137,239
Shares Redeemed (50,000) (2,904,650) (1) (40)
NET INCREASE IN SHARES 1,500,000 $ 82,747,550 5,300,000 $ 232,137,199
* Commencement of operations
7 . P O R T F O L I O S E C U R I T I E S T R A N S A C T I O N S
The cost of purchases and proceeds from sales of long-term securities for the fiscal year ended August 31, 2021, were as follows:
Fund Purchases Sales
MarketBeta® Emerging Markets Equity ETF $ 8,175,888 $13,851,724
MarketBeta® International Equity ETF 16,661,854 17,636,660
MarketBeta® U.S. Equity ETF 12,181,471 13,554,950
The purchases and sales from in-kind creation and redemption transactions for the fiscal year ended August 31, 2021, were as
follows:
Fund Purchases Sales
MarketBeta® Emerging Markets Equity ETF $ — $4,104,137
MarketBeta® International Equity ETF 16,302,783 5,347,141
MarketBeta® U.S. Equity ETF 85,651,147 2,634,159
8 . S E C U R I T I E S L E N D I N G
The Funds may lend their securities through a securities lending agent, the Bank of New York Mellon (“BNYM”), to certain
qualified borrowers. In accordance with the Funds’ securities lending procedures, the Funds receive cash collateral at least equal to
the market value of the securities on loan. The market value of the loaned securities is determined at the close of business of the
Funds, at their last sale price or official closing price on the principal exchange or system on which they are traded, and any
additional required collateral is delivered to the Funds on the next business day. As with other extensions of credit, the Funds may
experience delay in the recovery of their securities or incur a loss should the borrower of the securities breach its agreement with
the Funds or become insolvent at a time when the collateral is insufficient to cover the cost of repurchasing securities on loan.
Dividend income received from securities on loan may not be subject to withholding taxes and therefore withholding taxes paid
may differ from the amounts listed in the Statements of Operations. Loans of securities are terminable at any time and as such 1)
the remaining contractual maturities of the outstanding securities lending transactions are considered to be overnight and
continuous and 2) the borrower, after notice, is required to return borrowed securities within the standard time period for settlement
of securities transactions.
69

G O L D M A N S A C H S M A R K E T B E T A® E T F S
Notes to Financial Statements (continued)August 31, 2021
8 . S E C U R I T I E S L E N D I N G ( c o n t i n u e d )
The Funds invest the cash collateral received in connection with securities lending transactions in the Goldman Sachs
Financial Square Government Fund (“Government Money Market Fund”), an affiliated series of the Goldman Sachs Trust. The
Government Money Market Fund is registered under the Act as an open end investment company, is subject to Rule 2a-7 under the
Act, and is managed by GSAM, for which GSAM may receive a management fee of up to 0.16% on an annualized basis of the
average daily net assets of the Government Money Market Fund.
In the event of a default by a borrower with respect to any loan, BNYM may exercise any and all remedies provided under the
applicable borrower agreement to make the Funds whole. These remedies include purchasing replacement securities by applying
the collateral held from the defaulting broker against the purchase cost of the replacement securities. If BNYM is unable to
purchase replacement securities, BNYM will indemnify the Funds by paying the Funds an amount equal to the market value of the
securities loaned minus the value of cash collateral received from the borrower for the loan, subject to an exclusion for any
shortfalls resulting from a loss of value in such cash collateral due to reinvestment risk. The Funds’ master netting agreements with
certain borrowers provide the right, in the event of a default (including bankruptcy or insolvency), for the non-defaulting party to
liquidate the collateral and calculate net exposure to the defaulting party or request additional collateral. However, in the event of a
default by a borrower, a resolution authority could determine that such rights are not enforceable due to the restrictions or
prohibitions against the right of set-off that may be imposed in accordance with a particular jurisdiction’s bankruptcy or insolvency
laws. The Funds’ loaned securities were all subject to enforceable Securities Lending Agreements, and the value of the collateral
was at least equal to the value of the cash received. The amounts of the Funds’ overnight and continuous agreements, which
represent the gross amounts of recognized liabilities for securities lending transactions outstanding as of August 31, 2021, are
disclosed as “Payable upon return of securities loaned” on the Statements of Assets and Liabilities, where applicable.
Each of the Funds and BNYM received compensation relating to the lending of the Funds’ securities. The amounts earned, if
any, by the Funds for the fiscal year ended August 31, 2021, are reported under Investment Income on the Statements of
Operations.
The following table provides information about the Funds’ investment in the Government Money Market Fund for the fiscal
year ended August 31, 2021:
Fund
Beginning valueas of August 31,
2020Purchases at
CostProceeds
from Sales
Ending valueas of August 31,
2021
MarketBeta® Emerging Markets Equity ETF $212,078 $ 4,651,443 $ (4,294,654) $ 568,867
MarketBeta® International Equity ETF 292,150 37,659,133 (36,821,721) 1,129,562
MarketBeta® U.S. Equity ETF 278,029 5,415,409 (5,162,533) 530,905
9 . T A X I N F O R M A T I O N
The tax character of distributions paid during the fiscal year ended August 31, 2021 were as follows:
MarketBeta®
EmergingMarkets
Equity ETF
MarketBeta®
InternationalEquity ETF
MarketBeta®
U.S. Equity ETF
Distributions paid from:
Ordinary Income $1,171,922 $7,742,172 $4,402,171
Long-term capital gain — — 6,861
Total taxable distributions $1,171,922 $7,742,172 $4,409,032
There were no distributions from the Funds for the period ended August 31, 2020.70

G O L D M A N S A C H S M A R K E T B E T A® E T F S
9 . T A X I N F O R M A T I O N ( c o n t i n u e d )
As of August 31, 2021, the components of accumulated earnings (losses) on a tax-basis were as follows:
MarketBeta®
Emerging MarketsEquity ETF
MarketBeta®
InternationalEquity ETF
MarketBeta®
U.S. Equity ETF
Undistributed ordinary income — net $ 1,841,562 $ 2,548,696 $ 929,778
Total undistributed earnings $ 1,841,562 $ 2,548,696 $ 929,778
Capital loss carryforwards(1):
Perpetual Short-Term $ — $ — $ —
Perpetual Long-Term — (44,653) (84,374)
Timing differences — — —
Unrealized gains (losses) — net 10,376,409 70,594,294 112,165,674
Total accumulated earnings (losses) net $12,217,971 $73,098,337 $113,011,078
(1) The MarketBeta® International Equity ETF utilized $1,907 of capital losses in the current fiscal year.
As of August 31, 2021, the Funds’ aggregate security unrealized gains and losses based on cost for U.S. federal income tax
purposes were as follows:
MarketBeta®
Emerging MarketsEquity ETF
MarketBeta®
InternationalEquity ETF
MarketBeta®
U.S. Equity ETF
Tax Cost $23,368,518 $285,476,908 $315,278,582
Gross unrealized gain 10,842,643 75,713,914 114,937,279
Gross unrealized loss (466,234) (5,119,620) (2,771,605)
Net unrealized gains (losses) $10,376,409 $ 70,594,294 $112,165,674
The difference between GAAP-basis and tax-basis unrealized gains (losses) is attributable primarily to wash sales, net mark to
market gains/(losses) on regulated futures, and differences in the tax treatment of partnership investments, and passive foreign
investment company investments.
In order to present certain components of the Funds’ capital accounts on a tax-basis, certain reclassifications have been
recorded to the Funds’ accounts. These reclassifications have no impact on the net asset value of the Funds and result primarily
from redemptions utilized as distributions and redemption in-kind transactions.
Fund Paid-in CapitalTotal Distributable
Earnings
MarketBeta® Emerging Markets Equity ETF $1,115,237 $(1,115,237)
MarketBeta® International Equity ETF $1,086,422 $(1,086,422)
MarketBeta® U.S. Equity ETF $ 965,193 $ (965,193)
GSAM has reviewed the Funds’ tax positions for all open tax years (the current and prior year, as applicable) and has
concluded that no provision for income tax is required in the Funds’ financial statements. Such open tax years remain subject to
examination and adjustment by tax authorities.
71
G O L D M A N S A C H S M A R K E T B E T A® E T F S
Notes to Financial Statements (continued)August 31, 2021
1 0 . O T H E R R I S K S
The Funds’ risks include, but are not limited to, the following:
Derivatives Risk — The Funds’ use of derivatives may result in loss. Derivative instruments, which may pose risks in addition to and
greater than those associated with investing directly in securities, currencies or other instruments, may be illiquid or less liquid, volatile,
difficult to price and leveraged so that small changes in the value of the underlying instruments may produce disproportionate losses to
the Funds. Derivatives are also subject to counterparty risk, which is the risk that the other party in the transaction will not fulfill its
contractual obligation. The use of derivatives is a highly specialized activity that involves investment techniques and risks different from
those associated with investments in more traditional securities and instruments. Losses from derivatives can also result from a lack of
correlation between changes in the value of derivative instruments and the portfolio assets (if any) being hedged.
Foreign and Emerging Countries Risk — Investing in foreign markets may involve special risks and considerations not typically
associated with investing in the U.S. Foreign securities may be subject to risk of loss because of more or less foreign government
regulation; less public information; less stringent investor protections; less stringent accounting, corporate governance, financial
reporting and disclosure standards; and less economic, political and social stability in the countries in which a Fund invests. The
imposition of exchange controls (including repatriation restrictions), confiscation of assets and property, trade restrictions (including
tariffs) and other government restrictions by the U.S. or other governments, or problems with registration, settlement or custody, may
also result in losses. Foreign risk also involves the risk of negative foreign currency rate fluctuations, which may cause the value of
securities denominated in such foreign currency (or other instruments through which a Fund has exposure to foreign currencies) to
decline in value. Currency exchange rates may fluctuate significantly over short periods of time. To the extent that a Fund also invests in
securities of issuers located in, or economically tied to, emerging markets, these risks may be more pronounced.
Foreign Custody Risk — A Fund invests in foreign securities, and as such the Fund may hold such securities and cash with
foreign banks, agents, and securities depositories appointed by the Fund’s custodian (each a “Foreign Custodian”). Some foreign
custodians may be recently organized or new to the foreign custody business. In some countries, Foreign Custodians may be
subject to little or no regulatory oversight over, or independent evaluation of, their operations. Further, the laws of certain countries
may place limitations on a Fund’s ability to recover its assets if a Foreign Custodian enters bankruptcy. Investments in emerging
markets may be subject to even greater custody risks than investments in more developed markets. Custody services in emerging
market countries are very often undeveloped and may be considerably less well regulated than in more developed countries, and
thus may not afford the same level of investor protection as would apply in developed countries.
Investments in Other Investment Companies Risk — As a shareholder of another investment company, including an ETF, a
Fund will indirectly bear its proportionate share of any net management fees and other expenses paid by such other investment
companies, in addition to the fees and expenses regularly borne by the Fund. ETFs are subject to risks that do not apply to
conventional mutual funds, including, but not limited to, the following: (i) the market price of the ETF’s shares may trade at a
premium or a discount to their NAV; and (ii) an active trading market for an ETF’s shares may not develop or be maintained.
Index Risk — Solactive AG (the “Index Provider”) constructs each Fund’s Index in accordance with a rules-based methodology.
A Fund will be negatively affected by general declines in the securities and asset classes represented in its Index. In addition,
because the Funds are not “actively” managed, unless a specific security is removed from an Index, a Fund generally would not
sell a security because the security’s issuer was in financial trouble. Market disruptions and regulatory restrictions could have an
adverse effect on a Fund’s ability to adjust its exposure to the required levels in order to track the Index. A Fund also does not
attempt to take defensive positions under any market conditions, including declining markets. Therefore, a Fund’s performance
could be lower than funds that may actively shift their portfolio assets to take advantage of market opportunities or to lessen the
impact of a market decline or a decline in the value of one or more issuers. The Index Provider relies on third party data it believes
to be reliable in constructing each Index, but it does not guarantee the accuracy or availability of such third party data. Errors in
index data, index computation or the construction of an Index in accordance with its methodology may occur from time to time and
may not be identified and corrected by the Index Provider for a period of time or at all, which may have an adverse impact on the
applicable Fund and its shareholders. In addition, neither a Fund, the Investment Adviser, the Calculation Agent nor the Index
Provider can guarantee the availability or timeliness of the production of the Index.
72

G O L D M A N S A C H S M A R K E T B E T A® E T F S
1 0 . O T H E R R I S K S ( c o n t i n u e d )
Market and Credit Risks — In the normal course of business, a Fund trades financial instruments and enters into financial
transactions where risk of potential loss exists due to changes in the market (market risk). The value of the securities in which a Fund
invests may go up or down in response to the prospects of individual companies, particular sectors or governments and/or general
economic conditions throughout the world due to increasingly interconnected global economies and financial markets. Events such
as war, acts of terrorism, social unrest, natural disasters, the spread of infectious illness or other public health threats could also
significantly impact a Fund and its investments. Additionally, a Fund may also be exposed to credit risk in the event that an issuer or
guarantor fails to perform or that an institution or entity with which the Fund has unsettled or open transactions defaults.
Market Trading Risk — Each Fund faces numerous market trading risks, including disruptions to creations and redemptions, the
existence of extreme market volatility or potential lack of an active trading market for Shares. If a shareholder purchases Shares at
a time when the market price is at a premium to the NAV or sells Shares at a time when the market price is at a discount to the
NAV, the shareholder may sustain losses. The Investment Adviser cannot predict whether Shares will trade below, at or above
their NAV. Price differences may be due, in large part, to the fact that supply and demand forces at work in the secondary trading
market for Shares will be closely related to, but not identical to, the same forces influencing the prices of the securities of a Fund’s
Index trading individually or in the aggregate at any point in time.
Tracking Error Risk — Tracking error is the divergence of a Fund’s performance from that of its Index. The performance of a
Fund may diverge from that of its Index for a number of reasons. Tracking error may occur because of transaction costs, a Fund’s
holding of cash, differences in accrual of dividends, changes to its Index or the need to meet new or existing regulatory
requirements. Unlike a Fund, the returns of an Index are not reduced by investment and other operating expenses, including the
trading costs associated with implementing changes to its portfolio of investments. Tracking error risk may be heightened during
times of market volatility or other unusual market conditions.
1 1 . I N D E M N I F I C A T I O N S
Under the Trust’s organizational documents, its Trustees, officers, employees and agents are indemnified, to the extent permitted
by the Act and state law, against certain liabilities that may arise out of performance of their duties to the Funds. Additionally, in
the course of business, the Funds enter into contracts that contain a variety of indemnification clauses. The Funds’ maximum
exposure under these arrangements is unknown, as this would involve future claims that may be made against the Funds that have
not yet occurred. However, GSAM believes the risk of loss under these arrangements to be remote.
1 2 . O T H E R M A T T E R S
Pursuant to an effort to consolidate the membership of the Board of Trustees of the Trust (the “Board”) with the Board of Trustees
of each of Goldman Sachs Trust II, Goldman Sachs MLP and Energy Renaissance Fund and Goldman Sachs Real Estate
Diversified Income Fund, at a meeting held on July 22, 2021, the Board voted to nominate Cheryl K. Beebe, Lawrence Hughes,
John F. Killian, Steven D. Krichmar and Linda A. Lang (the “Nominees”) for election as Trustees of the Trust at a virtual special
joint meeting of shareholders to be held on December 3, 2021. Each of the Nominees (except Ms. Lang) currently serves as a
Trustee of Goldman Sachs Trust II. Ms. Lang currently serves as a Trustee of the Trust. If elected, the Nominees will serve as
Trustees alongside the current Trustees of the Trust. The Funds will bear a portion of the proxy solicitation, shareholder meeting
and other related costs and GSAM has agreed to reimburse each Fund if such expenses increase the Fund’s total expense ratio by
more than a specified percentage. This annual report is not a proxy statement. Information regarding the election of the Nominees
is contained in the proxy materials filed with the SEC. The proxy statement has been mailed to shareholders of record, and
shareholders can also access the proxy statement, and any other relevant documents, on the SEC’s website.
1 3 . S U B S E Q U E N T E V E N T S
Subsequent events after the Statements of Assets and Liabilities date have been evaluated and GSAM has concluded that there is
no impact requiring adjustment or disclosure in the financial statements.73
Report of Independent Registered PublicAccounting Firm
To the Board of Trustees of Goldman Sachs ETF Trust and Shareholders of Goldman Sachs MarketBeta® Emerging MarketsEquity ETF, Goldman Sachs MarketBeta® International Equity ETF, and Goldman Sachs MarketBeta® U.S. Equity ETF
Opinions on the Financial Statements
We have audited the accompanying statements of assets and liabilities, including the schedules of investments, of GoldmanSachs MarketBeta® Emerging Markets Equity ETF, Goldman Sachs MarketBeta® International Equity ETF, and GoldmanSachs MarketBeta® U.S. Equity ETF (three of the funds constituting Goldman Sachs ETF Trust, hereafter collectivelyreferred to as the “Funds”) as of August 31, 2021, the related statements of operations for the year ended August 31, 2021,and the statements of changes in net assets and the financial highlights for the year ended August 31, 2021, and for theperiod May 12, 2020 (commencement of operations) through August 31, 2020, including the related notes (collectivelyreferred to as the “financial statements”). In our opinion, the financial statements present fairly, in all material respects, thefinancial position of each of the Funds as of August 31, 2021, the results of each of their operations for the year endedAugust 31, 2021, and the changes in each of their net assets and each of the financial highlights for the year endedAugust 31, 2021, and for the period May 12, 2020 (commencement of operations) through August 31, 2020 in conformitywith accounting principles generally accepted in the United States of America.
Basis for Opinions
These financial statements are the responsibility of the Funds’ management. Our responsibility is to express an opinion onthe Funds’ financial statements based on our audits. We are a public accounting firm registered with the Public CompanyAccounting Oversight Board (United States) (PCAOB) and are required to be independent with respect to the Funds inaccordance with the U.S. federal securities laws and the applicable rules and regulations of the Securities and ExchangeCommission and the PCAOB.
We conducted our audits of these financial statements in accordance with the standards of the PCAOB. Those standardsrequire that we plan and perform the audit to obtain reasonable assurance about whether the financial statements are free ofmaterial misstatement, whether due to error or fraud.
Our audits included performing procedures to assess the risks of material misstatement of the financial statements, whetherdue to error or fraud, and performing procedures that respond to those risks. Such procedures included examining, on a testbasis, evidence regarding the amounts and disclosures in the financial statements. Our audits also included evaluating theaccounting principles used and significant estimates made by management, as well as evaluating the overall presentation ofthe financial statements. Our procedures included confirmation of securities owned as of August 31, 2021 bycorrespondence with the custodian, transfer agent and brokers; when replies were not received from brokers, we performedother auditing procedures. We believe that our audits provide a reasonable basis for our opinions.
/s/ PricewaterhouseCoopers LLP
Boston, MassachusettsOctober 26, 2021
We have served as the auditor of one or more investment companies in the Goldman Sachs fund complex since 2000.
74

G O L D M A N S A C H S M A R K E T B E T A® E T F S
Liquidity Risk Management Program (Unaudited)
Each Fund has adopted and implemented a liquidity risk management program (the “Program”) in accordance with Rule 22e-4
under the 1940 Act. The Program seeks to assess and manage each Fund’s liquidity risk, i.e., the risk that a Fund is unable to
satisfy redemption requests without significantly diluting remaining investors’ interests in the Fund. The Board of Trustees of the
Trust has designated GSAM, each Fund’s investment adviser, to administer the Program. Certain aspects of the Program rely on
third parties to perform certain functions, including the provision of market data and application of models.
The Program is comprised of various components designed to support the assessment and/or management of liquidity risk,
including: (1) the periodic assessment (no less frequently than annually) of certain factors that influence a Fund’s liquidity risk;
(2) the periodic classification (no less frequently than monthly) of a Fund’s investments into one of four liquidity categories that
reflect an estimate of their liquidity under current market conditions; (3) a 15% limit on the acquisition of “illiquid investments”
(as defined under Rule 22e-4); (4) for a Fund that does not invest primarily in “highly liquid investments” (as defined under
Rule 22e-4), the determination of a minimum percentage of the Fund’s assets that will generally be invested in highly liquid
investments (a “Highly Liquid Investment Minimum”); and (5) periodic reporting to the Board of Trustees.
At a meeting of the Board of Trustees on March 16-17, 2021, GSAM provided a written report to the Board addressing the
operation, and the adequacy and effectiveness of the implementation, of the Program, including, as applicable, the operation of any
Highly Liquid Investment Minimum and any material changes to the Program, for the period from January 1, 2020 through
December 31, 2020 (the “Reporting Period”). Among other things, the annual report discussed: (1) the results of stress tests
designed to assess liquidity under a hypothetical stressed scenario involving elevated redemptions; (2) an assessment of the
methodologies used to classify investments into one of four liquidity categories; and (3) the efficiency of the arbitrage function
during the Reporting Period (including during the stressed market conditions caused by the COVID-19 pandemic). The report
concluded that the Program continues to be reasonably designed to assess and manage liquidity risk and was adequately and
effectively implemented during the Reporting Period.
There can be no assurance that the Program will achieve its objectives under all circumstances in the future. Please refer to your
Fund’s prospectus for more information regarding the Fund’s exposure to liquidity risk and other risks to which it may be subject.
75

GO
LD
MA
NS
AC
HS
MA
RK
ET
BE
TA
®E
TF
S
Fun
dE
xpen
ses
—F
orth
eSi
xM
onth
Per
iod
End
ed8/
31/2
1(U
naud
ited
)
As
ash
areh
olde
ryo
uin
cur
ongo
ing
cost
s,in
clud
ing
man
agem
entf
ees
and
othe
rF
und
expe
nses
.Thi
sex
ampl
eis
inte
nded
tohe
lpyo
uun
ders
tand
your
ongo
ing
cost
s(i
ndo
llar
s)of
inve
stin
gin
Sha
res
ofth
eF
unds
and
toco
mpa
reth
ese
cost
sw
ith
the
ongo
ing
cost
sof
inve
stin
gin
othe
rex
chan
ge-t
rade
dfu
nds.
Thi
sex
ampl
edo
esno
tta
kein
toac
coun
tbr
oker
age
com
mis
sion
sth
atyo
um
aypa
yon
your
purc
hase
san
dsa
les
ofS
hare
sof
aF
und.
The
exam
ple
isba
sed
onan
inve
stm
ent
of$1
,000
inve
sted
atth
ebe
ginn
ing
ofth
epe
riod
from
Mar
ch1,
2021
and
held
for
the
enti
resi
xm
onth
sen
ded
Aug
ust
31,
2021
,w
hich
repr
esen
tsa
peri
odof
184
days
ofa
365
day
year
(or
less
whe
rein
dica
ted)
.
Act
ual
Exp
ense
s—
The
firs
tli
nein
the
tabl
ebe
low
prov
ides
info
rmat
ion
abou
tac
tual
acco
unt
valu
esan
dac
tual
expe
nses
.Y
oum
ayus
eth
ein
form
atio
nin
this
line
,to
geth
erw
ith
the
amou
ntyo
uin
vest
ed,
toes
tim
ate
the
expe
nses
that
you
paid
over
the
six
mon
ths.
Sim
ply
divi
deyo
urac
coun
tva
lue
by$1
,000
(for
exam
ple,
an$8
,600
acco
unt
valu
edi
vide
dby
$1,0
00=
8.6)
,th
enm
ulti
ply
the
resu
ltby
the
num
ber
inth
efi
rstl
ine
unde
rth
ehe
adin
gen
titl
ed“E
xpen
ses
Pai
d”to
esti
mat
eth
eex
pens
esyo
upa
idon
your
acco
untd
urin
gth
ispe
riod
.
Hyp
othe
tica
lE
xam
ple
for
Com
pari
son
Pur
pose
s—
The
seco
ndli
nein
the
tabl
ebe
low
prov
ides
info
rmat
ion
abou
thy
poth
etic
alac
coun
tva
lues
and
hypo
thet
ical
expe
nses
base
don
aF
und’
sac
tual
net
expe
nse
rati
osan
dan
assu
med
rate
ofre
turn
of5%
per
year
befo
reex
pens
es,
whi
chis
not
the
Fun
d’s
actu
alre
turn
.T
hehy
poth
etic
alac
coun
tva
lues
and
expe
nses
may
not
beus
edto
esti
mat
eth
eac
tual
endi
ngac
coun
tba
lanc
eor
expe
nses
you
paid
for
the
peri
od.Y
oum
ayus
eth
isin
form
atio
nto
com
pare
the
ongo
ing
cost
sof
inve
stin
gin
aF
und
and
othe
rfu
nds.
To
doso
,com
pare
this
5%hy
poth
etic
alex
ampl
ew
ith
the
5%hy
poth
etic
alex
ampl
esth
atap
pear
inth
esh
areh
olde
rre
port
sof
the
othe
rfu
nds.
Ple
ase
note
that
the
expe
nses
show
nin
the
tabl
ear
em
eant
tohi
ghli
ght
your
ongo
ing
cost
son
lyan
ddo
not
refl
ect
any
tran
sact
iona
lco
sts,
such
asre
dem
ptio
nfe
es,
orex
chan
gefe
es.
The
refo
re,
the
seco
ndli
neof
the
tabl
eis
usef
ulin
com
pari
ngon
goin
gco
sts
only
,and
wil
lnot
help
you
dete
rmin
eth
ere
lati
veto
talc
osts
ofow
ning
diff
eren
tfun
ds.I
nad
diti
on,i
fth
ese
tran
sact
iona
lcos
tsw
ere
incl
uded
,you
rco
sts
wou
ldha
vebe
enhi
gher
.
Mar
ketB
eta®
Emer
ging
Mar
kets
Equi
tyET
F*M
arke
tBet
a®In
tern
atio
nalE
quit
yET
F*M
arke
tBet
a®U
.S.E
quit
yET
F*
Begi
nnin
gA
ccou
ntVa
lue
5/12
/20
Endi
ngA
ccou
ntVa
lue
8/31
/21
Expe
nses
Paid
*
Begi
nnin
gA
ccou
ntVa
lue
5/12
/20
Endi
ngA
ccou
ntVa
lue
8/31
/21
Expe
nses
Paid
*
Begi
nnin
gA
ccou
ntVa
lue
5/12
/20
Endi
ngA
ccou
ntVa
lue
8/31
/21
Expe
nses
Paid
*
Act
ualb
ased
onN
AV
$1,0
00$
983.
09$1
.80
$1,0
00$1
,101
.73
$1.0
6$1
,000
$1,1
93.7
2$0
.39
Hyp
othe
tica
l5%
retu
rn1,
000
1,02
3.39
+1.
841,
000
1,02
4.20
+1.
021,
000
1,02
4.85
+0.
36
+H
ypot
heti
cale
xpen
ses
are
base
don
the
Fun
d’s
actu
alan
nual
ized
nete
xpen
sera
tios
and
anas
sum
edra
teof
retu
rnof
5%pe
rye
arbe
fore
expe
nses
.
*E
xpen
ses
for
each
Fun
dar
eca
lcul
ated
usin
gth
eF
und’
san
nual
ized
nete
xpen
sera
tio,
whi
chre
pres
ents
the
ongo
ing
expe
nses
asa
perc
enta
geof
neta
sset
sfo
rth
esi
xm
onth
sen
ded
Aug
ust3
1,20
21.E
xpen
ses
are
calc
ulat
edby
mul
tipl
ying
the
annu
aliz
edne
texp
ense
rati
oby
the
aver
age
acco
untv
alue
for
the
peri
od;t
hen
mul
tipl
ying
the
resu
ltby
the
num
ber
ofda
ysin
the
mos
trec
entf
isca
lyea
r;an
dth
endi
vidi
ngth
atre
sult
byth
enu
mbe
rof
days
inth
efi
scal
year
.The
annu
aliz
edne
tex
pens
era
tio
for
the
peri
odis
asfo
llow
s:
Fund
Mar
ketB
eta®
Em
ergi
ngM
arke
tsE
quit
yE
TF
0.36
%M
arke
tBet
a®In
tern
atio
nalE
quit
yE
TF
0.20
Mar
ketB
eta®
U.S
.Equ
ity
ET
F0.
07
76

G O L D M A N S A C H S M A R K E T B E T A® E T F S
Trustees and Officers (Unaudited)Independent Trustees
Name,Address and Age1
Position(s) Heldwith the Trust
Term ofOffice andLength ofTime Served2
Principal Occupation(s)During Past 5 Years
Number ofPortfolios inFund ComplexOverseen byTrustee3
OtherDirectorshipsHeld by Trustee4
Lawrence W.StranghoenerAge: 67
Chairman of theBoard of Trustees
TrusteeSince 2015;ChairmanSince 2017
Mr. Stranghoener is retired. He is Chairman,Kennametal, Inc. (a global manufacturer anddistributor of tooling and industrial materials)(2003-Present); and was formerly Director, AlerisCorporation and Aleris International, Inc. (aproducer of aluminum rolled products) (2011-2020); Interim Chief Executive Officer (2014); andExecutive Vice President and Chief FinancialOfficer (2004-2014), Mosaic Company (a fertilizermanufacturing company).
Chairman of the Board of Trustees — GoldmanSachs ETF Trust; Goldman Sachs MLP and EnergyRenaissance Fund; Goldman Sachs Credit IncomeFund; and Goldman Sachs Real Estate DiversifiedIncome Fund.
39 Kennametal, Inc.(a global manufacturerand distributor oftooling and industrialmaterials)
Linda A. LangAge: 63
Trustee Since 2016 Ms. Lang is retired. She was formerly Chair of theBoard of Directors (2016-2019); and Member ofthe Board of Directors, WD-40 Company (a globalconsumer products company) (2004-2019);Chairman and Chief Executive Officer(2005-2014); and Director, President and ChiefOperating Officer, Jack in the Box, Inc. (arestaurant company) (2003-2005). Previously,Ms. Lang served as an Advisory Board Member ofGoldman Sachs MLP and Energy RenaissanceFund (February 2016-March 2016).
Trustee — Goldman Sachs ETF Trust; GoldmanSachs MLP and Energy Renaissance Fund;Goldman Sachs Credit Income Fund; and GoldmanSachs Real Estate Diversified Income Fund.
39 None
Michael LathamAge: 55
Trustee Since 2015 Mr. Latham is retired. He currently serves as ChiefOperating Officer and Director of FinTechEvolution Acquisition Group (a special purposeacquisition company) (2021-Present). Formerly,Mr. Latham held senior management positionswith the iShares exchange-traded fund business,including Chairman (2011-2014); Global Head(2010-2011); U.S. Head (2007-2010); and ChiefOperating Officer (2003-2007).
Trustee — Goldman Sachs ETF Trust; GoldmanSachs MLP and Energy Renaissance Fund;Goldman Sachs Credit Income Fund; and GoldmanSachs Real Estate Diversified Income Fund.
39 FinTech EvolutionAcquisition Group (aspecial purposeacquisition company)
77

G O L D M A N S A C H S M A R K E T B E T A® E T F S
Trustees and Officers (Unaudited) (continued)Interested Trustee*
Name,Address and Age1
Position(s) Heldwith the Trust
Term ofOffice andLength ofTime Served2
Principal Occupation(s)During Past 5 Years
Number ofPortfolios inFund ComplexOverseen byTrustee3
OtherDirectorshipsHeld by Trustee4
James A. McNamaraAge: 58
President andTrustee
Since 2014 Advisory Director, Goldman Sachs (January 2018-Present); Managing Director, Goldman Sachs(January 2000-December 2017); Director ofInstitutional Fund Sales, GSAM (April 1998-December 2000); and Senior Vice President andManager, Dreyfus Institutional ServiceCorporation (January 1993-April 1998).
President and Trustee — Goldman Sachs ETFTrust; Goldman Sachs Trust; Goldman SachsVariable Insurance Trust; Goldman Sachs Trust II;Goldman Sachs MLP and Energy RenaissanceFund; Goldman Sachs Credit Income Fund; andGoldman Sachs Real Estate Diversified IncomeFund
166 None
* Mr. McNamara is considered to be an “Interested Trustee” because he holds a position with Goldman Sachs and owns securities issued by The Goldman SachsGroup, Inc. The Interested Trustee holds comparable positions with certain other companies of which Goldman Sachs, GSAM or an affiliate thereof is the investmentadviser, administrator and/or distributor.
1 Each Trustee may be contacted by writing to the Trustee, c/o Goldman Sachs, 200 West Street, New York, New York, 10282, Attn: Caroline L. Kraus. Information isprovided as of August 31, 2021.
2 Each Trustee holds office for an indefinite term, until the earliest of: (a) the election of his or her successor; (b) the date the Trustee resigns or is removed by theBoard or shareholders, in accordance with the Trust’s Declaration of Trust; or (c) the termination of the Trust. The Board has adopted policies which provide thateach Independent Trustee shall retire as of December 31st of the calendar year in which he or she reaches (a) his or her 74th birthday or (b) the 15th anniversary ofthe date he or she became a Trustee, whichever is earlier, unless a waiver of such requirements shall have been adopted by a majority of the other Trustees. Thesepolicies may be changed by the Trustees without shareholder vote.
3 The Goldman Sachs Fund Complex includes certain other companies listed above for each respective Trustee. As of August 31, 2021, Goldman Sachs ETF Trustconsisted of 36 portfolios (21 of which offered shares to the public); Goldman Sachs Trust consisted of 92 portfolios (90 of which offered shares to the public);Goldman Sachs Variable Insurance Trust consisted of 17 portfolios (13 of which offered shares to the public); Goldman Sachs Trust II consisted of 18 portfolios(16 of which offered shares to the public); and Goldman Sachs MLP and Energy Renaissance Fund, Goldman Sachs Credit Income Fund and Goldman Sachs RealEstate Diversified Income Fund each consisted of one portfolio. Goldman Sachs Credit Income Fund did not offer shares to the public.
4 This column includes only directorships of companies required to report to the Securities and Exchange Commission under the Securities Exchange Act of 1934 (i.e.,“public companies”) or other investment companies registered under the Act.
Additional information about the Trustees is available in the Funds’ Statement of Additional Information, which can be obtained from Goldman Sachs free of charge bycalling this toll-free number (in the United States of America): 1-800-526-7384.
78

G O L D M A N S A C H S M A R K E T B E T A® E T F S
Trustees and Officers (Unaudited) (continued)Officers of the Trust*
Name,Address and Age1
Positions Heldwith the Trust
Term ofOffice andLength ofTime Served2 Principal Occupation(s) During Past 5 Years
James A. McNamara200 West StreetNew York, NY 10282Age: 58
Trustee andPresident
Since 2014 Advisory Director, Goldman Sachs (January 2018-Present); Managing Director, GoldmanSachs (January 2000-December 2017); Director of Institutional Fund Sales, GSAM (April1998-December 2000); and Senior Vice President and Manager, Dreyfus InstitutionalService Corporation (January 1993-April 1998).President and Trustee — Goldman Sachs ETF Trust. Goldman Sachs Trust; Goldman SachsVariable Insurance Trust; Goldman Sachs Trust II; Goldman Sachs MLP and EnergyRenaissance Fund; Goldman Sachs Credit Income Fund; and Goldman Sachs Real EstateDiversified Income Fund.
Caroline L. Kraus200 West StreetNew York, NY 10282Age: 44
Secretary Since 2014 Managing Director, Goldman Sachs (January 2016-Present); Vice President, Goldman Sachs(August 2006-December 2015); Senior Counsel, Goldman Sachs (January 2020–Present);Associate General Counsel, Goldman Sachs (2012-December 2019); Assistant GeneralCounsel, Goldman Sachs (August 2006-December 2011); and Associate, Weil, Gotshal &Manges, LLP (2002-2006).Secretary — Goldman Sachs ETF Trust; Goldman Sachs Trust (previously AssistantSecretary (2012)); Goldman Sachs Variable Insurance Trust (previously Assistant Secretary(2012)); Goldman Sachs Trust II; Goldman Sachs BDC, Inc.; Goldman Sachs Private MiddleMarket Credit LLC; Goldman Sachs Private Middle Market Credit II LLC; Goldman SachsMiddle Market Lending Corp.; Goldman Sachs MLP and Energy Renaissance Fund; GoldmanSachs Credit Income Fund; and Goldman Sachs Real Estate Diversified Income Fund.
Joseph F. DiMaria30 Hudson StreetJersey City, NJ 07302Age: 53
Treasurer, PrincipalFinancial Officer andPrincipal AccountingOfficer
Since 2017(TreasurerandPrincipalFinancialOfficer since2019)
Managing Director, Goldman Sachs (November 2015-Present) and Vice President —Mutual Fund Administration, Columbia Management Investment Advisers, LLC (May 2010-October 2015).Treasurer, Principal Financial Officer and Principal Accounting Officer — Goldman SachsETF Trust (previously Assistant Treasurer (2017));Goldman Sachs Trust (previously AssistantTreasurer (2016)); Goldman Sachs Variable Insurance Trust (previously Assistant Treasurer(2016)); Goldman Sachs Trust II (previously Assistant Treasurer (2017)); Goldman SachsMLP and Energy Renaissance Fund (previously Assistant Treasurer (2017)); Goldman SachsCredit Income Fund; and Goldman Sachs Real Estate Diversified Income Fund.
* Represents a partial list of officers of the Trust. Additional information about all the officers is available in the Funds’ Statement of Additional Information, which canbe obtained from Goldman Sachs free of charge by calling this toll-free number (in the United States): 1-800-621-2550.
1 Information is provided as of August 31, 2021.2 Officers hold office at the pleasure of the Board of Trustees or until their successors are duly elected and qualified. Each officer holds comparable positions with
certain other companies of which Goldman Sachs, GSAM or an affiliate thereof is the investment adviser, administrator and/or distributor.
Goldman Sachs MarketBeta® ETFs — Tax Information (Unaudited)
From distributions paid during the fiscal year ended August 31, 2021, the total amount of incomereceived by the MarketBeta® Emerging Markets Equity ETF and the MarketBeta® International Equity ETF,from sources within foreign countries and possessions of the United States was $0.6155 and $0.1997 pershare, respectively, all of which is attributable to qualified passive income. The percentage of net investmentincome dividends paid from foreign sources by the MarketBeta® Emerging Markets Equity ETF and theMarketBeta® International Equity ETF was 68.44% and 78.93% respectively. The total amount of taxes paidby the MarketBeta® Emerging Markets Equity ETF and the MarketBeta® International Equity ETF to foreigncountries was $0.0933 and $0.0150 per share, respectively.
For the year ended August 31, 2021, 4.85% of the dividends paid from net investment companytaxable income by the MarketBeta® U.S. Equity ETF qualify as section 199A dividends.
For the fiscal year ended August 31, 2021, 25.51%, 33.20%, and 91.73% of the dividends paid from netinvestment company taxable income by the MarketBeta® Emerging Markets Equity ETF, MarketBeta®
International Equity ETF, and the MarketBeta® U.S. Equity ETF respectively, qualify for the reduced tax rateunder the Jobs and Growth Tax Relief and Reconciliation Act of 2003.
For the fiscal year ended August 31, 2021, 96.23% of the dividends paid from net investment companytaxable income by the MarketBeta® U.S. Equity ETF qualify for the dividends received deduction available tocorporations.
During the fiscal year ended August 31, 2021, the MarketBeta® Emerging Markets Equity ETF and theMarketBeta® U.S. Equity ETF designate $260,289 and $33,806, respectively as short-term capital gaindividends pursuant to Section 871(k) of the Internal Revenue Code.
Pursuant to Section 852 of the Internal Revenue Code, the MarketBeta® U.S. Equity ETF designates$6,861, or, if different, the maximum amount allowable, as capital gain dividends paid during the fiscal yearended August 31, 2021.
79

(This page intentionally left blank)

F U N D S P R O F I L E
Goldman Sachs ETFs
THE GOLDMAN
SACHS ADVANTAGE
Our goal is to deliver:
Global Resources andGlobal Research
Team Approach
Disciplined Processes
Strong, Consistent
Investment Results
Thoughtful Solutions
Risk Management
Innovative,
Value-Added
Investment Products
Dedicated Service Teams
Excellence and Integrity
Outstanding
Client Service
Goldman Sachs is a premier financial services firm, known since 1869 for creating thoughtful and customizedinvestment solutions in complex global markets.
Today, the Asset Management Division of Goldman Sachs serves a diverse set of clients worldwide, includingprivate institutions, public entities and individuals. With approximately $2.09 trillion in assets under supervision as ofJune 30, 2021, Goldman Sachs Asset Management has portfolio management teams located around the world and ourinvestment professionals bring firsthand knowledge of local markets to every investment decision. Assets undersupervision includes assets under management and other client assets for which Goldman Sachs does not have fulldiscretion. Goldman Sachs Asset Management leverages the resources of Goldman Sachs & Co. LLC subject to legal,internal and regulatory restrictions.
G O L D M A N S A C H S E X C H A N G E - T R A D E D F U N D SGoldman Sachs ActiveBeta® Emerging Markets Equity ETF
Goldman Sachs ActiveBeta® Europe Equity ETFGoldman Sachs ActiveBeta® International Equity ETF
Goldman Sachs ActiveBeta® Japan Equity ETFGoldman Sachs ActiveBeta® U.S. Large Cap Equity ETFGoldman Sachs ActiveBeta® U.S. Small Cap Equity ETFGoldman Sachs Equal Weight U.S. Large Cap Equity ETF
Goldman Sachs Hedge Industry VIP ETFGoldman Sachs JUST U.S. Large Cap Equity ETF
Goldman Sachs Access U.S. Aggregate Bond ETFGoldman Sachs Access High Yield Corporate Bond ETF
Goldman Sachs Access Inflation Protected USD Bond ETFGoldman Sachs Access Investment Grade Corporate Bond ETF
Goldman Sachs Access Investment Grade Corporate 1-5 Year Bond ETFGoldman Sachs Access Treasury 0-1 Year ETFGoldman Sachs Access Ultra Short Bond ETF
Goldman Sachs Future Planet Equity ETFGoldman Sachs Future Tech Leaders Equity ETF
Goldman Sachs Innovate Equity ETFGoldman Sachs MarketBeta® International Equity ETF
Goldman Sachs MarketBeta® Emerging Markets Equity ETFGoldman Sachs MarketBeta® U.S. Equity ETF
INDEX DISCLAIMERS
The Goldman Sachs MarketBeta® International Equity ETF, Goldman Sachs MarketBeta® EmergingMarkets Equity ETF, Goldman Sachs MarketBeta® International Small Cap Equity ETF, and GoldmanSachs MarketBeta® U.S. Equity ETF are not sponsored, promoted, sold or supported in any other mannerby Solactive AG nor does Solactive AG offer any express or implicit guarantee or assurance either withregard to the results of using the Solactive GBS Developed Markets ex North America Large & Mid CapIndex, the Solactive GBS Emerging Markets Large & Mid Cap Index, Solactive GBS Developed Marketsex North America Small Cap Index, Solactive GBS United States Large & Mid Cap Index (“SolactiveIndexes”) and/ or Solactive Index trade mark or the Solactive Index Price at any time or in any otherrespect. The Solactive Indexes are calculated and published by Solactive AG. Solactive AG uses its bestefforts to ensure that the Solactive Indexes are calculated correctly. Irrespective of its obligations towardsthe Funds, Solactive AG has no obligation to point out errors in the Solactive Indexes to third partiesincluding but not limited to investors and/or financial intermediaries of the Funds. Neither publication of aSolactive Index by Solactive AG nor the licensing of the Solactive Index or Solactive Index trade mark forthe purpose of use in connection with a Fund constitutes a recommendation by Solactive AG to investcapital in said fund nor does it in any way represent an assurance or opinion of Solactive AG with regardto any investment in this fund. Solactive AG is registered as a benchmark administrator under theRegulation (EU) 2016/2011 (BMR). Solactive appears on the ESMA register of administrators.

TRUSTEESLawrence W. Stranghoener, ChairmanLinda A. LangMichael LathamJames A. McNamara
OFFICERSJames A. McNamara, PresidentJoseph F. DiMaria, Principal Financial Officer,Principal Accounting Officer and TreasurerCaroline L. Kraus, Secretary
THE BANK OF NEW YORK MELLONTransfer Agent
ALPS DISTRIBUTORS, INC.Distributor
GOLDMAN SACHS ASSET MANAGEMENT, L.P.Investment Adviser
Visit our Website at www.GSAMFUNDS.com/ETFs to obtain the most recent month-end returns.
Goldman Sachs Asset Management, L.P., 200 West Street, New York, New York 10282
The reports concerning the Funds included in this shareholder report may contain certain forward-looking statements about the factors that may affect theperformance of the Funds in the future. These statements are based on Fund management’s predictions and expectations concerning certain future events andtheir expected impact on the Funds, such as performance of the economy as a whole and of specific industry sectors, changes in the levels of interest rates, theimpact of developing world events, and other factors that may influence the future performance of the Funds. Management believes these forward-lookingstatements to be reasonable, although they are inherently uncertain and difficult to predict. Actual events may cause adjustments in portfolio managementstrategies from those currently expected to be employed.A description of the policies and procedures that the Funds use to determine how to vote proxies relating to portfolio securities and information regarding how aFund voted proxies relating to portfolio securities during the most recent 12-month period ended June 30 is available (i) without charge, upon request by calling1-800-621-2550; and (ii) on the Securities and Exchange Commission (“SEC”) web site at http://www.sec.gov.The Funds will file portfolio holdings information for each month in a fiscal quarter within 60 days after the end of the relevant fiscal quarter on the FormN-PORT. Portfolio holdings information for the third month of each fiscal quarter will be made available on the SEC’s web site at http://www.sec.gov. Portfolioholdings information may be obtained upon request and without charge by calling 1-800-621-2550.Fund holdings and allocations shown are as of August 31, 2021 and may not be representative of future investments. Fund holdings should not be relied on inmaking investment decisions and should not be construed as research or investment advice regarding particular securities. Current and future holdings aresubject to risk.Economic and market forecasts presented herein reflect our judgment as of the date of this presentation and are subject to change without notice. Theseforecasts do not take into account the specific investment objectives, restrictions, tax and financial situation or other needs of any specific client. Actual datawill vary and may not be reflected here. These forecasts are subject to high levels of uncertainty that may affect actual performance. Accordingly, theseforecasts should be viewed as merely representative of a broad range of possible outcomes. These forecasts are estimated, based on assumptions, and aresubject to significant revision and may change materially as economic and market conditions change. Goldman Sachs has no obligation to provide updates orchanges to these forecasts. Case studies and examples are for illustrative purposes only.ETF Fund shares are not individually redeemable and are issued and redeemed by the Fund at their net asset value (“NAV”) only in large,specified blocks of shares called creation units. Shares otherwise can be bought and sold only through exchange trading at market price (notNAV). Shares may trade at a premium or discount to their NAV in the secondary market. Brokerage commissions will reduce returns. Ordinarybrokerage commissions apply. ALPS Distributors, Inc. is the distributor of the Goldman Sachs ETF Funds. ALPS Distributors, Inc. is unaffiliatedwith Goldman Sachs Asset Management.This material is not authorized for distribution to prospective investors unless preceded or accompanied by a current Prospectus or summaryprospectus, if applicable. Investors should consider a Fund’s objective, risks, and charges and expenses, and read the summary prospectus, ifavailable, and/or the Prospectus carefully before investing or sending money. The summary prospectus, if available, and the Prospectuscontain this and other information about a Fund and may be obtained from your authorized dealer or from Goldman Sachs & Co. LLC by calling1-800-621-2550.MarketBeta® and ActiveBeta® are registered trademarks of GSAM.© 2021 Goldman Sachs. All rights reserved. 256150-OTU-10/2021 MCEQWGETFAR-21
Copyright © 2022 FDOKUMEN