Profiles in Innovation: Factory of the Future - Goldman Sachs ...
83
Manufacturing is undergoing its greatest transformation since the Industrial Revolution. A wave of intelligent technologies is shaping a more connected, flexible and efficient factory floor—and redefining the ecosystem of equipment providers in the process. In the latest in our Profiles in Innovation series, we examine the six technologies driving this transition and explore how it could yield more than US$500 bn of cost savings. Daniela Costa +44(20)7774-8354 [email protected] Goldman Sachs International Goldman Sachs does and seeks to do business with companies covered in its research reports. As a result, investors should be aware that the firm may have a conflict of interest that could affect the objectivity of this report. Investors should consider this report as only a single factor in making their investment decision. For Reg AC certification and other important disclosures, see the Disclosure Appendix, or go to www.gs.com/research/hedge.html. Analysts employed by non-US affiliates are not registered/qualified as research analysts with FINRA in the U.S. The Goldman Sachs Group, Inc. EQUITY RESEARCH | April 13, 2016 Joe Ritchie (212) 357-8914 [email protected] Goldman, Sachs & Co. Yuichiro Isayama +81(3)6437-9806 [email protected] Goldman Sachs Japan Co., Ltd. Beyond the Assembly Line Tian Lu, CFA +852-2978-0748 [email protected] Goldman Sachs (Asia) L.L.C. P ROFILES IN I NNOVATION Factory of the Future Yuki Kawanishi +81(3)6437-9804 [email protected] Goldman Sachs Japan Co., Ltd. William Turner +44(20)7051-0662 [email protected] Goldman Sachs International Ashay Gupta (212) 902-9429 [email protected] Goldman, Sachs & Co.
-
Upload
khangminh22 -
Category
Documents
-
view
0 -
download
0
Transcript of Profiles in Innovation: Factory of the Future - Goldman Sachs ...

Manufacturing isundergoing its greatesttransformation since the Industrial Revolution. A wave of intelligenttechnologies is shaping amore connected, flexibleand efficient factoryfloor—and redefining theecosystem of equipmentproviders in the process.In the latest in our Profilesin Innovation series, weexamine the sixtechnologies driving thistransition and explore howit could yield more thanUS$500 bn of cost savings.
Daniela Costa +44(20)7774-8354
[email protected] Sachs International
Goldman Sachs does and seeks to do business with companies covered in its research reports. As aresult, investors should be aware that the firm may have a conflict of interest that could affect theobjectivity of this report. Investors should consider this report as only a single factor in making theirinvestment decision. For Reg AC certification and other important disclosures, see the DisclosureAppendix, or go to www.gs.com/research/hedge.html. Analysts employed by non-US affiliates are notregistered/qualified as research analysts with FINRA in the U.S.
The Goldman Sachs Group, Inc.
EQUITY RESEARCH | April 13, 2016
Joe Ritchie (212) 357-8914
[email protected] Goldman, Sachs & Co.
Yuichiro Isayama+81(3)6437-9806
[email protected] Sachs Japan Co., Ltd.
Beyond the Assembly Line
Tian Lu, CFA +852-2978-0748 [email protected]
Goldman Sachs (Asia) L.L.C.
P R O F I L E S I N I N N O V A T I O NFactory of the Future
Yuki Kawanishi+81(3)6437-9804
[email protected] Goldman Sachs Japan Co., Ltd.
William Turner+44(20)7051-0662
[email protected] Sachs International
Ashay Gupta(212) 902-9429
[email protected] Goldman, Sachs & Co.

April 13, 2016 Profiles in Innovation
Goldman Sachs Global Investment Research 2
Table of Contents
Portfolio manager’s summary 4
What technologies lead the Factory of the Future (FoF)? 4
Opportunity for >US$500+ bn of cost savings 4
Where will these technologies be built? 5
Winners and losers in a changing competitive landscape 5
What could derail increasing adoption? 5
Factory of the Future in six charts 6
Why are we talking about the Factory of the Future? 8
Technologies: Bottom-up: >US$250 bn addressable market 14
Six innovative technologies for the Factory of the Future 15
Product Lifecycle Management software 18
Internet of Things Platform as a Service 20
Collaborative robots 23
Additive manufacturing 26
Automated Guided Vehicles 28
Radio Frequency Identification 30
Other key technologies (ordered alphabetically) 32
Industries: Top-down: >US$500 bn addressable market 34
Total addressable market could be worth more than US$500 bn 35
Winners & losers 45
New players, new business models 46
28 companies with exposure to the Factory of the Future 52
Drivers & barriers 65
Ten reasons why we are talking about the ‘Factory of the Future’ 65
What could derail it? 73
Disclosure Appendix 80
Prices in this report are as of the close of April 12, 2016.
Other contributing authors: Robert D. Boroujerdi, Mohammed Moawalla, Jacqueline Du, Samuel Eisner, Willy Chen,
Stefan Burgstaller, Wei Chen, Daiki Takayama, Heather Bellini, CFA, Simona Jankowski, CFA, Toshiya Hari, Diana Zhao,
Gautam Pillai, Matthew Cabral, Jessica Kaur, Alex Karpos, Shateel Alam.
This is the third report in the Profiles in Innovation series analysing emerging technologies that are creating
profit pools and disrupting old ones. Access all the reports in the series below, and visit our portal to learn
more and see related resources.
Virtual & Augmented Reality: Understanding the Race for the Next Computing Platform
Drones: Flying into the Mainstream

FACTORY OF THE FUTURE in numbers
UNREALISED POTENTIAL
>US$500 billion
1 vs. 3
TECHNOLOGY IN PRACTICE
20%
50%
41 vs. 2
The increase in output per employee at Scott Fetzer Electrical Group after introducing cobots and automated guided vehicles. (p.25)
The number of buildings on Harley-Davidson’s York campus before and after adopting automated guided vehicles and robots to streamline production. (p.29)
The approximate amount of time it will take to recoup an investment in a collaborative robot (or “cobot”) in 2020 vs. the amount of time for an industrial robot. (p.23)
COST-EFFECTIVE & COLLABORATIVE
MAN VS. MACHINE Current level of automation by industry (maximum of 100%)
years
The reduction in time-to-market Maserati achieved using product lifecycle management software. (p.69)
18%
18%
21%
25%
25%
32%
62%
76%
Chemicals & Plastics
Food & Bev, Tobacco
Metals
Wood & Paper Products
Textiles, Leather & Apparel
Machinery
Electronics
Automotive
The increase in venture capital investment in industrial software and robotics, respectively, over the past four years. (p.72)
188% 139%
PRIVATE INTEREST
Industries where we expect “Factory of the Future” technologies to generate the greatest cost savings (p.35)
The cost-savings opportunity from bringing manufacturing up-to-date with the latest technology. This equates to c.10% of current fixed investment. (p.35)
The average potential cost-savings per factory from introducing the latest automation technologies. (p.12)
INNOVATIVE SOLUTIONS The number of cost-saving automation technologies we think will make the largest impact on manufacturing. (p.15)
10%-15%
The estimated size of the market for these technologies by 2020, vs. the US$100+ bn automation industry today. (p.15)
6
>US$250 billion
April 13, 2016 Profiles in Innovation
Goldman Sachs Global Investment Research 4
Portfolio manager’s summary
Manufacturing is entering a decade of significant transformation comparable to the
industrial revolution. While the years of abundant EM infrastructure investment are
gone, a growing middle class continues to demand higher wages, the skilled
manufacturing talent pool is shrinking, and new global competitors have emerged.
Across most manufacturing industries, companies are faced with the challenges of
less demand and greater supply, putting strains on margins already challenged by
growing labour and transportation costs.
This report leverages on our extensive interactions with companies and experts in
the field globally (some of those profiled throughout the report). We identify the
latest developments in manufacturing technologies that can materially improve cost
structures, either through capacity utilisation or time to market. These should allow
companies to maintain or improve their profitability and returns in an increasingly
competitive environment. We also consider how these technologies might develop,
reshaping the equipment makers’ competitive and regional landscapes.
What technologies lead the Factory of the Future (FoF)? The concept of ‘Factory of the Future’ is a broad one. We narrow the scope of our
analysis to three areas: (1) manufacturing design and production simulation – this
includes technologies such as product lifecycle management software (PLM) for both
factory and product design and Internet of Things software (cloud computing, data
analytics); (2) physical manufacturing – industrial robots, collaborative robots allowing for
human interaction (cobots), additive manufacturing (3D printing); and (3) in-factory
logistics – automated guided vehicles (AGVs), radio frequency identification (RFID). We
also take a brief look at adjacent technologies that might allow optimisation of manufacturing
processes or enable these six technologies (including virtual and augmented reality, machine
vision, machine learning, nanotechnology and demand response).
Opportunity for >US$500+ bn of cost savings We estimate the total addressable market (TAM) opportunity for the ‘Factory of the Future’
capped by the potential cost savings in the key adoption verticals at US$500-650 bn
(equating to c.10% of global fixed investment). We see the largest vertical
opportunities as electronics, food & beverage and machine making (e.g. tool makers,
electrical, resource and construction equipment). The TAM will likely be split between
payments to firms making enabling equipment, and benefits passed on to customers to
remain competitive. Margin increases for first-mover adopters are possible near term, but
likely will erode as adoption spreads to the rest of the industry. We use two approaches to
estimate TAM:
(1) Bottom-up (what is the revenue potential for equipment providers?): we assess the six
key innovative technologies we think are most relevant in taking out stranded
manufacturing costs, considering current penetration and potential pace of adoption to
forecast the size of their markets. These six technologies add up to >US$250 bn by 2020E.
(2) Top-down (what is the cost savings potential for industries?): we break down fixed
investment by industry and look at its level of automation (i.e. robot penetration) and
digitisation (i.e. software penetration). We pro-rata the opportunity in each case, looking at
the gap vs. the currently most-advanced manufacturing environment (automotive in
robots; electronics in software), and at the average cost savings indicated for each industry
by manufacturers of the key technologies. We estimate the TAM is capped at US$500-650 bn.
Cross-technology synergies, other technologies not profiled, deflating prices of technology
as adoption broadens and, most importantly, benefits sharing between makers and users
explain why our top-down forecast exceeds our bottom-up forecast.
We focus on the key
emerging
manufacturing
technologies that
should allow significant
cost savings, including
much faster time to
market
We estimate the TAM of
the six technologies we
analyse at >US$250 bn
by 2020, around half
the US$500+ bn overall
potential cost savings
we see as available to
manufacturers (c.10%
of global fixed
investment)
Electronics, food &
beverage and
machinery makers are
the largest verticals for
deployment

April 13, 2016 Profiles in Innovation
Goldman Sachs Global Investment Research 5
Where will these technologies be built?
We believe these technologies will allow manufacturers to be more agnostic over where
they locate their capacity, as cost structures become more similar across regions, with the
main determinant increasingly location of demand. While EMs should be able to leapfrog
stages of manufacturing infrastructure development (given less legacy physical capacity),
adoption of the technologies detailed here will likely decrease the dependence of DMs on
labour costs (still the main roadblock to reshoring of capacity in DMs).
Winners and losers in a changing competitive landscape
We expect to see tectonic shifts in the competitive landscape of equipment providers. The
number of players is rising, as software firms start to break into the industrial field,
traditionally led by hardware players (e.g. Cisco recently acquired IoT platform provider
Jasper). This will likely lead to new business models appearing (e.g. performance-based
contracts, equipment as a service). In addition, key breakthroughs in technology are
increasingly being driven by private, small firms. As a result, we expect more M&A within
product categories, as well as regionally. We believe traditional capital goods incumbents
with solid balance sheets (e.g. GE, Siemens, ABB) will engage in material consolidation of
smaller players. Regionally, we see government support and the pressure from rising
labour costs as driving Chinese companies to look to acquire international winners (albeit
hurdles for deal completion remain high). We profile 23 listed covered companies further
on in this report, and identify a non-exhaustive list of 24 private firms throughout this
report.
What could derail increasing adoption?
Excess manufacturing capacity (fixed investment-to-GDP has been high for several years),
legacy asset bases, IP questions and a lack of standards for data transfer and compatibility
are the key roadblocks to wider adoption of these technologies, despite healthy corporate
balance sheets to fund deployment. In addition, while technology cost has been falling, in
several cases it is either still prohibitive, or the productivity gains achieved remain
insufficient to materially change the user’s cost structure.
Exhibit 1: The cost breakdown of each manufacturing industry is different and therefore so is the technology impact Average cost structure by end market (EU-27) and machinery cost savings examples
Source: Eurostat, Goldman Sachs Global Investment Research.
45% 42% 40%50% 44% 40%
53%41%
15% 19% 17%12% 19%
21%
15%22%
26% 24% 24% 22% 22% 26%21%
22%
11% 11% 12% 11% 10% 11% 9% 12%
0%
10%
20%
30%
40%
50%
60%
70%
80%
90%
100%
Foo
d, t
obac
co&
bev
era
ges
Tex
tile
s
Wo
od &
pa
per
Ch
emic
als
Met
als
Ele
ctro
nics
Aut
omot
ive
Mac
hin
ery
Raw materials Labour Energy Services Construction D&A EBIT margin
RFIDs reduce labour costs >15% which can equate to >3pp margin impact for an average machinery manufacturer (e.g. Stanley Black & Decker case study)
Cobots allow >20% reduction in labour costs which can equate to > 4pp of margin impact for an average machinery manufacturer (e.g. Scott Fetzer Electrical Group case study)
PLM software that allows >10% reduction in raw material costs could equate to >4pp margin impact.
Cost structures likely to
converge regionally
over time
See our profiles of 28
equipment makers
best-positioned to
benefit from
investment in the FoF
(page 52)
Standards, IP and
legacy assets are key
barriers to adoption

April 13, 2016 Profiles in Innovation
Goldman Sachs Global Investment Research 6
Factory of the Future in six charts
Exhibit 2: Labour costs continue to increase the pressure
to automate 5-year CAGR of annual manufacturing wages; local currency
Exhibit 3: Customers are demanding unprecedented
levels of customisation and flexibility Combinations available when buying a Ford F150 pick-up
Source: International Labor Organization, Haver, Trading Economics, Eurostat.
Source: Siemens.
Exhibit 4: New, more affordable and flexible technologies
are emerging as solutions Labour costs and cobot installation costs, China
Exhibit 5: Automation adoption rates vary dramatically
across industries Robot density per 1,000 employees
Source: Goldman Sachs Global Investment Research.
Source: Goldman Sachs Global Investment Research.
Exhibit 6: Six technologies are most relevant Summary of current level of automation, technology
penetration and relevance
Exhibit 7: Top-down analysis suggests a >US$500 bn
opportunity for those that become best in class % fixed cost reduction vs. savings (mid-point)
Source: Goldman Sachs Global Investment Research.
Source: Goldman Sachs Global Investment Research.
-1.0%
1.0%
3.0%
5.0%
7.0%
9.0%
11.0%
13.0%
15.0%
Jap
an US
Sw
ede
n
Ca
nada
Italy
So
uth
Ko
rea
Fra
nce
Tai
wan
Au
stra
lia
Ger
man
y
Be
lgiu
m
Mex
ico* UK
Nor
wa
y
Sin
gapo
re
Est
onia
*
Ind
ia *
Ru
ssia
Chi
na
5yr
CA
GR
man
ufac
turin
g an
nual
wag
es
● Developed market
● Emerging market
* Indicates where manufacturing wages were not available and average total wages were used instead.
Equipment options VariantsTheoretical
combinationsTrim 6 6Passenger compartment 3 18Power train 2 36Cargo space 4 144Engine 3 432Transmission 3 1,296Rear axle ratio 7 9,072Wheels 9 81,648Tires 8 653,184Seats 18 11,757,312Power seats 2 23,514,624Radio 5 117,573,120Running boards 4 470,292,480Rear windows 3 1,410,877,440Colors 12 16,930,529,280Interior trim colors 3 50,791,587,84016 individual options 12,870 653,687,735,500,800
0
5
10
15
20
25
30
35
40
2015
E
2016
E
2017
E
2018
E
2019
E
2020
E
2021
E
2022
E
2023
E
2024
E
2025
E
2026
E
2027
E
2028
E
2029
E
2030
E
2031
E
2032
E
2033
E
2034
E
2035
E
Annual temporary worker cost per person ('000s USD)
Co-bots annual cost per unit ('000s USD)
15 -25
< 1
< 5
< 8
5 - 15
5 - 15
15 - 35
20 - 40
80 - 120
0 20 40 60 80 100 120
Total manufacturing
Textiles, leather, wearingapparel
Wood & paper products
Food products beverages;Tobacco products
Machinery
Metals
Plastic and chemicalproducts (inc. pharma)
Electrical/electronics
Automotive
Robots per 1,000 employees
IndustriesCurrent level of
automationCurrent technology penetration Relevance
Manufacturing sub-sectors
Automation index
IoT PaaS software
PLM software
Cobots3D
printingAGVs RFIDs
Relevant technologies
Automotive 76% ◕ ◕ ◔ ◑ ◔ ◑ All
Chemicals 18% ◔ ◕ ○ ○ ○ ○ IoT PaaS & PLM
Electronics 62% ◑ ◑ ◔ ◔ ◔ ◔ All
Machinery 32% ◔ ◑ ◔ ◑ ◔ ◑ All
Food & Beverages 18% ◔ ◔ ○ ○ ◔ ◑ All (ex. 3D printing)
Metals 21% ◔ ○ ◔ ○ ◔ ○ IoT PaaS, PLM & AGVs
Wood & paper products 25% ◕ ○ ○ ○ ◔ ○ IoT PaaS, PLM & AGVs
Textiles & apparel 25% ○ ◔ ○ ◔ ◔ ◔ All (ex. 3D printing)
0%
5%
10%
15%
20%
25%
30%
0 20 40 60 80 100 120 140
% F
ixed
cos
t red
uctio
n
Savings ($)
AutomotiveChemicals
Electronics
Machinery
Food & beverage
MetalsWood & paper products
Textiles

Profiles in Innovation
April 13, 2016
7
Goldm
an Sachs G
lobal Investment R
esearch
Exhibit 9: From design to servicing, the entire manufacturing ecosystem is becoming more connected and more intelligent Factory of the Future ecosystem
Source: Goldman Sachs Global Investment Research.

April 13, 2016 Profiles in Innovation
Goldman Sachs Global Investment Research 8
Why are we talking about the Factory of the Future?
The current state of manufacturing
Today, manufacturing accounts for 16% of global GDP. It is an important driver of an
economy’s productivity growth, quite often the largest component of an economy’s foreign
trade, and accounts for the largest share of private R&D spending in most major
economies. Over the past two decades, companies have often relocated to EMs to take
advantage of better growth and labour/environmental cost arbitrage. However, in the past
three years, growth has faded, putting pressure on returns. This is driving companies to
rectify key cost lines. Many factories are operating in a “disconnected” environment where
the root causes of inefficiencies are rarely fully understood – automation and connectivity
offer a solution to this.
Current manufacturing mostly lacks cost efficiency in three dimensions that drive
sub-optimal capacity use:
Machine-to-machine communication;
Two-way data transfer (from factory to enterprise resource planning system
(ERP), but also from ERP to factory); and
Inter-factory integration.
While automation is already a US$100+ bn global industry, and robots are no longer
science fiction, the penetration of semi-intelligent or intelligent production systems is still
limited to a couple of industrial areas (autos and electronics). Automation is easier to
achieve when a small number of products are made in large quantities. Major automakers
and some other companies have already created production systems that are able to
respond readily to these challenges, in terms of volume and product mix (e.g. Toyota has
perfected Kanban manufacturing over many years and continues to refine it to this day; see
Appendix 2). However, smaller companies and industries with end products that are not as
large have yet to put such systems in place, and ample room exists for capacity and cost
optimisation through broader technology adoption.
The emergence of new technologies heralds an era of significant change in
manufacturing. This is illustrated by the increased investment by venture capitalists
(page 72) as well as large corporates. The opportunity allows some equipment
providers to still benefit despite the trend of declining customer budgets (capex-to-
sales), a characteristic of mature industries.
Ten reasons why we’re talking about the Factory of the Future
Until the beginning of the last decade, factory automation was mostly triggered by the
need for traditional manufacturers to cut costs while increasing productivity, in order to
remain competitive with aggressive, lower-cost manufacturers entering their industries (e.g.
US automakers such as GM in the 1980s fighting for survival in the face of intense
Japanese competition).
Slowing growth recently, post 15 years of super-cycle, has seen a refocusing on
manufacturing margins and returns. Since the financial crisis, returns have stagnated, as
operating leverage has faded and fixed costs have continued to rise (mainly labour costs).
We highlight ten reasons why we believe manufacturing will see a significant focus on
implementing newer technologies over the coming years:

April 13, 2016 Profiles in Innovation
Goldman Sachs Global Investment Research 9
1. DMs need to reduce costs to remain competitive vs. EMs. The average DM
manufacturing hourly labour cost is still more than four times higher than the average
manufacturing wage in China.
2. But, rising EM wages are lowering the ‘low-cost location’ edge. For example, in
China, wages are growing at mid-teens percentages vs. less than 3% growth in most
developed markets.
3. Specialised manufacturing labour is increasingly scarce. The scarcity of specialised
labour is exacerbated in the largest manufacturing nations by ageing populations (e.g.
retiring baby boomers) and in EMs by younger generations that no longer aspire to
work in the factories.
4. Productivity is increasingly a way to differentiate when legacy capacity is
abundant. The last 15 years have seen an unprecedented level of capex globally. This
drove a new set of competitors to emerge, and in turn led to unproductive capacity in
many global industries, making time and cost to produce more significant
differentiators between manufacturers than availability of capacity.
5. There is an increased push to shorten time to market, particularly by eliminating
stranded inventories. Today’s market environment means information comes faster
and is more accessible than ever, with customers now expecting products sooner. This
is a key source of being able to generate a better return on capital for a manufacturer.
6. Customers demand unprecedented customisation. Personalisation today is used as
a competitive tool to capture sales and is something customers look for to distinguish
their purchases. In addition, the growth of consumers from emerging markets, which
are made up of a diverse range of cultural and ethnic groups, increases the complexity
of manufacturing in consumer segments when attempting to appeal to these new,
large markets.
7. Focus on safety and security has increased dramatically. A more automated,
controlled and less labour-intensive environment should reduce the likelihood of
accidents and costly litigation. In addition, factories need to be safe from cyber-attacks,
owing to the increasingly important role data has in the manufacturing process.
8. Several governments are actively pushing to stay ahead in manufacturing. In a
globalised world, with lower trade barriers, scarcer demand and greater supply,
countries have to fight hard to maintain competitiveness and to position themselves as
locations of choice for manufacturing. We have seen numerous initiatives over recent
years that stress this (e.g. China Manufacturing 2025, Germany’s Industrie 4.0).
9. Short-term demands from shareholders for dividends and buybacks put further
strain on cash available for organic investments. Short-term macro uncertainty and
a lack of visibility over growth has led to increasing demand from investors for cash
returns from corporates (dividends and buybacks). While this might not be a
sustainable form of long-term capital allocation, it has weighed on the short-term
considerations of corporates and puts further pressure on optimising FCF generation
through more productive capex.
10. Finally, key technologies now exist for fully optimised and connected
manufacturing. There have been rapid improvements in the capabilities of a number
of technologies which can drive substantial change in factories across the world (e.g.
sensors, computing power and robots).
See the section on Drivers and Barriers (page 65) for more detail.

The EcosystemFactory of the Future - Key Players
Collaborative Robots (Cobots) ABB GroupAutomata TechnologiesFanucFoxconnHarmonic Drive SystemsKawada IndustriesKawasakiKUKALifeRoboticsRethink RoboticsSiasunTeradyne [Universal Robots]Yaskawa
Internet of Things Platform as a ServiceAdvantechAmazonAtosBoschCisco [Jasper]CumulocityDevice InsightGEIBMIngenuMicrosoft [Azure]MJ Intelligent SystemOraclePTCRockwell AutomationSalesforceSAPSchneider ElectricSiemens
Radio FrequencyIdentification (RFID)Alien TechnologyCognexCipherLabDHLFedExHG TechHoneywellImpinjKeyenceSmartracZebra Technologies
Additive Manufacturing (3D Printing)3D SystemsEOSHan’s LaserHewlett-PackardHG TechRenishawStratasysTrumpf
Automated Guided VehiclesAmazon (Kiva Systems)BoschClearpath RoboticsDaifukuDematicJBT CorporationJungheinrichKION GroupKUKANidecSavant AutomationSeegridSiasunToyota
Product LifecycleManagement(PLM) SoftwareAnsysArena SolutionsAutodeskAvevaDassault SystèmesHexagon ABPTC
MANUFACTURING DESIGN AND PRODUCTION SIMULATION
PHYSICAL MANUFACTURING IN-FACTORY LOGISTICS
A sample of companies with exposure to enabling technologies

The EcosystemFactory of the Future - Sizing the Market
Total Addressable Market for Enabling Technologies (2020E)
US$230-285 bn MANUFACTURING DESIGN AND PRODUCTION SIMULATION US$30-35 bn Product Lifecycle Management Software Development stage: Commercialised Used to simulate the lifecycle of a product from inception to servicing to end of useful life
US$200-250 bn Internet of Things Platform as a Service Development stage: Early commercialisation Used for machine-to-machine communication and remote control of factories
US$28-34 bn PHYSICAL MANUFACTURING US$25-30 bn Additive Manufacturing (3D Printing) Development stage: Early commercialisation Used to create 3D objects from a digital model
US$3-4 bn Collaborative Robots (Cobots) Development stage: Early commercialisation Used to perform unstructured, often repetitive tasks alongside humans
US$4 bn IN-FACTORY LOGISTICS US$2 bn Automated Guided Vehicles Development stage: Early development Used to move materials throughout production and storage
US$2 bn Radio Frequency Identification Development stage: Mature with new applications Used to identify and track objects via radio signals
Manufacturing vertical
Electronics
Machinery
Food & Bev, Tobacco
Automotive
Chemicals & Plastics
Metals
Wood & Paper Products
Textiles, Leather & Apparel
Max cost-savings potential (USD)
$120 bn
$110 bn
$100 bn
$70 bn
$70 bn
$70 bn
$50 bn
c.$10 bn
(as a % offixed
investment)
13%
23%
27%
8%
7%
21%
25%
27%
IoT Cobot PLM
Software 3D
Printing AGV RFID
Technologies with greatest potential
Cost-Savings Potential by Industry

April 13, 2016
Profiles in Innovation
Goldm
an Sachs G
lobal Investment R
esearch
12
Exhibit 10: Our top-down analysis suggests a US$500-650 bn opportunity to bring manufacturing to best-in-class Industry-by-industry potential addressable market
Source: Goldman Sachs Global Investment Research.
Industries Current size of industry1 Current degree of automation 2 Potential savings 6Maximum
opportunity size
Manufacturing sub-sectors
% of global manuf. fixed asset investment
Amount ($bn)Robot intensity
per 1,000
employees 3
Robot penetration
index
Software % of fixed asset
investment4
Software penetration
index 5
Automation index
Savings from FoF technologies
($bn)
Automotive 19% 895 97 90% 9% 63% 76% 6 - 8% 50 - 70
Chemicals and plastics
21% 990 19 19% 3% 17% 18% 5 - 7% 50 - 70
Electronics 20% 965 33 34% 17% 90% 62% 9 - 13% 90 - 120
Machinery 10% 485 8 9% 9% 54% 32% 17 - 23% 90 - 110
Food products, beverages & tobacco
8% 365 5 6% 5% 30% 18% 20 - 27% 70 -100
Metals 8% 360 10 11% 5% 30% 21% 16 - 21% 60 - 70
Wood and paper products
4% 200 2 2% 8% 47% 25% 18 - 25% 40 - 50
Textiles, leather & wearing apparel
1% 50 0 0% 8% 49% 25% 20 - 27% c.10
Others / Not classified 9% 440 13 14% 7% 42% 28% 8 - 10% 40 - 50
Total Manufacturing 100% 4750 21 21% 8% 47% 34% 10 - 15% 500 - 650
Industries Pressure to automate Current technology penetration 7 Relevance factor
Manufacturing sub-sectors
Net margins
(2010-14) 6Net margins (2015-18E)
∆ net margins30yr average
age 7Current age
(2015)% difference
(100 = very likely)
IoT PaaS software
PLM software
Cobots 3D printing AGVs RFIDsIoT PaaS software
PLM software
Cobots 3D printing AGVs RFIDs
Automotive 4.9% 5.4% 0.5% 6.1 6.5 6.3% 85 ◕ ◕ ◔ ◑ ◔ ◑ 1.00 1.00 1.00 1.00 1.00 1.00
Chemicals and plastics
7.0% 7.5% 0.5% 8.0 7.9 -1.4% 72 ◔ ◕ ○ ○ ○ ○ 0.25 1.00 0.00 0.00 0.00 0.00
Electronics 10.2% 10.0% -0.3% 7.5 9.5 27.2% 80 ◑ ◑ ◔ ◔ ◔ ◔ 1.00 1.00 1.00 1.00 1.00 1.00
Machinery 7.9% 6.3% -1.6% 9.3 10.5 13.1% 86 ◔ ◑ ◔ ◑ ◔ ◑ 1.00 1.00 1.00 1.00 1.00 1.00
Food products, beverages & tobacco
9.3% 9.9% 0.6% 8.5 8.6 1.4% 68 ◔ ◔ ○ ○ ◔ ◑ 1.00 1.00 0.75 0.50 1.00 1.00
Metals 2.0% 2.7% 0.7% 11.8 11.4 -3.7% 72 ◔ ◔ ○ ○ ◔ ○ 0.75 1.00 0.00 0.50 0.75 0.50
Wood and paper products
4.8% 7.0% 2.2% 8.0 9.2 13.9% 74 ◕ ○ ○ ○ ◔ ○ 1.00 0.75 0.50 0.25 1.00 0.75
Textiles, leather & wearing apparel
n.a. n.a. n.a. 9.2 12.2 33.0% n.a. ○ ◔ ○ ◔ ◔ ◔ 1.00 0.75 1.00 0.50 1.00 1.00
Notes: 1 GFCF data from the World Bank, broken up using data from the OECD and China Statistical Yearbook 5 Automotive software penetration adjusted up according to analyst discretion 2 Robot penetration indexed against automotive; software penetration indexed against electronics 6 Net margins of global GS coverage in each industry, note not entire industry and some companies in the sample have exposures to other industries3 Weighted average of density in Germany, Japan, France, Italy and UK 7 Average age data is for the US only4 Software as a % of investments in private non-residential fixed assets in the US; automotive includes other transport equipment 8 Qualitative assessment of penetration at analyst's descretion (actual penetration may be less or greater)

April 13, 2016
Profiles in Innovation
Goldm
an Sachs G
lobal Investment R
esearch
13
Exhibit 11: Manufacturing has always been evolving
Source: Goldman Sachs Global Investment Research.
CobotsIoT software Autonomous
in-factory logisticsPLM software Additive
Manufacturing (industrial scale)
Nanotechnology
Factory Wide Control Systems Artificial (extension to process industries) intelligence
Functional Automation andManual Mechanization of Mass Computarization (in discreteWork Production Areas industries)
Timeline Before Industrial Industrial Revolution 70s-90s 90s-2000s Next 5 years 5 - 10 years from now >10 years
Revolution until the 70s from now from now
Winners Workers Large scale manufacturers Traditional Capital Goods Traditional automation Software providers 3D printer manufacturers Suppliers of complex chemical
manufacturers manufacturers (industrial & traditional) and composite materialsIndustrial software providers
Hardware makers (e.g., IT Industrial software providers Sensors & enabling technologies Software / AI providerssuppliers) (e.g., ABB, Siemens, Invensys, Niche manufacturers
Rockwell Automation) Robotics providers (e.g., ABB, Semiconductor manufacturersKuka, Fanuc)
Losers - Unskilled workers Unskilled workers Unskilled workers Low-value hardware Low-cost country manufacturers ... Ultimately companies with
providers (weak aftermarket) lack of ability to adapt due to Small size manufacturing Small size manufacturing Small size manufacturing Manufacturers of cutting either weak competitive shops unable to adapt shops unable to adapt shops unable to adapt Unskilled workers tools and machines, hand tools positioning or low cash
(e.g., Sandvik) returns
Manufacturers of spare parts and supplies
Discrete automation manufacturers?
Capital goods companies mainly Can capital goods companies benefited from changes still benefit from here? Which ones will be able to use these
technologies to lower their cost bases and time-to-market?
...

April 13, 2016 Profiles in Innovation
Goldman Sachs Global Investment Research 14
Technologies:
Bottom-up: >US$250 bn addressable market
Technological advancement is enabling greater flexibility, productivity and
connectivity within and among factories
We see six technologies as most disruptive, falling into three groups:
Manufacturing design and production simulation
1. Product lifecycle management software (PLM)
2. Internet of Things: Platform as a Service (IoT PaaS)
Physical manufacturing
3. Collaborative robots (cobots)
4. Additive manufacturing (3D printing)
In-factory logistics
5. Automated guided vehicles (AGVs)
6. Radio frequency identification (RFID)

April 13, 2016 Profiles in Innovation
Goldman Sachs Global Investment Research 15
“Industrie 4.0 will impact the whole product lifecycle end to end – from design to production, the actual usage phase until end-of-life – and cannot be attributed to one single department of the firm. The digital transformation is a cross-functional effort that needs to be addressed by the whole company.” Dr. Reinhold Achatz, Head of Corporate
Function Technology, Innovation &
Sustainability at ThyssenKrupp
Corporation
Six innovative technologies for the Factory of the Future
The factory is evolving and is entering an era of new technological innovation. We see
six technologies as key to this evolution: PLM software, Internet of Things (IoT) platform as
a service, collaborative robots, additive manufacturing, automated guided vehicles (AGVs)
and RFID. In the factory of the future, manufacturing should become increasingly flexible
with seamless integration of a range of physical and digital systems, and devices
communicating with each other to optimise production. We believe these technologies will
allow the shift from mass-production to mass-customisation that is required in the next era
of manufacturing.
We expect the entire production process to become more intelligent, from design to services:
1. Intelligent design: From inception, factories and products will be designed more
intelligently using the latest modelling and simulation software, optimised to reduce
downtime and with the construction process less likely to be subject to delays and
complications. This is particularly crucial since we estimate that choices made during
the design phase can affect up to 70% of the costs of a new product.
2. Intelligent administration: A remotely managed factory, allowing supervision of
factories located in low-cost areas, while working from the corporate HQ. Supply chain
management, allowing manufacturers to
monitor and manage inventory in real-time,
across different factories/geographies,
reducing transportation and inventory costs.
3. Intelligent production: Smart factories
improving operational performance
through greater productivity and reduced
costs. This is continuously being optimised
using automation equipment and the data
it collects. Cloud factories might emerge,
enabling manufacturers, particularly new
entrants, to focus on design and sales,
rather than heavy factory investment.
Smaller-scale production closer to
customers is also a possibility.
4. Intelligent product: Big data of users’ experiences helps make product design
adjustment/upgrades easier, as well as increasing customisation of products. Data
emitted also helps generate after-sales.
5. Intelligent sales: Increased customer-to-manufacturer direct sales. Optimised sales/
advertising channels based on buyers’ prior purchases.
6. Intelligent after-sales: Predictive maintenance, resulting in more stable cash flow
generation and avoiding unnecessary downtime for the customer, as well as
unnecessary, costly after-sales personnel (see Kaeser Kompressoren vignette page 49).
The technologies we focus on in this report address each of these steps above. When
taking a deep-dive into the practical equipment/software that allows these benefits to be
realised, we cluster these technologies into the three areas discussed previously:
manufacturing design and production simulation (1, 2, 4 and 6 above); physical
manufacturing (2 and 3 above); and in-factory logistics, a part (although not all) of that
encompassed in 2, 3 and 5.

April 13, 2016 Profiles in Innovation
Goldman Sachs Global Investment Research 16
A bottom-up approach to forecasting TAM for six core technologies
We make a detailed assessment of the six technologies that we believe will be most
disruptive to current manufacturing, grouped into three key areas: (1) manufacturing
design and production simulation; (2) physical manufacturing; and (3) in-factory logistics.
We forecast the TAM for each technology independently. For some, we rely on third-party
research. For others, we estimate and take into account the following factors:
The current status of the installed base where these technologies will be applicable
(e.g. cobots replacing labour that is in short supply);
The level of existing penetration of the disruptive technology (e.g. PLM software
penetration is currently around 20%-30% according to Siemens, and currently only
1%-2% of in-factory vehicles are automated);
We estimate the evolution of the penetration rates of these technologies over the next
five years (e.g. we estimate AGV penetration to rise to over 15% in manufacturing). While
many technologies in unconstrained conditions should follow the path of Moore’s Law,
in reality, technology adoption will likely be driven by the following elements:
o The average age of equipment in each industry, as an indicator of the level of
cumbersome legacy equipment (potentially incompatible with new technologies)
that remains as a barrier to adoption;
o The regional pressures to automate/digitise, such as labour cost growth,
constraints on skilled labour, government incentives, etc.; and
o The development of key technology enablers’ cost curves and value-add potential,
in order to command a greater proportion of customer spend.
Clearly, technologies are adopted at unpredictable rates, and entirely unexpected
applications can arise to dominate their uses. Furthermore, while we look at each
technology in isolation here, many of these emerging technologies will be used in
conjunction with each other, potentially multiplying their impact.
Exhibit 12: Age of legacy equipment should be a key
determinant of adoption of new technologies Average age of manufacturing assets in the US; 1947-2014
Exhibit 13: Market readiness and maturity of key
technologies Key technologies market readiness vs. technology maturity
Source: Company data, Goldman Sachs Global Investment Research.
Source: Goldman Sachs Global Investment Research.
6
6.5
7
7.5
8
8.5
9
9.5
10
1947
1950
1953
1956
1959
1962
1965
1968
1971
1974
1977
1980
1983
1986
1989
1992
1995
1998
2001
2004
2007
2010
2013
Age o
f equip
ment i
n t
he U
S
Manufacturing Manufacturing median
0%
10%
20%
30%
40%
50%
60%
70%
80%
90%
100%
0% 20% 40% 60% 80% 100%
Mar
ket
rea
din
ess
Technology maturity
Industrial robots
AGVs
Collaborative robots
Sensors
RFIDs
Additive manufacturing
IoT PaaS
Cloud computing
Data analytics
Digitalsimulation
Hig
hL
ow
Low High
DeploymentNiche
BarriersPilot

April 13, 2016 Profiles in Innovation
Goldman Sachs Global Investment Research 17
FoF technologies as enablers of the Internet of Things
The Internet of Things (IoT) concept is starting to revolutionise the manufacturing
landscape. Equipment is becoming more digital and connected, forming networks of
machines and new ecosystems. While we are still in the nascent stages of adoption, we
believe that the timing of the transformation will resemble that seen in the consumer
sector (e.g. penetration of mobile phones rose from 5% to 100% in 20 years), but that the
economic implications will be much bigger (we have seen estimates of 2.5-5.0x the size of
the consumer internet). See our report The next industrial revolution: Moving from B-R-I-C-
K-S to B-I-T-S, July 16, 2014 for more. The technologies highlighted in this report both help
enable the IoT and are critical to harnessing its full potential.
Less is more at Daimler
We interviewed Markus Schaefer, Member of the Divisional Board of Mercedes-Benz Cars, Production & Supply Chain
Management, discussing what the company is doing to stay ahead of the competition in automotive manufacturing.
The challenge: Daimler realised at an early stage that rapid growth of car production, a greater number of products (ten
years ago, it had 15 models; now it has 40), increased customisation and complexity of those products, and a rapidly
changing business environment require a very flexible and efficient production network.
The solution: To increase its flexibility and ability to handle complexity, Daimler is investing in its global production
network to standardise the plants and adopt the latest production technologies. The company is moving away from
fixed conveyance production lines into smaller individual production cells. This more fragmented system will reduce the
number of robots by increasing the utilisation of each, and also prevent the possibility of an entire production line
having to be halted in order to reprogramme an industrial robot. The use of IoT networks and AGVs will allow for just-
in-time transport between cells, quicker than a sequential production line. The process is also made more flexible
through the use of technologies such as collaborative robots that can work alongside human operators; Daimler
believes such technology will play an important role in the future of manufacturing. At the moment, it is working
alongside robot supplier Kuka in particular, and currently employs 20 cobots in production. The company notes,
however, that this technology first needs to overcome a number challenges, for example, to become more affordable
and lighter, and that it requires regulatory and other approvals.
Some things don’t change: When asked how Daimler chooses a factory location, Mr. Schaefer reiterated that the most
important factors are closeness to end markets, logistics cost, low labour costs and tariff incentives (beyond location of
demand). Its arsenal of technologies will be deployed when appropriate, regardless of location.
Exhibit 14: The use of individual production cells and
AGVs makes assembly more flexible
Exhibit 15: A Kuka cobot working inside a Daimler car
while humans work from the outside
Source: Daimler.
Source: Daimler.

April 13, 2016 Profiles in Innovation
Goldman Sachs Global Investment Research 18
The increasingly complex nature of products and the manufacturing process of these,
suggest that the future manufacturing process itself will be designed and perfected in a
virtual design and simulation. Manufacturers can use advanced computational methods to
create a 3D simulation of the entire manufacturing process, avoiding costly errors,
optimising the efficiency of the factory, and dramatically increasing time-to-market.
Sensors and detection hardware help to “synchronise” simulation and reality at every
point in the production process. Using similar technology, manufacturers can create a
simulation of the entire life-cycle of a product, from inception, through design and
development, to servicing and disposal. Better designs are a pre-condition for applying
new manufacturing technologies, realising full productivity potential and dealing with the
indirect costs associated with increased technological complexity. Payback times typically
range between one and five years, depending on the current status of the process
implemented, the addressed problems and the maturity of the business.
We highlight two key players: Siemens and Dassault Systemes, but there are also
other major players such as Ansys, PTC, Autodesk, Aveva and Hexagon. These key players
tend to have specialties, with only Dassault Systemes and Siemens having close to a
complete end-to-end offering
Engineering software needs to be developed differently for each industry, and requires a
learning ramp-up to use the software and to adjust engineering techniques. Another
challenge is the constraint imposed by computational capabilities; the greater the
computational power, the more simulations are possible and the more effective the software.
This technology disrupts conventional 2-dimensional design and architecture. It
dramatically reduces production errors and increases time-to-market. Therefore, engineers
have to adapt and incorporate it or risk being left behind.
PLM software has historically been high-usage in complex manufacturing industries and is
now penetrating all industries. For example, Dassault Systemes focuses on four core
industries: aerospace & defence, transportation & mobility, marine & offshore, and
industrial equipment. However, it also now highlights new industries: consumer retail &
packaged goods, energy, process & utilities, high tech, financial services, natural resources,
construction and even life sciences.
PLM software has a potential TAM of US$30-35 bn by 2020E. We arrive at this range
using estimates from Siemens and Dassault Systemes, the two market leaders in PLM
software. Siemens estimates that the market has a medium-term growth rate of 8% pa and
a market size of US$23 bn in 2015.
Competitive landscape
Applications and industries exposed
The challenges
Sizing the revenue opportunity
The markets disrupted
• Advanced computational methods to create a 3D simulation of entire
product life cycles
• Commercialised
• Savings example: MWV reduced time-to-market from 18 to 6 months
using Dassault Systemes’ PLM software
Product Lifecycle Management software US$30-35 bn (2020E base case)
MANUFACTURING DESIGN & PRODUCTION SIMULATION

April 13, 2016 Profiles in Innovation
Goldman Sachs Global Investment Research 19
Siemens’ PLM software achieves a three-fold increase in process planning capacity
The challenge: Perkins, a manufacturer of diesel engines and power solutions, wanted to eliminate late-stage changes
to expensive tooling and production processes. It also wanted to reduce the risk of escalating costs and disruption to
production schedules.
The solution: The company introduced Siemens’ PLM software: Teamcenter and Tecnomatix for successful new engine
launches; this achieved a three-fold increase in process planning capacity compared with its previous approach. It was
able to significantly reduce its time-to-market and continually increase its unique customer sales configurations (the
1200 series had 100 configurations in comparison to less than 40 previously). Other benefits included tighter
collaboration among colleagues, vendors and customers throughout the product lifecycle.
Exhibit 16: Siemens PLM software designs products…
Exhibit 17: ...plants, processes and more
Source: Siemens.
Source: Siemens.

April 13, 2016 Profiles in Innovation
Goldman Sachs Global Investment Research 20
Internet of Things platform as a service (PaaS) encompasses software applications,
cloud-based storage, big data analytics and an industrial internet operating system that
serves as the platform. In our view, this will be a differentiated growth avenue for select
industrial/technology companies that gain first-mover advantage. Already, a significant
number of companies are spending more than 20% of their tech budgets on big data, and
we believe this is about to accelerate. In our view, the next step is an integrated platform
with horizontal applications (e.g. asset monitoring, predictive maintenance, dynamic
manufacturing), like GE’s Predix, that allow for exponential data capture/analysis and real-
time decision making.
While Cisco is at the forefront of broader IoT trends, we see GE dominating within
industrials; others, including Rockwell Automation, Schneider Electric and Siemens, are
also participating prominently. Importantly, traditional software/hardware suppliers,
including Amazon (Amazon Web Services), Atos, Axeda, SAP, IBM, Microsoft, Oracle and
Salesforce, will be key partners/competitors in this space.
Cyber security, legacy infrastructure and protocol standardisation: (1) as IoT software
becomes more sophisticated, and more operations fall under the supervision of a holistic
system, privacy, data security and network reliability become increasingly important
concerns; (2) legacy infrastructure has been a bottleneck, but the exponential increase in
connected devices has been an enabler; (3) there is a lack of defined standards for machine
connectivity, which a platform like GE’s Predix aims to resolve.
Asset monitoring and safety/reliability checks have been around for over two decades, but
these were largely limited to either regular servicing visits by engineers (which help
preempt downtime) or circuit breaker type checks built in to shut down a system in the
event of a safety hazard. With IoT PaaS, companies can now: (1) predict when a
malfunction is imminent; (2) perform real-time assessments to help improve performance;
and (3) remotely adjust operations. In our view, this application is relevant to all industries.
IoT PaaS has the potential to be worth US$200-250 bn by 2020, we believe. Both GE
and Cisco believe the market for cloud computing and IoT-based software/analytics will
exceed US$220 bn by 2020.
Exhibit 18: Software penetration in fixed investment has
been increasing for a while in the US… Traditional capital goods equipment vs. software as a
percentage of total investment in fixed assets; US
Exhibit 19: …and in other countries Software as a percentage of gross fixed capital formation
Source: US Bureau of Economic Analysis, Goldman Sachs Global Investment Research.
Source: OECD, Goldman Sachs Global Investment Research.
0%
5%
10%
15%
20%
25%
196
21
964
196
61
968
197
01
972
197
41
976
197
81
980
198
21
984
198
61
988
199
01
992
199
41
996
199
82
000
200
22
004
200
62
008
201
02
012
201
4
% o
f tot
al in
vest
me
nt in
fixe
d a
sset
s
Traditional Capital Goods Software
8.0%
8.5%
9.0%
9.5%
10.0%
10.5%
11.0%
11.5%
12.0%
2004 2005 2006 2007 2008 2009 2010 2011 2012 2013 2014
Sof
twar
e a
s %
of
Gro
ss F
ixe
d C
apita
l F
orm
atio
n
France UK USA Japan
Applications and industries exposed
The challenges
Sizing the revenue opportunity
Competitive landscape
• Smarter manufacturing, increased productivity, reduced
downtime/costs
• Early commercialisation
• Savings example: GoPro cut its freight costs by 75% & inventory costs
by 9% by introducing SAP’s platform to manage the supply chain
Internet of Things Platform as a Service US$200-250 bn (2020E base case)
MANUFACTURING DESIGN & PRODUCT SIMULATION

April 13, 2016 Profiles in Innovation
Goldman Sachs Global Investment Research 21
Exhibit 20: Improving efficiency is one of the key benefits
of the industrial internet… Survey of 250 industry executives
Exhibit 21: …and big data has an impact across the entire
manufacturing value chain Use of big data in the manufacturing value chain matrix
Source: World Economic Forum (2015).
Source: McKinsey Global Institute.
Predix – GE’s leading Internet of Things platform as a service
What is Predix? GE’s Predix, a cloud-based, open-sourced platform, is designed specifically for the industrial user.
Think of it as the industrials version of Windows/Android with horizontal applications (e.g. asset performance, brilliant
manufacturing, etc.) that can be customised by industry. Predix is meant to be the world’s first and only cloud-based
software platform built by and for the industry. Domain expertise and industrial internet capability are key areas that GE
believes will differentiate its offering from more mainstream tech companies like Amazon (AWS), Microsoft (Azure) and
Salesforce.
As an example:
The challenge: GE Aviation analysed 340TB of data from 3.4 mn flights on 25 airlines to help improve asset
performance and minimise disruptions.
The solution: The result of implementing Predix: performance was boosted 287x and cost lowered 7x.
What does it mean for GE? We believe there is application beyond GE’s installed base, but see partnerships with
traditional ERP players as critical in driving the convergence of information technology and operating technology. It is
unclear who will ultimately own the customer relationship. In the end, with US$225 bn of value at stake by 2020E, we
expect the industrial IoT to provide a robust, margin-accretive revenue stream over the next several years for early
adopters such as GE.
The cloud decentralises storage, managing and processing of data. This, in turn, results in
a more productive and flexible way for companies to manage their IT, with the bulk of
computational work and storage done remotely, allowing them to streamline their
businesses and focus on their core competencies.
Previously, factory managers and workers gathered on location to discuss and resolve
issues in the production process. In the future, big data analytical software should allow for
automatic identification and adjustment of the manufacturing process to monitor and
improve efficiency.
0%
10%
20%
30%
40%
50%
60%
70%
80%
90%
100%
Optimizeasset
utilization
Reduceoperational
cost
Improveworker
productivity
Create newrevenuestreams
Improvesustainability
Enhancecustomer
experience
Enhanceworker safety
How important are the following benefits in driving business to adopt the Industrial Internet?
Extremely important Very important Important Somewhat important Not important
R&D and design
Supply-chain management
ProductionMarketing and sales
Aftersales services
Build interoperable, cross functional R&D and product design databases to enable concurrent engineering Aggregate and share customer data to improve service, increase sales, and enable design-to-value Source and share data through virtual collaboration sites (idea marketplaces to enable crowdsourcing) Implement advanced demand forecasting and supply planning across suppliers and use external variables Implement lean manufacturing; model and optimize production; develop dashboards Implement sensor data-driven analytics to improve throughput and enable mass customisation Collect real-time after-sales data from sensors and customer feedback to trigger services and detect flaws. Improve supply-chain visibility through control towers and organisation-wide collaboration
Enabler: Cloud computing
Enabler: Big data analytics

April 13, 2016 Profiles in Innovation
Goldman Sachs Global Investment Research 22
Exhibit 22: Cloud-based software helps manage production within a single factory and across a network of factories
Source: Goldman Sachs Global Investment Research.
Productionadjustment
Overproduction
Underproduction
Analysis
Internet server/Cloud
OK OK
Factory A
Factory B Factory C
Factory D Factory EOK
OK
OK
Productionadjustment
Overproduction
Productionadjustment
Analysis

April 13, 2016 Profiles in Innovation
Goldman Sachs Global Investment Research 23
We see collaborative robots or “cobots” (robots that work alongside humans), as one of the
fastest-growing areas in manufacturing machinery. The technology is typically smaller,
lighter, cheaper and more flexible than traditional robots. Until recently, the robotics industry
was dominated by the “big four”: Fanuc, Yaskawa, Kuka and ABB; but cobots open up the
market to smaller players and start-ups, as well as increasing the economic viability of
robotics in general industry. We estimate the payback time of a cobot to be less than one
year in comparison to nearly three years for industrial robots. As the technology develops,
we expect it to displace low-skilled, repetitive labour tasks and in the future, expect these
robots to incorporate increasing degrees of self-learning and rational independent decision
making. Key enablers, machine vision and machine learning, are discussed on page 32.
We highlight Teradyne (Universal Robots), ABB, Kuka and Fanuc. Kawada and Yaskawa
also have a collaborative robot offering. Indirect exposure is possible through suppliers
such as Harmonic Drive Systems. There are also a number of start-ups and private
companies in this space including Automata Technologies, LifeRobotics and Rethink
Robotics (Baxter).
Standardisation, improving performance, safety, weight and cost. The potential for
cobot use is huge, but first it must overcome a number of challenges: (1) there needs to be
a standardised programmable platform to increase adoption rates; (2) performance (such
as speed) must continue to improve; (3) they need to be safe and meet regulations as they
will often be used in hazardous environments; and (4) the cost and capability of the robot
must be sufficient for investments to be economically viable (currently US$40-90k).
Cobots still work more slowly than conventional industrial robots, and can only perform
simple operations. Therefore, we do not foresee them being used on highly automated
lines requiring little human input. However, we believe cobot penetration could advance
relatively quickly in areas where human involvement in production is needed, including
distribution/conveyor lines and assortment lines that use AGVs, as well as flexible
production cells. As the performance of cobots improves, we forecast a gradual increase in
their use on food/medicine packaging lines and semiconductor assembly lines.
We estimate total sales of cobots of US$3+ bn by 2020 and >US$6 bn by 2025. Using
data from the US, Japan, Western Europe, South Korea and China, we forecast cobot
demand to have greater potential in countries with the following features: (1) a likely large
decline in the manufacturing workforce; (2) labour costs exceeding/catching up to robot
installation costs; and (3) a certain level of conventional industrial robot penetration and
productivity. Subject to these and supply assumptions, we forecast the cobot TAM to 2025.
Exhibit 23: Cobot cost recovery period should be dramatically shortened over 10 years Cost recovery model for cobots (‘000s US$)
Source: Goldman Sachs Global Investment Research.
Co-bots 2015E 2016E 2017E 2018E 2019E 2020E 2021E 2022E 2023E 2024E 2025EAverage robot price 30.0 29.1 28.2 27.4 26.6 25.8 25.0 24.2 23.5 22.8 22.1System Integration cost 60.0 58.2 56.5 54.8 53.1 51.5 50.0 48.5 47.0 45.6 44.2Total cost 90.0 87.3 84.7 82.1 79.7 77.3 75.0 72.7 70.5 68.4 66.4 YoY, % -3% -3% -3% -3% -3% -3% -3% -3% -3% -3%Working hour per unit (hours) 24 24 24 24 24 24 24 24 24 24 24
Average labor cost 25.5 26.4 27.8 29.5 31.2 33.2 34.7 36.2 37.8 39.5 41.2 YoY, % 3% 6% 6% 6% 6% 4% 4% 4% 4% 4%Working hour per man (hours) 8 8 8 8 8 8 8 8 8 8 8Net staff replaced 2 2 2 2 2 2 2 2 2 2 2
Depreciation saved 3.0 2.9 2.8 2.7 2.7 2.6 2.5 2.4 2.4 2.3 2.2Maintenance costs 9.0 8.7 8.5 8.2 8.0 7.7 7.5 7.3 7.1 6.8 6.6Payback period (years) 2.0 1.9 1.7 1.5 1.4 1.3 1.2 1.1 1.0 0.9 0.9
Competitive landscape
Applications and industries exposed
The challenges
Sizing the revenue opportunity
• Lower-cost, smaller and more flexible robots capable of working
alongside humans
• Early commercialisation stage
• Savings example: PLC Industries boosted its output per worker 40%
using cobots supplied by Universal Robots
Collaborative robots US$3-4bn (2020E base case)
PHYSICAL MANUFACTURING

April 13, 2016 Profiles in Innovation
Goldman Sachs Global Investment Research 24
Exhibit 24: Labour costs likely to exceed robot
installation costs by around 2020 in China China: Comparison of labour costs and installation costs
Exhibit 25: Cobot demand to emerge early in advanced
economies Major advanced economies: Workforce and latent cobot
demand forecasts
Source: Goldman Sachs Global Investment Research.
Source: United Nations, Goldman Sachs Global Investment Research.
Exhibit 26: Estimating the potential of the collaborative robotics market US$ mn
Source: Goldman Sachs Global Investment Research.
0
5
10
15
20
25
30
35
40
2015
E
2016
E
2017
E
2018
E
2019
E
2020
E
2021
E
2022
E
2023
E
2024
E
2025
E
2026
E
2027
E
2028
E
2029
E
2030
E
2031
E
2032
E
2033
E
2034
E
2035
E
Annual temporary worker cost per person ('000s USD)
Co-bots annual cost per unit ('000s USD)
15,000
16,000
17,000
18,000
19,000
20,000
21,000
2015
E
2016
E
2017
E
2018
E
2019
E
2020
E
2021
E
2022
E
2023
E
2024
E
2025
E
Work force demand (thous)Co-bots force (conversion into manpower)Temporary worker population (thous)
2015E 2016E 2017E 2018E 2019E 2020E 2021E 2022E 2023E 2024E 2025E
Total worker population (thous) 1,471,313 1,470,389 1,468,401 1,465,884 1,463,566 1,461,897 1,460,635 1,459,805 1,459,161 1,458,189 1,456,496Population ratio for manufacturing 23.5% 23.5% 23.5% 23.4% 23.4% 23.3% 23.3% 23.3% 23.3% 23.3% 23.2%
Population ratio (temporary worker) 38.3% 38.2% 38.2% 38.1% 38.1% 38.1% 38.0% 38.0% 38.0% 37.9% 37.9%Manufacture regular worker population (thous) 213,622 213,340 212,883 212,342 211,838 211,446 211,170 210,970 210,807 210,594 210,266Temporary worker population (thous) 132,433 132,013 131,485 130,908 130,361 129,894 129,529 129,221 128,943 128,639 128,266Annual regular worker cost per person ($thous) 26.2 27.1 28.6 30.3 32.1 34.1 35.6 37.2 38.8 40.5 42.3
Annual temporary worker cost per person ($thous) 13.1 13.5 14.3 15.1 16.0 17.0 17.8 18.6 19.4 20.3 21.1Total worker cost ($bn) 7,329 7,567 7,967 8,409 8,888 9,419 9,824 10,240 10,683 11,138 11,597
Work force demand (thous) 133,095 133,620 134,047 134,439 134,836 135,262 135,731 136,250 136,823 137,457 138,157Worker's productivity growth, % 5.3% 5.0% 4.7% 4.4% 4.1% 3.9% 3.7% 3.5% 3.3% 3.1%Total Population 2,294,289 2,303,647 2,312,542 2,320,895 2,328,621 2,335,659 2,341,973 2,347,567 2,352,484 2,356,791 2,360,544GDP per capita 14,719 15,145 15,570 16,000 16,436 16,879 17,328 17,783 18,242 18,704 19,171GDP growth, % 3.3% 3.2% 3.1% 3.1% 3.0% 2.9% 2.9% 2.8% 2.7% 2.7%
Needed additional temporary worker (thous) 662 1,607 2,562 3,531 4,475 5,368 6,202 7,029 7,880 8,817 9,891
Co-bots effectivity (conversion into manpower) 1.6 1.7 1.7 1.8 1.9 2.0 2.1 2.1 2.2 2.3 2.4
Co-bots install base demand unit (thous) 16 115 251 421 615 827 1,046 1,267 1,479 1,712 1,977Substitutable ratio by Co-bots 4% 12% 17% 22% 26% 30% 35% 39% 42% 45% 48%Substitutable ratio by Industrial robots 96% 88% 83% 78% 74% 70% 65% 61% 58% 55% 52%
10 9 8 7 6 5 4 3 2 1Co-bots real install base unit (thous) 5 39 102 193 307 440 590 746 899 1,060 1,245
Penetration rate 29% 34% 41% 46% 50% 53% 56% 59% 61% 62% 63%Co-bots density (unit/10,000 workers) 0 2 5 9 14 21 28 35 43 50 59
YoY growth, % 763% 161% 89% 60% 44% 34% 27% 21% 18% 18%
Co-bots annual cost per unit ($thous) 17.9 17.5 17.2 16.8 16.5 16.1 15.8 15.5 15.2 14.9 14.6YoY growth, % -2.0% -2.0% -2.0% -2.0% -2.0% -2.0% -2.0% -2.0% -2.0% -2.0%
Co-bots work force 7 66 178 349 580 867 1,211 1,596 2,004 2,463 3,016Initial Co-bots cost ($mn) 81 606 1,065 1,484 1,819 2,050 2,228 2,231 2,087 2,129 2,381Additional Industrial robots cost ($mn) 67 376 450 494 489 448 380 313 250 230 222
Temporary worker + Co-bots work force 132,590 133,090 133,745 134,557 135,497 136,521 137,579 138,602 139,549 140,499 141,479YoY growth, % 0.4% 0.5% 0.6% 0.7% 0.8% 0.8% 0.7% 0.7% 0.7% 0.7%
Total cost ($bn) 7,329 7,568 7,969 8,411 8,890 9,422 9,826 10,242 10,686 11,140 11,600YoY growth, % 3.3% 5.3% 5.5% 5.7% 6.0% 4.3% 4.2% 4.3% 4.3% 4.1%
New Co-bots sales ($mn) 81 606 1,065 1,484 1,819 2,050 2,228 2,231 2,087 2,129 2,381Co-bots replacement sales ($mn) 0 20 168 429 793 1,239 1,741 2,287 2,834 3,345 3,867
Co-bots replacement unit (thous) 0 1 10 26 48 77 110 148 187 225 265Replacement rate 25% 25% 25% 25% 25% 25% 25% 25% 25% 25% 25%
Total Co-bots sales ($mn) 81 626 1,234 1,914 2,612 3,289 3,969 4,518 4,921 5,474 6,247
Collaborative robots

April 13, 2016 Profiles in Innovation
Goldman Sachs Global Investment Research 25
Scott Fetzer Electrical Group has optimised production costs by 20% by using Universal Robot’s cobots
The challenge: Tennessee-based Scott Fetzer Electrical Group (SFEG) manufactures a wide range of products in low
volumes, meaning that manufacturing tasks are constantly changing depending on demand. SFEG was under pressure
to remain competitive globally as the Asian electronics market expanded and wanted to avoid having to upgrade its
entire existing asset base. Given the high-mix, low-volume nature of order intake, traditional industrial robots were not
an economically viable option as lines would be unused for long periods of time.
The solution: Universal Robots’ model UR5 was adapted to work on a variety of tasks along with human operators,
when more capacity is needed. According to IFR, for example, one day the robot could be bedding metal sheets, the
next it could be performing pick and place tasks. The robot does not require a safety guarding like traditional industrial
robots; the robot arm will automatically stop operating if it encounters obstacles. To build on the collaborative potential
of the new robots, SFEG has put them on top of AGVs and now has a fleet of mobile UR robots deployed throughout
the sheet metal department, integrating them into the entire production cycle, from cutting the initial blank on the
blanking press to forming, folding and final assembly of the electrical components. Multiple robots are also being
connected to work together on complementary tasks, such as moving parts between workstations. Live testing of final
products was also automated. The cobots can turn the product on/off, run it for a couple of seconds and repeat that task
for a full cycle of testing (up to 400 hours). Furthermore, the robot collects live data from all tests across several
important variables. Preparing the robots for their tasks is also a much simpler process than for traditional industrial
robots: this can be done through a simple user-friendly screen or by simply grabbing the robot arm and performing the
desired task. SFEG says it took 30%-50% less time than with traditional robot implementations.
The result: According to the company, before it had the cobots on the transformer line, an operator could make on
average 10 parts per hour; collaboration with the robots increased this productivity by 20%. SFEG says it has won back
market share against Chinese competitors and brought back to the US some of its Chinese-sourced manufacturing as a
consequence. The company says the payback for UR robots was 12-14 months.
Glory (Japanese machinery maker) deploys cobots on cash register assembly lines
The challenge: Obtaining production line workers for factories to manufacture cash registers became a problem for
Glory in various countries because of declining/ageing populations.
The solution: The company introduced Kawada Technologies’ humanoid robot, Nextage, on assembly lines in 2012.
Cobots were given nicknames that matched local currencies (Yen-chan, Dollar-kun, Euro-kun) to help workers feel
comfortable with their new colleagues. Nextage is highly adept at simple picking work, like many cobots, but it also has
the dexterity to tighten screws and mount components. We view this as significant in that it shows the potential for
higher-value-added operations to be entrusted to cobots.
Exhibit 27: Universal Robots cobot alongside a worker…
Exhibit 28: …and in a production line
Source: Teradyne.
Source: Teradyne.

April 13, 2016 Profiles in Innovation
Goldman Sachs Global Investment Research 26
Additive manufacturing or 3D printing is the process of making a physical object from a
three-dimensional digital model, typically by laying down many successive thin layers of a
material. The technology facilitates several aspects of the evolution of the global economy,
and more specifically manufacturing, via: (1) reduced raw material consumption; (2) a
quicker design to production process; and (3) mass customisation. Within 3D printing,
printers and materials are the biggest opportunities, and we believe the industry could
move towards a razor/razor blade model as it matures. This means that the installed base
could become the driver of a more recurring and profitable opportunity, in the form of
materials sales and technology.
We highlight two public companies, 3D Systems and Stratasys, but also the leading
private company EOS. Other players include Renishaw and Hewlett-Packard. Han’s Laser
offers indirect exposure.
Speed, energy consumption and further technological progress: (1) slow print speed is
an impediment to high-volume production; (2) lack of material science advancement blocks
the use in several applications (e.g. metals); (3) high energy costs can affect economics; (4)
software development is in the early stages and needs to evolve in order to facilitate the
design of more complex products; and (5) there are safety/environmental concerns around
melting thermoplastic, which is one of the most used materials currently.
Similar to other manufacturing innovations such as robotics and vision systems, auto
companies were the early adopters of 3D printers and remain the biggest users. The key
application for 3D printing is rapid prototyping of new models. Going forward, we believe
autos will likely remain the biggest application, but see other end markets playing a major
role in the growth of the industry, namely aerospace and consumer goods.
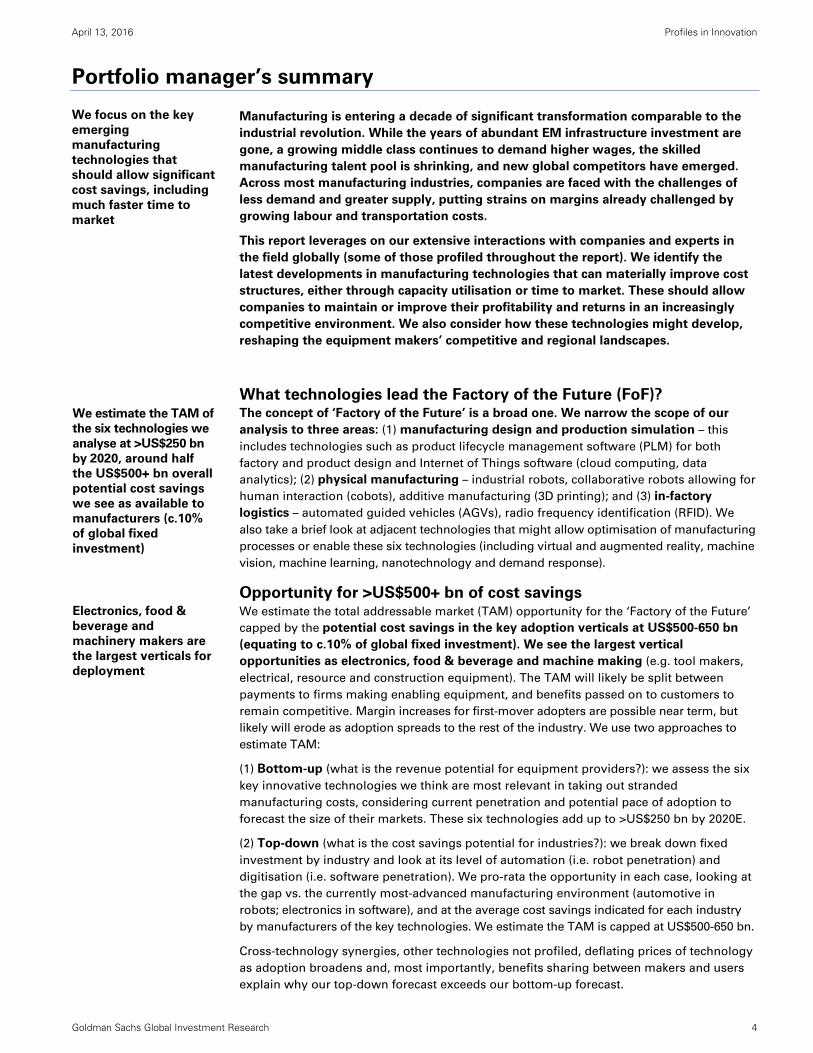
GE is leading the way in terms of commercial applications within aerospace. Specifically,
GE is deploying 3D printed fuel nozzles and sensors for the GEnx jet engine. These
components serve key purposes, allowing sensors to be mounted on parts that were
previously difficult to monitor, the ability to work in hazardous environments (2000
Fahrenheit) and the use of materials not traditionally associated with manufacturing.
Furthermore, companies like Siemens are using it as the next step after PLM simulation.
Additive manufacturing has a potential addressable market of US$25-30 bn by 2020E.
Per IDC, the global 3D printing market is worth c.US$11 bn currently, and is expected to
grow to c.US$27 bn by 2019, implying a 25% CAGR. We take a more conservative approach
in our base case, and assume a 20% CAGR through 2015-20 and a terminal rate of 5% by
2025. This yields a market size of US$40 bn by 2025, implying a CAGR of 14%.
Exhibit 29: Estimating the potential of the 3D printing market US$ bn
Source: Goldman Sachs Global Investment Research.
Additive manufacturing 2015E 2016E 2017E 2018E 2019E 2020E 2021E 2022E 2023E 2024E 2025E
3D printing potential revenue $11bn $13bn $16bn $19bn $23bn $27bn $30bn $33bn $36bn $38bn $40bn% yoy 20% 20% 20% 20% 20% 10% 10% 10% 5% 5%
2015 - 2025 CAGR: 14%
Competitive landscape
Applications and industries exposed
The challenges
Sizing the revenue opportunity
• Lower raw material consumption, quicker time-to-market and allows
mass-customisation
• Early commercialisation stage
• Savings example: Airbus production cost of satellites reduced by 20%
by using in-house 3D printer as opposed to outsourcing production
Additive manufacturingUS$25-30 bn (2020E base case)
PHYSICAL MANUFACTURING
April 13, 2016 Profiles in Innovation
Goldman Sachs Global Investment Research 27
Simplification and weight savings enabled with 3D printing of commercial aviation parts
The challenge: General Electric requires nozzles that hold the T25 sensor which monitors GE’s Leap jet engine.
Previously, the nozzles, like those used in the Leap engine, were machined from 20 separate parts, resulting in problems
with ice accumulation and welding and joint strength. With 19 fuel nozzles per engine and high development costs, GE
needed to streamline the manufacturing of the nozzles while satisfying strict aviation regulations.
The solution: With additive manufacturing technology, the newly certified part is made in one solid piece, reducing
manufacturing and development time (approximately one year) while improving part performance.
“Once we found a workable solution, it went straight to production. This technology is a breakthrough.” – Jonathan
Clarke, Program manager for the project.
Exhibit 30: 3D printed component used in GE’s Leap jet engines
Source: General Electric.

April 13, 2016 Profiles in Innovation
Goldman Sachs Global Investment Research 28
Within manufacturing, automated guided vehicles (AGVs) are used in the automation of
material handling, transporting objects through factories and distribution centres. As the
technology advances, they should be increasingly connected to the broader IoT network,
allowing for just-in-time delivery of components. As a result, the technology should help
reduce labour costs and allow for more flexible production that does not need to follow a
fixed conveyance line. Egemin, the AGV brand of Kion, estimates the payback time of an
AGV system is 2.75 years. We see AGVs as an important development in an increasingly
connected and automated logistics system, potentially leading to much lower levels of
work-in-progress and inventories.
We highlight four companies: Siasun, Kion, Dematic and Kuka. Other companies
pursuing this technology include Toyota, Jungheinrich, Amazon (formerly Kiva Systems)
and JBT Corporation. Private companies such as Savant Automation, Clearpath and
Seegrid Vision are also making inroads in this market.
Infrastructure costs, potential new entrants and safety. This technology must first
overcome a number of challenges: (1) widespread adoption may require large
infrastructure spend on factory layouts to ensure safe use, multiplying the cost; (2) it opens
up to competition similar technology used in autonomous cars; (3) similar to autonomous
cars, it needs to overcome safety concerns in a likely highly hazardous environment; and
(4) the technology still needs to advance and costs need to fall.
This technology will disrupt other material handling equipment (such as forklifts). For some
suppliers, it may cannibalise their primary offering, as evidenced by large investments
from some of the leading players (e.g. Kion acquiring Egemin).
The market for AGVs in industrial use could be worth c.US$2 bn by 2020 and almost
US$4 bn by 2025. We assume the current installed base of manned material handling
equipment as the potential market for this equipment (Class 2 and 3 industrial trucks).
Using industry data, we estimate the proportion of this equipment used in manufacturing
and logistics (57%), and forecast global demand to grow at long-run GDP (assumed at
3.0%). Using a variety of other industry sources and company data, we estimate the current
AGV installed base is less than 2%; we expect this to grow to c.15% by 2025. We expect
pricing to hold up for the next couple of years, as the technology makes significant
advances, and to begin deflating once there is broader adoption.
Exhibit 31: Estimating the potential of the AGV market within manufacturing US$ mn
Source: Goldman Sachs Global Investment Research.
Automated Guided Vehicles 2014E 2015E 2016E 2017E 2018E 2019E 2020E 2021E 2022E 2023E 2024E 2025E
Comparable material handling equipment manufacturing 342,000 352,260 362,828 373,713 384,924 396,472 408,366 420,617 433,235 446,232 459,619 473,408YoY growth, % 3.0% 3.0% 3.0% 3.0% 3.0% 3.0% 3.0% 3.0% 3.0% 3.0% 3.0%
Penetration of AGVs 1.2% 1.6% 2.1% 2.9% 4.2% 6.2% 7.8% 9.8% 11.4% 13.3% 14.2% 15.2%
AGV units sold 4,104 5,540 7,757 10,859 16,289 24,433 31,763 41,292 49,550 59,461 65,407 71,947YoY growth, % 35% 40% 40% 50% 50% 30% 30% 20% 20% 10% 10%
Average cost of AGV + installation costs ($'000s) $65 $65 $65 $65 $64 $62 $61 $60 $59 $58 $56 $55YoY growth, % 0% 0% 0% -2% -2% -2% -2% -2% -2% -2% -2%
Total AGV sales $267m $360m $504m $706m $1,038m $1,525m $1,943m $2,476m $2,911m $3,424m $3,691m $3,979mYoY growth, % 20% 20% 14% 14% 8% 47% 27% 27% 18% 18% 8%
Competitive landscape
The challenges
Sizing the revenue opportunity
The markets disrupted
• Autonomous material handling equipment eliminating labour costs
• Early development stage
• Savings example: Harley Davidson reduced costs 7% by introducing
AGVs and creating a more efficient production facility
Automated Guided Vehicles c.US$2 bn (2020E base case)
IN-FACTORY LOGISTICS

April 13, 2016 Profiles in Innovation
Goldman Sachs Global Investment Research 29
Harley Davidson: Automated guided vehicles
Harley Davidson took to transforming its York Vehicle Operations facility, which accounts for more than 60% of the
company’s motorcycle production.
The challenge: The original factory, laid out on mass-production principles, was becoming inefficient and inflexible.
Harley Davidson set as its objective the adoption of lean principles and reduced manufacturing floor complexity.
The solution: One key aspect of this transformation was removing the assembly line production chain and adopting a
digital chain (where assembly parts move on flexible automated guide vehicles (AGVs) which are driven by planning
needs and software). There was a significant reduction in inventory at hand levels, which currently stand at three hours
compared with 8-10 days in the legacy systems, owing to a major cut in the planning cycle, moving from a 21-day fixed
plan to only a six-hour time horizon.
Moreover, the low-value-add, repetitive works have been moved to robotic execution, increasing productivity.
Incorporation of a real-time performance management system helps in monitoring the entire manufacturing floor via
multiple connected devices. This transformation resulted in significant metric improvements for the company: it
reduced costs by 7% and productivity rose 2.4%, resulting in a net margin improvement of 19%.
Exhibit 32: An example of an AGV supplied by Siasun
Exhibit 33: An example of an Egemin AGV
Source: Siasun.
Source: Wikimedia.
April 13, 2016 Profiles in Innovation
Goldman Sachs Global Investment Research 30
Radio frequency identification (RFID) technologies are tags that use radio waves to transfer
data, to allow the identifying and tracking of objects. The technology has existed since at
least the 1970s. Until now, it has been too expensive to be practical for many commercial
applications within manufacturing. The technology solves many of the problems
associated with bar codes, as radio waves travel through most non-metallic materials, and
can be embedded in components. The tags can store data about each component
manufactured and allow tracking of their real time locations throughout the production
process (e.g. for work-in-progress, supplies and product inventory).
Active RFID tags use a battery and run an imbedded microchip, submitting signals to the
reader. They can be scanned over long ranges but cost a dollar or more. Passive tags have
no battery. Instead, they draw power from the reader. Manufacturing companies are
focusing on passive ultra high frequency (UHF) tags, which cost less than 50 cents today in
orders of one million or more. Their read range is typically less than 20 feet vs. 100 feet or
more for active tags, but they are far less expensive than active tags and can be disposed
of with the product packaging.
We highlight four of the largest specialist manufacturers: Zebra Technologies, Impinj,
Smartrac and Alien. We also note some larger companies that provide this technology or
components: DHL, FedEx and Honeywell (through Intermec). Software providers (e.g.
Oracle and SAP) provide integration solutions.
Cost deflation, compatibility and technological barriers. There are still a number of
barriers to widespread adoption within manufacturing: (1) even at 50 cents for a UHF tag,
costs need to come down substantially in order for it to be economically viable for
widespread adoption – currently their use is limited to only high-value items; (2) the RFID
technology must be compatible with the broader IoT system protocols and standards; and
(3) the technology still needs to overcome some barriers, such as not being able to send
signals through metallic materials.
RFID are a key enabling technology for connecting factories and managing inventory levels.
They are currently used in many industries around the world and on a variety of
applications. Club Car, a maker of golf carts, uses RFID to improve efficiency on its
production line. Paramount Farms, one of the world’s largest suppliers of pistachios, uses
RFID to manage its harvest more efficiently. Much of the recent growth has come from, and
is continuing to come from, uses in retail apparel, and the largest orders are placed by
governments. Food & beverages and textiles are positioned well, owing to the low number
of metallic components.
We estimate the Factory of the Future will offer a c.US$2 bn opportunity for RFID
providers by 2020. In 2014, around 7.5 bn total RFID units were sold, with between 3% and
6% of these sales made to manufacturing (mainly UHF tags). Using publically available
data from RFID Journal and other industry sources, we are able to forecast trends and
pricing. We estimate that the growth rate of manufacturing units sold will be over 20% pa
for the next five years. Despite this high rate, this is lower than is expected for the retail
industry (the largest end market for RFID technologies, which we expect to grow at a CAGR
of over 30%). We hold the average number of readers per 1,000 tags fixed in our forecasts,
owing to “reader collision” blocking signals and limiting the number of readers possible in
a fixed space. Note that given the growth in different sectors in our base case, by 2020E
manufacturing still represents only 4% of total RFID unit sales, and therefore the total
market for RFID should be much greater.
Competitive landscape
Applications and industries exposed
The challenges
Sizing the revenue opportunity
• Allow for identifying and tracking objects in complex and connected
networks
• Mature technology with new early applications in manufacturing
• Savings example: Griva, a textile manufacturer, achieved a ROI of 30%
in 9m from using Alien Technologies’ RFIDs to monitor inventory
Radio Frequency Identification c.US$2 bn (2020E base case)
IN-FACTORY LOGISTICS

April 13, 2016 Profiles in Innovation
Goldman Sachs Global Investment Research 31
Exhibit 34: Estimating the potential of the RFID market within manufacturing US$ mn
Source: Goldman Sachs Global Investment Research.
Bosch RFID tags cut inventory time by 97% in China
The challenge: In the Bosch plant in the Chinese city of Suzhou, the yearly task of taking machine inventory used to be
a major undertaking. Plant 1 has four manufacturing areas, each with up to 2,500 machines, test benches, and items of
measuring equipment. For ABS manufacturing alone, the inventory process used to take up to a month in some cases.
Sometimes associates printed out lists to help them manually record machine inventory.
The solution: Now, thanks to smart connectivity, inventory taking takes just four hours. All the machines and
equipment items have been fitted with RFID transponders. This allows objects to be identified without physical contact.
Now, associates push RFID trolleys fitted with a laptop and antennas through the manufacturing shop (in the future
AGVs could also do this too). As they move along, the trolleys use RFID technology to automatically identify machines
and devices. This cuts the time needed for inventory taking by 97%, or 440 man hours.
Stanley Black & Decker’s Mexico plant
The challenge: Stanley Black & Decker wanted to improve the overall operating efficiency of one of its largest plants in
Reynosa, Mexico.
The solution: It implemented real-time location systems (RTLS) on its production lines. RTLS include small and easily
deployed RFID tags that provide real-time location and status, thereby allowing better work efficiency, better
supervision of inventory, reduced working capital and improved production line throughput. Stanley Black & Decker had
a 15% increase in revenue per employee in 2014 and improved equipment effectiveness, resulting in a 300 bp operating
profit margin improvement.
RFID 2014E 2015E 2016E 2017E 2018E 2019E 2020E 2021E 2022E 2023E 2024E 2025E
RFID units sold (bn) 7.5 9.4 11.7 14.6 18.3 22.9 28.6 34.3 39.5 43.4 45.6 47.9YoY growth, % 25.0% 25.0% 25.0% 25.0% 25.0% 25.0% 20.0% 15.0% 10.0% 5.0% 5.0%
% of which in manufacturing 4.5% 4.4% 4.3% 4.2% 4.1% 4.0% 3.9% 3.8% 3.7% 3.6% 3.5% 3.4%
RFID manufacturing units sold (mn) 337.5 413 504 615 751 916 1116 1305 1461 1563 1596 1628YoY growth, % 22.2% 22.2% 22.1% 22.0% 22.0% 21.9% 16.9% 12.0% 7.0% 2.1% 2.0%
Average cost of UHF RFID ($) $0.50 $0.48 $0.45 $0.43 $0.41 $0.39 $0.37 $0.35 $0.33 $0.32 $0.30 $0.28YoY growth, % -5.0% -5.0% -5.0% -5.0% -5.0% -5.0% -5.0% -5.0% -5.0% -5.0% -5.0%
Total manufacturing RFID tags sales $169m $196m $227m $264m $306m $354m $410m $456m $485m $493m $478m $463mYoY growth, % 16.1% 16.1% 16.0% 15.9% 15.9% 15.8% 11.1% 6.4% 1.7% -3.0% -3.1%
Average number of readers per 1000 tags 2 2 2 2 2 2 2 2 2 2 2 2
Average cost of UHF reader $1,000 $950 $903 $857 $815 $774 $735 $698 $663 $630 $599 $569YoY growth, % -5.0% -5.0% -5.0% -5.0% -5.0% -5.0% -5.0% -5.0% -5.0% -5.0% -5.0%
Total manufacturing RFID reader sales $675m $784m $910m $1,055m $1,223m $1,417m $1,640m $1,822m $1,938m $1,971m $1,911m $1,852mYoY growth, % 16.1% 16.1% 16.0% 15.9% 15.9% 15.8% 11.1% 6.4% 1.7% -3.0% -3.1%
Total manufacturing RFID sales $844m $980m $1,137m $1,319m $1,529m $1,771m $2,051m $2,278m $2,423m $2,463m $2,389m $2,315m16.1% 16.1% 16.0% 15.9% 15.9% 15.8% 11.1% 6.4% 1.7% -3.0% -3.1%
April 13, 2016 Profiles in Innovation
Goldman Sachs Global Investment Research 32
Other key technologies (ordered alphabetically)
We briefly highlight five other technologies and key enablers that could have a dramatic
impact on the future of manufacturing:
Augmented reality vision
Augmented reality vision is an upcoming technology that superimposes a computer-
generated image on a user’s view of the real world. This technology could allow engineers
and workers a view of 3-dimensional designs and let them receive visual instruction to
complete their tasks, increasing productivity and reducing the likelihood of costly errors.
This could disrupt the market for 2-dimensional computer screens used to instruct
engineers currently.
In Profiles in Innovation Vol. 1: Virtual & Augmented Reality, January 13, 2016, GS analysts
estimated that, despite no adoption until 2017, and including virtual reality devices, this
market could be worth US$1.5 bn in 2020 and over US$4.5 bn in 2025. This technology is
also led by tech giants such as Facebook, Samsung, Google, and Microsoft.
Demand response
Demand response provides an opportunity for factories to play a significant role in their
own consumption from the electric grid by reducing or shifting their electricity use during
peak periods in response to time-based rates or other forms of financial incentives. Given
their large energy use, factories often have the most to gain from any commercial and
industrial customer by optimising their energy consumption and helping reduce costs. The
latest battery technology can help maximise this potential. Key to this technology is the use
of energy storage, which in The Great Battery Race, October 18, 2015, GS analysts
estimated was a TAM of US$100-150 bn, of which the demand response is worth
US$45-71 bn. Key players include Tesla, Saft Batteries and Schneider Electric.
Machine learning
Machine learning (or artificial intelligence) is the ability of machines to process data into
information and derive knowledge from that information to act independently or augment
human decision making. The key difference between machine learning and a smart piece
of code or smart connected devices is it is capable of self-learning/improving.
Machine learning has been introduced at a basic level in collaborative robots, and is touted
as a key enabler in optimising the IoT. Within IoT ecosystems, machines are able to
communicate with each other and adjust/work independently of human interaction. Key
players are the tech giants (Google, Microsoft, IBM) and GE, although there are numerous
exciting start-ups in this space across a variety of different applications.
Machine vision
Machine vision is the technology and methods used to provide imaging-based automatic
inspection, gauging, counting and analysis at high speeds, reliability and with greater
precision (exceeding the capabilities of the human eye).
This technology, which effectively consists of highly advanced sensors, has the potential to
dramatically increase the capability of other technologies such as collaborative robots,
AGVs, and other automated production processes. Key players include: Cognex, Omron,
Keyence and Google (through Industrial Perception).
Nanotechnology
Nanotechnology is engineering on an atomic scale. The analysis or manipulation of atoms
and molecules is key to addressing the challenge of extracting higher output from less
resource, and is becoming increasingly important in manufacturing. Nano materials are
already used in consumer goods such as make-up, and industrial products such as surface
coatings. In addition, the semiconductor roadmap provides a dramatic example of this in
the relentless miniaturisation and increasing power of electronic devices.

April 13, 2016 Profiles in Innovation
Goldman Sachs Global Investment Research 33
As the limitations of existing technologies become more binding, we believe the
importance of this technology will increase, in turn driving an increasing number of
nanotechnology applications (e.g. purifying silicon semiconductors). Nanotechnology
accounts for a small but growing share of public and corporate research budgets; Oxford
Instruments is a public company with larger exposure.
Autodesk is using augmented reality to enhance computer aided design (CAD)
Our US technology analysts spoke to Autodesk to discuss the augmented reality used in manufacturing to visualise 3D
models in a real-world context, avoiding costly errors and improving collaboration.
The challenge: While CAD software has done much to improve the design process it still has its limits. For example,
CAD is still generally constrained by the need to work on a 2D monitor. This limits the ability to view full-sized objects in
a real-world context, and hinders true collaboration when many people are working on the same design.
The Autodesk solution: Autodesk is a leading design software company with US$2.5 bn in annual revenues and with
customers primarily in the architecture, engineering, construction and manufacturing verticals. Our analysts spoke with
Autodesk’s emerging technology division, which is working with Microsoft HoloLens to incorporate AR into CAD.
Autodesk’s VRED 3D visualisation software product is currently used by auto makers to project things such as doors and
colours onto clay car models.
Wide-ranging applications: Autodesk envisions AR improving the design of items as small as videogame controllers or
as large as buildings, with the view that having the true 1-to-1 scale that’s not possible in 2D can go a long way towards
avoiding errors. Autodesk also sees value in looking at a 3D model and having metadata information behind the CAD at
your fingertips. Finally, if two people are collaborating on a project, they are better able to work through issues as they
go as opposed to working on separate desktops and realising there are issues when they come together. Given the wide
range of CAD use cases, we see potential for AR to impact Autodesk’s base of 5 mn customers worldwide.
Potential bottlenecks: The computing power of AR systems needs to improve to run large CAD files.
Exhibit 35: Autodesk is working with Microsoft
Source: Microsoft.

April 13, 2016 Profiles in Innovation
Goldman Sachs Global Investment Research 34
Industries:
Top-down: >US$500 bn addressable market
Higher labour costs and increased global competition and putting
pressure on manufacturers to automate and making time to market
increase in importance as a differentiator
We see the greatest opportunity from a shift to best-in-class
manufacturing for:
o Electronics – Up to US$120 bn
o Machinery – Up to US$110 bn
o Food & Beverages – Up to US$100 bn

April 13, 2016 Profiles in Innovation
Goldman Sachs Global Investment Research 35
Total addressable market could be worth more than US$500 bn
We believe the total addressable market for equipment manufacturers supplying
physical automation and software for full connectivity and optimisation of factories
could be worth more than US$500 bn, or 10% of fixed investment, in cost savings. We
assess this market size on a top-down basis across the relevant industries, based on
current levels of automation and digitisation and potential savings achieved in
existing technology pilots. This assessment provides a higher value than our bottom-
up analysis of the six core technologies we presented earlier, as: (1) our top-down
analysis includes other technologies (such as those that are more mature, but where
penetration can still be increased or efficiency improved); (2) it aggregates synergies
from using more than one of the six technologies profiled; (3) we use a savings
approach, which will not necessarily be realised as revenues by equipment providers
as some of the value identified will likely be shared with customers rather than
manufacturers (especially for technologies where prices deflate quickly).
Approach to our top-down TAM assessment
We believe the size of the total addressable market for all emerging technologies ensuring
optimal automation and digitisation of future manufacturing is capped by the potential size
of the savings achieved by using those technologies. This would be a best-case scenario, in
which the industries adopting these technologies do not retain or pass through to their
customers any achieved savings (the latter is what usually happens).
For our top-down assessment, we look at each industry’s level of automation and
digitisation vs. the best-in-class example of the automotive industry. We expect
manufacturing to evolve differently for each global industry. Currently, each is at a different
stage of automation and sophistication owing to the competitive dynamics and market
pressures it faces. For industries such as automotive, where factories are already highly
sophisticated, the incremental value-add of new technologies will be quite low.
We then collect numerous examples of full automation, digitisation and optimisation
achieved in pilots in the eight industries we analyse. Crossing those two data points, we
estimate the potential savings achieved, which we assume equates to the maximum
possible size of the addressable market of the technologies that allow for those gains.
In more detail, our top-down TAM assessment is based on the following:
Assessing the relevant pool of fixed investment. Manufacturing accounts for around
25% of global gross fixed capital formation (or fixed asset investment). Using data
from the World Bank, OECD and other national accounts, we are able to estimate the
proportion of fixed asset investment by each manufacturing industry.
Assessing the level of existing automation and digitisation. We capture the varying
degrees of automation in each industry by looking at the current penetration of robots
(in Japan, Germany, the UK, France and Italy) and software. This is important in
assessing the maximum potential for other manufacturing industries if they were to
catch up with the more advanced ones, most notably automotive.
Assessing the level of savings enabled by full automation/digitisation. Using
Goldman Sachs research, case studies and third-party sources, we estimate a range of
gross savings that each industry could generate by introducing and implementing the
latest technologies. For some industries such as autos, which have already automated
significantly, the extra savings are quite limited; for others, the potential is much
greater. We also apply a relevance factor for each technology.
Calculating the maximum revenue pool potential for equipment manufacturers.
Given the proportion of investment available, the potential savings for each industry
and the degree of automation already in place, we estimate the maximum potential
savings and revenue pool available.

April 13, 2016 Profiles in Innovation
Goldman Sachs Global Investment Research 36
Qualifying speed of adoption. It is unlikely that each industry will automate and
innovate to the extent the automotive industry has. Looking at the competitive
structure, age of assets and the margin pressure that industries are facing, we also
incorporate a metric that aims to capture the likelihood of this maximum revenue pool
per industry being realised. Unsurprisingly, the automotive industry is highly likely to
adopt new technologies, while the food products sector is less so, for reasons
highlighted further on.
Exhibit 36: We look at the key industries that drive fixed
investment … Global fixed investment broken down by industry
Exhibit 37: …assessing their software penetration… Software as % private non-resi fixed asset investment for
various industries in the United States (2015)
Source: World Bank, OECD, China Statistical Yearbook, Goldman Sachs Global Investment Research.
Source: US Bureau of Economic Analysis, Goldman Sachs Global Investment Research.
Exhibit 38: …as well as level of automation… Robot density per 1,000 employees
Exhibit 39: …and urgency of need for optimisation Net margins in 2010-14 and 2015-18E for selected
manufacturing industries
Source: Goldman Sachs Global Investment Research.
Source: Company data, Goldman Sachs Global Investment Research.
Automotive, 19%
Chemicals and plastics, 21%
Electronics, 20%Machinery, 10%
Food products, beverages & tobacco, 8%
Metals, 8%
Wood and paper products, 4%
Textiles, leather & wearing apparel,
1%
Others / Not classified, 10%
Global manufacturing
GFCF: ~$4.75tn
0%
2%
4%
6%
8%
10%
12%
14%
16%
18%
Ele
ctro
nics
Mac
hine
ry
Mot
or v
ehic
les
&tr
ansp
ort e
quip
.
Tex
tiles
, lea
ther
&w
earin
g ap
pare
l
Tot
alM
anuf
actu
ring
Woo
d &
pap
erpr
odu
cts
Oth
ers
/ Not
clas
sifie
d
Met
als
Foo
d pr
oduc
ts,
beve
rage
s &
toba
cco
Che
mic
als
&pl
astic
s
Sof
twar
e as
% o
f fix
ed a
sset
inve
stm
ent
15 -25
< 1
< 5
< 8
5 - 15
5 - 15
15 - 35
20 - 40
80 - 120
0 20 40 60 80 100 120
Total manufacturing
Textiles, leather, wearingapparel
Wood & paper products
Food products beverages;Tobacco products
Machinery
Metals
Plastic and chemicalproducts (inc. pharma)
Electrical/electronics
Automotive
Robots per 1,000 employees
0.0%
2.0%
4.0%
6.0%
8.0%
10.0%
12.0%
Electronics Foodproducts,
beverages &tobacco
Machinery Chemicalsand plastics
Automotive Wood andpaper
products
Metals
Net margins (2010-14)
Net margins (2015-18E)

April 13, 2016 Profiles in Innovation
Goldman Sachs Global Investment Research 37
Exhibit 40: We used 60+ examples of savings captured by introducing FoF technologies in their current state
Source: Company data, Goldman Sachs Global Investment Research.
We also perform a scenario analysis to calculate the savings based on the assumption that
using labour-reducing technologies (AGVs and cobots), labour-intensive industries (such as
textiles, wood and food products) are able to halve their gap with the automotive industry.
Using data from five of the ten largest manufacturing countries – Japan, Italy, the UK,
France and Germany – we follow five steps: (1) calculate labour intensity (number of
employees/output); (2) calculate the reduction in labour needed to halve the difference with
the automotive industry; (3) assign high (US$30,000) and low (US$15,000) wages; (4)
multiply wages by absolute labour reduction to calculate displaced savings; and (5) divide
by output to find the margin impact.
Exhibit 41: Our scenario analysis suggests significant savings potential for textiles and wood products Analysis of hypothetical scenario in which industries halve their labour intensity (no. employees/output) difference with autos
Source: BEA, OECD, World Bank, Goldman Sachs Global Investment Research.
Note: These estimates are not indicative of the revenue that we believe will be realised by
equipment providers, but represent a maximum cap to those revenues. These estimates
are also not fully risk- or probability-adjusted. In most case we use gross cost savings
(although we attempt to net the costs of introducing new technologies where we can).
While the price of key technologies may have declined significantly in the past few years,
we do not fully incorporate the cost of restructuring the fixed infrastructure to
accommodate this technology. As a consequence, our estimates are not a full
representation of the costs that may be incurred. Industry level data will still vary
significantly among countries; see Where will it be built? Page 49.
Company Fanuc FDM Flextronics Sub‐Zero Maserati Continental Stanley Black & Decker
Business Outcome Lower downtimeLarge savings & faster time‐
to‐marketReduce energy Faster time‐to‐market Shorten time‐to‐market Lower Inventory Reduce defects
Technology introduced IoT 3D printing IoT IoT PLM software IoT IoT
DescriptionMonitoring & predictive
maintenance
Use of 3D printing to
manufacturer component
used in drones
Machine level
consumption & demand
response
Collaboration enhanced
across platforms
Use PLM software to
design its complex
products
Real time supply chain
monitoring & interaction
Big data enabled quality
checks
Old state 11% unplanned downtime 20 days outsourcing $8.4mn/factory 15 months cycle 30 months time‐to‐market 14x inventory turnover 4.9% defect rate
New state 5.8% unplanned downtime2 days with a ROI of
$12,000$6.9mn/factory 11 months cycle 16 months time‐to‐market 19x inventory turnover 2.5% defect rate
Improvement 47.8% 10x faster & ROI in 9m 17.5% 23.0% 47.0% 34.8% 48.9%
ResultSavings of $40mn from
single customer
Savings of $800,000 cost
avoidance over 3 years
Savings of $1mn per
factory
15% reduction in cycle
time
Helped Maserati produce
3x more cars
Reduced certain
component costs by 20%DPM reduced by 16%
Savings from labor displacement
Manufacturing industryNo.
EmployeesOutput ($m)
Labour intensity
Labour reduction
Wages (high/low)
Savings in wages($m)
% of output
Food products beverages; Tobacco products 3,773,158 273,462 14 20% Low 14,827 5%Textiles, leather, wearing apparel 1,278,993 52,649 24 33% Low 8,380 16%Wood & paper products 2,033,371 89,648 23 32% Low 12,825 14%Plastic and chemical products (inc. pharma) 3,276,175 401,736 8 0% Low 0 0%Metal (exc. Machinery) 3,779,939 290,443 13 18% High 20,209 7%Machinery 3,286,976 257,301 13 17% High 16,978 7%Electrical/electronics 2,953,577 268,034 11 12% High 10,629 4%Automotive 2,548,188 304,233 8 0% High 0 0%Others / Not classified 3,168,377 210,498 15 22% Low 14,053 7%Total manufacturing 26,098,754 2,148,004 12 16% Medium 101,344 5%
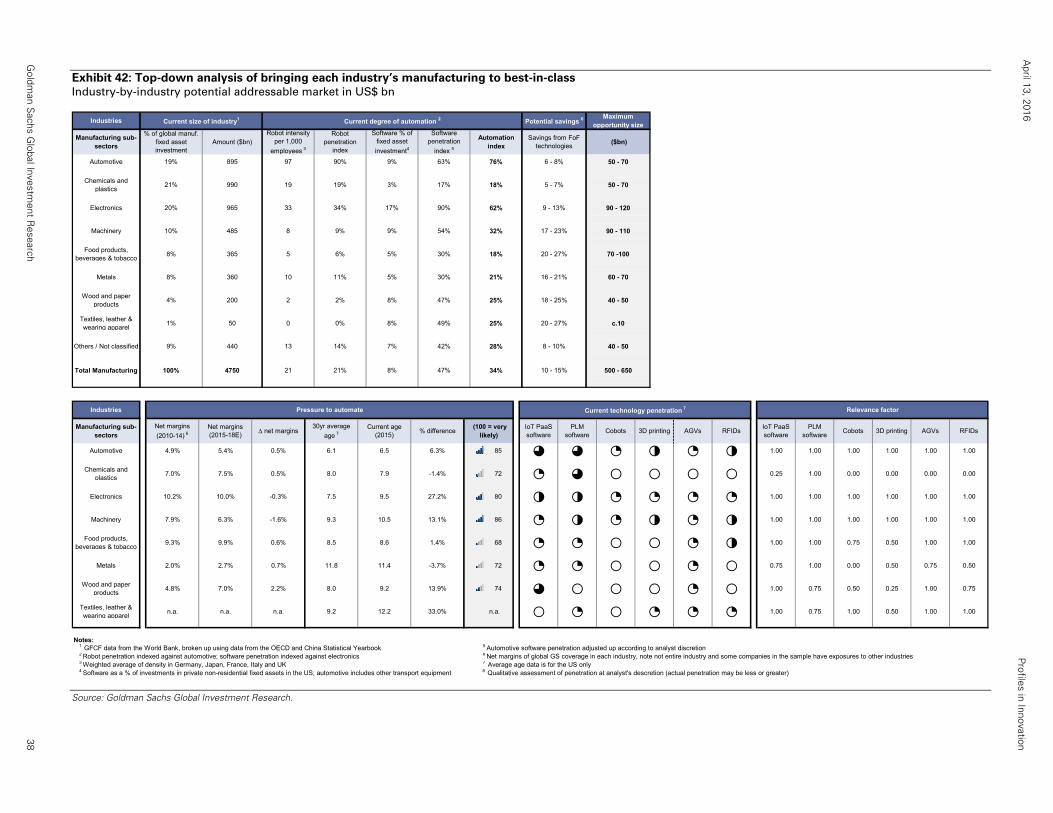
April 13, 2016
Profiles in Innovation
Goldm
an Sachs G
lobal Investment R
esearch
38
Exhibit 42: Top-down analysis of bringing each industry’s manufacturing to best-in-class Industry-by-industry potential addressable market in US$ bn
Source: Goldman Sachs Global Investment Research.
Industries Current size of industry1 Current degree of automation 2 Potential savings 6Maximum
opportunity size
Manufacturing sub-sectors
% of global manuf. fixed asset investment
Amount ($bn)Robot intensity
per 1,000
employees 3
Robot penetration
index
Software % of fixed asset
investment4
Software penetration
index 5
Automation index
Savings from FoF technologies
($bn)
Automotive 19% 895 97 90% 9% 63% 76% 6 - 8% 50 - 70
Chemicals and plastics
21% 990 19 19% 3% 17% 18% 5 - 7% 50 - 70
Electronics 20% 965 33 34% 17% 90% 62% 9 - 13% 90 - 120
Machinery 10% 485 8 9% 9% 54% 32% 17 - 23% 90 - 110
Food products, beverages & tobacco
8% 365 5 6% 5% 30% 18% 20 - 27% 70 -100
Metals 8% 360 10 11% 5% 30% 21% 16 - 21% 60 - 70
Wood and paper products
4% 200 2 2% 8% 47% 25% 18 - 25% 40 - 50
Textiles, leather & wearing apparel
1% 50 0 0% 8% 49% 25% 20 - 27% c.10
Others / Not classified 9% 440 13 14% 7% 42% 28% 8 - 10% 40 - 50
Total Manufacturing 100% 4750 21 21% 8% 47% 34% 10 - 15% 500 - 650
Industries Pressure to automate Current technology penetration 7 Relevance factor
Manufacturing sub-sectors
Net margins
(2010-14) 6Net margins (2015-18E)
∆ net margins30yr average
age 7Current age
(2015)% difference
(100 = very likely)
IoT PaaS software
PLM software
Cobots 3D printing AGVs RFIDsIoT PaaS software
PLM software
Cobots 3D printing AGVs RFIDs
Automotive 4.9% 5.4% 0.5% 6.1 6.5 6.3% 85 ◕ ◕ ◔ ◑ ◔ ◑ 1.00 1.00 1.00 1.00 1.00 1.00
Chemicals and plastics
7.0% 7.5% 0.5% 8.0 7.9 -1.4% 72 ◔ ◕ ○ ○ ○ ○ 0.25 1.00 0.00 0.00 0.00 0.00
Electronics 10.2% 10.0% -0.3% 7.5 9.5 27.2% 80 ◑ ◑ ◔ ◔ ◔ ◔ 1.00 1.00 1.00 1.00 1.00 1.00
Machinery 7.9% 6.3% -1.6% 9.3 10.5 13.1% 86 ◔ ◑ ◔ ◑ ◔ ◑ 1.00 1.00 1.00 1.00 1.00 1.00
Food products, beverages & tobacco
9.3% 9.9% 0.6% 8.5 8.6 1.4% 68 ◔ ◔ ○ ○ ◔ ◑ 1.00 1.00 0.75 0.50 1.00 1.00
Metals 2.0% 2.7% 0.7% 11.8 11.4 -3.7% 72 ◔ ◔ ○ ○ ◔ ○ 0.75 1.00 0.00 0.50 0.75 0.50
Wood and paper products
4.8% 7.0% 2.2% 8.0 9.2 13.9% 74 ◕ ○ ○ ○ ◔ ○ 1.00 0.75 0.50 0.25 1.00 0.75
Textiles, leather & wearing apparel
n.a. n.a. n.a. 9.2 12.2 33.0% n.a. ○ ◔ ○ ◔ ◔ ◔ 1.00 0.75 1.00 0.50 1.00 1.00
Notes: 1 GFCF data from the World Bank, broken up using data from the OECD and China Statistical Yearbook 5 Automotive software penetration adjusted up according to analyst discretion 2 Robot penetration indexed against automotive; software penetration indexed against electronics 6 Net margins of global GS coverage in each industry, note not entire industry and some companies in the sample have exposures to other industries3 Weighted average of density in Germany, Japan, France, Italy and UK 7 Average age data is for the US only4 Software as a % of investments in private non-residential fixed assets in the US; automotive includes other transport equipment 8 Qualitative assessment of penetration at analyst's descretion (actual penetration may be less or greater)
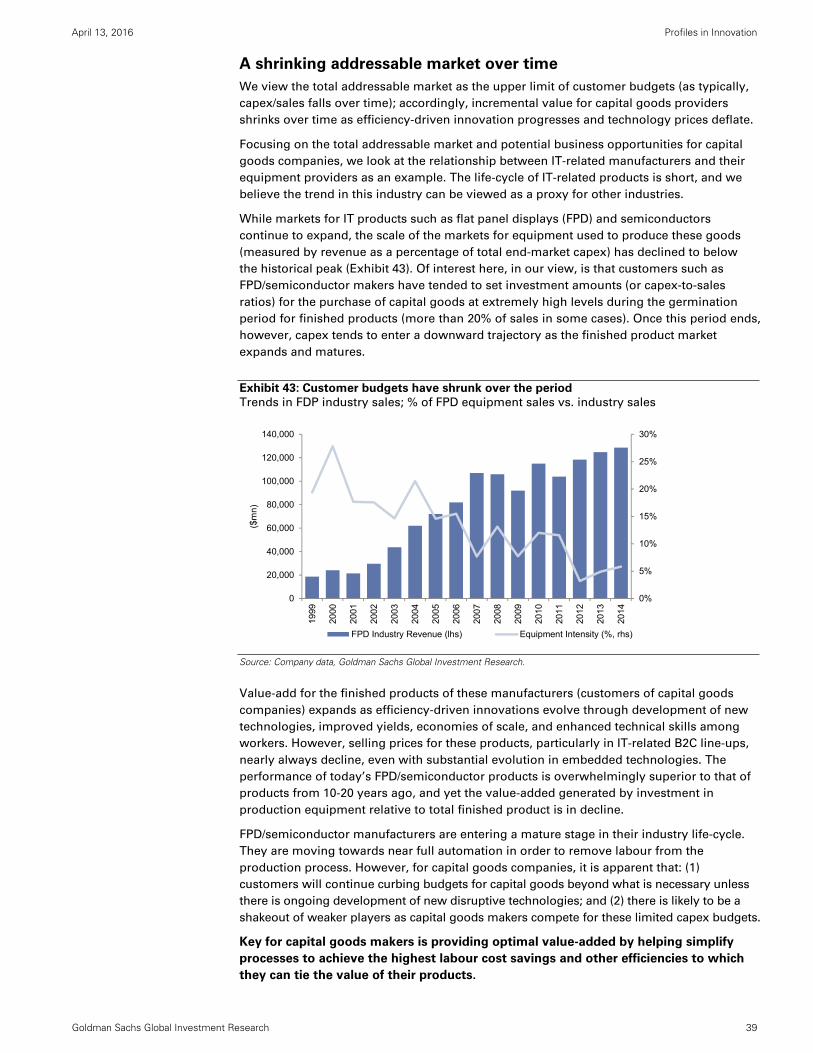
April 13, 2016 Profiles in Innovation
Goldman Sachs Global Investment Research 39
A shrinking addressable market over time
We view the total addressable market as the upper limit of customer budgets (as typically,
capex/sales falls over time); accordingly, incremental value for capital goods providers
shrinks over time as efficiency-driven innovation progresses and technology prices deflate.
Focusing on the total addressable market and potential business opportunities for capital
goods companies, we look at the relationship between IT-related manufacturers and their
equipment providers as an example. The life-cycle of IT-related products is short, and we
believe the trend in this industry can be viewed as a proxy for other industries.
While markets for IT products such as flat panel displays (FPD) and semiconductors
continue to expand, the scale of the markets for equipment used to produce these goods
(measured by revenue as a percentage of total end-market capex) has declined to below
the historical peak (Exhibit 43). Of interest here, in our view, is that customers such as
FPD/semiconductor makers have tended to set investment amounts (or capex-to-sales
ratios) for the purchase of capital goods at extremely high levels during the germination
period for finished products (more than 20% of sales in some cases). Once this period ends,
however, capex tends to enter a downward trajectory as the finished product market
expands and matures.
Exhibit 43: Customer budgets have shrunk over the period
Trends in FDP industry sales; % of FPD equipment sales vs. industry sales
Source: Company data, Goldman Sachs Global Investment Research.
Value-add for the finished products of these manufacturers (customers of capital goods
companies) expands as efficiency-driven innovations evolve through development of new
technologies, improved yields, economies of scale, and enhanced technical skills among
workers. However, selling prices for these products, particularly in IT-related B2C line-ups,
nearly always decline, even with substantial evolution in embedded technologies. The
performance of today’s FPD/semiconductor products is overwhelmingly superior to that of
products from 10-20 years ago, and yet the value-added generated by investment in
production equipment relative to total finished product is in decline.
FPD/semiconductor manufacturers are entering a mature stage in their industry life-cycle.
They are moving towards near full automation in order to remove labour from the
production process. However, for capital goods companies, it is apparent that: (1)
customers will continue curbing budgets for capital goods beyond what is necessary unless
there is ongoing development of new disruptive technologies; and (2) there is likely to be a
shakeout of weaker players as capital goods makers compete for these limited capex budgets.
Key for capital goods makers is providing optimal value-added by helping simplify
processes to achieve the highest labour cost savings and other efficiencies to which
they can tie the value of their products.
0%
5%
10%
15%
20%
25%
30%
0
20,000
40,000
60,000
80,000
100,000
120,000
140,000
1999
2000
2001
2002
2003
2004
2005
2006
2007
2008
2009
2010
2011
2012
2013
2014
($m
n)
FPD Industry Revenue (lhs) Equipment Intensity (%, rhs)

April 13, 2016 Profiles in Innovation
Goldman Sachs Global Investment Research 40
In the smile curve shown in Exhibit 44, which illustrates the general distribution of value-
added along the supply chain in the manufacturing industry, production processes are
located at the lowest point. In view of the downtrend of capex-to-sales throughout the life-
cycle of each product, as mentioned above, it is not easy for capital goods producers to
achieve an increase in payments from customers for value added. One solution to this
problem is to strive to provide value added to capture investments allocated by customers
to other areas. For instance, we think it is important to determine whether or not there are
economic rationalisations to be achieved simply by taking fixed operating costs and
turning them into depreciable costs.
Exhibit 44: Manufacturing is located at the lowest point
of value add in the production process Smile curve of value added in the production process
Exhibit 45: Japanese customer budgets entered a
downward trajectory once manufacturing had matured
2-year moving average (capex + R&D)/sales for 30 of the
largest manufacturing companies today
Source: IEC.
Source: Goldman Sachs Global Investment Research.
A typical example of where capital goods companies have been able to demand a greater
share of customer budget was the substantial value-added achieved through introducing
industrial robots in the autos industry. The cost of introducing robots is falling each year;
we estimate standard upfront costs are now around US$100,000-200,000, including system
integration costs. If the depreciation horizon (5-10 years) is taken into account, operating
costs fall to a level comparable with labour costs (around US$20,000-30,000 per year).
Depending on the size of the customer and production characteristics, the use of robots
can have significant advantages over labour in view of their higher productivity and
precision, as well as the potential to reduce trade union bargaining power and of course
labour costs. In the 1980s, this rationale triggered a sharp increase in the uptake of robots;
however, since this ‘revolution’, the capex-to-sales ratio for the industry has been in
decline. For the electronics, food & beverage and machinery industries, we believe FoF
technologies are capable of adding significant value and their share of customers’ budgets
will respond accordingly.
If we scale this analysis up and look at the world’s largest manufacturers, using Japan as a
case study, we can see how industrial development affects budgets. Since the 1980s,
Europe and US customer budgets have been on a downward trajectory. In Japan, during
the nascent years of its manufacturing industry, budgets rose and exceeded those of
Europe and the US until the broader manufacturing industry matured and budgets also
began heading into a downward trajectory. Currently, the (capex + R&D)-to-sales ratio for
China’s largest manufacturing companies is still at 5% (Exhibit 45), highlighting where
significant opportunities for equipment providers still exist.
Higher
Va
lue a
dd
ed
Lower
Time
Production chain
Manufacturing
Concept/R&D
Branding
Design Distribution
Marketing
Sales/after service
Manufacturing createsthe least value
3%
5%
7%
9%
11%
13%
15%
19
81
19
83
19
85
19
87
19
89
19
91
19
93
19
95
19
97
19
99
20
01
20
03
20
05
20
07
20
09
20
11
20
13
20
15
Japan
Europe
US
China
April 13, 2016 Profiles in Innovation
Goldman Sachs Global Investment Research 41
Industry-by-industry deep dive
The future of the manufacturing ecosystem will differ markedly for each industry.
Influencing factors include: (1) the current level of automation; (2) the market
pressures industries are facing; (3) the nature of the products they produce; and (4)
other factors such as labour intensity and asset age. Even within each industry,
companies are likely to employ different levels of sophistication depending on the
products that they manufacture and where the highest leverage in the cost structure
stands. While autos has pioneered automation owing to thin margins, even there
opportunities remain (e.g. for cross-plant integration). Within underpenetrated
industries, we see the highest potential for automation in electronics, food &
beverage and machinery.
Automotive – TAM up to US$70 bn
We estimate that around 19% of global manufacturing fixed asset investment goes into the
automotive industry, worth around US$900 bn. Regional hotspots include the US,
Germany, Japan and China. The automotive industry has pioneered industrial automation
from the early 1970s: it is by far the largest market for industrial robots, accounting for 43%
of global robotics sales in 2014. Its companies have also been early adopters of the latest
technologies highlighted in this report.
In our view, capital goods companies have limited scope to add incremental value in the
autos industry given its already highly sophisticated production processes. However, we
believe the competitiveness of the industry and the margin pressure that car manufacturers
face will continue to place them at the forefront of adopting the latest technologies. Given
that the market is dominated by a handful of OEMs, we expect automakers to continue to
exert increased pricing pressure on their equipment providers, squeezing capital goods
companies. We do not expect OEM capital goods budgets to get bigger, but rather to
shrink, reflecting the relentless pressure to reduce costs (with our GS Capex Tracker
pointing to a -0.8% capex CAGR for 2015-18E). When making the decision of where to
manufacture products, the automotive industry is still highly influenced by tariffs, which
are present in all major manufacturing locations.
We believe the two key technologies for this industry given the current levels of
penetration are increased usage of automatically guided vehicles and the
introduction of collaborative robots.

April 13, 2016 Profiles in Innovation
Goldman Sachs Global Investment Research 42
Electronics – TAM up to US$120 bn
We estimate that around 20% of global manufacturing fixed asset investment is into the
electronics industry, worth over US$950 bn. In our opinion, this industry has the greatest
opportunities despite its already relatively high levels of automation. If it were to fully
introduce the disruptive technologies that we highlight, in particular within the final
assembly line, then we believe maximum cost savings to the industry could equate to a
TAM of around US$120 bn. This would be a very important contributor in an industry
plagued by the challenge of constant product price deflation.
While not to the same extent as in the automotive industry, the manufacturing processes in
electronics are already quite mature in terms of automation, and there are powerful
customers within this industry. As a result, we predict a similar outcome for capital goods
companies in electronics as in the automotive industry: we expect the absolute volume size
to remain significant and the industry to be one of the early adopters of new technologies,
but capital goods companies’ ability to claim some of the profit pool and the growth in
customer budgets is likely be quite limited.
While all FoF technologies have significant relevance in electronics, we believe the
physical manufacturing technologies (cobots and 3D printing) and in-factory logistics
(AGVs and RFID) have the greatest potential.
BMW’s automation story
Stage 1: In the mid-1990s, BMW introduced its first large installations of industrial robots and leap-in automation. BMW
transformed its production lines from car-body manufacturing to employing hundreds of robots and pushing the level
of automation up to more than 80%.
This all came at the same time that substantial developments were made in the computer industry, which also had an
impact on Programmable Logic Controller (PLC) technology. The basic automation concept was born to link a
centralised PLC together with a number of robots. The robot was completely controlled by the PLC. With much larger
installations, machine and human safety became an issue as the PLC capacity became an increasing constraint.
Stage 2: After 2000, Safety PLCs and Decentralised Periphery (DP) were introduced to eliminate this constraint and
allow even larger installations with an automation level of up to 97%.
In parallel, the robot controller became more powerful and able to perform additional tasks such as safety-related
operations. Software replaced hardware and allowed the robot to operate in a safer way with higher flexibility. At the
same time, the mechanics got better, allowing a much higher degree of accuracy. New applications became possible,
such as Remote Laser Welding, creating new possibilities for products.
Stage 3: Now, a typical installation at BMW involves between 800 and 1,000 industrial robots able to handle 10-750 kg
payloads. Approximately 150 PLCs are connected to the robots and the Master Production Scheduling IT System,
allowing one-piece production for up to six different car derivatives on one line. Data-Matrix and Bar-Codes are used to
steer the manufacturing of the car body shell. The Master Production Scheduling is held in a Cloud and represents a
comprehensive virtual overview of what is happening on the shop floor to guarantee that the customer’s car is
delivered on time with the correct and individual specifications.
Source: International Federation of Robotics

April 13, 2016 Profiles in Innovation
Goldman Sachs Global Investment Research 43
“The food industry as a whole is probably the next largest sector [for automation] but it is very diverse. Robots are currently mainly being used here in downstream packaging, palletising and logistics and not very much in processes upstream of packaging. There is great potential to use robots in future for handling and processing tasks, such as cutting, positioning, inspection. It is already being done but much less than it could be.” Robotics expert from the International
Federation of Robotics Corporation
Machinery – TAM up to US$110 bn
We estimate that around 10% of global manufacturing fixed asset investment is into the
machinery industry, worth US$450-500 bn. Similar to the automotive and electronics
industries, competition is based on innovation and quality. Machinery also consists of
highly tradable goods, where manufacturers have access to global markets. However,
volumes are substantially lower than in autos and electronics and machinery
manufacturers are not able to take advantage of economies of scale in the same way that
those two industries can – this is one of the major reasons why the level of automation is
currently relatively low. As costs come down and capabilities improve, we expect to see
much greater adoption rates. Starting from a low level of automation, we see machinery as
having the potential to be one of the largest addressable markets.
Similar to the automotive industry and electronics, all FoF technologies highlighted
are relevant, but we see the most potential for the three with the lowest current
penetration: IoT PaaS, AGVs and cobots.
Food products, beverages & tobacco – TAM up to US$100 bn
We estimate that around 8% of global manufacturing fixed asset investment is into the
food products, beverages & tobacco industry, worth US$350-400 bn. Food products,
beverages & tobacco are manufactured in locations that simultaneously optimise proximity
to raw materials and end customers. This is because the products must be fresh and
appeal to local preferences. As a result, food manufacturing typically has quite low
tradability, although some products such as
powdered milk and frozen seafood are heavily
exported. As in chemicals (and indeed other
process industries), IoT cloud-based platforms for
holistic management of plant networks and the
use of virtual modelling for plant design and risk
mitigation during operations are likely to be the
more significant investments in the near term.
In our view, the FoF technologies AGVs, IoT
PaaS, and PLM software offer the greatest
opportunity. PLM software is used by Coca Cola
to design bottles for better CO2 dispersion and by
MWV, a global packaging provider, to reduce the
development timeline from 18 to six months.
Metals – TAM up to US$70 bn
We estimate around 8% of global manufacturing
fixed asset investment is into the metals industry, worth more than US$350 bn. Metals plants
are resource- and energy-intensive and their products are heavy and bulky, so the most
important factors for success in those industries include easy access to raw materials, low-cost
energy and inexpensive transportation. Similar to chemicals, the longevity of plants delays
adoption and some of the technologies highlighted in this report are not appropriate for the
industry (as it is characterised by flow type production vs. discrete batches). We believe PLM
software is the most relevant for this industry, but there is also significant potential for
AGVs and IoT PaaS.

April 13, 2016 Profiles in Innovation
Goldman Sachs Global Investment Research 44
Chemicals and plastics – TAM up to USS$70 bn
We estimate that around 21% of global manufacturing fixed asset investment is into the
chemical and plastics industry, worth US$950 bn-US$1 tn. Chemicals include bulky,
commodity-type products with relatively low trade intensity, but also R&D-intensive
pharmaceuticals and cosmetics that have high value density and tradability. The variety of
products within this industry requires a number of different production environments, and
the size of the opportunity for capital goods providers will vary accordingly.
Chemicals is the largest manufacturing industry in terms of fixed asset investment, and
given its size it is a huge market for equipment providers. However, we believe that the
chemicals industry will be especially slow to adopt the latest FoF technologies, if at all in
some cases. First, a number of the technologies highlighted are directed towards use in
discrete manufacturing industries rather than the production of continuous flow liquid or
gas processes (e.g. cobots or AGVs). Chemicals scores relatively low on our “pressures to
automate” metrics. And second, chemical refineries and plants are particularly risk averse,
for two main reasons:
The uncertain longevity of new technologies. According to BASF, the average
process plant has a lifecycle of 30 years, compared with 10-15 years for automation
hardware and just five years for software. A chemicals plant has to be certain that the
technology will last without resulting in downtime.
Confidence in cyber-security. As we are still in the nascent stages of IoT software, the
chemical industry has been reluctant to fully adopt the technology. Despite potential
productivity gains, in these early days, there is too high a cost of failure to decentralise
decision-making, as security breaches raise the possibility of explosions,
environmental damage and injuries or fatalities.
Nevertheless, we expect PLM software to be an increasingly important technology
for the industry. We also expect an increased adoption of IoT PaaS software; however,
this technology is only likely to be used for data analytics/real-time surveillance
rather than control actuators (which make decisions) using technologies such as
wireless secondary sensors.
Wood & paper products – TAM up to US$50 bn
We estimate that around 4% of global manufacturing fixed asset investment is into the
metals industry, worth more than US$200 bn. The manufacturing process is fairly resource-
intensive, involving products that have a low value density. This industry is already
characterised by high software intensity – above that of automotive and electronics – and it
is becoming increasingly automated, particularly in developed markets. We highlight IoT
PaaS software and AGVs as the two most relevant technologies, where AGVs is the
least penetrated of the two.
Textiles, leather & wearing apparel – TAM c.US$10 bn
Accounting for only c.1% of global manufacturing fixed asset investment (worth c.US$50 bn),
the textiles, leather & wearing apparel industry is the smallest industry we look at. Textiles,
leather & wearing apparel is the most labour-intensive industry in our analysis, and so far,
companies have typically responded to rising wages by moving to lower-cost locations. For
example, we are seeing dramatic growth of textile industries in countries such as
Cambodia, Bangladesh and Vietnam, as companies leave countries with rapidly rising
wages, including China. However, given the very low level of automation, we expect the
industry to benefit from labour-reducing technologies: cobots and AGVs. RFID and
IoT PaaS are also important technologies.

April 13, 2016 Profiles in Innovation
Goldman Sachs Global Investment Research 45
Winners & losers
Increasing factory floor digitisation leaves room for more players in the
manufacturing arena, beyond the traditional capital goods companies
As new players emerge, we are likely to see more M&A, redefining the
competitive landscape
New business models will also emerge, as localisation, customisation,
predictive management and control and monitoring are facilitated, but will
likely also drive deflationary pricing pressures in traditional hardware
April 13, 2016 Profiles in Innovation
Goldman Sachs Global Investment Research 46
New players, new business models
We expect more players to serve the market for future manufacturing technologies
than the traditional capital goods equipment providers that have dominated the past
decades. The boundaries between software/connectivity providers and hardware
equipment are blurring. As this happens, we expect M&A to increase, as well as new
business models to emerge through new aftermarket services and data analytics
consulting. Regional balances in manufacturing are also likely to be challenged, with
EMs that are pressured on cost leadership likely to adopt some of the newest
technologies more quickly.
New players emerging
The flip side of digitisation is that software allows for better optimisation of current asset
bases by increasing utilisation rates, reducing the need for capital goods, and introducing a
new set of formidable competitors: the SAPs and IBMs of this world. As the world of capital
goods goes increasingly digital, the incumbents need to navigate a fine line between the
opportunity and the threat of digitisation.
The opportunity sounds huge, but it is not free of challenges. Perhaps the most important
one for capital goods companies will be to grow fast enough and reach sufficient size to
offset the cannibalisation effect of better-optimised factories resulting in less demand for
‘hard’ equipment. For instance, increasing the utilisation of a fleet of compressors from
50% to 80% (through connecting it to an IoT PaaS) would reduce the number of
compressors needed by close to 40%, but would not materially change the service needed
and would involve substantial IT investments. Both servicing and IT investments are not
necessarily only provided by the manufacturers of equipment.
Second, some of the FoF-enabling technologies, such as software, are not exclusively
provided by traditional capital goods companies; indeed, the likes of IBM, Oracle and SAP
are increasingly trying to penetrate markets traditionally served by electrical and
machinery makers. Capital goods companies have the advantage of understanding how
the physical assets of their customers work, but lag on the software side of engineering
skills vs. the big IT providers.
Cisco expands IoT presence with cloud-based service platform provider Jasper
What is Jasper? In March, Cisco completed the acquisition of Jasper Technologies, a cloud-based IoT service platform,
for US$1.4 bn. Jasper allows both enterprises and service providers to automate management of IoT services and drive
monetisation on a global scale. Jasper currently has over 3,500 enterprise customers and works with 27 service
providers in over 100 countries. The company targets a wide range of verticals including automotive, home automation,
and manufacturing; customers include General Motors and Garmin. On the service provider side, per a 2014 Infonetics
report, Jasper is among the key technologies supporting M2M platforms for AT&T, China Unicom, Telefonica, and
Telenor. Jasper delivers its platform through a ‘Software as a Service’ revenue model.
What does it mean for Cisco? Cisco intends to wrap Jasper’s platform into a holistic IoT solution by layering in
additional services including enterprise Wi-Fi, security for connected devices, and analytics to add-in device
management. We view Jasper’s platform as complementary to Cisco’s existing IoT product suite and believe a
combined offering will further extend Cisco’s IoT leadership. Recall that over the past several years Cisco has invested
over US$1 bn in this emerging opportunity, which was generating US$2.4 bn in annual sales and growing at 45% per
annum (per IoTWF in October 2014).

April 13, 2016 Profiles in Innovation
Goldman Sachs Global Investment Research 47
More corporate action to come
Finally, it will be difficult to drive a meaningful earnings contribution from software and
more connected assets in the near term purely through organic actions. This leaves M&A
as one of the main levers companies are likely to use to tackle this opportunity. Several
deals over the past few years in the capital goods sector highlight that there is already a
focus on this: ABB acquired Ventyx and Mincom, two providers of enterprise software
solutions for asset monitoring, in 2010/11; Schneider acquired Telvent, a provider of
software for asset management, in 2011; Teradyne acquired Universal Robots in 2015; and
Amazon acquired AGV maker Kiva in 2012. Within the sector, the ability to generate value
from transformative deals has varied significantly by company. We believe the companies
that can generate cash more quickly through their current portfolios will be better
positioned to benefit from this inorganic opportunity; as tech companies enter the industrial
space, we expect to see more M&A from industrials into tech as firms try to stay ahead.
Exhibit 46: Sector boundaries are blurring… # of deals where cap goods companies acquire software
targets
Exhibit 47: …as US tech companies target manufacturing # of deals where US tech acquirer targets industrial targets
Source: Bloomberg, Goldman Sachs Global Investment Research
Source: Bloomberg, Goldman Sachs Global Investment Research
The emergence of new business models
For equipment makers to succeed in the next phase of manufacturing, a first-mover
advantage and leveraging the installed base will be key. Digitisation will affect
companies in different ways. In an environment with less growth and more EM
competition, installed bases will increasingly be the key competitive advantage for global
capital goods companies. Those that already have a high penetration of services and
maintenance in their sold equipment have a quicker lead into understanding what revenue
streams can be levered/protected by better device connectivity. Taking history as a guide,
we believe that whether digitisation turns out to be an opportunity or a threat will
ultimately reflect each company’s underlying ability to reinvent itself. We see companies
that have a good knowledge of their installed base and a superior ability to redeploy capital
as better positioned (as highlighted in the Competitive Positioning metrics presented in our
report Preparing for the next industrial revolution, April 28, 2014). Which players are able to
capture the benefits of the exponential creation of data in the industrial space remains to
be seen, but three benefits appear almost certain for those that can:
0.0%
0.5%
1.0%
1.5%
2.0%
2.5%
3.0%
3.5%
4.0%
4.5%
5.0%
0
10
20
30
40
50
60
2007 2008 2009 2010 2011 2012 2013 2014 2015
No. of software deals (LHS)
Software deals as % of CapGoods deals (RHS)
0.0%
1.0%
2.0%
3.0%
4.0%
5.0%
6.0%
7.0%
0
10
20
30
40
50
60
70
2009 2010 2011 2012 2013 2014 2015
No. of US technology industrial deals (LHS)
Industrial deals as % of US Tech deals (RHS)

April 13, 2016 Profiles in Innovation
Goldman Sachs Global Investment Research 48
Controlling data will probably mean more customised value-add client interactions.
Data gives companies capacity to be more proactive in addressing customer issues.
More frequent client interactions most likely mean more resilient revenue streams…
...while more customised value-add client interactions usually mean better margins
and returns.
As machines take over, business models will need to evolve quickly. In developed
markets, the penetration of PCs, tablets, and smartphones is now almost complete, with
75% of people in the United States having access to mobile broadband internet. This
phenomenon has changed the way we work, communicate and consume so much that it is
difficult to remember what it was like in the 1990s. As unintuitive as it sounds in the era of
Facebook, Google and SAP, the vast majority of capital goods companies still interact with
their installed base and customers in the same way we interacted with each other in the
1980s. For the majority of industrial companies, if equipment needs servicing, customers
will call an onsite technician. But this is all about to change. What the IT revolution has done
to how humans work and communicate over the past 20 years is now happening to machines;
and it has the potential to be as revolutionary to how machines operate from day to day as it
has been for us. In our view, this is likely to disrupt many business models for the
companies that produce and maintain these machines, creating business opportunities for
the companies that best utilise the data and, just as it has for consumers, imply
deflationary pressure on “like-for-like” products. Innovation will need to be faster and
business models more agile, and, most importantly, the way capital goods companies
interact with their customers will have to change.
However, when we look back historically, multi-industry capital goods companies have a
track record of reinventing themselves and some of them are already on that path again
with their latest digitisation-related deals (e.g. Schneider, Siemens and GE).
Exhibit 48: Digitisation amplifies recurring revenues Recurring revenues as % total for our European software vs.
capital goods coverage (2013)
Exhibit 49: Companies that succeed in leveraging
digitisation to create recurring revenues will benefit from
greater stability… Service/aftermarket estimated peak-to-trough sales growth
over the past 15 years
Source: Company data, Goldman Sachs Global Investment Research
Source: Company data, Goldman Sachs Global Investment Research.
59%
51%
20%
25%
0%
10%
20%
30%
40%
50%
60%
70%
Average Median
% S
ale
s fr
om c
aptiv
e bu
sin
ess
Software Traditional Capital Goods
0pp
10pp
20pp
30pp
40pp
50pp
60pp
70pp
80pp
90pp
Alstom(GE) -
ThermalPower
AtlasCopco
FLSmidth Kone Metso SchneiderElectric
Wartsila Weir -Minerals
Pea
k-to
-tro
ugh
Sal
es G
row
th G
ap
Aftermarket/Service Products

April 13, 2016 Profiles in Innovation
Goldman Sachs Global Investment Research 49
The expected winners – large installed bases; data analytics leaders
We do not have a clear-cut answer on whether hardware or software providers will win the
race to capture value from higher automation. What is clear to us is that hardware makers
with large installed bases will have a privileged position and software providers with big
data analytical expertise can make meaningful inroads. In the short to medium term, the
need for equipment to upgrade capex may benefit the hardware makers, but we believe
that over the long run, more of the technologies profiled will make the manufacturing
system more optimised, longer lived and ultimately in need of lower capex.
Leading hardware makers could leverage their large installed base and provide production
process/product optimisation services based on big data collected from their equipment.
Most major Western capital goods companies are already ramping up their software teams
and R&D spending in order to be prepared for this.
The largest beneficiaries will likely be the key component makers for enabling input
technologies, such as those in the semiconductor/sensor industry, as the billions of
machines to be inter-connected will create a substantial opportunity for their product.
Providers of integrated Enterprise Resource Planning and Manufacturing Execution System
software should also benefit from more data being available, which will drive upgrades of
capacity of existing systems.
Where will it be built? Challenging regional establishments The past three decades have seen unprecedented levels of globalisation as companies from
developed economies relocated their manufacturing practices to lower-cost emerging markets.
We expect the future of manufacturing to be less labour-intensive, although more skilled
labour will be needed. Speed to market will become increasingly important and we expect
transport costs as a percentage of total costs to increase. Therefore, some of the motives
that fuelled globalisation in recent years are no longer likely to influence decisions. Instead,
we expect a critical factor to be manufacturers’ need to be closer to their customers. Does
this mean we will see a wave of reshoring? Not necessarily, as most of the growth in new
customers is still coming from emerging economies.
IoT allows Kaeser Kompressoren to shift to a more competitive equipment-as-a-service business model
The challenge: Like any traditional manufacturer of capital goods equipment, Kaeser was searching for incremental
revenue drivers to optimise its capacity in the face of slowing end markets.
The solution: A few years ago, it began incorporating sensors in its compressors and examining the data it collected in
a SAP IoT platform as a potential source of incremental revenue. It started by building a predictive maintenance
programme, but ultimately it completely reinvented its way of selling its products while simultaneously increasing its
customer base: selling compressed air, instead of air compressors. This shift opened up the compressor market
opportunity to smaller customers for which the decision to buy compressors would mean too much of a capital
commitment; instead, these customers can tie their investment to their revenues (i.e. pay for the air as they use it).
Sensors and big data made it possible for Kaeser to build the platform for this new business. Furthermore, this new
business model encouraged the company to be more cost conscious: as the machines are no longer the revenue-
producing element and customers pay for uptime, having faultless compressors that do not require any onsite service is
the primary goal (i.e. Kaeser makes material savings on service staff).

April 13, 2016 Profiles in Innovation
Goldman Sachs Global Investment Research 50
China: The factory of the world
China is still the largest major manufacturing centre in the world, representing 30% of
global manufacturing GDP. Chinese companies have been talking extensively about
Industrie 4.0, but we think most companies have yet to complete the 3.0/automation stage.
Shanghai Highly Group, for example, one of China’s largest compressor manufacturers,
started to employ Industrie 4.0 in its production process, but a lack of big data analytical
capacity/platform has limited its efforts to move towards intelligent administration and
intelligent production.
Automation is still low in China, and while the labour cost gap is narrowing, the country
still benefits from significantly less expensive talent than in DMs, suggesting a continued
incentive for a slow conversion of manufacturing from manual to automated. In our
analysis of customer budgets, we note that the capex-to-sales ratio of manufacturing
companies is still much lower than that of the mature DM manufacturing companies.
Exhibit 50: Robot penetration varies markedly even in autosRobots per 10,000 workers vs. cars produced in 2014
Exhibit 51: China’s technology gap may be narrowing in
electrical engineering but mechanical engineering is still
far behind Patent Cooperation Treaty application by country
Source: IFR, IHS Global Insights, Goldman Sachs Global Investment Research.
Source: World Intellectual Property Organization.
What about the west?
The US and Germany continue to lead several new technological developments, although
even in these areas China is catching up. As our GS SUSTAIN team argue in their report
Germany AG: Don’t look back (September 16, 2015), corporate Germany’s leadership in
‘premium hardware’ has been a key driver of its success over the last decade. However, the
“premium” element of hardware will increasingly be defined by the software and servicing
elements attached to it. This transition introduces new and formidable competitors, changes
what constitutes a successful business model, and more broadly puts Germany’s competitive
advantage “up for renewal”. In its core areas of strength, autos, capital goods and consumer
durables, Germany’s corporates need to lead this technological transition in order to sustain
their leadership. The rise and fall of Germany’s consumer electronics industry provides an
example of the risks involved in not keeping pace with disruptive change.
0mn
5mn
10mn
15mn
20mn
25mn
0
200
400
600
800
1000
1200
1400
1600
Japan Germany USA France Italy Indionesia China Turkey India
Number of industrial robots per 10,000 persons employed in the automotive industry(LHS)Cars produced (RHS)
0
10,000
20,000
30,000
40,000
50,000
60,000
70,000
2004
2006
2008
2010
2012
2014
2004
2006
2008
2010
2012
2014
2004
2006
2008
2010
2012
2014
2004
2006
2008
2010
2012
2014
Mechanical engineering Chemicals Electrical engineering Others
China Germany Japan US

April 13, 2016 Profiles in Innovation
Goldman Sachs Global Investment Research 51
Asia’s Automation Future
Over March 9-29, we hosted a factory automation tour, visiting 26 factory automation-related companies in Japan and
China. Below, we highlight examples of how manufacturers in Asia, previously renowned for low labour costs, are in
the midst of rapid change to become the factories of the future.
Best in class of Asia part 1: New Chinese factories are among the most automated in the world
China is now experiencing the kind of rapid change that previously forced Japan and other developed economies to
increase factory automation. The pace at which it is happening in China is eye-catching. In addition to rising personnel
costs and other fixed costs, automation is being driven by demand for higher quality and precision, and limits to
economies of scale.
China’s auto industry is the most conspicuous example. Typically speaking, the auto industry has the highest
automation rate (robot penetration) of all industries. What is noteworthy is that the new auto plants in China actually
have the highest penetration rate of robots across the globe.
For example, Nissan’s Dalian plant, its newest plant in China (production started in October 2014), has a robot
penetration rate of 83%, the highest of any Nissan plant in the world. By contrast, the robot penetration rate at Nissan’s
Huadu plant, which started production in May 2004, is still around 56%. Local company Geely Auto is aggressively
automating/installing the newest machines in stamping, welding, and painting processes at its new Ningbo plant, which
was undergoing renewal to make the new model “Pore”. The reason for the aggressive automation on these processes
is that these are critical determinants of vehicle performance. Geely Auto has installed the newest foreign capital
goods/machines instead of Chinese local machines. The plant has monthly production capacity of around 150,000 units
and uses more than 100 spot welding robots; a ratio on a par with that of foreign automakers’ plants.
Best in class of Asia part 2: Penetration is uneven and initial investment is still large
Automation penetration in China’s electronics industry is very uneven. Shortening return on investment periods and
decreasing fixed-cost burdens are key factors in the semiconductor fabrication space. Having the newest SPEs/fully
automated production lines is critical to make the latest/most advanced nodes, and manufacturing in China is no
exception. Yet, the rate of automation is much lower on high-volume products with wider processing nodes (for devices
used in autos or conventional electronic applications) and among Chinese companies, as they try to balance the fixed
cost burden by leveraging manual labour/assemblies and second-hand SPEs.
Chinese electronic manufacturing service (EMS) companies have strengthened their market presence in recent years.
The level of automation in EMS plants is on an altogether different level to that of traditional industries, particularly for
smartphones, where annual production runs to several tens of millions of units. Hon Hai, China’s largest EMS company,
procures thousands or even tens of thousands of production machines from different FA companies every year, i.e. the
number of robots in a single-product new auto plant is typically in the hundreds. In contrast, an EMS may have to
introduce thousands more robots to make a new product.
Best in class of Asia part 3: Factories of the future may appear sooner than expected
Given China’s supportive policies, we think a factory of future may appear in China sooner than expected (even though
it may not be justified economically yet). A leading system integrator has stated that it is in discussion with a provincial
level government industrial investment fund (Rmb20 bn AUM) to build a highly automated pilot factory, fully funded by
the aforementioned fund, to set an example for the manufacturing industry for that region. The factory is supposed to
include hardware and manufacturing software that is as advanced as possible and may become a general
manufacturing services provider, or a factory that manufacturers in the region can rent in a flexible manner.

April 13, 2016 Profiles in Innovation
Goldman Sachs Global Investment Research 52
28 companies with exposure to the Factory of the Future
In this section we highlight a non-exhaustive group of companies exposed to the
highlighted technologies as well as some of their key suppliers.
3D Systems (DDD, Neutral): Metal platform a key differentiator
Company profile
DDD is a manufacturer and designer of additive manufacturing printers, materials, and
services, with a broad platform and historically acquisitive strategy. DDD focuses on
offering a full line of diverse printer types to service the additive manufacturing market.
Over a roughly 30-year history, DDD has pioneered many 3D printing technologies, and
through an aggressive acquisition strategy, has focused on developing an end-to-digital
manufacturing solution it calls the “digital thread”, allowing it to offer an extensive printer,
maintenance, software, healthcare, and printing service platform.
Exposure to the Factory of the Future
DDD is a global leading manufacturer of 3D printing; its technologies allow for small lot
sizes, more flexible manufacturing, and more complex manufacturing at lower costs. In
addition, we believe DDD has an advantage with respect to its ProX metal printing platform,
which it acquired in 2013 and has developed since then. We believe the industrial market is
likely to be a bigger end market for participants relative to the consumer/education markets,
and that a metal printing platform should offer a long-term competitive advantage. That
said, material knowledge needs to increase in order to spur greater adoption. DDD also
offers a more extensive suite of accessory products relative to competitors, including
design software, haptic control devices, handheld scanners, and other products.
ABB (ABBN.S, Sell): Exposed to the shift to human-robot collaboration
Company profile
ABB is a multinational group operating in the power and automation technologies sector. It
operates in around 100 countries, employing about 145,000 people. Its Power division
focuses on transmission & distribution equipment and power plant automation, serving
electric, gas and water utilities, as well as commercial and industrial customers. The
Automation business serves a full range of industries with measurement, control,
protection and process optimisation applications, including industrial robots, where it has a
global market share of 10%-15%.
Exposure to the Factory of the Future
ABB is a key enabler through its robotics business, which makes up c.5% of group
revenues. In particular, the group launched its dual-arm collaborative robot YuMi in 2015.
This product is extremely accurate, able to learn, and is connected to ABB’s global remote
condition monitoring centre. It can be integrated into production lines without the need to
redesign the space. However, ABB’s offering extends beyond just robots to software,
complete systems, fully integrated application equipment, manufacturing cells and a
comprehensive offering with IoT integration. ABB also offers additional services such as
remote monitoring and failure prediction, and remote services robot back-up. ABB’s most
recent acquisition in this space of collaborative robotics was Gomtec, a company
developing mechatronic systems combining mechanical, electrical, telecommunications,
control and computer engineering for a diverse range of customers.
Covered by Samuel
Eisner, US SMID
Capital Goods analyst
Covered by Daniela
Costa, European
Capital Goods analyst

April 13, 2016 Profiles in Innovation
Goldman Sachs Global Investment Research 53
Advantech (2395.TW, Neutral): Key supplier of embedded
components for industrial IoT systems
Company profile
Advantech is the global leader in embedded computer technology that is used to gather
data and process information in various end markets. Advantech is one of the few vendors
globally that has the capability to design from computer board & modules level to
application ready. This allows its downstream system integrator clients to easily embed
their products.
Exposure to the Factory of the Future
Advantech provides the gateways, networks, servers, visualisation and data management
products to connect and control the nodes (machines) in the Factory of the Future.
Advantech’s embedded products can be installed in the machines and make the
manufacturing process more intelligent and connected. In order to make its products
compatible with most devices globally, Advantech also partners with Intel and Microsoft and
provided the first IOT Gateway Development Integration Kit in March 2016 to accelerate the
adoption of smart factory (Industrial IoT). In addition to providing the hardware products,
Advantech also develops the IoT software “WebAccess”, which uses the Microsoft Azure
cloud platform to process comprehensive data gathered from Advantech devices in the
factory. Through the software and the cloud platform, users can benefit from highly efficient
management and fast interconnectivity among these cloud services.
Cisco (CSCO, Buy): Connecting the Internet of Things
Company profile
Cisco is a leading global provider of networking technology, including systems, software and
services, with US$49.6 bn in revenues in CY15. The company has been a long-standing leader
in the US$24 bn switching industry, with about 62% market share, and switching products
drove 30% of its total revenues in CY15. Cisco’s second-largest segment, routing, drove 15%
of total revenues, with the company having a share of about 40% in the US$10 bn service
provider routing market and 75% in the near-US$3.2 bn enterprise routing market. In addition
to its core switching and routing revenues, Cisco has a leading position in a number of other
categories, such as service provider video, which includes video infrastructure and software
(US$3.4 bn in CY15 sales), collaboration (US$4.2 bn in CY15 sales), Wi-Fi (US$2.6 bn), servers
(US$3.4 bn), and security (US$1.8 bn). Cisco’s services business, which generated sales of
US$11.5 bn last year, accounted for the remaining 23% of CY15 revenues.
Exposure to the Factory of the Future
Cisco is aggressively pushing into the IoT, with over US$1 bn of organic investment
supplemented with the recent US$1.4 bn purchase of Jasper Technologies. Jasper is a
leading cloud-based IoT service platform for both enterprises and service providers. The
company currently has more than 3,500 enterprise customers and works with 27 service
providers in over 100 countries. More broadly, Cisco’s approach to the IoT is focusing on the
industrial vertical rather than consumer markets, as that is where it sees the most value and
therefore the largest potential profit opportunity. Targeted industries include manufacturing,
transportation, smart/connected cities, oil and gas, and smart grid.
Covered by Willy Chen,
Taiwan Capital Goods
analyst
Covered by Simona
Jankowski, CFA, US
Hardware &
Communication
Technology analyst

April 13, 2016 Profiles in Innovation
Goldman Sachs Global Investment Research 54
Dassault Systemes (DAST.PA, Buy): PLM software market leader at
the heart of new industry expansion
Company profile
Dassault is a global software vendor that operates in the PLM (Product Lifecycle
Management) space, offering an integrated suite of software solutions across industries:
this accommodates the entire product lifecycle, from 3D design to mock-up, rendering,
collaboration, simulation and digital manufacturing. While historically Dassault’s core end-
markets have been automotive, aerospace and industrial equipment, over the past few
years, the company has expanded into industries such as consumer packaged goods, retail,
high-tech, construction and life sciences, which now represent c.30% of the group’s software
revenues (2015). Dassault has a total customer base of 190,000 and sells its solutions in more
than 140 countries. As of December 2015, Dassault had c.14,000 employees.
Exposure to the Factory of the Future
In our view, as the market leader in PLM software, Dassault remains a key beneficiary of
industry megatrends, such as the Internet of Things (IoT) and Factory of the Future, which
should drive pent-up demand for reinvestment to transform supply chains. Dassault has
developed, both organically and inorganically, a broad portfolio of PLM solutions
encompassing offerings such as CAD, collaboration, simulation and digital manufacturing,
catering to both OEMs and the supply chain. Its 3DExperience platform further enhances its
ability to provide a more holistic PLM offering. While historically, Dassault has had a focus
on automotive, aerospace and industrial equipment (c.60% of 2015 revenue), it has
significantly increased its addressable market by moving into adjacent product verticals
and diversified industries. Furthermore, 3DExperience will allow Dassault to create
packaged industry applications for specific processes, along with providing a common
infrastructure and thus tailoring it to specific vertical industry requirements.
Delta Electronics (2308.TW, Buy): Power behind the factory
Company profile
Delta Electronics was founded in 1971 and has been the global leader in switching power
supply since 2002 and DC (direct current) brushless fans since 2006. Delta has 38
production plants, 60 R&D centres and 153 offices across the world to provide rapid service
to its clients. Delta’s product portfolio includes power supply for consumer electronics,
system power for telecom and renewable energy, electronic components (thermal &
magnetic products) and industrial automation products (motion control & robotics). Delta
has been included in the Dow Jones Sustainability™ World Index (DJSI World) since 2011
and was the only company from Greater China to be named in the Climate Performance
Leadership Index (CPLI) of the 2014 Carbon Disclosure Project (CDP).
Exposure to the Factory of the Future
Delta launched its SCARA and articulated robots in 2015 and is planning to launch
lightweight articulated robots and parallel robots in 2016/17. With its capability to produce
the key components internally (controller, servo motor), Delta is able to provide
competitive robot products to its clients. Delta is the third-largest producer in China’s servo
motors/drives market (11% share). Aside from the robotics business, Delta also provides
power systems to datacentres and telecom base stations, which supply stable power to
support increasing demand for data processing in the Factory of the Future. Delta now
holds the global No.1 share (17%) in telecom power systems. For datacentres, Delta has
developed a modularised solution “Delta InfraSuite”, which provides a one-stop-shop
service, including power management (UPS and PDU), accessories, precision cooling and
environmental management.
Covered by
Mohammed Moawalla,
European Software
analyst
Covered by Willy Chen,
Taiwan Capital Goods
analyst

April 13, 2016 Profiles in Innovation
Goldman Sachs Global Investment Research 55
EOS GmbH (Private, Not Covered): Leader in metal printing
Company profile
EOS is a leader in sintering technology, and is headed by Dr. Hans Langer, its founder and
CEO. Following its establishment more than 20 years ago, the company expanded from the
production of SLA and SLS systems to the production of metal sintering platforms in the
late 1990s. Since the late 1990s, the company has focused exclusively on the production of
powder-based sintering. We believe EOS’s key competitive differentiation is achieved
through its expertise in laser optics and their influence on metal melt and print repeatability.
Exposure to the Factory of the Future
Additive manufacturing (AM) providers such as EOS will play a role in the Factory of the
Future by allowing for greater part complexity, smaller lot sizes, and faster prototyping and
product development. In particular, EOS focuses on a sintering-based platform, and leads
the aerospace and medical fields with its large format metal printers. One of EOS’s largest
customers is GE, which uses the company’s products in manufacturing its new LEAP
engine. In addition to the more customisable products that additive manufacturing allows,
we also believe that smaller lot sizes enabled by AM should allow for faster cycle times and
smaller capital investment for certain components of the supply chain. For instance, the
high-grade metal printing platforms offered by EOS could allow for leaner supply chains
and less inventory of replacement parts, as small footprint printers coupled with just-in-
time delivery of metal powder inventory could replace their larger investment peers.
Fanuc (6954.T, Buy): Global leader in industrial robots and CNCs
Company profile
Fanuc was founded in 1972 and is the global leader in the industrial robot and CNC
(computerised numerical control, the operating system of industrial machines such as
machine tools/plastic injection molding machines etc.) markets. Fanuc holds a global
market share of 17% in industrial robots, and more than 50% in CNC. Historically, its
operating margins (35%-40%) and CROCI (30%) have been among the highest in the global
industrials sector. The company has been able to maintain exceptionally high
margins/returns thanks to: (1) full integration of its key components (controllers, amps,
motors); and (2) a standardised and fully automated production system, which is often
represented by the term “robots making robots”.
Exposure to the Factory of the Future
Despite its dominant industry position, Fanuc has long been unable to launch new
products in entirely new sectors. However, its mass marketing of collaborative robots,
establishment of a fibre laser joint venture, and other initiatives to tap into new business
sectors suggest the company is changing. We think fully fledged development of
collaborative robots, in particular, reflects Fanuc’s efforts to generate new added value.
Collaborative robots, which are designed to work in the same environment as humans,
represent the opposite end of the spectrum to Fanuc’s founder’s concept of creating
separate working environments for humans and robots. Fanuc’s collaborative robots are
also very different in appearance, covered in a green sponge jacket as opposed to Fanuc’s
traditional yellow colour. We see this as a clear example of a change in Fanuc’s stance,
aimed at promoting products to a new customer segment.
Covered by Yuichiro
Isayama, Japan
Machinery analyst

April 13, 2016 Profiles in Innovation
Goldman Sachs Global Investment Research 56
General Electric (GE, Neutral): Driving force behind the Industrial
Internet concept
Company profile
GE is the biggest industrial player globally, with US$100 bn+ in annual revenues. GE has
dominant positions in key end markets such as power generation, jet engines, locomotives,
healthcare and O&G. In addition, GE has an extremely strong services model, as evidenced
by US$200 bn+ in services backlog that provides stability to an otherwise cyclical portfolio.
Exposure to the Factory of the Future
GE has been at the forefront of IoT, investing in and developing emerging technologies
such as additive manufacturing, data analytics and predictive maintenance. Over the long
term, we see GE as one of the best positioned companies to take advantage of these
technologies given its head start, a vast installed base and continued spending to develop
capabilities (currently c.US$1 bn run rate). Specifically, key GE initiatives that underpin our
view are: (1) Controls & sensors: several of GE’s products such as HDGTs, jet engines and
locos are big-ticket items that have long usable lives, high operating/maintenance costs
and generate a lot of data. GE has been one of the pioneers in developing sensors that can
work in hazardous environments (e.g. ceramic matrix composites) and are able to provide
detailed/real-time information; (2) Predix is the cloud platform for IoT (recently made open
source), which developers can use as the foundation for building apps that help businesses
optimise assets, fleets, and overall operations. Predix combines distributed computing, big
data analytics, asset data management, machine-to-machine communications and mobility.
The platform extends beyond GE assets to connect machines from any vendor or vintage.
Harmonic Drive Systems (6324.T, Buy): Global top share company
in small precision reducers for cobots
Company profile
Harmonic Drive Systems was established in 1970 and since its inception has concentrated
on the production of high-precision speed reducers (73% of sales). In 2014, HDS appointed
Akira Nagai, formerly of Mitsui & Co., as its new president, unveiling a long-term vision
targeting sales of ¥50 bn by FY2020.
Exposure to the Factory of the Future
Speed reducers are an important component of collaborative robots. With a global market
share of roughly 90% in speed reducers used in small assembly/transfer robots with
maximum load capacity of less than 6 kg, HDS is primed to benefit from the growth of
cobots in manufacturing. However, outside of manufacturing, we also see the service robot
market, with applications in nursing care and other services, as a promising source of
demand over the much longer term.
Han’s Laser (002008.SZ, CL-Buy): China’s leading laser solution
provider; a wide set of potential new applications
Company profile
Han’s Laser was established in 1996 and is now the No.1 laser equipment manufacturer in
China, with a 37% market share in smaller power equipment thanks to its strong market
access and cost advantage. The company has more than 200 machine models (including
the laser engraving/marking series, welding series, cutting series, sub-surface engraving
series and display series) and its equipment has been widely used in the manufacturing of
high-precision and high-consistency products such as smartphones, lithium-ion batteries
and semiconductors. Some of Han’s key customers include smartphone makers Apple,
Samsung, Huawei, Xiaomi and local lithium-ion battery makers. Han’s Laser could
potentially produce full in-house fibre laser, which may potentially further expand the
company’s margins.
Covered by Joe Ritchie,
US Multi-Industry
analyst
Covered by Yuichiro
Isayama, Machinery
analyst
Covered by Jacqueline
Du, China Machinery
analyst

April 13, 2016 Profiles in Innovation
Goldman Sachs Global Investment Research 57
Exposure to the Factory of the Future
Laser application is the icing on the cake for automation upgrades, as it is more stable,
flexible and easier to integrate into an automated production line. Han’s Laser has
comprehensive exposure to FoF in the following regards: (1) Integration of factory
automation with laser technology, such as 3D laser welding robot stations. With a laser
processing head and pre-set laser beam, the laser-robot can provide accurate multi-
dimensional welding depths/angles and capabilities. Currently, welding robots are the
second-largest industrial robot type, accounting for 25% of total robot sales in Japan as of
2014. (2) Han’s Laser established its metal 3D printing centre in December 2015. 3D
printing/additive manufacturing is a digital process using fibre lasers for metal melting or
sintering. Currently, the process is constrained by cost and material, but we expect the global
market to expand significantly over the next 15-20 years. (3) Potential new applications
include machine vision and LIDAR for autonomous driving and automated guided vehicles.
Honeywell (HON, CL Buy): Automation player leveraging a large
installed base
Company profile
HON is an industrial conglomerate with c.US$39 bn in annual revenues and diversified end
markets (resi, non res, O&G, aero and auto). HON maintains a strong position across key
end markets/product lines, which, coupled with the company’s internal repositioning
initiatives, has resulted in best-in-class execution over the past few years.
Exposure to the Factory of the Future
Since 2014, HON has greatly increased its focus on several fast-growing trends such as
connected homes and data analytics. HON has navigated through the evolving industrial
landscape by: (1) Introducing initiatives like HUE to drive faster product development; (2)
increasing its emphasis on software capabilities, with a higher proportion of headcount
additions and M&A spend going towards this; and (3) leveraging its vast and diversified
installed base (130,000 aircraft, 100 mn vehicles, 150 mn homes etc.) to drive increased
data collection; this, coupled with HON’s analytics and cloud services, should help with
predictive maintenance, improved productivity and higher customisation. In addition, HON
has a strong position in RFID (the number 2 player globally in scanning & mobility) and has
bolstered its portfolio through the acquisition of Intermec. HON’s products include RFID
readers, printers, tags, smart labels and mobile computing solutions. Specifically, HON’s
range of Optimus mobile computers helps customers realise the benefits of RFID in a
dynamic manner (including data collection), enabling better supply chain and inventory
management, and allowing for real-time decision making.
Inovance Technology (300124.SZ, Buy): China's top-class motion
control supplier
Company profile
Shenzhen Inovance Technology is one of the most innovative industrial motion control
suppliers in China. Inovance launched its first product, low-voltage inverters, back in 2004,
and became the No.1 domestic player in China’s servo market in 2008. Currently, the
company’s products are applied in a wide range of downstream industries, including
elevator control systems for elevator OEMs, and EV controllers for Yutong Bus (one of the
largest EV bus makers in China). The company also supplies a broad range of factory
automation products (including servo, PLC and sensors). Inovance has grown its business
organically through expanding its strong R&D workforce, while actively investing in
emerging areas of technology. The company invested in its machine vision subsidiary in
2013, and has become the domestic pioneer in this field.
Covered by Joe Ritchie,
US Multi-Industry
analyst
Jacqueline Du, China
Machinery analyst

April 13, 2016 Profiles in Innovation
Goldman Sachs Global Investment Research 58
Exposure to the Factory of the Future
We believe Inovance’s products are indispensable cornerstones for the China chapter of the
FoF revolution. The company has a footprint in the competitive motion control markets, mostly
dominated by European and Japanese automation giants such as Siemens/Schneider and
Mitsubishi/Yaskawa, while enjoying a strong domestic advantage underpinned by market
share gains from providing customised products to niche markets, and being relatively more
nimble than foreign peers. Inovance has maintained a solid track record of launching a new
product every 1-2 years and quickly becoming the domestic leader in that field.
Keyence (6861.T, Neutral): One-stop FA sales-shop/consultant, with
exceptionally high margin/returns
Company profile
Founded in 1972, Keyence is a leading maker of automatic control equipment, electronic
equipment and FA sensors. Keyence handles design, development and sales in-house and
outsources all production to Japanese companies. Keyence is well known for a consultative
sales approach in which it works closely with customers to determine how its products can
improve their productivity. In this sense, its business model is similar to that of a
consulting firm—it is selling its ability to add value. Keyence has one of the strongest
profitability measures of any listed machinery company in the world, including a gross
margin of 80%, an operating margin of more than 50%, and a high CROCI.
Exposure to the Factory of the Future
As a consulting-oriented company, Keyence’s competitiveness depends on its personnel.
Development and service expertise have enabled Keyence to consistently deliver highly
innovative products over a long period. While Keyence supplies products ranging from 3D
printers to PLCs, the sensor business – an area of strength since foundation – is the crown jewel.
Keyence has a broad sensor lineup and along with Cognex (US), it is well positioned to
benefit from the growth in machine vision driven by increasingly complex inspection processes.
Kion (KGX.DE, Not Covered): Staying ahead of the game in AGVs
Company profile
Kion is the world’s second-largest provider of forklift trucks and other material handling
equipment (including autonomous equipment). The group has sales of over €5 bn and
Europe is its largest market.
Exposure to the Factory of the Future
In 2015, Kion acquired Egemin, an automated logistics provider with operations that
include developing and manufacturing automated forklifts and automated guided vehicles;
these significantly reduce labour costs in factories and logistics centres (labour accounts
for 80% of the total cost of owning a forklift). In addition, its traditional trucks are becoming
more connected through the use of software, enabling higher utilisation rates within
factories, the monitoring of driving quality, and to an extent predictive maintenance.
Kuka (KU2G.DE, Not Covered): Pure-play automation company at
the forefront of collaborative robotics and AGVs
Company profile
Kuka is a manufacturer of industrial robots and provides solutions for factory automation.
The company is organised into three main operating segments: Robotics (30% of sales; the
group has a c.14% global share in this market), Systems (49% of sales; this involves
integrating automation equipment and helping assemble production lines) and Swisslog
(21%; automated logistics equipment). Group sales come almost entirely from
manufacturing industries, with the exception of a small proportion that comes from
healthcare and warehouse distribution logistics (mainly through Swisslog).
Covered by Yuichiro
Isayama, Japan
Machinery analyst
April 13, 2016 Profiles in Innovation
Goldman Sachs Global Investment Research 59
Exposure to the Factory of the Future
Kuka, through its iiwa (intelligent industrial work assistant) range, is at the forefront of
collaborative robotics. The group estimates that it has a market share of around 10%-15%
and expects not just increased cobot penetration, but increased use of mobile cobots.
Mobile cobots are enabled through the use of the AGVs that Kuka develops internally, with
this business strengthened in 2015 through its acquisition of Swisslog. Kuka is a pure-play
factory of the future enabler and is currently the leading robotics provider (by share) in the
automotive industry; however, the group is pushing forward with expansion into other
industries (in 2015, general industry robotics orders grew 19%, surpassing automotive,
which grew 4% yoy).
MJ Intelligent System (Private, Not Covered): Innovating China’s
“smart factory”
Company profile
MJ Intelligent System (MJ) is a Chinese factory automation system integrator, servicing a
wide group of industries, now including auto/auto parts, home appliances, machinery and
metal processing. MJ helps form “smart factories” by leveraging its proprietary SCADA
(supervision control and data acquisition), MES (manufacturing execution system), WMS
(warehouse management system) and big data analytics software. Some of its major
clients are global/domestic leaders in their respective industries. The company has been
selected to participate in the drafting of five industry standards under China’s
“Manufacturing 2025” policy initiative.
Exposure to the Factory of the Future
MJ’s “smart factory” goes beyond simply helping clients add robotic arms to the
production line. Compatible with most major brands’ CNC and PLC, MJ collects and
integrates real-time operating information from previously segregated automation
equipment on the factory floor and communicates it with MJ’s self-designed
Manufacturing Execution System. This helps the factory achieve flexible manufacturing
through its powerful production process simulation and to connect equipment such as
AGVs. Taking advantage of the information collected on the machine, MJ’s big data
software monitors the status and efficiency of each working station and helps the factory
maximise utilisation through predictive maintenance, as well as automatic adjustments.
Thanks to MJ’s SCADA compatibility, a “smart factory” can add different brands
equipment/sensors to the production process quickly and operating data can be fed back
for further optimisation
Nidec (6594.T, CL Buy): Positioned to benefit from motor and drive
system demand for robots/automation
Company profile
Nidec was established in 1973 in Kyoto by current president Shigenobu Nagamori and
three associates. The production of brushless DC motors started in 1975. In the 1990s Nidec
established a leading global share in HDD spindle motors on the back of expanding PC
demand. The company is renowned for its strategy of growth through M&A and has
accelerated its overseas M&A related to medium-sized and large motors for auto and home
appliance/commercial/industrial (ACIM). Products for auto and home
appliance/commercial/industrial applications already account for around 46% of total sales
(roughly half each), and we expect these areas to drive growth over the next decade,
backed by technological trends.
Covered by Daiki
Takayama, Japan
Electronic Components
analyst

April 13, 2016 Profiles in Innovation
Goldman Sachs Global Investment Research 60
Exposure to the Factory of the Future
In the home appliance/commercial/industrial domains (23% of total sales), Nidec is
focusing on new applications broadly related to the Internet of Things (IoT)—such as smart
factories, robotisation and automation of warehouses, automated guided vehicles (AGV),
cleaning robots, and high-performance drones. For instance, subsidiaries NMC (formerly
the motors division of Emerson), Nidec Shimpo (transmissions and speed reducers for
drive systems), and Nidec Kinetek (motor control technology) collaborated together to win
orders for a warehouse management system from a major US online retailer. We expect
this business to expand to ¥50-60 bn over the next few years (we think Nidec began
deliveries in earnest from the start of 2016). We believe the company is currently in
discussions and fielding many enquiries related to motors and systems for AGVs, cleaning
robots, and high-performance drones.
Rockwell Automation (ROK, Neutral): At the forefront of discrete
automation
Company profile
ROK is one of the global leaders in automation, particularly on the discrete side. Key
products include controllers, plant management systems, electronic operator interface
devices, visualisation software and intelligent motor control products. Over time, the
company has consistently demonstrated the ability to adapt to emerging
trends/technologies, which has resulted in top-line outperformance vs. peers over the cycle.
Exposure to the Factory of the Future
ROK was one of the first large industrial companies to talk about the “connected
enterprise” and has been in a partnership with Cisco for almost a decade, co-developing
products for IoT applications. Given Cisco’s leadership in Ethernet and security, and
Rockwell Automation’s familiarity with interface on the factory floor, the partnership seems
advantageous for both. ROK has also been one of the earliest to recognise the convergence
of capex and opex, as well as IT and machines, and has been working towards more
integrated solutions. To this end, ROK has developed a powerful web-based manufacturing
platform as a service that integrates all data into a single information management and
decision support system. The system is designed for industrial environments, and can
connect with existing PLCs (like ROK’s Logix) and databases.
SAP (SAPG.DE, Buy): Cloud products and S4HANA to enable factory
of the future
Company profile
SAP is a global enterprise software company which provides its customers with real-time,
cloud-based products and solutions. The company is a leader in business applications and
analytics software, especially Enterprise Resource Planning (ERP) and Supply Chain
Management (SCM). SAP's product strategy centres on applications (on-premises, cloud
and hybrid), platforms (database, analytics and platform as a service (PaaS)) and business
networks. SAP is investing heavily in developing its cloud product portfolio and in-memory
product offering: HANA. Its recently launched application offering, S/4HANA, is core to
SAP’s innovation. SAP has exposure to a diversified range of verticals with consumer,
manufacturing and energy/natural resources accounting for c.65% of 2015 revenues. SAP
has over 300,000 customers and S4 HANA is already gaining traction with 3,200+
customers (end 1Q 2016), the group operates in >180 countries with c.77,000 employees.
Covered by Joe Ritchie,
US Multi-Industry
analyst
Covered by
Mohammed Moawalla,
European Software
analyst

April 13, 2016 Profiles in Innovation
Goldman Sachs Global Investment Research 61
Exposure to the Factory of the Future
SAP has a strong entrenched position with manufacturing companies, especially in ERP,
SCM and Supplier Relationship Management (SRM). We see SAP as a key beneficiary of
emerging mega trends like IoT(Internet of Things), which require connecting and
collaborating mechanical, electrical and software elements in different industry segments.
Further, the shift to cloud as a means for applications delivery is driving investments in
integration, middleware, monitoring, security, and analytics technologies to enable the
factory of the future. We believe SAP’s strong applications footprint around sourcing,
supply chain, logistics and procurement coupled with strong analytics capability, will allow
it to develop next generation applications that enable the factory of the future. These will
be built on its S4HANA platform that facilitates real-time processes and can be deployed
either on premise, in the cloud or in a hybrid environment.
Schneider Electric (SCHN.PA, Neutral): Key player in the field of
Smart Factories
Company profile
Schneider is a specialist in energy management, offering integrated solutions across
multiple market segments, including energy and infrastructure, industrial processes,
building automation, and data networks, as well as a broad presence in residential
applications. The company operates in more than 100 countries, with c.152,000 employees.
The key end markets that Schneider sells into include construction, technology, utilities, oil
& gas, mining and general industrial. Of its products, 50% are sold through distributors.
Exposure to the Factory of the Future
Schneider’s offering includes software and hardware, which allows for automatic diagnosis,
as well as optimisation and configuration of industrial processes through the use of
sensors and control devices. Schneider has strengthened its offering here through the
acquisition of Invensys in 2013.The Wonderware systems platform is one example of
Schneider’s offering in the software space; this is a platform that integrates and
consolidates data across the different factory floor systems to be able to function pro-
actively rather than reactively. Other products include PlantStruxure, an information and
control system for factories, and Machine Struxure, which provides one single software
environment with end-to-end service support. Machine Struxure has seen sales grow 3.4x
over 2008-13 and connected 200,000 machines in 2013 vs. just 1,000 in 2008. In addition,
Schneider also aims to provide a leading digital experience through initiatives such as a
24x7 sales & marketing channel and a tailored customer care experience.
Siasun Robot (300024.SZ, Neutral): Engineering China’s intelligent
manufacturing, leading China’s development of cobots & AGVs
Company profile
Siasun is the largest Chinese robotics automation company, backed by the Chinese
Academy of Science. The company was officially founded in 2000, with an initial focus on
producing industrial robots for China’s fast-growing automobile market. Currently, it has a
complete range of automation-related businesses, including warehouse automation,
automatic assembly and testing line, industrial robotics, transportation automation and
core robotics parts. Siasun has strong R&D capabilities and has received a number of
national awards for robotics, as well as automated guided vehicles. Siasun has partnered
with automakers such as Ford Motor, SAIC, Brilliance, Mazda and Dongfeng Motor by
providing welding/painting and other robotics. It has also supplied AGVs (automated
guided vehicles) to companies such as Shanghai General Motor. Siasun also supplies
robots to other industries, such as electronics, textiles and tobacco.
Covered by Daniela
Costa, European
Capital Goods analyst
Covered by Jacqueline
Du, China Machinery
analyst
April 13, 2016 Profiles in Innovation
Goldman Sachs Global Investment Research 62
Exposure to the Factory of the Future
Siasun is a leading player in China’s factory automation upgrade. The company has
reinforced its leading position by expanding its business scale, while constructively
deploying its resources to realise its long-term plan of creating a “digital factory”. Siasun is
the leader in China’s development of cobots and AGVs, introducing its 7DOF cooperating
robots in mid-2015, one year after ABB and Kuka’s offering, and advancing the progress of
technology in China towards more flexibility with enhanced sensory capabilities. In the
AGV field, Siasun has an approximately 17% market share in China.
Siemens (SIEGn.DE, Buy): Strong presence in the industrial
software space including product lifecycle management
Company profile
Siemens is Europe’s largest industrial conglomerate, with core activities in the fields of
electrification, automation and digitisation and activities in nearly all countries in the world.
As of September 2015, Siemens had 348,000 employees. The key end markets that
Siemens sells into include utilities, oil & gas, mining, healthcare, rail, construction and
general industrial.
Exposure to the Factory of the Future
Siemens has bundled its Factory of the Future offerings under the Digital Factory business
segment, which provides industry software together with a comprehensive FoF product
and service portfolio. Siemens’ product offering aims to transform traditional companies
into digital enterprises, increasing the flexibility and efficiency of its production processes
and reducing the time to market. The Digital Factory division mainly sells into the
manufacturing industry, with the key markets being automotive, aerospace, machine tools
and plant installations. Siemens employs 17,500 software engineers and is continually
investing in technology and experts in smart data analytics and the cloud. Siemens also
has strong IT partnerships with companies such as Atos, Accenture and IBM. A key offering
by Siemens in this space is the Product Lifecycle Management software, which provides
simulation capabilities for different plant environments and the product lifecycle.
SMC (6273.T, Neutral): No.1 supplier of the basic automation
equipment, pneumatics
Company profile
SMC was established in 1959 as Sintered Metal Corporation to make and sell sintered
metal filters. The company began making pneumatic equipment in 1961 and automatic
control equipment in 1964. Today, these are SMC’s core businesses. SMC is a leading
maker of pneumatic equipment and has a high market share in many regions: Japan 65%,
Europe 20%, the Americas 22%, China 46% and global 33%. Notable features include an
operating margin of almost 30% and an inventory strategy that leverages an extremely
strong balance sheet (SMC has an inventory turnover period of more than 10-12 months
versus a global machinery sector average of three months).
Exposure to the Factory of the Future
Introducing pneumatic equipment is probably the easiest way to automate production
processes. Pneumatic equipment is not as precise as electric machinery and not as
powerful as motor-driven and hydraulic equipment, but in terms of growth potential it has
the advantages of being relatively inexpensive and easy to install. Regardless of the
introduction of other promising/destructive solutions, as long as there is a need for
equipment that converts some kind of signal into output, we forecast pneumatic equipment
will benefit from structural demand growth accompanying the advance of automation.
Covered by Daniela
Costa, European
Capital Goods analyst
Covered by Yuichiro
Isayama, Japan
Machinery analyst
April 13, 2016 Profiles in Innovation
Goldman Sachs Global Investment Research 63
Stratasys (SSYS, Neutral): Leader in prototyping and materials
benefiting from faster 3D printing cycle times
Company profile
SSYS is a leading manufacturer of rapid prototyping and additive manufacturing products.
The company’s product line covers basic desktop models primarily used in prototyping, as
well as higher-end professional grade printers capable of producing end use parts. At peak,
we believe SSYS’ share of the total 3DP market was roughly 39%, although given recent
declines in its low-end platform, this share could be lower today. Key printer technologies
include Fused Deposition Modeling and PolyJet. The company provides the “printers” and
the materials that they use to make products, as well as service bureaus that create products
for customers without the need to purchase a printer. The company has 2,900 employees and
operates globally, with principal operations in the US, Israel, Germany and Hong Kong.
Exposure to Factory of the Future
Stratasys’ products allow for rapid production, as well as production in small batches, key
to make the Factory of the Future more flexible. At the design level, time to market is
sharply reduced as iteration on prototypes can occur faster (build times in less than a day
vs. multiple weeks for traditional prototyping). On the service side, SSYS is attempting to
integrate its service platform with a vertical-based go-to-market model, which attempts to
tailor the manufacturing and design process to each application. Lastly, material
complexity and cost remain the largest barriers to broader adoption of additive
manufacturing. However, SSYS offers 138 “digital materials” that can be coupled with
more than 1,000 different colour variations – we see SSYS’s materials leadership, as well
as its larger installed base, as key competitive advantages.
Teradyne (TER, Neutral): Market leader in semiconductor testing at
the head of industry robotics push
Company profile
Teradyne is a market leader in the highly consolidated System on a Chip test sector (the
top 2 participants have nearly 95% share). Teradyne’s Automatic Test Equipment is used to
test a variety of products (such as semiconductors, wireless and data storage) employed
across a wide spectrum of end markets. The company has four core business units:
Semiconductor Test (i.e. logic, RF, analog, power and memory testing), Systems Test
(complex electronic systems test), Litepoint (wireless test business), and Collaborative Robots
(headed by the Universal Robots division). The company employs 4,100 people worldwide.
Exposure to the Factory of the Future
In 2015, Teradyne acquired Universal Robots (UR), a Denmark-based leader in collaborative
robotics, and has since built out its collaborative robots division around the acquisition. UR
was founded in 2005 and has expanded rapidly, launching its US office in 2012 (it now has
offices worldwide). Unlike past robots, which have historically faced a bottleneck at the
programming level, UR products are marked by ease of training and programming.
According to management, UR is by far an industry leader (it estimates a c.60% market
share), and Teradyne expects the market to grow 50%+ over the coming years. Overall,
Teradyne views UR products as well positioned to rapidly proliferate across simple
manufacturing tasks that can be quickly replicated, and noted that the robots are already
more cost-effective than employees in DMs, and also now China. By the end of 2014, there
were 3,500 UR robots installed worldwide.
Covered by Sam Eisner,
US SMID Capital Goods
analyst
Covered by Toshiya
Hari, US
Semiconductors
analyst

April 13, 2016 Profiles in Innovation
Goldman Sachs Global Investment Research 64
Yaskawa Electric (6506.T, CL-Buy): Top supplier of servos, and the
second-largest robotics supplier in the world
Company profile
Founded in 1915, Yaskawa has the top share of the global servo motor market at around
30%, and we estimate its share of the global industrial robot market is around 11%, the
second largest behind Fanuc (17%). Yaskawa Electric has a diverse product lineup (in terms
of load capacity) that ranges from medium and large robots used in auto production to
small vertically articulated robots used in the assembly and inspection of electronic
components.
Exposure to the Factory of the Future
Yaskawa Electric is developing cobots, and in December 2015, it exhibited a 10-kg load
capacity robot at the International Robot Exhibition 2015. Currently, Universal Robot,
Rethink Robotics, and other specialist companies are the most well-known makers of
cobots. However, we expect Yaskawa Electric, Fanuc, ABB, Kuka, and other major industrial
robot makers to make a fully-fledged entry into the cobot field. As is the case with
conventional industrial robots, new systems must be introduced with cobots. Yaskawa
Electric has accumulated system introduction know-how through its industrial robot
business and we believe it will be able to leverage this know-how in the cobot space.
Zebra Technologies (ZBRA, Not Covered): RFID technology
specialist with a global footprint and impressive customer base
Company profile
Zebra is a global leader in the Automatic Identification and Data Capture (AIDC) market,
which consists of mobile computing, data capture, radio frequency identification devices
(RFID), barcode printing and other automation products and services. Zebra has sales of
more than US$3.6 bn in 2015 and employs approximately 7,000 people. Zebra’s solutions
help customers and end-users achieve their strategic business objectives, including
improved efficiency and workflow management, increased productivity and asset
utilisation, real-time, actionable enterprise information, and better customer experiences.
Exposure to the Factory of the Future
Zebra is a pure-play designer, manufacturer, and vendor of a broad range of RFID products,
as well as other AIDC technologies including mobile computers, barcode scanners, wireless
LAN products, specialty printers for barcode labelling and personal identification, real-time
location systems, related accessories and supplies, such as self-adhesive labels and other
consumables, and utilities and application software. Manufacturing represents 19% of
Zebra’s total sales; the company is one of the largest publically listed RFID specialists, with a
global, blue-chip customer base (e.g. Bosch, Ford, Sony, Caterpillar and Boeing).
Covered by Yuichiro
Isayama, Japan
Machinery analyst

April 13, 2016 Profiles in Innovation
Goldman Sachs Global Investment Research 65
Drivers & barriers Rising labour costs, global competition and customers’ demand for
customisation and immediate access to products are the major forces
behind the latest FoF technologies being adopted.
Still, lack of standards, young asset bases and social pressure from
potential unemployment make the road to the optimal manufacturing
landscape potentially longer than technological developments alone
would allow.

April 13, 2016 Profiles in Innovation
Goldman Sachs Global Investment Research 66
Ten reasons why we are talking about the ‘Factory of the Future’
As growth slows post a 15-year super-cycle, all eyes are on the manufacturing
sector’s margins and returns; we expect these to stagnate over the coming years as
operating leverage fades and fixed costs continue to rise (especially labour).
Unsurprisingly, the problems have been exacerbated by increasingly unproductive
assets, partly owing to legacy assets in DMs and to overinvestment in EMs.
Manufacturers will have to increasingly focus on fighting labour cost appreciation in a
world where specialised manufacturing talent is becoming scarcer, despite
increasingly demanding customers and pressure on companies to return more cash
to shareholders. The good news is that more efficient manufacturing practices are
now being treated by governments as a priority for nations to stay competitive, and
unprecedented developments have taken place in sensing capabilities (the key
enabling technology for the Factory of the Future).
Exhibit 52: Slowing growth in manufacturing… Average of >800 GS covered manufacturing companies’ sales
growth
Exhibit 53: …has put returns under pressure Average of >800 GS manufacturing companies’ CROCI
Source: Company data, Goldman Sachs Global Investment Research
Source: Company data, Goldman Sachs Global Investment Research
1. DMs need to bring down costs to remain competitive vs. EMs…
The average DM manufacturing hourly labour cost is still more than three times higher
than the average manufacturing wage in China. The wave of globalisation over the past
three decades has seen a shift of manufacturing to low-cost centres in EM as DM labour
costs kept rising. More than half of global fixed investment is now in EMs and the growing
threat of EM competition, which is climbing up the value chain, is very real for a number of
western incumbents (for example, Chinese rail manufacturer CRRC is now more than 3x
bigger than the largest western manufacturer). In the face of continuing labour cost
increases, DM manufacturers must adopt the latest technologies and enhance productivity
to remain competitive.
2. …but rising EM wages are reducing the ‘low-cost location’ edge
The by-product of economic development and wealth creation has been EM labour cost
inflation far outstripping that of alternative manufacturing locations. Although the cost
advantage is still significant, we expect it to continue to narrow as wages rise. In order to
maintain or increase their share of global manufacturing, EM factories need to evolve to
remain competitive. Several are actively targeting higher efficiency (e.g. Foxconn, one of
China’s largest employers, which now designs, manufactures and deploys its own robots
has stated its desire to have a “robot army”).
-10%
-5%
0%
5%
10%
15%
20%
2004
2005
2006
2007
2008
2009
2010
2011
2012
2013
2014
2015
10.0%
10.5%
11.0%
11.5%
12.0%
12.5%
13.0%
13.5%
14.0%
14.5%
15.0%
2004
2005
2006
2007
2008
2009
2010
2011
2012
2013
2014
2015
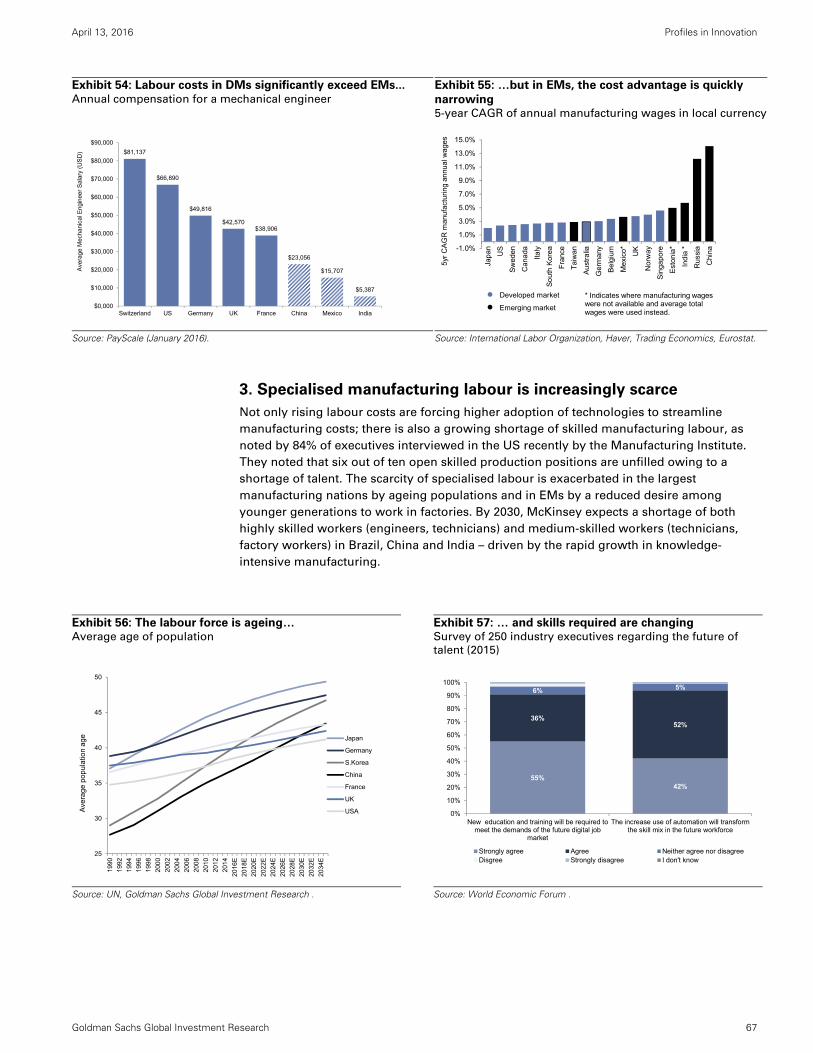
April 13, 2016 Profiles in Innovation
Goldman Sachs Global Investment Research 67
Exhibit 54: Labour costs in DMs significantly exceed EMs... Annual compensation for a mechanical engineer
Exhibit 55: …but in EMs, the cost advantage is quickly
narrowing 5-year CAGR of annual manufacturing wages in local currency
Source: PayScale (January 2016). Source: International Labor Organization, Haver, Trading Economics, Eurostat.
3. Specialised manufacturing labour is increasingly scarce
Not only rising labour costs are forcing higher adoption of technologies to streamline
manufacturing costs; there is also a growing shortage of skilled manufacturing labour, as
noted by 84% of executives interviewed in the US recently by the Manufacturing Institute.
They noted that six out of ten open skilled production positions are unfilled owing to a
shortage of talent. The scarcity of specialised labour is exacerbated in the largest
manufacturing nations by ageing populations and in EMs by a reduced desire among
younger generations to work in factories. By 2030, McKinsey expects a shortage of both
highly skilled workers (engineers, technicians) and medium-skilled workers (technicians,
factory workers) in Brazil, China and India – driven by the rapid growth in knowledge-
intensive manufacturing.
Exhibit 56: The labour force is ageing… Average age of population
Exhibit 57: … and skills required are changing Survey of 250 industry executives regarding the future of
talent (2015)
Source: UN, Goldman Sachs Global Investment Research .
Source: World Economic Forum .
$81,137
$66,890
$49,816
$42,570$38,906
$23,056
$15,707
$5,387
$0,000
$10,000
$20,000
$30,000
$40,000
$50,000
$60,000
$70,000
$80,000
$90,000
Switzerland US Germany UK France China Mexico India
Ave
rage
Mec
hani
cal E
ngin
eer
Sal
ary
(US
D)
-1.0%
1.0%
3.0%
5.0%
7.0%
9.0%
11.0%
13.0%
15.0%
Jap
an US
Sw
eden
Can
ada
Italy
So
uth
Kor
ea
Fra
nce
Tai
wan
Au
stra
lia
Ger
man
y
Be
lgiu
m
Mex
ico* UK
Nor
way
Sin
gapo
re
Est
onia
*
Ind
ia *
Rus
sia
Chi
na
5yr
CA
GR
man
ufac
turin
g an
nua
l wag
es
● Developed market
● Emerging market
* Indicates where manufacturing wages were not available and average total wages were used instead.
25
30
35
40
45
50
1990
1992
1994
1996
1998
2000
2002
2004
2006
2008
2010
2012
2014
2016
E
2018
E
2020
E
2022
E
2024
E
2026
E
2028
E
2030
E
2032
E
2034
E
Ave
rag
e p
op
ula
tion
ag
e Japan
Germany
S.Korea
China
France
UK
USA
55%42%
36%52%
6% 5%
0%
10%
20%
30%
40%
50%
60%
70%
80%
90%
100%
New education and training will be required tomeet the demands of the future digital job
market
The increase use of automation will transformthe skill mix in the future workforce
Strongly agree Agree Neither agree nor disagreeDisgree Strongly disagree I don't know

April 13, 2016 Profiles in Innovation
Goldman Sachs Global Investment Research 68
4. Productivity is a differentiator in a world with legacy capacity
The past 15 years saw an unprecedented level of fixed asset investment globally. This was
driven primarily by material investment in Chinese infrastructure, and we do not expect it
to be repeated over the next decade (see our report Capex Tracker: No end in sight to the
capex slide, September 18, 2015). Simultaneously, this investment wave drove a new set of
low-cost competitors to emerge in key capital goods areas such as electrical equipment,
rail and chemicals production. This has led to overcapacity across many global industries,
including general industrial manufacturing. One of the key benefits of the upcoming
manufacturing technology profiled in this report is not just that it can bring down costs, but
that it can increase the total potential output per unit of equipment, allowing companies to
improve returns by cutting capacity, but still fulfilling demand.
Furthermore, capital goods companies that serve manufacturing need to move in two
interlinked ways: (1) increasingly penetrate their installed bases; and (2) find new
services/products to differentiate their offer vs. old and new competitors. The “digitisation”
of many products and services is in the sweet spot for this.
Exhibit 58: Productivity is at a trough… Market cap-weighted asset turn (sales/GCI) for GS global
coverage ex-financials
Exhibit 59: …and manufacturing capacity utilisation
remains low… US and Europe manufacturing capacity utilisation
Source: Company data, Goldman Sachs Global Investment Research.
Source: Federal Reserve, Eurostat.
Exhibit 60: …in DM owing to legacy assets… Average age of manufacturing assets in the US; 1947-2014
Exhibit 61: ...and in EMs owing to overinvestment Fixed investment as a % of GDP; global and China
Source: BEA
Source: Haver, Goldman Sachs Global Investment Research.
0.70x
0.75x
0.80x
0.85x
0.90x
0.95x
1.00x
1.05x
2002
2003
2004
2005
2006
2007
2008
2009
2010
2011
2012
2013
2014
2015
2016
E
2017
E
2018
ECov
erag
e as
set t
urn
(MC
wei
ghte
d)
Market cap weighted asset turn (sales/GCI), GS analyst forecast for global coverage (ex-financials)
55%
60%
65%
70%
75%
80%
85%
90%
1985
1986
1987
1988
1990
1991
1992
1993
1995
1996
1997
1998
2000
2001
2002
2003
2005
2006
2007
2008
2010
2011
2012
2013
2015
Europe Manufacturing Capacity UtilizationUS Manufacturing Capacity Utilization
6
6.5
7
7.5
8
8.5
9
9.5
10
1947
1950
1953
1956
1959
1962
1965
1968
1971
1974
1977
1980
1983
1986
1989
1992
1995
1998
2001
2004
2007
2010
2013
Age
of e
quip
men
t in
the
US
Manufacturing Manufacturing median
0%
5%
10%
15%
20%
25%
30%
35%
40%
45%
50%
20%
21%
22%
23%
24%
25%
26%
27%
1995
1996
1997
1998
1999
2000
2001
2002
2003
2004
2005
2006
2007
2008
2009
2010
2011
2012
2013
2014
Fix
ed I
nves
tmen
t % o
f GD
P
Fix
ed I
nves
tmen
t % o
f GD
P
Global China (RHS)

April 13, 2016 Profiles in Innovation
Goldman Sachs Global Investment Research 69
“Industrie 4.0 basically takes the cost of scale close to zero. No matter what lot size you need, the unit cost is about the same. At some point, what will happen is this: You are a consumer and you want to buy a car. You go to the Internet, put your specs together, and send that order to BMW. Someone will check your credit history and your funds. Then, your car will go straight to production and the factory will build it to order. Four weeks from now, you will have a car. No more waiting six months or compromising at the dealership, where they have 50 cars but not the one you want.” Joe Kaeser, CEO of Siemens, on the future of
5. There is an increased push to shorten time to market, particularly
by eliminating stranded inventories
Lengthy product development times are costly and manufacturers are rapidly shortening
their time to market. Maserati, an automotive brand of Fiat Chrysler, has reduced time-to-
market to 16 months from 30 months by introducing some of the latest FoF technologies.
Today’s market environment means
information comes faster and is more
accessible than ever, and that customers
now expect products sooner.
Faster time to market also means a lower
gap from order to delivery on a day-to-day
basis. This is a key source of being able to
generate better return on capital for a
manufacturer, especially when available
capacity is not scarce. Technologies that
can integrate communication between
suppliers, manufacturers, distributors and
the final customers are a powerful tool to
eliminate stranded inventories. Atos, an IT
services provider, estimates that
manufacturing IoT platforms can reduce
idle time by up to 58%.
Exhibit 62: Overall inventory levels have not materially
declined outside Europe over the past years Inventory days across GS manufacturing coverage by region
Exhibit 63: Demand is rising for shorter time to market Survey of 100 companies (2015)
Source: Company data, Goldman Sachs Global Investment Research.
Source: 3Gamma
6. Customers demand unprecedented customisation
Personalisation today is used as a competitive tool to capture sales, and is something that
customers look for to distinguish their purchases. In addition, the growth of consumers
from emerging markets, encompassing a diverse range of cultural and ethnic groups,
increases the complexity of manufacturing in order to appeal to these new large markets.
Finally, manufacturers must also prepare for further proliferation of models and greater
customisation driven by shorter life cycles.
114.5
82.7
102.1
75
80
85
90
95
100
105
110
115
2009
2010
2011
2012
2013
2014
2015
E
inve
ntor
y D
ays
inde
xed
to 2
009
leve
l
China Europe US
0%
10%
20%
30%
40%
50%
60%
Disagree Somewhatdisagree
Somewhat agree Agree Don't know
Increased demand for shorter time to market

April 13, 2016 Profiles in Innovation
Goldman Sachs Global Investment Research 70
Exhibit 64: Customers are demanding personalised products Combinations available for a customer buying a Ford F150 pickup
Source: Siemens.
7. Focus on safety and security has increased significantly…
The emphasis on worker and product safety has scaled up significantly over the past few
years. A more automated, controlled and less labour-intensive environment will reduce the
likelihood of accidents and costly litigation. In addition, factories have to be safe from
cyber-attacks given the increasingly important role data plays in the manufacturing process.
Exhibit 65: High costs of safety incidents… Cost to society of work injuries in the UK (£ in 2013 prices)
Exhibit 66: …and increased focus on security Survey of 3,382 IT executives in Asia-Pacific; % answering
“increase 5-10% or more”
Source: HSE.
Source: Forrester.
8. …and some governments are actively pushing to stay ahead in
manufacturing
In a globalised world with lower trade barriers, scarcer demand and more supply, different
countries have to fight hard for competitiveness to be suppliers of choice for
manufacturing. We have seen numerous initiatives over the past few years that stress this.
For example, Germany has introduced the Industrie 4.0 initiative, representing the fourth
industrial revolution, through which it is promoting the concept of ‘smart factories’. The
use of cyber-physical systems and the communications between components allow for less
centralised process management, providing significant quality, time, resource, and cost
advantages in comparison with traditional production systems. Industrie 4.0 was a term
that originated in industry, but the initiative has received backing by the German
government and is a key feature of its High-Tech Strategy 2020 Action Plan.
Equipment options VariantsTheoretical
combinationsTrim 6 6Passenger compartment 3 18Power train 2 36Cargo space 4 144Engine 3 432Transmission 3 1,296Rear axle ratio 7 9,072Wheels 9 81,648Tires 8 653,184Seats 18 11,757,312Power seats 2 23,514,624Radio 5 117,573,120Running boards 4 470,292,480Rear windows 3 1,410,877,440Colors 12 16,930,529,280Interior trim colors 3 50,791,587,84016 individual options 12,870 653,687,735,500,800
Human cost
Financial cost
Total cost
Fatal injuries £1,153,000 £421,600 £1,574,600
Non-fatal injuries
£4,600 £2,900 £7,500
7 or more days absence
£17,600 £10,100 £27,700
Up to 6 days absence
£330 £550 £880
Ill health £9,900 £8,700 £18,600
7 or more days absence
£20,100 £17,300 £37,400
Up to 6 days absence
£290 £560 £850
55%
46%
46%
41%
40%
40%
39%
38%
38%
37%
17%
Security software
Infrastructure software
Business intelligence
SaaS (collaboration and email)
Collaboration application
Big data solutions
Platform software
Packaged process applications
SaaS (CRM and HR Process)
SaaS (industry specific process)
Mobile applications and mobile middleware
"How do you expect your spending on the following software categories to change in 2014 compared with 2013?"
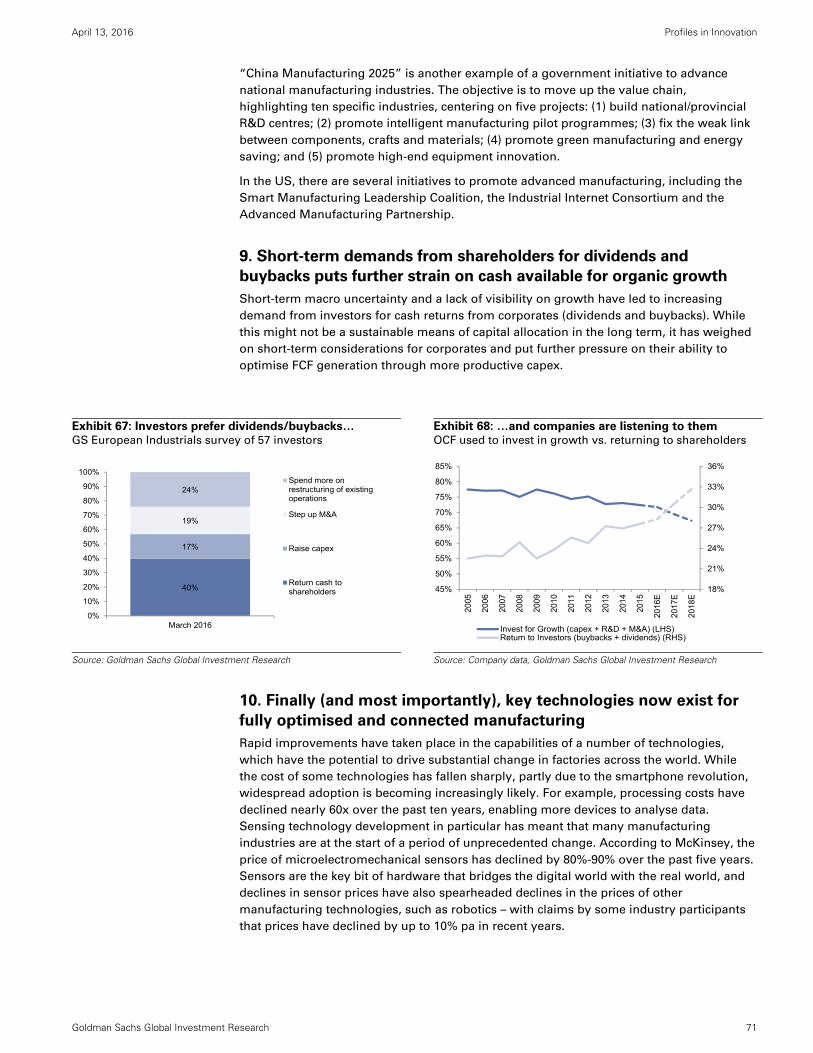
April 13, 2016 Profiles in Innovation
Goldman Sachs Global Investment Research 71
“China Manufacturing 2025” is another example of a government initiative to advance
national manufacturing industries. The objective is to move up the value chain,
highlighting ten specific industries, centering on five projects: (1) build national/provincial
R&D centres; (2) promote intelligent manufacturing pilot programmes; (3) fix the weak link
between components, crafts and materials; (4) promote green manufacturing and energy
saving; and (5) promote high-end equipment innovation.
In the US, there are several initiatives to promote advanced manufacturing, including the
Smart Manufacturing Leadership Coalition, the Industrial Internet Consortium and the
Advanced Manufacturing Partnership.
9. Short-term demands from shareholders for dividends and
buybacks puts further strain on cash available for organic growth
Short-term macro uncertainty and a lack of visibility on growth have led to increasing
demand from investors for cash returns from corporates (dividends and buybacks). While
this might not be a sustainable means of capital allocation in the long term, it has weighed
on short-term considerations for corporates and put further pressure on their ability to
optimise FCF generation through more productive capex.
Exhibit 67: Investors prefer dividends/buybacks… GS European Industrials survey of 57 investors
Exhibit 68: …and companies are listening to them OCF used to invest in growth vs. returning to shareholders
Source: Goldman Sachs Global Investment Research
Source: Company data, Goldman Sachs Global Investment Research
10. Finally (and most importantly), key technologies now exist for
fully optimised and connected manufacturing
Rapid improvements have taken place in the capabilities of a number of technologies,
which have the potential to drive substantial change in factories across the world. While
the cost of some technologies has fallen sharply, partly due to the smartphone revolution,
widespread adoption is becoming increasingly likely. For example, processing costs have
declined nearly 60x over the past ten years, enabling more devices to analyse data.
Sensing technology development in particular has meant that many manufacturing
industries are at the start of a period of unprecedented change. According to McKinsey, the
price of microelectromechanical sensors has declined by 80%-90% over the past five years.
Sensors are the key bit of hardware that bridges the digital world with the real world, and
declines in sensor prices have also spearheaded declines in the prices of other
manufacturing technologies, such as robotics – with claims by some industry participants
that prices have declined by up to 10% pa in recent years.
40%
17%
19%
24%
0%
10%
20%
30%
40%
50%
60%
70%
80%
90%
100%
March 2016
Spend more onrestructuring of existingoperations
Step up M&A
Raise capex
Return cash toshareholders 18%
21%
24%
27%
30%
33%
36%
45%
50%
55%
60%
65%
70%
75%
80%
85%20
05
2006
2007
2008
2009
2010
2011
2012
2013
2014
2015
2016
E
2017
E
2018
E
Invest for Growth (capex + R&D + M&A) (LHS)Return to Investors (buybacks + dividends) (RHS)

April 13, 2016 Profiles in Innovation
Goldman Sachs Global Investment Research 72
Exhibit 69: In general, the cost of sensors has more than halved over the past decade, with
the decline being even more pronounced for specific sensor applications in manufacturing
Source: Goldman Sachs Global Investment Research, BI Intelligence.
Venture capital investment in robotics and software is heating up
Venture capital and private equity investments in robotics have picked up in recent years,
and manufacturing, warehousing and industrial software investments have also risen
significantly, albeit from a low base. Unsurprisingly, given the maturity of RFID
technologies, VC/PE investment remains stable. However, this makes up only a small
fraction of the US$400 bn+ in venture capital and private equity deals completed in 2014
(where more than 70% were in software-related businesses, healthcare and telecoms).
Exhibit 70: Investment in robotics and software is heating up 12m rolling VC/PE investment in the US (US$ mn)
Source: CBInsights, Goldman Sachs Global Investment Research
$1.30
$1.11
$0.95
$0.82
$0.70
$0.60$0.51
$0.44
$0.38
$0.20
$0.40
$0.60
$0.80
$1.00
$1.20
$1.40
2004 2006 2008 2010 2012 2014 2016E 2018E 2020E
Average sensor cost
0
50
100
150
200
250
300
350
400
450
12 Q
1
12 Q
2
12 Q
3
12 Q
4
13 Q
1
13 Q
2
13 Q
3
13 Q
4
14 Q
1
14 Q
2
14 Q
3
14 Q
4
15 Q
1
15 Q
2
15 Q
3
15 Q
4
16 Q
1
12m
rol
ling
VC
/PE
inve
st. i
n U
S (
$mn)
RoboticsRFIDManufacturing, warehousing & industrial software

April 13, 2016 Profiles in Innovation
Goldman Sachs Global Investment Research 73
What could derail it?
Manufacturing is entering a decade of significant change and we have tackled some of the
latest technology developments. However, predicting the future of manufacturing comes
with innate challenges, as no-one can predict the full impact of technological innovation.
Technologies are adopted at unpredictable rates and entirely unexpected applications can
arise and dominate their uses. Below, we highlight the potential barriers to adoption that
could derail the evolution of manufacturing:
Lack of one single protocol and standard has been a recurring concern for a number
of suppliers and customers. This includes, for example, a commonly understood
programmable robotics language and allowing compatibility/integration between the
machines of various suppliers. For example, looking back at the electronics industry,
PCs only became widely adopted once the systems were standardised and user-friendly.
Lack of incentives owing to excess capacity in manufacturing industries could
prevent adoption of/investment in new technologies. We highlight that while capacity
may be not be stretched, pressure on margins is likely to drive disruption in
manufacturing in order to increase operating leverage.
Limited cost deflation: There is currently a clear deflationary cost trajectory for many
of the key technologies, but there is no certainty that this will continue.
Potential effect on employment may generate social and political unrest.
Ultimately, one of the key incentives to automate is to reduce wage costs. In China, for
example, over 230 mn people are employed in manufacturing jobs: the social
repercussions could be significant if unemployment were to rise rapidly should the
labour force not have time to adapt and find alternative work.
Longevity of capital goods assets postponing adoption. The rapid progress of
technological innovation in manufacturing could be delayed by the longevity of the
capital goods inputs (the average industrial robot lasts 12-15 years). If the benefits of
employing new equipment do not strongly outweigh the total costs incurred (including
installation costs, prior arrangement redundancy costs and fixed infrastructure
adjustments), investment may be delayed.
Decreases in demand for traditional industrial capex products as we shift towards
more opex-driven business models (e.g. equipment as a service). Firms may not wish
to make the heavy investment needed to automate their factories. We note automation
capex will ultimately reduce opex.
IP issues could prevent the Internet of Things from reaching its full potential. The
question of “who does the data belong to?” may prevent data from being shared
between machines owing to the potential proprietary and security-sensitive
information it may contain. Our discussions with companies suggest that data
generated from equipment consensually belongs to the client.
Development costs might be too high for equipment makers to pursue
revolutionary new products. As Google’s recent announcement of the sale of its
robotics arm Boston Dynamics suggests, corporates might not be willing to take the
burden of multiple years of development costs for products with a lack of prospects for
meaningful near-term revenues. This is exacerbated by the threat of slow adoption
given relatively new legacy installed bases (2000-13 saw substantial capacity
investments) and a conservative set of customers (compared with the less risk-averse
and ROIC-sensitive consumer segment).

April 13, 2016 Profiles in Innovation
Goldman Sachs Global Investment Research 74
Overautomation. In addition to a lack of system integration skills and bad selection of
FA equipment, we think overautomation is the common cause of bad automation.
• Additional overhead costs from over-automation may outweigh the savings
from direct labour, in particular when capacity utilisation falls. As factories
increase the pace of automation, overhead costs grow and direct labour costs fall.
Increased support costs associated with maintaining and running automated
equipment drive overhead costs up even more. The increase in operational
leverage owing to a higher proportion of fixed costs hits particularly hard when
capacity utilisation falls in a downturn.
• Overautomation with the wrong equipment reduces flexibility. While some of
the technologies highlighted in this report combat this challenge, most of today’s
machines/robots are good at performing one job at very high efficiency levels but
with limited flexibility. This is a common argument for not automating. Take a
robot gripper as an example. If it only has two positions, the gripper can only grab
parts that it has been designed for. If it is to grab different products, the gripper
needs to be more complex, more expensive, and often less effective.
Exhibit 71: Overautomation reduces flexibility Performance vs. flexibility of a robot gripper
Source: Goldman Sachs Global Investment Research.
Automation gone wrong: Increasing overheads and decreasing flexibility
According to a paper by the World Congress of Engineering on Volkswagen’s automation strategy, for certain sections
of the Golf A5 production line in Germany, it is optimal to limit automation as the additional personnel needed for
maintenance already offsets the saved labour cost, and readily available qualified workers produce similar quality while
offering much better flexibility. In terms of productivity, the paper finds that in certain sections well-trained manual
workers produce a higher percentage of faultless parts, as highly complicated automation systems are susceptible to
faults. Even in EMs such as China, over-automation may harm productivity as a result of inexperienced domestic
system integrators and an absence of qualified maintenance personnel for the automation equipment. A Chinese local
news report stated that in Zhejiang province, where a “robot for human” shift was greatly encouraged, some
companies had to set their Japan-made industrial robots aside for two weeks while waiting for the Japanese engineers
to arrive to fix technical issues that had arisen.

April 13, 2016
Profiles in Innovation
Goldm
an Sachs G
lobal Investment R
esearch
75
Appendix 1: Key names in the Factory of the Future competitive landscape
Exhibit 72: Key names in the competitive landscape (A-H) Non-exhaustive list of public and private companies
Source: Goldman Sachs Global Investment Research.
Manufacturing design & production simulation
Physical Maunfacturing In-factory logistics Other technologies
Company Type Location Ticker IoT PaaS PLM softwareAdditive
manufacturingCollaborative
robotsAGVs RFIDs
Augmented reality
Machine learning
Machine visionNano-
technologyDemand response
Other auto- mation equip.
1 3D Systems Public US DDD 2 ABB Public Switzerland ABBN.VX 3 Advantech Public Taiwan 2395.TW 4 Alien Technologies Private US n.a. 5 Alphabet (Google) Public US GOOGL 6 Amazon Public US AMZN 7 Ansys Public US ANSS 8 Arena Solutions Private US n.a. 9 Atos Public France ATO.PA 10 Autodesk Public US ADSK 11 Automata Technologies Private UK n.a. 12 Aveva Public UK AVV.L 13 Beckhoff Private Germany n.a. 14 Bosch Private Germany n.a. 15 Bruker Public US BRKR 16 CipherLab Public Taiwan 6160.TWO 17 Cisco (Jasper) Public US CSCO 18 Clearpath Private US n.a. 19 Cognex Public US CGNX 20 Cumulocity Private Germany n.a. 21 Daifuku Public Japan 6383 22 Dassault Systems Public France DAST.PA 23 Delta Electronics Public Taiwan 2308.TW 24 Dematic Private US n.a. 25 Device Insight Private Germany n.a. 26 Duerr Public Germany DEUG.DE 27 Duetsche Post (DHL) Public Germany DPW.DE 28 Efort Private China n.a. 29 EOS Private Germany n.a. 30 Epson Public Japan 6724.T 31 Estun Public China 002747.SZ 32 Fanuc Public Japan 6954.T 33 FedEx Public US FDX 34 Forcam Private Germany n.a. 35 GE Public US GE 36 GSK CNC Equipment Private China n.a. 37 Han's Laser Public China 002008.SZ 38 Harmonic Drive Systems Public Japan 6324.T 39 Hewlett-Packard Public US HPQ 40 Hexagon Public Sweeden HEXAb.ST 41 HG Tech Public China 000998.SZ 42 Hiwin Public Taiwan 2049.TW 43 Hollysys Public China HOLI 44 Hon Hai (Foxconn) Public Taiwan 2317.TW 45 Honeywell Public US HON

April 13, 2016
Profiles in Innovation
Goldm
an Sachs G
lobal Investment R
esearch
76
Exhibit 73: Key names in the competitive landscape (I-Z) Non-exhaustive list of public and private companies
Source: Goldman Sachs Global Investment Research
Manufacturing design & production simulation
Physical Maunfacturing In-factory logistics Other technologies
Company Type Location Ticker IoT PaaS PLM softwareAdditive
manufacturingCollaborative
robotsAGVs RFIDs
Augmented reality
Machine learning
Machine visionNano-
technologyDemand response
Other auto- mation equip.
46 IBM Public US IBM 47 Impinj Private US n.a. 48 Ingenu Private US n.a. 49 INSYS Microelectronics Private Germany n.a. 50 JBT Corporation Public US JBT 51 Junghenirich Public Germany JUN3.DE 52 Kawada Public Japan 3443.T 53 Kawasaki Robots Public Japan 3045.T 54 Keyence Public Japan 6861.T 55 KION Public Germany KGX.DE 56 KUKA Public Germany KU2G.DE 57 LifeRobotics Private Japan n.a. 58 Microsoft Public US MSFT 59 MioSoft Private US n.a. 60 Misumi Public Japan 9963.T 61 MJ Intelligent System Private China n.a. 62 Nidec Public Japan 6594.T 63 Omron Public Japan 6645.T 64 Oracle Publc US ORCL 65 Oxford Instruments Public UK OXIG.L 66 PTC Public US PTC 67 Renishaw Public UK RSW.L 68 Rethink Robotics Private US n.a. 69 Rockwell Automation Public US ROK 70 Salesforce Public US CRM 71 SAP Public Germany SAP.DE 72 Savant Automation Private US n.a. 73 Schneider Public France SCHN.PA 74 Seegrid Private US n.a. 75 Shenzhen Inovance Technology Public China 300124.SZ 76 Siasun Public China 300024.SZ 77 Siemens Public Germany SIEGn.DE 78 Smartrac Public Netherlands SM7v.DE 79 SMC Public Japan 6273.T 80 Spectris Public UK SXS.L 81 STEP Public China 002527.SZ 82 Stratasys Public US SSYS
83 THK Public Japan 6481.T
84 Tixi Private Germany n.a. 85 Toshiba Public Japan 6502.T 86 Toyota Motors Public Japan 7203.T 87 Teradyne (Universal Robots) Public US TER 88 Trumpf Private Germany n.a. 89 Yaskawa Public Japan 6506.T 90 Yokogowa Public Japan 6841.T 91 Zebra Technologies Public US ZBRA
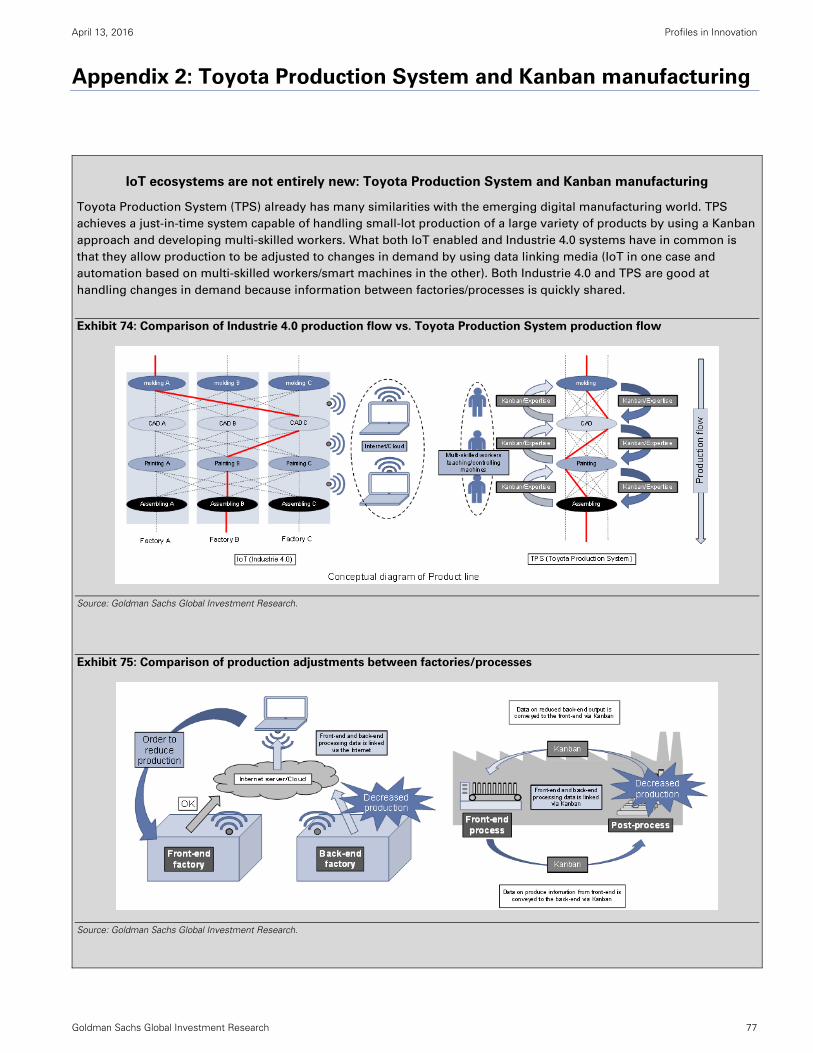
April 13, 2016 Profiles in Innovation
Goldman Sachs Global Investment Research 77
Appendix 2: Toyota Production System and Kanban manufacturing
IoT ecosystems are not entirely new: Toyota Production System and Kanban manufacturing
Toyota Production System (TPS) already has many similarities with the emerging digital manufacturing world. TPS
achieves a just-in-time system capable of handling small-lot production of a large variety of products by using a Kanban
approach and developing multi-skilled workers. What both IoT enabled and Industrie 4.0 systems have in common is
that they allow production to be adjusted to changes in demand by using data linking media (IoT in one case and
automation based on multi-skilled workers/smart machines in the other). Both Industrie 4.0 and TPS are good at
handling changes in demand because information between factories/processes is quickly shared.
Exhibit 74: Comparison of Industrie 4.0 production flow vs. Toyota Production System production flow
Source: Goldman Sachs Global Investment Research.
Exhibit 75: Comparison of production adjustments between factories/processes
Source: Goldman Sachs Global Investment Research.

April 13, 2016 Profiles in Innovation
Goldman Sachs Global Investment Research 78
Appendix 3: Glossary of terms
Exhibit 76: Glossary of terms
Source: Goldman Sachs Global Investment Research.
Term Definition
3D Printing or Additive Manufacturing; is the formation of 3D solid objects from a digital motel, typically by laying thin layers of a material
AGV Automated Guided Vehicle ; automatic material handling equipment
CAM Computer Aided Manufacturing; the use of software to help model the manufacturing of a product.
Cloud Decentralised storage, management and processing of data
Cobot Lower-cost, smaller and more flexible robots capable of working alongside humans
EAASEverything as a Service; pay-by-usage/subscription-based models for machinery, transferring capex into opex for manufacturers and creating a perpetuation of revenue streams instead of a one-off asset sale for suppliers.
ERPEnterprise Resource Planning; business-management software that can be used to collect, store, manage and interpret data from many business activities, including: product planning, purchase. manufacturing or service delivery.
IoT Internet of Things ; the network that connects devices and objects. Sensors and software allow for the collection and exchange of data.
IoT PaaS Internet of Things Platform as a Service; Industrial software as a service which is based on the cloud that allows machines to communicate and optimise production.
M2M Machine-to-Machine; refers to the communication and exchange of data between machines and other other devices
Machine learning or artificial intelligence; is the ability of machines to process data into information and derive knowledge from that information to act independently.
Machine visionTechnologies with imaging-based automatic inspection, gauging, counting and analysis at high speeds, reliability and with greater precision (exceeding the capabilities of the human eye).
MES Manufacturing Execution Systems; The central computational system which tracks and documents the transformation of raw materials to finished goods
PLCProgrammable logic controller; a digital computer used for automation of typically industrial electromechanical processes, such as control of machinery on factory assembly lines, amusement rides, or light fixtures
PLM Product Lifecycle Management; using advanced computational methods to create a simulation of a product’s production and its life cycle
RFIDRadio-frequency Identification devices; technologies that use radio waves to transfer to data for the purposes of automatically identifying and tracking tags attached to objects

April 13, 2016
Profiles in Innovation
Goldm
an Sachs G
lobal Investment R
esearch
79
Appendix 4: Price targets, methodologies and key risks
Exhibit 77: Covered companies profiled in the report
Source: Goldman Sachs Global Investment Research (all price targets are 12-months).
Ticker Name Currency Price Rating Price target Key risks Valuation Methodology
DDD 3D Systems Corp. USD 16.63 Neutral 10.00Upside: Direct Metal Laser Sintering ("DMLS") adoption, killer app discovery; Downside: Timing of new product introductions, execution on consumer strategy, integration risk.
50/50 Weighting of DCF and 1.2x EV/Sales
ABBN.S ABB Ltd. USD 18.87 Sell 17.00 Upside risks: M&A, accelerated buyback/key shareholders raising stakes, higher earnings. 2017E EV/IC vs ROIC/WACC
2395.TW Advantech Corporation TWD 224 Neutral 200End market demand; currency volatility (greatest exposure is to Euro, USD and RMB); higher-/lower-than expected operating expenses; lower/higher than expected synergies/returns on M&A.
12m EV/GCI vs. CROCI/WACC (cash return multiple at 13.8X)
CSCO Cisco Systems Inc. USD 27.64 Neutral 32Primary risks include macro, service provider capex, commoditization, competition, and execution around the recent executive transitions
14X our CY16 non-GAAP EPS
DAST.PA Dassault Systemes EUR 69.84 Buy 89.00 M&A integration; sales execution; higher investments; and FX exposure 29x CY17E PF EPS
2308.TW Delta Electronics TWD 138 Buy 208 Global economic slowdown, lower-than-expected synergies from Eltek acquisition, higher-than-expected operating expenses12m EV/GCI vs. CROCI/WACC (cash return multiple at 13.8X)
6954.T Fanuc JPY 18235 Buy 19500 Greater-than-expected decline in FA demand and weak autos/general industry demand in Europe, US, and China FY3/17-18avg. EV/GCI v CROCI/WACC
GE General Electric Co. USD 30.81 Neutral 28.00Upside: Further capital deployment, greater industrial cost‐outs; Downside: Execution missteps, O&G weakness, softer orders/pricing.
P/E (19.0x 2016 EPS)
6324.T Harmonic Drive Systems Inc. JPY 2976 Buy 3100 Yen appreciation, weaker-than-expected cobot demand, stiffer competition spurred by new entrants FY3/21E EV/GCI vs. CROCI/WACC
002008.SZ Han's Laser Technology Industry Group CNY 22.95 Buy 31.50 Downside risk: uptick in competition from local/foreign peers; less-than-expected smartphone capex2017E EV/GCI vs CROCI/WACC with cash return multiple of 3.1x with 35% discount
HON Honeywell International Inc. USD 113.03 Buy 126.00 Slower non res/aero/O&G growth; execution missteps P/E (19.0x 2016 EPS)
300124.SZ Shenzhen Inovance Technology Co., Ltd CNY 38.39 Buy 50.92Downside risk: Further shrinking margins caused by competition or weaker-than-expect cost control; less favorable government support on NEV industry
2017E EV/GCI vs CROCI/WACC with cash return multiple of 3.1x with 5% premium
6861.T Keyence JPY 61800 Neutral 66000 Forex fluctuations, FA demand trends in all regions, particularly Japan, Europe, the US, and China FY3/17E-FY3/18E average CROCI/WACC vs. EV/GCI,
6594.T Nidec JPY 7437 Buy 10000 Sharper than expected HDD decline, yen appreciation. FY3/17-18avg. EV/GCI v CROCI/WACC
ROK Rockwell Automation Inc. USD 112.99 Neutral 101.00Upside: Acceleration in US/Process; better productivity; accretive M&A; Downside: O&G project delays; weaker pricing; softer industrial backdrop
P/E (17.1x CY2016 EPS)
SAPG.DE SAP EUR 68.45 Buy 95.00 Macro headwinds; lack of traction in HANA or cloud; integration/execution issues with M&A; management changes. 21x 2017E PF EPS
SCHN.PA Schneider Electric EUR 53.69 Neutral 57.00Downside: greater-than-expected weakness in China, deteriorating oil & gas demand, delays with Invensys’ integration, lower volume/price, FX headwinds, large value-destructive M&A. Upside are the reverse of these.
2017E EV/IC vs ROIC/WACC
300024.SZ Siasun Robot&Automation Co., Ltd CNY 27.56 Neutral 22.49 Upside risks: Better-than-expected orders from new industry other than auto/auto parts; Downside risk: local/foreign competition 2017E EV/GCI vs CROCI/WACC with cash return multiple of 3.1x with 70% premium
SIEGn.DE Siemens AG EUR 89.81 Buy 102.00Downside: (1) slower restructuring of underperforming businesses; (2) execution risks; (3) value-dilutive M&A; (4) weaker FCF and volume/price.
2017E EV/IC vs ROIC/WACC
6273.T SMC JPY 26805 Neutral 30000 Fluctuations in FA demand, forex FY3/17-18avg. EV/GCI v CROCI/WACC
SSYS Stratasys Ltd. USD 27.27 Neutral 21.00Upside: Direct Metal Laser Sintering ("DMLS") adoption, killer app discovery; Downside: Timing of new product introductions, execution on consumer strategy, integration risk.
50/50 Weighting of DCF and 1.2x EV/Sales
TER Teradyne Inc. USD 20.65 Neutral 22.00 Semi test growth, cycle trajectory, and Universal Robots execution 12m 10x normalised EPS
6506.T Yaskawa Electric JPY 1336 Buy 1560 Yen appreciation, product mix improvement below our expectations, far lower-than-expected FA demand FY3/17-18avg. EV/GCI v CROCI/WACC

April 13, 2016 Profiles in Innovation
Goldman Sachs Global Investment Research 80
Disclosure Appendix
Reg AC
We, Daniela Costa, Yuichiro Isayama, Joe Ritchie, Tian Lu, CFA, William Turner, Ashay Gupta, Yuki Kawanishi, Mohammed Moawalla, Jacqueline Du,
Samuel H. Eisner, Willy Chen, Toshiya Hari, Stefan Burgstaller, Daiki Takayama, Simona Jankowski, CFA, Wei Chen, Heather Bellini, CFA, Diana Zhao,
Alex Karpos, Matthew Cabral, Gautam Pillai, Jessica Kaur, Shateel Alam and Robert D. Boroujerdi, hereby certify that all of the views expressed in
this report accurately reflect our personal views about the subject company or companies and its or their securities. We also certify that no part of our
compensation was, is or will be, directly or indirectly, related to the specific recommendations or views expressed in this report.
Unless otherwise stated, the individuals listed on the cover page of this report are analysts in Goldman Sachs' Global Investment Research division.
Investment Profile
The Goldman Sachs Investment Profile provides investment context for a security by comparing key attributes of that security to its peer group and
market. The four key attributes depicted are: growth, returns, multiple and volatility. Growth, returns and multiple are indexed based on composites
of several methodologies to determine the stocks percentile ranking within the region's coverage universe.
The precise calculation of each metric may vary depending on the fiscal year, industry and region but the standard approach is as follows:
Growth is a composite of next year's estimate over current year's estimate, e.g. EPS, EBITDA, Revenue. Return is a year one prospective aggregate
of various return on capital measures, e.g. CROCI, ROACE, and ROE. Multiple is a composite of one-year forward valuation ratios, e.g. P/E, dividend
yield, EV/FCF, EV/EBITDA, EV/DACF, Price/Book. Volatility is measured as trailing twelve-month volatility adjusted for dividends.
Quantum
Quantum is Goldman Sachs' proprietary database providing access to detailed financial statement histories, forecasts and ratios. It can be used for
in-depth analysis of a single company, or to make comparisons between companies in different sectors and markets.
GS SUSTAIN
GS SUSTAIN is a global investment strategy aimed at long-term, long-only performance with a low turnover of ideas. The GS SUSTAIN focus list
includes leaders our analysis shows to be well positioned to deliver long term outperformance through sustained competitive advantage and
superior returns on capital relative to their global industry peers. Leaders are identified based on quantifiable analysis of three aspects of corporate
performance: cash return on cash invested, industry positioning and management quality (the effectiveness of companies' management of the
environmental, social and governance issues facing their industry).
Disclosures
Coverage group(s) of stocks by primary analyst(s)
Daniela Costa: Europe-Machinery & Elec Equip. Yuichiro Isayama: Japan-Machinery. Joe Ritchie: America-Capital Goods: Multi-Industry. Tian Lu,
CFA: Asia Pacific Infrastructure, China Capital Goods. Mohammed Moawalla: Europe-IT Services, Europe-Software. Jacqueline Du: Asia Pacific
Infrastructure, China Capital Goods. Samuel H. Eisner: America-Additive Manufacturing, America-Building Products, America-SMID Capital Goods.
Willy Chen: Asia Pacific Autos & Auto Parts, Asia Pacific Chemicals, Asia Pacific Energy, Taiwan Machinery. Toshiya Hari: America-Semiconductor
Capital Equipment, America-Semiconductors. Stefan Burgstaller: Europe-Autos & Auto Parts. Daiki Takayama: Japan-Electronic Components.
Simona Jankowski, CFA: America-Consumer Hardware & Mobility, America-IT Hardware, America-Telecom Equipment. Wei Chen: Asia Pacific
Technology. Heather Bellini, CFA: America-Software. Matthew Cabral: America-IT Hardware.
America-Additive Manufacturing: 3D Systems Corp., Stratasys Ltd..
America-Building Products: A.O. Smith Corp., Apogee Enterprises Inc., Armstrong World Industries Inc., BMC Stock Holding Inc., Fortune Brands
Home & Security Inc., Lennox International Inc., Masco Corp., Mohawk Industries Inc., Owens Corning, Watsco Inc., Whirlpool Corp..
America-Capital Goods: Multi-Industry: 3M Co., Colfax Corp., Dover Corp., Eaton Corp., Emerson Electric Co., Flowserve Corp., General Electric Co.,
Graco Inc., HD Supply Holdings, Honeywell International Inc., Illinois Tool Works, Ingersoll-Rand Plc, ITT Corp., Parker Hannifin Corp., Pentair Plc,
Rockwell Automation Inc., Roper Technologies Inc., Tyco International Plc, W.W. Grainger Inc..
America-Consumer Hardware & Mobility: Apple Inc., BlackBerry Ltd., BlackBerry Ltd., Corning Inc., Garmin Ltd., GoPro Inc., Qualcomm Inc..
America-IT Hardware: Aerohive Networks Inc., Arista Networks Inc., Brocade Communications Systems, CDW Corp., Cisco Systems Inc., EMC Corp.,
F5 Networks Inc., Hewlett Packard Enterprise Co., HP Inc., Motorola Solutions Inc., NetApp Inc., Nimble Storage Inc., Pure Storage Inc., Ruckus
Wireless Inc., Xerox Corp..
America-SMID Capital Goods: Kennametal Inc., Milacron Holdings, RBC Bearings Inc., Regal Beloit Corp., Rexnord Corp., ServiceMaster Global
Holdings, Timken Co., TriMas Corp., Wabtec Corp..
America-Semiconductor Capital Equipment: Applied Materials Inc., Keysight Technologies Inc., Lam Research Corp., SunEdison Semiconductor Ltd.,
Teradyne Inc..
America-Semiconductors: Broadcom Ltd., Intel Corp., NXP Semiconductors NV, Qorvo Inc., Skyworks Solutions Inc., Texas Instruments Inc., Xilinx
Corp..
America-Software: Adobe Systems Inc., Akamai Technologies Inc., Alarm.com Holdings, Alphabet Inc., Atlassian Corp., Autodesk Inc., Citrix Systems
Inc., Facebook Inc., Microsoft Corp., Mimecast Ltd., MobileIron Inc., Oracle Corp., Rackspace Hosting Inc., Red Hat Inc., RingCentral, Salesforce.com
Inc., VMware Inc., Workday Inc..
America-Telecom Equipment: ADTRAN Inc., ARRIS International Plc, Ciena Corp., Finisar Corp., Infinera Corp., Juniper Networks Inc., Lumentum
Holdings.
Asia Pacific Autos & Auto Parts: Amara Raja Batteries Ltd, Ashok Leyland, Bajaj Auto, Cheng Shin Rubber, Eicher Motors, Exide Industries, Hankook
Tire, Hero MotoCorp, Hyundai Mobis, Hyundai Motor Co., Hyundai Wia, Kenda Rubber Industrial Co., Kia Motors, Mahindra & Mahindra, Maruti
Suzuki India, Nexen Tire, Tata Motors, TVS Motor.
Asia Pacific Chemicals: China Steel Chemical, Far Eastern New Century Corp., Formosa Chemicals & Fibre, Formosa Plastics, Hanwha Chemical,
Kumho Petro Chemical Co., LG Chem, Lotte Chemical, Nan Ya Plastics, Petronas Chemicals Group, PTT Global Chemical, Taiwan Synthetic Rubber
Corp..

April 13, 2016 Profiles in Innovation
Goldman Sachs Global Investment Research 81
Asia Pacific Energy: Bangchak Petroleum PCL, Bharat Petroleum, Cairn India Ltd., China Petroleum & Chemical (A), China Petroleum & Chemical
(ADS), China Petroleum & Chemical (H), CNOOC, CNOOC (ADR), Formosa Petrochemical Corp., Gas Authority of India, Gujarat State Petronet,
Hindustan Petroleum, Indian Oil Corp., Indraprastha Gas Ltd., IRPC PCL, OCI Co., Oil & Natural Gas Corp., Oil India, Perusahaan Gas, PetroChina (A),
PetroChina (ADR), PetroChina (H), Petronet LNG, PTT Exploration and Production PCL, PTT Public Co., Reliance Industries, Reliance Industries (GDR),
Thai Oil.
Asia Pacific Infrastructure: China Communications Construction (A), China Communications Construction (H), China Machinery Engineering Corp.,
China Railway Construction (A), China Railway Construction (H), China Railway Group (A), China Railway Group (H), China State Construction Intl,
Sinopec Engineering Group.
Asia Pacific Technology: AAC Technologies, Acer, Advanced Semiconductor Engineering, ASUSTeK Computer, Casetek Holdings, Catcher
Technology, Compal Electronics, Hon Hai Precision, Largan Precision, Lenovo Group, Pegatron, Quanta Computer, Siliconware Precision Industries,
TPK Holding, Wistron.
China Capital Goods: China Railway Signal & Communication, CRRC Corp. (A), CRRC Corp. (H), Estun Automation Co., Guangxi Liugong, Haitian
International Holdings Limited, Han's Laser Technology Industry Group, Heli, Hollysys Automation Technologies Ltd., Huagong Tech Co., Lonking
Holdings, Sany Heavy, Sany Heavy Equipment International, Shanghai STEP Electric Corporation, Shantui, Shenzhen Inovance Techology Co., Ltd,
Siasun Robot&Automation Co., Ltd, Tian Di Science & Technology, Yangtze Optical Fibre and Cable, Zhengzhou Coal Mining Machinery, Zhuzhou
CRRC Times Electric Co., Zoomlion (A), Zoomlion (H).
Europe-Autos & Auto Parts: Autoliv Inc., BMW, CNH Industrial, CNH Industrial, Continental, Daimler AG, Faurecia, Fiat Chrysler Automobiles NV, Fiat
Chrysler Automobiles NV, GKN, Hella KGaA Hueck, Michelin, Nokian Renkaat, Peugeot, Porsche, Renault, Valeo, Volkswagen, Volvo.
Europe-IT Services: Atos, Capgemini, Indra, Wirecard, Worldline, Worldpay Group.
Europe-Machinery & Elec Equip: ABB Ltd., Alfa Laval, Alstom, Assa Abloy B, Atlas Copco, Fincantieri SpA, FLSmidth & Co. A/S, Geberit Holding,
KONE Corp., Legrand, Metso OYJ, Nexans, Outotec, Philips, Prysmian, Sandvik, Schindler Holding, Schneider Electric, Siemens AG, SKF, Wartsila,
Weir Group.
Europe-Software: Aveva, Dassault Systemes, Hexagon AB, Sage Group, SAP, SAP, Software AG, Temenos.
Japan-Electronic Components: Alps Electric, Hirose Electric, Ibiden, IRISO Electronics, Japan Aviation Electronics Industry, Japan Display Inc.,
Kyocera, Mabuchi Motor, Minebea, Mitsumi Electric, Murata Mfg., NGK Insulators, NGK Spark Plug, Nichicon, Nidec, Nippon Ceramic, Nippon
Chemi-Con, Nitto Denko, Pacific Industrial, Shinko Electric Industries, Taiyo Yuden, TDK.
Japan-Machinery: Aida Engineering Ltd., Daikin Industries, Fanuc, Harmonic Drive Systems Inc., Hitachi Construction Machinery, JTEKT, Keyence,
Komatsu, Kubota, Makita, NSK, NTN, Okuma Corp., SMC, THK, Tsubaki Nakashima Co., Yaskawa Electric.
Taiwan Machinery: Advantech Corporation, Airtac International Group, Delta Electronics, Hiwin Corporation.
Company-specific regulatory disclosures
Compendium report: please see disclosures at http://www.gs.com/research/hedge.html. Disclosures applicable to the companies included in this
compendium can be found in the latest relevant published research
Distribution of ratings/investment banking relationships
Goldman Sachs Investment Research global Equity coverage universe
Rating Distribution Investment Banking Relationships
Buy Hold Sell Buy Hold Sell
Global 32% 53% 15% 65% 58% 51%
As of April 1, 2016, Goldman Sachs Global Investment Research had investment ratings on 3,029 equity securities. Goldman Sachs assigns stocks as
Buys and Sells on various regional Investment Lists; stocks not so assigned are deemed Neutral. Such assignments equate to Buy, Hold and Sell for
the purposes of the above disclosure required by the FINRA Rules. See 'Ratings, Coverage groups and views and related definitions' below. The
Investment Banking Relationships chart reflects the percentage of subject companies within each rating category for whom Goldman Sachs has
provided investment banking services within the previous twelve months.
Price target and rating history chart(s)
Compendium report: please see disclosures at http://www.gs.com/research/hedge.html. Disclosures applicable to the companies included in this
compendium can be found in the latest relevant published research
Regulatory disclosures
Disclosures required by United States laws and regulations
See company-specific regulatory disclosures above for any of the following disclosures required as to companies referred to in this report: manager
or co-manager in a pending transaction; 1% or other ownership; compensation for certain services; types of client relationships; managed/co-
managed public offerings in prior periods; directorships; for equity securities, market making and/or specialist role. Goldman Sachs trades or may
trade as a principal in debt securities (or in related derivatives) of issuers discussed in this report.
The following are additional required disclosures: Ownership and material conflicts of interest: Goldman Sachs policy prohibits its analysts,
professionals reporting to analysts and members of their households from owning securities of any company in the analyst's area of
coverage. Analyst compensation: Analysts are paid in part based on the profitability of Goldman Sachs, which includes investment banking
revenues. Analyst as officer or director: Goldman Sachs policy prohibits its analysts, persons reporting to analysts or members of their
households from serving as an officer, director, advisory board member or employee of any company in the analyst's area of coverage. Non-U.S. Analysts: Non-U.S. analysts may not be associated persons of Goldman, Sachs & Co. and therefore may not be subject to FINRA Rule 2241 or FINRA
Rule 2242 restrictions on communications with subject company, public appearances and trading securities held by the analysts.
Distribution of ratings: See the distribution of ratings disclosure above. Price chart: See the price chart, with changes of ratings and price targets in
prior periods, above, or, if electronic format or if with respect to multiple companies which are the subject of this report, on the Goldman Sachs
website at http://www.gs.com/research/hedge.html.

April 13, 2016 Profiles in Innovation
Goldman Sachs Global Investment Research 82
Additional disclosures required under the laws and regulations of jurisdictions other than the United States
The following disclosures are those required by the jurisdiction indicated, except to the extent already made above pursuant to United States laws
and regulations. Australia: Goldman Sachs Australia Pty Ltd and its affiliates are not authorised deposit-taking institutions (as that term is defined in
the Banking Act 1959 (Cth)) in Australia and do not provide banking services, nor carry on a banking business, in Australia. This research, and any
access to it, is intended only for "wholesale clients" within the meaning of the Australian Corporations Act, unless otherwise agreed by Goldman
Sachs. In producing research reports, members of the Global Investment Research Division of Goldman Sachs Australia may attend site visits and
other meetings hosted by the issuers the subject of its research reports. In some instances the costs of such site visits or meetings may be met in part
or in whole by the issuers concerned if Goldman Sachs Australia considers it is appropriate and reasonable in the specific circumstances relating to
the site visit or meeting. Brazil: Disclosure information in relation to CVM Instruction 483 is available at
http://www.gs.com/worldwide/brazil/area/gir/index.html. Where applicable, the Brazil-registered analyst primarily responsible for the content of this
research report, as defined in Article 16 of CVM Instruction 483, is the first author named at the beginning of this report, unless indicated otherwise at
the end of the text. Canada: Goldman Sachs Canada Inc. is an affiliate of The Goldman Sachs Group Inc. and therefore is included in the company
specific disclosures relating to Goldman Sachs (as defined above). Goldman Sachs Canada Inc. has approved of, and agreed to take responsibility for,
this research report in Canada if and to the extent that Goldman Sachs Canada Inc. disseminates this research report to its clients. Hong Kong: Further information on the securities of covered companies referred to in this research may be obtained on request from Goldman Sachs
(Asia) L.L.C. India: Further information on the subject company or companies referred to in this research may be obtained from Goldman Sachs
(India) Securities Private Limited, Research Analyst - SEBI Registration Number INH000001493, 951-A, Rational House, Appasaheb Marathe Marg,
Prabhadevi, Mumbai 400 025, India, Corporate Identity Number U74140MH2006FTC160634, Phone +91 22 6616 9000, Fax +91 22 6616 9001. Goldman
Sachs may beneficially own 1% or more of the securities (as such term is defined in clause 2 (h) the Indian Securities Contracts (Regulation) Act,
1956) of the subject company or companies referred to in this research report. Japan: See below. Korea: Further information on the subject
company or companies referred to in this research may be obtained from Goldman Sachs (Asia) L.L.C., Seoul Branch. New Zealand: Goldman
Sachs New Zealand Limited and its affiliates are neither "registered banks" nor "deposit takers" (as defined in the Reserve Bank of New Zealand Act
1989) in New Zealand. This research, and any access to it, is intended for "wholesale clients" (as defined in the Financial Advisers Act 2008) unless
otherwise agreed by Goldman Sachs. Russia: Research reports distributed in the Russian Federation are not advertising as defined in the Russian
legislation, but are information and analysis not having product promotion as their main purpose and do not provide appraisal within the meaning of
the Russian legislation on appraisal activity. Singapore: Further information on the covered companies referred to in this research may be obtained
from Goldman Sachs (Singapore) Pte. (Company Number: 198602165W). Taiwan: This material is for reference only and must not be reprinted
without permission. Investors should carefully consider their own investment risk. Investment results are the responsibility of the individual
investor. United Kingdom: Persons who would be categorized as retail clients in the United Kingdom, as such term is defined in the rules of the
Financial Conduct Authority, should read this research in conjunction with prior Goldman Sachs research on the covered companies referred to
herein and should refer to the risk warnings that have been sent to them by Goldman Sachs International. A copy of these risks warnings, and a
glossary of certain financial terms used in this report, are available from Goldman Sachs International on request.
European Union: Disclosure information in relation to Article 4 (1) (d) and Article 6 (2) of the European Commission Directive 2003/125/EC is available
at http://www.gs.com/disclosures/europeanpolicy.html which states the European Policy for Managing Conflicts of Interest in Connection with
Investment Research.
Japan: Goldman Sachs Japan Co., Ltd. is a Financial Instrument Dealer registered with the Kanto Financial Bureau under registration number Kinsho
69, and a member of Japan Securities Dealers Association, Financial Futures Association of Japan and Type II Financial Instruments Firms
Association. Sales and purchase of equities are subject to commission pre-determined with clients plus consumption tax. See company-specific
disclosures as to any applicable disclosures required by Japanese stock exchanges, the Japanese Securities Dealers Association or the Japanese
Securities Finance Company.
Ratings, coverage groups and views and related definitions
Buy (B), Neutral (N), Sell (S) -Analysts recommend stocks as Buys or Sells for inclusion on various regional Investment Lists. Being assigned a Buy
or Sell on an Investment List is determined by a stock's return potential relative to its coverage group as described below. Any stock not assigned as
a Buy or a Sell on an Investment List is deemed Neutral. Each regional Investment Review Committee manages various regional Investment Lists to a
global guideline of 25%-35% of stocks as Buy and 10%-15% of stocks as Sell; however, the distribution of Buys and Sells in any particular coverage
group may vary as determined by the regional Investment Review Committee. Regional Conviction Buy and Sell lists represent investment
recommendations focused on either the size of the potential return or the likelihood of the realization of the return.
Return potential represents the price differential between the current share price and the price target expected during the time horizon associated
with the price target. Price targets are required for all covered stocks. The return potential, price target and associated time horizon are stated in each
report adding or reiterating an Investment List membership.
Coverage groups and views: A list of all stocks in each coverage group is available by primary analyst, stock and coverage group at
http://www.gs.com/research/hedge.html. The analyst assigns one of the following coverage views which represents the analyst's investment outlook
on the coverage group relative to the group's historical fundamentals and/or valuation. Attractive (A). The investment outlook over the following 12
months is favorable relative to the coverage group's historical fundamentals and/or valuation. Neutral (N). The investment outlook over the
following 12 months is neutral relative to the coverage group's historical fundamentals and/or valuation. Cautious (C). The investment outlook over
the following 12 months is unfavorable relative to the coverage group's historical fundamentals and/or valuation.
Not Rated (NR). The investment rating and target price have been removed pursuant to Goldman Sachs policy when Goldman Sachs is acting in an
advisory capacity in a merger or strategic transaction involving this company and in certain other circumstances. Rating Suspended (RS). Goldman
Sachs Research has suspended the investment rating and price target for this stock, because there is not a sufficient fundamental basis for
determining, or there are legal, regulatory or policy constraints around publishing, an investment rating or target. The previous investment rating and
price target, if any, are no longer in effect for this stock and should not be relied upon. Coverage Suspended (CS). Goldman Sachs has suspended
coverage of this company. Not Covered (NC). Goldman Sachs does not cover this company. Not Available or Not Applicable (NA). The
information is not available for display or is not applicable. Not Meaningful (NM). The information is not meaningful and is therefore excluded.
Global product; distributing entities
The Global Investment Research Division of Goldman Sachs produces and distributes research products for clients of Goldman Sachs on a global
basis. Analysts based in Goldman Sachs offices around the world produce equity research on industries and companies, and research on
macroeconomics, currencies, commodities and portfolio strategy. This research is disseminated in Australia by Goldman Sachs Australia Pty Ltd
(ABN 21 006 797 897); in Brazil by Goldman Sachs do Brasil Corretora de Títulos e Valores Mobiliários S.A.; in Canada by either Goldman Sachs
Canada Inc. or Goldman, Sachs & Co.; in Hong Kong by Goldman Sachs (Asia) L.L.C.; in India by Goldman Sachs (India) Securities Private Ltd.; in
Japan by Goldman Sachs Japan Co., Ltd.; in the Republic of Korea by Goldman Sachs (Asia) L.L.C., Seoul Branch; in New Zealand by Goldman Sachs
New Zealand Limited; in Russia by OOO Goldman Sachs; in Singapore by Goldman Sachs (Singapore) Pte. (Company Number: 198602165W); and in

April 13, 2016 Profiles in Innovation
Goldman Sachs Global Investment Research 83
the United States of America by Goldman, Sachs & Co. Goldman Sachs International has approved this research in connection with its distribution in
the United Kingdom and European Union.
European Union: Goldman Sachs International authorised by the Prudential Regulation Authority and regulated by the Financial Conduct Authority
and the Prudential Regulation Authority, has approved this research in connection with its distribution in the European Union and United Kingdom;
Goldman Sachs AG and Goldman Sachs International Zweigniederlassung Frankfurt, regulated by the Bundesanstalt für
Finanzdienstleistungsaufsicht, may also distribute research in Germany.
General disclosures
This research is for our clients only. Other than disclosures relating to Goldman Sachs, this research is based on current public information that we
consider reliable, but we do not represent it is accurate or complete, and it should not be relied on as such. The information, opinions, estimates and
forecasts contained herein are as of the date hereof and are subject to change without prior notification. We seek to update our research as
appropriate, but various regulations may prevent us from doing so. Other than certain industry reports published on a periodic basis, the large
majority of reports are published at irregular intervals as appropriate in the analyst's judgment.
Goldman Sachs conducts a global full-service, integrated investment banking, investment management, and brokerage business. We have
investment banking and other business relationships with a substantial percentage of the companies covered by our Global Investment Research
Division. Goldman, Sachs & Co., the United States broker dealer, is a member of SIPC (http://www.sipc.org).
Our salespeople, traders, and other professionals may provide oral or written market commentary or trading strategies to our clients and principal
trading desks that reflect opinions that are contrary to the opinions expressed in this research. Our asset management area, principal trading desks
and investing businesses may make investment decisions that are inconsistent with the recommendations or views expressed in this research.
The analysts named in this report may have from time to time discussed with our clients, including Goldman Sachs salespersons and traders, or may
discuss in this report, trading strategies that reference catalysts or events that may have a near-term impact on the market price of the equity
securities discussed in this report, which impact may be directionally counter to the analyst's published price target expectations for such stocks. Any
such trading strategies are distinct from and do not affect the analyst's fundamental equity rating for such stocks, which rating reflects a stock's
return potential relative to its coverage group as described herein.
We and our affiliates, officers, directors, and employees, excluding equity and credit analysts, will from time to time have long or short positions in,
act as principal in, and buy or sell, the securities or derivatives, if any, referred to in this research.
The views attributed to third party presenters at Goldman Sachs arranged conferences, including individuals from other parts of Goldman Sachs, do
not necessarily reflect those of Global Investment Research and are not an official view of Goldman Sachs.
Any third party referenced herein, including any salespeople, traders and other professionals or members of their household, may have positions in
the products mentioned that are inconsistent with the views expressed by analysts named in this report.
This research is not an offer to sell or the solicitation of an offer to buy any security in any jurisdiction where such an offer or solicitation would be
illegal. It does not constitute a personal recommendation or take into account the particular investment objectives, financial situations, or needs of
individual clients. Clients should consider whether any advice or recommendation in this research is suitable for their particular circumstances and, if
appropriate, seek professional advice, including tax advice. The price and value of investments referred to in this research and the income from them
may fluctuate. Past performance is not a guide to future performance, future returns are not guaranteed, and a loss of original capital may occur.
Fluctuations in exchange rates could have adverse effects on the value or price of, or income derived from, certain investments.
Certain transactions, including those involving futures, options, and other derivatives, give rise to substantial risk and are not suitable for all investors.
Investors should review current options disclosure documents which are available from Goldman Sachs sales representatives or at
http://www.theocc.com/about/publications/character-risks.jsp. Transaction costs may be significant in option strategies calling for multiple purchase
and sales of options such as spreads. Supporting documentation will be supplied upon request.
All research reports are disseminated and available to all clients simultaneously through electronic publication to our internal client websites. Not all
research content is redistributed to our clients or available to third-party aggregators, nor is Goldman Sachs responsible for the redistribution of our
research by third party aggregators. For research, models or other data available on a particular security, please contact your sales representative or
go to http://360.gs.com.
Disclosure information is also available at http://www.gs.com/research/hedge.html or from Research Compliance, 200 West Street, New York, NY
10282.
© 2016 Goldman Sachs.
No part of this material may be (i) copied, photocopied or duplicated in any form by any means or (ii) redistributed without the prior written consent of The Goldman Sachs Group, Inc.