Goldman Sachs Trust II Form N-CSRS Filed 2017-06-30
479
Business Address 200 WEST STREET 15TH FLOOR NEW YORK NY 10282 212-902-1000 Mailing Address 200 WEST STREET 15TH FLOOR NEW YORK NY 10282 SECURITIES AND EXCHANGE COMMISSION FORM N-CSRS Certified semi-annual shareholder report of registered management investment companies filed on Form N-CSR Filing Date: 2017-06-30 | Period of Report: 2017-04-30 SEC Accession No. 0001193125-17-220153 (HTML Version on secdatabase.com) FILER Goldman Sachs Trust II CIK:1557156| IRS No.: 000000000 | State of Incorp.:DE | Fiscal Year End: 1231 Type: N-CSRS | Act: 40 | File No.: 811-22781 | Film No.: 17942843 Copyright © 2017 www.secdatabase.com . All Rights Reserved. Please Consider the Environment Before Printing This Document
-
Upload
khangminh22 -
Category
Documents
-
view
1 -
download
0
Transcript of Goldman Sachs Trust II Form N-CSRS Filed 2017-06-30

Business Address200 WEST STREET15TH FLOORNEW YORK NY 10282212-902-1000
Mailing Address200 WEST STREET15TH FLOORNEW YORK NY 10282
SECURITIES AND EXCHANGE COMMISSION
FORM N-CSRSCertified semi-annual shareholder report of registered management investment companies filed
on Form N-CSR
Filing Date: 2017-06-30 | Period of Report: 2017-04-30SEC Accession No. 0001193125-17-220153
(HTML Version on secdatabase.com)
FILERGoldman Sachs Trust IICIK:1557156| IRS No.: 000000000 | State of Incorp.:DE | Fiscal Year End: 1231Type: N-CSRS | Act: 40 | File No.: 811-22781 | Film No.: 17942843
Copyright © 2017 www.secdatabase.com. All Rights Reserved.Please Consider the Environment Before Printing This Document

UNITED STATESSECURITIES AND EXCHANGE COMMISSION
Washington, D.C. 20549
FORM N-CSRCERTIFIED SHAREHOLDER REPORT OF REGISTERED
MANAGEMENT INVESTMENT COMPANIES
Investment Company Act file number 811-22781
Goldman Sachs Trust II(Exact name of registrant as specified in charter)
200 West Street15th Floor
New York, New York 10282(Address of principal executive offices) (Zip code)
Copies to:Caroline Kraus Geoffrey R.T. Kenyon, Esq.
Goldman Sachs & Co. LLC Dechert LLP200 West Street 100 Oliver Street
New York, New York 10282 40th FloorBoston, MA 02110-2605
(Name and address of agents for service)
Registrant��s telephone number, including area code: (212) 902-1000
Date of fiscal year end: October 31
Date of reporting period: April 30, 2017
ITEM 1. REPORTS TO STOCKHOLDERS.
The Semi-Annual Report to Shareholders is filed herewith.
Copyright © 2017 www.secdatabase.com. All Rights Reserved.Please Consider the Environment Before Printing This Document

Goldman Sachs Funds
Semi-Annual Report April 30, 2017
Active Equity Multi-Manager FundsMulti-Manager International EquityMulti-Manager U.S. Dynamic EquityMulti-Manager U.S. Small Cap Equity
Copyright © 2017 www.secdatabase.com. All Rights Reserved.Please Consider the Environment Before Printing This Document

Active Equity Multi-Manager Funds∎ MULTI-MANAGER INTERNATIONAL EQUITY
∎ MULTI-MANAGER U.S. DYNAMIC EQUITY
∎ MULTI-MANAGER U.S. SMALL CAP EQUITY
TABLE OF CONTENTS
Market Review 1
Portfolio Management Discussions and Performance Summaries 3
Schedules of Investments 16
Financial Statements 28
Financial Highlights 32
Notes to the Financial Statements 38
Other Information 52
NOT FDIC-INSURED May Lose Value No Bank Guarantee
Copyright © 2017 www.secdatabase.com. All Rights Reserved.Please Consider the Environment Before Printing This Document

MARKET REVIEW
Active Equity Multi-Manager FundsMarket ReviewThe capital markets broadly rallied during the six months ended April 30, 2017 (the �Reporting Period�). In the U.S., the unexpected election ofDonald Trump led investors to rotate out of the defensive, yield-oriented positioning that had driven market returns in much of 2015 and 2016. TheFederal Reserve (the �Fed�), citing an improved labor market and moderately expanding economic activity, cautiously raised interest rates twice duringthe Reporting Period � in December 2016 and March 2017. Meanwhile, the U.K. officially triggered Article 50, beginning negotiations to extricateitself from the European Union, popularly known as Brexit.
The U.S. dollar rallied sharply following the U.S. elections but declined over the early part of 2017, ending the Reporting Period slightly higher than atthe start of the Reporting Period. The yield on 10-year U.S. Treasuries also increased during the Reporting Period, with the post-election U.S. Treasurysell-off moderately offset by a recovery in prices year-to-date through April 30, 2017. In commodities, oil rallied in November 2016 but declined in theearly months of 2017 on pricing concerns and on uncertainty around Organization of the Petroleum Exporting Countries (�OPEC�) production limits,leading to underperformance from energy-related assets worldwide during the Reporting Period overall. Gold moved in the opposite direction; after asteep sell-off following the U.S. elections, gold gained over the first few months of 2017 to end the Reporting Period only slightly below where itstarted.
Global equity markets ended the Reporting Period in positive territory. In the U.S., investors reacted to the prospect of business-friendly tax cuts,decreased regulations, and revisions to international trade agreements under the current Administration by rotating into more cyclical areas of themarket. Financial stocks were the best performers during the Reporting Period, followed by information technology, consumer discretionary andindustrials. Energy companies underperformed due to declines in oil prices, while the higher yielding, traditionally defensive sectors, such as utilities,telecommunication services and consumer staples, which had driven the market for much of 2015 and 2016 also underperformed. Small cap stocks, asmeasured by the applicable Russell indices, widely considered most likely to benefit from current Administration policies, outperformed large capstocks during the Reporting Period. International equity markets also gained during the Reporting Period, with European stocks rebounding from2016�s Brexit-driven selloff and emerging market equities rallying on improved prospects for economic growth.
Credit markets also largely ended the Reporting Period in positive territory. Despite volatility around U.S. elections and an increase in U.S. Treasuryrates during the Reporting Period, credit spreads, or yield differentials to U.S. Treasuries, tightened from their January 2016 highs, as economicrecovery improved and market participants became optimistic about the prospect of fiscal stimulus under the new Administration. In the U.S., issuerssought to take advantage of low interest rates and strong foreign demand to drive new offerings. Abroad, emerging market credit, generally offeringmore attractive yields and less sovereign leverage, rallied. (Less sovereign leverage refers to the fact that emerging markets generally have lesssovereign debt than developed markets as a percentage of Gross Domestic Product given the effects of quantitative easing in the U.S. and Europe.)
Public real estate markets moved higher on what investors broadly considered to be reasonable valuations and an attractive supply/demand backdrop atthis point in the cycle. While higher yield outperformed lower yield, the magnitude of outperformance of higher yield decreased toward the end of2016 and in the beginning of 2017. After selling off sharply in the aftermath of Brexit, U.K. real estate securities rallied back during the ReportingPeriod. Hong Kong and Singapore, which had also been out of favor, performed well, while Japan was the only major
1
Copyright © 2017 www.secdatabase.com. All Rights Reserved.Please Consider the Environment Before Printing This Document
MARKET REVIEW
real estate market to decline. Office and residential real estate moved higher, though prison and hotel real estate investment trusts (�REITs�)experienced the sharpest rally following the U.S. election on expectations of more favorable government policy and prospects of increased economicgrowth. Data center and logistics REITs also attracted capital as part of a broader play on cloud computing and growth of e-commerce. Conversely,mall REITs sold off in the first quarter of 2017 on the back of higher than market expected closures of brick and mortar stores.
At the end of the Reporting Period, investors appeared to be monitoring political developments in the U.S., particularly regarding tax and health carereform. We believe the rise of populism worldwide has challenged conventional leadership, most recently during the French election, and may lead tofurther market disruption. While most global central banks maintain policies of quantitative easing, investors also broadly anticipate at least one moreinterest rate hike in the U.S. in 2017.
2
Copyright © 2017 www.secdatabase.com. All Rights Reserved.Please Consider the Environment Before Printing This Document

PORTFOLIO RESULTS
Multi-Manager International Equity FundInvestment Objective and Principal StrategyThe Fund seeks to provide long-term capital growth.
Portfolio Management Discussion and AnalysisBelow, the Goldman Sachs Alternative Investments & Manager Selection (��AIMS��) Group discusses the Multi-Manager InternationalEquity Fund��s (the ��Fund��) performance and positioning for the six-month period ended April 30, 2017 (the ��Reporting Period��).
Q How did the Fund perform during the Reporting Period?
A During the Reporting Period, the Fund�s Institutional Shares generated a cumulative total return of 12.38%. This return compares to the 11.47%cumulative total return of the Fund�s benchmark, the MSCI® EAFE® Index (Net, USD, Unhedged) (the �Index�) during the same time period.
Q What key factors were responsible for the Fund��s performance during the Reporting Period?
A The Fund�s performance during the Reporting Period can be attributed to the performance of the Fund�s Underlying Managers, who are unaffiliatedinvestment managers that employ an international equity investment strategy. During the Reporting Period, the Fund allocated capital to threeUnderlying Managers as part of its top-level strategy allocation � Causeway Capital Management LLC (�Causeway�), Massachusetts FinancialServices Company doing business as MFS Investment Management (�MFS�) and WCM Investment Management (�WCM�).
All three of the Underlying Managers with allocated capital during the Reporting Period generated positive absolute returns and all threeoutperformed the Index on a relative basis, led by value-oriented Underlying Manager Causeway and growth-oriented Underlying Manager WCM.
Q Which international equity strategies most significantly affected Fund performance?
A The Fund�s relative outperformance was driven by value-oriented manager Causeway, which posted positive absolute returns and outperformed theIndex due to strong stock selection in financials and consumer discretionary. An overweight to and stock selection in telecommunication servicesdetracted, partially offsetting Causeway�s outperformance.
Growth-oriented manager WCM also posted positive absolute returns and outperformed the Index, benefiting from strong stock selection inconsumer discretionary. This was partially offset by an underweight to and stock selection in financials, particularly banks, which detracted.
Core-oriented manager MFS posted positive absolute returns and outperformed the Index as well. MFS� outperformance was due to positive stockselection in materials and health care and a favorable underweight to telecommunication services. An overweight to and stock selection in consumerstaples and an underweight to banks, which detracted, partially offset MFS� strong performance during the Reporting Period.
Q How did the Fund use derivatives and similar instruments during the Reporting Period?
A The Fund used forward foreign currency exchange contracts during the Reporting Period to take positions in select non-U.S. markets. The use ofthese derivatives did not have a material impact on the Fund�s results during the Reporting Period.
Q Were there any notable changes in the Fund��s allocations during the Reporting Period?
A There were no changes to the Fund�s allocations of assets to Underlying Managers during the Reporting Period. As of April 30, 2017, the Fund�sassets were allocated approximately 44% to Causeway, 19% to MFS and 36% to WCM. The remainder of the Fund�s assets were invested in cashand cash equivalents.
Q Were there any changes to the Fund��s management team during the Reporting Period?
A There were no changes to the Fund�s management team during the Reporting Period.
3
Copyright © 2017 www.secdatabase.com. All Rights Reserved.Please Consider the Environment Before Printing This Document

PORTFOLIO RESULTS
Q What is the Fund��s tactical view and strategy for the months ahead?
A At the end of the Reporting Period, the Fund was moderately more defensively positioned than the Index. Compared to the Index, the Fund wasoverweight information technology, consumer discretionary and health care, while underweight financials, materials, real estate and utilities at theend of the Reporting Period. The Fund held an approximately 3.8% position in cash at the end of April 2017. On a regional basis, the Fund wassignificantly underweight Japan and developed Asia, while maintaining out-of-Index exposure to emerging markets and North America. From amarket capitalization perspective, the Fund was overweight at the end of the Reporting Period in mega cap stocks, while maintaining anunderweight relative to the Index in mid-cap companies.
We intend to continue to position the Fund in alignment with our longer-term strategic views within the international equity complex. We furtherintend to continue to monitor allocations and Underlying Manager performance as we seek to generate long-term capital growth.
.
4
Copyright © 2017 www.secdatabase.com. All Rights Reserved.Please Consider the Environment Before Printing This Document

FUND BASICS
Multi-Manager International Equity Fundas of April 30, 2017
PERFORMANCE REVIEW
November 1, 2016��April 30, 2017Fund Total Return(based on NAV)1
MSCI® EAFE® Index(Net, USD, Unhedged)2
Institutional 12.38 % 11.47 %1 The net asset value (�NAV�) represents the net assets of the class of the Fund (ex-dividend) divided by the total number of shares of the class outstanding. The
Fund�s performance assumes the reinvestment of dividends and other distributions.2 The MSCI® EAFE® Index is a stock market index that is designed to measure the equity market performance of developed markets in Europe, Australasia and the
Far East, excluding the U.S. and Canada. The Index figures do not reflect any deductions for fees, expenses or taxes. It is not possible to invest directly in an index.
STANDARDIZED TOTAL RETURNS3For the period ended 3/31/17 One Year Since Inception Inception DateInstitutional 12.16 % 1.57 % 7/31/15
3 The Standardized Total Returns are average annual total returns or cumulative total returns (only if the performance period is one year or less) as of themost recent calendar quarter-end. They assume reinvestment of all distributions at NAV. Because Institutional Shares do not involve a sales charge, such acharge is not applied to their Standardized Total Returns.
The returns set forth in the tables above represent past performance. Past performance does not guarantee future results. The Fund��sinvestment return and principal value will fluctuate so that an investor��s shares, when redeemed, may be worth more or less than theiroriginal cost. Current performance may be lower or higher than the performance quoted above. Please visit our web site atwww.GSAMFUNDS.com to obtain the most recent month-end returns. Performance reflects applicable fee waivers and/or expenselimitations in effect during the periods shown. In their absence, performance would be reduced. Returns do not reflect the deduction of taxes thata shareholder would pay on Fund distributions or the redemption of Fund shares.
EXPENSE RATIOS4Net Expense Ratio (Current) Gross Expense Ratio (Before Waivers)
Institutional 0.57 % 0.98 %4 The expense ratios of the Fund, both current (net of applicable fee waivers and/or expense limitations) and before waivers (gross of applicable fee waivers
and/or expense limitations) are as set forth above according to the most recent publicly available Prospectus for the Fund and may differ from the expenseratios disclosed in the Financial Highlights in this report. Pursuant to a contractual arrangement, the Fund��s waivers and/or expense limitations willremain in place through at least February 28, 2018, and prior to such date the investment adviser may not terminate the arrangements without theapproval of the Fund��s Board of Trustees. If these arrangements are discontinued in the future, the expense ratios may change without shareholderapproval.
5
Copyright © 2017 www.secdatabase.com. All Rights Reserved.Please Consider the Environment Before Printing This Document

FUND BASICS
TOP TEN EQUITY HOLDINGS AS OF 4/30/175Holding % of Net Assets Line of BusinessCanadian Pacific Railway Ltd. 2.1 % Road & RailNestle SA 2.1 Food ProductsVolkswagen AG 1.9 AutomobilesReckitt Benckiser Group PLC 1.9 Household ProductsAkzo Nobel NV 1.9 ChemicalsSchneider Electric SE 1.8 Electrical EquipmentCompass Group PLC 1.8 Hotels, Restaurants & LeisureLVMH Moet Hennessy LouisVuitton SE
1.7 Textiles, Apparel & Luxury Goods
CSL Ltd. 1.7 BiotechnologyRoche Holding AG 1.6 Pharmaceuticals
5 The top 10 holdings may not be representative of the Fund�s future investments.
FUND VS. BENCHMARK SECTOR ALLOCATIONS (%)6As of April 30, 2017
6 The Fund is actively managed and, as such, its composition may differ over time. Consequently, the Fund�s overall sector allocations may differ from thepercentages contained in the graph above. The graph categorizes investments using the Global Industry Classification Standard (�GICS�), however, the sectorclassifications used by the portfolio management team may differ from GICS. The percentage shown for each investment category reflects the value of investmentsin that category as a percentage of market value. Short-term investments represent repurchase agreements. The graph depicts the Fund�s investments but may notrepresent the Fund�s market exposure due to the exclusion of certain derivatives, if any, as listed in the Additional Investment Information section of the Schedule ofInvestments.
6
Copyright © 2017 www.secdatabase.com. All Rights Reserved.Please Consider the Environment Before Printing This Document

PORTFOLIO RESULTS
Multi-Manager U.S. Dynamic Equity FundInvestment Objective and Principal StrategyThe Fund seeks to provide long-term capital growth.
Portfolio Management Discussion and AnalysisBelow, the Goldman Sachs Alternative Investments & Manager Selection (��AIMS��) Group discusses the Multi-Manager U.S. DynamicEquity Fund��s (the ��Fund��) performance and positioning for the six-month period ended April 30, 2017 (the ��Reporting Period��).
Q How did the Fund perform during the Reporting Period?
A During the Reporting Period, the Fund�s Institutional Shares generated a cumulative total return of 15.30%. This return compares to the 13.32%cumulative total return of the Fund�s benchmark, the S&P 500® Total Return Index (the �Index�) during the same time period.
Q What key factors were responsible for the Fund��s performance during the Reporting Period?
A The Fund�s performance during the Reporting Period can be attributed to the performance of the Fund�s Underlying Managers, who are unaffiliatedinvestment managers that employ a dynamic equity investment strategy. During the Reporting Period, the Fund allocated capital to four UnderlyingManagers as part of its top-level strategy allocation � Sirios Capital Management, L.P. (�Sirios�), Smead Capital Management, Inc. (�Smead�),Weitz Investment Management, Inc. (�Weitz�) and Lazard Asset Management LLC (�Lazard�). Weitz was redeemed from the Fund in January2017.
Of the four Underlying Managers with allocated capital during the Reporting Period, Smead and Sirios posted positive absolute returns andoutperformed the Index on a relative basis. Lazard posted a positive absolute return but underperformed the Index during the Reporting Period.Similarly, Weitz posted a positive absolute return but underperformed the Index while it had capital allocated to it, i.e. from November 2016 throughJanuary 2017.
Q Which dynamic equity strategies most significantly affected Fund performance?
A The Fund�s relative outperformance was driven most by core-oriented manager Smead and growth-oriented manager Sirios. Smead outperformedthe Index due to overweights to and stock selection in consumer discretionary and financials. Stock selection in health care detracted. Siriosoutperformed the Index due to an overweight to and stock selection in materials, partially offset by stock selection in consumer discretionary,particularly media, which detracted. Having a position in cash during a period when the Index rallied also proved to be a drag for Sirios.
Lazard underperformed the Index due to an overweight to and stock selection in consumer staples, but benefited from a lack of exposure to energy.During the time when Weitz had capital allocated to it, it underperformed the Index due to stock selection in financials, particularly an underweightto banks. Having a position in cash during a period when the Index rallied also proved to be a drag for Weitz.
Q How did the Fund use derivatives and similar instruments during the Reporting Period?
A The Fund used forward foreign currency exchange contracts during the Reporting Period to take positions in select non-U.S. markets. The use ofthese derivatives did not have a material impact on the Fund�s results during the Reporting Period.
Q Were there any notable changes in the Fund��s allocations during the Reporting Period?
A At the start of the Reporting Period, the Fund�s assets were allocated approximately 35.5% to Sirios, 35.5% to Smead, 18% to Weitz and 10% toLazard. Weitz was redeemed from the Fund in January 2017, and Lazard was increased to a 15% target weight, while the target Underlying Managerallocations for Sirios and Smead were increased to 42% each. At the end of the Reporting Period, the Fund allocated capital to three UnderlyingManagers as part of its top-level strategy allocation.
7
Copyright © 2017 www.secdatabase.com. All Rights Reserved.Please Consider the Environment Before Printing This Document

PORTFOLIO RESULTS
Q Were there any changes to the Fund��s management team during the Reporting Period?
A There were no changes to the Fund�s management team during the Reporting Period.
Q What is the Fund��s tactical view and strategy for the months ahead?
A At the end of the Reporting Period, the Fund remained overweight consumer discretionary, primarily concentrated in media, though the redemptionof Weitz reduced the media exposure in the Fund from 15% to 11% of Fund assets. The Fund was also overweight in materials and financials at theend of the Reporting Period, with notable bank exposure held by Smead and Sirios. Lazard has not historically invested in banks. The Fund wasunderweight energy, consumer staples, industrials and information technology relative to the Index at the end of the Reporting Period and had noexposure to utilities or real estate. The Fund held an approximately 4.6% position in cash at the end of April 2017. In terms of market capitalization,the Fund maintained a significant underweight to mega caps and an overweight relative to the Index in small/mid cap stocks. Regionally, the Fundwas primarily invested in North American equities, but also had modest exposure to companies domiciled in Europe and the U.K.
We intend to continue to position the Fund in alignment with our longer-term strategic views within the U.S. equity complex. We further intend tocontinue to monitor allocations and Underlying Manager performance as we seek to generate long-term capital growth.
8
Copyright © 2017 www.secdatabase.com. All Rights Reserved.Please Consider the Environment Before Printing This Document

FUND BASICS
Multi-Manager U.S. Dynamic Equity Fundas of April 30, 2017
PERFORMANCE REVIEW
November 1, 2016��April 30, 2017Fund Total Return(based on NAV)1
S&P 500®Total Return Index2
Institutional 15.30 % 13.32 %1 The net asset value (�NAV�) represents the net assets of the class of the Fund (ex-dividend) divided by the total number of shares of the class outstanding. The
Fund�s performance assumes the reinvestment of dividends and other distributions.2 The S&P 500® Total Return Index is the Standard & Poor�s 500 Composite Index of 500 stocks, an unmanaged index of common stock prices. The Index figures do
not reflect any deductions for fees, expenses or taxes. It is not possible to invest directly in an index.
STANDARDIZED TOTAL RETURNS3For the period ended 3/31/17 One Year Since Inception Inception DateInstitutional 14.93 % 2.87 % 7/31/15
3 The Standardized Total Returns are average annual total returns or cumulative total returns (only if the performance period is one year or less) as of themost recent calendar quarter-end. They assume reinvestment of all distributions at NAV. Because Institutional Shares do not involve a sales charge, such acharge is not applied to their Standardized Total Returns.
The returns set forth in the tables above represent past performance. Past performance does not guarantee future results. The Fund��sinvestment return and principal value will fluctuate so that an investor��s shares, when redeemed, may be worth more or less than theiroriginal cost. Current performance may be lower or higher than the performance quoted above. Please visit our web site atwww.GSAMFUNDS.com to obtain the most recent month-end returns. Performance reflects applicable fee waivers and/or expenselimitations in effect during the periods shown. In their absence, performance would be reduced. Returns do not reflect the deduction of taxes thata shareholder would pay on Fund distributions or the redemption of Fund shares.
EXPENSE RATIOS4Net Expense Ratio (Current) Gross Expense Ratio (Before Waivers)
Institutional 0.79 % 1.28 %4 The expense ratios of the Fund, both current (net of applicable fee waivers and/or expense limitations) and before waivers (gross of applicable fee waivers
and/or expense limitations) are as set forth above according to the most recent publicly available Prospectus for the Fund and may differ from the expenseratios disclosed in the Financial Highlights in this report. Pursuant to a contractual arrangement, the Fund��s waivers and/or expense limitations willremain in place through at least February 28, 2018, and prior to such date the investment adviser may not terminate the arrangements without theapproval of the Fund��s Board of Trustees. If these arrangements are discontinued in the future, the expense ratios may change without shareholderapproval.
Copyright © 2017 www.secdatabase.com. All Rights Reserved.Please Consider the Environment Before Printing This Document

9
Copyright © 2017 www.secdatabase.com. All Rights Reserved.Please Consider the Environment Before Printing This Document

FUND BASICS
TOP TEN EQUITY HOLDINGS AS OF 4/30/175Holding % of Net Assets Line of BusinessBank of America Corp. 4.0 % BanksThe Sherwin-Williams Co. 3.8 ChemicalsJPMorgan Chase & Co. 3.7 BankseBay, Inc. 3.0 Internet Software & ServicesNVR, Inc. 2.8 Household DurablesWalgreens Boots Alliance, Inc. 2.7 Food & Staples RetailingBerkshire Hathaway, Inc. Class B 2.4 Diversified Financial ServicesAmgen, Inc. 2.4 BiotechnologyAmerican Express Co. 2.2 Consumer FinanceFedEx Corp. 2.1 Air Freight & Logistics
5 The top 10 holdings may not be representative of the Fund�s future investments.
FUND VS. BENCHMARK SECTOR ALLOCATIONS (%)6As of April 30, 2017
6 The Fund is actively managed and, as such, its composition may differ over time. Consequently, the Fund�s overall sector allocations may differ from thepercentages contained in the graph above. The graph categorizes investments using the Global Industry Classification Standard (�GICS�), however, the sectorclassifications used by the portfolio management team may differ from GICS. The percentage shown for each investment category reflects the value of investmentsin that category as a percentage of market value. Short-term investments represent repurchase agreements. The graph depicts the Fund�s investments but may notrepresent the Fund�s market exposure due to the exclusion of certain derivatives, if any, as listed in the Additional Investment Information section of the Schedule ofInvestments.
10
Copyright © 2017 www.secdatabase.com. All Rights Reserved.Please Consider the Environment Before Printing This Document

PORTFOLIO RESULTS
Multi-Manager U.S. Small Cap Equity FundInvestment Objective and Principal StrategyThe Fund seeks to provide long-term capital growth.
Portfolio Management Discussion and AnalysisBelow, the Goldman Sachs Alternative Investments & Manager Selection (��AIMS��) Group discusses the Multi-Manager U.S. Small CapEquity Fund��s (the ��Fund��) performance and positioning for the six-month period ended April 30, 2017 (the ��Reporting Period��).
Q How did the Fund perform during the Reporting Period?
A During the Reporting Period, the Fund�s Institutional Shares generated a cumulative total return of 13.38%. This return compares to the 18.37%cumulative total return of the Fund�s benchmark, the Russell 2000® Total Return Index (the �Index�) during the same time period.
Q What key factors were responsible for the Fund��s performance during the Reporting Period?
A While the Fund posted robust positive absolute returns, it underperformed the Index during the Reporting Period. The Fund�s performance duringthe Reporting Period can be attributed to the performance of the Fund�s Underlying Managers, who are unaffiliated investment managers thatemploy a small-cap equity investment strategy. During the Reporting Period, the Fund allocated capital to three Underlying Managers as part of itstop-level strategy allocation � Boston Partners Global Investors, Inc. (�Boston Partners�), Brown Advisory LLC (�Brown Advisory�) and PNCCapital Advisors, LLC (�PNC�).
Of the three Underlying Managers with allocated capital during the Reporting Period, all three generated positive absolute returns. However, on arelative basis, all three of the Underlying Managers underperformed their respective benchmark index during the Reporting Period.
Q Which small-cap equity strategies most significantly affected Fund performance?
A The Fund�s relative underperformance was driven most by growth-oriented manager Brown Advisory and core-oriented manager PNC. BrownAdvisory underperformed the Russell 2000® Growth Index due to weak stock selection in consumer discretionary and an overweight to and poorstock selection in information technology. This was partially offset by a lack of exposure to energy, which contributed positively. PNCunderperformed the Index due to weak stock selection in financials, partially offset by an underweight to and stock selection in real estate, whichadded value. Value-oriented manager Boston Partners underperformed the Russell 2000® Value Index but by a smaller margin than the otherUnderlying Managers underperformed their respective benchmark index. Boston Partners� underperformance was due to an overweight to and weakstock selection in consumer discretionary and poor stock selection in health care. Its underperformance was partially mitigated by an underweight toreal estate and effective stock selection in financials, which contributed positively.
Q How did the Fund use derivatives and similar instruments during the Reporting Period?
A The Fund did not use derivatives or similar instruments during the Reporting Period.
Q Were there any notable changes in the Fund��s allocations during the Reporting Period?
A As of October 31, 2016, the Fund�s assets were allocated approximately 44% to Boston Partners, 30% to Brown Advisory and 25% to PNC. Therewere no changes in the Fund�s allocations during the Reporting Period, such that asset allocations remained the same at the end of the ReportingPeriod on April 30, 2017.
Q Were there any changes to the Fund��s management team during the Reporting Period?
A There were no changes to the Fund�s management team during the Reporting Period.
11
Copyright © 2017 www.secdatabase.com. All Rights Reserved.Please Consider the Environment Before Printing This Document

PORTFOLIO RESULTS
Q What is the Fund��s tactical view and strategy for the months ahead?
A At the end of the Reporting Period, the Fund was overweight industrials and moderately overweight financials and consumer discretionarycompared to the Index. The Fund was underweight real estate, utilities, consumer staples, materials and health care relative to the Index at the end ofthe Reporting Period. The Fund held an approximately 5.0% position in cash at the end of April 2017. In terms of market capitalization, the Fundmaintained a slight small-mid cap bias, driven predominantly by Underlying Manager Brown Advisory.
We intend to continue to position the Fund in alignment with our longer-term strategic views within the U.S. small-cap equity complex. We furtherintend to continue to monitor allocations and Underlying Manager performance as we seek to generate long-term capital growth.
12
Copyright © 2017 www.secdatabase.com. All Rights Reserved.Please Consider the Environment Before Printing This Document

FUND BASICS
Multi-Manager U.S. Small Cap Equity Fundas of April 30, 2017
PERFORMANCE REVIEW
November 1, 2016��April 30, 2017Fund Total Return(based on NAV)1
Russell 2000®Total Return Index2
Institutional 13.38 % 18.37 %1 The net asset value (�NAV�) represents the net assets of the class of the Fund (ex-dividend) divided by the total number of shares of the class outstanding. The
Fund�s performance assumes the reinvestment of dividends and other distributions.2 The Russell 2000® Total Return Index is an unmanaged index of common stock prices that measures the performance of the 2000 smallest companies in the Russell
3000® Index. The Index is constructed to provide a comprehensive and unbiased small-cap barometer and is completely reconstituted annually to ensure largerstocks do not distort the performance and characteristics of the true small-cap opportunity set.
STANDARDIZED TOTAL RETURNS3For the period ended 3/31/17 Since Inception Inception DateInstitutional 18.16 % 4/29/16
3 The Standardized Total Returns are average annual total returns or cumulative total returns (only if the performance period is one year or less) as of themost recent calendar quarter-end. They assume reinvestment of all distributions at NAV. Because Institutional Shares do not involve a sales charge, such acharge is not applied to their Standardized Total Returns.
The returns set forth in the tables above represent past performance. Past performance does not guarantee future results. The Fund��sinvestment return and principal value will fluctuate so that an investor��s shares, when redeemed, may be worth more or less than theiroriginal cost. Current performance may be lower or higher than the performance quoted above. Please visit our web site atwww.GSAMFUNDS.com to obtain the most recent month-end returns. Performance reflects applicable fee waivers and/or expenselimitations in effect during the periods shown. In their absence, performance would be reduced. Returns do not reflect the deduction of taxes thata shareholder would pay on Fund distributions or the redemption of Fund shares.
EXPENSE RATIOS4Net Expense Ratio (Current) Gross Expense Ratio (Before Waivers)
Institutional 0.80 % 1.36 %4 The expense ratios of the Fund, both current (net of applicable fee waivers and/or expense limitations) and before waivers (gross of applicable fee waivers
and/or expense limitations) are as set forth above according to the most recent publicly available Prospectus for the Fund and may differ from the expenseratios disclosed in the Financial Highlights in this report. Pursuant to a contractual arrangement, the Fund��s waivers and/or expense limitations willremain in place through at least February 28, 2018, and prior to such date the investment adviser may not terminate the arrangements without theapproval of the Fund��s Board of Trustees. If these arrangements are discontinued in the future, the expense ratios may change without shareholderapproval.
13
Copyright © 2017 www.secdatabase.com. All Rights Reserved.Please Consider the Environment Before Printing This Document

FUND BASICS
TOP TEN EQUITY HOLDINGS AS OF 4/30/175Holding % of Net Assets Line of BusinessEnerSys 1.6 % Electrical EquipmentLCI Industries 1.6 Auto ComponentsLithia Motors, Inc. Class A 1.5 Specialty RetailHEICO Corp. 1.5 Aerospace & DefenseWaste Connections, Inc. 1.3 Commercial Services & SuppliesSLM Corp. 1.2 Consumer FinanceAir Lease Corp. 1.1 Trading Companies & DistributorsPRA Group, Inc. 1.0 Consumer FinanceLiberty TripAdvisor Holdings, Inc. Class A 1.0 Internet & Direct Marketing RetailBank of the Ozarks, Inc. 1.0 Banks
5 The top 10 holdings may not be representative of the Fund�s future investments.
FUND VS. BENCHMARK SECTOR ALLOCATIONS (%)6As of April 30, 2017
6 The Fund is actively managed and, as such, its composition may differ over time. Consequently, the Fund�s overall sector allocations may differ from thepercentages contained in the graph above. The graph categorizes investments using the Global Industry Classification Standard (�GICS�), however, the sectorclassifications used by the portfolio management team may differ from GICS. The percentage shown for each investment category reflects the value of investmentsin that category as a percentage of market value. Short-term investments represent repurchase agreements. The graph depicts the Fund�s investments but may notrepresent the Fund�s market exposure due to the exclusion of certain derivatives, if any, as listed in the Additional Investment Information section of the Schedule ofInvestments.
14
Copyright © 2017 www.secdatabase.com. All Rights Reserved.Please Consider the Environment Before Printing This Document

PORTFOLIO RESULTS
Index DefinitionsThe Russell 2000® Growth Index measures the performance of the small-cap growth stocks of the U.S. equity universe.
The Russell 2000® Value Index measures the performance of the small-cap value stocks of the U.S. equity universe.
15
Copyright © 2017 www.secdatabase.com. All Rights Reserved.Please Consider the Environment Before Printing This Document

MULTI-MANAGER INTERNATIONAL EQUITY FUND
Schedule of InvestmentsApril 30, 2017 (Unaudited)
Shares Description ValueCommon Stocks �� 94.0%Australia �� 2.2%61,246 CSL Ltd. (Biotechnology) $ 6,073,15626,108 Orica Ltd. (Chemicals) 361,714216,150 Westfield Corp. (Equity Real Estate Investment Trusts (REITs)) 1,469,922
7,904,792Belgium �� 0.2%11,117 KBC Group NV (Banks) 803,391
Brazil �� 1.4%745,144 Ambev SA ADR (Beverages) 4,269,67540,711 Raia Drogasil SA (Food & Staples Retailing) 865,127
5,134,802Canada �� 4.7%16,379 Canadian National Railway Co. (Road & Rail) 1,184,03849,880 Canadian Pacific Railway Ltd. (Road & Rail) 7,643,658252 Constellation Software, Inc. (Software) 115,25743,396 Element Fleet Management Corp. (Diversified Financial Services) 381,171293,129 Encana Corp. (Oil, Gas & Consumable Fuels) 3,137,33263,576 Gildan Activewear, Inc. (Textiles, Apparel & Luxury Goods) 1,782,3913,379 Loblaw Cos. Ltd. (Food & Staples Retailing) 189,63888,000 Manulife Financial Corp. (Insurance) 1,543,32833,995 Suncor Energy, Inc. (Oil, Gas & Consumable Fuels) 1,065,387
17,042,200China �� 4.2%6,911 Alibaba Group Holding Ltd. ADR (Internet Software & Services)* 798,22016,000 Baidu, Inc. ADR (Internet Software & Services)* 2,883,6802,310,000 CNOOC Ltd. (Oil, Gas & Consumable Fuels) 2,694,83979,526 Ctrip.com International Ltd. ADR (Internet & Direct Marketing Retail) 4,016,858153,140 Tencent Holdings Ltd. (Internet Software & Services) 4,798,385
15,191,982Denmark �� 3.3%4,907 Carlsberg A/S Class B (Beverages) 489,63348,076 Chr Hansen Holding A/S (Chemicals) 3,239,07147,675 Coloplast A/S Class B (Health Care Equipment & Supplies) 4,082,20926,864 Novo Nordisk A/S Class B (Pharmaceuticals) 1,045,99973,818 Novozymes A/S Class B (Chemicals) 3,186,952
12,043,864Common Stocks �� (continued)France �� 9.7%14,655 Air Liquide SA (Chemicals) 1,765,72526,850 BNP Paribas SA (Banks) 1,894,99712,821 Danone SA (Food Products) 897,2906,363 Dassault Systemes (Software) 567,712343,385 Engie SA (Multi-Utilities) 4,841,74225,826 Essilor International SA (Health Care Equipment & Supplies) 3,346,8676,551 Hermes International (Textiles, Apparel & Luxury Goods) 3,131,8353,644 L�Oreal SA (Personal Products) 725,70110,588 Legrand SA (Electrical Equipment) 685,37124,640 LVMH Moet Hennessy Louis Vuitton SE (Textiles, Apparel & Luxury Goods) 6,082,84612,965 Pernod Ricard SA (Beverages) 1,622,59126,723 Sanofi (Pharmaceuticals) 2,525,15784,843 Schneider Electric SE (Electrical Equipment) 6,720,04910,191 TOTAL SA (Oil, Gas & Consumable Fuels) 523,137
35,331,020Germany �� 5.1%15,585 adidas AG (Textiles, Apparel & Luxury Goods) 3,124,61339,969 BASF SE (Chemicals) 3,893,73717,444 Bayer AG (Pharmaceuticals) 2,158,39915,049 Beiersdorf AG (Personal Products) 1,496,6428,770 Linde AG (Chemicals) 1,575,8687,700 Merck KGaA (Pharmaceuticals) 904,5313,355 MTU Aero Engines AG (Aerospace & Defense)* 481,22111,800 ProSiebenSat.1 Media SE (Media) 500,906
Copyright © 2017 www.secdatabase.com. All Rights Reserved.Please Consider the Environment Before Printing This Document

45,164 SAP SE (Software) 4,523,89518,659,812
Hong Kong �� 2.8%722,600 AIA Group Ltd. (Insurance) 5,001,429335,563 China Merchants Holdings International Co. Ltd. (Transportation Infrastructure) 958,758413,500 China Mobile Ltd. (Wireless Telecommunication Services) 4,402,377410,000 Global Brands Group Holding Ltd. (Textiles, Apparel & Luxury Goods)* 48,40312,000 Li & Fung Ltd. (Textiles, Apparel & Luxury Goods) 5,025
10,415,992India �� 1.6%53,117 HDFC Bank Ltd. ADR (Banks) 4,228,64435,483 Housing Development Finance Corp. Ltd. (Thrifts & Mortgage Finance) 847,15627,476 Tata Consultancy Services Ltd. (IT Services) 970,162
6,045,962
16 The accompanying notes are an integral part of these financial statements.
Copyright © 2017 www.secdatabase.com. All Rights Reserved.Please Consider the Environment Before Printing This Document

MULTI-MANAGER INTERNATIONAL EQUITY FUND
Shares Description ValueCommon Stocks �� (continued)Ireland �� 2.1%39,680 Accenture PLC Class A (IT Services) $ 4,813,18431,994 ICON PLC (Life Sciences Tools & Services)* 2,703,173
7,516,357Israel* �� 0.2%8,405 Check Point Software Technologies Ltd. (Software) 874,204
Italy �� 2.0%43,596 Eni SpA (Oil, Gas & Consumable Fuels) 676,21848,880 Luxottica Group SpA (Textiles, Apparel & Luxury Goods) 2,825,786237,290 UniCredit SpA (Banks)* 3,863,671
7,365,675Japan �� 9.9%20,500 Asahi Group Holdings Ltd. (Beverages) 774,5666,200 Daikin Industries Ltd. (Building Products) 602,78624,400 Denso Corp. (Auto Components) 1,053,04642,300 East Japan Railway Co. (Road & Rail) 3,796,1133,100 FANUC Corp. (Machinery) 631,148583,000 Hitachi Ltd. (Electronic Equipment, Instruments & Components) 3,220,70641,400 Hoya Corp. (Health Care Equipment & Supplies) 1,978,621103,400 Japan Airlines Co. Ltd. (Airlines) 3,265,51526,700 Japan Tobacco, Inc. (Tobacco) 888,46210,200 Kao Corp. (Personal Products) 562,873166,800 KDDI Corp. (Wireless Telecommunication Services) 4,422,54411,200 Keyence Corp. (Electronic Equipment, Instruments & Components) 4,502,557102,700 Komatsu Ltd. (Machinery) 2,744,30137,600 Kubota Corp. (Machinery) 592,30516,400 Kyocera Corp. (Electronic Equipment, Instruments & Components) 928,81561,700 Nikon Corp. (Household Durables) 880,7933,400 Shin-Etsu Chemical Co. Ltd. (Chemicals) 295,52035,400 Sumitomo Mitsui Financial Group, Inc. (Banks) 1,314,42440,895 Sysmex Corp. (Health Care Equipment & Supplies) 2,490,81737,300 Terumo Corp. (Health Care Equipment & Supplies) 1,362,141
36,308,053Luxembourg* �� 0.3%139,452 ArcelorMittal (Metals & Mining) 1,095,861
Mexico �� 0.9%1,478,865 Wal-Mart de Mexico SAB de CV (Food & Staples Retailing) 3,338,695
Common Stocks �� (continued)Netherlands �� 5.1%79,175 Akzo Nobel NV (Chemicals) 6,924,81232,292 Core Laboratories NV (Energy Equipment & Services) 3,578,599885 Heineken NV (Beverages) 78,936175,364 ING Groep NV (Banks) 2,858,3503,430 QIAGEN NV (Life Sciences Tools & Services)* 102,75317,709 Randstad Holding NV (Professional Services) 1,055,77441,062 RELX NV (Professional Services) 793,472123,682 Yandex NV Class A (Internet Software & Services)* 3,371,571
18,764,267Singapore �� 0.4%73,900 DBS Group Holdings Ltd. (Banks) 1,020,589120,900 Singapore Telecommunications Ltd. (Diversified Telecommunication Services) 323,683
1,344,272South Korea �� 2.2%9,755 Amorepacific Corp. (Personal Products) 2,501,7012,575 Samsung Electronics Co. Ltd. GDR (Technology Hardware, Storage & Peripherals) 2,526,075131,100 SK Telecom Co. Ltd. ADR (Wireless Telecommunication Services) 3,092,649
8,120,425Spain �� 1.3%18,989 Amadeus IT Group SA (IT Services) 1,024,822411,782 CaixaBank SA (Banks) 1,869,67250,606 Industria de Diseno Textil SA (Specialty Retail) 1,939,281
4,833,775Sweden �� 1.4%80,537 Alfa Laval AB (Machinery) 1,650,33972,482 Atlas Copco AB Class A (Machinery) 2,707,56830,389 Hennes & Mauritz AB (Specialty Retail) 752,447
5,110,354
Copyright © 2017 www.secdatabase.com. All Rights Reserved.Please Consider the Environment Before Printing This Document
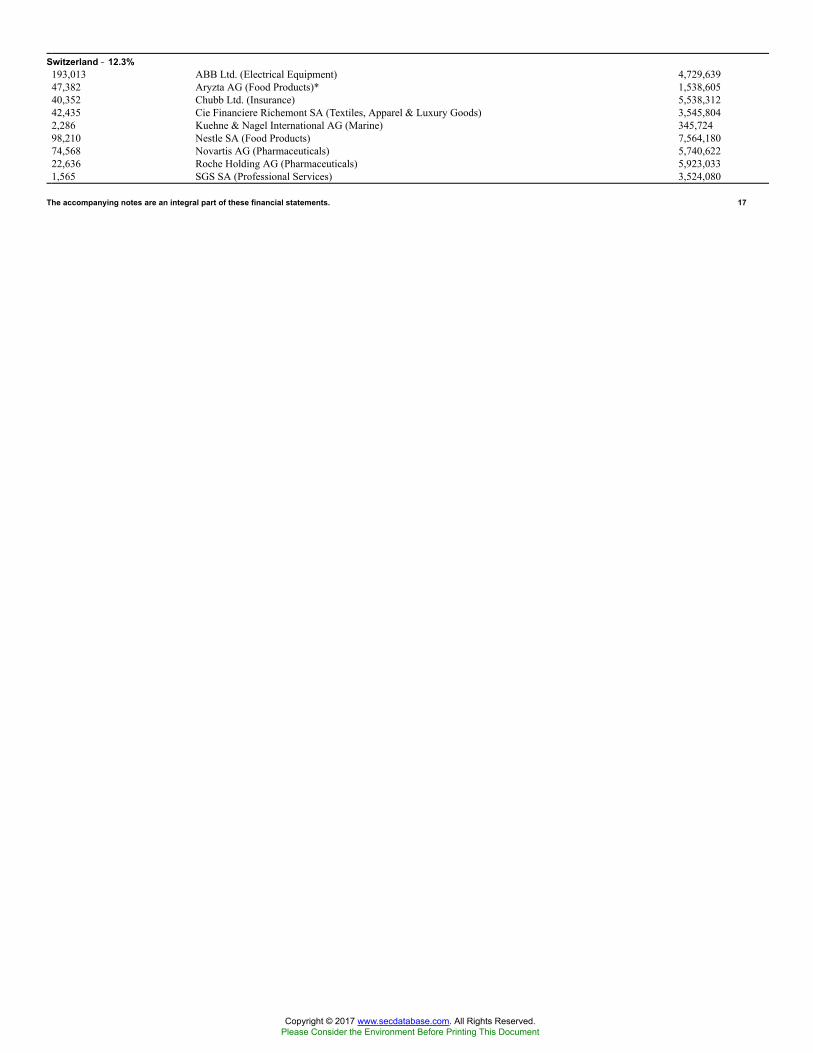
Switzerland �� 12.3%193,013 ABB Ltd. (Electrical Equipment) 4,729,63947,382 Aryzta AG (Food Products)* 1,538,60540,352 Chubb Ltd. (Insurance) 5,538,31242,435 Cie Financiere Richemont SA (Textiles, Apparel & Luxury Goods) 3,545,8042,286 Kuehne & Nagel International AG (Marine) 345,72498,210 Nestle SA (Food Products) 7,564,18074,568 Novartis AG (Pharmaceuticals) 5,740,62222,636 Roche Holding AG (Pharmaceuticals) 5,923,0331,565 SGS SA (Professional Services) 3,524,080
The accompanying notes are an integral part of these financial statements. 17
Copyright © 2017 www.secdatabase.com. All Rights Reserved.Please Consider the Environment Before Printing This Document

MULTI-MANAGER INTERNATIONAL EQUITY FUND
Schedule of Investments (continued)April 30, 2017 (Unaudited)
Shares Description ValueCommon Stocks �� (continued)Switzerland �� (continued)173,847 UBS Group AG (Capital Markets) $ 2,967,71412,853 Zurich Insurance Group AG (Insurance) 3,556,917
44,974,630Taiwan �� 1.6%171,806 Taiwan Semiconductor Manufacturing Co. Ltd. ADR (Semiconductors & Semiconductor
Equipment) 5,681,624United Kingdom �� 18.8%57,852 AstraZeneca PLC (Pharmaceuticals) 3,464,719570,143 Aviva PLC (Insurance) 3,877,203421,091 Balfour Beatty PLC (Construction & Engineering) 1,590,7851,289,606 Barclays PLC (Banks) 3,531,463256,927 BP PLC (Oil, Gas & Consumable Fuels) 1,470,80669,674 British American Tobacco PLC (Tobacco) 4,707,40448,889 Carnival PLC (Hotels, Restaurants & Leisure) 3,013,147961,028 Cobham PLC (Aerospace & Defense) 1,649,258331,860 Compass Group PLC (Hotels, Restaurants & Leisure) 6,700,5145,260 Delphi Automotive PLC (Auto Components) 422,90494,636 Diageo PLC (Beverages) 2,754,585267,350 Experian PLC (Professional Services) 5,751,434108,099 GlaxoSmithKline PLC (Pharmaceuticals) 2,175,8003,076,011 Lloyds Banking Group PLC (Banks) 2,763,873215,187 Prudential PLC (Insurance) 4,775,82576,764 Reckitt Benckiser Group PLC (Household Products) 7,072,83917,725 Rio Tinto PLC (Metals & Mining) 699,25552,223 Rolls-Royce Holdings PLC (Aerospace & Defense)* 548,9423,707,833 Rolls-Royce Holdings PLC Class C (Aerospace & Defense) 4,802190,562 Royal Dutch Shell PLC Class B (Oil, Gas & Consumable Fuels) 5,070,27520,832 Smiths Group PLC (Industrial Conglomerates) 442,856106,055 SSE PLC (Electric Utilities) 1,910,5121,021,893 Vodafone Group PLC (Wireless Telecommunication Services) 2,632,02883,240 WPP PLC (Media) 1,782,459
68,813,688Common Stocks �� (continued)United States* �� 0.3%27,942 Yum China Holdings, Inc. (Hotels, Restaurants & Leisure) 953,381TOTAL COMMON STOCKS(Cost $305,963,907) $ 343,669,078
Preferred Stock �� 2.0%Germany �� 2.0%44,743 Volkswagen AG (Automobiles) $ 7,102,804(Cost $6,430,636)
UnitsExpiration
Date ValueRight* �� 0.1%United Kingdom �� 0.1%Cobham PLC (Aerospace & Defense)339,396 05/04/17 $ 250,563(Cost $204,695)
PrincipalAmount
InterestRate
MaturityDate Value
Short-term Investment(a) �� 3.8%Repurchase Agreements �� 3.8%
Joint Repurchase Agreement Account II$ 13,900,000 0.821 % 05/01/17 $ 13,900,000
(Cost $13,900,000)TOTAL INVESTMENTS �� 99.9%(Cost $326,499,238) $ 364,922,445
Copyright © 2017 www.secdatabase.com. All Rights Reserved.Please Consider the Environment Before Printing This Document

OTHER ASSETS IN EXCESS OFLIABILITIES �� 0.1% 546,511
NET ASSETS �� 100.0% $ 365,468,956
The percentage shown for each investment category reflects the value of investments in that category as a percentage of net assets.* Non-income producing security.(a) Joint repurchase agreement was entered into on April 28, 2017. Additional information appears on page 27.
Currency Abbreviations:BRL �Brazilian RealGBP �British PoundJPY �Japanese YenUSD �U.S. Dollar
Investment Abbreviations:ADR �American Depositary ReceiptBP �British Pound Offered RateGDR �Global Depository ReceiptPLC �Public Limited Company
18 The accompanying notes are an integral part of these financial statements.
Copyright © 2017 www.secdatabase.com. All Rights Reserved.Please Consider the Environment Before Printing This Document

MULTI-MANAGER INTERNATIONAL EQUITY FUND
ADDITIONAL INVESTMENT INFORMATION
FORWARD FOREIGN CURRENCY EXCHANGE CONTRACTS � At April 30, 2017, the Fund had the following forward foreign currencyexchange contracts:
FORWARD FOREIGN CURRENCY EXCHANGE CONTRACTS WITH UNREALIZED GAIN
CounterpartyCurrency
PurchasedCurrency
SoldCurrentValue
SettlementDate
UnrealizedGain
State Street Bank and Trust GBP 254,546 USD 328,739 $329,726 05/04/17 $ 987USD 44,884 EUR 41,163 44,845 05/03/17 39USD 49,217 JPY 5,484,215 49,211 05/08/17 5
TOTAL $ 1,031
FORWARD FOREIGN CURRENCY EXCHANGE CONTRACTS WITH UNREALIZED LOSS
CounterpartyCurrency
PurchasedCurrency
SoldCurrentValue
SettlementDate
UnrealizedLoss
State Street Bank and Trust BRL 669,774 USD 211,239 $210,905 05/02/17 $ (334 )BRL 731,540 USD 230,624 230,294 05/03/17 (331 )
TOTAL $ (665 )
The accompanying notes are an integral part of these financial statements. 19
Copyright © 2017 www.secdatabase.com. All Rights Reserved.Please Consider the Environment Before Printing This Document
MULTI-MANAGER U.S. DYNAMIC EQUITY FUND
Schedule of InvestmentsApril 30, 2017 (Unaudited)
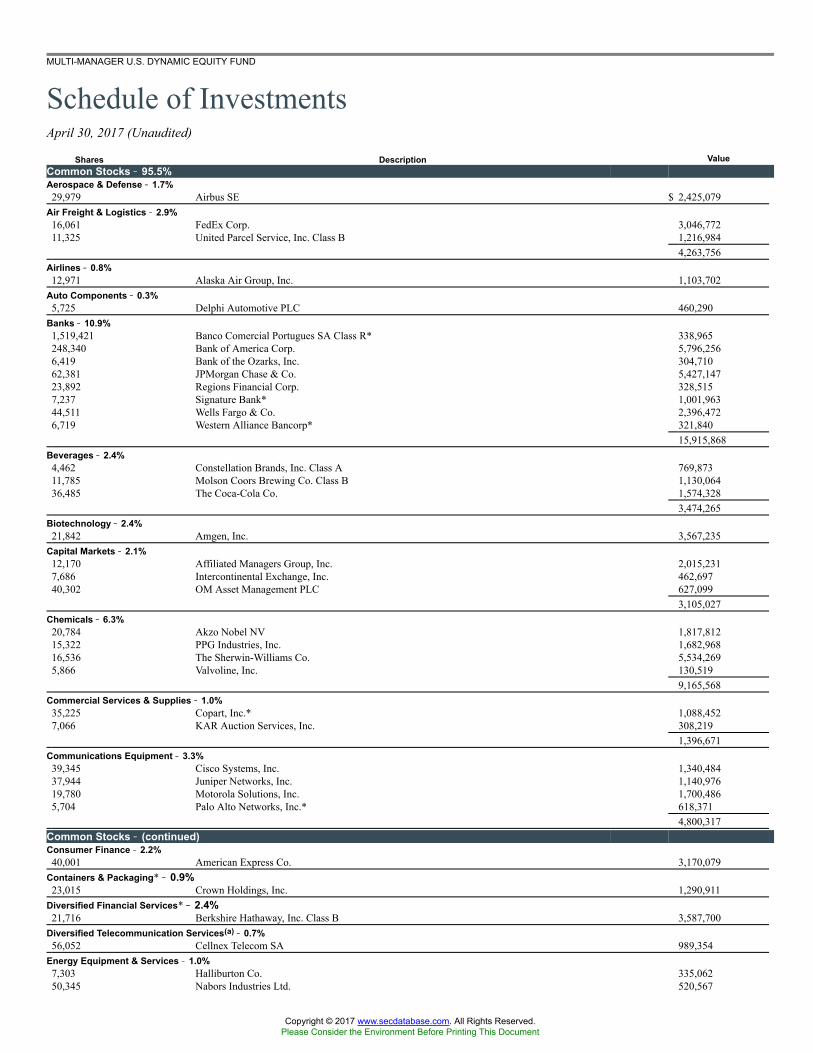
Shares Description ValueCommon Stocks �� 95.5%Aerospace & Defense �� 1.7%29,979 Airbus SE $ 2,425,079
Air Freight & Logistics �� 2.9%16,061 FedEx Corp. 3,046,77211,325 United Parcel Service, Inc. Class B 1,216,984
4,263,756Airlines �� 0.8%12,971 Alaska Air Group, Inc. 1,103,702
Auto Components �� 0.3%5,725 Delphi Automotive PLC 460,290
Banks �� 10.9%1,519,421 Banco Comercial Portugues SA Class R* 338,965248,340 Bank of America Corp. 5,796,2566,419 Bank of the Ozarks, Inc. 304,71062,381 JPMorgan Chase & Co. 5,427,14723,892 Regions Financial Corp. 328,5157,237 Signature Bank* 1,001,96344,511 Wells Fargo & Co. 2,396,4726,719 Western Alliance Bancorp* 321,840
15,915,868Beverages �� 2.4%4,462 Constellation Brands, Inc. Class A 769,87311,785 Molson Coors Brewing Co. Class B 1,130,06436,485 The Coca-Cola Co. 1,574,328
3,474,265Biotechnology �� 2.4%21,842 Amgen, Inc. 3,567,235
Capital Markets �� 2.1%12,170 Affiliated Managers Group, Inc. 2,015,2317,686 Intercontinental Exchange, Inc. 462,69740,302 OM Asset Management PLC 627,099
3,105,027Chemicals �� 6.3%20,784 Akzo Nobel NV 1,817,81215,322 PPG Industries, Inc. 1,682,96816,536 The Sherwin-Williams Co. 5,534,2695,866 Valvoline, Inc. 130,519
9,165,568Commercial Services & Supplies �� 1.0%35,225 Copart, Inc.* 1,088,4527,066 KAR Auction Services, Inc. 308,219
1,396,671Communications Equipment �� 3.3%39,345 Cisco Systems, Inc. 1,340,48437,944 Juniper Networks, Inc. 1,140,97619,780 Motorola Solutions, Inc. 1,700,4865,704 Palo Alto Networks, Inc.* 618,371
4,800,317Common Stocks �� (continued)Consumer Finance �� 2.2%40,001 American Express Co. 3,170,079
Containers & Packaging* �� 0.9%23,015 Crown Holdings, Inc. 1,290,911
Diversified Financial Services* �� 2.4%21,716 Berkshire Hathaway, Inc. Class B 3,587,700
Diversified Telecommunication Services(a) �� 0.7%56,052 Cellnex Telecom SA 989,354
Energy Equipment & Services �� 1.0%7,303 Halliburton Co. 335,06250,345 Nabors Industries Ltd. 520,567
Copyright © 2017 www.secdatabase.com. All Rights Reserved.Please Consider the Environment Before Printing This Document

74,448 Precision Drilling Corp.* 296,14511,871 TechnipFMC PLC* 357,673
1,509,447Food & Staples Retailing �� 2.7%45,153 Walgreens Boots Alliance, Inc. 3,907,541
Food Products �� 0.4%7,845 Nestle SA 604,226
Health Care Equipment & Supplies �� 4.6%16,169 Becton Dickinson & Co. 3,023,11810,070 Boston Scientific Corp.* 265,6465,975 C.R. Bard, Inc. 1,837,19319,875 Medtronic PLC 1,651,414
6,777,371Health Care Providers & Services �� 2.7%10,903 AmerisourceBergen Corp. 894,59131,088 Express Scripts Holding Co.* 1,906,9389,768 Universal Health Services, Inc. Class B 1,179,584
3,981,113Hotels, Restaurants & Leisure �� 1.5%11,208 Dunkin� Brands Group, Inc. 626,0796,616 McDonald�s Corp. 925,77711,018 Starbucks Corp. 661,741
2,213,597Household Durables �� 4.7%28,260 D.R. Horton, Inc. 929,47138,247 Lennar Corp. Class A 1,931,4741,925 NVR, Inc.* 4,064,156
6,925,101Insurance �� 2.0%39,771 Aflac, Inc. 2,978,053
Internet Software & Services* �� 4.1%1,745 Alphabet, Inc. Class A 1,613,287129,175 eBay, Inc. 4,315,7375,929,024
20 The accompanying notes are an integral part of these financial statements.
Copyright © 2017 www.secdatabase.com. All Rights Reserved.Please Consider the Environment Before Printing This Document

MULTI-MANAGER U.S. DYNAMIC EQUITY FUND
Shares Description ValueCommon Stocks �� (continued)IT Services �� 5.5%14,453 Accenture PLC Class A $ 1,753,14928,923 Cognizant Technology Solutions Corp. Class A* 1,742,0329,781 Convergys Corp. 220,17020,323 CSRA, Inc. 590,99313,040 DXC Technology Co.* 982,43459,105 PayPal Holdings, Inc.* 2,820,4918,109,269
Media �� 7.6%49,429 Comcast Corp. Class A 1,937,12310,446 DISH Network Corp. Class A* 673,1408,827 Scripps Networks Interactive, Inc. Class A 659,553107,392 TEGNA, Inc. 2,736,3482,110 The Madison Square Garden Co. Class A* 425,73520,895 The Walt Disney Co. 2,415,46221,307 Time Warner, Inc. 2,115,1466,901 World Wrestling Entertainment, Inc. Class A 147,88811,110,395
Multiline Retail �� 1.3%27,405 Nordstrom, Inc. 1,322,83911,482 Target Corp. 641,2701,964,109
Oil, Gas & Consumable Fuels �� 0.4%9,247 ConocoPhillips 443,0246,848 Parsley Energy, Inc. Class A* 204,002647,026
Personal Products �� 0.2%3,209 The Estee Lauder Cos., Inc. Class A 279,632
Pharmaceuticals �� 4.6%9,435 Johnson & Johnson 1,164,94034,749 Merck & Co., Inc. 2,165,90583,322 Pfizer, Inc. 2,826,2829,690 Zoetis, Inc. 543,7066,700,833
Road & Rail �� 0.8%10,378 Union Pacific Corp. 1,161,921
Semiconductors & Semiconductor Equipment �� 0.6%8,435 Skyworks Solutions, Inc. 841,307
Software �� 3.1%81,783 Nuance Communications, Inc.* 1,463,09815,985 Oracle Corp. 718,68621,592 PTC, Inc.* 1,167,04820,540 Verint Systems, Inc.* 807,2223,946 VMware, Inc. Class A* 371,3974,527,451
Common Stocks �� (continued)Specialty Retail �� 3.3%7,848 Advance Auto Parts, Inc. 1,115,51513,048 CarMax, Inc.* 763,30818,726 The Home Depot, Inc. 2,923,1284,801,951
Technology Hardware, Storage & Peripherals �� 3.1%61,750 NetApp, Inc. 2,460,73722,894 Western Digital Corp. 2,039,1694,499,906
Wireless Telecommunication Services �� 1.0%346,359 VEON Ltd. ADR 1,430,463TOTAL COMMON STOCKS(Cost $119,683,234) $ 139,615,558
PrincipalAmount
InterestRate
MaturityDate Value
Short-term Investment(b) �� 4.6%Repurchase Agreements �� 4.6%
Joint Repurchase Agreement Account II$ 6,800,000 0.821 % 05/01/17 $ 6,800,000
Copyright © 2017 www.secdatabase.com. All Rights Reserved.Please Consider the Environment Before Printing This Document

(Cost $6,800,000)TOTAL INVESTMENTS �� 100.1%(Cost $126,483,234) $ 146,415,558LIABILITIES IN EXCESS OF
OTHER ASSETS �� (0.1)% (142,759 )NET ASSETS �� 100.0% $ 146,272,799
The percentage shown for each investment category reflects the value of investments in that category as a percentage of net assets.* Non-income producing security.(a) Exempt from registration under Rule 144A of the Securities Act of 1933. Such securities may be deemed liquid by the investment adviser and may be resold, normally to qualified
institutional buyers in transactions exempt from registration. Total market value of Rule 144A securities amounts to $989,354, which represents approximately 0.7% of net assetsas of April 30, 2017.
(b) Joint repurchase agreement was entered into on April 28, 2017. Additional information appears on page 27.
Currency Abbreviations:CAD �Canadian DollarCHF �Swiss FrancEUR �EuroUSD �U.S. Dollar
Investment Abbreviations:ADR �American Depositary ReceiptPLC �Public Limited Company
The accompanying notes are an integral part of these financial statements. 21
Copyright © 2017 www.secdatabase.com. All Rights Reserved.Please Consider the Environment Before Printing This Document

MULTI-MANAGER U.S. DYNAMIC EQUITY FUND
Schedule of Investments (continued)April 30, 2017 (Unaudited)
ADDITIONAL INVESTMENT INFORMATION
FORWARD FOREIGN CURRENCY EXCHANGE CONTRACTS � At April 30, 2017, the Fund had the following forward foreign currencyexchange contracts:
FORWARD FOREIGN CURRENCY EXCHANGE CONTRACTS WITH UNREALIZED GAIN
CounterpartyCurrency
PurchasedCurrency
SoldCurrentValue
SettlementDate
UnrealizedGain
Morgan Stanley & Co. CHF 357,000 USD 357,509 $359,974 06/21/17 $ 2,466EUR 44,000 USD 47,259 48,057 06/21/17 797USD 306,795 CAD 413,000 302,792 06/21/17 4,002USD 66,699 CHF 66,266 66,610 05/03/17 89USD 34,290 CHF 34,000 34,283 06/21/17 7USD 1,265,313 EUR 1,156,000 1,262,586 06/21/17 2,727
TOTAL $ 10,088
FORWARD FOREIGN CURRENCY EXCHANGE CONTRACTS WITH UNREALIZED LOSS
CounterpartyCurrency
PurchasedCurrency
SoldCurrentValue
SettlementDate
UnrealizedLoss
Morgan Stanley & Co. CAD 72,404 USD 53,137 $53,043 05/02/17 $(94 )CHF 707,000 USD 717,266 712,889 06/21/17 (4,375 )USD 1,611,667 CHF 1,619,000 1,632,488 06/21/17 (20,821 )USD 4,322,026 EUR 4,015,000 4,385,193 06/21/17 (63,166 )
TOTAL $(88,456 )
22 The accompanying notes are an integral part of these financial statements.
Copyright © 2017 www.secdatabase.com. All Rights Reserved.Please Consider the Environment Before Printing This Document

MULTI-MANAGER U.S. SMALL CAP EQUITY FUND
Schedule of InvestmentsApril 30, 2017 (Unaudited)
Shares Description ValueCommon Stocks �� 94.8%Aerospace & Defense �� 3.7%11,567 Astronics Corp.* $ 376,0433,442 Curtiss-Wright Corp. 321,68912,732 DigitalGlobe, Inc.* 409,97130,575 HEICO Corp. 2,172,96520,164 Hexcel Corp. 1,043,48711,004 KLX, Inc.* 520,48922,916 The KEYW Holding Corp.* 217,47331,283 Wesco Aircraft Holdings, Inc.* 380,089
5,442,206Auto Components �� 3.0%11,313 American Axle & Manufacturing Holdings, Inc.* 198,99616,139 Dorman Products, Inc.* 1,341,95814,061 Fox Factory Holding Corp.* 422,53324,044 LCI Industries 2,432,050
4,395,537Banks �� 5.8%31,075 Bank of the Ozarks, Inc. 1,475,13012,477 BankUnited, Inc. 440,31314,422 Columbia Banking System, Inc. 569,81321,997 ConnectOne Bancorp, Inc. 488,33324,426 Eagle Bancorp, Inc.* 1,463,11810,764 FCB Financial Holdings, Inc. Class A* 508,5991,970 First Citizens BancShares, Inc. Class A 685,6788,398 First Midwest Bancorp, Inc. 190,71911,413 Hanmi Financial Corp. 331,54833,112 Home BancShares, Inc. 842,70129,269 LegacyTexas Financial Group, Inc. 1,106,6618,772 Prosperity Bancshares, Inc. 589,478
8,692,091Biotechnology* �� 1.5%8,987 Acceleron Pharma, Inc. 296,7515,163 Agios Pharmaceuticals, Inc. 256,65310,503 Alder Biopharmaceuticals, Inc. 210,5859,220 BeiGene Ltd. ADR 376,91410,217 Coherus Biosciences, Inc. 196,1665,572 Jounce Therapeutics, Inc. 157,7994,766 Neurocrine Biosciences, Inc. 254,5047,421 Ultragenyx Pharmaceutical, Inc. 477,838
2,227,210Building Products �� 0.7%9,298 Patrick Industries, Inc.* 660,6233,674 Universal Forest Products, Inc. 350,095
1,010,718Capital Markets �� 1.0%2,706 Diamond Hill Investment Group, Inc. 547,01819,597 Stifel Financial Corp.* 957,705
1,504,723Common Stocks �� (continued)Chemicals �� 1.6%10,247 Balchem Corp. 831,6473,397 Cabot Corp. 204,46511,388 Ferro Corp.* 204,0737,828 Minerals Technologies, Inc. 616,06410,149 Olin Corp. 326,0872,227 PolyOne Corp. 87,3218,117 Valvoline, Inc. 180,603
2,450,260Commercial Services & Supplies �� 3.4%16,092 ABM Industries, Inc. 695,01323,873 ACCO Brands Corp.* 340,190
Copyright © 2017 www.secdatabase.com. All Rights Reserved.Please Consider the Environment Before Printing This Document

19,116 Healthcare Services Group, Inc. 877,61513,522 KAR Auction Services, Inc. 589,83016,243 Tetra Tech, Inc. 713,88020,581 Waste Connections, Inc. 1,893,864
5,110,392Communications Equipment* �� 0.3%9,562 NETGEAR, Inc. 450,848
Construction & Engineering �� 0.7%22,096 Aegion Corp.* 504,2317,423 Granite Construction, Inc. 391,2666,330 Tutor Perini Corp.* 195,281
1,090,778Consumer Finance �� 4.4%5,267 Credit Acceptance Corp.* 1,070,51813,922 FirstCash, Inc. 723,24837,221 Navient Corp. 565,75918,979 Nelnet, Inc. Class A 854,24546,270 PRA Group, Inc.* 1,489,894150,464 SLM Corp.* 1,886,818
6,590,482Containers & Packaging �� 0.8%90,019 Graphic Packaging Holding Co. 1,222,458
Distributors �� 0.5%21,799 Core-Mark Holding Co., Inc. 763,401
Diversified Consumer Services* �� 0.9%17,957 Bright Horizons Family Solutions, Inc. 1,366,887
Diversified Telecommunication Services �� 1.0%32,733 Cogent Communications Holdings, Inc. 1,472,985
Electric Utilities �� 0.1%4,424 Portland General Electric Co. 200,584
Electrical Equipment �� 1.6%29,544 EnerSys 2,455,402
Electronic Equipment, Instruments & Components �� 2.6%4,902 Anixter International, Inc.* 399,75812,902 Belden, Inc. 899,2694,696 Coherent, Inc.* 1,012,45815,620 Insight Enterprises, Inc.* 657,602
The accompanying notes are an integral part of these financial statements. 23
Copyright © 2017 www.secdatabase.com. All Rights Reserved.Please Consider the Environment Before Printing This Document
MULTI-MANAGER U.S. SMALL CAP EQUITY FUND
Schedule of Investments (continued)April 30, 2017 (Unaudited)
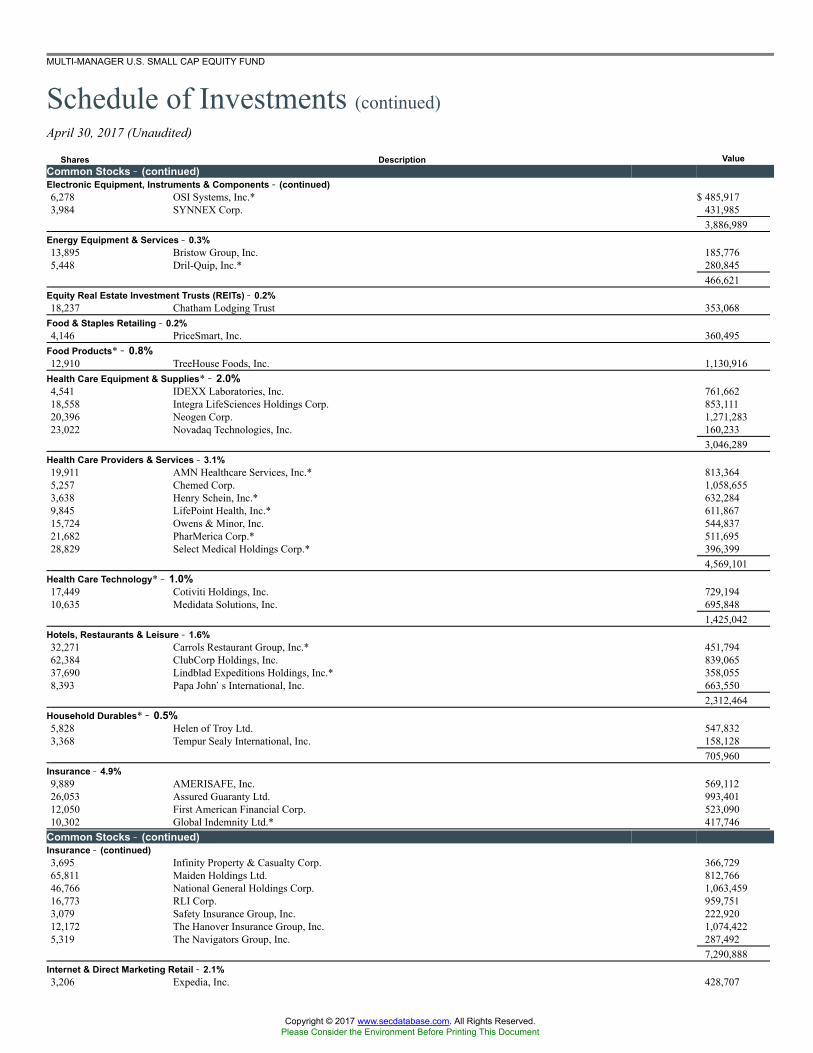
Shares Description ValueCommon Stocks �� (continued)Electronic Equipment, Instruments & Components �� (continued)6,278 OSI Systems, Inc.* $ 485,9173,984 SYNNEX Corp. 431,985
3,886,989Energy Equipment & Services �� 0.3%13,895 Bristow Group, Inc. 185,7765,448 Dril-Quip, Inc.* 280,845
466,621Equity Real Estate Investment Trusts (REITs) �� 0.2%18,237 Chatham Lodging Trust 353,068
Food & Staples Retailing �� 0.2%4,146 PriceSmart, Inc. 360,495
Food Products* �� 0.8%12,910 TreeHouse Foods, Inc. 1,130,916
Health Care Equipment & Supplies* �� 2.0%4,541 IDEXX Laboratories, Inc. 761,66218,558 Integra LifeSciences Holdings Corp. 853,11120,396 Neogen Corp. 1,271,28323,022 Novadaq Technologies, Inc. 160,233
3,046,289Health Care Providers & Services �� 3.1%19,911 AMN Healthcare Services, Inc.* 813,3645,257 Chemed Corp. 1,058,6553,638 Henry Schein, Inc.* 632,2849,845 LifePoint Health, Inc.* 611,86715,724 Owens & Minor, Inc. 544,83721,682 PharMerica Corp.* 511,69528,829 Select Medical Holdings Corp.* 396,399
4,569,101Health Care Technology* �� 1.0%17,449 Cotiviti Holdings, Inc. 729,19410,635 Medidata Solutions, Inc. 695,848
1,425,042Hotels, Restaurants & Leisure �� 1.6%32,271 Carrols Restaurant Group, Inc.* 451,79462,384 ClubCorp Holdings, Inc. 839,06537,690 Lindblad Expeditions Holdings, Inc.* 358,0558,393 Papa John�s International, Inc. 663,550
2,312,464Household Durables* �� 0.5%5,828 Helen of Troy Ltd. 547,8323,368 Tempur Sealy International, Inc. 158,128
705,960Insurance �� 4.9%9,889 AMERISAFE, Inc. 569,11226,053 Assured Guaranty Ltd. 993,40112,050 First American Financial Corp. 523,09010,302 Global Indemnity Ltd.* 417,746
Common Stocks �� (continued)Insurance �� (continued)3,695 Infinity Property & Casualty Corp. 366,72965,811 Maiden Holdings Ltd. 812,76646,766 National General Holdings Corp. 1,063,45916,773 RLI Corp. 959,7513,079 Safety Insurance Group, Inc. 222,92012,172 The Hanover Insurance Group, Inc. 1,074,4225,319 The Navigators Group, Inc. 287,492
7,290,888Internet & Direct Marketing Retail �� 2.1%3,206 Expedia, Inc. 428,707
Copyright © 2017 www.secdatabase.com. All Rights Reserved.Please Consider the Environment Before Printing This Document

13,007 FTD Cos., Inc.* 260,140101,226 Liberty TripAdvisor Holdings, Inc. Class A* 1,488,02210,080 Liberty Ventures Series A* 542,8089,485 MakeMyTrip Ltd.* 364,224
3,083,901Internet Software & Services* �� 1.5%12,975 2U, Inc. 589,06515,616 Envestnet, Inc. 543,43722,151 Mimecast Ltd. 535,3901,416 Nutanix, Inc. Class A 21,5098,479 SPS Commerce, Inc. 468,549
2,157,950IT Services �� 4.9%12,461 Acxiom Corp.* 360,12314,529 Booz Allen Hamilton Holding Corp. 522,02715,072 Broadridge Financial Solutions, Inc. 1,054,1368,153 Convergys Corp. 183,5248,459 CoreLogic, Inc.* 361,53835,287 Genpact Ltd. 861,70822,816 MAXIMUS, Inc. 1,391,54826,881 Sykes Enterprises, Inc.* 801,32220,055 TeleTech Holdings, Inc. 626,71911,107 WEX, Inc.* 1,126,916
7,289,561Leisure Products* �� 0.1%27,908 Black Diamond, Inc. 146,517
Life Sciences Tools & Services* �� 2.3%14,686 Charles River Laboratories International, Inc. 1,317,3348,350 ICON PLC 705,49122,426 PAREXEL International Corp. 1,431,452
3,454,277Machinery �� 2.6%8,603 Colfax Corp.* 348,16316,168 ESCO Technologies, Inc. 951,4879,343 Hillenbrand, Inc. 344,7576,676 IDEX Corp. 699,3786,358 John Bean Technologies Corp. 563,63714,081 Woodward, Inc. 952,861
3,860,283
24 The accompanying notes are an integral part of these financial statements.
Copyright © 2017 www.secdatabase.com. All Rights Reserved.Please Consider the Environment Before Printing This Document

MULTI-MANAGER U.S. SMALL CAP EQUITY FUND
Shares Description ValueCommon Stocks �� (continued)Media �� 1.5%73,827 Global Eagle Entertainment, Inc.* $ 228,86417,203 Liberty Media Corp.-Liberty Formula One Class A* 583,3546,352 Live Nation Entertainment, Inc.* 204,2807,092 Scholastic Corp. 306,5874,372 The Madison Square Garden Co. Class A* 882,138
2,205,223Metals & Mining �� 0.5%53,559 Ferroglobe PLC 516,84452,699 Ferroglobe Representation & Warranty Insurance Trust �22,227 SunCoke Energy, Inc.* 203,822
720,666Mortgage Real Estate Investment Trusts (REITs) �� 2.9%40,093 Anworth Mortgage Asset Corp. 234,94533,765 Ares Commercial Real Estate Corp. 466,97014,101 Blackstone Mortgage Trust, Inc. Class A 435,43996,297 CYS Investments, Inc. 821,41389,969 MFA Financial, Inc. 747,6429,200 MTGE Investment Corp. 165,60018,479 Starwood Property Trust, Inc. 419,289105,656 Two Harbors Investment Corp. 1,055,504
4,346,802Oil, Gas & Consumable Fuels �� 2.7%10,840 Gulfport Energy Corp.* 172,13932,902 Jagged Peak Energy, Inc.* 366,52972,763 Kosmos Energy Ltd.* 437,30621,425 RSP Permian, Inc.* 815,22114,539 Western Refining, Inc. 501,45023,134 WildHorse Resource Development Corp.* 252,39239,687 World Fuel Services Corp. 1,461,672
4,006,709Paper & Forest Products �� 0.8%8,383 Neenah Paper, Inc. 656,80811,094 Schweitzer-Mauduit International, Inc. 477,597
1,134,405Personal Products �� 0.3%8,662 Nu Skin Enterprises, Inc. Class A 478,402
Pharmaceuticals* �� 0.7%34,608 Catalent, Inc. 1,013,322
Professional Services �� 4.2%13,270 Exponent, Inc. 811,46111,091 FTI Consulting, Inc.* 383,63812,633 GP Strategies Corp.* 342,35412,780 Heidrick & Struggles International, Inc. 274,7705,158 Insperity, Inc. 471,1839,911 Korn/Ferry International 321,11624,031 Navigant Consulting, Inc.* 576,023
Common Stocks �� (continued)Professional Services �� (continued)24,735 On Assignment, Inc.* 1,280,53132,592 RPX Corp.* 418,48119,291 WageWorks, Inc.* 1,423,676
6,303,233Real Estate Management & Development �� 1.4%12,806 Colliers International Group, Inc. 625,57317,048 FirstService Corp. 1,059,1923,392 Jones Lang LaSalle, Inc. 389,605
2,074,370Road & Rail �� 0.7%4,333 Genesee & Wyoming, Inc. Class A* 293,60421,786 Knight Transportation, Inc. 747,260
1,040,864Semiconductors & Semiconductor Equipment �� 2.6%34,051 Brooks Automation, Inc. 860,12817,016 Cavium, Inc.* 1,171,5514,996 First Solar, Inc.* 147,632
Copyright © 2017 www.secdatabase.com. All Rights Reserved.Please Consider the Environment Before Printing This Document

21,327 MACOM Technology Solutions Holdings, Inc.* 1,042,46417,767 Teradyne, Inc. 626,642
3,848,417Software �� 4.9%12,590 Aspen Technology, Inc.* 774,15912,149 Blackbaud, Inc. 976,90130,911 BroadSoft, Inc.* 1,186,9825,473 Fair Isaac Corp. 741,4828,639 Guidewire Software, Inc.* 531,21215,126 Manhattan Associates, Inc.* 706,23311,134 Monotype Imaging Holdings, Inc. 226,5774,526 Open Text Corp. 156,9624,053 Paylocity Holding Corp.* 159,8503,142 Proofpoint, Inc.* 236,8133,244 The Ultimate Software Group, Inc.* 657,4615,350 Tyler Technologies, Inc.* 875,207
7,229,839Specialty Retail �� 3.1%33,326 Camping World Holdings, Inc. Class A 1,030,4402,833 Group 1 Automotive, Inc. 195,33522,840 Lithia Motors, Inc. Class A 2,182,36266,418 Office Depot, Inc. 330,09832,033 Tailored Brands, Inc. 394,96733,525 The Finish Line, Inc. Class A 530,030
4,663,232Technology Hardware, Storage & Peripherals* �� 0.2%7,373 Electronics For Imaging, Inc. 337,536
Textiles, Apparel & Luxury Goods* �� 0.9%24,613 Skechers U.S.A., Inc. Class A 621,47817,706 Steven Madden Ltd. 673,714
1,295,192
The accompanying notes are an integral part of these financial statements. 25
Copyright © 2017 www.secdatabase.com. All Rights Reserved.Please Consider the Environment Before Printing This Document

MULTI-MANAGER U.S. SMALL CAP EQUITY FUND
Schedule of Investments (continued)April 30, 2017 (Unaudited)
Shares Description ValueCommon Stocks �� (continued)Thrifts & Mortgage Finance �� 2.8%22,487 Essent Group Ltd.* $ 832,24412,626 Nationstar Mortgage Holdings, Inc.* 203,40561,552 Radian Group, Inc. 1,038,99829,258 Walker & Dunlop, Inc.* 1,312,22124,047 Washington Federal, Inc. 810,384
4,197,252Tobacco �� 0.3%6,790 Universal Corp. 498,725
Trading Companies & Distributors �� 2.6%43,350 Air Lease Corp. 1,653,36922,632 BMC Stock Holdings, Inc.* 527,32611,979 SiteOne Landscape Supply, Inc.* 572,71618,799 WESCO International, Inc.* 1,145,799
3,899,210TOTAL COMMON STOCKS(Cost $120,478,754) $ 141,280,683
PrincipalAmount
InterestRate
MaturityDate Value
Short-term Investment(a) �� 5.0%Repurchase Agreements �� 5.0%
Joint Repurchase Agreement Account II$ 7,400,000 0.821 % 05/01/17 $ 7,400,000
(Cost $7,400,000)TOTAL INVESTMENTS �� 99.8%(Cost $127,878,754) $ 148,680,683OTHER ASSETS IN EXCESS OF
LIABILITIES �� 0.2% 361,365NET ASSETS �� 100.0% $ 149,042,048
The percentage shown for each investment category reflects the value of investments in that category as a percentage of net assets.* Non-income producing security.(a) Joint repurchase agreement was entered into on April 28, 2017. Additional information appears on page 27.
Investment Abbreviations:ADR �American Depositary ReceiptGP �General PartnershipPLC �Public Limited Company
26 The accompanying notes are an integral part of these financial statements.
Copyright © 2017 www.secdatabase.com. All Rights Reserved.Please Consider the Environment Before Printing This Document

ACTIVE EQUITY MULTI-MANAGER FUNDS
ADDITIONAL INVESTMENT INFORMATION
JOINT REPURCHASE AGREEMENT ACCOUNT II � At April 30, 2017, certain Funds had undivided interests in the Joint RepurchaseAgreement Account II, with a maturity date of May 1, 2017, as follows:
FundPrincipalAmount
MaturityValue
CollateralAllocation
ValueMulti-Manager International Equity $13,900,000 $13,900,317 $14,178,000Multi-Manager U.S. Dynamic Equity 6,800,000 6,800,155 6,936,000Multi-Manager U.S. Small Cap Equity 7,400,000 7,400,169 7,548,000
REPURCHASE AGREEMENTS � At April 30, 2017, the Principal Amounts of certain Fund�s interest in the Joint Repurchase AgreementAccount II were as follows:
CounterpartyInterest
Rate
Multi-ManagerInternationalEquity Fund
Multi-ManagerU.S. DynamicEquity Fund
Multi-ManagerU.S. Small
CapEquity Fund
Citigroup Global Markets, Inc. 0.830 % $1,898,475 $4,903,256 $1,010,699Merrill Lynch & Co., Inc. 0.820 12,001,525 30,996,744 6,389,301TOTAL $13,900,000 $35,900,000 $7,400,000
At April 30, 2017, the Joint Repurchase Agreement Account II was fully collateralized by:
Issuer Interest Rates Maturity DatesFederal Home Loan Mortgage Corp. 1.000% to 6.000% 06/29/17 to 04/01/47Federal National Mortgage Association 1.000 to 6.000 10/01/33 to 04/01/47Government National Mortgage Association 3.500 to 4.500 03/15/45 to 04/20/47United States Treasury Notes 0.000 to 7.625 11/09/17 to 01/31/20
The accompanying notes are an integral part of these financial statements. 27
Copyright © 2017 www.secdatabase.com. All Rights Reserved.Please Consider the Environment Before Printing This Document

ACTIVE EQUITY MULTI-MANAGER FUNDS
Statements of Assets and LiabilitiesApril 30, 2017 (Unaudited)
Multi-ManagerInternationalEquity Fund
Multi-ManagerU.S. DynamicEquity Fund
Multi-ManagerU.S. Small Cap
Equity FundAssets:Investments, at value (cost $326,499,238, $126,483,234 and $127,878,754) $364,922,445 $146,415,558 $148,680,683Foreign currencies, at value (cost $334,069, $0 and $0, respectively) 336,324 � �
Cash � 222,543 224,927Unrealized gain on forward foreign currency exchange contracts 1,031 10,088 �Receivables:
Investments sold 1,449,060 852,953 149,965Dividends and interest 1,040,389 91,079 23,617Foreign tax reclaims 418,718 10,355 �
Fund shares sold 320,000 � 180,000Investments sold on an extended settlement basis 50,031 � �
Reimbursement from investment adviser � � 150,618Collateral on certain derivative contracts(a) � 400,000 �
Other assets 29,723 14,949 14,683Total assets $368,567,721 $148,017,525 149,424,493
Liabilities:Due to custodian 33,874 � �
Unrealized loss on forward foreign currency exchange contracts 665 88,456 �Payables:
Investments purchased 1,127,784 1,184,918 �Fund shares redeemed 705,000 50,000 75,000Investments purchased on an extended settlement basis 643,855 � �
Payables to investment adviser 145,741 123,663 �Management fees 128,868 84,543 177,805Distribution and service fees and transfer agency fees 5,790 2,392 2,396
Accrued expenses and other liabilities 307,188 210,754 127,244Total liabilities 3,098,765 1,744,726 382,445
Net Assets:Paid-in capital 332,614,977 131,793,623 127,280,611Undistributed net investment income 2,393,187 184,667 (21,621 )Accumulated net realized gain (loss) (7,982,434 ) (5,559,519 ) 981,129Net unrealized gain 38,443,226 19,854,028 20,801,929NET ASSETS $365,468,956 $146,272,799 $149,042,048Shares Outstanding $0.001 par value (unlimited number of shares authorized): 35,092,001 13,984,130 12,641,666Net asset value, offering and redemption price per share: $10.41 $10.46 $11.79
(a) Segregated for collateral on forward foreign currency exchange contracts transactions.
28 The accompanying notes are an integral part of these financial statements.
Copyright © 2017 www.secdatabase.com. All Rights Reserved.Please Consider the Environment Before Printing This Document

ACTIVE EQUITY MULTI-MANAGER FUNDS
Statements of OperationsFor the Six Months Ended April 30, 2017 (Unaudited)
Multi-ManagerInternationalEquity Fund
Multi-ManagerU.S. DynamicEquity Fund
Multi-ManagerU.S. Small Cap
Equity FundInvestment income:Dividends (net of foreign withholding taxes of $356,736, $20,241 and $2,472) $3,588,639 $1,021,403 $791,245Interest 31,142 24,670 20,551Total investment income 3,619,781 1,046,073 811,796
Expenses:Management fees 949,058 571,421 526,020Custody, accounting and administrative services 198,605 139,950 78,494Professional fees 102,453 103,291 71,530Registration fees 34,440 25,709 13,242Trustee fees 32,198 30,539 28,343Transfer Agency fees 31,635 14,285 14,027Printing and mailing costs 10,902 4,422 12,216Amortization of offering costs � � 85,463Other 24,785 20,101 23,524Total expenses 1,384,076 909,718 852,859Less � expense reductions (482,472 ) (345,442 ) (291,772 )Net expenses 901,604 564,276 561,087NET INVESTMENT INCOME 2,718,177 481,797 250,709
Realized and unrealized gain (loss):Net realized gain (loss) from:
Investments (1,709,214 ) 5,235,453 1,091,097Forward foreign currency exchange contracts (22,752 ) 56,862 �
Foreign currency transactions (41,255 ) 4,082 �Net change in unrealized gain (loss) on:
Investments 38,248,529 14,675,980 16,029,633Forward foreign currency exchange contracts 366 (100,150 ) �
Foreign currency translation 35,344 314 �
Net realized and unrealized gain 36,511,018 19,872,541 17,120,730NET INCREASE IN NET ASSETS RESULTING FROM OPERATIONS $39,229,195 $20,354,338 $17,371,439
The accompanying notes are an integral part of these financial statements. 29
Copyright © 2017 www.secdatabase.com. All Rights Reserved.Please Consider the Environment Before Printing This Document

ACTIVE EQUITY MULTI-MANAGER FUNDS
Statements of Changes in Net AssetsMulti-Manager International Equity Fund
For theSix Months Ended
April 30, 2017(Unaudited)
For the FiscalYear Ended
October 31, 2016From operations:Net investment income $ 2,718,177 $ 4,456,109Net realized gain (loss) (1,773,221 ) (5,554,892 )Net change in unrealized gain 38,284,239 3,173,926Net increase (decrease) in net assets resulting from operations 39,229,195 2,075,143
Distributions to shareholders:From net investment income (4,582,050 ) (662,291 )
From share transactions:Proceeds from sales of shares 49,716,005 128,804,010Reinvestment of distributions 4,582,050 662,291Cost of shares redeemed (17,096,419 ) (22,314,124 )Net increase (decrease) in net assets resulting from share transactions 37,201,636 107,152,177TOTAL INCREASE 71,848,781 108,565,029
Net assets:Beginning of period 293,620,175 185,055,146End of period $ 365,468,956 $ 293,620,175Undistributed net investment income $ 2,393,187 $ 4,257,060
30 The accompanying notes are an integral part of these financial statements.
Copyright © 2017 www.secdatabase.com. All Rights Reserved.Please Consider the Environment Before Printing This Document

ACTIVE EQUITY MULTI-MANAGER FUNDS
Statements of Changes in Net Assets (continued)Multi-Manager U.S. Dynamic Equity Fund Multi-Manager U.S. Small Cap Equity Fund
For theSix Months Ended
April 30, 2017(Unaudited)
For the FiscalYear Ended
October 31, 2016
For theSix Months Ended
April 30, 2017(Unaudited)
For thePeriod Ended
October 31, 2016(a)
From operations:Net investment income $ 481,797 $ 1,016,196 $ 250,709 $ 161,749Net realized gain (loss) 5,296,397 (8,969,522 ) 1,091,097 1,071,864Net change in unrealized gain 14,576,144 4,886,008 16,029,633 4,772,296Net increase (decrease) in net assets resulting from operations 20,354,338 (3,067,318 ) 17,371,439 6,005,909
Distributions to shareholders:From net investment income (896,870 ) (599,786 ) (451,085 ) �
From net realized gains � � (1,181,832 ) �
Total distributions to shareholders (896,870 ) (599,786 ) (1,632,917 ) �
From share transactions:Proceeds from sales of shares 1,535,000 58,640,000 15,887,000 132,504,436Reinvestment of distributions 896,870 599,786 1,632,917 �Cost of shares redeemed (11,612,173 ) (51,508,582 ) (12,991,731 ) (9,735,005 )Net increase (decrease) in net assets resulting from share transactions (9,180,303 ) 7,731,204 4,528,186 122,769,431TOTAL INCREASE 10,277,165 4,064,100 20,266,708 128,775,340
Net assets:Beginning of period 135,995,634 131,931,534 128,775,340 �
End of period $ 146,272,799 $ 135,995,634 $ 149,042,048 $ 128,775,340Undistributed net investment income $ 184,667 $ 599,740 $ (21,621 ) $ 178,755
(a) Commenced operations on April 29, 2016.
The accompanying notes are an integral part of these financial statements. 31
Copyright © 2017 www.secdatabase.com. All Rights Reserved.Please Consider the Environment Before Printing This Document

GOLDMAN SACHS MULTI-MANAGER INTERNATIONAL EQUITY FUND
Financial HighlightsSelected Data for a Share Outstanding Throughout Each Period
Income (loss) frominvestment operations
Year - Share Class
Net assetvalue,
beginningof period
Netinvestmentincome(a)
Net realizedand unrealized
gain (loss)
Total frominvestmentoperations
Distributionsto shareholders
from netinvestment
incomeFOR THE SIX MONTHS ENDED APRIL 30, (UNAUDITED)2017 - Institutional $ 9.41 $ 0.08 $ 1.07 $ 1.15 $ (0.15 )
FOR THE FISCAL YEAR ENDED OCTOBER 31,2016 - Institutional 9.52 0.17 (0.25 ) (0.08 ) (0.03 )
FOR THE PERIOD ENDED OCTOBER 31,2015 - Institutional (Commenced July 31, 2015) 10.00 0.03 (0.51 ) (0.48 ) �
(a) Calculated based on the average shares outstanding methodology.(b) Assumes investment at the NAV at the beginning of the period, reinvestment of all dividends and distributions, a complete redemption of the investment at the NAV at the end of the
period and no sales or redemption charges. Total returns would be reduced if a sales or redemption charge was taken into account. Returns do not reflect the impact of taxes toshareholder relating to Fund distributions or the redemption of Fund shares. Total returns for periods less than one full year are not annualized.
(c) The Fund�s portfolio turnover rate is calculated in accordance with regulatory requirements, without regard to transactions involving short term investments and certain derivatives. Ifsuch transactions were included, the Fund�s portfolio turnover rate may be higher.
(d) Annualized.
32 The accompanying notes are an integral part of these financial statements.
Copyright © 2017 www.secdatabase.com. All Rights Reserved.Please Consider the Environment Before Printing This Document

GOLDMAN SACHS MULTI-MANAGER INTERNATIONAL EQUITY FUND
Net assetvalue, endof period
Totalreturn(b)
Net assets,end ofperiod
(in 000s)
Ratio ofnet expenses
to averagenet assets
Ratio oftotal expenses
to averagenet assets
Ratio ofnet investment
incometo averagenet assets
Portfolioturnover
rate(c)
$ 10.41 12.38 % $365,469 0.57 %(d) 0.87 %(d) 1.72 %(d) 15 %
9.41 (0.82 ) 293,620 0.57 1.01 1.81 25
9.52 (4.80 ) 185,055 0.57 (d) 1.07 (d) 1.31 (d) 6
The accompanying notes are an integral part of these financial statements. 33
Copyright © 2017 www.secdatabase.com. All Rights Reserved.Please Consider the Environment Before Printing This Document

GOLDMAN SACHS MULTI-MANAGER U.S. DYNAMIC EQUITY FUND
Financial HighlightsSelected Data for a Share Outstanding Throughout Each Period
Income (loss) frominvestment operations
Year - Share Class
Net assetvalue,
beginningof period
Netinvestmentincome(a)
Net realizedand unrealized
gain (loss)
Total frominvestmentoperations
Distributionsto shareholders
from netinvestment
incomeFOR THE SIX MONTHS ENDED APRIL 30, (UNAUDITED)2017 - Institutional $ 9.13 $ 0.03 $ 1.36 $ 1.39 $ (0.06 )
FOR THE FISCAL YEAR ENDED OCTOBER 31,2016 - Institutional 9.51 0.06 (e) (0.40 ) (0.34 ) (0.04 )
FOR THE PERIOD ENDED OCTOBER 31,2015 - Institutional (Commenced July 31, 2015) 10.00 0.02 (0.51 ) (0.49 ) �
(a) Calculated based on the average shares outstanding methodology.(b) Assumes investment at the NAV at the beginning of the period, reinvestment of all dividends and distributions, a complete redemption of the investment at the NAV at the end of the
period and no sales or redemption charges. Total returns would be reduced if a sales or redemption charge was taken into account. Returns do not reflect the impact of taxes toshareholder relating to Fund distributions or the redemption of Fund shares. Total returns for periods less than one full year are not annualized.
(c) The Fund�s portfolio turnover rate is calculated in accordance with regulatory requirements, without regard to transactions involving short term investments and certain derivatives. Ifsuch transactions were included, the Fund�s portfolio turnover rate may be higher.
(d) Annualized.(e) Reflects income recognized from a special dividend which amounted to $0.01 per share and 0.17% of average net assets.
34 The accompanying notes are an integral part of these financial statements.
Copyright © 2017 www.secdatabase.com. All Rights Reserved.Please Consider the Environment Before Printing This Document

GOLDMAN SACHS MULTI-MANAGER U.S. DYNAMIC EQUITY FUND
Net assetvalue, endof period
Totalreturn(b)
Net assets,end ofperiod
(in 000s)
Ratio ofnet expenses
to averagenet assets
Ratio oftotal expenses
to averagenet assets
Ratio ofnet investment
incometo averagenet assets
Portfolioturnover
rate(c)
$ 10.46 15.30 % $146,273 0.79 %(d) 1.27 %(d) 0.67 %(d) 52 %
9.13 (3.54 ) 135,996 0.80 1.31 0.70 (e) 112
9.51 (4.90 ) 131,932 0.79 (d) 1.51 (d) 0.70 (d) 14
The accompanying notes are an integral part of these financial statements. 35
Copyright © 2017 www.secdatabase.com. All Rights Reserved.Please Consider the Environment Before Printing This Document

GOLDMAN SACHS MULTI-MANAGER U.S. SMALL CAP EQUITY FUND
Financial HighlightsSelected Data for a Share Outstanding Throughout Each Period
FromInvestment Operations
Distributionsto shareholders
Year - Share Class
Net assetvalue,
beginningof period
Netinvestmentincome(a)
Net realizedand unrealized
gain
Total frominvestmentoperations
From netinvestment
income
From netrealized
gainsTotal
distributionsFOR THE SIX MONTHS ENDED APRIL 30, (UNAUDITED)2017 - Institutional $ 10.52 $ 0.02 $ 1.39 $ 1.41 $ (0.04 ) $ (0.10 ) $ (0.14 )
FOR THE FISCAL YEAR ENDED OCTOBER 31,2016 - Institutional (Commenced April 29, 2016) 10.00 0.01 0.51 0.52 � � �
(a) Calculated based on the average shares outstanding methodology.(b) Assumes investment at the NAV at the beginning of the period, reinvestment of all dividends and distributions, a complete redemption of the investment at the NAV at the end of the
period and no sales or redemption charges. Total returns would be reduced if a sales or redemption charge was taken into account. Returns do not reflect the impact of taxes toshareholder relating to Fund distributions or the redemption of Fund shares. Total returns for periods less than one full year are not annualized.
(c) Annualized.(d) The Fund�s portfolio turnover rate is calculated in accordance with regulatory requirements, without regard to transactions involving short term investments. If such transactions were
included, the Fund�s portfolio turnover rate may be higher.
36 The accompanying notes are an integral part of these financial statements.
Copyright © 2017 www.secdatabase.com. All Rights Reserved.Please Consider the Environment Before Printing This Document

GOLDMAN SACHS MULTI-MANAGER U.S. SMALL CAP EQUITY FUND
Net assetvalue, endof period
Totalreturn(b)
Net assets,end ofperiod
(in 000s)
Ratio ofnet expenses
to averagenet assets(c)
Ratio oftotal expenses
to averagenet assets(c)
Ratio ofnet investment
incometo average
net assets(c)
Portfolioturnover
rate(d)
$ 11.79 13.38 % $149,042 0.80 % 1.15 % 0.36 % 19 %
10.52 5.20 128,775 0.80 1.32 0.26 15
The accompanying notes are an integral part of these financial statements. 37
Copyright © 2017 www.secdatabase.com. All Rights Reserved.Please Consider the Environment Before Printing This Document

ACTIVE EQUITY MULTI-MANAGER FUNDS
Notes to Financial StatementsApril 30, 2017 (Unaudited)
1. ORGANIZATION
Goldman Sachs Trust II (the �Trust�) is a Delaware statutory trust registered under the Investment Company Act of 1940, as amended (the �Act�), asan open-end management investment company. The following table lists those series of the Trust that are included in this report (collectively, the�Funds� or individually a �Fund�), along with their corresponding share classes and respective diversification status under the Act:
Fund Share Classes OfferedDiversified/
Non-diversifiedMulti-Manager International Equity Institutional DiversifiedMulti-Manager U.S. Dynamic Equity Institutional Non-diversifiedMulti-Manager U.S. Small Cap Equity Institutional Diversified
Goldman Sachs Asset Management, L.P. (�GSAM�), an affiliate of Goldman Sachs & Co. LLC (formerly Goldman, Sachs & Co.) (�GoldmanSachs�), serves as investment adviser to the Funds pursuant to a management agreement (the �Agreement�) with the Trust. As of April 30, 2017,GSAM had sub-advisory agreements (the �Sub-Advisory Agreements�) for the Multi-Manager International Equity Fund with Causeway CapitalManagement LLC, Massachusetts Financial Services Company, doing business as MFS Investment Management and WCM Investment Management;for the Multi-Manager U.S. Dynamic Equity Fund with Lazard Asset Management LLC, Sirios Capital Management, L.P. and Smead CapitalManagement, Inc. and for the Multi-Manager U.S. Small Cap Equity Fund with Boston Partners Global Investors, Inc., Brown Advisory LLC and PNCCapital Advisors, LLC (the �Underlying Managers�). Pursuant to the terms of the Sub-Advisory Agreements, the Underlying Managers are responsiblefor making investment decisions and managing the investments of the applicable Fund. GSAM compensates the Underlying Managers directly inaccordance with the terms of the applicable Sub-Advisory Agreements. The Funds are not charged any separate or additional investment advisory feesby the Underlying Managers. Weitz Investment Managerment, Inc., a former sub-adviser to the Multi-Manager U.S. Dynamic Equity Fund, wasredeemed from the Fund in January 2017.
2. SIGNIFICANT ACCOUNTING POLICIESThe financial statements have been prepared in accordance with accounting principles generally accepted in the United States of America (�GAAP�)and require management to make estimates and assumptions that may affect the reported amounts and disclosures. Actual results may differ from thoseestimates and assumptions.
A. Investment Valuation � The Funds� valuation policy is to value investments at fair value.
B. Investment Income and Investments � Investment income includes interest income, dividend income, net of any foreign withholding taxes, lessany amounts reclaimable, and securities lending income. Interest income is accrued daily and adjusted for amortization of premiums and accretion ofdiscounts. Dividend income is recognized on ex-dividend date or, for certain foreign securities, as soon as such information is obtained subsequent tothe ex-dividend date. Investment transactions are reflected on trade date. Realized gains and losses are calculated using identified cost. Investmenttransactions are recorded on the following business day for daily net asset value (�NAV�) calculations. Any foreign capital gains tax is accrued dailybased upon net unrealized gains, and is payable upon sale of such investments. Distributions received from the Funds� investments in U.S. real estateinvestment trusts (�REITs�) may be characterized as ordinary income, net capital gain or a return of capital. A return of capital is recorded by theFunds as a reduction to the cost basis of the REIT.
For derivative contracts, realized gains and losses are recorded upon settlement of the contract.
38
Copyright © 2017 www.secdatabase.com. All Rights Reserved.Please Consider the Environment Before Printing This Document

ACTIVE EQUITY MULTI-MANAGER FUNDS
2. SIGNIFICANT ACCOUNTING POLICIES (continued)
C. Expenses � Expenses incurred directly by a Fund are charged to the Fund, and certain expenses incurred by the Trust are allocated across theapplicable Funds on a straight-line and/or pro-rata basis, depending upon the nature of the expenses, and are accrued daily.
D. Offering Costs � Offering costs paid in connection with the offering of shares of Multi-Manager U.S. Small Cap Equity Fund were amortized on astraight-line basis over 12 months from the date of commencement of operations.
E. Federal Taxes and Distributions to Shareholders � It is each Fund�s policy to comply with the requirements of the Internal Revenue Code of1986, as amended (the �Code�), applicable to regulated investment companies (mutual funds) and to distribute each year substantially all of itsinvestment company taxable income and capital gains to its shareholders. Accordingly, the Funds are not required to make any provisions for thepayment of federal income tax. Distributions to shareholders are recorded on the ex-dividend date. Income and capital gains distributions, if any, aredeclared and paid annually.
Net capital losses, if any, are carried forward to future fiscal years and may be used to the extent allowed by the Code to offset any future capitalgains. Losses that are carried forward will retain their character as either short-term or long-term capital losses. Utilization of capital loss carryforwardswill reduce the requirement of future capital gains distributions.
The characterization of distributions to shareholders for financial reporting purposes is determined in accordance with federal income tax rules,which may differ from GAAP. The source of each Fund�s distributions may be shown in the accompanying financial statements as either from netinvestment income, net realized gain or capital. Certain components of the Funds� net assets on the Statements of Assets and Liabilities reflectpermanent GAAP/tax differences based on the appropriate tax character.
F. Foreign Currency Translation � The accounting records and reporting currency of the Funds are maintained in U.S. dollars. Assets and liabilitiesdenominated in foreign currencies are translated into U.S. dollars using the current exchange rates at the close of each business day. The effect ofchanges in foreign currency exchange rates on investments is included within net realized and unrealized gain (loss) on investments. Changes in thevalue of other assets and liabilities as a result of fluctuations in foreign exchange rates are included in the Statements of Operations within net changein unrealized gain (loss) on foreign currency translations. Transactions denominated in foreign currencies are translated into U.S. dollars on the date thetransaction occurred, the effects of which are included within net realized gain (loss) on foreign currency transactions.
3. INVESTMENTS AND FAIR VALUE MEASUREMENTSThe fair value of a financial instrument is the amount that would be received to sell an asset or paid to transfer a liability in an orderly transactionbetween market participants at the measurement date (i.e., the exit price). GAAP establishes a fair value hierarchy that prioritizes the inputs tovaluation techniques used to measure fair value. The hierarchy gives the highest priority to unadjusted quoted prices in active markets for identicalassets or liabilities (Level 1 measurements) and the lowest priority to unobservable inputs (Level 3 measurements). The levels used for classifyinginvestments are not necessarily an indication of the risk associated with investing in these investments. The three levels of the fair value hierarchy aredescribed below:
Level 1 � Unadjusted quoted prices in active markets that are accessible at the measurement date for identical, unrestricted assets or liabilities;Level 2 � Quoted prices in markets that are not active or financial instruments for which significant inputs are observable (including, but notlimited to, quoted prices for similar investments, interest rates, foreign exchange rates, volatility and credit spreads), either directly or indirectly;Level 3 � Prices or valuations that require significant unobservable inputs (including GSAM�s assumptions in determining fair valuemeasurement).
39
Copyright © 2017 www.secdatabase.com. All Rights Reserved.Please Consider the Environment Before Printing This Document

ACTIVE EQUITY MULTI-MANAGER FUNDS
Notes to Financial Statements (continued)April 30, 2017 (Unaudited)
3. INVESTMENTS AND FAIR VALUE MEASUREMENTS (continued)
Changes in valuation techniques may result in transfers into or out of an assigned level within the hierarchy. In accordance with the Funds� policy,transfers between different levels of the fair value hierarchy resulting from such changes are deemed to have occurred as of the beginning of thereporting period.
The Board of Trustees (�Trustees�) has approved Valuation Procedures that govern the valuation of the portfolio investments held by the Funds,including investments for which market quotations are not readily available. The Trustees have delegated to GSAM day-to-day responsibility forimplementing and maintaining internal controls and procedures related to the valuation of the Funds� portfolio investments. To assess the continuingappropriateness of pricing sources and methodologies, GSAM regularly performs price verification procedures and issues challenges as necessary tothird party pricing vendors or brokers, and any differences are reviewed in accordance with the Valuation Procedures.
A. Level 1 and Level 2 Fair Value Investments � The valuation techniques and significant inputs used in determining the fair values forinvestments classified as Level 1 and Level 2 are as follows:
Equity Securities � Equity securities traded on a United States (�U.S.�) securities exchange or the NASDAQ system, or those located on certainforeign exchanges, including but not limited to the Americas, are valued daily at their last sale price or official closing price on the principal exchangeor system on which they are traded. If there is no sale or official closing price or such price is believed by GSAM to not represent fair value, equitysecurities are valued at the last bid price for long positions and at the last ask price for short positions. To the extent these investments are activelytraded, they are classified as Level 1 of the fair value hierarchy, otherwise they are generally classified as Level 2.
Unlisted equity securities for which market quotations are available are valued at the last sale price on the valuation date, or if no sale occurs, atthe last bid price. Securities traded on certain foreign securities exchanges are valued daily at fair value determined by an independent fair value service(if available) under Valuation Procedures approved by the Trustees and consistent with applicable regulatory guidance. The independent fair valueservice takes into account multiple factors including, but not limited to, movements in the securities markets, certain depositary receipts, futurescontracts and foreign currency exchange rates that have occurred subsequent to the close of the foreign securities exchange. These investments aregenerally classified as Level 2 of the fair value hierarchy.
Derivative Contracts � A derivative is an instrument whose value is derived from underlying assets, indices, reference rates or a combination of thesefactors. A Fund enters into derivative transactions to hedge against changes in interest rates, securities prices, and/or currency exchange rates, toincrease total return, or to gain access to certain markets or attain exposure to other underliers.
Exchange-traded derivatives, including futures and options contracts, are valued at the last sale or settlement price and typically fall within Level 1of the fair value hierarchy. Over-the-counter (�OTC�) and centrally cleared derivatives are valued using market transactions and other market evidence,including market-based inputs to models, calibration to market-clearing transactions, broker or dealer quotations, or other alternative pricing sources.Where models are used, the selection of a particular model to value OTC and centrally cleared derivatives depends upon the contractual terms of, andspecific risks inherent in, the instrument, as well as the availability of pricing information in the market. Valuation models require a variety of inputs,including contractual terms, market prices, yield curves, credit curves, measures of volatility, voluntary and involuntary prepayment rates, loss severityrates and correlations of such inputs. For OTC and centrally cleared derivatives that trade in liquid markets, model inputs can generally be verified andmodel selection does not involve significant management judgment. OTC and centrally cleared derivatives are classified within Level 2 of the fairvalue hierarchy when significant inputs are corroborated by market evidence.
i. Forward Contracts � A forward contract is a contract between two parties to buy or sell an asset at a specified price on a future date. Aforward contract settlement can occur on a cash or delivery basis. Forward contracts are marked-to-market daily using independent vendor prices,and the change in value, if any, is recorded as an unrealized gain or loss. Cash and certain investments may be used to collateralize forwardcontracts.
40
Copyright © 2017 www.secdatabase.com. All Rights Reserved.Please Consider the Environment Before Printing This Document

ACTIVE EQUITY MULTI-MANAGER FUNDS
3. INVESTMENTS AND FAIR VALUE MEASUREMENTS (continued)
A forward foreign currency contract is a forward contract in which a Fund agrees to receive or deliver a fixed quantity of one currency foranother, at a pre-determined price at a future date. All forward foreign currency exchange contracts are marked-to-market daily at the applicableforward rate. Non-deliverable forward foreign currency exchange contracts are settled with the counterparty in cash without the delivery of foreigncurrency.
Short Term Investments � Short-term investments having a maturity of 60 days or less are valued using available market quotations as provided by athird party pricing vendor or broker. These investments are classified as Level 2 of the fair value hierarchy.
i. Repurchase Agreements � Repurchase agreements involve the purchase of securities subject to the seller�s agreement to repurchase thesecurities at a mutually agreed upon date and price, under the terms of a Master Repurchase Agreement (�MRA�). During the term of a repurchaseagreement, the value of the underlying securities held as collateral on behalf of a Fund, including accrued interest, is required to exceed the valueof the repurchase agreement, including accrued interest. The gross value of repurchase agreements is included in the Statements of Assets andLiabilities for financial reporting purposes. The underlying securities for all repurchase agreements are held at the Funds� custodian or designatedsub-custodians under tri-party repurchase agreements.
An MRA governs transactions between a Fund and select counterparties. An MRA contains provisions for, among other things, initiation ofthe transaction, income payments, events of default and maintenance of securities for repurchase agreements. An MRA also permits offsetting withcollateral to create one single net payment in the event of default or similar events, including the bankruptcy or insolvency of a counterparty.
If the seller defaults, a Fund could suffer a loss to the extent that the proceeds from the sale of the underlying securities and other collateralheld by the Fund are less than the repurchase price and the Fund�s costs associated with delay and enforcement of the repurchase agreement. Inaddition, in the event of default or insolvency of the seller, a court could determine that a Fund�s interest in the collateral is not enforceable,resulting in additional losses to the Fund.
Pursuant to exemptive relief granted by the Securities and Exchange Commission (�SEC�) and terms and conditions contained therein, theFunds, together with other funds of the Trust and registered investment companies having management agreements with GSAM or its affiliates,may transfer uninvested cash into joint accounts, the daily aggregate balance of which is invested in one or more repurchase agreements. Underthese joint accounts, the Funds maintain pro-rata credit exposure to the underlying repurchase agreements� counterparties. With the exception ofcertain transaction fees, the Funds are not subject to any expenses in relation to these investments.
B. Level 3 Fair Value Investments � To the extent that significant inputs to valuation models and other alternative pricing sources are unobservable,or if quotations are not readily available, or if GSAM believes that such quotations do not accurately reflect fair value, the fair value of the Funds�investments may be determined under Valuation Procedures approved by the Trustees. GSAM, consistent with its procedures and applicable regulatoryguidance, may make an adjustment to the most recent valuation prices of either domestic or foreign securities in light of significant events to reflectwhat it believes to be the fair value of the securities at the time of determining a Fund�s NAV. Significant events which could affect a large number ofsecurities in a particular market may include, but are not limited to: significant fluctuations in U.S. or foreign markets; market dislocations; marketdisruptions; or unscheduled market closings. Significant events which could also affect a single issuer may include, but are not limited to: corporateactions such as reorganizations, mergers and buy-outs; ratings downgrades; and bankruptcies.
41
Copyright © 2017 www.secdatabase.com. All Rights Reserved.Please Consider the Environment Before Printing This Document

ACTIVE EQUITY MULTI-MANAGER FUNDS
Notes to Financial Statements (continued)April 30, 2017 (Unaudited)
3. INVESTMENTS AND FAIR VALUE MEASUREMENTS (continued)
C. Fair Value Hierarchy � The following is a summary of the Funds� investments and derivatives classified in the fair value hierarchy as of April 30,2017:
MULTI-MANAGER INTERNATIONAL EQUITY
Investment Type Level 1 Level 2 Level 3AssetsCommon Stock and/or Other Equity Investments(a)
Asia $21,575,879 $62,406,635 $ �
Australia and Oceania � 7,904,792 �
Europe 23,615,606 206,037,308 �
North America 21,334,276 3,013,147 �
South America 5,134,802 � �
Short-term Investments � 13,900,000 �
Total $71,660,563 $293,261,882 $�
Derivative TypeAssets(b)Forward Foreign Currency Exchange Contracts $� $1,031 $�Liabilities(b)Forward Foreign Currency Exchange Contracts $� $(665 ) $�
MULTI-MANAGER U.S. DYNAMIC EQUITY
Investment Type Level 1 Level 2 Level 3AssetsCommon Stock and/or Other Equity Investments(a)
Europe $6,619,053 $5,836,471 $�North America 127,160,034 � �
Short-term Investments � 6,800,000 �
Total $133,779,087 $12,636,471 $�
Derivative TypeAssets(b)Forward Foreign Currency Exchange Contracts $� $10,088 $�Liabilities(b)Forward Foreign Currency Exchange Contracts $� $(88,456 ) $�
42
Copyright © 2017 www.secdatabase.com. All Rights Reserved.Please Consider the Environment Before Printing This Document

ACTIVE EQUITY MULTI-MANAGER FUNDS
3. INVESTMENTS AND FAIR VALUE MEASUREMENTS (continued)
MULTI-MANAGER U.S. SMALL CAP EQUITY
Investment Type Level 1 Level 2 Level 3AssetsCommon Stock and/or Other Equity Investments(a)
Asia $741,138 $� $ �
Europe 1,222,335 � �
North America 139,317,210 � �
Short-term Investments � 7,400,000 �
Total $141,280,683 $7,400,000 $�
(a) Amounts are disclosed by continent to highlight the impact of time zone differences between local market close and the calculation of NAV. Security valuations are based on the principalexchange or system on which they are traded, which may differ from country of domicile noted in the table. The Funds utilize fair value model prices provided by an independent fair valueservice for certain international equity securities, resulting in a Level 2 classification.
(b) Amount shown represents unrealized gain (loss) at period end.
For further information regarding security characteristics, see the Schedules of Investments.
4. INVESTMENTS IN DERIVATIVESThe following tables set forth, by certain risk types, the gross value of derivative contracts as of April 30, 2017. These instruments were used as part ofthe Funds� investment strategies and to obtain and/or manage exposure related to the risks below. The values in the tables below exclude the effects ofcash collateral received or posted pursuant to these derivative contracts, and therefore are not representative of the Funds� net exposure.
Multi-Manager International Equity Fund
RiskStatements of Assets
and Liabilities AssetsStatements of Assets
and Liabilities LiabilitiesCurrency Receivable for unrealized gain on forward foreign
currency exchange contracts $1,031Payable for unrealized loss on f orward foreigncurrency exchange contracts $(665)
Multi-Manager U.S. Dynamic Equity Fund
RiskStatements of Assets
and Liabilities AssetsStatements of Assets
and Liabilities LiabilitiesCurrency Receivable for unrealized gain on forward foreign
currency exchange contracts $10,088Payable for unrealized loss on forward foreign currencyexchange contracts $(88,456)
43
Copyright © 2017 www.secdatabase.com. All Rights Reserved.Please Consider the Environment Before Printing This Document

ACTIVE EQUITY MULTI-MANAGER FUNDS
Notes to Financial Statements (continued)April 30, 2017 (Unaudited)
4. INVESTMENTS IN DERIVATIVES (continued)
The following tables set forth, by certain risk types, the Funds� gains (losses) related to these derivatives and their indicative volumes for the sixmonths ended April 30, 2017. These gains (losses) should be considered in the context that these derivative contracts may have been executed to createinvestment opportunities and/or economically hedge certain investments, and accordingly, certain gains (losses) on such derivative contracts may offsetcertain (losses) gains attributable to investments. These gains (losses) are included in �Net realized gain (loss)� or �Net change in unrealized gain(loss)� on the Statements of Operations:
Multi-Manager International Equity Fund
Risk Statements of OperationsNet RealizedGain (Loss)
Net Change inUnrealizedGain (Loss)
AverageNumber of
Contracts(a)
Currency Net realized gain (loss) from forward foreign currency exchange contracts/Net unrealized gain(loss) on forward foreign currency exchange contracts $ (22,752 ) $ 366 2
Multi-Manager U.S. Dynamic Equity Fund
Risk Statements of OperationsNet RealizedGain (Loss)
Net Change inUnrealizedGain (Loss)
AverageNumber of
Contracts(a)
Currency Net realized gain (loss) from forward foreign currency exchange contracts/Net unrealized gain(loss) on forward foreign currency exchange contracts $ 56,862 $ (100,150 ) 11
(a) Average number of contracts is based on the average of month end balances for the six months ended April 30, 2017.
In order to better define its contractual rights and to secure rights that will help a Fund mitigate its counterparty risk, a Fund may enter into anInternational Swaps and Derivatives Association, Inc. Master Agreement (�ISDA Master Agreement�) or similar agreement with its derivativescounterparties. An ISDA Master Agreement is a bilateral agreement between a Fund and a counterparty that governs OTC derivatives (includingforward foreign currency exchange contracts, and certain options and swaps), and typically contains, among other things, collateral posting terms andnetting provisions in the event of a default and/or termination event. The provisions of the ISDA Master Agreement typically permit a single netpayment in the event of a default (close-out netting) or similar event, including the bankruptcy or insolvency of the counterparty.
Collateral and margin requirements differ between exchange traded derivatives and OTC derivatives. Margin requirements are established by thebroker or clearing house for exchange-traded and centrally cleared derivatives (financial futures contracts, options and centrally cleared swaps)pursuant to governing agreements for those instrument types. Brokers can ask for margin in excess of the minimum in certain circumstances. Collateralterms are contract-specific for OTC derivatives. For derivatives traded under an ISDA Master Agreement, the collateral requirements are typicallycalculated by netting the marked to market amount for each transaction under such agreement and comparing that amount to the value of any collateralcurrently pledged by a Fund and the counterparty. Additionally, a Fund may be required to post initial margin to the counterparty, the terms of whichwould be outlined in the confirmation of the OTC transaction.
For financial reporting purposes, cash collateral that has been pledged to cover obligations of a Fund and cash collateral received from thecounterparty, if any, is reported separately on the Statements of Assets and Liabilities as receivables/payables for collateral on certain derivativecontracts. Non-cash collateral pledged by a Fund, if any, is noted in the Schedules of Investments. Generally, the amount of collateral due from or to acounterparty must exceed a minimum transfer amount threshold before a transfer is required to be made. To the extent amounts due to a Fund from itscounterparties are not fully collateralized, contractually or otherwise, the Fund bears the risk of loss from counterparty nonperformance. A Fundattempts to mitigate counterparty risk by only entering into agreements with counterparties that the Underlying Managers believe to be of goodstanding and by monitoring the financial stability of those counterparties.
Additionally, the netting of assets and liabilities and the offsetting of collateral pledged or received are based on contractual netting/set-offprovisions in the ISDA Master Agreement or similar agreements. However, in the event of a default or insolvency of a counterparty, a court coulddetermine that such rights are not enforceable due to the restrictions or prohibitions against the right of setoff that may be imposed in accordance with aparticular jurisdiction�s bankruptcy or insolvency laws.
44
Copyright © 2017 www.secdatabase.com. All Rights Reserved.Please Consider the Environment Before Printing This Document

ACTIVE EQUITY MULTI-MANAGER FUNDS
5. AGREEMENTS AND AFFILIATED TRANSACTIONS
A. Management Agreement � Under the Agreement, GSAM manages the Funds, subject to the general supervision of the Trustees.As compensation for the services rendered pursuant to the Agreement, the assumption of the expenses related thereto and administration of the
Funds� business affairs, including providing facilities, GSAM is entitled to a management fee, accrued daily and paid monthly, equal to an annualpercentage rate of each Fund�s average daily net assets.
For the six months ended April 30, 2017 , contractual and effective net management fees with GSAM were at the following rates:
Management Rate
Fund
ContractualManagement Fee
Annual Rate
Effective NetManagement
Rate*Multi-Manager International Equity 0.60 % 0.45 %Multi-Manager U.S. Dynamic Equity 0.80 0.69Multi-Manager U.S. Small Cap Equity 0.75 0.68
* GSAM has agreed to waive a portion of its management fee for each Fund in order to achieve an effective net management fee rate that is equal to the actual cost of fees paid to the Fund�sUnderlying Managers. This arrangement will remain in effect through at least February 28, 2018 and prior to such date, GSAM may not terminate the applicable arrangement without theapproval of the Trustees.
B. Transfer Agency Agreement � Goldman Sachs also serves as the transfer agent of the Funds for a fee pursuant to the Transfer AgencyAgreement. The fees charged for such transfer agency services are accrued daily and paid monthly at annual rates of 0.02% of the average daily netassets of Institutional Shares.
C. Other Expense Agreements and Affiliated Transactions � GSAM has agreed to limit certain Funds� �Total Annual Operating Expenses�(excluding acquired fund fees and expenses, taxes, interest, brokerage fees, shareholder meeting, litigation, indemnification and extraordinaryexpenses) to the extent such expenses exceed, on an annual basis, a percentage rate of the average daily net assets of each Fund. Such Other Expensereimbursements, if any, are accrued daily and paid monthly. In addition, the Funds are not obligated to reimburse GSAM for prior fiscal year expensereimbursements, if any. Limitations as an annual percentage rate of average daily net assets for the Multi-Manager International Equity, Multi-ManagerU.S. Dynamic Equity and the Multi-Manager U.S. Small Cap Equity Funds are 0.57%, 0.79% and 0.80% respectively. These limitations will remain inplace through at least February 28, 2018, and prior to such date GSAM may not terminate the arrangements without the approval of the Trustees. Inaddition, the Funds have entered into certain offset arrangements with the transfer agent, which may result in a reduction of the Funds� expenses andare received irrespective of the application of the �Total Annual Operating Expense� limitations described above.
For the six months ended April 30, 2017, these expense reductions, including any fee waivers and Other Expense reimbursements, were asfollows:
FundManagementFee Waiver
OtherExpense
Reimbursements
TotalAnnual Operating
ExpenseReductions
Multi-Manager International Equity $ 230,066 $ 252,406 $ 482,472Multi-Manager U.S. Dynamic Equity 79,589 265,853 345,442Multi-Manager U.S. Small Cap Equity 51,276 240,496 291,772
45
Copyright © 2017 www.secdatabase.com. All Rights Reserved.Please Consider the Environment Before Printing This Document

ACTIVE EQUITY MULTI-MANAGER FUNDS
Notes to Financial Statements (continued)April 30, 2017 (Unaudited)
5. AGREEMENTS AND AFFILIATED TRANSACTIONS (continued)
D. Line of Credit Facility � As of April 30, 2017, the Funds participated in a $1,100,000,000 committed, unsecured revolving line of credit facility(the �facility�) together with other funds of the Trust and certain registered investment companies having management agreements with GSAM or itsaffiliates. This facility is to be used for temporary emergency purposes, or to allow for an orderly liquidation of securities to meet redemption requests.The interest rate on borrowings is based on the federal funds rate. The facility also requires a fee to be paid by the Funds based on the amount of thecommitment that has not been utilized. For the six months ended April 30, 2017, the Funds did not have any borrowings under the facility. The facilitywas renewed in the amount of $1,100,000,000 effective May 2, 2017.
E. Other Transactions with Affiliates � For the six months ended April 30, 2017 , Goldman Sachs earned $6, in brokerage commissions fromportfolio transactions, including futures transactions executed with Goldman Sachs as the Futures Commission Merchant, on behalf of the Multi-Manager U.S. Dynamic Equity Fund.
6. PORTFOLIO SECURITIES TRANSACTIONSThe cost of purchases and proceeds from sales and maturities of long-term securities for the six months ended April 30, 2017, were:
Fund Purchases Sales and MaturitiesMulti-Manager International Equity Fund $81,979,303 $ 45,832,018Multi-Manager U.S. Dynamic Equity Fund 70,563,403 78,913,118Multi-Manager U.S. Small Cap Equity Fund 27,814,446 25,856,851
7. TAX INFORMATIONAs of the Funds� most recent fiscal year end, October 31, 2016, the Funds� capital loss carryforwards were as follows:
Multi-ManagerInternationalEquity Fund
Multi-ManagerU.S. DynamicEquity Fund
Multi ManagerU.S. Small
CapEquity Fund
Capital loss carryforwards:Perpetual Short-term $(3,870,170 ) $(6,299,772 ) �
Perpetual Long-term (1,007,714 ) (381,593 ) �
Total capital loss carryforwards $(4,877,884 ) $(6,681,365 ) $ �
As of April 30, 2017, the Funds� aggregate security unrealized gains and losses based on cost for U.S. federal income tax purposes were asfollows:
Multi-Manager
InternationalEquity Fund
Multi-Manager
U.S. DynamicEquity Fund
Multi ManagerU.S. Small
CapEquity Fund
Tax Cost $327,858,263 $130,656,127 $128,026,735Gross unrealized gain 43,512,545 20,911,765 23,652,621Gross unrealized loss (6,448,363 ) (5,152,304 ) (2,998,673 )Net unrealizd security gain $37,064,182 $15,759,461 $20,653,948
46
Copyright © 2017 www.secdatabase.com. All Rights Reserved.Please Consider the Environment Before Printing This Document

ACTIVE EQUITY MULTI-MANAGER FUNDS
7. TAX INFORMATION (continued)
The difference between GAAP-basis and tax basis unrealized gains (losses) is attributable primarily to wash sales, net mark to market gains/(losses) on foreign currency contracts, differences in the tax treatment of underlying fund investments, and passive foreign investment companies.
GSAM has reviewed the Funds� tax positions for all open tax years (the current and prior two years, as applicable) and has concluded that noprovision for income tax is required in the Funds� financial statements. Such open tax years remain subject to examination and adjustment by taxauthorities.
8. OTHER RISKSThe Funds� risks include, but are not limited to, the following:
Derivatives Risk � The Funds� use of derivatives may result in loss. Derivative instruments, which may pose risks in addition to and greater thanthose associated with investing directly in securities, currencies or other instruments, may be illiquid or less liquid, volatile, difficult to price andleveraged so that small changes in the value of the underlying instruments may produce disproportionate losses to the Funds. Derivatives are alsosubject to counterparty risk, which is the risk that the other party in the transaction will not fulfill its contractual obligation. The use of derivatives is ahighly specialized activity that involves investment techniques and risks different from those associated with investments in more traditional securitiesand instruments. Losses from derivatives can also result from a lack of correlation between changes in the value of derivative instruments and theportfolio assets (if any) being hedged.
Foreign and Emerging Countries Risk � Investing in foreign markets may involve special risks and considerations not typically associated withinvesting in the United States. Foreign securities may be subject to risk of loss because of more or less foreign government regulation, less publicinformation and less economic, political and social stability in the countries in which the Funds invest. The imposition of exchange controls,confiscations, trade restrictions (including tariffs) and other government restrictions by the United States or other governments, or from problems inshare registration, settlement or custody, may also result in losses. Foreign risk also involves the risk of negative foreign currency rate fluctuations,which may cause the value of securities denominated in such foreign currency (or other instruments through which the Funds have exposure to foreigncurrencies) to decline in value. Currency exchange rates may fluctuate significantly over short periods of time. To the extent that a Fund also invests insecurities of issuers located in emerging markets, these risks may be more pronounced.
Foreign Custody Risk � If a Fund invests in foreign securities, the Fund may hold such securities and cash with foreign banks, agents, and securitiesdepositories appointed by the Fund�s custodian (each a �Foreign Custodian�). Some foreign custodians may be recently organized or new to theforeign custody business. In some countries, Foreign Custodians may be subject to little or no regulatory oversight over, or independent evaluation of,their operations. Further, the laws of certain countries may place limitations on a Fund�s ability to recover its assets if a Foreign Custodian entersbankruptcy. Investments in emerging markets may be subject to even greater custody risks than investments in more developed markets. Custodyservices in emerging market countries are very often undeveloped and may be considerably less well regulated than in more developed countries, andthus may not afford the same level of investor protection as would apply in developed countries.
Geographic Risk � If a Fund focuses its investments in securities of issuers located in a particular country or geographic region, it will subject theFund, to a greater extent than if its investments were less focused, to the risks of volatile economic cycles and/or conditions and developments that maybe particular to that country or region, such as: adverse securities markets; adverse exchange rates; adverse social, political, regulatory, economic,business, environmental or other developments; or natural disasters.
47
Copyright © 2017 www.secdatabase.com. All Rights Reserved.Please Consider the Environment Before Printing This Document

ACTIVE EQUITY MULTI-MANAGER FUNDS
Notes to Financial Statements (continued)April 30, 2017 (Unaudited)
8. OTHER RISKS (continued)
Large Shareholder Transactions Risk � A Fund may experience adverse effects when certain large shareholders, such as other funds, institutionalinvestors (including those trading by use of non-discretionary mathematical formulas), financial intermediaries (who may make investment decisionson behalf of underlying clients and/or include a Fund in their investment model), individuals, accounts and Goldman Sachs affiliates, purchase orredeem large amounts of shares of a Fund. Such large shareholder redemptions may cause a Fund to sell portfolio securities at times when it would nototherwise do so, which may negatively impact a Fund�s NAV and liquidity. These transactions may also accelerate the realization of taxable income toshareholders if such sales of investments resulted in gains, and may also increase transaction costs. In addition, a large redemption could result in aFund�s current expenses being allocated over a smaller asset base, leading to an increase in the Fund�s expense ratio. Similarly, large Fund sharepurchases may adversely affect a Fund�s performance to the extent that the Fund is delayed in investing new cash and is required to maintain a largercash position than it ordinarily would.
Leverage Risk � Leverage creates exposure to potential gains and losses in excess of the initial amount invested. Borrowing and the use of derivativesmay result in leverage and may make a Fund more volatile. When a Fund uses leverage, the sum of that Fund�s investment exposure may significantlyexceed the amount of assets invested in the Fund, although these exposures may vary over time. Relatively small market movements may result in largechanges in the value of a leveraged investment. A Fund will identify liquid assets on its books or otherwise cover transactions that may give rise tosuch risk, to the extent required by applicable law. The use of leverage may cause a Fund to liquidate portfolio positions to satisfy its obligations or tomeet segregation requirements when it may not be advantageous to do so. The use of leverage by a Fund can substantially increase the adverse impactto which the Fund�s investment portfolio may be subject.
Liquidity Risk � A Fund may make investments that are illiquid or that may become less liquid in response to market developments or adverse investorperceptions. Illiquid investments may be more difficult to value. Liquidity risk may also refer to the risk that a Fund will not be able to pay redemptionproceeds within the allowable time period because of unusual market conditions, an unusually high volume of redemption requests, or other reasons.To meet redemption requests, a Fund may be forced to sell investments at an unfavorable time and/or under unfavorable conditions.
Market and Credit Risks � In the normal course of business, the Funds trade financial instruments and enter into financial transactions where risk ofpotential loss exists due to changes in the market (market risk). Additionally, the Funds may also be exposed to credit risk in the event that an issuer orguarantor fails to perform or that an institution or entity with which the Funds have unsettled or open transactions defaults.
Multi-Manager Approach Risk � The Funds� performance depends on the ability of the Investment Adviser in selecting, overseeing, and allocatingFund assets to the Underlying Managers. The Underlying Managers� investment styles may not always be complementary. The Funds� multi-managerapproach may result in the Fund investing a significant percentage of its assets in certain types of investments, which could be beneficial or detrimentalto the Funds� performance depending on the performance of those investments and the overall market environment. The Funds� Underlying Managersmay underperform the market generally or underperform other investment managers that could have been selected for the Funds. Because the Funds�Underlying Managers may trade with counterparties, prime brokers, clearing brokers or futures commission merchants on terms that are different thanthose on which the Investment Adviser would trade, and because each Underlying Manager applies its own risk analysis in evaluating potentialcounterparties for the Funds, the Funds may be subject to greater counterparty risk than if they were managed directly by the Investment Adviser.
Non-Diversification Risk � The Multi-Manager U.S. Dynamic Equity Fund is non-diversified, meaning that it is permitted to invest a largerpercentage of its assets in fewer issuers than diversified mutual funds. Thus, the Fund may be more susceptible to adverse developments affecting anysingle issuer held in its portfolio, and may be more susceptible to greater losses because of these developments.
48
Copyright © 2017 www.secdatabase.com. All Rights Reserved.Please Consider the Environment Before Printing This Document

ACTIVE EQUITY MULTI-MANAGER FUNDS
9. INDEMNIFICATIONS
Under the Trust�s organizational documents, its Trustees, officers, employees and agents are indemnified, to the extent permitted by the Act and statelaw, against certain liabilities that may arise out of performance of their duties to the Funds. Additionally, in the course of business, the Funds enter intocontracts that contain a variety of indemnification clauses. The Funds� maximum exposure under these arrangements is unknown, as this wouldinvolve future claims that may be made against the Funds that have not yet occurred. However, GSAM believes the risk of loss under thesearrangements to be remote.
10. SUBSEQUENT EVENTSSubsequent events after the Statements of Assets and Liabilities date have been evaluated and GSAM has concluded that there is no impact requiringadjustment or disclosure in the financial statements.
49
Copyright © 2017 www.secdatabase.com. All Rights Reserved.Please Consider the Environment Before Printing This Document

ACTIVE EQUITY MULTI-MANAGER FUNDS
Notes to Financial Statements (continued)April 30, 2017 (Unaudited)
11. SUMMARY OF SHARE TRANSACTIONS
Share activity is as follows:Multi-Manager International Equity Fund
For the Six Months EndedApril 30, 2017(Unaudited)
For the Fiscal Year EndedOctober 31, 2016
Shares Dollars Shares DollarsInstitutional SharesShares sold 5,154,409 $49,716,005 14,091,399 $128,804,010Reinvestment of distributions 496,969 4,582,050 70,232 662,291Shares redeemed (1,758,014) (17,096,419) (2,398,379 ) (22,314,124 )NET INCREASE (DECREASE) 3,893,364 $37,201,636 11,763,252 $107,152,177
(a) Commenced operations on April 29, 2016.
50
Copyright © 2017 www.secdatabase.com. All Rights Reserved.Please Consider the Environment Before Printing This Document

ACTIVE EQUITY MULTI-MANAGER FUNDS
Multi-Manager U.S. Dynamic Equity Fund Multi-Manager U.S. Small Cap Equity Fund(a)
For the Six Months EndedApril 30, 2017(Unaudited)
For the Fiscal Year EndedOctober 31, 2016
For the Six Months EndedApril 30, 2017(Unaudited)
For the Fiscal Year EndedOctober 31, 2016
Shares Dollars Shares Dollars Shares Dollars Shares Dollars
156,000 $ 1,535,000 6,537,771 $ 58,640,000 1,367,238 $ 15,887,000 13,177,002 $ 132,504,43692,844 896,870 64,982 599,786 138,301 1,632,917 � �(1,166,594 ) (11,612,173 ) (5,573,673 ) (51,508,582 ) (1,101,500 ) (12,991,731 ) (939,375 ) (9,735,005 )(917,750 ) $ (9,180,303 ) 1,029,080 $ 7,731,204 404,039 $ 4,528,186 12,237,627 $ 122,769,431
51
Copyright © 2017 www.secdatabase.com. All Rights Reserved.Please Consider the Environment Before Printing This Document

ACTIVE EQUITY MULTI-MANAGER FUNDS
Fund Expenses �� Period Ended April 30, 2017 (Unaudited)As a shareholder of Institutional Shares of the Funds, you incur two types of costs: (1) transaction costs, including sales charges on purchase payments, and
(2) ongoing costs, including management fees; and other Fund expenses. This Example is intended to help you understand your ongoing costs (in dollars) of investingin the Funds and to compare these costs with the ongoing costs of investing in other mutual funds.
The Example is based on an investment of $1,000 invested at the beginning of the period and held for the entire period from November 1, 2016 throughApril 30, 2017, which represents a period of 181 days in a 365 day year.
Actual Expenses � The first line under each share class in the table below provides information about actual account values and actual expenses. You mayuse the information in this line, together with the amount you invested, to estimate the expenses that you paid over the period. Simply divide your account value by$1,000 (for example, an $8,600 account value divided by $1,000=8.6), then multiply the result by the number in the first line under the heading entitled �ExpensesPaid� to estimate the expenses you paid on your account during this period.
Hypothetical Example for Comparison Purposes � The second line under each share class in the table below provides information about hypotheticalaccount values and hypothetical expenses based on the Funds� actual net expense ratios and an assumed rate of return of 5% per year before expenses, which is not theFunds� actual return. The hypothetical account values and expenses may not be used to estimate the actual ending account balance or expenses you paid for the period.You may use this information to compare the ongoing costs of investing in the Funds and other funds. To do so, compare this 5% hypothetical example with the 5%hypothetical examples that appear in the shareholder reports of the other funds.
Please note that the expenses shown in the table are meant to highlight your ongoing costs only and do not reflect any transactional costs, such as salescharges, redemption fees, or exchange fees. Therefore, the second line of the table is useful in comparing ongoing costs only, and will not help you determine therelative total costs of owning different funds. In addition, if these transactional costs were included, your costs would have been higher.
Multi-Manager International Equity Fund Multi-Manager U.S. Dynamic Equity Fund Multi-Manager U.S. Small Cap Equity Fund
Share Class
BeginningAccount
Value11/1/16
EndingAccount
Value4/30/17
ExpensesPaid for the
6 months ended4/30/17*
BeginningAccount
Value11/1/16
EndingAccount
Value4/30/17
ExpensesPaid for the
6 months ended4/30/17*
BeginningAccount
Value11/1/16
EndingAccount
Value4/30/17
ExpensesPaid for the
6 months ended4/30/17*
InstitutionalActual $1,000.00 $1,123.80 $ 3.00 $1,000.00 $1,153.00 $ 4.22 $1,000.00 $1,133.80 $ 4.23Hypothetical 5% return 1,000.00 1,021.97+ 2.86 1,000.00 1,020.88+ 3.96 1,000.00 1,020.83+ 4.01
* Expenses for each share class are calculated using each Fund�s annualized net expense ratio for each class, which represents the ongoing expenses as a percentage of net assets for the sixmonths ended April 30, 2017. Expenses are calculated by multiplying the annualized net expense ratio by the average account value for the period; then multiplying the result by the numberof days in the most recent fiscal half year; and then dividing that result by the number of days in the fiscal year. The annualized net expense ratios for the period were as follows:
Fund InstitutionalMulti-Manager International Equity 0.57 %Multi-Manager U.S. Dynamic Equity 0.79Multi-Manager U.S. Small Cap Equity 0.80
+ Hypothetical expenses are based on the Fund�s actual annualized net expense ratios and an assumed rate of return of 5% per year before expenses.
52
Copyright © 2017 www.secdatabase.com. All Rights Reserved.Please Consider the Environment Before Printing This Document

FUND PROFILE
Goldman Sachs FundsGoldman Sachs is a premier financial services firm, known since 1869 for creating thoughtful and customized investment solutions in complex globalmarkets.Today, the Investment Management Division of Goldman Sachs serves a diverse set of clients worldwide, including private institutions, public entitiesand individuals. With approximately $1.17 trillion in assets under supervision as of March 31, 2017, Goldman Sachs Asset Management (�GSAM�)has portfolio management teams located around the world and our investment professionals bring firsthand knowledge of local markets to everyinvestment decision. Assets under supervision includes assets under management and other client assets for which Goldman Sachs does not have fulldiscretion. GSAM leverages the resources of Goldman Sachs & Co. LLC subject to legal, internal and regulatory restrictions.
Money MarketFinancial Square FundsSM
∎ Financial Square Treasury Solutions Fund1
∎ Financial Square Government Fund1
∎ Financial Square Money Market Fund2
∎ Financial Square Prime Obligations Fund2
∎ Financial Square Treasury Instruments Fund1
∎ Financial Square Treasury Obligations Fund1
∎ Financial Square Federal Instruments Fund1
∎ Financial Square Tax-Exempt Money∎ Market Fund2Investor FundsSM
∎ Investor Money Market Fund3
∎ Investor Tax-Exempt Money Market Fund3
Fixed IncomeShort Duration and Government∎ Enhanced Income Fund∎ High Quality Floating Rate Fund∎ Short-Term Conservative Income Fund4
∎ Short Duration Government Fund∎ Short Duration Income Fund∎ Government Income Fund∎ Inflation Protected Securities FundMulti-Sector∎ Bond Fund∎ Core Fixed Income Fund∎ Global Income Fund∎ Strategic Income FundMunicipal and Tax-Free∎ High Yield Municipal Fund∎ Dynamic Municipal Income Fund∎ Short Duration Tax-Free FundSingle Sector∎ Investment Grade Credit Fund∎ U.S. Mortgages Fund∎ High Yield Fund∎ High Yield Floating Rate Fund∎ Emerging Markets Debt Fund∎ Local Emerging Markets Debt Fund∎ Dynamic Emerging Markets Debt FundFixed Income Alternatives∎ Long Short Credit Strategies Fund∎ Strategic Macro Fund5
Fundamental Equity∎ Equity Income Fund6
∎ Small Cap Value Fund∎ Small/Mid Cap Value Fund∎ Mid Cap Value Fund∎ Large Cap Value Fund∎ Focused Value Fund∎ Capital Growth Fund∎ Strategic Growth Fund∎ Focused Growth Fund∎ Small/Mid Cap Growth Fund∎ Flexible Cap Growth Fund∎ Concentrated Growth Fund∎ Technology Opportunities Fund∎ Growth Opportunities Fund∎ Rising Dividend Growth Fund
Copyright © 2017 www.secdatabase.com. All Rights Reserved.Please Consider the Environment Before Printing This Document

∎ Dynamic U.S. Equity Fund∎ Income Builder Fund
Tax-Advantaged Equity∎ U.S. Tax-Managed Equity Fund∎ International Tax-Managed Equity Fund∎ U.S. Equity Dividend and Premium Fund∎ International Equity Dividend and Premium Fund
Equity Insights∎ Small Cap Equity Insights Fund∎ U.S. Equity Insights Fund∎ Small Cap Growth Insights Fund∎ Large Cap Growth Insights Fund∎ Large Cap Value Insights Fund∎ Small Cap Value Insights Fund∎ International Small Cap Insights Fund∎ International Equity Insights Fund∎ Emerging Markets Equity Insights Fund
Fundamental Equity International∎ Strategic International Equity Fund∎ Focused International Equity Fund∎ Asia Equity Fund∎ Emerging Markets Equity Fund∎ N-11 Equity Fund
Select Satellite∎ Real Estate Securities Fund∎ International Real Estate Securities Fund∎ Commodity Strategy Fund∎ Global Real Estate Securities Fund∎ Dynamic Allocation Fund∎ Absolute Return Tracker Fund∎ Long Short Fund∎ Managed Futures Strategy Fund∎ MLP Energy Infrastructure Fund∎ Multi-Manager Alternatives Fund∎ Absolute Return Multi-Asset Fund∎ Global Infrastructure Fund
Total Portfolio Solutions∎ Global Managed Beta Fund∎ Multi-Manager Non-Core Fixed Income Fund∎ Multi-Manager U.S. Dynamic Equity Fund∎ Multi-Manager Global Equity Fund∎ Multi-Manager International Equity Fund∎ Tactical Tilt Overlay Fund∎ Balanced Strategy Portfolio∎ Multi-Manager U.S. Small Cap Equity Fund∎ Multi-Manager Real Assets Strategy Fund∎ Growth and Income Strategy Portfolio∎ Growth Strategy Portfolio∎ Equity Growth Strategy Portfolio∎ Satellite Strategies Portfolio∎ Enhanced Dividend Global Equity Portfolio∎ Tax-Advantaged Global Equity Portfolio∎ Strategic Factor Allocation Fund∎ Target Date 2020 Portfolio∎ Target Date 2025 Portfolio∎ Target Date 2030 Portfolio∎ Target Date 2035 Portfolio∎ Target Date 2040 Portfolio∎ Target Date 2045 Portfolio∎ Target Date 2050 Portfolio∎ Target Date 2055 Portfolio∎ GQG Partners International Opportunities Fund
1 You could lose money by investing in the Fund. Although the Fund seeks to preserve the value of your investment at $1.00 per share, it cannot guarantee it will do so.An investment in the Fund is not a deposit of a bank and is not insured or guaranteed by the Federal Deposit Insurance Corporation or any other government agency.The Fund�s sponsor has no legal obligation to provide financial support to the Fund, and you should not expect that the sponsor will provide financial support to theFund at any time.
2 You could lose money by investing in the Fund. Because the share price of the Fund will fluctuate, when you sell your shares they may be worth more or less thanwhat you originally paid for them. The Fund may impose a fee upon sale of your shares or may temporarily suspend your ability to sell shares if the Fund�s liquidityfalls below required minimums because of market conditions or other factors. An investment in the Fund is not a deposit of a bank and is not insured or guaranteed bythe Federal Deposit Insurance Corporation or any other government agency. The Fund�s sponsor has no legal obligation to provide financial support to the Fund, andyou should not expect that the sponsor will provide financial support to the Fund at any time.
Copyright © 2017 www.secdatabase.com. All Rights Reserved.Please Consider the Environment Before Printing This Document

3 You could lose money by investing in the Fund. Although the Fund seeks to preserve the value of your investment at $1.00 per share, it cannot guarantee it will do so.The Fund may impose a fee upon sale of your shares or may temporarily suspend your ability to sell shares if the Fund�s liquidity falls below required minimumsbecause of market conditions or other factors. An investment in the Fund is not a deposit of a bank and is not insured or guaranteed by the Federal Deposit InsuranceCorporation or any other government agency. The Fund�s sponsor has no legal obligation to provide financial support to the Fund, and you should not expect that thesponsor will provide financial support to the Fund at any time.
4 Effective on July 29, 2016, the Goldman Sachs Limited Maturity Obligations Fund was renamed the Goldman Sachs Short-Term Conservative Income Fund.5 Effective on June 20, 2017, the Goldman Sachs Fixed Income Macro Strategies Fund was renamed the Goldman Sachs Strategic Macro Fund.6 Effective on June 20, 2017, the Goldman Sachs Growth and Income Fund was renamed the Goldman Sachs Equity Income Fund.Financial Square FundsSM and Investor FundsSM are registered service marks of Goldman Sachs & Co. LLC.
*This list covers open-end funds only. Please visit our website at www.GSAMFUNDS.com to learn about our closed-end funds and exchange-traded funds.
Copyright © 2017 www.secdatabase.com. All Rights Reserved.Please Consider the Environment Before Printing This Document

TRUSTEESCheryl K. Beebe, ChairLawrence HughesJohn F. KillianJames A. McNamaraWestley V. Thompson
OFFICERSJames A. McNamara, PresidentScott M. McHugh Treasurer, Senior Vice Presidentand Principal Financial OfficerJoseph F. DiMaria, Assistant Treasurer and PrincipalAccounting OfficerCaroline L. Kraus, Secretary
GOLDMAN SACHS & CO. LLCDistributor and Transfer Agent
GOLDMAN SACHS ASSET MANAGEMENT, L.P.Investment Adviser
Visit our Website at www.GSAMFUNDS.com to obtain the most recent month-endreturns.
Goldman Sachs Asset Management, L.P. 200 West Street, New York, New York 10282
The reports concerning the Funds included in this shareholder report may contain certain forward-looking statements about the factorsthat may affect the performance of the Funds in the future. These statements are based on the Funds� managements� predictions andexpectations concerning certain future events and their expected impact on the Funds, such as performance of the economy as a wholeand of specific industry sectors, changes in the levels of interest rates, the impact of developing world events, and other factors that mayinfluence the future performance of the Funds. Management believes these forward-looking statements to be reasonable, although theyare inherently uncertain and difficult to predict. Actual events may cause adjustments in portfolio management strategies from thosecurrently expected to be employed.A description of the policies and procedures that the Funds use to determine how to vote proxies relating to portfolio securities andinformation regarding how the Fund voted proxies relating to portfolio securities for the most recent 12-month period ended June 30, areavailable (I) without charge, upon request by calling 1-800-621-2550; and (II) on the Securities and Exchange Commission (�SEC��) website at http://www.sec.gov.The Funds file their complete schedules of portfolio holdings with the SEC for the first and third quarters of each fiscal year on Form N-Qs. The Fund�s Form N-Qs are available on the SEC�s web site at http://www.sec.gov within 60 days after the Fund�s first and thirdfiscal quarters. The Fund�s Form N-Qs may be reviewed and copied at the SEC�s Public Reference Room in Washington, D.C. andinformation on the operation of the Public Reference Room may also be obtained by calling 1-800-SEC-0330. Form N-Qs may beobtained upon request and without charge by calling 1-800-621-2550 (for Institutional Shareholders).Fund holdings and allocations shown are as of April 30, 2017 and may not be representative of future investments. Fund holdings shouldnot be relied on in making investment decisions and should not be construed as research or investment advice regarding particularsecurities. Current and future holdings are subject to risk.The Global Industry Classification Standard (GICS) was developed by and is the exclusive property and a service mark of MorganStanley Capital International Inc. (MSCI) and Standard & Poor�s, a division of The McGraw-Hill Companies, Inc. (S&P) and is licensedfor use by Goldman Sachs. Neither MSCI, S&P nor any other party involved in making or compiling the GICS or any GICS classificationsmakes any express or implied warranties or representations with respect to such standard or classification (or the results to be obtainedby the use thereof), and all such parties hereby expressly disclaim all warranties of originality, accuracy, completeness, merchantability orfitness for a particular purpose with respect to any of such standard or classification. Without limiting any of the foregoing, in no eventshall MSCI, S&P, any of their affiliates or any third party involved in making or compiling the GICS or any GICS classifications have anyliability for any direct, indirect, special, punitive, consequential or any other damages (including lost profits) even if notified of thepossibility of such damages.The portfolio risk management process includes an effort to monitor and manage risk, but does not imply low risk.This material is not authorized for distribution to prospective investors unless preceded or accompanied by a currentProspectus or summary prospectus, if applicable. Investors should consider a Fund��s objective, risks, and charges andexpenses, and read the summary prospectus, if available, and/or the Prospectus carefully before investing or sending money.The summary prospectus, if available, and the Prospectus contain this and other information about a Fund and may beobtained from your authorized dealer or from Goldman Sachs & Co. LLC by calling 1-800-621-2550.©2017 Goldman Sachs. All rights reserved. 94818-TMPL-06/2017-557116 MMGRFDSSAR-17/112
Copyright © 2017 www.secdatabase.com. All Rights Reserved.Please Consider the Environment Before Printing This Document

Goldman Sachs Funds
Semi-Annual Report April 30, 2017
GQG Partners InternationalOpportunities Fund
Copyright © 2017 www.secdatabase.com. All Rights Reserved.Please Consider the Environment Before Printing This Document

Goldman Sachs GQG Partners International OpportunitiesFund
TABLE OF CONTENTS
Portfolio Management Discussions and Performance Summaries 1
Schedule of Investments 6
Financial Statements 9
Financial Highlights 12
Notes to Financial Statements 14
Other Information 24
NOT FDIC-INSURED May Lose Value No Bank Guarantee
Copyright © 2017 www.secdatabase.com. All Rights Reserved.Please Consider the Environment Before Printing This Document

PORTFOLIO RESULTS
Goldman Sachs GQG Partners International OpportunitiesFund
Investment ObjectiveThe Fund seeks long-term capital appreciation.
Portfolio Management Discussion and AnalysisBelow, the GQG Partners LLC portfolio management team, the Goldman Sachs GQG Partners International Opportunities Fund��s (the��Fund��) sub-adviser, discusses the Fund��s performance and positioning for the period since its inception on December 15, 2016through April 30, 2017 (the ��Reporting Period��).
Q How did the Fund perform during the Reporting Period?
A During the Reporting Period, the Fund�s Class A, Class C, Institutional, Class IR, Class R and Class R6 Shares generated cumulative total returns,without sales charges, of 12.66%, 12.32%, 12.78%, 12.67%, 12.45% and 12.78%, respectively. These returns compare to the 10.59% cumulativetotal return of the Fund�s benchmark, the MSCI ACWI ex USA Index (Net, Unhedged) (the �Index�), during the same time period.
Q What economic and market factors most influenced the Fund during the Reporting Period?
A When the Reporting Period began, international equities advanced during an eventful December 2016, with the resignation of Italy�s prime ministerafter voters� rejection of its constitutional referendum, the Federal Reserve�s (�Fed�) interest rate hike, and the European Central Bank�s (�ECB�)decision to slow its monthly pace of quantitative easing while extending its program to the end of 2017. International equities continued to rally inearly January 2017 on the prospect of deregulation following executive orders on oil pipelines and optimism around infrastructure spending.However, they subsequently retreated on political uncertainty and protectionism concerns. In February 2017, international equities were buoyed by�risk on� sentiment owing to potential U.S. tax reform and deregulation as well as on strong economic data. In March 2017, the Fed raised U.S.interest rates for the third time since the 2008 global financial crisis. However, a seemingly cautious stance on the future path of monetary tighteningfrom the Fed chair and the presence of a dissenter on the Fed�s policy-making committee led to a dovish market reaction and the appreciation of theJapanese yen, despite the Bank of Japan maintaining its policy rate. (Dovish implies lower interest rates; opposite of hawkish.) Meanwhile, the ECBkept its monetary policy unchanged at its March 2017 meeting but revised its economic growth and inflation forecasts upwards. Equity marketsinterpreted the positive economic assessment as hawkish, sparking concerns around the sequencing of the ECB�s policy steps � namely, whetherinterest rates might rise before quantitative easing ends. During April 2017, first-round results in France�s presidential election, which were widelyinterpreted by investors as pro-market, buoyed global equities broadly. Strong first quarter 2017 corporate earnings results and a firm economicbackdrop were also supportive for equity markets. A health care bill setback tempered U.S. policy optimism, but an ambitious tax reform proposalfrom the White House subsequently lifted market sentiment. Japanese equities were initially hurt by a strong yen, which rose amid the politicaluncertainty and geopolitical tensions around the world. Various geopolitical events, such as a North Korean ballistic missile launch, a U.S. airstrikein Syria and terrorism in Russia all contributed negatively to investor sentiment. However, Japanese equities bounced back as yen strength fadedwith recovering global risk appetite.
Q What key factors were responsible for the Fund��s performance during the Reporting Period?
A The Fund generally outperformed the Index during the Reporting Period, primarily because of security selection. Our asset allocation decisions alsocontributed positively. The Fund�s returns were limited by its significant cash holdings, which we were in the process of investing during theReporting Period.
1
Copyright © 2017 www.secdatabase.com. All Rights Reserved.Please Consider the Environment Before Printing This Document

PORTFOLIO RESULTS
Q Which equity market sectors most significantly affected Fund performance?
A During the Reporting Period, the Fund benefited from its overweight relative to the Index in information technology. Underweight positions in thematerials and energy sectors also bolstered relative performance. From a stock selection perspective, the Fund was helped most by its investments ininformation technology, including Alibaba Group, a China-based online retailer; Facebook, a U.S. social networking company; Tencent Holdings, aChinese social media and online entertainment company; SAP, a German provider of software and technology solutions; and Samsung Electronics, aSouth Korea-based electronic products manufacturer. In addition, stock picks in the materials and consumer staples sectors added to results.
Conversely, compared to the Index the Fund�s overweight in the financials sector and its underweights in health care and industrials detracted fromrelative returns. Stock selection in the energy and consumer discretionary sectors dampened relative performance.
Q What were some of the Fund��s best-performing individual stocks during the Reporting Period?
A During the Reporting Period, the Fund�s best-performing individual holdings were British American Tobacco, Samsung Electronics and Sika.
British American Tobacco posted gains, as the U.K.-based tobacco company delivered strong operating results and announced it would acquire the58% of Reynolds American Tobacco that it did not already own. We trimmed the Fund�s position, though it remained a significant Fund holding atthe end of the Reporting Period.
Another leading contributor to the Fund�s relative performance was Samsung Electronics, already mentioned. Its shares advanced during theReporting Period amid strong demand and favorable pricing dynamics in the memory market.
Switzerland-headquartered Sika also added to the Fund�s relative returns. The specialty chemical maker benefited from increased demand for itshighly-engineered products, which it sells to companies in the building and automotive sectors.
Q Which stocks detracted most from the Fund��s relative performance during the Reporting Period?
A Banco Bilbao Vizcaya Argentaria (�BBVA�), Tokio Marine Holdings and Sumitomo Mitsui Financial Group detracted most from the Fund�srelative returns.
During the Reporting Period, the Fund was hurt most by a position in BBVA, a Spanish banking group. BBVA�s shares were pressured by negativeinvestor sentiment about the company�s franchises in Mexico and Turkey. By the end of the Reporting Period, we had eliminated the Fund�sposition in the stock.
Shares of Tokio Marine Holdings, a Japan-based insurance holding company, declined during the Reporting Period, reflecting U.S. dollar strengthversus the Japanese yen. We trimmed the size of the Fund�s position during the Reporting Period.
Another key detractor was Sumitomo Mitsui Financial Group. Its stock price fell after the Japanese bank holding/ financial services companydecided in early 2017 to raise capital through a small equity offering.
Q How did the Fund use derivatives and similar instruments during the Reporting Period?
A During the Reporting Period, the Fund used American depositary receipts (�ADRs�) and global depositary receipts (�GDRs�) to gain access toshares of non-U.S. companies. The use of ADRs and GDRs had a positive impact on the Fund�s performance during the Reporting Period. Inaddition, the Fund employed forward foreign currency exchange contracts to accumulate local currencies that were then utilized to make stockpurchases. The use of forward foreign currency exchange contracts did not have a material impact on the Fund�s performance during the ReportingPeriod.
Q How was the Fund positioned relative to its benchmark index at the end of the Reporting Period?
A At the end of the Reporting Period, the Fund was overweight relative to the Index in information technology and financials. Compared to the Index,it was underweight industrials, health care, real estate, consumer staples, consumer discretionary, materials and telecommunication services. TheFund was relatively neutral compared to the Index in the energy and utilities sectors at the end of the Reporting Period.
In terms of countries, the Fund had significant exposure to the U.S., which is not represented in the Index, at the end of the Reporting Period. It wasbroadly overweight Europe, most notably France and Germany. Compared to the Index, it was significantly underweight Japan. At the end of theReporting Period, the Fund was largely underweight the Asia/Pacific region, which included an underweight position in China and no exposure toTaiwan and Hong Kong.
2
Copyright © 2017 www.secdatabase.com. All Rights Reserved.Please Consider the Environment Before Printing This Document

PORTFOLIO RESULTS
Q What is the Fund��s tactical view and strategy for the months ahead?
A After years of slow economic growth and extremely accommodative policies by central banks, which came in the wake of the 2008-2009 globalfinancial crisis, we believe the developed markets are on the cusp of a significant turning point in terms of monetary policy. We also believe that anyincrease in developed markets� interest rates is likely to ripple through the world�s economies, impacting consumer prices and behavior in bothexpected and unexpected ways. Insofar as rising rates are a reflection of improved economic health, we expect equity markets to respond well to thechanges in the environment.
At the end of the Reporting Period, we maintained a positive outlook for global equities overall based on economic growth and earnings growthindicators. Global economic growth and earnings forecasts were trending upward at the end of April 2017 in all major regions for the first time since2010. In our view, this optimism will need to convert to confidence to turn sentiment into action, generating real business activity and maintaininginvestor enthusiasm. In the U.S., deregulation and tax reform are critical components of this transition, in our view. We believe regulatory reformmay be easier to enact because it can largely be accomplished with executive orders. Tax reform may be more challenging, but we think it is the keyto reviving confidence. Signs we expect to be watching to gauge whether the conversion to confidence is successful include rising corporateinvestment and earnings growth meeting or exceeding consensus forecasts.
As of the end of April 2017, we were more bullish than we had been earlier in the Reporting Period on Europe, as earnings forecasts were beingupgraded and political risk appeared to be receding following the recent elections in the Netherlands and France. We have long held the view that anearnings recovery had the greatest potential to drive European equities higher, since European earnings remained depressed following the financialcrisis, and European companies have high operational leverage, in general. (Operational leverage is a measurement of the degree to which a firm orproject incurs a combination of fixed and variable costs.) Finally, in 2017, through the end of the Reporting Period, earnings estimates were beingrevised upwards rather than downwards, as has been the case, on average, in previous years. We believe three key end-markets are driving theearnings upgrades: 1) European domestic economies, which represent about 50% of European corporate revenue exposure, are improving; 2) theU.S. economy, which represents approximately 20% of European corporate revenue exposure, is comparatively strong; and 3) many emergingmarket economies, which account for approximately 20% of European corporate revenue exposure, have been either stabilizing or recovering.Valuations have risen, but remain, in our view, below those of the U.S. market.
We also remained positive on Japan at the end of the Reporting Period based on what we consider to be strong corporate fundamentals. Corporatereforms appear to be bringing about structural and behavioral changes, and record high cash levels seem to be leading to rising shareholder returns.In addition, macroeconomic data shows some improvement, with robust consumption and business sentiment. Japan�s tight labor market may be apotential headwind, with rising labor costs becoming an increasing concern for companies.
Overall, at the end of the Reporting Period, our focus remained on seeking alpha opportunities through fundamental, bottom-up security selection.(Alpha, often considered the active return on an investment, gauges the performance of an investment against a market index used as a benchmark,since market indices are often considered to represent the market�s movement as a whole.) The excess returns of a fund relative to the return of abenchmark index is the fund�s alpha. We believe active managers should have the greatest ability to respond to potential changes in the post-monetary world, and value generated through active management may well become an increasingly important contributor to returns.
3
Copyright © 2017 www.secdatabase.com. All Rights Reserved.Please Consider the Environment Before Printing This Document

FUND BASICS
GQG Partners International Opportunities Fundas of April 30, 2017
PERFORMANCE REVIEW
December 15, 2016��April 30, 2017Fund Total Return(based on NAV)1
MSCI ACWI ex USA(Net, unhedged)2
Class A 12.66 % 10.59 %Class C 12.32 10.59Institutional 12.78 10.59
Copyright © 2017 www.secdatabase.com. All Rights Reserved.Please Consider the Environment Before Printing This Document

Class IR 12.67 10.59Class R 12.45 10.59Class R6 12.78 10.59
1 The net asset value (�NAV�) represents the net assets of the class of the Fund (ex-dividend) divided by the total number of shares of the class outstanding. TheFund�s performance assumes the reinvestment of dividends and other distributions. The Fund�s performance does not reflect the deduction of any applicable salescharges.
2 The MSCI ACWI ex USA Index is a free float adjusted market capitalization weighted index that is designed to measure the equity market performance of thedeveloped and emerging markets.
STANDARDIZED TOTAL RETURNS3For the period ended 3/31/17 Since Inception Inception DateClass A 2.70 % 12/15/16Class C 7.42 12/15/16Institutional 8.78 12/15/16Class IR 8.67 12/15/16Class R 8.55 12/15/16Class R6 8.78 12/15/16
3 The Standardized Total Returns are average annual total returns or cumulative total returns (only if the performance is one year or less) as of the mostrecent calendar quarter-end. They assume reinvestment of all distributions at NAV. These returns reflect a maximum initial sales charge of 5.5% forClass A Shares and the assumed contingent deferred sales charge for Class C Shares (1% if redeemed within 12 months of purchase). Because Institutional,Class IR, Class R and Class R6 Shares do not involve a sales charge, such a charge is not applied to their Standardized Total Returns.
The returns set forth in the tables above represent past performance. Past performance does not guarantee future results. The Fund��sinvestment return and principal value will fluctuate so that an investor��s shares, when redeemed, may be worth more or less than theiroriginal cost. Current performance may be lower or higher than the performance quoted above. Please visit our web site atwww.GSAMFUNDS.com to obtain the most recent month-end returns. Performance reflects applicable fee waivers and/or expenselimitations in effect during the periods shown. In their absence, performance would be reduced. Returns do not reflect the deduction of taxes thata shareholder would pay on Fund distributions or the redemption of Fund shares.
4
Copyright © 2017 www.secdatabase.com. All Rights Reserved.Please Consider the Environment Before Printing This Document

FUND BASICS
EXPENSE RATIOS4Net Expense Ratio (Current) Gross Expense Ratio (Before Waivers)
Class A 1.30 % 1.52 %Class C 2.05 2.27Institutional 0.90 1.12Class IR 1.05 1.27Class R 1.55 1.77Class R6 0.88 1.10
4 The expense ratios of the Fund, both current (net of applicable fee waivers and/or expense limitations) and before waivers (gross of applicable fee waiversand/or expense limitations) are as set forth above according to the most recent publicly available Prospectus for the Fund and may differ from the expenseratios disclosed in the Financial Highlights in this report. Pursuant to a contractual arrangement, the Fund��s waivers and/or expense limitations willremain in place through at least February 28, 2018, and prior to such date the Investment Adviser may not terminate the arrangements without theapproval of the Fund��s Board of Trustees. If these arrangements are discontinued in the future, the expense ratios may change without shareholderapproval.
SECTOR ALLOCATIONS�
� The Fund is actively managed and, as such, its composition may differ over time. Consequently, the Fund�s overall sector allocations may differ from thepercentages contained in the graph above. The graph categorizes investments using the Global Industry Classification Standard (�GICS�), however, the sectorclassifications used by the portfolio management team may differ from GICS. The percentage shown for each investment category reflects the value of investmentsin that category as a percentage of market value. The graph depicts the Fund�s investments but may not represent the Fund�s market exposure due to the exclusion ofcertain derivatives, if any, as listed in the Additional Investment Information section of the Schedule of Investments.
5
Copyright © 2017 www.secdatabase.com. All Rights Reserved.Please Consider the Environment Before Printing This Document

GOLDMAN SACHS GQG PARTNERS INTERNATIONAL OPPORTUNITIES FUND
Schedule of InvestmentsApril 30, 2017 (Unaudited)
Shares Description ValueCommon Stocks �� 92.6%Argentina* �� 0.9%21,718 Pampa Energia SA ADR (Electric Utilities) $ 1,184,500
Australia �� 6.4%201,959 Aristocrat Leisure Ltd. (Hotels, Restaurants & Leisure) 2,967,92276,394 Macquarie Group Ltd. (Capital Markets) 5,306,848
8,274,770Belgium �� 1.5%27,396 KBC Group NV (Banks) 1,979,823
Brazil �� 1.8%261,230 BM&FBovespa SA � Bolsa de Valores Mercadorias e Futuros (Capital Markets) 1,564,557177,866 Petroleo Brasileiro SA* (Oil, Gas & Consumable Fuels) 804,699
2,369,256Chile �� 0.6%78,528 Enersis Americas SA ADR (Electric Utilities) 778,212
China �� 4.1%11,227 Alibaba Group Holding Ltd. ADR* (Internet Software & Services) 1,296,718126,148 Tencent Holdings Ltd. (Internet Software & Services) 3,952,636
5,249,354France �� 10.3%54,259 BNP Paribas SA (Banks) 3,829,44719,215 Essilor International SA (Health Care Equipment & Supplies) 2,490,1282,650 Hermes International (Textiles, Apparel & Luxury Goods) 1,266,885201,234 Natixis SA (Banks) 1,400,42519,474 Safran SA (Aerospace & Defense) 1,612,34631,987 Vinci SA (Construction & Engineering) 2,726,524
13,325,755Germany �� 10.2%19,538 Bayer AG (Pharmaceuticals) 2,417,49626,989 Daimler AG (Automobiles) 2,011,06641,220 Deutsche Boerse AG (Capital Markets) 4,034,58728,506 SAP SE ADR (Software) 2,855,73112,951 Siemens AG (Industrial Conglomerates) 1,857,729
13,176,609India �� 1.6%25,550 HDFC Bank Ltd. ADR (Banks) 2,034,036
Italy �� 2.0%296,965 Enel SpA (Electric Utilities) 1,411,826407,800 Intesa Sanpaolo SpA (Banks) 1,190,409
2,602,235Common Stocks �� (continued)Japan �� 4.1%36,037 SoftBank Group Corp. (Wireless Telecommunication Services) 2,733,50362,320 Tokio Marine Holdings, Inc. (Insurance) 2,627,633
5,361,136Luxembourg* �� 0.9%156,525 ArcelorMittal (Metals & Mining) 1,230,027
Netherlands �� 5.4%49,648 EXOR NV (Diversified Financial Services) 2,786,80319,595 Heineken NV (Beverages) 1,747,74114,728 Royal Dutch Shell PLC Class B ADR (Oil, Gas & Consumable Fuels) 797,07922,403 Schlumberger Ltd. (Energy Equipment & Services) 1,626,234
6,957,857Russia �� 4.9%19,166 LUKOIL PJSC ADR (Oil, Gas & Consumable Fuels) 951,3367,327 MMC Norilsk Nickel PJSC (Metals & Mining) 1,125,651210,632 Rosneft Oil Co. PJSC (Oil, Gas & Consumable Fuels) 1,174,0981,047,220 Sberbank of Russia PJSC (Banks) 3,041,459
6,292,544South Korea �� 4.8%6,340 Samsung Electronics Co. Ltd. GDR (Technology Hardware, Storage & Peripherals) 6,221,095
Copyright © 2017 www.secdatabase.com. All Rights Reserved.Please Consider the Environment Before Printing This Document

Spain �� 5.9%7,781 Aena SA(a) (Transportation Infrastructure) 1,371,88635,756 Amadeus IT Group SA (IT Services) 1,929,724272,637 Banco Santander SA (Banks) 1,776,754222,368 Bankinter SA (Banks) 1,957,49728,676 Red Electrica Corp. SA (Electric Utilities) 558,870
7,594,731Sweden �� 1.6%165,208 Nordea Bank AB (Banks) 2,031,862
Switzerland �� 3.3%662 Sika AG (Chemicals) 4,225,124
United Kingdom �� 10.0%16,991 Aon PLC (Insurance) 2,036,20185,522 British American Tobacco PLC (Tobacco) 5,778,14737,767 Diageo PLC (Beverages) 1,099,29087,595 Royal Dutch Shell PLC Class B (Oil, Gas & Consumable Fuels) 2,330,637
6 The accompanying notes are an integral part of these financial statements.
Copyright © 2017 www.secdatabase.com. All Rights Reserved.Please Consider the Environment Before Printing This Document

GOLDMAN SACHS GQG PARTNERS INTERNATIONAL OPPORTUNITIES FUND
Shares Description ValueCommon Stocks �� (continued)United Kingdom �� (continued)75,796 WPP PLC (Media) $ 1,623,057
12,867,332United States �� 12.3%1,337 Alphabet, Inc. Class A* (Internet Software & Services) 1,236,0834,559 Alphabet, Inc. Class C* (Internet Software & Services) 4,130,27229,655 Facebook, Inc. Class A* (Internet Software & Services) 4,455,66411,886 MasterCard, Inc. Class A (IT Services) 1,382,5791,217 The Priceline Group, Inc.* (Internet & Direct Marketing Retail) 2,247,58026,042 Visa, Inc. Class A (IT Services) 2,375,551
15,827,729TOTAL COMMON STOCKS(Cost $111,197,486) $ 119,583,987
Shares Rate ValuePreferred Stock �� 0.7%Germany �� 0.7%5,860 Volkswagen AG (Automobiles) $ 930,256
(Cost $849,565)TOTAL INVESTMENTS �� 93.3%(Cost $112,047,051 ) $ 120,514,243OTHER ASSETS IN EXCESS OF
LIABILITIES �� 6.7% 8,594,880NET ASSETS �� 100.0% $ 129,109,123
The percentage shown for each investment category reflects the value of investments in that category as a percentage of net assets.* Non-income producing security.(a) Exempt from registration under Rule 144A of the Securities Act of 1933. Such securities may be deemed liquid by the Sub-Adviser and may be resold, normally to qualified
institutional buyers in transactions exempt from registration. Total market value of Rule 144A securities amounts to $1,371,886, which represents approximately 1.1% of theFund�s net assets as of April 30, 2017.
Investment Abbreviations:ADR �American Depositary ReceiptGDR �Global Depository ReceiptPLC �Public Limited Company
The accompanying notes are an integral part of these financial statements. 7
Copyright © 2017 www.secdatabase.com. All Rights Reserved.Please Consider the Environment Before Printing This Document

GOLDMAN SACHS GQG PARTNERS INTERNATIONAL OPPORTUNITIES FUND
Schedule of Investments (continued)April 30, 2017 (Unaudited)
ADDITIONAL INVESTMENT INFORMATION
FORWARD FOREIGN CURRENCY EXCHANGE CONTRACTS � At April 30, 2017, the Fund had the following forward foreign currencyexchange contracts:
FORWARD FOREIGN CURRENCY EXCHANGE CONTRACTS WITH UNREALIZED LOSS
CounterpartyCurrency
PurchasedCurrency
SoldCurrentValue
SettlementDate
UnrealizedLoss
State Street Bank and Trust BRL 302,576 USD 95,390 $95,253 05/03/17 $ (137 )
8 The accompanying notes are an integral part of these financial statements.
Copyright © 2017 www.secdatabase.com. All Rights Reserved.Please Consider the Environment Before Printing This Document

GOLDMAN SACHS GQG PARTNERS INTERNATIONAL OPPORTUNITIES FUND
Statement of Assets and LiabilitiesApril 30, 2017 (Unaudited)
Assets:Investments, at value (cost $112,047,051) $120,514,243Cash 9,437,055Receivables:
Fund shares sold 5,545,321Dividends 218,332Deferred offering costs 138,991Reimbursement from investment adviser 49,479Foreign tax reclaims 31,218
Total assets 135,934,639
Liabilities:Foreign currency overdraft, at value (identified cost $360,799) 360,659Unrealized loss on forward foreign currency exchange contracts 137Payables:
Investments purchased 5,010,710Fund shares redeemed 832,637Investments purchased on an extended settlement basis 464,445Management fees 74,915Distribution and Service fees and Transfer Agency fees 5,153
Accrued expenses 76,860Total liabilities 6,825,516
Net Assets:Paid-in capital 120,950,915Undistributed net investment income 264,262Accumulated net realized loss (577,592 )Net unrealized gain 8,471,538NET ASSETS $129,109,123Net Assets:
Class A $ 3,167,488Class C 1,059,209Institutional 123,747,120Class IR 1,112,777Class R 11,251Class R6 11,278
Total Net Assets $129,109,123Shares Outstanding $0.001 par value (unlimited number of shares authorized):
Class A 281,361Class C 94,308Institutional 10,978,885Class IR 98,784Class R 1,000Class R6 1,001
Net asset value, offering and redemption price per share:(a)Class A $11.26Class C 11.23Institutional 11.27Class IR 11.26Class R 11.25Class R6 11.27
(a) Maximum public offering price per share for Class A Shares is $11.92. At redemption, Class C Shares may be subject to a contingent deferred sales charge, assessed on the amountequal to the lesser of the current net asset value (�NAV�) or the original purchase price of the shares.
The accompanying notes are an integral part of these financial statements. 9
Copyright © 2017 www.secdatabase.com. All Rights Reserved.Please Consider the Environment Before Printing This Document

GOLDMAN SACHS GQG PARTNERS INTERNATIONAL OPPORTUNITIES FUND
Statement of OperationsFor the Period Ended April 30, 2017 (Unaudited)(a)
Investment income:Dividends � unaffiliated issuers (net of foreign withholding taxes of $55,853) $472,855Total investment income 472,855
Expenses:Management fees 176,415Amortization of offering costs 105,055Custody, accounting and administrative services 50,930Professional fees 41,073Organization costs 12,000Trustee fees 11,900Transfer Agency fees(b) 9,247Printing and mailing costs 8,926Distribution and Service fees(b) 2,134Registration fees 162Other 10,627Total expenses 428,469Less � expense reductions (237,766 )Net expenses 190,703NET INVESTMENT INCOME 282,152
Realized and unrealized gain (loss):Net realized gain (loss) from:
Investments � unaffiliated issuers (507,879 )Forward foreign currency exchange contracts 4,920Foreign currency transactions (74,633 )
Net unrealized gain (loss) on:Investments 8,467,192Forward foreign currency exchange contracts (137 )Foreign currency translation 4,483
Net realized and unrealized gain 7,893,946NET INCREASE IN NET ASSETS RESULTING FROM OPERATIONS $8,176,098
(a) Commenced operations on December 15, 2016.(b) Class specific Distribution and Service and Transfer Agency fees were as follows:
Distribution and Service Fees Transfer Agency FeesClass A Class C Class R Class A Class C Institutional Class IR Class R Class R6
$ 990 $ 1,125 $ 19 $ 753 $ 213 $ 8,049 $ 224 $ 7 $ 1
10 The accompanying notes are an integral part of these financial statements.
Copyright © 2017 www.secdatabase.com. All Rights Reserved.Please Consider the Environment Before Printing This Document

GOLDMAN SACHS GQG PARTNERS INTERNATIONAL OPPORTUNITIES FUND
Statement of Changes in Net AssetsFor the Period Ended April 30, 2017 (Unaudited)(a)
From operations:Net investment income $282,152Net realized loss (577,592 )Net unrealized gain 8,471,538Net increase in net assets resulting from operations 8,176,098
Distributions to shareholders:From net investment income
Class A Shares (5 )Class C Shares (2 )Institutional Shares (17,866 )Class IR Shares (6 )Class R Shares (4 )Class R6 Shares (7 )
Total distributions to shareholders (17,890 )
From share transactions:Proceeds from sales of shares 122,100,191Reinvestment of distributions 17,890Cost of shares redeemed (1,167,166 )Net increase in net assets resulting from share transactions 120,950,915TOTAL INCREASE 129,109,123
Net assets:Beginning of period �
End of period $129,109,123Undistributed net investment income $264,262
(a) Commenced operations on December 15, 2016.
The accompanying notes are an integral part of these financial statements. 11
Copyright © 2017 www.secdatabase.com. All Rights Reserved.Please Consider the Environment Before Printing This Document

GOLDMAN SACHS GQG PARTNERS INTERNATIONAL OPPORTUNITIES FUND
Financial HighlightsSelected Data for a Share Outstanding Throughout the Period
FromInvestment Operations
Year - Share Class
Net assetvalue,
beginningof period
Netinvestmentincome(a)
Net realizedand unrealized
gain
Total frominvestmentoperations
Distributionsto shareholders
from netinvestment
incomeFOR THE PERIOD ENDED APRIL 30, (UNAUDITED)2017 - A (Commenced December 15, 2016) $ 10.00 $ 0.04 $ 1.23 $ 1.27 $ (0.01 )2017 - C (Commenced December 15, 2016) 10.00 0.05 1.18 1.23 � (e)2017 - Institutional
(Commenced December 15, 2016) 10.00 0.05 1.23 1.28 (0.01 )2017 - IR (Commenced December 15, 2016) 10.00 0.07 1.20 1.27 (0.01 )2017 - R (Commenced December 15, 2016) 10.00 0.01 1.24 1.25 � (e)2017 - R6 (Commenced December 15, 2016) 10.00 0.04 1.24 1.28 (0.01 )
(a) Calculated based on the average shares outstanding methodology.(b) Assumes investment at the NAV at the beginning of the period, reinvestment of all dividends and distributions, a complete redemption of the investment at the NAV at the end of the
period and no sales or redemption charges. Total returns would be reduced if a sales or redemption charge was taken into account. Returns do not reflect the impact of taxes toshareholder relating to Fund distributions or the redemption of Fund shares. Total returns for periods less than one full year are not annualized.
(c) Annualized.(d) The Fund�s portfolio turnover rate is calculated in accordance with regulatory requirements, without regard to transactions involving short term investments. If such transactions were
included, the Fund�s portfolio turnover rate may be higher.(e) Amount is less than $0.005 per share.
12 The accompanying notes are an integral part of these financial statements.
Copyright © 2017 www.secdatabase.com. All Rights Reserved.Please Consider the Environment Before Printing This Document

GOLDMAN SACHS GQG PARTNERS INTERNATIONAL OPPORTUNITIES FUND
Net assetvalue, endof period
Totalreturn(b)
Net assets,end ofperiod
(in 000s)
Ratio ofnet expenses
to averagenet assets(c)
Ratio oftotal expenses
to averagenet assets(c)
Ratio ofnet investment
incometo average
net assets(c)
Portfolioturnover
rate(d)
$ 11.26 12.66 % $3,167 1.29 % 2.25 % 1.02 % 19 %11.23 12.32 1,059 2.04 2.72 1.21 19
11.27 12.78 123,747 0.90 1.96 1.36 1911.26 12.67 1,113 1.05 1.65 1.63 1911.25 12.45 11 1.51 2.95 0.34 1911.27 12.78 11 0.90 2.29 0.96 19
The accompanying notes are an integral part of these financial statements. 13
Copyright © 2017 www.secdatabase.com. All Rights Reserved.Please Consider the Environment Before Printing This Document

GOLDMAN SACHS GQG PARTNERS INTERNATIONAL OPPORTUNITIES FUND
Notes to Financial StatementsApril 30, 2017 (Unaudited)
1. ORGANIZATION
Goldman Sachs Trust II (the �Trust�) is a Delaware statutory trust registered under the Investment Company Act of 1940, as amended (the �Act�), asan open-end management investment company. The Trust includes the Goldman Sachs GQG Partners International Opportunities Fund (the �Fund�).The Fund is a non-diversified portfolio that currently offers six classes of shares: Class A, Class C, Institutional, Class IR, Class R and Class R6Shares. The Fund commenced operations on December 15, 2016.
Class A Shares are sold with a front-end sales charge of up to 5.50%. Class C Shares are sold with a contingent deferred sales charge (�CDSC�) of1.00%, which is imposed on redemptions made within 12 months of purchase. Institutional, Class IR, Class R and Class R6 Shares are not subject to asales charge.
Goldman Sachs Asset Management, L.P. (�GSAM�), an affiliate of Goldman Sachs & Co. LLC (formerly Goldman, Sachs & Co.) (�Goldman Sachs�),serves as investment adviser to the Fund pursuant to a management agreement (the �Agreement�) with the Trust.
GQG Partners LLC (�GQG Partners� or the �Sub-Adviser�) serves as the sub-adviser to the Fund. GSAM compensates the Sub-Adviser directly inaccordance with the terms of the Sub-Advisory Agreement. The Fund is not charged any separate or additional investment advisory fees by the Sub-Adviser.
2. SIGNIFICANT ACCOUNTING POLICIESThe financial statements have been prepared in accordance with accounting principles generally accepted in the United States of America (�GAAP�)and require management to make estimates and assumptions that may affect the reported amounts and disclosures. Actual results may differ from thoseestimates and assumptions.
A. Investment Valuation � The Fund�s valuation policy is to value investments at fair value.
B. Investment Income and Investments � Investment income includes interest income, dividend income, net of any foreign withholding taxes, lessany amounts reclaimable, and securities lending income. Interest income is accrued daily and adjusted for amortization of premiums and accretion ofdiscounts. Dividend income is recognized on ex-dividend date or, for certain foreign securities, as soon as such information is obtained subsequent tothe ex-dividend date. Investment transactions are reflected on trade date. Realized gains and losses are calculated using identified cost. Investmenttransactions are recorded on the following business day for daily net asset value (�NAV�) calculations. Any foreign capital gains tax is accrued dailybased upon net unrealized gains, and is payable upon sale of such investments.
For derivative contracts, realized gains and losses are recorded upon settlement of the contract.
C. Class Allocations and Expenses � Investment income, realized and unrealized gain (loss), and non-class specific expenses of the Fund areallocated daily based upon the proportion of net assets of each class. Non-class specific expenses directly incurred by the Fund are charged to the Fund,while such expenses incurred by the Trust are allocated across the Fund on a straight-line and/or pro-rata basis depending upon the nature of theexpenses. Class-specific expenses, where applicable, are borne by the respective share classes and include Distribution and Service and TransferAgency fees.
D. Offering and Organization Costs � Offering costs paid in connection with the initial offering of shares of the Fund are being amortized on astraight-line basis over 12 months from the date of commencement of operations. Organization costs paid in connection with the organization of theFund were expensed on the first day of operations.
E. Federal Taxes and Distributions to Shareholders � It is the Fund�s policy to comply with the requirements of the Internal Revenue Code of1986, as amended (the �Code�), applicable to regulated investment companies (mutual funds) and to distribute each year substantially all of itsinvestment company taxable income and capital gains to its shareholders. Accordingly, the Fund is not required to make any provisions for the paymentof federal income tax. Distributions to shareholders are recorded on the ex-dividend date. Income and capital gains distributions, if any, are declaredand paid annually.
14
Copyright © 2017 www.secdatabase.com. All Rights Reserved.Please Consider the Environment Before Printing This Document

GOLDMAN SACHS GQG PARTNERS INTERNATIONAL OPPORTUNITIES FUND
2. SIGNIFICANT ACCOUNTING POLICIES (continued)
Net capital losses, if any, are carried forward to future fiscal years and may be used to the extent allowed by the Code to offset any future capitalgains. Losses that are carried forward will retain their character as either short-term or long-term capital losses. Utilization of capital loss carryforwardswill reduce the requirement of future capital gains distributions.
The characterization of distributions to shareholders for financial reporting purposes is determined in accordance with federal income tax rules,which may differ from GAAP. The source of the Fund�s distributions may be shown in the accompanying financial statements as either from netinvestment income, net realized gain or capital. Certain components of the Fund�s net assets on the Statement of Assets and Liabilities reflectpermanent GAAP/tax differences based on the appropriate tax character.
F. Foreign Currency Translation � The accounting records and reporting currency of the Fund are maintained in U.S. dollars. Assets and liabilitiesdenominated in foreign currencies are translated into U.S. dollars using the current exchange rates at the close of each business day. The effect ofchanges in foreign currency exchange rates on investments is included within net realized and unrealized gain (loss) on investments. Changes in thevalue of other assets and liabilities as a result of fluctuations in foreign exchange rates are included in the Statement of Operations within net change inunrealized gain (loss) on foreign currency translations. Transactions denominated in foreign currencies are translated into U.S. dollars on the date thetransaction occurred, the effects of which are included within net realized gain (loss) on foreign currency transactions.
3. INVESTMENTS AND FAIR VALUE MEASUREMENTSThe fair value of a financial instrument is the amount that would be received to sell an asset or paid to transfer a liability in an orderly transactionbetween market participants at the measurement date (i.e., the exit price). GAAP establishes a fair value hierarchy that prioritizes the inputs tovaluation techniques used to measure fair value. The hierarchy gives the highest priority to unadjusted quoted prices in active markets for identicalassets or liabilities (Level 1 measurements) and the lowest priority to unobservable inputs (Level 3 measurements). The levels used for classifyinginvestments are not necessarily an indication of the risk associated with investing in these investments. The three levels of the fair value hierarchy aredescribed below:
Level 1 � Unadjusted quoted prices in active markets that are accessible at the measurement date for identical, unrestricted assets or liabilities;Level 2 � Quoted prices in markets that are not active or financial instruments for which significant inputs are observable (including, but notlimited to, quoted prices for similar investments, interest rates, foreign exchange rates, volatility and credit spreads), either directly or indirectly;Level 3 � Prices or valuations that require significant unobservable inputs (including GSAM�s assumptions in determining fair valuemeasurement).
Changes in valuation techniques may result in transfers into or out of an assigned level within the hierarchy. In accordance with the Fund�s policy,transfers between different levels of the fair value hierarchy resulting from such changes are deemed to have occurred as of the beginning of thereporting period.
The Board of Trustees (�Trustees�) has approved Valuation Procedures that govern the valuation of the portfolio investments held by the Fund,including investments for which market quotations are not readily available. The Trustees have delegated to GSAM day-to-day responsibility forimplementing and maintaining internal controls and procedures related to the valuation of the Fund�s portfolio investments. To assess the continuingappropriateness of pricing sources and methodologies, GSAM regularly performs price verification procedures and issues challenges as necessary tothird party pricing vendors or brokers, and any differences are reviewed in accordance with the Valuation Procedures.
A. Level 1 and Level 2 Fair Value Investments � The valuation techniques and significant inputs used in determining the fair values forinvestments classified as Level 1 and Level 2 are as follows:
Equity Securities � Equity securities traded on a United States (�U.S.�) securities exchange or the NASDAQ system, or those located on certainforeign exchanges, including but not limited to the Americas, are valued daily at their last sale price or official closing price on the principal exchangeor system on which they are traded. If there is no sale or official closing price or such price
15
Copyright © 2017 www.secdatabase.com. All Rights Reserved.Please Consider the Environment Before Printing This Document

GOLDMAN SACHS GQG PARTNERS INTERNATIONAL OPPORTUNITIES FUND
Notes to Financial Statements (continued)April 30, 2017 (Unaudited)
3. INVESTMENTS AND FAIR VALUE MEASUREMENTS (continued)
is believed by GSAM to not represent fair value, equity securities are valued at the last bid price for long positions and at the last ask price for shortpositions. To the extent these investments are actively traded, they are classified as Level 1 of the fair value hierarchy, otherwise they are generallyclassified as Level 2.
Unlisted equity securities for which market quotations are available are valued at the last sale price on the valuation date, or if no sale occurs, atthe last bid price. Securities traded on certain foreign securities exchanges are valued daily at fair value determined by an independent fair value service(if available) under Valuation Procedures approved by the Trustees and consistent with applicable regulatory guidance. The independent fair valueservice takes into account multiple factors including, but not limited to, movements in the securities markets, certain depositary receipts, futurescontracts and foreign currency exchange rates that have occurred subsequent to the close of the foreign securities exchange. These investments aregenerally classified as Level 2 of the fair value hierarchy.
Derivative Contracts � A derivative is an instrument whose value is derived from underlying assets, indices, reference rates or a combination of thesefactors. The Fund enters into derivative transactions to hedge against changes in interest rates, securities prices, and/or currency exchange rates, toincrease total return, or to gain access to certain markets or attain exposure to other underliers.
Exchange-traded derivatives, including futures and options contracts, are valued at the last sale or settlement price and typically fall within Level 1of the fair value hierarchy. Over-the-counter (�OTC�) and centrally cleared derivatives are valued using market transactions and other market evidence,including market-based inputs to models, calibration to market-clearing transactions, broker or dealer quotations, or other alternative pricing sources.Where models are used, the selection of a particular model to value OTC and centrally cleared derivatives depends upon the contractual terms of, andspecific risks inherent in, the instrument, as well as the availability of pricing information in the market. Valuation models require a variety of inputs,including contractual terms, market prices, yield curves, credit curves, measures of volatility, voluntary and involuntary prepayment rates, loss severityrates and correlations of such inputs. For OTC and centrally cleared derivatives that trade in liquid markets, model inputs can generally be verified andmodel selection does not involve significant management judgment. OTC and centrally cleared derivatives are classified within Level 2 of the fairvalue hierarchy when significant inputs are corroborated by market evidence.
i. Forward Contracts � A forward contract is a contract between two parties to buy or sell an asset at a specified price on a future date. A forwardcontract settlement can occur on a cash or delivery basis. Forward contracts are marked-to-market daily using independent vendor prices, and thechange in value, if any, is recorded as an unrealized gain or loss. Cash and certain investments may be used to collateralize forward contracts.
A forward foreign currency contract is a forward contract in which the Fund agrees to receive or deliver a fixed quantity of one currency foranother, at a pre-determined price at a future date. All forward foreign currency exchange contracts are marked-to-market daily at the applicableforward rate. Non-deliverable forward foreign currency exchange contracts are settled with the counterparty in cash without the delivery of foreigncurrency.
Short Term Investments � Short-term investments having a maturity of 60 days or less are valued using available market quotations as provided by athird party pricing vendor or broker. These investments are classified as Level 2 of the fair value hierarchy.
16
Copyright © 2017 www.secdatabase.com. All Rights Reserved.Please Consider the Environment Before Printing This Document

GOLDMAN SACHS GQG PARTNERS INTERNATIONAL OPPORTUNITIES FUND
3. INVESTMENTS AND FAIR VALUE MEASUREMENTS (continued)
B. Fair Value Hierarchy � The following is a summary of the Fund�s investments and derivatives classified in the fair value hierarchy as of April 30,2017:
Investment Type Level 1 Level 2 Level 3AssetsCommon Stock and/or Other Equity Investments(a)
Asia $3,330,754 $15,534,867 $ �
Australia and Oceania � 8,274,770 �
Europe 10,703,869 60,884,052 �
North America 17,453,963 � �
South America 2,767,411 1,564,557 �
Total $34,255,997 $86,258,246 $�
Derivative TypeLiabilities(b)Forward Foreign Currency Exchange Contracts $� $(137 ) $�
(a) Amounts are disclosed by continent to highlight the impact of time zone differences between local market close and the calculation of net asset value. Security valuations are based on theprinciple exchange or system on which they are traded, which may differ from country of domicile. The Fund utilizes fair value model prices provided by an independent fair value service forinternational equities, resulting in a Level 2 classification.
(b) Amount shown represents unrealized gain (loss) at period end.
For further information regarding security characteristics, see the Schedule of Investments.
4. INVESTMENTS IN DERIVATIVESThe following tables set forth, by certain risk types, the gross value of derivative contracts as of April 30, 2017. These instruments were used as part ofthe Fund�s investment strategies and to obtain and/or manage exposure related to the risks below. The values in the tables below exclude the effects ofcash collateral received or posted pursuant to these derivative contracts, and therefore are not representative of the Fund�s net exposure.
RiskStatement of Assets
and Liabilities AssetsStatement of Assets
and Liabilities LiabilitiesCurrency � $ � Payable for unrealized loss on forward foreign
currency exchange contracts $ 137
17
Copyright © 2017 www.secdatabase.com. All Rights Reserved.Please Consider the Environment Before Printing This Document

GOLDMAN SACHS GQG PARTNERS INTERNATIONAL OPPORTUNITIES FUND
Notes to Financial Statements (continued)April 30, 2017 (Unaudited)
4. INVESTMENTS IN DERIVATIVES (continued)
The following table sets forth, by certain risk types, the Fund�s gains (losses) related to these derivatives and their indicative volumes for theperiod ended April 30, 2017. These gains (losses) should be considered in the context that these derivative contracts may have been executed to createinvestment opportunities and/or economically hedge certain investments, and accordingly, certain gains (losses) on such derivative contracts may offsetcertain (losses) gains attributable to investments. These gains (losses) are included in �Net realized gain (loss)� or �Net change in unrealized gain(loss)� on the Statement of Operations:
Risk Statement of OperationsNet RealizedGain (Loss)
Net Change inUnrealizedGain (Loss)
AverageNumber of
Contracts(a)
Currency Net realized gain (loss) from forward foreign currency exchange contracts/Net change inunrealized gain (loss) on forward foreign currency exchange contracts $ 4,920 $ (137 ) 1
(a) Average number of contracts is based on the average of month end balances for the period ended April 30, 2017.
In order to better define its contractual rights and to secure rights that will help the Fund mitigate its counterparty risk, the Fund may enter into anInternational Swaps and Derivatives Association, Inc. Master Agreement (�ISDA Master Agreement�) or similar agreement with its derivativescounterparties. An ISDA Master Agreement is a bilateral agreement between the Fund and a counterparty that governs OTC derivatives (includingforward foreign currency exchange contracts, and certain options and swaps), and typically contains, among other things, collateral posting terms andnetting provisions in the event of a default and/or termination event. The provisions of the ISDA Master Agreement typically permit a single netpayment in the event of a default (close-out netting) or similar event, including the bankruptcy or insolvency of the counterparty.
Collateral and margin requirements differ between exchange traded derivatives and OTC derivatives. Margin requirements are established by thebroker or clearing house for exchange-traded and centrally cleared derivatives (financial futures contracts, options and centrally cleared swaps)pursuant to governing agreements for those instrument types. Brokers can ask for margin in excess of the minimum in certain circumstances. Collateralterms are contract-specific for OTC derivatives. For derivatives traded under an ISDA Master Agreement, the collateral requirements are typicallycalculated by netting the marked to market amount for each transaction under such agreement and comparing that amount to the value of any collateralcurrently pledged by the Fund and the counterparty. Additionally, the Fund may be required to post initial margin to the counterparty, the terms ofwhich would be outlined in the confirmation of the OTC transaction.
For financial reporting purposes, cash collateral that has been pledged to cover obligations of the Fund and cash collateral received from thecounterparty, if any, is reported separately on the Statement of Assets and Liabilities as receivables/payables for collateral on certain derivativecontracts. Non-cash collateral pledged by the Fund, if any, is noted in the Schedule of Investments. Generally, the amount of collateral due from or to acounterparty must exceed a minimum transfer amount threshold before a transfer is required to be made. To the extent amounts due to the Fund fromits counterparties are not fully collateralized, contractually or otherwise, the Fund bears the risk of loss from counterparty nonperformance. The Fundattempts to mitigate counterparty risk by only entering into agreements with counterparties that the Sub-Adviser believes to be of good standing and bymonitoring the financial stability of those counterparties.
Additionally, the netting of assets and liabilities and the offsetting of collateral pledged or received are based on contractual netting/set-offprovisions in the ISDA Master Agreement or similar agreements. However, in the event of a default or insolvency of a counterparty, a court coulddetermine that such rights are not enforceable due to the restrictions or prohibitions against the right of setoff that may be imposed in accordance with aparticular jurisdiction�s bankruptcy or insolvency laws.
18
Copyright © 2017 www.secdatabase.com. All Rights Reserved.Please Consider the Environment Before Printing This Document
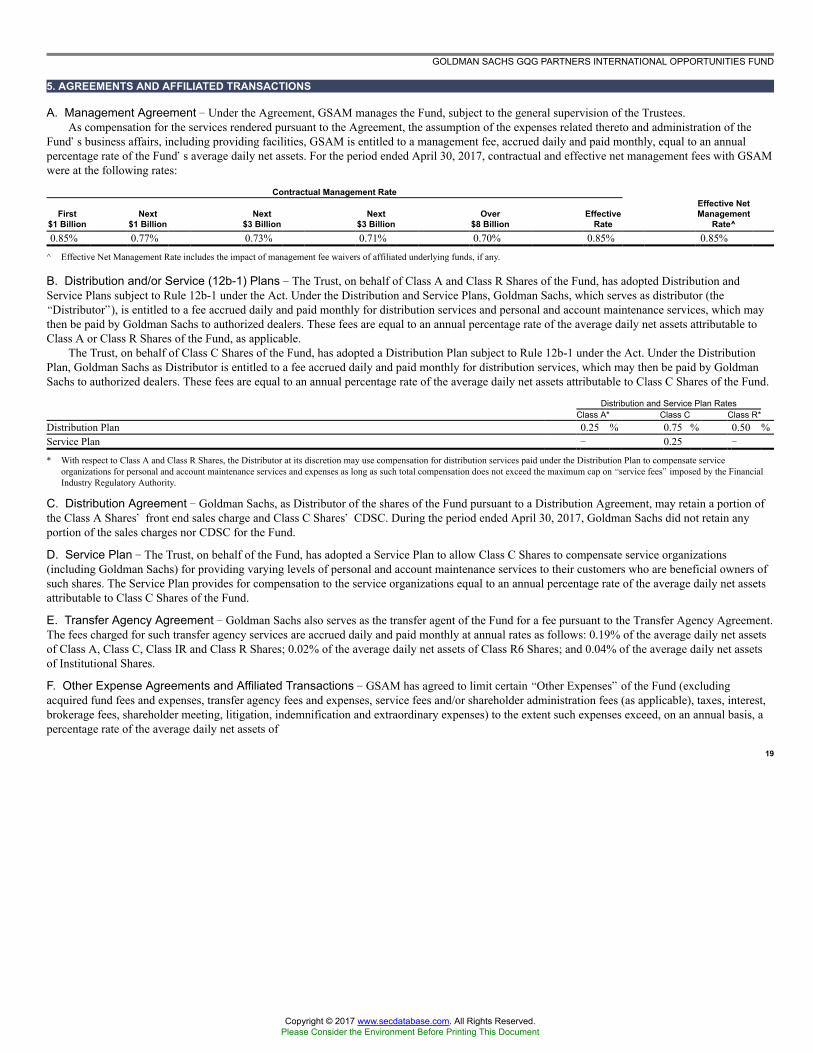
GOLDMAN SACHS GQG PARTNERS INTERNATIONAL OPPORTUNITIES FUND
5. AGREEMENTS AND AFFILIATED TRANSACTIONS
A. Management Agreement � Under the Agreement, GSAM manages the Fund, subject to the general supervision of the Trustees.As compensation for the services rendered pursuant to the Agreement, the assumption of the expenses related thereto and administration of the
Fund�s business affairs, including providing facilities, GSAM is entitled to a management fee, accrued daily and paid monthly, equal to an annualpercentage rate of the Fund�s average daily net assets. For the period ended April 30, 2017, contractual and effective net management fees with GSAMwere at the following rates:
Contractual Management Rate
First$1 Billion
Next$1 Billion
Next$3 Billion
Next$3 Billion
Over$8 Billion
EffectiveRate
Effective NetManagement
Rate^0.85% 0.77% 0.73% 0.71% 0.70% 0.85% 0.85%
^ Effective Net Management Rate includes the impact of management fee waivers of affiliated underlying funds, if any.
B. Distribution and/or Service (12b-1) Plans � The Trust, on behalf of Class A and Class R Shares of the Fund, has adopted Distribution andService Plans subject to Rule 12b-1 under the Act. Under the Distribution and Service Plans, Goldman Sachs, which serves as distributor (the�Distributor�), is entitled to a fee accrued daily and paid monthly for distribution services and personal and account maintenance services, which maythen be paid by Goldman Sachs to authorized dealers. These fees are equal to an annual percentage rate of the average daily net assets attributable toClass A or Class R Shares of the Fund, as applicable.
The Trust, on behalf of Class C Shares of the Fund, has adopted a Distribution Plan subject to Rule 12b-1 under the Act. Under the DistributionPlan, Goldman Sachs as Distributor is entitled to a fee accrued daily and paid monthly for distribution services, which may then be paid by GoldmanSachs to authorized dealers. These fees are equal to an annual percentage rate of the average daily net assets attributable to Class C Shares of the Fund.
Distribution and Service Plan RatesClass A* Class C Class R*
Distribution Plan 0.25 % 0.75 % 0.50 %Service Plan � 0.25 �
* With respect to Class A and Class R Shares, the Distributor at its discretion may use compensation for distribution services paid under the Distribution Plan to compensate serviceorganizations for personal and account maintenance services and expenses as long as such total compensation does not exceed the maximum cap on �service fees� imposed by the FinancialIndustry Regulatory Authority.
C. Distribution Agreement � Goldman Sachs, as Distributor of the shares of the Fund pursuant to a Distribution Agreement, may retain a portion ofthe Class A Shares� front end sales charge and Class C Shares� CDSC. During the period ended April 30, 2017, Goldman Sachs did not retain anyportion of the sales charges nor CDSC for the Fund.
D. Service Plan � The Trust, on behalf of the Fund, has adopted a Service Plan to allow Class C Shares to compensate service organizations(including Goldman Sachs) for providing varying levels of personal and account maintenance services to their customers who are beneficial owners ofsuch shares. The Service Plan provides for compensation to the service organizations equal to an annual percentage rate of the average daily net assetsattributable to Class C Shares of the Fund.
E. Transfer Agency Agreement � Goldman Sachs also serves as the transfer agent of the Fund for a fee pursuant to the Transfer Agency Agreement.The fees charged for such transfer agency services are accrued daily and paid monthly at annual rates as follows: 0.19% of the average daily net assetsof Class A, Class C, Class IR and Class R Shares; 0.02% of the average daily net assets of Class R6 Shares; and 0.04% of the average daily net assetsof Institutional Shares.
F. Other Expense Agreements and Affiliated Transactions � GSAM has agreed to limit certain �Other Expenses� of the Fund (excludingacquired fund fees and expenses, transfer agency fees and expenses, service fees and/or shareholder administration fees (as applicable), taxes, interest,brokerage fees, shareholder meeting, litigation, indemnification and extraordinary expenses) to the extent such expenses exceed, on an annual basis, apercentage rate of the average daily net assets of
19
Copyright © 2017 www.secdatabase.com. All Rights Reserved.Please Consider the Environment Before Printing This Document
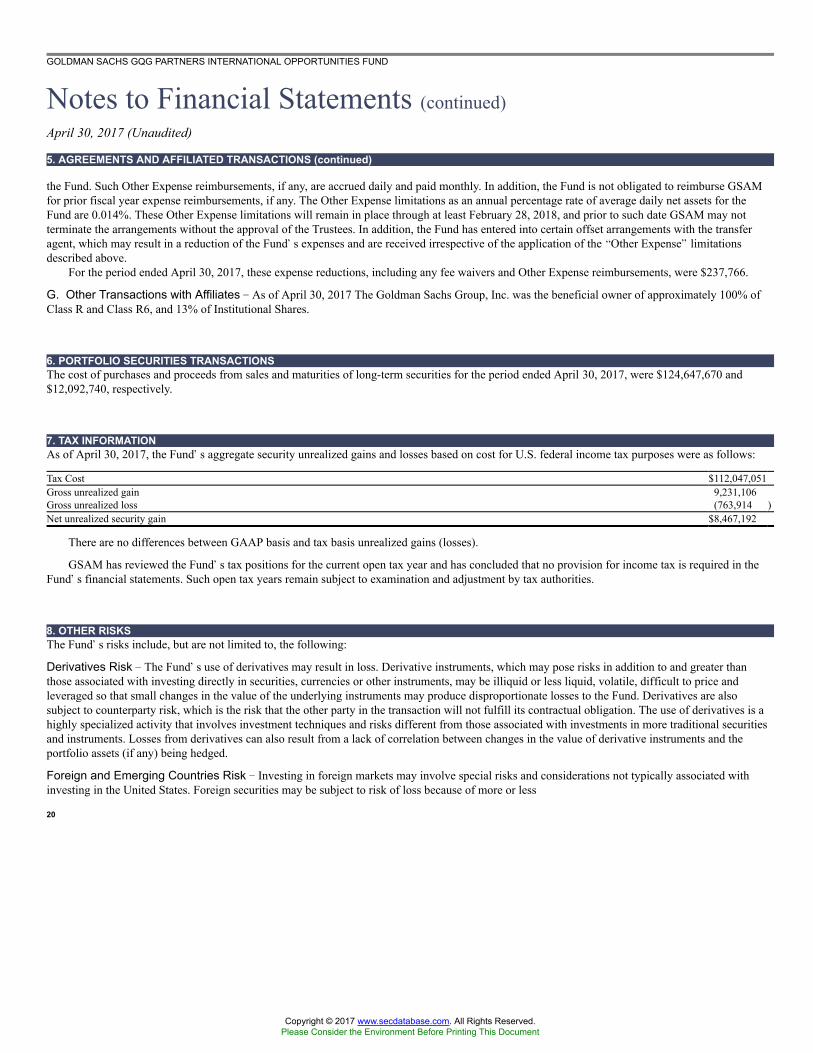
GOLDMAN SACHS GQG PARTNERS INTERNATIONAL OPPORTUNITIES FUND
Notes to Financial Statements (continued)April 30, 2017 (Unaudited)
5. AGREEMENTS AND AFFILIATED TRANSACTIONS (continued)
the Fund. Such Other Expense reimbursements, if any, are accrued daily and paid monthly. In addition, the Fund is not obligated to reimburse GSAMfor prior fiscal year expense reimbursements, if any. The Other Expense limitations as an annual percentage rate of average daily net assets for theFund are 0.014%. These Other Expense limitations will remain in place through at least February 28, 2018, and prior to such date GSAM may notterminate the arrangements without the approval of the Trustees. In addition, the Fund has entered into certain offset arrangements with the transferagent, which may result in a reduction of the Fund�s expenses and are received irrespective of the application of the �Other Expense� limitationsdescribed above.
For the period ended April 30, 2017, these expense reductions, including any fee waivers and Other Expense reimbursements, were $237,766.
G. Other Transactions with Affiliates � As of April 30, 2017 The Goldman Sachs Group, Inc. was the beneficial owner of approximately 100% ofClass R and Class R6, and 13% of Institutional Shares.
6. PORTFOLIO SECURITIES TRANSACTIONSThe cost of purchases and proceeds from sales and maturities of long-term securities for the period ended April 30, 2017, were $124,647,670 and$12,092,740, respectively.
7. TAX INFORMATIONAs of April 30, 2017, the Fund�s aggregate security unrealized gains and losses based on cost for U.S. federal income tax purposes were as follows:
Tax Cost $112,047,051Gross unrealized gain 9,231,106Gross unrealized loss (763,914 )Net unrealized security gain $8,467,192
There are no differences between GAAP basis and tax basis unrealized gains (losses).
GSAM has reviewed the Fund�s tax positions for the current open tax year and has concluded that no provision for income tax is required in theFund�s financial statements. Such open tax years remain subject to examination and adjustment by tax authorities.
8. OTHER RISKSThe Fund�s risks include, but are not limited to, the following:
Derivatives Risk � The Fund�s use of derivatives may result in loss. Derivative instruments, which may pose risks in addition to and greater thanthose associated with investing directly in securities, currencies or other instruments, may be illiquid or less liquid, volatile, difficult to price andleveraged so that small changes in the value of the underlying instruments may produce disproportionate losses to the Fund. Derivatives are alsosubject to counterparty risk, which is the risk that the other party in the transaction will not fulfill its contractual obligation. The use of derivatives is ahighly specialized activity that involves investment techniques and risks different from those associated with investments in more traditional securitiesand instruments. Losses from derivatives can also result from a lack of correlation between changes in the value of derivative instruments and theportfolio assets (if any) being hedged.
Foreign and Emerging Countries Risk � Investing in foreign markets may involve special risks and considerations not typically associated withinvesting in the United States. Foreign securities may be subject to risk of loss because of more or less
20
Copyright © 2017 www.secdatabase.com. All Rights Reserved.Please Consider the Environment Before Printing This Document

GOLDMAN SACHS GQG PARTNERS INTERNATIONAL OPPORTUNITIES FUND
8. OTHER RISKS (continued)
foreign government regulation, less public information and less economic, political and social stability in the countries in which the Fund invests. Theimposition of exchange controls, confiscations, trade restrictions (including tariffs) and other government restrictions by the United States or othergovernments, or from problems in share registration, settlement or custody, may also result in losses. Foreign risk also involves the risk of negativeforeign currency rate fluctuations, which may cause the value of securities denominated in such foreign currency (or other instruments through whichthe Fund has exposure to foreign currencies) to decline in value. Currency exchange rates may fluctuate significantly over short periods of time.
To the extent that the Fund also invests in securities of issuers located in emerging markets, these risks may be more pronounced.
Foreign Custody Risk � If the Fund invests in foreign securities, the Fund may hold such securities and cash with foreign banks, agents, andsecurities depositories appointed by the Fund�s custodian (each a �Foreign Custodian�). Some foreign custodians may be recently organized or new tothe foreign custody business. In some countries, Foreign Custodians may be subject to little or no regulatory oversight over, or independent evaluationof, their operations. Further, the laws of certain countries may place limitations on the Fund�s ability to recover its assets if a Foreign Custodian entersbankruptcy.
Investments in emerging markets may be subject to even greater custody risks than investments in more developed markets. Custody services inemerging market countries are very often undeveloped and may be considerably less well regulated than in more developed countries, and thus may notafford the same level of investor protection as would apply in developed countries.
Geographic Risk � If the Fund focuses its investments in securities of issuers located in a particular country or geographic region, it will subject theFund, to a greater extent than if its investments were less focused, to the risks of volatile economic cycles and/or conditions and developments that maybe particular to that country or region, such as: adverse securities markets; adverse exchange rates; adverse social, political, regulatory, economic,business, environmental or other developments; or natural disasters.Large Shareholder Transactions Risk � The Fund may experience adverse effects when certain large shareholders, such as other funds, institutionalinvestors (including those trading by use of non-discretionary mathematical formulas), financial intermediaries (who may make investment decisionson behalf of underlying clients and/or include the Fund in their investment model), individuals, accounts and Goldman Sachs affiliates, purchase orredeem large amounts of shares of the Fund. Such large shareholder redemptions may cause the Fund to sell portfolio securities at times when it wouldnot otherwise do so, which may negatively impact the Fund�s NAV and liquidity. These transactions may also accelerate the realization of taxableincome to shareholders if such sales of investments resulted in gains, and may also increase transaction costs. In addition, a large redemption couldresult in the Fund�s current expenses being allocated over a smaller asset base, leading to an increase in the Fund�s expense ratio. Similarly, large Fundshare purchases may adversely affect the Fund�s performance to the extent that the Fund is delayed in investing new cash and is required to maintain alarger cash position than it ordinarily would.Liquidity Risk � The Fund may make investments that are illiquid or that may become less liquid in response to market developments or adverseinvestor perceptions. Illiquid investments may be more difficult to value. Liquidity risk may also refer to the risk that a Fund will not be able to payredemption proceeds within the allowable time period because of unusual market conditions, an unusually high volume of redemption requests, orother reasons. To meet redemption requests, the Fund may be forced to sell investments at an unfavorable time and/or under unfavorable conditions.
Market and Credit Risks � In the normal course of business, the Fund trades financial instruments and enter into financial transactions where risk ofpotential loss exists due to changes in the market (market risk). Additionally, the Fund may also be exposed to credit risk in the event that an issuer orguarantor fails to perform or that an institution or entity with which the Fund has unsettled or open transactions defaults.Non-Diversification Risk � The Fund is non-diversified, meaning that it is permitted to invest a larger percentage of its assets in fewer issuers thandiversified mutual funds. Thus, the Fund may be more susceptible to adverse developments affecting any single issuer held in its portfolio, and may bemore susceptible to greater losses because of these developments.
21
Copyright © 2017 www.secdatabase.com. All Rights Reserved.Please Consider the Environment Before Printing This Document

GOLDMAN SACHS GQG PARTNERS INTERNATIONAL OPPORTUNITIES FUND
Notes to Financial Statements (continued)April 30, 2017 (Unaudited)
9. INDEMNIFICATIONS
Under the Trust�s organizational documents, its Trustees, officers, employees and agents are indemnified, to the extent permitted by the Act and statelaw, against certain liabilities that may arise out of performance of their duties to the Fund. Additionally, in the course of business, the Fund enters intocontracts that contain a variety of indemnification clauses. The Fund�s maximum exposure under these arrangements is unknown, as this wouldinvolve future claims that may be made against the Fund that have not yet occurred. However, GSAM believes the risk of loss under thesearrangements to be remote.
10. SUBSEQUENT EVENTSSubsequent events after the Statement of Asset and Liabilities date have been evaluated and GSAM has concluded that there is no impact requiringadjustment or disclosure in the financial statements.
11. SUMMARY OF SHARE TRANSACTIONSShare activity is as follows:
For the Period EndedApril 30, 2017(Unaudited)(a)
Shares DollarsClass A SharesShares sold 367,532 $3,986,290Reinvestment of distributions 1 5Shares redeemed (86,172 ) (969,694 )
281,361 3,016,601Class C SharesShares sold 94,308 1,007,961Reinvestment of distributions 1 2Shares redeemed (1 ) (10 )
94,308 1,007,953Institutional SharesShares sold 10,992,175 115,989,410Reinvestment of distributions 1,806 17,866Shares redeemed (15,096 ) (164,615 )
10,978,885 115,842,661Class IR SharesShares sold 101,792 1,096,510Reinvestment of distributions 1 6Shares redeemed (3,009 ) (32,827 )
98,784 1,063,689
22
Copyright © 2017 www.secdatabase.com. All Rights Reserved.Please Consider the Environment Before Printing This Document

GOLDMAN SACHS GQG PARTNERS INTERNATIONAL OPPORTUNITIES FUND
11. SUMMARY OF SHARE TRANSACTIONS (continued)
For the Period EndedApril 30, 2017(Unaudited)(a)
Shares DollarsClass R SharesShares sold 1,000 $10,010Reinvestment of distributions 1 4Shares redeemed (1 ) (10 )
1,000 10,004Class R6 SharesShares sold 1,001 10,010Reinvestment of distributions 1 7Shares redeemed (1 ) (10 )
1,001 10,007NET INCREASE 11,455,339 $120,950,915
(a) Commenced operations on December 15, 2016.
23
Copyright © 2017 www.secdatabase.com. All Rights Reserved.Please Consider the Environment Before Printing This Document

Fund Expenses �� Period Ended April 30, 2017 (Unaudited)As a shareholder of Class A, Class C, Institutional, Class IR, Class R or Class R6 Shares of the Fund, you incur two types of costs: (1) transaction costs,
including sales charges on purchase payments (with respect to Class A Shares) and contingent deferred sales charges on redemptions (with respect to Class C Shares);and (2) ongoing costs, including management fees; distribution and/or service (12b-1) fees (with respect to Class A, Class C and Class R Shares); and other Fundexpenses. This example is intended to help you understand your ongoing costs (in dollars) of investing in Class A, Class C, Institutional, Class IR, Class R and ClassR6 Shares of the Fund and to compare these costs with the ongoing costs of investing in other mutual funds.
The Example is based on an investment of $1,000 invested at the beginning of the period and held for the entire period from December 15, 2016 throughApril 30, 2017, which represents a period of 136 days out of 365 day year.
Actual Expenses � The first line in the table below provides information about actual account values and actual expenses. You may use the information inthis line, together with the amount you invested, to estimate the expenses that you paid over the period. Simply divide your account value by $1,000 (for example, an$8,600 account value divided by $1,000=8.6), then multiply the result by the number in the first line under the heading entitled �Expenses Paid� to estimate theexpenses you paid on your account during this period.
Hypothetical Example for Comparison Purposes � The second line in the table below provides information about hypothetical account values andhypothetical expenses based on the Fund�s actual net expense ratios and an assumed rate of return of 5% per year before expenses, which is not the Fund�s actualreturn. The hypothetical account values and expenses may not be used to estimate the actual ending account balance or expenses you paid for the period. You may usethis information to compare the ongoing costs of investing in the Fund and other funds. To do so, compare this 5% hypothetical example with the 5% hypotheticalexamples that appear in the shareholder reports of the other funds.
Please note that the expenses shown in the table are meant to highlight your ongoing costs only and do not reflect any transactional costs, such as salescharges, redemption fees, or exchange fees. Therefore, the second line of the table is useful in comparing ongoing costs only, and will not help you determine therelative total costs of owning different funds. In addition, if these transactional costs were included, your costs would have been higher.
GQG Partners International Opportunities Fund (a)
Share Class
BeginningAccount
Value12/15/2016
EndingAccount
Value4/30/17
ExpensesPaid for the
period ended4/30/17*
Class AActual $ 1,000.00 $ 1,126.60 $ 5.17Hypothetical 5% return 1,000.00 1,019.93 + 4.91Class CActual 1,000.00 1,123.20 8.11Hypothetical 5% return 1,000.00 1,017.16 + 7.70InstitutionalActual 1,000.00 1,127.80 3.59Hypothetical 5% return 1,000.00 1,021.42 + 3.41Class IRActual 1,000.00 1,126.70 4.17Hypothetical 5% return 1,000.00 1,020.88 + 3.96Class RActual 1,000.00 1,124.50 6.01Hypothetical 5% return 1,000.00 1,019.14 + 5.71Class R6Actual 1,000.00 1,127.80 3.59Hypothetical 5% return 1,000.00 1,021.42 + 3.41
* Expenses for each share class are calculated using the Fund�s annualized net expense ratio for each class, which represents the ongoing expenses as a percentage of net assets for the periodended April 30, 2017. Expenses are calculated by multiplying the annualized net expense ratio by the average account value for the period; then multiplying the result by the number of daysin the most recent fiscal half year; and then dividing that result by the number of days in the fiscal year. The annualized net expense ratios for the period were as follows:
Fund Class A Class C Institutional Class IR Class R Class R6GQG Partners International Opportunities Fund 1.30 2.05 0.90 1.05 1.52 0.90
+ Hypothetical expenses are based on the Fund�s actual annualized net expense ratios and an assumed rate of return of 5% per year before expenses.
(a) Commenced operations on December 15, 2016.
24
Copyright © 2017 www.secdatabase.com. All Rights Reserved.Please Consider the Environment Before Printing This Document

GOLDMAN SACHS GQG PARTNERS INTERNATIONAL OPPORTUNITIES FUND
Statement Regarding Basis for Approval of Management Agreement and Sub-Advisory Agreement (Unaudited)
BackgroundThe Goldman Sachs GQG Partners International Opportunities Fund (the �Fund�) is a newly-organized investment portfolio of Goldman Sachs
Trust II (the �Trust�) that commenced investment operations on December 15, 2016. At a meeting held on November 2-3, 2016 (the �Meeting�) inconnection with the Fund�s launch, the Board of Trustees, including those Trustees who are not parties to the Fund�s investment managementagreement or sub-advisory agreement or �interested persons� as defined in the Investment Company Act of 1940, as amended, of any party thereto (the�Independent Trustees�), approved (i) the investment management agreement (the �Management Agreement�) between the Trust on behalf of the Fundand Goldman Sachs Asset Management, L.P. (the �Investment Adviser�); and (ii) the sub-advisory agreement (the �Sub-Advisory Agreement� and,collectively with the Management Agreement, the �Agreements�) between the Investment Adviser and GQG Partners LLC (the �Sub-Adviser�), eachfor a term of two years.
In connection with their consideration of each Agreement, the Trustees received written materials and oral presentations prepared by theInvestment Adviser and the Sub-Adviser on the topics covered, and were advised by their independent legal counsel. In addition, the Trustees receivedinformation prepared by the Sub-Adviser in a written response to a formal request from the Investment Adviser. In evaluating the ManagementAgreement, the Trustees considered information included in presentations made by the Investment Adviser and other information received at priorBoard meetings.
Management AgreementAt the Meeting, the Trustees reviewed the Management Agreement, including information regarding the terms of the Management Agreement; the
nature, extent and quality of the Investment Adviser�s anticipated services; the fees and expenses to be paid by the Fund; a comparison of the Fund�sproposed management fees and anticipated expenses with those paid by similar mutual funds; potential ancillary benefits to be derived by theInvestment Adviser and its affiliates from their relationships with the Fund; and potential ancillary benefits to be derived by the Fund from itsrelationship with the Investment Adviser and its affiliates.
Nature, Extent, and Quality of the Services Provided Under the Management AgreementAs part of their review, the Trustees considered the nature, extent and quality of the services to be provided to the Fund by the Investment Adviser.
In this regard, the Trustees considered both the investment advisory services and non-advisory services that would be provided by the InvestmentAdviser and its affiliates (including the Investment Adviser�s oversight of the Sub-Adviser). The Trustees also considered information about theFund�s structure, investment objective, strategies and other characteristics. The Trustees noted the experience and capabilities of the InvestmentAdviser�s portfolio management team and other key personnel that would be providing services to the Fund.
25
Copyright © 2017 www.secdatabase.com. All Rights Reserved.Please Consider the Environment Before Printing This Document

GOLDMAN SACHS GQG PARTNERS INTERNATIONAL OPPORTUNITIES FUND
Statement Regarding Basis for Approval of Management Agreement and Sub-Advisory Agreement (Unaudited)(continued)
The Trustees concluded that the Investment Adviser would be able to commit substantial financial and other resources to the Fund. Theyconsidered that the Fund was new, and there was therefore no performance information to review with respect to the Fund. They observed that theInvestment Adviser had experience managing other sub-advised funds (including other series of the Trust), and has a team dedicated to sub-adviseroversight. The Trustees also reviewed the sub-adviser oversight process that the Investment Adviser had employed and was expected to employ goingforward, which included areas such as investment analytics, risk management and compliance.
Costs of Services to be Provided and ProfitabilityThe Trustees considered the contractual terms of the Management Agreement, the fee rates payable by the Fund thereunder, and the net amount
expected to be retained by the Investment Adviser after payment of sub-advisory fees. In this regard, the Trustees considered information on theservices to be rendered by the Investment Adviser to the Fund, which include both advisory and non-advisory services directed to the needs andoperations of the Fund as a registered mutual fund. The Trustees also reviewed the Fund�s projected total operating expense ratios (both gross and netof expense limitations). They compared the Fund�s projected fees and expenses to similar information for comparable mutual funds advised by other,unaffiliated investment management firms, as well as the peer group and category medians. The comparisons of the Fund�s fee rate and total operatingexpense ratios were prepared by a third-party provider of mutual fund data. The Trustees concluded that the information was useful in evaluating thereasonableness of the management fees and total expenses expected to be paid by the Fund.
The Trustees recognized that there was not yet profitability data to evaluate for the Fund, but considered the Investment Adviser�s representationsthat such data would be provided after the Fund commenced operations.
Economies of ScaleThe Trustees considered the breakpoints in the fee rate payable under the Management Agreement at the following annual percentage rates of the
average daily net assets of the Fund:
Average Daily Net Assets Management Fee Annual RateFirst $1 billion 0.85 %Next $1 billion 0.77 %Next $3 billion 0.73 %Next $3 billion 0.71 %Over $8 billion 0.70 %
26
Copyright © 2017 www.secdatabase.com. All Rights Reserved.Please Consider the Environment Before Printing This Document

GOLDMAN SACHS GQG PARTNERS INTERNATIONAL OPPORTUNITIES FUND
Statement Regarding Basis for Approval of Management Agreement and Sub-Advisory Agreement (Unaudited)(continued)
The Trustees noted that the breakpoints were meant to share potential economies of scale, if any, with the Fund and its shareholders as assets undermanagement reach those asset levels. The Trustees considered the Fund�s projected asset levels and information comparing the fee rate charged by theInvestment Adviser with fee rates charged to other funds in the peer group, as well as the Investment Adviser�s undertaking to limit certain expenses ofthe Fund that exceed a specified level. The Independent Trustees also considered the relationship between the advisory and sub-advisory fee rateschedules. Upon reviewing these matters, the Trustees concluded that the fee breakpoints represented a means of assuring that benefits of scalability, ifany, would be passed along to shareholders at the specified asset levels.
Other Benefits to the Investment Adviser and Its AffiliatesThe Trustees also considered the other benefits expected to be derived by the Investment Adviser and its affiliates from their relationships with the
Fund, including: (a) transfer agency fees received by Goldman, Sachs & Co. (�Goldman Sachs�); (b) brokerage and futures commissions earned byGoldman Sachs for executing securities and futures transactions on behalf of the Fund; (c) the Investment Adviser�s ability to leverage theinfrastructure designed to service the Fund on behalf of the Investment Adviser�s other clients; (d) the Investment Adviser�s ability to cross-marketother products and services to Fund shareholders; (e) Goldman Sachs� retention of certain fees as Distributor; (f) the Investment Adviser�s ability tonegotiate better pricing with custodians on behalf of its other clients, as a result of the relationship with the Fund; and (g) the possibility that theworking relationship between the Investment Adviser and the Fund�s third party service providers (including the Sub-Adviser) may cause those serviceproviders to be more likely to do business with other areas of Goldman Sachs.
Other Benefits to the Fund and Its ShareholdersThe Trustees also noted that the Fund is expected to receive certain potential benefits as a result of its relationship with the Investment Adviser,
including: (a) enhanced servicing and pricing from vendors because of the volume of business generated by the Investment Adviser and its affiliates;(b) the Investment Adviser�s ability to hire and retain qualified personnel, along with certain sub-advisers, to provide services to the Fund because ofthe reputation of the Goldman Sachs organization; and (c) the Fund�s access to certain affiliated distribution channels.
ConclusionIn connection with their consideration of the Management Agreement, the Trustees gave weight to various factors, but did not identify any
particular factor as controlling their decision. After deliberation and consideration of the information provided, including the factors described above,the Trustees concluded, in the exercise of their business judgment, that the investment management fees were reasonable. The Trustees, including theIndependent Trustees, unanimously concluded that the Management Agreement should be approved for a period of two years.
27
Copyright © 2017 www.secdatabase.com. All Rights Reserved.Please Consider the Environment Before Printing This Document

GOLDMAN SACHS GQG PARTNERS INTERNATIONAL OPPORTUNITIES FUND
Statement Regarding Basis for Approval of Management Agreement and Sub-Advisory Agreement (Unaudited)(continued)
Sub-Advisory Agreement with GQG Partners LLC
Nature, Extent, and Quality of the Services Provided Under the Sub-Advisory AgreementIn evaluating the Sub-Advisory Agreement, the Trustees relied on the information provided by the Investment Adviser and the Sub-Adviser. In
evaluating the nature, extent and quality of services to be provided by the Sub-Adviser, the Trustees considered information on the respective servicesto be provided to the Fund by the Investment Adviser and the Sub-Adviser, including information about the Sub-Adviser�s (a) personnel andcompensation structure; (b) track record in managing accounts with investment strategies similar to those to be employed on behalf of the Fund;(c) policies and procedures in place to address potential conflicts of interest; and (d) compliance program and code of ethics. In this regard, theyconsidered assessments provided by the Investment Adviser of the Sub-Adviser, the Sub-Adviser�s investment strategies and personnel, and itscompliance program.
Costs of Services to be ProvidedThe Trustees reviewed the terms of the Sub-Advisory Agreement and the proposed fee schedule, which included breakpoints. They noted that the
compensation paid to the Sub-Adviser would be paid by the Investment Adviser, not by the Fund. They also noted that the terms of the Sub-AdvisoryAgreement were the result of arms� length negotiations between the Investment Adviser and the Sub-Adviser. The Trustees considered the amount ofthe management fee expected to be retained by the Investment Adviser.
ConclusionIn connection with their consideration of the Sub-Advisory Agreement, the Trustees gave weight to various factors, but did not identify any
particular factor as controlling their decision. After deliberation and consideration of the information provided, the Trustees, including the IndependentTrustees, unanimously concluded that the Sub-Advisory Agreement should be approved for a period of two years.
28
Copyright © 2017 www.secdatabase.com. All Rights Reserved.Please Consider the Environment Before Printing This Document

FUNDS PROFILE
Goldman Sachs FundsGoldman Sachs is a premier financial services firm, known since 1869 for creating thoughtful and customized investment solutions in complex globalmarkets.Today, the Investment Management Division of Goldman Sachs serves a diverse set of clients worldwide, including private institutions, public entitiesand individuals. With approximately $1.17 trillion in assets under supervision as of March 31, 2017, Goldman Sachs Asset Management (�GSAM�)has portfolio management teams located around the world and our investment professionals bring firsthand knowledge of local markets to everyinvestment decision. Assets under supervision includes assets under management and other client assets for which Goldman Sachs does not have fulldiscretion. GSAM leverages the resources of Goldman Sachs & Co. LLC subject to legal, internal and regulatory restrictions.
Money MarketFinancial Square FundsSM
∎ Financial Square Treasury Solutions Fund1
∎ Financial Square Government Fund1
∎ Financial Square Money Market Fund2
∎ Financial Square Prime Obligations Fund2
∎ Financial Square Treasury Instruments Fund1
∎ Financial Square Treasury Obligations Fund1
∎ Financial Square Federal Instruments Fund1
∎ Financial Square Tax-Exempt Money Market Fund2Investor FundsSM
∎ Investor Money Market Fund3
∎ Investor Tax-Exempt Money Market Fund3
Fixed IncomeShort Duration and Government∎ Enhanced Income Fund∎ High Quality Floating Rate Fund∎ Short-Term Conservative Income Fund4
∎ Short Duration Government Fund∎ Short Duration Income Fund∎ Government Income Fund∎ Inflation Protected Securities FundMulti-Sector∎ Bond Fund∎ Core Fixed Income Fund∎ Global Income Fund∎ Strategic Income FundMunicipal and Tax-Free∎ High Yield Municipal Fund∎ Dynamic Municipal Income Fund∎ Short Duration Tax-Free Fund
Single Sector∎ Investment Grade Credit Fund∎ U.S. Mortgages Fund∎ High Yield Fund∎ High Yield Floating Rate Fund∎ Emerging Markets Debt Fund∎ Local Emerging Markets Debt Fund∎ Dynamic Emerging Markets Debt FundFixed Income Alternatives∎ Long Short Credit Strategies Fund∎ Strategic Macro Fund5
Fundamental Equity∎ Equity Income Fund6
∎ Small Cap Value Fund∎ Small/Mid Cap Value Fund∎ Mid Cap Value Fund∎ Large Cap Value Fund∎ Focused Value Fund∎ Capital Growth Fund∎ Strategic Growth Fund∎ Focused Growth Fund∎ Small/Mid Cap Growth Fund∎ Flexible Cap Growth Fund∎ Concentrated Growth Fund∎ Technology Opportunities Fund∎ Growth Opportunities Fund∎ Rising Dividend Growth Fund
Copyright © 2017 www.secdatabase.com. All Rights Reserved.Please Consider the Environment Before Printing This Document

∎ Dynamic U.S. Equity Fund∎ Income Builder Fund
Tax-Advantaged Equity∎ U.S. Tax-Managed Equity Fund∎ International Tax-Managed Equity Fund∎ U.S. Equity Dividend and Premium Fund∎ International Equity Dividend and Premium Fund
Equity Insights∎ Small Cap Equity Insights Fund∎ U.S. Equity Insights Fund∎ Small Cap Growth Insights Fund∎ Large Cap Growth Insights Fund∎ Large Cap Value Insights Fund∎ Small Cap Value Insights Fund∎ International Small Cap Insights Fund∎ International Equity Insights Fund∎ Emerging Markets Equity Insights Fund
Fundamental Equity International∎ Strategic International Equity Fund∎ Focused International Equity Fund∎ Asia Equity Fund∎ Emerging Markets Equity Fund∎ N-11 Equity Fund
Select Satellite∎ Real Estate Securities Fund∎ International Real Estate Securities Fund∎ Commodity Strategy Fund∎ Global Real Estate Securities Fund∎ Dynamic Allocation Fund∎ Absolute Return Tracker Fund∎ Long Short Fund∎ Managed Futures Strategy Fund∎ MLP Energy Infrastructure Fund∎ Multi-Manager Alternatives Fund∎ Absolute Return Multi-Asset Fund∎ Global Infrastructure Fund
Total Portfolio Solutions∎ Global Managed Beta Fund∎ Multi-Manager Non-Core Fixed Income Fund∎ Multi-Manager U.S. Dynamic Equity Fund∎ Multi-Manager Global Equity Fund∎ Multi-Manager International Equity Fund∎ Tactical Tilt Overlay Fund∎ Balanced Strategy Portfolio∎ Multi-Manager U.S. Small Cap Equity Fund∎ Multi-Manager Real Assets Strategy Fund∎ Growth and Income Strategy Portfolio∎ Growth Strategy Portfolio∎ Equity Growth Strategy Portfolio∎ Satellite Strategies Portfolio∎ Enhanced Dividend Global Equity Portfolio∎ Tax-Advantaged Global Equity Portfolio∎ Strategic Factor Allocation Fund∎ Target Date 2020 Portfolio∎ Target Date 2025 Portfolio∎ Target Date 2030 Portfolio∎ Target Date 2035 Portfolio∎ Target Date 2040 Portfolio∎ Target Date 2045 Portfolio∎ Target Date 2050 Portfolio∎ Target Date 2055 Portfolio∎ GQG Partners International Opportunities Fund
1 You could lose money by investing in the Fund. Although the Fund seeks to preserve the value of your investment at $1.00 per share, it cannot guarantee itwill do so. An investment in the Fund is not a deposit of a bank and is not insured or guaranteed by the Federal Deposit Insurance Corporation or any othergovernment agency. The Fund��s sponsor has no legal obligation to provide financial support to the Fund, and you should not expect that the sponsor willprovide financial support to the Fund at any time.
2 You could lose money by investing in the Fund. Because the share price of the Fund will fluctuate, when you sell your shares they may be worth more or lessthan what you originally paid for them. The Fund may impose a fee upon sale of your shares or may temporarily suspend your ability to sell shares if theFund��s liquidity falls below required minimums because of market conditions or other factors. An investment in the Fund is not a deposit of a bank and isnot insured or guaranteed by the Federal Deposit Insurance Corporation or any other government agency. The Fund��s sponsor has no legal obligation toprovide financial support to the Fund, and you should not expect that the sponsor will provide financial support to the Fund at any time.
Copyright © 2017 www.secdatabase.com. All Rights Reserved.Please Consider the Environment Before Printing This Document

3 You could lose money by investing in the Fund. Although the Fund seeks to preserve the value of your investment at $1.00 per share, it cannot guarantee itwill do so. The Fund may impose a fee upon sale of your shares or may temporarily suspend your ability to sell shares if the Fund��s liquidity falls belowrequired minimums because of market conditions or other factors. An investment in the Fund is not a deposit of a bank and is not insured or guaranteed bythe Federal Deposit Insurance Corporation or any other government agency. The Fund��s sponsor has no legal obligation to provide financial support to theFund, and you should not expect that the sponsor will provide financial support to the Fund at any time.
4 Effective on July 29, 2016, the Goldman Sachs Limited Maturity Obligations Fund was renamed the Goldman Sachs Short-Term Conservative Income Fund.5 Effective on June 20, 2017, the Goldman Sachs Fixed Income Macro Strategies Fund was renamed the Goldman Sachs Strategic Macro Fund.6 Effective on June 20, 2017, the Goldman Sachs Growth and Income Fund was renamed the Goldman Sachs Equity Income Fund.Financial Square FundsSM and Investor FundsSM are registered service marks of Goldman Sachs & Co. LLC.* This list covers open-end funds only. Please visit our website at www.GSAMFUNDS.com to learn about our closed-end funds and exchange-traded funds.
Copyright © 2017 www.secdatabase.com. All Rights Reserved.Please Consider the Environment Before Printing This Document

TRUSTEESCheryl K. Beebe, ChairLawrence HughesJohn F. KillianJames A. McNamaraWestley V. Thompson
OFFICERSJames A. McNamara, PresidentScott M. McHugh Treasurer, Senior Vice PresidentandPrincipal Financial OfficerJoseph F. DiMaria, Assistant Treasurer and PrincipalAccounting OfficerCaroline L. Kraus, Secretary
GOLDMAN SACHS & CO. LLCDistributor and Transfer Agent
GOLDMAN SACHS ASSET MANAGEMENT L.P.Investment Adviser
Visit our website at www.GSAMFUNDS.com to obtain the most recent month-endreturns.
Goldman Sachs Asset Management, L.P., 200 West Street, New York, New York 10282
The reports concerning the Fund included in this shareholder report may contain certain forward-looking statements about the factors that may affect theperformance of the Fund in the future. These statements are based on Fund management�s predictions and expectations concerning certain future eventsand their expected impact on the Fund, such as performance of the economy as a whole and of specific industry sectors, changes in the levels of interestrates, the impact of developing world events, and other factors that may influence the future performance of the Fund. Management believes theseforward-looking statements to be reasonable, although they are inherently uncertain and difficult to predict. Actual events may cause adjustments inportfolio management strategies from those currently expected to be employed.A description of the policies and procedures that the Fund uses to determine how to vote proxies relating to portfolio securities and information regardinghow the Fund voted proxies relating to portfolio securities during the most recent 12-month period ended June 30 is available (i) without charge, uponrequest by calling 1-800-526-7384 (for Retail Shareholders) or 1-800-621-2550 (for Institutional Shareholders); and (ii) on the Securities and ExchangeCommission (the �SEC�) web site at http://www.sec.gov.The Fund files its complete schedule of portfolio holdings with the SEC for the first and third quarters of each fiscal year on Form N-Qs. The Fund�s FormN-Qs are available on the SEC�s web site at http://www.sec.gov within 60 days after the Fund�s first and third fiscal quarters. The Fund�s Form N-Qs maybe reviewed and copied at the SEC�s Public Reference Room in Washington, D.C., and information on the operation of the Public Reference Room mayalso be obtained by calling 1-800-SEC-0330. Form N-Qs may be obtained upon request and without charge by calling 1-800-526-7384 (for RetailShareholders) or 1-800-621-2550 (for Institutional Shareholders).Holdings and allocations shown are as of April 30, 2017 and may not be representative of future investments. Fund holdings should not be relied on inmaking investment decisions and should not be construed as research or investment advice regarding particular securities. Current and future holdingsare subject to risk.Economic and market forecasts presented herein reflect our judgment as of the date of this presentation and are subject to change without notice. Theseforecasts do not take into account the specific investment objectives, restrictions, tax and financial situation or other needs of any specific client. Actualdata will vary and may not be reflected here. These forecasts are subject to high levels of uncertainty that may affect actual performance. Accordingly,these forecasts should be viewed as merely representative of a broad range of possible outcomes. These forecasts are estimated, based on assumptions,and are subject to significant revision and may change materially as economic and market conditions change. Goldman Sachs has no obligation to provideupdates or changes to these forecasts. Case studies and examples are for illustrative purposes only.The Global Industry Classification Standard (GICS) was developed by and is the exclusive property and a service mark of Morgan Stanley CapitalInternational Inc. (MSCI) and Standard & Poor�s, a division of The McGraw-Hill Companies, Inc. (S&P) and is licensed for use by Goldman Sachs. NeitherMSCI, S&P nor any other party involved in making or compiling the GICS or any GICS classifications makes any express or implied warranties orrepresentations with respect to such standard or classification (or the results to be obtained by the use thereof), and all such parties hereby expresslydisclaim all warranties of originality, accuracy, completeness, merchantability or fitness for a particular purpose with respect to any of such standard orclassification. Without limiting any of the foregoing, in no event shall MSCI, S&P, any of their affiliates or any third party involved in making or compiling theGICS or any GICS classifications have any liability for any direct, indirect, special, punitive, consequential or any other damages (including lost profits)even if notified of the possibility of such damages.The portfolio risk management process includes an effort to monitor and manage risk, but does not imply low risk.This material is not authorized for distribution to prospective investors unless preceded or accompanied by a current Prospectus or summaryprospectus, if applicable. Investors should consider a Fund��s objective, risks, and charges and expenses, and read the summary prospectus, ifavailable, and/or the Prospectus carefully before investing or sending money. The summary prospectus, if available, and the Prospectuscontain this and other information about a Fund and may be obtained from your authorized dealer or from Goldman Sachs & Co. LLC by calling(retail �� 1-800-526-7384) (institutional �� 1-800-621-2550).
© 2017 Goldman Sachs. All rights reserved. 95252-TMPL-06/2017-557219 GQGPIOSAR-17/2K
Copyright © 2017 www.secdatabase.com. All Rights Reserved.Please Consider the Environment Before Printing This Document

Goldman Sachs Funds
Semi-Annual Report April 30, 2017
Multi-Manager Alternatives Fund
Copyright © 2017 www.secdatabase.com. All Rights Reserved.Please Consider the Environment Before Printing This Document

Goldman Sachs Multi-Manager Alternatives FundTABLE OF CONTENTS
Investment Process 1
Portfolio Management Discussion and Performance Summaries 2
Schedule of Investments 9
Financial Statements 55
Financial Highlights 58
Notes to Financial Statements 60
Other Information 79
NOT FDIC-INSURED May Lose Value No Bank Guarantee
Copyright © 2017 www.secdatabase.com. All Rights Reserved.Please Consider the Environment Before Printing This Document

GOLDMAN SACHS MULTI-MANAGER ALTERNATIVES FUND
What Differentiates Goldman Sachs Multi-ManagerAlternatives Fund Investment Process?The Goldman Sachs Multi-Manager Alternatives Fund seeks long-term growth of capital by allocating its assets to underlyingmanagers who employ a range of alternative and non-traditional investment strategies. The Fund benefits from the dedicated expertiseof GSAM��s alternative investment team that has a legacy dating back to 19691 and is located in 8 offices globally.2
∎ We have over 150 alternative investment professionals2 dedicated to manager selection
∎ We employ a rigorous due diligence process to evaluate each manager�s skill, strategy, and team and continually monitor managers after aninvestment is made
∎ Our Investment Committee process includes an independent �Devil�s advocate� to promote fluid debate and intense examination of each manager
∎ We combine �top down� market and economic environment considerations with �bottom up� manager-specific factors
∎ We incorporate judgment and quantitative tools to determine the appropriate investment size in each manager
Copyright © 2017 www.secdatabase.com. All Rights Reserved.Please Consider the Environment Before Printing This Document

∎ The process is continual with ongoing re-balancing and active management to optimize diversification
∎ We have over 50 professionals2 focused on alternative investment risk management and operational diligence
∎ We consider risk management an all-encompassing and real time discipline
∎ Our dedicated strategists leverage our proprietary risk management systems to continually monitor risk
1 In June 1997, The Goldman Sachs Group, Inc. (GSG, Inc.) acquired the assets and business of Commodities Corporation, which GSG, Inc. subsequently renamedGoldman Sachs Hedge Fund Strategies LLC in December 2004.
2 As of March 2017.The portfolio risk management process includes an effort to monitor and manage risk, but does not imply low risk. Diversification does not protect an investor frommarket risk and does not ensure a profit.
1
Copyright © 2017 www.secdatabase.com. All Rights Reserved.Please Consider the Environment Before Printing This Document

PORTFOLIO RESULTS
Goldman Sachs Multi-Manager Alternatives FundInvestment ObjectiveThe Fund seeks long-term growth of capital.
Portfolio Management Discussion and AnalysisBelow, the Goldman Sachs Alternative Investments & Manager Selection (��AIMS��) Group discusses the Goldman Sachs Multi-ManagerAlternatives Fund��s (the ��Fund��) performance and positioning for the six-month period ended April 30, 2017 (the ��Reporting Period��).
Q How did the Fund perform during the Reporting Period?
A During the Reporting Period, the Fund�s Class A, C, Institutional, IR and R Shares generated cumulative total returns, without sales charges, of2.36%, 1.93%, 2.56%, 2.42% and 2.12%, respectively. These returns compare to the 0.23% cumulative total return of the Fund�s primarybenchmark, the Bank of America Merrill Lynch Three-Month U.S. Treasury Bill Index (the �BofA Index�) during the same time period. The HFRXGlobal Hedge Fund Index (net of management, administrative and performance/ incentive fees), a broad proxy for hedge fund performance and theFund�s secondary benchmark, returned 3.86% during the Reporting Period.
References to the Fund�s benchmarks mentioned herein are for informational purposes only, and unless otherwise noted, are not an indication ofhow the Fund is managed. The use of the BofA Index as the Fund�s benchmark does not imply the Fund is being managed like cash and does notimply low risk or low volatility.
Q What economic and market factors most influenced the financial markets as a whole during the Reporting Period?
A The capital markets broadly rallied during the Reporting Period. In the U.S., the unexpected results of the November 2016 U.S. presidential electionled investors to rotate out of the defensive, yield-oriented positioning that had driven market returns in much of 2015 and 2016. The Federal Reserve(the �Fed�), citing an improved labor market and moderately expanding economic activity, cautiously raised interest rates twice during theReporting Period � in December 2016 and March 2017. Meanwhile, the U.K. officially triggered Article 50, beginning negotiations to extricateitself from the European Union, popularly known as Brexit. Currency markets were characterized by a declining U.S. dollar and gains in emergingmarkets and developed markets currencies, particularly in the first months of 2017. In commodities, oil prices declined on pricing concerns and onuncertainty around Organization of the Petroleum Exporting Countries (�OPEC�) production limits, leading to underperformance from energy-related assets worldwide.
Global equity markets ended the Reporting Period in positive territory. In the U.S., investors reacted to the prospect of business-friendly tax cuts,decreased regulations, and revisions to international trade agreements under the current Administration by rotating into more cyclical areas of themarket. Financial stocks were the best performers during the Reporting Period, followed by information technology, consumer discretionary andindustrials. Energy companies underperformed due to declines in oil prices, while the higher yielding, traditionally defensive sectors, such asutilities, telecommunication services and consumer staples, which had driven the market for much of 2015 and 2016, also underperformed. Smallcap stocks, widely considered most likely to benefit from current Administration policies, outperformed large cap stocks during the ReportingPeriod. International equity markets also gained during the Reporting Period, with European stocks rebounding from 2016�s Brexit-driven selloffand emerging markets equities rallying on improved prospects for economic growth.
Credit markets also largely ended the Reporting Period in positive territory. Despite volatility around U.S. elections and an increase in U.S. Treasuryrates during the Reporting Period, credit spreads, or yield differentials to U.S. Treasuries, tightened from their January 2016 highs, as economicrecovery improved and market participants became optimistic about the prospect of fiscal stimulus under the new
2
Copyright © 2017 www.secdatabase.com. All Rights Reserved.Please Consider the Environment Before Printing This Document

PORTFOLIO RESULTS
Administration. In the U.S., issuers sought to take advantage of low interest rates and strong foreign demand to drive new offerings. Abroad,emerging markets credit, generally offering more attractive yields and less sovereign leverage, rallied. (Less sovereign leverage refers to the fact thatemerging markets generally have less sovereign debt than developed markets as a percentage of Gross Domestic Product given the effects ofquantitative easing in the U.S. and Europe.)
As the Reporting Period came to an end, investors appeared to be monitoring political developments in the U.S., particularly regarding tax andhealth care reform. We believe the rise of populism worldwide had challenged conventional leadership, most recently during the French election,with the potential to cause further market disruption. While most global central banks maintained policies of quantitative easing at the end of theReporting Period, investors also broadly anticipated at least one more interest rate hike in the U.S. in 2017.
Q What key factors were responsible for the Fund��s performance during the Reporting Period?
A The Fund�s performance during the Reporting Period can be attributed to the performance of the Fund�s Underlying Managers, who are unaffiliatedinvestment managers that employ one or more non-traditional and alternative investment strategies. At various points during the Reporting Period,the Fund allocated capital to 13 Underlying Managers � Acadian Asset Management LLC (�Acadian�); Algert Global LLC (�Algert�); Ares CapitalManagement II LLC (�Ares�); Atreaus Capital, LP (�Atreaus�); Brigade Capital Management, LP (�Brigade�); Corsair Capital Management, L.P.(�Corsair�); First Pacific Advisors, LLC (�FPA�); Graham Capital Management, L.P. (�GCM�); New Mountain Vantage Advisers, L.L.C. (�NewMountain Vantage�); One River Asset Management, LLC (�One River�); QMS Capital Management LP (�QMS�); Sirios Capital Management,L.P. (�Sirios�); and YG Partners, LLC (�YG Partners�).
These 13 Underlying Managers represented four strategies � equity long/short (Corsair, FPA, Sirios and YG Partners); event driven and credit (Ares,Brigade and New Mountain Vantage); tactical trading (Atreaus, GCM, One River and QMS); and relative value (Acadian and Algert).
Of the 13 Underlying Managers with allocated capital during the Reporting Period, nine generated positive returns and four generated negativereturns.
In addition, during the Reporting Period, the Fund allocated assets to Russell Investments Implementation Services, Inc. (�RIIS�). RIIS manages abeta completion mandate for the Fund, which provides us with an additional tool to manage the beta of the Fund and is not used to override anyviews and/or decisions of the Fund�s Underlying Managers. (Beta is a measure of the sensitivity of a portfolio�s returns to broad market returns.)During the Reporting Period, RIIS did not have a meaningful impact on the Fund�s performance.
Q Which strategies most significantly affected Fund performance?
A Of the four strategies employed across the Underlying Managers during the Reporting Period, three generated positive returns and one generatednegative returns. The Fund did not have allocations to the dynamic equity or opportunistic fixed income strategies during the Reporting Period.
The Fund�s equity long/short strategy added most to the Fund�s performance during the Reporting Period, mainly because of exposure to thefinancials, consumer discretionary and information technology sectors. Citigroup, Bank of America and MGM Resorts were among the top positivecontributors. Equity long/short strategies generally involve long and short investing, based on fundamental evaluations, research and variousanalytical measurements, in equity and equity-related investments. Equity long/short managers may, for example, buy stocks they expect tooutperform or they believe are undervalued, and may also sell short stocks they believe will underperform or they believe are overvalued. Longpositions benefit from an increase in the price of the underlying instrument or asset class, while short positions benefit from a decrease in that price.
The event driven and credit strategy generated the Fund�s second-strongest positive performance during the Reporting Period, led by topperforming positions in high yield corporate bonds and high yield loans within credit strategies and exposure to financials and health care stockswithin event driven equity strategies. Event driven and credit strategies seek to achieve gains from market movements in security prices caused byspecific corporate events or changes in perceived relative value. These strategies may include, among others, merger arbitrage, distressed credit,opportunistic credit and value with a catalyst investing styles.
The relative value strategy was the third source of the Fund�s positive results during the Reporting Period, driven by positions in the financials,consumer discretionary and health care sectors. These results were slightly offset by positions in
3
Copyright © 2017 www.secdatabase.com. All Rights Reserved.Please Consider the Environment Before Printing This Document

PORTFOLIO RESULTS
the materials and communications market segments. Relative value strategies seek to identify and benefit from price discrepancies between relatedassets (assets that share a common financial factor, such as interest rates, an issuer, or an index). Relative value opportunities generally rely onarbitrage (the simultaneous purchase and sale of related assets) and may exist between two issuers or within the capital structure of a single issuer.These strategies attempt to exploit a source of return with low correlation to the market and include, among others, fixed income arbitrage,convertible arbitrage, volatility arbitrage, statistical arbitrage and equity market neutral strategies.
Tactical trading was the only Fund strategy to generate negative returns during the Reporting Period. Both macro and trend-following strategiesdetracted from the Fund�s performance, mainly due to trading in specific G101 currencies and in precious metals. Within the trend-followingstrategy, the Underlying Managers� long positions in the U.S. dollar and short positions in U.S. interest rates, which proved beneficial during thefourth quarter of 2016, drove losses in early 2017 through the end of the Reporting Period. Generally speaking, the Fund�s Underlying Managerswere hurt by trend reversals in interest rates, currencies and commodities, which accelerated after the November 2016 U.S. elections. Within themacro strategy, long U.S. dollar positions held by Underlying Managers suffered on comments by the new Administration during January 2017about the strength of the U.S. dollar. In addition, House Republicans� failure to repeal the Affordable Care Act during March 2017 caused the U.S.dollar to sell off and interest rates to fall, dampening the performance of a majority of the trend-following strategy�s Underlying Managers. TheseUnderlying Managers were also hampered by a selloff in crude oil prices driven by increased U.S. supply and higher inventories. Tactical tradingstrategies seek to produce total return by long and short investing across global fixed income, currency, equity and commodity markets. Tacticaltrading managers may employ various investment styles of which the two major strategies are macro and managed futures. Tactical tradingmanagers that employ a global macro style may select their investments based upon fundamental and/or technical analysis. Tactical tradingmanagers that employ a managed futures investing style may use quantitative modeling techniques, e.g., determining an asset�s value based upon ananalysis of price history, price momentum and the asset�s value relative to that of other assets, among other factors. Some tactical trading managersmay employ both fundamental analysis and quantitative modeling techniques. Tactical trading managers typically have no bias to be long, short orneutral, but at any given time may have significant long or short exposures in a particular market or asset.
Q How did the Fund use derivatives and similar instruments during the Reporting Period?
A The Underlying Managers of the Fund employ derivatives and similar instruments as part of their underlying strategies to hedge market exposureand/or to gain implicit leverage, subject to the constraints of the Investment Company Act of 1940. The derivatives used most by UnderlyingManagers during the Reporting Period were commodity futures, equity futures, total returns swaps (single name and index), bond futures, creditdefault swaps (single name and index), interest rate futures, currency futures and forward foreign exchange contracts. Overall, the use of derivativesand similar instruments by the Underlying Managers had a negative impact on the Fund�s performance during the Reporting period.
Q Were there any notable changes in the Fund��s allocations and Underlying Managers during the Reporting Period?
A During the Reporting Period, shifts in the Fund�s asset allocation were made in response to the market environment and were also the result ofchanges in allocations to the Fund�s various strategies. The largest sector allocation shift was a reduction in the Fund�s exposure to corporate creditthrough the event driven and credit strategy. Most of the decrease occurred in February 2017, with further reductions in March and April. Althoughthe allocation had been an important driver of Fund returns during 2016, we had a more cautious outlook on corporate credit for 2017 given thecontinued compression in credit spreads (yields differentials versus U.S. Treasury securities of similar duration) during January and February 2017.We reallocated the majority of the proceeds to the Fund�s relative value strategy. In the process, we funded Algert, which had been approved by theFund�s Board of Trustees in September 2016 as an Underlying Manager within the Fund�s relative value strategy, joining Acadian.
1 The G10, or Group of Ten, are actually 11 industrialized nations that meet on an annual basis to consult each other and to debate and cooperate on internationalfinancial matters. They include Belgium, Canada, France, Germany, Italy, Japan, the Netherlands, Sweden, Switzerland, the U.K. and the U.S.
4
Copyright © 2017 www.secdatabase.com. All Rights Reserved.Please Consider the Environment Before Printing This Document

PORTFOLIO RESULTS
Also during the Reporting Period, we increased the Fund�s allocation overall to the equity long/short strategy, as we believed declining correlationswould create a constructive environment for the strategy�s Underlying Managers. We accomplished this partly through the addition of a newUnderlying Manager. YG Partners, approved by the Fund�s Board of Trustees in November 2016, was first allocated capital during December 2016.The addition of YG Partners was based on our continued positive view on equity alpha opportunities and also on our decision to diversify theFund�s equity long/short strategy. (Alpha opportunities refer to the prospect of potentially outperforming a benchmark index.)
During the Reporting Period, we funded and/or added a total of four Underlying Managers. As mentioned previously, YG Partners became anUnderlying Manager within the equity long/short strategy. YG Partners joins Corsair, FPA and Sirios. (Wellington, another Underlying Managerwithin the equity/long short strategy, was not allocated capital during the Reporting Period.) In addition, One River, which was approved by theFund�s Board of Trustees in November 2016, was added as an Underlying Manager within the tactical trading strategy and was allocated capital inApril 2017. One River joins Atreaus, GCM and QMS. Finally, Emso Asset Management Limited (�Emso�), approved by the Fund�s Board ofTrustees in March 2017 but not allocated capital during the Reporting Period, was added as a fifth Underlying Manager within the Fund�s tacticaltrading strategy. Emso has a focus on the emerging markets.
Q What is the Fund��s tactical view and strategy for the months ahead?
A We intend to continue to closely monitor global economic growth, monetary policy and market volatility, while using active portfolio managementand alternative investment strategies to position the Fund as we aim to deliver positive absolute returns across a variety of market environments. Webelieve the flexibility to allocate tactically across these alternative strategies may enable us to provide investors with positive absolute returns in avariety of market conditions and with significant diversification benefits. We intend to continue to actively explore adding new managers with whatwe consider to be unique alternative capabilities as market conditions warrant.
5
Copyright © 2017 www.secdatabase.com. All Rights Reserved.Please Consider the Environment Before Printing This Document

FUND BASICS
Multi-Manager Alternatives Fundas of April 30, 2017
PERFORMANCE REVIEW
November 1, 2016��April 30, 2017Fund Total Return(based on NAV)1
Bank of America MerrillLynch Three-Month U.S.
Treasury Bill Index2HFRX Global
Hedge Fund Index3
Class A 2.36 % 0.23 % 3.86 %Class C 1.93 0.23 3.86Institutional 2.56 0.23 3.86Class IR 2.42 0.23 3.86Class R 2.12 0.23 3.86
1 The net asset value (�NAV�) represents the net assets of the class of the Fund (ex-dividend) divided by the total number of shares of the class outstanding. TheFund�s performance reflects the reinvestment of dividends and other distributions. The Fund�s performance does not reflect the deduction of any applicable salescharges.
Copyright © 2017 www.secdatabase.com. All Rights Reserved.Please Consider the Environment Before Printing This Document

2 The Bank of America Merrill Lynch Three-Month U.S. Treasury Bill Index is comprised of a single issue purchased at the beginning of the month and held for a fullmonth. At the end of the month that issue is sold and rolled into a newly selected issue. The issue selected at each month-end rebalancing is the outstanding TreasuryBill that matures closest to, but not beyond, three months from the rebalancing date. To qualify for selection, an issue must have settled on or before the month-endrebalancing date. While the index will often hold the Treasury Bill issued at the most recent 3-month auction, it is also possible for a seasoned 6-month Bill to beselected.
3 The HFRX Global Hedge Fund Index is designed to be representative of the overall composition of the hedge fund universe. It is comprised of all eligible hedgefund strategies, including but not limited to convertible arbitrage, distressed securities, equity hedge, equity market neutral, event driven, macro, merger arbitrage,and relative value arbitrage. The strategies are asset weighted based on the distribution of assets in the hedge fund industry. The index is investable through productsmanaged by HFR Asset Management, LLC that track HFRX Indices. The HFRX Global Hedge Fund Index is a trademark of Hedge Fund Research, Inc. (�HFR�).HFR has not participated in the formation of the Fund. HFR does not endorse or approve the Fund or make any recommendation with respect to investing in theFund.HFRI and HFRX and related indices are trademarks and service marks of HFR which has no affiliation with GSAM. Information regarding HFR indices wasobtained from HFR�s website and other public sources and is provided for comparison purposes only. HFR does not endorse or approve any of the statements madeherein.
STANDARDIZED TOTAL RETURNS4For the period ended 3/31/17 One Year Since Inception Inception DateClass A -0.74 % 0.39 % 4/30/13Class C 3.22 1.08 4/30/13Institutional 5.42 2.24 4/30/13Class IR 5.28 2.11 4/30/13Class R 4.69 1.58 4/30/13
4 The Standardized Total Returns are average annual total returns or cumulative total returns (only if the performance period is one year or less) as of themost recent calendar quarter-end. They assume reinvestment of all distributions at NAV. These returns reflect a maximum initial sales charge of 5.50% forClass A Shares and the assumed contingent deferred sales charge for Class C Shares (1% if redeemed within 12 months of purchase). Because Institutional,Class IR and Class R Shares do not involve a sales charge, such a charge is not applied to their Standardized Total Returns.
The returns set forth in the tables above represent past performance. Past performance does not guarantee future results. The Fund��sinvestment return and principal value will fluctuate so that an investor��s shares, when redeemed, may be worth more or less than theiroriginal cost. Current performance may be lower or higher than the performance quoted above. Please visit our web site atwww.GSAMFUNDS.com to obtain the most recent month-end returns. Performance reflects applicable fee waivers and/or expenselimitations in effect during the periods shown. In their absence, performance would be reduced. Returns do not reflect the deduction of taxes thata shareholder would pay on Fund distributions or the redemption of Fund shares.
6
Copyright © 2017 www.secdatabase.com. All Rights Reserved.Please Consider the Environment Before Printing This Document

FUND BASICS
EXPENSE RATIOS5Net Expense Ratio (Current) Gross Expense Ratio (Before Waivers)
Class A 2.62 % 2.85 %Class C 3.37 3.60Institutional 2.22 2.45Class IR 2.38 2.61Class R 2.88 3.11
5 The expense ratios of the Fund, both current (net of applicable fee waivers and/or expense limitations) and before waivers (gross of applicable fee waiversand/or expense limitations) are as set forth above according to the most recent publicly available Prospectus for the Fund, as supplemented, and may differfrom the expense ratios disclosed in the Financial Highlights in this report. Pursuant to a contractual arrangement, the Fund��s waivers and/or expenselimitations will remain in place through at least February 28, 2018, and prior to such date the Investment Adviser may not terminate the arrangementswithout the approval of the Fund��s Board of Trustees. If these arrangements are discontinued in the future, the expense ratios may change withoutshareholder approval.
FUND COMPOSITION (%)6
6 The percentage shown for each investment category reflects the value of investments in that category as a percentage of the Fund�s market value, excluding cash andthe allocation to Russell Investments Implementation Services, LLC, which manages a beta completion mandate. The graph depicts the Fund�s investments but maynot represent the Fund�s market exposure due to the exclusion of certain derivatives, if any, as listed in the Additional Investment Information section of theSchedule of Investments. Short-term investments represent repurchase agreements.
7
Copyright © 2017 www.secdatabase.com. All Rights Reserved.Please Consider the Environment Before Printing This Document

FUND BASICS
TOP TEN HOLDINGS AS OF 4/30/177Holding % of Net Assets Line of BusinessGoldman Sachs Financial Square Government Fund 2.0 % Investment CompaniesUnited States Treasury Note 1.1 U.S. Treasury ObligationsThe Sherwin-Williams Co. 0.6 ChemicalsAxalta Coating Systems Ltd. 0.5 ChemicalsBank of America Corp. 0.4 BanksThe Madison Square Garden Co. Class A 0.4 MediaIntercontinental Exchange, Inc. 0.4 Capital MarketsConduent, Inc. 0.4 IT ServicesMacquarie Infrastructure Corp. 0.4 Transportation InfrastructureBecton Dickinson & Co. 0.3 Health Care Equipment & Supplies
7 The top ten holdings may not be representative of the Fund�s future investments.
UNDERLYING MANAGER ALLOCATION (%)8As of April 30, 2017Algert Global LLC 13.3%Acadian Asset Management LLC 12.1Atreaus Capital, LLC 10.5QMS Capital Management LP 10.3Brigade Capital Management, LP 9.8Graham Capital Management, L.P. 9.2Sirios Capital Management, L.P 7.3YG Partners, LLC 6.6Ares Capital Management II LLC 6.3First Pacific Advisors, LLC 4.1Corsair Capital Management, L.P. 3.7New Mountain Vantage Advisers, L.L.C 3.5One River Asset Management, LLC 3.4
8 The chart above represents capital allocated to the Underlying Managers, as a percentage of net assets, excluding cash and the allocation to Russell InvestmentsImplementation Services, LLC, which manages a beta completion mandate for the Fund, and as such the weightings may not sum to 100%.
STRATEGY ALLOCATION (%)9As of April 30, 2017
9 Equity Long/Short Strategies generally involve long and short investing, based on fundamental evaluations, research and various analytical measurements, in equityand equity-related investments. Relative Value Strategies seek to identify and benefit from pricing discrepancies between related assets. Event Driven and CreditStrategies achieve gains from market movements in security prices caused by specific corporate events or changes in perceived relative value. Tactical TradingStrategies seek to produce total return by long and short investing across global fixed income, currency, equity, and commodity markets. Tactical Trading managerstypically have no bias to be long, short, or neutral but at any given time may have significant long or short exposures in a particular market or asset class. Thepercentages above exclude cash and the allocation to Russell Investments Implementation Services, LLC, which manages a beta completion mandate for the Fund.
8
Copyright © 2017 www.secdatabase.com. All Rights Reserved.Please Consider the Environment Before Printing This Document

GOLDMAN SACHS MULTI-MANAGER ALTERNATIVES FUND
Consolidated Schedule of InvestmentsApril 30, 2017 (Unaudited)
PrincipalAmount
InterestRate
MaturityDate Value
Corporate Obligations �� 9.9%Aerospace & Defense(a) �� 0.1%
Bombardier, Inc.$209,000 7.750 % 03/15/20 $ 226,243
100,000 5.750 03/15/22 99,50040,000 6.000 (b) 10/15/22 39,900150,000 6.125 01/15/23 149,250489,000 7.500 (b) 03/15/25 507,337TransDigm, Inc.(b)155,000 6.500 05/15/25 158,875
1,181,105Banks(b)(c) �� 0.1%
Citigroup, Inc.315,000 6.250 12/29/49 341,775JPMorgan Chase & Co.305,000 5.150 12/29/49 308,050200,000 6.000 12/31/49 211,750
861,575Building Materials(b) �� 0.1%
American Builders & Contractors Supply Co., Inc.(a)137,000 5.750 12/15/23 145,563Builders FirstSource, Inc.(a)281,000 5.625 09/01/24 291,186Summit Materials LLC/Summit Materials Finance Corp.400,000 6.125 07/15/23 418,000
854,749Chemicals �� 0.4%
Alpha 3 BV/Alpha US Bidco, Inc.(a)(b)625,000 6.250 02/01/25 633,594Aruba Investments, Inc.(a)(b)410,000 8.750 02/15/23 428,450Blue Cube Spinco, Inc.(b)520,000 9.750 10/15/23 629,200CF Industries, Inc.125,000 5.150 03/15/34 113,310Cornerstone Chemical Co.(a)(b)1,470,000 9.375 03/15/18 1,484,700Kraton Polymers LLC/Kraton Polymers Capital Corp.(a)(b)72,000 7.000 04/15/25 75,510Rain CII Carbon LLC/CII Carbon Corp.(a)(b)845,000 7.250 04/01/25 847,112TPC Group, Inc.(a)(b)760,000 8.750 12/15/20 708,700Tronox Finance LLC(b)260,000 6.375 08/15/20 263,900304,000 7.500 (a) 03/15/22 318,440
5,502,916Commercial Services(a)(b) �� 0.1%
AMN Healthcare, Inc.425,000 5.125 10/01/24 429,250Prime Security Services Borrower LLC/Prime Finance, Inc.1,185,000 9.250 05/15/23 1,291,650
1,720,900Corporate Obligations �� (continued)Consumer Cyclical Services(b) �� 0.3%
Cenveo Corp.(a)790,000 6.000 08/01/19 643,8501,315,000 8.500 09/15/22 736,400First Data Corp.(a)600,000 5.000 01/15/24 613,500Monitronics International, Inc.880,000 9.125 04/01/20 851,400
Copyright © 2017 www.secdatabase.com. All Rights Reserved.Please Consider the Environment Before Printing This Document

Sabre GLBL, Inc.(a)218,000 5.250 11/15/23 225,630
3,070,780Diversified Financial Services �� 0.2%
ASP AMC Merger Sub, Inc.(a)(b)360,000 8.000 05/15/25 357,300CNG Holdings, Inc.(a)(b)630,000 9.375 05/15/20 573,300Credit Acceptance Corp.(b)580,000 6.125 02/15/21 580,000Springleaf Finance Corp.800,000 7.750 10/01/21 859,000
2,369,600Energy �� 0.3%
Blue Racer Midstream LLC/Blue Racer Finance Corp.(a)(b)1,000,000 6.125 11/15/22 1,025,000Calfrac Holdings LP(a)(b)260,000 7.500 12/01/20 238,550CITGO Petroleum Corp.(a)(b)350,000 6.250 08/15/22 357,000Parker Drilling Co.(b)610,000 6.750 07/15/22 536,800Seadrill Partners Finco LLC730,003 4.147 02/21/21 490,927Seventy Seven Energy, Inc.(b)(d)205,000 6.500 07/15/22 �Weatherford International Ltd.(b)495,000 5.950 04/15/42 436,838
3,085,115Energy �� Exploration & Production �� 0.6%
California Resources Corp.(b)7,500 5.000 01/15/20 6,15024,000 5.500 09/15/21 17,0401,025,000 8.000 (a) 12/15/22 784,1257,500 6.000 11/15/24 4,950CONSOL Energy, Inc.(b)1,395,000 5.875 04/15/22 1,358,382451,000 8.000 04/01/23 469,040Continental Resources, Inc.(b)466,000 4.500 04/15/23 459,010Extraction Oil & Gas Holdings LLC/Extraction Finance Corp.(a)(b)920,000 7.875 07/15/21 963,700Jupiter Resources, Inc.(a)(b)875,000 8.500 10/01/22 713,125MEG Energy Corp.(a)(b)265,000 6.375 01/30/23 233,200160,000 6.500 01/15/25 158,000
The accompanying notes are an integral part of these financial statements. 9
Copyright © 2017 www.secdatabase.com. All Rights Reserved.Please Consider the Environment Before Printing This Document

GOLDMAN SACHS MULTI-MANAGER ALTERNATIVES FUND
Consolidated Schedule of Investments (continued)April 30, 2017 (Unaudited)
PrincipalAmount
InterestRate
MaturityDate Value
Corporate Obligations �� (continued)Energy �� Exploration & Production �� (continued)
Memorial Production Partners LP/Memorial Production FinanceCorp.(b)(d)
$65,000 7.625 % 05/01/21 $ 23,4001,765,000 6.875 08/01/22 617,750Midstates Petroleum Co., Inc./Midstates Petroleum Co. LLC(b)(d)100,000 10.000 06/01/20 �951,000 10.750 10/01/20 �245,000 9.250 06/01/21 �Murray Energy Corp.(a)(b)140,000 11.250 04/15/21 105,000Parsley Energy LLC/Parsley Finance Corp.(a)(b)45,000 5.250 08/15/25 45,281Peabody Energy Corp.(d)95,000 6.250 11/15/21 �Rice Energy, Inc.(b)150,000 6.250 05/01/22 156,750SandRidge Energy, Inc.(b)(d)885,000 7.500 02/15/23 �Southwestern Energy Co.(b)550,000 6.700 01/23/25 547,250Whiting Petroleum Corp.(b)700,000 6.250 04/01/23 703,500
7,365,653Energy �� Services �� 0.3%
Atwood Oceanics, Inc.(b)250,000 6.500 02/01/20 225,000Ensco PLC(b)835,000 5.750 10/01/44 609,550FTS International, Inc.(b)670,000 6.250 05/01/22 575,362Noble Holding International Ltd.(b)355,000 7.750 01/15/24 323,938Precision Drilling Corp.(a)(b)104,000 7.750 12/15/23 110,240Pride International LLC145,000 7.875 08/15/40 131,950Rowan Cos., Inc.(b)875,000 5.850 01/15/44 680,312Transocean, Inc.555,000 5.550 (b) 10/15/22 516,150220,000 9.100 12/15/41 204,050
3,376,552Entertainment & Leisure(b) �� 0.3%
Cedar Fair LP/Canada�s Wonderland Co./Magnum ManagementCorp.
1,130,000 5.375 06/01/24 1,170,962ClubCorp Club Operations, Inc.(a)750,000 8.250 12/15/23 817,500Guitar Center, Inc.(a)2,199,000 9.625 04/15/20 1,209,450Six Flags Entertainment Corp.(a)700,000 4.875 07/31/24 706,125
3,904,037Corporate Obligations �� (continued)Finance �� 0.3%
Ally Financial, Inc.705,000 5.125 09/30/24 719,100Harland Clarke Holdings Corp.(a)(b)765,000 9.250 03/01/21 736,312Icahn Enterprises LP/Icahn Enterprises Finance Corp.(b)700,000 5.875 02/01/22 720,125
Copyright © 2017 www.secdatabase.com. All Rights Reserved.Please Consider the Environment Before Printing This Document

580,000 6.250 (a) 02/01/22 602,475330,000 6.750 (a) 02/01/24 344,438Navient Corp.335,000 6.625 07/26/21 354,497420,000 7.250 09/25/23 437,081Walter Investment Management Corp.352,000 4.500 11/01/19 112,640340,000 7.875 (b) 12/15/21 209,100
4,235,768Food and Beverage(b) �� 0.0%
B&G Foods, Inc.235,000 5.250 04/01/25 239,700Clearwater Seafoods, Inc.(a)165,000 6.875 05/01/25 170,775
410,475Gaming(b) �� 0.3%
Inn of the Mountain Gods Resort & Casino(a)(e)595,000 9.250 11/30/20 535,500Jacobs Entertainment, Inc.(a)955,000 7.875 02/01/24 993,200MGM Growth Properties Operating Partnership LP/MGP Finance
Co-Issuer, Inc.595,000 4.500 09/01/26 592,025Scientific Games International, Inc.660,000 10.000 12/01/22 714,450Seminole Hard Rock Entertainment, Inc./Seminole Hard Rock
International LLC(a)1,231,000 5.875 05/15/21 1,249,465
4,084,640Health Care �� Medical Products(b) �� 0.1%
Halyard Health, Inc.1,000,000 6.250 10/15/22 1,041,250Ortho-Clinical Diagnostics, Inc./Ortho-Clinical Diagnostics SA(a)580,000 6.625 05/15/22 533,600
1,574,850Health Care �� Pharmaceuticals(a)(b) �� 0.2%
Quintiles IMS, Inc.300,000 5.000 10/15/26 307,500Valeant Pharmaceuticals International, Inc.790,000 5.375 03/15/20 675,4501,870,000 7.500 07/15/21 1,547,425595,000 6.125 04/15/25 438,813
2,969,188Health Care �� Services �� 0.7%
Acadia Healthcare Co., Inc.(b)480,000 5.125 07/01/22 484,800
10 The accompanying notes are an integral part of these financial statements.
Copyright © 2017 www.secdatabase.com. All Rights Reserved.Please Consider the Environment Before Printing This Document

GOLDMAN SACHS MULTI-MANAGER ALTERNATIVES FUND
PrincipalAmount
InterestRate
MaturityDate Value
Corporate Obligations �� (continued)Health Care �� Services �� (continued)
BioScrip, Inc.(b)$829,000 8.875 % 02/15/21 $ 700,505
Centene Corp.(b)820,000 4.750 01/15/25 834,350DaVita, Inc.(b)1,000,000 5.000 05/01/25 1,007,500Envision Healthcare Corp.(b)604,000 5.625 07/15/22 622,120HCA, Inc.1,055,000 5.875 05/01/23 1,147,312190,000 7.690 06/15/25 216,600Kindred Healthcare, Inc.275,000 8.000 01/15/20 286,000875,000 6.375 (b) 04/15/22 848,750Molina Healthcare, Inc.(b)385,000 5.375 11/15/22 402,325Select Medical Corp.(b)570,000 6.375 06/01/21 582,825Tenet Healthcare Corp.300,000 7.500 (a)(b) 01/01/22 321,0001,080,000 8.125 04/01/22 1,096,200
8,550,287Health Care Products(a)(b) �� 0.0%
DJO Finco, Inc./DJO Finance LLC/DJO Finance Corp.499,000 8.125 06/15/21 444,110
Home Construction(b) �� 0.1%Century Communities, Inc.560,000 6.875 05/15/22 588,700Masonite International Corp.(a)215,000 5.625 03/15/23 223,600
812,300Insurance(a) �� 0.0%
MGIC Investment Corp.260,000 9.000 04/01/63 337,675
Internet(b) �� 0.0%Zayo Group LLC/Zayo Capital, Inc.500,000 6.375 05/15/25 540,000
Machinery �� 0.2%Boart Longyear Management Pty Ltd.(a)1,400,000 10.000 10/01/18 1,050,000325,000 7.000 (b) 04/01/21 68,250Xerium Technologies, Inc.(b)765,000 9.500 08/15/21 787,950
1,906,200Media �� Broadcasting & Radio(b) �� 0.5%
Cumulus Media Holdings, Inc.1,350,000 7.750 05/01/19 371,250Gray Television, Inc.(a)466,000 5.125 10/15/24 469,495iHeartCommunications, Inc.470,000 9.000 12/15/19 387,7501,201,345 14.000 (f) 02/01/21 348,390365,000 9.000 03/01/21 276,488
Corporate Obligations �� (continued)Media �� Broadcasting & Radio(b) �� (continued)
LIN Television Corp.750,000 5.875 11/15/22 782,812Nexstar Broadcasting, Inc.(a)500,000 6.125 02/15/22 521,250Sinclair Television Group, Inc.(a)850,000 5.625 08/01/24 884,000Sirius XM Radio, Inc.(a)750,000 5.375 04/15/25 768,750The E.W. Scripps Co.(a)140,000 5.125 05/15/25 143,500Townsquare Media, Inc.(a)
Copyright © 2017 www.secdatabase.com. All Rights Reserved.Please Consider the Environment Before Printing This Document

360,000 6.500 04/01/23 363,600Tribune Media Co.150,000 5.875 07/15/22 157,500Univision Communications, Inc.(a)700,000 5.125 02/15/25 695,625
6,170,410Media �� Cable �� 0.4%
Altice US Finance I Corp.(a)(b)582,000 5.375 07/15/23 607,463CSC Holdings LLC515,000 10.125 (a)(b) 01/15/23 596,756280,000 5.250 06/01/24 282,450400,000 10.875 (a)(b) 10/15/25 480,500DISH DBS Corp.720,000 5.000 03/15/23 721,800SFR Group SA(a)(b)300,000 6.000 05/15/22 312,750700,000 6.250 05/15/24 723,625Ziggo Secured Finance BV(a)(b)555,000 5.500 01/15/27 566,100
4,291,444Media �� Non Cable(b) �� 0.4%
Lee Enterprises, Inc.(a)170,000 9.500 03/15/22 178,925Liberty Interactive LLC2,020,357 4.000 11/15/29 1,251,359502,768 3.750 02/15/30 305,432Radio One, Inc.(a)1,615,000 9.250 02/15/20 1,594,812615,000 7.375 04/15/22 639,600The McClatchy Co.545,000 9.000 12/15/22 566,800
4,536,928Metal Fabricate/Hardware(a)(b) �� 0.1%
Grinding Media, Inc./MC Grinding Media Canada, Inc.163,000 7.375 12/15/23 174,003Optimas OE Solutions Holding LLC/Optimas OE Solutions, Inc.645,000 8.625 06/01/21 613,556The Hillman Group, Inc.830,000 6.375 07/15/22 791,612
1,579,171
The accompanying notes are an integral part of these financial statements. 11
Copyright © 2017 www.secdatabase.com. All Rights Reserved.Please Consider the Environment Before Printing This Document

GOLDMAN SACHS MULTI-MANAGER ALTERNATIVES FUND
Consolidated Schedule of Investments (continued)April 30, 2017 (Unaudited)
PrincipalAmount
InterestRate
MaturityDate Value
Corporate Obligations �� (continued)Metals(a)(b) �� 0.0%
Constellium NV$250,000 5.750 % 05/15/24 $ 233,125
Novelis Corp.175,000 6.250 08/15/24 184,188
417,313Metals & Mining �� 0.3%
Allegheny Technologies, Inc.(b)470,000 7.875 08/15/23 485,863Freeport-McMoRan, Inc.(b)244,000 3.875 03/15/23 226,310380,000 5.400 11/14/34 337,250Glencore Funding LLC(a)100,000 2.875 04/16/20 101,024Hecla Mining Co.(b)721,000 6.875 05/01/21 740,827Hudbay Minerals, Inc.(a)(b)104,000 7.250 01/15/23 110,890New Gold, Inc.(a)(b)1,220,000 6.250 11/15/22 1,248,975
3,251,139Packaging(a) �� 0.1%
ARD Finance SA(b)(f)150,000 7.125 09/15/23 155,625Ardagh Packaging Finance PLC/Ardagh Holdings USA, Inc.(b)550,000 7.250 05/15/24 595,375Owens-Brockway Glass Container, Inc.350,000 5.875 08/15/23 375,375
1,126,375Pipelines(b) �� 0.3%
Genesis Energy LP/Genesis Energy Finance Corp.888,000 6.000 05/15/23 888,000NuStar Logistics LP48,000 5.625 04/28/27 49,500Sabine Pass Liquefaction LLC540,000 5.750 05/15/24 596,915Summit Midstream Holdings LLC/Summit Midstream Finance
Corp.1,381,000 5.500 08/15/22 1,387,905Targa Resources Partners LP/Targa Resources Partners Finance
Corp.550,000 5.250 05/01/23 565,125
3,487,445Printing �� 0.0%
RR Donnelley & Sons Co.260,000 6.000 04/01/24 243,750
Property Insurance(a)(b) �� 0.1%HUB International Ltd.700,000 7.875 10/01/21 734,125
Publishing(a)(b) �� 0.1%The Nielsen Co. Luxembourg S.a.r.l.665,000 5.000 02/01/25 665,000
Corporate Obligations �� (continued)Real Estate(b) �� 0.2%
ESH Hospitality, Inc.(a)122,000 5.250 05/01/25 123,525Realogy Group LLC/Realogy Co-Issuer Corp.(a)750,000 4.875 06/01/23 757,500RHP Hotel Properties LP/RHP Finance Corp.15,000 5.000 04/15/21 15,300675,000 5.000 04/15/23 689,344
Copyright © 2017 www.secdatabase.com. All Rights Reserved.Please Consider the Environment Before Printing This Document
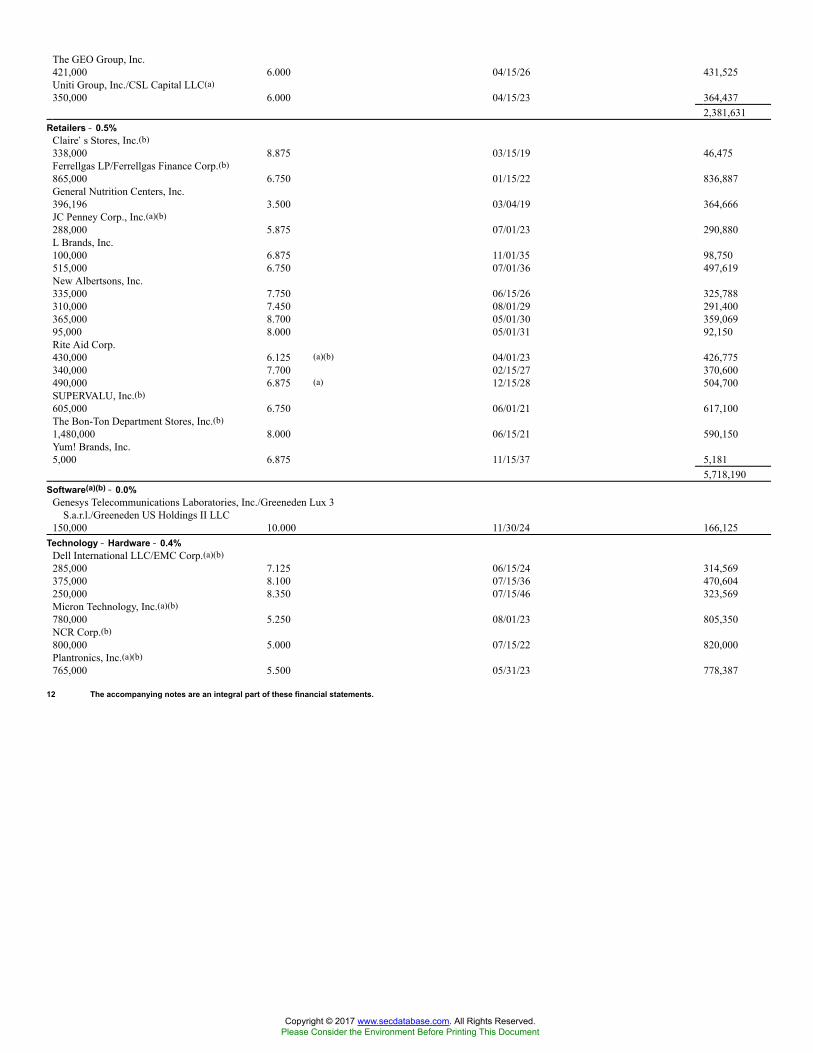
The GEO Group, Inc.421,000 6.000 04/15/26 431,525Uniti Group, Inc./CSL Capital LLC(a)350,000 6.000 04/15/23 364,437
2,381,631Retailers �� 0.5%
Claire�s Stores, Inc.(b)338,000 8.875 03/15/19 46,475Ferrellgas LP/Ferrellgas Finance Corp.(b)865,000 6.750 01/15/22 836,887General Nutrition Centers, Inc.396,196 3.500 03/04/19 364,666JC Penney Corp., Inc.(a)(b)288,000 5.875 07/01/23 290,880L Brands, Inc.100,000 6.875 11/01/35 98,750515,000 6.750 07/01/36 497,619New Albertsons, Inc.335,000 7.750 06/15/26 325,788310,000 7.450 08/01/29 291,400365,000 8.700 05/01/30 359,06995,000 8.000 05/01/31 92,150Rite Aid Corp.430,000 6.125 (a)(b) 04/01/23 426,775340,000 7.700 02/15/27 370,600490,000 6.875 (a) 12/15/28 504,700SUPERVALU, Inc.(b)605,000 6.750 06/01/21 617,100The Bon-Ton Department Stores, Inc.(b)1,480,000 8.000 06/15/21 590,150Yum! Brands, Inc.5,000 6.875 11/15/37 5,181
5,718,190Software(a)(b) �� 0.0%
Genesys Telecommunications Laboratories, Inc./Greeneden Lux 3S.a.r.l./Greeneden US Holdings II LLC
150,000 10.000 11/30/24 166,125Technology �� Hardware �� 0.4%
Dell International LLC/EMC Corp.(a)(b)285,000 7.125 06/15/24 314,569375,000 8.100 07/15/36 470,604250,000 8.350 07/15/46 323,569Micron Technology, Inc.(a)(b)780,000 5.250 08/01/23 805,350NCR Corp.(b)800,000 5.000 07/15/22 820,000Plantronics, Inc.(a)(b)765,000 5.500 05/31/23 778,387
12 The accompanying notes are an integral part of these financial statements.
Copyright © 2017 www.secdatabase.com. All Rights Reserved.Please Consider the Environment Before Printing This Document

GOLDMAN SACHS MULTI-MANAGER ALTERNATIVES FUND
PrincipalAmount
InterestRate
MaturityDate Value
Corporate Obligations �� (continued)Technology �� Hardware �� (continued)
Sensata Technologies BV(a)$ 1,250,000 5.000 % 10/01/25 $ 1,278,125
4,790,604Technology �� Software/Services(a)(b) �� 0.3%
Cengage Learning, Inc.775,000 9.500 06/15/24 699,438Global A&T Electronics Ltd.1,530,000 10.000 02/01/19 1,103,512Rackspace Hosting, Inc.520,000 8.625 11/15/24 551,200Solera LLC/Solera Finance, Inc.200,000 10.500 03/01/24 228,750TIBCO Software, Inc.358,000 11.375 12/01/21 395,590Unisys Corp.875,000 10.750 04/15/22 918,750
3,897,240Telecommunications �� Cellular(b) �� 0.1%
Altice Finco SA(a)140,000 8.125 01/15/24 150,850T-Mobile USA, Inc.520,000 6.000 04/15/24 562,250150,000 6.375 03/01/25 163,875
876,975Telecommunications �� Satellites(b) �� 0.1%
Intelsat Jackson Holdings SA455,000 7.250 10/15/20 425,425380,000 8.000 (a) 02/15/24 409,450Intelsat Luxembourg SA820,000 7.750 06/01/21 475,600
1,310,475Textile & Apparel(a) �� 0.1%
Nine West Holdings, Inc.3,235,000 8.250 03/15/19 792,575
Transportation �� 0.2%Air Medical Group Holdings, Inc.(a)(b)436,000 6.375 05/15/23 422,920Algeco Scotsman Global Finance PLC(a)(b)820,000 8.500 10/15/18 772,850BCD Acquisition, Inc.(a)(b)500,000 9.625 09/15/23 538,750Navistar International Corp.159,000 4.500 10/15/18 157,609242,500 4.750 04/15/19 236,437904,000 8.250 (b) 11/01/21 913,040
3,041,606Utilities �� Electric �� 0.2%
Dynegy, Inc.(b)127,765 8.034 02/02/24 117,544GenOn Americas Generation LLC550,000 8.500 10/01/21 499,125495,000 9.125 05/01/31 445,500
Corporate Obligations �� (continued)Utilities �� Electric �� (continued)
NRG Energy, Inc.(b)570,000 6.250 05/01/24 567,150NSG Holdings LLC/NSG Holdings, Inc.(a)300,428 7.750 12/15/25 323,711Texas Competitive Electric Holdings Co. LLC/TCEH Finance,
Inc.(a)(b)(d)3,500,000 11.500 10/01/20 �
1,953,030Wireless Telecommunications �� 0.7%
Altice Financing SA(a)(b)350,000 6.500 01/15/22 367,500
Copyright © 2017 www.secdatabase.com. All Rights Reserved.Please Consider the Environment Before Printing This Document
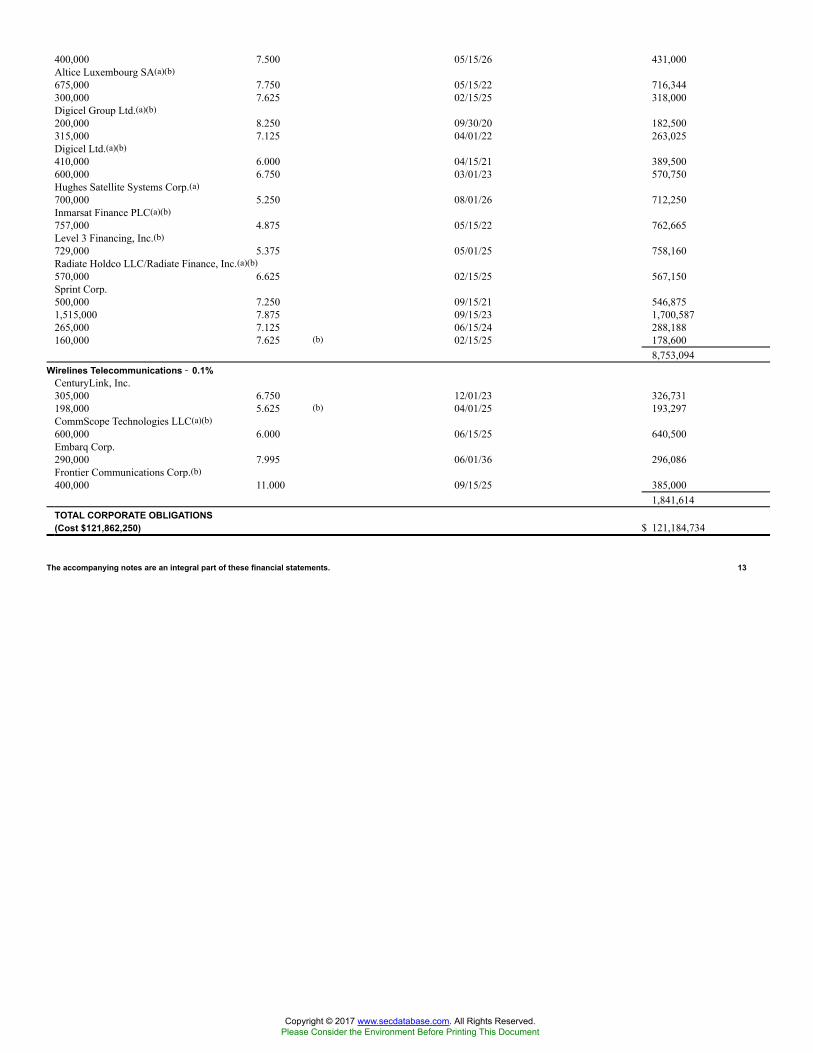
400,000 7.500 05/15/26 431,000Altice Luxembourg SA(a)(b)675,000 7.750 05/15/22 716,344300,000 7.625 02/15/25 318,000Digicel Group Ltd.(a)(b)200,000 8.250 09/30/20 182,500315,000 7.125 04/01/22 263,025Digicel Ltd.(a)(b)410,000 6.000 04/15/21 389,500600,000 6.750 03/01/23 570,750Hughes Satellite Systems Corp.(a)700,000 5.250 08/01/26 712,250Inmarsat Finance PLC(a)(b)757,000 4.875 05/15/22 762,665Level 3 Financing, Inc.(b)729,000 5.375 05/01/25 758,160Radiate Holdco LLC/Radiate Finance, Inc.(a)(b)570,000 6.625 02/15/25 567,150Sprint Corp.500,000 7.250 09/15/21 546,8751,515,000 7.875 09/15/23 1,700,587265,000 7.125 06/15/24 288,188160,000 7.625 (b) 02/15/25 178,600
8,753,094Wirelines Telecommunications �� 0.1%
CenturyLink, Inc.305,000 6.750 12/01/23 326,731198,000 5.625 (b) 04/01/25 193,297CommScope Technologies LLC(a)(b)600,000 6.000 06/15/25 640,500Embarq Corp.290,000 7.995 06/01/36 296,086Frontier Communications Corp.(b)400,000 11.000 09/15/25 385,000
1,841,614TOTAL CORPORATE OBLIGATIONS(Cost $121,862,250) $ 121,184,734
The accompanying notes are an integral part of these financial statements. 13
Copyright © 2017 www.secdatabase.com. All Rights Reserved.Please Consider the Environment Before Printing This Document

GOLDMAN SACHS MULTI-MANAGER ALTERNATIVES FUND
Consolidated Schedule of Investments (continued)April 30, 2017 (Unaudited)
Shares Description ValueCommon Stocks �� 20.5%Aerospace & Defense �� 0.9%40,844 Airbus SE $ 3,303,97756,440 Arconic, Inc. 1,542,5058,671 BWX Technologies, Inc. 426,3533,106 Huntington Ingalls Industries, Inc. 623,965138,670 Meggitt PLC 830,43417,975 Orbital ATK, Inc.(g) 1,779,52516,320 United Technologies Corp.(g) 1,941,917
10,448,676Air Freight & Logistics �� 0.3%21,893 FedEx Corp. 4,153,102
Auto Components �� 0.0%6,518 Adient PLC 479,464
Automobiles �� 0.0%19,297 Fiat Chrysler Automobiles NV* 219,407368 General Motors Co. 12,747
232,154Banks �� 1.7%2,065,439 Banco Comercial Portugues SA Class R* 461,444231,633 Bank of America Corp. 5,406,3148,883 Bank of the Ozarks, Inc. 421,67679,348 CIT Group, Inc. 3,674,60639,654 Citigroup, Inc.(g) 2,344,34479,982 Citizens Financial Group, Inc.(g) 2,936,13938,937 JPMorgan Chase & Co. 3,387,51933,029 Regions Financial Corp. 454,14910,004 Signature Bank* 1,385,0549,164 Western Alliance Bancorp* 438,956
20,910,201Beverages �� 0.1%9,768 Constellation Brands, Inc. Class A 1,685,371
Biotechnology �� 0.1%6,228 Shire PLC ADR 1,102,107
Building Products �� 0.1%14,428 Fortune Brands Home & Security, Inc. 919,641
Capital Markets �� 0.9%16,825 Affiliated Managers Group, Inc. 2,786,05232,459 Apollo Global Management LLC Class A 868,9274,422 Hamilton Lane, Inc. Class A* 82,78084,965 Intercontinental Exchange, Inc.(g) 5,114,89313,600 Legg Mason, Inc. 508,36815,440 LPL Financial Holdings, Inc. 649,09755,773 OM Asset Management PLC 867,8283,903 State Street Corp. 327,462
11,205,407Chemicals �� 1.6%28,732 Akzo Nobel NV 2,512,961205,253 Axalta Coating Systems Ltd.*(g) 6,438,787
Common Stocks �� (continued)Chemicals �� (continued)1,788 Kraton Corp.* 58,48517,884 Olin Corp. 574,61318,082 PPG Industries, Inc. 1,986,12722,861 The Sherwin-Williams Co. 7,651,1208,025 Valvoline, Inc. 178,556
19,400,649Commercial Services & Supplies(g) �� 0.1%23,225 KAR Auction Services, Inc. 1,013,074
Communications Equipment �� 0.4%35,870 Cisco Systems, Inc. 1,222,09115,771 CommScope Holding Co., Inc.* 663,013
Copyright © 2017 www.secdatabase.com. All Rights Reserved.Please Consider the Environment Before Printing This Document

52,419 Juniper Networks, Inc. 1,576,2397,880 Palo Alto Networks, Inc.* 854,271
4,315,614Construction Materials �� 0.2%23,064 Vulcan Materials Co.(g) 2,787,976
Consumer Finance �� 0.3%84,589 Ally Financial, Inc.(g) 1,674,8629,100 American Express Co. 721,1751,306 Capital One Financial Corp. 104,9763,376 Discover Financial Services 211,304425 Encore Capital Group, Inc.* 14,17436,163 Synchrony Financial 1,005,331
3,731,822Containers & Packaging �� 0.6%20,482 Ball Corp. 1,574,86166,105 Crown Holdings, Inc.*(g) 3,707,83061,004 Graphic Packaging Holding Co. 828,43423,499 Orora Ltd. 52,98333,030 Owens-Illinois, Inc.* 720,71510,100 Sealed Air Corp. 444,602
7,329,425Diversified Consumer Services �� 0.2%6,876 Houghton Mifflin Harcourt Co.* 79,07470,088 Service Corp. International(g) 2,258,235
2,337,309Diversified Financial Services �� 0.4%4,480 Berkshire Hathaway, Inc. Class B* 740,14159,955 ECN Capital Corp. 163,38810,570 Groupe Bruxelles Lambert SA 1,013,85655,670 Leucadia National Corp. 1,413,46133,650 Voya Financial, Inc.(g) 1,257,837
4,588,683Diversified Telecommunication Services(a) �� 0.1%76,193 Cellnex Telecom SA 1,344,856
Electronic Equipment, Instruments & Components �� 0.1%15,740 TE Connectivity Ltd. 1,217,804
14 The accompanying notes are an integral part of these financial statements.
Copyright © 2017 www.secdatabase.com. All Rights Reserved.Please Consider the Environment Before Printing This Document

GOLDMAN SACHS MULTI-MANAGER ALTERNATIVES FUND
Shares Description ValueCommon Stocks �� (continued)Energy Equipment & Services �� 0.3%9,957 Halliburton Co. $ 456,82769,600 Nabors Industries Ltd. 719,66428,739 National Oilwell Varco, Inc. 1,005,0032,017 Patterson-UTI Energy, Inc. 43,661102,923 Precision Drilling Corp.* 409,41553,191 Te Holdcorp LLC/Te Holdcorp 531,90516,158 TechnipFMC PLC* 486,841
3,653,316Equity Real Estate Investment Trusts (REITs) �� 0.4%86,702 Colony NorthStar, Inc. Class A(g) 1,133,19533,173 Equity Commonwealth* 1,061,20455,317 MGM Growth Properties LLC Class A 1,583,17314,764 Ryman Hospitality Properties, Inc.(g) 941,64810,180 Xenia Hotels & Resorts, Inc. 177,743
4,896,963Food & Staples Retailing �� 0.0%30,220 Lenta Ltd.*(a) 192,5013,048 Walgreens Boots Alliance, Inc. 263,774
456,275Food Products �� 0.1%3,958 AdvancePierre Foods Holdings, Inc. 160,77410,691 Nestle SA 823,42639,179 Nomad Foods Ltd.* 462,312
1,446,512Health Care Equipment & Supplies �� 0.6%22,338 Becton Dickinson & Co. 4,176,53613,728 Boston Scientific Corp.* 362,1448,289 C.R. Bard, Inc. 2,548,702
7,087,382Health Care Providers & Services �� 0.4%9,861 Aetna, Inc.(h) 1,331,92510,620 HCA Holdings, Inc.*(h) 894,3104,804 McKesson Corp.(h) 664,3453,660 Millennium Health LLC 4,20919,653 Universal Health Services, Inc. Class B 2,373,297
5,268,086Health Care Technology* �� 0.1%25,271 Cotiviti Holdings, Inc. 1,056,075
Hotels, Restaurants & Leisure �� 0.9%57,504 Aramark(g)(h) 2,100,04615,511 Dunkin� Brands Group, Inc. 866,44513,795 Extended Stay America, Inc. 240,58560,384 ILG, Inc.(g) 1,455,85849,189 La Quinta Holdings, Inc.* 694,0571,732 Marriott International, Inc. Class A 163,5359,156 McDonald�s Corp. 1,281,199120,978 MGM Resorts International(g) 3,715,234
Common Stocks �� (continued)Hotels, Restaurants & Leisure �� (continued)8,057 Six Flags Entertainment Corp. 504,449
11,021,408Household Durables �� 0.1%39,004 D.R. Horton, Inc. 1,282,842
Household Products �� 0.1%9,051 Spectrum Brands Holdings, Inc.(g) 1,300,900
Independent Power and Renewable Electricity Producers �� 0.1%50,889 Vistra Energy Corp. 760,791
Industrial Conglomerates �� 0.1%23,530 General Electric Co. 682,1357,110 Jardine Strategic Holdings Ltd. 300,439
982,574Insurance �� 0.7%40,106 American International Group, Inc.(h) 2,442,8573,365 AmTrust Financial Services, Inc. 54,00827,515 Aon PLC(g) 3,297,398
Copyright © 2017 www.secdatabase.com. All Rights Reserved.Please Consider the Environment Before Printing This Document

33,280 FNF Group(g) 1,362,8161,065 Loews Corp. 49,6502,714 MetLife, Inc. 140,61211,531 Willis Towers Watson PLC 1,529,241
8,876,582Internet & Direct Marketing Retail* �� 0.1%14,397 Liberty Expedia Holdings, Inc. Class A 695,5192,578 Liberty Ventures Series A 138,825
834,344Internet Software & Services* �� 0.5%2,270 Alphabet, Inc. Class A(h) 2,098,660819 Alphabet, Inc. Class C 741,9814,750 Baidu, Inc. ADR 856,09332,444 IAC/InterActiveCorp.(g) 2,693,177
6,389,911IT Services �� 1.9%3,200 Alliance Data Systems Corp. 798,81655,894 Cognizant Technology Solutions Corp. Class A* 3,366,496313,362 Conduent, Inc.*(g) 5,110,93413,530 Convergys Corp. 304,56086,159 CoreLogic, Inc.*(g) 3,682,43625,873 CSRA, Inc. 752,38722,148 DXC Technology Co.* 1,668,63047,713 EVERTEC, Inc. 756,25159,452 First Data Corp. Class A* 928,64027,744 Gartner, Inc.*(g) 3,165,31357,567 Leidos Holdings, Inc.(g) 3,031,478
23,565,941Life Sciences Tools & Services �� 0.2%22,059 Quintiles IMS Holdings, Inc.*(g) 1,859,133
The accompanying notes are an integral part of these financial statements. 15
Copyright © 2017 www.secdatabase.com. All Rights Reserved.Please Consider the Environment Before Printing This Document

GOLDMAN SACHS MULTI-MANAGER ALTERNATIVES FUND
Consolidated Schedule of Investments (continued)April 30, 2017 (Unaudited)
Shares Description ValueCommon Stocks �� (continued)Life Sciences Tools & Services �� (continued)4,210 Thermo Fisher Scientific, Inc. $ 696,039
2,555,172Machinery �� 0.3%34,088 Allison Transmission Holdings, Inc.(g) 1,318,52410,061 Flowserve Corp. 511,8031,107 Fortive Corp. 70,02924,370 Kennametal, Inc.(g) 1,013,30516,681 Mueller Water Products, Inc. Class A 187,6618,585 Pentair PLC 553,8189,883 SPX Corp.* 237,785
3,892,925Media �� 2.0%4,237 Cable One, Inc.(g) 2,889,0414,484 Charter Communications, Inc. Class A* 1,547,69814,436 DISH Network Corp. Class A* 930,25620,815 Liberty Global PLC Class A* 737,26748,830 Liberty Global PLC LiLAC Class A* 1,048,38034,933 Liberty Global PLC Series C* 1,209,03111,702 Liberty Media Corp.-Liberty Formula One Class A* 396,81533,512 Liberty Media Corp.-Liberty SiriusXM Class A* 1,276,80741,636 MSG Networks, Inc. Class A* 1,038,81812,161 Naspers Ltd. 2,312,432648 Quebecor, Inc. Class B 19,78138,848 Regal Entertainment Group Class A 857,37527,594 Sinclair Broadcast Group, Inc. Class A 1,088,58326,670 The Madison Square Garden Co. Class A*(g) 5,381,20629,414 Time Warner, Inc. 2,919,9289,409 World Wrestling Entertainment, Inc. Class A 201,63538,500 WPP PLC 824,420
24,679,473Metals & Mining �� 0.1%13,630 Alcoa Corp. 459,74065,048 Ferroglobe PLC 627,71353,835 Ferroglobe Representation & Warranty Insurance Trust �16,220 MMC Norilsk Nickel PJSC ADR 249,626
1,337,079Oil, Gas & Consumable Fuels �� 0.4%12,809 ConocoPhillips 613,679118 Energy & Exploration Partners, Inc.* 41,30047,030 Gazprom PJSC ADR 222,92229,450 Linn Energy, Inc.* 825,4835,390 LUKOIL PJSC ADR 267,5424,403 Midstates Petroleum Co., Inc.* 81,7202,300 Occidental Petroleum Corp. 141,5429,486 Parsley Energy, Inc. Class A* 282,5881,515 Peabody Energy Corp.* 38,496605 Phillips 66 48,134
Common Stocks �� (continued)Oil, Gas & Consumable Fuels �� (continued)21,170 Rosneft Oil Co. PJSC GDR 117,1762,009 SandRidge Energy, Inc.* 37,006145,730 Surgutneftegas OJSC 78,08919,917 TransCanada, Corp. 924,94513,271 Western Gas Partners LP 779,140
4,499,762Paper & Forest Products* �� 0.0%2,280 Clearwater Paper Corp. 110,808
Personal Products �� 0.1%4,434 The Estee Lauder Cos., Inc. Class A 386,3796,510 Unilever NV 341,029
727,408
Copyright © 2017 www.secdatabase.com. All Rights Reserved.Please Consider the Environment Before Printing This Document

Pharmaceuticals �� 0.2%3,456 Allergan PLC(h) 842,78017,580 Mylan NV* 656,61321,958 Zoetis, Inc.(g) 1,232,064
2,731,457Professional Services* �� 0.1%12,299 IHS Markit Ltd. 533,7762,817 The Advisory Board Co. 143,949
677,725Road & Rail �� 0.1%2,073 Kyushu Railway Co. 64,99314,106 Union Pacific Corp. 1,579,308
1,644,301Semiconductors & Semiconductor Equipment �� 0.1%11,130 Analog Devices, Inc. 848,1061,646 MModal, Inc. 31,2658,060 QUALCOMM, Inc. 433,144
1,312,515Software �� 0.9%20,790 Microsoft Corp.(g) 1,423,283111,249 Nuance Communications, Inc.* 1,990,24581,173 Oracle Corp.(g) 3,649,53829,845 PTC, Inc.* 1,613,12227,992 Verint Systems, Inc.* 1,100,0865,451 VMware, Inc. Class A* 513,048
10,289,322Specialty Retail �� 0.2%3,800 Advance Auto Parts, Inc. 540,13217,832 CarMax, Inc.* 1,043,1728,255 The Home Depot, Inc. 1,288,605
2,871,909Technology Hardware, Storage & Peripherals �� 0.5%83,653 NetApp, Inc. 3,333,57231,636 Western Digital Corp. 2,817,819
6,151,391
16 The accompanying notes are an integral part of these financial statements.
Copyright © 2017 www.secdatabase.com. All Rights Reserved.Please Consider the Environment Before Printing This Document

GOLDMAN SACHS MULTI-MANAGER ALTERNATIVES FUND
Shares Description ValueCommon Stocks �� (continued)Trading Companies & Distributors* �� 0.2%
1,386 AerCap Holdings NV $ 63,77036,801 HD Supply Holdings, Inc.(g) 1,483,08090,061 Nexeo Solutions, Inc. 820,456
2,367,306Transportation Infrastructure �� 0.4%
61,805 Macquarie Infrastructure Corp.(g) 5,029,073Wireless Telecommunication Services �� 0.2%
474,805 VEON Ltd. ADR 1,960,945TOTAL COMMON STOCKS(Cost $214,923,628) $ 250,921,808
PrincipalAmount
InterestRate
MaturityDate Value
Bank Loans(i) �� 3.8%Automotive �� Parts �� 0.1%
Evergreen Skills Lux S.a.r.l.$ 329,954 5.750 % 04/28/21 $ 308,233
Gates Global LLC704,376 4.408 04/01/24 707,546
1,015,779Building Materials �� 0.2%
Engility Corp.371,206 4.750 08/12/23 373,526Jeld-Wen, Inc.583,444 4.147 07/01/22 589,278Preferred Proppants LLC866,288 8.750 07/27/20 792,653Quikrete Holdings, Inc.426,501 4.243 11/15/23 427,124
2,182,581Chemicals �� 0.1%
AgroFresh, Inc.920,592 5.897 07/31/21 912,537
Commercial Services & Supplies �� 0.0%Fort Dearborn Co.548,537 5.150 10/19/23 554,022
Consumer Cyclical Services �� 0.1%Monitronics International, Inc.652,754 6.647 09/30/22 661,964
Consumer Products �� Household & Leisure �� 0.0%Calceus Acquisition, Inc.430,741 5.000 01/31/20 371,515
Energy �� 0.1%Chief Exploration & Development LLC138,130 7.932 05/16/21 132,605FTS International, Inc.75,000 5.750 04/16/21 65,062Gulf Finance LLC253,236 6.250 08/25/23 252,603
Bank Loans(i) �� (continued)Energy �� (continued)
KCA Deutag US Finance LLC760,388 6.807 05/15/20 720,467
1,170,737Energy �� Exploration & Production �� 0.1%
Energy & Exploration Partners, Inc.87,478 13.000 11/12/21 83,97945,763 0.000 05/13/22 20,593Murray Energy Corp.549,754 8.397 04/16/20 524,251
628,823Finance �� 0.1%
Quality Care Properties, Inc.687,377 6.250 10/31/22 698,980
Gaming �� 0.3%Affinity Gaming LLC
Copyright © 2017 www.secdatabase.com. All Rights Reserved.Please Consider the Environment Before Printing This Document

599,954 9.397 09/14/24 604,082Cowlitz Tribal Gaming Authority795,386 11.500 12/04/21 874,925Mashantucket (Western) Pequot Tribe158,784 5.000 07/01/18 147,1411,883,476 9.375 06/30/20 1,715,846
3,341,994Health Care �� Medical Products �� 0.2%
Carestream Health, Inc.1,062,858 5.147 06/07/19 1,053,3881,295,030 9.647 12/07/19 1,271,901
2,325,289Health Care �� Services �� 0.4%
Air Medical Group Holdings, Inc.1,024,918 4.250 04/28/22 1,017,231Alliance Healthcare Services, Inc.1,024,841 4.288 06/03/19 1,021,849American Renal Holdings, Inc.445,540 4.750 09/20/19 448,048BioClinica, Inc.443,943 5.375 10/20/23 446,718BPA Laboratories, Inc.160,673 3.672 04/29/20 109,258Community Health Systems, Inc.606,825 4.054 01/27/21 602,777Ortho-Clinical Diagnostics, Inc.544,933 4.750 06/30/21 541,984U.S. Renal Care, Inc.707,660 5.397 12/31/22 670,508
4,858,373Health Care Products �� 0.0%
DJO Finco, Inc./DJO Finance LLC/DJO Finance Corp.112,999 4.250 06/08/20 110,287
Machinery �� 0.0%Boart Longyear Management Pty Ltd.8,000 10.000 01/02/18 8,000
The accompanying notes are an integral part of these financial statements. 17
Copyright © 2017 www.secdatabase.com. All Rights Reserved.Please Consider the Environment Before Printing This Document

GOLDMAN SACHS MULTI-MANAGER ALTERNATIVES FUND
Consolidated Schedule of Investments (continued)April 30, 2017 (Unaudited)
PrincipalAmount
InterestRate
MaturityDate Value
Bank Loans(i) �� (continued)Media �� Broadcasting & Radio �� 0.2%
AP NMT Acquisition BV$ 450,951 6.898 % 08/13/21 $ 396,413
Cumulus Media Holdings, Inc.1,486,602 4.250 12/23/20 1,161,675EIG Investors Corp.566,887 6.532 11/09/19 568,775ION Media Networks, Inc.715,014 4.500 12/18/20 721,721
2,848,584Media �� Cable �� 0.1%
Virgin Media Investment Holdings Ltd.934,298 3.744 01/31/25 937,586
Media �� Non Cable �� 0.1%Affinion Group, Inc.846,120 6.750 04/30/18 843,886210,000 8.500 10/31/18 210,321Checkout Holding Corp.346,272 4.500 04/09/21 316,839
1,371,046Metals & Mining �� 0.0%
Fairmount Santrol, Inc.364,057 4.647 09/05/19 357,686
Packaging �� 0.1%Expera Specialty Solutions LLC717,342 5.750 11/03/23 718,239
Pharmaceuticals �� 0.1%Lantheus Medical Imaging, Inc.547,079 5.500 06/30/22 547,992Valeant Pharmaceuticals International, Inc.484,631 5.740 04/01/22 487,408
1,035,400Property/Casualty Insurance �� 0.0%
York Risk Services Holding Corp.124,888 4.897 10/01/21 121,714
Real Estate �� 0.1%DTZ U.S. Borrower LLC1,045,466 4.304 11/04/21 1,049,240Empire Generating Co. LLC540,238 5.430 03/14/21 537,53754,381 5.430 03/14/21 54,109
1,640,886Restaurants �� 0.1%
Red Lobster Management LLC759,309 6.250 07/28/21 763,105
Retailers �� 0.2%Academy Ltd.520,715 5.172 07/01/22 357,992Claire�s Stores, Inc.204,213 9.000 09/20/21 160,307442,439 9.000 09/20/21 309,707136,148 9.000 09/20/21 68,074
Bank Loans(i) �� (continued)Retailers �� (continued)
Gymboree Corp.1,072,739 5.000 02/23/18 481,907Hoffmaster Group, Inc.942,041 5.500 11/21/23 953,816Wilton Brands LLC554,805 8.500 08/30/18 543,708
2,875,511
Copyright © 2017 www.secdatabase.com. All Rights Reserved.Please Consider the Environment Before Printing This Document

Semiconductors & Semiconductor Equipment �� 0.1%Lumileds Holding B.V.600,796 5.500 02/27/24 607,555
Services Cyclical �� Business Services �� 0.2%Acosta Holdco, Inc.799,374 4.250 09/26/21 743,082Brickman Group Ltd.496,318 4.000 12/18/20 497,971Koosharem LLC616,304 7.647 05/16/20 571,511Tribune Publishing Co.883,542 5.750 07/07/21 879,125Weight Watchers International, Inc.228,451 4.000 04/02/20 216,672
2,908,361Technology �� Hardware �� 0.1%
Diebold, Inc.205,000 3.000 11/06/23 205,129409,425 5.500 11/06/23 411,730
616,859Technology �� Software �� 0.1%
Aricent Technologies Ltd.975,458 5.500 04/14/21 975,868
Technology �� Software/Services �� 0.4%BMC Software Finance, Inc.579,558 5.000 09/13/22 582,636Conduent, Inc.562,092 4.986 12/07/23 571,462Go Daddy Operating Co. LLC403,207 3.493 02/15/24 404,772Misys Europe SA200,913 8.250 04/27/25 204,931MModal, Inc.2,061,087 9.000 01/31/20 1,978,643Optiv Security, Inc.274,194 4.250 02/01/24 273,736Syniverse Holdings, Inc.440,877 4.147 04/23/19 404,505974,696 4.172 04/23/19 890,930
5,311,615Telecommunication Services �� 0.0%
Digicel International Finance Ltd.390,441 4.647 03/31/19 385,560
18 The accompanying notes are an integral part of these financial statements.
Copyright © 2017 www.secdatabase.com. All Rights Reserved.Please Consider the Environment Before Printing This Document

GOLDMAN SACHS MULTI-MANAGER ALTERNATIVES FUND
PrincipalAmount
InterestRate
MaturityDate Value
Bank Loans(i) �� (continued)Telecommunications �� Internet & Data �� 0.1%
Asurion LLC$ 569,773 4.243 % 07/08/20 $ 573,453
1,120,000 8.500 03/03/21 1,136,3301,709,783
Textiles �� 0.0%Indra Holdings Corp.635,308 5.422 05/01/21 388,065
Transportation �� 0.0%Syncreon Group Holdings B.V.482,637 5.250 10/28/20 435,884
Utilities �� 0.1%Longview Power LLC981,802 7.000 04/13/21 797,714
Wireless Telecommunications �� 0.0%Intelsat Jackson Holdings SA266,889 3.750 06/30/19 263,157TOTAL BANK LOANS(Cost $45,708,206) $ 45,911,059
Asset-Backed Securities �� 0.1%Home Equity(a)(c) �� 0.1%
ALM XIV Ltd. Series 14-14A, Class D$ 625,000 5.889 % 07/28/26 $ 599,576Other �� 0.0%
EFIH Intercompany Claim105,640 1.000 11/02/26 12,677TOTAL ASSET-BACKED SECURITIES(Cost $626,782) $ 612,253
Foreign Debt Obligations �� 0.1%Provincia de Buenos Aires(a)
$ 420,000 9.125 % 03/16/24 $ 475,650Republic of Argentina340,000 6.875 01/26/27 358,530600,000 2.260 (e) 12/31/38 406,854505,000 2.260 (e) 12/31/38 350,686TOTAL FOREIGN DEBT OBLIGATIONS(Cost $1,430,163) $ 1,591,720
Municipal Debt Obligations(b) �� 0.2%Puerto Rico �� 0.1%(d)
Puerto Rico Commonwealth GO Bonds (Unrefunded) (Balance-Public Improvement) Series A
$ 115,000 5.000 % 07/01/33 $ 70,294Puerto Rico Commonwealth GO Bonds Refunding for Public
Improvement Series 2011 A5,000 6.500 07/01/40 3,144
Municipal Debt Obligations(b) �� (continued)Puerto Rico �� (continued)
Puerto Rico Commonwealth GO Bonds Refunding for PublicImprovement Series 2012 A
420,000 5.750 07/01/28 259,87570,000 5.125 07/01/37 42,350245,000 5.500 07/01/39 151,90020,000 5.000 07/01/41 12,000Puerto Rico Commonwealth GO Bonds Series 2007 A5,000 5.250 07/01/29 3,0695,000 5.250 07/01/33 3,06985,000 5.250 07/01/37 52,169Puerto Rico Commonwealth GO Bonds Series 2014 A1,235,000 8.000 07/01/35 778,050Puerto Rico Government Development Bank Revenue Bonds
(Senior Notes) Series C55,000 5.400 08/01/19 11,687
Copyright © 2017 www.secdatabase.com. All Rights Reserved.Please Consider the Environment Before Printing This Document
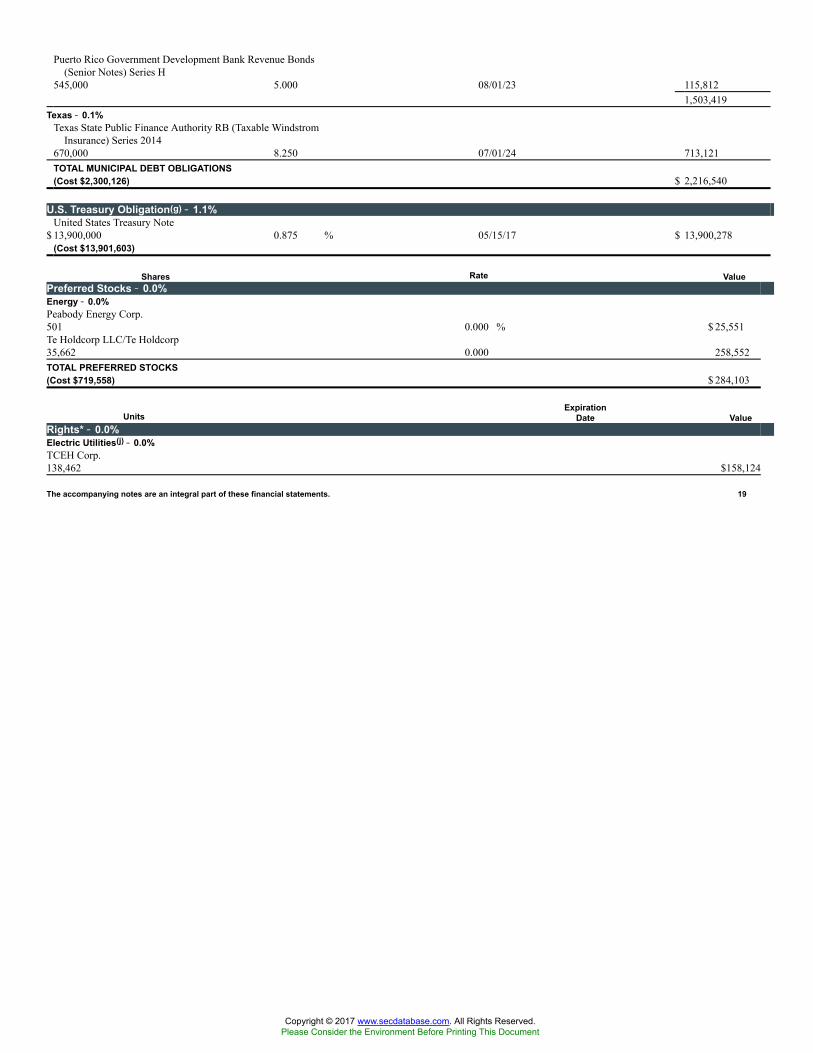
Puerto Rico Government Development Bank Revenue Bonds(Senior Notes) Series H
545,000 5.000 08/01/23 115,8121,503,419
Texas �� 0.1%Texas State Public Finance Authority RB (Taxable Windstrom
Insurance) Series 2014670,000 8.250 07/01/24 713,121TOTAL MUNICIPAL DEBT OBLIGATIONS(Cost $2,300,126) $ 2,216,540
U.S. Treasury Obligation(g) �� 1.1%United States Treasury Note
$ 13,900,000 0.875 % 05/15/17 $ 13,900,278(Cost $13,901,603)
Shares Rate ValuePreferred Stocks �� 0.0%Energy �� 0.0%Peabody Energy Corp.501 0.000 % $ 25,551Te Holdcorp LLC/Te Holdcorp35,662 0.000 258,552TOTAL PREFERRED STOCKS(Cost $719,558) $ 284,103
UnitsExpiration
Date ValueRights* �� 0.0%Electric Utilities(j) �� 0.0%TCEH Corp.138,462 $158,124
The accompanying notes are an integral part of these financial statements. 19
Copyright © 2017 www.secdatabase.com. All Rights Reserved.Please Consider the Environment Before Printing This Document

GOLDMAN SACHS MULTI-MANAGER ALTERNATIVES FUND
Consolidated Schedule of Investments (continued)April 30, 2017 (Unaudited)
Shares DescriptionExpiration
Date ValueRights* �� (continued)Hotels, Restaurants & Leisure �� 0.0%
Caesars Entertainment Operating Co., Inc.164,914 03/30/26 $ �TOTAL RIGHTS(Cost $204,051) $ 158,124
Warrants �� 0.0%Independent Power and Renewable Electricity Producers* �� 0.0%
Dynegy, Inc.6,085 02/02/24 $ 2,130
Life Sciences Tools & Services* �� 0.0%Lion Holdings, Inc. Series A540 04/29/24 �Lion Holdings, Inc. Series B860 04/29/24 �
�
Oil, Gas & Consumable Fuels �� 0.0%Midstates Petroleum Co., Inc.3,926 04/21/20 �Peabody Energy Corp.*3 07/03/17 76Peabody Energy Corp.*66 07/03/17 1,677SandRidge Energy, Inc.*1,740 10/04/22 1,740SandRidge Energy, Inc.*732 10/04/22 410
3,903Semiconductors & Semiconductor Equipment* �� 0.0%
MModal, Inc. Warrant A516 07/31/17 129MModal, Inc. Warrant B681 07/31/17 43TOTAL WARRANTS(Cost $22,533) $ 6,205
SharesDistribution
Rate ValueInvestment Company(c)(k) �� 2.0%
Goldman Sachs Financial Square Government Fund �Institutional Shares
24,218,587 0.656 % $ 24,218,587(Cost $24,218,587)
PrincipalAmount
InterestRate
MaturityDate Value
Short-term Investment(l) �� 46.9%Repurchase Agreements �� 46.9%
Joint Repurchase Agreement Account II$ 573,400,000 0.821 % 05/01/17 $ 573,400,000
(Cost $573,400,000)TOTAL INVESTMENTS BEFORE SHORTPOSITIONS �� 84.6%(Cost $999,317,487) $ 1,034,405,411
Shares Description ValueCommon Stocks Sold Short �� (2.9)%Aerospace & Defense �� (0.3)%14,838 Spirit AeroSystems Holdings, Inc. Class A $ (848,140 )3,021 The Boeing Co. (558,371 )7,761 TransDigm Group, Inc. (1,914,872 )14,460 Triumph Group, Inc. (378,852 )
Copyright © 2017 www.secdatabase.com. All Rights Reserved.Please Consider the Environment Before Printing This Document

(3,700,235 )Air Freight & Logistics �� (0.1)%9,480 C.H. Robinson Worldwide, Inc. (689,196 )
Auto Components �� (0.1)%7,500 LCI Industries (758,625 )9,713 The Goodyear Tire & Rubber Co. (351,902 )
(1,110,527 )Automobiles �� (0.0)%6,690 Ford Motor Co. (76,734 )
Banks �� (0.0)%40,379 Huntington Bancshares, Inc. (519,274 )
Chemicals �� (0.1)%10,037 H.B. Fuller Co. (530,255 )1,328 The Dow Chemical Co. (83,398 )
(613,653 )Commercial Services & Supplies �� (0.1)%18,832 HNI Corp. (880,584 )1,510 Pitney Bowes, Inc. (20,068 )
(900,652 )Construction & Engineering* �� (0.1)%8,582 Dycom Industries, Inc. (906,774 )
Containers & Packaging �� (0.1)%15,416 Bemis Co., Inc. (692,641 )2,143 Crown Holdings, Inc.* (120,201 )
(812,842 )Diversified Consumer Services* �� (0.0)%14,400 ServiceMaster Global Holdings, Inc. (548,640 )
Diversified Telecommunication Services �� (0.1)%460 Iridium Communications, Inc.* (4,876 )19,528 Verizon Communications, Inc. (896,531 )
(901,407 )
20 The accompanying notes are an integral part of these financial statements.
Copyright © 2017 www.secdatabase.com. All Rights Reserved.Please Consider the Environment Before Printing This Document

GOLDMAN SACHS MULTI-MANAGER ALTERNATIVES FUND
Shares Description ValueCommon Stocks Sold Short �� (continued)Electronic Equipment, Instruments & Components �� (0.0)%1,588 Amphenol Corp. Class A $ (114,828 )799 Belden, Inc. (55,691 )
(170,519 )Equity Real Estate Investment Trusts (REITs) �� (0.1)%5,126 DiamondRock Hospitality Co. (56,437 )2,974 Host Hotels & Resorts, Inc. (53,383 )3,886 LaSalle Hotel Properties (110,984 )7,591 Sunstone Hotel Investors, Inc. (113,030 )19,748 Ventas, Inc. (1,264,070 )
(1,597,904 )Food & Staples Retailing �� (0.1)%10,757 Walgreens Boots Alliance, Inc. (930,911 )
Hotels, Restaurants & Leisure �� (0.0)%4,055 Marriott International, Inc. Class A (382,873 )
Household Durables �� (0.1)%22,087 Newell Brands, Inc. (1,054,433 )4,300 Whirlpool Corp. (798,424 )
(1,852,857 )Household Products �� (0.2)%9,357 Energizer Holdings, Inc. (554,215 )18,334 The Procter & Gamble Co. (1,601,108 )
(2,155,323 )Insurance �� (0.1)%1,097 CNA Financial Corp. (49,650 )33,962 First American Financial Corp. (1,474,291 )
(1,523,941 )Internet & Direct Marketing Retail �� (0.0)%1,002 Expedia, Inc. (133,987 )
Internet Software & Services �� (0.2)%953 Match Group, Inc.* (17,755 )88,600 Tencent Holdings Ltd. (2,776,132 )
(2,793,887 )IT Services �� (0.2)%15,520 ExlService Holdings, Inc.* (740,459 )29,438 Genpact Ltd. (718,876 )22,548 Sykes Enterprises, Inc.* (672,156 )
(2,131,491 )Leisure Products �� (0.1)%18,078 Brunswick Corp. (1,025,927 )
Life Sciences Tools & Services* �� (0.0)%953 Cambrex Corp. (56,561 )
Machinery �� (0.1)%7,124 Illinois Tool Works, Inc. (983,753 )3,074 Snap-on, Inc. (514,987 )
(1,498,740 )Common Stocks Sold Short �� (continued)Marine* �� (0.0)%549 Kirby Corp. (38,759 )
Media �� (0.1)%1,584 Meredith Corp. (92,743 )12,936 Scripps Networks Interactive, Inc. Class A (966,578 )13,525 Sirius XM Holdings, Inc. (66,949 )
(1,126,270 )Multi-Utilities �� (0.2)%19,023 Consolidated Edison, Inc. (1,508,143 )18,976 SCANA Corp. (1,258,299 )
(2,766,442 )Semiconductors & Semiconductor Equipment �� (0.1)%25,133 Taiwan Semiconductor Manufacturing Co. Ltd. ADR (831,148 )
Software* �� (0.1)%19,938 Paycom Software, Inc. (1,201,265 )
Specialty Retail �� (0.1)%476 L Brands, Inc. (25,137 )
Copyright © 2017 www.secdatabase.com. All Rights Reserved.Please Consider the Environment Before Printing This Document

5,146 O�Reilly Automotive, Inc.* (1,276,980 )(1,302,117 )
Technology Hardware, Storage & Peripherals* �� (0.1)%14,303 Electronics For Imaging, Inc. (654,791 )
Textiles, Apparel & Luxury Goods �� (0.0)%4,989 VF Corp. (272,549 )
Trading Companies & Distributors �� (0.0)%108 W.W. Grainger, Inc. (20,812 )TOTAL COMMON STOCKS SOLD SHORT(Cost $(33,506,405)) $ (35,249,008 )
Exchange Traded Funds Sold Short �� (1.6)%8,210 iShares Core S&P U.S. Growth ETF $ (388,169 )18,801 iShares Russell 2000 ETF (2,614,467 )690 iShares Russell 2000 Growth Index Fund (113,650 )2,070 iShares US Real Estate ETF (163,385 )65,358 Real Estate Select Sector SPDR Fund (2,068,581 )43,070 SPDR S&P 500 ETF Trust (10,254,105 )7,105 SPDR S&P MidCap 400 Trust Fund (2,237,009 )47,056 SPDR S&P Retail ETF (2,019,173 )TOTAL EXCHANGE TRADED FUNDS SOLD SHORT(Cost $(18,631,159)) $ (19,858,539 )TOTAL SECURITIES SOLD SHORT �� (4.5)%(Cost $(52,137,564)) $ (55,107,547 )OTHER ASSETS IN EXCESS OF
LIABILITIES �� 19.9% $ 244,035,474NET ASSETS �� 100.0% $ 1,223,333,338
The accompanying notes are an integral part of these financial statements. 21
Copyright © 2017 www.secdatabase.com. All Rights Reserved.Please Consider the Environment Before Printing This Document

GOLDMAN SACHS MULTI-MANAGER ALTERNATIVES FUND
Consolidated Schedule of Investments (continued)April 30, 2017 (Unaudited)
The percentage shown for each investment category reflects the value of investments in that category as a percentage of net assets.* Non-income producing security.(a) Exempt from registration under Rule 144A of the Securities Act of 1933. Under procedures approved by the Board of Trustees, such securities have been determined to be liquid
by an Underlying Manager and may be resold, normally to qualified institutional buyers in transactions exempt from registration. Total market value of Rule 144A securitiesamounts to $67,007,407, which represents approximately 5.5% of net assets as of April 30, 2017.
(b) Security with �Call� features with resetting interest rates. Maturity dates disclosed are the final maturity dates.(c) Variable rate security. Interest rate or distribution rate disclosed is that which is in effect on April 30, 2017.(d) Security is currently in default.(e) Coupon changes periodically based upon a predetermined schedule. Interest rate disclosed is that which is in effect on April 30, 2017.(f) Pay-in-kind securities.(g) All or portion of security is pledged as collateral for short sales. Total market value of securities pledged as collateral on short sales amounts to $73,769,290, which represents
approximately 6.0% of net assets as of April 30, 2017.(h) A portion of this security is pledged as collateral for initial margin requirements on over the counter swap transactions. Total market value pledged as collateral amounts to
$3,534,415, which represents approximately 0.3% of net assets as of April 30, 2017.(i) Bank Loans often require prepayments from excess cash flows or permit the borrower to repay at its election. The degree to which borrowers repay, whether as a contractual
requirement or at their election, cannot be predicted with accuracy. As a result, the actual remaining maturity may be substantially less than the stated maturities shown. The statedinterest rate represents the weighted average interest rate of all contracts within the bank loan facility on April 30, 2017. Bank Loans typically have rates of interest which arepredetermined either daily, monthly, quarterly or semi-annually by reference to a base lending rate, plus a premium. These base lending rates are primarily the London-InterbankOffered Rate (�LIBOR�), and secondarily the prime rate offered by one or more major United States banks (the �Prime Rate�) and the certificate of deposit (�CD�) rate or otherbase lending rates used by commercial lenders.
(j) Expiration date occurs on payment date.(k) Represents an affiliated fund.(l) Joint repurchase agreement was entered into on April 28, 2017. Additional information appears on page 54.
Currency Abbreviations:AUD �Australian DollarBRL �Brazilian RealCAD �Canadian DollarCHF �Swiss FrancCNH �Chinese Yuan Renminbi OffshoreCNY �Chinese Yuan RenminbiDKK �Danish KroneEUR �EuroGBP �British PoundHKD �Hong Kong DollarINR �Indian RupeeJPY �Japanese YenKRW �South Korean WonMXN �Mexican PesoNOK �Norwegian KroneNZD �New Zealand DollarRUB �Russian RubleSEK �Swedish KronaSGD �Singapore DollarTWD �Taiwan DollarUSD �U.S. DollarZAR �South African Rand
Investment Abbreviations:ADR �American Depositary ReceiptCP �Commercial PaperETF �Exchange Traded FundGDR �Global Depository ReceiptGO �General ObligationLLC �Limited Liability CompanyLP �Limited PartnershipPLC �Public Limited CompanyRB �Revenue BondSPA �Stand-by Purchase AgreementWR �Withdrawn Rating
22 The accompanying notes are an integral part of these financial statements.
Copyright © 2017 www.secdatabase.com. All Rights Reserved.Please Consider the Environment Before Printing This Document

GOLDMAN SACHS MULTI-MANAGER ALTERNATIVES FUND
ADDITIONAL INVESTMENT INFORMATION
UNFUNDED LOAN COMMITMENTS � At April 30, 2017, the Fund had unfunded loan commitments which could be extended at the optionof the borrowers, pursuant to the following loan agreements:
BorrowerPrincipalAmount
CurrentValue
UnrealizedGain (Loss)
Energy & Exploration Partners, Inc. $31,571 $30,308 $ (1,263 )
FORWARD FOREIGN CURRENCY EXCHANGE CONTRACTS � At April 30, 2017, the Fund had the following forward foreign currencyexchange contracts:
FORWARD FOREIGN CURRENCY EXCHANGE CONTRACTS WITH UNREALIZED GAIN
CounterpartyCurrency
PurchasedCurrency
SoldCurrentValue
SettlementDate
UnrealizedGain
Bank of America Securities LLC CHF 748,000 USD 750,783 $754,322 06/23/17 $3,539EUR 8,178,000 USD 8,815,247 8,932,952 06/23/17 117,704GBP 12,596,000 USD 16,104,388 16,339,917 06/23/17 235,533JPY 206,550,000 USD 1,813,567 1,856,918 06/23/17 43,349MXN 138,017,000 USD 7,113,758 7,265,732 06/23/17 151,975USD 987,160 AUD 1,299,000 971,757 06/23/17 15,403USD 25,277,208 CAD 33,891,000 24,848,125 06/23/17 429,079USD 5,552,384 JPY 608,538,000 5,470,852 06/23/17 81,532USD 136,173 MXN 2,562,000 134,873 06/23/17 1,300USD 14,354,380 NZD 20,675,000 14,176,000 06/23/17 178,380
JPMorgan Chase Bank, N.A. AUD 6,375,140 USD 4,763,299 4,769,288 06/21/17 5,990EUR 106,355,659 USD 114,702,459 116,161,888 06/21/17 1,459,418GBP 13,663,223 USD 16,917,580 17,723,304 06/21/17 805,725JPY 4,640,453,738 USD 40,707,733 41,714,652 06/21/17 1,006,919NOK 4,278,459 USD 498,422 498,614 06/21/17 194NZD 594,000 USD 407,196 407,302 06/21/17 106SEK 68,644,313 USD 7,695,012 7,771,365 06/21/17 76,357USD 43,624,865 AUD 57,909,778 43,322,712 06/21/17 302,159USD 74,458,927 CAD 99,681,960 73,082,064 06/21/17 1,376,874USD 49,175,882 JPY 5,439,068,765 48,893,684 06/21/17 282,197USD 13,702,007 NOK 116,993,784 13,634,539 06/21/17 67,466USD 25,561,446 NZD 36,759,957 25,206,050 06/21/17 355,405USD 5,349,447 SEK 46,964,080 5,316,901 06/21/17 32,542
Morgan Stanley & Co. International PLC CHF 472,000 USD 472,741 475,932 06/21/17 3,191EUR 94,000 USD 100,963 102,667 06/21/17 1,704SEK 3,888,000 USD 433,832 440,169 06/21/17 6,337USD 424,150 CAD 571,000 418,630 06/21/17 5,519USD 59,503 CHF 59,000 59,492 06/21/17 12USD 1,780,000 CNH 12,378,120 1,774,789 09/20/17 5,211USD 1,752,399 EUR 1,601,000 1,748,616 06/21/17 3,784USD 2,250,000 JPY 247,407,000 2,224,027 06/21/17 25,973USD 3,622,200 KRW 4,092,440,700 3,598,889 06/21/17 23,311USD 2,070,000 KRW 2,336,616,000 2,057,538 09/20/17 12,462USD 1,160,000 SGD 1,613,792 1,156,752 09/20/17 3,248USD 1,020,000 TWD 30,722,400 1,019,230 06/21/17 770
Royal Bank of Scotland PLC USD 950,000 RUB 54,454,000 949,795 05/31/17 204State Street Bank and Trust USD 92,221 CHF 91,622 92,099 05/03/17 122UBS AG (London) INR 90,650,000 USD 1,400,000 1,405,208 05/31/17 5,207
The accompanying notes are an integral part of these financial statements. 23
Copyright © 2017 www.secdatabase.com. All Rights Reserved.Please Consider the Environment Before Printing This Document

GOLDMAN SACHS MULTI-MANAGER ALTERNATIVES FUND
Consolidated Schedule of Investments (continued)April 30, 2017 (Unaudited)
ADDITIONAL INVESTMENT INFORMATION (continued)
FORWARD FOREIGN CURRENCY EXCHANGE CONTRACTS WITH UNREALIZED GAIN (continued)
CounterpartyCurrency
PurchasedCurrency
SoldCurrentValue
SettlementDate
UnrealizedGain
UBS AG (London) (continued) INR 483,316,250 USD 7,464,344 $7,492,114 05/31/17 $27,769RUB 8,030,400 USD 140,000 140,068 05/31/17 67USD 940,000 INR 60,498,400 937,814 05/31/17 2,185USD 451,640 BRL 1,425,602 445,459 05/31/17 6,180USD 341,769 CNY 2,357,355 340,658 05/31/17 1,110USD 410,000 INR 26,389,650 409,078 05/31/17 921
TOTAL $7,164,433
FORWARD FOREIGN CURRENCY EXCHANGE CONTRACTS WITH UNREALIZED LOSS
CounterpartyCurrency
PurchasedCurrency
SoldCurrentValue
SettlementDate
UnrealizedLoss
Bank of America Securities LLC AUD 28,352,000 USD 21,366,158 $21,209,593 06/23/17 $(156,565 )CAD 7,163,000 USD 5,334,496 5,251,753 06/23/17 (82,745 )CHF 18,590,000 USD 18,842,990 18,747,088 06/23/17 (95,901 )EUR 367,000 USD 401,306 400,880 06/23/17 (427 )JPY 3,600,215,000 USD 32,680,737 32,366,501 06/23/17 (314,240 )MXN 25,900,000 USD 1,368,301 1,363,473 06/23/17 (4,827 )NZD 11,739,000 USD 8,102,010 8,048,950 06/23/17 (53,059 )USD 243,117 AUD 325,000 243,126 06/23/17 (10 )USD 26,266,932 CHF 26,311,000 26,533,331 06/23/17 (266,401 )USD 34,076,975 EUR 31,943,000 34,891,814 06/23/17 (814,840 )USD 24,667,073 GBP 20,094,000 26,066,552 06/23/17 (1,399,483 )USD 8,179,327 JPY 932,914,000 8,387,044 06/23/17 (207,718 )USD 2,514,968 MXN 49,987,000 2,631,503 06/23/17 (116,535 )USD 1,505,650 NZD 2,196,000 1,505,707 06/23/17 (57 )
Barclays Bank PLC EUR 250,000 USD 273,267 272,966 06/15/17 (301 )USD 1,013,290 EUR 947,000 1,033,995 06/15/17 (20,705 )
JPMorgan Chase Bank, N.A. AUD 71,496,076 USD 54,317,365 53,486,721 06/21/17 (830,646 )CAD 110,472,356 USD 82,382,407 80,993,070 06/21/17 (1,389,343 )EUR 10,900,601 USD 11,931,405 11,905,659 06/21/17 (25,743 )JPY 6,007,795,633 USD 54,617,052 54,006,168 06/21/17 (610,888 )NOK 513,780,820 USD 60,563,728 59,876,384 06/21/17 (687,342 )NZD 5,040,714 USD 3,483,247 3,456,383 06/21/17 (26,862 )SEK 49,052,139 USD 5,585,522 5,553,294 06/21/17 (32,228 )USD 1,813,557 CAD 2,474,722 1,814,349 06/21/17 (791 )USD 97,599,840 EUR 91,877,802 100,349,133 06/21/17 (2,749,285 )USD 63,436,570 GBP 50,829,752 65,934,016 06/21/17 (2,497,448 )USD 30,473,988 JPY 3,432,976,290 30,860,218 06/21/17 (386,233 )USD 5,080,451 NOK 43,769,383 5,100,914 06/21/17 (20,466 )USD 68,610,391 SEK 616,038,274 69,742,981 06/21/17 (1,132,588 )
Morgan Stanley & Co. International PLC CHF 986,000 USD 1,000,303 994,215 06/21/17 (6,087 )USD 2,202,976 CHF 2,213,000 2,231,436 06/21/17 (28,460 )USD 10,816,846 EUR 9,994,000 10,915,467 06/21/17 (98,623 )
Royal Bank of Scotland PLC INR 44,498,100 USD 690,000 689,786 05/31/17 (214 )State Street Bank and Trust CAD 100,094 USD 73,458 73,329 05/02/17 (130 )UBS AG (London) RUB 43,023,600 USD 760,000 750,425 05/31/17 (9,576 )
RUB 26,456,300 USD 470,000 461,455 05/31/17 (8,545 )USD 400,000 RUB 23,056,000 402,146 05/31/17 (2,146 )
TOTAL $(14,077,458)
24 The accompanying notes are an integral part of these financial statements.
Copyright © 2017 www.secdatabase.com. All Rights Reserved.Please Consider the Environment Before Printing This Document

GOLDMAN SACHS MULTI-MANAGER ALTERNATIVES FUND
ADDITIONAL INVESTMENT INFORMATION (continued)
FUTURES CONTRACTS � At April 30, 2017, the Fund had the following futures contracts:
Type
Number ofContracts
Long (Short)Expiration
DateCurrentValue
UnrealizedGain (Loss)
Amsterdam Exchanges Index 93 May 2017 $10,467,832 $170,797Australian 10 Year Government Bonds (4 ) June 2017 (388,535 ) (8,309 )Australian 10 Year Government Bonds 112 June 2017 10,878,976 (18,604 )Australian 3 Year Government Bonds 92 June 2017 7,723,830 260Australian Dollar (57 ) June 2017 (4,261,320 ) (14,761 )Bank Accept Index (64 ) September 2017 (11,608,659 ) (8,255 )Brent Crude (72 ) May 2017 (3,747,600 ) 118,747British Pound (7 ) June 2017 (567,175 ) (525 )CAC40 Index 148 May 2017 8,407,433 310,244Canada 10 Year Government Bonds (395 ) June 2017 (40,384,015 ) (885,557 )Canadian Dollar (4 ) June 2017 (292,800 ) (350 )Cocoa (74 ) July 2017 (1,375,372 ) 249,518Coffee (31 ) July 2017 (1,550,775 ) 83,910Copper 53 June 2017 7,590,925 (225,393 )Copper (21 ) June 2017 (3,007,725 ) (7,058 )Copper (10 ) July 2017 (651,875 ) (4,151 )Corn (126 ) July 2017 (2,308,950 ) 50,412Cotton No.2 27 July 2017 1,064,745 1,285Crude Oil 3 May 2017 147,990 (308 )Crude Oil (101 ) May 2017 (4,982,330 ) 247,084Crude soybean oil (55 ) July 2017 (1,046,430 ) (778 )Dax Index 108 June 2017 36,668,279 760,731DJIA E-Mini Index 343 June 2017 35,798,910 209,795Euro FX 190 June 2017 25,937,375 13,346Euro Stoxx 50 Index (94 ) June 2017 (3,591,988 ) 12,156Euro Stoxx 50 Index 308 June 2017 11,769,491 526,224Eurodollars (1,073 ) March 2018 (264,038,475) (370,447 )Eurodollars (60 ) June 2018 (14,750,250 ) (29,200 )French Government Bonds (107 ) June 2017 (17,464,611 ) (51,739 )FTSE 100 Index (103 ) June 2017 (9,558,505 ) (39,014 )FTSE 100 Index 121 June 2017 11,228,924 (139,110 )FTSE/MIB Index (38 ) June 2017 (4,199,566 ) (145,015 )Gasoline RBOB (71 ) May 2017 (4,616,434 ) 516,627Gold 100 Oz 81 June 2017 10,273,230 70,113Gold 100 Oz (5 ) June 2017 (634,150 ) (1,600 )Hard Red Winter Wheat (57 ) July 2017 (1,246,163 ) 48,577Italian Government Bonds (60 ) June 2017 (8,608,300 ) 14,379Japanese Yen (2 ) June 2017 (224,850 ) 934Low Sulphur Gas Oil (15 ) June 2017 (683,250 ) 12,060MSCI Singapore Index (52 ) May 2017 (1,293,533 ) (7,673 )Nasdaq 100 E-Mini Index 212 June 2017 23,661,320 688,445Natural Gas (63 ) May 2017 (2,063,880 ) 37,891Nikkei 225 Index 38 June 2017 6,544,965 (12,422 )Nikkei 225 Index (31 ) June 2017 (5,339,314 ) (183,912 )NY Harbor ULSD (74 ) May 2017 (4,684,378 ) 341,696OMXS 30 Index (41 ) May 2017 (748,964 ) (4,633 )Primary Aluminum 111 June 2017 5,292,619 18,314Primary Aluminum (7 ) June 2017 (333,769 ) 1,901Russell 2000 Mini Index 390 June 2017 27,268,800 529,572S&P 500 E-Mini Index 188 June 2017 22,376,700 132,521S&P 500 E-Mini Index (501 ) June 2017 (59,631,525 ) (545,587 )
The accompanying notes are an integral part of these financial statements. 25
Copyright © 2017 www.secdatabase.com. All Rights Reserved.Please Consider the Environment Before Printing This Document

GOLDMAN SACHS MULTI-MANAGER ALTERNATIVES FUND
Consolidated Schedule of Investments (continued)April 30, 2017 (Unaudited)
ADDITIONAL INVESTMENT INFORMATION (continued)
FUTURES CONTRACTS (continued)
Type
Number ofContracts
Long (Short)Expiration
DateCurrentValue
UnrealizedGain (Loss)
S&P Toronto Stock Exchange 60 Index 111 June 2017 $14,910,047 $161,259Silver 60 July 2017 5,178,600 (224,478 )Soybean (74 ) July 2017 (3,538,125 ) (26,921 )Soybean Meal (39 ) July 2017 (1,231,620 ) (17,843 )SPI 200 Index 19 June 2017 2,103,136 3,264Sugar No. 11 (74 ) June 2017 (1,336,854 ) 113,748Topix Index 188 June 2017 25,803,095 310,610U.S. Dollar Index Future (31 ) June 2017 (3,065,838 ) (243 )U.S. Long Bond (8 ) June 2017 (1,223,750 ) (3,505 )U.S. Long Bond 152 June 2017 23,251,250 (67,401 )Ultra 10 Year U.S. Treasury Notes (186 ) June 2017 (25,194,281 ) (36,927 )Wheat (69 ) July 2017 (1,491,263 ) 24,865Zinc (15 ) June 2017 (982,594 ) 14,826Zinc 67 June 2017 4,388,919 (324,234 )30 Day Federal Funds (25 ) June 2017 (10,313,846 ) (36 )3 Month Bank Bills 58 September 2017 43,248,050 1,4623 Month Euribor Interest Rate (256 ) March 2018 (69,889,469 ) (58,305 )3 Month Euribor Interest Rate (297 ) June 2018 (81,046,308 ) 18,2713 Month Euroswiss (14 ) September 2017 (3,545,025 ) (66 )3 Month Euroyen (5 ) September 2017 (1,120,991 ) (219 )3 Month Sterling Interest Rate (110 ) March 2018 (17,732,411 ) (11,422 )3 Month Sterling Interest Rate 446 June 2018 71,867,982 10,5035 Year German Euro-Bobl 376 June 2017 54,006,782 (91,799 )10 Year German Euro-Bund 79 June 2017 13,921,926 19,14110 Year German Euro-Bund (243 ) June 2017 (42,823,138 ) 73,8832 Year German Euro-Schatz 218 June 2017 26,653,334 (21,430 )2 Year German Euro-Schatz (970 ) June 2017 (118,595,108) 21,60810 Year Mini Japanese Government Bonds (6 ) June 2017 (812,900 ) (3,089 )10 Year U.K. Long Gilt 805 June 2017 133,738,839 1,338,4662 Year U.S. Treasury Notes (934 ) June 2017 (202,313,157) (353,771 )5 Year U.S. Treasury Notes 881 June 2017 104,315,906 (9,345 )5 Year U.S. Treasury Notes (41 ) June 2017 (4,854,656 ) (11,619 )10 Year U.S. Treasury Notes 1,359 June 2017 170,851,781 1,048,467TOTAL $4,360,858
26 The accompanying notes are an integral part of these financial statements.
Copyright © 2017 www.secdatabase.com. All Rights Reserved.Please Consider the Environment Before Printing This Document

GOLDMAN SACHS MULTI-MANAGER ALTERNATIVES FUND
ADDITIONAL INVESTMENT INFORMATION (continued)
SWAP CONTRACTS � At April 30, 2017, the Fund had the following swap contracts:
OVER THE COUNTER CREDIT DEFAULT SWAP CONTRACTS
Market Value
CounterpartyReferencedObligation
NotionalAmount(000s)
Rates Received(Paid)
TerminationDate
CreditSpread atApril 30,2017(a)
UpfrontPayments
Made (Received)UnrealizedGain (Loss)
Protection Purchased:Bank of America Securities
LLC Macy�s, Inc., 7.450%, 07/15/17 $95 (1.000 )% 06/20/21 1.540 % $ 5,407 $(3,494 )Barclays Bank PLC Nordstrom, Inc., 6.950%, 03/15/28 1,365 (1.000 ) 12/20/20 0.782 15,466 (27,583 )
Macy�s, Inc., 7.450%, 07/15/17 55 (1.000 ) 06/20/21 1.540 3,177 (2,070 )Nordstrom, Inc., 6.950%, 03/15/28 610 (1.000 ) 12/20/21 1.239 19,648 (13,932 )NYSE Archa Exchange Gold BUGSIndex 390 (1.000 ) 12/20/21 1.934 18,857 (3,459 )
JPMorgan Securities, Inc. Macy�s, Inc., 7.450%, 07/15/17 1,285 (1.000 ) 12/20/20 1.231 60,198 (51,249 )Nordstrom, Inc., 6.950%, 03/15/28 555 (1.000 ) 12/20/20 0.782 10,163 (15,089 )Nordstrom, Inc., 6.950%, 03/15/28 265 (1.000 ) 06/20/21 0.983 7,061 (7,547 )Macy�s, Inc., 7.450%, 07/15/17 60 (1.000 ) 06/20/21 1.540 3,001 (1,793 )Rite Aid Corp., 6.125%, 04/01/23 460 (5.000 ) 12/20/21 2.778 (56,204 ) 9,874
TOTAL $ 86,774 $(116,342 )
(a) Credit spread on the Referenced Obligation, together with the term of the swap contract, are indicators of payment/performance risk. The likelihood of a credit event occurring whichwould require the Fund or its counterparty to make a payment or otherwise be required to perform under the swap contract is generally greater as the credit spread and the term of theswap contract increase.
OVER THE COUNTER TOTAL RETURN SWAP CONTRACTS#
Market Value
Counterparty
NotionalAmount(000s)
ReferenceSecurity
TerminationDate
UpfrontPayments
Made (Received)UnrealizedGain (Loss)
JPMorgan Securities, Inc.$1 3M Co. 3/18/2019 $ � $5,131
3 AbbVie, Inc. 3/18/2019 � (2,907 )36 Acadia Healthcare Co., Inc. 7/2/2018 - 3/18/2019 � (9,282 )7 ACADIA Pharmaceuticals, Inc, 6/29/2018 - 10/19/2018 � (10,383 )1,378 Accenture PLCµ 12/31/2099 � 24,5171 Accenture PLC Class A§ 3/18/2019 � 8,90846 Acom Co. Ltd. 11/19/2018 � (21,489 )45 ACS Actividades de Construccion y Servicios SA 7/27/2018 - 2/19/2019 � 94,5597 Acuity Brands, Inc. 7/2/2018 - 4/15/2019 � 13,5538 Adecco Group AG 4/15/2019 � 22,00518 Adient PLC 3/4/2019 - 4/15/2019 � (104,916 )68 Admiral Group PLC 6/29/2018 - 3/15/2019 � (58,458 )64 Advanced Micro Devices, Inc. 1/9/2019 - 4/29/2019 � (8,813 )183 Aegon NV 3/29/2019 - 4/15/2019 � 46,2347 AEON Financial Service Co. Ltd. 2/4/2019 � (1,183 )71 AGL Energy Ltd. 8/17/2018 - 3/18/2019 � (50,914 )3 Akamai Technologies, Inc. 3/18/2019 � 5,12323 Akorn, Inc. 6/29/2018 - 7/26/2018 � 15,220
The accompanying notes are an integral part of these financial statements. 27
Copyright © 2017 www.secdatabase.com. All Rights Reserved.Please Consider the Environment Before Printing This Document

GOLDMAN SACHS MULTI-MANAGER ALTERNATIVES FUND
Consolidated Schedule of Investments (continued)April 30, 2017 (Unaudited)
ADDITIONAL INVESTMENT INFORMATION (continued)
OVER THE COUNTER TOTAL RETURN SWAP CONTRACTS# (continued)
Market Value
Counterparty
NotionalAmount(000s)
ReferenceSecurity
TerminationDate
UpfrontPayments
Made (Received)UnrealizedGain (Loss)
JPMorgan Securities, Inc.(continued) $2 Albemarle Corp. 3/29/2019 $ � $5,331
28 Alcoa Corp. 11/23/2018 - 3/29/2019 � (19,120 )38 Alfresa Holdings Corp. 7/27/2018 - 3/6/2019 � 12,81027 Alimentation Couche-Tard, Inc. 2/19/2019 - 3/29/2019 � (5,152 )5 Alliance Data Systems Corp. 4/29/2019 � (64,916 )5 Alnylam Pharmaceuticals, Inc. 11/19/2018 � (22,602 )� * Alphabet, Inc. Class C 8/9/2018 � (28,351 )1,042 Alumina Ltd. 7/16/2018 - 9/14/2018 � 16,460� * Amazon.com, Inc. 10/31/2018 - 11/19/2018 � 6,044133 Amcor Ltd. 9/4/2018 - 3/18/2019 � (28,253 )22 American Eagle Outfitters, Inc. 7/16/2018 - 8/9/2018 � 10,2069 Ameriprise Financial, Inc. 4/15/2019 - 4/29/2019 � (21,894 )1 AmerisourceBergen Corp. 4/15/2019 � (4,864 )20 ams AG 2/19/2019 - 3/6/2019 � (208,610 )39 AmTrust Financial Services, Inc. 3/29/2019 � (22,721 )55 ANA Holdings, Inc. 3/29/2019 � 2,1495 ANDRITZ AG 6/29/2018 - 7/16/2018 � 22,94511 Anglo American PLC 3/15/2019 - 4/15/2019 � 3,7012 Anheuser-Busch InBev SA/NV 3/18/2019 � (5,113 )27 Antofagasta PLC 7/5/2018 - 10/19/2018 � (10,035 )1 Apple, Inc. 3/29/2019 � (2,425 )8 Aqua America, Inc. 10/9/2018 - 2/4/2019 � (2,790 )34 ArcelorMittal 8/9/2018 - 10/19/2018 � (10,354 )6 Arconic, Inc. 4/25/2019 � (7,794 )8 Arista Networks, Inc. 3/29/2019 - 4/29/2019 � (47,800 )2 Aristocrat Leisure Ltd. 6/29/2018 - 7/26/2018 � 55633 Aryzta AG 4/29/2019 � 9,856186 Asahi Glass Co. Ltd. 7/2/2018 - 10/22/2018 � 120,83557 Ashtead Group PLC 3/4/2019 - 4/15/2019 � (5,878 )37 Asics Corp. 3/18/2019 - 5/1/2019 � (7,029 )6 ASML Holding NV 3/18/2019 � (4,558 )3 ASML Holding NV 3/29/2019 - 4/15/2019 � (4,386 )3 Aspen Technology, Inc. 3/18/2019 � 7,34517 Assa Abloy AB Class B 8/9/2018 - 4/15/2019 � (12,530 )21 Astellas Pharma, Inc. 7/2/2018 - 9/6/2018 � (11,082 )5 AstraZeneca PLC 3/29/2019 � (345 )7 AT&T, Inc. 6/29/2018 - 8/9/2018 � (798 )23 Atco Ltd. 10/9/2018 - 4/25/2019 � (34,087 )7 athenahealth, Inc. 3/18/2019 - 3/29/2019 � (110,436 )261 Aurizon Holdings Ltd. 10/9/2018 - 2/4/2019 � (26,640 )2 Autodesk, Inc. 3/29/2019 � (7,218 )24 AutoNation, Inc. 4/15/2019 - 4/29/2019 � 22,9911 Avangrid, Inc. 4/29/2019 � (190 )2 Avery Dennison Corp. 3/18/2019 � 7,53214 B&G Foods, Inc. 1/23/2019 � (22,807 )45 Banca Generali SpA 2/4/2019 - 4/15/2019 � (90,860 )12 Banca Mediolanum SpA 3/15/2019 � 4,651178 Banco BPM SpA 1/23/2019 - 4/25/2019 � (49,950 )372 Banco de Sabadell SA 3/29/2019 - 4/15/2019 � 80,592
28 The accompanying notes are an integral part of these financial statements.
Copyright © 2017 www.secdatabase.com. All Rights Reserved.Please Consider the Environment Before Printing This Document

GOLDMAN SACHS MULTI-MANAGER ALTERNATIVES FUND
ADDITIONAL INVESTMENT INFORMATION (continued)
OVER THE COUNTER TOTAL RETURN SWAP CONTRACTS# (continued)
Market Value
Counterparty
NotionalAmount(000s)
ReferenceSecurity
TerminationDate
UpfrontPayments
Made (Received)UnrealizedGain (Loss)
JPMorgan Securities, Inc.(continued) $ 295 Banco Popular Espanol SA Class A 8/10/2018 - 10/19/2018 $ � $(8,595 )
45 Bandai Namco Holdings, Inc. 8/13/2018 - 12/6/2018 � 93,848338 Bank Leumi Le-Israel BM 6/29/2018 - 12/17/2018 � 95,57328 Bank of the Ozarks, Inc. 11/23/2018 - 4/29/2019 � 58,42422 Bankinter SA 3/15/2019 � 9,27061 Barclays PLC 3/15/2019 � (4,418 )152 Barratt Developments PLC 1/10/2019 - 1/23/2019 � 81,819� * Barry Callebaut AG 3/18/2019 � (9,517 )21 BBA Aviation PLC 4/15/2019 � (3,690 )4 BCE, Inc. 3/18/2019 � 2212 Bellway PLC 3/29/2019 � (5,986 )38 Benesse Holdings, Inc. 3/18/2019 - 5/1/2019 � (47,947 )1 Berkshire Hathaway, Inc. Class B 4/11/2019 � (600 )6 Berry Global Group, Inc. 4/29/2019 � (1,877 )15 Best Buy Co., Inc. 4/15/2019 � 47,40515 BHP Billiton Ltd. 6/29/2018 - 8/9/2018 � 25,3451 BHP Billiton PLC 4/11/2019 � 64512 BillerudKorsnas AB 9/14/2018 - 9/27/2018 � 9,1851 Bio-Rad Laboratories, Inc.Class A 4/11/2019 � 11,85812 Bio-Techne Corp. 2/19/2019 - 4/15/2019 � (78,187 )1 Biogen, Inc. 2/7/2019 � 2,5549 Black Knight Financial Services, Inc. Class A 4/15/2019 � (22,588 )45 BLACKBERRY Ltd. 2/19/2019 - 4/29/2019 � (43,592 )2 Bluebird Bio, Inc. 3/18/2019 � (6,637 )92 Bollore SA 4/29/2019 � (3,945 )863 Bombardier, Inc. Class B 7/5/2018 - 10/19/2018 � 200,773165 Booker Group PLC 2/19/2019 - 3/18/2019 � (13,822 )7 Brembo SpA 3/18/2019 - 3/29/2019 � (22,096 )12 Bright Horizons Family Solutions, Inc. 3/4/2019 � (45,902 )8 Broadcom Ltd. 6/29/2018 - 8/9/2018 � (18,787 )6 Brookfield Asset Management, Inc. Class A 3/6/2019 � (836 )69 Bruker Corp. 7/6/2018 - 9/27/2018 � 136,32741 BT Group PLC 3/6/2019 - 3/15/2019 � 318121 BTG PLC 6/29/2018 - 8/17/2018 � 105,64815 Bunge Ltd. 3/4/2019 - 3/29/2019 � 31,33719 Bunzl PLC 3/4/2019 � (28,175 )23 Bureau Veritas SA 3/18/2019 � (39,869 )2 Burlington Stores, Inc. 2/19/2019 � 12,22328 Cabot Corp. 8/6/2018 - 1/9/2019 � 31,66411 CACI International, Inc. Class A 12/5/2018 - 12/24/2018 � 16,90956 Cadence Design Systems, Inc. 6/29/2018 - 3/18/2019 � 59,49959 Callon Petroleum Co. 12/24/2018 - 1/10/2019 � 104,05356 Caltex Australia Ltd. 11/23/2018 - 3/18/2019 � 6,92135 Canadian Natural Resources Ltd. 3/18/2019 � (62,050 )6 Canadian Utilities Ltd.Class A 3/18/2019 � (3,481 )206 Capita PLC 7/16/2018 - 3/15/2019 � (47,396 )12 Cargotec OYJ Class B 8/17/2018 - 2/4/2019 � 88,37923 CarMax, Inc. 6/29/2018 - 12/24/2018 � (28,690 )13 Carter�s, Inc. 3/4/2019 � 33,917
The accompanying notes are an integral part of these financial statements. 29
Copyright © 2017 www.secdatabase.com. All Rights Reserved.Please Consider the Environment Before Printing This Document

GOLDMAN SACHS MULTI-MANAGER ALTERNATIVES FUND
Consolidated Schedule of Investments (continued)April 30, 2017 (Unaudited)
ADDITIONAL INVESTMENT INFORMATION (continued)
OVER THE COUNTER TOTAL RETURN SWAP CONTRACTS# (continued)
Market Value
Counterparty
NotionalAmount(000s)
ReferenceSecurity
TerminationDate
UpfrontPayments
Made (Received)UnrealizedGain (Loss)
JPMorgan Securities, Inc.(continued) $11 Casey�s General Stores, Inc. 3/18/2019 $ � $3,795
3 CCL Industries, Inc. Class B 3/29/2019 � (30,051 )3 CDK Global, Inc. 3/18/2019 � 16992 Cenovus Energy, Inc. 3/18/2019 - 4/15/2019 � (99,012 )72 Centennial Resource Development, Inc. 12/17/2018 - 4/11/2019 � 266,7996 CenterPoint Energy, Inc. 3/18/2019 � 3,7849 Central Japan Railway Co. 7/2/2018 - 3/6/2019 � (18,779 )56 Centrica PLC 6/29/2018 - 4/11/2019 � (10,456 )54 CF Industries Holdings, Inc. 7/2/2018 - 4/29/2019 � 135,5196 CGI Group, Inc. 8/9/2018 � 7,25713 Charles River Laboratories International, Inc. 6/29/2018 - 4/29/2019 � 19,7001 Charter Communications, Inc. Class A 6/29/2018 - 8/9/2018 � (11,778 )12 Check Point Software Technologies Ltd. 2/4/2019 - 4/15/2019 � 7,44424 Chemical Financial Corp. 9/14/2018 - 4/15/2019 � 47,03640 Cheniere Energy, Inc. 6/29/2018 - 11/13/2018 � 123,4182 Chevron Corp. 7/6/2018 - 12/24/2018 � (3,657 )3 Chipotle Mexican Grill, Inc. 7/26/2018 - 11/13/2018 � (66,160 )� * Chocoladefabriken Lindt & Spruengli AG 6/29/2018 - 12/17/2018 � 14,04317 Chr Hansen Holding A/S 7/16/2018 - 4/29/2019 � (51,644 )1 Christian Dior SE 2/19/2019 � 35,41599 Chubu Electric Power Co., Inc. 3/6/2019 - 4/15/2019 � 18,84935 Chugai Pharmaceutical Co. Ltd. 8/8/2018 - 12/6/2018 � (15,279 )4 Cie Financiere Richemont SA 11/19/2018 � (11,553 )40 CIMIC Group Ltd. 2/19/2019 - 4/29/2019 � 19,9813 CIT Group, Inc. 2/19/2019 - 3/4/2019 � (8,541 )2 Citrix Systems, Inc. 3/18/2019 � (6,072 )21 Clean Harbors, Inc. 3/18/2019 - 3/29/2019 � (20,912 )26 CLP Holdings Ltd 6/29/2018 � 2,58428 CNA Financial Corp. 10/9/2018 - 3/4/2019 � 44,39129 CNH Industrial NV 7/5/2018 � (29,071 )383 Cobham PLC 8/6/2018 - 4/29/2019 � 17,505133 Cobham PLC 4/23/2019 � (98,417 )22 Coca-Cola Amatil Ltd. 8/9/2018 - 3/18/2019 � (21,154 )39 Coca-Cola European Partners PLC 7/26/2018 - 4/11/2019 � 161,11766 Coca-Cola HBC AG 6/29/2018 - 12/17/2018 � 98,03643 Coca-Cola West Co. Ltd. 7/2/2018 - 7/27/2018 � 23,0941 Cochlear Ltd. 7/16/2018 - 9/27/2018 � 11,0624 Coherent, Inc. 3/6/2019 - 4/15/2019 � (63,417 )2 Colgate-Palmolive Co. 3/18/2019 � (3,034 )6 Comcast Corp. Class A 2/25/2019 � 12,567102 ComfortDelGro Corp. Ltd. 12/19/2018 � 8,9722 Commonwealth Bank of Australia 3/18/2019 � (934 )75 Conduent, Inc. 1/7/2019 - 4/29/2019 � 17,63623 ConocoPhillips 4/15/2019 � (52,515 )73 CONSOL Energy, Inc. 4/29/2019 � 42,3324 Constellation Software, Inc. 6/29/2018 - 12/17/2018 � (72,163 )1,495 Consumer Discretionary Select Sector SPDR Fund 12/31/2099 � (54,388 )1,716 Consumer Staples Select Sector SPDR Fund 12/31/2099 � 2,662
30 The accompanying notes are an integral part of these financial statements.
Copyright © 2017 www.secdatabase.com. All Rights Reserved.Please Consider the Environment Before Printing This Document

GOLDMAN SACHS MULTI-MANAGER ALTERNATIVES FUND
ADDITIONAL INVESTMENT INFORMATION (continued)
OVER THE COUNTER TOTAL RETURN SWAP CONTRACTS# (continued)
Market Value
Counterparty
NotionalAmount(000s)
ReferenceSecurity
TerminationDate
UpfrontPayments
Made (Received)UnrealizedGain (Loss)
JPMorgan Securities, Inc.(continued) $ 12 Core Laboratories NV 6/29/2018 - 10/31/2018 $ � $86,529
9 Corning, Inc. 4/11/2019 - 4/15/2019 � 17,38388 Coty, Inc. Class A 10/19/2018 - 1/10/2019 � (40,923 )2 Credit Acceptance Corp. 10/19/2018 - 12/24/2018 � (18,651 )23 Credit Suisse Group AG Class D 1/10/2019 � (16,693 )105 Crescent Point Energy Corp. 6/29/2018 - 3/18/2019 � (131,100 )22 CRH PLC 3/4/2019 � 59,15924 Criteo SA 3/18/2019 � 102,0527 Croda International PLC 2/19/2019 - 3/4/2019 � (24,386 )2 CSL Ltd. 3/18/2019 � (5,298 )2 Curtiss-Wright Corp. 7/2/2018 - 3/18/2019 � 4,676217 CYBG PLC 11/13/2018 - 11/23/2018 � (6,556 )140 Cypress Semiconductor Corp. 7/27/2018 - 12/17/2018 � (20,304 )8 Daicel Corp. 2/4/2019 - 2/21/2019 � 1,08758 Daiwa Securities Group, Inc. 3/29/2019 � 16,1201 Darden Restaurants, Inc. 4/25/2019 � 2,4088 Davide Campari-Milano SpA 4/29/2019 � 71417 DaVita HealthCare Partners, Inc. 4/29/2019 � 10,2433 DCC PLC 4/15/2019 � (6,031 )2 Delphi Automotive PLC 4/11/2019 � 12,4521 Delta Air Lines, Inc. 3/29/2019 � 1339 DexCom, Inc. 2/4/2019 - 3/18/2019 � (7,635 )13 Diamondback Energy, Inc. 12/5/2018 - 4/25/2019 � 71,856219 Distribuidora Internacional de Alimentacion SA 3/4/2019 - 4/25/2019 � 35,73494 Dixons Carphone PLC 11/23/2018 - 12/17/2018 � 37,06124 Domino�s Pizza Enterprises Ltd. 6/29/2018 - 12/24/2018 � 17,0711 Domino�s Pizza, Inc. 3/18/2019 - 4/15/2019 � 7,41629 Don Quijote Holdings Co. Ltd. 5/1/2019 � (3,800 )� * dorma+kaba Holding AG 9/14/2018 - 10/19/2018 � 14,44081 DS Smith PLC 3/18/2019 - 4/15/2019 � (14,910 )5 DST Systems, Inc. 4/29/2019 � 1,30131 DSV A/S 6/29/2018 - 12/27/2018 � (123,358 )2 E*TRADE Financial Corp. 4/29/2019 � (1,963 )1 Eagle Materials, Inc. 4/15/2019 � (2,073 )58 EDP - Energias de Portugal SA 3/15/2019 � (3,649 )431 Electrolux AB^ 12/31/2099 � (45,143 )58 Electrolux AB 7/26/2018 - 12/17/2018 � 94,282171 Element Financial Corp. 6/29/2018 - 12/5/2018 � 66,55011 Ellie Mae, Inc. 4/29/2019 � 101,3286 Emerson Electric Co. 4/15/2019 � 3,24814 Enbridge Income Fund Holdings, Inc. 4/29/2019 � 10,37417 Encana Corp. 3/18/2019 � 22,8077 Endesa SA 3/29/2019 � 5946 Endo International PLC 10/19/2018 - 11/13/2018 � 27,64863 EnLink Midstream LLC 4/15/2019 - 5/1/2019 � (51,726 )77 Ensco PLC 12/17/2018 - 3/4/2019 � (111,537 )56 Entegris, Inc. 2/19/2019 - 3/18/2019 � 83,31525 Envision Healthcare Corp. 3/4/2019 - 4/29/2019 � 105,110
The accompanying notes are an integral part of these financial statements. 31
Copyright © 2017 www.secdatabase.com. All Rights Reserved.Please Consider the Environment Before Printing This Document

GOLDMAN SACHS MULTI-MANAGER ALTERNATIVES FUND
Consolidated Schedule of Investments (continued)April 30, 2017 (Unaudited)
ADDITIONAL INVESTMENT INFORMATION (continued)
OVER THE COUNTER TOTAL RETURN SWAP CONTRACTS# (continued)
Market Value
Counterparty
NotionalAmount(000s)
ReferenceSecurity
TerminationDate
UpfrontPayments
Made (Received)UnrealizedGain (Loss)
JPMorgan Securities, Inc.(continued) $ 15 EQT Corp. 4/15/2019 - 4/29/2019 $ � $(74,222 )
38 Erste Group Bank AG 6/29/2018 - 3/15/2019 � 143,61112 Eurazeo SA 9/27/2018 - 12/17/2018 � (17,042 )3 Eurofins Scientific SE 9/27/2018 - 3/18/2019 � (124,625 )16 Evercore Partners, Inc. Class A 2/4/2019 - 4/15/2019 � (33,695 )320 Evraz PLC 1/23/2019 - 4/29/2019 � 25,54812 Exelixis, Inc. 9/27/2018 � 17,01922 Extraction Oil & Gas, Inc. 3/4/2019 � 66,1713 Exxon Mobil Corp. 7/6/2018 - 8/9/2018 � (4,280 )13 F5 Networks, Inc. 6/29/2018 - 10/19/2018 � (99,174 )3 Fairfax Financial Holdings Ltd. 11/13/2018 - 4/25/2019 � 7,5221 FANUC Corp. 7/2/2018 - 8/10/2018 � 3,4675 First Citizens BancShares, Inc. Class A 10/9/2018 - 11/13/2018 � 66,01430 First Financial Bankshares, Inc. 1/10/2019 � (8,259 )18 First Quantum Minerals Ltd. 3/18/2019 - 4/25/2019 � 22,82119 Fisher & Paykel Healthcare Corp. Ltd. 11/15/2018 � 3,71711 FleetCor Technologies, Inc. 6/29/2018 - 12/17/2018 � 49,8782 Flowserve Corp. 12/17/2018 - 3/4/2019 � 7035 Foot Locker, Inc. 3/4/2019 � 25,81870 Fortescue Metals Group Ltd. 9/4/2018 - 4/15/2019 � (2,476 )33 Fortinet, Inc. 2/19/2019 - 3/29/2019 � 44,43987 Fortum OYJ 9/4/2018 - 4/29/2019 � (2,657 )28 Franklin Resources, Inc. 4/15/2019 � 59,01071 Freeport-McMoRan, Inc. Class B 12/17/2018 - 3/29/2019 � 61,98511 Fresh Del Monte Produce, Inc. 11/13/2018 � 19,64710 Fresnillo PLC 1/9/2019 - 3/6/2019 � 16,80993 Frontier Communications Corp. 6/29/2018 - 11/7/2018 � 25,615272 Fujitsu Ltd. 7/2/2018 - 4/26/2019 � 54,5155 Fulton Financial Corp. 4/29/2019 � (3,125 )334 G4S PLC 3/18/2019 � 35,318� * Galapagos NV 4/25/2019 � (300 )1 Galenica AG 7/16/2018 - 12/17/2018 � 64,24812 Galp Energia SGPS SA 3/15/2019 � (320 )1 General Dynamics Corp. 3/18/2019 � 5,58232 General Motors Co. 3/18/2019 � 22,7828 Gentex Corp. 4/25/2019 � 703256 Genting Singapore PLC 3/6/2019 � 10,106� * Georg Fischer AG 7/16/2018 - 12/17/2018 � 8,4392 George Weston Ltd. 3/18/2019 � 6,33747 Gildan Activewear, Inc. 3/18/2019 � (43,560 )3 Gilead Sciences, Inc. 3/29/2019 � 6,34514 GlaxoSmithKline PLC 7/5/2018 - 8/9/2018 � 13,00719 Global Payments, Inc. 8/9/2018 - 3/4/2019 � (75,400 )41 GN Store Nord A/S 10/31/2018 - 3/4/2019 � 124,661� * Grand Canyon Education, Inc. 3/29/2019 � 1,66516 Greif, Inc. Class A 11/23/2018 - 3/4/2019 � 61,13729 H Lundbeck A/S 6/29/2018 - 11/13/2018 � 93,96811 H&R Block, Inc. 3/6/2019 - 3/18/2019 � 15,52110 Halliburton Co. 11/23/2018 - 3/4/2019 � 42,862
32 The accompanying notes are an integral part of these financial statements.
Copyright © 2017 www.secdatabase.com. All Rights Reserved.Please Consider the Environment Before Printing This Document

GOLDMAN SACHS MULTI-MANAGER ALTERNATIVES FUND
ADDITIONAL INVESTMENT INFORMATION (continued)
OVER THE COUNTER TOTAL RETURN SWAP CONTRACTS# (continued)
Market Value
Counterparty
NotionalAmount(000s)
ReferenceSecurity
TerminationDate
UpfrontPayments
Made (Received)UnrealizedGain (Loss)
JPMorgan Securities, Inc.(continued) $121 Halma PLC 6/29/2018 - 12/17/2018 $ � $(70,823 )
51 Hamamatsu Photonics KK 7/2/2018 - 1/15/2019 � (48,690 )68 Hanesbrands, Inc. 1/10/2019 - 4/11/2019 � (65,621 )56 Hargreaves Lansdown PLC 7/26/2018 - 10/31/2018 � (52,073 )1 Hasbro, Inc. 4/15/2019 � 3,8284 Hawaiian Holdings, Inc. 12/24/2018 � 21,29214 HCA Holdings, Inc. 4/15/2019 - 4/29/2019 � (52,204 )922 Health Care Select Sector SPDR Fund 12/31/2099 � (11,921 )690 Healthscope Ltd. 6/29/2018 - 3/4/2019 � 20,5823 Heineken Holding NV 7/5/2018 � 10,1255 Helmerich & Payne, Inc. 4/15/2019 � 43,73812 Hennes & Mauritz AB 6/29/2018 - 8/9/2018 � 4,48921 Herbalife Ltd. 3/29/2019 � (95,085 )4 Hitachi High-Technologies Corp. 4/15/2019 - 5/1/2019 � (695 )222 Hitachi Ltd. 7/2/2018 - 4/15/2019 � 59,9066 Hitachi Metals Ltd. 5/1/2019 � (1,504 )46 Home BancShares, Inc. 12/17/2018 - 4/15/2019 � 28,2413 Hoshizaki Electric Co. Ltd. 7/2/2018 - 8/20/2018 � 7,689143 Howden Joinery Group PLC 4/15/2019 � 69,1966 Hoya Corp. 8/10/2018 - 9/6/2018 � 5,50565 HRG Group, Inc. 12/5/2018 - 3/4/2019 � 21,32910 Huhtamaki OYJ 4/15/2019 � (25,364 )64 Huntsman Corp. 10/31/2018 - 3/29/2019 � 17,02822 Husky Energy, Inc. 11/19/2018 � (1,242 )16 IAC/InterActiveCorp 3/4/2019 � 132,6871 IDEXX Laboratories, Inc. 3/29/2019 � 14,47219 IHI Corp. 5/1/2019 - 5/2/2019 � (890 )1 Iliad SA 6/29/2018 - 12/17/2018 � (14,942 )2 Illumina, Inc. 6/29/2018 - 10/19/2018 � 15,92045 Imperial Oil Ltd. 3/18/2019 - 3/29/2019 � 60,31470 Inchcape PLC 7/16/2018 - 1/10/2019 � 30,693352 Incitec Pivot Ltd. 6/29/2018 - 11/13/2018 � (27,016 )2 Industria de Diseno Textil SA 4/25/2019 � 4,76523 Industrial Alliance Insurance & Financial Services, Inc. 7/16/2018 - 3/18/2019 � (5,306 )1,112 Industrial Select Sector SPDR Fund 12/31/2099 � (7,879 )149 Informa PLC 3/29/2019 - 4/15/2019 � 12,38321 Integra LifeSciences Holdings Corp. 3/18/2019 - 4/15/2019 � (95,581 )34 Interactive Brokers Group, Inc. 2/4/2019 - 4/15/2019 � (16,017 )1 Intercept Pharmaceuticals, Inc. 3/18/2019 � (4,970 )4 InterDigital, Inc. 2/4/2019 � 14,4555 International Consolidated Airlines Group SA 4/15/2019 � 2,85557 International Game Technology PLC 7/26/2018 - 8/6/2018 � (67,372 )19 International Petroleum Corp. 4/24/2019 � (627,224 )1 Intuit, Inc. 3/18/2019 � 9,446164 Investec PLC 6/29/2018 - 12/17/2018 � 101,96545 ISS A/S 6/29/2018 - 3/15/2019 � 129,75391 Isuzu Motors Ltd. 12/19/2018 - 4/15/2019 � (65,723 )6 Itochu Techno-Solutions Corp 3/18/2019 � (3,354 )
The accompanying notes are an integral part of these financial statements. 33
Copyright © 2017 www.secdatabase.com. All Rights Reserved.Please Consider the Environment Before Printing This Document

GOLDMAN SACHS MULTI-MANAGER ALTERNATIVES FUND
Consolidated Schedule of Investments (continued)April 30, 2017 (Unaudited)
ADDITIONAL INVESTMENT INFORMATION (continued)
OVER THE COUNTER TOTAL RETURN SWAP CONTRACTS# (continued)
Market Value
Counterparty
NotionalAmount(000s)
ReferenceSecurity
TerminationDate
UpfrontPayments
Made (Received)UnrealizedGain (Loss)
JPMorgan Securities, Inc.(continued) $ 74 ITV PLC 3/4/2019 - 4/29/2019 $ � $2,873
83 IWG PLC 3/18/2019 � 18,4362 Jack Henry & Associates, Inc. 3/18/2019 � 5,78712 Jack in the Box, Inc. 3/18/2019 � 4,1143 Jacobs Engineering Group, Inc. 4/11/2019 � 88653 James Hardie Industries PLC 2/19/2019 - 3/18/2019 � (54,150 )11 Japan Airlines Co. Ltd. 3/6/2019 - 3/29/2019 � 17,06038 Japan Airport Terminal Co. Ltd. 7/17/2018 - 12/19/2018 � (9,780 )76 Japan Post Holdings Co. Ltd. 2/4/2019 - 2/21/2019 � 3,96934 JCDecaux SA 8/6/2018 - 12/17/2018 � (32,977 )116 JD Sports Fashion PLC 11/28/2018 � 14,12985 Jeronimo Martins SGPS SA 6/29/2018 - 10/31/2018 � 45,75636 JetBlue Airways Corp. 6/29/2018 - 12/24/2018 � 9,94466 JGC Corp. 12/6/2018 - 3/6/2019 � 21,826126 John Wood Group PLC 10/31/2018 - 1/10/2019 � (40,088 )2 Johnson & Johnson 11/7/2018 � 4,13376 JTEKT Corp. 7/17/2018 - 4/15/2019 � 18,44328 Julius Baer Group Ltd. 8/6/2018 - 11/13/2018 � 73,442241 Just Eat PLC 6/29/2018 - 10/31/2018 � (81,551 )19 Jyske Bank A/S 4/23/2019 � (66,166 )87 Kakaku.com, Inc. 1/24/2019 - 3/18/2019 � (660 )72 Kansai Paint Co. Ltd. 12/6/2018 - 1/15/2019 � (62,828 )26 KAR Auction Services, Inc. 4/15/2019 - 4/29/2019 � (13,232 )208 Keihan Holdings Co. Ltd. 7/2/2018 - 12/19/2018 � 6,347119 Keikyu Corp. 7/2/2018 - 12/27/2018 � (21,697 )6 Kesko OYJ 6/29/2018 - 2/4/2019 � 3,4574 Keyence Corp. 12/19/2018 - 1/23/2019 � (8,613 )47 Keyera Corp. 6/29/2018 - 12/17/2018 � 88,290316 Kingfisher PLC 7/16/2018 - 12/24/2018 � 106,14434 Kintetsu Group Holdings Co. Ltd. 3/18/2019 -3/29/2019 � 1,29826 Kirin Holdings Co. Ltd. 7/27/2018 -3/18/2019 � 14,5382 KLA-Tencor Corp. 3/18/2019 -4/15/2019 � 4,96336 Kohl�s Corp. 8/17/2018 -4/29/2019 � (5,566 )32 Konami Holdings Corp. 7/2/2018 -5/1/2019 � (4,551 )15 Koninklijke Philips NV 6/29/2018 - 3/4/2019 � 45,46312 Koninklijke Vopak NV 12/5/2018 -2/19/2019 � 12,2348 Lam Research Corp. 2/4/2019 -4/29/2019 � 23,67233 Lamb Weston Holdings, Inc. 12/5/2018 - 1/10/2019 � (32,207 )10 Lancaster Colony Corp. 7/26/2018 - 12/17/2018 � (31,640 )75 Laredo Petroleum, Inc. 3/4/2019 - 3/18/2019 � (147,932 )17 Lazard Ltd. Class A 11/13/2018 � (50,465 )13 Lear Corp. 6/29/2018 - 2/19/2019 � 108,90027 Leidos Holdings, Inc. 12/5/2018 - 4/25/2019 � (34,192 )83 Leonardo SpA 2/19/2019 - 4/15/2019 � 148,109452 Li & Fung Ltd. 6/29/2018 - 7/5/2018 � (1,980 )23 Liberty Broadband Corp. 6/29/2018 - 1/23/2019 � (79,054 )34 Liberty Global PLC Class C 4/15/2019 � 21,29846 Liberty Global PLC LiLAC Class C 1/9/2019 - 4/15/2019 � 74,0248 Liberty Media Corp-Liberty Formula One 3/4/2019 � 10,830
34 The accompanying notes are an integral part of these financial statements.
Copyright © 2017 www.secdatabase.com. All Rights Reserved.Please Consider the Environment Before Printing This Document

GOLDMAN SACHS MULTI-MANAGER ALTERNATIVES FUND
ADDITIONAL INVESTMENT INFORMATION (continued)
OVER THE COUNTER TOTAL RETURN SWAP CONTRACTS# (continued)
Market Value
Counterparty
NotionalAmount(000s)
ReferenceSecurity
TerminationDate
UpfrontPayments
Made (Received)UnrealizedGain (Loss)
JPMorgan Securities, Inc.(continued) $ 27 Liberty Ventures 1/10/2019 - 3/29/2019 $ � $(38,735 )
16 Lion Corp. 7/6/2018 - 8/10/2018 � 702� * Live Nation Entertainment, Inc. 3/18/2019 � 13840 LKQ Corp. 2/19/2019 - 3/18/2019 � (104,173 )207 Lloyds Banking Group PLC 3/15/2019 � (23,351 )34 Logitech International SA Class A 8/9/2018 - 11/13/2018 � 61,2033 London Stock Exchange Group PLC 4/25/2019 � (8,467 )17 Louisiana-Pacific Corp. 2/19/2019 - 4/29/2019 � (6,649 )1 Lowe�s Cos., Inc. 4/11/2019 � 2,9815 LSC Communications, Inc. 10/9/2018 � 4,7748 lululemon athletica, Inc. 4/15/2019 - 4/29/2019 � 1,779196 Lundin Mining Corp. 8/7/2018 - 12/17/2018 � (69,488 )63 Lundin Petroleum AB 11/13/2018 - 4/29/2019 � 115,97048 M3, Inc. 2/21/2019 - 3/18/2019 � (3,860 )26 MACOM Technology Solutions Holdings, Inc. 3/4/2019 - 4/15/2019 � 49,9889 Macquarie Group Ltd. 3/4/2019 � (27,233 )15 Macquarie Infrastructure Corp. 3/4/2019 � (6,966 )9 Magellan Financial Group Ltd. 3/18/2019 � (112 )16 Magna International, Inc. 6/29/2018 - 11/13/2018 � 27,94231 Mallinckrodt PLC 6/29/2018 - 4/29/2019 � 93,46018 ManpowerGroup, Inc. 9/4/2018 - 10/19/2018 � 15,15142 Maple Leaf Foods, Inc. 3/4/2019 - 3/18/2019 � 44,89911 Marine Harvest ASA 3/15/2019 � 11,7096 MarketAxess Holdings, Inc. 9/4/2018 - 4/15/2019 � (61,931 )5 Martin Marietta Materials, Inc. 2/19/2019 - 3/4/2019 � (559 )91 Marui Group Co. Ltd. 7/2/2018 - 1/15/2019 � (15,207 )41 Maruichi Steel Tube Ltd. 7/2/2018 - 1/15/2019 � 39,32211 Masimo Corp. 3/4/2019 - 4/11/2019 � 90,44521 MasTec, Inc. 3/4/2019 - 4/29/2019 � 47,17640 Mattel, Inc. 2/4/2019 - 4/29/2019 � 114,97731 Maxim Integrated Products, Inc. 3/18/2019 - 4/29/2019 � (30,076 )100 Mediaset Espana Comunicacion SA 7/2/2018 - 3/6/2019 � 71,813311 Mediaset SpA 2/19/2019 - 3/29/2019 � 59,97443 Mediclinic International PLC 2/19/2019 - 4/25/2019 � (59,554 )20 Medipal Holdings Corp. 7/2/2018 - 3/29/2019 � 3,5848 MEDNAX, Inc. 3/29/2019 - 4/29/2019 � 25,7422 Medtronic PLC 2/19/2019 - 3/18/2019 � (5,201 )190 Meggitt PLC 4/29/2019 � (10,117 )6 Melia Hotels International SA 4/15/2019 � 6,4051 MercadoLibre, Inc. 10/19/2018 � 12,2119 Merck & Co., Inc. 6/29/2018 - 3/18/2019 � 10,88914 Methanex Corp. 4/15/2019 - 4/29/2019 � (22,851 )1 Mettler-Toledo International, Inc. 6/29/2018 - 8/9/2018 � 19,5077 Micron Technology, Inc. 3/18/2019 � (3,329 )3 Millicom International Cellular SA Class A 3/15/2019 � 8,27421 Mitsubishi Electric Corp. 8/10/2018 � 7,116211 Mitsubishi Motors Corp. 3/6/2019 - 4/15/2019 � (85,391 )29 Mitsubishi UFJ Financial Group, Inc. 3/18/2019 - 4/12/2019 � (8,646 )160 Mitsubishi UFJ Lease & Finance Co. Ltd. 7/2/2018 - 12/27/2018 � 38,175
The accompanying notes are an integral part of these financial statements. 35
Copyright © 2017 www.secdatabase.com. All Rights Reserved.Please Consider the Environment Before Printing This Document

GOLDMAN SACHS MULTI-MANAGER ALTERNATIVES FUND
Consolidated Schedule of Investments (continued)April 30, 2017 (Unaudited)
ADDITIONAL INVESTMENT INFORMATION (continued)
OVER THE COUNTER TOTAL RETURN SWAP CONTRACTS# (continued)
Market Value
Counterparty
NotionalAmount(000s)
ReferenceSecurity
TerminationDate
UpfrontPayments
Made (Received)UnrealizedGain (Loss)
JPMorgan Securities, Inc.(continued) $42 Mixi, Inc. 1/11/2019 - 1/15/2019 $ � $243,433
19 Mizrahi Tefahot Bank Ltd. 3/4/2019 - 3/18/2019 � 5,00513 Molina Healthcare, Inc. 1/10/2019 - 2/19/2019 � 24,15253 MonotaRO Co. Ltd. 7/6/2018 - 11/1/2018 � (69,793 )19 Monster Beverage Corp. 6/29/2018 - 12/17/2018 � (172 )8 Murphy Oil Corp. 3/29/2019 � (18,206 )5 Nabors Industries Ltd. 2/4/2019 - 4/15/2019 � 19,65116 National Beverage Corp. 3/18/2019 � 46,6767,733 National Housing Resources Group, Inc. ~ 06/20/17 � (104,486 )11 NCR Corp. 4/15/2019 - 4/29/2019 � (3,182 )33 Nektar Therapeutics 3/29/2019 - 4/15/2019 � (14,744 )4 Nestle SA 6/29/2018 - 8/9/2018 � 8,21510 Netflix, Inc. 12/12/2018 - 4/29/2019 � (12,187 )2 NetScout Systems, Inc. 4/15/2019 � (1,217 )4 Neurocrine Biosciences, Inc. 3/18/2019 � (44,449 )29 New Jersey Resources Corp. 3/4/2019 - 4/15/2019 � 5,01489 New York Community Bancorp, Inc. 6/29/2018 - 10/9/2018 � 44,75120 Newfield Exploration Co. 4/15/2019 � (48,209 )76 Nexon Co. Ltd. 7/27/2018 - 3/18/2019 � 103,28341 NGK Spark Plug Co. Ltd. 9/28/2018 - 3/6/2019 � (24,408 )149 Nibe Industrier AB 10/31/2018 - 3/4/2019 � (82,580 )18 Nice Ltd. 3/18/2019 � 1,111633 Nike, Inc. Class B µ 12/31/2099 � 7,16022 Nikon Corp. 9/28/2018 � 1,8047 Nintendo Co. Ltd. 8/10/2018 - 3/6/2019 � (91,858 )4 Nippon Telegraph & Telephone Corp. 7/27/2018 - 4/12/2019 � (7,183 )39 Nissan Chemical Industries Ltd. 7/17/2018 - 5/1/2019 � (39,595 )44 NOK Corp. 1/15/2019 - 4/15/2019 � (60,374 )36 Nokian Renkaat OYJ 6/29/2018 - 12/17/2018 � (34,954 )3 Nomura Research Institute Ltd. 3/29/2019 � (3,819 )6 Nordstrom, Inc. 6/29/2018 - 8/9/2018 � 13,087224 Norsk Hydro ASA 7/16/2018 - 11/13/2018 � (50,418 )13 Northern Trust Corp. 6/29/2018 - 3/18/2019 � 51,02554 Northland Power, Inc. 7/26/2018 - 12/17/2018 � 63,6331 Northrop Grumman Corp. 3/18/2019 � 3,40316 Novartis AG 4/15/2019 � (49,120 )8 Novo Nordisk A/S 6/29/2018 - 2/4/2019 � 27,57869 NRG Energy, Inc. 3/29/2019 - 4/29/2019 � (117,303 )5 NTT Data Corp. 7/2/2018 - 7/17/2018 � (1,042 )11 NTT DOCOMO, Inc. 10/22/2018 � 6,65763 Nuance Communications, Inc. 12/5/2018 - 1/10/2019 � 57,60641 Numericable-SFR SA 10/19/2018 - 12/17/2018 � (77,251 )5 NVIDIA Corp. 3/29/2019 � (31,836 )14 Oasis Petroleum, Inc. 2/4/2019 - 3/6/2019 � 32,19422 Obic Co. Ltd. 7/2/2018 - 12/27/2018 � (114,812 )76 OCI NV 10/9/2018 - 2/19/2019 � (137,945 )58 Oil Search Ltd. 3/4/2019 � (15,321 )142 Oji Holdings Corp. 2/21/2019 - 5/1/2019 � 14,51031 OMV AG 10/31/2018 - 3/4/2019 � 121,555
36 The accompanying notes are an integral part of these financial statements.
Copyright © 2017 www.secdatabase.com. All Rights Reserved.Please Consider the Environment Before Printing This Document

GOLDMAN SACHS MULTI-MANAGER ALTERNATIVES FUND
ADDITIONAL INVESTMENT INFORMATION (continued)
OVER THE COUNTER TOTAL RETURN SWAP CONTRACTS# (continued)
Market Value
Counterparty
NotionalAmount(000s)
ReferenceSecurity
TerminationDate
UpfrontPayments
Made (Received)UnrealizedGain (Loss)
JPMorgan Securities, Inc.(continued) $ 45 OneMain Holdings, Inc. 4/29/2019 $ � $(65,628 )
17 Onex Corp. 3/18/2019 � (13,452 )� * Oracle Corp Japan 1/24/2019 - 3/18/2019 � (458 )58 Origin Energy Ltd. 3/29/2019 - 4/29/2019 � (15,931 )10 Orpea 4/29/2019 � (12,956 )193 Osaka Gas Co. Ltd. 2/4/2019 - 3/18/2019 � (17,643 )4 Oshkosh Corp. 3/29/2019 � (4,284 )78 Outokumpu OYJ 4/15/2019 � 7,66517 Owens Corning 4/29/2019 � (24,868 )9 Palo Alto Networks, Inc. 1/10/2019 � 43,6304 Panalpina Welttransport Holding AG 4/29/2019 � (852 )2 Pandora A/S 3/29/2019 � 3,234105 Pandora Media, Inc. 9/4/2018 - 2/4/2019 � 30,24850 Parsley Energy, Inc. Class A 7/2/2018 - 8/9/2018 � 96,5583 Partners Group Holding AG 6/29/2018 - 3/29/2019 � (115,972 )2 Patterson Cos., Inc. 4/29/2019 � (307 )25 Paycom Software, Inc. 10/31/2018 � (56,014 )7 PDC Energy, Inc. 3/18/2019 - 4/29/2019 � 39,59983 Pearson PLC 3/29/2019 � 7,8675 Pegasystems, Inc. 4/15/2019 � (7,457 )2 PepsiCo, Inc. 3/29/2019 � 2,28233 Persimmon PLC 1/23/2019 - 3/29/2019 � 96,945112 Petrofac Ltd. 11/23/2018 - 4/29/2019 � (21,512 )89 Peugeot SA 6/29/2018 - 10/19/2018 � 187,6918 Pfizer, Inc. 11/7/2018 � 1512 Philip Morris International, Inc. 6/29/2018 - 8/9/2018 � (2,813 )57 Pilgrim�s Pride Corp. 8/9/2018 - 4/29/2019 � 45,08989 Platform Specialty Products Corp 3/29/2019 - 4/15/2019 � 79,59412 Pola Orbis Holdings, Inc. 4/12/2019 - 5/1/2019 � (1,647 )14 Polaris Industries, Inc. 2/4/2019 - 4/29/2019 � (24,913 )12 Power Corp of Canada 3/18/2019 � 2,21718 PRA Health Sciences, Inc. 9/4/2018 � (3,090 )61 PrairieSky Royalty Ltd. 6/29/2018 - 8/9/2018 � 22,53520 Prestige Brands Holdings, Inc. 3/4/2019 � 13,6585 ProAssurance Corp. 4/29/2019 � (1,884 )39 Provident Financial PLC 6/29/2018 - 3/18/2019 � (104,730 )6 Proximus SADP 3/15/2019 � 2,1601 PTC, Inc. 4/29/2019 � (643 )5 PulteGroup, Inc. 3/18/2019 � 5,3012 PVH Corp 3/29/2019 - 4/29/2019 � (1,203 )592 Qantas Airways Ltd. 6/29/2018 - 11/23/2018 � 155,13745 Quebecor, Inc. Class B 6/29/2018 - 10/31/2018 � (28,080 )13 Raiffeisen Bank International AG 6/29/2018 - 11/23/2018 � 13,49027 Rakuten, Inc. 7/6/2018 - 11/9/2018 � 16,4212 Ralph Lauren Corp. Class A 4/15/2019 - 4/25/2019 � 3,03135 REA Group Ltd. 6/29/2018 - 12/17/2018 � (20,950 )2 Red Hat, Inc. 3/18/2019 � 6,06149 Regal Entertainment Group Class A 3/4/2019 - 3/18/2019 � 3,23219 Reliance Steel & Aluminum Co. 6/29/2018 - 10/19/2018 � (4,509 )
The accompanying notes are an integral part of these financial statements. 37
Copyright © 2017 www.secdatabase.com. All Rights Reserved.Please Consider the Environment Before Printing This Document
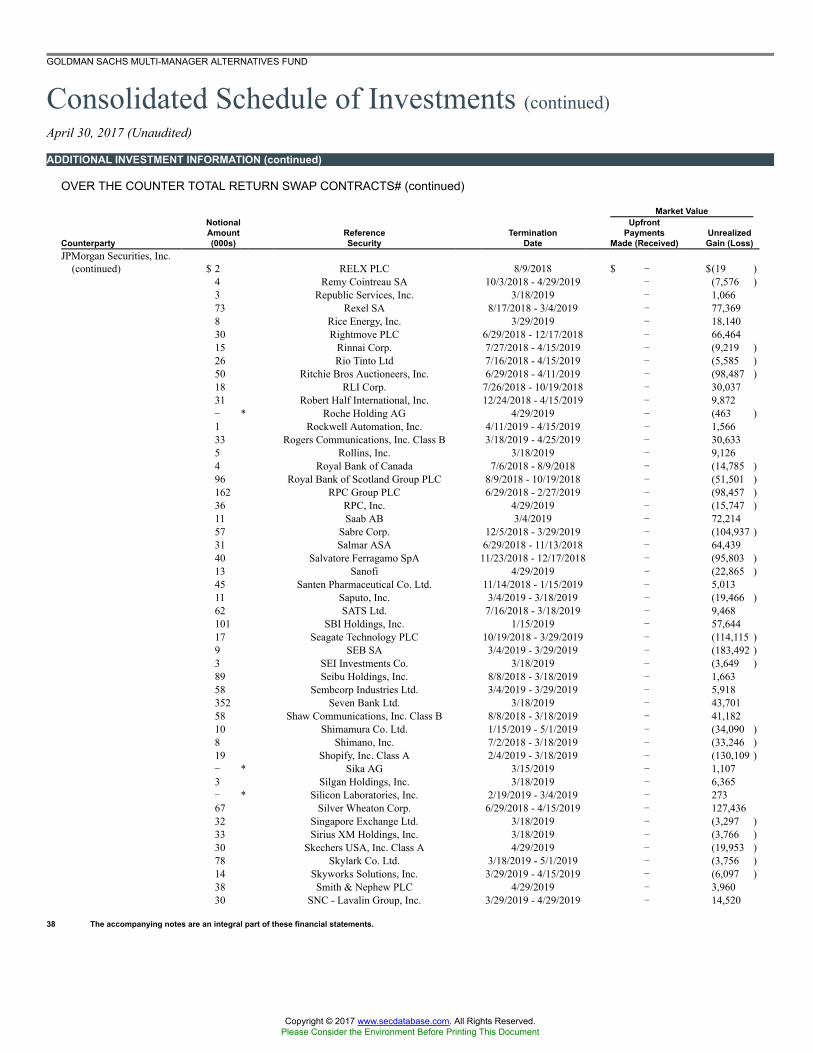
GOLDMAN SACHS MULTI-MANAGER ALTERNATIVES FUND
Consolidated Schedule of Investments (continued)April 30, 2017 (Unaudited)
ADDITIONAL INVESTMENT INFORMATION (continued)
OVER THE COUNTER TOTAL RETURN SWAP CONTRACTS# (continued)
Market Value
Counterparty
NotionalAmount(000s)
ReferenceSecurity
TerminationDate
UpfrontPayments
Made (Received)UnrealizedGain (Loss)
JPMorgan Securities, Inc.(continued) $ 2 RELX PLC 8/9/2018 $ � $(19 )
4 Remy Cointreau SA 10/3/2018 - 4/29/2019 � (7,576 )3 Republic Services, Inc. 3/18/2019 � 1,06673 Rexel SA 8/17/2018 - 3/4/2019 � 77,3698 Rice Energy, Inc. 3/29/2019 � 18,14030 Rightmove PLC 6/29/2018 - 12/17/2018 � 66,46415 Rinnai Corp. 7/27/2018 - 4/15/2019 � (9,219 )26 Rio Tinto Ltd 7/16/2018 - 4/15/2019 � (5,585 )50 Ritchie Bros Auctioneers, Inc. 6/29/2018 - 4/11/2019 � (98,487 )18 RLI Corp. 7/26/2018 - 10/19/2018 � 30,03731 Robert Half International, Inc. 12/24/2018 - 4/15/2019 � 9,872� * Roche Holding AG 4/29/2019 � (463 )1 Rockwell Automation, Inc. 4/11/2019 - 4/15/2019 � 1,56633 Rogers Communications, Inc. Class B 3/18/2019 - 4/25/2019 � 30,6335 Rollins, Inc. 3/18/2019 � 9,1264 Royal Bank of Canada 7/6/2018 - 8/9/2018 � (14,785 )96 Royal Bank of Scotland Group PLC 8/9/2018 - 10/19/2018 � (51,501 )162 RPC Group PLC 6/29/2018 - 2/27/2019 � (98,457 )36 RPC, Inc. 4/29/2019 � (15,747 )11 Saab AB 3/4/2019 � 72,21457 Sabre Corp. 12/5/2018 - 3/29/2019 � (104,937 )31 Salmar ASA 6/29/2018 - 11/13/2018 � 64,43940 Salvatore Ferragamo SpA 11/23/2018 - 12/17/2018 � (95,803 )13 Sanofi 4/29/2019 � (22,865 )45 Santen Pharmaceutical Co. Ltd. 11/14/2018 - 1/15/2019 � 5,01311 Saputo, Inc. 3/4/2019 - 3/18/2019 � (19,466 )62 SATS Ltd. 7/16/2018 - 3/18/2019 � 9,468101 SBI Holdings, Inc. 1/15/2019 � 57,64417 Seagate Technology PLC 10/19/2018 - 3/29/2019 � (114,115 )9 SEB SA 3/4/2019 - 3/29/2019 � (183,492 )3 SEI Investments Co. 3/18/2019 � (3,649 )89 Seibu Holdings, Inc. 8/8/2018 - 3/18/2019 � 1,66358 Sembcorp Industries Ltd. 3/4/2019 - 3/29/2019 � 5,918352 Seven Bank Ltd. 3/18/2019 � 43,70158 Shaw Communications, Inc. Class B 8/8/2018 - 3/18/2019 � 41,18210 Shimamura Co. Ltd. 1/15/2019 - 5/1/2019 � (34,090 )8 Shimano, Inc. 7/2/2018 - 3/18/2019 � (33,246 )19 Shopify, Inc. Class A 2/4/2019 - 3/18/2019 � (130,109 )� * Sika AG 3/15/2019 � 1,1073 Silgan Holdings, Inc. 3/18/2019 � 6,365� * Silicon Laboratories, Inc. 2/19/2019 - 3/4/2019 � 27367 Silver Wheaton Corp. 6/29/2018 - 4/15/2019 � 127,43632 Singapore Exchange Ltd. 3/18/2019 � (3,297 )33 Sirius XM Holdings, Inc. 3/18/2019 � (3,766 )30 Skechers USA, Inc. Class A 4/29/2019 � (19,953 )78 Skylark Co. Ltd. 3/18/2019 - 5/1/2019 � (3,756 )14 Skyworks Solutions, Inc. 3/29/2019 - 4/15/2019 � (6,097 )38 Smith & Nephew PLC 4/29/2019 � 3,96030 SNC - Lavalin Group, Inc. 3/29/2019 - 4/29/2019 � 14,520
38 The accompanying notes are an integral part of these financial statements.
Copyright © 2017 www.secdatabase.com. All Rights Reserved.Please Consider the Environment Before Printing This Document

GOLDMAN SACHS MULTI-MANAGER ALTERNATIVES FUND
ADDITIONAL INVESTMENT INFORMATION (continued)
OVER THE COUNTER TOTAL RETURN SWAP CONTRACTS# (continued)
Market Value
Counterparty
NotionalAmount(000s)
ReferenceSecurity
TerminationDate
UpfrontPayments
Made (Received)UnrealizedGain (Loss)
JPMorgan Securities, Inc.(continued) $32 Sohgo Security Services Co. Ltd. 10/11/2018 - 3/18/2019 $ � $(23,562 )
3 Sonoco Products Co. 3/18/2019 � 20146 Sony Financial Holdings, Inc. 3/29/2019 - 5/1/2019 � (18,220 )135 South32 Ltd. 6/29/2018 - 7/26/2018 � (14,079 )52 Spark New Zealand Ltd. 11/15/2018 � 6,2656,353 SPDR S&P 500 ETFµ 12/31/2099 � (32,567 )10 Spectrum Brands Holdings, Inc. 10/9/2018 - 3/18/2019 � 35,8473 Spirit AeroSystems Holdings, Inc. Class A 3/18/2019 � (1,774 )14 Sprint Corp. 4/25/2019 � (6,972 )40 Square Enix Holdings Co. Ltd. 3/29/2019 � 16,389116 SSAB AB 4/29/2019 � (17,387 )28 Stanley Electric Co. Ltd. 8/20/2018 - 11/26/2018 � (39,683 )54 Start Today Co. Ltd. 1/24/2019 - 5/1/2019 � 8,84736 Steel Dynamics, Inc. 6/29/2018 - 4/15/2019 � 38,75220 STERIS PLC 7/16/2018 - 12/17/2018 � (66,517 )12 Sterling Bancorp 4/29/2019 � 6,973124 STMicroelectronics NV 6/29/2018 - 7/26/2018 � 176,731101 Stora Enso OYJ 6/29/2018 - 11/13/2018 � 29,1489 Subaru Corp. 5/1/2019 � 1,851105 Subsea 7 SA 7/16/2018 - 1/10/2019 � 88,76011 Sugi Holdings Co. Ltd. 7/2/2018 - 1/15/2019 � 3,49580 Sumco Corp. 11/9/2018 - 12/27/2018 � (90,361 )272 Sumitomo Chemical Co. Ltd. 7/17/2018 - 8/8/2018 � 69,29646 Sumitomo Metal Mining Co. Ltd. 3/29/2019 - 4/15/2019 � 20,0674 Sumitomo Mitsui Financial Group, Inc. 4/12/2019 � (6,597 )21 SunTrust Banks, Inc. 4/15/2019 � 38,80742 Suzuken Co. Ltd. 7/2/2018 - 11/14/2018 � 33,31794 Svenska Handelsbanken AB 4/11/2019 - 4/15/2019 � (71,789 )5 Swedish Match AB 4/11/2019 � 2,098� * Swisscom AG 3/15/2019 � 2083 Symantec Corp. 4/29/2019 � (1,393 )85 Taiyo Nippon Sanso Corp. 3/29/2019 - 5/1/2019 � (25,203 )2 Taro Pharmaceutical Industries Ltd. 12/12/2018 - 2/19/2019 � (2,252 )108 Taylor Wimpey PLC 3/18/2019 � 14,67845 TCF Financial Corp. 3/4/2019 � (4,891 )13 Tech Data Corp. 12/17/2018 - 12/24/2018 � 44,5954,173 Technology Select Sector SPDR Fund 12/31/2099 � (130,442 )180 Tele2 AB 6/29/2018 - 12/3/2018 � (133,137 )1 Teledyne Technologies, Inc. 3/18/2019 � 10,05066 Telenor ASA 12/5/2018 - 3/15/2019 � (10,592 )6 Temenos Group AG 6/29/2018 - 9/27/2018 � 43,52928 Tenaris SA 3/18/2019 - 4/29/2019 � 97,42958 Teradata Corp. 6/29/2018 - 11/13/2018 � (74,311 )61 Teradyne, Inc. 6/29/2018 - 1/9/2019 � 216,42875 Tesco PLC 3/15/2019 � (4,781 )7 Tesla Motors, Inc. 12/17/2018 - 3/6/2019 � (38,891 )15 Texas Capital Bancshares, Inc. 4/29/2019 � 17,4702 Texas Instruments, Inc. 3/18/2019 � 490150 The Bank of Kyoto Ltd. 12/19/2018 - 5/1/2019 � 63,153
The accompanying notes are an integral part of these financial statements. 39
Copyright © 2017 www.secdatabase.com. All Rights Reserved.Please Consider the Environment Before Printing This Document

GOLDMAN SACHS MULTI-MANAGER ALTERNATIVES FUND
Consolidated Schedule of Investments (continued)April 30, 2017 (Unaudited)
ADDITIONAL INVESTMENT INFORMATION (continued)
OVER THE COUNTER TOTAL RETURN SWAP CONTRACTS# (continued)
Market Value
Counterparty
NotionalAmount(000s)
ReferenceSecurity
TerminationDate
UpfrontPayments
Made (Received)UnrealizedGain (Loss)
JPMorgan Securities, Inc.(continued) $ 1 The Boeing Co 3/18/2019 $ � $5,978
470 The Boeing Co.µ 12/31/2099 � (19,325 )48 The Chemours Co. 11/19/2018 - 1/10/2019 � 377,9452 The Gap, Inc. 6/29/2018 - 9/27/2018 � 6,7981 The Home Depot, Inc. 3/18/2019 - 3/29/2019 � 9,09448 The Interpublic Group of Cos., Inc. 2/19/2019 - 4/29/2019 � (50,199 )95 The Kansai Electric Power Co., Inc. 12/6/2018 - 1/15/2019 � 89,46554 The Michaels Cos., Inc. 3/18/2019 � 19,8627 The Middleby Corp. 6/29/2018 - 10/31/2018 � 3853 The Procter & Gamble Co. 6/29/2018 - 8/9/2018 � (5,815 )3 The Sage Group PLC 2/4/2019 � 1,60331 The Timken Co. 12/5/2018 � 126,6592 The Walt Disney Co. 3/18/2019 - 3/29/2019 � 3,78269 The Weir Group PLC 9/14/2018 - 3/15/2019 � (20,613 )22 The Williams Cos., Inc. 1/10/2019 - 3/29/2019 � 6,24212 The Yokohama Rubber Co. Ltd. 12/19/2018 - 1/15/2019 � 3,58518 Tohoku Electric Power Co., Inc. 3/18/2019 - 5/1/2019 � (6,762 )19 Tokyo Broadcasting System Holdings, Inc. 3/29/2019 � 1,248321 Tokyo Electric Power Co. Holdings, Inc. 7/2/2018 - 7/27/2018 � 38,773298 Tokyo Gas Co. Ltd. 9/18/2018 - 12/19/2018 � 19,7797 Toppan Printing Co. Ltd. 10/22/2018 � 2,4792 Toyota Motor Corp. 4/12/2019 � (2,622 )10 TPG TELECOM LTD. 04/21/17 � (6,416 )110 TPG Telecom Ltd. 6/29/2018 - 4/29/2019 � 70,2706 TransDigm Group, Inc. 6/29/2018 - 12/17/2018 � (57,188 )36 TransUnion 11/13/2018 - 12/24/2018 � (53,792 )68 Treasury Wine Estates Ltd. 3/4/2019 � 14,76937 Trelleborg AB 3/18/2019 - 4/15/2019 � (67,706 )15 TripAdvisor, Inc. 3/4/2019 - 3/18/2019 � (53,984 )67 Tryg A/S 6/29/2018 - 3/18/2019 � (84,309 )1 Tsuruha Holdings, Inc. 6/29/2018 - 3/18/2019 � (277 )113 Tullow Oil PLC Class A 2/19/2019 - 3/4/2019 � 22,38416 Twilio, Inc.Class A 2/19/2019 � (61,066 )70 Twitter, Inc. 3/18/2019 - 3/29/2019 � (151,951 )10 Tyler Technologies, Inc. 6/29/2018 - 12/17/2018 � (83,680 )20 Ubiquiti Networks, Inc. 3/29/2019 - 4/29/2019 � (40,496 )1 Ulta Salon Cosmetics & Fragrance, Inc. 3/18/2019 � (3,246 )2 Ultragenyx Pharmaceutical, Inc. 3/18/2019 � (13,480 )10 Umicore SA 3/29/2019 � (27,135 )4 Unilever PLC 3/15/2019 � (1,819 )323 Unione di Banche Italiane SpA 1/10/2019 - 1/23/2019 � (206,679 )30 United Bankshares, Inc. 11/23/2018 - 12/24/2018 � 32,7974 United Continental Holdings, Inc. 11/19/2018 � (2,198 )28 United States Cellular Corp. 12/24/2018 - 1/10/2019 � 25,38924 United States Steel Corp. 3/4/2019 - 3/29/2019 � 298,7032 United Technologies Corp. 3/18/2019 � 8,9492 United Therapeutics Corp. 6/29/2018 - 8/9/2018 � 8,16710 United Utilities Group PLC 3/29/2019 � 84140 Univar, Inc. 3/4/2019 - 3/29/2019 � (5,497 )
40 The accompanying notes are an integral part of these financial statements.
Copyright © 2017 www.secdatabase.com. All Rights Reserved.Please Consider the Environment Before Printing This Document

GOLDMAN SACHS MULTI-MANAGER ALTERNATIVES FUND
ADDITIONAL INVESTMENT INFORMATION (continued)
OVER THE COUNTER TOTAL RETURN SWAP CONTRACTS# (continued)
Market Value
Counterparty
NotionalAmount(000s)
ReferenceSecurity
TerminationDate
UpfrontPayments
Made (Received)UnrealizedGain (Loss)
JPMorgan Securities, Inc.(continued) $ 15 Universal Display Corp. 6/29/2018 - 2/19/2019 $ � $(79,247 )
14 Universal Health Services, Inc. Class B 6/29/2018 - 12/17/2018 � (28,936 )11 Urban Outfitters, Inc. 6/29/2018 - 10/19/2018 � 52128 US Silica Holdings, Inc. 11/19/2018 - 12/5/2018 � 223,9908 USG Corp. 3/29/2019 � (11,086 )41 Valeant Pharmaceuticals International, Inc. 4/11/2019 - 4/15/2019 � (13,527 )3 Valero Energy Corp. 12/24/2018 � (3,545 )67 Vallourec SA 1/10/2019 � 21,17111 Valvoline, Inc. 12/24/2018 � (17,111 )17 Vedanta Resources PLC 12/24/2018 � 10,93316 VeriSign, Inc. 7/26/2018 - 4/15/2019 � 15,0374 Verizon Communications, Inc. 3/18/2019 � (7,865 )1 Vertex Pharmaceuticals, Inc. 4/25/2019 � 4,50118 Vestas Wind Systems A/S 9/4/2018 - 3/15/2019 � 91,12019 ViaSat, Inc. 7/16/2018 - 3/29/2019 � (11,838 )2 VMware, Inc. Class A 3/18/2019 � 3,16212 Volvo AB Class B 4/11/2019 � (26,034 )33 Voya Financial, Inc. 6/29/2018 - 12/17/2018 � 12,35410 Vulcan Materials Co. 6/29/2018 - 3/29/2019 � 3,51959 VWR Corp. 7/6/2018 - 12/17/2018 � 45,79517 Wabtec Corp. 3/18/2019 - 3/29/2019 � (44,402 )845 Wal-Mart Stores, Inc.µ 12/31/2099 � (57,650 )2 Waste Management, Inc. 3/18/2019 � (308 )183 Weatherford International PLC 7/2/2018 - 3/4/2019 � 137,04814 WellCare Health Plans, Inc. 6/29/2018 - 8/9/2018 � 97,7942 Wells Fargo & Co. 3/29/2019 � 79224 West Fraser Timber Co. Ltd. 12/17/2018 � (1,818 )25 Williams - Sonoma, Inc. 3/29/2019 � (29,194 )10 Wintrust Financial Corp. 4/29/2019 � (19,729 )8 Wix.com Ltd. 5/1/2019 � (27,329 )18 Woodward, Inc. 4/29/2019 � 10,16229 World Fuel Services Corp. 6/29/2018 - 9/4/2018 � 17,0795 Worthington Industries, Inc. 2/4/2019 - 2/19/2019 � (334 )39 WPP PLC 7/26/2018 � (13,898 )39 Wright Medical Group NV 3/29/2019 - 4/15/2019 � (11,680 )30 WSP Global, Inc. 3/18/2019 � 10,5432 Wynn Resorts Ltd. 3/18/2019 � (11,774 )149 Xerox Corp. 1/7/2019 � 25,1293 Xilinx, Inc. 3/18/2019 � 20,72524 Xylem, Inc. 3/4/2019 � (17,742 )24 Yahoo Japan Corp. 4/12/2019 � 8,279233 Yamada Denki Co. Ltd. 2/4/2019 - 3/6/2019 � 82,37129 Yamaha Motor Co. Ltd. 3/29/2019 � (20,549 )35 Zillow Group, Inc. 2/4/2019 - 3/29/2019 � (157,951 )21 Zions Bancorp 6/29/2018 - 7/26/2018 � (19,696 )44 Zodiac Aerospace 3/18/2019 - 4/29/2019 � 21,900
Morgan Stanley & Co.201 Accenture PLC Class A 12/18/17 � (498 )187 Advanced Drainage Systems 12/18/17 1,891 (8,188 )
The accompanying notes are an integral part of these financial statements. 41
Copyright © 2017 www.secdatabase.com. All Rights Reserved.Please Consider the Environment Before Printing This Document

GOLDMAN SACHS MULTI-MANAGER ALTERNATIVES FUND
Consolidated Schedule of Investments (continued)April 30, 2017 (Unaudited)
ADDITIONAL INVESTMENT INFORMATION (continued)
OVER THE COUNTER TOTAL RETURN SWAP CONTRACTS# (continued)
Market Value
Counterparty
NotionalAmount(000s)
ReferenceSecurity
TerminationDate
UpfrontPayments
Made (Received)UnrealizedGain (Loss)
Morgan Stanley & Co.(continued) CAD 12 Alimentation Couche 12/18/17 $ � $12,023
$ 99 Artisan Partners Asset Management, Inc. 12/18/17 � (3,978 )273 Banco Santander SA 12/18/17 � 3,00887 Best Buy Co., Inc. 12/18/17 � (14,720 )84 Big 5 Sporting Goods Corp. 12/18/17 � (2,719 )80 Brunswick Corp. 12/18/17 � 2,597208 C.H. Robinson Worldwide, Inc. 12/18/17 1,377 8,354168 Carmax, Inc. 12/18/17 4,034 9,890395 Cullen/Frost Bankers, Inc.§ 12/18/17 � (36,686 )79 Del Taco Restaurants, Inc. 12/18/17 � (5,285 )59 Dicks Sporting Goods, Inc. 12/18/17 10 (2,982 )371 Eaton Vance Corp. 12/18/17 � (11,489 )169 Edgewell Personal Care Co. 12/18/17 3,885 12,478169 Financial Engine, Inc. 12/18/17 � (26,457 )72 Financial Select Sector SPDR Fund+ 3/31/18 � (18,390 )189 Greenhill & Co., Inc. 12/18/17 748 17,642381 Health Care Select Sector 12/18/17 (655 ) (36,753 )415 Healthcare Services Group 12/18/17 � (68,134 )298 Hni, Corp. 12/18/17 2,748 (5,641 )299 Hormel Foods Corp. 12/18/17 (23,233 ) 20,576295 Idexx Laboratories, Inc. 12/15/17 � (88,310 )192 International Business Machines Corp. 12/18/17 � 17,807401 iShares China Large Cap ETF 12/18/17 4,525 (14,735 )378 iShares iBoxx Usd High Yield 12/18/17 � (6,428 )392 iShares Nasdaq Biotechnology 12/18/17 (7,917 ) (24,838 )386 iShares Russell 2000 12/18/17 � (21,829 )66 JC Penney Co., Inc. 12/18/17 � 5,268207 Kellogg Co. 12/18/17 (579 ) 4,112340 Kilroy Realty Corp. 12/18/17 � 8,525212 Lear Corp. 12/18/17 2,228 (3,162 )206 Logitech International - Reg 12/18/17 � (42,607 )132 Netgear, Inc. 12/18/17 13 7,468336 Newmarket Corp. 12/18/17 � (23,749 )80 Nordstrom, Inc. 12/18/17 � (10,338 )54 Park City Group, Inc. 12/18/17 � (535 )176 Paycom Software, Inc. 12/18/17 � (36,848 )153 Paylocity Holding Corp. 12/18/17 (1,042 ) (23,034 )280 Petmed Express, Inc. 12/18/17 � (25,089 )121 Planet Fitness, Inc. Class A 12/18/17 1,529 (5,661 )180 PTC, Inc. 12/18/17 � (7,739 )101 Quotient Technology, Inc. 12/18/17 1,440 1,279157 2U Inc. 12/18/17 2,188 (45,654 )247 Sirius XM Radio, Inc. 12/18/17 � (20,503 )206 SPDR S&P Oil & Gas Exploration & Production 12/18/17 2,894 2,611162 Therapeuticsmd, Inc. 12/18/17 � 29,290257 Trimble, Inc. 12/18/17 � (33,307 )129 Trupanion, Inc. 12/18/17 � (1,185 )101 Viacom, Inc. Class B 12/18/17 � �
100 WildHorse Resource Development Corp. 12/18/17 � (2,205 )
42 The accompanying notes are an integral part of these financial statements.
Copyright © 2017 www.secdatabase.com. All Rights Reserved.Please Consider the Environment Before Printing This Document

GOLDMAN SACHS MULTI-MANAGER ALTERNATIVES FUND
ADDITIONAL INVESTMENT INFORMATION (continued)
OVER THE COUNTER TOTAL RETURN SWAP CONTRACTS# (continued)
Market Value
Counterparty
NotionalAmount(000s)
ReferenceSecurity
TerminationDate
UpfrontPayments
Made (Received)UnrealizedGain (Loss)
Morgan Stanley & Co.(continued) $ 341 Wiley (John) & Sons Class A 12/18/17 $ � $(953 )
140 Wingstop, Inc. 12/18/17 1,873 (6,378 )107 WW Grainger, Inc. 12/18/17 2,713 18,589
UBS AG (London)176 21Vianet Group, Inc. 12/14/18 � 2,860
JPY 28 ABC-Mart, Inc. 12/14/18 � (94,051 )$ 1,958 Acadia Healthcare Co., Inc. 12/14/18 � �
EUR 1,800 ACCOR SA 12/14/18 � (22,204 )CHF 1 Actelion Ltd. 12/14/18 (3,355 ) (15,482 )$ 2,000 Acuity Brands, Inc. 12/14/18 � 2,442CHF 21 Adecco Group AG 12/14/18 � (25,759 )GBP 1,526 Admiral Group PLC 12/14/18 � 13,990EUR 318 Aegon NV 12/14/18 � (22,186 )JPY 214,752 AEON Co. Ltd. 12/14/18 � (3,512 )EUR 1,174 Aeroports de Paris (ADP) 12/14/18 � (7,707 )GBP 1,299 Aggreko PLC 12/14/18 � 32,596$ 1,568 Air Lease Corp. 12/14/18 � (15,535 )HKD 181 Air Quality Management Corp. 12/14/18 � (22,671 )JPY 208,808 Air Water, Inc. 12/14/18 � (11,895 )
108 Alfresa Holdings Corp. 12/14/18 � 15,559$ 54 Allison Transmission Holdings 12/14/18 � 94,388
1 Alphabet, Inc. 12/14/18 � 20,516JPY 213,182 Alps Electric Co. Ltd. 12/14/18 � 15,017AUD 916 Alumina Ltd. 12/14/18 � �
$ 33 AMC Networks, Inc. 12/14/18 � 2,652EUR 1,178 Amer Sports OYJ 12/14/18 � 55,741$ 1,997 American Heard Association Rivers 12/14/18 � 8,144
1,967 Amorepacific Corp. 12/14/18 � (5,221 )CHF 1,977 ams AG 12/14/18 � 18,298EUR 1,795 Anheuser-Busch InBev SA/NV 12/14/18 � 6,647JPY 221,171 Aozora Bank Ltd. 12/14/18 � 14,317DKK 13,232 AP Moller - Marks A/S 12/14/18 � (18,832 )$ 49 Applied Materials, Inc. 12/14/18 � (8,900 )
1,183 Arista Networks, Inc. 12/14/18 � (1,956 )AUD 137 Aristocrat Leisure Ltd. 12/14/18 � 18,404$ 74 Arris International PLC 12/14/18 � 5,211GBP 1,555 Asahi Kasei Corp. 12/14/18 � (21,564 )EUR 1,801 ASML Holding NV 12/14/18 � 7,937GBP 28 Asos PLC 12/14/18 � 71,511
59 Associated British Foods PLC 12/14/18 � (11,509 )JPY 144 Astellas Pharma, Inc. 12/14/18 � (108,776 )$ 143 Asustek Computer, Inc. 12/14/18 � (19,109 )
1,902 athenahealth, Inc. 12/14/18 � 367,562EUR 1,789 Atlantia SpA 12/14/18 � (32,415 )SEK 55 Atlas Copco AB 12/14/18 � (18,531 )EUR 16 Atos SE 12/14/18 � 22,121AUD 94 Aurizon Holdings Ltd. 12/14/18 � (2,803 )$ 513 AutoNation, Inc. 12/14/18 � 21,762SEK 97 Axfood AB 12/14/18 � 13,091
The accompanying notes are an integral part of these financial statements. 43
Copyright © 2017 www.secdatabase.com. All Rights Reserved.Please Consider the Environment Before Printing This Document

GOLDMAN SACHS MULTI-MANAGER ALTERNATIVES FUND
Consolidated Schedule of Investments (continued)April 30, 2017 (Unaudited)
ADDITIONAL INVESTMENT INFORMATION (continued)
OVER THE COUNTER TOTAL RETURN SWAP CONTRACTS# (continued)
Market Value
Counterparty
NotionalAmount(000s)
ReferenceSecurity
TerminationDate
UpfrontPayments
Made (Received)UnrealizedGain (Loss)
UBS AG (London)(continued) JPY 64 Bandai Namco Holdings, Inc. 12/14/18 $ � $77,385
EUR 5 Bayer AG 12/14/18 � 32,290502 Bayerische Motoren Werke Aktiengesellschaft (BMW) 12/14/18 � 6,511
GBP 1,393 BBA Aviation PLC 12/14/18 � 3,513HKD 872 Belle International Holding Ltd. 12/14/18 � �
JPY 62 Benesse Holdings, Inc. 12/14/18 � (63,651 )$ 1,908 Bio-Techne Corp. 12/14/18 � (51,663 )
1,940 Bloombank 12/14/18 � 52,087AUD 58 Bluescope Steel Ltd. 12/14/18 � 4,768$ 7 Boeing Co. 12/14/18 � 9,761
8 Booz Allen Hamilton Holding CP 12/14/18 � 23538 Boston Scientific Corp. 12/14/18 � 24,401
EUR 1,600 Bouygues SA 12/14/18 � 12,52265 BPOST SA 12/14/18 � (4,583 )
HKD 5,397 Brilliance China Automotive Holdings Ltd. 12/14/18 � (10,593 )JPY 8 Brother Industries Ltd. 12/14/18 � 1,618$ 1,955 Brown Forman Corp. 12/14/18 � �
24 Bunge Ltd. 12/14/18 � 10,50420 Burlington Stores, Inc. 12/14/18 � 24,2255 CACI International, Inc. Class A 12/14/18 � (3,868 )62 Cadence Design Systems, Inc. 12/14/18 � 39,510
JPY 216,718 Calbee, Inc. 12/14/18 � 22,364$ 723 Callon Petroleum Co. 12/14/18 � 23,452GBP 501 Capita PLC 12/14/18 � 12,351DKK 3,300 Carlsberg A/S 12/14/18 � (5,983 )GBP 34 Carnival Corp. PLC 12/14/18 � 48,721EUR 1,889 Carrefour SA 12/14/18 � (13,144 )$ 21 Carters, Inc. 12/14/18 � (9,821 )EUR 1,764 Casino Guichard-Perrachon SA 12/14/18 � 13,982JPY 129,359 Casio Computer Co. Ltd. 12/14/18 � (1,451 )$ 1,930 Catcher Technology Co. Ltd. 12/14/18 � 6,987
1,941 Caterpillar, Inc. 12/14/18 � 45,017334 Cavium, Inc. 12/14/18 � 11,09727 Centene Corp. 12/14/18 � 25,489
JPY 12 Central Japan Railway Corp. 12/14/18 � (33,344 )$ 10 Centurylink, Inc. 12/14/18 � (2,506 )
1,904 Charter Communications, Inc. Class A 12/14/18 � (3,866 )29 Chemours Co. 12/14/18 � 11,3791,871 Cheniere Energy, Inc. 12/14/18 � 40,46385 Chesapeake Energy Corp. 12/14/18 � 3,505582 Chicago Bridge & Iron Co. NV 12/14/18 � 18,168
SGD 2,637 China Life Insurance Co. Ltd. 12/14/18 � 29,957HKD 195 China Shenhua Energy Co. Ltd. 12/14/18 � 1,504$ 861 China Steel Corp. 12/14/18 � 25,224
1,756 chipotle Mexican Grill, Inc. 12/14/18 � (11,168 )JPY 148 Chubu Electric Power Co., Inc. 12/14/18 � 9,924
217,822 Chugai Pharmaceutical Co. Ltd. 12/14/18 � (37,407 )$ 90 Ciena Corp. 12/14/18 � (15,267 )
13 Cigna Corp. 12/14/18 � (10,426 )
44 The accompanying notes are an integral part of these financial statements.
Copyright © 2017 www.secdatabase.com. All Rights Reserved.Please Consider the Environment Before Printing This Document

GOLDMAN SACHS MULTI-MANAGER ALTERNATIVES FUND
ADDITIONAL INVESTMENT INFORMATION (continued)
OVER THE COUNTER TOTAL RETURN SWAP CONTRACTS# (continued)
Market Value
Counterparty
NotionalAmount(000s)
ReferenceSecurity
TerminationDate
UpfrontPayments
Made (Received)UnrealizedGain (Loss)
UBS AG (London)(continued) $ 32 Cirrus Logic, Inc. 12/14/18 $ � $(47,376 )
HKD 3,856 CITIC Ltd. 12/14/18 � �
$ 7 Citrix Systems, Inc. 12/14/18 � (22,678 )1,829 Clean Harbors, Inc. 12/14/18 � 33,675
EUR 1,819 CNH Industrial NV 12/14/18 � (24,382 )$ � * Cobham PLC§ 05/04/17 � (124,209 )GBP 711 Cobham PLC 12/14/18 � (13,406 )AUD 37 Coca-Cola Amatil Ltd. 12/14/18 � (866 )JPY 32,955 Coca-Cola Bottlers Japan, Inc. 12/14/18 � 5,364AUD 18 Cochlear Ltd. 12/14/18 � 22,285$ 600 Cognax Corp. 12/14/18 � 1,387GBP 1,521 Coles Point Australia 12/14/18 � 96,175DKK 13,425 Coloplast A/S Class B 12/14/18 � (23,733 )$ 1,178 Columbia Sportswear Co. 12/14/18 � 54,403SGD 302 Comfortdelgro Corp. Ltd. 12/14/18 � (3,554 )EUR 462 Commerzbank AG 12/14/18 � 4,418GBP 102 Compass Group PLC 12/14/18 � 15,467$ 38 ConocoPhillips 12/14/18 � (33,494 )
17 Copa Holdings SA 12/14/18 � 49,64520 Corelogic, Inc. 12/14/18 � 15,3381,984 Coty, Inc. 12/14/18 � 40,1081,469 Coway Co. Ltd. 12/14/18 � 19,095
AUD 2,420 Crown Resort Ltd. 12/14/18 � (9,249 )HKD 480 Cspc Pharmaceutical Group 12/14/18 � (11,108 )$ 21 Curtiss-Wright Corp. 12/14/18 � (430 )JPY 8 Cyber Agent Ltd. 12/14/18 � 15,138$ 58 D R Horton, Inc. 12/14/18 � 13,830JPY 177 Dai Nippon Printing Co. Ltd. 12/14/18 � 33,344
44 Daicel Corp. 12/14/18 � 6,649223,499 Daifuku Co. Ltd. 12/14/18 � (78,959 )86 Daiichi Sankyo Co. Ltd. 12/14/18 � 20,420
EUR 539 Daimler AG 12/14/18 � 3,571DKK 33 Danske Bank A/S 12/14/18 � 28,816$ 2,163 Davidson Bros service Co., Inc. 12/14/18 � 43,591
1,918 Deere & Co. 12/14/18 � 27,224EUR 16 Deutsche Post AG 12/14/18 � (2,726 )$ 2,100 DexCom, Inc. 12/14/18 � (76,309 )EUR 13 Dialog Semiconductor PLC 12/14/18 � (2,855 )$ 17 Dicks Sporting Goods, Inc. 12/14/18 � 5,299
66 Discovery Communications, Inc. 12/14/18 � (33,900 )AUD 2,450 Domino�s Pizza Enterprises Ltd. 12/14/18 � 12,028JPY 25,610 Don Quijote Holdings Co. Ltd. 12/14/18 � 583CHF 2 Dormakaba Holdings AG 12/14/18 � 26,566DKK 13,345 DSV A/S 12/14/18 � (18,479 )CHF 1,853 Dufry AG 12/14/18 � (8,920 )$ 9 E-MART, Inc. 12/14/18 � (69,745 )
19 Eastman Chemical Co. 12/14/18 � (35,944 )5 Eaton Vance Corp. 12/14/18 � (3,843 )
JPY 37,611 EBARA Corp. 12/14/18 � (10,078 )
The accompanying notes are an integral part of these financial statements. 45
Copyright © 2017 www.secdatabase.com. All Rights Reserved.Please Consider the Environment Before Printing This Document

GOLDMAN SACHS MULTI-MANAGER ALTERNATIVES FUND
Consolidated Schedule of Investments (continued)April 30, 2017 (Unaudited)
ADDITIONAL INVESTMENT INFORMATION (continued)
OVER THE COUNTER TOTAL RETURN SWAP CONTRACTS# (continued)
Market Value
Counterparty
NotionalAmount(000s)
ReferenceSecurity
TerminationDate
UpfrontPayments
Made (Received)UnrealizedGain (Loss)
UBS AG (London)(continued) SEK 70 Electrolux Ab 12/14/18 $ � $21,971
17,022 Elekta AB Class B 12/14/18 � (9,016 )$ 1,367 Ellie Mae, Inc. 12/14/18 � 124,909
21 Emcor Group, Inc. 12/14/18 � 25,7864 EnerSys 12/14/18 � 1,3323 Eog Resources, Inc. 12/14/18 � (7,288 )
GBP 1,551 Epenchos Malal Plant 12/14/18 � 16,846$ 25 Evercore Partners, Inc. 12/14/18 � (127,947 )
29 Express Scripts Holding Co. 12/14/18 � 38,367JPY 173,307 FamilyMart UNY Holdings Co. Ltd. 12/14/18 � 39,471
219,023 FANUC Corp. 12/14/18 � (29,917 )6 Fast Retailing Co. Ltd. 12/14/18 � (18,524 )
$ 9 Finisar Corp. 12/14/18 � (3,824 )GBP 1,564 First Midwest Bank 12/14/18 � (32,493 )$ 2,018 First Solar, Inc. 12/14/18 � (146,358 )
377 FleetCor Technologies, Inc. 12/14/18 � 18,47463 Flowers Foods, Inc. 12/14/18 � (14,493 )1,887 Flowserve Corp. 12/14/18 � (10,783 )
AUD 76 Fortescue Metal Group 12/14/18 � (4,067 )HKD 2,565 Fosun International Ltd. 12/14/18 � (621 )GBP 1,526 Frank Cross tyres Pty Ltd. 12/14/18 � 47,327$ 46 Franklin Resources, Inc. 12/14/18 � 49,284EUR 6 Fresenius Medical Care AG & Co. 12/14/18 � (5,028 )
7 Fresenius Se & Co. KGaA 12/14/18 � 572$ � * Fresh Del Monte Produce, Inc. 12/14/18 � 127JPY 289 Fuji Electric Co. Ltd. 12/14/18 � (33,703 )
137 Fuji Media Holdings, Inc. 12/14/18 � (72,682 )52 Fujifilm Holdings Corp. 12/14/18 � 13,692316 Fujitsu Ltd. 12/14/18 � 28,347
CHF 1,921 Galencia AG 12/14/18 � (27,603 )EUR 548 GEA Group AG 12/14/18 � 7,925HKD 500 Geely Automobile Holdings Ltd. 12/14/18 � (20,570 )$ 1,910 General Electric Co. 12/14/18 � 29,605
1,980 Genesee & Wyoming, Inc. Class A 12/14/18 � 15,981SGD 2,623 Genting Singapore PLC 12/14/18 � 75,090CHF 2 Georg Fischer AG 12/14/18 � (3,276 )SEK 8 Getinge AB 12/14/18 � 2,904GBP 93 Glaxosmithkline PLC 12/14/18 � (19,270 )DKK 83 GN Store Nord A/S 12/14/18 � 18,755$ 51 Godaddy, Inc. 12/14/18 � 6,141
147 Graphic Packaging Holding Co. 12/14/18 � (14,680 )HKD 514 Great Wall Motor Co. 12/14/18 � (45,536 )GBP 1,618 GS Global Technology Portfolio 12/14/18 � 20,784$ 821 Gulfport Energy Corp. 12/14/18 � 41,277DKK 41 H Lundbeck A/S 12/14/18 � (20,014 )JPY 225,800 Hamamatsu Photonics KK 12/14/18 � (12,918 )$ 1,927 Hanesbrands, Inc. 12/14/18 � 13,935
12 Hankook Tire Co. Ltd. 12/14/18 � (12,643 )283 Hanon Systems 12/14/18 � 7,432
46 The accompanying notes are an integral part of these financial statements.
Copyright © 2017 www.secdatabase.com. All Rights Reserved.Please Consider the Environment Before Printing This Document

GOLDMAN SACHS MULTI-MANAGER ALTERNATIVES FUND
ADDITIONAL INVESTMENT INFORMATION (continued)
OVER THE COUNTER TOTAL RETURN SWAP CONTRACTS# (continued)
Market Value
Counterparty
NotionalAmount(000s)
ReferenceSecurity
TerminationDate
UpfrontPayments
Made (Received)UnrealizedGain (Loss)
UBS AG (London)(continued) $ 8 Hanssem Co. Ltd. 12/14/18 $ � $(57,029 )
2,068 Harley-Davidson, Inc. 12/14/18 � 13,703GBP 1,566 Heamburgische Landesbank 12/14/18 � 32,999SEK 737 Hennes & Mauritz AB 12/14/18 � 224JPY 90,606 Hikari Tsushin, Inc. 12/14/18 � 13,402GBP 1,576 Hikma Pharmaceuticals PLC 12/14/18 � 6,159JPY 27,300 Hirose Electric Co. Ltd. 12/14/18 � (6,346 )
81 Hitachi Constr Machinery Co. 12/14/18 � 130,707354 Hitachi Ltd. 12/14/18 � 57,796
EUR 4 Hochtief AG 12/14/18 � (7,238 )JPY 211,287 Hoshizaki Electric Corp. 12/14/18 � (68,237 )GBP 359 Howden Joinery Group PLC 12/14/18 � (37,197 )JPY 30 Hoya Corp. 12/14/18 � 18,713$ 101 HP, Inc. 12/14/18 � 21,119
13 HRG Group, Inc. 12/14/18 � (660 )45 Hyundai Engineering & Construction Co. 12/14/18 � (101,635 )12 Hyundai Industrial Development & Construction Co. 12/14/18 � (2,286 )1,993 Hyundai Motor Co. 12/14/18 � 92,534
JPY 608 IHI Corp. 12/14/18 � 130,899$ 685 Illumina, Inc. 12/14/18 � (13,474 )GBP 180 Inchcape PLC 12/14/18 � (11,631 )HKD 1,915 Incitec Pivot Ltd. 12/14/18 � 7,059$ 1,378 Integrated Device Tech, Inc. 12/14/18 � 8,174GBP 40 InterContinental Hotels Group PLC 12/14/18 � 17,965$ 19 Interdigital, Inc. 12/14/18 � (10,422 )
1,937 Interleukin Genetics, Inc. 12/14/18 � (45,880 )GBP 39 Intertek Group PLC 12/14/17 � (13,531 )$ 1,921 Intuitive Surgical, Inc. 12/14/18 � (21,704 )DKK 14 Iss A/S 12/14/18 � (3,781 )JPY 27 ITO EN Ltd. 12/14/18 � (8,352 )
66 Itochu Techno-Solutions Corp. 12/14/18 � 17,735GBP 408 IWG PLC 12/14/18 � (3,703 )
586 J Sainsbury PLC 12/14/18 � (5,290 )$ 67 Jabil Circuit, Inc. 12/14/18 � (28,161 )AUD 99 James Hardie Industries PLC 12/14/18 � 38,365JPY 188,535 Japan Airport Terminal Co. Ltd. 12/14/18 � 6,230$ 1,991 Japan Tankan 12/14/18 � 108,646SGD 10 Jardine Cycle & Carriage Ltd. 12/14/18 � (3,577 )JPY 217,448 JGC Corp. 12/14/18 � 13,903
124 Jtekt Corp. 12/14/18 � (28,945 )$ 69 Juniper Networks, Inc. 12/14/18 � 158,864
11 Kakao Corp. 12/14/18 � (24,203 )1,873 Kangwon Land, Inc. 12/14/18 � 78,786
JPY 35 Kao Corp. 12/14/18 � (931 )$ 1,632 KCC Corp. 12/14/18 � 30,886JPY 152,928 Keihan Holdings Co. Ltd. 12/14/18 � 15,501
221,823 Keikyu Corp. 12/14/18 � (20,292 )219,651 Keio Corp. 12/14/18 � 40,906
EUR 1,878 Kesko OYJ 12/14/18 � 39,210
The accompanying notes are an integral part of these financial statements. 47
Copyright © 2017 www.secdatabase.com. All Rights Reserved.Please Consider the Environment Before Printing This Document

GOLDMAN SACHS MULTI-MANAGER ALTERNATIVES FUND
Consolidated Schedule of Investments (continued)April 30, 2017 (Unaudited)
ADDITIONAL INVESTMENT INFORMATION (continued)
OVER THE COUNTER TOTAL RETURN SWAP CONTRACTS# (continued)
Market Value
Counterparty
NotionalAmount(000s)
ReferenceSecurity
TerminationDate
UpfrontPayments
Made (Received)UnrealizedGain (Loss)
UBS AG (London)(continued) JPY 210,759 Keyence Corp. 12/14/18 $ � $(37,524 )
$ 4 Kia Motors Corp. 12/14/18 � (3,909 )JPY 74,068 Kikkoman Corp. 12/14/18 � 4,822HKD 185 Kingboard Chemical Holdings Ltd. 12/14/18 � (8,302 )JPY 222,165 Kintetsu Group Holdings Co. Ltd. 12/14/18 � 19,018$ 468 Kirby Corp. 12/14/18 � 17,250JPY 100 Kirin Holdings Co. Ltd. 12/14/18 � 25,643$ 5 KLA-Tencor Corp. 12/14/18 � (18,783 )
438 Kohlberg & Co. LLC 12/14/18 � 3,000JPY 143,878 Konami Holdings Corp. 12/14/18 � (17,259 )
223 Konica Minolta, Inc. 12/14/18 � 19,978EUR 60 Koninklijke Philips NV 12/14/18 � 5,886$ 1,914 Korea Aerospace Industries Ltd. 12/14/18 � (34,274 )JPY 164,605 Kyushu Electric Power Co., Inc. 12/14/18 � �
$ 12 L-3 Technologies, Inc. 12/14/18 � 15,2792 Lam Research Corp. 12/14/18 � (1,606 )
HKD 4,133 Landesbank Berlin AG 12/14/18 � 10,336$ 22 Landstar System, Inc. 12/14/18 � (24,726 )
627 Largan Precision Co. Ltd. 12/14/18 � (814 )HKD 2,369 Lenovo Group Ltd. 12/14/18 � 2,119EUR 1,805 Leonardo SpA 12/14/18 � 65,080$ 31 LG Electronics, Inc. 12/14/18 � (103,385 )
154 LG Uplus Corp. 12/14/18 � 1,9651,897 Liberty Broadband Corp. 12/14/18 � (5,962 )55 Liberty Global PLC 12/14/18 � (19,368 )35 Liberty Media Siriusxm Group 12/14/18 � (85,316 )12 Lincoln Electric Holdings, Inc. 12/14/18 � (12,112 )1,970 LKQ Corp. 12/14/18 � (98,496 )
CHF 61 Logitech International SA 12/14/18 � 27,521$ 10 Logmein, Inc. 12/14/18 � 4,030
1 Lotte Shopping Co. 12/14/18 � (7,856 )23 Lowes Cos., Inc. 12/14/18 � 8,67322 Lyondellbasell Industries NV 12/14/18 � (50,553 )
JPY 222,869 Mabuchi Motor Co. Ltd. 12/14/18 � (22,104 )$ 3 Manpowergroup 12/14/18 � (7,146 )
122 Marathon Oil Corp. 12/14/18 � (89,951 )1 Marathon Petroleum Corp. 12/14/18 � 1,145
NOK 126 Marine Harvest ASA 12/14/18 � 52,583$ 3 MarketAxess Holdings, Inc. 12/14/18 � 22,098GBP 544 Marks & Spencer Group PLC 12/14/18 � (1,250 )JPY 222,584 Marui Group Co. Ltd. 12/14/18 � 29,360$ 128 Marvell Technology Group Ltd. 12/14/18 � (60,254 )
58 Masco Corp. 12/14/18 � 6,90750 Mastec, Inc. 12/14/18 � (19,928 )2,231 Mattle, Inc. 12/14/18 � (26,046 )10 Maximus, Inc. 12/14/18 � (5,832 )
JPY 143 Mazda Motor Corp. 12/14/18 � 71,786104,975 McDonalds Holdings Co. (Japan) Ltd. 12/14/18 � (8,693 )
$ 14 Mckesson Corp. 12/14/18 � 46,718
48 The accompanying notes are an integral part of these financial statements.
Copyright © 2017 www.secdatabase.com. All Rights Reserved.Please Consider the Environment Before Printing This Document
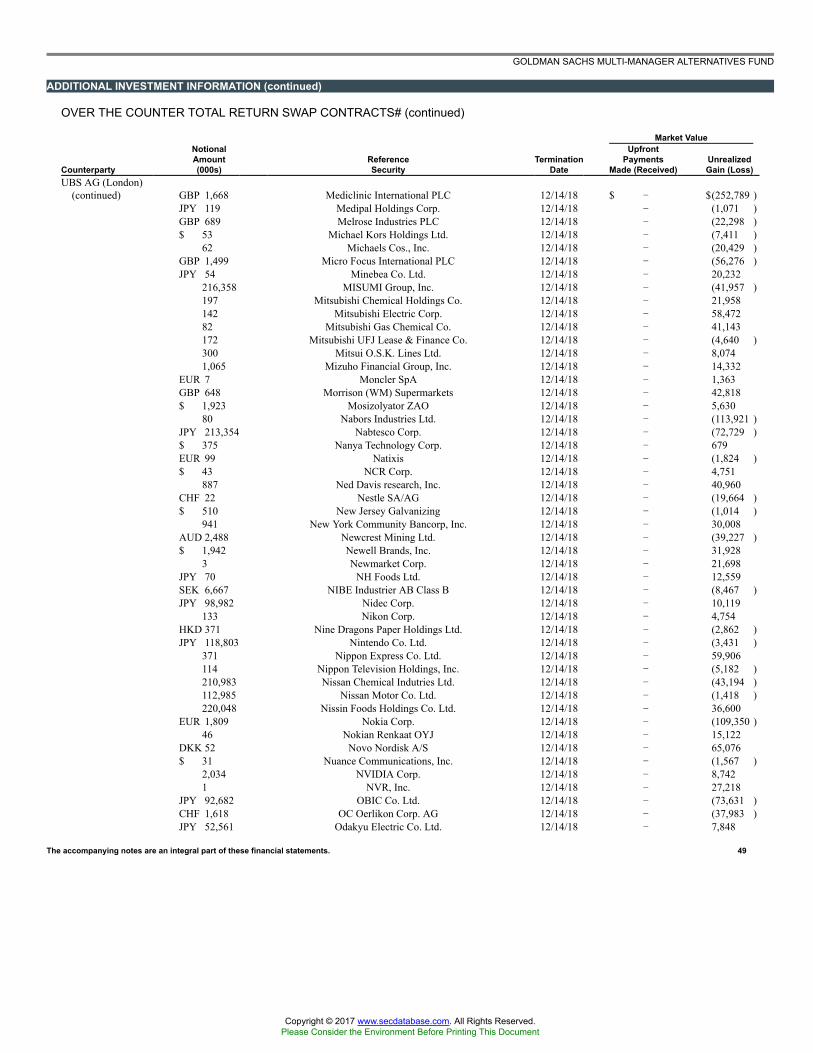
GOLDMAN SACHS MULTI-MANAGER ALTERNATIVES FUND
ADDITIONAL INVESTMENT INFORMATION (continued)
OVER THE COUNTER TOTAL RETURN SWAP CONTRACTS# (continued)
Market Value
Counterparty
NotionalAmount(000s)
ReferenceSecurity
TerminationDate
UpfrontPayments
Made (Received)UnrealizedGain (Loss)
UBS AG (London)(continued) GBP 1,668 Mediclinic International PLC 12/14/18 $ � $(252,789 )
JPY 119 Medipal Holdings Corp. 12/14/18 � (1,071 )GBP 689 Melrose Industries PLC 12/14/18 � (22,298 )$ 53 Michael Kors Holdings Ltd. 12/14/18 � (7,411 )
62 Michaels Cos., Inc. 12/14/18 � (20,429 )GBP 1,499 Micro Focus International PLC 12/14/18 � (56,276 )JPY 54 Minebea Co. Ltd. 12/14/18 � 20,232
216,358 MISUMI Group, Inc. 12/14/18 � (41,957 )197 Mitsubishi Chemical Holdings Co. 12/14/18 � 21,958142 Mitsubishi Electric Corp. 12/14/18 � 58,47282 Mitsubishi Gas Chemical Co. 12/14/18 � 41,143172 Mitsubishi UFJ Lease & Finance Co. 12/14/18 � (4,640 )300 Mitsui O.S.K. Lines Ltd. 12/14/18 � 8,0741,065 Mizuho Financial Group, Inc. 12/14/18 � 14,332
EUR 7 Moncler SpA 12/14/18 � 1,363GBP 648 Morrison (WM) Supermarkets 12/14/18 � 42,818$ 1,923 Mosizolyator ZAO 12/14/18 � 5,630
80 Nabors Industries Ltd. 12/14/18 � (113,921 )JPY 213,354 Nabtesco Corp. 12/14/18 � (72,729 )$ 375 Nanya Technology Corp. 12/14/18 � 679EUR 99 Natixis 12/14/18 � (1,824 )$ 43 NCR Corp. 12/14/18 � 4,751
887 Ned Davis research, Inc. 12/14/18 � 40,960CHF 22 Nestle SA/AG 12/14/18 � (19,664 )$ 510 New Jersey Galvanizing 12/14/18 � (1,014 )
941 New York Community Bancorp, Inc. 12/14/18 � 30,008AUD 2,488 Newcrest Mining Ltd. 12/14/18 � (39,227 )$ 1,942 Newell Brands, Inc. 12/14/18 � 31,928
3 Newmarket Corp. 12/14/18 � 21,698JPY 70 NH Foods Ltd. 12/14/18 � 12,559SEK 6,667 NIBE Industrier AB Class B 12/14/18 � (8,467 )JPY 98,982 Nidec Corp. 12/14/18 � 10,119
133 Nikon Corp. 12/14/18 � 4,754HKD 371 Nine Dragons Paper Holdings Ltd. 12/14/18 � (2,862 )JPY 118,803 Nintendo Co. Ltd. 12/14/18 � (3,431 )
371 Nippon Express Co. Ltd. 12/14/18 � 59,906114 Nippon Television Holdings, Inc. 12/14/18 � (5,182 )210,983 Nissan Chemical Indutries Ltd. 12/14/18 � (43,194 )112,985 Nissan Motor Co. Ltd. 12/14/18 � (1,418 )220,048 Nissin Foods Holdings Co. Ltd. 12/14/18 � 36,600
EUR 1,809 Nokia Corp. 12/14/18 � (109,350 )46 Nokian Renkaat OYJ 12/14/18 � 15,122
DKK 52 Novo Nordisk A/S 12/14/18 � 65,076$ 31 Nuance Communications, Inc. 12/14/18 � (1,567 )
2,034 NVIDIA Corp. 12/14/18 � 8,7421 NVR, Inc. 12/14/18 � 27,218
JPY 92,682 OBIC Co. Ltd. 12/14/18 � (73,631 )CHF 1,618 OC Oerlikon Corp. AG 12/14/18 � (37,983 )JPY 52,561 Odakyu Electric Co. Ltd. 12/14/18 � 7,848
The accompanying notes are an integral part of these financial statements. 49
Copyright © 2017 www.secdatabase.com. All Rights Reserved.Please Consider the Environment Before Printing This Document

GOLDMAN SACHS MULTI-MANAGER ALTERNATIVES FUND
Consolidated Schedule of Investments (continued)April 30, 2017 (Unaudited)
ADDITIONAL INVESTMENT INFORMATION (continued)
OVER THE COUNTER TOTAL RETURN SWAP CONTRACTS# (continued)
Market Value
Counterparty
NotionalAmount(000s)
ReferenceSecurity
TerminationDate
UpfrontPayments
Made (Received)UnrealizedGain (Loss)
UBS AG (London)(continued) JPY 237 OJI Holdings Corp. 12/14/18 $ � $17,008
218,674 Olympus Corp. 12/14/18 � (24,916 )$ 95 On Semiconductor Corp. 12/14/18 � (32,353 )
46 Onemain Holdings, Inc. 12/14/18 � (66,325 )JPY 129,078 Ono Pharmaceutical Co. Ltd. 12/14/18 � (15,243 )AUD 19 Orica Ltd. 12/14/18 � 2,646$ 49 Owens-Illinois, Inc. 12/14/18 � (7,871 )
1,947 Palo Alto Networks, Inc. 12/14/18 � 34,4691,629 Pandora Media, Inc. 12/14/18 � 2,78725 Patterson-UTI Energy, Inc. 12/14/18 � (24,106 )1,921 Paycom Software, Inc. 12/14/18 � 8,3801,163 PDC Energy, Inc. 12/14/18 � 63,8271,196 Pegasystems, Inc. 12/14/18 � (2,707 )655 Pegatron Corp. 12/14/18 � (27,338 )
HKD 4,995 PetroChina Co. Ltd. 12/14/18 � 2,002EUR 102 Peugeot SA 12/14/18 � 25,669$ 86 Pilgrims Pride Corp. 12/14/18 � 19,728EUR 18 Plastic Omnium SA 12/14/18 (86,500 ) 2,095$ 1,488 Platform Specialty Products Corp. 12/14/18 � 4,595
70 Polaris Industries, Inc. 12/14/18 � (1,398 )19 Popular, Inc. 12/14/18 � 19,037
EUR 6 Porsche Automobil Holding SE 12/14/18 � (2,619 )$ 1,909 Porteme-Portas e derivado SA 12/14/18 � 16,570
196 Post Holdings, Inc. 12/14/18 � 655921 Pou Chen 12/14/18 � (26,746 )30 Pra Health Sciences, Inc. 12/14/18 � (43,037 )165 President Chain Store Corp. 12/14/18 � (35,408 )566 Prospect Capital Corp. 12/14/18 � 5,59569 PulteGroup, Inc. 12/14/18 � 32,39824 Ralph Lauren Corp. 12/14/18 � 3,545
AUD 1,991 Ramsay Health Care Ltd. 12/14/18 � (47,176 )EUR 35 Randstad Holdings NV 12/14/18 � (7,147 )
1,887 Renault SA 12/14/18 � (49,781 )$ 346 ResMed, Inc. 12/14/18 � 14,169JPY 235 Ricoh Co. Ltd. 12/14/18 � 12,627$ 905 Rite Aid Corp. 12/14/18 � (5,994 )JPY 28 Rohm Co. Ltd. 12/14/18 � (2,467 )GBP 205 Rolls-Royce Holdings PLC 12/14/18 � (37,227 )$ 23 Ross Stores, Inc. 12/14/18 � 5,681GBP 1,540 Royal Mail Holdings 12/14/18 � 79,598$ 1,059 RPM International, Inc. 12/14/18 � 9,313JPY 206,588 Ryohin Keikaku Co. Ltd. 12/14/18 � 17,411$ 1,257 S-Oil Corp. 12/14/18 � 19,718EUR 25 Safran SA 12/14/18 � 555NOK 41 Salmar ASA 12/14/18 � 17,414$ 1 Samsung Electronics Co. Ltd. 12/14/18 � 77,743
2,006 Samsung Heavy Industries Co. Ltd. 12/14/18 � 56,9131,836 Samsung SDI Co. Ltd. 12/14/18 � 57,015
SEK 131 Sandvik AB 12/14/18 � 1,475
50 The accompanying notes are an integral part of these financial statements.
Copyright © 2017 www.secdatabase.com. All Rights Reserved.Please Consider the Environment Before Printing This Document

GOLDMAN SACHS MULTI-MANAGER ALTERNATIVES FUND
ADDITIONAL INVESTMENT INFORMATION (continued)
OVER THE COUNTER TOTAL RETURN SWAP CONTRACTS# (continued)
Market Value
Counterparty
NotionalAmount(000s)
ReferenceSecurity
TerminationDate
UpfrontPayments
Made (Received)UnrealizedGain (Loss)
UBS AG (London)(continued) EUR 18 Sanofi 12/14/18 $ � $18,694
JPY 240,089 Santen Pharmaceutical Co. Ltd. 12/14/18 � (11,586 )AUD 15 Santos Ltd. 12/14/18 � 467SGD 305 Sats Ltd. 12/14/18 � 28,361EUR 26 Schneider Electric SA 12/14/18 � (27,293 )$ 42 Seagate Technology PLC 12/14/18 � (355,739 )JPY 11 Secom Co. Ltd. 12/14/18 � 2,784SEK 17,224 Securitas AB Class B 12/14/18 � (1,393 )AUD 2,417 Seek Ltd. 12/14/18 � (13,577 )JPY 141 Sega Sammy Holdings, Inc. 12/14/18 � 25,315$ 20 SEI Investments Co. 12/14/18 � (1,830 )JPY 113 Seikan Group Holdings Ltd. 12/14/18 � 36,492
68 Seiko Epson Corp. 12/14/18 � (8,593 )HKD 4,043 SembCorp Industries Ltd. 12/14/18 � 2,661JPY 48 Seven & I Holdings Co. Ltd. 12/14/18 � 46,934
219,527 Shimadzu Corp. 12/14/18 � (51,311 )14 Shimamura Co. Ltd. 12/14/18 � (14,209 )219,776 Shimano, Inc. 12/14/18 � (11,482 )215,479 Shin-Etsu Chemical Co. 12/14/18 � 1,190
GBP 1,580 SHIRE PLC 12/14/18 � 27,538JPY 16,889 Shiseido Co. Ltd. 12/14/18 � (1,534 )$ 48 Sinclair Broadcast Group Class A 12/14/18 � 7,175SGD 742 Singapore technogies Engeineering Ltd. 12/14/18 � (9,817 )$ 9 SK Holdings Co. Ltd. 12/14/18 � (48,990 )
43 SK Hynix, Inc. 12/14/18 � 6,267SEK 17,183 Skanska AB Class B 12/14/18 � (6,515 )$ 73 Skechers USA, Inc. 12/14/18 � (39,913 )SEK 56 SKF AB 12/14/18 � 36,368GBP 64 Smiths Group PLC 12/14/18 � (9,124 )$ 2,164 Snyders-Lance, Inc. 12/14/18 � 2,277EUR 1,497 Societe BIC SA 12/14/18 � 75,266
39 Societe Generale Group 12/14/18 � (16,527 )JPY 209,415 Sohgo Security Services Co. Ltd. 12/14/18 � (57,143 )GBP 61 Spectris PLC 12/14/18 � 11,984
31 Spirax-Sarco Engineering PLC 12/14/18 � (34,011 )$ 1,881 Spirit Airlines, Inc. 12/14/18 � 21,704
1,708 Splunk, Inc. 12/14/18 � (12,825 )JPY 214,725 Stanley Electric Co. Ltd. 12/14/18 � (92,743 )SGD 2,564 Starhub Ltd. 12/14/18 � �
JPY 5 Start Today Co. Ltd. 12/14/18 � 4,292$ 1,946 Stichtingadministratiekantoor Veba Veher BV 12/14/18 � (19,069 )EUR 134 Stmicroelectronics NV 12/14/18 � 50,372
17 Suedzucker AG 12/14/18 � (9,354 )JPY 207,118 Sumco Corp. 12/14/18 � (70,687 )
144 Sumitomo Corp. 12/14/18 � 43,214115 Sumitomo Dainippon Pharma Co. 12/14/18 � 16,492
HKD 100 Sunny Optical Tech Group Co. 12/14/18 � 8,394JPY 216,449 Suruga Bank Ltd. 12/14/18 � (8,901 )
7 Suzuken Co. Ltd. 12/14/18 � (1,592 )
The accompanying notes are an integral part of these financial statements. 51
Copyright © 2017 www.secdatabase.com. All Rights Reserved.Please Consider the Environment Before Printing This Document

GOLDMAN SACHS MULTI-MANAGER ALTERNATIVES FUND
Consolidated Schedule of Investments (continued)April 30, 2017 (Unaudited)
ADDITIONAL INVESTMENT INFORMATION (continued)
OVER THE COUNTER TOTAL RETURN SWAP CONTRACTS# (continued)
Market Value
Counterparty
NotionalAmount(000s)
ReferenceSecurity
TerminationDate
UpfrontPayments
Made (Received)UnrealizedGain (Loss)
UBS AG (London)(continued) SEK 17,332 Svenska Cellulosa Aktiebolaget SCA Class B 12/14/18 $ � $(8,187 )
50 Swedish Match AB 12/14/18 � (32,388 )CHF 6 Swiss Life Holding 12/14/18 � (66,243 )AUD 71 Sydney Airport 12/14/18 � (867 )$ 40 Synchrony Financial 12/14/18 � (243,172 )
27 Synopsys, Inc. 12/14/18 � 9,589JPY 217,458 SYSMEX Corp. 12/14/18 � 53,860$ 799 Taiwan New Car License Automobile - Heavy Truck - General - Business - YoY 12/14/18 � 30,274
1,960 Taiwan Semiconductor Manufacturing Co. Ltd. 12/14/18 � (32,589 )JPY 200,428 Taiyo Nippon Sanso Corp. 12/14/18 � (45,839 )
84,714 Takeda Pharmaceutical Co. Ltd. 12/14/18 � (1,155 )$ 49 Tegna, Inc. 12/14/18 � (4,906 )SEK 304 Telefonaktiebolaget LM Ericsson Class B 12/14/18 � 32,641EUR 1,746 Teleperformance 12/14/18 � (173,464 )$ 22 Tenneco, Inc. 12/14/18 � 11,308JPY 121,696 Terumo Corp. 12/14/18 � (5,616 )$ 451 Tesaro, Inc. 12/14/18 � (26,645 )
1,794 Tesla, Inc. 12/14/18 � (1,810 )39 Teva Pharmaceutical Industries Ltd. 12/14/18 � 31,848197 Texas Roadhouse, Inc. 12/14/18 � (2,363 )
EUR 20 Thales 12/14/18 � (36,390 )$ 1,925 The Coca-colla Co. 12/14/18 � (1,814 )
503 The Kraft Heinz Co. 12/14/18 � 10,4521,946 The Madison Square Garden Co. 12/14/18 � (23,238 )1,940 The Medicines Co. 12/14/18 � (8,014 )
CHF 1,895 The Swatch Group AG 12/14/18 � 9,168$ 1,907 The Wendys Co. 12/14/18 � 4,254JPY 49,024 The Yokohama Rubber Co. Ltd. 12/14/18 � (9,285 )
510 Tokyo Electric Power Co. 12/14/18 � (36,629 )$ 17 Toll Brothers, Inc. 12/14/18 � 6,001JPY 187 Toppan Printing Co. Ltd. 12/14/18 � 23,485
216,466 Toray Industries, Inc. 12/14/18 � (22,639 )46 Toyota Boshoku Corp. 12/14/18 � (25,390 )64 Toyota Tsusho Corp. 12/14/18 � 108,401
AUD 2,700 TPG Telecom Ltd. 12/14/18 � (6,990 )$ 1,921 TransDigm Group, Inc. 12/14/18 � 12,659HKD 5,162 Treasury Wine Estates Ltd. 12/14/18 � (54,227 )SEK 17,302 Trelleborg AB 12/14/18 � (15,205 )DKK 11,465 Trgy A/S 12/14/18 � 19,998$ 523 Trinity Industries, Inc. 12/14/18 � (2,792 )
1,136 TripAdvisor, Inc. 12/14/18 � (35,905 )JPY 218,111 Tsuruha Holdings, Inc. 12/14/18 � (7,248 )$ 1,138 Tyler Technologies, Inc. 12/14/18 � (12,961 )
31 Tyson Foods, Inc. Class A 12/14/18 � (121,295 )1,955 Ubiquiti Networks, Inc. 12/14/18 � 8,4781,782 Under Armour, Inc. 12/14/18 � (177,302 )1,915 United Bankshares, Inc. 12/14/18 � 78,870
EUR 555 United Internet AG 12/14/18 � (6,937 )
52 The accompanying notes are an integral part of these financial statements.
Copyright © 2017 www.secdatabase.com. All Rights Reserved.Please Consider the Environment Before Printing This Document

GOLDMAN SACHS MULTI-MANAGER ALTERNATIVES FUND
ADDITIONAL INVESTMENT INFORMATION (continued)
OVER THE COUNTER TOTAL RETURN SWAP CONTRACTS# (continued)
Market Value
Counterparty
NotionalAmount(000s)
ReferenceSecurity
TerminationDate
UpfrontPayments
Made (Received)UnrealizedGain (Loss)
UBS AG (London)(continued) $ 1,666 United Microelectronics Corp. 12/14/18 $ � $10,016
2,010 Universal Display Corp. 12/14/18 � (21,382 )839 Urban Outfitters, Inc. 12/14/18 � 15,453
EUR 29 Valeo SA 12/14/18 � 10,248$ 30 Valero Energy Corp 12/14/18 � (37,134 )
406 Verisk Analytics, Inc. 12/14/18 � 812DKK 24 Vestas Wind Systems A/S 12/14/18 � 6,966$ 4 Viacom, Inc. 12/14/18 � (1,504 )
1,563 ViaSat, Inc. 12/14/18 � 37,1041,917 Visa, Inc. 12/14/18 � 19,153
EUR 1,790 Vivendi 12/14/18 � 76,585506 Volkswagen AG 12/14/18 � 840
SEK 17,467 Volvo AB Class B 12/14/18 � 43,899$ 1,873 Wabtec Corp. 12/14/18 � 12,074
8 Wal-Mart Stores, Inc. 12/14/18 � 1,014AUD 625 Want Want China Holdings Ltd. 12/14/18 � 3,466EUR 36 Wartsila OYJ ABP 12/14/18 � 35,015$ 10 Wellcare Health Plans, Inc. 12/14/18 � (1,077 )
23 Western Digital Corp. 12/14/18 � 51,2701,932 Wex, Inc. 12/14/18 � 86,298
GBP 1,531 Whitbread PLC 12/14/18 � (21,382 )432 William Hill PLC 12/14/18 � (41,953 )5 Wolseley PLC 12/14/18 � (18,626 )
$ 867 WR Grace & Co. 12/14/18 � 7,9051,099 Wynn Resorts Ltd. 12/14/18 � (45,716 )6 XPO Logistics, Inc. 12/14/18 � (3,486 )
JPY 212,673 Yamaha Corp. 12/14/18 � 37,03191 Yamazaki Baking Co. Ltd. 12/14/18 � (73,216 )
SGD 701 Yangzijiang Shipbuilding 12/14/18 � 15,061JPY 229,330 YASKAWA Electric Corp. 12/14/18 � (54,793 )$ 3,309 Yuanta Financial Holding Co. 12/14/18 � (15,636 )
458 Zillow Group, Inc. 12/14/18 � (19,623 )EUR 1,892 Zodiac Aerospace 12/14/18 � 1,668
TOTAL $ (89,185 ) $956,658
* Rounds to less than 1,000.# The Fund receives annual coupon payments in accordance with the swap contracts. On the termination date of the swap contracts, the Fund will either receive from or pay to the
counterparty an amount equal to the net of the accrued financing fees and the value of the reference security subtracted from the original notional cost (notional multiplied by the pricechange of the reference security, converted to U.S. Dollars).
+ Contracts subject to $1.488 financing fee.~ Contracts subject to $1.151 financing fee.^ Contracts subject to $0.160 financing fee.µ Contracts subject to $0.310 financing fee.§ Contracts subject to $1.000 financing fee.
The accompanying notes are an integral part of these financial statements. 53
Copyright © 2017 www.secdatabase.com. All Rights Reserved.Please Consider the Environment Before Printing This Document

GOLDMAN SACHS MULTI-MANAGER ALTERNATIVES FUND
Consolidated Schedule of Investments (continued)April 30, 2017 (Unaudited)
ADDITIONAL INVESTMENT INFORMATION (continued)
JOINT REPURCHASE AGREEMENT ACCOUNT II � At April 30, 2017, the fund had undivided interests in the Joint RepurchaseAgreement Account II, with a maturity date of May 1, 2017, as follows:
Principal Amount Maturity Value Collateral Allocation Value$573,400,000 $573,413,083 $584,868,001
REPURCHASE AGREEMENTS � At April 30, 2017, the Principal Amounts of certain Fund�s interest in the Joint Repurchase AgreementAccount II were as follows:
Counterparty Interest Rate Principal AmountCitigroup Global Markets, Inc. 0.830 % $78,315,519Merrill Lynch & Co., Inc. 0.820 495,084,481TOTAL $573,400,000
At April 30, 2017, the Joint Repurchase Agreement Account II was fully collateralized by:
Issuer Interest Rates Maturity DatesFederal Home Loan Mortgage Corp. 1.000% to 6.000% 06/29/17 to 04/01/47Federal National Mortgage Association 1.000 to 6.000 10/01/33 to 04/01/47Government National Mortgage Association 3.500 to 4.500 03/15/45 to 04/20/47United States Treasury Notes 0.000 to 7.625 11/09/17 to 01/31/20
54 The accompanying notes are an integral part of these financial statements.
Copyright © 2017 www.secdatabase.com. All Rights Reserved.Please Consider the Environment Before Printing This Document

GOLDMAN SACHS MULTI-MANAGER ALTERNATIVES FUND
Consolidated Statement of Assets and Liabilities(a)April 30, 2017 (Unaudited)
Assets:Investments, at value (cost $401,698,900) $436,786,824Investments of affiliated issuers, at value (cost $24,218,587) 24,218,587Repurchase agreement, at value which equals cost 573,400,000Cash 6,882,490Foreign currencies, at value (cost $1,176,241) 1,116,476Unrealized gain on swap contracts 20,700,168Variation margin on certain derivative contracts 358,514Unrealized gain on forward foreign currency exchange contracts 7,164,433Receivables:
Collateral on certain derivative contracts(b) 242,546,877Investments sold 17,256,863Investments sold on an extended settlement basis 3,971,807Due from broker � upfront payment 3,299,314Fund shares sold 2,408,601Dividends and interest 619,633Upfront payments made on swap contracts 177,074Reimbursement from investment adviser 108,326Foreign tax reclaims 84,909
Other assets 351,523Total assets 1,341,452,419
Liabilities:Securities sold short, at value (proceeds received $52,137,564) 55,107,547Unrealized loss on swap contracts 19,859,852Unrealized loss on unfunded loan commitment 1,263Unrealized loss on forward foreign currency exchange contracts 14,077,458Variation margin on certain derivative contracts 160,588Payables:
Investments purchased 16,785,921Fund shares redeemed 7,123,505Management fees 1,835,265Investments purchased on an extended settlement basis 1,424,295Distribution and service fees and transfer agency fees 120,279Dividend expense payable on securities sold short 32,310Upfront payments received on swap contracts 179,485
Accrued expenses and other liabilities 1,411,313Total liabilities 118,119,081
Net Assets:Paid-in capital 1,282,795,237Distributions in excess of net investment income (3,884,516 )Accumulated net realized loss (85,864,629 )Net unrealized gain 30,287,246NET ASSETS $1,223,333,338Net Assets:
Class A $74,631,387Class C 39,247,494Institutional 970,490,808Class IR 138,842,144Class R 121,505
Total Net Assets $1,223,333,338Shares Outstanding $0.001 par value (unlimited number of shares authorized):
Class A 7,214,864Class C 3,861,211Institutional 93,429,400Class IR 13,404,171Class R 11,806
Net asset value, offering and redemption price per share:(c)Class A $10.34Class C 10.16Institutional 10.39Class IR 10.36Class R 10.29
(a) Statement of Assets and Liabilities for the Fund is consolidated and includes the balances of two wholly-owned subsidiaries, Cayman Commodity �MMA, Ltd. and CaymanCommodity �MMA II, Ltd. Accordingly, all interfund balances and transactions have been eliminated.
(b) Includes segregated cash of $27,617,375, $22,999,502 and $191,930,000 relating to initial margin requirements and/or collateral on futures, forwards and swaps transactions,respectively.
(c) Maximum public offering price per share for Class A Shares is $11.44. At redemption, Class C Shares may be subject to a contingent deferred sales charge, assessed on the amountequal to the lesser of the current net asset value (�NAV�) or the original purchase price of the shares.
The accompanying notes are an integral part of these financial statements. 55
Copyright © 2017 www.secdatabase.com. All Rights Reserved.Please Consider the Environment Before Printing This Document

GOLDMAN SACHS MULTI-MANAGER ALTERNATIVES FUND
Consolidated Statement of Operations(a)For the Six Months Ended April 30, 2017 (Unaudited)
Investment income:Interest $12,871,092Dividends � unaffiliated issuers (net of foreign withholding taxes of $34,356) 2,020,034Dividends � affiliated issuers 61,762Total investment income 14,952,888
Expenses:Management fees 11,341,210Dividend expense for securities sold short 2,095,977Custody, accounting and administrative services 639,871Transfer Agency fees(b) 441,909Professional fees 352,240Prime broker fees 268,839Distribution and Service fees(b) 351,478Registration fees 92,356Printing and mailing costs 80,385Trustee fees 58,230Other 66,547Total expenses 15,789,042Less � expense reductions (1,028,604 )Net expenses 14,760,438NET INVESTMENT INCOME 192,450
Realized and unrealized gain (loss):Net realized gain (loss) from:
Investments 6,801,848Securities short sales (1,178,007 )Futures contracts (7,389,715 )Swap contracts 2,462,301Forward foreign currency exchange contracts 3,233,695Foreign currency transactions (24,346 )
Net change in unrealized gain (loss) on:Investments 28,332,226Securities short sales (2,661,818 )Futures contracts 6,899,047Unfunded loan commitments 631Swap contracts 549,944Forward foreign currency exchange contracts (8,259,558 )Foreign currency translation (108,047 )
Net realized and unrealized gain 28,658,201NET INCREASE IN NET ASSETS RESULTING FROM OPERATIONS $28,850,651
(a) Statement of Operations for the Fund is consolidated and includes the balances of two wholly-owned subsidiaries, Cayman Commodity � MMA, Ltd. and Cayman Commodity � MMAII, Ltd. Accordingly, all interfund balances and transactions have been eliminated.
(b) Class specific Distribution and Service, and Transfer Agency fees were as follows:
Distribution and Service Fees Transfer Agency FeesClass A Class C Class R Class A Class C Institutional Class IR Class R
$ 129,489 $ 221,689 $ 300 $ 98,412 $ 42,121 $ 184,590 $ 116,672 $ 114
56 The accompanying notes are an integral part of these financial statements.
Copyright © 2017 www.secdatabase.com. All Rights Reserved.Please Consider the Environment Before Printing This Document

GOLDMAN SACHS MULTI-MANAGER ALTERNATIVES FUND
Consolidated Statements of Changes in Net Assets(a)For the
Six Months EndedApril 30, 2017(Unaudited)
For the FiscalYear Ended
October 31, 2016From operations:Net investment income $192,450 $9,800,206Net realized gain (loss) 3,905,776 (53,069,350 )Net change in unrealized gain 24,752,425 33,118,163Net increase (decrease) in net assets resulting from operations 28,850,651 (10,150,981 )
Distributions to shareholders:From net investment income
Class A Shares (1,610,383 ) (204,033 )Class C Shares (200,238 ) �Institutional Shares (17,692,086 ) (4,424,446 )Class IR Shares (1,952,133 ) (288,398 )Class R Shares (1,227 ) (639 )
From net realized gainsClass A Shares � (934,629 )Class C Shares � (351,627 )Institutional Shares � (5,388,275 )Class IR Shares � (511,792 )Class R Shares � (1,298 )
Total distributions to shareholders (21,456,067 ) (12,105,137 )
From share transactions:Proceeds from sales of shares 302,626,164 557,864,388Reinvestment of distributions 19,961,361 11,328,743Cost of shares redeemed (303,680,821 ) (1,003,351,675 )Net increase (decrease) in net assets resulting from share transactions 18,906,704 (434,158,544 )TOTAL INCREASE (DECREASE) 26,301,288 (456,414,662 )
Net assets:Beginning of period 1,197,032,050 1,653,446,712End of period $1,223,333,338 $1,197,032,050Undistributed (distributions in excess of) net investment income $(3,884,516 ) $17,379,101
(a) Statements of Changes in Net Assets for the Fund is consolidated and includes the balances of two wholly-owned subsidiaries, Cayman Commodity � MMA, Ltd. and CaymanCommodity � MMA II, Ltd. Accordingly, all interfund balances and transactions have been eliminated.
The accompanying notes are an integral part of these financial statements. 57
Copyright © 2017 www.secdatabase.com. All Rights Reserved.Please Consider the Environment Before Printing This Document

GOLDMAN SACHS MULTI-MANAGER ALTERNATIVES FUND
Consolidated Financial HighlightsSelected Data for a Share Outstanding Throughout Each Period
Income (loss) frominvestment operations
Distributionsto shareholders
Year - Share Class
Net assetvalue,
beginningof period
Netinvestment
income (loss)(a)
Net realizedand unrealized
gain (loss)
Total frominvestmentoperations
From netinvestment
income
From netrealized
gainsTotal
distributionsFOR THE SIX MONTHS ENDED APRIL 30, (UNAUDITED)2017 - A $ 10.25 $ (0.01 ) $ 0.24 $ 0.23 $ (0.14 ) $ � $ (0.14 )2017 - C 10.02 (0.05 ) 0.23 0.18 (0.04 ) � (0.04 )2017 - Institutional 10.33 0.01 0.25 0.26 (0.20 ) � (0.20 )2017 - IR 10.30 � (e) 0.25 0.25 (0.19 ) � (0.19 )2017 - R 10.18 (0.03 ) 0.25 0.22 (0.11 ) � (0.11 )
FOR THE FISCAL YEAR ENDED OCTOBER 31,2016 - A 10.33 0.04 (0.06 ) (0.02 ) (0.01 ) (0.05 ) (0.06 )2016 - C 10.16 (0.04 ) (0.05 ) (0.09 ) � (0.05 ) (0.05 )2016 - Institutional 10.40 0.08 (0.07 ) 0.01 (0.03 ) (0.05 ) (0.08 )2016 - IR 10.37 0.07 (0.07 ) � (0.02 ) (0.05 ) (0.07 )2016 - R 10.29 0.01 (0.05 ) (0.04 ) (0.02 ) (0.05 ) (0.07 )
FOR THE PERIOD JANUARY 1, 2015 - OCTOBER 31,2015 - A 10.58 (0.03 ) (0.22 ) (0.25 ) � � �
2015 - C 10.47 (0.09 ) (0.22 ) (0.31 ) � � �
2015 - Institutional 10.61 0.01 (0.22 ) (0.21 ) � � �
2015 - IR 10.60 � (e) (0.23 ) (0.23 ) � � �
2015 - R 10.56 (0.04 ) (0.23 ) (0.27 ) � � �
FOR THE FISCAL YEAR ENDED DECEMBER 31,2014 - A 10.46 (0.06 ) 0.33 0.27 (0.03 ) (0.12 ) (0.15 )2014 - C 10.40 (0.14 ) 0.33 0.19 � (e) (0.12 ) (0.12 )2014 - Institutional 10.49 (0.01 ) 0.31 0.30 (0.06 ) (0.12 ) (0.18 )2014 - IR 10.48 (0.03 ) 0.33 0.30 (0.06 ) (0.12 ) (0.18 )2014 - R 10.44 (0.07 ) 0.31 0.24 � (e) (0.12 ) (0.12 )
FOR THE PERIOD ENDED DECEMBER 31,2013 - A (Commenced April 30, 2013) 10.00 (0.03 ) 0.55 0.52 � (0.06 ) (0.06 )2013 - C (Commenced April 30, 2013) 10.00 (0.08 ) 0.54 0.46 � (0.06 ) (0.06 )2013 - Institutional (Commenced April 30, 2013) 10.00 (0.01 ) 0.56 0.55 � (0.06 ) (0.06 )2013 - IR (Commenced April 30, 2013) 10.00 (0.01 ) 0.55 0.54 � (0.06 ) (0.06 )2013 - R (Commenced April 30, 2013) 10.00 (0.06 ) 0.56 0.50 � (0.06 ) (0.06 )
(a) Calculated based on the average shares outstanding methodology.(b) Assumes investment at the NAV at the beginning of the period, reinvestment of all dividends and distributions, a complete redemption of the investment at the NAV at the end of the
period and no sales or redemption charges. Total returns would be reduced if a sales or redemption charge was taken into account. Returns do not reflect the impact of taxes toshareholder relating to Fund distributions or the redemption of Fund shares. Total returns for periods less than one full year are not annualized.
(c) The Fund�s portfolio turnover rate is calculated in accordance with regulatory requirements, without regard to transactions involving short term investments and certain derivatives. Ifsuch transactions were included, the Fund�s portfolio turnover rate may be higher.
(d) Annualized.(e) Amount is less than $0.005 per share.(f) Amount has been revised to exclude prime brokerage expenses relating to short sales.
58 The accompanying notes are an integral part of these financial statements.
Copyright © 2017 www.secdatabase.com. All Rights Reserved.Please Consider the Environment Before Printing This Document
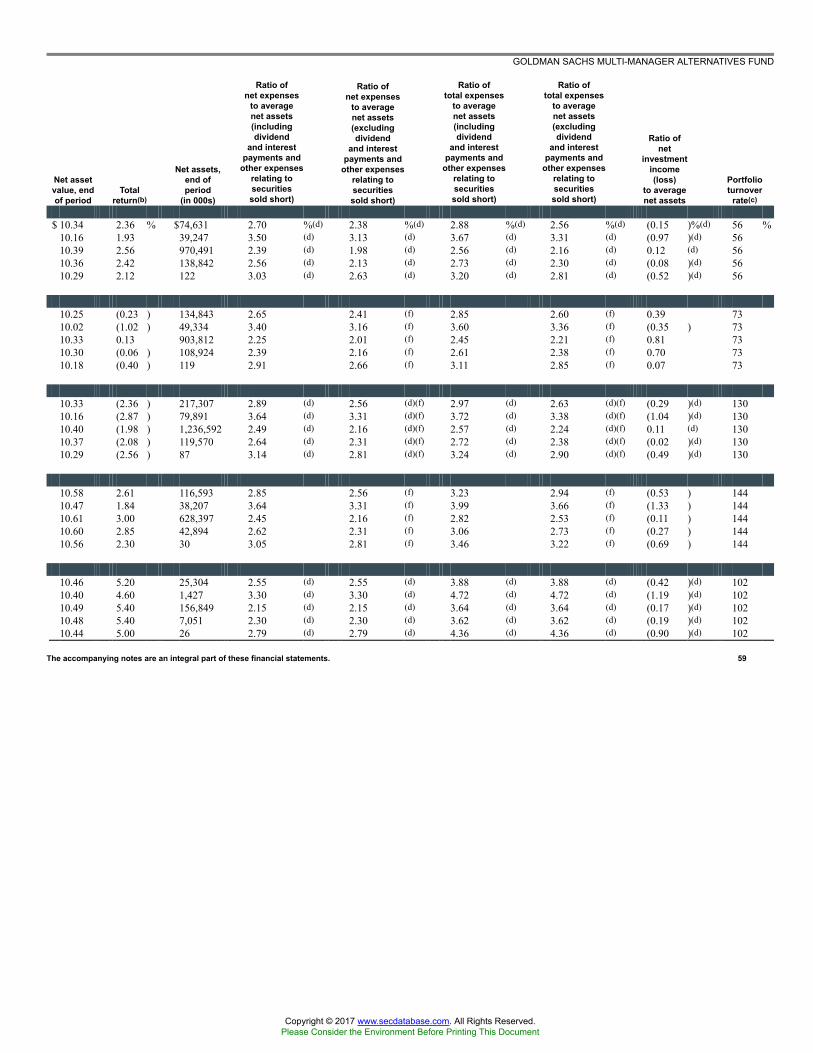
GOLDMAN SACHS MULTI-MANAGER ALTERNATIVES FUND
Net assetvalue, endof period
Totalreturn(b)
Net assets,end ofperiod
(in 000s)
Ratio ofnet expenses
to averagenet assets(includingdividend
and interestpayments and
other expensesrelating tosecuritiessold short)
Ratio ofnet expenses
to averagenet assets(excludingdividend
and interestpayments and
other expensesrelating tosecuritiessold short)
Ratio oftotal expenses
to averagenet assets(includingdividend
and interestpayments and
other expensesrelating tosecuritiessold short)
Ratio oftotal expenses
to averagenet assets(excludingdividend
and interestpayments and
other expensesrelating tosecuritiessold short)
Ratio ofnet
investmentincome(loss)
to averagenet assets
Portfolioturnover
rate(c)
$ 10.34 2.36 % $74,631 2.70 %(d) 2.38 %(d) 2.88 %(d) 2.56 %(d) (0.15 )%(d) 56 %10.16 1.93 39,247 3.50 (d) 3.13 (d) 3.67 (d) 3.31 (d) (0.97 )(d) 5610.39 2.56 970,491 2.39 (d) 1.98 (d) 2.56 (d) 2.16 (d) 0.12 (d) 5610.36 2.42 138,842 2.56 (d) 2.13 (d) 2.73 (d) 2.30 (d) (0.08 )(d) 5610.29 2.12 122 3.03 (d) 2.63 (d) 3.20 (d) 2.81 (d) (0.52 )(d) 56
10.25 (0.23 ) 134,843 2.65 2.41 (f) 2.85 2.60 (f) 0.39 7310.02 (1.02 ) 49,334 3.40 3.16 (f) 3.60 3.36 (f) (0.35 ) 7310.33 0.13 903,812 2.25 2.01 (f) 2.45 2.21 (f) 0.81 7310.30 (0.06 ) 108,924 2.39 2.16 (f) 2.61 2.38 (f) 0.70 7310.18 (0.40 ) 119 2.91 2.66 (f) 3.11 2.85 (f) 0.07 73
10.33 (2.36 ) 217,307 2.89 (d) 2.56 (d)(f) 2.97 (d) 2.63 (d)(f) (0.29 )(d) 13010.16 (2.87 ) 79,891 3.64 (d) 3.31 (d)(f) 3.72 (d) 3.38 (d)(f) (1.04 )(d) 13010.40 (1.98 ) 1,236,592 2.49 (d) 2.16 (d)(f) 2.57 (d) 2.24 (d)(f) 0.11 (d) 13010.37 (2.08 ) 119,570 2.64 (d) 2.31 (d)(f) 2.72 (d) 2.38 (d)(f) (0.02 )(d) 13010.29 (2.56 ) 87 3.14 (d) 2.81 (d)(f) 3.24 (d) 2.90 (d)(f) (0.49 )(d) 130
10.58 2.61 116,593 2.85 2.56 (f) 3.23 2.94 (f) (0.53 ) 14410.47 1.84 38,207 3.64 3.31 (f) 3.99 3.66 (f) (1.33 ) 14410.61 3.00 628,397 2.45 2.16 (f) 2.82 2.53 (f) (0.11 ) 14410.60 2.85 42,894 2.62 2.31 (f) 3.06 2.73 (f) (0.27 ) 14410.56 2.30 30 3.05 2.81 (f) 3.46 3.22 (f) (0.69 ) 144
10.46 5.20 25,304 2.55 (d) 2.55 (d) 3.88 (d) 3.88 (d) (0.42 )(d) 10210.40 4.60 1,427 3.30 (d) 3.30 (d) 4.72 (d) 4.72 (d) (1.19 )(d) 10210.49 5.40 156,849 2.15 (d) 2.15 (d) 3.64 (d) 3.64 (d) (0.17 )(d) 10210.48 5.40 7,051 2.30 (d) 2.30 (d) 3.62 (d) 3.62 (d) (0.19 )(d) 10210.44 5.00 26 2.79 (d) 2.79 (d) 4.36 (d) 4.36 (d) (0.90 )(d) 102
The accompanying notes are an integral part of these financial statements. 59
Copyright © 2017 www.secdatabase.com. All Rights Reserved.Please Consider the Environment Before Printing This Document

GOLDMAN SACHS MULTI-MANAGER ALTERNATIVES FUND
Notes to Financial StatementsApril 30, 2017
1. ORGANIZATION
Goldman Sachs Trust II (the �Trust�) is a Delaware statutory trust registered under the Investment Company Act of 1940, as amended (the �Act�), asan open-end management investment company. The Trust includes the Goldman Sachs Multi-Manager Alternatives Fund (the �Fund�). The Fund is anon-diversified portfolio and currently offers five classes of shares: Class A, Class C, Institutional, Class IR, and Class R Shares.
Class A Shares are sold with a front-end sales charge of up to 5.50%. Class C Shares are sold with a contingent deferred sales charge (�CDSC�) of1.00%, which is imposed on redemptions made within 12 months of purchase. Institutional, Class IR and Class R Shares are not subject to a salescharge.
Goldman Sachs Asset Management, L.P. (�GSAM�), an affiliate of Goldman Sachs & Co. LLC (formerly Goldman, Sachs & Co.) (�GoldmanSachs�), serves as investment adviser to the Fund pursuant to a management agreement (the �Agreement�) with the Trust. As of April 30, 2017,GSAM had sub-advisory agreements (the �Sub-Advisory Agreements�) for the Fund with Acadian Asset Management LLC (�Acadian�), AlgertGlobal LLC (�Algert�), Ares Capital Management II LLC (�Ares�), Atreaus Capital, LP (�Atreaus�), Brigade Capital Management, LP (�Brigade�),Corsair Capital Management, L.P. (�Corsair�), Emso Asset Management Limited (�Emso�), First Pacific Advisors, LLC (�FPA�), Graham CapitalManagement, L.P. (�GCM�), New Mountain Vantage Advisers, L.L.C. (�New Mountain Vantage�), One River Asset Management, LLC (�OneRiver�), QMS Capital Management LP (�QMS�), Russell Investments Implementation Services, LLC (�RIIS�), Sirios Capital Management, L.P.(�Sirios�), Wellington Management Company LLP (�Wellington�) and YG Partners LLC (�YG Partners�) (the �Underlying Managers�). Each ofAtreaus and GCM also serves as an Underlying Manager for a Subsidiary (as defined below). Pursuant to the terms of the Sub-Advisory Agreements,the Underlying Managers are responsible for making investment decisions and managing the investments of the Fund. GSAM compensates theUnderlying Managers directly in accordance with the terms of the Sub-Advisory Agreements. The Fund is not charged any separate or additionalinvestment advisory fees by the Underlying Managers.
2. SIGNIFICANT ACCOUNTING POLICIESThe financial statements have been prepared in accordance with accounting principles generally accepted in the United States of America (�GAAP�)and require management to make estimates and assumptions that may affect the reported amounts and disclosures. Actual results may differ from thoseestimates and assumptions.
A. Basis of Consolidation for the Goldman Sachs Multi-Manager Alternatives Fund � The Cayman Commodity � MMA, Ltd. and the CaymanCommodity � MMA II, Ltd. (each a �Subsidiary� and together the �Subsidiaries�), Cayman Islands exempted companies, respectively, and are wholly-owned subsidiaries of the Fund. The Subsidiaries act as investment vehicles for the Fund to enable the Fund to gain exposure to certain types ofcommodity-linked derivative instruments. The Fund is the sole shareholder of the Subsidiaries and it is intended that the Fund will remain the soleshareholder and will continue to control the Subsidiaries. Under the Memorandum and Articles of Association of each Subsidiary, shares issued by theSubsidiary confer upon a shareholder the right to vote at general meetings of the Subsidiary and certain rights in connection with any winding-up orrepayment of capital, as well as the right to participate in the profits or assets of the Subsidiary. All interfund balances and transactions have beeneliminated in consolidation. As of April 30, 2017, the Fund�s net assets were $1,223,333,338, of which, $26,950,470, or 2.2%, represented the CaymanCommodity � MMA, Ltd.�s net assets and $9,982,813, or 0.8%, represented the Cayman Commodity � MMA II, Ltd.�s net assets.
B. Investment Valuation � The Fund�s valuation policy is to value investments at fair value.
C. Investment Income and Investments � Investment income includes interest income, dividend income, net of any foreign withholding taxes, lessany amounts reclaimable, and securities lending income. Interest income is accrued daily and adjusted for amortization of premiums and accretion ofdiscounts. Dividend income is recognized on ex-dividend date or, for certain foreign securities, as soon as such information is obtained subsequent tothe ex-dividend date. Investment transactions are reflected on trade date. Realized gains and losses are calculated using identified cost. Investmenttransactions are recorded on the following business day for daily net asset value (�NAV�) calculations. Any foreign capital gains tax is accrued dailybased upon net
60
Copyright © 2017 www.secdatabase.com. All Rights Reserved.Please Consider the Environment Before Printing This Document

GOLDMAN SACHS MULTI-MANAGER ALTERNATIVES FUND
2. SIGNIFICANT ACCOUNTING POLICIES (continued)
unrealized gains, and is payable upon sale of such investments. Distributions received from the Fund�s investments in U.S. real estate investment trusts(�REITs�) may be characterized as ordinary income, net capital gain or a return of capital. A return of capital is recorded by the Fund as a reduction tothe cost basis of the REIT.
For derivative contracts, realized gains and losses are recorded upon settlement of the contract. Upfront payments, if any, are made or receivedupon entering into a swap agreement and are reflected in the Consolidated Statement of Assets and Liabilities. Upfront payments are recognized overthe contract�s term/event as realized gains or losses, with the exception of forward starting interest rate swaps whose realized gains or losses arerecognized from the effective start date. For securities with paydown provisions, principal payments received are treated as a proportionate reduction tothe cost basis of the securities, and excess or shortfall amounts are recorded as income.
D. Class Allocations and Expenses � Investment income, realized and unrealized gain (loss), and non-class specific expenses of the Fund areallocated daily based upon the proportion of net assets of each class. Non-class specific expenses directly incurred by the Fund are charged to the Fund,while such expenses incurred by the Trust are allocated across the Fund on a straight-line and/ or pro-rata basis depending upon the nature of theexpenses. Class specific expenses, where applicable, are borne by the respective share classes and include Distribution and Service, Transfer Agencyand Service and Shareholder Administration fees.
E. Federal Taxes and Distributions to Shareholders � It is the Fund�s policy to comply with the requirements of the Internal Revenue Code of1986, as amended (the �Code�), applicable to regulated investment companies (mutual funds) and to distribute each year substantially all of itsinvestment company taxable income and capital gains to its shareholders. Accordingly, the Fund is not required to make any provisions for the paymentof federal income tax. Distributions to shareholders are recorded on the ex-dividend date. Income and capital gains distributions, if any, are declaredand paid annually.
Net capital losses are carried forward to future fiscal years and may be used to the extent allowed by the Code to offset any future capital gains.Losses that are carried forward will retain their character as either short-term or long-term capital losses. Utilization of capital loss carryforwards willreduce the requirement of future capital gains distributions.
The characterization of distributions to shareholders for financial reporting purposes is determined in accordance with federal income tax rules,which may differ from GAAP. The source of the Fund�s distributions may be shown in the accompanying financial statements as either from netinvestment income, net realized gain or capital. Certain components of the Fund�s net assets on the Consolidated Statement of Assets and Liabilitiesreflect permanent GAAP/tax differences based on the appropriate tax character.
F. Foreign Currency Translation � The accounting records and reporting currency of the Fund are maintained in U.S. dollars. Assets and liabilitiesdenominated in foreign currencies are translated into U.S. dollars using the current exchange rates at the close of each business day. The effect ofchanges in foreign currency exchange rates on investments is included within net realized and unrealized gain (loss) on investments. Changes in thevalue of other assets and liabilities as a result of fluctuations in foreign exchange rates are included in the Consolidated Statement of Operations withinnet change in unrealized gain (loss) on foreign currency translations. Transactions denominated in foreign currencies are translated into U.S. dollars onthe date the transaction occurred, the effects of which are included within net realized gain (loss) on foreign currency transactions.
3. INVESTMENTS AND FAIR VALUE MEASUREMENTSThe fair value of a financial instrument is the amount that would be received to sell an asset or paid to transfer a liability in an orderly transactionbetween market participants at the measurement date (i.e., the exit price). GAAP establishes a fair value hierarchy that prioritizes the inputs tovaluation techniques used to measure fair value. The hierarchy gives the highest priority to unadjusted quoted prices in active markets for identicalassets or liabilities (Level 1 measurements) and the lowest priority to unobservable inputs (Level 3 measurements). The levels used for classifyinginvestments are not necessarily an indication of the risk associated with investing in these investments. The three levels of the fair value hierarchy aredescribed below:
Level 1 � Unadjusted quoted prices in active markets that are accessible at the measurement date for identical, unrestricted assets or liabilities;
61
Copyright © 2017 www.secdatabase.com. All Rights Reserved.Please Consider the Environment Before Printing This Document
GOLDMAN SACHS MULTI-MANAGER ALTERNATIVES FUND
Notes to Financial Statements (continued)April 30, 2017
3. INVESTMENTS AND FAIR VALUE MEASUREMENTS (continued)
Level 2 � Quoted prices in markets that are not active or financial instruments for which significant inputs are observable (including, but notlimited to, quoted prices for similar investments, interest rates, foreign exchange rates, volatility and credit spreads), either directly or indirectly;Level 3 � Prices or valuations that require significant unobservable inputs (including GSAM�s assumptions in determining fair valuemeasurement).
Changes in valuation techniques may result in transfers into or out of an assigned level within the hierarchy. In accordance with the Fund�s policy,transfers between different levels of the fair value hierarchy resulting from such changes are deemed to have occurred as of the beginning of thereporting period.
The Board of Trustees (�Trustees�) has approved Valuation Procedures that govern the valuation of the portfolio investments held by the Fund,including investments for which market quotations are not readily available. The Trustees have delegated to GSAM day-to-day responsibility forimplementing and maintaining internal controls and procedures related to the valuation of the Fund�s portfolio investments. To assess the continuingappropriateness of pricing sources and methodologies, GSAM regularly performs price verification procedures and issues challenges as necessary tothird party pricing vendors or brokers, and any differences are reviewed in accordance with the Valuation Procedures.
A. Level 1 and Level 2 Fair Value Investments � The valuation techniques and significant inputs used in determining the fair values forinvestments classified as Level 1 and Level 2 are as follows:
Equity Securities � Equity securities traded on a United States (�U.S.�) securities exchange or the NASDAQ system, or those located on certainforeign exchanges, including but not limited to the Americas, are valued daily at their last sale price or official closing price on the principal exchangeor system on which they are traded. If there is no sale or official closing price or such price is believed by GSAM to not represent fair value, equitysecurities are valued at the last bid price for long positions and at the last ask price for short positions. To the extent these investments are activelytraded, they are classified as Level 1 of the fair value hierarchy, otherwise they are generally classified as Level 2.
Unlisted equity securities for which market quotations are available are valued at the last sale price on the valuation date, or if no sale occurs, atthe last bid price. Securities traded on certain foreign securities exchanges are valued daily at fair value determined by an independent fair value service(if available) under Valuation Procedures approved by the Trustees and consistent with applicable regulatory guidance. The independent fair valueservice takes into account multiple factors including, but not limited to, movements in the securities markets, certain depositary receipts, futurescontracts and foreign currency exchange rates that have occurred subsequent to the close of the foreign securities exchange. These investments aregenerally classified as Level 2 of the fair value hierarchy.
Underlying Funds (including Money Market Funds) � Underlying Funds (�Underlying Funds�) include other investment companies and exchange-traded funds (�ETFs�). Investments in the Underlying Funds (except ETFs) are valued at the NAV per share of the Institutional Share class on the dayof valuation. ETFs are valued daily at the last sale price or official closing price on the principal exchange or system on which the investment is traded.Because the Fund invests in Underlying Funds that fluctuate in value, the Fund�s shares will correspondingly fluctuate in value. To the extent theseinvestments are actively traded, they are classified as Level 1 of the fair value hierarchy, otherwise they are generally classified as Level 2. Forinformation regarding an Underlying Fund�s accounting policies and investment holdings, please see the Underlying Fund�s shareholder report.
Debt Securities � Debt securities for which market quotations are readily available are valued daily on the basis of quotations supplied by dealers oran independent pricing service approved by the Trustees. The pricing services may use valuation models or matrix pricing, which consider: (i) yield orprice with respect to bonds that are considered comparable in characteristics such as rating, interest rate and maturity date or (ii) quotations fromsecurities dealers to determine current value. Short-term debt obligations that mature in sixty days or less and that do not exhibit signs of creditdeterioration are valued using available market quotations as provided by a third party pricing vendor or broker. With the exception of treasurysecurities of G8 countries, which are generally classified as Level 1, these investments are generally classified as Level 2 of the fair value hierarchy.
62
Copyright © 2017 www.secdatabase.com. All Rights Reserved.Please Consider the Environment Before Printing This Document

GOLDMAN SACHS MULTI-MANAGER ALTERNATIVES FUND
3. INVESTMENTS AND FAIR VALUE MEASUREMENTS (continued)
i. Bank Loans � Bank loans (�Loans�) are interests in amounts owed by corporate, governmental, or other borrowers to lenders or lendingsyndicates. Loans are arranged through private negotiations between the borrower and one or more financial institutions (�Lenders�). The Fund�sinvestments in Loans are in the form of either participations in Loans (�Participations�) or assignments of all or a portion of Loans from thirdparties (�Assignments�). With respect to Participations, the Fund has the right to receive payments of principal, interest and any fees to which it isentitled from the Lender selling the Participations and only upon receipt by the Lender of the payments from the borrower. The Fund generally hasno right to enforce compliance by the borrower with the terms of the loan agreement with respect to Participations. Conversely, assignments resultin the Fund having a direct contractual relationship with the borrower, and the Fund may be permitted to enforce compliance by the borrower withthe terms of the loan agreement.
ii. Mortgage-Backed and Asset-Backed Securities � Mortgage-backed securities represent direct or indirect participations in, or arecollateralized by and payable from, mortgage loans secured by residential and/or commercial real estate property. Asset-backed securities includesecurities whose principal and interest payments are collateralized by pools of other assets or receivables. The value of certain mortgage-backedand asset-backed securities (including adjustable rate mortgage loans) may be particularly sensitive to changes in prevailing interest rates. Thevalue of these securities may also fluctuate in response to the market�s perception of the creditworthiness of the issuers.
Asset-backed securities may present credit risks that are not presented by mortgage-backed securities because they generally do not have thebenefit of a security interest in collateral that is comparable to mortgage assets. Some asset-backed securities may only have a subordinated claimon collateral.
Stripped mortgage-backed securities are usually structured with two different classes: one that receives substantially all interest payments(interest-only, or �IO� and/or high coupon rate with relatively low principal amount, or �IOette�), and the other that receives substantially allprincipal payments (principal-only, or �PO�) from a pool of mortgage loans. Little to no principal will be received at the maturity of an IO; as aresult, periodic adjustments are recorded to reduce the cost of the security until maturity. These adjustments are included in interest income.
Securities Sold Short � Securities sold short are those securities which the Fund has sold but which it does not own. When the Fund sells a security itdoes not own, it must borrow the security that was sold and it generally delivers the proceeds from the short sale to the broker through which it madethe short sale. In addition, cash and certain investments in securities may be used to collateralize the securities sold short. Each day the securities soldshort transaction is open, the liability to replace the borrowed security is marked to market and an unrealized gain or loss is recorded. While thetransaction remains open, the Fund may also incur expenses for any dividends or interest which will be paid to the lender of the securities as well as afee to borrow the delivered security. During the term of the short sale, the value of the securities pledged as collateral on short sales is required toexceed the value of the securities sold short. The market value of securities pledged as collateral is included in the Consolidated Schedule ofInvestments.
Derivative Contracts � A derivative is an instrument whose value is derived from underlying assets, indices, reference rates or a combination of thesefactors. The Fund enters into derivative transactions to hedge against changes in interest rates, securities prices, and/or currency exchange rates, toincrease total return, or to gain access to certain markets or attain exposure to other underliers.
Exchange-traded derivatives, including futures and options contracts, are valued at the last sale or settlement price and typically fall within Level 1of the fair value hierarchy. Over-the-counter (�OTC�) and centrally cleared derivatives are valued using market transactions and other market evidence,including market-based inputs to models, calibration to market-clearing transactions, broker or dealer quotations, or other alternative pricing sources.Where models are used, the selection of a particular model to value OTC and centrally cleared derivatives depends upon the contractual terms of, andspecific risks inherent in, the instrument, as well as the availability of pricing information in the market. Valuation models require a variety of inputs,including contractual terms, market prices, yield curves, credit curves, measures of volatility, voluntary and involuntary prepayment rates, loss severityrates and correlations of such inputs. For OTC and centrally cleared derivatives that trade in liquid markets, model inputs can generally be verified andmodel selection does not involve significant management judgment. OTC and centrally cleared derivatives are classified within Level 2 of the fairvalue hierarchy when significant inputs are corroborated by market evidence.
63
Copyright © 2017 www.secdatabase.com. All Rights Reserved.Please Consider the Environment Before Printing This Document

GOLDMAN SACHS MULTI-MANAGER ALTERNATIVES FUND
Notes to Financial Statements (continued)April 30, 2017
3. INVESTMENTS AND FAIR VALUE MEASUREMENTS (continued)
i. Forward Contracts � A forward contract is a contract between two parties to buy or sell an asset at a specified price on a future date. Aforward contract settlement can occur on a cash or delivery basis. Forward contracts are marked-to-market daily using independent vendor prices,and the change in value, if any, is recorded as an unrealized gain or loss. Cash and certain investments may be used to collateralize forwardcontracts.
A forward foreign currency contract is a forward contract in which the Fund agrees to receive or deliver a fixed quantity of one currency foranother, at a pre-determined price at a future date. All forward foreign currency exchange contracts are marked-to-market daily at the applicableforward rate. Non-deliverable forward foreign currency exchange contracts are settled with the counterparty in cash without the delivery of foreigncurrency.
ii. Futures Contracts � Futures contracts are contracts to buy or sell a standardized quantity of a specified commodity or security and are valuedbased on exchanged settlement prices or independent market quotes. Futures contracts are valued at the last settlement price, or in the absence of asale, the last bid price for long positions and at the last ask price for short positions, at the end of each day on the board of trade or exchange uponwhich they are traded. Upon entering into a futures contract, the Fund deposits cash or securities in an account on behalf of the broker in anamount sufficient to meet the initial margin requirement. Subsequent payments are made or received by the Fund equal to the daily change in thecontract value and are recorded as variation margin receivable or payable with a corresponding offset to unrealized gains or losses.
iii. Swap Contracts � Swaps are marked-to-market daily using pricing vendor quotations, counterparty prices or model prices, and the change invalue, if any, is recorded as an unrealized gain or loss.
A credit default swap is an agreement that involves one party (the buyer of protection) making a stream of payments to another party (theseller of protection) in exchange for the right to receive protection on a reference security or obligation, including a group of assets or exposure tothe performance of an index. The Fund�s investment in credit default swaps may involve greater risks than if the Fund had invested in thereferenced obligation directly. Credit events are contract specific but may include bankruptcy, failure to pay, restructuring and obligationacceleration. If the Fund buys protection through a credit default swap and no credit event occurs, its payments are limited to the periodicpayments previously made to the counterparty. Upon the occurrence of a specified credit event, the Fund, as a buyer of credit protection, is entitledto receive an amount equal to the notional amount of the swap and deliver to the seller the defaulted reference obligation in a physically settledtrade. The Fund may also receive a net settlement amount in the form of cash or securities equal to the notional amount of the swap reduced by therecovery value of the reference obligation in a cash settled trade.
As a seller of protection, the Fund generally receives a payment stream throughout the term of the swap, provided that there is no credit event.In addition, if the Fund sells protection through a credit default swap, the Fund could suffer a loss because the value of the referenced obligationand the premium payments received may be less than the notional amount of the swap paid to the buyer of protection. Upon the occurrence of aspecified credit event, the Fund, as a seller of credit protection, may be required to take possession of the defaulted reference obligation and paythe buyer an amount equal to the notional amount of the swap in a physically settled trade. The Fund may also pay a net settlement amount in theform of cash or securities equal to the notional amount of the swap reduced by the recovery value of the reference obligation in a cash settled trade.Recovery values are at times established through the credit event auction process in which market participants are ensured that a transparent pricehas been set for the defaulted security or obligation. In addition, the Fund is entitled to a return of any assets, which have been pledged as collateralto the counterparty upon settlement.
The maximum potential amount of future payments (undiscounted) that the Fund as seller of protection could be required to make under acredit default swap would be an amount equal to the notional amount of the agreement. These potential amounts would be partially offset by anyrecovery values of the respective referenced obligations or net amounts received from a settlement of a credit default swap for the same referencesecurity or obligation where the Fund bought credit protection.
A total return swap is an agreement that gives the Fund the right to receive the appreciation in the value of a specified security, index or otherinstrument in return for a fee paid to the counterparty, which will typically be an agreed upon interest rate. If the underlying asset declines in valueover the term of the swap, the Fund may also be required to pay the dollar value of that decline to the counterparty.
64
Copyright © 2017 www.secdatabase.com. All Rights Reserved.Please Consider the Environment Before Printing This Document

GOLDMAN SACHS MULTI-MANAGER ALTERNATIVES FUND
3. INVESTMENTS AND FAIR VALUE MEASUREMENTS (continued)
Short Term Investments � Short-term investments having a maturity of 60 days or less are valued using available market quotations as provided by athird party pricing vendor or broker. These investments are classified as Level 2 of the fair value hierarchy.
i. Repurchase Agreements � Repurchase agreements involve the purchase of securities subject to the seller�s agreement to repurchase thesecurities at a mutually agreed upon date and price, under the terms of a Master Repurchase Agreement (�MRA�). During the term of a repurchaseagreement, the value of the underlying securities held as collateral on behalf of the Fund, including accrued interest is required to exceed the valueof the repurchase agreement, including accrued interest. The gross value of repurchase agreements is included in the Statement of Assets andLiabilities for financial reporting purposes. The underlying securities for all repurchase agreements are held at the Fund�s custodian or designatedsub-custodians under tri-party repurchase agreements.
An MRA governs transactions between the Fund and select counterparties. An MRA contains provisions for, among other things, initiation ofthe transaction, income payments, events of default and maintenance of securities for repurchase agreements. An MRA also permits offsetting withcollateral to create one single net payment in the event of default or similar events, including the bankruptcy or insolvency of a counterparty.
If the seller defaults, the Fund could suffer a loss to the extent that the proceeds from the sale of the underlying securities and other collateralheld by the Fund are less than the repurchase price and the Fund�s costs associated with delay and enforcement of the repurchase agreement. Inaddition, in the event of default or insolvency of the seller, a court could determine that the Fund�s interest in the collateral is not enforceable,resulting in additional losses to the Fund.
Pursuant to exemptive relief granted by the Securities and Exchange Commission (�SEC�) and terms and conditions contained therein, theFund, together with other funds of the Trust and registered investment companies having management agreements with GSAM or its affiliates,may transfer uninvested cash into joint accounts, the daily aggregate balance of which is invested in one or more repurchase agreements. Underthese joint accounts, the Fund maintains pro-rata credit exposure to the underlying repurchase agreements� counterparties. With the exception ofcertain transaction fees, the Fund is not subject to any expenses in relation to these investments.
B. Level 3 Fair Value Investments � To the extent that significant inputs to valuation models and other alternative pricing sources are unobservable,or if quotations are not readily available, or if GSAM believes that such quotations do not accurately reflect fair value, the fair value of the Fund�sinvestments may be determined under Valuation Procedures approved by the Trustees. GSAM, consistent with its procedures and applicable regulatoryguidance, may make an adjustment to the most recent valuation prices of either domestic or foreign securities in light of significant events to reflectwhat it believes to be the fair value of the securities at the time of determining the Fund�s NAV. Significant events which could affect a large number ofsecurities in a particular market may include, but are not limited to: significant fluctuations in U.S. or foreign markets; market dislocations; marketdisruptions; or unscheduled market closings. Significant events which could also affect a single issuer may include, but are not limited to: corporateactions such as reorganizations, mergers and buy-outs; ratings downgrades; and bankruptcies.
To the extent investments are valued using single source broker quotations obtained directly from the broker or passed through from third partypricing vendors, such investments are classified as Level 3 investments. GSAM did not develop the unobservable inputs (examples include but are notlimited to single source broker quotations, third party pricing, etc.) for the valuation of Level 3 Assets and Liabilities.
65
Copyright © 2017 www.secdatabase.com. All Rights Reserved.Please Consider the Environment Before Printing This Document

GOLDMAN SACHS MULTI-MANAGER ALTERNATIVES FUND
Notes to Financial Statements (continued)April 30, 2017
3. INVESTMENTS AND FAIR VALUE MEASUREMENTS (continued)
C. Fair Value Hierarchy � The following is a summary of the Fund�s investments and derivatives classified in the fair value hierarchy as of April 30,2017:
Investment Type Level 1 Level 2 Level 3AssetsFixed Income
Corporate Obligations $� $121,184,734 $�Bank Loans � 41,486,882 4,424,177Asset-Backed Securities � 599,576 12,677Foreign Debt Obligations � 1,591,720 �
Municipal Debt Obligations � 2,216,540 �
U.S. Treasury Obligations 13,900,278 � �
Unfunded Loan Committments � � 30,308Common Stock and/or Other Equity Investments(a)
Africa � 2,312,432 �
Asia 856,093 365,432 �
Australia and Oceania � 52,983 �
Europe 15,767,543 12,111,711 �North America 218,846,935 483,734 573,377
Investment Company 24,218,587 � �
Short-term Investments � 573,400,000 �
Total $273,589,436 $755,805,744 $5,040,539LiabilitiesCommon Stock and/or Other Equity Investments(a)
Asia $(831,148 ) $(2,776,132 ) $�North America (51,500,267 ) � �
Total $(52,331,415 ) $(2,776,132 ) $�
Derivative TypeAssets(b)Forward Foreign Currency Exchange Contracts $� $7,164,433 $�Futures Contracts 8,327,912 � �
Credit Default Swap Contracts � 9,874 �
Total Return Swap Contracts � 20,690,294 �
Total $8,327,912 $27,864,601 $�Liabilities(b)Forward Foreign Currency Exchange Contracts $� $(14,077,458 ) $�Futures Contracts (3,967,054 ) � �
Credit Default Swap Contracts � (126,216 ) �
Total Return Swap Contracts � (19,733,636 ) �
Total $(3,967,054 ) $(33,937,310 ) $�
(a) Amounts are disclosed by continent to highlight the impact of time zone differences between local market close and the calculation of net asset value. Security valuations are based on theprinciple exchange or system on which they are traded, which may differ from country of domicile. The Fund utilizes fair value model prices provided by an independent fair value service forinternational equities, resulting in a Level 2 classification.
(b) Amount shown represents unrealized gain (loss) at period end.
For further information regarding security characteristics, see the Consolidated Schedule of Investments.
66
Copyright © 2017 www.secdatabase.com. All Rights Reserved.Please Consider the Environment Before Printing This Document

GOLDMAN SACHS MULTI-MANAGER ALTERNATIVES FUND
4. INVESTMENTS IN DERIVATIVES
The following table sets forth, by certain risk types, the gross value of derivative contracts as of April 30, 2017. These instruments were used as part ofthe Fund�s investment strategies and to obtain and/or manage exposure related to the risks below. The values in the table below exclude the effects ofcash collateral received or posted pursuant to these derivative contracts, and therefore are not representative of the Fund�s net exposure.
RiskConsolidated Statement of Assets
and Liabilities AssetsConsolidated Statement of Assets
and Liabilities LiabilitiesInterest rate Variation margin on certain derivative
contracts $2,546,440 (a)Variation margin on certain derivativecontracts $(2,032,790) (a)
Credit Receivable for unrealized gain on swapcontracts 9,874
Payable for unrealized loss on swap contracts(126,216) (b)
Currency Receivable for unrealized gainon forward foreign currency exchangecontracts; Variation margin on certain derivativeContracts 7,178,713 (a)
Payable for unrealized loss onforward foreign currency exchangecontracts; Variation margin on certain derivativeContracts (14,093,337)(a)
Commodity Variation margin on certain derivativecontracts 1,951,574 (a)
Variation margin on certain derivativecontracts (832,764) (a)
Equity Receivable for unrealized gain on swap contracts;Variation margin on certain derivative Contracts 24,505,912(a)
Payable for unrealized loss on swap contracts;Variation margin on certain derivative contract (20,819,257)(b)
Total $36,192,513 $(37,904,364)
(a) Represents unrealized gain (loss) on futures contracts described in the Additional Investment Information sections of the Consolidated Schedule of Investments. Only current day�s variationmargin is reported within the Consolidated Statement of Assets and Liabilities.
(b) Aggregate of amounts include $19,859,852, which represent the payments to be made pursuant to bilateral agreements should counterparties exercise their �right to terminate� provisionsbased on, among others, the Fund�s performance, its failure to pay on its obligations or failure to pledge collateral. Such amounts do not include incremental charges directly associated withthe close-out of the agreements. They also do not reflect the fair value of any assets pledged as collateral which, through the daily margining process, substantially offsets the aforementionedamounts and for which the Fund is entitled to a full return.
The following table sets forth, by certain risk types, the Fund�s gains (losses) related to these derivatives and their indicative volumes for theperiod ended April 30, 2017. These gains (losses) should be considered in the context that these derivative contracts may have been executed to createinvestment opportunities and/or economically hedge certain investments, and accordingly, certain gains (losses) on such derivative contracts may offsetcertain (losses) gains attributable to investments. These
67
Copyright © 2017 www.secdatabase.com. All Rights Reserved.Please Consider the Environment Before Printing This Document

GOLDMAN SACHS MULTI-MANAGER ALTERNATIVES FUND
Notes to Financial Statements (continued)April 30, 2017
4. INVESTMENTS IN DERIVATIVES (continued)
gains (losses) are included in �Net realized gain (loss)� or �Net change in unrealized gain (loss)� on the Consolidated Statement of Operations:
Risk Consolidated Statement of Operations
NetRealized
Gain (Loss)
Net Changein
UnrealizedGain (Loss)
AverageNumber of
Contracts(a)
Interest rate Net realized gain (loss) from futures contracts/Net change in unrealized gain (loss) on futures contracts $(7,560,574 ) $2,477,601 10,627Credit Net realized gain (loss) from swap contracts/Net change in unrealized gain (loss) on swap contracts (289,685 ) 82,683 14Commodity Net realized gain (loss) from futures contracts/Net change in unrealized gain (loss) on futures contracts (8,839,336 ) 1,923,574 1,730Currency Net realized gain (loss) from forward foreign currency exchange contracts and futures contracts/Net
change in unrealized gain (loss) on forward foreign currency exchange contracts and futures contracts 3,841,176 (8,350,477) 1,660Equity Net realized gain (loss) from futures contracts and swap contracts/Net change in unrealized gain (loss) on
futures contracts and swap contracts 11,154,699 3,056,052 4,359Total $(1,693,720 ) $(810,567 ) 18,390
(a) Average number of contracts is based on the average of month end balances for the six months ended April 30, 2017.
In order to better define its contractual rights and to secure rights that will help the Fund mitigate its counterparty risk, the Fund may enter into anInternational Swaps and Derivatives Association, Inc. Master Agreement (�ISDA Master Agreement�) or similar agreement with its derivativescounterparties. An ISDA Master Agreement is a bilateral agreement between the Fund and a counterparty that governs OTC derivatives (includingforward foreign currency exchange contracts, and certain options and swaps), and typically contains, among other things, collateral posting terms andnetting provisions in the event of a default and/or termination event. The provisions of the ISDA Master Agreement typically permit a single netpayment in the event of a default (close-out netting) or similar event, including the bankruptcy or insolvency of the counterparty.
Collateral and margin requirements differ between exchange traded derivatives and OTC derivatives. Margin requirements are established by thebroker or clearing house for exchange-traded and centrally cleared derivatives (financial futures contracts, options and centrally cleared swaps)pursuant to governing agreements for those instrument types. Brokers can ask for margin in excess of the minimum in certain circumstances. Collateralterms are contract-specific for OTC derivatives. For derivatives traded under an ISDA Master Agreement, the collateral requirements are typicallycalculated by netting the marked to market amount for each transaction under such agreement and comparing that amount to the value of any collateralcurrently pledged by the Fund and the counterparty. Additionally, the Fund may be required to post initial margin to the counterparty, the terms ofwhich would be outlined in the confirmation of the OTC transaction.
For financial reporting purposes, cash collateral that has been pledged to cover obligations of the Fund and cash collateral received from thecounterparty, if any, is reported separately on the Consolidated Statement of Assets and Liabilities as receivables/payables for collateral on certainderivative contracts. Non-cash collateral pledged by the Fund if any, is noted in the Schedules of Investments. Generally, the amount of collateral duefrom or to a counterparty must exceed a minimum transfer amount threshold before a transfer is required to be made. To the extent amounts due to theFund from its counterparties are not fully collateralized, contractually or otherwise, the Fund bears the risk of loss from counterparty nonperformance.The Fund attempts to mitigate counterparty risk by only entering into agreements with counterparties that the Underlying Managers believe to be ofgood standing and by monitoring the financial stability of those counterparties.
Additionally, the netting of assets and liabilities and the offsetting of collateral pledged or received are based on contractual netting/set-offprovisions in the ISDA Master Agreement or similar agreements. However, in the event of a default or insolvency
68
Copyright © 2017 www.secdatabase.com. All Rights Reserved.Please Consider the Environment Before Printing This Document

GOLDMAN SACHS MULTI-MANAGER ALTERNATIVES FUND
4. INVESTMENTS IN DERIVATIVES (continued)
of a counterparty, a court could determine that such rights are not enforceable due to the restrictions or prohibitions against the right of setoff that maybe imposed in accordance with a particular jurisdiction�s bankruptcy or insolvency laws.
The following table sets forth the Fund�s net exposure for derivative instruments that are subject to enforceable master netting arrangements orsimilar agreements as of April 30, 2017:
Derivative Assets(1) Derivative Liabilities(1)
Counterparty Swaps
ForwardCurrencyContracts Total Swaps
ForwardCurrencyContracts Total
Net DerivativeAsset
(Liabilities)
Collateral(Received)Pledged(1)
NetAmount(2)
Bank of America Securities LLC $� $1,257,794 $1,257,794 $(3,494 ) $(3,512,808 ) $(3,516,302 ) $(2,258,508 ) $2,258,508 $�Barclays Bank PLC � � � (47,044 ) (21,006 ) (68,050 ) (68,050 ) � (68,050 )JPMorgan Chase Bank, N.A. � 5,771,352 5,771,352 � (10,389,863) (10,389,863) (4,618,511 ) 4,618,511 �
JPMorgan Securities, Inc. 13,596,503 � 13,596,503 (11,764,512) � (11,764,512) 1,831,991 � 1,831,991Morgan Stanley & Co. 181,517 � 181,517 (687,007 ) � (687,007 ) (505,490 ) 505,490 �Morgan Stanley & Co. International
PLC � 91,522 91,522 � (133,170 ) (133,170 ) (41,648 ) 41,648 �
Royal Bank of Scotland PLC � 204 204 � (214 ) (214 ) (10 ) � (10 )State Street Bank and Trust � 122 122 � (130 ) (130 ) (8 ) � (8 )UBS AG (London) 6,922,148 43,439 6,965,587 (7,357,795 ) (20,267 ) (7,378,062 ) (412,475 ) 412,475 �
Total $20,700,168 $7,164,433 $27,864,601 $(19,859,852) $(14,077,458) $(33,937,310) $(6,072,709 ) $7,836,632 $1,763,923
(1) Gross amounts available for offset but not netted in the Consolidated Statement of Assets and Liabilities.(2) Net amount represents the net amount due (to) from counterparty in the event of a default based on the contractual set-off rights under the agreement. Net amount excludes any over-
collateralized amounts.
5. AGREEMENTS AND AFFILIATED TRANSACTIONSA. Management Agreement � Under the Agreement, GSAM manages the Fund, subject to the general supervision of the Trustees.
As compensation for the services rendered pursuant to the Agreement, the assumption of the expenses related thereto and administration of theFund�s business affairs, including providing facilities, GSAM is entitled to a management fee, accrued daily and paid monthly, equal to an annualpercentage rate of the Fund�s average daily net assets.
For the six months ended April 30, 2017, the contractual and effective net management fee with GSAM were at the following rates:
Contractual Management RateFirst
$2 billionNext
$3 billionNext
$3 billionOver
$8 billionEffective
Rate
Effective NetManagement
Rate*^(a)
1.90% 1.80% 1.71% 1.68% 1.90% 1.81%
* GSAM has agreed to waive a portion of its management fee in order to achieve net management rates, as defined in the Fund�s most recent prospectus. This arrangement will be effectivethrough at least February 28, 2018, and prior to such date GSAM may not terminate the arrangement without the approval of the Trustees.
^ Effective Net Management Rate includes the impact of management fee waivers of affiliated underlying funds, if any.(a) Reflects combined management fees paid to GSAM under the Agreement and the Subsidiary Agreements as defined below after waivers.
The Fund invests in Institutional Shares of the Goldman Sachs Financial Square Government Fund, which is an affiliated Underlying Fund.GSAM has agreed to waive a portion of its management fee payable by the Fund in an amount equal to the management fee it earns as an investmentadviser to any of the affiliated Underlying Funds in which the Fund invest. For the six months ended April 30, 2017, GSAM waived $21,339 of theFund�s management fee.
69
Copyright © 2017 www.secdatabase.com. All Rights Reserved.Please Consider the Environment Before Printing This Document

GOLDMAN SACHS MULTI-MANAGER ALTERNATIVES FUND
Notes to Financial Statements (continued)April 30, 2017
5. AGREEMENTS AND AFFILIATED TRANSACTIONS (continued)
GSAM also provides management services to the Subsidiaries pursuant to the Subsidiary Management Agreements (the �Subsidiary Agreements�)and is entitled to a management fee accrued daily and paid monthly, equal to an annual percentage rate of 0.42% of each Subsidiary�s average daily netassets. In consideration of the Subsidiaries� management fee, and for as long as the Subsidiary Agreements remain in effect, GSAM has contractuallyagreed to waive irrevocably a portion of the Fund�s management fee in an amount equal to the management fee accrued and paid to GSAM by theSubsidiaries under the Subsidiary Agreements. For the six months ended April 30, 2017, GSAM waived $73,494 of the Fund�s management fee. Thiswaiver represents an inter-fund transaction and, accordingly, has been eliminated in consolidation.
B. Distribution and/or Service (12b-1) Plans � The Trust, on behalf of Class A and Class R Shares of the Fund has adopted Distribution andService Plans subject to Rule 12b-1 under the Act. Under the Distribution and Service Plans, Goldman Sachs, which serves as distributor (the�Distributor�), is entitled to a fee accrued daily and paid monthly for distribution services and personal and account maintenance services, which maythen be paid by Goldman Sachs to authorized dealers. These fees are equal to an annual percentage rate of the average daily net assets attributable toClass A or Class R Shares of the Fund, as applicable.
The Trust, on behalf of Class C Shares of the Fund has adopted a Distribution Plan subject to Rule 12b-1 under the Act. Under the DistributionPlan, Goldman Sachs as Distributor is entitled to a fee accrued daily and paid monthly for distribution services, which may then be paid by GoldmanSachs to authorized dealers. These fees are equal to an annual percentage rate of the average daily net assets attributable to Class C Shares of the Fund.
Distribution and/or Service Plan RatesClass A* Class C Class R*
Distribution Plan 0.25 % 0.75 % 0.50 %
* With respect to Class A and Class R Shares, the Distributor at its discretion may use compensation for distribution services paid under the Distribution Plan to compensate serviceorganizations for personal and account maintenance services and expenses as long as such total compensation does not exceed the maximum cap on �service fees� imposed by the FinancialIndustry Regulatory Authority.
C. Service Plan � The Trust, on behalf of the Fund, has adopted a Service Plan to allow Class C Shares to compensate service organizations(including Goldman Sachs) for providing varying levels of personal and account maintenance services to their customers who are beneficial owners ofsuch Shares. The Service Plan provides for compensation to the service organizations equal to an annual percentage rate of 0.25% of the average dailynet assets attributable to Class C Shares of the Fund.
D. Distribution Agreement � Goldman Sachs, as Distributor of the Shares of the Fund pursuant to a Distribution Agreement, may retain a portion ofthe Class A Shares� front end sales charge and Class C Shares� CDSC. During the six months ended April 30, 2017, Goldman Sachs advised that itretained $2,995 and $0, respectively.
E. Transfer Agency Agreement � Goldman Sachs also serves as the transfer agent of the Fund for a fee pursuant to the Transfer Agency Agreement.The fees charged for such transfer agency services are accrued daily and paid monthly at annual rates as follows: 0.19% of the average daily net assetsof Class A, Class C, Class IR and Class R Shares; and 0.04% of the average daily net assets of Institutional Shares.
F. Other Expense Agreements and Affiliated Transactions � GSAM has agreed to limit certain �Other Expenses� of the Fund (excludingacquired fund fees and expenses, dividend and interest payments on securities sold short, transfer agency fees and expenses, service fees andshareholder administration fees (as applicable), taxes, interest, brokerage fees, shareholder meeting, litigation, indemnification and extraordinaryexpenses) to the extent such expenses exceed, on an annual basis, a percentage rate of the average daily net assets of the Fund. Such Other Expensereimbursements, if any, are accrued daily and paid monthly. In addition, the Fund is not obligated to reimburse GSAM for prior fiscal year expensereimbursements, if any. The Other Expense limitations as an annual percentage rate of average daily net assets for the Fund are 0.114% and the totalannual operating expenses (excluding acquired fund fees and expenses, taxes, dividend and interest payments on securities sold short, interest,brokerage fees, shareholder meeting, litigation, indemnification and extraordinary expenses) of Class A, Class C, Institutional Class, Class IR, andClass R Shares are limited to 2.38%, 3.13%, 1.98%, 2.13% and 2.63%, respectively. The Other Expense limitations and the total
70
Copyright © 2017 www.secdatabase.com. All Rights Reserved.Please Consider the Environment Before Printing This Document

GOLDMAN SACHS MULTI-MANAGER ALTERNATIVES FUND
5. AGREEMENTS AND AFFILIATED TRANSACTIONS (continued)
operating expense limitation agreement will remain in place through at least February 28, 2018, and prior to such date GSAM may not terminate thearrangements without the approval of the Trustees. In addition, the Fund has entered into certain offset arrangements with the transfer agent, whichmay result in a reduction of the Fund�s expenses and are received irrespective of the application of the Other Expense limitations described above. Forthe six months ended April 30, 2017, these expense reductions, including any fee waivers and Other Expense reimbursements, were as follows:
ManagementFee Waiver
Other ExpenseReimbursements
Total ExpenseReductions
$ 439,173 $ 589,431 $1,028,604
G. Line of Credit Facility � As of April 30, 2017, the Fund participated in a $1,100,000,000 committed, unsecured revolving line of credit facility(the �facility�) together with other funds of the Trust and certain registered investment companies having management agreements with GSAM or itsaffiliates. This facility is to be used for temporary emergency purposes, or to allow for an orderly liquidation of securities to meet redemption requests.The interest rate on borrowings is based on the federal funds rate. The facility also requires a fee to be paid by the Fund based on the amount of thecommitment that has not been utilized. For the six months ended April 30, 2017, the Fund did not have any borrowings under the facility. The facilitywas renewed in the amount of $1,100,000,000 effective May 2, 2017.
H. Other Transactions with Affiliates � For the six months ended, April 30, 2017, Goldman Sachs earned $3,487, in brokerage commissions fromportfolio transactions, including futures transactions executed with Goldman Sachs as the Futures Commission Merchant, on behalf of the Fund.
As of April 30, 2017, The Goldman Sachs Group, Inc. was the beneficial owner of approximately 22% of Class R Shares of the Fund.The table below shows the transaction in and earnings from investments in the Underlying Fund for the six months ended April 30, 2017:
Underlying Fund
MarketValue
10/31/2016Purchases
at CostProceeds
from Sales
MarketValue
4/30/2017DividendIncome
Goldman Sachs Financial Square Government Fund � Institutional Shares $28,130,434 $ 61,995 $(3,973,842) $24,218,587 $61,762
6. PORTFOLIO SECURITIES TRANSACTIONSThe cost of purchases and proceeds from sales and maturities of long-term securities for the six months ended April 30, 2017, were $265,461,686 and$372,039,215, respectively.
The following table sets forth the Fund�s net exposure for short securities that are subject to enforceable master netting arrangements or similaragreements as of April 30, 2017:
CounterpartySecurities
Sold Short(1)CollateralPledged(2)
NetAmount(3)
JPMorgan Chase Bank $10,904,393 $(10,904,393) $ �
State Street Bank & Trust (4) 44,203,154 (44,203,154) �
Total $55,107,547 $(55,107,547) $ �
(1) Gross amounts available for offset but not netted in the Consolidated Statement of Assets and Liabilities.(2) At April 30, 2017, the value of securities received pledged exceeded the value of the related securities sold short.(3) Net amount represents the net amount due (to) from counterparty in the event of a default based on the contractual set-off rights under the agreement. Net amount excludes any over-
collateralized amounts.(4) Securities sold short were executed through separate Underlying Managers.
71
Copyright © 2017 www.secdatabase.com. All Rights Reserved.Please Consider the Environment Before Printing This Document
GOLDMAN SACHS MULTI-MANAGER ALTERNATIVES FUND
Notes to Financial Statements (continued)April 30, 2017
7. TAX INFORMATION
As of the Fund�s most recent fiscal year end, October 31, 2016, the Fund�s capital loss carryforwards and certain timing differences on a tax basiswere as follows:
Capital loss carryforwards:Perpetual Short-term $(62,516,733)Perpetual Long-term (18,357,246)
Total capital loss carryforwards $(80,873,979)Timing differences (Straddle Loss Deferral) $(2,558,430 )
As of April 30, 2017, the Fund�s aggregate security unrealized gains and losses based on cost for U.S. federal income tax purposes were asfollows:
Tax Cost $1,010,131,325Gross unrealized gain 47,015,292Gross unrealized loss (22,741,206 )Net unrealizd security gain $24,274,086
The difference between GAAP-basis and tax basis unrealized gains (losses) is attributable primarily to wash sales, net mark to market gains/(losses) on regulated futures, net mark to market gains/(losses) on foreign currency contracts, and differences in the tax treatment of partnershipinvestments, passive foreign investment company investments, swap transactions, material modification of debt securities and the recognition ofincome and gains/losses of certain bonds.
GSAM has reviewed the Fund�s tax positions for all open tax years (the current and 2 prior years, as applicable) and has concluded that noprovision for income tax is required in the Fund�s financial statements. Such open tax years remain subject to examination and adjustment by taxauthorities.
72
Copyright © 2017 www.secdatabase.com. All Rights Reserved.Please Consider the Environment Before Printing This Document

GOLDMAN SACHS MULTI-MANAGER ALTERNATIVES FUND
8. OTHER RISKS
The Fund�s risks include, but are not limited to, the following:
Derivatives Risk � The Fund�s use of derivatives may result in loss. Derivative instruments, which may pose risks in addition to and greater thanthose associated with investing directly in securities, currencies or other instruments, may be illiquid or less liquid, volatile, difficult to price andleveraged so that small changes in the value of the underlying instruments may produce disproportionate losses to the Fund. Derivatives are alsosubject to counterparty risk, which is the risk that the other party in the transaction will not fulfill its contractual obligation. The use of derivatives is ahighly specialized activity that involves investment techniques and risks different from those associated with investments in more traditional securitiesand instruments. Losses from investments in derivatives can also result from a lack of correlation between changes in the value of derivativeinstruments and the portfolio assets (if any) being hedged.
Foreign Custody Risk � The Fund that invests in foreign securities may hold such securities and cash with foreign banks, agents, and securitiesdepositories appointed by the Fund�s custodian (each a �Foreign Custodian�). Some foreign custodians may be recently organized or new to theforeign custody business. In some countries, Foreign Custodians may be subject to little or no regulatory oversight over, or independent evaluation of,their operations. Further, the laws of certain countries may place limitations on the Fund�s ability to recover its assets if a Foreign Custodian entersbankruptcy. Investments in emerging markets may be subject to even greater custody risks than investments in more developed markets. Custodyservices in emerging market countries are very often undeveloped and may be considerably less well regulated than in more developed countries, andthus may not afford the same level of investor protection as would apply in developed countries.
Foreign and Emerging Countries Risk � Investing in foreign markets may involve special risks and considerations not typically associated withinvesting in the United States. Foreign securities may be subject to risk of loss because of more or less foreign government regulation, less publicinformation and less economic, political and social stability in the countries in which the Fund invests. The imposition of exchange controls,confiscations, trade restrictions (including tariffs) and other government restrictions by the United States or other governments, or from problems inshare registration, settlement or custody, may also result in losses. Foreign risk also involves the risk of negative foreign currency rate fluctuations,which may cause the value of securities denominated in such foreign currency (or other instruments through which the Fund has exposure to foreigncurrencies) to decline in value. Currency exchange rates may fluctuate significantly over short periods of time. To the extent that the Fund also investsin securities of issuers located in emerging markets, these risks may be more pronounced.
Interest Rate Risk � When interest rates increase, fixed income securities or instruments held by the Fund will generally decline in value. Long-termfixed income securities or instruments will normally have more price volatility because of this risk than short-term fixed income securities orinstruments. The risks associated with increasing rates are heightened given that interest rates are near historic lows, but may be expected to increase inthe future with unpredictable effects on the markets and the Fund�s investments. Fluctuations in interest rates may also affect the liquidity of fixedincome securities and instruments held by the Fund.
73
Copyright © 2017 www.secdatabase.com. All Rights Reserved.Please Consider the Environment Before Printing This Document

GOLDMAN SACHS MULTI-MANAGER ALTERNATIVES FUND
Notes to Financial Statements (continued)April 30, 2017
8. OTHER RISKS (continued)
Investments in Other Investment Companies � As a shareholder of another investment company, including an exchangetraded fund (�ETF�), theFund will indirectly bear its proportionate share of any net management fees and other expenses paid by such other investment companies, in additionto the fees and expenses regularly borne by the Fund. ETFs are subject to risks that do not apply to conventional mutual funds, including but notlimited to the following: (i) the market price of the ETF�s shares may trade at a premium or a discount to their NAV; and (ii) an active trading marketfor an ETF�s shares may not develop or be maintained.
Large Shareholder Transactions Risk � The Fund may experience adverse effects when certain large shareholders, such as other funds, institutionalinvestors (including those trading by use of non-discretionary mathematical formulas), financial intermediaries (who may make investment decisionson behalf of underlying clients and/or include the Fund in their investment model), individuals, accounts and Goldman Sachs affiliates, purchase orredeem large amounts of shares of the Fund. Such large shareholder redemptions may cause the Fund to sell portfolio securities at times when it wouldnot otherwise do so, which may negatively impact the Fund�s NAV and liquidity. These transactions may also accelerate the realization of taxableincome to shareholders if such sales of investments resulted in gains, and may also increase transaction costs. In addition, a large redemption couldresult in the Fund current expenses being allocated over a smaller asset base, leading to an increase in the Fund�s expense ratio. Similarly, large Fundshare purchases may adversely affect the Fund�s performance to the extent that the Fund is delayed in investing new cash and is required to maintain alarger cash position than it ordinarily would.
Leverage Risk � Leverage creates exposure to potential gains and losses in excess of the initial amount invested. Borrowing and the use of derivativesmay result in leverage and may make the Fund more volatile. When the Fund uses leverage, the sum of that Fund�s investment exposure maysignificantly exceed the amount of assets invested in the Fund, although these exposures may vary over time. Relatively small market movements mayresult in large changes in the value of a leveraged investment. The Fund will identify liquid assets on its books or otherwise cover transactions that maygive rise to such risk, to the extent required by applicable law. The use of leverage may cause the Fund to liquidate portfolio positions to satisfy itsobligations or to meet segregation requirements when it may not be advantageous to do so. The use of leverage by the Fund can substantially increasethe adverse impact to which the Fund�s investment portfolio may be subject.
Liquidity Risk � The Fund may make investments that are illiquid or that may become less liquid in response to market developments or adverseinvestor perceptions. Illiquid investments may be more difficult to value. Liquidity risk may also refer to the risk that the Fund will not be able to payredemption proceeds within the allowable time period because of unusual market conditions, an unusually high volume of redemption requests, orother reasons. To meet redemption requests the Fund may be forced to sell investments at an unfavorable time and/or under unfavorable conditions.Liquidity risk may be the result of, among other things, the reduced number and capacity of traditional market participants to make a market in fixedincome securities or the lack of an active market. The potential for liquidity risk may be magnified by a rising interest rate environment or othercircumstances where investor redemptions from fixed income mutual funds may be higher than normal, potentially causing increased supply in themarket due to selling activity
74
Copyright © 2017 www.secdatabase.com. All Rights Reserved.Please Consider the Environment Before Printing This Document

GOLDMAN SACHS MULTI-MANAGER ALTERNATIVES FUND
8. OTHER RISKS (continued)
Loan-Related Investments Risk � In addition to risks generally associated with debt investments, loan-related investments such as loanparticipations and assignments are subject to other risks. Although a loan obligation may be fully collateralized at the time of acquisition, the collateralmay decline in value, be relatively illiquid, or lose all or substantially all of its value subsequent to investment. Many loan investments are subject tolegal or contractual restrictions on resale and may be relatively illiquid and difficult to value. There is less readily available, reliable information aboutmost loan investments than is the case for many other types of securities. Substantial increases in interest rates may cause an increase in loan obligationdefaults. With respect to loan participations, the Fund may not always have direct recourse against a borrower if the borrower fails to pay scheduledprincipal and/or interest; may be subject to greater delays, expenses and risks than if the Fund had purchased a direct obligation of the borrower; andmay be regarded as the creditor of the agent lender (rather than the borrower), subjecting the Fund to the creditworthiness of that lender as well.Investors in loans, such as the Fund, may not be entitled to rely on the anti-fraud protections of the federal securities laws, although they may beentitled to certain contractual remedies. The market for loan obligations may be subject to irregular trading activity, wide bid/ask spreads and extendedtrade settlement periods. Because transactions in many loans are subject to extended trade settlement periods, the Fund may not receive the proceedsfrom the sale of a loan for a period after the sale. As a result, sale proceeds related to the sale of loans may not be available to make additionalinvestments or to meet the Fund�s redemption obligations for a period after the sale of the loans, and, as a result, the Fund may have to sell otherinvestments or engage in borrowing transactions, such as borrowing from its credit facility, if necessary to raise cash to meet its obligations.
Senior Loans hold the most senior position in the capital structure of a business entity, and are typically secured with specific collateral, but arenevertheless usually rated below investment grade. Because Second Lien Loans are subordinated or unsecured and thus lower in priority of payment toSenior Loans, they are subject to the additional risk that the cash flow of the borrower and property securing the loan or debt, if any, may beinsufficient to meet scheduled payments after giving effect to the senior secured obligations of the borrower. Second Lien Loans generally have greaterprice volatility than Senior Loans and may be less liquid.
Market and Credit Risks � In the normal course of business, the Fund trades financial instruments and enters into financial transactions where risk ofpotential loss exists due to changes in the market (market risk). Additionally, the Fund may also be exposed to credit risk in the event that an issuer orguarantor fails to perform or that an institution or entity with which the Fund has unsettled or open transactions defaults.
Multi-Manager Approach Risk � The Fund�s performance depends on the ability of the Investment Adviser in selecting, overseeing, and allocatingFund assets to the Underlying Managers. The Underlying Managers� investment styles may not always be complementary. The Fund�s multi-managerapproach may result in the Fund investing a significant percentage of its assets in certain types of investments, which could be beneficial or detrimentalto the Fund�s performance depending on the performance of those investments and the overall market environment. The Fund�s Underlying Managersmay underperform the market generally or underperform other investment managers that could have been selected for the Fund. Because the Fund�sUnderlying Managers may trade with counterparties, prime brokers, clearing brokers or futures commission merchants on terms that are different thanthose on which the Investment Adviser would trade, and because each Underlying Manager applies its own risk analysis in evaluating potentialcounterparties for the Fund, the Fund may be subject to greater counterparty risk than if it was managed directly by the Investment Adviser.
75
Copyright © 2017 www.secdatabase.com. All Rights Reserved.Please Consider the Environment Before Printing This Document

GOLDMAN SACHS MULTI-MANAGER ALTERNATIVES FUND
Notes to Financial Statements (continued)April 30, 2017
8. OTHER RISKS (continued)
Short Position Risk � The Fund may enter into a short position through a futures contract, an option or swap agreement or through short sales of anyinstrument that the Fund may purchase for investment. Taking short positions involves leverage of the Fund�s assets and presents various risks,including counterparty risk. If the value of the underlying instrument or market in which the Fund has taken a short position increases, then the Fundwill incur a loss equal to the increase in value from the time that the short position was entered into plus any related interest payments or other fees.Taking short positions involves the risk that losses may be disproportionate, may exceed the amount invested, and may be unlimited.
Tax Risk � The Fund will seek to gain exposure to the commodity markets primarily through investments in the Subsidiaries and/or commodity index-linked structured notes, as applicable. Historically, the Internal Revenue Service (�IRS�) has issued private letter rulings (�PLRs�) in which the IRSspecifically concluded that income and gains from investments in commodity index-linked structured notes or a wholly-owned foreign subsidiary thatinvests in commodity-linked instruments are �qualifying income� for purposes of compliance with Subchapter M of the Code. However, the Fund hasnot received a PLR, and is not able to rely on PLRs issued to other taxpayers. Additionally, the IRS has suspended the granting of such PLR, pendingreview of its position on this matter. The IRS also recently issued proposed regulations that, if finalized, would generally treat the Fund�s incomeinclusion with respect to a subsidiary as qualifying income only if there is a distribution out of the earnings and profits of a subsidiary that areattributable to such income inclusion. The proposed regulations, if adopted, would apply to taxable years beginning on or after 90 days after theregulations are published as final.
The IRS also recently issued a revenue procedure, which states that the IRS will not in the future issue PLRs that would require a determination ofwhether an asset (such as a commodity index-linked note) is a �security� under the Investment Company Act of 1940. The Fund has obtained anopinion of counsel that the Fund�s income from such investments should constitute �qualifying income.� However, no assurances can be provided thatthe IRS would not be able to successfully assert that the Fund�s income from such investments was not �qualifying income,� in which case the Fundwould fail to qualify as a regulated investment company (�RIC�) under Subchapter M of the Code if over 10% of its gross income was derived fromthese investments. If the Fund failed to qualify as a RIC, it would be subject to federal and state income tax on all of its taxable income at regularcorporate tax rates. This would significantly adversely affect the returns to, and could cause substantial losses for, Fund shareholders.
76
Copyright © 2017 www.secdatabase.com. All Rights Reserved.Please Consider the Environment Before Printing This Document

GOLDMAN SACHS MULTI-MANAGER ALTERNATIVES FUND
9. INDEMNIFICATIONS
Under the Trust�s organizational documents, its Trustees, officers, employees and agents are indemnified, to the extent permitted by the Act and statelaw, against certain liabilities that may arise out of performance of their duties to the Fund. Additionally, in the course of business, the Fund enters intocontracts that contain a variety of indemnification clauses. The Fund�s maximum exposure under these arrangements is unknown, as this wouldinvolve future claims that may be made against the Fund that have not yet occurred. However, GSAM believes the risk of loss under thesearrangements to be remote.
10. SUBSEQUENT EVENTSSubsequent events after the Consolidated Statement of Assets and Liabilities date have been evaluated through the date the financial statements wereissued.
Effective June 16, 2017, Corsair will no longer be an Underlying Manager for the Fund.Other than the above, GSAM has concluded that there is no impact requiring adjustment or disclosure in the financial statements.
77
Copyright © 2017 www.secdatabase.com. All Rights Reserved.Please Consider the Environment Before Printing This Document

GOLDMAN SACHS MULTI-MANAGER ALTERNATIVES FUND
Notes to Financial Statements (continued)April 30, 2017
11. SUMMARY OF SHARE TRANSACTIONS
Share activity is as follows:For the Six Months Ended
April 30, 2017(Unaudited)
For the Fiscal Year EndedOctober 31, 2016
Shares Dollars Shares DollarsClass A SharesShares sold 1,392,606 $14,376,247 6,466,263 $64,825,296Reinvestment of distributions 154,896 1,590,786 111,867 1,130,892Shares redeemed (7,489,478 ) (77,506,412 ) (14,454,630) (144,922,875)
(5,941,976 ) (61,539,379 ) (7,876,500 ) (78,966,687 )Class C SharesShares sold 103,476 1,051,541 855,964 8,456,479Reinvestment of distributions 18,706 189,309 32,783 326,190Shares redeemed (1,186,449 ) (12,041,476 ) (3,823,802 ) (37,726,174 )
(1,064,267 ) (10,800,626 ) (2,935,055 ) (28,943,505 )Institutional SharesShares sold 21,843,792 227,145,310 39,736,722 402,931,900Reinvestment of distributions 1,575,525 16,227,907 893,194 9,069,534Shares redeemed (17,456,908) (181,434,529) (72,045,143) (728,652,554)
5,962,409 61,938,688 (31,415,227) (316,651,120)Class IR SharesShares sold 5,798,634 60,053,066 8,068,352 81,443,001Reinvestment of distributions 189,896 1,952,132 78,956 800,190Shares redeemed (3,160,975 ) (32,698,404 ) (9,097,182 ) (91,879,976 )
2,827,555 29,306,794 (949,874 ) (9,636,785 )Class R SharesShares sold � � 20,159 207,712Reinvestment of distributions 120 1,227 193 1,937Shares redeemed � � (17,158 ) (170,096 )
120 1,227 3,194 39,553NET INCREASE (DECREASE) 1,783,841 $18,906,704 (43,173,462) $(434,158,544)
78
Copyright © 2017 www.secdatabase.com. All Rights Reserved.Please Consider the Environment Before Printing This Document

GOLDMAN SACHS MULTI-MANAGER ALTERNATIVES FUND
Fund Expenses �� Six Month Period Ended April 30, 2017 (Unaudited)
As a shareholder of Class A, Class C, Institutional, Class IR or Class R Shares of the Fund, you incur two types of costs: (1) transaction costs, includingsales charges on purchase payments (with respect to Class A Shares), contingent deferred sales charges on redemptions (with respect to Class C Shares), and(2) ongoing costs, including management fees; distribution and/or service (12b-1) fees (with respect to Class A, Class C and Class R Shares); and other Fundexpenses. This Example is intended to help you understand your ongoing costs (in dollars) of investing in Class A, Class C, Institutional, Class IR or Class R Sharesof the Fund and to compare these costs with the ongoing costs of investing in other mutual funds.
The Example is based on an investment of $1,000 invested at the beginning of the period and held for the entire period from November 1, 2016 throughApril 30, 2017, which represents a period of 181 days of a 365 day year.
Actual Expenses � The first line under each share class in the table below provides information about actual account values and actual expenses. You mayuse the information in this line, together with the amount you invested, to estimate the expenses that you paid over the period. Simply divide your account value by$1,000 (for example, an $8,600 account value divided by $1,000=8.6), then multiply the result by the number in the first line under the heading entitled �ExpensesPaid� to estimate the expenses you paid on your account during this period.
Hypothetical Example for Comparison Purposes � The second line under each share class in the table below provides information about hypotheticalaccount values and hypothetical expenses based on the Fund�s actual net expense ratios and an assumed rate of return of 5% per year before expenses, which is notthe Fund�s actual return. The hypothetical account values and expenses may not be used to estimate the actual ending account balance or expenses you paid for theperiod. You may use this information to compare the ongoing costs of investing in the Fund and other funds. To do so, compare this 5% hypothetical example with the5% hypothetical examples that appear in the shareholder reports of the other funds.
Please note that the expenses shown in the table are meant to highlight your ongoing costs only and do not reflect any transactional costs, such as salescharges, redemption fees, or exchange fees. Therefore, the second line of the table is useful in comparing ongoing costs only, and will not help you determine therelative total costs of owning different funds. In addition, if these transactional costs were included, your costs would have been higher.
Multi Manager Alternatives Fund
Share Class
BeginningAccount Value
11/1/16
EndingAccount Value
4/30/17
Expenses Paid for the6 months ended
4/30/17*Class AActual $ 1,000.00 $ 1,023.60 $ 12.19Hypothetical 5% return 1,000.00 1,012.74 + 12.13Class CActual 1,000.00 1,019.30 15.92Hypothetical 5% return 1,000.00 1,009.03 + 15.84InstitutionalActual 1,000.00 1,025.60 10.20Hypothetical 5% return 1,000.00 1,014.73 + 10.14Class IRActual 1,000.00 1,024.20 10.94Hypothetical 5% return 1,000.00 1,013.98 + 10.89Class RActual 1,000.00 1,021.20 15.18Hypothetical 5% return 1,000.00 1,009.77 + 15.10
* Expenses for each share class are calculated using each Fund�s annualized net expense ratio for each class, which represents the ongoing expenses as a percentage of net assets for thesix months ended April 30, 2017. Expenses are calculated by multiplying the annualized net expense ratio by the average account value for the period; then multiplying the result by thenumber of days in the most recent fiscal half year; and then dividing that result by the number of days in the fiscal year. The annualized net expense ratios for the period were asfollows:
Fund Class A Class C Institutional Class IR Class RMulti Manager Alternatives 2.38 % 3.13 % 1.98 % 2.13 % 2.63 %
+ Hypothetical expenses are based on each Fund�s actual annualized net expense ratios and an assumed rate of return of 5% per year before expenses.
79
Copyright © 2017 www.secdatabase.com. All Rights Reserved.Please Consider the Environment Before Printing This Document

GOLDMAN SACHS MULTI-MANAGER ALTERNATIVES FUND
Statement Regarding Basis for Approval of Sub-Advisory Agreements (Unaudited)
BackgroundThe Goldman Sachs Multi-Manager Alternatives Fund (the �Fund�) is an investment portfolio of Goldman Sachs Trust II (the �Trust�). The Board
of Trustees oversees the management of the Trust and reviews the investment performance and expenses of the Fund at regularly scheduled meetingsheld throughout the year. The Fund employs a �manager of managers� structure, whereby Goldman Sachs Asset Management, L.P. (the �InvestmentAdviser�) is responsible for selecting sub-advisers (subject to Board approval), allocating the Fund�s assets among them, and overseeing their day-to-day management of Fund assets.
Upon the recommendation of the Investment Adviser, at meetings held on November 2-3, 2016 and March 21-22, 2017 (as applicable), the Boardof Trustees, including those Trustees who are not �interested persons� as defined in the Investment Company Act of 1940, as amended (the�Independent Trustees�), approved sub-advisory agreements (each, a �Sub-Advisory Agreement�) between the Investment Adviser and Emso AssetManagement Limited, One River Asset Management, LLC and YG Partners, LLC (each, a �Sub-Adviser� and, collectively, the �Sub-Advisers�) onbehalf of the Fund. In connection with their consideration of each Sub-Advisory Agreement, the Trustees received written materials and oralpresentations prepared by the Investment Adviser and the applicable Sub-Adviser on the topics covered, and were advised by their independent legalcounsel. In addition, the Trustees received information prepared by each Sub-Adviser in a written response to a formal request from the InvestmentAdviser.
Nature, Extent, and Quality of the Services Provided Under the Sub-Advisory AgreementsIn evaluating the Sub-Advisory Agreements, the Trustees relied on the information provided by the Investment Adviser and each Sub-Adviser. In
evaluating the nature, extent, and quality of services to be provided by each Sub-Adviser, the Trustees considered information on the services to beprovided to the Fund by the Sub-Adviser, including information about the Sub-Adviser�s (a) personnel and compensation structure; (b) track record inmanaging funds and/or accounts with investment strategies similar to those to be employed on behalf of the Fund; (c) policies and procedures in placeto address potential conflicts of interest; and (d) compliance program and code of ethics. In this regard, they considered assessments provided by theInvestment Adviser of each Sub-Adviser, the Sub-Adviser�s investment strategies and personnel and its compliance program. The Trustees consideredthat YG Partners and Emso manage other assets for the Investment Adviser�s clients. They noted that, because none of the Sub-Advisers hadpreviously provided services to the Fund, there was no performance information to evaluate with respect to the Fund.
Costs of Services to be ProvidedThe Trustees reviewed the terms of the Sub-Advisory Agreements and the proposed fee schedules. They noted that the compensation paid to the
Sub-Advisers would be paid by the Investment Adviser, not by the Fund. They also noted that the terms of the Sub-Advisory Agreements were theresult of arms� length negotiations between the Investment Adviser and the applicable Sub-Adviser. The Trustees reviewed the anticipated blendedaverage of all sub-advisory fees to be paid by the Investment Adviser and how it would change upon hiring the Sub-Advisers. They considered thisinformation in light of the overall management fee to be paid by the Fund.
ConclusionIn connection with their consideration of the Sub-Advisory Agreements, the Trustees gave weight to various factors, but did not identify any
particular factor as controlling their decision. After deliberation and consideration of the information provided, the Trustees, including the IndependentTrustees, unanimously concluded that each Sub-Advisory Agreement should be approved for a period of two years.
80
Copyright © 2017 www.secdatabase.com. All Rights Reserved.Please Consider the Environment Before Printing This Document

FUNDS PROFILE
Goldman Sachs FundsGoldman Sachs is a premier financial services firm, known since 1869 for creating thoughtful and customized investment solutions in complex globalmarkets.Today, the Investment Management Division of Goldman Sachs serves a diverse set of clients worldwide, including private institutions, public entitiesand individuals. With approximately $1.17 trillion in assets under supervision as of March 31, 2017, Goldman Sachs Asset Management (�GSAM�)has portfolio management teams located around the world and our investment professionals bring firsthand knowledge of local markets to everyinvestment decision. Assets under supervision includes assets under management and other client assets for which Goldman Sachs does not have fulldiscretion. GSAM leverages the resources of Goldman Sachs & Co. LLC subject to legal, internal and regulatory restrictions.
Money MarketFinancial Square FundsSM
∎ Financial Square Treasury Solutions Fund1
∎ Financial Square Government Fund1
∎ Financial Square Money Market Fund2
∎ Financial Square Prime Obligations Fund2
∎ Financial Square Treasury Instruments Fund1
∎ Financial Square Treasury Obligations Fund1
∎ Financial Square Federal Instruments Fund1
∎ Financial Square Tax-Exempt Money Market Fund2Investor FundsSM
∎ Investor Money Market Fund3
∎ Investor Tax-Exempt Money Market Fund3
Fixed IncomeShort Duration and Government∎ Enhanced Income Fund∎ High Quality Floating Rate Fund∎ Short-Term Conservative Income Fund4
∎ Short Duration Government Fund∎ Short Duration Income Fund∎ Government Income Fund∎ Inflation Protected Securities FundMulti-Sector∎ Bond Fund∎ Core Fixed Income Fund∎ Global Income Fund∎ Strategic Income FundMunicipal and Tax-Free∎ High Yield Municipal Fund∎ Dynamic Municipal Income Fund∎ Short Duration Tax-Free FundSingle Sector∎ Investment Grade Credit Fund∎ U.S. Mortgages Fund∎ High Yield Fund∎ High Yield Floating Rate Fund∎ Emerging Markets Debt Fund∎ Local Emerging Markets Debt Fund∎ Dynamic Emerging Markets Debt FundFixed Income Alternatives∎ Long Short Credit Strategies Fund∎ Strategic Macro Fund5
Fundamental Equity∎ Equity Income Fund6
∎ Small Cap Value Fund∎ Small/Mid Cap Value Fund∎ Mid Cap Value Fund∎ Large Cap Value Fund∎ Focused Value Fund∎ Capital Growth Fund∎ Strategic Growth Fund∎ Focused Growth Fund∎ Small/Mid Cap Growth Fund∎ Flexible Cap Growth Fund∎ Concentrated Growth Fund∎ Technology Opportunities Fund∎ Growth Opportunities Fund∎ Rising Dividend Growth Fund∎ Dynamic U.S. Equity Fund
Copyright © 2017 www.secdatabase.com. All Rights Reserved.Please Consider the Environment Before Printing This Document

∎ Income Builder Fund
Tax-Advantaged Equity∎ U.S. Tax-Managed Equity Fund∎ International Tax-Managed Equity Fund∎ U.S. Equity Dividend and Premium Fund∎ International Equity Dividend and Premium Fund
Equity Insights∎ Small Cap Equity Insights Fund∎ U.S. Equity Insights Fund∎ Small Cap Growth Insights Fund∎ Large Cap Growth Insights Fund∎ Large Cap Value Insights Fund∎ Small Cap Value Insights Fund∎ International Small Cap Insights Fund∎ International Equity Insights Fund∎ Emerging Markets Equity Insights Fund
Fundamental Equity International∎ Strategic International Equity Fund∎ Focused International Equity Fund∎ Asia Equity Fund∎ Emerging Markets Equity Fund∎ N-11 Equity Fund
Select Satellite∎ Real Estate Securities Fund∎ International Real Estate Securities Fund∎ Commodity Strategy Fund∎ Global Real Estate Securities Fund∎ Dynamic Allocation Fund∎ Absolute Return Tracker Fund∎ Long Short Fund∎ Managed Futures Strategy Fund∎ MLP Energy Infrastructure Fund∎ Multi-Manager Alternatives Fund∎ Absolute Return Multi-Asset Fund∎ Global Infrastructure Fund
Total Portfolio Solutions∎ Global Managed Beta Fund∎ Multi-Manager Non-Core Fixed Income Fund∎ Multi-Manager U.S. Dynamic Equity Fund∎ Multi-Manager Global Equity Fund∎ Multi-Manager International Equity Fund∎ Tactical Tilt Overlay Fund∎ Balanced Strategy Portfolio∎ Multi-Manager U.S. Small Cap Equity Fund∎ Multi-Manager Real Assets Strategy Fund∎ Growth and Income Strategy Portfolio∎ Growth Strategy Portfolio∎ Equity Growth Strategy Portfolio∎ Satellite Strategies Portfolio∎ Enhanced Dividend Global Equity Portfolio∎ Tax-Advantaged Global Equity Portfolio∎ Strategic Factor Allocation Fund∎ Target Date 2020 Portfolio∎ Target Date 2025 Portfolio∎ Target Date 2030 Portfolio∎ Target Date 2035 Portfolio∎ Target Date 2040 Portfolio∎ Target Date 2045 Portfolio∎ Target Date 2050 Portfolio∎ Target Date 2055 Portfolio∎ GQG Partners International Opportunities Fund1 You could lose money by investing in the Fund. Although the Fund seeks to preserve the value of your investment at $1.00 per share, it cannot guarantee it
will do so. An investment in the Fund is not a deposit of a bank and is not insured or guaranteed by the Federal Deposit Insurance Corporation or any othergovernment agency. The Fund��s sponsor has no legal obligation to provide financial support to the Fund, and you should not expect that the sponsor willprovide financial support to the Fund at any time.
2 You could lose money by investing in the Fund. Because the share price of the Fund will fluctuate, when you sell your shares they may be worth more or lessthan what you originally paid for them. The Fund may impose a fee upon sale of your shares or may temporarily suspend your ability to sell shares if theFund��s liquidity falls below required minimums because of market conditions or other factors. An investment in the Fund is not a deposit of a bank and isnot insured or guaranteed by the Federal Deposit Insurance Corporation or any other government agency. The Fund��s sponsor has no legal obligation toprovide financial support to the Fund, and you should not expect that the sponsor will provide financial support to the Fund at any time.
Copyright © 2017 www.secdatabase.com. All Rights Reserved.Please Consider the Environment Before Printing This Document

3 You could lose money by investing in the Fund. Although the Fund seeks to preserve the value of your investment at $1.00 per share, it cannot guarantee itwill do so. The Fund may impose a fee upon sale of your shares or may temporarily suspend your ability to sell shares if the Fund��s liquidity falls belowrequired minimums because of market conditions or other factors. An investment in the Fund is not a deposit of a bank and is not insured or guaranteed bythe Federal Deposit Insurance Corporation or any other government agency. The Fund��s sponsor has no legal obligation to provide financial support to theFund, and you should not expect that the sponsor will provide financial support to the Fund at any time.
4 Effective on July 29, 2016, the Goldman Sachs Limited Maturity Obligations Fund was renamed the Goldman Sachs Short-Term Conservative Income Fund.5 Effective on June 20, 2017, the Goldman Sachs Fixed Income Macro Strategies Fund was renamed the Goldman Sachs Strategic Macro Fund.6 Effective on June 20, 2017, the Goldman Sachs Growth and Income Fund was renamed the Goldman Sachs Equity Income Fund.Financial Square FundsSM and Investor FundsSM are registered service marks of Goldman Sachs & Co. LLC.* This list covers open-end funds only. Please visit our website at www.GSAMFUNDS.com to learn about our closed-end funds and exchange-traded funds.
Copyright © 2017 www.secdatabase.com. All Rights Reserved.Please Consider the Environment Before Printing This Document

TRUSTEESCheryl K. Beebe, ChairmanLawrence HughesJohn F. KillianJames A. McNamaraWestley V. Thompson
OFFICERSJames A. McNamara, PresidentScott M. McHugh Treasurer, Senior Vice Presidentand Principal Financial OfficerJoseph F. DiMaria, Assistant Treasurer and PrincipalAccounting OfficerCaroline L. Kraus, Secretary
GOLDMAN SACHS & CO. LLCDistributor and Transfer Agent
GOLDMAN SACHS ASSET MANAGEMENT, L.P.Investment Adviser
Visit our web site at www.GSAMFUNDS.com to obtain the most recent month-endreturns.
Goldman Sachs Asset Management, L.P. 200 West Street, New York, New York 10282
The reports concerning the Fund included in this shareholder report may contain certain forward-looking statements about the factors thatmay affect the performance of the Fund in the future. These statements are based on Fund management�s predictions and expectationsconcerning certain future events and their expected impact on the Fund, such as performance of the economy as a whole and of specificindustry sectors, changes in the levels of interest rates, the impact of developing world events, and other factors that may influence thefuture performance of the Fund. Management believes these forward-looking statements to be reasonable, although they are inherentlyuncertain and difficult to predict. Actual events may cause adjustments in portfolio management strategies from those currently expectedto be employed.A description of the policies and procedures that the Fund uses to determine how to vote proxies relating to portfolio securities andinformation regarding how the Fund voted proxies relating to portfolio securities during the most recent 12-month period ended June 30 isavailable (I) without charge, upon request by calling 1-800-526-7384 (for Retail Shareholders) or 1-800-621-2550 (for InstitutionalShareholders); and (II) on the Securities and Exchange Commission (�SEC�) web site at http://www.sec.gov.The Fund files its complete schedule of portfolio holdings with the SEC for the first and third quarters of each fiscal year on Form N-Qs.The Fund�s Form N-Qs are available on the SEC�s web site at http://www.sec.gov within 60 days after the Fund�s first and third fiscalquarters. The Fund�s Form N-Qs may be reviewed and copied at the SEC�s Public Reference Room in Washington, D.C., andinformation on the operation of the Public Reference Room may also be obtained by calling 1-800-SEC-0330. Form N-Qs may beobtained upon request and without charge by calling 1-800-526-7384 (for Retail Shareholders) or 1-800-621-2550 (for InstitutionalShareholders).Fund holdings and allocations shown are as of April 30, 2017 and may not be representative of future investments. Fund holdings shouldnot be relied on in making investment decisions and should not be construed as research or investment advice regarding particularsecurities. Current and future holdings are subject to risk. Economic and market forecasts presented herein reflect our judgment as of thedate of this presentation and are subject to change without notice. These forecasts do not take into account the specific investmentobjectives, restrictions, tax and financial situation or other needs of any specific client. Actual data will vary and may not be reflectedhere. These forecasts are subject to high levels of uncertainty that may affect actual performance. Accordingly, these forecasts should beviewed as merely representative of a broad range of possible outcomes. These forecasts are estimated, based on assumptions, and aresubject to significant revision and may change materially as economic and market conditions change. Goldman Sachs has no obligationto provide updates or changes to these forecasts. Case studies and examples are for illustrative purposes only.The portfolio risk management process includes an effort to monitor and manage risk, but does not imply low risk. Past correlations arenot indicative of future correlations, which may vary.This material is not authorized for distribution to prospective investors unless preceded or accompanied by a currentProspectus or summary prospectus, if applicable. Investors should consider the Fund��s objective, risks, and charges andexpenses, and read the summary prospectus, if available, and/or the Prospectus carefully before investing or sending money.The summary prospectus, if available, and the Prospectus contain this and other information about the Fund and may beobtained from your authorized dealer or from Goldman Sachs & Co. LLC by calling (retail �� 1-800-526-7384) (institutional ��1-800-621-2550).© 2017 Goldman Sachs. All rights reserved. 94675-TMPL-06/2017-557121 MMALTSAR-17/9.9k
Copyright © 2017 www.secdatabase.com. All Rights Reserved.Please Consider the Environment Before Printing This Document

Goldman Sachs Funds
Semi-Annual Report April 30, 2017
Strategic Multi-Asset Class FundsMulti-Manager Global EquityMulti-Manager Non-Core Fixed IncomeMulti-Manager Real Assets Strategy
Copyright © 2017 www.secdatabase.com. All Rights Reserved.Please Consider the Environment Before Printing This Document

Goldman Sachs StrategicMulti-Asset Class Funds∎ MULTI-MANAGER GLOBAL EQUITY
∎ MULTI-MANAGER NON-CORE FIXED INCOME
∎ MULTI-MANAGER REAL ASSETS STRATEGY
TABLE OF CONTENTS
Market Review 1
Portfolio Management Discussion and Performance Summaries 3
Schedules of Investments 20
Financial Statements 86
Financial Highlights 90
Notes to Financial Statements 96
Other Information 111
NOT FDIC-INSURED May Lose Value No Bank Guarantee
Copyright © 2017 www.secdatabase.com. All Rights Reserved.Please Consider the Environment Before Printing This Document

MARKET REVIEW
Goldman Sachs Strategic Multi-Asset Class FundsMarket Review
The capital markets broadly rallied during the six months ended April 30, 2017 (the �Reporting Period�). In the U.S., the unexpected election ofDonald Trump led investors to rotate out of the defensive, yield-oriented positioning that had driven market returns in much of 2015 and 2016. TheFederal Reserve (the �Fed�), citing an improved labor market and moderately expanding economic activity, cautiously raised interest rates twice duringthe Reporting Period � in December 2016 and March 2017. Meanwhile, the U.K. officially triggered Article 50, beginning negotiations to extricateitself from the European Union, popularly known as Brexit.
The U.S. dollar rallied sharply following the U.S. elections but declined over the early part of 2017, ending the Reporting Period slightly higher than atthe start of the Reporting Period. The yield on 10-year U.S. Treasuries also increased during the Reporting Period, with the post-election U.S. Treasurysell-off moderately offset by a recovery in prices year-to-date through April 30, 2017. In commodities, oil rallied in November 2016 but declined in theearly months of 2017 on pricing concerns and on uncertainty around Organization of the Petroleum Exporting Countries (�OPEC�) production limits,leading to underperformance from energy-related assets worldwide during the Reporting Period overall. Gold moved in the opposite direction; after asteep sell-off following the U.S. elections, gold gained over the first few months of 2017 to end the Reporting Period only slightly below where itstarted.
Global equity markets ended the Reporting Period in positive territory. In the U.S., investors reacted to the prospect of business-friendly tax cuts,decreased regulations, and revisions to international trade agreements under the current Administration by rotating into more cyclical areas of themarket. Financial stocks were the best performers during the Reporting Period, followed by information technology, consumer discretionary andindustrials. Energy companies underperformed due to declines in oil prices, while the higher yielding, traditionally defensive sectors, such as utilities,telecommunication services and consumer staples, which had driven the market for much of 2015 and 2016 also underperformed. Small cap stocks, asmeasured by applicable Russell indices, widely considered most likely to benefit from current Administration policies, outperformed large cap stocksduring the Reporting Period. International equity markets also gained during the Reporting Period, with European stocks rebounding from 2016�sBrexit-driven selloff and emerging market equities rallying on perceived prospects for economic growth.
Credit markets also largely ended the Reporting Period in positive territory. Despite volatility around U.S. elections and an increase in U.S. Treasuryrates during the Reporting Period, credit spreads, or yield differentials to U.S. Treasuries, tightened from their January 2016 highs, as economicrecovery improved and market participants became optimistic about the prospect of fiscal stimulus under the new Administration. In the U.S., issuerssought to take advantage of low interest rates and strong foreign demand to drive new offerings. Abroad, emerging market credit, generally offeringmore attractive yields and less sovereign leverage, rallied. (Less sovereign leverage refers to the fact that emerging markets generally have lesssovereign debt than developed markets as a percentage of Gross Domestic Product given the effects of quantitative easing in the U.S. and Europe.)
Public real estate markets moved higher on what investors broadly considered to be reasonable valuations and an attractive supply/demand backdrop atthis point in the cycle. While higher yield securities outperformed lower yield securities, the magnitude of outperformance of higher yield securitiesdecreased toward the end of 2016 and in the beginning of 2017. After selling off sharply in the aftermath of the Brexit vote, U.K. real estate securitiesrallied back
1
Copyright © 2017 www.secdatabase.com. All Rights Reserved.Please Consider the Environment Before Printing This Document

MARKET REVIEW
during the Reporting Period. Hong Kong and Singapore, which had also been out of favor, performed well, while Japan was the only major real estatemarket to decline. Office and residential real estate moved higher, though prison and hotel real estate investment trusts (�REITs�) experienced thesharpest rally following the U.S. election on expectations of more favorable government policy and prospects of increased economic growth. Datacenter and logistics REITs also attracted capital as part of a broader play on cloud computing and growth of e-commerce. Conversely, mall REITs soldoff in the first quarter of 2017 on the back of higher than market expected closures of brick and mortar stores.
At the end of the Reporting Period, investors appeared to be monitoring political developments in the U.S., particularly regarding tax and health carereform. We believe the rise of populism worldwide has challenged conventional leadership, most recently during the French election, and may lead tofurther market disruption. While most global central banks maintain policies of quantitative easing, investors also broadly anticipate at least one moreinterest rate hike in the U.S. in 2017.
Looking AheadAt the end of the Reporting Period, we were focused on three macro themes. First, widening economic expansion as growth in emerging marketsimproves from previous weakness while economic expansion in the U.S. and Europe appears to be continuing at a more moderate pace. Second, howthis improvement in economic growth along with building inflationary pressures in the U.S. may result in a weakening of the �secular stagnation�thesis in the minds of investors, with higher bond yields a likely consequence, in our view. (Secular stagnation is a condition of negligible or noeconomic growth in a market-based economy.) Third, the still elevated levels of uncertainty from macro risks that have the potential to cause temporarydrawdowns, possibly resulting in range-bound returns across most asset classes and thus making a compelling case for a dynamic approach to assetallocation.
At the asset class level, equities remained inexpensive relative to macro conditions and low bond yields at the end of the Reporting Period, in our view,though a significant part of the valuation gap had appeared to unwind. We expect the remainder of that valuation gap to be closed largely throughincreasing bond yields. That said, the widening economic expansion and recovering earnings should, we believe, support some upside in equities, andwe expect positive but moderate returns over the medium term. At the start of 2017, we saw the bond markets as too dovish in its pricing of Fedinterest rate hikes. (Dovish tends to suggest lower interest rates; opposite of hawkish.) In addition, we thought long-dated bond yields did notsufficiently reflect uncertainty about the tolerance of inflation in the U.S. nor our expectations of a decline in the duration of the European CentralBank�s bond purchases. The decline in yields since then, despite strong economic growth and a hawkish drift in central bank policy, have strengthenedour view. At the end of the Reporting Period, we saw a rapid rise in yields as the biggest near-term risk to markets. Hence, we remain moreconstructive on equities than on bonds.
At the regional level, we had a positive outlook at the end of the Reporting Period on emerging market equities versus developed market equities,which is reflected in the Funds� strategic allocations. We believe sufficient progress has been made in recent years on various fronts, includingvaluations, macro imbalances, dissipation of growth challenges and perceptions by investors of improvements in the emerging markets. We remainedconcerned about possible downside risks from the potential for higher rates, but we think the impact would be temporary. Additionally, we believethere is sufficient policy support in China to keep downside risks limited.
2
Copyright © 2017 www.secdatabase.com. All Rights Reserved.Please Consider the Environment Before Printing This Document

PORTFOLIO RESULTS
Goldman Sachs Multi-ManagerGlobal Equity Fund
Investment ObjectiveThe Fund seeks to provide long-term capital growth.
Portfolio Management Discussion and AnalysisBelow, the Goldman Sachs Global Portfolio Solutions (��GPS��) and Alternative Investments & Manager Selection (��AIMS��) Groupsdiscuss the Goldman Sachs Multi-Manager Global Equity Fund��s (the ��Fund��) performance and positioning for the six-month periodended April 30, 2017 (the ��Reporting Period��).
Q How did the Fund perform during the Reporting Period?
A During the Reporting Period, the Fund�s Institutional Shares generated a cumulative total return of 11.88%. This return compares to the 12.34%cumulative total return of the Fund�s benchmark, the MSCI All Country World Index Investable Market Index (�ACWI IMI�) (Net, USD, 50%Non-U.S. Developed Hedged to USD) (the �Index�), during the same time period.
Q What key factors were responsible for the Fund��s performance during the Reporting Period?
A The Fund posted robust double-digit positive absolute returns but underperformed the Index during the Reporting Period. The Fund�s performanceduring the Reporting Period can be attributed to the performance of the Fund�s Underlying Managers, who are unaffiliated investment managersthat employ a mix of international, global and U.S.-focused equity investment strategies. During the Reporting Period, the Fund allocated capital to11 Underlying Managers �Causeway Capital Management LLC (�Causeway�), Epoch Investment Partners, Inc. (�Epoch�), Fisher AssetManagement, LLC (�Fisher�), GW&K Investment Management, LLC (�GW&K�), Legal & General Investment Management America, Inc.(�Legal & General�), Parametric Portfolio Associates LLC (�Parametric�), Principal Global Investors, LLC (�Principal�), Boston Partners GlobalInvestors, Inc. (�Boston Partners�), Scharf Investments, LLC (�Scharf�); Vulcan Value Partners, LLC (�Vulcan�) and WCM InvestmentManagement (�WCM�). Epoch was redeemed on November 14, 2016, and funds were reallocated to Principal. Legal & General was initiallyallocated assets on December 21, 2016.
The 11 Underlying Managers with assets allocated to them during the Reporting Period represented five asset classes across global equity as part ofthe Fund�s top-level strategy allocation � U.S. large cap (Scharf and Vulcan), Europe, Australasia and Far East (�EAFE�) large cap (Causeway andWCM), U.S. small cap (GW&K and Boston Partners), EAFE small cap (Epoch and Principal) and emerging markets (Fisher and Parametric). Wemeasure the diversified beta manager, Legal & General, against the MSCI All Country World Index (�ACWI�).
Of the 11 Underlying Managers with allocated capital during the Reporting Period, 10 generated positive absolute returns and one posted a negativeabsolute return. On a relative basis, three Underlying Managers outperformed their respective strategy benchmark, while eight Underlying Managersunderperformed their respective strategy benchmark.
The Fund additionally uses Russell Investments Implementation Services, LLC (�Russell�) for a currency overlay program given the hedged natureof the Fund�s benchmark.
The Fund�s performance relative to the Index was mainly driven by manager selection, which overall detracted during the Reporting Period. Themost significant underperformance came from U.S. large cap Underlying Manager Scharf, who underperformed the S&P 500 Index, the index towhich we compare this Underlying Manager, and from U.S. small cap Underlying Manager GW&K, who underperformed the Russell 2000 Index.On the positive side, the strongest relative performance came from U.S. large cap Underlying Manager Vulcan, who outperformed the S&P 500Index, the index to which we compare this Underlying Manager, and from EAFE large cap Underlying Manager Causeway, who outperformed theMSCI EAFE Index, the index to which we compare this Underlying Manager.
Strategic asset allocation, which reflects a longer-term perspective to diversify and invest across global equity markets, performed in line with theIndex during the
3
Copyright © 2017 www.secdatabase.com. All Rights Reserved.Please Consider the Environment Before Printing This Document

PORTFOLIO RESULTS
Reporting Period. An underweight to U.S. large cap equities relative to EAFE small cap equities detracted from performance. Having an overweightto emerging markets equities contributed positively. Our medium-term view to overweight emerging markets equities relative to developed marketequities contributed positively to performance.
Q Which global equity asset classes most significantly affected Fund performance?
A In U.S. small cap, both Underlying Managers underperformed their respective benchmarks in a strong absolute return environment for small-capequities. GW&K underperformed the Russell 2000 Index due to weak stock selection in health care and materials. Positive stock selection ininformation technology partially mitigated GW&K�s underperformance. Boston Partners, the value-oriented Underlying Manager, underperformedthe Russell 2000 Value Index due to an overweight to and stock selection within consumer discretionary and stock selection in health care. Havingan underweight to and positive stock selection within real estate partially offset Boston Partners� underperformance.
In EAFE small cap, we redeemed Epoch on November 17, 2016. During the short time it served as an Underlying Manager during the ReportingPeriod, Epoch underperformed the MSCI World ex-U.S. Small Cap Index. Principal, which served as an Underlying Manager for the full ReportingPeriod, also underperformed the MSCI World ex-U.S. Small Cap Index during the Reporting Period. Principal underperformed due to stockselection within industrials and energy, partially offset by effective stock selection within consumer discretionary.
In emerging markets, Fisher and Parametric underperformed the MSCI Emerging Markets Index. Fisher�s underperformance can be attributed toweak stock selection within information technology and health care, offset by positive stock selection within consumer discretionary. Parametricunderperformed the MSCI Emerging Markets Index during the Reporting Period due to its underweight to information technology, partially offsetby stock selection in energy, which contributed positively.
We measure diversified beta manager Legal & General against the MSCI ACWI Index. During the period while it was allocated Fund assets, i.e.December 21, 2016 through April 30, 2017, Legal & General underperformed the MSCI ACWI Index due to an underweight to informationtechnology and weak stock selection in consumer staples and consumer discretionary. Its underperformance was partially offset by an underweightto and stock selection in energy, which contributed positively.
In U.S. large cap, which we measure relative to the S&P 500 Index, Underlying Manager performance was mixed. Scharf underperformed the S&P500 Index due to having a sizable position in cash during a Reporting Period when the U.S. equity markets rallied. Also, weak stock selection infinancials and industrials detracted, partially offset by effective stock selection in materials, which contributed positively. Vulcan, on the other hand,outperformed the S&P 500 Index during the Reporting Period due to effective stock selection in health care and an underweight to and stockselection in energy. Its strong performance was partially offset by weak stock selection in consumer discretionary, particularly apparel and luxurygoods.
In EAFE large cap, both Underlying Managers outperformed their respective benchmarks. WCM, who we compare to the MSCI ACWI ex-U.S.Index, outperformed due to stock selection in consumer discretionary and health care. Having underweights to energy and telecommunicationservices also helped. WCM�s outperformance was partially offset by an underweight to and stock selection in financials, particularly banks, whichdetracted. Causeway, who we compare to the MSCI EAFE Index, outperformed due to strong stock selection in financials and consumerdiscretionary. An overweight to and stock selection in telecommunication services, which detracted, partially offset Causeway�s outperformance.
Q How did the Fund use derivatives and similar instruments during the Reporting Period?
A Russell manages a currency overlay allocation that seeks to minimize unintended currency exposures that either reduce performance or increase riskof the Fund�s portfolio. Russell uses currency forwards as part of this strategy. Outside of Russell, the Fund did not use derivatives during theReporting Period. Overall, the use of derivatives and similar instruments by the Underlying Managers did not materially impact the Fund�sperformance during the Reporting Period.
Q Were there any notable changes in the Fund��s allocations during the Reporting Period?
A During the Reporting Period, the Fund shifted its strategic asset allocation to align with the new GPS model portfolio. The new strategic assetallocation increased the Fund�s allocation to U.S. equities (though the Fund is still underweight U.S. large cap relative to the Index) and
4
Copyright © 2017 www.secdatabase.com. All Rights Reserved.Please Consider the Environment Before Printing This Document
PORTFOLIO RESULTS
emerging markets equities and reduced the Fund�s allocations to non-U.S. developed market equities and the corresponding currency hedge. TheFund completed the shifts toward the new GPS model portfolio at the end of March 2017.
The Fund also implemented a medium-term �cycle aware view� to favor emerging market equities over developed markets large cap equities. The�cycle aware view� process aims to adjust the overall risk profile of the Fund�s strategic asset allocation to take into account where we are in theeconomic cycle. It is driven by a fundamental macro research process managed by GPS.
In addition, as mentioned earlier, Epoch was redeemed. Legal & General was allocated fund assets from a portion of the developed market large capand emerging market weights.
At the start of the Reporting Period, the Fund�s assets were allocated 33% to U.S. large cap, 28% to EAFE large cap, 9% to U.S. small cap, 17% toEAFE small cap and 11% to emerging markets with the remainder in cash and cash equivalents. At the end of the Reporting Period, the Fund�sassets were allocated 38% to U.S. large cap, 26% to EAFE large cap, 10% to U.S. small cap, 7% to EAFE small cap, and 17% to emerging marketswith the remainder in cash and cash equivalents.
Q Were there any changes to the Fund��s management team during the Reporting Period?
A There were no changes to the Fund�s management team during the Reporting Period.
Q What is the Fund��s tactical view and strategy for the months ahead?
A Overall, we intend to continue to position the Fund in alignment with our longer-term strategic views within the equity complex as a complement toadditional strategic market exposures. We further intend to continue to monitor allocations and Underlying Manager performance as we seek toprovide long-term capital growth.
5
Copyright © 2017 www.secdatabase.com. All Rights Reserved.Please Consider the Environment Before Printing This Document

PORTFOLIO RESULTS
Index DefinitionsThe S&P 500® Index is an American stock market index based on the market capitalizations of 500 large companies listed on the NYSEor NASDAQ.
The Russell 2000® Index is an unmanaged index of common stock prices that measures the performance of the 2000 smallestcompanies in the Russell 3000® Index. The Index is constructed to provide a comprehensive and unbiased small-cap barometer and iscompletely reconstituted annually to ensure larger stocks do not distort the performance and characteristics of the true small-capopportunity set.
The MSCI® EAFE® Index is a stock market index that is designed to measure the equity market performance of developed markets inEurope, Australasia and the Far East, excluding the U.S. and Canada.
The MSCI Emerging Markets Index is a free float-adjusted market capitalization index that is designed to measure equity marketperformance of emerging markets. As of April 30, 2017, the MSCI Emerging Markets Index consisted of the following 23 emerging marketcountry indices: Brazil, Chile, China, Colombia, Czech Republic, Egypt, Greece, Hungary, India, Indonesia, Korea, Malaysia, Mexico,Peru, Philippines, Poland, Qatar, Russia, South Africa, Taiwan, Thailand, Turkey, and the United Arab Emirates.
The MSCI World ex-U.S. Small Cap Index is an unmanaged index maintained by MSCI and considered representative of small-capstocks of global developed markets, excluding those of the U.S.
The MSCI ACWI ex-U.S. Index is a market-capitalization weighted index maintained by MSCI and designed to provide a broad measureof stock performance throughout the world, with the exception of U.S.-based companies. It includes both developed and emergingmarkets. It holds 23 countries classified as developed markets and 23 classified as emerging markets.
The Russell 2000® Value Index measures the performance of the small-cap value stocks of the U.S. equity universe.
The MSCI ACWI Index is a free float-adjusted market capitalization weighted index that is designed to measure the equity marketperformance of developed and emerging markets. The MSCI ACWI consists of 46 country indexes comprising 23 developed and 23emerging market country indexes. The developed market country indexes included are: Australia, Austria, Belgium, Canada, Denmark,Finland, France, Germany, Hong Kong, Ireland, Israel, Italy, Japan, Netherlands, New Zealand, Norway, Portugal, Singapore, Spain,Sweden, Switzerland, the United Kingdom and the United States. The emerging market country indexes included are: Brazil, Chile,China, Colombia, Czech Republic, Egypt, Greece, Hungary, India, Indonesia, Korea, Malaysia, Mexico, Peru, Philippines, Poland, Qatar,Russia, South Africa, Taiwan, Thailand, Turkey and United Arab Emirates.
6
Copyright © 2017 www.secdatabase.com. All Rights Reserved.Please Consider the Environment Before Printing This Document
FUND BASICS
Multi-Manager Global Equity Fundas of April 30, 2017
PERFORMANCE REVIEW
November 1, 2016��April 30, 2017Fund Total Return(based on NAV)1
MSCI ACWI IMI(Net, USD, 50% Non-U.S.
Developed Hedged to USD)2Institutional 11.88 % 12.34 %
1 The net asset value (�NAV�) represents the net assets of the class of the Fund (ex-dividend) divided by the total number of shares of the class outstanding. TheFund�s performance reflects the reinvestment of dividends and other distributions. The Fund�s performance does not reflect the deduction of any applicable salescharges.
2 The MSCI ACWI IMI (Net, USD, 50% Non-U.S. Developed Hedged to USD) captures large, mid and small cap representation across 23 developed markets and 23emerging markets and a currency hedge on 50% of the non-U.S. developed markets exposures back to U.S. dollars. With approximately 14,000 securities, the MSCIACWI IMI is comprehensive, covering approximately 99% of the global equity investment opportunity set. As of April 30, 2017, the 23 developed markets in theMSCI ACWI IMI include Australia, Austria, Belgium, Canada, Denmark, Finland, France, Germany, Hong Kong, Ireland, Israel, Italy, Japan, Netherlands, NewZealand, Norway, Portugal, Singapore, Spain, Sweden, Switzerland, the U.K. and the U.S. The 23 emerging markets include Brazil, Chile, China, Colombia, CzechRepublic, Egypt, Greece, Hungary, India, Indonesia, Korea, Malaysia, Mexico, Peru, Philippines, Poland, Russia, Qatar, South Africa, Taiwan, Thailand, Turkey andUnited Arab Emirates. The Index figures do not reflect any deductions for fees or expenses. It is not possible to invest directly in an index.
STANDARDIZED TOTAL RETURNS3For the period ended 3/31/17 One Year Since Inception Inception DateInstitutional 13.66 % 2.73 % 6/24/2015
3 The Standardized Total Returns are average annual total returns as of the most recent calendar quarter-end. They assume reinvestment of all distributionsat NAV. Because Institutional Shares do not involve a sales charge, such a charge is not applied to their Standardized Total Returns.
The returns set forth in the tables above represent past performance. Past performance does not guarantee future results. The Fund��sinvestment return and principal value will fluctuate so that an investor��s shares, when redeemed, may be worth more or less than theiroriginal cost. Current performance may be lower or higher than the performance quoted above. Please visit our web site atwww.GSAMFUNDS.com to obtain the most recent month-end returns. Performance reflects applicable fee waivers and/or expenselimitations in effect during the periods shown. In their absence, performance would be reduced. Returns do not reflect the deduction of taxes thata shareholder would pay on Fund distributions or the redemption of Fund shares.
EXPENSE RATIOS4Net Expense Ratio (Current) Gross Expense Ratio (Before Waivers)
Institutional 0.85 % 1.31 %
Copyright © 2017 www.secdatabase.com. All Rights Reserved.Please Consider the Environment Before Printing This Document

4 The expense ratios of the Fund, both current (net of applicable fee waivers and/or expense limitations) and before waivers (gross of applicable fee waiversand/or expense limitations) are as set forth above according to the most recent publicly available Prospectus for the Fund and may differ from the expenseratios disclosed in the Financial Highlights in this report. Pursuant to a contractual arrangement, the Fund��s waivers and/or expense limitations willremain in place through at least February 28, 2018, and prior to such date the investment adviser may not terminate the arrangements without theapproval of the Fund��s Board of Trustees. If these arrangements are discontinued in the future, the expense ratios may change without shareholderapproval.
7
Copyright © 2017 www.secdatabase.com. All Rights Reserved.Please Consider the Environment Before Printing This Document

FUND BASICS
TOP TEN HOLDINGS AS OF 4/30/17��Holding % of Net Assets Line of BusinessOracle Corp. 1.5 % SoftwareCVS Health Corp. 1.1 Food & Staples RetailingMcKesson Corp. 0.7 Health Care Providers & ServicesBerkshire Hathaway, Inc. Class B 0.7 Diversified Financial ServicesNational Oilwell Varco, Inc. 0.6 Energy Equipment & ServicesMicrosoft Corp. 0.6 SoftwareTencent Holdings Ltd. 0.6 Internet Software & ServicesTaiwan Semiconductor Manufacturing Co. Ltd. ADR 0.6 Semiconductors & Semiconductor
EquipmentVisa, Inc. Class A 0.5 IT ServicesComcast Corp. Class A 0.5 Media
� The top 10 holdings may not be representative of the Fund�s future investments.
FUND COMPOSITION (%)5
5 The percentage shown for each investment category reflects the value of investments in that category as a percentage of net assets. Short-term investments representrepurchase agreements. Figures in the graph may not sum to 100% due to the exclusion of other assets and liabilities. Underlying sector allocations of exchangetraded funds and investment companies held by the Fund are not reflected in the graph above. The graph depicts the Fund�s investments but may not represent theFund�s market exposure due to the exclusion of certain derivatives, if any, as listed in the Additional Investment Information section of the Schedule of Investments.
8
Copyright © 2017 www.secdatabase.com. All Rights Reserved.Please Consider the Environment Before Printing This Document

PORTFOLIO RESULTS
Goldman Sachs Multi-Manager Non-CoreFixed Income Fund
Investment ObjectiveThe Fund seeks a total return consisting of income and capital appreciation.
Portfolio Management Discussion and AnalysisBelow, the Goldman Sachs Global Portfolio Solutions (��GPS��) and Alternative Investments & Manager Selection (��AIMS��) Groupsdiscuss the Goldman Sachs Multi-Manager Non-Core Fixed Income Fund��s (the ��Fund��) performance and positioning for the six-monthperiod ended April 30, 2017 (the ��Reporting Period��).
Q How did the Fund perform during the Reporting Period?
A During the Reporting Period, the Fund�s Institutional Shares generated a cumulative total return of 2.37%. This return compares to the 3.69%cumulative total return of the Fund�s benchmark, the Multi-Manager Non-Core Fixed Income Composite Index (the �Index�), during the same timeperiod.
The Index is composed 40% of the Bloomberg Barclays U.S. High-Yield 2% Issuer Capped Bond Index (Gross, USD, Unhedged); 20% of theCredit Suisse Leveraged Loan Index (Gross, USD, Unhedged); 20% of the J.P. Morgan Emerging Market Bond Index (�EMBISM�) GlobalDiversified Index (Gross, USD, Unhedged); and 20% of the J.P. Morgan Government Bond Index � Emerging Markets (�GBI-EMSM�) GlobalDiversified Index (Gross, USD, Unhedged), which returned 5.30%, 3.14%, 2.45% and 2.04%, respectively, during the Reporting Period.
Q What key factors were responsible for the Fund��s performance during the Reporting Period?
A The Fund posted positive absolute returns but underperformed the Index during the Reporting Period. The Fund�s performance during the ReportingPeriod can be attributed to the performance of the Fund�s Underlying Managers, who are unaffiliated investment managers that employ a non-corefixed income investment strategy. Effective March 24, 2017, Brigade Capital Management, LP (�Brigade�) was added as an Underlying Managerand was allocated fund assets on March 31, 2017. Thus, during the Reporting Period, the Fund allocated capital to five Underlying Managers � AresCapital Management II LLC (�Ares�), BlueBay Asset Management LLP (�BlueBay�), Brigade, Lazard Asset Management LLC (�Lazard�) andSymphony Asset Management LLC (�Symphony�). These five Underlying Managers represented four sectors across non-core fixed income as partof the Fund�s top-level strategy allocation � high yield (Ares and Brigade), bank loans (Symphony), external emerging market debt (BlueBay andLazard) and local emerging market debt (BlueBay and Lazard). Of the five Underlying Managers with allocated capital during the Reporting Period,four generated positive absolute returns and one posted negative absolute returns but all five underperformed their respective strategy benchmark ona relative basis.
Performance relative to the Index was mainly driven by manager selection, which detracted during the Reporting Period. Underperformance relativeto the Index primarily came from high yield Underlying Manager Ares, who underperformed the Bloomberg Barclays U.S. High-Yield 2% IssuerCapped Bond Index. Brigade, who manages a dedicated high yield strategy for the Fund, also underperformed the Bloomberg Barclays U.S. High-Yield 2% Issuer Capped Bond Index for the month it was funded during the Reporting Period. Symphony, the bank loans Underlying Manager,underperformed the Credit Suisse Leveraged Loan Index during the Reporting Period. Emerging market debt Underlying Managers BlueBay andLazard each underperformed their custom benchmark (the benchmark was the 67% J.P. Morgan GBI-EMSM Global Diversified Index/33% J.P.Morgan EMBISM Global Diversified Index (the �EM Blended Index�) through February 2017 for Bluebay and through March 2017 for Lazard. Theblended benchmark weights were subsequently updated to 40% J.P. Morgan GBI-EMSM Global Diversified Index/60% J.P. Morgan EMBISMGlobal Diversified Index for both Underlying Managers).
Strategic asset allocation, which reflects a longer-term perspective to diversify and invest in non-core fixed income sectors, also detracted from theFund�s results, albeit more modestly. Strategic asset allocation detracted mainly driven
9
Copyright © 2017 www.secdatabase.com. All Rights Reserved.Please Consider the Environment Before Printing This Document

PORTFOLIO RESULTS
by underweights to emerging market hard currency debt and emerging market local debt relative to the Index. Such underperformance was partiallyoffset by the overweight to high yield bonds, which contributed positively. The Fund�s allocation to loans was relatively in line with that of theIndex during the Reporting Period and thus its effect was rather neutral.
Q Which non-core fixed income sectors most significantly affected Fund performance?
A Ares, a high yield Underlying Manager, underperformed the Bloomberg Barclays U.S. High-Yield 2% Issuer Capped Bond Index during theReporting Period. Its positions in the energy, telecommunication services, medical products and retail market segments weighed on its relativereturns. An overweight to and selection in bank securities contributed positively, partially offsetting Ares� underperformance.
Brigade, another high yield Underlying Manager, underperformed the Bloomberg Barclays U.S. High-Yield 2% Issuer Capped Bond Index in theone month it had capital allocated to it during the Reporting Period due primarily to security selection in telecommunication services andpharmaceuticals.
Symphony, the bank loans Underlying Manager, underperformed the Credit Suisse Leveraged Loan Index during the Reporting Period. Symphony�srelative underperformance was due to security selection in the technology and gaming/leisure industries and due to an underweight to the serviceindustry. Defensive cash positioning also hurt Symphony�s results.
BlueBay, one of the emerging market debt Underlying Managers, underperformed the EM Blended Index during the Reporting Period driven bothby duration and currency positioning, especially its underweights to the Indonesian rupiah and the Russian ruble and its underweight to Colombianlocal rates.
Lazard, the other emerging market debt Underlying Manager, also underperformed the EM Blended Index during the Reporting Period. Itsunderperformance was driven by the portfolio�s overweight to hard currency debt, which meaningfully lagged local currency debt during theReporting Period. Particularly hurting Lazard�s results was an overweight position in El Salvador. This was partially offset by an overweightduration position in Peru local bonds, which contributed positively during the Reporting Period.
Q How did the Fund use derivatives and similar instruments during the Reporting Period?
A The Fund�s Underlying Managers used currency forwards and interest rate swaps during the Reporting Period to implement their strategies.Overall, the use of derivatives by the Underlying Managers did not materially impact the Fund�s performance during the Reporting Period.
Q Were there any notable changes in the Fund��s allocations during the Reporting Period?
A During the Reporting Period, the Fund shifted its strategic asset allocation to align with the new GPS model portfolio. The new strategic assetallocation increased the Fund�s allocation to high yield bonds relative to senior loans and emerging markets debt. Also, as mentioned earlier, theFund updated the blended benchmarks used for emerging markets debt Underlying Managers from a blend of 67% J.P. Morgan GBI-EMSM GlobalDiversified Index/33% J.P. Morgan EMBISM Global Diversified Index to a blend of 40% J.P. Morgan GBI-EMSM Global Diversified Index/60%J.P. Morgan EMBISM Global Diversified Index. This transition occurred on February 28, 2017 for Bluebay and on March 31, 2017 for Lazard. TheFund completed the shifts toward the new GPS model portfolio at the end of March 2017.
In addition, as mentioned earlier, Brigade was allocated fund assets during the Reporting Period.
At the start of the Reporting Period, the Fund�s assets were allocated 25% to local emerging market debt, 14% to external emerging market debt,21% to bank loans and 39% to high yield with the remainder in cash and cash equivalents. At the end of the Reporting Period, the Fund�s assetswere allocated 12% to local emerging market debt, 18% to external emerging market debt, 13% to bank loans and 55% to high yield with theremainder in cash and cash equivalents.
Q Were there any changes to the Fund��s management team during the Reporting Period?
A There were no changes to the Fund�s management team during the Reporting Period.
Q What is the Fund��s tactical view and strategy for the months ahead?
A Overall, we intend to continue to position the Fund in alignment with our longer-term strategic views on the non-core fixed income market as acomplement to additional strategic market exposures. We further intend to continue to monitor allocations and Underlying Manager performance aswe seek to generate total return and capital appreciation.
10
Copyright © 2017 www.secdatabase.com. All Rights Reserved.Please Consider the Environment Before Printing This Document
PORTFOLIO RESULTS
Index DefinitionsThe Bloomberg Barclays U.S. High-Yield 2% Issuer Capped Bond Index (Gross, USD, Unhedged) is an issuer-constrained version ofthe U.S. Corporate High-Yield Index that measures the market of USD-denominated, non-investment grade, fixed-rate, taxable corporatebonds. The index follows the same rules as the uncapped index but limits the exposure of each issuer to 2% of the total market value andredistributes any excess market value index-wide on a pro-rata basis.
The Credit Suisse Leveraged Loan Index (Gross, USD, Unhedged) is designed to mirror the investable universe of the U.S. dollar-denominated leveraged loan market.
The J.P. Morgan EMBISM Global Diversified Index (Gross, USD, Unhedged) tracks total returns for U.S. dollar-denominated debtinstruments issued by emerging market sovereign and quasi-sovereign entities.
The J.P. Morgan GBI-EMSM Global Diversified Index (Gross, USD, Unhedged) is a comprehensive local emerging markets index,consisting of regularly traded, fixed-rate, local currency government bonds.
11
Copyright © 2017 www.secdatabase.com. All Rights Reserved.Please Consider the Environment Before Printing This Document

FUND BASICS
Multi-Manager Non-Core Fixed Income Fundas of April 30, 2017
PERFORMANCE REVIEW
November 1, 2016��April 30, 2017
Fund TotalReturn
(based on NAV)1
Multi-ManagerNon-Core
Fixed IncomeComposite
Index2
BloombergBarclays U.S.High-Yield 2%Issuer Capped
Bond Index(Gross, USD,Unhedged)
CreditSuisse
LeveragedLoan Index
(Gross, USD,Unhedged)
JP MorganEMBISMGlobal
DiversifiedIndex
(Gross, USD,Unhedged)
JP MorganGBI-EMSM
GlobalDiversified
Index(Gross, USD,Unhedged)
Institutional 2.37 % 3.69 % 5.30 % 3.14 % 2.45 % 2.04 %1 The net asset value (�NAV�) represents the net assets of the class of the Fund (ex-dividend) divided by the total number of shares of the class outstanding. The
Fund�s performance reflects the reinvestment of dividends and other distributions. The Fund�s performance does not reflect the deduction of any applicable salescharges.
2 The Multi-Manager Non-Core Fixed Income Composite Index is comprised of the Bloomberg Barclays U.S. High-Yield 2% Issuer Capped Bond Index (Gross,USD, Unhedged) (40%), the Credit Suisse Leveraged Loan Index (Gross, USD, Unhedged) (20%), the J.P. Morgan EMBISM Global Diversified Index (Gross, USD,Unhedged) (20%), and the J.P. Morgan GBI-EMSM Global Diversified Index (Gross, USD, Unhedged) (20%). The index figures do not reflect any deductions forfees, expenses or taxes. It is not possible to invest directly in an index.
STANDARDIZED TOTAL RETURNS3For the period ended 3/31/17 One Year Since Inception Inception DateInstitutional 7.51 % 2.41 % 3/31/2015
3 The Standardized Total Returns are average annual total returns as of the most recent calendar quarter-end. They assume reinvestment of all distributionsat NAV. Because Institutional Shares do not involve a sales charge, such a charge is not applied to their Standardized Total Returns.
The returns set forth in the tables above represent past performance. Past performance does not guarantee future results. The Fund��sinvestment return and principal value will fluctuate so that an investor��s shares, when redeemed, may be worth more or less than theiroriginal cost. Current performance may be lower or higher than the performance quoted above. Please visit our web site atwww.GSAMFUNDS.com to obtain the most recent month-end returns. Performance reflects applicable fee waivers and/or expenselimitations in effect during the periods shown. In their absence, performance would be reduced. Returns do not reflect the deduction of taxes thata shareholder would pay on Fund distributions or the redemption of Fund shares.
EXPENSE RATIOS4Net Expense Ratio (Current) Gross Expense Ratio (Before Waivers)
Institutional 0.70 % 1.20 %
Copyright © 2017 www.secdatabase.com. All Rights Reserved.Please Consider the Environment Before Printing This Document

4 The expense ratios of the Fund, both current (net of applicable fee waivers and/or expense limitations) and before waivers (gross of applicable fee waiversand/or expense limitations) are as set forth above according to the most recent publicly available Prospectus for the Fund and may differ from the expenseratios disclosed in the Financial Highlights in this report. Pursuant to a contractual arrangement, the Fund��s waivers and/or expense limitations willremain in place through at least February 28, 2018, and prior to such date the Investment Adviser may not terminate the arrangements without theapproval of the Fund��s Board of Trustees. If these arrangements are discontinued in the future, the expense ratios may change without shareholderapproval.
12
Copyright © 2017 www.secdatabase.com. All Rights Reserved.Please Consider the Environment Before Printing This Document

FUND BASICS
TOP TEN HOLDINGS AS OF 4/30/175Holding % of Net Assets Line of BusinessiShares iBoxx $ High Yield Corporate Bond ETF 0.9 % Exchange Traded FundsRepublic of Turkey 0.7 Foreign Debt ObligationsIntelsat Jackson Holdings SA 0.6 Telecommunications-SatelliteBrazil Notas do Tesouro Nacional 0.5 Foreign Debt ObligationsUnited Mexican States 0.5 Foreign Debt ObligationsRepublic of Poland 0.5 Foreign Debt ObligationsBrazil Notas do Tesouro Nacional 0.5 Foreign Debt ObligationsFirst Data Corp. 0.5 Consumer Cyclical ServicesSprint Corp. 0.4 Wireless Telecommunication ServicesBlue Racer Midstream LLC/Blue Racer Finance Corp. 0.4 Energy
5 The top 10 holdings may not be representative of the Fund�s future investments.
FUND COMPOSITION (%)6
6 The percentage shown for each investment category reflects the value of investments in that category as a percentage of net assets. Short-term investments representrepurchase agreements. Figures in the graph may not sum to 100% due to the exclusion of other assets and liabilities. Underlying sector allocations of exchangetraded funds and investment companies held by the Fund are not reflected in the graph above. The graph depicts the Fund�s investments but may not represent theFund�s market exposure due to the exclusion of certain derivatives, if any, as listed in the Additional Investment Information section of the Schedule of Investments.
13
Copyright © 2017 www.secdatabase.com. All Rights Reserved.Please Consider the Environment Before Printing This Document

PORTFOLIO RESULTS
Goldman Sachs Multi-ManagerReal Assets Strategy Fund
Investment ObjectiveThe Fund seeks to provide long-term capital growth through investments related to real assets.
Portfolio Management Discussion and AnalysisBelow, the Goldman Sachs Global Portfolio Solutions (��GPS��) and Alternative Investments & Manager Selection (��AIMS��) Groupsdiscuss the Goldman Sachs Multi-Manager Real Assets Strategy Fund��s (the ��Fund��) performance and positioning for the six-monthperiod ended April 30, 2017 (the ��Reporting Period��).
Q How did the Fund perform during the Reporting Period?
A During the Reporting Period, the Fund�s Institutional Shares generated a cumulative total return of 4.22%. This return compares to the 5.13%cumulative total return of the Fund�s benchmark, the Multi-Manager Real Assets Strategy Composite Index (the �Index�), during the same timeperiod.
The Index is composed 50% of the FTSE EPRA/NAREIT Developed Index (Net, USD, Unhedged) and 50% of the Dow Jones Brookfield GlobalInfrastructure Index (Net, USD, Unhedged), which returned 3.36% and 6.87%, respectively, during the Reporting Period.
Q What key factors were responsible for the Fund��s performance during the Reporting Period?
A The Fund posted solid positive absolute returns but underperformed the Index on a relative basis. The Fund�s performance during the ReportingPeriod can be attributed to the performance of the Fund�s Underlying Managers, who are unaffiliated investment managers that employ a real assetsinvestment strategy. Real assets are defined broadly by the Fund and include any assets that have physical properties or inflation sensitivecharacteristics, such as energy, real estate, infrastructure, commodities and inflation linked or floating rate fixed income securities. Inflation is asustained increase in prices that erodes the purchasing power of money. Assets with inflation sensitive characteristics are assets that benefit fromrising real cash flows in times of rising inflation.
On December 19, 2016, the Fund allocated capital to two Underlying Managers � Presima Inc. (�Presima�) and RARE Infrastructure (NorthAmerica) Pty Limited (�RARE�). These two Underlying Managers � along with Underlying Managers PGIM Real Estate, a business unit of PGIM,Inc. (�PGIM Real Estate�) and RREEF America L.L.C. (�RREEF�) � represented two asset classes of real assets as part of the Fund�s top-levelstrategy allocation. These were global infrastructure (RREEF and RARE) and global real estate (PGIM Real Estate and Presima).
Of the four Underlying Managers with allocated capital during the Reporting Period overall, all four generated positive absolute returns. On arelative basis, two of the Underlying Managers outperformed their respective benchmark index and two underperformed their respective benchmarkindex during the Reporting Period.
Performance relative to the Index was driven by both strategic asset allocation, which reflects a longer-term perspective to diversify and investacross real assets, and manager selection. Strategic asset allocation detracted, driven by an underweight to the infrastructure asset class, as marketsreacted positively to the new Administration�s fiscal policy plans and the potential benefits of proposed increases in infrastructure spending. TheFund�s overweight to real estate helped partially offset the underperformance but faced headwinds in a rising interest rate environment.
From a manager selection perspective, Fund underperformance relative to the Index was driven by global real estate Underlying Manager Presima,who underperformed the FTSE EPRA/NAREIT Developed Index (Net, USD, Unhedged) during the Reporting Period, and by global infrastructureUnderlying Manager RREEF, who underperformed the Dow Jones Brookfield Global Infrastructure Index during the Reporting Period.
Q Which real assets asset classes most significantly affected Fund performance?
A Both global real estate and global infrastructure generated mixed results during the Reporting Period.
In global real estate, Underlying Manager Presima posted positive absolute returns but underperformed the FTSE
14
Copyright © 2017 www.secdatabase.com. All Rights Reserved.Please Consider the Environment Before Printing This Document

PORTFOLIO RESULTS
EPRA/NAREIT Developed Index (Net, USD, Unhedged) during the time it was funded within the Reporting Period (i.e. December 19, 2016 �April 30, 2017). Its underperformance was due to weak stock selection in U.S. diversified, residential and retail real estate investment trusts(�REITs�). Weak stock selection in Hong Kong also detracted, though positive stock selection in Singapore and Australia partially offset itsunderperformance as did effective stock selection of U.S. hotel and office REITs.
Global real estate Underlying Manager PGIM Real Estate generated positive absolute returns and outperformed the FTSE EPRA/ NAREITDeveloped Index (Net, USD, Unhedged) during the Reporting Period. Its relative outperformance was due to an underweight to and strong stockselection within Asia, particularly Hong Kong and Australia, and due to effective stock selection within the U.S. office space. An underweight toand weak stock selection within the U.K. offset some these gains as did stock selection in U.S. residential, which detracted.
In global infrastructure, Underlying Manager RREEF posted positive absolute returns but underperformed the Dow Jones Brookfield GlobalInfrastructure Index (Net, USD, Unhedged) during the Reporting Period due to stock selection in the North American pipeline and utility marketsegments as well as in European transports. Having an allocation to cash when the Dow Jones Brookfield Global Infrastructure Index (Net, USD,Unhedged) rallied also hurt. Having an overweight to the U.K. dampened its relative results as well. On the positive side, effective stock selection inthe more pro-cyclical infrastructure segments, such as North American rail and waste helped somewhat offset negative stock selection elsewhere.
Global infrastructure Underlying Manager RARE produced positive absolute returns and outperformed the Dow Jones Brookfield GlobalInfrastructure Index (Net, USD, Unhedged) during the time it was funded within the Reporting Period (i.e. December 19, 2016 � April 30, 2017). Itsoutperformance can be attributed primarily to an overweight to rail and effective stock selection in gas and electric securities.
Q How did the Fund use derivatives and similar instruments during the Reporting Period?
A The Fund used forward currency exchange contracts to facilitate equity transactions settling in foreign currencies. During the Reporting Period,these transactions detracted from the Fund�s results.
Q Were there any notable changes in the Fund��s allocations during the Reporting Period?
A During the Reporting Period, the Fund shifted its strategic asset allocation to align with the new GPS model portfolio. The new strategic assetallocation increased the Fund�s allocation to global real estate relative to global infrastructure. The Fund completed the shifts toward the new GPSmodel portfolio at the end of March 2017.
Also, as mentioned earlier, Presima and RARE were allocated fund assets in December 2016.
At the beginning of the Reporting Period, the Fund�s assets were allocated 44% to global real estate and 54% to global infrastructure with theremainder in cash and cash equivalents. At the end of the Reporting Period, the Fund�s assets were allocated 60% to global real estate and 39% toglobal infrastructure with the remainder in cash and cash equivalents.
Q Were there any changes to the Fund��s management team during the Reporting Period?
A There were no changes to the Fund�s management team during the Reporting Period.
Q What is the Fund��s tactical view and strategy for the months ahead?
A Overall, we intend to continue to position the Fund in alignment with our longer-term strategic views on the real assets complex as a complement toadditional strategic market exposures. We further intend to continue to monitor allocations and Underlying Manager performance as we seek toprovide long-term capital growth through investments related to real assets.
15
Copyright © 2017 www.secdatabase.com. All Rights Reserved.Please Consider the Environment Before Printing This Document

PORTFOLIO RESULTS
Index Definitions:The FTSE EPRA/NAREIT Developed Index (Net, USD, Unhedged) is designed to track the performance of listed real estate companiesand REITS worldwide. The index incorporates REITs and Real Estate Holding & Development companies.
The Dow Jones Brookfield Global Infrastructure Index (Net, USD, Unhedged) intends to measure the stock performance of pure-playinfrastructure companies domiciled globally. The index covers all sectors of the infrastructure market. Components are required to havemore than 70% of cash flows derived from infrastructure lines of business.
16
Copyright © 2017 www.secdatabase.com. All Rights Reserved.Please Consider the Environment Before Printing This Document

FUND BASICS
Multi-Manager Real Assets Strategy Fundas of April 30, 2017
PERFORMANCE REVIEW
November 1, 2016��April 30, 2017
Fund TotalReturn
(based on NAV)1
Multi-ManagerReal Assets
StrategyComposite Index2
FTSE EPRA/NAREIT
DevelopedIndex
(Net, USD,Unhedged)
Dow JonesBrookfield
GlobalInfrastructure
Index(Net, USD,Unhedged)
Institutional 4.22 % 5.13 % 3.36 % 6.87 %1 The net asset value (�NAV�) represents the net assets of the class of the Fund (ex-dividend) divided by the total number of shares of the class outstanding. The
Fund�s performance reflects the reinvestment of dividends and other distributions. The Fund�s performance does not reflect the deduction of any applicable salescharges.
2 The Fund�s benchmark index is the Multi-Manager Real Assets Strategy Composite Index, which is composed of the FTSE EPRA/NAREIT Developed Index (Net,USD, Unhedged) (50%) and the Dow Jones Brookfield Global Infrastructure Index (Net, USD, Unhedged) (50%). The index figures do not reflect any deductionsfor fees, expenses or taxes. It is not possible to invest directly in an index.
STANDARDIZED TOTAL RETURNS3For the period ended 3/31/17 One Year Since Inception Inception DateInstitutional 3.25 % -2.09 % 6/30/2015
3 The Standardized Total Returns are average annual total returns as of the most recent calendar quarter-end. They assume reinvestment of all distributionsat NAV. Because Institutional Shares do not involve a sales charge, such a charge is not applied to their Standardized Total Returns.
The returns set forth in the tables above represent past performance. Past performance does not guarantee future results. The Fund��sinvestment return and principal value will fluctuate so that an investor��s shares, when redeemed, may be worth more or less than theiroriginal cost. Current performance may be lower or higher than the performance quoted above. Please visit our web site atwww.GSAMFUNDS.com to obtain the most recent month-end returns. Performance reflects applicable fee waivers and/or expenselimitations in effect during the periods shown. In their absence, performance would be reduced. Returns do not reflect the deduction of taxes thata shareholder would pay on Fund distributions or the redemption of Fund shares.
17
Copyright © 2017 www.secdatabase.com. All Rights Reserved.Please Consider the Environment Before Printing This Document

FUND BASICS
EXPENSE RATIOS4Net Expense Ratio (Current) Gross Expense Ratio (Before Waivers)
Institutional 0.90 % 1.34 %4 The expense ratios of the Fund, both current (net of applicable fee waivers and/or expense limitations) and before waivers (gross of applicable fee waivers
and/or expense limitations) are as set forth above according to the most recent publicly available Prospectus for the Fund and may differ from the expenseratios disclosed in the Financial Highlights in this report. Pursuant to a contractual arrangement, the Fund��s waivers and/or expense limitations willremain in place through at least February 28, 2018, and prior to such date the investment adviser may not terminate the arrangements without theapproval of the Fund��s Board of Trustees. If these arrangements are discontinued in the future, the expense ratios may change without shareholderapproval.
TOP TEN EQUITY HOLDINGS AS OF 4/30/175Holding % of Net Assets Line of BusinessAmerican Tower Corp. 2.1 % Equity Real Estate Investment Trusts
(REITs)Prologis, Inc. 2.0 Equity Real Estate Investment Trusts
(REITs)National Grid PLC 1.8 Multi-UtilitiesKinder Morgan, Inc. 1.7 Oil, Gas & Consumable FuelsCrown Castle International Corp. 1.7 Equity Real Estate Investment Trusts
(REITs)Sempra Energy 1.7 Multi-UtilitiesHudson Pacific Properties, Inc. 1.6 Equity Real Estate Investment Trusts
(REITs)GGP, Inc. 1.6 Equity Real Estate Investment Trusts
(REITs)Enbridge, Inc. 1.5 Oil, Gas & Consumable FuelsEssex Property Trust, Inc. 1.4 Equity Real Estate Investment Trusts
(REITs)5 The top 10 holdings may not be representative of the Fund�s future investments.
18
Copyright © 2017 www.secdatabase.com. All Rights Reserved.Please Consider the Environment Before Printing This Document

FUND BASICS
FUND COMPOSITION (%)6
6 The Fund is actively managed and, as such, its composition may differ over time. Consequently, the Fund�s overall sector allocations may differ from thepercentages contained in the graph above. The graph categorizes investments using the Global Industry Classification Standard (�GICS�), however, the sectorclassifications used by the portfolio management team may differ from GICS. The percentage shown for each investment category reflects the value of investmentsin that category as a percentage of market value. Short-term investments represent repurchase agreements. Underlying sector allocations of exchange traded fundsand investment companies held by the Fund are not reflected in the graph above. The graph depicts the Fund�s investments but may not represent the Fund�s marketexposure due to the exclusion of certain derivatives, if any, as listed in the Additional Investment Information section of the Schedule of Investments.
19
Copyright © 2017 www.secdatabase.com. All Rights Reserved.Please Consider the Environment Before Printing This Document

GOLDMAN SACHS MULTI-MANAGER GLOBAL EQUITY FUND
Schedule of InvestmentsApril 30, 2017 (Unaudited)
Shares Description ValueCommon Stocks �� 92.9%Argentina �� 0.0%160 Banco Macro SA ADR (Banks) $ 13,715947 Cresud SACIF y A ADR* (Real Estate Management & Development) 19,9061,310 Grupo Clarin SA Class B GDR (Media) 41,200422 Grupo Financiero Galicia SA ADR (Banks) 16,488800 Nortel Inversora SA Class B ADR (Diversified Telecommunication Services) 21,920552 Pampa Energia SA ADR* (Electric Utilities) 30,1061,480 YPF SA ADR (Oil, Gas & Consumable Fuels) 38,228
181,563Australia �� 1.3%1,991 Adelaide Brighton Ltd. (Construction Materials) 8,8274,337 AGL Energy Ltd. (Multi-Utilities) 86,8301,212 ALS Ltd. (Professional Services) 5,66990,564 Alumina Ltd. (Metals & Mining) 124,3231,047 Amcor Ltd. (Containers & Packaging) 12,31113,448 Ansell Ltd. (Health Care Equipment & Supplies) 239,387520 Aristocrat Leisure Ltd. (Hotels, Restaurants & Leisure) 7,642180 ASX Ltd. (Capital Markets) 6,8247,177 Aurizon Holdings Ltd. (Road & Rail) 27,67648,934 AusNet Services (Electric Utilities) 64,1231,116 Australia & New Zealand Banking Group Ltd. (Banks) 27,3192,365 Bank of Queensland Ltd. (Banks) 21,1602,635 Bendigo & Adelaide Bank Ltd. (Banks) 24,2491,061 BHP Billiton Ltd. (Metals & Mining) 18,89024,509 BlueScope Steel Ltd. (Metals & Mining) 214,1346,668 Boral Ltd. (Construction Materials) 30,7362,422 Brambles Ltd. (Commercial Services & Supplies) 18,742603 carsales.com Ltd. (Internet Software & Services) 5,28915,480 Challenger Ltd. (Diversified Financial Services) 152,894312 CIMIC Group Ltd. (Construction & Engineering) 8,6464,042 Coca-Cola Amatil Ltd. (Beverages) 28,328303 Cochlear Ltd. (Health Care Equipment & Supplies) 31,71815,050 CSL Ltd. (Biotechnology) 1,492,3597,402 CSR Ltd. (Construction Materials) 27,1425,665 Dexus Property Group (Equity Real Estate Investment Trusts (REITs)) 43,258530 Domino�s Pizza Enterprises Ltd. (Hotels, Restaurants & Leisure) 24,23742,467 Downer EDI Ltd. (Commercial Services & Supplies) 186,6142,435 DUET Group (Multi-Utilities) 5,502
Common Stocks �� (continued)Australia �� (continued)2,076 DuluxGroup Ltd. (Chemicals) 10,51119,850 Evolution Mining Ltd. (Metals & Mining) 34,50144,273 Fairfax Media Ltd. (Media) 35,0988,732 Fortescue Metals Group Ltd. (Metals & Mining) 34,6116,334 Goodman Group (Equity Real Estate Investment Trusts (REITs)) 38,4586,902 Harvey Norman Holdings Ltd. (Multiline Retail) 21,6497,445 Incitec Pivot Ltd. (Chemicals) 21,0932,397 Independence Group NL (Metals & Mining) 5,87275,383 Investa Office Fund (Equity Real Estate Investment Trusts (REITs)) 268,003735 IOOF Holdings Ltd. (Capital Markets) 4,8452,906 JB Hi-Fi Ltd. (Specialty Retail) 53,6912,595 LendLease Group (Real Estate Management & Development) 31,1552,017 Link Administration Holdings Ltd. (IT Services) 11,6596,815 Macquarie Atlas Roads Group (Transportation Infrastructure) 27,250196 Macquarie Group Ltd. (Capital Markets) 13,616277 Magellan Financial Group Ltd. (Capital Markets) 4,88319,265 Metcash Ltd.* (Food & Staples Retailing) 31,01518,588 Mirvac Group (Equity Real Estate Investment Trusts (REITs)) 31,572308 National Australia Bank Ltd. (Banks) 7,8182,203 Newcrest Mining Ltd. (Metals & Mining) 35,3437,611 nib holdings Ltd. (Insurance) 34,19534,531 Northern Star Resources Ltd. (Metals & Mining) 112,271391 Orica Ltd. (Chemicals) 5,425
Copyright © 2017 www.secdatabase.com. All Rights Reserved.Please Consider the Environment Before Printing This Document

1,305 Origin Energy Ltd.* (Oil, Gas & Consumable Fuels) 7,02398,803 Orora Ltd. (Containers & Packaging) 222,772977 OZ Minerals Ltd. (Metals & Mining) 5,188138 Perpetual Ltd. (Capital Markets) 5,45010,965 Primary Health Care Ltd. (Health Care Providers & Services) 27,803860 QBE Insurance Group Ltd. (Insurance) 8,2632,802 Qube Holdings Ltd. (Transportation Infrastructure) 5,508131 Ramsay Health Care Ltd. (Health Care Providers & Services) 7,025153 REA Group Ltd. (Media) 7,0261,852 Santos Ltd.* (Oil, Gas & Consumable Fuels) 4,8089,732 Scentre Group (Equity Real Estate Investment Trusts (REITs)) 31,400445 SEEK Ltd. (Professional Services) 5,66815,755 Seven Network Ltd. (Trading Companies & Distributors) 130,69722,249 Shopping Centres Australasia Property Group (Equity Real Estate Investment Trusts (REITs)) 38,489
20 The accompanying notes are an integral part of these financial statements.
Copyright © 2017 www.secdatabase.com. All Rights Reserved.Please Consider the Environment Before Printing This Document

GOLDMAN SACHS MULTI-MANAGER GLOBAL EQUITY FUND
Shares Description ValueCommon Stocks �� (continued)Australia �� (continued)2,058 Sims Metal Management Ltd. (Metals & Mining) $ 18,9552,308 Sonic Healthcare Ltd. (Health Care Providers & Services) 38,15414,757 South32 Ltd. (Metals & Mining) 30,58135,720 Spark Infrastructure Group (Electric Utilities) 66,6068,958 Stockland (Equity Real Estate Investment Trusts (REITs)) 32,5121,931 Suncorp Group Ltd. (Insurance) 19,9061,443 Sydney Airport (Transportation Infrastructure) 7,4451,513 Tabcorp Holdings Ltd. (Hotels, Restaurants & Leisure) 5,3751,488 Tatts Group Ltd. (Hotels, Restaurants & Leisure) 4,7871,343 Telstra Corp. Ltd. (Diversified Telecommunication Services) 4,2438,650 The GPT Group (Equity Real Estate Investment Trusts (REITs)) 33,97815,435 The Star Entertainment Grp Ltd. (Hotels, Restaurants & Leisure) 64,290981 TPG Telecom Ltd. (Diversified Telecommunication Services) 4,3282,802 Transurban Group (Transportation Infrastructure) 25,59918,841 Treasury Wine Estates Ltd. (Beverages) 169,16114,882 Vicinity Centres (Equity Real Estate Investment Trusts (REITs)) 32,077887 Wesfarmers Ltd. (Food & Staples Retailing) 28,55253,909 Westfield Corp. (Equity Real Estate Investment Trusts (REITs)) 366,606328 Woodside Petroleum Ltd. (Oil, Gas & Consumable Fuels) 7,8952,443 WorleyParsons Ltd.* (Energy Equipment & Services) 20,708
5,308,241Austria �� 0.3%687 ams AG (Semiconductors & Semiconductor Equipment) 44,1971,310 ANDRITZ AG (Machinery) 72,38710,182 BUWOG AG* (Real Estate Management & Development) 274,9522,078 Erste Groupe Bank AG (Banks) 74,40020,829 IMMOFINANZ AG (Real Estate Management & Development) 43,299589 Lenzing AG (Chemicals) 109,8414,152 OMV AG (Oil, Gas & Consumable Fuels) 191,2461,448 Raiffeisen Bank International AG* (Banks) 33,00910,726 UNIQA Insurance Group AG (Insurance) 89,5051,757 voestalpine AG (Metals & Mining) 73,248
Common Stocks �� (continued)Austria �� (continued)3,233 Wienerberger AG (Construction Materials) 75,692
1,081,776Belgium �� 0.3%787 Ackermans & van Haaren NV (Diversified Financial Services) 128,806957 Ageas (Insurance) 39,1852,737 bpost SA (Air Freight & Logistics) 65,600708 Cie d�Entreprises CFE (Construction & Engineering) 103,1851,031 Cofinimmo SA (Equity Real Estate Investment Trusts (REITs)) 124,7801,506 Colruyt SA (Food & Staples Retailing) 77,387717 Groupe Bruxelles Lambert SA (Diversified Financial Services) 68,773955 KBC Group NV (Banks) 69,0155,026 Ontex Group NV (Personal Products) 167,6932,035 Proximus SADP (Diversified Telecommunication Services) 62,238890 Sofina SA (Diversified Financial Services) 127,729517 Solvay SA (Chemicals) 65,7581,017 Telenet Group Holding NV* (Media) 61,794349 UCB SA (Pharmaceuticals) 27,2391,332 Umicore SA (Chemicals) 78,038
1,267,220Bermuda �� 0.0%5,800 VEON Ltd. ADR (Wireless Telecommunication Services) 23,954
Brazil �� 1.1%221,591 Ambev SA ADR (Beverages) 1,269,71620,959 Banco Bradesco SA ADR (Banks) 221,1182,300 Banco do Brasil SA (Banks) 23,8044,913 Banco Santander Brasil SA (Banks) 25,5407,500 BM&FBovespa SA � Bolsa de Valores Mercadorias e Futuros (Capital Markets) 44,91912,600 BR Malls Participacoes SA* (Real Estate Management & Development) 55,7743,700 BRF SA (Food Products) 46,1539,700 CCR SA (Transportation Infrastructure) 54,0921,900 Cia de Saneamento Basico do Estado de Sao Paulo (Water Utilities) 17,5212,100 Cia de Saneamento Basico do Estado de Sao Paulo ADR (Water Utilities) 19,320
Copyright © 2017 www.secdatabase.com. All Rights Reserved.Please Consider the Environment Before Printing This Document

5,500 Cia Siderurgica Nacional SA* (Metals & Mining) 13,42967,392 Cielo SA (IT Services) 511,6961,700 Cosan SA Industria e Comercio (Oil, Gas & Consumable Fuels) 19,8765,227 CPFL Energia SA (Electric Utilities) 42,8179,400 Cyrela Brazil Realty SA Empreendimentos e Participacoes (Household Durables) 39,092
The accompanying notes are an integral part of these financial statements. 21
Copyright © 2017 www.secdatabase.com. All Rights Reserved.Please Consider the Environment Before Printing This Document

GOLDMAN SACHS MULTI-MANAGER GLOBAL EQUITY FUND
Schedule of Investments (continued)April 30, 2017 (Unaudited)
Shares Description ValueCommon Stocks �� (continued)Brazil �� (continued)2,500 Duratex SA (Paper & Forest Products) $ 7,03410,100 EDP � Energias do Brasil SA (Electric Utilities) 42,7035,900 Embraer SA (Aerospace & Defense) 28,5521,600 Embraer SA ADR (Aerospace & Defense) 30,7202,480 Engie Brasil Energia SA (Independent Power and Renewable Electricity Producers) 26,5651,400 Equatorial Energia SA (Electric Utilities) 25,3581,100 Estacio Participacoes SA (Diversified Consumer Services) 6,1792,700 Fibria Celulose SA (Paper & Forest Products) 25,0091,700 Fleury SA (Health Care Providers & Services) 28,12910,900 Hypermarcas SA (Pharmaceuticals) 103,2293,100 Iguatemi Empresa de Shopping Centers SA (Real Estate Management & Development) 32,39618,422 Itau Unibanco Holding SA ADR (Banks) 226,59133 Itausa � Investimentos Itau SA* (Diversified Financial Services) 10310,000 JBS SA (Food Products) 32,3566,000 Klabin SA (Containers & Packaging) 29,86718,100 Kroton Educacional SA (Diversified Consumer Services) 85,2522,000 Localiza Rent a Car SA (Road & Rail) 29,8044,300 Lojas Renner SA (Multiline Retail) 40,073300 M Dias Branco SA (Food Products) 4,60610,300 MRV Engenharia e Participacoes SA (Household Durables) 51,7262,700 Multiplan Empreendimentos Imobiliarios SA (Real Estate Management & Development) 57,589700 Natura Cosmeticos SA (Personal Products) 6,67112,900 Odontoprev SA (Health Care Providers & Services) 46,53515,847 Petroleo Brasileiro SA ADR* (Oil, Gas & Consumable Fuels) 142,782600 Porto Seguro SA (Insurance) 5,4295,100 Qualicorp SA (Health Care Providers & Services) 36,31311,485 Raia Drogasil SA (Food & Staples Retailing) 244,0628,750 Rumo SA* (Road & Rail) 24,066900 Sao Martinho SA (Food Products) 5,0471,700 Smiles SA (Media) 36,9778,400 Telefonica Brasil SA ADR (Diversified Telecommunication Services) 124,2368,100 TIM Participacoes SA (Wireless Telecommunication Services) 26,1832,700 Tim Participacoes SA ADR (Wireless Telecommunication Services) 43,4973,400 TOTVS SA (Software) 29,779
Common Stocks �� (continued)Brazil �� (continued)11,200 Ultrapar Participacoes SA (Oil, Gas & Consumable Fuels) 248,4852,400 Valid Solucoes e Servicos de Seguranca em Meios de Pagamento e Identificacao SA (Commercial
Services & Supplies) 16,9758,500 WEG SA (Machinery) 47,400
4,403,145British Virgin Islands* �� 0.0%5,234 Lenta Ltd. (Food & Staples Retailing) 33,341300 Luxoft Holding, Inc. (IT Services) 18,4951,433 Mail.Ru Group Ltd. GDR (Internet Software & Services) 37,759
89,595Canada �� 2.5%701 Agnico Eagle Mines Ltd. (Metals & Mining) 33,50814,600 Alamos Gold, Inc. Class A (Metals & Mining) 104,4963,700 Allied Properties Real Estate Investment Trust (Equity Real Estate Investment Trusts (REITs)) 99,2871,800 ARC Resources Ltd. (Oil, Gas & Consumable Fuels) 23,6301,100 Bank of Montreal (Banks) 77,8921,900 Barrick Gold Corp. (Metals & Mining) 31,7632,000 BCE, Inc. (Diversified Telecommunication Services) 91,05916,292 Birchcliff Energy Ltd. (Oil, Gas & Consumable Fuels) 83,6652,700 Brookfield Asset Management, Inc. Class A (Capital Markets) 99,80712,385 Canadian Energy Services & Technology Corp. (Energy Equipment & Services) 58,520900 Canadian Imperial Bank of Commerce (Banks) 72,690600 Canadian National Railway Co. (Road & Rail) 43,3701,100 Canadian Natural Resources Ltd. (Oil, Gas & Consumable Fuels) 35,03811,812 Canadian Pacific Railway Ltd. 1,810,0851,000 Canadian Tire Corp. Ltd. Class A (Multiline Retail) 122,047
Copyright © 2017 www.secdatabase.com. All Rights Reserved.Please Consider the Environment Before Printing This Document

575 CCL Industries, Inc. Class B (Containers & Packaging) 133,1094,200 Cenovus Energy, Inc. (Oil, Gas & Consumable Fuels) 41,875400 CGI Group, Inc. Class A* (IT Services) 19,3051,500 CI Financial Corp. (Capital Markets) 29,340193 Constellation Software, Inc. (Software) 88,27216,700 Corus Entertainment, Inc. Class B (Media) 163,9352,700 Crescent Point Energy Corp. (Oil, Gas & Consumable Fuels) 26,7225,700 Detour Gold Corp.* (Metals & Mining) 72,030
22 The accompanying notes are an integral part of these financial statements.
Copyright © 2017 www.secdatabase.com. All Rights Reserved.Please Consider the Environment Before Printing This Document

GOLDMAN SACHS MULTI-MANAGER GLOBAL EQUITY FUND
Shares Description ValueCommon Stocks �� (continued)Canada �� (continued)2,100 Dollarama, Inc. (Multiline Retail) $ 183,8393,700 Emera, Inc. (Electric Utilities) 128,072500 Enbridge, Inc. (Oil, Gas & Consumable Fuels) 20,72570,559 Encana Corp. (Oil, Gas & Consumable Fuels) 755,1865,300 Enerflex, Ltd. (Energy Equipment & Services) 74,70215,300 Enerplus Corp. (Oil, Gas & Consumable Fuels) 110,403400 Fairfax Financial Holdings Ltd. (Insurance) 182,8504,400 Fortis, Inc. (Electric Utilities) 143,1801,500 Franco-Nevada Corp. (Metals & Mining) 102,01817,200 Gildan Activewear, Inc. (Textiles, Apparel & Luxury Goods) 482,2124,900 Goldcorp, Inc. (Metals & Mining) 68,4043,000 Great-West Lifeco, Inc. (Insurance) 80,7009,300 H&R Real Estate Investment Trust (Equity Real Estate Investment Trusts (REITs)) 157,78813,463 HudBay Minerals, Inc. (Metals & Mining) 80,3811,400 Imperial Oil Ltd. (Oil, Gas & Consumable Fuels) 40,7272,800 Intact Financial Corp. (Insurance) 191,808� International Petroleum Corp.* (Oil, Gas & Consumable Fuels) 13,600 Kinaxis, Inc.* (Software) 215,86013,000 Kirkland Lake Gold Ltd.* (Metals & Mining) 89,9971,200 Loblaw Cos. Ltd. (Food & Staples Retailing) 67,34720,812 Lundin Mining Corp. (Metals & Mining) 110,9931,500 Magna International, Inc. (Auto Components) 62,65722,000 Manulife Financial Corp. (Insurance) 385,8321,200 Metro, Inc. (Food & Staples Retailing) 41,1242,400 National Bank of Canada (Banks) 93,2716,800 New Flyer Industries, Inc. (Machinery) 253,30927,700 OceanaGold Corp. (Metals & Mining) 90,301900 Onex Corp. (Diversified Financial Services) 64,9366,000 Open Text Corp. 208,04811,100 Parex Resources, Inc.* (Oil, Gas & Consumable Fuels) 137,830909 Pembina Pipeline Corp. (Oil, Gas & Consumable Fuels) 28,9673,600 Potash Corp. of Saskatchewan, Inc. (Chemicals) 60,7102,600 Power Corp. of Canada (Insurance) 60,2452,300 Power Financial Corp. (Insurance) 58,45021,400 Pure Industrial Real Estate Trust (Equity Real Estate Investment Trusts (REITs)) 102,37117,900 Raging River Exploration, Inc.* (Oil, Gas & Consumable Fuels) 104,511
Common Stocks �� (continued)Canada �� (continued)400 Restaurant Brands International, Inc. (Hotels, Restaurants & Leisure) 22,4527,300 RioCan Real Estate Investment Trust (Equity Real Estate Investment Trusts (REITs)) 138,66811,960 Ritchie Bros. Auctioneers, Inc. (Commercial Services & Supplies) 391,8101,600 Rogers Communications, Inc. Class B (Wireless Telecommunication Services) 73,3631,300 Royal Bank of Canada (Banks) 89,0162,200 Saputo, Inc. (Food Products) 72,3315,200 Seven Generations Energy Ltd. Class A* (Oil, Gas & Consumable Fuels) 92,0733,800 Shaw Communications, Inc. Class B (Media) 80,5632,909 Silver Wheaton Corp. (Metals & Mining) 58,0501,500 SNC-Lavalin Group, Inc. (Construction & Engineering) 60,32724,601 Spartan Energy Corp.* (Oil, Gas & Consumable Fuels) 41,0903,100 Sun Life Financial, Inc. (Insurance) 109,484900 Suncor Energy, Inc. (Oil, Gas & Consumable Fuels) 28,2062,200 Teck Resources Ltd. Class B (Metals & Mining) 45,642900 TELUS Corp. (Diversified Telecommunication Services) 29,9467,000 TFI International, Inc. (Road & Rail) 152,4051,300 The Bank of Nova Scotia (Banks) 72,2642,200 The Toronto-Dominion Bank (Banks) 103,517763 Thomson Reuters Corp. (Capital Markets) 34,6724,100 Tourmaline Oil Corp.* (Oil, Gas & Consumable Fuels) 80,555703 TransCanada Corp. (Oil, Gas & Consumable Fuels) 32,6414,200 Westshore Terminals Investment Corp. (Transportation Infrastructure) 73,44418,600 Whitecap Resources, Inc. (Oil, Gas & Consumable Fuels) 131,626
10,415,345Chile �� 0.3%13,521 AES Gener SA (Independent Power and Renewable Electricity Producers) 5,13796,302 Aguas Andinas SA Class A (Water Utilities) 54,4484,388 AntarChile SA (Industrial Conglomerates) 53,926
Copyright © 2017 www.secdatabase.com. All Rights Reserved.Please Consider the Environment Before Printing This Document

218,921 Banco de Chile (Banks) 26,4061,127 Banco de Credito e Inversiones (Banks) 62,545547,723 Banco Santander Chile (Banks) 32,4479,000 Banmedica SA (Health Care Providers & Services) 20,22822,277 Cencosud SA (Food & Staples Retailing) 63,456
The accompanying notes are an integral part of these financial statements. 23
Copyright © 2017 www.secdatabase.com. All Rights Reserved.Please Consider the Environment Before Printing This Document

GOLDMAN SACHS MULTI-MANAGER GLOBAL EQUITY FUND
Schedule of Investments (continued)April 30, 2017 (Unaudited)
Shares Description ValueCommon Stocks �� (continued)Chile �� (continued)2,996 Cia Cervecerias Unidas SA (Beverages) $ 38,568239,736 Colbun SA (Independent Power and Renewable Electricity Producers) 53,05127,172 Empresa Nacional de Electricidad SA (Independent Power and Renewable Electricity Producers) 20,7986,893 Empresa Nacional de Telecomunicaciones SA* (Wireless Telecommunication Services) 82,73425,088 Empresas CMPC SA (Paper & Forest Products) 58,53210,947 Empresas COPEC SA (Oil, Gas & Consumable Fuels) 122,44529,783 Enel Americas SA (Electric Utilities) 5,8924,700 Enersis Americas SA ADR (Electric Utilities) 46,5773,200 Enersis Chile SA ADR (Electric Utilities) 17,47216,871 Engie Energia Chile SA (Electric Utilities) 30,8903,050,835 Itau CorpBanca (Banks) 27,8135,211 Latam Airlines Group SA* (Airlines) 65,74117,733 Parque Arauco SA (Real Estate Management & Development) 46,41539,088 Quinenco SA (Industrial Conglomerates) 106,09412,966 SACI Falabella (Multiline Retail) 103,67929,512 Sociedad Matriz del Banco de Chile SA (Banks) 10,4771,620 Sociedad Quimica y Minera de Chile SA ADR (Chemicals) 57,59118,731 SONDA SA (IT Services) 31,93618,774 Vina Concha y Toro SA (Beverages) 30,355
1,275,653China �� 3.7%6,000 AAC Technologies Holdings, Inc. (Electronic Equipment, Instruments & Components) 87,954129,000 Agricultural Bank of China Ltd. Class H (Banks) 59,46838,000 Air China Ltd. Class H (Airlines) 33,5987,632 Alibaba Group Holding Ltd. ADR* (Internet Software & Services) 881,496104,000 Aluminum Corp. of China Ltd. Class H* (Metals & Mining) 51,20916,500 Anhui Conch Cement Co. Ltd. Class H (Construction Materials) 57,71410,000 ANTA Sports Products Ltd. (Textiles, Apparel & Luxury Goods) 28,0676,705 Baidu, Inc. ADR* (Internet Software & Services) 1,208,442152,000 Bank of China Ltd. Class H (Banks) 73,59365,000 Bank of Communications Co. Ltd. Class H (Banks) 50,023
Common Stocks �� (continued)China �� (continued)79,000 BBMG Corp. Class H (Construction Materials) 42,24160,000 Beijing Capital International Airport Co. Ltd. (Transportation Infrastructure) 84,6449,000 Beijing Enterprises Holdings Ltd. (Industrial Conglomerates) 43,95050,000 Beijing Enterprises Water Group Ltd. (Water Utilities) 38,31146,000 Belle International Holdings Ltd. (Textiles, Apparel & Luxury Goods) 31,166114,000 Brilliance China Automotive Holdings Ltd. (Automobiles) 190,9955,000 Byd Co. Ltd. Class H (Automobiles) 29,46385,000 CGN Power Co. Ltd. Class H(a) (Independent Power and Renewable Electricity Producers) 25,680200 China Biologic Products, Inc.* (Biotechnology) 23,60042,000 China Coal Energy Co. Ltd. Class H* (Oil, Gas & Consumable Fuels) 20,38732,000 China Communications Construction Co. Ltd. Class H (Construction & Engineering) 44,0202,500 China Conch Venture Holdings Ltd. (Machinery) 4,982301,000 China Construction Bank Corp. Class H (Banks) 244,31158,000 China Eastern Airlines, Corp. Ltd. Class H (Airlines) 30,38844,000 China Everbright Bank Co. Ltd. Class H (Banks) 20,62318,000 China Everbright International Ltd. (Commercial Services & Supplies) 24,34479,000 China Evergrande Group (Real Estate Management & Development) 84,2615,000 China Galaxy Securities Co. Ltd. Class H (Capital Markets) 4,56421,000 China Hongqiao Group Ltd. (Metals & Mining) 19,03413,000 China Huarong Asset Management Co. Ltd. Class H*(a) (Capital Markets) 5,482113,000 China Huishan Dairy Holdings Co. Ltd. (Food Products) 6,1028,000 China Life Insurance Co. Ltd. Class H (Insurance) 24,32446,000 China Longyuan Power Group Corp. Ltd. Class H (Independent Power and Renewable
Electricity Producers) 35,42422,000 China Medical System Holdings Ltd. (Pharmaceuticals) 38,01323,000 China Mengniu Dairy Co. Ltd. (Food Products) 44,53113,500 China Merchants Bank Co. Ltd. Class H (Banks) 35,05993,264 China Merchants Holdings International Co. Ltd. (Transportation Infrastructure) 266,470
Copyright © 2017 www.secdatabase.com. All Rights Reserved.Please Consider the Environment Before Printing This Document

24 The accompanying notes are an integral part of these financial statements.
Copyright © 2017 www.secdatabase.com. All Rights Reserved.Please Consider the Environment Before Printing This Document

GOLDMAN SACHS MULTI-MANAGER GLOBAL EQUITY FUND
Shares Description ValueCommon Stocks �� (continued)China �� (continued)6,000 China Minsheng Banking Corp. Ltd. Class H (Banks) $ 5,909154,000 China Mobile Ltd. (Wireless Telecommunication Services) 1,639,57966,000 China Molybdenum Co. Ltd. Class H (Metals & Mining) 20,09234,000 China National Building Material Co. Ltd. Class H (Construction Materials) 22,6136,000 China Oilfield Services Ltd. Class H (Energy Equipment & Services) 5,52422,000 China Overseas Land & Investment Ltd. (Real Estate Management & Development) 63,82355,600 China Pacific Insurance Group Co. Ltd. Class H (Insurance) 205,130160,000 China Petroleum & Chemical Corp. Class H (Oil, Gas & Consumable Fuels) 129,92941,500 China Railway Construction Corp. Ltd. Class H (Construction & Engineering) 57,95541,000 China Railway Group Ltd. Class H (Construction & Engineering) 34,78916,000 China Resources Beer Holdings Co. Ltd.* (Beverages) 38,50718,000 China Resources Gas Group Ltd. (Gas Utilities) 60,70830,000 China Resources Power Holdings Co. Ltd. (Independent Power and Renewable Electricity Producers) 54,04532,500 China Shenhua Energy Co. Ltd. Class H (Oil, Gas & Consumable Fuels) 75,74048,000 China Southern Airlines Co. Ltd. Class H (Airlines) 31,90732,000 China State Construction International Holdings Ltd. (Construction & Engineering) 58,03256,000 China Telecom Corp. Ltd. Class H (Diversified Telecommunication Services) 27,35840,000 China Unicom Hong Kong Ltd. (Diversified Telecommunication Services) 51,76111,800 China Vanke Co. Ltd. Class H (Real Estate Management & Development) 29,90813,000 Chongqing Rural Commercial Bank Co. Ltd. Class H (Banks) 8,94142,000 CITIC Ltd. (Industrial Conglomerates) 60,905130,000 CITIC Securities Co. Ltd. Class H (Capital Markets) 272,488532,000 CNOOC Ltd. (Oil, Gas & Consumable Fuels) 620,630104,000 Country Garden Holdings Co. Ltd. (Real Estate Management & Development) 98,90934,000 CRRC Corp. Ltd. Class H (Machinery) 33,13230,000 CSPC Pharmaceutical Group Ltd. (Pharmaceuticals) 41,61033,193 Ctrip.com International Ltd. ADR* (Internet & Direct Marketing Retail) 1,676,578
Common Stocks �� (continued)China �� (continued)114,000 Datang International Power Generation Co. Ltd. Class H (Independent Power and Renewable
Electricity Producers) 33,96336,000 Dongfeng Motor Group Co. Ltd. Class H (Automobiles) 37,81285,000 Geely Automobile Holdings Ltd. (Automobiles) 114,5252,200 GF Securities Co. Ltd. Class H (Capital Markets) 4,55447,000 GOME Electrical Appliances Holding Ltd. (Specialty Retail) 6,40521,000 Great Wall Motor Co. Ltd. Class H (Automobiles) 22,78676,000 Guangdong Investment Ltd. (Water Utilities) 117,58222,000 Guangzhou Automobile Group Co. Ltd. Class H (Automobiles) 34,19012,000 Guangzhou Baiyunshan Pharmaceutical Holdings Co. Ltd. Class H (Pharmaceuticals) 34,29620,400 Guangzhou R&F Properties Co. Ltd. Class H (Real Estate Management & Development) 34,33726,000 Hengan International Group Co. Ltd. (Personal Products) 194,29362,000 Huadian Power International Co. Ltd. Class H (Independent Power and Renewable Electricity
Producers) 26,119108,000 Huaneng Power International Inc. Class H (Independent Power and Renewable Electricity Producers) 74,44444,000 Huaneng Renewables Corp. Ltd. Class H (Independent Power and Renewable Electricity Producers) 15,3592,400 Huatai Securities Co. Ltd.(a) (Capital Markets) 4,647328,000 Industrial and Commercial Bank of China Ltd. Class H (Banks) 213,91017,091 JD.com, Inc. ADR* (Internet & Direct Marketing Retail) 599,38158,000 Jiangsu Expressway Co. Ltd. (Transportation Infrastructure) 85,58536,000 Jiangxi Copper Co. Ltd. Class H (Metals & Mining) 56,14822,000 Kunlun Energy Co. Ltd. (Oil, Gas & Consumable Fuels) 19,85334,000 Longfor Properties Co. Ltd. (Real Estate Management & Development) 58,83180,000 Maanshan Iron & Steel Co. Ltd.* (Metals & Mining) 26,998760 NetEase, Inc. ADR (Internet Software & Services) 201,6961,100 New China Life Insurance Co. Ltd. (Insurance) 5,438500 New Oriental Education & Technology Group, Inc. ADR* (Diversified Consumer Services) 32,270
The accompanying notes are an integral part of these financial statements. 25
Copyright © 2017 www.secdatabase.com. All Rights Reserved.Please Consider the Environment Before Printing This Document

GOLDMAN SACHS MULTI-MANAGER GLOBAL EQUITY FUND
Schedule of Investments (continued)April 30, 2017 (Unaudited)
Shares Description ValueCommon Stocks �� (continued)China �� (continued)114,000 PetroChina Co. Ltd. Class H (Oil, Gas & Consumable Fuels) $ 80,31576,000 Ping An Insurance Group Co. of China Ltd. Class H (Insurance) 427,30057,500 Semiconductor Manufacturing International Corp.* (Semiconductors & Semiconductor Equipment) 72,63736,000 Shandong Weigao Group Medical Polymer Co. Ltd. Class H (Health Care Equipment & Supplies) 26,24268,000 Shanghai Electric Group Co. Ltd.* (Electrical Equipment) 32,0479,000 Shanghai Fosun Pharmaceutical Group Co. Ltd. Class H (Pharmaceuticals) 33,93039,800 Shanghai Pharmaceuticals Holding Co. Ltd. Class H (Health Care Providers & Services) 105,26915,000 Shenzhou International Group Holdings Ltd. (Textiles, Apparel & Luxury Goods) 98,69951,000 Sihuan Pharmaceutical Holdings Group Ltd. (Pharmaceuticals) 22,66448,000 Sinopec Shanghai Petrochemical Co. Ltd. Class H (Chemicals) 26,82712,800 Sinopharm Group Co. Ltd. Class H (Health Care Providers & Services) 57,43118,000 Sunac China Holdings Ltd. (Real Estate Management & Development) 23,4435,000 Sunny Optical Technology Group Co. Ltd. (Electronic Equipment, Instruments & Components) 41,08378,597 Tencent Holdings Ltd. (Internet Software & Services) 2,462,70558,000 The People�s Insurance Co. Group of China Ltd. (Insurance) 23,9016,000 Tingyi Cayman Islands Holding Corp. (Food Products) 7,7063,000 TravelSky Technology Ltd. Class H (IT Services) 7,90712,000 Tsingtao Brewery Co. Ltd. Class H (Beverages) 53,97736,000 Uni-President China Holdings Ltd. (Food Products) 25,29360,000 Want Want China Holdings Ltd. (Food Products) 43,1973,000 Weichai Power Co. Ltd. Class H (Machinery) 4,86756,000 Zhejiang Expressway Co. Ltd. Class H (Transportation Infrastructure) 69,663192,000 Zijin Mining Group Co. Ltd. Class H (Metals & Mining) 68,002
15,290,962Colombia �� 0.1%7,435 Almacenes Exito SA (Food & Staples Retailing) 38,514
Common Stocks �� (continued)Colombia �� (continued)1,299 Banco de Bogota SA (Banks) 26,6253,315 Bancolombia SA (Banks) 30,4681,100 Bancolombia SA ADR (Banks) 43,43917,310 Celsia SA ESP (Electric Utilities) 26,3599,553 Cementos Argos SA (Construction Materials) 38,6411,502 Corp. Financiera Colombiana SA (Diversified Financial Services) 14,4186,400 Ecopetrol SA ADR (Oil, Gas & Consumable Fuels) 58,49663,731 Empresa de Energia de Bogota SA ESP (Gas Utilities) 39,96771,482 Empresa de Telecomunicaciones de Bogota* (Diversified Telecommunication Services) 15,5505,230 Grupo Argos SA (Construction Materials) 36,2653,202 Grupo de Inversiones Suramericana SA (Diversified Financial Services) 42,33810,108 Grupo Nutresa SA (Food Products) 83,90113,628 Interconexion Electrica SA ESP (Electric Utilities) 54,012
548,993Croatia �� 0.0%167 Atlantic Grupa dd (Food Products) 19,1071,732 Hrvatski Telekom dd (Diversified Telecommunication Services) 45,169410 Podravka Prehrambena Ind DD (Food Products) 20,22410,000 Valamar Riviera DD (Hotels, Restaurants & Leisure) 61,2942,800 Zagrebacka Banka dd (Banks) 19,320
165,114Cyprus �� 0.0%1,500 QIWI PLC ADR (IT Services) 29,085
Czech Republic �� 0.1%9,029 CEZ AS (Electric Utilities) 157,5362,160 Komercni banka AS (Banks) 83,6898,215 Moneta Money Bank AS(a) (Banks) 26,5303,623 O2 Czech Republic AS (Diversified Telecommunication Services) 42,7733,512 Unipetrol AS (Chemicals) 39,753
350,281Denmark �� 0.9%22 AP Moller � Maersk A/S Class B (Marine) 37,9511,254 Carlsberg A/S Class B (Beverages) 125,127
Copyright © 2017 www.secdatabase.com. All Rights Reserved.Please Consider the Environment Before Printing This Document
12,914 Chr Hansen Holding A/S (Chemicals) 870,06711,856 Coloplast A/S Class B (Health Care Equipment & Supplies) 1,015,1793,595 Danske Bank A/S (Banks) 130,709522 DONG Energy A/S(a) (Electric Utilities) 20,555
26 The accompanying notes are an integral part of these financial statements.
Copyright © 2017 www.secdatabase.com. All Rights Reserved.Please Consider the Environment Before Printing This Document

GOLDMAN SACHS MULTI-MANAGER GLOBAL EQUITY FUND
Shares Description ValueCommon Stocks �� (continued)Denmark �� (continued)1,847 DSV A/S (Road & Rail) $ 102,851141 Genmab A/S* (Biotechnology) 28,0562,105 GN Store Nord A/S (Health Care Equipment & Supplies) 54,7153,143 ISS A/S (Commercial Services & Supplies) 130,3721,887 Jyske Bank A/S (Banks) 100,909230 Novo Nordisk A/S Class B (Pharmaceuticals) 8,95018,248 Novozymes A/S Class B (Chemicals) 787,8233,745 Royal Unibrew A/S (Beverages) 162,83721,879 TDC A/S (Diversified Telecommunication Services) 117,369110 Vestas Wind Systems A/S (Electrical Equipment) 9,472
3,702,942Finland �� 0.3%232 Amer Sports Oyj* (Leisure Products) 5,1431,201 Elisa Oyj (Diversified Telecommunication Services) 40,8425,692 Fortum Oyj (Electric Utilities) 82,7631,755 Huhtamaki Oyj (Containers & Packaging) 68,0282,553 Kesko Oyj Class B (Food & Staples Retailing) 119,569196 Kone Oyj Class B (Machinery) 8,9802,246 Metso Oyj (Machinery) 80,4383,535 Neste Oyj (Oil, Gas & Consumable Fuels) 144,0495,326 Nokia Oyj (Communications Equipment) 30,448906 Nokian Renkaat Oyj (Auto Components) 38,9411,878 Orion Oyj Class B (Pharmaceuticals) 107,6273,035 Outokumpu Oyj (Metals & Mining) 29,063961 Sampo Oyj Class A (Insurance) 45,9917,992 Sanoma Oyj (Media) 70,51616,138 Sponda OYJ (Real Estate Management & Development) 71,1822,836 Stora Enso Oyj Class R (Paper & Forest Products) 33,6571,377 Tieto OYJ (IT Services) 43,1771,565 UPM-Kymmene Oyj (Paper & Forest Products) 41,23312,661 Valmet Oyj (Machinery) 230,619
1,292,266France �� 2.8%291 Aeroports de Paris (Transportation Infrastructure) 38,81554 Air Liquide SA (Chemicals) 6,5063,991 Alstom SA* (Machinery) 126,6762,058 Altran Technologies SA (IT Services) 34,531629 Amundi SA(a) (Capital Markets) 41,392640 Arkema SA (Chemicals) 67,765251 Atos SE (IT Services) 32,8771,190 AXA SA (Insurance) 31,749202 BioMerieux (Health Care Equipment & Supplies) 40,395
Common Stocks �� (continued)France �� (continued)6,701 BNP Paribas SA (Banks) 472,93817,532 Bollore SA (Air Freight & Logistics) 71,3361,564 Bouygues SA (Construction & Engineering) 65,741656 Bureau Veritas SA (Professional Services) 15,196615 Cap Gemini SA (IT Services) 61,5751,115 Casino Guichard-Perrachon SA (Food & Staples Retailing) 67,150127 Christian Dior SE (Textiles, Apparel & Luxury Goods) 34,832578 Cie de Saint-Gobain (Building Products) 31,187601 Cie Generale des Etablissements Michelin (Auto Components) 78,6114,790 Cie Plastic Omnium SA (Auto Components) 187,4593,306 CNP Assurances (Insurance) 69,0581,793 Credit Agricole SA (Banks) 26,669389 Danone SA (Food Products) 27,225823 Dassault Systemes (Software) 73,4291,585 Edenred (Commercial Services & Supplies) 40,602741 Eiffage SA (Construction & Engineering) 62,7667,664 Electricity de France SA (Electric Utilities) 63,9773,949 Elior Group(a) (Hotels, Restaurants & Leisure) 98,5231,058 Elis SA (Commercial Services & Supplies) 21,89767,846 Engie SA (Multi-Utilities) 956,6316,210 Essilor International SA (Health Care Equipment & Supplies) 804,772505 Eurazeo SA (Diversified Financial Services) 34,229
Copyright © 2017 www.secdatabase.com. All Rights Reserved.Please Consider the Environment Before Printing This Document

343 Eurofins Scientific SE (Life Sciences Tools & Services) 168,9374,121 Eutelsat Communications SA (Media) 97,501511 Faurecia (Auto Components) 24,948942 Fonciere Des Regions (Equity Real Estate Investment Trusts (REITs)) 84,0721,103 Gecina SA (Equity Real Estate Investment Trusts (REITs)) 156,8783,063 Groupe Eurotunnel SE (Transportation Infrastructure) 33,6491,713 Hermes International (Textiles, Apparel & Luxury Goods) 818,9331,627 ICADE (Equity Real Estate Investment Trusts (REITs)) 120,817129 Iliad SA (Diversified Telecommunication Services) 31,311970 Imerys SA (Construction Materials) 83,450284 Ingenico SA (Electronic Equipment, Instruments & Components) 25,7152,604 Ipsen SA (Pharmaceuticals) 303,165349 JCDecaux SA (Media) 12,312363 Kering (Textiles, Apparel & Luxury Goods) 112,515
The accompanying notes are an integral part of these financial statements. 27
Copyright © 2017 www.secdatabase.com. All Rights Reserved.Please Consider the Environment Before Printing This Document

GOLDMAN SACHS MULTI-MANAGER GLOBAL EQUITY FUND
Schedule of Investments (continued)April 30, 2017 (Unaudited)
Shares Description ValueCommon Stocks �� (continued)France �� (continued)263 Klepierre (Equity Real Estate Investment Trusts (REITs)) $ 10,32567 L�Oreal SA (Personal Products) 13,3452,801 Lagardere SCA (Media) 85,7404,362 LVMH Moet Hennessy Louis Vuitton SE (Textiles, Apparel & Luxury Goods) 1,076,8425,081 Natixis SA (Banks) 35,3603,190 Nexans SA* (Electrical Equipment) 177,3384,138 Nexity SA (Real Estate Management & Development) 224,9932,095 Orange SA (Diversified Telecommunication Services) 32,4253,829 Orpea (Health Care Providers & Services) 391,09691 Pernod Ricard SA (Beverages) 11,3851,586 Peugeot SA* (Automobiles) 33,251421 Publicis Groupe SA (Media) 30,395105 Renault SA (Automobiles) 9,7922,592 Rexel SA (Trading Companies & Distributors) 46,2893,241 Rubis SCA (Gas Utilities) 329,259123 Safran SA (Aerospace & Defense) 10,1855,885 Sanofi (Pharmaceuticals) 556,09614,786 Schneider Electric SE (Electrical Equipment) 1,171,1366,972 SCOR SE (Insurance) 275,791606 SEB SA (Household Durables) 97,586245 SFR Group SA* (Diversified Telecommunication Services) 8,022500 Societe BIC SA (Commercial Services & Supplies) 56,189490 Societe Generale SA (Banks) 26,868330 Sodexo SA (Hotels, Restaurants & Leisure) 41,9403,283 SOITEC* (Semiconductors & Semiconductor Equipment) 139,3943,617 Suez (Multi-Utilities) 59,4163,397 Teleperformance (Professional Services) 427,169342 Thales SA (Aerospace & Defense) 35,9463,039 TOTAL SA (Oil, Gas & Consumable Fuels) 156,002804 Ubisoft Entertainment SA* (Software) 38,087162 Unibail-Rodamco SE (Equity Real Estate Investment Trusts (REITs)) 39,7781,765 Veolia Environnement SA (Multi-Utilities) 33,589376 Vinci SA (Construction & Engineering) 32,0502,554 Vivendi SA (Media) 50,659490 Wendel SA (Diversified Financial Services) 68,689
11,693,139Germany �� 2.0%7,237 Aareal Bank AG (Thrifts & Mortgage Finance) 291,0783,804 adidas AG (Textiles, Apparel & Luxury Goods) 762,649
Common Stocks �� (continued)Germany �� (continued)336 Allianz SE (Insurance) 63,9671,428 Aurubis AG (Metals & Mining) 99,796578 Axel Springer AG (Media) 32,4309,498 BASF SE (Chemicals) 925,285241 Bayerische Motoren Werke AG (Automobiles) 23,026782 Bechtle AG (IT Services) 89,72380 Beiersdorf AG (Personal Products) 7,960113 Brenntag AG (Trading Companies & Distributors) 6,7012,836 Carl Zeiss Meditec AG (Health Care Equipment & Supplies) 128,9203,228 Commerzbank AG* (Banks) 31,646140 Covestro AG(a) (Chemicals) 10,913297 Daimler AG (Automobiles) 22,131802 Deutsche Bank AG* (Capital Markets) 14,4212,795 Deutsche EuroShop AG (Real Estate Management & Development) 113,4734,653 Deutsche Lufthansa AG (Airlines) 80,275650 Deutsche Post AG (Air Freight & Logistics) 23,3631,709 Deutsche Telekom AG (Diversified Telecommunication Services) 29,9773,056 Deutsche Wohnen AG (Real Estate Management & Development) 104,495765 Drillisch AG (Wireless Telecommunication Services) 41,00167 Duerr AG (Machinery) 6,6784,423 E.ON SE (Multi-Utilities) 34,479
Copyright © 2017 www.secdatabase.com. All Rights Reserved.Please Consider the Environment Before Printing This Document

787 Evonik Industries AG (Chemicals) 26,278110 Fielmann AG (Specialty Retail) 8,4091,210 Fraport AG Frankfurt Airport Services Worldwide (Transportation Infrastructure) 95,1951,040 Freenet AG (Wireless Telecommunication Services) 32,639425 Fresenius Medical Care AG & Co. KGaA (Health Care Providers & Services) 37,727432 Fresenius SE & Co. KGaA (Health Care Providers & Services) 35,048739 GEA Group AG (Machinery) 31,417933 Gerresheimer AG (Life Sciences Tools & Services) 73,192470 Hannover Rueck SE (Insurance) 56,383350 HeidelbergCement AG (Construction Materials) 32,402211 Henkel AG & Co. KGaA (Household Products) 28,709371 HOCHTIEF AG (Construction & Engineering) 66,814474 HUGO BOSS AG (Textiles, Apparel & Luxury Goods) 36,0452,534 K+S AG (Chemicals) 60,457563 KION Group AG (Machinery) 38,141344 LANXESS AG (Chemicals) 24,8391,432 LEG Immobilien AG* (Real Estate Management & Development) 123,026
28 The accompanying notes are an integral part of these financial statements.
Copyright © 2017 www.secdatabase.com. All Rights Reserved.Please Consider the Environment Before Printing This Document

GOLDMAN SACHS MULTI-MANAGER GLOBAL EQUITY FUND
Shares Description ValueCommon Stocks �� (continued)Germany �� (continued)1,809 Linde AG (Chemicals) $ 325,0561,023 MAN SE (Machinery) 107,483183 Merck KGaA (Pharmaceuticals) 21,497560 MTU Aero Engines AG (Aerospace & Defense) 80,323362 Muenchener Rueckversicherungs-Gesellschaft AG in Muenchen (Insurance) 69,4021,172 OSRAM Licht AG (Electrical Equipment) 78,5121,159 Pfeiffer Vacuum Technology AG (Machinery) 150,4743,769 Rheinmetall AG (Industrial Conglomerates) 345,9554,092 RWE AG* (Multi-Utilities) 67,7776,577 SAP SE (Software) 658,79217,386 SAP SE ADR (Software) 1,741,729268 Siemens AG (Industrial Conglomerates) 38,4432,814 Siltronic AG* (Semiconductors & Semiconductor Equipment) 202,2941,815 Software AG (Software) 79,857450 Stada Arzneimittel AG (Pharmaceuticals) 31,887571 Symrise AG (Chemicals) 39,97516,805 Telefonica Deutschland Holding AG (Diversified Telecommunication Services) 81,4834,936 TLG Immobilien AG (Real Estate Management & Development) 99,8804,053 TUI AG (Hotels, Restaurants & Leisure) 58,963571 United Internet AG (Internet Software & Services) 26,2812,927 Vonovia SE (Real Estate Management & Development) 105,9701,358 Wirecard AG (IT Services) 80,299888 Zalando SE*(a) (Internet & Direct Marketing Retail) 39,172
8,282,612Greece �� 0.1%2,925 Aegean Airlines SA (Airlines) 25,1711,400 Aegean Marine Petroleum Network, Inc. (Oil, Gas & Consumable Fuels) 15,61021,591 Alpha Bank AE* (Banks) 45,9962,300 Costamare, Inc. (Marine) 15,5022,000 Diana Shipping, Inc.* (Marine) 7,98044,496 Eurobank Ergasias SA* (Banks) 35,7852,588 Grivalia Properties REIC AE (Equity Real Estate Investment Trusts (REITs)) 24,0758,812 Hellenic Telecommunications Organization SA (Diversified Telecommunication Services) 85,5823,753 JUMBO SA (Specialty Retail) 59,2372,047 Motor Oil Hellas Corinth Refineries SA (Oil, Gas & Consumable Fuels) 34,7182,500 Mytilineos Holdings SA* (Industrial Conglomerates) 18,792
Common Stocks �� (continued)Greece �� (continued)117,888 National Bank of Greece SA* (Banks) 36,7234,527 OPAP SA (Hotels, Restaurants & Leisure) 44,86122,900 Piraeus Bank SA* (Banks) 4,8658,497 Public Power Corp. SA* (Electric Utilities) 31,2693,269 Titan Cement Co. SA (Construction Materials) 85,4263,100 Tsakos Energy Navigation Ltd. (Oil, Gas & Consumable Fuels) 14,229
585,821Hong Kong �� 0.9%108,608 AIA Group Ltd. (Insurance) 751,7232,300 ASM Pacific Technology Ltd. (Semiconductors & Semiconductor Equipment) 34,2418,000 BOC Hong Kong Holdings Ltd. (Banks) 32,87623,000 Cathay Pacific Airways Ltd. (Airlines) 33,1023,000 Cheung Kong Infrastructure Holdings Ltd. (Electric Utilities) 26,2641,000 Cheung Kong Property Holdings Ltd. (Real Estate Management & Development) 7,17465,000 China Agri-Industries Holdings Ltd.* (Food Products) 32,15135,000 China CITIC Bank Corp. Ltd. Series H (Banks) 22,15612,000 China Everbright Ltd. (Capital Markets) 27,41332,000 China Gas Holdings Ltd. (Gas Utilities) 50,17116,000 China Resources Land Ltd. (Real Estate Management & Development) 44,3482,200 China Taiping Insurance Holdings Co. Ltd.* (Insurance) 5,4872,500 CK Hutchison Holdings Ltd. (Industrial Conglomerates) 31,2184,000 CLP Holdings Ltd. (Electric Utilities) 42,1854,000 COSCO SHIPPING Ports Ltd. (Transportation Infrastructure) 4,381178,000 CP Pokphand Co. Ltd. (Food Products) 15,3068,400 Dah Sing Financial Group Ltd. (Banks) 63,6794,000 Dairy Farm International Holdings Ltd. (Food & Staples Retailing) 35,58041,100 Esprit Holdings Ltd.* (Specialty Retail) 31,88754,000 Far East Horizon Ltd. (Diversified Financial Services) 49,674
Copyright © 2017 www.secdatabase.com. All Rights Reserved.Please Consider the Environment Before Printing This Document

82,000 First Pacific Co. Ltd. (Diversified Financial Services) 63,1423,500 Fosun International Ltd. (Industrial Conglomerates) 5,301135,000 Fullshare Holdings Ltd. (Real Estate Management & Development) 43,99861,000 GCL-Poly Energy Holdings Ltd.* (Semiconductors & Semiconductor Equipment) 7,3723,000 Haier Electronics Group Co. Ltd. (Household Durables) 6,966
The accompanying notes are an integral part of these financial statements. 29
Copyright © 2017 www.secdatabase.com. All Rights Reserved.Please Consider the Environment Before Printing This Document

GOLDMAN SACHS MULTI-MANAGER GLOBAL EQUITY FUND
Schedule of Investments (continued)April 30, 2017 (Unaudited)
Shares Description ValueCommon Stocks �� (continued)Hong Kong �� (continued)50,000 Haitong International Securities Group Ltd. (Capital Markets) $ 27,07910,000 Hang Lung Group Ltd. (Real Estate Management & Development) 41,6993,000 Hang Lung Properties Ltd. (Real Estate Management & Development) 7,868300 Hang Seng Bank Ltd. (Banks) 6,0821,000 Henderson Land Development Co. Ltd. (Real Estate Management & Development) 6,3383,000 Hong Kong & China Gas Co. Ltd. (Gas Utilities) 5,9944,700 Hongkong Land Holdings Ltd. (Real Estate Management & Development) 36,22319,000 Hopewell Holdings Ltd. (Industrial Conglomerates) 72,48821,000 Hysan Development Co. Ltd. (Real Estate Management & Development) 99,038200 Jardine Matheson Holdings Ltd. (Industrial Conglomerates) 12,906600 Jardine Strategic Holdings Ltd. (Industrial Conglomerates) 25,35410,000 Kerry Properties Ltd. (Real Estate Management & Development) 37,3832,000 Kingboard Chemical Holdings Ltd. (Electronic Equipment, Instruments & Components) 7,21212,000 Kingston Financial Group Ltd. (Capital Markets) 4,15014,000 Li & Fung Ltd. (Textiles, Apparel & Luxury Goods) 5,86810,500 Link REIT (Equity Real Estate Investment Trusts (REITs)) 75,47469,000 Melco International Development Ltd. (Hotels, Restaurants & Leisure) 141,6618,000 Minth Group Ltd. (Auto Components) 29,68918,500 MTR Corp. Ltd. (Road & Rail) 106,43427,000 New World Development Co. Ltd. (Real Estate Management & Development) 33,57525,000 Nine Dragons Paper Holdings Ltd. (Paper & Forest Products) 26,96251,000 NWS Holdings Ltd. (Industrial Conglomerates) 95,775101,000 PCCW Ltd. (Diversified Telecommunication Services) 57,0224,000 PICC Property and Casualty Co. Ltd. Class H (Insurance) 6,4387,500 Power Assets Holdings Ltd. (Electric Utilities) 67,45655,200 Sands China Ltd. (Hotels, Restaurants & Leisure) 250,00814,500 Shimao Property Holdings Ltd. (Real Estate Management & Development) 23,27367,000 Sino Biopharmaceutical Ltd (Pharmaceuticals) 55,10020,058 Sino Land Co. Ltd. (Real Estate Management & Development) 33,943
Common Stocks �� (continued)Hong Kong �� (continued)63,000 Sino-Ocean Group Holding Ltd. (Real Estate Management & Development) 30,73240,000 Sun Art Retail Group Ltd. (Food & Staples Retailing) 41,2432,000 Sun Hung Kai Properties Ltd. (Real Estate Management & Development) 29,9702,500 Swire Pacific Ltd. Class A (Real Estate Management & Development) 24,10710,800 Swire Properties Ltd. (Real Estate Management & Development) 36,2088,500 Techtronic Industries Co. Ltd. (Household Durables) 36,4687,660 The Bank of East Asia Ltd. (Banks) 31,6764,000 The Wharf Holdings Ltd. (Real Estate Management & Development) 34,10436,000 Vitasoy International Holdings Ltd. (Food Products) 71,0612,800 VTech Holdings Ltd. (Communications Equipment) 35,45955,000 WH Group Ltd.(a) (Food Products) 49,1435,000 Wheelock & Co. Ltd. (Real Estate Management & Development) 38,9473,200 Wynn Macau Ltd.* (Hotels, Restaurants & Leisure) 7,035230,000 Xinyi Glass Holdings Ltd. (Auto Components) 203,81833,500 Yue Yuen Industrial Holdings Ltd. (Textiles, Apparel & Luxury Goods) 132,435
3,668,693Hungary �� 0.1%15,273 Magyar Telekom Telecommunications PLC (Diversified Telecommunication Services) 25,5412,141 MOL Hungarian Oil & Gas PLC (Oil, Gas & Consumable Fuels) 161,0786,279 OTP Bank PLC (Banks) 176,5476,077 Richter Gedeon Nyrt (Pharmaceuticals) 147,162
510,328India �� 1.7%8,178 Adani Ports & Special Economic Zone Ltd. (Transportation Infrastructure) 41,65910,673 Ambuja Cements Ltd. (Construction Materials) 40,797267 Apollo Hospitals Enterprise Ltd. (Health Care Providers & Services) 5,11919,130 Ashok Leyland Ltd. (Machinery) 25,3964,009 Asian Paints Ltd. (Chemicals) 69,8464,208 Aurobindo Pharma Ltd. (Pharmaceuticals) 39,6774,143 Axis Bank Ltd. (Banks) 32,806258 Bajaj Auto Ltd. (Automobiles) 11,486
Copyright © 2017 www.secdatabase.com. All Rights Reserved.Please Consider the Environment Before Printing This Document

1,741 Bajaj Finance Ltd. (Consumer Finance) 34,510115 Bajaj Finserv Ltd. (Insurance) 8,1801,682 Bharat Forge Ltd. (Auto Components) 29,931
30 The accompanying notes are an integral part of these financial statements.
Copyright © 2017 www.secdatabase.com. All Rights Reserved.Please Consider the Environment Before Printing This Document

GOLDMAN SACHS MULTI-MANAGER GLOBAL EQUITY FUND
Shares Description ValueCommon Stocks �� (continued)India �� (continued)2,272 Bharat Petroleum Corp. Ltd. (Oil, Gas & Consumable Fuels) $ 25,40415,455 Bharti Airtel Ltd (Wireless Telecommunication Services) 85,29314,434 Bharti Infratel Ltd. (Diversified Telecommunication Services) 79,66064 Bosch Ltd. (Auto Components) 22,8623,388 Cipla Ltd. (Pharmaceuticals) 29,35931,148 Cipla Ltd. GDR (Pharmaceuticals) 269,9266,313 Coal India Ltd. (Oil, Gas & Consumable Fuels) 27,1491,399 Cummins India Ltd. (Machinery) 21,67713,764 Dabur India Ltd. (Personal Products) 61,33412,113 DLF Ltd. (Real Estate Management & Development) 35,034130 Dr Reddy�s Laboratories Ltd. (Pharmaceuticals) 5,2528,846 Dr. Reddy�s Laboratories Ltd. ADR (Pharmaceuticals) 361,359129 Eicher Motors Ltd. (Machinery) 52,2118,278 GAIL India Ltd. (Gas Utilities) 54,5202,496 Glenmark Pharmaceuticals Ltd. (Pharmaceuticals) 34,7241,561 Godrej Consumer Products Ltd. (Personal Products) 42,2903,167 Havells India Ltd. (Electrical Equipment) 23,8394,150 HCL Technologies Ltd. (IT Services) 52,510631 HDFC Bank Ltd. (Banks) 15,41224,480 HDFC Bank Ltd. ADR (Banks) 1,948,8531,045 Hero MotoCorp Ltd. (Automobiles) 53,91312,311 Hindalco Industries Ltd. (Metals & Mining) 38,1503,970 Hindustan Petroleum Corp. Ltd. (Oil, Gas & Consumable Fuels) 33,0876,075 Hindustan Unilever Ltd. (Household Products) 88,2882,788 Housing Development Finance Corp. Ltd. (Thrifts & Mortgage Finance) 66,5691,272 ICICI Bank Ltd. (Banks) 5,48511,690 ICICI Bank Ltd. ADR (Banks) 100,18323,540 Idea Cellular Ltd. (Wireless Telecommunication Services) 31,451509 Indiabulls Housing Finance Ltd. (Thrifts & Mortgage Finance) 8,04618,764 Indiabulls Real Estate Ltd.* (Real Estate Management & Development) 43,70928,467 Indian Oil Corp. Ltd. (Oil, Gas & Consumable Fuels) 194,830300 IndusInd Bank Ltd. (Banks) 6,737324 Infosys Ltd. (IT Services) 4,62843,632 Infosys Ltd. ADR (IT Services) 635,28218,227 ITC Ltd. (Tobacco) 78,70127,517 JSW Steel Ltd. (Metals & Mining) 85,1211,939 Kotak Mahindra Bank Ltd. (Banks) 27,1821,066 Larsen & Toubro Ltd. (Construction & Engineering) 28,984
Common Stocks �� (continued)India �� (continued)2,074 LIC Housing Finance Ltd. (Thrifts & Mortgage Finance) 21,5591,384 Lupin Ltd. (Pharmaceuticals) 28,7931,588 Mahindra & Mahindra Ltd. (Automobiles) 32,96813,348 Marico Ltd. (Personal Products) 65,402638 Maruti Suzuki India Ltd. (Automobiles) 64,6651,019 Motherson Sumi Systems Ltd. (Auto Components) 6,356477 Nestle India Ltd. (Food Products) 49,65457,851 NHPC Ltd. (Independent Power and Renewable Electricity Producers) 28,55228,135 NTPC Ltd. (Independent Power and Renewable Electricity Producers) 71,92911,011 Oil & Natural Gas Corp. Ltd. (Oil, Gas & Consumable Fuels) 31,9111,524 Piramal Enterprises Ltd. (Pharmaceuticals) 59,09616,798 Power Grid Corp. of India Ltd. (Electric Utilities) 54,2746,016 Reliance Industries Ltd. (Oil, Gas & Consumable Fuels) 130,3773,486 Reliance Infrastructure Ltd. (Electric Utilities) 32,31026 Shree Cement Ltd. (Construction Materials) 7,7551,403 Shriram Transport Finance Co. Ltd. (Consumer Finance) 22,6481,445 Siemens Ltd. (Industrial Conglomerates) 29,4815,714 State Bank of India (Banks) 25,71314,574 Sun Pharmaceutical Industries Ltd. (Pharmaceuticals) 145,4094,151 Tata Consultancy Services Ltd. (IT Services) 146,64080,746 Tata Global Beverages Ltd. GDR (Food Products) 192,2578,661 Tata Motors Ltd. ADR (Automobiles) 308,9385,472 Tata Steel Ltd. (Metals & Mining) 38,21413,736 The Tata Power Co. Ltd. (Electric Utilities) 18,0022,069 Titan Co. Ltd. (Textiles, Apparel & Luxury Goods) 15,116758 UltraTech Cement Ltd. (Construction Materials) 50,065555 United Spirits Ltd.* (Beverages) 16,185
Copyright © 2017 www.secdatabase.com. All Rights Reserved.Please Consider the Environment Before Printing This Document

4,275 UPL Ltd. (Chemicals) 53,5666,384 Vedanta Ltd. (Metals & Mining) 24,1403,703 Wipro Ltd. (IT Services) 28,4501,231 Yes Bank Ltd. (Banks) 31,2043,102 Zee Entertainment Enterprises Ltd. (Media) 25,400
6,975,450Indonesia �� 0.6%380,900 Adaro Energy Tbk PT (Oil, Gas & Consumable Fuels) 50,651
The accompanying notes are an integral part of these financial statements. 31
Copyright © 2017 www.secdatabase.com. All Rights Reserved.Please Consider the Environment Before Printing This Document
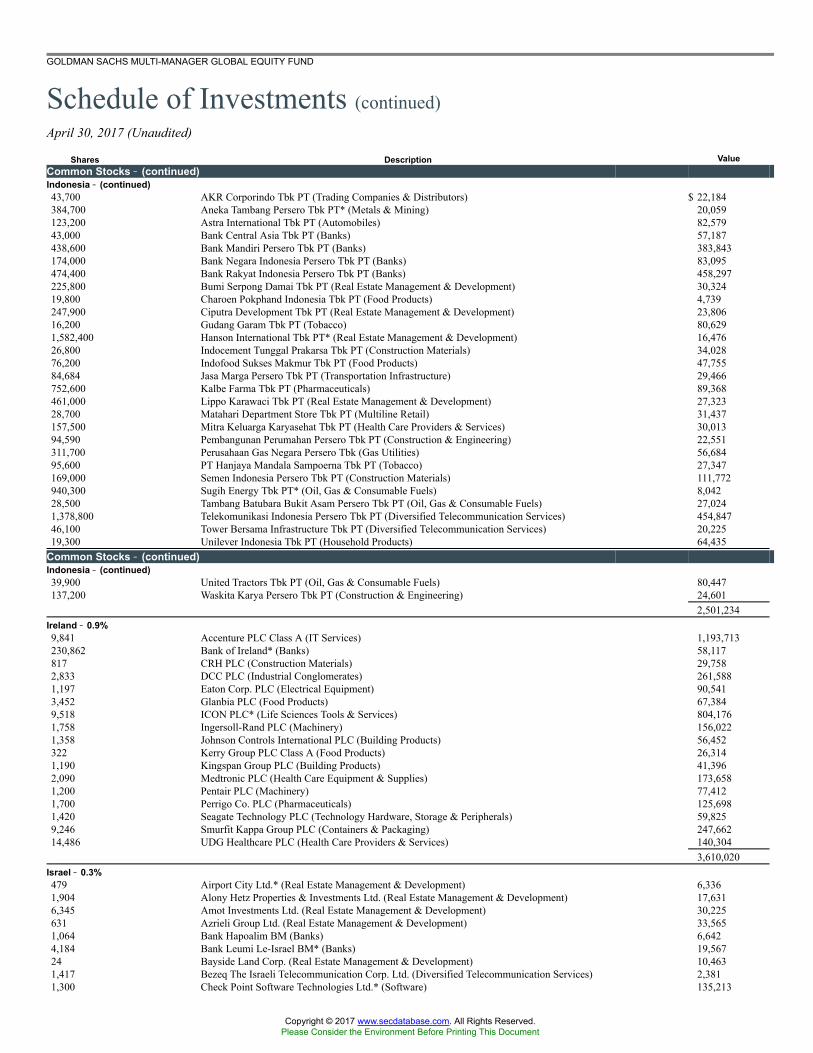
GOLDMAN SACHS MULTI-MANAGER GLOBAL EQUITY FUND
Schedule of Investments (continued)April 30, 2017 (Unaudited)
Shares Description ValueCommon Stocks �� (continued)Indonesia �� (continued)43,700 AKR Corporindo Tbk PT (Trading Companies & Distributors) $ 22,184384,700 Aneka Tambang Persero Tbk PT* (Metals & Mining) 20,059123,200 Astra International Tbk PT (Automobiles) 82,57943,000 Bank Central Asia Tbk PT (Banks) 57,187438,600 Bank Mandiri Persero Tbk PT (Banks) 383,843174,000 Bank Negara Indonesia Persero Tbk PT (Banks) 83,095474,400 Bank Rakyat Indonesia Persero Tbk PT (Banks) 458,297225,800 Bumi Serpong Damai Tbk PT (Real Estate Management & Development) 30,32419,800 Charoen Pokphand Indonesia Tbk PT (Food Products) 4,739247,900 Ciputra Development Tbk PT (Real Estate Management & Development) 23,80616,200 Gudang Garam Tbk PT (Tobacco) 80,6291,582,400 Hanson International Tbk PT* (Real Estate Management & Development) 16,47626,800 Indocement Tunggal Prakarsa Tbk PT (Construction Materials) 34,02876,200 Indofood Sukses Makmur Tbk PT (Food Products) 47,75584,684 Jasa Marga Persero Tbk PT (Transportation Infrastructure) 29,466752,600 Kalbe Farma Tbk PT (Pharmaceuticals) 89,368461,000 Lippo Karawaci Tbk PT (Real Estate Management & Development) 27,32328,700 Matahari Department Store Tbk PT (Multiline Retail) 31,437157,500 Mitra Keluarga Karyasehat Tbk PT (Health Care Providers & Services) 30,01394,590 Pembangunan Perumahan Persero Tbk PT (Construction & Engineering) 22,551311,700 Perusahaan Gas Negara Persero Tbk (Gas Utilities) 56,68495,600 PT Hanjaya Mandala Sampoerna Tbk PT (Tobacco) 27,347169,000 Semen Indonesia Persero Tbk PT (Construction Materials) 111,772940,300 Sugih Energy Tbk PT* (Oil, Gas & Consumable Fuels) 8,04228,500 Tambang Batubara Bukit Asam Persero Tbk PT (Oil, Gas & Consumable Fuels) 27,0241,378,800 Telekomunikasi Indonesia Persero Tbk PT (Diversified Telecommunication Services) 454,84746,100 Tower Bersama Infrastructure Tbk PT (Diversified Telecommunication Services) 20,22519,300 Unilever Indonesia Tbk PT (Household Products) 64,435
Common Stocks �� (continued)Indonesia �� (continued)39,900 United Tractors Tbk PT (Oil, Gas & Consumable Fuels) 80,447137,200 Waskita Karya Persero Tbk PT (Construction & Engineering) 24,601
2,501,234Ireland �� 0.9%9,841 Accenture PLC Class A (IT Services) 1,193,713230,862 Bank of Ireland* (Banks) 58,117817 CRH PLC (Construction Materials) 29,7582,833 DCC PLC (Industrial Conglomerates) 261,5881,197 Eaton Corp. PLC (Electrical Equipment) 90,5413,452 Glanbia PLC (Food Products) 67,3849,518 ICON PLC* (Life Sciences Tools & Services) 804,1761,758 Ingersoll-Rand PLC (Machinery) 156,0221,358 Johnson Controls International PLC (Building Products) 56,452322 Kerry Group PLC Class A (Food Products) 26,3141,190 Kingspan Group PLC (Building Products) 41,3962,090 Medtronic PLC (Health Care Equipment & Supplies) 173,6581,200 Pentair PLC (Machinery) 77,4121,700 Perrigo Co. PLC (Pharmaceuticals) 125,6981,420 Seagate Technology PLC (Technology Hardware, Storage & Peripherals) 59,8259,246 Smurfit Kappa Group PLC (Containers & Packaging) 247,66214,486 UDG Healthcare PLC (Health Care Providers & Services) 140,304
3,610,020Israel �� 0.3%479 Airport City Ltd.* (Real Estate Management & Development) 6,3361,904 Alony Hetz Properties & Investments Ltd. (Real Estate Management & Development) 17,6316,345 Amot Investments Ltd. (Real Estate Management & Development) 30,225631 Azrieli Group Ltd. (Real Estate Management & Development) 33,5651,064 Bank Hapoalim BM (Banks) 6,6424,184 Bank Leumi Le-Israel BM* (Banks) 19,56724 Bayside Land Corp. (Real Estate Management & Development) 10,4631,417 Bezeq The Israeli Telecommunication Corp. Ltd. (Diversified Telecommunication Services) 2,3811,300 Check Point Software Technologies Ltd.* (Software) 135,213
Copyright © 2017 www.secdatabase.com. All Rights Reserved.Please Consider the Environment Before Printing This Document

377 Clal Insurance Enterprises Holdings Ltd.* (Insurance) 6,1211,319 Delek Automotive Systems Ltd. (Specialty Retail) 11,581
32 The accompanying notes are an integral part of these financial statements.
Copyright © 2017 www.secdatabase.com. All Rights Reserved.Please Consider the Environment Before Printing This Document

GOLDMAN SACHS MULTI-MANAGER GLOBAL EQUITY FUND
Shares Description ValueCommon Stocks �� (continued)Israel �� (continued)20 Delek Energy Systems Ltd.* (Oil, Gas & Consumable Fuels) $ 10,95047 Elbit Systems Ltd. (Aerospace & Defense) 5,6001,207 First International Bank Of Israel Ltd. (Banks) 19,890549 Gazit-Globe Ltd. (Real Estate Management & Development) 5,5681,075 Harel Insurance Investments & Financial Services Ltd. (Insurance) 5,72366 IDI Insurance Co. Ltd. (Insurance) 3,51977,667 Israel Discount Bank Class A* (Banks) 188,045129 Jerusalem Oil Exploration* (Oil, Gas & Consumable Fuels) 7,494222 Melisron Ltd. (Real Estate Management & Development) 12,08911,704 Mizrahi Tefahot Bank Ltd. (Banks) 188,80275,624 Oil Refineries Ltd. (Oil, Gas & Consumable Fuels) 30,0205,875 Orbotech Ltd.* (Electronic Equipment, Instruments & Components) 193,4642,421 Shikun & Binui Ltd. (Construction & Engineering) 6,3501,094 Shufersal Ltd. (Food & Staples Retailing) 5,392400 SodaStream International Ltd.* (Household Durables) 21,7565,454 Tower Semiconductor Ltd.* (Semiconductors & Semiconductor Equipment) 117,3703,039 Wix.com Ltd.* (Internet Software & Services) 250,566
1,352,323Italy �� 1.0%27,972 A2A SpA (Multi-Utilities) 41,57615,036 Amplifon SpA (Health Care Providers & Services) 192,0722,109 Assicurazioni Generali SpA (Insurance) 33,40717,420 Astaldi SpA (Construction & Engineering) 114,2621,035 Atlantia SpA (Transportation Infrastructure) 26,24712,759 Banco BPM SpA (Banks) 37,2636,638 BPER Banca (Banks) 36,3147,364 Buzzi Unicem SpA (Construction Materials) 189,2285,911 Davide Campari-Milano SpA (Beverages) 69,8946,998 Enel SpA (Electric Utilities) 33,2701,831 Eni SpA (Oil, Gas & Consumable Fuels) 28,401286 Ferrari NV (Automobiles) 21,51217,538 Intesa Sanpaolo SpA (Banks) 51,19579,728 Iren SpA (Multi-Utilities) 168,0502,425 Leonardo SpA* (Aerospace & Defense) 38,10811,641 Luxottica Group SpA (Textiles, Apparel & Luxury Goods) 672,974
Common Stocks �� (continued)Italy �� (continued)11,317 Mediobanca SpA (Banks) 108,83113,174 Moncler SpA (Textiles, Apparel & Luxury Goods) 324,9371,389 Poste Italiane SpA(a) (Insurance) 9,5171,700 PRADA SpA (Textiles, Apparel & Luxury Goods) 7,9771,271 Prysmian SpA (Electrical Equipment) 36,6798,273 Recordati SpA (Pharmaceuticals) 306,490122,125 Saipem SpA* (Energy Equipment & Services) 52,56714,173 Snam SpA (Oil, Gas & Consumable Fuels) 62,61710,271 Societa Iniziative Autostradali e Servizi SpA (Transportation Infrastructure) 103,49136,813 Telecom Italia SpA* (Diversified Telecommunication Services) 32,67512,473 Terna Rete Elettrica Nazionale SpA (Electric Utilities) 62,88757,814 UniCredit SpA* (Banks) 941,3568,055 Unione di Banche Italiane SpA (Banks) 33,94028,866 UnipolSai Assicurazioni SpA (Insurance) 66,3081,098 Yoox Net-A-Porter Group SpA* (Internet & Direct Marketing Retail) 29,176
3,933,221Japan �� 5.9%16 Activia Properties, Inc. (Equity Real Estate Investment Trusts (REITs)) 76,21431 Advance Residence Investment Corp. (Equity Real Estate Investment Trusts (REITs)) 81,6074,500 AEON Co. Ltd. (Food & Staples Retailing) 66,6942,000 Air Water, Inc. (Chemicals) 38,5221,400 Aisin Seiki Co. Ltd. (Auto Components) 68,568600 Ajinomoto Co., Inc. (Food Products) 11,6742,000 Alfresa Holdings Corp. (Health Care Providers & Services) 36,1154,600 Alps Electric Co. Ltd. (Electronic Equipment, Instruments & Components) 135,2025,300 Amada Holdings Co. Ltd. (Machinery) 63,01323,000 ANA Holdings, Inc. (Airlines) 69,28212,000 Aozora Bank Ltd. (Banks) 43,7256,000 Asahi Glass Co. Ltd. (Building Products) 51,987
Copyright © 2017 www.secdatabase.com. All Rights Reserved.Please Consider the Environment Before Printing This Document

5,100 Asahi Group Holdings Ltd. (Beverages) 192,6789,000 Asahi Kasei Corp. (Chemicals) 85,820200 Asics Corp. (Textiles, Apparel & Luxury Goods) 3,536400 Astellas Pharma, Inc. (Pharmaceuticals) 5,268900 Bandai Namco Holdings, Inc. (Leisure Products) 28,2485,100 BML, Inc. (Health Care Providers & Services) 111,3171,300 Bridgestone Corp. (Auto Components) 54,225
The accompanying notes are an integral part of these financial statements. 33
Copyright © 2017 www.secdatabase.com. All Rights Reserved.Please Consider the Environment Before Printing This Document

GOLDMAN SACHS MULTI-MANAGER GLOBAL EQUITY FUND
Schedule of Investments (continued)April 30, 2017 (Unaudited)
Shares Description ValueCommon Stocks �� (continued)Japan �� (continued)1,700 Brother Industries Ltd. (Technology Hardware, Storage & Peripherals) $ 34,979800 Calbee, Inc. (Food Products) 27,9691,400 Canon, Inc. (Technology Hardware, Storage & Peripherals) 46,4632,000 Casio Computer Co. Ltd. (Household Durables) 28,1874,400 Century Tokyo Leasing Corp. (Diversified Financial Services) 151,6602,400 Chubu Electric Power Co., Inc. (Electric Utilities) 32,2255,500 Coca-Cola West Holdings Co. Ltd. (Beverages) 163,9963,700 Concordia Financial Group Ltd. (Banks) 17,0012,000 Credit Saison Co. Ltd. (Consumer Finance) 36,4434,000 Dai Nippon Printing Co. Ltd. (Commercial Services & Supplies) 44,5311,400 Dai-ichi Life Holdings, Inc. (Insurance) 23,8562,800 Daicel Corp. (Chemicals) 32,1432,800 Daiichi Sankyo Co. Ltd. (Pharmaceuticals) 62,2272,600 Daiichikosho Co. Ltd. (Media) 112,845100 Daikin Industries Ltd. (Building Products) 9,7114,400 Daikyonishikawa Corp. (Auto Components) 55,934200 Daito Trust Construction Co. Ltd. (Real Estate Management & Development) 29,4313 Daiwa House REIT Investment Corp. (Equity Real Estate Investment Trusts (REITs)) 7,5843,000 Daiwa Securities Group, Inc. (Capital Markets) 18,250200 Dena Co. Ltd. (Internet Software & Services) 4,28332,000 Denka Co. Ltd (Chemicals) 164,874900 Denso Corp. (Auto Components) 38,842200 Dentsu, Inc. (Media) 11,2676,800 DIC Corp. (Chemicals) 242,029400 Disco Corp. (Semiconductors & Semiconductor Equipment) 63,271100 Don Quijote Holdings Co. Ltd. (Multiline Retail) 3,6474,600 DTS Corp. (IT Services) 120,76710,500 East Japan Railway Co. (Road & Rail) 942,2984,000 Ebara Corp. (Machinery) 121,8553,200 Electric Power Development Co. Ltd. (Independent Power and Renewable Electricity Producers) 74,2343,000 Ezaki Glico Co. Ltd. (Food Products) 158,0936,200 F.C.C. Co. Ltd. (Auto Components) 118,3831,600 FamilyMart UNY Holdings Co. Ltd. (Food & Staples Retailing) 90,44312,000 Fuji Electric Co. Ltd. (Electrical Equipment) 65,775
Common Stocks �� (continued)Japan �� (continued)900 FUJIFILM Holdings Corp. (Technology Hardware, Storage & Peripherals) 33,40324,900 Fujikura Ltd. (Electrical Equipment) 187,19814,000 Fujitsu Ltd. (IT Services) 87,3922,500 Fukui Computer Holdings, Inc. (Software) 65,6508,000 Fukuoka Financial Group, Inc. (Banks) 36,49570 GLP J-REIT (Equity Real Estate Investment Trusts (REITs)) 78,8881,000 Hakuhodo DY Holdings, Inc. (Media) 12,173700 Hamamatsu Photonics KK (Electronic Equipment, Instruments & Components) 20,5842,000 Hankyu Hanshin Holdings, Inc. (Road & Rail) 66,06719,700 Haseko Corp. (Household Durables) 224,8682,900 Hino Motors Ltd. (Machinery) 36,387200 Hirose Electric Co. Ltd. (Electronic Equipment, Instruments & Components) 26,880600 Hisamitsu Pharmaceutical Co., Inc. (Pharmaceuticals) 30,716139,000 Hitachi Ltd. (Electronic Equipment, Instruments & Components) 767,88729,700 Hitachi Zosen Corp. (Machinery) 172,4851,000 Honda Motor Co. Ltd. (Automobiles) 29,106800 Hoshizaki Corp. (Machinery) 66,746200 Hoya Corp. (Health Care Equipment & Supplies) 9,552500 Hulic Co. Ltd. (Real Estate Management & Development) 4,710600 Idemitsu Kosan Co. Ltd. (Oil, Gas & Consumable Fuels) 19,18820,000 IHI Corp.* (Machinery) 67,7283,500 Inpex Corp. (Oil, Gas & Consumable Fuels) 33,5382,300 Isetan Mitsukoshi Holdings Ltd. (Multiline Retail) 25,133900 Isuzu Motors Ltd. (Automobiles) 12,2072,400 Itochu Corp. (Trading Companies & Distributors) 33,9601,900 J. Front Retailing Co. Ltd. (Multiline Retail) 27,3884,000 Jafco Co. Ltd. (Capital Markets) 142,480
Copyright © 2017 www.secdatabase.com. All Rights Reserved.Please Consider the Environment Before Printing This Document

24,700 Japan Airlines Co. Ltd. (Airlines) 780,059250 Japan Hotel REIT Investment Corp. (Equity Real Estate Investment Trusts (REITs)) 170,3961,800 Japan Post Bank Co. Ltd. (Banks) 22,419600 Japan Post Holdings Co. Ltd. (Insurance) 7,4339 Japan Prime Realty Investment Corp. (Equity Real Estate Investment Trusts (REITs)) 33,7906 Japan Real Estate Investment Corp. (Equity Real Estate Investment Trusts (REITs)) 31,595
34 The accompanying notes are an integral part of these financial statements.
Copyright © 2017 www.secdatabase.com. All Rights Reserved.Please Consider the Environment Before Printing This Document

GOLDMAN SACHS MULTI-MANAGER GLOBAL EQUITY FUND
Shares Description ValueCommon Stocks �� (continued)Japan �� (continued)13 Japan Retail Fund Investment Corp. (Equity Real Estate Investment Trusts (REITs)) $ 25,396500 Japan Tobacco, Inc. (Tobacco) 16,6381,500 JFE Holdings, Inc. (Metals & Mining) 25,5853,000 JGC Corp. (Construction & Engineering) 52,3861,900 JSR Corp. (Chemicals) 34,7243,800 JTEKT Corp. (Machinery) 59,94115,700 JXTG Holdings, Inc. (Oil, Gas & Consumable Fuels) 70,8399,000 K�s Holdings Corp. (Specialty Retail) 173,12816,000 Kajima Corp. (Construction & Engineering) 108,6435,200 Kanamoto Co. Ltd. (Trading Companies & Distributors) 140,9885,000 Kaneka Corp. (Chemicals) 39,424400 Kansai Paint Co. Ltd. (Chemicals) 8,8568,000 Kawasaki Heavy Industries Ltd. (Machinery) 24,22138,500 KDDI Corp. (Wireless Telecommunication Services) 1,020,7902,000 Keihan Holdings Co. Ltd. (Industrial Conglomerates) 12,5775,000 Keikyu Corp. (Road & Rail) 57,3941,000 Keio Corp. (Road & Rail) 8,0021,000 Keisei Electric Railway Co. Ltd. (Road & Rail) 23,7811,300 Kewpie Corp. (Food Products) 33,0792,710 Keyence Corp. (Electronic Equipment, Instruments & Components) 1,089,45810,000 Kinden Corp. (Construction & Engineering) 151,2917,000 Kintetsu Group Holdings Co. Ltd. (Road & Rail) 25,5621,900 Kirin Holdings Co. Ltd. (Beverages) 36,989700 Kobayashi Pharmaceutical Co. Ltd. (Personal Products) 36,7212,000 Kobe Steel Ltd.* (Metals & Mining) 17,762100 Koito Manufacturing Co. Ltd. (Auto Components) 5,15827,300 Komatsu Ltd. (Machinery) 729,4982,000 Konami Holdings Corp. (Software) 83,2556,600 Konica Minolta, Inc. (Technology Hardware, Storage & Peripherals) 58,4274,700 Kuraray Co. Ltd. (Chemicals) 75,8543,000 Kurita Water Industries Ltd. (Machinery) 77,4691,300 Kyocera Corp. (Electronic Equipment, Instruments & Components) 73,6263,200 Kyowa Hakko Kirin Co. Ltd. (Pharmaceuticals) 54,9794,600 Kyudenko Corp. (Construction & Engineering) 131,8173,800 Kyushu Electric Power Co., Inc. (Electric Utilities) 40,9901,500 Kyushu Financial Group, Inc. (Banks) 9,338300 Lawson, Inc. (Food & Staples Retailing) 19,905
Common Stocks �� (continued)Japan �� (continued)11,000 Lion Corp. (Household Products) 198,7704,200 LIXIL Group Corp. (Building Products) 104,970300 M3, Inc. (Health Care Technology) 7,667100 Mabuchi Motor Co. Ltd. (Electrical Equipment) 5,64314,000 Maeda Corp. (Construction & Engineering) 128,7471,000 Makita Corp. (Machinery) 35,6805,400 Marubeni Corp. (Trading Companies & Distributors) 33,2842,000 Marui Group Co. Ltd. (Multiline Retail) 27,3911,900 Matsumotokiyoshi Holdings Co. Ltd. (Food & Staples Retailing) 95,290400 Mazda Motor Corp. (Automobiles) 5,86312,100 MCJ Co. Ltd. (Technology Hardware, Storage & Peripherals) 139,54631 MCUBS MidCity Investment Corp. (Equity Real Estate Investment Trusts (REITs)) 92,58545,200 Mebuki Financial Group, Inc. (Banks) 177,3571,800 Medipal Holdings Corp. (Health Care Providers & Services) 29,8224,700 Megmilk Snow Brand Co. Ltd. (Food Products) 140,265100 MEIJI Holdings Co. Ltd. (Food Products) 8,4865,700 MINEBEA MITSUMI, Inc. (Machinery) 82,461600 Miraca Holdings, Inc. (Health Care Providers & Services) 27,6641,900 MISUMI Group, Inc. (Trading Companies & Distributors) 35,9964,300 Mitsubishi Chemical Holdings Corp. (Chemicals) 33,6571,600 Mitsubishi Corp. (Trading Companies & Distributors) 34,5281,000 Mitsubishi Electric Corp. (Electrical Equipment) 13,9401,000 Mitsubishi Gas Chemical Co., Inc. (Chemicals) 21,3682,000 Mitsubishi Heavy Industries Ltd. (Machinery) 8,0021,000 Mitsubishi Materials Corp. (Metals & Mining) 29,73813,800 Mitsubishi Motors Corp. (Automobiles) 88,3836,600 Mitsubishi Tanabe Pharma Corp. (Pharmaceuticals) 134,0651,200 Mitsubishi UFJ Financial Group, Inc. (Banks) 7,634
Copyright © 2017 www.secdatabase.com. All Rights Reserved.Please Consider the Environment Before Printing This Document

4,900 Mitsubishi UFJ Lease & Finance Co. Ltd. (Diversified Financial Services) 25,6074,200 Mitsui & Co. Ltd. (Trading Companies & Distributors) 59,30614,000 Mitsui Chemicals, Inc. (Chemicals) 71,6341,000 Mitsui Fudosan Co. Ltd. (Real Estate Management & Development) 21,97410,000 Mitsui OSK Lines Ltd. (Marine) 30,61616,700 Mizuho Financial Group, Inc. (Banks) 30,526
The accompanying notes are an integral part of these financial statements. 35
Copyright © 2017 www.secdatabase.com. All Rights Reserved.Please Consider the Environment Before Printing This Document

GOLDMAN SACHS MULTI-MANAGER GLOBAL EQUITY FUND
Schedule of Investments (continued)April 30, 2017 (Unaudited)
Shares Description ValueCommon Stocks �� (continued)Japan �� (continued)17,000 Morinaga Milk Industry Co. Ltd. (Food Products) $ 134,387200 MS & AD Insurance Group Holdings, Inc. (Insurance) 6,5161,400 Nabtesco Corp. (Machinery) 39,69017,000 Nagoya Railroad Co. Ltd. (Road & Rail) 78,0967,000 Nankai Electric Railway Co. Ltd. (Road & Rail) 34,42526,000 NEC Corp. (Technology Hardware, Storage & Peripherals) 64,648600 Nexon Co. Ltd. (Software) 10,2002,900 NGK Spark Plug Co. Ltd. (Auto Components) 62,8935,000 NH Foods Ltd. (Food Products) 142,5154,800 Nichiha Corp. (Building Products) 150,57512,200 Nichirei Corp. (Food Products) 303,689300 Nidec Corp. (Electrical Equipment) 27,52618,300 Nikon Corp. (Household Durables) 261,2403 Nippon Building Fund, Inc. (Equity Real Estate Investment Trusts (REITs)) 15,95912,000 Nippon Express Co. Ltd. (Road & Rail) 65,87440 Nippon Prologis REIT, Inc. (Equity Real Estate Investment Trusts (REITs)) 84,5263,300 Nippon Shinyaku Co. Ltd. (Pharmaceuticals) 175,490300 Nippon Steel & Sumitomo Metal Corp. (Metals & Mining) 6,7561,200 Nippon Telegraph & Telephone Corp. (Diversified Telecommunication Services) 51,42715,000 Nippon Yusen Kabushiki Kaisha* (Marine) 30,1581,000 Nissan Chemical Industries Ltd. (Chemicals) 31,0152,900 Nissan Motor Co. Ltd. (Automobiles) 27,6244,400 Nisshin Seifun Group, Inc. (Food Products) 67,605800 Nissin Foods Holdings Co. Ltd. (Food Products) 45,810400 Nitori Holdings Co. Ltd. (Specialty Retail) 52,0451,400 Nomura Holdings, Inc. (Capital Markets) 8,40219 Nomura Real Estate Master Fund, Inc. (Equity Real Estate Investment Trusts (REITs)) 27,385700 Nomura Research Institute Ltd. (IT Services) 24,3752,400 NSK Ltd. (Machinery) 32,820700 NTT Data Corp. (IT Services) 32,504600 NTT DOCOMO, Inc. (Wireless Telecommunication Services) 14,51811,500 Obayashi Corp. (Construction & Engineering) 111,652200 Obic Co. Ltd. (IT Services) 10,8011,000 Odakyu Electric Railway Co. Ltd. (Road & Rail) 19,413
Common Stocks �� (continued)Japan �� (continued)7,000 Oji Holdings Corp. (Paper & Forest Products) 33,8806,700 Okamura, Corp. (Commercial Services & Supplies) 59,325700 Oriental Land Co. Ltd. (Hotels, Restaurants & Leisure) 40,204500 ORIX Corp. (Diversified Financial Services) 7,63047 Orix JREIT, Inc. (Equity Real Estate Investment Trusts (REITs)) 74,53310,000 Osaka Gas Co. Ltd. (Gas Utilities) 37,4321,400 Otsuka Corp. (IT Services) 74,9911,700 Otsuka Holdings Co. Ltd. (Pharmaceuticals) 78,300800 Panasonic Corp. (Household Durables) 9,5482,500 Park24 Co. Ltd. (Commercial Services & Supplies) 64,505200 Pigeon Corp. (Household Products) 6,190200 Recruit Holdings Co. Ltd. (Professional Services) 10,1019,500 Resona Holdings, Inc. (Banks) 52,8124,000 Ricoh Co. Ltd. (Technology Hardware, Storage & Peripherals) 33,342900 Rinnai Corp. (Household Durables) 74,8421,100 Rohm Co. Ltd. (Semiconductors & Semiconductor Equipment) 77,251100 Ryohin Keikaku Co. Ltd. (Multiline Retail) 22,552400 Santen Pharmaceutical Co. Ltd. (Pharmaceuticals) 5,6232,200 Sanyo Chemical Industries Ltd. (Chemicals) 98,653200 Secom Co. Ltd. (Commercial Services & Supplies) 14,5071,800 Sega Sammy Holdings, Inc. (Leisure Products) 24,1681,700 Seibu Holdings, Inc. (Industrial Conglomerates) 29,6993,700 Seiko Epson Corp. (Technology Hardware, Storage & Peripherals) 75,78811,300 Seino Holdings Co. Ltd. (Road & Rail) 130,8753,700 Sekisui Chemical Co. Ltd. (Household Durables) 62,0992,100 Sekisui House Ltd. (Household Durables) 34,8853,000 Sharp Corp.* (Household Durables) 10,819
Copyright © 2017 www.secdatabase.com. All Rights Reserved.Please Consider the Environment Before Printing This Document

1,000 Shimadzu Corp. (Electronic Equipment, Instruments & Components) 16,9761,200 Shimamura Co. Ltd. (Specialty Retail) 164,23410,000 Shimizu Corp. (Construction & Engineering) 95,899500 Shin-Etsu Chemical Co. Ltd. (Chemicals) 43,45914,000 Shinmaywa Industries Ltd. (Machinery) 117,98423,000 Shinsei Bank Ltd. (Banks) 42,942100 Shionogi & Co. Ltd. (Pharmaceuticals) 5,143200 Shiseido Co. Ltd. (Personal Products) 5,411100 SMC Corp. (Machinery) 28,159
36 The accompanying notes are an integral part of these financial statements.
Copyright © 2017 www.secdatabase.com. All Rights Reserved.Please Consider the Environment Before Printing This Document

GOLDMAN SACHS MULTI-MANAGER GLOBAL EQUITY FUND
Shares Description ValueCommon Stocks �� (continued)Japan �� (continued)1,000 Sogo Medical Co. Ltd. (Food & Staples Retailing) $ 39,383100 Sohgo Security Services Co. Ltd. (Commercial Services & Supplies) 4,36412,600 Sojitz Corp. (Trading Companies & Distributors) 32,033600 Sompo Holdings, Inc. (Insurance) 22,6741,000 Square Enix Co. Ltd. (Software) 28,7922,400 Stanley Electric Co. Ltd. (Auto Components) 70,2771,400 Start Today Co. Ltd. (Internet & Direct Marketing Retail) 29,8742,000 Sumitomo Chemical Co. Ltd. (Chemicals) 11,2852,500 Sumitomo Corp. (Trading Companies & Distributors) 33,4084,700 Sumitomo Dainippon Pharma Co. Ltd. (Pharmaceuticals) 77,1892,300 Sumitomo Electric Industries Ltd. (Auto Components) 37,56313,200 Sumitomo Forestry Co. Ltd. (Household Durables) 202,10826,000 Sumitomo Heavy Industries Ltd. (Machinery) 181,3782,000 Sumitomo Metal Mining Co. Ltd. (Metals & Mining) 27,08310,000 Sumitomo Mitsui Financial Group, Inc. (Banks) 371,2791,000 Sumitomo Mitsui Trust Holdings, Inc. (Banks) 34,2413,700 Sumitomo Rubber Industries Ltd. (Auto Components) 66,5951,400 Suntory Beverage & Food Ltd. (Beverages) 63,0761,100 Suruga Bank Ltd. (Banks) 22,9971,900 Suzuken Co. Ltd. (Health Care Providers & Services) 62,873800 Suzuki Motor Corp. (Automobiles) 33,4429,851 Sysmex Corp. (Health Care Equipment & Supplies) 600,001600 T&D Holdings, Inc. (Insurance) 8,90030,000 Taiheiyo Cement Corp. (Construction Materials) 99,6955,000 Taisei Corp. (Construction & Engineering) 38,127800 Taisho Pharmaceutical Holdings Co. Ltd. (Pharmaceuticals) 65,825100 Takeda Pharmaceutical Co. Ltd. (Pharmaceuticals) 4,792500 TDK Corp. (Electronic Equipment, Instruments & Components) 30,9784,000 Teijin Ltd. (Chemicals) 77,5011,400 Temp Holdings Co. Ltd. (Professional Services) 26,345300 Terumo Corp. (Health Care Equipment & Supplies) 10,940
Common Stocks �� (continued)Japan �� (continued)39,000 The 77 Bank Ltd. (Banks) 168,6752,000 The Bank of Kyoto Ltd. (Banks) 15,8244,000 The Chiba Bank Ltd. (Banks) 26,7965,600 The Chugoku Electric Power Co., Inc. (Electric Utilities) 61,0485,000 The Furukawa Electric Co. Ltd. (Electrical Equipment) 202,4091,700 The Hachijuni Bank Ltd. (Banks) 10,0352,000 The Hiroshima Bank Ltd. (Banks) 8,6303,200 The Kansai Electric Power Co., Inc. (Electric Utilities) 43,2452,000 The Shizuoka Bank Ltd. (Banks) 16,8652,800 The Tokyo Electric Power Co., Inc.* (Electric Utilities) 10,8764,500 TIS, Inc. (IT Services) 113,42613,000 Tobu Railway Co. Ltd. (Road & Rail) 65,93323,000 Toda Corp. (Construction & Engineering) 141,9821,400 Toho Co. Ltd. (Media) 40,1847,000 Toho Gas Co. Ltd. (Gas Utilities) 50,0362,500 Tohoku Electric Power Co., Inc. (Electric Utilities) 33,330300 Tokio Marine Holdings, Inc. (Insurance) 12,627200 Tokyo Electron Ltd. (Semiconductors & Semiconductor Equipment) 24,2798,000 Tokyo Gas Co. Ltd. (Gas Utilities) 37,1432,300 Tokyo Tatemono Co. Ltd. (Real Estate Management & Development) 31,4231,900 Tokyu Fudosan Holdings Corp. (Real Estate Management & Development) 10,3636,000 Toppan Printing Co. Ltd. (Commercial Services & Supplies) 60,4014,000 Toray Industries, Inc. (Chemicals) 35,4023,100 Toridoll Holdings Corp. (Hotels, Restaurants & Leisure) 74,6437,600 Toshiba Plant Systems & Services Corp. (Construction & Engineering) 123,64930,000 Tosoh Corp. (Chemicals) 281,958100 TOTO Ltd. (Building Products) 3,8178,600 Towa Corp. (Semiconductors & Semiconductor Equipment) 145,9651,300 Toyo Seikan Group Holdings Ltd. (Containers & Packaging) 21,8021,000 Toyo Suisan Kaisha Ltd. (Food Products) 37,558600 Toyota Industries Corp. (Auto Components) 29,889500 Toyota Motor Corp. (Automobiles) 27,0601,200 Toyota Tsusho Corp. (Trading Companies & Distributors) 37,888800 Trend Micro, Inc. (Software) 35,199
Copyright © 2017 www.secdatabase.com. All Rights Reserved.Please Consider the Environment Before Printing This Document

1,400 Tsuruha Holdings, Inc. (Food & Staples Retailing) 141,7184,700 Ulvac, Inc. (Semiconductors & Semiconductor Equipment) 220,6558,600 Unipres Corp. (Auto Components) 182,18641 United Urban Investment Corp. (Equity Real Estate Investment Trusts (REITs)) 61,974
The accompanying notes are an integral part of these financial statements. 37
Copyright © 2017 www.secdatabase.com. All Rights Reserved.Please Consider the Environment Before Printing This Document

GOLDMAN SACHS MULTI-MANAGER GLOBAL EQUITY FUND
Schedule of Investments (continued)April 30, 2017 (Unaudited)
Shares Description ValueCommon Stocks �� (continued)Japan �� (continued)700 USS Co. Ltd. (Specialty Retail) $ 12,3705,800 Valor Holdings Co. Ltd. (Food & Staples Retailing) 138,647500 West Japan Railway Co. (Road & Rail) 33,409100 Yakult Honsha Co. Ltd. (Food Products) 5,68750,000 Yamada Denki Co. Ltd. (Specialty Retail) 262,580300 Yamaha Corp. (Leisure Products) 8,3161,300 Yamaha Motor Co. Ltd. (Automobiles) 30,873300 Yamato Holdings Co. Ltd. (Air Freight & Logistics) 6,4823,000 Yamazaki Baking Co. Ltd. (Food Products) 63,320600 Yaskawa Electric Corp. (Electronic Equipment, Instruments & Components) 11,4597,000 Yokogawa Bridge Holdings Corp. (Construction & Engineering) 86,4085,200 Yokogawa Electric Corp. (Electronic Equipment, Instruments & Components) 80,3673,700 Zenkoku Hosho Co. Ltd. (Diversified Financial Services) 133,84718,000 Zeon Corp. (Chemicals) 204,946
24,544,590Jordan �� 0.1%581 Al-Eqbal Investment Co. PLC (Tobacco) 18,9978,100 Arab Bank PLC (Banks) 70,0924,867 Bank of Jordan (Banks) 17,9033,707 Jordan Islamic Bank (Banks) 21,9436,041 Jordan Petroleum Refinery Co. (Oil, Gas & Consumable Fuels) 29,8835,022 Jordan Telecommunications Co. PSC (Diversified Telecommunication Services) 15,9965,828 Jordanian Electric Power Co. (Electric Utilities) 18,3981,020 The Arab Potash (Chemicals) 27,313
220,525Kazakhstan �� 0.0%7,353 Halyk Savings Bank of Kazakhstan JSC GDR* (Banks) 55,1474,870 KazMunaiGas Exploration Production JSC GDR* (Oil, Gas & Consumable Fuels) 47,2396,551 KCell JSC (Wireless Telecommunication Services) 22,601
124,987Lebanon �� 0.0%5,443 Bank Audi SAL GDR (Banks) 35,3791,131 BLOM Bank SAL GDR (Banks) 13,0074,858 Solidere GDR (Real Estate Management & Development) 42,750
91,136Common Stocks �� (continued)Liberia �� 0.0%1,552 Royal Caribbean Cruises Ltd. (Hotels, Restaurants & Leisure) $ 165,443
Luxembourg �� 0.2%2,200 Adecoagro SA* (Food Products) 24,3982,430 Ado Properties SA(a) (Real Estate Management & Development) 88,95840,040 ArcelorMittal* (Metals & Mining) 314,648666 Pegas Nonwovens SA (Textiles, Apparel & Luxury Goods) 22,95112,831 Subsea 7 SA (Energy Equipment & Services) 211,4506,386 Tenaris SA (Energy Equipment & Services) 99,761
762,166Malaysia �� 0.4%42,700 Astro Malaysia Holdings Bhd (Media) 26,55826,100 Axiata Group Bhd (Wireless Telecommunication Services) 30,9644,700 British American Tobacco Malaysia Bhd (Tobacco) 49,198105,400 Bumi Armada Bhd* (Energy Equipment & Services) 19,18137,927 CIMB Group Holdings Bhd (Banks) 50,12030,500 DiGi.Com Bhd (Wireless Telecommunication Services) 36,11446,600 Gamuda Bhd (Construction & Engineering) 56,55933,800 Genting Bhd (Hotels, Restaurants & Leisure) 76,55443,600 Genting Malaysia Bhd (Hotels, Restaurants & Leisure) 58,92517,900 Globetronics Technology Bhd (Semiconductors & Semiconductor Equipment) 22,39016,600 Hartalega Holdings Bhd (Health Care Equipment & Supplies) 18,7388,900 Hong Leong Bank Bhd (Banks) 28,27071,300 IGB Real Estate Investment Trust (Equity Real Estate Investment Trusts (REITs)) 27,92253,500 IHH Healthcare Bhd (Health Care Providers & Services) 76,164
Copyright © 2017 www.secdatabase.com. All Rights Reserved.Please Consider the Environment Before Printing This Document

66,300 IJM Corp. Bhd (Construction & Engineering) 53,45553,300 IOI Corp. Bhd (Food Products) 56,34665,300 IOI Properties Group Bhd (Real Estate Management & Development) 31,13815,500 KLCCP Stapled Group (Equity Real Estate Investment Trusts (REITs)) 27,9589,000 Kuala Lumpur Kepong Bhd (Food Products) 50,83629,900 Malayan Banking Bhd (Banks) 65,95218,400 Maxis Bhd (Wireless Telecommunication Services) 27,02347,600 MISC Bhd (Marine) 80,208
38 The accompanying notes are an integral part of these financial statements.
Copyright © 2017 www.secdatabase.com. All Rights Reserved.Please Consider the Environment Before Printing This Document

GOLDMAN SACHS MULTI-MANAGER GLOBAL EQUITY FUND
Shares Description ValueCommon Stocks �� (continued)Malaysia �� (continued)95,700 My EG Services Bhd (IT Services) $ 46,91442,600 Petronas Chemicals Group Bhd (Chemicals) 71,6386,700 Petronas Dagangan Bhd (Oil, Gas & Consumable Fuels) 37,1358,600 Petronas Gas Bhd (Gas Utilities) 36,58714,700 PPB Group Bhd (Food Products) 57,22961,000 Press Metal Bhd (Metals & Mining) 41,1738,000 Public Bank Bhd (Banks) 36,77070,900 Sapura Energy Bhd (Energy Equipment & Services) 32,58936,400 Sime Darby Bhd (Industrial Conglomerates) 78,29337,000 Telekom Malaysia Bhd (Diversified Telecommunication Services) 55,06132,100 Tenaga Nasional Berhad (Electric Utilities) 103,062174,800 YTL Corp. Bhd (Multi-Utilities) 59,172
1,626,196Malta* �� 0.0%808 Brait SE (Capital Markets) 5,159
Mexico �� 1.2%55,300 Alfa SAB de CV Class A (Industrial Conglomerates) 75,9949,600 Alsea SAB de CV (Hotels, Restaurants & Leisure) 34,11134,876 America Movil SAB de CV ADR Class L (Wireless Telecommunication Services) 536,742900 Arca Continental SAB de CV (Beverages) 6,63913,276 Cemex SA de CV ADR* (Construction Materials) 122,405518,932 Cemex SAB de CV* (Construction Materials) 477,439400 Coca-Cola Femsa SAB de CV ADR (Beverages) 29,08433,400 Concentradora Fibra Danhos SA de CV Class S (Equity Real Estate Investment Trusts (REITs)) 57,62626,100 Corp. Inmobiliaria Vesta SAB de CV (Real Estate Management & Development) 36,7822,500 El Puerto de Liverpool SAB de CV Series C1 (Multiline Retail) 19,28772,000 Fibra Uno Administracion SA de CV (Equity Real Estate Investment Trusts (REITs)) 125,7541,322 Fomento Economico Mexicano SA de CV ADR (Beverages) 119,03319,300 Fomento Economico Mexicano SAB de CV (Beverages) 173,68240,700 Genomma Lab Internacional SAB de CV Class B* (Pharmaceuticals) 51,347
Common Stocks �� (continued)Mexico �� (continued)13,200 Gentera SAB de CV (Consumer Finance) 22,1292,180 Gruma SAB de CV Class B (Food Products) 29,1108,909 Grupo Aeromexico SAB de CV* (Airlines) 17,6141,100 Grupo Aeroportuario del Centro Norte SAB de CV (Transportation Infrastructure) 6,1044,700 Grupo Aeroportuario del Pacifico SAB de CV Class B (Transportation Infrastructure) 48,3352,750 Grupo Aeroportuario del Sureste SAB de CV Class B (Transportation Infrastructure) 52,18373,000 Grupo Bimbo SAB de CV Series A (Food Products) 178,6887,900 Grupo Carso SAB de CV Series A1 (Industrial Conglomerates) 36,3121,500 Grupo Elektra SAB DE CV (Banks) 49,59537,200 Grupo Financiero Banorte SA de CV Class O (Banks) 215,29334,100 Grupo Financiero Inbursa SAB de CV Class O (Banks) 57,584119,100 Grupo Financiero Santander Mexico SAB de CV Class B (Banks) 216,37013,200 Grupo Lala SAB de CV (Food Products) 23,92430,900 Grupo Mexico SAB de CV Series B (Metals & Mining) 90,88522,503 Grupo Televisa SAB ADR (Media) 546,8234,100 Impulsora del Desarrollo y el Empleo en America Latina SAB de CV* (Construction & Engineering) 6,752800 Industrias CH SAB de CV Series B* (Metals & Mining) 4,3001,330 Industrias Penoles SAB de CV (Metals & Mining) 32,36812,100 Infraestructura Energetica Nova SAB de CV (Gas Utilities) 56,52418,900 Kimberly-Clark de Mexico SAB de CV Class A (Household Products) 40,34070,000 Macquarie Mexico Real Estate Management SA de CV* (Equity Real Estate Investment Trusts
(REITs)) 76,7117,600 Megacable Holdings SAB de CV (Media) 28,8419,842 Mexichem SAB de CV (Chemicals) 26,95113,900 Nemak SAB de CV(a) (Auto Components) 14,6946,400 OHL Mexico SAB de CV (Transportation Infrastructure) 7,86030,100 PLA Administradora Industrial S de RL de CV* (Equity Real Estate Investment Trusts (REITs)) 50,7824,000 Promotora y Operadora de Infraestructura SAB de CV (Transportation Infrastructure) 42,679
The accompanying notes are an integral part of these financial statements. 39
Copyright © 2017 www.secdatabase.com. All Rights Reserved.Please Consider the Environment Before Printing This Document

GOLDMAN SACHS MULTI-MANAGER GLOBAL EQUITY FUND
Schedule of Investments (continued)April 30, 2017 (Unaudited)
Shares Description ValueCommon Stocks �� (continued)Mexico �� (continued)509,531 Wal-Mart de Mexico SAB de CV (Food & Staples Retailing) $ 1,150,320
4,995,996Morocco �� 0.1%500 Attijariwafa Bank (Banks) 20,602950 Banque Centrale Populaire (Banks) 26,319884 BMCE Bank (Banks) 17,811942 Cosumar (Food Products) 37,0117,900 Douja Promotion Groupe Addoha SA (Real Estate Management & Development) 37,645153 LafargeHolcim Maroc SA (Construction Materials) 33,4482,857 Maroc Telecom (Diversified Telecommunication Services) 39,9071,700 Societe d�Exploitation des Ports* (Transportation Infrastructure) 23,292
236,035Netherlands �� 1.4%6,447 Aalberts Industries NV (Machinery) 255,6411,592 ABN AMRO Group NV(a) (Banks) 41,7955,674 Aegon NV (Insurance) 28,95914,033 Akzo Nobel NV (Chemicals) 1,227,356456 Altice NV Class A* (Media) 11,3281,135 ASM International NV (Semiconductors & Semiconductor Equipment) 68,3161,868 Boskalis Westminster (Construction & Engineering) 68,71056 Brack Capital Properties NV (Real Estate Management & Development) 5,3222,836 CNH Industrial NV (Machinery) 31,2747,765 Core Laboratories NV (Energy Equipment & Services) 860,51716,950 Echo Polska Properties NV (Real Estate Management & Development) 24,5053,214 Euronext NV(a) (Capital Markets) 157,6651,402 EXOR NV (Diversified Financial Services) 78,6962,840 Fiat Chrysler Automobiles NV* (Automobiles) 32,258147 Heineken Holding NV (Beverages) 12,315121 Heineken NV (Beverages) 10,788415 IMCD Group NV (Trading Companies & Distributors) 22,35420,755 ING Groep NV (Banks) 338,2971,651 Koninklijke Ahold Delhaize NV (Food & Staples Retailing) 34,2011,841 Koninklijke DSM NV (Chemicals) 131,7393,538 Koninklijke KPN NV (Diversified Telecommunication Services) 10,2321,297 Koninklijke Philips NV (Industrial Conglomerates) 44,789292 Koninklijke Vopak NV (Oil, Gas & Consumable Fuels) 13,175
Common Stocks �� (continued)Netherlands �� (continued)2,696 Mylan NV* (Pharmaceuticals) 100,6961,849 NN Group NV (Insurance) 61,303300 NXP Semiconductors NV* (Semiconductors & Semiconductor Equipment) 31,7257,733 PostNL NV (Air Freight & Logistics) 38,316631 RELX NV (Professional Services) 12,2042,571 Royal Dutch Shell PLC Class A (Oil, Gas & Consumable Fuels) 66,7656,399 SBM Offshore NV (Energy Equipment & Services) 105,41956,736 Steinhoff International Holdings NV (Household Durables) 288,6217,953 STMicroelectronics NV (Semiconductors & Semiconductor Equipment) 127,675211 Unilever NV (Personal Products) 11,0665,439 Wereldhave NV (Equity Real Estate Investment Trusts (REITs)) 250,443267 Wolters Kluwer NV (Professional Services) 11,34012,147 Wright Medical Group NV* (Health Care Equipment & Supplies) 369,14733,639 Yandex NV Class A* (Internet Software & Services) 916,999
5,901,951Netherlands Antilles �� 0.3%17,655 Schlumberger Ltd. (Energy Equipment & Services) 1,281,576
New Zealand �� 0.2%6,931 Auckland International Airport Ltd. (Transportation Infrastructure) 32,84323,150 Contact Energy Ltd. (Electric Utilities) 82,8115,635 Fisher & Paykel Healthcare Corp. Ltd. (Health Care Equipment & Supplies) 38,9834,359 Fletcher Building Ltd. (Construction Materials) 25,58067,485 Kiwi Property Group Ltd. (Equity Real Estate Investment Trusts (REITs)) 66,02841,593 Mercury NZ Ltd. (Electric Utilities) 91,813
Copyright © 2017 www.secdatabase.com. All Rights Reserved.Please Consider the Environment Before Printing This Document

18,376 Meridian Energy Ltd. (Independent Power and Renewable Electricity Producers) 34,9299,636 Ryman Healthcare Ltd. (Health Care Providers & Services) 57,0731,876 SKYCITY Entertainment Group Ltd. (Hotels, Restaurants & Leisure) 5,61085,055 Spark New Zealand Ltd. (Diversified Telecommunication Services) 215,5597,642 Trade Me Group Ltd. (Internet & Direct Marketing Retail) 27,8287,234 Z Energy Ltd. (Oil, Gas & Consumable Fuels) 37,020
716,077
40 The accompanying notes are an integral part of these financial statements.
Copyright © 2017 www.secdatabase.com. All Rights Reserved.Please Consider the Environment Before Printing This Document

GOLDMAN SACHS MULTI-MANAGER GLOBAL EQUITY FUND
Shares Description ValueCommon Stocks �� (continued)Norway �� 0.2%11,070 Aker BP ASA (Oil, Gas & Consumable Fuels) $ 187,4272,009 DNB ASA (Banks) 31,3537,898 Entra ASA(a) (Real Estate Management & Development) 90,6077,202 Gjensidige Forsikring ASA (Insurance) 110,6422,006 Marine Harvest ASA* (Food Products) 33,37612,887 Norsk Hydro ASA (Metals & Mining) 73,43813,015 Orkla ASA (Food Products) 118,08412,098 Skandiabanken ASA*(a) (Banks) 108,1801,820 Statoil ASA (Oil, Gas & Consumable Fuels) 29,9732,841 Yara International ASA (Chemicals) 105,643
888,723Oman �� 0.1%44,000 Al Anwar Ceramic Tiles Co. (Building Products) 16,68642,000 Bank Muscat SAOG (Banks) 43,85495,000 Bank Nizwa SAOG* (Banks) 22,94858,740 Bank Sohar SAOG (Banks) 23,19136,749 National Bank of Oman SAOG (Banks) 21,85817,000 Oman Cement Co. SAOG (Construction Materials) 20,3127,822 Oman Telecommunications Co. SAOG (Diversified Telecommunication Services) 26,71714,200 Ooredoo (Wireless Telecommunication Services) 19,03255,000 Phoenix Power Co. SAOC (Independent Power and Renewable Electricity Producers) 20,1435,200 Raysut Cement Co. SAOG (Construction Materials) 15,532
230,273Pakistan �� 0.1%8,500 Engro Corp. Ltd. (Chemicals) 28,60825,400 Fauji Fertilizer Co. Ltd. (Chemicals) 23,28919,700 Habib Bank Ltd. (Banks) 51,82728,000 Kot Addu Power Co. Ltd. (Independent Power and Renewable Electricity Producers) 20,6805,600 Lucky Cement Ltd. (Construction Materials) 47,15020,100 MCB Bank Ltd. (Banks) 41,71010,500 Nishat Mills Ltd. (Textiles, Apparel & Luxury Goods) 15,76620,400 Oil & Gas Development Co. Ltd. (Oil, Gas & Consumable Fuels) 30,05116,200 Pakistan Petroleum Ltd. (Oil, Gas & Consumable Fuels) 24,5414,600 Pakistan State Oil Co. Ltd. (Oil, Gas & Consumable Fuels) 19,0926,000 Thal Ltd. (Auto Components) 32,648
Common Stocks �� (continued)Pakistan �� (continued)45,300 The Hub Power Co. Ltd. (Independent Power and Renewable Electricity Producers) 56,1005,359 The Searle Co. Ltd. (Pharmaceuticals) 31,78577,500 TRG Pakistan* (Commercial Services & Supplies) 42,029
465,276Panama �� 0.1%2,593 Carnival Corp. (Hotels, Restaurants & Leisure) 160,170806 Copa Holdings SA Class A (Airlines) 93,8342,054 Intercorp Financial Services, Inc. (Banks) 65,995
319,999Peru �� 0.2%50,322 Alicorp SAA (Food Products) 119,4545,900 Cia de Minas Buenaventura SAA ADR (Metals & Mining) 70,85926,722 Cia Minera Milpo SAA (Metals & Mining) 33,3642,876 Credicorp Ltd. (Banks) 441,9267,412 Engie Energia Peru SA (Independent Power and Renewable Electricity Producers) 18,32660,448 Ferreycorp SAA (Trading Companies & Distributors) 34,848
718,777Philippines �� 0.4%34,350 Aboitiz Equity Ventures, Inc. (Industrial Conglomerates) 52,83374,000 Aboitiz Power Corp. (Independent Power and Renewable Electricity Producers) 62,9682,850 Ayala Corp. (Diversified Financial Services) 49,41656,900 Ayala Land, Inc. (Real Estate Management & Development) 40,21018,300 Bank of the Philippine Islands (Banks) 38,38431,022 BDO Unibank, Inc. (Banks) 74,487270,000 Bloomberry Resorts Corp.* (Hotels, Restaurants & Leisure) 48,634151,400 CEMEX Holdings Philippines, Inc.*(a) (Construction Materials) 22,241101,600 D&L Industries, Inc. (Chemicals) 26,028207,300 Energy Development Corp. (Independent Power and Renewable Electricity Producers) 25,018
Copyright © 2017 www.secdatabase.com. All Rights Reserved.Please Consider the Environment Before Printing This Document

60,600 First Gen Corp. (Independent Power and Renewable Electricity Producers) 26,076770 Globe Telecom, Inc. (Wireless Telecommunication Services) 32,0241,135 GT Capital Holdings, Inc. (Diversified Financial Services) 28,633
The accompanying notes are an integral part of these financial statements. 41
Copyright © 2017 www.secdatabase.com. All Rights Reserved.Please Consider the Environment Before Printing This Document

GOLDMAN SACHS MULTI-MANAGER GLOBAL EQUITY FUND
Schedule of Investments (continued)April 30, 2017 (Unaudited)
Shares Description ValueCommon Stocks �� (continued)Philippines �� (continued)16,140 International Container Terminal Services, Inc. (Transportation Infrastructure) $ 28,74928,090 JG Summit Holdings, Inc. (Industrial Conglomerates) 47,34519,720 Jollibee Foods Corp. (Hotels, Restaurants & Leisure) 82,8565,390 Manila Electric Co. (Electric Utilities) 30,205245,100 Metro Pacific Investments Corp. (Diversified Financial Services) 32,275146,210 Metropolitan Bank & Trust Co. (Banks) 247,039102,500 Petron Corp. (Oil, Gas & Consumable Fuels) 18,6891,975 PLDT, Inc. (Wireless Telecommunication Services) 70,09935,400 Puregold Price Club, Inc. (Food & Staples Retailing) 29,54444,100 Robinsons Land Corp. (Real Estate Management & Development) 22,63912,900 Robinsons Retail Holdings, Inc. (Food & Staples Retailing) 20,5045,690 Security Bank Corp. (Banks) 24,2796,840 Semirara Mining & Power Corp. (Oil, Gas & Consumable Fuels) 20,39822,770 SM Investments Corp. (Industrial Conglomerates) 331,817126,700 SM Prime Holdings, Inc. (Real Estate Management & Development) 75,57320,290 Universal Robina Corp. (Food Products) 69,823
1,678,786Poland �� 0.5%1,928 Alior Bank SA* (Banks) 37,0794,932 Asseco Poland SA (Software) 69,4189,586 Bank Pekao SA (Banks) 347,3991,326 Bank Zachodni WBK SA (Banks) 121,683404 Budimex SA (Construction & Engineering) 28,640473 CCC SA (Textiles, Apparel & Luxury Goods) 27,3562,056 CD Projekt SA* (Software) 35,929784 Ciech SA (Chemicals) 15,68511,957 Cyfrowy Polsat SA* (Media) 74,8509,340 Enea SA* (Electric Utilities) 28,7004,088 Eurocash SA (Food & Staples Retailing) 36,2521,168 Grupa Azoty SA (Chemicals) 20,6011,690 Grupa Lotos SA* (Oil, Gas & Consumable Fuels) 26,3531,350 ING Bank Slaski SA (Banks) 62,3291,353 Jastrzebska Spolka Weglowa SA* (Metals & Mining) 27,3102,247 KGHM Polska Miedz SA (Metals & Mining) 71,19329 LPP SA (Textiles, Apparel & Luxury Goods) 51,882452 mBank SA* (Banks) 50,443
Common Stocks �� (continued)Poland �� (continued)24,849 Orange Polska SA (Diversified Telecommunication Services) 29,63531,454 PGE Polska Grupa Energetyczna SA (Electric Utilities) 93,4261,163 PKP Cargo SA* (Road & Rail) 19,1578,713 Polski Koncern Naftowy ORLEN SA (Oil, Gas & Consumable Fuels) 260,39323,241 Polskie Gornictwo Naftowe i Gazownictwo SA (Oil, Gas & Consumable Fuels) 39,63642,918 Powszechna Kasa Oszczednosci Bank Polski SA* (Banks) 390,75016,938 Powszechny Zaklad Ubezpieczen SA (Insurance) 186,88726,017 Tauron Polska Energia SA* (Electric Utilities) 22,065
2,175,051Portugal �� 0.1%9,719 EDP � Energias de Portugal SA (Electric Utilities) 32,0756,293 Galp Energia SGPS SA (Oil, Gas & Consumable Fuels) 97,7993,923 Jeronimo Martins SGPS SA (Food & Staples Retailing) 71,991139,699 Sonae SGPS SA* (Food & Staples Retailing) 143,336
345,201Romania �� 0.1%99,724 Banca Transilvania SA (Banks) 66,0205,711 BRD-Groupe Societe Generale SA (Banks) 16,491450 New Europe Property Investments PLC (Real Estate Management & Development) 4,933499,361 OMV Petrom SA* (Oil, Gas & Consumable Fuels) 38,56214,500 Societatea Energetica Electrica SA (Electric Utilities) 49,4086,005 Societatea Nationala de Gaze Naturale ROMGAZ SA (Oil, Gas & Consumable Fuels) 44,5264,000 Transelectrica SA (Electric Utilities) 30,715
250,655
Copyright © 2017 www.secdatabase.com. All Rights Reserved.Please Consider the Environment Before Printing This Document

Russia �� 0.5%17,900 Aeroflot PJSC* (Airlines) 55,2613,200 Alrosa PAO* (Metals & Mining) 5,51723,600 Alrosa PJSC (Metals & Mining) 40,6857,330 Gazprom PJSC* (Oil, Gas & Consumable Fuels) 17,60832,437 Gazprom PJSC ADR (Oil, Gas & Consumable Fuels) 153,99693,000 Inter Rao Ues PJSC* (Electric Utilities) 6,618
42 The accompanying notes are an integral part of these financial statements.
Copyright © 2017 www.secdatabase.com. All Rights Reserved.Please Consider the Environment Before Printing This Document

GOLDMAN SACHS MULTI-MANAGER GLOBAL EQUITY FUND
Shares Description ValueCommon Stocks �� (continued)Russia �� (continued)888,000 Inter RAO UES PJSC (Electric Utilities) $ 63,1946,656 LSR Group PJSC GDR (Real Estate Management & Development) 22,065329 Lukoil PJSC* (Oil, Gas & Consumable Fuels) 16,3022,653 LUKOIL PJSC ADR (Oil, Gas & Consumable Fuels) 131,686870 Magnit PJSC (Food & Staples Retailing) 134,1605,383 Magnit PJSC GDR (Food & Staples Retailing) 188,2792,615 MegaFon PJSC GDR 27,9556,943 MMC Norilsk Nickel PJSC ADR (Metals & Mining) 106,65718,960 Mobile TeleSystems PJSC (Wireless Telecommunication Services) 91,22911,230 Moscow Exchange MICEX-RTS PJSC (Capital Markets) 22,707403 Novatek PJSC GDR 48,7951,465 PhosAgro PJSC GDR (Chemicals) 21,6097,150 PIK Group PJSC* (Household Durables) 36,1972,539 Polymetal International PLC (Metals & Mining) 33,3743,210 Rosneft Oil Co. PJSC* (Oil, Gas & Consumable Fuels) 17,8937,324 Rosneft Oil Co. PJSC GDR 40,52330,960 Rostelecom PJSC 40,5255,411,000 RusHydro PJSC 85,09264,290 Sberbank of Russia PJSC 186,7343,030 Severstal PJSC* (Metals & Mining) 41,3022,332 Severstal PJSC GDR (Metals & Mining) 31,85478,200 Sistema PJSC FC (Wireless Telecommunication Services) 29,3252,418 Sistema PJSC FC GDR (Wireless Telecommunication Services) 20,3359,600 Surgutneftegas OJSC* (Oil, Gas & Consumable Fuels) 4,7066,543 Surgutneftegas OJSC ADR (Oil, Gas & Consumable Fuels) 32,035860 Tatneft PJSC* (Oil, Gas & Consumable Fuels) 5,6961,611 Tatneft PJSC ADR (Oil, Gas & Consumable Fuels) 63,0552,256 Uralkali PJSC GDR* (Chemicals) 29,70137,760,000 VTB Bank PJSC 44,2581,960 X5 Retail Group NV GDR* (Food & Staples Retailing) 69,090
1,966,018Singapore �� 0.5%32,400 Ascendas Real Estate Investment Trust (Equity Real Estate Investment Trusts (REITs)) 59,383
Common Stocks �� (continued)Singapore �� (continued)26,500 BOC Aviation Ltd.(a) (Trading Companies & Distributors) 141,359234 Broadcom Ltd. (Semiconductors & Semiconductor Equipment) 51,67053,600 CapitaLand Commercial Trust (Equity Real Estate Investment Trusts (REITs)) 62,29413,100 CapitaLand Ltd. (Real Estate Management & Development) 35,19946,000 CapitaLand Mall Trust (Equity Real Estate Investment Trusts (REITs)) 64,8645,300 City Developments Ltd. (Real Estate Management & Development) 40,8992,900 ComfortDelGro Corp. Ltd. (Road & Rail) 5,6872,500 DBS Group Holdings Ltd. (Banks) 34,52669,600 Fortune Real Estate Investment Trust (Equity Real Estate Investment Trusts (REITs)) 81,06883,500 Genting Singapore PLC (Hotels, Restaurants & Leisure) 66,52819,300 Global Logistic Properties Ltd. (Real Estate Management & Development) 39,762108,900 Golden Agri-Resources Ltd. (Food Products) 28,01513,700 Hutchison Port Holdings Trust (Transportation Infrastructure) 5,54815,500 Intime Retail Group Co. Ltd. (Multiline Retail) 19,609200 Jardine Cycle & Carriage Ltd. (Distributors) 6,7611,400 Keppel Corp. Ltd. (Industrial Conglomerates) 6,52347,300 Keppel REIT (Equity Real Estate Investment Trusts (REITs)) 35,886239,521 Mapletree Commercial Trust (Equity Real Estate Investment Trusts (REITs)) 273,43947,700 Mapletree Greater China Commercial Trust (Equity Real Estate Investment Trusts (REITs)) 36,51681,200 Mapletree Industrial Trust (Equity Real Estate Investment Trusts (REITs)) 104,0233,500 Oversea-Chinese Banking Corp. Ltd. (Banks) 24,51318,400 SATS Ltd. (Transportation Infrastructure) 67,09614,800 Sembcorp Industries Ltd. (Industrial Conglomerates) 32,06757,500 Silverlake Axis Ltd. (Software) 23,2535,700 Singapore Airlines Ltd. (Airlines) 41,7579,400 Singapore Post Ltd. (Air Freight & Logistics) 9,2851,900 Singapore Press Holdings Ltd. (Media) 4,7193,000 Singapore Technologies Engineering Ltd. (Aerospace & Defense) 8,1381,900 Singapore Telecommunications Ltd. (Diversified Telecommunication Services) 5,072
The accompanying notes are an integral part of these financial statements. 43
Copyright © 2017 www.secdatabase.com. All Rights Reserved.Please Consider the Environment Before Printing This Document

GOLDMAN SACHS MULTI-MANAGER GLOBAL EQUITY FUND
Schedule of Investments (continued)April 30, 2017 (Unaudited)
Shares Description ValueCommon Stocks �� (continued)Singapore �� (continued)11,300 StarHub Ltd. (Wireless Telecommunication Services) $ 22,53347,800 Suntec Real Estate Investment Trust (Equity Real Estate Investment Trusts (REITs)) 60,5321,600 United Overseas Bank Ltd. (Banks) 24,91140,400 UOL Group Ltd. (Real Estate Management & Development) 209,25013,900 Venture Corp. Ltd. (Electronic Equipment, Instruments & Components) 121,31110,800 Wilmar International Ltd. (Food Products) 27,43329,400 Yangzijiang Shipbuilding Holdings Ltd. (Machinery) 24,199
1,905,628South Africa �� 0.7%262 Anglo American Platinum Ltd.* (Metals & Mining) 6,4713,106 AngloGold Ashanti Ltd. (Metals & Mining) 35,50012,953 Aspen Pharmacare Holdings Ltd. (Pharmaceuticals) 268,6637,006 AVI Ltd. (Food Products) 51,241564 Barclays Africa Group Ltd. (Banks) 6,2044,515 Barloworld Ltd. (Trading Companies & Distributors) 40,6842,364 Bid Corp. Ltd. (Food & Staples Retailing) 50,081104 Capitec Bank Holdings Ltd. (Banks) 5,9345,341 Clicks Group Ltd. (Food & Staples Retailing) 53,6781,006 Coronation Fund Managers Ltd. (Capital Markets) 4,7727,400 DataTec Ltd. (Electronic Equipment, Instruments & Components) 32,1503,631 Discovery Ltd. (Insurance) 36,3543,898 EOH Holdings Ltd. (IT Services) 41,25916,392 FirstRand Ltd. (Diversified Financial Services) 61,14622,733 Fortress Income Fund Ltd. Class A (Equity Real Estate Investment Trusts (REITs)) 29,82025,347 Gold Fields Ltd. (Metals & Mining) 83,03440,620 Growthpoint Properties Ltd. (Equity Real Estate Investment Trusts (REITs)) 77,84812,970 Harmony Gold Mining Co. Ltd. ADR (Metals & Mining) 28,0852,812 Hosken Consolidated Investments Ltd. (Industrial Conglomerates) 29,1398,667 Hyprop Investments Ltd. (Equity Real Estate Investment Trusts (REITs)) 80,0567,220 Impala Platinum Holdings Ltd.* (Metals & Mining) 23,176391 Imperial Holdings Ltd. (Distributors) 4,9444,061 Investec Ltd. (Capital Markets) 30,47265,600 KAP Industrial Holdings Ltd. (Industrial Conglomerates) 45,995
Common Stocks �� (continued)South Africa �� (continued)1,469 Liberty Holdings Ltd. (Insurance) 11,81715,600 Life Healthcare Group Holdings Ltd. (Health Care Providers & Services) 33,5381,277 Mondi Ltd. (Paper & Forest Products) 33,11716,331 MTN Group Ltd. (Wireless Telecommunication Services) 154,4472,408 Naspers Ltd. (Media) 457,8851,247 Nedbank Group Ltd. (Banks) 21,02430,429 Netcare Ltd. (Health Care Providers & Services) 60,3817,663 Northam Platinum Ltd.* (Metals & Mining) 28,4991,052 Pick n Pay Stores Ltd. (Food & Staples Retailing) 4,9993,194 Pioneer Foods Group Ltd. (Food Products) 39,4021,740 Rand Merchant Investment Holdings Ltd. (Insurance) 5,46275,713 Redefine Properties Ltd. (Equity Real Estate Investment Trusts (REITs)) 62,3182,114 Remgro Ltd. (Diversified Financial Services) 35,0935,528 Resilient REIT Ltd. (Equity Real Estate Investment Trusts (REITs)) 48,1616,600 Reunert Ltd. (Industrial Conglomerates) 35,0165,114 RMB Holdings Ltd. (Diversified Financial Services) 23,47312,234 SA Corporate Real Estate Ltd. (Equity Real Estate Investment Trusts (REITs)) 5,0354,531 Sanlam Ltd. (Insurance) 24,0626,736 Sappi Ltd. (Paper & Forest Products) 50,0243,044 Sasol Ltd. (Chemicals) 93,2893,789 Shoprite Holdings Ltd. (Food & Staples Retailing) 59,4466,510 Standard Bank Group Ltd. (Banks) 72,2773,962 Telkom SA SOC Ltd. (Diversified Telecommunication Services) 22,1707,121 The Bidvest Group Ltd. (Industrial Conglomerates) 84,997434 The Foschini Group Ltd. (Specialty Retail) 5,1841,660 The SPAR Group Ltd. (Food & Staples Retailing) 22,3761,702 Tiger Brands Ltd. (Food Products) 51,408
Copyright © 2017 www.secdatabase.com. All Rights Reserved.Please Consider the Environment Before Printing This Document

2,917 Tsogo Sun Holdings Ltd. (Hotels, Restaurants & Leisure) 5,4906,668 Vodacom Group Ltd. (Wireless Telecommunication Services) 75,4484,673 Woolworths Holdings Ltd. (Multiline Retail) 25,352
2,777,896South Korea �� 1.9%2,473 Amorepacific Corp. (Personal Products) 634,209251 AMOREPACIFIC Group (Personal Products) 29,006
44 The accompanying notes are an integral part of these financial statements.
Copyright © 2017 www.secdatabase.com. All Rights Reserved.Please Consider the Environment Before Printing This Document

GOLDMAN SACHS MULTI-MANAGER GLOBAL EQUITY FUND
Shares Description ValueCommon Stocks �� (continued)South Korea �� (continued)295 BGF retail Co. Ltd. (Food & Staples Retailing) $ 28,3881,953 Celltrion, Inc.* (Biotechnology) 153,66881 CJ CheilJedang Corp. (Food Products) 24,274106 E-MART, Inc. (Food & Staples Retailing) 21,411181 Green Cross Corp. (Biotechnology) 26,0871,187 Green Cross Holdings Corp. (Biotechnology) 34,007606 GS Holdings Corp. (Oil, Gas & Consumable Fuels) 31,581831 Hana Financial Group, Inc. (Banks) 28,541446 Hankook Tire Co. Ltd. (Auto Components) 23,08692 Hanmi Pharm Co. Ltd.* (Pharmaceuticals) 24,929467 Hanmi Science Co. Ltd.* (Pharmaceuticals) 24,8771,108 Hanwha Chemical Corp. (Chemicals) 24,489516 Hyundai Engineering & Construction Co. Ltd. (Construction & Engineering) 21,980190 Hyundai Glovis Co. Ltd. (Air Freight & Logistics) 24,211578 Hyundai Heavy Industries Co. Ltd.* (Machinery) 83,812155 Hyundai Mobis Co. Ltd. (Auto Components) 30,2281,328 Hyundai Motor Co. (Automobiles) 167,961412 Hyundai Steel Co. (Metals & Mining) 19,8458,804 Industrial Bank of Korea (Banks) 96,550927 Kangwon Land, Inc. (Hotels, Restaurants & Leisure) 29,4501,220 KB Financial Group, Inc. (Banks) 53,7157,478 KB Financial Group, Inc. ADR (Banks) 325,069635 Kia Motors Corp. (Automobiles) 19,438455 Korea Aerospace Industries Ltd. (Aerospace & Defense) 25,5112,227 Korea Electric Power Corp. (Electric Utilities) 88,769493 Korea Gas Corp.* (Gas Utilities) 20,19079 Korea Zinc Co. Ltd. (Metals & Mining) 29,5412,400 KT Corp. ADR (Diversified Telecommunication Services) 39,816538 KT&G Corp. (Tobacco) 47,9781,366 LG Chem Ltd. (Chemicals) 328,607612 LG Corp. (Industrial Conglomerates) 36,357371 LG Electronics, Inc. (Household Durables) 22,521217 LG Household & Health Care Ltd (Personal Products) 165,0411,514 LG Uplus Corp. (Diversified Telecommunication Services) 19,23877 Lotte Chemical Corp. (Chemicals) 23,115106 Lotte Shopping Co. Ltd. (Multiline Retail) 24,45376 Medy-Tox, Inc. (Biotechnology) 33,4081,020 NAVER Corp. (Internet Software & Services) 716,893270 POSCO (Metals & Mining) 63,742290 S-Oil Corp. (Oil, Gas & Consumable Fuels) 25,371
Common Stocks �� (continued)South Korea �� (continued)130 Samsung Biologics Co. Ltd.* (Life Sciences Tools & Services) 19,967209 Samsung C&T Corp. (Industrial Conglomerates) 22,64782 Samsung Electronics Co. Ltd. (Technology Hardware, Storage & Peripherals) 160,7551,769 Samsung Electronics Co. Ltd. GDR 1,735,680130 Samsung Fire & Marine Insurance Co. Ltd. (Insurance) 30,618332 Samsung Life Insurance Co. Ltd. (Insurance) 31,948746 Shinhan Financial Group Co. Ltd. (Banks) 31,1465,178 Shinhan Financial Group Co. Ltd. ADR (Banks) 216,233159 SK Holdings Co. Ltd. (Industrial Conglomerates) 33,88513,193 SK Hynix, Inc. (Semiconductors & Semiconductor Equipment) 624,9971,991 SK Innovation Co. Ltd. (Oil, Gas & Consumable Fuels) 298,700365 SK Telecom Co. Ltd. (Wireless Telecommunication Services) 77,04630,000 SK Telecom Co. Ltd. ADR (Wireless Telecommunication Services) 707,7002,642 Woori Bank (Banks) 34,711
7,717,396Spain �� 0.6%2,294 Abertis Infraestructuras SA (Transportation Infrastructure) 40,328456 Acciona SA (Electric Utilities) 37,6205,504 Acerinox SA (Metals & Mining) 76,6731,049 ACS Actividades de Construccion y Servicios SA (Construction & Engineering) 38,86648 Aena SA(a) (Transportation Infrastructure) 8,470642 Amadeus IT Group SA (IT Services) 34,6485,000 Banco Bilbao Vizcaya Argentaria SA (Banks) 40,05720,671 Banco de Sabadell SA (Banks) 39,759
Copyright © 2017 www.secdatabase.com. All Rights Reserved.Please Consider the Environment Before Printing This Document

54,905 Banco Popular Espanol SA* (Banks) 38,4192,225 Banco Santander SA (Banks) 14,51168,933 Bankia SA (Banks) 83,69613,963 Bankinter SA (Banks) 122,916260 Bolsas y Mercados Espanoles SHMSF SA (Capital Markets) 9,318113,140 CaixaBank SA (Banks) 513,705412 Cellnex Telecom SA(a) (Diversified Telecommunication Services) 7,28225,801 Distribuidora Internacional de Alimentacion SA (Food & Staples Retailing) 153,4177,404 Ebro Foods SA (Food Products) 165,372
The accompanying notes are an integral part of these financial statements. 45
Copyright © 2017 www.secdatabase.com. All Rights Reserved.Please Consider the Environment Before Printing This Document

GOLDMAN SACHS MULTI-MANAGER GLOBAL EQUITY FUND
Schedule of Investments (continued)April 30, 2017 (Unaudited)
Shares Description ValueCommon Stocks �� (continued)Spain �� (continued)1,240 Enagas SA (Oil, Gas & Consumable Fuels) $ 32,5848,752 Endesa SA (Electric Utilities) 206,1371,682 Ferrovial SA (Construction & Engineering) 35,7801,771 Gamesa Corp. Tecnologica SA (Electrical Equipment) 38,1951,629 Gas Natural SDG SA (Gas Utilities) 36,8118,797 Iberdrola SA (Electric Utilities) 63,24012,437 Industria de Diseno Textil SA (Specialty Retail) 476,60921,001 Mapfre SA (Insurance) 73,253584 Mediaset Espana Comunicacion SA (Media) 8,0503,979 Merlin Properties Socimi SA (Equity Real Estate Investment Trusts (REITs)) 47,054935 Red Electrica Corp. SA (Electric Utilities) 18,2312,096 Repsol SA (Oil, Gas & Consumable Fuels) 33,082636 Viscofan SA (Food Products) 38,015
2,532,098Swaziland �� 0.0%1,053 Wolseley PLC (Trading Companies & Distributors) 66,926
Sweden �� 0.8%21,064 Alfa Laval AB (Machinery) 431,63717,714 Atlas Copco AB Class A (Machinery) 661,7181,500 Autoliv, Inc. (Auto Components) 150,2853,968 BillerudKorsnas AB (Containers & Packaging) 63,5691,589 Boliden AB (Metals & Mining) 45,39522,306 Castellum AB (Real Estate Management & Development) 305,477400 Electrolux AB Series B (Household Durables) 11,8823,550 Elekta AB Class B (Health Care Equipment & Supplies) 37,0634,371 Getinge AB Class B (Health Care Equipment & Supplies) 85,37916,898 Hemfosa Fastigheter AB (Real Estate Management & Development) 156,5663,466 Husqvarna AB Class B (Household Durables) 34,4553,582 ICA Gruppen AB (Food & Staples Retailing) 122,2402,206 Industrivarden AB Class C (Diversified Financial Services) 51,300835 Investor AB Class B (Diversified Financial Services) 38,1521,207 Kinnevik AB Class B (Diversified Financial Services) 32,2106,072 Loomis AB Class B (Commercial Services & Supplies) 220,400
Common Stocks �� (continued)Sweden �� (continued)1,837 Lundin Petroleum AB* (Oil, Gas & Consumable Fuels) 35,0299,354 Mycronic AB (Electronic Equipment, Instruments & Components) 92,3715,240 Nordea Bank AB (Banks) 64,44613,155 Scandic Hotels Group AB*(a) (Hotels, Restaurants & Leisure) 148,0942,377 Securitas AB Class B (Commercial Services & Supplies) 39,2882,372 Skandinaviska Enskilda Banken AB (Banks) 27,3141,100 Skanska AB Class B (Construction & Engineering) 26,2921,418 SKF AB Class B (Machinery) 31,1183,824 Svenska Cellulosa AB SCA Class B (Household Products) 126,6022,698 Svenska Handelsbanken AB Class A (Banks) 38,2792,579 Swedbank AB Class A (Banks) 61,1222,727 Swedish Match AB (Tobacco) 89,92711,745 Tele2 AB Class B (Wireless Telecommunication Services) 118,1985,414 Telefonaktiebolaget LM Ericsson Class B (Communications Equipment) 35,1748,377 Telia Co. AB (Diversified Telecommunication Services) 34,1061,582 Trelleborg AB Class B (Machinery) 37,1503,059 Volvo AB Class B (Machinery) 49,956
3,502,194Switzerland �� 3.6%48,047 ABB Ltd. (Electrical Equipment) 1,177,35613,869 Aryzta AG* (Food Products) 450,2691,015 Baloise Holding AG (Insurance) 148,83533 Barry Callebaut AG* (Food Products) 45,3201,965 Cembra Money Bank AG (Consumer Finance) 167,63911,002 Chubb Ltd. (Insurance) 1,510,02511,318 Cie Financiere Richemont SA (Textiles, Apparel & Luxury Goods) 945,7153,426 Clariant AG* (Chemicals) 69,382
Copyright © 2017 www.secdatabase.com. All Rights Reserved.Please Consider the Environment Before Printing This Document

4,225 Credit Suisse Group AG* (Capital Markets) 64,435412 Dufry AG* (Specialty Retail) 67,509142 EMS-Chemie Holding AG (Chemicals) 88,979438 Flughafen Zuerich AG (Transportation Infrastructure) 96,52546 Galenica AG (Pharmaceuticals) 49,98394 Geberit AG (Building Products) 42,818304 Georg Fischer AG (Machinery) 286,66217 Givaudan SA (Chemicals) 32,75421,035 Glencore PLC* (Metals & Mining) 82,670167 Helvetia Holding AG (Insurance) 92,734615 Julius Baer Group Ltd.* (Capital Markets) 32,070273 Kuehne & Nagel International AG (Marine) 41,287
46 The accompanying notes are an integral part of these financial statements.
Copyright © 2017 www.secdatabase.com. All Rights Reserved.Please Consider the Environment Before Printing This Document

GOLDMAN SACHS MULTI-MANAGER GLOBAL EQUITY FUND
Shares Description ValueCommon Stocks �� (continued)Switzerland �� (continued)592 LafargeHolcim Ltd.* (Construction Materials) $ 33,571885 Logitech International SA (Technology Hardware, Storage & Peripherals) 29,578444 Lonza Group AG* (Life Sciences Tools & Services) 90,84716,029 Nestle SA (Food Products) 1,234,56113,501 Novartis AG (Pharmaceuticals) 1,039,3759,474 Novartis AG ADR (Pharmaceuticals) 729,7821,461 Pargesa Holding SA (Diversified Financial Services) 109,237248 Partners Group Holding AG (Capital Markets) 149,9181,466 PSP Swiss Property AG (Real Estate Management & Development) 131,4353,643 Roche Holding AG (Pharmaceuticals) 953,243173 Schindler Holding AG (Machinery) 35,351390 SGS SA (Professional Services) 878,2058 Sika AG (Chemicals) 51,059484 Sonova Holding AG (Health Care Equipment & Supplies) 71,569184 Straumann Holding AG (Health Care Equipment & Supplies) 97,125352 Swiss Life Holding AG* (Insurance) 114,5541,804 Swiss Prime Site AG* (Real Estate Management & Development) 156,39523,096 Swiss Re AG (Insurance) 2,008,87475 Swisscom AG (Diversified Telecommunication Services) 32,70638 Syngenta AG* (Chemicals) 17,6601,300 TE Connectivity Ltd. (Electronic Equipment, Instruments & Components) 100,581806 Temenos Group AG* (Software) 69,76489 The Swatch Group AG (Textiles, Apparel & Luxury Goods) 35,60618,763 UBS Group AG (Capital Markets) 320,300417 Valora Holding AG (Specialty Retail) 143,121520 Ypsomed Holding AG* (Health Care Equipment & Supplies) 100,0822,924 Zurich Insurance Group AG (Insurance) 809,183
15,036,649Taiwan �� 1.4%50,358 Advanced Semiconductor Engineering, Inc. ADR (Semiconductors & Semiconductor Equipment) 315,2412,000 Airtac International Group (Machinery) 22,86318,000 Asia Cement Corp. (Construction Materials) 17,7723,000 Catcher Technology Co. Ltd. (Technology Hardware, Storage & Peripherals) 30,82424,000 Cathay Financial Holding Co. Ltd. (Insurance) 38,46311,000 Cheng Shin Rubber Industry Co. Ltd. (Auto Components) 22,701
Common Stocks �� (continued)Taiwan �� (continued)90,000 China Airlines Ltd. (Airlines) 27,89157,000 China Development Financial Holding Corp. (Banks) 15,72346,000 China Steel Corp. (Metals & Mining) 36,86535,000 Chunghwa Telecom Co. Ltd. (Diversified Telecommunication Services) 118,393497,520 CTBC Financial Holding Co. Ltd. (Banks) 310,6846,000 Delta Electronics, Inc. (Electronic Equipment, Instruments & Components) 33,80755,000 E.Sun Financial Holding Co. Ltd. (Banks) 33,2442,045 Eclat Textile Co. Ltd. (Textiles, Apparel & Luxury Goods) 22,36663,000 Eva Airways Corp. (Airlines) 30,97233,000 Far Eastern New Century Corp. (Industrial Conglomerates) 27,76614,000 Far EasTone Telecommunications Co. Ltd. (Wireless Telecommunication Services) 34,4766,720 Feng TAY Enterprise Co. Ltd. (Textiles, Apparel & Luxury Goods) 25,82310,000 Formosa Chemicals & Fibre Corp. (Chemicals) 30,75020,000 Formosa Petrochemical Corp. (Oil, Gas & Consumable Fuels) 69,90819,000 Formosa Plastic Corp. (Chemicals) 57,09220,000 Fubon Financial Holding Co. Ltd. (Diversified Financial Services) 31,3555,000 Giant Manufacturing Co. Ltd. (Leisure Products) 30,2442,000 Ginko International Co. Ltd. (Health Care Equipment & Supplies) 16,4733,000 Grape King Bio Ltd. (Personal Products) 19,29026,000 Highwealth Construction Corp. (Real Estate Management & Development) 43,8635,000 Hiwin Technologies Corp. (Machinery) 31,90218,100 Hon Hai Precision Industry Co. Ltd. (Electronic Equipment, Instruments & Components) 59,24474,800 Hon Hai Precision Industry Co. Ltd. GDR (Electronic Equipment, Instruments & Components) 498,9164,000 Hotai Motor Co. Ltd. (Specialty Retail) 46,0712,000 King Slide Works Co. Ltd. (Machinery) 30,79125,000 MediaTek, Inc. (Semiconductors & Semiconductor Equipment) 179,720452,788 Mega Financial Holding Co. Ltd. (Banks) 363,54217,000 Nan Ya Plastics Corp. (Chemicals) 40,9482,000 OBI Pharma, Inc.* (Biotechnology) 18,826
Copyright © 2017 www.secdatabase.com. All Rights Reserved.Please Consider the Environment Before Printing This Document

5,000 Pegatron Corp. (Technology Hardware, Storage & Peripherals) 14,7254,000 PharmaEngine, Inc. (Biotechnology) 24,72632,000 Pou Chen Corp. (Textiles, Apparel & Luxury Goods) 44,811
The accompanying notes are an integral part of these financial statements. 47
Copyright © 2017 www.secdatabase.com. All Rights Reserved.Please Consider the Environment Before Printing This Document

GOLDMAN SACHS MULTI-MANAGER GLOBAL EQUITY FUND
Schedule of Investments (continued)April 30, 2017 (Unaudited)
Shares Description ValueCommon Stocks �� (continued)Taiwan �� (continued)8,000 President Chain Store Corp. (Food & Staples Retailing) $ 69,61910,000 Quanta Computer, Inc. (Technology Hardware, Storage & Peripherals) 20,71730,000 Ruentex Development Co. Ltd.* (Real Estate Management & Development) 36,64115,000 Ruentex Industries Ltd. (Textiles, Apparel & Luxury Goods) 24,1372,000 St. Shine Optical Co. Ltd. (Health Care Equipment & Supplies) 38,71311,550 Standard Foods Corp. (Food Products) 28,50319,000 Taiwan Cement Corp. (Construction Materials) 22,09915,000 Taiwan Mobile Co. Ltd. (Wireless Telecommunication Services) 55,43416,000 Taiwan Semiconductor Manufacturing Co. Ltd. (Semiconductors & Semiconductor Equipment) 103,07065,423 Taiwan Semiconductor Manufacturing Co. Ltd. ADR (Semiconductors & Semiconductor Equipment) 2,163,53917,000 Teco Electric and Machinery Co. Ltd. (Electrical Equipment) 16,83652,000 Uni-President Enterprises Corp. (Food Products) 95,99282,000 United Microelectronics Corp. (Semiconductors & Semiconductor Equipment) 32,75059,000 Walsin Lihwa Corp. (Electrical Equipment) 26,49780,000 Yuanta Financial Holding Co. Ltd. (Capital Markets) 34,205
5,587,823Thailand �� 0.6%9,600 Advanced Info Service PCL (Wireless Telecommunication Services) 48,52527,076 Advanced Info Service PCL ADR (Wireless Telecommunication Services) 136,2601,200 Advanced Info Service PCL NVDR (Wireless Telecommunication Services) 6,07137,000 Airports of Thailand PCL (Transportation Infrastructure) 43,04419,000 Airports of Thailand PCL NVDR (Transportation Infrastructure) 22,10510,160 Bangkok Bank PCL ADR (Banks) 263,32512,500 Bangkok Bank PCL. (Banks) 67,529350,900 Bangkok Dusit Medical Services PCL Class F (Health Care Providers & Services) 205,794133,400 Bangkok Dusit Medical Services PCL NVDR (Health Care Providers & Services) 78,236142,100 Bangkok Expressway & Metro PCL 29,555518,600 Bangkok Land PCL (Real Estate Management & Development) 28,028
Common Stocks �� (continued)Thailand �� (continued)51,300 Bank of Ayudhya PCL NVDR (Banks) 56,3263,400 Berli Jucker PCL NVDR (Industrial Conglomerates) 4,27664,300 BTS Group Holdings PCL (Road & Rail) 15,787159,600 BTS Group Holdings PCL NVDR (Road & Rail) 39,1867,500 Bumrungrad Hospital PCL (Health Care Providers & Services) 38,0184,800 Bumrungrad Hospital PCL NVDR (Health Care Providers & Services) 24,33222,700 Central Pattana PCL (Real Estate Management & Development) 39,33516,200 Central Pattana PCL NVDR (Real Estate Management & Development) 28,07267,900 Charoen Pokphand Foods PCL NVDR (Food Products) 52,44227,700 CP ALL PCL (Food & Staples Retailing) 48,86217,600 CP ALL PCL NVDR (Food & Staples Retailing) 31,04915,200 Delta Electronics Thailand PCL (Electronic Equipment, Instruments & Components) 40,41811,100 Delta Electronics Thailand PCL NVDR (Electronic Equipment, Instruments & Components) 29,5164,300 Electricity Generating PCL (Independent Power and Renewable Electricity Producers) 27,34614,900 Energy Absolute PCL NVDR (Oil, Gas & Consumable Fuels) 11,61413,900 Glow Energy PCL (Independent Power and Renewable Electricity Producers) 32,93515,800 Hana Microelectronics PCL (Electronic Equipment, Instruments & Components) 19,41398,200 Home Product Center PCL (Specialty Retail) 27,52224,000 Indorama Ventures PCL (Chemicals) 25,44833,700 Indorama Ventures PCL NVDR (Chemicals) 35,73313,100 Intouch Holdings PCL NVDR (Wireless Telecommunication Services) 20,2487,100 Kasikornbank PCL (Banks) 37,9734,800 Kasikornbank PCL NVDR (Banks) 25,6508,000 KCE Electronics PCL (Electronic Equipment, Instruments & Components) 24,60481,200 Krung Thai Bank PCL NVDR (Banks) 46,42532,000 Minor International PCL (Hotels, Restaurants & Leisure) 34,43526,400 Minor International PCL NVDR (Hotels, Restaurants & Leisure) 28,40913,500 PTT Exploration & Production PCL (Oil, Gas & Consumable Fuels) 37,8809,600 PTT Exploration & Production PCL NVDR (Oil, Gas & Consumable Fuels) 26,937
48 The accompanying notes are an integral part of these financial statements.
Copyright © 2017 www.secdatabase.com. All Rights Reserved.Please Consider the Environment Before Printing This Document

GOLDMAN SACHS MULTI-MANAGER GLOBAL EQUITY FUND
Shares Description ValueCommon Stocks �� (continued)Thailand �� (continued)12,200 PTT Global Chemical PCL (Chemicals) $ 26,40718,500 PTT Global Chemical PCL NVDR (Chemicals) 40,0445,000 PTT PCL (Oil, Gas & Consumable Fuels) 56,1312,600 PTT PCL NVDR (Oil, Gas & Consumable Fuels) 29,18838,535 Siam Global House PCL (Specialty Retail) 18,144542,700 Superblock PCL* (Independent Power and Renewable Electricity Producers) 23,68775,500 Thai Beverage PCL (Beverages) 49,98215,400 Thai Oil PCL NVDR (Oil, Gas & Consumable Fuels) 34,7012,100 The Siam Cement PCL (Construction Materials) 32,5171,600 The Siam Cement PCL NVDR (Construction Materials) 24,7756,000 The Siam Commercial Bank PCL 27,021373,200 TMB Bank PCL NVDR (Banks) 24,574140,984 True Corp. PCL (Diversified Telecommunication Services) 26,65524,200 True Corp. PCL NVDR (Diversified Telecommunication Services) 4,575303,100 WHA Corp. PCL* (Real Estate Management & Development) 27,507
2,284,571Turkey �� 0.3%25,238 Akbank TAS (Banks) 67,55126,474 Aksa Enerji Uretim AS* (Independent Power and Renewable Electricity Producers) 22,2865,738 Anadolu Efes Biracilik Ve Malt Sanayii AS (Beverages) 32,34112,909 Arcelik AS (Household Durables) 86,0633,743 Aygaz AS (Gas Utilities) 14,9323,807 BIM Birlesik Magazalar AS (Food & Staples Retailing) 62,187133,656 Emlak Konut Gayrimenkul Yatirim Ortakligi AS (Equity Real Estate Investment Trusts (REITs)) 110,96935,409 Enka Insaat ve Sanayi AS (Industrial Conglomerates) 54,41459,245 Eregli Demir ve Celik Fabrikalari TAS (Metals & Mining) 108,5251,777 Ford Otomotiv Sanayi AS (Automobiles) 19,7519,329 Haci Omer Sabanci Holding AS (Diversified Financial Services) 27,78552,570 Is Gayrimenkul Yatirim Ortakligi AS (Equity Real Estate Investment Trusts (REITs)) 20,57012,575 KOC Holding AS (Industrial Conglomerates) 59,10218,787 Petkim Petrokimya Holding AS (Chemicals) 25,965
Common Stocks �� (continued)Turkey �� (continued)9,633 Soda Sanayii AS (Chemicals) 17,3845,922 TAV Havalimanlari Holding AS (Transportation Infrastructure) 24,6754,800 Tofas Turk Otomobil Fabrikasi AS (Automobiles) 39,9744,691 Tupras Turkiye Petrol Rafinerileri AS (Oil, Gas & Consumable Fuels) 118,16715,994 Turk Hava Yollari AO* (Airlines) 27,28715,411 Turk Telekomunikasyon AS (Diversified Telecommunication Services) 27,67026,081 Turkcell Iletisim Hizmetleri AS* (Wireless Telecommunication Services) 91,25124,708 Turkiye Garanti Bankasi A/S (Banks) 66,69810,223 Turkiye Halk Bankasi AS (Banks) 33,90412,776 Turkiye Is Bankasi Class C (Banks) 25,2143,825 Turkiye Vakiflar Bankasi TAO Class D (Banks) 6,5375,178 Ulker Biskuvi Sanayi AS (Food Products) 29,418
1,220,620United Arab Emirates �� 0.1%96,000 Air Arabia PJSC (Airlines) 27,18258,590 Ajman Bank PJSC* (Banks) 18,92976,993 Arabtec Holding PJSC* (Construction & Engineering) 18,84621,366 DAMAC Properties Dubai Co. PJSC (Real Estate Management & Development) 14,89159,284 Dubai Financial Market PJSC (Capital Markets) 18,56251,450 Dubai Investments PJSC (Capital Markets) 29,61510,630 Dubai Islamic Bank PJSC (Banks) 16,98885,000 DXB Entertainments PJSC* (Hotels, Restaurants & Leisure) 22,31823,611 Emaar Malls Group PJSC (Real Estate Management & Development) 16,52410,324 Emaar Properties PJSC (Real Estate Management & Development) 20,16138,563 National Central Cooling Co. PJSC (Building Products) 19,843
223,859United Kingdom �� 7.8%28,220 3i Group PLC (Capital Markets) 290,01814,789 Abcam PLC (Biotechnology) 164,1655,224 Admiral Group PLC (Insurance) 136,0365,974 Anglo American PLC* (Metals & Mining) 85,53216,200 Aon PLC (Insurance) 1,941,4084,655 Ashtead Group PLC (Trading Companies & Distributors) 98,202
Copyright © 2017 www.secdatabase.com. All Rights Reserved.Please Consider the Environment Before Printing This Document

2,958 ASOS PLC* (Internet & Direct Marketing Retail) 222,94213,768 AstraZeneca PLC (Pharmaceuticals) 824,5577,115 Auto Trader Group PLC(a) (Internet Software & Services) 36,954
The accompanying notes are an integral part of these financial statements. 49
Copyright © 2017 www.secdatabase.com. All Rights Reserved.Please Consider the Environment Before Printing This Document

GOLDMAN SACHS MULTI-MANAGER GLOBAL EQUITY FUND
Schedule of Investments (continued)April 30, 2017 (Unaudited)
Shares Description ValueCommon Stocks �� (continued)United Kingdom �� (continued)142,541 Aviva PLC (Insurance) $ 969,3369,127 Babcock International Group PLC (Commercial Services & Supplies) 106,3214,240 BAE Systems PLC (Aerospace & Defense) 34,437109,028 Balfour Beatty PLC (Construction & Engineering) 411,883267,976 Barclays PLC (Banks) 733,82718,371 Barratt Developments PLC (Household Durables) 137,84931,458 Beazley PLC (Insurance) 179,2205,432 Bellway PLC (Household Durables) 200,1994,427 BHP Billiton PLC (Metals & Mining) 67,490100,626 boohoo.com PLC* (Internet & Direct Marketing Retail) 245,81371,735 BP PLC (Oil, Gas & Consumable Fuels) 410,65516,856 British American Tobacco PLC (Tobacco) 1,138,8475,897 BT Group PLC (Diversified Telecommunication Services) 23,2633,051 Bunzl PLC (Trading Companies & Distributors) 95,1121,768 Burberry Group PLC (Textiles, Apparel & Luxury Goods) 36,9488,618 Capita PLC (Professional Services) 62,11614,331 Carnival PLC (Hotels, Restaurants & Leisure) 883,254214,505 Cobham PLC (Aerospace & Defense) 368,12062,682 Compass Group PLC (Hotels, Restaurants & Leisure) 1,265,59918,090 Conviviality PLC (Food & Staples Retailing) 71,2282,514 Croda International PLC (Chemicals) 122,5403,447 Dechra Pharmaceuticals PLC (Pharmaceuticals) 75,45113,692 Diageo PLC (Beverages) 398,535839 Dialog Semiconductor PLC* (Semiconductors & Semiconductor Equipment) 39,25847,604 Direct Line Insurance Group PLC (Insurance) 215,11728,888 Domino�s Pizza Group PLC (Hotels, Restaurants & Leisure) 123,6095,775 DS Smith PLC (Containers & Packaging) 32,28859,807 Experian PLC (Professional Services) 1,286,61312,210 Ferroglobe PLC (Metals & Mining) 117,8268,166 Fevertree Drinks PLC (Beverages) 172,073394,179 GKN PLC (Auto Components) 1,831,85629,094 GlaxoSmithKline PLC (Pharmaceuticals) 585,59937,985 Greencore Group PLC (Food Products) 112,13319,047 GVC Holdings PLC (Hotels, Restaurants & Leisure) 184,2825,615 Halma PLC (Electronic Equipment, Instruments & Components) 76,580
Common Stocks �� (continued)United Kingdom �� (continued)12,085 Hammerson PLC (Equity Real Estate Investment Trusts (REITs)) 91,94718,026 Hastings Group Holdings PLC(a) (Insurance) 70,579103,520 Hays PLC (Professional Services) 229,7203,991 Hill & Smith Holdings PLC (Metals & Mining) 68,64612,888 Hiscox. Ltd. (Insurance) 189,00015,094 HSBC Holdings PLC (Banks) 124,4702,387 IHS Markit Ltd.* (Professional Services) 103,596948 Imperial Tobacco Group PLC (Tobacco) 46,42718,464 Inchcape PLC (Distributors) 204,2589,371 Informa PLC (Media) 77,9178,210 Inmarsat PLC (Diversified Telecommunication Services) 86,828672 InterContinental Hotels Group PLC (Hotels, Restaurants & Leisure) 35,61712,381 InterContinental Hotels Group PLC ADR (Hotels, Restaurants & Leisure) 653,59322,394 Intermediate Capital Group PLC (Capital Markets) 226,6651,226 Intertek Group PLC (Professional Services) 64,52639,787 J Sainsbury PLC (Food & Staples Retailing) 141,85929,449 JD Sports Fashion PLC (Specialty Retail) 169,815681 Johnson Matthey PLC (Chemicals) 26,26825,716 Just Eat PLC* (Internet Software & Services) 192,23712,973 KAZ Minerals PLC* (Metals & Mining) 84,61130,438 Kingfisher PLC (Specialty Retail) 134,6565,341 Land Securities Group PLC (Equity Real Estate Investment Trusts (REITs)) 76,492889,342 Lloyds Banking Group PLC (Banks) 799,096791 London Stock Exchange Group PLC (Capital Markets) 34,65915,145 Marks & Spencer Group PLC (Multiline Retail) 71,8804,491 Mediclinic International PLC (Health Care Providers & Services) 47,344
Copyright © 2017 www.secdatabase.com. All Rights Reserved.Please Consider the Environment Before Printing This Document

2,173 Micro Focus International PLC (Software) 72,8063,499 Mondi PLC (Paper & Forest Products) 90,52435,941 National Express Group PLC (Road & Rail) 166,32617,111 National Grid PLC (Multi-Utilities) 221,5571,154 Next PLC (Multiline Retail) 64,3282,066 Nielsen Holdings PLC (Professional Services) 84,97514,245 Northgate PLC (Road & Rail) 99,6315,649 Nostrum Oil & Gas PLC* (Oil, Gas & Consumable Fuels) 32,80819,321 Old Mutual PLC (Insurance) 48,5268,031 Pearson PLC (Media) 66,24511,739 Pennon Group PLC (Water Utilities) 130,234
50 The accompanying notes are an integral part of these financial statements.
Copyright © 2017 www.secdatabase.com. All Rights Reserved.Please Consider the Environment Before Printing This Document
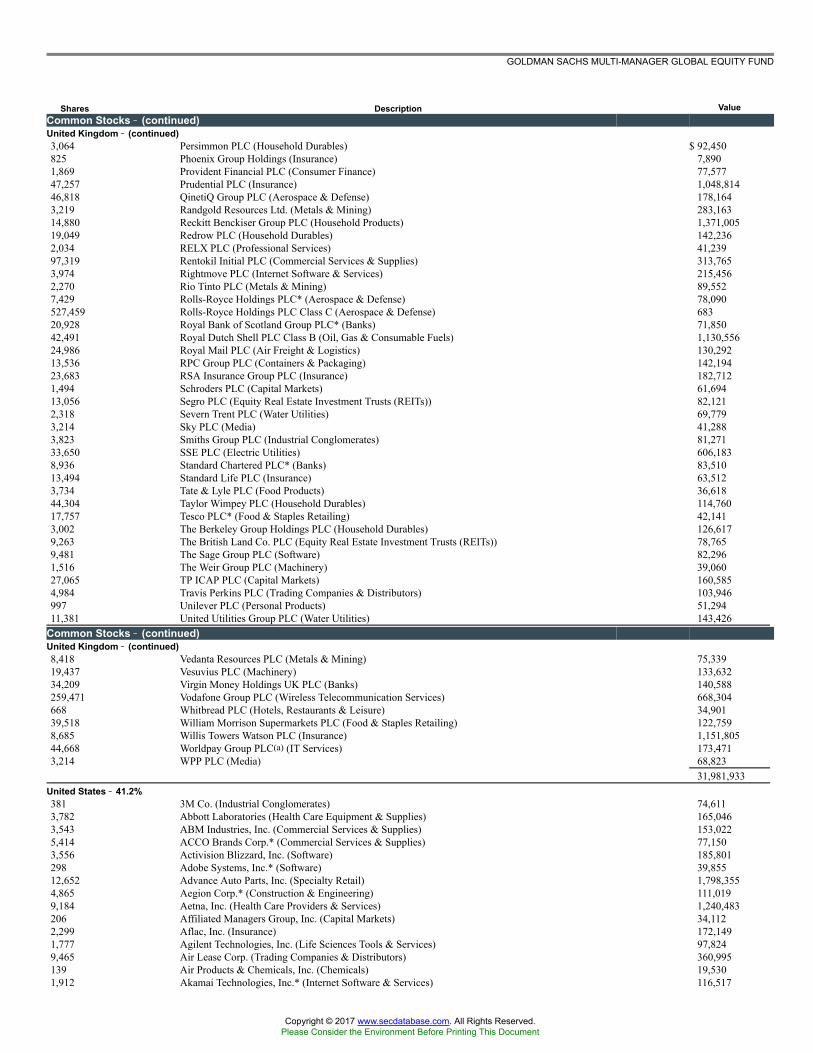
GOLDMAN SACHS MULTI-MANAGER GLOBAL EQUITY FUND
Shares Description ValueCommon Stocks �� (continued)United Kingdom �� (continued)3,064 Persimmon PLC (Household Durables) $ 92,450825 Phoenix Group Holdings (Insurance) 7,8901,869 Provident Financial PLC (Consumer Finance) 77,57747,257 Prudential PLC (Insurance) 1,048,81446,818 QinetiQ Group PLC (Aerospace & Defense) 178,1643,219 Randgold Resources Ltd. (Metals & Mining) 283,16314,880 Reckitt Benckiser Group PLC (Household Products) 1,371,00519,049 Redrow PLC (Household Durables) 142,2362,034 RELX PLC (Professional Services) 41,23997,319 Rentokil Initial PLC (Commercial Services & Supplies) 313,7653,974 Rightmove PLC (Internet Software & Services) 215,4562,270 Rio Tinto PLC (Metals & Mining) 89,5527,429 Rolls-Royce Holdings PLC* (Aerospace & Defense) 78,090527,459 Rolls-Royce Holdings PLC Class C (Aerospace & Defense) 68320,928 Royal Bank of Scotland Group PLC* (Banks) 71,85042,491 Royal Dutch Shell PLC Class B (Oil, Gas & Consumable Fuels) 1,130,55624,986 Royal Mail PLC (Air Freight & Logistics) 130,29213,536 RPC Group PLC (Containers & Packaging) 142,19423,683 RSA Insurance Group PLC (Insurance) 182,7121,494 Schroders PLC (Capital Markets) 61,69413,056 Segro PLC (Equity Real Estate Investment Trusts (REITs)) 82,1212,318 Severn Trent PLC (Water Utilities) 69,7793,214 Sky PLC (Media) 41,2883,823 Smiths Group PLC (Industrial Conglomerates) 81,27133,650 SSE PLC (Electric Utilities) 606,1838,936 Standard Chartered PLC* (Banks) 83,51013,494 Standard Life PLC (Insurance) 63,5123,734 Tate & Lyle PLC (Food Products) 36,61844,304 Taylor Wimpey PLC (Household Durables) 114,76017,757 Tesco PLC* (Food & Staples Retailing) 42,1413,002 The Berkeley Group Holdings PLC (Household Durables) 126,6179,263 The British Land Co. PLC (Equity Real Estate Investment Trusts (REITs)) 78,7659,481 The Sage Group PLC (Software) 82,2961,516 The Weir Group PLC (Machinery) 39,06027,065 TP ICAP PLC (Capital Markets) 160,5854,984 Travis Perkins PLC (Trading Companies & Distributors) 103,946997 Unilever PLC (Personal Products) 51,29411,381 United Utilities Group PLC (Water Utilities) 143,426
Common Stocks �� (continued)United Kingdom �� (continued)8,418 Vedanta Resources PLC (Metals & Mining) 75,33919,437 Vesuvius PLC (Machinery) 133,63234,209 Virgin Money Holdings UK PLC (Banks) 140,588259,471 Vodafone Group PLC (Wireless Telecommunication Services) 668,304668 Whitbread PLC (Hotels, Restaurants & Leisure) 34,90139,518 William Morrison Supermarkets PLC (Food & Staples Retailing) 122,7598,685 Willis Towers Watson PLC (Insurance) 1,151,80544,668 Worldpay Group PLC(a) (IT Services) 173,4713,214 WPP PLC (Media) 68,823
31,981,933United States �� 41.2%381 3M Co. (Industrial Conglomerates) 74,6113,782 Abbott Laboratories (Health Care Equipment & Supplies) 165,0463,543 ABM Industries, Inc. (Commercial Services & Supplies) 153,0225,414 ACCO Brands Corp.* (Commercial Services & Supplies) 77,1503,556 Activision Blizzard, Inc. (Software) 185,801298 Adobe Systems, Inc.* (Software) 39,85512,652 Advance Auto Parts, Inc. (Specialty Retail) 1,798,3554,865 Aegion Corp.* (Construction & Engineering) 111,0199,184 Aetna, Inc. (Health Care Providers & Services) 1,240,483206 Affiliated Managers Group, Inc. (Capital Markets) 34,1122,299 Aflac, Inc. (Insurance) 172,1491,777 Agilent Technologies, Inc. (Life Sciences Tools & Services) 97,8249,465 Air Lease Corp. (Trading Companies & Distributors) 360,995139 Air Products & Chemicals, Inc. (Chemicals) 19,5301,912 Akamai Technologies, Inc.* (Internet Software & Services) 116,517
Copyright © 2017 www.secdatabase.com. All Rights Reserved.Please Consider the Environment Before Printing This Document

2,632 Alamo Group, Inc. (Machinery) 208,086645 Alaska Air Group, Inc. (Airlines) 54,8831,232 Albemarle Corp. (Chemicals) 134,1771,044 Alexandria Real Estate Equities, Inc. (Equity Real Estate Investment Trusts (REITs)) 117,460343 Alleghany Corp.* (Insurance) 209,4707,658 Allergan PLC (Pharmaceuticals) 1,867,480269 Alliance Data Systems Corp. (IT Services) 67,1505,672 Alliant Energy Corp. (Electric Utilities) 223,0238,022 Ally Financial, Inc. (Consumer Finance) 158,8361,324 Altria Group, Inc. (Tobacco) 95,037
The accompanying notes are an integral part of these financial statements. 51
Copyright © 2017 www.secdatabase.com. All Rights Reserved.Please Consider the Environment Before Printing This Document

GOLDMAN SACHS MULTI-MANAGER GLOBAL EQUITY FUND
Schedule of Investments (continued)April 30, 2017 (Unaudited)
Shares Description ValueCommon Stocks �� (continued)United States �� (continued)83 Amazon.com, Inc.* (Internet & Direct Marketing Retail) $ 76,7745,655 Amdocs Ltd. (IT Services) 346,3124,156 Ameren Corp. (Multi-Utilities) 227,2926,285 American Campus Communities, Inc. (Equity Real Estate Investment Trusts (REITs)) 297,8463,362 American Electric Power Co., Inc. (Electric Utilities) 228,044750 American Express Co. (Consumer Finance) 59,43830,165 American International Group, Inc. (Insurance) 1,837,350442 American Tower Corp. (Equity Real Estate Investment Trusts (REITs)) 55,6655,234 American Water Works Co., Inc. (Water Utilities) 417,464616 Ameriprise Financial, Inc. (Capital Markets) 78,7568,105 Ameris Bancorp (Banks) 381,7455,360 AMERISAFE, Inc. (Insurance) 308,46821,451 AmerisourceBergen Corp. (Health Care Providers & Services) 1,760,0551,284 AMETEK, Inc. (Electrical Equipment) 73,4451,398 Amphenol Corp. Class A (Electronic Equipment, Instruments & Components) 101,08911,179 Amplify Snack Brands, Inc.* (Food Products) 100,611959 Anadarko Petroleum Corp. (Oil, Gas & Consumable Fuels) 54,6821,079 Anixter International, Inc.* (Electronic Equipment, Instruments & Components) 87,99249,580 Annaly Capital Management, Inc. (Mortgage Real Estate Investment Trusts (REITs)) 585,540722 ANSYS, Inc.* (Software) 79,5367,856 Anthem, Inc. (Health Care Providers & Services) 1,397,5048,828 Anworth Mortgage Asset Corp. (Mortgage Real Estate Investment Trusts (REITs)) 51,732539 Apache Corp. (Oil, Gas & Consumable Fuels) 26,21712,539 Apple, Inc. (Technology Hardware, Storage & Peripherals) 1,801,2275,485 Arch Capital Group Ltd.* (Insurance) 531,8802,008 Archer-Daniels-Midland Co. (Food Products) 91,8665,079 Arconic, Inc. (Aerospace & Defense) 138,8097,433 Ares Commercial Real Estate Corp. (Mortgage Real Estate Investment Trusts (REITs)) 102,7983,571 Arthur J. Gallagher & Co. (Insurance) 199,2985,938 Assured Guaranty Ltd. (Insurance) 226,4166,079 AT&T, Inc. (Diversified Telecommunication Services) 240,911
Common Stocks �� (continued)United States �� (continued)866 Autodesk, Inc.* (Software) 78,001406 Automatic Data Processing, Inc. (IT Services) 42,42375 AutoZone, Inc.* (Specialty Retail) 51,914973 AvalonBay Communities, Inc. (Equity Real Estate Investment Trusts (REITs)) 184,71419,948 Axis Capital Holdings Ltd. (Insurance) 1,314,5732,338 Baker Hughes, Inc. (Energy Equipment & Services) 138,8073,860 Balchem Corp. (Chemicals) 313,2781,748 Ball Corp. (Containers & Packaging) 134,4048,737 Bank of America Corp. (Banks) 203,9222,765 BankUnited, Inc. (Banks) 97,5775,020 Baxter International, Inc. (Health Care Equipment & Supplies) 279,5144,224 BB&T Corp. (Banks) 182,392697 Becton Dickinson & Co. (Health Care Equipment & Supplies) 130,3182,842 Belden, Inc. (Electronic Equipment, Instruments & Components) 198,08715,988 Berkshire Hathaway, Inc. Class B* (Diversified Financial Services) 2,641,3776,998 Best Buy Co., Inc. (Specialty Retail) 362,5661,008 BioMarin Pharmaceutical, Inc.* (Biotechnology) 96,6075,200 Blackbaud, Inc. (Software) 418,132215 BlackRock, Inc. (Capital Markets) 82,6833,163 Blackstone Mortgage Trust, Inc. Class A (Mortgage Real Estate Investment Trusts (REITs)) 97,6735,015 BMC Stock Holdings, Inc.* (Trading Companies & Distributors) 116,8503,199 Booz Allen Hamilton Holding Corp. (IT Services) 114,9401,863 BorgWarner, Inc. (Auto Components) 78,7681,902 Boston Scientific Corp.* (Health Care Equipment & Supplies) 50,1753,079 Bristow Group, Inc. (Energy Equipment & Services) 41,166921 Broadridge Financial Solutions, Inc. (IT Services) 64,4157,430 Brooks Automation, Inc. (Semiconductors & Semiconductor Equipment) 187,6821,433 Brown-Forman Corp. Class B (Beverages) 67,8105,918 Bunge Ltd. (Food Products) 467,7003,421 C.H. Robinson Worldwide, Inc. (Air Freight & Logistics) 248,707
Copyright © 2017 www.secdatabase.com. All Rights Reserved.Please Consider the Environment Before Printing This Document

703 C.R. Bard, Inc. (Health Care Equipment & Supplies) 216,1584,300 CA, Inc. (Software) 141,169755 Cabot Corp. (Chemicals) 45,4434,181 Cabot Oil & Gas Corp. (Oil, Gas & Consumable Fuels) 97,1668,714 CalAtlantic Group, Inc. (Household Durables) 315,621
52 The accompanying notes are an integral part of these financial statements.
Copyright © 2017 www.secdatabase.com. All Rights Reserved.Please Consider the Environment Before Printing This Document

GOLDMAN SACHS MULTI-MANAGER GLOBAL EQUITY FUND
Shares Description ValueCommon Stocks �� (continued)United States �� (continued)11,840 Callidus Software, Inc.* (Software) $ 249,2323,826 Campbell Soup Co. (Food Products) 220,1484,325 Cantel Medical Corp. (Health Care Equipment & Supplies) 321,823893 Capital One Financial Corp. (Consumer Finance) 71,77916,913 Cardinal Health, Inc. (Health Care Providers & Services) 1,227,71510,720 Catalent, Inc.* (Pharmaceuticals) 313,882925 Caterpillar, Inc. (Machinery) 94,59112,120 Cathay General Bancorp (Banks) 461,16631,746 CBRE Group, Inc. Class A* (Real Estate Management & Development) 1,136,824483 CBS Corp. Class B (Media) 32,1481,021 CDK Global, Inc. (Software) 66,3751,547 Celanese Corp. Series A (Chemicals) 134,6512,077 Centene Corp.* (Health Care Providers & Services) 154,5298,782 CenterPoint Energy, Inc. (Multi-Utilities) 250,5504,746 CenturyLink, Inc. (Diversified Telecommunication Services) 121,83016,336 Cerner Corp.* (Health Care Technology) 1,057,756571 Charter Communications, Inc. Class A* (Media) 197,0864,016 Chatham Lodging Trust (Equity Real Estate Investment Trusts (REITs)) 77,7501,239 Chemed Corp. (Health Care Providers & Services) 249,510686 Cheniere Energy, Inc.* (Oil, Gas & Consumable Fuels) 31,110788 Chevron Corp. (Oil, Gas & Consumable Fuels) 84,080313 Chipotle Mexican Grill, Inc.* (Hotels, Restaurants & Leisure) 148,5093,121 Church & Dwight Co., Inc. (Household Products) 154,5831,841 Cigna Corp. (Health Care Providers & Services) 287,877343 Cimarex Energy Co. (Oil, Gas & Consumable Fuels) 40,0212,937 Cincinnati Financial Corp. (Insurance) 211,728495 Cintas Corp. (Commercial Services & Supplies) 60,62315,437 Cisco Systems, Inc. (Communications Equipment) 525,9395,040 CIT Group, Inc. (Banks) 233,4021,388 Citigroup, Inc. (Banks) 82,0597,666 Citizens Financial Group, Inc. (Banks) 281,4191,216 Citrix Systems, Inc.* (Software) 98,42313,973 ClubCorp Holdings, Inc. (Hotels, Restaurants & Leisure) 187,9373,394 CME Group, Inc. (Capital Markets) 394,3497,827 CMS Energy Corp. (Multi-Utilities) 355,3463,092 Coach, Inc. (Textiles, Apparel & Luxury Goods) 121,794
Common Stocks �� (continued)United States �� (continued)6,730 Cognex Corp. (Electronic Equipment, Instruments & Components) 574,33829,775 Cognizant Technology Solutions Corp. Class A* (IT Services) 1,793,3487,570 Cohen & Steers, Inc. (Capital Markets) 302,0431,034 Coherent, Inc.* (Electronic Equipment, Instruments & Components) 222,9301,199 Colgate-Palmolive Co. (Household Products) 86,3763,175 Columbia Banking System, Inc. (Banks) 125,44452,566 Comcast Corp. Class A (Media) 2,060,0623,225 Compass Minerals International, Inc. (Metals & Mining) 212,8505,232 Conagra Brands, Inc. (Food Products) 202,8971,968 Concho Resources, Inc.* (Oil, Gas & Consumable Fuels) 249,2672,027 ConocoPhillips (Oil, Gas & Consumable Fuels) 97,1145,453 Consolidated Edison, Inc. (Multi-Utilities) 432,314590 Constellation Brands, Inc. Class A (Beverages) 101,7991,795 Convergys Corp. (IT Services) 40,4054,639 Corning, Inc. (Electronic Equipment, Instruments & Components) 133,835217 Costco Wholesale Corp. (Food & Staples Retailing) 38,5229,625 Cotiviti Holdings, Inc.* (Health Care Technology) 402,2292,240 Coty, Inc. Class A (Personal Products) 39,9841,102 Crown Castle International Corp. (Equity Real Estate Investment Trusts (REITs)) 104,2492,734 CSX Corp. (Road & Rail) 138,997975 Cummins, Inc. (Machinery) 147,166765 Curtiss-Wright Corp. (Aerospace & Defense) 71,49753,087 CVS Health Corp. (Food & Staples Retailing) 4,376,49222,280 CYS Investments, Inc. (Mortgage Real Estate Investment Trusts (REITs)) 190,0484,045 D.R. Horton, Inc. (Household Durables) 133,0402,125 Danaher Corp. (Health Care Equipment & Supplies) 177,0762,556 Darden Restaurants, Inc. (Hotels, Restaurants & Leisure) 217,7461,713 DaVita, Inc.* (Health Care Providers & Services) 118,2143,093 Deere & Co. (Machinery) 345,210
Copyright © 2017 www.secdatabase.com. All Rights Reserved.Please Consider the Environment Before Printing This Document

1,938 Delta Air Lines, Inc. (Airlines) 88,0632,111 DENTSPLY SIRONA, Inc. (Health Care Equipment & Supplies) 133,5001,697 Devon Energy Corp. (Oil, Gas & Consumable Fuels) 67,015777 Diamondback Energy, Inc.* (Oil, Gas & Consumable Fuels) 77,576
The accompanying notes are an integral part of these financial statements. 53
Copyright © 2017 www.secdatabase.com. All Rights Reserved.Please Consider the Environment Before Printing This Document

GOLDMAN SACHS MULTI-MANAGER GLOBAL EQUITY FUND
Schedule of Investments (continued)April 30, 2017 (Unaudited)
Shares Description ValueCommon Stocks �� (continued)United States �� (continued)1,659 Digital Realty Trust, Inc. (Equity Real Estate Investment Trusts (REITs)) $ 190,5208,320 Diplomat Pharmacy, Inc.* (Health Care Providers & Services) 129,7921,897 Discover Financial Services (Consumer Finance) 118,73347,877 Discovery Communications, Inc. Class C* (Media) 1,339,598589 DISH Network Corp. Class A* (Media) 37,95520,159 Dollar General Corp. (Multiline Retail) 1,465,761790 Dollar Tree, Inc.* (Multiline Retail) 65,388972 Dominion Resources, Inc. (Multi-Utilities) 75,2621,158 Dover Corp. (Machinery) 91,3431,219 Dr. Pepper Snapple Group, Inc. (Beverages) 111,7214,413 Dril-Quip, Inc.* (Energy Equipment & Services) 227,4902,555 DTE Energy Co. (Multi-Utilities) 267,2275,214 Duke Energy Corp. (Electric Utilities) 430,1553,226 Duke Realty Corp. (Equity Real Estate Investment Trusts (REITs)) 89,4574,147 E*TRADE Financial Corp.* (Capital Markets) 143,2791,567 Eastman Chemical Co. (Chemicals) 124,9683,979 Edison International (Electric Utilities) 318,2018,985 Education Realty Trust, Inc. (Equity Real Estate Investment Trusts (REITs)) 348,348766 Edwards Lifesciences Corp.* (Health Care Equipment & Supplies) 84,007904 Electronic Arts, Inc.* (Software) 85,717737 Eli Lilly & Co. (Pharmaceuticals) 60,4783,388 EnerSys (Electrical Equipment) 281,5772,713 Entergy Corp. (Electric Utilities) 206,8931,889 EOG Resources, Inc. (Oil, Gas & Consumable Fuels) 174,7325,432 EPAM Systems, Inc.* (IT Services) 418,2643,992 EQT Corp. (Oil, Gas & Consumable Fuels) 232,095834 Equifax, Inc. (Professional Services) 112,849131 Equinix, Inc. (Equity Real Estate Investment Trusts (REITs)) 54,7192,146 Equity Residential (Equity Real Estate Investment Trusts (REITs)) 138,5894,972 Essent Group Ltd.* (Thrifts & Mortgage Finance) 184,014873 Essex Property Trust, Inc. (Equity Real Estate Investment Trusts (REITs)) 213,4226,067 Everest Re Group Ltd. (Insurance) 1,527,1254,294 Eversource Energy (Electric Utilities) 255,0646,120 Exelon Corp. (Electric Utilities) 211,9364,969 ExlService Holdings, Inc.* (IT Services) 237,071319 Expedia, Inc. (Internet & Direct Marketing Retail) 42,6573,604 Expeditors International of Washington, Inc. (Air Freight & Logistics) 202,148
Common Stocks �� (continued)United States �� (continued)2,699 Express Scripts Holding Co.* (Health Care Providers & Services) 165,5571,395 Extra Space Storage, Inc. (Equity Real Estate Investment Trusts (REITs)) 105,3642,728 Exxon Mobil Corp. (Oil, Gas & Consumable Fuels) 222,741891 F5 Networks, Inc.* (Communications Equipment) 115,055387 Facebook, Inc. Class A* (Internet Software & Services) 58,1471,930 Fastenal Co. (Trading Companies & Distributors) 86,2322,406 FCB Financial Holdings, Inc. Class A* (Banks) 113,684535 Federal Realty Investment Trust (Equity Real Estate Investment Trusts (REITs)) 70,026680 FedEx Corp. (Air Freight & Logistics) 128,9962,493 Ferro Corp.* (Chemicals) 44,67517,993 Ferroglobe Representation & Warranty Insurance Trust* (Metals & Mining) �1,491 Fidelity National Information Services, Inc. (IT Services) 125,52712,102 Fifth Third Bancorp (Banks) 295,6522,685 First American Financial Corp. (Insurance) 116,556434 First Citizens BancShares, Inc. Class A (Banks) 151,0581,861 First Midwest Bancorp, Inc. (Banks) 42,2633,849 First Republic Bank (Banks) 355,8791,117 First Solar, Inc.* (Semiconductors & Semiconductor Equipment) 33,0073,097 FirstCash, Inc. (Consumer Finance) 160,8895,605 FirstEnergy Corp. (Electric Utilities) 167,814568 Fiserv, Inc.* (IT Services) 67,6728,050 Five Below, Inc.* (Specialty Retail) 395,416182 FleetCor Technologies, Inc.* (IT Services) 25,6871,535 Fluor Corp. (Construction & Engineering) 78,776
Copyright © 2017 www.secdatabase.com. All Rights Reserved.Please Consider the Environment Before Printing This Document
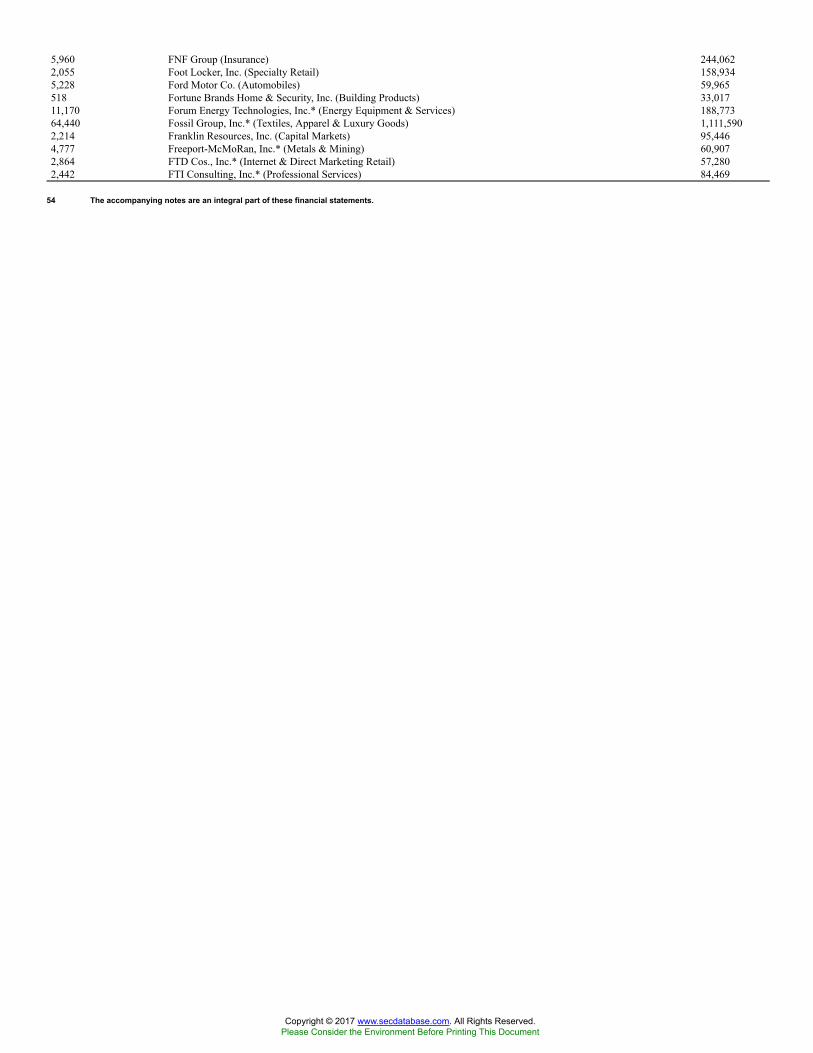
5,960 FNF Group (Insurance) 244,0622,055 Foot Locker, Inc. (Specialty Retail) 158,9345,228 Ford Motor Co. (Automobiles) 59,965518 Fortune Brands Home & Security, Inc. (Building Products) 33,01711,170 Forum Energy Technologies, Inc.* (Energy Equipment & Services) 188,77364,440 Fossil Group, Inc.* (Textiles, Apparel & Luxury Goods) 1,111,5902,214 Franklin Resources, Inc. (Capital Markets) 95,4464,777 Freeport-McMoRan, Inc.* (Metals & Mining) 60,9072,864 FTD Cos., Inc.* (Internet & Direct Marketing Retail) 57,2802,442 FTI Consulting, Inc.* (Professional Services) 84,469
54 The accompanying notes are an integral part of these financial statements.
Copyright © 2017 www.secdatabase.com. All Rights Reserved.Please Consider the Environment Before Printing This Document

GOLDMAN SACHS MULTI-MANAGER GLOBAL EQUITY FUND
Shares Description ValueCommon Stocks �� (continued)United States �� (continued)1,677 Gartner, Inc.* (IT Services) $ 191,329360 General Dynamics Corp. (Aerospace & Defense) 69,7643,338 General Electric Co. (Industrial Conglomerates) 96,7691,276 General Mills, Inc. (Food Products) 73,3831,872 General Motors Co. (Automobiles) 64,84646,343 Gentex Corp. (Auto Components) 956,983534 Genuine Parts Co. (Distributors) 49,1394,682 GGP, Inc. (Equity Real Estate Investment Trusts (REITs)) 101,1786,630 Glacier Bancorp, Inc. (Banks) 223,9612,347 Global Indemnity Ltd.* (Insurance) 95,1711,257 Global Payments, Inc. (IT Services) 102,77214,695 Globus Medical, Inc. Class A* (Health Care Equipment & Supplies) 445,69910,345 Grand Canyon Education, Inc.* (Diversified Consumer Services) 777,5301,658 Granite Construction, Inc. (Construction & Engineering) 87,39321,321 Graphic Packaging Holding Co. (Containers & Packaging) 289,539634 Group 1 Automotive, Inc. (Specialty Retail) 43,7142,431 Gulfport Energy Corp.* (Oil, Gas & Consumable Fuels) 38,6043,218 Halliburton Co. (Energy Equipment & Services) 147,6423,189 Hanesbrands, Inc. (Textiles, Apparel & Luxury Goods) 69,5522,731 Hanmi Financial Corp. (Banks) 79,3361,292 Harley-Davidson, Inc. (Automobiles) 73,3991,314 Harris Corp. (Communications Equipment) 147,0231,807 Hasbro, Inc. (Leisure Products) 179,0921,090 HCA Holdings, Inc.* (Health Care Providers & Services) 91,7894,595 HCP, Inc. (Equity Real Estate Investment Trusts (REITs)) 144,0539,200 Healthcare Services Group, Inc. (Commercial Services & Supplies) 422,37216,065 Heartland Express, Inc. (Road & Rail) 323,2285,819 HEICO Corp. (Aerospace & Defense) 413,5394,338 HEICO Corp. Class A (Aerospace & Defense) 265,8892,832 Heidrick & Struggles International, Inc. (Professional Services) 60,8882,295 Helen of Troy Ltd.* (Household Durables) 215,730421 Henry Schein, Inc.* (Health Care Providers & Services) 73,1701,346 Hess Corp. (Oil, Gas & Consumable Fuels) 65,7251,801 Hewlett Packard Enterprise Co. (Technology Hardware, Storage & Peripherals) 33,553
Common Stocks �� (continued)United States �� (continued)5,920 Hibbett Sports, Inc.* (Specialty Retail) 153,9202,056 Hillenbrand, Inc. (Machinery) 75,86614,649 Hilton Worldwide Holdings, Inc. (Hotels, Restaurants & Leisure) 863,8523,134 Hologic, Inc.* (Health Care Equipment & Supplies) 141,500320 Honeywell International, Inc. (Industrial Conglomerates) 41,9653,262 Hormel Foods Corp. (Food Products) 114,4315,033 Host Hotels & Resorts, Inc. (Equity Real Estate Investment Trusts (REITs)) 90,3422,389 HP, Inc. (Technology Hardware, Storage & Peripherals) 44,9616,515 HubSpot, Inc.* (Software) 436,831891 Humana, Inc. (Health Care Providers & Services) 197,78427,866 Huntington Bancshares, Inc. (Banks) 358,3573,835 IBERIABANK Corp. (Banks) 304,3073,880 ICU Medical, Inc.* (Health Care Equipment & Supplies) 596,7444,023 IDACORP, Inc. (Electric Utilities) 340,024506 IDEXX Laboratories, Inc.* (Health Care Equipment & Supplies) 84,871354 Illinois Tool Works, Inc. (Machinery) 48,8847,605 Impax Laboratories, Inc.* (Pharmaceuticals) 106,8508,555 INC Research Holdings, Inc. Class A* (Life Sciences Tools & Services) 384,975604 Incyte Corp.* (Biotechnology) 75,065814 Infinity Property & Casualty Corp. (Insurance) 80,790735 Ingredion, Inc. (Food Products) 91,0083,438 Insight Enterprises, Inc.* (Electronic Equipment, Instruments & Components) 144,7404,086 Integra LifeSciences Holdings Corp.* (Health Care Equipment & Supplies) 187,8332,051 Intel Corp. (Semiconductors & Semiconductor Equipment) 74,1445,052 Intercontinental Exchange, Inc. (Capital Markets) 304,130523 International Business Machines Corp. (IT Services) 83,8321,131 International Flavors & Fragrances, Inc. (Chemicals) 156,7451,555 International Paper Co. (Containers & Packaging) 83,923384 Intuit, Inc. (Software) 48,081150 Intuitive Surgical, Inc.* (Health Care Equipment & Supplies) 125,3812,949 Invesco Ltd. (Capital Markets) 97,140
Copyright © 2017 www.secdatabase.com. All Rights Reserved.Please Consider the Environment Before Printing This Document

842 J.B. Hunt Transport Services, Inc. (Road & Rail) 75,4947,435 Jagged Peak Energy, Inc.* (Oil, Gas & Consumable Fuels) 82,826630 Johnson & Johnson (Pharmaceuticals) 77,786737 Jones Lang LaSalle, Inc. (Real Estate Management & Development) 84,652
The accompanying notes are an integral part of these financial statements. 55
Copyright © 2017 www.secdatabase.com. All Rights Reserved.Please Consider the Environment Before Printing This Document

GOLDMAN SACHS MULTI-MANAGER GLOBAL EQUITY FUND
Schedule of Investments (continued)April 30, 2017 (Unaudited)
Shares Description ValueCommon Stocks �� (continued)United States �� (continued)2,301 JPMorgan Chase & Co. (Banks) $ 200,1876,369 Juniper Networks, Inc. (Communications Equipment) 191,51612,024 Kansas City Southern (Road & Rail) 1,083,00210,145 KapStone Paper and Packaging Corp. (Paper & Forest Products) 213,9583,035 KAR Auction Services, Inc. (Commercial Services & Supplies) 132,3871,748 Kellogg Co. (Food Products) 124,10817,598 KeyCorp (Banks) 320,988327 Kimberly-Clark Corp. (Household Products) 42,4285,438 Kimco Realty Corp. (Equity Real Estate Investment Trusts (REITs)) 110,3374,623 Kinder Morgan, Inc. (Oil, Gas & Consumable Fuels) 95,372968 KLA-Tencor Corp. (Semiconductors & Semiconductor Equipment) 95,0772,182 Korn/Ferry International (Professional Services) 70,69717,234 Kosmos Energy Ltd.* (Oil, Gas & Consumable Fuels) 103,57618,530 L Brands, Inc. (Specialty Retail) 978,5691,247 L3 Technologies, Inc. (Aerospace & Defense) 214,1971,867 Laboratory Corp. of America Holdings* (Health Care Providers & Services) 261,6601,169 Lam Research Corp. (Semiconductors & Semiconductor Equipment) 169,330692 Las Vegas Sands Corp. (Hotels, Restaurants & Leisure) 40,8212,637 LCI Industries (Auto Components) 266,733642 Lear Corp. (Auto Components) 91,5882,561 Lennar Corp. Class A (Household Durables) 129,3301,596 Level 3 Communications, Inc.* (Diversified Telecommunication Services) 96,9731,907 Liberty Broadband Corp. Class C* (Media) 173,8425,164 Liberty Interactive Corp. QVC Group Class A* (Internet & Direct Marketing Retail) 109,3742,210 LifePoint Health, Inc.* (Health Care Providers & Services) 137,3511,586 Lincoln National Corp. (Insurance) 104,5657,387 Lithia Motors, Inc. Class A (Specialty Retail) 705,8281,411 Live Nation Entertainment, Inc.* (Media) 45,3781,371 LKQ Corp.* (Distributors) 42,830424 Lockheed Martin Corp. (Aerospace & Defense) 114,2475,015 Loews Corp. (Insurance) 233,7996,710 LogMeIn, Inc. (Internet Software & Services) 758,2302,118 M&T Bank Corp. (Banks) 329,158
Common Stocks �� (continued)United States �� (continued)7,045 MACOM Technology Solutions Holdings, Inc.* (Semiconductors & Semiconductor Equipment) 344,3605,195 Macy�s, Inc. (Multiline Retail) 151,79814,663 Maiden Holdings Ltd. (Insurance) 181,0886,309 Marathon Oil Corp. (Oil, Gas & Consumable Fuels) 93,8151,979 Marathon Petroleum Corp. (Oil, Gas & Consumable Fuels) 100,810306 Markel Corp.* (Insurance) 296,6984,010 MarketAxess Holdings, Inc. (Capital Markets) 772,005590 Marriott International, Inc. Class A (Hotels, Restaurants & Leisure) 55,708927 Marsh & McLennan Cos., Inc. (Insurance) 68,7191,316 Martin Marietta Materials, Inc. (Construction Materials) 289,7702,418 Masco Corp. (Building Products) 89,51415,080 MasterCard, Inc. Class A (IT Services) 1,754,10618,753 Matador Resources Co.* (Oil, Gas & Consumable Fuels) 406,5654,286 Mattel, Inc. (Leisure Products) 96,0922,594 Maxim Integrated Products, Inc. (Semiconductors & Semiconductor Equipment) 114,5252,248 MAXIMUS, Inc. (IT Services) 137,1061,820 McCormick & Co., Inc. (Food Products) 181,818641 McDonald�s Corp. (Hotels, Restaurants & Leisure) 89,69521,666 McKesson Corp. (Health Care Providers & Services) 2,996,1916,310 Medidata Solutions, Inc.* (Health Care Technology) 412,863169 MercadoLibre, Inc. (Internet Software & Services) 38,6863,835 Merck & Co., Inc. (Pharmaceuticals) 239,0362,338 MetLife, Inc. (Insurance) 121,132259 Mettler-Toledo International, Inc.* (Life Sciences Tools & Services) 132,97619,808 MFA Financial, Inc. (Mortgage Real Estate Investment Trusts (REITs)) 164,6044,852 MGM Resorts International (Hotels, Restaurants & Leisure) 149,005966 Microchip Technology, Inc. (Semiconductors & Semiconductor Equipment) 73,0107,396 Micron Technology, Inc.* (Semiconductors & Semiconductor Equipment) 204,647
Copyright © 2017 www.secdatabase.com. All Rights Reserved.Please Consider the Environment Before Printing This Document

36,869 Microsoft Corp. (Software) 2,524,0521,681 Mid-America Apartment Communities, Inc. (Equity Real Estate Investment Trusts (REITs)) 166,7721,724 Minerals Technologies, Inc. (Chemicals) 135,6796,545 Mobile Mini, Inc. (Commercial Services & Supplies) 187,841
56 The accompanying notes are an integral part of these financial statements.
Copyright © 2017 www.secdatabase.com. All Rights Reserved.Please Consider the Environment Before Printing This Document

GOLDMAN SACHS MULTI-MANAGER GLOBAL EQUITY FUND
Shares Description ValueCommon Stocks �� (continued)United States �� (continued)699 Mohawk Industries, Inc.* (Household Durables) $ 164,1182,268 Molson Coors Brewing Co. Class B (Beverages) 217,4792,238 Mondelez International, Inc. Class A (Food Products) 100,777169 Monro Muffler Brake, Inc. (Specialty Retail) 8,763688 Monsanto Co. (Chemicals) 80,2289,227 Moody�s Corp. (Capital Markets) 1,091,7391,602 Morgan Stanley (Capital Markets) 69,47912,658 Motorola Solutions, Inc. (Communications Equipment) 1,088,2082,027 MTGE Investment Corp. (Mortgage Real Estate Investment Trusts (REITs)) 36,4863,118 NASDAQ, Inc. (Capital Markets) 214,7373,064 National General Holdings Corp. (Insurance) 69,6754,325 National Health Investors, Inc. (Equity Real Estate Investment Trusts (REITs)) 316,46072,854 National Oilwell Varco, Inc. (Energy Equipment & Services) 2,547,7042,797 Nationstar Mortgage Holdings, Inc.* (Thrifts & Mortgage Finance) 45,0608,193 Navient Corp. (Consumer Finance) 124,5345,338 Navigant Consulting, Inc.* (Professional Services) 127,9524,488 Nelnet, Inc. Class A (Consumer Finance) 202,0054,909 NetApp, Inc. (Technology Hardware, Storage & Peripherals) 195,6242,105 NETGEAR, Inc.* (Communications Equipment) 99,25119,075 New York Community Bancorp, Inc. (Thrifts & Mortgage Finance) 253,507854 Newell Brands, Inc. (Household Durables) 40,7701,618 Newfield Exploration Co.* (Oil, Gas & Consumable Fuels) 56,01515,612 Newmont Mining Corp. (Metals & Mining) 527,8421,789 NextEra Energy, Inc. (Electric Utilities) 238,939767 NIKE, Inc. Class B (Textiles, Apparel & Luxury Goods) 42,4996,117 NiSource, Inc. (Multi-Utilities) 148,3373,183 Noble Energy, Inc. (Oil, Gas & Consumable Fuels) 102,906871 Norfolk Southern Corp. (Road & Rail) 102,3349,107 Northern Trust Corp. (Capital Markets) 819,630261 Northrop Grumman Corp. (Aerospace & Defense) 64,1967,365 NorthWestern Corp. (Multi-Utilities) 440,2801,907 Nu Skin Enterprises, Inc. Class A (Personal Products) 105,3241,804 Nucor Corp. (Metals & Mining) 110,639382 NVIDIA Corp. (Semiconductors & Semiconductor Equipment) 39,843
Common Stocks �� (continued)United States �� (continued)132 O�Reilly Automotive, Inc.* (Specialty Retail) 32,7563,410 Occidental Petroleum Corp. (Oil, Gas & Consumable Fuels) 209,85114,723 Office Depot, Inc. (Specialty Retail) 73,1732,249 Olin Corp. (Chemicals) 72,260752 Omnicom Group, Inc. (Media) 61,7541,129 On Assignment, Inc.* (Professional Services) 58,4481,311 ONEOK, Inc. (Oil, Gas & Consumable Fuels) 68,972137,104 Oracle Corp. (Software) 6,164,1963,463 Owens & Minor, Inc. (Health Care Providers & Services) 119,9933,910 Oxford Industries, Inc. (Textiles, Apparel & Luxury Goods) 226,702587 Palo Alto Networks, Inc.* (Communications Equipment) 63,6372,488 PAREXEL International Corp.* (Life Sciences Tools & Services) 158,8094,546 Parker-Hannifin Corp. (Machinery) 730,9972,009 Patrick Industries, Inc.* (Building Products) 142,7391,509 Paychex, Inc. (IT Services) 89,454756 PayPal Holdings, Inc.* (IT Services) 36,0766,875 Pebblebrook Hotel Trust (Equity Real Estate Investment Trusts (REITs)) 204,600835 PepsiCo, Inc. (Beverages) 94,5896,499 Pfizer, Inc. (Pharmaceuticals) 220,4463,383 PG&E Corp. (Electric Utilities) 226,8305,112 PharMerica Corp.* (Health Care Providers & Services) 120,643871 Philip Morris International, Inc. (Tobacco) 96,542735 Phillips 66 (Oil, Gas & Consumable Fuels) 58,4772,459 Pinnacle West Capital Corp. (Electric Utilities) 209,236947 Pioneer Natural Resources Co. (Oil, Gas & Consumable Fuels) 163,8228,461 PolyOne Corp. (Chemicals) 331,756985 Portland General Electric Co. (Electric Utilities) 44,6605,095 Power Integrations, Inc. (Semiconductors & Semiconductor Equipment) 336,0153,559 PPL Corp. (Electric Utilities) 135,6335,717 PRA Group, Inc.* (Consumer Finance) 184,087381 Praxair, Inc. (Chemicals) 47,617
Copyright © 2017 www.secdatabase.com. All Rights Reserved.Please Consider the Environment Before Printing This Document

12,155 Primoris Services Corp. (Construction & Engineering) 279,2002,077 Principal Financial Group, Inc. (Insurance) 135,2755,870 ProAssurance Corp. (Insurance) 363,3532,169 Prologis, Inc. (Equity Real Estate Investment Trusts (REITs)) 118,015
The accompanying notes are an integral part of these financial statements. 57
Copyright © 2017 www.secdatabase.com. All Rights Reserved.Please Consider the Environment Before Printing This Document

GOLDMAN SACHS MULTI-MANAGER GLOBAL EQUITY FUND
Schedule of Investments (continued)April 30, 2017 (Unaudited)
Shares Description ValueCommon Stocks �� (continued)United States �� (continued)2,610 Proofpoint, Inc.* (Software) $ 196,716781 Prudential Financial, Inc. (Insurance) 83,5903,026 Public Service Enterprise Group, Inc. (Multi-Utilities) 133,29574 Public Storage (Equity Real Estate Investment Trusts (REITs)) 15,4943,378 PVH Corp. (Textiles, Apparel & Luxury Goods) 341,27917,253 Qorvo, Inc.* (Semiconductors & Semiconductor Equipment) 1,173,7221,565 QUALCOMM, Inc. (Semiconductors & Semiconductor Equipment) 84,1033,695 Quest Diagnostics, Inc. (Health Care Providers & Services) 389,859883 Quintiles IMS Holdings, Inc.* (Life Sciences Tools & Services) 74,41914,660 Radian Group, Inc. (Thrifts & Mortgage Finance) 247,4611,702 Raymond James Financial, Inc. (Capital Markets) 126,833673 Raytheon Co. (Aerospace & Defense) 104,4563,425 RBC Bearings, Inc.* (Machinery) 343,5277,272 Realty Income Corp. (Equity Real Estate Investment Trusts (REITs)) 424,32122,569 Regions Financial Corp. (Banks) 310,3245,540 Republic Services, Inc. (Commercial Services & Supplies) 348,9652,209 ResMed, Inc. (Health Care Equipment & Supplies) 150,1901,940 Reynolds American, Inc. (Tobacco) 125,130461 Rockwell Automation, Inc. (Electrical Equipment) 72,538717 Rockwell Collins, Inc. (Aerospace & Defense) 74,6331,838 Rogers Corp.* (Electronic Equipment, Instruments & Components) 189,204878 Roper Technologies, Inc. (Industrial Conglomerates) 192,019458 Ross Stores, Inc. (Specialty Retail) 29,7707,210 RPX Corp.* (Professional Services) 92,5764,717 RSP Permian, Inc.* (Oil, Gas & Consumable Fuels) 179,4824,839 S&P Global, Inc. (Capital Markets) 649,34527,984 Sabre Corp. (IT Services) 655,105678 Safety Insurance Group, Inc. (Insurance) 49,0871,038 SBA Communications Corp.* (Equity Real Estate Investment Trusts (REITs)) 131,2973,495 SCANA Corp. (Multi-Utilities) 231,7531,763 Scholastic Corp. (Media) 76,2142,442 Schweitzer-Mauduit International, Inc. (Paper & Forest Products) 105,1281,425 Sealed Air Corp. (Containers & Packaging) 62,7296,350 Select Medical Holdings Corp.* (Health Care Providers & Services) 87,313796 Sempra Energy (Multi-Utilities) 89,964
Common Stocks �� (continued)United States �� (continued)846 ServiceNow, Inc.* (Software) 79,9304,355 Silgan Holdings, Inc. (Containers & Packaging) 264,0003,962 Silicon Laboratories, Inc.* (Semiconductors & Semiconductor Equipment) 281,89624,020 Sirius XM Holdings, Inc. (Media) 118,8995,518 Skechers U.S.A., Inc. Class A* (Textiles, Apparel & Luxury Goods) 139,3296,561 Skyworks Solutions, Inc. (Semiconductors & Semiconductor Equipment) 654,3941,093 SL Green Realty Corp. (Equity Real Estate Investment Trusts (REITs)) 114,68837,528 SLM Corp.* (Consumer Finance) 470,601407 Snap-on, Inc. (Machinery) 68,1852,670 Southern Copper Corp. (Metals & Mining) 94,4382,365 Southwest Airlines Co. (Airlines) 132,96013,135 STAG Industrial, Inc. (Equity Real Estate Investment Trusts (REITs)) 346,2392,131 Stanley Black & Decker, Inc. (Machinery) 290,136732 Starbucks Corp. (Hotels, Restaurants & Leisure) 43,9644,085 Starwood Property Trust, Inc. (Mortgage Real Estate Investment Trusts (REITs)) 92,68921,421 State Street Corp. (Capital Markets) 1,797,2222,532 Steel Dynamics, Inc. (Metals & Mining) 91,5063,899 Steven Madden Ltd.* (Textiles, Apparel & Luxury Goods) 148,35711,753 Stifel Financial Corp.* (Capital Markets) 574,369599 Stryker Corp. (Health Care Equipment & Supplies) 81,6864,345 Sun Communities, Inc. (Equity Real Estate Investment Trusts (REITs)) 363,2852,022 Sun Hydraulics Corp. (Machinery) 78,5344,924 SunCoke Energy, Inc.* (Metals & Mining) 45,1532,712 SunTrust Banks, Inc. (Banks) 154,069374 SVB Financial Group* (Banks) 65,8025,918 Sykes Enterprises, Inc.* (IT Services) 176,416
Copyright © 2017 www.secdatabase.com. All Rights Reserved.Please Consider the Environment Before Printing This Document

8,420 Symantec Corp. (Software) 266,3252,356 Synchrony Financial (Consumer Finance) 65,497891 SYNNEX Corp. (Electronic Equipment, Instruments & Components) 96,6111,949 Synopsys, Inc.* (Software) 143,6412,303 Sysco Corp. (Food & Staples Retailing) 121,7605,037 T-Mobile US, Inc.* (Wireless Telecommunication Services) 338,8397,052 Tailored Brands, Inc. (Specialty Retail) 86,9511,458 Targa Resources Corp. (Oil, Gas & Consumable Fuels) 80,3803,136 Target Corp. (Multiline Retail) 175,1461,523 TD Ameritrade Holding Corp. (Capital Markets) 58,285
58 The accompanying notes are an integral part of these financial statements.
Copyright © 2017 www.secdatabase.com. All Rights Reserved.Please Consider the Environment Before Printing This Document

GOLDMAN SACHS MULTI-MANAGER GLOBAL EQUITY FUND
Shares Description ValueCommon Stocks �� (continued)United States �� (continued)4,470 TeleTech Holdings, Inc. (IT Services) $ 139,687756 Tempur Sealy International, Inc.* (Household Durables) 35,4943,912 Teradyne, Inc. (Semiconductors & Semiconductor Equipment) 137,976159 Tesla, Inc.* (Automobiles) 49,9371,839 Tesoro Corp. (Oil, Gas & Consumable Fuels) 146,5873,576 Tetra Tech, Inc. (Commercial Services & Supplies) 157,1655,870 Texas Capital Bancshares, Inc.* (Banks) 446,707520 Texas Instruments, Inc. (Semiconductors & Semiconductor Equipment) 41,17411,080 Texas Roadhouse, Inc. (Hotels, Restaurants & Leisure) 519,4301,879 Textron, Inc. (Aerospace & Defense) 87,6741,958 The Allstate Corp. (Insurance) 159,16626,078 The Bank of New York Mellon Corp. (Capital Markets) 1,227,2318,341 The Boeing Co. (Aerospace & Defense) 1,541,6674,575 The Charles Schwab Corp. (Capital Markets) 177,7391,582 The Clorox Co. (Household Products) 211,498939 The Coca-Cola Co. (Beverages) 40,5181,387 The Cooper Cos., Inc. (Health Care Equipment & Supplies) 277,8582,296 The Dow Chemical Co. (Chemicals) 144,1891,320 The Estee Lauder Cos., Inc. Class A (Personal Products) 115,0257,381 The Finish Line, Inc. Class A (Specialty Retail) 116,6943,162 The Goodyear Tire & Rubber Co. (Auto Components) 114,5592,712 The Hanover Insurance Group, Inc. (Insurance) 239,3883,287 The Hartford Financial Services Group, Inc. (Insurance) 158,9591,959 The Hershey Co. (Food Products) 211,9642,574 The Interpublic Group of Cos., Inc. (Media) 60,6692,010 The J.M. Smucker Co. (Food Products) 254,707957 The Kraft Heinz Co. (Food Products) 86,5031,085 The Kroger Co. (Food & Staples Retailing) 32,1703,338 The Macerich Co. (Equity Real Estate Investment Trusts (REITs)) 208,3916,050 The Mosaic Co. (Chemicals) 162,9261,171 The Navigators Group, Inc. (Insurance) 63,2932,095 The PNC Financial Services Group, Inc. (Banks) 250,8761,040 The Priceline Group, Inc.* (Internet & Direct Marketing Retail) 1,920,6931,024 The Procter & Gamble Co. (Household Products) 89,4266,377 The Progressive Corp. (Insurance) 253,2944,150 The Sherwin-Williams Co. (Chemicals) 1,388,922
Common Stocks �� (continued)United States �� (continued)7,325 The Southern Co. (Electric Utilities) 364,7851,498 The TJX Cos., Inc. (Specialty Retail) 117,8035,330 The Toro Co. (Machinery) 346,024999 The Travelers Cos., Inc. (Insurance) 121,5381,151 The Valspar Corp. (Chemicals) 129,4186,595 The Walt Disney Co. (Media) 762,3821,541 The Western Union Co. (IT Services) 30,6041,031 Thermo Fisher Scientific, Inc. (Life Sciences Tools & Services) 170,4551,965 Tiffany & Co. (Specialty Retail) 180,0928,452 Time Warner, Inc. (Media) 839,0301,637 Torchmark Corp. (Insurance) 125,5742,104 Total System Services, Inc. (IT Services) 120,580406 Tractor Supply Co. (Specialty Retail) 25,135731 TransDigm Group, Inc. (Aerospace & Defense) 180,3604,020 Tupperware Brands Corp. (Household Durables) 288,6761,414 Tutor Perini Corp.* (Construction & Engineering) 43,6227,054 Twitter, Inc.* (Internet Software & Services) 116,25023,795 Two Harbors Investment Corp. (Mortgage Real Estate Investment Trusts (REITs)) 237,7123,170 Tyler Technologies, Inc.* (Software) 518,5805,337 Tyson Foods, Inc. Class A (Food Products) 342,9562,866 U.S. Bancorp (Banks) 146,9684,254 UDR, Inc. (Equity Real Estate Investment Trusts (REITs)) 158,844543 Ulta Salon, Cosmetics & Fragrance, Inc.* (Specialty Retail) 152,822458 Union Pacific Corp. (Road & Rail) 51,2788,740 United Bankshares, Inc. (Banks) 348,7262,369 United Continental Holdings, Inc.* (Airlines) 166,327314 United Parcel Service, Inc. Class B (Air Freight & Logistics) 33,742400 United Rentals, Inc.* (Trading Companies & Distributors) 43,8642,394 United Technologies Corp. (Aerospace & Defense) 284,862
Copyright © 2017 www.secdatabase.com. All Rights Reserved.Please Consider the Environment Before Printing This Document

4,122 UnitedHealth Group, Inc. (Health Care Providers & Services) 720,8551,692 Universal Corp. (Tobacco) 124,2774,120 Universal Forest Products, Inc. (Building Products) 392,5952,588 Universal Health Services, Inc. Class B (Health Care Providers & Services) 312,5273,053 Unum Group (Insurance) 141,4454,430 US Ecology, Inc. (Commercial Services & Supplies) 208,8741,983 Valero Energy Corp. (Oil, Gas & Consumable Fuels) 128,1222,124 Valvoline, Inc. (Chemicals) 47,259
The accompanying notes are an integral part of these financial statements. 59
Copyright © 2017 www.secdatabase.com. All Rights Reserved.Please Consider the Environment Before Printing This Document
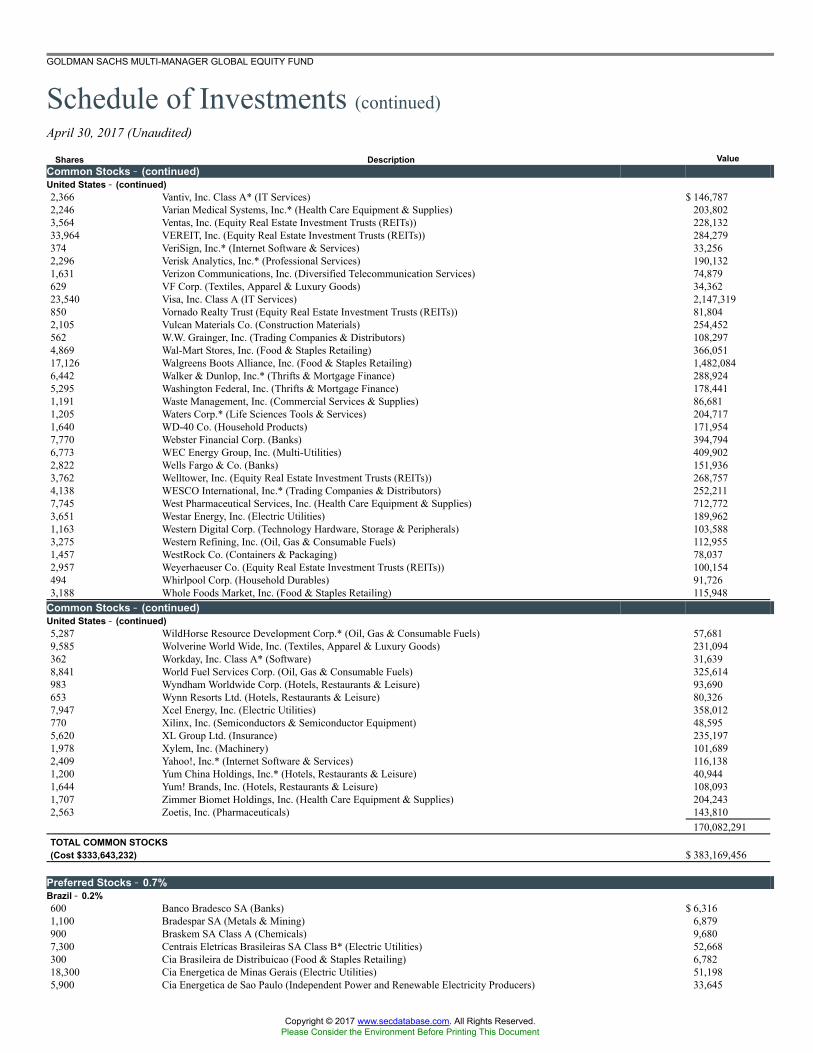
GOLDMAN SACHS MULTI-MANAGER GLOBAL EQUITY FUND
Schedule of Investments (continued)April 30, 2017 (Unaudited)
Shares Description ValueCommon Stocks �� (continued)United States �� (continued)2,366 Vantiv, Inc. Class A* (IT Services) $ 146,7872,246 Varian Medical Systems, Inc.* (Health Care Equipment & Supplies) 203,8023,564 Ventas, Inc. (Equity Real Estate Investment Trusts (REITs)) 228,13233,964 VEREIT, Inc. (Equity Real Estate Investment Trusts (REITs)) 284,279374 VeriSign, Inc.* (Internet Software & Services) 33,2562,296 Verisk Analytics, Inc.* (Professional Services) 190,1321,631 Verizon Communications, Inc. (Diversified Telecommunication Services) 74,879629 VF Corp. (Textiles, Apparel & Luxury Goods) 34,36223,540 Visa, Inc. Class A (IT Services) 2,147,319850 Vornado Realty Trust (Equity Real Estate Investment Trusts (REITs)) 81,8042,105 Vulcan Materials Co. (Construction Materials) 254,452562 W.W. Grainger, Inc. (Trading Companies & Distributors) 108,2974,869 Wal-Mart Stores, Inc. (Food & Staples Retailing) 366,05117,126 Walgreens Boots Alliance, Inc. (Food & Staples Retailing) 1,482,0846,442 Walker & Dunlop, Inc.* (Thrifts & Mortgage Finance) 288,9245,295 Washington Federal, Inc. (Thrifts & Mortgage Finance) 178,4411,191 Waste Management, Inc. (Commercial Services & Supplies) 86,6811,205 Waters Corp.* (Life Sciences Tools & Services) 204,7171,640 WD-40 Co. (Household Products) 171,9547,770 Webster Financial Corp. (Banks) 394,7946,773 WEC Energy Group, Inc. (Multi-Utilities) 409,9022,822 Wells Fargo & Co. (Banks) 151,9363,762 Welltower, Inc. (Equity Real Estate Investment Trusts (REITs)) 268,7574,138 WESCO International, Inc.* (Trading Companies & Distributors) 252,2117,745 West Pharmaceutical Services, Inc. (Health Care Equipment & Supplies) 712,7723,651 Westar Energy, Inc. (Electric Utilities) 189,9621,163 Western Digital Corp. (Technology Hardware, Storage & Peripherals) 103,5883,275 Western Refining, Inc. (Oil, Gas & Consumable Fuels) 112,9551,457 WestRock Co. (Containers & Packaging) 78,0372,957 Weyerhaeuser Co. (Equity Real Estate Investment Trusts (REITs)) 100,154494 Whirlpool Corp. (Household Durables) 91,7263,188 Whole Foods Market, Inc. (Food & Staples Retailing) 115,948
Common Stocks �� (continued)United States �� (continued)5,287 WildHorse Resource Development Corp.* (Oil, Gas & Consumable Fuels) 57,6819,585 Wolverine World Wide, Inc. (Textiles, Apparel & Luxury Goods) 231,094362 Workday, Inc. Class A* (Software) 31,6398,841 World Fuel Services Corp. (Oil, Gas & Consumable Fuels) 325,614983 Wyndham Worldwide Corp. (Hotels, Restaurants & Leisure) 93,690653 Wynn Resorts Ltd. (Hotels, Restaurants & Leisure) 80,3267,947 Xcel Energy, Inc. (Electric Utilities) 358,012770 Xilinx, Inc. (Semiconductors & Semiconductor Equipment) 48,5955,620 XL Group Ltd. (Insurance) 235,1971,978 Xylem, Inc. (Machinery) 101,6892,409 Yahoo!, Inc.* (Internet Software & Services) 116,1381,200 Yum China Holdings, Inc.* (Hotels, Restaurants & Leisure) 40,9441,644 Yum! Brands, Inc. (Hotels, Restaurants & Leisure) 108,0931,707 Zimmer Biomet Holdings, Inc. (Health Care Equipment & Supplies) 204,2432,563 Zoetis, Inc. (Pharmaceuticals) 143,810
170,082,291TOTAL COMMON STOCKS(Cost $333,643,232) $ 383,169,456
Preferred Stocks �� 0.7%Brazil �� 0.2%600 Banco Bradesco SA (Banks) $ 6,3161,100 Bradespar SA (Metals & Mining) 6,879900 Braskem SA Class A (Chemicals) 9,6807,300 Centrais Eletricas Brasileiras SA Class B* (Electric Utilities) 52,668300 Cia Brasileira de Distribuicao (Food & Staples Retailing) 6,78218,300 Cia Energetica de Minas Gerais (Electric Utilities) 51,1985,900 Cia Energetica de Sao Paulo (Independent Power and Renewable Electricity Producers) 33,645
Copyright © 2017 www.secdatabase.com. All Rights Reserved.Please Consider the Environment Before Printing This Document

900 Cia Paranaense de Energia (Electric Utilities) 8,2716,600 Gerdau SA (Metals & Mining) 20,3784,920 Itau Unibanco Holding SA (Banks) 60,8568,350 Itausa � Investimentos Itau SA (Banks) 26,0185,900 Klabin SA (Containers & Packaging) 5,26010,600 Lojas Americanas SA (Multiline Retail) 56,2383,600 Metalurgica Gerdau SA* (Metals & Mining) 5,217
60 The accompanying notes are an integral part of these financial statements.
Copyright © 2017 www.secdatabase.com. All Rights Reserved.Please Consider the Environment Before Printing This Document

GOLDMAN SACHS MULTI-MANAGER GLOBAL EQUITY FUND
Shares Description ValuePreferred Stocks �� (continued)Brazil �� (continued)30,200 Petroleo Brasileiro SA* (Oil, Gas & Consumable Fuels) $ 132,9207,800 Suzano Papel e Celulose SA Class A (Paper & Forest Products) 32,954500 Telefonica Brasil SA (Diversified Telecommunication Services) 7,44912,900 Vale SA (Metals & Mining) 106,726
629,455Chile �� 0.0%11,289 Embotelladora Andina SA (Beverages) 46,968174 Sociedad Quimica y Minera de Chile SA (Chemicals) 6,160
53,128Colombia �� 0.0%2,297 Banco Davivienda SA (Banks) 24,2032,018 Bancolombia SA (Banks) 19,7002,928 Grupo Argos SA (Construction Materials) 19,00974,499 Grupo Aval Acciones y Valores SA (Banks) 29,5016 Grupo de Inversiones Suramericana SA (Diversified Financial Services) 77
92,490Croatia �� 0.0%956 Adris Grupa DD (Industrial Conglomerates) 63,954
Germany �� 0.5%534 Fuchs Petrolub SE (Chemicals) 27,544588 Porsche Automobil Holding SE (Automobiles) 34,4133,216 Sartorius AG (Health Care Equipment & Supplies) 294,43111,642 Volkswagen AG (Automobiles) 1,848,129
2,204,517Panama �� 0.0%23,352 Avianca Holdings SA (Airlines) 21,114
Russia �� 0.0%9 AK Transneft OAO* (Oil, Gas & Consumable Fuels) 30,46767,200 Surgutneftegas OJSC (Oil, Gas & Consumable Fuels) 36,0098 Transneft PJSC (Oil, Gas & Consumable Fuels) 27,081
93,557TOTAL PREFERRED STOCKS �� 0.7%(Cost $2,277,073) $ 3,158,215
Units DescriptionExpiration
Date ValueRights* �� 0.0%Australia �� 0.0%88 TPG Telecom Ltd. 05/12/17 $ 42Hong Kong �� 0.0%130 Bank Of Commercial Assets Enterprises 05/31/17 �
United Kingdom �� 0.0%85,802 Cobham PLC 05/04/17 63,345TOTAL RIGHTS(Cost $53,826) $ 63,387
Shares Description ValueExchange Traded Funds �� 1.0%18,600 iShares MSCI Frontier 100 ETF $ 534,19224,382 iShares MSCI South Korea Capped ETF 1,514,12257,632 iShares MSCI Taiwan Capped ETF 1,945,656TOTAL EXCHANGE TRADED FUNDS(Cost $3,611,790) $ 3,993,970
PrincipalAmount
InterestRate
MaturityDate Value
Short-term Investment(b) �� 5.6%Repurchase Agreements �� 5.6%Joint Repurchase Agreement Account II$23,100,000 0.821 % 05/01/17 $ 23,100,000(Cost $23,100,000)TOTAL INVESTMENTS �� 100.2%(Cost $362,685,921) $ 413,485,028
Copyright © 2017 www.secdatabase.com. All Rights Reserved.Please Consider the Environment Before Printing This Document

LIABILITIES IN EXCESS OFOTHER ASSETS �� (0.2)% (976,847 )
NET ASSETS �� 100.0% $ 412,508,181
The percentage shown for each investment category reflects the value of investments in that category as a percentage of net assets.* Non-income producing security.(a) Exempt from registration under Rule 144A of the Securities Act of 1933. Such securities may be deemed liquid by an Underlying Manager and may be resold, normally to
qualified institutional buyers in transactions exempt from registration. Total market value of Rule 144A securities amounts to $1,441,903, which represents approximately 0.3% ofnet assets as of April 30, 2017.
(b) Joint repurchase agreement was entered into on April 28, 2017. Additional information appears on page 85.
The accompanying notes are an integral part of these financial statements. 61
Copyright © 2017 www.secdatabase.com. All Rights Reserved.Please Consider the Environment Before Printing This Document

GOLDMAN SACHS MULTI-MANAGER GLOBAL EQUITY FUND
Schedule of Investments (continued)April 30, 2017 (Unaudited)
Currency Abbreviations:AUD �Australian DollarBRL �Brazilian RealCAD �Canadian DollarCHF �Swiss FrancDKK �Danish KroneEUR �EuroGBP �British PoundHKD �Hong Kong DollarILS �Israeli ShekelJPY �Japanese YenNOK �Norwegian KroneNZD �New Zealand DollarPLN �Polish ZlotySEK �Swedish Krona
SGD �Singapore DollarTHB �Thai BahtUSD �U.S. Dollar
Investment Abbreviations:ADR �American Depositary ReceiptCP �Commercial PaperETF �Exchange Traded FundGDR �Global Depository ReceiptLLC �Limited Liability CompanyPLC �Public Limited CompanyREIT �Real Estate Investment Trust
ADDITIONAL INVESTMENT INFORMATION
FORWARD FOREIGN CURRENCY EXCHANGE CONTRACTS � At April 30, 2017, the Fund had the following forward foreign currencyexchange contracts:
FORWARD FOREIGN CURRENCY EXCHANGE CONTRACTS WITH UNREALIZED GAIN
CounterpartyCurrency
PurchasedCurrency
SoldCurrentValue
SettlementDate
UnrealizedGain
Bank of America Securities LLC CHF 1,539,430 USD 1,544,925 $1,552,255 06/21/17 $7,329DKK 2,306,840 USD 333,096 338,766 06/21/17 5,669GBP 2,809,590 USD 3,521,210 3,644,471 06/21/17 123,261ILS 275,520 USD 76,113 76,201 06/21/17 88NOK 1,339,960 USD 156,152 156,160 06/21/17 8SEK 5,638,030 USD 633,830 638,293 06/21/17 4,463USD 3,346,189 AUD 4,425,275 3,310,579 06/21/17 35,610USD 4,544,210 HKD 35,232,535 4,534,584 06/21/17 9,627USD 5,485 ILS 19,830 5,484 06/21/17 1USD 359,907 NOK 3,046,235 355,011 06/21/17 4,896USD 136,231 NZD 193,285 132,534 06/21/17 3,697
Commonwealth Bank of Australia EUR 4,646,950 USD 4,988,143 5,075,409 06/21/17 87,266USD 3,344,512 AUD 4,425,275 3,310,579 06/21/17 33,933USD 4,544,550 HKD 35,232,535 4,534,584 06/21/17 9,967USD 359,331 NOK 3,040,155 354,302 06/21/17 5,029USD 136,170 NZD 193,285 132,534 06/21/17 3,636
State Street Bank and Trust EUR 3,367 USD 3,664 3,668 05/02/17 3GBP 36,458 USD 47,061 47,224 05/02/17 164GBP 64,352 USD 83,108 83,358 05/04/17 250HKD 168,859 USD 21,704 21,709 05/02/17 6USD 31,492 CAD 42,949 31,465 05/02/17 27USD 11,249 EUR 10,317 11,239 05/03/17 10USD 53,527 GBP 41,313 53,512 05/03/17 17USD 11,358 JPY 1,265,588 11,356 05/08/17 1
TOTAL $334,958
62 The accompanying notes are an integral part of these financial statements.
Copyright © 2017 www.secdatabase.com. All Rights Reserved.Please Consider the Environment Before Printing This Document

GOLDMAN SACHS MULTI-MANAGER GLOBAL EQUITY FUND
ADDITIONAL INVESTMENT INFORMATION (continued)
FORWARD FOREIGN CURRENCY EXCHANGE CONTRACTS WITH UNREALIZED LOSS
CounterpartyCurrency
PurchasedCurrency
SoldCurrentValue
SettlementDate
UnrealizedLoss
Bank of America Securities LLC AUD 1,782,430 USD 1,357,887 $1,333,448 06/21/17 $(24,439 )HKD 14,783,520 USD 1,905,497 1,902,705 06/21/17 (2,792 )NZD 87,870 USD 61,309 60,252 06/21/17 (1,057 )SGD 370,780 USD 265,548 265,528 06/21/17 (21 )USD 65,539 AUD 87,720 65,624 06/21/17 (85 )USD 3,857,627 CHF 3,877,995 3,910,302 06/21/17 (52,675 )USD 811,130 DKK 5,688,600 835,386 06/21/17 (24,256 )USD 13,986,000 EUR 13,213,665 14,431,993 06/21/17 (445,993 )USD 8,013,939 GBP 6,515,090 8,451,075 06/21/17 (437,136 )USD 152,362 HKD 1,183,990 152,385 06/21/17 (23 )USD 168,084 ILS 618,545 171,072 06/21/17 (2,989 )USD 11,442,915 JPY 1,303,137,785 11,714,359 06/21/17 (271,444 )USD 7,844 NZD 11,440 7,844 06/21/17 (1 )USD 1,528,959 SEK 13,773,760 1,559,356 06/21/17 (30,397 )USD 618,605 SGD 872,960 625,155 06/21/17 (6,550 )
Commonwealth Bank of Australia JPY 587,740,850 USD 5,290,130 5,283,407 06/21/17 (6,723 )USD 3,687,895 CHF 3,708,695 3,739,592 06/21/17 (51,696 )USD 736,217 DKK 5,176,390 760,167 06/21/17 (23,950 )USD 13,209,720 EUR 12,499,025 13,651,462 06/21/17 (441,742 )USD 8,010,968 GBP 6,515,090 8,451,075 06/21/17 (440,107 )USD 168,186 ILS 618,545 171,072 06/21/17 (2,887 )USD 11,203,989 JPY 1,276,576,885 11,475,594 06/21/17 (271,605 )USD 1,438,860 SEK 12,967,290 1,468,054 06/21/17 (29,194 )USD 617,546 SGD 871,400 624,038 06/21/17 (6,492 )
State Street Bank and Trust BRL 160,975 USD 50,770 50,689 05/02/17 (80 )BRL 175,843 USD 55,436 55,356 05/03/17 (80 )EUR 86,671 USD 94,503 94,423 05/03/17 (78 )GBP 74,412 USD 96,481 96,385 05/03/17 (95 )HKD 222,235 USD 28,578 28,573 05/04/17 (5 )USD 17,581 CAD 24,008 17,588 05/03/17 (7 )USD 14,129 GBP 10,952 14,186 05/02/17 (57 )USD 1,466 GBP 1,131 1,465 05/03/17 �
TOTAL $(2,574,656)
The accompanying notes are an integral part of these financial statements. 63
Copyright © 2017 www.secdatabase.com. All Rights Reserved.Please Consider the Environment Before Printing This Document

GOLDMAN SACHS MULTI-MANAGER NON-CORE FIXED INCOME FUND
Schedule of InvestmentsApril 30, 2017 (Unaudited)
PrincipalAmount
InterestRate
MaturityDate Value
Foreign Debt Obligations �� 26.5%Sovereign �� 26.5%
Banque Centrale de Tunisie International BondEUR 450,000 5.625 % 02/17/24 $ 501,827$ 770,000 5.750 01/30/25 755,562
Brazil Letras do Tesouro Nacional(a)BRL 1,700,000 0.000 01/01/19 461,469
1,200,000 0.000 01/01/20 295,049Brazil Notas do Tesouro Nacional6,017,000 10.000 01/01/21 1,900,9625,310,000 10.000 01/01/25 1,652,904500,000 10.000 01/01/27 154,798537,911 6.000 05/15/35 180,974508,027 6.000 08/15/50 175,557Czech Republic Government Bond
CZK 5,480,000 1.500 10/29/19 230,797Dominican Republic
$ 190,000 5.500 01/27/25 196,888466,000 6.875 01/29/26 519,590159,000 5.950 01/25/27 166,354505,000 6.850 01/27/45 537,194Ecuador Government International Bond400,000 10.500 03/24/20 428,000220,000 10.750 (b) 03/28/22 238,150240,000 10.750 03/28/22 259,800485,000 7.950 06/20/24 463,175350,000 9.650 12/13/26 356,125Egypt Government International Bond480,000 6.125 01/31/22 499,800230,000 5.875 06/11/25 227,125200,000 8.500 01/31/47 217,500230,000 8.500 (b) 01/31/47 250,125El Salvador Government International Bond150,000 7.375 12/01/19 150,375504,000 5.875 01/30/25 449,820260,000 6.375 01/18/27 229,450325,000 8.625 02/28/29 328,25057,000 7.650 06/15/35 51,728Federal Republic of Brazil645,000 6.000 04/07/26 707,887115,000 10.125 05/15/27 167,038180,000 8.250 01/20/34 228,60080,000 5.000 01/27/45 72,600670,000 5.625 02/21/47 664,975Ghana Treasury Note
GHS 1,090,000 21.000 01/07/19 259,931Government of Jamaica
$ 260,000 8.000 03/15/39 302,250Hazine Mustesarligi Varlik Kiralama AS(b)60,000 5.004 04/06/23 61,200Hungary Government Bond
HUF 76,600,000 6.750 11/24/17 276,361145,960,000 7.000 06/24/22 632,05441,510,000 6.000 11/24/23 174,14547,280,000 5.500 06/24/25 193,02864,120,000 3.000 10/27/27 217,638Indonesia Government Bond
IDR 17,771,000,000 8.750 05/15/31 1,471,9842,807,000,000 8.375 03/15/34 223,0092,776,000,000 8.250 05/15/36 218,889
Foreign Debt Obligations �� (continued)Sovereign �� (continued)
Islamic Republic of Pakistan$ 310,000 8.250 04/15/24 345,365
Copyright © 2017 www.secdatabase.com. All Rights Reserved.Please Consider the Environment Before Printing This Document
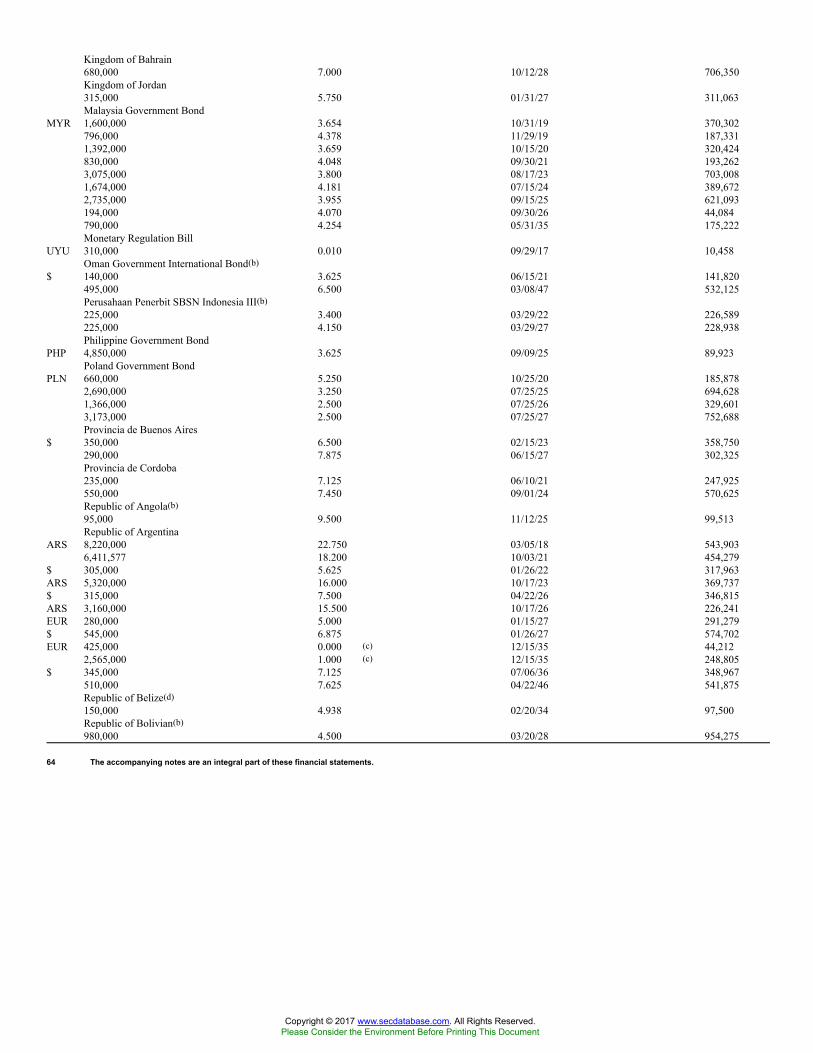
Kingdom of Bahrain680,000 7.000 10/12/28 706,350Kingdom of Jordan315,000 5.750 01/31/27 311,063Malaysia Government Bond
MYR 1,600,000 3.654 10/31/19 370,302796,000 4.378 11/29/19 187,3311,392,000 3.659 10/15/20 320,424830,000 4.048 09/30/21 193,2623,075,000 3.800 08/17/23 703,0081,674,000 4.181 07/15/24 389,6722,735,000 3.955 09/15/25 621,093194,000 4.070 09/30/26 44,084790,000 4.254 05/31/35 175,222Monetary Regulation Bill
UYU 310,000 0.010 09/29/17 10,458Oman Government International Bond(b)
$ 140,000 3.625 06/15/21 141,820495,000 6.500 03/08/47 532,125Perusahaan Penerbit SBSN Indonesia III(b)225,000 3.400 03/29/22 226,589225,000 4.150 03/29/27 228,938Philippine Government Bond
PHP 4,850,000 3.625 09/09/25 89,923Poland Government Bond
PLN 660,000 5.250 10/25/20 185,8782,690,000 3.250 07/25/25 694,6281,366,000 2.500 07/25/26 329,6013,173,000 2.500 07/25/27 752,688Provincia de Buenos Aires
$ 350,000 6.500 02/15/23 358,750290,000 7.875 06/15/27 302,325Provincia de Cordoba235,000 7.125 06/10/21 247,925550,000 7.450 09/01/24 570,625Republic of Angola(b)95,000 9.500 11/12/25 99,513Republic of Argentina
ARS 8,220,000 22.750 03/05/18 543,9036,411,577 18.200 10/03/21 454,279
$ 305,000 5.625 01/26/22 317,963ARS 5,320,000 16.000 10/17/23 369,737$ 315,000 7.500 04/22/26 346,815ARS 3,160,000 15.500 10/17/26 226,241EUR 280,000 5.000 01/15/27 291,279$ 545,000 6.875 01/26/27 574,702EUR 425,000 0.000 (c) 12/15/35 44,212
2,565,000 1.000 (c) 12/15/35 248,805$ 345,000 7.125 07/06/36 348,967
510,000 7.625 04/22/46 541,875Republic of Belize(d)150,000 4.938 02/20/34 97,500Republic of Bolivian(b)980,000 4.500 03/20/28 954,275
64 The accompanying notes are an integral part of these financial statements.
Copyright © 2017 www.secdatabase.com. All Rights Reserved.Please Consider the Environment Before Printing This Document

GOLDMAN SACHS MULTI-MANAGER NON-CORE FIXED INCOME FUND
PrincipalAmount
InterestRate
MaturityDate Value
Foreign Debt Obligations �� (continued)Sovereign �� (continued)
Republic of Chile$ 290,000 3.625 % 10/30/42 $ 286,738
Republic of ColombiaCOP 580,000,000 11.000 07/24/20 226,778
293,000,000 7.750 04/14/21 107,3501,098,000,000 7.000 05/04/22 391,4062,561,400,000 10.000 07/24/24 1,064,748
$ 420,000 4.500 (e) 01/28/26 447,300COP 438,200,000 7.500 08/26/26 161,520
163,000,000 9.850 06/28/27 72,750781,300,000 6.000 04/28/28 254,563
$ 175,000 7.375 09/18/37 224,875300,000 5.000 (e) 06/15/45 303,900Republic of Costa Rica60,000 5.625 04/30/43 54,075300,000 7.158 03/12/45 312,000Republic of Croatia600,000 5.500 04/04/23 650,400600,000 6.000 01/26/24 666,900Republic of Gabon740,000 6.375 12/12/24 724,275Republic of Ghana845,000 8.125 01/18/26 832,325Republic of Guatemala105,000 5.750 06/06/22 115,500Republic of Hondura300,000 6.250 01/19/27 311,250Republic of Honduras200,000 7.500 03/15/24 221,75075,000 6.250 (b) 01/19/27 77,813Republic of Hungary910,000 5.375 03/25/24 1,021,475Republic of Indonesia
IDR 18,316,000,000 7.875 04/15/19 1,404,37810,366,000,000 8.375 03/15/24 831,866
$ 420,000 4.750 01/08/26 449,925IDR 11,763,000,000 8.375 09/15/26 957,525$ 200,000 4.350 01/08/27 208,750IDR 2,890,000,000 7.000 05/15/27 215,525EUR 172,000 3.750 06/14/28 201,177IDR 6,601,000,000 9.000 03/15/29 552,654$ 295,000 6.625 02/17/37 361,744
140,000 6.750 01/15/44 179,725Republic of Iraq(e)125,000 5.800 01/15/28 111,406Republic of Ivory Coast(d)(e)291,060 5.750 12/31/32 280,145Republic of Kazakhstan375,000 3.875 10/14/24 380,062825,000 5.125 07/21/25 902,137200,000 4.875 10/14/44 198,000Republic of Kenya200,000 6.875 06/24/24 202,250Republic of Kuwait(b)500,000 3.500 03/20/27 511,250Republic of Lebanon870,000 6.650 11/03/28 868,912
Foreign Debt Obligations �� (continued)Sovereign �� (continued)
Republic of MalaysiaMYR 1,321,000 4.498 04/15/30 304,887
Republic of Mongolia$ 60,000 4.125 01/05/18 59,881
200,000 10.875 04/06/21 232,500240,000 5.125 12/05/22 229,200200,000 8.750 03/09/24 222,000
Copyright © 2017 www.secdatabase.com. All Rights Reserved.Please Consider the Environment Before Printing This Document

Republic of Morocco220,000 5.500 12/11/42 239,250Republic of Namibia(b)55,000 5.250 10/29/25 55,619Republic of Nigeria200,000 7.875 02/16/32 216,750560,000 7.875 02/16/32 606,900Republic of Panama1,035,000 5.200 01/30/20 1,121,681260,000 9.375 04/01/29 386,100210,000 6.700 01/26/36 271,425230,000 4.300 04/29/53 226,550Republic of Paraguay160,000 5.000 (b) 04/15/26 167,200200,000 5.000 04/15/26 208,250410,000 4.700 (b) 03/27/27 416,662165,000 6.100 08/11/44 176,963Republic of Peru360,000 4.125 08/25/27 390,780
PEN 165,000 6.350 (b) 08/12/28 53,3791,510,000 6.950 08/12/31 507,754
$ 366,000 6.550 03/14/37 479,460PEN 2,402,000 6.900 08/12/37 805,413$ 320,000 5.625 11/18/50 386,400
Republic of Poland(a)PLN 6,930,000 0.000 10/25/18 1,738,860
Republic of RomaniaRON 1,300,000 5.950 06/11/21 352,399
1,290,000 5.800 07/26/27 357,628Republic of Senegal
$ 200,000 6.250 07/30/24 204,250Republic of Serbia750,000 4.875 02/25/20 780,937205,000 7.250 09/28/21 236,006Republic of South Africa
ZAR 4,310,000 8.000 12/21/18 324,90412,808,602 6.750 03/31/21 927,998
$ 195,000 5.875 09/16/25 211,575ZAR 14,192,696 10.500 12/21/26 1,185,037$ 790,000 4.300 10/12/28 747,537ZAR 4,943,538 7.000 02/28/31 307,778
8,361,373 8.250 03/31/32 573,6695,499,916 6.250 03/31/36 296,7716,110,000 8.500 01/31/37 415,1009,130,000 6.500 02/28/41 486,8011,280,000 8.750 02/28/48 87,139Republic of Sri Lanka
$ 270,000 6.000 01/14/19 279,450100,000 5.750 (b) 01/18/22 103,375
The accompanying notes are an integral part of these financial statements. 65
Copyright © 2017 www.secdatabase.com. All Rights Reserved.Please Consider the Environment Before Printing This Document

GOLDMAN SACHS MULTI-MANAGER NON-CORE FIXED INCOME FUND
Schedule of Investments (continued)April 30, 2017 (Unaudited)
PrincipalAmount
InterestRate
MaturityDate Value
Foreign Debt Obligations �� (continued)Sovereign �� (continued)
Republic of Sri Lanka � (continued)$ 105,000 6.125 % 06/03/25 $ 106,969
135,000 6.850 (b) 11/03/25 142,088290,000 6.850 11/03/25 305,225Republic of Suriname(b)30,000 9.250 10/26/26 30,375Republic of Turkey
TRY 4,050,000 6.300 02/14/18 1,097,4611,750,000 8.500 07/10/19 469,284
$ 200,000 5.125 03/25/22 207,250110,000 6.250 09/26/22 119,625
TRY 750,000 7.100 03/08/23 180,218$ 70,000 7.375 02/05/25 81,375TRY 8,327,307 10.600 02/11/26 2,386,632$ 200,000 4.250 04/14/26 190,000
455,000 4.875 10/09/26 450,450880,000 6.000 03/25/27 941,600125,000 6.875 03/17/36 141,250200,000 4.875 04/16/43 181,000679,000 6.625 02/17/45 760,480Republic of Uruguay
UYU 1,877,773 4.375 12/15/28 62,904$ 200,000 7.625 03/21/36 264,000
801,000 5.100 06/18/50 792,990Republic of Venezuela10,000 13.625 08/15/18 8,413154,000 7.000 12/01/18 107,416125,000 12.750 08/23/22 77,500189,000 7.650 04/21/25 87,887150,000 11.750 10/21/26 87,001150,000 9.250 09/15/27 79,501125,000 9.250 05/07/28 59,375180,000 11.950 08/05/31 103,950125,000 9.375 01/13/34 60,62420,000 7.000 03/31/38 8,900Republic of Zambia465,000 8.500 04/14/24 488,831200,000 8.970 07/30/27 212,250Russian Federation Bond
RUB 20,887,000 6.700 05/15/19 357,9524,700,000 7.500 08/18/21 82,11639,550,000 7.600 07/20/22 696,09713,960,000 7.000 01/25/23 238,63029,174,000 7.000 08/16/23 496,102
$ 200,000 4.750 (b) 05/27/26 211,000600,000 4.750 05/27/26 633,000
RUB 12,469,000 7.750 09/16/26 221,44426,418,000 8.150 02/03/27 485,62323,950,000 7.050 01/19/28 404,49623,000,000 8.500 09/17/31 429,749Thailand Government Bond
THB 7,889,000 3.850 12/12/25 247,2522,905,000 4.875 06/22/29 99,9345,497,000 3.650 06/20/31 167,371Turkey Government Bond
TRY 1,320,000 9.000 07/24/24 347,7502,740,000 8.000 03/12/25 677,296
Foreign Debt Obligations �� (continued)Sovereign �� (continued)
Ukraine Government Bond$ 323,000 7.750 09/01/19 330,429
565,000 7.750 09/01/20 570,932
Copyright © 2017 www.secdatabase.com. All Rights Reserved.Please Consider the Environment Before Printing This Document

335,000 7.750 09/01/22 330,3101,357,000 0.000 (c) 05/31/40 478,342United Mexican States
MXN 22,012,000 5.000 12/11/19 1,115,23635,170,000 6.500 06/10/21 1,829,6998,050,000 6.500 06/09/22 416,2915,750,000 8.000 12/07/23 319,1559,463,000 10.000 12/05/24 585,8183,500,000 10.000 12/05/24 216,6722,130,000 5.750 03/05/26 102,506
$ 835,000 4.150 03/28/27 860,050MXN 16,240,000 7.500 06/03/27 876,881
9,910,000 7.750 05/29/31 538,6843,920,000 10.000 11/20/36 258,1291,900,000 7.750 11/13/42 102,181
$ 370,000 5.750 10/12/10 377,400Uruguay Notas del Tesoro
UYU 1,370,000 13.250 04/08/18 48,644Uruguay Treasury Bills(a)2,740,000 0.000 02/08/18 88,8152,405,000 0.000 03/08/18 77,194TOTAL FOREIGN DEBT OBLIGATIONS(Cost $89,342,034) $ 92,591,796
Corporate Obligations �� 46.0%Aerospace & Defense(b)(e) �� 0.4%
Bombardier, Inc.$ 290,000 6.000 10/15/22 289,275
StandardAero Aviation Holdings, Inc.700,000 10.000 07/15/23 765,625TransDigm, Inc.275,000 6.500 05/15/25 281,875
1,336,775Automotive(b)(e) �� 0.1%
BCD Acquisition, Inc.400,000 9.625 09/15/23 431,000
Banks �� 0.4%BGEO Group JSC125,000 6.000 07/26/23 125,625JPMorgan Chase & Co.(c)(e)350,000 6.000 08/01/49 370,562Oschadbank Via SSB #1 PLC(d)200,000 9.375 03/10/23 204,000200,000 9.625 03/20/25 199,750Vnesheconombank Via VEB Finance PLC200,000 5.942 11/21/23 214,500VTB Bank OJSC Via VTB Capital SA200,000 6.950 10/17/22 217,750
1,332,187
66 The accompanying notes are an integral part of these financial statements.
Copyright © 2017 www.secdatabase.com. All Rights Reserved.Please Consider the Environment Before Printing This Document

GOLDMAN SACHS MULTI-MANAGER NON-CORE FIXED INCOME FUND
PrincipalAmount
InterestRate
MaturityDate Value
Corporate Obligations �� (continued)Beverages(b)(e) �� 0.0%
Central American Bottling Corp.$80,000 5.750 % 01/31/27 $ 84,808Building Materials(e) �� 1.2%
American Builders & Contractors Supply Co., Inc.(b)262,000 5.625 04/15/21 269,533457,000 5.750 12/15/23 485,562Builders FirstSource, Inc.(b)669,000 5.625 09/01/24 693,251Cemex SAB de CV90,000 7.750 04/16/26 102,096Gibraltar Industries, Inc.500,000 6.250 02/01/21 515,000Masonite International Corp.(b)1,000,000 5.625 03/15/23 1,040,000Standard Industries, Inc.(b)85,000 6.000 10/15/25 90,738Summit Materials LLC/Summit Materials Finance Corp.730,000 6.125 07/15/23 762,850Taylor Morrison Communities, Inc./Taylor Morrison Holdings II,
Inc.(b)375,000 5.625 03/01/24 395,625
4,354,655Chemicals �� 1.1%
Alpha 3 BV/Alpha US Bidco, Inc.(b)(e)415,000 6.250 02/01/25 420,706Blue Cube Spinco, Inc.(e)300,000 9.750 10/15/23 363,000550,000 10.000 10/15/25 676,500CF Industries, Inc.100,000 5.150 03/15/34 90,648Kraton Polymers LLC/Kraton Polymers Capital Corp.(b)(e)129,000 7.000 04/15/25 135,289Rain CII Carbon LLC/CII Carbon Corp.(b)(e)750,000 7.250 04/01/25 751,875TPC Group, Inc.(b)(e)625,000 8.750 12/15/20 582,812Tronox Finance LLC(e)265,000 6.375 08/15/20 268,975541,000 7.500 (b) 03/15/22 566,698
3,856,503Commercial Services(e) �� 0.6%
AMN Healthcare, Inc.(b)415,000 5.125 10/01/24 419,150Cardtronics, Inc.400,000 5.125 08/01/22 408,000Prime Security Services Borrower LLC/Prime Finance, Inc.(b)1,100,000 9.250 05/15/23 1,199,000
2,026,150Construction & Engineering(b)(e) �� 0.1%
New Enterprise Stone & Lime Co., Inc.200,000 10.125 04/01/22 212,000
Corporate Obligations �� (continued)Consumer Cyclical Services(e) �� 1.1%
Cenveo Corp.(b)940,000 6.000 08/01/19 766,100Ceridian HCM Holding, Inc.(b)24,000 11.000 03/15/21 25,290First Data Corp.(b)1,615,000 5.000 01/15/24 1,651,337Monitronics International, Inc.775,000 9.125 04/01/20 749,813United Rentals North America, Inc.750,000 5.875 09/15/26 790,312
3,982,852
Copyright © 2017 www.secdatabase.com. All Rights Reserved.Please Consider the Environment Before Printing This Document

Consumer Noncyclical(e) �� 0.2%NeuStar, Inc.775,000 4.500 01/15/23 796,313
Consumer Products �� Household & Leisure(e) �� 0.7%Spectrum Brands, Inc.1,015,000 5.750 07/15/25 1,083,512The Scotts Miracle-Gro Co.1,200,000 6.000 10/15/23 1,284,000
2,367,512Diversified Financial Services �� 0.8%
ASP AMC Merger Sub, Inc.(b)(e)640,000 8.000 05/15/25 635,200Bankrate, Inc.(b)(e)700,000 6.125 08/15/18 707,000CNG Holdings, Inc.(b)(e)455,000 9.375 05/15/20 414,050Comcel Trust via Comunicaciones Celulares SA(e)130,000 6.875 02/06/24 138,421Springleaf Finance Corp.373,000 7.750 10/01/21 400,509Ukreximbank Via Biz Finance PLC150,000 9.625 04/27/22 152,813200,000 9.750 01/22/25 201,000
2,648,993Energy �� 2.7%
Blue Racer Midstream LLC/Blue Racer Finance Corp.(b)(e)1,470,000 6.125 11/15/22 1,506,750California Resources Corp.(b)(e)950,000 8.000 12/15/22 726,750CITGO Petroleum Corp.(b)(e)500,000 6.250 08/15/22 510,000Energy Transfer Equity LP(e)500,000 5.875 01/15/24 540,000Jupiter Resources, Inc.(b)(e)675,000 8.500 10/01/22 550,125KazMunayGas National Co. JSC(b)375,000 4.750 04/19/27 373,125200,000 5.750 04/19/47 195,200Pertamina Persero PT250,000 4.875 05/03/22 264,230145,000 4.300 05/20/23 149,167200,000 6.450 05/30/44 225,500
The accompanying notes are an integral part of these financial statements. 67
Copyright © 2017 www.secdatabase.com. All Rights Reserved.Please Consider the Environment Before Printing This Document

GOLDMAN SACHS MULTI-MANAGER NON-CORE FIXED INCOME FUND
Schedule of Investments (continued)April 30, 2017 (Unaudited)
PrincipalAmount
InterestRate
MaturityDate Value
Corporate Obligations �� (continued)Energy �� (continued)
Petrobras Global Finance BV$ 965,000 8.375 % 05/23/21 $ 1,093,828
130,000 6.125 01/17/22 136,279130,000 7.375 01/17/27 139,100Petroleos Mexicanos
EUR230,000 5.500 02/24/25 284,675$ 490,000 6.875 08/04/26 547,575EUR260,000 2.750 04/21/27 254,029$ 285,000 5.625 01/23/46 253,365
395,000 6.750 09/21/47 399,464State Oil Co. of the Azerbaijan Republic200,000 4.750 03/13/23 198,250Transportadora de Gas Internacional SA ESP(e)65,000 5.700 03/20/22 66,560Whiting Petroleum Corp.(e)150,000 5.750 03/15/21 148,875845,000 6.250 04/01/23 849,225
9,412,072Energy �� Coal(e) �� 0.2%
CONSOL Energy, Inc.400,000 5.875 04/15/22 389,500Murray Energy Corp.(b)250,000 11.250 04/15/21 187,500
577,000Energy �� Exploration & Production �� 1.5%
Alta Mesa Holdings LP/Alta Mesa Finance Services Corp.(b)(e)395,000 7.875 12/15/24 414,750Continental Resources, Inc.(e)439,000 4.500 04/15/23 432,415Extraction Oil & Gas Holdings LLC/Extraction Finance Corp.(b)(e)565,000 7.875 07/15/21 591,837Gulfport Energy Corp.(b)(e)200,000 6.000 10/15/24 197,000Halcon Resources Corp.(b)(e)425,000 6.750 02/15/25 408,000MEG Energy Corp.(b)(e)580,000 6.375 01/30/23 510,400150,000 7.000 03/31/24 133,875555,000 6.500 01/15/25 548,063Midstates Petroleum Co., Inc./Midstates Petroleum Co. LLC(e)(f)700,000 10.000 06/01/20 �72,000 10.750 10/01/20 �300,000 9.250 06/01/21 �Newfield Exploration Co.(e)380,000 5.375 01/01/26 399,000Parsley Energy LLC/Parsley Finance Corp.(b)(e)175,000 5.250 08/15/25 176,094PDC Energy, Inc.(e)500,000 7.750 10/15/22 525,00063,000 6.125 (b) 09/15/24 64,575Peabody Energy Corp.(f)40,000 6.250 11/15/21 �Petrobras Argentina SA(e)135,000 7.375 07/21/23 143,775
Corporate Obligations �� (continued)Energy �� Exploration & Production �� (continued)
Southwestern Energy Co.(e)415,000 6.700 01/23/25 412,925WildHorse Resource Development Corp.(b)(e)376,000 6.875 02/01/25 361,900
5,319,609
Copyright © 2017 www.secdatabase.com. All Rights Reserved.Please Consider the Environment Before Printing This Document
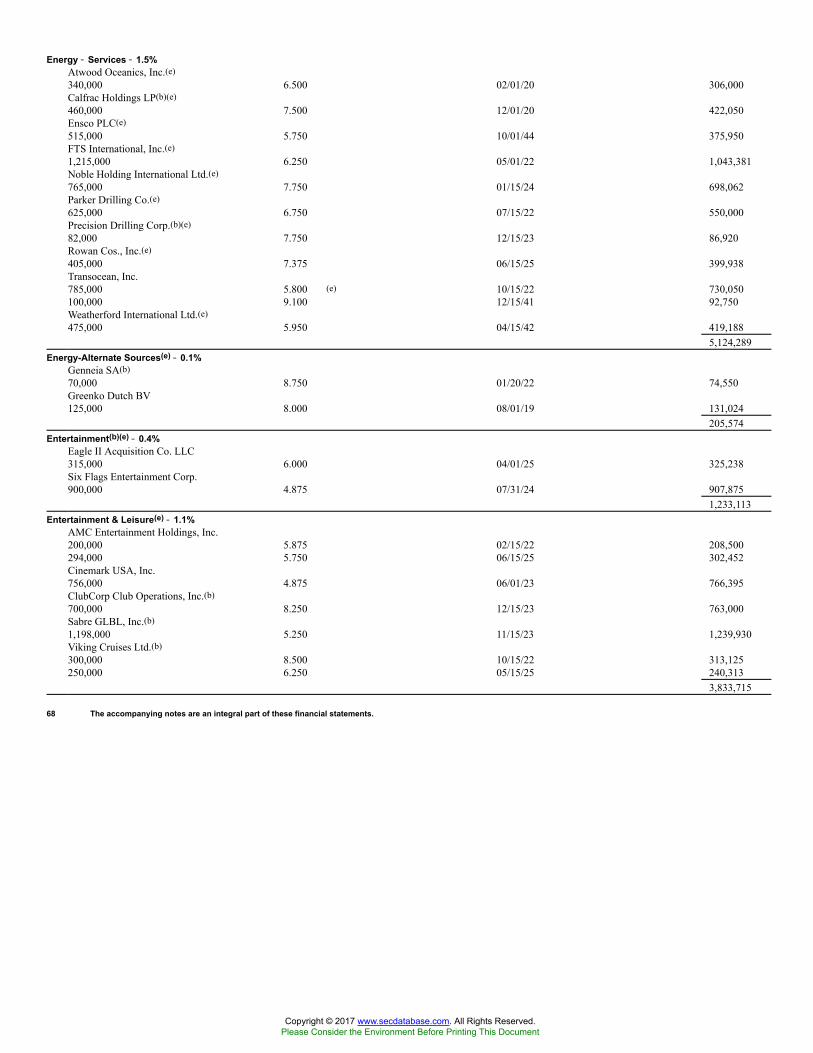
Energy �� Services �� 1.5%Atwood Oceanics, Inc.(e)340,000 6.500 02/01/20 306,000Calfrac Holdings LP(b)(e)460,000 7.500 12/01/20 422,050Ensco PLC(e)515,000 5.750 10/01/44 375,950FTS International, Inc.(e)1,215,000 6.250 05/01/22 1,043,381Noble Holding International Ltd.(e)765,000 7.750 01/15/24 698,062Parker Drilling Co.(e)625,000 6.750 07/15/22 550,000Precision Drilling Corp.(b)(e)82,000 7.750 12/15/23 86,920Rowan Cos., Inc.(e)405,000 7.375 06/15/25 399,938Transocean, Inc.785,000 5.800 (e) 10/15/22 730,050100,000 9.100 12/15/41 92,750Weatherford International Ltd.(e)475,000 5.950 04/15/42 419,188
5,124,289Energy-Alternate Sources(e) �� 0.1%
Genneia SA(b)70,000 8.750 01/20/22 74,550Greenko Dutch BV125,000 8.000 08/01/19 131,024
205,574Entertainment(b)(e) �� 0.4%
Eagle II Acquisition Co. LLC315,000 6.000 04/01/25 325,238Six Flags Entertainment Corp.900,000 4.875 07/31/24 907,875
1,233,113Entertainment & Leisure(e) �� 1.1%
AMC Entertainment Holdings, Inc.200,000 5.875 02/15/22 208,500294,000 5.750 06/15/25 302,452Cinemark USA, Inc.756,000 4.875 06/01/23 766,395ClubCorp Club Operations, Inc.(b)700,000 8.250 12/15/23 763,000Sabre GLBL, Inc.(b)1,198,000 5.250 11/15/23 1,239,930Viking Cruises Ltd.(b)300,000 8.500 10/15/22 313,125250,000 6.250 05/15/25 240,313
3,833,715
68 The accompanying notes are an integral part of these financial statements.
Copyright © 2017 www.secdatabase.com. All Rights Reserved.Please Consider the Environment Before Printing This Document

GOLDMAN SACHS MULTI-MANAGER NON-CORE FIXED INCOME FUND
PrincipalAmount
InterestRate
MaturityDate Value
Corporate Obligations �� (continued)Finance �� 1.2%
Ally Financial, Inc.$470,000 5.125 % 09/30/24 $ 479,400
Harland Clarke Holdings Corp.(b)(e)425,000 9.250 03/01/21 409,062Icahn Enterprises LP/Icahn Enterprises Finance Corp.(e)1,161,000 5.875 02/01/22 1,194,379200,000 6.250 (b) 02/01/22 207,750200,000 6.750 (b) 02/01/24 208,750Jefferies Finance LLC/JFIN Co-Issuer Corp.(b)(e)450,000 6.875 04/15/22 445,500Navient Corp.935,000 6.625 07/26/21 989,418Starwood Property Trust, Inc.(b)(e)400,000 5.000 12/15/21 417,000
4,351,259Finance Insurance �� 0.4%
HUB International Ltd.(b)(e)800,000 7.875 10/01/21 839,000MGIC Investment Corp.300,000 5.750 08/15/23 321,000200,000 9.000 (b) 04/01/63 259,750
1,419,750Food & Beverage(e) �� 0.3%
B&G Foods, Inc.415,000 5.250 04/01/25 423,300Clearwater Seafoods, Inc.(b)255,000 6.875 05/01/25 263,925Post Holdings, Inc.(b)175,000 7.750 03/15/24 194,250215,000 5.000 08/15/26 213,388
1,094,863Gaming �� 1.3%
Chester Downs & Marina LLC/Chester Downs Finance Corp.(b)(e)370,000 9.250 02/01/20 377,400GLP Capital LP/GLP Financing II, Inc.714,000 5.375 04/15/26 750,592Jack Ohio Finance LLC/Jack Ohio Finance 1 Corp.(b)(e)700,000 6.750 11/15/21 730,625Jacobs Entertainment, Inc.(b)(e)125,000 7.875 02/01/24 130,000MGM Growth Properties Operating Partnership LP/MGP Finance
Co-Issuer, Inc.(e)400,000 5.625 05/01/24 432,000650,000 4.500 09/01/26 646,750Scientific Games International, Inc.(e)385,000 10.000 12/01/22 416,763Seminole Hard Rock Entertainment, Inc./Seminole Hard Rock
International LLC(b)(e)1,000,000 5.875 05/15/21 1,015,000
4,499,130Corporate Obligations �� (continued)Health Care �� Medical Products(b)(e) �� 0.4%
DJO Finco, Inc./DJO Finance LLC/DJO Finance Corp.899,000 8.125 06/15/21 800,110Ortho-Clinical Diagnostics, Inc./Ortho-Clinical Diagnostics SA815,000 6.625 05/15/22 749,800
1,549,910Health Care �� Pharmaceuticals �� 1.4%
Mallinckrodt International Finance SA378,000 4.750 04/15/23 322,245Quintiles IMS, Inc.(b)(e)1,000,000 4.875 05/15/23 1,030,000415,000 5.000 10/15/26 425,375Valeant Pharmaceuticals International, Inc.(b)(e)
Copyright © 2017 www.secdatabase.com. All Rights Reserved.Please Consider the Environment Before Printing This Document

980,000 5.375 03/15/20 837,9001,010,000 7.500 07/15/21 835,775500,000 5.500 03/01/23 367,500215,000 7.000 03/15/24 219,3001,147,000 6.125 04/15/25 845,912
4,884,007Health Care �� Services �� 3.0%
BioScrip, Inc.(e)1,058,000 8.875 02/15/21 894,010Centene Corp.(e)235,000 6.125 02/15/24 253,2121,040,000 4.750 01/15/25 1,058,200CHS/Community Health Systems, Inc.(e)270,000 6.875 02/01/22 223,425150,000 6.250 03/31/23 152,813DaVita, Inc.(e)1,000,000 5.125 07/15/24 1,027,500328,000 5.000 05/01/25 330,460Envision Healthcare Corp.(e)1,000,000 5.625 07/15/22 1,030,000HCA, Inc.700,000 5.875 05/01/23 761,250900,000 5.250 04/15/25 967,221133,000 7.690 06/15/25 151,620Kindred Healthcare, Inc.650,000 8.000 01/15/20 676,000625,000 6.375 (e) 04/15/22 606,250Select Medical Corp.(e)750,000 6.375 06/01/21 766,875Tenet Healthcare Corp.600,000 8.125 04/01/22 609,000550,000 6.750 06/15/23 525,250WellCare Health Plans, Inc.(e)575,000 5.250 04/01/25 598,000
10,631,086Home Construction(e) �� 0.3%
Century Communities, Inc.1,050,000 6.875 05/15/22 1,103,813
Internet(e) �� 0.3%Zayo Group LLC/Zayo Capital, Inc.1,000,000 6.375 05/15/25 1,080,000
The accompanying notes are an integral part of these financial statements. 69
Copyright © 2017 www.secdatabase.com. All Rights Reserved.Please Consider the Environment Before Printing This Document
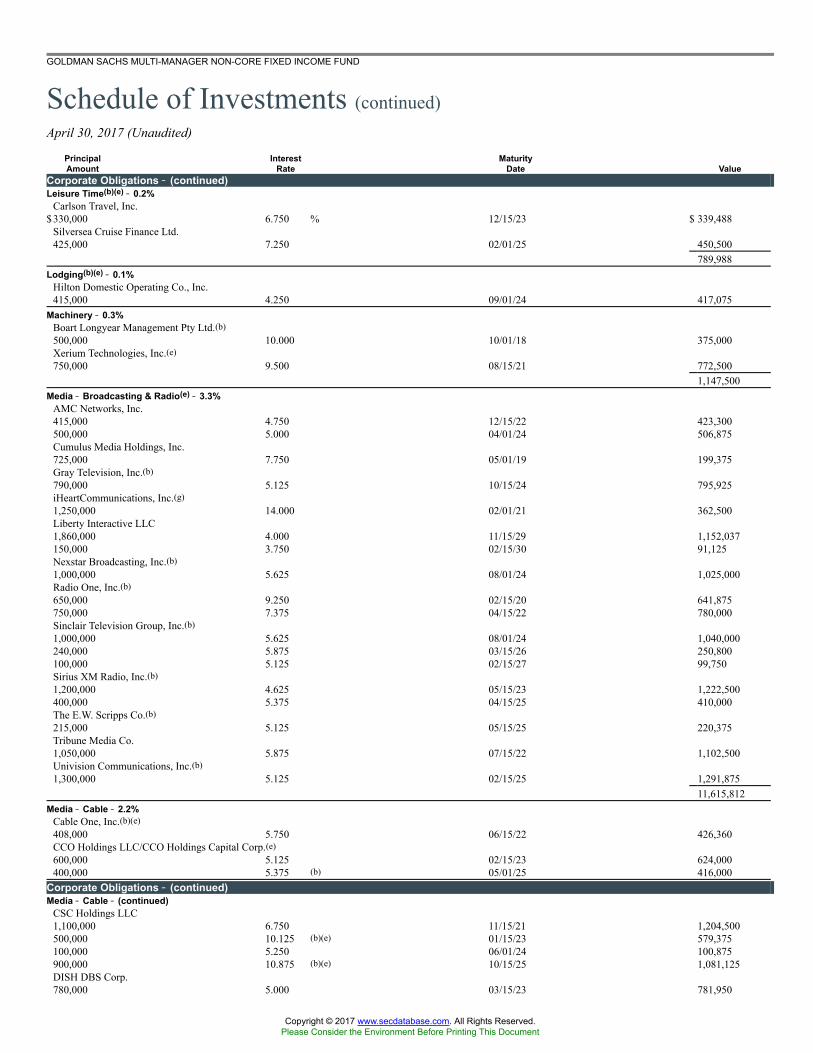
GOLDMAN SACHS MULTI-MANAGER NON-CORE FIXED INCOME FUND
Schedule of Investments (continued)April 30, 2017 (Unaudited)
PrincipalAmount
InterestRate
MaturityDate Value
Corporate Obligations �� (continued)Leisure Time(b)(e) �� 0.2%
Carlson Travel, Inc.$330,000 6.750 % 12/15/23 $ 339,488
Silversea Cruise Finance Ltd.425,000 7.250 02/01/25 450,500
789,988Lodging(b)(e) �� 0.1%
Hilton Domestic Operating Co., Inc.415,000 4.250 09/01/24 417,075
Machinery �� 0.3%Boart Longyear Management Pty Ltd.(b)500,000 10.000 10/01/18 375,000Xerium Technologies, Inc.(e)750,000 9.500 08/15/21 772,500
1,147,500Media �� Broadcasting & Radio(e) �� 3.3%
AMC Networks, Inc.415,000 4.750 12/15/22 423,300500,000 5.000 04/01/24 506,875Cumulus Media Holdings, Inc.725,000 7.750 05/01/19 199,375Gray Television, Inc.(b)790,000 5.125 10/15/24 795,925iHeartCommunications, Inc.(g)1,250,000 14.000 02/01/21 362,500Liberty Interactive LLC1,860,000 4.000 11/15/29 1,152,037150,000 3.750 02/15/30 91,125Nexstar Broadcasting, Inc.(b)1,000,000 5.625 08/01/24 1,025,000Radio One, Inc.(b)650,000 9.250 02/15/20 641,875750,000 7.375 04/15/22 780,000Sinclair Television Group, Inc.(b)1,000,000 5.625 08/01/24 1,040,000240,000 5.875 03/15/26 250,800100,000 5.125 02/15/27 99,750Sirius XM Radio, Inc.(b)1,200,000 4.625 05/15/23 1,222,500400,000 5.375 04/15/25 410,000The E.W. Scripps Co.(b)215,000 5.125 05/15/25 220,375Tribune Media Co.1,050,000 5.875 07/15/22 1,102,500Univision Communications, Inc.(b)1,300,000 5.125 02/15/25 1,291,875
11,615,812Media �� Cable �� 2.2%
Cable One, Inc.(b)(e)408,000 5.750 06/15/22 426,360CCO Holdings LLC/CCO Holdings Capital Corp.(e)600,000 5.125 02/15/23 624,000400,000 5.375 (b) 05/01/25 416,000
Corporate Obligations �� (continued)Media �� Cable �� (continued)
CSC Holdings LLC1,100,000 6.750 11/15/21 1,204,500500,000 10.125 (b)(e) 01/15/23 579,375100,000 5.250 06/01/24 100,875900,000 10.875 (b)(e) 10/15/25 1,081,125DISH DBS Corp.780,000 5.000 03/15/23 781,950
Copyright © 2017 www.secdatabase.com. All Rights Reserved.Please Consider the Environment Before Printing This Document

150,000 5.875 11/15/24 157,500SFR Group SA(b)(e)200,000 6.000 05/15/22 208,5001,000,000 6.250 05/15/24 1,033,750600,000 7.375 05/01/26 630,000Ziggo Secured Finance BV(b)(e)415,000 5.500 01/15/27 423,300
7,667,235Media �� Non Cable(e) �� 0.9%
Lee Enterprises, Inc.(b)230,000 9.500 03/15/22 242,075Outfront Media Capital LLC/Outfront Media Capital Corp.1,090,000 5.875 03/15/25 1,152,675The McClatchy Co.560,000 9.000 12/15/22 582,400VeriSign, Inc.1,000,000 4.625 05/01/23 1,027,500
3,004,650Metals & Mining �� 1.5%
Allegheny Technologies, Inc.(e)415,000 7.875 08/15/23 429,006Constellium NV(b)(e)350,000 5.750 05/15/24 326,375Evraz Group SA200,000 8.250 01/28/21 223,500100,000 5.375 (b) 03/20/23 100,375First Quantum Minerals Ltd.(b)(e)150,000 7.250 04/01/23 152,063350,000 7.500 04/01/25 357,000Freeport-McMoRan, Inc.(e)247,000 3.875 03/15/23 229,092240,000 5.400 11/14/34 213,000500,000 5.450 03/15/43 426,250Grinding Media, Inc./MC Grinding Media Canada, Inc.(b)(e)140,000 7.375 12/15/23 149,450Hecla Mining Co.(e)500,000 6.875 05/01/21 513,750Hudbay Minerals, Inc.(b)(e)91,000 7.250 01/15/23 97,029New Gold, Inc.(b)(e)1,100,000 6.250 11/15/22 1,126,125The Hillman Group, Inc.(b)(e)700,000 6.375 07/15/22 667,625TMK OAO Via TMK Capital SA200,000 6.750 04/03/20 212,500Vedanta Resources PLC(b)100,000 6.375 07/30/22 101,250
5,324,390
70 The accompanying notes are an integral part of these financial statements.
Copyright © 2017 www.secdatabase.com. All Rights Reserved.Please Consider the Environment Before Printing This Document

GOLDMAN SACHS MULTI-MANAGER NON-CORE FIXED INCOME FUND
PrincipalAmount
InterestRate
MaturityDate Value
Corporate Obligations �� (continued)Noncaptive �� Financial(b) �� 0.1%
Park Aerospace Holdings Ltd.$200,000 5.250 % 08/15/22 $ 211,239
180,000 5.500 02/15/24 191,206402,445
Packaging �� 0.6%ARD Finance SA(b)(e)(g)260,000 7.125 09/15/23 269,750Ardagh Packaging Finance PLC/Ardagh Holdings USA, Inc.(b)(e)350,000 7.250 05/15/24 378,875Ball Corp.775,000 5.250 07/01/25 836,031Owens-Brockway Glass Container, Inc.(b)500,000 5.875 08/15/23 536,250
2,020,906Pipelines �� 1.8%
Cheniere Corpus Christi Holdings LLC(b)175,000 5.875 03/31/25 186,594Crestwood Midstream Partners LP/Crestwood Midstream
Finance Corp.(b)(e)575,000 5.750 04/01/25 598,000Genesis Energy LP/Genesis Energy Finance Corp.(e)283,000 6.750 08/01/22 291,844161,000 6.000 05/15/23 161,000900,000 5.625 06/15/24 882,000NuStar Logistics LP(e)75,000 5.625 04/28/27 77,344Sabine Pass Liquefaction LLC(e)175,000 6.250 03/15/22 196,245175,000 5.750 05/15/24 193,444SemGroup Corp./Rose Rock Finance Corp.(e)760,000 5.625 07/15/22 752,400100,000 5.625 11/15/23 98,000Southern Gas Corridor CJSC(h)470,000 6.875 03/24/26 519,350Summit Midstream Holdings LLC/Summit Midstream
Finance Corp.(e)742,000 5.500 08/15/22 745,710620,000 5.750 04/15/25 626,200Targa Resources Partners LP/Targa Resources Partners
Finance Corp.(e)500,000 5.250 05/01/23 513,750600,000 4.250 11/15/23 594,000
6,435,881Publishing(b)(e) �� 0.3%
The Nielsen Co. Luxembourg S.a.r.l.930,000 5.000 02/01/25 930,000
Real Estate(e) �� 1.3%ESH Hospitality, Inc.(b)587,000 5.250 05/01/25 594,337Realogy Group LLC/Realogy Co-Issuer Corp.(b)1,000,000 4.875 06/01/23 1,010,000RHP Hotel Properties LP/RHP Finance Corp.100,000 5.000 04/15/21 102,000940,000 5.000 04/15/23 959,975
Corporate Obligations �� (continued)Real Estate(e) �� (continued)
The GEO Group, Inc.390,000 6.000 04/15/26 399,750The Howard Hughes Corp.(b)415,000 5.375 03/15/25 417,961Uniti Group, Inc./CSL Capital LLC550,000 6.000 (b) 04/15/23 572,688375,000 8.250 10/15/23 399,844
4,456,555
Copyright © 2017 www.secdatabase.com. All Rights Reserved.Please Consider the Environment Before Printing This Document

Retailers �� 1.4%Ferrellgas LP/Ferrellgas Finance Corp.(e)650,000 6.750 01/15/22 628,875Ferrellgas Partners LP/Ferrellgas Partners Finance Corp.(b)(e)350,000 8.625 06/15/20 339,500JC Penney Corp., Inc.(b)(e)520,000 5.875 07/01/23 525,200L Brands, Inc.341,000 5.625 02/15/22 360,181895,000 6.875 11/01/35 883,812New Albertsons, Inc.400,000 7.450 08/01/29 376,000400,000 8.700 05/01/30 393,500400,000 8.000 05/01/31 388,000SUPERVALU, Inc.(e)575,000 6.750 06/01/21 586,500Yum! Brands, Inc.415,000 6.875 11/15/37 430,044
4,911,612Services Cyclical �� Rental Equipment(b)(e) �� 0.1%
Algeco Scotsman Global Finance PLC350,000 8.500 10/15/18 329,875
Software(b)(e) �� 0.1%Genesys Telecommunications Laboratories, Inc./Greeneden Lux 3
S.a.r.l./Greeneden US Holdings II LLC190,000 10.000 11/30/24 210,425
Technology �� Hardware �� 1.6%Dell International LLC/EMC Corp.(b)(e)715,000 7.125 06/15/24 789,181300,000 8.100 07/15/36 376,483300,000 8.350 07/15/46 388,283Micron Technology, Inc.(b)(e)400,000 5.250 08/01/23 413,000Molina Healthcare, Inc.(e)695,000 5.375 11/15/22 726,275NCR Corp.(e)1,000,000 5.000 07/15/22 1,025,000Plantronics, Inc.(b)(e)375,000 5.500 05/31/23 381,563Sensata Technologies BV(b)1,380,000 5.000 10/01/25 1,411,050
5,510,835Technology �� Software/Services(e) �� 1.5%
BMC Software Finance, Inc.(b)$310,000 8.125 07/15/21 315,038
Cengage Learning, Inc.(b)625,000 9.500 06/15/24 564,062
The accompanying notes are an integral part of these financial statements. 71
Copyright © 2017 www.secdatabase.com. All Rights Reserved.Please Consider the Environment Before Printing This Document

GOLDMAN SACHS MULTI-MANAGER NON-CORE FIXED INCOME FUND
Schedule of Investments (continued)April 30, 2017 (Unaudited)
PrincipalAmount
InterestRate
MaturityDate Value
Corporate Obligations �� (continued)Technology �� Software/Services(e) �� (continued)
Equinix, Inc.$ 800,000 5.750 % 01/01/25 $ 856,000
MSCI, Inc.(b)1,000,000 5.250 11/15/24 1,057,500200,000 4.750 08/01/26 205,250Open Text Corp.(b)370,000 5.875 06/01/26 394,975Solera LLC/Solera Finance, Inc.(b)240,000 10.500 03/01/24 274,500Symantec Corp.(b)575,000 5.000 04/15/25 593,839TIBCO Software, Inc.(b)626,000 11.375 12/01/21 691,730Unisys Corp.(b)300,000 10.750 04/15/22 315,000Western Digital Corp.(b)66,000 7.375 04/01/23 72,270
5,340,164Telecommunications �� Cellular(e) �� 0.4%
SoftBank Group Corp.400,000 6.000 07/30/25 433,000T-Mobile USA, Inc.300,000 6.000 04/15/24 324,375500,000 6.375 03/01/25 546,250
1,303,625Transportation(b)(e) �� 0.2%
Air Medical Group Holdings, Inc.729,000 6.375 05/15/23 707,130
Utilities �� Electric �� 0.5%AES Argentina Generacion SA(b)(e)140,000 7.750 02/02/24 146,300AES Gener SA(c)(e)130,000 8.375 12/18/73 139,425Empresa Distribuidora Y Comercializadora Norte(e)125,000 9.750 10/25/22 135,938Eskom Holdings SOC Ltd.315,000 6.750 08/06/23 325,553GenOn Americas Generation LLC625,000 8.500 10/01/21 567,187NSG Holdings LLC/NSG Holdings, Inc.(b)557,937 7.750 12/15/25 601,177
1,915,580Wireless Telecommunication Services(e) �� 0.1%
Columbus Cable Barbados Ltd.275,000 7.375 03/30/21 294,594
Wireless Telecommunications �� 3.4%Altice Financing SA(b)(e)600,000 6.500 01/15/22 630,000900,000 7.500 05/15/26 969,750Altice Luxembourg SA(b)(e)
$ 500,000 7.750 05/15/22 530,625250,000 7.625 02/15/25 265,000Digicel Group Ltd.(b)(e)300,000 8.250 09/30/20 273,750335,000 7.125 04/01/22 279,725
Corporate Obligations �� (continued)Wireless Telecommunications �� (continued)
Digicel Ltd.(b)(e)1,000,000 6.000 04/15/21 950,000300,000 6.750 03/01/23 285,375
Copyright © 2017 www.secdatabase.com. All Rights Reserved.Please Consider the Environment Before Printing This Document

Hughes Satellite Systems Corp.(b)1,315,000 5.250 08/01/26 1,338,012Inmarsat Finance PLC(b)(e)1,429,000 4.875 05/15/22 1,439,695Intelsat Jackson Holdings SA(e)500,000 7.500 04/01/21 457,500240,000 8.000 (b) 02/15/24 258,600Radiate Holdco LLC/Radiate Finance, Inc.(b)(e)775,000 6.625 02/15/25 771,125Sprint Corp.1,050,000 7.250 09/15/21 1,148,4371,450,000 7.875 09/15/23 1,627,625350,000 7.125 06/15/24 380,625410,000 7.625 (e) 02/15/25 457,663
12,063,507Wirelines Telecommunications �� 1.3%
Anixter, Inc.500,000 5.125 10/01/21 530,000CenturyLink, Inc.300,000 6.750 12/01/23 321,375150,000 7.500 (e) 04/01/24 162,938370,000 5.625 (e) 04/01/25 361,212Embarq Corp.200,000 7.995 06/01/36 204,197Frontier Communications Corp.(e)715,000 6.875 01/15/25 595,237700,000 11.000 09/15/25 673,750Level 3 Financing, Inc.(e)413,000 5.375 05/01/25 429,520Sprint Capital Corp.150,000 6.875 11/15/28 162,750West Corp.(b)(e)960,000 5.375 % 07/15/22 960,000
4,400,979TOTAL CORPORATE OBLIGATIONS(Cost $158,407,996) $ 160,949,701
Bank Loans(i) �� 16.7%Aerospace & Defense �� 0.3%
Engility Corp.$ 225,375 4.750 % 08/12/23 $ 226,784
Sequa Corp.250,000 6.500 11/26/21 252,500250,000 10.000 04/13/22 254,062Transdigm, Inc.244,962 3.845 06/04/21 245,337
978,683Airlines �� 0.8%
American Airlines, Inc.995,000 3.278 04/28/23 995,468
72 The accompanying notes are an integral part of these financial statements.
Copyright © 2017 www.secdatabase.com. All Rights Reserved.Please Consider the Environment Before Printing This Document

GOLDMAN SACHS MULTI-MANAGER NON-CORE FIXED INCOME FUND
PrincipalAmount
InterestRate
MaturityDate Value
Bank Loans(i) �� (continued)Airlines �� (continued)
Delta Air Lines, Inc.$ 837,912 3.489 % 10/18/18 $ 843,744
1,000,000 5.068 02/01/24 1,001,0002,840,212
Automotive �� Parts �� 0.7%Capital Automotive LP500,000 4.000 03/24/24 503,750Evergreen Skills Lux S.A.R.L.1,153,464 5.750 04/28/21 1,077,531Jaguar Holding Company II837,600 4.250 08/18/22 841,788
2,423,069Building Materials �� 0.4%
Jeld-Wen, Inc.375,046 4.147 07/01/22 378,796Quikrete Holdings, Inc.1,097,250 4.243 11/15/23 1,098,852
1,477,648Chemicals �� 0.2%
Univar, Inc.748,125 3.743 07/01/22 749,995
Consumer Cyclical Services �� 0.3%First Data Corp.500,000 2.500 04/26/24 500,000Monitronics International, Inc.348,250 6.500 09/30/22 353,164
853,164Consumer Products �� Household & Leisure �� 0.3%
Affinion Group, Inc.408,268 6.750 04/30/18 407,190130,000 8.500 10/31/18 130,199Revlon Consumer Products Corp.497,500 4.250 % 09/07/23 498,002
1,035,391Diversified Manufacturing �� 0.3%
Gardner Denver, Inc.994,852 4.250 07/30/20 994,026
Energy �� 0.5%Chief Exploration & Development LLC410,000 7.932 05/16/21 393,600FTS International, Inc.130,000 5.750 04/16/21 112,775Gulf Finance LLC158,272 6.250 08/25/23 157,877Peabody Energy Corp.500,000 5.500 03/31/22 502,500Seadrill Partners Finco LLC1,036,012 4.147 02/21/21 696,718
1,863,470Bank Loans(i) �� (continued)Energy �� Exploration & Production �� 0.4%
Fieldwood Energy LLC554,514 3.875 10/01/18 540,191250,000 8.000 08/31/20 244,168Murray Energy Corp.686,545 7.500 04/16/20 654,696
1,439,055Entertainment �� 0.2%
Delta 2 (LUX) S.A.R.L.175,000 8.068 07/29/22 176,531LTF Merger Sub, Inc.498,750 4.000 06/10/22 499,643
676,174
Copyright © 2017 www.secdatabase.com. All Rights Reserved.Please Consider the Environment Before Printing This Document

Finance Insurance �� 0.5%Alliant Holdings I, Inc.498,733 4.387 08/12/22 499,950Hub International Ltd.1,079,531 4.000 10/02/20 1,084,583
1,584,533Financial Services �� 0.2%
Walter Investment Management Corp.698,954 4.750 12/18/20 629,716
Food & Beverage �� 0.1%US Foods, Inc.249,372 3.743 06/27/23 251,532
Food & Drug Retailers �� 0.1%Rite Aid Corp.250,000 5.750 08/21/20 250,390
Gaming �� 0.4%Fantasy Springs Resort230,677 9.000 12/17/21 226,351Mashantucket (Western) Pequot Tribe835,000 9.375 06/30/20 760,685Scientific Games International, Inc.500,000 5.000 10/01/21 508,750
1,495,786Health Care �� Medical Products �� 0.2%
Carestream Health, Inc.319,618 5.147 06/07/19 316,770250,000 9.647 12/07/19 245,535DJO Finco, Inc./DJO Finance LLC/DJO Finance Corp.97,933 4.250 06/08/20 95,582
657,887Health Care �� Pharmaceuticals �� 0.1%
Grifols Worldwide Operations USA, Inc.500,000 3.195 01/31/25 501,060
Health Care �� Services �� 1.5%Air Medical Group Holdings, Inc.794,597 4.250 04/28/22 788,637American Renal Holdings, Inc.642,194 4.750 09/20/19 645,810
The accompanying notes are an integral part of these financial statements. 73
Copyright © 2017 www.secdatabase.com. All Rights Reserved.Please Consider the Environment Before Printing This Document

GOLDMAN SACHS MULTI-MANAGER NON-CORE FIXED INCOME FUND
Schedule of Investments (continued)April 30, 2017 (Unaudited)
PrincipalAmount
InterestRate
MaturityDate Value
Bank Loans(i) �� (continued)Health Care �� Services �� (continued)
BPA Laboratories, Inc.$ 80,336 3.672 % 04/29/20 $ 54,629
Change Healthcare Holdings, Inc.1,000,000 3.750 03/01/24 1,002,630Community Health Systems, Inc.521,277 4.000 01/27/21 517,800Envision Healthcare Corp.498,750 4.150 12/01/23 503,364inVentiv Health, Inc.847,875 4.804 11/09/23 852,233Quorum Health Corp.123,106 7.750 04/29/22 122,798U.S. Renal Care, Inc.663,369 5.397 12/31/22 628,542
5,116,443Media �� Broadcasting & Radio �� 1.1%
Cumulus Media Holdings, Inc.770,000 4.250 12/23/20 601,701EIG Investors Corp.351,840 6.532 11/09/19 353,012iHeart Communications, Inc.1,600,000 7.743 01/30/19 1,361,136250,000 8.493 07/30/19 212,250Radio One, Inc.419,103 5.080 04/18/23 416,484RCN Grande464,722 3.750 02/01/24 466,093Tribune Media Co.361,582 3.993 12/27/20 363,690
3,774,366Media �� Cable �� 0.1%
TierPoint LLC500,000 4.750 05/18/24 503,750
Media �� Non Cable �� 0.8%Advantage Sales & Marketing, Inc.244,975 4.250 07/23/21 238,953156,977 7.500 07/25/22 149,363Cengage Learning Acquisitions, Inc.1,204,047 5.250 06/07/23 1,156,740Checkout Holding Corp.559,878 4.500 04/09/21 512,289Houghton Mifflin Harcourt Publishing Co.299,239 4.000 05/31/21 275,488McGraw-Hill Global Education Holdings LLC498,744 5.000 05/04/22 493,662
2,826,495Metals & Mining �� 0.4%
Fairmount Santrol, Inc.1,144,464 4.647 09/05/19 1,124,436FMG Resources (August 2006) Pty Ltd.272,502 4.647 06/30/19 274,274
1,398,710Bank Loans(i) �� (continued)Packaging �� 0.7%
Klockner-Pentaplast of America, Inc.696,858 4.397 04/28/20 702,085297,803 4.397 04/28/20 300,036Reynolds Group Holdings, Inc.1,246,875 3.993 02/05/23 1,253,035
2,255,156
Copyright © 2017 www.secdatabase.com. All Rights Reserved.Please Consider the Environment Before Printing This Document
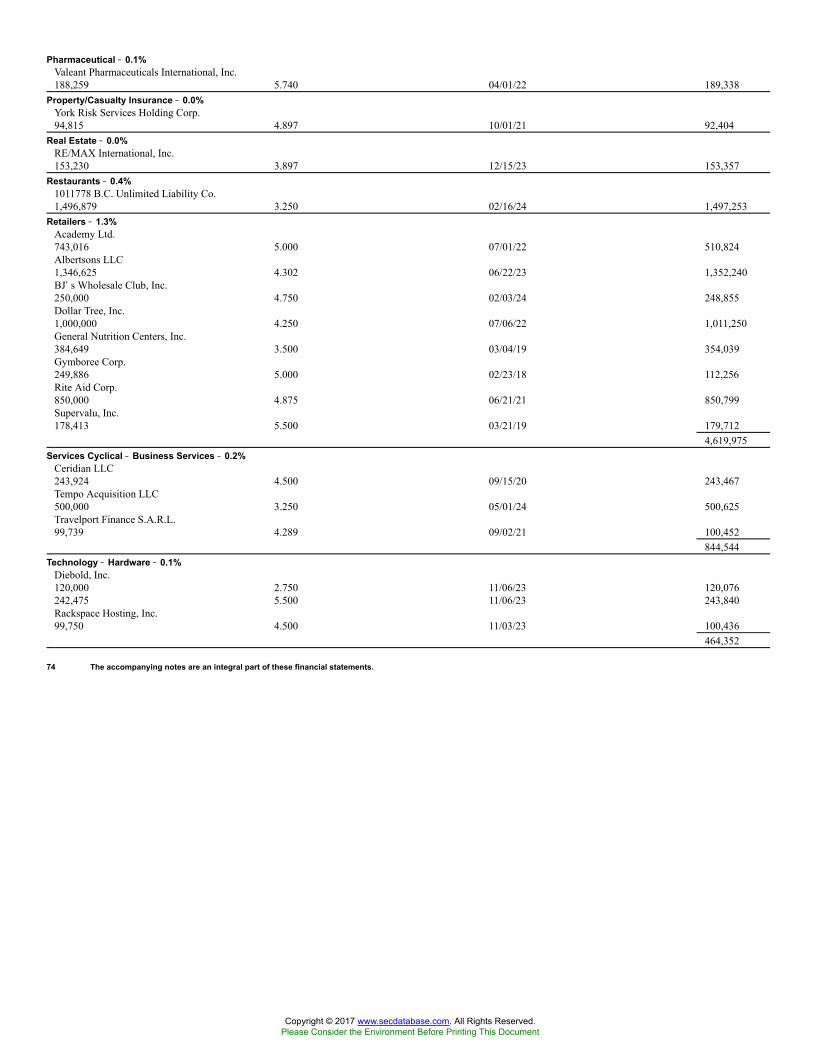
Pharmaceutical �� 0.1%Valeant Pharmaceuticals International, Inc.188,259 5.740 04/01/22 189,338
Property/Casualty Insurance �� 0.0%York Risk Services Holding Corp.94,815 4.897 10/01/21 92,404
Real Estate �� 0.0%RE/MAX International, Inc.153,230 3.897 12/15/23 153,357
Restaurants �� 0.4%1011778 B.C. Unlimited Liability Co.1,496,879 3.250 02/16/24 1,497,253
Retailers �� 1.3%Academy Ltd.743,016 5.000 07/01/22 510,824Albertsons LLC1,346,625 4.302 06/22/23 1,352,240BJ�s Wholesale Club, Inc.250,000 4.750 02/03/24 248,855Dollar Tree, Inc.1,000,000 4.250 07/06/22 1,011,250General Nutrition Centers, Inc.384,649 3.500 03/04/19 354,039Gymboree Corp.249,886 5.000 02/23/18 112,256Rite Aid Corp.850,000 4.875 06/21/21 850,799Supervalu, Inc.178,413 5.500 03/21/19 179,712
4,619,975Services Cyclical �� Business Services �� 0.2%
Ceridian LLC243,924 4.500 09/15/20 243,467Tempo Acquisition LLC500,000 3.250 05/01/24 500,625Travelport Finance S.A.R.L.99,739 4.289 09/02/21 100,452
844,544Technology �� Hardware �� 0.1%
Diebold, Inc.120,000 2.750 11/06/23 120,076242,475 5.500 11/06/23 243,840Rackspace Hosting, Inc.99,750 4.500 11/03/23 100,436
464,352
74 The accompanying notes are an integral part of these financial statements.
Copyright © 2017 www.secdatabase.com. All Rights Reserved.Please Consider the Environment Before Printing This Document

GOLDMAN SACHS MULTI-MANAGER NON-CORE FIXED INCOME FUND
PrincipalAmount
InterestRate
MaturityDate Value
Bank Loans(i) �� (continued)Technology �� Software/Services �� 1.9%
BMC Software Finance, Inc.$ 585,608 5.000 % 09/13/22 $ 588,717
Compuware Corp.493,750 5.250 12/15/21 495,602Conduent, Inc.428,261 4.986 12/07/23 435,400Dell, Inc.243,750 3.250 09/07/21 243,994GTT Communications, Inc.298,003 5.000 01/09/24 300,798Infoblox, Inc.240,000 5.993 11/01/23 242,251Infor (US), Inc.500,000 3.897 02/01/22 498,830Informatica Corp.490,007 4.647 08/05/22 487,822Kronos, Inc.847,875 5.034 11/01/23 850,419Misys Europe SA562,532 8.250 04/27/25 575,657MModal, Inc.400,000 9.000 01/31/20 384,000Optiv Security, Inc.236,559 4.250 02/01/24 236,164195,556 8.250 02/01/25 198,244Syniverse Holdings, Inc.321,469 4.147 04/23/19 294,948694,558 4.172 04/23/19 634,868
6,467,714Telecommunications �� Internet & Data �� 0.7%
Asurion LLC98,021 4.243 07/08/20 98,6541,225,000 8.500 03/03/21 1,242,860Avaya, Inc.803,526 5.390 10/26/17 669,9403,182 8.500 01/24/18 3,264484,710 6.282 05/29/20 404,127
2,418,845Telecommunications �� Satellites �� 0.6%
Intelsat Jackson Holdings SA2,220,777 3.750 06/30/19 2,189,731
Transportation �� 0.2%CEVA Group PLC54,585 6.500 03/19/21 46,124CEVA Intercompany B.V.55,836 6.500 03/19/21 48,896Ceva Logistics Canada ULC9,627 6.500 03/19/21 8,430Ceva Logistics US Holdings, Inc.77,015 6.672 03/19/21 67,443Syncreon Group Holdings B.V.677,279 5.250 10/28/20 611,671Uber Technologies15,301 5.000 07/13/23 15,253
797,817Bank Loans(i) �� (continued)Utilities �� 0.3%
TEX Operations Co. LLC185,714 3.500 08/04/23 185,308812,250 3.500 08/04/23 810,471
995,779Wireless Telecommunications �� 0.3%
Sprint Communications, Inc.1,000,000 3.500 02/02/24 1,000,630
Copyright © 2017 www.secdatabase.com. All Rights Reserved.Please Consider the Environment Before Printing This Document

TOTAL BANK LOANS(Cost $58,656,384) $ 58,308,450
Shares Description ValueCommon Stocks �� 0.3%Electric Utilities �� 0.1%
24,355 Te Holdcorp LLC/Te Holdcorp $ 243,552Oil, Gas & Consumable Fuels(f) �� 0.2%
17,633 Linn Energy, Inc. 494,25327,119 Midstates Petroleum Co., Inc. 503,329637 Peabody Energy Corp. 16,186
1,013,768TOTAL COMMON STOCKS(Cost $1,268,814) $ 1,257,320
Shares Rate ValuePreferred Stocks �� 0.0%Electric Utilities �� 0.0%
Te Holdcorp LLC/Te Holdcorp$ 16,329 0.000% $ 118,388Post Secondary Education �� 0.0%
Peabody Energy Corp.211 0.000 10,761TOTAL PREFERRED STOCKS �� %(Cost $283,772) $ 129,149
Units DescriptionExpiration
Date ValueWarrants(f) �� 0.0%Life Sciences Tools & Services �� 0.0%Lion Holdings, Inc. Series A270 04/29/24 $�Lion Holdings, Inc. Series B430 04/29/24 �
�
Oil, Gas & Consumable Fuels �� 0.0%Midstates Petroleum Co., Inc.1,204 04/21/20 �Peabody Energy Corp.1 07/03/17 25
The accompanying notes are an integral part of these financial statements. 75
Copyright © 2017 www.secdatabase.com. All Rights Reserved.Please Consider the Environment Before Printing This Document

GOLDMAN SACHS MULTI-MANAGER NON-CORE FIXED INCOME FUND
Schedule of Investments (continued)April 30, 2017 (Unaudited)
Units DescriptionExpiration
Date ValueWarrants(i) �� (continued)Oil, Gas & Consumable Fuels �� (continued)
Peabody Energy Corp.28 07/03/17 $ 712
737TOTAL WARRANTS(Cost $5,197) $ 737
Shares Description ValueExchange Traded Fund �� 0.9%iShares iBoxx $ High Yield Corporate Bond ETF35,000 $ 3,084,200TOTAL INVESTMENTS BEFORE SHORT-TERMINVESTMENT(Cost $311,039,647) $ 316,321,353
PrincipalAmount
InterestRate
MaturityDate Value
Short-term Investment(j) �� 10.3%Repurchase Agreements �� 10.3%
Joint Repurchase Agreement Account II$ 35,900,000 0.821 % 05/01/17 $ 35,900,000
(Cost $35,900,000)TOTAL INVESTMENTS �� 100.7%(Cost $346,939,647) $ 352,221,353
LIABILITIES IN EXCESS OFOTHER ASSETS �� (0.7)% (2,498,449 )
NET ASSETS �� 100.0% $ 349,722,904
The percentage shown for each investment category reflects the value of investments in that category as a percentage of net assets.(a) Issued with a zero coupon. Income is recognized through the accretion of discount.(b) Exempt from registration under Rule 144A of the Securities Act of 1933. Under procedures approved by the Board of Trustees, such securities have been determined to
be liquid by an Underlying Manager and may be resold, normally to qualified institutional buyers in transactions exempt from registration. Total market value of Rule144A securities amounts to $84,897,140, which represents approximately 24.3% of net assets as of April 30, 2017.
(c) Variable rate security. Interest rate or distribution rate disclosed is that which is in effect on April 30, 2017.(d) Coupon changes periodically based upon a predetermined schedule. Interest rate disclosed is that which is in effect on April 30, 2017.(e) Security with �Call� features with resetting interest rates. Maturity dates disclosed are the final maturity dates.(f) Security is currently in default and/or non-income producing.(g) Pay-in-kind securities.(h) Guaranteed by a foreign government until maturity.(i) Bank Loans often require prepayments from excess cash flows or permit the borrower to repay at its election. The degree to which borrowers repay, whether as a
contractual requirement or at their election, cannot be predicted with accuracy. As a result, the actual remaining maturity may be substantially less than the statedmaturities shown. The stated interest rate represents the weighted average interest rate of all contracts within the bank loan facility on April 30, 2017. Bank Loanstypically have rates of interest which are predetermined either daily, monthly, quarterly or semi-annually by reference to a base lending rate, plus a premium. These baselending rates are primarily the London-Interbank Offered Rate (�LIBOR�), and secondarily the prime rate offered by one or more major United States banks (the �PrimeRate�) and the certificate of deposit (�CD�) rate or other base lending rates used by commercial lenders.
(j) Joint repurchase agreement was entered into on April 28, 2017. Additional information appears on page 85.
Currency Abbreviations:ARS �Argentine PesoBRL �Brazilian RealCLP �Chilean PesoCNY �Chinese Yuan RenminbiCOP �Colombian PesoCZK �Czech KorunaEUR �EuroGHS �Ghana CediHUF �Hungarian ForintIDR �Indonesian RupiahINR �Indian RupeeKRW �South Korean WonMXN �Mexican PesoMYR �Malaysian RinggitPEN �Peruvian Nuevo SolPHP �Philippine PesoPLN �Polish ZlotyRON �New Romanian Leu
Copyright © 2017 www.secdatabase.com. All Rights Reserved.Please Consider the Environment Before Printing This Document

RUB �Russian RubleTHB �Thai BahtTRY �Turkish LiraTWD �Taiwan DollarUSD �U.S. DollarUYU �Uruguayan PesoZAR �South African RandInvestment Abbreviations:ETF �Exchange Traded FundKWCDC �South Korean Won Certificate of DepositLLC �Limited Liability CompanyLP �Limited PartnershipMIBOR �Mumbai Interbank Offered RatePLC �Public Limited CompanyTIIE �La Tasa de Interbank Equilibrium Interest Rate
76 The accompanying notes are an integral part of these financial statements.
Copyright © 2017 www.secdatabase.com. All Rights Reserved.Please Consider the Environment Before Printing This Document

GOLDMAN SACHS MULTI-MANAGER NON-CORE FIXED INCOME FUND
ADDITIONAL INVESTMENT INFORMATION
FORWARD FOREIGN CURRENCY EXCHANGE CONTRACTS � At April 30, 2017, the Fund had the following forward foreign currencyexchange contracts:
FORWARD FOREIGN CURRENCY EXCHANGE CONTRACTS WITH UNREALIZED GAIN
CounterpartyCurrency
PurchasedCurrency
SoldCurrentValue
SettlementDate
UnrealizedGain
Citibank NA (London) BRL 3,981,158 USD 1,242,991 $ 1,243,504 06/02/17 $513CLP 27,782,377 USD 41,388 41,574 05/24/17 186COP 512,216,525 USD 170,693 173,387 05/24/17 2,694EUR 106,000 USD 112,687 115,696 06/08/17 3,009HUF 61,180,710 USD 209,913 212,967 05/24/17 3,054IDR 13,322,948,484 USD 996,000 997,141 05/24/17 1,141MXN 1,504,849 USD 79,000 79,583 05/24/17 583PEN 1,468,810 USD 446,135 451,377 05/24/17 5,242PHP 4,229,214 USD 83,565 84,094 05/24/17 529PLN 4,454,995 EUR 1,042,812 1,148,075 05/24/17 10,714PLN 4,789,760 USD 1,181,067 1,234,345 05/24/17 53,278RON 1,294,572 USD 303,472 310,833 05/24/17 7,360RUB 6,768,833 USD 117,399 118,230 05/24/17 831THB 44,876,767 USD 1,272,553 1,297,170 05/24/17 24,617TRY 7,229,678 USD 1,944,269 2,021,073 05/24/17 76,804TWD 41,931,400 USD 1,376,301 1,389,236 05/24/17 12,936USD 1,308,467 BRL 4,152,754 1,307,312 05/03/17 1,154USD 31,000 COP 89,265,120 30,217 05/24/17 783USD 1,098,000 KRW 1,226,136,600 1,078,015 05/24/17 19,985USD 1,001,481 MXN 18,738,151 990,959 05/24/17 10,522USD 41,000 PLN 159,072 40,994 05/24/17 6USD 763,726 RUB 43,315,102 756,574 05/24/17 7,152USD 207,000 TRY 740,336 206,962 05/24/17 38USD 2,949,460 ZAR 38,250,938 2,849,365 05/24/17 100,096ZAR 2,550,566 USD 183,515 189,995 05/24/17 6,480
TOTAL $349,707
FORWARD FOREIGN CURRENCY EXCHANGE CONTRACTS WITH UNREALIZED LOSS
CounterpartyCurrency
PurchasedCurrency
SoldCurrentValue
SettlementDate
UnrealizedLoss
Citibank NA (London) BRL 4,152,754 USD 1,323,621 $1,307,313 05/03/17 $(16,308 )CLP 158,018,000 USD 238,000 236,463 05/24/17 (1,537 )CZK 5,756,400 USD 234,000 233,897 05/24/17 (103 )EUR 1,027,827 PLN 4,454,995 1,121,017 05/24/17 (27,057 )IDR 3,882,300,821 USD 291,898 290,566 05/24/17 (1,332 )KRW 1,933,786,823 USD 1,710,000 1,700,179 05/24/17 (9,821 )MXN 3,308,296 USD 176,356 174,958 05/24/17 (1,398 )USD 1,663,616 EUR 1,559,000 1,701,602 06/08/17 (37,985 )USD 179,000 HUF 51,736,851 180,093 05/24/17 (1,093 )USD 1,897,890 IDR 25,511,001,987 1,909,341 05/24/17 (11,451 )USD 3,742 INR 247,292 3,836 05/24/17 (94 )USD 1,662,983 KRW 1,901,787,570 1,672,045 05/24/17 (9,062 )USD 1,090,781 MXN 21,465,871 1,135,212 05/24/17 (44,431 )USD 26,366 MXN 500,000 26,381 06/08/17 (15 )USD 139,561 MYR 623,000 143,671 05/24/17 (4,110 )USD 25,000 PEN 81,578 25,070 05/24/17 (70 )USD 240,000 PLN 952,856 245,556 05/24/17 (5,556 )
The accompanying notes are an integral part of these financial statements. 77
Copyright © 2017 www.secdatabase.com. All Rights Reserved.Please Consider the Environment Before Printing This Document

GOLDMAN SACHS MULTI-MANAGER NON-CORE FIXED INCOME FUND
Schedule of Investments (continued)April 30, 2017 (Unaudited)
ADDITIONAL INVESTMENT INFORMATION (continued)
FORWARD FOREIGN CURRENCY EXCHANGE CONTRACTS WITH UNREALIZED LOSS (continued)
CounterpartyCurrency
PurchasedCurrency
SoldCurrentValue
SettlementDate
UnrealizedLoss
USD 34,000 RON 144,669 $34,736 05/24/17 $(736 )USD 1,943,299 RUB 116,569,344 2,036,088 05/24/17 (92,789 )USD 107,000 THB 3,703,481 107,050 05/24/17 (50 )USD 1,273,056 TRY 4,717,107 1,318,677 05/24/17 (45,621 )USD 1,365,399 TWD 41,931,400 1,389,236 05/24/17 (23,837 )USD 67,000 ZAR 932,495 69,463 05/24/17 (2,463 )ZAR 12,571,356 USD 982,980 936,457 05/24/17 (46,523 )
TOTAL $(383,442)
FUTURES CONTRACTS � At April 30, 2017, the Fund had the following futures contracts:
Type
Number ofContracts
Long (Short)Expiration
DateCurrentValue
UnrealizedGain (Loss)
10 Year German Euro-Bund (7 ) June 2017 $(1,233,589) $ (5,509 )10 Year U.S. Treasury Notes (47 ) June 2017 (5,908,781) (62,769 )TOTAL $(68,278 )
SWAP CONTRACTS � At April 30, 2017, the Fund had the following swap contracts:
OVER THE COUNTER INTEREST RATE SWAP CONTRACTS
Counterparty
NotionalAmount(000s)
TerminationDate
PaymentsReceived
PaymentsMade
UnrealizedGain (Loss)*
BNP Paribas SA KRW 1,895,700 01/31/22 3 month KWCDC 1.735% $ (2,075 )HSBC Bank PLC CNY 4,318 12/12/21 3 month KWCDC 3.520 11,337
INR 87,930 02/24/22 6.700 % 12 Month MIBOR 2,205KRW 1,700,000 04/03/22 3 month KWCDC 1.725 (865 )
TOTAL $ 10,602
* There are no upfront payments on the swap contract(s), therefore the unrealized gain (loss) on the swap contract(s) is equal to their market value.
CENTRALLY CLEARED INTEREST RATE SWAP CONTRACTS
Rates ExchangedNotionalAmount(000s)
TerminationDate
PaymentsReceived
PaymentsMade
UnrealizedGain (Loss)*
MXN 59,039 02/22/19 7.160 %Mexico Interbank
TIIE 28 Days $ (3,056 )
BRL 3,517 01/04/21 11.780
1 month BrazilianInterbank Deposit
Average 45,273TOTAL $ 42,217
* There are no upfront payments on the swap contract(s), therefore the unrealized gain (loss) on the swap contract(s) is equal to their market value.
78 The accompanying notes are an integral part of these financial statements.
Copyright © 2017 www.secdatabase.com. All Rights Reserved.Please Consider the Environment Before Printing This Document

GOLDMAN SACHS MULTI-MANAGER NON-CORE FIXED INCOME FUND
ADDITIONAL INVESTMENT INFORMATION (continued)
OVER THE COUNTER CREDIT DEFAULT SWAP CONTRACTS
Market Value
Swap CounterpartyReferencedObligation
NotionalAmount(000s)
Rates (Paid)Receivedby Fund
TerminationDate
CreditSpread atApril 30,2017(a)
UpfrontPayments
Made (received)UnrealizedGain (Loss)
Protection Purchased:
BNP Paribas SARepublic of Argentina,
7.625%, 04/22/46 $ 165 (5.000)% 06/20/22 3.253 % $ (7,859 ) $ (6,445 )(a) Credit spread on the Referenced Obligation, together with the term of the swap contract, are indicators of payment/performance risk. The likelihood of a credit event occurring which
would require a fund or its counterparty to make a payment or otherwise be required to perform under the swap contract is generally greater as the credit spread and the term of the swapcontract increase.
The accompanying notes are an integral part of these financial statements. 79
Copyright © 2017 www.secdatabase.com. All Rights Reserved.Please Consider the Environment Before Printing This Document
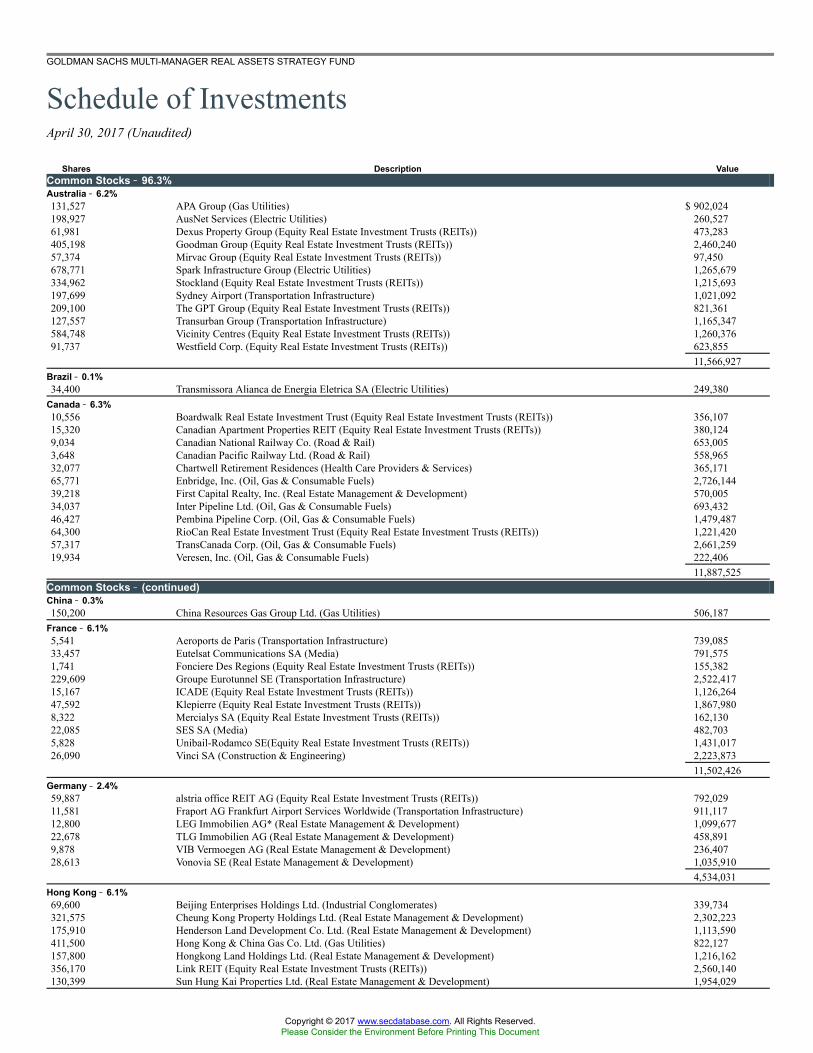
GOLDMAN SACHS MULTI-MANAGER REAL ASSETS STRATEGY FUND
Schedule of InvestmentsApril 30, 2017 (Unaudited)
Shares Description ValueCommon Stocks �� 96.3%Australia �� 6.2%131,527 APA Group (Gas Utilities) $ 902,024198,927 AusNet Services (Electric Utilities) 260,52761,981 Dexus Property Group (Equity Real Estate Investment Trusts (REITs)) 473,283405,198 Goodman Group (Equity Real Estate Investment Trusts (REITs)) 2,460,24057,374 Mirvac Group (Equity Real Estate Investment Trusts (REITs)) 97,450678,771 Spark Infrastructure Group (Electric Utilities) 1,265,679334,962 Stockland (Equity Real Estate Investment Trusts (REITs)) 1,215,693197,699 Sydney Airport (Transportation Infrastructure) 1,021,092209,100 The GPT Group (Equity Real Estate Investment Trusts (REITs)) 821,361127,557 Transurban Group (Transportation Infrastructure) 1,165,347584,748 Vicinity Centres (Equity Real Estate Investment Trusts (REITs)) 1,260,37691,737 Westfield Corp. (Equity Real Estate Investment Trusts (REITs)) 623,855
11,566,927Brazil �� 0.1%34,400 Transmissora Alianca de Energia Eletrica SA (Electric Utilities) 249,380
Canada �� 6.3%10,556 Boardwalk Real Estate Investment Trust (Equity Real Estate Investment Trusts (REITs)) 356,10715,320 Canadian Apartment Properties REIT (Equity Real Estate Investment Trusts (REITs)) 380,1249,034 Canadian National Railway Co. (Road & Rail) 653,0053,648 Canadian Pacific Railway Ltd. (Road & Rail) 558,96532,077 Chartwell Retirement Residences (Health Care Providers & Services) 365,17165,771 Enbridge, Inc. (Oil, Gas & Consumable Fuels) 2,726,14439,218 First Capital Realty, Inc. (Real Estate Management & Development) 570,00534,037 Inter Pipeline Ltd. (Oil, Gas & Consumable Fuels) 693,43246,427 Pembina Pipeline Corp. (Oil, Gas & Consumable Fuels) 1,479,48764,300 RioCan Real Estate Investment Trust (Equity Real Estate Investment Trusts (REITs)) 1,221,42057,317 TransCanada Corp. (Oil, Gas & Consumable Fuels) 2,661,25919,934 Veresen, Inc. (Oil, Gas & Consumable Fuels) 222,406
11,887,525Common Stocks �� (continued)China �� 0.3%150,200 China Resources Gas Group Ltd. (Gas Utilities) 506,187
France �� 6.1%5,541 Aeroports de Paris (Transportation Infrastructure) 739,08533,457 Eutelsat Communications SA (Media) 791,5751,741 Fonciere Des Regions (Equity Real Estate Investment Trusts (REITs)) 155,382229,609 Groupe Eurotunnel SE (Transportation Infrastructure) 2,522,41715,167 ICADE (Equity Real Estate Investment Trusts (REITs)) 1,126,26447,592 Klepierre (Equity Real Estate Investment Trusts (REITs)) 1,867,9808,322 Mercialys SA (Equity Real Estate Investment Trusts (REITs)) 162,13022,085 SES SA (Media) 482,7035,828 Unibail-Rodamco SE(Equity Real Estate Investment Trusts (REITs)) 1,431,01726,090 Vinci SA (Construction & Engineering) 2,223,873
11,502,426Germany �� 2.4%59,887 alstria office REIT AG (Equity Real Estate Investment Trusts (REITs)) 792,02911,581 Fraport AG Frankfurt Airport Services Worldwide (Transportation Infrastructure) 911,11712,800 LEG Immobilien AG* (Real Estate Management & Development) 1,099,67722,678 TLG Immobilien AG (Real Estate Management & Development) 458,8919,878 VIB Vermoegen AG (Real Estate Management & Development) 236,40728,613 Vonovia SE (Real Estate Management & Development) 1,035,910
4,534,031Hong Kong �� 6.1%69,600 Beijing Enterprises Holdings Ltd. (Industrial Conglomerates) 339,734321,575 Cheung Kong Property Holdings Ltd. (Real Estate Management & Development) 2,302,223175,910 Henderson Land Development Co. Ltd. (Real Estate Management & Development) 1,113,590411,500 Hong Kong & China Gas Co. Ltd. (Gas Utilities) 822,127157,800 Hongkong Land Holdings Ltd. (Real Estate Management & Development) 1,216,162356,170 Link REIT (Equity Real Estate Investment Trusts (REITs)) 2,560,140130,399 Sun Hung Kai Properties Ltd. (Real Estate Management & Development) 1,954,029
Copyright © 2017 www.secdatabase.com. All Rights Reserved.Please Consider the Environment Before Printing This Document

80 The accompanying notes are an integral part of these financial statements.
Copyright © 2017 www.secdatabase.com. All Rights Reserved.Please Consider the Environment Before Printing This Document

GOLDMAN SACHS MULTI-MANAGER REAL ASSETS STRATEGY FUND
Shares Description ValueCommon Stocks �� (continued)Hong Kong �� (continued)30,955 Swire Properties Ltd. (Real Estate Management & Development) $ 103,778128,649 The Wharf Holdings Ltd. (Real Estate Management & Development) 1,096,865
11,508,648Ireland �� 0.5%217,497 Green REIT PLC (Equity Real Estate Investment Trusts (REITs)) 323,395271,785 Hibernia REIT PLC (Equity Real Estate Investment Trusts (REITs)) 377,471143,325 Irish Residential Properties REIT PLC (Equity Real Estate Investment Trusts (REITs)) 204,522
905,388Italy �� 1.1%59,898 Atlantia SpA (Transportation Infrastructure) 1,518,962135,731 Snam SpA (Oil, Gas & Consumable Fuels) 599,669
2,118,631Japan �� 7.2%17 Activia Properties, Inc. (Equity Real Estate Investment Trusts (REITs)) 80,9783,270 Central Japan Railway Co. (Road & Rail) 548,4079,500 East Japan Railway Co. (Road & Rail) 852,55514,600 Electric Power Development Co. Ltd. (Independent Power and Renewable Electricity Producers) 338,69450,135 Hulic Co. Ltd. (Real Estate Management & Development) 472,8115,700 Japan Airport Terminal Co. Ltd. (Transportation Infrastructure) 197,99570 Japan Real Estate Investment Corp. (Equity Real Estate Investment Trusts (REITs)) 368,610392 Japan Retail Fund Investment Corp. (Equity Real Estate Investment Trusts (REITs)) 765,799106 Kenedix Office Investment Corp. (Equity Real Estate Investment Trusts (REITs)) 600,585264 Kenedix Retail REIT Corp. (Equity Real Estate Investment Trusts (REITs)) 575,0451,030 LaSalle Logiport REIT (Equity Real Estate Investment Trusts (REITs)) 978,370110,314 Mitsubishi Estate Co. Ltd. (Real Estate Management & Development) 2,112,27094,409 Mitsui Fudosan Co. Ltd. (Real Estate Management & Development) 2,077,211562 Mori Hills REIT Investment Corp. (Equity Real Estate Investment Trusts (REITs)) 730,008
Shares Description ValueCommon Stocks �� (continued)Japan �� (continued)27 Nippon Building Fund, Inc. (Equity Real Estate Investment Trusts (REITs)) $ 143,628407 Orix JREIT, Inc. (Equity Real Estate Investment Trusts (REITs)) 645,42242,570 Sumitomo Realty & Development Co. Ltd. (Real Estate Management & Development) 1,150,052177,950 Tokyo Gas Co. Ltd. (Gas Utilities) 826,204
13,464,644Luxembourg(a) �� 0.2%10,729 Ado Properties SA (Real Estate Management & Development) 392,767
Mexico �� 0.7%203,689 Infraestructura Energetica Nova SAB de CV (Gas Utilities) 951,510366,700 OHL Mexico SAB de CV (Transportation Infrastructure) 450,358
1,401,868Netherlands �� 0.7%6,060 Eurocommercial Properties NV (Equity Real Estate Investment Trusts (REITs)) 235,4965,243 Koninklijke Vopak NV (Oil, Gas & Consumable Fuels) 236,60716,700 Wereldhave NV (Equity Real Estate Investment Trusts (REITs)) 768,965
1,241,068Singapore �� 1.6%105,737 ENN Energy Holdings Ltd. (Gas Utilities) 573,188879,000 Frasers Logistics & Industrial Trust (Equity Real Estate Investment Trusts (REITs)) 635,008392,000 Global Logistic Properties Ltd. (Real Estate Management & Development) 807,592572,540 Keppel REIT (Equity Real Estate Investment Trusts (REITs)) 434,379482,097 Suntec Real Estate Investment Trust (Equity Real Estate Investment Trusts (REITs)) 610,504
3,060,671Spain �� 2.2%25,648 Axiare Patrimonio SOCIMI SA (Equity Real Estate Investment Trusts (REITs)) 425,78185,773 EDP Renovaveis SA (Independent Power and Renewable Electricity Producers) 653,64483,197 Ferrovial SA (Construction & Engineering) 1,769,814106,455 Iberdrola SA (Electric Utilities) 765,27923,451 Red Electrica Corp. SA (Electric Utilities) 457,039
4,071,557
The accompanying notes are an integral part of these financial statements. 81
Copyright © 2017 www.secdatabase.com. All Rights Reserved.Please Consider the Environment Before Printing This Document

GOLDMAN SACHS MULTI-MANAGER REAL ASSETS STRATEGY FUND
Schedule of Investments (continued)April 30, 2017 (Unaudited)
Shares Description ValueCommon Stocks �� (continued)Sweden �� 0.5%11,469 Atrium Ljungberg AB (Real Estate Management & Development) $ 189,69811,036 Fabege AB (Real Estate Management & Development) 190,04012,820 Hufvudstaden AB Class A (Real Estate Management & Development) 200,85737,397 Kungsleden AB (Real Estate Management & Development) 209,3769,879 Pandox AB (Hotels, Restaurants & Leisure) 165,853
955,824Switzerland �� 0.4%1,638 Flughafen Zuerich AG (Transportation Infrastructure) 360,9783,742 PSP Swiss Property AG (Real Estate Management & Development) 335,490
696,468United Arab Emirates �� 0.2%14,322 DP World Ltd. (Transportation Infrastructure) 292,742
United Kingdom �� 6.7%28,651 Big Yellow Group PLC (Equity Real Estate Investment Trusts (REITs)) 287,2223,450 Derwent London PLC (Equity Real Estate Investment Trusts (REITs)) 131,513204,069 Empiric Student Property PLC (Equity Real Estate Investment Trusts (REITs)) 289,420122,100 Great Portland Estates PLC (Equity Real Estate Investment Trusts (REITs)) 1,094,02941,697 Hammerson PLC (Equity Real Estate Investment Trusts (REITs)) 317,24629,544 Kennedy Wilson Europe Real Estate PLC (Real Estate Investment Trusts) 397,577111,493 Land Securities Group PLC (Equity Real Estate Investment Trusts (REITs)) 1,596,765259,587 National Grid PLC (Multi-Utilities) 3,361,197116,975 Pennon Group PLC (Water Utilities) 1,297,73536,113 Segro PLC (Equity Real Estate Investment Trusts (REITs)) 227,14927,273 Severn Trent PLC (Water Utilities) 820,99732,446 Shaftesbury PLC (Equity Real Estate Investment Trusts (REITs)) 391,59033,406 The British Land Co. PLC (Equity Real Estate Investment Trusts (REITs)) 284,056141,849 Tritax Big Box REIT PLC(Equity Real Estate Investment Trusts (REITs)) 236,389144,356 United Utilities Group PLC (Water Utilities) 1,819,206
12,552,091Common Stocks �� (continued)United States �� 46.8%7,378 Alexandria Real Estate Equities, Inc. (Equity Real Estate Investment Trusts (REITs)) 830,09929,307 American Campus Communities, Inc. (Equity Real Estate Investment Trusts (REITs)) 1,388,8593,612 American Electric Power Co., Inc. (Electric Utilities) 245,00231,788 American Tower Corp. (Equity Real Estate Investment Trusts (REITs)) 4,003,38135,600 Apartment Investment & Management Co. Class A (Equity Real Estate Investment Trusts (REITs)) 1,557,1443,723 Boston Properties, Inc. (Equity Real Estate Investment Trusts (REITs)) 471,33216,144 Camden Property Trust (Equity Real Estate Investment Trusts (REITs)) 1,329,13634,420 Cheniere Energy, Inc.* (Oil, Gas & Consumable Fuels) 1,560,9474,452 Chesapeake Lodging Trust (Equity Real Estate Investment Trusts (REITs)) 103,77628,725 Columbia Property Trust, Inc. (Equity Real Estate Investment Trusts (REITs)) 646,31220,325 Community Healthcare Trust, Inc. (Equity Real Estate Investment Trusts (REITs)) 502,43410,880 Consolidated Edison, Inc. (Multi-Utilities) 862,56633,095 Crown Castle International Corp. (Equity Real Estate Investment Trusts (REITs)) 3,130,78715,276 CSX Corp. (Road & Rail) 776,632104,326 CubeSmart (Equity Real Estate Investment Trusts (REITs)) 2,643,62154,159 DDR Corp. (Equity Real Estate Investment Trusts (REITs)) 585,45982,524 DiamondRock Hospitality Co. (Equity Real Estate Investment Trusts (REITs)) 908,58916,263 Digital Realty Trust, Inc. (Equity Real Estate Investment Trusts (REITs)) 1,867,64334,170 Duke Realty Corp. (Equity Real Estate Investment Trusts (REITs)) 947,53422,688 Edison International (Electric Utilities) 1,814,35919,288 Enbridge Energy Management LLC* (Oil, Gas & Consumable Fuels) 357,9859,809 Equity LifeStyle Properties, Inc. (Equity Real Estate Investment Trusts (REITs)) 793,64627,588 Equity Residential (Equity Real Estate Investment Trusts (REITs)) 1,781,63310,997 Essex Property Trust, Inc. (Equity Real Estate Investment Trusts (REITs)) 2,688,43723,269 Eversource Energy (Electric Utilities) 1,382,17911,004 Extra Space Storage, Inc. (Equity Real Estate Investment Trusts (REITs)) 831,132
82 The accompanying notes are an integral part of these financial statements.
Copyright © 2017 www.secdatabase.com. All Rights Reserved.Please Consider the Environment Before Printing This Document

GOLDMAN SACHS MULTI-MANAGER REAL ASSETS STRATEGY FUND
Shares Description ValueCommon Stocks �� (continued)United States �� (continued)18,425 Federal Realty Investment Trust (Equity Real Estate Investment Trusts (REITs)) $ 2,411,64819,272 First Industrial Realty Trust, Inc. (Equity Real Estate Investment Trusts (REITs)) 542,31474,775 First Potomac Realty Trust (Equity Real Estate Investment Trusts (REITs)) 822,52542,687 Forest City Realty Trust, Inc. Class A (Equity Real Estate Investment Trusts (REITs)) 964,72621,660 Four Corners Property Trust, Inc. (Equity Real Estate Investment Trusts (REITs)) 505,328138,133 GGP, Inc. (Equity Real Estate Investment Trusts (REITs)) 2,985,05411,287 Gramercy Property Trust (Equity Real Estate Investment Trusts (REITs)) 313,66635,500 Healthcare Trust of America, Inc. Class A (Equity Real Estate Investment Trusts (REITs)) 1,132,09588,717 Hudson Pacific Properties, Inc. (Equity Real Estate Investment Trusts (REITs)) 3,048,316534 Invitation Homes, Inc.* (Equity Real Estate Investment Trusts (REITs)) 11,508152,033 Kinder Morgan, Inc. (Oil, Gas & Consumable Fuels) 3,136,44129,100 Kite Realty Group Trust (Equity Real Estate Investment Trusts (REITs)) 592,47644,190 MedEquities Realty Trust, Inc. (Equity Real Estate Investment Trusts (REITs)) 522,32633,020 Medical Properties Trust, Inc. (Equity Real Estate Investment Trusts (REITs)) 431,57122,509 MGM Growth Properties LLC Class A (Equity Real Estate Investment Trusts (REITs)) 644,2085,297 Mid-America Apartment Communities, Inc. (Equity Real Estate Investment Trusts (REITs)) 525,51558,931 Monogram Residential Trust, Inc. (Equity Real Estate Investment Trusts (REITs)) 599,9188,011 National Retail Properties, Inc. (Equity Real Estate Investment Trusts (REITs)) 338,2246,801 NextEra Energy, Inc. (Electric Utilities) 908,34214,273 NiSource, Inc. (Multi-Utilities) 346,1203,556 Norfolk Southern Corp. (Road & Rail) 417,79413,115 OMEGA Healthcare Investors, Inc. (Equity Real Estate Investment Trusts (REITs)) 432,795111,300 Paramount Group, Inc. (Equity Real Estate Investment Trusts (REITs)) 1,825,32027,424 Park Hotels & Resorts, Inc. (Equity Real Estate Investment Trusts (REITs)) 703,9744,480 Pattern Energy Group, Inc. (Independent Power and Renewable Electricity Producers) 98,650
Common Stocks �� (continued)United States �� (continued)32,477 PG&E Corp. (Electric Utilities) 2,177,58331,291 Physicians Realty Trust (Equity Real Estate Investment Trusts (REITs)) 614,55569,448 Prologis, Inc. (Equity Real Estate Investment Trusts (REITs)) 3,778,6662,246 Public Storage (Equity Real Estate Investment Trusts (REITs)) 470,2675,448 QTS Realty Trust, Inc. Class A (Equity Real Estate Investment Trusts (REITs)) 291,14170,137 Retail Properties of America, Inc. Class A (Equity Real Estate Investment Trusts (REITs)) 935,62828,623 Rexford Industrial Realty, Inc. (Equity Real Estate Investment Trusts (REITs)) 713,85814,200 Ryman Hospitality Properties, Inc. (Equity Real Estate Investment Trusts (REITs)) 905,6763,871 SBA Communications Corp.* (Equity Real Estate Investment Trusts (REITs)) 489,64327,650 Sempra Energy (Multi-Utilities) 3,125,00310,597 Simon Property Group, Inc. (Equity Real Estate Investment Trusts (REITs)) 1,751,26010,318 SL Green Realty Corp. (Equity Real Estate Investment Trusts (REITs)) 1,082,668244,239 Spirit Realty Capital, Inc. (Equity Real Estate Investment Trusts (REITs)) 2,300,73124,453 STAG Industrial, Inc. (Equity Real Estate Investment Trusts (REITs)) 644,5815,594 Sun Communities, Inc. (Equity Real Estate Investment Trusts (REITs)) 467,71470,510 Sunstone Hotel Investors, Inc. (Equity Real Estate Investment Trusts (REITs)) 1,049,89414,141 Taubman Centers, Inc. (Equity Real Estate Investment Trusts (REITs)) 884,52015,168 The Macerich Co. (Equity Real Estate Investment Trusts (REITs)) 946,93838,213 The Williams Cos., Inc. (Oil, Gas & Consumable Fuels) 1,170,46410,491 Union Pacific Corp. (Road & Rail) 1,174,57224,259 Ventas, Inc. (Equity Real Estate Investment Trusts (REITs)) 1,552,8196,314 Vornado Realty Trust (Equity Real Estate Investment Trusts (REITs)) 607,65931,707 Welltower, Inc. (Equity Real Estate Investment Trusts (REITs)) 2,265,148
87,672,466TOTAL COMMON STOCKS(Cost $164,977,154) $ 180,581,309
The accompanying notes are an integral part of these financial statements. 83
Copyright © 2017 www.secdatabase.com. All Rights Reserved.Please Consider the Environment Before Printing This Document

GOLDMAN SACHS MULTI-MANAGER REAL ASSETS STRATEGY FUND
Schedule of Investments (continued)April 30, 2017 (Unaudited)
PrincipalAmount
InterestRate
MaturityDate Value
Short-term Investment(b) �� 3.5%Joint Repurchase Agreement Account II$6,500,000 0.821% 05/01/17 $ 6,500,000(Cost $6,500,000)TOTAL INVESTMENTS �� 99.8%(Cost $171,477,154) $ 187,081,309OTHER ASSETS IN EXCESS OF
LIABILITIES �� 0.2% 399,852NET ASSETS �� 100.0% $ 187,481,161
The percentage shown for each investment category reflects the value of investments in that category as a percentage of net assets.* Non-income producing security.(a) Securities are exempt from registration under Rule 144A of the Securities Act of 1933. Under procedures approved by the Board of Trustees, such securities have been determined
to be liquid by an Underlying Manager and may be resold, normally to qualified institutional buyers in transactions exempt from registration. Total market value of Rule 144Asecurities amounts to $392,767, which represents approximately 0.2% of net assets as of April 30, 2017.
(b) Joint repurchase agreement was entered into on April 28, 2017. Additional information appears on page 85.
84 The accompanying notes are an integral part of these financial statements.
Copyright © 2017 www.secdatabase.com. All Rights Reserved.Please Consider the Environment Before Printing This Document

GOLDMAN SACHS STRATEGIC MULTI-ASSET CLASS FUNDS
ADDITIONAL INVESTMENT INFORMATION
JOINT REPURCHASE AGREEMENT ACCOUNT II � At April 30, 2017, the Funds had undivided interests in the Joint Repurchase AgreementAccount II, with a maturity date of May 1, 2017, as follows:
FundPrincipalAmount
MaturityValue
CollateralAllocation
ValueMulti-Manager Global Equity $23,100,000 $23,100,527 $23,562,000Multi-Manager Non-Core Fixed Income 35,900,000 35,900,819 36,618,000Multi-Manager Real Assets Strategy 6,500,000 6,500,148 6,630,000
REPURCHASE AGREEMENTS � At April 30, 2017, the Principal Amounts of the Fund�s interest in the Joint Repurchase Agreement AccountII were as follows:
CounterpartyInterest
RateMulti-ManagerGlobal Equity
Multi-ManagerNon-Core
Fixed Income
Multi-ManagerReal Assets
StrategyCitigroup Global Markets, Inc. 0.830 % $3,155,020 $4,903,256 $887,776Merrill Lynch & Co., Inc. 0.820 19,944,980 30,996,744 5,612,224TOTAL $23,100,000 $35,900,000 $6,500,000
At April 30, 2017, the Joint Repurchase Agreement Account II was fully collateralized by:
Issuer Interest Rates Maturity DatesFederal Home Loan Mortgage Corp. 1.000% to 6.000% 06/29/17 to 04/01/47Federal National Mortgage Association 1.000 to 6.000 10/01/33 to 04/01/47Government National Mortgage Association 3.500 to 4.500 03/15/45 to 04/20/47United States Treasury Notes 0.000 to 7.625 11/09/17 to 01/31/20
The accompanying notes are an integral part of these financial statements. 85
Copyright © 2017 www.secdatabase.com. All Rights Reserved.Please Consider the Environment Before Printing This Document

GOLDMAN SACHS MULTI-MANAGER GLOBAL EQUITY FUND
Statements of Assets and LiabilitiesApril 30, 2017 (Unaudited)
Multi-ManagerGlobal Equity
Fund
Multi-ManagerNon-Core Fixed
Income Fund
Multi-ManagerReal Assets
Strategy FundAssets:Investments, at value (cost $339,585,921, $311,039,647 and $164,977,154, respectively) $390,385,028 $316,321,353 $180,581,309Repurchase agreement, at value which equals cost 23,100,000 35,900,000 6,500,000Cash 385,391 868,920 236,789Foreign currencies, at value (cost $1,078,961, $465,753 and $349,842, respectively) 1,082,438 466,816 349,926Unrealized gain on forward foreign currency exchange contracts 334,958 349,707 �
Variation margin on certain derivative contracts � 249,185 �
Unrealized gain on swap contracts � 13,542 �Receivables:
Investments sold 1,165,012 2,745,997 1,424,247Dividends and interest 770,464 4,607,658 259,602Foreign tax reclaims 327,588 30,727 80,079Reimbursement from investment adviser 28,915 37,217 25,982Investments sold on an extended-settlement basis � 2,917,372 14,703Collateral on certain derivative contracts(a) � 162,996 �
Other assets 60,903 31,066 29,402Total assets 417,640,697 364,702,556 189,502,039
Liabilities:Unrealized loss on forward foreign currency exchange contracts 2,574,656 383,442 �
Unrealized loss on swap contracts � 9,385 �Payables:
Investments purchased 1,868,468 3,700,898 1,266,588Management fees 176,154 151,170 97,698Transfer agency fees 6,672 5,703 3,083Investments purchased on an extended-settlement basis � 10,380,851 409,299Upfront payments received on swap contracts � 7,859 �
Accrued expenses and other liabilities 506,566 340,344 244,210Total liabilities 5,132,516 14,979,652 2,020,878
Net Assets:Paid-in capital 365,369,263 350,170,572 177,681,933Distributions in excess of net investment income (4,209,568 ) (3,347,777 ) (2,160,337 )Accumulated net realized gain (loss) 2,818,303 (2,303,775 ) (3,642,183 )Net unrealized gain 48,530,183 5,203,884 15,601,748NET ASSETS $412,508,181 $349,722,904 $187,481,161Shares Outstanding $0.001 par value (unlimited number of shares authorized): 39,474,145 36,479,107 19,942,753Net asset value, offering and redemption price per share: 10.45 9.59 9.40
(a) Includes amounts segregated for initial margin and/or collateral on futures transactions, swaps transactions and forwards transactions of $94,533, $58,685 and $10,000, respectively forMulti-Manager Non-Core Fixed Income Fund.
86 The accompanying notes are an integral part of these financial statements.
Copyright © 2017 www.secdatabase.com. All Rights Reserved.Please Consider the Environment Before Printing This Document

GOLDMAN SACHS MULTI-MANAGER GLOBAL EQUITY FUND
Statements of OperationsFor the Six Months Ended April 30, 2017 (Unaudited)
Multi-ManagerGlobal Equity
Fund
Multi-ManagerNon-Core Fixed
Income Fund
Multi-ManagerReal Assets
Strategy FundInvestment income:Dividends (net of foreign withholding taxes of $303,592, $0 and $211,569, respectively) $4,524,140 $ 40,174 $3,708,356Interest 56,162 8,637,461 23,013Total investment income 4,580,302 8,677,635 3,731,369
Expenses:Management fees 2,699,032 1,308,379 1,267,055Custody, accounting and administrative services 550,223 231,199 143,899Professional fees 120,050 124,857 138,558Transfer Agency fees 52,408 30,785 25,341Trustee fees 41,889 32,725 32,833Registration fees 27,980 20,790 17,658Printing and mailing costs 22,405 15,903 15,743Other 37,059 27,611 25,246Total expenses 3,551,046 1,792,249 1,666,333Less � expense reductions (1,323,690 ) (713,654 ) (525,984 )Net expenses 2,227,356 1,078,595 1,140,349NET INVESTMENT INCOME 2,352,946 7,599,040 2,591,020
Realized and unrealized gain (loss):Net realized gain (loss) from:
Investments 11,866,079 (244,809 ) 1,660,916Futures contracts � 57,713 �
Swap contracts � 49,346 �Forward foreign currency exchange contracts 9,850,469 (421,774 ) (50,055 )Foreign currency transactions 81,889 (187,705 ) (231,550 )
Net change in unrealized gain (loss) on:Investments 43,091,416 708,927 4,580,729Futures contracts � (100,304 ) �
Swap contracts � 63,111 �
Forward foreign currency exchange contracts (7,758,489 ) 90,596 �Foreign currency translation 31,029 58,490 4,931
Net realized and unrealized gain 57,162,393 73,591 5,964,971NET INCREASE IN NET ASSETS RESULTING FROM OPERATIONS $59,515,339 $ 7,672,631 $8,555,991
The accompanying notes are an integral part of these financial statements. 87
Copyright © 2017 www.secdatabase.com. All Rights Reserved.Please Consider the Environment Before Printing This Document

GOLDMAN SACHS MULTI-MANAGER GLOBAL EQUITY FUND
Statements of Changes in Net AssetsMulti-Manager Global Equity Fund
For theSix Months Ended
April 30, 2017(Unaudited)
For the FiscalYear Ended
October 31, 2016From operations:Net investment income $2,352,946 $7,388,769Net realized gain (loss) 21,798,437 (21,442,581 )Net change in unrealized gain 35,363,956 26,567,034Net increase (decrease) in net assets resulting from operations 59,515,339 12,513,222
Distributions to shareholders:From net investment income (9,419,142 ) (2,625,036 )From return of capital � �
Total distributions to shareholders (9,419,142 ) (2,625,036 )
From share transactions:Proceeds from sales of shares 5 232,750,015Reinvestment of distributions 9,419,142 2,625,036Cost of shares redeemed (252,060,005 ) (79,364,935 )Net increase (decrease) in net assets resulting from share transactions (242,640,858 ) 156,010,116TOTAL INCREASE (DECREASE) (192,544,661 ) 165,898,302
Net assets:Beginning of period 605,052,842 439,154,540End of period $412,508,181 $605,052,842Undistributed (distributions in excess of) net investment income $(4,209,568 ) $2,856,628
88 The accompanying notes are an integral part of these financial statements.
Copyright © 2017 www.secdatabase.com. All Rights Reserved.Please Consider the Environment Before Printing This Document

GOLDMAN SACHS MULTI-MANAGER GLOBAL EQUITY FUND
Multi-Manager Non-Core Fixed Income Fund Multi-Manager Real Assets Strategy FundFor the
Six Months EndedApril 30, 2017(Unaudited)
For the FiscalYear Ended
October 31, 2016
For theSix Months Ended
April 30, 2017(Unaudited)
For the FiscalYear Ended
October 31, 2016
$ 7,599,040 $14,275,226 $2,591,020 $5,815,358(747,229 ) (3,006,712 ) 1,379,311 (15,092,556 )820,820 10,647,166 4,585,660 7,563,3417,672,631 21,915,680 8,555,991 (1,713,857 )
(7,600,713 ) (13,242,128 ) (4,652,751 ) (6,496,622 )� (938,032 ) � �
(7,600,713 ) (14,180,160 ) (4,652,751 ) (6,496,622 )
53,850,015 21,565,005 1,100,000 117,600,0157,575,122 14,180,160 4,652,751 6,496,622(15,820,015 ) (10,121,966 ) (130,550,000 ) (4,940,015 )45,605,122 25,623,199 (124,797,249 ) 119,156,62245,677,040 33,358,719 (120,894,009 ) 110,946,143
304,045,864 270,687,145 308,375,170 197,429,027$ 349,722,904 $304,045,864 $187,481,161 $308,375,170$ (3,347,777 ) $(3,346,104 ) $(2,160,337 ) $(98,606 )
The accompanying notes are an integral part of these financial statements. 89
Copyright © 2017 www.secdatabase.com. All Rights Reserved.Please Consider the Environment Before Printing This Document

GOLDMAN SACHS MULTI-MANAGER GLOBAL EQUITY FUND
Financial HighlightsSelected Data for a Share Outstanding Throughout Each Period
Income FromInvestment Operations
Year - Share Class
Net assetvalue,
beginningof period
Netinvestmentincome(a)
Net realizedand unrealized
gain (loss)
Total frominvestmentoperations
Distributionsto shareholders
from netinvestment
incomeFOR THE SIX MONTHS ENDED APRIL 30, (UNAUDITED)2017 - Institutional $ 9.49 $ 0.04 $ 1.07 $ 1.11 $ (0.15 )
FOR THE FISCAL YEAR ENDED OCTOBER 31,2016 - Institutional 9.46 0.11 (0.04 ) 0.07 (0.04 )
FOR THE PERIOD ENDED OCTOBER 31,2015 - Institutional (Commenced June 24, 2015) 10.00 0.02 (0.56 ) (0.54 ) �
(a) Calculated based on the average shares outstanding methodology.(b) Assumes investment at the NAV at the beginning of the period, reinvestment of all dividends and distributions, a complete redemption of the investment at the NAV at the end of the
period and no sales or redemption charges. Total returns would be reduced if a sales or redemption charge was taken into account. Returns do not reflect the impact of taxes toshareholder relating to Fund distributions or the redemption of Fund shares. Total returns for periods less than one full year are not annualized.
(c) The Fund�s portfolio turnover rate is calculated in accordance with regulatory requirements, without regard to transactions involving short term investments and certain derivatives. Ifsuch transactions were included, the Fund�s portfolio turnover rate may be higher.
(d) Annualized.
90 The accompanying notes are an integral part of these financial statements.
Copyright © 2017 www.secdatabase.com. All Rights Reserved.Please Consider the Environment Before Printing This Document

GOLDMAN SACHS MULTI-MANAGER GLOBAL EQUITY FUND
Net assetvalue, endof period
Totalreturn(b)
Netassets,end ofperiod
(in 000s)
Ratio ofnet expenses
to averagenet assets
Ratio oftotal expenses
to averagenet assets
Ratio ofnet investment
incometo averagenet assets
Portfolioturnover
rate(c)
$ 10.45 11.88 % $412,508 0.85 %(d) 1.35 %(d) 0.90 %(d) 45 %
9.49 0.74 605,053 0.85 1.31 1.19 47
9.46 (5.40 ) 439,155 0.85 (d) 1.34 (d) 0.74 (d) 10
The accompanying notes are an integral part of these financial statements. 91
Copyright © 2017 www.secdatabase.com. All Rights Reserved.Please Consider the Environment Before Printing This Document

GOLDMAN SACHS MULTI-MANAGER NON-CORE FIXED INCOME FUND
Financial HighlightsSelected Data for a Share Outstanding Throughout Each Period
Income (loss) frominvestment operations
Distributionsto shareholders
Year - Share Class
Net assetvalue,
beginningof period
Netinvestmentincome(a)
Net realizedand unrealized
gain (loss)
Total frominvestmentoperations
From netinvestment
incomeFrom
capitalTotal
distributionsFOR THE SIX MONTHS ENDED APRIL 30, (UNAUDITED)2017 - Institutional $ 9.60 $ 0.23 $ (0.01 ) $ 0.22 $ (0.23 ) $� $ (0.23 )
FOR THE FISCAL YEAR ENDED OCTOBER 31,2016 - Institutional 9.37 0.46 0.23 0.69 (0.43 ) (0.03) (0.46 )
FOR THE PERIOD ENDED OCTOBER 31,2015 - Institutional (Commenced March 31, 2015) 10.00 0.25 (0.63 ) (0.38 ) (0.24 ) (0.01) (0.25 )
(a) Calculated based on the average shares outstanding methodology.(b) Assumes investment at the NAV at the beginning of the period, reinvestment of all dividends and distributions, a complete redemption of the investment at the NAV at the end of the
period and no sales or redemption charges. Total returns would be reduced if a sales or redemption charge was taken into account. Returns do not reflect the impact of taxes toshareholder relating to Fund distributions or the redemption of Fund shares. Total returns for periods less than one full year are not annualized.
(c) The Fund�s portfolio turnover rate is calculated in accordance with regulatory requirements, without regard to transactions involving short term investments and certain derivatives. Ifsuch transactions were included, the Fund�s portfolio turnover rate may be higher.
(d) Annualized.
92 The accompanying notes are an integral part of these financial statements.
Copyright © 2017 www.secdatabase.com. All Rights Reserved.Please Consider the Environment Before Printing This Document

GOLDMAN SACHS MULTI-MANAGER NON-CORE FIXED INCOME FUND
Net assetvalue, endof period
Totalreturn(b)
Net assets,end ofperiod
(in 000s)
Ratio ofnet expenses
to averagenet assets
Ratio oftotal expenses
to averagenet assets
Ratio ofnet investment
incometo averagenet assets
Portfolioturnover
rate(c)
$ 9.59 2.37 % $349,723 0.70 %(d) 1.17 %(d) 4.94 %(d) 87 %
9.60 7.54 304,046 0.70 1.20 4.91 96
9.37 (3.84 ) 270,687 0.70 (d) 1.19 (d) 4.45 (d) 82
The accompanying notes are an integral part of these financial statements. 93
Copyright © 2017 www.secdatabase.com. All Rights Reserved.Please Consider the Environment Before Printing This Document

GOLDMAN SACHS MULTI-MANAGER REAL ASSETS STRATEGY FUND
Financial HighlightsSelected Data for a Share Outstanding Throughout Each Period
FromInvestment Operations
Net assetvalue,
beginningof period)
Netinvestmentincome(a)
Net realizedand unrealized
gain (loss)
Total frominvestmentoperations
Distributionto Shareholders
from netinvestment
incomeFOR THE SIX MONTHS ENDED APRIL 30, (UNAUDITED)2017 - Institutional $ 9.17 $ 0.09 $ 0.29 $ 0.38 $ (0.15 )
FOR THE FISCAL YEAR ENDED OCTOBER 31,2016 - Institutional 9.57 0.18 (0.38 ) (0.20 ) (0.20 )
FOR THE PERIOD ENDED OCTOBER 31,2015 - Institutional (Commenced June 30, 2015) 10.00 0.02 (0.45 ) (0.43 ) �
(a) Calculated based on the average shares outstanding methodology.(b) Assumes investment at the NAV at the beginning of the period, reinvestment of all dividends and distributions, a complete redemption of the investment at the NAV at the end of the
period and no sales or redemption charges. Total returns would be reduced if a sales or redemption charge was taken into account. Returns do not reflect the impact of taxes toshareholders relating to Fund distributions or the redemption of Fund shares. Total returns for periods less than one full year are not annualized.
(c) The Fund�s portfolio turnover rate is calculated in accordance with regulatory requirements, without regard to transactions involving short term investments and certain derivatives. Ifsuch transactions were included, the Fund�s portfolio turnover rate may be higher.
(d) Annualized.
94 The accompanying notes are an integral part of these financial statements.
Copyright © 2017 www.secdatabase.com. All Rights Reserved.Please Consider the Environment Before Printing This Document

GOLDMAN SACHS MULTI-MANAGER REAL ASSETS STRATEGY FUND
Net assetvalue, endof period
Totalreturn(b)
Netassets,end ofperiod
(in 000s)
Ratio ofnet expenses
to averagenet assets
Ratio oftotal expenses
to averagenet assets
Ratio ofnet investment
incometo averagenet assets
Portfolioturnover
rate(c)
$ 9.40 4.22 % $187,481 0.90 %(d) 1.31 %(d) 2.04 %(d) 77 %
9.17 (2.14 ) 308,375 0.87 1.33 1.96 93
9.57 (4.30 ) 197,429 0.90 (d) 1.42 (d) 0.67 (d) 35
The accompanying notes are an integral part of these financial statements. 95
Copyright © 2017 www.secdatabase.com. All Rights Reserved.Please Consider the Environment Before Printing This Document

GOLDMAN SACHS STRATEGIC MULTI-ASSET CLASS FUNDS
Notes to Financial StatementsApril 30, 2017 (Unaudited)
1. ORGANIZATION
Goldman Sachs Trust II (the �Trust�) is a Delaware statutory trust registered under the Investment Company Act of 1940, as amended (the �Act�), asan open-end management investment company. The following table lists those series of the Trust that are included in this report (collectively, the�Funds� or individually a �Fund�), along with their corresponding share classes and respective diversification status under the Act:
Fund Share Classes OfferedDiversified/
Non-diversifiedMulti-Manager Global Equity Fund Institutional DiversifiedMulti-Manager Non-Core Fixed Income Fund Institutional Non-diversifiedMutli-Manager Real Assets Strategy Fund Institutional Diversified
Goldman Sachs Asset Management, L.P. (�GSAM�), an affiliate of Goldman, Sachs & Co. (�Goldman Sachs�), serves as investment adviser tothe Fund pursuant to a management agreement (the �Agreement�) with the Trust. As of April 30, 2017, GSAM had sub-advisory agreements (the�Sub-Advisory Agreements�) for the Multi-Manager Global Equity Fund with Causeway Capital Management LLC, Epoch Investment Partners, Inc.,Fisher Asset Management, LLC, GW&K Investment Management, LLC, Legal & General Investment Management America, Inc., ParametricPortfolio Associates LLC, Principal Global Investors, LLC, Boston Partners Global Investors, Inc., Russell Investments Implementation Services, LLC,Scharf Investments, LLC, Vulcan Value Partners, LLC and WCM Investment Management; for the Multi-Manager Non- Core Fixed Income Fund withAres Capital Management II LLC, BlueBay Asset Management LLP, Lazard Asset Management LLC and Symphony Asset Management LLC; and forthe Multi-Manager Real Assets Strategy Fund with PGIM Real Estate, a business unit of PGIM, Inc., Presima Inc., RARE Infrastructure (NorthAmerica) Pty Limited and RREEF America L.L.C. (the �Underlying Managers�). Pursuant to the terms of the Sub-Advisory Agreements, theUnderlying Managers are responsible for making investment decisions and managing the investments of the Fund. GSAM compensates the UnderlyingManagers directly in accordance with the terms of the Sub-Advisory Agreements. The Funds are not charged any separate or additional investmentadvisory fees by the Underlying Managers.
2. SIGNIFICANT ACCOUNTING POLICIESThe financial statements have been prepared in accordance with accounting principles generally accepted in the United States of America (�GAAP�)and require management to make estimates and assumptions that may affect the reported amounts and disclosures. Actual results may differ from thoseestimates and assumptions.A. Investment Valuation � The Funds� valuation policy is to value investments at fair value.
B. Investment Income and Investments � Investment income includes interest income, dividend income, net of any foreign withholding taxes, lessany amounts reclaimable, and securities lending income. Interest income is accrued daily and adjusted for amortization of premiums and accretion ofdiscounts. Dividend income is recognized on ex-dividend date or, for certain foreign securities, as soon as such information is obtained subsequent tothe ex-dividend date. Investment transactions are reflected on trade date. Realized gains and losses are calculated using identified cost. Investmenttransactions are recorded on the following business day for daily net asset value (�NAV�) calculations. Any foreign capital gains tax is accrued dailybased upon net unrealized gains, and is payable upon sale of such investments. Distributions received from the Funds� investments in U.S. real estateinvestment trusts (�REITs�) may be characterized as ordinary income, net capital gain or a return of capital. A return of capital is recorded by theFunds as a reduction to the cost basis of the REIT.
For derivative contracts, realized gains and losses are recorded upon settlement of the contract. Upfront payments, if any, are made or receivedupon entering into a swap agreement and are reflected in the Statements of Assets and Liabilities. Upfront payments are recognized over the contract�sterm/event as realized gains or losses, with the exception of forward starting interest rate swaps whose realized gains or losses are recognized from theeffective start date.
C. Expenses � Expenses incurred directly by a Fund are charged to the Fund, and certain expenses incurred by the Trust are allocated across theapplicable Funds on a straight-line and/or pro-rata basis, depending upon the nature of the expenses, and are accrued daily.
96
Copyright © 2017 www.secdatabase.com. All Rights Reserved.Please Consider the Environment Before Printing This Document

GOLDMAN SACHS STRATEGIC MULTI-ASSET CLASS FUNDS
2. SIGNIFICANT ACCOUNTING POLICIES (continued)
D. Federal Taxes and Distributions to Shareholders � It is each Fund�s policy to comply with the requirements of the Internal Revenue Code of1986, as amended (the �Code�), applicable to regulated investment companies (mutual funds) and to distribute each year substantially all of itsinvestment company taxable income and capital gains to its shareholders. Accordingly, the Funds are not required to make any provisions for thepayment of federal income tax. Distributions to shareholders are recorded on the ex-dividend date. Income and capital gains distributions, if any, aredeclared and paid according to the following schedule:
FundIncome Distributions
Declared/PaidCapital Gains Distributions
Declared/PaidMulti-Manager Global Equity Annually AnnuallyMulti-Manager Non-Core Fixed Income Daily/Monthly AnnuallyMulti-Manager Real Assets Strategy Quarterly Annually
Net capital losses, if any, are carried forward to future fiscal years and may be used to the extent allowed by the Code to offset any future capitalgains. Losses that are carried forward will retain their character as either short-term or long-term capital losses. Utilization of capital loss carryforwardswill reduce the requirement of future capital gains distributions.
The characterization of distributions to shareholders for financial reporting purposes is determined in accordance with federal income tax rules,which may differ from GAAP. The source of each Fund�s distributions may be shown in the accompanying financial statements as either from netinvestment income, net realized gain or capital. Certain components of the Funds� net assets on the Statements of Assets and Liabilities reflectpermanent GAAP/tax differences based on the appropriate tax character.
E. Foreign Currency Translation � The accounting records and reporting currency of the Funds are maintained in U.S. dollars. Assets and liabilitiesdenominated in foreign currencies are translated into U.S. dollars using the current exchange rates at the close of each business day. The effect ofchanges in foreign currency exchange rates on investments is included within net realized and unrealized gain (loss) on investments. Changes in thevalue of other assets and liabilities as a result of fluctuations in foreign exchange rates are included in the Statements of Operations within net changein unrealized gain (loss) on foreign currency translations. Transactions denominated in foreign currencies are translated into U.S. dollars on the date thetransaction occurred, the effects of which are included within net realized gain (loss) on foreign currency transactions.
3. INVESTMENTS AND FAIR VALUE MEASUREMENTSThe fair value of a financial instrument is the amount that would be received to sell an asset or paid to transfer a liability in an orderly transactionbetween market participants at the measurement date (i.e., the exit price). GAAP establishes a fair value hierarchy that prioritizes the inputs tovaluation techniques used to measure fair value. The hierarchy gives the highest priority to unadjusted quoted prices in active markets for identicalassets or liabilities (Level 1 measurements) and the lowest priority to unobservable inputs (Level 3 measurements). The levels used for classifyinginvestments are not necessarily an indication of the risk associated with investing in these investments. The three levels of the fair value hierarchy aredescribed below:
Level 1 � Unadjusted quoted prices in active markets that are accessible at the measurement date for identical, unrestricted assets or liabilities;Level 2 � Quoted prices in markets that are not active or financial instruments for which significant inputs are observable (including, but notlimited to, quoted prices for similar investments, interest rates, foreign exchange rates, volatility and credit spreads), either directly or indirectly;Level 3 � Prices or valuations that require significant unobservable inputs (including GSAM�s assumptions in determining fair valuemeasurement).
Changes in valuation techniques may result in transfers into or out of an assigned level within the hierarchy. In accordance with the Funds� policy,transfers between different levels of the fair value hierarchy resulting from such changes are deemed to have occurred as of the beginning of thereporting period.
97
Copyright © 2017 www.secdatabase.com. All Rights Reserved.Please Consider the Environment Before Printing This Document

GOLDMAN SACHS STRATEGIC MULTI-ASSET CLASS FUNDS
Notes to Financial Statements (continued)April 30, 2017 (Unaudited)
3. INVESTMENTS AND FAIR VALUE MEASUREMENTS (continued)
The Board of Trustees (�Trustees�) has approved Valuation Procedures that govern the valuation of the portfolio investments held by the Funds,including investments for which market quotations are not readily available. The Trustees have delegated to GSAM day-to-day responsibility forimplementing and maintaining internal controls and procedures related to the valuation of the Funds� portfolio investments. To assess the continuingappropriateness of pricing sources and methodologies, GSAM regularly performs price verification procedures and issues challenges as necessary tothird party pricing vendors or brokers, and any differences are reviewed in accordance with the Valuation Procedures.
A. Level 1 and Level 2 Fair Value Investments � The valuation techniques and significant inputs used in determining the fair values forinvestments classified as Level 1 and Level 2 are as follows:
Equity Securities � Equity securities traded on a United States (�U.S.�) securities exchange or the NASDAQ system, or those located on certainforeign exchanges, including but not limited to the Americas, are valued daily at their last sale price or official closing price on the principal exchangeor system on which they are traded. If there is no sale or official closing price or such price is believed by GSAM to not represent fair value, equitysecurities are valued at the last bid price for long positions and at the last ask price for short positions. To the extent these investments are activelytraded, they are classified as Level 1 of the fair value hierarchy, otherwise they are generally classified as Level 2.
Unlisted equity securities for which market quotations are available are valued at the last sale price on the valuation date, or if no sale occurs, atthe last bid price. Securities traded on certain foreign securities exchanges are valued daily at fair value determined by an independent fair value service(if available) under Valuation Procedures approved by the Trustees and consistent with applicable regulatory guidance. The independent fair valueservice takes into account multiple factors including, but not limited to, movements in the securities markets, certain depositary receipts, futurescontracts and foreign currency exchange rates that have occurred subsequent to the close of the foreign securities exchange. These investments aregenerally classified as Level 2 of the fair value hierarchy.
Debt Securities � Debt securities for which market quotations are readily available are valued daily on the basis of quotations supplied by dealers oran independent pricing service approved by the Trustees. The pricing services may use valuation models or matrix pricing, which consider: (i) yield orprice with respect to bonds that are considered comparable in characteristics such as rating, interest rate and maturity date or (ii) quotations fromsecurities dealers to determine current value. Short-term debt obligations that mature in sixty days or less and that do not exhibit signs of creditdeterioration are valued using available market quotations as provided by a third party pricing vendor or broker. With the exception of treasurysecurities of G8 countries, which are generally classified as Level 1, these investments are generally classified as Level 2 of the fair value hierarchy.
i. Bank Loans � Bank loans (�Loans�) are interests in amounts owed by corporate, governmental, or other borrowers to lenders or lendingsyndicates. Loans are arranged through private negotiations between the borrower and one or more financial institutions (�Lenders�). A Fund�sinvestments in Loans are in the form of either participations in Loans (�Participations�) or assignments of all or a portion of Loans from thirdparties (�Assignments�). With respect to Participations, a Fund has the right to receive payments of principal, interest and any fees to which it isentitled from the Lender selling the Participations and only upon receipt by the Lender of the payments from the borrower. A Fund generally hasno right to enforce compliance by the borrower with the terms of the loan agreement with respect to Participations. Conversely, assignments resultin a Fund having a direct contractual relationship with the borrower, and the Fund may be permitted to enforce compliance by the borrower withthe terms of the loan agreement.
Derivative Contracts � A derivative is an instrument whose value is derived from underlying assets, indices, reference rates or a combination of thesefactors. A Fund enters into derivative transactions to hedge against changes in interest rates, securities prices, and/or currency exchange rates, toincrease total return, or to gain access to certain markets or attain exposure to other underliers.
Exchange-traded derivatives, including futures and options contracts, are valued at the last sale or settlement price and typically fall within Level 1of the fair value hierarchy. Over-the-counter (�OTC�) and centrally cleared derivatives are valued using market transactions and other market evidence,including market-based inputs to models, calibration to market-clearing transactions, broker or dealer quotations, or other alternative pricing sources.Where models are used, the selection of a particular model to value OTC and centrally cleared derivatives depends upon the contractual terms of, andspecific risks inherent in, the
98
Copyright © 2017 www.secdatabase.com. All Rights Reserved.Please Consider the Environment Before Printing This Document

GOLDMAN SACHS STRATEGIC MULTI-ASSET CLASS FUNDS
3. INVESTMENTS AND FAIR VALUE MEASUREMENTS (continued)
instrument, as well as the availability of pricing information in the market. Valuation models require a variety of inputs, including contractual terms,market prices, yield curves, credit curves, measures of volatility, voluntary and involuntary prepayment rates, loss severity rates and correlations ofsuch inputs. For OTC and centrally cleared derivatives that trade in liquid markets, model inputs can generally be verified and model selection does notinvolve significant management judgment. OTC and centrally cleared derivatives are classified within Level 2 of the fair value hierarchy whensignificant inputs are corroborated by market evidence.
i. Forward Contracts � A forward contract is a contract between two parties to buy or sell an asset at a specified price on a future date. Aforward contract settlement can occur on a cash or delivery basis. Forward contracts are marked-to-market daily using independent vendor prices,and the change in value, if any, is recorded as an unrealized gain or loss. Cash and certain investments may be used to collateralize forwardcontracts.
A forward foreign currency contract is a forward contract in which a Fund agrees to receive or deliver a fixed quantity of one currency foranother, at a pre-determined price at a future date. All forward foreign currency exchange contracts are marked-to-market daily at the applicableforward rate. Non-deliverable forward foreign currency exchange contracts are settled with the counterparty in cash without the delivery of foreigncurrency.
ii. Futures Contracts � Futures contracts are contracts to buy or sell a standardized quantity of a specified commodity or security and are valuedbased on exchanged settlement prices or independent market quotes. Futures contracts are valued at the last settlement price, or in the absence of asale, the last bid price for long positions and at the last ask price for short positions, at the end of each day on the board of trade or exchange uponwhich they are traded. Upon entering into a futures contract, a Fund deposits cash or securities in an account on behalf of the broker in an amountsufficient to meet the initial margin requirement. Subsequent payments are made or received by a Fund equal to the daily change in the contractvalue and are recorded as variation margin receivable or payable with a corresponding offset to unrealized gains or losses.
iii. Options � When a Fund writes call or put options, an amount equal to the premium received is recorded as a liability and is subsequentlymarked-to-market to reflect the current value of the option written. Swaptions are options on interest rate swap contracts.
Upon the purchase of a call option or a put option by a Fund, the premium paid is recorded as an investment and subsequently marked-to-market to reflect the current value of the option. Certain options may be purchased with premiums to be determined on a future date. Thepremiums for these options are based upon implied volatility parameters at specified terms.
iv. Swap Contracts � Bilateral swap contracts are agreements in which a Fund and a counterparty agree to exchange periodic payments on aspecified notional amount or make a net payment upon termination. Bilateral swap transactions are privately negotiated in the OTC market andpayments are settled through direct payments between a Fund and the counterparty. By contrast, certain swap transactions are subject to mandatorycentral clearing. These swaps are executed through a derivatives clearing member (�DCM�), acting in an agency capacity, and submitted to acentral counterparty (�CCP�) (�centrally cleared swaps�), in which case all payments are settled with the CCP through the DCM. Swaps aremarked-to-market daily using pricing vendor quotations, counterparty or clearinghouse prices or model prices, and the change in value, if any, isrecorded as an unrealized gain or loss. Upon entering into a swap contract, a Fund is required to satisfy an initial margin requirement by deliveringcash or securities to the counterparty (or in some cases, segregated in a triparty account on behalf of the counterparty), which can be adjusted byany mark-to-market gains or losses pursuant to bilateral or centrally cleared arrangements. For centrally cleared swaps the daily change invaluation, if any, is recorded as a receivable or payable for variation margin.
An interest rate swap is an agreement that obligates two parties to exchange a series of cash flows at specified intervals, based upon orcalculated by reference to changes in interest rates on a specified notional principal amount. The payment flows are usually netted against eachother, with the difference being paid by one party to the other.
A credit default swap is an agreement that involves one party (the buyer of protection) making a stream of payments to another party (theseller of protection) in exchange for the right to receive protection on a reference security or obligation, including a group of assets or exposure tothe performance of an index. A Fund�s investment in credit default swaps may involve greater risks than if the Fund had invested in the referencedobligation directly. Credit events are contract specific but
99
Copyright © 2017 www.secdatabase.com. All Rights Reserved.Please Consider the Environment Before Printing This Document

GOLDMAN SACHS STRATEGIC MULTI-ASSET CLASS FUNDS
Notes to Financial Statements (continued)April 30, 2017 (Unaudited)
3. INVESTMENTS AND FAIR VALUE MEASUREMENTS (continued)
may include bankruptcy, failure to pay, restructuring and obligation acceleration. If a Fund buys protection through a credit default swap and nocredit event occurs, its payments are limited to the periodic payments previously made to the counterparty. Upon the occurrence of a specifiedcredit event, a Fund, as a buyer of credit protection, is entitled to receive an amount equal to the notional amount of the swap and deliver to theseller the defaulted reference obligation in a physically settled trade. A Fund may also receive a net settlement amount in the form of cash orsecurities equal to the notional amount of the swap reduced by the recovery value of the reference obligation in a cash settled trade.
As a seller of protection, a Fund generally receives a payment stream throughout the term of the swap, provided that there is no credit event.In addition, if a Fund sells protection through a credit default swap, a Fund could suffer a loss because the value of the referenced obligation andthe premium payments received may be less than the notional amount of the swap paid to the buyer of protection. Upon the occurrence of aspecified credit event, a Fund, as a seller of credit protection, may be required to take possession of the defaulted reference obligation and pay thebuyer an amount equal to the notional amount of the swap in a physically settled trade. A Fund may also pay a net settlement amount in the formof cash or securities equal to the notional amount of the swap reduced by the recovery value of the reference obligation in a cash settled trade.Recovery values are at times established through the credit event auction process in which market participants are ensured that a transparent pricehas been set for the defaulted security or obligation. In addition, a Fund is entitled to a return of any assets, which have been pledged as collateralto the counterparty upon settlement.
The maximum potential amount of future payments (undiscounted) that a Fund as seller of protection could be required to make under a creditdefault swap would be an amount equal to the notional amount of the agreement. These potential amounts would be partially offset by anyrecovery values of the respective referenced obligations or net amounts received from a settlement of a credit default swap for the same referencesecurity or obligation where a Fund bought credit protection.
Short Term Investments � Short-term investments having a maturity of 60 days or less are valued using available market quotations as provided by athird party pricing vendor or broker. Prior to October 11, 2016, such securities were valued at amortized cost. These investments are classified as Level2 of the fair value hierarchy.
i. Repurchase Agreements � Repurchase agreements involve the purchase of securities subject to the seller�s agreement to repurchase thesecurities at a mutually agreed upon date and price, under the terms of a Master Repurchase Agreement (�MRA�). During the term of a repurchaseagreement, the value of the underlying securities held as collateral on behalf of a Fund, including accrued interest, is required to exceed the valueof the repurchase agreement, including accrued interest. The gross value of repurchase agreements is included in the Statements of Assets andLiabilities for financial reporting purposes. The underlying securities for all repurchase agreements are held at the Funds� custodian or designatedsub-custodians under tri-party repurchase agreements.
An MRA governs transactions between a Fund and select counterparties. An MRA contains provisions for, among other things, initiation ofthe transaction, income payments, events of default and maintenance of securities for repurchase agreements. An MRA also permits offsetting withcollateral to create one single net payment in the event of default or similar events, including the bankruptcy or insolvency of a counterparty.
If the seller defaults, a Fund could suffer a loss to the extent that the proceeds from the sale of the underlying securities and other collateralheld by the Fund are less than the repurchase price and the Fund�s costs associated with delay and enforcement of the repurchase agreement. Inaddition, in the event of default or insolvency of the seller, a court could determine that a Fund�s interest in the collateral is not enforceable,resulting in additional losses to the Fund.
Pursuant to exemptive relief granted by the Securities and Exchange Commission (�SEC�) and terms and conditions contained therein, theFunds, together with other funds of the Trust and registered investment companies having management agreements with GSAM or its affiliates,may transfer uninvested cash into joint accounts, the daily aggregate balance of which is invested in one or more repurchase agreements. Underthese joint accounts, the Funds maintain pro-rata credit exposure to the underlying repurchase agreements� counterparties. With the exception ofcertain transaction fees, the Funds are not subject to any expenses in relation to these investments.
B. Level 3 Fair Value Investments � To the extent that significant inputs to valuation models and other alternative pricing sources are unobservable,or if quotations are not readily available, or if GSAM believes that such quotations do not accurately
100
Copyright © 2017 www.secdatabase.com. All Rights Reserved.Please Consider the Environment Before Printing This Document

GOLDMAN SACHS STRATEGIC MULTI-ASSET CLASS FUNDS
3. INVESTMENTS AND FAIR VALUE MEASUREMENTS (continued)
reflect fair value, the fair value of the Funds� investments may be determined under Valuation Procedures approved by the Trustees. GSAM, consistentwith its procedures and applicable regulatory guidance, may make an adjustment to the most recent valuation prices of either domestic or foreignsecurities in light of significant events to reflect what it believes to be the fair value of the securities at the time of determining a Fund�s NAV.Significant events which could affect a large number of securities in a particular market may include, but are not limited to: significant fluctuations inU.S. or foreign markets; market dislocations; market disruptions; or unscheduled market closings. Significant events which could also affect a singleissuer may include, but are not limited to: corporate actions such as reorganizations, mergers and buy-outs; ratings downgrades; and bankruptcies.
C. Fair Value Hierarchy � The following is a summary of the Funds� investments and derivatives classified in the fair value hierarchy as of April 30,2017:
MULTI-MANAGER GLOBAL EQUITY
Investment Type Level 1 Level 2 Level 3AssetsCommon Stock and/or Other Equity Investments(a)
Africa $643,840 $2,796,580 $�Asia 15,052,029 61,344,358 116,990Australia and Oceania 309,587 5,853,567 �
Europe 18,210,937 85,189,328 �
North America 187,571,411 1,112,323 �
South America 7,196,159 930,562 �
Rights � 63,387 �
Exchange Traded Funds 3,993,970 � �
Short-term Investments � 23,100,000 �
Total $232,977,933 $180,390,105 $116,990
Derivative TypeAssets(b)Forward Foreign Currency Exchange Contracts $� $334,958 $�Liabilities(b)Forward Foreign Currency Exchange Contracts $� $(2,574,656 ) $�
MULTI-MANAGER NON-CORE FIXED INCOME
Investment Type Level 1 Level 2 Level 3AssetsFixed Income
Foreign Debt Obligations $� $92,591,796 $�Corporate Obligations � 160,949,701 �
Bank Loans � 57,741,532 566,918Common Stock and/or Other Equity Investments(a)
North America 1,013,768 129,149 243,552Warrants � 737 �
Exchange Traded Fund 3,084,200 � �
Short-term Investments � 35,900,000 �
Total $4,097,968 $347,312,915 $810,470
101
Copyright © 2017 www.secdatabase.com. All Rights Reserved.Please Consider the Environment Before Printing This Document

GOLDMAN SACHS STRATEGIC MULTI-ASSET CLASS FUNDS
Notes to Financial Statements (continued)April 30, 2017 (Unaudited)
3. INVESTMENTS AND FAIR VALUE MEASUREMENTS (continued)
MULTI-MANAGER NON-CORE FIXED INCOME (continued)
Derivative Type Level 1 Level 2Level
3Assets(b)Forward Foreign Currency Exchange Contracts $� $349,707 $ �Interest Rate Swap Contracts � 58,815 �
Total $� $408,522 $ �Liabilities(b)Forward Foreign Currency Exchange Contracts $� $(383,442 ) $ �Futures Contracts (68,278 ) � �
Interest Rate Swap Contracts � (5,996 ) �
Credit Default Swap Contracts � (6,445 ) �
Total $(68,278 ) $(395,883 ) $ �
MULTI-MANAGER REAL ASSETS STRATEGY
Investment Type Level 1 Level 2Level
3AssetsCommon Stock and/or Other Equity Investments(a)
Asia $1,681,735 $27,151,157 $ �Australia and Oceania � 11,566,927 �
Europe 5,183,018 33,787,233 �
North America 100,961,859 � �
South America 249,380 � �
Short-term Investments � 6,500,000 �
Total $108,075,992 $79,005,317 $ �
(a) Amounts are disclosed by continent to highlight the impact of time zone differences between local market close and the calculation of net asset value. Security valuations are based on theprincipal exchange or system on which they are traded, which may differ from country of domicile. The Funds utilize fair value model prices provided by an independent fair value service forinternational equities, resulting in a Level 2 classification.
(b) Amount shown represents unrealized gain (loss) at period end.For further information regarding security characteristics, see the Schedules of Investments.
4. INVESTMENTS IN DERIVATIVES
The following tables set forth, by certain risk types, the gross value of derivative contracts as of April 30, 2017. These instruments were used as part ofthe Funds� investment strategies and to obtain and/or manage exposure related to the risks below. The values in the tables below exclude the effects ofcash collateral received or posted pursuant to these derivative contracts, and therefore are not representative of the Funds� net exposure.
Multi-Manager Global Equity
RiskStatements of Assets
and Liabilities AssetsStatements of Assets
and Liabilities LiabilitiesCurrency Receivable for unrealized gain on forward
foreign currency exchange contracts $334,958Payable for unrealized loss on forwardforeign currency exchange contracts $(2,574,656)
102
Copyright © 2017 www.secdatabase.com. All Rights Reserved.Please Consider the Environment Before Printing This Document

GOLDMAN SACHS STRATEGIC MULTI-ASSET CLASS FUNDS
4. INVESTMENTS IN DERIVATIVES (continued)
Multi-Manager Non-Core Fixed Income
RiskStatements of Assets
and Liabilities AssetsStatements of Assets
and Liabilities LiabilitiesInterest rate Receivable for unrealized gain on swap
contracts; Variation margin on certain derivative contracts$58,815 (a)
Payable for unrealized loss on swapcontracts; Variation margin on certainderivative contracts $(74,274 )(a)(b)
Credit � � Payable for unrealized loss on swap contracts (6,445 )(b)
Currency Receivable for unrealized gain on forward foreign currency exchange contracts
349,707
Payable for unrealized loss onforward foreign currency exchangecontracts (383,442)
Total $408,522 $(464,161)
(a) Includes unrealized gain (loss) on futures contracts and centrally cleared swaps described in the Additional Investment Information sections of the Schedules of Investments. Only currentday�s variation margin is reported within the Statements of Assets and Liabilities.
(b) Aggregate of amounts include $9,385 for Multi-Manager Non-Core Fixed Income, which represent the payments to be made pursuant to bilateral agreements should counterparties exercisetheir �right to terminate� provisions based on, among others, the Funds� performance, its failure to pay on its obligations or failure to pledge collateral. Such amounts do not includeincremental charges directly associated with the close-out of the agreements. They also do not reflect the fair value of any assets pledged as collateral which, through the daily marginingprocess, substantially offsets the aforementioned amounts and for which the Fund is entitled to a full return.
The following tables set forth, by certain risk types, the Funds� gains (losses) related to these derivatives and their indicative volumes for the sixmonths ended April 30, 2017. These gains (losses) should be considered in the context that these derivative contracts may have been executed to createinvestment opportunities and/or economically hedge certain investments, and accordingly, certain gains (losses) on such derivative contracts may offsetcertain (losses) gains attributable to investments. These gains (losses) are included in �Net realized gain (loss)� or �Net change in unrealized gain(loss)� on the Statements of Operations:
Multi-Manager Global Equity
Risk Statements of OperationsNet RealizedGain (Loss)
Net Change inUnrealizedGain (Loss)
AverageNumber of
Contracts(a)
Currency Net realized gain (loss) from forward foreign currency exchange contracts/Net change in unrealized gain(loss) on forward foreign currency exchange contracts $9,850,469 $(7,758,489) 92
Multi-Manager Non-Core Fixed Income
Risk Statements of OperationsNet RealizedGain (Loss)
Net Change inUnrealizedGain (Loss)
AverageNumber of
Contracts(a)
Interest rate Net realized gain (loss) from futures contracts and swap contracts/Net change in unrealized gain (loss)on futures contracts and swap contracts $107,640 $(42,439) 39
Credit Net realized gain (loss) from swap contracts/Net change in unrealized gain (loss) on swap contracts (94,702 ) 46,386 4Currency Net realized gain (loss) from forward foreign currency exchange contracts and swap contracts/Net
change in unrealized gain (loss) on forward foreign currency exchange contracts and swap contracts $(327,653 ) $49,456 87Total $(314,715 ) $53,403 130
(a) Average number of contracts is based on the average of month end balances for the six months ended April 30, 2017.
In order to better define its contractual rights and to secure rights that will help a Fund mitigate its counterparty risk, a Fund may enter into anInternational Swaps and Derivatives Association, Inc. Master Agreement (�ISDA Master Agreement�) or similar agreement with its derivativescounterparties. An ISDA Master Agreement is a bilateral agreement between a Fund and a
103
Copyright © 2017 www.secdatabase.com. All Rights Reserved.Please Consider the Environment Before Printing This Document
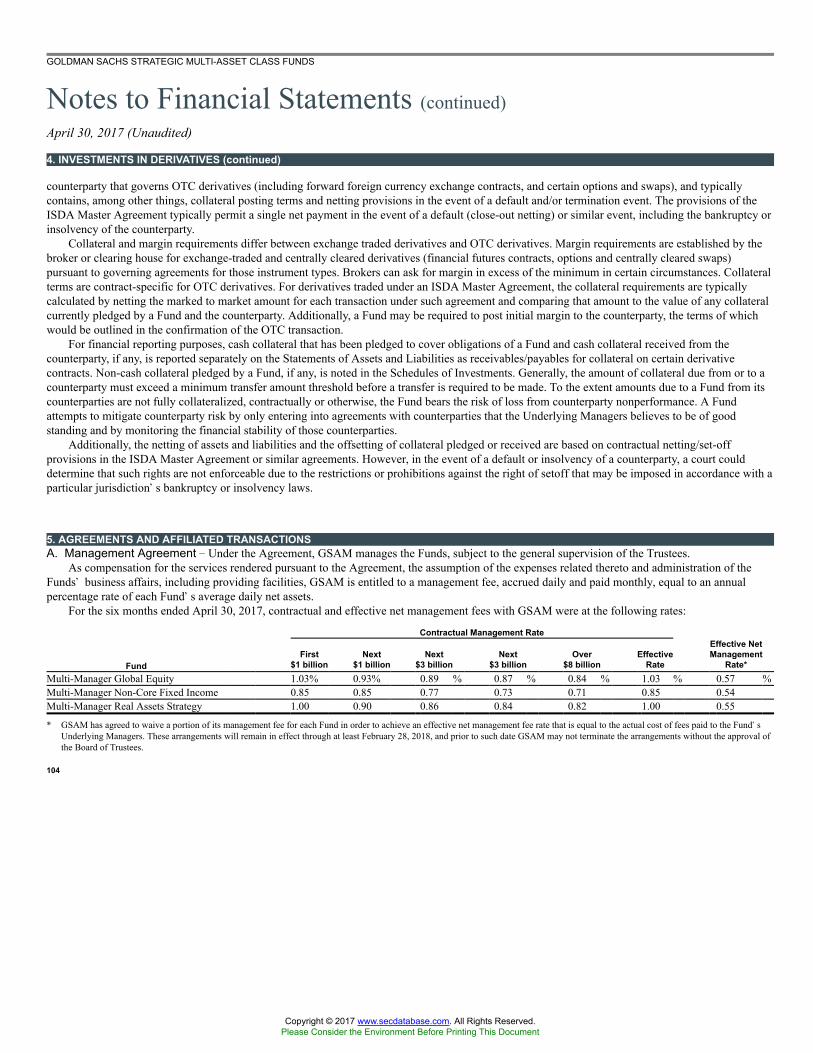
GOLDMAN SACHS STRATEGIC MULTI-ASSET CLASS FUNDS
Notes to Financial Statements (continued)April 30, 2017 (Unaudited)
4. INVESTMENTS IN DERIVATIVES (continued)
counterparty that governs OTC derivatives (including forward foreign currency exchange contracts, and certain options and swaps), and typicallycontains, among other things, collateral posting terms and netting provisions in the event of a default and/or termination event. The provisions of theISDA Master Agreement typically permit a single net payment in the event of a default (close-out netting) or similar event, including the bankruptcy orinsolvency of the counterparty.
Collateral and margin requirements differ between exchange traded derivatives and OTC derivatives. Margin requirements are established by thebroker or clearing house for exchange-traded and centrally cleared derivatives (financial futures contracts, options and centrally cleared swaps)pursuant to governing agreements for those instrument types. Brokers can ask for margin in excess of the minimum in certain circumstances. Collateralterms are contract-specific for OTC derivatives. For derivatives traded under an ISDA Master Agreement, the collateral requirements are typicallycalculated by netting the marked to market amount for each transaction under such agreement and comparing that amount to the value of any collateralcurrently pledged by a Fund and the counterparty. Additionally, a Fund may be required to post initial margin to the counterparty, the terms of whichwould be outlined in the confirmation of the OTC transaction.
For financial reporting purposes, cash collateral that has been pledged to cover obligations of a Fund and cash collateral received from thecounterparty, if any, is reported separately on the Statements of Assets and Liabilities as receivables/payables for collateral on certain derivativecontracts. Non-cash collateral pledged by a Fund, if any, is noted in the Schedules of Investments. Generally, the amount of collateral due from or to acounterparty must exceed a minimum transfer amount threshold before a transfer is required to be made. To the extent amounts due to a Fund from itscounterparties are not fully collateralized, contractually or otherwise, the Fund bears the risk of loss from counterparty nonperformance. A Fundattempts to mitigate counterparty risk by only entering into agreements with counterparties that the Underlying Managers believes to be of goodstanding and by monitoring the financial stability of those counterparties.
Additionally, the netting of assets and liabilities and the offsetting of collateral pledged or received are based on contractual netting/set-offprovisions in the ISDA Master Agreement or similar agreements. However, in the event of a default or insolvency of a counterparty, a court coulddetermine that such rights are not enforceable due to the restrictions or prohibitions against the right of setoff that may be imposed in accordance with aparticular jurisdiction�s bankruptcy or insolvency laws.
5. AGREEMENTS AND AFFILIATED TRANSACTIONSA. Management Agreement � Under the Agreement, GSAM manages the Funds, subject to the general supervision of the Trustees.
As compensation for the services rendered pursuant to the Agreement, the assumption of the expenses related thereto and administration of theFunds� business affairs, including providing facilities, GSAM is entitled to a management fee, accrued daily and paid monthly, equal to an annualpercentage rate of each Fund�s average daily net assets.
For the six months ended April 30, 2017, contractual and effective net management fees with GSAM were at the following rates:
Contractual Management Rate
FundFirst
$1 billionNext
$1 billionNext
$3 billionNext
$3 billionOver
$8 billionEffective
Rate
Effective NetManagement
Rate*Multi-Manager Global Equity 1.03% 0.93% 0.89 % 0.87 % 0.84 % 1.03 % 0.57 %Multi-Manager Non-Core Fixed Income 0.85 0.85 0.77 0.73 0.71 0.85 0.54Multi-Manager Real Assets Strategy 1.00 0.90 0.86 0.84 0.82 1.00 0.55
* GSAM has agreed to waive a portion of its management fee for each Fund in order to achieve an effective net management fee rate that is equal to the actual cost of fees paid to the Fund�sUnderlying Managers. These arrangements will remain in effect through at least February 28, 2018, and prior to such date GSAM may not terminate the arrangements without the approval ofthe Board of Trustees.
104
Copyright © 2017 www.secdatabase.com. All Rights Reserved.Please Consider the Environment Before Printing This Document

GOLDMAN SACHS STRATEGIC MULTI-ASSET CLASS FUNDS
5. AGREEMENTS AND AFFILIATED TRANSACTIONS (continued)
B. Transfer Agency Agreement � Goldman Sachs also serves as the transfer agent of the Funds for a fee pursuant to the Transfer AgencyAgreement. The fees charged for such transfer agency services are accrued daily and paid monthly at annual rates of 0.02% of the average daily netassets of Institutional Shares.
C. Other Expense Agreements and Affiliated Transactions � GSAM has agreed to limit each Fund�s �Total Annual Operating Expenses�(excluding acquired fund fees and expenses, taxes, interest, brokerage fees, shareholder meeting, litigation, indemnification and extraordinaryexpenses) to the extent such expenses exceed, on an annual basis, a percentage rate of the average daily net assets of each Fund. Such expensereimbursements, if any, are accrued daily and paid monthly. In addition, the Funds are not obligated to reimburse GSAM for prior fiscal year expensereimbursements, if any. The expense limitations as an annual percentage rate of average daily net assets for Multi-Manager Global Equity, Multi-Manager Non-Core Fixed Income and Multi-Manager Real Assets Strategy are 0.85%, 0.70%, and 0.90% respectively. These expense limitations willremain in place through at least February 28, 2018, and prior to such date GSAM may not terminate the arrangements without the approval of theTrustees. In addition, the Funds have entered into certain offset arrangements with the transfer agent, which may result in a reduction of the Funds�expenses and are received irrespective of the application of the �Total Annual Operating� limitations described above.
For the six months ended April 30, 2017, these expense reductions, including any fee waivers and Other Expense reimbursements, were asfollows:
FundManagementFee Waiver
OtherExpense
Reimbursements
TotalAnnual
OperatingExpense
ReductionsMulti-Manager Global Equity $1,215,576 $ 108,114 $1,323,690Multi-Manager Non-Core Fixed Income 475,295 238,359 713,654Multi-Manager Real Assets Strategy 481,511 44,473 525,984
D. Other Transactions with Affiliates � For the six months ended April 30, 2017 , Goldman Sachs earned $108 and $324 in brokerage commissionsfrom portfolio transactions, including futures transactions executed with Goldman Sachs as the Futures Commission Merchant, on behalf of the Multi-Manager Global Equity and Multi-Manager Real Assets Strategy Funds, respectively.
E. Line of Credit Facility � As of April 30, 2017, the Funds participated in a $1,100,000,000 committed, unsecured revolving line of credit facility(the �facility�) together with other funds of the Trust and certain registered investment companies having management agreements with GSAM or itsaffiliates. This facility is to be used for temporary emergency purposes, or to allow for an orderly liquidation of securities to meet redemption requests.The interest rate on borrowings is based on the federal funds rate. The facility also requires a fee to be paid by the Funds based on the amount of thecommitment that has not been utilized. For the six months ended April 30, 2017, the Funds did not have any borrowings under the facility. The facilitywas renewed in the amount of $1,100,000,000 effective May 2, 2017.
6. PORTFOLIO SECURITIES TRANSACTIONSThe cost of purchases and proceeds from sales and maturities of long-term securities for the six months ended April 30, 2017 were:
Fund
Purchasesof
GovernmentSecurities
Purchases ExcludingGovernment
Securities
Sales ofGovernment
Securities
Sales ExcludingGovernment
SecuritiesMulti-Manager Global Equity $� $ 218,493,310 $� $496,609,048Multi-Manager Non-Core Fixed Income 12,659,636 261,669,410 15,106,969 221,208,208Multi-Manager Real Assets Strategy � 183,011,837 � 304,819,353
105
Copyright © 2017 www.secdatabase.com. All Rights Reserved.Please Consider the Environment Before Printing This Document

GOLDMAN SACHS STRATEGIC MULTI-ASSET CLASS FUNDS
Notes to Financial Statements (continued)April 30, 2017 (Unaudited)
7. TAX INFORMATION
As of the Funds� most recent fiscal year end, October 31, 2016, the Funds� capital loss carryforwards and certain timing differences on a tax basiswere as follows:
Multi-ManagerGlobal Equity
Fund
Multi-ManagerNon-Core
Fixed Income
Multi-ManagerReal Assets
StrategyCapital loss carryforwards:
Perpetual Short-term $(13,909,366) $(750,532) $ (194,674)Perpetual Long-term (3,494,098) (154,194) �
Total capital loss carryforwards $(17,403,464) $(904,726) $ (194,674)Timing differences (Straddle Deferrals) $(80,839) $(2,196,843) $�
As of April 30, 2017, the Funds� aggregate security unrealized gains and losses based on cost for U.S. federal income tax purposes were asfollows:
Multi-ManagerGlobal Equity
Fund
Multi-ManagerNon-Core
Fixed Income
Multi-ManagerReal Assets
StrategyTax Cost $364,520,590 $348,768,167 $177,719,809Gross unrealized gain 57,696,942 8,712,530 24,398,814Gross unrealized loss (8,732,504) (5,259,344 ) (15,037,314 )Net unrealizd security gain $48,964,438 $3,453,186 $9,361,500
The difference between GAAP-basis and tax basis unrealized gains (losses) is attributable primarily to wash sales, net mark to market gains/(losses) on regulated futures, net mark to market gains/(losses) on foreign currency contracts, and differences in the tax treatment of underlying fundinvestments, passive foreign investment company investments, and swap transactions.
GSAM has reviewed the Funds� tax positions for all open tax years (the current and prior three years, as applicable) and has concluded that noprovision for income tax is required in the Funds� financial statements. Such open tax years remain subject to examination and adjustment by taxauthorities.
8. OTHER RISKSThe Funds� risks include, but are not limited to, the following:
Derivatives Risk � The Funds� use of derivatives may result in loss. Derivative instruments, which may pose risks in addition to and greater thanthose associated with investing directly in securities, currencies or other instruments, may be illiquid or less liquid, volatile, difficult to price andleveraged so that small changes in the value of the underlying instruments may produce disproportionate losses to the Funds. Derivatives are alsosubject to counterparty risk, which is the risk that the other party in the transaction will not fulfill its contractual obligation. The use of derivatives is ahighly specialized activity that involves investment techniques and risks different from those associated with investments in more traditional securitiesand instruments. Losses from derivatives can also result from a lack of correlation between changes in the value of derivative instruments and theportfolio assets (if any) being hedged.
Foreign and Emerging Countries Risk � Investing in foreign markets may involve special risks and considerations not typically associated withinvesting in the United States. Foreign securities may be subject to risk of loss because of more or less foreign government regulation, less publicinformation and less economic, political and social stability in the countries in which the Funds invest. The imposition of exchange controls,confiscations, trade restrictions (including tariffs) and other government restrictions by the United States or other governments, or from problems inshare registration, settlement or custody, may also
106
Copyright © 2017 www.secdatabase.com. All Rights Reserved.Please Consider the Environment Before Printing This Document

GOLDMAN SACHS STRATEGIC MULTI-ASSET CLASS FUNDS
8. OTHER RISKS (continued)
result in losses. Foreign risk also involves the risk of negative foreign currency rate fluctuations, which may cause the value of securities denominatedin such foreign currency (or other instruments through which the Funds have exposure to foreign currencies) to decline in value. Currency exchangerates may fluctuate significantly over short periods of time. To the extent that the Funds also invest in securities of issuers located in emerging markets,these risks may be more pronounced.
Foreign Custody Risk � If a Fund invests in foreign securities, the Fund may hold such securities and cash with foreign banks, agents, and securitiesdepositories appointed by the Fund�s custodian (each a �Foreign Custodian�). Some foreign custodians may be recently organized or new to theforeign custody business. In some countries, Foreign Custodians may be subject to little or no regulatory oversight over, or independent evaluation of,their operations. Further, the laws of certain countries may place limitations on a Fund�s ability to recover its assets if a Foreign Custodian entersbankruptcy. Investments in emerging markets may be subject to even greater custody risks than investments in more developed markets. Custodyservices in emerging market countries are very often undeveloped and may be considerably less well regulated than in more developed countries, andthus may not afford the same level of investor protection as would apply in developed countries.
Industry Concentration Risk � The Multi-Manager Real Assets Strategy Fund concentrates its investments in the real estate group of industries,which has historically experienced substantial price volatility. This concentration subjects the Fund to greater risk of loss as a result of adverseeconomic, business or other developments than if its investments were diversified across different industries.
Interest Rate Risk � When interest rates increase, fixed income securities or instruments held by the Funds will generally decline in value. Long-termfixed income securities or instruments will normally have more price volatility because of this risk than short-term fixed income securities orinstruments. The risks associated with increasing rates are heightened given that interest rates are near historic lows, but may be expected to increase inthe future with unpredictable effects on the markets and the Funds� investments. Fluctuations in interest rates may also affect the liquidity of fixedincome securities and instruments held by the Funds.
Investments in Other Investment Companies � As a shareholder of another investment company, including an exchange-traded fund (�ETF�), aFund will indirectly bear its proportionate share of any net management fees and other expenses paid by such other investment companies, in additionto the fees and expenses regularly borne by the Fund. ETFs are subject to risks that do not apply to conventional mutual funds, including but notlimited to the following: (i) the market price of the ETF�s shares may trade at a premium or a discount to their NAV; and (ii) an active trading marketfor an ETF�s shares may not develop or be maintained.
Large Shareholder Transactions Risk � A Fund may experience adverse effects when certain large shareholders, such as other funds, institutionalinvestors (including those trading by use of non-discretionary mathematical formulas), financial intermediaries (who may make investment decisionson behalf of underlying clients and/or include a Fund in their investment model), individuals, accounts and Goldman Sachs affiliates, purchase orredeem large amounts of shares of a Fund. Such large shareholder redemptions may cause a Fund to sell portfolio securities at times when it would nototherwise do so, which may negatively impact a Fund�s NAV and liquidity. These transactions may also accelerate the realization of taxable income toshareholders if such sales of investments resulted in gains, and may also increase transaction costs. In addition, a large redemption could result in aFund�s current expenses being allocated over a smaller asset base, leading to an increase in the Fund�s expense ratio. Similarly, large Fund sharepurchases may adversely affect a Fund�s performance to the extent that the Fund is delayed in investing new cash and is required to maintain a largercash position than it ordinarily would.
Liquidity Risk � A Fund may make investments that are illiquid or that may become less liquid in response to market developments or adverse investorperceptions. Illiquid investments may be more difficult to value. Liquidity risk may also refer to the risk that a Fund will not be able to pay redemptionproceeds within the allowable time period because of unusual market conditions, an unusually high volume of redemption requests, or other reasons.To meet redemption requests, a Fund may be forced to sell investments at an unfavorable time and/or under unfavorable conditions. Liquidity risk maybe the result of, among other things, the reduced number and capacity of traditional market participants to make a market in fixed income securities orthe lack of an active market. The potential for liquidity risk may be magnified by a rising interest rate environment or other
107
Copyright © 2017 www.secdatabase.com. All Rights Reserved.Please Consider the Environment Before Printing This Document

GOLDMAN SACHS STRATEGIC MULTI-ASSET CLASS FUNDS
Notes to Financial Statements (continued)April 30, 2017 (Unaudited)
8. OTHER RISKS (continued)
circumstances where investor redemptions from fixed income mutual funds may be higher than normal, potentially causing increased supply in themarket due to selling activity
Loan-Related Investments Risk � In addition to risks generally associated with debt investments, loan-related investments such as loanparticipations and assignments are subject to other risks. Although a loan obligation may be fully collateralized at the time of acquisition, the collateralmay decline in value, be relatively illiquid, or lose all or substantially all of its value subsequent to investment. Many loan investments are subject tolegal or contractual restrictions on resale and may be relatively illiquid and difficult to value. There is less readily available, reliable information aboutmost loan investments than is the case for many other types of securities. Substantial increases in interest rates may cause an increase in loan obligationdefaults. With respect to loan participations, the Fund may not always have direct recourse against a borrower if the borrower fails to pay scheduledprincipal and/or interest; may be subject to greater delays, expenses and risks than if the Fund had purchased a direct obligation of the borrower; andmay be regarded as the creditor of the agent lender (rather than the borrower), subjecting the Fund to the creditworthiness of that lender as well.Investors in loans, such as the Fund, may not be entitled to rely on the anti-fraud protections of the federal securities laws, although they may beentitled to certain contractual remedies. The market for loan obligations may be subject to irregular trading activity, wide bid/ask spreads and extendedtrade settlement periods. Because transactions in many loans are subject to extended trade settlement periods, the Fund may not receive the proceedsfrom the sale of a loan for a period after the sale. As a result, sale proceeds related to the sale of loans may not be available to make additionalinvestments or to meet the Fund�s redemption obligations for a period after the sale of the loans, and, as a result, the Fund may have to sell otherinvestments or engage in borrowing transactions, such as borrowing from its credit facility, if necessary to raise cash to meet its obligations.
Senior Loans hold the most senior position in the capital structure of a business entity, and are typically secured with specific collateral, but arenevertheless usually rated below investment grade. Because Second Lien Loans are subordinated or unsecured and thus lower in priority of payment toSenior Loans, they are subject to the additional risk that the cash flow of the borrower and property securing the loan or debt, if any, may beinsufficient to meet scheduled payments after giving effect to the senior secured obligations of the borrower. Second Lien Loans generally have greaterprice volatility than Senior Loans and may be less liquid.
Market and Credit Risks � In the normal course of business, the Funds trade financial instruments and enter into financial transactions where risk ofpotential loss exists due to changes in the market (market risk). Additionally, the Funds may also be exposed to credit risk in the event that an issuer orguarantor fails to perform or that an institution or entity with which the Funds have unsettled or open transactions defaults.
Multi-Manager Approach Risk � The Funds� performance depends on the ability of the Investment Adviser in selecting, overseeing, and allocatingFund assets to the Underlying Managers. The Underlying Managers� investment styles may not always be complementary. The Funds� multi-managerapproach may result in the Fund investing a significant percentage of its assets in certain types of investments, which could be beneficial or detrimentalto the Funds� performance depending on the performance of those investments and the overall market environment. The Funds� Underlying Managersmay underperform the market generally or underperform other investment managers that could have been selected for the Funds. Because the Funds�Underlying Managers may trade with counterparties, prime brokers, clearing brokers or futures commission merchants on terms that are different thanthose on which the Investment Adviser would trade, and because each Underlying Manager applies its own risk analysis in evaluating potentialcounterparties for the Funds, the Funds may be subject to greater counterparty risk than if they were managed directly by the Investment Adviser.
Non-Diversification Risk � The Multi-Manager Non-Core Fixed Income Fund is non-diversified, meaning that it is permitted to invest a largerpercentage of its assets in fewer issuers than diversified mutual funds. Thus, the Fund may be more susceptible to adverse developments affecting anysingle issuer held in its portfolio, and may be more susceptible to greater losses because of these developments.
Sector Risk � To the extent a Fund focuses its investments in securities of issuers in one or more sectors (such as the financial services ortelecommunications sectors), the Fund will be subject, to a greater extent than if its investments were diversified across
108
Copyright © 2017 www.secdatabase.com. All Rights Reserved.Please Consider the Environment Before Printing This Document

GOLDMAN SACHS STRATEGIC MULTI-ASSET CLASS FUNDS
8. OTHER RISKS (continued)
different sectors, to the risks of volatile economic cycles and/or conditions and developments that may be particular to that sector, such as: adverseeconomic, business, political, environmental or other developments.
Tax Risk � The Multi-Manager Real Assets Strategy Fund may seek to gain exposure to the commodity markets primarily through investments in thesubsidiary and/or commodity index-linked structured notes, as applicable. Historically, the Internal Revenue Service (�IRS�) issued private letterrulings (�PLRs�) in which the IRS specifically concluded that income and gains from investments in commodity index-linked structured notes or awholly-owned foreign subsidiary that invests in commodity-linked instruments are �qualifying income� for purposes of compliance with Subchapter Mof the Code. However, the Multi-Manager Real Assets Strategy Fund has not received a PLR, and is not able to rely on PLRs issued to other taxpayers.Additionally, the IRS has suspended the granting of such PLR, pending review of its position on this matter. The IRS also recently issued proposedregulations that, if finalized, would generally treat the Multi-Manager Real Assets Strategy Fund�s income inclusion with respect to a subsidiary asqualifying income only if there is a distribution out of the earnings and profits of a subsidiary that are attributable to such income inclusion. Theproposed regulations, if adopted, would apply to taxable years beginning on or after 90 days after the regulations are published as final.
The IRS also recently issued a revenue procedure, which states that the IRS will not in the future issue PLRs that would require a determination ofwhether an asset (such as a commodity index-linked note) is a �security� under the Investment Company Act of 1940. The Multi-Manager Real AssetsStrategy Fund has obtained an opinion of counsel that the Fund�s income from such investments should constitute �qualifying income.� However, noassurances can be provided that the IRS would not be able to successfully assert that the Multi-Manager Real Assets Strategy Fund�s income fromsuch investments was not �qualifying income,� in which case the Multi-Manager Real Assets Strategy Fund would fail to qualify as a regulatedinvestment company (�RIC�) under Subchapter M of the Code if over 10% of its gross income were derived from these investments. If the Multi-Manager Real Assets Strategy Fund failed to qualify as a RIC, it would be subject to federal and state income tax on all of its taxable income at regularcorporate tax rates. This would significantly adversely affect the returns to, and could cause substantial losses for, Multi-Manager Real Assets StrategyFund shareholders.
9. INDEMNIFICATIONSUnder the Trust�s organizational documents, its Trustees, officers, employees and agents are indemnified, to the extent permitted by the Act and statelaw, against certain liabilities that may arise out of performance of their duties to the Funds. Additionally, in the course of business, the Funds enter intocontracts that contain a variety of indemnification clauses. The Funds�s maximum exposure under these arrangements is unknown, as this wouldinvolve future claims that may be made against the Funds that have not yet occurred. However, GSAM believes the risk of loss under thesearrangements to be remote.
10. SUBSEQUENT EVENTSSubsequent events after the Statements of Assets and Liabilities date have been evaluated and GSAM has concluded that there is no impact requiringadjustment or disclosure in the financial statements.
109
Copyright © 2017 www.secdatabase.com. All Rights Reserved.Please Consider the Environment Before Printing This Document

GOLDMAN SACHS STRATEGIC MULTI-ASSET CLASS FUNDS
Notes to Financial Statements (continued)April 30, 2017 (Unaudited)
11. SUMMARY OF SHARE TRANSACTIONS
Share activity is as follows:
Multi-Manager Global Equity FundFor the Six Months Ended
April 30, 2017(Unaudited)
For the Fiscal Year EndedOctober 31, 2016
Shares Dollars Shares DollarsInstitutional SharesShares sold 1 $5 25,427,589 $232,750,015Reinvestment of distributions 978,104 9,419,142 284,095 2,625,036Shares redeemed (25,266,102) (252,060,005) (8,365,099 ) (79,364,935 )NET INCREASE (DECREASE) (24,287,997) $(242,640,858) 17,346,585 $156,010,116
Multi-Manager Non-Core Fixed Income FundFor the Six Months Ended
April 30, 2017(Unaudited)
For the Fiscal Year EndedOctober 31, 2016
Shares Dollars Shares DollarsInstitutional SharesShares sold 5,666,318 53,850,015 2,361,601 21,565,005Reinvestment of distributions 798,943 7,575,122 1,515,954 14,180,160Shares redeemed (1,671,761) (15,820,015) (1,066,293) (10,121,966)NET INCREASE 4,793,500 $45,605,122 2,811,262 $25,623,199
Multi-Manager Real Assets Strategy FundFor the Six Months Ended
April 30, 2017(Unaudited)
For the Fiscal Year EndedOctober 31, 2016(a)
Shares Dollars Shares DollarsInstitutional SharesShares sold 122,494 1,100,000 12,846,967 117,600,015Reinvestment of distributions 519,764 4,652,751 698,834 6,496,622Shares redeemed (14,349,291) (130,550,000) (521,785 ) (4,940,015 )NET INCREASE (DECREASE) (13,707,033) $(124,797,249) 13,024,016 $119,156,622
110
Copyright © 2017 www.secdatabase.com. All Rights Reserved.Please Consider the Environment Before Printing This Document

GOLDMAN SACHS STRATEGIC MULTI-ASSET CLASS FUNDS
Fund Expenses �� Period Ended April 30, 2017 (Unaudited)As a shareholder of Institutional Shares of the Funds, you incur two types of costs: (1) transaction costs, including sales charges on purchase payments, and (2) ongoing costs,
including management fees; and other Fund expenses. This Example is intended to help you understand your ongoing costs (in dollars) of investing in the Funds and to compare these costswith the ongoing costs of investing in other mutual funds.
The Example is based on an investment of $1,000 invested at the beginning of the period and held for the entire period from November 1, 2016 through April 30, 2017, whichrepresents a period of 181 days in a 365 day year.
Actual Expenses � The first line under each share class in the table below provides information about actual account values and actual expenses. You may use the information inthis line, together with the amount you invested, to estimate the expenses that you paid over the period. Simply divide your account value by $1,000 (for example, an $8,600 account valuedivided by $1,000=8.6), then multiply the result by the number in the first line under the heading entitled �Expenses Paid� to estimate the expenses you paid on your account during thisperiod.
Hypothetical Example for Comparison Purposes � The second line under each share class in the table below provides information about hypothetical account values andhypothetical expenses based on the Funds� actual net expense ratios and an assumed rate of return of 5% per year before expenses, which is not the Funds� actual return. The hypotheticalaccount values and expenses may not be used to estimate the actual ending account balance or expenses you paid for the period. You may use this information to compare the ongoing costsof investing in the Funds and other funds. To do so, compare this 5% hypothetical example with the 5% hypothetical examples that appear in the shareholder reports of the other funds.
Please note that the expenses shown in the table are meant to highlight your ongoing costs only and do not reflect any transactional costs, such as sales charges, redemption fees,or exchange fees. Therefore, the second line of the table is useful in comparing ongoing costs only, and will not help you determine the relative total costs of owning different funds. Inaddition, if these transactional costs were included, your costs would have been higher.
Multi-Manager Global Equity FundMulti-Manager Non-Core Fixed Income
Fund Multi-Manager Real Assets Strategy Fund
Share Class
BeginningAccount
Value11/1/16
EndingAccount
Value4/30/17
ExpensesPaid for the
6 months ended4/30/17*
BeginningAccount
Value11/1/16
EndingAccount
Value4/30/17
ExpensesPaid for the
6 months ended4/30/17*
BeginningAccount
Value11/1/16
EndingAccount
Value4/30/17
ExpensesPaid for the
6 months ended4/30/17*
InstitutionalActual 1,000.00 1,118.80 4.47 1,000.00 1,023.70 3.51 1,000.00 1,042.20 4.35Hypothethical 5% return 1,000.00 1,020.58 4.26 1,000.00 1,021.32+ 3.51 1,000.00 1,020.33 4.51
* Expenses for each share class are calculated using each Fund�s annualized net expense ratio for each class, which represents the ongoing expenses as a percentage of net assets for the sixmonths ended April 30, 2017. Expenses are calculated by multiplying the annualized net expense ratio by the average account value for the period; then multiplying the result by the numberof days in the most recent fiscal half year; and then dividing that result by the number of days in the fiscal year. The annualized net expense ratios for the period were as follows:
Fund InstitutionalMulti-Manager Global Equity 0.85 %Multi-Manager Non-Core Fixed Income 0.70Multi-Manager Real Assets Strategy 0.90
+ Hypothetical expenses are based on the Fund�s actual annualized net expense ratios and an assumed rate of return of 5% per year before expenses.
111
Copyright © 2017 www.secdatabase.com. All Rights Reserved.Please Consider the Environment Before Printing This Document

GOLDMAN SACHS STRATEGIC MULTI-ASSET CLASS FUNDS
Statement Regarding Basis for Approval of Sub-Advisory Agreement (Unaudited)
BackgroundThe Goldman Sachs Multi-Manager Non-Core Fixed Income Fund (the �Fund�) is an investment portfolio of Goldman Sachs Trust II (the
�Trust�). The Board of Trustees oversees the management of the Trust and reviews the investment performance and expenses of the Fund at regularlyscheduled meetings held throughout the year. The Fund employs a �manager of managers� structure, whereby Goldman Sachs Asset Management, L.P.(the �Investment Adviser�) is responsible for selecting sub-advisers (subject to Board approval), allocating the Fund�s assets among them, andoverseeing their day-to-day management of Fund assets.
Upon the recommendation of the Investment Adviser, at a meeting held on March 21-22, 2017, the Board of Trustees, including those Trusteeswho are not �interested persons� as defined in the Investment Company Act of 1940, as amended (the �Independent Trustees�), approved a sub-advisory agreement (the �Sub-Advisory Agreement�) between the Investment Adviser and Brigade Capital Management, LP (the �Sub-Adviser�) onbehalf of the Fund. In connection with their consideration of the Sub-Advisory Agreement, the Trustees received written materials and oralpresentations prepared by the Investment Adviser and the Sub-Adviser on the topics covered, and were advised by their independent legal counsel. Inaddition, the Trustees received information prepared by the Sub-Adviser in a written response to a formal request from the Investment Adviser.
Nature, Extent, and Quality of the Services Provided Under the Sub-Advisory AgreementIn evaluating the Sub-Advisory Agreement, the Trustees relied on the information provided by the Investment Adviser and the Sub-Adviser. In
evaluating the nature, extent, and quality of services to be provided by the Sub-Adviser, the Trustees considered information on the services to beprovided to the Fund by the Sub-Adviser, including information about the Sub-Adviser�s (a) personnel and compensation structure; (b) track record inmanaging accounts with investment strategies similar to those to be employed on behalf of the Fund; (c) policies and procedures in place to addresspotential conflicts of interest; and (d) compliance program and code of ethics. In this regard, they considered assessments provided by the InvestmentAdviser of the Sub-Adviser, the Sub-Adviser�s investment strategies and personnel and its compliance program. The Trustees considered that the Sub-Adviser manages other assets for the Investment Adviser�s clients, including a sleeve of the Goldman Sachs Multi-Manager Alternatives Fund, anotherseries of the Trust. They noted that, because the Sub-Adviser had not previously provided services to the Fund, there was no performance informationto evaluate with respect to the Fund.
Costs of Services to be ProvidedThe Trustees reviewed the terms of the Sub-Advisory Agreement and the proposed fee schedule. They noted that the compensation paid to the
Sub-Adviser would be paid by the Investment Adviser, not by the Fund. They also noted that the terms of the Sub-Advisory Agreement were the resultof arms� length negotiations between the Investment Adviser and the Sub-Adviser. They considered the Investment Adviser�s undertaking to waive theportion of its management fee which is in excess of the weighted average of the Fund�s sub-advisory fees.
ConclusionIn connection with their consideration of the Sub-Advisory Agreement, the Trustees gave weight to various factors, but did not identify any
particular factor as controlling their decision. After deliberation and consideration of the information provided, the Trustees, including the IndependentTrustees, unanimously concluded that the Sub-Advisory Agreement should be approved for a period of two years.
112
Copyright © 2017 www.secdatabase.com. All Rights Reserved.Please Consider the Environment Before Printing This Document

FUNDS PROFILE
Goldman Sachs FundsGoldman Sachs is a premier financial services firm, known since 1869 for creating thoughtful and customized investment solutions in complex globalmarkets.Today, the Investment Management Division of Goldman Sachs serves a diverse set of clients worldwide, including private institutions, public entitiesand individuals. With approximately $1.17 trillion in assets under supervision as of March 31, 2017, Goldman Sachs Asset Management (�GSAM�)has portfolio management teams located around the world and our investment professionals bring firsthand knowledge of local markets to everyinvestment decision. Assets under supervision includes assets under management and other client assets for which Goldman Sachs does not have fulldiscretion. GSAM leverages the resources of Goldman Sachs & Co. LLC subject to legal, internal and regulatory restrictions.
Money MarketFinancial Square FundsSM
∎ Financial Square Treasury Solutions Fund1
∎ Financial Square Government Fund1
∎ Financial Square Money Market Fund2
∎ Financial Square Prime Obligations Fund2
∎ Financial Square Treasury Instruments Fund1
∎ Financial Square Treasury Obligations Fund1
∎ Financial Square Federal Instruments Fund1
∎ Financial Square Tax-Exempt Money Market Fund2Investor FundsSM
∎ Investor Money Market Fund3
∎ Investor Tax-Exempt Money Market Fund3
Fixed IncomeShort Duration and Government∎ Enhanced Income Fund∎ High Quality Floating Rate Fund∎ Short-Term Conservative Income Fund4
∎ Short Duration Government Fund∎ Short Duration Income Fund∎ Government Income Fund∎ Inflation Protected Securities FundMulti-Sector∎ Bond Fund∎ Core Fixed Income Fund∎ Global Income Fund∎ Strategic Income FundMunicipal and Tax-Free∎ High Yield Municipal Fund∎ Dynamic Municipal Income Fund∎ Short Duration Tax-Free FundSingle Sector∎ Investment Grade Credit Fund∎ U.S. Mortgages Fund∎ High Yield Fund∎ High Yield Floating Rate Fund∎ Emerging Markets Debt Fund∎ Local Emerging Markets Debt Fund∎ Dynamic Emerging Markets Debt FundFixed Income Alternatives∎ Long Short Credit Strategies Fund∎ Strategic Macro Fund5
Fundamental Equity∎ Equity Income Fund6
∎ Small Cap Value Fund∎ Small/Mid Cap Value Fund∎ Mid Cap Value Fund∎ Large Cap Value Fund∎ Focused Value Fund∎ Capital Growth Fund∎ Strategic Growth Fund∎ Focused Growth Fund∎ Small/Mid Cap Growth Fund∎ Flexible Cap Growth Fund∎ Concentrated Growth Fund∎ Technology Opportunities Fund∎ Growth Opportunities Fund∎ Rising Dividend Growth Fund∎ Dynamic U.S. Equity Fund
Copyright © 2017 www.secdatabase.com. All Rights Reserved.Please Consider the Environment Before Printing This Document

∎ Income Builder Fund
Tax-Advantaged Equity∎ U.S. Tax-Managed Equity Fund∎ International Tax-Managed Equity Fund∎ U.S. Equity Dividend and Premium Fund∎ International Equity Dividend and Premium Fund
Equity Insights∎ Small Cap Equity Insights Fund∎ U.S. Equity Insights Fund∎ Small Cap Growth Insights Fund∎ Large Cap Growth Insights Fund∎ Large Cap Value Insights Fund∎ Small Cap Value Insights Fund∎ International Small Cap Insights Fund∎ International Equity Insights Fund∎ Emerging Markets Equity Insights Fund
Fundamental Equity International∎ Strategic International Equity Fund∎ Focused International Equity Fund∎ Asia Equity Fund∎ Emerging Markets Equity Fund∎ N-11 Equity Fund
Select Satellite∎ Real Estate Securities Fund∎ International Real Estate Securities Fund∎ Commodity Strategy Fund∎ Global Real Estate Securities Fund∎ Dynamic Allocation Fund∎ Absolute Return Tracker Fund∎ Long Short Fund∎ Managed Futures Strategy Fund∎ MLP Energy Infrastructure Fund∎ Multi-Manager Alternatives Fund∎ Absolute Return Multi-Asset Fund∎ Global Infrastructure Fund
Total Portfolio Solutions∎ Global Managed Beta Fund∎ Multi-Manager Non-Core Fixed Income Fund∎ Multi-Manager U.S. Dynamic Equity Fund∎ Multi-Manager Global Equity Fund∎ Multi-Manager International Equity Fund∎ Tactical Tilt Overlay Fund∎ Balanced Strategy Portfolio∎ Multi-Manager U.S. Small Cap Equity Fund∎ Multi-Manager Real Assets Strategy Fund∎ Growth and Income Strategy Portfolio∎ Growth Strategy Portfolio∎ Equity Growth Strategy Portfolio∎ Satellite Strategies Portfolio∎ Enhanced Dividend Global Equity Portfolio∎ Tax-Advantaged Global Equity Portfolio∎ Strategic Factor Allocation Fund∎ Target Date 2020 Portfolio∎ Target Date 2025 Portfolio∎ Target Date 2030 Portfolio∎ Target Date 2035 Portfolio∎ Target Date 2040 Portfolio∎ Target Date 2045 Portfolio∎ Target Date 2050 Portfolio∎ Target Date 2055 Portfolio∎ GQG Partners International Opportunities Fund
1 You could lose money by investing in the Fund. Although the Fund seeks to preserve the value of your investment at $1.00 per share, it cannot guarantee itwill do so. An investment in the Fund is not a deposit of a bank and is not insured or guaranteed by the Federal Deposit Insurance Corporation or any othergovernment agency. The Fund��s sponsor has no legal obligation to provide financial support to the Fund, and you should not expect that the sponsor willprovide financial support to the Fund at any time.
2 You could lose money by investing in the Fund. Because the share price of the Fund will fluctuate, when you sell your shares they may be worth more or lessthan what you originally paid for them. The Fund may impose a fee upon sale of your shares or may temporarily suspend your ability to sell shares if theFund��s liquidity falls below required minimums because of market conditions or other factors. An investment in the Fund is not a deposit of a bank and isnot insured or guaranteed by the Federal Deposit Insurance Corporation or any other government agency. The Fund��s sponsor has no legal obligation toprovide financial support to the Fund, and you should not expect that the sponsor will provide financial support to the Fund at any time.
Copyright © 2017 www.secdatabase.com. All Rights Reserved.Please Consider the Environment Before Printing This Document

3 You could lose money by investing in the Fund. Although the Fund seeks to preserve the value of your investment at $1.00 per share, it cannot guarantee itwill do so. The Fund may impose a fee upon sale of your shares or may temporarily suspend your ability to sell shares if the Fund��s liquidity falls belowrequired minimums because of market conditions or other factors. An investment in the Fund is not a deposit of a bank and is not insured or guaranteed bythe Federal Deposit Insurance Corporation or any other government agency. The Fund��s sponsor has no legal obligation to provide financial support to theFund, and you should not expect that the sponsor will provide financial support to the Fund at any time.
4 Effective on July 29, 2016, the Goldman Sachs Limited Maturity Obligations Fund was renamed the Goldman Sachs Short-Term Conservative Income Fund.5 Effective on June 20, 2017, the Goldman Sachs Fixed Income Macro Strategies Fund was renamed the Goldman Sachs Strategic Macro Fund.6 Effective on June 20, 2017, the Goldman Sachs Growth and Income Fund was renamed the Goldman Sachs Equity Income Fund.Financial Square FundsSM and Investor FundsSM are registered service marks of Goldman Sachs & Co. LLC.* This list covers open-end funds only. Please visit our website at www.GSAMFUNDS.com to learn about our closed-end funds and exchange-traded funds.
Copyright © 2017 www.secdatabase.com. All Rights Reserved.Please Consider the Environment Before Printing This Document

TRUSTEESCheryl K. Beebe, ChairLawrence HughesJohn F. KillianJames A. McNamaraWestley V. Thompson
OFFICERSJames A. McNamara, PresidentScott M. McHugh Treasurer, Senior Vice Presidentand Principal Financial OfficerJoseph F. DiMaria, Assistant Treasurer and PrincipalAccounting OfficerCaroline L. Kraus, Secretary
GOLDMAN SACHS & CO. LLCDistributor and Transfer Agent
GOLDMAN SACHS ASSET MANAGEMENT, L.P.Investment Adviser
Visit our web site at www.GSAMFUNDS.com to obtain the most recent month-endreturns.
Goldman Sachs Asset Management, L.P., 200 West Street, New York, New York 10282
The reports concerning the Funds included in this shareholder report may contain certain forward-looking statements about the factorsthat may affect the performance of the Funds in the future. These statements are based on Fund management�s predictions andexpectations concerning certain future events and their expected impact on the Funds, such as performance of the economy as a wholeand of specific industry sectors, changes in the levels of interest rates, the impact of developing world events, and other factors that mayinfluence the future performance of the Funds. Management believes these forward-looking statements to be reasonable, although theyare inherently uncertain and difficult to predict. Actual events may cause adjustments in portfolio management strategies from thosecurrently expected to be employed.A description of the policies and procedures that the Funds use to determine how to vote proxies relating to portfolio securities andinformation regarding how Funds voted proxies relating to portfolio securities during the most recent 12-month period ended June 30 isavailable (I) without charge, upon request by calling 1-800-621-2550; and (II) on the Securities and Exchange Commission (��SEC��)web site at http://www.sec.gov.Each Fund files its complete schedule of portfolio holdings with the SEC for the first and third quarters of each fiscal year on Form N-Qs.The Funds� Form N-Qs are available on the SEC�s web site at http://www.sec.gov within 60 days after the Funds� first and third fiscalquarters. The Funds� Form N-Qs may be reviewed and copied at the SEC�s Public Reference Room in Washington, D.C., andinformation on the operation of the Public Reference Room may also be obtained by calling 1-800-SEC-0330. Form N-Qs may beobtained upon request and without charge by calling 1-800-621-2550.Fund holdings and allocations shown are as of April 30, 2017 and may not be representative of future investments. Fund holdings shouldnot be relied on in making investment decisions and should not be construed as research or investment advice regarding particularsecurities. Current and future holdings are subject to risk.Economic and market forecasts presented herein reflect our judgment as of the date of this presentation and are subject to changewithout notice. These forecasts do not take into account the specific investment objectives, restrictions, tax and financial situation or otherneeds of any specific client. Actual data will vary and may not be reflected here. These forecasts are subject to high levels of uncertaintythat may affect actual performance. Accordingly, these forecasts should be viewed as merely representative of a broad range of possibleoutcomes. These forecasts are estimated, based on assumptions, and are subject to significant revision and may change materially aseconomic and market conditions change. Goldman Sachs has no obligation to provide updates or changes to these forecasts. Casestudies and examples are for illustrative purposes only.The portfolio risk management process includes an effort to monitor and manage risk, but does not imply low risk. Diversification does notprotect an investor from market risk and does not ensure a profit. Past correlations are not indicative of future correlations, which mayvary.This material is not authorized for distribution to prospective investors unless preceded or accompanied by a currentProspectus or summary prospectus, if applicable. Investors should consider the Funds�� objective, risks, and charges andexpenses, and read the summary prospectus, if available, and/or the Prospectus carefully before investing or sending money.The summary prospectus, if available, and the Prospectus contain this and other information about each Fund and may beobtained from your authorized dealer or from Goldman Sachs & Co. LLC by calling 1-800-621-2550.© 2017 Goldman Sachs. All rights reserved. 95263-TMPL-06/2017-548405 SMACSAR-17/116
Copyright © 2017 www.secdatabase.com. All Rights Reserved.Please Consider the Environment Before Printing This Document

Goldman Sachs Funds
Semi-Annual Report April 30, 2017
Target Date PortfoliosTarget Date 2020Target Date 2025Target Date 2030Target Date 2035Target Date 2040Target Date 2045Target Date 2050Target Date 2055
Copyright © 2017 www.secdatabase.com. All Rights Reserved.Please Consider the Environment Before Printing This Document

Goldman Sachs Target Date Portfolios∎ TARGET DATE 2020
∎ TARGET DATE 2025
∎ TARGET DATE 2030
∎ TARGET DATE 2035
∎ TARGET DATE 2040
∎ TARGET DATE 2045
∎ TARGET DATE 2050
∎ TARGET DATE 2055
TABLE OF CONTENTS
Market Review 1
Portfolio Management Discussions and Performance Summaries 6
Schedules of Investments 30
Financial Statements 38
Financial Highlights 48
Notes to Financial Statements 64
Other Information 78
NOT FDIC-INSURED May Lose Value No Bank Guarantee
Copyright © 2017 www.secdatabase.com. All Rights Reserved.Please Consider the Environment Before Printing This Document

MARKET REVIEW
Target Date PortfoliosMarket ReviewU.S., international and emerging markets equities posted solid gains during the six-month period ended April 30, 2017 (the �Reporting Period�).Although the broad U.S. fixed income market produced slightly negative returns, spread, or non-government bond, sectors generally advanced.
U.S. EquitiesWhen the Reporting Period began in November 2016, U.S. equities sold off ahead of the presidential election but surged higher after the surprise resulton anticipation of a potentially pro-growth effect from the incoming Administration�s fiscal stimulus plan. In December 2016, the Federal Reserve(�Fed�) raised interest rates 0.25% as had largely been anticipated, and set a more hawkish hike path for 2017, causing equities to decline, albeitmodestly, following the announcement. (Hawkish implies higher interest rates; opposite of dovish.)
In January 2017, U.S. equities rallied to new highs on the prospect of deregulation following executive orders on oil pipelines and on optimism aroundinfrastructure spending after a $1 trillion proposal from Senate Democrats made headlines. Despite political uncertainty and concerns aboutprotectionism, U.S. equities continued to advance in February 2017 amid �risk on� sentiment due to potential U.S. tax reform and deregulation as wellas stronger economic data. In March 2017, the Fed raised interest rates another 0.25%, while maintaining its projections for three rate hikes in 2017.However, a seemingly cautious stance on the future path of monetary tightening from the Fed chair and the presence of a dissenter on the Fed�s policy-making committee led to a dovish market reaction. Political risks subsequently drove U.S. equities lower as Republicans in the House ofRepresentatives struggled to schedule a vote on health care legislation.
The U.S. equity market initially fell in April 2017 as minutes from the Fed�s March meeting indicated policymakers were worried that stocks wereovervalued. Economic activity and inflation data also appeared to be moderating. The U.S. gross domestic product (�GDP�) grew at an annualized rateof just 0.7% during the first calendar quarter, while in April 2017, the Institute for Supply Management manufacturing index edged lower and the CorePersonal Consumption Expenditures (�PCE�) Index (which excludes food and energy expenditures) decreased. However, the unemployment rate fell to4.4%, while the Employment Cost Index (�ECI�) reached its highest level since 2007. (The ECI is a quarterly report from the U.S. Department ofLabor that details changes in the costs of labor, such as wages and benefits.) On the political front, a setback suffered by the House Republicans in theirfirst attempt to pass health care legislation tempered optimism about fiscal policy, but an ambitious tax reform proposal from the White House liftedmarket sentiment. In addition, first-round results in France�s presidential election, which were widely interpreted by investors as pro-market, buoyedglobal equities broadly. Strong first quarter 2017 corporate earnings results also supported equity performance.
For the Reporting Period overall, the broad U.S. equity market, as represented by the S&P 500® Index, returned 13.32%, with all its 11 sectorsgenerating positive returns. Financials, industrials and materials were the best performing sectors in the S&P 500® Index during the Reporting Period.The weakest performing sectors in the S&P 500® Index during the Reporting Period were energy, consumer staples and telecommunication services.
In terms of market capitalization, small-cap stocks outperformed large-cap stocks. The Russell 2000® Index, which measures the small-cap universe,returned 18.37% during the Reporting Period. In the style arena, growth stocks outperformed value stocks overall. The Russell 1000®
1
Copyright © 2017 www.secdatabase.com. All Rights Reserved.Please Consider the Environment Before Printing This Document

MARKET REVIEW
Growth Index, representing large-cap growth stocks, rose 15.23% during the Reporting Period, while the Russell 1000® Value Index, representinglarge-cap value stocks, returned 11.69%.
International EquitiesSoon after the Reporting Period began in early November 2016, international equities rallied on the unexpected outcome of the U.S. presidentialelection. Investors appeared optimistic about the potential pro-growth effect of the incoming Administration�s fiscal stimulus plan. That said, U.S.dollar appreciation against local currencies detracted from their U.S. dollar performance. International equities then saw a strong advance during aneventful December 2016, with the resignation of Italy�s prime minister after voters� rejection of its constitutional referendum, the Fed�s interest ratehike, and the European Central Bank�s (�ECB�) decision to slow its monthly pace of quantitative easing while extending its program to the end of2017.
International equities continued their rally in early January 2017 on the prospect of deregulation following executive orders on oil pipelines andoptimism around infrastructure spending. However, international equity markets subsequently retreated on political uncertainty and protectionismconcerns. In February 2017, international equities were buoyed by �risk on� sentiment owing to potential U.S. tax reform and deregulation as well ason strong economic data. In March 2017, the Fed raised U.S. interest rates for the third time since the 2008 global financial crisis. However, aseemingly cautious stance on the future path of monetary tightening from the Fed chair and the presence of a dissenter on the Fed�s policy-makingcommittee led to a dovish market reaction and the appreciation of the Japanese yen, despite the Bank of Japan (�BoJ�) maintaining its policy rate.Meanwhile, the ECB kept its monetary policy unchanged at its March 2017 meeting but revised its economic growth and inflation forecasts upwards.Equity markets interpreted the positive economic assessment as hawkish, sparking concerns around the sequencing of the ECB�s policy steps �namely, whether interest rates might rise before quantitative easing ends.
In April 2017, first-round results in France�s presidential election, which were widely interpreted by investors as pro-market, buoyed global equitiesbroadly. Strong first quarter 2017 corporate earnings results and a firm economic backdrop were also supportive for equity markets. A health care billsetback tempered U.S. policy optimism, but an ambitious tax reform proposal from the White House subsequently lifted market sentiment. Japaneseequities were initially hurt by a strong yen, which rose amid the political uncertainty and geopolitical tensions around the world. Various geopoliticalevents, such as a North Korean ballistic missile launch, a U.S. airstrike in Syria and terrorism in Russia all contributed negatively to investor sentiment.However, Japanese equities bounced back as yen strength faded with recovering global risk appetite.
For the Reporting Period as a whole, international equities, as measured by the MSCI Europe, Australasia, Far East (�EAFE�) Index (Net, USD,Unhedged) (the �MSCI EAFE Index�), posted a return of 11.47%.* Financials, information technology and industrials were the best performingsectors in the MSCI EAFE Index. The weakest performing sectors in the MSCI EAFE Index during the Reporting Period were telecommunicationservices, utilities and real estate.
From a country perspective, China, Austria and Sweden were the best performing individual constituents of the MSCI EAFE Index during theReporting Period. New Zealand was the weakest individual country constituent in the MSCI EAFE Index during the Reporting Period and the only oneto post a negative return, followed by Israel, Japan and Norway.
*All index returns are expressed in U.S. dollar terms.
2
Copyright © 2017 www.secdatabase.com. All Rights Reserved.Please Consider the Environment Before Printing This Document

MARKET REVIEW
Emerging Markets EquitiesIn early November 2016, soon after the Reporting Period started, emerging markets equities fell sharply following the unexpected outcome of the U.S.presidential election due to headwinds from the resulting rise in U.S. Treasury rates and the U.S. dollar. Concerns of protectionist U.S. trade andimmigration policies also weighed on emerging markets equities. In December 2016, emerging markets equities remained weak, as the Fed hikedinterest rates 0.25% and set a more hawkish tone for its 2017 hike path.
Despite the political uncertainty and protectionism concerns arising from the new U.S. Administration in January 2017, emerging markets equitieswere buoyed by optimism about economic growth, owing to strong economic data and rising metal and soft commodity prices. February 2017 wasanother month of positive performance for emerging markets equities, as investors continued to assess the outlook for potential tax reform,deregulation and other fiscal policies out of the new U.S. Administration. Indian equities were a standout performer, as a pragmatic Union Budget anda strong third quarter 2016 GDP number were supportive of risk sentiment, particularly following India�s November 2016 demonetization move. (OnNovember 8, 2016, India�s prime minister announced that 86% of the country�s currency would be rendered null and void in 50 days. It was posited asa move to crackdown on corruption and the country�s booming under-regulated and virtually untaxed grassroots economy, but was also being used as adriver to get millions of Indians onto the country�s official economic grid � many for the first time. The crackdown saw all 500 and 1,000 rupee notes �the country�s most popular currency denominations � removed from circulation, while a new 2,000 rupee note was added. Five hundred rupees isroughly the equivalent of $7.50.)
In March 2017, the Fed raised interest rates for the third time since the 2008 global financial crisis. However, a seemingly cautious stance on its futurepath of monetary tightening from the Fed chair and the presence of a dissenter on the Fed�s policy-making committee led to a dovish market reaction.Mexico was the best performing country within emerging markets equities in March 2017, buoyed by peso appreciation following a fourth consecutiverate hike by its central bank, Banxico.
In April 2017, emerging markets equities rallied, as global risk sentiment was buoyed by the results of the first round in the French presidentialelection, which were widely interpreted as pro-market by investors. Emerging markets equities were also driven by a weak U.S. dollar during themonth. Despite tighter regulation in its banking sector, Chinese equities were buoyed by a strong first quarter 2017 GDP growth rate, which came in at6.9% year over year and beat consensus expectations. Turkish equities saw a strong rally, as the Turkish lira strengthened on the back of a successfulconstitutional reform referendum. Russian equities fell with a depreciating Russian ruble, as the country�s central bank cut its policy rate 0.50%. LatinAmerican equity markets were the underperformers among emerging markets stocks despite continued easing from their central banks, as they facedheadwinds from declining commodity prices.
Emerging markets equities, as represented by the MSCI Emerging Markets Index (Net, USD, Unhedged) (the �MSCI EM Index�), generated a returnof 8.88%* during the Reporting Period. The best performing sectors in the MSCI EM Index were information technology, materials and financials.Health care, utilities and consumer staples were the weakest sectors in the MSCI EM Index during the Reporting Period, with health care the onlysector in the MSCI EM Index to post a negative return.
*All index returns are expressed in U.S. dollar terms.
3
Copyright © 2017 www.secdatabase.com. All Rights Reserved.Please Consider the Environment Before Printing This Document

MARKET REVIEW
From a country perspective, Poland, Greece and South Korea were the best performing individual constituents of the MSCI EM Index for theReporting Period. Conversely, Egypt was by far the weakest individual country constituent of the MSCI EM Index, followed at some distance by thePhilippines, Indonesia and the Czech Republic, which also significantly lagged the MSCI EM Index during the Reporting Period.
Fixed Income MarketsDuring November 2016, when the Reporting Period began, spread sectors were volatile. Investor sentiment was dominated by the results of the U.S.presidential election, which appeared to change expectations for future fiscal and regulatory policy. More specifically, investors appeared to anticipatefiscal stimulus, a looser regulatory agenda and a faster pace of Fed monetary policy tightening. Global interest rates rose, and the U.S. dollarappreciated versus other developed markets and emerging markets currencies. Meanwhile, the U.S. economy continued to strengthen, with strong jobsgrowth and increased consumer spending reported. In December 2016, spread sectors advanced, outpacing U.S. Treasury securities. Mid-month, theFed hiked short-term interest rates, which resulted in a further rise in U.S. Treasury yields, with a notable increase in shorter-term yields and additionalappreciation in the U.S. dollar. In Europe, the ECB announced it would reduce its monthly pace of asset purchases starting in April 2017 but stated itwould extend its quantitative easing program to the end of 2017. On the political front, Italy voted to reject its constitutional reforms, while theoutcome of Austria�s election defied the populist tide that had claimed victories in the U.K. and U.S. during 2016. In the fourth calendar quarteroverall, the Japanese economy expanded by 1.2%, annualized, from the previous calendar quarter.
During the first quarter of 2017, government bond sectors sold off and spread sectors generally posted gains. Investors focused on the prospect of pro-growth policies from the new U.S. Administration, which helped boost business and consumer sentiment to near record levels, and also on the positiveimpact of earlier fiscal stimulus in China. Global purchasing managers� indices pointed to solid expansion across the largest global economies, the U.S.in particular. In Europe, economic data strengthened and political risk remained contained, as markets weathered the official start of Brexitnegotiations. (Brexit refers to the U.K.�s efforts to exit the European Union.) The far right lost to centrists in the Netherlands� election. In France, pollsreflected a relatively low chance of victory for the far-right candidate in its then-upcoming presidential vote. Monetary policy presented few surprisesduring the first calendar quarter, as the ECB, BoJ and Bank of England kept policy unchanged. In March 2017, the ECB raised its economic growthand inflation forecast. The same month, Fed policymakers hiked interest rates. Minutes from the meeting suggested the Fed might start reducing itsbalance sheet near the end of 2017. The U.S. dollar weakened versus many global currencies during the first calendar quarter.
In April 2017, spread sectors generated positive returns. Investor sentiment was buoyed by the results of the first round of voting in France�spresidential election, a strong start to the corporate earnings season and optimism about the potential of fiscal expansion in the U.S. Although U.S.economic activity and inflation data moderated during the month, the labor market remained strong, with employment gains and steady wage growth.In Europe, positive economic data partly offset the impact on the European credit markets of reduced ECB asset purchases. Meanwhile, U.K. marketsshowed little reaction to the commencement of the Brexit process. The U.S. dollar weakened versus other developed markets and emerging marketscurrencies during April 2017.
4
Copyright © 2017 www.secdatabase.com. All Rights Reserved.Please Consider the Environment Before Printing This Document

MARKET REVIEW
The broad U.S. fixed income market, as represented by the Bloomberg Barclays U.S. Aggregate Bond Index, produced a return of -0.67% for theReporting Period overall. However, spreads sectors generally advanced. High yield corporate bonds and sovereign emerging markets debt recordedsolid gains, outperforming U.S. Treasuries. Investment grade corporate bonds also outpaced U.S. Treasuries. In addition, agency securities, commercialmortgage-backed securities, asset-backed securities and mortgage-backed securities outperformed U.S. Treasuries, though more modestly. The U.S.Treasury yield curve flattened slightly during the Reporting Period, as yields on longer- and intermediate-term maturities rose less than yields onshorter-term maturities. The yield on the bellwether 10-year U.S. Treasury rose approximately 16 basis points to end the Reporting Period at 1.99%. (Abasis point is 1/100th of a percentage point. A flattening yield curve is one wherein the differential in yields between longer-term and shorter-termmaturities narrows.)
Looking AheadAt the end of the Reporting Period, we believed the macro environment remained supportive of fixed income assets geared to economic growth. In ourview, developed markets are leading a synchronized global expansion, and financial conditions overall are easy, as evidenced by the strongperformance of the equities markets and the accessibility of credit. That said, at the end of the Reporting Period, we thought investors might havebecome complacent. In the U.S., sentiment is running ahead of hard data, while interest rates are, in our view, too low and financial conditions tooloose for the Fed�s projected policy tightening. In addition, we did not see much risk premium overall in the fixed income markets at the end of theReporting Period that would reflect the potential impact of central bank tapering of quantitative easing measures, political strains in Europe or risks inChina�s financial sector. Nevertheless, we do not anticipate an upheaval in the markets in the near term.
5
Copyright © 2017 www.secdatabase.com. All Rights Reserved.Please Consider the Environment Before Printing This Document

PORTFOLIO RESULTS
Goldman Sachs Target Date 2020 Portfolio, GoldmanSachs Target Date 2025 Portfolio, Goldman Sachs TargetDate 2030 Portfolio, Goldman Sachs Target Date 2035Portfolio, Goldman Sachs Target Date 2040 Portfolio,Goldman Sachs Target Date 2045 Portfolio, GoldmanSachs Target Date 2050 Portfolio and Goldman SachsTarget Date 2055 Portfolio
Investment Process and Principal StrategiesThe Goldman Sachs Target Date 2020 Portfolio, the Goldman Sachs Target Date 2025 Portfolio, the Goldman Sachs Target Date 2030 Portfolio,the Goldman Sachs Target Date 2035 Portfolio, the Goldman Sachs Target Date 2040 Portfolio, the Goldman Sachs Target Date 2045 Portfolio,the Goldman Sachs Target Date 2050 Portfolio and the Goldman Sachs Target Date 2055 Portfolio (collectively, the �Portfolios� or individually,a �Portfolio�) seek to provide capital appreciation and current income consistent with each respective Portfolio�s current asset allocation. ThePortfolios employ asset allocation strategies designed for investors who plan to retire and to begin gradually withdrawing their investmentbeginning in approximately 2020, 2025, 2030, 2035, 2040, 2045, 2050 and 2055 (respectively, the �Target Dates�). The Portfolios generally seekto achieve their investment objective by investing in shares of exchange-traded funds (�ETFs�) and other registered investment companies(collectively, the �Underlying Funds�), according to an asset allocation strategy developed by Madison Asset Management, LLC, the sub-adviser, which is unaffiliated with Goldman Sachs Asset Management, L.P., the investment adviser for the Portfolios.
Portfolio Management Discussion and AnalysisBelow, the Madison Asset Management, LLC portfolio management team, the Portfolios�� sub-adviser, discusses the Portfolios��performance and positioning for the six-month period ended April 30, 2017 (the ��Reporting Period��).
Q How did the Portfolios perform during the Reporting Period?
A Goldman Sachs Target Date 2020 Portfolio � During the Reporting Period, the Target Date 2020 Portfolio�s Class A, Institutional, Service, IR, Rand R6 Shares generated cumulative total returns of 3.60%, 3.75%, 3.46%, 3.69%, 3.41% and 3.75%, respectively. These returns compare to the5.83% cumulative total return of the Portfolio�s benchmark, the S&P Target Date To 2020 Index (Total Return, Unhedged, USD) during the sameperiod.
Goldman Sachs Target Date 2025 Portfolio � During the Reporting Period, the Target Date 2025 Portfolio�s Class A, Institutional, Service, IR, Rand R6 Shares generated cumulative total returns of 5.69%, 5.94%, 5.75%, 5.88%, 5.60% and 6.04%, respectively. These returns compare to the6.85% cumulative total return of the Portfolio�s benchmark, the S&P Target Date To 2025 Index (Total Return, Unhedged, USD) during the sameperiod.
Goldman Sachs Target Date 2030 Portfolio � During the Reporting Period, the Target Date 2030 Portfolio�s Class A, Institutional, Service, IR, Rand R6 Shares generated cumulative total returns of 7.01%, 7.20%, 7.01%, 7.14%, 6.85% and 7.21%, respectively. These returns compare to the7.79% cumulative total return of the Portfolio�s benchmark, the S&P Target Date To 2030 Index (Total Return, Unhedged, USD) during the sameperiod.
Goldman Sachs Target Date 2035 Portfolio � During the Reporting Period, the Target Date 2035 Portfolio�s Class A, Institutional, Service, IR, Rand R6 Shares generated cumulative total returns of 7.59%, 7.95%, 7.66%, 7.79%, 7.50% and 7.95%, respectively. These returns compare to the8.56% cumulative total return of the Portfolio�s benchmark, the S&P Target Date To 2035 Index (Total Return, Unhedged, USD) during the sameperiod.
Goldman Sachs Target Date 2040 Portfolio � During the Reporting Period, the Target Date 2040 Portfolio�s Class A,
6
Copyright © 2017 www.secdatabase.com. All Rights Reserved.Please Consider the Environment Before Printing This Document

PORTFOLIO RESULTS
Institutional, Service, IR, R and R6 Shares generated cumulative total returns of 8.36%, 8.72%, 8.31%, 8.55%, 8.26% and 8.61%, respectively.These returns compare to the 9.42% cumulative total return of the Portfolio�s benchmark, the S&P Target Date To 2040 Index (Total Return,Unhedged, USD) during the same period.
Goldman Sachs Target Date 2045 Portfolio � During the Reporting Period, the Target Date 2045 Portfolio�s Class A, Institutional, Service, IR, Rand R6 Shares generated cumulative total returns of 8.95%, 9.20%, 8.92%, 9.15%, 8.87% and 9.31%, respectively. These returns compare to the10.04% cumulative total return of the Portfolio�s benchmark, the S&P Target Date To 2045 Index (Total Return, Unhedged, USD) during the sameperiod.
Goldman Sachs Target Date 2050 Portfolio � During the Reporting Period, the Target Date 2050 Portfolio�s Class A, Institutional, Service, IR, Rand R6 Shares generated cumulative total returns of 9.77%, 10.03%, 9.74%, 9.97%, 9.68% and 10.03%, respectively. These returns compare to the10.57% cumulative total return of the Portfolio�s benchmark, the S&P Target Date To 2050 Index (Total Return, Unhedged, USD) during the sameperiod.
Goldman Sachs Target Date 2055 Portfolio � During the Reporting Period, the Target Date 2055 Portfolio�s Class A, Institutional, Service, IR, Rand R6 Shares generated cumulative total returns of 10.26%, 10.48%, 10.30%, 10.43%, 10.14% and 10.48%, respectively. These returns compare tothe 11.02% cumulative total return of the Portfolio�s benchmark, the S&P Target Date To 2055 Index (Total Return, Unhedged, USD) during thesame period.
Q What key factors affected the Portfolios�� performance during the Reporting Period?
A During the Reporting Period, the Portfolios benefited from our asset allocation decisions to favor certain asset classes through the UnderlyingFunds. Security selection produced mixed results during the Reporting Period.
Q How did the Portfolios�� asset allocations affect performance during the Reporting Period?
A Within the Portfolios� strategic allocations, our preference for U.S. equities over international equities added to returns, as U.S. stocks outperformedinternational stocks during the Reporting Period. Within U.S. equities, the Portfolios benefited from our decision to modestly increase tacticalexposure to U.S. small-cap stocks. Tactical overweights to the regional banking and homebuilders industries and a tactical overweight to companiesin the industrials sector also contributed positively to performance. Conversely, the Portfolios� allocations to dividend-paying stocks, which tend tobe interest-rate sensitive, detracted from results, as interest rates rose during the Reporting Period.
Within international equities, our slight preference for the developed markets versus the emerging markets helped the Portfolios� performance.More specifically, the Portfolios benefited from their overweighted exposure to European equities. On the other hand, allocations to exchange-tradedfunds (�ETFs�) that emphasize lower volatility detracted from performance.
Within fixed income, the Portfolios� bias toward U.S. Treasury securities, especially those of longer duration, hindered results. However, tacticalallocations to high yield loans and an overweight in corporate credit added to returns as spreads (or yield differentials) narrowed between U.S.Treasury securities and corporate bonds of comparable maturity. Corporate bond prices held up better than U.S. Treasury prices as interest rates roseduring the Reporting Period, while high yield loans tend to be less sensitive than other asset classes to rising interest rates.
Our tactical allocation to commodities versus U.S. equities detracted slightly from the Portfolios� performance during the Reporting Period.
7
Copyright © 2017 www.secdatabase.com. All Rights Reserved.Please Consider the Environment Before Printing This Document

PORTFOLIO RESULTS
Q Did the Underlying Funds help or hurt the Portfolios�� performance during the Reporting Period?
A During the Reporting Period, the Portfolios� Underlying Funds generated mixed results.
Within the Portfolios� equity-related Underlying Funds, tactical overweights to certain sectors added to overall performance. More specifically, theSPDR® S&P® Regional Banking ETF, the SPDR® S&P® Homebuilders ETF and the Industrial Select Sector SPDR® Fund made the largestpositive contributions to the Portfolios� overall performance. In addition, the Portfolios benefited from iShares Core® S&P Mid-Cap ETF�sapproximately 40% weighting in U.S. small-cap stocks. Within international equities, the Vanguard FTSE Europe ETF and the WisdomTree EuropeHedge Equity Fund added to returns. Detractors included the Schwab U.S. Dividend Equity ETF. The decision to manage downside risk bypurchasing low volatility ETFs rather than pure broad market ETFs detracted slightly from performance amid strong �risk on� market sentimentduring the Reporting Period. ETFs that emphasized lower volatility were iShares® Edge MSCI Min Vol EAFE ETF and iShares® Edge MSCI MinVol Emerging Markets ETF.
Of the Portfolios� fixed income-related Underlying Funds, the PowerShares Senior Loan ETF and the Vanguard Short-Term Corporate Bond ETFbolstered returns. Conversely, exposures to the iShares® 7-10 Year Treasury Bond ETF and the iShares® 20+ Year Treasury Bond ETF hurtperformance.
The PowerShares DB Gold ETF, representing the Portfolios� tactical allocation to commodities, generated negative returns, as interest rates roseand gold prices fell during the Reporting Period.
Q How did the Portfolios use derivatives and similar instruments during the Reporting Period?
A The Portfolios do not directly invest in derivatives. However, during the Reporting Period, some of the Underlying Funds may have used derivativesto allow them to track their respective benchmark indices with more precision. These included options, forwards, futures, swaps, structuredsecurities and other derivative instruments.
Q What changes did you make to the Portfolios�� strategic allocations during the Reporting Period?
A During the Reporting Period, we decided to increase the Portfolios� strategic allocations to international equities and to reduce their strategicallocations to U.S. equities. As uncertainty about Brexit eased during the Reporting Period, we believed international equities had become moreattractive than U.S. equities. (Brexit refers to the U.K.�s efforts to exit the European Union.)
Q What is the Portfolios�� tactical view and strategy for the months ahead?
A In the near term, we expect to see low returns from virtually all asset classes. Therefore, we believe managing risk is likely to be of greaterimportance going forward. We plan to maintain a defensive posture in the Portfolios, with a continued emphasis on seeking to generate strong risk-adjusted returns. Overall, at the end of the Reporting Period, the Portfolios� strategic allocations were generally closer to neutral relative to the glidepaths of their respective Target Dates than they were at the beginning of the Reporting Period. (Glide path refers to a formula that defines the assetallocation mix of a target date portfolio, based on the number of years to the target date. The glide path creates an asset allocation that becomes moreconservative the closer a portfolio gets to the target date.)
8
Copyright © 2017 www.secdatabase.com. All Rights Reserved.Please Consider the Environment Before Printing This Document

FUND BASICS
Target Date 2020 Portfolioas of April 30, 2017
PERFORMANCE REVIEW
November 1, 2016��April 30, 2017Portfolio Total Return
(based on NAV)1
S&P Target Date To2020 (Total Return,Unhedged, USD)2
Class A 3.60 % 5.83 %Institutional 3.75 5.83Service 3.46 5.83
Copyright © 2017 www.secdatabase.com. All Rights Reserved.Please Consider the Environment Before Printing This Document

Class IR 3.69 5.83Class R 3.41 5.83Class R6 3.75 5.83
1 The net asset value (�NAV�) represents the net assets of the class of the Portfolio (ex-dividend) divided by the total number of shares of the class outstanding. ThePortfolio�s performance assumes the reinvestment of dividends and other distributions. The Portfolio�s performance does not reflect the deduction of any applicablesales charges.
2 The S&P Target Date Index Series is a component of the S&P Target Allocation Index Family, and is related to the S&P Target Risk Index Series. Both series arebroadly representative of the investment opportunity available to investors in target risk and target date funds, respectively. The index series reflects the marketconsensus for asset allocations for different target date horizons. In particular, each index is representative of the investment opportunity available to investors for thecorresponding target date horizon, with asset class exposures driven by a survey of available target date funds for that horizon.
Effective August 22, 2016, the Madison Target Retirement 2020 Fund (the �Predecessor Fund�) was reorganized into the Portfolio. The Portfoliohas assumed the Predecessor Fund�s historical performance. The returns for the Predecessor Fund for periods prior to August 29, 2014 reflect theperformance of the Madison Target Retirement 2020 Fund�s Class I Shares, a series of Ultra Series Fund (the �Ultra Predecessor Fund�). As ofAugust 29, 2014, the inception date of the Predecessor Fund, the Ultra Predecessor Fund exchanged in kind substantially all of its portfolioholdings for Class R6 shares of the Predecessor Fund. As a result, the Predecessor Fund assumed the performance of the Ultra Predecessor Fund.Performance reflects applicable fee waivers and/or expense limitations in effect during the periods shown. Past performance does not guaranteefuture results, which may vary. The value of investments and the income derived from investments will fluctuate and can go down as well as up.A loss of principal may occur.
The returns set forth in the table above represent past performance. Past performance does not guarantee future results. The Portfolio��sinvestment return and principal value will fluctuate so that an investor��s shares, when redeemed, may be worth more or less than theiroriginal cost. Current performance may be lower or higher than the performance quoted above. Please visit our web site atwww.GSAMFUNDS.com to obtain the most recent month-end returns. Performance reflects fee waivers and/or expense limitations in effect.In their absence, performance would be reduced. Returns do not reflect the deduction of taxes that a shareholder would pay on Portfoliodistributions or the redemption of Portfolio shares. Returns less than 12 months are cumulative, not annualized.
9
Copyright © 2017 www.secdatabase.com. All Rights Reserved.Please Consider the Environment Before Printing This Document
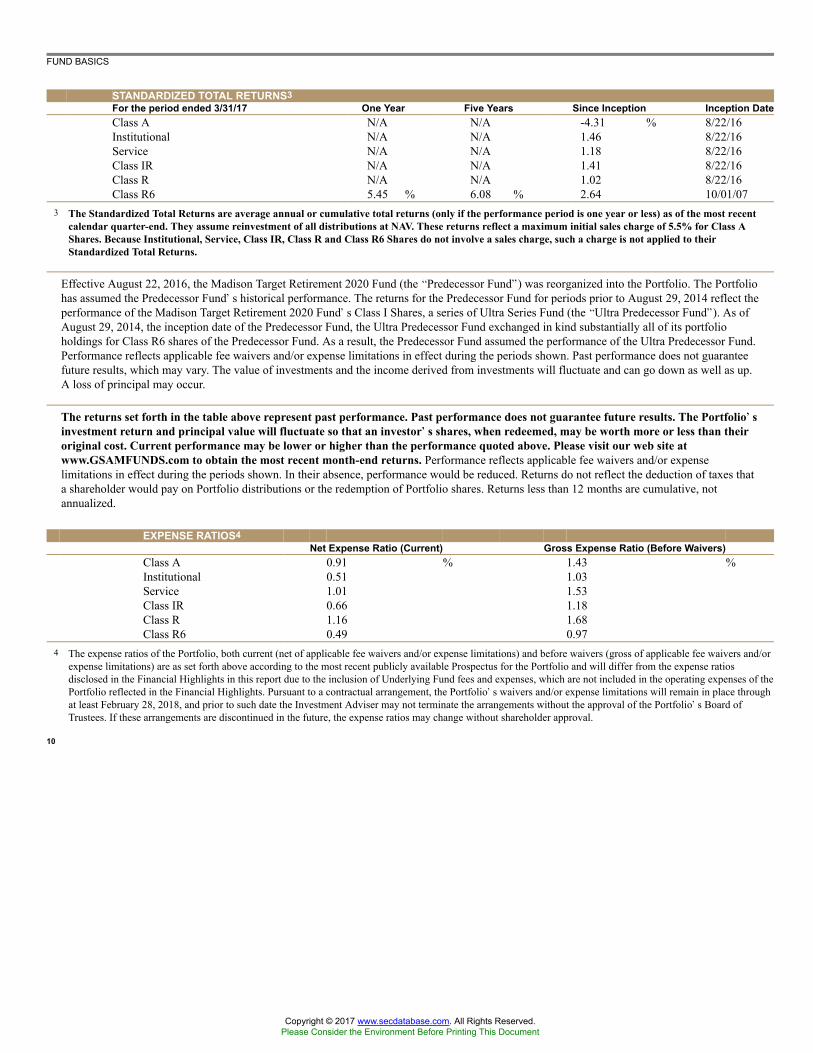
FUND BASICS
STANDARDIZED TOTAL RETURNS3For the period ended 3/31/17 One Year Five Years Since Inception Inception DateClass A N/A N/A -4.31 % 8/22/16Institutional N/A N/A 1.46 8/22/16Service N/A N/A 1.18 8/22/16Class IR N/A N/A 1.41 8/22/16Class R N/A N/A 1.02 8/22/16Class R6 5.45 % 6.08 % 2.64 10/01/07
3 The Standardized Total Returns are average annual or cumulative total returns (only if the performance period is one year or less) as of the most recentcalendar quarter-end. They assume reinvestment of all distributions at NAV. These returns reflect a maximum initial sales charge of 5.5% for Class AShares. Because Institutional, Service, Class IR, Class R and Class R6 Shares do not involve a sales charge, such a charge is not applied to theirStandardized Total Returns.
Effective August 22, 2016, the Madison Target Retirement 2020 Fund (the �Predecessor Fund�) was reorganized into the Portfolio. The Portfoliohas assumed the Predecessor Fund�s historical performance. The returns for the Predecessor Fund for periods prior to August 29, 2014 reflect theperformance of the Madison Target Retirement 2020 Fund�s Class I Shares, a series of Ultra Series Fund (the �Ultra Predecessor Fund�). As ofAugust 29, 2014, the inception date of the Predecessor Fund, the Ultra Predecessor Fund exchanged in kind substantially all of its portfolioholdings for Class R6 shares of the Predecessor Fund. As a result, the Predecessor Fund assumed the performance of the Ultra Predecessor Fund.Performance reflects applicable fee waivers and/or expense limitations in effect during the periods shown. Past performance does not guaranteefuture results, which may vary. The value of investments and the income derived from investments will fluctuate and can go down as well as up.A loss of principal may occur.
The returns set forth in the table above represent past performance. Past performance does not guarantee future results. The Portfolio��sinvestment return and principal value will fluctuate so that an investor��s shares, when redeemed, may be worth more or less than theiroriginal cost. Current performance may be lower or higher than the performance quoted above. Please visit our web site atwww.GSAMFUNDS.com to obtain the most recent month-end returns. Performance reflects applicable fee waivers and/or expenselimitations in effect during the periods shown. In their absence, performance would be reduced. Returns do not reflect the deduction of taxes thata shareholder would pay on Portfolio distributions or the redemption of Portfolio shares. Returns less than 12 months are cumulative, notannualized.
EXPENSE RATIOS4Net Expense Ratio (Current) Gross Expense Ratio (Before Waivers)
Class A 0.91 % 1.43 %Institutional 0.51 1.03Service 1.01 1.53Class IR 0.66 1.18Class R 1.16 1.68Class R6 0.49 0.97
4 The expense ratios of the Portfolio, both current (net of applicable fee waivers and/or expense limitations) and before waivers (gross of applicable fee waivers and/orexpense limitations) are as set forth above according to the most recent publicly available Prospectus for the Portfolio and will differ from the expense ratiosdisclosed in the Financial Highlights in this report due to the inclusion of Underlying Fund fees and expenses, which are not included in the operating expenses of thePortfolio reflected in the Financial Highlights. Pursuant to a contractual arrangement, the Portfolio�s waivers and/or expense limitations will remain in place throughat least February 28, 2018, and prior to such date the Investment Adviser may not terminate the arrangements without the approval of the Portfolio�s Board ofTrustees. If these arrangements are discontinued in the future, the expense ratios may change without shareholder approval.
10
Copyright © 2017 www.secdatabase.com. All Rights Reserved.Please Consider the Environment Before Printing This Document

FUND BASICS
TOP TEN HOLDINGS AS OF 4/30/175Holding % of Net Assets Line of BusinessVanguard Short-Term Corporate Bond ETF 15.6 % Exchange Traded FundsiShares 7-10 Year Treasury Bond ETF 12.6 Exchange Traded FundsiShares Core S&P 500 ETF 12.1 Exchange Traded FundsiShares 3-7 Year Treasury Bond ETF 10.6 Exchange Traded FundsSchwab U.S. TIPs ETF 7.0 Exchange Traded FundsRidgeWorth Seix Floating Rate High Income Fund 5.5 Investment CompanyVanguard Long-Term Corporate Bond ETF 5.0 Exchange Traded FundsVanguard Short-Term Inflation-Protected Securities 4.5 Exchange Traded FundsETFVanguard FTSE All-World ex-U.S. ETF 4.0 Exchange Traded FundsiShares 20+ Year Treasury Bond ETF 3.0 Exchange Traded Funds
5 The top 10 holdings may not be representative of the Portfolio�s future investments.
PORTFOLIO COMPOSITION6Holding As of April 30, 2017 As of October 31, 2016Bond Funds 63.9 % 60.6 %Stock Funds 20.8 27.4Foreign Stock Funds 9.8 7.4Alternative Funds 2.0 2.5Investment Companies 0.0 2.0
6 The Portfolio is actively managed and, as such, its composition may differ over time. The percentage shown for each fund type reflects the value of that fund type asa percentage of the Portfolio�s net assets. Figures above may not sum to 100% due to rounding and/or exclusion of other assets and liabilities.
11
Copyright © 2017 www.secdatabase.com. All Rights Reserved.Please Consider the Environment Before Printing This Document
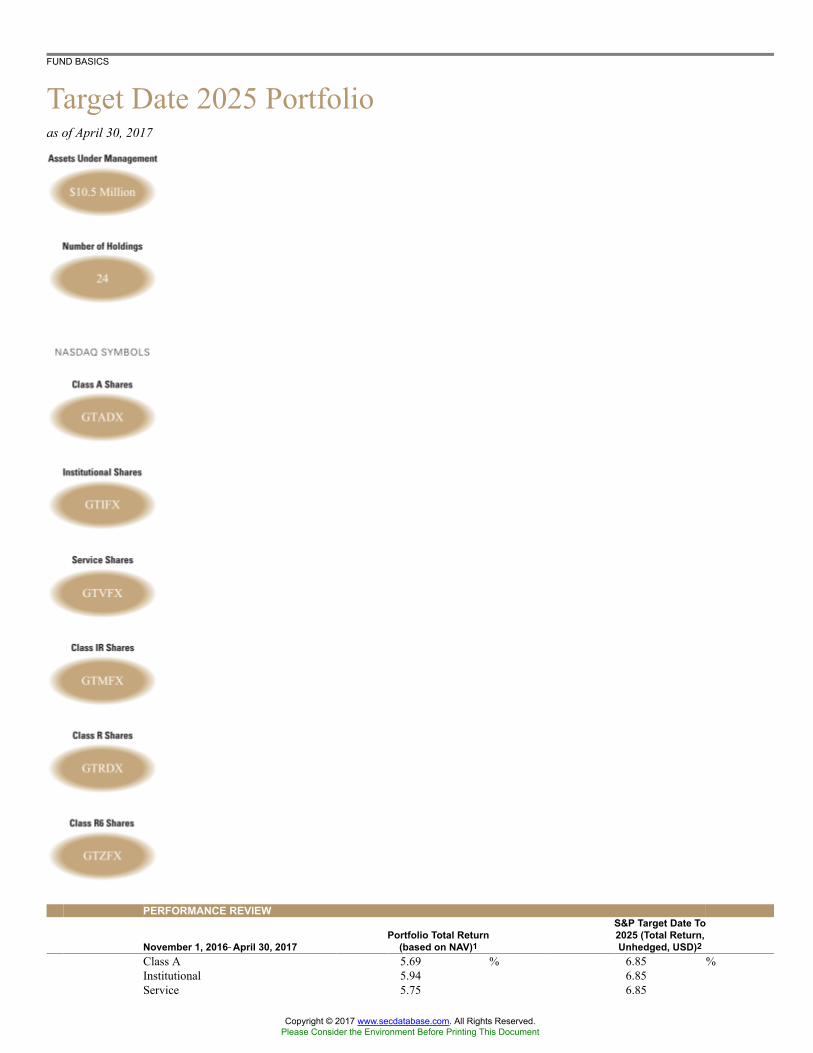
FUND BASICS
Target Date 2025 Portfolioas of April 30, 2017
PERFORMANCE REVIEW
November 1, 2016��April 30, 2017Portfolio Total Return
(based on NAV)1
S&P Target Date To2025 (Total Return,Unhedged, USD)2
Class A 5.69 % 6.85 %Institutional 5.94 6.85Service 5.75 6.85
Copyright © 2017 www.secdatabase.com. All Rights Reserved.Please Consider the Environment Before Printing This Document

Class IR 5.88 6.85Class R 5.60 6.85Class R6 6.04 6.85
1 The net asset value (�NAV�) represents the net assets of the class of the Portfolio (ex-dividend) divided by the total number of shares of the class outstanding. ThePortfolio�s performance assumes the reinvestment of dividends and other distributions. The Portfolio�s performance does not reflect the deduction of any applicablesales charges.
2 The S&P Target Date Index Series is a component of the S&P Target Allocation Index Family, and is related to the S&P Target Risk Index Series. Both series arebroadly representative of the investment opportunity available to investors in target risk and target date funds, respectively. The index series reflects the marketconsensus for asset allocations for different target date horizons. In particular, each index is representative of the investment opportunity available to investors for thecorresponding target date horizon, with asset class exposures driven by a survey of available target date funds for that horizon.
STANDARDIZED TOTAL RETURNS3For the period ended 3/31/17 Since Inception Inception DateClass A -2.75 % 8/22/16Institutional 3.23 8/22/16Service 2.84 8/22/16Class IR 3.07 8/22/16Class R 2.79 8/22/16Class R6 3.23 8/22/16
3 The Standardized Total Returns are average annual or cumulative total returns (only if the performance period is one year or less) as of the most recentcalendar quarter-end. They assume reinvestment of all distributions at NAV. These returns reflect a maximum initial sales charge of 5.5% for Class AShares. Because Institutional, Service, Class IR, Class R and Class R6 Shares do not involve a sales charge, such a charge is not applied to theirStandardized Total Returns.
The returns set forth in the tables above represent past performance. Past performance does not guarantee future results. ThePortfolio��s investment return and principal value will fluctuate so that an investor��s shares, when redeemed, may be worth more or lessthan their original cost. Current performance may be lower or higher than the performance quoted above. Please visit our web site atwww.GSAMFUNDS.com to obtain the most recent month-end returns. Performance reflects applicable fee waivers and/or expenselimitations in effect during the periods shown. In their absence, performance would be reduced. Returns do not reflect the deduction of taxes thata shareholder would pay on Portfolio distributions or the redemption of Portfolio shares. Returns less than 12 months are cumulative, notannualized.
12
Copyright © 2017 www.secdatabase.com. All Rights Reserved.Please Consider the Environment Before Printing This Document

FUND BASICS
EXPENSE RATIOS4Net Expense Ratio (Current) Gross Expense Ratio (Before Waivers)
Class A 0.91 % 3.20 %Institutional 0.51 2.80Service 1.01 3.30Class IR 0.66 2.95Class R 1.16 3.45Class R6 0.49 2.80
4 The expense ratios of the Portfolio, both current (net of applicable fee waivers and/or expense limitations) and before waivers (gross of applicable fee waivers and/orexpense limitations) are as set forth above according to the most recent publicly available Prospectus for the Portfolio and will differ from the expense ratiosdisclosed in the Financial Highlights in this report due to the inclusion of Underlying Fund fees and expenses, which are not included in the operating expenses of thePortfolio reflected in the Financial Highlights. Pursuant to a contractual arrangement, the Portfolio�s waivers and/or expense limitations will remain in place throughat least February 28, 2018, and prior to such date the Investment Adviser may not terminate the arrangements without the approval of the Portfolio�s Board ofTrustees. If these arrangements are discontinued in the future, the expense ratios may change without shareholder approval.
TOP TEN HOLDINGS AS OF 4/30/175Holding % of Net Assets Line of BusinessiShares Core S&P 500 ETF 19.5 % Exchange Traded FundsVanguard Short-Term Corporate Bond ETF 11.0 Exchange Traded FundsiShares 7-10 Year Treasury Bond ETF 10.6 Exchange Traded FundsVanguard FTSE All-World ex-U.S. ETF 6.5 Exchange Traded FundsiShares 3-7 Year Treasury Bond ETF 6.0 Exchange Traded FundsSchwab U.S. TIPs ETF 6.0 Exchange Traded FundsRidgeWorth Seix Floating Rate High Income Fund 5.0 Investment CompanyiShares Core S&P Mid-Cap ETF 4.5 Exchange Traded FundsiShares 20+ Year Treasury Bond ETF 3.0 Exchange Traded FundsVanguard FTSE Europe ETF 3.0 Exchange Traded Funds
5 The top 10 holdings may not be representative of the Portfolio�s future investments.
PORTFOLIO COMPOSITION6Holding As of April 30, 2017 As of October 31, 2016Bond Funds 46.1 % 42.2 %Stock Funds 32.3 37.9Foreign Stock Funds 15.3 12.3Alternative Funds 2.0 2.5Investment Companies 0.5 0.5
6 The Portfolio is actively managed and, as such, its composition may differ over time. The percentage shown for each fund type reflects the value of that fund type asa percentage of the Portfolio�s net assets. Figures above may not sum to 100% due to rounding and/or exclusion of other assets and liabilities.
13
Copyright © 2017 www.secdatabase.com. All Rights Reserved.Please Consider the Environment Before Printing This Document

FUND BASICS
Target Date 2030 Portfolioas of April 30, 2017
PERFORMANCE REVIEW
November 1, 2016��April 30, 2017Portfolio Total Return
(based on NAV)1
S&P Target Date To2030 (Total Return,Unhedged, USD)2
Class A 7.01 % 7.79 %Institutional 7.20 7.79Service 7.01 7.79
Copyright © 2017 www.secdatabase.com. All Rights Reserved.Please Consider the Environment Before Printing This Document

Class IR 7.14 7.79Class R 6.85 7.79Class R6 7.21 7.79
1 The net asset value (�NAV�) represents the net assets of the class of the Portfolio (ex-dividend) divided by the total number of shares of the class outstanding. ThePortfolio�s performance assumes the reinvestment of dividends and other distributions. The Portfolio�s performance does not reflect the deduction of any applicablesales charges.
2 The S&P Target Date Index Series is a component of the S&P Target Allocation Index Family, and is related to the S&P Target Risk Index Series. Both series arebroadly representative of the investment opportunity available to investors in target risk and target date funds, respectively. The index series reflects the marketconsensus for asset allocations for different target date horizons. In particular, each index is representative of the investment opportunity available to investors for thecorresponding target date horizon, with asset class exposures driven by a survey of available target date funds for that horizon.
Effective August 22, 2016, the Madison Target Retirement 2030 Fund (the �Predecessor Fund�) was reorganized into the Portfolio. The Portfoliohas assumed the Predecessor Fund�s historical performance. The returns for the Predecessor Fund for periods prior to August 29, 2014 reflect theperformance of the Madison Target Retirement 2030 Fund�s Class I Shares, a series of Ultra Series Fund (the �Ultra Predecessor Fund�). As ofAugust 29, 2014, the inception date of the Predecessor Fund, the Ultra Predecessor Fund exchanged in kind substantially all of its portfolioholdings for Class R6 shares of the Predecessor Fund. As a result, the Predecessor Fund assumed the performance of the Ultra Predecessor Fund.Performance reflects applicable fee waivers and/or expense limitations in effect during the periods shown. Past performance does not guaranteefuture results, which may vary. The value of investments and the income derived from investments will fluctuate and can go down as well as up.A loss of principal may occur.
The returns set forth in the table above represent past performance. Past performance does not guarantee future results. The Portfolio��sinvestment return and principal value will fluctuate so that an investor��s shares, when redeemed, may be worth more or less than theiroriginal cost. Current performance may be lower or higher than the performance quoted above. Please visit our web site atwww.GSAMFUNDS.com to obtain the most recent month-end returns. Performance reflects fee waivers and/or expense limitations in effect.In their absence, performance would be reduced. Returns do not reflect the deduction of taxes that a shareholder would pay on Portfoliodistributions or the redemption of Portfolio shares. Returns less than 12 months are cumulative, not annualized.
14
Copyright © 2017 www.secdatabase.com. All Rights Reserved.Please Consider the Environment Before Printing This Document

FUND BASICS
STANDARDIZED TOTAL RETURNS3For the period ended 3/31/17 One Year Five Years Since Inception Inception DateClass A N/A N/A -1.83 % 8/22/16Institutional N/A N/A 4.19 8/22/16Service N/A N/A 3.91 8/22/16Class IR N/A N/A 4.14 8/22/16Class R N/A N/A 3.85 8/22/16Class R6 9.15 % 7.82 % 3.21 10/01/07
3 The Standardized Total Returns are average annual or cumulative total returns (only if the performance period is one year or less) as of the most recentcalendar quarter-end. They assume reinvestment of all distributions at NAV. These returns reflect a maximum initial sales charge of 5.5% for Class AShares. Because Institutional, Service, Class IR, Class R and Class R6 Shares do not involve a sales charge, such a charge is not applied to theirStandardized Total Returns.
Effective August 22, 2016, the Madison Target Retirement 2030 Fund (the �Predecessor Fund�) was reorganized into the Portfolio. The Portfoliohas assumed the Predecessor Fund�s historical performance. The returns for the Predecessor Fund for periods prior to August 29, 2014 reflect theperformance of the Madison Target Retirement 2030 Fund�s Class I Shares, a series of Ultra Series Fund (the �Ultra Predecessor Fund�). As ofAugust 29, 2014, the inception date of the Predecessor Fund, the Ultra Predecessor Fund exchanged in kind substantially all of its portfolioholdings for Class R6 shares of the Predecessor Fund. As a result, the Predecessor Fund assumed the performance of the Ultra Predecessor Fund.Performance reflects applicable fee waivers and/or expense limitations in effect during the periods shown. Past performance does not guaranteefuture results, which may vary. The value of investments and the income derived from investments will fluctuate and can go down as well as up.A loss of principal may occur.
The returns set forth in the table above represent past performance. Past performance does not guarantee future results. The Portfolio��sinvestment return and principal value will fluctuate so that an investor��s shares, when redeemed, may be worth more or less than theiroriginal cost. Current performance may be lower or higher than the performance quoted above. Please visit our web site atwww.GSAMFUNDS.com to obtain the most recent month-end returns. Performance reflects applicable fee waivers and/or expenselimitations in effect during the periods shown. In their absence, performance would be reduced. Returns do not reflect the deduction of taxes thata shareholder would pay on Portfolio distributions or the redemption of Portfolio shares. Returns less than 12 months are cumulative, notannualized.
EXPENSE RATIOS4Net Expense Ratio (Current) Gross Expense Ratio (Before Waivers)
Class A 0.91 % 1.16 %Institutional 0.51 0.76Service 1.01 1.26Class IR 0.66 0.91Class R 1.16 1.41Class R6 0.49 0.83
4 The expense ratios of the Portfolio, both current (net of applicable fee waivers and/or expense limitations) and before waivers (gross of applicable fee waivers and/orexpense limitations) are as set forth above according to the most recent publicly available Prospectus for the Portfolio and will differ from the expense ratiosdisclosed in the Financial Highlights in this report due to the inclusion of Underlying Fund fees and expenses, which are not included in the operating expenses of thePortfolio reflected in the Financial Highlights. Pursuant to a contractual arrangement, the Portfolio�s waivers and/or expense limitations will remain in place throughat least February 28, 2018, and prior to such date the Investment Adviser may not terminate the arrangements without the approval of the Portfolio�s Board ofTrustees. If these arrangements are discontinued in the future, the expense ratios may change without shareholder approval.
15
Copyright © 2017 www.secdatabase.com. All Rights Reserved.Please Consider the Environment Before Printing This Document

FUND BASICS
TOP TEN HOLDINGS AS OF 4/30/175Holding % of Net Assets Line of BusinessiShares Core S&P 500 ETF 23.1 % Exchange Traded FundsiShares 7-10 Year Treasury Bond ETF 8.5 Exchange Traded FundsVanguard Short-Term Corporate Bond ETF 8.5 Exchange Traded FundsVanguard FTSE All-World ex-U.S. ETF 7.5 Exchange Traded FundsiShares 3-7 Year Treasury Bond ETF 5.5 Exchange Traded FundsSchwab U.S. TIPs ETF 5.5 Exchange Traded FundsiShares Core S&P Mid-Cap ETF 5.0 Exchange Traded FundsRidgeWorth Seix Floating Rate High Income Fund 4.0 Investment CompanyVanguard FTSE Europe ETF 4.0 Exchange Traded FundsiShares Edge MSCI Minimum Volatility EAFE ETF 3.5 Exchange Traded Funds
5 The top 10 holdings may not be representative of the Portfolio�s future investments.
PORTFOLIO COMPOSITION6Holding As of April 30, 2017 As of October 31, 2016Stock Funds 39.1 % 43.5 %Bond Funds 36.2 35.0Foreign Stock Funds 18.6 14.3Alternative Funds 2.0 2.5Investment Companies 0.5 0.8
6 The Portfolio is actively managed and, as such, its composition may differ over time. The percentage shown for each fund type reflects the value of that fund type asa percentage of the Portfolio�s net assets. Figures above may not sum to 100% due to rounding and/or exclusion of other assets and liabilities.
16
Copyright © 2017 www.secdatabase.com. All Rights Reserved.Please Consider the Environment Before Printing This Document

FUND BASICS
Target Date 2035 Portfolioas of April 30, 2017
PERFORMANCE REVIEW
November 1, 2016��April 30, 2017Portfolio Total Return
(based on NAV)1
S&P Target Date To2035 (Total Return,Unhedged, USD)2
Class A 7.59 % 8.56 %Institutional 7.95 8.56Service 7.66 8.56
Copyright © 2017 www.secdatabase.com. All Rights Reserved.Please Consider the Environment Before Printing This Document

Class IR 7.79 8.56Class R 7.50 8.56Class R6 7.95 8.56
1 The net asset value (�NAV�) represents the net assets of the class of the Portfolio (ex-dividend) divided by the total number of shares of the class outstanding. ThePortfolio�s performance assumes the reinvestment of dividends and other distributions. The Portfolio�s performance does not reflect the deduction of any applicablesales charges.
2 The S&P Target Date Index Series is a component of the S&P Target Allocation Index Family, and is related to the S&P Target Risk Index Series. Both series arebroadly representative of the investment opportunity available to investors in target risk and target date funds, respectively. The index series reflects the marketconsensus for asset allocations for different target date horizons. In particular, each index is representative of the investment opportunity available to investors for thecorresponding target date horizon, with asset class exposures driven by a survey of available target date funds for that horizon.
STANDARDIZED TOTAL RETURNS3For the period ended 3/31/17 Since Inception Inception DateClass A -1.19 % 8/22/16Institutional 4.69 8/22/16Service 4.40 8/22/16Class IR 4.63 8/22/16Class R 4.35 8/22/16Class R6 4.69 8/22/16
3 The Standardized Total Returns are average annual or cumulative total returns (only if the performance period is one year or less) as of the most recentcalendar quarter-end. They assume reinvestment of all distributions at NAV. These returns reflect a maximum initial sales charge of 5.5% for Class AShares. Because Institutional, Service, Class IR, Class R and Class R6 Shares do not involve a sales charge, such a charge is not applied to theirStandardized Total Returns.
The returns set forth in the tables above represent past performance. Past performance does not guarantee future results. ThePortfolio��s investment return and principal value will fluctuate so that an investor��s shares, when redeemed, may be worth more or lessthan their original cost. Current performance may be lower or higher than the performance quoted above. Please visit our web site atwww.GSAMFUNDS.com to obtain the most recent month-end returns. Performance reflects applicable fee waivers and/or expenselimitations in effect during the periods shown. In their absence, performance would be reduced. Returns do not reflect the deduction of taxes thata shareholder would pay on Portfolio distributions or the redemption of Portfolio shares. Returns less than 12 months are cumulative, notannualized.
17
Copyright © 2017 www.secdatabase.com. All Rights Reserved.Please Consider the Environment Before Printing This Document

FUND BASICS
EXPENSE RATIOS4Net Expense Ratio (Current) Gross Expense Ratio (Before Waivers)
Class A 0.91 % 3.20 %Institutional 0.51 2.81Service 1.01 3.30Class IR 0.66 2.95Class R 1.16 3.45Class R6 0.49 2.80
4 The expense ratios of the Portfolio, both current (net of applicable fee waivers and/or expense limitations) and before waivers (gross of applicable fee waivers and/orexpense limitations) are as set forth above according to the most recent publicly available Prospectus for the Portfolio and will differ from the expense ratiosdisclosed in the Financial Highlights in this report due to the inclusion of Underlying Fund fees and expenses, which are not included in the operating expenses of thePortfolio reflected in the Financial Highlights. Pursuant to a contractual arrangement, the Portfolio�s waivers and/or expense limitations will remain in place throughat least February 28, 2018, and prior to such date the Investment Adviser may not terminate the arrangements without the approval of the Portfolio�s Board ofTrustees. If these arrangements are discontinued in the future, the expense ratios may change without shareholder approval.
TOP TEN HOLDINGS AS OF 4/30/175Holding % of Net Assets Line of BusinessiShares Core S&P 500 ETF 24.5 % Exchange Traded FundsiShares 7-10 Year Treasury Bond ETF 8.1 Exchange Traded FundsVanguard FTSE All-World ex-U.S. ETF 8.0 Exchange Traded FundsVanguard Short-Term Corporate Bond ETF 6.5 Exchange Traded FundsiShares Core S&P Mid-Cap ETF 5.5 Exchange Traded FundsiShares 3-7 Year Treasury Bond ETF 5.0 Exchange Traded FundsSchwab U.S. TIPs ETF 4.5 Exchange Traded FundsVanguard FTSE Europe ETF 4.5 Exchange Traded FundsRidgeWorth Seix Floating Rate High Income Fund 3.5 Investment CompanyiShares Edge MSCI Minimum Volatility EAFE ETF 3.5 Exchange Traded Funds
5 The top 10 holdings may not be representative of the Portfolio�s future investments.
PORTFOLIO COMPOSITION6Holding As of April 30, 2017 As of October 31, 2016Stock Funds 42.6 % 46.7 %Bond Funds 31.1 29.8Foreign Stock Funds 20.0 15.4Alternative Funds 2.0 2.5Investment Companies 0.5 1.0
6 The Portfolio is actively managed and, as such, its composition may differ over time. The percentage shown for each fund type reflects the value of that fund type asa percentage of the Portfolio�s net assets. Figures above may not sum to 100% due to rounding and/or exclusion of other assets and liabilities.
18
Copyright © 2017 www.secdatabase.com. All Rights Reserved.Please Consider the Environment Before Printing This Document

FUND BASICS
Target Date 2040 Portfolioas of April 30, 2017
PERFORMANCE REVIEW
November 1, 2016��April 30, 2017Portfolio Total Return
(based on NAV)1
S&P Target Date To2040 (Total Return,Unhedged, USD)2
Class A 8.36 % 9.42 %Institutional 8.72 9.42Service 8.31 9.42
Copyright © 2017 www.secdatabase.com. All Rights Reserved.Please Consider the Environment Before Printing This Document

Class IR 8.55 9.42Class R 8.26 9.42Class R6 8.61 9.42
1 The net asset value (�NAV�) represents the net assets of the class of the Portfolio (ex-dividend) divided by the total number of shares of the class outstanding. ThePortfolio�s performance assumes the reinvestment of dividends and other distributions. The Portfolio�s performance does not reflect the deduction of any applicablesales charges.
2 The S&P Target Date Index Series is a component of the S&P Target Allocation Index Family, and is related to the S&P Target Risk Index Series. Both series arebroadly representative of the investment opportunity available to investors in target risk and target date funds, respectively. The index series reflects the marketconsensus for asset allocations for different target date horizons. In particular, each index is representative of the investment opportunity available to investors for thecorresponding target date horizon, with asset class exposures driven by a survey of available target date funds for that horizon.
Effective August 22, 2016, the Madison Target Retirement 2040 Fund (the �Predecessor Fund�) was reorganized into the Portfolio. The Portfoliohas assumed the Predecessor Fund�s historical performance. The returns for the Predecessor Fund for periods prior to August 29, 2014 reflect theperformance of the Madison Target Retirement 2040 Fund�s Class I Shares, a series of Ultra Series Fund (the �Ultra Predecessor Fund�). As ofAugust 29, 2014, the inception date of the Predecessor Fund, the Ultra Predecessor Fund exchanged in kind substantially all of its portfolioholdings for Class R6 shares of the Predecessor Fund. As a result, the Predecessor Fund assumed the performance of the Ultra Predecessor Fund.Performance reflects applicable fee waivers and/or expense limitations in effect during the periods shown. Past performance does not guaranteefuture results, which may vary. The value of investments and the income derived from investments will fluctuate and can go down as well as up.A loss of principal may occur.
The returns set forth in the table above represent past performance. Past performance does not guarantee future results. The Portfolio��sinvestment return and principal value will fluctuate so that an investor��s shares, when redeemed, may be worth more or less than theiroriginal cost. Current performance may be lower or higher than the performance quoted above. Please visit our web site atwww.GSAMFUNDS.com to obtain the most recent month-end returns. Performance reflects fee waivers and/or expense limitations in effect.In their absence, performance would be reduced. Returns do not reflect the deduction of taxes that a shareholder would pay on Portfoliodistributions or the redemption of Portfolio shares. Returns less than 12 months are cumulative, not annualized.
19
Copyright © 2017 www.secdatabase.com. All Rights Reserved.Please Consider the Environment Before Printing This Document

FUND BASICS
STANDARDIZED TOTAL RETURNS3For the period ended 3/31/17 One Year Five Years Since Inception Inception DateClass A N/A N/A -0.74 % 8/22/16Institutional N/A N/A 5.40 8/22/16Service N/A N/A 5.00 8/22/16Class IR N/A N/A 5.24 8/22/16Class R N/A N/A 4.95 8/22/16Class R6 10.97 % 8.62 % 3.08 10/01/07
3 The Standardized Total Returns are average annual or cumulative total returns (only if the performance period is one year or less) as of the most recentcalendar quarter-end. They assume reinvestment of all distributions at NAV. These returns reflect a maximum initial sales charge of 5.5% for Class AShares. Because Institutional, Service, Class IR, Class R and Class R6 Shares do not involve a sales charge, such a charge is not applied to theirStandardized Total Returns.
Effective August 22, 2016, the Madison Target Retirement 2040 Fund (the �Predecessor Fund�) was reorganized into the Portfolio. The Portfoliohas assumed the Predecessor Fund�s historical performance. The returns for the Predecessor Fund for periods prior to August 29, 2014 reflect theperformance of the Madison Target Retirement 2040 Fund�s Class I Shares, a series of Ultra Series Fund (the �Ultra Predecessor Fund�). As ofAugust 29, 2014, the inception date of the Predecessor Fund, the Ultra Predecessor Fund exchanged in kind substantially all of its portfolioholdings for Class R6 shares of the Predecessor Fund. As a result, the Predecessor Fund assumed the performance of the Ultra Predecessor Fund.Performance reflects applicable fee waivers and/or expense limitations in effect during the periods shown. Past performance does not guaranteefuture results, which may vary. The value of investments and the income derived from investments will fluctuate and can go down as well as up.A loss of principal may occur.
The returns set forth in the table above represent past performance. Past performance does not guarantee future results. The Portfolio��sinvestment return and principal value will fluctuate so that an investor��s shares, when redeemed, may be worth more or less than theiroriginal cost. Current performance may be lower or higher than the performance quoted above. Please visit our web site atwww.GSAMFUNDS.com to obtain the most recent month-end returns. Performance reflects applicable fee waivers and/or expenselimitations in effect during the periods shown. In their absence, performance would be reduced. Returns do not reflect the deduction of taxes thata shareholder would pay on Portfolio distributions or the redemption of Portfolio shares. Returns less than 12 months are cumulative, notannualized.
EXPENSE RATIOS4Net Expense Ratio (Current) Gross Expense Ratio (Before Waivers)
Class A 0.91 % 1.49 %Institutional 0.51 1.01Service 1.01 1.51Class IR 0.66 1.16Class R 1.16 1.66Class R6 0.49 1.01
4 The expense ratios of the Portfolio, both current (net of applicable fee waivers and/or expense limitations) and before waivers (gross of applicable fee waivers and/orexpense limitations) are as set forth above according to the most recent publicly available Prospectus for the Portfolio and will differ from the expense ratiosdisclosed in the Financial Highlights in this report due to the inclusion of Underlying Fund fees and expenses, which are not included in the operating expenses of thePortfolio reflected in the Financial Highlights. Pursuant to a contractual arrangement, the Portfolio�s waivers and/or expense limitations will remain in place throughat least February 28, 2018, and prior to such date the Investment Adviser may not terminate the arrangements without the approval of the Portfolio�s Board ofTrustees. If these arrangements are discontinued in the future, the expense ratios may change without shareholder approval.
20
Copyright © 2017 www.secdatabase.com. All Rights Reserved.Please Consider the Environment Before Printing This Document

FUND BASICS
TOP TEN HOLDINGS AS OF 4/30/175Holding % of Net Assets Line of BusinessiShares Core S&P 500 ETF 26.2 % Exchange Traded FundsVanguard FTSE All-World ex-U.S. ETF 8.6 Exchange Traded FundsiShares 7-10 Year Treasury Bond ETF 7.0 Exchange Traded FundsiShares Core S&P Mid-Cap ETF 6.0 Exchange Traded FundsVanguard FTSE Europe ETF 5.0 Exchange Traded FundsiShares 3-7 Year Treasury Bond ETF 4.5 Exchange Traded FundsVanguard Short-Term Corporate Bond ETF 4.5 Exchange Traded FundsiShares Edge MSCI Minimum Volatility EAFE ETF 3.8 Exchange Traded FundsVanguard Growth ETF 3.5 Exchange Traded FundsSchwab U.S. TIPs ETF 3.5 Exchange Traded Funds
5 The top 10 holdings may not be representative of the Portfolio�s future investments.
PORTFOLIO COMPOSITION6Holding As of April 30, 2017 As of October 31, 2016Stock Funds 46.0 % 50.5 %Bond Funds 26.2 25.0Foreign Stock Funds 21.6 16.8Alternative Funds 2.0 2.5Investment Companies 0.8 1.3
6 The Portfolio is actively managed and, as such, its composition may differ over time. The percentage shown for each fund type reflects the value of that fund type asa percentage of the Portfolio�s net assets. Figures above may not sum to 100% due to rounding and/or exclusion of other assets and liabilities.
21
Copyright © 2017 www.secdatabase.com. All Rights Reserved.Please Consider the Environment Before Printing This Document

FUND BASICS
Target Date 2045 Portfolioas of April 30, 2017
PERFORMANCE REVIEW
November 1, 2016��April 30, 2017Portfolio Total Return
(based on NAV)1
S&P Target Date To2045 (Total Return,Unhedged, USD)2
Class A 8.95 % 10.04 %Institutional 9.20 10.04Service 8.92 10.04
Copyright © 2017 www.secdatabase.com. All Rights Reserved.Please Consider the Environment Before Printing This Document
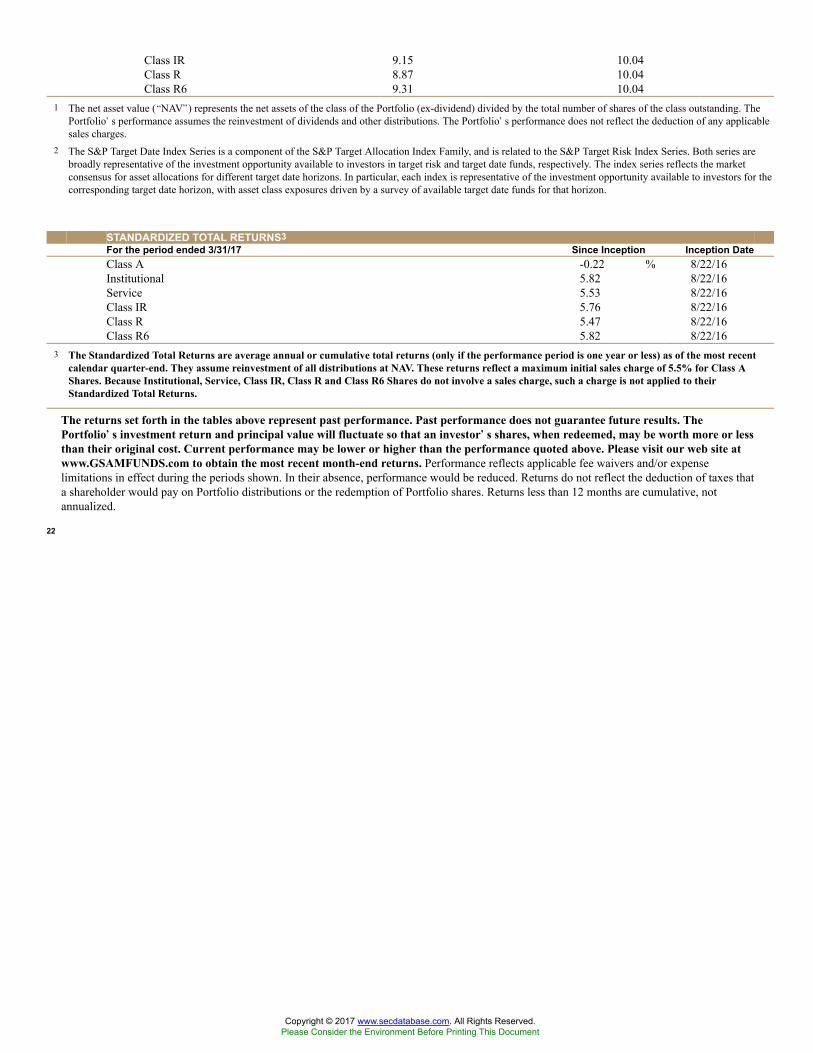
Class IR 9.15 10.04Class R 8.87 10.04Class R6 9.31 10.04
1 The net asset value (�NAV�) represents the net assets of the class of the Portfolio (ex-dividend) divided by the total number of shares of the class outstanding. ThePortfolio�s performance assumes the reinvestment of dividends and other distributions. The Portfolio�s performance does not reflect the deduction of any applicablesales charges.
2 The S&P Target Date Index Series is a component of the S&P Target Allocation Index Family, and is related to the S&P Target Risk Index Series. Both series arebroadly representative of the investment opportunity available to investors in target risk and target date funds, respectively. The index series reflects the marketconsensus for asset allocations for different target date horizons. In particular, each index is representative of the investment opportunity available to investors for thecorresponding target date horizon, with asset class exposures driven by a survey of available target date funds for that horizon.
STANDARDIZED TOTAL RETURNS3For the period ended 3/31/17 Since Inception Inception DateClass A -0.22 % 8/22/16Institutional 5.82 8/22/16Service 5.53 8/22/16Class IR 5.76 8/22/16Class R 5.47 8/22/16Class R6 5.82 8/22/16
3 The Standardized Total Returns are average annual or cumulative total returns (only if the performance period is one year or less) as of the most recentcalendar quarter-end. They assume reinvestment of all distributions at NAV. These returns reflect a maximum initial sales charge of 5.5% for Class AShares. Because Institutional, Service, Class IR, Class R and Class R6 Shares do not involve a sales charge, such a charge is not applied to theirStandardized Total Returns.
The returns set forth in the tables above represent past performance. Past performance does not guarantee future results. ThePortfolio��s investment return and principal value will fluctuate so that an investor��s shares, when redeemed, may be worth more or lessthan their original cost. Current performance may be lower or higher than the performance quoted above. Please visit our web site atwww.GSAMFUNDS.com to obtain the most recent month-end returns. Performance reflects applicable fee waivers and/or expenselimitations in effect during the periods shown. In their absence, performance would be reduced. Returns do not reflect the deduction of taxes thata shareholder would pay on Portfolio distributions or the redemption of Portfolio shares. Returns less than 12 months are cumulative, notannualized.
22
Copyright © 2017 www.secdatabase.com. All Rights Reserved.Please Consider the Environment Before Printing This Document

FUND BASICS
EXPENSE RATIOS4Net Expense Ratio (Current) Gross Expense Ratio (Before Waivers)
Class A 0.91 % 3.21 %Institutional 0.51 2.81Service 1.01 3.31Class IR 0.66 2.95Class R 1.16 3.46Class R6 0.49 2.80
4 The expense ratios of the Portfolio, both current (net of applicable fee waivers and/or expense limitations) and before waivers (gross of applicable fee waivers and/orexpense limitations) are as set forth above according to the most recent publicly available Prospectus for the Portfolio and will differ from the expense ratiosdisclosed in the Financial Highlights in this report due to the inclusion of Underlying Fund fees and expenses, which are not included in the operating expenses of thePortfolio reflected in the Financial Highlights. Pursuant to a contractual arrangement, the Portfolio�s waivers and/or expense limitations will remain in place throughat least February 28, 2018, and prior to such date the Investment Adviser may not terminate the arrangements without the approval of the Portfolio�s Board ofTrustees. If these arrangements are discontinued in the future, the expense ratios may change without shareholder approval.
TOP TEN HOLDINGS AS OF 4/30/175Holding % of Net Assets Line of BusinessiShares Core S&P 500 ETF 27.5 % Exchange Traded FundsVanguard FTSE All-World ex-U.S. ETF 9.0 Exchange Traded FundsiShares Core S&P Mid-Cap ETF 6.5 Exchange Traded FundsiShares 7-10 Year Treasury Bond ETF 6.0 Exchange Traded FundsVanguard FTSE Europe ETF 5.5 Exchange Traded FundsiShares 3-7 Year Treasury Bond ETF 4.1 Exchange Traded FundsVanguard Growth ETF 4.0 Exchange Traded FundsiShares Edge MSCI Minimum Volatility EAFE ETF 3.8 Exchange Traded FundsiShares 20+ Year Treasury Bond ETF 3.0 Exchange Traded FundsVanguard Short-Term Corporate Bond ETF 3.0 Exchange Traded Funds
5 The top 10 holdings may not be representative of the Portfolio�s future investments.
PORTFOLIO COMPOSITION6Holding As of April 30, 2017 As of October 31, 2016Stock Funds 49.0 % 53.9 %Foreign Stock Funds 23.1 17.8Bond Funds 21.1 19.9Alternative Funds 2.0 2.5Investment Companies 1.0 1.3
6 The Portfolio is actively managed and, as such, its composition may differ over time. The percentage shown for each fund type reflects the value of that fund type asa percentage of the Portfolio�s net assets. Figures above may not sum to 100% due to rounding and/or exclusion of other assets and liabilities.
23
Copyright © 2017 www.secdatabase.com. All Rights Reserved.Please Consider the Environment Before Printing This Document

FUND BASICS
Target Date 2050 Portfolioas of April 30, 2017
PERFORMANCE REVIEW
November 1, 2016��April 30,2017
Portfolio Total Return(based on NAV)1
S&P Target Date To2050 (Total Return,Unhedged, USD)2
Class A 9.77 % 10.57 %Institutional 10.03 10.57Service 9.74 10.57
Copyright © 2017 www.secdatabase.com. All Rights Reserved.Please Consider the Environment Before Printing This Document

Class IR 9.97 10.57Class R 9.68 10.57Class R6 10.03 10.57
1 The net asset value (�NAV�) represents the net assets of the class of the Portfolio (ex-dividend) divided by the total number of shares of the class outstanding. ThePortfolio�s performance assumes the reinvestment of dividends and other distributions. The Portfolio�s performance does not reflect the deduction of any applicablesales charges.
2 The S&P Target Date Index Series is a component of the S&P Target Allocation Index Family, and is related to the S&P Target Risk Index Series. Both series arebroadly representative of the investment opportunity available to investors in target risk and target date funds, respectively. The index series reflects the marketconsensus for asset allocations for different target date horizons. In particular, each index is representative of the investment opportunity available to investors for thecorresponding target date horizon, with asset class exposures driven by a survey of available target date funds for that horizon.
Effective August 22, 2016, the Madison Target Retirement 2050 Fund (the �Predecessor Fund�) was reorganized into the Portfolio. The Portfoliohas assumed the Predecessor Fund�s historical performance. The returns for the Predecessor Fund for periods prior to August 29, 2014 reflect theperformance of the Madison Target Retirement 2050 Fund�s Class I Shares, a series of Ultra Series Fund (the �Ultra Predecessor Fund�). As ofAugust 29, 2014, the inception date of the Predecessor Fund, the Ultra Predecessor Fund exchanged in kind substantially all of its portfolioholdings for Class R6 shares of the Predecessor Fund. As a result, the Predecessor Fund assumed the performance of the Ultra Predecessor Fund.Performance reflects applicable fee waivers and/or expense limitations in effect during the periods shown. Past performance does not guaranteefuture results, which may vary. The value of investments and the income derived from investments will fluctuate and can go down as well as up.A loss of principal may occur.
The returns set forth in the table above represent past performance. Past performance does not guarantee future results. The Portfolio��sinvestment return and principal value will fluctuate so that an investor��s shares, when redeemed, may be worth more or less than theiroriginal cost. Current performance may be lower or higher than the performance quoted above. Please visit our web site atwww.GSAMFUNDS.com to obtain the most recent month-end returns. Performance reflects fee waivers and/or expense limitations in effect.In their absence, performance would be reduced. Returns do not reflect the deduction of taxes that a shareholder would pay on Portfoliodistributions or the redemption of Portfolio shares. Returns less than 12 months are cumulative, not annualized.
24
Copyright © 2017 www.secdatabase.com. All Rights Reserved.Please Consider the Environment Before Printing This Document

FUND BASICS
STANDARDIZED TOTAL RETURNS3For the period ended 3/31/17 One Year Five Years Since Inception Inception DateClass A N/A N/A 0.47 % 8/22/16Institutional N/A N/A 6.55 8/22/16Service N/A N/A 6.27 8/22/16Class IR N/A N/A 6.50 8/22/16Class R N/A N/A 6.11 8/22/16Class R6 12.76 % 9.46 % 8.64 1/3/11
3 The Standardized Total Returns are average annual or cumulative total returns (only if the performance period is one year or less) as of the most recentcalendar quarter-end. They assume reinvestment of all distributions at NAV. These returns reflect a maximum initial sales charge of 5.5% for Class AShares. Because Institutional, Service, Class IR, Class R and Class R6 Shares do not involve a sales charge, such a charge is not applied to theirStandardized Total Returns.
Effective August 22, 2016, the Madison Target Retirement 2050 Fund (the �Predecessor Fund�) was reorganized into the Portfolio. The Portfoliohas assumed the Predecessor Fund�s historical performance. The returns for the Predecessor Fund for periods prior to August 29, 2014 reflect theperformance of the Madison Target Retirement 2050 Fund�s Class I Shares, a series of Ultra Series Fund (the �Ultra Predecessor Fund�). As ofAugust 29, 2014, the inception date of the Predecessor Fund, the Ultra Predecessor Fund exchanged in kind substantially all of its portfolioholdings for Class R6 shares of the Predecessor Fund. As a result, the Predecessor Fund assumed the performance of the Ultra Predecessor Fund.Performance reflects applicable fee waivers and/or expense limitations in effect during the periods shown. Past performance does not guaranteefuture results, which may vary. The value of investments and the income derived from investments will fluctuate and can go down as well as up.A loss of principal may occur.
The returns set forth in the table above represent past performance. Past performance does not guarantee future results. The Portfolio��sinvestment return and principal value will fluctuate so that an investor��s shares, when redeemed, may be worth more or less than theiroriginal cost. Current performance may be lower or higher than the performance quoted above. Please visit our web site atwww.GSAMFUNDS.com to obtain the most recent month-end returns. Performance reflects applicable fee waivers and/or expenselimitations in effect during the periods shown. In their absence, performance would be reduced. Returns do not reflect the deduction of taxes thata shareholder would pay on Portfolio distributions or the redemption of Portfolio shares. Returns less than 12 months are cumulative, notannualized.
EXPENSE RATIOS4Net Expense Ratio (Current) Gross Expense Ratio (Before Waivers)
Class A 0.91 % 2.19 %Institutional 0.51 1.79Service 1.01 2.29Class IR 0.66 1.94Class R 1.16 2.44Class R6 0.49 1.65
4 The expense ratios of the Portfolio, both current (net of applicable fee waivers and/or expense limitations) and before waivers (gross of applicable fee waivers and/orexpense limitations) are as set forth above according to the most recent publicly available Prospectus for the Portfolio and will differ from the expense ratiosdisclosed in the Financial Highlights in this report due to the inclusion of Underlying Fund fees and expenses, which are not included in the operating expenses of thePortfolio reflected in the Financial Highlights. Pursuant to a contractual arrangement, the Portfolio�s waivers and/or expense limitations will remain in place throughat least February 28, 2018, and prior to such date the Investment Adviser may not terminate the arrangements without the approval of the Portfolio�s Board ofTrustees. If these arrangements are discontinued in the future, the expense ratios may change without shareholder approval.
25
Copyright © 2017 www.secdatabase.com. All Rights Reserved.Please Consider the Environment Before Printing This Document

FUND BASICS
TOP TEN HOLDINGS AS OF 4/30/175Holding % of Net Assets Line of BusinessiShares Core S&P 500 ETF 29.3 % Exchange Traded FundsVanguard FTSE All-World ex-U.S. ETF 9.6 Exchange Traded FundsiShares Core S&P Mid-Cap ETF 7.1 Exchange Traded FundsVanguard FTSE Europe ETF 6.1 Exchange Traded FundsVanguard Growth ETF 4.6 Exchange Traded FundsiShares 7-10 Year Treasury Bond ETF 4.1 Exchange Traded FundsiShares Edge MSCI Minimum Volatility EAFE ETF 3.8 Exchange Traded FundsiShares 3-7 Year Treasury Bond ETF 3.5 Exchange Traded FundsiShares 20+ Year Treasury Bond ETF 3.1 Exchange Traded FundsSchwab U.S. Dividend Equity ETF 3.1 Exchange Traded Funds
5 The top 10 holdings may not be representative of the Portfolio�s future investments.
PORTFOLIO COMPOSITION6Holding As of April 30, 2017 As of October 31, 2016Stock Funds 53.1 % 58.0 %Foreign Stock Funds 24.8 19.3Bond Funds 16.2 15.0Alternative Funds 2.0 2.5Investment Companies 1.0 1.3
6 The Portfolio is actively managed and, as such, its composition may differ over time. The percentage shown for each fund type reflects the value of that fund type asa percentage of the Portfolio�s net assets. Figures above may not sum to 100% due to rounding and/or exclusion of other assets and liabilities.
26
Copyright © 2017 www.secdatabase.com. All Rights Reserved.Please Consider the Environment Before Printing This Document

FUND BASICS
Target Date 2055 Portfolioas of April 30, 2017
PERFORMANCE REVIEW
November 1, 2016��April 30, 2017Portfolio Total Return
(based on NAV)1
S&P Target Date To2055 (Total Return,Unhedged, USD)2
Class A 10.26 % 11.02 %Institutional 10.48 11.02Service 10.30 11.02
Copyright © 2017 www.secdatabase.com. All Rights Reserved.Please Consider the Environment Before Printing This Document

Class IR 10.43 11.02Class R 10.14 11.02Class R6 10.48 11.02
1 The net asset value (�NAV�) represents the net assets of the class of the Portfolio (ex-dividend) divided by the total number of shares of the class outstanding. ThePortfolio�s performance assumes the reinvestment of dividends and other distributions. The Portfolio�s performance does not reflect the deduction of any applicablesales charges.
2 The S&P Target Date Index Series is a component of the S&P Target Allocation Index Family, and is related to the S&P Target Risk Index Series. Both series arebroadly representative of the investment opportunity available to investors in target risk and target date funds, respectively. The index series reflects the marketconsensus for asset allocations for different target date horizons. In particular, each index is representative of the investment opportunity available to investors for thecorresponding target date horizon, with asset class exposures driven by a survey of available target date funds for that horizon.
STANDARDIZED TOTAL RETURNS3For the period ended 3/31/17 Since Inception Inception DateClass A 0.89 % 8/22/16Institutional 6.96 8/22/16Service 6.67 8/22/16Class IR 6.91 8/22/16Class R 6.62 8/22/16Class R6 6.96 8/22/16
3 The Standardized Total Returns are average annual or cumulative total returns (only if the performance period is one year or less) as of the most recentcalendar quarter-end. They assume reinvestment of all distributions at NAV. These returns reflect a maximum initial sales charge of 5.5% for Class AShares. Because Institutional, Service, Class IR, Class R and Class R6 Shares do not involve a sales charge, such a charge is not applied to theirStandardized Total Returns.
The returns set forth in the tables above represent past performance. Past performance does not guarantee future results. ThePortfolio��s investment return and principal value will fluctuate so that an investor��s shares, when redeemed, may be worth more or lessthan their original cost. Current performance may be lower or higher than the performance quoted above. Please visit our web site atwww.GSAMFUNDS.com to obtain the most recent month-end returns. Performance reflects applicable fee waivers and/or expenselimitations in effect during the periods shown. In their absence, performance would be reduced. Returns do not reflect the deduction of taxes thata shareholder would pay on Portfolio distributions or the redemption of Portfolio shares. Returns less than 12 months are cumulative, notannualized.
27
Copyright © 2017 www.secdatabase.com. All Rights Reserved.Please Consider the Environment Before Printing This Document

FUND BASICS
EXPENSE RATIOS4Net Expense Ratio (Current) Gross Expense Ratio (Before Waivers)
Class A 0.91 % 3.21 %Institutional 0.51 2.81Service 1.01 3.31Class IR 0.66 2.96Class R 1.16 3.46Class R6 0.49 2.81
4 The expense ratios of the Portfolio, both current (net of applicable fee waivers and/or expense limitations) and before waivers (gross of applicable fee waivers and/orexpense limitations) are as set forth above according to the most recent publicly available Prospectus for the Portfolio and will differ from the expense ratiosdisclosed in the Financial Highlights in this report due to the inclusion of Underlying Fund fees and expenses, which are not included in the operating expenses of thePortfolio reflected in the Financial Highlights. Pursuant to a contractual arrangement, the Portfolio�s waivers and/or expense limitations will remain in place throughat least February 28, 2018, and prior to such date the Investment Adviser may not terminate the arrangements without the approval of the Portfolio�s Board ofTrustees. If these arrangements are discontinued in the future, the expense ratios may change without shareholder approval.
TOP TEN HOLDINGS AS OF 4/30/175Holding % of Net Assets Line of BusinessiShares Core S&P 500 ETF 30.6 % Exchange Traded FundsVanguard FTSE All-World ex-U.S. ETF 10.0 Exchange Traded FundsiShares Core S&P Mid-Cap ETF 7.5 Exchange Traded FundsVanguard FTSE Europe ETF 6.5 Exchange Traded FundsVanguard Growth ETF 4.5 Exchange Traded FundsiShares Edge MSCI Minimum Volatility EAFE ETF 4.0 Exchange Traded FundsiShares 20+ Year Treasury Bond ETF 3.0 Exchange Traded FundsSchwab U.S. Dividend Equity ETF 3.0 Exchange Traded FundsVanguard Information Technology ETF 3.0 Exchange Traded FundsiShares 3-7 Year Treasury Bond ETF 3.0 Exchange Traded Funds
5 The top 10 holdings may not be representative of the Portfolio�s future investments.
PORTFOLIO COMPOSITION6Holding As of April 30, 2017 As of October 31, 2016Stock Funds 56.1 % 61.4 %Foreign Stock Funds 26.1 20.3Bond Funds 11.0 9.9Alternative Funds 2.0 2.5Investment Companies 1.0 1.3
6 The Portfolio is actively managed and, as such, its composition may differ over time. The percentage shown for each fund type reflects the value of that fund type asa percentage of the Portfolio�s net assets. Figures above may not sum to 100% due to rounding and/or exclusion of other assets and liabilities.
28
Copyright © 2017 www.secdatabase.com. All Rights Reserved.Please Consider the Environment Before Printing This Document

FUND BASICS
Index DefinitionsThe S&P 500® Index is the Standard & Poor�s 500 composite index of 500 stocks, an unmanaged index of common stockprices.
The MSCI EAFE Index is an equity index that captures large-cap and mid-cap representation across 21 developed marketscountries around the world, excluding the U.S. and Canada. The index covers approximately 85% of the free float-adjustedmarket capitalization in each country. Developed markets countries in the index include Australia, Austria, Belgium, Denmark,Finland, France, Germany, Hong Kong, Ireland, Israel, Italy, Japan, the Netherlands, New Zealand, Norway, Portugal,Singapore, Spain, Sweden, Switzerland and the U.K.
The MSCI Emerging Markets Index captures large-cap and mid-cap representation across 23 emerging markets countries.The index covers approximately 85% of the free float-adjusted market capitalization in each country. Emerging marketscountries in the index include Brazil, Chile, China, Colombia, the Czech Republic, Egypt, Greece, Hungary, India, Indonesia,South Korea, Malaysia, Mexico, Peru, the Philippines, Poland, Russia, Qatar, South Africa, Taiwan, Thailand, Turkey and theUnited Arab Emirates.
The Bloomberg Barclays U.S. Aggregate Bond Index is an unmanaged, broad-based index that measures the investmentgrade, U.S. dollar-denominated, fixed-rate taxable bond market. The index includes U.S. Treasury, government-related andcorporate securities, mortgage-backed securities (agency fixed-rate and hybrid adjustable-rate mortgage pass-throughsecurities), asset-backed securities and commercial mortgage-backed securities (agency and non-agency).
The Russell 1000® Index measures the performance of the large-cap segment of the U.S. equity universe. It is a subset of theRussell 3000® Index and includes approximately 1000 of the largest securities based on a combination of their market cap andcurrent index membership. The Russell 1000® Index represents approximately 92% of the U.S. market.
The Russell 1000® Growth Index is an unmanaged index of common stock prices that measures the performance of thoseRussell 1000 companies with higher price-to-book ratios and higher forecasted growth values.
The Russell 1000® Value Index measures the performance of the large-cap value segment of the U.S. equity universe. Itincludes those Russell 1000® Index companies with lower price-to-book ratios and lower expected growth values.
The Russell 2000® Index is an unmanaged index of common stock prices that measures the performance of the 2000 smallestcompanies in the Russell 3000 Index.
The Russell 2000® Growth Index is an unmanaged index of common stock prices that measures the performance of thoseRussell 2000 companies with higher price-to-book ratios and higher forecasted growth values.
The Russell 2000® Value Index measures the performance of small-cap value segment of the U.S. equity universe. It includesthose Russell 2000 companies with lower price-to-book ratios and lower forecasted growth values. The index is completelyreconstituted annually to ensure larger stocks do not distort the performance and characteristics of the true small-capopportunity set and that the represented companies continue to reflect value characteristics.
29
Copyright © 2017 www.secdatabase.com. All Rights Reserved.Please Consider the Environment Before Printing This Document

GOLDMAN SACHS TARGET DATE 2020 PORTFOLIO
Schedule of InvestmentsApril 30, 2017 (Unaudited)
Shares Description ValueExchange Traded Funds �� 91.0%Alternative Funds* �� 2.0%26,161 PowerShares DB Gold Fund $ 1,062,660
Bond Funds �� 58.4%13,046 iShares 20+ Year Treasury Bond ETF 1,596,17845,011 iShares 3-7 Year Treasury Bond ETF 5,568,76162,227 iShares 7-10 Year Treasury Bond ETF 6,633,39866,594 Schwab U.S. TIPS ETF 3,709,28629,329 Vanguard Long-Term Corporate Bond ETF 2,658,674102,820 Vanguard Short-Term Corporate Bond ETF 8,217,37448,223 Vanguard Short-Term Inflation-Protected Securities ETF 2,385,110
30,768,781Foreign Stock Funds �� 9.8%15,761 iShares Edge MSCI Minimum Volatility EAFE ETF 1,060,0859,796 iShares Edge MSCI Minimum Volatility Emerging Markets ETF 531,62943,431 Vanguard FTSE All-World ex-U.S. ETF 2,120,73619,766 Vanguard FTSE Europe ETF 1,059,0627,783 WisdomTree Japan Hedged Equity Fund 397,478
5,168,990Stock Funds �� 20.8%26,548 iShares Core S&P 500 ETF 6,359,8399,185 iShares Core S&P Mid-Cap ETF 1,585,23910,162 PowerShares Buyback Achievers Portfolio 530,15117,820 Schwab U.S. Dividend Equity ETF 796,3764,877 SPDR S&P Regional Banking ETF 263,6024,383 Vanguard Financials ETF 263,2436,390 Vanguard Growth ETF 795,1082,865 Vanguard Information Technology ETF 397,662
10,991,220TOTAL EXCHANGE TRADED FUNDS(Cost $45,568,784) $47,991,651
Investment Company �� 5.5%332,850 RidgeWorth Seix Floating Rate High Income Fund $ 2,919,092(Cost $2,909,119)TOTAL INVESTMENTS �� 96.5%(Cost $48,477,903) $ 50,910,743OTHER ASSETS IN EXCESS OF
LIABILITIES �� 3.5% 1,831,683NET ASSETS �� 100.0% $ 52,742,426
The percentage shown for each investment category reflects the value of investments in that category as a percentage of net assets.* Non-income producing security.
Investment Abbreviations:ETF �Exchange Traded FundTIPS �Treasury Inflation Protected Securites
30 The accompanying notes are an integral part of these financial statements.
Copyright © 2017 www.secdatabase.com. All Rights Reserved.Please Consider the Environment Before Printing This Document

GOLDMAN SACHS TARGET DATE 2025 PORTFOLIO
Schedule of InvestmentsApril 30, 2017 (Unaudited)
Shares Description ValueExchange Traded Funds �� 90.7%Alternative Funds* �� 2.0%5,187 PowerShares DB Gold Fund $ 210,696
Bond Funds �� 41.1%2,579 iShares 20+ Year Treasury Bond ETF 315,5415,085 iShares 3-7 Year Treasury Bond ETF 629,11610,333 iShares 7-10 Year Treasury Bond ETF 1,101,49811,284 Schwab U.S. TIPS ETF 628,5192,899 Vanguard Long-Term Corporate Bond ETF 262,79414,429 Vanguard Short-Term Corporate Bond ETF 1,153,1664,222 Vanguard Short-Term Inflation-Protected Securities ETF 208,820
4,299,454Foreign Stock Funds �� 15.3%4,286 iShares Edge MSCI Minimum Volatility EAFE ETF 288,2763,381 iShares Edge MSCI Minimum Volatility Emerging Markets ETF 183,48713,957 Vanguard FTSE All-World ex-U.S. ETF 681,5205,861 Vanguard FTSE Europe ETF 314,0322,563 WisdomTree Japan Hedged Equity Fund 130,893
1,598,208Stock Funds �� 32.3%8,528 iShares Core S&P 500 ETF 2,042,9682,726 iShares Core S&P Mid-Cap ETF 470,4812,502 PowerShares Buyback Achievers Portfolio 130,5294,110 Schwab U.S. Dividend Equity ETF 183,6761,446 SPDR S&P Regional Banking ETF 78,1561,295 Vanguard Financials ETF 77,7781,686 Vanguard Growth ETF 209,789378 Vanguard Health Care ETF 52,969944 Vanguard Information Technology ETF 131,027
3,377,373TOTAL EXCHANGE TRADED FUNDS(Cost $9,074,467) $ 9,485,731
Investment Company �� 5.5%3,333 Schwab Fundamental U.S. Large Company Index Fund Institutional Shares $ 52,654
59,764 RidgeWorth Seix Floating Rate High Income Fund 524,130TOTAL INVESTMENT COMPANY(Cost $574,108) $ 576,784TOTAL INVESTMENTS �� 96.2%
(Cost $9,648,575) $ 10,062,515OTHER ASSETS IN EXCESS OF
LIABILITIES �� 3.8% 399,560NET ASSETS �� 100.0% $ 10,462,075
The percentage shown for each investment category reflects the value of investments in that category as a percentage of net assets.* Non-income producing security.
Investment Abbreviations:ETF �Exchange Traded FundTIPS �Treasury Inflation Protected Securities
The accompanying notes are an integral part of these financial statements. 31
Copyright © 2017 www.secdatabase.com. All Rights Reserved.Please Consider the Environment Before Printing This Document

GOLDMAN SACHS TARGET DATE 2030 PORTFOLIO
Schedule of InvestmentsApril 30, 2017 (Unaudited)
Shares Description ValueExchange Traded Funds �� 91.9%Alternative Funds* �� 2.0%37,096 PowerShares DB Gold Fund $ 1,506,840
Bond Funds �� 32.2%18,499 iShares 20+ Year Treasury Bond ETF 2,263,35233,433 iShares 3-7 Year Treasury Bond ETF 4,136,33160,003 iShares 7-10 Year Treasury Bond ETF 6,396,32074,196 Schwab U.S. TIPs ETF 4,132,7178,318 Vanguard Long-Term Corporate Bond ETF 754,02779,979 Vanguard Short-Term Corporate Bond ETF 6,391,922
24,074,669Foreign Stock Funds �� 18.6%39,101 iShares Edge MSCI Minimum Volatility EAFE ETF 2,629,93327,737 iShares Edge MSCI Minimum Volatility Emerging Markets ETF 1,505,287115,474 Vanguard FTSE All-World ex-U.S. ETF 5,638,59656,057 Vanguard FTSE Europe ETF 3,003,53422,073 WisdomTree Japan Hedged Equity Fund 1,127,268
13,904,618Stock Funds �� 39.1%6,783 Consumer Staples Select Sector SPDR Fund 374,28672,154 iShares Core S&P 500 ETF 17,285,21221,727 iShares Core S&P Mid-Cap ETF 3,749,86321,636 PowerShares Buyback Achievers Portfolio 1,128,75033,672 Schwab U.S. Dividend Equity ETF 1,504,8029,983 SPDR S&P Homebuilders ETF 377,45713,833 SPDR S&P Regional Banking ETF 747,6739,331 Vanguard Financials ETF 560,42015,102 Vanguard Growth ETF 1,879,1424,036 Vanguard Health Care ETF 565,5658,126 Vanguard Information Technology ETF 1,127,889
29,301,059TOTAL EXCHANGE TRADED FUNDS(Cost $62,833,431) $ 68,787,186
Investment Company �� 4.5%23,706 Schwab Fundamental U.S. Large Company Index Fund Institutional Shares $ 374,547
342,960 RidgeWorth Seix Floating Rate High Income Fund 3,007,756TOTAL INVESTMENT COMPANY(Cost $3,316,547) $ 3,382,303TOTAL INVESTMENTS �� 96.4%(Cost $66,149,978) $ 72,169,489OTHER ASSETS IN EXCESS OF
LIABILITIES �� 3.6% 2,717,211NET ASSETS �� 100.0% $ 74,886,700
The percentage shown for each investment category reflects the value of investments in that category as a percentage of net assets.* Non-income producing security.
Investment Abbreviations:ETF �Exchange Traded FundTIPS �Treasury Inflation Protected Securities
32 The accompanying notes are an integral part of these financial statements.
Copyright © 2017 www.secdatabase.com. All Rights Reserved.Please Consider the Environment Before Printing This Document

GOLDMAN SACHS TARGET DATE 2035 PORTFOLIO
Schedule of InvestmentsApril 30, 2017 (Unaudited)
Shares Description ValueExchange Traded Funds �� 92.2%Alternative Funds* �� 2.0%5,248 PowerShares DB Gold Fund $ 213,174
Bond Funds �� 27.6%2,617 iShares 20+ Year Treasury Bond ETF 320,1904,300 iShares 3-7 Year Treasury Bond ETF 531,9967,989 iShares 7-10 Year Treasury Bond ETF 851,6278,588 Schwab U.S. TIPs ETF 478,352586 Vanguard Long-Term Corporate Bond ETF 53,1218,652 Vanguard Short-Term Corporate Bond ETF 691,468
2,926,754Foreign Stock Funds �� 20.0%5,535 iShares Edge MSCI Minimum Volatility EAFE ETF 372,2844,403 iShares Edge MSCI Minimum Volatility Emerging Markets ETF 238,95117,419 Vanguard FTSE All-World ex-U.S. ETF 850,5708,922 Vanguard FTSE Europe ETF 478,0403,685 WisdomTree Japan Hedged Equity Fund 188,193
2,128,038Stock Funds �� 42.6%957 Consumer Staples Select Sector SPDR Fund 52,80710,873 iShares Core S&P 500 ETF 2,604,7363,381 iShares Core S&P Mid-Cap ETF 583,5273,552 PowerShares Buyback Achievers Portfolio 185,3085,345 Schwab U.S. Dividend Equity ETF 238,8681,405 SPDR S&P Homebuilders ETF 53,1231,957 SPDR S&P Regional Banking ETF 105,7761,334 Vanguard Financials ETF 80,1202,568 Vanguard Growth ETF 319,536763 Vanguard Health Care ETF 106,9191,341 Vanguard Information Technology ETF 186,130
4,516,850TOTAL EXCHANGE TRADED FUNDS(Cost $9,253,700) $ 9,784,816
Investment Company �� 4.0%3,342 Schwab Fundamental U.S. Large Company Index Fund Institutional Shares $ 52,806
42,454 RidgeWorth Seix Floating Rate High Income Fund 372,320TOTAL INVESTMENT COMPANY(Cost $422,399) $ 425,126TOTAL INVESTMENTS �� 96.2%(Cost $9,676,099) $ 10,209,942OTHER ASSETS IN EXCESS OF
LIABILITIES �� 3.8% 406,027NET ASSETS �� 100.0% $ 10,615,969
The percentage shown for each investment category reflects the value of investments in that category as a percentage of net assets.* Non-income producing security.
Investment Abbreviations:ETF �Exchange Traded FundTIPS �Treasury Inflation Protected Securities
The accompanying notes are an integral part of these financial statements. 33
Copyright © 2017 www.secdatabase.com. All Rights Reserved.Please Consider the Environment Before Printing This Document

GOLDMAN SACHS TARGET DATE 2040 PORTFOLIO
Schedule of InvestmentsApril 30, 2017 (Unaudited)
Shares Description ValueExchange Traded Funds �� 92.8%Alternative Funds* �� 2.0%24,744 PowerShares DB Gold Fund $ 1,005,101
Bond Funds �� 23.2%12,339 iShares 20+ Year Treasury Bond ETF 1,509,67718,246 iShares 3-7 Year Treasury Bond ETF 2,257,39532,960 iShares 7-10 Year Treasury Bond ETF 3,513,53631,480 Schwab U.S. TIPs ETF 1,753,4362,748 Vanguard Long-Term Corporate Bond ETF 249,10628,242 Vanguard Short-Term Corporate Bond ETF 2,257,101
11,540,251Foreign Stock Funds �� 21.6%27,959 iShares Edge MSCI Minimum Volatility EAFE ETF 1,880,52216,180 iShares Edge MSCI Minimum Volatility Emerging Markets ETF 878,08987,292 Vanguard FTSE All-World ex-U.S. ETF 4,262,4686,185 Vanguard FTSE Emerging Markets ETF 249,50346,739 Vanguard FTSE Europe ETF 2,504,27619,728 WisdomTree Japan Hedged Equity Fund 1,007,509
10,782,367Stock Funds �� 46.0%4,551 Consumer Staples Select Sector SPDR Fund 251,12454,426 iShares Core S&P 500 ETF 13,038,29317,391 iShares Core S&P Mid-Cap ETF 3,001,51319,181 PowerShares Buyback Achievers Portfolio 1,000,67328,092 Schwab U.S. Dividend Equity ETF 1,255,4316,637 SPDR S&P Homebuilders ETF 250,9459,226 SPDR S&P Regional Banking ETF 498,6656,205 Vanguard Financials ETF 372,67214,103 Vanguard Growth ETF 1,754,8363,589 Vanguard Health Care ETF 502,9277,227 Vanguard Information Technology ETF 1,003,108
22,930,187TOTAL EXCHANGE TRADED FUNDS(Cost $41,586,677) $ 46,257,906
Investment Company �� 3.8%23,718 Schwab Fundamental U.S. Large Company Index Fund Institutional Shares $ 374,741
171,345 RidgeWorth Seix Floating Rate High Income Fund 1,502,698TOTAL INVESTMENT COMPANY(Cost $1,767,584) $ 1,877,439TOTAL INVESTMENTS �� 96.6%(Cost $43,354,261) $ 48,135,345OTHER ASSETS IN EXCESS OF
LIABILITIES �� 3.4% 1,711,069NET ASSETS �� 100.0% $ 49,846,414
The percentage shown for each investment category reflects the value of investments in that category as a percentage of net assets.* Non-income producing security.
Investment Abbreviations:ETF �Exchange Traded FundTIPS �Treasury Inflation Protected Securities
34 The accompanying notes are an integral part of these financial statements.
Copyright © 2017 www.secdatabase.com. All Rights Reserved.Please Consider the Environment Before Printing This Document
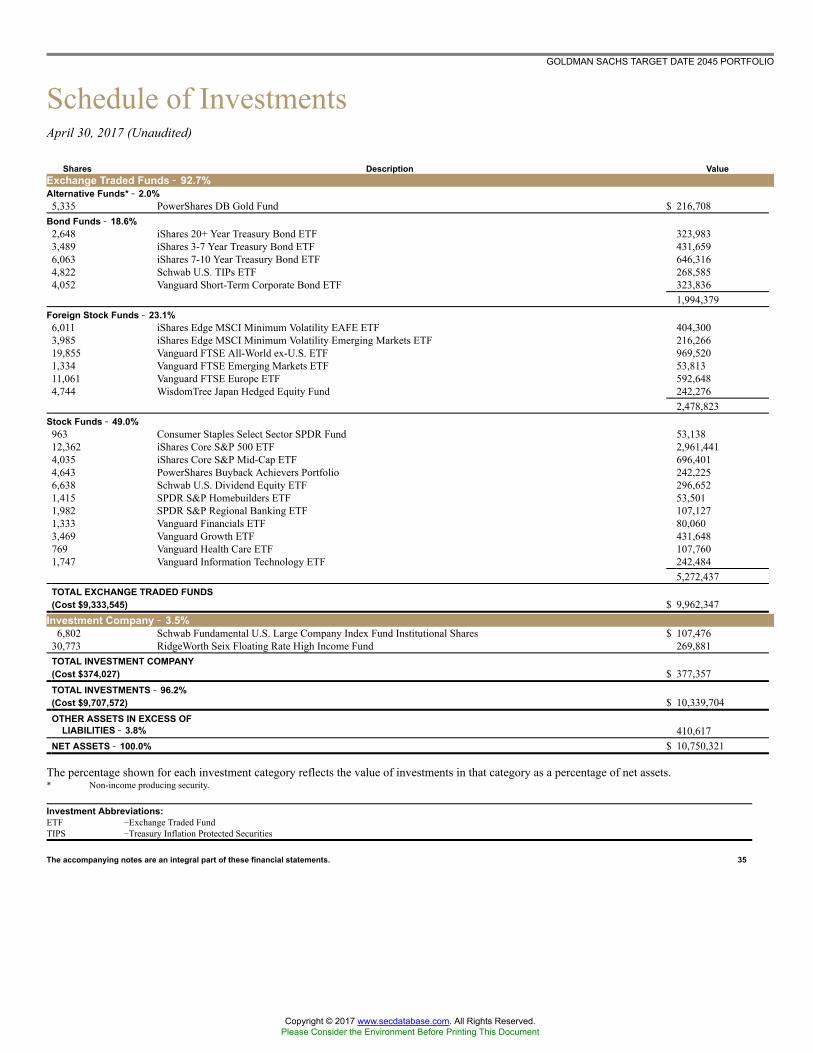
GOLDMAN SACHS TARGET DATE 2045 PORTFOLIO
Schedule of InvestmentsApril 30, 2017 (Unaudited)
Shares Description ValueExchange Traded Funds �� 92.7%Alternative Funds* �� 2.0%5,335 PowerShares DB Gold Fund $ 216,708
Bond Funds �� 18.6%2,648 iShares 20+ Year Treasury Bond ETF 323,9833,489 iShares 3-7 Year Treasury Bond ETF 431,6596,063 iShares 7-10 Year Treasury Bond ETF 646,3164,822 Schwab U.S. TIPs ETF 268,5854,052 Vanguard Short-Term Corporate Bond ETF 323,836
1,994,379Foreign Stock Funds �� 23.1%6,011 iShares Edge MSCI Minimum Volatility EAFE ETF 404,3003,985 iShares Edge MSCI Minimum Volatility Emerging Markets ETF 216,26619,855 Vanguard FTSE All-World ex-U.S. ETF 969,5201,334 Vanguard FTSE Emerging Markets ETF 53,81311,061 Vanguard FTSE Europe ETF 592,6484,744 WisdomTree Japan Hedged Equity Fund 242,276
2,478,823Stock Funds �� 49.0%963 Consumer Staples Select Sector SPDR Fund 53,13812,362 iShares Core S&P 500 ETF 2,961,4414,035 iShares Core S&P Mid-Cap ETF 696,4014,643 PowerShares Buyback Achievers Portfolio 242,2256,638 Schwab U.S. Dividend Equity ETF 296,6521,415 SPDR S&P Homebuilders ETF 53,5011,982 SPDR S&P Regional Banking ETF 107,1271,333 Vanguard Financials ETF 80,0603,469 Vanguard Growth ETF 431,648769 Vanguard Health Care ETF 107,7601,747 Vanguard Information Technology ETF 242,484
5,272,437TOTAL EXCHANGE TRADED FUNDS(Cost $9,333,545) $ 9,962,347
Investment Company �� 3.5%6,802 Schwab Fundamental U.S. Large Company Index Fund Institutional Shares $ 107,476
30,773 RidgeWorth Seix Floating Rate High Income Fund 269,881TOTAL INVESTMENT COMPANY(Cost $374,027) $ 377,357TOTAL INVESTMENTS �� 96.2%(Cost $9,707,572) $ 10,339,704OTHER ASSETS IN EXCESS OF
LIABILITIES �� 3.8% 410,617NET ASSETS �� 100.0% $ 10,750,321
The percentage shown for each investment category reflects the value of investments in that category as a percentage of net assets.* Non-income producing security.
Investment Abbreviations:ETF �Exchange Traded FundTIPS �Treasury Inflation Protected Securities
The accompanying notes are an integral part of these financial statements. 35
Copyright © 2017 www.secdatabase.com. All Rights Reserved.Please Consider the Environment Before Printing This Document

GOLDMAN SACHS TARGET DATE 2050 PORTFOLIO
Schedule of InvestmentsApril 30, 2017 (Unaudited)
Shares Description ValueExchange Traded Funds �� 94.1%Alternative Funds* �� 2.0%12,507 PowerShares DB Gold Fund $ 508,034
Bond Funds �� 14.2%6,237 iShares 20+ Year Treasury Bond ETF 763,0977,173 iShares 3-7 Year Treasury Bond ETF 887,4439,520 iShares 7-10 Year Treasury Bond ETF 1,014,8326,817 Schwab U.S. TIPs ETF 379,7076,345 Vanguard Short-Term Corporate Bond ETF 507,092
3,552,171Foreign Stock Funds �� 24.8%14,133 iShares Edge MSCI Minimum Volatility EAFE ETF 950,58610,510 iShares Edge MSCI Minimum Volatility Emerging Markets ETF 570,37849,315 Vanguard FTSE All-World ex-U.S. ETF 2,408,0513,117 Vanguard FTSE Emerging Markets ETF 125,74028,350 Vanguard FTSE Europe ETF 1,518,99312,503 WisdomTree Japan Hedged Equity Fund 638,528
6,212,276Stock Funds �� 53.1%2,301 Consumer Staples Select Sector SPDR Fund 126,96930,674 iShares Core S&P 500 ETF 7,348,26410,256 iShares Core S&P Mid-Cap ETF 1,770,08312,114 PowerShares Buyback Achievers Portfolio 631,98717,040 Schwab U.S. Dividend Equity ETF 761,5183,353 SPDR S&P Homebuilders ETF 126,7774,664 SPDR S&P Regional Banking ETF 252,0894,206 Vanguard Financials ETF 252,6129,165 Vanguard Growth ETF 1,140,4011,814 Vanguard Health Care ETF 254,1964,566 Vanguard Information Technology ETF 633,761
13,298,657TOTAL EXCHANGE TRADED FUNDS(Cost $20,839,834) $ 23,571,138
Investment Company �� 3.0%15,985 Schwab Fundamental U.S. Large Company Index Fund Institutional Shares $ 252,56457,715 RidgeWorth Seix Floating Rate High Income Fund 506,159TOTAL INVESTMENT COMPANY(Cost $684,874) $ 758,723TOTAL INVESTMENTS �� 97.1%(Cost $21,524,708) $ 24,329,861OTHER ASSETS IN EXCESS OF
LIABILITIES �� 2.9% 718,320NET ASSETS �� 100.0% $ 25,048,181
The percentage shown for each investment category reflects the value of investments in that category as a percentage of net assets.* Non-income producing security.
Investment Abbreviations:ETF �Exchange Traded FundTIPS �Treasury Inflation Protected Securities
36 The accompanying notes are an integral part of these financial statements.
Copyright © 2017 www.secdatabase.com. All Rights Reserved.Please Consider the Environment Before Printing This Document

GOLDMAN SACHS TARGET DATE 2055 PORTFOLIO
Schedule of InvestmentsApril 30, 2017 (Unaudited)
Shares Description ValueExchange Traded Funds �� 93.7%Alternative Funds* �� 2.0%5,396 PowerShares DB Gold Fund $ 219,186
Bond Funds �� 9.5%2,691 iShares 20+ Year Treasury Bond ETF 329,2442,652 iShares 3-7 Year Treasury Bond ETF 328,1051,540 iShares 7-10 Year Treasury Bond ETF 164,1641,962 Schwab U.S. TIPs ETF 109,2831,369 Vanguard Short-Term Corporate Bond ETF 109,411
1,040,207Foreign Stock Funds �� 26.1%6,503 iShares Edge MSCI Minimum Volatility EAFE ETF 437,3925,043 iShares Edge MSCI Minimum Volatility Emerging Markets ETF 273,68422,394 Vanguard FTSE All-World ex-U.S. ETF 1,093,4991,356 Vanguard FTSE Emerging Markets ETF 54,70113,266 Vanguard FTSE Europe ETF 710,7925,351 WisdomTree Japan Hedged Equity Fund 273,275
2,843,343Stock Funds �� 56.1%975 Consumer Staples Select Sector SPDR Fund 53,80013,917 iShares Core S&P 500 ETF 3,333,9564,740 iShares Core S&P Mid-Cap ETF 818,0776,284 PowerShares Buyback Achievers Portfolio 327,8367,351 Schwab U.S. Dividend Equity ETF 328,5162,157 SPDR S&P Homebuilders ETF 81,5562,012 SPDR S&P Regional Banking ETF 108,7491,815 Vanguard Financials ETF 109,0093,962 Vanguard Growth ETF 492,992974 Vanguard Health Care ETF 136,4872,364 Vanguard Information Technology ETF 328,123
6,119,101TOTAL EXCHANGE TRADED FUNDS(Cost $9,466,749) $ 10,221,837
Investment Company �� 2.5%6,896 Schwab Fundamental U.S. Large Company Index Fund Institutional Shares $ 108,964
18,706 RidgeWorth Seix Floating Rate High Income Fund 164,054TOTAL INVESTMENT COMPANY(Cost $269,782) $ 273,018TOTAL INVESTMENTS �� 96.2%(Cost $9,736,531) $ 10,494,855OTHER ASSETS IN EXCESS OF
LIABILITIES �� 3.8% 417,618NET ASSETS �� 100.0% $ 10,912,473
The percentage shown for each investment category reflects the value of investments in that category as a percentage of net assets.* Non-income producing security.
Investment Abbreviations:ETF �Exchange Traded FundTIPS �Treasury Inflation Protected Securities
The accompanying notes are an integral part of these financial statements. 37
Copyright © 2017 www.secdatabase.com. All Rights Reserved.Please Consider the Environment Before Printing This Document

Statements of Assets and LiabilitiesApril 30, 2017 (Unaudited)
Target Date 2020Portfolio
Assets:Investments, at value (cost $48,477,903, $9,648,575, $66,149,978, $9,676,099, $43,354,261, $9,707,572, $21,524,708 and $9,736,531) $ 50,910,743Cash 1,919,873Deferred offering costs �Receivables:
Investments sold 644,545Dividends 12,413Fund shares sold 1,090Reimbursement from investment adviser �
Other assets 5,669Total assets 53,494,333
Liabilities:Payables:
Investments purchased 442,067Management fees 10,860Distribution and Service fees and Transfer Agency fees 885Fund shares redeemed �
Offering expense �Accrued expenses 298,095Total liabilities 751,907
Net Assets:Paid-in capital 48,528,614Undistributed net investment income 186,934Accumulated net realized gain (loss) 1,594,038Net unrealized gain 2,432,840NET ASSETS $ 52,742,426Net Assets:
Class A $ 15,741Institutional 10,232Service 10,196Class IR 10,221Class R 10,185Class R6 52,685,851
Total Net Assets $ 52,742,426Shares Outstanding $0.001 par value (unlimited number of shares authorized):
Class A 1,623Institutional 1,054Service 1,052Class IR 1,053Class R 1,051Class R6 5,424,205
Net asset value, offering and redemption price per share:(a)Class A $9.70Institutional 9.71Service 9.69Class IR 9.71Class R 9.69Class R6 9.71
(a) Maximum public offering price per share for Class A Shares of the Target Date 2020, Target Date 2025, Target Date 2030, Target Date 2035, Target Date 2040, Target Date 2045, TargetDate 2050, and Target Date 2055 Portfolios is $10.26, $10.91, $10.48, $11.09, $10.30, $11.22, $10.72 and $11.33, respectively.
(b) Net asset value may not recalculate due to rounding of fractional shares.
38 The accompanying notes are an integral part of these financial statements.
Copyright © 2017 www.secdatabase.com. All Rights Reserved.Please Consider the Environment Before Printing This Document

Target Date 2025Portfolio
Target Date 2030Portfolio
Target Date 2035Portfolio
Target Date 2040Portfolio
Target Date 2045Portfolio
Target Date 2050Portfolio
Target Date 2055Portfolio
$ 10,062,515 $ 72,169,489 $ 10,209,942 $ 48,135,345 $ 10,339,704 $ 24,329,861 $ 10,494,855439,448 2,788,426 445,326 1,982,585 449,887 998,033 457,10638,032 � 38,032 � 38,032 � 37,760
138,885 704,260 84,312 585,235 120,871 304,551 146,8132,150 13,613 1,644 6,724 1,234 2,214 876� 319 922 1,614 � 1,729 37626,028 � 25,921 � 25,871 � 25,9011,251 7,925 13,599 5,160 1,262 2,509 13,81410,708,309 75,684,032 10,819,698 50,716,663 10,976,861 25,638,897 11,177,501
159,211 482,203 104,199 561,013 139,379 289,331 166,3342,134 15,581 2,161 10,221 2,186 5,119 2,215370 1,332 365 840 380 426 39218 � � � � � �
43,395 � 43,396 � 43,397 � 42,85041,106 298,216 53,608 298,175 41,198 295,840 53,237246,234 797,332 203,729 870,249 226,540 590,716 265,028
10,122,047 63,886,306 10,114,419 41,365,291 10,127,377 21,555,614 10,170,87831,287 227,643 28,262 143,196 27,130 64,730 24,519(105,199 ) 4,753,240 (60,555 ) 3,556,843 (36,318 ) 622,684 (41,248 )413,940 6,019,511 533,843 4,781,084 632,132 2,805,153 758,324
$ 10,462,075 $ 74,886,700 $ 10,615,969 $ 49,846,414 $ 10,750,321 $ 25,048,181 $ 10,912,473
$ 54,165 $ 203,118 $ 27,809 $ 14,381 $ 36,377 $ 10,754 $ 81,22310,366,328 10,530 10,532,454 10,656 10,656,136 10,785 10,777,33710,383 10,493 10,549 10,619 10,674 10,747 10,79510,408 10,518 10,575 10,645 10,699 10,773 10,82110,372 20,597 10,606 21,575 25,725 10,761 10,78310,419 74,631,444 23,976 49,778,538 10,710 24,994,361 21,514
$ 10,462,075 $ 74,886,700 $ 10,615,969 $ 49,846,414 $ 10,750,321 $ 25,048,181 $ 10,912,473
5,254 20,521 2,652 1,478 3,431 1,062 7,5811,003,051 1,061 1,003,493 1,094 1,003,690 1,063 1,004,0141,006 1,059 1,007 1,092 1,007 1,062 1,0071,008 1,061 1,008 1,093 1,008 1,063 1,0091,006 2,080 1,013 2,219 2,428 1,064 1,0071,008 7,524,325 2,284 5,105,755 1,009 2,464,652 2,005
$10.31 $9.90 $10.48 $9.73 $10.60 $10.13 $10.7110.33 9.92 10.50 9.75 10.62 10.14 10.7310.32 9.91 10.48 9.73 10.60 10.12 10.7210.33 9.92 10.49 9.74 10.61 10.14 10.73 (b)
10.31 9.90 10.47 9.72 10.59 10.12 10.7110.34 9.92 10.50 9.75 10.62 10.14 10.73
The accompanying notes are an integral part of these financial statements. 39
Copyright © 2017 www.secdatabase.com. All Rights Reserved.Please Consider the Environment Before Printing This Document
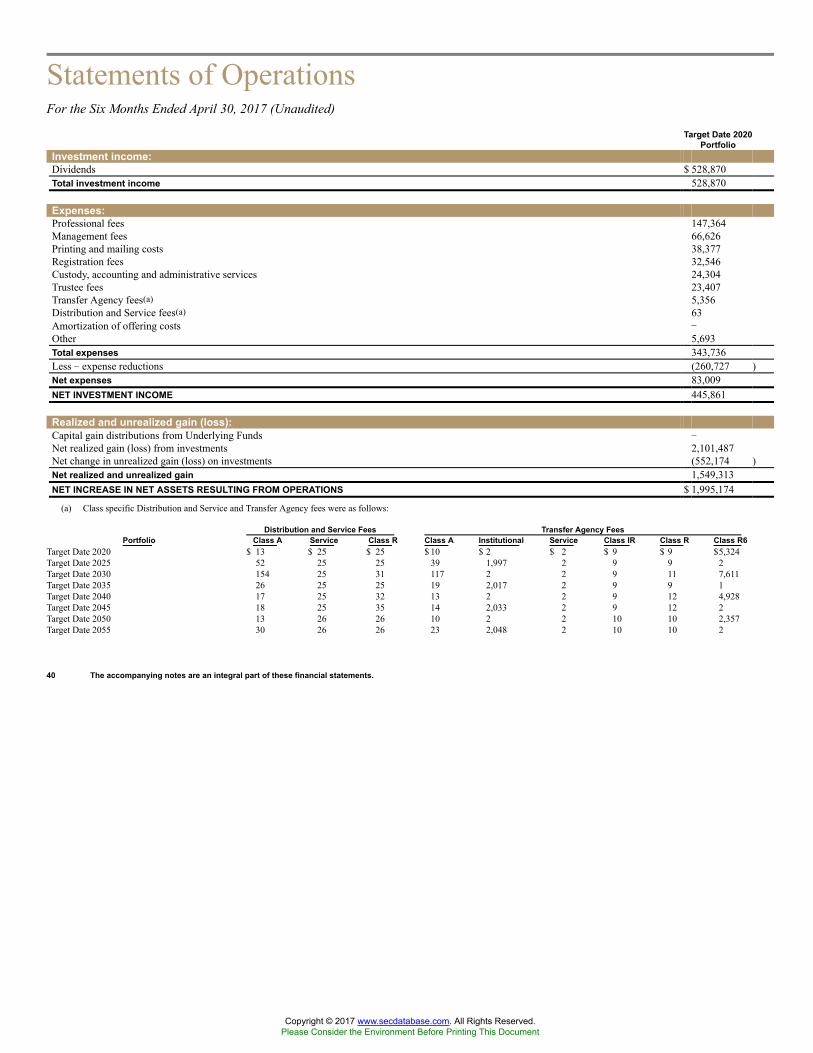
Statements of OperationsFor the Six Months Ended April 30, 2017 (Unaudited)
Target Date 2020Portfolio
Investment income:Dividends $ 528,870Total investment income 528,870
Expenses:Professional fees 147,364Management fees 66,626Printing and mailing costs 38,377Registration fees 32,546Custody, accounting and administrative services 24,304Trustee fees 23,407Transfer Agency fees(a) 5,356Distribution and Service fees(a) 63Amortization of offering costs �Other 5,693Total expenses 343,736Less � expense reductions (260,727 )Net expenses 83,009NET INVESTMENT INCOME 445,861
Realized and unrealized gain (loss):Capital gain distributions from Underlying Funds �Net realized gain (loss) from investments 2,101,487Net change in unrealized gain (loss) on investments (552,174 )Net realized and unrealized gain 1,549,313NET INCREASE IN NET ASSETS RESULTING FROM OPERATIONS $ 1,995,174
(a) Class specific Distribution and Service and Transfer Agency fees were as follows:
Distribution and Service Fees Transfer Agency FeesPortfolio Class A Service Class R Class A Institutional Service Class IR Class R Class R6
Target Date 2020 $ 13 $ 25 $ 25 $ 10 $ 2 $ 2 $ 9 $ 9 $5,324Target Date 2025 52 25 25 39 1,997 2 9 9 2Target Date 2030 154 25 31 117 2 2 9 11 7,611Target Date 2035 26 25 25 19 2,017 2 9 9 1Target Date 2040 17 25 32 13 2 2 9 12 4,928Target Date 2045 18 25 35 14 2,033 2 9 12 2Target Date 2050 13 26 26 10 2 2 10 10 2,357Target Date 2055 30 26 26 23 2,048 2 10 10 2
40 The accompanying notes are an integral part of these financial statements.
Copyright © 2017 www.secdatabase.com. All Rights Reserved.Please Consider the Environment Before Printing This Document

Target Date 2025Portfolio
Target Date 2030Portfolio
Target Date 2035Portfolio
Target Date 2040Portfolio
Target Date 2045Portfolio
Target Date 2050Portfolio
Target Date 2055Portfolio
$ 100,931 $ 767,759 $ 102,226 $ 504,932 $ 103,903 $ 239,339 $ 105,483100,931 767,759 102,226 504,932 103,903 239,339 105,483
20,620 147,364 20,620 147,364 20,620 147,364 20,62012,584 95,348 12,686 61,688 12,779 29,550 12,89017,108 38,377 17,108 38,377 17,108 38,377 17,1069,230 32,539 9,230 32,539 9,230 32,552 9,23017,834 23,787 17,595 23,485 17,486 18,312 17,55721,914 24,204 21,914 23,288 21,915 22,321 21,9162,058 7,752 2,057 4,966 2,072 2,391 2,095102 210 76 74 78 65 8282,019 � 82,019 � 82,019 � 82,0193,102 5,666 3,102 5,656 3,103 5,645 3,102186,571 375,247 186,407 337,437 186,410 296,577 186,617(169,943 ) (256,277 ) (169,692 ) (260,620 ) (169,572 ) (259,782 ) (169,630 )16,628 118,970 16,715 76,817 16,838 36,795 16,98784,303 648,789 85,511 428,115 87,065 202,544 88,496
4,000 34,942 5,746 28,049 5,796 12,983 5,840(51,689 ) 5,887,135 (9,964 ) 4,480,475 15,213 1,112,140 17,255550,941 (1,211,022 ) 691,108 (851,755 ) 796,436 907,602 923,504503,252 4,711,055 686,890 3,656,769 817,445 2,032,725 946,599
$ 587,555 $ 5,359,844 $ 772,401 $ 4,084,884 $ 904,510 $ 2,235,269 $ 1,035,095
The accompanying notes are an integral part of these financial statements. 41
Copyright © 2017 www.secdatabase.com. All Rights Reserved.Please Consider the Environment Before Printing This Document

Statements of Changes in Net AssetsTarget Date 2020 Portfolio
For theSix Months Ended
April 30, 2017(Unaudited)
For the FiscalYear Ended
October 31, 2016From operations:Net investment income $ 445,861 $ 969,310Net realized gain (loss) 2,101,487 2,304,750Net change in unrealized gain (loss) (552,174 ) (1,317,333 )Net increase (decrease) in net assets resulting from operations 1,995,174 1,956,727
Distributions to shareholders:From net investment income
Class A Shares (167 ) �
Institutional Shares (182 ) �
Service Shares (164 ) �
Class IR Shares (177 ) �
Class R Shares (159 ) �Class R6 Shares (1,005,896 ) (899,589 )
From net realized gainsClass A Shares (374 ) �
Institutional Shares (373 ) �
Service Shares (374 ) �
Class IR Shares (373 ) �
Class R Shares (373 ) �Class R6 Shares (2,022,264 ) (1,764,331 )
Total distributions to shareholders (3,030,876 ) (2,663,920 )
From share transactions:Proceeds from sales of shares 1,402,403 5,445,589Reinvestment of distributions 3,030,875 2,663,920Cost of shares redeemed (4,375,733 ) (7,300,343 )Net increase (decrease) in net assets resulting from share transactions 57,545 809,166TOTAL INCREASE (DECREASE) (978,157 ) 101,973
Net assets:Beginning of period 53,720,583 53,618,610End of period $ 52,742,426 $ 53,720,583Undistributed net investment income $ 186,934 $ 747,818
(a) Commenced operations on August 22, 2016.
42 The accompanying notes are an integral part of these financial statements.
Copyright © 2017 www.secdatabase.com. All Rights Reserved.Please Consider the Environment Before Printing This Document

Target Date 2025 Portfolio Target Date 2030 PortfolioFor the
Six Months EndedApril 30, 2017(Unaudited)
For the FiscalYear Ended
October 31, 2016(a)
For theSix Months Ended
April 30, 2017(Unaudited)
For the FiscalYear Ended
October 31, 2016
$ 84,303 $ 26,825 $ 648,789 $ 1,461,869(47,689 ) (57,510 ) 5,922,077 2,737,159550,941 (137,001 ) (1,211,022 ) (1,710,529 )587,555 (167,686 ) 5,359,844 2,488,499
(375 ) � (306 ) �
(79,700 ) � (198 ) �
(62 ) � (181 ) �
(75 ) � (193 ) �
(57 ) � (175 ) �
(80 ) � (1,529,883 ) (1,258,551 )
� � (318 ) �� � (317 ) �� � (318 ) �� � (317 ) �� � (317 ) �� � (2,407,010 ) (2,672,152 )(80,349 ) � (3,939,533 ) (3,930,703 )
42,246 10,000,066 2,224,671 2,761,28580,349 � 3,939,531 3,930,703(41 ) (65 ) (6,970,954 ) (9,983,568 )122,554 10,000,001 (806,752 ) (3,291,580 )629,760 9,832,315 613,559 (4,733,784 )
9,832,315 � 74,273,141 79,006,925$ 10,462,075 $ 9,832,315 $ 74,886,700 $ 74,273,141$ 31,287 $ 27,333 $ 227,643 $ 1,109,790
The accompanying notes are an integral part of these financial statements. 43
Copyright © 2017 www.secdatabase.com. All Rights Reserved.Please Consider the Environment Before Printing This Document

Statements of Changes in Net Assets (continued)Target Date 2035 Portfolio
For theSix Months Ended
April 30, 2017(Unaudited)
For the FiscalYear Ended
October 31, 2016(a)
From operations:Net investment income $ 85,511 $ 27,283Net realized gain (loss) (4,218 ) (56,337 )Net change in unrealized gain (loss) 691,108 (157,265 )Net increase (decrease) in net assets resulting from operations 772,401 (186,319 )
Distributions to shareholders:From net investment income
Class A Shares (71 ) �
Institutional Shares (84,675 ) �
Service Shares (67 ) �
Class IR Shares (80 ) �
Class R Shares (62 ) �
Class R6 Shares (85 ) �From net realized gains
Class A Shares � �
Institutional Shares � �
Service Shares � �
Class IR Shares � �
Class R Shares � �
Class R6 Shares � �
Total distributions to shareholders (85,040 ) �
From share transactions:Proceeds from sales of shares 29,891 10,000,066Reinvestment of distributions 85,040 �Cost of shares redeemed (5 ) (65 )Net increase (decrease) in net assets resulting from share transactions 114,926 10,000,001TOTAL INCREASE (DECREASE) 802,287 9,813,682
Net assets:Beginning of period 9,813,682 �
End of period $ 10,615,969 $ 9,813,682Undistributed net investment income $ 28,262 $ 27,791
(a) Commenced operations on August 22, 2016.
44 The accompanying notes are an integral part of these financial statements.
Copyright © 2017 www.secdatabase.com. All Rights Reserved.Please Consider the Environment Before Printing This Document

Target Date 2040 Portfolio Target Date 2045 PortfolioFor the
Six Months EndedApril 30, 2017(Unaudited)
For the FiscalYear Ended
October 31, 2016
For theSix Months Ended
April 30, 2017(Unaudited)
For the FiscalYear Ended
October 31, 2016(a)
$ 428,115 $ 983,035 $ 87,065 $ 27,0974,508,524 2,200,742 21,009 (57,327 )(851,755 ) (1,495,190 ) 796,436 (164,304 )4,084,884 1,688,587 904,510 (194,534 )
(256 ) � (73 ) �
(211 ) � (87,162 ) �
(193 ) � (70 ) �
(206 ) � (82 ) �
(188 ) � (65 ) �
(1,022,650 ) (839,070 ) (88 ) �
(571 ) � � �
(442 ) � � �
(442 ) � � �
(442 ) � � �
(442 ) � � �
(2,134,309 ) (2,209,026 ) � �
(3,160,352 ) (3,048,096 ) (87,540 ) �
1,719,052 1,187,738 40,349 10,000,0663,160,351 3,048,096 87,540 �(3,349,241 ) (5,514,019 ) (5 ) (65 )1,530,162 (1,278,185 ) 127,884 10,000,0012,454,694 (2,637,694 ) 944,854 9,805,467
47,391,720 50,029,414 9,805,467 �
$ 49,846,414 $ 47,391,720 $ 10,750,321 $ 9,805,467$ 143,196 $ 738,785 $ 27,130 $ 27,605
The accompanying notes are an integral part of these financial statements. 45
Copyright © 2017 www.secdatabase.com. All Rights Reserved.Please Consider the Environment Before Printing This Document

Statements of Changes in Net Assets (continued)Target Date 2050 Portfolio
For theSix Months Ended
April 30, 2017(Unaudited)
For the FiscalYear Ended
October 31, 2016From operations:Net investment income $ 202,544 $ 446,501Net realized gain (loss) 1,125,123 844,921Net change in unrealized gain (loss) 907,602 (529,507 )Net increase (decrease) in net assets resulting from operations 2,235,269 761,915
Distributions to shareholders:From net investment income
Class A Shares (196 ) �
Institutional Shares (210 ) �
Service Shares (192 ) �
Class IR Shares (205 ) �
Class R Shares (187 ) �Class R6 Shares (470,084 ) (348,249 )
From net realized gainsClass A Shares (404 ) �
Institutional Shares (404 ) �
Service Shares (404 ) �
Class IR Shares (404 ) �
Class R Shares (404 ) �Class R6 Shares (892,169 ) (629,298 )
Total distributions to shareholders (1,365,263 ) (977,547 )
From share transactions:Proceeds from sales of shares 2,330,588 1,728,932Reinvestment of distributions 1,365,263 977,547Cost of shares redeemed (1,223,381 ) (1,267,315 )Net increase in net assets resulting from share transactions 2,472,470 1,439,164TOTAL INCREASE 3,342,476 1,223,532
Net assets:Beginning of period 21,705,705 20,482,173End of period $ 25,048,181 $ 21,705,705Undistributed net investment income $ 64,730 $ 333,260
(a) Commenced operations on August 22, 2016.
46 The accompanying notes are an integral part of these financial statements.
Copyright © 2017 www.secdatabase.com. All Rights Reserved.Please Consider the Environment Before Printing This Document

Target Date 2055 PortfolioFor the
Six Months EndedApril 30, 2017(Unaudited)
For the FiscalYear Ended
October 31, 2016(a)
$ 88,496 $ 26,97723,095 (64,343 )923,504 (165,180 )1,035,095 (202,546 )
(98 ) �
(91,043 ) �
(74 ) �
(86 ) �
(69 ) �
(92 ) �
� �� �� �� �� �� �
(91,462 ) �
79,941 10,000,06691,462 �(18 ) (65 )171,385 10,000,0011,115,018 9,797,455
9,797,455 �
$ 10,912,473 $ 9,797,455$ 24,519 $ 27,485
The accompanying notes are an integral part of these financial statements. 47
Copyright © 2017 www.secdatabase.com. All Rights Reserved.Please Consider the Environment Before Printing This Document

GOLDMAN SACHS TARGET DATE 2020 PORTFOLIO
Financial HighlightsSelected Data for a Share Outstanding Throughout Each Period
Income (loss) fromInvestment Operations
Distributionsto shareholders
Year - Share Class
Net assetvalue,
beginningof period
Netinvestmentincome(a)
Net realizedand unrealized
gain (loss)
Total frominvestmentoperations
From netinvestment
income
From netrealized
gainsTotal
distributionsFOR THE SIX MONTHS ENDED APRIL 30, (UNAUDITED)2017 - A $ 9.90 $ 0.05 $ 0.29 $ 0.34 $ (0.16 ) $ (0.38 ) $ (0.54 )2017 - Institutional 9.91 0.08 0.28 0.36 (0.18 ) (0.38 ) (0.56 )2017 - Service 9.90 0.05 0.28 0.33 (0.16 ) (0.38 ) (0.54 )2017 - IR 9.91 0.07 0.28 0.35 (0.17 ) (0.38 ) (0.55 )2017 - R 9.90 0.05 0.27 0.32 (0.15 ) (0.38 ) (0.53 )2017 - R6 9.91 0.08 0.28 0.36 (0.18 ) (0.38 ) (0.56 )
FOR THE FISCAL YEARS ENDED OCTOBER 31,2016 - A (Commenced August 22, 2016) 10.05 0.02 (0.17 ) (0.15 ) � � �
2016 - Institutional (Commenced August 22, 2016) 10.05 0.03 (0.17 ) (0.14 ) � � �
2016 - Service (Commenced August 22, 2016) 10.05 0.02 (0.17 ) (0.15 ) � � �
2016 - IR (Commenced August 22, 2016) 10.05 0.02 (0.16 ) (0.14 ) � � �
2016 - R (Commenced August 22, 2016) 10.05 0.01 (0.16 ) (0.15 ) � � �2016 - R6 10.07 0.18 0.16 0.34 (0.17 ) (0.33 ) (0.50 )2015 - R6 10.00 0.16 0.10 0.26 (0.09 ) (0.10 ) (0.19 )
FOR THE PERIOD ENDED OCTOBER 31,2014 - R6 (Commenced August 29, 2014) 10.00 0.03 (0.03 ) � � � �
(a) Calculated based on the average shares outstanding methodology.(b) Assumes investment at the NAV at the beginning of the period, reinvestment of all dividends and distributions, a complete redemption of the investment at the NAV at the end of the
period and no sales or redemption charges. Total returns would be reduced if a sales or redemption charge was taken into account. Returns do not reflect the impact of taxes toshareholder relating to Portfolio distributions or the redemption of Portfolio shares. Total returns for periods less than one full year are not annualized. The Goldman Sachs Target Date2020 Portfolio�s predecessor was the Madison Target Retirement 2020 Fund (the �Predecessor Fund�). On August 22, 2016, the Predecessor Fund was reorganized as a new series ofGoldman Sachs Trust II. Performance prior to August 22, 2016 is that of the Predecessor Fund. Total return information of the Predecessor Fund is included in the above table becausethe Predecessor Fund is considered the accounting survivor of the reorganization.
(c) The Portfolio�s portfolio turnover rate is calculated in accordance with regulatory requirements, without regard to transactions involving short term investments. If such transactionswere included, the Portfolio�s portfolio turnover rate may be higher.
(d) Annualized.
48 The accompanying notes are an integral part of these financial statements.
Copyright © 2017 www.secdatabase.com. All Rights Reserved.Please Consider the Environment Before Printing This Document

GOLDMAN SACHS TARGET DATE 2020 PORTFOLIO
Net assetvalue, endof period
Totalreturn(b)
Net assets,end ofperiod
(in 000s)
Ratio ofnet expenses
to averagenet assets
Ratio oftotal expenses
to averagenet assets
Ratio ofnet investment
incometo averagenet assets
Portfolioturnover
rate(c)
$ 9.70 3.60 % $ 16 0.73 %(d) 1.65 %(d) 1.14 %(d) 119 %9.71 3.75 10 0.33 (d) 1.31 (d) 1.64 (d) 1199.69 3.46 10 0.83 (d) 1.81 (d) 1.14 (d) 1199.71 3.69 10 0.48 (d) 1.46 (d) 1.49 (d) 1199.69 3.41 10 0.98 (d) 1.96 (d) 0.99 (d) 1199.71 3.75 52,686 0.31 (d) 1.29 (d) 1.67 (d) 119
9.90 (1.49 ) 10 0.74 (d) 3.01 (d) 0.94 (d) 2049.91 (1.39 ) 10 0.34 (d) 2.61 (d) 1.34 (d) 2049.90 (1.49 ) 10 0.84 (d) 3.11 (d) 0.84 (d) 2049.91 (1.39 ) 10 0.48 (d) 2.75 (d) 1.19 (d) 2049.90 (1.49 ) 10 0.98 (d) 3.25 (d) 0.69 (d) 2049.91 3.65 53,671 0.31 0.76 1.79 20410.07 2.61 53,619 0.30 0.30 1.46 207
10.00 � 61,964 0.32 (d) 0.32 (d) 1.82 (d) 48
The accompanying notes are an integral part of these financial statements. 49
Copyright © 2017 www.secdatabase.com. All Rights Reserved.Please Consider the Environment Before Printing This Document

GOLDMAN SACHS TARGET DATE 2025 PORTFOLIO
Financial HighlightsSelected Data for a Share Outstanding Throughout Each Period
Frominvestment operations
Year - Share Class
Net assetvalue,
beginningof period
Netinvestmentincome(a)
Net realizedand unrealized
gain (loss)
Total frominvestmentoperations
Distributionsto shareholders
from netinvestment
incomeFOR THE SIX MONTHS ENDED APRIL 30, (UNAUDITED)2017 - A $ 9.82 $ 0.07 $ 0.50 $ 0.57 $ (0.08 )2017 - Institutional 9.83 0.08 0.50 0.58 (0.08 )2017 - Service 9.82 0.06 0.50 0.56 (0.06 )2017 - IR 9.83 0.08 0.49 0.57 (0.07 )2017 - R 9.82 0.05 0.50 0.55 (0.06 )2017 - R6 9.83 0.08 0.51 0.59 (0.08 )
FOR THE PERIOD ENDED OCTOBER 31,2016 - A (Commenced August 22, 2016) 10.00 0.02 (0.20 ) (0.18 ) �
2016 - Institutional (Commenced August 22, 2016) 10.00 0.03 (0.20 ) (0.17 ) �
2016 - Service (Commenced August 22, 2016) 10.00 0.02 (0.20 ) (0.18 ) �
2016 - IR (Commenced August 22, 2016) 10.00 0.02 (0.19 ) (0.17 ) �
2016 - R (Commenced August 22, 2016) 10.00 0.01 (0.19 ) (0.18 ) �
2016 - R6 (Commenced August 22, 2016) 10.00 0.03 (0.20 ) (0.17 ) �
(a) Calculated based on the average shares outstanding methodology.(b) Assumes investment at the NAV at the beginning of the period, reinvestment of all dividends and distributions, a complete redemption of the investment at the NAV at the end of the
period and no sales or redemption charges. Total returns would be reduced if a sales or redemption charge was taken into account. Returns do not reflect the impact of taxes toshareholder relating to Portfolio distributions or the redemption of Portfolio shares. Total returns for periods less than one full year are not annualized.
(c) Annualized.(d) The Portfolio�s portfolio turnover rate is calculated in accordance with regulatory requirements, without regard to transactions involving short term investments. If such transactions
were included, the Portfolio�s portfolio turnover rate may be higher.
50 The accompanying notes are an integral part of these financial statements.
Copyright © 2017 www.secdatabase.com. All Rights Reserved.Please Consider the Environment Before Printing This Document

GOLDMAN SACHS TARGET DATE 2025 PORTFOLIO
Net assetvalue, endof period
Totalreturn(b)
Net assets,end ofperiod
(in 000s)
Ratio ofnet expenses
to averagenet assets(c)
Ratio oftotal expenses
to averagenet assets(c)
Ratio ofnet investment
incometo average
net assets(c)
Portfolioturnover
rate(d)
$ 10.31 5.69 % $ 54 0.73 % 3.22 % 1.45 % 110 %10.33 5.94 10,366 0.33 2.88 1.68 11010.32 5.75 10 0.83 3.38 1.18 11010.33 5.88 10 0.47 3.02 1.54 11010.31 5.60 10 0.97 3.52 1.03 11010.34 6.04 10 0.32 2.89 1.68 110
9.82 (1.70 ) 10 0.75 4.23 1.01 339.83 (1.70 ) 9,783 0.34 3.85 1.42 339.82 (1.80 ) 10 0.84 4.32 0.91 339.83 (1.70 ) 10 0.49 3.97 1.27 339.82 (1.80 ) 10 0.99 4.47 0.77 339.83 (1.70 ) 10 0.33 3.92 1.43 33
The accompanying notes are an integral part of these financial statements. 51
Copyright © 2017 www.secdatabase.com. All Rights Reserved.Please Consider the Environment Before Printing This Document

GOLDMAN SACHS TARGET DATE 2030 PORTFOLIO
Financial HighlightsSelected Data for a Share Outstanding Throughout Each Period
Frominvestment operations
Distributionsto shareholders
Year - Share Class
Net assetvalue,
beginningof period
Netinvestmentincome(a)
Net realizedand unrealized
gain (loss)
Total frominvestmentoperations
From netinvestment
income
From netrealized
gainsTotal
distributionsFOR THE SIX MONTHS ENDED APRIL 30, (UNAUDITED)2017 - A $ 9.74 $ 0.03 $ 0.63 $ 0.66 $ (0.18 ) $ (0.32 ) $ (0.50 )2017 - Institutional 9.75 0.08 0.60 0.68 (0.19 ) (0.32 ) (0.51 )2017 - Service 9.74 0.06 0.60 0.66 (0.17 ) (0.32 ) (0.49 )2017 - IR 9.75 0.07 0.61 0.68 (0.19 ) (0.32 ) (0.51 )2017 - R 9.74 0.05 0.60 0.65 (0.17 ) (0.32 ) (0.49 )2017 - R6 9.75 0.08 0.60 0.68 (0.19 ) (0.32 ) (0.51 )
FOR THE FISCAL YEARS ENDED OCTOBER 31,2016 - A (Commenced August 22, 2016) 9.93 0.02 (0.21 ) (0.19 ) � � �
2016 - Institutional (Commenced August 22, 2016) 9.93 0.03 (0.21 ) (0.18 ) � � �
2016 - Service (Commenced August 22, 2016) 9.93 0.02 (0.21 ) (0.19 ) � � �
2016 - IR (Commenced August 22, 2016) 9.93 0.02 (0.20 ) (0.18 ) � � �
2016 - R (Commenced August 22, 2016) 9.93 0.02 (0.21 ) (0.19 ) � � �2016 - R6 9.97 0.19 0.11 0.30 (0.17 ) (0.35 ) (0.52 )2015 - R6 9.99 0.15 0.12 0.27 (0.09 ) (0.20 ) (0.29 )
FOR THE PERIOD ENDED OCTOBER 31,2014 - R6 (Commenced August 29,2014) 10.00 0.03 (0.04 ) (0.01 ) � � �
(a) Calculated based on the average shares outstanding methodology.(b) Assumes investment at the net asset value at the beginning of the year, reinvestment of all dividends and distributions, a complete redemption of the investment at the net asset value at
the end of the year and no sales or redemption charges. Total returns would be reduced if a sales or redemption charge was taken into account. Returns do not reflect the impact of taxesto shareholders relating to Portfolio distributions or the redemption of Portfolio shares. Total returns for periods less than one full year are not annualized. The Goldman Sachs TargetDate 2030 Portfolio�s predecessor was the Madison Target Retirement 2030 Fund (the �Predecessor Fund�). On August 22, 2016, the Predecessor Fund was reorganized as a new seriesof Goldman Sachs Trust II. Performance prior to August 22, 2016 is that of the Predecessor Fund. Total return information of the Predecessor Fund is included in the above tablebecause the Predecessor Fund is considered the accounting survivor of the reorganization.
(c) The Portfolio�s portfolio turnover rate is calculated in accordance with regulatory requirements, without regard to transactions involving short term investments. If such transactionswere included, the Portfolio�s portfolio turnover rate may be higher.
(d) Annualized.
52 The accompanying notes are an integral part of these financial statements.
Copyright © 2017 www.secdatabase.com. All Rights Reserved.Please Consider the Environment Before Printing This Document

GOLDMAN SACHS TARGET DATE 2030 PORTFOLIO
Net assetvalue, endof period
Totalreturn(b)
Net assets,end ofperiod
(in 000s)
Ratio ofnet expenses
to averagenet assets
Ratio oftotal expenses
to averagenet assets
Ratio ofnet investment
incometo averagenet assets
Portfolioturnover
rate(c)
$ 9.90 7.01 % $ 203 0.74 %(d) 1.16 %(d) 0.60 %(d) 92 %9.92 7.20 11 0.33 (d) 0.99 (d) 1.67 (d) 929.91 7.01 10 0.83 (d) 1.49 (d) 1.17 (d) 929.92 7.14 11 0.47 (d) 1.13 (d) 1.53 (d) 929.90 6.85 21 0.97 (d) 1.49 (d) 1.06 (d) 929.92 7.21 74,631 0.31 (d) 0.98 (d) 1.70 (d) 92
9.74 (1.91 ) 10 0.74 (d) 2.33 (d) 1.01 (d) 1769.75 (1.81 ) 10 0.34 (d) 1.93 (d) 1.41 (d) 1769.74 (1.91 ) 10 0.83 (d) 2.43 (d) 0.92 (d) 1769.75 (1.81 ) 10 0.48 (d) 2.08 (d) 1.27 (d) 1769.74 (1.91 ) 10 0.98 (d) 2.57 (d) 0.77 (d) 1769.75 3.23 74,224 0.31 0.62 1.91 1769.97 2.76 79,007 0.30 0.30 1.49 156
9.99 (0.10 ) 82,852 0.32 (d) 0.32 (d) 1.87 (d) 44
The accompanying notes are an integral part of these financial statements. 53
Copyright © 2017 www.secdatabase.com. All Rights Reserved.Please Consider the Environment Before Printing This Document

GOLDMAN SACHS TARGET DATE 2035 PORTFOLIO
Financial HighlightsSelected Data for a Share Outstanding Throughout Each Period
Frominvestment operations
Year - Share Class
Net assetvalue,
beginningof period
Netinvestmentincome(a)
Net realizedand unrealized
gain (loss)
Total frominvestmentoperations
Distributionsto shareholders
from netinvestment
incomeFOR THE SIX MONTHS ENDED APRIL 30, (UNAUDITED)2017 - A $ 9.81 $ 0.05 $ 0.69 $ 0.74 $ (0.07 )2017 - Institutional 9.81 0.09 0.69 0.78 (0.09 )2017 - Service 9.80 0.06 0.69 0.75 (0.07 )2017 - IR 9.81 0.08 0.68 0.76 (0.08 )2017 - R 9.80 0.05 0.68 0.73 (0.06 )2017 - R6 9.81 0.08 0.70 0.78 (0.09 )
FOR THE PERIOD ENDED OCTOBER 31,2016 - A (Commenced August 22, 2016) 10.00 0.02 (0.21 ) (0.19 ) �
2016 - Institutional (Commenced August 22, 2016) 10.00 0.03 (0.22 ) (0.19 ) �
2016 - Service (Commenced August 22, 2016) 10.00 0.02 (0.22 ) (0.20 ) �
2016 - IR (Commenced August 22, 2016) 10.00 0.02 (0.21 ) (0.19 ) �
2016 - R (Commenced August 22, 2016) 10.00 0.02 (0.22 ) (0.20 ) �
2016 - R6 (Commenced August 22, 2016) 10.00 0.03 (0.22 ) (0.19 ) �
(a) Calculated based on the average shares outstanding methodology.(b) Assumes investment at the NAV at the beginning of the period, reinvestment of all dividends and distributions, a complete redemption of the investment at the NAV at the end of the
period and no sales or redemption charges. Total returns would be reduced if a sales or redemption charge was taken into account. Returns do not reflect the impact of taxes toshareholder relating to Portfolio distributions or the redemption of Portfolio shares. Total returns for periods less than one full year are not annualized.
(c) Annualized.(d) The Portfolio�s portfolio turnover rate is calculated in accordance with regulatory requirements, without regard to transactions involving short term investments. If such transactions
were included, the Portfolio�s portfolio turnover rate may be higher.
54 The accompanying notes are an integral part of these financial statements.
Copyright © 2017 www.secdatabase.com. All Rights Reserved.Please Consider the Environment Before Printing This Document

GOLDMAN SACHS TARGET DATE 2035 PORTFOLIO
Net assetvalue, endof period
Totalreturn(b)
Net assets,end ofperiod
(in 000s)
Ratio ofnet expenses
to averagenet assets(c)
Ratio oftotal expenses
to averagenet assets(c)
Ratio ofnet investment
incometo average
net assets(c)
Portfolioturnover
rate(d)
$ 10.48 7.59 % $ 28 0.73 % 3.17 % 0.92 % 89 %10.50 7.95 10,532 0.33 2.86 1.69 8910.48 7.66 11 0.82 3.34 1.19 8910.49 7.79 11 0.47 2.98 1.55 8910.47 7.50 11 0.97 3.48 1.05 8910.50 7.95 24 0.29 2.77 1.62 89
9.81 (1.90 ) 10 0.75 4.23 1.03 299.81 (1.90 ) 9,765 0.34 3.85 1.44 299.80 (2.00 ) 10 0.84 4.33 0.94 299.81 (1.90 ) 10 0.49 3.97 1.29 299.80 (2.00 ) 10 0.99 4.47 0.79 299.81 (1.90 ) 10 0.32 3.93 1.46 29
The accompanying notes are an integral part of these financial statements. 55
Copyright © 2017 www.secdatabase.com. All Rights Reserved.Please Consider the Environment Before Printing This Document

GOLDMAN SACHS TARGET DATE 2040 PORTFOLIO
Financial HighlightsSelected Data for a Share Outstanding Throughout Each Period
Frominvestment operations
Distributionsto shareholders
Year - Share Class
Net assetvalue,
beginningof period
Netinvestmentincome(a)
Net realizedand unrealized
gain (loss)
Total frominvestmentoperations
From netinvestment
income
From netrealized
gainsTotal
distributionsFOR THE SIX MONTHS ENDED APRIL 30, (UNAUDITED)2017 - A $ 9.58 $ 0.06 $ 0.71 $ 0.77 $ (0.19 ) $ (0.43 ) $ (0.62 )2017 - Institutional 9.58 0.08 0.72 0.80 (0.20 ) (0.43 ) (0.63 )2017 - Service 9.58 0.06 0.70 0.76 (0.18 ) (0.43 ) (0.61 )2017 - IR 9.58 0.07 0.71 0.78 (0.19 ) (0.43 ) (0.62 )2017 - R 9.57 0.05 0.71 0.76 (0.18 ) (0.43 ) (0.61 )2017 - R6 9.59 0.08 0.71 0.79 (0.20 ) (0.43 ) (0.63 )
FOR FISCAL YEARS ENDED OCTOBER 31,2016 - A (Commenced August 22, 2016) 9.77 0.02 (0.21 ) (0.19 ) � � �
2016 - Institutional (Commenced August 22, 2016) 9.77 0.03 (0.22 ) (0.19 ) � � �
2016 - Service (Commenced August 22, 2016) 9.77 0.02 (0.21 ) (0.19 ) � � �
2016 - IR (Commenced August 22, 2016) 9.77 0.02 (0.21 ) (0.19 ) � � �
2016 - R (Commenced August 22, 2016) 9.77 0.01 (0.21 ) (0.20 ) � � �2016 - R6 9.90 0.19 0.11 0.30 (0.17 ) (0.44 ) (0.61 )2015 - R6 9.98 0.15 0.13 0.28 (0.10 ) (0.26 ) (0.36 )
FOR THE PERIOD ENDED OCTOBER 31,2014 - R6 (Commenced August 29, 2016) 10.00 0.03 (0.05 ) (0.02 ) � � �
(a) Calculated based on the average shares outstanding methodology.(b) Assumes investment at the net asset value at the beginning of the year, reinvestment of all dividends and distributions, a complete redemption of the investment at the net asset value at
the end of the year and no sales or redemption charges. Total returns would be reduced if a sales or redemption charge was taken into account. Returns do not reflect the impact of taxesto shareholders relating to Portfolio distributions or the redemption of Portfolio shares. Total returns for periods less than one full year are not annualized. The Goldman Sachs TargetDate 2040 Portfolio�s predecessor was the Madison Target Retirement 2040 Fund (the �Predecessor Fund�). On August 22, 2016, the Predecessor Fund was reorganized as a new seriesof Goldman Sachs Trust II. Performance prior to August 22, 2016 is that of the Predecessor Fund. Total return information of the Predecessor Fund is included in the above tablebecause the Predecessor Fund is considered the accounting survivor of the reorganization.
(c) The Portfolio�s portfolio turnover rate is calculated in accordance with regulatory requirements, without regard to transactions involving short term investments. If such transactionswere included, the Portfolio�s portfolio turnover rate may be higher.
(d) Annualized.
56 The accompanying notes are an integral part of these financial statements.
Copyright © 2017 www.secdatabase.com. All Rights Reserved.Please Consider the Environment Before Printing This Document

GOLDMAN SACHS TARGET DATE 2040 PORTFOLIO
Net assetvalue, endof period
Totalreturn(b)
Net assets,end ofperiod
(in 000s)
Ratio ofnet expenses
to averagenet assets
Ratio oftotal expenses
to averagenet assets
Ratio ofnet investment
incometo averagenet assets
Portfolioturnover
rate(c)
$ 9.73 8.36 % $ 14 0.73 %(d) 1.77 %(d) 1.29 %(d) 90 %9.75 8.72 11 0.33 (d) 1.38 (d) 1.71 (d) 909.73 8.31 11 0.83 (d) 1.88 (d) 1.21 (d) 909.74 8.55 11 0.47 (d) 1.53 (d) 1.57 (d) 909.72 8.26 22 0.98 (d) 1.80 (d) 1.11 (d) 909.75 8.61 49,779 0.31 (d) 1.37 (d) 1.74 (d) 90
9.58 (1.94 ) 13 0.74 (d) 3.23 (d) 0.98 (d) 1749.58 (1.94 ) 10 0.34 (d) 2.82 (d) 1.41 (d) 1749.58 (1.94 ) 10 0.83 (d) 3.31 (d) 0.92 (d) 1749.58 (1.94 ) 10 0.48 (d) 2.96 (d) 1.27 (d) 1749.57 (2.05 ) 10 0.98 (d) 3.46 (d) 0.77 (d) 1749.59 3.33 47,340 0.31 (d) 0.80 (d) 1.97 (d) 1749.90 2.86 50,029 0.30 0.30 1.50 160
9.98 (0.20 ) 58,903 0.32 (d) 0.32 (d) 1.84 (d) 46
The accompanying notes are an integral part of these financial statements. 57
Copyright © 2017 www.secdatabase.com. All Rights Reserved.Please Consider the Environment Before Printing This Document

GOLDMAN SACHS TARGET DATE 2045 PORTFOLIO
Financial HighlightsSelected Data for a Share Outstanding Throughout Each Period
Frominvestment operations
Year - Share Class
Net assetvalue,
beginningof period
Netinvestmentincome(a)
Net realizedand unrealized
gain (loss)
Total frominvestmentoperations
Distributionsto shareholders
from netinvestment
incomeFOR THE SIX MONTHS ENDED APRIL 30, (UNAUDITED)2017 - A $ 9.80 $ 0.04 $ 0.83 $ 0.87 $ (0.07 )2017 - Institutional 9.81 0.09 0.81 0.90 (0.09 )2017 - Service 9.80 0.06 0.81 0.87 (0.07 )2017 - IR 9.80 0.08 0.81 0.89 (0.08 )2017 - R 9.79 0.06 0.80 0.86 (0.06 )2017 - R6 9.81 0.09 0.81 0.90 (0.09 )
FOR THE PERIOD ENDED OCTOBER 31,2016 - A (Commenced August 22,2016) 10.00 0.02 (0.22 ) (0.20 ) �
2016 - Institutional (Commenced August 22, 2016) 10.00 0.03 (0.22 ) (0.19 ) �
2016 - Service(Commenced August 22, 2016) 10.00 0.02 (0.22 ) (0.20 ) �
2016 - IR (Commenced August 22, 2016) 10.00 0.02 (0.22 ) (0.20 ) �
2016 - R (Commenced August 22, 2016) 10.00 0.01 (0.22 ) (0.21 ) �
2016 - R6 (Commenced August 22, 2016) 10.00 0.03 (0.22 ) (0.19 ) �
(a) Calculated based on the average shares outstanding methodology.(b) Assumes investment at the NAV at the beginning of the period, reinvestment of all dividends and distributions, a complete redemption of the investment at the NAV at the end of the
period and no sales or redemption charges. Total returns would be reduced if a sales or redemption charge was taken into account. Returns do not reflect the impact of taxes toshareholder relating to Portfolio distributions or the redemption of Portfolio shares. Total returns for periods less than one full year are not annualized.
(c) Annualized.(d) The Portfolio�s portfolio turnover rate is calculated in accordance with regulatory requirements, without regard to transactions involving short term investments. If such transactions
were included, the Portfolio�s portfolio turnover rate may be higher.
58 The accompanying notes are an integral part of these financial statements.
Copyright © 2017 www.secdatabase.com. All Rights Reserved.Please Consider the Environment Before Printing This Document

GOLDMAN SACHS TARGET DATE 2045 PORTFOLIO
Net assetvalue, endof period
Totalreturn(b)
Net assets,end ofperiod
(in 000s)
Ratio ofnet expenses
to averagenet assets(c)
Ratio oftotal expenses
to averagenet assets(c)
Ratio ofnet investment
incometo average
net assets(c)
Portfolioturnover
rate(d)
$ 10.60 8.95 % $ 36 0.72 % 3.12 % 0.84 % 92 %10.62 9.20 10,656 0.33 2.83 1.70 9210.60 8.92 11 0.82 3.31 1.21 9210.61 9.15 11 0.47 2.96 1.56 9210.59 8.87 26 0.96 3.38 1.15 9210.62 9.31 11 0.32 2.88 1.71 92
9.80 (2.00 ) 10 0.75 4.23 1.02 299.81 (1.90 ) 9,756 0.34 3.85 1.43 299.80 (2.00 ) 10 0.84 4.33 0.93 299.80 (2.00 ) 10 0.49 3.97 1.28 299.79 (2.10 ) 10 0.99 4.48 0.78 299.81 (2.00 ) 10 0.32 3.93 1.45 29
The accompanying notes are an integral part of these financial statements. 59
Copyright © 2017 www.secdatabase.com. All Rights Reserved.Please Consider the Environment Before Printing This Document

GOLDMAN SACHS TARGET DATE 2050 PORTFOLIO
Financial HighlightsSelected Data for a Share Outstanding Throughout Each Period
Frominvestment operations
Distributionsto shareholders
Year - Share Class
Net assetvalue,
beginningof period
Netinvestmentincome(a)
Net realizedand unrealized
gain (loss)
Total frominvestmentoperations
From netinvestment
income
From netrealized
gainsTotal
distributionsFOR THE SIX MONTHS ENDED APRIL 30, (UNAUDITED)2017 - A $ 9.80 $ 0.06 $ 0.86 $ 0.92 $ (0.19 ) $ (0.40 ) $ (0.59 )2017 - Institutional 9.80 0.08 0.86 0.94 (0.20 ) (0.40 ) (0.60 )2017 - Service 9.79 0.06 0.85 0.91 (0.18 ) (0.40 ) (0.58 )2017 - IR 9.80 0.08 0.86 0.94 (0.20 ) (0.40 ) (0.60 )2017 - R 9.79 0.05 0.86 0.91 (0.18 ) (0.40 ) (0.58 )2017 - R6 9.80 0.08 0.86 0.94 (0.20 ) (0.40 ) (0.60 )
FOR THE FISCAL YEARS ENDED OCTOBER 31,2016 - A (Commenced August 22, 2016) 10.00 0.02 (0.22 ) (0.20 ) � � �
2016 - Institutional (Commenced August 22, 2016) 10.00 0.03 (0.23 ) (0.20 ) � � �
2016 - Service (Commenced August 22, 2016) 10.00 0.02 (0.23 ) (0.21 ) � � �
2016 - IR (Commenced August 22, 2016) 10.00 0.02 (0.22 ) (0.20 ) � � �
2016 - R (Commenced August 22, 2016) 10.00 0.02 (0.23 ) (0.21 ) � � �2016 - R6 9.95 0.20 0.11 0.31 (0.16 ) (0.30 ) (0.46 )2015 - R6 9.98 0.15 0.13 0.28 (0.10 ) (0.21 ) (0.31 )2014 - R6 (Commenced August 29, 2014) 10.00 0.03 (0.05 ) (0.02 ) � � �
(a) Calculated based on the average shares outstanding methodology.(b) Assumes investment at the net asset value at the beginning of the year, reinvestment of all dividends and distributions, a complete redemption of the investment at the net asset value at
the end of the year and no sales or redemption charges. Total returns would be reduced if a sales or redemption charge was taken into account. Returns do not reflect the impact of taxesto shareholders relating to Portfolio distributions or the redemption of Portfolio shares. Total returns for periods less than one full year are not annualized. The Goldman Sachs TargetDate 2050 Portfolio�s predecessor was the Madison Target Retirement 2050 Fund (the �Predecessor Fund�). On August 22, 2016, the Predecessor Fund was reorganized as a new seriesof Goldman Sachs Trust II. Performance prior to August 22, 2016 is that of the Predecessor Fund. Total return information of the Predecessor Fund is included in the above tablebecause the Predecessor Fund is considered the accounting survivor of the reorganization.
(c) The Portfolio�s portfolio turnover rate is calculated in accordance with regulatory requirements, without regard to transactions involving short term investments. If such transactionswere included, the Portfolio�s portfolio turnover rate may be higher.
(d) Annualized.
60 The accompanying notes are an integral part of these financial statements.
Copyright © 2017 www.secdatabase.com. All Rights Reserved.Please Consider the Environment Before Printing This Document

GOLDMAN SACHS TARGET DATE 2050 PORTFOLIO
Net assetvalue, endof period
Totalreturn(b)
Net assets,end ofperiod
(in 000s)
Ratio ofnet expenses
to averagenet assets
Ratio oftotal expenses
to averagenet assets
Ratio ofnet investment
incometo averagenet assets
Portfolioturnover
rate(c)
$ 10.13 9.77 % $ 11 0.72 %(d) 2.99 %(d) 1.31 %(d) 81 %10.14 10.03 11 0.32 (d) 2.58 (d) 1.71 (d) 8110.12 9.74 11 0.83 (d) 3.09 (d) 1.21 (d) 8110.14 9.97 11 0.48 (d) 2.74 (d) 1.56 (d) 8110.12 9.68 11 0.98 (d) 3.24 (d) 1.06 (d) 8110.14 10.03 24,994 0.31 (d) 2.51 (d) 1.71 (d) 81
9.80 (2.00 ) 10 0.74 (d) 6.30 (d) 1.04 (d) 1919.80 (2.00 ) 10 0.34 (d) 5.90 (d) 1.44 (d) 1919.79 (2.10 ) 10 0.83 (d) 6.40 (d) 0.95 (d) 1919.80 (2.00 ) 10 0.48 (d) 6.04 (d) 1.30 (d) 1919.79 (2.10 ) 10 0.98 (d) 6.54 (d) 0.80 (d) 1919.80 3.37 21,657 0.31 1.45 2.07 1919.95 2.87 20,482 0.30 0.30 1.51 2049.98 (0.20 ) 21,266 0.32 (d) 0.32 (d) 1.72 (d) 52
The accompanying notes are an integral part of these financial statements. 61
Copyright © 2017 www.secdatabase.com. All Rights Reserved.Please Consider the Environment Before Printing This Document

GOLDMAN SACHS TARGET DATE 2055 PORTFOLIO
Financial HighlightsSelected Data for a Share Outstanding Throughout Each Period
Frominvestment operations
Year - Share Class
Net assetvalue,
beginningof period
Netinvestmentincome(a)
Net realizedand unrealized
gain (loss)
Total frominvestmentoperations
Distributionsto shareholders
from netinvestment
incomeFOR THE SIX MONTHS ENDED APRIL 30, (UNAUDITED)2017 - A $ 9.79 $ 0.02 $ 0.98 $ 1.00 $ (0.08 )2017 - Institutional 9.80 0.09 0.93 1.02 (0.09 )2017 - Service 9.79 0.06 0.94 1.00 (0.07 )2017 - IR 9.79 0.08 0.95 1.03 (0.09 )2017 - R 9.79 0.05 0.94 0.99 (0.07 )2017 - R6 9.80 0.09 0.93 1.02 (0.09 )
FOR THE PEROD ENDED OCTOBER 31,2016 - A (Commenced August 22, 2016) 10.00 0.02 (0.23 ) (0.21 ) �
2016 - Institutional (Commenced August 22, 2016) 10.00 0.03 (0.23 ) (0.20 ) �
2016 - Service (Commenced August 22, 2016) 10.00 0.02 (0.23 ) (0.21 ) �
2016 - IR (Commenced August 22, 2016) 10.00 0.02 (0.23 ) (0.21 ) �
2016 - R (Commenced August 22, 2016) 10.00 0.01 (0.22 ) (0.21 ) �
2016 - R6 (Commenced August 22, 2016) 10.00 0.03 (0.23 ) (0.20 ) �
(a) Calculated based on the average shares outstanding methodology.(b) Assumes investment at the NAV at the beginning of the period, reinvestment of all dividends and distributions, a complete redemption of the investment at the NAV at the end of the
period and no sales or redemption charges. Total returns would be reduced if a sales or redemption charge was taken into account. Returns do not reflect the impact of taxes toshareholder relating to Portfolio distributions or the redemption of Portfolio shares. Total returns for periods less than one full year are not annualized.
(c) Annualized.(d) The Portfolio�s portfolio turnover rate is calculated in accordance with regulatory requirements, without regard to transactions involving short term investments. If such transactions
were included, the Portfolio�s portfolio turnover rate may be higher.(e) Amount is less than 0.005% per share.
62 The accompanying notes are an integral part of these financial statements.
Copyright © 2017 www.secdatabase.com. All Rights Reserved.Please Consider the Environment Before Printing This Document

GOLDMAN SACHS TARGET DATE 2055 PORTFOLIO
Net assetvalue, endof period
Totalreturn(b)
Net assets,end ofperiod
(in 000s)
Ratio ofnet expenses
to averagenet assets(c)
Ratio oftotal expenses
to averagenet assets(c)
Ratio ofnet investment
incometo average
net assets(c)
Portfolioturnover
rate(d)
$ 10.71 10.26 % $ 81 0.72 % 3.03 % 0.41 % 115 %10.73 10.48 10,777 0.33 2.81 1.72 11510.72 10.30 11 0.82 3.30 1.22 11510.73 10.43 11 0.48 2.95 1.57 11510.71 10.14 11 0.98 3.46 1.07 11510.73 10.48 22 0.31 2.76 1.69 115
9.79 (2.10 ) 10 0.75 4.23 1.02 349.80 (2.00 ) 9,748 0.34 3.85 1.43 349.79 (2.10 ) 10 0.84 4.33 0.92 349.79 (2.00 ) 10 0.49 3.97 1.28 349.79 (2.10 ) 10 0.99 4.48 0.77 349.80 (2.00 ) 10 0.32 3.92 1.45 34
The accompanying notes are an integral part of these financial statements. 63
Copyright © 2017 www.secdatabase.com. All Rights Reserved.Please Consider the Environment Before Printing This Document

Notes to Financial StatementsApril 30, 2017 (Unaudited)
1. ORGANIZATION
Goldman Sachs Trust II (the �Trust�) is a Delaware statutory trust registered under the Investment Company Act of 1940, as amended (the �Act�), asan open-end management investment company. The following table lists those series of the Trust that are included in this report (collectively, the�Portfolios� or individually a �Portfolio�), along with their corresponding share classes and respective diversification status under the Act:
Portfolio Share Classes OfferedDiversified/
Non-diversifiedAll Portfolios A, Institutional, Service, IR, R, R6 Diversified
Class A Shares are sold with a front-end sales charge of up to 5.50%. Institutional, Service, Class IR, Class R and Class R6 Shares are not subjectto a sales charge.
Goldman Sachs Asset Management, L.P. (�GSAM�), an affiliate of Goldman Sachs & Co. LLC (formerly Goldman, Sachs &Co. (�GoldmanSachs�), serves as investment adviser to the Portfolios pursuant to a management agreement (each, an �Agreement�) with the Trust. Madison AssetManagement, LLC, (the �Sub Adviser�) serves as the subadviser to the Portfolios. GSAM compensates the Sub Adviser directly in accordance with theterms of the Sub-Advisory Agreement. The Portfolios are not charged any separate or additional investment advisory fees by the Sub Adviser.
2. SIGNIFICANT ACCOUNTING POLICIESThe financial statements have been prepared in accordance with accounting principles generally accepted in the United States of America (�GAAP�)and require management to make estimates and assumptions that may affect the reported amounts and disclosures. Actual results may differ from thoseestimates and assumptions.
A. Investment Valuation � The Portfolios� valuation policy is to value investments at fair value.
B. Investment Income and Investments � Investment income includes interest income, dividend income, net of any foreign withholding taxes, lessany amounts reclaimable, and securities lending income. Interest income is accrued daily and adjusted for amortization of premiums and accretion ofdiscounts. Dividend income is recognized on ex-dividend date or, for certain foreign securities, as soon as such information is obtained subsequent tothe ex-dividend date. Investment transactions are reflected on trade date. Realized gains and losses are calculated using identified cost. Investmenttransactions are recorded on the following business day for daily net asset value (�NAV�) calculations. Any foreign capital gains tax is accrued dailybased upon net unrealized gains, and is payable upon sale of such investments. Income distributions are recognized as capital gains or income in thefinancial statements in accordance with the character that is distributed.
C. Class Allocations and Expenses � Investment income, realized and unrealized gain (loss), and non-class specific expenses of each Portfolio areallocated daily based upon the proportion of net assets of each class. Non-class specific expenses directly incurred by a Portfolio are charged to thatPortfolio, while such expenses incurred by the Trust are allocated across the applicable Portfolios on a straight-line and/or pro-rata basis dependingupon the nature of the expenses. Class specific expenses, where applicable, are borne by the respective share classes and include Distribution andService, Transfer Agency and Service and Shareholder Administration fees.
Expenses included in the accompanying financial statements reflect the expenses of each Portfolio and do not include any expenses associatedwith the Underlying Funds (�Underlying Funds�). Because the Underlying Funds have varied expense and fee levels and the Portfolios may owndifferent proportions of the Underlying Funds at different times, the amount of fees and expenses incurred indirectly by each Portfolio will vary.
D. Offering Costs � Offering costs paid in connection with the initial offering of shares of Target Date 2025, Target Date 2035, Target Date 2045 andTarget Date 2055 are being amortized on a straight-line basis over 12 months from the date of commencement of operations.
64
Copyright © 2017 www.secdatabase.com. All Rights Reserved.Please Consider the Environment Before Printing This Document

2. SIGNIFICANT ACCOUNTING POLICIES (continued)
E. Federal Taxes and Distributions to Shareholders � It is each Portfolio�s policy to comply with the requirements of the Internal Revenue Codeof 1986, as amended (the �Code�), applicable to regulated investment companies (mutual funds) and to distribute each year substantially all of itsinvestment company taxable income and capital gains to its shareholders. Accordingly, the Portfolios are not required to make any provisions for thepayment of federal income tax. Distributions to shareholders are recorded on the ex-dividend date. Income and capital gains distributions, if any, aredeclared and paid annually.
Net capital losses, if any, are carried forward to future fiscal years and may be used to the extent allowed by the Code to offset any future capitalgains. Losses that are carried forward will retain their character as either short-term or long-term capital losses. Utilization of capital loss carryforwardswill reduce the requirement of future capital gains distributions.
The characterization of distributions to shareholders for financial reporting purposes is determined in accordance with federal income tax rules,which may differ from GAAP. The source of each Portfolio�s distributions may be shown in the accompanying financial statements as either from netinvestment income, net realized gain or capital. Certain components of the Portfolios� net assets on the Statements of Assets and Liabilities reflectpermanent GAAP/tax differences based on the appropriate tax character.
3. INVESTMENTS AND FAIR VALUE MEASUREMENTSThe fair value of a financial instrument is the amount that would be received to sell an asset or paid to transfer a liability in an orderly transactionbetween market participants at the measurement date (i.e., the exit price). GAAP establishes a fair value hierarchy that prioritizes the inputs tovaluation techniques used to measure fair value. The hierarchy gives the highest priority to unadjusted quoted prices in active markets for identicalassets or liabilities (Level 1 measurements) and the lowest priority to unobservable inputs (Level 3 measurements). The levels used for classifyinginvestments are not necessarily an indication of the risk associated with investing in these investments. The three levels of the fair value hierarchy aredescribed below:
Level 1 � Unadjusted quoted prices in active markets that are accessible at the measurement date for identical, unrestricted assets or liabilities;Level 2 � Quoted prices in markets that are not active or financial instruments for which significant inputs are observable (including, but notlimited to, quoted prices for similar investments, interest rates, foreign exchange rates, volatility and credit spreads), either directly or indirectly;Level 3 � Prices or valuations that require significant unobservable inputs (including GSAM�s assumptions in determining fair valuemeasurement).
Changes in valuation techniques may result in transfers into or out of an assigned level within the hierarchy. In accordance with the Portfolios� policy,transfers between different levels of the fair value hierarchy resulting from such changes are deemed to have occurred as of the beginning of thereporting period.
The Board of Trustees (�Trustees�) has approved Valuation Procedures that govern the valuation of the portfolio investments held by thePortfolios, including investments for which market quotations are not readily available. The Trustees have delegated to GSAM day-to-dayresponsibility for implementing and maintaining internal controls and procedures related to the valuation of the Portfolios� portfolio investments. Toassess the continuing appropriateness of pricing sources and methodologies, GSAM regularly performs price verification procedures and issueschallenges as necessary to third party pricing vendors or brokers, and any differences are reviewed in accordance with the Valuation Procedures.
A. Level 1 and Level 2 Fair Value Investments � The valuation techniques and significant inputs used in determining the fair values forinvestments classified as Level 1 and Level 2 are as follows:
Underlying Funds � Underlying Funds include other investment companies and exchange-traded funds (�ETFs�). Investments in the UnderlyingFunds (except ETFs) are valued at the NAV per share of the Institutional Share class on the day of valuation. ETFs are valued daily at the last sale priceor official closing price on the principal exchange or system on which the investment is traded. Because the Portfolios invest in Underlying Funds thatfluctuate in value, the Portfolios� shares will correspondingly fluctuate in value. To the extent these investments are actively traded, they are classifiedas Level 1 of the fair value hierarchy,
65
Copyright © 2017 www.secdatabase.com. All Rights Reserved.Please Consider the Environment Before Printing This Document

Notes to Financial Statements (continued)April 30, 2017 (Unaudited)
3. INVESTMENTS AND FAIR VALUE MEASUREMENTS (continued)
otherwise they are generally classified as Level 2. For information regarding an Underlying Fund�s accounting policies and investment holdings,please see the Underlying Fund�s shareholder report.
B. Level 3 Fair Value Investments � To the extent that significant inputs to valuation models and other alternative pricing sources are unobservable,or if quotations are not readily available, or if GSAM believes that such quotations do not accurately reflect fair value, the fair value of the Portfolios�investments may be determined under Valuation Procedures approved by the Trustees. GSAM, consistent with its procedures and applicable regulatoryguidance, may make an adjustment to the most recent valuation prices of either domestic or foreign securities in light of significant events to reflectwhat it believes to be the fair value of the securities at the time of determining a Portfolio�s NAV. Significant events which could affect a large numberof securities in a particular market may include, but are not limited to: significant fluctuations in U.S. or foreign markets; market dislocations; marketdisruptions; or unscheduled market closings. Significant events which could also affect a single issuer may include, but are not limited to: corporateactions such as reorganizations, mergers and buy-outs; ratings downgrades; and bankruptcies.
C. Fair Value Hierarchy � The following is a summary of the Portfolios� investments classified in the fair value hierarchy as of April 30, 2017:
TARGET DATE 2020 PORTFOLIO
Investment Type Level 1 Level 2 Level 3AssetsExchange Traded Funds $47,991,651 $ � $ �
Investment Company 2,919,092 � �
Total $50,910,743 $� $�
TARGET DATE 2025 PORTFOLIO
Investment Type Level 1 Level 2 Level 3AssetsExchange Traded Funds $9,485,731 $� $�Investment Company 576,784 � �
Total $10,062,515 $� $�
TARGET DATE 2030 PORTFOLIO
Investment Type Level 1 Level 2 Level 3AssetsExchange Traded Funds $68,787,186 $� $�Investment Company 3,382,303 � �
Total $72,169,489 $� $�
66
Copyright © 2017 www.secdatabase.com. All Rights Reserved.Please Consider the Environment Before Printing This Document

3. INVESTMENTS AND FAIR VALUE MEASUREMENTS (continued)
TARGET DATE 2035 PORTFOLIO
Investment Type Level 1 Level 2 Level 3AssetsExchange Traded Funds $9,784,816 $� $�Investment Company 425,126 � �
Total $10,209,942 $� $�
TARGET DATE 2040 PORTFOLIO
Investment Type Level 1 Level 2 Level 3AssetsExchange Traded Funds $46,257,906 $ � $ �
Investment Company 1,877,439 � �
Total $48,135,345 $� $�
TARGET DATE 2045 PORTFOLIO
Investment Type Level 1 Level 2 Level 3AssetsExchange Traded Funds $9,962,347 $� $�Investment Company 377,357 � �
Total $10,339,704 $� $�
TARGET DATE 2050 PORTFOLIO
Investment Type Level 1 Level 2 Level 3AssetsExchange Traded Funds $23,571,138 $� $�Investment Company 758,723 � �
Total $24,329,861 $� $�
TARGET DATE 2055 PORTFOLIO
Investment Type Level 1 Level 2 Level 3AssetsExchange Traded Funds $10,221,837 $� $�Investment Company 273,018 � �
Total $10,494,855 $� $�
For further information regarding security characteristics, see the Schedules of Investments.
67
Copyright © 2017 www.secdatabase.com. All Rights Reserved.Please Consider the Environment Before Printing This Document

Notes to Financial Statements (continued)April 30, 2017 (Unaudited)
4. AGREEMENTS AND AFFILIATED TRANSACTIONS
A. Management Agreement � Under the Agreement, GSAM manages the Portfolios, subject to the general supervision of the Trustees.As compensation for the services rendered pursuant to the Agreement, the assumption of the expenses related thereto and administration of the
Portfolios� business affairs, including providing facilities, GSAM is entitled to a management fee, accrued daily and paid monthly, equal to an annualpercentage rate of each Portfolio�s average daily net assets.
For the six months ended April 30, 2017, contractual and effective net management fees with GSAM were at the following rates:
Contractual Management RateFirst
$2 billionNext
$3 billionOver
$5 billion
EffectiveManagement Fee
Annual Rate0.25% 0.23% 0.21% 0.25%
B. Distribution and/or Service (12b-1) Plans � The Trust, on behalf of Class A and Class R Shares of each applicable Portfolio, has adoptedDistribution and Service Plans subject to Rule 12b-1 under the Act. Under the Distribution and Service Plans, Goldman Sachs, which serves asdistributor (the �Distributor�), is entitled to a fee accrued daily and paid monthly, for distribution services and personal and account maintenanceservices, which may then be paid by Goldman Sachs to authorized dealers. These fees are equal to an annual percentage rate of the average daily netassets attributable to Class A or Class R Shares of the Portfolios, as applicable.
The Trust, on behalf of Services Shares of each applicable Portfolio, has adopted a Service Plan subject to Rule 12b-1 under the Act to allowService Shares to compensate service organizations (including Goldman Sachs) for providing personal account maintenance to their customers who arebeneficial owners of such shares. The Service Plan provides for compensation to the service organizations equal to an annual percentage rate of theaverage daily net assets attributable to Services Shares of the Portfolios.
Distribution and Service Plan RatesClass A* Class R* Service
Distribution Plan 0.25 % 0.50 % � %Service Plan � � 0.25
* With respect to Class A and Class R Shares, the Distributor at its discretion may use compensation for distribution services paid under the Distribution and Service Plans to compensateservice organizations for personal and account maintenance services and expenses as long as such total compensation does not exceed the maximum cap on �service fees� imposed by theFinancial Industry Regulatory Authority.
C. Distribution Agreement � Goldman Sachs, as Distributor of the shares of the Portfolios pursuant to a Distribution Agreement, may retain aportion of the Class A Shares� front end sales charge. For the six months ended April 30, 2017, Goldman Sachs did not retain any of the Class AShares� front end sales charges.
D. Shareholder Administration Plan � The Trust, on behalf of the Portfolios, has adopted a Shareholder Administration Plan to allow ServiceShares to compensate service organizations (including Goldman Sachs) for providing varying levels of shareholder administration services to theircustomers who are beneficial owners of such shares. The Shareholder Administration Plan provides for compensation to the service organizations equalto an annual percentage rate of the average daily net assets attributable to Service Shares of the Portfolios.
E. Transfer Agency Agreement � Goldman Sachs also serves as the transfer agent of the Portfolios for a fee pursuant to the Transfer AgencyAgreement. The fees charged for such transfer agency services are accrued daily and paid monthly at annual rates as follows: 0.19% of the averagedaily net assets of Class A, Class IR and Class R Shares; 0.02% of the average daily net assets of Class R6 Shares; and 0.04% of the average daily netassets of Institutional and Service Shares.
68
Copyright © 2017 www.secdatabase.com. All Rights Reserved.Please Consider the Environment Before Printing This Document

4. AGREEMENTS AND AFFILIATED TRANSACTIONS (continued)
F. Other Expense Agreements and Affiliated Transactions � GSAM has agreed to limit certain �Other Expenses� of the Portfolios (excludingacquired fund fees and expenses, transfer agency fees and expenses, service fees and shareholder administration fees (as applicable), taxes, interest,brokerage fees, shareholder meeting, litigation, indemnification and extraordinary expenses) to the extent such expenses exceed, on an annual basis, apercentage rate of the average daily net assets of each Portfolio. Such Other Expense reimbursements, if any, are accrued daily and paid monthly. Inaddition, the Portfolios are not obligated to reimburse GSAM for prior fiscal year expense reimbursements, if any. The Other Expense limitations as anannual percentage rate of average daily net assets for Target Date 2020, Target Date 2030, Target Date 2040, and Target Date 2050 Portfolios are each0.024% and Target Date 2025, Target Date 2035, Target Date 2045 and Target Date 2055, are each 0.014%, respectively. These Other Expenselimitations will remain in place through at least February 28, 2018, and prior to such date, GSAM may not terminate the arrangements without theapproval of the Trustees. In addition, the Portfolios have entered into certain offset arrangements with the transfer agent, which may result in areduction of the Portfolios� expenses and are received irrespective of the application of the �Other Expense� limitations described above.
For the six months ended April 30, 2017, these expense reductions, including any fee waivers and Other Expense reimbursements, were asfollows:
Portfolio
OtherExpense
ReimbursementsTarget Date 2020 $ 260,727Target Date 2025 169,943Target Date 2030 256,277Target Date 2035 169,692Target Date 2040 260,620Target Date 2045 169,572Target Date 2050 259,782Target Date 2055 169,630
As of April 30, 2017, The Goldman Sachs Group, Inc. was the beneficial owner of 5% or more of total outstanding shares of the followingPortfolios:
Class A Institutional Service Class IR Class R Class R6Target Date 2020 65 % 100 % 100 % 100 % 100 % � %Target Date 2025 19 100 100 100 100 100Target Date 2030 5 100 100 100 51 �
Target Date 2035 38 100 100 100 99 44Target Date 2040 74 100 100 100 49 �
Target Date 2045 29 100 100 100 41 100Target Date 2050 100 100 100 100 100 �
Target Date 2055 13 100 100 100 100 50
69
Copyright © 2017 www.secdatabase.com. All Rights Reserved.Please Consider the Environment Before Printing This Document

Notes to Financial Statements (continued)April 30, 2017 (Unaudited)
5. PORTFOLIO SECURITIES TRANSACTIONS
The cost of purchases and proceeds from sales and maturities of long-term securities for the six months ended April 30, 2017, were:
Fund Purchases Sales and MaturitiesTarget Date 2020 $61,985,239 $ 64,227,590Target Date 2025 10,874,034 10,689,264Target Date 2030 67,509,746 71,359,434Target Date 2035 8,889,961 8,721,242Target Date 2040 43,189,425 44,207,398Target Date 2045 9,277,008 9,100,727Target Date 2050 20,025,067 18,570,080Target Date 2055 11,628,309 11,418,362
6. TAX INFORMATION
As of the Portfolios� most recent fiscal year end, October 31, 2016, the Portfolios� capital loss carryforwards and certain timing differences on a taxbasis were as follows:
Target Date2020
Target Date2025
Target Date2030
Target Date2035
Target Date2040
Target Date2045
Target Date2050
Target Date2055
Capital loss carryforwards:Perpetual Short-Term $ � $(42,018 ) $ � $(43,545 ) $ � $(42,812 ) $ � $(42,112 )
Total capital loss carryforwards $ � $(42,018 ) $ � $(43,545 ) $ � $(42,812 ) $ � $(42,112 )
As of April 30, 2017, the Portfolios� aggregate security unrealized gains and losses based on cost for U.S. federal income tax purposes were asfollows:
Target Date2020
Target Date2025
Target Date2030
Target Date2035
Target Date2040
Target Date2045
Target Date2050
Target Date2055
Tax Cost $48,985,297 $9,664,067 $67,317,668 $9,688,891 $44,305,052 $9,722,087 $22,027,045 $9,758,762Gross unrealized gain 2,450,947 434,363 6,139,615 558,674 4,849,432 649,454 2,821,809 758,496Gross unrealized loss (525,501 ) (35,915 ) (1,287,794 ) (37,623 ) (1,019,139 ) (31,837 ) (518,993 ) (22,403 )Net unrealized gains (losses) $1,925,446 $398,448 $4,851,821 $521,051 $3,830,293 $617,617 $2,302,816 $736,093
The difference between GAAP-basis and tax basis unrealized gains (losses) is attributable primarily to wash sales. GSAM has reviewed thePortfolios� tax positions for all open tax years (the current and prior three years, as applicable) and has concluded that no provision for income tax isrequired in the Portfolios� financial statements. Such open tax years remain subject to examination and adjustment by tax authorities.
70
Copyright © 2017 www.secdatabase.com. All Rights Reserved.Please Consider the Environment Before Printing This Document

7. OTHER RISKSThe Portfolios� risks include, but are not limited to, the following:
Investments in Other Investment Companies � As a shareholder of another investment company, including an exchange-traded fund (�ETF�), aPortfolio will indirectly bear its proportionate share of any net management fees and other expenses paid by such other investment companies, inaddition to the fees and expenses regularly borne by the Portfolio. ETFs are subject to risks that do not apply to conventional mutual funds, includingbut not limited to the following: (i) the market price of the ETF�s shares may trade at a premium or a discount to their NAV; and (ii) an active tradingmarket for an ETF�s shares may not develop or be maintained.
The Portfolios may be indirectly exposed to the following risks through their investments in the Underlying Funds. For more informationregarding the risks of an Underlying Fund, please see the Underlying Fund�s shareholder report.Liquidity Risk � A Portfolio may make investments that are illiquid or that may become less liquid in response to market developments or adverseinvestor perceptions. Illiquid investments may be more difficult to value. Liquidity risk may also refer to the risk that a Portfolio will not be able to payredemption proceeds within the allowable time period because of unusual market conditions, an unusually high volume of redemption requests, orother reasons. To meet redemption requests, a Portfolio may be forced to sell investments at an unfavorable time and/or under unfavorable conditions.
Market and Credit Risks � In the normal course of business, the Portfolios trade financial instruments and enter into financial transactions where riskof potential loss exists due to changes in the market (market risk). Additionally, the Portfolios may also be exposed to credit risk in the event that anissuer or guarantor fails to perform or that an institution or entity with which the Portfolios have unsettled or open transactions defaults.
8. INDEMNIFICATIONSUnder the Trust�s organizational documents, its Trustees, officers, employees and agents are indemnified, to the extent permitted by the Act and statelaw, against certain liabilities that may arise out of performance of their duties to the Portfolios. Additionally, in the course of business, the Portfoliosenter into contracts that contain a variety of indemnification clauses. The Portfolios� maximum exposure under these arrangements is unknown, as thiswould involve future claims that may be made against the Portfolios that have not yet occurred. However, GSAM believes the risk of loss under thesearrangements to be remote.
9. OTHER MATTERSChange in Fiscal Year End � On May 9, 2017, the Trustees approved a change of the Portfolios� fiscal year end from October 31 to August 31,effective August 1, 2017.
10. SUBSEQUENT EVENTS
Subsequent events after the Statements of Assets and Liabilities date have been evaluated, and GSAM has concluded that there is no impact requiringadjustment or disclosure in the financial statements.
71
Copyright © 2017 www.secdatabase.com. All Rights Reserved.Please Consider the Environment Before Printing This Document

Notes to Financial Statements (continued)April 30, 2017 (Unaudited)
11. SUMMARY OF SHARE TRANSACTIONS
Target Date 2020 PortfolioFor the Six Months Ended
April 30, 2017(Unaudited)
For the Fiscal Year EndedOctober 31, 2016
Shares Dollars Shares DollarsClass A Shares(a)Shares sold 571 $5,507 996 $10,010Reinvestment of distributions 57 541 � �
Shares redeemed � � (1 ) (11 )628 6,048 995 9,999
Institutional Shares(a)Shares sold 1 5 996 10,010Reinvestment of distributions 59 555 � �Shares redeemed (1 ) (5 ) (1 ) (10 )
59 555 995 10,000Service Shares(a)Shares sold � � 996 10,010Reinvestment of distributions 57 538 � �
Shares redeemed � � (1 ) (11 )57 538 995 9,999
Class IR Shares(a)Shares sold � � 996 10,010Reinvestment of distributions 58 550 � �
Shares redeemed � � (1 ) (11 )58 550 995 9,999
Class R Shares(a)Shares sold � � 996 10,010Reinvestment of distributions 56 532 � �
Shares redeemed � � (1 ) (11 )56 532 995 9,999
Class R6 SharesShares sold 145,799 1,396,891 556,157 5,395,539Reinvestment of distributions 319,101 3,028,159 282,195 2,663,920Shares redeemed (456,088 ) (4,375,728 ) (745,292 ) (7,300,289 )
8,812 49,322 93,060 759,170NET INCREASE 9,670 $57,545 98,035 $809,166
(a) Commenced operations on August 22, 2016.
72
Copyright © 2017 www.secdatabase.com. All Rights Reserved.Please Consider the Environment Before Printing This Document

Target Date 2025 Portfolio Target Date 2030 PortfolioFor the Six Months Ended
April 30, 2017(Unaudited)
For the Fiscal Year EndedOctober 31, 2016(a)
For the Six Months EndedApril 30, 2017(Unaudited)
For the Fiscal Year EndedOctober 31, 2016
Shares Dollars Shares Dollars Shares Dollars Shares Dollars
4,216 $ 42,205 1,001 $10,011 19,448 $ 184,655 1,008 $10,01038 375 � � 66 623 � �� � (1 ) (11 ) � � (1 ) (11 )4,254 42,580 1,000 10,000 19,514 185,278 1,007 9,999
1 5 995,001 9,950,011 1 5 1,008 10,0108,051 79,700 � � 54 515 � �(1 ) (5 ) (1 ) (10 ) (1 ) (5 ) (1 ) (10 )8,051 79,700 995,000 9,950,001 54 515 1,007 10,000
� � 1,001 10,011 � � 1,008 10,0106 62 � � 52 498 � �� � (1 ) (11 ) � � (1 ) (11 )6 62 1,000 10,000 52 498 1,007 9,999
� � 1,001 10,011 � � 1,008 10,0108 75 � � 54 510 � �� � (1 ) (11 ) � � (1 ) (11 )8 75 1,000 10,000 54 510 1,007 9,999
3 36 1,001 10,011 1,021 10,020 1,008 10,0106 57 � � 52 492 � �
(3 ) (36 ) (1 ) (11 ) � � (1 ) (11 )6 57 1,000 10,000 1,073 10,512 1,007 9,999
� � 1,001 10,011 209,429 2,029,991 284,587 2,711,2358 80 � � 412,273 3,936,893 422,202 3,930,703� � (1 ) (11 ) (713,129 ) (6,970,949 ) (1,015,250 ) (9,983,514 )8 80 1,000 10,000 (91,427 ) (1,004,065 ) (308,461 ) (3,341,576 )12,333 $ 122,554 1,000,000 $10,000,001 (70,680 ) $ (806,752 ) (303,426 ) $(3,291,580 )
73
Copyright © 2017 www.secdatabase.com. All Rights Reserved.Please Consider the Environment Before Printing This Document

Notes to Financial Statements (continued)April 30, 2017 (Unaudited)
11. SUMMARY OF SHARE TRANSACTIONS (continued)
Target Date 2035 PortfolioFor the Six Months Ended
April 30, 2017(Unaudited)
For the Fiscal Year EndedOctober 31, 2016(a)
Shares Dollars Shares DollarsClass A Shares(a)Shares sold 1,645 $16,616 1,001 $10,011Reinvestment of distributions 7 71 � �
Shares redeemed � � (1 ) (11 )1,652 16,687 1,000 10,000
Institutional Shares(a)Shares sold 1 5 995,001 9,950,011Reinvestment of distributions 8,493 84,675 � �Shares redeemed (1 ) (5 ) (1 ) (10 )
8,493 84,675 995,000 9,950,001Service Shares(a)Shares sold � � 1,001 10,011Reinvestment of distributions 7 67 � �
Shares redeemed � � (1 ) (11 )7 67 1,000 10,000
Class IR Shares(a)Shares sold � � 1,001 10,011Reinvestment of distributions 8 80 � �
Shares redeemed � � (1 ) (11 )8 80 1,000 10,000
Class R Shares(a)Shares sold 7 67 1,001 10,011Reinvestment of distributions 6 62 � �
Shares redeemed � � (1 ) (11 )13 129 1,000 10,000
Class R6 SharesShares sold 1,275 13,203 1,001 10,011Reinvestment of distributions 9 85 � �
Shares redeemed � � (1 ) (11 )1,284 13,288 1,000 10,000
NET INCREASE 11,457 $114,926 1,000,000 $10,000,001
(a) Commenced operations on August 22, 2016.
74
Copyright © 2017 www.secdatabase.com. All Rights Reserved.Please Consider the Environment Before Printing This Document

Target Date 2040 Portfolio Target Date 2045 PortfolioFor the Six Months Ended
April 30, 2017(Unaudited)
For the Fiscal Year EndedOctober 31, 2016
For the Six Months EndedApril 30, 2017(Unaudited)
For the Fiscal Year EndedOctober 31, 2016(a)
Shares Dollars Shares Dollars Shares Dollars Shares Dollars
68 $ 653 1,323 $ 12,879 2,424 $ 25,418 1,001 $10,01189 827 � � 7 73 � �
(1 ) (10 ) (1 ) (11 ) � � (1 ) (11 )156 1,470 1,322 12,868 2,431 25,491 1,000 10,000
1 5 1,025 10,010 1 5 995,001 9,950,01170 653 � � 8,690 87,162 � �(1 ) (5 ) (1 ) (10 ) (1 ) (5 ) (1 ) (10 )70 653 1,024 10,000 8,690 87,162 995,000 9,950,001
� � 1,025 10,010 � � 1,001 10,01168 635 � � 7 70 � �� � (1 ) (11 ) � � (1 ) (11 )68 635 1,024 9,999 7 70 1,000 10,000
� � 1,025 10,010 � � 1,001 10,01169 648 � � 8 82 � �� � (1 ) (11 ) � � (1 ) (11 )69 648 1,024 9,999 8 82 1,000 10,000
1,128 10,867 1,025 10,010 1,422 14,926 1,001 10,01167 630 � � 6 65 � �� � (1 ) (11 ) � � (1 ) (11 )1,195 11,497 1,024 9,999 1,428 14,991 1,000 10,000
180,182 1,707,527 121,810 1,134,819 � � 1,001 10,011337,128 3,156,958 333,125 3,048,096 9 88 � �
(348,502 ) (3,349,226 ) (572,414 ) (5,513,965 ) � � (1 ) (11 )168,808 1,515,259 (117,479 ) (1,331,050 ) 9 88 1,000 10,000170,366 $ 1,530,162 (112,061 ) $ (1,278,185 ) 12,573 $ 127,884 1,000,000 $10,000,001
75
Copyright © 2017 www.secdatabase.com. All Rights Reserved.Please Consider the Environment Before Printing This Document

Notes to Financial Statements (continued)April 30, 2017 (Unaudited)
11. SUMMARY OF SHARE TRANSACTIONS (continued)
Target Date 2050 PortfolioFor the Six Months Ended
April 30, 2017(Unaudited)
For the Fiscal Year EndedOctober 31, 2016
Shares Dollars Shares DollarsClass A Shares(a)Shares sold � $� 1,001 $10,010Reinvestment of distributions 62 600 � �
Shares redeemed � � (1 ) (11 )62 600 1,000 9,999
Institutional Shares(a)Shares sold 1 5 1,001 10,010Reinvestment of distributions 63 614 � �Shares redeemed (1 ) (5 ) (1 ) (10 )
63 614 1,000 10,000Service Shares(a)Shares sold � � 1,001 10,010Reinvestment of distributions 62 596 � �
Shares redeemed � � (1 ) (11 )62 596 1,000 9,999
Class IR Shares(a)Shares sold � � 1,001 10,010Reinvestment of distributions 63 609 � �
Shares redeemed � � (1 ) (11 )63 609 1,000 9,999
Class R Shares(a)Shares sold 3 25 1,001 10,010Reinvestment of distributions 61 591 � �
Shares redeemed � � (1 ) (11 )64 616 1,000 9,999
Class R6 SharesShares sold 237,197 2,330,558 175,129 1,678,882Reinvestment of distributions 140,583 1,362,253 104,550 977,547Shares redeemed (122,264 ) (1,223,376 ) (128,796 ) (1,267,261 )
255,516 2,469,435 150,883 1,389,168NET INCREASE 255,830 $2,472,470 155,883 $1,439,164
(a) Commenced operations on August 22, 2016.
76
Copyright © 2017 www.secdatabase.com. All Rights Reserved.Please Consider the Environment Before Printing This Document

Target Date 2055 PortfolioFor the Six Months Ended
April 30, 2017(Unaudited)
For the Fiscal Year EndedOctober 31, 2016(a)
Shares Dollars Shares Dollars
6,572 $ 69,476 1,001 $10,01110 98 � �(1 ) (10 ) (1 ) (11 )6,581 69,564 1,000 10,000
� 5 995,001 9,950,0119,014 91,043 � �� (5 ) (1 ) (10 )9,014 91,043 995,000 9,950,001
� � 1,001 10,0117 74 � �� � (1 ) (11 )7 74 1,000 10,000
� � 1,001 10,0119 86 � �� � (1 ) (11 )9 86 1,000 10,000
� � 1,001 10,0117 69 � �� � (1 ) (11 )7 69 1,000 10,000
996 10,460 1,001 10,0119 92 � �� (3 ) (1 ) (11 )1,005 10,549 1,000 10,00016,623 $ 171,385 1,000,000 $10,000,001
77
Copyright © 2017 www.secdatabase.com. All Rights Reserved.Please Consider the Environment Before Printing This Document
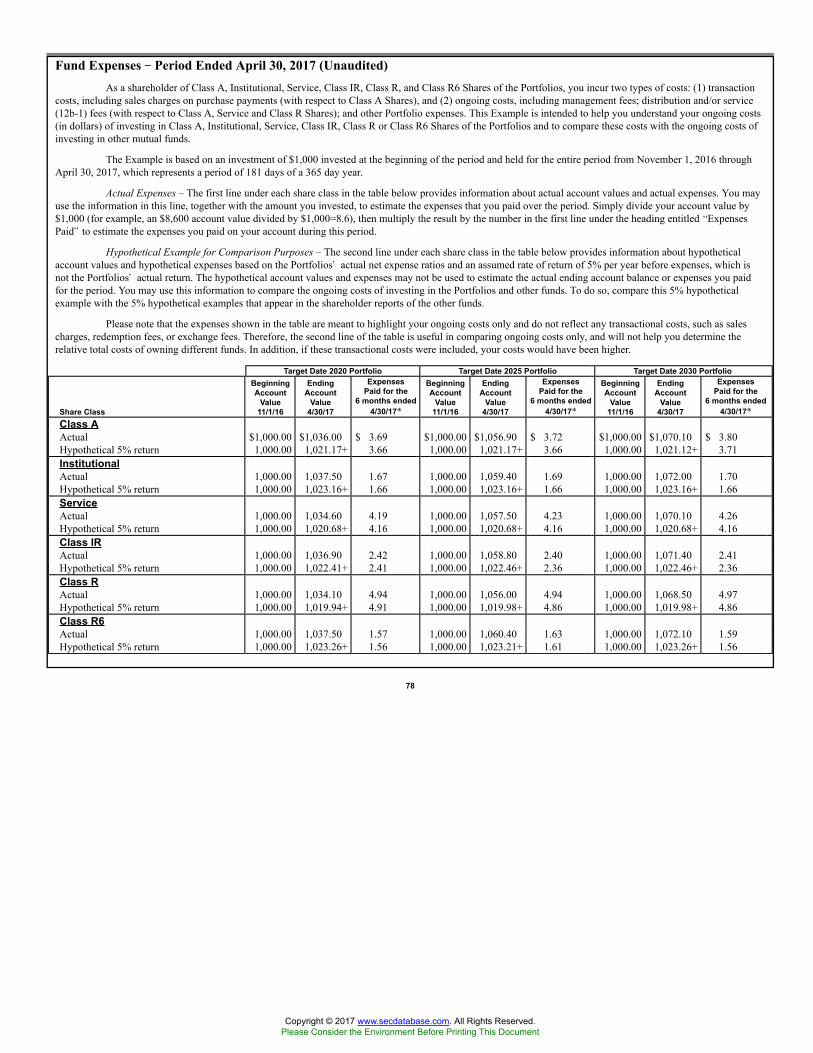
Fund Expenses �� Period Ended April 30, 2017 (Unaudited)As a shareholder of Class A, Institutional, Service, Class IR, Class R, and Class R6 Shares of the Portfolios, you incur two types of costs: (1) transaction
costs, including sales charges on purchase payments (with respect to Class A Shares), and (2) ongoing costs, including management fees; distribution and/or service(12b-1) fees (with respect to Class A, Service and Class R Shares); and other Portfolio expenses. This Example is intended to help you understand your ongoing costs(in dollars) of investing in Class A, Institutional, Service, Class IR, Class R or Class R6 Shares of the Portfolios and to compare these costs with the ongoing costs ofinvesting in other mutual funds.
The Example is based on an investment of $1,000 invested at the beginning of the period and held for the entire period from November 1, 2016 throughApril 30, 2017, which represents a period of 181 days of a 365 day year.
Actual Expenses � The first line under each share class in the table below provides information about actual account values and actual expenses. You mayuse the information in this line, together with the amount you invested, to estimate the expenses that you paid over the period. Simply divide your account value by$1,000 (for example, an $8,600 account value divided by $1,000=8.6), then multiply the result by the number in the first line under the heading entitled �ExpensesPaid� to estimate the expenses you paid on your account during this period.
Hypothetical Example for Comparison Purposes � The second line under each share class in the table below provides information about hypotheticalaccount values and hypothetical expenses based on the Portfolios� actual net expense ratios and an assumed rate of return of 5% per year before expenses, which isnot the Portfolios� actual return. The hypothetical account values and expenses may not be used to estimate the actual ending account balance or expenses you paidfor the period. You may use this information to compare the ongoing costs of investing in the Portfolios and other funds. To do so, compare this 5% hypotheticalexample with the 5% hypothetical examples that appear in the shareholder reports of the other funds.
Please note that the expenses shown in the table are meant to highlight your ongoing costs only and do not reflect any transactional costs, such as salescharges, redemption fees, or exchange fees. Therefore, the second line of the table is useful in comparing ongoing costs only, and will not help you determine therelative total costs of owning different funds. In addition, if these transactional costs were included, your costs would have been higher.
Target Date 2020 Portfolio Target Date 2025 Portfolio Target Date 2030 Portfolio
Share Class
BeginningAccount
Value11/1/16
EndingAccount
Value4/30/17
ExpensesPaid for the
6 months ended4/30/17*
BeginningAccount
Value11/1/16
EndingAccount
Value4/30/17
ExpensesPaid for the
6 months ended4/30/17*
BeginningAccount
Value11/1/16
EndingAccount
Value4/30/17
ExpensesPaid for the
6 months ended4/30/17*
Class AActual $1,000.00 $1,036.00 $ 3.69 $1,000.00 $1,056.90 $ 3.72 $1,000.00 $1,070.10 $ 3.80Hypothetical 5% return 1,000.00 1,021.17+ 3.66 1,000.00 1,021.17+ 3.66 1,000.00 1,021.12+ 3.71InstitutionalActual 1,000.00 1,037.50 1.67 1,000.00 1,059.40 1.69 1,000.00 1,072.00 1.70Hypothetical 5% return 1,000.00 1,023.16+ 1.66 1,000.00 1,023.16+ 1.66 1,000.00 1,023.16+ 1.66ServiceActual 1,000.00 1,034.60 4.19 1,000.00 1,057.50 4.23 1,000.00 1,070.10 4.26Hypothetical 5% return 1,000.00 1,020.68+ 4.16 1,000.00 1,020.68+ 4.16 1,000.00 1,020.68+ 4.16Class IRActual 1,000.00 1,036.90 2.42 1,000.00 1,058.80 2.40 1,000.00 1,071.40 2.41Hypothetical 5% return 1,000.00 1,022.41+ 2.41 1,000.00 1,022.46+ 2.36 1,000.00 1,022.46+ 2.36Class RActual 1,000.00 1,034.10 4.94 1,000.00 1,056.00 4.94 1,000.00 1,068.50 4.97Hypothetical 5% return 1,000.00 1,019.94+ 4.91 1,000.00 1,019.98+ 4.86 1,000.00 1,019.98+ 4.86Class R6Actual 1,000.00 1,037.50 1.57 1,000.00 1,060.40 1.63 1,000.00 1,072.10 1.59Hypothetical 5% return 1,000.00 1,023.26+ 1.56 1,000.00 1,023.21+ 1.61 1,000.00 1,023.26+ 1.56
78
Copyright © 2017 www.secdatabase.com. All Rights Reserved.Please Consider the Environment Before Printing This Document

Fund Expenses �� Period Ended April 30, 2017 (Unaudited) (continued)Target Date 2035 Portfolio Target Date 2040 Portfolio Target Date 2045 Portfolio
Share Class
BeginningAccount
Value11/1/16
EndingAccount
Value4/30/17
ExpensesPaid for the
6 months ended4/30/17*
BeginningAccount
Value11/1/16
EndingAccount
Value4/30/17
ExpensesPaid for the
6 months ended4/30/17*
BeginningAccount
Value11/1/16
EndingAccount
Value4/30/17
ExpensesPaid for the
6 months ended4/30/17*
Class AActual $1,000.00 $1,075.90 $ 3.76 $1,000.00 $1,083.60 $ 3.77 $1,000.00 $1,089.50 $ 3.73Hypothetical 5% return 1,000.00 1,021.17+ 3.66 1,000.00 1,021.17+ 3.66 1,000.00 1,021.22+ 3.61InstitutionalActual 1,000.00 1,079.50 1.70 1,000.00 1,087.20 1.71 1,000.00 1,092.00 1.71Hypothetical 5% return 1,000.00 1,023.16+ 1.66 1,000.00 1,023.16+ 1.66 1,000.00 1,023.16+ 1.66ServiceActual 1,000.00 1,076.60 4.22 1,000.00 1,083.10 4.29 1,000.00 1,089.20 4.25Hypothetical 5% return 1,000.00 1,020.73+ 4.11 1,000.00 1,020.68+ 4.16 1,000.00 1,020.73+ 4.11Class IRActual 1,000.00 1,077.90 2.42 1,000.00 1,085.50 2.43 1,000.00 1,091.50 2.44Hypothetical 5% return 1,000.00 1,022.46+ 2.36 1,000.00 1,022.46+ 2.36 1,000.00 1,022.46+ 2.36Class RActual 1,000.00 1,075.00 4.99 1,000.00 1,082.60 5.06 1,000.00 1,088.70 4.97Hypothetical 5% return 1,000.00 1,019.98+ 4.86 1,000.00 1,019.94+ 4.91 1,000.00 1,020.03+ 4.81Class R6Actual 1,000.00 1,079.50 1.50 1,000.00 1,086.10 1.60 1,000.00 1,093.10 1.66Hypothetical 5% return 1,000.00 1,023.36+ 1.45 1,000.00 1,023.26+ 1.56 1,000.00 1,023.21+ 1.61
79
Copyright © 2017 www.secdatabase.com. All Rights Reserved.Please Consider the Environment Before Printing This Document

Fund Expenses �� Period Ended April 30, 2017 (Unaudited) (continued)Target Date 2050 Portfolio Target Date 2055 Portfolio
Share Class
BeginningAccount
Value11/1/16
EndingAccount
Value4/30/17
ExpensesPaid for the
6 months ended4/30/17*
BeginningAccount
Value11/1/16
EndingAccount
Value4/30/17
ExpensesPaid for the
6 months ended4/30/17*
Class AActual $1,000.00 $1,097.70 $ 3.74 $1,000.00 $1,102.60 $ 3.75Hypothetical 5% return 1,000.00 1,021.22+ 3.61 1,000.00 1,021.22+ 3.61InstitutionalActual 1,000.00 1,100.30 1.67 1,000.00 1,104.80 1.72Hypothetical 5% return 1,000.00 1,023.21+ 1.61 1,000.00 1,023.16+ 1.66ServiceActual 1,000.00 1,097.40 4.32 1,000.00 1,103.00 4.28Hypothetical 5% return 1,000.00 1,020.68+ 4.16 1,000.00 1,020.73+ 4.11Class IRActual 1,000.00 1,099.70 2.50 1,000.00 1,104.30 2.50Hypothetical 5% return 1,000.00 1,022.41+ 2.41 1,000.00 1,022.41+ 2.41Class RActual 1,000.00 1,096.80 5.09 1,000.00 1,101.40 5.11Hypothetical 5% return 1,000.00 1,019.94+ 4.91 1,000.00 1,019.94+ 4.91Class R6Actual 1,000.00 1,100.30 1.61 1,000.00 1,104.80 1.62Hypothetical 5% return 1,000.00 1,023.26+ 1.56 1,000.00 1,023.26+ 1.56
* Expenses for each share class are calculated using each Portfolio�s annualized net expense ratio for each class, which represents the ongoing expenses as a percentage of net assets for the sixmonths ended April 30, 2017. Expenses are calculated by multiplying the annualized net expense ratio by the average account value for the period; then multiplying the result by the numberof days in the most recent fiscal half year; and then dividing that result by the number of days in the fiscal year. The annualized net expense ratios for the period were as follows:
Portfolio Class A Institutional Service Class IR Class R Class R6Target Date 2020 0.73 % 0.33 % 0.83 % 0.48 % 0.98 % 0.31 %Target Date 2025 0.73 0.33 0.83 0.47 0.97 0.32Target Date 2030 0.74 0.33 0.83 0.47 0.97 0.31Target Date 2035 0.73 0.33 0.82 0.47 0.97 0.29Target Date 2040 0.73 0.33 0.83 0.47 0.98 0.31Target Date 2045 0.72 0.33 0.82 0.47 0.96 0.32Target Date 2050 0.72 0.32 0.83 0.48 0.98 0.31Target Date 2055 0.72 0.33 0.82 0.48 0.98 0.31
+ Hypothetical expenses are based on each Portfolio�s actual annualized net expense ratios and an assumed rate of return of 5% per year before expenses.
80
Copyright © 2017 www.secdatabase.com. All Rights Reserved.Please Consider the Environment Before Printing This Document

FUNDS PROFILE
Goldman Sachs FundsGoldman Sachs is a premier financial services firm, known since 1869 for creating thoughtful and customized investment solutions in complex globalmarkets.Today, the Investment Management Division of Goldman Sachs serves a diverse set of clients worldwide, including private institutions, public entitiesand individuals. With approximately $1.17 trillion in assets under supervision as of March 31, 2017, Goldman Sachs Asset Management (�GSAM�)has portfolio management teams located around the world and our investment professionals bring firsthand knowledge of local markets to everyinvestment decision. Assets under supervision includes assets under management and other client assets for which Goldman Sachs does not have fulldiscretion. GSAM leverages the resources of Goldman Sachs & Co. LLC subject to legal, internal and regulatory restrictions.
Money MarketFinancial Square FundsSM
∎ Financial Square Treasury Solutions Fund1
∎ Financial Square Government Fund1
∎ Financial Square Money Market Fund2
∎ Financial Square Prime Obligations Fund2
∎ Financial Square Treasury Instruments Fund1
∎ Financial Square Treasury Obligations Fund1
∎ Financial Square Federal Instruments Fund1
∎ Financial Square Tax-Exempt Money Market Fund2Investor FundsSM
∎ Investor Money Market Fund3
∎ Investor Tax-Exempt Money Market Fund3
Fixed IncomeShort Duration and Government∎ Enhanced Income Fund∎ High Quality Floating Rate Fund∎ Short-Term Conservative Income Fund4
∎ Short Duration Government Fund∎ Short Duration Income Fund∎ Government Income Fund∎ Inflation Protected Securities FundMulti-Sector∎ Bond Fund∎ Core Fixed Income Fund∎ Global Income Fund∎ Strategic Income FundMunicipal and Tax-Free∎ High Yield Municipal Fund∎ Dynamic Municipal Income Fund∎ Short Duration Tax-Free FundSingle Sector∎ Investment Grade Credit Fund∎ U.S. Mortgages Fund∎ High Yield Fund∎ High Yield Floating Rate Fund∎ Emerging Markets Debt Fund∎ Local Emerging Markets Debt Fund∎ Dynamic Emerging Markets Debt FundFixed Income Alternatives∎ Long Short Credit Strategies Fund∎ Strategic Macro Fund5
Fundamental Equity∎ Equity Income Fund6
∎ Small Cap Value Fund∎ Small/Mid Cap Value Fund∎ Mid Cap Value Fund∎ Large Cap Value Fund∎ Focused Value Fund∎ Capital Growth Fund∎ Strategic Growth Fund∎ Focused Growth Fund∎ Small/Mid Cap Growth Fund∎ Flexible Cap Growth Fund∎ Concentrated Growth Fund∎ Technology Opportunities Fund∎ Growth Opportunities Fund∎ Rising Dividend Growth Fund∎ Dynamic U.S. Equity Fund
Copyright © 2017 www.secdatabase.com. All Rights Reserved.Please Consider the Environment Before Printing This Document

∎ Income Builder Fund
Tax-Advantaged Equity∎ U.S. Tax-Managed Equity Fund∎ International Tax-Managed Equity Fund∎ U.S. Equity Dividend and Premium Fund∎ International Equity Dividend and Premium Fund
Equity Insights∎ Small Cap Equity Insights Fund∎ U.S. Equity Insights Fund∎ Small Cap Growth Insights Fund∎ Large Cap Growth Insights Fund∎ Large Cap Value Insights Fund∎ Small Cap Value Insights Fund∎ International Small Cap Insights Fund∎ International Equity Insights Fund∎ Emerging Markets Equity Insights Fund
Fundamental Equity International∎ Strategic International Equity Fund∎ Focused International Equity Fund∎ Asia Equity Fund∎ Emerging Markets Equity Fund∎ N-11 Equity Fund
Select Satellite∎ Real Estate Securities Fund∎ International Real Estate Securities Fund∎ Commodity Strategy Fund∎ Global Real Estate Securities Fund∎ Dynamic Allocation Fund∎ Absolute Return Tracker Fund∎ Long Short Fund∎ Managed Futures Strategy Fund∎ MLP Energy Infrastructure Fund∎ Multi-Manager Alternatives Fund∎ Absolute Return Multi-Asset Fund∎ Global Infrastructure Fund
Total Portfolio Solutions∎ Global Managed Beta Fund∎ Multi-Manager Non-Core Fixed Income Fund∎ Multi-Manager U.S. Dynamic Equity Fund∎ Multi-Manager Global Equity Fund∎ Multi-Manager International Equity Fund∎ Tactical Tilt Overlay Fund∎ Balanced Strategy Portfolio∎ Multi-Manager U.S. Small Cap Equity Fund∎ Multi-Manager Real Assets Strategy Fund∎ Growth and Income Strategy Portfolio∎ Growth Strategy Portfolio∎ Equity Growth Strategy Portfolio∎ Satellite Strategies Portfolio∎ Enhanced Dividend Global Equity Portfolio∎ Tax-Advantaged Global Equity Portfolio∎ Strategic Factor Allocation Fund∎ Target Date 2020 Portfolio∎ Target Date 2025 Portfolio∎ Target Date 2030 Portfolio∎ Target Date 2035 Portfolio∎ Target Date 2040 Portfolio∎ Target Date 2045 Portfolio∎ Target Date 2050 Portfolio∎ Target Date 2055 Portfolio∎ GQG Partners International Opportunities Fund
1 You could lose money by investing in the Fund. Although the Fund seeks to preserve the value of your investment at $1.00 per share, it cannot guarantee itwill do so. An investment in the Fund is not a deposit of a bank and is not insured or guaranteed by the Federal Deposit Insurance Corporation or any othergovernment agency. The Fund��s sponsor has no legal obligation to provide financial support to the Fund, and you should not expect that the sponsor willprovide financial support to the Fund at any time.
2 You could lose money by investing in the Fund. Because the share price of the Fund will fluctuate, when you sell your shares they may be worth more or lessthan what you originally paid for them. The Fund may impose a fee upon sale of your shares or may temporarily suspend your ability to sell shares if theFund��s liquidity falls below required minimums because of market conditions or other factors. An investment in the Fund is not a deposit of a bank and isnot insured or guaranteed by the Federal Deposit Insurance Corporation or any other government agency. The Fund��s sponsor has no legal obligation toprovide financial support to the Fund, and you should not expect that the sponsor will provide financial support to the Fund at any time.
Copyright © 2017 www.secdatabase.com. All Rights Reserved.Please Consider the Environment Before Printing This Document

3 You could lose money by investing in the Fund. Although the Fund seeks to preserve the value of your investment at $1.00 per share, it cannot guarantee itwill do so. The Fund may impose a fee upon sale of your shares or may temporarily suspend your ability to sell shares if the Fund��s liquidity falls belowrequired minimums because of market conditions or other factors. An investment in the Fund is not a deposit of a bank and is not insured or guaranteed bythe Federal Deposit Insurance Corporation or any other government agency. The Fund��s sponsor has no legal obligation to provide financial support to theFund, and you should not expect that the sponsor will provide financial support to the Fund at any time.
4 Effective on July 29, 2016, the Goldman Sachs Limited Maturity Obligations Fund was renamed the Goldman Sachs Short-Term Conservative Income Fund.5 Effective on June 20, 2017, the Goldman Sachs Fixed Income Macro Strategies Fund was renamed the Goldman Sachs Strategic Macro Fund.6 Effective on June 20, 2017, the Goldman Sachs Growth and Income Fund was renamed the Goldman Sachs Equity Income Fund.Financial Square FundsSM and Investor FundsSM are registered service marks of Goldman Sachs & Co. LLC.* This list covers open-end funds only. Please visit our website at www.GSAMFUNDS.com to learn about our closed-end funds and exchange-traded funds.
Copyright © 2017 www.secdatabase.com. All Rights Reserved.Please Consider the Environment Before Printing This Document

TRUSTEESCheryl K. Beebe, ChairLawrence HughesJohn F. KillianJames A. McNamaraWestley V. Thompson
OFFICERSJames A. McNamara, PresidentScott M. McHugh, Treasurer, Senior Vice Presidentand Principal Financial OfficerJoseph F. DiMaria, Assistant Treasurer and PrincipalAccounting OfficerCaroline L. Kraus, Secretary
GOLDMAN SACHS & CO. LLCDistributor and Transfer Agent
GOLDMAN SACHS ASSET MANAGEMENT, L.P.Investment Adviser
Visit our Web site at www.GSAMFUNDS.com to obtain the most recent month-endreturns.
Goldman Sachs Asset Management, L.P. 200 West Street, New York, New York 10282The portfolio risk management process includes an effort to monitor and manage risk, but does not imply low risk.The reports concerning the Portfolios included in this shareholder report may contain certain forward-looking statements about the factorsthat may affect the performance of the Portfolios in the future. These statements are based on Portfolio management�s predictions andexpectations concerning certain future events and their expected impact on the Portfolios, such as performance of the economy as awhole and of specific industry sectors, changes in the levels of interest rates, the impact of developing world events, and other factorsthat may influence the future performance of the Portfolios. Management believes these forward-looking statements to be reasonable,although they are inherently uncertain and difficult to predict. Actual events may cause adjustments in portfolio management strategiesfrom those currently expected to be employed.Views and opinions expressed are for informational purposes only and do not constitute a recommendation by GSAM to buy, sell, or holdany security. Views and opinions are current as of the date of this presentation and may be subject to change, they should not beconstrued as investment advice.A description of the policies and procedures that the Portfolios use to determine how to vote proxies relating to portfolio securities andinformation regarding how a Portfolio voted proxies relating to portfolio securities during the most recent 12-month period ended June 30is available (i) without charge, upon request by calling 1-800-526-7384 (for Retail Shareholders) or 1-800-621-2550 (for InstitutionalShareholders); and (ii) on the Securities and Exchange Commission (�SEC�) web site at http://www.sec.gov.References to indices, benchmarks or other measures of relative market performance over a specified period of time are provided foryour information only and do not imply that the portfolio will achieve similar results. The index composition may not reflect the manner inwhich a portfolio is constructed. While an adviser seeks to design a portfolio which reflects appropriate risk and return features, portfoliocharacteristics may deviate from those of the benchmark.The Portfolios file their complete schedule of portfolio holdings with the SEC for the first and third quarters of each fiscal year on Form N-Qs. The Portfolios� Form N-Qs are available on the SEC�s website at http://www.sec.gov within 60 days after the Portfolios� first andthird fiscal quarters. The Portfolios� Form N-Qs may be reviewed and copied at the SEC�s Public Reference Room in Washington, D.C.and information on the operation of the Public Reference Room may also be obtained by calling 1-800-SEC-0330. Form N-Qs may beobtained upon request and without charge by calling 1-800-526-7384 (for Retail Shareholders) or 1-800-621-2550 (for InstitutionalShareholders).Economic and market forecasts presented herein reflect a series of assumptions and judgments as of the date of this presentation andare subject to change without notice. These forecasts do not take into account the specific investment objectives, restrictions, tax andfinancial situation or other needs of any specific client. Actual data will vary and may not be reflected here. These forecasts are subject tohigh levels of uncertainty that may affect actual performance. Accordingly, these forecasts should be viewed as merely representative ofa broad range of possible outcomes. These forecasts are estimated, based on assumptions, land are subject to significant revision andmay change materially as economic and market conditions change. Goldman Sachs has no obligation to provide updates or changes tothese forecasts. Case studies and examples are for illustrative purposes only.Portfolio holdings and allocations shown are as of April 30, 2017 and may not be representative of future investments. Portfolio holdingsshould not be relied on in making investment decisions and should not be construed as research or investment advice regardingparticular securities. Current and future holdings are subject to risk.This material is not authorized for distribution to prospective investors unless preceded or accompanied by a currentProspectus or summary prospectus, if applicable. Investors should consider a Portfolio��s objective, risks, and charges andexpenses, and read the summary prospectus, if available, and/or the Prospectus carefully before investing or sending money.The summary prospectus, if available, and the Prospectus contain this and other information about a Portfolio and may beobtained from your authorized dealer or from Goldman Sachs & Co. LLC by calling (retail �� 1-800-526-7384) (institutional ��1-800-621-2550).© 2017 Goldman Sachs. All rights reserved. 94974-TMPL-06/2017-553952 TARGDATESAR-17/186
Copyright © 2017 www.secdatabase.com. All Rights Reserved.Please Consider the Environment Before Printing This Document

ITEM 2. CODE OF ETHICS.
(a) As of the end of the period covered by this report, the registrant has adopted a code of ethics that applies to the registrant�s principalexecutive officer, principal financial officer, principal accounting officer or controller, or persons performing similar functions,regardless of whether these individuals are employed by the registrant or a third party (the �Code of Ethics�).
(b) During the period covered by this report, no amendments were made to the provisions of the Code of Ethics.
(c) During the period covered by this report, the registrant did not grant any waivers, including an implicit waiver, from any provision ofthe Code of Ethics.
(d) A copy of the Code of Ethics is available as provided in Item 12(a)(1) of this report.
ITEM 3. AUDIT COMMITTEE FINANCIAL EXPERT.
The registrant�s board of trustees has determined that the registrant has at least one �audit committee financial expert� (as defined inItem 3 of Form N-CSR) serving on its audit committee. John F. Killian is the �audit committee financial expert� and is �independent�(as each term is defined in Item 3 of Form N-CSR).
ITEM 4. PRINCIPAL ACCOUNTANT FEES AND SERVICES.
The information required by this Item is only required in an annual report on this Form N-CSR.
Copyright © 2017 www.secdatabase.com. All Rights Reserved.Please Consider the Environment Before Printing This Document

ITEM 5. AUDIT COMMITTEE OF LISTED REGISTRANTS.
Not applicable.
ITEM 6. SCHEDULE OF INVESTMENTS.
Schedule of Investments is included as part of the Report to Shareholders filed under Item 1.
ITEM 7. DISCLOSURE OF PROXY VOTING POLICIES AND PROCEDURES FOR CLOSED-END MANAGEMENTINVESTMENT COMPANIES.
Not applicable.
ITEM 8. PORTFOLIO MANAGERS OF CLOSED-END MANAGEMENT INVESTMENT COMPANIES.
Not applicable.
ITEM 9. PURCHASES OF EQUITY SECURITIES BY CLOSED-END MANAGEMENT INVESTMENT COMPANY ANDAFFILIATED PURCHASERS.
Not applicable.
Copyright © 2017 www.secdatabase.com. All Rights Reserved.Please Consider the Environment Before Printing This Document

ITEM 10. SUBMISSION OF MATTERS TO A VOTE OF SECURITY HOLDERS.
There have been no material changes to the procedures by which shareholders may recommend nominees to the registrant�sboard of trustees.
ITEM 11. CONTROLS AND PROCEDURES.
(a) The registrant�s principal executive and principal financial officers, or persons performing similar functions haveconcluded that the registrant�s disclosure controls and procedures (as defined in Rule 30a-3(c) under theInvestment Company Act of 1940, as amended (the �1940 Act�)) are effective as of a date within 90 days of thefiling of this report that includes the disclosure required by this paragraph, based on the evaluation of these controlsand procedures required by Rule 30a-3(b) under the 1940 Act and 15d-15(b) under the Securities Exchange Act of1934, as amended.
(b) There were no changes in the registrant�s internal control over financial reporting (as defined in Rule 30a-3(d)under the 1940 Act) that occurred during the registrant�s most recent fiscal quarter of the period covered by thisreport that have materially affected, or are reasonably likely to materially affect, the registrant�s internal controlover financial reporting.
ITEM 12. EXHIBITS.
(a)(1) Goldman Sachs Trust II�s Code of Ethics for Principal Executive and Senior Financial Officers isincorporated by reference to Exhibit 12(a)(1) of the registrant�s Form N-CSR filed on July 8, 2015 forits Multi-Manager Non-Core Fixed Income Fund.
(a)(2) Exhibit 99.CERT Certifications pursuant to Section 302 of the Sarbanes-Oxley Act of 2002filed herewith.
(b) Exhibit 99.906CERT Certifications pursuant to Section 906 of the Sarbanes-Oxley Act of 2002filed herewith.
Copyright © 2017 www.secdatabase.com. All Rights Reserved.Please Consider the Environment Before Printing This Document

SIGNATURES
Pursuant to the requirements of the Securities Exchange Act of 1934 and the Investment Company Act of 1940, the registranthas duly caused this report to be signed on its behalf by the undersigned, thereunto duly authorized.
Goldman Sachs Trust II
By: /s/ James A. McNamaraJames A. McNamaraPresident/Chief Executive OfficerGoldman Sachs Trust II
Date: June 30, 2017
Pursuant to the requirements of the Securities Exchange Act of 1934 and the Investment Company Act of 1940, this report hasbeen signed below by the following persons on behalf of the registrant and in the capacities and on the dates indicated.
By: /s/ James A. McNamaraJames A. McNamaraPresident/Chief Executive OfficerGoldman Sachs Trust II
Date: June 30, 2017
By: /s/ Scott McHughScott McHughPrincipal Financial OfficerGoldman Sachs Trust II
Date: June 30, 2017
Copyright © 2017 www.secdatabase.com. All Rights Reserved.Please Consider the Environment Before Printing This Document

CERTIFICATIONS(Section 302)
I, James A. McNamara, certify that:
1. I have reviewed this report on Form N-CSR of the Goldman Sachs Trust II;
2. Based on my knowledge, this report does not contain any untrue statement of a material fact or omit to state a material factnecessary to make the statements made, in light of the circumstances under which such statements were made, not misleading withrespect to the period covered by this report;
3. Based on my knowledge, the financial statements, and other financial information included in this report, fairly present in allmaterial respects the financial condition, results of operations, changes in net assets, and cash flows (if the financial statements arerequired to include a statement of cash flows) of the registrant as of, and for, the periods presented in this report;
4. The registrant�s other certifying officer(s) and I are responsible for establishing and maintaining disclosure controls andprocedures (as defined in Rule 30a-3(c) under the Investment Company Act of 1940) and internal control over financial reporting (asdefined in Rule 30a-3(d) under the Investment Company Act of 1940) for the registrant and have:
(a) Designed such disclosure controls and procedures, or caused such disclosure controls and procedures to be designedunder our supervision, to ensure that material information relating to the registrant, including its consolidated subsidiaries, is madeknown to us by others within those entities, particularly during the period in which this report is being prepared;
(b) Designed such internal control over financial reporting, or caused such internal control over financial reporting to bedesigned under our supervision, to provide reasonable assurance regarding the reliability of financial reporting and the preparationof financial statements for external purposes in accordance with generally accepted accounting principles;
(c) Evaluated the effectiveness of the registrant�s disclosure controls and procedures and presented in this report ourconclusions about the effectiveness of the disclosure controls and procedures, as of a date within 90 days prior to the filing date ofthis report based on such evaluation; and
(d) Disclosed in this report any change in the registrant�s internal control over financial reporting that occurred during theregistrant�s most recent fiscal quarter that has materially affected, or is reasonably likely to materially affect, the registrant�sinternal control over financial reporting; and
5. The registrant�s other certifying officer(s) and I have disclosed to the registrant�s auditors and the audit committee of theregistrant�s board of directors (or persons performing the equivalent functions):
(a) All significant deficiencies and material weaknesses in the design or operation of internal control over financial reportingwhich are reasonably likely to adversely affect the registrant�s ability to record, process, summarize, and report financialinformation; and
(b) Any fraud, whether or not material, that involves management or other employees who have a significant role in theregistrant�s internal control over financial reporting.
Dated: June 30, 2017
/s/ James A. McNamaraJames A. McNamaraPresident/Chief Executive Officer
Copyright © 2017 www.secdatabase.com. All Rights Reserved.Please Consider the Environment Before Printing This Document

CERTIFICATIONS(Section 302)
I, Scott McHugh, certify that:
1. I have reviewed this report on Form N-CSR of the Goldman Sachs Trust II;
2. Based on my knowledge, this report does not contain any untrue statement of a material fact or omit to state a material factnecessary to make the statements made, in light of the circumstances under which such statements were made, not misleading withrespect to the period covered by this report;
3. Based on my knowledge, the financial statements, and other financial information included in this report, fairly present in allmaterial respects the financial condition, results of operations, changes in net assets, and cash flows (if the financial statements arerequired to include a statement of cash flows) of the registrant as of, and for, the periods presented in this report;
4. The registrant�s other certifying officer(s) and I are responsible for establishing and maintaining disclosure controls andprocedures (as defined in Rule 30a-3(c) under the Investment Company Act of 1940) and internal control over financial reporting (asdefined in Rule 30a-3(d) under the Investment Company Act of 1940) for the registrant and have:
(a) Designed such disclosure controls and procedures, or caused such disclosure controls and procedures to be designedunder our supervision, to ensure that material information relating to the registrant, including its consolidated subsidiaries, is madeknown to us by others within those entities, particularly during the period in which this report is being prepared;
(b) Designed such internal control over financial reporting, or caused such internal control over financial reporting to bedesigned under our supervision, to provide reasonable assurance regarding the reliability of financial reporting and the preparationof financial statements for external purposes in accordance with generally accepted accounting principles;
(c) Evaluated the effectiveness of the registrant�s disclosure controls and procedures and presented in this report ourconclusions about the effectiveness of the disclosure controls and procedures, as of a date within 90 days prior to the filing date ofthis report based on such evaluation; and
(d) Disclosed in this report any change in the registrant�s internal control over financial reporting that occurred during theregistrant�s most recent fiscal quarter that has materially affected, or is reasonably likely to materially affect, the registrant�sinternal control over financial reporting; and
5. The registrant�s other certifying officer(s) and I have disclosed to the registrant�s auditors and the audit committee of theregistrant�s board of directors (or persons performing the equivalent functions):
(a) All significant deficiencies and material weaknesses in the design or operation of internal control over financial reportingwhich are reasonably likely to adversely affect the registrant�s ability to record, process, summarize, and report financialinformation; and
(b) Any fraud, whether or not material, that involves management or other employees who have a significant role in theregistrant�s internal control over financial reporting.
Dated: June 30, 2017
/s/ Scott McHughScott McHughPrincipal Financial Officer
Copyright © 2017 www.secdatabase.com. All Rights Reserved.Please Consider the Environment Before Printing This Document

EX-99.906CERT
Certification Under Section 906of the Sarbanes-Oxley Act of 2002
James A. McNamara, President/Chief Executive Officer, and Scott McHugh, Principal Financial Officer of the Goldman Sachs Trust II(the �Registrant�), each certify to the best of his knowledge that:
1. The Registrant�s periodic report on Form N-CSR for the period ended April 30, 2017 (the �Form N-CSR�) fully complies with therequirements of section 15(d) of the Securities Exchange Act of 1934, as amended; and
2. The information contained in the Form N-CSR fairly presents, in all material respects, the financial condition and results ofoperations of the Registrant.
President/Chief Executive Officer Principal Financial Officer
Goldman Sachs Trust II Goldman Sachs Trust II
/s/ James A. McNamara /s/ Scott McHughJames A. McNamara Scott McHugh
Date: June 30, 2017 June 30, 2017
This certification is being furnished to the Securities and Exchange Commission pursuant to Rule 30a-2(b) under the InvestmentCompany Act of 1940, as amended, and 18 U.S.C. § 1350 and is not being filed as part of the Form N-CSR with the Securities andExchange Commission.
Copyright © 2017 www.secdatabase.com. All Rights Reserved.Please Consider the Environment Before Printing This Document