SCORPIO BULKERS INC. - Eneti Inc.
158
UNITED STATES SECURITIES AND EXCHANGE COMMISSION Washington, D.C. 20549 FORM 20-F (Mark One) REGISTRATION STATEMENT PURSUANT TO SECTION 12(b) OR (g) OF THE SECURITIES EXCHANGE ACT OF 1934 OR ANNUAL REPORT PURSUANT TO SECTION 13 OR 15(d) OF THE SECURITIES EXCHANGE ACT OF 1934 For the fiscal year ended December 31, 2018 OR TRANSITION REPORT PURSUANT TO SECTION 13 OR 15(d) OF THE SECURITIES EXCHANGE ACT OF 1934 For the transition period from _________________ to _________________ OR SHELL COMPANY REPORT PURSUANT TO SECTION 13 OR 15(d) OF THE SECURITIES EXCHANGE ACT OF 1934 Date of event requiring this shell company report _________________ Commission file number: 001-36231 SCORPIO BULKERS INC. (Exact name of Registrant as specified in its charter) (Translation of Registrant’s name into English) Republic of the Marshall Islands (Jurisdiction of incorporation or organization) 9, Boulevard Charles III Monaco 98000 (Address of principal executive offices) Mr. Emanuele Lauro 377-9798-5715 [email protected] 9, Boulevard Charles III Monaco 98000 (Name, Telephone, E-mail and/or Facsimile, and address of Company Contact Person) Securities registered or to be registered pursuant to Section 12(b) of the Act. Title of each class Name of each exchange on which registered Common stock, par value $0.01 per share New York Stock Exchange 7.50% Senior Notes due 2019 New York Stock Exchange Securities registered or to be registered pursuant to section 12(g) of the Act. NONE (Title of class)
-
Upload
khangminh22 -
Category
Documents
-
view
0 -
download
0
Transcript of SCORPIO BULKERS INC. - Eneti Inc.
UNITED STATES
SECURITIES AND EXCHANGE COMMISSION
Washington, D.C. 20549
FORM 20-F
(Mark One)
REGISTRATION STATEMENT PURSUANT TO SECTION 12(b) OR (g) OF THE
SECURITIES EXCHANGE ACT OF 1934 OR
ANNUAL REPORT PURSUANT TO SECTION 13 OR 15(d) OF THE SECURITIES
EXCHANGE ACT OF 1934 For the fiscal year ended December 31, 2018
OR TRANSITION REPORT PURSUANT TO SECTION 13 OR 15(d) OF THE
SECURITIES EXCHANGE ACT OF 1934 For the transition period from _________________ to _________________
OR
SHELL COMPANY REPORT PURSUANT TO SECTION 13 OR 15(d) OF THE
SECURITIES EXCHANGE ACT OF 1934 Date of event requiring this shell company report _________________
Commission file number: 001-36231
SCORPIO BULKERS INC. (Exact name of Registrant as specified in its charter)
(Translation of Registrant’s name into English)
Republic of the Marshall Islands
(Jurisdiction of incorporation or organization)
9, Boulevard Charles III Monaco 98000
(Address of principal executive offices)
Mr. Emanuele Lauro
377-9798-5715
9, Boulevard Charles III Monaco 98000 (Name, Telephone, E-mail and/or Facsimile, and address of Company Contact Person)
Securities registered or to be registered pursuant to Section 12(b) of the Act.
Title of each class Name of each exchange on which registered
Common stock, par value $0.01 per share New York Stock Exchange
7.50% Senior Notes due 2019 New York Stock Exchange
Securities registered or to be registered pursuant to section 12(g) of the Act.
NONE
(Title of class)

Securities for which there is a reporting obligation pursuant to Section 15(d) of the Act.
NONE
(Title of class)
Indicate the number of outstanding shares of each of the issuer’s classes of capital or common stock as of the close of the period
covered by the annual report.
As of December 31, 2018, there were 71,217,258 outstanding shares of common stock, par value $0.01 per share.
Indicate by check mark if the registrant is a well-known seasoned issuer, as defined in Rule 405 of the Securities Act.
Yes No
If this report is an annual or transition report, indicate by check mark if the registrant is not required to file reports pursuant to
Section 13 or 15(d) of the Securities Exchange Act of 1934.
Yes No
Note – Checking the box above will not relieve any registrant required to file reports pursuant to Section 13 or 15(d) of the
Securities Exchange Act of 1934 from their obligations under those Sections.
Indicate by check mark whether the registrant (1) has filed all reports required to be filed by Section 13 or 15(d) of the Securities
Exchange Act of 1934 during the preceding 12 months (or for such shorter period that the registrant was required to file such
reports), and (2) has been subject to such filing requirements for the past 90 days.
Yes No
Indicate by check mark whether the registrant has submitted electronically every Interactive Data File required to be submitted
pursuant to Rule 405 of Regulation S-T (§232.405 of this chapter) during the preceding 12 months (or for such shorter period
that the registrant was required to submit such files).
Yes No
Indicate by check mark whether the registrant is a large accelerated filer, an accelerated filer, a non-accelerated filer or an
emerging growth company. See definition of “large accelerated filer”, “accelerated filer”, and “emerging growth company” in
Rule 12b-2 of the Exchange Act.
Large accelerated filer Accelerated filer Non-accelerated filer Emerging growth company
If an emerging growth company that prepares its financial statements in accordance with U.S. GAAP, indicate by check mark if
the registrant has elected not to use the extended transition period for complying with any new or revised financial accounting
standards† provided pursuant to Section 13(a) of the Exchange Act.
† The term “new or revised financial accounting standard” refers to any update issued by the Financial Accounting Standards
Board to its Accounting Standards Codification after April 5, 2012.
Indicate by check mark which basis of accounting the registrant has used to prepare the financial statements included in this
filing:

U.S. GAAP
International Financial Reporting Standards as issued by the international Accounting Standards Board
Other
If “Other” has been checked in response to the previous question, indicate by check mark which financial statement item the
registrant has elected to follow:
Item 17 Item 18
If this is an annual report, indicate by check mark whether the registrant is a shell company (as defined in Rule 12b-2 of the
Exchange Act).
Yes No

TABLE OF CONTENTS
PART I 1
ITEM 1. IDENTITY OF DIRECTORS, SENIOR MANAGEMENT AND ADVISERS 1
ITEM 2. OFFER STATISTICS AND EXPECTED TIMETABLE 1
ITEM 3. KEY INFORMATION 1
ITEM 4. INFORMATION ON THE COMPANY 22
ITEM 4A. UNRESOLVED STAFF COMMENTS 53
ITEM 5. OPERATING AND FINANCIAL REVIEW AND PROSPECTS 54
ITEM 6. DIRECTORS, SENIOR MANAGEMENT AND EMPLOYEES 76
ITEM 7. MAJOR SHAREHOLDERS AND RELATED PARTY TRANSACTIONS 82
ITEM 8. FINANCIAL INFORMATION 87
ITEM 9. OFFER AND THE LISTING 89
ITEM 10. ADDITIONAL INFORMATION 89
ITEM 11. QUANTITATIVE AND QUALITATIVE DISCLOSURES ABOUT MARKET RISK 97
ITEM 12. DESCRIPTION OF SECURITIES OTHER THAN EQUITY SECURITIES 98
PART II 98
ITEM 13. DEFAULTS, DIVIDEND ARREARAGES AND DELINQUENCIES 98
ITEM 14. MATERIAL MODIFICATIONS TO THE RIGHTS OF SECURITY HOLDERS AND
USE OF PROCEEDS 98
ITEM 15. CONTROLS AND PROCEDURES 98
ITEM 16A. AUDIT COMMITTEE FINANCIAL EXPERT 99
ITEM 16B. CODE OF ETHICS 99
ITEM 16C. PRINCIPAL ACCOUNTING FEES AND SERVICES 100
ITEM 16D. EXEMPTIONS FROM LISTING STANDARDS FOR AUDIT COMMITTEES 100
ITEM 16E. PURCHASES OF EQUITY SECURITIES BY THE ISSUER AND AFFILIATED
PURCHASERS 100
ITEM 16F. CHANGE IN REGISTRANT’S CERTIFYING ACCOUNTANT 101
ITEM 16G. CORPORATE GOVERNANCE 101
ITEM 16H. MINE SAFETY DISCLOSURE 102
PART III 102
ITEM 17. FINANCIAL STATEMENTS 102
ITEM 18. FINANCIAL STATEMENTS 102
ITEM 19. EXHIBITS 103

Table of Contents
CAUTIONARY STATEMENT REGARDING FORWARD-LOOKING STATEMENTS
Scorpio Bulkers Inc. desires to take advantage of the safe harbor provisions of the Private Securities Litigation Reform
Act of 1995 and is including this cautionary statement in connection therewith. This document and any other written or oral
statements made by the Company or on its behalf may include forward-looking statements, which reflect its current views with
respect to future events and financial performance. The Private Securities Litigation Reform Act of 1995 provides safe harbor
protections for forward-looking statements in order to encourage companies to provide prospective information about their
business. Forward-looking statements include statements concerning plans, objectives, goals, strategies, future events or
performance, and underlying assumptions and other statements, which are other than statements of historical facts. This document
includes assumptions, expectations, projections, intentions and beliefs about future events. These statements are intended as
“forward-looking statements.” We caution that assumptions, expectations, projections, intentions and beliefs about future events
may and often do vary from actual results and the differences can be material. When used in this document, the words “believe,”
“expect,” “anticipate,” “estimate,” “intend,” “plan,” “targets,” “projects,” “likely,” “will,” “would,” “could” and similar
expressions or phrases may identify forward-looking statements.
All statements in this document that are not statements of historical fact are forward-looking statements. Forward-
looking statements include, but are not limited to, such matters as:
• our future operating or financial results;
• statements about planned, pending or recent acquisitions, business strategy and expected capital spending or
operating expenses, including drydocking, surveys, upgrades and insurance costs;
• the strength of world economies;
• the stability of Europe and the Euro;
• fluctuations in interest rates and foreign exchange rates;
• changes in the supply of drybulk vessels, including when caused by new newbuilding vessel orders or changes to
or terminations of existing orders, and vessel scrapping levels;
• general drybulk shipping market conditions, including fluctuations in charter hire rates and vessel values;
• changes in demand in the drybulk shipping industry, including the market for our vessels;
• changes in the value of our vessels;
• changes in our operating expenses, including bunker prices, drydocking and insurance costs;
• compliance with, and our liabilities under, governmental, tax environmental and safety laws and regulations;
• changes in governmental rules and regulations or actions taken by regulatory authorities;
• potential liability from pending or future litigation;
• general domestic and international political conditions;
• potential disruption of shipping routes due to accidents or political events;
• our ability to procure or have access to financing, our liquidity and the adequacy of cash flows for our
operations;
• our continued borrowing availability under our debt agreements and compliance with the covenants contained
therein;

Table of Contents
• our ability to successfully employ our drybulk vessels;
• our ability to fund future capital expenditures and investments in the construction, acquisition and refurbishment
of our vessels (including the amount and nature thereof and the timing of completion thereof, the delivery and
commencement of operations dates, expected downtime and lost revenue);
• potential exposure or loss from investment in derivative instruments or other equity investments in which we
invest;
• potential conflicts of interest involving members of our board and senior management and our significant
shareholders;
• our expectations regarding the availability of vessel acquisitions and our ability to complete acquisition
transactions planned;
• vessel breakdowns and instances of off-hire; and
• drybulk shipping market trends, charter rates and factors affecting supply and demand.
We have based these statements on assumptions and analyses formed by applying our experience and perception of
historical trends, current conditions, expected future developments and other factors we believe are appropriate in the
circumstances. All future written and verbal forward-looking statements attributable to us or any person acting on our behalf are
expressly qualified in their entirety by the cautionary statements contained in or referred to in this section. We undertake no
obligation, and specifically decline any obligation, except as required by law, to publicly update or revise any forward-looking
statements, whether as a result of new information, future events or otherwise. In light of these risks, uncertainties and
assumptions, the forward-looking events discussed in this annual report might not occur.
See “Item 3. Key Information—D. Risk Factors” for a more complete discussion of these risks and uncertainties and for
other risks and uncertainties. These factors and the other risk factors described in this annual report are not necessarily all of the
important factors that could cause actual results or developments to differ materially from those expressed in any of our forward-
looking statements. Other unknown or unpredictable factors also could harm our results. Consequently, there can be no assurance
that actual results or developments anticipated by us will be realized or, even if substantially realized, that they will have the
expected consequences to, or effects on, us. Given these uncertainties, prospective investors are cautioned not to place undue
reliance on such forward-looking statements.

Table of Contents
1
PART I
ITEM 1. IDENTITY OF DIRECTORS, SENIOR MANAGEMENT AND ADVISERS
Not applicable.
ITEM 2. OFFER STATISTICS AND EXPECTED TIMETABLE
Not applicable.
ITEM 3. KEY INFORMATION
Unless otherwise indicated, references to “Scorpio Bulkers,” the “Company,” “we,” “our,” “us” or similar terms refer
to the registrant, Scorpio Bulkers Inc., and its subsidiaries, except where the context otherwise requires. We use the term
deadweight tons, or dwt, expressed in metric tons, each of which is equivalent to 1,000 kilograms, in describing the size of our
vessels.
On December 31, 2015, we effected a one-for-twelve reverse stock split. All share and per share information throughout
this annual report has been retroactively adjusted to reflect the reverse stock split. The par value was not adjusted as a result of
the reverse stock split.
A. Selected Financial Data
The selected Consolidated Statement of Operations data and the Consolidated Balance Sheet data presented for the years
ended December 31, 2018, 2017, 2016, 2015 and 2014, are derived from our audited consolidated financial statements. Such
selected financial data should be read in connection with the consolidated financial statements contained in this report.
For the Year Ended December 31,
2018 2017 2016 2015 2014
Dollars in thousands, except per share data
Consolidated Statement of Operations Data:
Total vessel revenue $ 242,502 $ 162,205 $ 78,402 $ 62,521 $ 48,987
Total operating expenses 199,192 187,777 179,133 554,130 166,475
Operating Income (loss) 43,310 (25,572 ) (100,731 ) (491,609 ) (117,488 )
Total other (loss) income (56,008 ) (34,154 ) (24,104 ) (19,180 ) 923
Net loss $ (12,698 ) $ (59,726 ) $ (124,835 ) $ (510,789 ) $ (116,565 )
Basic weighted average shares outstanding 71,827 71,794 56,174 21,410 11,466
Diluted weighted average shares outstanding 71,827 71,794 56,174 21,410 11,466
Basic loss per share $ (0.18 ) $ (0.83 ) $ (2.22 ) $ (23.86 ) $ (10.17 )
Diluted loss per share $ (0.18 ) $ (0.83 ) $ (2.22 ) $ (23.86 ) $ (10.17 )

Table of Contents
2
As of December 31,
Dollars in thousands 2018 2017 2016 2015 2014
Consolidated Balance Sheet Data:
Cash and cash equivalents $ 67,495 $ 68,535 $ 101,734 $ 200,300 $ 272,673
Assets held for sale — — — 172,888 43,781
Vessels, net 1,507,918 1,534,782 1,234,081 764,454 66,633
Vessels under construction — 6,710 180,000 288,282 866,844
Equity method investment 92,281 — — — —
Total assets 1,703,826 1,643,410 1,547,157 1,473,093 1,321,024
Current liabilities (including current portion of bank
loans, financing obligations and Senior Notes, net) 152,614
58,590
24,550
124,577
20,265
Bank loans, net 621,179 576,967 493,793 342,314 29,549
Financing obligations 69,229 17,747 — — —
Senior Notes, net — 72,726 72,199 71,671 71,222
Total liabilities 843,022 726,030 590,542 538,562 121,036
Shareholders’ equity 860,804 917,380 956,615 934,561 1,199,988
B. Capitalization and Indebtedness
Not applicable.
C. Reasons for the Offer and Use of Proceeds
Not applicable.
D. Risk Factors
The following risks relate principally to the industry in which we operate and our business in general. Other risks relate
principally to the securities market and ownership of our securities, including our common shares and our 7.50% Senior Notes
due 2019, which we refer to as our Senior Notes. The occurrence of any of the events described in this section could significantly
and negatively affect our business, financial condition, operating results or cash available for the payment of dividends on our
common shares and interest on our Senior Notes, or the trading price of our securities.
INDUSTRY SPECIFIC RISK FACTORS
Charter hire rates for drybulk vessels are volatile, which has in the past and may in the future adversely affect
our earnings, revenue and profitability and our ability to comply with our loan covenants.
The drybulk shipping industry is cyclical with high volatility in charter hire rates and profitability. The degree of charter
hire rate volatility among different types of drybulk vessels has varied widely, and in recent years charter hire rates for drybulk
vessels have declined significantly from historically high levels. In the past, time charter and spot market charter rates for drybulk
carriers have declined below operating costs of vessels. The Baltic Dry Index, or the BDI, a daily average of charter rates for key
drybulk routes published by the Baltic Exchange Limited, which has long been viewed as the main benchmark to monitor the
movements of the drybulk vessel charter market and the performance of the entire drybulk shipping market, declined from a high
of 11,793 on May 20, 2008 to a low of 290 on February 10, 2016, which represents a decline of 98%. In 2018, the BDI ranged
from a low of 948 on April 6, 2018, to a high of 1,774 on July 24, 2018. As of February 28, 2019, the BDI was 658.

Table of Contents
3
Fluctuations in charter rates result from changes in the supply of and demand for vessel capacity and changes in the
supply of and demand for the major commodities carried by water internationally. Because the factors affecting the supply of and
demand for vessels are outside of our control and are unpredictable, the nature, timing, direction and degree of changes in industry
conditions are also unpredictable. Since we primarily charter our vessels in the spot market we are exposed to the cyclicality and
volatility of the spot market. Spot market charter hire rates may fluctuate significantly based upon available charters and the
supply of and demand for seaborne shipping capacity, and we may be unable to keep our vessels fully employed in these short-
term markets. Alternatively, charter rates available in the spot market may be insufficient to enable our vessels to operate
profitably. A significant decrease in charter rates would affect asset values and adversely affect our profitability, cash flows and
ability to pay dividends on our common shares, and interest on our Senior Notes. Furthermore, a continued decrease in charter
rates may cause asset values to decline, and we may have to record an impairment charge in our consolidated financial statements
which could adversely affect our financial results.
Factors that influence demand for drybulk vessel capacity include:
• supply of and demand for energy resources, commodities and industrial products;
• changes in the exploration or production of energy resources, commodities, consumer and industrial products;
• the location of regional and global production and manufacturing facilities;
• the location of consuming regions for energy resources, commodities, consumer and industrial products;
• the globalization of production and manufacturing;
• global and regional economic and political conditions, including armed conflicts and terrorist activities,
embargoes and strikes;
• natural disasters;
• disruptions and developments in international trade;
• changes in seaborne and other transportation patterns, including the distance cargo is transported by sea;
• environmental and other regulatory developments;
• currency exchange rates; and
• weather.
Factors that influence the supply of drybulk vessel capacity include:
• the number of newbuilding orders and deliveries, including slippage in deliveries;
• the number of shipyards and ability of shipyards to deliver vessels;
• port and canal congestion;
• the scrapping rate of older vessels;
• speed of vessel operation;
• vessel casualties; and
• the number of vessels that are out of service, namely those that are laid-up, drydocked, awaiting repairs or
otherwise not available for hire.
In addition to the prevailing and anticipated freight rates, factors that affect the rate of newbuilding, scrapping and
laying-up include newbuilding prices, secondhand vessel values in relation to scrap prices, costs of bunkers and other operating
costs, costs associated with classification society surveys, normal maintenance and insurance coverage costs, the efficiency and
age profile of the existing drybulk fleet in the market and government and industry regulation of maritime transportation practices,
particularly environmental protection laws and regulations. These factors influencing the supply of and demand for shipping
capacity are outside of our control, and we may not be able to correctly assess the nature, timing and degree of changes in industry
conditions.
We anticipate that the future demand for our drybulk vessels will be dependent upon economic growth in the world’s
economies, including China and India, seasonal and regional changes in demand, changes in the capacity of the global drybulk
fleet and the sources and supply of drybulk cargo to be transported by sea. Adverse economic, political, social or other
developments could have a material adverse effect on our business and operating results.

Table of Contents
4
Global economic conditions may continue to negatively impact the drybulk shipping industry.
Global financial markets and economic conditions have been, and continue to be, volatile. Relatively weak global
economic conditions during periods of volatility have and may continue to have a number of adverse consequences for drybulk
and other shipping sectors, including, among other things:
• low charter rates, particularly for vessels employed on short-term time charters or in the spot market;
• decreases in the market value of drybulk vessels and limited second-hand market for the sale of vessels;
• limited financing for vessels;
• widespread loan covenant defaults; and
• declaration of bankruptcy by certain vessel operators, vessel owners, shipyards and charterers.
The occurrence of one or more of these events could have a material adverse effect on our business, results of operations,
cash flows and financial condition.
If economic conditions throughout the world decline, particularly in China and the rest of the Asia-Pacific region,
this could negatively affect our results of operations, financial condition, cash flows and ability to obtain financing, and
may adversely affect the market price of our common shares.
Negative trends in the global economy that emerged in 2008 continue to adversely affect global economic conditions.
The credit markets in the United States and Europe have experienced contraction, deleveraging and reduced liquidity since the
financial crisis in 2008, and the U.S. federal and state governments and European authorities have implemented or are considering
a broad variety of governmental action and/or new regulation of the financial markets and may implement additional regulations
in the future. Securities and futures markets and the credit markets are subject to comprehensive statutes, regulations and other
requirements. The Securities and Exchange Commission, or the SEC, other regulators, self-regulatory organizations and
exchanges are authorized to take extraordinary actions in the event of market emergencies, and may effect changes in law or
interpretations of existing laws.
As a result of any renewed concerns about the stability of financial markets generally and the solvency of counterparties
specifically, the cost of obtaining money from the credit markets may increase as lenders have increased interest rates, enacted
tighter lending standards, refused to refinance existing debt at all or on terms similar to current debt and reduced, and in some
cases, ceased to provide funding to borrowers. Due to these factors, we cannot be certain that financing will be available to the
extent required, or that we will be able to refinance our credit facilities, on acceptable terms or at all. If financing or refinancing
is not available when needed, or is available only on unfavorable terms, we may be unable to meet our obligations as they come
due or we may be unable to enhance our existing business, complete the acquisition of our newbuildings and additional vessel
acquisitions or otherwise take advantage of business opportunities as they arise.
We face risks attendant to changes in economic environments, changes in interest rates, and instability in the banking
and securities markets around the world, among other factors. Major market disruptions may adversely affect our business or
impair our ability to borrow amounts under credit facilities or any future financial arrangements.
Economic slowdown in the Asia Pacific region, particularly in China, may have a materially adverse effect on us, as we
anticipate a significant number of the port calls made by our vessels will continue to involve the loading or discharging of drybulk
commodities in ports in the Asia Pacific region. Before the global economic financial crisis that began in 2008, China had one of
the world’s fastest growing economies in terms of GDP, which had a significant impact on shipping demand. The growth rate of
China’s GDP is estimated to be approximately 6.5% for the year ended December 31, 2018, which is 0.3% lower than the growth
rate for the year ended December 31, 2017. This forecasted growth would be China’s slowest growth rate for the previous five
years, and continues to remain below pre-2008 levels. Our business, financial condition and results of operations, ability to pay
dividends, as well as our future prospects, will likely be materially and adversely affected by an economic downturn in China or
other countries in the Asia Pacific region.

Table of Contents
5
The fair market values of our vessels have declined and may decline further, which could cause us to breach
certain financial covenants in our credit facilities, or result in an impairment charge, and we may incur a loss if we sell
vessels following a decline in their market value.
The fair market values of drybulk vessels, including our vessels, have generally experienced high volatility and have
declined in recent years. The fair market value of our vessels may continue to fluctuate depending on a number of factors,
including:
• prevailing level of charter rates;
• general economic and market conditions affecting the shipping industry;
• types, sizes and ages of vessels;
• supply of and demand for vessels;
• other modes of transportation;
• cost of newbuildings;
• governmental or other regulations;
• the need to upgrade vessels as a result of charterer requirements, technological advances in vessel design or
equipment or otherwise;
• technological advances; and
• competition from other shipping companies and other modes of transportation.
If the fair market values of our vessels decline further, we may not be in compliance with certain covenants contained
in our secured credit facilities, which may result in an event of default. In such circumstances, we may not be able to refinance
our debt or obtain additional financing. If we are not able to comply with the covenants in our secured credit facilities, and are
unable to remedy the relevant breach, our lenders could accelerate our debt and foreclose on our fleet. In addition, if we sell one
or more of our vessels at a time when vessel prices have fallen, the sale may be less than the vessel’s carrying value on our
consolidated financial statements, resulting in a loss and a reduction in earnings.
Conversely, if vessel values are elevated at a time when we wish to acquire additional vessels, the cost of such
acquisitions may increase and this could adversely affect our business, results of operations, cash flow and financial condition.
A reduction in charter rates and other market deterioration may require us to record impairment charges related
to our long-lived assets (our vessels) and such charges may be large and have a material impact on our consolidated
financial statements.
At December 31, 2018, we had vessels of $1.5 billion in total on our consolidated balance sheet, representing 175% of
our shareholders’ equity.
Our vessels are assessed if an event occurs or circumstances change that would more likely than not reduce the fair value
of our vessels and vessels under construction below their carrying value. As of December 31, 2018, we have determined that the
estimated undiscounted future cash flows (as determined under U.S. GAAP) of our vessels exceeded the carrying value. However,
if our charter rates decline, we may be required to record impairment charges on our vessels and vessels under construction,
which would require us to write down the carrying value of these assets to their fair value. Since vessels and vessels under
construction comprise a substantial portion of our balance sheet, such charges could have a material impact on our consolidated
financial statements.

Table of Contents
6
We are subject to complex laws and regulations, including environmental regulations that can adversely affect
the cost, manner or feasibility of doing business.
Our operations are subject to numerous international, national, state and local laws, regulations, treaties and conventions
in force in international waters and the jurisdictions in which our vessels operate or are registered, which can significantly affect
the ownership and operation of our vessels. These laws and regulations include, but are not limited to, the U.S. Oil Pollution Act
of 1990, or OPA, the Comprehensive Environmental Response, Compensation and Liability Act, or CERCLA, the U.S. Clean
Air Act, the U.S. Clean Water Act, or the CWA, and the U.S. Maritime Transportation Security Act of 2002, or the MTSA, and
regulations of the International Maritime Organization, or IMO, including the International Convention for the Prevention of
Pollution from Ships of 1973 (as from time to time amended and generally referred to as MARPOL) including the designation
of Emission Control Areas, or ECAs, thereunder, the International Convention for the Safety of Life at Sea of 1974 (as from time
to time amended and generally referred to as SOLAS), the International Convention on Civil Liability for Bunker Oil Pollution
Damage, and the International Convention on Load Lines of 1966 (as from time to time amended), or the LL Convention.
Compliance with such laws, regulations and standards, where applicable, may require installation of costly equipment
or implementation of operational changes and may affect the resale value or useful lives of our vessels. These costs could have a
material adverse effect on our business, results of operations, cash flows and financial condition. A failure to comply with
applicable laws and regulations may result in administrative and civil penalties, criminal sanctions or the suspension or
termination of our operations. Because such conventions, laws, and regulations are often revised, we cannot predict the ultimate
cost of complying with them or the impact thereof on the resale prices or useful lives of our vessels. Additional conventions, laws
and regulations may be adopted which could limit our ability to do business or increase the cost of our doing business and which
may materially adversely affect our operations. For example, the International Convention for the Control and Management of
Ships’ Ballast Water and Sediments, or the BWM Convention, which was adopted by the UN International Maritime Organization
in February 2004 and entered into force on September 8, 2017, calls for the phased introduction of mandatory reducing living
organism limits in ballast water over time (as discussed further below). In order to comply with these living organism limits,
vessel owners must install expensive ballast water treatment systems or make port facility disposal arrangements and modify
existing vessels to accommodate those systems.
Environmental laws often impose strict liability for remediation of spills and releases of oil and hazardous substances,
which could subject us to liability without regard to whether we were negligent or at fault. Under OPA, for example, owners,
operators and bareboat charterers are jointly and severally strictly liable for the discharge of oil within the 200-mile exclusive
economic zone around the United States.
We are required by various governmental and quasi-governmental agencies to obtain certain permits, licenses, and
certificates with respect to our operations, and satisfy insurance and financial responsibility requirements for potential oil
(including marine fuel) spills and other pollution incidents. Although we have insurance to cover certain environmental risks,
there can be no assurance that such insurance will be sufficient to cover all such risks or that any claims will not have a material
adverse effect on our business, results of operations, cash flows, financial condition, and our future ability to pay dividends on
our common shares, and interest on our Senior Notes.
Regulations relating to ballast water discharge coming into effect during September 2019 may adversely affect
our revenues and profitability.
The IMO has imposed updated guidelines for ballast water management systems specifying the maximum amount of
viable organisms allowed to be discharged from a vessel’s ballast water. Depending on the date of the IOPP renewal survey,
existing vessels constructed before September 8, 2017 must comply with the updated D-2 standard on or after September 8, 2019.
For most vessels, compliance with the D-2 standard will involve installing on-board systems to treat ballast water and eliminate
unwanted organisms. Our vessels have been fitted with alternate management systems (“AMS”) (IMO-approved ballast water
treatment systems) that comply with the updated guideline and standards, and all but two of these have also been approved by
the U.S. Coast Guard. While we believe that our vessels have been fitted with systems that comply with the updated guideline
and standards, we cannot be assured that these systems will be approved by the regulatory bodies of every jurisdiction in which
we may wish to conduct our business. If they are not approved it could have an adverse material impact on our business, financial

Table of Contents
7
condition, and results of operations depending on the available ballast water treatment systems and the extent to which existing
vessels must be modified to accommodate such systems.
Furthermore, United States regulations are currently changing. Although the 2013 Vessel General Permit (“VGP”)
program and U.S. National Invasive Species Act (“NISA”) are currently in effect to regulate ballast discharge, exchange and
installation, the Vessel Incidental Discharge Act (“VIDA”), which was signed into law on December 4, 2018, requires that the
U.S. Coast Guard develop implementation, compliance, and enforcement regulations regarding ballast water within two years.
The new regulations could require the installation of new equipment, which may cause us to incur substantial costs.
Sulfur regulations to reduce air pollution from ships are likely to require retrofitting of vessels and may cause us
to incur significant costs.
In October 2016, the International Maritime Organization, the United Nations agency for maritime safety and the
prevention of pollution by vessels, set January 1, 2020 as the implementation date for vessels to comply with its low sulfur fuel
oil requirement, which cuts sulfur levels from 3.5% to 0.5%. The interpretation of "fuel oil used on board" includes use in main
engines, auxiliary engines and boilers. Shipowners may comply with this regulation by (i) using 0.5% sulfur fuels on board,
which is likely to be available around the world by 2020 but likely at a higher cost; (ii) installing scrubbers for cleaning of the
exhaust gas; or (iii) by retrofitting vessels to be powered by liquefied natural gas, which may not be a viable option for shipowners
due to the lack of supply network and high costs involved in this process. Costs of compliance with these regulatory changes may
be significant and may have a material adverse effect on our future performance, results of operations, cash flows and financial
position.
On November 30, 2018, we entered into agreements with third parties to purchase Exhaust Gas Cleaning Systems,
known as “Scrubbers,” for 18 of our vessels in 2019 and 10 of our vessels in 2020 for an estimated total cost of $41.9 million, or
approximately $1.5 million per vessel. The systems that are being fitted are of ‘hybrid ready’ design, which allows them to be
upgraded to a ‘closed loop’ configuration at a future date. As part of these agreements, we also have an option to purchase exhaust
gas cleaning systems for up to 18 additional vessels in 2020.
An over-supply of drybulk carrier capacity may prolong or further depress the current low charter rates, which
may limit our ability to operate our drybulk carriers profitably.
The supply of drybulk vessels has increased significantly since the beginning of 2006. According to SSY, as of December
2018, newbuilding orders have been placed for approximately 11.2% of the existing fleet capacity. Vessel supply growth has been
outpacing vessel demand growth over the past few years causing downward pressure on charter rates. Until the new supply is
fully absorbed by the market, charter rates may continue to be under pressure due to vessel supply in the near to medium term.
World events could affect our results of operations and financial condition.
Past terrorist attacks, as well as the threat of future terrorist attacks around the world, continue to cause uncertainty in
the world’s financial markets and may affect our business, operating results and financial condition. Continuing conflicts and
recent developments in Russia, North Korea, the Middle East, including Iran, Iraq, Syria, Egypt and North Africa, and the
presence of U.S. or other armed forces in the Middle East, may lead to additional acts of terrorism and armed conflict around the
world, which may contribute to further economic instability in the global financial markets. These uncertainties could also
adversely affect our ability to obtain additional financing on terms acceptable to us or at all. In the past, political conflicts have
also resulted in attacks on vessels, mining of waterways and other efforts to disrupt international shipping, particularly in the
Arabian Gulf region. Acts of terrorism and piracy have also affected vessels trading in regions such as the South China Sea, the
Gulf of Aden off the coast of Somalia and West Africa. Any of these occurrences could have a material adverse impact on our
operating results, revenues and costs.

Table of Contents
8
Negative trends in the global economy that emerged in 2008 continue to adversely affect global economic conditions.
In addition, the world economy is currently facing a number of new challenges. Geopolitical events such as the withdrawal of
the U.K. from the European Union, or "Brexit," and changes in U.S. trade policies, treaties and tariffs. Brexit, or similar events
in other jurisdictions, could impact global markets, including foreign exchange and securities markets; any resulting changes in
currency exchange rates, tariffs, treaties and other regulatory matters could in turn adversely impact our business and operations.
Further, governments may turn to trade barriers to protect their domestic industries against foreign imports, thereby
depressing shipping demand. In particular, leaders in the United States have indicated the United States may seek to implement
more protective trade measures. President Trump was elected on a platform promoting trade protectionism. The results of the
presidential election have thus created significant uncertainty about the future relationship between the United States, China and
other exporting countries, including with respect to trade policies, treaties, government regulations and tariffs. For example, on
January 23, 2017, President Trump signed an executive order withdrawing the United States from the Trans-Pacific Partnership,
a global trade agreement intended to include the United States, Canada, Mexico, Peru and a number of Asian countries. In March
2018, President Trump announced tariffs on imported steel and aluminum into the United States that could have a negative impact
on international trade generally. Most recently, in January 2019, the United States announced expanded sanctions against
Venezuela, which may have an effect on its oil output and in turn affect global oil supply. Protectionist developments, or the
perception they may occur, may have a material adverse effect on global economic conditions, and may significantly reduce
global trade. Moreover, increasing trade protectionism may cause an increase in (a) the cost of goods exported from regions
globally, (b) the length of time required to transport goods and (c) the risks associated with exporting goods. Such increases may
significantly affect the quantity of goods to be shipped, shipping time schedules, voyage costs and other associated costs, which
could have an adverse impact on our charterers' business, operating results and financial condition and could thereby affect their
ability to make timely charter hire payments to us and to renew and increase the number of their time charters with us. This could
have a material adverse effect on our business, results of operations, financial condition and our ability to pay any cash
distributions to our shareholders.
Acts of piracy on ocean-going vessels have had and may continue to have an adverse effect on our business.
Acts of piracy have historically affected ocean-going vessels trading in regions of the world such as the South China
Sea, the Indian Ocean and in the Gulf of Aden off the coast of Somalia. Sea piracy incidents continue to occur with drybulk
vessels particularly vulnerable to such attacks. If these piracy attacks result in regions in which our vessels are deployed being
characterized as “war risk” zones by insurers or Joint War Committee “war and strikes” listed areas, premiums payable for such
coverage could increase significantly and such insurance coverage may be more difficult to obtain. In addition, crew costs,
including due to employing onboard security guards, could increase in such circumstances. Furthermore, while we believe the
charterer remains liable for charter payments when a vessel is seized by pirates, the charterer may dispute this and withhold
charter hire until the vessel is released. A charterer may also claim that a vessel seized by pirates was not “on-hire” for a certain
number of days and is therefore entitled to cancel the charter party, a claim that we would dispute. We may not be adequately
insured to cover losses from these incidents, which could have a material adverse effect on us. In addition, any detention hijacking
as a result of an act of piracy against our vessels, or an increase in cost, or unavailability, of insurance for our vessels, could have
a material adverse impact on our business, financial condition and results of operations.
Our vessels may call on ports located in countries that are subject to restrictions imposed by the U.S. or other
governments, which could adversely affect our reputation and the market for our common shares.
Although we do not expect that our vessels will call on ports located in countries subject to sanctions and embargoes
imposed by the U.S. government and other authorities or countries identified by the U.S. government or other authorities as state
sponsors of terrorism, such as Iran, Sudan, Syria and North Korea, from time to time on charterers’ instructions, our vessels may
call on ports located in such countries in the future. The U.S. sanctions and embargo laws and regulations vary in their application,
as they do not all apply to the same covered persons or proscribe the same activities, and such sanctions and embargo laws and
regulations may be amended or strengthened over time.
Although we believe that we are in compliance with all applicable sanctions and embargo laws and regulations, and
intend to maintain such compliance, there can be no assurance that we will be in compliance in the future, particularly as the

Table of Contents
9
scope of certain laws may be unclear and may be subject to changing interpretations. Any such violation could result in fines or
other penalties and could severely impact our ability to access U.S. capital markets and conduct our business, and could result in
some investors deciding, or being required, to divest their interest, or not to invest, in us. In addition, certain institutional investors
may have investment policies or restrictions that prevent them from holding securities of companies that have contracts with
countries identified by the U.S. government as state sponsors of terrorism. The determination by these investors not to invest in,
or to divest from, our securities may adversely affect the price at which our securities trade. Moreover, our charterers may violate
applicable sanctions and embargo laws and regulations as a result of actions that do not involve us or our vessels, and those
violations could in turn negatively affect our reputation. In addition, our reputation and the market for our securities may be
adversely affected if we engage in certain other activities, such as entering into charters with individuals or entities in countries
subject to U.S. sanctions and embargo laws that are not controlled by the governments of those countries, or engaging in
operations associated with those countries pursuant to contracts with third parties that are unrelated to those countries or entities
controlled by their governments. Investor perception of the value of our securities may be adversely affected by the consequences
of war, the effects of terrorism, civil unrest and governmental actions in these and surrounding countries.
Our operating results are subject to seasonal fluctuations, which could affect our operating results.
We operate our vessels in markets that have historically exhibited seasonal variations in demand and, as a result, in
charter hire rates. This seasonality may result in volatility in our operating results to the extent that we enter into new charter
agreements or renew existing agreements during a time when charter rates are weaker or we operate our vessels on the spot
market or index based time charters, which may result in quarter-to-quarter volatility in our operating results. The drybulk sector
is typically stronger in the fall and winter months in anticipation of increased consumption of coal and other raw materials in the
northern hemisphere. The celebration of Chinese New Year in the first quarter of each year, also results in lower volumes of
seaborne trade into China during this period. In addition, unpredictable weather patterns in these months tend to disrupt vessel
scheduling and supplies of certain commodities. As a result, our revenues from our drybulk carriers may be weaker during the
fiscal quarters ended June 30 and September 30, and, conversely, our revenues from our drybulk carriers may be stronger in fiscal
quarters ended December 31 and March 31.
We are subject to international safety regulations and requirements imposed by our classification societies and
the failure to comply with these regulations and requirements may subject us to increased liability, may adversely affect
our insurance coverage and may result in a denial of access to, or detention in, certain ports.
The operation of our vessels is affected by the requirements set forth in the International Management Code for the Safe
Operation of Ships and for Pollution Prevention, or the ISM Code. The ISM Code requires ship owners, ship managers and
bareboat charterers to develop and maintain an extensive “Safety Management System” that includes the adoption of a safety and
environmental protection policy setting forth instructions and procedures for safe operation of vessels and describing procedures
for dealing with emergencies. In addition, vessel classification societies impose significant safety and other requirements on our
vessels.
The failure of a shipowner or bareboat charterer to comply with the ISM Code may subject it to increased liability, may
invalidate existing insurance or decrease available insurance coverage for the affected vessels and may result in a denial of access
to, or detention in, certain ports. Each of our vessels is ISM Code-certified. However, if we are subject to increased liability for
non-compliance or if our insurance coverage is adversely impacted as a result of non-compliance, it may negatively affect our
ability to pay dividends on our common shares and interest on our Senior Notes. If any of our vessels are denied access to, or are
detained in, certain ports as a result of non-compliance with the ISM Code, our revenues may be adversely impacted.
In addition, the hull and machinery of every commercial vessel must be classed by a classification society authorized
by its country of registry. The classification society certifies that a vessel is safe and seaworthy in accordance with the applicable
rules and regulations of the country of registry of the vessel and the Safety of Life at Sea Convention. The cost of maintaining
our vessels’ classifications may be substantial. If any vessel does not maintain its class or fails any annual, intermediate or special
survey, the vessel will be unable to trade between ports and will be unemployable and uninsurable, which could negatively impact
our results of operations and financial condition.

Table of Contents
10
Increased inspection procedures and tighter import and export controls could increase costs and disrupt our
business.
International shipping is subject to various security and customs inspection and related procedures in countries of origin
and destination and trans-shipment points. Inspection procedures may result in the seizure of contents of our vessels, delays in
the loading, offloading, trans-shipment or delivery of cargo, and the levying of customs duties, fines or other penalties against
us.
It is possible that changes to inspection procedures could impose additional financial and legal obligations on us.
Changes to inspection procedures could also impose additional costs and obligations on our customers and may, in certain cases,
render the shipment of certain types of cargo uneconomical or impractical. Any such changes or developments may have a
material adverse effect on our business, financial condition and results of operations.
Rising fuel, or bunker, prices may adversely affect our profits.
Since we primarily employ our vessels in the spot market or in spot market-oriented pools, we expect that fuel, or
bunkers, will be typically the largest expense in our shipping operations for our vessels. While we believe that we will experience
a competitive advantage as a result of increased bunker prices due to the greater fuel efficiency of our vessels compared to the
average global fleet, changes in the price of fuel may adversely affect our profitability. The price and supply of fuel is
unpredictable and fluctuates based on events outside our control, including geopolitical developments, supply and demand for
oil and gas, actions by the Organization of the Petroleum Exporting Countries, or OPEC, and other oil and gas producers, war
and unrest in oil producing countries and regions, regional production patterns and environmental concerns. Further, fuel may
become much more expensive in the future, which may reduce our profitability and the competitiveness of our business compared
to other forms of transportation.
We operate drybulk vessels worldwide and as a result, our business has inherent operational risks, which may
reduce our revenue or increase our expenses, and we may not be adequately covered by insurance.
The international shipping industry is an inherently risky business involving global operations. Our vessels and their
cargoes are at risk of being damaged or lost because of events such as marine disasters, bad weather, mechanical failures, human
error, environmental accidents, war, terrorism, piracy and other circumstances or events. In addition, transporting cargoes across
a wide variety of international jurisdictions creates a risk of business interruptions due to political circumstances in foreign
countries, hostilities, labor strikes and boycotts, the potential for changes in tax rates or policies, and the potential for government
expropriation of our vessels. Any of these events may result in loss of revenues, increased costs and decreased cash flows to our
customers, which could impair their ability to make payments to us under our charters.
Furthermore, the operation of certain vessel types, such as drybulk carriers, has certain unique risks. With a drybulk
carrier, the cargo itself and its interaction with the vessel can be an operational risk. By their nature, drybulk cargoes are often
heavy, dense, easily shifted, and react badly to water exposure. In addition, drybulk carriers are often subjected to battering
treatment during unloading operations with grabs, jackhammers (to pry encrusted cargoes out of the hold) and small bulldozers.
This treatment may cause damage to the vessel. Vessels damaged due to treatment during unloading procedures may be more
susceptible to breach at sea. Hull breaches in drybulk carriers may lead to the flooding of the vessels’ holds. If a drybulk carrier
suffers flooding in its forward holds, the bulk cargo may become so dense and waterlogged that its pressure may buckle the
vessel’s bulkheads, leading to the loss of a vessel. If we are unable to adequately maintain our vessels, we may be unable to
prevent these events. Any of these circumstances or events may have a material adverse effect on our business, results of
operations, cash flows, financial condition and ability to pay dividends on our common shares and interest on our Senior Notes.
In addition, the loss of any of our vessels could harm our reputation as a safe and reliable vessel owner and operator.
In the event of a casualty to a vessel or other catastrophic event, we will rely on our insurance to pay the insured value
of the vessel or the damages incurred. We procure insurance for the vessels in our fleet against those risks that we believe the
shipping industry commonly insures against. These insurances include marine hull and machinery insurance, protection and
indemnity insurance, which include pollution risks and crew insurances, and war risk insurance. Currently, the amount of

Table of Contents
11
coverage for liability for pollution, spillage and leakage available to us on commercially reasonable terms through protection and
indemnity associations and providers of excess coverage is $1.0 billion per vessel per occurrence.
We have procured hull and machinery insurance, protection and indemnity insurance, which includes environmental
damage and pollution insurance coverage, and war risk insurance for our fleet. We do not maintain for our vessels insurance
against loss of hire, which covers business interruptions that result from the loss of use of a vessel. We cannot assure you that
we will be adequately insured against any or all risks, or that we will be able to obtain adequate insurance coverage for our fleet
in the future. For example, in the past more stringent environmental regulations have led to increased costs for, and in the future
may result in the lack of availability of, insurance against risks of environmental damage or pollution. Additionally, our insurers
may not pay particular claims, or may default on claims they are required to pay. Our insurance policies may contain deductibles
for which we will be responsible and limitations and exclusions which may increase our costs or lower our revenue. Moreover,
insurers may default on claims they are required to pay. Any significant loss or liability for which we are not insured could have
a material adverse effect on our financial condition.
Maritime claimants could arrest or attach one or more of our vessels, which could interrupt our cash flows.
Crew members, suppliers of goods and services to a vessel, shippers of cargo, lenders, and other parties may be entitled
to a maritime lien against a vessel for unsatisfied debts, claims or damages. In many jurisdictions, a maritime lien holder may
enforce its lien by arresting or attaching a vessel through foreclosure proceedings. The arrest or attachment of one or more of our
vessels could interrupt our cash flows and require us to pay large sums of money to have the arrest or attachment lifted. In
addition, in some jurisdictions, such as South Africa, under the “sister ship” theory of liability, a claimant may arrest both the
vessel that is subject to the claimant’s maritime lien and any “associated” vessel, which is any vessel owned or controlled by the
same owner. Claimants could attempt to assert “sister ship” liability against one vessel in our fleet for claims relating to another
of our vessels.
Governments could requisition our vessels during a period of war or emergency, which could negatively impact
our business, financial condition, results of operations, and available cash.
A government could requisition one or more of our vessels for title or for hire. Requisition for title occurs when a
government takes control of a vessel and becomes its owner, while requisition for hire occurs when a government takes control
of a vessel and effectively becomes its charterer at dictated charter rates. Generally, requisitions occur during periods of war or
emergency, although governments may elect to requisition vessels in other circumstances. Although we would be entitled to
compensation in the event of a requisition of one or more of our vessels, the amount and timing of payment would be uncertain.
Government requisition of one or more of our vessels may negatively impact our revenues.
Failure to comply with the U.S. Foreign Corrupt Practices Act could result in fines, criminal penalties, contract
terminations and an adverse effect on our business.
We operate in a number of countries throughout the world, including countries known to have a reputation for corruption.
We are committed to doing business in accordance with applicable anti-corruption laws and have adopted a code of business
conduct and ethics which is consistent and in full compliance with the U.S. Foreign Corrupt Practices Act of 1977, or the FCPA.
We are subject, however, to the risk that we, our affiliated entities or our or their respective officers, directors, employees and
agents may take actions determined to be in violation of such anti-corruption laws, including the FCPA. Any such violation could
result in substantial fines, sanctions, civil and/or criminal penalties and curtailment of operations in certain jurisdictions, and
might adversely affect our business, results of operations or financial condition. In addition, actual or alleged violations could
damage our reputation and ability to do business. Furthermore, detecting, investigating, and resolving actual or alleged violations
is expensive and can consume significant time and attention of our senior management.
COMPANY SPECIFIC RISK FACTORS
We cannot assure you that our available liquidity will be sufficient to meet our ongoing capital and operating
needs.

Table of Contents
12
We are exposed to the cyclicality and volatility of spot market charter hire rates, which have fluctuated, and may continue
to fluctuate, significantly based upon available charters and the supply of and demand for seaborne shipping capacity. If charter
rates available in the spot market are insufficient to enable our vessels to operate profitably it could adversely affect our available
liquidity, profitability, cash flows, and financial results. Furthermore, a prolonged period of depressed charter rates or a
significant decrease in charter rates may negatively impact our liquidity position and may cause our vessel values to decline,
which could, among other things, affect our ability to comply with the financial covenants in our loan agreements. Please see
“The fair market values of our vessels have declined and may decline further, which could limit the amount of funds that we can
borrow, cause us to breach certain financial covenants in our credit facilities, or result in an impairment charge, and we may incur
a loss if we sell vessels following a decline in their market value” and “We are leveraged, which could significantly limit our
ability to execute our business strategy, and we may be unable to comply with our covenants in our credit facilities that impose
operating and financial restrictions on us, which could result in a default under the terms of these agreements.”
We are subject to certain risks with respect to our counterparties on contracts, and failure of such counterparties
to meet their obligations could cause us to suffer losses or negatively impact our results of operations and cash flows.
We have entered, and may enter, into various contracts, including pooling arrangements, time charters, spot voyage
charters, bareboat charters, shipbuilding contracts, credit facilities and other agreements. Such agreements subject us to
counterparty risks. The ability and willingness of each of our counterparties to perform its obligations under a contract with us
will depend on a number of factors that are beyond our control and may include, among other things, general economic conditions,
the condition of the maritime and offshore industries, the overall financial condition of the counterparty, and various expenses.
Should a counterparty fail to honor its obligations under agreements with us, we could sustain significant losses which could
have a material adverse effect on our business, financial condition, results of operations and cash flows.
In addition, in depressed market conditions, our charterers may no longer need a vessel that is then under charter or may
be able to obtain a comparable vessel at lower rates. As a result, charterers may seek to renegotiate the terms of their existing
charter agreements or avoid their obligations under those contracts. If our charterers fail to meet their obligations to us or attempt
to renegotiate our charter agreements, it may be difficult to secure substitute employment for such vessel, and any new charter
arrangements we secure in the spot market or on time charters may be at lower rates given currently depressed drybulk carrier
charter rate levels. As a result, we could sustain significant losses which could have a material adverse effect on our business,
financial condition, results of operations and cash flows, as well as our ability to pay dividends on our common shares and interest
on our Senior Notes, and comply with covenants in our credit facilities.
We are, and expect to continue to be, dependent on spot market-oriented pools and spot charters and currently
low spot charter rates, or any further decrease in spot charter rates in the future will result in significant operating losses.
All of our vessels are employed in the Scorpio Kamsarmax Pool or the Scorpio Ultramax Pool, which we refer to together
as the Scorpio Pools. During the year ended December 31, 2018, we earned approximately 36% and 64% of our revenue from
the Scorpio Kamsarmax Pool and the Scorpio Ultramax Pool, respectively. The Scorpio Pools in which our vessels operate are
spot market-oriented commercial pools managed by our commercial manager, which are exposed to fluctuations in spot market
charter rates. The spot charter market may fluctuate significantly based upon drybulk carrier supply and demand. The successful
operation of our vessels in the competitive spot charter market, including within the Scorpio Pools, depends on, among other
things, obtaining profitable spot charters and minimizing, to the extent possible, time spent waiting for charters and time spent
traveling unladen to pick up cargo. The spot market is very volatile, and, there have been periods when spot charter rates have
declined below the operating cost of vessels. If future spot charter rates decline we may be unable to operate our vessels trading
in the spot market profitably, meet our obligations, including payments on indebtedness, or pay dividends in the future.
Furthermore, as charter rates for spot charters are fixed for a single voyage which may last up to several weeks, during periods
in which spot charter rates are rising, we will generally experience delays in realizing the benefits from such increases.
Our ability to renew expiring charters or obtain new charters will depend on the prevailing market conditions at the time.
If we are not able to obtain new charters in direct continuation with previous charters or for our newbuilding vessels upon their
delivery to us, or if new charters are entered into at charter rates substantially below the existing charter rates or on terms otherwise
less favorable compared to previous charter terms, our revenues and profitability could be adversely affected.

Table of Contents
13
We cannot assure you that our Board of Directors will continue to declare dividends.
Our board of directors, or our Board of Directors, declared and we paid quarterly cash dividends of $0.02 per share in
2018. However, we cannot assure you that we will continue to declare dividends in the future. The declaration and payment of
dividends, if any, will always be subject to the discretion of our Board of Directors, restrictions contained in our credit facilities
and the requirements of Marshall Islands law. The timing and amount of any dividends declared will depend on, among other
things, our earnings, financial condition and cash requirements and availability, our ability to obtain debt and equity financing on
acceptable terms as contemplated by our growth strategy, the terms of our outstanding indebtedness and the ability of our
subsidiaries to distribute funds to us. The international drybulk shipping industry is highly volatile, and we cannot predict with
certainty the amount of cash, if any, that will be available for distribution as dividends in any period. Also, there may be a high
degree of variability from period to period in the amount of cash that is available for the payment of dividends.
We may incur expenses or liabilities or be subject to other circumstances in the future that reduce or eliminate the amount
of cash that we have available for distribution as dividends, including as a result of the risks described herein. Our growth strategy
contemplates that we will finance our acquisitions of additional vessels through debt financings or the net proceeds of future
equity issuances on terms acceptable to us. If financing is not available to us on acceptable terms, our Board of Directors may
determine to finance or refinance acquisitions with cash from operations, which would reduce the amount of any cash available
for the payment of dividends.
In general, under the terms of our credit facilities, we are not permitted to pay dividends if there is a default or a breach
of a loan covenant. Please see “Item 5. Operating and Financial Review and Prospects-B. Liquidity and Capital Resources” for
more information relating to restrictions on our ability to pay dividends under the terms of our credit facilities.
The Republic of Marshall Islands laws generally prohibit the payment of dividends other than from surplus (retained
earnings and the excess of consideration received for the sale of shares above the par value of the shares) or while a company is
insolvent or would be rendered insolvent by the payment of such a dividend. We may not have sufficient surplus in the future to
pay dividends and our subsidiaries may not have sufficient funds or surplus to make distributions to us. We can give no assurance
that we will continue to declare dividends on our common shares in the future. Please see “Item 8. Financial Information-A.
Consolidated Statements and other Financial Information-Dividend Policy.”
We may have difficulty managing growth properly.
As of the date of this annual report, our operating fleet of 57 vessels consists of 56 wholly-owned or finance leased
drybulk vessels (including 19 Kamsarmax vessels and 37 Ultramax vessels), and one time chartered-in Ultramax vessel. One of
our principal strategies is to continue to grow by expanding our operations, and we may, in the future, increase the size of our
fleet through timely and selective acquisitions. Our future growth will primarily depend upon a number of factors, some of which
may not be within our control. These factors include our ability to:
• identify suitable drybulk carriers, including newbuilding slots at shipyards and/or shipping companies for
acquisitions at attractive prices;
• obtain required financing for our existing and new operations;
• identify businesses engaged in managing, operating or owning drybulk carriers for acquisitions or joint ventures;
• integrate any acquired drybulk carriers or businesses successfully with our existing operations, including obtaining
any approvals and qualifications necessary to operate vessels that we acquire;
• hire, train and retain qualified personnel and crew to manage and operate our growing business and fleet;
• identify additional new markets;
• enhance our customer base; and
• improve our operating, financial and accounting systems and controls.
Our failure to effectively identify, acquire, develop and integrate any drybulk carriers or businesses, or our inability to
effectively manage the size of our fleet, could adversely affect our business, financial condition and results of operations.

Table of Contents
14
Furthermore, the number of employees that perform services for us and our current operating and financial systems may
not be adequate as we expand the size of our fleet in the drybulk sector, and we may not be able to effectively hire more employees
or adequately improve those systems. In addition, if we further expand our fleet, we will need to recruit suitable additional
seafarers and shore side administrative and management personnel. We cannot guarantee that we will be able to hire suitable
employees as we expand our fleet. If we or our crewing agent encounters business or financial difficulties, we may not be able
to adequately staff our vessels. If we are unable to grow our financial and operating systems or to recruit suitable employees as
we expand our fleet, our financial performance may be adversely affected and, among other things, the amount of cash available
for distribution as dividends to our shareholders may be reduced. Finally, acquisitions may require additional equity issuances,
which may dilute our common shareholders if issued at lower prices than the price at which they acquired their shares, or debt
issuances (with amortization payments), both of which could lower our available cash. If any such events occur, our financial
condition may be adversely affected.
Additionally, in the event we undertake newbuilding projects, construction projects are subject to risks of delay or cost
overruns inherent in any large construction project from numerous factors. Significant cost overruns or delays could adversely
affect our financial position, results of operations and cash flows. Additionally, failure to complete a project on time may result
in the delay of revenue from that vessel.
In addition, in the event the shipyard does not perform under its contract and we are unable to enforce the refund
guarantee with a third-party bank for any reason, we may lose all or part of our investment, which would have an adverse effect
on our results of operations, financial condition and cash flows.
Growing any business by acquisition presents numerous risks such as undisclosed liabilities and obligations, difficulty
in obtaining additional qualified personnel and managing relationships with customers and suppliers and integrating newly
acquired operations into existing infrastructures. The expansion of our fleet may impose significant additional responsibilities on
our management and staff, and the management and staff of our commercial and technical managers, and may necessitate that
we, and they, increase the number of personnel. We cannot give any assurance that we will be successful in executing our growth
plans or that we will not incur significant expenses and losses in connection with our future growth.
Operating secondhand vessels exposes us to increased operating costs which may adversely affect our earnings
and, as our fleet ages, the risks associated with older vessels could adversely affect our ability to obtain profitable charters.
We have and may continue to acquire and operate secondhand vessels. While we typically inspect secondhand vessels
prior to acquisition, this does not provide us with the same knowledge about their condition that we would have had if these
vessels had been built for and operated exclusively by us. Generally, purchasers of secondhand vessels do not receive the benefit
of warranties from the builders for the secondhand vessels that they acquire. A secondhand vessel may have conditions or defects
that we were not aware of when we bought the vessel and which may require us to incur costly repairs to the vessel. These repairs
may require us to put a vessel into drydock, which would reduce our operating days.
Governmental regulations, safety or other equipment standards related to the age of vessels may require expenditures
for alterations, or the addition of new equipment to our vessels and may restrict the type of activities in which the vessels may
engage. As our vessels age, market conditions may not justify those expenditures or enable us to operate our vessels profitably
during the remainder of their useful lives.
The aging of our fleet may result in increased operating costs in the future, which could adversely affect our
earnings.
In general, the cost of maintaining a vessel in good operating condition increases with the age of the vessel. As our
vessels age typically they will become less fuel-efficient and more costly to maintain than more recently constructed vessels due
to improvements in engine technology. Cargo insurance rates increase with the age of a vessel, making older vessels less desirable
to charterers. Governmental regulations and safety or other equipment standards related to the age of vessels may also require
expenditures for alterations or the addition of new equipment to our vessels and may restrict the type of activities in which our
vessels may engage. We cannot assure you that, as our vessels age, market conditions will justify those expenditures or enable us
to operate our vessels profitably during the remainder of their useful lives.

Table of Contents
15
Technological innovation could reduce our charter hire income and the value of our vessels.
The charter hire rates and the value and operational life of a vessel are determined by a number of factors including the
vessel’s efficiency, operational flexibility and physical life. Efficiency includes speed, fuel economy and the ability to load and
discharge cargo quickly. Flexibility includes the ability to enter harbors, utilize related docking facilities and pass through canals
and straits. The length of a vessel’s physical life is related to its original design and construction, its maintenance and the impact
of the stress of operations. If new drybulk carriers are built that are more efficient or more flexible or have longer physical lives
than our vessels, competition from these more technologically advanced vessels could adversely affect the amount of charter hire
payments we receive for our vessels once their initial charters expire and the resale value of our vessels could significantly
decrease. As a result, our business, results of operations, cash flows and financial condition could be adversely affected.
In the highly competitive international shipping industry, we may not be able to compete for charters with new
entrants or established companies with greater resources, and as a result, we may be unable to employ our vessels
profitably.
Our vessels are employed in a highly competitive market that is capital intensive and highly fragmented. Competition
arises primarily from other vessel owners, some of whom have substantially greater resources than we do. Competition for the
transportation of drybulk cargo by sea is intense and depends on price, location, size, age, condition and the acceptability of the
vessel and its operators to the charterers. Due in part to the highly fragmented market, competitors with greater resources could
enter the drybulk shipping industry and operate larger fleets through consolidations or acquisitions and may be able to offer lower
charter rates and higher quality vessels than we are able to offer. If we are unable to successfully compete with other drybulk
shipping companies, our results of operations would be adversely impacted.
We may be subject to litigation that, if not resolved in our favor and not sufficiently insured against, could have
a material adverse effect on us.
We may be, from time to time, involved in various litigation matters. These matters may include, among other things,
contract disputes, personal injury claims, environmental claims or proceedings, asbestos and other toxic tort claims, employment
matters, governmental claims for taxes or duties, and other litigation that arises in the ordinary course of our business. Although
we intend to defend these matters vigorously, we cannot predict with certainty the outcome or effect of any claim or other litigation
matter, and the ultimate outcome of any litigation or the potential costs to resolve them may have a material adverse effect on us.
Insurance may not be applicable or sufficient in all cases and/or insurers may not remain solvent which may have a material
adverse effect on our financial condition.
We are a holding company, and we depend on the ability of our subsidiaries to distribute funds to us in order to
satisfy our financial obligations and to make dividend payments.
We are a holding company and our subsidiaries conduct all of our operations and own all of our operating assets. We
have no significant assets other than the equity interests in our subsidiaries. As a result, our ability to satisfy our financial
obligations and to pay dividends to our shareholders depends on our subsidiaries and their ability to distribute funds to us. If we
are unable to obtain funds from our subsidiaries, our Board of Directors may exercise its discretion not to declare dividends.
Our costs of operating as a public company are significant, and our management is required to devote substantial
time to complying with public company regulations. We cannot assure you that our internal controls and procedures over
financial reporting will be sufficient.
We are subject to the reporting requirements of the Securities Exchange Act of 1934, as amended, or the Exchange Act,
and the other rules and regulations of the SEC, including the Sarbanes-Oxley Act of 2002, or the Sarbanes-Oxley Act, and as
such, we will have significant legal, accounting and other expenses. These reporting obligations impose various requirements on
public companies, including changes in corporate governance practices, and these requirements may continue to evolve. We and
our management personnel, and other personnel, if any, need to devote a substantial amount of time to comply with these
requirements. Moreover, these rules and regulations increase our legal and financial compliance costs and make some activities
more time-consuming and costly.
Table of Contents
16
The Sarbanes-Oxley Act requires, among other things, that we maintain and periodically evaluate our internal control
over financial reporting and disclosure controls and procedures. In particular, we need to perform system and process evaluation
and testing of our internal control over financial reporting to allow management and our independent registered public accounting
firm to report on the effectiveness of our internal control over financial reporting, as required by Section 404 of the Sarbanes-
Oxley Act. If we have a material weakness in our internal controls over financial reporting, we may not detect errors on a timely
basis and our financial statements may be materially misstated. We dedicate a significant amount of time and resources and incur
substantial accounting expenses to ensure compliance with these regulatory requirements. We will continue to evaluate areas
such as corporate governance, corporate control, internal audit, disclosure controls and procedures and financial reporting and
accounting systems. We will make changes in any of these and other areas, including our internal control over financial reporting,
which we believe are necessary. However, these and other measures we may take may not be sufficient to allow us to satisfy our
obligations as a public company on a timely and reliable basis.
Because we are organized under the laws of the Marshall Islands, it may be difficult to serve us with legal process
or enforce judgments against us, our directors or our management.
We are organized under the laws of the Marshall Islands, and substantially all of our assets are located outside of the
United States. In addition, the majority of our directors and officers are non-residents of the United States, and all or a substantial
portion of the assets of these non-residents are located outside the United States. As a result, it may be difficult or impossible for
someone to bring an action against us or against these individuals in the United States if they believe that their rights have been
infringed under securities laws or otherwise. Even if you are successful in bringing an action of this kind, the laws of the Marshall
Islands and of other jurisdictions may prevent or restrict them from enforcing a judgment against our assets or the assets of our
directors or officers.
The international nature of our operations may make the outcome of any bankruptcy proceedings difficult to
predict.
We are incorporated under the laws of the Republic of the Marshall Islands and we conduct operations in countries
around the world. Consequently, in the event of any bankruptcy, insolvency, liquidation, dissolution, reorganization or similar
proceeding involving us or any of our subsidiaries, bankruptcy laws other than those of the United States could apply. If we
become a debtor under U.S. bankruptcy law, bankruptcy courts in the United States may seek to assert jurisdiction over all of our
assets, wherever located, including property situated in other countries. There can be no assurance, however, that we would
become a debtor in the United States, or that a U.S. bankruptcy court would be entitled to, or accept, jurisdiction over such a
bankruptcy case, or that courts in other countries that have jurisdiction over us and our operations would recognize a U.S.
bankruptcy court’s jurisdiction if any other bankruptcy court would determine it had jurisdiction.
We may have to pay tax on U.S. source income, which would reduce our earnings and cash flow.
Under the U.S. Internal Revenue Code of 1986, as amended, or the Code, 50% of the gross shipping income of a vessel
owning or chartering corporation, such as ourselves and our subsidiaries, that is attributable to transportation that begins or ends,
but that does not both begin and end, in the United States is characterized as U.S. source shipping income and such income is
subject to a 4% U.S. federal income tax without allowance for any deductions, unless that corporation qualifies for exemption
from tax under Section 883 of the Code and the Treasury regulations promulgated thereunder.
We believe that we qualify for this statutory exemption for our 2018 taxable year and we expect to so qualify for our
subsequent taxable years. However, there are factual circumstances beyond our control that could cause us to lose the benefit of
this tax exemption and thereby cause us to become subject to U.S. federal income tax on our U.S. source shipping income. For
example, there is a risk that we could no longer qualify for exemption under Section 883 of the Code for a particular taxable year
if “non-qualified” shareholders with a five percent or greater interest in our stock were, in combination with each other, to own
50% or more of the outstanding shares of our stock on more than half the days during the taxable year. Due to the factual nature
of the issues involved, we can give no assurances on our tax-exempt status or that of any of our subsidiaries.
If we are not entitled to this exemption under Section 883 of the Code for any taxable year, we would be subject for
such taxable year to a 4% U.S. federal income tax on our U.S. source shipping income on a gross basis. The imposition of this

Table of Contents
17
taxation could have a negative effect on our business and would result in decreased earnings and cash available for distribution
to our shareholders and to pay amounts due on our Senior Notes.
U.S. tax authorities could treat us as a “passive foreign investment company,” which could have adverse U.S.
federal income tax consequences to our U.S. shareholders.
A foreign corporation will be treated as a “passive foreign investment company,” or PFIC, for U.S. federal income tax
purposes if either (1) at least 75% of its gross income for any taxable year consists of certain types of “passive income” or (2) at
least 50% of the average value of the corporation’s assets produce or are held for the production of those types of “passive
income,” including cash. For purposes of these tests, “passive income” includes dividends, interest, and gains from the sale or
exchange of investment property and rents and royalties other than rents and royalties which are received from unrelated parties
in connection with the active conduct of a trade or business. For purposes of these tests, income derived from the performance of
services to third parties does not constitute “passive income.” U.S. shareholders of a PFIC are subject to a disadvantageous U.S.
federal income tax regime with respect to the income derived by the PFIC, the distributions they receive from the PFIC and the
gain, if any, they derive from the sale or other disposition of their shares in the PFIC.
For our 2018 taxable year and subsequent taxable years, whether we will be treated as a PFIC will depend upon the
nature and extent of our operations. In this regard, we intend to treat the gross income we derive or are deemed to derive from
our time chartering activities as services income, rather than rental income. Accordingly, we believe that our income from our
time chartering activities does not constitute “passive income,” and the assets that we own and operate in connection with the
production of that income do not constitute passive assets. There is, however, no direct legal authority under the PFIC rules
addressing our method of operation. Accordingly, no assurance can be given that the United States Internal Revenue Service, or
IRS, or a court of law will accept our position, and there is a risk that the IRS or a court of law could determine that we are a
PFIC. Moreover, no assurance can be given that we would not constitute a PFIC for any taxable year if there were to be changes
in the nature and extent of our operations.
If we were treated as a PFIC for any taxable year, our U.S. shareholders may face adverse U.S. federal income tax
consequences and information reporting obligations. Under the PFIC rules, unless those shareholders made an election available
under the Code (which election could itself have adverse consequences for such shareholders), such shareholders would be liable
to pay U.S. federal income tax upon excess distributions and upon any gain from the disposition of our common shares at the
then prevailing income tax rates applicable to ordinary income plus interest as if the excess distribution or gain had been
recognized ratably over the shareholder’s holding period of our common shares. See “Item 10. Additional Information - E.
Taxation - U.S. Federal Income Tax Considerations - U.S. Federal Income Taxation of U.S. Holders - Passive Foreign Investment
Company Status and Significant Tax Consequences” for a more comprehensive discussion of the U.S. federal income tax
consequences to U.S. holders of our common shares if we are or were to be treated as a PFIC.
Risks Related to Our Relationship with the Scorpio Group of Companies (“Scorpio”) and its Affiliates
We are dependent on our managers and their ability to hire and retain key personnel, and there may be conflicts
of interest between us and our managers that may not be resolved in our favor.
Our success depends to a significant extent upon the abilities and efforts of our technical manager, Scorpio Ship
Management S.A.M., or SSM, our commercial manager, Scorpio Commercial Management, or SCM, and our management team
and upon our and our managers’ ability to hire and retain key members of our and their management teams, respectively. The
loss of any of these individuals could adversely affect our business prospects and financial condition. Difficulty in hiring and
retaining personnel could adversely affect our results of operations. We do not maintain “key man” life insurance on any of our
officers.
Our technical and commercial managers are affiliates of Scorpio, which is owned and controlled by the Lolli-Ghetti
family, of which our co-founder, Chairman and Chief Executive Officer, Mr. Emanuele Lauro, and our Vice President, Mr. Filippo
Lauro, are members. Conflicts of interest may arise between us, on the one hand, and our commercial and technical managers,
on the other hand. These conflicts may arise in connection with the chartering, purchase, sale and operation of the vessels in our
fleet versus vessels managed by other companies affiliated with our commercial or technical managers. In particular, as of the

Table of Contents
18
date of this annual report, our commercial and technical managers, which are operated by entities affiliated with Scorpio, provide
commercial and technical management services to approximately 180 and 145 vessels, respectively, in addition to vessels in our
fleet, and our commercial and technical managers may operate additional vessels that will compete with our vessels in the future.
Such conflicts may have an adverse effect on our results of operations. In addition, certain members of Scorpio may benefit from
economies of scale, all of which may not be passed along to us.
Our Chief Executive Officer, President, Chief Operating Officer, Chief Financial Officer, Vice President and
Secretary do not devote all of their time to our business, which may hinder our ability to operate successfully.
Our Chief Executive Officer, President, Chief Operating Officer, Chief Financial Officer, Vice President and Secretary
participate in business activities not associated with us, some of whom serve as members of the management teams of Scorpio
Tankers Inc. (NYSE: STNG), or Scorpio Tankers, and Nordic American Offshore Ltd (NYSE: NAO), or NAO, and are not
required to work full-time on our affairs. We expect that each of our executive officers will continue to devote a substantial
portion of their business time to the management of the Company. Additionally, our Chief Executive Officer, President, Chief
Operating Officer, Vice President and Secretary serve in similar positions in other entities within Scorpio. As a result, such
executive officers may devote less time to us than if they were not engaged in other business activities and may owe fiduciary
duties to both our shareholders as well as shareholders of other companies which they may be affiliated with, including Scorpio
Tankers, NAO and Scorpio. This may create conflicts of interest in matters involving or affecting us and our customers and it is
not certain that any of these conflicts of interest will be resolved in our favor. This could have a material adverse effect on our
business, financial condition, results of operations and cash flows.
Our commercial and technical managers are each privately held companies and there is little or no publicly
available information about them.
Our vessels are commercially managed by SCM and technically managed by SSM. SCM’s and SSM’s ability to render
management services will depend in part on their own financial strength. Circumstances beyond our control could impair our
commercial manager’s or technical manager’s financial strength, and because each is a privately held company, information
about the financial strength of our commercial manager and technical manager is not available. As a result, we and our
shareholders might have little advance warning of financial or other problems affecting our commercial manager or technical
manager even though their financial or other problems could have a material adverse effect on us.
We rely on our information systems to conduct our business, and failure to protect these systems against security
breaches could adversely affect our business and results of operations. Additionally, if these systems fail or become
unavailable for any significant period of time, our business could be harmed.
The efficient operation of our business, including processing, transmitting and storing electronic and financial
information, is dependent on computer hardware and software systems. Information systems are vulnerable to security breaches
by computer hackers and cyber terrorists. We rely on industry accepted security measures and technology to securely maintain
confidential and proprietary information maintained on our information systems. However, these measures and technology may
not adequately prevent security breaches. In addition, the unavailability of the information systems or the failure of these systems
to perform as anticipated for any reason could disrupt our business and could result in decreased performance and increased
operating costs, causing our business and results of operations to suffer. Any significant interruption or failure of our information
systems or any significant breach of security could adversely affect our business and results of operations.
RISKS RELATED TO OUR INDEBTEDNESS
Servicing our current or future indebtedness limits funds available for other purposes and if we cannot service
our debt, we may lose our vessels.
Borrowing under our credit facilities requires us to dedicate a part of our cash flow from operations to paying interest
on our indebtedness under such facilities. These payments limit funds available for working capital, capital expenditures and
other purposes, including further equity or debt financing in the future. Amounts borrowed under our credit facilities bear interest
at variable rates. Increases in prevailing rates could increase the amounts that we would have to pay to our lenders, even though
Table of Contents
19
the outstanding principal amount remains the same, and our net income and cash flows would decrease. We expect our earnings
and cash flow to vary from year to year due to the cyclical nature of the drybulk carrier industry. If we do not generate or reserve
enough cash flow from operations to satisfy our debt obligations, we may have to undertake alternative financing plans, such as:
• seeking to raise additional capital;
• refinancing or restructuring our debt;
• selling drybulk carriers; or
• reducing or delaying capital investments.
However, these alternative financing plans, if necessary, may not be sufficient to allow us to meet our debt obligations.
If we are unable to meet our debt obligations or if some other default occurs under our credit facilities, our lenders could elect to
declare that debt, together with accrued interest and fees, to be immediately due and payable and proceed against the collateral
vessels securing that debt.
We are exposed to volatility in the London Interbank Offered Rate, or LIBOR, and have entered into derivative
contracts, which can result in higher than market interest rates and charges against our income.
The loans under our secured credit facilities are generally advanced at a floating rate based on LIBOR, which has been
stable, but was volatile in prior years, which can affect the amount of interest payable on our debt, and which, in turn, could have
an adverse effect on our earnings and cash flow. Recently, however, there is uncertainty relating to the LIBOR calculation process
which may result in the phasing out of LIBOR in the future. Indeed, the banks currently reporting information used to set LIBOR
will likely stop such reporting after 2021, when their commitment to reporting information ends. The Alternative Reference Rate
Committee, or "Committee", a committee convened by the Federal Reserve that includes major market participants, has proposed
an alternative rate to replace U.S. Dollar LIBOR: the Secured Overnight Financing Rate, or "SOFR." As a result, lenders have
insisted on provisions that entitle the lenders, in their discretion, to replace published LIBOR as the base for the interest
calculation with their cost-of-funds rate. If we are required to agree to such a provision in future loan agreements, our lending
costs could increase, which would have an adverse effect on our profitability, earnings and cash flow. As a result, our financial
condition could be materially adversely affected.
We have entered, and may enter, into derivative contracts to hedge our overall exposure to interest rate risk exposure.
Entering into swaps and derivatives transactions is inherently risky and presents various possibilities for incurring significant
expenses. The derivatives strategies that we employ, and may employ, may not be successful or effective, and we could, as a
result, incur substantial additional interest costs. Please see “Item 11. Quantitative and Qualitative Disclosures About Market
Risk - Interest Rate Risk.”
We are leveraged, which could significantly limit our ability to execute our business strategy and we may be
unable to comply with our covenants in our credit facilities that impose operating and financial restrictions on us, which
could result in a default under the terms of these agreements.
As of December 31, 2018, we had $841.0 million of outstanding indebtedness under our credit facilities, financing
obligation and debt securities.
Our credit facilities impose operating and financial restrictions on us, that limit our ability, or the ability of our
subsidiaries party thereto, to:
• pay dividends and make capital expenditures if we do not repay amounts drawn under our credit facilities or if
there is another default under our credit facilities;
• incur additional indebtedness, including the issuance of guarantees;
• create liens on our assets;
• change the flag, class or management of our vessels or terminate or materially amend the management agreement
relating to each vessel;
• sell our vessels;
• merge or consolidate with, or transfer all or substantially all our assets to, another person; and/or

Table of Contents
20
• enter into a new line of business.
Therefore, we may need to seek permission from our lenders in order to engage in some corporate actions. Our lenders’
interests may be different from ours and we may not be able to obtain our lenders’ permission when needed. This may limit our
ability to pay dividends on our common shares and interest on our Senior Notes, finance our future operations or capital
requirements, make acquisitions or pursue business opportunities.
In addition, our secured credit facilities require us to maintain specified financial ratios and satisfy financial covenants,
including ratios and covenants based on the market value of the vessels in our fleet. Should our charter rates or vessel values
materially decline in the future, we may seek to obtain waivers or amendments from our lenders with respect to such financial
ratios and covenants, or we may be required to take action to reduce our debt or to act in a manner contrary to our business
objectives to meet any such financial ratios and satisfy any such financial covenants. In 2016, we amended our credit facilities to
reduce the minimum liquidity, interest coverage ratio and loan-to-value ratio covenants, as well as to amend the definition of net
worth used in the leverage and net worth covenants. There can be no assurances that our lenders will grant any waivers or
additional amendments in the future.
Events beyond our control, including changes in the economic and business conditions in the shipping markets in which
we operate, may affect our ability to comply with these covenants. We cannot assure you that we will meet these ratios or satisfy
these covenants or that our lenders will waive any failure to do so or amend these requirements. A breach of any of the covenants
in, or our inability to maintain the required financial ratios under, our credit facilities would prevent us from borrowing additional
money under our credit facilities and could result in a default under our credit facilities. If a default occurs under our credit
facilities, the lenders could elect to declare the outstanding debt, together with accrued interest and other fees, to be immediately
due and payable and foreclose on the collateral securing that debt, which could constitute all or substantially all of our assets.
Moreover, in connection with any waivers or amendments to our credit facilities that we may obtain, our lenders may impose
additional operating and financial restrictions on us or modify the terms of our existing credit facilities. These restrictions may
further restrict our ability to, among other things, pay dividends, repurchase our common shares, make capital expenditures, or
incur additional indebtedness.
Furthermore, our debt agreements contain cross-default provisions that may be triggered if we default under the terms
of any one of our financing agreements. In the event of default by us under one of our debt agreements, the lenders under our
other debt agreements could determine that we are in default under such other financing agreements. Such cross defaults could
result in the acceleration of the maturity of such debt under these agreements and the lenders thereunder may foreclose upon any
collateral securing that debt, including our vessels, even if we were to subsequently cure such default. In the event of such
acceleration or foreclosure, we might not have sufficient funds or other assets to satisfy all of our obligations, which would have
a material adverse effect on our business, results of operations and financial condition.
Please see “Item 5. Operating Financial Review and Prospects-B. Liquidity and Capital Resources-Credit Facilities,
Finance Lease and Unsecured Notes.”
RISKS RELATING TO OUR COMMON SHARES
We are incorporated in the Marshall Islands, which does not have a well-developed body of corporate law.
Our corporate affairs are governed by our amended and restated articles of incorporation and bylaws and by the Marshall
Islands Business Corporations Act, or the BCA. The provisions of the BCA resemble provisions of the corporation laws of a
number of states in the United States. However, there have been few judicial cases in the Marshall Islands interpreting the BCA.
The rights and fiduciary responsibilities of directors under the laws of the Marshall Islands are not as clearly established as the
rights and fiduciary responsibilities of directors under statutes or judicial precedent in existence in the United States. The rights
of shareholders of companies incorporated in the Marshall Islands may differ from the rights of shareholders of companies
incorporated in the United States. While the BCA provides that it is to be interpreted according to the laws of the State of Delaware
and other states with substantially similar legislative provisions, there have been few, if any, court cases interpreting the BCA in
the Marshall Islands and we cannot predict whether Marshall Islands courts would reach the same conclusions as U.S. courts.
Thus, you may have more difficulty in protecting your interests in the face of actions by the management, directors or controlling

Table of Contents
21
shareholders than would shareholders of a corporation incorporated in a U.S. jurisdiction which has developed a relatively more
substantial body of case law.
The market price of our common shares has fluctuated widely and may fluctuate widely in the future, or there
may be no continuing public market for you to resell our common shares.
The market price of our common shares has fluctuated widely since our common shares began trading on the NYSE in
December 2013, and may continue to do so as a result of many factors such as actual or anticipated fluctuations in our quarterly
and annual results and those of other public companies in our industry, mergers and strategic alliances in the shipping industry,
market conditions in the shipping industry, particularly the drybulk sector, changes in government regulation, shortfalls in our
operating results from levels forecast by securities analysts, announcements concerning us or our competitors and the general
state of the securities market. Further, there may be no continuing active or liquid public market for our common shares.
If the market price of our common shares falls below $5.00 per share, under NYSE rules, our shareholders will not be
able to use such shares as collateral for borrowing in margin accounts. This inability to continue to use our common shares as
collateral may lead to sales of such shares creating downward pressure on and increased volatility in the market price of our
common shares.
The shipping industry has been highly unpredictable and volatile. The market for common shares in this industry may
be equally volatile. Therefore, we cannot assure you that you will be able to sell any of our common shares you may have
purchased at a price greater than or equal to its original purchase price, or that you will be able to sell them at all.
Future sales of our common shares could cause the market price of our common shares to decline.
Our amended and restated articles of incorporation authorize us to issue 212.5 million common shares, of which we had
issued approximately 79.8 million common shares as of December 31, 2018. Sales of a substantial number of common shares in
the public market, or the perception that these sales could occur, may depress the market price for our common shares. These
sales could also impair our ability to raise additional capital through the sale of our equity securities in the future. We intend to
issue additional common shares in the future. Our shareholders may incur dilution from any future equity offering and upon the
issuance of additional common shares upon the exercise of options we may grant to certain of our executive officers, or upon the
issuance of additional common shares pursuant to our equity incentive plan.
Anti-takeover provisions in our organizational documents could have the effect of discouraging, delaying or
preventing a merger or acquisition, or could make it difficult for our shareholders to replace or remove our current Board
of Directors, which could adversely affect the market price of our common shares.
Several provisions of our amended and restated articles of incorporation and bylaws could make it difficult for our
shareholders to change the composition of our Board of Directors in any one year, preventing them from changing the
composition of management. In addition, the same provisions may discourage, delay or prevent a merger or acquisition that
shareholders may consider favorable. These provisions include:
• authorizing our Board of Directors to issue “blank check” preferred stock without shareholder approval;
• providing for a classified Board of Directors with staggered, three-year terms;
• establishing certain advance notice requirements for nominations for election to our Board of Directors or for
proposing matters that can be acted on by shareholders at shareholder meetings;
• prohibiting cumulative voting in the election of directors;
• limiting the persons who may call special meetings of shareholders;
• authorizing the removal of directors only for cause and only upon the affirmative vote of the holders of a majority
of the outstanding common shares entitled to vote for the directors; and
• establishing super majority voting provisions with respect to amendments to certain provisions of our amended
and restated articles of incorporation and bylaws.

Table of Contents
22
These anti-takeover provisions could substantially impede the ability of public shareholders to benefit from a change in
control and, as a result, may adversely affect the market price of our common shares and shareholders’ ability to realize any
potential change of control premium.
ITEM 4. INFORMATION ON THE COMPANY
A. History and Development of the Company
Scorpio Bulkers Inc. is an international shipping company that was incorporated in the Republic of the Marshall Islands
pursuant to the BCA on March 20, 2013. In December 2013, we completed our underwritten initial public offering of 2,608,333
common shares at $117.00 per share, and in January 2014, the underwriters in the initial public offering exercised their option to
purchase an additional 391,250 common shares. In February 2014, we completed our offer to exchange unregistered common
shares that were previously issued in Norwegian equity private placements (other than the common shares owned by affiliates of
us) for common shares that were registered under the Securities Act of 1933, as amended, or the Securities Act, which we refer
to as the Exchange Offer. Upon completion of the Exchange Offer, holders of 7,980,565 unregistered common shares validly
tendered their shares in exchange for such registered common shares, representing a participation rate of 99.7%. On July 31,
2014, we delisted from the Norwegian Over-the-Counter List, or Norwegian OTC List. Our common shares are listed for trading
on the New York Stock Exchange, or NYSE, under the symbol “SALT.”
Our principal executive offices are located at 9, Boulevard Charles III, Monaco 98000 and our telephone number at that
location is +377-9798-5715. The SEC maintains an Internet site that contains reports, proxy and information statements, and
other information regarding issuers that file electronically with the SEC. The address of the SEC's Internet site is
http://www.sec.gov. The address of the Company's Internet site is http://www.scorpiobulkers.com/.
B. Business Overview
We are an international shipping company that owns and operates the latest generation of newbuilding drybulk carriers
with fuel-efficient specifications and carrying capacities of greater than 30,000 dwt. All of our owned vessels have carrying
capacities of greater than 60,000 dwt. Our vessels transport a broad range of major and minor bulk commodities, including ores,
coal, grains, and fertilizers, along worldwide shipping routes, and are employed primarily in the spot market or in spot market-
oriented pools of similarly sized vessels. As of the date of this annual report, our operating fleet of 57 vessels consisted of 56
wholly-owned or finance leased drybulk vessels and one time chartered-in drybulk vessel, which we refer to collectively as our
“Operating Fleet” (see below table for details). Our owned and financed leased fleet has a total carrying capacity of approximately
3.9 million dwt.
Our Fleet
The following tables set forth certain summary information regarding our Operating Fleet as of the date of this annual
report:
Operating Fleet
Owned and Finance Leased fleet **
Vessel Name Year Built DWT
Kamsarmax Vessels
SBI Samba 2015 84,000
SBI Rumba 2015 84,000
SBI Capoeira 2015 82,000
SBI Electra * 2015 82,000
SBI Carioca 2015 82,000
SBI Conga 2015 82,000
SBI Flamenco * 2015 82,000

Table of Contents
23
Owned and Finance Leased fleet **
Vessel Name Year Built DWT
SBI Bolero 2015 82,000
SBI Sousta 2016 82,000
SBI Rock 2016 82,000
SBI Lambada 2016 82,000
SBI Reggae 2016 82,000
SBI Zumba 2016 82,000
SBI Macarena 2016 82,000
SBI Parapara 2017 82,000
SBI Mazurka 2017 82,000
SBI Swing 2017 82,000
SBI Jive 2017 82,000
SBI Lynx 2018 82,000
Total Kamsarmax 1,562,000
Ultramax Vessels
SBI Antares 2015 61,000
SBI Athena 2015 64,000
SBI Bravo 2015 61,000
SBI Leo 2015 61,000
SBI Echo 2015 61,000
SBI Lyra 2015 61,000
SBI Tango 2015 61,000
SBI Maia 2015 61,000
SBI Hydra 2015 61,000
SBI Subaru 2015 61,000
SBI Pegasus 2015 64,000
SBI Ursa 2015 61,000
SBI Thalia 2015 64,000
SBI Cronos 2015 61,000
SBI Orion 2015 64,000
SBI Achilles 2016 61,000
SBI Hercules 2016 64,000
SBI Perseus 2016 64,000
SBI Hermes 2016 61,000
SBI Zeus 2016 60,200
SBI Hera 2016 60,200
SBI Hyperion 2016 61,000
SBI Tethys 2016 61,000
SBI Phoebe 2016 64,000
SBI Poseidon 2016 60,200
SBI Apollo 2016 60,200
SBI Samson 2017 64,000
SBI Phoenix 2017 64,000
SBI Gemini 2015 64,000
SBI Libra 2017 64,000
SBI Puma 2014 64,000
SBI Jaguar 2014 64,000
SBI Cougar 2015 64,000
SBI Aries 2015 64,000
SBI Taurus 2015 64,000
SBI Pisces 2016 64,000
SBI Virgo 2017 64,000
Total Ultramax 2,307,800

Table of Contents
24
Owned and Finance Leased fleet **
Vessel Name Year Built DWT
Aggregate Owned and Financed Leased DWT 3,869,800 * During the first quarter of 2019, we agreed to sell the SBI Electra and SBI Flamenco. The vessels are expected to be delivered to the buyer in June 2019.
** Our vessels are flagged in the Republic of the Marshall Islands or Liberia.
Time chartered-in vessel
Vessel Type Year Built DWT Where Built Daily Base
Rate Earliest Expiry
Ultramax 2017 62,100 Japan $ 10,125 30-Sep-19 (1)
Aggregate Time Chartered-in DWT 62,100
(1) This vessel has been time chartered-in for 22 to 24 months at our option at $10,125 per day. We have the option to extend this time charter for one year at $10,885 per day.
Employment of Our Fleet
We typically operate our vessels in spot market-oriented commercial pools, in the spot market or, under certain
circumstances, on time charters.
Spot Market-Oriented Commercial Pools
To increase vessel utilization and thereby revenues, we participate in commercial pools with other shipowners with
similar modern, well-maintained vessels. By operating a large number of vessels as an integrated transportation system,
commercial pools offer customers greater flexibility and a higher level of service while achieving scheduling efficiencies. Pools
employ experienced commercial managers and operators who have close working relationships with customers and brokers,
while technical management is performed by each shipowner. The managers of the pools negotiate charters with customers
primarily in the spot market but may also arrange time charter agreements. The size and scope of these pools enable them to
enhance vessel utilization rates for pool vessels by securing backhaul voyages, which is when cargo is transported on the return
leg of a journey, and contracts of affreightment, or COAs, thus generating higher effective time charter equivalent, or TCE,
revenues than otherwise might be obtainable in the spot market, while providing a higher level of service offerings to customers.
As of the date of this annual report, all of the vessels in our Operating Fleet are employed in one of the Scorpio Pools,
which are spot market-oriented commercial pools managed by our commercial manager, which exposes us to fluctuations in spot
market charter rates. Our vessels participate in the Scorpio Pools under the same contractual terms and conditions as the third
party vessels in the pool. Each pool aggregates the revenues and expenses of all of the pool participants and distributes the net
earnings calculated on (i) the number of pool points for the vessel, which are based on vessel attributes such as cargo carrying
capacity, fuel consumption, and construction characteristics, and (ii) the number of days the vessel operated in the period. SCM,
a Monaco corporation controlled by the Lolli-Ghetti family of which our co-founder, Chairman and Chief Executive Officer is a
member, as is our Vice President, is responsible for the administration of the pool and the commercial management of the
participating vessels, including marketing the pool, negotiating charters, including voyage charters, short duration time charters
and COAs, conducting pool operations, including the distribution of pool cash earnings, and managing bunker (fuel oil)
purchases, port charges and administrative services for the vessels. SCM, as operator of the Scorpio Pools, charges $300 a day
for each vessel, whether owned by us or chartered-in, plus a 1.75% commission on the gross revenues per charter fixture. See “-
Management of our Business” below.
The pool participants remain responsible for all other costs including the financing, insurance, manning and technical
management of their vessels. The earnings of all of the vessels are aggregated and divided according to the relative performance
capabilities of the vessel and the actual earning days each vessel is available.

Table of Contents
25
Spot Market
A spot market voyage charter is generally a contract to carry a specific cargo from a load port to a discharge port for an
agreed freight per ton of cargo or a specified total amount. Under spot market voyage charters, we pay specific voyage expenses
such as port, canal and bunker costs. Spot charter rates are volatile and fluctuate on a seasonal and year-to-year basis.
Fluctuations derive from imbalances in the availability of cargoes for shipment and the number of vessels available at
any given time to transport these cargoes. Vessels operating in the spot market generate revenue that is less predictable than those
under time charters, but may enable us to capture increased profit margins during periods of improvements in drybulk vessel
charter rates. Downturns in the drybulk industry would result in a reduction in profit margins.
Time Charters
Time charters give us a fixed and stable cash flow for a known period of time. Time charters also mitigate in part the
volatility and seasonality of the spot market business, which is generally weaker in the second and third quarters of the year. We
opportunistically employ vessels under time charter contracts. We may also enter into time charter contracts with profit sharing
agreements, which enable us to benefit when the spot market rates increase.
Management of Our Business
In 2016, we agreed to amend our master agreement, or the Master Agreement, with SCM and SSM, and our
administrative services agreement, or the Administrative Services Agreement, with Scorpio Services Holding Limited, or SSH,
under a deed of amendment, or the Deed of Amendment. Pursuant to the terms of the Deed of Amendment, on December 9, 2016,
we entered into definitive documentation to memorialize the agreed amendments to the Master Agreement, or the Amended and
Restated Master Agreement. The Amended and Restated Master Agreement and the Administrative Services Agreement as
amended by the Deed of Amendment, or the Amended Administrative Services Agreement, are effective as from September 29,
2016.
In December 2017, we agreed to amend the Amended and Restated Master Agreement to amend and restate the technical
management agreement thereunder subject to bank consents being obtained (where required), which were subsequently obtained.
On February 22, 2018, we entered into definitive documentation to memorialize the agreed amendments to the Amended and
Restated Master Agreement under a deed of amendment, or the Amendment Agreement. The Amended and Restated Master
Agreement as amended by the Amendment Agreement, or the Revised Master Agreement, is effective as from January 1, 2018.
Set forth below is a description of the other material terms of the Revised Master Agreement and the Amended
Administrative Services Agreement. Please also see Note 15, Related Party Transactions, to the Consolidated Financial
Statements included herein for additional information.
Commercial and Technical Management - Revised Master Agreement
Our vessels are commercially managed by SCM and technically managed by SSM pursuant to the Revised Master
Agreement, which may be terminated by either party upon 24 months’ notice, unless terminated earlier in accordance with the
provisions of the Revised Master Agreement. In the event of the sale of one or more vessels, a notice period of three months’
and a payment equal to three months of management fees will apply, provided that the termination does not amount to a change
of control, including a sale of substantially all vessels, in which case a payment equal to 24 months of management fees will
apply. Additional vessels that we may charter-in or acquire in the future are expected to be managed under the Revised Master
Agreement or on substantially similar terms as the Revised Master Agreement.
SCM’s commercial management services include securing employment for our vessels in the spot market or on time
charters. SCM also manages the Scorpio Pools (spot market-oriented vessel pools) including the Scorpio Ultramax Pool, the
Scorpio Kamsarmax Pool and the currently inactive Scorpio Capesize Pool in which our owned, finance leased and time
chartered-in vessels are employed and from which a significant portion of our revenue is generated. For commercial management
of any of our vessels that does not operate in one of these pools, we pay SCM a daily fee of $300 per vessel, plus a 1.75%
commission on the gross revenues per charter fixture. The Scorpio Ultramax Pool and Scorpio Kamsarmax Pool participants,

Table of Contents
26
including us and third-party owners of similar vessels, pay SCM a pool management fee of $300 per vessel per day, plus a 1.75%
commission on the gross revenues per charter fixture.
SSM’s technical management services include providing technical support, such as arranging the hiring of qualified
officers and crew, supervising the maintenance and performance of vessels, purchasing supplies, spare parts and new equipment,
arranging and supervising drydocking and repairs, and monitoring regulatory and classification society compliance and customer
standards. We pay SSM an annual fee of $160,000 plus charges for certain itemized services per vessel to provide technical
management services for each of our owned or finance leased vessels. In addition, representatives of SSM, including certain
subcontractors, previously provided us with construction supervisory services while our vessels were being constructed in
shipyards. For these services, we compensated SSM for its direct expenses, which varied between $200,000 and $500,000 per
vessel. Please see “Item 7. Major Shareholders and Related Party Transactions—B. Related Party Transactions—Commercial
and Technical Management Agreements” for additional information.
Amended Administrative Services Agreement
In 2016, we entered into the Amended Administrative Services Agreement with SSH for the provision of administrative
staff, office space and accounting, legal compliance, financial and information technology services for which we reimburse SSH
for the reasonable direct and indirect expenses incurred while providing such services. The services provided to us by SSH may
be sub-contracted to other entities within Scorpio.
SSH also arranges vessel sales and purchases for us, for which we previously paid SSH a fee, payable in our common
shares, for arranging vessel acquisitions, including newbuildings. The amount of common shares payable was determined by
dividing $250,000 by the market value of our common shares based on the volume weighted average price of our common shares
over the 30 trading day period immediately preceding the contract date of a definitive agreement to acquire any vessel. As of the
date of this annual report, we issued an aggregate of 180,716 common shares to SSH in connection with the deliveries of
newbuilding vessels. In November 2014, SSH agreed to waive its fee on vessel acquisitions contracted after November 20, 2014,
for so long as the closing price of our common shares remained below a specified threshold. Effective September 29, 2016,
pursuant to the terms of the Amended Administrative Services Agreement, we agreed with SSH to eliminate this fee on all future
acquisitions.
In addition, SSH has agreed with us not to own any drybulk carriers greater than 30,000 dwt for so long as the Amended
Administrative Services Agreement is in full force and effect. This agreement may be terminated by SSH upon 12 months’ notice
or by us with 24 months’ notice.
Recent and Other Developments
Share Repurchase Program
During the fourth quarter of 2018, we repurchased a total of approximately 4.5 million shares of our common stock
under the then existing share repurchase programs at an aggregate cost of approximately $27.0 million, or an average cost of
$6.05 per share, which was funded from available cash resources. As of January 25, 2019, $24.8 million remained available under
the then existing share repurchase program.
On January 25, 2019, our Board of Directors authorized a new share repurchase program to purchase up to an aggregate
of $50.0 million of our common shares. This new share repurchase program replaced our previous share repurchase program
that was authorized in October 2018 and that was terminated in conjunction with the authorization of the new share repurchase
program. The specific timing and amounts of the repurchases will be in the sole discretion of management and may vary based
on market conditions and other factors. We are not obligated under the terms of the program to repurchase any of our common
shares. The authorization has no expiration date.
Dividend
In the fourth quarter of 2018, our Board of Directors declared and we paid a quarterly cash dividend of $0.02 per share
totaling approximately $1.5 million.

Table of Contents
27
On January 25, 2019, our Board of Directors declared a quarterly cash dividend of $0.02 per share, payable on or about
March 15, 2019, to all shareholders of record as of February 15, 2019. As of February 15, 2019, 71,217,258 shares were
outstanding.
Investment in Scorpio Tankers Inc.
On October 12, 2018, we invested $100.0 million in a related party, Scorpio Tankers Inc. (NYSE:STNG), or Scorpio
Tankers, for approximately 54.1 million common shares of Scorpio Tankers, representing approximately 10.9% of its then issued
and outstanding common shares. The investment was part of a larger $337.0 million equity raise through a public offering of
common shares by Scorpio Tankers.
We measure our investment in Scorpio Tankers based on the quoted market price of Scorpio Tankers’ common stock,
discounted for a temporary lack of marketability as at December 31, 2018 pursuant to the terms of a lock-up agreement we
entered into at the time of the investment. The lock-up agreement expired on January 7, 2019. At December 31, 2018, we recorded
a $7.7 million non-cash loss and $0.5 million cash dividend related income from our investment in Scorpio Tankers, which were
recorded in Income (loss) from equity investment, on our Consolidated Statement of Operations.
On January 18, 2019, Scorpio Tankers effected a one-for-ten reverse stock split and as such we now own approximately
5.4 million common shares of Scorpio Tankers.
IMO 2020
In November 2018, we entered into agreements with third parties to purchase exhaust gas cleanings systems, or
scrubbers, for 18 of our vessels in 2019 and for 10 of our vessels in 2020. The total value of these agreements is estimated to
be $41.9 million. The systems that are being fitted are of ‘hybrid ready’ design, which allows them to be upgraded to a ‘closed
loop’ configuration at a future date. As part of these agreements, we also have an option to purchase exhaust gas cleaning systems
for up to 18 additional vessels in 2020.
As of March 15, 2019, our projected scrubber installation schedule and estimated payments for such installation on all
the vessels in our owned or finance leased fleet is as follows (dollars in thousands):
Number of Vessels by Type Estimated
Payments (1)
Ultramax Kamsarmax
Q1 2019 — — $ 4,904
Q2 2019 — 3 11,547
Q3 2019 9 1 19,365
Q4 2019 1 4 24,578
Q1 2020 11 1 26,783
Q2 2020 9 4 24,666
Q3 2020 4 4 13,823
Q4 2020 3 — 5,580
Q1 2021 — — 859
Total 37 17 $ 132,105
(1) Includes estimated cash payments for scrubbers that are due in advance of the scheduled service and may be scheduled to
occur in quarters prior to the actual installation. In addition to these installment payments, these amounts also include estimates
of the installation costs of such systems. The timing of the payments set forth are estimates only and may vary as the timing of
the related installations finalize.
$21.4 Million Lease Financing - SBI Samba

Table of Contents
28
In February 2019, we entered into a financing transaction with an unaffiliated third party involving the sale and leaseback of
the SBI Samba, a 2015 Japanese built Kamsarmax vessel, for consideration of $21.4 million. As part of the transaction, we
have agreed to make payments of $6,850 per day under a five-year bareboat charter agreement with the buyer.
The transaction also provides us with the option to repurchase the vessel beginning on the third anniversary of the sale until the
end of the bareboat charter agreement. This transaction is expected to increase our liquidity by approximately $6.9 million after
repayment of outstanding debt under the credit facility under which the vessels were previously financed.
CMBFL Lease Financing
In March 2019, we agreed to sell and leaseback three Ultramax vessels (SBI Pegasus, SBI Subaru and SBI Ursa) and four
Kamsarmax vessels (SBI Lambada, SBI Macarena, SBI Carioca and SBI Capoeira) to CMB Financial Leasing Co., Ltd. Upon
completion, which is estimated to take place in the second quarter of 2019, our liquidity is expected to increase by $57.2
million in aggregate ($45.4 million upon closing after the repayment of outstanding debt and an additional tranche of up to
$11.8 million for installation of scrubbers on the seven vessels). As part of the agreements, we will bareboat charter-in the
vessels for a period of seven years. In addition, the Company has purchase options beginning after the end of the third year of
each agreement. There is also a purchase option for each vessel upon the expiration of each agreement.
Vessel Sales
In March 2019, we entered into agreements with unaffiliated third parties to sell the SBI Electra and SBI Flamenco, two 2015
Chinese built Kamsarmax vessels, for approximately $48.0 million in aggregate. Delivery of the vessels is estimated to take
place in the second quarter of 2019. It is estimated that our liquidity will increase by approximately $18.6 million after the
repayment of the vessels’ outstanding debt under the credit facility under which the vessels were previously financed.
Our Customers
We believe that developing strong relationships with the end users of our services allows us to better satisfy their needs
with appropriate and capable vessels. All of our vessels are employed in Scorpio Pools, which are spot market-oriented
commercial pools managed by our commercial manager, SCM. A prospective charterer’s financial condition, creditworthiness,
reliability and track record are important factors in negotiating our vessels’ employment, which SCM evaluates on our behalf.
We earned 36% and 64% of our revenue from the Scorpio Kamsarmax Pool and the Scorpio Ultramax Pool, respectively, during
the year ended December 31, 2018, 42% and 58% of our revenue from the Scorpio Kamsarmax Pool and the Scorpio Ultramax
Pool, respectively, during the year ended December 31, 2017, and 40% and 60% of our revenue (including commissions from
SCM) from the Scorpio Kamsarmax Pool and the Scorpio Ultramax Pool, respectively, during the year ended December 31,
2016.
Seasonality
We operate our vessels in markets that have historically exhibited seasonal variations in demand and, as a result, in
charter hire rates. This seasonality may result in quarter to quarter volatility in our operating results. The drybulk carrier market
is typically stronger in the fall and winter months in anticipation of increased consumption of coal and other raw materials in the
northern hemisphere during the winter months. In addition, unpredictable weather patterns in these months may disrupt vessel
scheduling and supplies of certain commodities. As a result, revenues of drybulk carrier operators in general have historically
been weaker during the fiscal quarters ended June 30 and September 30, and, conversely, been stronger in fiscal quarters ended
December 31 and March 31. This seasonality may materially affect our operating results and cash available for the payment of
dividends.
Competition
We operate in markets that are highly competitive and based primarily on supply and demand. We compete for charters
on the basis of price, vessel location, size, age and condition of the vessel, as well as on our reputation and that of our commercial
manager. We compete primarily with other independent and state-owned drybulk vessel-owners. Our competitors may have more

Table of Contents
29
resources than us and may operate vessels that are newer, and therefore more attractive to charterers, than our vessels. Ownership
of drybulk vessels is highly fragmented and is divided among publicly listed companies, state-controlled owners and private
shipowners.
Industry and Market Conditions
The Drybulk Shipping Industry
Except as otherwise indicated, the statistical information and industry and market data contained in this section is based
on or derived from statistical information and industry and market data collated and prepared by SSY Consultancy & Research
Ltd (“SSY”). The data is based on SSY's review of such statistical information and market data available at the time (including
internal surveys and sources, independent financial information, independent external industry publications, reports or other
publicly available information). Due to the incomplete nature of the statistical information and market data available, SSY has
had to make some estimates where necessary when preparing the data. The data is subject to change and may differ from similar
assessments obtained from other analysts of shipping markets. While reasonable care has been taken in the preparation of the
data, SSY has not undertaken any independent verification of the information and market data obtained from published sources.
Industry Overview
Drybulk shipping mainly comprises the shipment of minerals, such as iron ore and coal, other industrial raw materials
and various agricultural products. Of these, the major cargoes are iron ore, coal and grain. The remaining minor bulk cargoes
include steel products, bauxite/alumina, nickel ore, cement, petroleum coke, forest products, fertilizers and non-grain agricultural
products, such as sugar.
Charterers in the drybulk shipping industry range from cargo owners (such as mining companies and grain houses) to
end-users (such as steel producers and power utilities) and also include a number of different trading companies and ship
operators.
Total international seaborne drybulk trade is estimated to have reached a new annual record of approximately 4.65 billion
tonnes in 2018. This represents an increase of an estimated 2.6% from the 2017 level and an estimated 15.0% from the 2013
level, which was close to the compound annual average growth rate, or CAGR, for the period 2013 to 2018. With the exception
of 2009, when the global economy was in recession, seaborne drybulk trade has recorded positive annual growth in every year
since 1998. While the 2018 trade estimates set out in the table below will be subject to revision, as final trade statistics become
available, our current estimates indicate a third consecutive year in which annual growth in seaborne trade volumes exceeded
100 million tonnes, albeit that this growth was unevenly distributed between the various dry bulk cargo types.
World Seaborne Drybulk Trade
(million tonnes)
Cargo/Year 2013 2014 2015 2016 2017 2018 2013-18
% Growth CAGR
Major Bulks 2,825 3,000 2,992 3,088 3,192 3,238 15% 3%
Iron Ore 1,256 1,391 1,414 1,484 1,532 1,524 21% 4%
Coal 1,200 1,186 1,128 1,130 1,155 1,201 —% —%
Grains 369 423 450 474 505 513 39% 7%
Minor Bulks 1,222 1,242 1,264 1,293 1,347 1,417 16% 3%
Total 4,047 4,242 4,256 4,381 4,539 4,655 15% 3%
Totals may not add due to rounding
Cargo Types
Iron ore: The key raw material for steelmaking, and single largest seaborne drybulk cargo, iron ore trade expanded more
than three-fold between 2002 and 2017 on the back of unprecedented Chinese import demand. Preliminary estimates for 2018 do

Table of Contents
30
however indicate the first annual decrease for 17 years, but only marginally with an estimated decline of 0.5% to 1,524 million
tonnes, or Mt. By comparison, the CAGR was approximately 4% for the five years since 2013. Last year’s decline in trade was
despite positive growth in world steel production in 2018, which rose by an estimated 4.6% to a new all-time high, led by increases
in China. In addition to China which, as described elsewhere in this section, has become the dominant importer accounting for
over two-thirds of seaborne imports in 2018, the main import markets for iron ore are Japan, Western Europe and South Korea.
South and Southeast Asia generated positive import growth in 2018. Exports are dominated by Australia and Brazil, which
together accounted for an estimated 83% of the seaborne market in 2018 with a large majority of their cargoes carried by Capesize
vessels given the favorable unit economies. This market share has increased from 75% in 2013, mainly due to the introduction
of additional Australian export capacity, with both countries recording new annual export records in 2018. Other iron ore exporters
include South Africa, Canada, India, Sweden, Ukraine and West Africa.
Coal: At an estimated 1,201 Mt in 2018, global seaborne coal trade increased by an estimated 4.0% from its 2017 level
and represented only the second year of positive annual growth since 2013 against a background of improved overall energy
demand. By comparison, the CAGR was close to zero percent for the entire five-year period from 2013 to 2018. Coal trade is
comprised of two main categories: (1) steam coal (which is chiefly used for electricity generation, but also by industrial users,
such as the cement industry) and (2) coking coal (a key input for blast furnace steelmaking). Both categories experienced lower
trade volumes between 2013 and 2016, but steam coal trade in 2018 is estimated to have risen above the previous annual all-time
high level in 2013 for the first time.
Although the import market for coal was historically dominated by import demand from Japan and Western Europe, the
last 10 to 15 years has seen China and India emerge as key importers of both categories of coal. The leading exporter of coking
coal is Australia, followed by the United States and Canada. Indonesia is the largest exporter of steam coal, ahead of Australia,
the former Soviet Union, Colombia, South Africa and the United States.
Between 2005 and 2013, China transformed from a major steam coal exporting nation to the single largest importer,
representing the strength of the country’s domestic demand for power generation. However, imports represent a very small share
(i.e. less than 10%) of coal consumption in China (which is the world’s largest coal producer) and, as a result, imports have been
subject to major fluctuations in response to changes in domestic market conditions. For example, in 2014 China recorded a sharp
annual decline in steam coal imports, in light of an oversupplied domestic coal market and government intervention to restrict
imports. The rate of decline quickened in 2015, reducing the country’s steam coal imports to a six-year low, before the downward
trend was reversed in 2016 with both coking and steam coal imports increasing, mainly as a result of government-driven cuts in
domestic coal production. Further Chinese government interventions aimed at managing the domestic coal market since 2017
contributed to some significant monthly variations in import volumes, but the combined annual total for coking and steam coal
imports in 2018 was only 1.2% below the corresponding level in 2017.
India remained the world’s single largest coal importer in 2018, with strong gains in both steam and coking coal volumes,
which are estimated to have pushed the aggregate annual volume above its previous peak in 2014. Annual growth in Indian
imports had been dampened between 2014 and 2017, mainly due to rising domestic coal production. Japan, South Korea and
Taiwan, together with Western Europe, remain major import markets, while South East Asia and Latin America have grown in
importance as coal import generators. Although investments in new port facilities enabled the participation of Capesize vessels
in the Asia-led coal trade growth during the period from 2010 to 2013, more recent changes in coal trade patterns (in particular,
the rising share of exports from Indonesia, Russia and the US) has chiefly benefitted demand for Panamax and Handymax vessels.
Grains: Seaborne grain trade is comprised of wheat, coarse grains (corn, barley, oats, rye and sorghum) and
soybeans/meal, which together totaled an estimated new record of 513 Mt in 2018, according to preliminary trade data. This was
up by an estimated 1.6% from 2017 and compares with a CAGR of approximately 7.0% for the period from 2013 to 2018, which
is the highest of the major bulk cargoes. In addition, the grain trades remain an important source of freight market volatility due
to both the seasonality of export flows, year-on-year variations in crop surpluses and deficits and, latterly, by import tariffs.
Soy is the largest of the three main categories of grain trade with Brazil, the United States and Argentina the leading
export countries. The principal markets are in Europe and Far East Asia with China being the world’s single largest soybean
importer. Shipments are dominated by Panamax and Handymax vessels. The introduction of import tariffs by China on U.S.

Table of Contents
31
soybeans in 2018 boosted soybean volumes from Brazil to China at the expense of the U.S. suppliers, leading U.S. suppliers to
seek alternative markets. This contributed to slower, yet still positive, world soybean and meal trade growth of 2.7% in 2018.
Wheat and coarse grains are also primarily carried by mid-size vessels with the United States, Canada, Russia, Ukraine,
Argentina, Brazil, Australia and the European Union being the main exporting regions. In addition to Far East Asia and Europe,
the Middle East, Africa and Latin America are all significant import markets.
Minor Bulks: A diversity of cargo types are covered under this heading with different sets of demand drivers.
Nevertheless, together at approximately 1.4 billion tonnes per annum these trades represent a major source of employment for
the smaller Handysize and Handymax vessels.
In recent years the pattern of minor bulk trade has been altered by government restrictions on the export of key industrial
ores in South East Asia. This was led by an Indonesian ban on the export of unprocessed mineral ores beginning in January 2014,
which reduced the country’s combined exports of bauxite and nickel ore from 121 Mt in 2013 to zero in 2015 and 2016. Bauxite
trade did benefit from a sharp increase in exports from Malaysia in 2015, but in early 2016 the Malaysian government announced
a temporary suspension of domestic bauxite mining, which was subsequently extended into the first quarter of 2019. This turned
the focus of importers in China (the world’s biggest bauxite market) to longer haul supplies, particularly from West Africa (where
fronthaul cargoes are now predominantly carried by Capesize vessels). Since the beginning of 2017 the Indonesian government
has moved to partially relax its ban on unprocessed mineral ore exports with limited volumes re-entering the international market
and in February 2019 it was reported that bauxite mining in Malaysia can resume from April (albeit under strict conditions).
However, uncertainties continue to surround the availability of South East Asian mineral ores with, for example, reported mining
restrictions imposed by the government of the Philippines potentially constraining nickel ore exports.
Despite these constraints, total minor bulk trade is estimated to have achieved a new annual record in 2018. The
estimated CAGR for minor bulk trade volumes for the period from 2013 to 2018 was 3.0%.
Demand for Drybulk Shipping
Drybulk trade is a function of levels of (a) economic activity, (b) the industrialization/urbanization of developing
countries, (c) population growth (plus changes in dietary habits) and (d) regional shifts in cargo supply/demand balances, which
can occur, for example, due to the development of new export/import capacity or depletion/development of mineral reserves. The
distances shipped chiefly reflect regional commodity surpluses and deficits. Generally, the more concentrated the sources of
cargo supply, the greater the average distance shipped.
Ship demand is determined by the overall volumes of cargo moved and the distance that these are shipped, or tonne-
mile demand, as well as changes in vessel efficiency. These changes may be caused by such factors as (1) vessel speed (which
will change in response to movements in fuel costs and freight market earnings); (2) port delays (which have been a common
occurrence in the last 15 years as inland and port logistics in several key export areas struggled to meet surging global demand)
and (3) laden to ballast ratios, or how much time vessels spend sailing empty on re-positioning voyages. Ballasting has also been
on the increase over the last 10 to 15 years due to the widening imbalance in cargo flows between the Atlantic and Pacific Basins.
World seaborne drybulk trade followed a steady underlying upward trend during the 1980s and 1990s. CAGR in the
major drybulk cargoes over this period was an estimated 2.5%, before accelerating sharply to 6.3% during the period from 2000
to 2009 and being sustained at an estimated 4.9% between 2010 and 2018.
The growth in drybulk trade volumes since 2000 has been primarily due to the rapid industrialization and urbanization
of China. From approximately 130 Mt in 2000, Chinese drybulk imports have increased more than thirteen-fold, as illustrated in
the chart below. Such an expansion was facilitated by investments in new mining and port facilities in key exporting areas around
the world initially in response to Chinese-driven rises in commodity prices from 2004 to 2011 and subsequently reflecting
movements in the commodity price cycle.
The table below provides a more detailed comparison of China’s drybulk imports from 2013 to 2018, which shows a
new annual record last year with preliminary data indicating an increase in aggregate volumes of approximately 29 Mt to

Table of Contents
32
approximately 1,763 Mt in 2018. This was despite an annual decline in imports of iron ore, which had made the greatest
contribution to China’s drybulk import growth over the last five years. The 247 Mt estimated increase in iron ore imports between
2013 and 2018 reflects not only increases in domestic steel production (and, therefore, iron ore consumption) to meet the needs
of an industrializing and urbanizing economy as well as exports of steel products, but also the substitution of higher-quality
imported iron ore for lower-quality domestic supplies and increases in port stocks. Consequently, iron ore imports grew more
rapidly than Chinese steel production between 2013 and 2017.
However, the relationship between domestic steel production and iron ore consumption changed in 2018, as the net fall
in iron ore imports was accompanied by record levels of Chinese steel production. This was partly due to the government-enforced
removal of scrap steel-consuming induction furnace capacity in 2017 (which had hitherto been excluded from official Chinese
steel production statistics) for environmental reasons. This move not only inflated steel production growth in 2018 official data,
but also constrained iron ore consumption growth due to the abundance of steel scrap previously used in induction furnaces. In
addition, winter curtailment measures introduced by the government to combat pollution by heavy industry restricted iron ore
sintering to the detriment of imported iron ore fines. There was also some destocking at China’s iron ore ports in 2018.
With grains impacted by tariffs, coal and, especially, the minor bulks drove Chinese drybulk import growth in 2018.
Bauxite (the main raw material for the aluminium industry) was the single largest category of minor bulk cargo imported by
China in 2018, at an estimated 86.6 Mt, which was 26% above the annual total in 2017 and the highest year on record. This
growth was dominated by Guinea, the biggest bauxite supplier to China, followed by Australia. There was continued resumption
in imports from Indonesia in 2018, which had been the leading source of Chinese bauxite imports prior to 2014, but volumes
remained modest by historical standards. The re-emergence of some Indonesian supplies helped lift China’s total annual nickel
ore imports from 35.0 Mt in 2017 to an estimated 45.3 Mt in 2018.
Chinese Drybulk Imports (Million Tonnes)
2013 2017 2018 CAGR
Iron Ore 820.3 1,075.4 1,064.8 5%
Coal* 327.2 271.1 280.8 (2)%
Bauxite/Alumina 75.4 71.6 88.0 3%
Grains 78.0 121.2 108.6 7%
Other** 204.9 195.4 221.2 1%
Total of above 1,505.8 1,734.7 1,763.4 3%
* Includes lignite, which is excluded from SSY’s estimates for seaborne coal trade and categorized as a minor bulk.
** Includes mineral ores (such as nickel), pulp/wood chip/logs and petroleum coke.
Source: Chinese Customs
Growth in China’s iron ore trades over the last 15 years has mainly been to the benefit of Capesize vessels, hauling
cargoes from West Australia and Brazil. Australia and Indonesia are the primary sources of Chinese coal imports, while in the
grain trades increased Chinese demand for soybeans from Latin America and the United States has boosted tonne-mile demand
for Panamax and Supramax vessels.
Outside of China, most of the additional growth in drybulk cargo import demand during the past five years has been
generated by other Asian economies. For example, and despite setbacks since 2014, Indian coal imports in 2018 were estimated
to be 45 Mt higher than their corresponding level in 2013, reflecting the strength of demand from electricity generators and the
cement and steel industries. Although India has added several Capesize coal import terminals in recent years, a majority of the
coal cargoes arriving in the country are shipped by Supramax, Panamax and Kamsarmax vessels. More established Asian import
markets, such as South Korea, have also contributed to the region’s import growth with its combined imports of coal and iron
ore increasing by an estimated 32 Mt between 2013 and 2018.
In contrast, European mineral imports staged only a partial recovery from their cyclical lows in 2009 and have remained
below their 2007 totals, before trending lower in 2014. This is due in part to slow economic growth in the Eurozone, but also in

Table of Contents
33
part to policy-driven changes in the region’s energy mix away from coal. Consequently, Asia’s share of world seaborne major
bulk imports is estimated to have climbed to approximately 79% from approximately 60% in the middle of the last decade and
53% to 54% in 2000.
As a result, the fastest drybulk trade growth has been seen within the Pacific Basin, which has been supplemented by
increases in front-haul trade from the Atlantic to the Pacific (chiefly iron ore on Capesize vessels and grains on Panamaxes and
Supramaxes, but also U.S. coal).
Drybulk Global Fleet
The cargoes outlined above are predominantly carried by drybulk carriers of more than 10,000 dwt. Drybulk carriers are
single-decked ships that transport dry cargoes in “bulk” form, that is loose within cargo holds, rather than in bags, crates or on
pallets.

Table of Contents
34
As of the end of December 2018, the total fleet of 10,000+ dwt drybulk carriers numbered approximately 10,920 vessels
of 830.6 million deadweight tonnes, or Mdwt.
This fleet is divided into four principal size segments: Handysize (10,000-39,999 dwt), Handymax (40,000-64,999 dwt),
Panamax (65,000-99,999 dwt) and Capesize (100,000+ dwt). Aside from size, the main distinction between drybulk vessel types
is whether they are geared (that is, equipped with cranes for loading/discharge) or gearless. The main characteristics of these four
vessel types are summarized below, while the table below summarizes the current structure of the fleet by age and size. It shows
that in terms of deadweight capacity, the Capesize sector is the largest with 40.4% of the end-of-December 2018 total, followed
by Panamaxes at 24.9%, Handymaxes at 23.6% and Handysizes at 11.1%.
Handysize (10,000-39,999 dwt): These ships carry the widest range of cargoes of any drybulk size segment and are the
most dependent on the minor bulks for employment. They are usually equipped with cargo-handling gear (cranes or derricks)
and are widely used on routes to and from draft-restricted ports that (a) cannot receive larger ships and (b) often lack their own
land-based cargo-handling equipment. Many such loading or discharge facilities are located in the developing nations. Due to the
limited economies of scale that these vessels offer, compared to larger tonnage vessels, many of these ships are extensively
employed on intra-regional, shorter-haul trades. Special designs of ships are associated with the carriage of such cargoes as steel
products and logs, or open-hatch and log-fitted vessels; some variants also exist in terms of cargo-handling equipment, such as
grab-fitted tonnage possessing scoops that facilitate unloading of certain cargo types.
Handymax (40,000-64,999 dwt): This segment of the drybulk carrier fleet contains three distinct sub-categories - the
traditional Handymax size (40,000-49,999 dwt), the Supramax size (50,000-59,999 dwt) and the Ultramax size (60,000-64,999
dwt). There are some Ultramax newbuilding designs of above 65,000 dwt, but as these are much fewer in number than existing
gearless vessels of 65-69.9 kdwt, they currently fall in SSY’s Panamax size range. Despite their increased size, these vessels
retain a high degree of trading flexibility as their cargo gear enables them to load and/or discharge at ports with limited facilities.
They are more widely deployed on longer-haul routes than are Handysizes (due to the greater scale economies that they offer).
Whereas the traditional Handymax types have gained market share from the sub-40,000 dwt fleet of Handysizes over the past 20
years, the new generation of Supramax and Ultramax vessels are also competing for business on Panamax routes.
Panamax (65,000-99,999 dwt): The strict definition of a Panamax bulk carrier is a ship able to transit the Panama Canal
fully laden. However, in recent years this definition has become blurred as (1) only a minority of the vessels in this size range
pass through the Panama Canal in any 12-month period and (2) the opening of an additional trade lane with a new set of locks in
mid-2016 expanded the Panama Canal’s dimensions to enable the transit of ships of maximum beam, or extreme vessel breadth,
of 49 metres, maximum length overall, or LOA, of 366m and maximum draft of 15.2m tropical fresh water, or TFW. This
compares with the pre-existing, and still operational, locks which can accommodate ships to a maximum of 32.3m beam, 294.1m
LOA and 12m TFW draft. For these reasons our fleet definition stretches from 65,000 to 99,999 dwt, encompassing three main
sub-types: traditional Panamaxes (70,000-79,999 dwt), Kamsarmaxes (82,000-83,000 dwt, which prior to the enlargement were
the largest bulk carrier to transit the Panama Canal fully laden) and post-Panamaxes (85,000-99,999 dwt). The base load demand
for these vessel types is provided by coal and grain cargoes, although they also participate in a number of other trades (including
iron ore, bauxite and fertilizers). Only a small minority of vessels in this size range are equipped with cargo gear as most of the
ports served have well developed cargo loading or discharge terminals.
Capesize (100,000+dwt): These ships are almost exclusively deployed in the iron ore and coal trades, which benefit
most from their scale economies. There are three main sub-types: small Capes (100,000-119,999 dwt), standard Capes (160,000-
209,999 dwt, which are mainly concentrated between 170,000 dwt and 180,000 dwt, but also include Newcastlemaxes of
200,000-209,999 dwt) and Very Large Ore Carriers (220,000 dwt and above). In recent years the average size of these Very Large
Ore Carriers has been increasing, through the serial ordering of 400,000 dwt and 325,000 dwt designs.
Drybulk Carrier Fleet by Size/Age (Million Dwt):

Table of Contents
35
As of December 31, 2018
Built/Dwt 10-39,999 40-64,999 65-99,999 100,000+ Total
Pre-1994 3.9 2.9 2.9 7.2 17.0
1994-98 7.5 11.0 10.1 10.1 38.7
1999-03 7.3 16.0 21.6 18.5 63.3
2004-08 10.5 26.6 34.0 45.5 116.5
2009-13 40.9 84.5 90.3 169.2 384.8
2014-18 22.3 55.2 48.0 85.0 210.4
Total Fleet 92.4 196.2 206.9 335.5 830.7
Average Age 10 Yrs 9 Yrs 9 Yrs 8 Yrs 9 Yrs
Totals may not add due to rounding
Ownership
Unlike other specialist areas of the world shipping fleet, ownership in the drybulk segment is highly fragmented, with
SSY’s database showing approximately 2,000 different owners. The largest 50 owners account for approximately 34% of the
fleet in terms of deadweight carrying capacity, but this includes a large number of Chinese-flagged vessels that will trade on
domestic as well as international routes.
While such analysis will tend to understate levels of market concentration, due to the operation of vessel pools and
chartered in fleets, the drybulk segment is sufficiently competitive to ensure that vessel spot market earnings are extremely
responsive to fluctuations in the supply/demand balance globally and regionally.
Supply of Drybulk Shipping
The supply of drybulk carriers is fundamentally determined by the delivery of new vessels from the world’s shipbuilding
industry and the removal of older vessels, mainly through demolition.
Newbuilding deliveries not only reflect the demand from ship owners for new tonnage, but also available shipyard
capacity. Following a sharp upswing in demand for new vessels in all of the main sectors of the commercial shipping industry
during the last decade, and an accompanying rise in shipbuilding prices to record levels in 2007 to 2008, there was a massive
China-led expansion in world shipbuilding capacity. In the case of the drybulk sector, annual newbuilding deliveries surged from
24.4 Mdwt in 2008 (and an average of 19.1 Mdwt p.a. between 2000 and 2007, inclusive) to 44.3 Mdwt in 2009, 79.8 Mdwt in
2010 and a peak of 100.6 Mdwt in 2012.
The resulting impact on freight market balances and vessel earnings, as described elsewhere in this section, led to
sharply-reduced levels of drybulk carrier ordering in 2011 and 2012, which led to a slower pace of newbuilding deliveries in
2013 at an estimated 61.7 Mdwt followed by a further slowdown to 47.8 Mdwt in 2014.
There was an increase in drybulk carrier newbuilding investments during 2013, which continued into 2014 and reversed
the downward trend in the newbuilding orderbook. These orders were focused on new, more fuel-efficient ship designs, for which
shipyard descriptions offer significantly lower fuel consumption compared with existing vessels through a combination of new
technology main engines and refinements of hull forms.
The rising costs of bunker fuels between 2004 and 2012 are illustrated in the chart below, which is based on the 58,238
dwt Supramax vessel specifications used by the Baltic Exchange in constructing its daily Supramax Index. Using estimated
bunker prices in Singapore, our calculations assume that at a speed of 14.0 knots the vessel consumes 33 tonnes of 380cst fuel
oil per day laden and 32 tonnes per day in ballast. However, SSY stresses that (1) there is a wide variance in individual vessel
fuel consumptions, even within the same size segments, and (2) as described earlier in this section, many vessels have been
operating at slower speeds in order to lower their daily fuel consumption and costs.

Table of Contents
36
Our calculations show an increase at sea, at full speed, from approximately $5,600 per day in 2004 to approximately
$21,700 per day in 2012. Reflecting the general decline in world oil prices, annual average bunker fuel costs for our Supramax
example fell from approximately $18,200 per day in 2014 to approximately $7,500 per day in 2016. A partial rebound in global
oil prices from the lows of early 2016 lifted estimated Supramax bunkering costs to an average of approximately $10,600 per
day in 2017 and a four-year high of approximately $14,000/day in 2018. Last year’s average did, however, cover a wide range
of daily bunkering costs from a high of approximately $17,100/day to a low of approximately $10,700/day, reflecting volatility
in world oil markets.
Although bunkering costs fell towards the end of 2018, this remains a key area of attention for the shipping industry due
to the International Maritime Organization’s mandated requirement for a lowering of the global limit for sulphur in marine fuel
from the current 3.5% to 0.5% from January 1, 2020. In order to comply, shipowners will have to either switch to alternative
bunker fuels or invest in the installation of scrubbers to allow the continued use of existing bunker fuels.
Reflecting the increased ordering of more fuel-efficient vessels, there was a small net rise in drybulk carrier newbuilding
deliveries in 2015 to 48.9 Mdwt, but the downward trend resumed in 2016 and continued in 2017 and 2018 with last year’s annual
newbuilding delivery total of 28.2 Mdwt the lowest since 2008.
After a sharp reduction in new drybulk carrier ordering in 2015 and 2016, in response to the deterioration in freight
market conditions, there was some revival in the contracting of new vessels in 2017 and 2018 as vessel earnings firmed. At an
estimated 95.3 Mdwt, the total tonnage on order at the end of December 2018 represented approximately 11.5% of the existing
fleet, compared with 10.1% at the end of December 2017. To provide some longer-term perspective, the corresponding end-year
shares were 56.1% in 2007, 57.3% in 2009 and 67.6% in 2008, as illustrated in the chart below.
The table below summarizes the confirmed drybulk carrier orderbook as of the end of December 2018, by vessel size
and scheduled year of delivery. These delivery dates can be subject to delay. For example, 2018 deliveries were an estimated 15%
below the scheduled total as of January 1, 2018, which compared with a corresponding average rate of slippage from scheduled
delivery dates in the previous five years of approximately 34.6%.
Drybulk Carrier Newbuilding Orderbook by Size Range (Million Dwt): As of December 31, 2018
Delivery 10-39,999 40-64,999 65-99,999 100,000+ Total
2019 3.5 9.6 14.3 21.9 49.3
2020 1.5 5.8 10.2 20.8 38.3
2021 0.3 0.9 0.5 5.5 7.2
2022+ — — — 0.7 0.7
Total 5.3 16.3 25 48.9 95.5
% of Fleet 5.7% 8.3% 12.1% 14.5% 11.5%
Totals may not add due to rounding

Table of Contents
37
Typically, drybulk carriers are scrapped between the ages of 25 and 30 years, but the removal of 20-24 year-old vessels
is common during periods of freight market weakness, and there have also been examples of scrapping of 15-19 year-old vessels
(especially in the larger-sized vessels). In 2018, against the background of a generally firmer freight market, the average age of
Handysize and Handymax vessels scrapped was over 30 years, whereas for Panamax and Capesize vessels it was 24-25 years.
However, demolition is not simply a function of the fleet’s age profile. Several factors will influence an owner’s decision on
whether to scrap older vessels, notably (1) actual and anticipated returns from the charter market, (2) the relative running costs
and fuel-efficiency of the vessel, (3) prospective expenditure at classification society surveys (which, as well as general costs of
repair and maintenance can be impacted by new regulations, such as the International Maritime Organization’s convention on
Ballast Water Management, where effective implementation for existing vessels is now scheduled to enter into force in September
2019) and (4) the second-hand re-sale value (that is, whether it provides a premium to scrap). For much of the period from 2000
to 2009, returns from the drybulk charter markets supported continued investment in vessel life extension, and scrapping volumes
fell to minimal levels. This, however, ensured an accumulation of older tonnage in the fleet and, as a result, demolition proved
extremely responsive to a deterioration in freight market conditions. For instance, deletions from the drybulk fleet rose from 3.6

Table of Contents
38
Mdwt in 2008 to 14.7 Mdwt in 2009 and reached a new annual record of 35.4 Mdwt in 2012. Over the last five years, scrapping
volumes have remained very reactive to changes in vessel earnings with, for example, deletions dropping to a 10-year low of 4.8
Mdwt in 2018 from approximately 30.0 Mdwt p.a. in both 2015 and 2016.
The low levels of demolition in 2018 helped to ensure a net rise in the pool of drybulk tonnage aged over 15 years. At
the end of December 2018, there were approximately 17.0 Mdwt of ships aged 25 years or older in the drybulk carrier fleet, with
an additional 38.7 Mdwt aged 20 to 24 years and 63.3 Mdwt aged 15 to 19 years. The highest concentration of vessels 20+ years
old was in the Handysize sector, accounting for 12.3% of dwt capacity in this size range as of the end of December 2018,
compared with 7.1% of Handymaxes, 6.3% of Panamaxes and 5.2% of Capesizes.
As the chart below illustrates, historically high levels of ship demolition contributed to a marked slowdown in the rate
of drybulk carrier net fleet growth in 2015 and 2016 with the estimated 2.2% rise in 2016 representing the lowest annual
percentage increase since the 1990s. There was some re-acceleration in fleet supply growth in 2017 with an estimated net rise in
total drybulk tonnage of 3.0%, before edging lower to an estimated 2.9% between 1 January and 31 December 2018, despite the
limited scrapping activity. However, this remained well below the rapid rates of expansion over the five-year period from 2009
to 2013 when the total drybulk fleet grew at an annual average of 11.3% p.a.
All of the four main segments of the drybulk fleet grew at a similar rate in 2018, ranging from an estimated 2.3% for
Handysizes to 3.4% for Capesizes. A greater contrast is apparent when reviewing fleet developments over the period between
2013 and 2018, when the 10,000-39,999 dwt Handysize fleet grew at an estimated CAGR of 1.8%, compared with 4.5% for
40,000-64,999 dwt Handymaxes, 2.7% for 65,000-99,999 dwt Panamaxes and 2.7% for 100,000+ dwt Capes. Reflecting its faster
than average growth, the Handymax sector’s share of total dwt capacity has risen from 22.0% at the end of 2013 to an estimated
23.6% as of the end of December 2018. By comparison, the same five-year period saw a decreased share of the fleet accounted
for by Handysizes, falling from 11.8% to 11.1%, Panamaxes, from 25.3% to 24.9% and Capesizes, from 41.0% to 40.4%.
Charter Market & Freight Rates
The chartering of drybulk vessels can take several different forms, the most typical of which are summarized below.
(a) Single voyage (“spot”) charter
This involves the hire of a vessel for just one stipulated voyage, carrying a designated quantity of a named commodity. For most
such charters, an individual ship is specified that will carry out the voyage to be undertaken. The terms of the agreement between
the charterer and vessel owner usually define the port (or ports) of cargo loading and discharge, the dates between which the

Table of Contents
39
cargo is to be loaded, and the cargo-handling terms. The vessel owner will receive from the charterer a mutually agreed-upon
payment (normally quoted as a US$ per ton freight rate). In return, the ship owner pays all voyage expenses (such as the costs of
fuel consumed on the voyage, plus port expenses), all operating costs (such as insurance and crewing of the vessel), and capital
expenses (such as the servicing of any mortgage debt on the ship).
(b) Contract of affreightment, or COA
Under a COA, the vessel owner and charterer agree to terms for the carriage of a designated volume of a given commodity on a
specified route (or routes), with such shipments being carried out on a regular basis. The agreement does not normally identify
an individual ship that will be used to fulfill its terms, but includes more general specifications on the vessels to be used (such as
maximum age). Under the terms of a COA, freight is normally paid on a mutually agreed-upon US$ per ton basis, with the vessel
owner then meeting all voyage, operating and capital costs incurred in the execution of such a charter.
(c) Time charter
Under a time charter, the charterer takes the ship on hire for either (1) a trip between designated delivery and re-delivery positions
or (2) for a designated period (for example, 12 months). The freight rate agreed upon between the ship owner and charterer is in
terms of a daily hire rate (in U.S. dollars), rather than as a US$ per ton figure. For longer term period charters, this may escalate
at a rate mutually agreed upon between vessel owner and charterer. Under the terms of such charters, the vessel owner meets the
ship’s operating and capital costs, with the charterer paying all variable voyage expenses (mainly fuel costs, plus port and canal
dues). In addition, and unless otherwise stipulated in the charter agreement, the period charterer is able to trade the vessel to and
from whichever loading and discharge ports that it may choose, carrying whichever cargoes they prefer.
(d) Bareboat charter
Under a bareboat charter, the vessel owner effectively relinquishes control of its ship to the charterer (usually for a period of
several years). The ship owner receives an agreed-upon level of remuneration (which may again escalate at a mutually agreed-
upon rate) for the duration of the charter, and remains responsible for the vessel’s capital costs. In return, the charterer assumes
total control of the vessel, thereby becoming responsible for operating the ship and meeting all costs of such operation (such as
crewing, repairs and maintenance), as well as the direct voyage expenses incurred (such as fuel costs and port expenses) when it
is trading.
Freight Rates
Freight rates are determined by the balance of tonnage demand and tonnage supply. Primarily as the result of record
newbuilding deliveries, fleet utilization rates have dropped sharply from the peak levels of 2007, as illustrated by movements in
key freight market indicators.
Given the diversity of routes and cargoes traded by the drybulk fleet, freight market measures tend to focus on average
worldwide spot earnings (expressed in US$ per day). The most recognized of these measures are published on a daily basis by
the Baltic Exchange in London. In addition to global averages for standard designs of Handysize (28,000 dwt), Supramax (58,328
dwt), Panamax (74,000 dwt) and Capesize (180,000 dwt) vessels, together with a number of component routes, the Baltic
Exchange also publishes a daily composite Index for the entire drybulk market (the BDI or Baltic Exchange Dry Index).
From its all-time high of almost 12,000 points in May 2008, just prior to the global financial crisis, the BDI fell to below
700 points in December of the same year. After partial recovery in 2009, negative pressure on freight markets returned under the
weight of sustained fleet supply growth. At 920 points in 2012, the BDI’s annual average was a 26-year low. A combination of
sharply reduced fleet supply, generally slower vessel speeds and new peaks for dry bulk trade lifted the 2013 annual average of
the BDI to 1,206 points. Yet, despite continued spot market volatility, the corresponding 2014 level slipped to 1,105 points and
spot market weakness intensified in 2015, chiefly due to a sharp slowdown in drybulk trade growth, with the BDI’s annual
average falling to 718 points. This was followed by new daily, monthly and quarterly lows in the first quarter of 2016, when weak
global steel production, disruptions to cargo availability and lower bunker prices, together with negative seasonal factors, all

Table of Contents
40
contributed to the further weakening in the freight market. Despite a partial rebound over the rest of the year, the BDI’s annual
average in 2016 of 673 points was the lowest since its inception in 1985.
However, 2017 did see the first rise in the BDI’s annual average for four years, to 1,145 points, and this was followed
by further gains in 2018, when the annual average of 1,353 points was a 7-year high. Volatility remained a feature of drybulk
spot markets in 2018 with the BDI fluctuating between a low of 948 points and a high of 1,774 points. August proved to be the
strongest month of the year for the BDI for only the second time since its inception (but the second time in three years) with a
monthly average of 1,710 points, before slipping towards the end of 2018. Further falls in freight rates were recorded in the early
weeks of 2019, as dry bulk trade was impacted by a combination of negative seasonal, exceptional and cyclical factors. As a
result, the BDI slipped to its lowest levels since 2016 with a monthly average of 629 points in February 2019.
The first of the charts below traces developments in representative 12-month charter rates for the four main vessel sizes
from January 2003 to late February 2019, encompassing the all-time highs in vessel earnings and the subsequent slump in rates.
The second chart looks in more detail at developments since the beginning of 2013. It shows the Capesize-led rebound from mid-
2013 to the first quarter of 2014 and subsequent slide to the depressed levels in the first quarter of 2016 before the commencement
of a revival during the second half of 2016. This was followed by further increases in 2017 and 2018, which saw period rates rise
to their highest levels since 2014 before some softening towards the end of last year and into early 2019. These assessments are
based on existing modern (that is, under 10 years of age) vessels. Within these individual size ranges, period rates will vary
according to such factors as vessel age, size, fuel consumption and yard of build.
Although both charts show the extent to which vessel earnings in the different size ranges move broadly in tandem, they
also highlight that the sharpness of market rises and falls vary in degree. Those size groups that carry the narrowest range of
cargoes, or those employed on the least number of routes, tend to experience the greatest variations in charter rates. Hence, in the
drybulk shipping sector, earnings of Capesizes have been prone to fluctuate to a far greater degree than those of smaller vessels
(with their greater trading versatility, assisted by the cargo gear on these vessel types).

Table of Contents
41
Asset Values
In addition to the global balance between the demand for new vessels and available shipbuilding capacity, newbuilding
prices are also influenced by changes in vessel construction costs, due to such factors as movements in steel plate prices or
exchange rates against the U.S. dollar in key shipbuilding nations (principally China, Japan and South Korea).
Panamax bulk carrier newbuilding prices in Japan peaked at $56 million in the third quarter of 2008 and subsequently
fell to $29 million in the final quarter of 2012. By the end of 2013 Japanese prices had climbed to a 38-month high of $35 million,
chiefly as the result of recovering newbuilding demand, and remained at similar levels through much of 2014. However, prices
entered a downward trend in 2015 which continued into 2016 and, by the final quarter of that year, Japanese Panamax newbuilding
prices reached their lowest level since 2003 at an estimated $23.5 million. From these lows there was a sharp rebound in Japanese
prices to an estimated $33.0 million during the second half of 2018, which was the highest level in four years and has been
sustained into the first quarter of 2019.
Second-hand values are primarily shaped by actual and anticipated earnings, newbuilding replacement costs (which are
relevant for modern vessels) and residual scrap value (more relevant for older units). To an extent, prices are also influenced by
the availability and cost of ship financing, as this will help to determine whether investors are able to realize their demand for
new or second-hand vessels.
The charts below compare the development of representative newbuilding, five-year old and ten-year old second-hand
prices for Handysize, Handymax, Panamax and Capesize vessels since 2003. Individual vessel prices vary according to such
factors as specific size, age, cargo gear, yard of build and fuel consumption. Following the pattern of the charter markets, prices
peaked between mid-2007 and mid-2008. Such was the shortage of shipbuilding capacity during that period, with a lengthening
lead time between contracting and delivery, that demand for existing vessels with prompt delivery briefly created the unusual
situation where second-hand vessels were priced at a premium to newbuildings.
Consequently, the percentage decline in second-hand prices between 2008 and 2012 was more severe than for
newbuildings. Prices showed a firmer trend from the beginning of 2013 to March 2014, when five-year old values rose by an
average of approximately 50%, led by a 60-70% increase in Capesize prices. The onset of generally weaker spot and period
charter rates began to erode second-hand values during the latter months of 2014, and downward pressure intensified during
2015 and into 2016, sharply reducing prices. By the end of February 2016, Panamax five-year old prices of approximately
$11.0 million were at their lowest since the 1980s. However, from these lows, second-hand prices have shown a significant
improvement, with Panamax five-year old values reaching approximately $20.5 million at the end of 2017 and approximately
$22.5 million in June 2018, before ending the year at approximately $21.0 million. There were similar percentage movements

Table of Contents
42
in Supramax and Handysize five-year old prices over the same period, while Capesize values are estimated to have shown
smaller, but still substantial, percentage increases from the lows of 2016.

Table of Contents
43
Environmental and Other Regulations in the Shipping Industry
Government regulation and laws significantly affect the ownership and operation of our fleet. We are subject to
international conventions and treaties, national, state and local laws and regulations in force in the countries in which our vessels
may operate or are registered relating to safety and health and environmental protection including the storage, handling, emission,
transportation and discharge of hazardous and non-hazardous materials, and the remediation of contamination and liability for
damage to natural resources. Compliance with such laws, regulations and other requirements entails significant expense,
including vessel modifications and implementation of certain operating procedures.
A variety of government and private entities subject our vessels to both scheduled and unscheduled inspections. These
entities include the local port authorities (applicable national authorities such as the United States Coast Guard (“USCG”), harbor

Table of Contents
44
master or equivalent), classification societies, flag state administrations (countries of registry) and charterers, particularly terminal
operators. Certain of these entities require us to obtain permits, licenses, certificates and other authorizations for the operation of
our vessels. Failure to maintain necessary permits or approvals could require us to incur substantial costs or result in the temporary
suspension of the operation of one or more of our vessels.
Increasing environmental concerns have created a demand for vessels that conform to the stricter environmental
standards. We are required to maintain operating standards for all of our vessels that emphasize operational safety, quality
maintenance, continuous training of our officers and crews and compliance with United States and international regulations. We
believe that the operation of our vessels is in substantial compliance with applicable environmental laws and regulations and that
our vessels have all material permits, licenses, certificates or other authorizations necessary for the conduct of our operations.
However, because such laws and regulations frequently change and may impose increasingly stricter requirements, we cannot
predict the ultimate cost of complying with these requirements, or the impact of these requirements on the resale value or useful
lives of our vessels. In addition, a future serious marine incident that causes significant adverse environmental impact could result
in additional legislation or regulation that could negatively affect our profitability.
International Maritime Organization
The International Maritime Organization, the United Nations agency for maritime safety and the prevention of pollution
by vessels (the “IMO”), has adopted the International Convention for the Prevention of Pollution from Ships, 1973, as modified
by the Protocol of 1978 relating thereto, collectively referred to as MARPOL 73/78 and herein as “MARPOL,” adopted the
International Convention for the Safety of Life at Sea of 1974 (“SOLAS Convention”), and the International Convention on Load
Lines of 1966 (the “LL Convention”). MARPOL establishes environmental standards relating to oil leakage or spilling, garbage
management, sewage, air emissions, handling and disposal of noxious liquids and the handling of harmful substances in packaged
forms. MARPOL is applicable to drybulk, tanker and LNG carriers, among other vessels, and is broken into six Annexes, each
of which regulates a different source of pollution. Annex I relates to oil leakage or spilling; Annexes II and III relate to harmful
substances carried in bulk in liquid or in packaged form, respectively; Annexes IV and V relate to sewage and garbage
management, respectively; and Annex VI, lastly, relates to air emissions. Annex VI was separately adopted by the IMO in
September of 1997.
In 2013, the IMO’s Marine Environmental Protection Committee, or the “MEPC,” adopted a resolution amending
MARPOL Annex I Condition Assessment Scheme, or “CAS.” These amendments became effective on October 1, 2014, and
require compliance with the 2011 International Code on the Enhanced Programme of Inspections during Surveys of Bulk Carriers
and Oil Tankers, or “ESP Code,” which provides for enhanced inspection programs. We may need to make certain financial
expenditures to comply with these amendments.
In June 2015 the IMO formally adopted the International Code of Safety for Ships using Gases or Low flashpoint Fuels,
or the IGF Code, which is designed to minimize the risks involved with ships using low flashpoint fuels- including LNG. The
IGF Code will be mandatory under SOLAS through the adopted amendments. The IGF Code and the amendments to SOLAS
became effective January 1, 2017.
Air Emissions
In September of 1997, the IMO adopted Annex VI to MARPOL to address air pollution from vessels. Effective May
2005, Annex VI sets limits on sulfur oxide and nitrogen oxide emissions from all commercial vessel exhausts and prohibits
“deliberate emissions” of ozone depleting substances (such as halons and chlorofluorocarbons), emissions of volatile compounds
from cargo tanks, and the shipboard incineration of specific substances. Annex VI also includes a global cap on the sulfur content
of fuel oil and allows for special areas to be established with more stringent controls on sulfur emissions, as explained below.
Emissions of “volatile organic compounds” from certain vessels, and the shipboard incineration (from incinerators installed after
January 1, 2000) of certain substances (such as polychlorinated biphenyls, or PCBs) are also prohibited. We believe that all our
vessels are currently compliant in all material respects with these regulations.
The MEPC, adopted amendments to Annex VI regarding emissions of sulfur oxide, nitrogen oxide, particulate matter
and ozone depleting substances, which entered into force on July 1, 2010. The amended Annex VI seeks to further reduce air

Table of Contents
45
pollution by, among other things, implementing a progressive reduction of the amount of sulfur contained in any fuel oil used on
board ships. On October 27, 2016, at its 70th session, the MEPC agreed to implement a global 0.5% m/m sulfur oxide emissions
limit (reduced from 3.50%) starting from January 1, 2020. This limitation can be met by using low-sulfur complaint fuel oil,
alternative fuels, or certain exhaust gas cleaning systems. Once the cap becomes effective, ships will be required to obtain bunker
delivery notes and International Air Pollution Prevention (“IAPP”) Certificates from their flag states that specify sulfur content.
Additionally, at MEPC 73, amendments to Annex VI to prohibit the carriage of bunkers above 0.5% Sulphur on ships were
adopted and will take effect March 1, 2020. These regulations subject ocean-going vessels to stringent emissions controls, and
may cause us to incur substantial costs.
Sulfur content standards are even stricter within certain “Emission Control Areas,” or (“ECAs”). As of January 1, 2015,
ships operating within an ECA were not permitted to use fuel with sulfur content in excess of 0.1%. Amended Annex VI
establishes procedures for designating new ECAs. Currently, the IMO has designated four ECAs, including specified portions of
the Baltic Sea area, North Sea area, North American area and United States Caribbean area. Ocean-going vessels in these areas
will be subject to stringent emission controls and may cause us to incur additional costs. If other ECAs are approved by the IMO,
or other new or more stringent requirements relating to emissions from marine diesel engines or port operations by vessels are
adopted by the U.S. Environmental Protection Agency (“EPA”) or the states where we operate, compliance with these regulations
could entail significant capital expenditures or otherwise increase the costs of our operations.
Amended Annex VI also establishes new tiers of stringent nitrogen oxide emissions standards for marine diesel engines,
depending on their date of installation. At the MEPC meeting held from March to April 2014, amendments to Annex VI were
adopted which address the date on which Tier III Nitrogen Oxide (NOx) standards in ECAs will go into effect. Under the
amendments, Tier III NOx standards apply to ships that operate in the North American and U.S. Caribbean Sea ECAs designed
for the control of NOx with a marine diesel engine installed and constructed on or after January 1, 2016. Tier III requirements
could apply to areas that will be designated for Tier III NOx in the future. At MEPC 70 and MEPC 71, the MEPC approved the
North Sea and Baltic Sea as ECAs for nitrogen oxide for ships built after January 1, 2021. The EPA promulgated equivalent (and
in some senses stricter) emissions standards in late 2009. As a result of these designations or similar future designations, we may
be required to incur additional operating or other costs.
As determined at the MEPC 70, the new Regulation 22A of MARPOL Annex VI is effective as of March 1, 2018 and
requires ships above 5,000 gross tonnage to collect and report annual data on fuel oil consumption to an IMO database, with the
first year of data collection commencing on January 1, 2019. The IMO intends to use such data as the first step in its roadmap
(through 2023) for developing its strategy to reduce greenhouse gas emissions from ships, as discussed further below.
As of January 1, 2013, MARPOL made mandatory certain measures relating to energy efficiency for ships. All ships are
now required to develop and implement Ship Energy Efficiency Management Plans (“SEEMPS”), and new ships must be
designed in compliance with minimum energy efficiency levels per capacity mile as defined by the Energy Efficiency Design
Index (“EEDI”). Under these measures, by 2025, all new ships built will be 30% more energy efficient than those built in 2014.
We may incur costs to comply with these revised standards. Additional or new conventions, laws and regulations may
be adopted that could require the installation of expensive emission control systems and could adversely affect our business,
results of operations, cash flows and financial condition.
Safety Management System Requirements
The SOLAS Convention was amended to address the safe manning of vessels and emergency training drills. The
Convention of Limitation of Liability for Maritime Claims (the “LLMC”) sets limitations of liability for a loss of life or personal
injury claim or a property claim against ship owners. We believe that our vessels are in substantial compliance with SOLAS and
LL Convention standards.
Under Chapter IX of the SOLAS Convention, or the International Safety Management Code for the Safe Operation of
Ships and for Pollution Prevention (the “ISM Code”), our operations are also subject to environmental standards and
requirements. The ISM Code requires the party with operational control of a vessel to develop an extensive safety management
system that includes, among other things, the adoption of a safety and environmental protection policy setting forth instructions

Table of Contents
46
and procedures for operating its vessels safely and describing procedures for responding to emergencies. We rely upon the safety
management system that we and our technical management team have developed for compliance with the ISM Code. The failure
of a vessel owner or bareboat charterer to comply with the ISM Code may subject such party to increased liability, may decrease
available insurance coverage for the affected vessels and may result in a denial of access to, or detention in, certain ports.
The ISM Code requires that vessel operators obtain a safety management certificate for each vessel they operate. This
certificate evidences compliance by a vessel’s management with the ISM Code requirements for a safety management system.
No vessel can obtain a safety management certificate unless its manager has been awarded a document of compliance, issued by
each flag state, under the ISM Code. We have obtained applicable documents of compliance for our offices and safety
management certificates for all of our vessels for which the certificates are required by the IMO. The document of compliance
and safety management certificate are renewed as required.
Regulation II-1/3-10 of the SOLAS Convention governs ship construction and stipulates that ships over 150 meters in
length must have adequate strength, integrity and stability to minimize risk of loss or pollution. Goal-based standards amendments
in SOLAS regulation II-1/3-10 entered into force in 2012, with July 1, 2016 set for application to new oil tankers and bulk
carriers. The SOLAS Convention regulation II-1/3-10 on goal-based ship construction standards for bulk carriers and oil tankers,
which entered into force on January 1, 2012, requires that all oil tankers and bulk carriers of 150 meters in length and above, for
which the building contract is placed on or after July 1, 2016, satisfy applicable structural requirements conforming to the
functional requirements of the International Goal-based Ship Construction Standards for Bulk Carriers and Oil Tankers (GBS
Standards).
Amendments to the SOLAS Convention Chapter VII apply to vessels transporting dangerous goods and require those
vessels be in compliance with the International Maritime Dangerous Goods Code (“IMDG Code”). Effective January 1, 2018,
the IMDG Code includes (1) updates to the provisions for radioactive material, reflecting the latest provisions from the
International Atomic Energy Agency, (2) new marking, packing and classification requirements for dangerous goods, and (3)
new mandatory training requirements.
The IMO has also adopted the International Convention on Standards of Training, Certification and Watchkeeping for
Seafarers (“STCW”). As of February 2017, all seafarers are required to meet the STCW standards and be in possession of a valid
STCW certificate. Flag states that have ratified SOLAS and STCW generally employ the classification societies, which have
incorporated SOLAS and STCW requirements into their class rules, to undertake surveys to confirm compliance.
The IMO's Maritime Safety Committee and MEPC, respectively, each adopted relevant parts of the International Code
for Ships Operating in Polar Water (the “Polar Code”). The Polar Code, which entered into force on January 1, 2017, covers
design, construction, equipment, operational, training, search and rescue as well as environmental protection matters relevant to
ships operating in the waters surrounding the two poles. It also includes mandatory measures regarding safety and pollution
prevention as well as recommendatory provisions. The Polar Code applies to new ships constructed after January 1, 2017, and
after January 1, 2018, ships constructed before January 1, 2017 are required to meet the relevant requirements by the earlier of
their first intermediate or renewal survey.
Furthermore, recent action by the IMO’s Maritime Safety Committee and United States agencies indicate that
cybersecurity regulations for the maritime industry are likely to be further developed in the near future in an attempt to combat
cybersecurity threats. For example, cyber-risk management systems must be incorporated by ship-owners and managers by 2021.
This might cause companies to create additional procedures for monitoring cybersecurity, which could require additional
expenses and/or capital expenditures. The impact of such regulations is hard to predict at this time.
Pollution Control and Liability Requirements
The IMO has negotiated international conventions that impose liability for pollution in international waters and the
territorial waters of the signatories to such conventions. For example, the IMO adopted an International Convention for the
Control and Management of Ships’ Ballast Water and Sediments (the “BWM Convention”) in 2004. The BWM Convention
entered into force on September 9, 2017. The BWM Convention requires ships to manage their ballast water to remove, render
harmless, or avoid the uptake or discharge of new or invasive aquatic organisms and pathogens within ballast water and sediments.

Table of Contents
47
The BWM Convention’s implementing regulations call for a phased introduction of mandatory ballast water exchange
requirements, to be replaced in time with mandatory concentration limits, and require all ships to carry a ballast water record
book and an international ballast Water management certificate.
On December 4, 2013, the IMO Assembly passed a resolution revising the application dates of BWM Convention so
that the dates are triggered by the entry into force date and not the dates originally in the BWM Convention. This, in effect,
makes all vessels delivered before the entry into force date “existing vessels” and allows for the installation of ballast water
management systems on such vessels at the first International Oil Pollution Prevention (IOPP) renewal survey following entry
into force of the convention. The MEPC adopted updated guidelines for approval of ballast water management systems (G8) at
MEPC 70. At MEPC 71, the schedule regarding the BWM Convention’s implementation dates was also discussed and
amendments were introduced to extend the date existing vessels are subject to certain ballast water standards. Ships over 400
gross tons generally must comply with a “D-1 standard,” requiring the exchange of ballast water only in open seas and away
from coastal waters. The “D-2 standard” specifies the maximum amount of viable organisms allowed to be discharged, and
compliance dates vary depending on the IOPP renewal dates. Depending on the date of the IOPP renewal survey, existing vessels
must comply with the D-2 standard on or after September 8, 2019. For most ships, compliance with the D-2 standard will involve
installing on-board systems to treat ballast water and eliminate unwanted organisms. Ballast Water Management systems, which
include systems that make use of chemical, biocides, organisms or biological mechanisms, or which alter the chemical or physical
characteristics of the Ballast Water, must be approved in accordance with IMO Guidelines (Regulation D-3). Costs of compliance
with these regulations may be substantial.
Once mid-ocean ballast exchange ballast water treatment requirements become mandatory under the BWM Convention,
the cost of compliance could increase for ocean carriers and may have a material effect on our operations. However, many
countries already regulate the discharge of ballast water carried by vessels from country to country to prevent the introduction of
invasive and harmful species via such discharges. The U.S., for example, requires vessels entering its waters from another country
to conduct mid-ocean ballast exchange, or undertake some alternate measure, and to comply with certain reporting requirements.
The IMO also adopted the International Convention on Civil Liability for Bunker Oil Pollution Damage (the “Bunker
Convention”) to impose strict liability on ship owners (including the registered owner, bareboat charterer, manager or operator)
for pollution damage in jurisdictional waters of ratifying states caused by discharges of bunker fuel. The Bunker Convention
requires registered owners of ships over 1,000 gross tons to maintain insurance for pollution damage in an amount equal to the
limits of liability under the applicable national or international limitation regime (but not exceeding the amount calculated in
accordance with the LLMC). With respect to non-ratifying states, liability for spills or releases of oil carried as fuel in ship’s
bunkers typically is determined by the national or other domestic laws in the jurisdiction where the events or damages occur.
Ships are required to maintain a certificate attesting that they maintain adequate insurance to cover an incident. In
jurisdictions, such as the United States where the Bunker Convention has not been adopted, various legislative schemes or
common law govern, and liability is imposed either on the basis of fault or on a strict-liability basis.
Anti-Fouling Requirements
In 2001, the IMO adopted the International Convention on the Control of Harmful Anti-fouling Systems on Ships, or
the “Anti-fouling Convention.” The Anti-fouling Convention, which entered into force on September 17, 2008, prohibits the use
of organotin compound coatings to prevent the attachment of mollusks and other sea life to the hulls of vessels. Vessels of over
400 gross tons engaged in international voyages will also be required to undergo an initial survey before the vessel is put into
service or before an International Anti-fouling System Certificate is issued for the first time; and subsequent surveys when the
anti-fouling systems are altered or replaced. We have obtained Anti-fouling System Certificates for all of our vessels that are
subject to the Anti-fouling Convention.
Compliance Enforcement
Noncompliance with the ISM Code or other IMO regulations may subject the ship owner or bareboat charterer to
increased liability, may lead to decreases in available insurance coverage for affected vessels and may result in the denial of
access to, or detention in, some ports. The USCG and European Union authorities have indicated that vessels not in compliance

Table of Contents
48
with the ISM Code by applicable deadlines will be prohibited from trading in U.S. and European Union ports, respectively. As
of the date of this report, each of our vessels is ISM Code certified. However, there can be no assurance that such certificates will
be maintained in the future. The IMO continues to review and introduce new regulations. It is impossible to predict what
additional regulations, if any, may be passed by the IMO and what effect, if any, such regulations might have on our operations.
United States Regulations
The U.S. Oil Pollution Act of 1990 and the Comprehensive Environmental Response, Compensation and Liability Act
The U.S. Oil Pollution Act of 1990 (“OPA”) established an extensive regulatory and liability regime for the protection
and cleanup of the environment from oil spills. OPA affects all “owners and operators” whose vessels trade or operate within the
U.S., its territories and possessions or whose vessels operate in U.S. waters, which includes the U.S.’s territorial sea and its 200
nautical mile exclusive economic zone around the U.S. The U.S. has also enacted the Comprehensive Environmental Response,
Compensation and Liability Act (“CERCLA”), which applies to the discharge of hazardous substances other than oil, except in
limited circumstances, whether on land or at sea. OPA and CERCLA both define “owner and operator” in the case of a vessel as
any person owning, operating or chartering by demise, the vessel. Both OPA and CERCLA impact our operations.
Under OPA, vessel owners and operators are “responsible parties” and are jointly, severally and strictly liable (unless
the spill results solely from the act or omission of a third party, an act of God or an act of war) for all containment and clean-up
costs and other damages arising from discharges or threatened discharges of oil from their vessels, including bunkers (fuel). OPA
defines these other damages broadly to include:
(i) injury to, destruction or loss of, or loss of use of, natural resources and related assessment costs;
(ii) injury to, or economic losses resulting from, the destruction of real and personal property;
(iv) loss of subsistence use of natural resources that are injured, destroyed or lost;
(iii) net loss of taxes, royalties, rents, fees or net profit revenues resulting from injury, destruction or loss of real or
personal property, or natural resources;
(v) lost profits or impairment of earning capacity due to injury, destruction or loss of real or personal property or
natural resources; and
(vi) net cost of increased or additional public services necessitated by removal activities following a discharge of
oil, such as protection from fire, safety or health hazards, and loss of subsistence use of natural resources.
OPA contains statutory caps on liability and damages; such caps do not apply to direct cleanup costs. Effective
December 21, 2015, the USCG adjusted the limits of OPA liability for non-tank vessels, edible oil tank vessels, and any oil spill
response vessels, to the greater of $1,100 per gross ton or $939,800 (subject to periodic adjustment for inflation). These limits of
liability do not apply if an incident was proximately caused by the violation of an applicable U.S. federal safety, construction or
operating regulation by a responsible party (or its agent, employee or a person acting pursuant to a contractual relationship), or a
responsible party's gross negligence or willful misconduct. The limitation on liability similarly does not apply if the responsible
party fails or refuses to (i) report the incident where the responsible party knows or has reason to know of the incident; (ii)
reasonably cooperate and assist as requested in connection with oil removal activities; or (iii) without sufficient cause, comply
with an order issued under the Federal Water Pollution Act (Section 311 (c), (e)) or the Intervention on the High Seas Act.
CERCLA contains a similar liability regime whereby owners and operators of vessels are liable for cleanup, removal
and remedial costs, as well as damages for injury to, or destruction or loss of, natural resources, including the reasonable costs
associated with assessing same, and health assessments or health effects studies. There is no liability if the discharge of a
hazardous substance results solely from the act or omission of a third party, an act of God or an act of war. Liability under
CERCLA is limited to the greater of $300 per gross ton or $5.0 million for vessels carrying a hazardous substance as cargo and
the greater of $300 per gross ton or $500,000 for any other vessel. These limits do not apply (rendering the responsible person
liable for the total cost of response and damages) if the release or threat of release of a hazardous substance resulted from willful

Table of Contents
49
misconduct or negligence, or the primary cause of the release was a violation of applicable safety, construction or operating
standards or regulations. The limitation on liability also does not apply if the responsible person fails or refused to provide all
reasonable cooperation and assistance as requested in connection with response activities where the vessel is subject to OPA.
OPA and CERCLA each preserve the right to recover damages under existing law, including maritime tort law. OPA
and CERCLA both require owners and operators of vessels to establish and maintain with the USCG evidence of financial
responsibility sufficient to meet the maximum amount of liability to which the particular responsible person may be subject.
Vessel owners and operators may satisfy their financial responsibility obligations by providing a proof of insurance, a surety
bond, qualification as a self-insurer or a guarantee. We comply with the USCG’s financial responsibility regulations by providing
applicable certificates of financial responsibility.
The 2010 Deepwater Horizon oil spill in the Gulf of Mexico resulted in additional regulatory initiatives or statutes,
including higher liability caps under OPA, new regulations regarding offshore oil and gas drilling, and a pilot inspection program
for offshore facilities. However, several of these initiatives and regulations have been or may be revised. For example, the U.S.
Bureau of Safety and Environmental Enforcement’s (“BSEE”) revised Production Safety Systems Rule (“PSSR”), effective
December 27, 2018, modified and relaxed certain environmental and safety protections under the 2016 PSSR. Additionally, the
BSEE released proposed changes to the Well Control Rule, which could roll back certain reforms regarding the safety of drilling
operations, and the U.S. President proposed leasing new sections of U.S. waters to oil and gas companies for offshore drilling,
expanding the U.S. waters that are available for such activity over the next five years. The effects of these proposals are currently
unknown. Compliance with any new requirements of OPA and future legislation or regulations applicable to the operation of our
vessels could impact the cost of our operations and adversely affect our business.
OPA specifically permits individual states to impose their own liability regimes with regard to oil pollution incidents
occurring within their boundaries, provided they accept, at a minimum, the levels of liability established under OPA and some
states have enacted legislation providing for unlimited liability for oil spills. Many U.S. states that border a navigable waterway
have enacted environmental pollution laws that impose strict liability on a person for removal costs and damages resulting from
a discharge of oil or a release of a hazardous substance. These laws may be more stringent than U.S. federal law. Moreover,
some states have enacted legislation providing for unlimited liability for discharge of pollutants within their waters, although in
some cases, states which have enacted this type of legislation have not yet issued implementing regulations defining vessel
owners’ responsibilities under these laws. We intend to comply with all applicable state regulations in the ports where the our
vessels call.
We currently maintain pollution liability coverage insurance in the amount of $1.0 billion per incident for each of our
vessels. If the damages from a catastrophic spill were to exceed our insurance coverage, it could have an adverse effect on our
business and results of operation.
Other United States Environmental Initiatives
The U.S. Clean Air Act of 1970 (including its amendments of 1977 and 1990) (“CAA”) requires the EPA to promulgate
standards applicable to emissions of volatile organic compounds and other air contaminants. The CAA requires states to adopt
State Implementation Plans, or SIPs, some of which regulate emissions resulting from vessel loading and unloading operations
which may affect our vessels.
The U.S. Clean Water Act (“CWA”) prohibits the discharge of oil, hazardous substances and ballast water in U.S.
navigable waters unless authorized by a duly-issued permit or exemption, and imposes strict liability in the form of penalties for
any unauthorized discharges. The CWA also imposes substantial liability for the costs of removal, remediation and damages and
complements the remedies available under OPA and CERCLA. In 2015, the EPA expanded the definition of “waters of the United
States” (“WOTUS”), thereby expanding federal authority under the CWA. Following litigation on the revised WOTUS rule, in
December 2018, the EPA and Department of the Army proposed a revised, limited definition of “waters of the United States.”
The effect of this proposal on U.S. environmental regulations is still unknown.
The EPA and the USCG have also enacted rules relating to ballast water discharge, compliance with which requires the
installation of equipment on our vessels to treat ballast water before it is discharged or the implementation of other port facility

Table of Contents
50
disposal arrangements or procedures at potentially substantial costs, and/or otherwise restrict our vessels from entering U.S.
Waters. The EPA will regulate these ballast water discharges and other discharges incidental to the normal operation of certain
vessels within United States waters pursuant to the Vessel Incidental Discharge Act (“VIDA”), which was signed into law on
December 4, 2018 and will replace the 2013 Vessel General Permit (“VGP”) program (which authorizes discharges incidental to
operations of commercial vessels and contains numeric ballast water discharge limits for most vessels to reduce the risk of
invasive species in U.S. waters, stringent requirements for scrubbers, and requirements for the use of environmentally acceptable
lubricants) and current Coast Guard ballast water management regulations adopted under the U.S. National Invasive Species Act
(“NISA”), such as mid-ocean ballast exchange programs and installation of approved USCG technology. VIDA establishes a
new framework for the regulation of vessel incidental discharges under Clean Water Act (CWA), requires the EPA to develop
performance standards for those discharges within two years of enactment, and requires the U.S. Coast Guard to develop
implementation, compliance, and enforcement regulations within two years of EPA’s promulgation of standards. Under VIDA,
all provisions of the 2013 VPG and USCG regulations regarding ballast water treatment remain in force and effect until the EPA
and U.S. Coast Guard regulations are finalized. Non-military, non-recreational vessels greater than 79 feet in length must
continue to comply with the requirements of the VGP, including submission of a Notice of Intent (“NOI”) or retention of a PARI
form and submission of annual reports. We have submitted NOIs for our vessels where required. Compliance with the EPA, U.S.
Coast Guard and state regulations could require the installation of ballast water treatment equipment on our vessels or the
implementation of other port facility disposal procedures at potentially substantial cost, or may otherwise restrict our vessels
from entering U.S. waters.
European Union Regulations
In October 2009, the European Union amended a directive to impose criminal sanctions for illicit ship-source discharges
of polluting substances, including minor discharges, if committed with intent, recklessly or with serious negligence and the
discharges individually or in the aggregate result in deterioration of the quality of water. Aiding and abetting the discharge of a
polluting substance may also lead to criminal penalties. The directive applies to all types of vessels, irrespective of their flag, but
certain exceptions apply to warships or where human safety or that of the ship is in danger. Criminal liability for pollution may
result in substantial penalties or fines and increased civil liability claims. Regulation (EU) 2015/757 of the European Parliament
and of the Council of 29 April 2015 (amending EU Directive 2009/16/EC) governs the monitoring, reporting and verification of
carbon dioxide emissions from maritime transport, and, subject to some exclusions, requires companies with ships over 5,000
gross tonnage to monitor and report carbon dioxide emissions annually starting on January 1, 2018, which may cause us to incur
additional expenses.
The European Union has adopted several regulations and directives requiring, among other things, more frequent
inspections of high-risk ships, as determined by type, age, and flag as well as the number of times the ship has been detained.
The European Union also adopted and extended a ban on substandard ships and enacted a minimum ban period and a definitive
ban for repeated offenses. The regulation also provided the European Union with greater authority and control over classification
societies, by imposing more requirements on classification societies and providing for fines or penalty payments for organizations
that failed to comply. Furthermore, the EU has implemented regulations requiring vessels to use reduced sulfur content fuel for
their main and auxiliary engines. The EU Directive 2005/33/EC (amending Directive 1999/32/EC) introduced requirements
parallel to those in Annex VI relating to the sulfur content of marine fuels. In addition, the EU imposed a 0.1% maximum sulfur
requirement for fuel used by ships at berth in EU ports.
Greenhouse Gas Regulation
Currently, the emissions of greenhouse gases from international shipping are not subject to the Kyoto Protocol to the
United Nations Framework Convention on Climate Change, which entered into force in 2005 and pursuant to which adopting
countries have been required to implement national programs to reduce greenhouse gas emissions with targets extended through
2020. International negotiations are continuing with respect to a successor to the Kyoto Protocol, and restrictions on shipping
emissions may be included in any new treaty. In December 2009, more than 27 nations, including the U.S. and China, signed the
Copenhagen Accord, which includes a non-binding commitment to reduce greenhouse gas emissions. The 2015 United Nations
Climate Change Conference in Paris resulted in the Paris Agreement, which entered into force on November 4, 2016 and does
not directly limit greenhouse gas emissions from ships. On June 1, 2017, the U.S. President announced that the United States
Table of Contents
51
intends to withdraw from the Paris Agreement. The timing and effect of such action has yet to be determined, but the Paris
Agreement provides for a four-year exit process.
At MEPC 70 and MEPC 71, a draft outline of the structure of the initial strategy for developing a comprehensive IMO
strategy on reduction of greenhouse gas emissions from ships was approved. In accordance with this roadmap, in April 2018,
nations at the MEPC 72 adopted an initial strategy to reduce greenhouse gas emissions from ships. The initial strategy identifies
“levels of ambition” to reducing greenhouse gas emissions, including (1) decreasing the carbon intensity from ships through
implementation of further phases of the EEDI for new ships; (2) reducing carbon dioxide emissions per transport work, as an
average across international shipping, by at least 40% by 2030, pursuing efforts towards 70% by 2050, compared to 2008; and
(3) reducing the total annual greenhouse emissions by at least 50% by 2050 compared to 2008 while pursuing efforts towards
phasing them out entirely. The initial strategy notes that technological innovation, alternative fuels and/or energy sources for
international shipping will be integral to achieve the overall ambition. These regulations could cause us to incur additional
substantial expenses.
The EU made a unilateral commitment to reduce overall greenhouse gas emissions from its member states from 20% of
1990 levels by 2020. The EU also committed to reduce its emissions by 20% under the Kyoto Protocol’s second period from
2013 to 2020. Starting in January 2018, large ships calling at EU ports are required to collect and publish data on carbon dioxide
emissions and other information.
In the United States, the EPA issued a finding that greenhouse gases endanger the public health and safety, adopted
regulations to limit greenhouse gas emissions from certain mobile sources, and proposed regulations to limit greenhouse gas
emissions from large stationary sources. However, in March 2017, the U.S. President signed an executive order to review and
possibly eliminate the EPA’s plan to cut greenhouse gas emissions. The EPA or individual U.S. states could enact environmental
regulations that would affect our operations.
Any passage of climate control legislation or other regulatory initiatives by the IMO, the EU, the U.S. or other countries
where we operate, or any treaty adopted at the international level to succeed the Kyoto Protocol or Paris Agreement, that restricts
emissions of greenhouse gases could require us to make significant financial expenditures which we cannot predict with certainty
at this time. Even in the absence of climate control legislation, our business may be indirectly affected to the extent that climate
change may result in sea level changes or certain weather events.
International Labour Organization
The International Labor Organization (the “ILO”) is a specialized agency of the UN that has adopted the Maritime Labor
Convention 2006 (“MLC 2006”). A Maritime Labor Certificate and a Declaration of Maritime Labor Compliance is required to
ensure compliance with the MLC 2006 for all ships above 500 gross tons in international trade. We believe that all our vessels
are in substantial compliance with and are certified to meet MLC 2006.
Vessel Security Regulations
Since the terrorist attacks of September 11, 2001 in the United States, there have been a variety of initiatives intended
to enhance vessel security such as the U.S. Maritime Transportation Security Act of 2002 (“MTSA”). To implement certain
portions of the MTSA, the USCG issued regulations requiring the implementation of certain security requirements aboard vessels
operating in waters subject to the jurisdiction of the United States and at certain ports and facilities, some of which are regulated
by the EPA.
Similarly, Chapter XI-2 of the SOLAS Convention imposes detailed security obligations on vessels and port authorities
and mandates compliance with the International Ship and Port Facilities Security Code (“the ISPS Code”). The ISPS Code is
designed to enhance the security of ports and ships against terrorism. To trade internationally, a vessel must attain an International
Ship Security Certificate (“ISSC”) from a recognized security organization approved by the vessel’s flag state. Ships operating
without a valid certificate may be detained, expelled from, or refused entry at port until they obtain an ISSC. The various
requirements, some of which are found in the SOLAS Convention, include, for example, on-board installation of automatic
identification systems to provide a means for the automatic transmission of safety-related information from among similarly

Table of Contents
52
equipped ships and shore stations, including information on a ship’s identity, position, course, speed and navigational status; on-
board installation of ship security alert systems, which do not sound on the vessel but only alert the authorities on shore; the
development of vessel security plans; ship identification number to be permanently marked on a vessel’s hull; a continuous
synopsis record kept onboard showing a vessel's history including the name of the ship, the state whose flag the ship is entitled
to fly, the date on which the ship was registered with that state, the ship's identification number, the port at which the ship is
registered and the name of the registered owner(s) and their registered address; and compliance with flag state security
certification requirements.
The USCG regulations, intended to align with international maritime security standards, exempt non-U.S. vessels from
MTSA vessel security measures, provided such vessels have on board a valid ISSC that attests to the vessel’s compliance with
the SOLAS Convention security requirements and the ISPS Code. Future security measures could have a significant financial
impact on us. We intend to comply with the various security measures addressed by MTSA, the SOLAS Convention and the
ISPS Code.
Inspection by Classification Societies
The hull and machinery of every commercial vessel must be classed by a classification society authorized by its country
of registry. The classification society certifies that a vessel is safe and seaworthy in accordance with the applicable rules and
regulations of the country of registry of the vessel and SOLAS. Most insurance underwriters make it a condition for insurance
coverage and lending that a vessel be certified “in class” by a classification society which is a member of the International
Association of Classification Societies, the IACS. The IACS has adopted harmonized Common Structural Rules, or the Rules,
which apply to oil tankers and bulk carriers constructed on or after July 1, 2015. The Rules attempt to create a level of consistency
between IACS Societies. All our vessels will be certified as being “in class” by the American Bureau of Shipping, or ABS, and
Det Norske Veritas, or DNV, major classification societies. All new and secondhand vessels that we acquire must be certified
prior to their delivery under our standard purchase contracts and memorandum of agreement. If the vessel is not certified on the
date of closing, we have no obligation to take delivery of the vessel.
A vessel must undergo annual surveys, intermediate surveys, drydockings and special surveys. In lieu of a special survey,
a vessel’s machinery may be on a continuous survey cycle, under which the machinery would be surveyed periodically over a
five-year period. Every vessel is also required to be drydocked every 30 to 36 months for inspection of the underwater parts of
the vessel. If any vessel does not maintain its class and/or fails any annual survey, intermediate survey, drydocking or special
survey, the vessel will be unable to carry cargo between ports and will be unemployable and uninsurable which could cause us
to be in violation of certain covenants in our loan agreements. Any such inability to carry cargo or be employed, or any such
violation of covenants, could have a material adverse impact on our financial condition and results of operations.
Risk of Loss and Liability Insurance
General
The operation of any cargo vessel includes risks such as mechanical failure, physical damage, collision, property loss,
cargo loss or damage and business interruption due to political circumstances in foreign countries, piracy incidents, hostilities
and labor strikes. In addition, there is always an inherent possibility of marine disaster, including oil spills and other
environmental mishaps, and the liabilities arising from owning and operating vessels in international trade. OPA, which imposes
near unlimited liability upon shipowners, operators and bareboat charterers of any vessel trading in the exclusive economic zone
of the United States for certain oil pollution accidents in the United States, has made liability insurance more expensive for
shipowners and operators trading in the United States market. We carry insurance coverage as customary in the shipping industry.
However, not all risks can be insured, specific claims may be rejected, and we might not be always able to obtain adequate
insurance coverage at reasonable rates.
Hull and Machinery Insurance
We maintain marine hull and machinery and war risks insurance, which will include the risk of partial, actual or
constructive total loss, for all of our vessels. Each of our vessels is covered up to at least fair market value with deductibles of

Table of Contents
53
$100,000-$150,000 per vessel per incident. We also maintain increased value coverage for most of our vessels. Under this
increased value coverage, in the event of total loss of a vessel, we will be able to recover the sum insured under the increased
value policy in addition to the sum insured under the hull and machinery policy. Increased value insurance also covers excess
liabilities which are not recoverable under our hull and machinery policy by reason of under insurance. Under our war risks
coverage a total loss would also be paid in the event a vessel were confiscated or detained by unauthorized persons. We generally
do not maintain insurance against loss of hire (except for certain charters for which we consider it appropriate), which covers
business interruptions that result in the loss of use of a vessel.
Protection and Indemnity Insurance
Protection and indemnity insurance is provided by mutual protection and indemnity associations, or P&I Associations,
and covers our third-party liabilities in connection with our shipping activities. This includes third-party liability and other related
expenses of injury or death of crew, passengers and other third parties, loss or damage to cargo, claims arising from collisions
with other vessels, damage to other third-party property, pollution arising from oil or other substances, and salvage, towing and
other related costs, including wreck removal. Protection and indemnity insurance is a form of mutual indemnity insurance,
extended by protection and indemnity mutual associations, or “clubs.” Our coverage is limited to approximately $8.0 billion,
except for pollution which is limited to $1.0 billion. If pollution liability costs are greater than $1.0 billion, the International Oil
Pollution Funds would be expected to be utilized.
Our current protection and indemnity insurance coverage for pollution is $1 billion per vessel per incident. The 13 P&I
Associations that comprise the International Group insure approximately 90% of the world’s commercial tonnage and have
entered into a pooling agreement to reinsure each association’s liabilities. The International Group’s website states that the Pool
provides a mechanism for sharing all claims in excess of $10 million up to, currently, approximately US$ 8.2 billion. As a
member of a P&I Association, which is a member of the International Group, we are subject to calls payable to the associations
based on our claim records as well as the claim records of all other members of the individual associations and members of the
shipping pool of P&I Associations comprising the International Group.
Permits and Authorizations
We are required by various governmental and quasi-governmental agencies to obtain certain permits, licenses and
certificates with respect to our vessels. The kinds of permits, licenses and certificates required depend upon several factors,
including the commodity transported, the waters in which the vessel operates, the nationality of the vessel’s crew and the age of
a vessel. We believe that we have obtained all permits, licenses and certificates currently required to permit our vessels to operate.
Additional laws and regulations, environmental or otherwise, may be adopted which could limit our ability to do business or
increase the cost of us doing business.
C. Organizational Structure
Scorpio Bulkers Inc. is a company incorporated under the laws of the Marshall Islands. We own our vessels through
separate wholly-owned subsidiaries that are incorporated in the Marshall Islands. Please see Exhibit 8.1 to this annual report for
a list of our current subsidiaries.
D. Property, Plants and Equipment
Our only material physical assets consist of our vessels which are owned through our separate wholly owned
subsidiaries.
For a description of our fleet, see “Item 4. Information on the Company—B. Business Overview—Our Fleet.”
ITEM 4A. UNRESOLVED STAFF COMMENTS
None.

Table of Contents
54
ITEM 5. OPERATING AND FINANCIAL REVIEW AND PROSPECTS
A. Operating Results
The following presentation of management’s discussion and analysis of results of operations and financial condition
should be read in conjunction with our consolidated financial statements, including the notes thereto.
Overview
We are an international shipping company that owns and operates the latest generation of newbuilding drybulk carriers
with fuel-efficient specifications and carrying capacities of greater than 30,000 dwt. All of our owned vessels have carrying
capacities of greater than 60,000 dwt. Our vessels transport a broad range of major and minor bulk commodities, including ores,
coal, grains, and fertilizers, along worldwide shipping routes, and are employed primarily in the spot market or in spot market-
oriented pools of similarly sized vessels.
We are organized by vessel type into two operating segments:
• Ultramax Operations: includes vessels ranging from approximately 60,200 dwt to 64,000 dwt.
• Kamsarmax Operations: includes vessels ranging from approximately 82,000 dwt to 84,000 dwt.
Certain of the corporate general and administrative and financial expenses incurred by us are not attributable to any
specific segment. Accordingly, these costs are not allocated to any of our segments and are included in the results below as
“Corporate.”
We generate revenues by charging customers for the transportation of their drybulk cargoes using our vessels.
Historically, these services generally have been provided under the following basic types of contractual relationships:
• Commercial Pools, whereby we participate with other shipowners to operate a large number of vessels as an integrated
transportation system, which offers customers greater flexibility and a higher level of service while achieving scheduling
efficiencies. Pools negotiate charters primarily in the spot market but may also arrange time charter agreements. The
size and scope of these pools enable them to enhance utilization rates for pool vessels by securing backhaul voyages and
COAs (described below), thus generating higher effective TCE revenues than otherwise might be obtainable in the spot
market.
• Voyage charters, which are charters for short intervals that are priced on current, or “spot,” market rates.
• Time charters, which are chartered to customers for a fixed period of time at rates that are generally fixed, but may
contain a variable component based on inflation, interest rates, or current market rates.
• For all of our vessels in contractual relationships, we are responsible for crewing and other vessel operating costs for
our owned or finance leased vessels and the charterhire expense for vessels that we time charter-in.

Table of Contents
55
The table below illustrates the primary distinctions among these different employment arrangements:
Voyage Charter Time Charter Commercial Pool
Typical contract length Single voyage One year or more Varies
Hire rate basis Varies Daily Varies
Voyage expenses We pay Customer pays Pool pays
Vessel operating costs for owned vessels We pay We pay We pay
Charterhire expense for vessels chartered-in We pay We pay We pay
Off-hire Customer does not pay Customer does not pay Pool does not pay
During 2018, and as of the date of this annual report, all of our owned, finance leased and time chartered-in vessels are
operating in the Scorpio Pools.
Important Financial and Operational Terms and Concepts
We use a variety of financial and operational terms and concepts. These include the following:
Hire rate. The basic payment from the charterer for the use of the vessel.
Vessel revenues. Vessel revenues primarily include revenues from time charters, pool revenues and voyage charters.
Vessel revenues are affected by hire rates and the number of days a vessel operates. Vessel revenues are also affected by the mix
of business between vessels on time charter, vessels in pools and vessels operating on voyage charter. Revenues from vessels in
pools and on voyage charter are more volatile, as they are typically tied to prevailing market rates.
Voyage charters. Voyage charters or spot voyages are charters under which the customer pays a transportation charge
for the movement of a specific cargo between two or more specified ports. We pay all of the voyage expenses.
Voyage expenses. Voyage expenses primarily include bunkers, port charges, canal tolls, cargo handling operations and
brokerage commissions paid by us under voyage charters, as well as brokerage commissions and miscellaneous voyage expenses
that we are unable to collect under time charter and pool arrangements. These expenses are subtracted from voyage charter
revenues to calculate TCE revenues.
Vessel operating costs. For our owned vessels, we are responsible for vessel operating costs, which include crewing,
repairs and maintenance, insurance, stores, lube oils, communication expenses, and technical management fees.
Technical management fees are paid to SSM, which is controlled by the Lolli-Ghetti family. Pursuant to our Revised
Master Agreement, SSM provides us with technical services, and we provide it with the ability to subcontract technical
management of our vessels.
Charterhire. Charterhire is the amount we pay the owner for time chartered-in vessels. The amount is usually for a fixed
period of time at rates that are generally fixed, but may contain a variable component based on inflation, interest rates, or current
market rates. The vessel’s owner is responsible for crewing and other vessel operating costs.
Drydocking. We periodically drydock each of our owned vessels for inspection, repairs and maintenance and any
modifications to comply with industry certification or governmental requirements. Generally, each vessel is drydocked every 30
months to 60 months. We capitalize a substantial portion of the costs incurred during drydocking and amortize those costs on a
straight-line basis from the completion of a drydocking to the estimated completion of the next drydocking. We immediately
expense costs for routine repairs and maintenance performed during drydocking that do not improve or extend the useful lives of
the assets. The number of drydockings undertaken in a given period and the nature of the work performed determine the level of
drydocking expenditures.

Table of Contents
56
Depreciation. Depreciation expense typically consists of:
• charges related to the depreciation of the historical cost of our owned vessels (less an estimated residual value)
over the estimated useful lives of the vessels;
• charges related to the amortization of drydocking expenditures over the estimated number of years to the next
scheduled drydocking; and
• amortization of assets under finance lease.
Time charter equivalent (TCE) revenue or rates. We report TCE revenues, a non-GAAP financial measure, because
(i) we believe it provides additional meaningful information in conjunction with voyage revenues and voyage expenses, the most
directly comparable U.S.-GAAP measure, (ii) it assists our management in making decisions regarding the deployment and use
of our vessels and in evaluating their financial performance, (iii) it is a standard shipping industry performance measure used
primarily to compare period-to-period changes in a shipping company’s performance irrespective of changes in the mix of charter
types (i.e., spot charters, time charters and bareboat charters) under which the vessels may be employed between the periods, and
(iv) we believe that it presents useful information to investors. TCE revenue is vessel revenue less voyage expenses, including
bunkers and port charges. The TCE rate achieved on a given voyage is expressed in U.S. dollars/day and is generally calculated
by taking TCE revenue and dividing that figure by the number of revenue days in the period. For a reconciliation of TCE revenue,
deduct voyage expenses from revenue on our Statement of Operations. Please also see “Non-GAAP Financial Measures.”
Revenue days. Revenue days are the total number of calendar days our vessels were in our possession during a period,
less the total number of off-hire days during the period associated with repairs or drydockings. Consequently, revenue days
represent the total number of days available for the vessel to earn revenue. Idle days, which are days when a vessel is available
to earn revenue, yet is not employed, are included in revenue days. We use revenue days to show changes in net vessel revenues
between periods.
Contract of affreightment. A contract of affreightment, or COA, relates to the carriage of specific quantities of cargo
with multiple voyages over the same route and over a specific period of time which usually spans a number of years. A COA
does not designate the specific vessels or voyage schedules that will transport the cargo, thereby providing both the charterer and
shipowner greater operating flexibility than with voyage charters alone. The charterer has the flexibility to determine the
individual voyage scheduling at a future date while the shipowner may use different vessels to perform these individual voyages.
As a result, COAs are mostly entered into by large fleet operators, such as pools or shipowners with large fleets of the same
vessel type. We pay the voyage expenses while the freight rate normally is agreed on a per cargo ton basis.
Commercial pools. To increase vessel utilization and revenues, we participate in commercial pools with other
shipowners and operators of similar modern, well-maintained vessels. By operating a large number of vessels as an integrated
transportation system, commercial pools offer customers greater flexibility and a higher level of service while achieving
scheduling efficiencies. Pools employ experienced commercial charterers and operators who have close working relationships
with customers and brokers, while technical management is performed by each shipowner. Pools negotiate charters with
customers primarily in the spot market. The size and scope of these pools enable them to enhance utilization rates for pool vessels
by securing backhaul voyages and COAs, thus generating higher effective TCE revenues than otherwise might be obtainable in
the spot market while providing a higher level of service offerings to customers.
Operating days. Operating days are the total number of available days in a period with respect to the owned vessels,
before deducting available days due to off-hire days and days in drydock. Operating days is a measurement that is only applicable
to our owned vessels, not our chartered-in vessels.
Off-hire. Time a vessel is not available for service due primarily to scheduled and unscheduled repairs or drydockings.
For time chartered-in vessels, we do not pay the charterhire expense when the vessel is off-hire.
Non-GAAP Financial Measures

Table of Contents
57
To supplement our financial information presented in accordance with accounting principles generally accepted in
the United States, or GAAP, management uses certain “non-GAAP financial measures” as such term is defined in Regulation G
promulgated by the SEC. Generally, a non-GAAP financial measure is a numerical measure of a company’s operating
performance, financial position or cash flows that excludes or includes amounts that are included in, or excluded from, the most
directly comparable measure calculated and presented in accordance with GAAP. Management believes the presentation of these
measures provides investors with greater transparency and supplemental data relating to our financial condition and results of
operations, and therefore a more complete understanding of factors affecting our business than GAAP measures alone. In
addition, management believes the presentation of these matters is useful to investors for period-to-period comparison of results
as the items may reflect certain unique and/or non-operating items such as asset sales, write-offs, contract termination costs or
items outside of management’s control.
Earnings before interest, taxes, depreciation and amortization, or EBITDA, adjusted net loss and related per share
amounts, as well as adjusted EBITDA and TCE revenue are non-GAAP financial measures that we believe provide investors
with a means of evaluating and understanding how our management evaluates our operating performance. These non-GAAP
financial measures should not be considered in isolation from, as substitutes for, nor superior to financial measures prepared in
accordance with GAAP.
Reconciliations of EBITDA, and TCE revenue as determined in accordance with U.S. GAAP for the years ended
December 31, 2018, 2017 and 2016, as well as reconciliations of adjusted net loss and related per share amounts and adjusted
EBITDA in accordance with U.S. GAAP for the years ended December 31, 2017 and 2016 are provided below.
EBITDA
For the Year Ended December 31,
In thousands 2018 2017 2016
Net loss $ (12,698 ) $ (59,726 ) $ (124,835 )
Add Back:
Net interest expense 39,180 27,307 16,326
Depreciation and amortization (1) 74,070 67,710 62,835
EBITDA $ 100,552 $ 35,291 $ (45,674 )
(1) Includes depreciation, amortization of deferred financing costs and restricted stock amortization.
Adjusted net loss
For the Year Ended December 31,
2017 2016
In thousands, except per share amounts Amount Per share Amount Per share
Net loss $ (59,726 ) $ (0.83 ) $ (124,835 ) $ (2.22 )
Adjustments:
Loss / write down on assets held for sale 17,701 0.25 12,433 0.22
Write down of deferred financing cost 470 0.01 2,456 0.05
Charterhire contract termination — — 10,000 0.18
Total adjustments 18,171 0.26 24,889 0.45
Adjusted net loss $ (41,555 ) $ (0.57 ) $ (99,946 ) $ (1.77 )

Table of Contents
58
Adjusted EBITDA
For the Year Ended
December 31,
In thousands 2017 2016
Net loss $ (59,726 ) $ (124,835 )
Impact of Adjustments (1) 18,171 24,889
Adjusted net loss (41,555 ) (99,946 )
Add Back:
Net interest expense 27,307 16,326
Depreciation and amortization (2) 67,710 62,835
Adjusted EBITDA $ 53,462 $ (20,785 )
(1) Includes loss/write down on assets held for sale of $17.7 million and a write off of deferred financing costs of $0.5 million for 2017
and loss/write down on assets held for sale of $12.4 million, a write off of deferred financing costs of $2.5 million and charterhire
contract termination charges of $10.0 million for 2016.
(2) Includes depreciation, amortization of deferred financing costs and restricted stock amortization.
TCE Revenue
Time Charter Equivalent, or TCE, revenue is defined as voyage revenues less voyage expenses. Such TCE revenue,
divided by the number of our available days during the period, or revenue days, is TCE per revenue day, which we believe is
consistent with industry standards. TCE per revenue day is a common shipping industry performance measure used primarily to
compare daily earnings generated by vessels on time charters with daily earnings generated by vessels on voyage charters,
because charter hire rates for vessels on voyage charters are generally not expressed in per-day amounts while charter hire rates
for vessels on time charters generally are expressed in such amounts.
For the Year Ended
December 31,
In thousands 2018 2017
Vessel Revenues $ 242,502 $ 162,205
Less:
Voyage expenses (549 ) (429 )
TCE revenue $ 241,953 $ 161,776
Executive Summary for the Year Ended December 31, 2018
For the year ended December 31, 2018, our GAAP net loss was $12.7 million or $0.18 loss per diluted share compared
to a GAAP net loss of $59.7 million, or $0.83 loss per diluted share in the same period in 2017. Results for the year ended
December 31, 2018 include a non-cash loss of $7.7 million and a cash dividend of $0.5 million, or $0.10 loss per diluted share
from our equity investment in Scorpio Tankers and a write-off of deferred financing costs of $3.8 million, or $0.05 loss per diluted
share, related to the refinancing of existing debt. EBITDA for the years ended December 31, 2018 and 2017 were $100.6 million
and $35.3 million, respectively (see Non-GAAP Financial Measures). Excluding the loss/write-off of vessels and assets held for
sale of $17.7 million and the write-off of deferred financing costs on the credit facility related to those specific vessels of $0.5
million, our adjusted net loss for the year ended December 31, 2017 was $41.6 million, or $0.57 adjusted loss per diluted share,
and adjusted EBITDA was $53.5 million (see Non-GAAP Financial Measures below). There were no such non-GAAP
adjustments to our net income for the year ended December 31, 2018.
Total vessel revenues for the year ended December 31, 2018 were $242.5 million, an increase of 50% from $162.2
million for the same period in 2017. Our TCE revenue (see Non-GAAP Financial Measures) for the year ended December 31,
2018 was $242.0 million compared to $161.8 million for the same period in 2017. The rates earned in 2018 by both our Ultramax

Table of Contents
59
and Kamsarmax Operations were driven by a decrease in the supply of tonnage and the United States and China trade war which
resulted in longer voyages as Chinese imports from the United States were replaced with imports from South America.
Total operating expenses for the year ended December 31, 2018 were $199.2 million compared to $187.8 million for
the same period in 2017. The year over year increase relates to increases in vessel operating costs and depreciation resulting from
the increase in the size of our fleet, offset in part by the loss/write-off of vessels and assets held for sale of $17.7 million recorded
in 2017.
During 2018, we repurchased 7.1 million shares under the Board of Directors authorized stock repurchase program at a
cost of approximately $45.7 million, or at an average cost of $6.44 per share. We also maintained our $0.02 quarterly dividend,
paying out approximately $6.0 million in cash in aggregate.
During 2018, we also invested $100.0 million in Scorpio Tankers for approximately 54.1 million, or 10.9% (as of
October 12, 2018), of Scorpio Tankers’ issued and outstanding common shares. The investment was part of a larger $337.0 million
equity raise through a public offering of common shares by Scorpio Tankers. On January 18, 2019, Scorpio Tankers effected a
one-for-ten reverse stock split and as such we now own approximately 5.4 million common shares of Scorpio Tankers.
Results for the Year Ended December 31, 2018 Compared to the Year Ended December 31, 2017
Ultramax Operations
For the Year Ended December 31,
2018 2017 Change % Change
TCE Revenue:
Vessel revenue $ 155,197 $ 94,380
$ 60,817
64
Voyage expenses 330 129
201
156
TCE Revenue $ 154,867 $ 94,251 $ 60,616 64
Operating expenses:
Vessel operating costs 71,220 51,445
19,775
38
Charterhire expense 3,754 975
2,779
285
Vessel depreciation 37,287 29,797
7,490
25
General and administrative expense 4,344 3,389
955
28
Total operating expenses $ 116,605 $ 85,606 $ 30,999 36
Operating income $ 38,262 $ 8,645 $ 29,617 343
Vessel revenue for our Ultramax Operations increased to $155.2 million in 2018 from $94.4 million in 2017. Despite
tariffs and sanctions disrupting 2018, rates earned by our Ultramax Operations increased by 23% compared to 2017 due to lower
levels of tonnage supply, grain exports from the South American and Black Sea markets and petcoke and coal cargoes out of the
United States Gulf.
TCE revenue (see Non-GAAP Financial Measures) for our Ultramax Operations was $154.9 million for 2018 and was
associated with a day-weighted average of 37 vessels owned and one vessel time chartered-in, compared to $94.3 million for the
prior year, which was associated with a day-weighted average of 29 vessels owned. TCE revenue per day was $11,226 and $9,159
for 2018 and 2017, respectively.

Table of Contents
60
For the Year Ended December 31,
Ultramax Operations: 2018 2017 Change % Change
TCE Revenue $ 154,867 $ 94,251 $ 60,616 64
TCE Revenue / Day $ 11,226 $ 9,159 $ 2,067 23
Revenue Days 13,795 10,291 3,504 34
Our Ultramax Operations vessel operating costs were $71.2 million in 2018, relating to 37 vessels owned on average
during the period and included approximately $4.2 million of takeover and contingency costs. Vessel operating costs for the prior
year were $51.4 million and related to 29 vessels owned on average during the period. Daily operating costs excluding takeover
costs, contingency expenses and other non-operating expenses for the years ended December 31, 2018 and 2017 were $4,962
and $4,842, respectively. The increase is due to an increase of purchases of spares and stores, as well as freight and forwarding
expense.
Charterhire expense for our Ultramax Operations was approximately $3.8 million for the year ended December 31,
2018, and relates to the vessel we have time chartered-in at $10,125 per day since the end of the third quarter of 2017.
Ultramax Operations depreciation increased to $37.3 million for the year ended December 31, 2018 from $29.8 million
in the prior year reflecting the increase in our weighted average vessels owned to 37 from 29.
General and administrative expense for our Ultramax Operations was $4.3 million for 2018 and $3.4 million in the prior
year period. General and administrative expenses consist primarily of administrative service fees, which are incurred on a per
vessel per day basis, and bank charges, which are incurred based on the number of transactions. The increase versus the prior
year reflects the growth of the fleet.
Kamsarmax Operations
For the Year Ended December 31,
2018 2017 Change % Change
TCE Revenue:
Vessel revenue $ 87,305 $ 67,825
$ 19,480
29
Voyage expenses 219 300
(81 ) (27 )
TCE Revenue $ 87,086 $ 67,525 $ 19,561 29
Operating expenses:
Vessel operating costs 34,255 35,336
(1,081 ) (3 )
Charterhire expense 422 4,417
(3,995 ) (90 )
Vessel depreciation 19,320 18,713
607
3
General and administrative expense 2,069 1,916
153
8
Loss / write down on assets held for sale — 17,701
(17,701 ) (100 )
Total operating expenses $ 56,066 $ 78,083 $ (22,017 ) (28 )
Operating loss $ 31,020 $ (10,558 ) $ 41,578 394
Vessel revenue for our Kamsarmax Operations increased to $87.3 million for the year ended December 31, 2018 from
$67.8 million in the prior year. Rates earned by our Kamsarmax Operations during the year ended December 31, 2018 increased
31% compared to 2017, as supply was down due to a lack of new deliveries, as well as increased ton per mile utilization due to
an increase in voyages from the east coast of South America to China resulting from the United States and China trade wars.

Table of Contents
61
TCE revenue (see Non-GAAP Financial Measures) for our Kamsarmax Operations was $87.1 million for the year ended
December 31, 2018 associated with a day-weighted average of 19 vessels owned, compared to $67.5 million for the prior year,
associated with a day-weighted average of 18 vessels owned and one vessel time chartered-in. TCE revenue per day was $13,127
and $10,051 for the years ended December 31, 2018 and 2017, respectively.
For the Year Ended December 31,
Kamsarmax Operations: 2018 2017 Change % Change
TCE Revenue $ 87,086 $ 67,525 $ 19,561 29
TCE Revenue / Day $ 13,127 $ 10,051 $ 3,076 31
Revenue Days 6,634 6,718 (84 ) (1 )
Kamsarmax Operations vessel operating costs were $34.3 million for the year ended December 31, 2018, which related
to the 19 vessels owned on average during the period and included approximately $1.1 million of takeover costs and contingency
expenses. Vessel operating costs for the prior year were $35.3 million and related to the 18 vessels owned on average during the
period. Daily operating costs excluding takeover costs, contingency expenses and other non-operating expenses for the years
ended December 31, 2018 and 2017 were $4,940 and $5,028, respectively.
While we do not time charter-in any Kamsarmax vessels, we have a profit and loss sharing agreement relating to one
Kamsarmax vessel with a third party and during the year ended December 31, 2018, our share of the loss on that vessel was $0.4
million compared to $0.8 million in the prior year period. During the prior year period, a Kamsarmax vessel was time chartered-
in through August 2017 at a cost of $3.6 million.
Kamsarmax Operations depreciation increased to $19.3 million for the year ended December 31, 2018 from $18.7
million in the prior year period. Our weighted average vessels owned was 19 and 18 for the years ended December 31, 2018 and
2017, respectively.
General and administrative expense for the Kamsarmax Operations was $2.1 million and $1.9 million for the years
ended December 31, 2018 and 2017, respectively. The expense consists primarily of administrative services fees, which are
incurred on a per vessel per day basis, and bank charges, which are incurred based on the number of transactions.
During the year ended December 31, 2017, we recorded a write-down on assets held for sale of $17.7 million related
to the sale of two Kamsarmax vessels to an unaffiliated third party.
Corporate
Certain general and administrative expenses we incur as well as all of our financial expenses and income or losses from
an equity investment are not attributable to a specific segment. Accordingly, these costs are not allocated to our segments. These
general and administrative expenses, including compensation, audit, legal and other professional fees, as well as the costs of
being a public company, such as director fees, increased slightly year over year totaling $25.9 million and $23.8 million for the
years ended December 31, 2018 and 2017, respectively.
We recorded a non cash loss of $7.7 million for the fourth quarter of 2018 and a cash dividend of $0.5 million on our
equity investment in Scorpio Tankers.
Financial expenses, net increased to $49.9 million in the year ended December 31, 2018 from $35.0 million in the prior
year period due to an increase in the LIBOR rate and higher levels of debt related to the increase in overall fleet size and debt
refinancing, as well as the write-off of $3.8 million of deferred financing costs related to such refinancing.
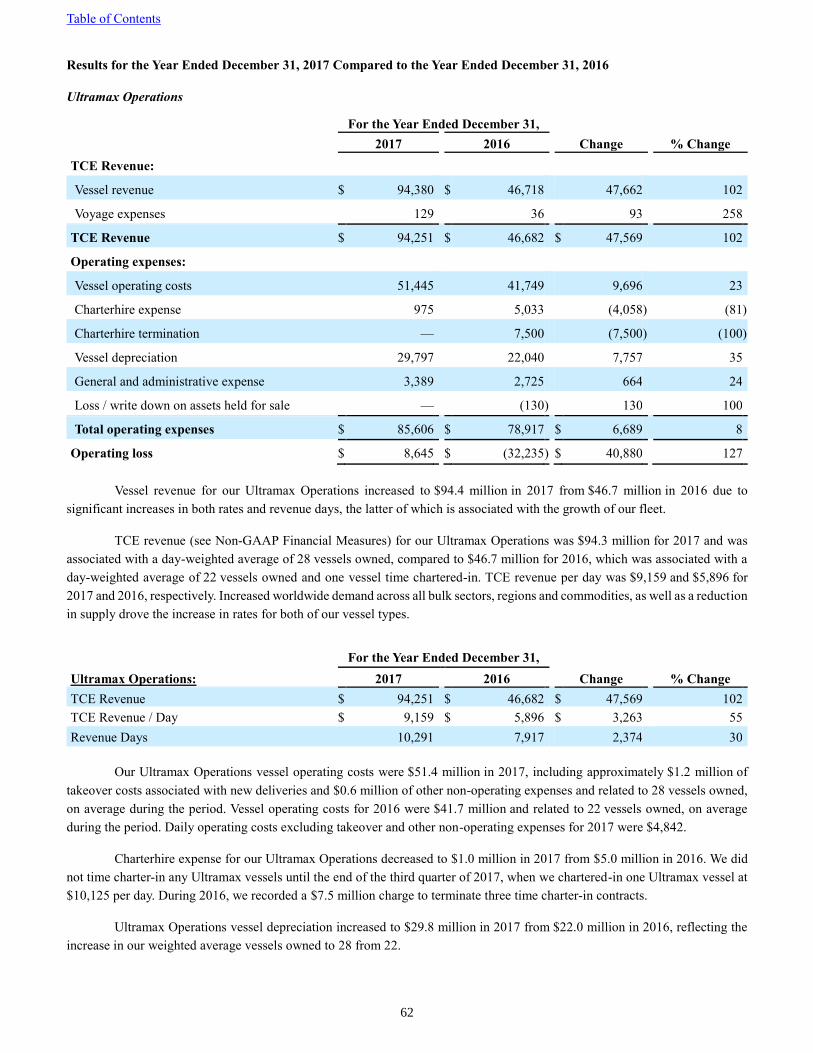
Table of Contents
62
Results for the Year Ended December 31, 2017 Compared to the Year Ended December 31, 2016
Ultramax Operations
For the Year Ended December 31,
2017 2016 Change % Change
TCE Revenue:
Vessel revenue $ 94,380 $ 46,718
47,662
102
Voyage expenses 129 36
93
258
TCE Revenue $ 94,251 $ 46,682 $ 47,569 102
Operating expenses:
Vessel operating costs 51,445 41,749
9,696
23
Charterhire expense 975 5,033
(4,058 ) (81 )
Charterhire termination — 7,500
(7,500 ) (100 )
Vessel depreciation 29,797 22,040
7,757
35
General and administrative expense 3,389 2,725
664
24
Loss / write down on assets held for sale — (130 ) 130
100
Total operating expenses $ 85,606 $ 78,917 $ 6,689 8
Operating loss $ 8,645 $ (32,235 ) $ 40,880 127
Vessel revenue for our Ultramax Operations increased to $94.4 million in 2017 from $46.7 million in 2016 due to
significant increases in both rates and revenue days, the latter of which is associated with the growth of our fleet.
TCE revenue (see Non-GAAP Financial Measures) for our Ultramax Operations was $94.3 million for 2017 and was
associated with a day-weighted average of 28 vessels owned, compared to $46.7 million for 2016, which was associated with a
day-weighted average of 22 vessels owned and one vessel time chartered-in. TCE revenue per day was $9,159 and $5,896 for
2017 and 2016, respectively. Increased worldwide demand across all bulk sectors, regions and commodities, as well as a reduction
in supply drove the increase in rates for both of our vessel types.
For the Year Ended December 31,
Ultramax Operations: 2017 2016 Change % Change
TCE Revenue $ 94,251 $ 46,682 $ 47,569 102
TCE Revenue / Day $ 9,159 $ 5,896 $ 3,263 55
Revenue Days 10,291 7,917 2,374 30
Our Ultramax Operations vessel operating costs were $51.4 million in 2017, including approximately $1.2 million of
takeover costs associated with new deliveries and $0.6 million of other non-operating expenses and related to 28 vessels owned,
on average during the period. Vessel operating costs for 2016 were $41.7 million and related to 22 vessels owned, on average
during the period. Daily operating costs excluding takeover and other non-operating expenses for 2017 were $4,842.
Charterhire expense for our Ultramax Operations decreased to $1.0 million in 2017 from $5.0 million in 2016. We did
not time charter-in any Ultramax vessels until the end of the third quarter of 2017, when we chartered-in one Ultramax vessel at
$10,125 per day. During 2016, we recorded a $7.5 million charge to terminate three time charter-in contracts.
Ultramax Operations vessel depreciation increased to $29.8 million in 2017 from $22.0 million in 2016, reflecting the
increase in our weighted average vessels owned to 28 from 22.
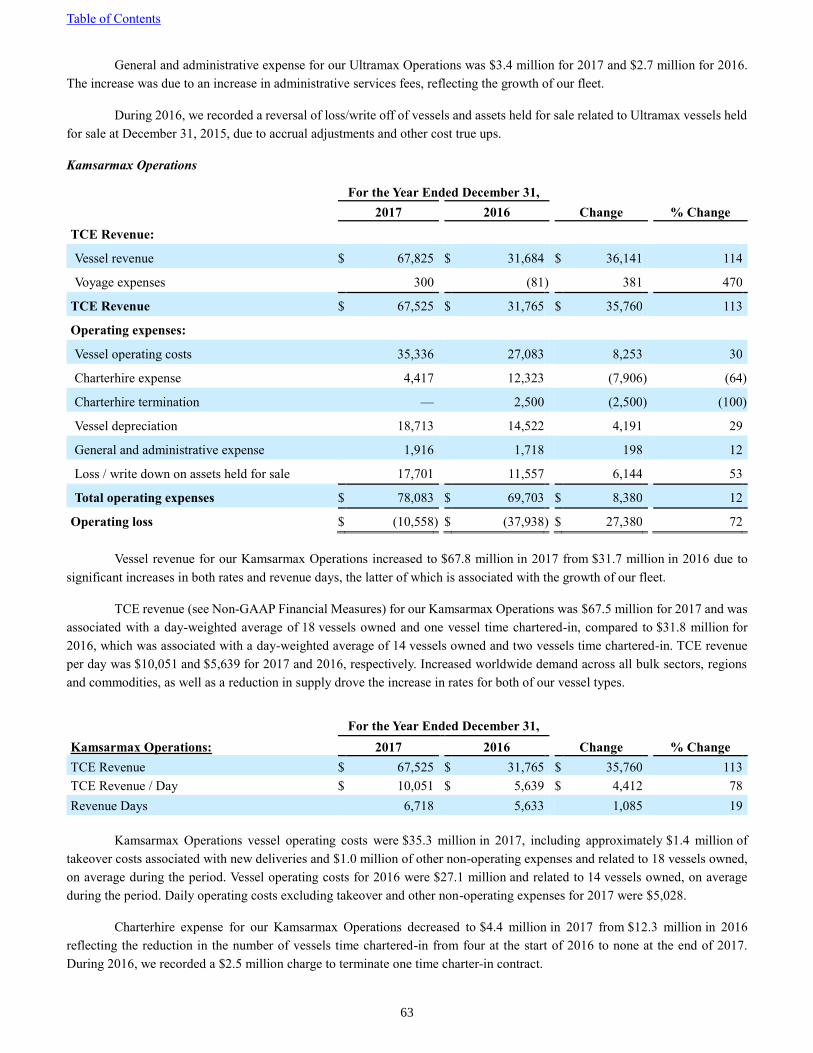
Table of Contents
63
General and administrative expense for our Ultramax Operations was $3.4 million for 2017 and $2.7 million for 2016.
The increase was due to an increase in administrative services fees, reflecting the growth of our fleet.
During 2016, we recorded a reversal of loss/write off of vessels and assets held for sale related to Ultramax vessels held
for sale at December 31, 2015, due to accrual adjustments and other cost true ups.
Kamsarmax Operations
For the Year Ended December 31,
2017 2016 Change % Change
TCE Revenue:
Vessel revenue $ 67,825 $ 31,684
$ 36,141
114
Voyage expenses 300 (81 ) 381
470
TCE Revenue $ 67,525 $ 31,765 $ 35,760 113
Operating expenses:
Vessel operating costs 35,336 27,083
8,253
30
Charterhire expense 4,417 12,323
(7,906 ) (64 )
Charterhire termination — 2,500
(2,500 ) (100 )
Vessel depreciation 18,713 14,522
4,191
29
General and administrative expense 1,916 1,718
198
12
Loss / write down on assets held for sale 17,701 11,557
6,144
53
Total operating expenses $ 78,083 $ 69,703 $ 8,380 12
Operating loss $ (10,558 ) $ (37,938 ) $ 27,380 72
Vessel revenue for our Kamsarmax Operations increased to $67.8 million in 2017 from $31.7 million in 2016 due to
significant increases in both rates and revenue days, the latter of which is associated with the growth of our fleet.
TCE revenue (see Non-GAAP Financial Measures) for our Kamsarmax Operations was $67.5 million for 2017 and was
associated with a day-weighted average of 18 vessels owned and one vessel time chartered-in, compared to $31.8 million for
2016, which was associated with a day-weighted average of 14 vessels owned and two vessels time chartered-in. TCE revenue
per day was $10,051 and $5,639 for 2017 and 2016, respectively. Increased worldwide demand across all bulk sectors, regions
and commodities, as well as a reduction in supply drove the increase in rates for both of our vessel types.
For the Year Ended December 31,
Kamsarmax Operations: 2017 2016 Change % Change
TCE Revenue $ 67,525 $ 31,765 $ 35,760 113
TCE Revenue / Day $ 10,051 $ 5,639 $ 4,412 78
Revenue Days 6,718 5,633 1,085 19
Kamsarmax Operations vessel operating costs were $35.3 million in 2017, including approximately $1.4 million of
takeover costs associated with new deliveries and $1.0 million of other non-operating expenses and related to 18 vessels owned,
on average during the period. Vessel operating costs for 2016 were $27.1 million and related to 14 vessels owned, on average
during the period. Daily operating costs excluding takeover and other non-operating expenses for 2017 were $5,028.
Charterhire expense for our Kamsarmax Operations decreased to $4.4 million in 2017 from $12.3 million in 2016
reflecting the reduction in the number of vessels time chartered-in from four at the start of 2016 to none at the end of 2017.
During 2016, we recorded a $2.5 million charge to terminate one time charter-in contract.

Table of Contents
64
Kamsarmax Operations vessel depreciation increased to $18.7 million in 2017 from $14.5 million in 2016 reflecting the
increase in our weighted average vessels owned to 18 from 14.
General and administrative expense for our Kamsarmax Operations was $1.9 million and $1.7 million for 2017 and
2016, respectively. The increase was due to an increase in administrative services fees, reflecting the growth of our fleet.
During 2017, we recorded a write down on assets held for sale related to the sale of two Kamsarmax vessels to an
unaffiliated third party and in 2016, we recorded a write down of vessels and assets held for sale related to the cancellation of a
shipbuilding contract for a Kamsarmax vessel.
Corporate
Corporate general and administrative and financial expenses increased from $53.3 million in 2016 to $57.9 million in
2017, as increases in financial expenses due to increasing LIBOR rates, higher levels of debt and reduced capitalization of interest
outweighed decreases in restricted stock amortization as prior year grants, with higher fair values than current grants, vested and
were fully expensed.
During 2017 and 2016, we wrote off $0.5 million and $2.5 million, respectively, of deferred financing costs
accumulated on credit facilities for which the related vessels were sold or the commitments were otherwise reduced.
Recent accounting pronouncements
In February 2016, the Financial Accounting Standards Board (“FASB”) issued Accounting Standards Update (“ASU”)
2016-02, “Leases”, which was intended to improve financial reporting of leasing transactions. The ASU requires organizations
that lease assets, or lessees, to recognize on the balance sheet the assets and liabilities for the rights and obligations created by
those leases with terms of more than twelve months. The accounting for lease arrangements by the lessors will remain largely
unchanged from current U.S. GAAP. The ASU also requires additional quantitative and qualitative disclosures to help financial
statement users better understand the amount, timing, and uncertainty of cash flows arising from leases. The ASU is effective for
fiscal years and interim periods beginning after December 15, 2018 although early adoption is permitted. The ASU requires
reporting organizations to take a modified retrospective transition approach.
In our review of our contracts to assess the overall impact of the guidance, we determined that the existing pool
arrangements meet the definition of leases under ASU 2016-02. As lessor, we lease our vessels to pools, which manage the
vessels in order to enter into transportation contracts with their customers and enjoy the economic benefits derived from such
arrangements. Furthermore, the pools can direct the use of a vessel (subject to certain limitations in the pool or charter agreement)
throughout the period of use. In July 2018, the FASB issued ASU 2018-11, “Leases (Topic 842): Targeted Improvements”, which
amended FASB Accounting Standards Codification (ASC) Topic 842, “Leases”, to (i) provide a practical expedient for lessors
regarding the separation of the lease and non-lease components of a contract and (ii) add an optional transition method that would
permit entities to apply the new requirements by recognizing a cumulative-effect adjustment to the opening balance of retained
earnings in the year of the adoption. In our assessment, we concluded that the criteria for not separating the lease and non-lease
components of our arrangements are met since: (a) the timing and pattern of transfer are the same for both the lease and non-
lease components, (b) the lease component of the contracts, if accounted for separately, would be classified as an operating lease,
and (c) the lease component is the predominant component in the arrangement. Therefore, we will account for the combined
component as an operating lease in accordance with ASC 842. As a result, an entity’s reporting for the comparative periods
presented in the financial statements in which it adopts the new lease standard will continue to be in accordance with current
GAAP. We adopted this new standard on January 1, 2019, applying the optional transition option, with no restatement of
comparative figures for prior periods. We do not expect this standard to impact the accounting for our vessels operating within
the pools or under time chartered-out arrangements.
The standard will result in the recognition of right-of-use assets and corresponding liabilities, on the basis of the
discounted remaining future minimum lease payments, for chartered-in vessel commitments of over 12 months only, which have
historically been reported as operating leases and recognized solely in the income statement on a straight-line basis. The impact
of this standard as it pertains to time or bareboat chartered-in vessels will not have an impact upon first time adoption, as the

Table of Contents
65
Company’s operating fleet includes only one chartered-in vessel at December 31, 2018, which has a lease term of less than 12
months and does not require recognition on the Consolidated Balance Sheet.
Critical Accounting Estimates
Our consolidated financial statements and accompanying notes are prepared in accordance with U.S. GAAP. In many
instances, the application of such principles requires management to make estimates or to apply subjective principles to particular
facts and circumstances. A change in the estimates or a variance in the application, or interpretation of U.S. GAAP could yield a
materially different accounting result. A summary of our critical accounting estimates where we believe that the estimations,
judgments or interpretations that we made, if different, would have yielded the most significant differences in our consolidated
financial statements, can be found in the notes to the consolidated financial statements. In addition, for a summary of all of our
significant accounting policies see Note 1, Organization and Basis of Presentation, in the notes to the consolidated financial
statements.
Vessels and depreciation
We record the value of our vessels at their cost (which includes acquisition costs directly attributable to the vessel
including capitalized interest and expenditures made to prepare the vessel for its initial voyage) less accumulated depreciation.
We depreciate our vessels on a straight-line basis to their residual value over their estimated useful lives of 25 years from the date
the vessel is ready for its first voyage. The estimated useful life of 25 years is management’s best estimate and is also consistent
with industry practice for similar vessels. The residual value is estimated as the lightweight tonnage of each vessel multiplied by
an estimated scrap value per ton. The scrap value per ton is estimated taking into consideration the historical four years average
scrap market rates at the balance sheet date.
An increase in the useful life of a vessel or in its residual value would have the effect of decreasing the annual
depreciation charge and extending it into later periods. A decrease in the useful life of a vessel or in its residual value would have
the effect of increasing the annual depreciation charge.
When regulations place limitations over the ability of a vessel to trade on a worldwide basis, or when the cost of
complying with such regulations is not expected to be recovered, we will adjust the vessel’s useful life to end at the date such
regulations preclude such vessel’s further commercial use.
The carrying value of our vessels does not represent the fair market value of such vessels or the amount we could obtain
if we were to sell any of our vessels, which could be more or less. Under U.S. GAAP, we would not record a loss if the fair market
value of a vessel (excluding its charter) is below its carrying value unless and until we determine to sell that vessel or the vessel
is impaired as discussed below under “Impairment of long-lived assets held for use.”
Pursuant to our bank credit facilities, prior to drawdown of loans under the credit facilities we submit to the lenders
valuations of the vessels collateralizing the relevant facility. Thereafter, we will regularly submit to the lenders valuations of our
vessels on an individual charter free basis in order to evidence our compliance with the collateral maintenance covenants under
our bank credit facilities. Such a valuation is not necessarily the same as the amount any vessel may bring upon sale, which may
be more or less, and should not be relied upon as such. We have received valuations on each vessel in our fleet as of December 31,
2018. If we were to apply those valuations to the carrying value of our vessels as of December 31, 2018, the aggregate carrying
value would exceed the aggregate fair value of our vessels by approximately $135.7 million. The fair values of our vessels can
fluctuate depending on the shipyards and the dates of delivery. These assumptions have not been taken into account in the amounts
disclosed above.
Impairment of long-lived assets held for use
In accordance with ASC subtopic 360-10, Property, Plant and Equipment, long-lived assets to be held and used are
reviewed for impairment whenever events or changes in circumstances indicate that the carrying amount of such assets may not

Table of Contents
66
be recoverable. Determination of recoverability is based on an estimate of undiscounted future cash flows resulting from the use
of the asset or asset group and its eventual disposition.
For purposes of recognition and measurement of an impairment loss, long-lived assets are grouped with other assets at
the lowest level for which identifiable cash flows are largely independent of the cash flows of other assets, which is generally at
the vessel pool level for vessels operating within pools. In performing our impairment review, we perform a recoverability test
comparing an estimate of undiscounted cash flows to carrying value to determine if the asset group is impaired. In developing
our estimates of undiscounted cash flows, we make significant assumptions and estimates about future performance, with the
most significant assumptions relating to (i) charter rates on expiry of existing charters, which are based on the current fixing
applicable to five-year time charter rates and thereafter, the ten-year historical average for each category of vessel (ii) off-hire
days, which are based on actual off-hire statistics for our fleet (iii) operating costs, based on current levels escalated over time
based on long term trends (iv) drydocking frequency, duration and cost, (v) estimated useful life which is assessed as a total of
25 years and (vi) estimated scrap values.
An impairment loss is recognized when the carrying amount of the asset group is greater than both the undiscounted
cash flows and its fair value. In instances where the carrying value of an asset group is not recoverable, measurement of the
impairment loss is based upon the amount by which the collective fair values of the vessels in the asset group exceed their
collective carrying values. The fair values are determined based upon available market data as well as third party valuations
performed on each individual vessel.
During our fourth quarter 2018 assessment, we determined that the undiscounted future income streams expected to be
generated by each asset group, over their remaining operating lives exceeded and therefore would be sufficient to recover their
respective carrying values and, accordingly, we confirmed that our vessels were not impaired under U.S. GAAP. As of
December 31, 2018 we owned 56 vessels with an average remaining useful life of 22 years.
During the year ended December 31, 2017, there were no changes in circumstances or events that indicated that the
carrying amount of our vessel pools or vessels under construction may not be recoverable and therefore, an assessment of
impairment was not performed.
During our fourth quarter 2016 assessment, we determined that the undiscounted future income streams expected to be
generated by each asset group, over their remaining operating lives exceeded and therefore would be sufficient to recover their
respective carrying values and, accordingly, we confirmed that our vessels were not impaired under U.S. GAAP. As of
December 31, 2016 we owned 42 vessels with an average remaining useful life of 24 years.
In our impairment testing, we also examine the sensitivity of the future income streams expected to be earned by
reviewing other scenarios relative to the initial assumptions we used to see if the resulting impact would have resulted in a
different conclusion. Accordingly, we perform sensitivity analyses based on more conservative charter rates and expected
useful lives for our vessels. In the first sensitivity analysis, we lowered charter rate assumptions to 96% of the long-term
averages of Kamsarmax and Ultramax vessels, respectively (holding all other critical assumptions constant), while in our
second sensitivity analysis; we decreased our vessels’ estimated useful lives by approximately 9% for each vessel class
(holding all other critical assumptions constant). We then evaluated the outcomes of the sensitivity analyses performed to assess
their impact on our conclusions. In both analyses, we found that there was no impairment of any of our assets or asset groups.
Although we believe that the assumptions used to evaluate potential impairment are reasonable and appropriate, such
assumptions are highly subjective. There can be no assurance as to how long charter rates and vessel values will remain at their
currently low levels or whether they will improve by any significant degree. Charter rates may decrease, which could adversely
affect our revenue and profitability, and any future assessments of vessel impairment.
Management will continue to monitor developments in charter rates in the markets in which it participates with respect
to the expectation of future rates over an extended period of time that are utilized in the analyses.

Table of Contents
67
Valuation of equity investment
On October 12, 2018, we invested $100.0 million in a related party, Scorpio Tankers, through participation in a public
offering on a basis equivalent to other investors. We use the fair value option in accounting for our investment in Scorpio
Tankers based upon the quoted market price of Scorpio Tankers common stock discounted for a lack of marketability due to our
inability to sell the common stock until January 7, 2019. In calculating the lack of marketability discount, we relied on the
Finnerty Model, an alternative option-based approach that estimates a discount as an average strike put option, effectively
assuming that if the stock were freely tradable, the holder could sell evenly over the restriction period. Inputs to this model
included expected option life, risk-free interest rate and expected volatility.
B. Liquidity and Capital Resources
Our primary source of funds for our short-term and long-term liquidity needs will be the cash flows generated from our
vessels, which primarily operate in the Scorpio Pools, in the spot market or on time charter. We believe that the Scorpio Pools
reduce volatility because (i) they aggregate the revenues and expenses of all pool participants and distribute net earnings to the
participants based on an agreed upon formula and (ii) some of the vessels in the pool are on time charter. Furthermore, spot
charters provide flexibility and allow us to fix vessels at prevailing rates.
At December 31, 2018, cash and cash equivalents totaled $67.5 million. We believe that our current cash and cash
equivalents balance and operating cash flows, our ability to sell or refinance certain vessels or to sell our investment in Scorpio
Tankers, as well as our access to credit markets will be sufficient to meet our short-term and long-term liquidity needs for the
next 12 months from the date of this annual report, which are primarily comprised of debt repayment obligations and contractual
payments for exhaust gas cleaning systems (see Liquidity Risk section of Note 1, Organization and Basis of Presentation, to the
consolidated financial statements).
Equity Issuances
On May 30, 2018, our shareholders approved an amendment to our Amended and Restated Articles of Incorporation to
increase our total number of authorized shares to 262.5 million, consisting of 212.5 million common shares and 50.0 million
preferred shares at the annual general meeting of shareholders.
In November 2017, in connection with the purchase of three Ultramax vessels, we issued warrants to purchase
approximately 1.6 million common shares at an exercise price of $8.10 per share to an unaffiliated third party as part of the total
consideration paid. The warrants were exercised and we issued the shares in January 2018.
In connection with the purchase of one Ultramax vessel, we issued approximately 0.9 million common shares to the
parent of the seller of the vessel on December 29, 2017, upon delivery of such vessel.
During the years ended December 31, 2017 and 2016, we issued 12,946 common shares and 51,679 common shares,
respectively, both with a fair value of $0.1 million, to SSH pursuant to the Amended Administrative Services Agreement, relating
to our Newbuilding Program.
On June 20, 2016, we issued 23.0 million common shares, par value $0.01 per share, at $3.05 per share in an underwritten
public offering. SSH purchased an aggregate of approximately 5.3 million common shares at the public offering price. We
received approximately $67.5 million of net proceeds from the issuance.
On June 1, 2016, our shareholders approved an amendment to our Amended and Restated Articles of Incorporation to
increase our total number of authorized shares to 162.5 million, consisting of 112.5 million common shares and 50.0 million
preferred shares at the annual general meeting of shareholders.
On March 22, 2016, we issued 21.0 million common shares, par value $0.01 per share, at $3.00 per share in an underwritten
public offering. SSH and certain of our directors purchased an aggregate of 5,030,000 common shares at the public offering
price. We received approximately $60.6 million of net proceeds from the issuance.

Table of Contents
68
For a description of issuances of common shares pursuant to our Equity Incentive Plan, please see “Item 6. Directors, Senior
Management and Employees - B. Compensation - Equity Incentive Plan.”
Cash Flow
Operating Activities
The table below summarizes the effect of the major components of operating cash flow.
For the Year Ended December 31,
(in thousands) 2018 2017 2016
Net loss $ (12,698 ) $ (59,726 ) $ (124,835 )
Adjustment to reconcile net loss to net cash provided by (used in) operating
activities: 81,247
84,181
73,644
Related party balances (195 ) (7,568 ) 5,656
Effect of changes in other working capital and operating assets and liabilities 2,092 2,695 (6,661 )
Net cash used in operating activities $ 70,446 $ 19,582
$ (52,196 )
The cash flow provided by operating activities for 2018 reflects the increase in time charter rates earned during the
period. Our non-cash items include vessel depreciation, amortization of restricted stock and deferred financing costs, and a non-
cash loss on our investment in Scorpio Tankers.
Investing Activities
Net cash used in investing activities of $122.5 million during the year ended December 31, 2018 reflects the equity
investment we made in Scorpio Tankers, and installments paid to the shipyard, as well as new equipment purchases and building
supervision costs for the newly constructed SBI Lynx. We also made our first payment pursuant to the contract for the purchase
and installation of exhaust gas cleaning systems.
Financing Activities
Net cash provided by financing activities of $51.0 million during the year ended December 31, 2018 reflects the net
proceeds of $110.4 million from increased debt financing, partially offset by $45.7 million of share repurchases (7.1 million
shares at an average price of $6.44 per share) and the payment of quarterly cash dividends totaling $0.08 per share, or an aggregate
of $6.0 million in 2018.
Credit Facilities, Finance Lease and Unsecured Notes
$330.0 Million Credit Facility
On July 29, 2014, we entered into a $330.0 million senior secured credit facility, or the $330.0 Million Credit Facility,
with Credit Agricole Corporate and Investment Bank and Deutsche Bank AG London to finance a portion of the purchase price
of 22 of the vessels then in our Newbuilding Program, which was subsequently reduced by $15.0 million due to the sale of one
of the vessels that was to collateralize this facility. This facility bears interest at LIBOR plus a margin of 2.925% and has a term
of seven years. This facility is secured by, among other things, a first preferred cross-collateralized mortgage on each of 13 of the
vessels financed by this loan (consisting of nine Ultramax vessels and four Kamsarmax vessels) and guaranteed by each of the
vessel owning subsidiaries.
During 2018, we repaid approximately $84.8 million of our $330.0 Million Credit Facility as two of the Kamsarmax
vessels and six of the Ultramax vessels previously financed by this loan are now financed under the $34.0 Million Credit Facility
and the $90.0 Million Credit Facility, respectively.
As of December 31, 2018, approximately $140.7 million was outstanding.

Table of Contents
69
$67.5 Million Credit Facility
On July 30, 2014, we entered into a $67.5 million credit facility, or the $67.5 Million Credit Facility, with a leading
European financial institution. The proceeds of this facility were used to fund a portion of the purchase price of four of the vessels
then in our Newbuilding Program that secure this facility. This facility had a seven year term from the date of delivery of each
such vessel securing the loan, with customary financial and restrictive covenants. This facility bore interest at LIBOR plus a
margin of 2.95%. The $67.5 Million Credit Facility was secured by, among other things, a first priority mortgage on four of the
vessels then in our Newbuilding Program (two Ultramax and two Kamsarmax vessels), and a parent company guarantee.
As of December 31, 2018, this facility has been fully repaid and terminated.
$409.0 Million Credit Facility
On December 30, 2014, we entered into a $409.0 million senior secured credit facility, or the $409.0 Million Credit
Facility, with Nordea Bank Finland PLC, New York Branch, and Skandinaviska Enskilda Banken AB (publ) to partially finance
a portion of the acquisition of 20 of the vessels then in our Newbuilding Program (six Ultramax, nine Kamsarmax, and five
Capesize vessels). This credit facility was subsequently (i) reduced by $136.0 million due to the sale of five Capesize vessels and
the addition of one Ultramax vessel to the security package under the facility, (ii) further reduced by $14.6 million due to the
cancellation of a shipbuilding contract for a Kamsarmax vessel that would serve as partial security under the facility, and (iii)
further reduced by approximately $22.5 million due to the drop in vessel values. As amended, this credit facility was used to
finance a portion of the purchase price of 15 vessels (seven Ultramax and eight Kamsarmax vessels). This facility bore interest
at LIBOR plus a margin of 3.00% and had a term of six years. This facility was secured by, among other things, a first preferred
mortgage on each of the 15 vessels.
As of December 31, 2018, this facility has been fully repaid and terminated.
$42.0 Million Credit Facility
On January 30, 2015, we entered into a senior secured credit facility for up to $42.0 million, or the $42.0 Million Credit
Facility, with a leading European financial institution to finance a portion of the purchase price of two Kamsarmax vessels which
were delivered to us, and subsequently upsized by $10.8 million to finance a portion of the purchase price of one Ultramax vessel.
Each tranche for the Kamsarmax vessels has a final maturity of six years from the drawdown date of the respective vessel, and
the tranche for the Ultramax vessel matures on September 21, 2021. This facility bears interest at LIBOR plus a margin of 2.97%.
This facility is secured by, among other things, a first preferred mortgage on the three vessels and guaranteed by each of the
vessel owning subsidiaries.
During 2018, we repaid approximately $8.2 million of the $42.0 Million Credit Facility upon the completion of the
$19.0 Million Lease Financing - SBI Tango transaction. As of December 31, 2018, the outstanding balance on this facility was
approximately $14.1 million.
$12.5 Million Credit Facility
On December 22, 2015, we entered into a senior secured credit facility for up to $12.5 million, or the $12.5 Million
Credit Facility, which was used to finance a portion of the purchase price of one Ultramax vessel which was delivered to us. The
facility has a maturity date of December 22, 2020. This facility bears interest at LIBOR plus a margin of 3.00%. This facility is
secured by, among other things, a first preferred mortgage on the Ultramax vessel and guaranteed by the vessel owning subsidiary.
As of December 31, 2018, the outstanding balance on this facility was approximately $9.4 million.
$27.3 Million Credit Facility
On December 22, 2015, we entered into a senior secured credit facility for up to $27.3 million, or the $27.3 Million
Credit Facility, which was used to finance a portion of the purchase price of two Ultramax vessels then in our Newbuilding
Program. During 2018, we repaid approximately $8.8 million of the $27.3 Million Credit Facility upon the completion of the

Table of Contents
70
$20.5 Million Lease Financing - SBI Hermes transaction and refinanced the SBI Hermes. This facility has a maturity of five
years from the drawdown date and bears interest at LIBOR plus a margin of 2.95%. This facility is secured by, among other
things, a first preferred mortgage on the Ultramax vessel and guaranteed by the vessel owning subsidiary.
As of December 31, 2018, the outstanding balance on this facility was approximately $9.0 million.
$85.5 Million Credit Facility
On December 5, 2017, we entered into a senior secured credit facility for up to $85.5 million, or the $85.5 Million Credit
Facility, which was used to finance a portion of the purchase price of six Ultramax vessels we acquired in the fourth quarter of
2017. The facility has a maturity date of February 15, 2023 and bears interest at LIBOR plus a margin of 2.85%. This facility is
secured by, among other things, a first preferred mortgage on the six Ultramax vessels and guaranteed by each vessel owning
subsidiary.
As of December 31, 2018, the outstanding balance on this facility was approximately $79.0 million.
$38.7 Million Credit Facility
On December 13, 2017, we entered into a senior secured credit facility for up to $38.7 million, or the $38.7 Million
Credit Facility, which was used to finance a portion of the purchase price of three Ultramax vessels we acquired in the fourth
quarter of 2017. The facility has a maturity date of December 13, 2022 and bears interest at LIBOR plus a margin of 2.85%. This
facility is secured by, among other things, a first preferred mortgage on the three Ultramax vessels and guaranteed by each vessel
owning subsidiary.
As of December 31, 2018, the outstanding balance on this facility was approximately $35.1 million.
$12.8 Million Credit Facility
On June 21, 2018, we entered into a senior secured credit facility for up to $12.8 million, or the $12.8 Million Credit
Facility. The loan facility was used to finance up to 50% of the fair market value of the SBI Lynx. The facility has a final maturity
date of June 15, 2023 and bears interest at LIBOR plus a margin of 2.40% per annum. This facility is secured by, among other
things, a first preferred mortgage on the vessel and guaranteed by the vessel owning subsidiary.
As of December 31, 2018, the outstanding balance on this facility was approximately $12.3 million.
$60.0 Million Credit Facility
On September 11, 2018, we entered into a senior secured credit facility for up to $60.0 million, or the $60.0 Million
Credit Facility. The loan facility was used to finance up to 60% of the fair market value of two Ultramax vessels (SBI Perseus
and SBI Phoebe) and two Kamsarmax vessels (SBI Electra and SBI Flamenco). The facility has a final maturity date of five years
from drawdown date and bears interest at LIBOR plus a margin of 2.25% per annum. This facility is secured by, among other
things, a first preferred mortgage on the four vessels and guaranteed by each of the vessel owning subsidiaries.
As of December 31, 2018, the outstanding balance on this facility was approximately $58.8 million.
$30.0 Million Credit Facility
On September 13, 2018, we entered into a senior secured credit facility for up to $30.0 million, or the $30.0 Million
Credit Facility, with ING Bank N.V. to refinance two Kamsarmax vessels (SBI Zumba and SBI Parapara). The facility has a final
maturity date of five years from drawdown date and bears interest at LIBOR plus a margin of 2.20% per annum. This facility is
secured by, among other things, a first preferred mortgage on the two Kamsarmax vessels and guaranteed by each of the vessel
owning subsidiaries.
As of December 31, 2018, the outstanding balance on this facility was approximately $29.4 million.
$184.0 Million Credit Facility

Table of Contents
71
On September 21, 2018, we entered into a senior secured credit facility for up to $184.0 million, or the $184.0 Million
Credit Facility, with Nordea Bank AB (publ), acting through its New York branch, and Skandinaviska Enskilda Banken AB (publ)
to refinance up to 60% of the fair market value of six Ultramax vessels (SBI Athena, SBI Thalia, SBI Zeus, SBI Hera, SBI
Poseidon and SBI Apollo) and six Kamsarmax vessels (SBI Conga, SBI Bolero, SBI Sousta, SBI Rock, SBI Reggae and SBI
Mazurka). The facility, which is comprised of a term loan of up to $104.0 million and a revolver of up to $80.0 million, has a
final maturity date of five years from signing date and bears interest at LIBOR plus a margin of 2.40% per annum. This facili ty
is secured by, among other things, a first preferred mortgage on the 12 vessels and guaranteed by each of the vessel owning
subsidiaries.
As of December 31, 2018, the outstanding balance on this facility was approximately $180.2 million.
$34.0 Million Credit Facility
On October 3, 2018, we entered into a senior secured credit facility for up to $34.0 million, or the $34.0 Million Credit
Facility, with Credit Agricole Corporate and Investment Bank to refinance up to 62.5% of the fair market value of two Kamsarmax
vessels (SBI Jive and SBI Swing). The loan facility, which is comprised of a term loan up to $17.0 million and a revolver up
to $17.0 million, has a final maturity date of seven years from signing date and bears interest at LIBOR plus a margin of 2.35%
per annum. This facility is secured by, among other things, a first preferred mortgage on the two vessels and guaranteed by each
of the vessel owning subsidiaries.
As of December 31, 2018, the outstanding balance on this facility was approximately $34.0 million.
$90.0 Million Credit Facility
On November 8, 2018, we entered into a senior secured credit facility for up to $90.0 million, or the $90.0 Million Credit
Facility, with Nordea Bank Abp, acting through its New York branch, and DVB Bank SE. The loan facility, which has a final
maturity date of five years from signing date and bears interest at LIBOR plus a margin of 2.35% per annum, was used to finance
up to 60% of the fair market value of six Ultramax vessels (SBI Orion, SBI Hyperion, SBI Tethys, SBI Hercules, SBI Samson
and SBI Phoenix). This facility is secured by, among other things, a first preferred mortgage on the six vessels and is guaranteed
by each of the vessel owning subsidiaries.
As of December 31, 2018, the outstanding balance on this facility was approximately $90.0 million.
$19.6 Million Lease Financing - SBI Rumba
In October 2017, we entered into a financing transaction with unaffiliated third parties involving the sale and leaseback
of the SBI Rumba, a 2015 Japanese built Kamsarmax vessel, for consideration of approximately $19.6 million. As part of the
transaction, we have agreed to make monthly payments of $164,250 under a nine and a half year bareboat charter agreement with
the buyers, which we have the option to extend for a further six months. The cost of the financing is equivalent to an implied
fixed interest rate of 4.23% for 10 years. If converted to floating interest rates, based on the expected weighted average life of
the transaction, the equivalent margin at the then prevailing swap rates would be LIBOR plus 2.07%. The agreement also provides
us with the option to repurchase the vessel beginning on the fifth anniversary of the sale and until the end of the agreement.
$19.0 Million Lease Financing - SBI Echo
On July 18, 2018, we closed a financing transaction with an unaffiliated third party involving the sale and leaseback of
the SBI Echo, a 2015 Japanese built Ultramax vessel, for consideration of $19.0 million. As part of the transaction, we agreed
with the buyer to bareboat charter the vessel for a period of five years at $5,400 per day. If converted to floating interest rates,
based on the expected weighted average life of the transaction, the equivalent cost of financing at the then prevailing swap rates
would have been LIBOR plus 1.97% per annum. The transaction also provides us with the option to repurchase the vessel
beginning on the third anniversary of the sale until the end of the bareboat charter agreement.
$19.0 Million Lease Financing - SBI Tango

Table of Contents
72
On July 18, 2018, we closed a financing transaction with an unaffiliated third party involving the sale and leaseback of
the SBI Tango, a 2015 Japanese built Ultramax vessel, for consideration of $19.0 million. As part of the transaction, we agreed
to make payments of $5,400 per day under a five-year bareboat charter agreement with the buyer. If converted to floating interest
rates, based on the expected weighted average life of the transaction, the equivalent cost of financing at the then prevailing swap
rates would have been LIBOR plus 1.65% per annum. The transaction also provides us with the option to repurchase the vessel
beginning on the third anniversary of the sale until the end of the bareboat charter agreement.
$20.5 Million Lease Financing - SBI Hermes
On November 16, 2018, we closed a financing transaction with an unaffiliated third party involving the sale and
leaseback of the SBI Hermes, a 2016 Japanese built Ultramax vessel, for consideration of $20.5 million. As part of the transaction,
we agreed with the buyer to bareboat charter the vessel for a period of five years at $5,850 per day. The transaction also provides
us with an option to repurchase the vessel beginning on the third anniversary of the sale until the end of the bareboat charter
agreement. If converted to floating interest rates, based on the expected weighted average life of the transaction, the equivalent
cost of financing at the then prevailing swap rates would have been LIBOR plus a margin of 1.43% per annum.
As of December 31, 2018, we had $767.4 million of outstanding borrowings under the credit agreements and lease
financings described above as shown in the following table (dollars in thousands):
December 31, 2018 March 20, 2019
Amount outstanding Amount outstanding
$330 Million Credit Facility 140,677 140,677
$42 Million Credit Facility 14,105 14,105
$12.5 Million Credit Facility 9,400 9,400
$27.3 Million Credit Facility 9,008 9,008
$85.5 Million Credit Facility 78,972 78,972
$38.7 Million Credit Facility 35,100 35,100
$19.6 Million Lease Financing - SBI Rumba 18,101 17,898
$12.8 Million Credit Facility 12,325 12,325
$19.0 Million Lease Financing - SBI Tango 18,451 18,259
$19.0 Million Lease Financing - SBI Echo 18,481 18,300
$30.0 Million Credit Facility 29,420 29,420
$34.0 Million Credit Facility 34,000 34,000
$60.0 Million Credit Facility 58,797 57,594
$184.0 Million Credit Facility 180,229 180,229
$20.5 Million Lease Financing - SBI Hermes 20,299 20,092
$90.0 Million Credit Facility 90,000 88,025
Total $ 767,365 $ 763,404
Our secured credit facilities are secured by, among other things: a first priority mortgage over the relevant collateralized
vessels; a first priority assignment of earnings, and insurances from the mortgaged vessels for the specific facility; a pledge of
the earnings account of the mortgaged vessels for the specific facility; and a pledge of the equity interests of each vessel owning
subsidiary under the specific facility.
$21.4 Million Lease Financing - SBI Samba
In February 2019, we entered into a financing transaction with an unaffiliated third party involving the sale and
leaseback of the SBI Samba, a 2015 Japanese built Kamsarmax vessel, for a consideration of $21.4 million. As part of the
transaction, we agreed to make payments of $6,850 per day under a five-year bareboat charter agreement with the buyer. The
transaction also provides us with the option to repurchase the vessel beginning on the third anniversary of the sale until the end

Table of Contents
73
of the bareboat charter agreement. This transaction, which is expected to close in the second quarter of 2019, is expected to
increase our liquidity by approximately $6.9 million after repayment of outstanding debt under the $42 Million Credit Facility,
under which the SBI Samba was previously financed.
CMBFL Lease Financing
In March 2019, we agreed to sell and leaseback three Ultramax vessels (SBI Pegasus, SBI Subaru and SBI Ursa) and
four Kamsarmax vessels (SBI Lambada, SBI Macarena, SBI Carioca and SBI Capoeira) to CMB Financial Leasing Co., Ltd.
Upon completion, which is estimated to take place in the second quarter of 2019, our liquidity is expected to increase by $57.2
million in aggregate ($45.4 million upon closing after the repayment of outstanding debt and an additional tranche of up to
$11.8 million for installation of scrubbers on the seven vessels). As part of the agreements, we will bareboat charter-in the
vessels for a period of seven years. In addition, we have purchase options beginning after the end of the third year of each
agreement. There is also a purchase option for each vessel upon the expiration of each agreement.
Vessel Sales
In March 2019, we entered into agreements with unaffiliated third parties to sell the SBI Electra and SBI Flamenco,
two 2015 Chinese built Kamsarmax vessels, for approximately $48.0 million in aggregate. Delivery of the vessels is estimated
to take place in the second quarter of 2019. It is estimated that our liquidity will increase by approximately $18.6 million after
the repayment of outstanding debt under the $38.7 Million Credit Facility under which the vessels were previously financed.
Loan Covenants
Certain of our credit facilities discussed above, have, among other things, the following financial covenants, as
amended or waived, the most stringent of which require us to maintain:
• The ratio of net debt to total capitalization no greater than 0.60 to 1.00.
• Consolidated tangible net worth (adjusted for a minimum amount of $100.0 million in historical non-operating costs
and to exclude certain future non-operating items, including impairments), no less than $500.0 million plus (i) 25% of
cumulative positive net income (on a consolidated basis) for each fiscal quarter commencing on or after December 31,
2013 and (ii) 50% of the value of any new equity issues occurring on or after December 31, 2013.
• The ratio of EBITDA to net interest expense calculated on a year-to-date basis of greater than 1.00 to 1.00 for the quarters
ending March 31, 2019 and June 30, 2019, 2.50 to 1.00 for the quarter ending September 30, 2019, calculated on a year-
to-date basis and 2.50 to 1.00 for each quarter thereafter, calculated on a trailing four quarter basis.
• Minimum liquidity of not less than the greater of $25.0 million or $0.7 million per owned vessel.
• Maintain a minimum fair value of the collateral for each credit facility, such that the aggregate fair value of the vessels
collateralizing the credit facility is between 140% and 150% of the aggregate principal amount outstanding under such
credit facility, or, if we do not meet these thresholds to prepay a portion of the loan or provide additional security to
eliminate the shortfall.
Our credit facilities discussed above have, among other things, the following restrictive covenants which would restrict
our ability to:
• incur additional indebtedness;
• sell the collateral vessel, if applicable;
• make additional investments or acquisitions;
• pay dividends; and

Table of Contents
74
• effect a change of control of us.
A violation of any of the financial covenants contained in our credit facilities described above may constitute an event
of default under all of our credit facilities, which, unless cured within the grace period set forth under the credit facility, if
applicable, or waived or modified by our lenders, provides our lenders with the right to, among other things, require us to post
additional collateral, enhance our equity and liquidity, increase our interest payments, pay down our indebtedness to a level where
we are in compliance with our loan covenants, sell vessels in our fleet, reclassify our indebtedness as current liabilities and
accelerate our indebtedness and foreclose their liens on our vessels and the other assets securing the credit facilities, which would
impair our ability to continue to conduct our business.
Furthermore, our credit facilities contain a cross-default provision that may be triggered by a default under one of our
other credit facilities. A cross-default provision means that a default on one loan would result in a default on certain of our other
loans. Because of the presence of cross-default provisions in certain of our credit facilities, the refusal of any one lender under
our credit facilities to grant or extend a waiver could result in certain of our indebtedness being accelerated, even if our other
lenders under our credit facilities have waived covenant defaults under the respective credit facilities. If our secured indebtedness
is accelerated in full or in part, it would be very difficult in the current financing environment for us to refinance our debt or
obtain additional financing and we could lose our vessels and other assets securing our credit facilities if our lenders foreclose
their liens, which would adversely affect our ability to conduct our business.
Moreover, in connection with any waivers of or amendments to our credit facilities that we have obtained, or may obtain
in the future, our lenders may impose additional operating and financial restrictions on us or modify the terms of our existing
credit facilities. These restrictions may further restrict our ability to, among other things, pay dividends, make capital expenditures
or incur additional indebtedness, including through the issuance of guarantees. In addition, our lenders may require the payment
of additional fees, require prepayment of a portion of our indebtedness to them, accelerate the amortization schedule for our
indebtedness and increase the interest rates they charge us on our outstanding indebtedness.
As of December 31, 2018, we were in compliance with all of the financial covenants contained in the credit facilities
that we had entered into as of that date.
Please see Note 11, Debt, to our consolidated financial statements for additional information about our credit facilities.
Senior Notes due 2019
On September 22, 2014, we issued $65.0 million aggregate principal amount of our 7.50% senior unsecured notes due
2019, or our Senior Notes, in a registered public offering. The Senior Notes will mature on September 15, 2019, and may be
redeemed in whole or in part at any time, or from time to time, after September 15, 2016. Interest on the Senior Notes is payable
quarterly on each of March 15, June 15, September 15 and December 15, commencing on December 15, 2014. We used the net
proceeds we received to fund installment payments due under our Newbuilding Program. On October 16, 2014, we issued an
additional $8.625 million aggregate principal amount of our Senior Notes, pursuant to the underwriters’ option to purchase
additional Senior Notes. Our Senior Notes due 2019 commenced trading on the NYSE on September 29, 2014 under the symbol
“SLTB.”
The indenture governing our Senior Notes contains certain restrictive covenants, including:
(a) Limitation on Borrowings. We are prohibited from letting net borrowings equal or exceed 70% of our total assets,
which are calculated as all of our assets of the types presented on our consolidated balance sheet.
(b) Limitation on Minimum Tangible Net Worth. We shall ensure that our net worth always exceeds $500 million.
(c) Reports. Following any cross default, we shall promptly notify the holders of our Senior Notes of the occurrence
of such cross default.
(d) Limitation on Asset Sales. We shall not, and shall not permit any subsidiary to, in the ordinary course of business
or otherwise, sell, lease, convey, transfer or otherwise dispose of any of our or any such subsidiary’s assets
(including capital stock and warrants, options or other rights to acquire capital stock) other than pursuant to a

Table of Contents
75
Permitted Asset Sale or a Limited Permitted Asset Sale (as such terms are defined in the indenture governing our
Senior Notes and described below), unless (A) we receive, or the relevant subsidiary receives, consideration at the
time of such asset sale at least equal to the fair market value (including as to the value of all non-cash consideration),
as determined in good faith by our Board of Directors, of the assets subject to such asset sale, and (B) within 365
days after the receipt of any net proceeds from an asset sale, we or the relevant subsidiary, as the case may be, shall
apply all such net proceeds to certain permitted purposes, including the repayment of secured indebtedness, capital
expenditures, repayment of unsecured indebtedness, acquire all or substantially all of the assets or, or the capital
stock of, a person primarily engaged in a permitted business; provided, that in the case of the acquisition of capital
stock of any person, such person is or becomes a subsidiary of the Company.
For purposes of this covenant: a Permitted Asset Sale includes certain specified asset sales, certain vessel losses not
to exceed 10% of the consolidated aggregate market value of our assets and any transaction or series of transactions
involving assets disposed of for fair market value and having an aggregate market value in any one fiscal year of
up to 25% of the consolidated aggregate market value of our assets; and a Limited Permitted Asset Sale includes
any transaction or series of transactions during a single fiscal year, the net proceeds of which are not otherwise
applied pursuant to the requirements set forth in this clause (d), that results in net proceeds in excess of 25% of the
consolidated aggregate market value of our assets.
As of December 31, 2018, we were in compliance with the financial covenants of our Senior Notes.
If a Limited Permitted Asset Sale occurs, we must make an offer to purchase our Senior Notes having a principal amount
equal to the excess proceeds of such Limited Permitted Asset Sale at a purchase price of 101% of the principal amount of our
Senior Notes to be purchased, plus accrued and unpaid interest.
In addition, if a Change of Control (as defined in the indenture for the Senior Notes) occurs, holders of our Senior Notes
have the right, at their option, to require us to purchase any or all of such holders’ Senior Notes at a purchase price of 101% of
the principal amount of our Senior Notes to be purchased, plus accrued and unpaid interest.
In addition, if an event of default or an event or circumstance which, with the giving of any notice or the lapse of time,
would constitute an event of default under our Senior Notes has occurred and is continuing, or we are not in compliance with the
covenant described under Limitation on Borrowings or Limitation on Minimum Tangible Net Worth described above, then none
of the Company or any subsidiary will be permitted to declare or pay any dividends or return any capital to its equity holders
(other than the Company or a wholly-owned subsidiary of the Company) or authorize or make any other distribution, payment
or delivery of property or cash to its equity holders (other than the Company or a wholly-owned subsidiary of the Company), or
redeem, retire, purchase or otherwise acquire, directly or indirectly, for value, any interest of any class or series of its equity
interests (or acquire any rights, options or warrants relating thereto but not including convertible debt) now or hereafter
outstanding and held by persons other than the Company or any wholly-owned subsidiary, or repay any subordinated loans to
equity holders (other than the Company or a wholly-owned subsidiary of the Company) or set aside any funds for any of the
foregoing purposes.
In December 2016, our Board of Directors authorized the repurchase of up to $20.0 million of the outstanding Senior
Notes in open market or privately negotiated transactions. The specific timing and amounts of the repurchases, which will be
funded by available cash, will be in the sole discretion of management and vary based on market conditions and other factors.
This authorization has no expiration date. As of December 31, 2018, the full $20.0 million remained available for repurchase
under this authorization.
C. Research and Development, Patents and Licenses, Etc.
Not applicable
D. Trend Information
See “Item 4. Information on the Company - B. Business Overview - Industry and Market Conditions.”

Table of Contents
76
E. Off-Balance Sheet Arrangements
As of December 31, 2018, we did not have any off-balance sheet arrangements, however, we were committed to make
charter-hire payments to a third party for a chartered-in vessel. That arrangement is accounted for as an operating lease. Please
see “Tabular Disclosure of Contractual Obligations” for our other contractual obligations and commitments.
F. Tabular Disclosure of Contractual Obligations
The following table sets forth our total contractual obligations at December 31, 2018:
(in millions of U.S. dollars)
Less than
1 year
1 to 3
years
3 to 5
years
More
than 5
years Total
Exhaust cleaning systems (1) $ 32.9 $ 7.8 $ — $ — $ 40.7
Time charter-in commitments (2) 2.8 — — — 2.8
Senior Notes (3) 73.6 — — — 73.6
Bank loans (4) 61.5 241.3 367.4 21.9 692.1
Interest payments (5) 40.6 58.6 29.8 1.7 130.7
Financing obligation (6) 8.0 16.1 53.5 12.8 90.4
Commercial management fee (7) 1.5 — — — 1.5
Technical management fee (8) 2.2 — — — 2.2
Total $ 223.1 $ 323.8 $ 450.7 $ 36.4 $ 1,034.0
(1) Represents the unpaid installments as of December 31, 2018 relating to the purchase of exhaust gas cleaning systems.
(2) Represents the amounts expected to be paid by us on the vessel that we have time chartered-in as of December 31, 2018,
assuming we redeliver the vessel to its owner on the earliest redelivery date.
(3) Represents the repayment of our Senior Notes which mature in September 2019.
(4) Represents the repayment of installments under the bank loans outstanding as of December 31, 2018.
(5) Represents the interest payments on outstanding balances of our Senior Notes at 7.50% per annum and bank loans at the
interest rates in effect at December 31, 2018.
(6) Represents the monthly payments under bareboat charter agreements.
(7) Represents the fixed component of the termination fees we would have to pay our commercial manager, SCM, of $300 per
day for a notice period of three months’ and a payment equal to three months of management fees for each vessel that we
own as of December 31, 2018. Due to the variable nature of the commissions, they have been excluded from the above table.
(8) Represents the termination fees we would have to pay our technical manager, SSM, of $0.2 million per vessel per year for a
notice period of three months’ and a payment equal to three months of management fees for each vessel that we own as of
December 31, 2018.
ITEM 6. DIRECTORS, SENIOR MANAGEMENT AND EMPLOYEES
A. Directors and Senior Management
Set forth below are the names, ages and positions of our directors and executive officers. Our Board of Directors is
elected annually on a staggered basis, and each director elected holds office for a three-year term or until their successor shall
have been duly elected and qualified, except in the event of their death, resignation, removal or the earlier termination of their
term of office. Our Class C directors will serve for a term expiring at the 2019 annual meeting of shareholders, our Class A

Table of Contents
77
directors will serve for a term expiring at the 2020 annual meeting, and our Class B directors will serve for a term expiring at the
2021 annual meeting. Officers are elected from time to time by vote of our Board of Directors and hold office until a successor
is elected. The business address of each of our directors and executive officers listed below is Scorpio Bulkers Inc., 9, Boulevard
Charles III, MC 98000 Monaco.
Name Age Position
Emanuele A. Lauro 40 Chairman, Class A Director and Chief Executive Officer
Robert Bugbee 58 Class B Director and President
Cameron Mackey 50 Chief Operating Officer
Filippo Lauro 42 Vice President
Hugh Baker 51 Chief Financial Officer
Fan Yang 30 Secretary
Einar Michael Steimler 70 Class B Director
Roberto Giorgi 68 Class A Director
Christian M. Gut 39 Class C Director
Thomas Ostrander 68 Class A Director
James B. Nish 60 Class C Director
Berit Ledel Henriksen 65 Class B Director
On December 4, 2018, Ms. Anoushka Kachelo resigned as Secretary of the Company and Ms. Fan Yang was appointed
as Secretary of the Company.
On February 27, 2019, the Company increased the size of its Board of Directors from seven to eight members, and
appointed Berit Ledel Henriksen to serve as a Class B Director, effective as of the same date. The Board of Directors has
determined that Ms. Henriksen is an “independent director” as such term is defined under the Securities Exchange Act of 1934,
as amended, and the New York Exchange Listing Manual.
Biographical information concerning the directors and executive officers listed above is set forth below.
Emanuele A. Lauro, Chairman and Chief Executive Officer
Emanuele A. Lauro, the Company’s co-founder, has served as our Chairman and Class A Director since April 2013 and
as our Chief Executive Officer since July 1, 2013. Mr. Lauro has also served as Chairman and Chief Executive Officer of Scorpio
Tankers (NYSE: STNG) since its initial public offering in April 2010, and as Chairman and Chief Executive Officer of Nordic
American Offshore Ltd. (NYSE: NAO) since December 2018. He also served as Director of the Standard Club from May 2013
to January 2019. Mr. Lauro joined Scorpio in 2003 and has continued to serve there in a senior management position since 2004.
Under his leadership, Scorpio has grown from an owner of three vessels in 2003 to become a leading operator and manager of
more than 230 vessels in 2018. Over the course of the last several years, Mr. Lauro has founded and developed all of the Scorpio
Pools in addition to several other ventures such as Scorpio Logistics, which owns and operates specialized assets engaged in the
transshipment of dry cargo commodities and invests in coastal transportation and port infrastructure developments in Asia and
Africa since 2007. Mr. Lauro has a degree in international business from the European Business School, London. Mr. Lauro is
the brother of our Vice President, Mr. Filippo Lauro.
Robert Bugbee, President and Director
Robert Bugbee, the Company’s co-founder, has served as our Class B Director since April 2013 and as our President
since July 1, 2013. Mr. Bugbee has more than 34 years of experience in the shipping industry. Mr. Bugbee has also served as
President and Director of Scorpio Tankers since its initial public offering in April 2010 and as President and a Director of Nordic
American Offshore Ltd. since December 2018. He joined Scorpio in March 2009 and has continued to serve there in a senior
management position. Prior to joining Scorpio, Mr. Bugbee was a partner at Ospraie Management LLP between 2007 and 2008,
a company which advises and invests in commodities and basic industry. From 1995 to 2007, Mr. Bugbee was employed at OMI

Table of Contents
78
Corporation, or OMI, a NYSE-listed tanker company sold in 2007. While at OMI, Mr. Bugbee served as President from January
2002 until the sale of the company, and before that served as Executive Vice President since January 2001, Chief Operating
Officer since March 2000 and Senior Vice President from August 1995 to June 1998. Mr. Bugbee joined OMI in February 1995.
Prior to this, he was employed by Gotaas-Larsen Shipping Corporation since 1984. During this time he took a two year sabbatical
from 1987 for the M.I.B. Program at the Norwegian School for Economics and Business Administration in Bergen. He has a B.A.
(Honors) from London University.
Cameron Mackey, Chief Operating Officer
Cameron Mackey has served as our Chief Operating Officer since July 2013. Mr. Mackey has also served as Chief
Operating Officer of Scorpio Tankers since its initial public offering in April 2010 and as a Director since May 2013, and as Chief
Operating Officer of Nordic American Offshore Ltd. since December 2018. He joined Scorpio in March 2009, where he continues
to serve in a senior management position. Prior to joining Scorpio, he was an equity and commodity analyst at Ospraie
Management LLC from 2007 to 2008. Prior to that, he was Senior Vice President of OMI Marine Services LLC from 2004 to
2007, where he was also in Business Development from 2002 to 2004. He has been employed in the shipping industry since 1994
and, earlier in his career, was employed in unlicensed and licensed positions in the merchant navy, primarily on tankers in the
international fleet of Mobil Oil Corporation, where he held the qualification of Master Mariner. He has an M.B.A. from the Sloan
School of Management at the Massachusetts Institute of Technology, a B.S. from the Massachusetts Maritime Academy and a
B.A. from Princeton University.
Filippo Lauro, Vice President
Filippo Lauro has served as an executive officer of the Company with the title of Vice President since June 2016.
Mr. Filippo Lauro has also served as Vice President of Scorpio Tankers since May 2015, and as Vice President of Nordic
American Offshore Ltd. since December 2018. He joined Scorpio in 2010 and has continued to serve there in a senior
management position. Prior to joining Scorpio, Mr. Filippo Lauro was the founder of and held senior executive roles in several
private companies, primarily active in real estate, golf courses and resorts development. Mr. Filippo Lauro is the brother of our
Chairman and Chief Executive Officer, Mr. Emanuele Lauro.
Hugh Baker, Chief Financial Officer
Hugh Baker has served as our Chief Financial Officer since July 2013. Since 2012, Mr. Baker has also been employed
by Scorpio Tankers focusing on business development and finance. For three years before joining Scorpio, Mr. Baker was a
Managing Director in the investment banking team at Evercore Partners in New York, concentrating on the shipping industry.
Prior to Evercore, he was the Head of Shipping at HSH Nordbank in New York and was previously a Managing Director in the
ship finance team at ING Bank in London. Prior to banking, Mr. Baker worked in commercial roles for Greek-owned shipping
companies in London. Mr. Baker has a BA from the London School of Economics and a MSc in Shipping, Trade & Finance from
Cass Business School. Mr. Baker is a Fellow of the Institute of Chartered Shipbrokers.
Fan Yang, Secretary
Fan Yang has served as our Secretary since December 2018. Ms. Yang joined Scorpio in February 2018 and also serves
as Secretary of Scorpio Tankers. Ms. Yang is admitted as a solicitor of the Supreme Court of England and Wales. Prior to joining
Scorpio, Ms. Yang was in private practice in London at Travers Smith LLP and Freshfields Bruckhaus Deringer LLP, and led a
law reform project at the Law Commission, an independent body that makes recommendations for the reform of the law of
England and Wales to Parliament. She has a BA in Law from the University of Cambridge.
Roberto Giorgi, Director
Roberto Giorgi has served as our Class A Director since the closing of our initial public offering in December 2013. Mr.
Giorgi has also served as Chairman of Fraser Yachts since September 2014 and as a committee member of Skuld P&I Club since
June 2013. From 2014 to 2015, he served as Honorary President and member of the Group Executive of V.Ships, the world’s
largest ship management company. From 1988 to 2014, Mr. Giorgi has held various roles within V.Ships, including President of
Table of Contents
79
V.Ships Ship Management, Managing Director of V.Ships New York, head of V.Ships Leisure in the cruise sector, and head of
V.Ship’s ship management operation from its Monaco office. From 2008 to 2010, Mr. Giorgi also served as President of
InterManager, the international trade association for third-party and in-house ship managers, whose members between them are
responsible for approximately 3,700 ships and more than 200,000 crew members. Prior to joining the V.Ships Group, he attended
the San Giorgio Nautical College in Genoa (1964 - 1969) and sailed from Deck Cadet to First Officer with Navigazione Alta
Italia, Italian line and Sitmar Cruises. Before joining the merchant marine, he spent one year (1970/71) in the Naval Academy of
Leghorn and sailed with the Italian Navy as Lieutenant.
Einar Michael Steimler, Director
Einar Michael Steimler has served as our Class B Director since the closing of our initial public offering in December
2013 and is our lead independent director. Mr. Steimler has also served as a director of DHT Holdings Inc. (NYSE:DHT), where
he is also a member of the Nominating and Corporate Governance Committees, and the Chairman of the Compensation
Committee. Mr. Steimler has over 46 years of experience in the shipping industry. In 2000, he was instrumental in the formation
of Tanker (UK) Agencies, the commercial agent to Tankers International. He served as its Chief Executive Officer until the end
of 2007, and subsequently as its Chairman until 2011. From 1998 to 2010, Mr. Steimler served as a Director of Euronav NV
(EURN:EN Brussels). He has been involved in both sale and purchase and chartering brokerage in the tanker, gas and chemical
sectors and was a founder of Stemoco, a Norwegian ship brokerage firm. He graduated from the Norwegian School of Business
Management in 1973 with a degree in Economics.
Christian M. Gut, Director
Christian M. Gut has served as our Class C Director since the closing of our initial public offering in December 2013.
Mr. Gut is the founder and manager of P2P Lending Fund, a Luxembourg based fund (SICAV-RAIF) launched in 2018 focused
on marketplace consumer lending. He has over 15 years of experience in the consulting industry in the Asia Pacific region. Mr.
Gut started his professional career at ThyssenKrupp Technologies AG (as it then was) in Essen, Germany in 2002. He later joined
Singapore based EABC Pte Ltd., or EABC, in 2003 where he served as Director from 2006 to 2018. EABC’s services comprise
market intelligence and strategy, sales promotion and support to project management in selected Asia Pacific countries,
principally Australia. Furthermore, Mr. Gut co-founded and was a past manager of the Stellar Energy Fund, launched in Singapore
in 2006, which invested in energy focused private companies to finance projects and expansion plans in Asia, Middle East and
Europe in the following industries: oil trading and bunkering, gas E&P, solar, geothermal and power generating heat plants. Mr.
Gut has a Bachelor’s degree in international business from the European Business School in London.
Thomas Ostrander, Director
Thomas Ostrander has served as our Class A director since January 2016. From 2013 to 2015, Mr. Ostrander served as
Chief Financial Officer of U.S. Alliance Paper Inc., a privately held business involved in consumer tissue converting and
marketing in the eastern half of the United States. From 2011 to 2013, he served as a Managing Director at GCA Savvian, a
global investment bank. From 2006 to 2008, Mr. Ostrander served as a Managing Director and Sector Head in the Industrial
Group at Banc of America Securities. From 1989 to 2006, he held various roles within Citigroup (legacy Salomon Brothers),
where he was most recently Chairman of the Global Industrial Group for North America. Prior to that, he was Head of the Global
Industrial Group for North America and Co-Head of the Global group. From 1976 to 1989, he served in various roles, including
as a Managing Director, and he was a member of the Board of Directors of New York based Kidder Peabody & Co., where he
also was Co-Founder and Co-Head of Equity Capital Markets. Furthermore, Mr. Ostrander was a Director of Westmoreland Coal
Company for over 12 years, where he served as Chairman of the Corporate Governance Committee and was a member of the
Audit, Compensation and Benefits, Finance and Nominating Committees. Mr. Ostrander has an MBA from Harvard Business
School and an AB from the University of Michigan in Economics and Accounting.
James B. Nish, Director
James B. Nish has served as our Class C director since January 2016. Mr. Nish has over 30 years of experience in
investment banking, serving clients across a variety of international industrial markets. Since 2015, he has served as a Board
member and Chairman of the Audit Committee of Gibraltar Industries, Inc. (NASDAQ: ROCK), a manufacturer and distributor

Table of Contents
80
of products for building markets, and was also appointed as Chairman of its Capital Structure and Asset Management Committee
in 2018. Mr. Nish has also served as a Board member of the CSG Group since 2014, a private company that provides security
alarm monitoring and related home automation services to subscribers in the United States. From 2008 to 2012, he was Group
Head of Middle Corporate Investment Banking at J.P. Morgan. From 1986 to 2008, Mr. Nish served as Co-Chairman of the
Investment Banking Commitment Committee and Group Head of the General Industries Group of Bear Stearns & Co. Inc., where
he organized and managed investment banking coverage of a diversified group of industrial companies. Mr. Nish is a Certified
Public Accountant and Adjunct Professor in both the Undergraduate Business School and MBA Programs at Baruch College,
Zicklin School of Business in New York and at Pace University, Lubin School of Business in New York, where he teaches a
number of courses in both the Accounting and Finance departments. Mr. Nish has an MBA from the Wharton School at the
University of Pennsylvania and a BS from the State University of New York at Buffalo in Accounting and Business.
Berit Ledel Henriksen, Director
Berit Ledel Henriksen has served as our Class B Director since February 2019. Ms. Henriksen has extensive experience
from the banking and finance industries. She serves as a director of Ferd Holding AS, a Norwegian investment company that
manages a broad portfolio of privately owned and Nordic listed companies. Furthermore, Ms. Henriksen serves on the board of
directors of three privately held companies in Norway and Canada, and on the Nomination Committees of Equinor ASA and
Norsk Hydro ASA, two Norwegian listed companies. She is also a member of Norsk Hydro ASA’s Corporate Assembly. From
1985 to 2017, Ms. Henriksen held a range of management positions at DNB, Norway's largest financial services group, where
she focused on shipping, energy and other international industries. Ms. Henriksen most recently served as DNB’s Executive Vice
President and Global Head of Energy, and was Head of DNB Americas in New York between 1998 and 2004. She also previously
held various other bank related board positions. Ms. Henriksen has an MBA from the Ivey Business School at the University of
Western Ontario, and a BSc from the Dalhousie University in Halifax, Canada.
B. Compensation
Each of our non-employee directors receive cash compensation in the aggregate amount of $60,000 annually, plus either
(i) an additional fee of $10,000 per year for each committee on which a director serves or (ii) an additional fee of $20,000 per
year for each committee for which a director serves as Chairman. In addition, our lead independent director receives an additional
fee of $20,000 per year. All actual expenses incurred while acting in their capacity as a director are reimbursed. For each board
or committee meeting the non-employee director attends, the director receives $2,000. There are no material post-employment
benefits for our executive officers or directors. By law, our employees in Monaco are entitled to a one-time payment of up to
two months salary upon retirement if they meet certain minimum service requirements. For the year ended December 31, 2018,
we paid an aggregate compensation to our directors and senior management of approximately $6.3 million.
Executive Officers
We have employment agreements with the majority of our executive officers. These employment agreements remain in
effect until terminated in accordance with their terms upon no less than 24 months’ prior written notice. Pursuant to the terms of
their respective employment agreements, our executive officers are prohibited from disclosing or unlawfully using any of our
material confidential information.
Upon a change in control of us, the annual bonus provided under the employment agreement becomes a fixed bonus of
between 150% and 250% of the executive’s base salary, depending on the terms of the employment agreement applicable to each
executive.
Any such executive may be entitled to receive upon termination an assurance bonus equal to such fixed bonus and an
immediate lump-sum payment in an amount equal to up to three times the sum of the executive’s then current base salary and
the assurance bonus. If an executive’s employment is terminated for cause or voluntarily by the employee, he shall not be entitled
to any salary, benefits or reimbursements beyond those accrued through the date of his termination, unless he voluntarily
terminated his employment in connection with certain conditions. Those conditions include a change in control combined with a

Table of Contents
81
significant geographic relocation of his office, a material diminution of his duties and responsibilities, and other conditions
identified in the employment agreement.
We believe that it is important to align the interests of our directors and management with that of our shareholders. In
this regard, we have determined that it will generally be beneficial to us and to our shareholders for our directors and management
to have a stake in our long-term performance. We expect to have a meaningful component of our compensation package for our
directors and management consist of equity interests in us in order to provide them on an on-going basis with a meaningful
percentage of ownership in us.
Equity Incentive Plan
Our Board of Directors has adopted an equity incentive plan, which we refer to as the Equity Incentive Plan, under
which directors, officers and employees of us and our subsidiaries, as well as employees of affiliated companies are eligible to
receive incentive stock options and non-qualified stock options, stock appreciation rights, restricted stock, restricted stock units
and unrestricted common shares. As of December 31, 2018, we had reserved a total of 5,931,962 common shares, for issuance
under the Equity Incentive Plan, subject to adjustment for changes in capitalization as provided in the Equity Incentive Plan. Our
Equity Incentive Plan is administered by our Compensation Committee.
Under the terms of the Equity Incentive Plan, stock options and stock appreciation rights granted under the Equity
Incentive Plan will have an exercise price equal to the fair market value of a common share on the date of grant, unless otherwise
determined by the plan administrator, but in no event will the exercise price be less than the fair market value of a common share
on the date of grant. Options and stock appreciation rights will be exercisable at times and under conditions as determined by the
plan administrator, but in no event will they be exercisable later than ten years from the date of grant.
The plan administrator may grant shares of restricted stock and awards of restricted stock units subject to vesting,
forfeiture and other terms and conditions as determined by the plan administrator.
Adjustments may be made to outstanding awards in the event of a corporate transaction or change in capitalization or
other extraordinary event. In the event of a “change in control” (as defined in the Equity Incentive Plan), unless otherwise
provided by the plan administrator in an award agreement, awards then outstanding will become fully vested and exercisable in
full.
Our Board of Directors may amend or terminate the Equity Incentive Plan and may amend outstanding awards, provided
that no such amendment or termination may be made that would materially impair any rights, or materially increase any
obligations, of a grantee under an outstanding award. Shareholder approval of Equity Incentive Plan amendments will be required
under certain circumstances. Unless terminated earlier by our Board of Directors, the Equity Incentive Plan will expire ten years
from the date the Equity Incentive Plan is adopted.
On September 28, 2018, we granted 1,189,350 restricted shares with an aggregate fair value of $8.6 million to our
officers, employees and members of our Board of Directors pursuant to the Equity Incentive Plan. Of these restricted shares,
150,000 restricted shares vest in three equal annual installments beginning June 10, 2019 and 1,039,350 restricted shares vest in
three equal annual installments beginning on June 10, 2020.
On February 2, 2018, we granted 646,182 restricted shares with an aggregate fair value of $4.8 million to our officers,
employees, members of our Board of Directors and SSH employees pursuant to the Equity Incentive Plan. These awards will
vest in three equal annual installments beginning on December 9, 2019.
On June 1, 2017, we granted 150,000 restricted shares with an aggregate fair value of $0.9 million to our independent
directors pursuant to the Equity Incentive Plan. These awards will vest in three equal annual installments beginning on the first
anniversary of the date of grant.
On July 28, 2016, we granted 2,582,000 restricted shares to our officers, employees, members of our Board of Directors
and SSH employees pursuant to the Equity Incentive Plan. Of these restricted shares, 150,000 restricted shares vest in three equal

Table of Contents
82
annual installments beginning June 5, 2017 and 2,432,000 restricted shares vest in three equal annual installments beginning on
June 5, 2018. The aggregate fair value of these awards is $8.4 million.
Compensation cost is recognized on a straight-line basis over the requisite service period for each separately vesting
portion of the award as if the award was, in-substance, multiple awards. Please see Note 10, Equity Incentive Plan, to our
Consolidated Financial Statements included herein for additional information.
C. Board Practices
Our Board of Directors currently consists of eight directors, six of whom have been determined by our Board of Directors
to be independent under the rules of the NYSE and the rules and regulations of the SEC. Mr. Steimler is our lead independent
director. Our Board of Directors has an Audit Committee, a Nominating and Corporate Governance Committee and a
Compensation Committee. Our Audit Committee is comprised of Messrs. Ostrander, Nish and Giorgi. Our Nominating and
Corporate Governance Committee and our Compensation Committee are comprised of Messrs. Steimler, Giorgi and Gut. The
Audit Committee, which operates under a charter, among other things, reviews our external financial reporting, engages our
external auditors and oversees our internal audit activities, procedures and the adequacy of our internal controls. In addition,
provided that no member of the Audit Committee has a material interest in such transaction, the Audit Committee is responsible
for reviewing transactions that we may enter into in the future with other members of Scorpio that our Board of Directors believes
may present potential conflicts of interests between us and Scorpio. The Nominating and Corporate Governance Committee is
responsible for recommending to the Board of Directors nominees for director and directors for appointment to board committees
and advising the board with regard to corporate governance practices. Our shareholders may also nominate directors in
accordance with procedures set forth in our bylaws. The Compensation Committee oversees our equity incentive plan and
recommends director and senior employee compensation.
D. Employees
For the years ended December 31, 2018, 2017, and 2016 we had six, six, and three full time equivalents (excluding our
executive officers), respectively.
Our executive officers are employed by us and our support staff is provided by SSH pursuant to the Amended
Administrative Services Agreement. Our technical manager, SSM, is responsible for identifying, screening and recruiting,
directly or through a crewing agent, the officers and all other crew members for our vessels that are employed by our vessel-
owning subsidiaries.
E. Share ownership
The common shares beneficially owned by our directors and our executive officers are disclosed in “Item 7. Major
Shareholders and Related Party Transactions—A. Major Shareholders.”
ITEM 7. MAJOR SHAREHOLDERS AND RELATED PARTY TRANSACTIONS.

Table of Contents
83
A. Major shareholders.
The following table sets forth information regarding beneficial ownership of our common shares for (i) owners of more
than five percent of our common shares and (ii) our directors and executive officers, of which we are aware as of March 15, 2019.
All of our shareholders, including the shareholders listed in the table below, are entitled to one vote for each share of our common
stock held.
Name No. of Shares % Owned (1)
Scorpio Holdings Limited 13,977,513 (2 ) 19.6 %
GRM Investments Ltd. 12,839,328 (3 ) 18.0 %
Evermore Global Advisors, LLC * 6,248,277 (4 ) 8.8 %
Raging Capital Management LLC 3,538,399 (5 ) 5.0 %
Directors and executive officers as a group 4,122,353 5.8 %
____________________
(1) Calculated based on 71,217,258 common shares outstanding as of March 15, 2019.
(2) This information is derived from a Schedule 13D/A filed with the SEC on February 22, 2019 by Scorpio Holdings
Limited, Scorpio Services Holding Limited, Scorpio Assets Holding Limited, Scorpio Assets SALT Limited, and Ms.
Annalisa Lolli-Ghetti. Ms. Annalisa Lolli-Ghetti may be deemed to be the ultimate beneficial owner of these shares by
virtue of being the majority shareholder of Scorpio Holdings Limited. Emanuele Lauro, our Director and Chief
Executive Officer, Robert Bugbee, our Director and President, and Cameron Mackey, our Chief Operating Officer,
own 10%, 10% and 7% of Scorpio Holdings Limited, respectively.
(3) This information is derived from Schedule 13G/A filed with the SEC on July 25, 2017.
(4) This information is derived from Schedule 13G/A filed with the SEC on February 11, 2019.
(5) This information is derived from Schedule 13G/A filed with the SEC on February 14, 2018.
* Includes common shares held by funds managed thereby.
As of March 15, 2019, we had 64 shareholders of record, 15 of which were located in the United States and held an
aggregate of 67,619,958 shares of our common stock, representing 94.9% of our outstanding common shares. However, one of
the U.S. shareholders of record is Cede & Co., a nominee of The Depository Trust Company, which held 65,545,567 shares of
our common stock, as of that date. Accordingly, we believe that the shares held by Cede & Co. include common shares
beneficially owned by both holders in the United States and non-U.S. beneficial owners. We are not aware of any arrangements
the operation of which may at a subsequent date result in our change of control.

Table of Contents
84
B. Related Party Transactions
Management of Our Fleet
Commercial and Technical Management Agreements - Revised Master Agreement
Our vessels are commercially managed by SCM and technically managed by SSM pursuant to the Revised Master
Agreement, which may be terminated by either party upon 24 months’ notice, unless terminated earlier in accordance with the
provisions of the Revised Master Agreement. In the event of the sale of one or more vessels, a notice period of three months’ and
a payment equal to three months of management fees will apply, provided that the termination does not amount to a change of
control, including a sale of substantially all vessels, in which case a payment equal to 24 months of management fees will apply.
SCM and SSM are companies affiliated with us. The vessel we charter-in is also commercially managed by SCM. We expect that
additional vessels that we may charter-in or acquire in the future will also be managed under the Revised Master Agreement or
on substantially similar terms.
SCM’s services include securing employment for our vessels in the spot market and on time charters. SCM also manages
the Scorpio Pools in which our vessels are employed. For commercial management of any of our vessels that does not operate in
one of these pools, we pay SCM a daily fee of $300 per vessel, plus a 1.75% commission on the gross revenues per charter
fixture. The Scorpio Pool participants, including us and third-party owners of similar vessels, are each expected to pay SCM a
pool management fee of $300 per vessel per day, plus a 1.75% commission on the gross revenues per charter fixture.
SSM’s services include providing technical support, such as arranging the hiring of qualified officers and crew,
supervising the maintenance and performance of vessels, purchasing supplies, spare parts and new equipment, arranging and
supervising drydocking and repairs, and monitoring regulatory and classification society compliance and customer standards. We
pay SSM an annual fee of $160,000 plus charges for certain itemized services per vessel to provide technical management services
for each of our owned vessels. In addition, representatives of SSM, including certain subcontractors, previously provided us with
construction supervisory services while our vessels were being constructed in shipyards. For these services, we compensated
SSM for its direct expenses, which varied between $200,000 and $500,000 per vessel.
Amended Administrative Services Agreement
In 2016, we entered into the Amended Administrative Services Agreement with SSH for the provision of administrative
staff, office space and accounting, legal compliance, financial and information technology services. SSH is a company affiliated
with us. The services provided to us by SSH may be sub-contracted to other entities within Scorpio. Pursuant to the Amended
Administrative Services Agreement, we reimburse SSH for the reasonable direct or indirect expenses it incurs in providing us
with the administrative services described above.
SSH also arranges vessel sales and purchases for us. We previously paid SSH a fee, payable in our common shares, for
arranging vessel acquisitions, including newbuildings. The amount of common shares payable was determined by dividing
$250,000 by the market value of our common shares based on the volume weighted average price of our common shares over
the 30 trading day period immediately preceding the contract date of a definitive agreement to acquire any vessel. As of the date
of this annual report, we issued an aggregate of 180,716 common shares to SSH in connection with the deliveries of newbuilding
vessels. Effective September 29, 2016, pursuant to the terms of the Amended Administrative Services Agreement, we agreed
with SSH to eliminate this fee on all future acquisitions.
SSH has agreed with us not to own any drybulk carriers greater than 30,000 dwt for so long as the Amended
Administrative Services Agreement is in full force and effect. This agreement may be terminated by SSH upon 12 months’ prior
written notice or by us with 24 months’ notice.
The fees and rates charged as vessel operating costs by the related party port agent are based on the prevailing market
rates for such services in each respective region.
Other Related Party Transactions

Table of Contents
85
In 2016, an Executive Officer of the Company acquired a minority interest, which in 2018 increased to a majority
interest, in an insurance broker which arranges hull and machinery and war risk insurance for certain of our owned and finance
leased vessels. This broker has arranged such policies for the Company since 2013 and the extent of the coverage and the manner
in which the policies are priced did not change as a result of this transaction. In September 2018 the Executive Officer disposed
of their interest in the insurance broker in its entirety to a third party not affiliated with the Company. The amounts recorded
reflect the amortization of the policy premiums, which are paid directly to the broker, who then remits the premiums to the
underwriters. Such payments, which are made in advance, are classified as prepaid expenses and other current assets on the
Consolidated Balance Sheet until they are expensed at which point they are recorded as vessel operating expenses in the
Consolidated Statement of Operations.
On October 12, 2018, we invested $100.0 million in Scorpio Tankers, a related party of ours, for approximately 54.1
million shares of Scorpio Tankers, representing approximately 10.9% of Scorpio Tankers’ then issued and outstanding common
shares. The investment was part of a larger $337.0 million equity raise through a public offering of common shares by Scorpio
Tankers. Scorpio Tankers owns and operates a fleet of tankers transporting petroleum products. Certain of our directors and
executive officers serve in similar positions in Scorpio Tankers and in other entities within Scorpio. On January 18, 2019, Scorpio
Tankers effected a one-for-ten reverse stock split and as such we now own approximately 5.4 million common shares of Scorpio
Tankers.
Please see Note 15, Related Party Transactions, to our consolidated financial statements for additional information about
our related party transactions.
Related Party Balances
For the years ended December 31, 2018, 2017 and 2016, we had the following balances with entities controlled by the
Lolli-Ghetti family and with Scorpio Tankers (herein referred to as “related parties”), which have been included in the
consolidated statement of operations (amounts in thousands):

Table of Contents
86
For the year ended December 31,
2018 2017 2016
Vessel revenue
Scorpio Kamsarmax Pool $ 87,305 $ 67,825 $ 31,319
Scorpio Ultramax Pool 155,197 94,380 46,227
SCM — — 856
Total vessel revenue $ 242,502 $ 162,205 $ 78,402
Voyage expense
SCM $ — $ 172 $ 319
Vessel operating cost
SSM $ 13,361 $ 9,379 $ 7,191
Port agent 117 13 —
Insurance brokerage 1,721 — —
Total vessel operating cost $ 15,199 $ 9,392 $ 7,191
General and administrative expense:
SCM $ 45 $ 108 $ 43
SSM 99 — —
SSH 6,707 5,643 3,949
Scorpio UK Limited 1,665 971 862
Total general and administrative expense $ 8,516 $ 6,722 $ 4,854
Income (loss) from equity investment
Scorpio Tankers Inc. $ (7,178 ) $ — $ —
Write down on assets held for sale
SCM $ — $ 147 $ 500
SSM — 200 500
Total write down on assets held for sale $ — $ 347 $ 1,000

Table of Contents
87
At December 31, 2018 and 2017, we had the following balances with related parties, which have been included in the
consolidated balance sheets (amounts in thousands):
As of December 31,
2018 2017
Assets
Due from related parties-current:
Scorpio Kamsarmax Pool $ 4,017 $ 3,977
Scorpio Ultramax Pool 3,321 2,578
Total due from related parties-current $ 7,338 $ 6,555
Due from related parties non-current:
Scorpio Kamsarmax Pool $ 4,806 $ 5,080
Scorpio Ultramax Pool 10,542 10,741
Total due from related parties non-current $ 15,348 $ 15,821
Equity investment in Scorpio Tankers Inc. $ 92,281 $ —
Liabilities
Due to related parties-current:
SCM $ 8 $ —
SSM 116 69
SSH 357 297
Total due from related parties-current $ 481 $ 366
Please see “Item 3. Key Information - D. Risk Factors - Risks Related to our Relationship with Scorpio and its Affiliates”.
Related Party Share Issuances
On June 20, 2016, we issued 23.0 million common shares, par value $0.01 per share, at $3.05 per share in an underwritten
public offering. SSH purchased an aggregate of approximately 5.3 million common shares at the public offering price.
On March 22, 2016, we issued 21.0 million common shares, par value $0.01 per share, at $3.00 per share in an
underwritten public offering. SSH and certain of our directors purchased an aggregate of approximately 5.0 million common
shares at the public offering price.
For information on additional share issuances under the Equity Incentive Plan see “Item 6. Directors, Senior
Management and Employees - B. Equity Incentive Plan.”
C. INTERESTS OF EXPERTS AND COUNSEL
Not applicable.
ITEM 8. FINANCIAL INFORMATION
A. Consolidated Statements and Other Financial Information
See “Item 18. Financial Statements.”

Table of Contents
88
Legal Proceedings
To our knowledge, we are not currently a party to any lawsuit that, if adversely determined, would have a material
adverse effect on our financial position, results of operations or liquidity. As such, we do not believe that pending legal
proceedings, taken as a whole, should have any significant impact on our financial statements. From time to time in the future
we may be subject to legal proceedings and claims in the ordinary course of business, principally personal injury and property
casualty claims. While we expect that these claims would be covered by our existing insurance policies, those claims, even if
lacking merit, could result in the expenditure of significant financial and managerial resources. We have not been involved in any
legal proceedings which may have, or have had, a significant effect on our financial position, results of operations or liquidity,
nor are we aware of any proceedings that are pending or threatened which may have a significant effect on our financial position,
results of operations or liquidity.
Dividend Policy
The declaration and payment of dividends is subject at all times to the discretion of our Board of Directors. The timing
and amount of dividends, if any, depends on, among other things, our earnings, financial condition, cash requirements and
availability, fleet renewal and expansion, restrictions in our loan agreements, the provisions of Marshall Islands law affecting the
payment of dividends and other factors.
We are a holding company with no material assets other than the equity interests in our wholly-owned subsidiaries. As
a result, our ability to pay dividends, if any, depends on our subsidiaries and their ability to distribute funds to us. Our credit
facilities have restrictions on our ability, and the ability of certain of our subsidiaries, to pay dividends in the event of a default
or breach of covenants under the credit facility agreement. Under such circumstances, we or our subsidiaries may not be able to
pay dividends so long as we are in default or have breached certain covenants of the credit facility without our lender’s consent
or waiver of the default or breach. In addition, Marshall Islands law generally prohibits the payment of dividends (i) other than
from surplus (retained earnings and the excess of consideration received for the sale of shares above the par value of the shares)
or (ii) when a company is insolvent or (iii) if the payment of the dividend would render the company insolvent.
In addition, we may incur expenses or liabilities, including extraordinary expenses, decreases in revenues, including as
a result of unanticipated off-hire days or loss of a vessel, or increased cash needs that could reduce or eliminate the amount of
cash that we have available for distribution as dividends.
During 2018, our Board of Directors declared and we paid a quarterly cash dividends of $0.02 per share totaling
approximately $6.0 million in the aggregate. In January 2019, our Board of Directors declared a quarterly cash dividend of $0.02
per share, payable on or about March 15, 2019, to all shareholders of record as of February 15, 2019. Please see “Item 10.
Additional Information - E. Taxation” for additional information relating to the U.S. federal income tax treatment of our dividend
payments, if any are declared in the future.
B. Significant Changes.
There have been no significant changes since the date of the consolidated financial statements included in this annual
report.

Table of Contents
89
ITEM 9. OFFER AND THE LISTING
A. Offer and Listing Details.
Please see “Item 9. Offer and the Listing - C. Markets”
B. Plan of Distribution
Not applicable
C. Markets
Our common shares have traded on the NYSE since December 12, 2013, under the symbol “SALT,” and our Senior
Notes have traded on the NYSE since September 29, 2014 under the symbol “SLTB.” During the period from July 3, 2013
through July 31, 2014, our common shares minimally traded on the Norwegian OTC under the symbol “SALT.”
D. Selling Shareholders
Not applicable.
E. Dilution
Not applicable.
F. Expenses of the Issue
Not applicable.
ITEM 10. ADDITIONAL INFORMATION
A. Share capital.
Not applicable.
B. Memorandum and Articles of Association.
Our Amended and Restated Articles of Incorporation and bylaws have been filed as Exhibit 3.1 and Exhibit 3.2,
respectively, to our Registration Statement on Form F-1 (Registration No. 333-192246), declared effective by the SEC on
December 11, 2013, and are hereby incorporated by reference into this annual report. In December 2015, upon receiving
shareholder approval, we amended our Amended and Restated Articles of Incorporation to effect a one-for-twelve reverse stock
split of our common shares, par value $0.01 per share, and to reduce the total number of authorized common shares to 56,250,000
shares. In June 2016, upon receiving shareholder approval, we amended our Amended and Restated Articles of Incorporation to
increase the aggregate number of shares of capital stock that we are authorized to issue to One Hundred and Sixty-Two Million
Five Hundred Thousand (162,500,000), consisting of One Hundred and Twelve Million Five Hundred Thousand (112,500,000)
common shares, par value $0.01 per share, and Fifty Million (50,000,000) preferred shares, par value $0.01 per share. In June
2018, upon receiving shareholder approval, we amended our Amended and Restated Articles of Incorporation to increase the
aggregate number of shares of capital stock that we are authorized to issue to Two Hundred and Sixty-Two Million Five Hundred
Thousand (262,500,000), consisting of Two Hundred and Twelve Million Five Hundred Thousand (212,500,000) common shares,
par value $0.01 per share, and Fifty Million (50,000,000) preferred shares, par value $0.01 per share. These amendments to our
Amended and Restated Articles of Incorporation are filed as exhibits to this annual report.
Information regarding the rights, preferences and restrictions attaching to each class of our shares is described in the
section entitled “Description of Capital Stock” in the accompanying prospectus to our Registration Statement on Form F-3 (File
No. 333-222013) declared effective by the SEC on December 27, 2017, provided that since the date of such Registration
Statement, our authorized capital stock includes 212.5 million common shares, of which 71.2 million were issued and outstanding
as of March 15, 2019.

Table of Contents
90
C. Material contracts.
Attached as exhibits to this annual report are the contracts we consider to be both material and outside the ordinary
course of business during the two-year period immediately preceding the date of this annual report. We refer you to “Item 4.
Information on the Company”, “Item 5. Operating and Financial Review and Prospects - B. Liquidity and Capital Resources”,
“Item 6. Directors, Senior Management and Employees—B. Compensation” and “Item 7. Major Shareholders and Related Party
Transactions—B. Related Party Transactions” for a discussion of these agreements.
Other than as set forth above, there were no material contracts, other than contracts entered into in the ordinary course
of business, to which we were a party during the two-year period immediately preceding the date of this annual report.
D. Exchange controls.
Under Marshall Islands law, there are currently no restrictions on the export or import of capital, including foreign
exchange controls or restrictions that affect the remittance of dividends, interest or other payments to non-resident holders of our
common shares.
E. Taxation
The following is a discussion of the material Marshall Islands and U.S. federal income tax considerations of the
ownership and disposition by a U.S. Holder and a Non-U.S. Holder, each as defined below, with respect to our common shares.
This discussion does not purport to deal with the tax consequences of owning common shares to all categories of investors, some
of which, such as dealers in securities or commodities, financial institutions, insurance companies, tax-exempt organizations,
U.S. expatriates, persons liable for the alternative minimum tax, persons who hold common shares as part of a straddle, hedge,
conversion transaction or integrated investment, U.S. Holders whose functional currency is not the United States dollar, persons
required to recognize income no later than when such income is included on an “applicable financial statement” and investors
that own, actually or under applicable constructive ownership rules, 10% or more of our common shares, may be subject to
special rules. This discussion deals only with holders who hold our common shares as a capital asset. You are encouraged to
consult your own tax advisors concerning the overall tax consequences arising in your own particular situation under U.S. federal,
state, local or foreign law of the ownership of our common shares.
Marshall Islands Tax Considerations
In the opinion of Seward & Kissel LLP, the following are the material Marshall Islands tax consequences of our activities
to us and of our common shares to our shareholders. We are incorporated in the Marshall Islands. Under current Marshall Islands
law, we are not subject to tax on income or capital gains, and no Marshall Islands withholding tax will be imposed upon payments
of dividends by us to our shareholders.
U.S. Federal Income Tax Considerations
In the opinion of Seward & Kissel LLP, our U.S. counsel, the following are the material U.S. federal income tax
consequences of our activities to us, and of the ownership of our common shares to U.S. Holders and Non-U.S. Holders, each as
defined below. The following discussion of U.S. federal income tax matters is based on the Code, judicial decisions,
administrative pronouncements, and existing and proposed regulations issued by the U.S. Department of the Treasury, or the
Treasury Regulations, all of which are subject to change, possibly with retroactive effect.
U.S. Federal Income Taxation of Operating Income: In General
We anticipate that we will earn substantially all our income from the hiring or leasing of vessels for use on a spot or
time charter basis, from participation in a pool or from the performance of services directly related to those uses, all of which we
refer to as “shipping income.”
Unless we qualify from an exemption from U.S. federal income taxation under Section 883 of the Code, or Section 883,
as discussed below, a foreign corporation will be subject to U.S. federal income taxation on its “shipping income” that is treated

Table of Contents
91
as derived from sources within the United States, to which we refer as “U.S. source shipping income.” For U.S. federal income
tax purposes, “U.S. source shipping income” includes 50% of shipping income that is attributable to transportation that begins or
ends, but that does not both begin and end, in the United States.
Shipping income attributable to transportation exclusively between non-U.S. ports will be considered to be 100%
derived from sources entirely outside the United States. Shipping income derived from sources outside the United States will not
be subject to any U.S. federal income tax.
Shipping income attributable to transportation exclusively between U.S. ports is considered to be 100% derived from
U.S. sources. However, we are not permitted by U.S. law to engage in the transportation that produces 100% U.S. source shipping
income.
In the absence of exemption from tax under Section 883, we anticipate that our gross U.S. source shipping income would
be subject to a 4% U.S. federal income tax imposed without allowance for deductions, as described below.
Exemption of Operating Income from U.S. Federal Income Taxation
Under Section 883 and the Treasury Regulations thereunder, a foreign corporation will be exempt from U.S. federal
income taxation of its U.S. source shipping income if:
(1) it is organized in a “qualified foreign country,” which is one that grants an “equivalent exemption” from tax to
corporations organized in the U.S. in respect of each category of shipping income for which exemption is being claimed under
Section 883; and
(2) one of the following tests is met: (A) more than 50% of the value of its shares is beneficially owned, directly or
indirectly, by “qualified shareholders,” which as defined includes individuals who are “residents” of a qualified foreign country,
to which we refer as the “50% Ownership Test”; or (B) its shares are “primarily and regularly traded on an established securities
market” in a qualified foreign country or in the United States, to which we refer as the “Publicly-Traded Test.”
The Republic of the Marshall Islands, the jurisdiction where we are incorporated, has been officially recognized by the
IRS as a qualified foreign country that grants the requisite “equivalent exemption” from tax in respect of each category of shipping
income we earn and currently expect to earn in the future. Therefore, we will be exempt from U.S. federal income taxation with
respect to our U.S. source shipping income if we satisfy either the 50% Ownership Test or the Publicly-Traded Test.
Given the widely held nature of our common shares, we do not currently anticipate circumstances under which we would
be able to satisfy the 50% Ownership Test.
Publicly-Traded Test
The Treasury Regulations promulgated under Section 883 provide, in pertinent part, that shares of a foreign corporation
will be considered to be “primarily traded” on an established securities market in a country if the number of shares of each class
of stock that are traded during any taxable year on all established securities markets in that country exceeds the number of shares
in each such class that are traded during that year on established securities markets in any other single country. Our common
shares, which constitute our sole class of issued and outstanding stock, are “primarily traded” on the NYSE, which is an
established market for these purposes.
Under the Treasury Regulations, our common shares will be considered to be “regularly traded” on an established
securities market if one or more classes of our shares representing more than 50% of our outstanding stock, by both total combined
voting power of all classes of stock entitled to vote and total value, are listed on such market, to which we refer as the “listing
threshold.” Our common shares, which constitutes our sole class of issued and outstanding stock, are listed on the NYSE.
Accordingly, we will satisfy the listing threshold.
The Treasury Regulations also require that with respect to each class of stock relied upon to meet the listing threshold,
(1) such class of stock is traded on the market, other than in minimal quantities, on at least 60 days during the taxable year or

Table of Contents
92
one-sixth of the days in a short taxable year, which we refer to as the “trading frequency test”; and (2) the aggregate number of
shares of such class of stock traded on such market during the taxable year must be at least 10% of the average number of shares
of such class of stock outstanding during such year or as appropriately adjusted in the case of a short taxable year, which we refer
to as the “trading volume” test. Even if this were not the case, the Treasury Regulations provide that the trading frequency and
trading volume tests will be deemed satisfied if, as is expected to be the case with our common shares, such class of stock is
traded on an established securities market in the United States and such shares are regularly quoted by dealers making a market
in such shares.
Notwithstanding the foregoing, the Treasury Regulations provide, in pertinent part, that a class of shares will not be
considered to be “regularly traded” on an established securities market for any taxable year in which 50% or more of the vote
and value of the outstanding shares of such class are owned, actually or constructively under specified share attribution rules, on
more than half the days during the taxable year by persons who each own 5% or more of the vote and value of such class of
outstanding stock, to which we refer as the “5% Override Rule.”
For purposes of being able to determine the persons who actually or constructively own 5% or more of the vote and
value of our common shares, or “5% Shareholders,” the Treasury Regulations permit us to rely on those persons that are identified
on Schedule 13G and Schedule 13D filings with the SEC, as owning 5% or more of our common shares. The Treasury Regulations
further provide that an investment company that is registered under the Investment Company Act of 1940, as amended, will not
be treated as a 5% Shareholder for such purposes.
In the event the 5% Override Rule is triggered, the Treasury Regulations provide that the 5% Override Rule will
nevertheless not apply if we can establish that within the group of 5% Shareholders, qualified shareholders (as defined for
purposes of Section 883) own sufficient number of shares to preclude non-qualified shareholders in such group from owning
50% or more of our common shares for more than half the number of days during the taxable year.
We believe that we satisfied the Publicly-Traded Test for the 2018 taxable year and were not subject to the 5% Override
Rule, and we intend to take that position on our 2018 U.S. federal income tax returns.
Taxation in Absence of Section 883 Exemption
If the benefits of Section 883 are unavailable, our U.S. source shipping income would be subject to a 4% tax imposed
by Section 887 of the Code on a gross basis, without the benefit of deductions, or the “4% gross basis tax regime,” to the extent
that such income is not considered to be “effectively connected” with the conduct of a U.S. trade or business, as described below.
Since under the sourcing rules described above, no more than 50% of our shipping income would be treated as being U.S. source
shipping income, the maximum effective rate of U.S. federal income tax on our shipping income would never exceed 2% (i.e.,
50% of 4% gross basis tax regime).
To the extent our U.S. source shipping income is considered to be “effectively connected” with the conduct of a U.S.
trade or business, as described below, any such “effectively connected” U.S. source shipping income, net of applicable deductions,
would be subject to U.S. federal income tax, currently imposed at a rate of up to 21%. In addition, we would generally be subject
to the 30% “branch profits” tax on earnings effectively connected with the conduct of such trade or business, as determined after
allowance for certain adjustments, and on certain interest paid or deemed paid attributable to the conduct of our U.S. trade or
business.
Our U.S. source shipping income would be considered “effectively connected” with the conduct of a U.S. trade or
business only if:
(1) we have, or are considered to have, a fixed place of business in the United States involved in the earning
of U.S. source shipping income; and
(2) substantially all of our U.S. source shipping income is attributable to regularly scheduled transportation,
such as the operation of a vessel that follows a published schedule with repeated sailings at regular
intervals between the same points for voyages that begin or end in the United States.

Table of Contents
93
We do not intend to have, or permit circumstances that would result in having, any vessel sailing to or from the United
States on a regularly scheduled basis. Based on the foregoing and on the expected mode of our shipping operations and other
activities, it is anticipated that none of our U.S. source shipping income will be treated as “effectively connected” with the conduct
of a U.S. trade or business, which we refer to as ECI.
U.S. Taxation of Gain on Sale of Vessels
Regardless of whether we qualify for exemption under Section 883, we will not be subject to U.S. federal income tax
with respect to gain realized on a sale of a vessel, provided the sale is considered to occur outside of the United States under U.S.
federal income tax principles. In general, a sale of a vessel will be considered to occur outside of the United States for this purpose
if title to the vessel, and risk of loss with respect to the vessel, pass to the buyer outside of the United States. It is expected that
any sale of a vessel by us will be considered to occur outside of the United States.
U.S. Federal Income Taxation of U.S. Holders
As used herein, the term “U.S. Holder” means a holder that for U.S. federal income tax purposes is a beneficial owner
of common shares and is an individual U.S. citizen or resident, a U.S. corporation or other U.S. entity taxable as a corporation,
an estate the income of which is subject to U.S. federal income taxation regardless of its source, or a trust if a court within the
United States is able to exercise primary jurisdiction over the administration of the trust and one or more U.S. persons have the
authority to control all substantial decisions of the trust.
If a partnership holds the common shares, the tax treatment of a partner will generally depend upon the status of the
partner and upon the activities of the partnership. If you are a partner in a partnership holding the common shares, you are
encouraged to consult your tax advisor.
Distributions
Subject to the discussion of passive foreign investment companies below, any distributions made by us with respect to
our common shares to a U.S. Holder will generally constitute dividends to the extent of our current or accumulated earnings and
profits, as determined under U.S. federal income tax principles. Distributions in excess of such earnings and profits will be treated
first as a nontaxable return of capital to the extent of the U.S. Holder’s tax basis in our common shares and thereafter as capital
gain. Because we are not a U.S. corporation, U.S. Holders that are corporations generally will not be entitled to claim a dividends
received deduction with respect to any distributions they receive from us. Dividends paid with respect to our common shares will
generally be treated as foreign source dividend income and will generally constitute “passive category income” for purposes of
computing allowable foreign tax credits for U.S. foreign tax credit purposes.
Dividends paid on our common shares to certain non-corporate U.S. Holders will generally be treated as “qualified
dividend income” that is taxable to such U.S. Holders at preferential tax rates provided that (1) the common shares are readily
tradable on an established securities market in the United States (such as the NYSE); (2) we are not a passive foreign investment
company for the taxable year during which the dividend is paid or the immediately preceding taxable year (as discussed in detail
below); (3) the non-corporate U.S. Holder has owned the common shares for more than 60 days in the 121-day period beginning
60 days before the date on which the common shares become ex-dividend; and (4) certain other conditions are met.
There is no assurance that any dividends paid on our common shares will be eligible for these preferential rates in the
hands of such non-corporate U.S. Holders. Any dividends paid by us which are not eligible for these preferential rates will be
taxed as ordinary income to a non-corporate U.S. Holder.
Special rules may apply to any “extraordinary dividend” generally, a dividend in an amount which is equal to or in
excess of 10% of a shareholder’s adjusted tax basis in a common share-paid by us. If we pay an “extraordinary dividend” on our
common shares that is treated as “qualified dividend income,” then any loss derived by certain non-corporate U.S. Holders from
the sale or exchange of such common shares will be treated as long term capital loss to the extent of such dividend.
Sale, Exchange or Other Disposition of Common Shares

Table of Contents
94
Assuming we do not constitute a passive foreign investment company for any taxable year, a U.S. Holder generally will
recognize taxable gain or loss upon a sale, exchange or other disposition of our common shares in an amount equal to the
difference between the amount realized by the U.S. Holder from such sale, exchange or other disposition and the U.S. Holder’s
tax basis in such shares. Such gain or loss will be treated as long-term capital gain or loss if the U.S. Holder’s holding period is
greater than one year at the time of the sale, exchange or other disposition. Such capital gain or loss will generally be treated as
U.S. source income or loss, as applicable, for U.S. foreign tax credit purposes. Long-term capital gains of certain non-corporate
U.S. Holders are currently eligible for reduced rates of taxation. A U.S. Holder’s ability to deduct capital losses is subject to
certain limitations.
Passive Foreign Investment Company Status and Significant Tax Consequences
Special U.S. federal income tax rules apply to a U.S. Holder that holds shares in a foreign corporation classified as a
“passive foreign investment company,” or a PFIC, for U.S. federal income tax purposes. In general, we will be treated as a PFIC
with respect to a U.S. Holder if, for any taxable year in which such holder holds our common shares, either
(1) at least 75% of our gross income for such taxable year consists of passive income (e.g., dividends, interest,
capital gains and rents derived other than in the active conduct of a rental business), which we refer to as the
income test; or
(2) at least 50% of the average value of our assets during such taxable year produce, or are held for the production
of, passive income, which we refer to as the asset test.
For purposes of determining whether we are a PFIC, cash will be treated as an asset which is held for the production of
passive income. In addition, we will be treated as earning and owning our proportionate share of the income and assets,
respectively, of any of our subsidiary corporations in which we own at least 25% of the value of the subsidiary’s stock. Income
earned, or deemed earned, by us in connection with the performance of services would not constitute passive income. By contrast,
rental income would generally constitute “passive income” unless we were treated under specific rules as deriving our rental
income in the active conduct of a trade or business.
For our 2018 taxable year and subsequent taxable years, whether we will be treated as a PFIC will depend upon the
nature and extent of our operations. In making the determination as to whether we are a PFIC, we intend to treat the gross income
that we derive or that we are deemed to derive from the spot chartering and time chartering activities of us or any of our
subsidiaries as services income, rather than rental income. Correspondingly, such income should not constitute passive income,
and the assets that we or our wholly owned subsidiaries own and operate in connection with the production of such income should
not constitute passive assets for purposes of determining whether we are a PFIC. We believe that there is substantial legal authority
supporting our position consisting of case law and IRS pronouncements concerning the characterization of income derived from
time charters and voyage charters as services income for other tax purposes. However, there is also authority which characterizes
time charter income as rental income rather than services income for other tax purposes. In the absence of any legal authority
specifically relating to the statutory provisions governing PFICs, the IRS or a court could disagree with our position. In addition,
although we intend to conduct our affairs in a manner to avoid being classified as a PFIC with respect to any taxable year, we
cannot assure you that the nature of our operations will not change in the future.
As discussed more fully below, if we were to be treated as a PFIC for any taxable year, a U.S. Holder would be subject
to different taxation rules depending on whether the U.S. Holder makes an election to treat us as a “Qualified Electing Fund,”
which election we refer to as a “QEF election.” As an alternative to making a QEF election, a U.S. Holder should be able to make
a “mark-to-market” election with respect to our common shares, as discussed below. If we were treated as a PFIC, a U.S. Holder
will generally be required to file IRS Form 8621 with respect to its ownership of our common shares, and may be subject to
additional U.S. tax or information reporting obligations in connection with the acquisition, holding or disposition of our common
shares.
Taxation of U.S. Holders Making a Timely QEF Election

Table of Contents
95
If a U.S. Holder makes a timely QEF election, which U.S. Holder we refer to as an “Electing Holder,” the Electing
Holder must report for U.S. federal income tax purposes its pro rata share of our ordinary earnings and net capital gain, if any,
for each of our taxable years during which we are a PFIC that ends with or within the taxable year of the Electing Holder,
regardless of whether distributions were received from us by the Electing Holder. No portion of any such inclusions of ordinary
earnings will be treated as “qualified dividend income.” Net capital gain inclusions of certain non-corporate U.S. Holders may
be eligible for preferential capital gains tax rates. The Electing Holder’s adjusted tax basis in the common shares will be increased
to reflect any income included under the QEF election. Distributions of previously taxed income will not be subject to tax upon
distribution but will decrease the Electing Holder’s tax basis in the common shares. An Electing Holder would not, however, be
entitled to a deduction for its pro rata share of any losses that we incur with respect to any taxable year. An Electing Holder would
generally recognize capital gain or loss on the sale, exchange or other disposition of our common shares. A U.S. Holder would
make a timely QEF election for our common shares by filing IRS Form 8621 with his U.S. federal income tax return for the first
year in which he held such shares when we were a PFIC. If we determine that we are a PFIC for any taxable year, we intend to
provide each U.S. Holder with information necessary for the U.S. Holder to make the QEF election described above. If we were
treated as a PFIC for our 2018 taxable year, we anticipate that, based on our current projections, we would not have a significant
amount of taxable income or gain that would be required to be taken into account by U.S. Holders making a QEF election effective
for such taxable year.
Taxation of U.S. Holders Making a “Mark-to-Market” Election
If we were to be treated as a PFIC for any taxable year and, as we anticipate will be the case, our shares are treated as
“marketable stock,” a U.S. Holder would be allowed to make a “mark-to-market” election with respect to our common shares,
provided the U.S. Holder completes and files IRS Form 8621 in accordance with the relevant instructions and related Treasury
Regulations. If that election is made, the U.S. Holder generally would include as ordinary income in each taxable year the excess,
if any, of the fair market value of the common shares at the end of the taxable year over such Holder’s adjusted tax basis in the
common shares. The U.S. Holder would also be permitted an ordinary loss in respect of the excess, if any, of the U.S. Holder’s
adjusted tax basis in the common shares over its fair market value at the end of the taxable year, but only to the extent of the net
amount previously included in income as a result of the mark-to-market election. A U.S. Holder’s tax basis in our common shares
would be adjusted to reflect any such income or loss amount recognized. Any gain realized on the sale, exchange or other
disposition of our common shares would be treated as ordinary income, and any loss realized on the sale, exchange or other
disposition of the common shares would be treated as ordinary loss to the extent that such loss does not exceed the net mark-to-
market gains previously included by the U.S. Holder.
Taxation of U.S. Holders Not Making a Timely QEF or Mark-to-Market Election
If we were to be treated as a PFIC for any taxable year, a U.S. Holder who does not make either a QEF election or a
“mark-to-market” election for that year, which we refer to as a “Non-Electing Holder,” would be subject to special rules with
respect to (1) any excess distribution (i.e., the portion of any distributions received by the Non-Electing Holder on the common
shares in a taxable year in excess of 125% of the average annual distributions received by the Non-Electing Holder in the three
preceding taxable years, or, if shorter, the Non-Electing Holder’s holding period for the common shares), and (2) any gain realized
on the sale, exchange or other disposition of our common shares. Under these special rules:
(1) the excess distribution or gain would be allocated ratably over the Non-Electing Holder’s aggregate holding
period for the common shares;
(2) the amount allocated to the current taxable year, and any taxable year prior to the first taxable year in which we
were a PFIC, would be taxed as ordinary income and would not be “qualified dividend income”; and
(3) the amount allocated to each of the other taxable years would be subject to tax at the highest rate of tax in effect
for the applicable class of taxpayer for that year, and an interest charge for the deemed tax deferral benefit would
be imposed with respect to the resulting tax attributable to each such other taxable year.
U.S. Federal Income Taxation of “Non-U.S. Holders”

Table of Contents
96
As used herein, the term “Non-U.S. Holder” means a holder that, for U.S. federal income tax purposes, is a beneficial
owner of common shares (other than a partnership) and who is not a U.S. Holder.
If a partnership holds our common shares, the tax treatment of a partner will generally depend upon the status of the
partner and upon the activities of the partnership. If you are a partner in a partnership holding our common shares, you are
encouraged to consult your tax adviser.
Dividends on Common Shares
A Non-U.S. Holder generally will not be subject to U.S. federal income or withholding tax on dividends received from
us with respect to our common shares, unless that income is effectively connected with the Non-U.S. Holder’s conduct of a trade
or business in the United States. In general, if the Non-U.S. Holder is entitled to the benefits of an applicable U.S. income tax
treaty with respect to those dividends, that income is taxable only if it is attributable to a permanent establishment maintained by
the Non-U.S. Holder in the United States.
Sale, Exchange or Other Disposition of Common Shares
A Non-U.S. Holder generally will not be subject to U.S. federal income or withholding tax on any gain realized upon
the sale, exchange or other disposition of our common shares, unless:
(1) the gain is effectively connected with the Non-U.S. Holder’s conduct of a trade or business in the United States;
in general, in the case of a Non-U.S. Holder entitled to the benefits of an applicable U.S. income tax treaty with
respect to that gain, that gain is taxable only if it is attributable to a permanent establishment maintained by the
Non-U.S. Holder in the United States; or
(2) the Non-U.S. Holder is an individual who is present in the United States for 183 days or more during the taxable
year of disposition and who also meets other conditions.
Income or Gains Effectively Connected with a U.S. Trade or Business
If the Non-U.S. Holder is engaged in a U.S. trade or business for U.S. federal income tax purposes, dividends on the
common shares and gains from the sale, exchange or other disposition of the shares, that are effectively connected with the
conduct of that trade or business (and, if required by an applicable U.S. income tax treaty, is attributable to a U.S. permanent
establishment), will generally be subject to regular U.S. federal income tax in the same manner as discussed in the previous
section relating to the taxation of U.S. Holders. In addition, in the case of a corporate Non-U.S. Holder, its earnings and profits
that are attributable to the effectively connected income, which are subject to certain adjustments, may be subject to an additional
U.S. federal branch profits tax at a rate of 30%, or at a lower rate as may be specified by an applicable U.S. income tax treaty.
Backup Withholding and Information Reporting
In general, dividend payments, or other taxable distributions, and the payment of gross proceeds on a sale or other
disposition of our common shares, made within the United States to a non-corporate U.S. Holder will be subject to information
reporting. Such payments or distributions may also be subject to backup withholding if the non-corporate U.S. Holder:
(1) fails to provide an accurate taxpayer identification number;
(2) is notified by the IRS that it has failed to report all interest or dividends required to be shown on its U.S. federal
income tax returns; or
(3) in certain circumstances, fails to comply with applicable certification requirements.
Non-U.S. Holders may be required to establish their exemption from information reporting and backup withholding
with respect to dividend payments or other taxable distributions on our common shares by certifying their status on an applicable
IRS Form W-8. If a Non-U.S. Holder sells our common shares to or through a U.S. office of a broker, the payment of the proceeds
is subject to both U.S. backup withholding and information reporting unless the Non-U.S. Holder certifies that it is a non-U.S.

Table of Contents
97
person, under penalties of perjury, or it otherwise establishes an exemption. If a Non-U.S. Holder sells our common shares
through a non-U.S. office of a non-U.S. broker and the sales proceeds are paid outside the United States, then information
reporting and backup withholding generally will not apply to that payment. However, U.S. information reporting requirements,
but not backup withholding, will apply to a payment of sales proceeds, even if that payment is made outside the United States, if
a Non-U.S. Holder sells our common shares through a non-U.S. office of a broker that is a U.S. person or has some other contacts
with the United States. Such information reporting requirements will not apply, however, if the broker has documentary evidence
in its records that the Non-U.S. Holder is not a U.S. person and certain other conditions are met, or the Non-U.S. Holder otherwise
establishes an exemption.
Backup withholding is not an additional tax. Rather, a refund may generally be obtained of any amounts withheld under
backup withholding rules that exceed the taxpayer’s U.S. federal income tax liability by filing a timely refund claim with the
IRS.
Individuals who are U.S. Holders (and to the extent specified in applicable Treasury Regulations, Non-U.S. Holders and
certain U.S. entities) who hold “specified foreign financial assets” (as defined in Section 6038D of the Code) are required to file
IRS Form 8938 with information relating to the asset for each taxable year in which the aggregate value of all such assets exceeds
$75,000 at any time during the taxable year or $50,000 on the last day of the taxable year (or such higher dollar amount as
prescribed by applicable Treasury Regulations). Specified foreign financial assets would include, among other assets, our
common shares, unless the common shares are held in an account maintained with a U.S. financial institution. Substantial
penalties apply to any failure to timely file IRS Form 8938, unless the failure is shown to be due to reasonable cause and not due
to willful neglect. Additionally, in the event an individual U.S. Holder (and to the extent specified in applicable Treasury
Regulations, a Non-U.S. Holder or a U.S. entity) that is required to file IRS Form 8938 does not file such form, the statute of
limitations on the assessment and collection of U.S. federal income taxes of such holder for the related tax year may not close
until three years after the date that the required information is filed. U.S. Holders (including U.S. entities) and Non-U.S. Holders
are encouraged to consult their own tax advisors regarding their reporting obligations in respect of our common shares.
F. Dividends and paying agents.
Not applicable.
G. Statement by experts.
Not applicable.
H. Documents on display.
We file reports and other information with the SEC. These materials, including this annual report and the accompanying
exhibits are available from http://www.sec.gov.
Shareholders may also request a copy of our filings at no cost, by writing to us at the following address: 9, Boulevard
Charles III, Monaco, 98000 or telephoning us at + 377 9798 5715.
I. Subsidiary Information
Not applicable.
ITEM 11. QUANTITATIVE AND QUALITATIVE DISCLOSURES ABOUT MARKET RISK
Interest Rate Risk
We are exposed to the impact of interest rate changes primarily through our unhedged variable-rate borrowings.
Significant increases in interest rates could adversely affect our operating margins, results of operations and our ability to service
our debt. As of December 31, 2018, we have variable-rate borrowings totaling $841.0 million. A one percent increase in LIBOR

Table of Contents
98
rates would increase our interest payments by approximately $8.4 million per year from January 1, 2019. We entered into interest
rate cap agreements, in which we receive payments if floating rates rise above a specified cap rate, to help mitigate the interest
rate volatility associated with the variable rate interest on the amounts outstanding. Please see Note 12, Derivatives, to our
Consolidated Financial Statements included herein for additional information.
Spot Market Rate Risk
The cyclical nature of the drybulk industry causes significant increases or decreases in the revenue that we earn from
our vessels, particularly those vessels that operate in the spot market or participate in pools that are concentrated in the spot
market such as the Scorpio Pools. Our owned and chartered-in vessels operated for 20,429 days in the spot market or in the
Scorpio Pools during 2018. Additionally, we have the ability to remove our vessels from the pools on relatively short notice if
attractive time charter opportunities arise. A $1,000 per day increase or decrease in spot rates for our operating fleet of 57 vessels
would increase or decrease our operating income by $20.4 million on an annual basis.
Foreign Exchange Rate Risk
Our primary economic environment is the international shipping market. This market utilizes the U.S. dollar as its
functional currency. Consequently, virtually all of our revenues and the majority of our operating expenses will be in U.S. dollars.
However, we will incur some of our combined expenses in other currencies, particularly the Euro. The amount and frequency of
some of these expenses (such as vessel repairs, supplies and stores) may fluctuate from period to period. Depreciation in the
value of the U.S. dollar relative to other currencies will increase the U.S. dollar cost of us paying such expenses. The portion of
our business conducted in other currencies could increase in the future, which could expand our exposure to losses arising from
currency fluctuations.
There is a risk that currency fluctuations will have a negative effect on our cash flows. We have not entered into any
hedging contracts to protect against currency fluctuations. However, we have some ability to shift the purchase of goods and
services from one country to another and, thus, from one currency to another, on relatively short notice. We may seek to hedge
this currency fluctuation risk in the future.
ITEM 12. DESCRIPTION OF SECURITIES OTHER THAN EQUITY SECURITIES
Not applicable.
PART II
ITEM 13. DEFAULTS, DIVIDEND ARREARAGES AND DELINQUENCIES
None.
ITEM 14. MATERIAL MODIFICATIONS TO THE RIGHTS OF SECURITY HOLDERS AND USE OF
PROCEEDS
None.
ITEM 15. CONTROLS AND PROCEDURES
A. Disclosure Controls and Procedures
We maintain disclosure controls and procedures that are designed to ensure that information required to be disclosed in
our reports under the Exchange Act is recorded, processed, summarized and reported within time periods specified in the SEC’s
rules and forms, and that such information is accumulated and communicated to management, including the Chief Executive
Officer and Chief Financial Officer, as appropriate, to allow timely decisions regarding required disclosures. Our controls and
procedures are designed to provide reasonable assurance of achieving their objectives.
We carried out an evaluation under the supervision, and with the participation of our management, including our Chief
Executive Officer and Chief Financial Officer, of the effectiveness of the design and operation of our disclosure controls and
procedures (as defined in Rules 13a-15(e) and 15d-15e under the Securities Act) as of December 31, 2018. Based upon that
evaluation, our Chief Executive Officer and Chief Financial Officer concluded that our disclosure controls and procedures were

Table of Contents
99
effective as of December 31, 2018 to provide reasonable assurance that (1) information required to be disclosed by us in the
reports that we file under the Exchange Act is recorded, processed, summarized and reported within the time periods specified in
the SEC’s rules and forms, and (2) such information is accumulated and communicated to our management, including our Chief
Executive Officer and our Chief Financial Officer, as appropriate, to allow timely decisions regarding required disclosures.
There are inherent limitations to the effectiveness of any system of disclosure controls and procedures, including the
possibility of human error and the circumvention or overriding of the controls and procedures. Accordingly, even effective
disclosure controls and procedures can only provide reasonable assurance of achieving their control objectives.
B. Management’s Annual Report on Internal Control Over Financial Reporting.
In accordance with Rule 13a-15(f) of the Exchange Act, the management of the Company is responsible for the
establishment and maintenance of adequate internal controls over financial reporting for the Company. Internal control over
financial reporting is a process designed to provide reasonable assurance regarding the reliability of financial reporting and the
preparation of financial statements for external purposes in accordance with generally accepted accounting principles. The
Company’s system of internal control over financial reporting includes those policies and procedures that (i) pertain to the
maintenance of records that, in reasonable detail, accurately and fairly reflect the transactions and dispositions of the assets of
the Company; (ii) provide reasonable assurance that transactions are recorded as necessary to permit preparation of financial
statements in accordance with generally accepted accounting principles, and that receipts and expenditures of the Company are
being made only in accordance with authorizations of management and directors of the Company; and (iii) provide reasonable
assurance regarding prevention or timely detection of unauthorized acquisition, use, or disposition of the Company’s assets that
could have a material effect on the financial statements. Management has performed an assessment of the effectiveness of the
Company’s internal controls over financial reporting as of December 31, 2018 based on the provisions of Internal Control—
Integrated Framework issued by the Committee of Sponsoring Organizations of the Treadway Commission or COSO in 2013.
Based on our assessment, management determined that the Company’s internal controls over financial reporting were effective
as of December 31, 2018 based on the criteria in Internal Control—Integrated Framework issued by COSO (2013).
The Company’s internal control over financial reporting, at December 31, 2018, has been audited by
PricewaterhouseCoopers Audit, an independent registered public accounting firm, who also audited the Company’s consolidated
financial statements for that year, which are filed as a part of this annual report. PricewaterhouseCoopers Audit has issued an
attestation report on management’s assessment of the Company’s internal control over financial reporting.
C. Attestation Report of the Registered Public Accounting Firm.
The attestation report of PricewaterhouseCoopers Audit is presented on page F-2 of the Financial Statements filed as
part of this annual report.
D. Changes in Internal Control Over Financial Reporting.
None
ITEM 16A. AUDIT COMMITTEE FINANCIAL EXPERT
Our Board of Directors has determined that Mr. James B. Nish, who serves on the Audit Committee, qualifies as an
“audit committee financial expert” and that he is “independent” under the rules of the NYSE and the rules and regulations of the
SEC.
ITEM 16B. CODE OF ETHICS

Table of Contents
100
We have adopted a Code of Conduct and Ethics that applies to all of our employees, directors, officers and agents. A
copy of our Code of Conduct and Ethics, as in effect on the date hereof, has been filed as an exhibit to this annual report.
Shareholders may also request a copy of our Code of Conduct and Ethics at no cost, by writing to us at 9, Boulevard
Charles III, Monaco, 98000 or telephoning us at + 377 9798 5715.
ITEM 16C. PRINCIPAL ACCOUNTING FEES AND SERVICES
A. Audit Fees
Our principal accountant for the years ended December 31, 2018 and December 31, 2017 was PricewaterhouseCoopers
Audit, and the audit fees for those periods were approximately $349,000 and $417,000 respectively.
B. Audit-Related Fees
None.
C. Tax Fees
None.
D. All Other Fees
None.
E. Audit Committee’s Pre-Approval Policies and Procedures
Our Audit Committee pre-approves all audit, audit-related and non-audit services not prohibited by law to be performed
by our independent auditors and associated fees prior to the engagement of the independent auditor with respect to such services.
F. Audit Work Performed by Other Than Principal Accountant if Greater Than 50%
Not applicable.
ITEM 16D. EXEMPTIONS FROM LISTING STANDARDS FOR AUDIT COMMITTEES
Not applicable.
ITEM 16E. PURCHASES OF EQUITY SECURITIES BY THE ISSUER AND AFFILIATED PURCHASERS

Table of Contents
101
The following table sets forth our stock repurchase activity during 2018, including the number of shares purchased,
the average price paid per share, the number of shares repurchased as part of a publicly announced plan or program and the
amount yet to be used on share repurchases under the plan or program.
Period
Total Number of
Common Shares
Purchased
Average Price
Paid per
Common
Share
Total Number of
Shares Purchased
as Part of Publicly
Announced Plan or
Program (a)
Maximum Amount
that May Yet Be
Expected on Share
Repurchases Under
the Plan or Program
(a)
January 2018 — $ — — $ 39.0
February 2018 — $ — — $ 39.0
March 2018 1,169,965 $ 7.39 1,169,965 $ 30.4
April 208 — $ — — $ 30.4
May 2018 — $ — — $ 30.4
June 2018 — $ — — $ 30.4
July 2018 — $ — — $ 30.4
August 2018 510,134 $ 6.78 510,134 $ 26.9
September 2018 961,380 $ 6.87 961,380 $ 20.3
October 2018 1,846,710 $ 6.44 1,846,710 $ 40.0
November 2018 2,383,022 $ 5.83 2,383,022 $ 26.1
December 2018 231,187 $ 5.26 231,187 $ 24.8
7,102,398 $ 6.44 7,102,398
(a) On October 19, 2018, our Board of Directors authorized a share repurchase program to purchase up to $50.0 million of our common stock in
open market or privately negotiated transactions. This share repurchase program replaced the previous $50.0 million share repurchase program
authorized in September 2017 and that was terminated in conjunction with the authorization of this new share repurchase program. The specific
timing and amounts of the repurchases were in the sole discretion of management and were subject to variation based on market conditions and
other factors, but we were not obligated under the terms of the program to repurchase any of our common stock. The authorization had no expiration
date.
On January 25, 2019, our Board of Directors authorized a new share repurchase program to purchase up to an aggregate of $50.0 million of our
common shares. This new share repurchase program replaced our previous share repurchase program that was authorized in October 2018 and that
was terminated in conjunction with the authorization of the new share repurchase program. The specific timing and amounts of the repurchases will
be in the sole discretion of management and may vary based on market conditions and other factors. We are not obligated under the terms of the
program to repurchase any of our common shares. The authorization has no expiration date.
In 2016, our Board of Directors authorized the repurchase of up to $20.0 million of our outstanding Senior Notes in
open market or privately negotiated transactions. As of December 31, 2018, the entire $20.0 million was available.
ITEM 16F. CHANGE IN REGISTRANT’S CERTIFYING ACCOUNTANT
None.
ITEM 16G. CORPORATE GOVERNANCE

Table of Contents
102
Pursuant to an exception for foreign private issuers, we, as a Marshall Islands company, are not required to comply with
the corporate governance practices followed by U.S. companies under the NYSE listing standards. We believe that our established
practices in the area of corporate governance are in line with the spirit of the NYSE standards and provide adequate protection
to our shareholders. In this respect, we have voluntarily adopted NYSE required practices, such as (i) having a majority of
independent directors, (ii) establishing audit, compensation and nominating committees and (iii) adopting a Code of Conduct and
Ethics.
There are two significant differences between our corporate governance practices and the practices required by the
NYSE. The NYSE requires that non-management directors meet regularly in executive sessions without management. The NYSE
also requires that all independent directors meet in an executive session at least once a year. Marshall Islands law and our bylaws
do not require our non-management directors to regularly hold executive sessions without management. During 2018 and through
the date of this annual report, our non-management directors met in executive session five times. The NYSE requires companies
to adopt and disclose corporate governance guidelines. The guidelines must address, among other things: director qualification
standards, director responsibilities, director access to management and independent advisers, director compensation, director
orientation and continuing education, management succession and an annual performance evaluation. We are not required to
adopt such guidelines under Marshall Islands law and we have not adopted such guidelines.
ITEM 16H. MINE SAFETY DISCLOSURE
Not applicable.
PART III
ITEM 17. FINANCIAL STATEMENTS
See “Item 18. Financial Statements.”
ITEM 18. FINANCIAL STATEMENTS
The financial statements, together with the report of PricewaterhouseCoopers Audit thereon, beginning on page F-1, are
filed as a part of this annual report.
Separate consolidated financial statements and notes thereto for Scorpio Tankers as of and for the three years ended
December 31, 2018 are being provided pursuant to Rule 3-09 of Regulation S-X as Exhibit 99.1.

Table of Contents
103
ITEM 19. EXHIBITS
Number Description
1.1 Amended and Restated Articles of Incorporation of the Company (1)
1.2 Amendment to the Amended and Restated Articles of Incorporation of the Company, effective December 30,
2015 (5)
1.3 Certificate of Correction to the Amended and Restated Articles of Incorporation of the Company (6)
1.4 Amendment to the Amended and Restated Articles of Incorporation of the Company, effective June 1, 2016 (7)
1.5 Amendment to the Amended and Restated Articles of Incorporation of the Company, effective June 1, 2018 (8)
1.6 Amended and Restated Bylaws of the Company (1)
2.1 Form of Common Share Certificate (6)
2.2 Base Indenture, dated September 22, 2014, by and between the Company and Deutsche Bank Trust Company
Americas, relating to the 7.50% Senior Notes due 2019 (3)
2.3 First Supplemental Indenture, dated September 22, 2014, by and between the Company and Deutsche Bank
Trust Company Americas (3)
4.1 Master Agreement (1)
4.2 Administrative Services Agreement (1)
4.3 Equity Incentive Plan (1)

Table of Contents
104
4.4 $330.0 Million Credit Facility (2)
4.5 $42.0 Million Credit Facility (4)
4.6 $12.5 Million Credit Facility (6)
4.7 $27.3 Million Credit Facility (6)
4.8 Deed of Amendment to the Master Agreement, Dated September 29, 2016 (7)
4.9 Deed of Amendment to the Master Agreement, Dated November 25, 2016 (7)
4.10 Letter Agreement, dated July 10, 2015, relating to the $330.0 Million Senior Secured Credit Facility (7)
4.11 Letter Agreement, dated October 27, 2015, relating to the $330.0 Million Senior Secured Credit Facility (7)
4.12 Letter Agreement, dated April 26, 2016, relating to the $330.0 Million Senior Secured Credit Facility (7)
4.13 Letter Agreement, dated June 15, 2016, relating to the $330.0 Million Senior Secured Credit Facility (7)
4.14 Letter Agreement, dated December 15, 2016, relating to the $330.0 Million Senior Secured Credit Facility (7)
4.15 Letter Agreement, dated May 04, 2016, relating to the $42.0 Million Senior Secured Credit Facility (7)
4.16 Letter Agreement, dated June 28, 2016, relating to the $42.0 Million Senior Secured Credit Facility (7)
4.17 Letter Agreement, dated January 4, 2017, relating to the $42.0 Million Senior Secured Credit Facility (7)
4.18 Letter Agreement, dated February 25, 2016 relating to the $12.5 Million Senior Secured Credit Facility (7)
4.19 Letter Agreement, dated June 14, 2016, relating to the $12.5 Million Senior Secured Credit Facility (7)
4.20 Letter Agreement, dated December 16, 2016, relating to the $12.5 Million Senior Secured Credit Facility (7)
4.21 First Supplemental Agreement to the $27.3 Million Senior Secured Credit Facility, dated April 6, 2016 (7)
4.22 Second Supplemental Agreement to the $27.3 Million Senior Secured Credit Facility, dated June 2, 2016 (7)
4.23
Third Supplemental Agreement to the $27.3 Million Senior Secured Credit Facility, dated December 30, 2016
(7)
4.24 $85.5 Million Senior Secured Credit Facility (7)
4.25 $38.7 Million Senior Secured Credit Facility (7)
4.26 $19.6 Million Lease Financing (7)
4.27 Deed of Amendment to the Master Agreement, dated February 22, 2018 (7)
4.28 $12.8 Million Credit Facility
4.29 $19.0 Million Lease Financing - SBI Echo
4.30 $19.0 Million Lease Financing - SBI Tango
4.31 $30.0 Million Credit Facility
4.32 $60.0 Million Credit Facility
4.33 $184.0 Million Credit Facility
4.34 $34.0 Million Credit Facility
4.35 $90.0 Million Credit Facility
4.36 $20.5 Million Lease Financing - SBI Hermes
4.37 Scorpio Bulkers Framework Agreement
8.1 List of Subsidiaries
11.1 Code of Conduct and Ethics
12.1 Rule 13a-14(a)/15d-14(a) Certification of Principal Executive Officer
12.2 Rule 13a-14(a)/15d-14(a) Certification of Principal Financial Officer
13.1
Certification of Principal Executive Officer pursuant to 18 U.S.C. Section 1350, as adopted pursuant to Section
906 of the Sarbanes-Oxley Act of 2002
13.2
Certification of Principal Financial Officer pursuant to 18 U.S.C. Section 1350, as adopted pursuant to Section
906 of the Sarbanes-Oxley Act of 2002
15.1 Consent of Independent Registered Public Accounting Firm
15.2 Consent of SSY Consultancy & Research Ltd
99.1 Audited financial statements of Scorpio Tankers Inc as of and for the year ended December 31, 2018. (9)
101. INS XBRL Instance Document
101. SCH XBRL Taxonomy Extension Schema
101. CAL XBRL Taxonomy Extension Schema Calculation Linkbase
101. DEF XBRL Taxonomy Extension Schema Definition Linkbase

Table of Contents
105
101. LAB XBRL Taxonomy Extension Schema Label Linkbase
101. PRE XBRL Taxonomy Extension Schema Presentation Linkbase
(1) Incorporated by reference to the Company’s Registration Statement on Form F-1, which was declared effective by the
SEC on December 11, 2013 (File No. 333-192246).
(2) Incorporated by reference to the Company’s Registration Statement on Form F-1, which was declared effective by the
SEC on September 15, 2014 (File No. 333-197949).
(3) Incorporated by reference to the Company’s Report on Form 6-K, filed with the SEC on September 25, 2014.
(4) Incorporated by reference to the Company’s Annual Report on Form 20-F, filed with the SEC on April 2, 2015.
(5) Incorporated by reference to the Company’s Report on Form 6-K, filed with the SEC on January 4, 2016.
(6) Incorporated by reference to the Company’s Annual Report on Form 20-F, filed with the SEC on March 1, 2016.
(7) Incorporated by reference to the Company’s Annual Report on Form 20-F, filed with the SEC on February 28, 2017.
(8) Incorporated by reference to the Company’s Report on Form 6-K, filed with the SEC on June 1, 2018.
(9) The financial statements as of and for the three years ended December 31, 2018 of Scorpio Tankers Inc., prepared by
Scorpio Tankers and audited by its independent registered public accounting firm, are included in this Annual Report
pursuant to Rule 3-09 of Regulation S-X.

Table of Contents
106
SIGNATURES
The registrant hereby certifies that it meets all of the requirements for filing on Form 20-F and has duly caused and authorized
the undersigned to sign this annual report on its behalf.
Dated March 20, 2019
Scorpio Bulkers Inc.
(Registrant)
/s/ Emanuele Lauro
Emanuele Lauro
Chief Executive Officer

Table of Contents
F- 1
INDEX TO CONSOLIDATED FINANCIAL STATEMENTS
Page
Report of Independent Registered Public Accounting Firm F-2
Consolidated Balance Sheets as of the years ended December 31, 2018 and 2017 F-3
Consolidated Statements of Operations for the years ended December 31, 2018, 2017 and 2016
F-4
Consolidated Statements of Changes in Shareholders’ Equity for the years ended December 31, 2018, 2017
and 2016 F-5
Consolidated Statements of Cash Flows for the years ended December 31, 2018, 2017 and 2016 F-6
Notes to the Consolidated Financial Statements F-7

F- 2
To the Board of Directors and Shareholders of Scorpio Bulkers Inc.
Opinions on the Financial Statements and Internal Control over Financial Reporting
We have audited the accompanying consolidated balance sheets of Scorpio Bulkers Inc. and its subsidiaries (the “Company”) as
of December 31, 2018 and 2017, and the related consolidated statements of operations, of changes in shareholders’ equity and
of cash flows for each of the three years in the period ended December 31, 2018, including the related notes (collectively
referred to as the “consolidated financial statements”). We also have audited the Company's internal control over financial
reporting as of December 31, 2018, based on criteria established in Internal Control - Integrated Framework (2013) issued by
the Committee of Sponsoring Organizations of the Treadway Commission (COSO).
In our opinion, the consolidated financial statements referred to above present fairly, in all material respects, the financial
position of the Company as of December 31, 2018 and 2017, and the results of its operations and its cash flows for each of the
three years in the period ended December 31, 2018 in conformity with accounting principles generally accepted in the United
States of America. Also in our opinion, the Company maintained, in all material respects, effective internal control over
financial reporting as of December 31, 2018, based on criteria established in Internal Control - Integrated Framework (2013)
issued by the COSO.
Basis for Opinions
The Company's management is responsible for these consolidated financial statements, for maintaining effective internal
control over financial reporting, and for its assessment of the effectiveness of internal control over financial reporting, included
in Management’s Annual Report on Internal Control over Financial Reporting appearing under Item 15. Our responsibility is to
express opinions on the Company’s consolidated financial statements and on the Company's internal control over financial
reporting based on our audits. We are a public accounting firm registered with the Public Company Accounting Oversight
Board (United States) (PCAOB) and are required to be independent with respect to the Company in accordance with the U.S.
federal securities laws and the applicable rules and regulations of the Securities and Exchange Commission and the PCAOB.
We conducted our audits in accordance with the standards of the PCAOB. Those standards require that we plan and perform the
audits to obtain reasonable assurance about whether the consolidated financial statements are free of material misstatement,
whether due to error or fraud, and whether effective internal control over financial reporting was maintained in all material
respects.
Our audits of the consolidated financial statements included performing procedures to assess the risks of material misstatement
of the consolidated financial statements, whether due to error or fraud, and performing procedures that respond to those risks.
Such procedures included examining, on a test basis, evidence regarding the amounts and disclosures in the consolidated
financial statements. Our audits also included evaluating the accounting principles used and significant estimates made by
management, as well as evaluating the overall presentation of the consolidated financial statements. Our audit of internal
control over financial reporting included obtaining an understanding of internal control over financial reporting, assessing the
risk that a material weakness exists, and testing and evaluating the design and operating effectiveness of internal control based
on the assessed risk. Our audits also included performing such other procedures as we considered necessary in the
circumstances. We believe that our audits provide a reasonable basis for our opinions.
Definition and Limitations of Internal Control over Financial Reporting
A company’s internal control over financial reporting is a process designed to provide reasonable assurance regarding the
reliability of financial reporting and the preparation of financial statements for external purposes in accordance with generally
accepted accounting principles. A company’s internal control over financial reporting includes those policies and procedures
that (i) pertain to the maintenance of records that, in reasonable detail, accurately and fairly reflect the transactions and
dispositions of the assets of the company; (ii) provide reasonable assurance that transactions are recorded as necessary to permit
preparation of financial statements in accordance with generally accepted accounting principles, and that receipts and
expenditures of the company are being made only in accordance with authorizations of management and directors of the
F- 3
company; and (iii) provide reasonable assurance regarding prevention or timely detection of unauthorized acquisition, use, or
disposition of the company’s assets that could have a material effect on the financial statements.
Because of its inherent limitations, internal control over financial reporting may not prevent or detect misstatements. Also,
projections of any evaluation of effectiveness to future periods are subject to the risk that controls may become inadequate
because of changes in conditions, or that the degree of compliance with the policies or procedures may deteriorate.
PricewaterhouseCoopers Audit
PricewaterhouseCoopers is represented by PricewaterhouseCoopers Audit, 63 rue de Villiers - 92200 Neuilly-sur-Seine, France.
Marseille, France
March 20, 2019
We have served as the Company’s auditor since 2013.

Scorpio Bulkers Inc. and Subsidiaries
Consolidated Balance Sheets
(Dollars in thousands, except per share data)
F- 4
As of December 31,
2018 2017
Assets
Current assets
Cash and cash equivalents $ 67,495 $ 68,535
Due from related parties 7,338 6,555
Inventories 3,595 3,674
Prepaid expenses and other current assets 5,671 3,791
Total current assets 84,099 82,555
Non-current assets
Vessels, net 1,507,918 1,534,782
Equity investment 92,281 —
Vessels under construction — 6,710
Deferred financing cost, net 3,706 3,068
Other assets 474 474
Due from related parties 15,348 15,821
Total non-current assets 1,619,727 1,560,855
Total assets $ 1,703,826 $ 1,643,410
Liabilities and shareholders’ equity
Current liabilities
Bank loans, net $ 60,310 $ 46,993
Financing obligation 4,594 1,144
Senior Notes, net 73,253 —
Accounts payable and accrued expenses 13,976 10,087
Due to related parties 481 366
Total current liabilities 152,614 58,590
Non-current liabilities
Bank loans, net 621,179 576,967
Financing obligation 69,229 17,747
Senior Notes, net — 72,726
Total non-current liabilities 690,408 667,440
Total liabilities 843,022 726,030
Commitment and contingencies (Note 7)
Shareholders’ equity
Preferred shares, $0.01 par value; 50,000,000 shares authorized; no shares
issued or outstanding —
—
Common shares, $0.01 par value per share; authorized 212,500,000 and
112,500,000 shares as of December 31, 2018 and December 31, 2017,
respectively; issued and outstanding 71,217,258 and 74,902,364 shares as
of December 31, 2018 and December 31, 2017, respectively 796
762
Paid-in capital 1,747,648 1,745,844
Common shares held in treasury, at cost; 8,567,846 and 1,465,448 shares
at December 31, 2018 and December 31, 2017, respectively (56,720 ) (11,004 )
Accumulated deficit (830,920 ) (818,222 )

Scorpio Bulkers Inc. and Subsidiaries
Consolidated Balance Sheets
(Dollars in thousands, except per share data)
F- 5
Total shareholders’ equity 860,804 917,380
Total liabilities and shareholders’ equity $ 1,703,826 $ 1,643,410
See notes to the consolidated financial statements.

Scorpio Bulkers Inc. and Subsidiaries
Consolidated Statements of Operations
(Amounts in thousands, except per share data)
F- 6
For the Year Ended December 31,
2018 2017 2016
Revenue:
Vessel revenue $ — $ — $ —
Vessel revenue-related party pools 242,502 162,205 78,402
Total vessel revenue 242,502 162,205 78,402
Operating expenses:
Voyage expenses 549 257 (364 )
Voyage expenses-related party — 172 319
Vessel operating costs 90,276 77,272 61,641
Vessel operating costs-related party 15,199 9,392 7,191
Charterhire expense 4,176 5,392 17,356
Charterhire termination — — 10,000
Vessel depreciation 56,607 48,510 36,562
General and administrative expenses 23,869 22,359 29,141
General and administrative expenses-related party 8,516 6,722 4,854
Loss / write down on assets held for sale — 17,354 11,433
Loss / write down on assets held for sale-related party — 347 1,000
Total operating expenses 199,192 187,777 179,133
Operating income (loss) 43,310 (25,572 ) (100,731 )
Other income (expense):
Interest income 1,107 1,100 933
Income (loss) from equity investment-related party (7,178 ) — —
Foreign exchange gain (loss) (68 ) (292 ) (116 )
Financial expense, net (49,869 ) (34,962 ) (24,921 )
Total other expense (56,008 ) (34,154 ) (24,104 )
Net loss $ (12,698 ) $ (59,726 ) $ (124,835 )
Weighted-average shares outstanding:
Basic 71,827 71,794 56,174
Diluted 71,827 71,794 56,174
Loss per common share:
Basic $ (0.18 ) $ (0.83 ) $ (2.22 )
Diluted $ (0.18 ) $ (0.83 ) $ (2.22 )
See notes to the consolidated financial statements.

Scorpio Bulkers Inc. and Subsidiaries
Consolidated Statements of Changes in Shareholders’ Equity
(Dollars in thousands)
F- 7
Number of
shares
outstanding
Common
stock
Paid-in
capital
Treasury
stock
Accumulated
deficit Total
Balance as of December 31, 2015 28,686,561
$ 287
$ 1,567,905
$ —
$ (633,661 ) $ 934,531
Net loss (124,835 ) (124,835 )
Net proceeds from common stock
offering:
Public offering 44,000,000 440 127,672 — — 128,112
Common stock issued to SSH 51,679 — 198 — — 198
Issuance of shares of restricted stock, net
of forfeitures 2,560,436
26
(26 ) —
—
—
Restricted stock amortization — — 18,609 — — 18,609
Balance as of December 31, 2016 75,298,676
$ 753
$ 1,714,358
$ —
$ (758,496 ) $ 956,615
Net loss (59,726 ) (59,726 )
Common stock issued to SSH 12,946 — 82 — — 82
Common stock issued purchase of
vessels 910,802
9
7,368
—
—
7,377
Warrants issued for vessel purchase — — 12,900 — — 12,900
Purchase of common stock for treasury (1,465,448 ) — — (11,004 ) — (11,004 )
Cash dividends declared on common
stock ($0.02 per common share) —
—
(1,509 ) —
—
(1,509 )
Issuance of restricted stock, net of
forfeitures 145,388
—
—
—
—
—
Restricted stock amortization — — 12,645 — — 12,645
Balance as of December 31, 2017 74,902,364
762
1,745,844
(11,004 ) (818,222 ) 917,380
Net loss (12,698 ) (12,698 )
Common stock issued 1,592,594
16
(16 ) —
—
—
Purchase of common stock for treasury (7,102,398 ) —
—
(45,716 ) —
(45,716 )
Cash dividends declared on common
stock ($0.08 per common share) —
(6,042 ) —
—
(6,042 )
Issuance of restricted stock, net of
forfeitures 1,824,698
18
(18 ) —
—
—
Restricted stock amortization —
7,880
—
—
7,880
Balance as of December 31, 2018 71,217,258
796
1,747,648
(56,720 ) (830,920 ) 860,804
See notes to the consolidated financial statements.

Scorpio Bulkers Inc. and Subsidiaries
Consolidated Statements of Cash Flows
(Dollars in thousands)
F- 8
December 31,
2018 2017 2016
Operating activities
Net loss $ (12,698 ) $ (59,726 ) $ (124,835 )
Adjustment to reconcile net loss to net cash provided by (used
in) operating activities:
Restricted stock amortization 7,880 12,645 18,609
Vessel depreciation 56,607 48,510 36,562
Amortization of deferred financing costs 9,582 6,085 4,137
Write off of deferred financing costs — 470 3,781
Loss / write down on assets held for sale — 16,471 10,555
Net unrealized losses on investments 7,719 — —
Dividend income on equity investment (541 ) — —
Changes in operating assets and liabilities:
Increase (decrease) in inventories, prepaid expenses and other
current assets (1,798 ) 1,982
(483 )
Decrease (increase) in accounts payable and accrued expenses 3,890 713 (6,178 )
(Decrease) increase in related party balances (195 ) (7,568 ) 5,656
Net cash provided by (used in) operating activities 70,446 19,582 (52,196 )
Investing activities
Equity investment (100,000 ) — —
Dividend income on equity investment 541 — —
Proceeds from sale of assets held for sale — 44,340 271,376
Payments on assets classified as held for sale — — (98,445 )
Drydock and scrubber payments (1,235 ) — —
Payments for vessels and vessels under construction (21,799 ) (217,033 ) (408,307 )
Net cash used in investing activities (122,493 ) (172,693 ) (235,376 )
Financing activities
Proceeds from issuance of common stock — — 128,112
Common stock repurchased (45,716 ) (11,004 ) —
Dividends paid (6,042 ) (1,509 ) —
Proceeds from issuance of debt 469,225 287,554 247,243
Repayments of long term debt (358,858 ) (153,003 ) (185,239 )
Debt issue cost paid (7,602 ) (2,126 ) (1,110 )
Net cash provided by financing activities 51,007 119,912 189,006
Decrease in cash and cash equivalents (1,040 ) (33,199 ) (98,566 )
Cash and cash equivalents, beginning of period 68,535 101,734 200,300
Cash and cash equivalents, end of period $ 67,495 $ 68,535 $ 101,734
Supplemental cash flow information:
Interest paid $ 39,727 $ 27,667 $ 22,647
Non-cash investing and financing activities
Amounts payable vessels and vessels under construction $ — $ — $ 207
Issuance of common stock — — 147
Interest capitalized — 361 6,951

Scorpio Bulkers Inc. and Subsidiaries
Consolidated Statements of Cash Flows
(Dollars in thousands)
F- 9
Issuance of shares and warrants for vessel purchases — 20,268 —
See notes to the consolidated financial statements.

Table of Contents
SCORPIO BULKERS INC. AND SUBSIDIARIES
Notes to the Consolidated Financial Statements
(Dollars in thousands, except per share, per day and per vessel data)
F- 10
1. Organization and Basis of Presentation
Company
Scorpio Bulkers Inc. and its subsidiaries (together “we”, “us”, “our” or the “Company”) is an international shipping company
that owns and operates the latest generation newbuilding drybulk carriers with fuel-efficient specifications and carrying capacities
of greater than 30,000 dwt in the international shipping markets. Scorpio Bulkers Inc. was incorporated in the Republic of the
Marshall Islands on March 20, 2013.
As of December 31, 2018, the Company owned or finance leased 56 vessels (consisting of 19 Kamsarmax vessels and 37
Ultramax vessels) and time chartered-in one Ultramax vessel.
Our vessels are commercially managed by Scorpio Commercial Management S.A.M., or SCM, which is majority owned by the
Lolli-Ghetti family of which Emanuele Lauro, our Chairman and Chief Executive Officer, and Filippo Lauro, our Vice President,
are members. SCM’s services include securing employment, in pools, in the spot market, and on time charters.
Our vessels are technically managed by Scorpio Ship Management S.A.M., or SSM, which is majority owned by the Lolli-Ghetti
family. SSM facilitates vessel support such as crew, provisions, deck and engine stores, insurance, maintenance and repairs, and
other services as necessary to operate the vessels such as drydocks and vetting/inspection under a technical management
agreement.
We also have an administrative services agreement with Scorpio Services Holding Limited, or SSH, which is majority owned by
the Lolli-Ghetti family. The administrative services provided under this agreement primarily include accounting, legal
compliance, financial, information technology services, the provision of administrative staff, and office space. Under the
administrative services agreement, we also reimburse SSH for any direct or indirect expenses that it incurs in providing these
services.
Basis of accounting
The consolidated financial statements and accompanying notes have been prepared in accordance with accounting principles
generally accepted in the United States of America, or U.S. GAAP. All intercompany accounts and transactions have been
eliminated in consolidation. The consolidated financial statements reflect all adjustments which, in the opinion of management,
are necessary for the fair presentation of results.
Other comprehensive income is net income and thus not presented separately.
Going concern
The Company’s revenue is primarily derived from pool revenue. The bulker shipping industry is volatile and has experienced a
sustained cyclical downturn recently. While the outlook has brightened, if the recovery is not sustained, this could have a material
adverse effect on the Company’s business, financial condition, results of operations and cash flows.
The fair market values of the Company’s vessels also experience high volatility. The fair market value of the vessels may increase
or decrease depending on a number of factors including, but not limited to, the prevailing level of charter rates and day rates,
general economic and market conditions affecting the international shipping industry, types, sizes and ages of vessels, supply and
demand for vessels, availability of or developments in other modes of transportation, competition from other shipping companies,
cost of newbuildings, governmental or other regulations and technological advances. In addition, as vessels grow older they
generally decline in value. If the fair market value of vessels declines, the Company may not be in compliance with certain
provisions of its credit facilities and it may not be able to refinance its debt. The prepayment of certain credit facilities may be
necessary for the Company to maintain compliance with certain covenants in the event that the value of its vessels falls below a
certain level. Additionally, if the Company sells any of its vessels at a time when vessel prices have fallen, the sale price may be

Table of Contents
SCORPIO BULKERS INC. AND SUBSIDIARIES
Notes to the Consolidated Financial Statements
(Dollars in thousands, except per share, per day and per vessel data)
F- 11
less than the vessel’s carrying value on its consolidated financial statements, resulting in a loss on sale or an impairment loss
being recognized, ultimately leading to a reduction in earnings. Furthermore, if vessel values fall significantly, this could indicate
a decrease in the recoverable amount for the vessel which may result in an impairment adjustment in the carrying value of the
vessel.
These consolidated financial statements have been prepared on a going concern basis, which contemplates the realization of assets
and the satisfaction of liabilities in the normal course of business. The consolidated financial statements do not include any
adjustments relating to the recoverability and classification of recorded assets, nor to the amounts and classification of liabilities
that may be necessary should the Company be unable to continue as a going concern.
Significant Accounting Policies
Principles of Consolidation
The consolidated financial statements represent the consolidation of the accounts of Scorpio Bulkers Inc. and its subsidiaries in
conformity with U.S. GAAP. All intercompany accounts and transactions have been eliminated in consolidation. Investments in
unconsolidated companies (generally 20 to 50 percent ownership), in which the Company has the ability to exercise significant
influence but neither has a controlling interest nor is the primary beneficiary, are accounted for under the equity method. Under
certain criteria indicated in Accounting Standards Codification ("ASC") 810, Consolidation, a partially-owned affiliate would be
consolidated as a variable interest entity when it has less than a 50% ownership if the Company was the primary beneficiary of
that entity. At the present time, there are no interests in variable interest entities.
Accounting estimates
The preparation of financial statements in conformity with U.S. GAAP requires management to make estimates and assumptions
that affect the reported amounts of assets, liabilities, revenues and expenses and disclosures of contingent assets, liabilities,
revenues, and expenses. Actual results could differ from those results.
In addition to the estimates noted above, significant estimates include vessel valuations, useful life of vessels, and residual value
of vessels.
Revenue recognition
The Company adopted ASU 2014-9, “Revenue from Contracts with Customers”, for the reporting period commencing on
January 1, 2018 and elected to use the modified retrospective approach. The core principal of the standard is that an entity will
recognize revenue at an amount that reflects the consideration to which the entity expects to be entitled in exchange for
transferring such goods or services to a customer (as defined in the standard). Its adoption primarily changes the method of
recognizing revenue for voyage charters from the discharge-to-discharge method to the loading-to-discharge method. Under the
discharge-to-discharge method, revenue is recognized from the discharge of the prior voyage, or contract date of the current
voyage if later, until the discharge of the current voyage. Under the load-to-discharge method, revenue is recognized from the
load of a voyage until its discharge. The quantitative impact of the adoption of this new guidance did not have any effect on the
timing of revenue recognition and therefore required no adjustment to the opening retained earnings as of January 1, 2018 as
the Company was not engaged in any voyage charters. At the present time, virtually all of the Company’s revenues are sourced
from commercial pools which, along with time charters, fall under the guidance of US GAAP for leases. In commercial pools
the Company participates with other shipowners to operate a large number of vessels as an integrated transportation system,
which offers customers greater flexibility and a higher level of service while achieving scheduling efficiencies. The operation of
the pool enables both pool customers and participants to share the benefits achieved from these efficiencies. Under pooling
arrangements, vessels are leased to and placed at the disposal and control of the pool during their participation in the pool. The
Pool Manager negotiates and enters into arrangements for the commercial employment and operation of the pool vessels so as
to secure the highest earnings to be shared among the pool participants. All revenues earned by the pool from the operation of

Table of Contents
SCORPIO BULKERS INC. AND SUBSIDIARIES
Notes to the Consolidated Financial Statements
(Dollars in thousands, except per share, per day and per vessel data)
F- 12
the pool vessels, after deduction of all costs involved in the operation of the pool, is shared among the pool participants based
upon pool points, in accordance with the contract.
Voyage expenses
Voyage expenses primarily include bunkers, port charges, canal tolls, cargo handling operations and brokerage commissions paid
by us under voyage charters, brokerage commissions and miscellaneous voyage expenses that the Company is unable to recoup
under time charter and pool arrangements.
Charterhire expense
Charterhire expense is the amount we pay the owner for time chartered-in vessels. The amount is usually for a fixed period of
time at charter rates that are generally fixed, but may contain a variable component based on drybulk indices, inflation, interest
rates, profit sharing, or current market rates. The vessel’s owner is responsible for crewing and other vessel operating costs.
Charterhire expense is recognized ratably over the charterhire period.
Operating leases
Costs in respect of operating leases are charged to the Consolidated Statement of Operations on a straight line basis over the lease
term.
Vessel operating costs
Vessel operating costs, which include crewing, repairs and maintenance, insurance, stores, lube oils, communication expenses,
and technical management fees, are expensed as incurred.
Technical management fees are paid to SSM (See Note 15, Related Party Transactions). Pursuant to the Revised Master
Agreement, SSM provides us with technical services, and we provide it with the ability to subcontract technical management of
our vessels.
Foreign currencies
The individual financial statements of Scorpio Bulkers Inc. and each of its subsidiaries are maintained in the currency of the
primary economic environment in which we operate (its functional currency), which in all cases is U.S. dollars. For the purpose
of the consolidated financial statements, our results and financial position are also expressed in U.S. dollars.
In preparing the consolidated financial statements of Scorpio Bulkers Inc. and each of its subsidiaries, transactions in currencies
other than the U.S. dollar are recorded at the rate of exchange prevailing on the dates of the transactions. Any change in exchange
rate between the date of recognition and the date of settlement may result in a gain or loss which is included in the Consolidated
Statement of Operations. At the end of each reporting period, monetary assets and liabilities denominated in other currencies are
retranslated into the functional currency at rates ruling at that date. All resultant exchange differences are included in the
Consolidated Statement of Operations.
Cash and cash equivalents
Cash and cash equivalents are comprised of cash on hand and demand deposits, and other short-term highly-liquid investments
with original maturities of three months or less, and that are readily convertible to a known amount of cash and are subject to an
insignificant risk of changes in value.
Table of Contents
SCORPIO BULKERS INC. AND SUBSIDIARIES
Notes to the Consolidated Financial Statements
(Dollars in thousands, except per share, per day and per vessel data)
F- 13
Inventories
Inventories consist mainly of lubricating oils used in the operations of the vessels and are stated at the lower of cost or net
realizable value. Cost is determined using the first in first out method.
Assets held for sale
Assets held for sale include vessels and contracts for the construction of vessels and are classified in accordance with ASC 360,
Property, Plant, and Equipment. The Company considers such assets to be held for sale when all of the following criteria are
met:
• management commits to a plan to sell the property;
• it is unlikely that the disposal plan will be significantly modified or discontinued;
• the property is available for immediate sale in its present condition;
• actions required to complete the sale of the property have been initiated;
• sale of the property is probable and we expect the completed sale will occur within one year; and
• the property is actively being marketed for sale at a price that is reasonable given its current market value.
Upon designation as an asset held for sale, the Company records the asset at the lower of its carrying value or its estimated fair
value, less estimated costs to sell, and, if the asset is a vessel, the Company ceases depreciation.
Vessels, net
Vessels, net is stated at historical cost less accumulated depreciation. Included in vessel costs are acquisition costs directly
attributable to the acquisition of a vessel including capitalized interest and expenditures made to prepare the vessel for its initial
voyage. Vessels are depreciated to their residual value on a straight-line basis over their estimated useful lives of 25 years from
the date the vessel is ready for its first voyage. The estimated useful life of 25 years is management’s best estimate and is also
consistent with industry practice for similar vessels. The residual value is estimated as the lightweight tonnage of each vessel
multiplied by an estimated scrap value per ton. The scrap value per ton is estimated taking into consideration the historical four
years average scrap market rates at the balance sheet date.
When regulations place limitations over the ability of a vessel to trade on a worldwide basis, or when the cost of complying with
such regulations is not expected to be recovered, we will adjust the vessel’s useful life to end at the date such regulations preclude
such vessel’s further commercial use.
The carrying value of the Company’s vessels does not represent the fair market value of such vessels or the amount it could obtain
if it were to sell any of its vessels, which could be more or less. Under U.S. GAAP, the Company would not record a loss if the
fair market value of a vessel (excluding its charter) is below its carrying value unless and until it determines to sell that vessel or
the vessel is impaired as discussed below under “Impairment of long-lived assets held for use.”
Vessels under construction
Vessels under construction are measured at cost and include costs incurred that are directly attributable to bringing the asset to
the location and condition necessary for it to be capable of operating in the manner intended by management. These costs include
installment payments made to the shipyards, capitalized interest, professional fees, and other costs deemed directly attributable
to the construction of the asset. Vessels under construction are not depreciated.

Table of Contents
SCORPIO BULKERS INC. AND SUBSIDIARIES
Notes to the Consolidated Financial Statements
(Dollars in thousands, except per share, per day and per vessel data)
F- 14
Deferred drydocking costs
The vessels are required to undergo planned drydocks or underwater inspections for replacement of certain components, major
repairs and maintenance of other components, which cannot be carried out while the vessels are operating, approximately every
30 months or 60 months depending on the nature of work and external requirements. These drydock costs are capitalized and
depreciated on a straight-line basis over the estimated period until the next drydock. When the drydock expenditure occurs prior
to the expiry of the period, the remaining balance is expensed. The Company had no drydocking activity during the three years
ended December 31, 2018.
We only include in deferred drydocking those direct costs that are incurred as part of the drydocking to meet regulatory
requirements, or are expenditures that add economic life to the vessel, increase the vessel’s earnings capacity or improve the
vessel’s efficiency. Direct costs include shipyard costs as well as the costs of placing the vessel in the shipyard; cost of travel,
lodging and subsistence of personnel sent to the drydocking site to supervise; and the cost of hiring a third party to oversee the
drydocking. Expenditures for normal maintenance and repairs, whether incurred as part of the drydocking or not, are expensed
as incurred.
Impairment of long-lived assets held for use
In accordance with ASC subtopic 360-10, Property, Plant and Equipment, long-lived assets to be held and used are reviewed
for impairment whenever events or changes in circumstances indicate that the carrying amount of such assets may not be
recoverable. Determination of recoverability is based on an estimate of undiscounted future cash flows resulting from the use
of the asset or asset group and its eventual disposition.
For purposes of recognition and measurement of an impairment loss, long-lived assets are grouped with other assets at the
lowest level for which identifiable cash flows are largely independent of the cash flows of other assets, which is generally at the
vessel pool level for vessels operating within pools. In performing its impairment review, the Company performs a
recoverability test comparing an estimate of undiscounted cash flows to carrying value to determine if the asset group is
impaired. In developing its estimates of undiscounted cash flows, the Company makes significant assumptions and estimates
about future performance, with the most significant assumptions relating to (i) charter rates on expiry of existing charters,
which are based on the current fixing applicable to five-year time charter rates and thereafter, the ten-year historical average for
each category of vessel (ii) off-hire days, which are based on actual off-hire statistics for the Company’s fleet (iii) operating
costs, based on current levels escalated over time based on long term trends (iv) drydocking frequency, duration and cost (v)
estimated useful life which is assessed as a total of 25 years and (vi) estimated scrap values. In the case of an indication of
impairment, the results of a recoverability test would also be sensitive to the discount rate applied.
An impairment loss is recognized when the carrying amount of the asset group is greater than both the undiscounted cash flows
and its fair value. In instances where the carrying value of an asset group is not recoverable, measurement of the impairment
loss is based upon the amount by which the collective fair values of the vessels in the asset group exceed their collective
carrying values. The fair values are determined based upon available market data as well as third party valuations performed on
each individual vessel.
During our fourth quarter 2018 assessment, we determined that the undiscounted future income streams expected to be
generated by each asset group, over their remaining operating lives exceeded and therefore would be sufficient to recover their
respective carrying values and, accordingly, we confirmed that our vessels were not impaired under U.S. GAAP. As of
December 31, 2018 we owned 56 vessels with an average remaining useful life of 22 years.
During the year ended December 31, 2017, there were no changes in circumstances or events that indicated that the carrying
amount of our vessel pools or vessels under construction may not be recoverable and therefore, an assessment of impairment
was not performed.

Table of Contents
SCORPIO BULKERS INC. AND SUBSIDIARIES
Notes to the Consolidated Financial Statements
(Dollars in thousands, except per share, per day and per vessel data)
F- 15
During our fourth quarter 2016 assessment, we determined that the undiscounted future income streams expected to be
generated by each of our asset groups, over their remaining operating lives exceeded and therefore would be sufficient to
recover their respective carrying values and, accordingly, we confirmed that our vessels were not impaired under U.S.
GAAP. As of December 31, 2016 we owned 42 vessels with an average remaining useful life of 24 years.
In our impairment testing, we also examine the sensitivity of the future income streams expected to be earned by reviewing
other scenarios relative to the initial assumptions we used to see if the resulting impact would have resulted in a different
conclusion. Accordingly, we perform sensitivity analyses based on more conservative charter rates and expected useful lives for
our vessels. In the first sensitivity analysis, we lowered charter rate assumptions to 96% of the long-term averages of
Kamsarmax and Ultramax vessels, respectively (holding all other critical assumptions constant), while in our second sensitivity
analysis; we decreased our vessels’ estimated useful lives by approximately 9% for each vessel class (holding all other critical
assumptions constant). We then evaluated the outcomes of the sensitivity analyses performed to assess their impact on our
conclusions. In both analyses, we found that there was no impairment of any of our assets or asset groups.
Although we believe that the assumptions used to evaluate potential impairment are reasonable and appropriate, such assumptions
are highly subjective. There can be no assurance as to how long charter rates and vessel values will remain at their currently low
levels or whether they will improve by any significant degree. Charter rates may decrease, which could adversely affect our
revenue and profitability, and any future assessments of vessel impairment.
Management will continue to monitor developments in charter rates in the markets in which it participates with respect to the
expectation of future rates over an extended period of time that are utilized in the analyses.
Fair value of financial instruments
Substantially all of the Company’s financial instruments are carried at fair value or amounts approximating fair value. Cash and
cash equivalents, interest rate caps, amounts due to / from charterers, accounts payable and long-term debt, are carried at market
value or estimated fair value. Please also see “Equity Investments” below.
Deferred financing costs, net
Deferred financing costs, included in other assets or as a reduction to debt balances (as described above), consist of fees,
commissions and legal expenses associated with obtaining or modifying loan facilities. These costs are amortized over the life of
the related debt using the effective interest rate method and are included in Financial expense, net in the Consolidated Statement
of Operations. Amortization was $9.6 million, $6.1 million, and $4.1 million, respectively, for the years ended December 31,
2018, 2017 and 2016. Deferred financing costs were $37.8 million and $30.2 million, and accumulated amortization was $21.7
million and $12.1 million as of December 31, 2018 and 2017, respectively. Amortization for the next five years based on balances
as of December 31, 2018 are as follows (in millions):
2019 $ 4.5
2020 3.7
2021 2.8
2022 2.1
2023 1.3
Total $ 14.4
The Company wrote off $3.8 million of deferred financing costs during the year ended December 31, 2018 related to the
refinancing of existing debt. The Company wrote off $0.5 million during the year ended December 31, 2017 associated with the
portion of deferred financing costs accumulated on credit facilities for which the commitments were reduced due to the sale of
vessels.

Table of Contents
SCORPIO BULKERS INC. AND SUBSIDIARIES
Notes to the Consolidated Financial Statements
(Dollars in thousands, except per share, per day and per vessel data)
F- 16
Earnings per share
Basic earnings per share is determined by dividing the net income (loss) by the weighted average number of common shares
outstanding, while diluted earnings per share is determined by dividing net income (loss) by the average number of common
stock adjusted for the dilutive effect of common stock equivalents by application of the treasury stock method. Common stock
equivalents are excluded from the diluted calculation if their effect is anti-dilutive.
Share-based Compensation
We follow ASC Subtopic 718-10, Compensation-Stock Compensation, for restricted stock issued under our equity incentive plan.
Share-based compensation expense requires measurement of compensation cost for share-based awards at fair value and
recognition of compensation cost over the vesting period. The restricted stock awards granted to our employees and directors
have graded vesting schedules and contain only service conditions. The Company recognizes compensation cost on a straight-
line basis over the requisite service period for each separately vesting portion of the award as if the award was, in substance,
multiple awards.
The fair value of restricted stock awards is based on the fair value of the Company’s common stock on the grant date.
Income tax
Scorpio Bulkers Inc. is incorporated in the Republic of the Marshall Islands, and its vessel owning subsidiaries are incorporated
in the Republic of the Marshall Islands. In accordance with the income tax laws of the Marshall Islands, we are not subject to
Marshall Islands income tax. We are also exempt from income tax in other jurisdictions including the United States of America
due to tax treaties or domestic tax laws; therefore, we will not have any tax charges, benefits, or balances.
Concentration of credit risk
Financial instruments that potentially subject the Company to concentrations of credit risk are amounts due from charterers and
from related parties. With respect to balances due from the Scorpio Ultramax Pool, and the Scorpio Kamsarmax Pool (see Note
15, Related Party Transactions), the Company, through SCM, limits its credit risk by performing ongoing credit evaluations and,
when deemed necessary, requires letters of credit, guarantees or collateral. The Company earned 36%, and 64% of its revenues
from two customers during the year ended December 31, 2018. The Company earned 42% and 58% of its revenues, from two
customers during the year ended December 31, 2017. During the year ended December 31, 2016, the Company earned 40% and
60% of its revenues (including commissions from SCM) from two customers. Management does not believe significant risk
exists in connection with the Company’s concentrations of credit at December 31, 2018 due to the number of charterers with
which the pools conduct business.
At December 31, 2018, the Company maintains all of its cash and cash equivalents with seven financial institutions. None of the
Company’s cash and cash equivalent balances are covered by insurance in the event of default by these financial institutions.
Interest rate risk
The Company is exposed to the impact of interest rate changes primarily through its variable-rate borrowings which consist of
borrowings under its secured credit facilities. Significant increases in interest rates could adversely affect our margins, net income
and our ability to service our debt. The Company has entered into derivative contracts to hedge its overall exposure to interest
rate risk exposure (see Derivative financial instruments below for further information).

Table of Contents
SCORPIO BULKERS INC. AND SUBSIDIARIES
Notes to the Consolidated Financial Statements
(Dollars in thousands, except per share, per day and per vessel data)
F- 17
Liquidity risk
Liquidity risk is the risk that an entity will encounter difficulty in raising funds to meet commitments associated with financial
instruments. We manage liquidity risk by maintaining adequate reserves and borrowing facilities and by continuously monitoring
forecast and actual cash flows.
Current economic conditions make forecasting difficult, and there is the possibility that our actual trading performance during
the coming year may be materially different from expectations. Additionally, it is also likely that additional, currently
uncommitted, sources of financing will be required to meet the financial commitments relating to the scheduled maturities of our
Senior Notes due 2019 and to finance the final portion of our investment in exhaust gas cleaning systems (“scrubbers”). We could
also pursue other means to raise liquidity, such as through the sale of vessels, to meet these obligations. There can be no assurance
that these or other measures will be successful and a deterioration in economic conditions or a failure to refinance our debt that
is maturing could cause us to breach our debt covenants and could have a material adverse effect on our business, results of
operations, cash flows and financial condition.
Based on internal forecasts and projections, which assume the refinancing of certain outstanding debt and the financing of the
final portion of our investment in scrubbers, and that take into account reasonably possible changes in our trading performance,
in addition to our ability to (i) sell or refinance certain vessels or to (ii) sell our investment in Scorpio Tankers Inc. (“Scorpio
Tankers”), we believe that we have adequate financial resources to continue in operation and meet our financial commitments
(including but not limited to debt service obligations, installments relating to the purchase of exhaust gas cleaning systems and
charterhire commitments) for a period of at least 12 months from the date of issuance of this annual report. Accordingly, we
continue to adopt the going concern basis in preparing our financial statements.
Currency and exchange rate risk
The international shipping industry’s functional currency is the U.S. Dollar. Virtually all of our revenues and most of our operating
costs are in U.S. Dollars. We incur certain operating expenses in currencies other than the U.S. Dollar, and the foreign exchange
risk associated with these operating expenses is immaterial.
Equity Investments
We account for equity investments under the equity method. Equity investments for which we have the ability to exercise
significant influence, but not control over the investee and are not the primary beneficiary of the investee’s activities are
accounted for under the equity method. At December 31, 2018, the Company’s equity method investments consist solely of an
approximately 10.5% common stock ownership interest in a related party over which it has the ability to exercise significant
influence, Scorpio Tankers acquired in October 2018. In accounting for its investment in Scorpio Tankers, the Company has
elected to use the fair value option, available under ASC 825 for investments subject to the equity method of accounting, as it
more accurately reflects the economic substance of its ownership interest in Scorpio Tankers. The initial election of the fair
value option did not have any impact on the Company’s earnings. The Company measures its fair value based upon the quoted
market price of Scorpio Tankers common stock. Our share of gains and losses in the fair value of the Scorpio Tankers
investment as well as dividend income are recorded in Income (loss) from equity investment - related party in the Consolidated
Statement of Operations. At December 31, 2018, the Company did not have any cost method investments.
Derivative financial instruments
The Company uses derivative financial instruments, primarily interest rate caps, to hedge certain interest rate exposure. The
Company does not use derivative financial instruments for speculative purposes.
All derivative financial instruments are carried on the balance sheet at fair value. Fair value of derivatives is determined by
reference to observable prices that are based on inputs not quoted on active markets, but corroborated by market data. The
accounting for changes in the fair value of a derivative instrument depends on whether the derivative has been designated as and

Table of Contents
SCORPIO BULKERS INC. AND SUBSIDIARIES
Notes to the Consolidated Financial Statements
(Dollars in thousands, except per share, per day and per vessel data)
F- 18
qualifies as part of a hedging relationship. The use of derivative instruments has been limited to interest rate cap agreements. The
fair values of derivative instruments are included in Other assets in the accompanying balance sheets. The Company has not
elected to designate any of its derivative instruments as hedging instruments under ASC 815, Derivatives and Hedging, and as
such the gain or loss on the derivative is recognized in Financial expense, net in current earnings during the period of change.
The valuation of interest rate cap agreements is determined using the Black Model, which considers among other factors, the
contractual terms of derivatives, including the period to maturity, and uses observable market-based inputs, including interest rate
curves and expected volatility, adjusted for counter-party risk. The Company may enter into derivative contracts that are intended
to economically hedge certain of its risks, even though hedge accounting does not apply or we elect not to apply hedge accounting.
Recent accounting pronouncements
In February 2016, the Financial Accounting Standards Board (“FASB”) issued Accounting Standards Update (“ASU”) 2016-02,
“Leases”, which was intended to improve financial reporting of leasing transactions. The ASU requires organizations that lease
assets, or lessees, to recognize on the balance sheet the assets and liabilities for the rights and obligations created by those leases
with terms of more than twelve months. The accounting for lease arrangements by the lessors will remain largely unchanged from
current U.S. GAAP. The ASU also requires additional quantitative and qualitative disclosures to help financial statement users
better understand the amount, timing, and uncertainty of cash flows arising from leases. The ASU is effective for fiscal years and
interim periods beginning after December 15, 2018 although early adoption is permitted. The ASU requires reporting
organizations to take a modified retrospective transition approach.
In its review of its contracts to assess the overall impact of the guidance, the Company has determined that the existing pool
arrangements meet the definition of leases under ASU 2016-02. As lessor, the Company leases its vessels to pools, which manage
the vessels in order to enter into transportation contracts with their customers and enjoy the economic benefits derived from such
arrangements. Furthermore, the pools can direct the use of a vessel (subject to certain limitations in the pool or charter agreement)
throughout the period of use. In July 2018, the FASB issued ASU 2018-11, “Leases (Topic 842): Targeted Improvements”, which
amended FASB Accounting Standards Codification (“ASC”) Topic 842, “Leases”, to (i) provide a practical expedient for lessors
regarding the separation of the lease and non-lease components of a contract and (ii) add an optional transition method that would
permit entities to apply the new requirements by recognizing a cumulative-effect adjustment to the opening balance of retained
earnings in the year of the adoption. In its assessment, the Company concluded that the criteria for not separating the lease and
non-lease components of its arrangements are met since: (a) the timing and pattern of transfer are the same for both the lease and
non-lease components, (b) the lease component of the contracts, if accounted for separately, would be classified as an operating
lease, and (c) the lease component is the predominant component in the arrangement. Therefore, the Company will account for
the combined component as an operating lease in accordance with ASC 842. As a result, an entity’s reporting for the comparative
periods presented in the financial statements in which it adopts the new lease standard will continue to be in accordance with
current GAAP. The Company adopted this new standard on January 1, 2019, applying the optional transition option, with no
restatement of comparative figures for prior periods. The Company does not expect this standard to impact the accounting for its
vessels operating within the pools or under time chartered-out arrangements.
The standard will result in the recognition of right-of-use assets and corresponding liabilities, on the basis of the discounted
remaining future minimum lease payments, for chartered-in vessel commitments of over 12 months only, which have historically
been reported as operating leases and recognized solely in the income statement on a straight-line basis. The impact of this
standard as it pertains to time or bareboat chartered-in vessels will not have an impact upon first time adoption, as the Company’s
operating fleet includes only one chartered-in vessel at December 31, 2018, which has a lease term of less than twelve months
and does not require recognition on the Consolidated Balance Sheet.
Table of Contents
SCORPIO BULKERS INC. AND SUBSIDIARIES
Notes to the Consolidated Financial Statements
(Dollars in thousands, except per share, per day and per vessel data)
F- 19
Recently adopted accounting standards
In May 2017, the FASB issued ASU 2017-09, “Compensation - Stock Compensation (Topic 718): Scope of Modification
Accounting”, which clarifies when changes to the terms or conditions of a share-based payment must be accounted for as
modifications. Under the new guidance, an entity will not apply modification accounting to a share-based payment award if all
of the following are the same immediately before and after the change: (i) the award’s fair value, (ii) the award’s vesting
conditions, and (iii) the award’s classification as an equity or liability instrument. The new guidance does not change the
accounting for modifications. The guidance is effective for annual periods, and interim periods within those annual periods,
beginning after December 15, 2017 for all entities. The adoption of ASU 2017-09 did not have a significant impact on the
Company’s Consolidated Financial Statements or financial disclosures.
In November 2016, the FASB issued ASU 2016-18, “Restricted Cash”. When cash, cash equivalents, restricted cash and
restricted cash equivalents are presented in more than one line item on the balance sheet, the new guidance requires a
reconciliation of the totals in the statement of cash flows to the related captions in the balance sheet. This reconciliation can be
presented either on the face of the statement of cash flows or in the notes to the financial statements. The guidance is effective
for fiscal years beginning after December 15, 2017, and interim periods within those years. The adoption of ASU 2016-018 did
not have a significant impact on the Company’s Consolidated Statement of Cash Flows.
In August 2016, the FASB issued ASU 2016-15, “Classification of Certain Cash Receipts and Cash Payments”, which
addresses classification issues related to the statement of cash flows. Classification issues relate to (i) debt repayment or debt
extinguishment costs, (ii) settlement of zero-coupon bonds, (iii) contingent consideration payments made after a business
combination, (iv) proceeds from the settlement of insurance claims, (v) proceeds from the settlement of corporate-owned life
insurance policies, including bank-owned life insurance policies, (vi) distributions received from equity method investees, (vii)
beneficial interests in securitization transactions, and (viii) separately identifiable cash flows and application of the
predominance principle. The guidance is effective for annual and interim periods in fiscal years beginning after December 15,
2017. The adoption of ASU 2016-15 did not have a significant impact on the Company’s Consolidated Statement of Cash
Flows.
In May 2014, the FASB issued ASU 2014-09, “Revenue from Contracts with Customers” (Topic 606). This standard requires
entities to (i) identify the contract(s) with a customer; (ii) identify the performance obligations in the contract; (iii) determine
the transaction price; (iv) allocate the transaction price to the performance obligations in the contract; and (v) recognize revenue
when (or as) the entity satisfies a performance obligation. The Company adopted ASU 2014-9 for the reporting period
commencing on January 1, 2018 and elected to use the modified retrospective approach. Its adoption primarily changes the
method of recognizing revenue for voyage charters from the discharge-to-discharge method to the loading-to-discharge method.
Under the discharge-to-discharge method, revenue is recognized from the discharge of the prior voyage, or contract date of the
current voyage if later, until the discharge of the current voyage. Under the load-to-discharge method, revenue is recognized
from the load of a voyage until its discharge. The Company’s quantitative assessment of the effects of the adoption of this new
guidance indicated that the financial impact of the change in timing of revenue recognition as outlined above required no
adjustment to the opening retained earnings as of January 1, 2018 as the Company was not engaged in any voyage charters. At
the present time, virtually all of the Company’s revenues are sourced from commercial pools which, along with time charters,
fall under the guidance of ASC Topic 842 “Leases”.
2. Cash and cash equivalents
Cash and cash equivalents includes $10.1 million and $20.2 million of short-term deposits with original maturities of less than
three months, at December 31, 2018 and 2017, respectively.

Table of Contents
SCORPIO BULKERS INC. AND SUBSIDIARIES
Notes to the Consolidated Financial Statements
(Dollars in thousands, except per share, per day and per vessel data)
F- 20
3. Earnings Per Common Share
The following is a reconciliation of the basic and diluted earnings per share computations (amounts in thousands, except per share
data):
For the years ended December 31,
2018 2017 2016
Net loss for basic and diluted earnings per share $ (12,698 ) $ (59,726 ) $ (124,835 )
Shares of common stock and common stock equivalents:
Weighted average shares basic 71,827 71,794 56,174
Effect of dilutive securities — — —
Weighted average common shares - diluted 71,827 71,794 56,174
Loss per share:
Basic $ (0.18 ) $ (0.83 ) $ (2.22 )
Diluted $ (0.18 ) $ (0.83 ) $ (2.22 )
The following is a summary of share equivalents not included in the computation of diluted earnings per share because their
effects would have been anti-dilutive for the years ended December 31, 2018, 2017 and 2016 (in thousands).
For the years ended December 31,
2018 2017 2016
Share equivalents 3,754
4,734
3,600
4. Vessels
At December 31, 2018, the Company owned or financed leased 19 Kamsarmax vessels and 37 Ultramax vessels. A rollforward
of activity within vessels is as follows (in thousands):
Balance December 31, 2016 $ 1,234,081
Transfer from vessels under construction and other additions 203,682
Vessel purchases 207,000
Vessel sales (61,471 )
Depreciation (48,510 )
Balance December 31, 2017 $ 1,534,782
Transfer from vessels under construction and other additions 29,743
Depreciation (56,607 )
Balance December 31, 2018 $ 1,507,918
Depreciation includes depreciation related to our finance leased vessels. All of our vessels serve as collateral against existing loan
facilities.
In November 2018, the Company entered into agreements with third parties to purchase exhaust gas cleanings systems
(“scrubbers”) for 18 of its vessels in 2019 and for 10 of its vessels in 2020. The total value of these agreements is estimated to

Table of Contents
SCORPIO BULKERS INC. AND SUBSIDIARIES
Notes to the Consolidated Financial Statements
(Dollars in thousands, except per share, per day and per vessel data)
F- 21
be $41.9 million. The systems that are being fitted are of ‘hybrid ready’ design, which allows them to be upgraded to a ‘closed
loop’ configuration at a future date. As part of the agreement, the Company also has an option to purchase exhaust gas cleaning
systems for up to 18 additional vessels in 2020.
Vessel Purchases
During 2017, the Company acquired nine Ultramax vessels from two unaffiliated third parties for an aggregate of $207.0 million
($186.7 million in cash and $20.3 million in the Company’s common stock). All of the vessels were built in Chinese shipyards.
Two were built in 2014, four were built in 2015, one was built in 2016 and two were built in 2017.
Vessel Sales
During 2017, the Company sold the SBI Charleston and SBI Cakewalk, two 2014 built Kamsarmax vessels, for approximately
$22.5 million each, recorded a loss of $17.7 million and wrote off $0.5 million of deferred financing costs. The Company also
repaid the related debt of approximately $20.1 million.
Owned or Finance Leased vessels
Vessel Name Year Built DWT Vessel Type
SBI Antares 2015 61,000 Ultramax
SBI Athena 2015 64,000 Ultramax
SBI Bravo 2015 61,000 Ultramax
SBI Leo 2015 61,000 Ultramax
SBI Echo 2015 61,000 Ultramax
SBI Lyra 2015 61,000 Ultramax
SBI Tango 2015 61,000 Ultramax
SBI Maia 2015 61,000 Ultramax
SBI Hydra 2015 61,000 Ultramax
SBI Subaru 2015 61,000 Ultramax
SBI Pegasus 2015 64,000 Ultramax
SBI Ursa 2015 61,000 Ultramax
SBI Thalia 2015 64,000 Ultramax
SBI Cronos 2015 61,000 Ultramax
SBI Orion 2015 64,000 Ultramax
SBI Achilles 2016 61,000 Ultramax
SBI Hercules 2016 64,000 Ultramax
SBI Perseus 2016 64,000 Ultramax
SBI Hermes 2016 61,000 Ultramax
SBI Zeus 2016 60,200 Ultramax
SBI Hera 2016 60,200 Ultramax
SBI Hyperion 2016 61,000 Ultramax
SBI Tethys 2016 61,000 Ultramax
SBI Phoebe 2016 64,000 Ultramax
SBI Poseidon 2016 60,200 Ultramax
SBI Apollo 2016 60,200 Ultramax
SBI Samson 2017 64,000 Ultramax
SBI Phoenix 2017 64,000 Ultramax
SBI Aries 2015 64,000 Ultramax
SBI Taurus 2015 64,000 Ultramax
SBI Gemini 2015 64,000 Ultramax

Table of Contents
SCORPIO BULKERS INC. AND SUBSIDIARIES
Notes to the Consolidated Financial Statements
(Dollars in thousands, except per share, per day and per vessel data)
F- 22
Vessel Name Year Built DWT Vessel Type
SBI Pisces 2016 64,000 Ultramax
SBI Libra 2017 64,000 Ultramax
SBI Virgo 2017 64,000 Ultramax
SBI Jaguar 2014 64,000 Ultramax
SBI Cougar 2015 64,000 Ultramax
SBI Puma 2014 64,000 Ultramax
Total Ultramax 2,307,800
SBI Samba 2015 84,000 Kamsarmax
SBI Rumba 2015 84,000 Kamsarmax
SBI Capoeira 2015 82,000 Kamsarmax
SBI Electra 2015 82,000 Kamsarmax
SBI Carioca 2015 82,000 Kamsarmax
SBI Conga 2015 82,000 Kamsarmax
SBI Flamenco 2015 82,000 Kamsarmax
SBI Bolero 2015 82,000 Kamsarmax
SBI Sousta 2016 82,000 Kamsarmax
SBI Rock 2016 82,000 Kamsarmax
SBI Lambada 2016 82,000 Kamsarmax
SBI Reggae 2016 82,000 Kamsarmax
SBI Zumba 2016 82,000 Kamsarmax
SBI Macarena 2016 82,000 Kamsarmax
SBI Parapara 2017 82,000 Kamsarmax
SBI Swing 2017 82,000 Kamsarmax
SBI Mazurka 2017 82,000 Kamsarmax
SBI Jive 2017 82,000 Kamsarmax
SBI Lynx 2018 82,000 Kamsarmax
Total Kamsarmax 1,562,000
Total Owned or Finance Leased Vessels DWT 3,869,800
5. Vessels under construction
The Company had no vessels under construction at December 31, 2018. Vessels under construction amounted to $6.7 million as
of December 31, 2017.
A rollforward of activity within vessels under construction is as follows (in thousands):
Balance December 31, 2016 $ 180,000
Installment payments and other 29,642
Capitalized interest 361
Transferred to vessels (203,293 )
Balance December 31, 2017 $ 6,710
Installment payments and other 20,366
Transferred to vessels (27,076 )
Balance December 31, 2018 $ —

Table of Contents
SCORPIO BULKERS INC. AND SUBSIDIARIES
Notes to the Consolidated Financial Statements
(Dollars in thousands, except per share, per day and per vessel data)
F- 23
During 2017, the Company agreed to acquire one Kamsarmax vessel from an unaffiliated third party for $25.5 million. $6.7
million of the contract price was paid as of December 31, 2017, with the remainder of the contract price paid in full and the vessel
delivered from the Chinese shipyard in which it was constructed during 2018.

Table of Contents
SCORPIO BULKERS INC. AND SUBSIDIARIES
Notes to the Consolidated Financial Statements
(Dollars in thousands, except per share, per day and per vessel data)
F- 24
6. Assets Held for Sale
The Company did not have any vessels classified as held for sale at December 31, 2018 or 2017.
During 2017, the Company entered into agreements with an unaffiliated third party to sell the SBI Charleston and SBI Cakewalk,
two 2014 built Kamsarmax vessels, for approximately $22.5 million each. As such, the Company classified these vessels as held
for sale until the completion of the sale, recorded a loss of $17.7 million and wrote off $0.5 million of deferred financing costs.
The Company also repaid the related debt of approximately $20.1 million in full.
7. Commitment and Contingencies
Legal Matters
The Company is periodically involved in litigation and various legal matters that arise in the normal course of business. Such
matters are subject to many uncertainties and outcomes which are not predictable. At the current time, the Company does not
believe that any legal matters could have a material adverse effect on its financial position or future results of operations and
therefore has not recorded any reserves in relation thereto as of December 31, 2018.
Capital Commitments
At December 31, 2018, the Company is a party to an agreement to purchase exhaust gas cleaning systems for 18 of its vessels in
2019 and for 10 of its vessels in 2020. The total value of these agreements is estimated to be $41.9 million, of which $40.7
million remained unpaid at December 31, 2018. Payments are expected to be made throughout 2019 and 2020 as the scrubber
systems are installed on the vessels, with final payments expected to be made in the first quarter of 2021.
Time chartered-in vessels
The Company time charters-in one vessel, which was entered into and operated out of a spot market-oriented commercial pool
managed by our commercial manager. The Company has an agreement to charter-in one drybulk vessel. The terms of the time
charter-in contract are summarized as follows:
Vessel Type Year Built DWT Where Built Daily Base Rate Earliest Expiry
Ultramax 2017 62,100 Japan $10,125 30-Sept-19
Aggregate TC DWT 62,100
The future minimum obligation under the non-cancellable time charter-in agreement as of December 31, 2018 was $2.8 million.
Debt
See Note 11, Debt, to the consolidated financial statements for a schedule of debt and financing obligation payments as of
December 31, 2018.
Other
The Company also has certain commitments related to the commercial and technical management of its vessels. As of
December 31, 2018, we would be obligated to pay termination fees of $3.8 million to SCM and SSM if we were to cancel our
service agreements with them as of December 31, 2018. We are also required to pay SCM for each vessel that we own an amount
equal to three months of commissions that SCM would have expected to earn had the contracts not been terminated. Due to the
variable nature of the commissions, they have been excluded from these figures.
There are no material post-employment benefits for our executive officers or directors. By law, our employees in Monaco are
entitled to a one-time payment of up to two months salary upon retirement if they meet certain minimum service requirements.

Table of Contents
SCORPIO BULKERS INC. AND SUBSIDIARIES
Notes to the Consolidated Financial Statements
(Dollars in thousands, except per share, per day and per vessel data)
F- 25
8. Accounts Payable and Accrued Expenses
Accounts payable and accrued expenses consist of the following:
As of
(in thousands) December 31, 2018 December 31, 2017
Accounts payable $ 4,948 $ 3,907
Accrued operating 1,705 2,580
Accrued administrative 7,323 3,600
Accounts payable and accrued expenses $ 13,976 $ 10,087
Accounts payable primarily consists of obligations to suppliers arising in the normal course of business. Accrued operating
relates to obligations arising from operation of the Company’s owned, financed leased and chartered-in vessels, such as operating
costs. Accrued administrative relates to obligations that are corporate or financing in nature, such as payroll, professional fees,
interest and commitment fees.
9. Common Shares
As of December 31, 2018 the Company had:
• Approximately 71.2 million common shares outstanding, the $0.01 par value of which is recorded as common
stock of $0.8 million.
• Paid-in capital of $1.7 billion which substantially represents the excess net proceeds from common stock
issuances over the par value as well as the amount of cumulative restricted stock amortization.
• Treasury stock of $56.7 million representing the cost at which the Company repurchased approximately 8.6
million shares
Share Repurchase Program
In October 2018, the Company’s Board of Directors authorized a new share repurchase program to purchase up to an aggregate
of $50.0 million of its common shares (the “New Share Repurchase Program”). This New Share Repurchase Program replaced
the Company’s Share Repurchase Program that was previously authorized in September 2017 and that was terminated in
conjunction with the New Share Repurchase Program. The specific timing and amounts of the repurchases were in the sole
discretion of management and subject to variation based on market conditions and other factors. The Company was not
obligated under the terms of the program to repurchase any of its common shares. The authorization had no expiration date. As
of December 31, 2018, $24.8 million remained available under the program. The New Share Repurchase Program was
terminated on January 25, 2019; please see Note 18 “Subsequent Events”.
Dividend
During 2018, the Company’s Board of Directors declared and we paid quarterly cash dividends totaling $0.08 per share, or $6.0
million.
Other

Table of Contents
SCORPIO BULKERS INC. AND SUBSIDIARIES
Notes to the Consolidated Financial Statements
(Dollars in thousands, except per share, per day and per vessel data)
F- 26
In June 2018, upon receiving shareholder approval, the Company further amended its Amended and Restated Articles of
Incorporation to increase the Company’s total number of authorized shares to 262,500,000, consisting of 212,500,000 common
shares and 50,000,000 preferred shares.
In connection with an agreement to purchase three Ultramax vessels, on November 5, 2017, the Company issued warrants to
purchase approximately 1.6 million common shares at an exercise price of $8.10 per share to an unaffiliated third party as part of
the total consideration paid. The warrants were exercised in the first quarter of 2018.
In connection with an agreement to purchase one Ultramax vessel, on December 4, 2017, the Company issued approximately 0.9
million common shares to an unaffiliated third party. The shares were issued to the seller of the vessel upon delivery of such
vessel on December 29, 2017.
During 2017, the Company issued a total of 12,946 shares, with a fair value of $0.1 million to SSH pursuant to the Administrative
Services Agreement relating to our Newbuilding Program.
In June 2016, upon receiving shareholder approval, the Company further amended its Amended and Restated Articles of
Incorporation to increase the Company’s total number of authorized shares to 162,500,000, consisting of 112,500,000 common
shares and 50,000,000 preferred shares.
During 2016, the Company issued a total of 51,679 shares, with a fair value of $0.2 million, to SSH pursuant to the Administrative
Services Agreement in connection with the deliveries of newbuilding vessels.
During 2016, the Company issued an aggregate of 44.0 million shares of common stock, par value $0.01 per share, at $3.00 per
share in two separate underwritten public offerings. SSH and certain of the Company's directors purchased an aggregate of $10.3
million common shares at the public offering prices. The Company received approximately $128.1 million of net proceeds from
the issuance.
10. Equity Incentive Plan
The Scorpio Bulkers Inc. 2013 Equity Incentive Plan, or the Plan, was approved by the Company’s Board of Directors and became
effective on September 30, 2013 and was last amended to reserve additional common shares for issuance pursuant to the Plan on
August 20, 2018. Adjustments may be made to outstanding awards in the event of a corporate transaction or change in
capitalization or other extraordinary event. In the event of a “change in control” (as defined in the Plan), unless otherwise provided
by the Plan administrator in an award agreement, awards then outstanding will become fully vested and exercisable in full. The
Board of Directors may amend or terminate the Plan and may amend outstanding awards, provided that no such amendment or
termination may be made that would materially impair any rights, or materially increase any obligations, of a grantee under an
outstanding award. Shareholder approval of Plan amendments will be required under certain circumstances. As of December 31,
2018, we had reserved a total of 5,931,962 common shares for issuance under the Plan, subject to adjustment for changes in
capitalization as provided in the Plan. The Plan is administered by the Company’s Compensation Committee. The Plan will
remain in effect until the tenth anniversary of the date on which the Plan was adopted by the Board of Directors, unless terminated,
or extended by the Board of Directors. After the termination date, no further awards shall be granted pursuant to the Plan, but
previously granted awards will remain outstanding in accordance with their applicable terms and conditions.
Under the Plan, the Company is permitted to grant incentive stock options, non-qualified stock options, stock appreciation rights,
restricted stock, restricted stock units and unrestricted common shares.
Under the terms of the Plan, stock options and stock appreciation rights granted under the Plan will have an exercise price equal
to the fair value of a common share on the date of grant, unless otherwise determined by the Plan administrator, but in no event
will the exercise price be less than the fair value of a common share on the date of grant. Options and stock appreciation rights
will be exercisable at times and under conditions as determined by the Plan administrator, but in no event will they be exercisable

Table of Contents
SCORPIO BULKERS INC. AND SUBSIDIARIES
Notes to the Consolidated Financial Statements
(Dollars in thousands, except per share, per day and per vessel data)
F- 27
later than ten years from the date of grant. The Company did not grant any option awards or stock appreciation rights under the
Plan during the three years ended December 31, 2018.
The Plan administrator may grant shares of restricted stock and awards of restricted stock units subject to vesting, forfeiture and
other terms and conditions as determined by the Plan administrator. Generally, restricted stock granted under the Plan vests in
one of the following manners: (a) annually in three equal installments, if the independent director has continued to serve on the
Board of Directors from the grant date to the applicable vesting date or (b) serial vest on each of the second, third and fourth
anniversaries of the date of grant so long as the award recipient is employed on such date. The Company recognizes share-based
compensation expense (see Note 1, Summary of Significant Accounting Polices) over this three-year period or four-year period,
as applicable.
The Company recorded share-based compensation expense of $7.9 million, $12.6 million, and $18.6 million for the years ended
December 31, 2018, 2017 and 2016, respectively, related to restricted stock awards, which is included in General and
administrative expenses in the Consolidated Statement of Operations.
A summary of activity for restricted stock awards during the three years ended December 31, 2018 is as follows:
Number of
Shares
Weighted
Average
Grant
Date Fair
Value $
Outstanding at December 31, 2015 1,248,163 53.56
Granted 2,582,000 3.26
Vested (208,266 ) 107.82
Forfeited (21,564 ) 51.50
Outstanding at December 31, 2016 3,600,333 14.36
Granted 150,000 6.25
Vested (604,151 ) 44.80
Forfeited (4,612 ) 5.33
Outstanding at December 31, 2017 3,141,570 8.13
Granted 1,835,532 7.33
Vested (1,212,629 ) 11.79
Forfeited (10,834 ) 6.57
Outstanding at December 31, 2018 3,753,639 6.56
As of December 31, 2018, there was $13.4 million of total unrecognized compensation cost related to restricted stock awards.
These costs are expected to be recognized over the weighted average period of approximately one year. During 2018, restricted
stock with a fair value of approximately $8.9 million vested.

Table of Contents
SCORPIO BULKERS INC. AND SUBSIDIARIES
Notes to the Consolidated Financial Statements
(Dollars in thousands, except per share, per day and per vessel data)
F- 28
11. Debt
The Company’s long-term debt consists of Senior Notes, bank loans and finance leases, summarized as follows:
December 31,
(amounts in thousands) 2018 2017
Senior Notes $ 73,625 $ 73,625
Credit Facilities:
$409 Million Credit Facility — 174,443
$330 Million Credit Facility 140,677 247,876
$42 Million Credit Facility 14,105 22,354
$67.5 Million Credit Facility — 40,461
$12.5 Million Credit Facility 9,400 10,183
$27.3 Million Credit Facility 9,008 18,213
$85.5 Million Credit Facility 78,972 85,500
$38.7 Million Credit Facility 35,100 38,700
$19.6 Million Lease Financing - SBI Rumba 18,101 19,268
$12.8 Million Credit Facility 12,325 —
$19.0 Million Lease Financing - SBI Tango 18,451 —
$19.0 Million Lease Financing - SBI Echo 18,481 —
$30.0 Million Credit Facility 29,420 —
$34.0 Million Credit Facility 34,000 —
$60.0 Million Credit Facility 58,797 —
$184.0 Million Credit Facility 180,229 —
$20.5 Million Lease Financing - SBI Hermes 20,299 —
$90.0 Million Credit Facility 90,000 —
Total bank loans and lease financings outstanding 767,365 656,998
Less: Current portion (66,156 ) (49,266 )
$ 701,209 $ 607,732
December 31, 2018 December 31, 2017
(amounts in thousands) Current Non-
current Total Current Non-
current Total
Total bank loans, financing obligations
and senior notes, gross 139,781
701,209
840,990
49,266
681,357
730,623
Unamortized deferred financing costs (1,624 ) (10,801 ) (12,425 ) (1,129 ) (13,917 ) (15,046 )
Total bank loans, financing obligations
and senior notes, net 138,157
690,408
828,565
48,137
667,440
715,577

Table of Contents
SCORPIO BULKERS INC. AND SUBSIDIARIES
Notes to the Consolidated Financial Statements
(Dollars in thousands, except per share, per day and per vessel data)
F- 29
The future principal and estimated interest payments (based on the interest rates in effect as of December 31, 2018) under the
Company’s long-term debt over the next five years on the Company’s Senior Notes, credit facilities and financing obligations as
of December 31, 2018 is as follows:
(amounts in thousands)
Principal on
Bank Loans
and Senior
Notes
Interest on
Bank Loans
and Senior
Notes
Financing
Obligations Total
2019 135,093 40,586 8,048 183,727
2020 70,234 32,807 8,048 111,089
2021 171,110 25,782 8,048 204,940
2022 62,824 18,515 8,048 89,387
2023 304,540 11,329 45,479 361,348
Thereafter 21,857 1,700 12,841 36,398
Total 765,658 130,719 90,512 986,889
Unsecured Senior Notes
On September 22, 2014, the Company issued $65.0 million in aggregate principal amount of 7.5% Senior Notes due September
2019, or the Senior Notes, and on October 16, 2014 the Company issued an additional $8.6 million aggregate principal amount
of Senior Notes when the underwriters partially exercised their option to purchase additional Senior Notes on the same terms and
conditions.
All terms mentioned are defined in the indenture governing the Senior Notes.
The Senior Notes will mature on September 15, 2019 and bear interest at a rate of 7.5% per year, payable quarterly on each March
15, June 15, September 15 and December 15. The Senior Notes are redeemable at the Company’s option in whole or in part, at
any time on or after September 15, 2016 at a redemption price equal to 100% of the principal amount to be redeemed plus accrued
and unpaid interest to, but excluding, the redemption date.
The Senior Notes are our senior unsecured obligations and rank equally with all of our existing and future senior unsecured and
unsubordinated debt and are effectively subordinated to our existing and future secured debt, to the extent of the value of the
assets securing such debt, and will be structurally subordinated to all existing and future debt and other liabilities of our
subsidiaries. No sinking fund is provided for the Senior Notes. The Senior Notes were issued in minimum denominations of
$25.00 and integral multiples of $25.00 in excess thereof and are listed on the New York Stock Exchange under the symbol
“SLTB”. The Senior Notes require us to comply with certain covenants, including financial covenants, restrictions on
consolidations, mergers or sales of assets and prohibitions on paying dividends or returning capital to equity holders if a covenant
breach or an event of default has occurred or would occur as a result of such payment. If the Company undergoes a change of
control, holders may require us to repurchase for cash all or any portion of their notes at a change of control repurchase price
equal to 101% of the principal amount of the notes to be repurchased, plus accrued and unpaid interest to, but excluding, the
change of control purchase date.
The financial covenants include:
• Net borrowings shall not equal or exceed 70% of total assets.
• Tangible net worth shall always exceed $500.0 million.
The outstanding balance at December 31, 2018 was $73.6 million, which is classified as a current liability and the Company was
in compliance with the financial covenants relating to the Senior Notes as of that date.

Table of Contents
SCORPIO BULKERS INC. AND SUBSIDIARIES
Notes to the Consolidated Financial Statements
(Dollars in thousands, except per share, per day and per vessel data)
F- 30
In December 2016, our Board of Directors authorized the repurchase of up to $20.0 million of our outstanding Senior Notes in
open market or privately negotiated transactions. The specific timing and amounts of the repurchases, which will be funded by
available cash, will be in the sole discretion of management and vary based on market conditions and other factors. This
authorization has no expiration date. As of December 31, 2018, the full $20.0 million remained available for repurchase under
this authorization.
Secured Credit Facilities
The Company had 12 credit agreements in place, which are all collateralized by certain of the Company’s vessels. The following
is a summary of those credit agreements as of December 31, 2018.
$330
Million
Credit
Facility $42 Million
Credit Facility
$12.5
Million
Credit
Facility
$27.3
Million
Credit
Facility
$85.5
Million
Credit
Facility
$38.7
Million
Credit
Facility
$12.8
Million
Credit
Facility
$30.0
Million
Credit
Facility
$60.0
Million
Credit
Facility
$184.0
Million
Credit
Facility
$34.0
Million
Credit
Facility
$90.0
Million
Credit
Facility
Date of Agreement July 29,
2014 January 30, 2015 December
22, 2015 December
22, 2015 December
5, 2017 December
13, 2017 June 21,
2018 September
13, 2018 September
11, 2018 September
21, 2018 October 3,
2018 November
8, 2018
Total Vessels
Financed
Kamsarmax 4 1 — — — — 1 2 2 6 2 —
Ultramax 9 — 1 1 6 3 — — 2 6 — 6
Interest Rate-LIBOR+ 2.925 % 2.970 % 3.000 % 2.950 % 2.850 % 2.850 % 2.400 % 2.200 % 2.250 % 2.400 % 2.350 % 2.350 %
Commitment Fee 1.170 % 1.120 % — % 1.180 % 1.140 % 0.998 % 0.960 % 0.880 % 0.900 % 0.960 % 1.175 % 1.000 %
Maturity Date
July 29,
2021 6 years from each
drawdown December
22, 2020 5 years
from each
drawdown
February
15, 2023 December
13, 2022 June 15,
2023 September
18, 2023 September
14, 2023 September
21, 2023 October 3,
2025 November
8, 2023
Amount drawn down
(in thousands) 294,225 48,870
11,750
23,250
85,500
38,700
12,750
29,975
60,000
184,000
34,000
90,000
Amount outstanding
(in thousands) 140,677
14,105
9,400
9,008
78,972
35,100
12,325
29,420
58,797
180,229
34,000
90,000
Carrying Value of
Vessels Collateralized
(in thousands) 341,875
30,507
28,723
29,463
137,819
62,314
27,188
58,584
108,364
347,736
52,822
163,961
$12.8 Million Credit Facility
On June 21, 2018, the Company entered into a senior secured credit facility for up to $12.8 million. The loan facility
was used to finance up to 50% of the fair market value of the SBI Lynx. The facility has a final maturity date of June 15, 2023
and bears interest at LIBOR plus a margin of 2.40% per annum. This facility is secured by, among other things, a first preferred
mortgage on the vessel and guaranteed by the vessel owning subsidiary.
$60.0 Million Credit Facility
On September 11, 2018, the Company entered into a senior secured credit facility for up to $60.0 million. The loan facility was
used to finance up to 60% of the fair market value of two Ultramax vessels (SBI Perseus and SBI Phoebe) and two Kamsarmax
vessels (SBI Electra and SBI Flamenco). The facility has a final maturity date of five years from drawdown date and bears interest

Table of Contents
SCORPIO BULKERS INC. AND SUBSIDIARIES
Notes to the Consolidated Financial Statements
(Dollars in thousands, except per share, per day and per vessel data)
F- 31
at LIBOR plus a margin of 2.25% per annum. This facility is secured by, among other things, a first preferred mortgage on the
four vessels and guaranteed by each of the vessel owning subsidiaries.
$30.0 Million Credit Facility
On September 13, 2018, the Company entered into a senior secured credit facility for up to $30.0 million with ING Bank N.V. to
refinance two Kamsarmax vessels (SBI Zumba and SBI Parapara). The facility has a final maturity date of five years from
drawdown date and bears interest at LIBOR plus a margin of 2.20% per annum. This facility is secured by, among other things,
a first preferred mortgage on the two Kamsarmax vessels and guaranteed by each of the vessel owning subsidiaries.
$184.0 Million Credit Facility
On September 21, 2018, the Company entered into a senior secured credit facility for up to $184.0 million with Nordea Bank AB
(publ), acting through its New York branch, and Skandinaviska Enskilda Banken AB (publ) to refinance up to 60% of the fair
market value of six Ultramax vessels (SBI Athena, SBI Thalia, SBI Zeus, SBI Hera, SBI Poseidon and SBI Apollo) and six
Kamsarmax vessels (SBI Conga, SBI Bolero, SBI Sousta, SBI Rock, SBI Reggae and SBI Mazurka). The facility, which is
comprised of a term loan of up to $104.0 million and a revolver of up to $80.0 million, has a final maturity date of five years
from signing date and bears interest at LIBOR plus a margin of 2.40% per annum. This facility is secured by, among other things,
a first preferred mortgage on the 12 vessels and guaranteed by each of the vessel owning subsidiaries.
$34.0 Million Credit Facility
On October 3, 2018, the Company entered into a senior secured credit facility for up to $34.0 million with Credit Agricole
Corporate and Investment Bank to refinance up to 62.5% of the fair market value of two Kamsarmax vessels (SBI Jive and SBI
Swing). The loan facility, which is comprised of a term loan up to $17.0 million and a revolver up to $17.0 million, has a final
maturity date of seven years from signing date and bears interest at LIBOR plus a margin of 2.35% per annum. This facility is
secured by, among other things, a first preferred mortgage on the two vessels and guaranteed by each of the vessel owning
subsidiaries.
$90.0 Million Credit Facility
On November 8, 2018, the Company entered into a senior secured credit facility for up to $90.0 million with Nordea Bank Abp,
acting through its New York branch, and DVB Bank SE. The loan facility, which has a final maturity date of five years from
signing date and bears interest at LIBOR plus a margin of 2.35% per annum, is being used to finance up to 60% of the fair market
value of six Ultramax vessels (SBI Orion, SBI Hyperion, SBI Tethys, SBI Hercules, SBI Samson and SBI Phoenix). This facility
is secured by, among other things, a first preferred mortgage on the six vessels and is guaranteed by each of the vessel owning
subsidiaries.
Finance Leases
$19.6 Million Lease Financing - SBI Rumba
In October 2017, the Company entered into a financing transaction with respect to one of its Kamsarmax vessels with unaffiliated
third parties involving the sale and leaseback of the SBI Rumba, a 2015 Japanese built Kamsarmax vessel, for consideration of
approximately $19.6 million. As part of the transaction, the Company will make monthly payments of $164,250 under a nine and
a half year bareboat charter agreement with the buyer, which the Company has the option to extend for a further six months. The
agreement also provides the Company the option to repurchase the vessel beginning on the fifth anniversary of the sale and until
the end of the agreement.
$19.0 Million Lease Financing - SBI Echo

Table of Contents
SCORPIO BULKERS INC. AND SUBSIDIARIES
Notes to the Consolidated Financial Statements
(Dollars in thousands, except per share, per day and per vessel data)
F- 32
On July 18, 2018, the Company entered into a financing transaction with an unaffiliated third party involving the sale and
leaseback of the SBI Echo, a 2015 Japanese built Ultramax vessel, for consideration of $19.0 million. As part of the transaction,
the Company will make payments of $5,400 per day under a five-year bareboat charter agreement with the buyer. The agreement
also provides the Company with the option to repurchase the vessel beginning on the third anniversary of the sale until the end
of the bareboat charter agreement.
$19.0 Million Lease Financing - SBI Tango
On July 18, 2018, the Company entered into a financing transaction with an unaffiliated third party involving the sale and
leaseback of the SBI Tango, a 2015 Japanese built Ultramax vessel, for consideration of $19.0 million. As part of the
transaction, the Company will make payments of $5,400 per day under a five-year bareboat charter agreement with the buyer.
The agreement also provides the Company with the option to repurchase the vessel beginning on the third anniversary of the
sale until the end of the bareboat charter agreement.
$20.5 Million Lease Financing - SBI Hermes
On November 16, 2018, the Company closed a financing transaction with an unaffiliated third party involving the sale and
leaseback of the SBI Hermes, a 2016 Japanese built Ultramax vessel, for consideration of $20.5 million. As part of the
transaction, the Company will make payments of $5,850 per day under a five-year bareboat charter agreement with the buyer.
The transaction also provides the Company with the option to repurchase the vessel beginning on the third anniversary of the
sale until the end of the bareboat charter agreement.
In addition to the credit agreements described above, which are in effect as of December 31, 2018, the Company entered into the
following agreements which were repaid in full during the year ended December 31, 2018.
$67.5 Million Credit Facility
On July 30, 2014, we entered into a $67.5 million credit facility which was originally used to finance a portion of the purchase
price of two Ultramax and two Kamsarmax vessels. During the third quarter of 2018, the Company fully repaid this loan and
terminated the credit facility. The four vessels previously financed by this loan are now financed under the $60.0 million Credit
Facility.
$409.0 Million Credit Facility
On December 30, 2014, we entered into a $409.0 million senior secured credit facility with Nordea Bank Finland PLC, New York
Branch, and Skandinaviska Enskilda Banken AB (publ) which was used to partially finance a portion of the purchase price of
eight Kamsarmax and seven Ultramax vessels. During the third quarter of 2018, the Company fully repaid this loan and terminated
the credit facility. Two of the Kamsarmax vessels previously financed by this loan are now financed under the $30.0 million
Credit Facility, 12 vessels previously financed by this loan are now financed under the $184.0 million Credit Facility and the SBI
Echo is now financed under the $19.0 million Lease Financing - SBI Echo.
Each of the Company’s credit agreements, as amended through December 31, 2018, has, among other things, financial
covenants with which the Company must comply. The most stringent are as follows:
• The ratio of net debt to total capitalization no greater than 0.60 to 1.00.
• Consolidated tangible net worth (adjusted for a minimum amount of $100.0 million in historical non-operating costs and
to exclude certain future non-operating items, including impairments) no less than $500.0 million plus (i) 25% of
cumulative positive net income (on a consolidated basis) for each fiscal quarter commencing on or after December 31,
2013 and (ii) 50% of the value of any new equity issues occurring on or after December 31, 2013.

Table of Contents
SCORPIO BULKERS INC. AND SUBSIDIARIES
Notes to the Consolidated Financial Statements
(Dollars in thousands, except per share, per day and per vessel data)
F- 33
• The ratio of EBITDA to net interest expense calculated on a year to date basis of greater than 1.00 to 1.00 for the quarters
ending March 31, 2019 and June 30, 2019, 2.50 to 1.00 for the quarter ending September 30, 2019, calculated on a year-
to-date basis and 2.50 to 1.00 for each quarter thereafter, calculated on a trailing four quarter basis.
• Minimum liquidity of not less than the greater of $25.0 million or $0.7 million per owned vessel.
• Maintain a minimum fair value of the collateral for each credit facility, such that the aggregate fair value of the vessels
collateralizing the credit facility is between 140% and 150% of the aggregate principal amount outstanding under such
credit facility, or, if we do not meet these thresholds to prepay a portion of the loan or provide additional security to
eliminate the shortfall.
The Company’s credit facilities discussed above have, among other things, the following restrictive covenants which could restrict
the Company’s ability to, among other things:
• incur additional indebtedness;
• sell the collateral vessel, if applicable;
• make additional investments or acquisitions;
• pay dividends; and
• effect a change of control of the Company.
In addition, the Company’s credit facilities and finance leases contain customary events of default, including cross-default
provisions. As of December 31, 2018, the Company was in compliance with all the financial covenants of each of its credit
facilities and finance leases. The Company expects to remain in compliance with the financial covenants of each of its credit
facilities and finance leases for the next twelve months.
Interest rates on all of the Company’s secured credit facilities during the year ended December 31, 2018 ranged from 4.3% to
5.8%. The Company records its interest expense as a component of Financial expense, net on its Consolidated Statement of
Operations. For the years ended December 31, 2018, 2017 and 2016, Financial expense, net consists of:
Year ended December 31,
(in thousands) 2018 2017 2016
Interest expense $ 39,855 $ 27,719 $ 16,002
Amortization of deferred financing costs 9,582 6,085 4,137
Write off of deferred financing costs — 470 3,781
Change in the fair value of interest rate caps (27 ) 63 —
Other, net 459 625 1,001
$ 49,869 $ 34,962 $ 24,921

Table of Contents
SCORPIO BULKERS INC. AND SUBSIDIARIES
Notes to the Consolidated Financial Statements
(Dollars in thousands, except per share, per day and per vessel data)
F- 34
12. Derivatives
The Company is exposed to, among other things, the impact of changes in interest rates in the normal course of business. The
Company manages the exposure to and volatility arising from these risks, and utilizes derivative financial instruments to offset a
portion of these risks. The Company uses derivative financial instruments only to the extent necessary to hedge identified business
risks and does not enter into such transactions for speculative purposes.
The Company uses variable rate debt as a source of funds for use in the Company's investment activities. These debt obligations
expose the Company to variability in interest payments due to changes in interest rates. If interest rates increase, interest expense
increases. Interest rate cap agreements are used to manage interest rate risk associated with floating-rate borrowings under the
Company’s credit facilities. The interest rate cap agreements utilized by the Company effectively modify the Company’s
exposure to interest rate risk by converting a portion of the Company’s floating-rate debt to a fixed-rate basis through December
31, 2020, thereby reducing the impact of interest rate changes on future interest expense.
The Company has not elected to designate any of its derivative instruments as hedging instruments under ASC 815, “Derivatives
and Hedging”, and as such the gain or loss on the derivative is recognized in current earnings during the period of change and is
included in Financial expense, net on the Consolidated Statement of Operations.
Information pertaining to outstanding interest rate caps is as follows:
Aggregate Notional Amount
(in millions) Start Date End Date
Offsets Variable Rate Debt Attributable to
Fluctuations Above:
$100 November 9, 2017 December 31, 2020 Three Month LIBOR of 3.5%
$100 November 9, 2017 December 31, 2020 Three Month LIBOR of 3.5%
$100 November 21, 2017 December 31, 2020 Three Month LIBOR of 3.5%
The aggregate fair value of these interest rate caps was $0.2 million at December 31, 2018 and 2017, and is included in Other
assets on the Company’s Consolidated Balance Sheet. During 2018 and 2017, we recorded a reduction of expense of less than
$0.1 million and an increase in expense of $0.1 million, respectively, representing the change in the fair value of these caps to
Financial expense, net on the Consolidated Statement of Operations. Refer to Note 14, Fair value of Financial Instruments, for
related fair value disclosures.

Table of Contents
SCORPIO BULKERS INC. AND SUBSIDIARIES
Notes to the Consolidated Financial Statements
(Dollars in thousands, except per share, per day and per vessel data)
F- 35
13. Equity Method Investment
On October 12, 2018 the Company invested $100.0 million in a related party, Scorpio Tankers, through participation in a public
offering on a basis equivalent to other investors. As a result of this investment, the Company became a significant investor in
Scorpio Tankers, holding a total of approximately 54.1 million shares of common stock, which was approximately 10.9% of the
then issued and outstanding shares of Scorpio Tankers. While the Company was not directly invested in Scorpio Tankers, prior
to this investment, it shared a number of shareholders, directors and officers (see Note 15, Related Party Transactions), which
along with its investment interest indicated its ability to exercise significant influence. Accordingly, this investment is
accounted for under the equity method. The Company uses the fair value option in accounting for its investment in Scorpio
Tankers based upon the quoted market price of Scorpio Tankers common stock discounted for a lack of marketability due to our
inability to sell the shares until January 7, 2019. As of December 31, 2018, the Company’s share of investee net assets
exceeded its carrying value in its equity method investment by approximately $100.8 million.
Below is a table of equity investment activity (in thousands):
2018
Beginning balance $ —
Investment in Scorpio Tankers 100,000
Gain (loss) from change in fair value of investment in
Scorpio Tankers (7,719 )
Equity Method investments at fair value $ 92,281
Dividend income from Scorpio Tankers common stock $ 541
The following table represents summarized information regarding the Company’s equity investee as of December 31, 2018 (in
thousands):
December 31, 2018
Total revenues $ 585,047
Operating income 10,542
Net loss (190,071 )
Current assets $ 687,341
Non-current assets 4,096,823
Total assets $ 4,784,164
Current liabilities $ 447,200
Non-current liabilities 2,497,952
Total liabilities $ 2,945,152

Table of Contents
SCORPIO BULKERS INC. AND SUBSIDIARIES
Notes to the Consolidated Financial Statements
(Dollars in thousands, except per share, per day and per vessel data)
F- 36
14. Fair value of financial instruments
The carrying amount and fair value of financial instruments at December 31, 2018 and 2017 were as follows (in thousands):
2018 2017
Level Carrying
value Fair Value Carrying
value Fair Value
Financial assets:
Cash and cash equivalents 1 $ 67,495 $ 67,495 $ 68,535 $ 68,535
Other assets - interest rate cap 2 219 219 192 192
Equity investment - Common stock of
Scorpio Tankers Inc. 2 92,281
92,281
—
—
Financial liabilities:
Bank loans, net 1 681,489 681,489 623,960 623,960
Financing obligation 1 73,823 73,823 18,891 18,891
Senior Notes, net 1 73,253 74,214 72,726 74,921
Fair value is the price that would be received to sell an asset or paid to transfer a liability in an orderly transaction between market
participants at the measurement date. In determining fair value, various methods are used including market, income and cost
approaches. Based on these approaches, certain assumptions that market participants would use in pricing the asset or liability
are used, including assumptions about risk and/or the risks inherent in the inputs to the valuation technique. These inputs can be
readily observable, market-corroborated, or generally unobservable firm inputs. Valuation techniques that are used maximize the
use of observable inputs and minimize the use of unobservable inputs. Based on the observability of the inputs used in the
valuation techniques, fair value measured financial instruments are categorized according to the fair value hierarchy prescribed
by ASC 820, “Fair Value Measurements and Disclosures”. The fair value hierarchy ranks the quality and reliability of the
information used to determine fair values. Financial assets and liabilities carried at fair value are classified and disclosed in one
of the following three categories:
• Level 1: Fair value measurements using unadjusted quoted market prices in active markets for identical, unrestricted
assets or liabilities.
• Level 2: Fair value measurements using correlation with (directly or indirectly) observable market-based inputs,
unobservable inputs that are corroborated by market data, or quoted prices in markets that are not active.
• Level 3: Fair value measurements using inputs that are significant and not readily observable in the market.
Cash and cash equivalents comprise cash on hand and demand deposits, and other short-term highly-liquid investments with
original maturities of three months or less, and that are readily convertible to a known amount of cash and are subject to an
insignificant risk of changes in value. The carrying value of cash and cash equivalents approximates fair value due to the short-
term nature of these instruments.
The interest rate caps were measured at fair value using implied volatility rates of each caplet and the yield curve for the related
periods.
At December 31, 2018, the Company held an equity investment consisting of approximately 54.1 million shares of common stock
of Scorpio Tankers at an estimated fair value of $92.3 million. Although a quoted market price in active securities markets was
available for these shares at December 31, 2018, we were prohibited from selling our shares through January 7, 2019, pursuant
to the terms of a lock-up agreement we entered into at the time of the investment. Accordingly, a discount for lack of marketability
was included when arriving at the appropriate fair value of the shares, which value was reduced from the quoted market value of
$95.1 million at December 31, 2018, to $92.3 million. The discount for marketability was calculated using the Finnerty Model,
Table of Contents
SCORPIO BULKERS INC. AND SUBSIDIARIES
Notes to the Consolidated Financial Statements
(Dollars in thousands, except per share, per day and per vessel data)
F- 37
an option-based approach that takes into account the remaining term until the end of the restriction, the risk free rate and expected
volatility. Unrealized gains and losses are included in Income (loss) from equity investment in the Consolidated Statement of
Operations.
The carrying value of our secured bank loans are measured at amortized cost using the effective interest method. The Company
believes the carrying amounts of its bank loans at December 31, 2018 and December 31, 2017 approximate fair value because
the interest rates on these instruments change with, or approximate, market interest rates. These amounts are shown net of $10.5
million and $13.8 million of unamortized deferred financing fees on the Company’s consolidated balance sheet as of
December 31, 2018 and 2017, respectively.
The Senior Notes are publicly traded on the New York Stock Exchange and are considered a level 1 item. The carrying values
shown in the table are the face value of the notes net of $0.4 million and $0.9 million of unamortized deferred financing fees as
of December 31, 2018 and 2017, respectively.
Certain of the Company’s assets and liabilities are carried at contracted amounts that approximate fair value. Assets and liabilities
that are recorded at contracted amounts approximating fair value consist primarily of balances with related parties, prepaid
expenses and other current assets, accounts payable and accrued expenses.
15. Related Party Transactions
The Company’s Co-Founder, Chairman and Chief Executive Officer, Mr. Emanuele Lauro, is a member of the Lolli-Ghetti family,
which is the majority owner and controls the Scorpio group of companies (“Scorpio”), including SSM, which provides the
Company with vessel technical management services, SCM, which provides the Company with vessel commercial management
services, SSH, which provides the Company and other related entities with administrative services and services related to the
acquisition of vessels and Scorpio UK Limited (“SUK”) which provides the Company with vessel chartering services. SSH also
has a majority equity interest in a port agent that provides supply and logistical services for the Company’s vessels operating in
its regions. In 2009, the Lolli-Ghetti family founded Scorpio Tankers Inc. (“Scorpio Tankers”) (NYSE: “STNG”), a large
international shipping company engaged in seaborne transportation of refined petroleum products, of which Mr. Emanuele Lauro
is currently the Chairman and Chief Executive Officer. The Company’s Co-Founder, President and Director, Mr. Robert Bugbee,
is also the President and a Director of Scorpio Tankers and has a senior management position at Scorpio. The Company’s Vice
President, Mr. Filippo Lauro is also the Vice President of Scorpio Tankers and has a senior management position at Scorpio.
In 2016, we agreed to amend our master agreement, or the Master Agreement, with SCM and SSM, and our administrative
services agreement. or the Administrative Services Agreement, with SSH, under a deed of amendment, or the Deed of
Amendment. Pursuant to the terms of the Deed of Amendment, on December 9, 2016, we entered into definitive documentation
to memorialize the agreed amendments to the Master Agreement, or the Amended and Restated Master Agreement. The Amended
and Restated Master Agreement and the Administrative Services Agreement as amended by the Deed of Amendment, or the
Amended Administrative Services Agreement, were effective as from September 29, 2016.
In December 2017, we agreed to amend the Amended and Restated Master Agreement to amend and restate the technical
management agreement thereunder subject to bank consents being obtained (where required), which were subsequently obtained.
On February 22, 2018, we entered into definitive documentation to memorialize the agreed amendments to the Amended and
Restated Master Agreement under a deed of amendment, or the Amendment Agreement. The Amended and Restated Master
Agreement as amended by the Amendment Agreement, or the Revised Master Agreement is effective as from January 1, 2018.
Amended Administrative Services Agreement

Table of Contents
SCORPIO BULKERS INC. AND SUBSIDIARIES
Notes to the Consolidated Financial Statements
(Dollars in thousands, except per share, per day and per vessel data)
F- 38
The Company entered into the Amended Administrative Services Agreement with SSH for the provision of administrative staff,
office space and accounting, legal compliance, financial and information technology services for which the Company reimburses
SSH for the reasonable direct and indirect expenses incurred while providing such services. Such costs are classified as general
and administrative expenses in the Consolidated Statement of Operations.
SSH also arranges vessel sales and purchases for the Company, for which it previously paid SSH a fee, payable in its common
shares, for arranging vessel acquisitions, including newbuildings. The amount of common shares payable was determined by
dividing $250,000 by the market value of the Company’s common shares based on the volume weighted average price of its
common shares over the 30 trading day period immediately preceding the contract date of a definitive agreement to acquire any
vessel. During the years ended December 31, 2017 and 2016, the Company issued 12,946 and 51,679, respectively, of its common
shares to SSH.
In addition, SSH has agreed with the Company not to own any drybulk carriers greater than 30,000 dwt for so long as the Amended
Administrative Services Agreement is in full force and effect. This agreement may be terminated by SSH upon 12 months’ notice
or by the Company upon 24 months’ notice.
The services provided to the Company by SSH may be sub-contracted to other entities within Scorpio.
The Company issued 5,000,000 and 5,250,000 shares to SSH for $15.0 million and $16.0 million, respectively, as part of two
separate public offerings occurring in March and June 2016.
Revised Master Agreement
The Company’s vessels are commercially managed by SCM and technically managed by SSM pursuant to the Revised Master
Agreement, which may be terminated by either party upon 24 months notice, unless terminated earlier in accordance with the
provisions of the Revised Master Agreement. In the event of a sale of any vessels, a notice period of three months and a payment
equal to three months of management fees will apply, provided that the termination does not amount to a change of control,
including a sale of substantially all vessels, in which case a payment equal to 24 months of management fees will apply. Additional
vessels that the Company may acquire in the future are expected to be managed under the Revised Master Agreement or on
substantially similar terms as the Revised Master Agreement.
SCM’s commercial management services include securing employment for the Company’s vessels in the spot market and on
time charters. SCM also manages the Scorpio Pools (spot market-oriented vessel pools) including the Scorpio Ultramax Pool,
the Scorpio Kamsarmax Pool and the currently inactive Scorpio Capesize Pool in which the Company’s owned, finance leased
and time chartered-in vessels are employed and from which a significant portion of its revenue is generated. The Scorpio
Ultramax Pool and the Scorpio Kamsarmax Pool participants, including the Company and third-party owners of similar vessels,
pay SCM a pool management fee of $300 per vessel per day, plus a 1.75% commission on the gross revenues per charter
fixture. The Company typically has balances due from these pools, consisting primarily of working capital, undistributed
earnings and reimbursable costs. These receivables are either classified as current or non-current assets within the Consolidated
Balance Sheet depending upon whether the associated vessel is expected to exit the pool within the next 12 months. The
Company is also allocated general and administrative expenses from SCM. The Scorpio Kamsarmax Pool and the Scorpio
Ultramax Pool were significant customers for the year ended December 31, 2018, accounting for 36% and 64% of the
Company’s total vessel revenue, respectively. During the year ended December 31, 2017, the Scorpio Kamsarmax Pool and the
Scorpio Ultramax Pool accounted for 42% and 58% of the Company’s total vessel revenue, respectively. During the year ended
December 31, 2016, the Scorpio Kamsarmax Pool and the Scorpio Ultramax Pool accounted for 40% and 60% of the
Company’s total vessel revenue (including commissions from SCM), respectively.
For the commercial management of any of the Company’s vessels that do not operate in one of these pools, it pays SCM a daily
fee of $300 per vessel, plus a 1.75% commission on the gross revenues per charter fixture, which are classified as voyage expenses
in the Consolidated Statement of Operations.

Table of Contents
SCORPIO BULKERS INC. AND SUBSIDIARIES
Notes to the Consolidated Financial Statements
(Dollars in thousands, except per share, per day and per vessel data)
F- 39
Prior to the amendment to the Master Agreement effective as from September 29, 2016, contracts for the construction of vessels
that were sold or cancelled prior to the Company taking delivery of the vessels resulted in a termination fee of $0.5 million per
vessel and the termination fee for a vessel which was under SCM management was two years of daily fees of $300, or $0.2
million per vessel plus 1.00% of the estimated revenue SCM would have generated for the vessel over the next two years. This
fee was classified as a loss/write off of vessels and assets held for sale in the Consolidated Statement of Operations. Following
the amendment to the Master Agreement on September 29, 2016, the fees due for a termination of the commercial management
arrangements in the event of the sale of one or more vessels, provided it does not amount to a change of control of the Company,
including a sale of substantially all vessels, was reduced to a three month notice period and payment equal to three months of
management fees.
Effective January 1, 2018, pursuant to the Revised Master Agreement, the fixed annual technical management fee was reduced
from $200,000 to $160,000, and certain services previously provided as part of the fixed fee are itemized. The aggregate cost,
including the costs that are now itemized, for the services provided under the technical management agreement do not materially
differ from the annual management fee charged prior to the amendment.
SSM’s technical management services include providing technical support, such as arranging the hiring of qualified officers and
crew, supervising the maintenance and performance of vessels, purchasing supplies, spare parts and new equipment, arranging
and supervising drydocking and repairs, and monitoring regulatory and classification society compliance and customer standards.
The Company pays SSM an annual fee of $160,000 plus charges for certain itemized services per vessel to provide technical
management services for each of its owned or finance leased vessels, which is a component of vessel operating cost in the
Consolidated Statement of Operations. In addition, representatives of SSM, including certain subcontractors, previously provided
the Company with construction supervisory services while its vessels were being constructed in shipyards. For these services,
SSM was compensated for its direct expenses, which varied between $0.2 million and $0.5 million per vessel.
Prior to the amendment to the Master Agreement effective as from September 29, 2016, contracts for the construction of vessels
that were sold or canceled prior to the Company taking delivery of the vessels resulted in a termination fee of $0.5 million per
vessel and the termination fee for a vessel which was under SSM management was two years of annual fees of $0.2 million per
vessel, or $0.4 million per vessel. This fee was included in loss/write off of vessels and assets held for sale in the Consolidated
Statement of Operations.
Following the amendment to the Master Agreement effective as from September 29, 2016, the fees due for a termination of the
technical management arrangements in the event of the sale of any vessels, provided it does not amount to a change of control of
the Company, including a sale of substantially all vessels, have been reduced to a notice period of three months and a payment
equal to three months of management fees.
SUK allocates salaries of certain SUK employees to the Company for services performed for the Company.
The fees and rates charged as vessel operating costs by the related party port agent are based on the prevailing market rates for
such services in each respective region.
In 2016, an Executive Officer of the Company acquired a minority interest, which in 2018 increased to a majority interest, in an
insurance broker which arranges hull and machinery and war risk insurance for certain of our owned and finance leased vessels.
This broker has arranged such policies for the Company since 2013 and the extent of the coverage and the manner in which the
policies are priced did not change as a result of this transaction. In September 2018 the Executive Officer disposed of their
interest in the insurance broker in its entirety to a third party not affiliated with the Company. The amounts recorded reflect the
amortization of the policy premiums, which are paid directly to the broker, who then remits the premiums to the underwriters.
Such payments, which are made in advance, are classified as prepaid expenses and other current assets on the Consolidated
Balance Sheet until they are expensed at which point they are recorded as vessel operating expenses in the Consolidated Statement
of Operations.

Table of Contents
SCORPIO BULKERS INC. AND SUBSIDIARIES
Notes to the Consolidated Financial Statements
(Dollars in thousands, except per share, per day and per vessel data)
F- 40
In October 2018, the Company invested $100.0 million in Scorpio Tankers for approximately 54.1 million, or 10.9% (as of
October 12, 2018), of Scorpio Tankers’ issued and outstanding common shares. The investment was part of a larger $337.0
million equity raise through a public offering of common shares by Scorpio Tankers. Scorpio Tankers is a large international
shipping company incorporated in the Republic of the Marshall Islands engaged in seaborne transportation of refined petroleum
products. The Company and Scorpio Tankers have a number of common shareholders. They also share a number of directors
and officers, including Mr. Emanuele Lauro who serves as the Chairman and Chief Executive Officer of both companies, Mr.
Robert Bugbee, who serves as President and a Director of both companies, Mr. Cameron Mackey, who serves as Chief
Operating Officer of both companies, and Mr. Filippo Lauro, who serves as the Vice President of both companies. There are no
other significant transactions between the Company and Scorpio Tankers. As discussed in Note 1, Organization and Basis of
Presentation, this investment is accounted for under the equity method.
Transactions with entities controlled by the Lolli-Ghetti family and with Scorpio Tankers (herein referred to as related party
affiliates) in the Consolidated Statement of Operations and Consolidated Balance Sheet are summarized in the following tables
(in thousands).
For the Year Ended December 31,
2018 2017 2016
Vessel revenue
Scorpio Kamsarmax Pool $ 87,305 $ 67,825 $ 31,319
Scorpio Ultramax Pool 155,197 94,380 46,227
SCM — — 856
Total vessel revenue $ 242,502 $ 162,205 $ 78,402
Voyage expense:
SCM $ — $ 172 $ 319
Vessel operating cost:
SSM $ 13,361 $ 9,379 7,191
Port agent 117 13 —
Insurance brokerage 1,721 — —
Total vessel operating cost $ 15,199 $ 9,392 $ 7,191
General and administrative expense:
SCM $ 45 $ 108 $ 43
SSM 99 — —
SSH 6,707 5,643 3,949
SUK 1,665 971 862
Total general and administrative expense $ 8,516 $ 6,722 $ 4,854
Income (loss) from equity investment
Scorpio Tankers Inc. $ (7,178 ) $ — $ —
Write down on assets held for sale
SCM $ — $ 147 $ 500
SSM — 200 500
Total write down on assets held for sale $ — $ 347 $ 1,000

Table of Contents
SCORPIO BULKERS INC. AND SUBSIDIARIES
Notes to the Consolidated Financial Statements
(Dollars in thousands, except per share, per day and per vessel data)
F- 41
At December 31, 2018 and December 31, 2017, we had the following balances with related parties, which have been included
in the Consolidated Balance Sheet:
December 31,
2018 2017
Assets
Due from related parties-current:
Scorpio Kamsarmax Pool $ 4,017 $ 3,977
Scorpio Ultramax Pool 3,321 2,578
Total due from related parties-current $ 7,338 $ 6,555
Due from related parties non-current:
Scorpio Kamsarmax Pool $ 4,806 $ 5,080
Scorpio Ultramax Pool 10,542 10,741
Total due from related parties non-current $ 15,348 $ 15,821
Equity investment in Scorpio Tankers Inc. $ 92,281 $ —
Liabilities
Due to related parties-current :
SCM $ 8 $ —
SSM 116 69
SSH 357 297
Total due to related parties-current $ 481 $ 366

Table of Contents
SCORPIO BULKERS INC. AND SUBSIDIARIES
Notes to the Consolidated Financial Statements
(Dollars in thousands, except per share, per day and per vessel data)
F- 42
16. Segment Reporting
Effective January 1, 2016, the Company is organized by vessel type into two operating segments through which the Company’s
chief operating decision maker manages the Company’s business. The Kamsarmax and Ultramax Operations segments include
the following:
• Kamsarmax - includes vessels ranging from approximately 82,000 DWT to 84,000 DWT
• Ultramax - includes vessels ranging from approximately 60,200 DWT to 64,000 DWT
Although each vessel within its respective class qualifies as an operating segment under U.S. GAAP, each vessel also exhibits
similar long-term financial performance and similar economic characteristics to the other vessels within the respective vessel
class, thereby meeting the aggregation criteria in U.S. GAAP. We have therefore chosen to present our segment information by
vessel class using the aggregated information from the individual vessels.
The Company’s vessels regularly move between countries in international waters, over dozens of trade routes and, as a result, the
disclosure of financial information about geographic areas is impracticable.
Certain expenses incurred by the Company are not attributable to any specific segment. Accordingly, these costs are not allocated
to the Company’s Kamsarmax or Ultramax segments and are included in the results below as “Corporate”.
The following schedule presents segment information about the Company’s operations and identifiable assets for the years ended
December 31, 2018, 2017 and 2016 (in thousands).
December 31, 2018 Kamsarmax Ultramax Corporate Total
Vessel revenue $ 87,305 $ 155,197 $ 242,502
Voyage expenses 219 330 549
Vessel operating cost 34,255 71,220 105,475
Charterhire expense 422 3,754 4,176
Vessel depreciation 19,320 37,287 56,607
General and administrative expenses 2,069 4,344 25,972 32,385
Interest income 1,107 1,107
Income (loss) from equity investment (7,178 ) (7,178 )
Foreign exchange gain (loss) (68 ) (68 )
Financial expense, net (49,869 ) (49,869 )
Segment loss $ 31,020 $ 38,262 $ (81,980 ) $ (12,698 )

Table of Contents
SCORPIO BULKERS INC. AND SUBSIDIARIES
Notes to the Consolidated Financial Statements
(Dollars in thousands, except per share, per day and per vessel data)
F- 43
December 31, 2017 Kamsarmax Ultramax Corporate Total
Vessel revenue $ 67,825 $ 94,380 $ 162,205
Voyage expenses 300 129 429
Vessel operating cost 35,336 51,445 (117 ) 86,664
Charterhire expense 4,417 975 5,392
Vessel depreciation 18,713 29,797 48,510
General and administrative expenses 1,916 3,389 23,776 29,081
Loss / write down on assets held for sale 17,701 17,701
Interest income 1,100 1,100
Foreign exchange gain (loss) (292 ) (292 )
Financial expense, net (34,962 ) (34,962 )
Segment loss $ (10,558 ) $ 8,645 $ (57,813 ) $ (59,726 )
December 31, 2016 Kamsarmax Ultramax Corporate Total
Vessel revenue $ 31,684 $ 46,718 $ 78,402
Voyage expenses (81 ) 36 (45 )
Vessel operating cost 27,083 41,749 68,832
Charterhire expense 12,323 5,033 17,356
Charterhire termination 2,500 7,500 10,000
Vessel depreciation 14,522 22,040 36,562
General and administrative expenses 1,718 2,725 29,552 33,995
Loss / write down on assets held for sale 11,557 (130 ) 1,006 12,433
Interest income 933 933
Foreign exchange loss (116 ) (116 )
Financial expense, net (24,921 ) (24,921 )
Segment loss $ (37,938 ) $ (32,235 ) $ (54,662 ) $ (124,835 )
Identifiable assets, classified by the segment by which the Company operates, are as follows:
Identifiable assets
December 31, 2018 December 31, 2017
Held by vessel owning subsidiaries or allocated to segments:
Kamsarmax $ 553,790 $ 549,444
Ultramax 994,812 1,028,798
Held by parent and other subsidiaries, not allocated to segments:
Cash and cash equivalents 55,884 59,278
Other 99,340 5,890
Total identifiable assets $ 1,703,826 $ 1,643,410

Table of Contents
SCORPIO BULKERS INC. AND SUBSIDIARIES
Notes to the Consolidated Financial Statements
(Dollars in thousands, except per share, per day and per vessel data)
F- 44
17. Unaudited Quarterly Results of Operations
The following tables set forth certain unaudited financial data for the Company's quarterly operations in 2018 and 2017. The
following information has been prepared on the same basis as the annual information presented elsewhere in this report and, in
the opinion of management, includes all adjustments, consisting only of normal recurring adjustments, necessary for a fair
presentation of the information for the quarterly periods presented. The operating results for any quarter are not necessarily
indicative of results for any future period.
(amounts in thousands) (Unaudited) 2018 Quarter Ended (Unaudited) 2017 Quarter Ended
First
Quarter Second
Quarter Third
Quarter Fourth
Quarter First
Quarter(1) Second
Quarter Third
Quarter Fourth
Quarter
Revenues $ 54,253 $ 60,614 $ 62,464 $ 65,171 $ 37,428 $ 37,742 $ 38,608 $ 51,127
Operating loss 4,468 12,049 12,987 13,806 (26,173 ) (4,734 ) (2,555 ) 7,891
Net loss (5,772 ) 800 (353 ) (7,373 ) (34,564 ) (13,418 ) (10,674 ) (1,068 )
Basic earnings (loss) per
share $ (0.08 ) $ 0.01
$ (0.01 ) $ (0.11 ) $ (0.48 ) $ (0.19 ) $ (0.15 ) $ (0.01 )
Diluted earnings (loss) per
share $ (0.08 ) $ 0.01
$ (0.01 ) $ (0.11 ) $ (0.48 ) $ (0.19 ) $ (0.15 ) $ (0.01 )
Basic weighted average
common shares outstanding 72,702
72,494
72,749
69,387
71,735
71,804
71,936
71,702
Diluted weighted average
common shares outstanding 72,702
74,718
72,749
69,387 71,735
71,804
71,936
71,702
Earnings per share for quarterly periods are based on the weighted average common shares outstanding in individual quarters;
thus, the sum of earnings per share of the quarters may not equal the amounts reported for the full year.
(1) First quarter 2017 results include a loss / write down on assets held for sale of $17.7 million.
18. Subsequent Events
Investment in Scorpio Tankers Inc.
On January 18, 2019, Scorpio Tankers effected a one-for-ten reverse stock split and as such the Company now owns
approximately 5.4 million common shares of Scorpio Tankers.
Dividend
On January 25, 2019, the Company’s Board of Directors declared a quarterly cash dividend of $0.02 per share, payable on or
about March 15, 2019, to all shareholders of record as of February 15, 2019.
Share Repurchase Program
On January 25, 2019, the Company’s Board of Directors authorized a new share repurchase program to purchase up to an
aggregate of $50.0 million of the Company’s common shares. This new share repurchase program replaced the Company’s

Table of Contents
SCORPIO BULKERS INC. AND SUBSIDIARIES
Notes to the Consolidated Financial Statements
(Dollars in thousands, except per share, per day and per vessel data)
F- 45
previous share repurchase program that was authorized in October 2018 and that was terminated in conjunction with the
authorization of the new share repurchase program. The specific timing and amounts of the repurchases will be in the sole
discretion of management and may vary based on market conditions and other factors. The Company is not obligated under the
terms of the program to repurchase any of its common shares. The authorization has no expiration date.
$21.4 Million Lease Financing - SBI Samba
In February 2019, the Company entered into a financing transaction with an unaffiliated third party involving the sale and
leaseback of the SBI Samba, a 2015 Japanese built Kamsarmax vessel, for a consideration of $21.4 million. As part of the
transaction, the Company will make payments of $6,850 per day under a five-year bareboat charter agreement with the buyer.
The transaction also provides the Company with the option to repurchase the vessel beginning on the third anniversary of the sale
until the end of the bareboat charter agreement.
Vessel Sales
In March 2019, the Company entered into agreements with unaffiliated third parties to sell the SBI Electra and SBI Flamenco,
two 2015 Chinese built Kamsarmax vessels, for approximately $48.0 million in aggregate. Delivery of the vessels is estimated to
take place in the second quarter of 2019. The Company expects to take a charge of approximately $8.0 million, including the
write off of deferred finance charges costs, in the first quarter of 2019.
CMBFL Lease Financing
In March 2019, the Company agreed to sell and leaseback three Ultramax vessels (SBI Pegasus, SBI Subaru and SBI Ursa) and
four Kamsarmax vessels (SBI Lambada, SBI Macarena, SBI Carioca and SBI Capoeira) to CMB Financial Leasing Co., Ltd. As
part of the agreements, the Company will bareboat charter-in the vessels for a period of seven years . In addition, the Company
has purchase options beginning after the end of the third year of each agreement. There is also a purchase option for each vessel
upon the expiration of each agreement.

Table of Contents
SCORPIO BULKERS INC. AND SUBSIDIARIES
Notes to the Consolidated Financial Statements
(Dollars in thousands, except per share, per day and per vessel data)
F- 46