Citigroup Inc.
210
UNITED STATES SECURITIES AND EXCHANGE COMMISSION WASHINGTON, D.C. 20549 FORM 10-Q QUARTERLY REPORT PURSUANT TO SECTION 13 OR 15(d) OF THE SECURITIES EXCHANGE ACT OF 1934 For the quarterly period ended September 30, 2018 Commission file number 1-9924 Citigroup Inc. (Exact name of registrant as specified in its charter) Delaware (State or other jurisdiction of incorporation or organization) 52-1568099 (I.R.S. Employer Identification No.) 388 Greenwich Street, New York, NY (Address of principal executive offices) 10013 (Zip code) (212) 559-1000 (Registrant's telephone number, including area code) Indicate by check mark whether the registrant (1) has filed all reports required to be filed by Section 13 or 15(d) of the Securities Exchange Act of 1934 during the preceding 12 months (or for such shorter period that the registrant was required to file such reports), and (2) has been subject to such filing requirements for the past 90 days. Yes No Indicate by check mark whether the registrant has submitted electronically every Interactive Data File required to be submitted pursuant to Rule 405 of Regulation S-T (§232.405 of this chapter) during the preceding 12 months (or for such shorter period that the registrant was required to submit such files). Yes No Indicate by check mark whether the registrant is a large accelerated filer, an accelerated filer, a non-accelerated filer, smaller reporting, or an emerging growth company. See the definitions of "large accelerated filer," "accelerated filer," "smaller reporting company" and “emerging growth company” in Rule 12b-2 of the Exchange Act. Large accelerated filer Accelerated filer Non-accelerated filer Smaller reporting company Emerging growth company If an emerging growth company, indicate by check mark if the registrant has elected not to use the extended transition period for complying with any new or revised financial accounting standards provided pursuant to Section 13(a) of the Exchange Act. Yes Indicate by check mark whether the registrant is a shell company (as defined in Rule 12b-2 of the Exchange Act). Yes No Number of shares of Citigroup Inc. common stock outstanding on September 30, 2018: 2,442,136,813 Available on the web at www.citigroup.com
-
Upload
khangminh22 -
Category
Documents
-
view
1 -
download
0
Transcript of Citigroup Inc.
UNITED STATESSECURITIES AND EXCHANGE COMMISSION
WASHINGTON, D.C. 20549
FORM 10-Q QUARTERLY REPORT PURSUANT TO SECTION 13 OR 15(d) OF
THE SECURITIES EXCHANGE ACT OF 1934
For the quarterly period ended September 30, 2018
Commission file number 1-9924
Citigroup Inc.(Exact name of registrant as specified in its charter)
Delaware(State or other jurisdiction of incorporation or organization)
52-1568099(I.R.S. Employer Identification No.)
388 Greenwich Street, New York, NY(Address of principal executive offices)
10013(Zip code)
(212) 559-1000(Registrant's telephone number, including area code)
Indicate by check mark whether the registrant (1) has filed all reports required to be filed by Section 13 or 15(d) of the Securities Exchange Act of 1934 during the preceding 12 months (or for such shorter period that the registrant was required to file such reports), and (2) has been subject to such filing requirements for the past 90 days. Yes No
Indicate by check mark whether the registrant has submitted electronically every Interactive Data File required to be submitted pursuant to Rule 405 of Regulation S-T (§232.405 of this chapter) during the preceding 12 months (or for such shorter period that the registrant was required to submit such files). Yes No
Indicate by check mark whether the registrant is a large accelerated filer, an accelerated filer, a non-accelerated filer, smaller reporting, or an emerging growth company. See the definitions of "large accelerated filer," "accelerated filer," "smaller reporting company" and “emerging growth company” in Rule 12b-2 of the Exchange Act.
Large accelerated filer Accelerated filer Non-accelerated filer Smaller reporting company Emerging growth company
If an emerging growth company, indicate by check mark if the registrant has elected not to use the extended transition period for complying with any new or revised financial accounting standards provided pursuant to Section 13(a) of the Exchange Act. Yes
Indicate by check mark whether the registrant is a shell company (as defined in Rule 12b-2 of the Exchange Act). Yes No
Number of shares of Citigroup Inc. common stock outstanding on September 30, 2018: 2,442,136,813
Available on the web at www.citigroup.com
CITIGROUP’S THIRD QUARTER 2018—FORM 10-Q
OVERVIEW
MANAGEMENT'S DISCUSSION AND ANALYSIS OF FINANCIAL CONDITION AND RESULTS OF OPERATIONS
Executive SummarySummary of Selected Financial Data
SEGMENT AND BUSINESS—INCOME (LOSS) AND REVENUESSEGMENT BALANCE SHEET
Global Consumer Banking (GCB)North America GCBLatin America GCBAsia GCB
Institutional Clients GroupCorporate/Other
OFF-BALANCE SHEET ARRANGEMENTSCAPITAL RESOURCESMANAGING GLOBAL RISK TABLE OF CONTENTS
MANAGING GLOBAL RISKINCOME TAXES
FUTURE APPLICATION OF ACCOUNTING STANDARDS
DISCLOSURE CONTROLS AND PROCEDURES
DISCLOSURE PURSUANT TO SECTION 219 OF THE IRAN THREAT REDUCTION AND SYRIA HUMAN RIGHTS ACTFORWARD-LOOKING STATEMENTSFINANCIAL STATEMENTS AND NOTES TABLE OF CONTENTS
CONSOLIDATED FINANCIAL STATEMENTSNOTES TO CONSOLIDATED FINANCIAL STATEMENTS (UNAUDITED)UNREGISTERED SALES OF EQUITY SECURITIES, PURCHASES OF EQUITY SECURITIES AND DIVIDENDS
1
336
89
101214161823
2425
38
3976
77
78
7879
81
82
90
206

1
OVERVIEW
This Quarterly Report on Form 10-Q should be read in conjunction with Citigroup’s Annual Report on Form 10-K for the year ended December 31, 2017 (2017 Annual Report on Form 10-K) and Citigroup’s Quarterly Reports on Form 10-Q for the quarters ended March 31, 2018 (First Quarter of 2018 Form 10-Q) and June 30, 2018 (Second Quarter of 2018 Form 10-Q).
Additional information about Citigroup is available on Citi’s website at www.citigroup.com. Citigroup’s annual reports on Form 10-K, quarterly reports on Form 10-Q and proxy statements, as well as other filings with the U.S. Securities and Exchange Commission (SEC), are available free of charge through Citi’s website by clicking on the “Investors” page and selecting “All SEC Filings.” The SEC’s website also contains current reports on Form 8-K, and other information regarding Citi at www.sec.gov.
Certain reclassifications, including a realignment of certain businesses, have been made to the prior periods’ financial statements and disclosures to conform to the current period’s presentation. For additional information on certain recent reclassifications, see Notes 1 and 3 to the Consolidated Financial Statements below and Notes 1 and 3 to the Consolidated Financial Statements in Citi’s 2017 Annual Report on Form 10-K.
Throughout this report, “Citigroup,” “Citi” and “the Company” refer to Citigroup Inc. and its consolidated subsidiaries.

2
Citigroup is managed pursuant to two business segments: Global Consumer Banking and Institutional Clients Group, with the remaining operations in Corporate/Other.
The following are the four regions in which Citigroup operates. The regional results are fully reflected in the segment results above.
(1) Latin America GCB consists of Citi’s consumer banking business in Mexico.(2) Asia GCB includes the results of operations of GCB activities in certain EMEA countries for all periods presented.(3) North America includes the U.S., Canada and Puerto Rico, Latin America includes Mexico and Asia includes Japan.
3
MANAGEMENT’S DISCUSSION AND ANALYSIS OF FINANCIAL CONDITION AND RESULTS OF OPERATIONS
EXECUTIVE SUMMARY
Third Quarter of 2018—Solid Operating Results and Continued MomentumAs described further throughout this Executive Summary, Citi reported solid operating results in the third quarter of 2018, reflecting continued momentum across businesses and geographies, including in many of the areas where Citi has been making ongoing investments.
During the third quarter of 2018, Citi had solid revenue growth across treasury and trade solutions, fixed income markets, securities services and the private bank in the Institutional Clients Group (ICG) and in international Global Consumer Banking (GCB), with particular strength in Latin America GCB. Results in the current quarter and prior-year period also reflected the impact of gains on sale of businesses in ICG and Latin America GCB (see “Citigroup” below). During the quarter, Citi continued to demonstrate expense and credit discipline, resulting in positive operating leverage and an improvement in pretax earnings. Citi also had broad-based loan growth in GCB and ICG, as well as deposit growth.
In addition, Citi continued to return capital to its shareholders. In the quarter, Citi returned $6.4 billion in the form of common stock repurchases and dividends. Citi repurchased approximately 75 million common shares during the quarter and over 200 million over the last 12 months, resulting in an 8% reduction in outstanding common shares from the prior-year period. Despite the continued progress in returning capital to shareholders during the quarter, each of Citi’s key regulatory capital metrics remained strong (see “Capital” below).
While global economic growth has continued and the macroeconomic environment remains largely positive, there continue to be various economic, political and other risks and uncertainties that could impact Citi’s businesses and future results. For a discussion of the risks and uncertainties that could impact Citi’s businesses, results of operations and financial condition during the remainder of 2018, see each respective business’s results of operations and “Forward-Looking Statements” below, as well as each respective business’s results of operations and the “Managing Global Risk” and “Risk Factors” sections in Citi’s 2017 Annual Report on Form 10-K.
Third Quarter of 2018 Summary Results
CitigroupCitigroup reported net income of $4.6 billion, or $1.73 per share, compared to net income of $4.1 billion, or $1.42 per share, in the prior-year period. The 12% increase in net income was primarily driven by a lower effective tax rate due to the impact of the Tax Cuts and Jobs Act (Tax Reform), and also reflected lower expenses and lower cost of credit. Earnings per share increased 22% due to the growth in net income and the 8% reduction in average shares outstanding driven by the common stock repurchases.
Citigroup revenues of $18.4 billion in the third quarter of 2018 were largely unchanged from the prior-year period, primarily reflecting the net impact of a gain on sale (approximately $580 million) of a fixed income analytics business in ICG in the prior-year period and a gain on sale (approximately $250 million) of an asset management business in Latin America GCB in the current quarter as well as the impact of foreign currency translation (which increased reported revenues in the prior-year period by $335 million). Excluding the gains on sale as well as the impact of foreign currency translation in U.S. dollars for reporting purposes (FX translation), revenues increased 4%, driven by growth in ICG (Citi’s results of operations excluding the gains on sale as well as the impact of FX translation are non-GAAP financial measures).
Citigroup’s end-of-period loans increased 3% to $675 billion versus the prior-year period. Excluding the impact of FX translation, Citigroup’s end-of-period loans grew 4%, as 6% aggregate growth in GCB and ICG was partially offset by the continued wind-down of legacy assets in Corporate/Other. Citigroup’s end-of-period deposits increased 4% to $1.0 trillion versus the prior-year period. Excluding the impact of FX translation, Citigroup’s deposits increased 5%, primarily driven by 8% growth in ICG deposits.
ExpensesCitigroup operating expenses of $10.3 billion decreased 1% versus the prior-year period, as the impact of higher volume-related expenses and ongoing investments was more than offset by efficiency savings and the wind-down of legacy assets. Year-over-year, GCB operating expenses were up 5% and ICG operating expenses increased 1%, while Corporate/Other operating expenses declined 44%, all versus the prior-year period.
Cost of CreditCiti’s total provisions for credit losses and for benefits and claims of $2.0 billion decreased 1% from the prior-year period. The decrease was primarily driven by lower net loan loss reserve builds in both Citi retail services and Citi-branded cards in North America GCB, partially offset by a net loan loss reserve build in ICG, driven by volume growth.
Net credit losses of $1.8 billion declined 1% versus the prior-year period. Consumer net credit losses of $1.7 billion were largely unchanged from the prior-year period. Corporate net credit losses decreased from $43 million in the prior-year period to $30 million.
For additional information on Citi’s consumer and corporate credit costs and allowance for loan losses, see each respective business’s results of operations and “Credit Risk” below.
CapitalCitigroup’s Common Equity Tier 1 (CET1) Capital and Tier 1 Capital ratios, on a fully implemented basis, were 11.7% and 13.4% as of September 30, 2018, respectively, compared to
4
13.0% and 14.6% as of September 30, 2017, both based on the Basel III Standardized Approach for determining risk-weighted assets. The decline in regulatory capital ratios reflected the return of capital to common shareholders, the previously disclosed approximate $6 billion reduction in CET1 Capital in the fourth quarter of 2017 due to the impact of Tax Reform as well as an increase in risk-weighted assets, partially offset by net income. Citigroup’s Supplementary Leverage ratio as of September 30, 2018, on a fully implemented basis, was 6.5%, compared to 7.1% as of September 30, 2017. For additional information on Citi’s capital ratios and related components, including the impact of Tax Reform on its capital ratios, see “Capital Resources” below.
Global Consumer BankingGCB net income of $1.6 billion increased 34%, driven primarily by lower cost of credit and a lower effective tax rate, as well as the gain on sale in Latin America GCB, partially offset by higher expenses. Operating expenses were $4.7 billion, up 5%, or 6% excluding the impact of FX translation, driven by the timing of investment spending versus the prior-year period.
GCB revenues of $8.7 billion increased 2% versus the prior-year period, and 3% excluding the impact of FX translation, driven primarily by strength in Latin America GCB as well as the gain on sale. North America GCB revenues decreased 1% to $5.1 billion, as higher revenues in Citi retail services were more than offset by lower revenues in Citi-branded cards and retail banking. Citi-branded cards revenues of $2.1 billion were down 3% versus the prior-year period, as growth in interest-earning balances was more than offset by the impact of the previously disclosed Hilton portfolio sale as well as previously disclosed partnership terms. Citi retail services revenues of $1.7 billion increased 2% versus the prior-year period, primarily reflecting organic loan growth and the benefit of the L.L.Bean portfolio acquisition, partially offset by higher partner payments. Retail banking revenues decreased 3% from the prior-year period to $1.3 billion. Excluding mortgage revenues, retail banking revenues of $1.2 billion were up 1% from the prior-year period, driven by continued growth in deposit margins and investments, largely offset by lower episodic transaction activity in commercial banking.
North America GCB average deposits of $180 billion decreased 2% year-over-year, primarily driven by a reduction in money market balances, as clients transferred money to investments. North America GCB average retail loans of $56 billion grew 1% year-over-year and assets under management of $64 billion grew 9%. Average Citi-branded card loans of $88 billion increased 3%, while Citi-branded card purchase sales of $87 billion increased 9% versus the prior-year period. Average Citi retail services loans of $49 billion increased 7% versus the prior-year period, while Citi retail services purchase sales of $22 billion were up 11%. For additional information on the results of operations of North America GCB for the third quarter of 2018, see “Global Consumer Banking—North America GCB” below.
International GCB revenues (consisting of Latin America GCB and Asia GCB (which includes the results of operations in certain EMEA countries)) increased 8%, versus the prior-year period to $3.5 billion. Excluding the impact of FX translation, international GCB revenues increased 11% versus the prior-year period. On this basis, Latin America GCB revenues increased 26% versus the prior-year period, including the gain on sale. Excluding the gain on sale, Latin America GCB revenues increased 8%, driven by continued volume growth across commercial, mortgage and card loans as well as deposits. Asia GCB revenues increased 1%, as continued growth in deposit, cards and insurance revenues was largely offset by lower investment revenues due to weaker market sentiment. For additional information on the results of operations of Latin America GCB and Asia GCB for the third quarter of 2018, including the impact of FX translation, see “Global Consumer Banking—Latin America GCB” and “Global Consumer Banking—Asia GCB” below.
Year-over-year, international GCB average deposits of $127 billion increased 5%, average retail loans of $90 billion increased 4%, assets under management of $105 billion increased 8%, average card loans of $24 billion increased 2% and card purchase sales of $26 billion increased 7%, all excluding the impact of FX translation.
Institutional Clients GroupICG net income of $3.1 billion increased 2%, driven primarily by the lower effective tax rate, which more than offset the lower revenues as well as the higher cost of credit and operating expenses. ICG operating expenses increased 1% to $5.2 billion, driven by an increase in compensation costs, volume-related expenses and investments, partially offset by efficiency savings.
ICG revenues were $9.2 billion in the third quarter of 2018, down 2% from the prior-year period, as a 1% increase in Banking revenues was more than offset by a 5% decrease in Markets and securities services, reflecting the impact of the gain on sale in the prior-year period. Excluding the gain on sale in the prior-year period, revenues increased 4%, driven by growth in both Markets and securities services (up 8%) and Banking (up 1%). The increase in Banking revenues included the impact of $106 million of losses on loan hedges within corporate lending, compared to losses of $48 million in the prior-year period.
Banking revenues of $4.9 billion (excluding the impact of losses on loan hedges within corporate lending) increased 2%, driven by solid growth in treasury and trade solutions, private bank and corporate lending, partially offset by lower revenues in investment banking. Investment banking revenues of $1.2 billion decreased 8% versus the prior-year period, as growth in advisory was more than offset by a decline in both debt and equity underwriting, reflecting lower market activity. Advisory revenues increased 9% to $262 million, equity underwriting revenues decreased 17% to $259 million and debt underwriting revenues decreased 9% to $660 million, all versus the prior-year period.
Treasury and trade solutions revenues of $2.3 billion increased 4% versus the prior-year period, and 8% excluding the impact of FX translation, reflecting continued growth in

5
transaction volumes, loans and deposits. Private bank revenues increased 7% to $849 million versus the prior-year period, driven by growth in loans and investments, as well as improved deposit spreads. Corporate lending revenues were largely unchanged at $457 million. Excluding the impact of losses on loan hedges, corporate lending revenues increased 11% versus the prior-year period, primarily driven by loan growth and lower hedging costs.
Markets and securities services revenues of $4.5 billion decreased 5% from the prior-year period. Excluding the gain on sale, Markets and securities services increased 8%, driven by revenue growth in both fixed income and equity markets as well as securities services. Fixed income markets revenues of $3.2 billion increased 9% from the prior-year period, with contributions from both rates and currencies as well as spread products. Equity markets revenues of $792 million increased 1% from the prior-year period, as strength in prime finance and derivatives was largely offset by lower revenues in cash equities, reflecting a more challenging trading environment and lower commissions. Securities services revenues of $672 million increased 11%, and 15% excluding the impact of FX translation, driven by continued growth in client volumes and higher net interest revenue. For additional information on the results of operations of ICG for the third quarter of 2018, see “Institutional Clients Group” below.
Corporate/OtherCorporate/Other net loss was $67 million in the third quarter of 2018, compared to a net loss of $83 million in the prior-year period. Operating expenses of $459 million declined 44% from the prior-year period, largely reflecting the wind-down of legacy assets as well as lower infrastructure costs.
Corporate/Other revenues were $494 million, down 5% from the prior-year period, primarily reflecting the continued wind-down of legacy assets.
For additional information on the results of operations of Corporate/Other for the third quarter of 2018, see “Corporate/Other” below.

6
RESULTS OF OPERATIONS
SUMMARY OF SELECTED FINANCIAL DATA—PAGE 1Citigroup Inc. and Consolidated Subsidiaries
Third Quarter Nine MonthsIn millions of dollars, except per-share amounts and ratios 2018 2017 % Change 2018 2017 % ChangeNet interest revenue $ 11,802 $ 11,535 2 % $ 34,639 $ 33,748 3 %Non-interest revenue 6,587 6,884 (4) 21,091 21,192 —Revenues, net of interest expense $ 18,389 $ 18,419 — % $ 55,730 $ 54,940 1 %Operating expenses 10,311 10,417 (1) 31,948 31,900 —Provisions for credit losses and for benefits and claims 1,974 1,999 (1) 5,643 5,378 5Income from continuing operations before income taxes $ 6,104 $ 6,003 2 % $ 18,139 $ 17,662 3 %Income taxes(1) 1,471 1,866 (21) 4,356 5,524 (21)Income from continuing operations $ 4,633 $ 4,137 12 % $ 13,783 $ 12,138 14 %Income (loss) from discontinued operations, net of taxes(2) (8) (5) (60) — (2) 100Net income before attribution of noncontrolling interests $ 4,625 $ 4,132 12 % $ 13,783 $ 12,136 14 %Net income attributable to noncontrolling interests 3 (1) NM 51 41 24Citigroup’s net income $ 4,622 $ 4,133 12 % $ 13,732 $ 12,095 14 %Less:Preferred dividends—Basic $ 270 $ 272 (1)% $ 860 $ 893 (4)%Dividends and undistributed earnings allocated to employeerestricted and deferred shares that contain nonforfeitablerights to dividends, applicable to basic EPS 51 53 (4) 151 156 (3)
Income allocated to unrestricted common shareholders for basic and diluted EPS $ 4,301 $ 3,808 13 % $ 12,721 $ 11,046 15 %Earnings per share Basic Income from continuing operations $ 1.74 $ 1.42 23 % $ 5.04 $ 4.05 24 %Net income 1.73 1.42 22 5.04 4.05 24DilutedIncome from continuing operations $ 1.74 $ 1.42 23 % $ 5.04 $ 4.05 24 %Net income 1.73 1.42 22 5.04 4.05 24Dividends declared per common share 0.45 0.32 41 1.09 0.64 70
Table continues on the next page, including footnotes.

7
SUMMARY OF SELECTED FINANCIAL DATA—PAGE 2Citigroup Inc. and Consolidated Subsidiaries
Third Quarter Nine MonthsIn millions of dollars, except per-share amounts, ratios and direct staff 2018 2017 % Change 2018 2017 % ChangeAt September 30:Total assets $1,925,165 $1,889,133 2 %Total deposits 1,005,176 964,038 4Long-term debt 235,270 232,673 1Citigroup common stockholders’ equity(1) 177,969 208,381 (15)Total Citigroup stockholders’ equity(1) 197,004 227,634 (13)Direct staff (in thousands) 206 213 (3)Performance metricsReturn on average assets 0.95% 0.87% 0.96% 0.87%Return on average common stockholders’ equity(1)(3) 9.6 7.3 9.5 7.2Return on average total stockholders’ equity(1)(3) 9.2 7.2 9.2 7.1Efficiency ratio (total operating expenses/total revenues) 56.1 56.6 57.3 58.1Basel III ratios—full implementation(1)(4)
Common Equity Tier 1 Capital(5) 11.73% 12.98%Tier 1 Capital(5) 13.36 14.61Total Capital(5) 15.98 16.95Supplementary Leverage ratio 6.50 7.11Citigroup common stockholders’ equity to assets(1) 9.24% 11.03%Total Citigroup stockholders’ equity to assets(1) 10.23 12.05Dividend payout ratio(6) 26.0 22.5 21.6% 15.8%Total payout ratio(7) 147.0 164.6 98.1 96.5Book value per common share(1) $ 72.88 $ 78.81 (8)%Tangible book value (TBV) per share(1)(8) 61.91 68.55 (10)
(1) The third quarter and nine months of 2018 reflect the impact of Tax Reform. For additional information on Tax Reform, including the impact on Citi’s fourth quarter and full-year 2017 results, see Citi’s 2017 Annual Report on Form 10-K.
(2) See Note 2 to the Consolidated Financial Statements for additional information on Citi’s discontinued operations.(3) The return on average common stockholders’ equity is calculated using net income less preferred stock dividends divided by average common stockholders’
equity. The return on average total Citigroup stockholders’ equity is calculated using net income divided by average Citigroup stockholders’ equity.(4) Citi’s risk-based capital and leverage ratios as of September 30, 2017 are non-GAAP financial measures, which reflect full implementation of regulatory
capital adjustments and deductions prior to the effective date of January 1, 2018.(5) Citi’s reportable Common Equity Tier 1 (CET1) Capital and Tier 1 Capital ratios were the lower derived under the U.S. Basel III Standardized Approach and
Citi’s reportable Total Capital ratios were derived under the U.S. Basel III Advanced Approaches for both periods presented. This reflects the U.S. Basel III requirement to report the lower of risk-based capital ratios under both the Standardized Approach and Advanced Approaches in accordance with the Collins Amendment of the Dodd-Frank Act.
(6) Dividends declared per common share as a percentage of net income per diluted share.(7) Total common dividends declared plus common stock repurchases as a percentage of net income available to common shareholders. See “Consolidated
Statement of Changes in Stockholders’ Equity,” Note 9 to the Consolidated Financial Statements and “Equity Security Repurchases” below for the component details.
(8) For information on TBV, see “Capital Resources—Tangible Common Equity, Book Value Per Share, Tangible Book Value Per Share and Returns on Equity” below.
NM Not meaningful

8
SEGMENT AND BUSINESS—INCOME (LOSS) AND REVENUES
CITIGROUP INCOME
Third Quarter Nine MonthsIn millions of dollars 2018 2017 % Change 2018 2017 % ChangeIncome from continuing operationsGlobal Consumer Banking North America $ 850 $ 642 32 % $ 2,407 $ 1,913 26 % Latin America 334 169 98 717 445 61 Asia(1) 383 359 7 1,116 938 19Total $ 1,567 $ 1,170 34 % $ 4,240 $ 3,296 29 %Institutional Clients Group North America $ 870 $ 1,298 (33)% $ 2,755 $ 3,463 (20)% EMEA 972 753 29 3,072 2,401 28 Latin America 541 388 39 1,546 1,211 28 Asia 734 623 18 2,310 1,778 30Total $ 3,117 $ 3,062 2 % $ 9,683 $ 8,853 9 %Corporate/Other (51) (95) 46 (140) (11) NMIncome from continuing operations $ 4,633 $ 4,137 12 % $ 13,783 $ 12,138 14 %Discontinued operations $ (8) $ (5) (60)% $ — $ (2) 100 %Net income attributable to noncontrolling interests 3 (1) NM 51 41 24Citigroup’s net income $ 4,622 $ 4,133 12 % $ 13,732 $ 12,095 14 %
(1) Asia GCB includes the results of operations of GCB activities in certain EMEA countries for all periods presented.NM Not meaningful
CITIGROUP REVENUES
Third Quarter Nine MonthsIn millions of dollars 2018 2017 % Change 2018 2017 % ChangeGlobal Consumer Banking North America $ 5,129 $ 5,197 (1)% $ 15,290 $ 15,088 1 % Latin America 1,670 1,388 20 4,398 3,863 14 Asia(1) 1,855 1,885 (2) 5,649 5,438 4Total $ 8,654 $ 8,470 2 % $ 25,337 $ 24,389 4 %Institutional Clients Group North America $ 3,329 $ 3,709 (10)% $ 10,105 $ 10,877 (7)% EMEA 2,927 2,703 8 9,137 8,438 8 Latin America 1,055 1,099 (4) 3,427 3,354 2 Asia 1,930 1,919 1 6,111 5,501 11Total $ 9,241 $ 9,430 (2)% $ 28,780 $ 28,170 2 %Corporate/Other 494 519 (5) 1,613 2,381 (32)Total Citigroup net revenues $ 18,389 $ 18,419 — % $ 55,730 $ 54,940 1 %
(1) Asia GCB includes the results of operations of GCB activities in certain EMEA countries for all periods presented.

9
SEGMENT BALANCE SHEET(1)
In millions of dollars
GlobalConsumerBanking
InstitutionalClientsGroup
Corporate/Otherand
consolidatingeliminations(2)
Citigroupparent company-issued long-term
debt andstockholders’
equity(3)
TotalCitigroup
consolidatedAssets
Cash and deposits with banks $ 10,034 $ 66,084 $ 123,168 $ — $ 199,286Federal funds sold and securities borrowed and purchased under agreements to resell 157 280,556 228 — 280,941Trading account assets 754 249,904 6,844 — 257,502Investments 1,271 108,942 235,300 — 345,513Loans, net of unearned income and allowance for loan losses 299,493 347,050 16,030 — 662,573Other assets 37,605 105,200 36,545 — 179,350Net inter-segment liquid assets(4) 77,370 246,754 (324,124) — —
Total assets $ 426,684 $ 1,404,490 $ 93,991 $ — $ 1,925,165Liabilities and equity
Total deposits $ 310,689 $ 684,623 $ 9,864 $ — $ 1,005,176Federal funds purchased and securities loaned and sold under agreements to repurchase 3,054 172,851 10 — 175,915Trading account liabilities 141 147,115 396 — 147,652Short-term borrowings 473 22,798 10,499 — 33,770Long-term debt(3) 1,831 41,351 43,905 148,183 235,270Other liabilities 19,613 94,913 14,993 — 129,519Net inter-segment funding (lending)(3) 90,883 240,839 13,465 (345,187) —
Total liabilities $ 426,684 $ 1,404,490 $ 93,132 $ (197,004) $ 1,727,302Total stockholders’ equity(5) — — 859 197,004 197,863Total liabilities and equity $ 426,684 $ 1,404,490 $ 93,991 $ — $ 1,925,165
(1) The supplemental information presented in the table above reflects Citigroup’s consolidated GAAP balance sheet by reporting segment as of September 30, 2018. The respective segment information depicts the assets and liabilities managed by each segment as of such date.
(2) Consolidating eliminations for total Citigroup and Citigroup parent company assets and liabilities are recorded within Corporate/Other.(3) The total stockholders’ equity and the majority of long-term debt of Citigroup reside in the Citigroup parent company Consolidated Balance Sheet. Citigroup
allocates stockholders’ equity and long-term debt to its businesses through inter-segment allocations as shown above.(4) Represents the attribution of Citigroup’s liquid assets (primarily consisting of cash, marketable equity securities, and available-for-sale debt securities) to the
various businesses based on Liquidity Coverage Ratio (LCR) assumptions.(5) Corporate/Other equity represents noncontrolling interests.

10
GLOBAL CONSUMER BANKING
Global Consumer Banking (GCB) consists of consumer banking businesses in North America, Latin America (consisting of Citi’s consumer banking business in Mexico) and Asia. GCB provides traditional banking services to retail customers through retail banking, including commercial banking, and Citi-branded cards and Citi retail services (for additional information on these businesses, see “Citigroup Segments” above and “Managing Global Risk—Consumer Credit” below). GCB is focused on its priority markets in the U.S., Mexico and Asia with 2,417 branches in 19 countries and jurisdictions as of September 30, 2018. At September 30, 2018, GCB had approximately $427 billion in assets and $311 billion in deposits.
GCB’s overall strategy is to leverage Citi’s global footprint and be the pre-eminent bank for the emerging affluent and affluent consumers in large urban centers. In credit cards and in certain retail markets (including commercial banking), Citi serves customers in a somewhat broader set of segments and geographies.
Third Quarter Nine MonthsIn millions of dollars except as otherwise noted 2018 2017 % Change 2018 2017 % ChangeNet interest revenue $ 7,236 $ 7,071 2 % $ 21,235 $ 20,410 4 %Non-interest revenue 1,418 1,399 1 4,102 3,979 3Total revenues, net of interest expense $ 8,654 $ 8,470 2 % $ 25,337 $ 24,389 4 %Total operating expenses $ 4,661 $ 4,452 5 % $ 13,997 $ 13,440 4 %Net credit losses $ 1,714 $ 1,704 1 % $ 5,176 $ 4,922 5 %Credit reserve build (release) 186 486 (62) 484 788 (39)Provision (release) for unfunded lending commitments 6 (5) NM 8 — NMProvision for benefits and claims 27 28 (4) 75 80 (6)Provisions for credit losses and for benefits and claims (LLR& PBC) $ 1,933 $ 2,213 (13)% $ 5,743 $ 5,790 (1)%Income from continuing operations before taxes $ 2,060 $ 1,805 14 % $ 5,597 $ 5,159 8 %Income taxes 493 635 (22) 1,357 1,863 (27)Income from continuing operations $ 1,567 $ 1,170 34 % $ 4,240 $ 3,296 29 %Noncontrolling interests 1 2 (50) 4 7 (43)Net income $ 1,566 $ 1,168 34 % $ 4,236 $ 3,289 29 %Balance Sheet data (in billions of dollars)
Total EOP assets $ 427 $ 419 2 %Average assets 424 421 1 $ 421 $ 415 1 %Return on average assets 1.47% 1.10% 1.35% 1.06%Efficiency ratio 54 53 55 55Average deposits $ 307 $ 308 — $ 307 $ 306 —Net credit losses as a percentage of average loans 2.22% 2.26% 2.27% 2.24%Revenue by business
Retail banking $ 3,717 $ 3,521 6 % $ 10,677 $ 10,024 7 %Cards(1) 4,937 4,949 — 14,660 14,365 2
Total $ 8,654 $ 8,470 2 % $ 25,337 $ 24,389 4 %Income from continuing operations by business
Retail banking $ 666 $ 546 22 % $ 1,770 $ 1,298 36 %Cards(1) 901 624 44 2,470 1,998 24
Total $ 1,567 $ 1,170 34 % $ 4,240 $ 3,296 29 %
Table continues on the next page, including footnotes.
11
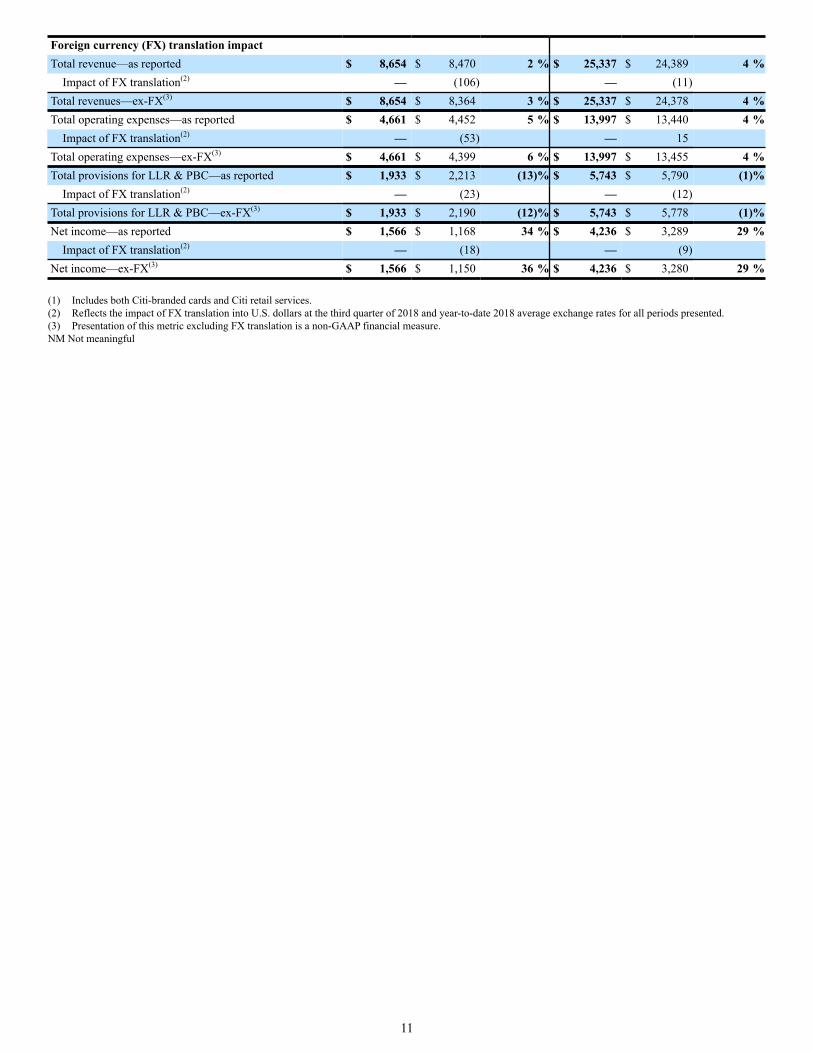
Foreign currency (FX) translation impactTotal revenue—as reported $ 8,654 $ 8,470 2 % $ 25,337 $ 24,389 4 %
Impact of FX translation(2) — (106) — (11)Total revenues—ex-FX(3) $ 8,654 $ 8,364 3 % $ 25,337 $ 24,378 4 %Total operating expenses—as reported $ 4,661 $ 4,452 5 % $ 13,997 $ 13,440 4 %
Impact of FX translation(2) — (53) — 15Total operating expenses—ex-FX(3) $ 4,661 $ 4,399 6 % $ 13,997 $ 13,455 4 %Total provisions for LLR & PBC—as reported $ 1,933 $ 2,213 (13)% $ 5,743 $ 5,790 (1)%
Impact of FX translation(2) — (23) — (12)Total provisions for LLR & PBC—ex-FX(3) $ 1,933 $ 2,190 (12)% $ 5,743 $ 5,778 (1)%Net income—as reported $ 1,566 $ 1,168 34 % $ 4,236 $ 3,289 29 %
Impact of FX translation(2) — (18) — (9)Net income—ex-FX(3) $ 1,566 $ 1,150 36 % $ 4,236 $ 3,280 29 %
(1) Includes both Citi-branded cards and Citi retail services.(2) Reflects the impact of FX translation into U.S. dollars at the third quarter of 2018 and year-to-date 2018 average exchange rates for all periods presented.(3) Presentation of this metric excluding FX translation is a non-GAAP financial measure. NM Not meaningful

12
NORTH AMERICA GCB
North America GCB provides traditional retail banking, including commercial banking, and its Citi-branded cards and Citi retail services card products to retail customers and small to mid-size businesses, as applicable, in the U.S. North America GCB’s U.S. cards product portfolio includes its proprietary portfolio (including the Citi Double Cash, Thank You and Value cards) and co-branded cards (including, among others, American Airlines and Costco) within Citi-branded cards as well as its co-brand and private label relationships (including, among others, Sears, The Home Depot, Best Buy and Macy’s) within Citi retail services.
As of September 30, 2018, North America GCB’s 692 retail bank branches are concentrated in the six key metropolitan areas of New York, Chicago, Miami, Washington, D.C., Los Angeles and San Francisco. Also as of September 30, 2018, North America GCB had approximately 9.0 million retail banking customer accounts, $56.3 billion in retail banking loans and $181.9 billion in deposits. In addition, North America GCB had approximately 120.2 million Citi-branded and Citi retail services credit card accounts with $137.8 billion in outstanding card loan balances, including the newly acquired $1.5 billion L.L.Bean portfolio.
Third Quarter Nine MonthsIn millions of dollars, except as otherwise noted 2018 2017 % Change 2018 2017 % ChangeNet interest revenue $ 4,984 $ 4,825 3 % $ 14,514 $ 14,074 3 %Non-interest revenue 145 372 (61) 776 1,014 (23)Total revenues, net of interest expense $ 5,129 $ 5,197 (1)% $ 15,290 $ 15,088 1 %Total operating expenses $ 2,668 $ 2,482 7 % $ 7,979 $ 7,677 4 %Net credit losses $ 1,242 $ 1,239 — % $ 3,816 $ 3,610 6 %Credit reserve build (release) 116 463 (75) 354 716 (51)Provision (release) for unfunded lending commitments 5 (3) NM 3 6 (50)Provision for benefits and claims 5 9 (44) 16 23 (30)Provisions for credit losses and for benefits and claims $ 1,368 $ 1,708 (20)% $ 4,189 $ 4,355 (4)%Income from continuing operations before taxes $ 1,093 $ 1,007 9 % $ 3,122 $ 3,056 2 %Income taxes 243 365 (33) 715 1,143 (37)Income from continuing operations $ 850 $ 642 32 % $ 2,407 $ 1,913 26 %Noncontrolling interests — — — — — —Net income $ 850 $ 642 32 % $ 2,407 $ 1,913 26 %Balance Sheet data (in billions of dollars) Average assets $ 249 $ 250 — % $ 247 $ 246 — %Return on average assets 1.35% 1.02% 1.30% 1.04%Efficiency ratio 52 48 52 51Average deposits $ 180.2 $ 184.1 (2) $ 180.3 $ 184.6 (2)Net credit losses as a percentage of average loans 2.56% 2.63% 2.68% 2.62%Revenue by business Retail banking $ 1,329 $ 1,366 (3)% $ 3,984 $ 3,916 2 %Citi-branded cards 2,108 2,178 (3) 6,402 6,353 1Citi retail services 1,692 1,653 2 4,904 4,819 2Total $ 5,129 $ 5,197 (1)% $ 15,290 $ 15,088 1 %Income from continuing operations by business Retail banking $ 131 $ 169 (22)% $ 432 $ 371 16 %Citi-branded cards 375 342 10 1,109 890 25Citi retail services 344 131 NM 866 652 33Total $ 850 $ 642 32 % $ 2,407 $ 1,913 26 %
NM Not meaningful

13
3Q18 vs. 3Q17 Net income increased 32%, due to lower cost of credit and a lower effective tax rate due to the impact of Tax Reform, partially offset by lower revenues and higher expenses.
Revenues decreased 1%, as higher revenues in Citi retail services were more than offset by lower revenues in Citi-branded cards and retail banking.
Retail banking revenues decreased 3%. Excluding mortgage revenues (decline of 28%), retail banking revenues were up 1%, driven by continued growth in deposit margins and investments, largely offset by lower episodic transaction activity in commercial banking as well as increasingrate sensitivity. Average deposits decreased 2% year-over-year, primarily driven by a reduction in money market balances, as clients transferred money to investments. Assets under management were up 9%. The decline in mortgage revenues was driven by lower origination activity and higher cost of funds, reflecting the higher interest rate environment.
Cards revenues decreased 1%. In Citi-branded cards, revenues decreased 3%, as growth in interest-earning balances was more than offset by the impact of the Hilton portfolio sale as well as previously disclosed partnership terms that went into effect earlier in 2018. Average loans increased 3% and purchase sales increased 9%.
Citi retail services revenues increased 2%, primarily reflecting organic loan growth and the benefit of the L.L.Bean portfolio acquisition, partially offset by higher partner payments. Average loans increased 7% and purchase sales increased 11%.
Expenses increased 7%, driven by volume growth and the timing of investment spending versus the prior-year period.
Provisions decreased 20% from the prior-year period, driven by a lower net loan loss reserve build. The net loan loss reserve build in the current quarter was $121 million, primarily due to volume growth in both cards portfolios. This compares to a build of $460 million in the prior-year period, which included $300 million related to an increase in net flow rates in the later delinquency buckets in Citi retail services and a slight increase in delinquencies for the Citi-branded cards portfolio.
Net credit losses were largely unchanged at $1.2 billion, driven by higher net credit losses in Citi-branded cards (up 5% to $644 million) and Citi retail services (up 5% to $566 million), offset by a $56 million decrease in retail banking, driven by episodic charge-offs in the commercial portfolio in the prior-year period. The increase in the cards net credit losses primarily reflected volume growth and seasoning in both portfolios.
For additional information on North America GCB’s retail banking, including commercial banking, and its Citi-branded cards and Citi retail services portfolios, see “Credit Risk—Consumer Credit” below.
As part of its Citi retail services business, Citi issues co-brand and private label credit card products with Sears. As has been widely reported, on October 15, 2018, Sears filed for Chapter 11 bankruptcy protection that includes, among other things, plans to close additional stores. The impact to Citi retail services, including on revenues due to reduced new
account acquisitions or lower purchase sales, will depend, among other things, on the magnitude and timing of the Sears store closures. Citi retail services could also incur additional costs related to customer communications, including to support spending activity on the predominantly general-purpose MasterCard portfolio. Citi does not currently expect the Chapter 11 filing to have an immediate or ongoing material impact on its consolidated results. For additional information, see “Forward-Looking Statements” below and “Risk-Factors—Strategic Risks” in Citi’s 2017 Annual Report on Form 10-K.
2018 YTD vs. 2017 YTDNet income increased 26%, driven by higher revenues, a lower effective tax rate due to the impact of Tax Reform and lower cost of credit, partially offset by higher expenses.
Revenues increased 1%, reflecting higher revenues across retail banking, Citi retail services and Citi-branded cards. Retail banking revenues increased 2%. Excluding mortgage revenues (decline of 24%), retail banking revenues increased 6%, driven by growth in deposit margins and investments. Cards revenues increased 1%. In Citi-branded cards, revenues increased 1% driven by the same factors described above, as well as the sale of the Hilton portfolio, which resulted in a gain of approximately $150 million in the first quarter of 2018. This gain was largely offset by the loss of operating revenues from the portfolio. Citi retail services revenues increased 2%, driven by the same factors described above.
Expenses increased 4%, driven by the same factors described above, partially offset by efficiency savings.
Provisions decreased 4%. Net credit losses increased 6%, driven by volume growth and seasoning in both cards portfolios. This increase was more than offset by a 51% decline in the net loan loss reserve build, driven by the same factors described above.

14
LATIN AMERICA GCB
Latin America GCB provides traditional retail banking, including commercial banking, and its Citi-branded card products to retail customers and small to mid-size businesses in Mexico through Citibanamex, one of Mexico’s largest banks.
At September 30, 2018, Latin America GCB had 1,463 retail branches in Mexico, with approximately 29.1 million retail banking customer accounts, $21.0 billion in retail banking loans and $30.1 billion in deposits. In addition, the business had approximately 5.7 million Citi-branded card accounts with $5.8 billion in outstanding loan balances.
Third Quarter Nine Months% ChangeIn millions of dollars, except as otherwise noted 2018 2017 % Change 2018 2017
Net interest revenue $ 1,042 $ 1,038 — % $ 3,052 $ 2,853 7 %Non-interest revenue(1) 628 350 79 1,346 1,010 33Total revenues, net of interest expense $ 1,670 $ 1,388 20 % $ 4,398 $ 3,863 14 %Total operating expenses $ 828 $ 779 6 % $ 2,369 $ 2,191 8 %Net credit losses $ 307 $ 295 4 % $ 863 $ 825 5 %Credit reserve build 31 44 (30) 106 106 —Provision (release) for unfunded lending commitments — (1) 100 1 (2) NMProvision for benefits and claims 22 19 16 59 57 4
Provisions for credit losses and for benefits and claims (LLR& PBC) $ 360 $ 357 1 % $ 1,029 $ 986 4 %Income from continuing operations before taxes $ 482 $ 252 91 % $ 1,000 $ 686 46 %Income taxes 148 83 78 283 241 17Income from continuing operations $ 334 $ 169 98 % $ 717 $ 445 61 %Noncontrolling interests — 1 (100) — 4 (100)Net income $ 334 $ 168 99 % $ 717 $ 441 63 %Balance Sheet data (in billions of dollars) Average assets $ 45 $ 47 (4)% $ 44 $ 45 (2)%Return on average assets 2.94% 1.42% 2.18% 1.31%Efficiency ratio 50 56 54 57Average deposits $ 29.4 $ 28.8 2 $ 28.9 $ 27.3 6Net credit losses as a percentage of average loans 4.63% 4.37% 4.44% 4.39%Revenue by businessRetail banking $ 1,265 $ 992 28 % $ 3,230 $ 2,781 16 %Citi-branded cards 405 396 2 1,168 1,082 8Total $ 1,670 $ 1,388 20 % $ 4,398 $ 3,863 14 %Income from continuing operations by business Retail banking $ 279 $ 129 NM $ 572 $ 310 85 %Citi-branded cards 55 40 38 % 145 135 7Total $ 334 $ 169 98 % $ 717 $ 445 61 %

15
FX translation impact Total revenues—as reported $ 1,670 $ 1,388 20 % $ 4,398 $ 3,863 14 %
Impact of FX translation(2) — (66) — (45)Total revenues—ex-FX(3) $ 1,670 $ 1,322 26 % $ 4,398 $ 3,818 15 %Total operating expenses—as reported $ 828 $ 779 6 % $ 2,369 $ 2,191 8 %
Impact of FX translation(2) — (31) — (21)Total operating expenses—ex-FX(3) $ 828 $ 748 11 % $ 2,369 $ 2,170 9 %Provisions for LLR & PBC—as reported $ 360 $ 357 1 % $ 1,029 $ 986 4 %
Impact of FX translation(2) — (17) — (12)Provisions for LLR & PBC—ex-FX(3) $ 360 $ 340 6 % $ 1,029 $ 974 6 %Net income—as reported $ 334 $ 168 99 % $ 717 $ 441 63 %
Impact of FX translation(2) — (11) — (9)Net income—ex-FX(3) $ 334 $ 157 NM $ 717 $ 432 66 %
(1) Third quarter of 2018 includes an approximate $250 million gain on the sale of an asset management business. See Note 2 to the Consolidated Financial Statements.
(2) Reflects the impact of FX translation into U.S. dollars at the third quarter of 2018 and year-to-date 2018 average exchange rates for all periods presented.(3) Presentation of this metric excluding FX translation is a non-GAAP financial measure. NM Not meaningful
The discussion of the results of operations for Latin America GCB below excludes the impact of FX translation for all periods presented. Presentations of the results of operations, excluding the impact of FX translation, are non-GAAP financial measures. For a reconciliation of certain of these metrics to the reported results, see the table above.
3Q18 vs. 3Q17 Net income increased $177 million to $334 million, reflecting higher revenues and a lower effective tax rate as a result of Tax Reform, partially offset by higher expenses and cost of credit.
Revenues increased 26%, including the gain on sale of an asset management business (approximately $250 million). For additional information, see Note 2 to the Consolidated Financial Statements. Excluding the gain on sale, revenues were up 8%, driven by increases in both retail banking and cards.
Retail banking revenues increased 34%. Excluding the gain on sale, retail banking revenues increased 8%, driven by continued growth across commercial and mortgage loans and deposits, as well as improved deposit spreads due to higher interest rates. Average loans grew 4%, average deposits grew 8% and assets under management grew 5%. Cards revenues increased 7%, due to continued volume growth, reflecting higher purchase sales (up 14%) and full-rate revolving loans. Average cards loans grew 6%.
Expenses increased 11%, driven by volume growth, ongoing investment spending and higher repositioning charges, partially offset by efficiency savings.
Provisions increased 6%, as higher net credit losses were partially offset by a lower net loan loss reserve build. The net credit loss increase primarily reflected an episodic commercial charge-off that was fully offset by a related loan loss reserve release.
For additional information on Latin America GCB’s retail banking, including commercial banking, and its Citi-branded cards portfolios, see “Credit Risk—Consumer Credit” below.
2018 YTD vs. 2017 YTDYear-to-date, Latin America GCB has experienced similar trends to those described above. Net income increased 66%, driven by the same factors described above.
Revenues increased 15%, including the gain on sale in the third quarter of 2018. Excluding the gain on sale, revenues increased 9%, reflecting higher revenues in both retail banking and cards. Retail banking revenues increased 8%, driven by the same factors described above. Cards revenues increased 9%, driven by the same factors described above.
Expenses increased 9%, driven by the same factors described above.
Provisions increased 6%, driven by higher net credit losses and a higher net loan loss reserve build, primarily due to volume growth and seasoning in cards. The increase in net credit losses also reflected the episodic commercial charge-off that was fully offset by a related loan loss reserve release.

16
ASIA GCB
Asia GCB provides traditional retail banking, including commercial banking, and its Citi-branded card products to retail customers and small to mid-size businesses, as applicable. During the third quarter of 2018, Asia GCB’s most significant revenues in Asia were from Singapore, Hong Kong, Korea, India, Australia, Taiwan, Thailand, Philippines, Indonesia and Malaysia. Included within Asia GCB, traditional retail banking and Citi-branded card products are also provided to retail customers in certain EMEA countries, primarily Poland, Russia and the United Arab Emirates.
At September 30, 2018, on a combined basis, the businesses had 262 retail branches, approximately 15.9 million retail banking customer accounts, $69.5 billion in retail banking loans and $98.7 billion in deposits. In addition, the businesses had approximately 15.4 million Citi-branded card accounts with $18.6 billion in outstanding loan balances.
Third Quarter Nine Months% ChangeIn millions of dollars, except as otherwise noted (1) 2018 2017 % Change 2018 2017
Net interest revenue $ 1,210 $ 1,208 — % $ 3,669 $ 3,483 5%Non-interest revenue 645 677 (5) 1,980 1,955 1Total revenues, net of interest expense $ 1,855 $ 1,885 (2)% $ 5,649 $ 5,438 4%Total operating expenses $ 1,165 $ 1,191 (2)% $ 3,649 $ 3,572 2%Net credit losses $ 165 $ 170 (3)% $ 497 $ 487 2%Credit reserve build (release) 39 (21) NM 24 (34) NMProvision (release) for unfunded lending commitments 1 (1) NM 4 (4) NMProvisions for credit losses $ 205 $ 148 39 % $ 525 $ 449 17%Income from continuing operations before taxes $ 485 $ 546 (11)% $ 1,475 $ 1,417 4%Income taxes 102 187 (45) 359 479 (25)Income from continuing operations $ 383 $ 359 7 % $ 1,116 $ 938 19%Noncontrolling interests 1 1 — 4 3 33Net income $ 382 $ 358 7 % $ 1,112 $ 935 19%Balance Sheet data (in billions of dollars) Average assets $ 130 $ 124 5 % $ 130 $ 124 5%Return on average assets 1.17% 1.15% 1.14% 1.01%Efficiency ratio 63 63 65 66Average deposits $ 97.6 $ 95.2 3 $ 98.1 $ 94.1 4Net credit losses as a percentage of average loans 0.75% 0.78% 0.75% 0.77%Revenue by businessRetail banking $ 1,123 $ 1,163 (3)% $ 3,463 $ 3,327 4%Citi-branded cards 732 722 1 2,186 2,111 4Total $ 1,855 $ 1,885 (2)% $ 5,649 $ 5,438 4%Income from continuing operations by businessRetail banking $ 256 $ 248 3 % $ 766 $ 617 24%Citi-branded cards 127 111 14 350 321 9Total $ 383 $ 359 7 % $ 1,116 $ 938 19%

17
FX translation impactTotal revenues—as reported $ 1,855 $ 1,885 (2)% $ 5,649 $ 5,438 4%
Impact of FX translation(2) — (40) — 34Total revenues—ex-FX(3) $ 1,855 $ 1,845 1 % $ 5,649 $ 5,472 3%Total operating expenses—as reported $ 1,165 $ 1,191 (2)% $ 3,649 $ 3,572 2%
Impact of FX translation(2) — (22) — 36Total operating expenses—ex-FX(3) $ 1,165 $ 1,169 — % $ 3,649 $ 3,608 1%Provisions for loan losses—as reported $ 205 $ 148 39 % $ 525 $ 449 17%
Impact of FX translation(2) — (6) — —Provisions for loan losses—ex-FX(3) $ 205 $ 142 44 % $ 525 $ 449 17%Net income—as reported $ 382 $ 358 7 % $ 1,112 $ 935 19%
Impact of FX translation(2) — (7) — —Net income—ex-FX(3) $ 382 $ 351 9 % $ 1,112 $ 935 19%
(1) Asia GCB includes the results of operations of GCB activities in certain EMEA countries for all periods presented.(2) Reflects the impact of FX translation into U.S. dollars at the third quarter of 2018 and year-to-date 2018 average exchange rates for all periods presented.(3) Presentation of this metric excluding FX translation is a non-GAAP financial measure. NM Not meaningful
The discussion of the results of operations for Asia GCB below excludes the impact of FX translation for all periods presented. Presentations of the results of operations, excluding the impact of FX translation, are non-GAAP financial measures. For a reconciliation of certain of these metrics to the reported results, see the table above.
3Q18 vs. 3Q17 Net income increased 9%, reflecting higher revenues and a lower effective tax rate as a result of Tax Reform, partially offset by higher cost of credit.
Revenues increased 1%, driven by higher cards revenues, partially offset by lower retail banking revenues.
Retail banking revenues decreased 2%, as continued growth in deposit and insurance revenues was more than offset by lower investment revenues due to weaker market sentiment. Investment sales decreased 22%, while assets under management grew 9% and average deposits increased 4%. Retail lending revenues declined 1%, as volume growth in personal and commercial loans was more than offset by lower mortgage revenues due to spread compression. Average loans grew 4%.
Cards revenues increased 4%, driven by continued growth in average loans (up 2%) and purchase sales (up 6%).
Expenses were largely unchanged, as volume-driven growth and ongoing investment spending were offset by efficiency savings.
Provisions increased 44%, primarily driven by a net loan loss reserve build compared to a net loan loss reserve release in the prior-year period. Overall credit quality continued to remain stable in the region.
For additional information on Asia GCB’s retail banking, including commercial banking, and its Citi-branded cards portfolios, see “Credit Risk—Consumer Credit” below.
2018 YTD vs. 2017 YTDYear-to-date, Asia GCB has experienced similar trends tothose described above. Net income increased 19%, due to higher revenues and the lower effective tax rate, partially offset by higher expenses and a higher cost of credit.
Revenues increased 3%, driven by continued momentum in retail banking and cards. Retail banking revenues increased 3%, driven by growth in deposits, partially offset by lower investment and mortgage revenues. Cards revenues were up 3%, driven by the same factors described above.
Expenses increased 1%, as volume-driven growth and ongoing investment spending were partially offset by efficiency savings.
Provisions were up 17%, primarily driven by a net loan loss reserve build compared to a release in the prior-year period and modestly higher net credit losses related to volume growth and seasoning.

18
INSTITUTIONAL CLIENTS GROUP
Institutional Clients Group (ICG) includes Banking and Markets and securities services (for additional information on these businesses, see “Citigroup Segments” above). ICG provides corporate, institutional, public sector and high-net-worth clients around the world with a full range of wholesale banking products and services, including fixed income and equity sales and trading, foreign exchange, prime brokerage, derivative services, equity and fixed income research, corporate lending, investment banking and advisory services, private banking, cash management, trade finance and securities services. ICG transacts with clients in both cash instruments and derivatives, including fixed income, foreign currency, equity and commodity products.
ICG revenue is generated primarily from fees and spreads associated with these activities. ICG earns fee income for assisting clients with transactional services and clearing, providing brokerage and investment banking services and other such activities. Such fees are recognized at the point in time when Citigroup’s performance under the terms of a contractual arrangement is completed, which is typically at the trade/execution date or closing of a transaction. Revenue generated from these activities is recorded in Commissions and fees and Investment banking. Revenue is also generated from assets under custody and administration, which is recognized as/when the associated promised service is satisfied, which normally occurs at the point in time the service is requested by the customer and provided by Citi. Revenue generated from these activities is primarily recorded in Administration and other fiduciary fees. For additional information on these various types of revenues, see Note 5 to the Consolidated Financial Statements.
In addition, as a market maker, ICG facilitates transactions, including holding product inventory to meet client demand, and earns the differential between the price at which it buys and sells the products. These price differentials and the unrealized gains and losses on the inventory are recorded in Principal transactions (for additional information on Principal transactions revenue, see Note 6 to the Consolidated Financial Statements). Other primarily includes mark-to-market gains and losses on certain credit derivatives, gains and losses on available-for-sale (AFS) debt securities, gains and losses on equity securities not held in trading accounts, and other non-recurring gains and losses. Interest income earned on assets held, less interest paid to customers on deposits and long- and short-term debt, is recorded as Net interest revenue.
The amount and types of Markets revenues are impacted by a variety of interrelated factors, including market liquidity; changes in market variables such as interest rates, foreign exchange rates, equity prices, commodity prices and credit spreads, as well as their implied volatilities; investor confidence; and other macroeconomic conditions. Assuming all other market conditions do not change, increases in client activity levels or bid/offer spreads generally result in increases in revenues. However, changes in market conditions can significantly impact client activity levels, bid/offer spreads and the fair value of product inventory. For example, a decrease in market liquidity may increase bid/offer spreads, decrease client activity levels and widen credit spreads on product inventory positions.
ICG’s management of the Markets businesses involves daily monitoring and evaluating of the above factors at the trading desk as well as the country level. ICG does not separately track the impact on total Markets revenues of the volume of transactions, bid/offer spreads, fair value changes of product inventory positions and economic hedges because, as noted above, these components are interrelated and are not deemed useful or necessary individually to manage the Markets businesses at an aggregate level.
In the Markets businesses, client revenues are those revenues directly attributable to client transactions at the time of inception, including commissions, interest or fees earned. Client revenues do not include the results of client facilitation activities (for example, holding product inventory in anticipation of client demand) or the results of certain economic hedging activities.
ICG’s international presence is supported by trading floors in approximately 80 countries and a proprietary network in 98 countries and jurisdictions. At September 30, 2018, ICG had approximately $1.4 trillion of assets and $685 billion of deposits, while two of its businesses—securities services and issuer services—managed approximately $18.0 trillion of assets under custody compared to $17.1 trillion at the end of the prior-year period.

19
Third Quarter Nine Months% ChangeIn millions of dollars, except as otherwise noted 2018 2017 % Change 2018 2017
Commissions and fees $ 1,085 $ 1,100 (1)% $ 3,425 $ 3,230 6 %Administration and other fiduciary fees 686 688 — 2,093 1,997 5Investment banking 1,029 1,163 (12) 3,260 3,516 (7)Principal transactions 2,447 1,827 34 7,689 6,709 15Other(1) (18) 704 NM 554 951 (42)Total non-interest revenue $ 5,229 $ 5,482 (5)% $ 17,021 $ 16,403 4 %Net interest revenue (including dividends) 4,012 3,948 2 11,759 11,767 —Total revenues, net of interest expense $ 9,241 $ 9,430 (2)% $ 28,780 $ 28,170 2 %Total operating expenses $ 5,191 $ 5,138 1 % $ 16,152 $ 15,503 4 %Net credit losses $ 23 $ 44 (48)% $ 127 $ 140 (9)%Credit reserve build (release) 7 (38) NM (136) (229) 41Provision (release) for unfunded lending commitments 41 (170) NM 64 (193) NMProvisions for credit losses $ 71 $ (164) NM $ 55 $ (282) NMIncome from continuing operations before taxes $ 3,979 $ 4,456 (11)% $ 12,573 $ 12,949 (3)%Income taxes 862 1,394 (38) 2,890 4,096 (29)Income from continuing operations $ 3,117 $ 3,062 2 % $ 9,683 $ 8,853 9 %Noncontrolling interests (6) 14 NM 21 47 (55)Net income $ 3,123 $ 3,048 2 % $ 9,662 $ 8,806 10 %EOP assets (in billions of dollars) $ 1,404 $ 1,370 2 %Average assets (in billions of dollars) 1,402 1,369 2 $ 1,399 $ 1,349 4 %Return on average assets 0.88% 0.88% 0.92% 0.87%Efficiency ratio 56 54 56 55Revenues by regionNorth America $ 3,329 $ 3,709 (10)% $ 10,105 $ 10,877 (7)%EMEA 2,927 2,703 8 9,137 8,438 8Latin America 1,055 1,099 (4) 3,427 3,354 2Asia 1,930 1,919 1 6,111 5,501 11Total $ 9,241 $ 9,430 (2)% $ 28,780 $ 28,170 2 %Income from continuing operations by region North America $ 870 $ 1,298 (33)% $ 2,755 $ 3,463 (20)%EMEA 972 753 29 3,072 2,401 28Latin America 541 388 39 1,546 1,211 28Asia 734 623 18 2,310 1,778 30Total $ 3,117 $ 3,062 2 % $ 9,683 $ 8,853 9 %Average loans by region (in billions of dollars) North America $ 166 $ 152 9 % $ 164 $ 149 10 %EMEA 82 71 15 80 68 18Latin America 33 34 (3) 33 34 (3)Asia 65 64 2 67 61 10Total $ 346 $ 321 8 % $ 344 $ 312 10 %EOP deposits by business (in billions of dollars)
Treasury and trade solutions $ 470 $ 428 10 %All other ICG businesses 215 212 1Total $ 685 $ 640 7 %
(1) Third quarter of 2017 includes an approximate $580 million gain on the sale of a fixed income analytics business.NM Not meaningful
20
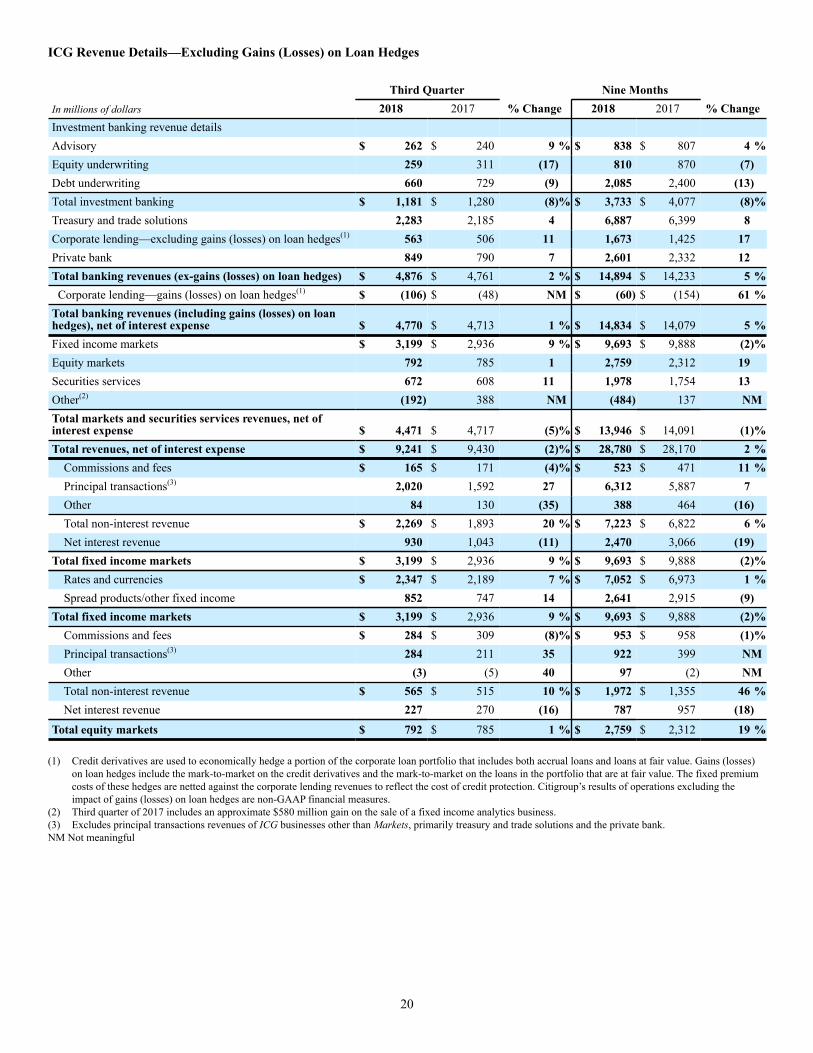
ICG Revenue Details—Excluding Gains (Losses) on Loan Hedges
Third Quarter Nine Months% ChangeIn millions of dollars 2018 2017 % Change 2018 2017
Investment banking revenue detailsAdvisory $ 262 $ 240 9 % $ 838 $ 807 4 %Equity underwriting 259 311 (17) 810 870 (7)Debt underwriting 660 729 (9) 2,085 2,400 (13)Total investment banking $ 1,181 $ 1,280 (8)% $ 3,733 $ 4,077 (8)%Treasury and trade solutions 2,283 2,185 4 6,887 6,399 8Corporate lending—excluding gains (losses) on loan hedges(1) 563 506 11 1,673 1,425 17Private bank 849 790 7 2,601 2,332 12Total banking revenues (ex-gains (losses) on loan hedges) $ 4,876 $ 4,761 2 % $ 14,894 $ 14,233 5 %Corporate lending—gains (losses) on loan hedges(1) $ (106) $ (48) NM $ (60) $ (154) 61 %
Total banking revenues (including gains (losses) on loanhedges), net of interest expense $ 4,770 $ 4,713 1 % $ 14,834 $ 14,079 5 %Fixed income markets $ 3,199 $ 2,936 9 % $ 9,693 $ 9,888 (2)%Equity markets 792 785 1 2,759 2,312 19Securities services 672 608 11 1,978 1,754 13Other(2) (192) 388 NM (484) 137 NMTotal markets and securities services revenues, net ofinterest expense $ 4,471 $ 4,717 (5)% $ 13,946 $ 14,091 (1)%Total revenues, net of interest expense $ 9,241 $ 9,430 (2)% $ 28,780 $ 28,170 2 % Commissions and fees $ 165 $ 171 (4)% $ 523 $ 471 11 % Principal transactions(3) 2,020 1,592 27 6,312 5,887 7 Other 84 130 (35) 388 464 (16) Total non-interest revenue $ 2,269 $ 1,893 20 % $ 7,223 $ 6,822 6 % Net interest revenue 930 1,043 (11) 2,470 3,066 (19)Total fixed income markets $ 3,199 $ 2,936 9 % $ 9,693 $ 9,888 (2)% Rates and currencies $ 2,347 $ 2,189 7 % $ 7,052 $ 6,973 1 % Spread products/other fixed income 852 747 14 2,641 2,915 (9)Total fixed income markets $ 3,199 $ 2,936 9 % $ 9,693 $ 9,888 (2)% Commissions and fees $ 284 $ 309 (8)% $ 953 $ 958 (1)% Principal transactions(3) 284 211 35 922 399 NM Other (3) (5) 40 97 (2) NM Total non-interest revenue $ 565 $ 515 10 % $ 1,972 $ 1,355 46 % Net interest revenue 227 270 (16) 787 957 (18)
Total equity markets $ 792 $ 785 1 % $ 2,759 $ 2,312 19 %
(1) Credit derivatives are used to economically hedge a portion of the corporate loan portfolio that includes both accrual loans and loans at fair value. Gains (losses) on loan hedges include the mark-to-market on the credit derivatives and the mark-to-market on the loans in the portfolio that are at fair value. The fixed premium costs of these hedges are netted against the corporate lending revenues to reflect the cost of credit protection. Citigroup’s results of operations excluding the impact of gains (losses) on loan hedges are non-GAAP financial measures.
(2) Third quarter of 2017 includes an approximate $580 million gain on the sale of a fixed income analytics business.(3) Excludes principal transactions revenues of ICG businesses other than Markets, primarily treasury and trade solutions and the private bank.NM Not meaningful

21
3Q18 vs. 3Q17 Net income increased 2%, driven primarily by a lower effective tax rate due to Tax Reform, which more than offset lower revenues, higher cost of credit and expenses.
• Revenues decreased 2%, as a 1% increase in Banking revenues was more than offset by a 5% decrease in Markets and securities services, reflecting the impact of the approximate $580 million gain on sale of a fixed income analytics business in the prior-year period. Excluding the gain on sale in the prior-year period, revenues were up 4%, driven by higher revenues in both Banking and Markets and securities services. The increase in Banking revenues was driven by improved performance in treasury and trade solutions and the private bank, partially offset by a decline in investment banking. Excluding the gain on sale, Markets and securities services revenues increased 8%, driven by higher revenues in fixed income markets and securities services.
Within Banking:
• Investment banking revenues declined 8%, driven by a drop in market wallet across all major products. Advisory revenues increased 9%, reflecting strong performance in North America. Equity underwriting revenues decreased 17%, driven by lower market wallet as well as a decline in market share. Debt underwriting revenues decreased 9%, due to the decline in market wallet despite gaining market share.
• Treasury and trade solutions revenues increased 4%. Excluding the impact of FX translation, revenues increased 8%, reflecting strength in all regions. Revenue growth in the cash business was primarily driven by continued growth in deposit balances and improved deposit spreads, as well as higher transaction volumes from both new and existing clients. Trade revenues were largely unchanged, as loan growth was offset by the tightening of loan spreads and lower episodic fees. Average deposit balances increased 7% (8% excluding the impact of FX translation), with strong growth in deposits across all regions. Average loans increased 3% (4% excluding the impact of FX translation), driven by EMEA and Latin America.
• Corporate lending revenues of $457 million were largely unchanged. Excluding the losses on loan hedges, revenues increased 11%, driven by lower hedging cost and higher loan volumes. Average loans increased 8% versus the prior-year period.
• Private bank revenues increased 7%, driven by North America and EMEA, reflecting higher deposit spreads, an increase in loans and higher managed investments revenues due to strong client activity.
Within Markets and securities services:
• Fixed income markets revenues increased 9%, driven by higher revenues in EMEA and North America. The increase in revenues was largely due to higher non-interest revenue (an increase of 20%) in rates and
currencies as well as spread products and other fixed income, partially offset by lower net interest revenue, mainly reflecting a change in the mix of trading positions in support of client activity as well as higher funding costs, given the higher interest rate environment. The increase in non-interest revenues was driven by higher principal transaction revenues (increase of 27%), primarily in rates and currencies, reflecting higher client activity and facilitation gains.
Rates and currencies revenues increased 7%, driven by higher G10 rates and G10 FX revenues in all regions, reflecting strength in corporate client activity, as well as benefiting from a continuation of volatility in the FX markets.
Spread products and other fixed income revenues increased 14%, primarily due to a comparison to a weak prior-year period, particularly in North America and EMEA.
• Equity markets revenues increased 1%, as growth in equity derivatives and prime finance was partially offset by lower cash equities revenues. Equity derivatives and prime finance revenues increased in EMEA, North America and Asia, driven by higher investor client activity and higher client balances. Cash equities revenues decreased across regions, reflecting a more challenging trading environment and lower commissions, as well as comparison to a strong prior-year period. Principal transactions revenues increased 35%, partially offset by a decrease in net interest revenue, mainly reflecting a change in the mix of trading positions in support of client activity.
• Securities services revenues increased 11%. Excluding the impact of FX translation, revenues increased 15%, reflecting growth in all regions. The increase in revenues was driven by higher fee revenues, reflecting growth in both client volumes and assets under custody, as well as higher net interest revenue driven by higher deposit volume and higher interest rates.
Expenses increased 1%, driven by an increase in compensation costs, volume-related expenses and investments, partially offset by efficiency savings and a benefit from FX translation.
Provisions increased $235 million to $71 million, driven by higher provisions for unfunded lending commitments (up $211 million) and a higher net loan loss reserve build (up $45 million), partially offset by lower net credit losses (down $21 million). The increase in provisions was largely driven by volume-related reserve builds and an absence of a large release in the prior-year period.

22
2018 YTD vs. 2017 YTDNet income increased 10%, primarily driven by higher revenues and a lower effective tax rate due to the impact of Tax Reform, partially offset by higher expenses and higher credit costs.
• Revenues increased 2%, driven by a 5% increase in Banking revenues, partially offset by a 1% decrease in Markets and securities services revenues. Excluding the gain on sale in the prior-year period, revenues increased 4%, reflecting higher revenues in both Banking (increase of 5%) and Markets and securities services (increase of 3%).
Within Banking:
• Investment banking revenues declined 8%, due to a decline in market wallet across all major products as well as a particularly strong performance in the prior-year period. Advisory revenues increased 4%, reflecting gains in wallet share despite a decline in the overall market wallet. Equity underwriting revenues declined 7%, driven by the decline in market wallet. Debt underwriting revenues declined 13%, driven by the decline in market wallet as well as a decline in wallet share.
• Treasury and trade solutions revenues increased 8%, reflecting growth across both net interest and fee income, driven by continued growth in deposit and loan volumes, improved deposit spreads and strong fee growth across most cash products.
• Corporate lending revenues increased 27%. Excluding the impact of losses on loan hedges, revenues increased 17%, driven by the same factors described above. Average loans increased 10% versus the prior-year period.
• Private bank revenues increased 12%, driven by strong client activity across all regions. The increase in revenues reflected higher deposit spreads, an increase in loans, higher managed investments revenues and increased capital markets activity.
Within Markets and securities services:
• Fixed income markets revenues decreased 2%, primarily due to lower revenues in North America, Asia and Latin America. Rates and currencies revenues increased 1%, driven by higher G10 FX revenues that benefited from the return of volatility in the FX markets, as well as strong corporate and investor client activity. This increase was partially offset by lower G10 rates revenues due to lower client activity, as well as a comparison to a strong prior-year period, primarily in EMEA. Spread products and other fixed income revenues decreased 9%, primarily in North America, largely due to lower investor client activity, reflecting the more challenging market environment and a comparison to a strong prior-year period.
• Equity markets revenues increased 19%, reflecting strength in Asia, North America and EMEA, due to growth in equity derivatives and prime finance, driven by a more favorable operating environment with higher
market volatility and increased investor and corporate client activity, as well as higher client balances.
• Securities services revenues increased 13%, driven by the same factors described above.
Expenses increased 4%, driven by the same factors described above.
Provisions increased $337 million to $55 million, primarily due to volume-related reserve builds for both funded loans and unfunded lending commitments, and a lower loan loss reserve release as compared to the prior-year period.

23
CORPORATE/OTHER
Corporate/Other includes certain unallocated costs of global staff functions (including finance, risk, human resources, legal and compliance), other corporate expenses and unallocated global operations and technology expenses and income taxes, as well as Corporate Treasury, certain North America legacy consumer loan portfolios, other legacy assets and discontinued operations (for additional information on Corporate/Other, see “Citigroup Segments” above). At September 30, 2018, Corporate/Other had $94 billion in assets, down $6 billion year-over-year.
Third Quarter Nine Months% ChangeIn millions of dollars 2018 2017 % Change 2018 2017
Net interest revenue $ 554 $ 516 7 % $ 1,645 $ 1,571 5 %Non-interest revenue (60) 3 NM (32) 810 NMTotal revenues, net of interest expense $ 494 $ 519 (5)% $ 1,613 $ 2,381 (32)%Total operating expenses $ 459 $ 827 (44)% $ 1,799 $ 2,957 (39)%Net credit losses $ 19 $ 29 (34)% $ 24 $ 134 (82)%Credit reserve build (release) (43) (79) 46 (171) (268) 36Provision (release) for unfunded lending commitments (5) — — (6) 3 NMProvision for benefits and claims (1) — NM (2) 1 NMProvisions for credit losses and for benefits and claims $ (30) $ (50) 40 % $ (155) $ (130) (19)%Income (loss) from continuing operations before taxes $ 65 $ (258) NM $ (31) $ (446) 93 %Income taxes (benefits) 116 (163) NM 109 (435) NMIncome (loss) from continuing operations $ (51) $ (95) 46 % $ (140) $ (11) NMIncome (loss) from discontinued operations, net of taxes (8) (5) (60) — (2) 100 %Net income (loss) before attribution of noncontrollinginterests $ (59) $ (100) 41 % $ (140) $ (13) NMNoncontrolling interests 8 (17) NM 26 (13) NMNet income (loss) $ (67) $ (83) 19 % $ (166) $ — — %
NM Not meaningful
3Q18 vs. 3Q17 The net loss was $67 million, compared to a net loss of $83 million in the prior-year period. The lower net loss was largely driven by lower expenses, partially offset by higher taxes and a lower net loan loss reserve release.
Revenues decreased 5%, driven by the continued wind-down of legacy assets.
Expenses decreased 44%, primarily driven by the wind-down of legacy assets as well as lower infrastructure costs.
Provisions increased $20 million to a net benefit of $30 million, as lower net credit losses were more than offset by a lower net loan loss reserve release. The decline in net credit losses reflected the impact of ongoing divestiture activity, including the impact of the continued wind-down in the legacy North America mortgage portfolio.
2018 YTD vs. 2017 YTDThe net loss was $166 million, compared to $0 net income in the prior-year period, reflecting lower revenues and higher taxes, partially offset by lower expenses and a higher net benefit from credit.
Revenues decreased 32%, primarily driven by the same factors described above.
Expenses decreased 39%, driven by the same factors described above, as well as lower legal costs.
Provisions decreased $25 million to a net benefit of $155 million, driven by lower net credit losses, partially offset by a lower net loan loss reserve release. Net credit losses declined 82% to $24 million, driven by the same factors described above.

24
OFF-BALANCE SHEET ARRANGEMENTS
The table below shows where a discussion of Citi’s various off-balance sheet arrangements in this Form 10-Q may be found. For additional information, see “Off-Balance Sheet Arrangements” and Notes 1, 21 and 26 to the Consolidated Financial Statements in Citigroup’s 2017 Annual Report on Form 10-K.
Types of Off-Balance Sheet Arrangements Disclosures in this Form 10-Q
Variable interests and otherobligations, including contingentobligations, arising fromvariable interests innonconsolidated VIEs
See Note 18 to the ConsolidatedFinancial Statements.
Letters of credit, and lendingand other commitments
See Note 22 to the ConsolidatedFinancial Statements.
Guarantees See Note 22 to the ConsolidatedFinancial Statements.

25
CAPITAL RESOURCES
Overview Capital is used principally to support assets in Citi’s businesses and to absorb credit, market and operational losses. Citi primarily generates capital through earnings from its operating businesses. Citi may augment its capital through issuances of common stock, noncumulative perpetual preferred stock and equity issued through awards under employee benefit plans, among other issuances. Further, Citi’s capital levels may also be affected by changes in accounting and regulatory standards, as well as U.S. corporate tax laws and the impact of future events on Citi’s business results, such as changes in interest and foreign exchange rates, as well as business and asset dispositions.
During the third quarter of 2018, Citi returned a total of $6.4 billion of capital to common shareholders in the form of share repurchases (approximately 75 million common shares) and dividends.
Capital ManagementCiti’s capital management framework is designed to ensure that Citigroup and its principal subsidiaries maintain sufficient capital consistent with each entity’s respective risk profile, management targets and all applicable regulatory standards and guidelines. Based on Citigroup’s current regulatory capital requirements, as well as consideration of potential future changes to the U.S. Basel III rules, management currently believes that a targeted Common Equity Tier 1 Capital ratio of approximately 11.5% represents the amount necessary to prudently operate and invest in Citi’s franchise, including when considering future growth plans, capital return projections and other factors that may impact Citi’s businesses. However, management may revise Citigroup’s targeted Common Equity Tier 1 Capital ratio in response to changing regulatory capital requirements as well as other relevant factors. For additional information regarding Citi’s capital management, see “Capital Resources—Capital Management” in Citigroup’s 2017 Annual Report on Form 10-K.
Stress Testing Component of Capital Planning Citi is subject to an annual assessment by the Federal Reserve Board as to whether Citigroup has effective capital planning processes as well as sufficient regulatory capital to absorb losses during stressful economic and financial conditions, while also meeting obligations to creditors and counterparties and continuing to serve as a credit intermediary. This annual assessment includes two related programs: the Comprehensive Capital Analysis and Review (CCAR) and Dodd-Frank Act Stress Testing (DFAST). For additional information regarding the stress testing component of capital planning, see “Forward-Looking Statements” below and “Capital Resources—Current Regulatory Capital Standards—Stress Testing Component of Capital Planning” and “Risk Factors—Strategic Risks”
in Citigroup’s 2017 Annual Report on Form 10-K. For additional information regarding a recent proposed rulemaking and other potential changes in Citi’s regulatory capital requirements and future CCAR processes, see “Regulatory Capital Standards Developments” in the First Quarter of 2018 Form 10-Q.
Current Regulatory Capital StandardsCiti is subject to regulatory capital standards issued by the Federal Reserve Board, which constitute the U.S. Basel III rules. These rules establish an integrated capital adequacy framework, encompassing both risk-based capital ratios and leverage ratios. For additional information regarding the risk-based capital ratios, Tier 1 Leverage ratio and Supplementary Leverage ratio, see “Capital Resources—Current Regulatory Capital Standards” in Citigroup’s 2017 Annual Report on Form 10-K.
GSIB SurchargeThe Federal Reserve Board also adopted a rule that imposes a risk-based capital surcharge upon U.S. GSIBs, including Citi. Citi’s GSIB surcharge effective for 2018 remains unchanged from 2017 at 3.0%. For additional information regarding the identification of a GSIB and the methodology for annually determining the GSIB surcharge, see “Capital Resources—Current Regulatory Capital Standards—GSIB Surcharge” in Citigroup’s 2017 Annual Report on Form 10-K.
Transition ProvisionsThe U.S. Basel III rules contain several differing, largely multi-year transition provisions (i.e., “phase-ins” and “phase-outs”). Moreover, the GSIB surcharge, Capital Conservation Buffer, and any Countercyclical Capital Buffer (currently 0%), commenced phase-in on January 1, 2016, becoming fully effective on January 1, 2019. With the exception of the non-grandfathered trust preferred securities, which do not fully phase-out until January 1, 2022, and the capital buffers and GSIB surcharge, which do not fully phase-in until January 1, 2019, all other transition provisions are entirely reflected in Citi’s regulatory capital ratios beginning January 1, 2018. Accordingly, commencing with the first quarter of 2018, Citi is presenting a single set of regulatory capital components and ratios, reflecting current regulatory capital standards in effect throughout 2018. Citi previously disclosed its Basel III risk-based capital and leverage ratios and related components reflecting Basel III Transition Arrangements with respect to regulatory capital adjustments and deductions, as well as Full Implementation, in Citi’s 2017 Annual Report on Form 10-K and Quarterly Reports on Form 10-Q; however, beginning January 1, 2018, that distinction is no longer relevant.
For additional information regarding the transition provisions under the U.S. Basel III rules, including with respect to the GSIB surcharge, see “Capital Resources—

26
Current Regulatory Capital Standards—Transition Provisions” in Citigroup’s 2017 Annual Report on Form 10-K. For information regarding Citigroup’s capital resources reflecting Basel III Transition Arrangements as of December 31, 2017, see “Capital Resources—Current Regulatory Capital Standards—Citigroup’s Capital Resources Under Current Regulatory Standards” in Citigroup’s 2017 Annual Report on Form 10-K.
Citigroup’s Capital Resources Citi is required to maintain stated minimum Common Equity Tier 1 Capital, Tier 1 Capital and Total Capital ratios of 4.5%, 6.0% and 8.0%, respectively.
Citi’s effective minimum Common Equity Tier 1 Capital, Tier 1 Capital and Total Capital ratios during 2018, inclusive of the 75% phase-in of both the 2.5% Capital Conservation Buffer and the 3.0% GSIB surcharge (all of which is to be composed of Common Equity Tier 1 Capital), are 8.625%, 10.125% and 12.125%, respectively. Citi’s effective minimum Common Equity Tier 1 Capital, Tier 1 Capital and Total Capital ratios during 2017, inclusive of the 50% phase-in of both the 2.5% Capital Conservation Buffer and the 3.0% GSIB surcharge (all of which is to be composed of Common Equity Tier 1 Capital), were 7.25%, 8.75% and 10.75%, respectively.
Citi currently estimates that its effective minimum Common Equity Tier 1 Capital, Tier 1 Capital and Total Capital ratio requirements during 2019, inclusive of the 2.5% Capital Conservation Buffer and the Countercyclical Capital Buffer at its current level of 0%, as well as a 3.0% GSIB surcharge, may be 10.0%, 11.5% and 13.5%, respectively.
Furthermore, to be “well capitalized” under current federal bank regulatory agency definitions, a bank holdingcompany must have a Tier 1 Capital ratio of at least 6.0%, a Total Capital ratio of at least 10.0%, and not be subject to a Federal Reserve Board directive to maintain higher capital levels.
Under the U.S. Basel III rules, Citi must comply with a 4.0% minimum Tier 1 Leverage ratio requirement. Effective January 1, 2018, Citi must also comply with an effective 5.0% minimum Supplementary Leverage ratio requirement.
The following tables set forth the capital tiers, total risk-weighted assets and underlying risk components, risk-based capital ratios, quarterly adjusted average total assets, Total Leverage Exposure and leverage ratios for Citi as of September 30, 2018 and December 31, 2017.
Citigroup Capital Components and Ratios
September 30, 2018 December 31, 2017
In millions of dollars, except ratiosAdvanced
ApproachesStandardized
ApproachAdvanced
ApproachesStandardized
ApproachCommon Equity Tier 1 Capital $ 140,428 $ 140,428 $ 142,822 $ 142,822Tier 1 Capital 159,877 159,877 162,377 162,377Total Capital (Tier 1 Capital + Tier 2 Capital) 184,623 196,808 187,877 199,989Total Risk-Weighted Assets 1,155,188 1,196,923 1,152,644 1,155,099 Credit Risk $ 769,942 $ 1,126,869 $ 767,102 $ 1,089,372 Market Risk 68,647 70,054 65,003 65,727 Operational Risk 316,599 — 320,539 —Common Equity Tier 1 Capital ratio(1)(2) 12.16% 11.73% 12.39% 12.36%Tier 1 Capital ratio(1)(2) 13.84 13.36 14.09 14.06Total Capital ratio(1)(2) 15.98 16.44 16.30 17.31
In millions of dollars, except ratios September 30, 2018 December 31, 2017
Quarterly Adjusted Average Total Assets(3) $ 1,882,493 $ 1,868,326
Total Leverage Exposure(4) 2,459,993 2,432,491
Tier 1 Leverage ratio(2) 8.49% 8.69%
Supplementary Leverage ratio(2) 6.50 6.68
(1) As of September 30, 2018 and December 31, 2017, Citi’s reportable Common Equity Tier 1 Capital and Tier 1 Capital ratios were the lower derived under the Basel III Standardized Approach, whereas the reportable Total Capital ratio was the lower derived under the Basel III Advanced Approaches framework.
(2) Citi’s risk-based capital and leverage ratios and related components as of December 31, 2017 are non-GAAP financial measures, which reflect full implementation of regulatory capital adjustments and deductions prior to the effective date of January 1, 2018.
(3) Tier 1 Leverage ratio denominator. (4) Supplementary Leverage ratio denominator.
27
As indicated in the table above, Citigroup’s risk-based capital ratios at September 30, 2018 were in excess of the stated and effective minimum requirements under the U.S. Basel III rules. In addition, Citi was also “well capitalized” under current federal bank regulatory agency definitions as of September 30, 2018.
Common Equity Tier 1 Capital Ratio Citi’s Common Equity Tier 1 Capital ratio was 11.7% at September 30, 2018, compared to 12.1% at June 30, 2018 and 12.4% at December 31, 2017. The ratio decreased from the second quarter of 2018 primarily due to the return of $6.4 billion of capital to common shareholders, increases in credit and market risk-weighted assets, and adverse net movements in Accumulated other comprehensive income (AOCI), partially offset by quarterly net income of $4.6 billion. Citi’s Common Equity Tier 1 Capital ratio declined from year-end 2017 primarily due to the return of $12.6 billion of capital to common shareholders, increases in credit and market risk-weighted assets, and adverse net movements in AOCI, partially offset by year-to-date net income of $13.7 billion.

28
Components of Citigroup Capital
In millions of dollarsSeptember 30,
2018December 31,
2017Common Equity Tier 1 CapitalCitigroup common stockholders’ equity(1) $ 178,153 $ 181,671Add: Qualifying noncontrolling interests 148 153Regulatory Capital Adjustments and Deductions:Less: Accumulated net unrealized losses on cash flow hedges, net of tax(2) (1,095) (698)Less: Cumulative unrealized net loss related to changes in fair value of financial liabilities attributable to own creditworthiness, net of tax(3) (503) (721)Less: Intangible assets:
Goodwill, net of related DTLs(4) 21,891 22,052Identifiable intangible assets other than MSRs, net of related DTLs 4,304 4,401
Less: Defined benefit pension plan net assets 931 896Less: DTAs arising from net operating loss, foreign tax credit and general business credit carry-forwards(5) 12,345 13,072Total Common Equity Tier 1 Capital (Standardized Approach and Advanced Approaches) $ 140,428 $ 142,822Additional Tier 1 CapitalQualifying noncumulative perpetual preferred stock(1) $ 18,851 $ 19,069Qualifying trust preferred securities(6) 1,382 1,377Qualifying noncontrolling interests 56 61Regulatory Capital Deductions:Less: Permitted ownership interests in covered funds(7) 795 900Less: Minimum regulatory capital requirements of insurance underwriting subsidiaries(8) 45 52Total Additional Tier 1 Capital (Standardized Approach and Advanced Approaches) $ 19,449 $ 19,555Total Tier 1 Capital (Common Equity Tier 1 Capital + Additional Tier 1 Capital) (Standardized Approach and Advanced Approaches) $ 159,877 $ 162,377Tier 2 CapitalQualifying subordinated debt $ 22,948 $ 23,673Qualifying trust preferred securities(9) 324 329Qualifying noncontrolling interests 48 50Eligible allowance for credit losses(10) 13,656 13,612Regulatory Capital Deduction:Less: Minimum regulatory capital requirements of insurance underwriting subsidiaries(8) 45 52Total Tier 2 Capital (Standardized Approach) $ 36,931 $ 37,612Total Capital (Tier 1 Capital + Tier 2 Capital) (Standardized Approach) $ 196,808 $ 199,989Adjustment for excess of eligible credit reserves over expected credit losses(10) $ (12,185) $ (12,112)Total Tier 2 Capital (Advanced Approaches) $ 24,746 $ 25,500Total Capital (Tier 1 Capital + Tier 2 Capital) (Advanced Approaches) $ 184,623 $ 187,877
(1) Issuance costs of $184 million related to noncumulative perpetual preferred stock outstanding at September 30, 2018 and December 31, 2017 are excluded from common stockholders’ equity and netted against such preferred stock in accordance with Federal Reserve Board regulatory reporting requirements, which differ from those under U.S. GAAP.
(2) Common Equity Tier 1 Capital is adjusted for accumulated net unrealized gains (losses) on cash flow hedges included in AOCI that relate to the hedging of items not recognized at fair value on the balance sheet.
(3) The cumulative impact of changes in Citigroup’s own creditworthiness in valuing liabilities for which the fair value option has been elected, and own-credit valuation adjustments on derivatives, are excluded from Common Equity Tier 1 Capital, in accordance with the U.S. Basel III rules.
(4) Includes goodwill “embedded” in the valuation of significant common stock investments in unconsolidated financial institutions.
Footnotes continue on the following page.

29
(5) Of Citi’s $23.0 billion of net DTAs at September 30, 2018, $11.4 billion were includable in Common Equity Tier 1 Capital pursuant to the U.S. Basel III rules, while $11.6 billion were excluded. Excluded from Citi’s Common Equity Tier 1 Capital as of September 30, 2018 was $12.3 billion of net DTAs arising from net operating loss, foreign tax credit and general business credit carry-forwards, which was reduced by $0.7 billion of net DTLs primarily associated with goodwill and certain other intangible assets. Separately, under the U.S. Basel III rules, goodwill and these other intangible assets are deducted net of associated DTLs in arriving at Common Equity Tier 1 Capital. DTAs arising from net operating loss, foreign tax credit and general business credit carry-forwards are required to be entirely deducted from Common Equity Tier 1 Capital under the U.S. Basel III rules. Commencing on December 31, 2017, Citi’s DTAs arising from temporary differences were less than the 10% limitation under the U.S. Basel III rules and therefore not subject to deduction from Common Equity Tier 1 Capital, but are subject to risk-weighting at 250%.
(6) Represents Citigroup Capital XIII trust preferred securities, which are permanently grandfathered as Tier 1 Capital under the U.S. Basel III rules. (7) Banking entities are required to be in compliance with the Volcker Rule of the Dodd-Frank Act, which prohibits conducting certain proprietary investment
activities and limits their ownership of, and relationships with, covered funds. Accordingly, Citi is required by the Volcker Rule to deduct from Tier 1 Capital all permitted ownership interests in covered funds that were acquired after December 31, 2013.
(8) 50% of the minimum regulatory capital requirements of insurance underwriting subsidiaries must be deducted from each of Tier 1 Capital and Tier 2 Capital.
(9) Represents the amount of non-grandfathered trust preferred securities eligible for inclusion in Tier 2 Capital under the U.S. Basel III rules, which will be fully phased-out of Tier 2 Capital by January 1, 2022.
(10) Under the Standardized Approach, the allowance for credit losses is eligible for inclusion in Tier 2 Capital up to 1.25% of credit risk-weighted assets, with any excess allowance for credit losses being deducted in arriving at credit risk-weighted assets, which differs from the Advanced Approaches framework, in which eligible credit reserves that exceed expected credit losses are eligible for inclusion in Tier 2 Capital to the extent the excess reserves do not exceed 0.6% of credit risk-weighted assets. The total amount of eligible credit reserves in excess of expected credit losses that were eligible for inclusion in Tier 2 Capital, subject to limitation, under the Advanced Approaches framework was $1.5 billion at both September 30, 2018 and December 31, 2017.

30
Citigroup Capital Rollforward
In millions of dollarsThree Months Ended September 30, 2018
Nine Months Ended September 30, 2018
Common Equity Tier 1 Capital, beginning of period $ 142,868 $ 142,822Net income 4,622 13,732Common and preferred stock dividends declared (1,397) (3,637)Net increase in treasury stock (5,265) (9,369)Net change in common stock and additional paid-in capital 98 (184)Net increase in foreign currency translation losses net of hedges, net of tax (221) (1,968)Net increase in unrealized losses on debt securities AFS, net of tax (605) (2,164)Net decrease in defined benefit plans liability adjustment, net of tax 26 415Net change in adjustment related to changes in fair value of financial liabilities attributable to own creditworthiness, net of tax 54 (59)Net change in ASC 815—excluded component of fair value hedges 10 (22)Net change in goodwill, net of related DTLs (82) 161Net decrease in identifiable intangible assets other than MSRs, net of related DTLs 157 97Net increase in defined benefit pension plan net assets (49) (35)Net decrease in DTAs arising from net operating loss, foreign tax credit and general business credit carry-forwards 206 727Other 6 (88)Net decrease in Common Equity Tier 1 Capital $ (2,440) $ (2,394)Common Equity Tier 1 Capital, end of period (Standardized Approach and Advanced Approaches) $ 140,428 $ 140,428Additional Tier 1 Capital, beginning of period $ 19,134 $ 19,555Net decrease in qualifying perpetual preferred stock — (218)Net increase in qualifying trust preferred securities 2 5Net decrease in permitted ownership interests in covered funds 314 105Other (1) 2Net change in Additional Tier 1 Capital $ 315 $ (106)Tier 1 Capital, end of period (Standardized Approach and Advanced Approaches) $ 159,877 $ 159,877Tier 2 Capital, beginning of period (Standardized Approach) $ 36,962 $ 37,612Net decrease in qualifying subordinated debt (286) (725)Net increase in eligible allowance for credit losses 253 44Other 2 —Net decrease in Tier 2 Capital (Standardized Approach) $ (31) $ (681)Tier 2 Capital, end of period (Standardized Approach) $ 36,931 $ 36,931Total Capital, end of period (Standardized Approach) $ 196,808 $ 196,808Tier 2 Capital, beginning of period (Advanced Approaches) $ 25,238 $ 25,500Net decrease in qualifying subordinated debt (286) (725)Net decrease in excess of eligible credit reserves over expected credit losses (208) (29)Other 2 —Net decrease in Tier 2 Capital (Advanced Approaches) $ (492) $ (754)Tier 2 Capital, end of period (Advanced Approaches) $ 24,746 $ 24,746Total Capital, end of period (Advanced Approaches) $ 184,623 $ 184,623

31
Citigroup Risk-Weighted Assets Rollforward (Basel III Standardized Approach)
In millions of dollarsThree Months Ended September 30, 2018
Nine Months Ended September 30, 2018
Total Risk-Weighted Assets, beginning of period $ 1,176,863 $ 1,155,099Changes in Credit Risk-Weighted AssetsNet increase in general credit risk exposures(1) 2,730 2,715Net increase in repo-style transactions(2) 3,761 5,621Net decrease in securitization exposures (1,078) (232)Net increase in equity exposures 1,139 2,679Net increase in over-the-counter (OTC) derivatives(3) 7,489 18,213Net change in other exposures(4) (321) 1,999Net increase in off-balance sheet exposures(5) 266 6,502Net increase in Credit Risk-Weighted Assets $ 13,986 $ 37,497Changes in Market Risk-Weighted AssetsNet increase in risk levels(6) $ 5,673 $ 11,603Net change due to model and methodology updates(7) 401 (7,276)Net increase in Market Risk-Weighted Assets $ 6,074 $ 4,327Total Risk-Weighted Assets, end of period $ 1,196,923 $ 1,196,923
(1) General credit risk exposures include cash and balances due from depository institutions, securities, and loans and leases. General credit risk exposures increased during the three and nine months ended September 30, 2018, driven by growth in corporate loans.
(2) Repo-style transactions include repurchase and reverse repurchase transactions as well as securities borrowing and securities lending transactions. (3) OTC derivatives increased during the three and nine months ended September 30, 2018, primarily due to increased notional amounts for bilateral trades.(4) Other exposures include cleared transactions, unsettled transactions and other assets. Other exposures increased during the nine months ended
September 30, 2018, primarily due to additional DTAs arising from temporary differences, which are subject to risk-weighting at 250%.(5) Off-balance sheet exposures increased during the nine months ended September 30, 2018, primarily due to an increase in commitments to extend credit that
will drive future corporate loan growth.(6) Risk levels increased during the three months ended September 30, 2018 primarily due to an increase in positions subject to specific risk charges, partially
offset by decreases in exposure levels subject to Stressed Value at Risk. Risk levels increased during the nine months ended September 30, 2018 primarily due to an increase in positions subject to specific risk charges.
(7) Risk-weighted assets decreased during the nine months ended September 30, 2018 due to changes in model inputs regarding volatility and the correlation between market risk factors, as well as methodology changes for standard specific risk charges.

32
Citigroup Risk-Weighted Assets Rollforward (Basel III Advanced Approaches)
In millions of dollarsThree Months Ended September 30, 2018
Nine Months Ended September 30, 2018
Total Risk-Weighted Assets, beginning of period $ 1,147,865 $ 1,152,644Changes in Credit Risk-Weighted AssetsNet change in retail exposures(1) 2,293 (14,218)Net change in wholesale exposures(2) (2,519) 5,756Net increase in repo-style transactions(3) 98 1,394Net change in securitization exposures (637) 387Net increase in equity exposures 1,320 2,878Net change in over-the-counter (OTC) derivatives(4) (189) 1,754Net change in derivatives CVA(5) (1,415) 1,783Net increase in other exposures(6) 1,594 3,046Net increase in supervisory 6% multiplier(7) 118 60Net increase in Credit Risk-Weighted Assets $ 663 $ 2,840Changes in Market Risk-Weighted AssetsNet increase in risk levels(8) $ 5,159 $ 10,920Net change due to model and methodology updates(9) 401 (7,276)Net increase in Market Risk-Weighted Assets $ 5,560 $ 3,644Net change in Operational Risk-Weighted Assets(10) $ 1,100 $ (3,940)Total Risk-Weighted Assets, end of period $ 1,155,188 $ 1,155,188
(1) Retail exposures increased during the three months ended September 30, 2018, primarily due to new accounts and spending for qualifying revolving (cards) exposures. Retail exposures decreased during the nine months ended September 30, 2018, primarily due to net reductions in qualifying revolving (cards) exposures attributable to seasonal holiday spending repayments, as well as residential mortgage loan sales and repayments.
(2) Wholesale exposures decreased during the three months ended September 30, 2018 primarily due to decreases in commercial loans. Wholesale exposures increased during the nine months ended September 30, 2018, primarily due to increases in commercial loans and loan commitments.
(3) Repo-style transactions include repurchase and reverse repurchase transactions as well as securities borrowing and securities lending transactions. (4) OTC derivatives increased during the nine months ended September 30, 2018, primarily due to increases in potential future exposure and fair value.(5) Derivatives CVA decreased during the three months ended September 30, 2018, primarily due to decreases in exposures. Derivatives CVA increased during
the nine months ended September 30, 2018, primarily due to increased exposures and changes in credit spreads.(6) Other exposures include cleared transactions, unsettled transactions, assets other than those reportable in specific exposure categories and non-material
portfolios. Other exposures increased during the three months ended September 30, 2018, primarily due to an increase in other assets. Other exposures increased during the nine months ended September 30, 2018, primarily due to an increase in other assets and additional DTAs arising from temporary differences, which are subject to risk-weighting at 250%.
(7) Supervisory 6% multiplier does not apply to derivatives CVA. (8) Risk levels increased during the three months ended September 30, 2018 primarily due to an increase in positions subject to specific risk charges, partially
offset by decreases in exposure levels subject to Stressed Value at Risk. Risk levels increased during the nine months ended September 30, 2018 primarily due to an increase in positions subject to specific risk charges.
(9) Risk-weighted assets decreased during the nine months ended September 30, 2018 due to changes in model inputs regarding volatility and the correlation between market risk factors, as well as methodology changes for standard specific risk charges.
(10) Operational risk-weighted assets increased during the three months ended September 30, 2018, and decreased during the nine months ended September 30, 2018, primarily due to changes in operational loss severity and frequency.
As set forth in the table above, total risk-weighted assets under the Basel III Standardized Approach increased from year-end 2017 due to higher credit and market risk-weighted assets. The increase in credit risk-weighted assets was primarily due to increased OTC derivatives, corporate loan commitments and an increase in repo-style transactions.
Total risk-weighted assets under the Basel III Advanced Approaches increased from year-end 2017, as higher credit and market risk-weighted assets were partially offset by a decrease in operational risk-weighted assets. The increase in credit risk-weighted assets was primarily due to increases in commercial loans and loan commitments, increases in equity exposures, and additional temporary difference DTAs subject to risk weighting, partially offset
by a decline in retail exposures due to reductions in qualifying revolving (cards) exposures attributable to seasonal holiday spending repayments as well as residential mortgage loan sales and repayments. The decline in operational risk-weighted assets was primarily due to changes in operational loss severity and frequency.
Market risk-weighted assets increased under both the Basel III Standardized Approach and Basel III Advanced Approaches primarily due to increases in positions subject to specific risk charges, partially offset by changes in model inputs regarding volatility and the correlation between market risk factors, as well as methodology changes for standard specific risk charges.

33
Supplementary Leverage RatioAs set forth in the table below, Citigroup’s Supplementary Leverage ratio was 6.5% for the third quarter of 2018, compared to 6.6% for the second quarter of 2018 and 6.7% for the fourth quarter of 2017. The decline in the ratio quarter-over-quarter was principally driven by the return of $6.4 billion of capital to common shareholders as well as adverse net movements in AOCI, partially offset by quarterly net income of $4.6 billion. The ratio decreased from the fourth quarter of 2017, principally driven by the return of capital to common shareholders, adverse net
movements in AOCI and an increase in Total Leverage Exposure (TLE) primarily due to growth in average on-balance sheet assets and off-balance sheet commitments, partially offset by year-to-date net income. The following table sets forth Citi’s Supplementary Leverage ratio and related components for the three months ended September 30, 2018 and December 31, 2017.
Citigroup Basel III Supplementary Leverage Ratio and Related Components
In millions of dollars, except ratios September 30, 2018 December 31, 2017Tier 1 Capital $ 159,877 $ 162,377Total Leverage Exposure (TLE)
On-balance sheet assets(1) $ 1,922,804 $ 1,909,699Certain off-balance sheet exposures:(2)
Potential future exposure on derivative contracts 191,557 191,555 Effective notional of sold credit derivatives, net(3) 48,047 59,207 Counterparty credit risk for repo-style transactions(4) 22,732 27,005 Unconditionally cancellable commitments 69,794 67,644 Other off-balance sheet exposures 245,370 218,754
Total of certain off-balance sheet exposures $ 577,500 $ 564,165Less: Tier 1 Capital deductions 40,311 41,373Total Leverage Exposure $ 2,459,993 $ 2,432,491Supplementary Leverage ratio 6.50% 6.68%
(1) Represents the daily average of on-balance sheet assets for the quarter.(2) Represents the average of certain off-balance sheet exposures calculated as of the last day of each month in the quarter. (3) Under the U.S. Basel III rules, banking organizations are required to include in TLE the effective notional amount of sold credit derivatives, with netting of
exposures permitted if certain conditions are met. (4) Repo-style transactions include repurchase and reverse repurchase transactions as well as securities borrowing and securities lending transactions.

34
Capital Resources of Citigroup’s Subsidiary U.S. Depository Institutions Citigroup’s subsidiary U.S. depository institutions are also subject to regulatory capital standards issued by their respective primary federal bank regulatory agencies, which are similar to the standards of the Federal Reserve Board.
During 2018, Citi’s primary subsidiary U.S. depository institution, Citibank, N.A. (Citibank), is subject to effective minimum Common Equity Tier 1 Capital, Tier 1 Capital and Total Capital ratios, inclusive of the 75% phase-in of the 2.5% Capital Conservation Buffer, of 6.375%, 7.875% and 9.875%, respectively. Citibank’s effective minimum Common Equity Tier 1 Capital, Tier 1 Capital and Total Capital ratios during 2017, inclusive of the 50% phase-in of
the 2.5% Capital Conservation Buffer, were 5.75%, 7.25% and 9.25%, respectively. Citibank is required to maintain stated minimum Common Equity Tier 1 Capital, Tier 1 Capital and Total Capital ratios of 4.5%, 6.0% and 8.0%, respectively.
The following tables set forth the capital tiers, total risk-weighted assets and underlying risk components, risk-based capital ratios, quarterly adjusted average total assets, Total Leverage Exposure and leverage ratios for Citibank, Citi’s primary subsidiary U.S. depository institution, as of September 30, 2018 and December 31, 2017.
Citibank Capital Components and Ratios
September 30, 2018 December 31, 2017
In millions of dollars, except ratiosAdvanced
ApproachesStandardized
ApproachAdvanced
ApproachesStandardized
ApproachCommon Equity Tier 1 Capital $ 128,097 $ 128,097 $ 122,848 $ 122,848Tier 1 Capital 130,222 130,222 124,952 124,952Total Capital (Tier 1 Capital + Tier 2 Capital)(1) 143,471 154,081 138,008 148,946Total Risk-Weighted Assets 946,235 1,043,721 965,435 1,024,502 Credit Risk $ 667,549 $ 1,007,205 $ 674,659 $ 980,324 Market Risk 36,141 36,516 43,300 44,178 Operational Risk 242,545 — 247,476 —Common Equity Tier 1 Capital ratio(2)(3)(4) 13.54% 12.27% 12.72% 11.99%Tier 1 Capital ratio(2)(3)(4) 13.76 12.48 12.94 12.20Total Capital ratio(2)(3)(4) 15.16 14.76 14.29 14.54
In millions of dollars, except ratios September 30, 2018 December 31, 2017
Quarterly Adjusted Average Total Assets(5) $ 1,396,471 $ 1,401,187
Total Leverage Exposure(6) 1,920,675 1,900,641
Tier 1 Leverage ratio(2)(4) 9.33% 8.92%
Supplementary Leverage ratio(2)(4) 6.78 6.57
(1) Under the Advanced Approaches framework, eligible credit reserves that exceed expected credit losses are eligible for inclusion in Tier 2 Capital to the extent that the excess reserves do not exceed 0.6% of credit risk-weighted assets, which differs from the Standardized Approach in which the allowance for credit losses is eligible for inclusion in Tier 2 Capital up to 1.25% of credit risk-weighted assets, with any excess allowance for credit losses being deducted in arriving at credit risk-weighted assets.
(2) Citibank’s risk-based capital and leverage ratios and related components as of December 31, 2017 are non-GAAP financial measures, which reflect full implementation of regulatory capital adjustments and deductions prior to the effective date of January 1, 2018.
(3) As of September 30, 2018, Citibank’s reportable Common Equity Tier 1 Capital, Tier 1 Capital and Total Capital ratios were the lower derived under the Basel III Standardized Approach. As of December 31, 2017, Citibank’s reportable Common Equity Tier 1 Capital and Tier 1 Capital ratios were the lower derived under the Basel III Standardized Approach, whereas the reportable Total Capital ratio was the lower derived under the Basel III Advanced Approaches framework.
(4) Citibank must maintain minimum Common Equity Tier 1 Capital, Tier 1 Capital, Total Capital and Tier 1 Leverage ratios of 6.5%, 8.0%, 10.0% and 5.0%, respectively, to be considered “well capitalized” under the revised Prompt Corrective Action (PCA) regulations applicable to insured depository institutions as established by the U.S. Basel III rules. Effective January 1, 2018, Citibank must also maintain a minimum Supplementary Leverage ratio of 6.0% to be considered “well capitalized.” For additional information, see “Capital Resources—Current Regulatory Capital Standards—Prompt Corrective Action Framework” in Citigroup’s 2017 Annual Report on Form 10-K.
(5) Tier 1 Leverage ratio denominator. (6) Supplementary Leverage ratio denominator.
As indicated in the table above, Citibank’s capital ratios at September 30, 2018 were in excess of the stated and effective minimum requirements under the U.S.
Basel III rules. In addition, Citibank was also “well capitalized” as of September 30, 2018 under the revised PCA regulations.

35
Impact of Changes on Citigroup and Citibank Capital RatiosThe following tables present the estimated sensitivity of Citigroup’s and Citibank’s capital ratios to changes of $100 million in Common Equity Tier 1 Capital, Tier 1 Capital and Total Capital (numerator), and changes of $1 billion in Advanced Approaches and Standardized Approach risk-weighted assets and quarterly adjusted average total assets, as well as Total Leverage Exposure (denominator), as of September 30, 2018. This information is provided for the
purpose of analyzing the impact that a change in Citigroup’s or Citibank’s financial position or results of operations could have on these ratios. These sensitivities only consider a single change to either a component of capital, risk-weighted assets, quarterly adjusted average total assets or Total Leverage Exposure. Accordingly, an event that affects more than one factor may have a larger basis point impact than is reflected in these tables.
Impact of Changes on Citigroup and Citibank Risk-Based Capital Ratios
Common Equity Tier 1 Capital ratio Tier 1 Capital ratio Total Capital ratio
In basis points
Impact of$100 million
change inCommon
EquityTier 1 Capital
Impact of$1 billionchange in
risk-weighted
assets
Impact of$100 million
change inTier 1 Capital
Impact of$1 billionchange in
risk-weighted
assets
Impact of$100 million
change inTotal Capital
Impact of$1 billionchange in
risk-weighted
assetsCitigroup
Advanced Approaches 0.9 1.1 0.9 1.2 0.9 1.4Standardized Approach 0.8 1.0 0.8 1.1 0.8 1.4
CitibankAdvanced Approaches 1.1 1.4 1.1 1.5 1.1 1.6Standardized Approach 1.0 1.2 1.0 1.2 1.0 1.4
Impact of Changes on Citigroup and Citibank Leverage Ratios
Tier 1 Leverage ratio Supplementary Leverage ratio
In basis points
Impact of$100 million
change inTier 1 Capital
Impact of$1 billionchange in quarterly adjusted
average total assets
Impact of$100 million
change inTier 1 Capital
Impact of$1 billionchange in
Total Leverage Exposure
Citigroup 0.5 0.5 0.4 0.3Citibank 0.7 0.7 0.5 0.4
Citigroup Broker-Dealer SubsidiariesAt September 30, 2018, Citigroup Global Markets Inc., a U.S. broker-dealer registered with the SEC that is an indirect wholly owned subsidiary of Citigroup, had net capital, computed in accordance with the SEC’s net capital rule, of $10.5 billion, which exceeded the minimum requirement by $8.1 billion.
Moreover, Citigroup Global Markets Limited, a broker-dealer registered with the United Kingdom’s Prudential Regulation Authority (PRA) that is also an indirect wholly owned subsidiary of Citigroup, had total capital of $20.9 billion at September 30, 2018, which exceeded the PRA's minimum regulatory capital requirements.
In addition, certain of Citi’s other broker-dealer subsidiaries are subject to regulation in the countries in which they do business, including requirements to maintain specified levels of net capital or its equivalent. Citigroup’s other broker-dealer subsidiaries were in compliance with their regulatory capital requirements at September 30, 2018.

36
Regulatory Capital Standards Developments
Leverage Ratio Treatment of Client Cleared DerivativesIn October 2018, the Basel Committee on Banking Supervision (Basel Committee) issued a consultative document seeking views as to whether a targeted and limited revision of the leverage ratio exposure measure is warranted with regard to the treatment of client cleared derivatives. In the U.S., the Basel Committee’s leverage ratio framework and leverage ratio exposure measure are most closely aligned with the Supplementary Leverage Ratio and Total Leverage Exposure, respectively. Under the Basel Committee’s leverage ratio framework, which was last updated in December 2017, the leverage ratio exposure measure is generally not adjusted for physical or financial collateral, guarantees or other credit risk mitigation techniques. However, the Basel Committee consultative document proposes two alternative treatments for client cleared derivatives that would reduce the leverage ratio exposure measure, to varying degrees, in recognition of the beneficial effects of margin requirements and overcollateralization, as applicable.
One of the options under consideration would allow amounts of cash and non-cash initial margin that are received from the client to offset the potential future exposure of derivatives centrally cleared on the client’s behalf. Another option would amend the currently specified treatment of client cleared derivatives to align it with the measurement as determined per the Basel Committee’s standardized approach for measuring counterparty credit risk exposures, as used for risk-based capital requirements. This option would permit both cash and non-cash forms of initial margin and variation margin received from the client to offset replacement cost and potential future exposure for client cleared derivatives only.
The U.S. banking agencies may revise the treatment of client cleared derivatives under the Supplementary Leverage Ratio in the future, based upon any revisions adopted by the Basel Committee.

37
Tangible Common Equity, Book Value Per Share, Tangible Book Value Per Share and Returns on EquityTangible common equity (TCE), as defined by Citi, represents common stockholders’ equity less goodwill and identifiable intangible assets (other than MSRs). Other companies may calculate TCE in a different manner. TCE, tangible book value per share and returns on average TCE are non-GAAP financial measures.
In millions of dollars or shares, except per share amountsSeptember 30,
2018December 31,
2017Total Citigroup stockholders’ equity $ 197,004 $ 200,740Less: Preferred stock 19,035 19,253Common stockholders’ equity $ 177,969 $ 181,487Less: Goodwill 22,187 22,256 Identifiable intangible assets (other than MSRs) 4,598 4,588 Goodwill and identifiable intangible assets (other than MSRs) related to assets held-for-sale (HFS) — 32Tangible common equity (TCE) $ 151,184 $ 154,611Common shares outstanding (CSO) 2,442.1 2,569.9Book value per share (common equity/CSO) $ 72.88 $ 70.62Tangible book value per share (TCE/CSO) 61.91 60.16
In millions of dollars
Three MonthsEnded
September 30,2018
Three MonthsEnded
September 30,2017
Nine MonthsEnded
September 30,2018
Nine MonthsEnded
September 30,2017
Net income available to common shareholders $ 4,352 $ 3,861 $ 12,872 $ 11,202Average common stockholders’ equity(1) $ 179,459 $ 209,764 $ 180,772 $ 208,787Average TCE $ 152,712 $ 182,333 $ 153,909 $ 181,271Return on average common stockholders’ equity 9.6% 7.3% 9.5% 7.2%Return on average TCE (ROTCE)(2) 11.3 8.4 11.2 8.3
(1) Average common stockholders’ equity for the 2018 periods includes the $22.6 billion impact from Tax Reform recorded at the end of the fourth quarter of 2017.(2) ROTCE represents annualized net income available to common shareholders as a percentage of average TCE.

38
Managing Global Risk Table of Contents
MANAGING GLOBAL RISKCREDIT RISK(1)
Consumer CreditCorporate CreditAdditional Consumer and Corporate Credit Details
Loans Outstanding Details of Credit Loss Experience Allowance for Loan Losses 50 Non-Accrual Loans and Assets and Renegotiated LoansLIQUIDITY RISKHigh-Quality Liquid Assets (HQLA)Loans 56Deposits 56Long-Term Debt 57Secured Funding Transactions and Short-Term Borrowings 59Liquidity Coverage Ratio (LCR) 59Credit Ratings 60MARKET RISK(1)
Market Risk of Non-Trading PortfoliosMarket Risk of Trading PortfoliosCOUNTRY RISK
(1) For additional information regarding certain credit risk, market risk and other quantitative and qualitative information, refer to Citi’s Pillar 3 Basel III Advanced Approaches Disclosures, as required by the rules of the Federal Reserve Board, on Citi’s Investor Relations website.
39393946484849
515555
62627375

39
MANAGING GLOBAL RISK
For Citi, effective risk management is of primary importance to its overall operations. Accordingly, Citi’s risk management process has been designed to identify, monitor, evaluate and manage the principal risks it assumes in conducting its activities. Specifically, the activities that Citi engages in, and the risks those activities generate, must be consistent with Citi’s mission and value proposition, the key principles that guide it and Citi's risk appetite.
For more information on Citi’s management of global risk, including its three lines of defense, see “Managing Global Risk” in Citi’s 2017 Annual Report on Form 10-K.
CREDIT RISK
For additional information on credit risk, including Citi’s credit risk management, measurement and stress testing, see “Credit Risk” and “Risk Factors” in Citi’s 2017 Annual Report on Form 10-K.
CONSUMER CREDITCiti provides traditional retail banking, including commercial banking, and credit card products in 19 countries and jurisdictions through North America GCB, Latin America GCB and Asia GCB. The retail banking products include consumer mortgages, home equity, personal and commercial loans and lines of credit and similar related products with a focus on lending to prime customers. Citi uses its risk appetite framework to define its lending parameters. In addition, Citi uses proprietary scoring models for new customer approvals.
As stated in “Global Consumer Banking” above, GCB’s overall strategy is to leverage Citi’s global footprint and be the pre-eminent bank for the affluent and emerging affluent consumers in large urban centers. In credit cards and in certain retail markets (including commercial banking), Citi serves customers in a somewhat broader set of segments and geographies. GCB’s commercial banking business primarily focuses on small to mid-size businesses and also serves larger middle market companies in certain regions.
Consumer Credit PortfolioThe following table shows Citi’s quarterly end-of-period consumer loans:(1)
In billions of dollars 3Q’17 4Q’17 1Q’18 2Q’18 3Q’18
Retail banking:
Mortgages $ 81.4 $ 81.7 $ 82.1 $ 80.5 $ 80.9
Commercial banking 35.5 36.3 36.8 36.5 37.2
Personal and other 27.3 27.9 28.5 28.1 28.7
Total retail banking $ 144.2 $ 145.9 $ 147.4 $ 145.1 $ 146.8
Cards:
Citi-branded cards $ 110.7 $ 115.7 $ 110.6 $ 112.3 $ 112.8
Citi retail services 45.9 49.2 46.0 48.6 49.4
Total cards $ 156.6 $ 164.9 $ 156.6 $ 160.9 $ 162.2
Total GCB $ 300.8 $ 310.8 $ 304.0 $ 306.0 $ 309.0
GCB regional distribution:
North America 62% 63% 61% 63% 62%
Latin America 9 8 9 8 9
Asia(2) 29 29 30 29 29
Total GCB 100% 100% 100% 100% 100%
Corporate/Other(3) $ 24.8 $ 22.9 $ 21.1 $ 17.6 $ 16.5
Total consumer loans $ 325.6 $ 333.7 $ 325.1 $ 323.6 $ 325.5
(1) End-of-period loans include interest and fees on credit cards.(2) Asia includes loans and leases in certain EMEA countries for all periods presented.(3) Primarily consists of legacy assets, principally North America consumer mortgages.

40
For information on changes to Citi’s end-of-period consumer loans, see “Liquidity Risk—Loans” below.
Overall Consumer Credit TrendsThe following charts show the quarterly trends in delinquencies and net credit losses across both retail banking, including commercial banking, and cards for total GCB and by region.
Global Consumer Banking
North America GCB
North America GCB provides mortgages, home equity loans, personal loans and commercial banking products through Citi’s retail banking network and card products through Citi-branded cards and Citi retail services businesses. The retail bank is concentrated in six major metropolitan cities in the United States (for additional information on the U.S. retail bank, see “North America GCB” above).
As of September 30, 2018, approximately 71% of North America GCB consumer loans consisted of Citi-branded and Citi retail services cards, which generally drives the overall credit performance of North America GCB (for additional information on North America GCB’s cards portfolios, including delinquency and net credit loss rates, see “Credit Card Trends” below).
As shown in the chart above, the quarter-over-quarter net credit loss rate decreased while the 90+ days past due delinquency rate slightly increased, primarily driven by seasonality in both cards portfolios. The year-over-year net credit loss rate decreased due to an episodic charge-off in the commercial portfolio in the prior-year period, while the delinquency rate was broadly stable.
Latin America GCB
Latin America GCB operates in Mexico through Citibanamex, one of Mexico’s largest banks, and provides credit cards, consumer mortgages, personal loans and commercial banking products. Latin America GCB serves a more mass market segment in Mexico and focuses on developing multi-product relationships with customers.
As set forth in the chart above, the 90+ days past due delinquency rate decreased quarter-over-quarter and year-over-year, primarily due to improvements in mortgages and the commercial portfolio. The quarter-over-quarter and year-over year net credit loss rate increased, primarily driven by an episodic charge-off in the commercial portfolio, which was offset by a related loan loss reserve release.
Asia(1) GCB
(1) Asia includes GCB activities in certain EMEA countries for all periods presented.
Asia GCB operates in 17 countries in Asia and EMEA and provides credit cards, consumer mortgages, personal loans and commercial banking products.
As shown in the chart above, the 90+ days past due delinquency and net credit loss rates were broadly stable in Asia GCB quarter-over-quarter and year-over-year as of the third quarter of 2018. This stability reflects the strong credit profiles in Asia GCB’s target customer segments. In addition, regulatory changes in many markets in Asia over the past few years have resulted in stable portfolio credit quality.
For additional information on cost of credit, loan delinquency and other information for Citi’s consumer loan portfolios, see each respective business’s results of operations above and Note 13 to the Consolidated Financial Statements.

41
Credit Card TrendsThe following charts show the quarterly trends in delinquencies and net credit losses for total GCB cards, North America Citi-branded cards and Citi retail services portfolios as well as for Latin America and Asia Citi-branded cards portfolios.
Global Cards
North America Citi-Branded Cards
North America GCB’s Citi-branded cards portfolio issues proprietary and co-branded cards. As shown in the chart above, quarter-over-quarter the 90+ days past due delinquency rate was stable while the net credit loss rate decreased primarily due to seasonality. The year-over-year increases in both the delinquency and net credit loss rates were driven primarily by portfolio seasoning.
North America Citi Retail Services
Citi retail services partners directly with more than 20 retailers and dealers to offer private-label and co-branded consumer and commercial cards. Citi retail services’ target market is focused on select industry segments such as home improvement, specialty retail, consumer electronics and fuel. Citi retail services continually evaluates opportunities to add partners within target industries that have strong loyalty, lending or payment programs and growth potential.
As shown in the chart above, Citi retail services’ 90+ days past due delinquency rate increased quarter-over-quarter, mainly due to seasonality, while the net credit loss rate decreased, primarily due to seasonality and the impact of recently acquired portfolios. The year-over-year net credit loss rate decrease was primarily driven by the impact of recently acquired portfolios.
Latin America Citi-Branded Cards
Latin America GCB issues proprietary and co-branded cards. As set forth in the chart above, the quarter-over-quarter net credit loss rate increased while the 90+ days past due delinquency rate decreased, both primarily driven by seasonality. The year-over-year net credit loss and delinquency rates increased, primarily due to portfolio seasoning.

42
Asia Citi-Branded Cards(1)
(1) Asia includes loans and leases in certain EMEA countries for all periods presented.
Asia GCB issues proprietary and co-branded cards. As set forth in the chart above, the 90+ days past due delinquency rate has remained broadly stable, driven by the mature and well-diversified cards portfolios. The increase in the year-over-year net credit loss rate was primarily driven by the conversion of an acquired portfolio in Australia. The quarter-over-quarter decrease in the net credit loss rate was primarily related to improvements in this portfolio.
For additional information on cost of credit, delinquency and other information for Citi’s cards portfolios, see each respective business’s results of operations above and Note 13 to the Consolidated Financial Statements.
North America Cards FICO DistributionThe following tables show the current FICO score distributions for Citi’s North America Citi-branded cards and Citi retail services portfolios based on end-of-period receivables. FICO scores are updated monthly for substantially all of the portfolio and on a quarterly basis for the remaining portfolio.
Citi-Branded
FICO distributionSeptember 30,
2018June 30,
2018September 30,
2017
> 760 42% 43% 40%
680 - 760 41 40 41
< 680 17 17 19
Total 100% 100% 100%
Citi Retail Services
FICO distributionSeptember 30,
2018June 30,
2018September 30,
2017
> 760 24% 24% 23%
680 - 760 43 43 43
< 680 33 33 34
Total 100% 100% 100%
The FICO distribution of both portfolios was stable compared to the previous quarter and previous year. The portfolios continued to demonstrate strong underlying credit quality. For additional information on FICO scores, see Note 13 to the Consolidated Financial Statements.

43
North America Consumer Mortgage LendingCiti’s North America consumer mortgage portfolio consists of both residential first mortgages and home equity loans. The following table shows the outstanding quarterly end-of-period loans for Citi’s North America residential first mortgage and home equity loan portfolios:
In billions of dollars 3Q’17 4Q’17 1Q’18 2Q’18 3Q’18
GCB:Residential firsts $ 40.1 $ 40.1 $ 40.1 $ 40.3 $ 40.7
Home equity 4.1 4.2 4.1 4.1 3.9
Total GCB $ 44.2 $ 44.3 $ 44.2 $ 44.4 $ 44.6
Corporate/Other:Residential firsts $ 10.1 $ 9.3 $ 8.1 $ 7.6 $ 7.0
Home equity 11.5 10.6 9.9 8.8 8.2Total Corporate/ Other $ 21.6 $ 19.9 $ 18.0 $ 16.4 $ 15.2
Total Citigroup— North America $ 65.8 $ 64.2 $ 62.2 $ 60.8 $ 59.8
For additional information on delinquency and net credit loss trends in Citi’s consumer mortgage portfolio, see “Additional Consumer Credit Details” below.
Home Equity Loans—Revolving HELOCsAs set forth in the table above, Citi had $12.1 billion of home equity loans as of September 30, 2018, of which $2.5 billion were fixed-rate home equity loans and $9.6 billion were extended under home equity lines of credit (Revolving HELOCs). Fixed-rate home equity loans are fully amortizing. Revolving HELOCs allow for amounts to be drawn for a period of time with the payment of interest only until the end of the draw period, when the outstanding amount is converted to an amortizing loan, or “reset” (the interest-only payment feature during the revolving period is standard for this product across the industry). Upon reset, these borrowers will be required to pay both interest, usually at a variable rate, and principal that amortizes typically over 20 years, rather than the standard 30-year amortization.
Of the Revolving HELOCs at September 30, 2018, $6.2 billion had reset (compared to $6.4 billion at June 30, 2018) and $3.4 billion were still within their revolving period and had not reset (compared to $3.7 billion at June 30, 2018). The following chart indicates the FICO and combined loan-to-value (CLTV) characteristics of Citi’s Revolving HELOCs portfolio and the year in which they reset:
North America Home Equity Lines of Credit Amortization – CitigroupTotal ENR by Reset YearIn billions of dollars as of September 30, 2018
Note: Totals may not sum due to rounding.
Approximately 64% of Citi’s total Revolving HELOCs portfolio had reset as of September 30, 2018 (compared to 63% as of June 30, 2018). Of the remaining Revolving HELOCs portfolio, approximately 2% will commence amortization during the remainder of 2018. Citi’s customers with Revolving HELOCs that reset could experience “payment shock” due to the higher required payments on the loans. Citi currently estimates that the monthly loan payment for its Revolving HELOCs that reset during the remainder of 2018 could increase on average by approximately $270, or 98%. Increases in interest rates could further increase these payments given the variable nature of the interest rates on these loans post-reset. Borrowers’ high loan-to-value positions, as well as the cost and availability of refinancing options, could limit borrowers’ ability to refinance their Revolving HELOCs as these loans continue to reset.
Approximately 5.5% of the Revolving HELOCs that have reset as of September 30, 2018 were 30+ days past due, compared to 3.7% of the total outstanding home equity loan portfolio (amortizing and non-amortizing). This compared to 5.3% and 3.6%, respectively, as of June 30, 2018. As newly amortizing loans continue to season, the delinquency rate of Citi’s total home equity loan portfolio could increase. Although interest rates have steadily increased over the past 12 months, resets to date have generally occurred during a period of historically low interest rates, which Citi believes has likely reduced the overall “payment shock” to the borrower.
Citi monitors this reset risk closely and will continue to consider any potential impact in determining its allowance for loan loss reserves. In addition, management continues to review and take additional actions to offset potential reset risk, such as establishing a borrower outreach program to provide reset risk education and proactively working with high-risk borrowers through a specialized single point of contact unit.

44
Additional Consumer Credit Details
Consumer Loan Delinquency Amounts and Ratios
EOP
loans(1) 90+ days past due(2) 30–89 days past due(2)
In millions of dollars,except EOP loan amounts in billions
September30,
2018
September30,
2018June 30,
2018
September30,
2017
September30,
2018June 30,
2018
September30,
2017Global Consumer Banking(3)(4)
Total $ 309.0 $ 2,404 $ 2,345 $ 2,279 $ 2,890 $ 2,558 $ 2,763Ratio 0.78% 0.77% 0.76% 0.94% 0.84% 0.92%
Retail bankingTotal $ 146.8 $ 508 $ 500 $ 489 $ 857 $ 754 $ 805
Ratio 0.35% 0.35% 0.34% 0.59% 0.52% 0.56%North America 56.3 188 179 167 320 252 270
Ratio 0.34% 0.33% 0.30% 0.58% 0.46% 0.49%Latin America 21.0 126 132 151 235 183 244
Ratio 0.60% 0.66% 0.72% 1.12% 0.91% 1.16%Asia(5) 69.5 194 189 171 302 319 291
Ratio 0.28% 0.27% 0.25% 0.43% 0.46% 0.43%Cards
Total $ 162.2 $ 1,896 $ 1,845 $ 1,790 $ 2,033 $ 1,804 $ 1,958Ratio 1.17% 1.15% 1.14% 1.25% 1.12% 1.25%
North America—Citi-branded 88.4 707 712 668 722 627 705Ratio 0.80% 0.81% 0.77% 0.82% 0.71% 0.82%
North America—Citi retail services 49.4 832 781 772 890 761 836Ratio 1.68% 1.61% 1.68% 1.80% 1.57% 1.82%
Latin America 5.8 169 160 159 170 156 163Ratio 2.91% 2.96% 2.84% 2.93% 2.89% 2.91%
Asia(5) 18.6 188 192 191 251 260 254Ratio 1.01% 1.02% 1.02% 1.35% 1.38% 1.35%
Corporate/Other—Consumer(6)
Total $ 16.5 $ 401 $ 415 $ 605 $ 422 $ 355 $ 643Ratio 2.57% 2.49% 2.57% 2.71% 2.13% 2.74%
International — — — 57 — — 47Ratio —% —% 3.35% —% —% 2.76%
North America 16.5 401 415 548 422 355 596Ratio 2.57% 2.49% 2.51% 2.71% 2.13% 2.73%
Total Citigroup $ 325.5 $ 2,805 $ 2,760 $ 2,884 $ 3,312 $ 2,913 $ 3,406Ratio 0.87% 0.86% 0.89% 1.02% 0.90% 1.05%
(1) End-of-period (EOP) loans include interest and fees on credit cards.(2) The ratios of 90+ days past due and 30–89 days past due are calculated based on EOP loans, net of unearned income.(3) The 90+ days past due balances for North America—Citi-branded and North America—Citi retail services are generally still accruing interest. Citigroup’s policy
is generally to accrue interest on credit card loans until 180 days past due, unless notification of bankruptcy filing has been received earlier.(4) The 90+ days past due and 30–89 days past due and related ratios for North America GCB exclude U.S. mortgage loans that are guaranteed by U.S. government-
sponsored entities since the potential loss predominantly resides within the U.S. government-sponsored entities. The amounts excluded for loans 90+ days past due and (EOP loans) were $235 million ($0.7 billion), $244 million ($0.7 billion) and $289 million ($0.7 billion) as of September 30, 2018, June 30, 2018 and September 30, 2017, respectively. The amounts excluded for loans 30–89 days past due and (EOP loans) were $82 million ($0.7 billion), $87 million ($0.7 billion), and $79 million ($0.7 billion) as of September 30, 2018, June 30, 2018 and September 30, 2017, respectively.
(5) Asia includes delinquencies and loans in certain EMEA countries for all periods presented.(6) The loans 90+ days past due and related ratios exclude U.S. mortgage loans that are guaranteed by U.S. government-sponsored agencies since the potential loss
predominantly resides with the U.S. agencies. The amounts excluded for 90+ days past due and (EOP loans) for each period were $0.4 billion ($0.8 billion), $0.4 billion ($0.9 billion) and $0.7 billion ($1.2 billion) as of September 30, 2018, June 30, 2018 and September 30, 2017, respectively. The amounts excluded for loans 30–89 days past due and (EOP loans) for each period were $0.1 billion ($0.8 billion), $0.1 billion ($0.9 billion), and $0.1 billion ($1.2 billion) as of September 30, 2018, June 30, 2018 and September 30, 2017, respectively.

45
Consumer Loan Net Credit Losses and Ratios
Averageloans(1) Net credit losses(2)(3)
In millions of dollars, except average loan amounts in billions 3Q18 3Q18 2Q18 3Q17Global Consumer Banking
Total $ 306.8 $ 1,714 $ 1,726 $ 1,704Ratio 2.22% 2.28 % 2.26%
Retail bankingTotal $ 145.9 $ 243 $ 228 $ 300
Ratio 0.66% 0.63 % 0.82%North America 56.0 32 32 88
Ratio 0.23% 0.23 % 0.63%Latin America 20.7 153 138 143
Ratio 2.93% 2.75 % 2.68%Asia(4) 69.2 58 58 69
Ratio 0.33% 0.33 % 0.41%Cards
Total $ 160.9 $ 1,471 $ 1,498 $ 1,404Ratio 3.63% 3.81 % 3.58%
North America—Citi-branded 87.8 644 657 611Ratio 2.91% 3.04 % 2.84%
North America—Citi retail services 49.0 566 589 540Ratio 4.58% 5.07 % 4.70%
Latin America 5.6 154 140 152Ratio 10.91% 10.40 % 10.77%
Asia(4) 18.5 107 112 101Ratio 2.29% 2.38 % 2.13%
Corporate/Other—Consumer(3)
Total $ 17.0 $ 12 $ (20) $ 52Ratio 0.28% (0.41)% 0.80%
International — — 19 25Ratio —% 6.93 % 5.22%
North America 17.0 12 (39) 27Ratio 0.28% (0.85)% 0.45%
Other(5) — — — (22)Total Citigroup $ 323.8 $ 1,726 $ 1,706 $ 1,734
Ratio 2.11% 2.12 % 2.11%
(1) Average loans include interest and fees on credit cards.(2) The ratios of net credit losses are calculated based on average loans, net of unearned income.(3) In October 2016, Citi entered into an agreement to sell Citi’s Brazil consumer banking business. The sale was completed at the end of the fourth quarter of 2017.
As a result of HFS accounting treatment, approximately $37 million of net credit losses (NCLs) was recorded as a reduction in revenue (Other revenue) during the third quarter of 2017. Accordingly, these NCLs are not included in this table. Loans classified as HFS are excluded from this table as they are recorded in Other assets.
(4) Asia includes NCLs and average loans in certain EMEA countries for all periods presented.(5) The third quarter of 2017 NCLs reflected a recovery related to legacy assets.

46
CORPORATE CREDIT Consistent with its overall strategy, Citi’s corporate clients are typically large, multinational corporations that value the depth and breadth of Citi’s global network. Citi aims to establish relationships with these clients that encompass multiple products, consistent with client needs, including cash management and trade services, foreign exchange, lending, capital markets and M&A advisory.
Corporate Credit PortfolioThe following table sets forth Citi’s corporate credit portfolio within ICG (excluding private bank), before consideration of collateral or hedges, by remaining tenor for the periods indicated:
At September 30, 2018 June 30, 2018 December 31, 2017
In billions ofdollars
Duewithin1 year
Greaterthan
1 yearbut
within5 years
Greaterthan
5 yearsTotal
exposure
Duewithin1 year
Greaterthan
1 yearbut
within5 years
Greaterthan
5 yearsTotal
exposure
Duewithin1 year
Greaterthan
1 yearbut
within5 years
Greaterthan
5 yearsTotal
exposure
Direct outstandings (on-balance sheet)(1) $ 131 $ 103 $ 20 $ 254 $ 133 $ 103 $ 19 $ 255 $ 127 $ 96 $ 22 $ 245
Unfunded lending commitments (off-balance sheet)(2) 115 253 25 393 127 235 20 382 111 222 20 353Totalexposure $ 246 $ 356 $ 45 $ 647 $ 260 $ 338 $ 39 $ 637 $ 238 $ 318 $ 42 $ 598
(1) Includes drawn loans, overdrafts, bankers’ acceptances and leases. (2) Includes unused commitments to lend, letters of credit and financial guarantees.
Portfolio Mix—Geography, Counterparty and IndustryCiti’s corporate credit portfolio is diverse across geography and counterparty. The following table shows the percentage of this portfolio by region based on Citi’s internal management geography:
September 30,2018
June 30,2018
December 31,2017
North America 55% 54% 54%EMEA 27 27 27Asia 11 12 12Latin America 7 7 7Total 100% 100% 100%
The maintenance of accurate and consistent risk ratings across the corporate credit portfolio facilitates the comparison of credit exposure across all lines of business, geographic regions and products. Counterparty risk ratings reflect an estimated probability of default for a counterparty and are derived primarily through the use of validated statistical models, scorecard models and external agency ratings (under defined circumstances), in combination with consideration of factors specific to the obligor or market, such as management experience, competitive position,
regulatory environment and commodity prices. Facility risk ratings are assigned that reflect the probability of default of the obligor and factors that affect the loss-given-default of the facility, such as support or collateral. Internal obligor ratings that generally correspond to BBB and above are considered investment grade, while those below are considered non-investment grade.
Citigroup also has incorporated environmental factors like climate risk assessment and reporting criteria for certain obligors, as necessary. Factors evaluated include consideration of climate risk to an obligor’s business and physical assets and, when relevant, consideration of cost-effective options to reduce greenhouse gas emissions.
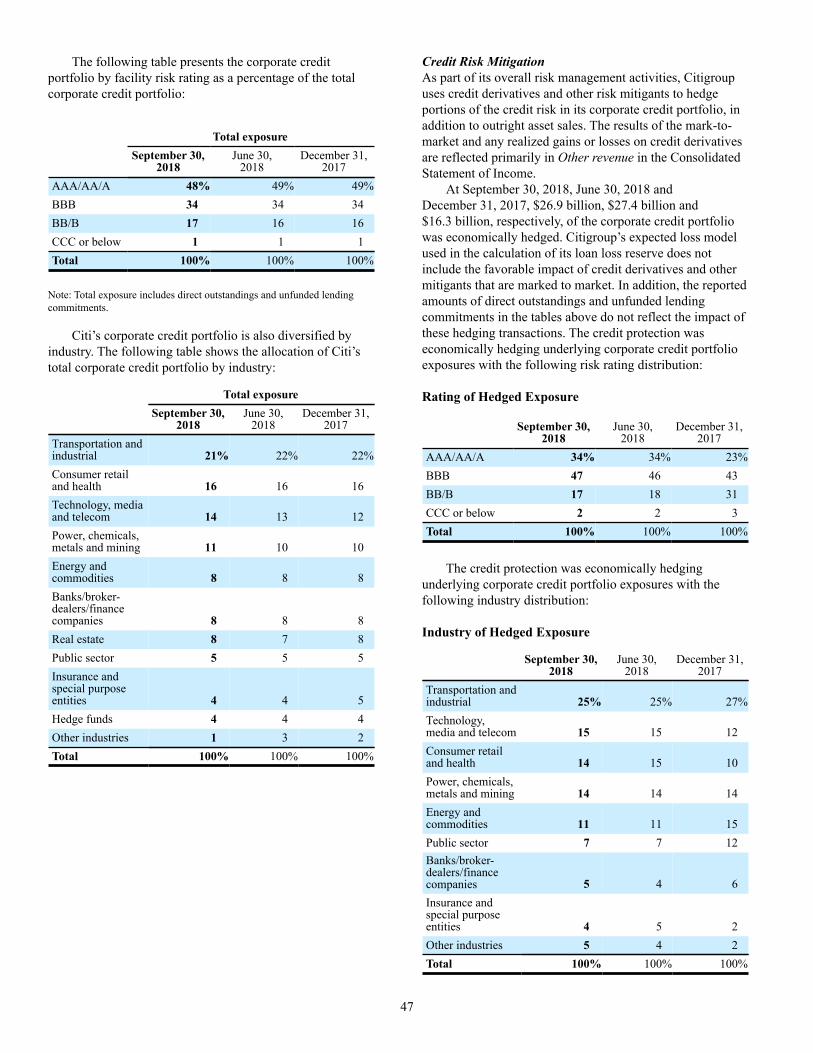
47
The following table presents the corporate credit portfolio by facility risk rating as a percentage of the total corporate credit portfolio:
Total exposure
September 30,
2018June 30,
2018December 31,
2017AAA/AA/A 48% 49% 49%BBB 34 34 34BB/B 17 16 16CCC or below 1 1 1Total 100% 100% 100%
Note: Total exposure includes direct outstandings and unfunded lending commitments.
Citi’s corporate credit portfolio is also diversified by industry. The following table shows the allocation of Citi’s total corporate credit portfolio by industry:
Total exposure
September 30,
2018June 30,
2018December 31,
2017Transportation andindustrial 21% 22% 22%Consumer retailand health 16 16 16Technology, mediaand telecom 14 13 12Power, chemicals,metals and mining 11 10 10Energy andcommodities 8 8 8Banks/broker-dealers/financecompanies 8 8 8Real estate 8 7 8Public sector 5 5 5Insurance andspecial purposeentities 4 4 5Hedge funds 4 4 4Other industries 1 3 2Total 100% 100% 100%
Credit Risk MitigationAs part of its overall risk management activities, Citigroup uses credit derivatives and other risk mitigants to hedge portions of the credit risk in its corporate credit portfolio, in addition to outright asset sales. The results of the mark-to-market and any realized gains or losses on credit derivatives are reflected primarily in Other revenue in the Consolidated Statement of Income.
At September 30, 2018, June 30, 2018 and December 31, 2017, $26.9 billion, $27.4 billion and $16.3 billion, respectively, of the corporate credit portfolio was economically hedged. Citigroup’s expected loss model used in the calculation of its loan loss reserve does not include the favorable impact of credit derivatives and other mitigants that are marked to market. In addition, the reported amounts of direct outstandings and unfunded lending commitments in the tables above do not reflect the impact of these hedging transactions. The credit protection was economically hedging underlying corporate credit portfolio exposures with the following risk rating distribution:
Rating of Hedged Exposure
September 30,2018
June 30,2018
December 31,2017
AAA/AA/A 34% 34% 23%BBB 47 46 43BB/B 17 18 31CCC or below 2 2 3Total 100% 100% 100%
The credit protection was economically hedging underlying corporate credit portfolio exposures with the following industry distribution:
Industry of Hedged Exposure
September 30,2018
June 30,2018
December 31,2017
Transportation andindustrial 25% 25% 27%Technology,media and telecom 15 15 12Consumer retailand health 14 15 10Power, chemicals,metals and mining 14 14 14Energy andcommodities 11 11 15Public sector 7 7 12Banks/broker-dealers/finance companies 5 4 6Insurance andspecial purposeentities 4 5 2Other industries 5 4 2Total 100% 100% 100%

48
ADDITIONAL CONSUMER AND CORPORATE CREDIT DETAILS
Loans Outstanding
3rd Qtr. 2nd Qtr. 1st Qtr. 4th Qtr. 3rd Qtr.In millions of dollars 2018 2018 2018 2017 2017Consumer loansIn U.S. offices
Mortgage and real estate(1) $ 61,048 $ 61,692 $ 63,412 $ 65,467 $ 67,131Installment, revolving credit and other 3,515 3,759 3,306 3,398 3,191Cards 137,051 135,968 131,081 139,006 131,476Commercial and industrial 7,686 7,459 7,493 7,840 7,619
Total $ 209,300 $ 208,878 $ 205,292 $ 215,711 $ 209,417In offices outside the U.S.
Mortgage and real estate(1) $ 43,714 $ 43,056 $ 44,833 $ 44,081 $ 43,723Installment, revolving credit and other 27,899 27,254 27,651 26,556 26,153Cards 24,971 24,712 25,993 26,257 25,443Commercial and industrial 18,821 18,966 20,526 20,238 20,015Lease financing 52 55 62 76 77
Total $ 115,457 $ 114,043 $ 119,065 $ 117,208 $ 115,411Total consumer loans $ 324,757 $ 322,921 $ 324,357 $ 332,919 $ 324,828Unearned income(2) 712 711 727 737 748Consumer loans, net of unearned income $ 325,469 $ 323,632 $ 325,084 $ 333,656 $ 325,576Corporate loansIn U.S. offices
Commercial and industrial $ 51,365 $ 53,260 $ 54,005 $ 51,319 $ 51,679Financial institutions 46,255 42,867 40,472 39,128 37,203Mortgage and real estate(1) 47,629 46,310 45,581 44,683 43,274Installment, revolving credit and other 32,201 32,663 32,866 33,181 32,464Lease financing 1,445 1,445 1,463 1,470 1,493
Total $ 178,895 $ 176,545 $ 174,387 $ 169,781 $ 166,113In offices outside the U.S.
Commercial and industrial $ 98,281 $ 98,068 $ 101,368 $ 93,750 $ 93,107Financial institutions 37,851 38,312 35,659 35,273 33,050Mortgage and real estate(1) 7,344 7,261 7,543 7,309 6,383Installment, revolving credit and other 22,827 22,755 23,338 22,638 23,830Lease financing 131 139 167 190 216Governments and official institutions 4,898 5,270 6,170 5,200 5,628
Total $ 171,332 $ 171,805 $ 174,245 $ 164,360 $ 162,214Total corporate loans $ 350,227 $ 348,350 $ 348,632 $ 334,141 $ 328,327Unearned income(3) (787) (802) (778) (763) (720)Corporate loans, net of unearned income $ 349,440 $ 347,548 $ 347,854 $ 333,378 $ 327,607Total loans—net of unearned income $ 674,909 $ 671,180 $ 672,938 $ 667,034 $ 653,183Allowance for loan losses—on drawn exposures (12,336) (12,126) (12,354) (12,355) (12,366)Total loans—net of unearned income and allowance for credit losses $ 662,573 $ 659,054 $ 660,584 $ 654,679 $ 640,817Allowance for loan losses as a percentage of total loans— net of unearned income(4) 1.84% 1.81% 1.85% 1.87% 1.91%Allowance for consumer loan losses as a percentage of total consumer loans—net of unearned income(4) 3.07% 3.03% 3.09% 2.96% 3.04%Allowance for corporate loan losses as a percentage of total corporate loans—net of unearned income(4) 0.68% 0.68% 0.67% 0.76% 0.77%
(1) Loans secured primarily by real estate.(2) Unearned income on consumer loans primarily represents unamortized origination fees and costs, premiums and discounts. (3) Unearned income on corporate loans primarily represents interest received in advance, but not yet earned, on loans originated on a discounted basis.(4) All periods exclude loans that are carried at fair value.

49
Details of Credit Loss Experience
3rd Qtr. 2nd Qtr. 1st Qtr. 4th Qtr. 3rd Qtr.In millions of dollars 2018 2018 2018 2017 2017Allowance for loan losses at beginning of period $ 12,126 $ 12,354 $ 12,355 $ 12,366 $ 12,025Provision for loan losses
Consumer $ 1,869 $ 1,764 $ 1,881 $ 1,785 $ 2,142Corporate 37 31 (78) 231 4
Total $ 1,906 $ 1,795 $ 1,803 $ 2,016 $ 2,146Gross credit lossesConsumer
In U.S. offices $ 1,462 $ 1,490 $ 1,542 $ 1,426 $ 1,429In offices outside the U.S. 596 599 615 611 642
CorporateIn U.S. offices 15 5 65 21 15In offices outside the U.S. 21 15 74 221 34
Total $ 2,094 $ 2,109 $ 2,296 $ 2,279 $ 2,120Credit recoveries(1)
ConsumerIn U.S. offices $ 212 $ 255 $ 238 $ 228 $ 167In offices outside the U.S. 120 128 148 151 170
CorporateIn U.S. offices 1 5 13 4 2In offices outside the U.S. 5 17 30 16 4
Total $ 338 $ 405 $ 429 $ 399 $ 343Net credit losses
In U.S. offices $ 1,264 $ 1,235 $ 1,356 $ 1,215 $ 1,275In offices outside the U.S. 492 469 511 665 502
Total $ 1,756 $ 1,704 $ 1,867 $ 1,880 $ 1,777Other—net(2)(3)(4)(5)(6)(7) $ 60 $ (319) $ 63 $ (147) $ (28)Allowance for loan losses at end of period $ 12,336 $ 12,126 $ 12,354 $ 12,355 $ 12,366Allowance for loan losses as a percentage of total loans(8) 1.84% 1.81% 1.85% 1.87% 1.91%Allowance for unfunded lending commitments(9) $ 1,321 $ 1,278 $ 1,290 $ 1,258 $ 1,232Total allowance for loan losses and unfunded lending commitments $ 13,657 $ 13,404 $ 13,644 $ 13,613 $ 13,598Net consumer credit losses $ 1,726 $ 1,706 $ 1,771 $ 1,658 $ 1,734As a percentage of average consumer loans 2.11% 2.12% 2.19% 2.02% 2.11%Net corporate credit losses (recoveries) $ 30 $ (2) $ 96 $ 222 $ 43As a percentage of average corporate loans 0.03% —% 0.11% 0.27% 0.05%Allowance by type at end of period(10)
Consumer $ 9,997 $ 9,796 $ 10,039 $ 9,869 $ 9,892Corporate 2,339 2,330 2,315 2,486 2,474
Total $ 12,336 $ 12,126 $ 12,354 $ 12,355 $ 12,366
(1) Recoveries have been reduced by certain collection costs that are incurred only if collection efforts are successful.(2) Includes all adjustments to the allowance for credit losses, such as changes in the allowance from acquisitions, dispositions, securitizations, FX translation,
purchase accounting adjustments, etc.(3) The third quarter of 2018 includes a reduction of approximately $5 million related to the sale or transfers to held-for-sale (HFS) of various loan portfolios,
including a reduction of $2 million related to the transfers of a real estate loan portfolio to HFS. Additionally, the third quarter includes an increase of approximately $62 million related to FX translation.
(4) The second quarter of 2018 includes a reduction of approximately $137 million related to the sale or transfer to HFS of various loan portfolios, including a reduction of $33 million related to the transfer of a real estate loan portfolio to HFS. Additionally, the second quarter includes a decrease of approximately $164 million related to FX translation.
(5) The first quarter of 2018 includes a reduction of approximately $55 million related to the sale or transfer to HFS of various loan portfolios, including a reduction of $53 million related to the transfer of a real estate loan portfolio to HFS. Additionally, the first quarter includes an increase of approximately $118 million related to FX translation.

50
(6) The fourth quarter of 2017 includes a reduction of approximately $47 million related to the sale or transfer to HFS of various loan portfolios, including a reduction of $22 million related to the transfer of a real estate loan portfolio to HFS. Additionally, the fourth quarter includes a decrease of approximately $106 million related to FX translation.
(7) The third quarter of 2017 includes a reduction of approximately $34 million related to the sale or transfer to HFS of various loan portfolios, including a reduction of $28 million related to the transfer of a real estate loan portfolio to HFS. Additionally, the third quarter includes an increase of approximately $7 million related to FX translation.
(8) September 30, 2018, June 30, 2018, March 31, 2018, December 31, 2017 and September 30, 2017 exclude $4.2 billion, $3.0 billion, $4.5 billion, $4.9 billion and $4.3 billion, respectively, of loans which are carried at fair value.
(9) Represents additional credit reserves recorded as Other liabilities on the Consolidated Balance Sheet.(10) Allowance for loan losses represents management’s best estimate of probable losses inherent in the portfolio, as well as probable losses related to large
individually evaluated impaired loans and troubled debt restructurings. See “Significant Accounting Policies and Significant Estimates” and Note 1 to the Consolidated Financial Statements in Citi’s 2017 Annual Report on Form 10-K. Attribution of the allowance is made for analytical purposes only and the entire allowance is available to absorb probable credit losses inherent in the overall portfolio.
Allowance for Loan LossesThe following tables detail information on Citi’s allowance for loan losses, loans and coverage ratios:
September 30, 2018
In billions of dollarsAllowance for
loan lossesLoans, net of
unearned incomeAllowance as a
percentage of loans(1)
North America cards(2) $ 6.4 $ 137.9 4.6%North America mortgages(3) 0.5 59.8 0.8North America other 0.3 12.8 2.3International cards 1.4 24.4 5.7International other(4) 1.4 90.6 1.5Total consumer $ 10.0 $ 325.5 3.1%Total corporate 2.3 349.4 0.7Total Citigroup $ 12.3 $ 674.9 1.8%
(1) Allowance as a percentage of loans excludes loans that are carried at fair value.(2) Includes both Citi-branded cards and Citi retail services. The $6.4 billion of loan loss reserves represented approximately 16 months of coincident net credit loss
coverage.(3) Of the $0.5 billion, approximately $0.4 billion was allocated to North America mortgages in Corporate/Other. Of the $0.5 billion, approximately $0.2 billion and
$0.3 billion are determined in accordance with ASC 450-20 and ASC 310-10-35 (troubled debt restructurings), respectively. Of the $59.8 billion in loans, approximately $57.0 billion and $2.7 billion of the loans are evaluated in accordance with ASC 450-20 and ASC 310-10-35 (troubled debt restructurings), respectively. For additional information, see Note 14 to the Consolidated Financial Statements.
(4) Includes mortgages and other retail loans.
December 31, 2017
In billions of dollarsAllowance for
loan lossesLoans, net of
unearned incomeAllowance as a
percentage of loans(1)
North America cards(2) $ 6.1 $ 139.7 4.4%North America mortgages(3) 0.7 64.2 1.1North America other 0.3 13.0 2.3International cards 1.3 25.7 5.1International other(4) 1.5 91.1 1.6Total consumer $ 9.9 $ 333.7 3.0%Total corporate 2.5 333.3 0.8Total Citigroup $ 12.4 $ 667.0 1.9%
(1) Allowance as a percentage of loans excludes loans that are carried at fair value.(2) Includes both Citi-branded cards and Citi retail services. The $6.1 billion of loan loss reserves represented approximately 16 months of coincident net credit loss
coverage.(3) Of the $0.7 billion, approximately $0.6 billion was allocated to North America mortgages in Corporate/Other. Of the $0.7 billion, approximately $0.2 billion and
$0.5 billion are determined in accordance with ASC 450-20 and ASC 310-10-35 (troubled debt restructurings), respectively. Of the $64.2 billion in loans, approximately $60.4 billion and $3.7 billion are evaluated in accordance with ASC 450-20 and ASC 310-10-35 (troubled debt restructurings), respectively. For additional information, see Note 14 to the Consolidated Financial Statements.
(4) Includes mortgages and other retail loans.

51
Non-Accrual Loans and Assets and Renegotiated LoansThere is a certain amount of overlap among non-accrual loans and assets and renegotiated loans. The following summary provides a general description of each category:
Non-Accrual Loans and Assets:
• Corporate and consumer (including commercial banking) non-accrual status is based on the determination that payment of interest or principal is doubtful.
• A corporate loan may be classified as non-accrual and still be performing under the terms of the loan structure. Payments received on corporate non-accrual loans are generally applied to loan principal and not reflected as interest income. Approximately 57%, 68% and 74% of Citi’s corporate non-accrual loans were performing at September 30, 2018, June 30, 2018 and December 31, 2017, respectively.
• Consumer non-accrual status is generally based on aging, i.e., the borrower has fallen behind on payments.
• Consumer mortgage loans, other than Federal Housing Administration (FHA) insured loans, are classified as non-accrual within 60 days of notification that the borrower has filed for bankruptcy. In addition, home equity loans are classified as non-accrual if the related residential first mortgage loan is 90 days or more past due.
• North America Citi-branded cards and Citi retail services are not included because, under industry standards, credit card loans accrue interest until such loans are charged off, which typically occurs at 180 days of contractual delinquency.
Renegotiated Loans:
• Includes both corporate and consumer loans whose terms have been modified in a troubled debt restructuring (TDR).
• Includes both accrual and non-accrual TDRs.

52
Non-Accrual LoansThe table below summarizes Citigroup’s non-accrual loans as of the periods indicated. Non-accrual loans may still be current on interest payments. In situations where Citi reasonably expects that only a portion of the principal owed will ultimately be collected, all payments received are reflected as a reduction of principal and not as interest income. For all other non-accrual loans, cash interest receipts are generally recorded as revenue.
Sept. 30, Jun. 30, Mar. 31, Dec. 31, Sept. 30,In millions of dollars 2018 2018 2018 2017 2017Corporate non-accrual loans(1)
North America $ 679 $ 784 $ 817 $ 784 $ 915EMEA 362 391 561 849 681Latin America 266 204 263 280 312Asia 233 244 27 29 146Total corporate non-accrual loans $ 1,540 $ 1,623 $ 1,668 $ 1,942 $ 2,054Consumer non-accrual loans(1)
North America $ 1,323 $ 1,373 $ 1,500 $ 1,650 $ 1,721Latin America 764 726 791 756 791Asia(2) 287 284 284 284 271Total consumer non-accrual loans $ 2,374 $ 2,383 $ 2,575 $ 2,690 $ 2,783Total non-accrual loans $ 3,914 $ 4,006 $ 4,243 $ 4,632 $ 4,837
(1) Excludes purchased distressed loans, as they are generally accreting interest. The carrying value of these loans was $131 million at September 30, 2018, $149 million at June 30, 2018, $126 million at March 31, 2018, $167 million at December 31, 2017 and $177 million at September 30, 2017.
(2) Asia GCB includes balances in certain EMEA countries for all periods presented.
The changes in Citigroup’s non-accrual loans were as follows:
Three Months Ended Three Months Ended
September 30, 2018 September 30, 2017
In millions of dollars Corporate Consumer Total Corporate Consumer TotalNon-accrual loans at beginning of period $ 1,623 $ 2,383 $ 4,006 $ 2,098 $ 2,848 $ 4,946
Additions 436 758 1,194 190 1,042 1,232Sales and transfers to HFS (9) (44) (53) (1) (69) (70)
Returned to performing (14) (136) (150) (2) (133) (135)
Paydowns/settlements (479) (207) (686) (196) (291) (487)
Charge-offs (18) (417) (435) (33) (611) (644)
Other 1 37 38 (2) (3) (5)
Ending balance $ 1,540 $ 2,374 $ 3,914 $ 2,054 $ 2,783 $ 4,837
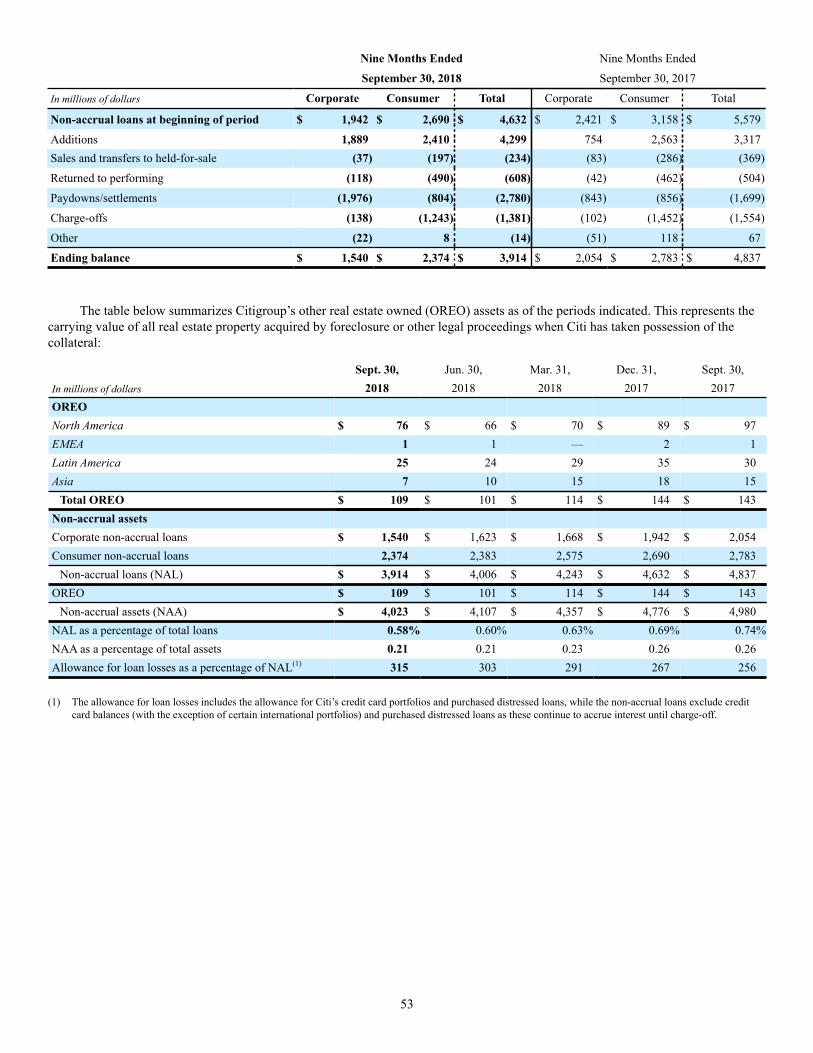
53
Nine Months Ended Nine Months Ended
September 30, 2018 September 30, 2017
In millions of dollars Corporate Consumer Total Corporate Consumer Total
Non-accrual loans at beginning of period $ 1,942 $ 2,690 $ 4,632 $ 2,421 $ 3,158 $ 5,579
Additions 1,889 2,410 4,299 754 2,563 3,317Sales and transfers to held-for-sale (37) (197) (234) (83) (286) (369)
Returned to performing (118) (490) (608) (42) (462) (504)
Paydowns/settlements (1,976) (804) (2,780) (843) (856) (1,699)
Charge-offs (138) (1,243) (1,381) (102) (1,452) (1,554)
Other (22) 8 (14) (51) 118 67
Ending balance $ 1,540 $ 2,374 $ 3,914 $ 2,054 $ 2,783 $ 4,837
The table below summarizes Citigroup’s other real estate owned (OREO) assets as of the periods indicated. This represents the carrying value of all real estate property acquired by foreclosure or other legal proceedings when Citi has taken possession of the collateral:
Sept. 30, Jun. 30, Mar. 31, Dec. 31, Sept. 30,In millions of dollars 2018 2018 2018 2017 2017OREONorth America $ 76 $ 66 $ 70 $ 89 $ 97EMEA 1 1 — 2 1Latin America 25 24 29 35 30Asia 7 10 15 18 15
Total OREO $ 109 $ 101 $ 114 $ 144 $ 143Non-accrual assetsCorporate non-accrual loans $ 1,540 $ 1,623 $ 1,668 $ 1,942 $ 2,054Consumer non-accrual loans 2,374 2,383 2,575 2,690 2,783
Non-accrual loans (NAL) $ 3,914 $ 4,006 $ 4,243 $ 4,632 $ 4,837OREO $ 109 $ 101 $ 114 $ 144 $ 143
Non-accrual assets (NAA) $ 4,023 $ 4,107 $ 4,357 $ 4,776 $ 4,980NAL as a percentage of total loans 0.58% 0.60% 0.63% 0.69% 0.74%NAA as a percentage of total assets 0.21 0.21 0.23 0.26 0.26Allowance for loan losses as a percentage of NAL(1) 315 303 291 267 256
(1) The allowance for loan losses includes the allowance for Citi’s credit card portfolios and purchased distressed loans, while the non-accrual loans exclude credit card balances (with the exception of certain international portfolios) and purchased distressed loans as these continue to accrue interest until charge-off.

54
Renegotiated LoansThe following table presents Citi’s loans modified in TDRs:
In millions of dollarsSept. 30,
2018Dec. 31,
2017Corporate renegotiated loans(1) In U.S. offices
Commercial and industrial(2) $ 226 $ 225Mortgage and real estate 64 90Financial institutions 21 33Other 33 45
Total $ 344 $ 393In offices outside the U.S.
Commercial and industrial(2) $ 254 $ 392Mortgage and real estate 7 11Financial institutions — 15Other 9 7
Total $ 270 $ 425Total corporate renegotiated loans $ 614 $ 818
Consumer renegotiated loans(3)(4)(5) In U.S. offices
Mortgage and real estate(6) $ 2,698 $ 3,709Cards 1,308 1,246Installment and other 84 169
Total $ 4,090 $ 5,124In offices outside the U.S.
Mortgage and real estate $ 320 $ 345Cards 493 541Installment and other 415 427
Total $ 1,228 $ 1,313Total consumer renegotiated loans $ 5,318 $ 6,437
(1) Includes $504 million and $715 million of non-accrual loans included in the non-accrual loans table above at September 30, 2018 and December 31, 2017, respectively. The remaining loans are accruing interest.
(2) In addition to modifications reflected as TDRs at September 30, 2018, Citi also modified $6 million of commercial loans risk rated “Substandard Non-Performing” or worse (asset category defined by banking regulators) in offices outside the U.S. These modifications were not considered TDRs because the modifications did not involve a concession.
(3) Includes $1,113 million and $1,376 million of non-accrual loans included in the non-accrual loans table above at September 30, 2018 and December 31, 2017, respectively. The remaining loans are accruing interest.
(4) Includes $19 million and $26 million of commercial real estate loans at September 30, 2018 and December 31, 2017, respectively.
(5) Includes $94 million and $165 million of other commercial loans at September 30, 2018 and December 31, 2017, respectively.
(6) Reduction in the nine months ended September 30, 2018 compared with December 31, 2017 includes $641 million related to TDRs sold or transferred to HFS.

55
LIQUIDITY RISK
For additional information on funding and liquidity at Citigroup, including its objectives, management and measurement, see “Liquidity Risk” and “Risk Factors” in Citi’s 2017 Annual Report on Form 10-K.
High-Quality Liquid Assets (HQLA)
Citibank Non-Bank and Other Total
In billions of dollarsSept. 30,
2018Jun. 30,
2018Sept. 30,
2017Sept. 30,
2018Jun. 30,
2018Sept. 30,
2017Sept. 30,
2018Jun. 30,
2018Sept. 30,
2017Available cash $ 105.1 $ 97.3 $ 92.7 $ 35.1 $ 27.4 $ 32.9 $ 140.2 $ 124.7 $ 125.6U.S. sovereign 102.2 101.4 108.4 29.7 28.7 26.6 131.9 130.1 135.0U.S. agency/agency MBS 56.4 59.5 68.1 6.5 6.7 0.6 62.9 66.2 68.7Foreign government debt(1) 74.9 73.5 101.3 9.6 10.9 16.3 84.5 84.4 117.6Other investment grade 0.2 0.1 0.5 1.1 1.0 1.2 1.3 1.2 1.7Total HQLA (AVG) $ 338.8 $ 331.8 $ 371.0 $ 82.0 $ 74.8 $ 77.6 $ 420.8 $ 406.6 $ 448.6
Note: The amounts set forth in the table above are presented on an average basis and reflect HQLA held at Citigroup’s operating entities, which are eligible for inclusion in Citigroup’s consolidated HQLA. For securities, the amounts represent the liquidity value that potentially could be realized and, therefore, exclude any securities that are encumbered and incorporate any haircuts that would be required for securities financing transactions.(1) Foreign government debt includes securities issued or guaranteed by foreign sovereigns, agencies and multilateral development banks. Foreign government debt
securities are held largely to support local liquidity requirements and Citi’s local franchises and principally include government bonds from Hong Kong, Singapore, Korea, Taiwan, India, Mexico and Brazil.
The table above includes average amounts of HQLA held at Citigroup’s operating entities that are eligible for inclusion in the calculation of Citigroup’s consolidated LCR, pursuant to the U.S. LCR rules. These amounts include the HQLA needed to meet the minimum requirements at these entities and any amounts in excess of these minimums that are assumed to be transferable to Citigroup. While available liquidity resources at operating entities generally increased, the amount of HQLA included in the table above declined year-over-year as less HQLA in the operating entities was eligible for inclusion in the consolidated metric. Sequentially, Citi’s total HQLA increased, primarily due to an increase in average cash driven by a reduction in illiquid assets and the timing of long-term debt issuance. Citi’s HQLA as set forth above does not include Citi’s available borrowing capacity from the Federal Home Loan Banks (FHLBs) of which Citi is a member, which was approximately $29 billion as of September 30, 2018 (compared to $21 billion as of June 30, 2018 and $16 billion as of September 30, 2017) and maintained by eligible collateral pledged to such banks. The HQLA also does not include Citi’s borrowing capacity at the U.S. Federal Reserve Bank discount window or other central banks, which would be in addition to the resources noted above. In general, Citi’s liquidity is fungible across legal entities within its bank group. Citi’s bank subsidiaries, including Citibank, can lend to the Citi parent and broker-dealer entities in accordance with Section 23A of the Federal Reserve Act. As of September 30, 2018, the capacity available for lending to these entities under Section 23A was approximately $15 billion, unchanged from both June 30, 2018 and
September 30, 2017, subject to certain eligible non-cash collateral requirements.

56
LoansThe table below details the average loans, by business and/or segment, and the total end-of-period loans for each of the periods indicated:
In billions of dollarsSept. 30,
2018Jun. 30,
2018Sept. 30,
2017Global Consumer Banking
North America $ 192.8 $ 188.8 $ 186.7Latin America 26.3 25.5 26.8Asia(1) 87.7 88.8 86.2
Total $ 306.8 $ 303.1 $ 299.7Institutional Clients Group
Corporate lending $ 130.9 $ 135.5 $ 123.3Treasury and trade solutions(TTS) 76.9 77.7 74.9Private bank 92.8 90.7 82.6
Markets and securities services and other 45.6 43.0 40.1
Total $ 346.2 $ 346.9 $ 320.9Total Corporate/Other $ 17.3 $ 19.7 $ 25.7Total Citigroup loans (AVG) $ 670.3 $ 669.7 $ 646.3Total Citigroup loans (EOP) $ 674.9 $ 671.2 $ 653.2
(1) Includes loans in certain EMEA countries for all periods presented.
End-of-period loans increased 3% year-over-year and 1% sequentially. On an average basis, loans increased 4% year-over-year and were largely unchanged sequentially.
Excluding the impact of FX translation, average loans increased 5% year-over-year and 6% in aggregate across GCB and ICG. Average GCB loans grew 3% year-over-year, driven by growth across all regions. Average ICG loans increased 9% year-over-year, with continued momentum across businesses, including in TTS, the private bank and corporate lending.
Average Corporate/Other loans continued to decline (down 34%), driven by the wind-down of legacy assets.
DepositsThe table below details the average deposits, by business and/or segment, and the total end-of-period deposits for each of the periods indicated:
In billions of dollarsSept. 30,
2018Jun. 30,
2018Sept. 30,
2017Global Consumer Banking
North America $ 180.2 $ 179.9 $ 184.1
Latin America 29.4 28.3 28.8Asia(1) 97.6 97.6 95.2Total $ 307.2 $ 305.8 $ 308.1
Institutional Clients GroupTreasury and trade solutions(TTS) $ 456.7 $ 448.7 $ 427.8Banking ex-TTS 124.6 125.5 122.4Markets and securities services 86.7 88.2 84.7Total $ 668.0 $ 662.4 $ 634.9
Corporate/Other $ 10.6 $ 18.0 $ 22.9Total Citigroup deposits (AVG) $ 985.7 $ 986.2 $ 965.9Total Citigroup deposits (EOP) $ 1,005.2 $ 996.7 $ 964.0
(1) Includes deposits in certain EMEA countries for all periods presented.
End-of-period deposits increased 4% year-over-year and 1% sequentially. On an average basis, deposits increased 2% year-over-year and were largely unchanged sequentially.
Excluding the impact of FX translation, average deposits grew 3% from the prior-year period. In GCB, deposits increased 1%, as strong growth in Asia GCB and Latin America GCB more than offset a 2% decline in North America GCB, primarily driven by a reduction in money market balances as clients transferred cash into investment accounts.
Within ICG, average deposits grew 6% year-over-year, primarily driven by continued high-quality deposit growth in TTS.
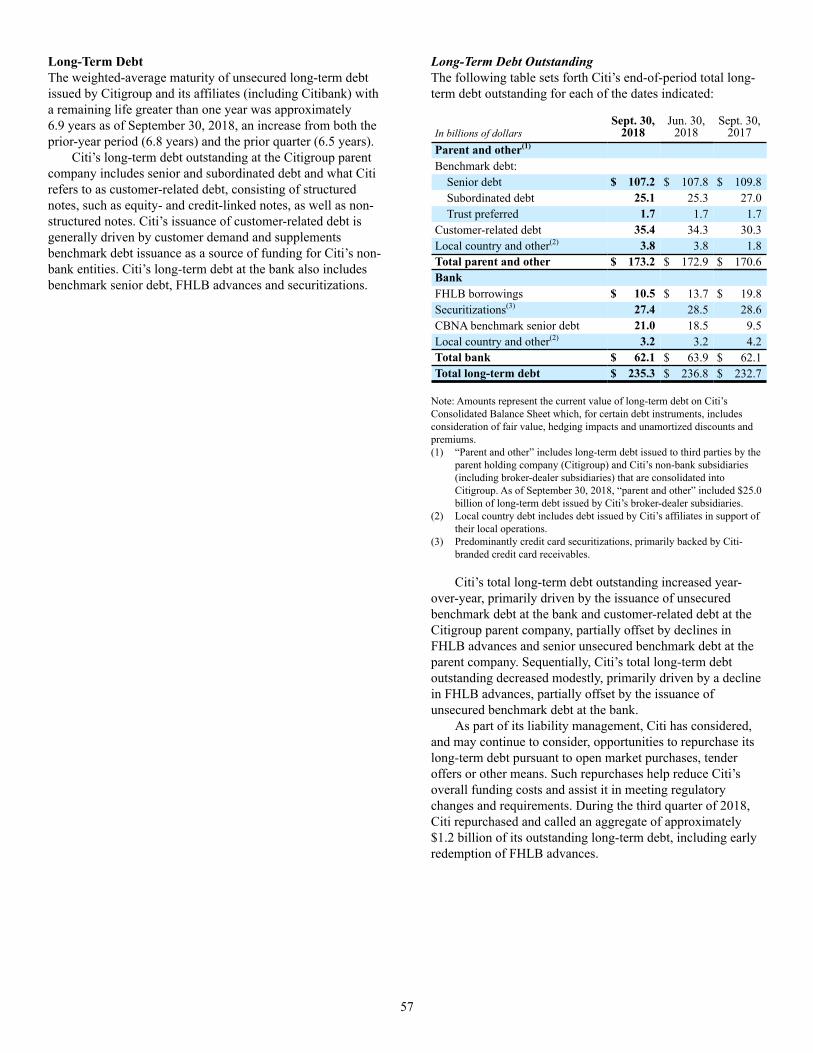
57
Long-Term Debt The weighted-average maturity of unsecured long-term debt issued by Citigroup and its affiliates (including Citibank) with a remaining life greater than one year was approximately 6.9 years as of September 30, 2018, an increase from both the prior-year period (6.8 years) and the prior quarter (6.5 years).
Citi’s long-term debt outstanding at the Citigroup parent company includes senior and subordinated debt and what Citi refers to as customer-related debt, consisting of structured notes, such as equity- and credit-linked notes, as well as non-structured notes. Citi’s issuance of customer-related debt is generally driven by customer demand and supplements benchmark debt issuance as a source of funding for Citi’s non-bank entities. Citi’s long-term debt at the bank also includes benchmark senior debt, FHLB advances and securitizations.
Long-Term Debt OutstandingThe following table sets forth Citi’s end-of-period total long-term debt outstanding for each of the dates indicated:
In billions of dollarsSept. 30,
2018Jun. 30,
2018Sept. 30,
2017Parent and other(1)
Benchmark debt:Senior debt $ 107.2 $ 107.8 $ 109.8Subordinated debt 25.1 25.3 27.0Trust preferred 1.7 1.7 1.7
Customer-related debt 35.4 34.3 30.3Local country and other(2) 3.8 3.8 1.8Total parent and other $ 173.2 $ 172.9 $ 170.6BankFHLB borrowings $ 10.5 $ 13.7 $ 19.8Securitizations(3) 27.4 28.5 28.6CBNA benchmark senior debt 21.0 18.5 9.5Local country and other(2) 3.2 3.2 4.2Total bank $ 62.1 $ 63.9 $ 62.1Total long-term debt $ 235.3 $ 236.8 $ 232.7
Note: Amounts represent the current value of long-term debt on Citi’s Consolidated Balance Sheet which, for certain debt instruments, includes consideration of fair value, hedging impacts and unamortized discounts and premiums.(1) “Parent and other” includes long-term debt issued to third parties by the
parent holding company (Citigroup) and Citi’s non-bank subsidiaries (including broker-dealer subsidiaries) that are consolidated into Citigroup. As of September 30, 2018, “parent and other” included $25.0 billion of long-term debt issued by Citi’s broker-dealer subsidiaries.
(2) Local country debt includes debt issued by Citi’s affiliates in support of their local operations.
(3) Predominantly credit card securitizations, primarily backed by Citi-branded credit card receivables.
Citi’s total long-term debt outstanding increased year-over-year, primarily driven by the issuance of unsecured benchmark debt at the bank and customer-related debt at the Citigroup parent company, partially offset by declines in FHLB advances and senior unsecured benchmark debt at the parent company. Sequentially, Citi’s total long-term debt outstanding decreased modestly, primarily driven by a decline in FHLB advances, partially offset by the issuance of unsecured benchmark debt at the bank.
As part of its liability management, Citi has considered, and may continue to consider, opportunities to repurchase its long-term debt pursuant to open market purchases, tender offers or other means. Such repurchases help reduce Citi’s overall funding costs and assist it in meeting regulatory changes and requirements. During the third quarter of 2018, Citi repurchased and called an aggregate of approximately $1.2 billion of its outstanding long-term debt, including early redemption of FHLB advances.

58
Long-Term Debt Issuances and MaturitiesThe table below details Citi’s long-term debt issuances and maturities (including repurchases and redemptions) during the periods presented:
3Q18 2Q18 3Q17In billions of dollars Maturities Issuances Maturities Issuances Maturities IssuancesParent and otherBenchmark debt:
Senior debt $ 4.2 $ 4.5 $ 7.2 $ 4.9 $ 2.5 $ 5.7Subordinated debt — — 0.3 0.3 — —Trust preferred — — — — — —
Customer-related debt 1.2 2.9 1.5 4.7 1.8 3.0Local country and other 0.3 0.1 0.2 2.1 0.4 —Total parent and other $ 5.7 $ 7.6 $ 9.1 $ 12.0 $ 4.7 $ 8.7BankFHLB borrowings $ 3.3 $ — $ 4.5 $ 2.5 $ 1.5 $ 1.0Securitizations 2.9 1.9 2.7 1.1 1.8 2.2CBNA benchmark senior debt — 2.5 — 3.5 — 2.2Local country and other 0.2 0.3 0.9 0.9 0.5 0.5Total bank $ 6.4 $ 4.7 $ 8.1 $ 8.0 $ 3.8 $ 5.9Total $ 12.1 $ 12.3 $ 17.2 $ 20.0 $ 8.5 $ 14.6
The table below shows Citi’s aggregate long-term debt maturities (including repurchases and redemptions) year-to-date in 2018, as well as its aggregate expected annual long-term debt maturities as of September 30, 2018:
Maturities2018 YTD
MaturitiesIn billions of dollars 2018 2019 2020 2021 2022 2023 Thereafter TotalParent and otherBenchmark debt:
Senior debt $ 14.9 $ 3.5 $ 14.3 $ 8.7 $ 14.2 $ 8.0 $ 12.4 $ 46.1 $ 107.2Subordinated debt 1.8 1.0 — — — 0.7 1.1 22.3 $ 25.1Trust preferred — — — — — — — 1.7 1.7
Customer-related debt 5.2 0.9 3.7 5.7 3.2 2.6 2.5 16.8 35.4Local country and other 0.5 2.2 0.4 0.1 0.4 — — 0.7 3.8Total parent and other $ 22.4 $ 7.6 $ 18.4 $ 14.5 $ 17.8 $ 11.3 $ 16.0 $ 87.6 $ 173.2BankFHLB borrowings $ 14.3 $ 1.5 $ 5.6 $ 3.4 $ — $ — $ — $ — $ 10.5Securitizations 8.5 0.1 7.9 6.1 5.7 2.2 2.5 2.9 27.4CBNA benchmark debt — 2.2 4.7 8.7 5.0 — — 0.4 21.0Local country and other 2.0 0.1 0.5 1.7 0.1 0.3 0.2 0.3 3.2Total bank $ 24.8 $ 3.9 $ 18.7 $ 19.9 $ 10.8 $ 2.5 $ 2.7 $ 3.6 $ 62.1Total long-term debt $ 47.2 $ 11.5 $ 37.1 $ 34.4 $ 28.6 $ 13.8 $ 18.7 $ 91.2 $ 235.3

59
Secured Funding Transactions and Short-Term BorrowingsCiti supplements its primary sources of funding with short-term borrowings. Short-term borrowings generally include (i) secured funding transactions (securities loaned or sold under agreements to repurchase, or repos) and (ii) to a lesser extent, short-term borrowings consisting of commercial paper and borrowings from the FHLB and other market participants (see Note 16 to the Consolidated Financial Statements for further information on Citigroup’s and its affiliates’ outstanding short-term borrowings).
Outside of secured funding transactions, Citi’s short-term borrowings decreased 11% year-over-year and 9% sequentially, driven primarily by Citi’s continued efforts to optimize its funding profile.
Secured Funding Secured funding is primarily accessed through Citi’s broker-dealer subsidiaries to fund efficiently both secured lending activity and a portion of the securities inventory held in the context of market making and customer activities. Citi also executes a smaller portion of its secured funding transactions through its bank entities, which is typically collateralized by foreign government debt securities. Generally, daily changes in the level of Citi’s secured funding are primarily due to fluctuations in secured lending activity in the matched book (as described below) and securities inventory.
Secured funding of $176 billion as of September 30, 2018 increased 9% from the prior-year period and declined 1% sequentially. Excluding the impact of FX translation, secured funding increased 11% from the prior-year period and declined 1% sequentially, both driven by normal business activity. Average balances for secured funding were also approximately $176 billion for the quarter ended September 30, 2018.
The portion of secured funding in the broker-dealer subsidiaries that funds secured lending is commonly referred to as “matched book” activity. The majority of this activity is secured by high-quality liquid securities such as U.S. Treasury securities, U.S. agency securities and foreign government debt securities. Other secured funding is secured by less-liquid securities, including equity securities, corporate bonds and asset-backed securities. The tenor of Citi’s matched book liabilities is generally equal to or longer than the tenor of the corresponding matched book assets.
The remainder of the secured funding activity in the broker-dealer subsidiaries serves to fund securities inventory held in the context of market making and customer activities. To maintain reliable funding under a wide range of market conditions, including under periods of stress, Citi manages these activities by taking into consideration the quality of the underlying collateral and stipulating financing tenor. The weighted average maturity of Citi’s secured funding of less-liquid securities inventory was greater than 110 days as of September 30, 2018.
Citi manages the risks in its secured funding by conducting daily stress tests to account for changes in capacity, tenors, haircut, collateral profile and client actions. Additionally, Citi maintains counterparty diversification by
establishing concentration triggers and assessing counterparty reliability and stability under stress. Citi generally sources secured funding from more than 150 counterparties.
Liquidity Coverage Ratio (LCR)In addition to internal liquidity stress metrics that Citi has developed for a 30-day stress scenario, Citi also monitors its liquidity by reference to the LCR, as calculated pursuant to the U.S. LCR rules. The table below sets forth the components of Citi’s LCR calculation and HQLA in excess of net outflows for the periods indicated:
In billions of dollarsSept. 30,
2018Jun. 30,
2018Sept. 30,
2017HQLA $ 420.8 $ 406.6 $ 448.6Net outflows 350.8 341.5 365.1LCR 120% 119% 123%HQLA in excess of net outflows $70.0 $ 65.1 $ 83.5
Note: The amounts are presented on an average basis.
Citi’s average LCR decreased year-over-year, driven by a decline in average HQLA, partially offset by a decline in modeled net outflows. Sequentially, Citi’s average LCR increased slightly, due to the increase in HQLA, as described above (see “High-Quality Liquid Assets” above), partially offset by an increase in modeled net outflows.
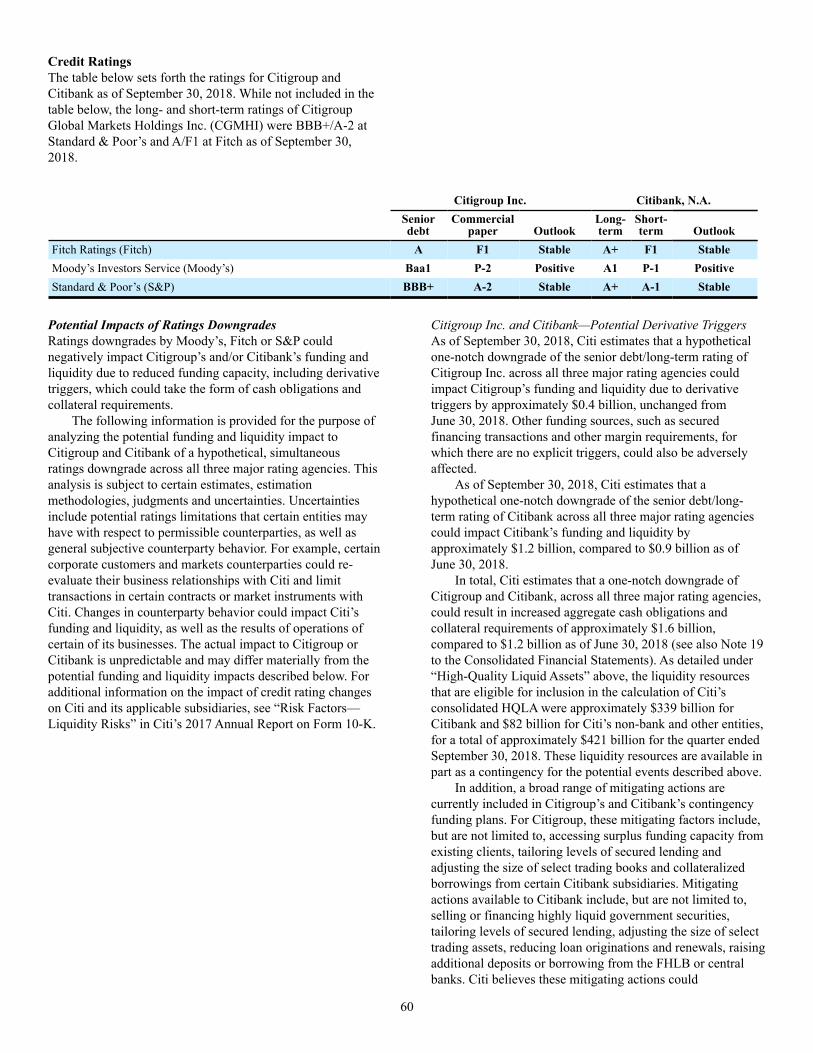
60
Credit RatingsThe table below sets forth the ratings for Citigroup and Citibank as of September 30, 2018. While not included in the table below, the long- and short-term ratings of Citigroup Global Markets Holdings Inc. (CGMHI) were BBB+/A-2 at Standard & Poor’s and A/F1 at Fitch as of September 30, 2018.
Citigroup Inc. Citibank, N.A.
Seniordebt
Commercialpaper Outlook
Long-term
Short-term Outlook
Fitch Ratings (Fitch) A F1 Stable A+ F1 StableMoody’s Investors Service (Moody’s) Baa1 P-2 Positive A1 P-1 PositiveStandard & Poor’s (S&P) BBB+ A-2 Stable A+ A-1 Stable
Potential Impacts of Ratings DowngradesRatings downgrades by Moody’s, Fitch or S&P could negatively impact Citigroup’s and/or Citibank’s funding and liquidity due to reduced funding capacity, including derivative triggers, which could take the form of cash obligations and collateral requirements.
The following information is provided for the purpose of analyzing the potential funding and liquidity impact to Citigroup and Citibank of a hypothetical, simultaneous ratings downgrade across all three major rating agencies. This analysis is subject to certain estimates, estimation methodologies, judgments and uncertainties. Uncertainties include potential ratings limitations that certain entities may have with respect to permissible counterparties, as well as general subjective counterparty behavior. For example, certain corporate customers and markets counterparties could re-evaluate their business relationships with Citi and limit transactions in certain contracts or market instruments with Citi. Changes in counterparty behavior could impact Citi’s funding and liquidity, as well as the results of operations of certain of its businesses. The actual impact to Citigroup or Citibank is unpredictable and may differ materially from the potential funding and liquidity impacts described below. For additional information on the impact of credit rating changes on Citi and its applicable subsidiaries, see “Risk Factors— Liquidity Risks” in Citi’s 2017 Annual Report on Form 10-K.
Citigroup Inc. and Citibank—Potential Derivative TriggersAs of September 30, 2018, Citi estimates that a hypothetical one-notch downgrade of the senior debt/long-term rating of Citigroup Inc. across all three major rating agencies could impact Citigroup’s funding and liquidity due to derivative triggers by approximately $0.4 billion, unchanged from June 30, 2018. Other funding sources, such as secured financing transactions and other margin requirements, for which there are no explicit triggers, could also be adversely affected.
As of September 30, 2018, Citi estimates that a hypothetical one-notch downgrade of the senior debt/long-term rating of Citibank across all three major rating agencies could impact Citibank’s funding and liquidity by approximately $1.2 billion, compared to $0.9 billion as of June 30, 2018.
In total, Citi estimates that a one-notch downgrade of Citigroup and Citibank, across all three major rating agencies, could result in increased aggregate cash obligations and collateral requirements of approximately $1.6 billion, compared to $1.2 billion as of June 30, 2018 (see also Note 19 to the Consolidated Financial Statements). As detailed under “High-Quality Liquid Assets” above, the liquidity resources that are eligible for inclusion in the calculation of Citi’s consolidated HQLA were approximately $339 billion for Citibank and $82 billion for Citi’s non-bank and other entities, for a total of approximately $421 billion for the quarter ended September 30, 2018. These liquidity resources are available in part as a contingency for the potential events described above.
In addition, a broad range of mitigating actions are currently included in Citigroup’s and Citibank’s contingency funding plans. For Citigroup, these mitigating factors include, but are not limited to, accessing surplus funding capacity from existing clients, tailoring levels of secured lending and adjusting the size of select trading books and collateralized borrowings from certain Citibank subsidiaries. Mitigating actions available to Citibank include, but are not limited to, selling or financing highly liquid government securities, tailoring levels of secured lending, adjusting the size of select trading assets, reducing loan originations and renewals, raising additional deposits or borrowing from the FHLB or central banks. Citi believes these mitigating actions could

61
substantially reduce the funding and liquidity risk, if any, of the potential downgrades described above.
Citibank—Additional Potential ImpactsIn addition to the above derivative triggers, Citi believes that a potential one-notch downgrade of Citibank’s senior debt/long-term rating by S&P could also have an adverse impact on the commercial paper/short-term rating of Citibank. As of September 30, 2018, Citibank had liquidity commitments of approximately $12.1 billion to consolidated asset-backed commercial paper conduits, compared to $12.0 billion as of June 30, 2018 (as referenced in Note 18 to the Consolidated Financial Statements).
In addition to the above-referenced liquidity resources of certain Citibank entities, Citibank could reduce the funding and liquidity risk, if any, of the potential downgrades described above through mitigating actions, including repricing or reducing certain commitments to commercial paper conduits. In the event of the potential downgrades described above, Citi believes that certain corporate customers could re-evaluate their deposit relationships with Citibank. This re-evaluation could result in clients adjusting their discretionary deposit levels or changing their depository institution, which could potentially reduce certain deposit levels at Citibank. However, Citi could choose to adjust pricing, offer alternative deposit products to its existing customers or seek to attract deposits from new customers, in addition to the mitigating actions referenced above.

62
MARKET RISK
Market risk emanates from both Citi’s trading and non-trading portfolios. For additional information on market risk and market risk management at Citi, see “Market Risk” and “Risk Factors” in Citi’s 2017 Annual Report on Form 10-K.
Market Risk of Non-Trading Portfolios For additional information on Citi’s net interest revenue (for interest rate exposure purposes), interest rate risk and interest rate risk measurement, see “Market Risk of Non-Trading Portfolios” in Citi’s 2017 Annual Report on Form 10-K.
The following table sets forth the estimated impact to Citi’s net interest revenue, AOCI and the Common Equity Tier 1 Capital ratio (on a fully implemented basis), each assuming an unanticipated parallel instantaneous 100 basis point (bps) increase in interest rates:
In millions of dollars (unless otherwise noted) Sept. 30, 2018 Jun. 30, 2018 Sept. 30, 2017Estimated annualized impact to net interest revenueU.S. dollar(1) $ 879 $ 1,046 $ 1,449All other currencies 649 635 610Total $ 1,528 $ 1,681 $ 2,059
As a percentage of average interest-earning assets 0.09% 0.10% 0.12%Estimated initial impact to AOCI (after-tax)(2) $ (4,597) $ (4,713) $ (4,206)Estimated initial impact on Common Equity Tier 1 Capital ratio (bps)(3) (31) (32) (48)
(1) Certain trading-oriented businesses within Citi have accrual-accounted positions that are excluded from the estimated impact to net interest revenue in the table, since these exposures are managed economically in combination with mark-to-market positions. The U.S. dollar interest rate exposure associated with these businesses was $(212) million for a 100 bps instantaneous increase in interest rates as of September 30, 2018.
(2) Includes the effect of changes in interest rates on AOCI related to investment securities, cash flow hedges and pension liability adjustments.(3) Results as of September 30, 2018 and June 30, 2018 reflect the impact of Tax Reform, including the lower expected effective tax rate and the impact to Citi’s
DTA position. Results as of September 30, 2017 have not been restated.
The estimated impact to net interest revenue decreased on a sequential basis, reflecting changes in balance sheet composition, including increased sensitivity in deposits combined with loan growth and other actions. The decrease in the estimated impact to AOCI primarily reflected changes to the positioning of Citi Treasury’s investment securities and related interest rate derivatives portfolio.
In the event of an unanticipated parallel instantaneous 100 bps increase in interest rates, Citi expects that the negative impact to AOCI would be offset in stockholders’ equity through the combination of expected incremental net interest revenue and the expected recovery of the impact on AOCI through accretion of Citi’s investment portfolio over a period of time. As of September 30, 2018, Citi expects that the negative $4.6 billion impact to AOCI in such a scenario could potentially be offset over approximately 19 months.
The following table sets forth the estimated impact to Citi’s net interest revenue, AOCI and the Common Equity Tier 1 Capital ratio (on a fully implemented basis) under four different changes in interest rate scenarios for the U.S. dollar and Citi’s other currencies. While Citi also monitors the impact of a parallel decrease in interest rates, a 100 bps decrease in short-term rates is not meaningful, as it would imply negative interest rates in many of Citi's markets.
In millions of dollars (unless otherwise noted) Scenario 1 Scenario 2 Scenario 3 Scenario 4Overnight rate change (bps) 100 100 — —10-year rate change (bps) 100 — 100 (100)Estimated annualized impact to net interest revenue
U.S. dollar $ 879 $ 906 $ 47 $ (56)All other currencies 649 617 37 (37)
Total $ 1,528 $ 1,523 $ 84 $ (93)Estimated initial impact to AOCI (after-tax)(1) $ (4,597) $ (2,547) $ (2,279) $ 1,772Estimated initial impact to Common Equity Tier 1 Capital ratio (bps) (31) (17) (16) 12
Note: Each scenario assumes that the rate change will occur instantaneously. Changes in interest rates for maturities between the overnight rate and the 10-year rate are interpolated. (1) Includes the effect of changes in interest rates on AOCI related to investment securities, cash flow hedges and pension liability adjustments.

63
As shown in the table above, the magnitude of the impact to Citi’s net interest revenue and AOCI is greater under scenario 2 as compared to scenario 3. This is because the combination of changes to Citi’s investment portfolio, partially offset by changes related to Citi’s pension liabilities, results in a net position that is more sensitive to rates at shorter- and intermediate-term maturities.
In recent years, a number of central banks, including the European Central Bank, the Bank of Japan and the Swiss National Bank, have implemented negative interest rates, and additional governmental entities could do so in the future. While negative interest rates can adversely impact net interest revenue (as well as net interest margin), Citi has, to date, been able to partially offset the impact of negative rates in these jurisdictions through a combination of business and Citi Treasury interest rate risk mitigation activities, including applying negative rates to client accounts (for additional information on Citi Treasury’s ongoing interest rate mitigation activities, see “Market Risk—Market Risk of Non-Trading Portfolios” in Citi’s 2017 Annual Report on Form 10-K).
Changes in Foreign Exchange Rates—Impacts on AOCI and CapitalAs of September 30, 2018, Citi estimates that an unanticipated parallel instantaneous 5% appreciation of the U.S. dollar against all of the other currencies in which Citi has invested capital could reduce Citi’s tangible common equity (TCE) by approximately $1.4 billion, or 0.9%, as a result of changes to Citi’s foreign currency translation adjustment in AOCI, net of hedges. This impact would be primarily due to changes in the value of the Mexican peso, the Euro and the Australian dollar.
This impact is also before any mitigating actions Citi may take, including ongoing management of its foreign currency translation exposure. Specifically, as currency movements change the value of Citi’s net investments in foreign currency-denominated capital, these movements also change the value of Citi’s risk-weighted assets denominated in those currencies. This, coupled with Citi’s foreign currency hedging strategies, such as foreign currency borrowings, foreign currency forwards and other currency hedging instruments, lessens the impact of foreign currency movements on Citi’s Common Equity Tier 1 Capital ratio. Changes in these hedging strategies, as well as hedging costs, divestitures and tax impacts, can further affect the actual impact of changes in foreign exchange rates on Citi’s capital as compared to an unanticipated parallel shock, as described above.
The effect of Citi’s ongoing management strategies with respect to changes in foreign exchange rates and the impact of these changes on Citi’s TCE and Common Equity Tier 1 Capital ratio are shown in the table below. For additional information on the changes in AOCI, see Note 17 to the Consolidated Financial Statements.
For the quarter endedIn millions of dollars (unless otherwise noted) Sept. 30, 2018 Jun. 30, 2018 Sept. 30, 2017Change in FX spot rate(1) (0.2)% (5.8)% 1.1%Change in TCE due to FX translation, net of hedges $ (354) $ (2,241) $ 222
As a percentage of TCE (0.2)% (1.5)% 0.1%Estimated impact to Common Equity Tier 1 Capital ratio (on a fully implemented basis) due to changes in FX translation, net of hedges (bps) — — (3)
(1) FX spot rate change is a weighted average based upon Citi’s quarterly average GAAP capital exposure to foreign countries.

64
Interest Revenue/Expense and Net Interest Margin
3rd Qtr. 2nd Qtr. 3rd Qtr. ChangeIn millions of dollars, except as otherwise noted 2018 2018 2017 3Q18 vs. 3Q17Interest revenue(1) $ 18,228 $ 17,613 $ 16,037 14%Interest expense(2) 6,368 5,885 4,379 45Net interest revenue $ 11,860 $ 11,728 $ 11,658 2%Interest revenue—average rate 4.15% 4.05% 3.77% 38 bps
Interest expense—average rate 1.83 1.73 1.33 50 bps
Net interest margin(3) 2.70 2.70 2.74 (4) bps
Interest-rate benchmarks Two-year U.S. Treasury note—average rate 2.67% 2.48% 1.36% 131 bps
10-year U.S. Treasury note—average rate 2.92 2.92 2.24 68 bps
10-year vs. two-year spread 25 bps 44 bps 88 bps
Note: All interest expense amounts include FDIC, as well as other similar deposit insurance assessments outside of the U.S.(1) Net interest revenue includes the taxable equivalent adjustments related to the tax-exempt bond portfolio (based on the U.S. federal statutory tax rates of 21% in
2018 and 35% in 2017) of $58 million, $63 million and $123 million for the three months ended September 30, 2018, June 30, 2018 and September 30, 2017, respectively.
(2) Interest expense associated with certain hybrid financial instruments, which are classified as Long-term debt and accounted for at fair value, is reported together with any changes in fair value as part of Principal transactions in the Consolidated Statements of Income and is therefore not reflected in Interest expense in the table above.
(3) Citi’s net interest margin (NIM) is calculated by dividing gross interest revenue less gross interest expense by average interest-earning assets.
Citi’s net interest revenue in the third quarter of 2018 increased 2% to $11.9 billion (as set forth in the table above, also up 2% on a taxable equivalent basis) versus the prior-year period. Excluding the impact of FX translation, net interest revenue increased 5%, or approximately $520 million. This increase was primarily due to higher net interest revenue ($11.3 billion, up approximately 9% or $1.0 billion) from Citi’s core accrual activities, which are mainly driven by its deposit and lending businesses. The increase in core accrual net interest revenue was partially offset by lower trading-related net interest revenue ($0.4 billion, down approximately 47% or $0.3 billion) and lower net interest revenue associated with the wind-down of legacy assets in Corporate/Other ($0.2
billion, down approximately 45% or $0.1 billion). The increase in the core accrual net interest revenue was driven mainly by higher interest rates, loan growth and an improved loan mix.
Citi’s NIM was 2.70% on a taxable equivalent basis in the third quarter of 2018, a decrease of 4 bps from the prior- year period, driven primarily by lower trading-related NIM. Citi’s core accrual NIM was 3.60%, an increase of 12 bps versus the prior-year period, primarily driven by higher interest rates, loan growth and an improved loan mix. (Citi’s core accrual net interest revenue and core accrual NIM are non-GAAP financial measures.)

65
Additional Interest Rate Details
Average Balances and Interest Rates—Assets(1)(2)(3)
Taxable Equivalent Basis
Average volume Interest revenue % Average rate3rd Qtr. 2nd Qtr. 3rd Qtr. 3rd Qtr. 2nd Qtr. 3rd Qtr. 3rd Qtr. 2nd Qtr. 3rd Qtr.
In millions of dollars, except rates 2018 2018 2017 2018 2018 2017 2018 2018 2017Assets Deposits with banks(4) $ 186,907 $ 176,151 $ 176,942 $ 629 $ 493 $ 486 1.34% 1.12% 1.09%Federal funds sold and securities borrowed or purchased under agreements to resell(5)
In U.S. offices $ 154,120 $ 153,273 $ 136,681 $ 1,065 $ 838 $ 524 2.74% 2.19% 1.52%In offices outside the U.S.(4) 114,389 118,098 108,770 360 498 334 1.25 1.69 1.22Total $ 268,509 $ 271,371 $ 245,451 $ 1,425 $ 1,336 $ 858 2.11% 1.97% 1.39%Trading account assets(6)(7)
In U.S. offices $ 92,034 $ 92,791 $ 98,725 $ 1,048 $ 851 $ 918 4.52% 3.68% 3.69%In offices outside the U.S.(4) 112,979 117,840 105,882 614 922 555 2.16 3.14 2.08Total $ 205,013 $ 210,631 $ 204,607 $ 1,662 $ 1,773 $ 1,473 3.22% 3.38% 2.86%InvestmentsIn U.S. offices
Taxable $ 227,282 $ 225,886 $ 227,680 $ 1,343 $ 1,315 $ 1,138 2.34% 2.34% 1.98%Exempt from U.S. income tax 17,088 17,339 17,890 175 180 181 4.06 4.16 4.01
In offices outside the U.S.(4) 103,120 104,562 106,456 903 913 835 3.47 3.50 3.11Total $ 347,490 $ 347,787 $ 352,026 $ 2,421 $ 2,408 $ 2,154 2.76% 2.78% 2.43%Loans (net of unearned income)(8)
In U.S. offices $ 385,610 $ 382,972 $ 372,067 $ 7,331 $ 6,958 $ 6,650 7.54% 7.29% 7.09%In offices outside the U.S.(4) 284,663 286,772 274,254 4,326 4,251 4,124 6.03 5.95 5.97Total $ 670,273 $ 669,744 $ 646,321 $ 11,657 $ 11,209 $ 10,774 6.90% 6.71% 6.61%Other interest-earning assets(9) $ 63,741 $ 69,341 $ 61,677 $ 434 $ 394 $ 292 2.70% 2.28% 1.88%Total interest-earning assets $ 1,741,933 $ 1,745,025 $ 1,687,024 $ 18,228 $ 17,613 $ 16,037 4.15% 4.05% 3.77%Non-interest-earning assets(6) $ 180,871 $ 172,077 $ 205,268Total assets $ 1,922,804 $ 1,917,102 $ 1,892,292
(1) Net interest revenue includes the taxable equivalent adjustments related to the tax-exempt bond portfolio (based on the U.S. federal statutory tax rates of 21% in 2018 and 35% in 2017) of $58 million, $63 million and $123 million for the three months ended September 30, 2018, June 30, 2018 and September 30, 2017, respectively.
(2) Interest rates and amounts include the effects of risk management activities associated with the respective asset categories.(3) Monthly or quarterly averages have been used by certain subsidiaries where daily averages are unavailable.(4) Average rates reflect prevailing local interest rates, including inflationary effects and monetary corrections in certain countries.(5) Average volumes of securities borrowed or purchased under agreements to resell are reported net pursuant to ASC 210-20-45. However, Interest revenue excludes
the impact of ASC 210-20-45.(6) The fair value carrying amounts of derivative contracts are reported net, pursuant to ASC 815-10-45, in Non-interest-earning assets and Other non-interest-
bearing liabilities.(7) Interest expense on Trading account liabilities of ICG is reported as a reduction of Interest revenue. Interest revenue and Interest expense on cash collateral
positions are reported in interest on Trading account assets and Trading account liabilities, respectively.(8) Includes cash-basis loans. (9) Includes brokerage receivables.

66
Average Balances and Interest Rates—Liabilities and Equity, and Net Interest Revenue(1)(2)(3)
Taxable Equivalent Basis
Average volume Interest expense % Average rate
3rd Qtr. 2nd Qtr. 3rd Qtr. 3rd Qtr. 2nd Qtr. 3rd Qtr. 3rd Qtr. 2nd Qtr. 3rd Qtr.In millions of dollars, except rates 2018 2018 2017 2018 2018 2017 2018 2018 2017Liabilities Deposits In U.S. offices(4) $ 341,679 $ 332,595 $ 318,881 $ 1,231 $ 1,041 $ 695 1.43% 1.26% 0.86%In offices outside the U.S.(5) 452,197 453,025 438,561 1,349 1,203 1,080 1.18 1.07 0.98Total $ 793,876 $ 785,620 $ 757,442 $ 2,580 $ 2,244 $ 1,775 1.29% 1.15% 0.93%Federal funds purchased and securities loaned or sold under agreements to repurchase(6)
In U.S. offices $ 105,194 $ 102,517 $ 93,167 $ 872 $ 796 $ 423 3.29% 3.11% 1.80%In offices outside the U.S.(5) 70,638 68,556 64,897 378 428 289 2.12 2.50 1.77Total $ 175,832 $ 171,073 $ 158,064 $ 1,250 $ 1,224 $ 712 2.82% 2.87% 1.79%Trading account liabilities(7)(8)
In U.S. offices $ 38,385 $ 36,103 $ 32,622 $ 167 $ 140 $ 104 1.73% 1.56% 1.26%In offices outside the U.S.(5) 57,746 61,048 57,187 106 96 65 0.73 0.63 0.45Total $ 96,131 $ 97,151 $ 89,809 $ 273 $ 236 $ 169 1.13% 0.97% 0.75%Short-term borrowings(9)
In U.S. offices $ 85,592 $ 84,338 $ 77,211 $ 502 $ 439 $ 234 2.33% 2.09% 1.20%In offices outside the U.S.(5) 22,579 23,854 20,928 76 84 84 1.34 1.41 1.59Total $ 108,171 $ 108,192 $ 98,139 $ 578 $ 523 $ 318 2.12% 1.94% 1.29%Long-term debt(10)
In U.S. offices $ 200,199 $ 198,291 $ 198,766 $ 1,647 $ 1,620 $ 1,377 3.26% 3.28% 2.75%In offices outside the U.S.(5) 5,390 4,980 4,298 40 38 28 2.94 3.06 2.58Total $ 205,589 $ 203,271 $ 203,064 $ 1,687 $ 1,658 $ 1,405 3.26% 3.27% 2.75%Total interest-bearing liabilities $ 1,379,599 $ 1,365,307 $ 1,306,518 $ 6,368 $ 5,885 $ 4,379 1.83% 1.73% 1.33%Demand deposits in U.S. offices $ 31,697 $ 33,737 $ 37,673Other non-interest-bearing liabilities(7) 312,174 316,907 318,060Total liabilities $ 1,723,470 $ 1,715,951 $ 1,662,251Citigroup stockholders’ equity $ 198,494 $ 200,295 $ 229,017Noncontrolling interest 840 856 1,024Total equity $ 199,334 $ 201,151 $ 230,041Total liabilities and stockholders’equity $ 1,922,804 $ 1,917,102 $ 1,892,292Net interest revenue as a percentage of average interest-earning assets(11)
In U.S. offices $ 1,005,236 $ 983,786 $ 975,283 $ 7,307 $ 6,710 $ 7,046 2.88% 2.74% 2.87%In offices outside the U.S.(6) 736,697 761,239 711,741 4,553 5,018 4,612 2.45 2.64 2.57Total $ 1,741,933 $ 1,745,025 $ 1,687,024 $ 11,860 $ 11,728 $ 11,658 2.70% 2.70% 2.74%
(1) Net interest revenue includes the taxable equivalent adjustments related to the tax-exempt bond portfolio (based on the U.S. federal statutory tax rates of 21% in 2018 and 35% in 2017) of $58 million, $63 million and $123 million for the three months ended September 30, 2018, June 30, 2018 and September 30, 2017, respectively.
(2) Interest rates and amounts include the effects of risk management activities associated with the respective liability categories.(3) Monthly or quarterly averages have been used by certain subsidiaries where daily averages are unavailable.(4) Consists of other time deposits and savings deposits. Savings deposits are made up of insured money market accounts, NOW accounts and other savings deposits.
The interest expense on savings deposits includes FDIC deposit insurance assessments.(5) Average rates reflect prevailing local interest rates, including inflationary effects and monetary corrections in certain countries.(6) Average volumes of securities sold under agreements to repurchase are reported net pursuant to ASC 210-20-45. However, Interest expense excludes the impact of
ASC 210-20-45.(7) The fair value carrying amounts of derivative contracts are reported net, pursuant to ASC 815-10-45, in Non-interest-earning assets and Other non-interest-
bearing liabilities.

67
(8) Interest expense on Trading account liabilities of ICG is reported as a reduction of Interest revenue. Interest revenue and Interest expense on cash collateral positions are reported in interest on Trading account assets and Trading account liabilities, respectively.
(9) Includes brokerage payables.(10) Excludes hybrid financial instruments and beneficial interests in consolidated VIEs that are classified as Long-term debt, as the changes in fair value for these
obligations are recorded in Principal transactions.(11) Includes allocations for capital and funding costs based on the location of the asset.
Average Balances and Interest Rates—Assets(1)(2)(3)(4)
Taxable Equivalent Basis
Average volume Interest revenue % Average rate
Nine Months Nine Months Nine Months Nine Months Nine Months Nine MonthsIn millions of dollars, except rates 2018 2017 2018 2017 2018 2017Assets Deposits with banks(5) $ 177,975 $ 165,910 $ 1,554 $ 1,156 1.17% 0.93%Federal funds sold and securities borrowed or purchased under agreements to resell(6) In U.S. offices $ 149,251 $ 141,723 $ 2,616 $ 1,364 2.34% 1.29%In offices outside the U.S.(5) 115,469 105,527 1,184 984 1.37 1.25Total $ 264,720 $ 247,250 $ 3,800 $ 2,348 1.92% 1.27%Trading account assets(7)(8) In U.S. offices $ 94,128 $ 100,214 $ 2,768 $ 2,679 3.93% 3.57%In offices outside the U.S.(5) 116,474 101,159 2,048 1,624 2.35 2.15Total $ 210,602 $ 201,373 $ 4,816 $ 4,303 3.06% 2.86%Investments In U.S. offices
Taxable $ 227,525 $ 224,384 $ 3,882 $ 3,258 2.28% 1.94%Exempt from U.S. income tax 17,319 18,345 525 574 4.05 4.18
In offices outside the U.S.(5) 104,330 106,813 2,693 2,454 3.45 3.07Total $ 349,174 $ 349,542 $ 7,100 $ 6,286 2.72% 2.40%Loans (net of unearned income)(9) In U.S. offices $ 382,980 $ 369,602 $ 21,021 $ 19,316 7.34% 6.99%In offices outside the U.S.(5) 286,334 265,060 12,754 11,844 5.96 5.97Total $ 669,314 $ 634,662 $ 33,775 $ 31,160 6.75% 6.56%Other interest-earning assets(10) $ 66,614 $ 59,506 $ 1,192 $ 846 2.39% 1.90%Total interest-earning assets $ 1,738,399 $ 1,658,243 $ 52,237 $ 46,099 4.02% 3.72%Non-interest-earning assets(7) $ 176,312 $ 205,775 Total assets $ 1,914,711 $ 1,864,018
(1) Net interest revenue includes the taxable equivalent adjustments (based on the U.S. federal statutory tax rates of 21% in 2018 and 35% in 2017) of $185 million and $370 million for the nine months ended September 30, 2018 and 2017, respectively.
(2) Interest rates and amounts include the effects of risk management activities associated with the respective asset and liability categories.(3) Monthly or quarterly averages have been used by certain subsidiaries where daily averages are unavailable.(4) Detailed average volume, Interest revenue and Interest expense exclude Discontinued operations. See Note 2 to the Consolidated Financial Statements.(5) Average rates reflect prevailing local interest rates, including inflationary effects and monetary corrections in certain countries.(6) Average volumes of securities borrowed or purchased under agreements to resell are reported net pursuant to FIN 41 (ASC 210-20-45). However, Interest revenue
excludes the impact of FIN 41 (ASC 210-20-45).(7) The fair value carrying amounts of derivative contracts are reported in Non-interest-earning assets and Other non-interest-bearing liabilities.(8) Interest expense on Trading account liabilities of ICG is reported as a reduction of Interest revenue. Interest revenue and Interest expense on cash collateral
positions are reported in interest on Trading account assets and Trading account liabilities, respectively.(9) Includes cash-basis loans.(10) Includes brokerage receivables.

68
Average Balances and Interest Rates—Liabilities and Equity, and Net Interest Revenue(1)(2)(3)(4)
Taxable Equivalent Basis
Average volume Interest expense % Average rateNine Months Nine Months Nine Months Nine Months Nine Months Nine Months
In millions of dollars, except rates 2018 2017 2018 2017 2018 2017Liabilities Deposits In U.S. offices(5) $ 332,542 $ 310,977 $ 3,169 $ 1,795 1.27% 0.77 %In offices outside the U.S.(6) 450,546 435,704 3,652 2,998 1.08 0.92Total $ 783,088 $ 746,681 $ 6,821 $ 4,793 1.16% 0.86 %Federal funds purchased and securities loaned or sold under agreements to repurchase(7) In U.S. offices $ 102,242 $ 96,417 $ 2,272 $ 1,101 2.97% 1.53 %In offices outside the U.S.(6) 68,215 59,559 1,151 780 2.26 1.75Total $ 170,457 $ 155,976 $ 3,423 $ 1,881 2.68% 1.61 %Trading account liabilities(8)(9) In U.S. offices $ 36,161 $ 33,041 $ 434 $ 269 1.60% 1.09 %In offices outside the U.S.(6) 58,840 57,862 290 193 0.66 0.45Total $ 95,001 $ 90,903 $ 724 $ 462 1.02% 0.68 %Short-term borrowings(10) In U.S. offices $ 86,377 $ 72,435 $ 1,330 $ 422 2.06% 0.78 %In offices outside the U.S.(6) 23,305 22,668 242 297 1.39 1.75Total $ 109,682 $ 95,103 $ 1,572 $ 719 1.92% 1.01 %Long-term debt(11) In U.S. offices $ 199,471 $ 188,344 $ 4,749 $ 3,993 3.18% 2.83 %In offices outside the U.S.(6) 4,908 4,715 124 133 3.38 3.77Total $ 204,379 $ 193,059 $ 4,873 $ 4,126 3.19% 2.86 %Total interest-bearing liabilities $ 1,362,607 $ 1,281,722 $ 17,413 $ 11,981 1.71% 1.25 %Demand deposits in U.S. offices $ 33,654 $ 38,064 Other non-interest-bearing liabilities(8) 317,697 313,605 Total liabilities $ 1,713,958 $ 1,633,391 Citigroup stockholders’ equity(12) $ 199,874 $ 229,618 Noncontrolling interest 879 1,009 Total equity(12) $ 200,753 $ 230,627 Total liabilities and stockholders’ equity $ 1,914,711 $ 1,864,018 Net interest revenue as a percentage of averageinterest-earning assets In U.S. offices $ 987,592 $ 963,789 $ 20,734 $ 20,588 2.81% 2.86 %In offices outside the U.S.(6) 750,807 694,454 14,090 13,530 2.51 2.60Total $ 1,738,399 $ 1,658,243 $ 34,824 $ 34,118 2.68% 2.75 %
(1) Net interest revenue includes the taxable equivalent adjustments (based on the U.S. federal statutory tax rates of 21% in 2018 and 35% in 2017) of $185 million and $370 million for the nine months ended September 30, 2018 and 2017, respectively.
(2) Interest rates and amounts include the effects of risk management activities associated with the respective asset and liability categories.(3) Monthly or quarterly averages have been used by certain subsidiaries where daily averages are unavailable.(4) Detailed average volume, Interest revenue and Interest expense exclude Discontinued operations. See Note 2 to the Consolidated Financial Statements.(5) Consists of other time deposits and savings deposits. Savings deposits are made up of insured money market accounts, NOW accounts and other savings deposits.
The interest expense on savings deposits includes FDIC deposit insurance fees and charges.(6) Average rates reflect prevailing local interest rates, including inflationary effects and monetary corrections in certain countries.(7) Average volumes of securities loaned or sold under agreements to repurchase are reported net pursuant to FIN 41 (ASC 210-20-45). However, Interest expense
excludes the impact of FIN 41 (ASC 210-20-45).(8) The fair value carrying amounts of derivative contracts are reported in Non-interest-earning assets and Other non-interest-bearing liabilities.(9) Interest expense on Trading account liabilities of ICG is reported as a reduction of Interest revenue. Interest revenue and Interest expense on cash collateral
positions are reported in interest on Trading account assets and Trading account liabilities, respectively.(10) Excludes hybrid financial instruments and beneficial interests in consolidated VIEs that are classified as Long-term debt, as these obligations are accounted for in
changes in fair value recorded in Principal transactions.(11) Includes stockholders' equity from discontinued operations.(12) Includes allocations for capital and funding costs based on the location of the asset.

69
Analysis of Changes in Interest Revenue(1)(2)(3)
3rd Qtr. 2018 vs. 2nd Qtr. 2018 3rd Qtr. 2018 vs. 3rd Qtr. 2017
Increase (decrease)due to change in:
Increase (decrease)due to change in:
In millions of dollarsAveragevolume
Averagerate
Netchange
Averagevolume
Averagerate
Netchange
Deposits with banks(4) $ 32 $ 104 $ 136 $ 29 $ 114 $ 143Federal funds sold and securities borrowed or purchased under agreements to resellIn U.S. offices $ 5 $ 222 $ 227 $ 74 $ 467 $ 541In offices outside the U.S.(4) (15) (123) (138) 18 8 26Total $ (10) $ 99 $ 89 $ 92 $ 475 $ 567Trading account assets(5)
In U.S. offices $ (7) $ 204 $ 197 $ (65) $ 195 $ 130In offices outside the U.S.(4) (37) (271) (308) 38 21 59Total $ (44) $ (67) $ (111) $ (27) $ 216 $ 189Investments(1)
In U.S. offices $ 7 $ 16 $ 23 $ (6) $ 205 $ 199In offices outside the U.S.(4) (13) 3 (10) (27) 95 68Total $ (6) $ 19 $ 13 $ (33) $ 300 $ 267Loans (net of unearned income)(6)
In U.S. offices $ 48 $ 325 $ 373 $ 248 $ 433 $ 681In offices outside the U.S.(4) (31) 106 75 158 44 202Total $ 17 $ 431 $ 448 $ 406 $ 477 $ 883Other interest-earning assets(7) $ (34) $ 74 $ 40 $ 10 $ 132 $ 142Total interest revenue $ (45) $ 660 $ 615 $ 477 $ 1,714 $ 2,191
(1) The taxable equivalent adjustment is related to the tax-exempt bond portfolio based on the U.S. federal statutory tax rates of 21% in 2018 and 35% in 2017 and is included in this presentation.
(2) Rate/volume variance is allocated based on the percentage relationship of changes in volume and changes in rate to the total net change.(3) Detailed average volume, Interest revenue and Interest expense exclude Discontinued operations. See Note 2 to the Consolidated Financial Statements.(4) Changes in average rates reflect changes in prevailing local interest rates, including inflationary effects and monetary corrections in certain countries.(5) Interest expense on Trading account liabilities of ICG is reported as a reduction of Interest revenue. Interest revenue and Interest expense on cash collateral
positions are reported in interest on Trading account assets and Trading account liabilities, respectively.(6) Includes cash-basis loans.(7) Includes brokerage receivables.

70
Analysis of Changes in Interest Expense and Net Interest Revenue(1)(2)(3)
3rd Qtr. 2018 vs. 2nd Qtr. 2018 3rd Qtr. 2018 vs. 3rd Qtr. 2017
Increase (decrease)due to change in:
Increase (decrease)due to change in:
In millions of dollarsAveragevolume
Averagerate
Netchange
Averagevolume
Averagerate
Netchange
DepositsIn U.S. offices $ 29 $ 161 $ 190 $ 53 $ 483 $ 536In offices outside the U.S.(4) (2) 148 146 34 235 269Total $ 27 $ 309 $ 336 $ 87 $ 718 $ 805Federal funds purchased and securities loaned or sold under agreements to repurchaseIn U.S. offices $ 21 $ 55 $ 76 $ 61 $ 388 $ 449In offices outside the U.S.(4) 13 (63) (50) 27 62 89Total $ 34 $ (8) $ 26 $ 88 $ 450 $ 538Trading account liabilities(5)
In U.S. offices $ 9 $ 18 $ 27 $ 21 $ 42 $ 63In offices outside the U.S.(4) (5) 15 10 1 40 41Total $ 4 $ 33 $ 37 $ 22 $ 82 $ 104Short-term borrowings(6)
In U.S. offices $ 7 $ 56 $ 63 $ 28 $ 240 $ 268In offices outside the U.S.(4) (4) (4) (8) 6 (14) (8)Total $ 3 $ 52 $ 55 $ 34 $ 226 $ 260Long-term debtIn U.S. offices $ 16 $ 11 $ 27 $ 10 $ 260 $ 270In offices outside the U.S.(4) 3 (1) 2 8 4 12Total $ 19 $ 10 $ 29 $ 18 $ 264 $ 282Total interest expense $ 85 $ 396 $ 483 $ 249 $ 1,740 $ 1,989Net interest revenue $ (130) $ 262 $ 132 $ 225 $ (23) $ 202
(1) The taxable equivalent adjustment is related to the tax-exempt bond portfolio based on the U.S. federal statutory tax rates of 21% in 2018 and 35% in 2017 and is included in this presentation.
(2) Rate/volume variance is allocated based on the percentage relationship of changes in volume and changes in rate to the total net change.(3) Detailed average volume, Interest revenue and Interest expense exclude Discontinued operations. See Note 2 to the Consolidated Financial Statements.(4) Changes in average rates reflect changes in prevailing local interest rates, including inflationary effects and monetary corrections in certain countries.(5) Interest expense on Trading account liabilities of ICG is reported as a reduction of Interest revenue. Interest revenue and Interest expense on cash collateral
positions are reported in interest on Trading account assets and Trading account liabilities, respectively.(6) Includes brokerage payables.

71
Analysis of Changes in Interest Revenue, Interest Expense and Net Interest Revenue(1)(2)(3)
Nine Months 2018 vs. Nine Months 2017
Increase (decrease)due to change in:
In millions of dollarsAveragevolume
Averagerate
Netchange(2)
Deposits with banks(4) $ 89 $ 309 $ 398Federal funds sold and securities borrowed or purchased under agreements to resell In U.S. offices $ 76 $ 1,176 $ 1,252In offices outside the U.S.(4) 97 103 200Total $ 173 $ 1,279 $ 1,452Trading account assets(5) In U.S. offices $ (169) $ 258 $ 89In offices outside the U.S.(4) 260 164 424Total $ 91 $ 422 $ 513Investments(1) In U.S. offices $ 34 $ 541 $ 575In offices outside the U.S.(4) (58) 297 239Total $ (24) $ 838 $ 814Loans (net of unearned income)(6) In U.S. offices $ 714 $ 991 $ 1,705In offices outside the U.S.(4) 948 (38) 910Total $ 1,662 $ 953 $ 2,615Other interest-earning assets $ 109 $ 237 $ 346Total interest revenue $ 2,100 $ 4,038 $ 6,138Deposits(7) In U.S. offices $ 132 $ 1,242 $ 1,374In offices outside the U.S.(4) 105 549 654Total $ 237 $ 1,791 $ 2,028Federal funds purchased and securities loaned or sold under agreements to repurchaseIn U.S. offices $ 70 $ 1,101 $ 1,171In offices outside the U.S.(4) 124 247 371Total $ 194 $ 1,348 $ 1,542Trading account liabilities(5) In U.S. offices $ 27 $ 138 $ 165In offices outside the U.S.(4) 3 94 97Total $ 30 $ 232 $ 262Short-term borrowings In U.S. offices $ 95 $ 813 $ 908In offices outside the U.S.(4) 8 (63) (55)Total $ 103 $ 750 $ 853Long-term debt In U.S. offices $ 245 $ 511 $ 756In offices outside the U.S.(4) 5 (14) (9)Total $ 250 $ 497 $ 747Total interest expense $ 814 $ 4,618 $ 5,432Net interest revenue $ 1,286 $ (580) $ 706
(1) The taxable equivalent adjustment is related to the tax-exempt bond portfolio based on the U.S. federal statutory tax rates of 21% in 2018 and 35% in 2017 and is included in this presentation.
(2) Rate/volume variance is allocated based on the percentage relationship of changes in volume and changes in rate to the total net change.(3) Detailed average volume, Interest revenue and Interest expense exclude Discontinued operations.

72
(4) Changes in average rates reflect changes in prevailing local interest rates, including inflationary effects and monetary corrections in certain countries.(5) Interest expense on Trading account liabilities of ICG is reported as a reduction of Interest revenue. Interest revenue and Interest expense on cash collateral
positions are reported in Trading account assets and Trading account liabilities, respectively.(6) Includes cash-basis loans.(7) The interest expense on deposits includes the FDIC assessment and deposit insurance fees and charges of $1,006 million and $935 million for the nine months
ended September 30, 2018 and 2017, respectively.

73
Market Risk of Trading PortfoliosFor additional information on Citi’s market risk of trading portfolios, see “Market Risk—Market Risk of Trading Portfolios” in Citi’s 2017 Annual Report on Form 10-K.
Value at RiskAs of September 30, 2018, Citi estimates that the conservative features of its VAR calibration contributed an approximate 22% add-on to what would be a VAR estimated under the assumption of stable and perfectly normal distributed markets. As of June 30, 2018, the add-on was 25%.
As set forth in the table below, Citi's average trading VAR as of September 30, 2018 decreased compared to June 30, 2018. The decrease was mainly due to lower foreign exchange risk in the Markets businesses within ICG. The decrease of average trading and credit portfolio VAR was in line with the decrease in average trading VAR.
Quarter-end and Average Trading VAR and Trading and Credit Portfolio VAR
ThirdQuarter
SecondQuarter
ThirdQuarter
In millions of dollarsSeptember 30,
20182018
Average June 30, 20182018
AverageSeptember 30,
20172017
AverageInterest rate $ 33 $ 58 $ 60 $ 61 $ 63 $ 63Credit spread 45 42 46 47 43 44Covariance adjustment(1) (17) (24) (25) (26) (28) (23)Fully diversified interest rate and credit spread(2) $ 61 $ 76 $ 81 $ 82 $ 78 $ 84Foreign exchange 18 21 29 30 26 26Equity 23 21 23 20 15 13Commodity 17 21 16 17 20 23Covariance adjustment(1) (58) (68) (74) (69) (64) (65)
Total trading VAR—all market risk factors, including general and specific risk (excluding credit portfolios)(2) $ 61 $ 71 $ 75 $ 80 $ 75 $ 81Specific risk-only component(3) $ 7 $ 1 $ 2 $ 3 $ 3 $ 2
Total trading VAR—general market risk factorsonly (excluding credit portfolios) $ 54 $ 70 $ 73 $ 77 $ 72 $ 79Incremental impact of the credit portfolio(4) $ 11 $ 11 $ 16 $ 10 $ 8 $ 8Total trading and credit portfolio VAR $ 72 $ 82 $ 91 $ 90 $ 83 $ 89
(1) Covariance adjustment (also known as diversification benefit) equals the difference between the total VAR and the sum of the VARs tied to each individual risk type. The benefit reflects the fact that the risks within each and across risk types are not perfectly correlated and, consequently, the total VAR on a given day will be lower than the sum of the VARs relating to each individual risk type. The determination of the primary drivers of changes to the covariance adjustment is made by an examination of the impact of both model parameter and position changes.
(2) The total trading VAR includes mark-to-market and certain fair value option trading positions in ICG, with the exception of hedges to the loan portfolio, fair value option loans and all CVA exposures. Available-for-sale and accrual exposures are not included.
(3) The specific risk-only component represents the level of equity and fixed income issuer-specific risk embedded in VAR. (4) The credit portfolio is composed of mark-to-market positions associated with non-trading business units including Citi Treasury, the CVA relating to
derivative counterparties and all associated CVA hedges. FVA and DVA are not included. The credit portfolio also includes hedges to the loan portfolio, fair value option loans and hedges to the leveraged finance pipeline within capital markets origination in ICG.

74
The table below provides the range of market factor VARs associated with Citi’s total trading VAR, inclusive of specific risk:
Third Quarter Second Quarter Third Quarter2018 2018 2017
In millions of dollars Low High Low High Low HighInterest rate $ 33 $ 80 $ 38 $ 91 $ 33 $ 97Credit spread 38 47 43 52 38 52Fully diversified interest rate and credit spread $ 61 $ 95 $ 59 $ 118 $ 59 $ 108Foreign exchange 13 27 20 44 19 38Equity 16 28 15 26 8 18Commodity 16 27 13 22 14 31Total trading $ 56 $ 91 $ 57 $ 120 $ 58 $ 106Total trading and credit portfolio 66 101 69 123 67 112
Note: No covariance adjustment can be inferred from the above table as the high and low for each market factor will be from different close-of-business dates.
The following table provides the VAR for ICG, excluding the CVA relating to derivative counterparties, hedges of CVA, fair value option loans and hedges to the loan portfolio:
In millions of dollars Sept. 30, 2018Total—all market risk factors, including general and specific riskAverage—during quarter $ 71High—during quarter 91Low—during quarter 56
Regulatory VAR Back-testingIn accordance with Basel III, Citi is required to perform back-testing to evaluate the effectiveness of its Regulatory VAR model. Regulatory VAR back-testing is the process in which the daily one-day VAR, at a 99% confidence interval, is compared to the buy-and-hold profit and loss (i.e., the profit and loss impact if the portfolio is held constant at the end of the day and re-priced the following day). Buy-and-hold profit and loss represents the daily mark-to-market profit and loss attributable to price movements in covered positions from the close of the previous business day. Buy-and-hold profit and loss excludes realized trading revenue, net interest, fees and commissions, intra-day trading profit and loss and changes in reserves.
Based on a 99% confidence level, Citi would expect two to three days in any one year where buy-and-hold losses exceeded the Regulatory VAR. Given the conservative calibration of Citi’s VAR model (as a result of taking the greater of short- and long-term volatilities and fat-tail scaling of volatilities), Citi would expect fewer exceptions under normal and stable market conditions. Periods of unstable market conditions could increase the number of back-testing exceptions.
As of September 30, 2018, there was one back-testing exception observed for Citi’s Regulatory VAR for the prior 12 months, due to market moves triggered by political events in Italy.

75
Country Risk
For additional information on country risk at Citi, see “Country Risk” in Citi’s 2017 Annual Report on Form 10-K.
Top 25 Country Exposures The following table presents Citi’s top 25 exposures bycountry (excluding the U.S.) as of September 30, 2018. The total exposure as of September 30, 2018 to the top 25 countries disclosed below in combination with the U.S., would represent approximately 95% of Citi’s exposure to all countries. For purposes of the table, loan amounts are reflected in the country where the loan is booked, which is generally based on the domicile of the borrower. For example, a loan to a Chinese subsidiary of a Switzerland-based corporation will generally be categorized as a loan in China. In addition, Citi has developed regional booking centers in certain countries, most significantly in the United Kingdom (U.K.) and Ireland,
in order to more efficiently serve its corporate customers. As an example, with respect to the U.K., only 28% of corporateloans presented in the table below are to U.K. domiciledentities (29% for unfunded commitments), with the balance ofthe loans predominately to European domiciled counterparties.Approximately 83% of the total U.K. funded loans and 91% ofthe total U.K. unfunded commitments were investment gradeas of September 30, 2018. Trading account assets and investment securities are generally categorized based on the domicile of the issuer of the security of the underlying reference entity. For additional information on the assets included in the table, see the footnotes to the table below.
For a discussion of uncertainties arising as a result of the U.K.’s potential exit from the EU, see “Risk Factors—Strategic Risks” in Citigroup’s 2017 Annual Report on Form 10-K.
In billions ofdollars
ICG loans(1)
GCBloans
Other funded(2) Unfunded(3)
Net MTM on
derivatives/repos(4)
Totalhedges
(on loansand
CVA)Investment securities(5)
Trading account assets(6)
Total as of 3Q18
Total as of 2Q18
Total as of 3Q17
Total as a% of Citi
as of3Q18
UnitedKingdom $ 40.3 $ — $ 8.3 $ 62.1 $ 11.6 $ (3.4) $ 5.6 $ (0.8) $ 123.7 $ 125.8 $ 110.2 7.7%
Mexico 9.9 26.8 0.3 7.9 0.9 (0.7) 12.4 4.4 61.9 60.2 62.8 3.9
Hong Kong 16.8 12.3 0.8 6.9 1.6 (0.2) 6.6 1.1 45.9 45.1 40.8 2.9
Singapore 13.3 12.3 0.4 5.1 1.6 (0.2) 7.9 0.6 41.0 41.2 43.8 2.6
Korea 2.1 19.0 0.2 2.8 1.2 (1.1) 8.8 0.7 33.7 35.0 34.2 2.1
Ireland 12.2 — 0.8 16.7 0.5 — — 0.9 31.1 31.3 28.8 1.9
India 4.1 6.7 0.8 5.1 2.6 (0.8) 7.8 0.9 27.2 27.6 28.7 1.7
Brazil 12.8 — — 3.0 4.5 (1.0) 3.2 3.4 25.9 24.4 28.0 1.6
Australia 5.1 10.0 — 6.2 1.0 (0.4) 1.8 0.4 24.1 23.2 27.0 1.5
Germany 0.1 — 0.1 4.1 3.7 (3.4) 9.3 5.8 19.7 16.8 18.6 1.2
China 7.4 4.7 0.4 1.9 1.5 (0.5) 2.8 0.6 18.8 19.5 20.8 1.2
Japan 2.9 0.1 0.1 2.5 4.4 (1.4) 4.7 5.1 18.4 15.9 18.8 1.1
Taiwan 5.1 8.9 0.1 1.1 0.4 — 1.1 1.1 17.8 19.0 18.5 1.1
Canada 2.3 0.7 0.5 7.4 2.3 (0.3) 3.1 0.4 16.4 15.8 16.0 1.0
Poland 3.7 2.0 0.1 3.8 0.1 (0.1) 4.0 0.8 14.4 13.0 13.6 0.9Jersey 6.6 — 0.3 3.4 — — — — 10.3 10.0 4.5 0.6United ArabEmirates 5.6 1.6 0.1 2.5 0.1 (0.1) — — 9.8 10.2 6.7 0.6Malaysia 1.8 4.7 0.3 1.1 0.2 (0.1) 1.3 0.3 9.6 9.7 9.1 0.6
Thailand 1.2 2.4 — 1.5 — — 1.4 0.7 7.2 6.9 7.0 0.4Indonesia 2.2 1.0 0.1 1.3 0.1 (0.1) 1.1 0.1 5.8 6.2 6.2 0.4Luxembourg — — — — 0.5 (0.3) 4.1 0.8 5.1 4.9 6.1 0.3South Africa 1.8 — — 1.4 0.5 (0.1) 1.5 (0.1) 5.0 5.3 4.3 0.3Philippines 0.8 1.2 — 0.4 1.1 (0.1) 1.4 0.1 4.9 5.2 3.6 0.3
Russia 1.8 0.9 — 0.8 0.1 (0.1) 0.7 (0.1) 4.1 4.6 5.0 0.3
Italy 0.2 — — 2.3 5.0 (4.3) — 0.5 3.7 3.2 3.1 0.2
Total 36.4%
(1) ICG loans reflect funded corporate loans and private bank loans, net of unearned income. As of September 30, 2018, private bank loans in the table above totaled $24.5 billion, concentrated in Hong Kong ($7.0 billion), Singapore ($6.8 billion) and the U.K. ($6.1 billion).

76
(2) Other funded includes other direct exposure such as accounts receivable, loans HFS, other loans in Corporate/Other and investments accounted for under the equity method.
(3) Unfunded exposure includes unfunded corporate lending commitments, letters of credit and other contingencies. (4) Net mark-to-market counterparty risk on OTC derivatives and securities lending/borrowing transactions (repos). Exposures are shown net of collateral and
inclusive of CVA. Includes margin loans.(5) Investment securities include securities available-for-sale, recorded at fair market value, and securities held-to-maturity, recorded at historical cost. (6) Trading account assets are shown on a net basis and include issuer risk on cash products and derivative exposure where the underlying reference entity/issuer is
located in that country.
INCOME TAXES
Deferred Tax Assets For additional information on Citi’s deferred tax assets (DTAs), see “Risk Factors—Strategic Risks,” “Significant Accounting Policies and Significant Estimates—Income Taxes” and Notes 1 and 9 to the Consolidated Financial Statements in Citi’s 2017 Annual Report on Form 10-K.
At September 30, 2018, Citigroup had recorded net DTAs of approximately $23.0 billion, an increase of $0.1 billion from June 30, 2018 and an increase of $0.5 billion from December 31, 2017. The increase for the quarter was primarily driven by losses in Other comprehensive income, partially offset by earnings. The increase for the nine months was primarily driven by losses in Other comprehensive income and adoption of ASU 2016-16 (see Note 1 to the Consolidated Financial Statements), partially offset by earnings.
The table below summarizes Citi’s net DTAs balance. Of Citi’s net DTAs as of September 30, 2018, those arising from net operating losses, foreign tax credit and general business credit carry-forwards are 100% deducted in calculating Citi’s regulatory capital, while DTAs arising from temporary differences are deducted from regulatory capital if in excess of the 10%/15% limitations.
Despite the $0.5 billion increase in net DTAs from December 31, 2017, Citi was able to reduce the amount of DTAs arising from net operating losses, foreign tax credits and general business credit carry-forwards by $0.7 billion, thereby reducing the amount of DTAs that was excluded from Common Equity Tier 1 Capital from $12.3 billion to $11.6 billion as of September 30, 2018. There were no DTAs in excess of the 10%/15% limitations as of September 30, 2018, (see “Capital Resources” above). Thus, approximately $11.4 billion of net DTAs was not deducted in calculating regulatory capital pursuant to Basel III standards as of September 30, 2018, and was appropriately risk weighted as per those rules.
Jurisdiction/Component DTAs balance
In billions of dollarsSeptember 30,
2018December 31,
2017Total U.S. $ 20.4 $ 19.9Total foreign 2.6 2.6Total $ 23.0 $ 22.5
Effective Tax RateCiti’s effective tax rate for the third quarter of 2018 was 24.1%, as compared with 31.1% in the third quarter of 2017. The decrease in the effective tax rate was primarily due to the lower U.S. federal statutory tax rate pursuant to Tax Reform.
SEC Staff Accounting Bulletin 118Citi’s third quarter of 2018 tax provision did not include any changes to Citi’s provisional income tax estimates recorded in the fourth quarter of 2017. The U.S. Treasury issued certain U.S. tax reform guidance through September 30, 2018 and it is anticipated that additional guidance will be issued by the end of 2018. Citi expects to complete its analysis within the one-year measurement period and record final adjustments to the provisional income tax estimates during the fourth quarter of 2018.

77
FUTURE APPLICATION OF ACCOUNTING STANDARDS
Accounting for Financial Instruments—Credit LossesIn June 2016, the Financial Accounting Standards Board (FASB) issued ASU No. 2016-13, Financial Instruments—Credit Losses (Topic 326). The ASU introduces a new credit loss methodology, the Current Expected Credit Losses (CECL) methodology, which requires earlier recognition of credit losses, while also providing additional transparency about credit risk.
The CECL methodology utilizes a lifetime “expected credit loss” measurement objective for the recognition of credit losses for loans, held-to-maturity debt securities and other receivables at the time the financial asset is originated or acquired. The expected credit losses (ECL) are adjusted each period for changes in expected lifetime credit losses. This methodology replaces the multiple existing impairment methods in current GAAP, which generally require that a loss be incurred before it is recognized. For available-for-sale debt securities where fair value is less than cost, credit-related impairment, if any, will be recognized through an allowance for credit losses and adjusted each period for changes in credit risk.
The CECL methodology represents a significant change from existing GAAP and may result in material changes to the Company’s accounting for financial instruments. The Company is evaluating the effect that ASU 2016-13 will have on its Consolidated Financial Statements and related disclosures. The impact of the ASU will depend upon the state of the economy and the nature of Citi’s portfolios at the date of adoption. Based on a preliminary analysis performed in 2018 and the environment and portfolios at that time, the overall impact is estimated to be an approximate 10% to 20% increase in credit loss reserves. However, there are still some implementation questions to be resolved by the FASB that could affect the estimated impact, including (i) the amounts and types of recoveries that can be included in expected credit loss estimates and (ii) whether recovery inputs can be discounted under a non-discounted cash flow approach to estimating expected credit losses.
The ASU will be effective for Citi as of January 1, 2020. For additional information, see “Capital Resources—Regulatory Capital Treatment—Implementation and Transition of the Current Expected Credit Losses (CECL) Methodology” in the First Quarter of 2018 Form 10-Q.
Lease AccountingIn February 2016, the FASB issued ASU No. 2016-02, Leases (Topic 842), which is intended to increase transparency and comparability of accounting for lease transactions. The ASU will require lessees to recognize leases on the balance sheet as lease assets and lease liabilities and will require both quantitative and qualitative disclosures regarding key information about leasing arrangements. Lessor accounting is largely unchanged. The guidance is effective beginning January 1, 2019 and will be adopted prospectively with a cumulative adjustment to Retained earnings. The Company estimates that upon adoption, its Consolidated Balance Sheet
will have an approximate $5 billion increase in assets and liabilities. Additionally, the Company estimates an approximate $140 million increase in retained earnings due to the cumulative effect of recognizing previously deferred gains on sale/leaseback transactions.
Subsequent Measurement of GoodwillIn January 2017, the FASB issued ASU No. 2017-04, Intangibles—Goodwill and Other (Topic 350): Simplifying the Test for Goodwill Impairment. The ASU simplifies the subsequent measurement of goodwill impairment by eliminating the requirement to calculate the implied fair value of goodwill (i.e., the current Step 2 of the goodwill impairment test) to measure a goodwill impairment charge. Under the ASU, the impairment test is the comparison of the fair value of a reporting unit with its carrying amount (the current Step 1), with the impairment charge being the deficit in fair value but not exceeding the total amount of goodwill allocated to that reporting unit. The simplified one-step impairment test applies to all reporting units (including those with zero or negative carrying amounts).
The ASU will be effective for Citi as of January 1, 2020. The impact of the ASU will depend upon the performance of Citi’s reporting units and the market conditions impacting the fair value of each reporting unit going forward.
Fair Value MeasurementIn August 2018, the FASB issued ASU No. 2018-13, Fair Value Measurement (Topic 820): Disclosure Framework—Changes to the Disclosure Requirements for Fair Value Measurement. The amendments modify certain disclosure requirements for fair value measurements and are effective January 1, 2020, with early adoption permitted. Adoption of this standard is not expected to have a material impact on the Company.
See Note 1 to the Consolidated Financial Statements for a discussion of “Accounting Changes.”

78
DISCLOSURE CONTROLS AND PROCEDURES
Citi’s disclosure controls and procedures are designed to ensure that information required to be disclosed under the Securities Exchange Act of 1934, as amended, is recorded, processed, summarized and reported within the time periods specified in the SEC’s rules and forms, including without limitation that information required to be disclosed by Citi in its SEC filings is accumulated and communicated to management, including the Chief Executive Officer (CEO) and Chief Financial Officer (CFO), as appropriate, to allow for timely decisions regarding required disclosure.
Citi’s Disclosure Committee assists the CEO and CFO in their responsibilities to design, establish, maintain and evaluate the effectiveness of Citi’s disclosure controls and procedures. The Disclosure Committee is responsible for, among other things, the oversight, maintenance and implementation of the disclosure controls and procedures, subject to the supervision and oversight of the CEO and CFO.
Citi’s management, with the participation of its CEO and CFO, has evaluated the effectiveness of Citigroup’s disclosure controls and procedures (as defined in Rule 13a-15(e) under the Securities Exchange Act of 1934) as of September 30, 2018 and, based on that evaluation, the CEO and CFO have concluded that at that date, Citigroup’s disclosure controls and procedures were effective.
DISCLOSURE PURSUANT TO SECTION 219 OF THE IRAN THREAT REDUCTION AND SYRIA HUMAN RIGHTS ACT
Pursuant to Section 219 of the Iran Threat Reduction and Syria Human Rights Act of 2012, which added Section 13(r) to the Securities Exchange Act of 1934, as amended, Citi is required to disclose in its annual or quarterly reports, as applicable, whether it or any of its affiliates knowingly engaged in certain activities, transactions or dealings relating to Iran or with individuals or entities that are subject to sanctions under U.S. law. Disclosure is generally required even where the activities, transactions or dealings were conducted in compliance with applicable law. Citi disclosed reportable activities pursuant to Section 219 in the second quarter of 2018 in the Second Quarter of 2018 Form 10-Q.
During the third quarter of 2018, Bank Handlowy w Warszawie S.A., a Citibank subsidiary located in Poland, processed a funds transfer involving the Iranian Embassy in Poland. The value of the funds transfer was EUR 100.00 (approximately USD 116.54). In addition, Citibank N.A., India Branch, processed a payment involving the Consulate General of Iran in India. The value of the payment was INR 8,200.00 (approximately USD 111.62). These payments were for visa- and passport-related fees respectively, which are permissible under the travel exemption in the Iranian Transactions and Sanctions Regulations. Citibank realized nominal fees for the processing of these payments.

79
FORWARD-LOOKING STATEMENTS
Certain statements in this Form 10-Q, including but not limited to statements included within the Management’s Discussion and Analysis of Financial Condition and Results of Operations, are “forward-looking statements” within the meaning of the rules and regulations of the SEC. In addition, Citigroup also may make forward-looking statements in its other documents filed or furnished with the SEC, and its management may make forward-looking statements orally to analysts, investors, representatives of the media and others.
Generally, forward-looking statements are not based on historical facts but instead represent Citigroup’s and its management’s beliefs regarding future events. Such statements may be identified by words such as believe, expect, anticipate, intend, estimate, may increase, may fluctuate, target, illustrative, and similar expressions or future or conditional verbs such as will, should, would and could.
Such statements are based on management’s current expectations and are subject to risks, uncertainties and changes in circumstances. Actual results and capital and other financial conditions may differ materially from those included in these statements due to a variety of factors, including without limitation (i) the precautionary statements included within each individual business’s discussion and analysis of its results of operations above and in Citi’s 2017 Annual Report on Form 10-K, First Quarter of 2018 Form 10-Q and Second Quarter of 2018 Form 10-Q; (ii) the factors listed and described under “Risk Factors” in Citi’s 2017 Annual Report on Form 10-K; and (iii) the risks and uncertainties summarized below:
• the potential impact on Citi’s ability to return capital to common shareholders, consistent with its capital optimization efforts and targets, due to, among other things, Citi’s results of operations, Citi’s ability to effectively manage its level of risk weighted assets and GSIB surcharge, potential changes to the regulatory capital framework, the CCAR process and the results of regulatory stress tests or any changes to the stress testing and CCAR requirements or process, such as the proposed introduction of a firm-specific “stress capital buffer” (SCB), including as a result of any year-to-year variability resulting from the SCB and the impact on Citi’s estimated management buffer;
• the ongoing regulatory and other uncertainties and changes faced by financial institutions, including Citi, in the U.S. and globally, including, uncertainties and potential changes to various aspects of the regulatory capital framework, and the potential impact these uncertainties and changes could have on Citi’s businesses, results of operations, financial condition, strategy or organizational structure and compliance risks and costs;
• Citi’s ability to utilize its remaining DTAs (including the foreign tax credit component of its DTAs) and thus reduce the negative impact of the DTAs on Citi’s regulatory capital, including as a result of its ability to generate U.S. taxable income and by the provisions of and guidance issued in connection with Tax Reform;
• the potential impact to Citi if its interpretation or application of the complex tax laws to which it is subject, such as withholding tax obligations and stamp and other transactional taxes, differs from those of the relevant governmental authorities;
• Citi’s ability to achieve its expected results from ongoing investments in its businesses and efficiency initiatives, including revenue growth, as part of Citi’s operational and financial objectives and targets, including as a result of factors that Citi cannot control;
• the potential impact from declining sales and revenues or other difficulties of any retailer or merchant with whom Citi has a co-branding or private label credit card relationship, such as Sears, including as a result of accelerated store closures, termination of a particular relationship, external factors outside the control of either party to the relationship, such as the general economic environment, or other factors, including bankruptcies, liquidations, consolidations and other similar events, and the potential negative impact any such event could have on Citi retail services, including as a result of loss of revenues, higher cost of credit, impairment of purchased credit card relationships and contract-related intangibles or other losses;
• the potential impact to Citi’s businesses, including funding costs, level and mix of deposits and other products and net interest revenues, from ongoing increases in interest rates;
• the potential impact to Citi’s businesses, credit costs, revenues or other results of operations and financial condition as a result of macroeconomic and geopolitical challenges and uncertainties and volatility, including, among others, potential policy and/or regulatory changes arising from a new administration in Mexico, the implementation of protectionist trade or other related policies by the U.S. and/or other countries, governmental fiscal and monetary actions, or expected actions, such as any balance sheet normalization program implemented by the Federal Reserve Board or other central banks, any agreement, or lack thereof, for the U.K. to withdraw from the European Union, or geopolitical disputes;
• the various risks faced by Citi as a result of its presence in the emerging markets, including, among others, sovereign volatility, political events, foreign exchange controls, limitations on foreign investment, sociopolitical instability (including from hyper-inflation), fraud, nationalization or loss of licenses, business restrictions, sanctions or asset freezes, potential criminal charges, closure of branches or subsidiaries and confiscation of assets as well as the increased compliance, regulatory and legal risks and costs;
• Citi’s ability in its resolution plan submissions to address any deficiencies identified or future guidance, including any final 2019 resolution plan guidance, provided by the Federal Reserve Board and FDIC;
• the potential impact on Citi’s performance, including its competitive position and ability to effectively manage its businesses and continue to execute its strategies, if Citi is

80
unable to hire and retain highly qualified employees for any reason;
• Citi’s ability to effectively compete with U.S. and non-U.S. financial services companies and others;
• the potential impact of concentrations of risk, such as credit and market risk arising from the size and volume of Citi’s transactions with counterparties in the public sector, including the U.S. government and its agencies, or in the financial services industry, on Citi’s results of operations;
• the potential impacts on Citi’s liquidity and/or costs of funding as a result of external factors, including, among others, market disruptions and governmental fiscal and monetary policies as well as regulatory changes or negative investor perceptions of Citi’s creditworthiness;
• the impact of ratings downgrades of Citi or one or more of its more significant subsidiaries or issuing entities on Citi’s funding and liquidity as well as the results of operations of certain of its businesses;
• the potential impact to Citi from a disruption of its operational systems, including as a result of, among other things, human error, fraud or malice, accidental technological failure, electrical or telecommunication outages or failure of computer servers, or other similar damage to Citi’s property or assets, or failures by third parties with whom Citi does business, as well as disruptions in the operations of Citi’s clients, customers or other third parties;
• the increasing risk of continually evolving, sophisticated cybersecurity risks faced by financial institutions, including Citi and third parties with whom it does business, and others (such as theft of funds or theft, loss, misuse or disclosure of confidential client, customer, corporate or network information or assets and other attempts by unauthorized parties to disrupt computer and network systems), and the potential impact from such risks, including, among others, reputational damage with clients, customers and others, lost revenues, additional costs (including credit, remediation and other costs), regulatory penalties and inquiries, legal exposure and other financial losses;
• the potential impact of incorrect assumptions or estimates in Citi’s financial statements or the impact of ongoing changes to financial accounting and reporting standards or interpretations, on how Citi records and reports its financial condition and results of operations;
• the potential impact to Citi’s results of operations and/or regulatory capital and capital ratios if Citi’s risk management process, strategies or models, including those related to its ability to manage and aggregate data, are deficient or ineffective, require refinement, modification or enhancement or any approval is withdrawn by Citi’s U.S. banking regulators;
• the potential impact to Citi of ongoing implementation and interpretation of regulatory changes and requirements in the U.S. and globally, such as on Citi’s compliance risks and costs, including reputational and legal risks as
well as remediation and other financial costs, such as penalties and fines; and
• the potential outcomes of the extensive legal and regulatory proceedings, investigations and other inquiries to which Citi is or may be subject at any given time, particularly given the increased focus on conduct risk and the severity of the remedies sought and potential collateral consequences to Citi arising from such outcomes.
Any forward-looking statements made by or on behalf of Citigroup speak only as to the date they are made, and Citi does not undertake to update forward-looking statements to reflect the impact of circumstances or events that arise after the date the forward-looking statements were made.
81
FINANCIAL STATEMENTS AND NOTES TABLE OF CONTENTS
CONSOLIDATED FINANCIAL STATEMENTS Consolidated Statement of Income (Unaudited)—
For the Three and Nine Months Ended September 30, 2018 and 2017
Consolidated Statement of Comprehensive Income(Unaudited)—For the Three and Nine Months EndedSeptember 30, 2018 and 2017
Consolidated Balance Sheet—September 30, 2018(Unaudited) and December 31, 2017
Consolidated Statement of Changes in Stockholders’ Equity(Unaudited)—For the Three and Nine Months EndedSeptember 30, 2018 and 2017
Consolidated Statement of Cash Flows (Unaudited)—For the Nine Months Ended September 30, 2018 and 2017
NOTES TO CONSOLIDATED FINANCIALSTATEMENTS (UNAUDITED)
Note 1—Basis of Presentation and Accounting ChangesNote 2—Discontinued Operations and Significant DisposalsNote 3—Business SegmentsNote 4—Interest Revenue and ExpenseNote 5—Commissions and Fees; Administration and Other Fiduciary FeesNote 6—Principal TransactionsNote 7—Incentive PlansNote 8—Retirement BenefitsNote 9—Earnings per ShareNote 10—Federal Funds, Securities Borrowed, Loaned and Subject to Repurchase AgreementsNote 11—Brokerage Receivables and Brokerage PayablesNote 12—Investments
Note 13—LoansNote 14—Allowance for Credit LossesNote 15—Goodwill and Intangible AssetsNote 16—DebtNote 17—Changes in Accumulated Other Comprehensive Income (Loss) (AOCI)Note 18—Securitizations and Variable Interest EntitiesNote 19—Derivatives ActivitiesNote 20—Fair Value MeasurementNote 21—Fair Value Elections
Note 22—Guarantees and CommitmentsNote 23—Contingencies
Note 24—Condensed Consolidating Financial Statements
82
83
84
86
88
90939495
9699
100100105
106109110
123136138140
141147156167186190195197
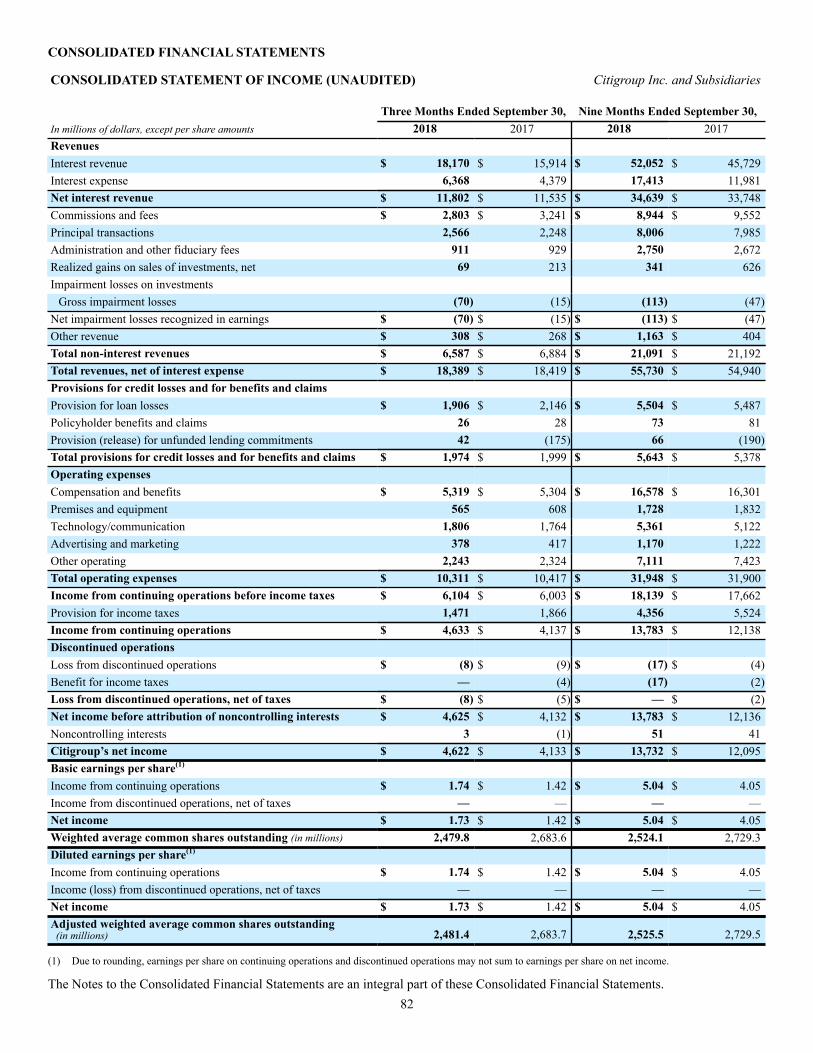
82
CONSOLIDATED FINANCIAL STATEMENTS
CONSOLIDATED STATEMENT OF INCOME (UNAUDITED) Citigroup Inc. and Subsidiaries
Three Months Ended September 30, Nine Months Ended September 30,In millions of dollars, except per share amounts 2018 2017 2018 2017Revenues Interest revenue $ 18,170 $ 15,914 $ 52,052 $ 45,729Interest expense 6,368 4,379 17,413 11,981Net interest revenue $ 11,802 $ 11,535 $ 34,639 $ 33,748Commissions and fees $ 2,803 $ 3,241 $ 8,944 $ 9,552Principal transactions 2,566 2,248 8,006 7,985Administration and other fiduciary fees 911 929 2,750 2,672Realized gains on sales of investments, net 69 213 341 626Impairment losses on investments
Gross impairment losses (70) (15) (113) (47)Net impairment losses recognized in earnings $ (70) $ (15) $ (113) $ (47)Other revenue $ 308 $ 268 $ 1,163 $ 404Total non-interest revenues $ 6,587 $ 6,884 $ 21,091 $ 21,192Total revenues, net of interest expense $ 18,389 $ 18,419 $ 55,730 $ 54,940Provisions for credit losses and for benefits and claims Provision for loan losses $ 1,906 $ 2,146 $ 5,504 $ 5,487Policyholder benefits and claims 26 28 73 81Provision (release) for unfunded lending commitments 42 (175) 66 (190)Total provisions for credit losses and for benefits and claims $ 1,974 $ 1,999 $ 5,643 $ 5,378Operating expenses Compensation and benefits $ 5,319 $ 5,304 $ 16,578 $ 16,301Premises and equipment 565 608 1,728 1,832Technology/communication 1,806 1,764 5,361 5,122Advertising and marketing 378 417 1,170 1,222Other operating 2,243 2,324 7,111 7,423Total operating expenses $ 10,311 $ 10,417 $ 31,948 $ 31,900Income from continuing operations before income taxes $ 6,104 $ 6,003 $ 18,139 $ 17,662Provision for income taxes 1,471 1,866 4,356 5,524Income from continuing operations $ 4,633 $ 4,137 $ 13,783 $ 12,138Discontinued operations Loss from discontinued operations $ (8) $ (9) $ (17) $ (4)Benefit for income taxes — (4) (17) (2)Loss from discontinued operations, net of taxes $ (8) $ (5) $ — $ (2)Net income before attribution of noncontrolling interests $ 4,625 $ 4,132 $ 13,783 $ 12,136Noncontrolling interests 3 (1) 51 41Citigroup’s net income $ 4,622 $ 4,133 $ 13,732 $ 12,095Basic earnings per share(1) Income from continuing operations $ 1.74 $ 1.42 $ 5.04 $ 4.05Income from discontinued operations, net of taxes — — — —Net income $ 1.73 $ 1.42 $ 5.04 $ 4.05Weighted average common shares outstanding (in millions) 2,479.8 2,683.6 2,524.1 2,729.3Diluted earnings per share(1) Income from continuing operations $ 1.74 $ 1.42 $ 5.04 $ 4.05Income (loss) from discontinued operations, net of taxes — — — —Net income $ 1.73 $ 1.42 $ 5.04 $ 4.05Adjusted weighted average common shares outstanding (in millions) 2,481.4 2,683.7 2,525.5 2,729.5
(1) Due to rounding, earnings per share on continuing operations and discontinued operations may not sum to earnings per share on net income.
The Notes to the Consolidated Financial Statements are an integral part of these Consolidated Financial Statements.

83
CONSOLIDATED STATEMENT OF COMPREHENSIVE INCOME Citigroup Inc. and Subsidiaries(UNAUDITED)
Three Months Ended September 30, Nine Months Ended September 30,In millions of dollars 2018 2017 2018 2017Citigroup’s net income $ 4,622 $ 4,133 $ 13,732 $ 12,095Add: Citigroup's other comprehensive income Net change in unrealized gains and losses on investment securities, net of taxes(1)(2) $ (605) $ (66) $ (2,161) $ 127Net change in debt valuation adjustment (DVA), net of taxes(1) (287) (123) 159 (267)Net change in cash flow hedges, net of taxes (74) 8 (397) 123Benefit plans liability adjustment, net of taxes 26 (29) 415 (176)Net change in foreign currency translation adjustment, net of taxes and hedges (221) 218 (1,968) 2,179Net change in excluded component of fair value hedges, net of taxes 10 — (22) —Citigroup’s total other comprehensive income (loss) $ (1,151) $ 8 $ (3,974) $ 1,986Citigroup’s total comprehensive income $ 3,471 $ 4,141 $ 9,758 $ 14,081Add: Other comprehensive income attributable to noncontrolling interests $ 8 $ 12 $ (35) $ 82Add: Net income attributable to noncontrolling interests 3 (1) 51 41Total comprehensive income $ 3,482 $ 4,152 $ 9,774 $ 14,204
(1) See Note 1 to the Consolidated Financial Statements.(2) For the three and nine months ended September 30, 2018, respectively, amount represents the net change in unrealized gains and losses on available-for-sale
(AFS) debt securities. Effective January 1, 2018, the AFS category is eliminated for equity securities under ASU 2016-01.
The Notes to the Consolidated Financial Statements are an integral part of these Consolidated Financial Statements.
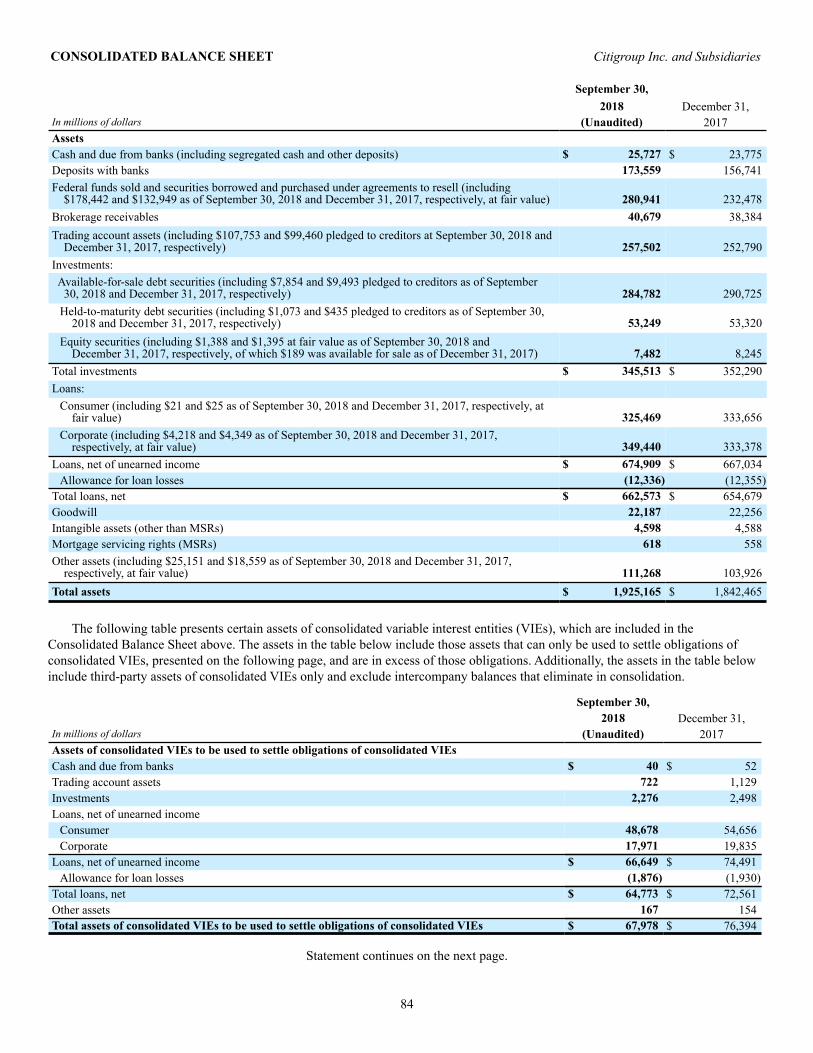
84
CONSOLIDATED BALANCE SHEET Citigroup Inc. and Subsidiaries
September 30,2018 December 31,
In millions of dollars (Unaudited) 2017Assets
Cash and due from banks (including segregated cash and other deposits) $ 25,727 $ 23,775Deposits with banks 173,559 156,741Federal funds sold and securities borrowed and purchased under agreements to resell (including
$178,442 and $132,949 as of September 30, 2018 and December 31, 2017, respectively, at fair value) 280,941 232,478Brokerage receivables 40,679 38,384Trading account assets (including $107,753 and $99,460 pledged to creditors at September 30, 2018 and
December 31, 2017, respectively) 257,502 252,790Investments: Available-for-sale debt securities (including $7,854 and $9,493 pledged to creditors as of September
30, 2018 and December 31, 2017, respectively) 284,782 290,725Held-to-maturity debt securities (including $1,073 and $435 pledged to creditors as of September 30,
2018 and December 31, 2017, respectively) 53,249 53,320Equity securities (including $1,388 and $1,395 at fair value as of September 30, 2018 and
December 31, 2017, respectively, of which $189 was available for sale as of December 31, 2017) 7,482 8,245Total investments $ 345,513 $ 352,290Loans:
Consumer (including $21 and $25 as of September 30, 2018 and December 31, 2017, respectively, atfair value) 325,469 333,656
Corporate (including $4,218 and $4,349 as of September 30, 2018 and December 31, 2017,respectively, at fair value) 349,440 333,378
Loans, net of unearned income $ 674,909 $ 667,034Allowance for loan losses (12,336) (12,355)
Total loans, net $ 662,573 $ 654,679Goodwill 22,187 22,256Intangible assets (other than MSRs) 4,598 4,588Mortgage servicing rights (MSRs) 618 558Other assets (including $25,151 and $18,559 as of September 30, 2018 and December 31, 2017,
respectively, at fair value) 111,268 103,926Total assets $ 1,925,165 $ 1,842,465
The following table presents certain assets of consolidated variable interest entities (VIEs), which are included in the Consolidated Balance Sheet above. The assets in the table below include those assets that can only be used to settle obligations of consolidated VIEs, presented on the following page, and are in excess of those obligations. Additionally, the assets in the table below include third-party assets of consolidated VIEs only and exclude intercompany balances that eliminate in consolidation.
September 30,2018 December 31,
In millions of dollars (Unaudited) 2017Assets of consolidated VIEs to be used to settle obligations of consolidated VIEs Cash and due from banks $ 40 $ 52Trading account assets 722 1,129Investments 2,276 2,498Loans, net of unearned income
Consumer 48,678 54,656Corporate 17,971 19,835
Loans, net of unearned income $ 66,649 $ 74,491Allowance for loan losses (1,876) (1,930)
Total loans, net $ 64,773 $ 72,561Other assets 167 154Total assets of consolidated VIEs to be used to settle obligations of consolidated VIEs $ 67,978 $ 76,394
Statement continues on the next page.

85
CONSOLIDATED BALANCE SHEET Citigroup Inc. and Subsidiaries(Continued)
September 30,2018 December 31,
In millions of dollars, except shares and per share amounts (Unaudited) 2017Liabilities Non-interest-bearing deposits in U.S. offices $ 111,446 $ 126,880Interest-bearing deposits in U.S. offices (including $354 and $303 as of September 30, 2018 and
December 31, 2017, respectively, at fair value) 351,291 318,613Non-interest-bearing deposits in offices outside the U.S. 83,200 87,440Interest-bearing deposits in offices outside the U.S. (including $1,086 and $1,162 as of September 30,
2018 and December 31, 2017, respectively, at fair value) 459,239 426,889Total deposits $ 1,005,176 $ 959,822Federal funds purchased and securities loaned and sold under agreements to repurchase (including
$48,148 and $40,638 as of September 30, 2018 and December 31, 2017, respectively, at fair value) 175,915 156,277Brokerage payables 73,346 61,342Trading account liabilities 147,652 125,170Short-term borrowings (including $5,041 and $4,627 as of September 30, 2018 and December 31, 2017,
respectively, at fair value) 33,770 44,452
Long-term debt (including $36,771 and $31,392 as of September 30, 2018 and December 31, 2017,respectively, at fair value) 235,270 236,709
Other liabilities (including $19,947 and $13,961 as of September 30, 2018 and December 31, 2017,respectively, at fair value) 56,173 57,021
Total liabilities $ 1,727,302 $ 1,640,793Stockholders’ equity Preferred stock ($1.00 par value; authorized shares: 30 million), issued shares: as of September 30, 2018
—761,400 and as of December 31, 2017—770,120, at aggregate liquidation value $ 19,035 $ 19,253Common stock ($0.01 par value; authorized shares: 6 billion), issued shares: as of September 30, 2018—
3,099,567,177 and as of December 31, 2017—3,099,523,273 31 31Additional paid-in capital 107,825 108,008Retained earnings 148,436 138,425Treasury stock, at cost: September 30, 2018—657,430,364 shares and December 31, 2017—529,614,728 shares (39,678) (30,309)Accumulated other comprehensive income (loss) (AOCI) (38,645) (34,668)Total Citigroup stockholders’ equity $ 197,004 $ 200,740Noncontrolling interest 859 932Total equity $ 197,863 $ 201,672Total liabilities and equity $ 1,925,165 $ 1,842,465
The following table presents certain liabilities of consolidated VIEs, which are included in the Consolidated Balance Sheet above. The liabilities in the table below include third-party liabilities of consolidated VIEs only and exclude intercompany balances that eliminate in consolidation. The liabilities also exclude amounts where creditors or beneficial interest holders have recourse to the general credit of Citigroup.
September 30,2018 December 31,
In millions of dollars (Unaudited) 2017Liabilities of consolidated VIEs for which creditors or beneficial interest holders do not have recourse to the general credit of Citigroup Short-term borrowings $ 12,307 $ 10,142Long-term debt 27,625 30,492Other liabilities 748 611Total liabilities of consolidated VIEs for which creditors or beneficial interest holders do not have recourse to the general credit of Citigroup $ 40,680 $ 41,245
The Notes to the Consolidated Financial Statements are an integral part of these Consolidated Financial Statements.

86
CONSOLIDATED STATEMENT OF CHANGES IN STOCKHOLDERS’ EQUITY Citigroup Inc. and Subsidiaries(UNAUDITED)
Three Months EndedSeptember 30,
Nine Months EndedSeptember 30,
In millions of dollars 2018 2017 2018 2017Preferred stock at aggregate liquidation value Balance, beginning of period $ 19,035 $ 19,253 $ 19,253 $ 19,253Redemption of preferred stock — — (218) —Balance, end of period $ 19,035 $ 19,253 $ 19,035 $ 19,253Common stock and additional paid-in capital Balance, beginning of period $ 107,755 $ 107,829 $ 108,039 $ 108,073Employee benefit plans 98 102 (187) (137)Other 3 (4) 4 (9)Balance, end of period $ 107,856 $ 107,927 $ 107,856 $ 107,927Retained earnings Balance, beginning of period $ 145,211 $ 152,178 $ 138,425 $ 146,477Adjustment to opening balance, net of taxes(1) — — (84) (660)Adjusted balance, beginning of period $ 145,211 $ 152,178 $ 138,341 $ 145,817Citigroup’s net income 4,622 4,133 13,732 12,095Common dividends(2) (1,127) (865) (2,777) (1,755)Preferred dividends (270) (272) (860) (893)Other(3) — — — (90)Balance, end of period $ 148,436 $ 155,174 $ 148,436 $ 155,174Treasury stock, at cost Balance, beginning of period $ (34,413) $ (19,342) $ (30,309) $ (16,302)Employee benefit plans(4) 6 3 477 526Treasury stock acquired(5) (5,271) (5,490) (9,846) (9,053)Balance, end of period $ (39,678) $ (24,829) $ (39,678) $ (24,829)Citigroup’s accumulated other comprehensive income (loss) Balance, beginning of period $ (37,494) $ (29,899) $ (34,668) $ (32,381)Adjustment to opening balance, net of taxes(1) — — (3) 504Adjusted balance, beginning of period $ (37,494) $ (29,899) $ (34,671) $ (31,877)Citigroup’s total other comprehensive income (loss) (1,151) 8 (3,974) 1,986Balance, end of period $ (38,645) $ (29,891) $ (38,645) $ (29,891)Total Citigroup common stockholders’ equity $ 177,969 $ 208,381 $ 177,969 $ 208,381Total Citigroup stockholders’ equity $ 197,004 $ 227,634 $ 197,004 $ 227,634Noncontrolling interests Balance, beginning of period $ 874 $ 1,088 $ 932 $ 1,023
Transactions between noncontrolling-interest shareholders and the relatedconsolidated subsidiary — (3) — (3)
Transactions between Citigroup and the noncontrolling-interest shareholders (23) (56) (39) (50)Net income attributable to noncontrolling-interest shareholders 3 — 51 41Distributions paid to noncontrolling-interest shareholders (2) (44) (38) (44)Other comprehensive income (loss) attributable to noncontrolling-interest shareholders 8 12 (35) 82Other (1) (9) (12) (61)
Net change in noncontrolling interests $ (15) $ (100) $ (73) $ (35)Balance, end of period $ 859 $ 988 $ 859 $ 988Total equity $ 197,863 $ 228,622 $ 197,863 $ 228,622
(1) See Note 1 to the Consolidated Financial Statements for additional details.(2) Common dividends declared were $0.32 per share in the first and second quarters and $0.45 per share in the third quarter of 2018. Common dividends declared
were $0.16 per share in the first and second quarters and $0.32 for the third quarter of 2017. (3) Includes the impact of ASU 2016-09, Compensation—Stock Compensation (Topic 718): Improvements to Employee Share-Based Payment Accounting. See Note 1
to the Consolidated Financial Statements.

87
(4) Includes treasury stock related to (i) certain activity on employee stock option program exercises where the employee delivers existing shares to cover the option exercise, or (ii) under Citi’s employee restricted or deferred stock programs where shares are withheld to satisfy tax requirements.
(5) For the three and nine months ended September 30, 2018 and 2017, primarily consists of open market purchases under Citi’s Board of Directors-approved common stock repurchase program.
The Notes to the Consolidated Financial Statements are an integral part of these Consolidated Financial Statements.

88
CONSOLIDATED STATEMENT OF CASH FLOWS Citigroup Inc. and Subsidiaries(UNAUDITED)
Nine Months Ended September 30,In millions of dollars 2018 2017Cash flows from operating activities of continuing operations Net income before attribution of noncontrolling interests $ 13,783 $ 12,136Net income attributable to noncontrolling interests 51 41Citigroup’s net income $ 13,732 $ 12,095
Loss from discontinued operations, net of taxes — (2)Income from continuing operations—excluding noncontrolling interests $ 13,732 $ 12,097Adjustments to reconcile net income to net cash provided by operating activities of
continuing operations Net gains on significant disposals(1) (247) (602)Depreciation and amortization 2,800 2,717Provision for loan losses 5,504 5,487Realized gains from sales of investments (341) (626)Net impairment losses on investments, goodwill and intangible assets 113 75Change in trading account assets (4,831) (14,383)Change in trading account liabilities 22,482 (1,015)Change in brokerage receivables net of brokerage payables 9,709 (3,136)Change in loans HFS 1,380 1,969Change in other assets (8,696) (5,351)Change in other liabilities (848) 1,569Other, net (10,691) (2,262)
Total adjustments $ 16,334 $ (15,558)Net cash provided by (used in) operating activities of continuing operations $ 30,066 $ (3,461)Cash flows from investing activities of continuing operations Change in federal funds sold and securities borrowed or purchased under agreements to resell $ (48,462) $ (15,795) Change in loans (16,131) (41,569) Proceeds from sales and securitizations of loans 4,021 7,019 Purchases of investments (129,054) (151,362) Proceeds from sales of investments 52,170 89,724 Proceeds from maturities of investments 82,940 67,166 Proceeds from significant disposals(1) 314 3,411 Capital expenditures on premises and equipment and capitalized software (2,682) (2,502) Proceeds from sales of premises and equipment, subsidiaries and affiliates and repossessed assets 174 292 Other, net 147 156Net cash used in investing activities of continuing operations $ (56,563) $ (43,460)Cash flows from financing activities of continuing operations Dividends paid $ (3,616) $ (2,639) Redemption of preferred stock (218) — Treasury stock acquired (9,848) (9,071) Stock tendered for payment of withholding taxes (479) (402) Change in federal funds purchased and securities loaned or sold under agreements to repurchase 19,638 19,461 Issuance of long-term debt 53,027 52,293 Payments and redemptions of long-term debt (47,201) (29,785) Change in deposits 45,354 34,632 Change in short-term borrowings (10,681) 7,448

89
CONSOLIDATED STATEMENT OF CASH FLOWS(UNAUDITED) (Continued) Nine Months Ended September 30,
In millions of dollars 2018 2017Net cash provided by financing activities of continuing operations $ 45,976 $ 71,937Effect of exchange rate changes on cash and due from banks $ (709) $ 599Change in cash and due from banks and deposits with banks(2) $ 18,770 $ 25,615Cash, due from banks and deposits with banks at beginning of period(2) 180,516 160,494Cash, due from banks and deposits with banks at end of period(2) $ 199,286 $ 186,109Cash and due from banks $ 25,727 $ 22,604Deposits with banks 173,559 163,505Cash, due from banks and deposits with banks at end of period $ 199,286 $ 186,109Supplemental disclosure of cash flow information for continuing operations Cash paid during the period for income taxes $ 3,261 $ 2,714Cash paid during the period for interest 16,278 11,604Non-cash investing activities Transfers to loans HFS from loans $ 3,300 $ 3,800Transfers to OREO and other repossessed assets 94 85
(1) See Note 2 to the Consolidated Financial Statements for further information on significant disposals.(2) Includes the impact of ASU 2016-18, Restricted Cash. See Notes 1 and 22 to the Consolidated Financial Statements.
The Notes to the Consolidated Financial Statements are an integral part of these Consolidated Financial Statements.

90
NOTES TO CONSOLIDATED FINANCIAL STATEMENTS (UNAUDITED)
1. BASIS OF PRESENTATION AND ACCOUNTING CHANGES
Basis of PresentationThe accompanying unaudited Consolidated Financial Statements as of September 30, 2018 and for the three- and nine-month periods ended September 30, 2018 and 2017 include the accounts of Citigroup Inc. and its consolidated subsidiaries.
In the opinion of management, all adjustments, consisting of normal recurring adjustments, necessary for a fair presentation have been reflected. The accompanying unaudited Consolidated Financial Statements should be read in conjunction with the Consolidated Financial Statements and related notes included in Citigroup’s Annual Report on Form 10-K for the fiscal year ended December 31, 2017 (2017 Annual Report on Form 10-K) and Citigroup’s Quarterly Reports on Form 10-Q for the quarters ended June 30, 2018 (Second Quarter of 2018 Form 10-Q) and March 31, 2018 (First Quarter of 2018 Form 10-Q).
Certain financial information that is normally included in annual financial statements prepared in accordance with U.S. generally accepted accounting principles (GAAP), but is not required for interim reporting purposes, has been condensed or omitted.
Management must make estimates and assumptions that affect the Consolidated Financial Statements and the related footnote disclosures. While management uses its best judgment, actual results could differ from those estimates.
As noted above, the Notes to Consolidated Financial Statements are unaudited.
Throughout these Notes, “Citigroup,” “Citi” and the “Company” refer to Citigroup Inc. and its consolidated subsidiaries.
Certain reclassifications have been made to the prior periods’ financial statements and notes to conform to the current period’s presentation.
ACCOUNTING CHANGES
Revenue RecognitionIn May 2014, the Financial Accounting Standards Board (FASB) issued ASU 2014-09, Revenue from Contracts with Customers (Revenue Recognition), which outlines a single comprehensive model for entities to use in accounting for revenue arising from contracts with customers. The core principle of the revenue model is that an entity recognizes revenue to depict the transfer of promised goods or services to customers in an amount that reflects the consideration to which the entity expects to be entitled in exchange for those goods or services. The ASU defines the promised good or service as the performance obligation under the contract.
While the guidance replaces most existing revenue recognition guidance in GAAP, the ASU is not applicable to financial instruments and, therefore, does not impact a majority of the Company’s revenues, including net interest
income, loan fees, gains on sales and mark-to-market accounting.
In accordance with the new revenue recognition standard, Citi has identified the specific performance obligation (promised services) associated with the contract with the customer and has determined when that specific performance obligation has been satisfied, which may be at a point in time or over time depending on how the performance obligation is defined. The contracts with customers also contain the transaction price, which consists of fixed consideration and/or consideration that may vary (variable consideration), and is defined as the amount of consideration an entity expects to be entitled to when or as the performance obligation is satisfied, excluding amounts collected on behalf of third parties (including transaction taxes). The amounts recognized at the point in time the performance obligation is satisfied may differ from the ultimate transaction price associated with that performance obligation when a portion of it is based on variable consideration. For example, some consideration is based on the client’s month-end balance or market values which are unknown at the time the contract is executed. The remaining transaction price amount, if any, will be recognized as the variable consideration becomes determinable. In certain transactions, the performance obligation is considered satisfied at a point in time in the future. In this instance, Citi defers revenue on the balance sheet that will only be recognized upon completion of the performance obligation.
The new revenue recognition standard further clarified the guidance related to reporting revenue gross as principal versus net as an agent. In many cases, Citi outsources a component of its performance obligations to third parties. The Company has determined that it acts as principal in the majority of these transactions and therefore presents the amounts paid to these third parties gross within operating expenses.
The Company has retrospectively adopted this standard as of January 1, 2018 and as a result was required to report amounts paid to third parties where Citi is principal to the contract within Operating expenses. The adoption resulted in an increase in both revenue and expenses of approximately $250 million for the three-month period ended September 30, 2018 and approximately $750 million for the nine-month period ended September 30, 2018, respectively, while increasing approximately $1 billion for the year ended December 31, 2017 with similar amounts for prior periods. Prior to adoption, these expense amounts were reported as contra revenue primarily within Commissions and fees and Administration and other fiduciary fees revenue. Accordingly, prior periods have been reclassified to conform to the new presentation.
See Note 5 to the Consolidated Financial Statements for a description of the Company’s revenue recognition policies for Commissions and fees and Administration and other fiduciary fees.

91
Income Tax Impact of Intra-Entity Transfers of AssetsIn October 2016, the FASB issued ASU No. 2016-16, Income Taxes—Intra-Entity Transfers of Assets Other Than Inventory, which requires an entity to recognize the income tax consequences of an intra-entity transfer of an asset other than inventory when the transfer occurs. The ASU was effective January 1, 2018 and was adopted as of that date. The impact of this standard was an increase of DTAs by approximately $300 million, a decrease of retained earnings by approximately $80 million and a decrease of prepaid tax assets by approximately $380 million.
Clarifying the Definition of a BusinessIn January 2017, the FASB issued ASU No. 2017-01, Business Combinations (Topic 805): Clarifying the Definition of a Business. The definition of a business directly and indirectly affects many areas of accounting (e.g., acquisitions, disposals, goodwill and consolidation). The ASU narrows the definition of a business by introducing a quantitative screen as the first step, such that if substantially all of the fair value of the gross assets acquired is concentrated in a single identifiable asset or a group of similar identifiable assets, then the set of transferred assets and activities is not a business. If the set is not scoped out from the quantitative screen, the entity then evaluates whether the set meets the requirement that a business include, at a minimum, an input and a substantive process that together significantly contribute to the ability to create outputs.
The ASU was effective for public entities, including Citi, as of January 1, 2018 with prospective application. The ongoing impact of the ASU will depend upon the acquisition and disposal activities of Citi. If fewer transactions qualify as a business, there could be less initial recognition of goodwill, but also less goodwill allocated to disposals.
Changes in Accounting for Pension and Postretirement (Benefit) ExpenseIn March 2017, the FASB issued ASU No. 2017-07, Compensation—Retirement Benefits (Topic 715): Improving the Presentation of Net Periodic Pension Cost and Net Periodic Postretirement Benefit Cost, which changes the income statement presentation of net benefit expense and requires restating the Company’s financial statements for each of the earlier periods presented in Citi’s annual and interim financial statements. The change in presentation was effective for annual and interim periods starting January 1, 2018. The ASU requires that only the service cost component of net benefit expense be included in Compensation and benefits on the income statement. The other components of net benefit expense are required to be presented outside of Compensation and benefits and are presented in Other operating expenses. Since both of these income statement line items are part of Operating expenses, total Operating expenses and Net income will not change. This change in presentation did not have a material effect on Compensation and benefits and Other operating expenses and is applied prospectively. The components of
the net benefit expense are currently disclosed in Note 8 to the Consolidated Financial Statements.
The new standard also changes the components of net benefit expense that are eligible for capitalization when employee costs are capitalized in connection with various activities, such as internally developed software, construction-in-progress and loan origination costs. Prospectively from January 1, 2018, only the service cost component of net benefit expense may be capitalized. Existing capitalized balances are not affected. This change in amounts eligible for capitalization does not have a material effect on the Company’s Consolidated Financial Statements and related disclosures.
HedgingIn August 2017, the FASB issued ASU No. 2017-12, Targeted Improvements to Accounting for Hedging Activities, which better aligns an entity’s risk management activities and financial reporting for hedging relationships through changes to the designation and measurement guidance for qualifying hedging relationships and the presentation of hedge results. The ASU requires the change in the fair value of the hedging instrument to be presented in the same income statement line as the hedged item and also requires expanded disclosures. Citi adopted this standard on January 1, 2018 and transferred approximately $4 billion of pre-payable mortgage-backed securities and municipal bonds from held-to-maturity (HTM) into available-for-sale (AFS) securities classification as permitted as a one-time transfer upon adoption of the standard, as these assets were deemed to be eligible to be hedged under the last of layer hedge strategy. The impact to opening retained earnings was immaterial. See Note 19 to the Consolidated Financial Statements for more information.
Recognition and Measurement of Financial Assets and Financial LiabilitiesIn January 2016, the FASB issued ASU No. 2016-01, Financial Instruments—Overall (Subtopic 825-10): Recognition and Measurement of Financial Assets and Financial Liabilities, which addresses certain aspects of recognition, measurement, presentation and disclosure of financial instruments. In February 2018, the FASB issued ASU No. 2018-03, Technical Corrections and Improvements to Financial Instruments—Overall (Subtopic 825-10), to clarify certain provisions in ASU 2016-01.
The ASUs require entities to present separately in AOCI the portion of the total change in the fair value of a liability resulting from a change in the instrument-specific credit risk when the entity has elected to measure the liability at fair value in accordance with the fair value option for financial instruments. The ASUs also require equity investments (except those accounted for under the equity method of accounting or those that result in consolidation of the investee) to be measured at fair value with changes in fair value recognized in net income, thus eliminating the AFS category for equity investments. However, Federal Reserve Bank and Federal Home Loan Bank stock, as well as certain exchange seats, will continue to be presented at cost. The

92
ASUs also provide an instrument-by-instrument election to measure non-marketable equity investments using a measurement alternative. Under the measurement alternative, the investment is carried at cost plus or minus changes resulting from observable prices in orderly transactions for the identical or a similar investment of the same issuer. Equity securities under the measurement alternative are also assessed for impairment. Finally, the ASUs require that fair value disclosures for financial instruments not measured at fair value on the balance sheet be presented at their exit prices (e.g., held-for-investment loans).
Citi early adopted the provisions of ASU 2016-01 related to presentation of the change in fair value of liabilities for which the fair value option was elected, related to changes in Citigroup’s own credit spreads in Accumulated other comprehensive income (loss) (AOCI) effective January 1, 2016. Accordingly, since the first quarter of 2016, these amounts have been reflected as a component of AOCI, whereas these amounts were previously recognized in Citigroup’s revenues and net income. The impact of adopting this amendment resulted in a cumulative catch-up reclassification from Retained earnings to AOCI of an accumulated after-tax loss of approximately $15 million at January 1, 2016. Financial statements for periods prior to 2016 were not subject to restatement under the provisions of this ASU. For additional information, see Notes 17, 20 and 21 to the Consolidated Financial Statements.
The other provisions of ASU 2016-01, as discussed above, were effective on January 1, 2018. Citi has adopted both ASU 2016-01 and ASU 2018-03 as of January 1, 2018. Accordingly, as of the first quarter of 2018, the changes to accounting for equity securities and fair value disclosures have been reflected in Citigroup’s financial statements. The impact of adopting the change to AFS equity securities resulted in a cumulative catch-up reclassification from AOCI to Retained earnings of an accumulated after-tax gain of approximately $3 million at January 1, 2018. Citi elected the measurement alternative for all non-marketable equity investments that no longer qualify for cost measurement under the ASUs. This provision in the ASUs was adopted prospectively. Financial statements for periods prior to 2018 were not subject to restatement under the provisions of the ASUs. For additional information, see Notes 12, 17 and 20 to the Consolidated Financial Statements.
Statement of Cash FlowsIn November 2016, the FASB issued ASU No. 2016-18, Restricted Cash, which requires that companies present cash, cash equivalents and amounts generally described as restricted cash or restricted cash equivalents (restricted cash) when reconciling beginning-of-period and end-of-period totals on the Statement of Cash Flows. In connection with the adoption of the ASU, Citigroup also changed its definition of cash and cash equivalents to include all of Cash and due from banks and predominately all of Deposits with banks. The Company has retrospectively adopted this ASU as of January 1, 2018 and as a result Net cash provided by investing activities of continuing operations on the
Statement of Cash Flows increased by $26.1 billion for the nine months ended September 30, 2017.
In August 2016, the FASB issued ASU No. 2016-15, Classification of Certain Cash Receipts and Cash Payments, which provides guidance on the classification and presentation of certain cash receipts and payments on the Statement of Cash Flows. The Company has retrospectively adopted this ASU as of January 1, 2018, which resulted in immaterial changes to Citi’s Consolidated Statement of Cash Flows.
Premium Amortization on Purchased Callable Debt SecuritiesIn March 2017, the FASB issued Accounting Standards Update (ASU) No. 2017-08, Receivables—Nonrefundable Fees and Other Costs (Subtopic 310-20): Premium Amortization on Purchased Callable Debt Securities, which amends the amortization period for certain purchased callable debt securities held at a premium. The ASU requires entities to amortize premiums on debt securities by the first call date when the securities have fixed and determinable call dates and prices. The scope of the ASU includes all accounting premiums, such as purchase premiums and cumulative fair value hedge adjustments. The ASU does not change the accounting for discounts, which continue to be recognized over the contractual life of a security.
Citi early adopted the ASU in the second quarter of 2017, with an effective date of January 1, 2017. Adoption of the ASU is on a modified retrospective basis through a cumulative effect adjustment to Retained earnings as of the beginning of the year of adoption. Adoption of the ASU primarily affected Citi’s AFS and HTM portfolios of callable state and municipal debt securities. The ASU adoption resulted in a net reduction to total stockholders’ equity of $156 million (after-tax), effective as of January 1, 2017. This amount is composed of a reduction of approximately $660 million to Retained earnings for the incremental amortization of purchase premiums and cumulative hedge adjustments generated under fair value hedges of these callable debt securities, offset by an increase to AOCI of $504 million related to the cumulative fair value hedge adjustments reclassified to Retained earnings for AFS debt securities.

93
2. DISCONTINUED OPERATIONS AND SIGNIFICANT DISPOSALS
Summary of Discontinued OperationsCiti sold its German retail banking operations and Egg Banking plc credit card business in 2008 and 2011, respectively. Residual items from these disposals are summarized below. All Discontinued operations results are recorded within Corporate/Other.
Three Months Ended
September 30,
Nine Months Ended
September 30,In millions of dollars 2018 2017 2018 2017Total revenues, net of
interest expense $ — $ — $ — $ —Loss from discontinued
operations $ (8) $ (9) $ (17) $ (4)
Benefit for income taxes — (4) (17) (2)Loss from discontinuedoperations, net of taxes $ (8) $ (5) $ — $ (2)
Cash flows for discontinued operations were not material for the periods presented.
Significant DisposalsDuring the third quarter of 2018, one previously disclosed significant disposal transaction was completed as summarized below. There were no new significant disposal transactions during the three and nine months ended September 30, 2018. For a description of the Company’s significant disposal transactions and financial impact, see Note 2 to the Consolidated Financial Statements in Citi’s 2017 Annual Report on Form 10-K.
Sale of Mexico Asset Management BusinessOn September 21, 2018, Citi completed the sale of its Mexico asset management business, which was part of Latin America Global Consumer Banking (GCB). As part of the sale, Citi derecognized net assets of $96 million, including goodwill of $32 million, already classified as held-for-sale beginning in the fourth quarter of 2017. The transaction resulted in a pretax gain on sale of approximately $250 million (approximately $150 million after-tax) recorded in Other revenue in the third quarter of 2018.
Income before taxes, excluding the pretax gain on sale, of the divested business was immaterial for the periods presented. Going forward, revenues in Latin America GCB will reflect the loss of ongoing operating revenues from the Mexico asset management business. However, this impact should be partially offset by lower operating expenses related to the asset management business, as well as expected growth in distribution revenues resulting from the transaction over time.

94
3. BUSINESS SEGMENTS
Citigroup’s activities are conducted through the following business segments: GCB and Institutional Clients Group (ICG). In addition, Corporate/Other includes activities not assigned to a specific business segment, as well as certain North America and international loan portfolios, discontinued operations and other legacy assets.
The prior-period balances reflect reclassifications to conform the presentation for all periods to the current period’s presentation. Effective January 1, 2018, financial data was reclassified to reflect:
• adoption of ASU No. 2014-09, Revenue Recognition, which occurred on January 1, 2018 on a retrospective basis. See “Accounting Changes” in Note 1 to the Consolidated Financial Statements;
• the re-attribution of certain costs between Corporate/Other and GCB and ICG; and
• certain other immaterial reclassifications.
Citi’s consolidated results remain unchanged for all periods presented as a result of the changes and reclassifications discussed above.
For additional information regarding Citigroup’s business segments, see Note 3 to the Consolidated Financial Statements in Citi’s 2017 Annual Report on Form 10-K.
The following table presents certain information regarding the Company’s continuing operations by segment:
Three Months Ended September 30,Revenues,
net of interest expense(1)Provision (benefits)
for income taxesIncome (loss) from
continuing operations(2) Identifiable assets
In millions of dollars, exceptidentifiable assets in billions 2018 2017 2018 2017 2018 2017
September 30,2018
December 31,2017
Global Consumer Banking $ 8,654 $ 8,470 $ 493 $ 635 $ 1,567 $ 1,170 $ 427 $ 428Institutional Clients Group 9,241 9,430 862 1,394 3,117 3,062 1,404 1,336Corporate/Other 494 519 116 (163) (51) (95) 94 78Total $ 18,389 $ 18,419 $ 1,471 $ 1,866 $ 4,633 $ 4,137 $ 1,925 $ 1,842
(1) Includes total revenues, net of interest expense (excluding Corporate/Other), in North America of $8.5 billion and $8.9 billion; in EMEA of $2.9 billion and $2.7 billion; in Latin America of $2.7 billion and $2.5 billion; and in Asia of $3.8 billion and $3.8 billion for the three months ended September 30, 2018 and 2017, respectively. These regional numbers exclude Corporate/Other, which largely operates within the U.S.
(2) Includes pretax provisions for credit losses and for benefits and claims in the GCB results of $1.9 billion and $2.2 billion; in the ICG results of $71 million and $(164) million; and in the Corporate/Other results of $(30) million and $(50) million for the three months ended September 30, 2018 and 2017, respectively.
Nine Months Ended September 30,Revenues,
net of interest expense(1)Provision (benefits)
for income taxesIncome (loss) from
continuing operations(2)
In millions of dollars 2018 2017 2018 2017 2018 2017Global Consumer Banking $ 25,337 $ 24,389 $ 1,357 $ 1,863 $ 4,240 $ 3,296Institutional Clients Group 28,780 28,170 2,890 4,096 9,683 8,853Corporate/Other 1,613 2,381 109 (435) (140) (11)Total $ 55,730 $ 54,940 $ 4,356 $ 5,524 $ 13,783 $ 12,138
(1) Includes total revenues, net of interest expense, in North America of $25.4 billion and $26.0 billion; in EMEA of $9.1 billion and $8.4 billion; in Latin America of $7.8 billion and $7.2 billion; and in Asia of $11.8 billion and $10.9 billion for the nine months ended September 30, 2018 and 2017, respectively. Regional numbers exclude Corporate/Other, which largely operates within the U.S.
(2) Includes pretax provisions for credit losses and for benefits and claims in the GCB results of $5.7 billion and $5.8 billion; in the ICG results of $55 million and $(282) million; and in Corporate/Other results of $(155) million and $(130) million for the nine months ended September 30, 2018 and 2017, respectively.

95
4. INTEREST REVENUE AND EXPENSE
Interest revenue and Interest expense consisted of the following:
Three Months EndedSeptember 30,
Nine Months EndedSeptember 30,
In millions of dollars 2018 2017 2018 2017Interest revenue Loan interest, including fees $ 11,639 $ 10,745 $ 33,721 $ 31,082Deposits with banks 629 486 1,554 1,156Federal funds sold and securities borrowed or purchased under agreements to resell 1,425 858 3,800 2,348Investments, including dividends 2,388 2,104 6,996 6,122Trading account assets(1) 1,655 1,429 4,789 4,175Other interest 434 292 1,192 846Total interest revenue $ 18,170 $ 15,914 $ 52,052 $ 45,729Interest expenseDeposits(2) $ 2,580 $ 1,775 $ 6,821 $ 4,793Federal funds purchased and securities loaned or sold under agreements to repurchase 1,250 712 3,423 1,881Trading account liabilities(1) 273 169 724 462Short-term borrowings 578 318 1,572 719Long-term debt 1,687 1,405 4,873 4,126Total interest expense $ 6,368 $ 4,379 $ 17,413 $ 11,981Net interest revenue $ 11,802 $ 11,535 $ 34,639 $ 33,748Provision for loan losses 1,906 2,146 5,504 5,487Net interest revenue after provision for loan losses $ 9,896 $ 9,389 $ 29,135 $ 28,261
(1) Interest expense on Trading account liabilities is reported as a reduction of interest revenue from Trading account assets.(2) Includes deposit insurance fees and charges of $311 million and $301 million for the three months ended September 30, 2018 and 2017, respectively, and $1,006
million and $935 million for the nine months ended September 30, 2018 and 2017, respectively.

96
5. COMMISSIONS AND FEES; ADMINISTRATION AND OTHER FIDUCIARY FEES
The primary components of Commissions and fees revenue are investment banking fees, brokerage commissions, credit- and bank-card income and deposit-related fees.
Investment banking fees are substantially composed of underwriting and advisory revenues. Such fees are recognized at the point in time when Citigroup’s performance under the terms of a contractual arrangement is completed, which is typically at the closing of a transaction. Reimbursed expenses related to these transactions are recorded as revenue and are included within investment banking fees. In certain instances for advisory contracts, Citi will receive amounts in advance of the deal’s closing. In these instances, the amounts received will be recognized as a liability and not recognized in revenue until the transaction closes. The contract liability amount for the periods presented was negligible. Out-of-pocket expenses associated with underwriting activity are deferred and recognized at the time the related revenue is recognized, while out-of-pocket expenses associated with advisory arrangements are expensed as incurred. In general, expenses incurred related to investment banking transactions, whether consummated or not, are recorded in Other operating expenses. The Company has determined that it acts as principal in the majority of these transactions and therefore presents expenses gross within Other operating expenses.
Brokerage commissions primarily include commissions and fees from the following: executing transactions for clients on exchanges and over-the-counter markets; sales of mutual funds and other annuity products; and assisting clients in clearing transactions, providing brokerage services and other such activities. Brokerage commissions are recognized in Commissions and fees at the point in time the associated service is fulfilled, generally on trade-execution date. Gains or losses, if any, on these transactions are included in Principal transactions (see Note 6 to the Consolidated Financial Statements). Sales of certain investment products include a portion of variable consideration associated with the underlying product. In these instances, a portion of the revenue associated with the sale of the product is not recognized until the variable consideration becomes fixed. The Company recognized $130 million and $107 million of revenue related to such variable consideration for the three months ended September 30, 2018 and 2017, respectively, and $402 million and $302 million for the nine months ended September 30, 2018 and 2017, respectively. These amounts primarily relate to performance obligations satisfied in prior periods.
Credit- and bank-card income is primarily composed of interchange fees, which are earned by card issuers based on purchase sales, and certain card fees, including annual fees. Costs related to customer reward programs and certain payments to partners (primarily based on program sales, profitability and customer acquisitions) are recorded as a reduction of credit- and bank-card income. Interchange revenues are recognized as earned on a daily basis when Citi's performance obligation to transmit funds to the payment networks has been satisfied. Annual card fees, net of origination costs, are deferred and amortized on a straight-line basis over a 12-month period. Costs related to card reward programs are recognized when the rewards are earned by the cardholders. Payments to partners are recognized when incurred.
Deposit-related fees consist of service charges on deposit accounts and fees earned from performing cash management activities and other deposit account services. Such fees are recognized in the period in which the related service is provided.
Transactional service fees primarily consist of fees charged for processing services such as cash management, global payments, clearing, international funds transfer and other trade services. Such fees are recognized as/when the associated service is satisfied, which normally occurs at the point in time the service is requested by the customer and provided by Citi.
Insurance distribution revenue consists of commissions earned from third-party insurance companies for marketing and selling insurance policies on behalf of such entities. Such commissions are recognized in Commissions and fees at the point in time the associated service is fulfilled, generally when the insurance policy is sold to the policyholder. Sales of certain insurance products include a portion of variable consideration associated with the underlying product. In these instances, a portion of the revenue associated with the sale of the policy is not recognized until the variable consideration becomes determinable. The Company recognized $92 million and $115 million for the three months ended September 30, 2018 and 2017, respectively, and $296 million and $342 million for the nine months ended September 30, 2018 and 2017, respectively. These amounts primarily relate to performance obligations in prior periods.
Insurance premiums consist of premium income from insurance policies that Citi has underwritten and sold to policyholders.

97
The following tables present Commissions and fees revenue:
Three Months Ended September 30, Nine Months Ended September 30,2018 2018
In millions of dollars ICG GCBCorporate
/Other Total ICG GCBCorporate
/Other TotalInvestment banking $ 856 $ — $ — $ 856 $ 2,695 $ — $ — $ 2,695Brokerage commissions 453 199 — 652 1,510 654 — 2,164Credit- and bank-card income Interchange fees 268 2,063 1 2,332 804 5,963 11 6,778 Card-related loan fees 16 172 — 188 47 474 12 533 Card rewards and partner payments (125) (2,130) — (2,255) (375) (6,070) (11) (6,456)Deposit-related fees(1) 239 160 — 399 711 503 1 1,215Transactional service fees 171 22 1 194 543 64 4 611Corporate finance(2) 145 1 — 146 506 4 — 510Insurance distribution revenue(3) 3 144 (4) 143 13 429 6 448Insurance premiums(3) — 31 (2) 29 — 96 (4) 92Loan servicing 42 27 8 77 118 89 31 238Other 10 29 3 42 20 90 6 116Total commissions and fees(4) $ 2,078 $ 718 $ 7 $ 2,803 $ 6,592 $ 2,296 $ 56 $ 8,944
Three Months Ended September 30, Nine Months Ended September 30,2017 2017
In millions of dollars ICG GCBCorporate/
Other Total ICG GCBCorporate/
Other TotalInvestment banking $ 961 $ — $ — $ 961 $ 2,840 $ — $ — $ 2,840Brokerage commissions 459 222 1 682 1,431 615 3 2,049Credit- and bank-card income Interchange fees 242 1,912 24 2,178 705 5,507 87 6,299 Card-related loan fees 13 172 13 198 39 526 41 606 Card rewards and partner payments (105) (1,822) (8) (1,935) (316) (5,352) (49) (5,717)Deposit-related fees(1) 249 188 4 441 696 554 12 1,262Transactional service fees 185 21 11 217 556 74 44 674Corporate finance(2) 183 2 — 185 616 4 — 620Insurance distribution revenue(3) 5 142 17 164 10 425 58 493Insurance premiums(3) — 32 (1) 31 — 97 (4) 93Loan servicing 38 25 25 88 109 79 89 277Other 2 25 4 31 (36) 64 28 56Total commissions and fees(4) $ 2,232 $ 919 $ 90 $ 3,241 $ 6,650 $ 2,593 $ 309 $ 9,552
(1) Includes overdraft fees of $33 million and $35 million for the three months ended September 30, 2018 and 2017, respectively, and $95 million and $101 million for the nine months ended September 30, 2018 and 2017, respectively. Overdraft fees are accounted for under ASC 310.
(2) Consists primarily of fees earned from structuring and underwriting loan syndications or related financing activity. This activity is accounted for under ASC 310.(3) Previously reported as insurance premiums on the Consolidated Statement of Income.(4) Commissions and fees includes $(1,774) million and $(1,398) million not accounted for under ASC 606, Revenue from Contracts with Customers, for the three
months ended September 30, 2018 and 2017, respectively, and $(4,967) million and $(4,023) million for the nine months ended September 30, 2018 and 2017, respectively. Amounts reported in Commissions and fees accounted for under other guidance primarily include card-related loan fees, card reward programs and certain partner payments, corporate finance fees, insurance premiums and loan servicing fees.

98
Administration and Other Fiduciary FeesAdministration and other fiduciary fees are primarily composed of custody fees and fiduciary fees.
The custody product is composed of numerous services related to the administration, safekeeping and reporting for both U.S. and non-U.S. denominated securities. The services offered to clients include trade settlement, safekeeping, income collection, corporate action notification, record-keeping and reporting, tax reporting and cash management. These services are provided for a wide range of securities, including but not limited to equities, municipal and corporate bonds, mortgage-backed and asset-backed securities, money market instruments, U.S. Treasuries and agencies, derivative instruments, mutual funds, alternative investments and precious metals. Custody fees are recognized as/when the associated promised service is satisfied, which normally occurs at the point in time the service is requested by the customer and provided by Citi.
Fiduciary fees consist of trust services and investment management services. As an escrow agent, Citi receives, safe-
keeps, services and manages clients’ escrowed assets such as cash, securities, property (including intellectual property), contracts or other collateral. Citi performs its escrow agent duties by safekeeping the funds during the specified time period agreed upon by all parties and therefore earns its revenue evenly during the contract duration.
Investment management services consist of managing assets on behalf of Citi’s retail and institutional clients. Revenue from these services primarily consists of asset-based fees for advisory accounts, which are based on the market value of the client’s assets and recognized monthly, when the market value is fixed. In some instances, the Company contracts with third-party advisors and with third-party custodians. The Company has determined that it acts as principal in the majority of these transactions and therefore presents the amounts paid to third parties gross within Other operating expenses.
The following table presents Administration and other fiduciary fees:
Three Months Ended September 30, Nine Months Ended September 30,2018 2018
In millions of dollars ICG GCBCorporate
/Other Total ICG GCBCorporate
/Other TotalCustody fees $ 371 $ 41 $ 18 $ 430 $ 1,138 $ 133 $ 50 $ 1,321Fiduciary fees 160 158 12 330 492 455 31 978Guarantee fees 136 14 1 151 403 43 5 451Total administration and other fiduciary fees(1) $ 667 $ 213 $ 31 $ 911 $ 2,033 $ 631 $ 86 $ 2,750
Three Months Ended September 30, Nine Months Ended September 30,2017 2017
In millions of dollars ICG GCBCorporate/
Other Total ICG GCBCorporate/
Other TotalCustody fees $ 397 $ 44 $ 14 $ 455 $ 1,135 $ 123 $ 41 $ 1,299Fiduciary fees 149 157 18 324 437 431 59 927Guarantee fees 134 13 3 150 400 39 7 446Total administration and other fiduciary fees(1) $ 680 $ 214 $ 35 $ 929 $ 1,972 $ 593 $ 107 $ 2,672
(1) Administration and other fiduciary fees includes $151 million and $150 million for the three months ended September 30, 2018 and 2017, respectively, and $451 million and $446 million for the nine months ended September 30, 2018 and 2017, respectively, that are not accounted for under ASC 606, Revenue from Contracts with Customers. These amounts include guarantee fees.

99
6. PRINCIPAL TRANSACTIONS
Principal transactions revenue consists of realized and unrealized gains and losses from trading activities. Trading activities include revenues from fixed income, equities, credit and commodities products and foreign exchange transactions that are managed on a portfolio basis characterized by primary risk. Not included in the table below is the impact of net interest revenue related to trading activities, which is anintegral part of trading activities’ profitability. See Note 4 to the Consolidated Financial Statements for information about net interest revenue related to trading activities. Principal transactions include CVA (credit valuation adjustments on derivatives) and FVA (funding valuation adjustments) on over-the-counter derivatives. These adjustments are discussed further in Note 20 to the Consolidated Financial Statements.
In certain transactions, Citi incurs fees and presents these fees paid to third parties in operating expenses.
The following table presents Principal transactionsrevenue:
Three Months Ended September 30, Nine Months Ended September 30,In millions of dollars 2018 2017 2018 2017Interest rate risks(1) $ 1,403 $ 1,180 $ 4,576 $ 4,421Foreign exchange risks(2) 467 606 1,387 1,942Equity risks(3) 311 154 997 440Commodity and other risks(4) 244 112 544 434Credit products and risks(5) 141 196 502 748Total $ 2,566 $ 2,248 $ 8,006 $ 7,985
(1) Includes revenues from government securities and corporate debt, municipal securities, mortgage securities and other debt instruments. Also includes spot and forward trading of currencies and exchange-traded and over-the-counter (OTC) currency options, options on fixed income securities, interest rate swaps, currency swaps, swap options, caps and floors, financial futures, OTC options and forward contracts on fixed income securities.
(2) Includes revenues from foreign exchange spot, forward, option and swap contracts, as well as foreign currency translation (FX translation) gains and losses.(3) Includes revenues from common, preferred and convertible preferred stock, convertible corporate debt, equity-linked notes and exchange-traded and OTC equity
options and warrants.(4) Primarily includes revenues from crude oil, refined oil products, natural gas and other commodities trades.(5) Includes revenues from structured credit products.

100
7. INCENTIVE PLANS
For additional information on Citi’s incentive plans, see Note 7 to the Consolidated Financial Statements in Citi’s 2017 Annual Report on Form 10-K.
8. RETIREMENT BENEFITS
For additional information on Citi’s retirement benefits, see Note 8 to the Consolidated Financial Statements in Citi’s 2017 Annual Report on Form 10-K.
Net (Benefit) ExpenseThe following table summarizes the components of net (benefit) expense recognized in the Consolidated Statement of Income for the Company’s pension and postretirement plans for Significant Plans and All Other Plans:
Three Months Ended September 30, Pension plans Postretirement benefit plans U.S. plans Non-U.S. plans U.S. plans Non-U.S. plansIn millions of dollars 2018 2017 2018 2017 2018 2017 2018 2017Benefits earned during the period $ — $ 1 $ 35 $ 38 $ — $ — $ 2 $ 3Interest cost on benefit obligation 132 131 73 76 6 9 26 27Expected return on plan assets (210) (217) (71) (77) (4) (2) (22) (24)Amortization of unrecognized:
Prior service benefit — — (1) (1) — — (2) (2)Net actuarial loss 39 45 14 15 — — 7 8
Curtailment loss(1) — 1 — — — — — —Settlement loss(1) — — — 4 — — — —Total net (benefit) expense $ (39) $ (39) $ 50 $ 55 $ 2 $ 7 $ 11 $ 12
(1) Losses due to curtailment and settlement relate to repositioning and divestiture activities.
Nine Months Ended September 30, Pension plans Postretirement benefit plans
U.S. plans Non-U.S. plans U.S. plans Non-U.S. plansIn millions of dollars 2018 2017 2018 2017 2018 2017 2018 2017Benefits earned during the period $ 1 $ 2 $ 111 $ 112 $ — $ — $ 7 $ 7Interest cost on benefit obligation 381 406 220 221 19 20 77 76Expected return on plan assets (634) (650) (221) (223) (10) (5) (67) (67)Amortization of unrecognized:
Prior service benefit — 1 (3) (3) — — (7) (7)Net actuarial loss 128 129 41 46 — — 22 25
Curtailment loss(1) 1 4 — — — — — —Settlement loss(1) — — 5 8 — — — —
Total net (benefit) expense $ (123) $ (108) $ 153 $ 161 $ 9 $ 15 $ 32 $ 34
(1) Losses due to curtailment and settlement relate to repositioning and divestiture activities.

101
Funded Status and Accumulated Other Comprehensive Income (AOCI)The following tables summarize the funded status and amounts recognized in the Consolidated Balance Sheet for the Company’sSignificant Plans:
Nine Months Ended September 30, 2018 Pension plans Postretirement benefit plansIn millions of dollars U.S. plans Non-U.S. plans U.S. plans Non-U.S. plans
Change in projected benefit obligation Projected benefit obligation at beginning of year $ 14,040 $ 7,433 $ 699 $ 1,261Plans measured annually (28) (1,987) — (334)Projected benefit obligation at beginning of year—Significant Plans $ 14,012 $ 5,446 $ 699 $ 927First quarter activity (576) 151 (32) 89Second quarter activity (595) (344) — (65)Projected benefit obligation at June 30, 2018—Significant Plans $ 12,841 $ 5,253 $ 667 $ 951Benefits earned during the period — 20 — 2Interest cost on benefit obligation 132 60 6 23Actuarial gain (60) (59) — (61)Benefits paid, net of participants’ contributions and governmentsubsidy (217) (68) (15) (14)Foreign exchange impact and other — 48 — 48Projected benefit obligation at period end—Significant Plans $ 12,696 $ 5,254 $ 658 $ 949

102
Nine Months Ended September 30, 2018 Pension plans Postretirement benefit plansIn millions of dollars U.S. plans Non-U.S. plans U.S. plans Non-U.S. plansChange in plan assets Plan assets at fair value at beginning of year $ 12,725 $ 7,128 $ 262 $ 1,119Plans measured annually — (1,305) — (10)Plan assets at fair value at beginning of year—Significant Plans $ 12,725 $ 5,823 $ 262 $ 1,109First quarter activity (349) 115 (21) 58Second quarter activity (220) (328) (4) (78)Plan assets at fair value at June 30, 2018—Significant Plans $ 12,156 $ 5,610 $ 237 $ 1,089Actual return on plan assets 123 7 1 23Company contributions, net of reimbursements 13 15 153 —Benefits paid, net of participants’ contributions and government subsidy (217) (68) (15) (14)Foreign exchange impact and other — 40 — 56Plan assets at fair value at period end—Significant Plans $ 12,075 $ 5,604 $ 376 $ 1,154Funded status of the Significant PlansQualified plans(1) $ 36 $ 350 $ (282) $ 205Nonqualified plans (657) — — —Funded status of the plans at period end—Significant Plans $ (621) $ 350 $ (282) $ 205Net amount recognized at period end Benefit asset $ 36 $ 850 $ — $ 205Benefit liability (657) (500) (282) —Net amount recognized on the balance sheet—Significant Plans $ (621) $ 350 $ (282) $ 205Amounts recognized in AOCI at period end Prior service benefit $ — $ 25 $ — $ 80Net actuarial (loss) gain (6,313) (807) 77 (284)Net amount recognized in equity (pretax)—Significant Plans $ (6,313) $ (782) $ 77 $ (204)
Accumulated benefit obligation at period end—Significant Plans $ 12,689 $ 4,980 $ 658 $ 949
(1) The U.S. qualified pension plan is fully funded pursuant to the Employee Retirement Income Security Act of 1974, as amended (ERISA), funding rules as of January 1, 2018 and no minimum required funding is expected for 2018.
The following table shows the change in AOCI related to the Company’s pension, postretirement and post employment plans:
In millions of dollarsThree Months Ended September 30, 2018
Nine Months EndedSeptember 30, 2018
Beginning of period balance, net of tax(1)(2) $ (5,794) $ (6,183)Actuarial assumptions changes and plan experience 181 1,300Net asset loss due to difference between actual and expected returns (140) (919)Net amortization 49 161Curtailment/settlement gain(3) — 6Foreign exchange impact and other (35) 1Change in deferred taxes, net (29) (134)Change, net of tax $ 26 $ 415End of period balance, net of tax(1)(2) $ (5,768) $ (5,768)
(1) See Note 17 to the Consolidated Financial Statements for further discussion of net AOCI balance.(2) Includes net-of-tax amounts for certain profit sharing plans outside the U.S.(3) Gains due to curtailment and settlement relate to repositioning and divestiture activities.

103
Plan AssumptionsThe discount rates utilized during the period in determining the pension and postretirement net (benefit) expense for the Significant Plans are as follows:
Net (benefit) expense assumed discountrates during the period
Three Months EndedSept. 30,
2018Jun. 30,
2018U.S. plans
Qualified pension 4.25% 3.95%Nonqualified pension 4.25 3.95Postretirement 4.20 3.90
Non-U.S. plansPension 0.80-10.70 0.75-9.90Weighted average 4.88 4.86Postretirement 9.50 9.50
The discount rates utilized at period-end in determining the pension and postretirement benefit obligations for the Significant Plans are as follows:
Plan obligations assumeddiscount rates at periodended
Sept. 30,2018
Jun. 30,2018
Mar. 31,2018
U.S. plans
Qualified pension 4.30% 4.25% 3.95%
Nonqualified pension 4.30 4.25 3.95
Postretirement 4.20 4.20 3.90
Non-U.S. plans
Pension 0.95-10.75 0.80-10.70 0.75-9.90
Weighted average 5.08 4.88 4.86
Postretirement 10.10 9.50 9.50
Sensitivities of Certain Key Assumptions The following table summarizes the estimated effect on the
Company’s Significant Plans quarterly expense of a one-percentage-point change in the discount rate:
Three Months Ended September 30, 2018
In millions of dollarsOne-percentage-
point increaseOne-percentage-point decrease
Pension U.S. plans $ 5 $ (8) Non-U.S. plans (3) 5Postretirement U.S. plans — (1) Non-U.S. plans (2) 2
ContributionsFor the U.S. pension plans, there were no required minimum cash contributions during the first nine months of 2018.
The following table summarizes the Company’s actual contributions for the nine months ended September 30, 2018 and 2017, as well as estimated expected Company contributions for the remainder of 2018 and the actual contributions made for the remainder of 2017:
Pension plans Postretirement plans U.S. plans(1) Non-U.S. plans U.S. plans Non-U.S. plansIn millions of dollars 2018 2017 2018 2017 2018 2017 2018 2017
Company contributions(2) for the nine months ended September 30 $ 42 $ 90 $ 143 $ 109 $ 159 $ 30 $ 7 $ 7Company contributions made during the remainder of the year — 15 — 26 — 146 — 3
Company contributions expected to be made during the remainder of the year 15 — 33 — 2 — 2 —
(1) The U.S. pension plans include benefits paid directly by the Company for the nonqualified pension plans.(2) Company contributions are composed of cash contributions made to the plans and benefits paid directly by the Company.

104
Defined Contribution PlansThe following table summarizes the Company’s contributions for the defined contribution plans:
Three Months EndedSeptember 30,
Nine Months EndedSeptember 30,
In millions of dollars 2018 2017 2018 2017 U.S. plans $ 90 $ 95 $ 293 $ 293 Non-U.S. plans 68 68 216 203
Post Employment PlansThe following table summarizes the components of net expense recognized in the Consolidated Statement of Income for the Company’s U.S. post employment plans:
Three Months EndedSeptember 30,
Nine Months Ended September 30,
In millions of dollars 2018 2017 2018 2017Interest cost onbenefit obligation $ — $ — $ 1 $ 1Expected returnon plan assets — — (1) —Amortization ofunrecognized: Prior service benefit (8) (8) (23) (23) Net actuarial loss 1 1 2 2Total service- related benefit $ (7) $ (7) $ (21) $ (20)Non-service- related expense $ 4 $ 9 $ 7 $ 21Total net (benefit) expense $ (3) $ 2 $ (14) $ 1

105
9. EARNINGS PER SHARE
The following table reconciles the income and share data used in the basic and diluted earnings per share (EPS) computations:
Three Months EndedSeptember 30,
Nine Months EndedSeptember 30,
In millions of dollars, except per share amounts 2018 2017 2018 2017Income from continuing operations before attribution of noncontrolling interests $ 4,633 $ 4,137 $ 13,783 $ 12,138Less: Noncontrolling interests from continuing operations 3 (1) 51 41Net income from continuing operations (for EPS purposes) $ 4,630 $ 4,138 $ 13,732 $ 12,097Loss from discontinued operations, net of taxes (8) (5) — (2)Citigroup's net income $ 4,622 $ 4,133 $ 13,732 $ 12,095Less: Preferred dividends(1) 270 272 860 893Net income available to common shareholders $ 4,352 $ 3,861 $ 12,872 $ 11,202Less: Dividends and undistributed earnings allocated to employee restricted and deferred
shares with nonforfeitable rights to dividends, applicable to basic EPS 51 53 151 156Net income allocated to common shareholders for basic EPS $ 4,301 $ 3,808 $ 12,721 $ 11,046Net income allocated to common shareholders for diluted EPS 4,301 3,808 12,721 11,046Weighted-average common shares outstanding applicable to basic EPS (in millions) 2,479.8 2,683.6 2,524.1 2,729.3Effect of dilutive securities(2) Options(3) 0.2 0.1 0.1 0.1Other employee plans 1.4 — 1.3 —
Adjusted weighted-average common shares outstanding applicable to diluted EPS(4) 2,481.4 2,683.7 2,525.5 2,729.5Basic earnings per share(5) Income from continuing operations $ 1.74 $ 1.42 $ 5.04 $ 4.05Discontinued operations — — — —Net income $ 1.73 $ 1.42 $ 5.04 $ 4.05Diluted earnings per share(5) Income from continuing operations $ 1.74 $ 1.42 $ 5.04 $ 4.05Discontinued operations — — — —Net income $ 1.73 $ 1.42 $ 5.04 $ 4.05
(1) As of September 30, 2018, Citi estimates it will distribute preferred dividends of approximately $313 million during the remainder of 2018, assuming such dividends are declared by the Citi Board of Directors. During the first nine months of 2018, Citi redeemed all of its 3.8 million Series AA preferred shares for $96.8 million and all of its 4.9 million Series E preferred shares for $121.3 million. All preferred shares were redeemed at par value. Citi redeemed all of its 23 million Series C preferred shares for $575 million in October 2018.
(2) Warrants issued to the U.S. Treasury as part of the Troubled Asset Relief Program (TARP) and the loss-sharing agreement (all of which were subsequently sold to the public in January 2011), with exercise prices of $178.50 and $103.82 per share for approximately 21.0 million and 25.5 million shares of Citigroup common stock, respectively. Both warrants were not included in the computation of earnings per share in the three and nine months ended September 30, 2018 and 2017 because they were anti-dilutive.
(3) During the third quarters of 2018 and 2017, weighted-average options to purchase 0.5 million and 0.8 million shares of common stock, respectively, were outstanding, but not included in the computation of earnings per share because the weighted-average exercise prices of $142.30 and $206.70 per share, respectively, were anti-dilutive.
(4) Due to rounding, common shares outstanding applicable to basic EPS and the effect of dilutive securities may not sum to common shares outstanding applicable to diluted EPS.
(5) Due to rounding, earnings per share on continuing operations and discontinued operations may not sum to earnings per share on net income.

106
10. FEDERAL FUNDS, SECURITIES BORROWED, LOANED AND SUBJECT TO REPURCHASE AGREEMENTS
For additional information on the Company’s resale and repurchase agreements and securities borrowing and lending agreements, see Note 11 to the Consolidated Financial Statements in Citi’s 2017 Annual Report on Form 10-K.
Federal funds sold and securities borrowed and purchased under agreements to resell, at their respective carrying values, consisted of the following:
In millions of dollarsSeptember 30,
2018December 31,
2017Federal funds sold $ 20 $ —Securities purchased underagreements to resell 152,889 130,984Deposits paid for securitiesborrowed 128,032 101,494Total(1) $ 280,941 $ 232,478
Federal funds purchased and securities loaned and sold under agreements to repurchase, at their respective carrying values, consisted of the following:
In millions of dollarsSeptember 30,
2018December 31,
2017Federal funds purchased $ 117 $ 326Securities sold under agreementsto repurchase 161,987 142,646Deposits received for securitiesloaned 13,811 13,305Total(1) $ 175,915 $ 156,277
(1) The above tables do not include securities-for-securities lending transactions of $19.9 billion and $14.0 billion at September 30, 2018 and December 31, 2017, respectively, where the Company acts as lender and receives securities that can be sold or pledged as collateral. In these transactions, the Company recognizes the securities received at fair value within Other assets and the obligation to return those securities as a liability within Brokerage payables.
It is the Company’s policy to take possession of the underlying collateral, monitor its market value relative to the amounts due under the agreements and, when necessary, require prompt transfer of additional collateral in order to maintain contractual margin protection. For resale and repurchase agreements, when necessary, the Company posts additional collateral in order to maintain contractual margin protection.
A substantial portion of the resale and repurchase agreements is recorded at fair value, as described in Notes 20 and 21 to the Consolidated Financial Statements. The remaining portion is carried at the amount of cash initially advanced or received, plus accrued interest, as specified in the respective agreements.
A substantial portion of securities borrowing and lending agreements is recorded at the amount of cash advanced or received. The remaining portion is recorded at fair value as the Company elected the fair value option for certain securities borrowed and loaned portfolios, as described in Note 21 to the Consolidated Financial Statements. With respect to securities loaned, the Company receives cash collateral in an amount generally in excess of the market value of the securities loaned. The Company monitors the market value of securities borrowed and securities loaned on a daily basis and obtains or posts additional collateral in order to maintain contractual margin protection.
The following tables present the gross and net resale and repurchase agreements and securities borrowing and lending agreements and the related offsetting amount permitted under ASC 210-20-45. The tables also include amounts related to financial instruments that are not permitted to be offset under ASC 210-20-45, but would be eligible for offsetting to the extent that an event of default occurred and a legal opinion supporting enforceability of the offsetting rights has been obtained. Remaining exposures continue to be secured by financial collateral, but the Company may not have sought or been able to obtain a legal opinion evidencing enforceability of the offsetting right.
As of September 30, 2018
In millions of dollars
Gross amountsof recognized
assets
Gross amountsoffset on theConsolidated
Balance Sheet(1)
Net amounts ofassets included onthe ConsolidatedBalance Sheet(2)
Amountsnot offset on the
Consolidated BalanceSheet but eligible for
offsetting uponcounterparty default(3)
Netamounts(4)
Securities purchased under agreements toresell $ 248,802 $ 95,913 $ 152,889 $ 121,141 $ 31,748Deposits paid for securities borrowed 128,032 — 128,032 29,461 98,571Total $ 376,834 $ 95,913 $ 280,921 $ 150,602 $ 130,319

107
In millions of dollars
Gross amountsof recognized
liabilities
Gross amountsoffset on theConsolidated
Balance Sheet(1)
Net amounts ofliabilities included on
the ConsolidatedBalance Sheet(2)
Amountsnot offset on the
Consolidated BalanceSheet but eligible for
offsetting uponcounterparty default(3)
Netamounts(4)
Securities sold under agreements torepurchase $ 257,900 $ 95,913 $ 161,987 $ 87,917 $ 74,070Deposits received for securities loaned 13,811 — 13,811 4,730 9,081Total $ 271,711 $ 95,913 $ 175,798 $ 92,647 $ 83,151
As of December 31, 2017
In millions of dollars
Gross amountsof recognized
assets
Gross amountsoffset on theConsolidated
Balance Sheet(1)
Net amounts ofassets included onthe ConsolidatedBalance Sheet(2)
Amountsnot offset on the
Consolidated BalanceSheet but eligible for
offsetting uponcounterparty default(3)
Netamounts(4)
Securities purchased under agreements toresell $ 204,460 $ 73,476 $ 130,984 $ 103,022 $ 27,962Deposits paid for securities borrowed 101,494 — 101,494 22,271 79,223Total $ 305,954 $ 73,476 $ 232,478 $ 125,293 $ 107,185
In millions of dollars
Gross amountsof recognized
liabilities
Gross amountsoffset on theConsolidated
Balance Sheet(1)
Net amounts ofliabilities included on
the ConsolidatedBalance Sheet(2)
Amountsnot offset on the
Consolidated BalanceSheet but eligible for
offsetting uponcounterparty default(3)
Netamounts(4)
Securities sold under agreements torepurchase $ 216,122 $ 73,476 $ 142,646 $ 73,716 $ 68,930Deposits received for securities loaned 13,305 — 13,305 4,079 9,226Total $ 229,427 $ 73,476 $ 155,951 $ 77,795 $ 78,156
(1) Includes financial instruments subject to enforceable master netting agreements that are permitted to be offset under ASC 210-20-45.(2) The total of this column for each period excludes federal funds sold/purchased. See tables above.(3) Includes financial instruments subject to enforceable master netting agreements that are not permitted to be offset under ASC 210-20-45, but would be eligible for
offsetting to the extent that an event of default has occurred and a legal opinion supporting enforceability of the offsetting right has been obtained.(4) Remaining exposures continue to be secured by financial collateral, but the Company may not have sought or been able to obtain a legal opinion evidencing
enforceability of the offsetting right.
The following tables present the gross amount of liabilities associated with repurchase agreements and securities lending agreements, by remaining contractual maturity:
As of September 30, 2018
In millions of dollarsOpen andovernight
Up to 30days 31–90 days
Greater than90 days Total
Securities sold under agreements to repurchase $ 121,109 $ 59,246 $ 30,558 $ 46,987 $ 257,900Deposits received for securities loaned 7,091 307 3,200 3,213 13,811Total $ 128,200 $ 59,553 $ 33,758 $ 50,200 $ 271,711
As of December 31, 2017
In millions of dollarsOpen andovernight Up to 30 days 31–90 days
Greater than90 days Total
Securities sold under agreements to repurchase $ 82,073 $ 68,372 $ 33,846 $ 31,831 $ 216,122Deposits received for securities loaned 9,946 266 1,912 1,181 13,305Total $ 92,019 $ 68,638 $ 35,758 $ 33,012 $ 229,427

108
The following tables present the gross amount of liabilities associated with repurchase agreements and securities lending agreements, by class of underlying collateral:
As of September 30, 2018
In millions of dollarsRepurchaseagreements
Securitieslending
agreements Total
U.S. Treasury and federal agency securities $ 95,116 $ 110 $ 95,226State and municipal securities 2,803 — 2,803Foreign government securities 94,306 301 94,607Corporate bonds 22,247 545 22,792Equity securities 18,759 11,982 30,741Mortgage-backed securities 15,088 — 15,088Asset-backed securities 6,513 — 6,513Other 3,068 873 3,941Total $ 257,900 $ 13,811 $ 271,711
As of December 31, 2017
In millions of dollarsRepurchaseagreements
Securitieslending
agreements Total
U.S. Treasury and federal agency securities $ 58,774 $ — $ 58,774State and municipal securities 1,605 — 1,605Foreign government securities 89,576 105 89,681Corporate bonds 20,194 657 20,851Equity securities 20,724 11,907 32,631Mortgage-backed securities 17,791 — 17,791Asset-backed securities 5,479 — 5,479Other 1,979 636 2,615Total $ 216,122 $ 13,305 $ 229,427

109
11. BROKERAGE RECEIVABLES AND BROKERAGEPAYABLES
The Company has receivables and payables for financial instruments sold to and purchased from brokers, dealers and customers, which arise in the ordinary course of business.
For additional information on these receivables and payables, see Note 12 to the Consolidated Financial Statements in Citi’s 2017 Annual Report on Form 10-K.
Brokerage receivables and Brokerage payables consisted of the following:
In millions of dollarsSeptember 30,
2018December 31,
2017Receivables from customers $ 15,195 $ 19,215Receivables from brokers,dealers and clearingorganizations 25,484 19,169Total brokerage receivables(1) $ 40,679 $ 38,384Payables to customers $ 41,414 $ 38,741Payables to brokers, dealersand clearing organizations 31,932 22,601Total brokerage payables(1) $ 73,346 $ 61,342
(1) Includes brokerage receivables and payables recorded by Citi broker-dealer entities that are accounted for in accordance with the AICPA Accounting Guide for Brokers and Dealers in Securities as codified in ASC 940-320.

110
12. INVESTMENTS
For additional information regarding Citi’s investment portfolios, including evaluating investments for other-than-temporary impairment (OTTI), see Note 13 to the Consolidated Financial Statements in Citi’s 2017 Annual Report on Form 10-K.
OverviewCiti adopted ASU 2016-01 and ASU 2018-03 as of January 1, 2018. The ASUs require fair value changes on marketable equity securities to be recognized in earnings. The available-for-sale category was eliminated for equity securities. Also, non-marketable equity securities are required to be measured at fair value with changes in fair value recognized in earnings unless (i) the measurement alternative is elected or (ii) the investment represents Federal Reserve Bank and Federal Home Loan Bank stock or certain exchange seats that continue to be carried at cost. See Note 1 to the Consolidated Financial Statements for additional details.
The following tables present Citi’s investments by category:
In millions of dollarsSeptember 30,
2018Debt securities available-for-sale (AFS) $ 284,782Debt securities held-to-maturity (HTM)(1) 53,249
Marketable equity securities carried at fair value(2) 260Non-marketable equity securities carried at fair value(2) 1,128Non-marketable equity securities measured using the measurement alternative(3) 452Non-marketable equity securities carried at cost(4) 5,642Total investments $ 345,513
In millions of dollarsDecember 31,
2017Securities available-for-sale (AFS) $ 290,914Debt securities held-to-maturity (HTM)(1) 53,320Non-marketable equity securities carried at fair value(2) 1,206Non-marketable equity securities carried at cost(4) 6,850Total investments $ 352,290
(1) Carried at adjusted amortized cost basis, net of any credit-related impairment.(2) Unrealized gains and losses are recognized in earnings.(3) Impairment losses and adjustments to the carrying value as a result of observable price changes are recognized in earnings.(4) Represents shares issued by the Federal Reserve Bank, Federal Home Loan Banks and certain exchanges of which Citigroup is a member.
The following table presents interest and dividend income on investments:
Three Months Ended September 30, Nine Months Ended September 30,In millions of dollars 2018 2017 2018 2017Taxable interest $ 2,195 $ 1,922 $ 6,395 $ 5,545Interest exempt from U.S. federal income tax 130 129 392 412Dividend income 63 53 209 165Total interest and dividend income $ 2,388 $ 2,104 $ 6,996 $ 6,122

111
The following table presents realized gains and losses on the sales of investments, which excludes OTTI losses:
Three Months Ended September 30, Nine Months Ended September 30,In millions of dollars 2018 2017 2018 2017Gross realized investment gains $ 153 $ 293 $ 550 $ 840Gross realized investment losses (84) (80) (209) (214)Net realized gains on sale of investments $ 69 $ 213 $ 341 $ 626
Securities Available-for-SaleThe amortized cost and fair value of AFS securities were as follows:
September 30, 2018 December 31, 2017
In millions of dollarsAmortized
cost
Grossunrealized
gains
Grossunrealized
lossesFairvalue
Amortizedcost
Grossunrealized
gains
Grossunrealized
lossesFair
valueSecurities AFS Mortgage-backed securities(1)
U.S. government-sponsored agencyguaranteed $ 46,675 $ 61 $ 1,575 $ 45,161 $ 42,116 $ 125 $ 500 $ 41,741Prime — — — — 11 6 — 17Alt-A 1 — — 1 26 90 — 116Non-U.S. residential 1,620 7 1 1,626 2,744 13 6 2,751Commercial 233 1 3 231 334 — 2 332
Total mortgage-backed securities $ 48,529 $ 69 $ 1,579 $ 47,019 $ 45,231 $ 234 $ 508 $ 44,957U.S. Treasury and federal agency securities
U.S. Treasury $ 108,509 $ 28 $ 1,949 $ 106,588 $ 108,344 $ 77 $ 971 $ 107,450Agency obligations 9,752 — 197 9,555 10,813 7 124 10,696
Total U.S. Treasury and federal agencysecurities $ 118,261 $ 28 $ 2,146 $ 116,143 $ 119,157 $ 84 $ 1,095 $ 118,146State and municipal(2) $ 9,662 $ 87 $ 269 $ 9,480 $ 8,870 $ 140 $ 245 $ 8,765Foreign government 94,937 293 769 94,461 100,615 508 590 100,533Corporate 12,498 21 139 12,380 14,144 51 86 14,109Asset-backed securities(1) 1,265 3 6 1,262 3,906 14 2 3,918Other debt securities 4,036 1 — 4,037 297 — — 297Total debt securities AFS $ 289,188 $ 502 $ 4,908 $ 284,782 $ 292,220 $ 1,031 $ 2,526 $ 290,725Marketable equity securities AFS(3) $ — $ — $ — $ — $ 186 $ 4 $ 1 $ 189Total securities AFS $ 289,188 $ 502 $ 4,908 $ 284,782 $ 292,406 $ 1,035 $ 2,527 $ 290,914
(1) The Company invests in mortgage-backed and asset-backed securities. These securitizations are generally considered VIEs. The Company’s maximum exposure to loss from these VIEs is equal to the carrying amount of the securities, which is reflected in the table above. For mortgage-backed and asset-backed securitizations in which the Company has other involvement, see Note 18 to the Consolidated Financial Statements.
(2) In the second quarter of 2017, Citi early adopted ASU 2017-08, Receivables—Nonrefundable Fees and Other Costs (Subtopic 310-20): Premium Amortization on Purchased Callable Debt Securities. Upon adoption, a cumulative effect adjustment was recorded to reduce Retained earnings, effective January 1, 2017, for the incremental amortization of purchase premiums and cumulative fair value hedge adjustments on callable state and municipal debt securities. For additional information, see Note 1 to the Consolidated Financial Statements.
(3) Citi adopted ASU 2016-01 and ASU 2018-03 as of January 1, 2018, resulting in a cumulative effect adjustment from AOCI to Retained earnings for net unrealized gains on marketable equity securities AFS. The available-for-sale category was eliminated for equity securities effective January 1, 2018. See Note 1 to the Consolidated Financial Statements for additional details.

112
The following table shows the fair value of AFS securities that have been in an unrealized loss position:
Less than 12 months 12 months or longer Total
In millions of dollarsFairvalue
Grossunrealized
lossesFairvalue
Grossunrealized
lossesFairvalue
Grossunrealized
lossesSeptember 30, 2018 Debt Securities AFS(1) Mortgage-backed securities
U.S. government-sponsored agency guaranteed $ 21,723 $ 574 $ 18,828 $ 1,001 $ 40,551 $ 1,575Non-U.S. residential 256 1 1 — 257 1Commercial 168 2 51 1 219 3
Total mortgage-backed securities $ 22,147 $ 577 $ 18,880 $ 1,002 $ 41,027 $ 1,579U.S. Treasury and federal agency securities
U.S. Treasury $ 27,095 $ 279 $ 65,789 $ 1,670 $ 92,884 $ 1,949Agency obligations 1,549 15 8,004 182 9,553 197
Total U.S. Treasury and federal agency securities $ 28,644 $ 294 $ 73,793 $ 1,852 $ 102,437 $ 2,146State and municipal $ 1,811 $ 48 $ 1,260 $ 221 $ 3,071 $ 269Foreign government 48,491 463 11,598 306 60,089 769Corporate 6,556 114 798 25 7,354 139Asset-backed securities 604 6 27 — 631 6Other debt securities 1,313 — — — 1,313 —Total debt securities AFS $ 109,566 $ 1,502 $ 106,356 $ 3,406 $ 215,922 $ 4,908December 31, 2017 Securities AFS Mortgage-backed securities
U.S. government-sponsored agency guaranteed $ 30,994 $ 438 $ 2,206 $ 62 $ 33,200 $ 500Non-U.S. residential 753 6 — — 753 6Commercial 150 1 57 1 207 2
Total mortgage-backed securities $ 31,897 $ 445 $ 2,263 $ 63 $ 34,160 $ 508U.S. Treasury and federal agency securities
U.S. Treasury $ 79,050 $ 856 $ 7,404 $ 115 $ 86,454 $ 971Agency obligations 8,857 110 1,163 14 10,020 124
Total U.S. Treasury and federal agency securities $ 87,907 $ 966 $ 8,567 $ 129 $ 96,474 $ 1,095State and municipal $ 1,009 $ 11 $ 1,155 $ 234 $ 2,164 $ 245Foreign government 53,206 356 9,051 234 62,257 590Corporate 6,737 74 859 12 7,596 86Asset-backed securities 449 1 25 1 474 2Other debt securities — — — — — —Marketable equity securities AFS(1) 11 1 — — 11 1Total securities AFS $ 181,216 $ 1,854 $ 21,920 $ 673 $ 203,136 $ 2,527
(1) Citi adopted ASU 2016-01 and ASU 2018-03 as of January 1, 2018, resulting in a cumulative effect adjustment from AOCI to retained earnings for net unrealized gains on marketable equity securities AFS. The available-for-sale category was eliminated for equity securities effective January 1, 2018. See Note 1 to the Consolidated Financial Statements for additional details.

113
The following table presents the amortized cost and fair value of AFS debt securities by contractual maturity dates:
September 30, 2018 December 31, 2017
In millions of dollarsAmortized
costFairvalue
Amortizedcost
Fairvalue
Mortgage-backed securities(1) Due within 1 year $ 434 $ 431 $ 45 $ 45After 1 but within 5 years 1,201 1,194 1,306 1,304After 5 but within 10 years 2,159 2,119 1,376 1,369After 10 years(2) 44,735 43,275 42,504 42,239Total $ 48,529 $ 47,019 $ 45,231 $ 44,957U.S. Treasury and federal agency securities Due within 1 year $ 34,543 $ 34,471 $ 4,913 $ 4,907After 1 but within 5 years 81,735 79,739 111,236 110,238After 5 but within 10 years 1,893 1,842 3,008 3,001After 10 years(2) 90 91 — —Total $ 118,261 $ 116,143 $ 119,157 $ 118,146State and municipal Due within 1 year $ 2,773 $ 2,772 $ 1,792 $ 1,792After 1 but within 5 years 1,575 1,570 2,579 2,576After 5 but within 10 years 572 590 514 528After 10 years(2) 4,742 4,548 3,985 3,869Total $ 9,662 $ 9,480 $ 8,870 $ 8,765Foreign government Due within 1 year $ 34,686 $ 34,649 $ 32,130 $ 32,100After 1 but within 5 years 47,933 47,416 53,034 53,165After 5 but within 10 years 10,371 10,386 12,949 12,680After 10 years(2) 1,947 2,010 2,502 2,588Total $ 94,937 $ 94,461 $ 100,615 $ 100,533All other(3) Due within 1 year $ 6,439 $ 6,435 $ 3,998 $ 3,991After 1 but within 5 years 9,151 9,068 9,047 9,027After 5 but within 10 years 1,614 1,603 3,415 3,431After 10 years(2) 595 573 1,887 1,875Total $ 17,799 $ 17,679 $ 18,347 $ 18,324Total debt securities AFS $ 289,188 $ 284,782 $ 292,220 $ 290,725
(1) Includes mortgage-backed securities of U.S. government-sponsored agencies.(2) Investments with no stated maturities are included as contractual maturities of greater than 10 years. Actual maturities may differ due to call or prepayment rights.(3) Includes corporate, asset-backed and other debt securities.
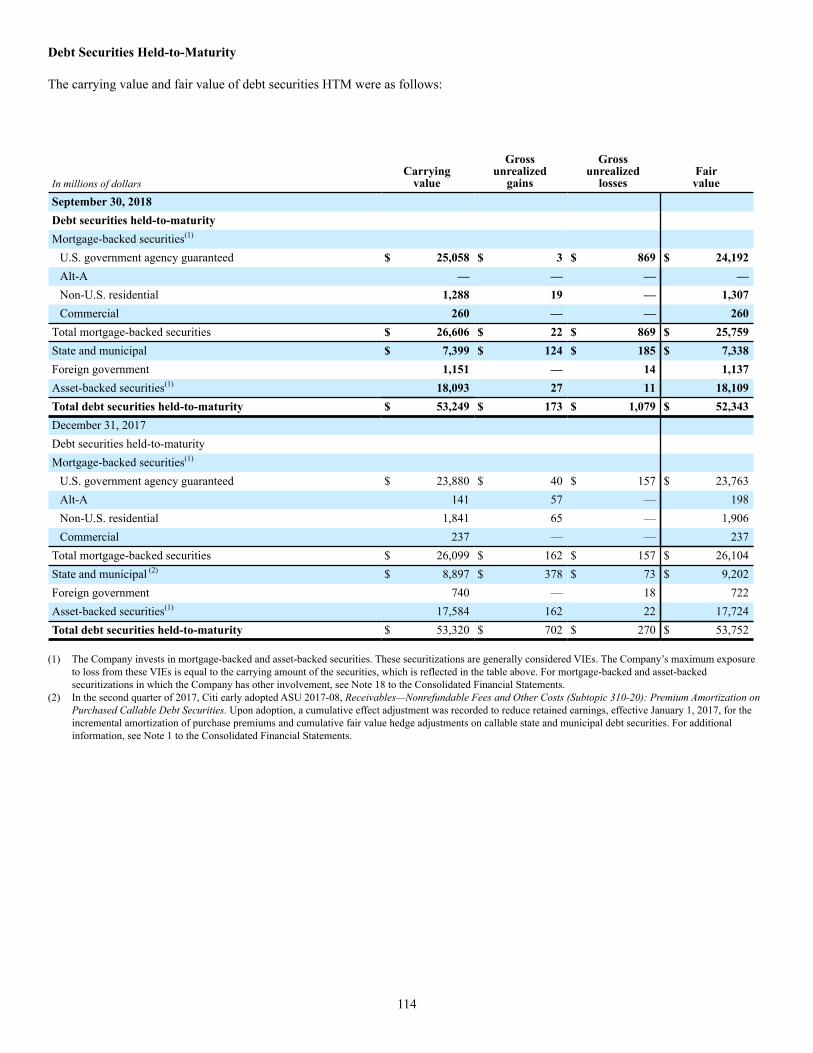
114
Debt Securities Held-to-Maturity
The carrying value and fair value of debt securities HTM were as follows:
In millions of dollarsCarrying
value
Grossunrealized
gains
Grossunrealized
lossesFairvalue
September 30, 2018 Debt securities held-to-maturity Mortgage-backed securities(1)
U.S. government agency guaranteed $ 25,058 $ 3 $ 869 $ 24,192Alt-A — — — —Non-U.S. residential 1,288 19 — 1,307Commercial 260 — — 260
Total mortgage-backed securities $ 26,606 $ 22 $ 869 $ 25,759State and municipal $ 7,399 $ 124 $ 185 $ 7,338Foreign government 1,151 — 14 1,137Asset-backed securities(1) 18,093 27 11 18,109Total debt securities held-to-maturity $ 53,249 $ 173 $ 1,079 $ 52,343December 31, 2017 Debt securities held-to-maturity Mortgage-backed securities(1)
U.S. government agency guaranteed $ 23,880 $ 40 $ 157 $ 23,763Alt-A 141 57 — 198Non-U.S. residential 1,841 65 — 1,906Commercial 237 — — 237
Total mortgage-backed securities $ 26,099 $ 162 $ 157 $ 26,104State and municipal (2) $ 8,897 $ 378 $ 73 $ 9,202Foreign government 740 — 18 722Asset-backed securities(1) 17,584 162 22 17,724Total debt securities held-to-maturity $ 53,320 $ 702 $ 270 $ 53,752
(1) The Company invests in mortgage-backed and asset-backed securities. These securitizations are generally considered VIEs. The Company’s maximum exposure to loss from these VIEs is equal to the carrying amount of the securities, which is reflected in the table above. For mortgage-backed and asset-backed securitizations in which the Company has other involvement, see Note 18 to the Consolidated Financial Statements.
(2) In the second quarter of 2017, Citi early adopted ASU 2017-08, Receivables—Nonrefundable Fees and Other Costs (Subtopic 310-20): Premium Amortization on Purchased Callable Debt Securities. Upon adoption, a cumulative effect adjustment was recorded to reduce retained earnings, effective January 1, 2017, for the incremental amortization of purchase premiums and cumulative fair value hedge adjustments on callable state and municipal debt securities. For additional information, see Note 1 to the Consolidated Financial Statements.

115
The table below shows the fair value of debt securities HTM that have been in an unrecognized loss position:
Less than 12 months 12 months or longer Total
In millions of dollarsFairvalue
Grossunrecognized
lossesFairvalue
Grossunrecognized
lossesFairvalue
Grossunrecognized
lossesSeptember 30, 2018 Debt securities held-to-maturity Mortgage-backed securities $ 13,815 $ 392 $ 9,815 $ 477 $ 23,630 $ 869State and municipal 2,283 58 799 127 3,082 185Foreign government 1,138 14 — — 1,138 14Asset-backed securities 3,670 11 2 — 3,672 11Total debt securities held-to-maturity $ 20,906 $ 475 $ 10,616 $ 604 $ 31,522 $ 1,079December 31, 2017 Debt securities held-to-maturity Mortgage-backed securities $ 8,569 $ 50 $ 6,353 $ 107 $ 14,922 $ 157State and municipal 353 5 835 68 1,188 73Foreign government 723 18 — — 723 18Asset-backed securities 71 3 134 19 205 22Total debt securities held-to-maturity $ 9,716 $ 76 $ 7,322 $ 194 $ 17,038 $ 270
Note: Excluded from the gross unrecognized losses presented in the table above are $(65) million and $(117) million of net unrealized losses recorded in AOCI as of September 30, 2018 and December 31, 2017, respectively, primarily related to the difference between the amortized cost and carrying value of HTM debt securities that were reclassified from AFS. Substantially all of these net unrecognized losses relate to securities that have been in a loss position for 12 months or longer at September 30, 2018 and December 31, 2017.

116
The following table presents the carrying value and fair value of HTM debt securities by contractual maturity dates:
September 30, 2018 December 31, 2017
In millions of dollarsCarrying
value Fair valueCarrying
value Fair valueMortgage-backed securities Due within 1 year $ — $ — $ — $ —After 1 but within 5 years 129 127 720 720After 5 but within 10 years 101 99 148 149After 10 years(1) 26,376 25,533 25,231 25,235Total $ 26,606 $ 25,759 $ 26,099 $ 26,104State and municipal Due within 1 year $ 31 $ 31 $ 407 $ 425After 1 but within 5 years 131 133 259 270After 5 but within 10 years 492 495 512 524After 10 years(1) 6,745 6,679 7,719 7,983Total $ 7,399 $ 7,338 $ 8,897 $ 9,202Foreign government Due within 1 year $ 114 $ 114 $ 381 $ 381After 1 but within 5 years 1,037 1,023 359 341After 5 but within 10 years — — — —After 10 years(1) — — — —Total $ 1,151 $ 1,137 $ 740 $ 722All other(2) Due within 1 year $ — $ — $ — $ —After 1 but within 5 years — — — —After 5 but within 10 years 2,244 2,250 1,669 1,680After 10 years(1) 15,849 15,859 15,915 16,044Total $ 18,093 $ 18,109 $ 17,584 $ 17,724Total debt securities held-to-maturity $ 53,249 $ 52,343 $ 53,320 $ 53,752
(1) Investments with no stated maturities are included as contractual maturities of greater than 10 years. Actual maturities may differ due to call or prepayment rights.(2) Includes corporate and asset-backed securities.

117
Evaluating Investments for Other-Than-Temporary Impairment
OverviewThe Company conducts periodic reviews of all securities with unrealized losses to evaluate whether the impairment is other-than-temporary. This review applies to all securities that are not measured at fair value through earnings. Effective January 1, 2018, the AFS category was eliminated for equity securities and, therefore, other-than-temporary impairment (OTTI) review is not required for those securities. See Note 1 to the Consolidated Financial Statements for additional details.
An unrealized loss exists when the current fair value of an individual security is less than its amortized cost basis. Unrealized losses that are determined to be temporary in nature are recorded, net of tax, in AOCI for AFS securities. Temporary losses related to HTM debt securities generally are not recorded, as these investments are carried at adjusted amortized cost basis. However, for HTM debt securities with credit-related impairment, the credit loss is recognized in earnings as OTTI, and any difference between the cost basis adjusted for the OTTI and fair value is recognized in AOCI and amortized as an adjustment of yield over the remaining contractual life of the security. For debt securities transferred to HTM from Trading account assets, amortized cost is defined as the fair value of the securities at the date of transfer, plus any accretion income and less any impairment recognized in earnings subsequent to transfer. For debt securities transferred to HTM from AFS, amortized cost is defined as the original purchase cost, adjusted for the cumulative accretion or amortization of any purchase discount or premium, plus or minus any cumulative fair value hedge adjustments, net of accretion or amortization, and less any impairment recognized in earnings.
Regardless of the classification of securities as AFS or HTM, the Company assesses each position with an unrealized loss for OTTI. Factors considered in determining whether a loss is temporary include:
• the length of time and the extent to which fair value has been below cost;
• the severity of the impairment;• the cause of the impairment and the financial condition
and near-term prospects of the issuer;• activity in the market of the issuer that may indicate
adverse credit conditions; and• the Company’s ability and intent to hold the investment
for a period of time sufficient to allow for any anticipated recovery.
The Company’s review for impairment generally entails:
• identification and evaluation of impaired investments;• analysis of individual investments that have fair values
less than amortized cost, including consideration of the length of time the investment has been in an unrealized loss position and the expected recovery period;
• consideration of evidential matter, including an evaluation of factors or triggers that could cause individual investments to qualify as having other-than-temporary
impairment and those that would not support other-than-temporary impairment; and
• documentation of the results of these analyses, as required under business policies.
Debt SecuritiesThe entire difference between amortized cost basis and fair value is recognized in earnings as OTTI for impaired debt securities that the Company has an intent to sell or for which the Company believes it will more-likely-than-not be required to sell prior to recovery of the amortized cost basis. However, for those securities that the Company does not intend to sell and is not likely to be required to sell, only the credit-related impairment is recognized in earnings and any non-credit-related impairment is recorded in AOCI.
For debt securities, credit impairment exists where management does not expect to receive contractual principal and interest cash flows sufficient to recover the entire amortized cost basis of a security.
AFS Equity Securities and Equity Method InvestmentsFor AFS equity securities, prior to January 1, 2018, management considered the various factors described above, including its intent and ability to hold an equity security for a period of time sufficient for recovery to cost or whether it was more-likely-than-not that the Company would have been required to sell the security prior to recovery of its cost basis. Where management lacked that intent or ability, the security’s decline in fair value was deemed to be other-than-temporary and was recorded in earnings. Effective January 1, 2018, the AFS category has been eliminated for equity securities and, therefore, OTTI review is not required for those securities. See Note 1 to the Consolidated Financial Statements for additional details.
Management assesses equity method investments that have fair values that are less than their respective carrying values for OTTI. Fair value is measured as price multiplied by quantity if the investee has publicly listed securities. If the investee is not publicly listed, other methods are used (see Note 20 to the Consolidated Financial Statements).
For impaired equity method investments that Citi plans to sell prior to recovery of value or would likely be required to sell, with no expectation that the fair value will recover prior to the expected sale date, the full impairment is recognized in earnings as OTTI regardless of severity and duration. The measurement of the OTTI does not include partial projected recoveries subsequent to the balance sheet date.
For impaired equity method investments that management does not plan to sell and is not likely to be required to sell prior to recovery of value, the evaluation of whether an impairment is other-than-temporary is based on (i) whether and when an equity method investment will recover in value and (ii) whether the investor has the intent and ability to hold that investment for a period of time sufficient to recover the value. The determination of whether the impairment is considered other-than-temporary considers the following indicators:
• the cause of the impairment and the financial condition and near-term prospects of the issuer, including any
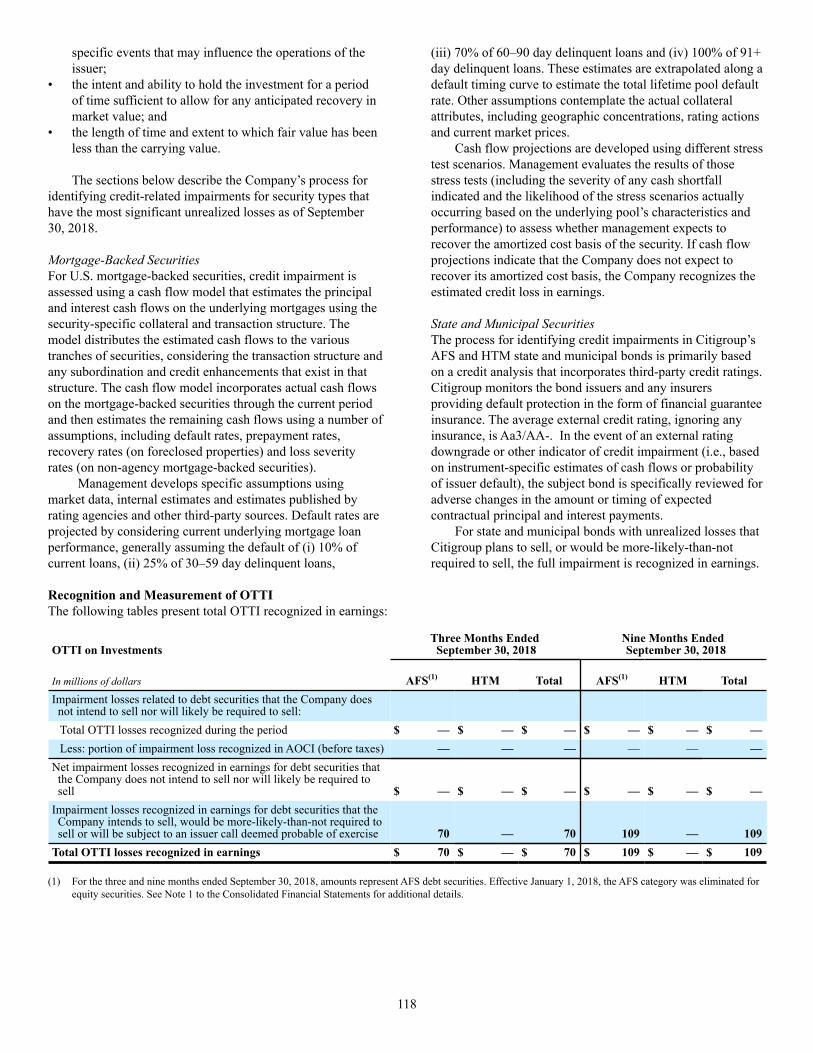
118
specific events that may influence the operations of the issuer;
• the intent and ability to hold the investment for a period of time sufficient to allow for any anticipated recovery in market value; and
• the length of time and extent to which fair value has been less than the carrying value.
The sections below describe the Company’s process for identifying credit-related impairments for security types that have the most significant unrealized losses as of September 30, 2018.
Mortgage-Backed SecuritiesFor U.S. mortgage-backed securities, credit impairment is assessed using a cash flow model that estimates the principal and interest cash flows on the underlying mortgages using the security-specific collateral and transaction structure. The model distributes the estimated cash flows to the various tranches of securities, considering the transaction structure and any subordination and credit enhancements that exist in that structure. The cash flow model incorporates actual cash flows on the mortgage-backed securities through the current period and then estimates the remaining cash flows using a number of assumptions, including default rates, prepayment rates, recovery rates (on foreclosed properties) and loss severity rates (on non-agency mortgage-backed securities).
Management develops specific assumptions using market data, internal estimates and estimates published by rating agencies and other third-party sources. Default rates are projected by considering current underlying mortgage loan performance, generally assuming the default of (i) 10% of current loans, (ii) 25% of 30–59 day delinquent loans,
(iii) 70% of 60–90 day delinquent loans and (iv) 100% of 91+ day delinquent loans. These estimates are extrapolated along a default timing curve to estimate the total lifetime pool default rate. Other assumptions contemplate the actual collateral attributes, including geographic concentrations, rating actions and current market prices.
Cash flow projections are developed using different stress test scenarios. Management evaluates the results of those stress tests (including the severity of any cash shortfall indicated and the likelihood of the stress scenarios actually occurring based on the underlying pool’s characteristics and performance) to assess whether management expects to recover the amortized cost basis of the security. If cash flow projections indicate that the Company does not expect to recover its amortized cost basis, the Company recognizes the estimated credit loss in earnings.
State and Municipal SecuritiesThe process for identifying credit impairments in Citigroup’s AFS and HTM state and municipal bonds is primarily based on a credit analysis that incorporates third-party credit ratings. Citigroup monitors the bond issuers and any insurers providing default protection in the form of financial guarantee insurance. The average external credit rating, ignoring any insurance, is Aa3/AA-. In the event of an external rating downgrade or other indicator of credit impairment (i.e., based on instrument-specific estimates of cash flows or probability of issuer default), the subject bond is specifically reviewed for adverse changes in the amount or timing of expected contractual principal and interest payments.
For state and municipal bonds with unrealized losses that Citigroup plans to sell, or would be more-likely-than-not required to sell, the full impairment is recognized in earnings.
Recognition and Measurement of OTTIThe following tables present total OTTI recognized in earnings:
OTTI on InvestmentsThree Months Ended September 30, 2018
Nine Months Ended September 30, 2018
In millions of dollars AFS(1) HTM Total AFS(1) HTM TotalImpairment losses related to debt securities that the Company doesnot intend to sell nor will likely be required to sell: Total OTTI losses recognized during the period $ — $ — $ — $ — $ — $ —Less: portion of impairment loss recognized in AOCI (before taxes) — — — — — —
Net impairment losses recognized in earnings for debt securities thatthe Company does not intend to sell nor will likely be required tosell $ — $ — $ — $ — $ — $ —
Impairment losses recognized in earnings for debt securities that theCompany intends to sell, would be more-likely-than-not required tosell or will be subject to an issuer call deemed probable of exercise 70 — 70 109 — 109
Total OTTI losses recognized in earnings $ 70 $ — $ 70 $ 109 $ — $ 109
(1) For the three and nine months ended September 30, 2018, amounts represent AFS debt securities. Effective January 1, 2018, the AFS category was eliminated for equity securities. See Note 1 to the Consolidated Financial Statements for additional details.

119
OTTI on InvestmentsThree Months Ended September 30, 2017
Nine Months Ended September 30, 2017
In millions of dollars AFS (1) HTM Total AFS(1) HTM Total
Impairment losses related to securities that the Company does notintend to sell nor will likely be required to sell: Total OTTI losses recognized during the period $ 2 $ — $ 2 $ 2 $ — $ 2Less: portion of impairment loss recognized in AOCI (before taxes) — — — — — —
Net impairment losses recognized in earnings for securities that theCompany does not intend to sell nor will likely be required to sell $ 2 $ — $ 2 $ 2 $ — $ 2
Impairment losses recognized in earnings for securities that theCompany intends to sell, would be more-likely-than-not required tosell or will be subject to an issuer call deemed probable of exerciseand FX losses 12 1 13 43 2 45
Total impairment losses recognized in earnings $ 14 $ 1 $ 15 $ 45 $ 2 $ 47
(1) Includes OTTI on non-marketable equity securities.
The following are three-month rollforwards of the credit-related impairments recognized in earnings for AFS and HTM debt securities held that the Company does not intend to sell nor likely will be required to sell:
Cumulative OTTI credit losses recognized in earnings on debt securities still held
In millions of dollarsJune 30, 2018
balance
Creditimpairmentsrecognized inearnings on
securities notpreviouslyimpaired
Creditimpairmentsrecognized inearnings on
securities thathave
been previouslyimpaired
Changes due tocredit-impairedsecurities sold,transferred or
matured
September30, 2018balance
AFS debt securities Mortgage-backed securities(1) $ 1 $ — $ — $ — $ 1State and municipal — — — — —Foreign government securities — — — — —Corporate 4 — — — 4All other debt securities 2 — — — 2Total OTTI credit losses recognized for AFS debtsecurities $ 7 $ — $ — $ — $ 7HTM debt securities Mortgage-backed securities $ — $ — $ — $ — $ —State and municipal — — — — —Total OTTI credit losses recognized for HTM debtsecurities $ — $ — $ — $ — $ —
(1) Primarily consists of Prime securities.

120
Cumulative OTTI credit losses recognized in earnings on debt securities still held
In millions of dollarsJune 30, 2017
balance
Creditimpairmentsrecognized inearnings on
securities notpreviouslyimpaired
Creditimpairmentsrecognized inearnings on
securities thathave
been previouslyimpaired
Reductions due tocredit-impairedsecurities sold,transferred or
maturedSeptember 30,2017 balance
AFS debt securities Mortgage-backed securities $ — $ — $ — $ — $ —State and municipal 4 — — — 4Foreign government securities — — — — —Corporate 4 — — — 4All other debt securities — — 2 — 2Total OTTI credit losses recognized for AFS debtsecurities $ 8 $ — $ 2 $ — $ 10HTM debt securities Mortgage-backed securities(1) $ 97 $ — $ — $ — $ 97State and municipal 3 — — — 3Total OTTI credit losses recognized for HTM debtsecurities $ 100 $ — $ — $ — $ 100
(1) Primarily consists of Alt-A securities.
The following are nine-month rollforwards of the credit-related impairments recognized in earnings for AFS and HTM debt securities held that the Company does not intend to sell nor likely will be required to sell:
Cumulative OTTI credit losses recognized in earnings on debt securities still held
In millions of dollarsDecember 31,2017 balance
Creditimpairmentsrecognized inearnings on
securities notpreviouslyimpaired
Creditimpairmentsrecognized inearnings on
securities thathave
been previouslyimpaired
Changes due tocredit-impairedsecurities sold,transferred or
matured(1)September 30,2018 balance
AFS debt securities Mortgage-backed securities(2) $ 38 $ — $ — $ (37) $ 1State and municipal 4 — — (4) —Foreign government securities — — — — —Corporate 4 — — — 4All other debt securities 2 — — — 2Total OTTI credit losses recognized for AFS debtsecurities $ 48 $ — $ — $ (41) $ 7HTM debt securities Mortgage-backed securities(3) $ 54 $ — $ — $ (54) $ —State and municipal 3 — — (3) —Total OTTI credit losses recognized for HTM debtsecurities $ 57 $ — $ — $ (57) $ —
(1) Includes $18 million in cumulative OTTI reclassified from HTM to AFS due to the transfer of the related debt securities from HTM to AFS. Citi adopted ASU 2017-12, Targeted Improvements to Accounting for Hedge Activities, on January 1, 2018 and transferred approximately $4 billion of HTM debt securities into AFS classification as permitted as a one-time transfer under the standard.
(2) Primarily consists of Prime securities.(3) Primarily consists of Alt-A securities.

121
Cumulative OTTI credit losses recognized in earnings on debt securities still held
In millions of dollarsDecember 31,2016 balance
Creditimpairmentsrecognized inearnings on
securities notpreviouslyimpaired
Creditimpairmentsrecognized inearnings on
securities thathave
been previouslyimpaired
Reductions due tocredit-impairedsecurities sold,transferred or
maturedSeptember 30,2017 balance
AFS debt securities Mortgage-backed securities $ — $ — $ — $ — $ —State and municipal 4 — — — 4Foreign government securities — — — — —Corporate 5 — — (1) 4All other debt securities 22 — 2 (22) 2Total OTTI credit losses recognized for AFS debtsecurities $ 31 $ — $ 2 $ (23) $ 10HTM debt securities Mortgage-backed securities(1) $ 101 $ — $ — $ (4) $ 97State and municipal 3 — — — 3Total OTTI credit losses recognized for HTM debtsecurities $ 104 $ — $ — $ (4) $ 100
(1) Primarily consists of Alt-A securities.
Non-Marketable Equity Securities Not Carried at Fair ValueEffective January 1, 2018, non-marketable equity securities are required to be measured at fair value with changes in fair value recognized in earnings unless (i) the measurement alternative is elected or (ii) the investment represents Federal Reserve Bank and Federal Home Loan Bank stock or certain exchange seats that continue to be carried at cost. See Note 1 to the Consolidated Financial Statements for additional details.
The election to measure a non-marketable equity security using the measurement alternative is made on an instrument-by-instrument basis. Under the measurement alternative, an equity security is carried at cost plus or minus changes resulting from observable prices in orderly transactions for the identical or a similar investment of the same issuer. The carrying value of the equity security is adjusted to fair value on the date of an observed transaction. Fair value may differ from the observed transaction price due to a number of factors, including marketability adjustments and differences in rights and obligations when the observed transaction is not for the identical investment held by Citi.
Equity securities under the measurement alternative are also assessed for impairment. On a quarterly basis, management qualitatively assesses whether each equity security under the measurement alternative is impaired. Impairment indicators that are considered include, but are not limited to, the following:
• a significant deterioration in the earnings performance, credit rating, asset quality or business prospects of the investee;
• a significant adverse change in the regulatory, economic or technological environment of the investee;
• a significant adverse change in the general market condition of either the geographical area or the industry in which the investee operates;
• a bona fide offer to purchase, an offer by the investee to sell or a completed auction process for the same or similar investment for an amount less than the carrying amount of that investment; and
• factors that raise significant concerns about the investee’s ability to continue as a going concern, such as negative cash flows from operations, working capital deficiencies or noncompliance with statutory capital requirements or debt covenants.
When the qualitative assessment indicates that impairment exists, the investment is written down to fair value, with the full difference between the fair value of the investment and its carrying amount recognized in earnings.

122
Below is the carrying value of non-marketable equity securities measured using the measurement alternative at September 30, 2018, and amounts recognized in earnings for the three and nine months ended September 30, 2018:
In millions of dollars
Three Months Ended
September 30, 2018
Nine MonthsEnded
September30, 2018
Measurement alternative:Balance as of September 30, 2018
$ 452 $ 452
Impairment losses(1) — 4
Downward changes for observable prices(1) 14 18
Upward changes for observable prices(1) 21 133
(1) See Note 20 to the Consolidated Financial Statements for additional information on these nonrecurring fair value measurements.
A similar impairment analysis is performed for non-marketable equity securities carried at cost. For the three and nine months ended September 30, 2018, there was no
impairment loss recognized in earnings for non-marketable equity securities carried at cost.
Investments in Alternative Investment Funds That Calculate Net Asset ValueThe Company holds investments in certain alternative investment funds that calculate net asset value (NAV), or its equivalent, including hedge funds, private equity funds, fundsof funds and real estate funds, as provided by third-party asset managers. Investments in such funds are generally classified as non-marketable equity securities carried at fair value. The fair values of these investments are estimated using the NAV of the Company’s ownership interest in the funds. Some ofthese investments are in “covered funds” for purposes of the Volcker Rule, which prohibits certain proprietary investment activities and limits the ownership of, and relationships with, covered funds. On April 21, 2017, Citi’s request for extension of the permitted holding period under the Volcker Rule for certain of its investments in illiquid funds was approved, allowing the Company to hold such investments until the earlier of 5 years from the July 21, 2017 expiration date of the general conformance period, or the date such investments mature or are otherwise conformed with the Volcker Rule.
Fair valueUnfunded
commitments
Redemption frequency(if currently eligible)
monthly, quarterly, annually
Redemption noticeperiod
In millions of dollarsSeptember 30,
2018December 31,
2017September 30,
2018December 31,
2017Hedge funds $ — $ 1 $ — $ — Generally quarterly 10–95 daysPrivate equity funds(1)(2) 186 372 62 62 — —Real estate funds (2)(3) 14 31 19 20 — —Mutual/collectiveinvestment funds 25 — — — — —Total $ 225 $ 404 $ 81 $ 82 — —
(1) Private equity funds include funds that invest in infrastructure, emerging markets and venture capital.(2) With respect to the Company’s investments in private equity funds and real estate funds, distributions from each fund will be received as the underlying assets
held by these funds are liquidated. It is estimated that the underlying assets of these funds will be liquidated over a period of several years as market conditions allow. Private equity and real estate funds do not allow redemption of investments by their investors. Investors are permitted to sell or transfer their investments, subject to the approval of the general partner or investment manager of these funds, which generally may not be unreasonably withheld.
(3) Includes several real estate funds that invest primarily in commercial real estate in the U.S., Europe and Asia.

123
13. LOANS
Citigroup loans are reported in two categories: consumer and corporate. These categories are classified primarily according to the segment and subsegment that manage the loans. For additional information regarding Citi’s consumer and corporate loans, including related accounting policies, see Note 14 to the Consolidated Financial Statements in Citi’s 2017 Annual Report on Form 10-K.
Consumer LoansConsumer loans represent loans and leases managed primarily by GCB and Corporate/Other. The following table provides Citi’s consumer loans by loan type:
In millions of dollarsSeptember 30,
2018December 31,
2017In U.S. offices
Mortgage and real estate(1) $ 61,048 $ 65,467Installment, revolving creditand other 3,515 3,398Cards 137,051 139,006Commercial and industrial 7,686 7,840
$ 209,300 $ 215,711In offices outside the U.S.
Mortgage and real estate(1) $ 43,714 $ 44,081Installment, revolving creditand other 27,899 26,556Cards 24,971 26,257Commercial and industrial 18,821 20,238Lease financing 52 76
$ 115,457 $ 117,208Total consumer loans $ 324,757 $ 332,919Net unearned income $ 712 $ 737Consumer loans, net ofunearned income $ 325,469 $ 333,656
(1) Loans secured primarily by real estate.
The Company sold and/or reclassified to held-for-sale $0.3 billion and $3.0 billion, $0.4 billion and $3.2 billion of consumer loans during the three and nine months ended September 30, 2018 and 2017, respectively.

124
Consumer Loan Delinquency and Non-Accrual Details at September 30, 2018
In millions of dollarsTotal
current(1)(2)30–89 dayspast due(3)
90 dayspast due(3)
Past duegovernmentguaranteed(4)
Totalloans(2)
Totalnon-
accrual90 days past due
and accruingIn North America offices
Residential first mortgages(5) $ 46,038 $ 503 $ 263 $ 903 $ 47,707 $ 628 $ 641Home equity loans(6)(7) 11,693 174 264 — 12,131 561 —Credit cards 134,721 1,612 1,539 — 137,872 — 1,539Installment and other 3,473 40 14 — 3,527 20 —Commercial banking loans 9,206 25 48 — 9,279 114 —
Total $ 205,131 $ 2,354 $ 2,128 $ 903 $ 210,516 $ 1,323 $ 2,180In offices outside North America
Residential first mortgages(5) $ 35,919 $ 217 $ 146 $ — $ 36,282 $ 397 $ —Credit cards 23,638 420 356 — 24,414 314 223Installment and other 25,192 267 108 — 25,567 163 —Commercial banking loans 28,569 54 66 — 28,689 177 —
Total $ 113,318 $ 958 $ 676 $ — $ 114,952 $ 1,051 $ 223Total GCB and Corporate/Other— Consumer $ 318,449 $ 3,312 $ 2,804 $ 903 $ 325,468 $ 2,374 $ 2,403Other(8) 1 — — — 1 — —Total Citigroup $ 318,450 $ 3,312 $ 2,804 $ 903 $ 325,469 $ 2,374 $ 2,403
(1) Loans less than 30 days past due are presented as current.(2) Includes $21 million of residential first mortgages recorded at fair value.(3) Excludes loans guaranteed by U.S. government-sponsored entities.(4) Consists of residential first mortgages that are guaranteed by U.S. government-sponsored entities that are 30–89 days past due of $0.2 billion and 90 days or more
past due of $0.7 billion.(5) Includes approximately $0.1 billion of residential first mortgage loans in process of foreclosure.(6) Includes approximately $0.1 billion of home equity loans in process of foreclosure.(7) Fixed-rate home equity loans and loans extended under home equity lines of credit, which are typically in junior lien positions.(8) Represents loans classified as consumer loans on the Consolidated Balance Sheet that are not included in GCB or Corporate/Other consumer credit metrics.
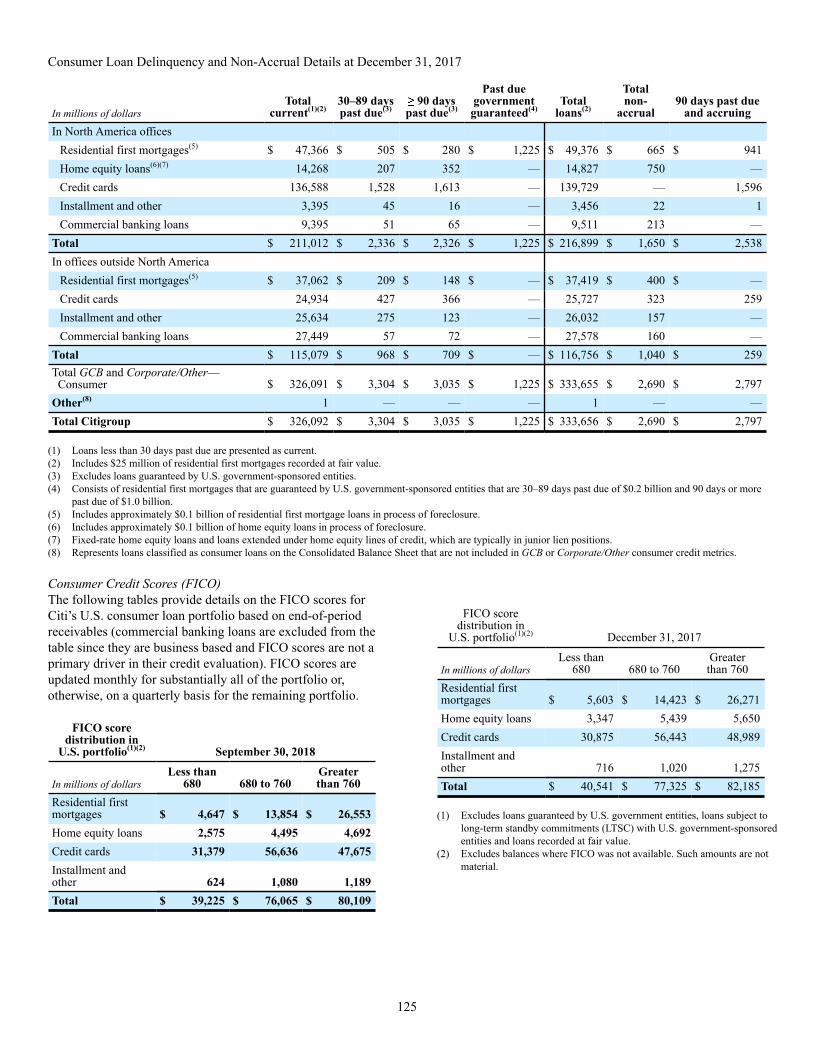
125
Consumer Loan Delinquency and Non-Accrual Details at December 31, 2017
In millions of dollarsTotal
current(1)(2)30–89 dayspast due(3)
90 dayspast due(3)
Past duegovernmentguaranteed(4)
Totalloans(2)
Totalnon-
accrual90 days past due
and accruingIn North America offices
Residential first mortgages(5) $ 47,366 $ 505 $ 280 $ 1,225 $ 49,376 $ 665 $ 941Home equity loans(6)(7) 14,268 207 352 — 14,827 750 —Credit cards 136,588 1,528 1,613 — 139,729 — 1,596Installment and other 3,395 45 16 — 3,456 22 1Commercial banking loans 9,395 51 65 — 9,511 213 —
Total $ 211,012 $ 2,336 $ 2,326 $ 1,225 $ 216,899 $ 1,650 $ 2,538In offices outside North America
Residential first mortgages(5) $ 37,062 $ 209 $ 148 $ — $ 37,419 $ 400 $ —Credit cards 24,934 427 366 — 25,727 323 259Installment and other 25,634 275 123 — 26,032 157 —Commercial banking loans 27,449 57 72 — 27,578 160 —
Total $ 115,079 $ 968 $ 709 $ — $ 116,756 $ 1,040 $ 259Total GCB and Corporate/Other— Consumer $ 326,091 $ 3,304 $ 3,035 $ 1,225 $ 333,655 $ 2,690 $ 2,797Other(8) 1 — — — 1 — —Total Citigroup $ 326,092 $ 3,304 $ 3,035 $ 1,225 $ 333,656 $ 2,690 $ 2,797
(1) Loans less than 30 days past due are presented as current.(2) Includes $25 million of residential first mortgages recorded at fair value.(3) Excludes loans guaranteed by U.S. government-sponsored entities.(4) Consists of residential first mortgages that are guaranteed by U.S. government-sponsored entities that are 30–89 days past due of $0.2 billion and 90 days or more
past due of $1.0 billion.(5) Includes approximately $0.1 billion of residential first mortgage loans in process of foreclosure.(6) Includes approximately $0.1 billion of home equity loans in process of foreclosure.(7) Fixed-rate home equity loans and loans extended under home equity lines of credit, which are typically in junior lien positions.(8) Represents loans classified as consumer loans on the Consolidated Balance Sheet that are not included in GCB or Corporate/Other consumer credit metrics.
Consumer Credit Scores (FICO)The following tables provide details on the FICO scores for Citi’s U.S. consumer loan portfolio based on end-of-period receivables (commercial banking loans are excluded from the table since they are business based and FICO scores are not a primary driver in their credit evaluation). FICO scores are updated monthly for substantially all of the portfolio or, otherwise, on a quarterly basis for the remaining portfolio.
FICO score distribution in
U.S. portfolio(1)(2) September 30, 2018
In millions of dollarsLess than
680 680 to 760Greaterthan 760
Residential firstmortgages $ 4,647 $ 13,854 $ 26,553Home equity loans 2,575 4,495 4,692Credit cards 31,379 56,636 47,675Installment andother 624 1,080 1,189Total $ 39,225 $ 76,065 $ 80,109
FICO score distribution in
U.S. portfolio(1)(2) December 31, 2017
In millions of dollarsLess than
680 680 to 760Greaterthan 760
Residential firstmortgages $ 5,603 $ 14,423 $ 26,271Home equity loans 3,347 5,439 5,650Credit cards 30,875 56,443 48,989Installment andother 716 1,020 1,275Total $ 40,541 $ 77,325 $ 82,185
(1) Excludes loans guaranteed by U.S. government entities, loans subject to long-term standby commitments (LTSC) with U.S. government-sponsored entities and loans recorded at fair value.
(2) Excludes balances where FICO was not available. Such amounts are not material.
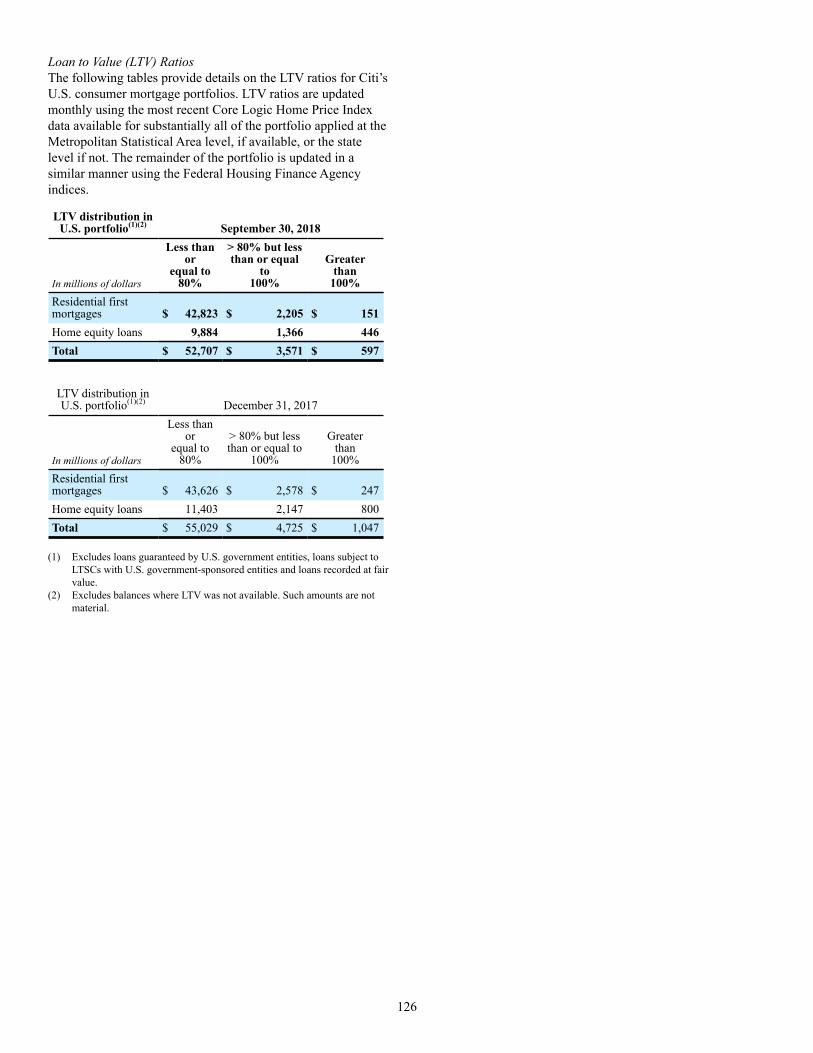
126
Loan to Value (LTV) RatiosThe following tables provide details on the LTV ratios for Citi’s U.S. consumer mortgage portfolios. LTV ratios are updated monthly using the most recent Core Logic Home Price Index data available for substantially all of the portfolio applied at the Metropolitan Statistical Area level, if available, or the state level if not. The remainder of the portfolio is updated in a similar manner using the Federal Housing Finance Agency indices.
LTV distribution in U.S. portfolio(1)(2) September 30, 2018
In millions of dollars
Less than or
equal to 80%
> 80% but lessthan or equal
to100%
Greaterthan
100%Residential firstmortgages $ 42,823 $ 2,205 $ 151Home equity loans 9,884 1,366 446Total $ 52,707 $ 3,571 $ 597
LTV distribution in U.S. portfolio(1)(2) December 31, 2017
In millions of dollars
Less than or
equal to 80%
> 80% but lessthan or equal to
100%
Greaterthan
100%Residential firstmortgages $ 43,626 $ 2,578 $ 247Home equity loans 11,403 2,147 800Total $ 55,029 $ 4,725 $ 1,047
(1) Excludes loans guaranteed by U.S. government entities, loans subject to LTSCs with U.S. government-sponsored entities and loans recorded at fair value.
(2) Excludes balances where LTV was not available. Such amounts are not material.

127
Impaired Consumer LoansThe following tables present information about impaired consumer loans and interest income recognized on impaired consumer loans:
Three Months Ended September 30,
Nine Months EndedSeptember 30,
Balance at September 30, 2018 2018 2017 2018 2017
In millions of dollarsRecorded
investment(1)(2)
Unpaidprincipal balance
Relatedspecific
allowance(3)
Averagecarrying value(4)
Interest income
recognized(5)
Interest income
recognized(5)
Interest income
recognized(5)
Interest income
recognized(5)
Mortgage and real estate Residential first mortgages $ 2,294 $ 2,508 $ 197 $ 2,670 $ 21 $ 29 $ 63 $ 97Home equity loans 704 980 125 815 2 7 10 21
Credit cards 1,801 1,828 654 1,807 24 37 79 110Installment and other
Individual installment andother 406 436 153 421 5 5 17 18Commercial banking 296 441 46 306 2 4 10 18
Total $ 5,501 $ 6,193 $ 1,175 $ 6,019 $ 54 $ 82 $ 179 $ 264
(1) Recorded investment in a loan includes net deferred loan fees and costs, unamortized premium or discount and direct write-downs and includes accrued interest only on credit card loans.
(2) $529 million of residential first mortgages, $270 million of home equity loans and $25 million of commercial market loans do not have a specific allowance.(3) Included in the Allowance for loan losses.(4) Average carrying value represents the average recorded investment ending balance for the last four quarters and does not include the related specific allowance.(5) Includes amounts recognized on both an accrual and cash basis.
Balance, December 31, 2017
In millions of dollarsRecorded
investment(1)(2)Unpaid
principal balance
Relatedspecific
allowance(3)Average
carrying value(4)
Mortgage and real estate Residential first mortgages $ 2,877 $ 3,121 $ 278 $ 3,155Home equity loans 1,151 1,590 216 1,181
Credit cards 1,787 1,819 614 1,803Installment and other
Individual installment and other 431 460 175 415Commercial banking 334 541 51 429
Total $ 6,580 $ 7,531 $ 1,334 $ 6,983
(1) Recorded investment in a loan includes net deferred loan fees and costs, unamortized premium or discount and direct write-downs and includes accrued interest only on credit card loans.
(2) $607 million of residential first mortgages, $370 million of home equity loans and $10 million of commercial market loans do not have a specific allowance.(3) Included in the Allowance for loan losses.(4) Average carrying value represents the average recorded investment ending balance for the last four quarters and does not include the related specific allowance.

128
Consumer Troubled Debt Restructurings
For the Three Months Ended September 30, 2018
In millions of dollars, except number ofloans modified
Number ofloans modified
Post-modification
recordedinvestment(1)(2)
Deferredprincipal(3)
Contingentprincipal
forgiveness(4)Principal
forgiveness(5)
Averageinterest rate
reduction
North America
Residential first mortgages 461 $ 66 $ — $ — $ — —%
Home equity loans 261 26 1 — — 1
Credit cards 61,508 253 — — — 18
Installment and other revolving 322 2 — — — 5
Commercial banking(6) 11 3 — — — —
Total(8) 62,563 $ 350 $ 1 $ — $ —
International
Residential first mortgages 660 $ 22 $ — $ — $ — —%
Credit cards 18,413 77 — — 2 17
Installment and other revolving 6,421 34 — — 2 10
Commercial banking(6) 131 9 — — — —
Total(8) 25,625 $ 142 $ — $ — $ 4
For the Three Months Ended September 30, 2017
In millions of dollars, except number ofloans modified
Number ofloans modified
Post-modification
recordedinvestment(1)(7)
Deferredprincipal(3)
Contingentprincipal
forgiveness(4)Principal
forgiveness(5)
Averageinterest ratereduction
North America
Residential first mortgages 1,400 $ 199 $ 1 $ — $ — —%
Home equity loans 830 70 5 — — 1
Credit cards 59,285 225 — — — 17
Installment and other revolving 299 2 — — — 6
Commercial banking(6) 33 59 — — — —
Total(8) 61,847 $ 555 $ 6 $ — $ —
International
Residential first mortgages 703 $ 25 $ — $ — $ — —%
Credit cards 28,254 103 — — 2 11
Installment and other revolving 11,725 70 — — 3 11
Commercial banking(6) 97 11 — — — —
Total(8) 40,779 $ 209 $ — $ — $ 5
(1) Post-modification balances include past due amounts that are capitalized at the modification date.(2) Post-modification balances in North America include $10 million of residential first mortgages and $2 million of home equity loans to borrowers who have gone
through Chapter 7 bankruptcy in the three months ended September 30, 2018. These amounts include $7 million of residential first mortgages and $2 million of home equity loans that were newly classified as TDRs in the three months ended September 30, 2018, based on previously received OCC guidance.
(3) Represents portion of contractual loan principal that is non-interest bearing, but still due from the borrower. Such deferred principal is charged off at the time of permanent modification to the extent that the related loan balance exceeds the underlying collateral value.
(4) Represents portion of contractual loan principal that is non-interest bearing and, depending upon borrower performance, eligible for forgiveness.(5) Represents portion of contractual loan principal that was forgiven at the time of permanent modification.(6) Commercial banking loans are generally borrower-specific modifications and incorporate changes in the amount and/or timing of principal and/or interest.(7) Post-modification balances in North America include $12 million of residential first mortgages and $5 million of home equity loans to borrowers who have gone
through Chapter 7 bankruptcy in the three months ended September 30, 2017. These amounts include $7 million of residential first mortgages and $5 million of home equity loans that were newly classified as TDRs in the three months ended September 30, 2017, based on previously received OCC guidance.
(8) The above tables reflect activity for loans outstanding that were considered TDRs as of the end of the reporting period.

129
For the Nine Months Ended September 30, 2018
In millions of dollars, except number ofloans modified
Number ofloans modified
Post-modification
recordedinvestment(1)(2)
Deferredprincipal(3)
Contingentprincipal
forgiveness(4)Principal
forgiveness(5)
Averageinterest rate
reductionNorth America
Residential first mortgages 1,544 $ 233 $ 2 $ — $ — —%Home equity loans 1,097 104 4 — — 1Credit cards 180,170 717 — — — 17Installment and other revolving 956 7 — — — 5Commercial banking(6) 37 5 — — — —
Total(8) 183,804 $ 1,066 $ 6 $ — $ —International
Residential first mortgages 1,833 $ 62 $ — $ — $ — —%Credit cards 59,589 249 — — 7 16Installment and other revolving 22,918 136 — — 6 10Commercial banking(6) 433 60 — — — 1
Total(8) 84,773 $ 507 $ — $ — $ 13
For the Nine Months Ended September 30, 2017
In millions of dollars, except number ofloans modified
Number ofloans modified
Post-modification
recordedinvestment(1)(7)
Deferredprincipal(3)
Contingentprincipal
forgiveness(4)Principal
forgiveness(5)
Averageinterest ratereduction
North America Residential first mortgages 3,172 $ 445 $ 5 $ — $ 2 1%Home equity loans 2,186 185 13 — — 1Credit cards 171,702 659 — — — 17Installment and other revolving 770 6 — — — 5Commercial banking(6) 89 107 — — — —
Total(8) 177,919 $ 1,402 $ 18 $ — $ 2International
Residential first mortgages 2,071 $ 80 $ — $ — $ — —%Credit cards 82,042 286 — — 6 12Installment and other revolving 34,654 194 — — 9 9Commercial banking(6) 182 30 — — — —
Total(8) 118,949 $ 590 $ — $ — $ 15
(1) Post-modification balances include past due amounts that are capitalized at the modification date.(2) Post-modification balances in North America include $29 million of residential first mortgages and $10 million of home equity loans to borrowers who have gone
through Chapter 7 bankruptcy in the nine months ended September 30, 2018. These amounts include $20 million of residential first mortgages and $9 million of home equity loans that were newly classified as TDRs in the nine months ended September 30, 2018, based on previously received OCC guidance.
(3) Represents portion of contractual loan principal that is non-interest bearing but still due from the borrower. Such deferred principal is charged off at the time of permanent modification to the extent that the related loan balance exceeds the underlying collateral value.
(4) Represents portion of contractual loan principal that is non-interest bearing and, depending upon borrower performance, eligible for forgiveness.(5) Represents portion of contractual loan principal that was forgiven at the time of permanent modification.(6) Commercial banking loans are generally borrower-specific modifications and incorporate changes in the amount and/or timing of principal and/or interest.(7) Post-modification balances in North America include $42 million of residential first mortgages and $16 million of home equity loans to borrowers who have gone
through Chapter 7 bankruptcy in the nine months ended September 30, 2017. These amounts include $28 million of residential first mortgages and $14 million of home equity loans that were newly classified as TDRs in the nine months ended September 30, 2017, based on previously received OCC guidance.
(8) The above tables reflect activity for loans outstanding that were considered TDRs as of the end of the reporting period.

130
The following table presents consumer TDRs that defaulted for which the payment default occurred within one year of a permanent modification. Default is defined as 60 days past due, except for classifiably managed commercial banking loans, where default is defined as 90 days past due.
Three Months Ended September 30, Nine Months Ended September 30,In millions of dollars 2018 2017 2018 2017North America
Residential first mortgages $ 31 $ 57 $ 105 $ 156Home equity loans 5 8 21 25Credit cards 57 54 173 163Installment and other revolving 1 1 2 2Commercial banking 1 — 22 2
Total $ 95 $ 120 $ 323 $ 348International
Residential first mortgages $ 2 $ 3 $ 6 $ 8Credit cards 48 48 156 136Installment and other revolving 18 25 62 71Commercial banking 7 — 17 —
Total $ 75 $ 76 $ 241 $ 215
Corporate LoansCorporate loans represent loans and leases managed by ICG. The following table presents information by corporate loan type:
In millions of dollarsSeptember 30,
2018December 31,
2017In U.S. offices
Commercial and industrial $ 51,365 $ 51,319Financial institutions 46,255 39,128Mortgage and real estate(1) 47,629 44,683Installment, revolving creditand other 32,201 33,181Lease financing 1,445 1,470
$ 178,895 $ 169,781In offices outside the U.S.
Commercial and industrial $ 98,281 $ 93,750Financial institutions 37,851 35,273Mortgage and real estate(1) 7,344 7,309Installment, revolving creditand other 22,827 22,638Lease financing 131 190Governments and officialinstitutions 4,898 5,200
$ 171,332 $ 164,360Total corporate loans $ 350,227 $ 334,141Net unearned income $ (787) $ (763)Corporate loans, net ofunearned income $ 349,440 $ 333,378
(1) Loans secured primarily by real estate.
The Company sold and/or reclassified to held-for-sale $0.3 billion and $0.8 billion of corporate loans during the three and nine months ended September 30, 2018, respectively, and $0.1 billion and $0.6 billion during three and nine months ended September 30, 2017, respectively. The Company did not have significant purchases of corporate loans classified as held-for-investment for the three and nine months ended September 30, 2018 or 2017.

131
Corporate Loan Delinquency and Non-Accrual Details at September 30, 2018
In millions of dollars
30–89 dayspast due
and accruing(1)
90 dayspast due andaccruing(1)
Total past dueand accruing
Totalnon-accrual(2)
Totalcurrent(3)
Totalloans(4)
Commercial and industrial $ 430 $ 30 $ 460 $ 1,123 $ 145,612 $ 147,195Financial institutions 146 9 155 74 82,299 82,528Mortgage and real estate 209 5 214 258 54,492 54,964Leases 16 3 19 — 1,557 1,576Other 79 41 120 85 58,754 58,959
Loans at fair value 4,218Total $ 880 $ 88 $ 968 $ 1,540 $ 342,714 $ 349,440
Corporate Loan Delinquency and Non-Accrual Details at December 31, 2017
In millions of dollars
30–89 dayspast due
and accruing(1)
90 dayspast due andaccruing(1)
Total past dueand accruing
Totalnon-accrual(2)
Totalcurrent(3)
Totalloans(4)
Commercial and industrial $ 249 $ 13 $ 262 $ 1,506 $ 139,554 $ 141,322Financial institutions 93 15 108 92 73,557 73,757Mortgage and real estate 147 59 206 195 51,563 51,964Leases 68 8 76 46 1,533 1,655Other 70 13 83 103 60,145 60,331
Loans at fair value 4,349Total $ 627 $ 108 $ 735 $ 1,942 $ 326,352 $ 333,378
(1) Corporate loans that are 90 days past due are generally classified as non-accrual. Corporate loans are considered past due when principal or interest is contractually due but unpaid.
(2) Non-accrual loans generally include those loans that are 90 days past due or those loans for which Citi believes, based on actual experience and a forward-looking assessment of the collectability of the loan in full, that the payment of interest or principal is doubtful.
(3) Loans less than 30 days past due are presented as current.(4) Total loans include loans at fair value, which are not included in the various delinquency columns.

132
Corporate Loans Credit Quality Indicators
Recorded investment in loans(1)
In millions of dollarsSeptember 30,
2018December 31,
2017Investment grade(2) Commercial and industrial $ 102,875 $ 101,313Financial institutions 70,435 60,404Mortgage and real estate 24,351 23,213Leases 1,054 1,090Other 53,609 56,306Total investment grade $ 252,324 $ 242,326Non-investment grade(2) Accrual Commercial and industrial $ 43,196 $ 38,503Financial institutions 12,019 13,261Mortgage and real estate 3,240 2,881Leases 523 518Other 5,264 3,924Non-accrual Commercial and industrial 1,123 1,506Financial institutions 74 92Mortgage and real estate 258 195Leases — 46Other 85 103Total non-investment grade $ 65,782 $ 61,029Non-rated private bank loans managed on a delinquency basis(2) $ 27,116 $ 25,674Loans at fair value 4,218 4,349Corporate loans, net ofunearned income $ 349,440 $ 333,378
(1) Recorded investment in a loan includes net deferred loan fees and costs, unamortized premium or discount, less any direct write-downs.
(2) Held-for-investment loans are accounted for on an amortized cost basis.

133
Non-Accrual Corporate LoansThe following tables present non-accrual loan information by corporate loan type and interest income recognized on non-accrual corporate loans:
September 30, 2018
Three MonthsEnded
September 30,2018
Nine MonthsEnded
September 30,2018
In millions of dollarsRecorded
investment(1)
Unpaidprincipal balance
Related specific
allowance
Averagecarrying value(2)
Interest income
recognized(3)
Interest income
recognized(3)
Non-accrual corporate loans Commercial and industrial $ 1,123 $ 1,379 $ 207 $ 1,246 $ 8 $ 24Financial institutions 74 90 39 97 — —Mortgage and real estate 258 423 45 228 — 1Lease financing — 39 — 33 — —Other 85 205 13 90 — —Total non-accrual corporateloans $ 1,540 $ 2,136 $ 304 $ 1,694 $ 8 $ 25
December 31, 2017
In millions of dollarsRecorded
investment(1)
Unpaidprincipal balance
Related specific
allowance
Averagecarrying value(2)
Non-accrual corporate loans Commercial and industrial $ 1,506 $ 1,775 $ 368 $ 1,547Financial institutions 92 102 41 212Mortgage and real estate 195 324 11 183Lease financing 46 46 4 59Other 103 212 2 108Total non-accrual corporate loans $ 1,942 $ 2,459 $ 426 $ 2,109
September 30, 2018 December 31, 2017
In millions of dollarsRecorded
investment(1)Related specific
allowanceRecorded
investment(1)Related specific
allowanceNon-accrual corporate loans with valuation allowances
Commercial and industrial $ 643 $ 207 $ 1,017 $ 368Financial institutions 72 39 88 41Mortgage and real estate 122 45 51 11Lease financing — — 46 4Other 17 13 13 2
Total non-accrual corporate loans with specificallowance $ 854 $ 304 $ 1,215 $ 426
Non-accrual corporate loans without specific allowance Commercial and industrial $ 480 $ 489 Financial institutions 2 4 Mortgage and real estate 136 144 Lease financing — — Other 68 90 Total non-accrual corporate loans without specificallowance $ 686 N/A $ 727 N/A
(1) Recorded investment in a loan includes net deferred loan fees and costs, unamortized premium or discount, less any direct write-downs.(2) Average carrying value represents the average recorded investment balance and does not include related specific allowance.(3) Interest income recognized for the three and nine months ended September 30, 2017 was $11 million and $30 million, respectively.N/A Not applicable

134
Corporate Troubled Debt Restructurings
For the three months ended September 30, 2018:
In millions of dollars
Carrying value ofTDRs modified
during the period
TDRsinvolving changes
in the amountand/or timing of
principal payments(1)
TDRsinvolving changes
in the amountand/or timing of
interest payments(2)
TDRsinvolving changes
in the amountand/or timing of
both principal andinterest payments
Commercial and industrial $ 62 $ 1 $ 4 $ 57Mortgage and real estate 3 — — 3Total $ 65 $ 1 $ 4 $ 60
For the three months ended September 30, 2017:
In millions of dollars
Carrying valueof TDRs modifiedduring the period
TDRsinvolving changes
in the amountand/or timing of
principal payments(1)
TDRsinvolving changes
in the amountand/or timing of
interest payments(2)
TDRsinvolving changes
in the amountand/or timing of
both principal andinterest payments
Commercial and industrial $ 175 $ 99 $ — $ 76Mortgage and real estate 14 — — 14Total $ 189 $ 99 $ — $ 90
For the nine months ended September 30, 2018:
In millions of dollars
Carrying valueof TDRs modifiedduring the period
TDRsinvolving changes
in the amountand/or timing of
principal payments(1)
TDRsinvolving changes
in the amountand/or timing of
interest payments(2)
TDRsinvolving changes
in the amountand/or timing of
both principal andinterest payments
Commercial and industrial $ 103 $ 5 $ 8 $ 90Mortgage and real estate 6 — — 6Total $ 109 $ 5 $ 8 $ 96
For the nine months ended September 30, 2017:
In millions of dollars
Carrying valueof TDRs modifiedduring the period
TDRsinvolving changes
in the amountand/or timing of
principal payments(1)
TDRsinvolving changes
in the amountand/or timing of
interest payments(2)
TDRsinvolving changes
in the amountand/or timing of
both principal andinterest payments
Commercial and industrial $ 463 $ 131 $ — $ 332Mortgage and real estate 15 — — 15Other 18 — — 18Total $ 496 $ 131 $ — $ 365
(1) TDRs involving changes in the amount or timing of principal payments may involve principal forgiveness or deferral of periodic and/or final principal payments. Because forgiveness of principal is rare for corporate loans, modifications typically have little to no impact on the loans’ projected cash flows and thus little to no impact on the allowance established for the loans. Charge-offs for amounts deemed uncollectable may be recorded at the time of the restructuring or may have already been recorded in prior periods such that no charge-off is required at the time of the modification.
(2) TDRs involving changes in the amount or timing of interest payments may involve a below-market interest rate.

135
The following table presents total corporate loans modified in a TDR as well as those TDRs that defaulted and for which the payment default occurred within one year of a permanent modification. Default is defined as 60 days past due, except for classifiably managed commercial banking loans, where default is defined as 90 days past due.
In millions of dollars
TDR balances atSeptember 30,
2018
TDR loans in payment default during the three months ended September 30,
2018
TDR loans inpayment
default ninemonths endedSeptember 30,
2018
TDR balances atSeptember 30,
2017
TDR loans inpayment defaultduring the threemonths endedSeptember 30,
2017
TDR loans inpayment defaultduring the ninemonths endedSeptember 30,
2017Commercial and industrial $ 480 $ — $ 70 $ 686 $ — $ 12Financial institutions 21 — — 24 — 3Mortgage and real estate 71 — — 84 — —Other 42 — — 155 — —Total(1) $ 614 $ — $ 70 $ 949 $ — $ 15
(1) The above table reflects activity for loans outstanding that were considered TDRs as of the end of the reporting period.

136
14. ALLOWANCE FOR CREDIT LOSSES
Three Months EndedSeptember 30,
Nine Months Ended September 30,
In millions of dollars 2018 2017 2018 2017Allowance for loan losses at beginning of period $ 12,126 $ 12,025 $ 12,355 $ 12,060
Gross credit losses (2,094) (2,120) (6,499) (6,394)Gross recoveries(1) 338 343 1,172 1,198
Net credit losses (NCLs) $ (1,756) $ (1,777) $ (5,327) $ (5,196)NCLs $ 1,756 $ 1,777 $ 5,327 $ 5,196Net reserve builds (releases) 169 419 302 466Net specific reserve builds (releases) (19) (50) (125) (175)
Total provision for loan losses $ 1,906 $ 2,146 $ 5,504 $ 5,487Other, net (see table below) 60 (28) (196) 15Allowance for loan losses at end of period $ 12,336 $ 12,366 $ 12,336 $ 12,366Allowance for credit losses on unfunded lending commitments at beginning of period $ 1,278 $ 1,406 $ 1,258 $ 1,418Provision (release) for unfunded lending commitments 42 (175) 66 (190)Other, net 1 1 (3) 4Allowance for credit losses on unfunded lending commitments at end of period(2) $ 1,321 $ 1,232 $ 1,321 $ 1,232Total allowance for loans, leases and unfunded lending commitments $ 13,657 $ 13,598 $ 13,657 $ 13,598
(1) Recoveries have been reduced by certain collection costs that are incurred only if collection efforts are successful.(2) Represents additional credit loss reserves for unfunded lending commitments and letters of credit recorded in Other liabilities on the Consolidated Balance Sheet.
Other, net detailsThree Months Ended
September 30,Nine Months Ended
September 30,In millions of dollars 2018 2017 2018 2017Sales or transfers of various consumer loan portfolios to HFS
Transfer of real estate loan portfolios $ (2) $ (28) $ (88) $ (84)Transfer of other loan portfolios (3) (6) (109) (130)
Sales or transfers of various consumer loan portfolios to HFS $ (5) $ (34) $ (197) $ (214)FX translation, consumer 62 7 16 221Other 3 (1) (15) 8Other, net $ 60 $ (28) $ (196) $ 15
Allowance for Credit Losses and Investment in Loans
Three Months EndedSeptember 30, 2018 September 30, 2017
In millions of dollars Corporate Consumer Total Corporate Consumer TotalAllowance for loan losses at beginning of period $ 2,330 $ 9,796 $ 12,126 $ 2,510 $ 9,515 $ 12,025
Charge-offs (36) (2,058) (2,094) (49) (2,071) (2,120)Recoveries 6 332 338 6 337 343Replenishment of net charge-offs 30 1,726 1,756 43 1,734 1,777Net reserve builds (releases) 34 135 169 (60) 479 419Net specific reserve builds (releases) (27) 8 (19) 21 (71) (50)Other 2 58 60 3 (31) (28)
Ending balance $ 2,339 $ 9,997 $ 12,336 $ 2,474 $ 9,892 $ 12,366

137
Nine Months EndedSeptember 30, 2018 September 30, 2017
In millions of dollars Corporate Consumer Total Corporate Consumer TotalAllowance for loan losses at beginning of period $ 2,486 $ 9,869 $ 12,355 $ 2,702 $ 9,358 $ 12,060
Charge-offs (195) (6,304) (6,499) (248) (6,146) (6,394)Recoveries 71 1,101 1,172 91 1,107 1,198Replenishment of net charge-offs 124 5,203 5,327 157 5,039 5,196Net reserve builds (releases) (15) 317 302 (230) 696 466Net specific reserve builds (releases) (119) (6) (125) (18) (157) (175)Other (13) (183) (196) 20 (5) 15
Ending balance $ 2,339 $ 9,997 $ 12,336 $ 2,474 $ 9,892 $ 12,366
September 30, 2018 December 31, 2017In millions of dollars Corporate Consumer Total Corporate Consumer TotalAllowance for loan losses
Collectively evaluated in accordance with ASC 450 $ 2,035 $ 8,820 $ 10,855 $ 2,060 $ 8,531 $ 10,591Individually evaluated in accordance with ASC 310-10-35 304 1,175 1,479 426 1,334 1,760Purchased credit impaired in accordance with ASC 310-30 — 2 2 — 4 4
Total allowance for loan losses $ 2,339 $ 9,997 $ 12,336 $ 2,486 $ 9,869 $ 12,355Loans, net of unearned income
Collectively evaluated in accordance with ASC 450 $ 343,774 $ 319,816 $ 663,590 $ 327,142 $ 326,884 $ 654,026Individually evaluated in accordance with ASC 310-10-35 1,448 5,501 6,949 1,887 6,580 8,467Purchased credit impaired in accordance with ASC 310-30 — 131 131 — 167 167Held at fair value 4,218 21 4,239 4,349 25 4,374
Total loans, net of unearned income $ 349,440 $ 325,469 $ 674,909 $ 333,378 $ 333,656 $ 667,034

138
15. GOODWILL AND INTANGIBLE ASSETS
GoodwillThe changes in Goodwill were as follows:
In millions of dollars
GlobalConsumerBanking
InstitutionalClients Group
Corporate/Other Total
Balance at December 31, 2017 $ 12,784 $ 9,456 $ 16 $ 22,256Foreign currency translation and other $ 184 $ 235 $ — $ 419Divestiture(1) — — (16) (16)Balance at March 31, 2018 $ 12,968 $ 9,691 $ — $ 22,659Foreign exchange translation and other $ (226) $ (375) $ — $ (601)Balance at June 30, 2018 $ 12,742 $ 9,316 $ — $ 22,058Foreign exchange translation and other $ 7 $ 122 $ — $ 129
Balance at September 30, 2018 $ 12,749 $ 9,438 $ — $ 22,187
(1) Goodwill allocated to the sale of the Citi Colombia consumer business, the only remaining business in Citi Holdings—Consumer Latin America reporting unit reported as part of Corporate/Other, which was classified as HFS beginning the first quarter of 2018. The sale was completed during the second quarter of 2018.
Goodwill impairment testing is performed at the level below each business segment (referred to as a reporting unit). See Note 3 for further information on business segments. For additional information regarding Citi’s goodwill impairment testing process, see Notes 1 and 16 to the Consolidated Financial Statements in Citi’s 2017 Annual Report on Form 10-K.
The Company performed its annual goodwill impairment test as of July 1, 2018. The fair values of the Company’s reporting units exceeded their carrying values by approximately 14% to 243% and no reporting unit is at risk of impairment. Further, there were no triggering events identified and no goodwill was impaired during the three and nine months ended September 30, 2018.
Intangible AssetsThe components of intangible assets were as follows:
September 30, 2018 December 31, 2017
In millions of dollars
Grosscarryingamount
Accumulatedamortization
Netcarryingamount
Grosscarryingamount
Accumulatedamortization
Netcarryingamount
Purchased credit card relationships $ 5,732 $ 3,890 $ 1,842 $ 5,375 $ 3,836 $ 1,539Credit card contract related intangibles(1) 5,042 2,708 2,334 5,045 2,456 2,589Core deposit intangibles 438 433 5 639 628 11Other customer relationships 463 289 174 459 272 187Present value of future profits 34 30 4 32 28 4Indefinite-lived intangible assets 227 — 227 244 — 244Other 84 72 12 100 86 14Intangible assets (excluding MSRs) $ 12,020 $ 7,422 $ 4,598 $ 11,894 $ 7,306 $ 4,588Mortgage servicing rights (MSRs)(2) 618 — 618 558 — 558Total intangible assets $ 12,638 $ 7,422 $ 5,216 $ 12,452 $ 7,306 $ 5,146
(1) Primarily reflects contract-related intangibles associated with the American Airlines, The Home Depot, Costco, Sears and AT&T credit card program agreements, which represented 97% of the aggregate net carrying amount as of September 30, 2018.
(2) For additional information on Citi’s MSRs, see Note 18 to the Consolidated Financial Statements.

139
The changes in intangible assets were as follows:
Net carryingamount at
Net carryingamount at
In millions of dollarsDecember 31,
2017Acquisitions/divestitures Amortization
FX translationand other
September 30,2018
Purchased credit card relationships(1) $ 1,539 $ 429 $ (124) $ (2) $ 1,842Credit card contract related intangibles(2) 2,589 — (255) — 2,334Core deposit intangibles 11 — (6) — 5Other customer relationships 187 — (19) 6 174Present value of future profits 4 — — — 4Indefinite-lived intangible assets 244 — — (17) 227Other 14 — (9) 7 12Intangible assets (excluding MSRs) $ 4,588 $ 429 $ (413) $ (6) $ 4,598Mortgage servicing rights (MSRs)(3) 558 618Total intangible assets $ 5,146 $ 5,216
(1) Reflects intangibles for the value of cardholder relationships, which are discrete from partner contract intangibles and include credit card accounts primarily in the Costco, Macy’s and Sears portfolios. The increase since December 31, 2017 reflects the purchase of certain rights related to credit card accounts in the Sears portfolio.
(2) Primarily reflects contract-related intangibles associated with the American Airlines, The Home Depot, Costco, Sears and AT&T credit card program agreements, which represented 97% of the aggregate net carrying amount at September 30, 2018 and December 31, 2017.
(3) For additional information on Citi’s MSRs, including the rollforward for the nine months ended September 30, 2018, see Note 18 to the Consolidated Financial Statements.

140
16. DEBT
For additional information regarding Citi’s short-term borrowings and long-term debt, see Note 17 to the Consolidated Financial Statements in Citi’s 2017 Annual Report on Form 10-K.
Short-Term Borrowings
In millions of dollarsSeptember 30,
2018December 31,
2017Commercial paper $ 12,051 $ 9,940Other borrowings(1) 21,719 34,512Total $ 33,770 $ 44,452
(1) Includes borrowings from Federal Home Loan Banks and other market participants. At September 30, 2018 and December 31, 2017, collateralized short-term advances from the Federal Home Loan Banks were $10.5 billion and $23.8 billion, respectively.
Long-Term Debt
In millions of dollarsSeptember 30,
2018December 31,
2017Citigroup Inc.(1) $ 148,183 $ 152,163Bank(2) 62,085 65,856Broker-dealer and other(3) 25,002 18,690Total $ 235,270 $ 236,709
(1) Represents the parent holding company.(2) Represents Citibank entities as well as other bank entities. At
September 30, 2018 and December 31, 2017, collateralized long-term advances from the Federal Home Loan Banks were $10.5 billion and $19.3 billion, respectively.
(3) Represents broker-dealer and other non-bank subsidiaries that are consolidated into Citigroup Inc., the parent holding company.
Long-term debt outstanding includes trust preferred securities with a balance sheet carrying value of $1.7 billion at both September 30, 2018 and December 31, 2017.
The following table summarizes Citi’s outstanding trust preferred securities at September 30, 2018:
Junior subordinated debentures owned by trust
TrustIssuance
dateSecurities
issuedLiquidation
value(1)Couponrate(2)
Commonsharesissued
to parent Amount Maturity
Redeemableby issuerbeginning
In millions of dollars, except share amounts
Citigroup Capital III Dec. 1996 194,053 $ 194 7.625% 6,003 $ 200 Dec. 1, 2036 Not redeemable
Citigroup Capital XIII Sept. 2010 89,840,000 2,2463 mo LIBOR +
637 bps 1,000 2,246 Oct. 30, 2040 Oct. 30, 2015
Citigroup Capital XVIII Jun. 2007 99,901 1303 mo LIBOR +
88.75 bps 50 130 Jun. 28, 2067 June 28, 2017Total obligated $ 2,570 $ 2,576
Note: Distributions on the trust preferred securities and interest on the subordinated debentures are payable semiannually for Citigroup Capital III and Citigroup Capital XVIII and quarterly for Citigroup Capital XIII.(1) Represents the notional value received by outside investors from the trusts at the time of issuance.(2) In each case, the coupon rate on the subordinated debentures is the same as that on the trust preferred securities.

141
17. CHANGES IN ACCUMULATED OTHER COMPREHENSIVE INCOME (LOSS) (AOCI)
Changes in each component of Citigroup’s Accumulated other comprehensive income (loss) were as follows:
Three Months Ended September 30, 2018
In millions of dollars
Netunrealized
gains(losses)
oninvestmentsecurities
Debtvaluation
adjustment(DVA)
Cash flow hedges(1)
Benefit plans(2)
Foreigncurrency
translationadjustment (CTA), net of hedges(3)
Excluded component of fair value
hedges(4)
Accumulatedother
comprehensiveincome (loss)
Balance, June 30, 2018 $ (2,717) $ (475) $ (1,021) $ (5,794) $ (27,455) $ (32) $ (37,494)Other comprehensive income beforereclassifications (601) (294) (114) (14) (221) 10 (1,234)Increase (decrease) due to amountsreclassified from AOCI (4) 7 40 40 — — 83Change, net of taxes $ (605) $ (287) $ (74) $ 26 $ (221) $ 10 $ (1,151)Balance at September 30, 2018 $ (3,322) $ (762) $ (1,095) $ (5,768) $ (27,676) $ (22) $ (38,645)
Nine Months Ended September 30, 2018
In millions of dollars
Netunrealized
gains(losses)
oninvestmentsecurities
Debtvaluation
adjustment(DVA)
Cash flow
hedges(1)Benefit plans(2)
Foreigncurrency
translationadjustment (CTA), net of hedges(3)
Excluded component of
fair value hedges(4)
Accumulatedother
comprehensiveincome (loss)
Balance, December 31, 2017 $ (1,158) $ (921) $ (698) $ (6,183) $ (25,708) $ — $ (34,668)Adjustment to opening balance, net of taxes(5) (3) — — — — — (3)Adjusted balance, beginning of period $ (1,161) $ (921) $ (698) $ (6,183) $ (25,708) $ — $ (34,671)Other comprehensive income beforereclassifications (1,984) 123 (393) 288 (1,968) (22) (3,956)Increase (decrease) due to amountsreclassified from AOCI (177) 36 (4) 127 — — (18)Change, net of taxes $ (2,161) $ 159 $ (397) $ 415 $ (1,968) $ (22) $ (3,974)Balance, September 30, 2018 $ (3,322) $ (762) $ (1,095) $ (5,768) $ (27,676) $ (22) $ (38,645)
Note: Footnotes to the tables above appear on the following page.

142
Three Months Ended September 30, 2017
In millions of dollars
Netunrealized
gains(losses)
oninvestmentsecurities
Debtvaluation
adjustment(DVA)
Cash flow hedges(1)
Benefit plans(2)
Foreigncurrency
translationadjustment (CTA), net of hedges(3)
Excluded component of fair value
hedges(4)
Accumulatedother
comprehensiveincome (loss)
Balance, June 30, 2017 $ (102) $ (496) $ (445) $ (5,311) $ (23,545) $ — $ (29,899)Other comprehensive income beforereclassifications 60 (125) (27) (71) 218 — 55Increase (decrease) due to amountsreclassified from AOCI (126) 2 35 42 — — (47)Change, net of taxes $ (66) $ (123) $ 8 $ (29) $ 218 $ — $ 8Balance, September 30, 2017 $ (168) $ (619) $ (437) $ (5,340) $ (23,327) $ — $ (29,891)
Nine Months Ended September 30, 2017
In millions of dollars
Netunrealized
gains(losses)
oninvestmentsecurities
Debtvaluation
adjustment(DVA)
Cash flow hedges(1)
Benefit plans(2)
Foreigncurrency
translationadjustment (CTA), net of hedges(3)
Excluded component of fair value
hedges(4)
Accumulatedother
comprehensiveincome (loss)
Balance, December 31, 2016 $ (799) $ (352) $ (560) $ (5,164) $ (25,506) $ — $ (32,381)Adjustment to opening balance, net of taxes(6) 504 — — — — — 504
Adjusted balance, beginning of period $ (295) $ (352) $ (560) $ (5,164) $ (25,506) $ — $ (31,877)Other comprehensive income beforereclassifications 495 (259) 59 (293) 2,326 — 2,328Increase (decrease) due to amountsreclassified from AOCI (368) (8) 64 117 (147) — (342)Change, net of taxes $ 127 $ (267) $ 123 $ (176) $ 2,179 $ — $ 1,986Balance, September 30, 2017 $ (168) $ (619) $ (437) $ (5,340) $ (23,327) $ — $ (29,891)
(1) Primarily driven by Citigroup’s pay fixed/receive floating interest rate swap programs that hedge the floating rates on liabilities.(2) Primarily reflects adjustments based on the quarterly actuarial valuations of the Company’s significant pension and postretirement plans, annual actuarial
valuations of all other plans and amortization of amounts previously recognized in other comprehensive income. (3) Primarily reflects the movements in (by order of impact) the Indian rupee, Chinese yuan renminbi, Turkish lira and Brazilian real against the U.S. dollar and
changes in related tax effects and hedges for the three months ended September 30, 2018. Primarily reflects the movements in (by order of impact) the Brazilian real, Indian rupee, Australian dollar, and Argentine peso against the U.S. dollar and changes in related tax effects and hedges for the nine months ended September 30, 2018. Primarily reflects the movements in (by order of impact) the Euro, British pound, Chilean peso and Brazilian real against the U.S. dollar and changes in related tax effects and hedges for the three months ended September 30, 2017. Primarily reflects the movements in (by order of impact) the Mexican peso, Euro, Korean won and Polish zloty against the U.S. dollar and changes in related tax effects and hedges for the nine months ended September 30, 2017. Amounts recorded in the CTA component of AOCI remain in AOCI until the sale or substantial liquidation of the foreign entity, at which point such amounts related to the foreign entity are reclassified into earnings.
(4) Beginning in the first quarter of 2018, changes in the excluded component of fair value hedges are reflected as a component of AOCI, pursuant to the early adoption of ASU No. 2017-12, Targeted Improvements to Accounting for Hedging Activities. See Note 1 to the Consolidated Financial Statements for further information regarding this change.
(5) Citi adopted ASU 2016-01 and ASU 2018-03 on January 1, 2018. Upon adoption, a cumulative effect adjustment was recorded from AOCI to Retained earnings for net unrealized gains on former AFS equity securities. For additional information, see Note 1 to the Consolidated Financial Statements.
(6) In the second quarter of 2017, Citi early adopted ASU 2017-08, Receivables—Nonrefundable Fees and Other Costs (Subtopic 310-20): Premium Amortization on Purchased Callable Debt Securities. Upon adoption, a cumulative effect adjustment was recorded to reduce Retained earnings, effective January 1, 2017, for the incremental amortization of cumulative fair value hedge adjustments on callable state and municipal debt securities. For additional information, see Note 1 to the Consolidated Financial Statements.

143
The pretax and after-tax changes in each component of Accumulated other comprehensive income (loss) were as follows:
Three Months Ended September 30, 2018
In millions of dollars Pretax Tax effect(1) After-taxBalance, June 30, 2018 $ (44,407) $ 6,913 $ (37,494)Change in net unrealized gains (losses) on AFS debt securities (810) 205 (605)Debt valuation adjustment (DVA) (377) 90 (287)Cash flow hedges (97) 23 (74)Benefit plans 55 (29) 26Foreign currency translation adjustment (192) (29) (221)Excluded component of fair value hedges 13 (3) 10Change $ (1,408) $ 257 $ (1,151)Balance, September 30, 2018 $ (45,815) $ 7,170 $ (38,645)
Nine Months Ended September 30, 2018
In millions of dollars Pretax Tax effect(1) After-tax
Balance, December 31, 2017(1) $ (41,228) $ 6,560 $ (34,668)
Adjustment to opening balance(2) (4) 1 (3)
Adjusted balance, beginning of period $ (41,232) $ 6,561 $ (34,671)
Change in net unrealized gains (losses) on investment securities (2,861) 700 (2,161)
Debt valuation adjustment (DVA) 208 (49) 159
Cash flow hedges (519) 122 (397)
Benefit plans 549 (134) 415
Foreign currency translation adjustment (1,931) (37) (1,968)
Excluded component of fair value hedges (29) 7 (22)
Change $ (4,583) $ 609 $ (3,974)
Balance, September 30, 2018 $ (45,815) $ 7,170 $ (38,645)
(1) Includes the impact of ASU 2018-02, which transferred amounts from AOCI to Retained earnings. For additional information, see Note 19 to the Consolidated Financial Statements in Citi’s 2017 Annual Report on Form 10-K.
(2) Citi adopted ASU 2016-01 and ASU 2018-03 on January 1, 2018. Upon adoption, a cumulative effect adjustment was recorded from AOCI to Retained earnings for net unrealized gains on former AFS equity securities. For additional information, see Note 1 to the Consolidated Financial Statements.

144
Three Months Ended September 30, 2017
In millions of dollars Pretax Tax effect After-tax
Balance, June 30, 2017 $ (39,106) $ 9,207 $ (29,899)
Change in net unrealized gains (losses) on investment securities (107) 41 (66)
Debt valuation adjustment (DVA) (195) 72 (123)
Cash flow hedges 12 (4) 8
Benefit plans (45) 16 (29)
Foreign currency translation adjustment 285 (67) 218
Excluded component of fair value hedges — — —
Change $ (50) $ 58 $ 8
Balance, September 30, 2017 $ (39,156) $ 9,265 $ (29,891)
Nine Months Ended September 30, 2017
In millions of dollars Pretax Tax effect After-taxBalance, December 31, 2016 $ (42,035) $ 9,654 $ (32,381)Adjustment to opening balance(1) 803 (299) 504Adjusted balance, beginning of period $ (41,232) $ 9,355 $ (31,877)Change in net unrealized gains (losses) on investment securities 194 (67) 127Debt valuation adjustment (DVA) (422) 155 (267)Cash flow hedges 198 (75) 123Benefit plans (266) 90 (176)Foreign currency translation adjustment 2,372 (193) 2,179Excluded component of fair value hedges — — —Change $ 2,076 $ (90) $ 1,986Balance, September 30, 2017 $ (39,156) $ 9,265 $ (29,891)
(1) In the second quarter of 2017, Citi early adopted ASU 2017-08. Upon adoption, a cumulative effect adjustment was recorded to reduce Retained earnings, effective January 1, 2017, for the incremental amortization of cumulative fair value hedge adjustments on callable state and municipal debt securities. See Note 1 to the Consolidated Financial Statements.

145
The Company recognized pretax gains (losses) related to amounts in AOCI reclassified to the Consolidated Statement of Income as follows:
Increase (decrease) in AOCI due to amounts reclassified to
Consolidated Statement of Income
Three Months EndedSeptember 30,
Nine Months EndedSeptember 30,
In millions of dollars 2018 2018Realized (gains) losses on sales of investments $ (69) $ (341)Gross impairment losses 68 111
Subtotal, pretax $ (1) $ (230)Tax effect (3) 53
Net realized (gains) losses on investments after-tax(1) $ (4) $ (177)Realized DVA (gains) losses on fair value option liabilities $ 9 $ 46
Subtotal, pretax $ 9 $ 46Tax effect (2) (10)
Net realized debt valuation adjustment, after-tax $ 7 $ 36Interest rate contracts $ 54 $ 3Foreign exchange contracts (2) (8)
Subtotal, pretax $ 52 $ (5)Tax effect (12) 1
Amortization of cash flow hedges, after-tax(2) $ 40 $ (4)Amortization of unrecognized
Prior service cost (benefit) $ (10) $ (32)Net actuarial loss 60 193
Curtailment/settlement impact(3) — 6Subtotal, pretax $ 50 $ 167Tax effect (10) (40)
Amortization of benefit plans, after-tax(3) $ 40 $ 127Foreign currency translation adjustment $ — $ —
Tax effect — — Foreign currency translation adjustment $ — $ —Total amounts reclassified out of AOCI, pretax $ 110 $ (22)Total tax effect (27) 4Total amounts reclassified out of AOCI, after-tax $ 83 $ (18)
(1) The pretax amount is reclassified to Realized gains (losses) on sales of investments, net and Gross impairment losses in the Consolidated Statement of Income. See Note 12 to the Consolidated Financial Statements for additional details.
(2) See Note 19 to the Consolidated Financial Statements for additional details.(3) See Note 8 to the Consolidated Financial Statements for additional details.

146
The Company recognized pretax gains (losses) related to amounts in AOCI reclassified to the Consolidated Statement of Income as follows:
Increase (decrease) in AOCI due to amounts reclassified to
Consolidated Statement of IncomeThree Months Ended
September 30,Nine Months Ended
September 30,In millions of dollars 2017 2017Realized (gains) losses on sales of investments $ (213) $ (626)OTTI gross impairment losses 15 47
Subtotal, pretax $ (198) $ (579)Tax effect 72 211
Net realized (gains) losses on investment securities, after-tax(1) $ (126) $ (368)Realized DVA (gains) losses on fair value option liabilities $ 3 $ (13)Subtotal, pretax $ 3 $ (13)Tax effect $ (1) $ 5Net realized debt valuation adjustment, after-tax $ 2 $ (8)Interest rate contracts $ 48 $ 94Foreign exchange contracts 7 8
Subtotal, pretax $ 55 $ 102Tax effect (20) (38)
Amortization of cash flow hedges, after-tax(2) $ 35 $ 64Amortization of unrecognized
Prior service cost (benefit) $ (10) $ (32)Net actuarial loss 70 203
Curtailment/settlement impact(3) 5 12Subtotal, pretax $ 65 $ 183Tax effect (23) (66)
Amortization of benefit plans, after-tax(3) $ 42 $ 117Foreign currency translation adjustment $ — $ (232)
Tax effect — 85Foreign currency translation adjustment $ — $ (147)Total amounts reclassified out of AOCI, pretax $ (75) $ (539)Total tax effect 28 197Total amounts reclassified out of AOCI, after-tax $ (47) $ (342)
(1) The pretax amount is reclassified to Realized gains (losses) on sales of investments, net and Gross impairment losses on the Consolidated Statement of Income. See Note 12 to the Consolidated Financial Statements for additional details.
(2) See Note 19 to the Consolidated Financial Statements for additional details.(3) See Note 8 to the Consolidated Financial Statements for additional details.

147
18. SECURITIZATIONS AND VARIABLE INTEREST ENTITIES
For additional information regarding Citi’s use of special purpose entities (SPEs) and variable interest entities (VIEs), see Note 21 to the Consolidated Financial Statements in Citi’s 2017 Annual Report on Form 10-K.
Citigroup’s involvement with consolidated and unconsolidated VIEs with which the Company holds significant variable interests or has continuing involvement through servicing a majority of the assets in a VIE is presented below:
As of September 30, 2018Maximum exposure to loss in significant unconsolidated VIEs(1)
Funded exposures(2) Unfunded exposures
In millions of dollars
Totalinvolvement
with SPEassets
ConsolidatedVIE/SPE
assets
Significantunconsolidated
VIE assets(3)Debt
investmentsEquity
investmentsFunding
commitments
Guaranteesand
derivatives TotalCredit card securitizations $ 45,319 $ 45,319 $ — $ — $ — $ — $ — $ —Mortgage securitizations(4)
U.S. agency-sponsored 113,565 — 113,565 2,965 — — 68 3,033Non-agency-sponsored 25,452 1,580 23,872 356 — — 1 357
Citi-administered asset-backed commercial paperconduits (ABCP) 17,435 17,435 — — — — — —
Collateralized loanobligations (CLOs) 17,870 — 17,870 5,524 — — 9 5,533
Asset-based financing 64,817 639 64,178 20,060 601 9,214 — 29,875Municipal securities tender
option bond trusts (TOBs) 8,016 2,029 5,987 37 — 4,106 — 4,143Municipal investments 17,765 1 17,764 2,622 3,798 2,268 — 8,688Client intermediation 592 419 173 72 — — 9 81Investment funds 1,353 525 828 12 — 3 5 20Other 652 31 621 39 8 22 46 115Total $ 312,836 $ 67,978 $ 244,858 $ 31,687 $ 4,407 $ 15,613 $ 138 $ 51,845
As of December 31, 2017Maximum exposure to loss in significant unconsolidated VIEs(1)
Funded exposures(2) Unfunded exposures
In millions of dollars
Totalinvolvement
with SPEassets
ConsolidatedVIE/SPE
assets
Significantunconsolidated
VIE assets(3)Debt
investmentsEquity
investmentsFunding
commitments
Guaranteesand
derivatives TotalCredit card securitizations $ 50,795 $ 50,795 $ — $ — $ — $ — $ — $ —Mortgage securitizations(4)
U.S. agency-sponsored 116,610 — 116,610 2,647 — — 74 2,721Non-agency-sponsored 22,251 2,035 20,216 330 — — 1 331
Citi-administered asset-backed commercial paperconduits (ABCP) 19,282 19,282 — — — — — —
Collateralized loanobligations (CLOs) 20,588 — 20,588 5,956 — — 9 5,965
Asset-based financing 60,472 633 59,839 19,478 583 5,878 — 25,939Municipal securities tender
option bond trusts (TOBs) 6,925 2,166 4,759 138 — 3,035 — 3,173Municipal investments 19,119 7 19,112 2,709 3,640 2,344 — 8,693Client intermediation 958 824 134 32 — — 9 41Investment funds 1,892 616 1,276 14 7 13 — 34Other 677 36 641 27 9 34 47 117Total $ 319,569 $ 76,394 $ 243,175 $ 31,331 $ 4,239 $ 11,304 $ 140 $ 47,014
(1) The definition of maximum exposure to loss is included in the text that follows this table.(2) Included on Citigroup’s September 30, 2018 and December 31, 2017 Consolidated Balance Sheet.(3) A significant unconsolidated VIE is an entity in which the Company has any variable interest or continuing involvement considered to be significant, regardless of
the likelihood of loss.(4) Citigroup mortgage securitizations also include agency and non-agency (private-label) re-securitization activities. These SPEs are not consolidated. See “Re-
securitizations” below for further discussion.

148
The previous tables do not include:
• certain venture capital investments made by some of the Company’s private equity subsidiaries, as the Company accounts for these investments in accordance with the Investment Company Audit Guide (codified in ASC 946);
• certain investment funds for which the Company provides investment management services and personal estate trusts for which the Company provides administrative, trustee and/or investment management services;
• certain VIEs structured by third parties in which the Company holds securities in inventory, as these investments are made on arm’s-length terms;
• certain positions in mortgage-backed and asset-backed securities held by the Company, which are classified as Trading account assets or Investments, in which the Company has no other involvement with the related securitization entity deemed to be significant (for more information on these positions, see Notes 12 and 20 to the Consolidated Financial Statements);
• certain representations and warranties exposures in legacy ICG-sponsored mortgage-backed and asset-backed securitizations in which the Company has no variable interest or continuing involvement as servicer. The outstanding balance of mortgage loans securitized during 2005 to 2008 in which the Company has no variable interest or continuing involvement as servicer was approximately $8 billion and $9 billion at September 30, 2018 and December 31, 2017, respectively;
• certain representations and warranties exposures in Citigroup residential mortgage securitizations, where the original mortgage loan balances are no longer outstanding; and
• VIEs such as trust preferred securities trusts used in connection with the Company’s funding activities. The Company does not have a variable interest in these trusts.
The asset balances for consolidated VIEs represent the carrying amounts of the assets consolidated by the Company. The carrying amount may represent the amortized cost or the current fair value of the assets depending on the legal form of the asset (e.g., loan or security) and the Company’s standard accounting policies for the asset type and line of business.
The asset balances for unconsolidated VIEs in which the Company has significant involvement represent the most current information available to the Company. In most cases, the asset balances represent an amortized cost basis without regard to impairments, unless fair value information is readily available to the Company.
The maximum funded exposure represents the balance sheet carrying amount of the Company’s investment in the VIE. It reflects the initial amount of cash invested in the VIE, adjusted for any accrued interest and cash principal payments received. The carrying amount may also be adjusted for increases or declines in fair value or any impairment in value recognized in earnings. The maximum exposure of unfunded positions represents the remaining undrawn committed amount, including liquidity and credit facilities provided by the Company or the notional amount of a derivative instrument considered to be a variable interest. In certain transactions, the Company has entered into derivative instruments or other arrangements that are not considered variable interests in the VIE (e.g., interest rate swaps, cross-currency swaps or where the Company is the purchaser of credit protection under a credit default swap or total return swap where the Company pays the total return on certain assets to the SPE). Receivables under such arrangements are not included in the maximum exposure amounts.

149
Funding Commitments for Significant Unconsolidated VIEs—Liquidity Facilities and Loan CommitmentsThe following table presents the notional amount of liquidity facilities and loan commitments that are classified as funding commitments in the VIE tables above:
September 30, 2018 December 31, 2017
In millions of dollarsLiquidityfacilities
Loan/equitycommitments
Liquidityfacilities
Loan/equitycommitments
Asset-based financing $ — $ 9,214 $ — $ 5,878Municipal securities tender option bond trusts (TOBs) 4,106 — 3,035 —Municipal investments — 2,268 — 2,344Investment funds — 3 — 13Other — 22 — 34Total funding commitments $ 4,106 $ 11,507 $ 3,035 $ 8,269
Significant Interests in Unconsolidated VIEs—Balance Sheet ClassificationThe following table presents the carrying amounts and classification of significant variable interests in unconsolidated VIEs:
In billions of dollarsSeptember 30,
2018December 31,
2017Cash $ — $ —Trading account assets 8.2 8.5Investments 4.7 4.4Total loans, net of allowance 22.7 22.2Other 0.5 0.5Total assets $ 36.1 $ 35.6
Credit Card SecuritizationsSubstantially all of the Company’s credit card securitization activity is through two trusts—Citibank Credit Card Master Trust (Master Trust) and Citibank Omni Master Trust (Omni
Trust), with the substantial majority through the Master Trust. These trusts are consolidated entities.
The following table reflects amounts related to the Company’s securitized credit card receivables:
In billions of dollarsSeptember 30,
2018December 31,
2017Ownership interests in principal amount of trust credit card receivables Sold to investors via trust-issued securities $ 26.3 $ 28.8 Retained by Citigroup as trust-issued securities 7.5 7.6 Retained by Citigroup via non-certificated interests 11.6 14.4Total $ 45.4 $ 50.8
The following tables summarize selected cash flow information related to Citigroup’s credit card securitizations:
Three Months EndedSeptember 30,
In billions of dollars 2018 2017Proceeds from new securitizations $ 1.9 $ 2.2Pay down of maturing notes (2.9) (1.8)
Nine Months EndedSeptember 30,
In billions of dollars 2018 2017Proceeds from new securitizations $ 5.8 $ 9.8Pay down of maturing notes (8.3) (4.6)
Master Trust Liabilities (at Par Value)The weighted average maturity of the third-party term notes issued by the Master Trust was 3.0 years as of September 30, 2018 and 2.6 years as of December 31, 2017.
In billions of dollarsSept. 30,
2018Dec. 31,
2017Term notes issued to third parties $ 24.8 $ 27.8Term notes retained by Citigroup
affiliates 5.7 5.7Total Master Trust liabilities $ 30.5 $ 33.5
Omni Trust Liabilities (at Par Value)The weighted average maturity of the third-party term notes issued by the Omni Trust was 1.7 years as of September 30, 2018 and 1.9 years as of December 31, 2017.
In billions of dollarsSept. 30,
2018Dec. 31,
2017Term notes issued to third parties $ 1.5 $ 1.0Term notes retained by Citigroup
affiliates 1.9 1.9Total Omni Trust liabilities $ 3.4 $ 2.9

150
Mortgage SecuritizationsThe following tables summarize selected cash flow information and retained interests related to Citigroup mortgage securitizations:
Three Months Ended September 30,2018 2017
In billions of dollars
U.S. agency-sponsoredmortgages
Non-agency-sponsoredmortgages
U.S. agency-sponsoredmortgages
Non-agency-sponsoredmortgages
Proceeds from new securitizations $ 7.9 $ 2.1 $ 11.7 $ 4.1Contractual servicing fees received — — 0.1 —
Nine Months Ended September 30,2018 2017
In billions of dollars
U.S. agency-sponsoredmortgages
Non-agency-sponsoredmortgages
U.S. agency-sponsoredmortgages
Non-agency-sponsoredmortgages
Proceeds from new securitizations $ 23.7 $ 8.2 $ 26.2 $ 6.9Contractual servicing fees received 0.1 — 0.2 —
Gains recognized on the securitization of U.S. agency-sponsored mortgages were $6 million and $18 million for the three and nine months ended September 30, 2018, respectively. For the three and nine months ended September 30, 2018, gains recognized on the securitization of non-agency-sponsored mortgages were $5 million and $40 million, respectively.
Gains recognized on the securitization of U.S. agency-sponsored mortgages were $14 million and $61 million for the three and nine months ended September 30, 2017, respectively. For the three and nine months ended September 30, 2017, gains recognized on the securitization of non-agency-sponsored mortgages were $29 million and $75 million, respectively.
September 30, 2018 December 31, 2017Non-agency-sponsored
mortgages(1)Non-agency-sponsored
mortgages(1)
In millions of dollars
U.S. agency-sponsoredmortgages
Seniorinterests
Subordinatedinterests
U.S. agency-sponsoredmortgages
Seniorinterests
Subordinatedinterests
Carrying value of retained interests $ 2,092 $ 296 $ 112 $ 1,634 $ 214 $ 139
(1) Disclosure of non-agency-sponsored mortgages as senior and subordinated interests is indicative of the interests’ position in the capital structure of the securitization.
Key assumptions used in measuring the fair value of retained interests at the date of sale or securitization of mortgage receivables were as follows:
Three Months Ended September 30, 2018Non-agency-sponsored mortgages(1)
U.S. agency- sponsored mortgages
Senior interests
Subordinated interests
Discount rate 3.0% to 10.4% 3.8% to 4.2% 4.1% to 8.6% Weighted average discount rate 6.9% 4.1% 5.6%Constant prepayment rate 5.3% to 12.8% 7.0% to 10.0% 7.0% to 10.0% Weighted average constant prepayment rate 8.1% 7.9% 8.2%Anticipated net credit losses(2) NM 3.4% to 3.7% 3.4% to 3.7% Weighted average anticipated net credit losses NM 3.6% 3.6%Weighted average life 6.9 to 22.1 years 3.0 to 3.9 years 7.3 to 15.7 years

151
Three Months Ended September 30, 2017Non-agency-sponsored mortgages(1)
U.S. agency-sponsoredmortgages
Seniorinterests
Subordinatedinterests
Discount rate 2.0% to 13.2% 1.4% to 4.5% 1.7% to 4.2% Weighted average discount rate 8.5% 2.8% 3.5%Constant prepayment rate 6.6% to 31.6% — — Weighted average constant prepayment rate 10.6% — —Anticipated net credit losses(2) NM 6.7% to 6.8% 6.4% Weighted average anticipated net credit losses NM 6.7 6.4%Weighted average life 2.5 to 10.5 years 4.9 to 9.4 years 5.0 to 9.1 years
Nine Months Ended September 30, 2018Non-agency-sponsored mortgages(1)
U.S. agency-sponsoredmortgages
Seniorinterests
Subordinatedinterests
Discount rate 3.0% to 11.4% 1.6% to 4.5% 3.0% to 8.6% Weighted average discount rate 6.3% 3.6% 4.4%Constant prepayment rate 3.5% to 16.0% 7.0% to 12.0% 7.0% to 12.0% Weighted average constant prepayment rate 8.2% 8.8% 9.1%Anticipated net credit losses(2) NM 2.0% to 6.7% 2.0% to 4.6% Weighted average anticipated net credit losses NM 4.4% 3.4%Weighted average life 5.0 to 22.1 years 2.5 to 9.9 years 2.5 to 15.7 years
Nine Months Ended September 30, 2017Non-agency-sponsored mortgages(1)
U.S. agency-sponsoredmortgages
Seniorinterests
Subordinatedinterests
Discount rate 2.0% to 19.9% 1.4% to 4.5% 1.7% to 19.1% Weighted average discount rate 9.1% 2.8% 4.0%Constant prepayment rate 3.8% to 31.6% — — Weighted average constant prepayment rate 9.6% — —Anticipated net credit losses(2) NM 6.7% to 6.8% 6.4% to 69.1% Weighted average anticipated net credit losses NM 6.7% 10.8%Weighted average life 2.5 to 14.5 years 4.9 to 10.0 years 5.0 to 10.0 years
(1) Disclosure of non-agency-sponsored mortgages as senior and subordinated interests is indicative of the interests’ position in the capital structure of the securitization.
(2) Anticipated net credit losses represent estimated loss severity associated with defaulted mortgage loans underlying the mortgage securitizations disclosed above. Anticipated net credit losses, in this instance, do not represent total credit losses incurred to date, nor do they represent credit losses expected on retained interests in mortgage securitizations.
NM Anticipated net credit losses are not meaningful due to U.S. agency guarantees.
The interests retained by the Company range from highly rated and/or senior in the capital structure to unrated and/or residual interests.
The key assumptions used to value retained interests, and the sensitivity of the fair value to adverse changes of 10% and 20% in each of the key assumptions, are set forth in the tables
below. The negative effect of each change is calculated independently, holding all other assumptions constant. Because the key assumptions may not be independent, the net effect of simultaneous adverse changes in the key assumptions may be less than the sum of the individual effects shown below.

152
September 30, 2018Non-agency-sponsored mortgages(1)
U.S. agency-sponsoredmortgages
Seniorinterests
Subordinatedinterests
Discount rate 2.6% to 55.0% 12.2% 4.9% to 5.8% Weighted average discount rate 6.0% 12.2% 5.2%Constant prepayment rate 3.7% to 19.6% 8.0% 5.0% to 16.0% Weighted average constant prepayment rate 8.8% 8.0% 7.7%Anticipated net credit losses(2) NM 38.0% 37.0% to 91.0% Weighted average anticipated net credit losses NM 38.0% 49.7%Weighted average life 0.5 to 28.2 years 7.6 years 6.2 to 15.5 years
December 31, 2017Non-agency-sponsored mortgages(1)
U.S. agency-sponsoredmortgages
Seniorinterests
Subordinatedinterests
Discount rate 1.8% to 84.2% 5.8% to 100.0% 2.8% to 35.1% Weighted average discount rate 7.1% 5.8% 9.0%Constant prepayment rate 6.9% to 27.8% 8.9% to 15.5% 8.6% to 13.1% Weighted average constant prepayment rate 11.6% 8.9% 10.6%Anticipated net credit losses(2) NM 0.4% to 46.9% 35.1% to 52.1% Weighted average anticipated net credit losses NM 46.9% 44.9%Weighted average life 0.1 to 27.8 years 4.8 to 5.3 years 0.2 to 18.6 years
(1) Disclosure of non-agency-sponsored mortgages as senior and subordinated interests is indicative of the interests’ position in the capital structure of the securitization.
(2) Anticipated net credit losses represent estimated loss severity associated with defaulted mortgage loans underlying the mortgage securitizations disclosed above. Anticipated net credit losses, in this instance, do not represent total credit losses incurred to date, nor do they represent credit losses expected on retained interests in mortgage securitizations.
NM Anticipated net credit losses are not meaningful due to U.S. agency guarantees.
September 30, 2018Non-agency-sponsored mortgages
In millions of dollars
U.S. agency- sponsored mortgages
Senior interests
Subordinated interests
Discount rates Adverse change of 10% $ (61) $ — $ (1) Adverse change of 20% (119) — (2)Constant prepayment rate Adverse change of 10% (32) — — Adverse change of 20% (63) — —Anticipated net credit losses Adverse change of 10% NM — — Adverse change of 20% NM — —

153
December 31, 2017Non-agency-sponsored mortgages
In millions of dollars
U.S. agency-sponsoredmortgages
Seniorinterests
Subordinatedinterests
Discount rates Adverse change of 10% $ (44) $ (2) $ (3) Adverse change of 20% (85) (4) (5)Constant prepayment rate Adverse change of 10% (41) (1) (1) Adverse change of 20% (84) (1) (2)Anticipated net credit losses Adverse change of 10% NM (3) — Adverse change of 20% NM (7) —
NM Anticipated net credit losses are not meaningful due to U.S. agency guarantees.
Mortgage Servicing Rights (MSRs)The fair value of Citi’s capitalized MSRs was $618 million and $553 million at September 30, 2018 and 2017, respectively. The MSRs correspond to principal loan balances of $62 billion and $68 billion as of September 30, 2018 and 2017, respectively. The following tables summarize the changes in capitalized MSRs:
Three Months EndedSeptember 30,
In millions of dollars 2018 2017Balance, as of June 30 $ 596 $ 560Originations 14 19Changes in fair value of MSRs due to
changes in inputs and assumptions 25 (6)Other changes(1) (17) (20)Sale of MSRs — —Balance, as of September 30 $ 618 $ 553
Nine Months EndedSeptember 30,
In millions of dollars 2018 2017Balance, beginning of year $ 558 $ 1,564Originations 46 75Changes in fair value of MSRs due to
changes in inputs and assumptions 82 50Other changes(1) (50) (90)Sale of MSRs(2) (18) (1,046)Balance, as of September 30 $ 618 $ 553
(1) Represents changes due to customer payments and passage of time.(2) See Note 2 to the Consolidated Financial Statements in Citi’s 2017
Annual Report on Form 10-K for more information on the exit of the U.S. mortgage servicing operations and sale of MSRs in 2017.
The Company receives fees during the course of servicing previously securitized mortgages. The amounts of these fees were as follows:
Three Months EndedSeptember 30,
Nine Months EndedSeptember 30,
In millions of dollars 2018 2017 2018 2017Servicing fees $ 41 $ 65 $ 130 $ 236Late fees 1 2 3 8Ancillary fees 1 3 7 11Total MSR fees $ 43 $ 70 $ 140 $ 255
In the Consolidated Statement of Income these fees are primarily classified as Commissions and fees, and changes in MSR fair values are classified as Other revenue.

154
Re-securitizationsThe Company engages in re-securitization transactions in which debt securities are transferred to a VIE in exchange for new beneficial interests. Citi did not transfer non-agency (private-label) securities to re-securitization entities during the three and nine months ended September 30, 2018 and 2017. These securities are backed by either residential or commercial mortgages and are often structured on behalf of clients.
As of September 30, 2018, the fair value of Citi-retained interests in private-label re-securitization transactions structured by Citi totaled approximately $33 million (all related to re-securitization transactions executed prior to 2016), which has been recorded in Trading account assets. Of this amount, substantially all was related to subordinated beneficial interests. As of December 31, 2017, the fair value of Citi-retained interests in private-label re-securitization transactions structured by Citi totaled approximately $79 million (all related to re-securitization transactions executed prior to 2016). Of this amount, substantially all was related to subordinated beneficial interests. The original par value of private-label re-securitization transactions in which Citi holds a retained interest as of September 30, 2018 and December 31, 2017 was approximately $316 million and $887 million, respectively.
The Company also re-securitizes U.S. government-agency guaranteed mortgage-backed (agency) securities. During the three and nine months ended September 30, 2018, Citi transferred agency securities with a fair value of approximately $6.8 billion and $20.4 billion, respectively, to re-securitization entities compared to approximately $9.9 billion and $20.0 billion for the three and nine months ended September 30, 2017, respectively.
As of September 30, 2018, the fair value of Citi-retained interests in agency re-securitization transactions structured by Citi totaled approximately $2.4 billion (including $1.3 billion related to re-securitization transactions executed in 2018) compared to $2.1 billion as of December 31, 2017 (including $854 million related to re-securitization transactions executed in 2017), which is recorded in Trading account assets. The original fair value of agency re-securitization transactions in which Citi holds a retained interest as of September 30, 2018 and December 31, 2017 was approximately $67.2 billion and $68.3 billion, respectively.
As of September 30, 2018 and December 31, 2017, the Company did not consolidate any private-label or agency re-securitization entities.
Citi-Administered Asset-Backed Commercial Paper ConduitsAt September 30, 2018 and December 31, 2017, the commercial paper conduits administered by Citi had approximately $17.4 billion and $19.3 billion of purchased assets outstanding, respectively, and had incremental funding commitments with clients of approximately $16.3 billion and $14.5 billion, respectively.
Substantially all of the funding of the conduits is in the form of short-term commercial paper. At September 30, 2018 and December 31, 2017, the weighted average remaining lives of the commercial paper issued by the conduits were approximately 55 and 51 days, respectively.
The primary credit enhancement provided to the conduit investors is in the form of transaction-specific credit enhancements described above. In addition to the transaction-specific credit enhancements, the conduits, other than the government guaranteed loan conduit, have obtained a letter of credit from the Company, which is equal to at least 8% to 10% of the conduit’s assets with a minimum of $200 million. The letters of credit provided by the Company to the conduits total approximately $1.6 billion as of September 30, 2018 and December 31, 2017. The net result across multi-seller conduits administered by the Company is that, in the event defaulted assets exceed the transaction-specific credit enhancements described above, any losses in each conduit are allocated first to the Company and then to the commercial paper investors.
At September 30, 2018 and December 31, 2017, the Company owned $5.4 billion and $9.3 billion, respectively, of the commercial paper issued by its administered conduits. The Company's investments were not driven by market illiquidity and the Company is not obligated under any agreement to purchase the commercial paper issued by the conduits.
Collateralized Loan ObligationsThe following tables summarize selected cash flow information and retained interests related to Citigroup CLOs:
Three Months EndedSeptember 30,
In billions of dollars 2018 2017Proceeds from new securitizations $ 0.4 $ 1.1
Nine Months EndedSeptember 30,
In billions of dollars 2018 2017Proceeds from new securitizations $ 4.0 $ 2.5Cash flows received on retained
interests and other cash flows 0.1 0.1
In millions of dollarsSept. 30,
2018Dec. 31,
2017Carrying value of retained interests $ 3,461 $ 4,079

155
Asset-Based FinancingThe primary types of Citi’s asset-based financings, total assets of the unconsolidated VIEs with significant involvement and Citi’s maximum exposure to loss are shown below. For Citi to realize the maximum loss, the VIE (borrower) would have to default with no recovery from the assets held by the VIE.
September 30, 2018
In millions of dollars
Total unconsolidated
VIE assets
Maximum exposure to
unconsolidated VIEs
TypeCommercial and other real estate $ 18,098 $ 6,949Corporate loans 6,815 5,764Hedge funds and equities 416 54Airplanes, ships and other assets 38,849 17,108Total $ 64,178 $ 29,875
December 31, 2017
In millions of dollars
Total unconsolidated
VIE assets
Maximum exposure to
unconsolidated VIEs
TypeCommercial and other real estate $ 15,370 $ 5,445Corporate loans 4,725 3,587Hedge funds and equities 542 58Airplanes, ships and other assets 39,202 16,849Total $ 59,839 $ 25,939
Municipal Securities Tender Option Bond (TOB) TrustsAt September 30, 2018 and December 31, 2017, none of the municipal bonds owned by non-customer TOB trusts were subject to a credit guarantee provided by the Company.
At September 30, 2018 and December 31, 2017, liquidity agreements provided with respect to customer TOB trusts totaled $4.1 billion and $3.2 billion, respectively, of which $2.2 billion and $2.0 billion, respectively, were offset by reimbursement agreements. For the remaining exposure related to TOB transactions, where the residual owned by the customer was at least 25% of the bond value at the inception of the transaction, no reimbursement agreement was executed.
The Company also provides other liquidity agreements or letters of credit to customer-sponsored municipal investment funds, which are not variable interest entities, and municipality-related issuers that totaled $6.1 billion as of September 30, 2018 and December 31, 2017. These liquidity agreements and letters of credit are offset by reimbursement agreements with various term-out provisions.
Client IntermediationThe proceeds from new securitizations related to the Company’s client intermediation transactions for the three and nine months ended September 30, 2018 totaled approximately $0.2 billion and $0.7 billion, respectively, compared to $0.2 billion and $0.9 billion for the three and nine months ended September 30, 2017, respectively.
156
19. DERIVATIVES ACTIVITIES
As of January 1, 2018, Citigroup early adopted ASU 2017-12, Targeted Improvements to Accounting for Hedge Activities. This standard primarily impacts Citi’s accounting for derivatives designated as cash flow hedges and fair value hedges. Refer to the respective sections below for details.
In the ordinary course of business, Citigroup enters into various types of derivative transactions. All derivatives are recorded in Trading account assets/Trading account liabilities on the Consolidated Balance Sheet. For additional information regarding Citi’s use of and accounting for derivatives, see Note 22 to the Consolidated Financial Statements in Citi’s 2017 Annual Report on Form 10-K.
Information pertaining to Citigroup’s derivative activities, based on notional amounts, is presented in the table below. Derivative notional amounts are reference amounts from which contractual payments are derived and do not represent a complete measure of Citi’s exposure to derivative transactions. Rather, Citi’s derivative exposure arises primarily from market fluctuations (i.e., market risk), counterparty failure (i.e., credit risk) and/or periods of high volatility or financial stress (i.e., liquidity risk), as well as any market valuation adjustments that may be required on the transactions. Moreover, notional amounts do not reflect the netting of offsetting trades. For example, if Citi enters into a receive-fixed interest rate swap with $100 million notional, and offsets this risk with an identical but opposite pay-fixed position with a different counterparty, $200 million in derivative notionals is reported, although these offsetting positions may result in de minimis overall market risk. In addition, aggregate derivative notional amounts can fluctuate from period to period in the normal course of business based on Citi’s market share, levels of client activity and other factors.

157
Derivative Notionals
Hedging instruments under
ASC 815 Trading derivative instruments
In millions of dollarsSeptember 30,
2018December 31,
2017September 30,
2018December 31,
2017Interest rate contracts
Swaps $ 246,079 $ 189,779 $ 19,759,439 $ 18,754,219Futures and forwards — — 8,297,965 6,460,539Written options — — 3,857,773 3,516,131Purchased options — — 3,236,924 3,234,025
Total interest rate contract notionals $ 246,079 $ 189,779 $ 35,152,101 $ 31,964,914Foreign exchange contracts
Swaps $ 54,502 $ 37,162 $ 7,004,521 $ 5,576,357Futures, forwards and spot 37,769 33,103 5,711,577 3,097,700Written options 2,497 3,951 1,727,916 1,127,728Purchased options 2,934 6,427 1,695,392 1,148,686
Total foreign exchange contract notionals $ 97,702 $ 80,643 $ 16,139,406 $ 10,950,471Equity contracts
Swaps $ — $ — $ 245,167 $ 215,834Futures and forwards — — 70,526 72,616Written options — — 436,032 389,961Purchased options — — 333,448 328,154
Total equity contract notionals $ — $ — $ 1,085,173 $ 1,006,565Commodity and other contracts
Swaps $ — $ — $ 118,699 $ 82,039Futures and forwards 397 23 164,427 153,248Written options — — 72,021 62,045Purchased options — — 69,862 60,526
Total commodity and other contract notionals $ 397 $ 23 $ 425,009 $ 357,858Credit derivatives(1)
Protection sold $ — $ — $ 723,060 $ 735,142Protection purchased — — 793,792 777,713
Total credit derivatives $ — $ — $ 1,516,852 $ 1,512,855Total derivative notionals $ 344,178 $ 270,445 $ 54,318,541 $ 45,792,663
(1) Credit derivatives are arrangements designed to allow one party (protection buyer) to transfer the credit risk of a “reference asset” to another party (protection seller). These arrangements allow a protection seller to assume the credit risk associated with the reference asset without directly purchasing that asset. The Company enters into credit derivative positions for purposes such as risk management, yield enhancement, reduction of credit concentrations and diversification of overall risk.

158
The following tables present the gross and net fair values of the Company’s derivative transactions and the related offsetting amounts as of September 30, 2018 and December 31, 2017. Gross positive fair values are offset against gross negative fair values by counterparty, pursuant to enforceable master netting agreements. Under ASC 815-10-45, payables and receivables in respect of cash collateral received from or paid to a given counterparty pursuant to a credit support annex are included in the offsetting amount, if a legal opinion supporting the enforceability of netting and collateral rights has been obtained. GAAP does not permit similar offsetting for security collateral.
In addition, the following tables reflect rule changes adopted by clearing organizations that require or allow entities to treat certain derivative assets, liabilities and the related variation margin as settlement of the related derivative fair values for legal and accounting purposes, as opposed to presenting gross derivative assets and liabilities that are subject to collateral, whereby the counterparties would record a related collateral payable or receivable. As a result, the tables reflect a reduction of approximately $110 billion and $100 billion as of September 30, 2018 and December 31, 2017, respectively, of derivative assets and derivative liabilities that previously would have been reported on a gross basis, but are now settled and not subject to collateral. The tables also present amounts that are not permitted to be offset, such as security collateral or cash collateral posted at third-party custodians, but which would be eligible for offsetting to the extent that an event of default occurred and a legal opinion supporting enforceability of the netting and collateral rights has been obtained.

159
Derivative Mark-to-Market (MTM) Receivables/Payables
In millions of dollars at September 30, 2018Derivatives classified in
Trading account assets/liabilities(1)(2)
Derivatives instruments designated as ASC 815 hedges Assets LiabilitiesOver-the-counter $ 1,411 $ 81Cleared 137 575Interest rate contracts $ 1,548 $ 656Over-the-counter $ 1,568 $ 718Foreign exchange contracts $ 1,568 $ 718Total derivatives instruments designated as ASC 815 hedges $ 3,116 $ 1,374Derivatives instruments not designated as ASC 815 hedgesOver-the-counter $ 155,901 $ 136,989Cleared 8,262 10,062Exchange traded 130 136Interest rate contracts $ 164,293 $ 147,187Over-the-counter $ 169,989 $ 164,571Cleared 3,326 3,360Exchange traded 88 236Foreign exchange contracts $ 173,403 $ 168,167Over-the-counter $ 19,891 $ 24,766Cleared 10 9Exchange traded 10,143 10,354Equity contracts $ 30,044 $ 35,129Over-the-counter $ 22,449 $ 25,024Exchange traded 826 756Commodity and other contracts $ 23,275 $ 25,780Over-the-counter $ 4,240 $ 5,912Cleared 7,326 5,781Credit derivatives $ 11,566 $ 11,693Total derivatives instruments not designated as ASC 815 hedges $ 402,581 $ 387,956Total derivatives $ 405,697 $ 389,330Cash collateral paid/received(3) $ 10,759 $ 13,676Less: Netting agreements(4) (322,565) (322,565)Less: Netting cash collateral received/paid(5) (37,678) (30,701)Net receivables/payables included on the Consolidated Balance Sheet(6) $ 56,213 $ 49,740Additional amounts subject to an enforceable master netting agreement, but not
offset on the Consolidated Balance SheetLess: Cash collateral received/paid $ (739) $ (83)Less: Non-cash collateral received/paid (12,389) (11,376)Total net receivables/payables(6) $ 43,085 $ 38,281
(1) The derivatives fair values are also presented in Note 20 to the Consolidated Financial Statements. (2) Over-the-counter (OTC) derivatives are derivatives executed and settled bilaterally with counterparties without the use of an organized exchange or central
clearing house. Cleared derivatives include derivatives executed bilaterally with a counterparty in the OTC market, but then novated to a central clearing house, whereby the central clearing house becomes the counterparty to both of the original counterparties. Exchange-traded derivatives include derivatives executed directly on an organized exchange that provides pre-trade price transparency.
(3) Reflects the net amount of the $41,460 million and $51,354 million of gross cash collateral paid and received, respectively. Of the gross cash collateral paid, $30,701 million was used to offset trading derivative liabilities and, of the gross cash collateral received, $37,678 million was used to offset trading derivative assets.
(4) Represents the netting of derivative receivable and payable balances with the same counterparty under enforceable netting agreements. Approximately $304 billion, $9 billion and $10 billion of the netting against trading account asset/liability balances is attributable to each of the OTC, cleared and exchange-traded derivatives, respectively.
(5) Represents the netting of cash collateral paid and received by counterparty under enforceable credit support agreements. Substantially all cash collateral received and paid is netted against OTC derivative assets and liabilities, respectively.

160
(6) The net receivables/payables include approximately $6 billion of derivative asset and $7 billion of derivative liability fair values not subject to enforceable master netting agreements, respectively.
In millions of dollars at December 31, 2017Derivatives classified in
Trading account assets/liabilities(1)(2)
Derivatives instruments designated as ASC 815 hedges Assets LiabilitiesOver-the-counter $ 1,969 $ 134Cleared 110 92Interest rate contracts $ 2,079 $ 226Over-the-counter $ 1,143 $ 1,150Foreign exchange contracts $ 1,143 $ 1,150Total derivatives instruments designated as ASC 815 hedges $ 3,222 $ 1,376Derivatives instruments not designated as ASC 815 hedgesOver-the-counter $ 195,677 $ 173,937Cleared 7,129 10,381Exchange traded 102 95Interest rate contracts $ 202,908 $ 184,413Over-the-counter $ 119,092 $ 117,473Cleared 1,690 2,028Exchange traded 34 121Foreign exchange contracts $ 120,816 $ 119,622Over-the-counter $ 17,221 $ 21,201Cleared 21 25Exchange traded 9,736 10,147Equity contracts $ 26,978 $ 31,373Over-the-counter $ 13,499 $ 16,362Exchange traded 604 665Commodity and other contracts $ 14,103 $ 17,027Over-the-counter $ 12,972 $ 12,958Cleared 7,562 8,575Credit derivatives $ 20,534 $ 21,533Total derivatives instruments not designated as ASC 815 hedges $ 385,339 $ 373,968Total derivatives $ 388,561 $ 375,344Cash collateral paid/received(3) $ 7,541 $ 14,308Less: Netting agreements(4) (306,401) (306,401)Less: Netting cash collateral received/paid(5) (38,532) (35,666)Net receivables/payables included on the Consolidated Balance Sheet(6) $ 51,169 $ 47,585Additional amounts subject to an enforceable master netting agreement,
but not offset on the Consolidated Balance SheetLess: Cash collateral received/paid $ (872) $ (121)Less: Non-cash collateral received/paid (12,739) (6,929)Total net receivables/payables(6) $ 37,558 $ 40,535
(1) The derivatives fair values are presented in Note 20 to the Consolidated Financial Statements. Derivative mark-to-market receivables/payables previously reported within Other assets/Other liabilities have been reclassified to Trading account assets/Trading account liabilities to conform with the current-period presentation.
(2) Over-the-counter (OTC) derivatives are derivatives executed and settled bilaterally with counterparties without the use of an organized exchange or central clearing house. Cleared derivatives include derivatives executed bilaterally with a counterparty in the OTC market, but then novated to a central clearing house, whereby the central clearing house becomes the counterparty to both of the original counterparties. Exchange-traded derivatives include derivatives executed directly on an organized exchange that provides pre-trade price transparency.
(3) Reflects the net amount of the $43,207 million and $52,840 million of gross cash collateral paid and received, respectively. Of the gross cash collateral paid, $35,666 million was used to offset trading derivative liabilities and, of the gross cash collateral received, $38,532 million was used to offset trading derivative assets.
(4) Represents the netting of derivative receivable and payable balances with the same counterparty under enforceable netting agreements. Approximately $283 billion, $14 billion and $9 billion of the netting against trading account asset/liability balances is attributable to each of the OTC, cleared and exchange-traded derivatives, respectively.

161
(5) Represents the netting of cash collateral paid and received by counterparty under enforceable credit support agreements. Substantially all cash collateral received and paid is netted against OTC derivative assets and liabilities, respectively.
(6) The net receivables/payables include approximately $6 billion of derivative asset and $8 billion of derivative liability fair values not subject to enforceable master netting agreements, respectively.
For the three and nine months ended September 30, 2018 and 2017, the amounts recognized in Principal transactions in the Consolidated Statement of Income related to derivatives not designated in a qualifying hedging relationship, as well as the underlying non-derivative instruments, are presented in Note 6 to the Consolidated Financial Statements. Citigroup presents this disclosure by business classification, showing derivative gains and losses related to its trading activities together with gains and losses related to non-derivative instruments within the same trading portfolios, as this represents how these portfolios are risk managed.
The amounts recognized in Other revenue in the Consolidated Statement of Income related to derivatives not designated in a qualifying hedging relationship are shown below. The table below does not include any offsetting gains (losses) on the economically hedged items to the extent such amounts are also recorded in Other revenue.
Gains (losses) included in
Other revenueThree Months
Ended September 30,
Nine MonthsEnded September
30,In millions of dollars 2018 2017 2018 2017Interest rate contracts $ (22) $ (5) $ (65) $ (72)Foreign exchange 7 596 (6) 1,897Credit derivatives (200) (125) (271) (501)Total $ (215) $ 466 $ (342) $ 1,324

162
Fair Value Hedges
Hedging of Benchmark Interest Rate RiskCitigroup’s fair value hedges are primarily hedges of fixed-rate long-term debt or assets, such as available-for-sale debt securities or loans.
For qualifying fair value hedges of interest rate risk, the changes in the fair value of the derivative and the change in the fair value of the hedged item attributable to the hedged risk, either total cash flows or benchmark only cash flows are presented within Interest revenue or Interest expense based on whether the hedged item is an asset or a liability. Prior to the adoption of ASU 2017-12, the fair value of the derivative was presented in Other revenue or Principal transactions and the difference between the changes in the hedged item and the derivative was defined as ineffectiveness.
Hedging of Foreign Exchange RiskCitigroup hedges the change in fair value attributable to foreign exchange rate movements in available-for-sale debt securities and long-term debt that are denominated in currencies other than the functional currency of the entity holding the securities or issuing the debt, which may be within or outside the U.S. The hedging instrument may be a forward foreign exchange contract or a cross-currency swap contract. Citigroup considers the premium associated with forward contracts (i.e., the differential between the spot and contractual forward rates) as the cost of hedging; this amount is excluded from the assessment of hedge effectiveness and reflected directly in earnings over the life of the hedge. Beginning January 1, 2018, Citi excludes changes in cross-currency basis associated with cross-currency swaps from the assessment of hedge effectiveness and records it in Other comprehensive income.
Hedging of Commodity Price RiskCitigroup hedges the change in fair value attributable to spot price movements in physical commodities inventory. The hedging instrument is a futures contract to sell the underlying commodity. In this hedge, the change in the value of the hedged inventory is reflected in earnings, which offsets the change in the fair value of the futures contract that is also reflected in earnings. Although the change in the fair value of the hedging instrument recorded in earnings includes changes in forward rates, Citigroup excludes the differential between the spot and the contractual forward rates under the futures contract from the assessment of hedge effectiveness and amortizes it directly into earnings over the life of the hedge.

163
The following table summarizes the gains (losses) on the Company’s fair value hedges:
Gains (losses) on fair value hedges(1)
Three Months Ended September 30, Nine Months Ended September 30,2018 2017(3) 2018 2017(3)
In millions of dollarsOther
revenueNet interest
revenueOther
revenueOther
revenueNet interest
revenueOther
revenueGain (loss) on the derivatives indesignated and qualifying fair valuehedges Interest rate hedges $ — $ (857) $ (194) $ — $ (497) $ (570)Foreign exchange hedges (158) — (166) 341 — (803)Commodity hedges (14) — (11) (14) — (20)
Total gain (loss) on the derivatives indesignated and qualifying fair valuehedges $ (172) $ (857) $ (371) $ 327 $ (497) $ (1,393)
Gain (loss) on the hedged item indesignated and qualifying fair valuehedgesInterest rate hedges $ — $ 871 $ 189 $ — $ 525 $ 532Foreign exchange hedges 132 — 144 (464) — 910Commodity hedges 8 — 12 9 — 22
Total gain (loss) on the hedged item indesignated and qualifying fair valuehedges $ 140 $ 871 $ 345 $ (455) $ 525 $ 1,464
Net gain (loss) excluded fromassessment of the effectiveness of fairvalue hedges Interest rate hedges $ — $ — $ — $ — $ (5) $ (7)Foreign exchange hedges(2) 7 — (5) 63 — 75Commodity hedges (7) — 1 (5) — 2Total net gain (loss) excluded fromassessment of the effectiveness of fairvalue hedges $ — $ — $ (4) $ 58 $ (5) $ 70
(1) Beginning January 1, 2018, gain (loss) amounts for interest rate risk hedges are included in Interest income/Interest expense, while the remaining amounts including the amounts for interest rate hedges prior to January 1, 2018 are included in Other revenue or Principal transactions on the Consolidated Statement of Income. The accrued interest income on fair value hedges both prior to and after January 1, 2018 is recorded in Net interest revenue and is excluded from this table.
(2) Amounts relate to the premium associated with forward contracts (differential between spot and contractual forward rates). These amounts are excluded from the assessment of hedge effectiveness and are reflected directly in earnings. After January 1, 2018, amounts include cross-currency basis, which is recognized in accumulated other comprehensive income. The amount of cross-currency basis that was included in accumulated other comprehensive income was $15 million and $57 million for the three and nine months ended September 30, 2018, respectively, none of which was recognized in earnings.
(3) Hedge ineffectiveness recognized in earnings on designated and qualifying fair value hedges for the three months ended September 30, 2017 was $(5) million for interest rate hedges and $(17) million for foreign exchange hedges, for a total of $(22) million. Hedge ineffectiveness recognized in earnings on designated and qualifying fair value hedges for the nine months ended September 30, 2017 was $(31) million for interest rate hedges and $32 million for foreign exchange hedges, for a total of $1 million.
Cumulative Basis AdjustmentUpon electing to apply ASC 815 fair value hedge accounting, the carrying value of the hedged item is adjusted to reflect the cumulative impact of changes in the hedged risk. The hedge basis adjustment, whether arising from an active or de-designated hedge relationship, remains with the hedged item until the hedged item is derecognized from the balance sheet. The table below presents the carrying amount of Citi’s hedged assets and liabilities under qualifying fair value hedges at September 30, 2018, along with the cumulative hedge basis adjustments included in the carrying value of those hedged assets and liabilities.
In millions of dollars as of September 30, 2018
Balance sheetline item inwhich hedgeditem is recorded
Carryingamount of
hedgedasset/
liability
Cumulative fair value hedgingadjustment increasing
(decreasing) the carryingamount
Active De-designatedDebt securities AFS $ 80,244 $ (326) $ 421
Long-term debt 154,540 (775) 1,218

164
Cash Flow HedgesCitigroup hedges the variability of forecasted cash flows associated with floating-rate assets/liabilities and other forecasted transactions. Variable cash flows from those liabilities are synthetically converted to fixed-rate cash flows by entering into receive-variable, pay-fixed interest rate swaps and receive-variable, pay-fixed forward-starting interest rate swaps. Variable cash flows associated with certain assets are synthetically converted to fixed-rate cash flows by entering into receive-fixed, pay-variable interest rate swaps. These cash flow hedging relationships use either regression analysis or dollar-offset ratio analysis to assess whether the hedging relationships are highly effective at inception and on an ongoing basis. Prior to the adoption of ASU 2017-12, Citigroup designated the risk being hedged as the risk of overall variability in the hedged cash flows for certain items.
With the adoption of ASU 2017-12, Citigroup hedges the variability from changes in a contractually specified rate and recognizes the entire change in fair value of the cash flow hedging instruments in AOCI. Prior to the adoption of ASU 2017-12, to the extent that these derivatives were not fully effective, changes in their fair values in excess of changes in the value of the hedged transactions were immediately included in Other revenue. With the adoption of ASU 2017-12, such amounts are no longer required to be immediately recognized in income, but instead the full change in the value of the hedging instrument is required to be recognized in AOCI, and then recognized in earnings in the same period that the cash flows impact earnings. The pretax change in AOCI from cash flow hedges is presented below:
Three Months Ended September 30, Nine Months Ended September 30,In millions of dollars 2018 2017 2018 2017Amount of gain (loss) recognized in AOCIon derivativeInterest rate contracts(1) $ (146) $ (36) $ (665) $ 103Foreign exchange contracts (3) (7) (4) (7)Total gain (loss) recognized in AOCI $ (149) $ (43) $ (669) $ 96
Amount of gain (loss) reclassified fromAOCI to earnings
Other revenue
Net interest revenue
Other revenue
Other revenue
Net interest revenue
Other revenue
Interest rate contracts(1) $ — $ (54) $ (48) $ — $ (142) $ (94)Foreign exchange contracts 2 — (7) (8) — (8)
Total gain (loss) reclassified from AOCI intoearnings $ 2 $ (54) $ (55) $ (8) $ (142) $ (102)
(1) After January 1, 2018, all amounts reclassified into earnings for interest rate contracts are included in Interest income/Interest expense (Net interest revenue). For all other hedges, including interest rate hedges prior to January 1, 2018, the amounts reclassified to earnings are included primarily in Other revenue and Net interest revenue on the Consolidated Income Statement.
For cash flow hedges, the changes in the fair value of the hedging derivative remain in AOCI on the Consolidated Balance Sheet and will be included in the earnings of future periods to offset the variability of the hedged cash flows when such cash flows affect earnings. The net gain (loss) associated with cash flow hedges expected to be reclassified from AOCI within 12 months of September 30, 2018 is approximately $475 million. The maximum length of time over which forecasted cash flows are hedged is 10 years.
The after-tax impact of cash flow hedges on AOCI is shown in Note 17 to the Consolidated Financial Statements.

165
Net Investment HedgesThe pretax gain (loss) recorded in the Foreign currency translation adjustment account within AOCI, related to net investment hedges, is $(46) million and $1,587 million for the three and nine months ended September 30, 2018, and $(245) million and $(1,993) million for the three and nine months ended September 30, 2017, respectively.
Credit DerivativesThe following tables summarize the key characteristics of Citi’s credit derivatives portfolio by counterparty and derivative form:
Fair values Notionals
In millions of dollars at September 30, 2018 Receivable(1) Payable(2)Protectionpurchased
Protectionsold
By industry/counterpartyBanks $ 5,366 $ 5,097 $ 222,802 $ 234,338Broker-dealers 1,826 1,661 66,676 67,833Non-financial 65 90 2,823 4,247Insurance and other financial institutions 4,309 4,845 501,491 416,642Total by industry/counterparty $ 11,566 $ 11,693 $ 793,792 $ 723,060By instrumentCredit default swaps and options $ 10,997 $ 11,168 $ 771,239 $ 712,451Total return swaps and other 569 525 22,553 10,609Total by instrument $ 11,566 $ 11,693 $ 793,792 $ 723,060By ratingInvestment grade $ 5,180 $ 5,014 $ 616,595 $ 552,452Non-investment grade 6,386 6,679 177,197 170,608Total by rating $ 11,566 $ 11,693 $ 793,792 $ 723,060By maturityWithin 1 year $ 1,442 $ 1,680 $ 232,670 $ 204,358From 1 to 5 years 8,083 7,855 472,276 439,089After 5 years 2,041 2,158 88,846 79,613Total by maturity $ 11,566 $ 11,693 $ 793,792 $ 723,060
(1) The fair value amount receivable is composed of $3,657 million under protection purchased and $7,909 million under protection sold.(2) The fair value amount payable is composed of $8,476 million under protection purchased and $3,217 million under protection sold.

166
Fair values Notionals
In millions of dollars at December 31, 2017 Receivable(1) Payable(2)Protectionpurchased
Protectionsold
By industry/counterpartyBanks $ 7,471 $ 6,669 $ 264,414 $ 273,711Broker-dealers 2,325 2,285 73,273 83,229Non-financial 70 91 1,288 1,140Insurance and other financial institutions 10,668 12,488 438,738 377,062Total by industry/counterparty $ 20,534 $ 21,533 $ 777,713 $ 735,142By instrumentCredit default swaps and options $ 20,251 $ 20,554 $ 754,114 $ 724,228Total return swaps and other 283 979 23,599 10,914Total by instrument $ 20,534 $ 21,533 $ 777,713 $ 735,142By ratingInvestment grade $ 10,473 $ 10,616 $ 588,324 $ 557,987Non-investment grade 10,061 10,917 189,389 177,155Total by rating $ 20,534 $ 21,533 $ 777,713 $ 735,142By maturityWithin 1 year $ 2,477 $ 2,914 $ 231,878 $ 218,097From 1 to 5 years 16,098 16,435 498,606 476,345After 5 years 1,959 2,184 47,229 40,700Total by maturity $ 20,534 $ 21,533 $ 777,713 $ 735,142
(1) The fair value amount receivable is composed of $3,195 million under protection purchased and $17,339 under protection sold.(2) The fair value amount payable is composed of $3,147 million under protection purchased and $18,386 million under protection sold.
Credit Risk-Related Contingent Features in DerivativesCertain derivative instruments contain provisions that require the Company to either post additional collateral or immediately settle any outstanding liability balances upon the occurrence of a specified event related to the credit risk of the Company. These events, which are defined by the existing derivative contracts, are primarily downgrades in the credit ratings of the Company and its affiliates.
The fair value (excluding CVA) of all derivative instruments with credit risk-related contingent features that were in a net liability position at both September 30, 2018 and December 31, 2017 was $37 billion and $29 billion, respectively. The Company posted $36 billion and $28 billion as collateral for this exposure in the normal course of business as of September 30, 2018 and December 31, 2017, respectively.
A downgrade could trigger additional collateral or cash settlement requirements for the Company and certain affiliates. In the event that Citigroup and Citibank were downgraded a single notch by all three major rating agencies as of September 30, 2018, the Company could be required to post an additional $1.4 billion as either collateral or settlement of the derivative transactions. Additionally, the Company could be required to segregate with third-party custodians collateral previously received from existing derivative counterparties in the amount of $0.2 billion upon the single notch downgrade, resulting in aggregate cash obligations and collateral requirements of approximately $1.6 billion.
Derivatives Accompanied by Financial Asset TransfersFor transfers of financial assets accounted for as a sale by the Company and for which the Company has retained substantially all of the economic exposure to the transferred asset through a total return swap executed with the same counterparty in contemplation of the initial sale (and still outstanding), both the asset amounts derecognized and the gross cash proceeds received as of the date of derecognition were $3.3 billion and $3.0 billion as of September 30, 2018 and December 31, 2017, respectively.
At September 30, 2018, the fair value of these previously derecognized assets was $3.2 billion. The fair value of the total return swaps as of September 30, 2018 was $24 million recorded as gross derivative assets and $31 million recorded as gross derivative liabilities. At December 31, 2017, the fair value of these previously derecognized assets was $3.1 billion, and the fair value of the total return swaps was $89 million recorded as gross derivative assets and $15 million recorded as gross derivative liabilities.
The balances for the total return swaps are on a gross basis, before the application of counterparty and cash collateral netting, and are included primarily as equity derivatives in the tabular disclosures in this Note.

167
20. FAIR VALUE MEASUREMENT
For additional information regarding fair value measurement at Citi, see Note 24 to the Consolidated Financial Statements in Citi’s 2017 Annual Report on Form 10-K.
Market Valuation AdjustmentsThe table below summarizes the credit valuation adjustments (CVA) and funding valuation adjustments (FVA) applied to the fair value of derivative instruments at September 30, 2018 and December 31, 2017:
Credit and funding valuation adjustments
contra-liability (contra-asset)
In millions of dollarsSeptember 30,
2018December 31,
2017Counterparty CVA $ (815) $ (970)Asset FVA (324) (447)Citigroup (own-credit) CVA 317 287Liability FVA 39 47Total CVA—derivative instruments(1) $ (783) $ (1,083)
(1) FVA is included with CVA for presentation purposes.
The table below summarizes pretax gains (losses) related to changes in CVA on derivative instruments, net of hedges, FVA on derivatives and debt valuation adjustments (DVA) on Citi’s own fair value option (FVO) liabilities for the periods indicated:
Credit/funding/debt valuation
adjustments gain (loss)Three Months
EndedSeptember 30,
Nine MonthsEnded
September 30,In millions of dollars 2018 2017 2018 2017Counterparty CVA $ 94 $ 27 $ 117 $ 197Asset FVA 74 (5) 123 74Own-credit CVA (75) (2) 24 (127)Liability FVA (23) (16) (8) (10)Total CVA—derivativeinstruments $ 70 $ 4 $ 256 $ 134DVA related to own FVO liabilities(1) $ (377) $ (195) $ 208 $ (422)Total CVA and DVA(2) $ (307) $ (191) $ 464 $ (288)
(1) See Note 1 and Note 17 to the Consolidated Financial Statements. (2) FVA is included with CVA for presentation purposes.

168
Items Measured at Fair Value on a Recurring BasisThe following tables present for each of the fair value hierarchy levels the Company’s assets and liabilities that are measured at fair value on a recurring basis at September 30, 2018 and December 31, 2017. The Company may hedge positions that have been classified in the Level 3 category with other financial instruments (hedging instruments) that may be
classified as Level 3, but also with financial instruments classified as Level 1 or Level 2 of the fair value hierarchy. The effects of these hedges are presented gross in the following tables:
Fair Value Levels
In millions of dollars at September 30, 2018 Level 1(1) Level 2(1) Level 3Gross
inventory Netting(2)Net
balanceAssets Federal funds sold and securities borrowed and purchasedunder agreements to resell $ — $ 241,745 $ 65 $ 241,810 $ (63,368) $ 178,442Trading non-derivative assets
Trading mortgage-backed securitiesU.S. government-sponsored agency guaranteed — 20,293 128 20,421 — 20,421Residential 1 730 215 946 — 946Commercial — 1,346 57 1,403 — 1,403
Total trading mortgage-backed securities $ 1 $ 22,369 $ 400 $ 22,770 $ — $ 22,770U.S. Treasury and federal agency securities $ 22,054 $ 5,347 $ 6 $ 27,407 $ — $ 27,407State and municipal — 3,612 200 3,812 — 3,812Foreign government 44,714 19,945 52 64,711 — 64,711Corporate 835 13,409 253 14,497 — 14,497Equity securities 45,556 8,195 170 53,921 — 53,921Asset-backed securities — 1,628 1,453 3,081 — 3,081Other trading assets(3) 5 10,355 730 11,090 — 11,090
Total trading non-derivative assets $ 113,165 $ 84,860 $ 3,264 $ 201,289 $ — $ 201,289Trading derivatives
Interest rate contracts $ 183 $ 163,345 $ 2,313 $ 165,841Foreign exchange contracts 6 174,455 510 174,971Equity contracts 2,495 27,255 294 30,044Commodity contracts 15 22,576 684 23,275Credit derivatives — 10,750 816 11,566
Total trading derivatives $ 2,699 $ 398,381 $ 4,617 $ 405,697Cash collateral paid(4) $ 10,759Netting agreements $ (322,565)Netting of cash collateral received (37,678)
Total trading derivatives $ 2,699 $ 398,381 $ 4,617 $ 416,456 $ (360,243) $ 56,213Investments
Mortgage-backed securitiesU.S. government-sponsored agency guaranteed $ — $ 45,127 $ 34 $ 45,161 $ — $ 45,161Residential — 1,627 — 1,627 — 1,627Commercial — 226 5 231 — 231
Total investment mortgage-backed securities $ — $ 46,980 $ 39 $ 47,019 $ — $ 47,019 U.S. Treasury and federal agency securities $ 106,098 $ 10,045 $ — $ 116,143 $ — $ 116,143
State and municipal — 8,798 682 9,480 — 9,480Foreign government 56,866 37,514 81 94,461 — 94,461Corporate 4,687 7,693 — 12,380 — 12,380Equity securities 246 14 — 260 — 260Asset-backed securities — 978 284 1,262 — 1,262Other debt securities — 4,037 — 4,037 — 4,037Non-marketable equity securities(5) — 170 733 903 — 903
Total investments $ 167,897 $ 116,229 $ 1,819 $ 285,945 $ — $ 285,945
Table continues on the next page.

169
In millions of dollars at September 30, 2018 Level 1(1) Level 2(1) Level 3Gross
inventory Netting(2)Net
balanceLoans $ — $ 3,856 $ 383 $ 4,239 $ — $ 4,239Mortgage servicing rights — — 618 618 — 618Non-trading derivatives and other financial assets measuredon a recurring basis $ 19,789 $ 5,362 $ — $ 25,151 $ — $ 25,151Total assets $ 303,550 $ 850,433 $ 10,766 $1,175,508 $ (423,611) $ 751,897Total as a percentage of gross assets(6) 26.1% 73.0% 0.9%LiabilitiesInterest-bearing deposits $ — $ 1,137 $ 303 $ 1,440 $ — $ 1,440Federal funds purchased and securities loaned and sold underagreements to repurchase — 110,519 997 111,516 (63,368) 48,148Trading account liabilities
Securities sold, not yet purchased 85,760 10,281 387 96,428 — 96,428Other trading liabilities — 1,484 — 1,484 — 1,484
Total trading liabilities $ 85,760 $ 11,765 $ 387 $ 97,912 $ — $ 97,912Trading derivatives
Interest rate contracts $ 189 $ 145,460 $ 2,194 $ 147,843Foreign exchange contracts 7 168,557 321 168,885Equity contracts 2,667 31,254 1,208 35,129Commodity contracts 5 23,286 2,489 25,780Credit derivatives — 9,871 1,822 11,693
Total trading derivatives $ 2,868 $ 378,428 $ 8,034 $ 389,330Cash collateral received(7) $ 13,676Netting agreements $ (322,565)Netting of cash collateral paid (30,701)Total trading derivatives $ 2,868 $ 378,428 $ 8,034 $ 403,006 $ (353,266) $ 49,740
Short-term borrowings $ — $ 5,002 $ 39 $ 5,041 $ — $ 5,041Long-term debt — 22,980 13,791 36,771 — 36,771Total non-trading derivatives and other financial liabilitiesmeasured on a recurring basis $ 19,789 $ 158 $ — $ 19,947 $ — $ 19,947Total liabilities $ 108,417 $ 529,989 $ 23,551 $ 675,633 $ (416,634) $ 258,999Total as a percentage of gross liabilities(6) 16.4% 80.1% 3.6%
(1) For the three and nine months ended September 30, 2018, the Company transferred assets of approximately $1.7 billion and $3.4 billion from Level 1 to Level 2, primarily related to foreign government securities and equity securities not traded in active markets. During the three and nine months ended September 30, 2018, the Company transferred assets of approximately $2.6 billion and $7.9 billion from Level 2 to Level 1, primarily related to foreign government bonds, foreign corporate securities, marketable certificates of deposits and equity securities traded with sufficient frequency to constitute an active market. For the three and nine months ended September 30, 2018, there were $0.1 billion and $0.3 billion transfers of liabilities from Level 1 to Level 2. During the three and nine months ended September 30, 2018, the Company transferred liabilities of approximately $0.3 billion and $0.7 billion, from Level 2 to Level 1.
(2) Represents netting of (i) the amounts due under securities purchased under agreements to resell and the amounts owed under securities sold under agreements to repurchase and (ii) derivative exposures covered by a qualifying master netting agreement and cash collateral offsetting.
(3) Includes positions related to investments in unallocated precious metals, as discussed in Note 21 to the Consolidated Financial Statements. Also includes physical commodities accounted for at the lower of cost or fair value and unfunded credit products.
(4) Reflects the net amount of $48,437 million gross cash collateral paid, of which $37,678 million was used to offset trading derivative liabilities.(5) Amounts exclude $0.2 billion of investments measured at Net Asset Value (NAV) in accordance with ASU 2015-07, Fair Value Measurement (Topic 820):
Disclosures for Investments in Certain Entities That Calculate Net Asset Value per Share (or Its Equivalent).(6) Because the amount of the cash collateral paid/received has not been allocated to the Level 1, 2 and 3 subtotals, these percentages are calculated based on total
assets and liabilities measured at fair value on a recurring basis, excluding the cash collateral paid/received on derivatives.(7) Reflects the net amount $44,377 million of gross cash collateral received, of which $30,701 million was used to offset trading derivative assets.

170
Fair Value Levels
In millions of dollars at December 31, 2017 Level 1(1) Level 2(1) Level 3Gross
inventory Netting(2)Net
balanceAssets Federal funds sold and securities borrowed and purchased underagreements to resell $ — $ 188,571 $ 16 $ 188,587 $ (55,638) $132,949Trading non-derivative assets
Trading mortgage-backed securitiesU.S. government-sponsored agency guaranteed — 22,801 163 22,964 — 22,964Residential — 649 164 813 — 813Commercial — 1,309 57 1,366 — 1,366
Total trading mortgage-backed securities $ — $ 24,759 $ 384 $ 25,143 $ — $ 25,143U.S. Treasury and federal agency securities $ 17,524 $ 3,613 $ — $ 21,137 $ — $ 21,137State and municipal — 4,426 274 4,700 — 4,700Foreign government 39,347 20,843 16 60,206 — 60,206Corporate 301 15,129 275 15,705 — 15,705Equity securities 53,305 6,794 120 60,219 — 60,219Asset-backed securities — 1,198 1,590 2,788 — 2,788Other trading assets(3) 3 11,105 615 11,723 — 11,723
Total trading non-derivative assets $ 110,480 $ 87,867 $ 3,274 $ 201,621 $ — $201,621Trading derivatives
Interest rate contracts $ 145 $ 203,134 $ 1,708 $ 204,987Foreign exchange contracts 19 121,363 577 121,959Equity contracts 2,364 24,170 444 26,978Commodity contracts 282 13,252 569 14,103Credit derivatives — 19,624 910 20,534
Total trading derivatives $ 2,810 $ 381,543 $ 4,208 $ 388,561Cash collateral paid(4) $ 7,541Netting agreements $ (306,401)Netting of cash collateral received (38,532)
Total trading derivatives $ 2,810 $ 381,543 $ 4,208 $ 396,102 $ (344,933) $ 51,169Investments
Mortgage-backed securitiesU.S. government-sponsored agency guaranteed $ — $ 41,717 $ 24 $ 41,741 $ — $ 41,741Residential — 2,884 — 2,884 — 2,884Commercial — 329 3 332 — 332
Total investment mortgage-backed securities $ — $ 44,930 $ 27 $ 44,957 $ — $ 44,957U.S. Treasury and federal agency securities $ 106,964 $ 11,182 $ — $ 118,146 $ — $118,146State and municipal — 8,028 737 8,765 — 8,765Foreign government 56,456 43,985 92 100,533 — 100,533Corporate 1,911 12,127 71 14,109 — 14,109Equity securities 176 11 2 189 — 189Asset-backed securities — 3,091 827 3,918 — 3,918Other debt securities — 297 — 297 — 297Non-marketable equity securities(5) — 121 681 802 — 802Total investments $ 165,507 $ 123,772 $ 2,437 $ 291,716 $ — $291,716
Table continues on the next page.
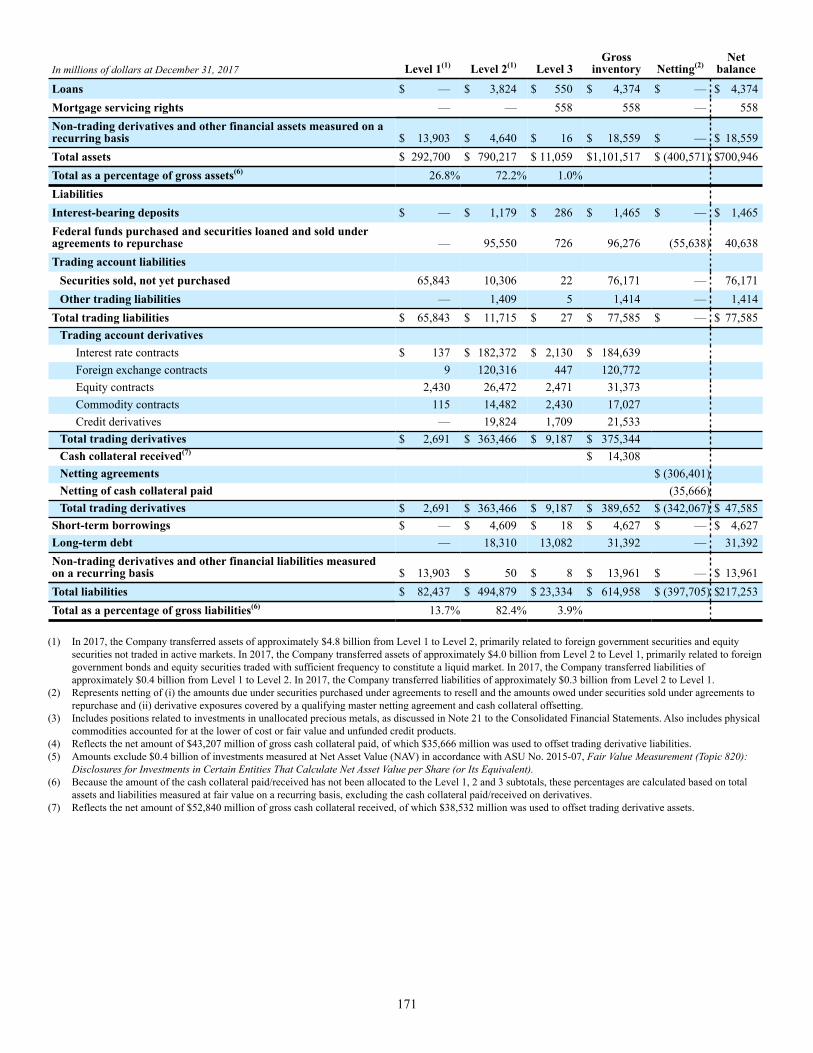
171
In millions of dollars at December 31, 2017 Level 1(1) Level 2(1) Level 3Gross
inventory Netting(2)Net
balance
Loans $ — $ 3,824 $ 550 $ 4,374 $ — $ 4,374Mortgage servicing rights — — 558 558 — 558Non-trading derivatives and other financial assets measured on arecurring basis $ 13,903 $ 4,640 $ 16 $ 18,559 $ — $ 18,559Total assets $ 292,700 $ 790,217 $ 11,059 $1,101,517 $ (400,571) $700,946Total as a percentage of gross assets(6) 26.8% 72.2% 1.0%LiabilitiesInterest-bearing deposits $ — $ 1,179 $ 286 $ 1,465 $ — $ 1,465Federal funds purchased and securities loaned and sold underagreements to repurchase — 95,550 726 96,276 (55,638) 40,638Trading account liabilities
Securities sold, not yet purchased 65,843 10,306 22 76,171 — 76,171Other trading liabilities — 1,409 5 1,414 — 1,414
Total trading liabilities $ 65,843 $ 11,715 $ 27 $ 77,585 $ — $ 77,585Trading account derivatives
Interest rate contracts $ 137 $ 182,372 $ 2,130 $ 184,639Foreign exchange contracts 9 120,316 447 120,772Equity contracts 2,430 26,472 2,471 31,373Commodity contracts 115 14,482 2,430 17,027Credit derivatives — 19,824 1,709 21,533
Total trading derivatives $ 2,691 $ 363,466 $ 9,187 $ 375,344Cash collateral received(7) $ 14,308Netting agreements $ (306,401)Netting of cash collateral paid (35,666)Total trading derivatives $ 2,691 $ 363,466 $ 9,187 $ 389,652 $ (342,067) $ 47,585
Short-term borrowings $ — $ 4,609 $ 18 $ 4,627 $ — $ 4,627Long-term debt — 18,310 13,082 31,392 — 31,392Non-trading derivatives and other financial liabilities measuredon a recurring basis $ 13,903 $ 50 $ 8 $ 13,961 $ — $ 13,961Total liabilities $ 82,437 $ 494,879 $ 23,334 $ 614,958 $ (397,705) $217,253Total as a percentage of gross liabilities(6) 13.7% 82.4% 3.9%
(1) In 2017, the Company transferred assets of approximately $4.8 billion from Level 1 to Level 2, primarily related to foreign government securities and equity securities not traded in active markets. In 2017, the Company transferred assets of approximately $4.0 billion from Level 2 to Level 1, primarily related to foreign government bonds and equity securities traded with sufficient frequency to constitute a liquid market. In 2017, the Company transferred liabilities of approximately $0.4 billion from Level 1 to Level 2. In 2017, the Company transferred liabilities of approximately $0.3 billion from Level 2 to Level 1.
(2) Represents netting of (i) the amounts due under securities purchased under agreements to resell and the amounts owed under securities sold under agreements to repurchase and (ii) derivative exposures covered by a qualifying master netting agreement and cash collateral offsetting.
(3) Includes positions related to investments in unallocated precious metals, as discussed in Note 21 to the Consolidated Financial Statements. Also includes physical commodities accounted for at the lower of cost or fair value and unfunded credit products.
(4) Reflects the net amount of $43,207 million of gross cash collateral paid, of which $35,666 million was used to offset trading derivative liabilities.(5) Amounts exclude $0.4 billion of investments measured at Net Asset Value (NAV) in accordance with ASU No. 2015-07, Fair Value Measurement (Topic 820):
Disclosures for Investments in Certain Entities That Calculate Net Asset Value per Share (or Its Equivalent).(6) Because the amount of the cash collateral paid/received has not been allocated to the Level 1, 2 and 3 subtotals, these percentages are calculated based on total
assets and liabilities measured at fair value on a recurring basis, excluding the cash collateral paid/received on derivatives.(7) Reflects the net amount of $52,840 million of gross cash collateral received, of which $38,532 million was used to offset trading derivative assets.

172
Changes in Level 3 Fair Value Category
The following tables present the changes in the Level 3 fair value category for the three and nine months ended September 30, 2018 and 2017. The gains and losses presented below include changes in the fair value related to both observable and unobservable inputs.
The Company often hedges positions with offsetting positions that are classified in a different level. For example,
the gains and losses for assets and liabilities in the Level 3 category presented in the tables below do not reflect the effect of offsetting losses and gains on hedging instruments that may be classified in the Level 1 or Level 2 categories. In addition, the Company hedges items classified in the Level 3 category with instruments also classified in Level 3 of the fair value hierarchy. The hedged items and related hedges are presented gross in the following tables:
Level 3 Fair Value Rollforward
Net realized/unrealized
gains (losses) incl. in Transfers Unrealizedgains
(losses)still held(3)In millions of dollars
Jun. 30,2018
Principaltransactions Other(1)(2)
intoLevel 3
out ofLevel 3 Purchases Issuances Sales Settlements
Sept. 30,2018
AssetsFederal funds sold and securities borrowed and purchased under agreements to resell $ 66 $ — $ — $ (1) $ — $ 61 $ — $ — $ (61) $ 65 $ 4Trading non-derivativeassets
Trading mortgage- backed securities
U.S. government-sponsored agencyguaranteed 99 (2) — 3 (7) 38 — (3) — 128 (2)Residential 132 111 — 17 (36) 8 — (17) — 215 (2)Commercial 51 (2) — 4 (8) 29 — (17) — 57 (1)
Total trading mortgage- backed securities $ 282 $ 107 $ — $ 24 $ (51) $ 75 $ — $ (37) $ — $ 400 $ (5)
U.S. Treasury andfederal agency securities $ 7 $ — $ — $ — $ — $ — $ — $ — $ (1) $ 6 $ —State and municipal 226 6 — — (52) 22 — (2) — 200 6Foreign government 36 27 — — (8) 4 — (7) — 52 26Corporate 520 (214) — 24 (15) 110 — (172) — 253 7Equity securities 293 (87) — 7 (21) 24 — (46) — 170 (99)Asset-backed securities 1,688 (44) — 20 (39) 305 — (477) — 1,453 (45)Other trading assets 542 78 — 94 (10) 185 2 (157) (4) 730 53
Total trading non- derivative assets $ 3,594 $ (127) $ — $ 169 $ (196) $ 725 $ 2 $ (898) $ (5) $ 3,264 $ (57)Trading derivatives, net(4)
Interest rate contracts $ 86 $ 10 $ — $ (11) $ (2) $ — $ 8 $ — $ 28 $ 119 $ 59Foreign exchangecontracts 239 (16) — (15) 56 4 — (66) (13) 189 (51)Equity contracts (1,446) 265 — 3 372 3 (15) (3) (93) (914) 283Commodity contracts (1,906) (67) — 44 (16) 12 — (8) 136 (1,805) 1Credit derivatives (848) (240) — (6) 7 — — — 81 (1,006) (231)
Total trading derivatives, net(4) $ (3,875) $ (48) $ — $ 15 $ 417 $ 19 $ (7) $ (77) $ 139 $ (3,417) $ 61
Table continues on the next page.

173
Net realized/unrealized
gains (losses) incl. in Transfers Unrealizedgains
(losses)still held(3)In millions of dollars
Jun. 30,2018
Principaltransactions Other(1)(2)
intoLevel 3
out ofLevel 3 Purchases Issuances Sales Settlements
Sept. 30,2018
InvestmentsMortgage-backedsecurities
U.S. government-sponsored agencyguaranteed $ 34 $ — $ — $ — $ — $ — $ — $ — $ — $ 34 $ —
Residential — — — — — — — — — — —
Commercial 6 — — — (1) — — — — 5 —Total investmentmortgage-backedsecurities $ 40 $ — $ — $ — $ (1) $ — $ — $ — $ — $ 39 $ —U.S. Treasury and federalagency securities $ — $ — $ — $ — $ — $ — $ — $ — $ — $ — $ —
State and municipal 762 — (10) — — 17 — (87) — 682 (7)
Foreign government 54 — (3) — (2) 45 — (13) — 81 (3)
Corporate 68 — — — (64) — — (4) — — —
Equity securities 1 — — — — — — — (1) — —
Asset-backed securities 456 — (6) — (177) 34 — (23) — 284 (5)
Other debt securities — — — — — — — — — — —Non-marketable equitysecurities 611 — (73) 163 — 71 — (40) 1 733 (70)
Total investments $ 1,992 $ — $ (92) $ 163 $ (244) $ 167 $ — $ (167) $ — $ 1,819 $ (85)
Loans $ 381 $ — $ (27) $ — $ (46) $ 79 $ — $ (3) $ (1) $ 383 $ 95
Mortgage servicing rights 596 — 25 — — — 14 — (17) 618 26Other financial assetsmeasured on a recurringbasis — — 15 — — — — (4) (11) — 14
Liabilities
Interest-bearing deposits $ 320 $ — $ 14 $ — $ — $ — $ — $ — $ (3) $ 303 $ 14Federal funds purchasedand securities loaned andsold under agreements torepurchase 966 (31) — — — — — — — 997 24
Trading account liabilitiesSecurities sold, not yetpurchased 189 (137) — 28 (55) 14 121 (45) (2) 387 (90)
Other trading liabilities — — — — — — — — — — —
Short-term borrowings 90 1 — — (18) — 5 — (37) 39 19
Long-term debt 13,781 (231) — 445 (646) — (42) (1) 23 13,791 (298)Other financial liabilitiesmeasured on a recurringbasis — — — — — — — — — — —
(1) Changes in fair value of available-for-sale debt securities are recorded in AOCI, unless related to other-than-temporary impairment, while gains and losses from sales are recorded in Realized gains (losses) from sales of investments on the Consolidated Statement of Income.
(2) Unrealized gains (losses) on MSRs are recorded in Other revenue on the Consolidated Statement of Income.(3) Represents the amount of total gains or losses for the period, included in earnings (and AOCI for changes in fair value of available-for-sale debt securities),
attributable to the change in fair value relating to assets and liabilities classified as Level 3 that are still held at September 30, 2018.(4) Total Level 3 trading derivative assets and liabilities have been netted in these tables for presentation purposes only.

174
Net realized/unrealized
gains (losses) incl. in Transfers Unrealizedgains
(losses)still held(3)In millions of dollars
Dec. 31,2017
Principaltransactions Other(1)(2)
intoLevel 3
out ofLevel 3 Purchases Issuances Sales Settlements
Sept. 30,2018
Assets Federal funds sold andsecurities borrowed andpurchased underagreements to resell 16 19 — 48 — 61 — — (79) 65 10Trading non-derivativeassets
Trading mortgage-backed securities
U.S. government-sponsored agencyguaranteed 163 — — 92 (97) 191 — (221) — 128 —Residential 164 116 — 75 (124) 99 — (115) — 215 (1)Commercial 57 (3) — 15 (45) 67 — (34) — 57 2
Total trading mortgage-backed securities 384 113 — 182 (266) 357 — (370) — 400 1
U.S. Treasury andfederal agency securities — — — 6 — 1 — — (1) 6 —State and municipal 274 16 — — (96) 35 — (29) — 200 8Foreign government 16 26 — 2 (13) 50 — (29) — 52 26Corporate 275 (119) — 85 (106) 389 — (271) — 253 (1)Equity securities 120 (5) — 24 (41) 266 — (194) — 170 (68)Asset-backed securities 1,590 31 — 65 (86) 994 — (1,141) — 1,453 (6)Other trading assets 615 161 — 179 (52) 342 7 (509) (13) 730 31
Total trading non-derivative assets 3,274 223 — 543 (660) 2,434 7 (2,543) (14) 3,264 (9)Trading derivatives, net(4)
Interest rate contracts (422) 597 — (6) (74) 8 8 (16) 24 119 540Foreign exchangecontracts 130 89 — (28) 59 11 — (71) (1) 189 52Equity contracts (2,027) 163 — (70) 1,123 20 (15) (14) (94) (914) 66Commodity contracts (1,861) (241) — 1 82 39 — (8) 183 (1,805) (70)Credit derivatives (799) (338) — (15) 19 2 — 1 124 (1,006) (468)
Total trading derivatives, net(4) (4,979) 270 — (118) 1,209 80 (7) (108) 236 (3,417) 120Investments
Mortgage-backedsecurities
U.S. government-sponsored agencyguaranteed 24 — 10 — — — — — — 34 (12)Residential — — — — — — — — — — —Commercial 3 — 2 1 (1) — — — — 5 —
Total investmentmortgage-backedsecurities 27 — 12 1 (1) — — — — 39 (12)U.S. Treasury andfederal agency securities — — — — — — — — — — —State and municipal 737 — (23) — (18) 157 — (171) — 682 (32)Foreign government 92 — (7) 1 (4) 107 — (108) — 81 (3)Corporate 71 — (1) 3 (66) 3 — (10) — — —Equity securities 2 — — — — — — (1) (1) — —Asset-backed securities 827 — (21) 3 (521) 45 — (49) — 284 (6)Other debt securities — — — — — — — — — — —Non-marketable equitysecurities 681 — (103) 193 — 86 — (73) (51) 733 (56)
Total investments 2,437 — (143) 201 (610) 398 — (412) (52) 1,819 (109)

175
Net realized/unrealized
gains (losses) incl. in Transfers Unrealizedgains
(losses)still held(3)In millions of dollars
Dec. 31,2017
Principaltransactions Other(1)(2)
intoLevel 3
out ofLevel 3 Purchases Issuances Sales Settlements
Sept. 30,2018
Loans 550 — (282) — 13 130 — (25) (3) 383 286Mortgage servicing rights 558 — 82 — — — 46 (18) (50) 618 83Other financial assetsmeasured on a recurringbasis 16 — 37 — (11) 4 12 (8) (50) — 53LiabilitiesInterest-bearing deposits 286 — 37 12 — — 45 — (3) 303 (104)Federal funds purchasedand securities loaned andsold under agreements torepurchase 726 8 — — — — 243 — 36 997 52Trading account liabilities
Securities sold, not yetpurchased 22 (384) — 35 (86) 14 121 (36) (67) 387 (128)
Other trading liabilities 5 5 — — — — — — — — —Short-term borrowings 18 2 — 48 (39) — 54 — (40) 39 22Long-term debt 13,082 (474) — 2,200 (1,950) 36 (35) (45) 29 13,791 (1,709)Other financial liabilitiesmeasured on a recurringbasis 8 — (2) 1 (10) — 2 — (3) — (9)
(1) Changes in fair value of available-for-sale debt securities are recorded in AOCI, unless related to other-than-temporary impairment, while gains and losses from sales are recorded in Realized gains (losses) from sales of investments on the Consolidated Statement of Income.
(2) Unrealized gains (losses) on MSRs are recorded in Other revenue on the Consolidated Statement of Income.(3) Represents the amount of total gains or losses for the period, included in earnings (and AOCI for changes in fair value of available-for-sale debt securities),
attributable to the change in fair value relating to assets and liabilities classified as Level 3 that are still held at December 31, 2017.(4) Total Level 3 trading derivative assets and liabilities have been netted in these tables for presentation purposes only.
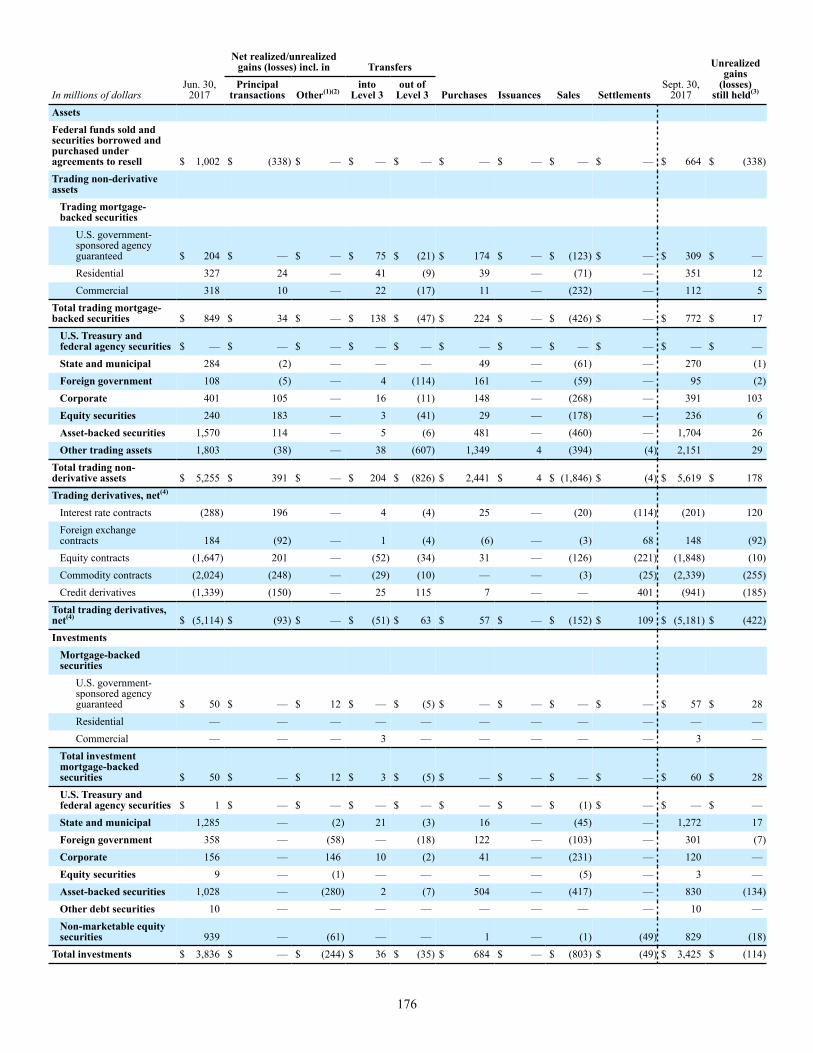
176
Net realized/unrealized
gains (losses) incl. in Transfers Unrealizedgains
(losses)still held(3)In millions of dollars
Jun. 30,2017
Principaltransactions Other(1)(2)
intoLevel 3
out ofLevel 3 Purchases Issuances Sales Settlements
Sept. 30,2017
Assets Federal funds sold andsecurities borrowed andpurchased underagreements to resell $ 1,002 $ (338) $ — $ — $ — $ — $ — $ — $ — $ 664 $ (338)Trading non-derivativeassets
Trading mortgage-backed securities
U.S. government-sponsored agencyguaranteed $ 204 $ — $ — $ 75 $ (21) $ 174 $ — $ (123) $ — $ 309 $ —Residential 327 24 — 41 (9) 39 — (71) — 351 12Commercial 318 10 — 22 (17) 11 — (232) — 112 5
Total trading mortgage-backed securities $ 849 $ 34 $ — $ 138 $ (47) $ 224 $ — $ (426) $ — $ 772 $ 17
U.S. Treasury andfederal agency securities $ — $ — $ — $ — $ — $ — $ — $ — $ — $ — $ —State and municipal 284 (2) — — — 49 — (61) — 270 (1)Foreign government 108 (5) — 4 (114) 161 — (59) — 95 (2)Corporate 401 105 — 16 (11) 148 — (268) — 391 103Equity securities 240 183 — 3 (41) 29 — (178) — 236 6Asset-backed securities 1,570 114 — 5 (6) 481 — (460) — 1,704 26Other trading assets 1,803 (38) — 38 (607) 1,349 4 (394) (4) 2,151 29
Total trading non-derivative assets $ 5,255 $ 391 $ — $ 204 $ (826) $ 2,441 $ 4 $ (1,846) $ (4) $ 5,619 $ 178Trading derivatives, net(4)
Interest rate contracts (288) 196 — 4 (4) 25 — (20) (114) (201) 120Foreign exchangecontracts 184 (92) — 1 (4) (6) — (3) 68 148 (92)Equity contracts (1,647) 201 — (52) (34) 31 — (126) (221) (1,848) (10)Commodity contracts (2,024) (248) — (29) (10) — — (3) (25) (2,339) (255)Credit derivatives (1,339) (150) — 25 115 7 — — 401 (941) (185)
Total trading derivatives, net(4) $ (5,114) $ (93) $ — $ (51) $ 63 $ 57 $ — $ (152) $ 109 $ (5,181) $ (422)Investments
Mortgage-backedsecurities
U.S. government-sponsored agencyguaranteed $ 50 $ — $ 12 $ — $ (5) $ — $ — $ — $ — $ 57 $ 28Residential — — — — — — — — — — —Commercial — — — 3 — — — — — 3 —
Total investmentmortgage-backedsecurities $ 50 $ — $ 12 $ 3 $ (5) $ — $ — $ — $ — $ 60 $ 28U.S. Treasury andfederal agency securities $ 1 $ — $ — $ — $ — $ — $ — $ (1) $ — $ — $ —State and municipal 1,285 — (2) 21 (3) 16 — (45) — 1,272 17Foreign government 358 — (58) — (18) 122 — (103) — 301 (7)Corporate 156 — 146 10 (2) 41 — (231) — 120 —Equity securities 9 — (1) — — — — (5) — 3 —Asset-backed securities 1,028 — (280) 2 (7) 504 — (417) — 830 (134)Other debt securities 10 — — — — — — — — 10 —Non-marketable equitysecurities 939 — (61) — — 1 — (1) (49) 829 (18)
Total investments $ 3,836 $ — $ (244) $ 36 $ (35) $ 684 $ — $ (803) $ (49) $ 3,425 $ (114)
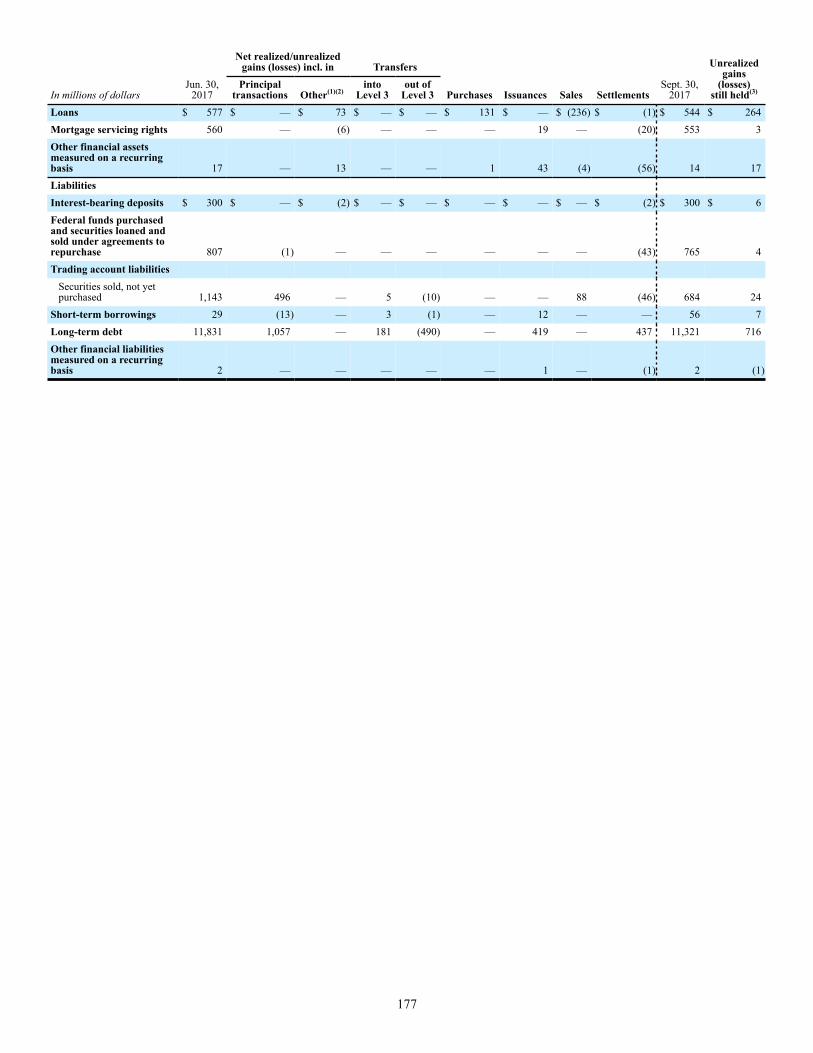
177
Net realized/unrealized
gains (losses) incl. in Transfers Unrealizedgains
(losses)still held(3)In millions of dollars
Jun. 30,2017
Principaltransactions Other(1)(2)
intoLevel 3
out ofLevel 3 Purchases Issuances Sales Settlements
Sept. 30,2017
Loans $ 577 $ — $ 73 $ — $ — $ 131 $ — $ (236) $ (1) $ 544 $ 264Mortgage servicing rights 560 — (6) — — — 19 — (20) 553 3Other financial assetsmeasured on a recurringbasis 17 — 13 — — 1 43 (4) (56) 14 17LiabilitiesInterest-bearing deposits $ 300 $ — $ (2) $ — $ — $ — $ — $ — $ (2) $ 300 $ 6Federal funds purchasedand securities loaned andsold under agreements torepurchase 807 (1) — — — — — — (43) 765 4Trading account liabilities
Securities sold, not yetpurchased 1,143 496 — 5 (10) — — 88 (46) 684 24
Short-term borrowings 29 (13) — 3 (1) — 12 — — 56 7Long-term debt 11,831 1,057 — 181 (490) — 419 — 437 11,321 716Other financial liabilitiesmeasured on a recurringbasis 2 — — — — — 1 — (1) 2 (1)

178
Net realized/unrealized
gains (losses) incl. in Transfers Unrealizedgains
(losses)still held(3)In millions of dollars
Dec. 31,2016
Principaltransactions Other(1)(2)
intoLevel 3
out ofLevel 3 Purchases Issuances Sales Settlements
Sept. 30,2017
Assets Federal funds sold andsecurities borrowed andpurchased underagreements to resell $ 1,496 $ (340) $ — $ — $ (491) $ — $ — $ — $ (1) $ 664 $ —Trading non-derivativeassets
Trading mortgage-backed securities
U.S. government-sponsored agencyguaranteed 176 4 — 154 (86) 438 — (377) — 309 1Residential 399 61 — 88 (58) 105 — (244) — 351 35Commercial 206 7 — 66 (46) 445 — (566) — 112 (5)
Total trading mortgage-backed securities $ 781 $ 72 $ — $ 308 $ (190) $ 988 $ — $ (1,187) $ — $ 772 $ 31
U.S. Treasury andfederal agency securities $ 1 $ — $ — $ — $ — $ — $ — $ (1) $ — $ — $ —State and municipal 296 3 — 24 (48) 137 — (142) — 270 (1)Foreign government 40 2 — 88 (204) 288 — (119) — 95 (1)Corporate 324 320 — 132 (84) 424 — (725) — 391 167Equity securities 127 212 — 135 (54) 38 — (222) — 236 20Asset-backed securities 1,868 251 — 28 (87) 1,185 — (1,541) — 1,704 34Other trading assets 2,814 (88) — 470 (1,381) 2,002 5 (1,652) (19) 2,151 29
Total trading non-derivative assets $ 6,251 $ 772 $ — $ 1,185 $ (2,048) $ 5,062 $ 5 $ (5,589) $ (19) $ 5,619 $ 279Trading derivatives, net(4)
Interest rate contracts $ (663) $ 4 $ — $ (24) $ 647 $ 90 $ — $ (225) $ (30) $ (201) $ 65Foreign exchangecontracts 413 (389) — 54 (63) 32 — (37) 138 148 (134)Equity contracts (1,557) 98 — (34) (8) 180 — (263) (264) (1,848) (22)Commodity contracts (1,945) (576) — 29 39 — — (3) 117 (2,339) (255)Credit derivatives (1,001) (535) — (43) 91 5 — 2 540 (941) (197)
Total trading derivatives, net(4) $ (4,753) $ (1,398) $ — $ (18) $ 706 $ 307 $ — $ (526) $ 501 $ (5,181) $ (543)Investments
Mortgage-backedsecurities
U.S. government-sponsored agencyguaranteed $ 101 $ — $ 15 $ 1 $ (60) $ — $ — $ — $ — $ 57 $ 30Residential 50 — 2 — (47) — — (5) — — —Commercial — — — 3 — 8 — (8) — 3 —
Total investmentmortgage-backedsecurities $ 151 $ — $ 17 $ 4 $ (107) $ 8 $ — $ (13) $ — $ 60 $ 30U.S. Treasury andfederal agency securities $ 2 $ — $ — $ — $ — $ — $ — $ (2) $ — $ — $ —State and municipal 1,211 — 37 70 (36) 92 — (102) — 1,272 35Foreign government 186 — (47) 2 (37) 455 — (258) — 301 (5)Corporate 311 — 11 74 (6) 224 — (494) — 120 —Equity securities 9 — (1) — — — — (5) — 3 —Asset-backed securities 660 — (98) 23 (20) 864 — (599) — 830 (134)Other debt securities — — — — — 21 — (11) — 10 —Non-marketable equitysecurities 1,331 — (124) 2 — 10 — (228) (162) 829 49
Total investments $ 3,861 $ — $ (205) $ 175 $ (206) $ 1,674 $ — $ (1,712) $ (162) $ 3,425 $ (25)
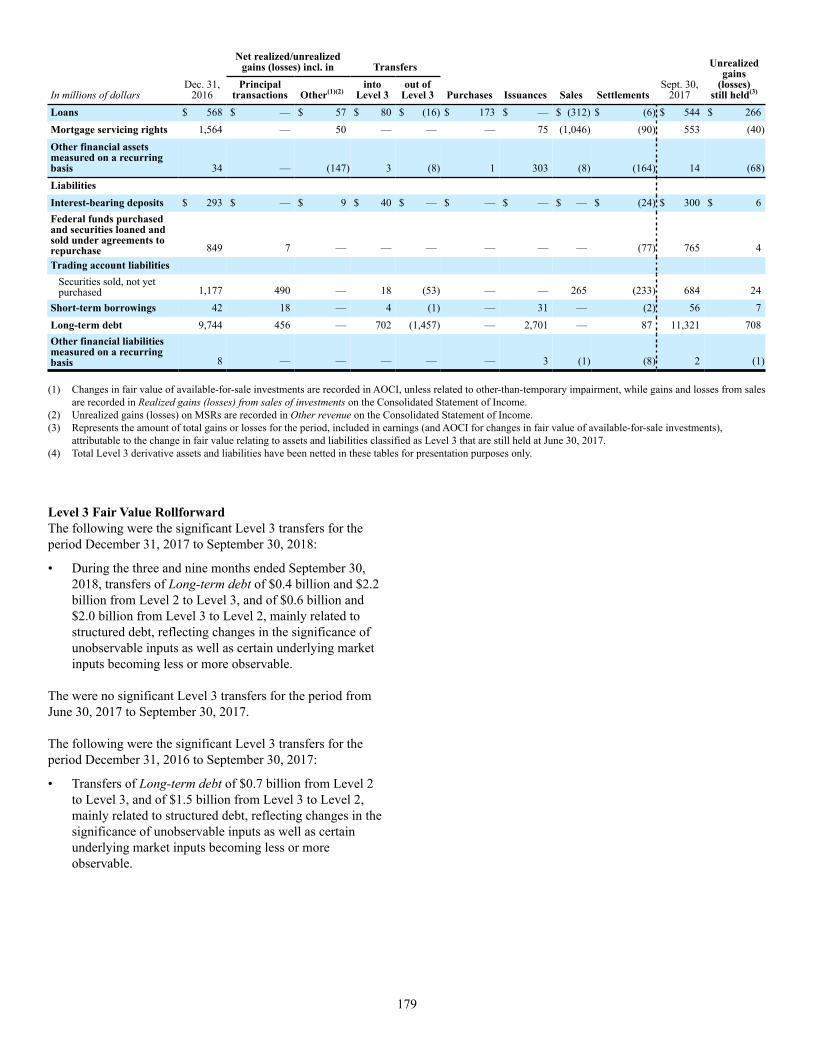
179
Net realized/unrealized
gains (losses) incl. in Transfers Unrealizedgains
(losses)still held(3)In millions of dollars
Dec. 31,2016
Principaltransactions Other(1)(2)
intoLevel 3
out ofLevel 3 Purchases Issuances Sales Settlements
Sept. 30,2017
Loans $ 568 $ — $ 57 $ 80 $ (16) $ 173 $ — $ (312) $ (6) $ 544 $ 266Mortgage servicing rights 1,564 — 50 — — — 75 (1,046) (90) 553 (40)Other financial assetsmeasured on a recurringbasis 34 — (147) 3 (8) 1 303 (8) (164) 14 (68)LiabilitiesInterest-bearing deposits $ 293 $ — $ 9 $ 40 $ — $ — $ — $ — $ (24) $ 300 $ 6Federal funds purchasedand securities loaned andsold under agreements torepurchase 849 7 — — — — — — (77) 765 4Trading account liabilities
Securities sold, not yetpurchased 1,177 490 — 18 (53) — — 265 (233) 684 24
Short-term borrowings 42 18 — 4 (1) — 31 — (2) 56 7Long-term debt 9,744 456 — 702 (1,457) — 2,701 — 87 11,321 708Other financial liabilitiesmeasured on a recurringbasis 8 — — — — — 3 (1) (8) 2 (1)
(1) Changes in fair value of available-for-sale investments are recorded in AOCI, unless related to other-than-temporary impairment, while gains and losses from sales are recorded in Realized gains (losses) from sales of investments on the Consolidated Statement of Income.
(2) Unrealized gains (losses) on MSRs are recorded in Other revenue on the Consolidated Statement of Income.(3) Represents the amount of total gains or losses for the period, included in earnings (and AOCI for changes in fair value of available-for-sale investments),
attributable to the change in fair value relating to assets and liabilities classified as Level 3 that are still held at June 30, 2017.(4) Total Level 3 derivative assets and liabilities have been netted in these tables for presentation purposes only.
Level 3 Fair Value RollforwardThe following were the significant Level 3 transfers for the period December 31, 2017 to September 30, 2018:
• During the three and nine months ended September 30, 2018, transfers of Long-term debt of $0.4 billion and $2.2 billion from Level 2 to Level 3, and of $0.6 billion and $2.0 billion from Level 3 to Level 2, mainly related to structured debt, reflecting changes in the significance of unobservable inputs as well as certain underlying market inputs becoming less or more observable.
The were no significant Level 3 transfers for the period from June 30, 2017 to September 30, 2017.
The following were the significant Level 3 transfers for the period December 31, 2016 to September 30, 2017:
• Transfers of Long-term debt of $0.7 billion from Level 2 to Level 3, and of $1.5 billion from Level 3 to Level 2, mainly related to structured debt, reflecting changes in the significance of unobservable inputs as well as certain underlying market inputs becoming less or more observable.
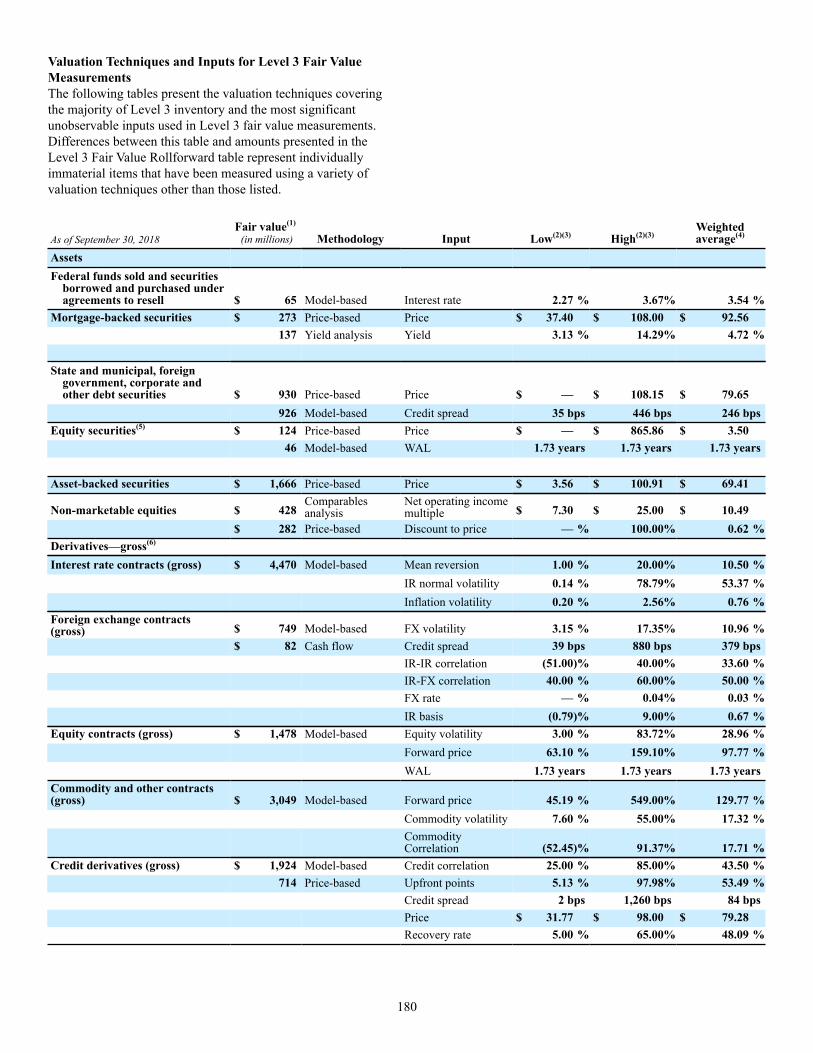
180
Valuation Techniques and Inputs for Level 3 Fair Value MeasurementsThe following tables present the valuation techniques covering the majority of Level 3 inventory and the most significant unobservable inputs used in Level 3 fair value measurements. Differences between this table and amounts presented in the Level 3 Fair Value Rollforward table represent individually immaterial items that have been measured using a variety of valuation techniques other than those listed.
As of September 30, 2018Fair value(1)
(in millions) Methodology Input Low(2)(3) High(2)(3)Weightedaverage(4)
Assets Federal funds sold and securities
borrowed and purchased underagreements to resell $ 65 Model-based Interest rate 2.27 % 3.67% 3.54 %
Mortgage-backed securities $ 273 Price-based Price $ 37.40 $ 108.00 $ 92.56137 Yield analysis Yield 3.13 % 14.29% 4.72 %
State and municipal, foreigngovernment, corporate andother debt securities $ 930 Price-based Price $ — $ 108.15 $ 79.65
926 Model-based Credit spread 35 bps 446 bps 246 bpsEquity securities(5) $ 124 Price-based Price $ — $ 865.86 $ 3.50
46 Model-based WAL 1.73 years 1.73 years 1.73 years
Asset-backed securities $ 1,666 Price-based Price $ 3.56 $ 100.91 $ 69.41
Non-marketable equities $ 428Comparablesanalysis
Net operating incomemultiple $ 7.30 $ 25.00 $ 10.49
$ 282 Price-based Discount to price — % 100.00% 0.62 %Derivatives—gross(6)
Interest rate contracts (gross) $ 4,470 Model-based Mean reversion 1.00 % 20.00% 10.50 %IR normal volatility 0.14 % 78.79% 53.37 %Inflation volatility 0.20 % 2.56% 0.76 %
Foreign exchange contracts(gross) $ 749 Model-based FX volatility 3.15 % 17.35% 10.96 %
$ 82 Cash flow Credit spread 39 bps 880 bps 379 bpsIR-IR correlation (51.00)% 40.00% 33.60 %IR-FX correlation 40.00 % 60.00% 50.00 %FX rate — % 0.04% 0.03 %IR basis (0.79)% 9.00% 0.67 %
Equity contracts (gross) $ 1,478 Model-based Equity volatility 3.00 % 83.72% 28.96 %Forward price 63.10 % 159.10% 97.77 %WAL 1.73 years 1.73 years 1.73 years
Commodity and other contracts(gross) $ 3,049 Model-based Forward price 45.19 % 549.00% 129.77 %
Commodity volatility 7.60 % 55.00% 17.32 %CommodityCorrelation (52.45)% 91.37% 17.71 %
Credit derivatives (gross) $ 1,924 Model-based Credit correlation 25.00 % 85.00% 43.50 %714 Price-based Upfront points 5.13 % 97.98% 53.49 %
Credit spread 2 bps 1,260 bps 84 bpsPrice $ 31.77 $ 98.00 $ 79.28Recovery rate 5.00 % 65.00% 48.09 %

181
As of September 30, 2018Fair value(1)
(in millions) Methodology Input Low(2)(3) High(2)(3)Weightedaverage(4)
Loans and leases $ 318 Model-based Credit spread 128 bps 215 bps 161 bps66 Price-based Yield 4.15 % 4.15% 4.15 %
Mortgage servicing rights $ 531 Cash flow Yield 4.79 % 12.00% 8.31 %87 Model-based WAL 4.11 years 8.10 years 6.92 years
LiabilitiesInterest-bearing deposits $ 303 Model-based Mean reversion — % 20.00% 7.95 %
Forward price 99.23 % 106.69% 101.80 %
Equity volatility 7.34 % 20.78% 17.98 %Federal funds purchased and
securities loaned and soldunder agreement to repurchase $ 997 Model-based Interest rate 2.27 % 3.41% 3.14 %
Trading account liabilitiesSecurities sold, not yet purchased $ 360 Model-based Forward price 45.19 % 549.00% 100.21 %
Equity volatility 3.00 % 83.72% 22.17 %Equity-equity
correlation (81.39)% 100.00% 41.02 %Equity-FX
correlation (82.74)% 54.00% (32.58)%Mean reversion 1.00 % 20.00% 10.50 %
Short-term borrowings and long-term debt $ 12,944 Model-based Mean reversion 1.00 % 20.00% 10.50 %
Forward price 65.99 % 259.53% 103.59 %
Equity volatility 3.00 % 83.72% 19.28 %
As of December 31, 2017Fair value(1)
(in millions) Methodology Input Low(2)(3) High(2)(3)Weightedaverage(4)
Assets Federal funds sold and securities
borrowed and purchased underagreements to resell $ 16 Model-based Interest rate 1.43 % 2.16% 2.09%
Mortgage-backed securities $ 214 Price-based Price $ 2.96 $ 101.00 $ 56.52184 Yield analysis Yield 2.52 % 14.06% 5.97%
State and municipal, foreigngovernment, corporate and otherdebt securities $ 949 Model-based Price $ — $ 184.04 $ 91.74
914 Price-based Credit spread 35 bps 500 bps 249 bpsYield 2.36 % 14.25% 6.03%
Equity securities(5) $ 65 Price-based Price $ — $ 25,450.00 $ 2,526.6255 Model-based WAL 2.50 years 2.50 years 2.50 years
Asset-backed securities $ 2,287 Price-based Price $ 4.25 $ 100.60 $ 74.57
Non-marketable equity $ 423 Comparables analysis EBITDA multiples 6.90x 12.80x 8.66x223 Price-based Discount to price — % 100.00% 11.83%
Price-to-book ratio 0.05x 1.00x 0.32xDerivatives—gross(6)
Interest rate contracts (gross) $ 3,818 Model-basedIR normal
volatility 9.40 % 77.40% 58.86%Mean reversion 1.00 % 20.00% 10.50%
Foreign exchange contracts (gross) $ 940 Model-basedForeign exchange
(FX) volatility 4.58 % 15.02% 8.16%

182
As of December 31, 2017Fair value(1)
(in millions) Methodology Input Low(2)(3) High(2)(3)Weightedaverage(4)
Interest rate (0.55)% 0.28% 0.04%IR-IR correlation (51.00)% 40.00% 36.56%IR-FX correlation (7.34)% 60.00% 49.04%Credit spread 11 bps 717 bps 173 bps
Equity contracts (gross)(7) $ 2,897 Model-based Equity volatility 3.00 % 68.93% 24.66%Forward price 69.74 % 154.19% 92.80%
Commodity contracts (gross) $ 2,937 Model-based Forward price 3.66 % 290.59% 114.16%Commodityvolatility 8.60 % 66.73% 25.04%Commoditycorrelation (37.64)% 91.71% 15.21%
Credit derivatives (gross) $ 1,797 Model-based Credit correlation 25.00 % 90.00% 44.64%823 Price-based Upfront points 6.03 % 97.26% 62.88%
Credit spread 3 bps 1,636 bps 173 bpsPrice $ 1.00 $ 100.24 $ 57.63
Nontrading derivatives and other financial assets and liabilities measured on a recurring basis (gross)(6) $ 24 Model-based Recovery rate 25.00 % 40.00% 31.56%
Redemption rate 10.72 % 99.50% 74.24%Credit spread 38 bps 275 bps 127 bpsUpfront points 61.00 % 61.00% 61.00%
Loans and leases $ 391 Model-based Equity volatility 3.00 % 68.93% 22.52%148 Price-based Credit spread 134 bps 500 bps 173 bps
Yield 3.09 % 4.40% 3.13%Mortgage servicing rights $ 471 Cash flow Yield 8.00 % 16.38% 11.47%
87 Model-based WAL 3.83 years 6.89 years 5.93 yearsLiabilitiesInterest-bearing deposits $ 286 Model-based Mean reversion 1.00 % 20.00% 10.50%
Forward price 99.56 % 99.95% 99.72%Federal funds purchased and
securities loaned and sold underagreements to repurchase $ 726 Model-based Interest rate 1.43 % 2.16% 2.09%
Trading account liabilitiesSecurities sold, not yet purchased $ 21 Price-based Price $ 1.00 $ 287.64 $ 88.19
Short-term borrowings and long-term debt $ 13,100 Model-based Forward price 69.74 % 161.11% 100.70%
(1) The fair value amounts presented in these tables represent the primary valuation technique or techniques for each class of assets or liabilities.(2) Some inputs are shown as zero due to rounding.(3) When the low and high inputs are the same, there is either a constant input applied to all positions, or the methodology involving the input applies to only one
large position.(4) Weighted averages are calculated based on the fair values of the instruments.(5) For equity securities, the price inputs are expressed on an absolute basis, not as a percentage of the notional amount.(6) Both trading and nontrading account derivatives—assets and liabilities—are presented on a gross absolute value basis.(7) Includes hybrid products.
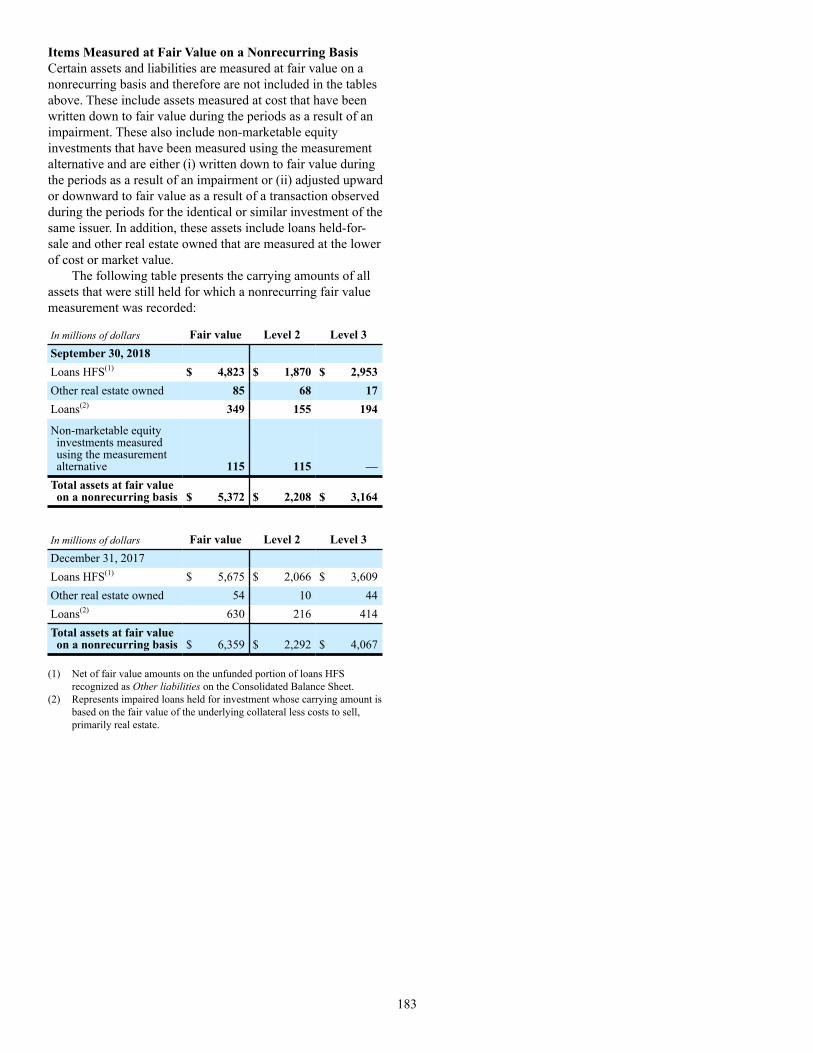
183
Items Measured at Fair Value on a Nonrecurring BasisCertain assets and liabilities are measured at fair value on a nonrecurring basis and therefore are not included in the tables above. These include assets measured at cost that have been written down to fair value during the periods as a result of an impairment. These also include non-marketable equity investments that have been measured using the measurement alternative and are either (i) written down to fair value during the periods as a result of an impairment or (ii) adjusted upward or downward to fair value as a result of a transaction observed during the periods for the identical or similar investment of the same issuer. In addition, these assets include loans held-for-sale and other real estate owned that are measured at the lower of cost or market value.
The following table presents the carrying amounts of all assets that were still held for which a nonrecurring fair value measurement was recorded:
In millions of dollars Fair value Level 2 Level 3September 30, 2018 Loans HFS(1) $ 4,823 $ 1,870 $ 2,953Other real estate owned 85 68 17Loans(2) 349 155 194
Non-marketable equityinvestments measuredusing the measurementalternative 115 115 —
Total assets at fair valueon a nonrecurring basis $ 5,372 $ 2,208 $ 3,164
In millions of dollars Fair value Level 2 Level 3December 31, 2017 Loans HFS(1) $ 5,675 $ 2,066 $ 3,609Other real estate owned 54 10 44Loans(2) 630 216 414Total assets at fair valueon a nonrecurring basis $ 6,359 $ 2,292 $ 4,067
(1) Net of fair value amounts on the unfunded portion of loans HFS recognized as Other liabilities on the Consolidated Balance Sheet.
(2) Represents impaired loans held for investment whose carrying amount is based on the fair value of the underlying collateral less costs to sell, primarily real estate.

184
Valuation Techniques and Inputs for Level 3 Nonrecurring Fair Value Measurements The following table presents the valuation techniques covering the majority of Level 3 nonrecurring fair value measurements and the most significant unobservable inputs used in those measurements:
As of September 30, 2018Fair value(1)
(in millions) Methodology Input Low(2) HighWeightedaverage(3)
Loans held-for-sale $ 2,533 Price-based Price $ 80.90 $ 100.00 $ 99.26Other real estate owned $ 17 Price-based Appraised value $ 2,353,777 $ 8,394,102 $ 7,071,276
Discount to price 13.00% 13.00% 13.00%Price $ 56.31 $ 56.31 $ 56.31
Loans(5) $ 123 Recovery analysis Price $ 13.36 $ 100.00 $ 92.33
54 Price-based Recovery rate 9.00% 90.00% 76.62%
Appraised Value $ 9,855,140 $ 55,972,000 $ 38,154,269
As of December 31, 2017Fair value(1)
(in millions) Methodology Input Low(2) HighWeightedaverage(3)
Loans held-for-sale $ 3,186 Price-based Price $ 77.93 $ 100.00 $ 99.26Other real estate owned $ 42 Price-based Appraised value(4) $ 20,278 $ 8,091,760 $ 4,016,665
Discount to price(5) 34.00% 34.00% 34.00%Price $ 30.00 $ 50.36 $ 49.09
Loans(6) $ 133 Price-based Price $ 2.80 $ 100.00 $ 62.46129 Cash flow Recovery rate 50.00% 100.00% 63.59%127 Recovery analysis Appraised value $ — $ 45,500,000 $ 38,785,667
(1) The fair value amounts presented in this table represent the primary valuation technique or techniques for each class of assets or liabilities.(2) Some inputs are shown as zero due to rounding.(3) Weighted averages are calculated based on the fair values of the instruments.(4) Appraised values are disclosed in whole dollars.(5) Includes estimated costs to sell.(6) Represents impaired loans held for investment whose carrying amounts are based on the fair value of the underlying collateral, primarily real estate secured loans.
Nonrecurring Fair Value ChangesThe following table presents total nonrecurring fair value measurements for the period, included in earnings, attributable to the change in fair value relating to assets that were still held:
Three Months EndedSeptember 30,
In millions of dollars 2018 2017Loans HFS $ (1) $ 10Other real estate owned (1) (4)Loans(1) (22) (66)Non-marketable equity investments measured using the measurement alternative 7 —
Total nonrecurring fair value gains (losses) $ (17) $ (60)
(1) Represents loans held for investment whose carrying amount is based on the fair value of the underlying collateral, primarily real estate.
Nine Months EndedSeptember 30,
In millions of dollars 2018 2017Loans HFS $ 8 $ (15)Other real estate owned (2) (6)Loans(1) (51) (110)Non-marketable equity investmentsmeasured using the measurementalternative 111 —
Total nonrecurring fair value gains (losses) $ 66 $ (131)
(1) Represents loans held for investment whose carrying amount is based on the fair value of the underlying collateral, primarily real estate.

185
Estimated Fair Value of Financial Instruments Not Carried at Fair Value The following table presents the carrying value and fair value of Citigroup’s financial instruments that are not carried at fair value. The table below therefore excludes items measured at fair value on a recurring basis presented in the tables above.
September 30, 2018 Estimated fair value Carrying
valueEstimatedfair valueIn billions of dollars Level 1 Level 2 Level 3
Assets Investments $ 58.9 $ 58.0 $ 1.1 $ 54.9 $ 2.0Federal funds sold and securities borrowed and purchased under agreements toresell 102.5 102.5 — 100.5 2.0Loans(1)(2) 656.7 655.2 — 5.2 650.0Other financial assets(2)(3) 263.9 264.4 184.6 14.7 65.1Liabilities Deposits $ 1,003.7 $ 1,002.8 $ — $ 836.7 $ 166.1Federal funds purchased and securities loaned or sold under agreements torepurchase 127.8 127.8 — 127.8 —Long-term debt(4) 198.5 200.6 — 186.3 14.3Other financial liabilities(5) 110.6 110.6 — 16.1 94.5
December 31, 2017 Estimated fair value Carrying
valueEstimatedfair valueIn billions of dollars Level 1 Level 2 Level 3
Assets Investments $ 60.2 $ 60.6 $ 0.5 $ 57.5 $ 2.6Federal funds sold and securities borrowed and purchased under agreements toresell 99.5 99.5 — 94.4 5.1Loans(1)(2) 648.6 644.9 — 6.0 638.9Other financial assets(2)(3) 242.6 243.0 166.4 14.1 62.5Liabilities Deposits $ 958.4 $ 955.6 $ — $ 816.1 $ 139.5Federal funds purchased and securities loaned or sold under agreements torepurchase 115.6 115.6 — 115.6 —Long-term debt(4) 205.3 214.0 — 187.2 26.8Other financial liabilities(5) 129.9 129.9 — 15.5 114.4
(1) The carrying value of loans is net of the Allowance for loan losses of $12.3 billion for September 30, 2018 and $12.4 billion for December 31, 2017. In addition, the carrying values exclude $1.6 billion and $1.7 billion of lease finance receivables at September 30, 2018 and December 31, 2017, respectively.
(2) Includes items measured at fair value on a nonrecurring basis.(3) Includes cash and due from banks, deposits with banks, brokerage receivables, reinsurance recoverables and other financial instruments included in Other assets
on the Consolidated Balance Sheet, for all of which the carrying value is a reasonable estimate of fair value.(4) The carrying value includes long-term debt balances under qualifying fair value hedges.(5) Includes brokerage payables, separate and variable accounts, short-term borrowings (carried at cost) and other financial instruments included in Other liabilities
on the Consolidated Balance Sheet, for all of which the carrying value is a reasonable estimate of fair value.
The estimated fair values of the Company’s corporate unfunded lending commitments at September 30, 2018 and December 31, 2017 were liabilities of $3.2 billion, respectively, substantially all of which are classified as Level 3. The Company does not estimate the fair values of consumer unfunded lending commitments, which are generally cancellable by providing notice to the borrower.

186
21. FAIR VALUE ELECTIONS
The Company may elect to report most financial instruments and certain other items at fair value on an instrument-by-instrument basis with changes in fair value reported in earnings, other than DVA (see below). The election is made upon the initial recognition of an eligible financial asset, financial liability or firm commitment or when certain specified reconsideration events occur. The fair value election may not be revoked once an election is made. The changes in
fair value are recorded in current earnings, other than DVA, which from January 1, 2016 are reported in AOCI. Additional discussion regarding the applicable areas in which fair value elections were made is presented in Note 20 to the Consolidated Financial Statements.
The Company has elected fair value accounting for its mortgage servicing rights. See Note 18 to the Consolidated Financial Statements for further discussions regarding the accounting and reporting of MSRs.
The following table presents the changes in fair value of those items for which the fair value option has been elected:
Changes in fair value—gains (losses) Three Months Ended September 30, Nine Months Ended September 30,In millions of dollars 2018 2017 2018 2017Assets Federal funds sold and securities borrowed andpurchased under agreements to resell $ (17) $ (17) $ (14) $ (108)Trading account assets 3 581 (98) 1,243Investments — — — (3)Loans
Certain corporate loans 11 (61) (115) (42)Certain consumer loans — 1 — 3
Total loans $ 11 $ (60) $ (115) $ (39)Other assets
MSRs $ 25 $ (6) $ 82 $ 50Certain mortgage loans held-for-sale(1) 9 34 21 115
Total other assets $ 34 $ 28 $ 103 $ 165Total assets $ 31 $ 532 $ (124) $ 1,258Liabilities Interest-bearing deposits $ (20) $ (16) $ 18 $ (60)Federal funds purchased and securities loaned and soldunder agreements to repurchase 230 97 104 183Trading account liabilities 25 19 4 70Short-term borrowings 20 (30) 138 (110)Long-term debt (270) (510) 1,269 (981)Total liabilities $ (15) $ (440) $ 1,533 $ (898)
(1) Includes gains (losses) associated with interest rate lock commitments for those loans that have been originated and elected under the fair value option.

187
Own Debt Valuation Adjustments (DVA)Own debt valuation adjustments are recognized on Citi’s liabilities for which the fair value option has been elected using Citi’s credit spreads observed in the bond market. Effective January 1, 2016, changes in fair value of fair value option liabilities related to changes in Citigroup’s own credit spreads (DVA) are reflected as a component of AOCI; previously these amounts were recognized in Citigroup’s Revenues and Net income along with all other changes in fair value. See Note 1 to the Consolidated Financial Statements for additional information.
Among other variables, the fair value of liabilities for which the fair value option has been elected (other than non-recourse and similar liabilities) is impacted by the narrowing or widening of the Company’s credit spreads.
The estimated change in the fair value of these liabilities due to such changes in the Company’s own credit spread (or instrument-specific credit risk) was a loss of $377 million and a loss of $195 million for the three months ended September 30, 2018 and 2017, and a gain of $208 million and a loss of $422 million for the nine months ended September 30, 2018 and 2017, respectively. Changes in fair value resulting from changes in instrument-specific credit risk were estimated by incorporating the Company’s current credit spreads observable in the bond market into the relevant valuation technique used to value each liability as described above.
The Fair Value Option for Financial Assets and Financial Liabilities
Selected Portfolios of Securities Purchased Under Agreements to Resell, Securities Borrowed, Securities Sold Under Agreements to Repurchase, Securities Loaned and Certain Non-Collateralized Short-Term BorrowingsThe Company elected the fair value option for certain portfolios of fixed income securities purchased under agreements to resell and fixed income securities sold under agreements to repurchase, securities borrowed, securities loaned and certain non-collateralized short-term borrowings held primarily by broker-dealer entities in the United States, United Kingdom and Japan. In each case, the election was made because the related interest rate risk is managed on a portfolio basis, primarily with offsetting derivative instruments that are accounted for at fair value through earnings.
Changes in fair value for transactions in these portfolios are recorded in Principal transactions. The related interest revenue and interest expense are measured based on the contractual rates specified in the transactions and are reported as Interest revenue and Interest expense in the Consolidated Statement of Income.
Certain Loans and Other Credit ProductsCitigroup has also elected the fair value option for certain other originated and purchased loans, including certain unfunded loan products, such as guarantees and letters of credit, executed by Citigroup’s lending and trading businesses. None of these credit products are highly leveraged financing commitments. Significant groups of transactions include loans and unfunded loan products that are expected to be either sold or securitized in the near term, or transactions where the economic risks are hedged with derivative instruments, such as purchased credit default swaps or total return swaps where the Company pays the total return on the underlying loans to a third party. Citigroup has elected the fair value option to mitigate accounting mismatches in cases where hedge accounting is complex and to achieve operational simplifications. Fair value was not elected for most lending transactions across the Company.
The following table provides information about certain credit products carried at fair value:
September 30, 2018 December 31, 2017
In millions of dollars Trading assets Loans Trading assets LoansCarrying amount reported on the Consolidated Balance Sheet $ 8,922 $ 4,239 $ 8,851 $ 4,374Aggregate unpaid principal balance in excess of (less than) fair value 432 538 623 682Balance of non-accrual loans or loans more than 90 days past due — 1 — 1Aggregate unpaid principal balance in excess of fair value for non-accrual loans orloans more than 90 days past due — — — 1

188
In addition to the amounts reported above, $1,043 million and $508 million of unfunded commitments related to certain credit products selected for fair value accounting were outstanding as of September 30, 2018 and December 31, 2017, respectively.
Changes in the fair value of funded and unfunded credit products are classified in Principal transactions in Citi’s Consolidated Statement of Income. Related interest revenue is measured based on the contractual interest rates and reported as Interest revenue on Trading account assets or loan interest depending on the balance sheet classifications of the credit products. The changes in fair value for the nine months ended September 30, 2018 and 2017 due to instrument-specific credit risk totaled to a loss of $13 million and a gain of $57 million, respectively.
Certain Investments in Unallocated Precious MetalsCitigroup invests in unallocated precious metals accounts (gold, silver, platinum and palladium) as part of its commodity and foreign currency trading activities or to economically hedge certain exposures from issuing structured liabilities. Under ASC 815, the investment is bifurcated into a debt host contract and a commodity forward derivative instrument. Citigroup elects the fair value option for the debt host contract, and reports the debt host contract within Trading account assets on the Company’s Consolidated Balance Sheet. The total carrying amount of debt host contracts across unallocated precious metals accounts was approximately $0.4 billion and $0.9 billion at September 30, 2018 and December 31, 2017, respectively. The amounts are expected to fluctuate based on trading activity in future periods.
As part of its commodity and foreign currency trading activities, Citi trades unallocated precious metals investments and executes forward purchase and forward sale derivative contracts with trading counterparties. When Citi sells an unallocated precious metals investment, Citi’s receivable from its depository bank is repaid and Citi derecognizes its investment in the unallocated precious metal. The forward purchase or sale contract with the trading counterparty indexed to unallocated precious metals is accounted for as a derivative, at fair value through earnings. As of September 30, 2018, there were approximately $12.0 billion and $10.6 billion of notional amounts of such forward purchase and forward sale derivative contracts outstanding, respectively.
Certain Investments in Private Equity and Real Estate Ventures and Certain Equity Method and Other InvestmentsCitigroup invests in private equity and real estate ventures for the purpose of earning investment returns and for capital appreciation. The Company has elected the fair value option for certain of these ventures, because such investments are considered similar to many private equity or hedge fund activities in Citi’s investment companies, which are reported at fair value. The fair value option brings consistency in the accounting and evaluation of these investments. All investments (debt and equity) in such private equity and real estate entities are accounted for at fair value. These investments are classified as Investments on Citigroup’s Consolidated Balance Sheet.
Changes in the fair values of these investments are classified in Other revenue in the Company’s Consolidated Statement of Income.
Citigroup also elected the fair value option for certain non-marketable equity securities, whose risk is managed with derivative instruments that are accounted for at fair value through earnings. These securities are classified as Trading account assets on Citigroup’s Consolidated Balance Sheet. Changes in the fair value of these securities and the related derivative instruments are recorded in Principal transactions. Effective January 1, 2018, under ASU 2016-01 and ASU 2018-03, a fair value option election is no longer required to measure these non-marketable equity securities at fair value through earnings. See Note 1 to the Consolidated Financial Statements for additional details.
Certain Mortgage Loans Held-for-Sale (HFS)Citigroup has elected the fair value option for certain purchased and originated prime fixed-rate and conforming adjustable-rate first mortgage loans HFS. These loans are intended for sale or securitization and are hedged with derivative instruments. The Company has elected the fair value option to mitigate accounting mismatches in cases where hedge accounting is complex and to achieve operational simplifications.
The following table provides information about certain mortgage loans HFS carried at fair value:
In millions of dollarsSeptember 30,
2018December 31,
2017Carrying amount reported on the Consolidated Balance Sheet $ 480 $ 426Aggregate fair value in excess of (less than) unpaid principal balance 9 14Balance of non-accrual loans or loans more than 90 days past due — —Aggregate unpaid principal balance in excess of fair value for non-accrual loans or loans more than 90 dayspast due — —

189
The changes in the fair values of these mortgage loans are reported in Other revenue in the Company’s Consolidated Statement of Income. There was no net change in fair value during the nine months ended September 30, 2018 and 2017 due to instrument-specific credit risk. Related interest income continues to be measured based on the contractual interest rates and reported as Interest revenue in the Consolidated Statement of Income.
Certain Structured LiabilitiesThe Company has elected the fair value option for certain structured liabilities whose performance is linked to structured interest rates, inflation, currency, equity, referenced credit or commodity risks. The Company elected the fair value option because these exposures are considered to be trading-related positions and, therefore, are managed on a fair value basis. These positions will continue to be classified as debt, deposits or derivatives (Trading account liabilities) on the Company’s Consolidated Balance Sheet according to their legal form.
The following table provides information about the carrying value of structured notes, disaggregated by type of embedded derivative instrument:
In billions of dollars September 30, 2018 December 31, 2017Interest rate linked $ 16.8 $ 13.9Foreign exchange linked 0.4 0.3Equity linked 15.2 13.0Commodity linked 0.2 0.2Credit linked 1.4 1.9Total $ 34.0 $ 29.3
Prior to 2016, the total change in the fair value of these structured liabilities was reported in Principal transactions in the Company’s Consolidated Statement of Income. Beginning in the first quarter of 2016, the portion of the changes in fair value attributable to changes in Citigroup’s own credit spreads (DVA) is reflected as a component of AOCI while all other changes in fair value will continue to be reported in Principal transactions. Changes in the fair value of these structured liabilities include accrued interest, which is also included in the change in fair value reported in Principal transactions.
Certain Non-Structured LiabilitiesThe Company has elected the fair value option for certain non-structured liabilities with fixed and floating interest rates. The Company has elected the fair value option where the interest rate risk of such liabilities may be economically hedged with derivative contracts or the proceeds are used to purchase financial assets that will also be accounted for at fair value through earnings. The elections have been made to mitigate accounting mismatches and to achieve operational simplifications. These positions are reported in Short-term borrowings and Long-term debt on the Company’s Consolidated Balance Sheet. Prior to 2016, the total change in the fair value of these non-structured liabilities was reported in Principal transactions in the Company’s Consolidated Statement of Income. Beginning in the first quarter of 2016, the portion of the changes in fair value attributable to changes in Citigroup’s own credit spreads (DVA) is reflected as a component of AOCI while all other changes in fair value will continue to be reported in Principal transactions.
Interest expense on non-structured liabilities is measured based on the contractual interest rates and reported as Interest expense in the Consolidated Statement of Income.
The following table provides information about long-term debt carried at fair value:
In millions of dollars September 30, 2018 December 31, 2017Carrying amount reported on the Consolidated Balance Sheet $ 36,772 $ 31,392Aggregate unpaid principal balance in excess of (less than) fair value 1,967 (579)
The following table provides information about short-term borrowings carried at fair value:
In millions of dollars September 30, 2018 December 31, 2017Carrying amount reported on the Consolidated Balance Sheet $ 5,042 $ 4,627Aggregate unpaid principal balance in excess of fair value 781 74

190
22. GUARANTEES AND COMMITMENTS
Citi provides a variety of guarantees and indemnifications to its customers to enhance their credit standing and enable them to complete a wide variety of business transactions. Forcertain contracts meeting the definition of a guarantee, the guarantor must recognize, at inception, a liability for the fair value of the obligation undertaken in issuing the guarantee.
In addition, the guarantor must disclose the maximum potential amount of future payments that the guarantor could be required to make under the guarantee, if there were a total default by the guaranteed parties. The determination of the maximum potential future payments is based on the notional amount of the guarantees without consideration of possible
recoveries under recourse provisions or from collateral held or pledged. As such, Citi believes such amounts bear no relationship to the anticipated losses, if any, on these guarantees.
For additional information regarding Citi’s guarantees and indemnifications included in the tables below, as well as its other guarantees and indemnifications excluded from the tables below, see Note 26 to the Consolidated Financial Statements in Citi’s 2017 Annual Report on Form 10-K.
The following tables present information about Citi’s guarantees at September 30, 2018 and December 31, 2017:
Maximum potential amount of future
payments
In billions of dollars at September 30, 2018 except carrying value inmillions
Expire within1 year
Expire after1 year
Total amountoutstanding
Carrying value (in millions of dollars)
Financial standby letters of credit $ 29.9 $ 65.5 $ 95.4 $ 165Performance guarantees 7.8 4.0 11.8 30Derivative instruments considered to be guarantees 21.2 84.5 105.7 307Loans sold with recourse — 1.4 1.4 9Securities lending indemnifications(1) 120.5 — 120.5 —Credit card merchant processing(1)(2) 95.5 — 95.5 —Credit card arrangements with partners — 1.1 1.1 162Custody indemnifications and other — 38.6 38.6 62Total $ 274.9 $ 195.1 $ 470.0 $ 735
Maximum potential amount of future
payments
In billions of dollars at December 31, 2017 except carrying value inmillions
Expire within1 year
Expire after1 year
Total amountoutstanding
Carrying value (in millions of dollars)
Financial standby letters of credit $ 27.9 $ 65.9 $ 93.8 $ 93Performance guarantees 7.2 4.1 11.3 20Derivative instruments considered to be guarantees 11.0 84.9 95.9 423Loans sold with recourse — 1.4 1.4 9Securities lending indemnifications(1) 103.7 — 103.7 —Credit card merchant processing(1)(2) 85.5 — 85.5 —Credit card arrangements with partners 0.3 1.1 1.4 205Custody indemnifications and other — 36.0 36.0 59Total $ 235.6 $ 193.4 $ 429.0 $ 809
(1) The carrying values of securities lending indemnifications and credit card merchant processing were not material for either period presented, as the probability of potential liabilities arising from these guarantees is minimal.
(2) At September 30, 2018 and December 31, 2017, this maximum potential exposure was estimated to be $96 billion and $86 billion, respectively. However, Citi believes that the maximum exposure is not representative of the actual potential loss exposure based on its historical experience. This contingent liability is unlikely to arise, as most products and services are delivered when purchased and amounts are refunded when items are returned to merchants.

191
Loans sold with recourseLoans sold with recourse represent Citi’s obligations toreimburse the buyers for loan losses under certaincircumstances. Recourse refers to the clause in a salesagreement under which a seller/lender will fully reimbursethe buyer/investor for any losses resulting from thepurchased loans. This may be accomplished by the sellertaking back any loans that become delinquent.
In addition to the amounts shown in the tables above,Citi has recorded a repurchase reserve for its potentialrepurchases or make-whole liability regarding residentialmortgage representation and warranty claims related to itswhole loan sales to U.S. government-sponsoredenterprises (GSEs) and, to a lesser extent, private investors.The repurchase reserve was approximately $54 million and $66 million at September 30, 2018 and December 31, 2017, respectively, and these amounts are included in Other liabilities on the Consolidated Balance Sheet.
Credit card arrangements with partnersCiti, in certain of its credit card partner arrangements,provides guarantees to the partner regarding the volume ofcertain customer originations during the term of theagreement. To the extent such origination targets are not met,the guarantees serve to compensate the partner for certainpayments that otherwise would have been generated inconnection with such originations.
Other guarantees and indemnifications
Credit Card Protection ProgramsCiti, through its credit card businesses, provides variouscardholder protection programs on several of its cardproducts, including programs that provide insurancecoverage for rental cars, coverage for certain lossesassociated with purchased products, price protection forcertain purchases and protection for lost luggage. Theseguarantees are not included in the table, since the totaloutstanding amount of the guarantees and Citi’s maximumexposure to loss cannot be quantified. The protection islimited to certain types of purchases and losses, and it is notpossible to quantify the purchases that would qualify forthese benefits at any given time. Citi assesses the probabilityand amount of its potential liability related to these programsbased on the extent and nature of its historical lossexperience. At September 30, 2018 and December 31, 2017, the actual and estimated losses incurred and the carrying value of Citi’s obligations related to these programs wereimmaterial.
Value-Transfer NetworksCiti is a member of, or shareholder in, hundreds of value-transfer networks (VTNs) (payment, clearing and settlementsystems as well as exchanges) around the world. As acondition of membership, many of these VTNs require thatmembers stand ready to pay a pro rata share of the lossesincurred by the organization due to another member’s defaulton its obligations. Citi’s potential obligations may be limitedto its membership interests in the VTNs, contributions to the
VTN’s funds, or, in limited cases, the obligation may be unlimited. The maximum exposure cannot be estimated asthis would require an assessment of claims that havenot yet occurred. Citi believes the risk of loss is remotegiven historical experience with the VTNs. Accordingly,Citi’s participation in VTNs is not reported in the guaranteestables above, and there are no amounts reflected on theConsolidated Balance Sheet as of September 30, 2018 orDecember 31, 2017 for potential obligations that could arisefrom Citi’s involvement with VTN associations.
Long-Term Care Insurance IndemnificationIn 2000, Travelers Life & Annuity (Travelers), then a subsidiary of Citi, entered into a reinsurance agreement to transfer the risks and rewards of its long-term care (LTC) business to GE Life (now Genworth Financial Inc., or Genworth), then a subsidiary of the General Electric Company (GE). As part of this transaction, the reinsurance obligations were provided by two regulated insurance subsidiaries of GE Life, which funded two collateral trusts with securities. Presently, as discussed below, the trusts are referred to as the Genworth Trusts.
As part of GE’s spin-off of Genworth in 2004, GE retained the risks and rewards associated with the 2000 Travelers reinsurance agreement by providing a reinsurance contract to Genworth through its Union Fidelity Life Insurance Company (UFLIC) subsidiary that covers the Travelers LTC policies. In addition, GE provided a capital maintenance agreement in favor of UFLIC that is designed to assure that UFLIC will have the funds to pay its reinsurance obligations. As a result of these reinsurance agreements and the spin-off of Genworth, Genworth has reinsurance protection from UFLIC (supported by GE) and has reinsurance obligations in connection with the Travelers LTC policies. As noted below, the Genworth reinsurance obligations now benefit Brighthouse Financial, Inc. (Brighthouse). While neither Brighthouse nor Citi are direct beneficiaries of the capital maintenance agreement between GE and UFLIC, Brighthouse and Citi benefit indirectly from the existence of the capital maintenance agreement, which helps assure that UFLIC will continue to have funds necessary to pay its reinsurance obligations to Genworth.
In connection with Citi’s 2005 sale of Travelers to MetLife Inc. (MetLife), Citi provided an indemnification to MetLife for losses (including policyholder claims) relating to the LTC business for the entire term of the Travelers LTC policies, which, as noted above, are reinsured by subsidiaries of Genworth. In 2017, MetLife spun off its retail insurance business to Brighthouse. As a result, the Travelers LTC policies now reside with Brighthouse. The original reinsurance agreement between Travelers (now Brighthouse) and Genworth remains in place and Brighthouse is the sole beneficiary of the Genworth Trusts. The fair value of the Genworth Trusts is approximately $7.4 billion as of September 30, 2018, compared to $7.5 billion at December 31, 2017. The Genworth Trusts are designed to provide collateral to Brighthouse in an amount equal to the statutory liabilities of Brighthouse in respect of the Travelers LTC policies. The assets in the Genworth Trusts are

192
evaluated and adjusted periodically to ensure that the fair value of the assets continues to provide collateral in an amount equal to these estimated statutory liabilities, as the liabilities change over time.
If both (i) Genworth fails to perform under the originalTravelers/GE Life reinsurance agreement for any reason,including insolvency or the failure of UFLIC to perform in a timely manner, and (ii) the assets of the two Genworth Trustsare insufficient or unavailable, then Citi, through its LTCreinsurance indemnification, must reimburse Brighthouse forany losses incurred in connection with the LTC policies. Since both events would have to occur before Citi would become responsible for any payment to Brighthouse pursuant to its indemnification obligation, and the likelihood of such events occurring is currently not probable, there is no liability reflected on the Consolidated Balance Sheet as of September 30, 2018 and December 31, 2017 related to this indemnification. Citi continues to closely monitor its potential exposure under this indemnification obligation.
Separately, Genworth announced that it had agreed tobe purchased by China Oceanwide Holdings Co., Ltd, subject to a series of conditions and regulatory approvals. Citi is monitoring these developments.
Futures and over-the-counter derivatives clearingCiti provides clearing services on central clearing parties (CCP) for clients that need to clear exchange-traded and over-the-counter (OTC) derivative contracts with CCPs. Based on all relevant facts and circumstances, Citi has concluded that it acts as an agent for accounting purposes in its role as clearing member for these client transactions. As such, Citi does not reflect the underlying exchange-traded or OTC derivatives contracts in its Consolidated Financial Statements. See Note 19 for a discussion of Citi’s derivatives activities that are reflected in its Consolidated Financial Statements.
As a clearing member, Citi collects and remits cash and securities collateral (margin) between its clients and therespective CCP. In certain circumstances, Citi collects a higher amount of cash (or securities) from its clients than it needs to remit to the CCPs. This excess cash is then held at depository institutions such as banks or carry brokers.
There are two types of margin: initial and variation. Where Citi obtains benefits from or controls cash initial margin (e.g., retains an interest spread), cash initial margin collected from clients and remitted to the CCP or depository institutions is reflected within Brokerage payables (payables to customers) and Brokerage receivables (receivables from brokers, dealers and clearing organizations) or Cash and due from banks, respectively.
However, for exchange-traded and OTC-cleared derivative contracts where Citi does not obtain benefits from or control the client cash balances, the client cash initial margin collected from clients and remitted to the CCP or depository institutions is not reflected on Citi’s Consolidated Balance Sheet. These conditions are met when Citi has contractually agreed with the client that (i) Citi will pass through to the client all interest paid by the CCP or depository institutions on the cash initial margin, (ii) Citi
will not utilize its right as a clearing member to transform cash margin into other assets, (iii) Citi does not guarantee and is not liable to the client for the performance of the CCP or the depository institution and (iv) the client cash balances are legally isolated from Citi’s bankruptcy estate. The total amount of cash initial margin collected and remitted in this manner was approximately $13.2 billion and $10.7 billion as of September 30, 2018 and December 31, 2017, respectively.
Variation margin due from clients to the respective CCP, or from the CCP to clients, reflects changes in the value of the client’s derivative contracts for each trading day. As a clearing member, Citi is exposed to the risk of non-performance by clients (e.g., failure of a client to postvariation margin to the CCP for negative changes in thevalue of the client’s derivative contracts). In the event ofnon-performance by a client, Citi would move to close outthe client’s positions. The CCP would typically utilize initialmargin posted by the client and held by the CCP, with anyremaining shortfalls required to be paid by Citi as clearingmember. Citi generally holds incremental cash or securitiesmargin posted by the client, which would typically beexpected to be sufficient to mitigate Citi’s credit risk in theevent the client fails to perform.
As required by ASC 860-30-25-5, securities collateral posted by clients is not recognized on Citi’s Consolidated Balance Sheet.
Carrying Value—Guarantees and IndemnificationsAt September 30, 2018 and December 31, 2017, the total carrying amounts of the liabilities related to the guarantees and indemnifications included in the tables above amounted to approximately $0.7 billion and $0.8 billion. The carrying value of financial and performance guarantees is included in Other liabilities. For loans sold with recourse, the carrying value of the liability is included in Other liabilities.
CollateralCash collateral available to Citi to reimburse losses realized under these guarantees and indemnifications amounted to $51 billion and $46 billion at September 30, 2018 and December 31, 2017, respectively. Securities and other marketable assets held as collateral amounted to $82 billion and $70 billion at September 30, 2018 and December 31, 2017, respectively. The majority of collateral is held to reimburse losses realized under securities lending indemnifications. Additionally, letters of credit in favor of Citi held as collateral amounted to $3.9 billion and $3.7 billion at September 30, 2018 and December 31, 2017, respectively. Other property may also be available to Citi to cover losses under certain guarantees and indemnifications; however, the value of such property has not been determined.

193
Performance riskPresented in the tables below are the maximum potential amounts of future payments that are classified based upon internal and external credit ratings. The determination of the maximum potential future payments is based on the notional amount of the guarantees without consideration of possible recoveries under recourse provisions or from collateral held or pledged. As such, Citi believes such amounts bear no relationship to the anticipated losses, if any, on these guarantees.
Maximum potential amount of future payments
In billions of dollars at September 30, 2018Investment
grade
Non-investment
gradeNot
rated TotalFinancial standby letters of credit $ 68.0 $ 11.4 $ 16.0 $ 95.4Performance guarantees 8.6 2.2 1.0 11.8Derivative instruments deemed to be guarantees — — 105.7 105.7Loans sold with recourse — — 1.4 1.4Securities lending indemnifications — — 120.5 120.5Credit card merchant processing — — 95.5 95.5Credit card arrangements with partners — — 1.1 1.1Custody indemnifications and other 25.7 12.9 — 38.6Total $ 102.3 $ 26.5 $ 341.2 $ 470.0
Maximum potential amount of future payments
In billions of dollars at December 31, 2017Investment
grade
Non-investment
gradeNotrated Total
Financial standby letters of credit $ 68.1 $ 10.9 $ 14.8 $ 93.8Performance guarantees 7.9 2.4 1.0 11.3Derivative instruments deemed to be guarantees — — 95.9 95.9Loans sold with recourse — — 1.4 1.4Securities lending indemnifications — — 103.7 103.7Credit card merchant processing — — 85.5 85.5Credit card arrangements with partners — — 1.4 1.4Custody indemnifications and other 23.7 12.3 — 36.0Total $ 99.7 $ 25.6 $ 303.7 $ 429.0

194
Credit Commitments and Lines of CreditThe table below summarizes Citigroup’s credit commitments:
In millions of dollars U.S.Outside of
U.S.September 30,
2018December 31,
2017Commercial and similar letters of credit $ 798 $ 4,290 $ 5,088 $ 5,000One- to four-family residential mortgages 1,199 1,709 2,908 2,674Revolving open-end loans secured by one- to four-family residentialproperties 10,212 1,391 11,603 12,323Commercial real estate, construction and land development 12,175 1,971 14,146 11,151Credit card lines 605,614 94,646 700,260 678,300Commercial and other consumer loan commitments 199,722 107,517 307,239 272,655Other commitments and contingencies 3,165 516 3,681 3,071Total $ 832,885 $ 212,040 $ 1,044,925 $ 985,174
The majority of unused commitments are contingent upon customers maintaining specific credit standards. Commercial commitments generally have floating interest rates and fixed expiration dates and may require payment of fees. Such fees (net of certain direct costs) are deferred and, upon exercise of the commitment, amortized over the life of the loan or, if exercise is deemed remote, amortized over the commitment period.
Other commitments and contingenciesOther commitments and contingencies include all other transactions related to commitments and contingencies not reported on the lines above.
Unsettled reverse repurchase and securities borrowing agreements and unsettled repurchase and securities lending agreementsIn addition, in the normal course of business, Citigroup enters into reverse repurchase and securities borrowing agreements, as well as repurchase and securities lending agreements, which settle at a future date. At September 30, 2018, and December 31, 2017, Citigroup had $54.1 billion and $35.0 billion of unsettled reverse repurchase and securities borrowing agreements, respectively, and $43.0 billion and $19.1 billion of unsettled repurchase and securities lending agreements, respectively. For a further discussion of securities purchased under agreements to resell and securities borrowed, and securities sold under agreements to repurchase and securities loaned, including the Company’s policy for offsetting repurchase and reverse repurchase agreements, see Note 10 to the Consolidated Financial Statements.
Restricted CashCitigroup defines restricted cash (as cash subject to withdrawal restrictions) to include cash deposited with central banks that must be maintained to meet minimum regulatory requirements, and cash set aside for the benefit of customers or for other purposes such as compensating balance arrangements or debt retirement. Restricted cash includes minimum reserve requirements with the Federal Reserve Bank and certain other central banks and cash segregated to satisfy rules regarding the protection of customer assets as required by Citigroup broker-dealers’ primary regulators, including the United States Securities and Exchange Commission (SEC), the Commodities Futures Trading Commission and the United Kingdom’s Prudential Regulation Authority.
Restricted cash is included on the Consolidated Balance Sheet within the following balance sheet lines:
In millions of dollarsSeptember 30,
2018December 31,
2017
Cash and due from banks $ 3,488 $ 3,151
Deposits with banks 24,106 27,664
Total $ 27,594 $ 30,815

195
23. CONTINGENCIES
The following information supplements and amends, as applicable, the disclosures in Note 23 to the Consolidated Financial Statements of Citigroup’s First Quarter of 2018 Form 10-Q and Second Quarter of 2018 Form 10-Q and Note 27 to the Consolidated Financial Statements of Citigroup’s 2017 Annual Report on Form 10-K. For purposes of this Note, Citigroup, its affiliates and subsidiaries and current and former officers, directors and employees, are sometimes collectively referred to as Citigroup and Related Parties.
In accordance with ASC 450, Citigroup establishes accruals for contingencies, including the litigation and regulatory matters disclosed herein, when Citigroup believes it is probable that a loss has been incurred and the amount of the loss can be reasonably estimated. Once established, accruals are adjusted from time to time, as appropriate, in light of additional information. The amount of loss ultimately incurred in relation to those matters may be substantially higher or lower than the amounts accrued for those matters.
If Citigroup has not accrued for a matter because the matter does not meet the criteria for accrual (as set forth above), or Citigroup believes an exposure to loss exists in excess of the amount accrued for a particular matter, in each case assuming a material loss is reasonably possible, Citigroup discloses the matter. In addition, for such matters, Citigroup discloses an estimate of the aggregate reasonably possible loss or range of loss in excess of the amounts accrued for those matters as to which an estimate can be made. At September 30, 2018, Citigroup’s estimate of the reasonably possible unaccrued loss for these matters was materially unchanged from the estimate of approximately $1.0 billion in the aggregate as of June 30, 2018.
As available information changes, the matters for which Citigroup is able to estimate will change, and the estimates themselves will change. In addition, while many estimates presented in financial statements and other financial disclosures involve significant judgment and may be subject to significant uncertainty, estimates of the range of reasonably possible loss arising from litigation and regulatory proceedings are subject to particular uncertainties. For example, at the time of making an estimate, Citigroup may have only preliminary, incomplete or inaccurate information about the facts underlying the claim; its assumptions about the future rulings of the court or other tribunal on significant issues, or the behavior and incentives of adverse parties or regulators, may prove to be wrong; and the outcomes it is attempting to predict are often not amenable to the use of statistical or other quantitative analytical tools. In addition, from time to time an outcome may occur that Citigroup had not accounted for in its estimates because it had deemed such an outcome to be remote. For all these reasons, the amount of loss in excess of accruals ultimately incurred for the matters as to which an estimate has been made could be substantially higher or lower than the range of loss included in the estimate.
Subject to the foregoing, it is the opinion of Citigroup's management, based on current knowledge and after taking into account its current legal accruals, that the eventual outcome of all matters described in this Note would not be likely to have a
material adverse effect on the consolidated financial condition of Citigroup. Nonetheless, given the substantial or indeterminate amounts sought in certain of these matters and the inherent unpredictability of such matters, an adverse outcome in certain of these matters could, from time to time, have a material adverse effect on Citigroup’s consolidated results of operations or cash flows in particular quarterly or annual periods.
For further information on ASC 450 and Citigroup's accounting and disclosure framework for contingencies, including for litigation and regulatory matters disclosed herein, see Note 27 to the Consolidated Financial Statements of Citigroup’s 2017 Annual Report on Form 10-K.
Depositary Receipts MattersRegulatory Actions: The SEC’s Division of Enforcement has been investigating depositary banks and broker-dealers, including Citigroup and Related Parties, in connection with activity relating to pre-released American Depositary Receipts from 2011 to 2015. Citi has been in active discussions with the SEC about a potential resolution of the investigation.
Other Litigation: On August 20, 2018, plaintiffs filed a motion for preliminary approval of a class action settlement, which the court subsequently granted. A hearing for final approval of the settlement is scheduled for December 21, 2018. Additional information concerning this action is publicly available in court filings under the docket number 15 Civ. 9185 (S.D.N.Y.) (McMahon, C.).
Foreign Exchange MattersAntitrust and Other Litigation: On August 6, 2018, in IN REFOREIGN EXCHANGE BENCHMARK RATESANTITRUST LITIGATION, the court granted plaintiffs’ motion for final approval of the proposed class settlements with Citigroup, Citibank, Citicorp, and Citigroup Global Markets Inc. (CGMI), and certain other defendants. Additional information concerning this action is publicly available in court filings under the docket number 13 Civ. 7789 (S.D.N.Y.) (Schofield, J.).
On June 20, 2018, in NYPL v. JPMORGAN CHASE & CO., ET AL., the court denied plaintiffs’ request to expand their class to include credit card, wire and ATM transactions with a foreign currency exchange component. On September 6, 2018, the court denied plaintiffs’ motion for reconsideration. Additional information concerning this action is publicly available in court filings under the docket numbers 15 Civ. 2290 (N.D. Cal.) (Chhabria, J.) and 15 Civ. 9300 (S.D.N.Y.) (Schofield, J.).
On August 21, 2018, in CONTANT, ET AL. v. BANK OF AMERICA CORPORATION, ET AL., plaintiffs moved for preliminary approval of a proposed class settlement with Citigroup, Citibank, Citicorp and CGMI. Additional information concerning this action is publicly available in court filings under the docket number 17 Civ. 3139 (S.D.N.Y.) (Schofield, J.).

196
Interbank Offered Rates-Related Litigation and Other MattersAntitrust and Other Litigation: On July 19, 2018, in IN RE LIBOR-BASED FINANCIAL INSTRUMENTS ANTITRUST LITIGATION, the court granted preliminary approval of the settlement between a putative class of plaintiffs (lending institutions with interests in loans tied to USD LIBOR) and Citigroup and Citibank.
On August 1, 2018, the court granted final approval of the settlement between the largest plaintiffs’ class (investors who purchased over-the-counter derivatives from USD LIBOR panel banks) and Citigroup and Citibank.
On September 8, 2018, a putative class of plaintiffs (investors who transacted in Eurodollar futures or options on exchanges) filed motions for approval of a settlement with Citigroup, Citibank, CGMI and other settling defendants.
Additional information concerning these actions and related actions and appeals is publicly available in court filings under the docket numbers 11 MD 2262 (S.D.N.Y.) (Buchwald, J.) and 16-1189 (2d Cir.).
On October 4, 2018, in FRONTPOINT ASIAN EVENT DRIVEN FUND, LTD., ET AL. v. CITIBANK, N.A., ET AL., the court allowed FrontPoint Asian Event Driven Fund, Ltd.’s antitrust claim and claim for breach of the implied covenant of good faith and fair dealing based on transactions linked to the Singapore dollar Singapore Interbank Offered Rate to proceed. The court also dismissed Sonterra Capital Master Fund, Ltd.’s antitrust claims and both named plaintiffs’ RICO claims in their entirety. Additional information concerning this action is publicly available in court filings under the docket number 16 Civ. 5263 (S.D.N.Y.) (Hellerstein, J.).
Interchange Fee Litigation On September 18, 2018, the plaintiffs purporting to act on behalf of the putative class primarily seeking damages (the Damages Class) moved for preliminary approval of a proposed amended settlement agreement that supersedes the original settlement agreement as of October 19, 2012 to resolve claims of the Damages Class in IN RE PAYMENT CARD INTERCHANGE FEE AND MERCHANT DISCOUNT ANTITRUST LITIGATION. Additional information regarding this matter is publicly available under the docket number MDL 05-1720 (E.D.N.Y.) (Brodie, J.).
Interest Rate Swaps MattersAntitrust and Other Litigation: On August 7, 2018, in TRUEEX LLC v. BANK OF AMERICA CORPORATION, ET AL., plaintiff filed an amended complaint. On August 28, 2018, defendants moved to dismiss the amended complaint. Additional information concerning this action is publicly available in court filings under the docket numbers 18-CV-5361 (S.D.N.Y.) (Engelmayer, J.) and 16-MDL-2704 (S.D.N.Y.) (Engelmayer, J.).
Oceanografía Fraud and Related MattersOther Litigation: On September 28, 2018, in the action commenced by Oceanografia and its former controlling shareholder, Amado Yáñez Osuna, the court granted defendants’ motion to dismiss with prejudice as to the breach of contract claim and without prejudice as to the remaining claims for malicious prosecution, tortious interference with contract and fraud on forum non conveniens grounds. Additional information concerning this action is publicly available in court filings under the docket number 1:17-cv-01434 (S.D.N.Y.) (Sullivan, J.). Sovereign Securities MattersAntitrust and Other Litigation: On August 24, 2018, the court granted defendants’ motion to dismiss consolidated putative class action complaints related to the supranational, sub-sovereign and agency (SSA) bond market. Plaintiffs may file a second amended complaint by November 6, 2018. Additional information relating to this action is publicly available in court filings under the docket number 16 Civ. 3711 (S.D.N.Y.) (Ramos, J.).
On September 17, 2018, in IN RE MEXICAN GOVERNMENT BONDS ANTITRUST LITIGATION, defendants moved to dismiss the consolidated amended complaint. Additional information concerning this action is publicly available in court filings under the docket number 18 Civ. 2830 (S.D.N.Y.) (Oetken, J.).
Settlement PaymentsPayments required in settlement agreements described above have been made or are covered by existing litigation accruals.

197
24. CONDENSED CONSOLIDATING FINANCIAL STATEMENTS
Citigroup amended its Registration Statement on Form S-3 on file with the SEC (File No. 33-192302) to add its wholly owned subsidiary, Citigroup Global Markets Holdings Inc. (CGMHI), as a co-registrant. Any securities issued by CGMHI under the Form S-3 will be fully and unconditionally guaranteed by Citigroup.
The following are the Condensed Consolidating Statements of Income and Comprehensive Income for the three and nine months ended September 30, 2018 and 2017, Condensed Consolidating Balance Sheet as of September 30, 2018 and December 31, 2017 and Condensed Consolidating Statement of Cash Flows for the nine months ended September 30, 2018 and 2017 for Citigroup Inc., the parent holding company (Citigroup parent company), CGMHI, other Citigroup subsidiaries and eliminations and total consolidating adjustments. “Other Citigroup subsidiaries and eliminations” includes all other subsidiaries of Citigroup, intercompany eliminations and income (loss) from discontinued operations. “Consolidating adjustments” includes Citigroup parent company elimination of distributed and undistributed income of subsidiaries and investment in subsidiaries.
These Condensed Consolidating Financial Statements have been prepared and presented in accordance with SEC Regulation S-X Rule 3-10, “Financial Statements of Guarantors and Issuers of Guaranteed Securities Registered or Being Registered.”
These Condensed Consolidating Financial Statements are presented for purposes of additional analysis, but should be considered in relation to the Consolidated Financial Statements of Citigroup taken as a whole.

198
Condensed Consolidating Statements of Income and Comprehensive Income
Three Months Ended September 30, 2018
In millions of dollars
Citigroupparent
company CGMHI
Other Citigroupsubsidiaries and
eliminationsConsolidatingadjustments
Citigroupconsolidated
RevenuesDividends from subsidiaries $ 7,948 $ — $ — $ (7,948) $ —Interest revenue 1 2,291 15,878 — 18,170Interest revenue—intercompany 1,281 424 (1,705) — —Interest expense 1,068 1,405 3,895 — 6,368Interest expense—intercompany 492 899 (1,391) — —Net interest revenue $ (278) $ 411 $ 11,669 $ — $ 11,802Commissions and fees $ — $ 1,194 $ 1,609 $ — $ 2,803Commissions and fees—intercompany — 72 (72) — —Principal transactions (100) 581 2,085 — 2,566Principal transactions—intercompany (303) (10) 313 — —Other income 266 325 627 — 1,218Other income—intercompany (46) 57 (11) — —Total non-interest revenues $ (183) $ 2,219 $ 4,551 $ — $ 6,587Total revenues, net of interest expense $ 7,487 $ 2,630 $ 16,220 $ (7,948) $ 18,389Provisions for credit losses and for benefits and claims $ — $ 3 $ 1,971 $ — $ 1,974Operating expensesCompensation and benefits $ 14 $ 1,148 $ 4,157 $ — $ 5,319Compensation and benefits—intercompany 19 — (19) — —Other operating (201) 558 4,635 — 4,992Other operating—intercompany 13 564 (577) — —Total operating expenses $ (155) $ 2,270 $ 8,196 $ — $ 10,311Equity in undistributed income of subsidiaries $ (3,098) $ — $ — $ 3,098 $ —Income (loss) from continuing operations before incometaxes $ 4,544 $ 357 $ 6,053 $ (4,850) $ 6,104Provision (benefit) for income taxes (78) 169 1,380 — 1,471Income (loss) from continuing operations $ 4,622 $ 188 $ 4,673 $ (4,850) $ 4,633Loss from discontinued operations, net of taxes — — (8) — (8)Net income before attribution of noncontrolling interests $ 4,622 $ 188 $ 4,665 $ (4,850) $ 4,625Noncontrolling interests — — 3 — 3Net income (loss) $ 4,622 $ 188 $ 4,662 $ (4,850) $ 4,622Comprehensive incomeAdd: Other comprehensive income (loss) $ (1,151) $ (196) $ (458) $ 654 $ (1,151)Total Citigroup comprehensive income (loss) $ 3,471 $ (8) $ 4,204 $ (4,196) $ 3,471Add: Other comprehensive income attributable tononcontrolling interests $ — $ — $ 8 $ — $ 8Add: Net income attributable to noncontrolling interests — — 3 — 3Total comprehensive income (loss) $ 3,471 $ (8) $ 4,215 $ (4,196) $ 3,482

199
Condensed Consolidating Statements of Income and Comprehensive Income
Three Months Ended September 30, 2017
In millions of dollars
Citigroupparent
company CGMHI
Other Citigroupsubsidiaries and
eliminationsConsolidatingadjustments
Citigroupconsolidated
RevenuesDividends from subsidiaries $ 5,360 $ — $ — $ (5,360) $ —Interest revenue — 1,442 14,472 — 15,914Interest revenue—intercompany 1,040 313 (1,353) — —Interest expense 1,195 643 2,541 — 4,379Interest expense—intercompany 240 580 (820) — —Net interest revenue $ (395) $ 532 $ 11,398 $ — $ 11,535Commissions and fees $ — $ 1,262 $ 1,979 $ — $ 3,241Commissions and fees—intercompany — 13 (13) — —Principal transactions 610 501 1,137 — 2,248Principal transactions—intercompany 168 (401) 233 — —Other income (860) 729 1,526 — 1,395Other income—intercompany 32 153 (185) — —Total non-interest revenues $ (50) $ 2,257 $ 4,677 $ — $ 6,884Total revenues, net of interest expense $ 4,915 $ 2,789 $ 16,075 $ (5,360) $ 18,419Provisions for credit losses and for benefits and claims $ — $ (1) $ 2,000 $ — $ 1,999Operating expensesCompensation and benefits $ (3) $ 1,104 $ 4,203 $ — $ 5,304Compensation and benefits—intercompany 46 — (46) — —Other operating (18) 560 4,571 — 5,113Other operating—intercompany 8 310 (318) — —Total operating expenses $ 33 $ 1,974 $ 8,410 $ — $ 10,417Equity in undistributed income of subsidiaries $ (1,015) $ — $ — $ 1,015 $ —Income (loss) from continuing operations before incometaxes $ 3,867 $ 816 $ 5,665 $ (4,345) $ 6,003Provision (benefit) for income taxes (266) 324 1,808 — 1,866Income (loss) from continuing operations $ 4,133 $ 492 $ 3,857 $ (4,345) $ 4,137Loss from discontinued operations, net of taxes — — (5) — (5)Net income (loss) before attribution of noncontrollinginterests $ 4,133 $ 492 $ 3,852 $ (4,345) $ 4,132Noncontrolling interests — — (1) — (1)Net income (loss) $ 4,133 $ 492 $ 3,853 $ (4,345) $ 4,133Comprehensive incomeAdd: Other comprehensive income (loss) $ 8 $ (84) $ (762) $ 846 $ 8Total Citigroup comprehensive income (loss) $ 4,141 $ 408 $ 3,091 $ (3,499) $ 4,141
Add: Other comprehensive income attributable tononcontrolling interests $ — $ — $ 12 $ — $ 12Add: Net income attributable to noncontrolling interests — — (1) — (1)Total comprehensive income (loss) $ 4,141 $ 408 $ 3,102 $ (3,499) $ 4,152

200
Condensed Consolidating Statements of Income and Comprehensive Income
Nine Months Ended September 30, 2018
In millions of dollars
Citigroupparent
company CGMHI
Other Citigroupsubsidiaries and
eliminationsConsolidatingadjustments
Citigroupconsolidated
RevenuesDividends from subsidiaries $ 16,648 $ — $ — $ (16,648) $ —Interest revenue 67 6,344 45,641 — 52,052Interest revenue—intercompany 3,636 1,206 (4,842) — —Interest expense 3,119 3,732 10,562 — 17,413Interest expense—intercompany 1,467 2,567 (4,034) — —Net interest revenue $ (883) $ 1,251 $ 34,271 $ — $ 34,639Commissions and fees $ — $ 3,793 $ 5,151 $ — $ 8,944Commissions and fees—intercompany (1) 163 (162) — —Principal transactions (275) 805 7,476 — 8,006Principal transactions—intercompany (1,161) 1,461 (300) — —Other income 817 666 2,658 — 4,141Other income—intercompany (111) 88 23 — —Total non-interest revenues $ (731) $ 6,976 $ 14,846 $ — $ 21,091Total revenues, net of interest expense $ 15,034 $ 8,227 $ 49,117 $ (16,648) $ 55,730Provisions for credit losses and for benefits and claims $ — $ (21) $ 5,664 $ — $ 5,643Operating expensesCompensation and benefits $ 149 $ 3,695 $ 12,734 $ — $ 16,578Compensation and benefits—intercompany 82 — (82) — —Other operating (210) 1,684 13,896 — 15,370Other operating—intercompany 38 1,835 (1,873) — —Total operating expenses $ 59 $ 7,214 $ 24,675 $ — $ 31,948Equity in undistributed income of subsidiaries $ (2,060) $ — $ — $ 2,060 $ —Income (loss) from continuing operations before incometaxes $ 12,915 $ 1,034 $ 18,778 $ (14,588) $ 18,139Provision (benefit) for income taxes (817) 853 4,320 — 4,356Income (loss) from continuing operations $ 13,732 $ 181 $ 14,458 $ (14,588) $ 13,783Net income (loss) before attribution of noncontrollinginterests $ 13,732 $ 181 $ 14,458 $ (14,588) $ 13,783Noncontrolling interests — — 51 — 51Net income (loss) $ 13,732 $ 181 $ 14,407 $ (14,588) $ 13,732Comprehensive incomeAdd: Other comprehensive income (loss) $ (3,974) $ (186) $ 1,787 $ (1,601) $ (3,974)Total Citigroup comprehensive income (loss) $ 9,758 $ (5) $ 16,194 $ (16,189) $ 9,758Add: Other comprehensive income attributable tononcontrolling interests $ — $ — $ (35) $ — $ (35)Add: Net income attributable to noncontrolling interests — — 51 — 51Total comprehensive income (loss) $ 9,758 $ (5) $ 16,210 $ (16,189) $ 9,774

201
Condensed Consolidating Statements of Income and Comprehensive Income
Nine Months Ended September 30, 2017
In millions of dollars
Citigroupparent
company CGMHI
Other Citigroupsubsidiaries and
eliminationsConsolidatingadjustments
Citigroupconsolidated
RevenuesDividends from subsidiaries $ 11,625 $ — $ — $ (11,625) $ —Interest revenue — 3,873 41,856 — 45,729Interest revenue—intercompany 2,909 847 (3,756) — —Interest expense 3,549 1,578 6,854 — 11,981Interest expense—intercompany 593 1,666 (2,259) — —Net interest revenue $ (1,233) $ 1,476 $ 33,505 $ — $ 33,748Commissions and fees $ — $ 3,933 $ 5,619 $ — $ 9,552Commissions and fees—intercompany (1) 123 (122) — —Principal transactions 1,569 2,377 4,039 — 7,985Principal transactions—intercompany 768 (207) (561) — —Other income (2,500) 868 5,287 — 3,655Other income—intercompany 70 156 (226) — —Total non-interest revenues $ (94) $ 7,250 $ 14,036 $ — $ 21,192Total revenues, net of interest expense $ 10,298 $ 8,726 $ 47,541 $ (11,625) $ 54,940Provisions for credit losses and for benefits and claims $ — $ — $ 5,378 $ — $ 5,378Operating expensesCompensation and benefits $ (18) $ 3,578 $ 12,741 $ — $ 16,301Compensation and benefits—intercompany 97 — (97) — —Other operating (334) 1,605 14,328 — 15,599Other operating—intercompany (41) 1,633 (1,592) — —Total operating expenses $ (296) $ 6,816 $ 25,380 $ — $ 31,900Equity in undistributed income of subsidiaries $ 755 $ — $ — $ (755) $ —Income (loss) from continuing operations before incometaxes $ 11,349 $ 1,910 $ 16,783 $ (12,380) $ 17,662Provision (benefit) for income taxes (746) 800 5,470 — 5,524Income (loss) from continuing operations $ 12,095 $ 1,110 $ 11,313 $ (12,380) $ 12,138Loss from discontinued operations, net of taxes — — (2) — (2)Net income (loss) before attribution of noncontrollinginterests $ 12,095 $ 1,110 $ 11,311 $ (12,380) $ 12,136Noncontrolling interests — — 41 — 41Net income (loss) $ 12,095 $ 1,110 $ 11,270 $ (12,380) $ 12,095Comprehensive incomeAdd: Other comprehensive income (loss) $ 1,986 $ (142) $ (4,638) $ 4,780 $ 1,986Total Citigroup comprehensive income (loss) $ 14,081 $ 968 $ 6,632 $ (7,600) $ 14,081Add: Other comprehensive income attributable tononcontrolling interests $ — $ — $ 82 $ — $ 82Add: Net income attributable to noncontrolling interests — — 41 — 41Total comprehensive income (loss) $ 14,081 $ 968 $ 6,755 $ (7,600) $ 14,204

202
Condensed Consolidating Balance Sheet
September 30, 2018
In millions of dollars
Citigroupparent
company CGMHI
OtherCitigroup
subsidiariesand
eliminationsConsolidatingadjustments
Citigroupconsolidated
AssetsCash and due from banks $ 1 $ 543 $ 25,183 $ — $ 25,727Cash and due from banks—intercompany 17 2,104 (2,121) — —Deposits with banks — 3,302 170,257 — 173,559Deposits with banks—intercompany 3,000 6,386 (9,386) — —Federal funds sold and resale agreements — 227,147 53,794 — 280,941Federal funds sold and resale agreements—intercompany — 19,572 (19,572) — —Trading account assets 258 144,440 112,804 — 257,502Trading account assets—intercompany 963 2,934 (3,897) — —Investments 7 215 345,291 — 345,513Loans, net of unearned income — 1,518 673,391 — 674,909Loans, net of unearned income—intercompany — — — — —Allowance for loan losses — — (12,336) — (12,336)Total loans, net $ — $ 1,518 $ 661,055 $ — $ 662,573Advances to subsidiaries $ 146,339 $ — $ (146,339) $ — $ —Investments in subsidiaries 203,896 — — (203,896) —Other assets(1) 12,517 67,087 99,746 — 179,350Other assets—intercompany 3,638 45,654 (49,292) — —Total assets $ 370,636 $ 520,902 $ 1,237,523 $ (203,896) $ 1,925,165Liabilities and equityDeposits $ — $ — $ 1,005,176 $ — $ 1,005,176Deposits—intercompany — — — — —Federal funds purchased and securities loaned and sold — 154,341 21,574 — 175,915Federal funds purchased and securities loaned and sold—intercompany — 34,948 (34,948) — —Trading account liabilities 16 94,163 53,473 — 147,652Trading account liabilities—intercompany 448 3,143 (3,591) — —Short-term borrowings 254 4,358 29,158 — 33,770Short-term borrowings—intercompany — 18,100 (18,100) — —Long-term debt 148,183 24,324 62,763 — 235,270Long-term debt—intercompany — 65,811 (65,811) — —Advances from subsidiaries 21,965 — (21,965) — —Other liabilities 2,440 73,178 53,901 — 129,519Other liabilities—intercompany 326 16,369 (16,695) — —Stockholders’ equity 197,004 32,167 172,588 (203,896) 197,863Total liabilities and equity $ 370,636 $ 520,902 $ 1,237,523 $ (203,896) $ 1,925,165
(1) Other assets for Citigroup parent company at September 30, 2018 included $30.9 billion of placements to Citibank and its branches, of which $18.1 billion had a remaining term of less than 30 days.

203
Condensed Consolidating Balance Sheet
December 31, 2017
In millions of dollars
Citigroupparent
company CGMHI
OtherCitigroup
subsidiariesand
eliminationsConsolidatingadjustments
Citigroupconsolidated
AssetsCash and due from banks $ — $ 378 $ 23,397 $ — $ 23,775Cash and due from banks—intercompany 13 3,750 (3,763) — —Deposits with banks — 3,348 153,393 — 156,741Deposits with banks—intercompany 11,000 5,219 (16,219) — —Federal funds sold and resale agreements — 182,685 49,793 — 232,478Federal funds sold and resale agreements—intercompany — 16,091 (16,091) — —Trading account assets — 139,462 113,328 — 252,790Trading account assets—intercompany 38 2,711 (2,749) — —Investments 27 181 352,082 — 352,290Loans, net of unearned income — 900 666,134 — 667,034Loans, net of unearned income—intercompany — — — — —Allowance for loan losses — — (12,355) — (12,355)Total loans, net $ — $ 900 $ 653,779 $ — $ 654,679Advances to subsidiaries $ 139,722 $ — $ (139,722) $ — $ —Investments in subsidiaries 210,537 — — (210,537) —Other assets(1) 10,844 58,299 100,569 — 169,712Other assets—intercompany 3,428 43,613 (47,041) — —Total assets $ 375,609 $ 456,637 $ 1,220,756 $ (210,537) $ 1,842,465Liabilities and equityDeposits $ — $ — $ 959,822 $ — $ 959,822Deposits—intercompany — — — — —Federal funds purchased and securities loaned and sold — 134,888 21,389 — 156,277Federal funds purchased and securities loaned and sold—intercompany — 18,597 (18,597) — —Trading account liabilities — 80,801 44,369 — 125,170Trading account liabilities—intercompany 15 2,182 (2,197) — —Short-term borrowings 251 3,568 40,633 — 44,452Short-term borrowings—intercompany — 32,871 (32,871) — —Long-term debt 152,163 18,048 66,498 — 236,709Long-term debt—intercompany — 60,765 (60,765) — —Advances from subsidiaries 19,136 — (19,136) — —Other liabilities 2,673 62,113 53,577 — 118,363Other liabilities—intercompany 631 9,753 (10,384) — —Stockholders’ equity 200,740 33,051 178,418 (210,537) 201,672Total liabilities and equity $ 375,609 $ 456,637 $ 1,220,756 $ (210,537) $ 1,842,465
(1) Other assets for Citigroup parent company at December 31, 2017 included $29.7 billion of placements to Citibank and its branches, of which $18.9 billion had a remaining term of less than 30 days.

204
Condensed Consolidating Statement of Cash Flows
Nine Months Ended September 30, 2018
In millions of dollars
Citigroupparent
company CGMHI
OtherCitigroup
subsidiariesand
eliminationsConsolidatingadjustments
Citigroupconsolidated
Net cash provided by operating activities of continuingoperations $ 12,581 $ 16,232 $ 1,253 $ — $ 30,066
Cash flows from investing activities of continuing operationsPurchases of investments $ (7,955) $ (18) $ (121,081) $ — $ (129,054)Proceeds from sales of investments 7,634 3 44,533 — 52,170Proceeds from maturities of investments — — 82,940 — 82,940Change in loans — — (16,131) — (16,131)Proceeds from sales and securitizations of loans — — 4,021 — 4,021Proceeds from significant disposals — — 314 — 314Change in federal funds sold and resales — (47,943) (519) — (48,462)Changes in investments and advances—intercompany (7,769) (2,338) 10,107 — —Other investing activities 214 (41) (2,534) — (2,361)Net cash provided by (used in) investing activities ofcontinuing operations $ (7,876) $ (50,337) $ 1,650 $ — $ (56,563)Cash flows from financing activities of continuing operationsDividends paid $ (3,616) $ — $ — $ — $ (3,616)Redemption of preferred stock (218) — — — (218)Treasury stock acquired (9,848) — — — (9,848)Proceeds (repayments) from issuance of long-term debt, net (883) 7,538 (829) — 5,826Proceeds (repayments) from issuance of long-term debt—intercompany, net — 5,048 (5,048) — —Change in deposits — — 45,354 — 45,354Change in federal funds purchased and repos — 35,804 (16,166) — 19,638Change in short-term borrowings 32 790 (11,503) — (10,681)Net change in short-term borrowings and other advances—intercompany 2,312 (14,771) 12,459 — —Capital contributions from (to) parent — (663) 663 — —Other financing activities (479) — — — (479)Net cash provided by (used in) financing activities ofcontinuing operations $ (12,700) $ 33,746 $ 24,930 $ — $ 45,976Effect of exchange rate changes on cash and due from banks $ — $ — $ (709) $ — $ (709)Change in cash and due from banks and deposits with banks $ (7,995) $ (359) $ 27,124 $ — $ 18,770Cash and due from banks and deposits with banks atbeginning of period 11,013 12,695 156,808 — 180,516Cash and due from banks and deposits with banks at end ofperiod $ 3,018 $ 12,336 $ 183,932 $ — $ 199,286
Cash and due from banks $ 18 $ 2,648 $ 23,061 $ — $ 25,727
Deposits with banks 3,000 9,688 160,871 — 173,559Cash and due from banks and deposits with banks at end ofperiod $ 3,018 $ 12,336 $ 183,932 $ — $ 199,286Supplemental disclosure of cash flow information forcontinuing operationsCash paid during the year for income taxes $ 873 $ 138 $ 2,250 $ — $ 3,261Cash paid during the year for interest 2,870 6,045 7,363 — 16,278Non-cash investing activitiesTransfers to loans HFS from loans $ — $ — $ 3,300 $ — $ 3,300Transfers to OREO and other repossessed assets — — 94 — 94

205
Condensed Consolidating Statement of Cash Flows
Nine Months Ended September 30, 2017
In millions of dollars
Citigroupparent
company CGMHI
OtherCitigroup
subsidiariesand
eliminationsConsolidatingadjustments
Citigroupconsolidated
Net cash provided by (used in) operating activities ofcontinuing operations $ 5,712 $ (15,236) $ 6,063 $ — $ (3,461)
Cash flows from investing activities of continuing operationsPurchases of investments $ — $ — $ (151,362) $ — $ (151,362)Proceeds from sales of investments 132 — 89,592 — 89,724Proceeds from maturities of investments — — 67,166 — 67,166Change in loans — — (41,569) — (41,569)Proceeds from sales and securitizations of loans — — 7,019 — 7,019Proceeds from significant disposals — — 3,411 — 3,411Change in federal funds sold and resales — (8,840) (6,955) — (15,795)Changes in investments and advances—intercompany 13,269 (5,439) (7,830) — —Other investing activities — — (2,054) — (2,054)Net cash provided by (used in) investing activities ofcontinuing operations $ 13,401 $ (14,279) $ (42,582) $ — $ (43,460)Cash flows from financing activities of continuing operationsDividends paid $ (2,639) $ — $ — $ — $ (2,639)Treasury stock acquired (9,071) — — — (9,071)Proceeds from issuance of long-term debt, net 6,665 4,385 11,458 — 22,508Proceeds (repayments) from issuance of long-term debt—intercompany, net — (1,300) 1,300 — —Change in deposits — — 34,632 — 34,632Change in federal funds purchased and repos — 6,910 12,551 — 19,461Change in short-term borrowings 44 1,865 5,539 — 7,448Net change in short-term borrowings and other advances—intercompany (23,342) 6,573 16,769 — —Capital contributions from parent — (60) 60 — —Other financing activities (402) — — — (402)Net cash provided by (used in) financing activities ofcontinuing operations $ (28,745) $ 18,373 $ 82,309 $ — $ 71,937Effect of exchange rate changes on cash and due from banks $ — $ — $ 599 $ — $ 599Change in cash and due from banks and deposits with banks $ (9,632) $ (11,142) $ 46,389 $ — $ 25,615Cash and due from banks and deposits with banks atbeginning of period 20,811 25,118 114,565 — 160,494Cash and due from banks and deposits with banks at end ofperiod $ 11,179 $ 13,976 $ 160,954 $ — $ 186,109Cash and due from banks $ 179 $ 4,519 $ 17,906 $ — $ 22,604Deposits with banks 11,000 9,457 143,048 — 163,505Cash and due from banks and deposits with banks at end ofperiod $ 11,179 $ 13,976 $ 160,954 $ — $ 186,109Supplemental disclosure of cash flow information forcontinuing operationsCash paid (received) during the year for income taxes $ (772) $ 470 $ 3,016 $ — $ 2,714Cash paid during the year for interest 3,319 3,175 5,110 — 11,604Non-cash investing activitiesTransfers to loans HFS from loans $ — $ — $ 3,800 $ — $ 3,800Transfers to OREO and other repossessed assets — — 85 — 85

206
UNREGISTERED SALES OF EQUITY SECURITIES, PURCHASES OF EQUITY SECURITIES AND DIVIDENDS
Unregistered Sales of Equity SecuritiesNone.
Equity Security RepurchasesThe following table summarizes Citi’s equity security repurchases, which consisted entirely of common stock repurchases:
In millions, except per share amountsTotal sharespurchased
Averageprice paidper share
Approximate dollarvalue of shares that
may yet be purchasedunder the plan or
programsJuly 2018
Open market repurchases(1) 21.0 $ 69.06 $ 16,146Employee transactions(2) — — N/A
August 2018 Open market repurchases(1) 30.0 71.05 14,018Employee transactions(2) — — N/A
September 2018 Open market repurchases(1) 23.6 71.62 12,330Employee transactions(2) — — N/A
Total for 3Q18 and remaining program balance as of September 30, 2018 74.6 $ 70.67 $ 12,330
(1) Represents repurchases under the $17.6 billion 2018 common stock repurchase program (2018 Repurchase Program) that was approved by Citigroup’s Board of Directors and announced on June 28, 2018. The 2018 Repurchase Program was part of the planned capital actions included by Citi in its 2018 Comprehensive Capital Analysis and Review (CCAR). The 2018 Repurchase Program expires on June 30, 2019. Shares repurchased under the 2018 Repurchase Program were added to treasury stock.
(2) Consisted of shares added to treasury stock related to (i) certain activity on employee stock option program exercises where the employee delivers existing shares to cover the option exercise, or (ii) under Citi’s employee restricted share awards where shares are withheld to satisfy tax requirements.
N/A Not applicable
DividendsIn addition to Board of Directors’ approval, Citi’s ability to pay common stock dividends substantially depends on regulatory approval, including an annual regulatory review of the results of the CCAR process required by the Federal Reserve Board and the supervisory stress tests required under the Dodd-Frank Act. For additional information regarding Citi’s capital planning and stress testing, see “Capital Resources—Current Regulatory Capital Standards” and “Regulatory Capital Standards Developments” above and “Risk Factors—Strategic Risks” and “Stress Testing Component on Capital Planning” in Citi’s 2017 Annual Report on Form 10-K.
For information on the ability of Citigroup’s subsidiary depository institutions to pay dividends, see Note 18 to the Consolidated Financial Statements in Citi’s 2017 Annual Report on Form 10-K.

207
SIGNATURES
Pursuant to the requirements of the Securities Exchange Act of 1934, the Registrant has duly caused this report to be signed on its behalf by the undersigned, thereunto duly authorized, on the 30th day of October, 2018.
CITIGROUP INC.(Registrant)
By /s/ John C. GerspachJohn C. GerspachChief Financial Officer(Principal Financial Officer)
By /s/ Raja J. AkramRaja J. AkramController and Chief Accounting Officer(Principal Accounting Officer)
208
EXHIBIT INDEX
ExhibitNumber Description of Exhibit
3.01
Restated Certificate of Incorporation of the Company, as in effect on the date hereof, incorporated by reference to Exhibit 3.01 to the Company’s Quarterly Report on Form 10-Q for the quarter ended June 30, 2018 (File No. 1-9924).
31.01+ Certification of principal executive officer pursuant to Section 302 of the Sarbanes-Oxley Act of 2002.
31.02+ Certification of principal financial officer pursuant to Section 302 of the Sarbanes-Oxley Act of 2002.
32.01+ Certification pursuant to 18 U.S.C. Section 1350, as adopted pursuant to Section 906 of the Sarbanes-Oxley Act of 2002.
101.01+
Financial statements from the Quarterly Report on Form 10-Q of the Company for the quarter ended September 30, 2018, filed on October 30, 2018, formatted in XBRL: (i) the Consolidated Statement of Income, (ii) the Consolidated Balance Sheet, (iii) the Consolidated Statement of Changes in Equity, (iv) the Consolidated Statement of Cash Flows and (v) the Notes to Consolidated Financial Statements.
The total amount of securities authorized pursuant to any instrument defining rights of holders of long-term debt of the Company does not exceed 10% of the total assets of the Company and its consolidated subsidiaries. The Company will furnish copies of any such instrument to the SEC upon request. * Denotes a management contract or compensatory plan or arrangement. + Filed herewith.