Annual Report - December 31, 2021 - Goldman Sachs
64
Annual Report December 31, 2021 Goldman Sachs International Bank (unlimited company) Company Number: 01122503 GOLDMAN SACHS INTERNATIONAL BANK (UNLIMITED COMPANY) ANNUAL REPORT FOR THE FINANCIAL PERIOD ENDED DECEMBER 31, 2021
-
Upload
khangminh22 -
Category
Documents
-
view
1 -
download
0
Transcript of Annual Report - December 31, 2021 - Goldman Sachs

Annual ReportDecember 31, 2021
Goldman Sachs International Bank (unlimited company)Company Number: 01122503
GOLDMAN SACHS INTERNATIONAL BANK (UNLIMITED COMPANY)ANNUAL REPORT FOR THE FINANCIAL PERIOD ENDED DECEMBER 31, 2021

INDEXPage No.
Part I
Strategic Report 2
Introduction 2
Executive Overview 2
Business Environment 3
Principal Risks and Uncertainties 4
Credit Ratings 5
Section 172(1) Statement 5
Date of Authorisation of Issue 5
Page No.
Part II
Directors’ Report and Audited Financial Statements 6
Directors’ Report 6
Independent Auditors’ Report 13
Income Statement 19
Statement of Comprehensive Income 19
Balance Sheet 20
Statement of Changes in Equity 21
Statement of Cash Flows 22
Notes to the Financial Statements 23
Note 1. General Information 23
Note 2. Basis of Preparation 23
Note 3. Summary of Significant Accounting Policies 24
Note 4. Critical Accounting Estimates and Judgements 31
Note 5. Net Revenues 31
Note 6. Operating Expenses 32
Note 7. Compensation and Benefits 33
Note 8. Share-Based Payments 33
Note 9. Income Tax Expense 34
Note 10. Collateralised Agreements 35
Note 11. Customer and Other Receivables 35
Note 12. Trading Assets and Liabilities 35
Note 13. Loans 36
Note 14. Investments 36
Note 15. Other Assets 36
Note 16. Deferred Tax Assets 37
Note 17. Collateralised Financings 37
Note 18. Customer and Other Payables 37
Note 19. Deposits 37
Note 20. Unsecured Borrowings 39
Note 21. Other Liabilities 39
Note 22. Share Capital 39
Note 23. Statement of Cash Flows Reconciliations 39
Note 24. Commitments and Contingencies 40
Note 25. Maturity of Assets and Liabilities 40
Note 26. Related Party Disclosures 41
Note 27. Financial Instruments 43
Note 28. Fair Value Measurement 46Note 29. Financial Risk Management and Capital
Management 53
Note 30. Transferred Assets 63
GOLDMAN SACHS INTERNATIONAL BANK (UNLIMITED COMPANY)ANNUAL REPORT FOR THE FINANCIAL PERIOD ENDED DECEMBER 31, 2021
1

Introduction
Goldman Sachs International Bank (GSIB or the bank) is involved in lending and deposit-taking activities, securities lending and acts as a primary dealer for U.K. government bonds.
The bank’s primary regulators are the Prudential Regulation Authority (PRA) and the Financial Conduct Authority (FCA).
The bank’s ultimate parent undertaking and controlling entity is The Goldman Sachs Group, Inc. (Group Inc.). Group Inc. is a bank holding company and a financial holding company regulated by the Board of Governors of the Federal Reserve System (FRB). In relation to the bank, “GS Group affiliate” means Group Inc. or any of its subsidiaries. Group Inc., together with its consolidated subsidiaries, form “GS Group”. GS Group is a leading global financial institution that delivers a broad range of financial services across investment banking, securities, investment management and consumer banking to a large and diversified client base that includes corporations, financial institutions, governments and individuals. The bank’s results prepared under United States Generally Accepted Accounting Principles (U.S. GAAP) are included in the consolidated financial statements of GS Group.
The bank’s principal office is in the U.K., and the bank has branches in Germany (the Frankfurt branch), which is involved in lending and deposit-taking activities, and South Africa (the Johannesburg branch), which is involved in client execution activities.
References to “the financial statements” are to the directors’ report and audited financial statements as presented in Part II of this annual report.
All references to December 2021 refer to the twelve months ended, or the date, as the context requires, December 31, 2021. All references to December 2020 refer to the thirteen months ended, or the date, as the context requires, December 31, 2020.
During the period ended December 2020, the bank changed its accounting reference date from November 30 to December 31 to conform to the period used by the bank for U.S. tax reporting purposes. These financial statements have been prepared for the twelve months ended December 31, 2021, with comparative information being presented for the thirteen months ended December 31, 2020. As a result, amounts presented in this annual report are not directly comparable.
Executive OverviewThe directors consider profit for the period, total assets and Common Equity Tier 1 (CET1) capital as the bank’s key performance indicators.
Income StatementThe income statement is set out on page 19 of this annual report. The bank’s profit for the period ended December 2021 was $201 million, an increase of 42% compared with the period ended December 2020.
Net interest income was $374 million for the period ended December 2021, compared with $322 million for the period ended December 2020. This increase primarily reflects lower interest rates paid on deposits.
Non-interest income was $27 million for the period ended December 2021, compared with $173 million for the period ended December 2020. This decrease primarily reflects unrealised net losses on collateralised agreements and lower gains associated with primary dealer activities.
Impairments on financial instruments comprised a release of $89 million for the period ended December 2021. This reflects a decrease in the allowance for impairment associated with lending activities following an improvement in the macroeconomic environment. The period ended December 2020 comprised an increase of $147 million reflecting a deteriorating macroeconomic environment resulting from COVID-19.
Operating expenses were $207 million for the period ended December 2021, compared with $149 million for the period ended December 2020. This increase reflects higher management charges from GS Group affiliates.
Balance SheetThe balance sheet is set out on page 20 of this annual report.
As of December 2021, total assets were $86.52 billion, an increase of $26.75 billion from December 2020, reflecting an increase in collateralised agreements of $22.30 billion primarily due to an increase in deposit-taking activities.
As of December 2021, total liabilities were $83.02 billion, an increase of $26.61 billion from December 2020, reflecting an increase in deposits of $26.84 billion. Deposits increased from $52.80 billion as of December 2020 to $79.64 billion as of December 2021 primarily due to an increase in deposits from institutional clients.
The bank’s CET1 capital was $3.41 billion as of December 2021 and $3.32 billion as of December 2020.
GOLDMAN SACHS INTERNATIONAL BANK (UNLIMITED COMPANY)
Strategic Report
2

Future OutlookThe directors consider that the period end financial position of the bank was satisfactory. Developments that may impact or continue to impact the bank include:
• Russian Invasion of Ukraine. The Russian invasion of Ukraine in February 2022 has resulted in governments around the world introducing significant sanctions on Russian entities and individuals, triggered disruption across global financial markets and increased uncertainty in the business environment in which the bank operates.
In particular, there has been an unprecedented decline in equity prices and widening in credit spreads of Russian companies, and a sharp increase in volatility of the Russian ruble compared to the U.S. dollar. The war has also triggered a sharp rise in commodity prices, notably oil and gas, base and precious metals, and agricultural products.
The bank continues to proactively manage its market risk and credit risk exposures to Russia, and more broadly to other companies with exposure to the region or to commodity prices. See Note 29 to the financial statements for information about the bank’s credit and market risk exposure to Russia as of December 2021 and at the time of publication.
GS Group remains focused on providing support to its employees impacted by the war and on supporting the humanitarian efforts of its non-profit partners.
The future impact of the war on the bank remains difficult to predict. However, further escalation of the war or increases in the scope of sanctions could have adverse economic consequences, including a slowdown in economic growth, an acceleration of inflation and a reduction in client activity levels, which would likely have a negative impact on the bank’s operating results, financial condition, and liquidity.
• COVID-19. As at the time of publication, there continues to be uncertainty regarding the impact of COVID-19 on the bank’s operational and financial performance. The extent of the impact will depend on future developments including the duration of the pandemic and potential future variants.
Business Environment
In 2021, the global economy continued to recover from the impact of the COVID-19 pandemic, as the distribution of vaccines helped facilitate an increase in global economic activity. Economic activity continued to benefit from ongoing fiscal stimulus from governments and continued accommodative monetary policy from global central banks. In the second half of the year, the growth in economic activity and demand for goods and services, alongside supply chain complications, contributed to inflationary pressures. Late in the year, the surge in Omicron cases sparked renewed concerns globally, contributing to increased market volatility and increased pressures on labour supply. This may result in a negative impact on economic activity.
Despite broad improvements in the overall economy since the initial impact of the COVID-19 pandemic, uncertainty remains on the pace of the recovery going forward, reflecting concerns about virus resurgence from the Omicron variant and other possible variants and related concerns regarding vaccine distribution, efficacy and hesitancy, as well as concerns relating to inflation, supply chain complications and geopolitical risks.
GOLDMAN SACHS INTERNATIONAL BANK (UNLIMITED COMPANY)
Strategic Report
3

Principal Risks and Uncertainties
The bank faces a variety of risks that are substantial and inherent in its businesses.
The principal risks and uncertainties that the bank faces are: liquidity risk, market risk, credit risk, operational risk, legal and regulatory risk, competition and market developments and general business environment. These risks have been summarised below.
These risks are primarily addressed through the bank’s corporate governance framework, see “Directors’ Report – Corporate Governance” for further information. For further information about the bank’s areas of risk and mitigants to risk, see Note 29 to the financial statements.
Liquidity• The bank’s liquidity, profitability and businesses may be
adversely affected by an inability to access the debt capital markets or to sell assets.
• Loss of deposits could increase the bank’s funding costs and adversely affect the bank’s liquidity and ability to grow its business.
• Reductions in the bank’s credit ratings or an increase in its credit spreads may adversely affect its liquidity and cost of funding.
Market• The bank’s businesses have been and may in the future be
adversely affected by conditions in the global financial markets and broader economic conditions.
• Changes in market interest rates could adversely affect the bank’s revenues and expenses, the value of assets and obligations, and the availability and cost of funding.
Credit• The bank’s businesses, profitability and liquidity may be
adversely affected by deterioration in the credit quality of or defaults by third parties.
• Concentration of risk increases the potential for significant losses in the bank’s underwriting, investing and financing activities.
• Derivative transactions and delayed documentation or settlements may expose the bank to credit risk, unexpected risks and potential losses.
• The bank might underestimate the credit losses inherent in its loan portfolio and have credit losses in excess of the amount reserved.
Operational• A failure in the bank’s operational systems or infrastructure,
or those of third parties, as well as human error, malfeasance or other misconduct, could impair the bank’s liquidity, disrupt its businesses, result in the disclosure of confidential information, damage its reputation and cause losses.
• A failure to protect the bank’s computer systems, networks and information, and its clients’ information, against cyber attacks and similar threats could impair its ability to conduct its businesses, result in the disclosure, theft or destruction of confidential information, damage its reputation and cause losses.
• The bank may incur losses as a result of ineffective risk management processes and strategies.
• The bank may incur losses as a result of unforeseen or catastrophic events, including pandemics, terrorist attacks, extreme weather events or other natural disasters.
• Climate change could disrupt the bank’s businesses, adversely affect client activity levels, and the creditworthiness of its client counterparties and the bank’s efforts to address concerns relating to climate change could result in damage to its reputation.
• The bank is reliant on Group Inc. and other GS Group affiliates for client business, various services and capital.
Legal and Regulatory• The bank’s businesses and those of its clients are subject to
extensive and pervasive regulation around the world.
• A failure to appropriately identify and address potential conflicts of interest could adversely affect the bank’s businesses.
Competition• The financial services industry is highly competitive.
Market Developments and General Business Environment• The bank’s businesses, financial condition, liquidity and
results of operations have been and may in the future be adversely affected by the COVID-19 pandemic.
• The bank may be adversely affected by negative publicity.
• Certain of the bank’s businesses, its funding instruments and financial products may be adversely affected by changes in or the discontinuance of Interbank Offered Rates (IBORs), in particular LIBOR.
• The bank faces enhanced risks as new business initiatives and acquisitions lead it to engage in new activities, operate in new locations, transact with a broader array of clients and counterparties and expose it to new asset classes and new markets.
GOLDMAN SACHS INTERNATIONAL BANK (UNLIMITED COMPANY)
Strategic Report
4

Credit Ratings
The table below presents the unsecured credit ratings and outlook of the bank.
As of December 2021Fitch Moody’s S&P
Short-term bank deposits F1 P-1 N/AShort-term debt F1 P-1 A-1Long-term bank deposits A+ A1 N/ALong-term debt A+ A1 A+Ratings outlook Stable Stable Stable
Section 172(1) Statement
The directors have included the section 172(1) statement in the directors’ report, consistent with corporate governance disclosures.
Date of Authorisation of Issue
The strategic report was authorised for issue by the Board of Directors on April 14, 2022.
By order of the BoardD. M. Bicarregui
DirectorApril 14, 2022
GOLDMAN SACHS INTERNATIONAL BANK (UNLIMITED COMPANY)
Strategic Report
5
The directors present their report and the audited financial statements for the period ended December 2021.
IntroductionIn accordance with section 414A of the Companies Act 2006, the directors have prepared a strategic report, which is included in Part I of this annual report and which contains a review of the bank’s businesses and a description of the principal risks and uncertainties facing the bank. The directors have chosen to make reference to the future outlook of the bank in the strategic report in accordance with section 414C(11) of the Companies Act 2006. The bank’s risk management objectives and policies, including exposures to liquidity risk, market risk and credit risk, are described in Note 29 to the financial statements.
Accounting Reference DateDuring the period ended December 2020, the bank changed its accounting reference date from November 30 to December 31 to conform to the period used by the bank for U.S. tax reporting purposes. These financial statements have been prepared for the twelve months ended December 31, 2021, with comparative information being presented for the thirteen months ended December 31, 2020. As a result, amounts presented in this annual report are not directly comparable.
Corporate GovernanceThe bank has a robust corporate governance framework which is embedded in its approach to running its business. This framework aligns with legal and regulatory requirements and guidance issued by various bodies as relevant to the bank and as appropriate for its business and shareholding structure. As a wholly-owned subsidiary within GS Group, the bank also aligns its corporate governance code with that of GS Group. While the bank does not formally apply any single corporate governance code, its governance arrangements are broadly consistent with the Financial Reporting Council (FRC) Wates Corporate Governance Principles for Large Private Companies.
Role of the Board. The Board of Directors (the Board) has overall responsibility for the management of the bank. As part of this role, the Board approves and oversees implementation of the bank’s strategic objectives, risk strategy and internal governance. The Board ensures the integrity of the bank’s accounting and financial reporting systems including financial and operational controls and regulatory compliance and has oversight of senior management.
Purpose, Values and Culture. Whilst some of these areas of responsibility are delegated to Board committees, the Board as a whole is responsible for overseeing the bank’s strategic direction and culture.
The purpose of GS Group as a whole is to advance sustainable economic growth and financial opportunity across the globe. As a subsidiary within GS Group, the bank is aligned to this purpose.
The bank strives to maintain a work environment that fosters professionalism, excellence, diversity, cooperation among employees and high standards of business ethics. The bank recognises that it needs the most talented people to deliver outstanding results for clients. A diverse workforce in terms of gender, ethnicity, sexual orientation, background, culture and education ensures the development of better ideas, products and services.
The Board recognises the importance of maintaining and developing the culture of the bank, and do so by setting the ‘tone from the top’ and overseeing how culture and values are fostered by the management of the bank. The Board receives regular updates on culture, conduct and diversity and inclusion from management.
GS Group maintains a Code of Business Conduct and Ethics, which was updated in March 2021, supplemented by 14 Business Principles, and a compendium of internal policies to inform and guide employees in their roles.
Strategy. GS Group’s focus is on delivering sustainable, long-term returns for its shareholders through a strategy that revolves around its clients. Its strategy comprises three core objectives:
• To grow and strengthen its existing franchise: to capture wallet share across a wider range of clients.
• To diversify its products and services: to build a more durable source of earnings.
• To operate more efficiently: so that it can drive higher margins and returns across the organisation.
The bank’s strategy, aligned with that of GS Group, is implemented by the executive management of the bank with Board oversight. The Chief Executive Officer of the bank updates the Board on the bank’s performance against its strategic objectives at Board meetings.
Composition of the Board. The directors collectively possess a broad range of skills, backgrounds, experience and knowledge appropriate for the effective oversight of the bank’s business. The roles of the Chair of the Board and the Chief Executive Officer are held by different individuals.
The Board considers that the size and structure of the Board is appropriate to oversee the businesses conducted by the bank. As of December 2021, the Board is comprised of seven directors, four of whom are independent. The bank has Audit, Risk, Nominations and Remuneration Board committees.
GOLDMAN SACHS INTERNATIONAL BANK (UNLIMITED COMPANY)
Directors’ Report
6

The Board Nominations Committee is responsible for identifying and recommending qualified candidates for Board membership and utilises a Succession Planning Framework which sets out the process and criteria, which includes a consideration of Board diversity, for the selection of new directors. The use of a skills matrix enables the experience and expertise of the Board both individually and as a whole to be assessed. New directors are provided with a comprehensive and bespoke induction programme. The chair of the Board oversees an ongoing training and development programme for the directors to enhance their knowledge and engagement.
The Board Nominations Committee oversees the effectiveness of the Board, its committees and their chairs and members, and evaluates this annually. It also reviews the size, structure and composition of the Board, including the balance of independent and non-independent directors.
The approach to directors’ conflicts of interest and the anticipated time commitment required is discussed with each director on their joining the Board and reviewed annually as part of the fitness and propriety assessment process. All the directors meet the applicable regulatory requirements for the number of directorships they are permitted to hold.
Responsibilities and Accountability. The bank’s governance model fully incorporates the Senior Managers and Certification Regime.
The Board is supported by various Board committees, each with a charter setting out its duties and the responsibilities delegated to it. The committees are comprised of non-executives only to enable them to provide oversight and challenge to management. The chairs of these Board committees report to the Board on the proceedings and recommendations of the committees. Certain matters are reserved for decision by the Board alone.
Opportunity and Risk. The bank believes that effective risk management is critical to its success, and so has established an enterprise risk management framework that employs a comprehensive, integrated approach to risk management, and through which the risks associated with the bank’s businesses are identified, assessed, monitored and managed. The bank’s risk management structure is built around three core components: governance, processes and people.
Risk management governance starts with the Board, which both directly and through its committees, including the GSIB Board Risk Committee and the GSIB Risk Committee, oversee the bank’s risk management policies and practices implemented through the enterprise risk management framework. The Board is responsible for the annual review and approval of the bank’s risk appetite statement, which describes the levels and types of risk it is willing to accept, in order to achieve the objectives included in its strategic business plan, while remaining in compliance with regulatory requirements. The bank’s strategy set out above is aligned with that of GS Group and the Board is ultimately responsible for overseeing and providing direction about the bank’s strategic business plan and risk appetite.
As part of the review of the firmwide risk portfolio, the chief risk officer regularly advises the GSIB Board Risk Committee of relevant risk metrics and material exposures, including risk limits and thresholds established in the bank’s risk appetite statement.
Remuneration Framework. Attracting and retaining talent is fundamental to GS Group’s long-term success as a firm. Compensation, when structured appropriately, is an important way of attracting, retaining and incentivising talent and in reinforcing GS Group’s culture. GS Group’s remuneration philosophy is reflected in the Goldman Sachs Compensation Principles as posted on the Goldman Sachs public website. In particular, effective remuneration practices should: (i) Encourage a real sense of teamwork and communication, binding individual short-term interests to the institution’s long-term interests; (ii) Evaluate performance on a multi-year basis; (iii) Discourage excessive or concentrated risk-taking; (iv) Allow an institution to attract and retain proven talent; and (v) Align aggregate remuneration for GS Group with performance over the cycle.
The bank develops remuneration policies and practices in accordance with applicable regulatory rules whilst ensuring that these are aligned so far as possible with the Goldman Sachs Compensation Principles. Employees share in performance-based incentive schemes.
The GSIB Board Remuneration Committee oversees the development and implementation of these remuneration policies and practices.
Stakeholder Engagement. The bank’s stakeholders include its shareholder, employees, suppliers, clients, regulators and the communities and environment in which it operates.
GOLDMAN SACHS INTERNATIONAL BANK (UNLIMITED COMPANY)
Directors’ Report
7
Engagement with ShareholderThe bank is a wholly-owned subsidiary of Group Inc. As such its purpose, culture, values and strategies are aligned with those of its ultimate shareholder. The Board receives regular updates on GS Group strategy. Chairs of Board committees meet regularly with their counterparts on the GS Group board of directors.
Engagement with EmployeesThe bank considers its employees as its greatest asset and the Board is responsible for overseeing the bank’s engagement with them. This includes regular updates from management on various metrics, including on diversity and inclusion.
Senior management engaged with employees in various ways during the period including firmwide or regional ‘Town Halls’, where questions are solicited in advance and feedback gathered afterwards; Talks at GS with external and internal speakers; employee feedback surveys; email and voicemail communications and manager engagement at a divisional level. Employees are invited to watch quarterly earnings announcements and receive internal briefings so that they are made aware of the financial and economic factors affecting the performance of the bank. A sophisticated firmwide intranet further enables employees to be engaged.
The bank supports the diversity and inclusion initiatives of GS Group and is committed to sustaining a work environment where its people feel comfortable bringing their authentic selves to work and are empowered to reach their full potential. GS Group has a range of initiatives in place to increase diverse representation at all levels and foster inclusion. Various affinity groups for employees are supported by the bank. Certain GS Group affiliates are a signatory to the U.K. Race at Work Charter and the U.K. Women in Finance Charter, meeting the commitment to have women professionals comprising 30% of the senior talent (vice presidents and above) of their workforce by 2023 in September 2021.
With respect to the COVID-19 pandemic, the bank’s priority remains to safeguard its employees and to seek to ensure continuity of business operations on behalf of its clients. Throughout the year, the bank has invested in supporting its employees working remotely and is focused on ensuring that employees are able to safely work from its’ offices. Senior management make regular announcements to employees on the latest governmental and public health advice on COVID-19 and continue to monitor employee sentiment around the bank’s management of the pandemic to inform its decisions around the type of support to make available.
Engagement with Other StakeholdersClients – The Board as a whole regularly receives updates from management on client engagement.
Suppliers – GS Group has globally consistent standards and procedures for the on-boarding, use and payment of external suppliers (vendors). In partnering with GS Group to deliver on its objectives, suppliers are required to meet business, compliance and financial stability requirements and adhere to GS Group’s vendor code of conduct, which describes the expectations GS Group has of it suppliers to conduct business responsibly. Suppliers in industries perceived to be of higher risk in relation to Environmental, Social and Governance (ESG) or modern slavery and human trafficking are subject to enhanced due diligence and monitoring. GS Group has a long history of working with small and diverse businesses as part of its vendor diversity programme and has implemented strategies to promote greater diversity within its supplier base and remains committed to its goal to increase spend with small and diverse suppliers by 50% by 2025 (from its 2020 baseline).
Regulators – the bank has an active dialogue with its regulators. Senior management and directors meet with regulators on a frequent basis.
Environment – GS Group has a global approach to sustainability through its platform for sustainable finance. GS Group’s approach to sustainable finance is focused on two long-term imperatives: advancing the climate transition by helping industries usher in and thrive in a low-carbon economy; and driving inclusive growth by leveraging its business capabilities to improve access and affordability and to advance economic empowerment. GS Group has announced a target to deploy $750 billion in sustainable financing, investing and advisory activity by the beginning of 2030, in which the bank will play a part.
As part of its ESG framework, GS Group’s Corporate and Workplace Solutions Division looks to reduce the environmental impact of GS Group’s global operations and supply chain, through operational resiliency; ensuring facilities adhere to the highest levels of environmentally sustainable standards; carbon footprint and energy usage reduction initiatives; the sourcing of sustainably produced goods and resource conservation. This approach is applied consistently across all entities in GS Group including the bank. GS Group has been carbon neutral across its operations and business travel since 2015, and met its 2020 goal of procuring 100% of electricity from renewable sources.
GOLDMAN SACHS INTERNATIONAL BANK (UNLIMITED COMPANY)
Directors’ Report
8
Communities – the bank supports its communities in many ways, with global initiatives coordinated through GS Group’s Office of Corporate Engagement. These include the 10,000 Small Businesses entrepreneurship programme which helps small business owners create jobs and economic opportunity by providing access to education, capital and business support services and the 10,000 Women programme which fosters economic growth by providing women entrepreneurs with a business and management education, mentoring and networking, and access to capital. Charitable initiatives include Goldman Sachs Gives which supports innovative ideas, solving economic and social issues, and enabling progress in underserved communities and the Community Teamworks volunteering initiative which enables the bank’s employees to contribute their ideas, time and expertise to drive tangible progress in communities through work in partnership with non-profit organisations.
Internal Control over Financial Reporting. Management of the bank is responsible for establishing and maintaining adequate internal control over financial reporting. The bank’s internal control over financial reporting is designed to provide reasonable assurance regarding the reliability of financial reporting and the preparation of the bank’s financial statements for external reporting purposes in accordance with U.K.-adopted international accounting standards and International Financial Reporting Standards (IFRS).
The bank’s internal control over financial reporting includes policies and procedures that pertain to the maintenance of records that, in reasonable detail, accurately and fairly reflect transactions and dispositions of assets; provide reasonable assurance that transactions are recorded as necessary to permit preparation of financial statements in accordance with IFRS; and that receipts and expenditures are being made only in accordance with authorisations of management and the directors of the bank; and provide reasonable assurance regarding prevention or timely detection of unauthorised acquisition, use or disposition of the bank’s assets that could have a material effect on the bank’s financial statements.
Section 172(1) StatementUnder section 172 of the Companies Act 2006, the directors of the bank are required to act in the way they consider, in good faith, would be most likely to promote the success of the bank for the benefit of its stakeholders as a whole. In doing this, section 172 requires a director to have regard, among other matters, to: the likely consequences of any decision in the long term; the interests of the bank’s employees; the need to foster the bank’s business relationships with clients, suppliers and others; the impact of the bank’s operations on the community and the environment; the desirability of the bank for maintaining a reputation for high standards of business conduct; and the need to act fairly with stakeholders of the bank.
The directors give careful consideration to the factors set out above in discharging their duties under section 172 and they inform the directors’ decision-making as a Board. The bank endorses GS Group’s updated code of Business Conduct and Ethics set out on the Goldman Sachs public website and looks to conduct its business in accordance with the highest ethical standards and in compliance with all applicable laws, rules and regulations.
The directors are committed to effective engagement with all of the bank’s stakeholders. They recognise that building strong relationships with these stakeholders will help the bank deliver its strategy in line with its long-term values, and operate the business in a sustainable way. The Board seeks to understand and balance the relative interests and priorities of each group and to have regard to these, as appropriate, in their discussions and in the decision-making process. The Board receives regular updates from the chief executive officer of the bank and from the bank’s shareholder. A rigorous agenda setting process for Board meetings ensures topics relevant to stakeholders are brought to the board in a frequent and timely manner.
In addition, the Board may receive training and other information to further develop its understanding of key issues impacting the bank’s stakeholders. The Board is further supported by the GSIB Board Audit Committee, the GSIB Board Risk Committee and the GSIB Board Remuneration Committee who consider in more detail the systems and controls in place in relation to engagement with stakeholders.
GOLDMAN SACHS INTERNATIONAL BANK (UNLIMITED COMPANY)
Directors’ Report
9
Carbon, Energy and Business Travel Consumption and ReportingThe bank’s main sources of Greenhouse Gas (GHG) emissions are the operation of office facilities, dedicated data centres and business travel. Carbon neutrality is a priority for the operation of GS Group and its supply chain. In 2015, GS Group achieved carbon neutrality in its operations and business travel, ahead of its 2020 goal announced in 2009 and the offices and data centres utilised by the bank in the U.K. source 100% renewable electricity. GS Group has expanded its operational carbon commitment to include its supply chain, targeting net-zero carbon emissions by 2030. More information on GS Group’s sustainability efforts, including its sustainable finance strategy, energy consumption and carbon emissions can be found in the annual Goldman Sachs Sustainability Report, available at www.goldmansachs.com/s/sustainability-report.
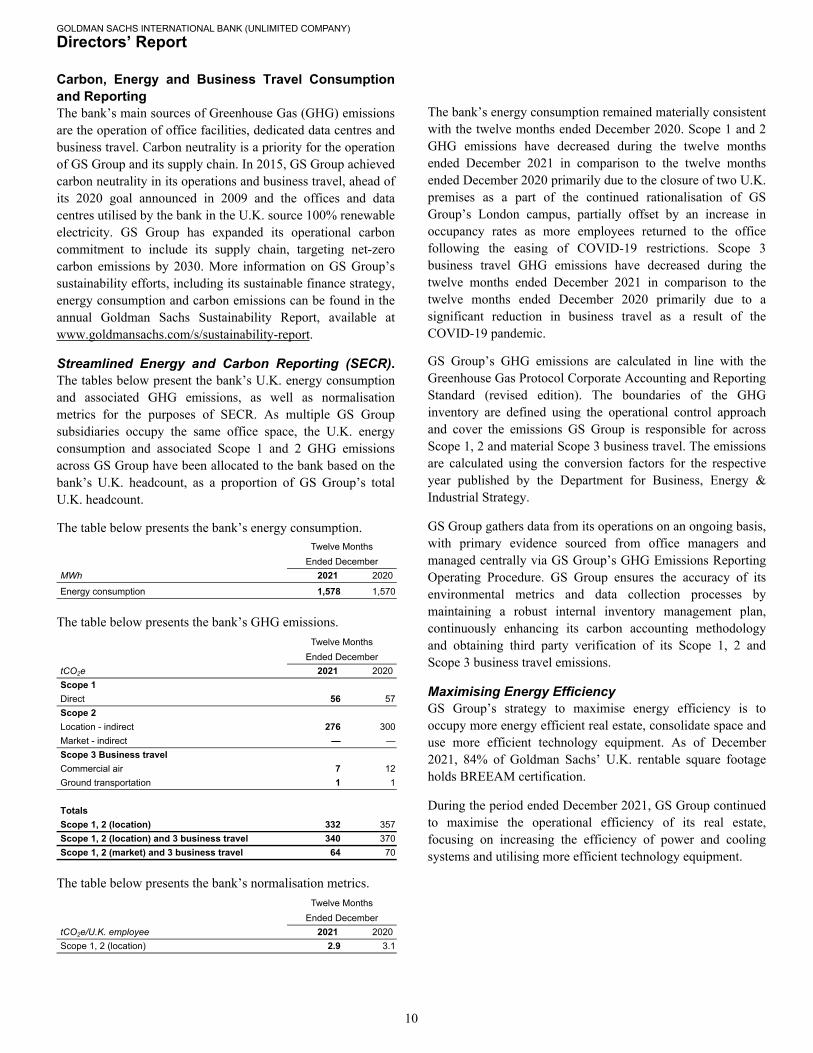
Streamlined Energy and Carbon Reporting (SECR). The tables below present the bank’s U.K. energy consumption and associated GHG emissions, as well as normalisation metrics for the purposes of SECR. As multiple GS Group subsidiaries occupy the same office space, the U.K. energy consumption and associated Scope 1 and 2 GHG emissions across GS Group have been allocated to the bank based on the bank’s U.K. headcount, as a proportion of GS Group’s total U.K. headcount.
The table below presents the bank’s energy consumption.Twelve Months
Ended DecemberMWh 2021 2020
Energy consumption 1,578 1,570
The table below presents the bank’s GHG emissions.Twelve Months
Ended DecembertCO2e 2021 2020Scope 1Direct 56 57 Scope 2Location - indirect 276 300 Market - indirect — — Scope 3 Business travelCommercial air 7 12 Ground transportation 1 1
TotalsScope 1, 2 (location) 332 357 Scope 1, 2 (location) and 3 business travel 340 370 Scope 1, 2 (market) and 3 business travel 64 70
The table below presents the bank’s normalisation metrics.Twelve Months
Ended DecembertCO2e/U.K. employee 2021 2020Scope 1, 2 (location) 2.9 3.1
The bank’s energy consumption remained materially consistent with the twelve months ended December 2020. Scope 1 and 2 GHG emissions have decreased during the twelve months ended December 2021 in comparison to the twelve months ended December 2020 primarily due to the closure of two U.K. premises as a part of the continued rationalisation of GS Group’s London campus, partially offset by an increase in occupancy rates as more employees returned to the office following the easing of COVID-19 restrictions. Scope 3 business travel GHG emissions have decreased during the twelve months ended December 2021 in comparison to the twelve months ended December 2020 primarily due to a significant reduction in business travel as a result of the COVID-19 pandemic.
GS Group’s GHG emissions are calculated in line with the Greenhouse Gas Protocol Corporate Accounting and Reporting Standard (revised edition). The boundaries of the GHG inventory are defined using the operational control approach and cover the emissions GS Group is responsible for across Scope 1, 2 and material Scope 3 business travel. The emissions are calculated using the conversion factors for the respective year published by the Department for Business, Energy & Industrial Strategy.
GS Group gathers data from its operations on an ongoing basis, with primary evidence sourced from office managers and managed centrally via GS Group’s GHG Emissions Reporting Operating Procedure. GS Group ensures the accuracy of its environmental metrics and data collection processes by maintaining a robust internal inventory management plan, continuously enhancing its carbon accounting methodology and obtaining third party verification of its Scope 1, 2 and Scope 3 business travel emissions.
Maximising Energy EfficiencyGS Group’s strategy to maximise energy efficiency is to occupy more energy efficient real estate, consolidate space and use more efficient technology equipment. As of December 2021, 84% of Goldman Sachs’ U.K. rentable square footage holds BREEAM certification.
During the period ended December 2021, GS Group continued to maximise the operational efficiency of its real estate, focusing on increasing the efficiency of power and cooling systems and utilising more efficient technology equipment.
GOLDMAN SACHS INTERNATIONAL BANK (UNLIMITED COMPANY)
Directors’ Report
10
DividendsThe directors do not recommend the payment of an ordinary dividend for the period ended December 2021. No dividends were paid in the period ended December 2020.
Exchange RateThe British pound/U.S. dollar exchange rate was £/$1.3535 as of December 2021 and £/$1.3653 as of December 2020. The average rate for the period ended December 2021 was £/$1.3739 and for the period ended December 2020 was £/$1.2950.
Disclosure of Information to AuditorsIn the case of each of the persons who are directors of the bank at the date when this report was approved:
• So far as each of the directors is aware, there is no relevant audit information of which the bank’s auditors are unaware; and
• Each of the directors has taken all the steps that they ought to have taken as a director to make themselves aware of any relevant audit information and to establish that the bank’s auditors are aware of that information.
Independent AuditorsThe bank has passed a resolution to appoint Mazars LLP as auditors of the bank for the period ended December 2021.
Statement of Directors’ Responsibilities in Respect of the Financial StatementsThe directors are responsible for preparing the strategic report, the directors’ report and the consolidated financial statements in accordance with applicable law and regulation.
Company law requires the directors to prepare financial statements for each financial year. Under that law, the directors have prepared the financial statements in accordance with U.K.-adopted international accounting standards.
The bank has also prepared financial statements in accordance with International Financial Reporting Standards (IFRS) adopted pursuant to Regulation (EC) No 1606/2002 as it applies in the E.U.
Under company law, directors must not approve the financial statements unless they are satisfied that they give a true and fair view of the state of affairs of the bank and of the profit or loss of the bank for that period. In preparing the financial statements, the directors are required to:
• Select suitable accounting policies and then apply them consistently;
• State whether applicable U.K.-adopted international accounting standards and IFRS adopted pursuant to Regulation (EC) No 1606/2002 as it applies in the E.U. have been followed, subject to any material departures disclosed and explained in the financial statements;
• Make judgements and estimates that are reasonable and prudent; and
• Prepare the financial statements on the going concern basis unless it is inappropriate to presume that the bank will continue in business.
The directors are responsible for safeguarding the assets of the bank and hence for taking reasonable steps for the prevention and detection of fraud and other irregularities.
The directors are also responsible for keeping adequate accounting records that are sufficient to show and explain the bank’s transactions and disclose with reasonable accuracy at any time the financial position of the bank and enable them to ensure that the financial statements comply with the Companies Act 2006.
The directors are responsible for the maintenance and integrity of the bank’s financial statements on the Goldman Sachs website.
Legislation in the U.K. governing the preparation and dissemination of financial statements may differ from legislation in other jurisdictions.
GOLDMAN SACHS INTERNATIONAL BANK (UNLIMITED COMPANY)
Directors’ Report
11
Directors’ ConfirmationsEach of the directors, whose names and functions are listed in “Directors” below, confirm that to the best of their knowledge:
• The financial statements, which have been prepared in accordance with U.K.-adopted international accounting standards and IFRS adopted pursuant to Regulation (EC) No 1606/2002 as it applies in the E.U., give a true and fair view of the assets, liabilities, financial position and profit or loss of the bank; and
• The strategic report includes a fair review of the development and performance of the business and the position of the bank, together with a description of the principal risks and uncertainties that the bank faces.
DirectorsThe directors of the bank who served throughout the year and to the date of this report, except where noted, were:
NameD. M. BicarreguiC. G. CrippsLord Grabiner QC (resigned on May 31, 2021)S. P. GyimahN. HarmanD. W. McDonogh, Chief executive officerT. L. Miller OBEE. E. Stecher, ChairD. D. Wildermuth (resigned on July 27, 2021)
The appointment of L. A. Donnelly and N. Pathmanabhan was approved by the Board on November 18, 2021 subject to regulatory approval.
No director had, at the period end, any interest requiring note herein.
Date of Authorisation of IssueThe financial statements were authorised for issue by the Board of Directors on April 14, 2022.
By order of the BoardD. M. Bicarregui
DirectorApril 14, 2022
GOLDMAN SACHS INTERNATIONAL BANK (UNLIMITED COMPANY)
Directors’ Report
12
Opinion
We have audited the financial statements of Goldman Sachs International Bank (the bank) for the year ended 31 December 2021 which comprise, the Income Statement, Statement of Comprehensive Income, Balance Sheet, Statement of Changes in Equity, Statement of Cash Flows, and notes to the financial statements, including a summary of significant accounting policies.
The financial reporting framework that has been applied in their preparation is applicable law and U.K.-adopted international accounting standards as applied in accordance with the provisions of the Companies Act 2006.
In our opinion, the financial statements:
• give a true and fair view of the state of the bank’s affairs as at 31 December 2021 and of the bank’s profit for the year then ended;
• have been properly prepared in accordance with U.K.-adopted international accounting standards; and
• have been prepared in accordance with the requirements of the Companies Act 2006.
Basis for opinion
We conducted our audit in accordance with International Standards on Auditing (UK) (ISAs (UK)) and applicable law. Our responsibilities under those standards are further described in the “Auditors’ responsibilities for the audit of the financial statements” section of our report. We are independent of the bank in accordance with the ethical requirements that are relevant to our audit of the financial statements in the U.K., including the Finance Reporting Council’s (FRC) Ethical Standard, and we have fulfilled our other ethical responsibilities in accordance with these requirements. We believe that the audit evidence we have obtained is sufficient and appropriate to provide a basis for our opinion.
Conclusions relating to going concern
In auditing the financial statements, we have concluded that the directors’ use of the going concern basis of accounting in the preparation of the financial statements is appropriate.
Our audit procedures to evaluate the directors’ assessment of the bank’s ability to continue to adopt the going concern basis of accounting included but were not limited to:
• undertaking an initial assessment at the planning stage of the audit to identify events or conditions that may cast significant doubt on the bank’s ability to continue as a going concern;
• obtaining an understanding of the relevant controls relating to the directors’ going concern assessment;
• reviewing the directors’ going concern assessment, to determine that it appropriately considers an assessment of key business risks including assessing the sufficiency of the bank’s capital and liquidity taking into consideration the most recent Internal Capital Adequacy Assessment Process and Internal Liquidity Adequacy Assessment Process;
• challenging the assumptions used in the forecasts and management assessments, including incorporating back-testing to determine the historical accuracy of management's forecasting and budgeting, and considering the extent of reliance on capital invested by the bank's parent company;
• making inquiries of management, reading correspondence with regulators and minutes of board meetings;
• assessing and challenging key assumptions and mitigating actions put in place in response to external factors including the continued impact of COVID-19;
• considering whether there were events subsequent to the balance sheet date which could have a bearing on the going concern conclusion; and
• evaluating the appropriateness of the disclosures in the financial statements in relation to the description of the directors' assessment of going concern.
Based on the work we have performed, we have not identified any material uncertainties relating to events or conditions that, individually or collectively, may cast significant doubt on the bank’s ability to continue as a going concern for a period of at least twelve months from when the financial statements are authorised for issue.
Our responsibilities and the responsibilities of the directors with respect to going concern are described in the relevant sections of this report.
Key audit matters
Key audit matters are those matters that, in our professional judgement, were of most significance in our audit of the financial statements of the current period and include the most significant assessed risks of material misstatement (whether or not due to fraud) we identified, including those which had the greatest effect on: the overall audit strategy; the allocation of resources in the audit; and directing the efforts of the engagement team. These matters were addressed in the context of our audit of the financial statements as a whole, and in forming our opinion thereon, and we do not provide a separate opinion on these matters.
We summarise below the key audit matter in forming our audit opinion above, together with an overview of the principal audit procedures performed to address this matter and our key observations arising from those procedures. This matter, together with our findings was communicated to those charged with governance.
Independent auditors’ report to the members ofGoldman Sachs International Bank (unlimited company)
13

Key Audit Matter How our scope addressed this matterValuation of allowance for impairment (including ECL) on loans held at amortised cost under IFRS 9 ‘Financial Instruments’ (IFRS 9)As at December 2021, the bank had $14.91 billion (December 2020: $15.78 billion) gross exposure to loans held at amortised cost with an Expected Credit Loss (ECL) of $60 million (December 2020: $151 million).
Note 4 ‘Critical Accounting Estimates and Judgements’ sets out that the measurement of ECL for financial assets classified at amortised cost requires the use of complex models and significant forward-looking assumptions about the credit behaviour and economic conditions.
This is a key audit matter as estimating impairment provisions under IFRS 9 requires significant judgements, primarily:
• Model estimations – Inherently judgemental modelling and assumptions are used to estimate ECL which involves determining Probabilities of Default (PD), Loss Given Default (LGD), and Exposures at Default (EAD), including quantitative and qualitative assessments.
• Economic scenarios – IFRS 9 requires the bank to measure ECLs on an unbiased forward-looking basis reflecting a range of future economic conditions. Significant management judgement is applied in determining the forward-looking economic scenarios used, and the probability weightings associated with the scenarios. The models used to derive the probability weightings are complex in nature.
Our audit procedures included, but were not limited to:
We performed end to end process walkthroughs to identify the key systems, applications and controls used in the ECL processes and critically assessed the appropriateness of management’s impairment policy in relation to IFRS 9 principles.
Key aspects of our controls testing involved evaluating the design and implementation, and testing the operating effectiveness of the key controls over the:
• completeness and accuracy of the key inputs into the IFRS 9 impairment models;
• model governance including approval of changes in assumptions or methodologies, model validation, implementation and monitoring;
• definition and application of the staging criteria;
• internal credit ratings and credit quality reviews process;
• authorisation and calculation of qualitative adjustments; and
• selection and implementation of economic variables and controls over the economic scenario selection and probability weightings.
We determined that we could rely on these controls for the purposes of our audit.
With the support of our credit risk specialists we:
• assessed the compliance of the bank’s impairment methodologies with IFRS 9 requirements;
• assessed the proper specifications of the statistical models;
• tested the proper calibration of the models’ parameters; and
• assessed the appropriateness of qualitative assessments.
With the support of our economist we:
• assessed the reasonableness of the bank’s methodology and models for determining the economic scenarios used and the probability weightings applied to them;
• evaluated the appropriateness of key economic variables which included comparing samples of economic variables to external sources; and
• assessed the reasonableness of the bank’s qualitative assessments by challenging key economic assumptions applied in their calculation based on external sources.
.
Independent auditors’ report to the members ofGoldman Sachs International Bank (unlimited company)
14
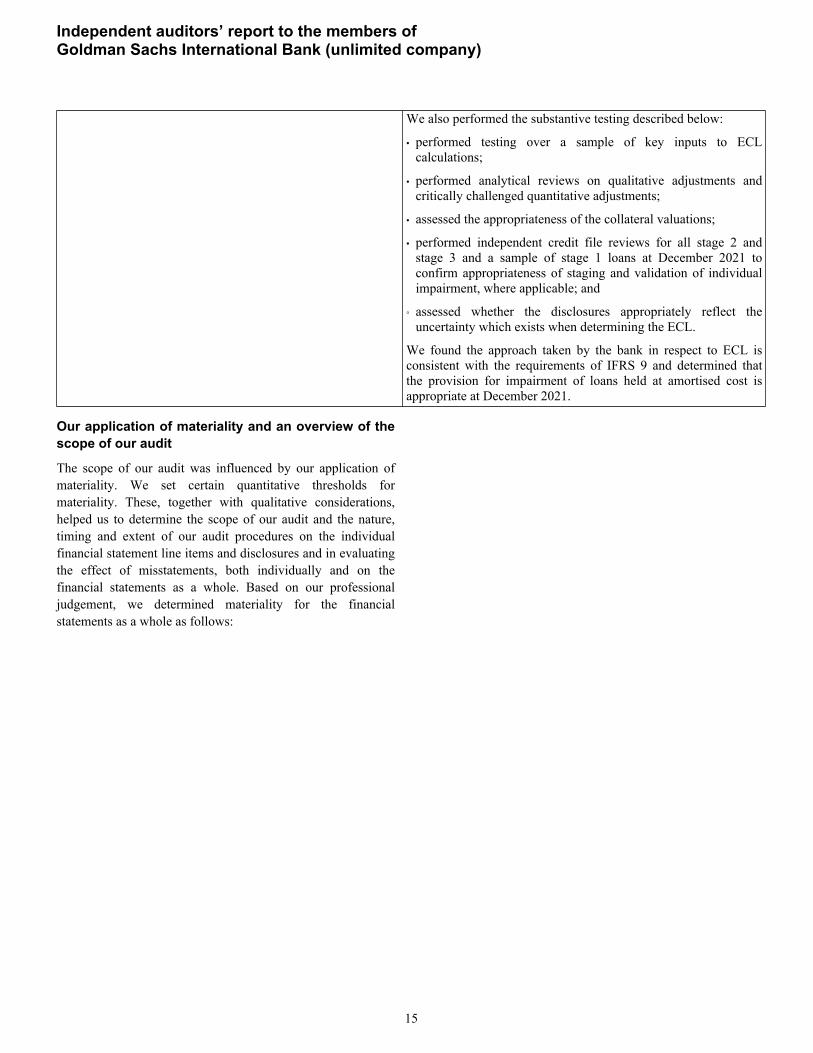
We also performed the substantive testing described below:
• performed testing over a sample of key inputs to ECL calculations;
• performed analytical reviews on qualitative adjustments and critically challenged quantitative adjustments;
• assessed the appropriateness of the collateral valuations;
• performed independent credit file reviews for all stage 2 and stage 3 and a sample of stage 1 loans at December 2021 to confirm appropriateness of staging and validation of individual impairment, where applicable; and
◦ assessed whether the disclosures appropriately reflect the uncertainty which exists when determining the ECL.
We found the approach taken by the bank in respect to ECL is consistent with the requirements of IFRS 9 and determined that the provision for impairment of loans held at amortised cost is appropriate at December 2021.
Our application of materiality and an overview of the scope of our audit
The scope of our audit was influenced by our application of materiality. We set certain quantitative thresholds for materiality. These, together with qualitative considerations, helped us to determine the scope of our audit and the nature, timing and extent of our audit procedures on the individual financial statement line items and disclosures and in evaluating the effect of misstatements, both individually and on the financial statements as a whole. Based on our professional judgement, we determined materiality for the financial statements as a whole as follows:
Independent auditors’ report to the members ofGoldman Sachs International Bank (unlimited company)
15
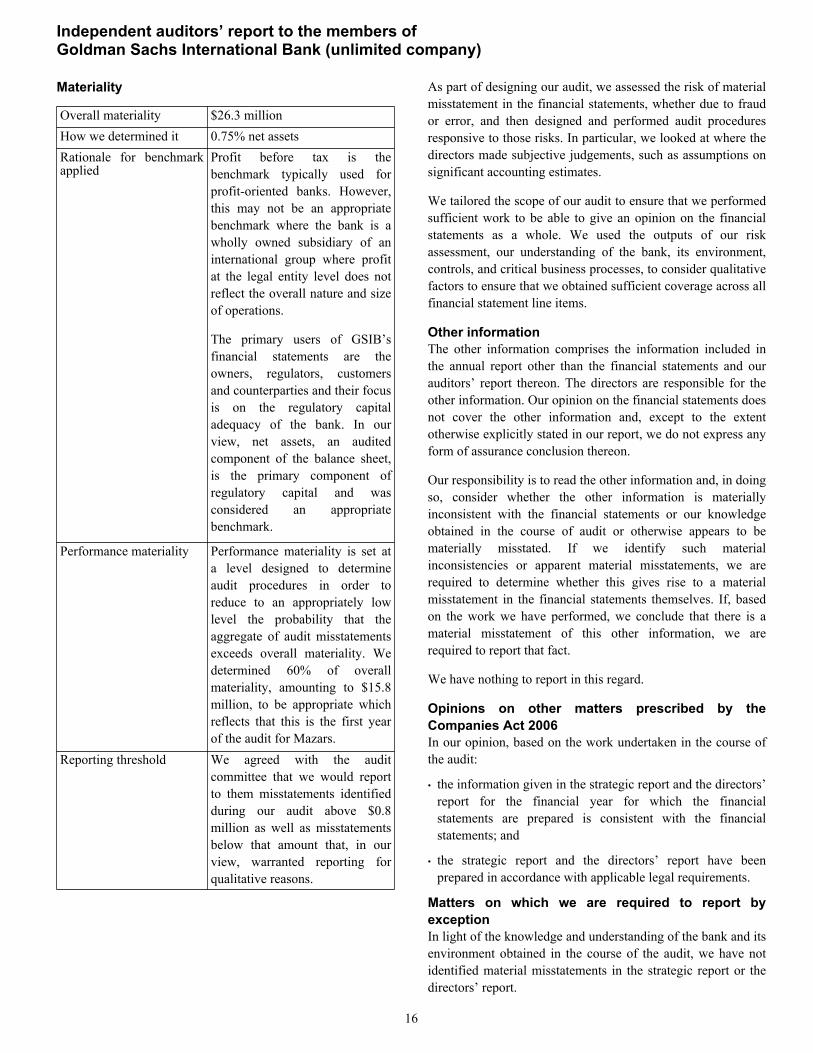
Materiality
Overall materiality $26.3 millionHow we determined it 0.75% net assetsRationale for benchmark applied
Profit before tax is the benchmark typically used for profit-oriented banks. However, this may not be an appropriate benchmark where the bank is a wholly owned subsidiary of an international group where profit at the legal entity level does not reflect the overall nature and size of operations.
The primary users of GSIB’s financial statements are the owners, regulators, customers and counterparties and their focus is on the regulatory capital adequacy of the bank. In our view, net assets, an audited component of the balance sheet, is the primary component of regulatory capital and was considered an appropriate benchmark.
Performance materiality Performance materiality is set at a level designed to determine audit procedures in order to reduce to an appropriately low level the probability that the aggregate of audit misstatements exceeds overall materiality. We determined 60% of overall materiality, amounting to $15.8 million, to be appropriate which reflects that this is the first year of the audit for Mazars.
Reporting threshold We agreed with the audit committee that we would report to them misstatements identified during our audit above $0.8 million as well as misstatements below that amount that, in our view, warranted reporting for qualitative reasons.
As part of designing our audit, we assessed the risk of material misstatement in the financial statements, whether due to fraud or error, and then designed and performed audit procedures responsive to those risks. In particular, we looked at where the directors made subjective judgements, such as assumptions on significant accounting estimates.
We tailored the scope of our audit to ensure that we performed sufficient work to be able to give an opinion on the financial statements as a whole. We used the outputs of our risk assessment, our understanding of the bank, its environment, controls, and critical business processes, to consider qualitative factors to ensure that we obtained sufficient coverage across all financial statement line items.
Other informationThe other information comprises the information included in the annual report other than the financial statements and our auditors’ report thereon. The directors are responsible for the other information. Our opinion on the financial statements does not cover the other information and, except to the extent otherwise explicitly stated in our report, we do not express any form of assurance conclusion thereon.
Our responsibility is to read the other information and, in doing so, consider whether the other information is materially inconsistent with the financial statements or our knowledge obtained in the course of audit or otherwise appears to be materially misstated. If we identify such material inconsistencies or apparent material misstatements, we are required to determine whether this gives rise to a material misstatement in the financial statements themselves. If, based on the work we have performed, we conclude that there is a material misstatement of this other information, we are required to report that fact.
We have nothing to report in this regard.
Opinions on other matters prescribed by the Companies Act 2006In our opinion, based on the work undertaken in the course of the audit:
• the information given in the strategic report and the directors’ report for the financial year for which the financial statements are prepared is consistent with the financial statements; and
• the strategic report and the directors’ report have been prepared in accordance with applicable legal requirements.
Matters on which we are required to report by exceptionIn light of the knowledge and understanding of the bank and its environment obtained in the course of the audit, we have not identified material misstatements in the strategic report or the directors’ report.
Independent auditors’ report to the members ofGoldman Sachs International Bank (unlimited company)
16

We have nothing to report in respect of the following matters in relation to which the Companies Act 2006 requires us to report to you if, in our opinion:
• adequate accounting records have not been kept by the bank, or returns adequate for our audit have not been received from branches not visited by us; or
• the bank’s financial statements are not in agreement with the accounting records and returns; or
• certain disclosures of directors’ remuneration specified by law are not made; or
• we have not received all the information and explanations we require for our audit.
Responsibilities of directorsAs explained more fully in the directors’ responsibilities statement set out on page 11, the directors are responsible for the preparation of the financial statements and for being satisfied that they give a true and fair view, and for such internal control as the directors determine is necessary to enable the preparation of financial statements that are free from material misstatement, whether due to fraud or error.
In preparing the financial statements, the directors are responsible for assessing the bank’s ability to continue as a going concern, disclosing, as applicable, matters related to going concern and using the going concern basis of accounting unless the directors either intend to liquidate the bank or to cease operations, or have no realistic alternative but to do so.
Auditors’ responsibilities for the audit of the financial statementsOur objectives are to obtain reasonable assurance about whether the financial statements as a whole are free from material misstatement, whether due to fraud or error, and to issue an auditors’ report that includes our opinion. Reasonable assurance is a high level of assurance but is not a guarantee that an audit conducted in accordance with ISAs (UK) will always detect a material misstatement when it exists. Misstatements can arise from fraud or error and are considered material if, individually or in the aggregate, they could reasonably be expected to influence the economic decisions of users taken on the basis of the financial statements.
The extent to which our procedures are capable of detecting irregularities, including fraud is detailed below.
Irregularities, including fraud, are instances of non-compliance with laws and regulations. We design procedures in line with our responsibilities, outlined above, to detect material misstatements in respect of irregularities, including fraud.
Based on our understanding of bank and its industry, we considered that non-compliance with the following laws and regulations might have a material effect on the financial statements: financial crime regulations, and regulatory and supervisory requirements from the regulatory authorities where the bank conducts its business, including primarily the Prudential Regulatory Authority (PRA) and the Financial Conduct Authority (FCA).
To help us identify instances of non-compliance with these laws and regulations, and in identifying and assessing the risks of material misstatement in respect to non-compliance, our procedures included, but were not limited to:
• obtaining and understanding of the legal and regulatory frameworks applicable to the bank and the industry in which it operates;
• inquiring of management and, where appropriate, those charged with governance, as to whether the bank is in compliance with laws and regulations, and discussing their policies and procedures regarding compliance with laws and regulations;
• inspecting correspondence with the PRA and FCA;
• reviewing minutes of directors’ meetings; and
• discussing amongst the engagement team the identified laws and regulations and remaining alert to any indications of non-compliance throughout our audit.
We also considered those laws and regulations that have a direct effect on the preparation of the financial statements, such as tax legislation and Companies Act 2006.
In addition, we evaluated the directors’ and management’s incentives and opportunities for fraudulent manipulation of the financial statements, including the risk of management override of controls, and determined that the principal risks related to posting manual journal entries to manipulate financial performance, management bias through judgements and assumptions in significant accounting estimates, in particular in relation to expected credit losses and valuation of financial instruments measured at fair value, and revenue recognition (which we pinpointed to the occurrence assertion mainly emanating from unauthorised trading).
Our audit procedures in relation to fraud included but were not limited to:
• making enquiries of the directors and management on whether they had knowledge of any actual, suspected or alleged fraud;
• gaining an understanding of the internal controls established to mitigate risks related to fraud;
• discussing amongst the engagement team the risks of fraud;
Independent auditors’ report to the members ofGoldman Sachs International Bank (unlimited company)
17

• addressing the risks of fraud through management override of controls by performing journal entry testing; and
• reviewing the accounting estimates in relation to expected credit losses (as described in our key audit matter) and valuation of financial instruments measured at fair value for evidence of management bias and performing procedures to respond to the fraud risk in revenue recognition.
There are inherent limitations in the audit procedures described above and the primary responsibility for the prevention and detection of irregularities including fraud rests with management. As with any audit, there remained a risk of non-detection of irregularities, as these may involve collusion, forgery, intentional omissions, misrepresentations or the override of internal controls.
The risks of material misstatement that had the greatest effect on our audit are discussed in the “Key audit matters” section of this report.
A further description of our responsibilities for the audit of the financial statements is located on the FRC’s website at www.frc.org.uk/auditorsresponsibilities. This description forms part of our auditors’ report.
Use of the audit report This report is made solely to the bank’s members as a body in accordance with Chapter 3 of Part 16 of the Companies Act 2006. Our audit work has been undertaken so that we might state to the bank’s members those matters we are required to state to them in an auditors’ report and for no other purpose. To the fullest extent permitted by law, we do not accept or assume responsibility to anyone other than the bank and the bank’s members as a body for our audit work, for this report, or for the opinions we have formed.
Greg Simpson (Senior Statutory Auditor)for and on behalf of Mazars LLPChartered Accountants and Statutory AuditorTower Bridge House,St Katharine’s Dock,LondonApril 14, 2022
Independent auditors’ report to the members ofGoldman Sachs International Bank (unlimited company)
18

Period Ended December$ in millions Note 2021 20201
Interest income from financial instruments measured at fair value through profit or loss $ 346 $ 538 Interest income from financial instruments measured at fair value through other comprehensive income 6 1 Interest income from financial instruments measured at amortised cost 340 381 Interest expense from financial instruments measured at fair value through profit or loss (101) (180) Interest expense from financial instruments measured at amortised cost (217) (418) Net interest income 374 322
Gains or losses from financial instruments at fair value through profit or loss (75) 111 Fees and commissions 102 62 Non-interest income 27 173 Net revenues 5 401 495
Impairments on financial instruments 29 89 (147) Operating expenses 6 (207) (149) Profit before taxation 283 199
Income tax expense 9 (82) (57) Profit for the financial period $ 201 $ 142
1. The comparative period was for the thirteen months ended December 2020. See Note 2 for further details.
Net revenues and profit before taxation of the bank are derived from continuing operations in the current and prior periods.
Statement of Comprehensive Income
Period Ended December$ in millions Note 2021 20201
Profit for the financial period $ 201 $ 142
Other comprehensive income
Items that will not be reclassified subsequently to profit or lossDebt valuation adjustment 19 14 (19) U.K. deferred tax attributable to the components of other comprehensive income (4) 5 Total items that will not be reclassified subsequently to profit or loss 10 (14)
Items that will be reclassified subsequently to profit or lossTranslation gains/(losses) and net investment hedges 1 (1) Gains/(losses) from financial instruments measured at fair value through other comprehensive income (95) 9 U.K. deferred tax attributable to the components of other comprehensive income 25 (2) Total items that will be reclassified subsequently to profit or loss (69) 6 Other comprehensive loss for the financial period, net of tax (59) (8) Total comprehensive income for the financial period $ 142 $ 134
1. The comparative period was for the thirteen months ended December 2020. See Note 2 for further details.
The accompanying notes are an integral part of these financial statements.
GOLDMAN SACHS INTERNATIONAL BANK (UNLIMITED COMPANY)
Income Statement
19
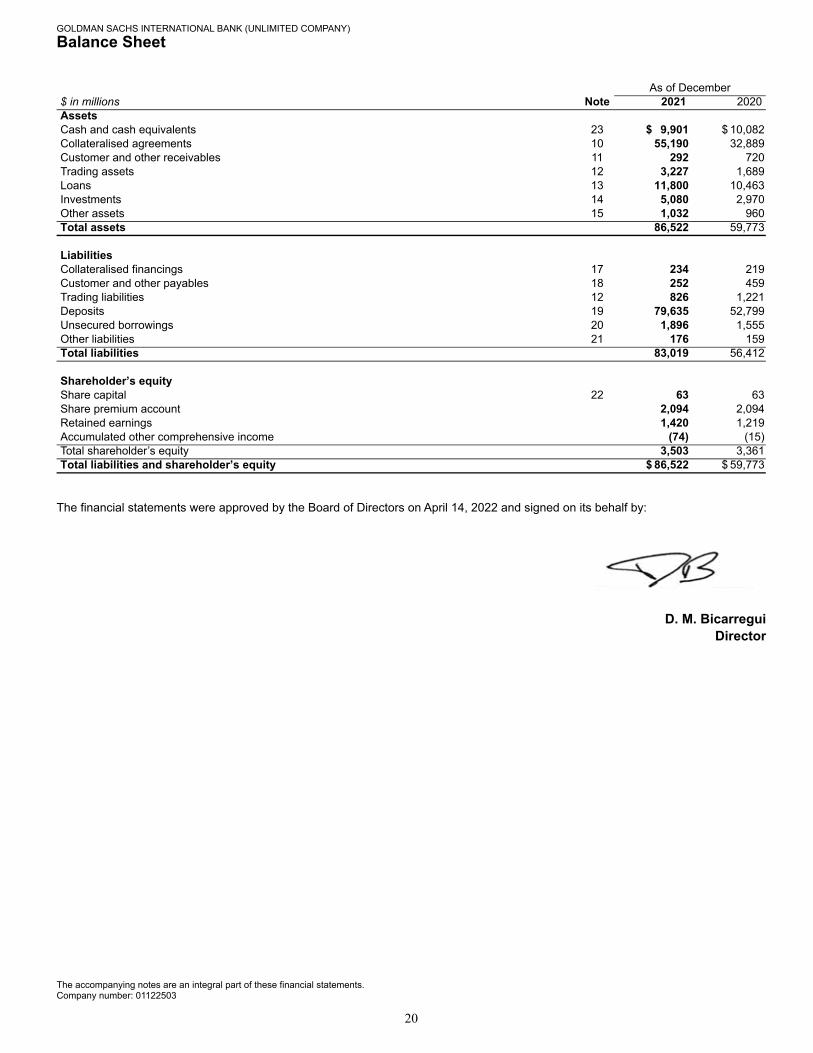
As of December$ in millions Note 2021 2020AssetsCash and cash equivalents 23 $ 9,901 $ 10,082 Collateralised agreements 10 55,190 32,889 Customer and other receivables 11 292 720 Trading assets 12 3,227 1,689 Loans 13 11,800 10,463 Investments 14 5,080 2,970 Other assets 15 1,032 960 Total assets 86,522 59,773
LiabilitiesCollateralised financings 17 234 219 Customer and other payables 18 252 459 Trading liabilities 12 826 1,221 Deposits 19 79,635 52,799 Unsecured borrowings 20 1,896 1,555 Other liabilities 21 176 159 Total liabilities 83,019 56,412
Shareholder’s equityShare capital 22 63 63 Share premium account 2,094 2,094 Retained earnings 1,420 1,219 Accumulated other comprehensive income (74) (15) Total shareholder’s equity 3,503 3,361 Total liabilities and shareholder’s equity $ 86,522 $ 59,773
The financial statements were approved by the Board of Directors on April 14, 2022 and signed on its behalf by:
D. M. BicarreguiDirector
The accompanying notes are an integral part of these financial statements.Company number: 01122503
GOLDMAN SACHS INTERNATIONAL BANK (UNLIMITED COMPANY)
Balance Sheet
20
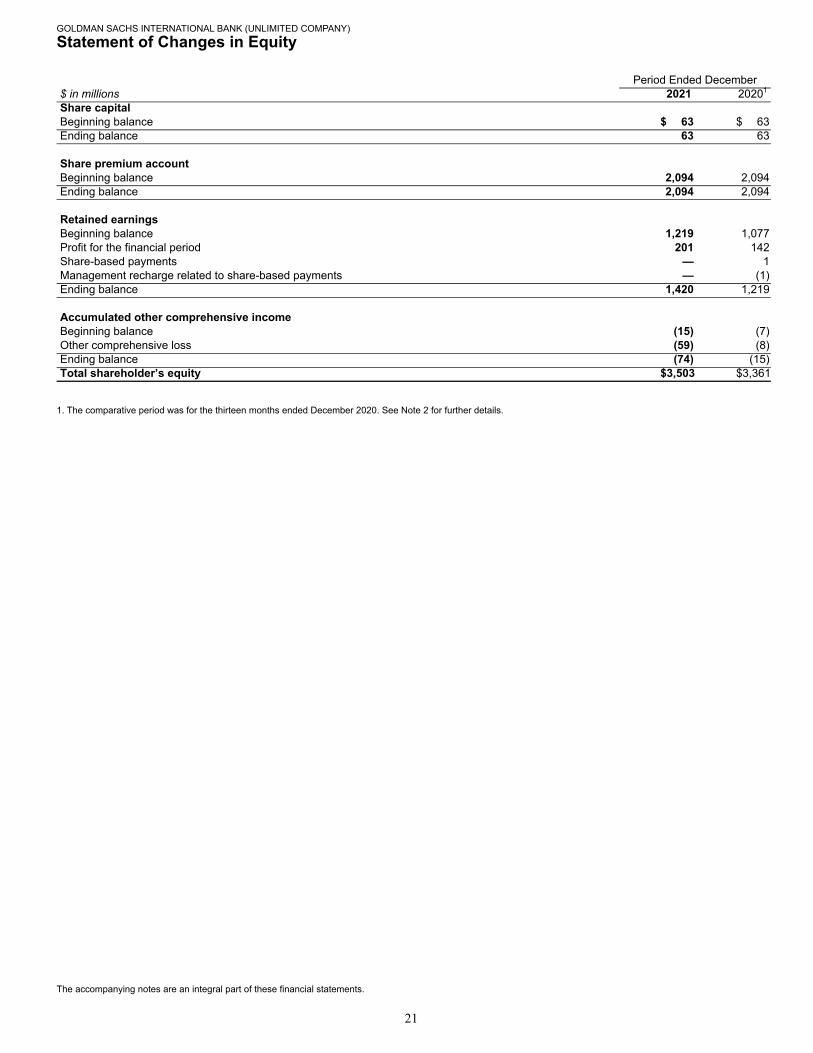
Period Ended December$ in millions 2021 20201
Share capitalBeginning balance $ 63 $ 63 Ending balance 63 63
Share premium accountBeginning balance 2,094 2,094 Ending balance 2,094 2,094
Retained earningsBeginning balance 1,219 1,077 Profit for the financial period 201 142 Share-based payments — 1 Management recharge related to share-based payments — (1) Ending balance 1,420 1,219
Accumulated other comprehensive incomeBeginning balance (15) (7) Other comprehensive loss (59) (8) Ending balance (74) (15) Total shareholder’s equity $ 3,503 $ 3,361
1. The comparative period was for the thirteen months ended December 2020. See Note 2 for further details.
The accompanying notes are an integral part of these financial statements.
GOLDMAN SACHS INTERNATIONAL BANK (UNLIMITED COMPANY)
Statement of Changes in Equity
21
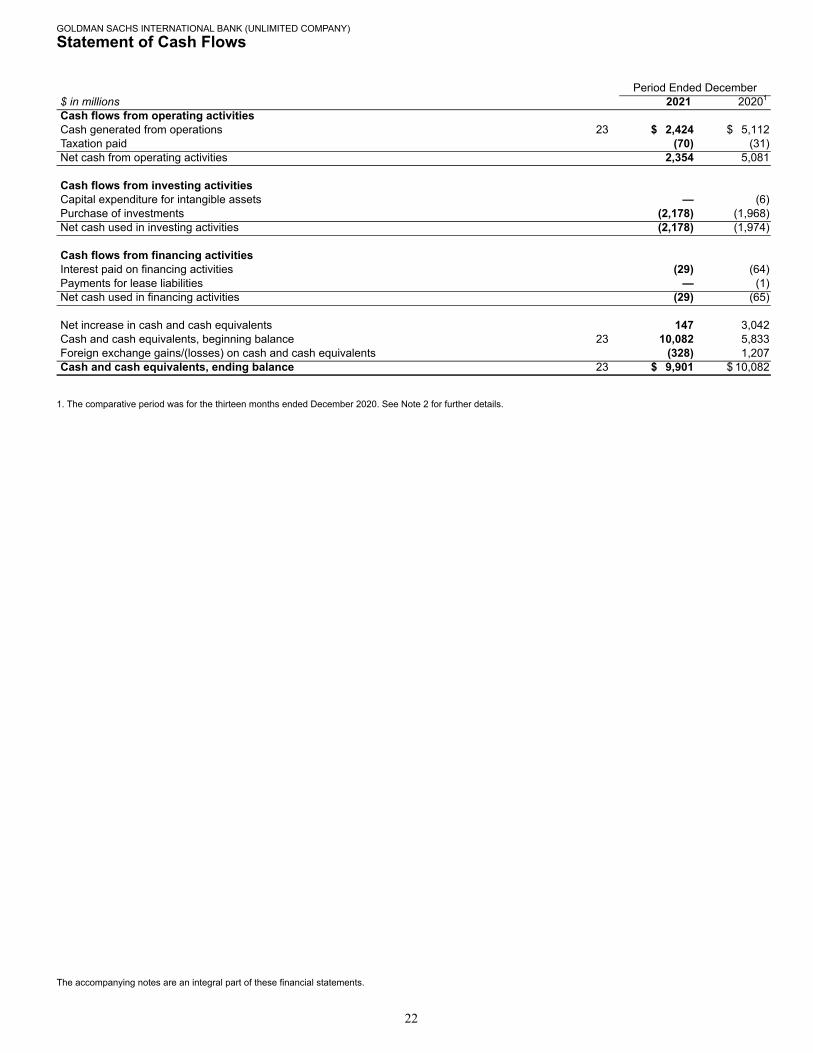
Period Ended December$ in millions 2021 20201
Cash flows from operating activitiesCash generated from operations 23 $ 2,424 $ 5,112 Taxation paid (70) (31) Net cash from operating activities 2,354 5,081
Cash flows from investing activitiesCapital expenditure for intangible assets — (6) Purchase of investments (2,178) (1,968) Net cash used in investing activities (2,178) (1,974)
Cash flows from financing activitiesInterest paid on financing activities (29) (64) Payments for lease liabilities — (1) Net cash used in financing activities (29) (65)
Net increase in cash and cash equivalents 147 3,042 Cash and cash equivalents, beginning balance 23 10,082 5,833 Foreign exchange gains/(losses) on cash and cash equivalents (328) 1,207 Cash and cash equivalents, ending balance 23 $ 9,901 $ 10,082
1. The comparative period was for the thirteen months ended December 2020. See Note 2 for further details.
The accompanying notes are an integral part of these financial statements.
GOLDMAN SACHS INTERNATIONAL BANK (UNLIMITED COMPANY)
Statement of Cash Flows
22
Note 1.
General Information
The bank is a private unlimited company and is incorporated and domiciled in England and Wales. The address of its registered office is Plumtree Court, 25 Shoe Lane, London, EC4A 4AU, United Kingdom.
The bank’s immediate parent undertaking is Goldman Sachs Group UK Limited (GSG UK), a company incorporated and domiciled in England and Wales.
The ultimate controlling undertaking and the parent company of the smallest and largest group for which consolidated financial statements are prepared is The Goldman Sachs Group, Inc., a company incorporated in the United States of America. Copies of its consolidated financial statements, as well as certain regulatory filings, for example Quarterly Reports on Form 10-Q and the Annual Report on Form 10-K, that provide further information about GS Group and its business activities, can be obtained from Investor Relations, 200 West Street, New York, NY 10282, United States of America, GS Group’s principal place of business, or at www.goldmansachs.com/investor-relations.
Basel III Pillar 3 DisclosuresThe bank is included in the consolidated Pillar 3 disclosures of GSG UK, as required by the U.K. capital framework. GSG UK’s December 2021 Pillar 3 disclosures will be made available in conjunction with the publication of its consolidated financial information at www.goldmansachs.com/disclosures.
Country-by-Country ReportingThe bank is included in the consolidated country-by-country reporting disclosures of GSG UK, as required by the Capital Requirements (Country-by-Country Reporting) Regulations 2013. GSG UK’s December 2021 Country-by-Country Reporting will be made available by December 31, 2022 at www.goldmansachs.com/disclosures.
Branch Information The Frankfurt branch had total assets of $7.68 billion (€6.74 billion) as of December 2021 and $176 million (€144 million) as of December 2020. The increase primarily reflects higher overnight cash deposits.
The Johannesburg branch had total assets of $108 million (R1.72 billion) as of December 2021 and $51 million (R752 million) as of December 2020.
Note 2.
Basis of Preparation
Statement of ComplianceThese financial statements have been prepared in accordance with U.K.-adopted international accounting standards, the requirements of the Companies Act 2006, as applicable to companies reporting under those standards, and International Financial Reporting Standards (IFRS) adopted pursuant to Regulation (EC) No 1606/2002 as it applies in the E.U. (IFRS as it applies in the E.U.).
In the prior period, the bank’s financial statements were prepared in accordance with international accounting standards, the requirements of Companies Act 2006, as applicable to companies reporting under those standards, and IFRS as it applies in the E.U.
As of December 2020, IFRS as it applies in the E.U. was incorporated into U.K. law and became U.K.-adopted international accounting standards, with future changes being subject to endorsement by the U.K. Endorsement Board. As required by the Companies Act 2006, from January 1, 2021, the bank applied the requirements of U.K.-adopted international accounting standards instead of international accounting standards. This change had no impact on the bank’s recognition, measurement or disclosure as U.K.-adopted international accounting standards were consistent with international accounting standards as of December 2021.
As of December 2021, U.K.-adopted international accounting standards were consistent with IFRS as it applies in the E.U.
These financial statements have been prepared on the going concern basis, under the historical cost basis (modified as explained in “Financial Assets and Liabilities” below).
Going ConcernThese financial statements have been prepared on a going concern basis. The directors are satisfied that the bank has sufficient capital and resources to continue to operate for the foreseeable future. In reaching this conclusion, the directors have considered the financial results of the bank, its capital management activities and liquidity as set out in Note 29 of this annual report.
ConsolidationThe bank has elected not to prepare consolidated financial statements as permitted by section 402 of the Companies Act 2006 as its subsidiaries are not material for the purpose of giving a true and fair view.
GOLDMAN SACHS INTERNATIONAL BANK (UNLIMITED COMPANY)
Notes to the Financial Statements
23
The bank has interests in the below special purpose entities that are fully funded by the bank through profit participating loan arrangements:
• Elan Woninghypotheken B.V. (incorporated in The Netherlands).
• Parkmore Point Limited (incorporated in England Wales).
The activities of these special purpose entities consist of the origination and purchase of mortgage loans with intention to subsequently securitise or sell as a portfolio of whole loans at a future date. These special purpose entities are consolidated in the financial statements of Group Inc.
These financial statements are individual financial statements.
Accounting Reference DateDuring the period ended December 2020, the bank changed its accounting reference date from November 30 to December 31 to conform to the period used by the bank for U.S. tax reporting purposes. These financial statements have been prepared for the twelve months ended December 31, 2021, with comparative information being presented for the thirteen months ended December 31, 2020. As a result, amounts presented in this annual report are not directly comparable.
Note 3.
Summary of Significant Accounting Policies
New Standards, Amendments and InterpretationsAmendments to IFRS 9 ‘Financial Instruments’ (IFRS 9), IAS 39 ‘Financial Instruments: Recognition and Measurement’ (IAS 39), IFRS 7 ‘Financial Instruments: Disclosures’ (IFRS ), IFRS 4 ‘Insurance Contracts’ (IFRS 4) and IFRS 16 ‘Leases’ (IFRS 16). On January 1, 2021, “Interest Rate Benchmark Reform – Phase 2” became effective and was applied by the bank. The amendments introduced the following changes:
• Practical expedients for changes in contractual cash flows (IFRS 9, IFRS 4, and IFRS 16).
• Relief from discontinuing hedge account requirements (IFRS 9 and IAS 29).
• Disclosure requirements (IFRS 7).
The bank utilised the practical expedient for modifications to amortised cost instruments which allows the benchmark interest rate change to be reflected prospectively by updating the effective interest rate of the instrument, with no immediate gain or loss, when the change is a direct consequence of the reform and occurs on an economically equivalent basis. The relief from discontinuing hedge accounting requirements was not utilised. The practical expedients in IFRS 4 and IFRS 16 were not relevent for the bank. See “Note 29 – Replacement of Interbank Offered Rates (IBORs), including London Interbank Offered Rate (LIBOR)” for new disclosures required by IFRS 7.
Accounting PoliciesRevenue Recognition. Net revenues consists of revenues from lending and deposit-taking activities, securities lending and from primary dealer activities in European government bonds.
Non-derivative financial assets mandatorily at fair value through profit or loss and non-derivative financial liabilities held for trading or designated at fair value through profit or loss are recognised at fair value with realised and unrealised gains and losses included in gains or losses from financial instruments at fair value through profit or loss, with the exception of changes in the fair value of financial liabilities designated at fair value through profit or loss attributable to own credit spreads (debt valuation adjustment or DVA), which is recognised in other comprehensive income, unless this would create or enlarge an accounting mismatch in profit or loss. Associated interest and expenses are included within net interest income.
Unrealised gains and losses related to the change in fair value of financial assets and liabilities measured at fair value through profit or loss are recognised from trade date in gains or losses from financial instruments at fair value through profit or loss or other comprehensive income in the case of DVA.
Derivative financial assets and liabilities are recognised at fair value with realised and unrealised gains and losses included in gains or losses from financial instruments at fair value through profit or loss, with the exception of exchange of interest in currency derivative instruments related to funding products, which is included in net interest income. Financial assets are marked to bid prices and financial liabilities are marked to offer prices. Fair value measurements do not include transaction costs.
GOLDMAN SACHS INTERNATIONAL BANK (UNLIMITED COMPANY)
Notes to the Financial Statements
24
Financial assets and liabilities measured at amortised cost are initially recognised at fair value plus transaction costs and subsequently measured at amortised cost using the effective interest method. Finance revenue is recorded in interest income from financial instruments measured at amortised cost. Finance costs, including discounts allowed on issue, are recorded in interest expense from financial instruments measured at amortised cost.
Financial instruments at fair value through other comprehensive income are measured at fair value with gains or losses recognised in other comprehensive income. On derecognition, gains or losses accumulated in other comprehensive income are reclassified to the income statement. Finance income, foreign exchange gains and losses and impairment are recognised in the income statement.
Fees from the bank’s lending activities which are not an integral component of Effective Interest Rate, and fees from securities lending activities are included in fees and commissions.
Revenue from Contracts with ClientsRevenues earned from contracts with clients are recognised when the performance obligations related to the underlying transactions are completed.
If the bank is principal to the transaction, the bank recognises revenue on contracts with clients, gross of expenses incurred to satisfy some or all of its performance obligations. The bank is principal to the transaction if it has the primary obligation to provide the service to the client. The bank satisfies the performance obligation by itself, or by engaging other GS Group affiliates to satisfy some or all of its performance obligations on its behalf. Such revenue is recognised in net revenues and expenses incurred are recognised in operating expenses.
Segment Reporting. The directors manage the bank’s business activities as a single operating segment and accordingly no segmental reporting has been provided.
Short-Term Employee Benefits. Short-term employee benefits, such as wages and salaries, are measured on an undiscounted basis and accrued as an expense over the period in which the employee renders the service to the bank. Provision is made for discretionary year-end compensation whether to be paid in cash or share-based awards where, as a result of bank policy and past practice, a constructive obligation exists at the balance sheet date.
Share-Based Payments. Group Inc. issues awards in the form of restricted stock units (RSUs) to the bank’s employees in exchange for employee services. Awards are classified as equity settled and hence the cost of share-based transactions with employees is measured based on the grant-date fair value of the award. Share-based awards that do not require future service (i.e., vested awards, including awards granted to retirement eligible employees) are expensed immediately. Share-based awards that require future service are amortised over the relevant service period. Expected forfeitures are included in determining share-based employee compensation expense.
Group Inc. generally issues new shares of common stock upon delivery of share-based awards. Cash dividend equivalents, unless prohibited by regulation, are generally paid on outstanding RSUs. The bank has also entered into a chargeback agreement with Group Inc. under which it is committed to pay to Group Inc. (a) the grant-date fair value of those awards and (b) subsequent movements in the fair value of those awards between the grant date and delivery to employees. As a result, the share-based payment transaction and chargeback agreement, in aggregate, gives rise to a total charge to the income statement based on the grant-date fair value of the awards adjusted for subsequent movements in the fair value of those awards prior to delivery.
Current and Deferred Taxation. Current tax is calculated on the basis of the tax laws enacted or substantively enacted at the balance sheet date in the countries where the bank operates and generates taxable income.
Deferred tax is recognised in respect of all temporary differences that have originated, but not reversed at the balance sheet date, where transactions or events have occurred at that date that will result in an obligation to pay more tax or a right to pay less tax in the future with the following exceptions:
• Deferred tax assets are recognised only to the extent that it is more likely than not that there will be suitable taxable profits from which the future reversal of the underlying temporary differences can be deducted.
• Deferred tax is measured on an undiscounted basis at the tax rates that are expected to apply in the periods in which temporary differences reverse, based on tax rates and laws enacted or substantively enacted at the balance sheet date.
Current tax and deferred tax is generally recognised in the income statement or directly in other comprehensive income according to where the associated gain or loss was recognised.
Dividends. Final equity dividends are recognised as a liability and deducted from equity in the period in which the dividends are approved by the bank’s shareholder. Interim equity dividends are recognised and deducted from equity when paid.
GOLDMAN SACHS INTERNATIONAL BANK (UNLIMITED COMPANY)
Notes to the Financial Statements
25
Cash and cash equivalents. This includes cash at bank and highly liquid overnight deposits held in the ordinary course of business.
Foreign Currencies. The bank’s financial statements are presented in U.S. dollars, which is also the bank’s functional currency.
Transactions denominated in foreign currencies are translated into U.S. dollars at rates of exchange ruling on the date the transaction occurred. Monetary assets and liabilities, and non-monetary assets and liabilities measured at fair value, denominated in foreign currencies are translated into U.S. dollars at rates of exchange ruling at the balance sheet date. Foreign exchange gains and losses are recognised in net revenues.
The results of branches and representative offices with non-U.S. dollar functional currencies are translated at the average rates of exchange during the period and their statement of position at the rates ruling at the statement of position date. Exchange differences arising from the retranslation of their statement of position and results are reported in other comprehensive income.
Financial Assets and Liabilities.Recognition and DerecognitionFinancial assets and liabilities, other than cash instruments purchased or sold in regular way transactions, are recognised when the bank becomes party to the contractual provisions of the instrument. Financial assets are derecognised when the contractual rights to the cash flows from the financial asset expire or if the bank transfers the financial asset and the transfer qualifies for derecognition. A transferred financial asset qualifies for derecognition if the bank transfers substantially all the risks and rewards of ownership of the financial asset or if the bank neither transfers nor retains substantially all the risks and rewards of ownership of the financial asset but does not retain control. Financial liabilities are derecognised only when they are extinguished, i.e., when the obligation specified in the contract is discharged or cancelled or expires.
Cash instruments purchased or sold in regular way transactions are recognised and derecognised using settlement date accounting.
Classification and Measurement: Financial AssetsThe bank classifies financial assets as subsequently measured at amortised cost, fair value through profit or loss or fair value through other comprehensive income on the basis of both the bank’s business model for managing financial assets and the contractual cash flow characteristics of the financial assets. The business model reflects how the bank manages particular groups of assets in order to generate future cash flows. Where the bank’s business model is to hold the assets to collect contractual cash flows, the bank subsequently assesses whether the financial assets’ cash flows represent solely payments of principal and interest.
• Financial assets measured at amortised cost. Financial assets that are held for the collection of contractual cash flows and have cash flows that represent solely payments of principal and interest are measured at amortised cost. The bank considers whether the cash flows represent basic lending arrangements, and where contractual terms introduce exposure to risk or volatility inconsistent with a basic lending arrangement, the financial asset is mandatorily measured at fair value through profit or loss (see below).
Financial assets measured at amortised cost are initially measured at fair value plus transaction costs and subsequently at amortised cost using the effective interest method. The effective interest method is a method of calculating the amortised cost of a financial instrument and allocating the interest income over the relevant period. The effective interest rate is the rate that exactly discounts estimated future cash receipts through the expected life of the financial asset or, when appropriate, a shorter period to the net carrying value of the financial asset. When calculating the effective interest rate, the bank estimates cash flows considering all contractual terms of the financial asset but does not consider future credit losses. Finance revenue is recorded in interest income from financial assets at amortised cost. Financial assets measured at amortised cost include:
• Cash and cash equivalents;
• Certain collateralised agreements, which consists of certain resale agreements and intercompany loans;
• Customer and other receivables;
• Certain loans and investments; and
• Certain other assets, which consists of certain intercompany loans and miscellaneous receivables and other.
GOLDMAN SACHS INTERNATIONAL BANK (UNLIMITED COMPANY)
Notes to the Financial Statements
26

• Financial assets mandatorily measured at fair value through profit or loss. Financial assets that are not held for the collection of contractual cash flows and/or do not have cash flows that represent solely payments of principal and interest are mandatorily measured at fair value through profit or loss. Financial assets mandatorily measured at fair value are initially measured at fair value with transaction costs expensed in the income statement. Such financial assets are subsequently measured at fair value with gains or losses recognised in gains or losses from financial instruments at fair value through profit or loss. Financial assets mandatorily measured at fair value include:
• Certain collateralised agreements, which consists of all securities borrowed, and certain resale agreements and intercompany loans;
• Trading assets, which consists of trading cash instruments and derivative instruments; and
• Certain loans and investments.
• Financial assets measured at fair value through other comprehensive income. Financial assets that are held for the collection of contractual cash flows and sale and have cash flows that represent solely payments of principal and interest are measured at fair value through other comprehensive income. Financial assets measured at fair value through other comprehensive income are initially measured at fair value with transaction costs expensed in the income statement. Such financial assets are subsequently measured at fair value with gains or losses recognised in other comprehensive income. On derecognition, gains or losses accumulated in other comprehensive income are reclassified to the income statement. Finance income calculated using the effective interest method, foreign exchange gains and losses and impairment are recognised in the income statement. Financial assets measured at fair value through other comprehensive income include government and agency obligations within investments.
Classification and Measurement: Financial LiabilitiesThe bank classifies its financial liabilities into the below categories based on the purpose for which they were acquired or originated.
• Financial liabilities held for trading. Financial liabilities held for trading are initially measured at fair value and subsequently at fair value through profit or loss, with gains or losses recognised in gains or losses from financial instruments at fair value through profit or loss. Financial liabilities held for trading include trading liabilities, which consists of:
• Trading cash instruments; and
• Derivative instruments.
• Financial liabilities designated at fair value through profit or loss. The bank designates certain financial liabilities at fair value through profit or loss. Financial liabilities designated at fair value through profit or loss are initially measured at fair value and subsequently at fair value through profit or loss, with DVA being recognised in other comprehensive income, if it does not create or enlarge an accounting mismatch, and the remaining changes in the fair value being recognised in gains or losses from financial instruments at fair value through profit or loss. Amounts recognised in other comprehensive income attributable to own credit spreads are not subsequently transferred to the income statement, even upon derecognition of the financial liability. Gains or losses exclude contractual interest, which is included in net interest income, for all instruments other than hybrid financial instruments. The primary reasons for designating such financial liabilities at fair value through profit or loss are:
• To eliminate or significantly reduce a measurement or recognition inconsistency that would otherwise arise from measuring assets or liabilities or recognising the gains and losses on them on different bases; and
• The group of financial liabilities, or financial assets and liabilities, is managed and its performance evaluated on a fair value basis.
Financial liabilities designated at fair value through profit or loss include:
• Collateralised financings;
• Certain deposits, which consists of certain time deposits; and
• Certain unsecured borrowings, which consists of certain intercompany loans.
• Financial liabilities measured at amortised cost. Financial liabilities measured at amortised cost are initially measured at fair value plus transaction costs and subsequently measured at amortised cost using the effective interest method. See “Financial assets measured at amortised cost” above for further information on the effective interest method. Finance costs, including discounts allowed on issue, are recorded in interest expense on financial instruments measured at amortised cost. Financial liabilities measured at amortised cost include:
• Customer and other payables;
• Certain deposits, which consists of all overnight deposits and certain time deposits;
• Certain unsecured borrowings that have not been designated at fair value through profit or loss; and
GOLDMAN SACHS INTERNATIONAL BANK (UNLIMITED COMPANY)
Notes to the Financial Statements
27

• Certain other liabilities, which primarily consists of compensation and benefits and accrued expenses and other.
ImpairmentThe bank assesses the expected credit losses associated with financial assets measured at amortised cost, debt financial assets at fair value through other comprehensive income, loan commitments and financial guarantee contracts on a forward-looking basis in accordance with the provisions of IFRS 9. The measurement of expected credit losses reflects an unbiased and probability weighted amount that is determined by evaluating a range of possible outcomes, the time value of money, and reasonable and supportable information that is available without undue cost or effort at the reporting date about past events, current conditions and forecasts of future economic conditions. Expected credit losses are recorded in impairments on financial instruments.
The bank’s impairment model is based on changes in credit quality since initial recognition of financial assets measured at amortised cost and incorporates the following three stages:
• Stage 1. Financial assets measured at amortised cost that are not credit-impaired on initial recognition and there has been no significant increase in credit risk since initial recognition. The ECL is measured at an amount equal to the expected credit losses that result from default events possible within the next twelve months.
• Stage 2. Financial assets measured at amortised cost where there has been a significant increase in credit risk since initial recognition, however not yet deemed to be credit-impaired. The ECL is measured based on expected credit losses on a lifetime basis.
• Stage 3. Financial assets measured at amortised cost that are in default, or are defined as credit-impaired. The ECL is measured based on expected credit losses on a lifetime basis.
Determination of the relevant staging for each financial asset is dependent on the definition of ‘significant increase in credit risk’ (stage 1 to stage 2) and the definition of ‘credit-impaired’ (stage 3). The bank considers a financial asset to have experienced a significant increase in credit risk when certain quantitative or qualitative conditions are met. Quantitative thresholds include absolute probability of default thresholds on investment-grade financial assets and relative probability of default thresholds on non-investment grade financial assets. Qualitative review is also performed as part of the bank’s credit risk management process, including a back-stop consideration of 30 days past due. The bank considers a financial asset to be credit-impaired when it meets Credit Risk’s definition of default, which is either when the bank considers that the obligor is unlikely to pay its credit obligations to the bank in full, without recourse by the bank to actions, such as realising security (if held), or the obligor has defaulted on a payment and/or is past due more than 90 days.
The ECL is determined by projecting the probability of default, loss given default and exposure at default for each individual exposure. To calculate expected credit losses, these three components are multiplied together and discounted back to the reporting date. The discount rate used in the ECL calculation is the original effective interest rate. The probability of default represents the likelihood of a borrower defaulting on its financial obligation. The loss given default is the bank’s expectation of the extent of loss on the default exposure, and takes into consideration amongst other things, collateral on the financial asset. The exposure at default is the amount the bank expects to be owed at the time the financial obligation defaults. The bank uses internal credit risk ratings that reflect the assessment of the probability of default of individual counterparties. The bank uses multiple macroeconomic scenarios within the ECL calculation, the weightings for which are subject to ongoing internal review and approval.
The ECL model takes into account the weighted average of a range of forecasts of future economic conditions. The forecasts include baseline, favourable and adverse economic scenarios over a three-year period. For financial assets in stage 2 or stage 3 which have an expected life beyond three years, the model reverts to historical loss information based on a non-linear modelled approach. The bank applies judgement in weighing individual scenarios each quarter based on a variety of factors, including internally derived economic outlook, market consensus, recent macroeconomic conditions and industry trends.
Forward-looking information, such as key economic variables impacting credit risk and expected credit losses, is incorporated into both the assessment of staging and the calculation of ECL.
GOLDMAN SACHS INTERNATIONAL BANK (UNLIMITED COMPANY)
Notes to the Financial Statements
28

The allowance for impairment losses also includes qualitative components which allow management to reflect the uncertain nature of economic forecasting and account for model imprecision and concentration risk.
The bank writes off financial assets, in whole or in part, when it has concluded that there is no reasonable expectation of recovery. When a financial asset is deemed to be uncollectable, the bank concludes this to be an indicator that there is no reasonable expectation of recovery. The bank still seeks to recover amounts it is legally owed in full, but which have been wholly or partially written off due to no reasonable expectation of full recovery.
Classification of Financial Liabilities and EquityFinancial liabilities and equity instruments are classified according to the substance of the contractual arrangements. A financial liability is any liability that is a contractual obligation to deliver cash or another financial asset to another entity; or to exchange financial assets or financial liabilities with another entity under conditions that are potentially unfavourable to the entity. An equity investment is any contract that evidences a residual interest in the assets of the entity after deducting all liabilities. Instruments are evaluated to determine if they contain both liability and equity components. The initial carrying value of a compound financial instrument is allocated first to the liability component, measured at fair value, and the equity is assigned the residual amount.
Offsetting Financial Assets and LiabilitiesFinancial assets and liabilities are offset and the net amount presented in the balance sheet where there is:
• Currently a legally enforceable right to set-off the recognised amounts; and
• Intent to settle on a net basis or to realise the asset and settle the liability simultaneously.
Where these conditions are not met, financial assets and liabilities are presented on a gross basis in the balance sheet.
Fair Value MeasurementSee Note 28 for details about the fair value measurement of the bank’s financial assets and liabilities.
Fair Value HedgesThe bank applies hedge accounting under IAS 39 ‘Financial Instruments: Recognition and Measurement’ for certain interest rate swaps used to manage the interest rate exposure of certain fixed-rate deposits. To qualify for hedge accounting, the derivative hedge must be highly effective at reducing the risk from the exposure being hedged. Additionally, the bank must formally document the hedging relationship at inception and test the hedging relationship to ensure the derivative hedge continues to be highly effective over the life of the hedging relationship.
Net Investment Hedging. Where net investment hedging is employed, all gains and losses on the effective portion of the hedging instrument, together with any gains and losses on the foreign currency translation of the hedge investment, are taken directly to other comprehensive income. Any gains or losses on the ineffective portion are recognised immediately in the income statement. The cumulative gains and losses on the hedging instrument and gains and losses on the translation of the hedged investment are recognised in the income statement only on substantial liquidation of the investment.
Collateralised Agreements and Collateralised Financings. Collateralised agreements include resale agreements, securities borrowed and intercompany loans. Collateralised financings include repurchase agreements, securities loaned and other borrowings. See “Classification and Measurement: Financial Assets” and “Classification and Measurement: Financial Liabilities” above for details on the classification and measurement of these instruments. Collateral received or posted can be in the form of cash or securities. Cash collateral is recognised/derecognised when received/paid. Collateral posted by the bank in the form of securities is not derecognised from the balance sheet, whilst collateral received in the form of securities is not recognised in the balance sheet. If collateral received is subsequently sold, the obligation to return the collateral and the cash received are recognised in the balance sheet.
Pension Arrangements. The bank is a participating employer of a defined contribution pension plan. The contributions payable for the period are charged to operating expenses. Differences between contributions payable for the period and contributions actually paid are shown as either accruals or prepayments in the balance sheet.
GOLDMAN SACHS INTERNATIONAL BANK (UNLIMITED COMPANY)
Notes to the Financial Statements
29

Intangible Assets. Intangible assets are stated at cost less accumulated amortisation and provision for impairment. Subject to the recognition criteria in IAS 38 ‘Intangible Assets’ being met, costs incurred during the period that are directly attributable to the development or improvement of new business application software are capitalised as assets in the course of construction. Assets in the course of construction are transferred to computer software once completed and ready for their intended use.
Computer software is amortised on a straight-line basis over its estimated useful life, which is three years. No amortisation is charged on assets in the course of construction. Amortisation is included in operating expenses and the amortisation policies are reviewed on an annual basis.
Intangible fixed assets are tested for impairment whenever events or changes in circumstances suggest that an asset’s or asset group’s carrying value may not be fully recoverable.
Leases. Leases are recognised as a right-of-use asset and a corresponding liability at the date of commencement of the lease.
Lease liabilities were measured at the present value of the remaining lease payments, discounted using the lessee’s incremental borrowing rate (IBR) as of the lease commencement date or adoption of IFRS 16, whichever is later, as the interest rate implicit in the lease cannot be readily determined. The weighted average discount rate applied to the lease liabilities on adoption of IFRS 16 was 3.9%.
Assets and liabilities arising from a lease are initially measured on a present value basis. Lease liabilities include the net present value of fixed and variable payments (including those under reasonably certain extension options), less any lease incentives receivable, and payment of penalties for terminating any lease. The lease payments are discounted using the lessee’s IBR. The finance cost is charged to the income statement over the lease period so as to produce a constant periodic rate of interest on the remaining balance of the liability for each period.
Right-of-use assets are measured at cost comprising the initial measurement of lease liability, any lease payments made at or before the commencement date less any lease incentives received, and any initial direct costs. Right-of-use assets are depreciated over the lease term on a straight line basis.
Extension and termination options are included in the office premises lease entered into by the bank. These are used to maximise operational flexibility in terms of managing the assets used in the bank’s operations. The extension and termination options held are exercisable only by the bank and not by the respective lessor.
Right-of-use assets are tested for impairment whenever events or changes in circumstances suggest that an asset’s or asset group’s carrying value may not be fully recoverable. An impairment loss, calculated as the difference between the estimated recoverable amount (being the fair value) and the carrying value of an asset or asset group, is recognised if the sum of its expected undiscounted cash flows is less than its corresponding carrying value.
Provisions, Contingent Liabilities and Contingent Assets. Provisions are recognised in the financial statements when it is probable that an outflow of economic benefits will be required to settle a present (legal or constructive) obligation, which has arisen as a result of past events, and for which a reliable estimate can be made of the amount of the obligation. Legal obligations that may arise as a result of proposed new laws are recognised as obligations only when the legislation is virtually certain to be enacted as drafted.
A contingent liability is a possible obligation that arises from past events and whose existence will be confirmed only by the occurrence or non-occurrence of one or more uncertain future events not wholly within the control of the bank or a present obligation that arises from past events but is not recognised because either an outflow of economic benefits is not probable or the amount of the obligation cannot be reliably measured.
A contingent asset is a possible asset that arises from past events and whose existence will be confirmed only by the occurrence or non-occurrence of one or more uncertain future events not wholly within the control of the bank.
Contingent liabilities and contingent assets are not recognised in the financial statements. However, disclosure is made unless the probability of settlement is remote.
GOLDMAN SACHS INTERNATIONAL BANK (UNLIMITED COMPANY)
Notes to the Financial Statements
30

Note 4.
Critical Accounting Estimates and Judgements
The preparation of financial statements requires management to make judgements, estimates and assumptions that affect the amounts recognised in these financial statements. The nature of estimation means that actual outcomes could differ from those estimates. The following estimates have had the most significant effect on amounts recognised in the financial statements:
Allowance for ImpairmentThe allowance for impairment (see Notes 13, 21 and 29) is determined by an ECL model internally developed to meet the impairment requirements of IFRS 9. The measurement of ECL requires the use of a complex model and significant assumptions about future economic conditions and credit behaviour. Significant judgements are also required in applying the accounting requirements for measuring ECL including determining criteria for significant increases in credit risk and establishing the number and weighting of forward looking scenarios.
Management’s estimates of credit losses entails judgement about loan collectability at the reporting dates, and there are uncertainties inherent in those judgements. The allowance for impairment is subject to a governance process that involves review and approval by senior management within the bank’s independent risk oversight and control functions. Personnel within the bank’s independent risk oversight and control functions are responsible for forecasting the economic variables that underlie the economic scenarios that are used in the modelling of ECL. While management uses the best information to determine this estimate, future adjustments to the allowance for impairment may be necessary based on, among other things, changes in the economic environment or variances between actual results and the original assumptions used.
Fair Value MeasurementCertain of the bank’s financial assets and liabilities include significant unobservable inputs (i.e., level 3). See Note 28 for information about the carrying value, valuation techniques and significant inputs of these instruments.
Note 5.
Net Revenues
Net revenues include net interest income and non-interest income. Net interest income includes interest on financial instruments measured at fair value and amortised cost. Non-interest income includes:
• Gains and losses on financial instruments mandatorily measured at fair value through profit or loss, which primarily relate to non-interest gains and losses on trading assets and trading liabilities, and certain collateralised agreements, loans and investments.
• Gains and losses on financial instruments designated at fair value through profit or loss, which primarily relate to non-interest gains and losses on collateralised financings and certain deposits and unsecured borrowings.
• Fees and commissions, which primarily relates to lending and securities lending activities.
The table below presents net revenues.Period Ended December
$ in millions 2021 2020Interest incomeInterest income from financial instruments measured
at fair value through profit or loss $ 346 $ 538 Interest income from financial instruments measured
at fair value through other comprehensive income 6 1 Interest income from financial instruments measured
at amortised cost 340 381 Total interest income 692 920 Interest expenseInterest expense from financial instruments measured
at fair value through profit or loss (101) (180) Interest expense from financial instruments measured
at amortised cost (217) (418) Total interest expense (318) (598) Net interest income 374 322 Non-interest incomeFinancial instruments mandatorily at fair value through
profit or loss 110 146 Financial instruments designated at fair value through
profit or loss (185) (35) Fees and commissions 102 62 Total non-interest income 27 173 Net revenues $ 401 $ 495
In the table above, financial instruments designated at fair value through profit or loss are frequently economically hedged with financial instruments measured mandatorily at fair value through profit or loss. Accordingly, gains or losses that are reported in financial instruments designated at fair value through profit or loss can be partially offset by gains or losses reported in financial instruments measured mandatorily at fair value through profit or loss.
GOLDMAN SACHS INTERNATIONAL BANK (UNLIMITED COMPANY)
Notes to the Financial Statements
31

Interest Income and Interest ExpenseThe table below presents sources of interest income and interest expense.
Period Ended December$ in millions 2021 2020Interest incomeCash and cash equivalents $ 11 $ 11 Collateralised agreements 183 346 Trading assets 29 10 Loans 314 323 Investments 14 12 Derivative instruments 105 180 Negative interest on financial liabilities 23 18 Other assets 13 20 Total interest income 692 920 Interest expenseCollateralised financings — (1) Trading liabilities (4) (2) Deposits (217) (476) Unsecured borrowings (33) (49) Derivative instruments (6) (8) Negative interest on financial assets (58) (62) Total interest expense (318) (598) Net interest income $ 374 $ 322
In the table above, interest on derivative instruments consists of exchange of interest in currency derivative instruments related to funding products.
Note 6.
Operating Expenses
The table below presents operating expenses.Period Ended December
$ in millions 2021 2020Management charges from GS Group affiliates $ 102 $ 70 Transaction based expenses 40 30 Compensation and benefits 20 16 Market development 16 12 Depreciation and amortisation 2 1 Professional fees 10 5 Occupancy 2 1 Other expenses 15 14 Operating expenses $ 207 $ 149
In the table above:
• Management charges from GS Group affiliates includes charges relating to operational and administrative support and management services, received from GS Group affiliates.
• Transaction based expenses includes expenses resulting from completed transactions, which are directly related to client revenues, and certain expenses incurred to satisfy performance obligations where the bank is principal to a transaction as required by IFRS 15 ‘Revenue from Contracts with Customers’ (IFRS 15). Such expenses were $34 million for the period ended December 2021 and $25 million for the period ended December 2020.
The table below presents the fees payable to the bank’s auditor, which are included in professional fees.
Period Ended December$ in millions 2021 2020Audit fees $ 2.4 $ 0.6
Audit related assurance services — 0.4 Other 0.6 0.1 Total $ 3.0 $ 1.1
The GSIB Board Audit Committee appointed Mazars LLP as the bank’s statutory auditor for financial periods commencing on or after January 1, 2021. As such, in the table above:
• Amounts presented for the period ended December 2021 are in respect of audit services performed by Mazars LLP. Amounts presented for the period ended December 2020 are in respect of audit services performed by PricewaterhouseCoopers LLP.
• For the period ended December 2021, other relates to fees in respect of the transition from the previous auditor.
GOLDMAN SACHS INTERNATIONAL BANK (UNLIMITED COMPANY)
Notes to the Financial Statements
32
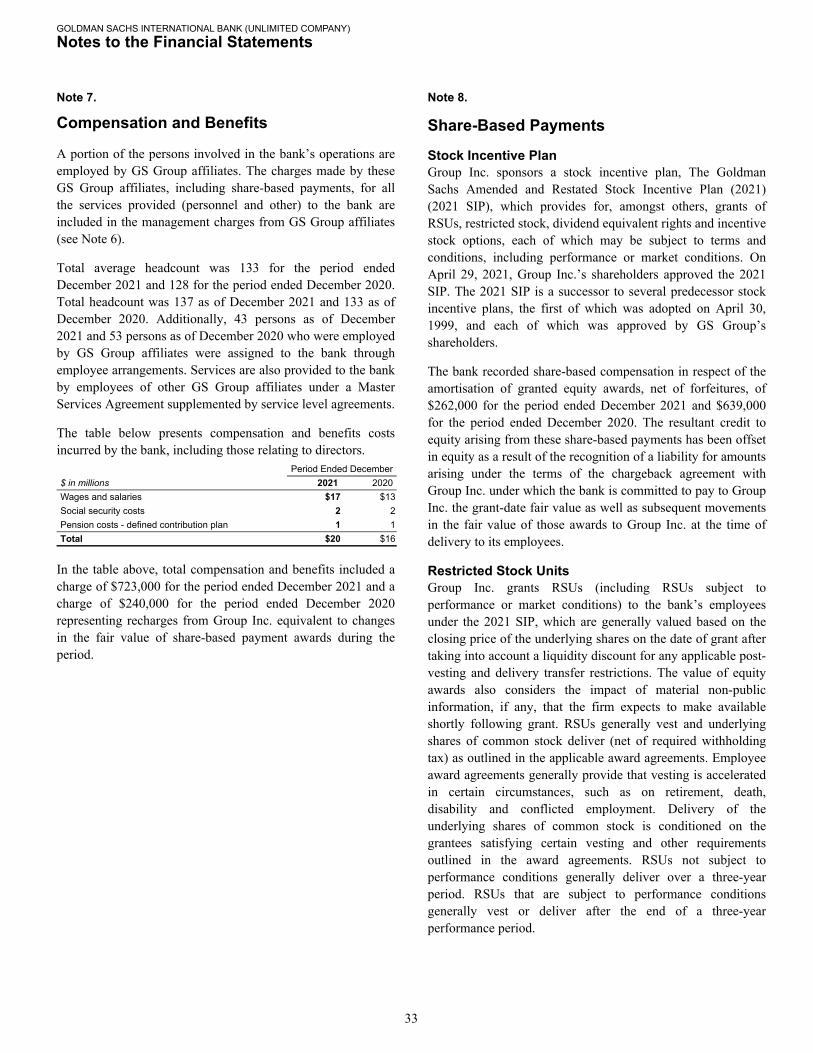
Note 7.
Compensation and Benefits
A portion of the persons involved in the bank’s operations are employed by GS Group affiliates. The charges made by these GS Group affiliates, including share-based payments, for all the services provided (personnel and other) to the bank are included in the management charges from GS Group affiliates (see Note 6).
Total average headcount was 133 for the period ended December 2021 and 128 for the period ended December 2020. Total headcount was 137 as of December 2021 and 133 as of December 2020. Additionally, 43 persons as of December 2021 and 53 persons as of December 2020 who were employed by GS Group affiliates were assigned to the bank through employee arrangements. Services are also provided to the bank by employees of other GS Group affiliates under a Master Services Agreement supplemented by service level agreements.
The table below presents compensation and benefits costs incurred by the bank, including those relating to directors.
Period Ended December$ in millions 2021 2020Wages and salaries $17 $13 Social security costs 2 2 Pension costs - defined contribution plan 1 1 Total $20 $16
In the table above, total compensation and benefits included a charge of $723,000 for the period ended December 2021 and a charge of $240,000 for the period ended December 2020 representing recharges from Group Inc. equivalent to changes in the fair value of share-based payment awards during the period.
Note 8.
Share-Based Payments
Stock Incentive PlanGroup Inc. sponsors a stock incentive plan, The Goldman Sachs Amended and Restated Stock Incentive Plan (2021) (2021 SIP), which provides for, amongst others, grants of RSUs, restricted stock, dividend equivalent rights and incentive stock options, each of which may be subject to terms and conditions, including performance or market conditions. On April 29, 2021, Group Inc.’s shareholders approved the 2021 SIP. The 2021 SIP is a successor to several predecessor stock incentive plans, the first of which was adopted on April 30, 1999, and each of which was approved by GS Group’s shareholders.
The bank recorded share-based compensation in respect of the amortisation of granted equity awards, net of forfeitures, of $262,000 for the period ended December 2021 and $639,000 for the period ended December 2020. The resultant credit to equity arising from these share-based payments has been offset in equity as a result of the recognition of a liability for amounts arising under the terms of the chargeback agreement with Group Inc. under which the bank is committed to pay to Group Inc. the grant-date fair value as well as subsequent movements in the fair value of those awards to Group Inc. at the time of delivery to its employees.
Restricted Stock UnitsGroup Inc. grants RSUs (including RSUs subject to performance or market conditions) to the bank’s employees under the 2021 SIP, which are generally valued based on the closing price of the underlying shares on the date of grant after taking into account a liquidity discount for any applicable post-vesting and delivery transfer restrictions. The value of equity awards also considers the impact of material non-public information, if any, that the firm expects to make available shortly following grant. RSUs generally vest and underlying shares of common stock deliver (net of required withholding tax) as outlined in the applicable award agreements. Employee award agreements generally provide that vesting is accelerated in certain circumstances, such as on retirement, death, disability and conflicted employment. Delivery of the underlying shares of common stock is conditioned on the grantees satisfying certain vesting and other requirements outlined in the award agreements. RSUs not subject to performance conditions generally deliver over a three-year period. RSUs that are subject to performance conditions generally vest or deliver after the end of a three-year performance period.
GOLDMAN SACHS INTERNATIONAL BANK (UNLIMITED COMPANY)
Notes to the Financial Statements
33
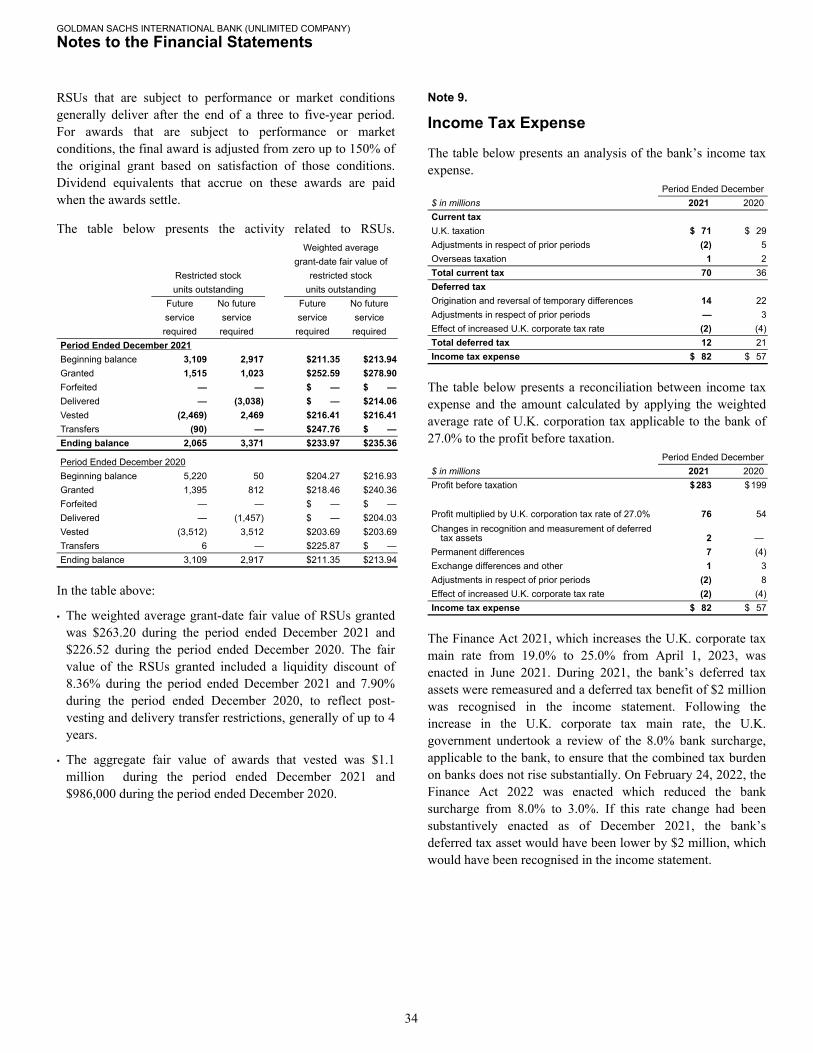
RSUs that are subject to performance or market conditions generally deliver after the end of a three to five-year period. For awards that are subject to performance or market conditions, the final award is adjusted from zero up to 150% of the original grant based on satisfaction of those conditions. Dividend equivalents that accrue on these awards are paid when the awards settle.
The table below presents the activity related to RSUs.Weighted average
grant-date fair value ofRestricted stock restricted stockunits outstanding units outstanding
Future No future Future No futureservice service service servicerequired required required required
Period Ended December 2021Beginning balance 3,109 2,917 $ 211.35 $ 213.94 Granted 1,515 1,023 $ 252.59 $ 278.90 Forfeited — — $ — $ — Delivered — (3,038) $ — $ 214.06 Vested (2,469) 2,469 $ 216.41 $ 216.41 Transfers (90) — $ 247.76 $ — Ending balance 2,065 3,371 $ 233.97 $ 235.36
Period Ended December 2020Beginning balance 5,220 50 $ 204.27 $ 216.93 Granted 1,395 812 $ 218.46 $ 240.36 Forfeited — — $ — $ — Delivered — (1,457) $ — $ 204.03 Vested (3,512) 3,512 $ 203.69 $ 203.69 Transfers 6 — $ 225.87 $ — Ending balance 3,109 2,917 $ 211.35 $ 213.94
In the table above:
• The weighted average grant-date fair value of RSUs granted was $263.20 during the period ended December 2021 and $226.52 during the period ended December 2020. The fair value of the RSUs granted included a liquidity discount of 8.36% during the period ended December 2021 and 7.90% during the period ended December 2020, to reflect post-vesting and delivery transfer restrictions, generally of up to 4 years.
• The aggregate fair value of awards that vested was $1.1 million during the period ended December 2021 and $986,000 during the period ended December 2020.
Note 9.
Income Tax Expense
The table below presents an analysis of the bank’s income tax expense.
Period Ended December$ in millions 2021 2020Current taxU.K. taxation $ 71 $ 29 Adjustments in respect of prior periods (2) 5 Overseas taxation 1 2 Total current tax 70 36 Deferred taxOrigination and reversal of temporary differences 14 22 Adjustments in respect of prior periods — 3 Effect of increased U.K. corporate tax rate (2) (4) Total deferred tax 12 21 Income tax expense $ 82 $ 57
The table below presents a reconciliation between income tax expense and the amount calculated by applying the weighted average rate of U.K. corporation tax applicable to the bank of 27.0% to the profit before taxation.
Period Ended December$ in millions 2021 2020Profit before taxation $ 283 $ 199
Profit multiplied by U.K. corporation tax rate of 27.0% 76 54 Changes in recognition and measurement of deferred
tax assets 2 — Permanent differences 7 (4) Exchange differences and other 1 3 Adjustments in respect of prior periods (2) 8 Effect of increased U.K. corporate tax rate (2) (4) Income tax expense $ 82 $ 57
The Finance Act 2021, which increases the U.K. corporate tax main rate from 19.0% to 25.0% from April 1, 2023, was enacted in June 2021. During 2021, the bank’s deferred tax assets were remeasured and a deferred tax benefit of $2 million was recognised in the income statement. Following the increase in the U.K. corporate tax main rate, the U.K. government undertook a review of the 8.0% bank surcharge, applicable to the bank, to ensure that the combined tax burden on banks does not rise substantially. On February 24, 2022, the Finance Act 2022 was enacted which reduced the bank surcharge from 8.0% to 3.0%. If this rate change had been substantively enacted as of December 2021, the bank’s deferred tax asset would have been lower by $2 million, which would have been recognised in the income statement.
GOLDMAN SACHS INTERNATIONAL BANK (UNLIMITED COMPANY)
Notes to the Financial Statements
34
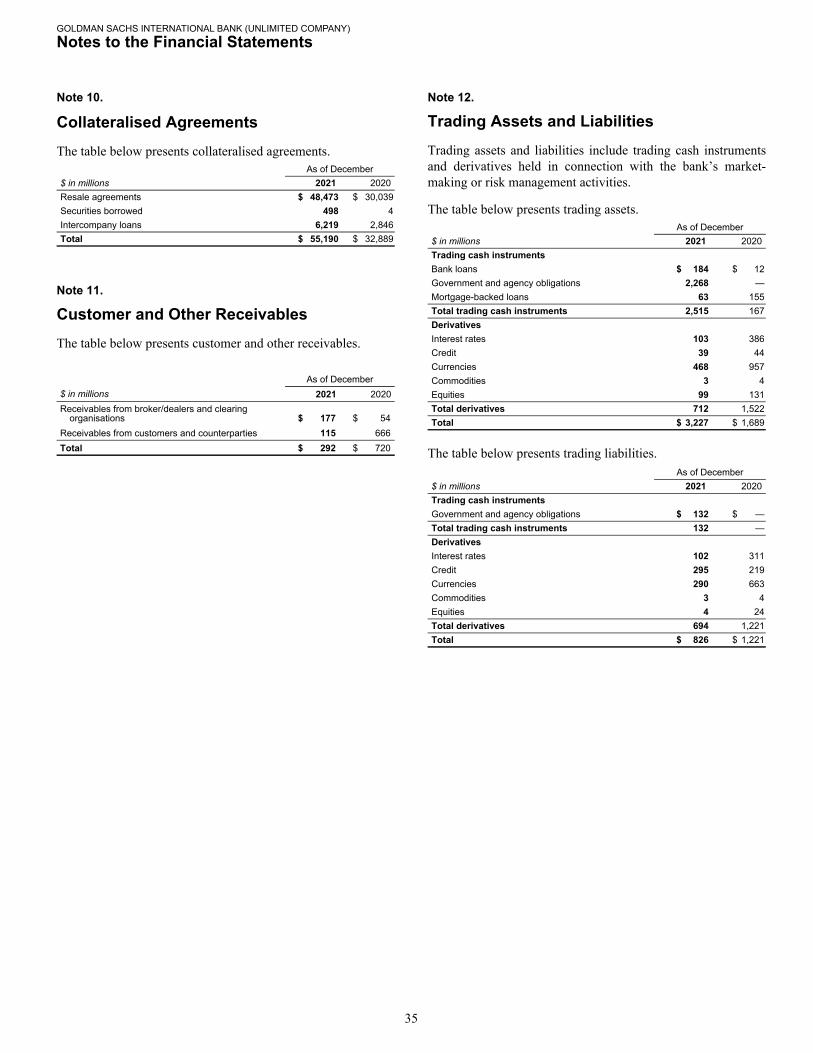
Note 10.
Collateralised Agreements
The table below presents collateralised agreements.As of December
$ in millions 2021 2020Resale agreements $ 48,473 $ 30,039 Securities borrowed 498 4 Intercompany loans 6,219 2,846 Total $ 55,190 $ 32,889
Note 11.
Customer and Other Receivables
The table below presents customer and other receivables.
As of December$ in millions 2021 2020Receivables from broker/dealers and clearing
organisations $ 177 $ 54 Receivables from customers and counterparties 115 666 Total $ 292 $ 720
Note 12.
Trading Assets and Liabilities
Trading assets and liabilities include trading cash instruments and derivatives held in connection with the bank’s market-making or risk management activities.
The table below presents trading assets.As of December
$ in millions 2021 2020Trading cash instrumentsBank loans $ 184 $ 12 Government and agency obligations 2,268 — Mortgage-backed loans 63 155 Total trading cash instruments 2,515 167 DerivativesInterest rates 103 386 Credit 39 44 Currencies 468 957 Commodities 3 4 Equities 99 131 Total derivatives 712 1,522 Total $ 3,227 $ 1,689
The table below presents trading liabilities.As of December
$ in millions 2021 2020Trading cash instrumentsGovernment and agency obligations $ 132 $ — Total trading cash instruments 132 — DerivativesInterest rates 102 311 Credit 295 219 Currencies 290 663 Commodities 3 4 Equities 4 24 Total derivatives 694 1,221 Total $ 826 $ 1,221
GOLDMAN SACHS INTERNATIONAL BANK (UNLIMITED COMPANY)
Notes to the Financial Statements
35

Note 13.
Loans
The table below presents loans.As of December
$ in millions 2021 2020Bank loans $ 10,644 $ 9,641 Mortgage-backed loans 1,156 822 Total $ 11,800 $ 10,463
In the table above, total loans included an allowance for impairment of $51 million as of December 2021 and $130 million as of December 2020.
Note 14.
Investments
Investments are generally held by the bank in connection with its long-term investing or risk management activities.
The table below presents investments.As of December
$ in millions 2021 2020Government and agency obligations $ 2,667 $ 2,101 Debt instruments 2,413 869 Total $ 5,080 $ 2,970
In the table above, government and agency obligations were held for the purposes of managing the bank’s fixed interest rate risk from deposit-taking activities.
Note 15.
Other Assets
The table below presents other assets by type.As of December
$ in millions 2021 2020Financial assetsIntercompany loans $ 792 $ 767 Miscellaneous receivables and other 178 147 Total financial assets 970 914 Non-financial assetsIntangible assets 8 5 Right-of-use assets 3 3 Deferred tax assets 38 28 Prepayments and accrued income 4 2 Tax-related assets 9 8 Total non-financial assets 62 46 Total $ 1,032 $ 960
In the table above
• Miscellaneous receivables and other primarily includes receivables for allocation of net revenues among GS Group affiliates for their participation in GS Group’s business activities.
• Total other assets includes receivables from contracts with clients of $nil as of December 2021 and $1 million as of December 2020.
GOLDMAN SACHS INTERNATIONAL BANK (UNLIMITED COMPANY)
Notes to the Financial Statements
36
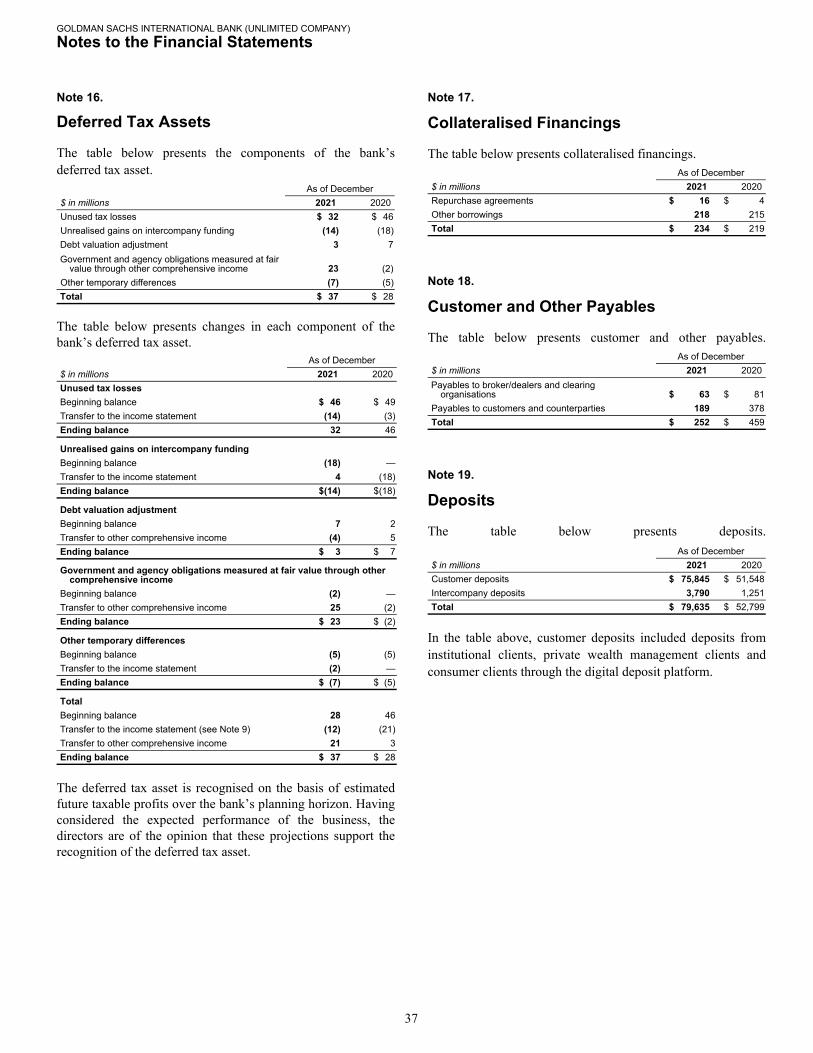
Note 16.
Deferred Tax Assets
The table below presents the components of the bank’s deferred tax asset.
As of December$ in millions 2021 2020Unused tax losses $ 32 $ 46 Unrealised gains on intercompany funding (14) (18) Debt valuation adjustment 3 7 Government and agency obligations measured at fair
value through other comprehensive income 23 (2) Other temporary differences (7) (5) Total $ 37 $ 28
The table below presents changes in each component of the bank’s deferred tax asset.
As of December$ in millions 2021 2020Unused tax lossesBeginning balance $ 46 $ 49 Transfer to the income statement (14) (3) Ending balance 32 46
Unrealised gains on intercompany fundingBeginning balance (18) — Transfer to the income statement 4 (18) Ending balance $ (14) $ (18)
Debt valuation adjustmentBeginning balance 7 2 Transfer to other comprehensive income (4) 5 Ending balance $ 3 $ 7
Government and agency obligations measured at fair value through other comprehensive income
Beginning balance (2) — Transfer to other comprehensive income 25 (2) Ending balance $ 23 $ (2)
Other temporary differencesBeginning balance (5) (5) Transfer to the income statement (2) — Ending balance $ (7) $ (5)
TotalBeginning balance 28 46 Transfer to the income statement (see Note 9) (12) (21) Transfer to other comprehensive income 21 3 Ending balance $ 37 $ 28
The deferred tax asset is recognised on the basis of estimated future taxable profits over the bank’s planning horizon. Having considered the expected performance of the business, the directors are of the opinion that these projections support the recognition of the deferred tax asset.
Note 17.
Collateralised Financings
The table below presents collateralised financings.As of December
$ in millions 2021 2020Repurchase agreements $ 16 $ 4 Other borrowings 218 215 Total $ 234 $ 219
Note 18.
Customer and Other Payables
The table below presents customer and other payables.As of December
$ in millions 2021 2020Payables to broker/dealers and clearing
organisations $ 63 $ 81 Payables to customers and counterparties 189 378 Total $ 252 $ 459
Note 19.
Deposits
The table below presents deposits.As of December
$ in millions 2021 2020Customer deposits $ 75,845 $ 51,548 Intercompany deposits 3,790 1,251 Total $ 79,635 $ 52,799
In the table above, customer deposits included deposits from institutional clients, private wealth management clients and consumer clients through the digital deposit platform.
GOLDMAN SACHS INTERNATIONAL BANK (UNLIMITED COMPANY)
Notes to the Financial Statements
37

Debt Valuation AdjustmentThe bank calculates the fair value of deposits that are designated at fair value through profit or loss by discounting future cash flows at a rate which incorporates GS Group’s credit spreads.
The table below presents information about the net DVA losses (pre-tax) on such financial liabilities, which is included in other comprehensive income.
Period Ended December$ in millions 2021 2020DVA gains/(losses) (Pre-tax) $ 14 $ (19)
The table below presents information about the cumulative net DVA losses included in accumulated other comprehensive income.
As of December$ in millions 2021 2020DVA losses (Pre-tax) $ (14) $ (28)
Hedge AccountingThe bank designates certain interest rate swaps as fair value hedges that are used to manage the interest rate exposure of certain fixed-rate deposits. These interest rate swaps hedge changes in fair value attributable to the relevant benchmark interest rate, effectively converting fixed-rate obligations into floating-rate obligations.
The bank applies a statistical method that utilises regression analysis when assessing the effectiveness of its fair value hedging relationships in achieving offsetting changes in the fair values of the hedging instrument and the risk being hedged (i.e., interest rate risk). An interest rate swap is considered highly effective in offsetting changes in fair value attributable to changes in the hedged risk when the regression analysis results in a coefficient of determination of 80% or greater and a slope between 80% and 125%. Possible sources of ineffectiveness on these hedges include:
• Differences in timing of cash flows between the hedged item and hedging instrument.
• Differences in discounting between the hedged item and the hedging instrument, as cash collateralised derivatives are discounted using Overnight Indexed Swap discount curves, which are not consistently applied to the hedged item.
• Counterparty credit risk impacting fair value movements on uncollateralised interest rate swaps but not the underlying hedged item.
For qualifying fair value hedges, gains or losses on derivatives and the change in fair value of the hedged item attributable to the hedged risk are included in net revenues. When a derivative is no longer designated as a hedge, any remaining difference between the carrying value and par value of the hedged item is amortised over the remaining life of the hedged item using the effective interest method.
The table below presents information about hedging instruments, which are classified in derivatives within trading assets and liabilities in the balance sheet.
As of December$ in millions 2021 2020Asset carrying value $ 27 $ 50 Liability carrying value $ — $ —
The table below presents the notional of hedging instruments by contractual maturity date.
As of December$ in millions 2021 2020Between three months and one year $ 80 $ 42 Between one and five years 315 218 Over five years 230 453 Total $ 625 $ 713
The average fixed rate of the bank’s hedging instruments was 1.26% for the period ended December 2021 and 1.25% for the period ended December 2020.
The table below presents the carrying value of hedged items that are designated in a hedging relationship and the related cumulative hedging adjustment (increase/(decrease)) from current and prior hedging relationships included in such carrying values.
CumulativeCarrying hedging
$ in millions amount adjustmentAs of December 2021Deposits $ 666 $ 18 As of December 2020Deposits $ 742 $ 40
The table below presents the bank’s gains/(losses) from interest rate derivatives accounted for as hedges, the related hedged deposits and the hedge ineffectiveness on these derivatives, recognised in net revenues.
Period Ended December$ in millions 2021 2020Interest rate hedges $ (20) $ 5 Hedged deposits 19 (6) Hedge ineffectiveness $ (1) $ (1)
GOLDMAN SACHS INTERNATIONAL BANK (UNLIMITED COMPANY)
Notes to the Financial Statements
38

Note 20.
Unsecured Borrowings
The table below presents unsecured borrowings.As of December
$ in millions 2021 2020Intercompany loans $ 1,067 $ 726 Subordinated loans 829 829 Total $ 1,896 $ 1,555
In the table above, subordinated loans consist of a long-term loan from other GS Group affiliates of $826 million and accrued interest on this loan. The loan is unsecured and carries interest at a margin over the U.S. Federal Reserve’s Federal Funds rate and constitutes regulatory capital as approved by the PRA. The loan is repayable on September 8, 2030. Any repayment prior to this maturity date requires PRA approval.
Note 21.
Other Liabilities
The table below presents other liabilities by type.As of December
$ in millions 2021 2020Financial liabilitiesAllowance for impairment on unfunded commitments
measured at amortised cost $ 9 $ 21 Compensation and benefits 4 3 Lease liabilities 3 4 Accrued expenses and other 103 79 Total financial liabilities 119 107 Non-financial liabilitiesIncome tax-related liabilities 53 51 Other taxes and social security costs 4 1 Total non-financial liabilities 57 52 Total $ 176 $ 159
Note 22.
Share Capital
The table below presents share capital.Ordinary shares
Allotted, called up and fully paid of £1 each $ in millionsAs of December 2020 40,169,994 $ 63 As of December 2021 40,169,994 $ 63
Note 23.
Statement of Cash Flows Reconciliations
The table below presents cash and cash equivalents for the purpose of the statement of cash flows.
As of December$ in millions 2021 2020Cash and cash equivalents $ 9,901 $ 10,082
Reconciliation of Cash Flows From Operating ActivitiesThe table below presents a reconciliation of cash flows from operating activities.
Period Ended December$ in millions 2021 2020Profit before taxation $ 283 $ 199 Adjustments forDepreciation and amortisation (see Note 6) 2 1 Foreign exchange gains/(losses) 329 (1,210) Share-based compensation expense 1 1 Change in value of investing activities (18) (33) Interest expense on financing activity 29 35 Cash generated before changes in operating assets
and liabilities 626 (1,007) Changes in operating assetsIncrease in collateralised agreements (22,301) (5,061) (Increase)/decrease in customer and other
receivables 428 (342) Increase in trading assets (1,538) (61) Increase in loans (1,337) (2,509) Increase in other assets (71) (134) Changes in operating assets (24,819) (8,107) Changes in operating liabilitiesIncrease in collateralised financings 15 219 Decrease in customer and other payables (207) (1) Increase/(decrease) in trading liabilities (395) 460 Increase in deposits 26,836 13,304 Increase in unsecured borrowings 341 200 Increase in other liabilities 27 44 Changes in operating liabilities 26,617 14,226 Cash generated from operations $ 2,424 $ 5,112
In the table above, cash generated from operations included interest paid of $328 million for the period ended December 2021 and $670 million for the period ended December 2020, and interest received of $682 million for the period ended December 2021 and $943 million for the period ended December 2020.
Both the principal and interest related to subordinated loans is classified as financing activity.
GOLDMAN SACHS INTERNATIONAL BANK (UNLIMITED COMPANY)
Notes to the Financial Statements
39

Note 24.
Commitments and Contingencies
CommitmentsThe table below presents commitments.
As of December$ in millions 2021 2020Unfunded lending commitmentsPrincipal risk $ 4,205 $ 6,702 Sub-participated 2,750 1,975 Total unfunded lending commitments 6,955 8,677 Other commitmentsInvestment commitments 6 38 Forward starting resale agreements 372 217 Forward starting repurchase agreements 291 — Other 54 — Total other commitments 723 255 Total $ 7,678 $ 8,932
The bank originates a number of bank loans and mortgage-backed loans which are held as principal risk. The bank also holds bank loans and mortgage-backed loans which are sub-participated to GS Group affiliates and third party institutions. The unfunded portion of these agreements, where cash has not been deposited with the bank to collateralise the undrawn commitment is presented above.
The bank enters into repurchase and resale agreements that settle at a future date, generally within three business days. The bank’s funding of these commitments depends on the satisfaction of all contractual conditions to the resale agreement and these commitments can expire unused.
Contingent Liabilities and Financial Guarantee ContractsThe bank, in its capacity as an agent in securities lending, indemnifies most of its securities lending customers against losses incurred in the event that borrowers do not return securities. The maximum exposure to loss under guarantees was $810 million as of December 2021 and $809 million as of December 2020. The market value of the collateral held to cover the loss was $892 million as of December 2021 and $897 million as of December 2020.
The bank has contingent liabilities in relation to financial guarantee contracts written of $nil as of December 2021 and $45 million as of December 2020. This represents the maximum exposure in excess of the amount recorded in the balance sheet as financial guarantee contracts.
Note 25.
Maturity of Assets and Liabilities
The table below presents the expected maturity of the bank’s assets and liabilities.$ in millions Non-current Current TotalAs of December 2021AssetsCash and cash equivalents $ — $ 9,901 $ 9,901 Collateralised agreements 16,290 38,900 55,190 Customer and other receivables — 292 292 Trading assets — 3,227 3,227 Loans 5,516 6,284 11,800 Investments 4,674 406 5,080 Other assets 792 240 1,032 Total assets $ 27,272 $ 59,250 $ 86,522
LiabilitiesCollateralised financings $ — $ 234 $ 234 Customer and other payables — 252 252 Trading liabilities — 826 826 Deposits 3,257 76,378 79,635 Unsecured borrowings 1,889 7 1,896 Other liabilities — 176 176 Total liabilities $ 5,146 $ 77,873 $ 83,019
As of December 2020AssetsCash and cash equivalents $ — $ 10,082 $ 10,082 Collateralised agreements 11,650 21,239 32,889 Customer and other receivables — 720 720 Trading assets — 1,689 1,689 Loans 6,358 4,105 10,463 Investments 2,668 302 2,970 Other assets 723 237 960 Total assets $ 21,399 $ 38,374 $ 59,773
LiabilitiesCollateralised financings $ 215 $ 4 $ 219 Customer and other payables — 459 459 Trading liabilities — 1,221 1,221 Deposits 2,051 50,748 52,799 Unsecured borrowings 1,534 21 1,555 Other liabilities — 159 159 Total liabilities $ 3,800 $ 52,612 $ 56,412
In the table above:
• Current assets and liabilities include amounts that the bank expects to realise or settle in its normal operating cycle and includes assets and liabilities held for trading purposes and cash and cash equivalents.
• Non-current assets and liabilities are amounts that the bank expects to be recovered or settled after more than twelve months and includes the bank’s deferred tax asset and assets and liabilities with contractual maturities greater than one year.
GOLDMAN SACHS INTERNATIONAL BANK (UNLIMITED COMPANY)
Notes to the Financial Statements
40

Note 26.
Related Party Disclosures
Parties are considered to be related if one party has the ability to directly or indirectly control the other party or exercise significant influence over the party in making financial or operational decisions. The bank’s related parties include:
• The bank’s parent entities;
• Other GS Group affiliates; and
• Key management personnel of the bank.
Key management personnel are defined as those persons having authority and responsibility for planning, directing and controlling the activities of the bank. Key management personnel include the directors of the bank and members of senior management who are designated as managers under the PRA and FCA’s Senior Managers and Certification Regime.
Key Management CompensationKey management personnel are employed by GS Group affiliates. Compensation is included in the management charges from GS Group affiliates (see Note 6).
Directors’ EmolumentsIn accordance with the Companies Act 2006, directors’ emoluments represent the proportion of total emoluments paid or payable in respect of qualifying services only. This total only includes the value of cash and benefits in kind, and does not include the value of equity awards in accordance with the provisions of Schedule 5 of the Statutory Instruments 2008/410. Directors also receive emoluments for non-qualifying services which are not required to be disclosed. The table below presents the bank’s directors’ emoluments.
Period Ended December$ in millions 2021 2020Aggregate emoluments $ 1.5 $ 1.6
Company pension contributions to money purchase schemes — —
Total $ 1.5 $ 1.6
The table below presents emoluments for the highest paid director.
Period Ended December$ in millions 2021 2020Aggregate emoluments $ 0.4 $ 0.4
Company pension contributions to money purchase schemes $ — $ —
Accrued annual pension at end of the period $ — $ —
Two directors were members of a defined contribution scheme for both the period ended December 2021 and December 2020. Two directors, including the highest paid director, have received or are due to receive Group Inc. shares in respect of long-term incentive schemes for both the period ended December 2021 and December 2020. No director has exercised stock options during both the period ended December 2021 and December 2020.
The aggregate emoluments of the six non-executive directors who were members of the Board for all or part of the period ended December 2021 was approximately $725,000 and approximately $900,000 for the period ended December 2020.
Transactions with Related PartiesThe bank’s transactions with related parties primarily include the following.
Risk Management and Market-Making ActivityThe bank routinely enters into derivatives and buys and sells securities and loans with related parties for risk management and market-making purposes, which are recognised in trading assets and trading liabilities.
The table below presents the gross outstanding buys and sells of regular-way securities and loans from/to other GS Group affiliates.
As of December$ in millions 2021 2020Outstanding regular-way buys of securities and loans $ 464 $ — Outstanding regular-way sells of securities and loans $ 725 $ 51
The bank also holds securities in, and makes loans to other GS Group affiliates. The bank also exchanges cash and security collateral in connection with derivative transactions. Cash collateral received is recognised in customer and other payables. Cash collateral paid is recognised in customer and other receivables. The bank received security collateral from other GS Group affiliates of $50.93 billion as of December 2021 and $31.14 billion as of December 2020, primarily on collateralised agreements, and posted security collateral to related parties of $287 million as of December 2021 and $nil as of December 2020.
GOLDMAN SACHS INTERNATIONAL BANK (UNLIMITED COMPANY)
Notes to the Financial Statements
41

Funding ActivityThe bank routinely enters into collateralised agreements and collateralised financings with GS Group affiliates, primarily to deploy liquidity, source securities and fund inventory on a secured basis.
In addition, the bank’s unsecured borrowings is from GS Group affiliates, see Note 20 for further details. The bank has received deposits, and has also made loans to, and holds investments in certain GS Group affiliates. See Notes 19, 14 and 15, respectively, for further details.
Interest-bearing instruments are typically priced based on the term, currency, size, subordination and whether the instrument is secured or unsecured.
Commitments and GuaranteesThe table below presents financial commitments with other GS Group affiliates.
As of December$ in millions 2021 2020Sub-participated loans $ 1,496 $ 822 Forward starting resale agreements 372 217 Forward starting repurchase agreements 291 — Other 40 — Total $ 2,199 $ 1,039
Transfer Pricing and Management ChargesThe bank participates in the allocation of net revenues among GS Group affiliates for their involvement in GS Group’s business activities. In addition, the bank incurs management charges from GS Group affiliates relating to operational and administrative support and management services.
TaxationThe bank both receives and passes group relief from other GS Group affiliates. The bank received tax-effected losses from GS Group affiliates of $2 million for the period ended December 2021 and $32 million for the period ended December 2020 for which it paid consideration. The bank transferred tax-effected losses to other GS Group affiliates of $nil for the period ended December 2021 and $6 million for the period ended December 2020.
Share-Based PaymentsThe bank has entered into a chargeback agreement with Group Inc. under which it is committed to pay the grant-date fair value as well as subsequent movements in the fair value of those awards to Group Inc. at the time of delivery to its employees. See Note 8 for further information.
Related Party Assets and LiabilitiesThe table below presents assets and liabilities with related parties.
OtherParent GS Group
$ in millions entities affiliates TotalAs of December 2021AssetsCash and cash equivalents $ — $ — $ — Collateralised agreements — 55,190 55,190 Customer and other receivables — 152 152 Trading assets — 505 505 Loans — — — Investments — 1,870 1,870 Other assets — 805 805 Total assets $ — $ 58,522 $ 58,522
LiabilitiesCollateralised financings $ — $ 234 $ 234 Customer and other payables — 124 124 Trading liabilities — 440 440 Deposits — 3,790 3,790 Unsecured borrowings 1,080 816 1,896 Other liabilities 35 74 109 Total liabilities $ 1,115 $ 5,478 $ 6,593
As of December 2020AssetsCash and cash equivalents $ — $ — $ — Collateralised agreements — 32,889 32,889 Customer and other receivables — 533 533 Trading assets — 1,218 1,218 Loans — — — Investments — 300 300 Other assets — 794 794 Total assets $ — $ 35,734 $ 35,734
LiabilitiesCollateralised financings $ — $ 219 $ 219 Customer and other payables — 211 211 Trading liabilities — 1,155 1,155 Deposits — 1,251 1,251 Unsecured borrowings 1,006 549 1,555 Other liabilities 34 45 79 Total liabilities $ 1,040 $ 3,430 $ 4,470
GOLDMAN SACHS INTERNATIONAL BANK (UNLIMITED COMPANY)
Notes to the Financial Statements
42

Related Party Income and ExpenseThe table below presents income and expenses related to transactions with related parties other than Key Management Personnel.
OtherParent GS Group
$ in millions entities affiliates TotalPeriod Ended December 2021Net revenuesInterest income $ — $ 221 $ 221 Interest expense (30) (52) (82) Transfer pricing revenues — 75 75 Total net revenues $ (30) $ 244 $ 214
Operating expensesManagement charges from GS Group
affiliates $ — $ 102 $ 102 Transaction based expenses — 34 34 Total operating expenses $ — $ 136 $ 136
Period Ended December 2020Net revenuesInterest income $ — $ 382 $ 382 Interest expense (37) (49) (86) Transfer pricing revenues — 108 108 Total net revenues $ (37) $ 441 $ 404
Operating expensesManagement charges from GS Group
affiliates $ — $ 70 $ 70 Transaction based expenses — 19 19 Total operating expenses $ — $ 89 $ 89
In the table above, transaction based expenses primarily include expenses for activity where the bank is principal to transactions for which it engages other GS Group affiliates to satisfy some or all of its performance obligations, resulting in a gross up in net revenues and expenses as required by IFRS 15.
Note 27.
Financial Instruments
Financial Assets and Liabilities by CategoryThe tables below present the carrying value of financial assets and liabilities by category.
Financial AssetsMandatorily Fair value
at fair Amortised through$ in millions value cost OCI TotalAs of December 2021Cash and cash equivalents $ — $ 9,901 $ — $ 9,901 Collateralised agreements 46,840 8,350 — 55,190 Customer and other receivables — 292 — 292 Trading assets 3,227 — — 3,227 Loans 950 10,850 — 11,800 Investments 2,046 424 2,610 5,080 Other assets — 970 — 970 Total $ 53,063 $ 30,787 $ 2,610 $ 86,460
As of December 2020Cash and cash equivalents $ — $ 10,082 $ — $ 10,082 Collateralised agreements 31,876 1,013 — 32,889 Customer and other receivables — 720 — 720 Trading assets 1,689 — — 1,689 Loans 1,402 9,061 — 10,463 Investments 382 487 2,101 2,970 Other assets — 914 — 914 Total $ 35,349 $ 22,277 $ 2,101 $ 59,727
Financial LiabilitiesDesignated
Held for at fair Amortised$ in millions trading value cost TotalAs of December 2021Collateralised financings $ — $ 234 $ — $ 234 Customer and other payables — — 252 252 Trading liabilities 826 — — 826 Deposits — 30,265 49,370 79,635 Unsecured borrowings — 643 1,253 1,896 Other liabilities — — 119 119 Total $ 826 $ 31,142 $ 50,994 $ 82,962
As of December 2020Collateralised financings $ — $ 219 $ — $ 219 Customer and other payables — — 459 459 Trading liabilities 1,221 — — 1,221 Deposits — 10,504 42,295 52,799 Unsecured borrowings — 327 1,228 1,555 Other liabilities — — 107 107 Total $ 1,221 $ 11,050 $ 44,089 $ 56,360
GOLDMAN SACHS INTERNATIONAL BANK (UNLIMITED COMPANY)
Notes to the Financial Statements
43

Offsetting of Financial Assets and LiabilitiesThe tables below present financial assets and liabilities that are subject to enforceable netting agreements and offsetting. Amounts are only offset in the balance sheet, when the bank currently has a legally enforceable right to set-off the recognised amounts and an intention either to settle on a net basis, or to realise the asset and settle the liability simultaneously. In the tables below:
• Gross amounts exclude the effects of both counterparty netting and collateral, and therefore are not representative of the bank’s economic exposure.
• Amounts not offset in the balance sheet include counterparty netting (i.e., the netting of financial assets and liabilities for a given counterparty when a legal right of set-off exists under an enforceable netting agreement), and cash and security collateral received and posted under enforceable credit support agreements, that do not meet the criteria for offsetting under IFRS.
• Where the bank has received or posted collateral under credit support agreements, but has not yet determined whether such agreements are enforceable, the related collateral has not been included in the amounts not offset in the balance sheet.
• Gross amounts included derivative assets of $177 million as of December 2021 and $128 million as of December 2020, and derivative liabilities of $168 million as of December 2021 and $17 million as of December 2020, which are not subject to an enforceable netting agreement or are subject to a netting agreement that the bank has not yet determined to be enforceable.
• All collateralised agreements and collateralised financings are subject to enforceable netting agreements as of December 2021 and December 2020.
GOLDMAN SACHS INTERNATIONAL BANK (UNLIMITED COMPANY)
Notes to the Financial Statements
44

As of December 2021Amounts not offset in the balance sheet
Amounts Net amountoffset in the presented in
Gross balance the balance Counterparty Cash Security Net$ in millions amounts sheet sheet netting collateral collateral amountFinancial assetsCollateralised agreements $ 49,228 $ (257) $ 48,971 $ (16) $ — $ (47,735) $ 1,220 Customer and other receivables 91 — 91 — (85) — 6 Derivatives 712 — 712 (478) (15) (5) 214 Trading assets 712 — 712 (478) (15) (5) 214 Loans 7,248 — 7,248 — — (7,248) — Investments 2,413 — 2,413 — — (2,413) — Financial assets subject to enforceable netting agreements 59,692 (257) 59,435 (494) (100) (57,401) 1,440 Financial assets not subject to enforceable netting agreements 27,025 — 27,025 — — — 27,025 Total financial assets $ 86,717 $ (257) $ 86,460 $ (494) $ (100) $ (57,401) $ 28,465
Financial liabilitiesCollateralised financings $ 491 $ (257) $ 234 $ (109) $ — $ — $ 125 Customer and other payables 46 — 46 — (15) — 31 Derivatives 694 — 694 (385) (85) — 224 Trading liabilities 694 — 694 (385) (85) — 224 Financial liabilities subject to enforceable netting agreements 1,231 (257) 974 (494) (100) — 380 Financial liabilities not subject to enforceable netting agreements 81,987 — 81,987 — — — 81,987 Total financial liabilities $ 83,218 $ (257) $ 82,961 $ (494) $ (100) $ — $ 82,367
As of December 2020Amounts not offset in the balance sheet
Amounts Net amountoffset in the presented in
Gross balance the balance Counterparty Cash Security Net$ in millions amounts sheet sheet netting collateral collateral amountFinancial assetsCollateralised agreements $ 30,043 $ — $ 30,043 $ (4) $ — $ (30,004) $ 35 Customer and other receivables 373 — 373 — (256) — 117 Derivatives 1,522 — 1,522 (1,155) (196) (115) 56 Trading assets 1,522 — 1,522 (1,155) (196) (115) 56 Loans 5,433 — 5,433 — — (5,433) — Investments 569 — 569 — — (569) — Financial assets subject to enforceable netting agreements 37,940 — 37,940 (1,159) (452) (36,121) 208 Financial assets not subject to enforceable netting agreements 21,787 — 21,787 — — — 21,787 Total financial assets $ 59,727 $ — $ 59,727 $ (1,159) $ (452) $ (36,121) $ 21,995
Financial liabilitiesCollateralised financings $ 219 $ — $ 219 $ (219) $ — $ — $ — Customer and other payables 219 — 219 — (196) — 23 Derivatives 1,221 — 1,221 (940) (256) — 25 Trading liabilities 1,221 — 1,221 (940) (256) — 25 Financial liabilities subject to enforceable netting agreements 1,659 — 1,659 (1,159) (452) — 48 Financial liabilities not subject to enforceable netting agreements 54,701 — 54,701 — — — 54,701 Total financial liabilities $ 56,360 $ — $ 56,360 $ (1,159) $ (452) $ — $ 54,749
GOLDMAN SACHS INTERNATIONAL BANK (UNLIMITED COMPANY)
Notes to the Financial Statements
45
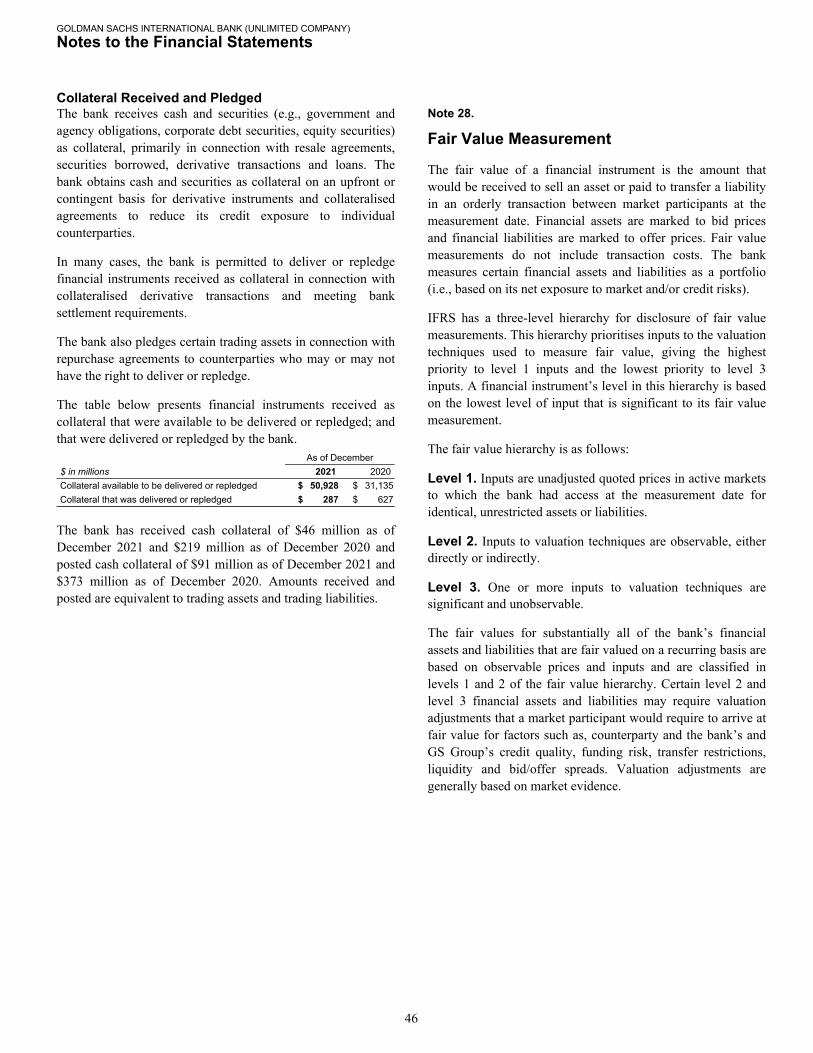
Collateral Received and PledgedThe bank receives cash and securities (e.g., government and agency obligations, corporate debt securities, equity securities) as collateral, primarily in connection with resale agreements, securities borrowed, derivative transactions and loans. The bank obtains cash and securities as collateral on an upfront or contingent basis for derivative instruments and collateralised agreements to reduce its credit exposure to individual counterparties.
In many cases, the bank is permitted to deliver or repledge financial instruments received as collateral in connection with collateralised derivative transactions and meeting bank settlement requirements.
The bank also pledges certain trading assets in connection with repurchase agreements to counterparties who may or may not have the right to deliver or repledge.
The table below presents financial instruments received as collateral that were available to be delivered or repledged; and that were delivered or repledged by the bank.
As of December$ in millions 2021 2020Collateral available to be delivered or repledged $ 50,928 $ 31,135 Collateral that was delivered or repledged $ 287 $ 627
The bank has received cash collateral of $46 million as of December 2021 and $219 million as of December 2020 and posted cash collateral of $91 million as of December 2021 and $373 million as of December 2020. Amounts received and posted are equivalent to trading assets and trading liabilities.
Note 28.
Fair Value Measurement
The fair value of a financial instrument is the amount that would be received to sell an asset or paid to transfer a liability in an orderly transaction between market participants at the measurement date. Financial assets are marked to bid prices and financial liabilities are marked to offer prices. Fair value measurements do not include transaction costs. The bank measures certain financial assets and liabilities as a portfolio (i.e., based on its net exposure to market and/or credit risks).
IFRS has a three-level hierarchy for disclosure of fair value measurements. This hierarchy prioritises inputs to the valuation techniques used to measure fair value, giving the highest priority to level 1 inputs and the lowest priority to level 3 inputs. A financial instrument’s level in this hierarchy is based on the lowest level of input that is significant to its fair value measurement.
The fair value hierarchy is as follows:
Level 1. Inputs are unadjusted quoted prices in active markets to which the bank had access at the measurement date for identical, unrestricted assets or liabilities.
Level 2. Inputs to valuation techniques are observable, either directly or indirectly.
Level 3. One or more inputs to valuation techniques are significant and unobservable.
The fair values for substantially all of the bank’s financial assets and liabilities that are fair valued on a recurring basis are based on observable prices and inputs and are classified in levels 1 and 2 of the fair value hierarchy. Certain level 2 and level 3 financial assets and liabilities may require valuation adjustments that a market participant would require to arrive at fair value for factors such as, counterparty and the bank’s and GS Group’s credit quality, funding risk, transfer restrictions, liquidity and bid/offer spreads. Valuation adjustments are generally based on market evidence.
GOLDMAN SACHS INTERNATIONAL BANK (UNLIMITED COMPANY)
Notes to the Financial Statements
46

Valuation Techniques and Significant InputsTrading Cash Instruments, Loans and Investments. Valuation techniques and significant inputs for each level of the fair value hierarchy include:
Level 1Level 1 instruments are valued using quoted prices for identical unrestricted instruments in active markets. The bank defines active markets for equity instruments based on the average daily trading volume both in absolute terms and relative to the market capitalisation for the instrument. The bank defines active markets for debt instruments based on both the average daily trading volume and the number of days with trading activity.
Level 2Level 2 instruments can be verified to quoted prices, recent trading activity for identical or similar instruments, broker or dealer quotations or alternative pricing sources with reasonable levels of price transparency. Consideration is given to the nature of the quotations (e.g., indicative or firm) and the relationship of recent market activity to the prices provided from alternative pricing sources.
Valuation adjustments are typically made to level 2 instruments (i) if the instrument is subject to transfer restrictions and/or (ii) for other premiums and liquidity discounts that a market participant would require to arrive at fair value. Valuation adjustments are generally based on market evidence.
Level 3Level 3 instruments have one or more significant valuation inputs that are not observable. Absent evidence to the contrary, level 3 instruments are initially valued at transaction price, which is considered to be the best initial estimate of fair value. Subsequently, the bank uses other methodologies to determine fair value, which vary based on the type of instrument. Valuation inputs and assumptions are changed when corroborated by substantive observable evidence, including values realised on sales of financial assets.
Valuation techniques of level 3 instruments vary by instrument, but are generally based on discounted cash flow techniques. The valuation techniques and the nature of significant inputs used to determine the fair values of each type of level 3 trading cash instrument, investments and loans are described below:
• Mortgages and Other Asset-Backed Loans and Securities. Significant inputs are generally determined based on relative value analyses and include:
• Market yields implied by transactions of similar or related assets;
• Transaction prices in both the underlying collateral and instruments with the same or similar underlying collateral;
• Current performance of the borrower or loan collateral and recovery assumptions if a default occurs; and
• Timing of expected future cash flows (duration) which, in certain cases, may incorporate the impact of other unobservable inputs (e.g., prepayment speeds).
• Corporate Debt Instruments, Government and Agency Obligations and Loans. Significant inputs are generally determined based on relative value analyses, which incorporate comparisons both to prices of credit default swaps that reference the same or similar underlying instrument or entity and to other debt instruments for the same or similar issuer for which observable prices or broker quotations are available. Significant inputs include:
• Market yields implied by transactions of similar or related assets;
• Current levels and changes in market indices, such as the iTraxx and CDX (indices that track the performance of corporate credit);
• Current performance of the borrower or loan collateral and recovery assumptions if a default occurs;
• Maturity and coupon profile of the instrument; and
• Market and transaction multiples for corporate debt instruments with convertibility or participation options.
Derivatives. Derivatives may be traded on an exchange (exchange-traded) or they may be privately negotiated contracts, which are usually referred to as OTC derivatives. Certain of the bank’s OTC derivatives are cleared and settled through central clearing counterparties (OTC-cleared), while others are bilateral contracts between two counterparties (bilateral OTC).
The bank’s level 2 and level 3 derivatives are valued using derivative pricing models (e.g., discounted cash flow models, correlation models, and models that incorporate option pricing methodologies, such as Monte Carlo simulations). Price transparency of derivatives can generally be characterised by product type, as described below.
• Interest Rate. In general, the key inputs used to value interest rate derivatives are transparent, even for most long-dated contracts. Interest rate swaps and options denominated in the currencies of leading industrialised nations are characterised by high trading volumes and tight bid/offer spreads. Interest rate derivatives that reference indices, such as an inflation index, or the shape of the yield curve (e.g., 10-year swap rate vs. 2-year swap rate) are more complex, but the key inputs are generally observable.
GOLDMAN SACHS INTERNATIONAL BANK (UNLIMITED COMPANY)
Notes to the Financial Statements
47

• Credit. Price transparency for credit default swaps, including both single names and baskets of credits, varies by market and underlying reference entity or obligation. Credit default swaps that reference indices, large corporates and major sovereigns generally exhibit the most price transparency. For credit default swaps with other underliers, price transparency varies based on credit rating, the cost of borrowing the underlying reference obligations, and the availability of the underlying reference obligations for delivery upon the default of the issuer. Credit default swaps that reference loans, asset-backed securities and emerging market debt instruments tend to have less price transparency than those that reference corporate bonds. In addition, more complex credit derivatives, such as those sensitive to the correlation between two or more underlying reference obligations or to secured funding spreads, generally have less price transparency.
• Currency. Prices for currency derivatives based on the exchange rates of leading industrialised nations, including those with longer tenors, are generally transparent. The primary difference between the price transparency of developed and emerging market currency derivatives is that emerging markets tend to be only observable for contracts with shorter tenors.
• Equity. Price transparency for equity derivatives varies by market and underlier. Options on indices and the common stock of corporates included in major equity indices exhibit the most price transparency. Equity derivatives generally have observable market prices, except for contracts with long tenors or reference prices that differ significantly from current market prices. More complex equity derivatives, such as those sensitive to the correlation between two or more individual stocks, generally have less price transparency.
Liquidity is essential to observability of all product types. If transaction volumes decline, previously transparent prices and other inputs may become unobservable. Conversely, even highly structured products may at times have trading volumes large enough to provide observability of prices and other inputs.
Level 1Level 1 derivatives include short-term contracts for future delivery of securities when the underlying security is a level 1 instrument, and exchange-traded derivatives if they are actively traded and are valued at their quoted market price.
Level 2Level 2 derivatives include OTC derivatives for which all significant valuation inputs are corroborated by market evidence and exchange-traded derivatives that are not actively traded and/or that are valued using models that calibrate to market-clearing levels of OTC derivatives.
In evaluating the significance of a valuation input, the bank considers, among other factors, a portfolio’s net risk exposure to that input.
The selection of a particular model to value a derivative depends on the contractual terms of and specific risks inherent in the instrument, as well as the availability of pricing information in the market. For derivatives that trade in liquid markets, model selection does not involve significant management judgement because outputs of models can be calibrated to market-clearing levels.
Valuation models require a variety of inputs, such as contractual terms, market prices, yield curves, discount rates (including those derived from interest rates on collateral received and posted as specified in credit support agreements for collateralised derivatives), credit curves, measures of volatility and correlations of such inputs. Significant inputs to the valuations of level 2 derivatives can be verified to market transactions, broker or dealer quotations or other alternative pricing sources with reasonable levels of price transparency. Consideration is given to the nature of the quotations (e.g., indicative or firm) and the relationship of recent market activity to the prices provided from alternative pricing sources.
Level 3Level 3 derivatives are valued using models which utilise observable level 1 and/or level 2 inputs, as well as unobservable level 3 inputs. Unobservable inputs include certain correlations, illiquid credit and secured funding spreads, recovery rates and certain equity and interest rate volatilities.
Subsequent to the initial valuation of a level 3 derivative, the bank updates the level 1 and level 2 inputs to reflect observable market changes and any resulting gains and losses are classified in level 3. Level 3 inputs are changed when corroborated by evidence such as similar market transactions, third-party pricing services and/or broker or dealer quotations or other empirical market data. In circumstances where the bank cannot verify the model value by reference to market transactions, it is possible that a different valuation model could produce a materially different estimate of fair value. See below for further information about significant unobservable inputs used in the valuation of level 3 derivatives.
Where there is a difference between the initial transaction price and the fair value calculated by internal models, a gain or loss is recognised after initial recognition only to the extent that it arises from a change in a factor (including time) that market participants would consider in setting a price.
GOLDMAN SACHS INTERNATIONAL BANK (UNLIMITED COMPANY)
Notes to the Financial Statements
48
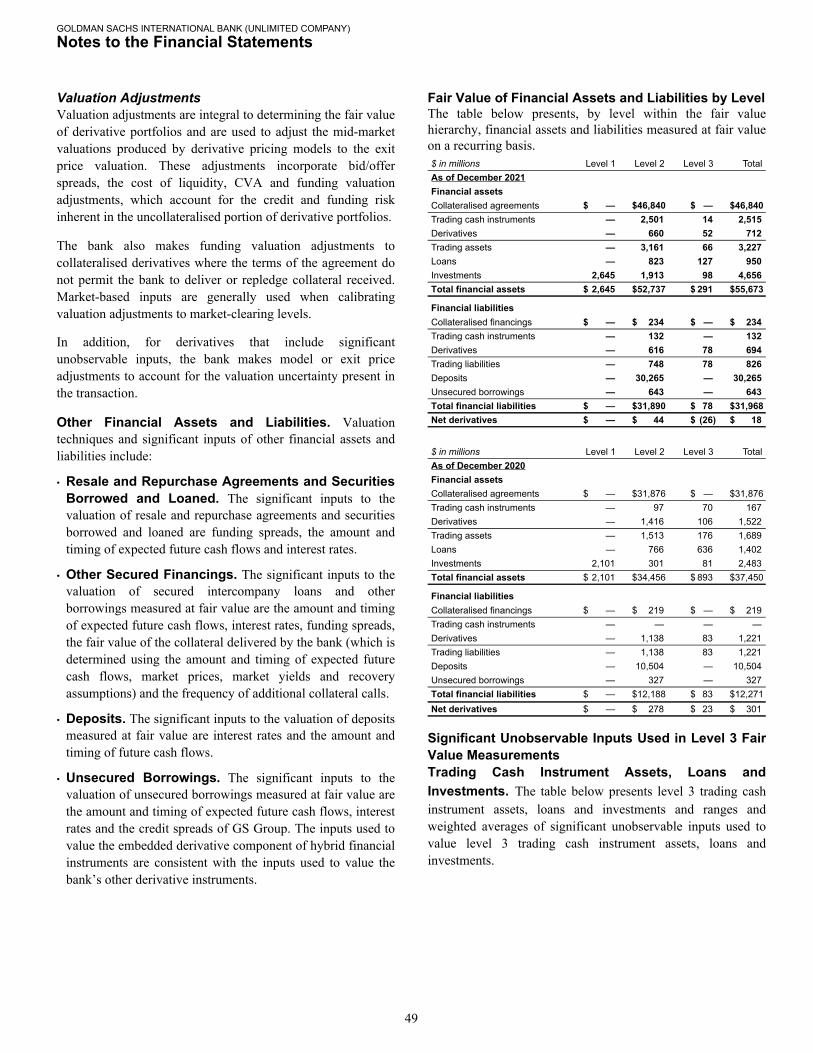
Valuation AdjustmentsValuation adjustments are integral to determining the fair value of derivative portfolios and are used to adjust the mid-market valuations produced by derivative pricing models to the exit price valuation. These adjustments incorporate bid/offer spreads, the cost of liquidity, CVA and funding valuation adjustments, which account for the credit and funding risk inherent in the uncollateralised portion of derivative portfolios.
The bank also makes funding valuation adjustments to collateralised derivatives where the terms of the agreement do not permit the bank to deliver or repledge collateral received. Market-based inputs are generally used when calibrating valuation adjustments to market-clearing levels.
In addition, for derivatives that include significant unobservable inputs, the bank makes model or exit price adjustments to account for the valuation uncertainty present in the transaction.
Other Financial Assets and Liabilities. Valuation techniques and significant inputs of other financial assets and liabilities include:
• Resale and Repurchase Agreements and Securities Borrowed and Loaned. The significant inputs to the valuation of resale and repurchase agreements and securities borrowed and loaned are funding spreads, the amount and timing of expected future cash flows and interest rates.
• Other Secured Financings. The significant inputs to the valuation of secured intercompany loans and other borrowings measured at fair value are the amount and timing of expected future cash flows, interest rates, funding spreads, the fair value of the collateral delivered by the bank (which is determined using the amount and timing of expected future cash flows, market prices, market yields and recovery assumptions) and the frequency of additional collateral calls.
• Deposits. The significant inputs to the valuation of deposits measured at fair value are interest rates and the amount and timing of future cash flows.
• Unsecured Borrowings. The significant inputs to the valuation of unsecured borrowings measured at fair value are the amount and timing of expected future cash flows, interest rates and the credit spreads of GS Group. The inputs used to value the embedded derivative component of hybrid financial instruments are consistent with the inputs used to value the bank’s other derivative instruments.
Fair Value of Financial Assets and Liabilities by LevelThe table below presents, by level within the fair value hierarchy, financial assets and liabilities measured at fair value on a recurring basis.$ in millions Level 1 Level 2 Level 3 TotalAs of December 2021Financial assetsCollateralised agreements $ — $ 46,840 $ — $ 46,840 Trading cash instruments — 2,501 14 2,515 Derivatives — 660 52 712 Trading assets — 3,161 66 3,227 Loans — 823 127 950 Investments 2,645 1,913 98 4,656 Total financial assets $ 2,645 $ 52,737 $ 291 $ 55,673
Financial liabilitiesCollateralised financings $ — $ 234 $ — $ 234 Trading cash instruments — 132 — 132 Derivatives — 616 78 694 Trading liabilities — 748 78 826 Deposits — 30,265 — 30,265 Unsecured borrowings — 643 — 643 Total financial liabilities $ — $ 31,890 $ 78 $ 31,968 Net derivatives $ — $ 44 $ (26) $ 18
$ in millions Level 1 Level 2 Level 3 TotalAs of December 2020Financial assetsCollateralised agreements $ — $ 31,876 $ — $ 31,876 Trading cash instruments — 97 70 167 Derivatives — 1,416 106 1,522 Trading assets — 1,513 176 1,689 Loans — 766 636 1,402 Investments 2,101 301 81 2,483 Total financial assets $ 2,101 $ 34,456 $ 893 $ 37,450
Financial liabilitiesCollateralised financings $ — $ 219 $ — $ 219 Trading cash instruments — — — — Derivatives — 1,138 83 1,221 Trading liabilities — 1,138 83 1,221 Deposits — 10,504 — 10,504 Unsecured borrowings — 327 — 327 Total financial liabilities $ — $ 12,188 $ 83 $ 12,271 Net derivatives $ — $ 278 $ 23 $ 301
Significant Unobservable Inputs Used in Level 3 Fair Value MeasurementsTrading Cash Instrument Assets, Loans and Investments. The table below presents level 3 trading cash instrument assets, loans and investments and ranges and weighted averages of significant unobservable inputs used to value level 3 trading cash instrument assets, loans and investments.
GOLDMAN SACHS INTERNATIONAL BANK (UNLIMITED COMPANY)
Notes to the Financial Statements
49

Level 3 trading cash instrument assets, loans and investments andrange of significant unobservable inputs (weighted average) as of
$ in millions December 2021 December 2020Bank loans, mortgage-backed loans and debt instruments $239 $787Yield 1.5% to 29.7% (10.6%) 2% to 29.9% (6.0%)Recovery rate 57.8% to 57.8% (57.8%) 57.8% to 57.8% (57.8%)Duration (years) 0.1 to 5.4 (2.1) 0.6 to 9.1 (3.7)
In the table above:
• Ranges represent the significant unobservable inputs that were used in the valuation of each type of instrument.
• Weighted averages are calculated by weighting each input by the relative fair value of the instrument.
• The ranges and weighted averages of these inputs are not representative of the appropriate inputs to use when calculating the fair value of any one instrument. For example, the highest yield for mortgage-backed loans is appropriate for valuing a specific mortgage but may not be appropriate for valuing any other mortgages. Accordingly, the ranges of inputs do not represent uncertainty in, or possible ranges of, fair value measurements of level 3 instruments.
• Increases in yield or duration used in the valuation of level 3 instruments would have resulted in a lower fair value measurement, while increases in recovery rate or multiples would have resulted in a higher fair value measurement as of both December 2021 and December 2020. Due to the distinctive nature of each level 3 instrument, the interrelationship of inputs is not necessarily uniform within each product type.
• Instruments are valued using discounted cash flows.
GOLDMAN SACHS INTERNATIONAL BANK (UNLIMITED COMPANY)
Notes to the Financial Statements
50

Derivatives. The table below presents net level 3 derivatives and ranges, averages and medians of significant unobservable inputs used to value level 3 derivatives.
Level 3 derivatives and range of significant unobservableinputs (average/median) as of
$ in millions December 2021 December 2020Credit, net $(74) $(79)Credit spreads (bps) 900 to 900 (900/900) 900 to 900 (900/900)Equities, net $48 $102Correlation 65% to 90% (78%/78%) 32% to 32% (32%/32%)Volatility 15% to 18% (17%/17%) 17% to 17% (17%/17%)
Transfers Between Level 1 and Level 2 of the Fair Value HierarchyDuring both the periods ended December 2021 and December 2020, there were no significant transfers between level 1 and level 2 financial assets and liabilities measured at fair value on a recurring basis.
Level 3 RollforwardThe table below presents a summary of the changes in fair value for all level 3 financial assets and liabilities measured at fair value on a recurring basis.
Period Ended December$ in millions 2021 2020Financial assetsBeginning balance $ 893 $ 435 Gains 2 66 Purchases 149 687 Sales (159) (296) Settlements (186) (84) Transfers into level 3 4 86 Transfers out of level 3 (412) (1) Ending balance $ 291 $ 893
Financial liabilitiesBeginning balance $ (83) $ (73) Losses (4) (16) Settlements 9 6 Ending balance $ (78) $ (83)
In the table above:
• If a financial asset or financial liability was transferred to level 3 during a reporting period, its entire gain or loss for the period is classified in level 3. For level 3 financial assets, increases are shown as positive amounts, while decreases are shown as negative amounts. For level 3 financial liabilities, increases are shown as negative amounts, while decreases are shown as positive amounts.
• Transfers between levels of the fair value hierarchy are recognised at the beginning of the reporting period in which they occur. Accordingly, the tables do not include gains or losses for level 3 financial assets and liabilities that were transferred out of level 3 prior to the end of the period.
• Level 3 financial assets and liabilities are frequently economically hedged with level 1 and level 2 financial assets and liabilities. Accordingly, level 3 gains or losses that are reported for a particular class of financial asset or financial liability can be partially offset by gains or losses attributable to level 1 or level 2 in the same class of financial asset or financial liability or gains or losses attributable to level 1, level 2 or level 3 in a different class of financial asset or financial liability. As a result, gains or losses included in the level 3 rollforward do not necessarily represent the overall impact on the bank’s results of operations, liquidity or capital resources.
• The net gains on level 3 financial assets for the period ended December 2021 and period ended December 2020 are reported in “Gains or losses from financial instruments at fair value through profit or loss” in the income statement.
Transfers Between Level 2 and Level 3 of the Fair Value HierarchyTransfers between level 2 and level 3 generally occur due to changes in the transparency of level 3 inputs. A lack of market evidence leads to reduced transparency, whereas an increase in the availability of market evidence leads to an increase in transparency.
Transfers out of level 3 for the period ended December 2021 primarily reflected transfers of certain loans to level 2, principally due to increased transparency of certain yield inputs. During the period ended December 2020, there were no significant transfers between level 2 and level 3 financial assets and liabilities measured at fair value on a recurring basis.
GOLDMAN SACHS INTERNATIONAL BANK (UNLIMITED COMPANY)
Notes to the Financial Statements
51

Fair Value Financial Assets and Liabilities Valued Using Techniques That Incorporate Unobservable InputsThe fair value of financial assets and liabilities may be determined in whole or part using a valuation technique based on assumptions that are not supported by prices from observable current market transactions in the same instrument or based on available observable market data and changing these assumptions will change the resultant estimate of fair value. The potential impact of using reasonable possible alternative assumptions for the valuations, including significant unobservable inputs, has been quantified as approximately $30 million as of December 2021 and $25 million as of December 2020, for favourable changes, and $3 million as of December 2021 and $22 million as of December 2020, for unfavourable changes.
In determining reasonably possible alternative assumptions, a detailed business and position level review has been performed to identify and quantify instances where potential uncertainty exists. This has taken into account the positions’ fair value as compared to the range of available market information.
Fair Value of Financial Assets and Liabilities Not Measured at Fair ValueThe table below presents the bank’s financial assets and liabilities that are not measured at fair value by expected maturity.
As of December$ in millions 2021 2020Financial assetsCurrent $ 16,636 $ 11,635 Non-current 14,151 10,642 Total financial assets $ 30,787 $ 22,277
Financial liabilitiesCurrent $ 49,159 $ 42,117 Non-current 1,835 1,972 Total financial liabilities $ 50,994 $ 44,089
In the table above:
• Current financial assets and liabilities are short-term in nature and therefore their carrying values in the balance sheet are a reasonable approximation of fair value.
• Non-current financial assets primarily include collateralised agreements and loans. The fair value of these was higher than the carrying value by approximately $22 million as of December 2021 and $68 million as of December 2020. The fair values have been determined based on level 2 of the fair value hierarchy, with the exception of $2.47 billion as of December 2021 and $4.14 billion as of December 2020, which have been determined based on level 3 of the fair value hierarchy.
• Non-current financial liabilities are primarily related to intercompany loans and subordinated loans. The interest rates of these are variable in nature and approximate prevailing market interest rates for instruments with similar terms and characteristics. As such, their carrying values in the balance sheet are a reasonable approximation of fair value.
Hedge AccountingNet Investment Hedging. The bank seeks to reduce the impact of fluctuations in foreign exchange rates on its foreign operations through the use of foreign currency forward contracts. For foreign currency forward contracts designated as hedges, the effectiveness of the hedge is assessed based on the overall changes in the fair value of the forward contracts (i.e., based on changes in forward rates).
For qualifying net investment hedges, the gains or losses on the hedging instruments, to the extent effective, are included in the statement of comprehensive income.
The table below presents the fair value of asset and liability derivative instruments designated as hedges.
As of December2021 2020
Derivative Derivative Derivative Derivative$ in millions assets liabilities assets liabilitiesDerivative instruments
designated as hedges $1 $— $— $3
Unconsolidated Structured EntitiesThe bank has interests in structured entities that it does not control (unconsolidated structured entities), which primarily includes senior and subordinated debt in residential and commercial mortgage-backed securitisation entities.
Structured entities generally finance the purchase of assets by issuing debt securities that are either collateralised by or indexed to the assets held by the structured entity. The debt securities issued by a structured entity may include tranches of varying levels of subordination. The bank’s involvement with structured entities primarily includes securitisation of financial assets.
The table below presents a summary of the unconsolidated structured entities in which the bank holds interests.
As of December$ in millions 2021 2020Assets in structured entities $ 10,496 $ 11,830 Carrying value of interests - assets $ 531 $ 596 Maximum exposure to loss $ 531 $ 596
The carrying values of the bank’s interests are included in the balance sheet in “Investments”.
GOLDMAN SACHS INTERNATIONAL BANK (UNLIMITED COMPANY)
Notes to the Financial Statements
52

Note 29.
Financial Risk Management and Capital Management
Equity Capital Management and Regulatory Capital
OverviewThe bank determines the appropriate amount and composition of its equity capital by considering multiple factors including the bank’s current and future regulatory capital requirements, the results of the bank’s capital planning and stress testing process, the results of resolution capital models and other factors, such as rating agency guidelines, the business environment and conditions in the financial markets.
The table below presents information about the bank’s risk-based capital.
As of December$ in millions 2021 2020Share capital $ 63 $ 63 Share premium account 2,094 2,094 Retained earnings 1,420 1,219 Accumulated other comprehensive income (74) (15) Deductions (91) (41) CET1 and Tier 1 capital $ 3,412 $ 3,320 Subordinated loans $ 826 $ 826 Tier 2 capital $ 826 $ 826 Total capital $ 4,238 $ 4,146
During the period ended December 2021 and period ended December 2020, the bank was in compliance with the capital requirements set by the PRA.
Liquidity Risk Management
OverviewLiquidity risk is the risk that the bank will be unable to fund itself or meet its liquidity needs in the event of bank-specific, broader industry or market liquidity stress events. The bank has in place a comprehensive and conservative set of liquidity and funding policies. The bank’s principal objective is to be able to fund itself and to enable its core businesses to continue to serve clients and generate revenues, even under adverse circumstances.
Treasury, which reports to GS Group’s Chief Financial Officer, has primary responsibility for developing, managing and executing GS Group’s liquidity and funding strategy within its risk appetite.
Liquidity Risk, which is independent of the revenue-producing units and Treasury, and reports to GS Group’s Chief Risk Officer, has primary responsibility for assessing, monitoring and managing GS Group’s liquidity risk through oversight across GS Group’s global businesses and the establishment of stress testing and limits frameworks. The bank’s framework for managing liquidity risk is consistent with, and part of, the GS Group framework.
Liquidity Risk Management PrinciplesThe bank manages liquidity risk according to three principles: (i) hold sufficient excess liquidity in the form of Global Core Liquid Assets (GCLA) to cover outflows during a stressed period; (ii) maintain appropriate Asset-Liability Management; and (iii) maintain a viable Contingency Funding Plan.
GCLA. GCLA is liquidity that the bank maintains to meet a broad range of potential cash outflows and collateral needs in a stressed environment. A primary liquidity principle is to pre-fund its estimated potential cash and collateral needs during a liquidity crisis and hold this liquidity in the form of unencumbered, highly liquid securities and cash.
The bank believes that the securities held in its GCLA would be readily convertible to cash in a matter of days, through liquidation, by entering into repurchase agreements or from maturities of resale agreements, and that this cash would allow it to meet immediate obligations without needing to sell other assets or depend on additional funding from credit-sensitive markets.
GOLDMAN SACHS INTERNATIONAL BANK (UNLIMITED COMPANY)
Notes to the Financial Statements
53
Asset-Liability Management. The bank’s liquidity risk management policies are designed to ensure the bank has a sufficient amount of financing, even when funding markets experience persistent stress. The bank manages maturities and diversity of funding across markets, products and counterparties, and seeks to maintain a diversified external funding profile with an appropriate tenor, taking into consideration the characteristics and liquidity profile of its assets.
The bank’s goal is to ensure it maintains sufficient liquidity to fund its assets and meet its contractual and contingent obligations in normal times, as well as during periods of market stress. Through the dynamic balance sheet management process, actual and projected asset balances are used to determine secured and unsecured funding requirements. In a liquidity crisis, the bank would first use its GCLA in order to avoid reliance on asset sales (other than its GCLA). However, the bank recognises that orderly asset sales may be prudent or necessary in a severe or persistent liquidity crisis.
Contingency Funding Plan. GS Group maintains a contingency funding plan, which has a Goldman Sachs International Bank-specific addendum, to provide a framework for analysing and responding to a liquidity crisis situation or periods of market stress. The contingency funding plan outlines a list of potential risk factors, key reports and metrics that are reviewed on an ongoing basis to assist in assessing the severity of, and managing through, a liquidity crisis and/or market dislocation. The contingency funding plan also describes the bank’s potential responses if assessments indicate that the bank has entered a liquidity crisis, which include pre-funding for what the bank estimates will be its potential cash and collateral needs, as well as utilising secondary sources of liquidity. Mitigants and action items to address specific risks which may arise are also described and assigned to individuals responsible for execution.
GOLDMAN SACHS INTERNATIONAL BANK (UNLIMITED COMPANY)
Notes to the Financial Statements
54

Maturity of Financial LiabilitiesThe table below presents the cash flows of the bank’s financial liabilities by contractual maturity including interest that will accrue, except for trading liabilities. Trading liabilities are classified as trading/on demand. Financial liabilities, with the exception of those that are held for trading or designated at fair value through profit and loss, are disclosed at their undiscounted cash flows.
The fair values of financial liabilities held for trading and financial liabilities designated at fair value through profit and loss have been disclosed as this is consistent with the values used in the liquidity risk management of these instruments. Liquidity risk on derivatives is mitigated through master netting agreements and cash collateral arrangements.
Trading/ Less Between Between Between Overon than one and three months one and five
$ in millions demand one month three months and one year five years years TotalAs of December 2021Collateralised financings $ — $ 16 $ 218 $ — $ — $ — $ 234 Customer and other payables — 252 — — — — 252 Trading liabilities 826 — — — — — 826 Deposits 42,810 2,427 9,993 21,189 2,599 678 79,696 Unsecured borrowings — 7 7 — 1,178 954 2,146 Other liabilities — 119 — — — — 119 Total – on balance sheet 43,636 2,821 10,218 21,189 3,777 1,632 83,273 Off balance sheet — 7,678 — — — — 7,678 Total $ 43,636 $ 10,499 $ 10,218 $ 21,189 $ 3,777 $ 1,632 $ 90,951 As of December 2020Collateralised financings $ — $ 4 $ — $ — $ 215 $ — $ 219 Customer and other payables — 459 — — — — 459 Trading liabilities 1,221 — — — — — 1,221 Deposits 37,549 836 5,046 7,358 1,083 1,017 52,889 Unsecured borrowings — 18 10 41 914 967 1,950 Other liabilities — 103 — — 2 2 107 Total – on balance sheet 38,770 1,420 5,056 7,399 2,214 1,986 56,845 Off balance sheet — 8,932 — — — — 8,932 Total $ 38,770 $ 10,352 $ 5,056 $ 7,399 $ 2,214 $ 1,986 $ 65,777
GOLDMAN SACHS INTERNATIONAL BANK (UNLIMITED COMPANY)
Notes to the Financial Statements
55

Market Risk Management
OverviewMarket risk is the risk of loss in the value of the bank’s instruments accounted for at fair value due to changes in market conditions. The bank employs a variety of risk measures to monitor market risk. Categories of market risk include the following:
• Interest rate risk: results from exposures to changes in the level, slope and curvature of yield curves, the volatilities of interest rates, prepayment speeds and credit spreads;
• Equity price risk: results from exposures to changes in prices and volatilities of individual equities, baskets of equities and equity indices;
• Currency rate risk: results from exposures to changes in spot prices, forward prices and volatilities of currency rates; and
• Commodity price risk: results from exposures to changes in spot prices, forward prices and volatilities of commodities, such as crude oil and metals.
Market Risk, which is independent of the revenue-producing units and reports to GS Group’s chief risk officer, has primary responsibility for assessing, monitoring and managing GS Group’s market risk through oversight across GS Group’s global businesses.
Managers in revenue-producing units and Market Risk discuss market information, positions and estimated loss scenarios on an ongoing basis. Managers in revenue-producing units are accountable for managing risk within prescribed limits, both at the GS Group and bank level.
Market Risk Management ProcessThe bank’s process for managing market risk includes:
• Monitoring compliance with established market risk limits and reporting the bank’s exposure;
• Diversifying exposures;
• Controlling position sizes; and
• Evaluating mitigants, such as economic hedges in related securities or derivatives.
The bank’s framework for managing market risk is consistent with, and part of, the GS Group framework, and results are analysed by business and in aggregate, at both the GS Group and bank level.
Risk MeasuresThe bank produces risk measures and monitors them against established market risk limits. These measures reflect an extensive range of scenarios and the results are aggregated at the product, business and bank-wide level.
A variety of risk measures are used to estimate the size of potential losses for both moderate and more extreme market moves over both short and long-term time horizons. Primary risk measures are VaR, which is used for shorter-term periods, and stress tests. The bank’s risk report details key risks, drivers and changes for each business, and is distributed daily to senior management of both the revenue-producing units and independent risk oversight and control functions.
VaR. VaR is the potential loss in value due to adverse market movements over a defined time horizon with a specified confidence level. A one-day time horizon with a 95% confidence level is typically employed. The VaR model is a single model which captures risks, including interest rates, equity prices, currency rates and commodity prices. As such, VaR facilitates comparison across portfolios of different risk characteristics. VaR also captures the diversification of aggregated risk across the bank.
MetricsThe table below presents average daily VaR and period-end VaR, as well as the high and low VaR for the period.
As of or for the Period Ended December$ in millions 2021 2020Average daily VaR $4 $4 Period-end VaR $4 $6 High VaR $6 $9 Low VaR $3 $2
GOLDMAN SACHS INTERNATIONAL BANK (UNLIMITED COMPANY)
Notes to the Financial Statements
56

Credit Risk Management
OverviewCredit risk represents the potential for loss due to the default or deterioration in credit quality of a counterparty (e.g., an OTC derivatives counterparty or a borrower) or an issuer of securities or other instruments the bank holds. The bank’s exposure to credit risk comes mostly from lending activities and client transactions in OTC derivatives. Credit risk also comes from cash placed with banks, securities financing transactions (i.e., resale and repurchase agreements and securities borrowing and lending activities) and customer and other receivables. In addition, the bank holds other positions that give rise to credit risk (e.g., bonds) – these credit risks are captured as a component of market risk measures, which are monitored and managed by Market Risk.
Credit Risk, which is independent of the revenue-producing units and reports to GS Group’s Chief Risk Officer, has primary responsibility for assessing, monitoring and managing GS Group’s credit risk through oversight across GS Group’s global businesses. The bank’s framework for managing credit risk is consistent with the framework of GS Group, established by GS Group’s Risk Governance Committee.
Credit Risk Management ProcessThe process for managing credit risk includes:
• Monitoring compliance with established credit risk limits and reporting the bank’s exposure and credit concentrations;
• Assessing the likelihood that a counterparty will default on its payment obligations;
• Measuring the bank’s current and potential credit exposure and losses resulting from a counterparty default;
• Using credit risk mitigants, including collateral and hedging; and
• Maximising recovery through active workout and restructuring of claims.
As part of the risk assessment process, Credit Risk performs credit reviews, which include initial and ongoing analyses of the bank’s counterparties. A credit review is an independent analysis of the capacity and willingness of a counterparty to meet its financial obligations, resulting in an internal credit rating. The determination of internal credit ratings also incorporates assumptions with respect to the nature of and outlook for the counterparty’s industry, and the economic environment. Senior personnel within Credit Risk Management, with expertise in specific industries, inspect and approve credit reviews and internal credit ratings.
Maximum Exposure to Credit Risk – Financial Assets Subject to ImpairmentThe table below presents an analysis of the credit risk exposure for loans for which an allowance for impairment is recognised. The gross carrying value of financial assets below also represents the bank’s maximum exposure to credit risk on these financial assets. Investment grade exposures include counterparties with internally determined credit ratings between AAA and BBB-. Non-investment grade exposures include counterparties with internally determined credit ratings of BB+ or lower.$ in millions Stage 1 Stage 2 Stage 3 TotalAs of December 2021Credit rating equivalentInvestment grade $ 6,930 $ — $ — $ 6,930 Non-investment grade 3,823 146 2 3,971 Gross carrying value 10,753 146 2 10,901 Allowance for impairment (32) (18) (1) (51) Carrying value $ 10,721 $ 128 $ 1 $ 10,850
As of December 2020Credit rating equivalentInvestment grade $ 5,073 $ — $ — $ 5,073 Non-investment grade 3,680 436 2 4,118 Gross carrying value 8,753 436 2 9,191 Allowance for impairment (93) (36) (1) (130) Carrying value $ 8,660 $ 400 $ 1 $ 9,061
The allowance for impairment ratio decreased to 0.5% at December 2021 compared with 1.4% as of December 2020.
The table below presents an analysis of the credit risk exposure for unfunded commitments for which an allowance for impairment is recognised.$ in millions Stage 1 Stage 2 Stage 3 TotalAs of December 2021Credit rating equivalentInvestment grade $ 2,383 $ — $ — $ 2,383 Non-investment grade 1,547 80 — 1,627 Unfunded commitments 3,930 80 — 4,010 Allowance for impairment $ (5) $ (4) $ — $ (9) As of December 2020Credit rating equivalentInvestment grade $ 4,101 $ — $ — $ 4,101 Non-investment grade 2,188 299 — 2,487 Unfunded commitments 6,289 299 — 6,588 Allowance for impairment $ (14) $ (7) $ — $ (21)
The allowance for impairment also includes qualitative components which allow management to reflect the uncertain nature of economic forecasting, capture uncertainty regarding model inputs, and account for model imprecision and concentration risk. While the assessment is qualitative in nature, the quantification and implementation of these assessments are systematic and model based and considered a core component of the bank’s modelled loan losses.
GOLDMAN SACHS INTERNATIONAL BANK (UNLIMITED COMPANY)
Notes to the Financial Statements
57

The bank also has credit risk exposure to the following financial assets where the allowance for impairment is not material:
• Cash and cash equivalents of $9.90 billion as of December 2021 and $10.08 billion as of December 2020;
• Collateralised agreements of $8.35 billion as of December 2021 and $1.01 billion as of December 2020;
• Customer and other receivables of $292 million as of December 2021 and $720 million as of December 2020;
• Investments of $3.03 billion as of December 2021 and $2.59 billion as of December 2020; and
• Other assets of $970 million as of December 2021 and $914 million as of December 2020.
The total amount of undiscounted expected credit losses at initial recognition for purchased or originated credit-impaired financial assets recognised was $nil for both the periods ended December 2021 and December 2020.
Collateral and Other Credit EnhancementsThe bank employs a range of policies and practices to mitigate credit risk. The most common of these is accepting collateral for funds advanced. The bank has internal policies on the acceptability of specific classes of collateral or credit risk mitigation. The bank prepares a valuation of the collateral obtained as part of the loan origination process. This assessment is reviewed periodically.
The bank closely monitors collateral held for financial assets considered to be credit-impaired, as it becomes more likely that the bank will take possession of collateral to mitigate potential credit losses. Credit-impaired financial assets were $2 million as of December 2021 and $2 million as of December 2020 and the allowance for impairment on these credit-impaired financial assets was $1 million as of December 2021 and $1 million as of December 2020. No collateral was held on these loans.
Allowance for ImpairmentThe allowance for impairment recorded in the period is impacted by a variety of factors including transfers between stages as a result of financial instruments experiencing significant increases in credit risk or becoming credit-impaired, new financial instruments recognised during the period and changes in modelling assumptions such as PDs, LGDs and EADs based on updated macroeconomic assumptions. Other factors include foreign exchange revaluations and derecognition of financial instruments.
The table below presents changes in the allowance for impairment for loans.$ in millions Stage 1 Stage 2 Stage 3 TotalPeriod Ended December 2021Beginning balance $ 93 $ 36 $ 1 $ 130 Items with profit or loss impactTransfers:‒ Stage 2 to stage 1 3 (3) — — New financial assets originated
or purchased 14 — — 14 Financial assets de-recognised
during the period (44) (16) — (60) Changes in PDs/LGDs/EADs (31) (1) — (32) Translation (gains)/ losses (3) 3 — — Total items with profit or loss
impact (61) (17) — (78) Charge-offs — (1) — (1) Ending balance $ 32 $ 18 $ 1 $ 51 Period Ended December 2020Beginning balance $ 22 $ 4 $ 1 $ 27 Items with profit or loss impactTransfers:‒ Stage 1 to stage 2 (2) 2 – –New financial assets
originated or purchased 38 14 1 53 Financial assets de-recognised
during the period (9) (3) (1) (13) Changes in PDs/LGDs/EADs 40 18 26 84 Translation losses 4 1 1 6 Total items with profit or loss
impact 71 32 27 130 Charge-offs – – (27) (27) Ending balance $ 93 $ 36 $ 1 $ 130
The allowance for impairment for other financial assets where the bank has credit risk exposure did not change significantly during both the periods ended December 2021 and December 2020.
GOLDMAN SACHS INTERNATIONAL BANK (UNLIMITED COMPANY)
Notes to the Financial Statements
58

The table below presents changes in the allowance for impairment for unfunded commitments. $ in millions Stage 1 Stage 2 Stage 3 TotalPeriod Ended December 2021Beginning balance $ 14 $ 7 $– $ 21 Items with profit or loss impactTransfers:‒ Stage 2 to stage 1 1 (1) – –New financial assets
originated or purchased 4 2 – 6 Financial assets de-recognised
during the period (14) (6) – (20) Changes in PDs/LGDs/EADs (3) (4) – (7) Translation losses 4 5 – 9 Total items with profit or loss
impact (8) (4) – (12) Ending balance $ 6 $ 3 $– $ 9 Period Ended December 2020Beginning balance $ 3 $ 1 $– $ 4 Items with profit or loss impactNew financial assets
originated or purchased 8 4 – 12 Financial assets de-recognised
during the period (3) – – (3) Changes in PDs/LGDs/EADs 4 2 – 6 Translation losses 2 – – 2 Total items with profit or loss
impact 11 6 – 17 Ending balance $ 14 $ 7 $– $ 21
Forward Looking InformationAs of December 2021, the forecasted economic scenarios were most heavily weighted towards the baseline and adverse scenarios. The forecast model incorporated adjustments to reflect the impact of COVID-19-related concession programmes and also considered the impact of the macroeconomic environment including GDP growth, unemployment rates and inflation.
The bank’s allowance for impairment primarily related to corporate loans to borrowers in the U.K. and E.U.
The table below presents the forecasted range (across the baseline, adverse and favourable scenarios) of the U.K. and E.U. unemployment and GDP growth rates used in the forecast model.
U.K. unemployment Growth/(decline)rate in U.K. GDP
As of December 2021Forecast for the quarter endedJune 2022 4.0% to 7.2% (0.2)% to 1.8%December 2022 3.8% to 9.0% (1.9)% to 3.3%June 2023 3.7% to 8.7% (2.3)% to 4.7%
As of December 2020Forecast for the quarter endedJune 2021 7.3% to 10.0% (6.5)% to (15.9)%December 2021 6.6% to 9.1% (2.1)% to (12.5)%June 2022 6.0% to 8.3% (0.3)% to (10.8)%
E.U. unemployment Growth/(decline)rate in E.U. GDP
As of December 2021Forecast for the quarter endedJune 2022 7.1% to 9.3% (0.1)% to 2.1%December 2022 7.0% to 10.8% (1.8)% to 3.5%June 2023 7.0% to 10.8% (2.3)% to 4.6%
As of December 2020Forecast for the quarter endedJune 2021 9.7% to 12.0% (1.7)% to (11.9)%December 2021 9.1% to 10.8% 0.9% to (8.0)%June 2022 8.5% to 9.7% 2.3% to (6.0)%
Sensitivity of Expected Credit LossesThe ECL is sensitive to assumptions about future economic conditions, including the macro-economic variables used and the respective probability weightings assigned to the scenarios used to determine the probability-weighted ECL, as well as to assumptions of credit behaviour.
The following table presents the probability-weighted ECL (actual) compared to the ECL arising when 100% weighting is applied to the adverse scenario. The sensitivity analysis is applied to the stage 1 and stage 2 positions. Stage 3 provisions are not subject to the same level of measurement uncertainty as default has been observed at the balance sheet date. Stage 3 positions have therefore been excluded from the analysis.
As of December2021 2020
$ in millions Actual Adverse Actual AdverseStage 1 $ 37 $ 45 $ 107 $ 113 Stage 2 22 73 43 152 Total $ 59 $ 118 $ 150 $ 265
Transfers between stage 1 and stage 2 are based on the assessment of significant increases in credit risk relative to initial recognition. The impact of moving from 12 months expected credit losses to lifetime expected losses, or vice versa, can have a significant impact on expected credit losses.
The following table illustrates the impact of staging on the ECL by comparing, the allowance if all performing loans were in stage 2, to the actual ECL on these positions based on their stage allocation at the balance sheet date.
As of December$ in millions 2021 2020Aggregate stage 1 and stage 2 based on actual
staging $ 59 $ 150 All performing loans using lifetime ECL 109 211 Difference $ 50 $ 61
GOLDMAN SACHS INTERNATIONAL BANK (UNLIMITED COMPANY)
Notes to the Financial Statements
59

Gross Carrying ValueThe table below presents changes in the gross carrying value of bank loans and mortgage-backed loans.$ in millions Stage 1 Stage 2 Stage 3 TotalPeriod Ended December 2021Beginning balance $ 8,753 $ 436 $ 2 $ 9,191 Transfers:‒ Stage 2 to stage 1 44 (44) — — New financial assets originated
or purchased 6,046 4 — 6,050 Financial assets de-recognised
during the period (4,090) (250) — (4,340) Ending balance $ 10,753 $ 146 $ 2 $ 10,901
Period Ended December 2020Beginning balance $ 6,381 $ 121 $ 3 $ 6,505 Transfers:‒ Stage 1 to stage 2 (200) 200 – –New financial assets originated
or purchased 6,159 193 2 6,354 Financial assets de-recognised
during the period (3,587) (78) (3) (3,668) Ending balance $ 8,753 $ 436 $ 2 $ 9,191
Maximum Exposure to Credit Risk – Financial Instruments Not Subject to ImpairmentThe table below contains an analysis of the credit risk exposure for financial assets not subject to impairment (i.e., mandatorily at fair value). This presents the bank’s gross credit exposure to and net credit exposure after taking account of assets captured by market risk in the bank’s risk management process, counterparty netting (i.e., the netting of financial assets and liabilities for a given counterparty when a legal right of set-off exists under an enforceable netting agreement), and cash and security collateral received under credit support agreements, which management considers when determining credit risk.
GOLDMAN SACHS INTERNATIONAL BANK (UNLIMITED COMPANY)
Notes to the Financial Statements
60

Collateralised$ in millions agreements Trading assets Loans Investments TotalPeriod Ended December 2021Gross credit exposure $ 46,840 $ 3,227 $ 950 $ 2,046 $ 53,063 Assets captured by market risk — — — — — Counterparty netting (16) (478) — — (494) Cash collateral — (15) — — (15) Security collateral received (45,603) (67) (835) (1,959) (48,464) Net credit exposure $ 1,221 $ 2,667 $ 115 $ 87 $ 4,090
Period Ended December 2020Gross credit exposure $ 31,876 $ 1,689 $ 1,402 $ 382 $ 35,349 Assets captured by market risk — — — — — Counterparty netting (4) (1,155) — — (1,159) Cash collateral — (196) — — (196) Security collateral received (31,838) (270) — (379) (32,487) Net credit exposure $ 34 $ 68 $ 1,402 $ 3 $ 1,507
The table below present the bank’s gross credit exposure to financial instruments measured at fair value through profit or loss by internally determined public rating agency equivalents and other credit metrics.
As of December$ in millions 2021 2020AAA $ 56 $ 6 AA 108 — A 37,436 21,524 BBB 12,251 12,532 BB or lower 3,124 1,218 Unrated 88 69 Total $ 53,063 $ 35,349
In the table above, the bank’s unrated gross credit exposure includes assets captured by market risk. The bank’s unrated gross credit exposure excluding assets captured by market risk was $88 million as of December 2021 and $69 million as of December 2020, which are financial assets for which the bank has not assigned an internally determined public rating agency equivalent.
In addition to credit risk on financial assets, the bank also has credit exposure in respect of contingent and forward starting resale agreements, financial guarantee contracts written and in its capacity as an agent in securities lending.
The bank’s gross credit exposure related to contingent and forward starting resale agreements was $372 million as of December 2021 and $217 million as of December 2020. However, this is fully mitigated by collateral if these commitments are fulfilled. The bank’s gross credit exposure related to financial guarantee contracts written was $nil as of December 2021 and $45 million as of December 2020.
The maximum exposure to the bank as an agent in securities lending was $810 million as of December 2021 and $809 million as of December 2020. However, this is fully mitigated by the market value of the collateral held to cover the loss.
Russia and Ukraine Exposure.The bank’s exposures to Russia and Ukraine as of December 2021 are described below. Credit exposure represents the potential for loss due to the default or deterioration in credit quality of a counterparty or borrower. Market exposure represents the potential for loss in value of the bank’s long and short positions due to changes in market prices.
Russia ExposureAs of December 2021, the bank’s total credit exposure to Russia was $191 million, comprising $116 million of loans and a $75 million unfunded lending commitment, to non-sovereign borrowers. These credit exposures are before the application of certain credit risk mitigants. In addition, the bank’s total market exposure to Russia was insignificant.
Since the conflict escalated, the bank has substantially reduced its credit exposure to Russia through a combination of repayment and subsequent termination of certain loans, and through economic hedges established by entering into credit derivatives. Additionally, conditions precedent to draw down on the unfunded lending commitment remain unsatisfied.
Ukraine ExposureAs of December 2021 and date of publication, the bank had no credit and market exposure to Ukraine.
GOLDMAN SACHS INTERNATIONAL BANK (UNLIMITED COMPANY)
Notes to the Financial Statements
61

Replacement of Interbank Offered Rates (IBORs), including London Interbank Offered Rate (LIBOR)On January 1, 2022, the publication of all EUR, CHF, JPY and GBP LIBOR (non-USD LIBOR) settings along with certain USD LIBOR settings ceased. The publication of the most commonly used USD LIBOR settings will cease after June 2023. The FCA has allowed the publication and use of synthetic rates for certain GBP and JPY LIBOR settings in legacy GBP- or JPY LIBOR-based derivative contracts through December 2022. The U.S. federal banking agencies’ guidance strongly encourages banking organisations to cease using USD LIBOR.
The International Swaps and Derivatives Association (ISDA) 2020 IBOR Fallbacks Protocol (IBOR Protocol) has provided derivatives market participants with amended fallbacks for legacy and new derivative contracts to mitigate legal or economic uncertainty. Both counterparties have to adhere to the IBOR Protocol or engage in bilateral amendments for the terms to be effective for derivative contracts. ISDA confirmed that the FCA’s formal announcement in March 2021 fixed the spread adjustment for all LIBOR rates and that fallbacks will automatically occur for outstanding derivative contracts that incorporate the relevant terms. In April 2021, the State of New York approved legislation intended to minimise legal and economic uncertainty for contracts that are governed by New York law and have no fallback provisions or have fallback provisions that are based on USD LIBOR by providing a statutory framework to replace USD LIBOR with a benchmark rate based on the Secured Overnight Financing Rate (SOFR).
IBOR Exposure. GS Group, including the bank, has facilitated an orderly transition from non-USD LIBORs to alternative risk-free reference rates for itself and its clients and continues to make progress on its transition programme as it relates to USD LIBOR.
The table below presents the bank’s exposure to interest rate benchmarks subject to reform.
As of December 2021
$ in millionsNon-derivative
financial assetsDerivative
notional amountUSD LIBOR $ 366 $ 1,642 GBP LIBOR 177 — Other 24 19 Total $ 567 $ 1,661
In the table above:
• Non-derivative financial assets consists of loans.
• Non-USD IBOR derivative notionals excludes amounts for which fallbacks apply from January 1, 2022 , or amounts for which all future cashflows have already been fixed, as the bank has no ongoing IBOR exposure related to these transactions.
• USD LIBOR based derivative contracts notional of $1.6 billion included approximately $1.1 billion of derivative contracts which will mature after June 2023 based on their contractual terms. A majority of such derivative contracts are with counterparties under bilateral agreements subject to the IBOR Protocol, or with central clearing counterparties or exchanges which have incorporated fallbacks consistent with the IBOR Protocol in their rulebooks and have announced that they plan to convert USD LIBOR contracts to alternative risk-free reference rates.
The bank is engaged with its clients in order to remediate contractual agreements related to cash products where necessary and feasible. Remediation of such agreements is executed via bilateral or multilateral transaction-specific amendments depending on the nature of the transactions. In addition to managing the transition of existing LIBOR based contracts, the bank has executed SOFR and Sterling Overnight Index Average-based derivative contracts to make markets and facilitate client activities.
GS Group’s LIBOR transition programme continues to make progress with a focus on:
• Evaluating and monitoring the impacts of USD LIBOR settings across its businesses, including transactions and products;
• Ensuring that legacy financial instruments and contracts that continue to be impacted by the transition already contain appropriate fallback language or are being amended, either through bilateral negotiation or using industry-wide tools, such as protocols;
• Enhancements to infrastructure (for example, models and systems) to prepare for a smooth transition from USD LIBOR to alternative risk-free reference rates;
• Ensuring operational readiness to offer and support various alternative risk-free reference rate products;
• Active participation in central bank and sector working groups, including responding to industry consultations; and
• Client education and communication.
GOLDMAN SACHS INTERNATIONAL BANK (UNLIMITED COMPANY)
Notes to the Financial Statements
62
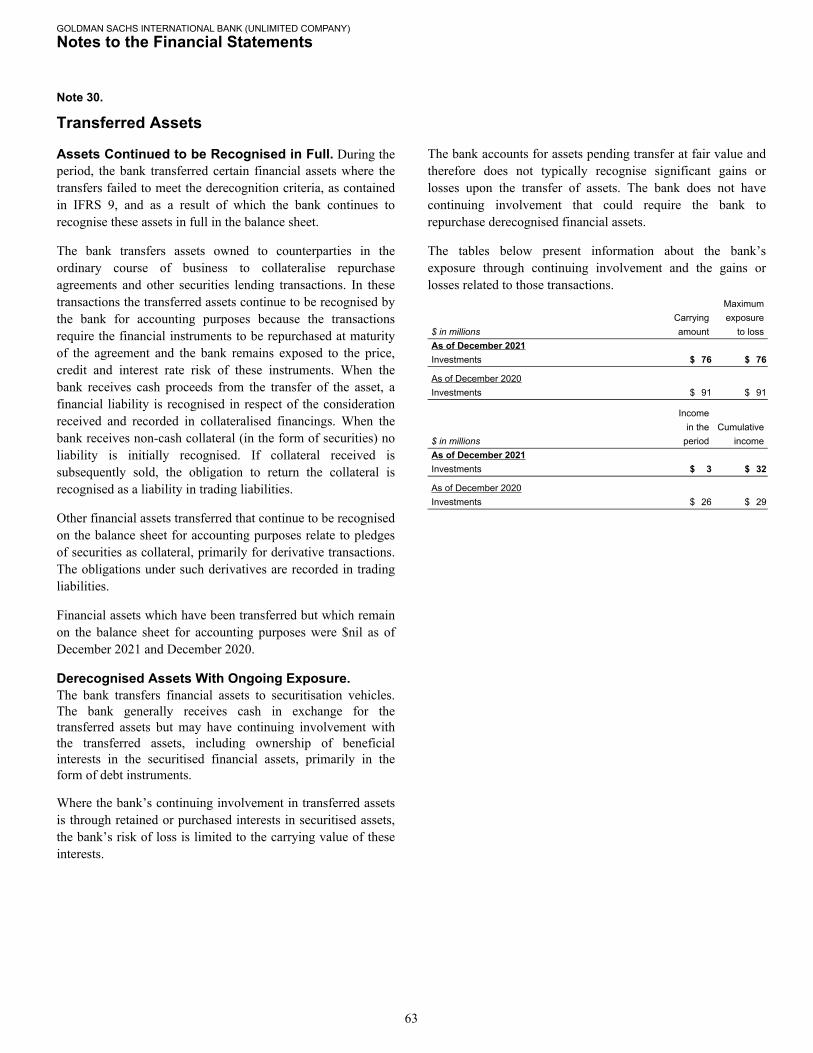
Note 30.
Transferred Assets
Assets Continued to be Recognised in Full. During the period, the bank transferred certain financial assets where the transfers failed to meet the derecognition criteria, as contained in IFRS 9, and as a result of which the bank continues to recognise these assets in full in the balance sheet.
The bank transfers assets owned to counterparties in the ordinary course of business to collateralise repurchase agreements and other securities lending transactions. In these transactions the transferred assets continue to be recognised by the bank for accounting purposes because the transactions require the financial instruments to be repurchased at maturity of the agreement and the bank remains exposed to the price, credit and interest rate risk of these instruments. When the bank receives cash proceeds from the transfer of the asset, a financial liability is recognised in respect of the consideration received and recorded in collateralised financings. When the bank receives non-cash collateral (in the form of securities) no liability is initially recognised. If collateral received is subsequently sold, the obligation to return the collateral is recognised as a liability in trading liabilities.
Other financial assets transferred that continue to be recognised on the balance sheet for accounting purposes relate to pledges of securities as collateral, primarily for derivative transactions. The obligations under such derivatives are recorded in trading liabilities.
Financial assets which have been transferred but which remain on the balance sheet for accounting purposes were $nil as of December 2021 and December 2020.
Derecognised Assets With Ongoing Exposure. The bank transfers financial assets to securitisation vehicles. The bank generally receives cash in exchange for the transferred assets but may have continuing involvement with the transferred assets, including ownership of beneficial interests in the securitised financial assets, primarily in the form of debt instruments.
Where the bank’s continuing involvement in transferred assets is through retained or purchased interests in securitised assets, the bank’s risk of loss is limited to the carrying value of these interests.
The bank accounts for assets pending transfer at fair value and therefore does not typically recognise significant gains or losses upon the transfer of assets. The bank does not have continuing involvement that could require the bank to repurchase derecognised financial assets.
The tables below present information about the bank’s exposure through continuing involvement and the gains or losses related to those transactions.
MaximumCarrying exposure
$ in millions amount to lossAs of December 2021Investments $ 76 $ 76
As of December 2020Investments $ 91 $ 91
Incomein the Cumulative
$ in millions period incomeAs of December 2021Investments $ 3 $ 32
As of December 2020Investments $ 26 $ 29
GOLDMAN SACHS INTERNATIONAL BANK (UNLIMITED COMPANY)
Notes to the Financial Statements
63