december 2015 - Almega
68
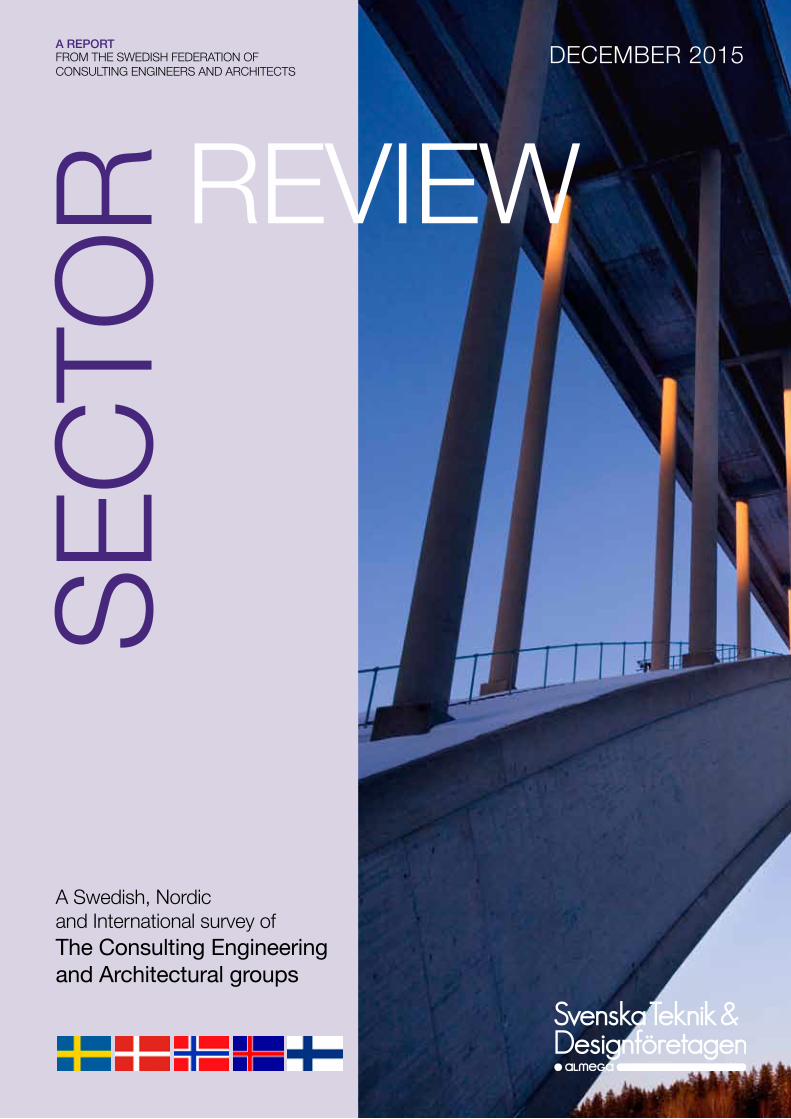
A REPORT FROM THE SWEDISH FEDERATION OF CONSULTING ENGINEERS AND ARCHITECTS DECEMBER 2015 A Swedish, Nordic and International survey of The Consulting Engineering and Architectural groups SECTOR REVIEW
-
Upload
khangminh22 -
Category
Documents
-
view
4 -
download
0
Transcript of december 2015 - Almega
1Sector review • the SwediSh Federation oF conSulting engineerS and architectS • december 2015
A report From the SwediSh Federation oF conSulting engineerS and architectS
december 2015
a Swedish, nordic and international survey ofThe Consulting Engineering and Architectural groups
Sec
tor review
2 Sector review • the SwediSh Federation oF conSulting engineerS and architectS • december 2015
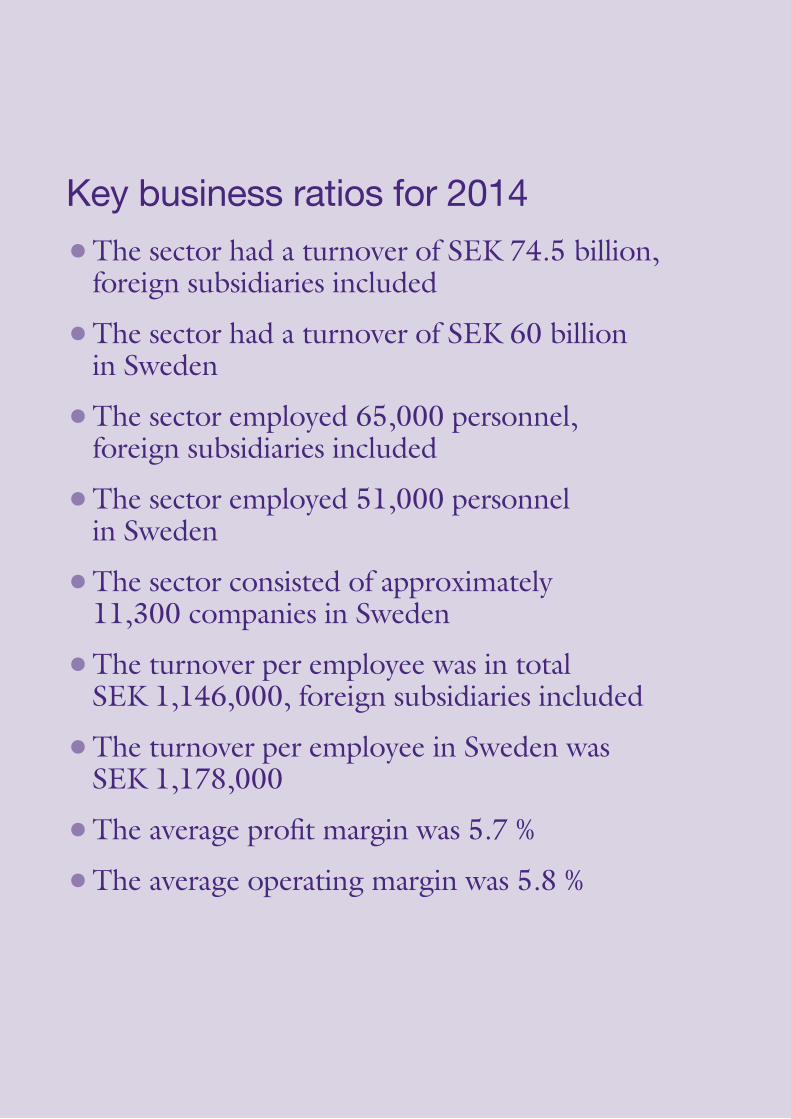
Key business ratios for 2014
• The sector had a turnover of SEK 74.5 billion, foreign subsidiaries included
• The sector had a turnover of SEK 60 billion in Sweden
• The sector employed 65,000 personnel, foreign subsidiaries included
• The sector employed 51,000 personnel in Sweden
• The sector consisted of approximately 11,300 companies in Sweden
• The turnover per employee was in total SEK 1,146,000, foreign subsidiaries included
• The turnover per employee in Sweden was SEK 1,178,000
• The average profit margin was 5.7 %
• The average operating margin was 5.8 %
3Sector review • the SwediSh Federation oF conSulting engineerS and architectS • december 2015
about the Sector review 4
Foreword by magnus höij, association’s managing director 5
introduction, lena hagman, chief economist almega 6
the SwediSh MArket 8
Sector development 2014 and 2015 8
development, by sectors 9
interview, markus granlund, Semcon 11
interview, bent Johannesson, ramböll 12
interview, ulrika Francke, tyréns 15
a comparison with other knowledge-intensive industries 15
Key figures for the largest Swedish consulting firms 16
Swedish structural deals 17
the 50 largest architectural groups 18
the 50 largest industrial consultancies 19
interview, monica von Schmalensee, white 20
the 30 largest groups in Sweden 23
Sweden’s 300 largest groups 24
the Nordic MArket 31
introduction 32
nordic comparison of key figures 32
the 100 largest architectural groups in the nordic region 33
Fri – the danish market 35
denmark’s 100 largest groups 38
riF – the norwegian market 40
norway’s 100 largest groups 44
Frv/SamarK – the icelandic market 46
iceland’s 14 largest groups 48
SKol – the Finnish market 49
atl – the Finnish market 51
Finland’s 100 largest groups 53
the iNterNAtioNAl MArket 55
international development 56
Profit margin development, europe’s 300 largest firms 56
listed consultancies in the west – a comparison 57
europe’s 50 largest architectural groups 58
the world’s 10 largest groups 59
europe’s 300 largest groups 60
Contents
cover photo
the Sandö bridge is an arched bridge over the Ångermanälven-river, between lunde and Klockestrand in the municipality of Kramfors, Ångermanland-region. Photo from Peab, infrastructure division.
Photo: bruno ehrs
graphics: Frankfeldt grafisk FormPrinting: ineko Stockholmtranslations: Jng ainscough hb
4 Sector review • the SwediSh Federation oF conSulting engineerS and architectS • december 2015
The Sector Review
the Sector review has been published by the Swedish Federation of consulting engineers and architects (Std-företagen) since 1995. it is a compilation of the architectural, engineering consultancy and industrial consultancy sectors in Sweden, the nordic countries and europe. the review presents ranking lists of the largest corporate groups on the respective markets, interesting key business ratios, news about structural transactions and information on the development and economy within the sector over the past year.
Since 2005, Std-företagen’s counterparts in the neighbouring nordic countries have contributed to the review. Std-företagen represents architects, engineering consultants and industrial engineering consultants, whereas the nordic organisations only represent engineering consultants and, in certain cases, industrial engineering consultants. the organisations that participate in this cooperation are Fri in denmark, riF in norway, SKol and atl (architectural association) in Finland and Frv and SamarK (architectural association) in iceland.
the figures in the review are based on the latest available data that we have been able to find on the respective firms. For just over half the firms the review is equivalent to a calendar closing for 2014. the remaining firms have split financial years. in most cases, we have received their annual reports for 2014/15. however, some annual accounts were not ready when work on the collection of basic data came to an end, for example for those companies whose annual accounts close at the end of august. in these cases, we have retained the same figures as for 2013/14. For the sake of simplicity, we refer to the compiled figures that applied for 2014.
the corporate information in the review has been acquired via the databases Soliditet (Sweden) and Factiva dow Jones companies & executives (europe), from the nordic organisations, direct from companies or via the companies’ home pages. the monitoring covers some 1 500 companies in Sweden, the nordic area and europe. collecting the information is an extensive and time-consuming task, and in some cases it is impossible to obtain reliable information. the information on the international companies is more difficult to access. in Sweden, annual reports are public documents. this is not the case in all countries, and many firms are reluctant to disclose their figures. in these cases, we use the most recent material we can find. consequently, all companies that appear in – or should appear in – the review are requested to contact Std-företagen (Swedish Federation of consulting engineers and architects) and to submit their details in order to make sure that the information published on them is correct.
we would in particular like to thank those companies that have helped us by submitting their annual reports.
Swedish Federation of consulting engineers and architects
5Sector review • the SwediSh Federation oF conSulting engineerS and architectS • december 2015
Foreword
A changing industry
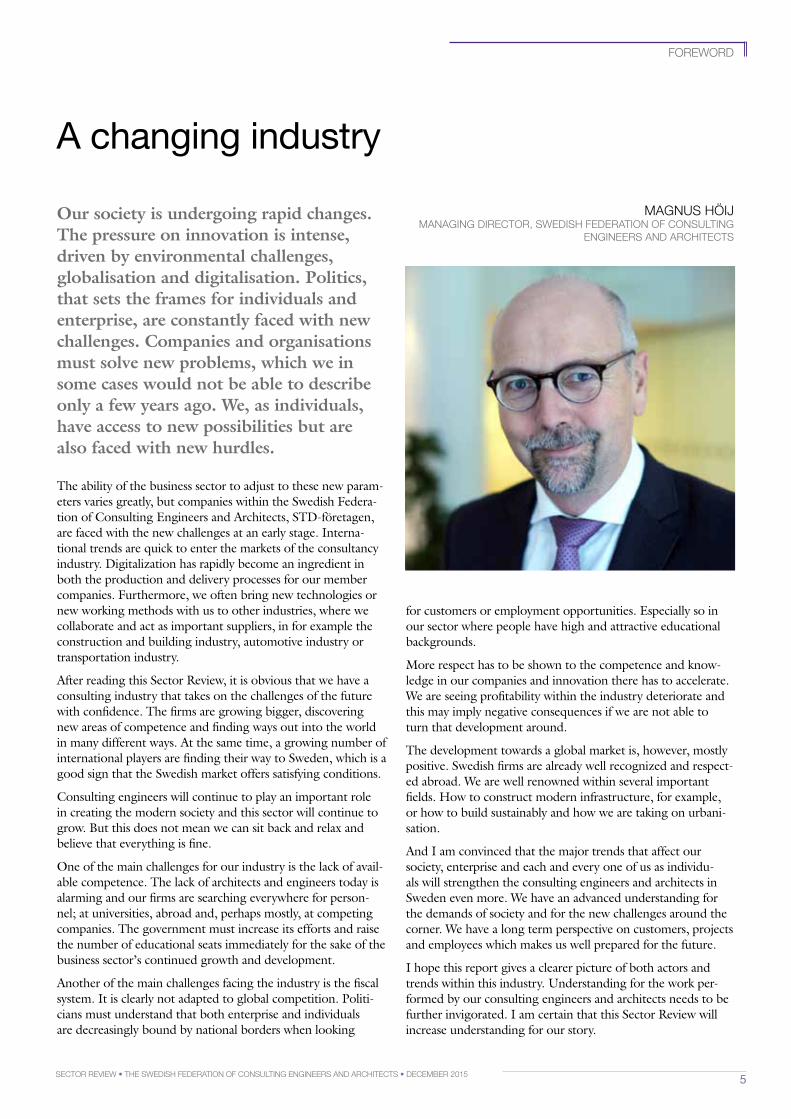
magnuS höiJmanaging director, SwediSh Federation oF conSulting
engineerS and architectS
Our society is undergoing rapid changes. The pressure on innovation is intense, driven by environmental challenges, globalisation and digitalisation. Politics, that sets the frames for individuals and enterprise, are constantly faced with new challenges. Companies and organisations must solve new problems, which we in some cases would not be able to describe only a few years ago. We, as individuals, have access to new possibilities but are also faced with new hurdles.
The ability of the business sector to adjust to these new param-eters varies greatly, but companies within the Swedish Federa-tion of Consulting Engineers and Architects, STD-företagen, are faced with the new challenges at an early stage. Interna-tional trends are quick to enter the markets of the consultancy industry. Digitalization has rapidly become an ingredient in both the production and delivery processes for our member companies. Furthermore, we often bring new technologies or new working methods with us to other industries, where we collaborate and act as important suppliers, in for example the construction and building industry, automotive industry or transportation industry.
After reading this Sector Review, it is obvious that we have a consulting industry that takes on the challenges of the future with confidence. The firms are growing bigger, discovering new areas of competence and finding ways out into the world in many different ways. At the same time, a growing number of international players are finding their way to Sweden, which is a good sign that the Swedish market offers satisfying conditions.
Consulting engineers will continue to play an important role in creating the modern society and this sector will continue to grow. But this does not mean we can sit back and relax and believe that everything is fine.
One of the main challenges for our industry is the lack of avail-able competence. The lack of architects and engineers today is alarming and our firms are searching everywhere for person-nel; at universities, abroad and, perhaps mostly, at competing companies. The government must increase its efforts and raise the number of educational seats immediately for the sake of the business sector’s continued growth and development.
Another of the main challenges facing the industry is the fiscal system. It is clearly not adapted to global competition. Politi-cians must understand that both enterprise and individuals are decreasingly bound by national borders when looking
for customers or employment opportunities. Especially so in our sector where people have high and attractive educational backgrounds.
More respect has to be shown to the competence and know-ledge in our companies and innovation there has to accelerate. We are seeing profitability within the industry deteriorate and this may imply negative consequences if we are not able to turn that development around.
The development towards a global market is, however, mostly positive. Swedish firms are already well recognized and respect-ed abroad. We are well renowned within several important fields. How to construct modern infrastructure, for example, or how to build sustainably and how we are taking on urbani-sation.
And I am convinced that the major trends that affect our society, enterprise and each and every one of us as individu-als will strengthen the consulting engineers and architects in Sweden even more. We have an advanced understanding for the demands of society and for the new challenges around the corner. We have a long term perspective on customers, projects and employees which makes us well prepared for the future.
I hope this report gives a clearer picture of both actors and trends within this industry. Understanding for the work per-formed by our consulting engineers and architects needs to be further invigorated. I am certain that this Sector Review will increase understanding for our story.
6 Sector review • the SwediSh Federation oF conSulting engineerS and architectS • december 2015
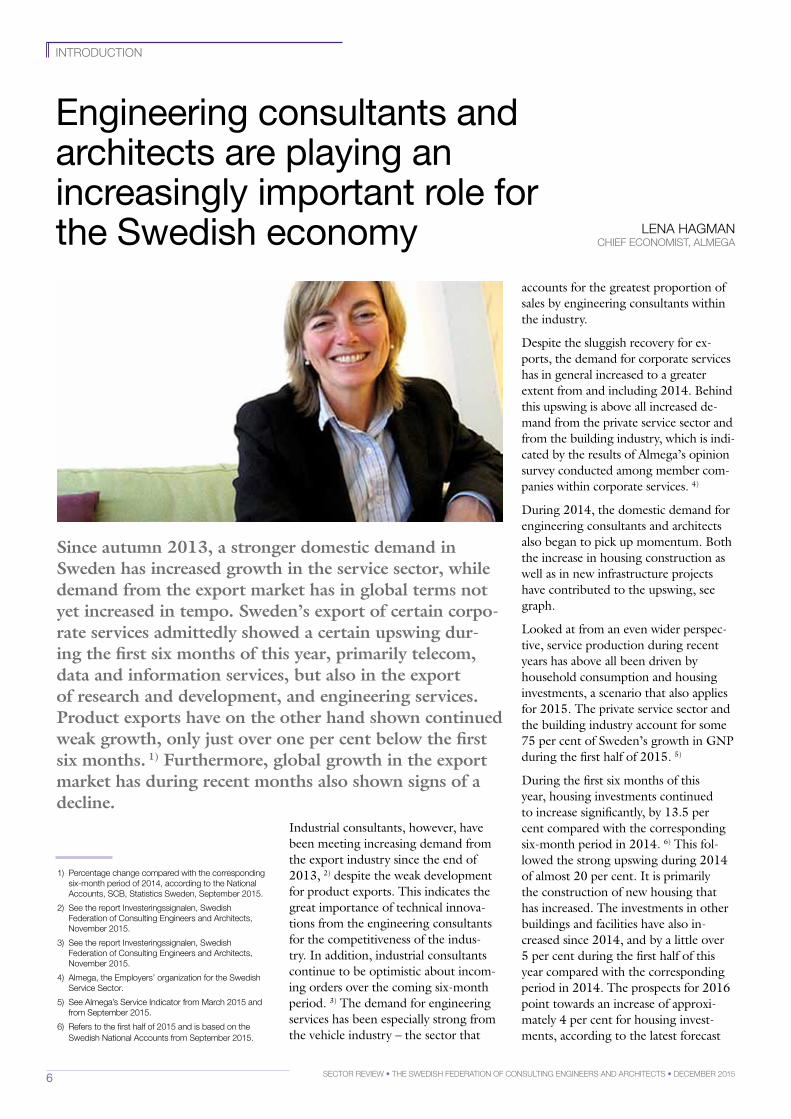
Since autumn 2013, a stronger domestic demand in Sweden has increased growth in the service sector, while demand from the export market has in global terms not yet increased in tempo. Sweden’s export of certain corporate services admittedly showed a certain upswing during the first six months of this year, primarily telecom, data and information services, but also in the export of research and development, and engineering services. Product exports have on the other hand shown continued weak growth, only just over one per cent below the first six months. 1) Furthermore, global growth in the export market has during recent months also shown signs of a decline.
Industrial consultants, however, have been meeting increasing demand from the export industry since the end of 2013, 2) despite the weak development for product exports. This indicates the great importance of technical innova-tions from the engineering consultants for the competitiveness of the indus-try. In addition, industrial consultants continue to be optimistic about incom-ing orders over the coming six-month period. 3) The demand for engineering services has been especially strong from the vehicle industry – the sector that
Engineering consultants and architects are playing an increasingly important role for the Swedish economy
accounts for the greatest proportion of sales by engineering consultants within the industry.
Despite the sluggish recovery for ex-ports, the demand for corporate services has in general increased to a greater extent from and including 2014. Behind this upswing is above all increased de-mand from the private service sector and from the building industry, which is indi-cated by the results of Almega’s opinion survey conducted among member com-panies within corporate services. 4)
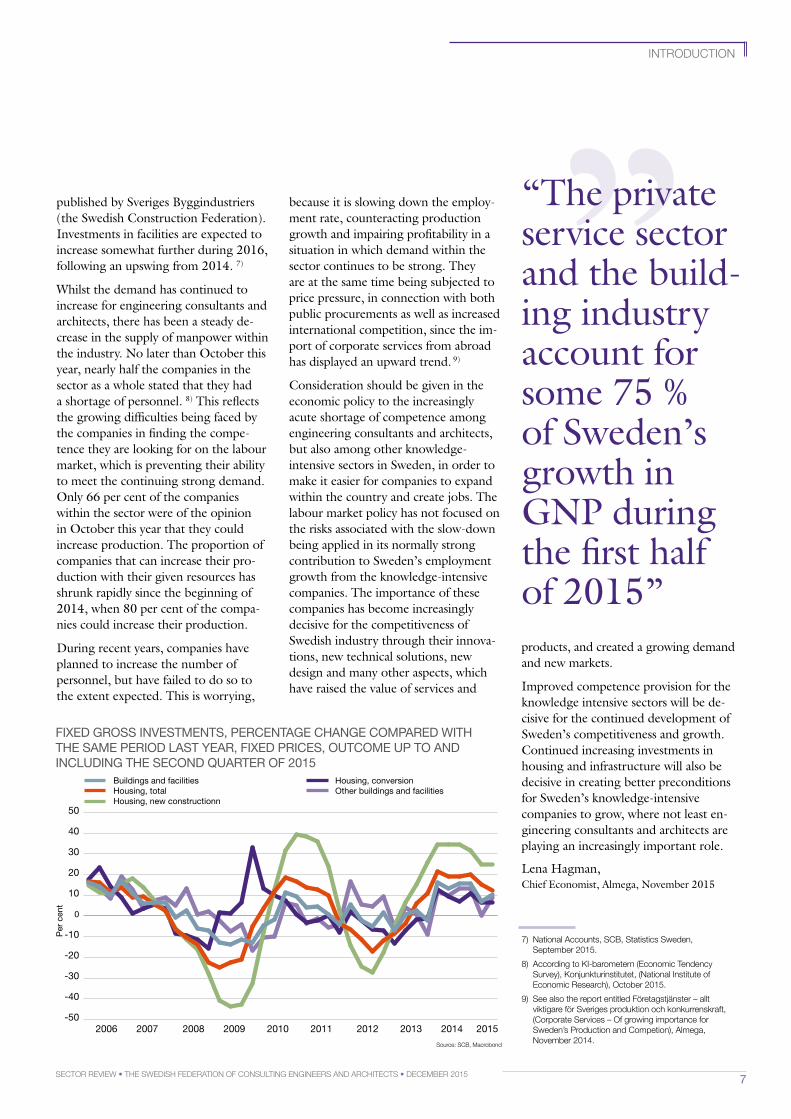
During 2014, the domestic demand for engineering consultants and architects also began to pick up momentum. Both the increase in housing construction as well as in new infrastructure projects have contributed to the upswing, see graph.
Looked at from an even wider perspec-tive, service production during recent years has above all been driven by household consumption and housing investments, a scenario that also applies for 2015. The private service sector and the building industry account for some 75 per cent of Sweden’s growth in GNP during the first half of 2015. 5)
During the first six months of this year, housing investments continued to increase significantly, by 13.5 per cent compared with the corresponding six-month period in 2014. 6) This fol-lowed the strong upswing during 2014 of almost 20 per cent. It is primarily the construction of new housing that has increased. The investments in other buildings and facilities have also in-creased since 2014, and by a little over 5 per cent during the first half of this year compared with the corresponding period in 2014. The prospects for 2016 point towards an increase of approxi-mately 4 per cent for housing invest-ments, according to the latest forecast
introduction
1) Percentage change compared with the corresponding six-month period of 2014, according to the national accounts, Scb, Statistics Sweden, September 2015.
2) See the report investeringssignalen, Swedish Federation of consulting engineers and architects, november 2015.
3) See the report investeringssignalen, Swedish Federation of consulting engineers and architects, november 2015.
4) almega, the employers’ organization for the Swedish Service Sector.
5) See almega’s Service indicator from march 2015 and from September 2015.
6) refers to the first half of 2015 and is based on the Swedish national accounts from September 2015.
lena hagmanchieF economiSt, almega
7Sector review • the SwediSh Federation oF conSulting engineerS and architectS • december 2015
”
7) national accounts, Scb, Statistics Sweden, September 2015.
8) according to Ki-barometern (economic tendency Survey), Konjunkturinstitutet, (national institute of economic research), october 2015.
9) See also the report entitled Företagstjänster – allt viktigare för Sveriges produktion och konkurrenskraft, (corporate Services – of growing importance for Sweden’s Production and competion), almega, november 2014.
FixEd gRoSS invESTmEnTS, pERCEnTAgE ChAngE CompAREd wiTh ThE SAmE pERiod lAST yEAR, FixEd pRiCES, ouTComE up To And inCluding ThE SECond quARTER oF 2015
published by Sveriges Byggindustriers (the Swedish Construction Federation). Investments in facilities are expected to increase somewhat further during 2016, following an upswing from 2014. 7)
Whilst the demand has continued to increase for engineering consultants and architects, there has been a steady de-crease in the supply of manpower within the industry. No later than October this year, nearly half the companies in the sector as a whole stated that they had a shortage of personnel. 8) This reflects the growing difficulties being faced by the companies in finding the compe-tence they are looking for on the labour market, which is preventing their ability to meet the continuing strong demand. Only 66 per cent of the companies within the sector were of the opinion in October this year that they could increase production. The proportion of companies that can increase their pro-duction with their given resources has shrunk rapidly since the beginning of 2014, when 80 per cent of the compa-nies could increase their production.
During recent years, companies have planned to increase the number of personnel, but have failed to do so to the extent expected. This is worrying,
because it is slowing down the employ-ment rate, counteracting production growth and impairing profitability in a situation in which demand within the sector continues to be strong. They are at the same time being subjected to price pressure, in connection with both public procurements as well as increased international competition, since the im-port of corporate services from abroad has displayed an upward trend. 9)
Consideration should be given in the economic policy to the increasingly acute shortage of competence among engineering consultants and architects, but also among other knowledge-intensive sectors in Sweden, in order to make it easier for companies to expand within the country and create jobs. The labour market policy has not focused on the risks associated with the slow-down being applied in its normally strong contribution to Sweden’s employment growth from the knowledge-intensive companies. The importance of these companies has become increasingly decisive for the competitiveness of Swedish industry through their innova-tions, new technical solutions, new design and many other aspects, which have raised the value of services and
introduction
“The private service sector and the build-ing industry account for some 75 % of Sweden’s growth in GNP during the first half of 2015”
Buildings and facilitiesHousing, total Housing, new constructionn
-50
-40
-30
-20
-10
0
10
20
30
40
50
2006 2007 2008 2009 2010 2011 2012 2013 2014 2015
Per
cen
t
Housing, conversionOther buildings and facilities
products, and created a growing demand and new markets.
Improved competence provision for the knowledge intensive sectors will be de-cisive for the continued development of Sweden’s competitiveness and growth. Continued increasing investments in housing and infrastructure will also be decisive in creating better preconditions for Sweden’s knowledge-intensive companies to grow, where not least en-gineering consultants and architects are playing an increasingly important role.
Lena Hagman, Chief Economist, Almega, November 2015
Source: Scb, macrobond
8 Sector review • the SwediSh Federation oF conSulting engineerS and architectS • december 2015
Sector development in 2014 and 2015
the SwediSh marKet
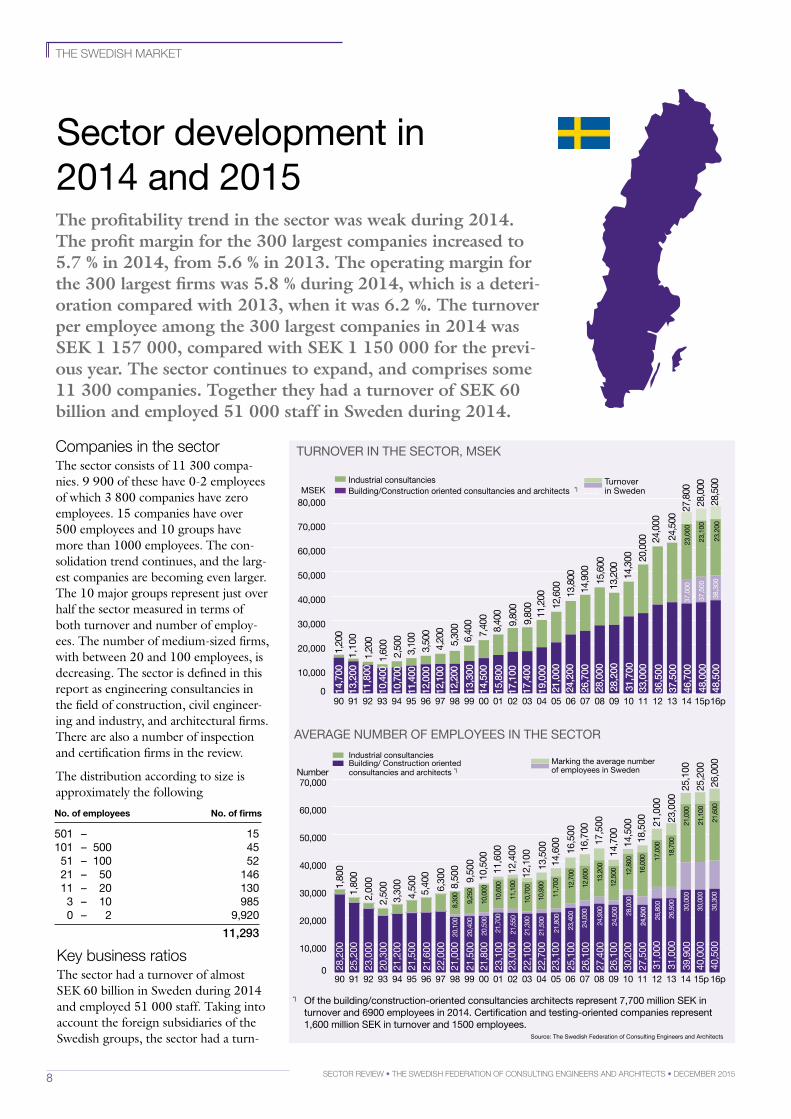
The profitability trend in the sector was weak during 2014. The profit margin for the 300 largest companies increased to 5.7 % in 2014, from 5.6 % in 2013. The operating margin for the 300 largest firms was 5.8 % during 2014, which is a deterioration compared with 2013, when it was 6.2 %. The turnover per employee among the 300 largest companies in 2014 was SEK 1 157 000, compared with SEK 1 150 000 for the previous year. The sector continues to expand, and comprises some 11 300 companies. Together they had a turnover of SEK 60 billion and employed 51 000 staff in Sweden during 2014.
TuRnovER in ThE SECToR, mSEK
AvERAgE numbER oF EmployEES in ThE SECToR
0
10,000
20,000
30,000
40,000
50,000
60,000
70,000
80,000
16p15p14131211100908070605040302010099989796959493929190
MSEKIndustrial consultancies Building/Construction oriented consultancies and architects *)
Turnover in Sweden
12,2
0013
,300
14,5
0015
,800
17,1
0017
,400
12,1
0012
,000
11,4
00
10,4
0011
,800
13,2
0014
,700
19,0
0021
,000
24,2
0026
,700
28,0
0028
,200
31,7
0033
,000
36,5
0037
,500
46,7
0048
,000
10,7
00
5,30
06,
400
7,40
0
4,20
03,
500
3,10
02,
500
1,60
01,
200
1,10
01,
200 8,
400
9,80
09,
800
11,2
0012
,600 13,8
0014
,900
15,6
0013
,200 14,3
00 20,0
00 24,0
0024
,500
27,8
0028
,000
37,0
00
37,5
00
23,0
00
23,1
00
48,5
0028
,500
38,3
0023
,200
0
10,000
20,000
30,000
40,000
50,000
60,000
70,000
16p15p14131211100908070605040302010099989796959493929190
21,5
00
21,0
00
21,8
00
23,1
0023
,000
22,1
00
22,0
0021
,600
21,5
00
21,2
0020
,300
23,0
00
25,2
0028
,200
22,7
0023
,100
25,1
00
26,1
00
27,4
0026
,100
30,2
00
27,5
0031
,000
31,0
00
39,9
0040
,000
20,1
00
20,4
00
20,5
00
21,7
00
21,5
50
21,3
00
21,5
00
21,8
00
23,4
00
24,0
00 28,0
00
24,5
00
24,9
00
24,5
00
26,8
00
26,9
00
30,0
00
30,0
00
Industrial consultancies Building/ Construction oriented consultancies and architects *)
Marking the average number of employees in SwedenNumber
8,30
0
9,25
0
10,0
00
10,6
00
11,1
00
12,6
00
12,7
00
10,7
00
10,9
00
11,7
00 12,5
00
12,8
00
13,2
00
16,0
00
17,0
00
18,7
00
21,0
00
21,1
00
9,50
010
,500
11,6
00
8,50
0 12,4
0012
,100
6,30
0
5,40
04,
500
3,30
02,
500
2,00
0
1,80
01,
800 13
,500
14,6
00
16,5
0016
,700
17,5
00
14,7
00
14,5
0018
,500 21
,000
23,0
0025
,100
25,2
0040
,500
30,3
0021
,600
26
,000
No. of employees No. of firms
501 – 15 101 – 500 45 51 – 100 52 21 – 50 146 11 – 20 130 3 – 10 985 0 – 2 9,920
11,293
*) of the building/construction-oriented consultancies architects represent 7,700 million SEK in turnover and 6900 employees in 2014. Certification and testing-oriented companies represent 1,600 million SEK in turnover and 1500 employees.
Key business ratiosThe sector had a turnover of almost SEK 60 billion in Sweden during 2014 and employed 51 000 staff. Taking into account the foreign subsidiaries of the Swedish groups, the sector had a turn-
companies in the sectorThe sector consists of 11 300 compa-nies. 9 900 of these have 0-2 employees of which 3 800 companies have zero employees. 15 companies have over 500 employees and 10 groups have more than 1000 employees. The con-solidation trend continues, and the larg-est companies are becoming even larger. The 10 major groups represent just over half the sector measured in terms of both turnover and number of employ-ees. The number of medium-sized firms, with between 20 and 100 employees, is decreasing. The sector is defined in this report as engineering consultancies in the field of construction, civil engineer-ing and industry, and architectural firms. There are also a number of inspection and certification firms in the review.
The distribution according to size is approximately the following
Source: The Swedish Federation of Consulting Engineers and Architects
9Sector review • the SwediSh Federation oF conSulting engineerS and architectS • december 2015
the SwediSh marKet
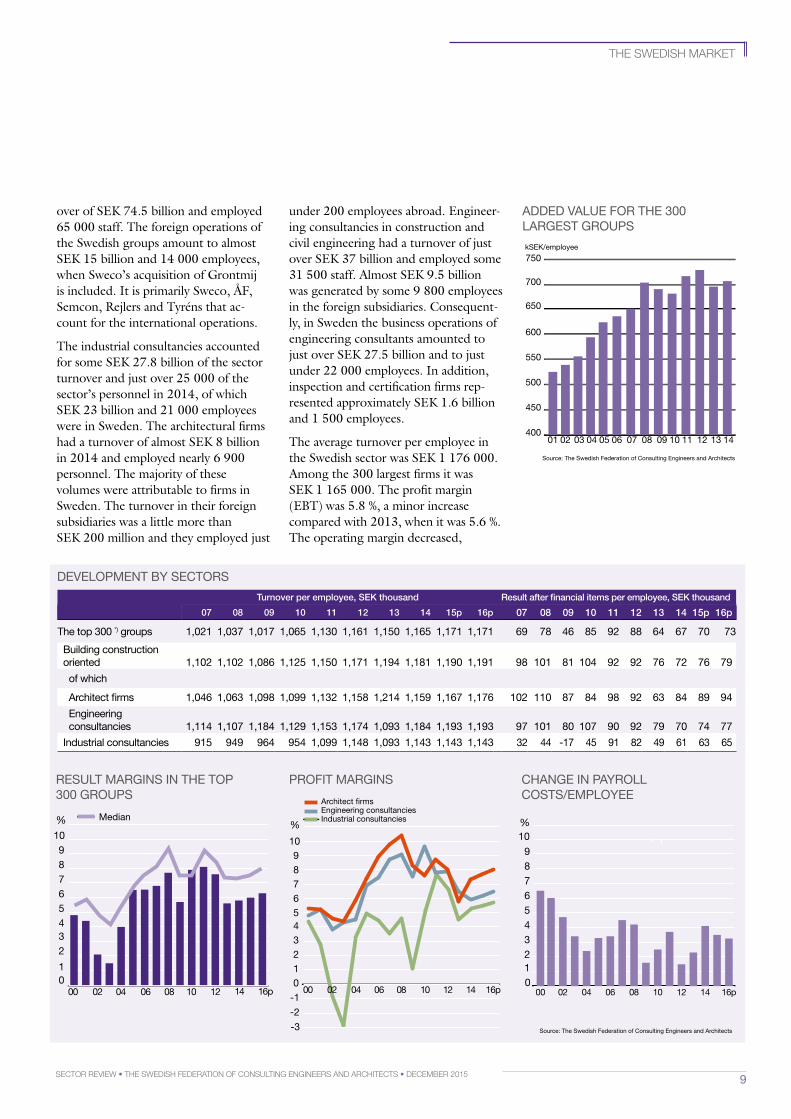
turnover per employee, Sek thousand result after financial items per employee, Sek thousand
07 08 09 10 11 12 13 14 15p 16p 07 08 09 10 11 12 13 14 15p 16p
The top 300 *) groups 1,021 1,037 1,017 1,065 1,130 1,161 1,150 1,165 1,171 1,171 69 78 46 85 92 88 64 67 70 73
building construction oriented 1,102 1,102 1,086 1,125 1,150 1,171 1,194 1,181 1,190 1,191 98 101 81 104 92 92 76 72 76 79
of which
Architect firms 1,046 1,063 1,098 1,099 1,132 1,158 1,214 1,159 1,167 1,176 102 110 87 84 98 92 63 84 89 94
Engineering consultancies 1,114 1,107 1,184 1,129 1,153 1,174 1,093 1,184 1,193 1,193 97 101 80 107 90 92 79 70 74 77
industrial consultancies 915 949 964 954 1,099 1,148 1,093 1,143 1,143 1,143 32 44 -17 45 91 82 49 61 63 65
dEvElopmEnT by SECToRS
pRoFiT mARginSRESulT mARginS in ThE Top 300 gRoupS
ChAngE in pAyRoll CoSTS/EmployEE
01
23456789
10
% Median
040200 06 08 10 12 14 16p0123456789
10
%
-2
-1
-3
040200 16p06
08 10 1412
Architect �rmsEngineering consultanciesIndustrial consultancies
0123456789
10
16p1412100806040200
%
AddEd vAluE FoR ThE 300 lARgEST gRoupS
400
450
500
550
600
650
700
750
1413121110090807060504030201
kSEK/employee
over of SEK 74.5 billion and employed 65 000 staff. The foreign operations of the Swedish groups amount to almost SEK 15 billion and 14 000 employees, when Sweco’s acquisition of Grontmij is included. It is primarily Sweco, ÅF, Semcon, Rejlers and Tyréns that ac-count for the international operations.
The industrial consultancies accounted for some SEK 27.8 billion of the sector turnover and just over 25 000 of the sector’s personnel in 2014, of which SEK 23 billion and 21 000 employees were in Sweden. The architectural firms had a turnover of almost SEK 8 billion in 2014 and employed nearly 6 900 personnel. The majority of these volumes were attributable to firms in Sweden. The turnover in their foreign subsidiaries was a little more than SEK 200 million and they employed just
under 200 employees abroad. Engineer-ing consultancies in construction and civil engineering had a turnover of just over SEK 37 billion and employed some 31 500 staff. Almost SEK 9.5 billion was generated by some 9 800 employees in the foreign subsidiaries. Consequent-ly, in Sweden the business operations of engineering consultants amounted to just over SEK 27.5 billion and to just under 22 000 employees. In addition, inspection and certification firms rep-resented approximately SEK 1.6 billion and 1 500 employees.
The average turnover per employee in the Swedish sector was SEK 1 176 000. Among the 300 largest firms it was SEK 1 165 000. The profit margin (EBT) was 5.8 %, a minor increase compared with 2013, when it was 5.6 %. The operating margin decreased,
Source: The Swedish Federation of Consulting Engineers and Architects
Source: The Swedish Federation of Consulting Engineers and Architects
10 Sector review • the SwediSh Federation oF conSulting engineerS and architectS • december 2015
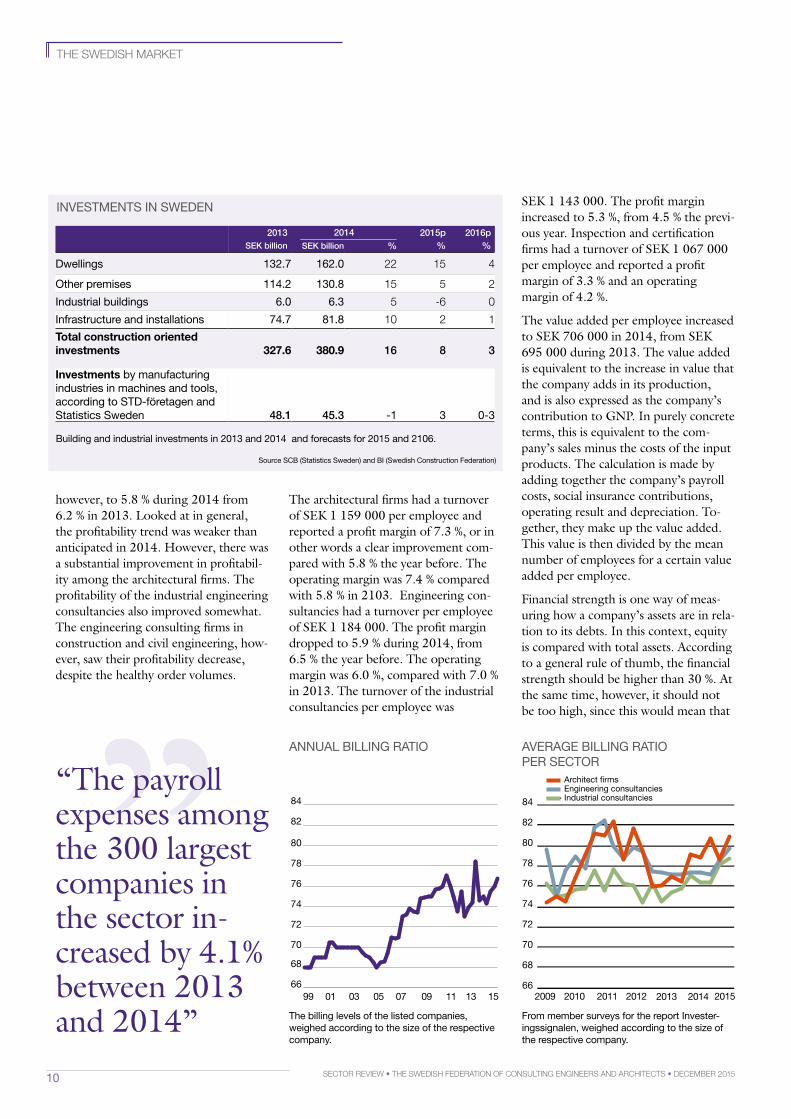
building and industrial investments in 2013 and 2014 and forecasts for 2015 and 2106.
Source SCb (Statistics Sweden) and bi (Swedish Construction Federation)
2013 2014 2015p 2016pSek billion Sek billion % % %
dwellings 132.7 162.0 22 15 4
other premises 114.2 130.8 15 5 2
industrial buildings 6.0 6.3 5 -6 0
infrastructure and installations 74.7 81.8 10 2 1
Total construction oriented investments 327.6 380.9 16 8 3
Investments by manufacturing industries in machines and tools, according to STd-företagen and Statistics Sweden 48.1 45.3 -1 3 0-3
invESTmEnTS in SwEdEn
the SwediSh marKet
AnnuAl billing RATio AvERAgE billing RATio pER SECToR
The billing levels of the listed companies, weighed according to the size of the respective company.
From member surveys for the report invester-ingssignalen, weighed according to the size of the respective company.
66
68
70
72
74
76
78
80
82
84
99 01 03 05 07 09 11 13 1566
68
70
72
74
76
78
80
82
84
2009 2010 2011 2012 2013 2014 2015
Architect �rmsEngineering consultanciesIndustrial consultancies
however, to 5.8 % during 2014 from 6.2 % in 2013. Looked at in general, the profitability trend was weaker than anticipated in 2014. However, there was a substantial improvement in profitabil-ity among the architectural firms. The profitability of the industrial engineering consultancies also improved somewhat. The engineering consulting firms in construction and civil engineering, how-ever, saw their profitability decrease, despite the healthy order volumes.
The architectural firms had a turnover of SEK 1 159 000 per employee and reported a profit margin of 7.3 %, or in other words a clear improvement com-pared with 5.8 % the year before. The operating margin was 7.4 % compared with 5.8 % in 2103. Engineering con-sultancies had a turnover per employee of SEK 1 184 000. The profit margin dropped to 5.9 % during 2014, from 6.5 % the year before. The operating margin was 6.0 %, compared with 7.0 % in 2013. The turnover of the industrial consultancies per employee was
SEK 1 143 000. The profit margin increased to 5.3 %, from 4.5 % the previ-ous year. Inspection and certification firms had a turnover of SEK 1 067 000 per employee and reported a profit margin of 3.3 % and an operating margin of 4.2 %.
The value added per employee increased to SEK 706 000 in 2014, from SEK 695 000 during 2013. The value added is equivalent to the increase in value that the company adds in its production, and is also expressed as the company’s contribution to GNP. In purely concrete terms, this is equivalent to the com-pany’s sales minus the costs of the input products. The calculation is made by adding together the company’s payroll costs, social insurance contributions, operating result and depreciation. To-gether, they make up the value added. This value is then divided by the mean number of employees for a certain value added per employee.
Financial strength is one way of meas-uring how a company’s assets are in rela-tion to its debts. In this context, equity is compared with total assets. According to a general rule of thumb, the financial strength should be higher than 30 %. At the same time, however, it should not be too high, since this would mean that
”“The payroll expenses among the 300 largest companies in the sector in-creased by 4.1% between 2013 and 2014”
11Sector review • the SwediSh Federation oF conSulting engineerS and architectS • december 2015
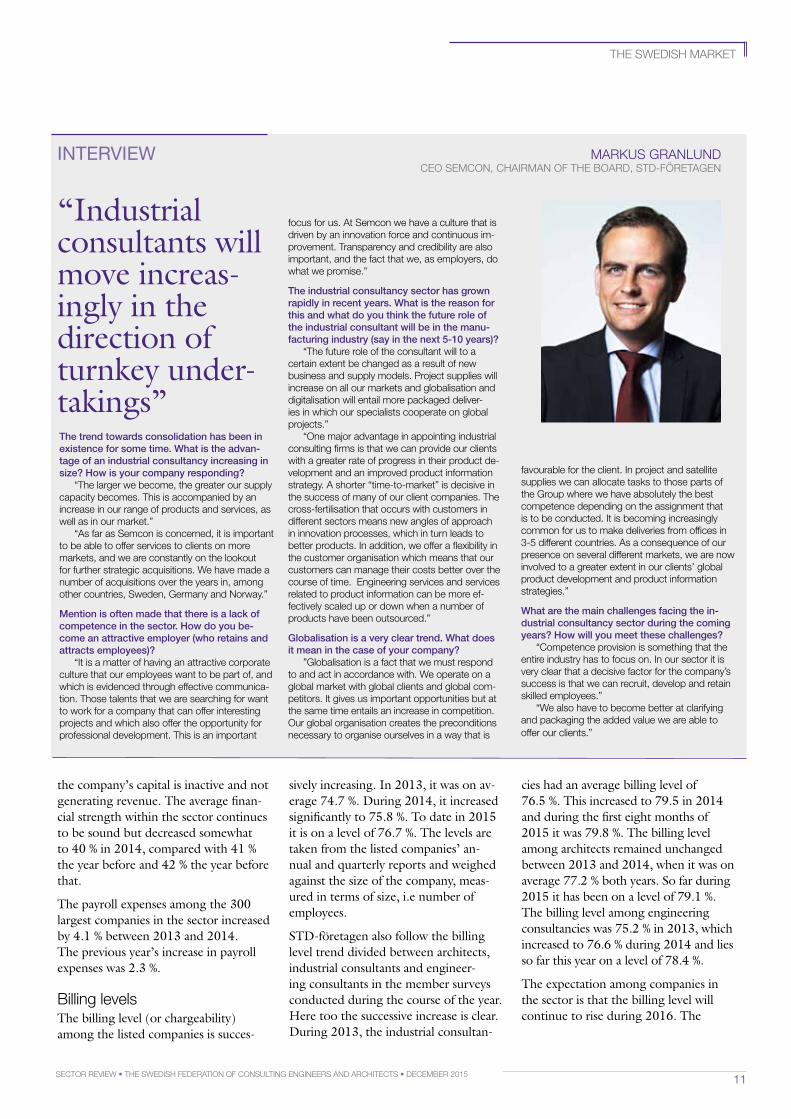
inTERviEw marKuS granlund ceo Semcon, chairman oF the board, Std-Företagen
“Industrial consultants will move increas-ingly in the direction of turnkey under-takings”the trend towards consolidation has been in existence for some time. what is the advan-tage of an industrial consultancy increasing in size? how is your company responding?
“the larger we become, the greater our supply capacity becomes. this is accompanied by an increase in our range of products and services, as well as in our market.”
“as far as Semcon is concerned, it is important to be able to offer services to clients on more markets, and we are constantly on the lookout for further strategic acquisitions. we have made a number of acquisitions over the years in, among other countries, Sweden, germany and norway.”
Mention is often made that there is a lack of competence in the sector. how do you be-come an attractive employer (who retains and attracts employees)?
“it is a matter of having an attractive corporate culture that our employees want to be part of, and which is evidenced through effective communica-tion. those talents that we are searching for want to work for a company that can offer interesting projects and which also offer the opportunity for professional development. this is an important
focus for us. at Semcon we have a culture that is driven by an innovation force and continuous im-provement. transparency and credibility are also important, and the fact that we, as employers, do what we promise.”
the industrial consultancy sector has grown rapidly in recent years. what is the reason for this and what do you think the future role of the industrial consultant will be in the manu-facturing industry (say in the next 5-10 years)?
“the future role of the consultant will to a certain extent be changed as a result of new business and supply models. Project supplies will increase on all our markets and globalisation and digitalisation will entail more packaged deliver-ies in which our specialists cooperate on global projects.”
“one major advantage in appointing industrial consulting firms is that we can provide our clients with a greater rate of progress in their product de-velopment and an improved product information strategy. a shorter “time-to-market” is decisive in the success of many of our client companies. the cross-fertilisation that occurs with customers in different sectors means new angles of approach in innovation processes, which in turn leads to better products. in addition, we offer a flexibility in the customer organisation which means that our customers can manage their costs better over the course of time. engineering services and services related to product information can be more ef-fectively scaled up or down when a number of products have been outsourced.”
Globalisation is a very clear trend. what does it mean in the case of your company?
”globalisation is a fact that we must respond to and act in accordance with. we operate on a global market with global clients and global com-petitors. it gives us important opportunities but at the same time entails an increase in competition. our global organisation creates the preconditions necessary to organise ourselves in a way that is
favourable for the client. in project and satellite supplies we can allocate tasks to those parts of the group where we have absolutely the best competence depending on the assignment that is to be conducted. it is becoming increasingly common for us to make deliveries from offices in 3-5 different countries. as a consequence of our presence on several different markets, we are now involved to a greater extent in our clients’ global product development and product information strategies.”
what are the main challenges facing the in-dustrial consultancy sector during the coming years? how will you meet these challenges?
“competence provision is something that the entire industry has to focus on. in our sector it is very clear that a decisive factor for the company’s success is that we can recruit, develop and retain skilled employees.”
“we also have to become better at clarifying and packaging the added value we are able to offer our clients.”
the SwediSh marKet
the company’s capital is inactive and not generating revenue. The average finan-cial strength within the sector continues to be sound but decreased somewhat to 40 % in 2014, compared with 41 % the year before and 42 % the year before that.
The payroll expenses among the 300 largest companies in the sector increased by 4.1 % between 2013 and 2014. The previous year’s increase in payroll expenses was 2.3 %.
billing levelsThe billing level (or chargeability) among the listed companies is succes-
sively increasing. In 2013, it was on av-erage 74.7 %. During 2014, it increased significantly to 75.8 %. To date in 2015 it is on a level of 76.7 %. The levels are taken from the listed companies’ an-nual and quarterly reports and weighed against the size of the company, meas-ured in terms of size, i.e number of employees.
STD-företagen also follow the billing level trend divided between architects, industrial consultants and engineer-ing consultants in the member surveys conducted during the course of the year. Here too the successive increase is clear. During 2013, the industrial consultan-
cies had an average billing level of 76.5 %. This increased to 79.5 in 2014 and during the first eight months of 2015 it was 79.8 %. The billing level among architects remained unchanged between 2013 and 2014, when it was on average 77.2 % both years. So far during 2015 it has been on a level of 79.1 %. The billing level among engineering consultancies was 75.2 % in 2013, which increased to 76.6 % during 2014 and lies so far this year on a level of 78.4 %.
The expectation among companies in the sector is that the billing level will continue to rise during 2016. The
12 Sector review • the SwediSh Federation oF conSulting engineerS and architectS • december 2015
inTERviEw bent JohanneSSon managing director, ramböll Sverige
“If we do not expand it means we will be marginal-ised in the long term”the consolidation trend has been with us for some time. what is the advantage for a small architectural firm of being larger? how does your firm regard the situation?
“it is our ambition to expand, and to do so with a retained or improved profitability. if we do not expand, it means that in the long term we will be marginalised. consolidation largely reflects so-cial development. it is part of the global trends we see in the world today. Social development and the market conditions establish the frameworks for the company’s development and consolida-tion aims also at reinforcing competence and the need for resources”.
“there are a number of factors and objectives that are completely decisive when a company is expanding. the assignments cover most disciplines, overall responsibility and differentiation compared with our competitors. new geographi-cal markets also generate new clients. a larger company reaches a new “critical mass” within a large number of areas, both in the question of developing offers to our employees as well as to our clients. the benefits of scale that a major company provides also entails improvements in cost effectiveness. it is possible to share business systems, share costly equipment, professional
management and provide greater opportunities for r&d.
Size also makes it possible to dominate a market through volume”.
Mention is often made of a lack of compe-tence in the sector. how do you become an attractive employer (who retains and attracts employees)?
“anyone having the solution of how to succeed as the most attractive employer, who both attracts and retains his/her employees, has an unbeat-able position. in this context, social development and attitudes are of the greatest importance. the attitudes between the generations are entirely different. Sweden distinguishes itself in the nordic countries through a significantly higher personnel turnover.
Globalisation is an extremely important trend. do you see any other trends in the sector?
i see a number of major trends in the world that affect us both privately and professionally. globalisation is mentioned, but at the same time questions such as population growth, environ-mental problems, urbanisation and global climate changes and how their consequences affect us. of the greatest current interest at present is
perhaps the refugee crisis in europe. exactly how it will come to affect us is too early to say yet, but it will quite clearly influence our society and, in the long term, affect our sector.
if you were to be a visionary, when will we be living in the sustainable society and what is the role of the engineering consultant on the way there?
”the answer to that question is beyond by visionary capacity. i am worried that people will fail to realise in time what has to be done in order for society not to collapse under the burden of globalisation, urbanisation and environmental problems. both the political and the economic situations in the world bear witness to the fact that we still have a long way to go.
the engineering sector has a very important role to play in the development of society, and it has always been decisive. technical development has despite all had an extremely positive role in connection with welfare and social development.
the SwediSh marKet
question is how much higher it can rise before reaching maximum level.
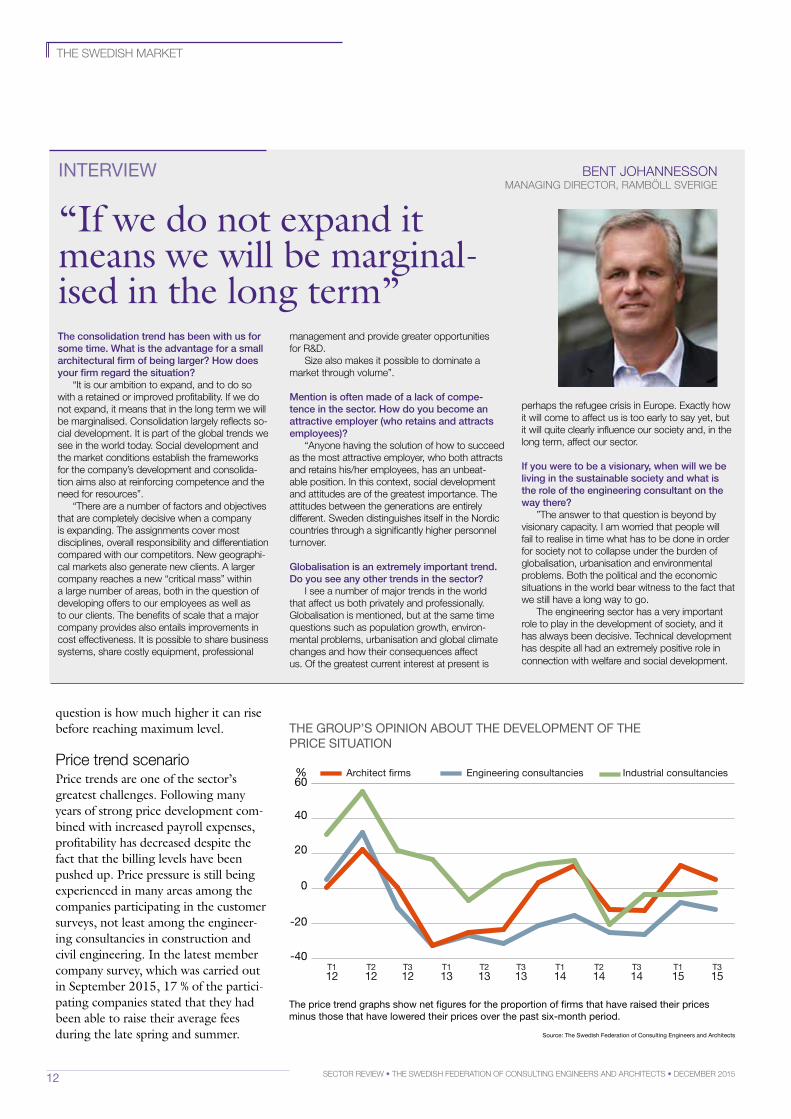
Price trend scenario Price trends are one of the sector’s greatest challenges. Following many years of strong price development com-bined with increased payroll expenses, profitability has decreased despite the fact that the billing levels have been pushed up. Price pressure is still being experienced in many areas among the companies participating in the customer surveys, not least among the engineer-ing consultancies in construction and civil engineering. In the latest member company survey, which was carried out in September 2015, 17 % of the partici-pating companies stated that they had been able to raise their average fees during the late spring and summer.
ThE gRoup’S opinion AbouT ThE dEvElopmEnT oF ThE pRiCE SiTuATion
The price trend graphs show net figures for the proportion of firms that have raised their prices minus those that have lowered their prices over the past six-month period.
Architect �rms Engineering consultancies Industrial consultancies
-40
-20
20
40
60%
0
-40
-20
0
20
40
60
T113
T213
T313
T114
T214
T314
T115
T112
T212
T312
T315
Source: The Swedish Federation of Consulting Engineers and Architects
13Sector review • the SwediSh Federation oF conSulting engineerS and architectS • december 2015
the SwediSh marKet
21 % answered that the fees had de-creased. There were nevertheless a number of positive signals in this investigation. Even though there are still relatively few companies that state they have been able to raise their prices, the average fees have increased somewhat since May, if average fees are weighed against the size of the respec-tive firms. This applies to all three areas of activity. If we see how weak the profitability trend has been during recent years despite the increase in bill-ing levels, it can be concluded that the fees must continue to increase if profit-ability is to improve.
In the graph on page 10, it can be seen how the companies have experienced the price trend over the course of time, where each point on the curve corres-ponds to the net figure between the proportion of companies that have raised their fees minus the proportion of companies whose fees have been lowered.
Profitability forecast for 2015 and 2016The deterioration in profitability during 2013 and 2014 is largely attributable to the pressure on prices that continues to apply on the market. The payroll expenses are increasing each year – last 4.1 %. The prices are falling behind, which has meant that the companies have successively raised their billing levels. The profit margin for the 300 largest firms increased to 5.7 % in 2014 (5.8 % if inspection and certification firms are excluded), which is exactly the same as the forecast in last year’s report. However, in the case of the engineer-ing consultancies the profit margin trend was weaker than expected, while it developed better than expected for the architectural firms and industrial consultancies.
In 2015, profitability is expected to im-prove, but the forecast has been written down to 6.0 % for the 300 largest firms compared with the forecast in the Sec-
tor Review 2014. This is because many firms have reported a weaker profit-ability than expected during the course of the year. Looked at from the point of view of order levels, an even better level of profitability could perhaps have been expected. But the price trend has been too weak compared with the cost increases. With the current order level trends, as well as certain signals of im-proved average fees during the autumn, the profit margin should have increased when we sum up 2015. The forecast for
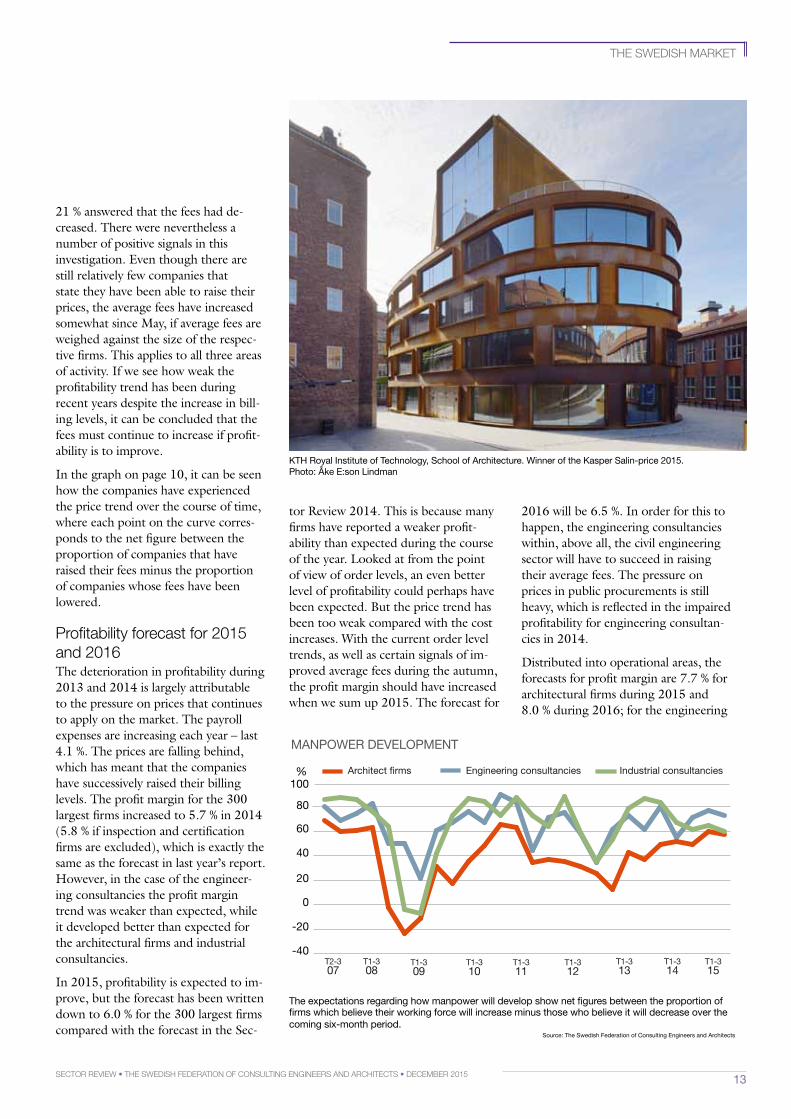
mAnpowER dEvElopmEnT
Architect �rms Engineering consultancies Industrial consultancies
-40
-20
20
40
60
%
0
-40
-20
0
20
40
60
80
100
T1-310
T1-311
T1-312
T1-313
T1-314
T1-315
T2-307
T1-308
T1-309
80
100
2016 will be 6.5 %. In order for this to happen, the engineering consultancies within, above all, the civil engineering sector will have to succeed in raising their average fees. The pressure on prices in public procurements is still heavy, which is reflected in the impaired profitability for engineering consultan-cies in 2014.
Distributed into operational areas, the forecasts for profit margin are 7.7 % for architectural firms during 2015 and 8.0 % during 2016; for the engineering
The expectations regarding how manpower will develop show net figures between the proportion of firms which believe their working force will increase minus those who believe it will decrease over the coming six-month period.
KTh Royal institute of Technology, School of Architecture. winner of the Kasper Salin-price 2015. photo: Åke E:son lindman
Source: The Swedish Federation of Consulting Engineers and Architects
14 Sector review • the SwediSh Federation oF conSulting engineerS and architectS • december 2015
the SwediSh marKet
EquiTy RATio, %
0
10
20
30
40
50 1-30 31-200 201-300
0504030201
% Company Size
06 07 08 09 10 11 12 13 14
consultants it is 6.2 % and 6.5 % respec-tively and for industrial consultancies it is 5.5 % and 5.7 % respectively.
investments within the sectorThe table below shows the investments made in the sector during 2013 and 2014 together with forecasts as to the investment trends in 2015 and 2016. The total building investments were just over SEK 380 billion during 2014, with the housing sector accounting for SEK 162 billion and other premises for SEK 131 billion. Infrastructure and civil engineering investments amount to SEK 82 billion. Building investments
are anticipated to continue to increase during 2015, although at a somewhat slower rate than previously.
Forecasts show that building invest-ments in 2015 are increasing by 8 %, which is equivalent to just over SEK 410 billion. It is still housing investments that are accounting for the increase, with an anticipated investment increase of 15 %. The investments in premises are expected to increase by 5 % during the year and in civil engineering by 2 %. The industrial investments in machinery and equipment are expected to increase by some 3 % during 2015.
During 2016, the rate of increase is ex-pected to continue to decline. Building investments are anticipated to increase by 3 % and the industrial investments in machinery and equipment by 0-3 %.
age and gender structureThe member firms of Svenska Teknik&Designföretagen have a total staff of some 32 000 in Sweden.
29.5 % of these are women, according to the Confederation of Swedish Enter-prises’ payroll statistics. The correspond-ing figure in 2014 was 30.4 %. The pro-portion of women in decision-making positions among the 300 largest firms in the sector is 25.3 %, the same figure
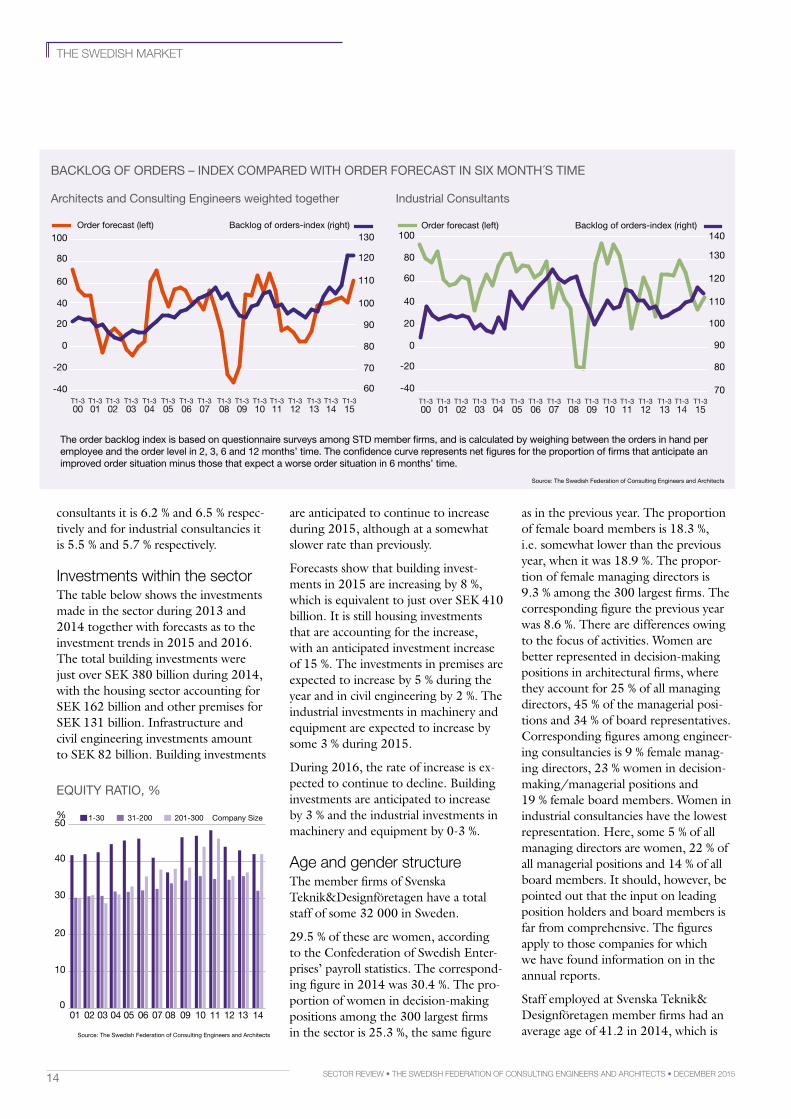
bACKlog oF oRdERS – indEx CompAREd wiTh oRdER FoRECAST in Six monTh´S TimE
Architects and Consulting Engineers weighted together industrial Consultants
The order backlog index is based on questionnaire surveys among STd member firms, and is calculated by weighing between the orders in hand per employee and the order level in 2, 3, 6 and 12 months’ time. The confidence curve represents net figures for the proportion of firms that anticipate an improved order situation minus those that expect a worse order situation in 6 months’ time.
-40
-20
0
20
40
60
80
100
70
80
90
100
110
120
130
140
70
80
90
100
110
120
130
140
T1-301
T1-300
T1-302
T1-303
T1-304
T1-305
T1-306
T1-307
T1-308
T1-309
T1-310
T1-311
T1-312
T1-313
T1-314
T1-315
Order forecast (left) Backlog of orders-index (right)
-40
-20
0
20
40
60
80
100
60
70
80
90
100
110
120
130
T1-301
T1-300
T1-302
T1-303
T1-304
T1-305
T1-306
T1-307
T1-308
T1-309
T1-310
T1-311
T1-312
70
80
90
100
110
120
130
60T1-313
T1-314
T1-315
Order forecast (left) Backlog of orders-index (right)
as in the previous year. The proportion of female board members is 18.3 %, i.e. somewhat lower than the previous year, when it was 18.9 %. The propor-tion of female managing directors is 9.3 % among the 300 largest firms. The corresponding figure the previous year was 8.6 %. There are differences owing to the focus of activities. Women are better represented in decision-making positions in architectural firms, where they account for 25 % of all managing directors, 45 % of the managerial posi-tions and 34 % of board representatives. Corresponding figures among engineer-ing consultancies is 9 % female manag-ing directors, 23 % women in decision-making/managerial positions and 19 % female board members. Women in industrial consultancies have the lowest representation. Here, some 5 % of all managing directors are women, 22 % of all managerial positions and 14 % of all board members. It should, however, be pointed out that the input on leading position holders and board members is far from comprehensive. The figures apply to those companies for which we have found information on in the annual reports.
Staff employed at Svenska Teknik& Designföretagen member firms had an average age of 41.2 in 2014, which is Source: The Swedish Federation of Consulting Engineers and Architects
Source: The Swedish Federation of Consulting Engineers and Architects
15Sector review • the SwediSh Federation oF conSulting engineerS and architectS • december 2015
the SwediSh marKet
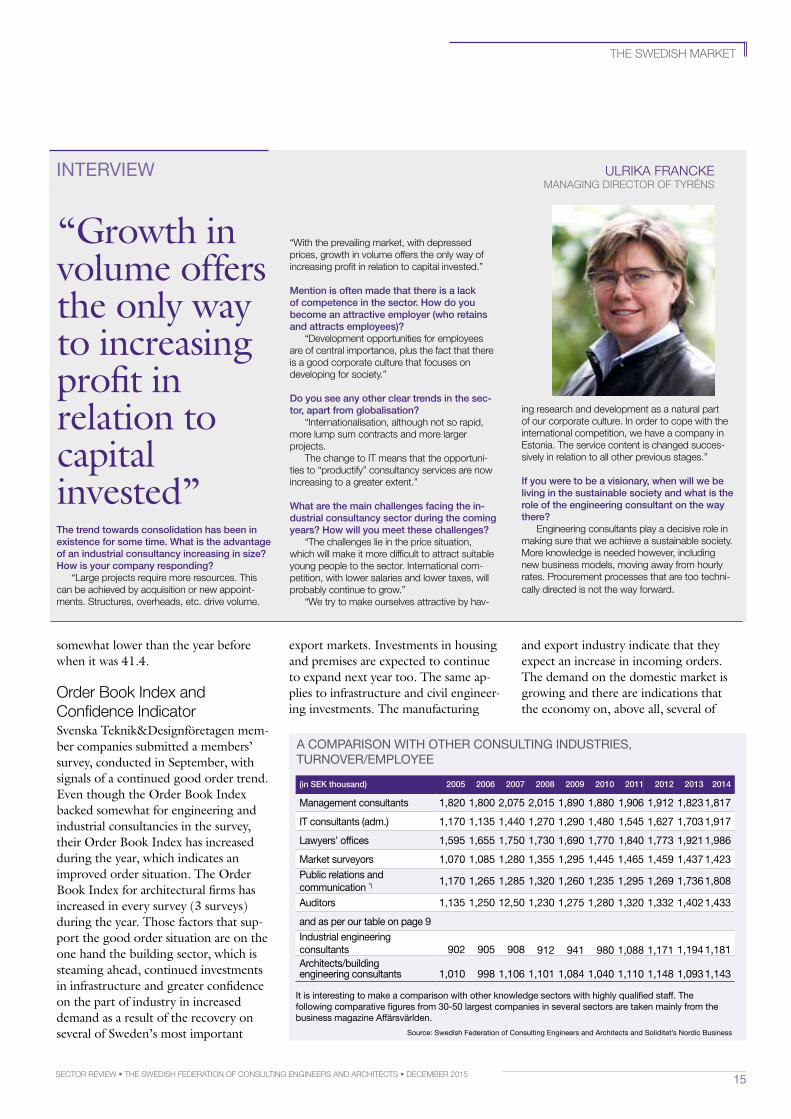
inTERviEw ulriKa FrancKe managing director oF tyrénS
the trend towards consolidation has been in existence for some time. what is the advantage of an industrial consultancy increasing in size? how is your company responding?
“large projects require more resources. this can be achieved by acquisition or new appoint-ments. Structures, overheads, etc. drive volume.
“with the prevailing market, with depressed prices, growth in volume offers the only way of increasing profit in relation to capital invested.”
Mention is often made that there is a lack of competence in the sector. how do you become an attractive employer (who retains and attracts employees)?
“development opportunities for employees are of central importance, plus the fact that there is a good corporate culture that focuses on developing for society.”
do you see any other clear trends in the sec-tor, apart from globalisation?
“internationalisation, although not so rapid, more lump sum contracts and more larger projects.
the change to it means that the opportuni-ties to “productify” consultancy services are now increasing to a greater extent.”
what are the main challenges facing the in-dustrial consultancy sector during the coming years? how will you meet these challenges?
“the challenges lie in the price situation, which will make it more difficult to attract suitable young people to the sector. international com-petition, with lower salaries and lower taxes, will probably continue to grow.”
“we try to make ourselves attractive by hav-
“Growth in volume offers the only way to increasing profit in relation to capital invested”
A CompARiSon wiTh oThER ConSulTing induSTRiES, TuRnovER/EmployEE
Source: Swedish Federation of Consulting Engineers and Architects and Soliditet’s nordic business
(in Sek thousand) 2005 2006 2007 2008 2009 2010 2011 2012 2013 2014
management consultants 1,820 1,800 2,075 2,015 1,890 1,880 1,906 1,912 1,8231,817
iT consultants (adm.) 1,170 1,135 1,440 1,270 1,290 1,480 1,545 1,627 1,7031,917
lawyers’ offices 1,595 1,655 1,750 1,730 1,690 1,770 1,840 1,773 1,9211,986
market surveyors 1,070 1,085 1,280 1,355 1,295 1,445 1,465 1,459 1,4371,423public relations and communication *)
1,170 1,265 1,285 1,320 1,260 1,235 1,295 1,269 1,7361,808
Auditors 1,135 1,250 12,50 1,230 1,275 1,280 1,320 1,332 1,4021,433
and as per our table on page 9industrial engineering consultants 902 905 908 912 941 980 1,088 1,171 1,1941,181Architects/building engineering consultants 1,010 998 1,106 1,101 1,084 1,040 1,110 1,148 1,0931,143
ing research and development as a natural part of our corporate culture. in order to cope with the international competition, we have a company in estonia. the service content is changed succes-sively in relation to all other previous stages.”
if you were to be a visionary, when will we be living in the sustainable society and what is the role of the engineering consultant on the way there?
engineering consultants play a decisive role in making sure that we achieve a sustainable society. more knowledge is needed however, including new business models, moving away from hourly rates. Procurement processes that are too techni-cally directed is not the way forward.
somewhat lower than the year before when it was 41.4.
order book index and confidence indicator Svenska Teknik&Designföretagen mem-ber companies submitted a members’ survey, conducted in September, with signals of a continued good order trend. Even though the Order Book Index backed somewhat for engineering and industrial consultancies in the survey, their Order Book Index has increased during the year, which indicates an improved order situation. The Order Book Index for architectural firms has increased in every survey (3 surveys) during the year. Those factors that sup-port the good order situation are on the one hand the building sector, which is steaming ahead, continued investments in infrastructure and greater confidence on the part of industry in increased demand as a result of the recovery on several of Sweden’s most important
export markets. Investments in housing and premises are expected to continue to expand next year too. The same ap-plies to infrastructure and civil engineer-ing investments. The manufacturing
and export industry indicate that they expect an increase in incoming orders. The demand on the domestic market is growing and there are indications that the economy on, above all, several of
it is interesting to make a comparison with other knowledge sectors with highly qualified staff. The following comparative figures from 30-50 largest companies in several sectors are taken mainly from the business magazine Affärsvärlden.
16 Sector review • the SwediSh Federation oF conSulting engineerS and architectS • december 2015
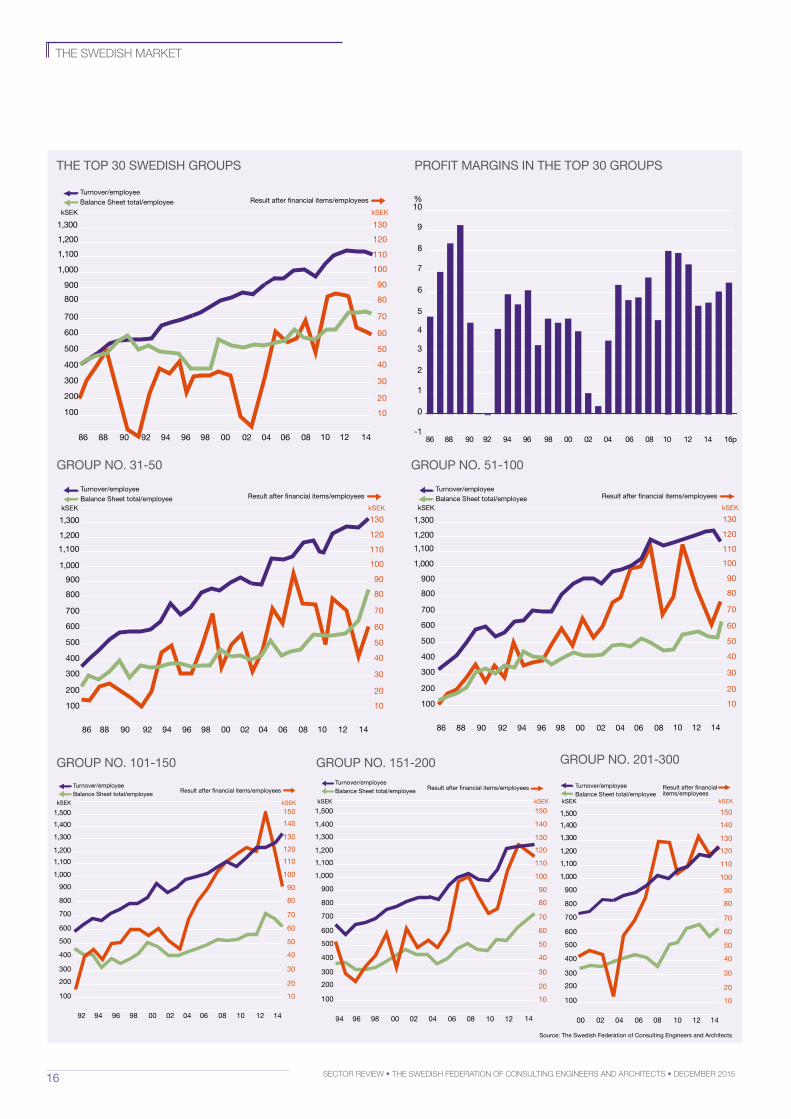
ThE Top 30 SwEdiSh gRoupS pRoFiT mARginS in ThE Top 30 gRoupS
gRoup no. 31-50 gRoup no. 51-100
gRoup no. 101-150 gRoup no. 151-200 gRoup no. 201-300
the SwediSh marKet
600
700
500
400
300
200
100
86 88 90 94 96 98
60
70
50
40
30
20
10
800 80
00
900 90
0292 04
1,000 100
06 08 10
1,100 110
12 14
1201,200
1301,300
kSEK kSEK
Turnover/employeeBalance Sheet total/employee Result after �nancial items/employees
600
700
500
400
300
200
100
86 88 90 94 96 98
60
70
50
40
30
20
10
800 80
00
900 90
0292 04
1,000 100
06 08
1,100 110
10 12
1201,200
14
1301,300
kSEK kSEK
Turnover/employeeBalance Sheet total/employee Result after �nancial items/employees
600
700
500
400
300
200
100
60
70
50
40
30
20
10
800 80
900 90
1,000 100
1,100 110
1201,200
1301,300
86 88 90 94 96 98 00 0292 04 06 08 10 12 14
kSEK kSEK
Turnover/employeeBalance Sheet total/employee Result after �nancial items/employees
92 94 96 98 00 02 04
600
700
500
400
300
200
100
60
70
50
40
30
20
10
800 80
900 90
1,000 100
06
110
120
1,100
1,200
08 10 12
1301,300
1401,400
14
1501,500kSEK kSEK
Turnover/employeeBalance Sheet total/employee
Result after �nancial items/employees
94 96 98 00 02 04
600
700
500
400
300
200
100
60
70
50
40
30
20
10
800 80
900 90
1,000 100
06
110
120
1,100
1,200
08 10 12
1301,300
1401,400
14
1501,500kSEK kSEK
Turnover/employeeBalance Sheet total/employee Result after �nancial items/employees
00 02 04
600
700
500
400
300
200
100
60
70
50
40
30
20
10
800 80
900 90
1,000 100
06
110
120
1,100
1,200
08 10 12
1301,300
1401,400
14
1501,500
kSEK kSEK
Turnover/employeeBalance Sheet total/employee
Result after �nancial items/employees
%
0604020098969492908886 08 10 12 14 16p-1
0
1
2
3
4
5
6
7
8
9
10
Source: The Swedish Federation of Consulting Engineers and Architects
17Sector review • the SwediSh Federation oF conSulting engineerS and architectS • december 2015
the SwediSh marKet
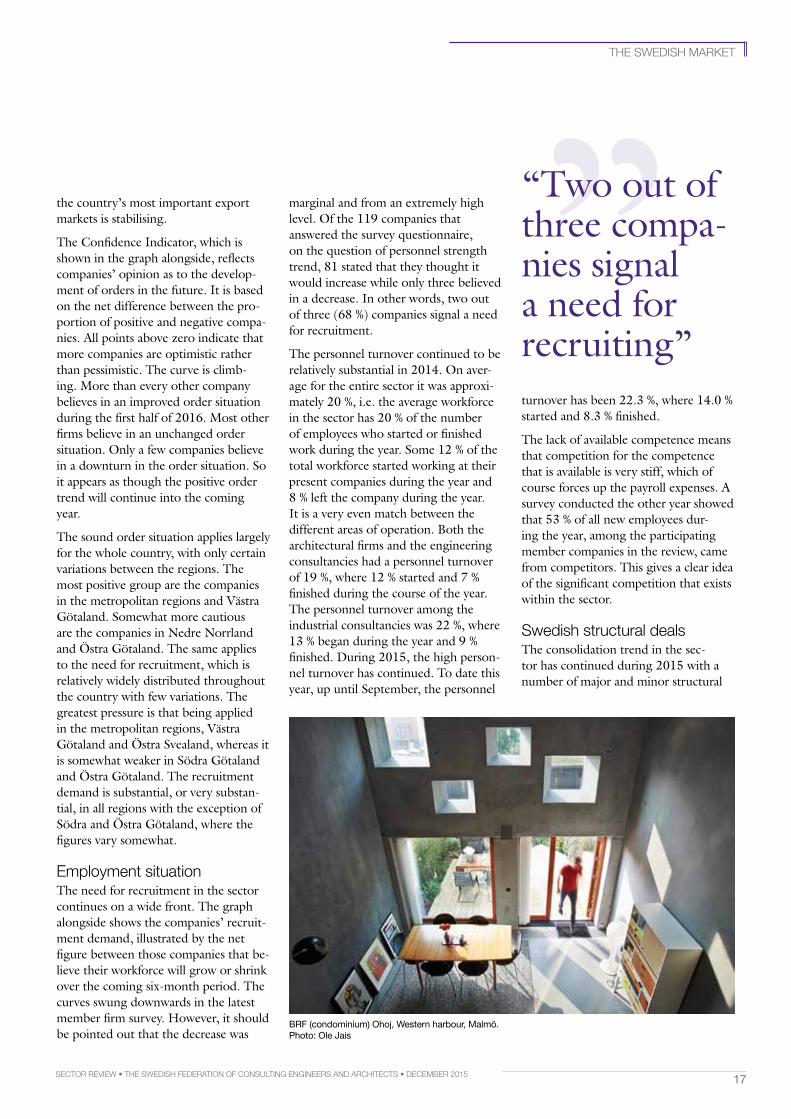
”“Two out of three compa-nies signal a need for recruiting”
the country’s most important export markets is stabilising.
The Confidence Indicator, which is shown in the graph alongside, reflects companies’ opinion as to the develop-ment of orders in the future. It is based on the net difference between the pro-portion of positive and negative compa-nies. All points above zero indicate that more companies are optimistic rather than pessimistic. The curve is climb-ing. More than every other company believes in an improved order situation during the first half of 2016. Most other firms believe in an unchanged order situation. Only a few companies believe in a downturn in the order situation. So it appears as though the positive order trend will continue into the coming year.
The sound order situation applies largely for the whole country, with only certain variations between the regions. The most positive group are the companies in the metropolitan regions and Västra Götaland. Somewhat more cautious are the companies in Nedre Norrland and Östra Götaland. The same applies to the need for recruitment, which is relatively widely distributed throughout the country with few variations. The greatest pressure is that being applied in the metropolitan regions, Västra Götaland and Östra Svealand, whereas it is somewhat weaker in Södra Götaland and Östra Götaland. The recruitment demand is substantial, or very substan-tial, in all regions with the exception of Södra and Östra Götaland, where the figures vary somewhat.
employment situationThe need for recruitment in the sector continues on a wide front. The graph alongside shows the companies’ recruit-ment demand, illustrated by the net figure between those companies that be-lieve their workforce will grow or shrink over the coming six-month period. The curves swung downwards in the latest member firm survey. However, it should be pointed out that the decrease was
marginal and from an extremely high level. Of the 119 companies that answered the survey questionnaire, on the question of personnel strength trend, 81 stated that they thought it would increase while only three believed in a decrease. In other words, two out of three (68 %) companies signal a need for recruitment.
The personnel turnover continued to be relatively substantial in 2014. On aver-age for the entire sector it was approxi-mately 20 %, i.e. the average workforce in the sector has 20 % of the number of employees who started or finished work during the year. Some 12 % of the total workforce started working at their present companies during the year and 8 % left the company during the year. It is a very even match between the different areas of operation. Both the architectural firms and the engineering consultancies had a personnel turnover of 19 %, where 12 % started and 7 % finished during the course of the year. The personnel turnover among the industrial consultancies was 22 %, where 13 % began during the year and 9 % finished. During 2015, the high person-nel turnover has continued. To date this year, up until September, the personnel
turnover has been 22.3 %, where 14.0 % started and 8.3 % finished.
The lack of available competence means that competition for the competence that is available is very stiff, which of course forces up the payroll expenses. A survey conducted the other year showed that 53 % of all new employees dur-ing the year, among the participating member companies in the review, came from competitors. This gives a clear idea of the significant competition that exists within the sector.
Swedish structural dealsThe consolidation trend in the sec-tor has continued during 2015 with a number of major and minor structural
bRF (condominium) ohoj, western harbour, malmö. photo: ole Jais
18 Sector review • the SwediSh Federation oF conSulting engineerS and architectS • december 2015
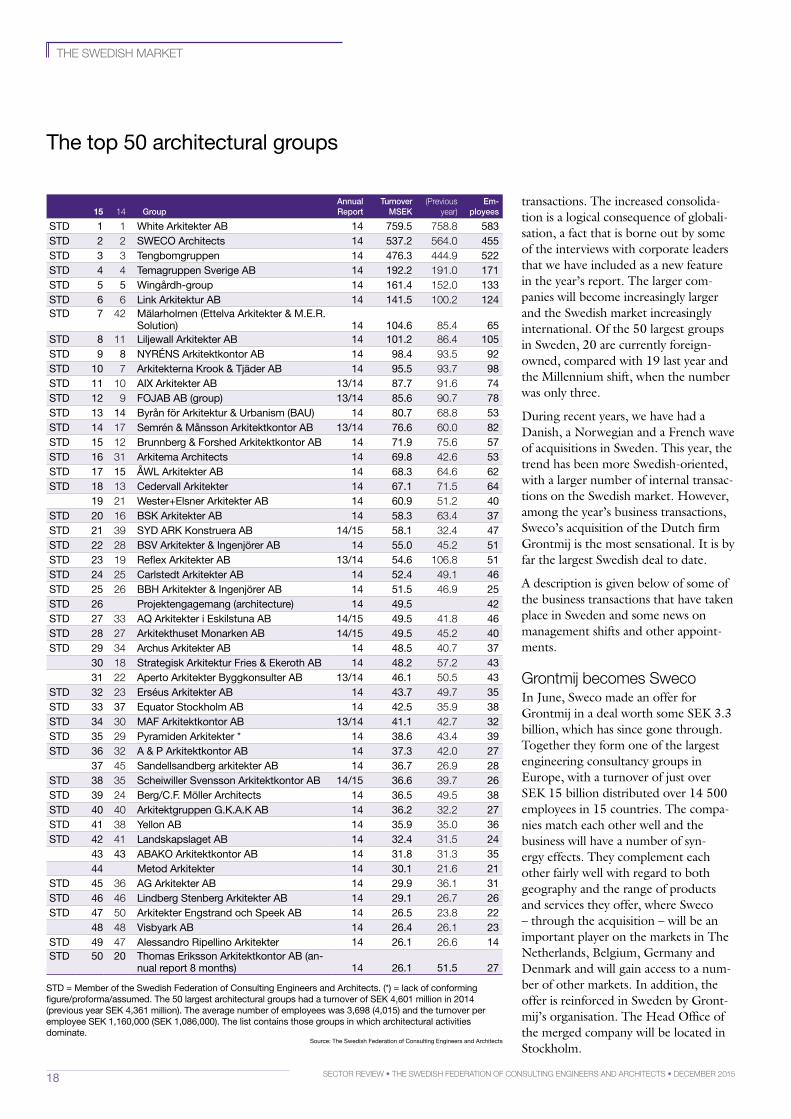
The top 50 architectural groups
Source: The Swedish Federation of Consulting Engineers and Architects
STd = member of the Swedish Federation of Consulting Engineers and Architects. (*) = lack of conforming figure/proforma/assumed. The 50 largest architectural groups had a turnover of SEK 4,601 million in 2014 (previous year SEK 4,361 million). The average number of employees was 3,698 (4,015) and the turnover per employee SEK 1,160,000 (SEK 1,086,000). The list contains those groups in which architectural activities dominate.
15 14 GroupAnnualreport
turnover MSek
(Previousyear)
em- ployees
STd 1 1 white Arkitekter Ab 14 759.5 758.8 583STd 2 2 SwECo Architects 14 537.2 564.0 455STd 3 3 Tengbomgruppen 14 476.3 444.9 522STd 4 4 Temagruppen Sverige Ab 14 192.2 191.0 171STd 5 5 wingårdh-group 14 161.4 152.0 133STd 6 6 link Arkitektur Ab 14 141.5 100.2 124STd 7 42 mälarholmen (Ettelva Arkitekter & m.E.R.
Solution) 14 104.6 85.4 65STd 8 11 liljewall Arkitekter Ab 14 101.2 86.4 105STd 9 8 nyRÉnS Arkitektkontor Ab 14 98.4 93.5 92STd 10 7 Arkitekterna Krook & Tjäder Ab 14 95.5 93.7 98STd 11 10 Aix Arkitekter Ab 13/14 87.7 91.6 74STd 12 9 FoJAb Ab (group) 13/14 85.6 90.7 78STd 13 14 byrån för Arkitektur & urbanism (bAu) 14 80.7 68.8 53STd 14 17 Semrén & månsson Arkitektkontor Ab 13/14 76.6 60.0 82STd 15 12 brunnberg & Forshed Arkitektkontor Ab 14 71.9 75.6 57STd 16 31 Arkitema Architects 14 69.8 42.6 53STd 17 15 Åwl Arkitekter Ab 14 68.3 64.6 62STd 18 13 Cedervall Arkitekter 14 67.1 71.5 64
19 21 wester+Elsner Arkitekter Ab 14 60.9 51.2 40STd 20 16 bSK Arkitekter Ab 14 58.3 63.4 37STd 21 39 Syd ARK Konstruera Ab 14/15 58.1 32.4 47STd 22 28 bSv Arkitekter & ingenjörer Ab 14 55.0 45.2 51STd 23 19 Reflex Arkitekter Ab 13/14 54.6 106.8 51STd 24 25 Carlstedt Arkitekter Ab 14 52.4 49.1 46STd 25 26 bbh Arkitekter & ingenjörer Ab 14 51.5 46.9 25STd 26 projektengagemang (architecture) 14 49.5 42STd 27 33 Aq Arkitekter i Eskilstuna Ab 14/15 49.5 41.8 46STd 28 27 Arkitekthuset monarken Ab 14/15 49.5 45.2 40STd 29 34 Archus Arkitekter Ab 14 48.5 40.7 37
30 18 Strategisk Arkitektur Fries & Ekeroth Ab 14 48.2 57.2 4331 22 Aperto Arkitekter byggkonsulter Ab 13/14 46.1 50.5 43
STd 32 23 Erséus Arkitekter Ab 14 43.7 49.7 35STd 33 37 Equator Stockholm Ab 14 42.5 35.9 38STd 34 30 mAF Arkitektkontor Ab 13/14 41.1 42.7 32STd 35 29 pyramiden Arkitekter * 14 38.6 43.4 39STd 36 32 A & p Arkitektkontor Ab 14 37.3 42.0 27
37 45 Sandellsandberg arkitekter Ab 14 36.7 26.9 28STd 38 35 Scheiwiller Svensson Arkitektkontor Ab 14/15 36.6 39.7 26STd 39 24 berg/C.F. möller Architects 14 36.5 49.5 38STd 40 40 Arkitektgruppen g.K.A.K Ab 14 36.2 32.2 27STd 41 38 yellon Ab 14 35.9 35.0 36STd 42 41 landskapslaget Ab 14 32.4 31.5 24
43 43 AbAKo Arkitektkontor Ab 14 31.8 31.3 3544 metod Arkitekter 14 30.1 21.6 21
STd 45 36 Ag Arkitekter Ab 14 29.9 36.1 31STd 46 46 lindberg Stenberg Arkitekter Ab 14 29.1 26.7 26STd 47 50 Arkitekter Engstrand och Speek Ab 14 26.5 23.8 22
48 48 visbyark Ab 14 26.4 26.1 23STd 49 47 Alessandro Ripellino Arkitekter 14 26.1 26.6 14STd 50 20 Thomas Eriksson Arkitektkontor Ab (an-
nual report 8 months) 14 26.1 51.5 27
the SwediSh marKet
transactions. The increased consolida-tion is a logical consequence of globali-sation, a fact that is borne out by some of the interviews with corporate leaders that we have included as a new feature in the year’s report. The larger com-panies will become increasingly larger and the Swedish market increasingly international. Of the 50 largest groups in Sweden, 20 are currently foreign-owned, compared with 19 last year and the Millennium shift, when the number was only three.
During recent years, we have had a Danish, a Norwegian and a French wave of acquisitions in Sweden. This year, the trend has been more Swedish-oriented, with a larger number of internal transac-tions on the Swedish market. However, among the year’s business transactions, Sweco’s acquisition of the Dutch firm Grontmij is the most sensational. It is by far the largest Swedish deal to date.
A description is given below of some of the business transactions that have taken place in Sweden and some news on management shifts and other appoint-ments.
grontmij becomes SwecoIn June, Sweco made an offer for Grontmij in a deal worth some SEK 3.3 billion, which has since gone through. Together they form one of the largest engineering consultancy groups in Europe, with a turnover of just over SEK 15 billion distributed over 14 500 employees in 15 countries. The compa-nies match each other well and the business will have a number of syn-ergy effects. They complement each other fairly well with regard to both geography and the range of products and services they offer, where Sweco – through the acquisition – will be an important player on the markets in The Netherlands, Belgium, Germany and Denmark and will gain access to a num-ber of other markets. In addition, the offer is reinforced in Sweden by Gront-mij’s organisation. The Head Office of the merged company will be located in Stockholm.
19Sector review • the SwediSh Federation oF conSulting engineerS and architectS • december 2015
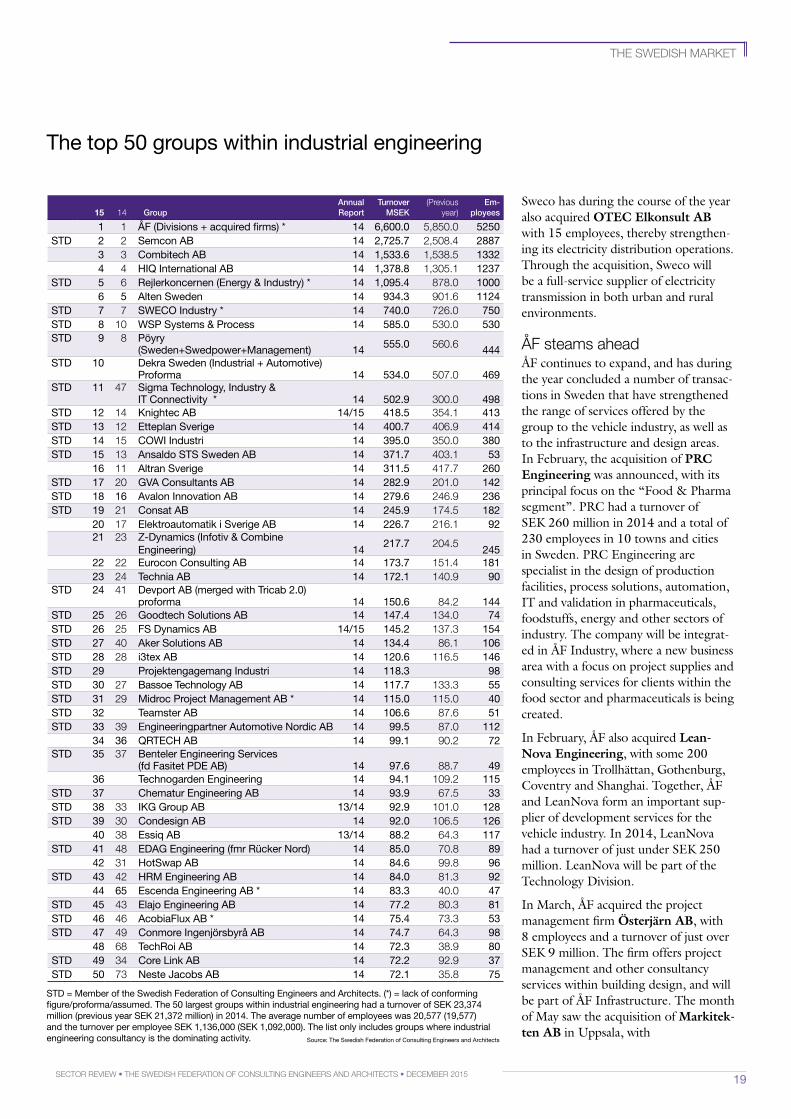
The top 50 groups within industrial engineering
Source: The Swedish Federation of Consulting Engineers and Architects
STd = member of the Swedish Federation of Consulting Engineers and Architects. (*) = lack of conforming figure/proforma/assumed. The 50 largest groups within industrial engineering had a turnover of SEK 23,374 million (previous year SEK 21,372 million) in 2014. The average number of employees was 20,577 (19,577) and the turnover per employee SEK 1,136,000 (SEK 1,092,000). The list only includes groups where industrial engineering consultancy is the dominating activity.
15 14 GroupAnnualreport
turnover MSek
(Previousyear)
em- ployees
1 1 ÅF (divisions + acquired firms) * 14 6,600.0 5,850.0 5250STd 2 2 Semcon Ab 14 2,725.7 2,508.4 2887
3 3 Combitech Ab 14 1,533.6 1,538.5 13324 4 hiq international Ab 14 1,378.8 1,305.1 1237
STd 5 6 Rejlerkoncernen (Energy & industry) * 14 1,095.4 878.0 10006 5 Alten Sweden 14 934.3 901.6 1124
STd 7 7 SwECo industry * 14 740.0 726.0 750STd 8 10 wSp Systems & process 14 585.0 530.0 530STd 9 8 pöyry
(Sweden+Swedpower+management) 14 555.0 560.6 444STd 10 dekra Sweden (industrial + Automotive)
proforma 14 534.0 507.0 469STd 11 47 Sigma Technology, industry &
iT Connectivity * 14 502.9 300.0 498STd 12 14 Knightec Ab 14/15 418.5 354.1 413STd 13 12 Etteplan Sverige 14 400.7 406.9 414STd 14 15 Cowi industri 14 395.0 350.0 380STd 15 13 Ansaldo STS Sweden Ab 14 371.7 403.1 53
16 11 Altran Sverige 14 311.5 417.7 260STd 17 20 gvA Consultants Ab 14 282.9 201.0 142STd 18 16 Avalon innovation Ab 14 279.6 246.9 236STd 19 21 Consat Ab 14 245.9 174.5 182
20 17 Elektroautomatik i Sverige Ab 14 226.7 216.1 9221 23 Z-dynamics (infotiv & Combine
Engineering) 14217.7 204.5
24522 22 Eurocon Consulting Ab 14 173.7 151.4 18123 24 Technia Ab 14 172.1 140.9 90
STd 24 41 devport Ab (merged with Tricab 2.0) proforma 14 150.6 84.2 144
STd 25 26 goodtech Solutions Ab 14 147.4 134.0 74STd 26 25 FS dynamics Ab 14/15 145.2 137.3 154STd 27 40 Aker Solutions Ab 14 134.4 86.1 106STd 28 28 i3tex Ab 14 120.6 116.5 146STd 29 projektengagemang industri 14 118.3 98STd 30 27 bassoe Technology Ab 14 117.7 133.3 55STd 31 29 midroc project management Ab * 14 115.0 115.0 40STd 32 Teamster Ab 14 106.6 87.6 51STd 33 39 Engineeringpartner Automotive nordic Ab 14 99.5 87.0 112
34 36 qRTECh Ab 14 99.1 90.2 72STd 35 37 benteler Engineering Services
(fd Fasitet pdE Ab) 14 97.6 88.7 4936 Technogarden Engineering 14 94.1 109.2 115
STd 37 Chematur Engineering Ab 14 93.9 67.5 33STd 38 33 iKg group Ab 13/14 92.9 101.0 128STd 39 30 Condesign Ab 14 92.0 106.5 126
40 38 Essiq Ab 13/14 88.2 64.3 117STd 41 48 EdAg Engineering (fmr Rücker nord) 14 85.0 70.8 89
42 31 hotSwap Ab 14 84.6 99.8 96STd 43 42 hRm Engineering Ab 14 84.0 81.3 92
44 65 Escenda Engineering Ab * 14 83.3 40.0 47STd 45 43 Elajo Engineering Ab 14 77.2 80.3 81STd 46 46 AcobiaFlux Ab * 14 75.4 73.3 53STd 47 49 Conmore ingenjörsbyrå Ab 14 74.7 64.3 98
48 68 TechRoi Ab 14 72.3 38.9 80STd 49 34 Core link Ab 14 72.2 92.9 37STd 50 73 neste Jacobs Ab 14 72.1 35.8 75
the SwediSh marKet
Sweco has during the course of the year also acquired OTEC Elkonsult AB with 15 employees, thereby strengthen-ing its electricity distribution operations. Through the acquisition, Sweco will be a full-service supplier of electricity transmission in both urban and rural environments.
ÅF steams aheadÅF continues to expand, and has during the year concluded a number of transac-tions in Sweden that have strengthened the range of services offered by the group to the vehicle industry, as well as to the infrastructure and design areas. In February, the acquisition of PRC Engineering was announced, with its principal focus on the “Food & Pharma segment”. PRC had a turnover of SEK 260 million in 2014 and a total of 230 employees in 10 towns and cities in Sweden. PRC Engineering are specialist in the design of production facilities, process solutions, automation, IT and validation in pharmaceuticals, foodstuffs, energy and other sectors of industry. The company will be integrat-ed in ÅF Industry, where a new business area with a focus on project supplies and consulting services for clients within the food sector and pharmaceuticals is being created.
In February, ÅF also acquired LeanNova Engineering, with some 200 employees in Trollhättan, Gothenburg, Coventry and Shanghai. Together, ÅF and LeanNova form an important sup-plier of development services for the vehicle industry. In 2014, LeanNova had a turnover of just under SEK 250 million. LeanNova will be part of the Technology Division.
In March, ÅF acquired the project management firm Österjärn AB, with 8 employees and a turnover of just over SEK 9 million. The firm offers project management and other consultancy services within building design, and will be part of ÅF Infrastructure. The month of May saw the acquisition of Markitekten AB in Uppsala, with
20 Sector review • the SwediSh Federation oF conSulting engineerS and architectS • december 2015
the SwediSh marKet
inTERviEw monica von SchmalenSee managing director, white arKiteKter
the consolidation trend has been with us for some time. what is the advantage for a small architectural firm of being larger? how does your firm regard the situation?
as far as we are concerned, being larger – or in other words increasing the size of our staff – is not an end in itself. we have deliberately worked on raising our quality and our hourly rates. in parallel with this we have employed more special-ists. our size and our ownership give us the opportunity to invest some of our profit in r&d and international competition activities, which are an important part of our business strategy. different categories of competence and specialist knowledge in an interdisciplinary process are required in order to be able to provide sustainable architecture.
Globalisation is a very clear trend. what does it mean as far as your firm is concerned?
we are attracting more and more employees from other countries. our offices in Sweden, denmark, norway and england need material in a common language, and english is becom-ing increasingly this common language. the challenges we face in other countries are similar – urbanisation, a shortage of housing and town planning issues from a sustainability point of view. here we can make a contribution and serve as an example.
do you see any other clear trends in the sector, apart from globalisation?
the interest in architecture and town planning has increased in general. the definition of sustain-ability, not only the ecological but also social and economic sustainability, as well as the need to work on this in a strategic way, has increased. this is a gratifying fact in that it requires a long-term perspective.
another important trend is urbanisation. the preconditions are changing rapidly owing
to climate changes, with rising water levels and heavy storms as a consequence. it will change our town planning and require both the adaptation of existing structure as well as new innovative solutions that reduce carbon dioxide emissions. the city’s ecosystem will be even more important.
what are the main challenges facing the architectural sector during the coming years? how will you meet these challenges?
recruitment and competence provision. through our internationalisation, we are broad-ening our recruitment base to include a number of high-performance geographical areas such as the uK, germany and north america. the question of the Public Procurement act, lou, is important from a client/employer point of view. lowest price rarely gives better quality. we meet this by indicating value on the basis of total cost and encouraging the client to perform lca (life cycle) analyses.
if you were a visionary, when will we be living in a sustainable society and what is the role of the architect on the way there?
the architect is the plough or the battering ram and has the visionary capacity to think in a long-term way. the architect will be an even more important adviser to the client.
the questions associated with sustainability will be increasingly important in all sectors. the building industry still accounts for a large propor-tion of the carbon dioxide emissions and our footprint must decrease. we will also plan our towns and cities with the individual in the centre, not as the situation is today with the car as the starting point.
“Lowest price rarely gives better quality”
5 employees and a turnover of just under SEK 5 million. Markitekten offers consulting services within the construc-tion sector, above all in the areas of roads, land, water supply and wastewa-ter, and landscape engineering coupled with the planning and design of new housing and development areas.
In June, ÅF purchased the fast-growing EQC Group, which is operational in the fields of infrastructure and the industry sector. The company has expanded from 17 to 180 employees in only four years, and last year had a turnover of SEK 180 million divided between 130 staff. The merger strengthens the range of services
offered by ÅF Infrastructure and will be included in ÅFs Infrastructure Division. June also saw the acquisition of L.E.B. Consult, with a turnover of some SEK 60 million and 50 employees in Stock-holm, Eskilstuna and Linköping. The acquisition strengthens the range of services offered by ÅF to clients in de-sign and installations for, among other facilities, hospitals and other complex buildings, and will be integrated in ÅF Infrastructure’s business area buildings.
wSP continues to expandWSP continues to expand in Sweden with a total of three acquisitions in 2015: FLK AB, Vicicom AB and Faveo. In April, the acquisition of installation consultants FLK AB was announced, with its head office in Växjö. In 2014, the company had a turnover of just over SEK 40 million and 55 employees in six Swedish towns and cities. FLK strengthens WSP’s range of services in HVAC and electricity supply in Sweden. In May, WSP purchased all the shares in broadband specialists Vicicom AB, with a turnover of 40 million and 32 employ-ees. Vicicom is a consulting firm that is currently in the process of generating the coming generation’s broadband and telecommunications network for local authorities and operators. The deal entails an investment in a new segment of the market for WSP – communication networks.
An announcement was made at the end of June of WSP’s acquisition of the Swedish/Norwegian project manage-ment company Faveo, with a turnover of just under SEK 500 million and approxi-mately 350 employees in Sweden and Norway. The company complements WSP’s project management operations, above all in the areas of energy and infra-structure. With the purchase of Faveo, WSP has acquired some 4 000 employ-ees in the Nordic countries, 3 000 of whom in Sweden. The goal, according to WSP’s MD Magnus Meyer, is to employ at least 5 000 personnel in the Nordic countries.
21Sector review • the SwediSh Federation oF conSulting engineerS and architectS • december 2015
Semcon strengthens its position in norway By increasing its ownership share in the Nordic engineering company Kongsberg Devotek AS from 30 to 97 %, Semcon has strengthened its position in Norway. Devotek will thereby become fully integrated in Semcon’s structure. The company had a turnover of NOK 114 million in 2014 and 75 employees. The investment is a step in Semcon’s strategic expansion on the Norwegian market, where Devotek is judged to have specialist competence in complex product development in, as far as Semcon is concerned, prioritised tech-nological areas.
In February, Semcon opened its new head office in the free port area of Gothenburg. The new head office is 9 000 m2 in size and was built between the months of June 2013 and Decem-ber 2014. It will serve as the home office for some 700 employees.
rejlers makes more acquisitionsRejlers continues to expand and has during the year made a number of acquisitions. In March, they purchased Energy Business Sweden AB (EBS), the Swedish operations in Eneas Energy AB. EBS offers energy-effective services that give lower energy consumption in properties and local authorities. The company has 11 employees and a turnover of approximately SEK 30 million. In May, Rejlers purchased the Finnish electricity network company Caruna’s business operations in the field of project monitoring, with 26 employees. The business that Rejlers has acquired covers services in the field of project monitoring, inspection, auditing and quality control, as well as safety and environmental coordination. The deals strengthen Rejlers’ service range in the field of electricity distribution on the Finnish market.
In June, Rejlers purchased the consul-tancy activities of Automationscenter & Bråvalla Elteknik AB, with seven employees in Norrköping. October saw the purchase of 88.52 % of the shares in the Norwegian IT company Embriq. The purchase price was in the order of NOK 78 million. The company has 120 employees and a turnover of approxi-mately SEK 240 million. With Embriq, Rejlers Norge will acquire an annual turnover of NOK 550 million and almost 400 employees. At the end of November, Orbion Consulting AB was also acquired, from Relacom AB. The company strengthens the range of ser-vices offered by Rejlers in the telecom sector which means that Rejlers now has 270 telecom consultants. Orbion had a turnover in 2014 of some SEK 200 mil-lion and 147 employees.
In May, Combitech acquired the pay-ment security firm SecureCom, with primarily client segments in the finance
Roof landscape on Sveavägen, Stockholm. photo: Åke E:son lindman.
the SwediSh marKet
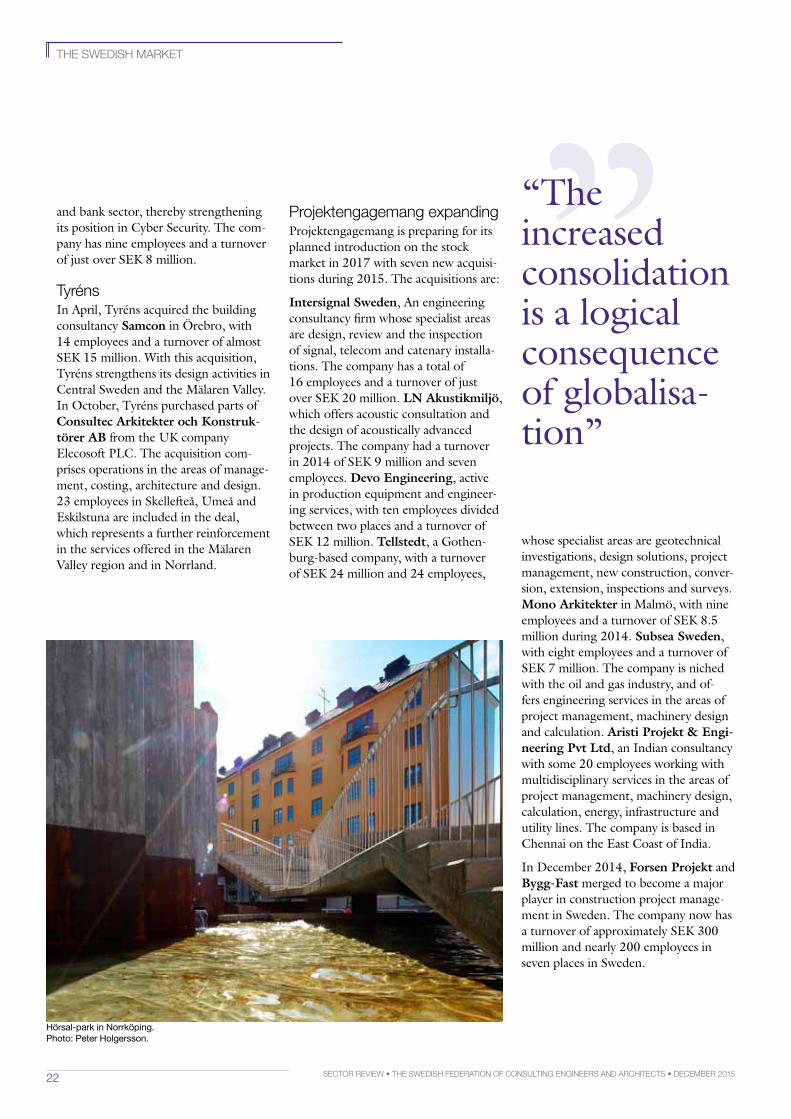
22 Sector review • the SwediSh Federation oF conSulting engineerS and architectS • december 2015
and bank sector, thereby strengthening its position in Cyber Security. The com-pany has nine employees and a turnover of just over SEK 8 million.
tyrénsIn April, Tyréns acquired the building consultancy Samcon in Örebro, with 14 employees and a turnover of almost SEK 15 million. With this acquisition, Tyréns strengthens its design activities in Central Sweden and the Mälaren Valley. In October, Tyréns purchased parts of Consultec Arkitekter och Konstruktörer AB from the UK company Elecosoft PLC. The acquisition com-prises opera tions in the areas of manage-ment, costing, architecture and design. 23 employees in Skellefteå, Umeå and Eskilstuna are included in the deal, which represents a further reinforcement in the services offered in the Mälaren Valley region and in Norrland.
Projektengagemang expandingProjektengagemang is preparing for its planned introduction on the stock market in 2017 with seven new acquisi-tions during 2015. The acquisitions are:
Intersignal Sweden, An engineering consultancy firm whose specialist areas are design, review and the inspection of signal, telecom and catenary installa-tions. The company has a total of 16 employees and a turnover of just over SEK 20 million. LN Akustikmiljö, which offers acoustic consultation and the design of acoustically advanced projects. The company had a turnover in 2014 of SEK 9 million and seven employees. Devo Engineering, active in production equipment and engineer-ing services, with ten employees divided between two places and a turnover of SEK 12 million. Tellstedt, a Gothen-burg-based company, with a turnover of SEK 24 million and 24 employees,
”“The increased consolidation is a logical consequence of globalisa-tion”
hörsal-park in norrköping. photo: peter holgersson.
the SwediSh marKet
whose specialist areas are geotechnical investigations, design solutions, project management, new construction, conver-sion, extension, inspections and surveys. Mono Arkitekter in Malmö, with nine employees and a turnover of SEK 8.5 million during 2014. Subsea Sweden, with eight employees and a turnover of SEK 7 million. The company is niched with the oil and gas industry, and of-fers engineering services in the areas of project management, machinery design and calculation. Aristi Projekt & Engineering Pvt Ltd, an Indian consultancy with some 20 employees working with multidisciplinary services in the areas of project management, machinery design, calculation, energy, infrastructure and utility lines. The company is based in Chennai on the East Coast of India.
In December 2014, Forsen Projekt and ByggFast merged to become a major player in construction project manage-ment in Sweden. The company now has a turnover of approximately SEK 300 million and nearly 200 employees in seven places in Sweden.
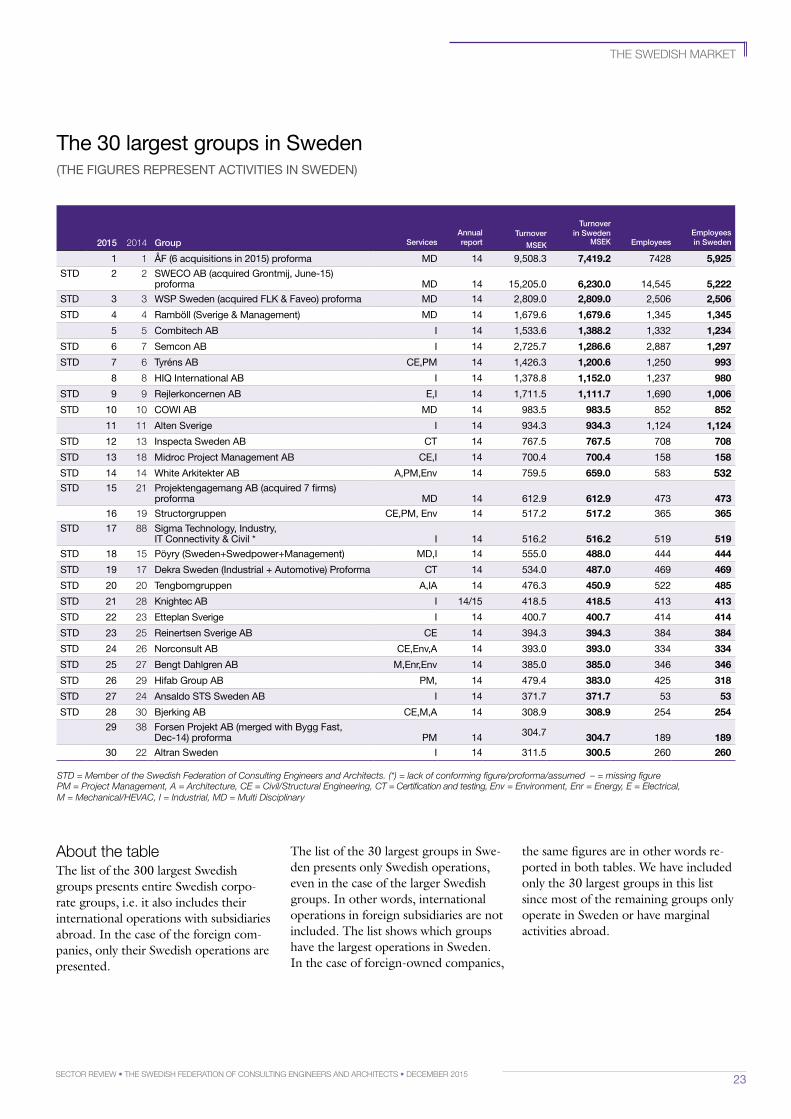
23Sector review • the SwediSh Federation oF conSulting engineerS and architectS • december 2015
the SwediSh marKet
The 30 largest groups in Sweden(ThE FiguRES REpRESEnT ACTiviTiES in SwEdEn)
about the table The list of the 300 largest Swedish groups presents entire Swedish corpo-rate groups, i.e. it also includes their international operations with subsidiaries abroad. In the case of the foreign com-panies, only their Swedish operations are presented.
2015 2014 Group ServicesAnnualreport
turnover
MSek
turnover
in SwedenMSek employees
employeesin Sweden
1 1 ÅF (6 acquisitions in 2015) proforma md 14 9,508.3 7,419.2 7428 5,925STd 2 2 SwECo Ab (acquired grontmij, June-15)
proforma md 14 15,205.0 6,230.0 14,545 5,222STd 3 3 wSp Sweden (acquired FlK & Faveo) proforma md 14 2,809.0 2,809.0 2,506 2,506
STd 4 4 Ramböll (Sverige & management) md 14 1,679.6 1,679.6 1,345 1,345
5 5 Combitech Ab i 14 1,533.6 1,388.2 1,332 1,234
STd 6 7 Semcon Ab i 14 2,725.7 1,286.6 2,887 1,297
STd 7 6 Tyréns Ab CE,pm 14 1,426.3 1,200.6 1,250 993
8 8 hiq international Ab i 14 1,378.8 1,152.0 1,237 980
STd 9 9 Rejlerkoncernen Ab E,i 14 1,711.5 1,111.7 1,690 1,006
STd 10 10 Cowi Ab md 14 983.5 983.5 852 852
11 11 Alten Sverige i 14 934.3 934.3 1,124 1,124
STd 12 13 inspecta Sweden Ab CT 14 767.5 767.5 708 708
STd 13 18 midroc project management Ab CE,i 14 700.4 700.4 158 158
STd 14 14 white Arkitekter Ab A,pm,Env 14 759.5 659.0 583 532STd 15 21 projektengagemang Ab (acquired 7 firms)
proforma md 14 612.9 612.9 473 47316 19 Structorgruppen CE,pm, Env 14 517.2 517.2 365 365
STd 17 88 Sigma Technology, industry, iT Connectivity & Civil * i 14 516.2 516.2 519 519
STd 18 15 pöyry (Sweden+Swedpower+management) md,i 14 555.0 488.0 444 444
STd 19 17 dekra Sweden (industrial + Automotive) proforma CT 14 534.0 487.0 469 469
STd 20 20 Tengbomgruppen A,iA 14 476.3 450.9 522 485
STd 21 28 Knightec Ab i 14/15 418.5 418.5 413 413
STd 22 23 Etteplan Sverige i 14 400.7 400.7 414 414
STd 23 25 Reinertsen Sverige Ab CE 14 394.3 394.3 384 384
STd 24 26 norconsult Ab CE,Env,A 14 393.0 393.0 334 334
STd 25 27 bengt dahlgren Ab m,Enr,Env 14 385.0 385.0 346 346
STd 26 29 hifab group Ab pm, 14 479.4 383.0 425 318
STd 27 24 Ansaldo STS Sweden Ab i 14 371.7 371.7 53 53
STd 28 30 bjerking Ab CE,m,A 14 308.9 308.9 254 25429 38 Forsen projekt Ab (merged with bygg Fast,
dec-14) proforma pm 14 304.7 304.7 189 18930 22 Altran Sweden i 14 311.5 300.5 260 260
The list of the 30 largest groups in Swe-den presents only Swedish operations, even in the case of the larger Swedish groups. In other words, international operations in foreign subsidiaries are not included. The list shows which groups have the largest operations in Sweden. In the case of foreign-owned companies,
the same figures are in other words re-ported in both tables. We have included only the 30 largest groups in this list since most of the remaining groups only operate in Sweden or have marginal activities abroad.
STD = Member of the Swedish Federation of Consulting Engineers and Architects. (*) = lack of conforming figure/proforma/assumed – = missing figure PM = Project Management, A = Architecture, CE = Civil/Structural Engineering, CT = Certification and testing, Env = Environment, Enr = Energy, E = Electrical, M = Mechanical/HEVAC, I = Industrial, MD = Multi Disciplinary
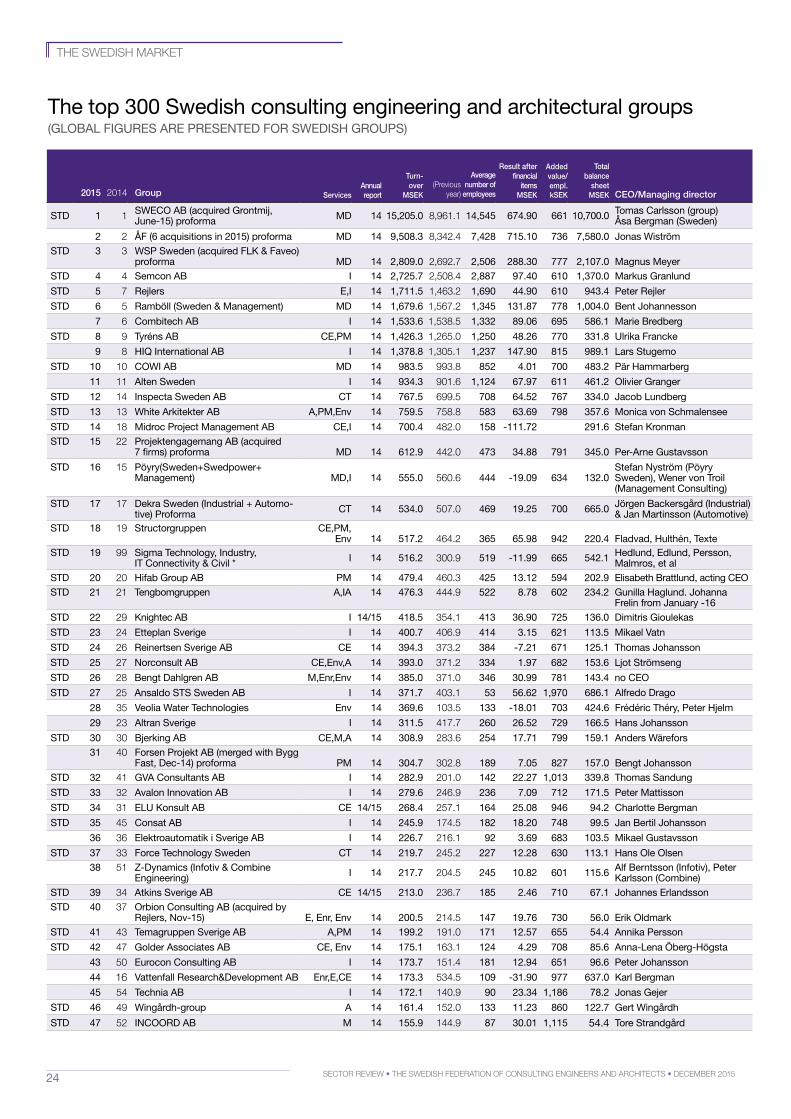
24 Sector review • the SwediSh Federation oF conSulting engineerS and architectS • december 2015
2015 2014 Group ServicesAnnual report
turn-over
MSek(Previous
year)
Average number of
employees
result after financial
items MSek
Added value/empl. kSek
total balance
sheet MSek ceo/Managing director
STd 1 1 SwECo Ab (acquired grontmij, June-15) proforma md 14 15,205.0 8,961.1 14,545 674.90 661 10,700.0 Tomas Carlsson (group)
Åsa bergman (Sweden)
2 2 ÅF (6 acquisitions in 2015) proforma md 14 9,508.3 8,342.4 7,428 715.10 736 7,580.0 Jonas wiströmSTd 3 3 wSp Sweden (acquired FlK & Faveo)
proforma md 14 2,809.0 2,692.7 2,506 288.30 777 2,107.0 magnus meyerSTd 4 4 Semcon Ab i 14 2,725.7 2,508.4 2,887 97.40 610 1,370.0 markus granlund
STd 5 7 Rejlers E,i 14 1,711.5 1,463.2 1,690 44.90 610 943.4 peter Rejler
STd 6 5 Ramböll (Sweden & management) md 14 1,679.6 1,567.2 1,345 131.87 778 1,004.0 bent Johannesson
7 6 Combitech Ab i 14 1,533.6 1,538.5 1,332 89.06 695 586.1 marie bredberg
STd 8 9 Tyréns Ab CE,pm 14 1,426.3 1,265.0 1,250 48.26 770 331.8 ulrika Francke
9 8 hiq international Ab i 14 1,378.8 1,305.1 1,237 147.90 815 989.1 lars Stugemo
STd 10 10 Cowi Ab md 14 983.5 993.8 852 4.01 700 483.2 pär hammarberg
11 11 Alten Sweden i 14 934.3 901.6 1,124 67.97 611 461.2 olivier granger
STd 12 14 inspecta Sweden Ab CT 14 767.5 699.5 708 64.52 767 334.0 Jacob lundberg
STd 13 13 white Arkitekter Ab A,pm,Env 14 759.5 758.8 583 63.69 798 357.6 monica von Schmalensee
STd 14 18 midroc project management Ab CE,i 14 700.4 482.0 158 -111.72 291.6 Stefan Kronman STd 15 22 projektengagemang Ab (acquired
7 firms) proforma md 14 612.9 442.0 473 34.88 791 345.0 per-Arne gustavsson
STd 16 15 pöyry(Sweden+Swedpower+ management) md,i 14 555.0 560.6 444 -19.09 634 132.0
Stefan nyström (pöyry Sweden), wener von Troil (management Consulting)
STd 17 17 dekra Sweden (industrial + Automo-tive) proforma CT 14 534.0 507.0 469 19.25 700 665.0 Jörgen backersgård (industrial)
& Jan martinsson (Automotive)STd 18 19 Structorgruppen CE,pm,
Env 14 517.2 464.2 365 65.98 942 220.4 Fladvad, hulthén, TexteSTd 19 99 Sigma Technology, industry,
iT Connectivity & Civil * i 14 516.2 300.9 519 -11.99 665 542.1 hedlund, Edlund, persson, malmros, et al
STd 20 20 hifab group Ab pm 14 479.4 460.3 425 13.12 594 202.9 Elisabeth brattlund, acting CEoSTd 21 21 Tengbomgruppen A,iA 14 476.3 444.9 522 8.78 602 234.2 gunilla haglund. Johanna
Frelin from January -16STd 22 29 Knightec Ab i 14/15 418.5 354.1 413 36.90 725 136.0 dimitris gioulekas
STd 23 24 Etteplan Sverige i 14 400.7 406.9 414 3.15 621 113.5 mikael vatn
STd 24 26 Reinertsen Sverige Ab CE 14 394.3 373.2 384 -7.21 671 125.1 Thomas Johansson
STd 25 27 norconsult Ab CE,Env,A 14 393.0 371.2 334 1.97 682 153.6 ljot Strömseng
STd 26 28 bengt dahlgren Ab m,Enr,Env 14 385.0 371.0 346 30.99 781 143.4 no CEo
STd 27 25 Ansaldo STS Sweden Ab i 14 371.7 403.1 53 56.62 1,970 686.1 Alfredo drago
28 35 veolia water Technologies Env 14 369.6 103.5 133 -18.01 703 424.6 Frédéric Théry, peter hjelm
29 23 Altran Sverige i 14 311.5 417.7 260 26.52 729 166.5 hans Johansson
STd 30 30 bjerking Ab CE,m,A 14 308.9 283.6 254 17.71 799 159.1 Anders wärefors31 40 Forsen projekt Ab (merged with bygg
Fast, dec-14) proforma pm 14 304.7 302.8 189 7.05 827 157.0 bengt JohanssonSTd 32 41 gvA Consultants Ab i 14 282.9 201.0 142 22.27 1,013 339.8 Thomas Sandung
STd 33 32 Avalon innovation Ab i 14 279.6 246.9 236 7.09 712 171.5 peter mattisson
STd 34 31 Elu Konsult Ab CE 14/15 268.4 257.1 164 25.08 946 94.2 Charlotte bergman
STd 35 45 Consat Ab i 14 245.9 174.5 182 18.20 748 99.5 Jan bertil Johansson
36 36 Elektroautomatik i Sverige Ab i 14 226.7 216.1 92 3.69 683 103.5 mikael gustavsson
STd 37 33 Force Technology Sweden CT 14 219.7 245.2 227 12.28 630 113.1 hans ole olsen38 51 Z-dynamics (infotiv & Combine
Engineering) i 14 217.7 204.5 245 10.82 601 115.6 Alf berntsson (infotiv), peter Karlsson (Combine)
STd 39 34 Atkins Sverige Ab CE 14/15 213.0 236.7 185 2.46 710 67.1 Johannes Erlandsson STd 40 37 orbion Consulting Ab (acquired by
Rejlers, nov-15) E, Enr, Env 14 200.5 214.5 147 19.76 730 56.0 Erik oldmarkSTd 41 43 Temagruppen Sverige Ab A,pm 14 199.2 191.0 171 12.57 655 54.4 Annika persson
STd 42 47 golder Associates Ab CE, Env 14 175.1 163.1 124 4.29 708 85.6 Anna-lena Öberg-högsta
43 50 Eurocon Consulting Ab i 14 173.7 151.4 181 12.94 651 96.6 peter Johansson
44 16 vattenfall Research&development Ab Enr,E,CE 14 173.3 534.5 109 -31.90 977 637.0 Karl bergman
45 54 Technia Ab i 14 172.1 140.9 90 23.34 1,186 78.2 Jonas gejer
STd 46 49 wingårdh-group A 14 161.4 152.0 133 11.23 860 122.7 gert wingårdh
STd 47 52 inCooRd Ab m 14 155.9 144.9 87 30.01 1,115 54.4 Tore Strandgård
the SwediSh marKet
The top 300 Swedish consulting engineering and architectural groups(globAl FiguRES ARE pRESEnTEd FoR SwEdiSh gRoupS)
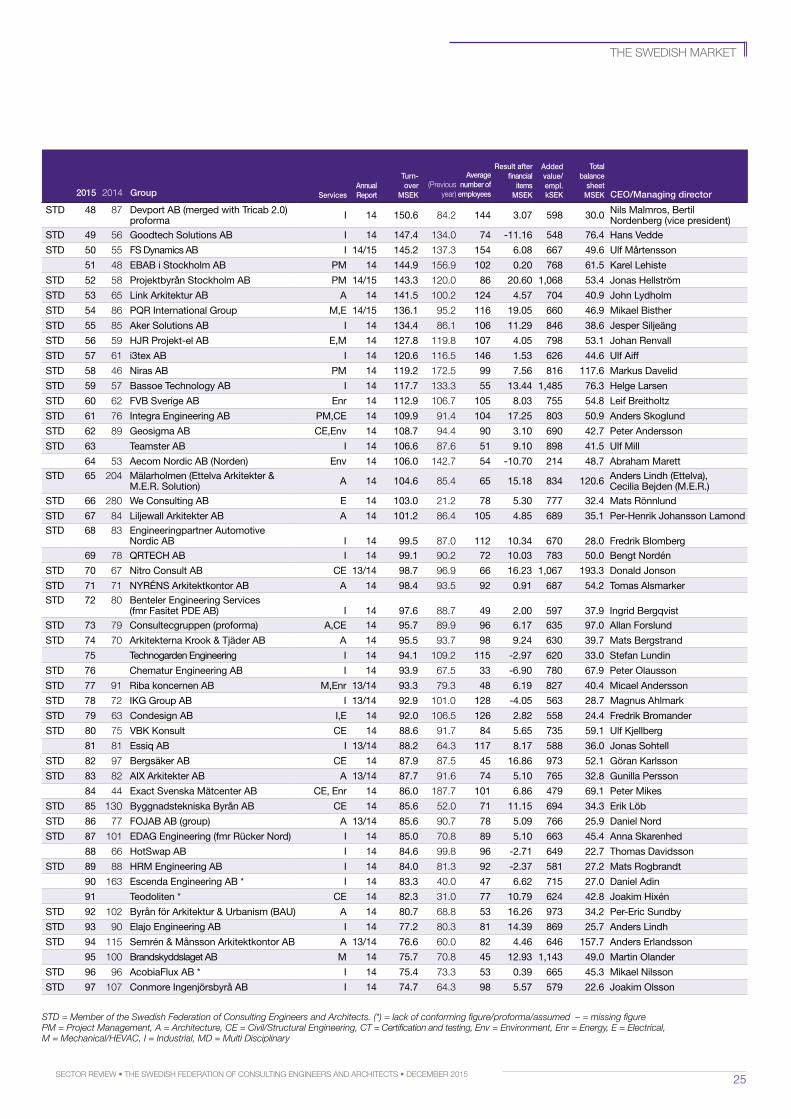
25Sector review • the SwediSh Federation oF conSulting engineerS and architectS • december 2015
STd 48 87 devport Ab (merged with Tricab 2.0) proforma i 14 150.6 84.2 144 3.07 598 30.0 nils malmros, bertil
nordenberg (vice president)STd 49 56 goodtech Solutions Ab i 14 147.4 134.0 74 -11.16 548 76.4 hans vedde
STd 50 55 FS dynamics Ab i 14/15 145.2 137.3 154 6.08 667 49.6 ulf mårtensson
51 48 EbAb i Stockholm Ab pm 14 144.9 156.9 102 0.20 768 61.5 Karel lehiste
STd 52 58 projektbyrån Stockholm Ab pm 14/15 143.3 120.0 86 20.60 1,068 53.4 Jonas hellström
STd 53 65 link Arkitektur Ab A 14 141.5 100.2 124 4.57 704 40.9 John lydholm
STd 54 86 pqR international group m,E 14/15 136.1 95.2 116 19.05 660 46.9 mikael bisther
STd 55 85 Aker Solutions Ab i 14 134.4 86.1 106 11.29 846 38.6 Jesper Siljeäng
STd 56 59 hJR projekt-el Ab E,m 14 127.8 119.8 107 4.05 798 53.1 Johan Renvall
STd 57 61 i3tex Ab i 14 120.6 116.5 146 1.53 626 44.6 ulf Aiff
STd 58 46 niras Ab pm 14 119.2 172.5 99 7.56 816 117.6 markus davelid
STd 59 57 bassoe Technology Ab i 14 117.7 133.3 55 13.44 1,485 76.3 helge larsen
STd 60 62 Fvb Sverige Ab Enr 14 112.9 106.7 105 8.03 755 54.8 leif breitholtz
STd 61 76 integra Engineering Ab pm,CE 14 109.9 91.4 104 17.25 803 50.9 Anders Skoglund
STd 62 89 geosigma Ab CE,Env 14 108.7 94.4 90 3.10 690 42.7 peter Andersson
STd 63 Teamster Ab i 14 106.6 87.6 51 9.10 898 41.5 ulf mill
64 53 Aecom nordic Ab (norden) Env 14 106.0 142.7 54 -10.70 214 48.7 Abraham marettSTd 65 204 mälarholmen (Ettelva Arkitekter &
m.E.R. Solution) A 14 104.6 85.4 65 15.18 834 120.6 Anders lindh (Ettelva), Cecilia bejden (m.E.R.)
STd 66 280 we Consulting Ab E 14 103.0 21.2 78 5.30 777 32.4 mats Rönnlund
STd 67 84 liljewall Arkitekter Ab A 14 101.2 86.4 105 4.85 689 35.1 per-henrik Johansson lamondSTd 68 83 Engineeringpartner Automotive
nordic Ab i 14 99.5 87.0 112 10.34 670 28.0 Fredrik blomberg69 78 qRTECh Ab i 14 99.1 90.2 72 10.03 783 50.0 bengt nordén
STd 70 67 nitro Consult Ab CE 13/14 98.7 96.9 66 16.23 1,067 193.3 donald Jonson
STd 71 71 nyRÉnS Arkitektkontor Ab A 14 98.4 93.5 92 0.91 687 54.2 Tomas AlsmarkerSTd 72 80 benteler Engineering Services
(fmr Fasitet pdE Ab) i 14 97.6 88.7 49 2.00 597 37.9 ingrid bergqvistSTd 73 79 Consultecgruppen (proforma) A,CE 14 95.7 89.9 96 6.17 635 97.0 Allan Forslund
STd 74 70 Arkitekterna Krook & Tjäder Ab A 14 95.5 93.7 98 9.24 630 39.7 mats bergstrand
75 Technogarden Engineering i 14 94.1 109.2 115 -2.97 620 33.0 Stefan lundin
STd 76 Chematur Engineering Ab i 14 93.9 67.5 33 -6.90 780 67.9 peter olausson
STd 77 91 Riba koncernen Ab m,Enr 13/14 93.3 79.3 48 6.19 827 40.4 micael Andersson
STd 78 72 iKg group Ab i 13/14 92.9 101.0 128 -4.05 563 28.7 magnus Ahlmark
STd 79 63 Condesign Ab i,E 14 92.0 106.5 126 2.82 558 24.4 Fredrik bromander
STd 80 75 vbK Konsult CE 14 88.6 91.7 84 5.65 735 59.1 ulf Kjellberg
81 81 Essiq Ab i 13/14 88.2 64.3 117 8.17 588 36.0 Jonas Sohtell
STd 82 97 bergsäker Ab CE 14 87.9 87.5 45 16.86 973 52.1 göran Karlsson
STd 83 82 Aix Arkitekter Ab A 13/14 87.7 91.6 74 5.10 765 32.8 gunilla persson
84 44 Exact Svenska mätcenter Ab CE, Enr 14 86.0 187.7 101 6.86 479 69.1 peter mikes
STd 85 130 byggnadstekniska byrån Ab CE 14 85.6 52.0 71 11.15 694 34.3 Erik löb
STd 86 77 FoJAb Ab (group) A 13/14 85.6 90.7 78 5.09 766 25.9 daniel nord
STd 87 101 EdAg Engineering (fmr Rücker nord) i 14 85.0 70.8 89 5.10 663 45.4 Anna Skarenhed
88 66 hotSwap Ab i 14 84.6 99.8 96 -2.71 649 22.7 Thomas davidsson
STd 89 88 hRm Engineering Ab i 14 84.0 81.3 92 -2.37 581 27.2 mats Rogbrandt
90 163 Escenda Engineering Ab * i 14 83.3 40.0 47 6.62 715 27.0 daniel Adin
91 Teodoliten * CE 14 82.3 31.0 77 10.79 624 42.8 Joakim hixén
STd 92 102 byrån för Arkitektur & urbanism (bAu) A 14 80.7 68.8 53 16.26 973 34.2 per-Eric Sundby
STd 93 90 Elajo Engineering Ab i 14 77.2 80.3 81 14.39 869 25.7 Anders lindh
STd 94 115 Semrén & månsson Arkitektkontor Ab A 13/14 76.6 60.0 82 4.46 646 157.7 Anders Erlandsson
95 100 brandskyddslaget Ab m 14 75.7 70.8 45 12.93 1,143 49.0 martin olander
STd 96 96 AcobiaFlux Ab * i 14 75.4 73.3 53 0.39 665 45.3 mikael nilsson
STd 97 107 Conmore ingenjörsbyrå Ab i 14 74.7 64.3 98 5.57 579 22.6 Joakim olsson
2015 2014 Group ServicesAnnualreport
turn-over
MSek(Previous
year)
Average number of
employees
result after financial
items MSek
Added value/empl. kSek
total balance
sheet MSek ceo/Managing director
the SwediSh marKet
STD = Member of the Swedish Federation of Consulting Engineers and Architects. (*) = lack of conforming figure/proforma/assumed – = missing figure PM = Project Management, A = Architecture, CE = Civil/Structural Engineering, CT = Certification and testing, Env = Environment, Enr = Energy, E = Electrical, M = Mechanical/HEVAC, I = Industrial, MD = Multi Disciplinary
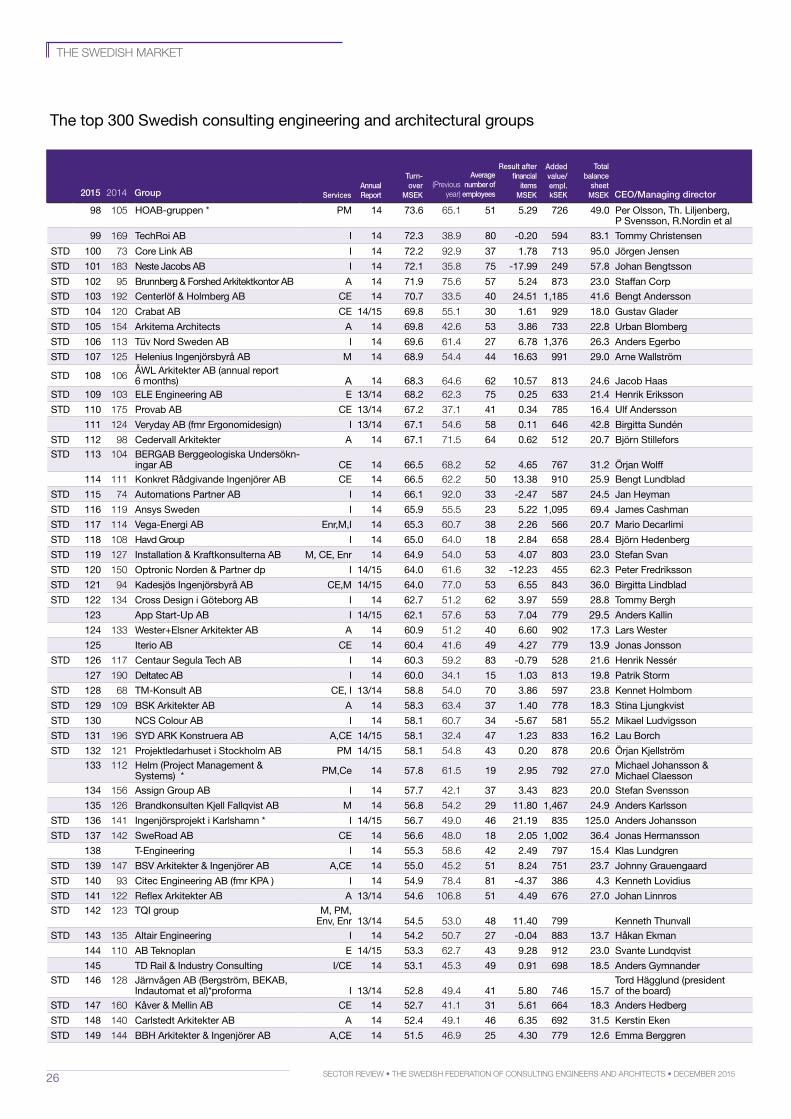
26 Sector review • the SwediSh Federation oF conSulting engineerS and architectS • december 2015
98 105 hoAb-gruppen * pm 14 73.6 65.1 51 5.29 726 49.0 per olsson, Th. liljenberg, p Svensson, R.nordin et al
99 169 TechRoi Ab i 14 72.3 38.9 80 -0.20 594 83.1 Tommy Christensen
STd 100 73 Core link Ab i 14 72.2 92.9 37 1.78 713 95.0 Jörgen Jensen
STd 101 183 neste Jacobs Ab i 14 72.1 35.8 75 -17.99 249 57.8 Johan bengtsson
STd 102 95 brunnberg & Forshed Arkitektkontor Ab A 14 71.9 75.6 57 5.24 873 23.0 Staffan Corp
STd 103 192 Centerlöf & holmberg Ab CE 14 70.7 33.5 40 24.51 1,185 41.6 bengt Andersson
STd 104 120 Crabat Ab CE 14/15 69.8 55.1 30 1.61 929 18.0 gustav glader
STd 105 154 Arkitema Architects A 14 69.8 42.6 53 3.86 733 22.8 urban blomberg
STd 106 113 Tüv nord Sweden Ab i 14 69.6 61.4 27 6.78 1,376 26.3 Anders Egerbo
STd 107 125 helenius ingenjörsbyrå Ab m 14 68.9 54.4 44 16.63 991 29.0 Arne wallström
STd 108 106 Åwl Arkitekter Ab (annual report 6 months) A 14 68.3 64.6 62 10.57 813 24.6 Jacob haas
STd 109 103 ElE Engineering Ab E 13/14 68.2 62.3 75 0.25 633 21.4 henrik Eriksson
STd 110 175 provab Ab CE 13/14 67.2 37.1 41 0.34 785 16.4 ulf Andersson
111 124 veryday Ab (fmr Ergonomidesign) i 13/14 67.1 54.6 58 0.11 646 42.8 birgitta Sundén
STd 112 98 Cedervall Arkitekter A 14 67.1 71.5 64 0.62 512 20.7 björn StilleforsSTd 113 104 bERgAb berggeologiska undersökn-
ingar Ab CE 14 66.5 68.2 52 4.65 767 31.2 Örjan wolff114 111 Konkret Rådgivande ingenjörer Ab CE 14 66.5 62.2 50 13.38 910 25.9 bengt lundblad
STd 115 74 Automations partner Ab i 14 66.1 92.0 33 -2.47 587 24.5 Jan heyman
STd 116 119 Ansys Sweden i 14 65.9 55.5 23 5.22 1,095 69.4 James Cashman
STd 117 114 vega-Energi Ab Enr,m,i 14 65.3 60.7 38 2.26 566 20.7 mario decarlimi
STd 118 108 havd group i 14 65.0 64.0 18 2.84 658 28.4 björn hedenberg
STd 119 127 installation & Kraftkonsulterna Ab m, CE, Enr 14 64.9 54.0 53 4.07 803 23.0 Stefan Svan
STd 120 150 optronic norden & partner dp i 14/15 64.0 61.6 32 -12.23 455 62.3 peter Fredriksson
STd 121 94 Kadesjös ingenjörsbyrå Ab CE,m 14/15 64.0 77.0 53 6.55 843 36.0 birgitta lindblad
STd 122 134 Cross design i göteborg Ab i 14 62.7 51.2 62 3.97 559 28.8 Tommy bergh
123 App Start-up Ab i 14/15 62.1 57.6 53 7.04 779 29.5 Anders Kallin
124 133 wester+Elsner Arkitekter Ab A 14 60.9 51.2 40 6.60 902 17.3 lars wester
125 iterio Ab CE 14 60.4 41.6 49 4.27 779 13.9 Jonas Jonsson
STd 126 117 Centaur Segula Tech Ab i 14 60.3 59.2 83 -0.79 528 21.6 henrik nessér
127 190 deltatec Ab i 14 60.0 34.1 15 1.03 813 19.8 patrik Storm
STd 128 68 Tm-Konsult Ab CE, i 13/14 58.8 54.0 70 3.86 597 23.8 Kennet holmbom
STd 129 109 bSK Arkitekter Ab A 14 58.3 63.4 37 1.40 778 18.3 Stina ljungkvist
STd 130 nCS Colour Ab i 14 58.1 60.7 34 -5.67 581 55.2 mikael ludvigsson
STd 131 196 Syd ARK Konstruera Ab A,CE 14/15 58.1 32.4 47 1.23 833 16.2 lau borch
STd 132 121 projektledarhuset i Stockholm Ab pm 14/15 58.1 54.8 43 0.20 878 20.6 Örjan Kjellström133 112 helm (project management &
Systems) * pm,Ce 14 57.8 61.5 19 2.95 792 27.0 michael Johansson & michael Claesson
134 156 Assign group Ab i 14 57.7 42.1 37 3.43 823 20.0 Stefan Svensson
135 126 brandkonsulten Kjell Fallqvist Ab m 14 56.8 54.2 29 11.80 1,467 24.9 Anders Karlsson
STd 136 141 ingenjörsprojekt i Karlshamn * i 14/15 56.7 49.0 46 21.19 835 125.0 Anders Johansson
STd 137 142 SweRoad Ab CE 14 56.6 48.0 18 2.05 1,002 36.4 Jonas hermansson
138 T-Engineering i 14 55.3 58.6 42 2.49 797 15.4 Klas lundgren
STd 139 147 bSv Arkitekter & ingenjörer Ab A,CE 14 55.0 45.2 51 8.24 751 23.7 Johnny grauengaard
STd 140 93 Citec Engineering Ab (fmr KpA ) i 14 54.9 78.4 81 -4.37 386 4.3 Kenneth lovidius
STd 141 122 Reflex Arkitekter Ab A 13/14 54.6 106.8 51 4.49 676 27.0 Johan linnrosSTd 142 123 Tqi group m, pm,
Env, Enr 13/14 54.5 53.0 48 11.40 799 Kenneth ThunvallSTd 143 135 Altair Engineering i 14 54.2 50.7 27 -0.04 883 13.7 håkan Ekman
144 110 Ab Teknoplan E 14/15 53.3 62.7 43 9.28 912 23.0 Svante lundqvist
145 Td Rail & industry Consulting i/CE 14 53.1 45.3 49 0.91 698 18.5 Anders gymnanderSTd 146 128 Järnvågen Ab (bergström, bEKAb,
indautomat et al)*proforma i 13/14 52.8 49.4 41 5.80 746 15.7Tord hägglund (president of the board)
STd 147 160 Kåver & mellin Ab CE 14 52.7 41.1 31 5.61 664 18.3 Anders hedberg
STd 148 140 Carlstedt Arkitekter Ab A 14 52.4 49.1 46 6.35 692 31.5 Kerstin Eken
STd 149 144 bbh Arkitekter & ingenjörer Ab A,CE 14 51.5 46.9 25 4.30 779 12.6 Emma berggren
The top 300 Swedish consulting engineering and architectural groups
the SwediSh marKet
2015 2014 Group ServicesAnnualreport
turn-over
MSek(Previous
year)
Average number of
employees
result after financial
items MSek
Added value/empl. kSek
total balance
sheet MSek ceo/Managing director
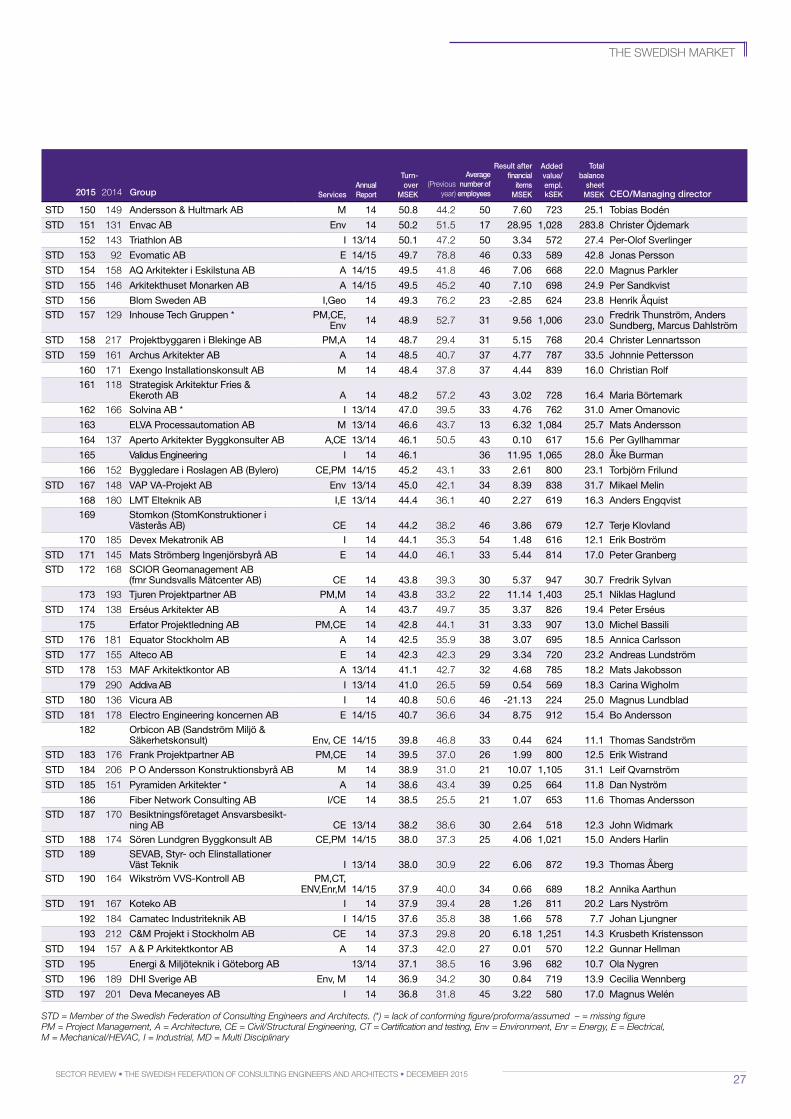
27Sector review • the SwediSh Federation oF conSulting engineerS and architectS • december 2015
STd 150 149 Andersson & hultmark Ab m 14 50.8 44.2 50 7.60 723 25.1 Tobias bodén
STd 151 131 Envac Ab Env 14 50.2 51.5 17 28.95 1,028 283.8 Christer Öjdemark
152 143 Triathlon Ab i 13/14 50.1 47.2 50 3.34 572 27.4 per-olof Sverlinger
STd 153 92 Evomatic Ab E 14/15 49.7 78.8 46 0.33 589 42.8 Jonas persson
STd 154 158 Aq Arkitekter i Eskilstuna Ab A 14/15 49.5 41.8 46 7.06 668 22.0 magnus parkler
STd 155 146 Arkitekthuset monarken Ab A 14/15 49.5 45.2 40 7.10 698 24.9 per Sandkvist
STd 156 blom Sweden Ab i,geo 14 49.3 76.2 23 -2.85 624 23.8 henrik ÅquistSTd 157 129 inhouse Tech gruppen * pm,CE,
Env 14 48.9 52.7 31 9.56 1,006 23.0 Fredrik Thunström, Anders Sundberg, marcus dahlström
STd 158 217 projektbyggaren i blekinge Ab pm,A 14 48.7 29.4 31 5.15 768 20.4 Christer lennartsson
STd 159 161 Archus Arkitekter Ab A 14 48.5 40.7 37 4.77 787 33.5 Johnnie pettersson
160 171 Exengo installationskonsult Ab m 14 48.4 37.8 37 4.44 839 16.0 Christian Rolf161 118 Strategisk Arkitektur Fries &
Ekeroth Ab A 14 48.2 57.2 43 3.02 728 16.4 maria börtemark162 166 Solvina Ab * i 13/14 47.0 39.5 33 4.76 762 31.0 Amer omanovic
163 ElvA processautomation Ab m 13/14 46.6 43.7 13 6.32 1,084 25.7 mats Andersson
164 137 Aperto Arkitekter byggkonsulter Ab A,CE 13/14 46.1 50.5 43 0.10 617 15.6 per gyllhammar
165 validus Engineering i 14 46.1 36 11.95 1,065 28.0 Åke burman
166 152 byggledare i Roslagen Ab (bylero) CE,pm 14/15 45.2 43.1 33 2.61 800 23.1 Torbjörn Frilund
STd 167 148 vAp vA-projekt Ab Env 13/14 45.0 42.1 34 8.39 838 31.7 mikael melin
168 180 lmT Elteknik Ab i,E 13/14 44.4 36.1 40 2.27 619 16.3 Anders Engqvist169 Stomkon (StomKonstruktioner i
västerås Ab) CE 14 44.2 38.2 46 3.86 679 12.7 Terje Klovland170 185 devex mekatronik Ab i 14 44.1 35.3 54 1.48 616 12.1 Erik boström
STd 171 145 mats Strömberg ingenjörsbyrå Ab E 14 44.0 46.1 33 5.44 814 17.0 peter granbergSTd 172 168 SCioR geomanagement Ab
(fmr Sundsvalls mätcenter Ab) CE 14 43.8 39.3 30 5.37 947 30.7 Fredrik Sylvan173 193 Tjuren projektpartner Ab pm,m 14 43.8 33.2 22 11.14 1,403 25.1 niklas haglund
STd 174 138 Erséus Arkitekter Ab A 14 43.7 49.7 35 3.37 826 19.4 peter Erséus
175 Erfator projektledning Ab pm,CE 14 42.8 44.1 31 3.33 907 13.0 michel bassili
STd 176 181 Equator Stockholm Ab A 14 42.5 35.9 38 3.07 695 18.5 Annica Carlsson
STd 177 155 Alteco Ab E 14 42.3 42.3 29 3.34 720 23.2 Andreas lundström
STd 178 153 mAF Arkitektkontor Ab A 13/14 41.1 42.7 32 4.68 785 18.2 mats Jakobsson
179 290 Addiva Ab i 13/14 41.0 26.5 59 0.54 569 18.3 Carina wigholm
STd 180 136 vicura Ab i 14 40.8 50.6 46 -21.13 224 25.0 magnus lundblad
STd 181 178 Electro Engineering koncernen Ab E 14/15 40.7 36.6 34 8.75 912 15.4 bo Andersson 182 orbicon Ab (Sandström miljö &
Säkerhetskonsult) Env, CE 14/15 39.8 46.8 33 0.44 624 11.1 Thomas SandströmSTd 183 176 Frank projektpartner Ab pm,CE 14 39.5 37.0 26 1.99 800 12.5 Erik wistrand
STd 184 206 p o Andersson Konstruktionsbyrå Ab m 14 38.9 31.0 21 10.07 1,105 31.1 leif qvarnström
STd 185 151 pyramiden Arkitekter * A 14 38.6 43.4 39 0.25 664 11.8 dan nyström
186 Fiber network Consulting Ab i/CE 14 38.5 25.5 21 1.07 653 11.6 Thomas AnderssonSTd 187 170 besiktningsföretaget Ansvarsbesikt-
ning Ab CE 13/14 38.2 38.6 30 2.64 518 12.3 John widmarkSTd 188 174 Sören lundgren byggkonsult Ab CE,pm 14/15 38.0 37.3 25 4.06 1,021 15.0 Anders harlin STd 189 SEvAb, Styr- och Elinstallationer
väst Teknik i 13/14 38.0 30.9 22 6.06 872 19.3 Thomas ÅbergSTd 190 164 wikström vvS-Kontroll Ab pm,CT,
Env,Enr,m 14/15 37.9 40.0 34 0.66 689 18.2 Annika AarthunSTd 191 167 Koteko Ab i 14 37.9 39.4 28 1.26 811 20.2 lars nyström
192 184 Camatec industriteknik Ab i 14/15 37.6 35.8 38 1.66 578 7.7 Johan ljungner
193 212 C&m projekt i Stockholm Ab CE 14 37.3 29.8 20 6.18 1,251 14.3 Krusbeth Kristensson
STd 194 157 A & p Arkitektkontor Ab A 14 37.3 42.0 27 0.01 570 12.2 gunnar hellman
STd 195 Energi & miljöteknik i göteborg Ab 13/14 37.1 38.5 16 3.96 682 10.7 ola nygren
STd 196 189 dhi Sverige Ab Env, m 14 36.9 34.2 30 0.84 719 13.9 Cecilia wennberg
STd 197 201 deva mecaneyes Ab i 14 36.8 31.8 45 3.22 580 17.0 magnus welén
the SwediSh marKet
STD = Member of the Swedish Federation of Consulting Engineers and Architects. (*) = lack of conforming figure/proforma/assumed – = missing figure PM = Project Management, A = Architecture, CE = Civil/Structural Engineering, CT = Certification and testing, Env = Environment, Enr = Energy, E = Electrical, M = Mechanical/HEVAC, I = Industrial, MD = Multi Disciplinary
2015 2014 Group ServicesAnnualreport
turn-over
MSek(Previous
year)
Average number of
employees
result after financial
items MSek
Added value/empl. kSek
total balance
sheet MSek ceo/Managing director
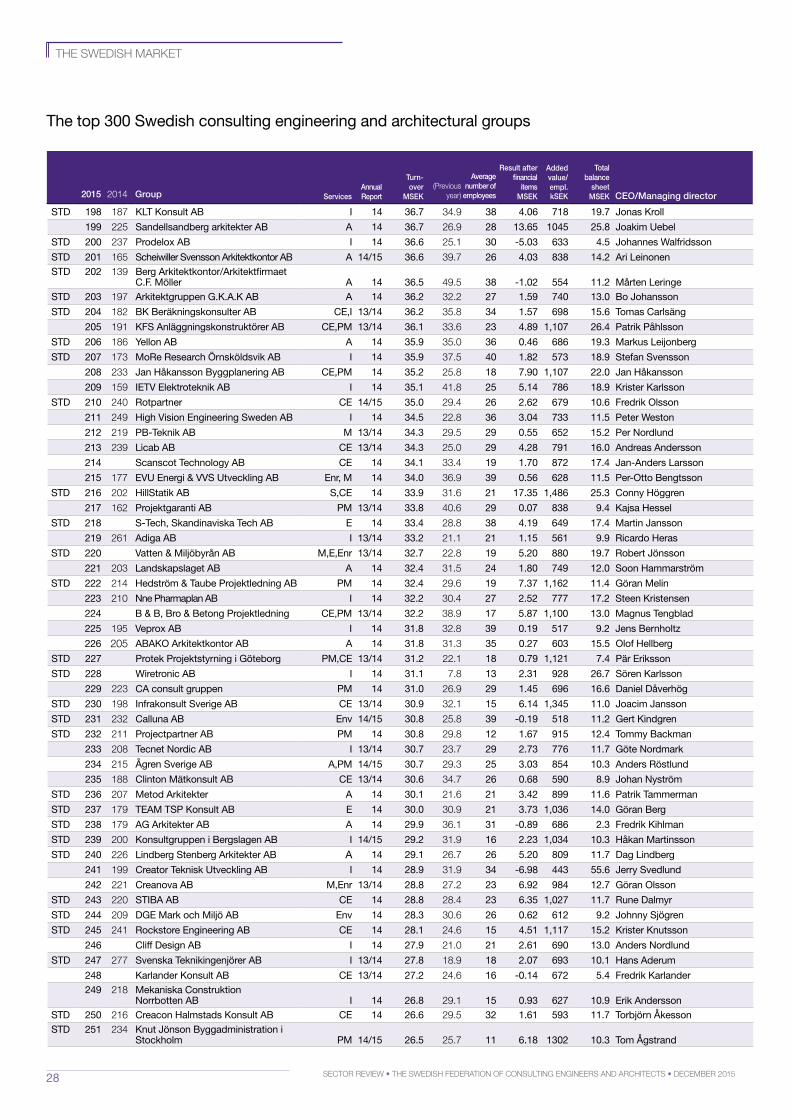
28 Sector review • the SwediSh Federation oF conSulting engineerS and architectS • december 2015
STd 198 187 KlT Konsult Ab i 14 36.7 34.9 38 4.06 718 19.7 Jonas Kroll
199 225 Sandellsandberg arkitekter Ab A 14 36.7 26.9 28 13.65 1045 25.8 Joakim uebel
STd 200 237 prodelox Ab i 14 36.6 25.1 30 -5.03 633 4.5 Johannes walfridsson
STd 201 165 Scheiwiller Svensson Arkitektkontor Ab A 14/15 36.6 39.7 26 4.03 838 14.2 Ari leinonenSTd 202 139 berg Arkitektkontor/Arkitektfirmaet
C.F. möller A 14 36.5 49.5 38 -1.02 554 11.2 mårten leringeSTd 203 197 Arkitektgruppen g.K.A.K Ab A 14 36.2 32.2 27 1.59 740 13.0 bo Johansson
STd 204 182 bK beräkningskonsulter Ab CE,i 13/14 36.2 35.8 34 1.57 698 15.6 Tomas Carlsäng
205 191 KFS Anläggningskonstruktörer Ab CE,pm 13/14 36.1 33.6 23 4.89 1,107 26.4 patrik påhlsson
STd 206 186 yellon Ab A 14 35.9 35.0 36 0.46 686 19.3 markus leijonberg
STd 207 173 moRe Research Örnsköldsvik Ab i 14 35.9 37.5 40 1.82 573 18.9 Stefan Svensson
208 233 Jan håkansson byggplanering Ab CE,pm 14 35.2 25.8 18 7.90 1,107 22.0 Jan håkansson
209 159 iETv Elektroteknik Ab i 14 35.1 41.8 25 5.14 786 18.9 Krister Karlsson
STd 210 240 Rotpartner CE 14/15 35.0 29.4 26 2.62 679 10.6 Fredrik olsson
211 249 high vision Engineering Sweden Ab i 14 34.5 22.8 36 3.04 733 11.5 peter weston
212 219 pb-Teknik Ab m 13/14 34.3 29.5 29 0.55 652 15.2 per nordlund
213 239 licab Ab CE 13/14 34.3 25.0 29 4.28 791 16.0 Andreas Andersson
214 Scanscot Technology Ab CE 14 34.1 33.4 19 1.70 872 17.4 Jan-Anders larsson
215 177 Evu Energi & vvS utveckling Ab Enr, m 14 34.0 36.9 39 0.56 628 11.5 per-otto bengtsson
STd 216 202 hillStatik Ab S,CE 14 33.9 31.6 21 17.35 1,486 25.3 Conny höggren
217 162 projektgaranti Ab pm 13/14 33.8 40.6 29 0.07 838 9.4 Kajsa hessel
STd 218 S-Tech, Skandinaviska Tech Ab E 14 33.4 28.8 38 4.19 649 17.4 martin Jansson
219 261 Adiga Ab i 13/14 33.2 21.1 21 1.15 561 9.9 Ricardo heras
STd 220 vatten & miljöbyrån Ab m,E,Enr 13/14 32.7 22.8 19 5.20 880 19.7 Robert Jönsson
221 203 landskapslaget Ab A 14 32.4 31.5 24 1.80 749 12.0 Soon hammarström
STd 222 214 hedström & Taube projektledning Ab pm 14 32.4 29.6 19 7.37 1,162 11.4 göran melin
223 210 nne pharmaplan Ab i 14 32.2 30.4 27 2.52 777 17.2 Steen Kristensen
224 b & b, bro & betong projektledning CE,pm 13/14 32.2 38.9 17 5.87 1,100 13.0 magnus Tengblad
225 195 veprox Ab i 14 31.8 32.8 39 0.19 517 9.2 Jens bernholtz
226 205 AbAKo Arkitektkontor Ab A 14 31.8 31.3 35 0.27 603 15.5 olof hellberg
STd 227 protek projektstyrning i göteborg pm,CE 13/14 31.2 22.1 18 0.79 1,121 7.4 pär Eriksson
STd 228 wiretronic Ab i 14 31.1 7.8 13 2.31 928 26.7 Sören Karlsson
229 223 CA consult gruppen pm 14 31.0 26.9 29 1.45 696 16.6 daniel dåverhög
STd 230 198 infrakonsult Sverige Ab CE 13/14 30.9 32.1 15 6.14 1,345 11.0 Joacim Jansson
STd 231 232 Calluna Ab Env 14/15 30.8 25.8 39 -0.19 518 11.2 gert Kindgren
STd 232 211 projectpartner Ab pm 14 30.8 29.8 12 1.67 915 12.4 Tommy backman
233 208 Tecnet nordic Ab i 13/14 30.7 23.7 29 2.73 776 11.7 göte nordmark
234 215 Ågren Sverige Ab A,pm 14/15 30.7 29.3 25 3.03 854 10.3 Anders Röstlund
235 188 Clinton mätkonsult Ab CE 13/14 30.6 34.7 26 0.68 590 8.9 Johan nyström
STd 236 207 metod Arkitekter A 14 30.1 21.6 21 3.42 899 11.6 patrik Tammerman
STd 237 179 TEAm TSp Konsult Ab E 14 30.0 30.9 21 3.73 1,036 14.0 göran berg
STd 238 179 Ag Arkitekter Ab A 14 29.9 36.1 31 -0.89 686 2.3 Fredrik Kihlman
STd 239 200 Konsultgruppen i bergslagen Ab i 14/15 29.2 31.9 16 2.23 1,034 10.3 håkan martinsson
STd 240 226 lindberg Stenberg Arkitekter Ab A 14 29.1 26.7 26 5.20 809 11.7 dag lindberg
241 199 Creator Teknisk utveckling Ab i 14 28.9 31.9 34 -6.98 443 55.6 Jerry Svedlund
242 221 Creanova Ab m,Enr 13/14 28.8 27.2 23 6.92 984 12.7 göran olsson
STd 243 220 STibA Ab CE 14 28.8 28.4 23 6.35 1,027 11.7 Rune dalmyr
STd 244 209 dgE mark och miljö Ab Env 14 28.3 30.6 26 0.62 612 9.2 Johnny Sjögren
STd 245 241 Rockstore Engineering Ab CE 14 28.1 24.6 15 4.51 1,117 15.2 Krister Knutsson
246 Cliff design Ab i 14 27.9 21.0 21 2.61 690 13.0 Anders nordlund
STd 247 277 Svenska Teknikingenjörer Ab i 13/14 27.8 18.9 18 2.07 693 10.1 hans Aderum
248 Karlander Konsult Ab CE 13/14 27.2 24.6 16 -0.14 672 5.4 Fredrik Karlander249 218 mekaniska Construktion
norrbotten Ab i 14 26.8 29.1 15 0.93 627 10.9 Erik AnderssonSTd 250 216 Creacon halmstads Konsult Ab CE 14 26.6 29.5 32 1.61 593 11.7 Torbjörn ÅkessonSTd 251 234 Knut Jönson byggadministration i
Stockholm pm 14/15 26.5 25.7 11 6.18 1302 10.3 Tom Ågstrand
the SwediSh marKet
The top 300 Swedish consulting engineering and architectural groups
2015 2014 Group ServicesAnnualreport
turn-over
MSek(Previous
year)
Average number of
employees
result after financial
items MSek
Added value/empl. kSek
total balance
sheet MSek ceo/Managing director
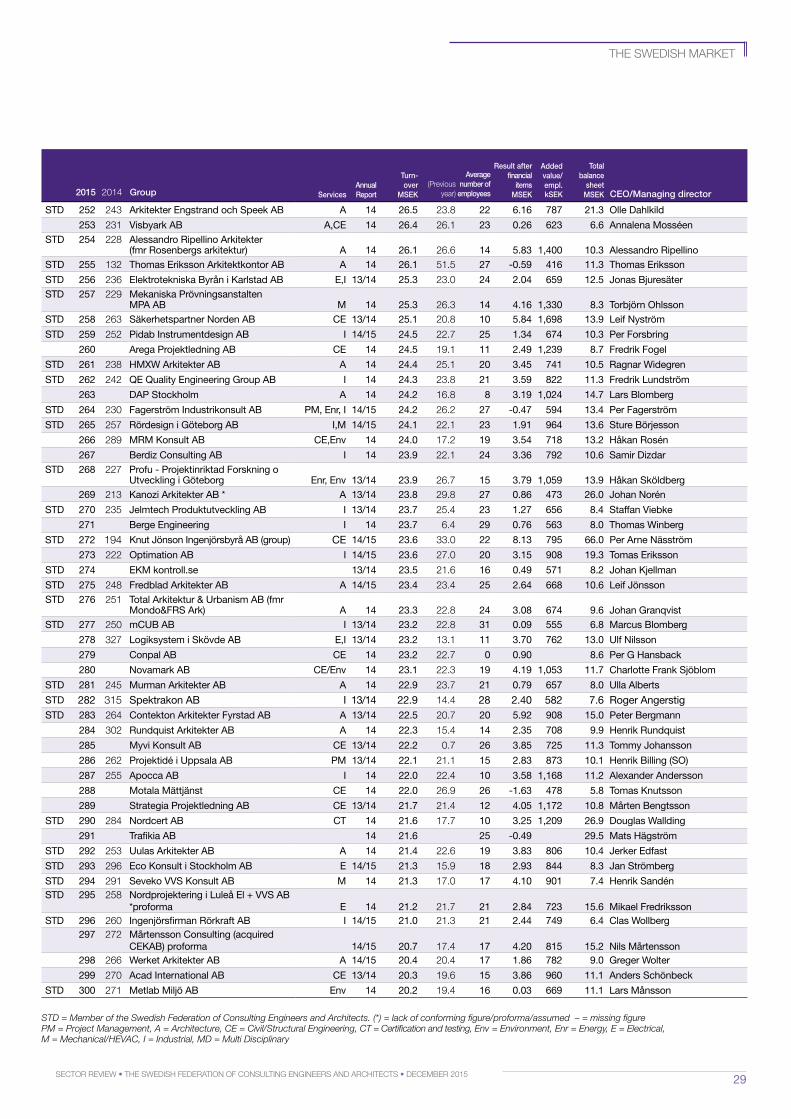
29Sector review • the SwediSh Federation oF conSulting engineerS and architectS • december 2015
STd 252 243 Arkitekter Engstrand och Speek Ab A 14 26.5 23.8 22 6.16 787 21.3 olle dahlkild
253 231 visbyark Ab A,CE 14 26.4 26.1 23 0.26 623 6.6 Annalena mosséenSTd 254 228 Alessandro Ripellino Arkitekter
(fmr Rosenbergs arkitektur) A 14 26.1 26.6 14 5.83 1,400 10.3 Alessandro RipellinoSTd 255 132 Thomas Eriksson Arkitektkontor Ab A 14 26.1 51.5 27 -0.59 416 11.3 Thomas Eriksson
STd 256 236 Elektrotekniska byrån i Karlstad Ab E,i 13/14 25.3 23.0 24 2.04 659 12.5 Jonas bjuresäterSTd 257 229 mekaniska prövningsanstalten
mpA Ab m 14 25.3 26.3 14 4.16 1,330 8.3 Torbjörn ohlssonSTd 258 263 Säkerhetspartner norden Ab CE 13/14 25.1 20.8 10 5.84 1,698 13.9 leif nyström
STd 259 252 pidab instrumentdesign Ab i 14/15 24.5 22.7 25 1.34 674 10.3 per Forsbring
260 Arega projektledning Ab CE 14 24.5 19.1 11 2.49 1,239 8.7 Fredrik Fogel
STd 261 238 hmxw Arkitekter Ab A 14 24.4 25.1 20 3.45 741 10.5 Ragnar widegren
STd 262 242 qE quality Engineering group Ab i 14 24.3 23.8 21 3.59 822 11.3 Fredrik lundström
263 dAp Stockholm A 14 24.2 16.8 8 3.19 1,024 14.7 lars blomberg
STd 264 230 Fagerström industrikonsult Ab pm, Enr, i 14/15 24.2 26.2 27 -0.47 594 13.4 per Fagerström
STd 265 257 Rördesign i göteborg Ab i,m 14/15 24.1 22.1 23 1.91 964 13.6 Sture börjesson
266 289 mRm Konsult Ab CE,Env 14 24.0 17.2 19 3.54 718 13.2 håkan Rosén
267 berdiz Consulting Ab i 14 23.9 22.1 24 3.36 792 10.6 Samir dizdarSTd 268 227 profu - projektinriktad Forskning o
utveckling i göteborg Enr, Env 13/14 23.9 26.7 15 3.79 1,059 13.9 håkan Sköldberg269 213 Kanozi Arkitekter Ab * A 13/14 23.8 29.8 27 0.86 473 26.0 Johan norén
STd 270 235 Jelmtech produktutveckling Ab i 13/14 23.7 25.4 23 1.27 656 8.4 Staffan viebke
271 berge Engineering i 14 23.7 6.4 29 0.76 563 8.0 Thomas winberg
STd 272 194 Knut Jönson ingenjörsbyrå Ab (group) CE 14/15 23.6 33.0 22 8.13 795 66.0 per Arne näsström
273 222 optimation Ab i 14/15 23.6 27.0 20 3.15 908 19.3 Tomas Eriksson
STd 274 EKm kontroll.se 13/14 23.5 21.6 16 0.49 571 8.2 Johan Kjellman
STd 275 248 Fredblad Arkitekter Ab A 14/15 23.4 23.4 25 2.64 668 10.6 leif JönssonSTd 276 251 Total Arkitektur & urbanism Ab (fmr
mondo&FRS Ark) A 14 23.3 22.8 24 3.08 674 9.6 Johan granqvistSTd 277 250 mCub Ab i 13/14 23.2 22.8 31 0.09 555 6.8 marcus blomberg
278 327 logiksystem i Skövde Ab E,i 13/14 23.2 13.1 11 3.70 762 13.0 ulf nilsson
279 Conpal Ab CE 14 23.2 22.7 0 0.90 8.6 per g hansback
280 novamark Ab CE/Env 14 23.1 22.3 19 4.19 1,053 11.7 Charlotte Frank Sjöblom
STd 281 245 murman Arkitekter Ab A 14 22.9 23.7 21 0.79 657 8.0 ulla Alberts
STd 282 315 Spektrakon Ab i 13/14 22.9 14.4 28 2.40 582 7.6 Roger AngerstigSTd 283 264 Contekton Arkitekter Fyrstad Ab A 13/14 22.5 20.7 20 5.92 908 15.0 peter bergmann
284 302 Rundquist Arkitekter Ab A 14 22.3 15.4 14 2.35 708 9.9 henrik Rundquist
285 myvi Konsult Ab CE 13/14 22.2 0.7 26 3.85 725 11.3 Tommy Johansson
286 262 projektidé i uppsala Ab pm 13/14 22.1 21.1 15 2.83 873 10.1 henrik billing (So)
287 255 Apocca Ab i 14 22.0 22.4 10 3.58 1,168 11.2 Alexander Andersson
288 motala mättjänst CE 14 22.0 26.9 26 -1.63 478 5.8 Tomas Knutsson
289 Strategia projektledning Ab CE 13/14 21.7 21.4 12 4.05 1,172 10.8 mårten bengtsson
STd 290 284 nordcert Ab CT 14 21.6 17.7 10 3.25 1,209 26.9 douglas wallding
291 Trafikia Ab 14 21.6 25 -0.49 29.5 mats hägström
STd 292 253 uulas Arkitekter Ab A 14 21.4 22.6 19 3.83 806 10.4 Jerker Edfast
STd 293 296 Eco Konsult i Stockholm Ab E 14/15 21.3 15.9 18 2.93 844 8.3 Jan Strömberg
STd 294 291 Seveko vvS Konsult Ab m 14 21.3 17.0 17 4.10 901 7.4 henrik Sandén STd 295 258 nordprojektering i luleå El + vvS Ab
*proforma E 14 21.2 21.7 21 2.84 723 15.6 mikael FredrikssonSTd 296 260 ingenjörsfirman Rörkraft Ab i 14/15 21.0 21.3 21 2.44 749 6.4 Clas wollberg
297 272 mårtensson Consulting (acquired CEKAb) proforma 14/15 20.7 17.4 17 4.20 815 15.2 nils mårtensson
298 266 werket Arkitekter Ab A 14/15 20.4 20.4 17 1.86 782 9.0 greger wolter
299 270 Acad international Ab CE 13/14 20.3 19.6 15 3.86 960 11.1 Anders Schönbeck
STd 300 271 metlab miljö Ab Env 14 20.2 19.4 16 0.03 669 11.1 lars månsson
the SwediSh marKet
STD = Member of the Swedish Federation of Consulting Engineers and Architects. (*) = lack of conforming figure/proforma/assumed – = missing figure PM = Project Management, A = Architecture, CE = Civil/Structural Engineering, CT = Certification and testing, Env = Environment, Enr = Energy, E = Electrical, M = Mechanical/HEVAC, I = Industrial, MD = Multi Disciplinary
2015 2014 Group ServicesAnnualreport
turn-over
MSek(Previous
year)
Average number of
employees
result after financial
items MSek
Added value/empl. kSek
total balance
sheet MSek ceo/Managing director
30 Sector review • the SwediSh Federation oF conSulting engineerS and architectS • december 2015
””Norway had the best profit margin in the Nordic region during 2014, with 7.1 %”
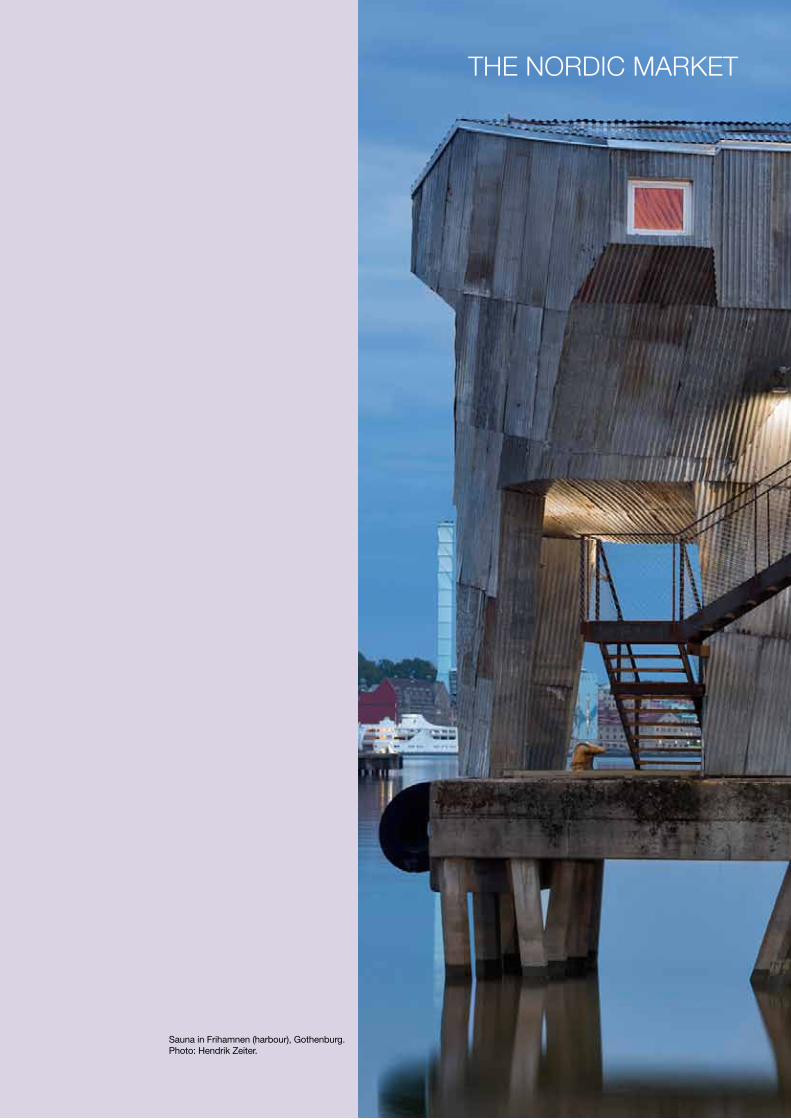
31Sector review • the SwediSh Federation oF conSulting engineerS and architectS • december 2015
the nordic marKet
Sauna in Frihamnen (harbour), gothenburg. photo: hendrik Zeiter.
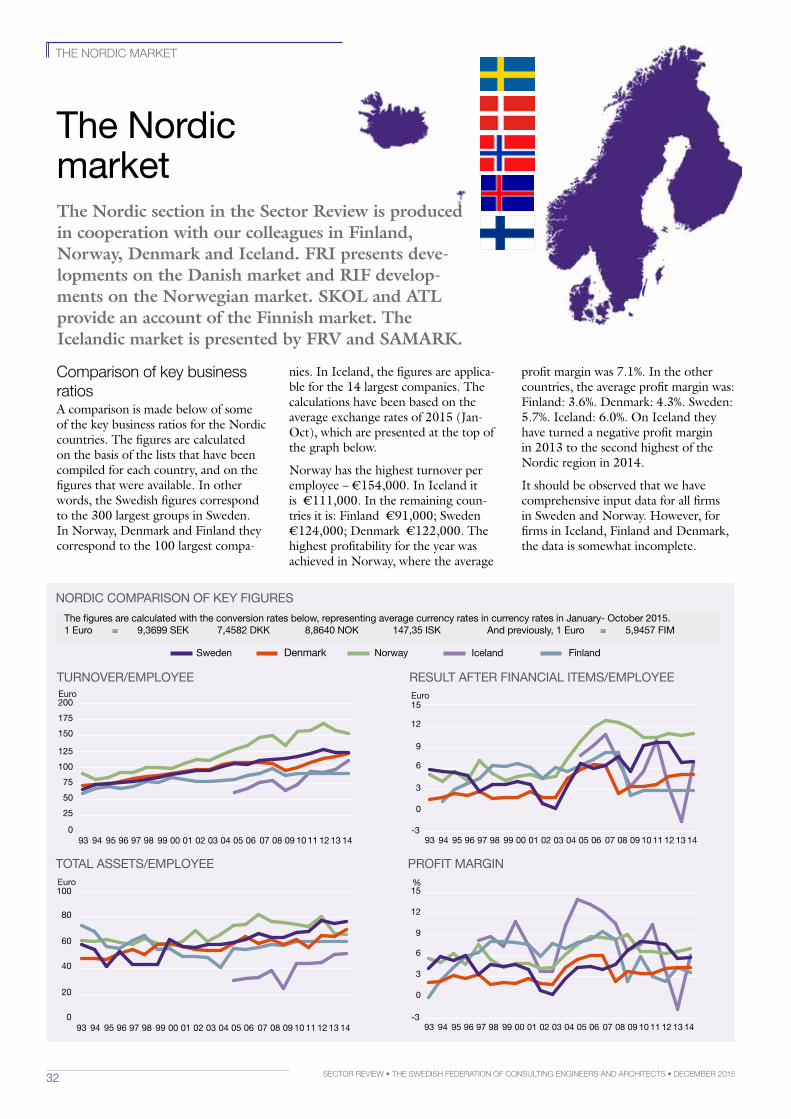
32 Sector review • the SwediSh Federation oF conSulting engineerS and architectS • december 2015
noRdiC CompARiSon oF KEy FiguRES
TuRnovER/EmployEE RESulT AFTER FinAnCiAl iTEmS/EmployEE
ToTAl ASSETS/EmployEE pRoFiT mARgin
The figures are calculated with the conversion rates below, representing average currency rates in currency rates in January- october 2015.1 Euro = 9,3699 SEK 7,4582 dKK 8,8640 noK 147,35 iSK And previously, 1 Euro = 5,9457 Fim
The nordic market
the nordic marKet
The Nordic section in the Sector Review is produced in cooperation with our colleagues in Finland, Norway, Denmark and Iceland. FRI presents developments on the Danish market and RIF developments on the Norwegian market. SKOL and ATL provide an account of the Finnish market. The Icelandic market is presented by FRV and SAMARK.
comparison of key business ratiosA comparison is made below of some of the key business ratios for the Nordic countries. The figures are calculated on the basis of the lists that have been compiled for each country, and on the figures that were available. In other words, the Swedish figures correspond to the 300 largest groups in Sweden. In Norway, Denmark and Finland they correspond to the 100 largest compa-
nies. In Iceland, the figures are applica-ble for the 14 largest companies. The calculations have been based on the average exchange rates of 2015 (Jan-Oct), which are presented at the top of the graph below.
Norway has the highest turnover per employee – €154,000. In Iceland it is €111,000. In the remaining coun-tries it is: Finland €91,000; Sweden €124,000; Denmark €122,000. The highest profitability for the year was achieved in Norway, where the average
profit margin was 7.1%. In the other countries, the average profit margin was: Finland: 3.6%. Denmark: 4.3%. Sweden: 5.7%. Iceland: 6.0%. On Iceland they have turned a negative profit margin in 2013 to the second highest of the Nordic region in 2014.
It should be observed that we have comprehensive input data for all firms in Sweden and Norway. However, for firms in Iceland, Finland and Denmark, the data is somewhat incomplete.
0
20
40
60
80
100Euro
14131211100908070605040302010099989796959493
-3
0
3
6
9
12
15Euro
141312111009080706050403020100999897969594930
25
50
75
100
125
150
175
200Euro
14131211100908070605040302010099989796959493
-3
0
3
6
9
12
15
14131211100908070605040302010099989796959493
%
Sweden denmark norway iceland Finland
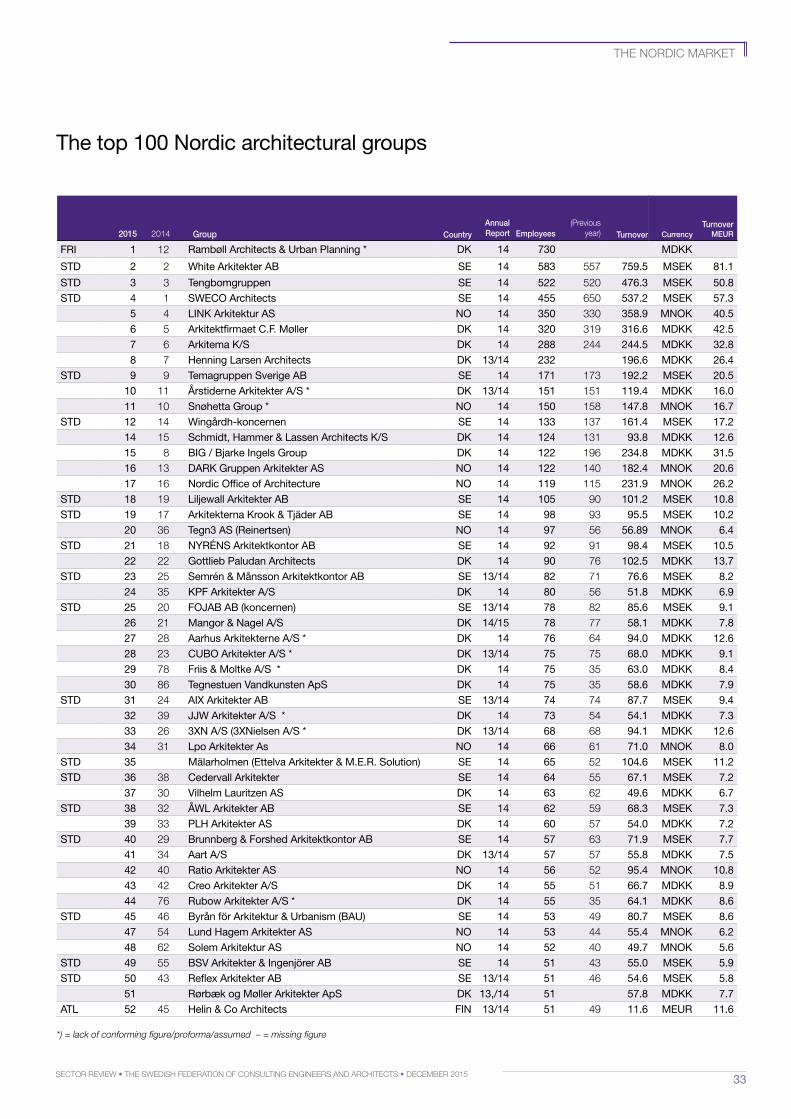
33Sector review • the SwediSh Federation oF conSulting engineerS and architectS • december 2015
The top 100 nordic architectural groups
the nordic marKet
FRi 1 12 Rambøll Architects & urban planning * dK 14 730 mdKK
STd 2 2 white Arkitekter Ab SE 14 583 557 759.5 mSEK 81.1
STd 3 3 Tengbomgruppen SE 14 522 520 476.3 mSEK 50.8STd 4 1 SwECo Architects SE 14 455 650 537.2 mSEK 57.3
5 4 linK Arkitektur AS no 14 350 330 358.9 mnoK 40.56 5 Arkitektfirmaet C.F. møller dK 14 320 319 316.6 mdKK 42.57 6 Arkitema K/S dK 14 288 244 244.5 mdKK 32.88 7 henning larsen Architects dK 13/14 232 196.6 mdKK 26.4
STd 9 9 Temagruppen Sverige Ab SE 14 171 173 192.2 mSEK 20.510 11 Årstiderne Arkitekter A/S * dK 13/14 151 151 119.4 mdKK 16.011 10 Snøhetta group * no 14 150 158 147.8 mnoK 16.7
STd 12 14 wingårdh-koncernen SE 14 133 137 161.4 mSEK 17.214 15 Schmidt, hammer & lassen Architects K/S dK 14 124 131 93.8 mdKK 12.615 8 big / bjarke ingels group dK 14 122 196 234.8 mdKK 31.516 13 dARK gruppen Arkitekter AS no 14 122 140 182.4 mnoK 20.617 16 nordic office of Architecture no 14 119 115 231.9 mnoK 26.2
STd 18 19 liljewall Arkitekter Ab SE 14 105 90 101.2 mSEK 10.8STd 19 17 Arkitekterna Krook & Tjäder Ab SE 14 98 93 95.5 mSEK 10.2
20 36 Tegn3 AS (Reinertsen) no 14 97 56 56.89 mnoK 6.4STd 21 18 nyRÉnS Arkitektkontor Ab SE 14 92 91 98.4 mSEK 10.5
22 22 gottlieb paludan Architects dK 14 90 76 102.5 mdKK 13.7STd 23 25 Semrén & månsson Arkitektkontor Ab SE 13/14 82 71 76.6 mSEK 8.2
24 35 KpF Arkitekter A/S dK 14 80 56 51.8 mdKK 6.9STd 25 20 FoJAb Ab (koncernen) SE 13/14 78 82 85.6 mSEK 9.1
26 21 mangor & nagel A/S dK 14/15 78 77 58.1 mdKK 7.827 28 Aarhus Arkitekterne A/S * dK 14 76 64 94.0 mdKK 12.628 23 Cubo Arkitekter A/S * dK 13/14 75 75 68.0 mdKK 9.129 78 Friis & moltke A/S * dK 14 75 35 63.0 mdKK 8.430 86 Tegnestuen vandkunsten ApS dK 14 75 35 58.6 mdKK 7.9
STd 31 24 Aix Arkitekter Ab SE 13/14 74 74 87.7 mSEK 9.432 39 JJw Arkitekter A/S * dK 14 73 54 54.1 mdKK 7.333 26 3xn A/S (3xnielsen A/S * dK 13/14 68 68 94.1 mdKK 12.634 31 lpo Arkitekter As no 14 66 61 71.0 mnoK 8.0
STd 35 mälarholmen (Ettelva Arkitekter & m.E.R. Solution) SE 14 65 52 104.6 mSEK 11.2STd 36 38 Cedervall Arkitekter SE 14 64 55 67.1 mSEK 7.2
37 30 vilhelm lauritzen AS dK 14 63 62 49.6 mdKK 6.7STd 38 32 Åwl Arkitekter Ab SE 14 62 59 68.3 mSEK 7.3
39 33 plh Arkitekter AS dK 14 60 57 54.0 mdKK 7.2STd 40 29 brunnberg & Forshed Arkitektkontor Ab SE 14 57 63 71.9 mSEK 7.7
41 34 Aart A/S dK 13/14 57 57 55.8 mdKK 7.542 40 Ratio Arkitekter AS no 14 56 52 95.4 mnoK 10.843 42 Creo Arkitekter A/S dK 14 55 51 66.7 mdKK 8.944 76 Rubow Arkitekter A/S * dK 14 55 35 64.1 mdKK 8.6
STd 45 46 byrån för Arkitektur & urbanism (bAu) SE 14 53 49 80.7 mSEK 8.647 54 lund hagem Arkitekter AS no 14 53 44 55.4 mnoK 6.248 62 Solem Arkitektur AS no 14 52 40 49.7 mnoK 5.6
STd 49 55 bSv Arkitekter & ingenjörer Ab SE 14 51 43 55.0 mSEK 5.9STd 50 43 Reflex Arkitekter Ab SE 13/14 51 46 54.6 mSEK 5.8
51 Rørbæk og møller Arkitekter ApS dK 13,/14 51 57.8 mdKK 7.7ATl 52 45 helin & Co Architects Fin 13/14 51 49 11.6 mEuR 11.6
2015 2014 Group countryAnnualreport
employees
(Previousyear)
turnover currency
turnover MeUr
*) = lack of conforming figure/proforma/assumed – = missing figure
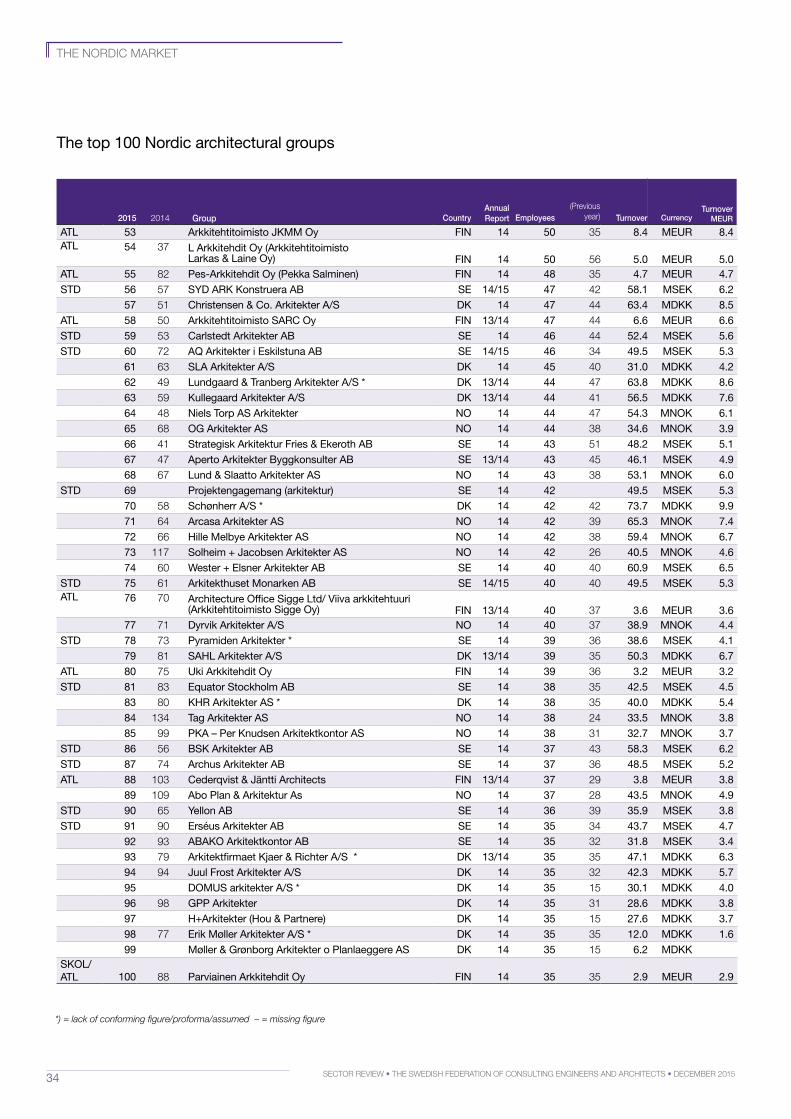
34 Sector review • the SwediSh Federation oF conSulting engineerS and architectS • december 2015
ATl 53 Arkkitehtitoimisto JKmm oy Fin 14 50 35 8.4 mEuR 8.4ATl 54 37 l Arkkitehdit oy (Arkkitehtitoimisto
larkas & laine oy) Fin 14 50 56 5.0 mEuR 5.0ATl 55 82 pes-Arkkitehdit oy (pekka Salminen) Fin 14 48 35 4.7 mEuR 4.7STd 56 57 Syd ARK Konstruera Ab SE 14/15 47 42 58.1 mSEK 6.2
57 51 Christensen & Co. Arkitekter A/S dK 14 47 44 63.4 mdKK 8.5ATl 58 50 Arkkitehtitoimisto SARC oy Fin 13/14 47 44 6.6 mEuR 6.6STd 59 53 Carlstedt Arkitekter Ab SE 14 46 44 52.4 mSEK 5.6STd 60 72 Aq Arkitekter i Eskilstuna Ab SE 14/15 46 34 49.5 mSEK 5.3
61 63 SlA Arkitekter A/S dK 14 45 40 31.0 mdKK 4.262 49 lundgaard & Tranberg Arkitekter A/S * dK 13/14 44 47 63.8 mdKK 8.663 59 Kullegaard Arkitekter A/S dK 13/14 44 41 56.5 mdKK 7.664 48 niels Torp AS Arkitekter no 14 44 47 54.3 mnoK 6.165 68 og Arkitekter AS no 14 44 38 34.6 mnoK 3.966 41 Strategisk Arkitektur Fries & Ekeroth Ab SE 14 43 51 48.2 mSEK 5.167 47 Aperto Arkitekter byggkonsulter Ab SE 13/14 43 45 46.1 mSEK 4.968 67 lund & Slaatto Arkitekter AS no 14 43 38 53.1 mnoK 6.0
STd 69 projektengagemang (arkitektur) SE 14 42 49.5 mSEK 5.370 58 Schønherr A/S * dK 14 42 42 73.7 mdKK 9.971 64 Arcasa Arkitekter AS no 14 42 39 65.3 mnoK 7.472 66 hille melbye Arkitekter AS no 14 42 38 59.4 mnoK 6.773 117 Solheim + Jacobsen Arkitekter AS no 14 42 26 40.5 mnoK 4.674 60 wester + Elsner Arkitekter Ab SE 14 40 40 60.9 mSEK 6.5
STd 75 61 Arkitekthuset monarken Ab SE 14/15 40 40 49.5 mSEK 5.3ATl 76 70 Architecture office Sigge ltd/ viiva arkkitehtuuri
(Arkkitehtitoimisto Sigge oy) Fin 13/14 40 37 3.6 mEuR 3.677 71 dyrvik Arkitekter A/S no 14 40 37 38.9 mnoK 4.4
STd 78 73 pyramiden Arkitekter * SE 14 39 36 38.6 mSEK 4.179 81 SAhl Arkitekter A/S dK 13/14 39 35 50.3 mdKK 6.7
ATl 80 75 uki Arkkitehdit oy Fin 14 39 36 3.2 mEuR 3.2STd 81 83 Equator Stockholm Ab SE 14 38 35 42.5 mSEK 4.5
83 80 KhR Arkitekter AS * dK 14 38 35 40.0 mdKK 5.484 134 Tag Arkitekter AS no 14 38 24 33.5 mnoK 3.885 99 pKA – per Knudsen Arkitektkontor AS no 14 38 31 32.7 mnoK 3.7
STd 86 56 bSK Arkitekter Ab SE 14 37 43 58.3 mSEK 6.2STd 87 74 Archus Arkitekter Ab SE 14 37 36 48.5 mSEK 5.2ATl 88 103 Cederqvist & Jäntti Architects Fin 13/14 37 29 3.8 mEuR 3.8
89 109 Abo plan & Arkitektur As no 14 37 28 43.5 mnoK 4.9STd 90 65 yellon Ab SE 14 36 39 35.9 mSEK 3.8STd 91 90 Erséus Arkitekter Ab SE 14 35 34 43.7 mSEK 4.7
92 93 AbAKo Arkitektkontor Ab SE 14 35 32 31.8 mSEK 3.493 79 Arkitektfirmaet Kjaer & Richter A/S * dK 13/14 35 35 47.1 mdKK 6.394 94 Juul Frost Arkitekter A/S dK 14 35 32 42.3 mdKK 5.795 domuS arkitekter A/S * dK 14 35 15 30.1 mdKK 4.096 98 gpp Arkitekter dK 14 35 31 28.6 mdKK 3.897 h+Arkitekter (hou & partnere) dK 14 35 15 27.6 mdKK 3.798 77 Erik møller Arkitekter A/S * dK 14 35 35 12.0 mdKK 1.699 møller & grønborg Arkitekter o planlaeggere AS dK 14 35 15 6.2 mdKK
SKol/ATl 100 88 parviainen Arkkitehdit oy Fin 14 35 35 2.9 mEuR 2.9
*) = lack of conforming figure/proforma/assumed – = missing figure
2015 2014 Group countryAnnualreport
employees
(Previous year)
turnover currency
turnover MeUr
The top 100 nordic architectural groups
the nordic marKet
35Sector review • the SwediSh Federation oF conSulting engineerS and architectS • december 2015
the daniSh marKet
AbouT FRi
The danish Association of Consulting Engineers (FRi), founded in 1904, is a trade association for danish consultancy firms providing independent consultancy services on market terms. FRi is a part of the Confederation of danish industry (di).
Approximately 330 firms are members of FRi and, in total, they employ 25.000 staff in denmark and abroad. The as-sociation is the only trade association for independent technical consultants in denmark.
The objective of FRi is to support its member firms by contributing to improv-ing their business conditions, strengthen-ing the industry’s framework conditions, profiling the industry and increasing its recognition on national and international levels.
FRi is an association for firms. it focuses on business matters and has established good liaisons with authorities and other partners. The association attempts as far as possible to gain influence on the drafting of framework conditions and legislation affecting market conditions in the industry.
internationally, the association is a member of FidiC and, in Europe, it is a member of EFCA.
Address: vesterbrogade 1E, 3rd floor p.o. box 367 dK-1504 Copenhagen v, denmark
Tel: +45-35 25 37 37E-mail: [email protected] www.frinet.dk
henrik garver, FRi david hedegaard meyer, FRi
Ramboll achieved gross revenue of EUR 723 million in the first half year of 2015, which is 30% up compared to the same period in 2014. The number of employees grew by 19% in the first half of 2015, mainly due to the acquisition of the US based consultancy ENVIRON. Ramboll now has 12,841 employees globally.
Ramboll grows by 30%
One of those employees, 33-year-old Anne Moloney, was named Young Pro-fessional of the Year 2015 by FRI as well as by EFCA (European Federation of Engineering Consultancy Associations) for her work on the Queensferry Cross-ing project in Scotland. With Ramboll’s global presence, several major projects has been won all over the world in 2015. Ramboll has secured a contract for a very big district cooling project in Makkah, Kingdom of Saudi Arabia. The project will need 150 MW power to produce the 500 MW of cooling and the construction area will cover 6.3 million m2. In the UK, Ramboll was
awarded the design of a reactive com-pensation substation for the Hornsea Project One offshore wind farm devel-opment. The substation will be stand-ing in 23 m of water and will service a wind farm that is expected to host 150-240 turbines. In Canada, Ramboll was appointed Independent Engineer for the new Champlain Bridge Corridor Project in Montreal - one of the largest infrastructure projects in North America. Ramboll has invested heavily in the North American market in recent years with the acquisition of ENVIRON and its 1,500 employees. Ramboll has also acquired Projectus Team with 130 em-
ployees in Finland, bringing the number of employees in Finland to over 2,000.
best financial result in cowi’s history2014 was a strong year for COWI with a gross revenue of EUR 714 million and a record high profit (EBIT) of EUR 30 million. This is in no small part due to an extensive organizational restruc-turing, which resulted in a more agile organization. COWI also increased the number of employees and the global workforce of COWI came to 6,300 in 2014. Being one of the world’s leading consulting engineers on bridges and maritime constructions, COWI was chosen to head one of the three work-ing groups planning the world’s longest floating bridge over the five km wide Bjørnafjord in Norway. The bridge is to carry a four-lane motorway and will cross depths of up to 550 m, which makes conventional bridges impossible. In Iceland, COWI won the master plan contest for Keflavik International Airport, which is the fastest growing airport in Europe. Major railway pro-jects were also won by COWI in 2015, where the company will be working on the Østfold line in Norway and The Eastern Link, a new high speed connec-tion between Stockholm and Gothen-burg/Malmö in Sweden. As technical advisor and consultant, COWI will help Volvo Cars in the USA by providing project organization, planning, system documentation as well as services within several technical disciplines prior to the tendering of a new factory. COWI also won a contract for a new 80,000 m² hospital in Norway, which will replace the existing hospitals in the towns of Kristiansund and Molde.
niraS continues growth in Scandinavian marketsWith good profits in both Denmark, Sweden and Finland and successful assignments in the growing Norwegian market, the year 2014 proved a good year for NIRAS. Consolidated revenues
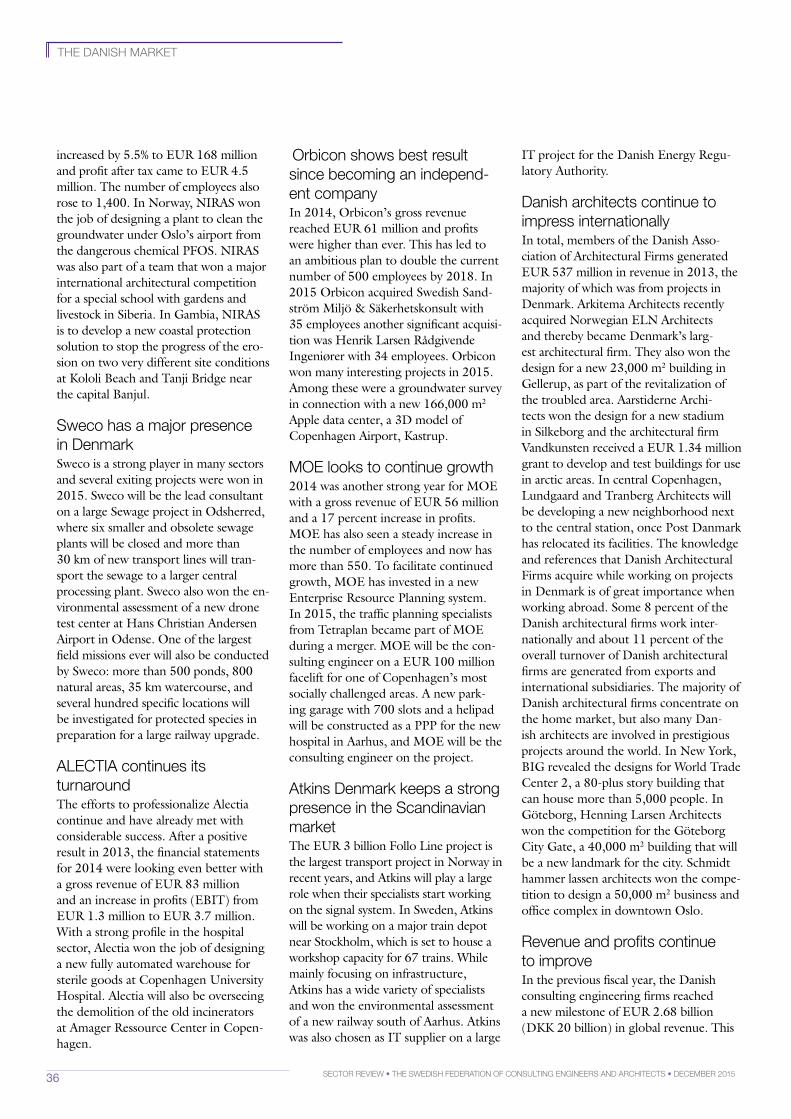
36 Sector review • the SwediSh Federation oF conSulting engineerS and architectS • december 2015
increased by 5.5% to EUR 168 million and profit after tax came to EUR 4.5 million. The number of employees also rose to 1,400. In Norway, NIRAS won the job of designing a plant to clean the groundwater under Oslo’s airport from the dangerous chemical PFOS. NIRAS was also part of a team that won a major international architectural competition for a special school with gardens and livestock in Siberia. In Gambia, NIRAS is to develop a new coastal protection solution to stop the progress of the ero-sion on two very different site conditions at Kololi Beach and Tanji Bridge near the capital Banjul.
Sweco has a major presence in denmark Sweco is a strong player in many sectors and several exiting projects were won in 2015. Sweco will be the lead consultant on a large Sewage project in Odsherred, where six smaller and obsolete sewage plants will be closed and more than 30 km of new transport lines will tran-sport the sewage to a larger central processing plant. Sweco also won the en-vironmental assessment of a new drone test center at Hans Christian Andersen Airport in Odense. One of the largest field missions ever will also be conducted by Sweco: more than 500 ponds, 800 natural areas, 35 km watercourse, and several hundred specific locations will be investigated for protected species in preparation for a large railway upgrade.
alectia continues its turnaroundThe efforts to professionalize Alectia continue and have already met with considerable success. After a positive result in 2013, the financial statements for 2014 were looking even better with a gross revenue of EUR 83 million and an increase in profits (EBIT) from EUR 1.3 million to EUR 3.7 million. With a strong profile in the hospital sector, Alectia won the job of designing a new fully automated warehouse for sterile goods at Copenhagen University Hospital. Alectia will also be overseeing the demolition of the old incinerators at Amager Ressource Center in Copen-hagen.
orbicon shows best result since becoming an independ-ent companyIn 2014, Orbicon’s gross revenue reached EUR 61 million and profits were higher than ever. This has led to an ambitious plan to double the current number of 500 employees by 2018. In 2015 Orbicon acquired Swedish Sand-ström Miljö & Säkerhetskonsult with 35 employees another significant acquisi-tion was Henrik Larsen Rådgivende Ingeniører with 34 employees. Orbicon won many interesting projects in 2015. Among these were a groundwater survey in connection with a new 166,000 m2 Apple data center, a 3D model of Copenhagen Airport, Kastrup.
moe looks to continue growth2014 was another strong year for MOE with a gross revenue of EUR 56 million and a 17 percent increase in profits. MOE has also seen a steady increase in the number of employees and now has more than 550. To facilitate continued growth, MOE has invested in a new Enterprise Resource Planning system. In 2015, the traffic planning specialists from Tetraplan became part of MOE during a merger. MOE will be the con-sulting engineer on a EUR 100 million facelift for one of Copenhagen’s most socially challenged areas. A new park-ing garage with 700 slots and a helipad will be constructed as a PPP for the new hospital in Aarhus, and MOE will be the consulting engineer on the project.
atkins denmark keeps a strong presence in the Scandinavian market The EUR 3 billion Follo Line project is the largest transport project in Norway in recent years, and Atkins will play a large role when their specialists start working on the signal system. In Sweden, Atkins will be working on a major train depot near Stockholm, which is set to house a workshop capacity for 67 trains. While mainly focusing on infrastructure, Atkins has a wide variety of specialists and won the environmental assessment of a new railway south of Aarhus. Atkins was also chosen as IT supplier on a large
IT project for the Danish Energy Regu-latory Authority.
danish architects continue to impress internationallyIn total, members of the Danish Asso-ciation of Architectural Firms generated EUR 537 million in revenue in 2013, the majority of which was from projects in Denmark. Arkitema Architects recently acquired Norwegian ELN Architects and thereby became Denmark’s larg-est architectural firm. They also won the design for a new 23,000 m2 building in Gellerup, as part of the revitalization of the troubled area. Aarstiderne Archi-tects won the design for a new stadium in Silkeborg and the architectural firm Vandkunsten received a EUR 1.34 million grant to develop and test buildings for use in arctic areas. In central Copenhagen, Lundgaard and Tranberg Architects will be developing a new neighborhood next to the central station, once Post Danmark has relocated its facilities. The knowledge and references that Danish Architectural Firms acquire while working on projects in Denmark is of great importance when working abroad. Some 8 percent of the Danish architectural firms work inter-nationally and about 11 percent of the overall turnover of Danish architectural firms are generated from exports and international subsidiaries. The majority of Danish architectural firms concentrate on the home market, but also many Dan-ish architects are involved in prestigious projects around the world. In New York, BIG revealed the designs for World Trade Center 2, a 80-plus story building that can house more than 5,000 people. In Göteborg, Henning Larsen Architects won the competition for the Göteborg City Gate, a 40,000 m2 building that will be a new landmark for the city. Schmidt hammer lassen architects won the compe-tition to design a 50,000 m2 business and office complex in downtown Oslo.
revenue and profits continue to improveIn the previous fiscal year, the Danish consulting engineering firms reached a new milestone of EUR 2.68 billion (DKK 20 billion) in global revenue. This
the daniSh marKet
37Sector review • the SwediSh Federation oF conSulting engineerS and architectS • december 2015
growth continued in 2014, where the Danish consulting engineering firms’ global revenue totaled EUR 2.84 billion (DKK 21.2 billion). Contrary to 2013 where the main growth derived from the foreign subsidiaries, 2014 showed a strong growth of 5.8 percent from EUR 1.55 billion to EUR 1.64 billion on the domestic market. At the same time, revenue in subsidiaries only grew by 2.5 percent from EUR 1.18 billion to EUR 1.21 billion. Export accounted for approximately 19 percent of the domes-tic revenue, which was a decline from 21 percent in 2013. In 2014, the profit margin (EBIT) improved to 6.7 percent from 6.1 percent the year before. Danish consulting engineering firms employed approximately 25,500 staff globally, with 13,000 staff employed in foreign subsidiaries and 12,500 staff employed in Denmark.
outlookThe Danish economy is still feeling the effects of the economic crisis. The GDP growth is expected to reach 1.5 percent in 2015 and 1.7 percent in 2016. Resi-dential investments are expected to rise by 1.0 percent in 2015 and a significant 7.0 percent in 2016 due to the rising prices on housing. Business investments are expected to increase by 3.1 percent in 2015 and 6.9 percent in 2016. Based on the latest FRI survey (October 2015), the Danish consulting engineer-ing industry expects a small increase in the number of employees over the next six months. The survey shows that 40 percent of the firms expect to increase their workforce, while 24 percent expect to decrease it. When asked about ex-pected backlog, 30 percent of the firms expect an increased backlog over the coming six months, while no one expect their workload to decrease. With several major acquisitions abroad in 2015, the past several years of growth in foreign subsidiaries is expected to continue if not accelerate. Revenue generated by exports and in foreign subsidiaries accounts for 53 percent of total revenue in the industry. On the domestic market, Dan-ish consulting engineering firms expect a slow but steady growth in revenue.
Sector market performanceIn 2014, FRI made some revisions to the sector calculations that moved the Infrastructure Sector with 24 percent of total revenue from first to second place. Thus, the Building Sector with 38 per-cent of total revenue is now the largest sector. Firms in the building sector saw a decline in public orders, while private orders were on the rise. Other major sectors were Environment and Energy with 14 percent and 13 percent, respec-tively, of total revenue. The remaining revenue was produced in smaller sectors like IT, Management Consultancy and Process Engineering.
construction on Fehmarnbelt tunnel delayedThe Fehmarnbelt Tunnel, which is one of the largest infrastructure projects in Europe and the world’s longest car tun-nel of 17.6 kilometres, has been delayed due to rising costs and delays in the German environmental approvals. The estimated cost of the project has risen from EUR 6.38 billion to EUR 8.58 bil-lion and the tunnel will not open before 2026 and possibly later. These changes will have major impacts on other projects that were designed to interact with the Fehmarnbelt Tunnel, for instance the upgrade of the railway by building the new Stormstrøm Bridge. The Danish consulting engineers are keenly follow-ing the Fehmarnbelt Tunnel develop-ments, as these will have a direct impact on their businesses.
engineer the FutureProjections show that Denmark will need an additional 13.500 engineers by 2025. This is a huge problem, not only for consulting engineering firms, but for Denmark as a country. To combat this problem, FRI joined an alliance in 2014 called “Engineer the Future” that
seeks to increase the future supply of engineers. The alliance is chaired by The Danish Society of Engineers and consists of private companies, universities and organisations such as FRI.
revising the general conditions of contractIn 2015, an official committee was formed with the mission to revise the general conditions of contract (ABR 89, AB 92 and ABT 93). Fourteen organisa-tions representing construction clients, the government and private parties will be working together on the revision. The work is expected to take up to three years and FRI will be an active partici-pant in the committee, as the revision will have great impact on the future con-ditions for consulting engineering firms.
new water Sector act – new opportunities The new Act on the organisation and economic conditions of the Danish wa-ter sector will become effective in 2016. The political ambitions of the reformed Act are to ensure a sector with: higher economic efficiency; high level environ-mental and service goals and security of supply; less bureaucracy and supervision; better framework conditions for in-novation, technology development and export of Danish water technology and know-how. The New Water Sector Act undoubtedly secures a better framework for business development and exports and, with an annual global market for water solutions close to EUR 400 billion the Danish water sector, including con-sulting engineers, has a huge potential for improving exports to countries not only in Europe, but also in North and South America, Asia and Africa.
David Hedegaard Meyer and Henrik Garver, FRI
”“The GDP growth is expected to reach 1.5 percent in 2015 and 1.7 percent in 2016”
the daniSh marKet
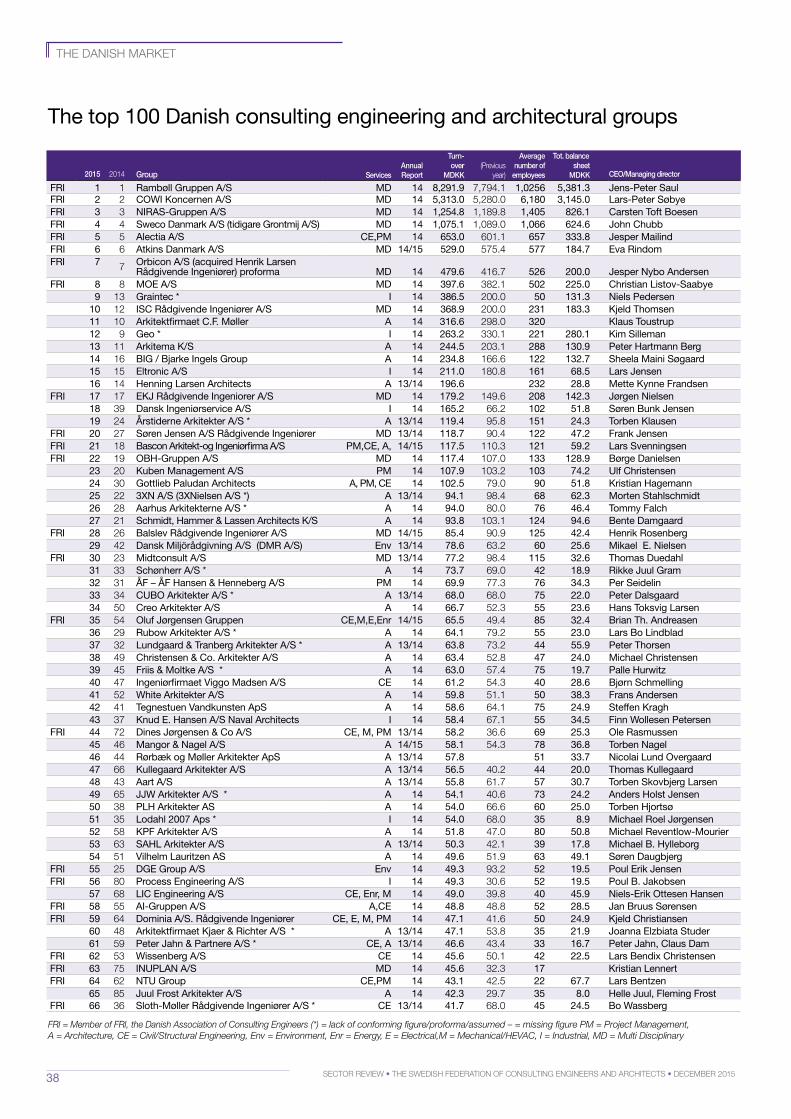
38 Sector review • the SwediSh Federation oF conSulting engineerS and architectS • december 2015
The top 100 danish consulting engineering and architectural groups
2015 2014 Group
ServicesAnnual report
turn- over
Mdkk(Previous
year)
Average number of
employees
tot. balancesheet
Mdkk ceo/Managing director
FRi 1 1 Rambøll gruppen A/S md 14 8,291.9 7,794.1 1,0256 5,381.3 Jens-peter SaulFRi 2 2 Cowi Koncernen A/S md 14 5,313.0 5,280.0 6,180 3,145.0 lars-peter SøbyeFRi 3 3 niRAS-gruppen A/S md 14 1,254.8 1,189.8 1,405 826.1 Carsten Toft boesenFRi 4 4 Sweco danmark A/S (tidigare grontmij A/S) md 14 1,075.1 1,089.0 1,066 624.6 John ChubbFRi 5 5 Alectia A/S CE,pm 14 653.0 601.1 657 333.8 Jesper mailindFRi 6 6 Atkins danmark A/S md 14/15 529.0 575.4 577 184.7 Eva RindomFRi 7 7 orbicon A/S (acquired henrik larsen
Rådgivende ingeniører) proforma md 14 479.6 416.7 526 200.0 Jesper nybo Andersen FRi 8 8 moE A/S md 14 397.6 382.1 502 225.0 Christian listov-Saabye
9 13 graintec * i 14 386.5 200.0 50 131.3 niels pedersen10 12 iSC Rådgivende ingeniører A/S md 14 368.9 200.0 231 183.3 Kjeld Thomsen11 10 Arkitektfirmaet C.F. møller A 14 316.6 298.0 320 Klaus Toustrup12 9 geo * i 14 263.2 330.1 221 280.1 Kim Silleman13 11 Arkitema K/S A 14 244.5 203.1 288 130.9 peter hartmann berg 14 16 big / bjarke ingels group A 14 234.8 166.6 122 132.7 Sheela maini Søgaard15 15 Eltronic A/S i 14 211.0 180.8 161 68.5 lars Jensen16 14 henning larsen Architects A 13/14 196.6 232 28.8 mette Kynne Frandsen
FRi 17 17 EKJ Rådgivende ingeniorer A/S md 14 179.2 149.6 208 142.3 Jørgen nielsen 18 39 dansk ingeniørservice A/S i 14 165.2 66.2 102 51.8 Søren bunk Jensen19 24 Årstiderne Arkitekter A/S * A 13/14 119.4 95.8 151 24.3 Torben Klausen
FRi 20 27 Søren Jensen A/S Rådgivende ingeniører md 13/14 118.7 90.4 122 47.2 Frank JensenFRi 21 18 bascon Arkitekt-og ingeniørfirma A/S pm,CE, A, 14/15 117.5 110.3 121 59.2 lars SvenningsenFRi 22 19 obh-gruppen A/S md 14 117.4 107.0 133 128.9 børge danielsen
23 20 Kuben management A/S pm 14 107.9 103.2 103 74.2 ulf Christensen24 30 gottlieb paludan Architects A, pm, CE 14 102.5 79.0 90 51.8 Kristian hagemann25 22 3xn A/S (3xnielsen A/S *) A 13/14 94.1 98.4 68 62.3 morten Stahlschmidt26 28 Aarhus Arkitekterne A/S * A 14 94.0 80.0 76 46.4 Tommy Falch27 21 Schmidt, hammer & lassen Architects K/S A 14 93.8 103.1 124 94.6 bente damgaard
FRi 28 26 balslev Rådgivende ingeniører A/S md 14/15 85.4 90.9 125 42.4 henrik Rosenberg29 42 dansk miljörådgivning A/S (dmR A/S) Env 13/14 78.6 63.2 60 25.6 mikael E. nielsen
FRi 30 23 midtconsult A/S md 13/14 77.2 98.4 115 32.6 Thomas duedahl31 33 Schønherr A/S * A 14 73.7 69.0 42 18.9 Rikke Juul gram32 31 ÅF – ÅF hansen & henneberg A/S pm 14 69.9 77.3 76 34.3 per Seidelin 33 34 Cubo Arkitekter A/S * A 13/14 68.0 68.0 75 22.0 peter dalsgaard34 50 Creo Arkitekter A/S A 14 66.7 52.3 55 23.6 hans Toksvig larsen
FRi 35 54 oluf Jørgensen gruppen CE,m,E,Enr 14/15 65.5 49.4 85 32.4 brian Th. Andreasen36 29 Rubow Arkitekter A/S * A 14 64.1 79.2 55 23.0 lars bo lindblad37 32 lundgaard & Tranberg Arkitekter A/S * A 13/14 63.8 73.2 44 55.9 peter Thorsen38 49 Christensen & Co. Arkitekter A/S A 14 63.4 52.8 47 24.0 michael Christensen 39 45 Friis & moltke A/S * A 14 63.0 57.4 75 19.7 palle hurwitz40 47 ingeniørfirmaet viggo madsen A/S CE 14 61.2 54.3 40 28.6 bjørn Schmelling 41 52 white Arkitekter A/S A 14 59.8 51.1 50 38.3 Frans Andersen42 41 Tegnestuen vandkunsten ApS A 14 58.6 64.1 75 24.9 Steffen Kragh43 37 Knud E. hansen A/S naval Architects i 14 58.4 67.1 55 34.5 Finn wollesen petersen
FRi 44 72 dines Jørgensen & Co A/S CE, m, pm 13/14 58.2 36.6 69 25.3 ole Rasmussen45 46 mangor & nagel A/S A 14/15 58.1 54.3 78 36.8 Torben nagel46 44 Rørbæk og møller Arkitekter ApS A 13/14 57.8 51 33.7 nicolai lund overgaard47 66 Kullegaard Arkitekter A/S A 13/14 56.5 40.2 44 20.0 Thomas Kullegaard48 43 Aart A/S A 13/14 55.8 61.7 57 30.7 Torben Skovbjerg larsen49 65 JJw Arkitekter A/S * A 14 54.1 40.6 73 24.2 Anders holst Jensen50 38 plh Arkitekter AS A 14 54.0 66.6 60 25.0 Torben hjortsø51 35 lodahl 2007 Aps * i 14 54.0 68.0 35 8.9 michael Roel Jørgensen52 58 KpF Arkitekter A/S A 14 51.8 47.0 80 50.8 michael Reventlow-mourier53 63 SAhl Arkitekter A/S A 13/14 50.3 42.1 39 17.8 michael b. hylleborg54 51 vilhelm lauritzen AS A 14 49.6 51.9 63 49.1 Søren daugbjerg
FRi 55 25 dgE group A/S Env 14 49.3 93.2 52 19.5 poul Erik JensenFRi 56 80 process Engineering A/S i 14 49.3 30.6 52 19.5 poul b. Jakobsen
57 68 liC Engineering A/S CE, Enr, m 14 49.0 39.8 40 45.9 niels-Erik ottesen hansenFRi 58 55 Ai-gruppen A/S A,CE 14 48.8 48.8 52 28.5 Jan bruus SørensenFRi 59 64 dominia A/S. Rådgivende ingeniører CE, E, m, pm 14 47.1 41.6 50 24.9 Kjeld Christiansen
60 48 Arkitektfirmaet Kjaer & Richter A/S * A 13/14 47.1 53.8 35 21.9 Joanna Elzbiata Studer61 59 peter Jahn & partnere A/S * CE, A 13/14 46.6 43.4 33 16.7 peter Jahn, Claus dam
FRi 62 53 wissenberg A/S CE 14 45.6 50.1 42 22.5 lars bendix ChristensenFRi 63 75 inuplAn A/S md 14 45.6 32.3 17 Kristian lennertFRi 64 62 nTu group CE,pm 14 43.1 42.5 22 67.7 lars bentzen
65 85 Juul Frost Arkitekter A/S A 14 42.3 29.7 35 8.0 helle Juul, Fleming FrostFRi 66 36 Sloth-møller Rådgivende ingeniører A/S * CE 13/14 41.7 68.0 45 24.5 bo wassberg
the daniSh marKet
FRI = Member of FRI, the Danish Association of Consulting Engineers (*) = lack of conforming figure/proforma/assumed – = missing figure PM = Project Management, A = Architecture, CE = Civil/Structural Engineering, Env = Environment, Enr = Energy, E = Electrical,M = Mechanical/HEVAC, I = Industrial, MD = Multi Disciplinary
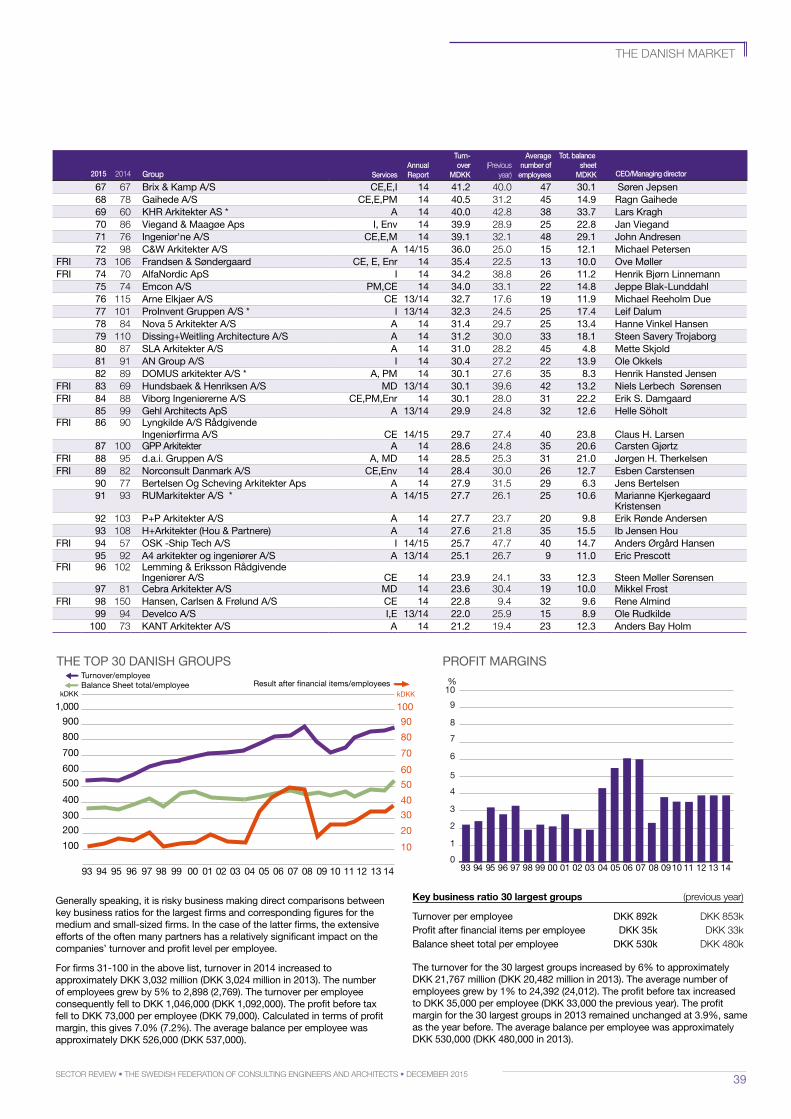
39Sector review • the SwediSh Federation oF conSulting engineerS and architectS • december 2015
ThE Top 30 dAniSh gRoupS pRoFiT mARginS
generally speaking, it is risky business making direct comparisons between key business ratios for the largest firms and corresponding figures for the medium and small-sized firms. in the case of the latter firms, the extensive efforts of the often many partners has a relatively significant impact on the companies’ turnover and profit level per employee.
For firms 31-100 in the above list, turnover in 2014 increased to approximately dKK 3,032 million (dKK 3,024 million in 2013). The number of employees grew by 5% to 2,898 (2,769). The turnover per employee consequently fell to dKK 1,046,000 (dKK 1,092,000). The profit before tax fell to dKK 73,000 per employee (dKK 79,000). Calculated in terms of profit margin, this gives 7.0% (7.2%). The average balance per employee was approximately dKK 526,000 (dKK 537,000).
67 67 brix & Kamp A/S CE,E,i 14 41.2 40.0 47 30.1 Søren Jepsen68 78 gaihede A/S CE,E,pm 14 40.5 31.2 45 14.9 Ragn gaihede69 60 KhR Arkitekter AS * A 14 40.0 42.8 38 33.7 lars Kragh70 86 viegand & maagøe Aps i, Env 14 39.9 28.9 25 22.8 Jan viegand71 76 ingeniør'ne A/S CE,E,m 14 39.1 32.1 48 29.1 John Andresen72 98 C&w Arkitekter A/S A 14/15 36.0 25.0 15 12.1 michael petersen
FRi 73 106 Frandsen & Søndergaard CE, E, Enr 14 35.4 22.5 13 10.0 ove møllerFRi 74 70 Alfanordic ApS i 14 34.2 38.8 26 11.2 henrik bjørn linnemann
75 74 Emcon A/S pm,CE 14 34.0 33.1 22 14.8 Jeppe blak-lunddahl76 115 Arne Elkjaer A/S CE 13/14 32.7 17.6 19 11.9 michael Reeholm due 77 101 proinvent gruppen A/S * i 13/14 32.3 24.5 25 17.4 leif dalum78 84 nova 5 Arkitekter A/S A 14 31.4 29.7 25 13.4 hanne vinkel hansen79 110 dissing+weitling Architecture A/S A 14 31.2 30.0 33 18.1 Steen Savery Trojaborg80 87 SlA Arkitekter A/S A 14 31.0 28.2 45 4.8 mette Skjold81 91 An group A/S i 14 30.4 27.2 22 13.9 ole okkels82 89 domuS arkitekter A/S * A, pm 14 30.1 27.6 35 8.3 henrik hansted Jensen
FRi 83 69 hundsbaek & henriksen A/S md 13/14 30.1 39.6 42 13.2 niels lerbech SørensenFRi 84 88 viborg ingeniørerne A/S CE,pm,Enr 14 30.1 28.0 31 22.2 Erik S. damgaard
85 99 gehl Architects ApS A 13/14 29.9 24.8 32 12.6 helle SöholtFRi 86 90 lyngkilde A/S Rådgivende
ingeniørfirma A/S CE 14/15 29.7 27.4 40 23.8 Claus h. larsen87 100 gpp Arkitekter A 14 28.6 24.8 35 20.6 Carsten gjørtz
FRi 88 95 d.a.i. gruppen A/S A, md 14 28.5 25.3 31 21.0 Jørgen h. TherkelsenFRi 89 82 norconsult danmark A/S CE,Env 14 28.4 30.0 26 12.7 Esben Carstensen
90 77 bertelsen og Scheving Arkitekter Aps A 14 27.9 31.5 29 6.3 Jens bertelsen91 93 Rumarkitekter A/S * A 14/15 27.7 26.1 25 10.6 marianne Kjerkegaard
Kristensen92 103 p+p Arkitekter A/S A 14 27.7 23.7 20 9.8 Erik Rønde Andersen93 108 h+Arkitekter (hou & partnere) A 14 27.6 21.8 35 15.5 ib Jensen hou
FRi 94 57 oSK -Ship Tech A/S i 14/15 25.7 47.7 40 14.7 Anders Ørgård hansen95 92 A4 arkitekter og ingeniører A/S A 13/14 25.1 26.7 9 11.0 Eric prescott
FRi 96 102 lemming & Eriksson Rådgivende ingeniører A/S CE 14 23.9 24.1 33 12.3 Steen møller Sørensen
97 81 Cebra Arkitekter A/S md 14 23.6 30.4 19 10.0 mikkel FrostFRi 98 150 hansen, Carlsen & Frølund A/S CE 14 22.8 9.4 32 9.6 Rene Almind
99 94 develco A/S i,E 13/14 22.0 25.9 15 8.9 ole Rudkilde100 73 KAnT Arkitekter A/S A 14 21.2 19.4 23 12.3 Anders bay holm
2015 2014 Group
ServicesAnnual report
turn-over
Mdkk(Previous
year)
Average number of
employees
tot. balancesheet
Mdkk ceo/Managing director
Key business ratio 30 largest groups (previous year)
Turnover per employee dKK 892k dKK 853kprofit after financial items per employee dKK 35k dKK 33kbalance sheet total per employee dKK 530k dKK 480k
The turnover for the 30 largest groups increased by 6% to approximately dKK 21,767 million (dKK 20,482 million in 2013). The average number of employees grew by 1% to 24,392 (24,012). The profit before tax increased to dKK 35,000 per employee (dKK 33,000 the previous year). The profit margin for the 30 largest groups in 2013 remained unchanged at 3.9%, same as the year before. The average balance per employee was approximately dKK 530,000 (dKK 480,000 in 2013).
the daniSh marKet
0
1
2
3
4
5
6
7
8
9
%10
0302010099989796959493 04 05 06 07 08 0910 11 12 13 14
kDKK
600
700
500
400
300
200
100
kDKK
60
70
50
40
30
20
10
800 80
900 90
1,000 100
93 94 95 96 97 98 99 00 01 02 0403 05 06 07 0908 10 11 12 13 14
Turnover/employeeBalance Sheet total/employee Result after �nancial items/employees
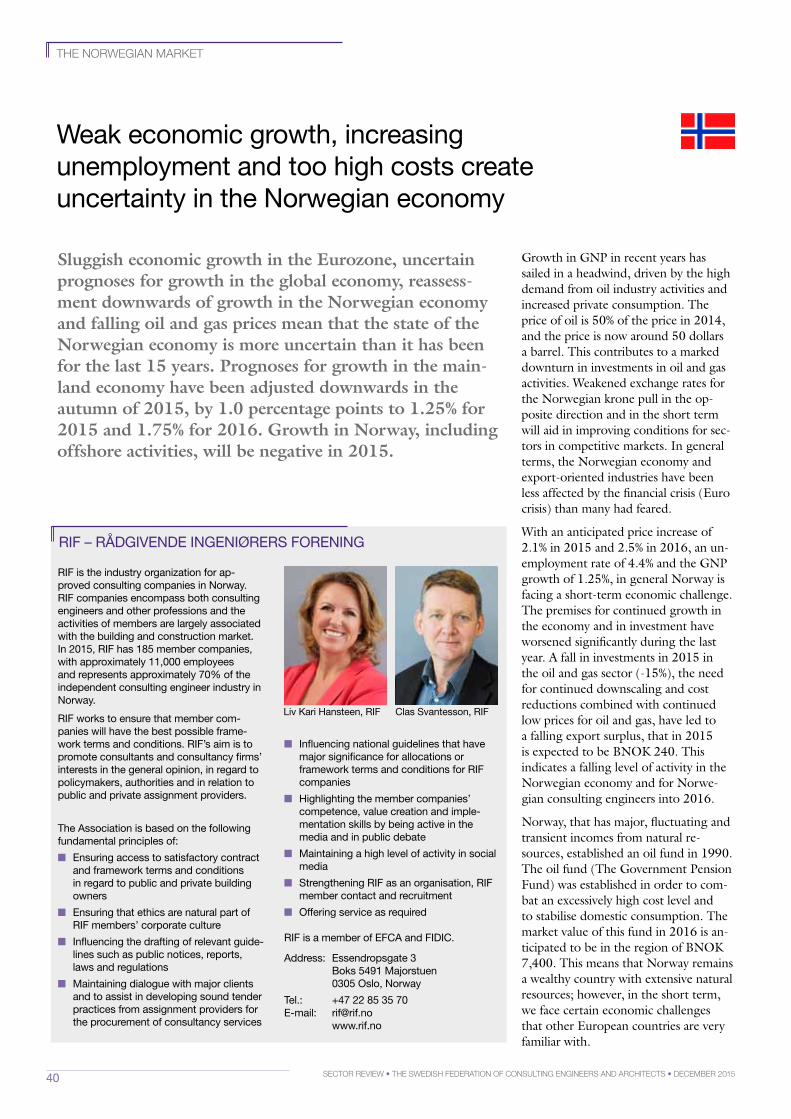
40 Sector review • the SwediSh Federation oF conSulting engineerS and architectS • december 2015
weak economic growth, increasing unemployment and too high costs create uncertainty in the norwegian economy
RiF is the industry organization for ap-proved consulting companies in norway. RiF companies encompass both consulting engineers and other professions and the activities of members are largely associated with the building and construction market. in 2015, RiF has 185 member companies, with approximately 11,000 employees and represents approximately 70% of the independent consulting engineer industry in norway.
RiF works to ensure that member com-panies will have the best possible frame-work terms and conditions. RiF’s aim is to promote consultants and consultancy firms’ interests in the general opinion, in regard to policymakers, authorities and in relation to public and private assignment providers.
The Association is based on the following fundamental principles of:
■ Ensuring access to satisfactory contract and framework terms and conditions in regard to public and private building owners
■ Ensuring that ethics are natural part of RiF members’ corporate culture
■ influencing the drafting of relevant guide-lines such as public notices, reports, laws and regulations
■ maintaining dialogue with major clients and to assist in developing sound tender practices from assignment providers for the procurement of consultancy services
■ influencing national guidelines that have major significance for allocations or framework terms and conditions for RiF companies
■ highlighting the member companies’ competence, value creation and imple-mentation skills by being active in the media and in public debate
■ maintaining a high level of activity in social media
■ Strengthening RiF as an organisation, RiF member contact and recruitment
■ offering service as required
RiF is a member of EFCA and FidiC.
Address: Essendropsgate 3 boks 5491 majorstuen 0305 oslo, norway
Tel.: +47 22 85 35 70E-mail: [email protected] www.rif.no
Clas Svantesson, RiFliv Kari hansteen, RiF
RiF – RÅdgivEndE ingEniØRERS FoREning
Sluggish economic growth in the Eurozone, uncertain prognoses for growth in the global economy, reassessment downwards of growth in the Norwegian economy and falling oil and gas prices mean that the state of the Norwegian economy is more uncertain than it has been for the last 15 years. Prognoses for growth in the mainland economy have been adjusted downwards in the autumn of 2015, by 1.0 percentage points to 1.25% for 2015 and 1.75% for 2016. Growth in Norway, including offshore activities, will be negative in 2015.
Growth in GNP in recent years has sailed in a headwind, driven by the high demand from oil industry activities and increased private consumption. The price of oil is 50% of the price in 2014, and the price is now around 50 dollars a barrel. This contributes to a marked downturn in investments in oil and gas activities. Weakened exchange rates for the Norwegian krone pull in the op-posite direction and in the short term will aid in improving conditions for sec-tors in competitive markets. In general terms, the Norwegian economy and export-oriented industries have been less affected by the financial crisis (Euro crisis) than many had feared.
With an anticipated price increase of 2.1% in 2015 and 2.5% in 2016, an un-employment rate of 4.4% and the GNP growth of 1.25%, in general Norway is facing a short-term economic challenge. The premises for continued growth in the economy and in investment have worsened significantly during the last year. A fall in investments in 2015 in the oil and gas sector (-15%), the need for continued downscaling and cost reductions combined with continued low prices for oil and gas, have led to a falling export surplus, that in 2015 is expected to be BNOK 240. This indicates a falling level of activity in the Norwegian economy and for Norwe-gian consulting engineers into 2016.
Norway, that has major, fluctuating and transient incomes from natural re-sources, established an oil fund in 1990. The oil fund (The Government Pension Fund) was established in order to com-bat an excessively high cost level and to stabilise domestic consumption. The market value of this fund in 2016 is an-ticipated to be in the region of BNOK 7,400. This means that Norway remains a wealthy country with extensive natural resources; however, in the short term, we face certain economic challenges that other European countries are very familiar with.
the norwegian marKet
41Sector review • the SwediSh Federation oF conSulting engineerS and architectS • december 2015
the norwegian marKet
”the consulting industry in norway – major concentration and increased international competition The consulting industry in Norway has in many ways become more and more international, both in terms of owner-ship and competition in the Norwegian market. In 2015, approximately 37% of employees in RIF – Association of Consulting Engineers are wholly or partly owned by international consul-tancy groups. If we include international groups working in Norway that are not associated with RIF, this figure is even higher.
Furthermore, activity in the market is characterised by that 6–7 of the largest companies have as much as 70% of the market, i.e. a significant market con-centration. This has not led to reduced competition. Turnover per employee and operating results have been re-duced from 2014 as a result of tougher competition and a high level of cost in the industry. To combat this, in the last 10 years the industry has invested a great deal in the recruitment of younger employees, which has meant that the average age in the industry has fallen by 4 years during the same period.
the market – a somewhat weaker market – still good activity in the development of infrastructure and the energy marketIn Norway in recent years, significant resources have been employed on con-struction and roads, railways, transfer of energy and telecommunications in order to make the country more competitive. For the industry and consulting engi-neers, this offers many exciting oppor-tunities and challenges in the coming years. These markets apparently remain good. In regard to other markets, these have levelled off or experienced a minor reduction in activity. In the oil and offshore market, falling activity is in part dramatic.
Building and construction activities have from 2011 to 2014 experienced contin-ued growth in all markets. The industry
anticipates, as of November 2015, a general, stable activity in the building and construction market in Norway and a marked decline in the offshore market. Employment is expected to remain stable in 2016 and 2017.
Production in the building and con-struction market, apart from oil and gas, has increased by 12% in the period 2010–2014. For 2015 and 2016, pro-duction is expected to increase by 3%. The number of employed in the building and construction sector has in the same period increased by 25,000 to 215,000.
The market for consulting engineers is expected to level out in 2015–2016. The construction market is expected to remain largely stable in 2015. Prognoses for 2016 and 2017 indicate corres-ponding developments. Investment is expected to be reduced by 1%. In the construction market (infrastructure), we anticipate an increase in activity in 2015, 2016 and 2017. Investment in this market is expected to increase by 5% in 2015 and further to 6% up to 2017. The number of employees from 2010 to 2015 has increased by 33% in RIF com-panies. The average age of employees in RIF companies has fallen by almost 3 years during the same period.
consulting engineers – anticipated developments in 2016 and 2017Norway still has broad economic freedom of action and we will see an increase in resources focused on the fol-lowing areas:
Infrastructure. The development and maintenance of infrastructure in Norway is largely governed by public financing. The National Transport Plan 2014–2023 has a total framework plan of BNOK 508. The objective of the authorities is to halve the time for completion of the projects, through simplification of the planning processes and organisation of major road and railway projects as dedicated projects where public-private corporation (PPC) will be employed as the implementation strategy.
In order to become less dependent on annual allocations, in 2013, a separate infrastructure fund of BNOK 100 was established. This is fully financed in 2016. Dividends are earmarked to speed up road projects, more for maintenance of roads, railways and collective trans-port networks, along with broadband and IT infrastructure. The aim of building up this type of fund is to create more predictable financing of projects and maintenance. In 2015, in addition to the Norwegian Public Roads Admini-stration, a separate public road company was established that has been assigned the task of carrying out the develop-ment of 8 selected stretches of motor-way.
In addition, the task of catching up on a major backlog of maintenance of infrastructure has been started. The aim is to quantify the value of public assets and thereby also quantify the backlog of maintenance in annual budgets. Other priorities include simplification of the act of public procurement, hereun-der the development of guidelines for public-private innovative co-operation.
These objectives have been carried forward and concretised in the 2016 budgets. For consulting engineers, the public budgets will result in moderate developments in the level of activity in
“Investments in the con-struction market are expected to increase by 3 % per year in 2016 and 2017”
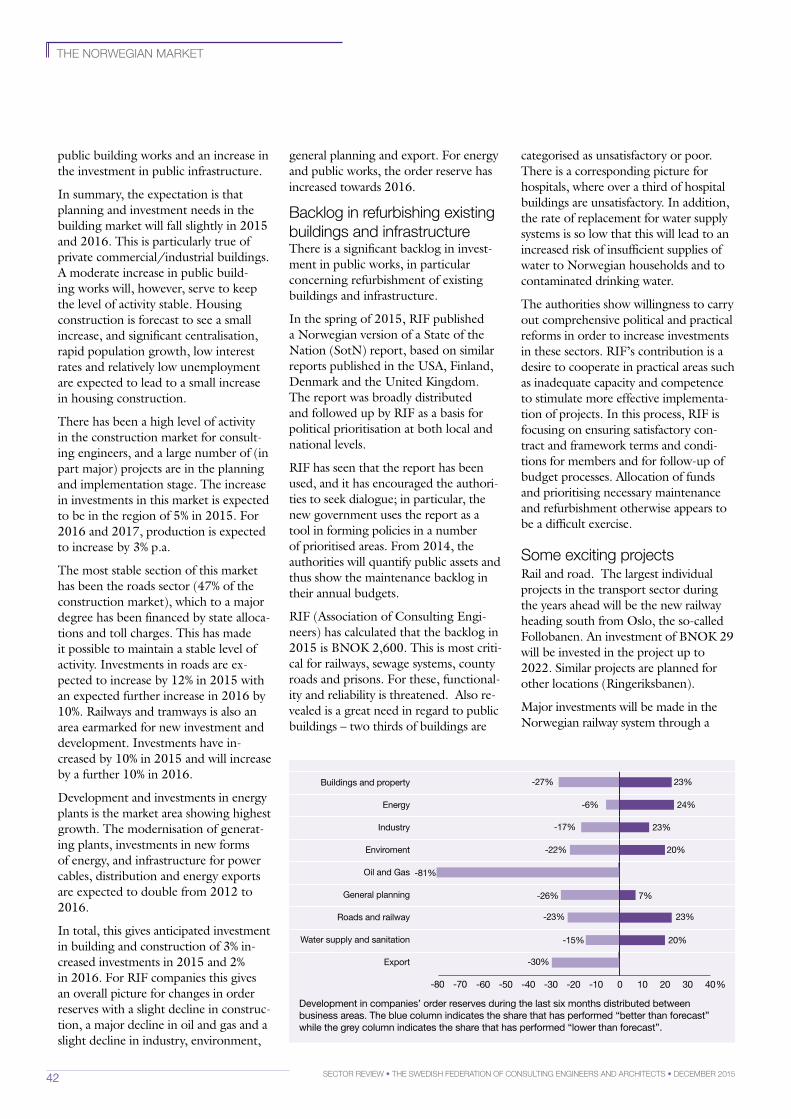
42 Sector review • the SwediSh Federation oF conSulting engineerS and architectS • december 2015
public building works and an increase in the investment in public infrastructure.
In summary, the expectation is that planning and investment needs in the building market will fall slightly in 2015 and 2016. This is particularly true of private commercial/industrial buildings. A moderate increase in public build-ing works will, however, serve to keep the level of activity stable. Housing construction is forecast to see a small increase, and significant centralisation, rapid population growth, low interest rates and relatively low unemployment are expected to lead to a small increase in housing construction.
There has been a high level of activity in the construction market for consult-ing engineers, and a large number of (in part major) projects are in the planning and implementation stage. The increase in investments in this market is expected to be in the region of 5% in 2015. For 2016 and 2017, production is expected to increase by 3% p.a.
The most stable section of this market has been the roads sector (47% of the construction market), which to a major degree has been financed by state alloca-tions and toll charges. This has made it possible to maintain a stable level of activity. Investments in roads are ex-pected to increase by 12% in 2015 with an expected further increase in 2016 by 10%. Railways and tramways is also an area earmarked for new investment and development. Investments have in-creased by 10% in 2015 and will increase by a further 10% in 2016.
Development and investments in energy plants is the market area showing highest growth. The modernisation of generat-ing plants, investments in new forms of energy, and infrastructure for power cables, distribution and energy exports are expected to double from 2012 to 2016.
In total, this gives anticipated investment in building and construction of 3% in - creased investments in 2015 and 2% in 2016. For RIF companies this gives an overall picture for changes in order reserves with a slight decline in construc-tion, a major decline in oil and gas and a slight decline in industry, environment,
general planning and export. For energy and public works, the order reserve has increased towards 2016.
backlog in refurbishing existing buildings and infrastructureThere is a significant backlog in invest-ment in public works, in particular concerning refurbishment of existing buildings and infrastructure.
In the spring of 2015, RIF published a Norwegian version of a State of the Nation (SotN) report, based on similar reports published in the USA, Finland, Denmark and the United Kingdom. The report was broadly distributed and followed up by RIF as a basis for political prioritisation at both local and national levels.
RIF has seen that the report has been used, and it has encouraged the authori-ties to seek dialogue; in particular, the new government uses the report as a tool in forming policies in a number of prioritised areas. From 2014, the authorities will quantify public assets and thus show the maintenance backlog in their annual budgets.
RIF (Association of Consulting Engi-neers) has calculated that the backlog in 2015 is BNOK 2,600. This is most criti-cal for railways, sewage systems, county roads and prisons. For these, functional-ity and reliability is threatened. Also re-vealed is a great need in regard to public buildings – two thirds of buildings are
development in companies’ order reserves during the last six months distributed between business areas. The blue column indicates the share that has performed “better than forecast” while the grey column indicates the share that has performed “lower than forecast”.
categorised as unsatisfactory or poor. There is a corresponding picture for hospitals, where over a third of hospital buildings are unsatisfactory. In addition, the rate of replacement for water supply systems is so low that this will lead to an increased risk of insufficient supplies of water to Norwegian households and to contaminated drinking water.
The authorities show willingness to carry out comprehensive political and practical reforms in order to increase investments in these sectors. RIF’s contribution is a desire to cooperate in practical areas such as inadequate capacity and competence to stimulate more effective implementa-tion of projects. In this process, RIF is focusing on ensuring satisfactory con-tract and framework terms and condi-tions for members and for follow-up of budget processes. Allocation of funds and prioritising necessary maintenance and refurbishment otherwise appears to be a difficult exercise.
Some exciting projectsRail and road. The largest individual projects in the transport sector during the years ahead will be the new railway heading south from Oslo, the so-called Follobanen. An investment of BNOK 29 will be invested in the project up to 2022. Similar projects are planned for other locations (Ringeriksbanen).
Major investments will be made in the Norwegian railway system through a
-60 -50 -40 -30 -20 -10 0 10 20 30 40 50 60
-60 -50 -40 -30 -20 -10 0 10 20 30 40%
-30%
-15%
-23%
-26%
-81%
-22%
-17%
-6%
-27%
20%
7%
20%
23%
24%
23%
23%
Buildings and property
Energy
Industry
Enviroment
Oil and Gas
General planning
Roads and railway
Water supply and sanitation
Export
-80 -70
the norwegian marKet
43Sector review • the SwediSh Federation oF conSulting engineerS and architectS • december 2015
number of projects during the next 10–20 years. In addition to this, there are ongoing investments in tramways and rail to improve punctuality and increase capacity in order to serve a growing pop-ulation in and around the larger towns and cities. Bybanen and a new Ulriken tunnel in Bergen, the new railways Eids-voll–Hamar and Farisseidet–Porsgrunn are examples of major projects.
A number of major motorway projects are also in the planning and construc-tion stage, with focus on major road, bridge and tunnel projects designed to link regions and reduce threats posed by avalanches and land/rockslides. Examples of larger projects are several stretches of the European standard roads E6 and E18, which are developed parallel to rail development. At the Norwegian west coast, plans are under way for continuous improved, ferry free roads with improved protection against land/rockslides and avalanches. Some of the fjord crossings will be the long-est and deepest in the world and there are currently over 40 PhD candidates working on different aspects of this mega-project. New bridges, such as the Nordland Bridge, are under construc-tion, and there are several other projects that are currently in the planning stage and under construction.
Energy. The need to develop trade and industry, increased energy prices and the demand for renewable energy has resul-ted in the planning and implementation of several exciting projects. Investments are being made in new hydroelectric plants, older generating plants are being refurbished and new small-scale gen-eration plants are being constructed in order to increase the capacity for renewable energy. Grid capacity for the transport of power is being increased for the transport and export of energy, and almost BNOK 160 is being invested in safer and higher capacity power distribu-tion in Norway and to Europe.
Airports. The new Oslo – Gardermoen airport and Bergen – Flesland terminals are in the planning and construction stage. In addition, work is ongoing on the merging and re-localising of the smaller short runway airports in the outlying districts.
Cultural buildings. Major investments have been made in new cultural build-ings. New projects are under planning such as the new National Museum, the new Munch Museum and a new main library in Oslo. Several large municipal cultural centres are being planned and constructed throughout the country.
Education. A new veterinary institute is under construction at the Norwegian University of Life Sciences in Ås near Oslo. Furthermore, a new large Life Sci-ences building is being planned at Oslo University. Other major new buildings and refurbishment projects at several Universities and University Colleges in Norway are at the planning stage.
New government buildings. After the terrorist attack on the government and ministerial buildings, a major, com-prehensive planning process has been started to construct completely new government buildings in Oslo.
Norwegian Defence Estates Agency. The largest new land-based project under planning in Norway is the new fighter aircraft base at Ørlandet in Trøndelag and a forward base at Evenes in Troms.
International projects. Almost 40% of employees in Norway work for compa-nies that are owned by foreign con-sultancy groups, primarily serving the Norwegian market.
In addition, an attractive domestic market with lower ethical and commer-
cial risks along with a high cost level for consulting engineers from Norway has resulted in that Norwegian consulting engineering companies have changed their strategies with regard to interna-tional activities.
This has in turn meant that international activities have turned away from mainly aid-related projects and are now focused more on investments in more developed countries and on purely commercial projects with a low risk profile. Over-seas activities have a particular focus on energy projects such as hydroelectric power developments and oil and gas. The export share has halved in the last 10 years, and is now in the region of 5% of turnover and is apparently still falling.
continued increased concentration in the industryThere is a major concentration in the industry with 6–7 larger consulting enterprises. These now have over 70% of all employees in RIF. Growth in 2014 and 2015 is characterised by organic growth, and RIF companies have been at the forefront, employing newly qualified engineers, scientists, social scientists and architects. We have seen some acquisitions; however, these have been small in size and have not led to restructured strategies in the industry. These have been acquisitions designed to bolster professional skills and/or local and international market positions.
Some interesting acquisitions and merg-ers in 2015:
In the spring of 2015, Multiconsult AS was listed on the stock exchange. WSP, as a major owner, in this process sold itself out of Multiconsult. Further, in 2015 Multiconsult acquired 100% of the shares in the Nordic countries’ largest architect firm, Link Arkitektur.
In 2015, WSP acquired Norway’s larg-est project management company, Faveo Prosjektledelse AS.
In 2015, Atkins acquired the project management company Terramar AS.
Liv Kari Hansteen and Clas Svanteson, RIF
the norwegian marKet
”“Investments in roads are expectedto increase by 12 % in 2015… and by 10 % in 2016”
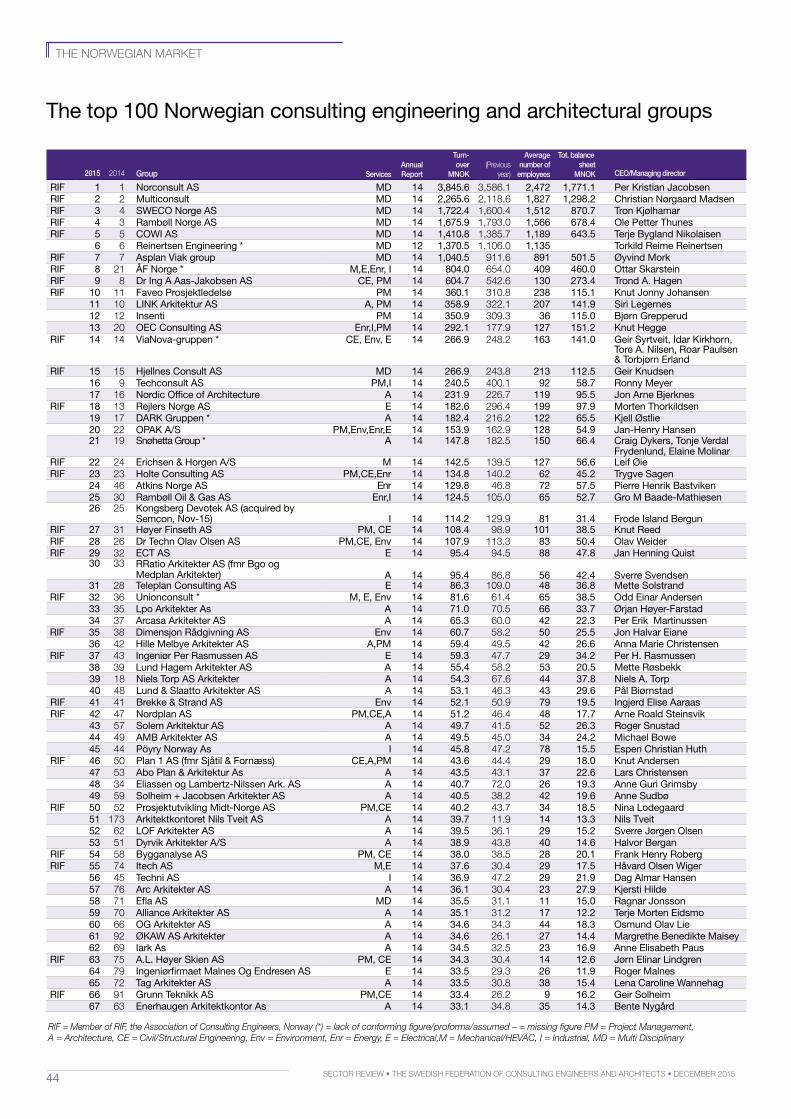
44 Sector review • the SwediSh Federation oF conSulting engineerS and architectS • december 2015
The top 100 norwegian consulting engineering and architectural groups
2015 2014 Group
ServicesAnnual report
turn-over
MNok(Previous
year)
Average number of
employees
tot. balancesheet
MNok ceo/Managing director
RiF 1 1 norconsult AS md 14 3,845.6 3,586.1 2,472 1,771.1 per Kristian JacobsenRiF 2 2 multiconsult md 14 2,265.6 2,118.6 1,827 1,298.2 Christian nørgaard madsenRiF 3 4 SwECo norge AS md 14 1,722.4 1,600.4 1,512 870.7 Tron KjølhamarRiF 4 3 Rambøll norge AS md 14 1,675.9 1,793.0 1,566 678.4 ole petter ThunesRiF 5 5 Cowi AS md 14 1,410.8 1,385.7 1,189 643.5 Terje bygland nikolaisen
6 6 Reinertsen Engineering * md 12 1,370.5 1,106.0 1,135 Torkild Reime ReinertsenRiF 7 7 Asplan viak group md 14 1,040.5 911.6 891 501.5 Øyvind morkRiF 8 21 ÅF norge * m,E,Enr, i 14 804.0 654.0 409 460.0 ottar SkarsteinRiF 9 8 dr ing A Aas-Jakobsen AS CE, pm 14 604.7 542.6 130 273.4 Trond A. hagenRiF 10 11 Faveo prosjektledelse pm 14 360.1 310.8 238 115.1 Knut Jonny Johansen
11 10 linK Arkitektur AS A, pm 14 358.9 322.1 207 141.9 Siri legernes12 12 insenti pm 14 350.9 309.3 36 115.0 bjørn grepperud13 20 oEC Consulting AS Enr,i,pm 14 292.1 177.9 127 151.2 Knut hegge
RiF 14 14 vianova-gruppen * CE, Env, E 14 266.9 248.2 163 141.0 geir Syrtveit, idar Kirkhorn, Tore A. nilsen, Roar paulsen & Torbjørn Erland
RiF 15 15 hjellnes Consult AS md 14 266.9 243.8 213 112.5 geir Knudsen 16 9 Techconsult AS pm,i 14 240.5 400.1 92 58.7 Ronny meyer17 16 nordic office of Architecture A 14 231.9 226.7 119 95.5 Jon Arne bjerknes
RiF 18 13 Rejlers norge AS E 14 182.6 296.4 199 97.9 morten Thorkildsen19 17 dARK gruppen * A 14 182.4 216.2 122 65.5 Kjell Østlie 20 22 opAK A/S pm,Env,Enr,E 14 153.9 162.9 128 54.9 Jan-henry hansen21 19 Snøhetta group * A 14 147.8 182.5 150 66.4 Craig dykers, Tonje verdal
Frydenlund, Elaine molinarRiF 22 24 Erichsen & horgen A/S m 14 142.5 139.5 127 56.6 leif ØieRiF 23 23 holte Consulting AS pm,CE,Enr 14 134.8 140.2 62 45.2 Trygve Sagen
24 46 Atkins norge AS Enr 14 129.8 46.8 72 57.5 pierre henrik bastviken25 30 Rambøll oil & gas AS Enr,i 14 124.5 105.0 65 52.7 gro m baade-mathiesen26 25 Kongsberg devotek AS (acquired by
Semcon, nov-15) i 14 114.2 129.9 81 31.4 Frode island bergunRiF 27 31 høyer Finseth AS pm, CE 14 108.4 98.9 101 38.5 Knut ReedRiF 28 26 dr Techn olav olsen AS pm,CE, Env 14 107.9 113.3 83 50.4 olav weiderRiF 29 32 ECT AS E 14 95.4 94.5 88 47.8 Jan henning quist
30 33 RRatio Arkitekter AS (fmr bgo og medplan Arkitekter) A 14 95.4 86.8 56 42.4 Sverre Svendsen
31 28 Teleplan Consulting AS E 14 86.3 109.0 48 36.8 mette SolstrandRiF 32 36 unionconsult * m, E, Env 14 81.6 61.4 65 38.5 odd Einar Andersen
33 35 lpo Arkitekter As A 14 71.0 70.5 66 33.7 Ørjan høyer-Farstad34 37 Arcasa Arkitekter AS A 14 65.3 60.0 42 22.3 per Erik martinussen
RiF 35 38 dimensjon Rådgivning AS Env 14 60.7 58.2 50 25.5 Jon halvar Eiane36 42 hille melbye Arkitekter AS A,pm 14 59.4 49.5 42 26.6 Anna marie Christensen
RiF 37 43 ingeniør per Rasmussen AS E 14 59.3 47.7 29 34.2 per h. Rasmussen38 39 lund hagem Arkitekter AS A 14 55.4 58.2 53 20.5 mette Røsbekk39 18 niels Torp AS Arkitekter A 14 54.3 67.6 44 37.8 niels A. Torp40 48 lund & Slaatto Arkitekter AS A 14 53.1 46.3 43 29.6 pål biørnstad
RiF 41 41 brekke & Strand AS Env 14 52.1 50.9 79 19.5 ingjerd Elise AaraasRiF 42 47 nordplan AS pm,CE,A 14 51.2 46.4 48 17.7 Arne Roald Steinsvik
43 57 Solem Arkitektur AS A 14 49.7 41.5 52 26.3 Roger Snustad44 49 Amb Arkitekter AS A 14 49.5 45.0 34 24.2 michael bowe45 44 pöyry norway As i 14 45.8 47.2 78 15.5 Espen Christian huth
RiF 46 50 plan 1 AS (fmr Sjåtil & Fornæss) CE,A,pm 14 43.6 44.4 29 18.0 Knut Andersen47 53 Abo plan & Arkitektur As A 14 43.5 43.1 37 22.6 lars Christensen48 34 Eliassen og lambertz-nilssen Ark. AS A 14 40.7 72.0 26 19.3 Anne guri grimsby49 59 Solheim + Jacobsen Arkitekter AS A 14 40.5 38.2 42 19.6 Anne Sudbø
RiF 50 52 prosjektutvikling midt-norge AS pm,CE 14 40.2 43.7 34 18.5 nina lodegaard51 173 Arkitektkontoret nils Tveit AS A 14 39.7 11.9 14 13.3 nils Tveit52 62 loF Arkitekter AS A 14 39.5 36.1 29 15.2 Sverre Jørgen olsen53 51 dyrvik Arkitekter A/S A 14 38.9 43.8 40 14.6 halvor bergan
RiF 54 58 bygganalyse AS pm, CE 14 38.0 38.5 28 20.1 Frank henry Roberg RiF 55 74 itech AS m,E 14 37.6 30.4 29 17.5 håvard olsen wiger
56 45 Techni AS i 14 36.9 47.2 29 21.9 dag Almar hansen57 76 Arc Arkitekter AS A 14 36.1 30.4 23 27.9 Kjersti hilde58 71 Efla AS md 14 35.5 31.1 11 15.0 Ragnar Jonsson59 70 Alliance Arkitekter AS A 14 35.1 31.2 17 12.2 Terje morten Eidsmo 60 66 og Arkitekter AS A 14 34.6 34.3 44 18.3 osmund olav lie 61 92 ØKAw AS Arkitekter A 14 34.6 26.1 27 14.4 margrethe benedikte maisey62 69 iark As A 14 34.5 32.5 23 16.9 Anne Elisabeth paus
RiF 63 75 A.l. høyer Skien AS pm, CE 14 34.3 30.4 14 12.6 Jørn Elinar lindgren64 79 ingeniørfirmaet malnes og Endresen AS E 14 33.5 29.3 26 11.9 Roger malnes65 72 Tag Arkitekter AS A 14 33.5 30.8 38 15.4 lena Caroline wannehag
RiF 66 91 grunn Teknikk AS pm,CE 14 33.4 26.2 9 16.2 geir Solheim67 63 Enerhaugen Arkitektkontor As A 14 33.1 34.8 35 14.3 bente nygård
the norwegian marKet
RIF = Member of RIF, the Association of Consulting Engineers, Norway (*) = lack of conforming figure/proforma/assumed – = missing figure PM = Project Management, A = Architecture, CE = Civil/Structural Engineering, Env = Environment, Enr = Energy, E = Electrical,M = Mechanical/HEVAC, I = Industrial, MD = Multi Disciplinary
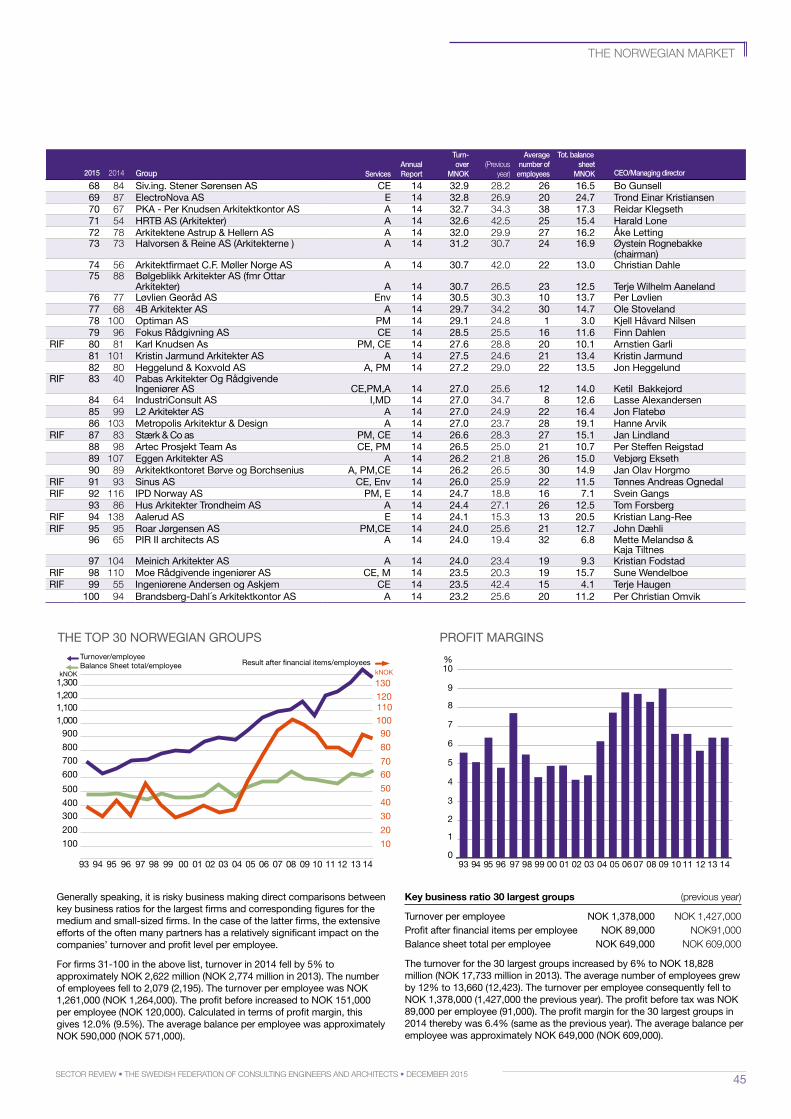
45Sector review • the SwediSh Federation oF conSulting engineerS and architectS • december 2015
ThE Top 30 noRwEgiAn gRoupS pRoFiT mARginS
Key business ratio 30 largest groups (previous year)
Turnover per employee noK 1,378,000 noK 1,427,000 profit after financial items per employee noK 89,000 noK91,000balance sheet total per employee noK 649,000 noK 609,000
The turnover for the 30 largest groups increased by 6% to noK 18,828 million (noK 17,733 million in 2013). The average number of employees grew by 12% to 13,660 (12,423). The turnover per employee consequently fell to noK 1,378,000 (1,427,000 the previous year). The profit before tax was noK 89,000 per employee (91,000). The profit margin for the 30 largest groups in 2014 thereby was 6.4% (same as the previous year). The average balance per employee was approximately noK 649,000 (noK 609,000).
generally speaking, it is risky business making direct comparisons between key business ratios for the largest firms and corresponding figures for the medium and small-sized firms. in the case of the latter firms, the extensive efforts of the often many partners has a relatively significant impact on the companies’ turnover and profit level per employee.
For firms 31-100 in the above list, turnover in 2014 fell by 5% to approximately noK 2,622 million (noK 2,774 million in 2013). The number of employees fell to 2,079 (2,195). The turnover per employee was noK 1,261,000 (noK 1,264,000). The profit before increased to noK 151,000 per employee (noK 120,000). Calculated in terms of profit margin, this gives 12.0% (9.5%). The average balance per employee was approximately noK 590,000 (noK 571,000).
68 84 Siv.ing. Stener Sørensen AS CE 14 32.9 28.2 26 16.5 bo gunsell69 87 Electronova AS E 14 32.8 26.9 20 24.7 Trond Einar Kristiansen70 67 pKA - per Knudsen Arkitektkontor AS A 14 32.7 34.3 38 17.3 Reidar Klegseth71 54 hRTb AS (Arkitekter) A 14 32.6 42.5 25 15.4 harald lone72 78 Arkitektene Astrup & hellern AS A 14 32.0 29.9 27 16.2 Åke letting73 73 halvorsen & Reine AS (Arkitekterne ) A 14 31.2 30.7 24 16.9 Øystein Rognebakke
(chairman)74 56 Arkitektfirmaet C.F. møller norge AS A 14 30.7 42.0 22 13.0 Christian dahle75 88 bølgeblikk Arkitekter AS (fmr ottar
Arkitekter) A 14 30.7 26.5 23 12.5 Terje wilhelm Aaneland76 77 løvlien georåd AS Env 14 30.5 30.3 10 13.7 per løvlien77 68 4b Arkitekter AS A 14 29.7 34.2 30 14.7 ole Stoveland78 100 optiman AS pm 14 29.1 24.8 1 3.0 Kjell håvard nilsen79 96 Fokus Rådgivning AS CE 14 28.5 25.5 16 11.6 Finn dahlen
RiF 80 81 Karl Knudsen As pm, CE 14 27.6 28.8 20 10.1 Arnstien garli81 101 Kristin Jarmund Arkitekter AS A 14 27.5 24.6 21 13.4 Kristin Jarmund82 80 heggelund & Koxvold AS A, pm 14 27.2 29.0 22 13.5 Jon heggelund
RiF 83 40 pabas Arkitekter og Rådgivende ingeniører AS CE,pm,A 14 27.0 25.6 12 14.0 Ketil bakkejord
84 64 industriConsult AS i,md 14 27.0 34.7 8 12.6 lasse Alexandersen85 99 l2 Arkitekter AS A 14 27.0 24.9 22 16.4 Jon Flatebø86 103 metropolis Arkitektur & design A 14 27.0 23.7 28 19.1 hanne Arvik
RiF 87 83 Stærk & Co as pm, CE 14 26.6 28.3 27 15.1 Jan lindland88 98 Artec prosjekt Team As CE, pm 14 26.5 25.0 21 10.7 per Steffen Reigstad 89 107 Eggen Arkitekter AS A 14 26.2 21.8 26 15.0 vebjørg Ekseth90 89 Arkitektkontoret børve og borchsenius A, pm,CE 14 26.2 26.5 30 14.9 Jan olav horgmo
RiF 91 93 Sinus AS CE, Env 14 26.0 25.9 22 11.5 Tønnes Andreas ognedal RiF 92 116 ipd norway AS pm, E 14 24.7 18.8 16 7.1 Svein gangs
93 86 hus Arkitekter Trondheim AS A 14 24.4 27.1 26 12.5 Tom ForsbergRiF 94 138 Aalerud AS E 14 24.1 15.3 13 20.5 Kristian lang-ReeRiF 95 95 Roar Jørgensen AS pm,CE 14 24.0 25.6 21 12.7 John dæhli
96 65 piR ii architects AS A 14 24.0 19.4 32 6.8 mette melandsø & Kaja Tiltnes
97 104 meinich Arkitekter AS A 14 24.0 23.4 19 9.3 Kristian FodstadRiF 98 110 moe Rådgivende ingeniører AS CE, m 14 23.5 20.3 19 15.7 Sune wendelboeRiF 99 55 ingeniørene Andersen og Askjem CE 14 23.5 42.4 15 4.1 Terje haugen
100 94 brandsberg-dahl´s Arkitektkontor AS A 14 23.2 25.6 20 11.2 per Christian omvik
the norwegian marKet
2015 2014 Group
ServicesAnnual report
turn-over
MNok(Previous
year)
Average number of
employees
tot. balancesheet
MNok ceo/Managing director
kNOK
600
700
500
400300
200
100
130
6070
50
40
30
20
10
800 80
900 901,000 1001,100 1101,200 120
93 94 95 96 97 98 99 00 01 02 0403 05 06 07 0908 10 11 12 13
kNOK
1,300
14
Turnover/employeeBalance Sheet total/employee Result after �nancial items/employees
0
1
2
3
4
5
6
7
8
9
%10
0302010099989796959493 04 05 06 07 08 09 10 11 12 13 14
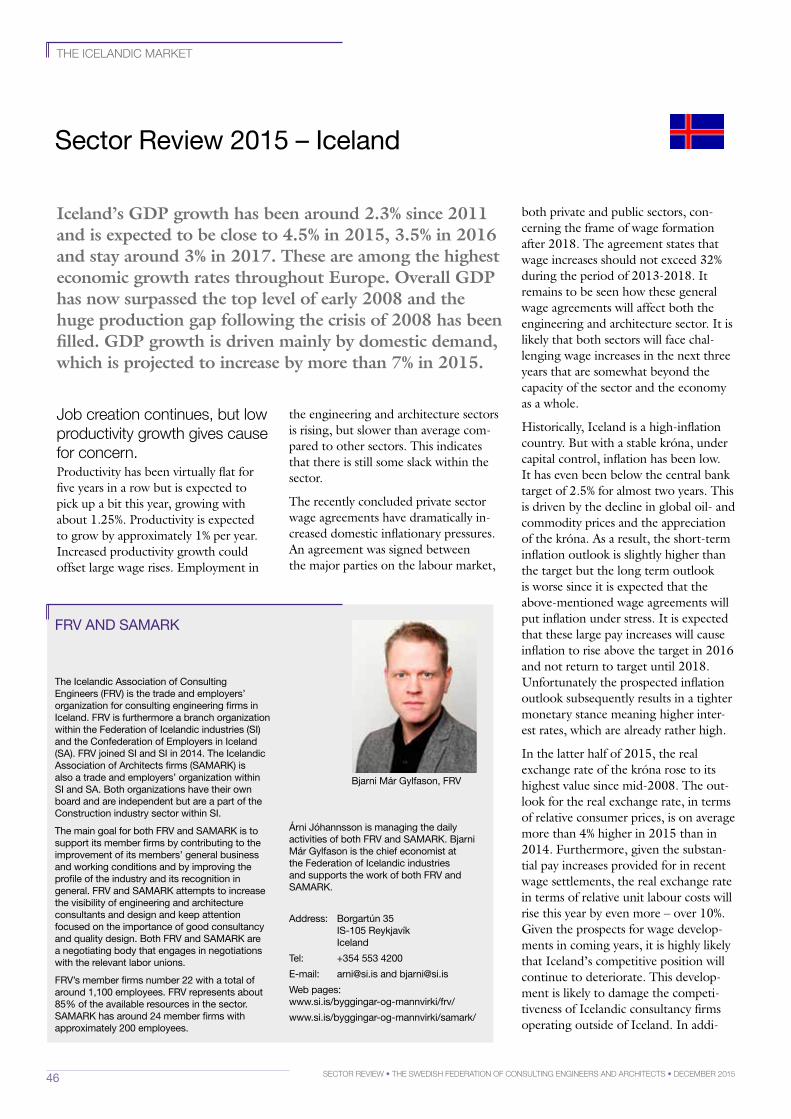
46 Sector review • the SwediSh Federation oF conSulting engineerS and architectS • december 2015
the icelandic marKet
FRv And SAmARK
bjarni már gylfason, FRv
The icelandic Association of Consulting Engineers (FRv) is the trade and employers’ organization for consulting engineering firms in iceland. FRv is furthermore a branch organization within the Federation of icelandic industries (Si) and the Confederation of Employers in iceland (SA). FRv joined Si and Si in 2014. The icelandic Association of Architects firms (SAmARK) is also a trade and employers’ organization within Si and SA. both organizations have their own board and are independent but are a part of the Construction industry sector within Si.
The main goal for both FRv and SAmARK is to support its member firms by contributing to the improvement of its members’ general business and working conditions and by improving the profile of the industry and its recognition in general. FRv and SAmARK attempts to increase the visibility of engineering and architecture consultants and design and keep attention focused on the importance of good consultancy and quality design. both FRv and SAmARK are a negotiating body that engages in negotiations with the relevant labor unions.
FRv’s member firms number 22 with a total of around 1,100 employees. FRv represents about 85% of the available resources in the sector. SAmARK has around 24 member firms with approximately 200 employees.
Árni Jóhannsson is managing the daily activities of both FRv and SAmARK. bjarni már gylfason is the chief economist at the Federation of icelandic industries and supports the work of both FRv and SAmARK.
Address: borgartún 35 iS-105 Reykjavík iceland
Tel: +354 553 4200
E-mail: [email protected] and [email protected]
web pages:www.si.is/byggingar-og-mannvirki/frv/
www.si.is/byggingar-og-mannvirki/samark/
Sector Review 2015 – iceland
Iceland’s GDP growth has been around 2.3% since 2011 and is expected to be close to 4.5% in 2015, 3.5% in 2016 and stay around 3% in 2017. These are among the highest economic growth rates throughout Europe. Overall GDP has now surpassed the top level of early 2008 and the huge production gap following the crisis of 2008 has been filled. GDP growth is driven mainly by domestic demand, which is projected to increase by more than 7% in 2015.
both private and public sectors, con-cerning the frame of wage formation after 2018. The agreement states that wage increases should not exceed 32% during the period of 2013-2018. It remains to be seen how these general wage agreements will affect both the engineering and architecture sector. It is likely that both sectors will face chal-lenging wage increases in the next three years that are somewhat beyond the capacity of the sector and the economy as a whole.
Historically, Iceland is a high-inflation country. But with a stable króna, under capital control, inflation has been low. It has even been below the central bank target of 2.5% for almost two years. This is driven by the decline in global oil- and commodity prices and the appreciation of the króna. As a result, the short-term inflation outlook is slightly higher than the target but the long term outlook is worse since it is expected that the above-mentioned wage agreements will put inflation under stress. It is expected that these large pay increases will cause inflation to rise above the target in 2016 and not return to target until 2018. Unfortunately the prospected inflation outlook subsequently results in a tighter monetary stance meaning higher inter-est rates, which are already rather high.
In the latter half of 2015, the real exchange rate of the króna rose to its highest value since mid-2008. The out-look for the real exchange rate, in terms of relative consumer prices, is on average more than 4% higher in 2015 than in 2014. Furthermore, given the substan-tial pay increases provided for in recent wage settlements, the real exchange rate in terms of relative unit labour costs will rise this year by even more – over 10%. Given the prospects for wage develop-ments in coming years, it is highly likely that Iceland’s competitive position will continue to deteriorate. This develop-ment is likely to damage the competi-tiveness of Icelandic consultancy firms operating outside of Iceland. In addi-
Job creation continues, but low productivity growth gives cause for concern.Productivity has been virtually flat for five years in a row but is expected to pick up a bit this year, growing with about 1.25%. Productivity is expected to grow by approximately 1% per year. Increased productivity growth could offset large wage rises. Employment in
the engineering and architecture sectors is rising, but slower than average com-pared to other sectors. This indicates that there is still some slack within the sector.
The recently concluded private sector wage agreements have dramatically in-creased domestic inflationary pressures. An agreement was signed between the major parties on the labour market,
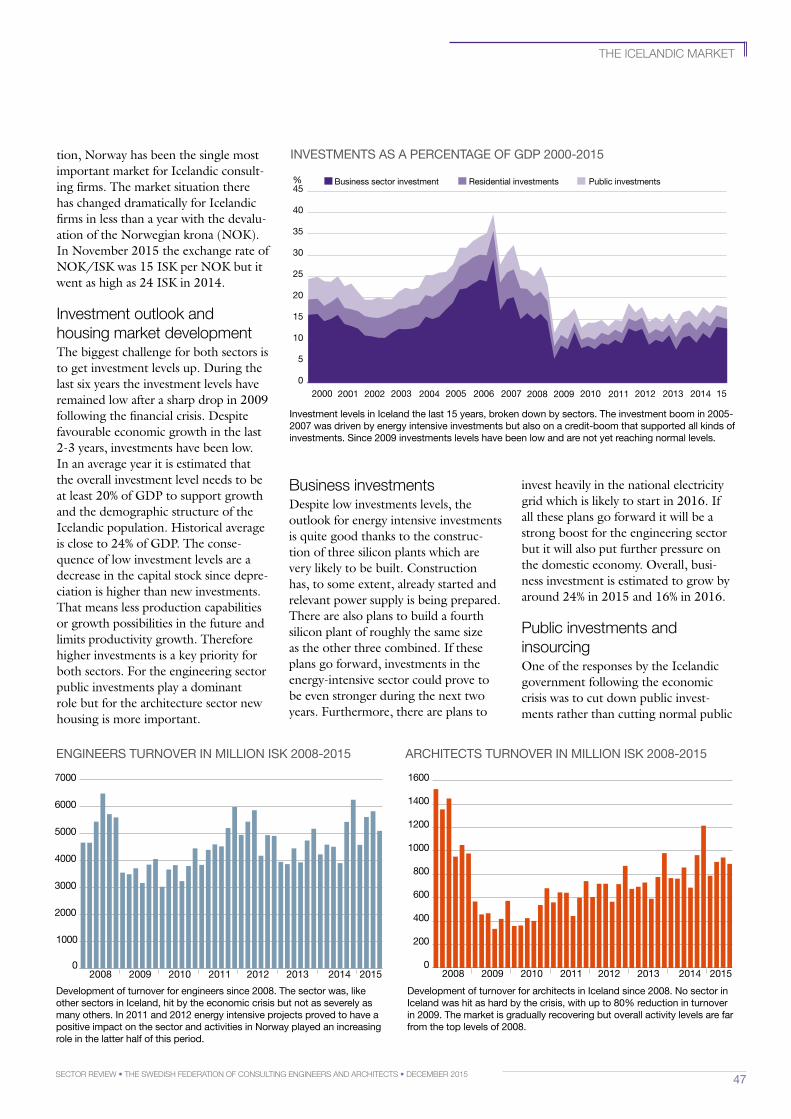
47Sector review • the SwediSh Federation oF conSulting engineerS and architectS • december 2015
the icelandic marKet
tion, Norway has been the single most important market for Icelandic consult-ing firms. The market situation there has changed dramatically for Icelandic firms in less than a year with the devalu-ation of the Norwegian krona (NOK). In November 2015 the exchange rate of NOK/ISK was 15 ISK per NOK but it went as high as 24 ISK in 2014.
investment outlook and housing market developmentThe biggest challenge for both sectors is to get investment levels up. During the last six years the investment levels have remained low after a sharp drop in 2009 following the financial crisis. Despite favourable economic growth in the last 2-3 years, investments have been low. In an average year it is estimated that the overall investment level needs to be at least 20% of GDP to support growth and the demographic structure of the Icelandic population. Historical average is close to 24% of GDP. The conse-quence of low investment levels are a decrease in the capital stock since depre-ciation is higher than new investments. That means less production capabilities or growth possibilities in the future and limits productivity growth. Therefore higher investments is a key priority for both sectors. For the engineering sector public investments play a dominant role but for the architecture sector new housing is more important.
business investmentsDespite low investments levels, the outlook for energy intensive investments is quite good thanks to the construc-tion of three silicon plants which are very likely to be built. Construction has, to some extent, already started and relevant power supply is being prepared. There are also plans to build a fourth silicon plant of roughly the same size as the other three combined. If these plans go forward, investments in the energy-intensive sector could prove to be even stronger during the next two years. Furthermore, there are plans to
invest heavily in the national electricity grid which is likely to start in 2016. If all these plans go forward it will be a strong boost for the engineering sector but it will also put further pressure on the domestic economy. Overall, busi-ness investment is estimated to grow by around 24% in 2015 and 16% in 2016.
Public investments and insourcingOne of the responses by the Icelandic government following the economic crisis was to cut down public invest-ments rather than cutting normal public
0
5
10
15
20
25
30
35
40
45
2008 2009 2010 2011 2012 2013 2014
%
2001 2002 2003 2004 2005 2006 20072000 15
Business sector investment Residential investments Public investments
investment levels in iceland the last 15 years, broken down by sectors. The investment boom in 2005-2007 was driven by energy intensive investments but also on a credit-boom that supported all kinds of investments. Since 2009 investments levels have been low and are not yet reaching normal levels.
invESTmEnTS AS A pERCEnTAgE oF gdp 2000-2015
ARChiTECTS TuRnovER in million iSK 2008-2015EnginEERS TuRnovER in million iSK 2008-2015
0
200
400
600
800
1000
1200
1400
1600
2008 2009 2010 2011 2012 2013 2014 20150
1000
2000
3000
4000
5000
6000
7000
2008 2009 2010 2011 2012 2013 2014 2015
development of turnover for engineers since 2008. The sector was, like other sectors in iceland, hit by the economic crisis but not as severely as many others. in 2011 and 2012 energy intensive projects proved to have a positive impact on the sector and activities in norway played an increasing role in the latter half of this period.
development of turnover for architects in iceland since 2008. no sector in iceland was hit as hard by the crisis, with up to 80% reduction in turnover in 2009. The market is gradually recovering but overall activity levels are far from the top levels of 2008.
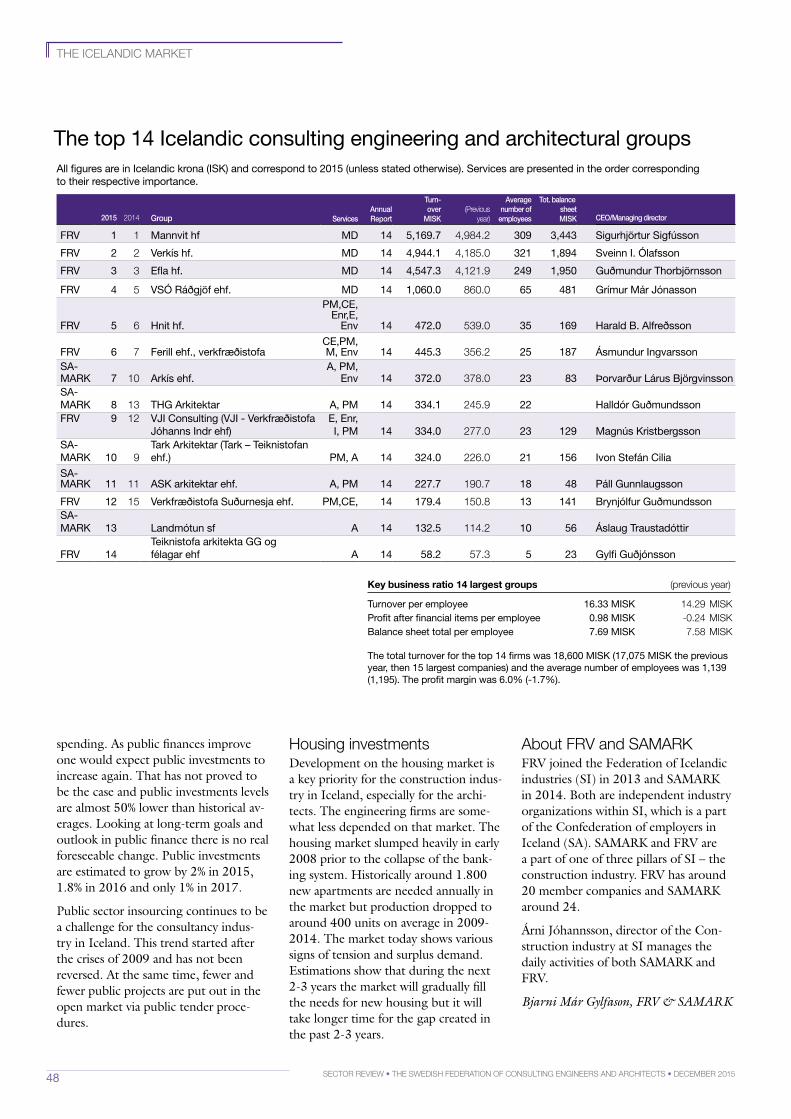
48 Sector review • the SwediSh Federation oF conSulting engineerS and architectS • december 2015
the icelandic marKet
The top 14 icelandic consulting engineering and architectural groupsAll figures are in icelandic krona (iSK) and correspond to 2015 (unless stated otherwise). Services are presented in the order corresponding to their respective importance.
FRv 1 1 mannvit hf md 14 5,169.7 4,984.2 309 3,443 Sigurhjörtur Sigfússon
FRv 2 2 verkís hf. md 14 4,944.1 4,185.0 321 1,894 Sveinn i. Ólafsson
FRv 3 3 Efla hf. md 14 4,547.3 4,121.9 249 1,950 guðmundur Thorbjörnsson
FRv 4 5 vSÓ Ráðgjöf ehf. md 14 1,060.0 860.0 65 481 grímur már Jónasson
FRv 5 6 hnit hf.
pm,CE, Enr,E,
Env 14 472.0 539.0 35 169 harald b. Alfreðsson
FRv 6 7 Ferill ehf., verkfræðistofaCE,pm, m, Env 14 445.3 356.2 25 187 Ásmundur ingvarsson
SA-mARK 7 10 Arkís ehf.
A, pm, Env 14 372.0 378.0 23 83 Þorvarður lárus björgvinsson
SA-mARK 8 13 Thg Arkitektar A, pm 14 334.1 245.9 22 halldór guðmundssonFRv 9 12 vJi Consulting (vJi - verkfræðistofa
Jóhanns indr ehf)E, Enr, i, pm 14 334.0 277.0 23 129 magnús Kristbergsson
SA-mARK 10 9
Tark Arkitektar (Tark – Teiknistofan ehf.) pm, A 14 324.0 226.0 21 156 ivon Stefán Cilia
SA-mARK 11 11 ASK arkitektar ehf. A, pm 14 227.7 190.7 18 48 páll gunnlaugsson
FRv 12 15 verkfræðistofa Suðurnesja ehf. pm,CE, 14 179.4 150.8 13 141 brynjólfur guðmundssonSA-mARK 13 landmótun sf A 14 132.5 114.2 10 56 Áslaug Traustadóttir
FRv 14Teiknistofa arkitekta gg og félagar ehf A 14 58.2 57.3 5 23 gylfi guðjónsson
spending. As public finances improve one would expect public investments to increase again. That has not proved to be the case and public investments levels are almost 50% lower than historical av-erages. Looking at long-term goals and outlook in public finance there is no real foreseeable change. Public investments are estimated to grow by 2% in 2015, 1.8% in 2016 and only 1% in 2017.
Public sector insourcing continues to be a challenge for the consultancy indus-try in Iceland. This trend started after the crises of 2009 and has not been reversed. At the same time, fewer and fewer public projects are put out in the open market via public tender proce-dures.
housing investmentsDevelopment on the housing market is a key priority for the construction indus-try in Iceland, especially for the archi-tects. The engineering firms are some-what less depended on that market. The housing market slumped heavily in early 2008 prior to the collapse of the bank-ing system. Historically around 1.800 new apartments are needed annually in the market but production dropped to around 400 units on average in 2009-2014. The market today shows various signs of tension and surplus demand. Estimations show that during the next 2-3 years the market will gradually fill the needs for new housing but it will take longer time for the gap created in the past 2-3 years.
about Frv and SamarKFRV joined the Federation of Icelandic industries (SI) in 2013 and SAMARK in 2014. Both are independent industry organizations within SI, which is a part of the Confederation of employers in Iceland (SA). SAMARK and FRV are a part of one of three pillars of SI – the construction industry. FRV has around 20 member companies and SAMARK around 24.
Árni Jóhannsson, director of the Con-struction industry at SI manages the daily activities of both SAMARK and FRV.
Bjarni Már Gylfason, FRV & SAMARK
2015 2014 Group ServicesAnnual report
turn-over
MiSk(Previous
year)
Average number of
employees
tot. balancesheet
MiSk ceo/Managing director
Key business ratio 14 largest groups (previous year)
Turnover per employee 16.33 miSK 14.29 miSKprofit after financial items per employee 0.98 miSK -0.24 miSKbalance sheet total per employee 7.69 miSK 7.58 miSK
The total turnover for the top 14 firms was 18,600 miSK (17,075 miSK the previous year, then 15 largest companies) and the average number of employees was 1,139 (1,195). The profit margin was 6.0% (-1.7%).
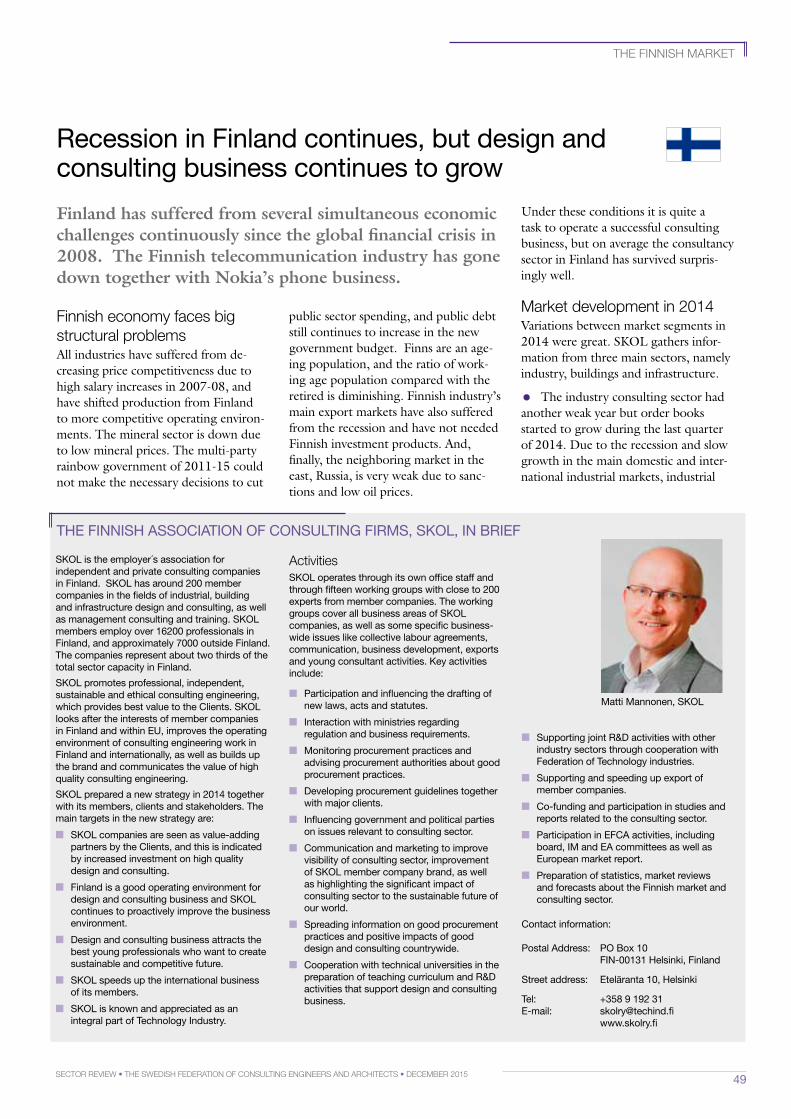
49Sector review • the SwediSh Federation oF conSulting engineerS and architectS • december 2015
the FinniSh marKet
matti mannonen, SKol
ThE FinniSh ASSoCiATion oF ConSulTing FiRmS, SKol, in bRiEF
SKol is the employer´s association for independent and private consulting companies in Finland. SKol has around 200 member companies in the fields of industrial, building and infrastructure design and consulting, as well as management consulting and training. SKol members employ over 16200 professionals in Finland, and approximately 7000 outside Finland. The companies represent about two thirds of the total sector capacity in Finland.
SKol promotes professional, independent, sustainable and ethical consulting engineering, which provides best value to the Clients. SKol looks after the interests of member companies in Finland and within Eu, improves the operating environment of consulting engineering work in Finland and internationally, as well as builds up the brand and communicates the value of high quality consulting engineering.
SKol prepared a new strategy in 2014 together with its members, clients and stakeholders. The main targets in the new strategy are:
■ SKol companies are seen as value-adding partners by the Clients, and this is indicated by increased investment on high quality design and consulting.
■ Finland is a good operating environment for design and consulting business and SKol continues to proactively improve the business environment.
■ design and consulting business attracts the best young professionals who want to create sustainable and competitive future.
■ SKol speeds up the international business of its members.
■ SKol is known and appreciated as an integral part of Technology industry.
activitiesSKol operates through its own office staff and through fifteen working groups with close to 200 experts from member companies. The working groups cover all business areas of SKol companies, as well as some specific business-wide issues like collective labour agreements, communication, business development, exports and young consultant activities. Key activities include:
■ participation and influencing the drafting of new laws, acts and statutes.
■ interaction with ministries regarding regulation and business requirements.
■ monitoring procurement practices and advising procurement authorities about good procurement practices.
■ developing procurement guidelines together with major clients.
■ influencing government and political parties on issues relevant to consulting sector.
■ Communication and marketing to improve visibility of consulting sector, improvement of SKol member company brand, as well as highlighting the significant impact of consulting sector to the sustainable future of our world.
■ Spreading information on good procurement practices and positive impacts of good design and consulting countrywide.
■ Cooperation with technical universities in the preparation of teaching curriculum and R&d activities that support design and consulting business.
■ Supporting joint R&d activities with other industry sectors through cooperation with Federation of Technology industries.
■ Supporting and speeding up export of member companies.
■ Co-funding and participation in studies and reports related to the consulting sector.
■ participation in EFCA activities, including board, im and EA committees as well as European market report.
■ preparation of statistics, market reviews and forecasts about the Finnish market and consulting sector.
Contact information:
postal Address: po box 10 Fin-00131 helsinki, Finland
Street address: Eteläranta 10, helsinki
Tel: +358 9 192 31E-mail: [email protected] www.skolry.fi
Recession in Finland continues, but design and consulting business continues to grow
Finland has suffered from several simultaneous economic challenges continuously since the global financial crisis in 2008. The Finnish telecommunication industry has gone down together with Nokia’s phone business.
Finnish economy faces big structural problemsAll industries have suffered from de-creasing price competitiveness due to high salary increases in 2007-08, and have shifted production from Finland to more competitive operating environ-ments. The mineral sector is down due to low mineral prices. The multi-party rainbow government of 2011-15 could not make the necessary decisions to cut
public sector spending, and public debt still continues to increase in the new government budget. Finns are an age-ing population, and the ratio of work-ing age population compared with the retired is diminishing. Finnish industry’s main export markets have also suffered from the recession and have not needed Finnish investment products. And, finally, the neighboring market in the east, Russia, is very weak due to sanc-tions and low oil prices.
Under these conditions it is quite a task to operate a successful consulting business, but on average the consultancy sector in Finland has survived surpris-ingly well.
market development in 2014Variations between market segments in 2014 were great. SKOL gathers infor-mation from three main sectors, namely industry, buildings and infrastructure.
• The industry consulting sector had another weak year but order books started to grow during the last quarter of 2014. Due to the recession and slow growth in the main domestic and inter-national industrial markets, industrial
50 Sector review • the SwediSh Federation oF conSulting engineerS and architectS • december 2015
consultancies have also suffered. Some improvement in industrial production was forecasted for 2015, which has not materialized. Also, the practical close-down of the Russian market probably hits Finnish exports harder than any other European country.
• The building sector continued to have a good workload throughout the year, especially in the growing cities. Profitability of consulting engineering in the building sector also remained reasonable, or even good, in 2014. Rehabilitation design, renovation and building of public hospitals and demand for modern offices kept the market going. Also increasing energy efficiency demands both through regulation and by increasingly “green” clients has kept the business busy. The same pace has continued during 2015 and there is actually a lack of professionals in certain areas of expertise.
• The infrastructure sector is mostly tied to public investments and in 2014 it was a fairly difficult market. Some large infrastructure projects started during the last quarter of 2014, increasing the order books of consulting engineers in the infrastructure sector. Growing cities in Finland continue to need new infrastructure for new inhabitants and big cities actually give more work to engineering consultancies than does the state Transport Authority. The new government has made further cuts in transport investments during 2015, and redirected the money to maintenance and rehabilitation of the transportation
network. This will not employ designers in the same way as new investments do. It is foreseen that the domestic work-load will drop dramatically during 2016.
Statistics from 2014The total turnover of SKOL member companies in 2014 was 1 565 mil-lion EUR, which is a growth of 4 % compared with the previous year. The increase came entirely from domestic sector, which increased by 8 %. Exports of consulting services decreased by 10 % from the previous year, with a total volume of 270 million EUR in 2014.
The decrease of exports was due to a decrease in overall industrial exports from Finland. The biggest exporter was the industrial consultancies, with exports representing about 30 % of their turnover. Infrastructure consultancies exported about 10 % of their turnover and building consultancies only 5 %. The downturn of the Russian mar-ket was a major reason for decreasing export figures, and the situation has not changed much during 2015.
The industry sector represents over 40 % of the total turnover of SKOL members. The building sector is second in line, with 35 %. The infrastructure sector is diminishing, and represents only 20 % of total turnover. The rest comes from other business sectors including e.g. management consulting and training.
The building sector had the biggest growth of domestic invoicing, at 13 %, followed by domestic industrial consult-ing, growing by 11 %. Infrastructure invoicing decreased by 4 % from the previous year.
The total staff of SKOL’s member companies increased by 4 % to 16 250 employees. Of these, 4000 have higher university degrees, over 8000 have col-lege (polytechnic etc.) degrees, 2000 are technicians and building masters, and the rest administrative and other staff.
Profitability The profitability figures of 100 largest companies on the Finnish market are
presented in the Nordic comparison part of this report, but the preliminary figures that SKOL has collected from all member companies in the spring of 2015 show that profitability was still unsatisfactory in 2014. Average net profit of SKOL member companies was 4.1 %. The building sector showed the best profitability with 6.5 %, followed by infrastructure at 3.8 % and industry at 2.9 %.
biggest companies, mergers and acquisitionsPöyry continues to be by far the biggest Finnish consulting company in this Nordic sector review, as it is listed in Finland and reports its total turnover, in-cluding global operations. When looking only at the operations in Finland, which is the basis of SKOL statistics, there were some changes in the top ten list.
In 2014, Sweco had the biggest turn-over in Finland, about 165 million EUR followed by Ramboll (145 MEUR) and Pöyry (139 MEUR). Other companies in top ten included Neste Jacobs (123,4 MEUR), Etteplan (79 MEUR), FCG (56,5 MEUR), Citec (49,5 MEUR), Granlund (45,5 MEUR), Elomatic (45,4 MEUR) and A-Insinöörit (45 MEUR).
The fastest growing companies were Neste Jacobs and Indufor, with over 37 % growth from the previous year, followed by TSS, Nissinen and HTJ with over 30 % growth in turnover. Citec kept its position as the biggest exporter from Finland, followed by Neste Jacobs.
The biggest deal in the consulting sector in 2014 was done between Ramboll and Pöyry. Ramboll acquired the project management, HVAC design and con-sulting, real estate consulting and urban planning units of Pöyry, with a total of 435 staff. Another major merger took place at the end of 2014 when A-Insinöörit acquired Saanio & Riekkola, an 80-staff company in rock engineering and underground facilities design.
the FinniSh marKet
”“Average net profit of SKOL member companies was 4.1 % in 2014”
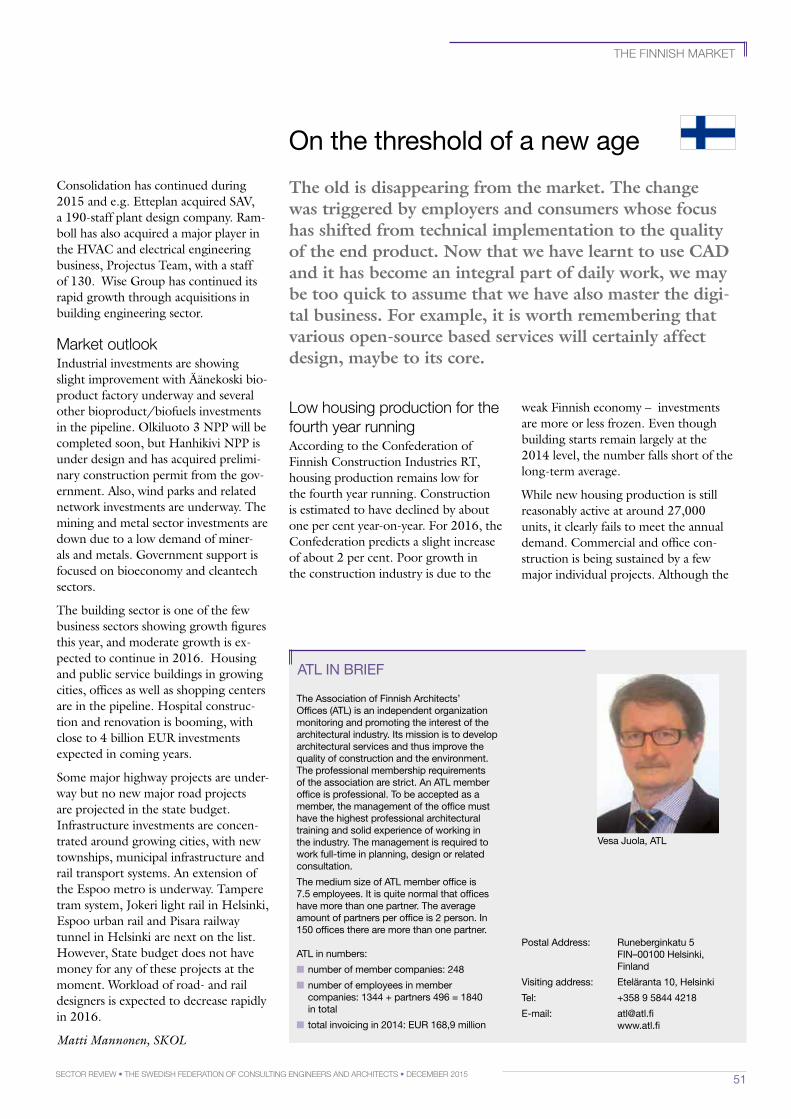
51Sector review • the SwediSh Federation oF conSulting engineerS and architectS • december 2015
Consolidation has continued during 2015 and e.g. Etteplan acquired SAV, a 190-staff plant design company. Ram-boll has also acquired a major player in the HVAC and electrical engineering business, Projectus Team, with a staff of 130. Wise Group has continued its rapid growth through acquisitions in building engineering sector.
market outlookIndustrial investments are showing slight improvement with Äänekoski bio-product factory underway and several other bioproduct/biofuels investments in the pipeline. Olkiluoto 3 NPP will be completed soon, but Hanhikivi NPP is under design and has acquired prelimi-nary construction permit from the gov-ernment. Also, wind parks and related network investments are underway. The mining and metal sector investments are down due to a low demand of miner-als and metals. Government support is focused on bioeconomy and cleantech sectors.
The building sector is one of the few business sectors showing growth figures this year, and moderate growth is ex-pected to continue in 2016. Housing and public service buildings in growing cities, offices as well as shopping centers are in the pipeline. Hospital construc-tion and renovation is booming, with close to 4 billion EUR investments expected in coming years.
Some major highway projects are under-way but no new major road projects are projected in the state budget. Infrastructure investments are concen-trated around growing cities, with new townships, municipal infrastructure and rail transport systems. An extension of the Espoo metro is underway. Tampere tram system, Jokeri light rail in Helsinki, Espoo urban rail and Pisara railway tunnel in Helsinki are next on the list. However, State budget does not have money for any of these projects at the moment. Workload of road- and rail designers is expected to decrease rapidly in 2016.
Matti Mannonen, SKOL
the FinniSh marKet
vesa Juola, ATl
ATl in bRiEF
The Association of Finnish Architects’ offices (ATl) is an independent organization monitoring and promoting the interest of the architectural industry. its mission is to develop architectural services and thus improve the quality of construction and the environment. The professional membership requirements of the association are strict. An ATl member office is professional. To be accepted as a member, the management of the office must have the highest professional architectural training and solid experience of working in the industry. The management is required to work full-time in planning, design or related consultation.
The medium size of ATl member office is 7.5 employees. it is quite normal that offices have more than one partner. The average amount of partners per office is 2 person. in 150 offices there are more than one partner.
ATl in numbers:
■ number of member companies: 248
■ number of employees in member companies: 1344 + partners 496 = 1840 in total
■ total invoicing in 2014: EuR 168,9 million
postal Address: Runeberginkatu 5 Fin–00100 helsinki, Finland
visiting address: Eteläranta 10, helsinki
Tel: +358 9 5844 4218
E-mail: [email protected] www.atl.fi
The old is disappearing from the market. The change was triggered by employers and consumers whose focus has shifted from technical implementation to the quality of the end product. Now that we have learnt to use CAD and it has become an integral part of daily work, we may be too quick to assume that we have also master the digital business. For example, it is worth remembering that various opensource based services will certainly affect design, maybe to its core.
on the threshold of a new age
low housing production for the fourth year runningAccording to the Confederation of Finnish Construction Industries RT, housing production remains low for the fourth year running. Construction is estimated to have declined by about one per cent year-on-year. For 2016, the Confederation predicts a slight increase of about 2 per cent. Poor growth in the construction industry is due to the
weak Finnish economy – investments are more or less frozen. Even though building starts remain largely at the 2014 level, the number falls short of the long-term average.
While new housing production is still reasonably active at around 27,000 units, it clearly fails to meet the annual demand. Commercial and office con-struction is being sustained by a few major individual projects. Although the
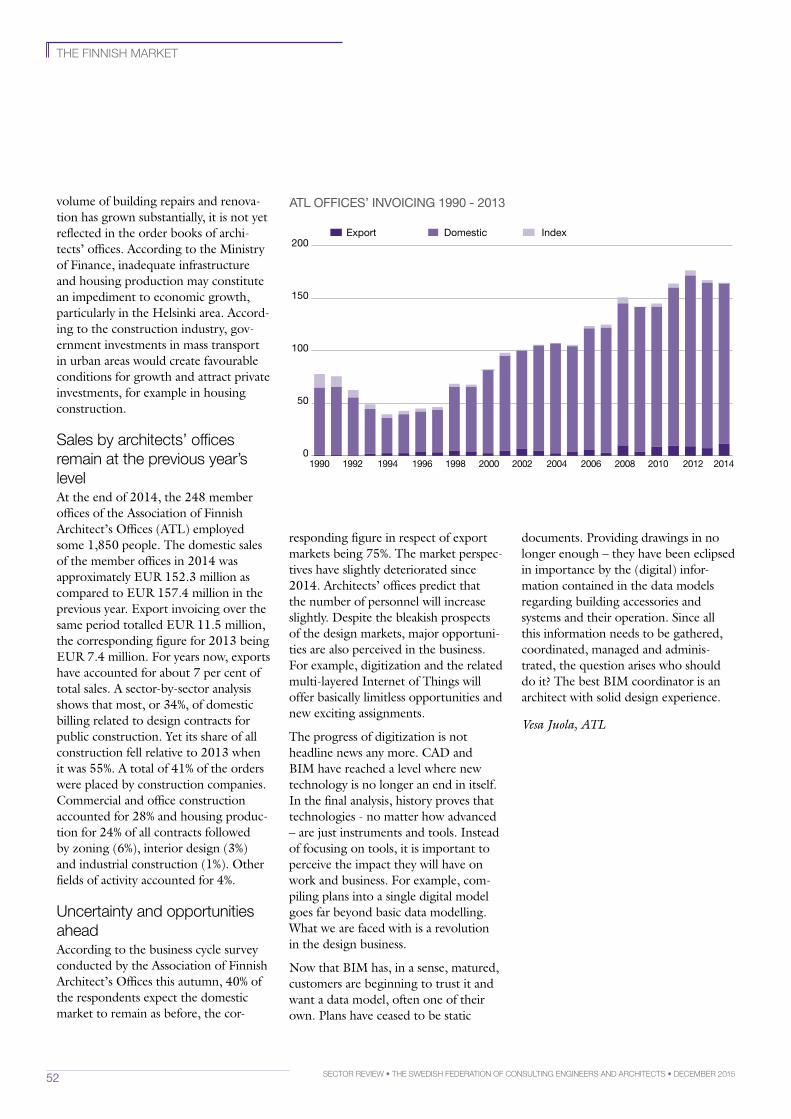
52 Sector review • the SwediSh Federation oF conSulting engineerS and architectS • december 2015
the FinniSh marKet
volume of building repairs and renova-tion has grown substantially, it is not yet reflected in the order books of archi-tects’ offices. According to the Ministry of Finance, inadequate infrastructure and housing production may constitute an impediment to economic growth, particularly in the Helsinki area. Accord-ing to the construction industry, gov-ernment investments in mass transport in urban areas would create favourable conditions for growth and attract private investments, for example in housing construction.
Sales by architects’ offices remain at the previous year’s levelAt the end of 2014, the 248 member offices of the Association of Finnish Architect’s Offices (ATL) employed some 1,850 people. The domestic sales of the member offices in 2014 was approximately EUR 152.3 million as compared to EUR 157.4 million in the previous year. Export invoicing over the same period totalled EUR 11.5 million, the corresponding figure for 2013 being EUR 7.4 million. For years now, exports have accounted for about 7 per cent of total sales. A sector-by-sector analysis shows that most, or 34%, of domestic billing related to design contracts for public construction. Yet its share of all construction fell relative to 2013 when it was 55%. A total of 41% of the orders were placed by construction companies. Commercial and office construction accounted for 28% and housing produc-tion for 24% of all contracts followed by zoning (6%), interior design (3%) and industrial construction (1%). Other fields of activity accounted for 4%.
uncertainty and opportunities aheadAccording to the business cycle survey conducted by the Association of Finnish Architect’s Offices this autumn, 40% of the respondents expect the domestic market to remain as before, the cor-
responding figure in respect of export markets being 75%. The market perspec-tives have slightly deteriorated since 2014. Architects’ offices predict that the number of personnel will increase slightly. Despite the bleakish prospects of the design markets, major opportuni-ties are also perceived in the business. For example, digitization and the related multi-layered Internet of Things will offer basically limitless opportunities and new exciting assignments.
The progress of digitization is not headline news any more. CAD and BIM have reached a level where new technology is no longer an end in itself. In the final analysis, history proves that technologies - no matter how advanced – are just instruments and tools. Instead of focusing on tools, it is important to perceive the impact they will have on work and business. For example, com-piling plans into a single digital model goes far beyond basic data modelling. What we are faced with is a revolution in the design business.
Now that BIM has, in a sense, matured, customers are beginning to trust it and want a data model, often one of their own. Plans have ceased to be static
ATl oFFiCES’ invoiCing 1990 - 2013
0
50
100
150
200Export Domestic Index
2008 2010 20121994 1996 1998 2000 2002 2004 20061990 1992 2014
documents. Providing drawings in no longer enough – they have been eclipsed in importance by the (digital) infor-mation contained in the data models regarding building accessories and systems and their operation. Since all this information needs to be gathered, coordinated, managed and adminis-trated, the question arises who should do it? The best BIM coordinator is an architect with solid design experience.
Vesa Juola, ATL
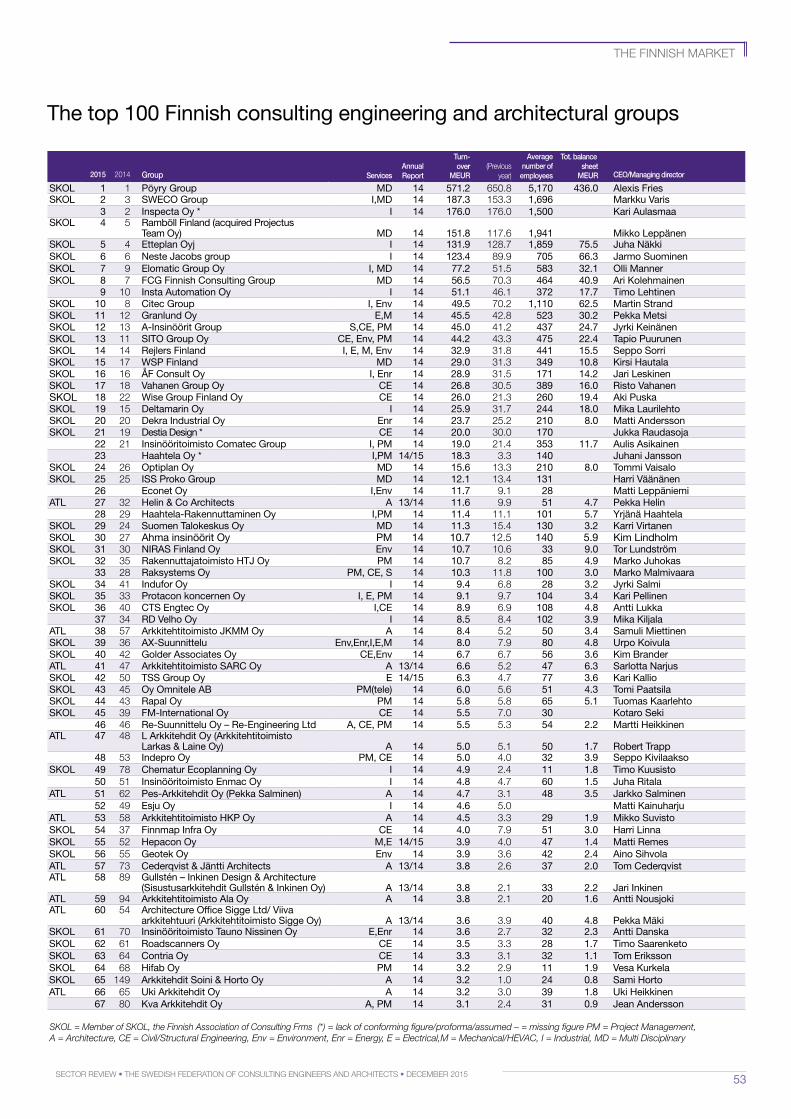
53Sector review • the SwediSh Federation oF conSulting engineerS and architectS • december 2015
The top 100 Finnish consulting engineering and architectural groups
2015 2014 Group
ServicesAnnual report
turn-over
MeUr(Previous
year)
Average number of
employees
tot. balancesheet
MeUr ceo/Managing director
SKol 1 1 pöyry group md 14 571.2 650.8 5,170 436.0 Alexis FriesSKol 2 3 SwECo group i,md 14 187.3 153.3 1,696 markku varis
3 2 inspecta oy * i 14 176.0 176.0 1,500 Kari AulasmaaSKol 4 5 Ramböll Finland (acquired projectus
Team oy) md 14 151.8 117.6 1,941 mikko leppänenSKol 5 4 Etteplan oyj i 14 131.9 128.7 1,859 75.5 Juha näkki SKol 6 6 neste Jacobs group i 14 123.4 89.9 705 66.3 Jarmo SuominenSKol 7 9 Elomatic group oy i, md 14 77.2 51.5 583 32.1 olli mannerSKol 8 7 FCg Finnish Consulting group md 14 56.5 70.3 464 40.9 Ari Kolehmainen
9 10 insta Automation oy i 14 51.1 46.1 372 17.7 Timo lehtinenSKol 10 8 Citec group i, Env 14 49.5 70.2 1,110 62.5 martin StrandSKol 11 12 granlund oy E,m 14 45.5 42.8 523 30.2 pekka metsiSKol 12 13 A-insinöörit group S,CE, pm 14 45.0 41.2 437 24.7 Jyrki KeinänenSKol 13 11 SiTo group oy CE, Env, pm 14 44.2 43.3 475 22.4 Tapio puurunenSKol 14 14 Rejlers Finland i, E, m, Env 14 32.9 31.8 441 15.5 Seppo SorriSKol 15 17 wSp Finland md 14 29.0 31.3 349 10.8 Kirsi hautalaSKol 16 16 ÅF Consult oy i, Enr 14 28.9 31.5 171 14.2 Jari leskinenSKol 17 18 vahanen group oy CE 14 26.8 30.5 389 16.0 Risto vahanenSKol 18 22 wise group Finland oy CE 14 26.0 21.3 260 19.4 Aki puska SKol 19 15 deltamarin oy i 14 25.9 31.7 244 18.0 mika laurilehtoSKol 20 20 dekra industrial oy Enr 14 23.7 25.2 210 8.0 matti AnderssonSKol 21 19 destia design * CE 14 20.0 30.0 170 Jukka Raudasoja
22 21 insinööritoimisto Comatec group i, pm 14 19.0 21.4 353 11.7 Aulis Asikainen23 haahtela oy * i,pm 14/15 18.3 3.3 140 Juhani Jansson
SKol 24 26 optiplan oy md 14 15.6 13.3 210 8.0 Tommi vaisaloSKol 25 25 iSS proko group md 14 12.1 13.4 131 harri väänänen
26 Econet oy i,Env 14 11.7 9.1 28 matti leppäniemiATl 27 32 helin & Co Architects A 13/14 11.6 9.9 51 4.7 pekka helin
28 29 haahtela-Rakennuttaminen oy i,pm 14 11.4 11.1 101 5.7 yrjänä haahtelaSKol 29 24 Suomen Talokeskus oy md 14 11.3 15.4 130 3.2 Karri virtanenSKol 30 27 Ahma insinöörit oy pm 14 10.7 12.5 140 5.9 Kim lindholmSKol 31 30 niRAS Finland oy Env 14 10.7 10.6 33 9.0 Tor lundströmSKol 32 35 Rakennuttajatoimisto hTJ oy pm 14 10.7 8.2 85 4.9 marko Juhokas
33 28 Raksystems oy pm, CE, S 14 10.3 11.8 100 3.0 marko malmivaaraSKol 34 41 indufor oy i 14 9.4 6.8 28 3.2 Jyrki SalmiSKol 35 33 protacon koncernen oy i, E, pm 14 9.1 9.7 104 3.4 Kari pellinenSKol 36 40 CTS Engtec oy i,CE 14 8.9 6.9 108 4.8 Antti lukka
37 34 Rd velho oy i 14 8.5 8.4 102 3.9 mika KiljalaATl 38 57 Arkkitehtitoimisto JKmm oy A 14 8.4 5.2 50 3.4 Samuli miettinenSKol 39 36 Ax-Suunnittelu Env,Enr,i,E,m 14 8.0 7.9 80 4.8 urpo KoivulaSKol 40 42 golder Associates oy CE,Env 14 6.7 6.7 56 3.6 Kim branderATl 41 47 Arkkitehtitoimisto SARC oy A 13/14 6.6 5.2 47 6.3 Sarlotta narjusSKol 42 50 TSS group oy E 14/15 6.3 4.7 77 3.6 Kari KallioSKol 43 45 oy omnitele Ab pm(tele) 14 6.0 5.6 51 4.3 Tomi paatsilaSKol 44 43 Rapal oy pm 14 5.8 5.8 65 5.1 Tuomas KaarlehtoSKol 45 39 Fm-international oy CE 14 5.5 7.0 30 Kotaro Seki
46 46 Re-Suunnittelu oy – Re-Engineering ltd A, CE, pm 14 5.5 5.3 54 2.2 martti heikkinen ATl 47 48 l Arkkitehdit oy (Arkkitehtitoimisto
larkas & laine oy) A 14 5.0 5.1 50 1.7 Robert Trapp48 53 indepro oy pm, CE 14 5.0 4.0 32 3.9 Seppo Kivilaakso
SKol 49 78 Chematur Ecoplanning oy i 14 4.9 2.4 11 1.8 Timo Kuusisto50 51 insinööritoimisto Enmac oy i 14 4.8 4.7 60 1.5 Juha Ritala
ATl 51 62 pes-Arkkitehdit oy (pekka Salminen) A 14 4.7 3.1 48 3.5 Jarkko Salminen52 49 Esju oy i 14 4.6 5.0 matti Kainuharju
ATl 53 58 Arkkitehtitoimisto hKp oy A 14 4.5 3.3 29 1.9 mikko SuvistoSKol 54 37 Finnmap infra oy CE 14 4.0 7.9 51 3.0 harri linnaSKol 55 52 hepacon oy m,E 14/15 3.9 4.0 47 1.4 matti RemesSKol 56 55 geotek oy Env 14 3.9 3.6 42 2.4 Aino SihvolaATl 57 73 Cederqvist & Jäntti Architects A 13/14 3.8 2.6 37 2.0 Tom CederqvistATl 58 89 gullstén – inkinen design & Architecture
(Sisustusarkkitehdit gullstén & inkinen oy) A 13/14 3.8 2.1 33 2.2 Jari inkinenATl 59 94 Arkkitehtitoimisto Ala oy A 14 3.8 2.1 20 1.6 Antti nousjokiATl 60 54 Architecture office Sigge ltd/ viiva
arkkitehtuuri (Arkkitehtitoimisto Sigge oy) A 13/14 3.6 3.9 40 4.8 pekka mäkiSKol 61 70 insinööritoimisto Tauno nissinen oy E,Enr 14 3.6 2.7 32 2.3 Antti danskaSKol 62 61 Roadscanners oy CE 14 3.5 3.3 28 1.7 Timo SaarenketoSKol 63 64 Contria oy CE 14 3.3 3.1 32 1.1 Tom ErikssonSKol 64 68 hifab oy pm 14 3.2 2.9 11 1.9 vesa KurkelaSKol 65 149 Arkkitehdit Soini & horto oy A 14 3.2 1.0 24 0.8 Sami horto ATl 66 65 uki Arkkitehdit oy A 14 3.2 3.0 39 1.8 uki heikkinen
67 80 Kva Arkkitehdit oy A, pm 14 3.1 2.4 31 0.9 Jean Andersson
the FinniSh marKet
SKOL = Member of SKOL, the Finnish Association of Consulting Frms (*) = lack of conforming figure/proforma/assumed – = missing figure PM = Project Management, A = Architecture, CE = Civil/Structural Engineering, Env = Environment, Enr = Energy, E = Electrical,M = Mechanical/HEVAC, I = Industrial, MD = Multi Disciplinary
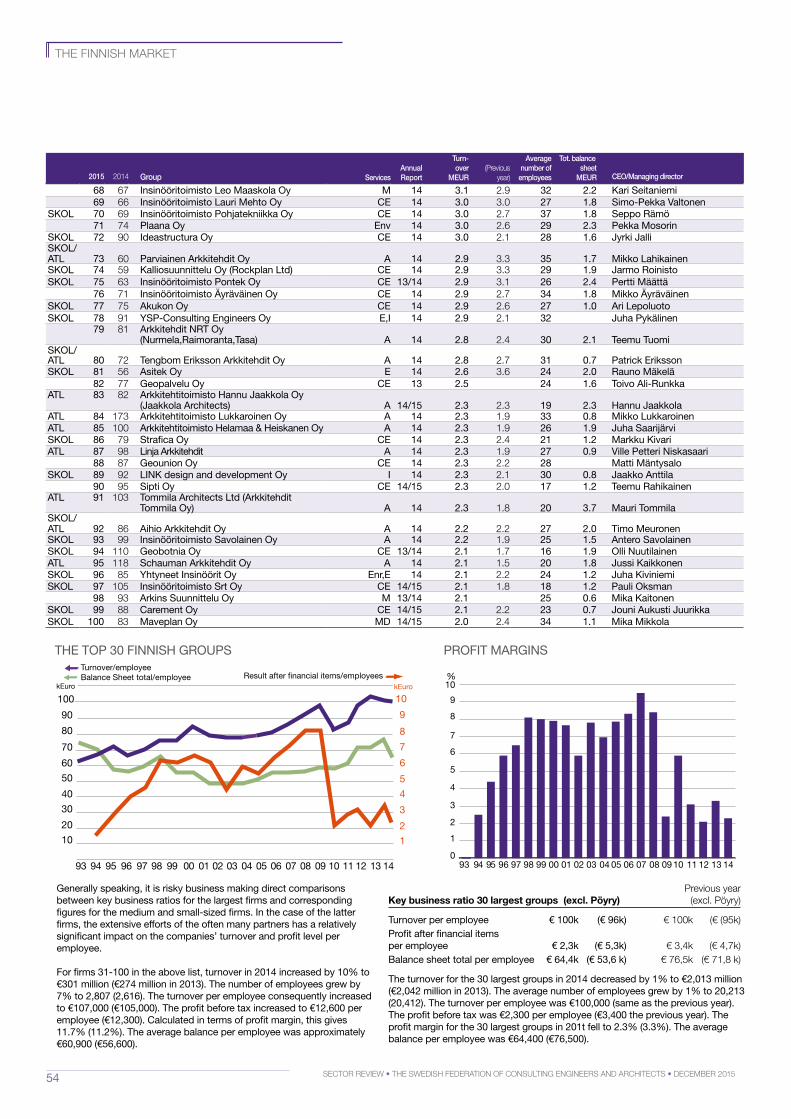
54 Sector review • the SwediSh Federation oF conSulting engineerS and architectS • december 2015
ThE Top 30 FinniSh gRoupS pRoFiT mARginS
generally speaking, it is risky business making direct comparisons between key business ratios for the largest firms and corresponding figures for the medium and small-sized firms. in the case of the latter firms, the extensive efforts of the often many partners has a relatively significant impact on the companies’ turnover and profit level per employee.
For firms 31-100 in the above list, turnover in 2014 increased by 10% to €301 million (€274 million in 2013). The number of employees grew by 7% to 2,807 (2,616). The turnover per employee consequently increased to €107,000 (€105,000). The profit before tax increased to €12,600 per employee (€12,300). Calculated in terms of profit margin, this gives 11.7% (11.2%). The average balance per employee was approximately €60,900 (€56,600).
68 67 insinööritoimisto leo maaskola oy m 14 3.1 2.9 32 2.2 Kari Seitaniemi69 66 insinööritoimisto lauri mehto oy CE 14 3.0 3.0 27 1.8 Simo-pekka valtonen
SKol 70 69 insinööritoimisto pohjatekniikka oy CE 14 3.0 2.7 37 1.8 Seppo Rämö71 74 plaana oy Env 14 3.0 2.6 29 2.3 pekka mosorin
SKol 72 90 ideastructura oy CE 14 3.0 2.1 28 1.6 Jyrki Jalli SKol/ATl 73 60 parviainen Arkkitehdit oy A 14 2.9 3.3 35 1.7 mikko lahikainenSKol 74 59 Kalliosuunnittelu oy (Rockplan ltd) CE 14 2.9 3.3 29 1.9 Jarmo RoinistoSKol 75 63 insinööritoimisto pontek oy CE 13/14 2.9 3.1 26 2.4 pertti määttä
76 71 insinööritoimisto Äyräväinen oy CE 14 2.9 2.7 34 1.8 mikko ÄyräväinenSKol 77 75 Akukon oy CE 14 2.9 2.6 27 1.0 Ari lepoluotoSKol 78 91 ySp-Consulting Engineers oy E,i 14 2.9 2.1 32 Juha pykälinen
79 81 Arkkitehdit nRT oy (nurmela,Raimoranta,Tasa) A 14 2.8 2.4 30 2.1 Teemu Tuomi
SKol/ATl 80 72 Tengbom Eriksson Arkkitehdit oy A 14 2.8 2.7 31 0.7 patrick ErikssonSKol 81 56 Asitek oy E 14 2.6 3.6 24 2.0 Rauno mäkelä
82 77 geopalvelu oy CE 13 2.5 24 1.6 Toivo Ali-RunkkaATl 83 82 Arkkitehtitoimisto hannu Jaakkola oy
(Jaakkola Architects) A 14/15 2.3 2.3 19 2.3 hannu JaakkolaATl 84 173 Arkkitehtitoimisto lukkaroinen oy A 14 2.3 1.9 33 0.8 mikko lukkaroinenATl 85 100 Arkkitehtitoimisto helamaa & heiskanen oy A 14 2.3 1.9 26 1.9 Juha SaarijärviSKol 86 79 Strafica oy CE 14 2.3 2.4 21 1.2 markku KivariATl 87 98 linja Arkkitehdit A 14 2.3 1.9 27 0.9 ville petteri niskasaari
88 87 geounion oy CE 14 2.3 2.2 28 matti mäntysaloSKol 89 92 linK design and development oy i 14 2.3 2.1 30 0.8 Jaakko Anttila
90 95 Sipti oy CE 14/15 2.3 2.0 17 1.2 Teemu RahikainenATl 91 103 Tommila Architects ltd (Arkkitehdit
Tommila oy) A 14 2.3 1.8 20 3.7 mauri TommilaSKol/ATl 92 86 Aihio Arkkitehdit oy A 14 2.2 2.2 27 2.0 Timo meuronenSKol 93 99 insinööritoimisto Savolainen oy A 14 2.2 1.9 25 1.5 Antero SavolainenSKol 94 110 geobotnia oy CE 13/14 2.1 1.7 16 1.9 olli nuutilainenATl 95 118 Schauman Arkkitehdit oy A 14 2.1 1.5 20 1.8 Jussi KaikkonenSKol 96 85 yhtyneet insinöörit oy Enr,E 14 2.1 2.2 24 1.2 Juha Kiviniemi SKol 97 105 insinööritoimisto Srt oy CE 14/15 2.1 1.8 18 1.2 pauli oksman
98 93 Arkins Suunnittelu oy m 13/14 2.1 25 0.6 mika KaitonenSKol 99 88 Carement oy CE 14/15 2.1 2.2 23 0.7 Jouni Aukusti Juurikka SKol 100 83 maveplan oy md 14/15 2.0 2.4 34 1.1 mika mikkola
2015 2014 Group ServicesAnnual report
turn-over
MeUr(Previous
year)
Average number of
employees
tot. balancesheet
MeUr ceo/Managing director
the FinniSh marKet
0
1
2
3
4
5
6
7
8
9
%10
0302010099989796959493 04 05 06 07 08 0910 11 12 13 14
kEuro
60
70
50
40
30
20
10
kEuro
6
7
5
4
3
2
1
80 8
90 9
100 10
93 94 95 96 97 98 99 00 01 02 0403 05 06 07 0908 10 11 12 13 14
Turnover/employeeBalance Sheet total/employee Result after �nancial items/employees
Previous yearKey business ratio 30 largest groups (excl. Pöyry) (excl. Pöyry)
Turnover per employee € 100k (€ 96k) € 100k (€ (95k)profit after financial items per employee € 2,3k (€ 5,3k) € 3,4k (€ 4,7k)balance sheet total per employee € 64,4k (€ 53,6 k) € 76,5k (€ 71,8 k)
The turnover for the 30 largest groups in 2014 decreased by 1% to €2,013 million (€2,042 million in 2013). The average number of employees grew by 1% to 20,213 (20,412). The turnover per employee was €100,000 (same as the previous year). The profit before tax was €2,300 per employee (€3,400 the previous year). The profit margin for the 30 largest groups in 201t fell to 2.3% (3.3%). The average balance per employee was €64,400 (€76,500).
55Sector review • the SwediSh Federation oF conSulting engineerS and architectS • december 2015
den internationella marKnadenthe international marKet
”
gothia Towers, gothenburg. pEAb, division industry. photo: Andreas ulvedell.
“The profit margin for the 300 largest European architectural and consulting firms was 2.1 % in 2014”
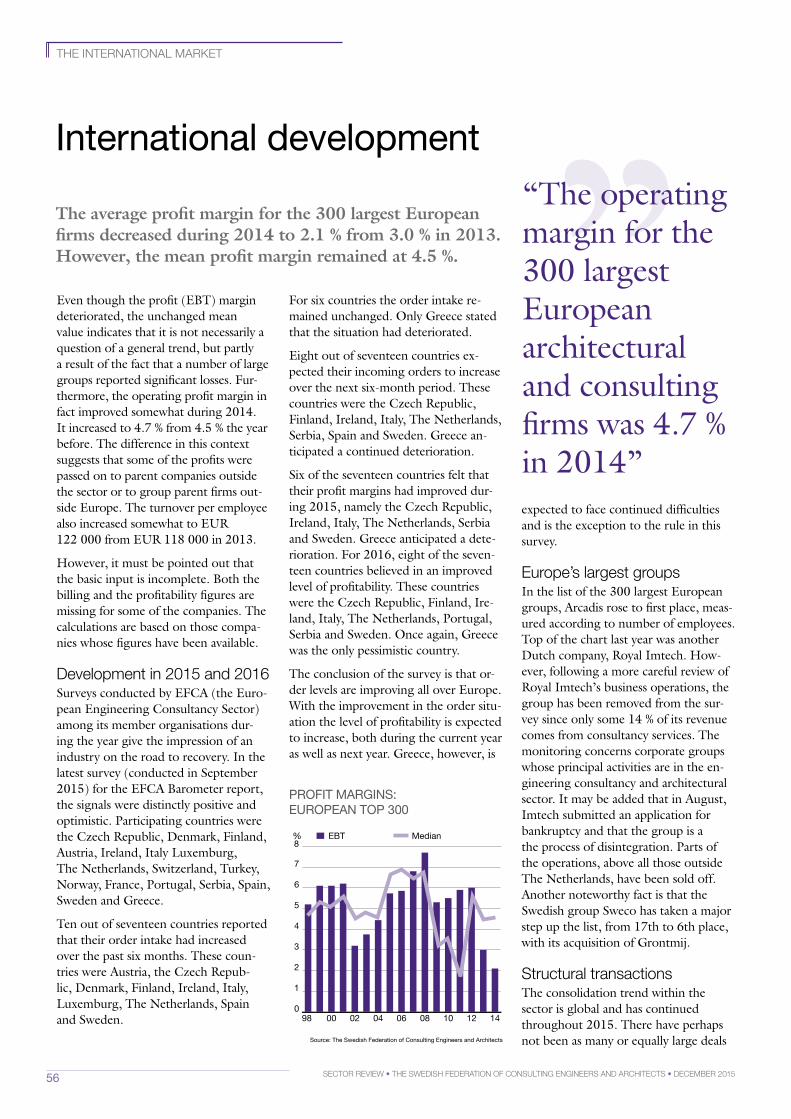
56 Sector review • the SwediSh Federation oF conSulting engineerS and architectS • december 2015
”the international marKet
international development
The average profit margin for the 300 largest European firms decreased during 2014 to 2.1 % from 3.0 % in 2013. However, the mean profit margin remained at 4.5 %.
Even though the profit (EBT) margin deteriorated, the unchanged mean value indicates that it is not necessarily a question of a general trend, but partly a result of the fact that a number of large groups reported significant losses. Fur-thermore, the operating profit margin in fact improved somewhat during 2014. It increased to 4.7 % from 4.5 % the year before. The difference in this context suggests that some of the profits were passed on to parent companies outside the sector or to group parent firms out-side Europe. The turnover per employee also increased somewhat to EUR 122 000 from EUR 118 000 in 2013.
However, it must be pointed out that the basic input is incomplete. Both the billing and the profitability figures are missing for some of the companies. The calculations are based on those compa-nies whose figures have been available.
development in 2015 and 2016Surveys conducted by EFCA (the Euro-pean Engineering Consultancy Sector) among its member organisations dur-ing the year give the impression of an industry on the road to recovery. In the latest survey (conducted in September 2015) for the EFCA Barometer report, the signals were distinctly positive and optimistic. Participating countries were the Czech Republic, Denmark, Finland, Austria, Ireland, Italy Luxemburg, The Netherlands, Switzerland, Turkey, Norway, France, Portugal, Serbia, Spain, Sweden and Greece.
Ten out of seventeen countries reported that their order intake had increased over the past six months. These coun-tries were Austria, the Czech Repub-lic, Denmark, Finland, Ireland, Italy, Luxemburg, The Netherlands, Spain and Sweden.
pRoFiT mARginS: EuRopEAn Top 300
0
1
2
3
4
5
6
7
141210080604020098
%8
EBT Median
For six countries the order intake re-mained unchanged. Only Greece stated that the situation had deteriorated.
Eight out of seventeen countries ex-pected their incoming orders to increase over the next six-month period. These countries were the Czech Republic, Finland, Ireland, Italy, The Netherlands, Serbia, Spain and Sweden. Greece an-ticipated a continued deterioration.
Six of the seventeen countries felt that their profit margins had improved dur-ing 2015, namely the Czech Republic, Ireland, Italy, The Netherlands, Serbia and Sweden. Greece anticipated a dete-rioration. For 2016, eight of the seven-teen countries believed in an improved level of profitability. These countries were the Czech Republic, Finland, Ire-land, Italy, The Netherlands, Portugal, Serbia and Sweden. Once again, Greece was the only pessimistic country.
The conclusion of the survey is that or-der levels are improving all over Europe. With the improvement in the order situ-ation the level of profitability is expected to increase, both during the current year as well as next year. Greece, however, is
expected to face continued difficulties and is the exception to the rule in this survey.
europe’s largest groupsIn the list of the 300 largest European groups, Arcadis rose to first place, meas-ured according to number of employees. Top of the chart last year was another Dutch company, Royal Imtech. How-ever, following a more careful review of Royal Imtech’s business operations, the group has been removed from the sur-vey since only some 14 % of its revenue comes from consultancy services. The monitoring concerns corporate groups whose principal activities are in the en-gineering consultancy and architectural sector. It may be added that in August, Imtech submitted an application for bankruptcy and that the group is a the process of disintegration. Parts of the operations, above all those outside The Netherlands, have been sold off. Another noteworthy fact is that the Swedish group Sweco has taken a major step up the list, from 17th to 6th place, with its acquisition of Grontmij.
Structural transactionsThe consolidation trend within the sector is global and has continued throughout 2015. There have perhaps not been as many or equally large deals
“The operating margin for the 300 largest European architectural and consulting firms was 4.7 % in 2014”
Source: The Swedish Federation of Consulting Engineers and Architects
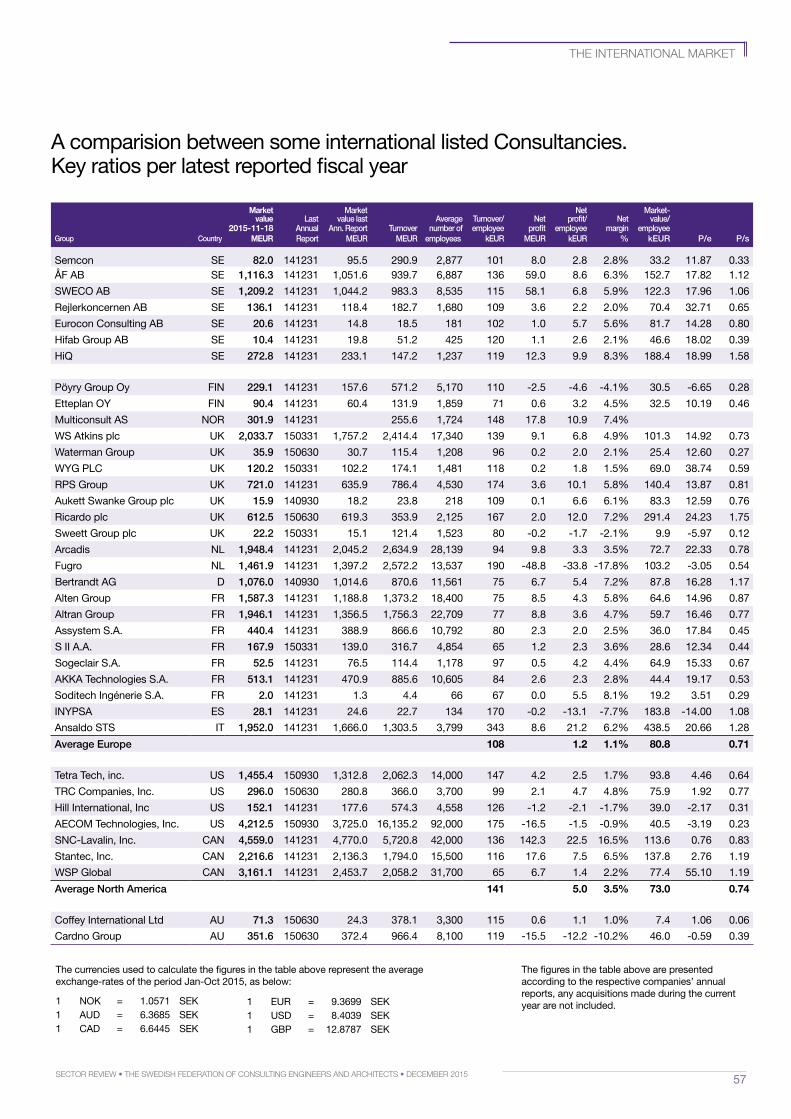
57Sector review • the SwediSh Federation oF conSulting engineerS and architectS • december 2015
the international marKet
Market Market Net Market-value last value last Average turnover/ Net profit/ Net value/
2015-11-18 Annual Ann. report turnover number of employee profit employee margin employeeGroup country MEUR report MeUr MeUr employees keUr MeUr keUr % keUr p/e p/s
Semcon SE 82.0 141231 95.5 290.9 2,877 101 8.0 2.8 2.8% 33.2 11.87 0.33ÅF Ab SE 1,116.3 141231 1,051.6 939.7 6,887 136 59.0 8.6 6.3% 152.7 17.82 1.12
SwECo Ab SE 1,209.2 141231 1,044.2 983.3 8,535 115 58.1 6.8 5.9% 122.3 17.96 1.06
Rejlerkoncernen Ab SE 136.1 141231 118.4 182.7 1,680 109 3.6 2.2 2.0% 70.4 32.71 0.65
Eurocon Consulting Ab SE 20.6 141231 14.8 18.5 181 102 1.0 5.7 5.6% 81.7 14.28 0.80
hifab group Ab SE 10.4 141231 19.8 51.2 425 120 1.1 2.6 2.1% 46.6 18.02 0.39
hiq SE 272.8 141231 233.1 147.2 1,237 119 12.3 9.9 8.3% 188.4 18.99 1.58
pöyry group oy Fin 229.1 141231 157.6 571.2 5,170 110 -2.5 -4.6 -4.1% 30.5 -6.65 0.28
Etteplan oy Fin 90.4 141231 60.4 131.9 1,859 71 0.6 3.2 4.5% 32.5 10.19 0.46
multiconsult AS noR 301.9 141231 255.6 1,724 148 17.8 10.9 7.4%
wS Atkins plc uK 2,033.7 150331 1,757.2 2,414.4 17,340 139 9.1 6.8 4.9% 101.3 14.92 0.73
waterman group uK 35.9 150630 30.7 115.4 1,208 96 0.2 2.0 2.1% 25.4 12.60 0.27
wyg plC uK 120.2 150331 102.2 174.1 1,481 118 0.2 1.8 1.5% 69.0 38.74 0.59
RpS group uK 721.0 141231 635.9 786.4 4,530 174 3.6 10.1 5.8% 140.4 13.87 0.81
Aukett Swanke group plc uK 15.9 140930 18.2 23.8 218 109 0.1 6.6 6.1% 83.3 12.59 0.76
Ricardo plc uK 612.5 150630 619.3 353.9 2,125 167 2.0 12.0 7.2% 291.4 24.23 1.75
Sweett group plc uK 22.2 150331 15.1 121.4 1,523 80 -0.2 -1.7 -2.1% 9.9 -5.97 0.12
Arcadis nl 1,948.4 141231 2,045.2 2,634.9 28,139 94 9.8 3.3 3.5% 72.7 22.33 0.78
Fugro nl 1,461.9 141231 1,397.2 2,572.2 13,537 190 -48.8 -33.8 -17.8% 103.2 -3.05 0.54
bertrandt Ag d 1,076.0 140930 1,014.6 870.6 11,561 75 6.7 5.4 7.2% 87.8 16.28 1.17
Alten group FR 1,587.3 141231 1,188.8 1,373.2 18,400 75 8.5 4.3 5.8% 64.6 14.96 0.87
Altran group FR 1,946.1 141231 1,356.5 1,756.3 22,709 77 8.8 3.6 4.7% 59.7 16.46 0.77
Assystem S.A. FR 440.4 141231 388.9 866.6 10,792 80 2.3 2.0 2.5% 36.0 17.84 0.45
S ii A.A. FR 167.9 150331 139.0 316.7 4,854 65 1.2 2.3 3.6% 28.6 12.34 0.44
Sogeclair S.A. FR 52.5 141231 76.5 114.4 1,178 97 0.5 4.2 4.4% 64.9 15.33 0.67
AKKA Technologies S.A. FR 513.1 141231 470.9 885.6 10,605 84 2.6 2.3 2.8% 44.4 19.17 0.53
Soditech ingénerie S.A. FR 2.0 141231 1.3 4.4 66 67 0.0 5.5 8.1% 19.2 3.51 0.29
inypSA ES 28.1 141231 24.6 22.7 134 170 -0.2 -13.1 -7.7% 183.8 -14.00 1.08
Ansaldo STS iT 1,952.0 141231 1,666.0 1,303.5 3,799 343 8.6 21.2 6.2% 438.5 20.66 1.28
Average europe 108 1.2 1.1% 80.8 0.71
Tetra Tech, inc. uS 1,455.4 150930 1,312.8 2,062.3 14,000 147 4.2 2.5 1.7% 93.8 4.46 0.64
TRC Companies, inc. uS 296.0 150630 280.8 366.0 3,700 99 2.1 4.7 4.8% 75.9 1.92 0.77
hill international, inc uS 152.1 141231 177.6 574.3 4,558 126 -1.2 -2.1 -1.7% 39.0 -2.17 0.31
AECom Technologies, inc. uS 4,212.5 150930 3,725.0 16,135.2 92,000 175 -16.5 -1.5 -0.9% 40.5 -3.19 0.23
SnC-lavalin, inc. CAn 4,559.0 141231 4,770.0 5,720.8 42,000 136 142.3 22.5 16.5% 113.6 0.76 0.83
Stantec, inc. CAn 2,216.6 141231 2,136.3 1,794.0 15,500 116 17.6 7.5 6.5% 137.8 2.76 1.19
wSp global CAn 3,161.1 141231 2,453.7 2,058.2 31,700 65 6.7 1.4 2.2% 77.4 55.10 1.19
Average North America 141 5.0 3.5% 73.0 0.74
Coffey international ltd Au 71.3 150630 24.3 378.1 3,300 115 0.6 1.1 1.0% 7.4 1.06 0.06
Cardno group Au 351.6 150630 372.4 966.4 8,100 119 -15.5 -12.2 -10.2% 46.0 -0.59 0.39
A comparision between some international listed Consultancies. Key ratios per latest reported fiscal year
The currencies used to calculate the figures in the table above represent the average exchange-rates of the period Jan-oct 2015, as below:
1 noK = 1.0571 SEK1 Aud = 6.3685 SEK1 CAd = 6.6445 SEK
The figures in the table above are presented according to the respective companies’ annual reports, any acquisitions made during the current year are not included.1 EuR = 9.3699 SEK
1 uSd = 8.4039 SEK1 gbp = 12.8787 SEK
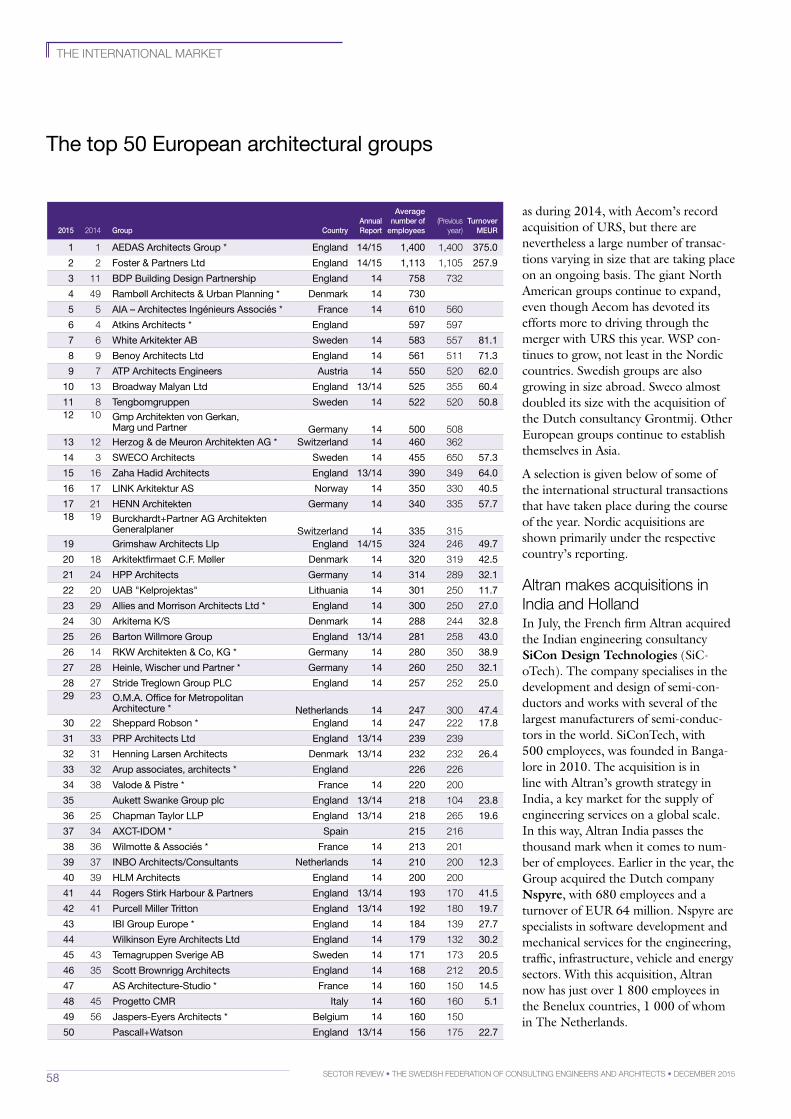
58 Sector review • the SwediSh Federation oF conSulting engineerS and architectS • december 2015
The top 50 European architectural groups
the international marKet
2015 2014 Group countryAnnualreport
Averagenumber of
employees(Previous
year)
turnover
MeUr
1 1 AEdAS Architects group * England 14/15 1,400 1,400 375.0
2 2 Foster & partners ltd England 14/15 1,113 1,105 257.9
3 11 bdp building design partnership England 14 758 732
4 49 Rambøll Architects & urban planning * denmark 14 730
5 5 AiA – Architectes ingénieurs Associés * France 14 610 560
6 4 Atkins Architects * England 597 597
7 6 white Arkitekter Ab Sweden 14 583 557 81.1
8 9 benoy Architects ltd England 14 561 511 71.3
9 7 ATp Architects Engineers Austria 14 550 520 62.0
10 13 broadway malyan ltd England 13/14 525 355 60.4
11 8 Tengbomgruppen Sweden 14 522 520 50.812 10 gmp Architekten von gerkan,
marg und partner germany 14 500 50813 12 herzog & de meuron Architekten Ag * Switzerland 14 460 362
14 3 SwECo Architects Sweden 14 455 650 57.3
15 16 Zaha hadid Architects England 13/14 390 349 64.0
16 17 linK Arkitektur AS norway 14 350 330 40.5
17 21 hEnn Architekten germany 14 340 335 57.718 19 burckhardt+partner Ag Architekten
generalplaner Switzerland 14 335 31519 grimshaw Architects llp England 14/15 324 246 49.7
20 18 Arkitektfirmaet C.F. møller denmark 14 320 319 42.5
21 24 hpp Architects germany 14 314 289 32.1
22 20 uAb "Kelprojektas" lithuania 14 301 250 11.7
23 29 Allies and morrison Architects ltd * England 14 300 250 27.0
24 30 Arkitema K/S denmark 14 288 244 32.8
25 26 barton willmore group England 13/14 281 258 43.0
26 14 RKw Architekten & Co, Kg * germany 14 280 350 38.9
27 28 heinle, wischer und partner * germany 14 260 250 32.1
28 27 Stride Treglown group plC England 14 257 252 25.029 23 o.m.A. office for metropolitan
Architecture * netherlands 14 247 300 47.430 22 Sheppard Robson * England 14 247 222 17.8
31 33 pRp Architects ltd England 13/14 239 239
32 31 henning larsen Architects denmark 13/14 232 232 26.4
33 32 Arup associates, architects * England 226 226
34 38 valode & pistre * France 14 220 200
35 Aukett Swanke group plc England 13/14 218 104 23.8
36 25 Chapman Taylor llp England 13/14 218 265 19.6
37 34 AxCT-idom * Spain 215 216
38 36 wilmotte & Associés * France 14 213 201
39 37 inbo Architects/Consultants netherlands 14 210 200 12.3
40 39 hlm Architects England 14 200 200
41 44 Rogers Stirk harbour & partners England 13/14 193 170 41.5
42 41 purcell miller Tritton England 13/14 192 180 19.7
43 ibi group Europe * England 14 184 139 27.7
44 wilkinson Eyre Architects ltd England 14 179 132 30.2
45 43 Temagruppen Sverige Ab Sweden 14 171 173 20.5
46 35 Scott brownrigg Architects England 14 168 212 20.5
47 AS Architecture-Studio * France 14 160 150 14.5
48 45 progetto CmR italy 14 160 160 5.1
49 56 Jaspers-Eyers Architects * belgium 14 160 150
50 pascall+watson England 13/14 156 175 22.7
as during 2014, with Aecom’s record acquisition of URS, but there are nevertheless a large number of transac-tions varying in size that are taking place on an ongoing basis. The giant North American groups continue to expand, even though Aecom has devoted its efforts more to driving through the merger with URS this year. WSP con-tinues to grow, not least in the Nordic countries. Swedish groups are also growing in size abroad. Sweco almost doubled its size with the acquisition of the Dutch consultancy Grontmij. Other European groups continue to establish themselves in Asia.
A selection is given below of some of the international structural transactions that have taken place during the course of the year. Nordic acquisitions are shown primarily under the respective country’s reporting.
altran makes acquisitions in india and hollandIn July, the French firm Altran acquired the Indian engineering consultancy SiCon Design Technologies (SiC-oTech). The company specialises in the development and design of semi-con-ductors and works with several of the largest manufacturers of semi-conduc-tors in the world. SiConTech, with 500 employees, was founded in Banga-lore in 2010. The acquisition is in line with Altran’s growth strategy in India, a key market for the supply of engineering services on a global scale. In this way, Altran India passes the thousand mark when it comes to num-ber of employees. Earlier in the year, the Group acquired the Dutch company Nspyre, with 680 employees and a turnover of EUR 64 million. Nspyre are specialists in software development and mechanical services for the engineering, traffic, infrastructure, vehicle and energy sectors. With this acquisition, Altran now has just over 1 800 employees in the Benelux countries, 1 000 of whom in The Netherlands.
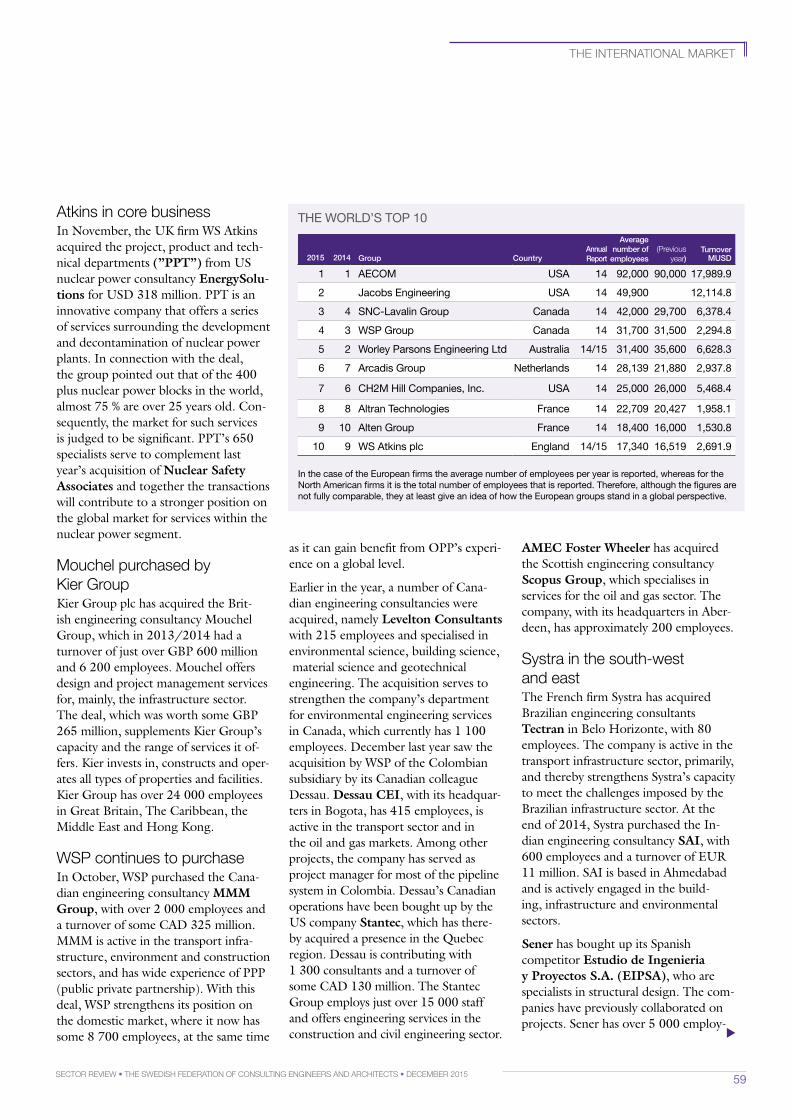
59Sector review • the SwediSh Federation oF conSulting engineerS and architectS • december 2015
the international marKet
ThE woRld’S Top 10
in the case of the European firms the average number of employees per year is reported, whereas for the north American firms it is the total number of employees that is reported. Therefore, although the figures are not fully comparable, they at least give an idea of how the European groups stand in a global perspective.
2015 2014 Group countryAnnual report
Averagenumber of
employees(Previous
year)
turnover
MUSd
1 1 AECom uSA 14 92,000 90,000 17,989.9
2 Jacobs Engineering uSA 14 49,900 12,114.8
3 4 SnC-lavalin group Canada 14 42,000 29,700 6,378.4
4 3 wSp group Canada 14 31,700 31,500 2,294.8
5 2 worley parsons Engineering ltd Australia 14/15 31,400 35,600 6,628.3
6 7 Arcadis group netherlands 14 28,139 21,880 2,937.8
7 6 Ch2m hill Companies, inc. uSA 14 25,000 26,000 5,468.4
8 8 Altran Technologies France 14 22,709 20,427 1,958.1
9 10 Alten group France 14 18,400 16,000 1,530.8
10 9 wS Atkins plc England 14/15 17,340 16,519 2,691.9
atkins in core businessIn November, the UK firm WS Atkins acquired the project, product and tech-nical departments (”PPT”) from US nuclear power consultancy EnergySolutions for USD 318 million. PPT is an innovative company that offers a series of services surrounding the development and decontamination of nuclear power plants. In connection with the deal, the group pointed out that of the 400 plus nuclear power blocks in the world, almost 75 % are over 25 years old. Con-sequently, the market for such services is judged to be significant. PPT’s 650 specialists serve to complement last year’s acquisition of Nuclear Safety Associates and together the transactions will contribute to a stronger position on the global market for services within the nuclear power segment.
mouchel purchased by Kier groupKier Group plc has acquired the Brit-ish engineering consultancy Mouchel Group, which in 2013/2014 had a turnover of just over GBP 600 million and 6 200 employees. Mouchel offers design and project management services for, mainly, the infrastructure sector. The deal, which was worth some GBP 265 million, supplements Kier Group’s capacity and the range of services it of-fers. Kier invests in, constructs and oper-ates all types of properties and facilities. Kier Group has over 24 000 employees in Great Britain, The Caribbean, the Middle East and Hong Kong.
wSP continues to purchaseIn October, WSP purchased the Cana-dian engineering consultancy MMM Group, with over 2 000 employees and a turnover of some CAD 325 million. MMM is active in the transport infra-structure, environment and construction sectors, and has wide experience of PPP (public private partnership). With this deal, WSP strengthens its position on the domestic market, where it now has some 8 700 employees, at the same time
as it can gain benefit from OPP’s experi-ence on a global level.
Earlier in the year, a number of Cana-dian engineering consultancies were acquired, namely Levelton Consultants with 215 employees and specialised in environmental science, building science, material science and geotechnical engineering. The acquisition serves to strengthen the company’s department for environmental engineering services in Canada, which currently has 1 100 employees. December last year saw the acquisition by WSP of the Colombian subsidiary by its Canadian colleague Dessau. Dessau CEI, with its headquar-ters in Bogota, has 415 employees, is active in the transport sector and in the oil and gas markets. Among other projects, the company has served as project manager for most of the pipeline system in Colombia. Dessau’s Canadian operations have been bought up by the US company Stantec, which has there-by acquired a presence in the Quebec region. Dessau is contributing with 1 300 consultants and a turnover of some CAD 130 million. The Stantec Group employs just over 15 000 staff and offers engineering services in the construction and civil engineering sector.
AMEC Foster Wheeler has acquired the Scottish engineering consultancy Scopus Group, which specialises in services for the oil and gas sector. The company, with its headquarters in Aber-deen, has approximately 200 employees.
Systra in the south-west and eastThe French firm Systra has acquired Brazilian engineering consultants Tectran in Belo Horizonte, with 80 employees. The company is active in the transport infrastructure sector, primarily, and thereby strengthens Systra’s capacity to meet the challenges imposed by the Brazilian infrastructure sector. At the end of 2014, Systra purchased the In-dian engineering consultancy SAI, with 600 employees and a turnover of EUR 11 million. SAI is based in Ahmedabad and is actively engaged in the build-ing, infrastructure and environmental sectors.
Sener has bought up its Spanish competitor Estudio de Ingenieria y Proyectos S.A. (EIPSA), who are specialists in structural design. The com-panies have previously collaborated on projects. Sener has over 5 000 employ- ▲
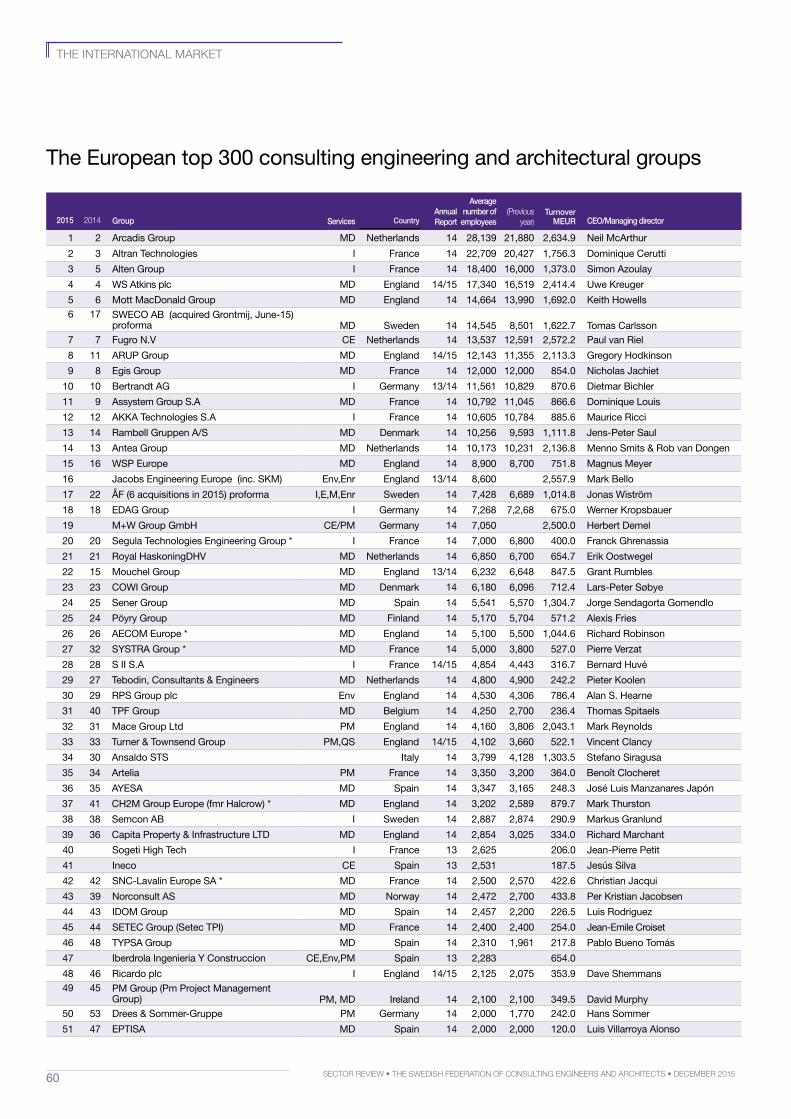
60 Sector review • the SwediSh Federation oF conSulting engineerS and architectS • december 2015
2015 2014 Group Services countryAnnualreport
Average number of
employees(Previous
year)
turnover
MeUr ceo/Managing director
1 2 Arcadis group md netherlands 14 28,139 21,880 2,634.9 neil mcArthur
2 3 Altran Technologies i France 14 22,709 20,427 1,756.3 dominique Cerutti
3 5 Alten group i France 14 18,400 16,000 1,373.0 Simon Azoulay
4 4 wS Atkins plc md England 14/15 17,340 16,519 2,414.4 uwe Kreuger
5 6 mott macdonald group md England 14 14,664 13,990 1,692.0 Keith howells6 17 SwECo Ab (acquired grontmij, June-15)
proforma md Sweden 14 14,545 8,501 1,622.7 Tomas Carlsson7 7 Fugro n.v CE netherlands 14 13,537 12,591 2,572.2 paul van Riel
8 11 ARup group md England 14/15 12,143 11,355 2,113.3 gregory hodkinson
9 8 Egis group md France 14 12,000 12,000 854.0 nicholas Jachiet
10 10 bertrandt Ag i germany 13/14 11,561 10,829 870.6 dietmar bichler
11 9 Assystem group S.A md France 14 10,792 11,045 866.6 dominique louis
12 12 AKKA Technologies S.A i France 14 10,605 10,784 885.6 maurice Ricci
13 14 Rambøll gruppen A/S md denmark 14 10,256 9,593 1,111.8 Jens-peter Saul
14 13 Antea group md netherlands 14 10,173 10,231 2,136.8 menno Smits & Rob van dongen
15 16 wSp Europe md England 14 8,900 8,700 751.8 magnus meyer
16 Jacobs Engineering Europe (inc. SKm) Env,Enr England 13/14 8,600 2,557.9 mark bello
17 22 ÅF (6 acquisitions in 2015) proforma i,E,m,Enr Sweden 14 7,428 6,689 1,014.8 Jonas wiström
18 18 EdAg group i germany 14 7,268 7,2,68 675.0 werner Kropsbauer
19 m+w group gmbh CE/pm germany 14 7,050 2,500.0 herbert demel
20 20 Segula Technologies Engineering group * i France 14 7,000 6,800 400.0 Franck ghrenassia
21 21 Royal haskoningdhv md netherlands 14 6,850 6,700 654.7 Erik oostwegel
22 15 mouchel group md England 13/14 6,232 6,648 847.5 grant Rumbles
23 23 Cowi group md denmark 14 6,180 6,096 712.4 lars-peter Søbye
24 25 Sener group md Spain 14 5,541 5,570 1,304.7 Jorge Sendagorta gomendlo
25 24 pöyry group md Finland 14 5,170 5,704 571.2 Alexis Fries
26 26 AECom Europe * md England 14 5,100 5,500 1,044.6 Richard Robinson
27 32 SySTRA group * md France 14 5,000 3,800 527.0 pierre verzat
28 28 S ii S.A i France 14/15 4,854 4,443 316.7 bernard huvé
29 27 Tebodin, Consultants & Engineers md netherlands 14 4,800 4,900 242.2 pieter Koolen
30 29 RpS group plc Env England 14 4,530 4,306 786.4 Alan S. hearne
31 40 TpF group md belgium 14 4,250 2,700 236.4 Thomas Spitaels
32 31 mace group ltd pm England 14 4,160 3,806 2,043.1 mark Reynolds
33 33 Turner & Townsend group pm,qS England 14/15 4,102 3,660 522.1 vincent Clancy
34 30 Ansaldo STS italy 14 3,799 4,128 1,303.5 Stefano Siragusa
35 34 Artelia pm France 14 3,350 3,200 364.0 benoît Clocheret
36 35 AyESA md Spain 14 3,347 3,165 248.3 José luis manzanares Japón
37 41 Ch2m group Europe (fmr halcrow) * md England 14 3,202 2,589 879.7 mark Thurston
38 38 Semcon Ab i Sweden 14 2,887 2,874 290.9 markus granlund
39 36 Capita property & infrastructure lTd md England 14 2,854 3,025 334.0 Richard marchant
40 Sogeti high Tech i France 13 2,625 206.0 Jean-pierre petit
41 ineco CE Spain 13 2,531 187.5 Jesús Silva
42 42 SnC-lavalin Europe SA * md France 14 2,500 2,570 422.6 Christian Jacqui
43 39 norconsult AS md norway 14 2,472 2,700 433.8 per Kristian Jacobsen
44 43 idom group md Spain 14 2,457 2,200 226.5 luis Rodriguez
45 44 SETEC group (Setec Tpi) md France 14 2,400 2,400 254.0 Jean-Emile Croiset
46 48 TypSA group md Spain 14 2,310 1,961 217.8 pablo bueno Tomás
47 iberdrola ingenieria y Construccion CE,Env,pm Spain 13 2,283 654.0
48 46 Ricardo plc i England 14/15 2,125 2,075 353.9 dave Shemmans 49 45 pm group (pm project management
group) pm, md ireland 14 2,100 2,100 349.5 david murphy50 53 drees & Sommer-gruppe pm germany 14 2,000 1,770 242.0 hans Sommer
51 47 EpTiSA md Spain 14 2,000 2,000 120.0 luis villarroya Alonso
The European top 300 consulting engineering and architectural groups
the international marKet
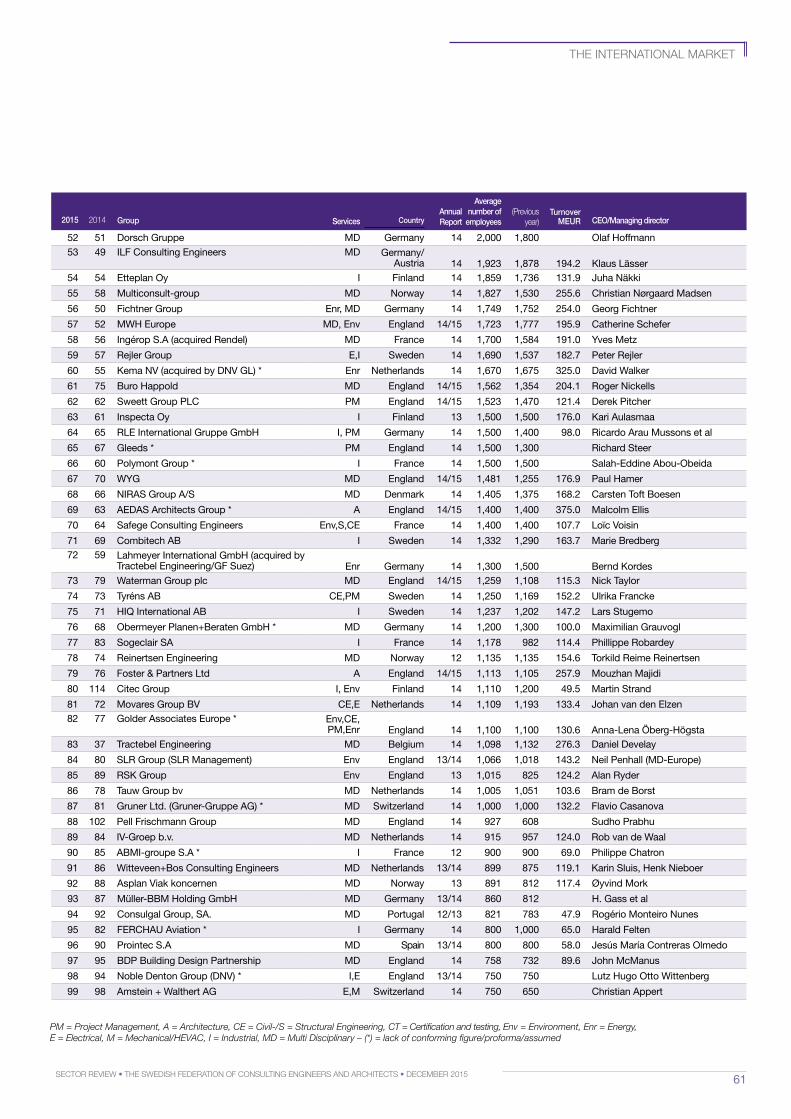
61Sector review • the SwediSh Federation oF conSulting engineerS and architectS • december 2015
the international marKet
52 51 dorsch gruppe md germany 14 2,000 1,800 olaf hoffmann53 49 ilF Consulting Engineers md germany/
Austria 14 1,923 1,878 194.2 Klaus lässer54 54 Etteplan oy i Finland 14 1,859 1,736 131.9 Juha näkki
55 58 multiconsult-group md norway 14 1,827 1,530 255.6 Christian nørgaard madsen
56 50 Fichtner group Enr, md germany 14 1,749 1,752 254.0 georg Fichtner
57 52 mwh Europe md, Env England 14/15 1,723 1,777 195.9 Catherine Schefer
58 56 ingérop S.A (acquired Rendel) md France 14 1,700 1,584 191.0 yves metz
59 57 Rejler group E,i Sweden 14 1,690 1,537 182.7 peter Rejler
60 55 Kema nv (acquired by dnv gl) * Enr netherlands 14 1,670 1,675 325.0 david walker
61 75 buro happold md England 14/15 1,562 1,354 204.1 Roger nickells
62 62 Sweett group plC pm England 14/15 1,523 1,470 121.4 derek pitcher
63 61 inspecta oy i Finland 13 1,500 1,500 176.0 Kari Aulasmaa
64 65 RlE international gruppe gmbh i, pm germany 14 1,500 1,400 98.0 Ricardo Arau mussons et al
65 67 gleeds * pm England 14 1,500 1,300 Richard Steer
66 60 polymont group * i France 14 1,500 1,500 Salah-Eddine Abou-obeida
67 70 wyg md England 14/15 1,481 1,255 176.9 paul hamer
68 66 niRAS group A/S md denmark 14 1,405 1,375 168.2 Carsten Toft boesen
69 63 AEdAS Architects group * A England 14/15 1,400 1,400 375.0 malcolm Ellis
70 64 Safege Consulting Engineers Env,S,CE France 14 1,400 1,400 107.7 loïc voisin
71 69 Combitech Ab i Sweden 14 1,332 1,290 163.7 marie bredberg72 59 lahmeyer international gmbh (acquired by
Tractebel Engineering/gF Suez) Enr germany 14 1,300 1,500 bernd Kordes73 79 waterman group plc md England 14/15 1,259 1,108 115.3 nick Taylor
74 73 Tyréns Ab CE,pm Sweden 14 1,250 1,169 152.2 ulrika Francke
75 71 hiq international Ab i Sweden 14 1,237 1,202 147.2 lars Stugemo
76 68 obermeyer planen+beraten gmbh * md germany 14 1,200 1,300 100.0 maximilian grauvogl
77 83 Sogeclair SA i France 14 1,178 982 114.4 phillippe Robardey
78 74 Reinertsen Engineering md norway 12 1,135 1,135 154.6 Torkild Reime Reinertsen
79 76 Foster & partners ltd A England 14/15 1,113 1,105 257.9 mouzhan majidi
80 114 Citec group i, Env Finland 14 1,110 1,200 49.5 martin Strand
81 72 movares group bv CE,E netherlands 14 1,109 1,193 133.4 Johan van den Elzen82 77 golder Associates Europe * Env,CE,
pm,Enr England 14 1,100 1,100 130.6 Anna-lena Öberg-högsta83 37 Tractebel Engineering md belgium 14 1,098 1,132 276.3 daniel develay
84 80 SlR group (SlR management) Env England 13/14 1,066 1,018 143.2 neil penhall (md-Europe)
85 89 RSK group Env England 13 1,015 825 124.2 Alan Ryder
86 78 Tauw group bv md netherlands 14 1,005 1,051 103.6 bram de borst
87 81 gruner ltd. (gruner-gruppe Ag) * md Switzerland 14 1,000 1,000 132.2 Flavio Casanova
88 102 pell Frischmann group md England 14 927 608 Sudho prabhu
89 84 iv-groep b.v. md netherlands 14 915 957 124.0 Rob van de waal
90 85 Abmi-groupe S.A * i France 12 900 900 69.0 philippe Chatron
91 86 witteveen+bos Consulting Engineers md netherlands 13/14 899 875 119.1 Karin Sluis, henk nieboer
92 88 Asplan viak koncernen md norway 13 891 812 117.4 Øyvind mork
93 87 müller-bbm holding gmbh md germany 13/14 860 812 h. gass et al
94 92 Consulgal group, SA. md portugal 12/13 821 783 47.9 Rogério monteiro nunes
95 82 FERChAu Aviation * i germany 14 800 1,000 65.0 harald Felten
96 90 prointec S.A md Spain 13/14 800 800 58.0 Jesús maría Contreras olmedo
97 95 bdp building design partnership md England 14 758 732 89.6 John mcmanus
98 94 noble denton group (dnv) * i,E England 13/14 750 750 lutz hugo otto wittenberg
99 98 Amstein + walthert Ag E,m Switzerland 14 750 650 Christian Appert
2015 2014 Group Services countryAnnualreport
Average number of
employees(Previous
year)
turnover
MeUr ceo/Managing director
PM = Project Management, A = Architecture, CE = Civil-/S = Structural Engineering, CT = Certification and testing, Env = Environment, Enr = Energy, E = Electrical, M = Mechanical/HEVAC, I = Industrial, MD = Multi Disciplinary – (*) = lack of conforming figure/proforma/assumed
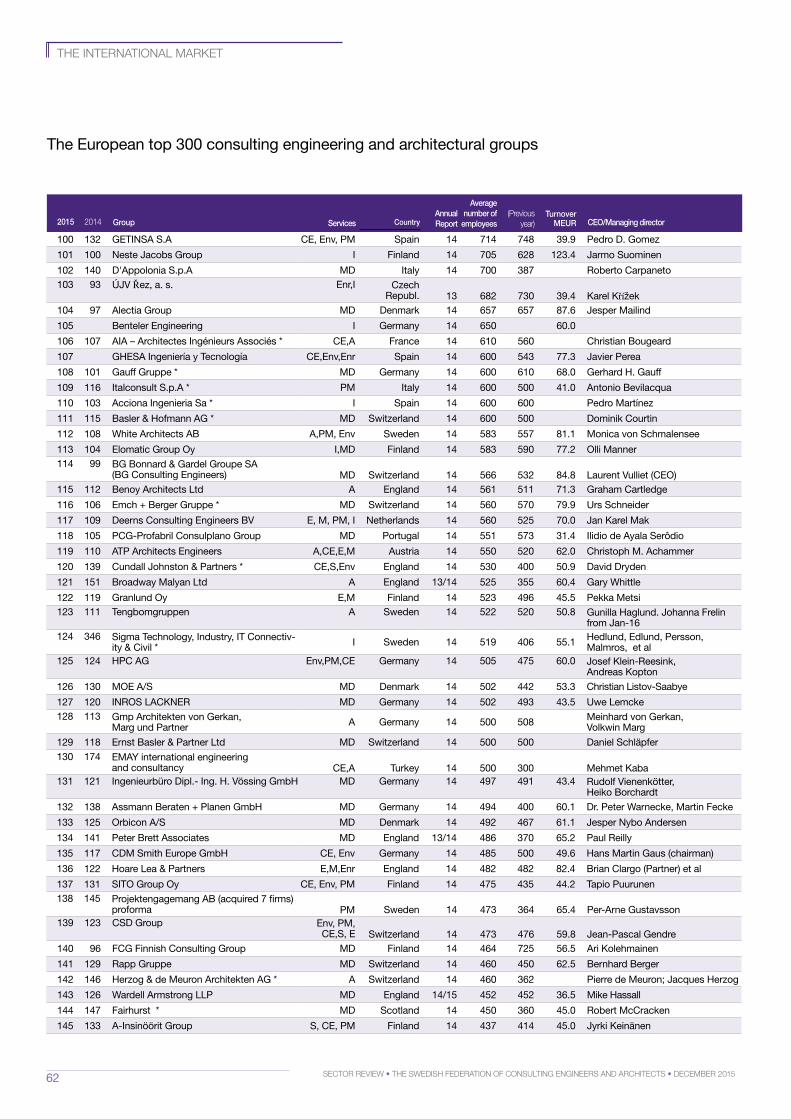
62 Sector review • the SwediSh Federation oF conSulting engineerS and architectS • december 2015
100 132 gETinSA S.A CE, Env, pm Spain 14 714 748 39.9 pedro d. gomez
101 100 neste Jacobs group i Finland 14 705 628 123.4 Jarmo Suominen
102 140 d'Appolonia S.p.A md italy 14 700 387 Roberto Carpaneto103 93 ÚJv Řez, a. s. Enr,i Czech
Republ. 13 682 730 39.4 Karel Křížek104 97 Alectia group md denmark 14 657 657 87.6 Jesper mailind
105 benteler Engineering i germany 14 650 60.0
106 107 AiA – Architectes ingénieurs Associés * CE,A France 14 610 560 Christian bougeard
107 ghESA ingeniería y Tecnología CE,Env,Enr Spain 14 600 543 77.3 Javier perea
108 101 gauff gruppe * md germany 14 600 610 68.0 gerhard h. gauff
109 116 italconsult S.p.A * pm italy 14 600 500 41.0 Antonio bevilacqua
110 103 Acciona ingenieria Sa * i Spain 14 600 600 pedro martínez
111 115 basler & hofmann Ag * md Switzerland 14 600 500 dominik Courtin
112 108 white Architects Ab A,pm, Env Sweden 14 583 557 81.1 monica von Schmalensee
113 104 Elomatic group oy i,md Finland 14 583 590 77.2 olli manner114 99 bg bonnard & gardel groupe SA
(bg Consulting Engineers) md Switzerland 14 566 532 84.8 laurent vulliet (CEo)115 112 benoy Architects ltd A England 14 561 511 71.3 graham Cartledge
116 106 Emch + berger gruppe * md Switzerland 14 560 570 79.9 urs Schneider
117 109 deerns Consulting Engineers bv E, m, pm, i netherlands 14 560 525 70.0 Jan Karel mak
118 105 pCg-profabril Consulplano group md portugal 14 551 573 31.4 ilidio de Ayala Serôdio
119 110 ATp Architects Engineers A,CE,E,m Austria 14 550 520 62.0 Christoph m. Achammer
120 139 Cundall Johnston & partners * CE,S,Env England 14 530 400 50.9 david dryden
121 151 broadway malyan ltd A England 13/14 525 355 60.4 gary whittle
122 119 granlund oy E,m Finland 14 523 496 45.5 pekka metsi123 111 Tengbomgruppen A Sweden 14 522
520 50.8 gunilla haglund. Johanna Frelin
from Jan-16124 346 Sigma Technology, industry, iT Connectiv-
ity & Civil * i Sweden 14 519 406 55.1 hedlund, Edlund, persson, malmros, et al
125 124 hpC Ag Env,pm,CE germany 14 505
475 60.0 Josef Klein-Reesink, Andreas Kopton
126 130 moE A/S md denmark 14 502 442 53.3 Christian listov-Saabye
127 120 inRoS lACKnER md germany 14 502 493 43.5 uwe lemcke128 113 gmp Architekten von gerkan,
marg und partner A germany 14 500 508 meinhard von gerkan, volkwin marg
129 118 Ernst basler & partner ltd md Switzerland 14 500 500 daniel Schläpfer130 174 EmAy international engineering
and consultancy CE,A Turkey 14 500 300 mehmet Kaba131 121 ingenieurbüro dipl.- ing. h. vössing gmbh md germany 14 497
491 43.4 Rudolf vienenkötter,
heiko borchardt
132 138 Assmann beraten + planen gmbh md germany 14 494 400 60.1 dr. peter warnecke, martin Fecke
133 125 orbicon A/S md denmark 14 492 467 61.1 Jesper nybo Andersen
134 141 peter brett Associates md England 13/14 486 370 65.2 paul Reilly
135 117 Cdm Smith Europe gmbh CE, Env germany 14 485 500 49.6 hans martin gaus (chairman)
136 122 hoare lea & partners E,m,Enr England 14 482 482 82.4 brian Clargo (partner) et al
137 131 SiTo group oy CE, Env, pm Finland 14 475 435 44.2 Tapio puurunen138 145 projektengagemang Ab (acquired 7 firms)
proforma pm Sweden 14 473 364 65.4 per-Arne gustavsson139 123 CSd group Env, pm,
CE,S, E Switzerland 14 473 476 59.8 Jean-pascal gendre140 96 FCg Finnish Consulting group md Finland 14 464 725 56.5 Ari Kolehmainen
141 129 Rapp gruppe md Switzerland 14 460 450 62.5 bernhard berger
142 146 herzog & de meuron Architekten Ag * A Switzerland 14 460 362 pierre de meuron; Jacques herzog
143 126 wardell Armstrong llp md England 14/15 452 452 36.5 mike hassall
144 147 Fairhurst * md Scotland 14 450 360 45.0 Robert mcCracken
145 133 A-insinöörit group S, CE, pm Finland 14 437 414 45.0 Jyrki Keinänen
the international marKet
The European top 300 consulting engineering and architectural groups
2015 2014 Group Services countryAnnualreport
Average number of
employees(Previous
year)
turnover
MeUr ceo/Managing director
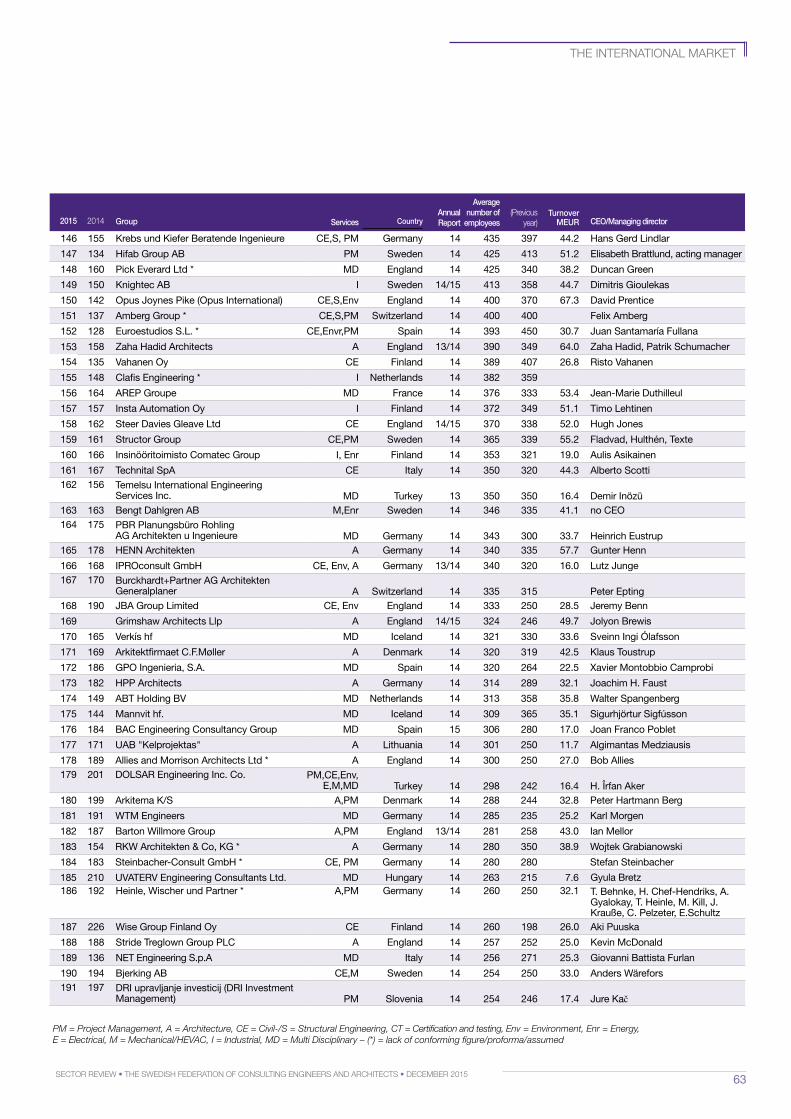
63Sector review • the SwediSh Federation oF conSulting engineerS and architectS • december 2015
146 155 Krebs und Kiefer beratende ingenieure CE,S, pm germany 14 435 397 44.2 hans gerd lindlar
147 134 hifab group Ab pm Sweden 14 425 413 51.2 Elisabeth brattlund, acting manager
148 160 pick Everard ltd * md England 14 425 340 38.2 duncan green
149 150 Knightec Ab i Sweden 14/15 413 358 44.7 dimitris gioulekas
150 142 opus Joynes pike (opus international) CE,S,Env England 14 400 370 67.3 david prentice
151 137 Amberg group * CE,S,pm Switzerland 14 400 400 Felix Amberg
152 128 Euroestudios S.l. * CE,Envr,pm Spain 14 393 450 30.7 Juan Santamaría Fullana
153 158 Zaha hadid Architects A England 13/14 390 349 64.0 Zaha hadid, patrik Schumacher
154 135 vahanen oy CE Finland 14 389 407 26.8 Risto vahanen
155 148 Clafis Engineering * i netherlands 14 382 359
156 164 AREp groupe md France 14 376 333 53.4 Jean-marie duthilleul
157 157 insta Automation oy i Finland 14 372 349 51.1 Timo lehtinen
158 162 Steer davies gleave ltd CE England 14/15 370 338 52.0 hugh Jones
159 161 Structor group CE,pm Sweden 14 365 339 55.2 Fladvad, hulthén, Texte
160 166 insinööritoimisto Comatec group i, Enr Finland 14 353 321 19.0 Aulis Asikainen
161 167 Technital SpA CE italy 14 350 320 44.3 Alberto Scotti162 156 Temelsu international Engineering
Services inc. md Turkey 13 350 350 16.4 demir inözü163 163 bengt dahlgren Ab m,Enr Sweden 14 346 335 41.1 no CEo164 175 pbR planungsbüro Rohling
Ag Architekten u ingenieure md germany 14 343 300 33.7 heinrich Eustrup165 178 hEnn Architekten A germany 14 340 335 57.7 gunter henn
166 168 ipRoconsult gmbh CE, Env, A germany 13/14 340 320 16.0 lutz Junge167 170 burckhardt+partner Ag Architekten
generalplaner A Switzerland 14 335 315 peter Epting168 190 JbA group limited CE, Env England 14 333 250 28.5 Jeremy benn
169 grimshaw Architects llp A England 14/15 324 246 49.7 Jolyon brewis
170 165 verkís hf md iceland 14 321 330 33.6 Sveinn ingi Ólafsson
171 169 Arkitektfirmaet C.F.møller A denmark 14 320 319 42.5 Klaus Toustrup
172 186 gpo ingenieria, S.A. md Spain 14 320 264 22.5 xavier montobbio Camprobi
173 182 hpp Architects A germany 14 314 289 32.1 Joachim h. Faust
174 149 AbT holding bv md netherlands 14 313 358 35.8 walter Spangenberg
175 144 mannvit hf. md iceland 14 309 365 35.1 Sigurhjörtur Sigfússon
176 184 bAC Engineering Consultancy group md Spain 15 306 280 17.0 Joan Franco poblet
177 171 uAb "Kelprojektas" A lithuania 14 301 250 11.7 Algimantas medziausis
178 189 Allies and morrison Architects ltd * A England 14 300 250 27.0 bob Allies179 201 dolSAR Engineering inc. Co. pm,CE,Env,
E,m,md Turkey 14 298 242 16.4 h. Îrfan Aker180 199 Arkitema K/S A,pm denmark 14 288 244 32.8 peter hartmann berg
181 191 wTm Engineers md germany 14 285 235 25.2 Karl morgen
182 187 barton willmore group A,pm England 13/14 281 258 43.0 ian mellor
183 154 RKw Architekten & Co, Kg * A germany 14 280 350 38.9 wojtek grabianowski
184 183 Steinbacher-Consult gmbh * CE, pm germany 14 280 280 Stefan Steinbacher
185 210 uvATERv Engineering Consultants ltd. md hungary 14 263 215 7.6 gyula bretz 186 192 heinle, wischer und partner * A,pm germany 14 260
250 32.1 T. behnke, h. Chef-hendriks, A. gyalokay, T. heinle, m. Kill, J. Krauße, C. pelzeter, E.Schultz
187 226 wise group Finland oy CE Finland 14 260 198 26.0 Aki puuska
188 188 Stride Treglown group plC A England 14 257 252 25.0 Kevin mcdonald
189 136 nET Engineering S.p.A md italy 14 256 271 25.3 giovanni battista Furlan
190 194 bjerking Ab CE,m Sweden 14 254 250 33.0 Anders wärefors191 197 dRi upravljanje investicij (dRi investment
management) pm Slovenia 14 254 246 17.4 Jure Kač
the international marKet
2015 2014 Group Services countryAnnualreport
Average number of
employees(Previous
year)
turnover
MeUr ceo/Managing director
PM = Project Management, A = Architecture, CE = Civil-/S = Structural Engineering, CT = Certification and testing, Env = Environment, Enr = Energy, E = Electrical, M = Mechanical/HEVAC, I = Industrial, MD = Multi Disciplinary – (*) = lack of conforming figure/proforma/assumed
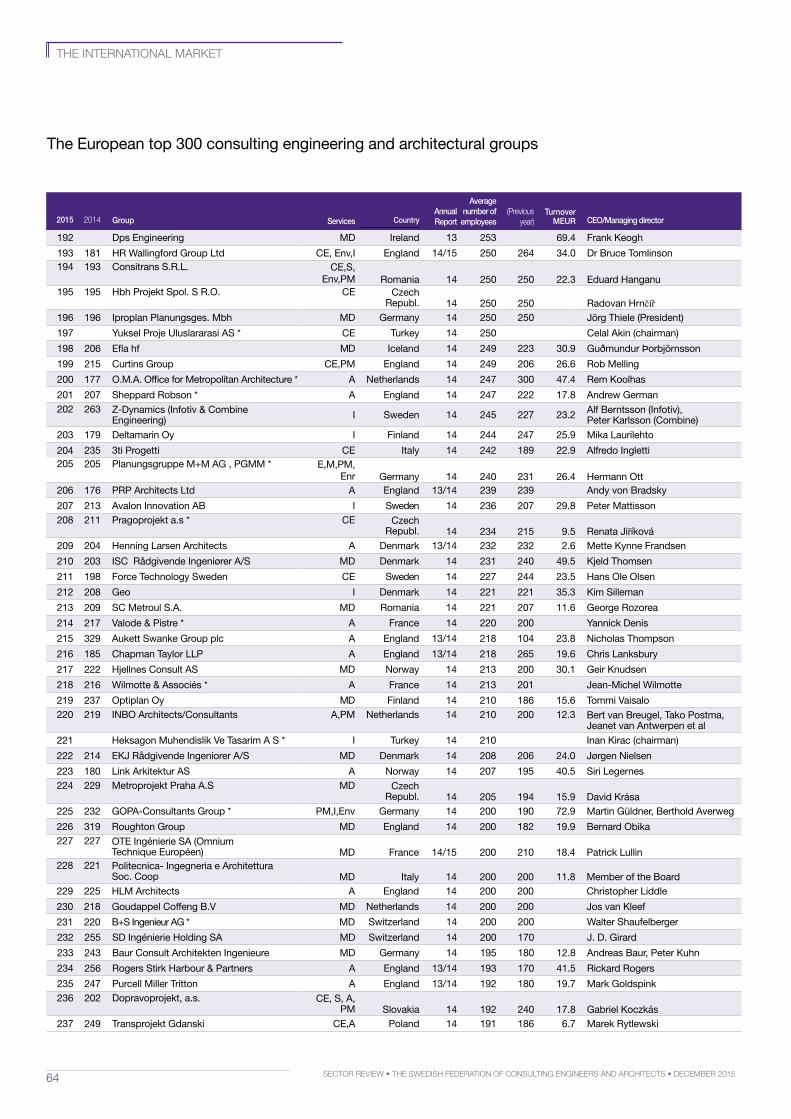
64 Sector review • the SwediSh Federation oF conSulting engineerS and architectS • december 2015
192 dps Engineering md ireland 13 253 69.4 Frank Keogh
193 181 hR wallingford group ltd CE, Env,i England 14/15 250 264 34.0 dr bruce Tomlinson194 193 Consitrans S.R.l. CE,S,
Env,pm Romania 14 250 250 22.3 Eduard hanganu195 195 hbh projekt Spol. S R.o. CE Czech
Republ. 14 250 250 Radovan hrnčíř196 196 iproplan planungsges. mbh md germany 14 250 250 Jörg Thiele (president)
197 yuksel proje uluslararasi AS * CE Turkey 14 250 Celal Akin (chairman)
198 206 Efla hf md iceland 14 249 223 30.9 guðmundur Þorbjörnsson
199 215 Curtins group CE,pm England 14 249 206 26.6 Rob melling
200 177 o.m.A. office for metropolitan Architecture * A netherlands 14 247 300 47.4 Rem Koolhas
201 207 Sheppard Robson * A England 14 247 222 17.8 Andrew german202 263 Z-dynamics (infotiv & Combine
Engineering) i Sweden 14 245 227 23.2 Alf berntsson (infotiv), peter Karlsson (Combine)
203 179 deltamarin oy i Finland 14 244 247 25.9 mika laurilehto
204 235 3ti progetti CE italy 14 242 189 22.9 Alfredo ingletti205 205 planungsgruppe m+m Ag , pgmm * E,m,pm,
Enr germany 14 240 231 26.4 hermann ott206 176 pRp Architects ltd A England 13/14 239 239 Andy von bradsky
207 213 Avalon innovation Ab i Sweden 14 236 207 29.8 peter mattisson208 211 pragoprojekt a.s * CE Czech
Republ. 14 234 215 9.5 Renata Jiříková209 204 henning larsen Architects A denmark 13/14 232 232 2.6 mette Kynne Frandsen
210 203 iSC Rådgivende ingeniører A/S md denmark 14 231 240 49.5 Kjeld Thomsen
211 198 Force Technology Sweden CE Sweden 14 227 244 23.5 hans ole olsen
212 208 geo i denmark 14 221 221 35.3 Kim Silleman
213 209 SC metroul S.A. md Romania 14 221 207 11.6 george Rozorea
214 217 valode & pistre * A France 14 220 200 yannick denis
215 329 Aukett Swanke group plc A England 13/14 218 104 23.8 nicholas Thompson
216 185 Chapman Taylor llp A England 13/14 218 265 19.6 Chris lanksbury
217 222 hjellnes Consult AS md norway 14 213 200 30.1 geir Knudsen
218 216 wilmotte & Associés * A France 14 213 201 Jean-michel wilmotte
219 237 optiplan oy md Finland 14 210 186 15.6 Tommi vaisalo220 219 inbo Architects/Consultants A,pm netherlands 14 210
200 12.3 bert van breugel, Tako postma,
Jeanet van Antwerpen et al
221 heksagon muhendislik ve Tasarim A S * i Turkey 14 210 inan Kirac (chairman)
222 214 EKJ Rådgivende ingeniorer A/S md denmark 14 208 206 24.0 Jørgen nielsen
223 180 link Arkitektur AS A norway 14 207 195 40.5 Siri legernes224 229 metroprojekt praha A.S md Czech
Republ. 14 205 194 15.9 david Krása225 232 gopA-Consultants group * pm,i,Env germany 14 200 190 72.9 martin güldner, berthold Averweg
226 319 Roughton group md England 14 200 182 19.9 bernard obika227 227 oTE ingénierie SA (omnium
Technique Européen) md France 14/15 200 210 18.4 patrick lullin228 221 politecnica- ingegneria e Architettura
Soc. Coop md italy 14 200 200 11.8 member of the board229 225 hlm Architects A England 14 200 200 Christopher liddle
230 218 goudappel Coffeng b.v md netherlands 14 200 200 Jos van Kleef
231 220 b+S ingenieur Ag * md Switzerland 14 200 200 walter Shaufelberger
232 255 Sd ingénierie holding SA md Switzerland 14 200 170 J. d. girard
233 243 baur Consult Architekten ingenieure md germany 14 195 180 12.8 Andreas baur, peter Kuhn
234 256 Rogers Stirk harbour & partners A England 13/14 193 170 41.5 Rickard Rogers
235 247 purcell miller Tritton A England 13/14 192 180 19.7 mark goldspink236 202 dopravoprojekt, a.s. CE, S, A,
pm Slovakia 14 192 240 17.8 gabriel Koczkás237 249 Transprojekt gdanski CE,A poland 14 191 186 6.7 marek Rytlewski
the international marKet
The European top 300 consulting engineering and architectural groups
2015 2014 Group Services countryAnnualreport
Average number of
employees(Previous
year)
turnover
MeUr ceo/Managing director
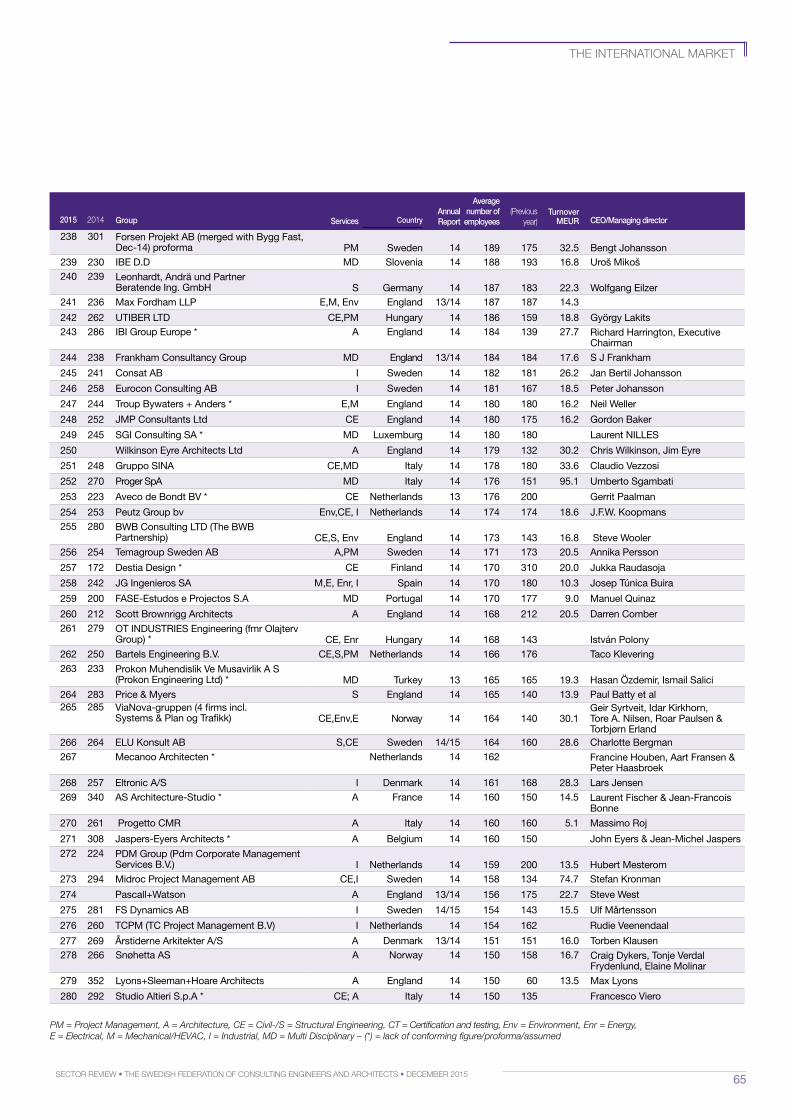
65Sector review • the SwediSh Federation oF conSulting engineerS and architectS • december 2015
238 301 Forsen projekt Ab (merged with bygg Fast, dec-14) proforma pm Sweden 14 189 175 32.5 bengt Johansson
239 230 ibE d.d md Slovenia 14 188 193 16.8 uroš mikoš240 239 leonhardt, Andrä und partner
beratende ing. gmbh S germany 14 187 183 22.3 wolfgang Eilzer241 236 max Fordham llp E,m, Env England 13/14 187 187 14.3
242 262 uTibER lTd CE,pm hungary 14 186 159 18.8 györgy lakits243 286 ibi group Europe * A England 14 184
139 27.7 Richard harrington, Executive
Chairman
244 238 Frankham Consultancy group md England 13/14 184 184 17.6 S J Frankham
245 241 Consat Ab i Sweden 14 182 181 26.2 Jan bertil Johansson
246 258 Eurocon Consulting Ab i Sweden 14 181 167 18.5 peter Johansson
247 244 Troup bywaters + Anders * E,m England 14 180 180 16.2 neil weller
248 252 Jmp Consultants ltd CE England 14 180 175 16.2 gordon baker
249 245 Sgi Consulting SA * md luxemburg 14 180 180 laurent nillES
250 wilkinson Eyre Architects ltd A England 14 179 132 30.2 Chris wilkinson, Jim Eyre
251 248 gruppo SinA CE,md italy 14 178 180 33.6 Claudio vezzosi
252 270 proger SpA md italy 14 176 151 95.1 umberto Sgambati
253 223 Aveco de bondt bv * CE netherlands 13 176 200 gerrit paalman
254 253 peutz group bv Env,CE, i netherlands 14 174 174 18.6 J.F.w. Koopmans255 280 bwb Consulting lTd (The bwb
partnership) CE,S, Env England 14 173 143 16.8 Steve wooler256 254 Temagroup Sweden Ab A,pm Sweden 14 171 173 20.5 Annika persson
257 172 destia design * CE Finland 14 170 310 20.0 Jukka Raudasoja
258 242 Jg ingenieros SA m,E, Enr, i Spain 14 170 180 10.3 Josep Túnica buira
259 200 FASE-Estudos e projectos S.A md portugal 14 170 177 9.0 manuel quinaz
260 212 Scott brownrigg Architects A England 14 168 212 20.5 darren Comber261 279 oT induSTRiES Engineering (fmr olajterv
group) * CE, Enr hungary 14 168 143 istván polony262 250 bartels Engineering b.v. CE,S,pm netherlands 14 166 176 Taco Klevering263 233 prokon muhendislik ve musavirlik A S
(prokon Engineering ltd) * md Turkey 13 165 165 19.3 hasan Özdemir, ismail Salici264 283 price & myers S England 14 165 140 13.9 paul batty et al265 285 vianova-gruppen (4 firms incl.
Systems & plan og Trafikk) CE,Env,E norway 14 164 140 30.1geir Syrtveit, idar Kirkhorn, Tore A. nilsen, Roar paulsen & Torbjørn Erland
266 264 Elu Konsult Ab S,CE Sweden 14/15 164 160 28.6 Charlotte bergman 267 mecanoo Architecten * netherlands 14 162
Francine houben, Aart Fransen & peter haasbroek
268 257 Eltronic A/S i denmark 14 161 168 28.3 lars Jensen269 340 AS Architecture-Studio * A France 14 160
150 14.5 laurent Fischer & Jean-Francois
bonne
270 261 progetto CmR A italy 14 160 160 5.1 massimo Roj
271 308 Jaspers-Eyers Architects * A belgium 14 160 150 John Eyers & Jean-michel Jaspers272 224 pdm group (pdm Corporate management
Services b.v.) i netherlands 14 159 200 13.5 hubert mesterom 273 294 midroc project management Ab CE,i Sweden 14 158 134 74.7 Stefan Kronman
274 pascall+watson A England 13/14 156 175 22.7 Steve west
275 281 FS dynamics Ab i Sweden 14/15 154 143 15.5 ulf mårtensson
276 260 TCpm (TC project management b.v) i netherlands 14 154 162 Rudie veenendaal
277 269 Årstiderne Arkitekter A/S A denmark 13/14 151 151 16.0 Torben Klausen278 266 Snøhetta AS A norway 14 150
158 16.7 Craig dykers, Tonje verdal
Frydenlund, Elaine molinar
279 352 lyons+Sleeman+hoare Architects A England 14 150 60 13.5 max lyons
280 292 Studio Altieri S.p.A * CE; A italy 14 150 135 Francesco viero
the international marKet
2015 2014 Group Services countryAnnualreport
Average number of
employees(Previous
year)
turnover
MeUr ceo/Managing director
PM = Project Management, A = Architecture, CE = Civil-/S = Structural Engineering, CT = Certification and testing, Env = Environment, Enr = Energy, E = Electrical, M = Mechanical/HEVAC, I = Industrial, MD = Multi Disciplinary – (*) = lack of conforming figure/proforma/assumed
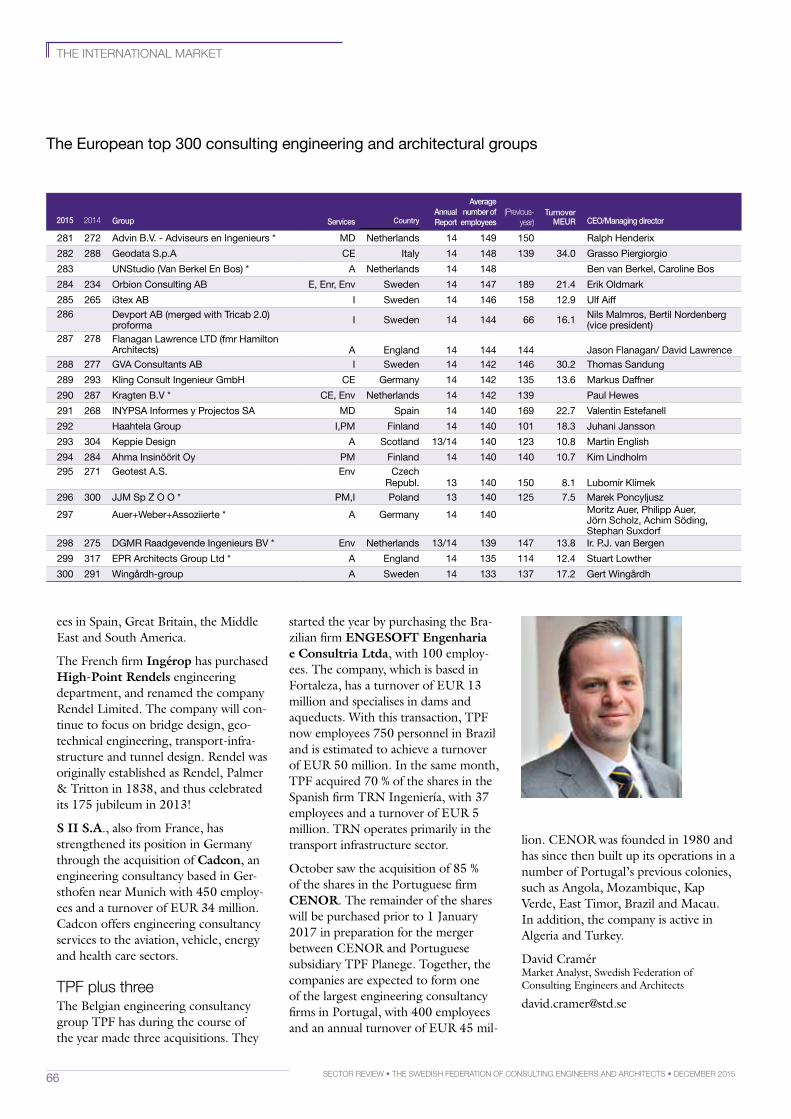
66 Sector review • the SwediSh Federation oF conSulting engineerS and architectS • december 2015
281 272 Advin b.v. - Adviseurs en ingenieurs * md netherlands 14 149 150 Ralph henderix
282 288 geodata S.p.A CE italy 14 148 139 34.0 grasso piergiorgio
283 unStudio (van berkel En bos) * A netherlands 14 148 ben van berkel, Caroline bos
284 234 orbion Consulting Ab E, Enr, Env Sweden 14 147 189 21.4 Erik oldmark
285 265 i3tex Ab i Sweden 14 146 158 12.9 ulf Aiff286 devport Ab (merged with Tricab 2.0)
proforma i Sweden 14 144 66 16.1 nils malmros, bertil nordenberg (vice president)
287 278 Flanagan lawrence lTd (fmr hamilton Architects) A England 14 144 144 Jason Flanagan/ david lawrence
288 277 gvA Consultants Ab i Sweden 14 142 146 30.2 Thomas Sandung
289 293 Kling Consult ingenieur gmbh CE germany 14 142 135 13.6 markus daffner
290 287 Kragten b.v * CE, Env netherlands 14 142 139 paul hewes
291 268 inypSA informes y projectos SA md Spain 14 140 169 22.7 valentin Estefanell
292 haahtela group i,pm Finland 14 140 101 18.3 Juhani Jansson
293 304 Keppie design A Scotland 13/14 140 123 10.8 martin English
294 284 Ahma insinöörit oy pm Finland 14 140 140 10.7 Kim lindholm295 271 geotest A.S. Env Czech
Republ. 13 140 150 8.1 lubomír Klímek296 300 JJm Sp Z o o * pm,i poland 13 140 125 7.5 marek poncyljusz
297 Auer+weber+Assoziierte * A germany 14 140
moritz Auer, philipp Auer, Jörn Scholz, Achim Söding, Stephan Suxdorf
298 275 dgmR Raadgevende ingenieurs bv * Env netherlands 13/14 139 147 13.8 ir. p.J. van bergen
299 317 EpR Architects group ltd * A England 14 135 114 12.4 Stuart lowther
300 291 wingårdh-group A Sweden 14 133 137 17.2 gert wingårdh
the international marKet
The European top 300 consulting engineering and architectural groups
ees in Spain, Great Britain, the Middle East and South America.
The French firm Ingérop has purchased HighPoint Rendels engineering department, and renamed the company Rendel Limited. The company will con-tinue to focus on bridge design, geo-technical engineering, transport-infra-structure and tunnel design. Rendel was originally established as Rendel, Palmer & Tritton in 1838, and thus celebrated its 175 jubileum in 2013!
S II S.A., also from France, has strengthened its position in Germany through the acquisition of Cadcon, an engineering consultancy based in Ger-sthofen near Munich with 450 employ-ees and a turnover of EUR 34 million. Cadcon offers engineering consultancy services to the aviation, vehicle, energy and health care sectors.
tPF plus threeThe Belgian engineering consultancy group TPF has during the course of the year made three acquisitions. They
started the year by purchasing the Bra-zilian firm ENGESOFT Engenharia e Consultria Ltda, with 100 employ-ees. The company, which is based in Fortaleza, has a turnover of EUR 13 million and specialises in dams and aqueducts. With this transaction, TPF now employees 750 personnel in Brazil and is estimated to achieve a turnover of EUR 50 million. In the same month, TPF acquired 70 % of the shares in the Spanish firm TRN Ingeniería, with 37 employees and a turnover of EUR 5 million. TRN operates primarily in the transport infrastructure sector.
October saw the acquisition of 85 % of the shares in the Portuguese firm CENOR. The remainder of the shares will be purchased prior to 1 January 2017 in preparation for the merger between CENOR and Portuguese subsidiary TPF Planege. Together, the companies are expected to form one of the largest engineering consultancy firms in Portugal, with 400 employees and an annual turnover of EUR 45 mil-
lion. CENOR was founded in 1980 and has since then built up its operations in a number of Portugal’s previous colonies, such as Angola, Mozambique, Kap Verde, East Timor, Brazil and Macau. In addition, the company is active in Algeria and Turkey.
David CramérMarket Analyst, Swedish Federation of Consulting Engineers and Architects
2015 2014 Group Services countryAnnualreport
Average number of
employees(Previous-
year)
turnover
MeUr ceo/Managing director
67Sector review • the SwediSh Federation oF conSulting engineerS and architectS • december 2015
”“The member associations in 8 out of 17 coun-tries believed in an improvement in profitability during 2016, while one anticipated a deterioration”
68 Sector review • the SwediSh Federation oF conSulting engineerS and architectS • december 2015
The Consulting Engineering and Architectural groups A Swedish and international survey
the danish association of consulting engineers
association of consulting engineers, norway
the icelandic association of consulting engineers
the icelandic association of architects firms, SamarK
the Finnish association of consulting Firms
the association of Finnish architects‘ offices
R Å D G I V E N D E I N G E N I Ø R E R S F O R E N I N G
in co-oPeration with
the Swedish Federation of consulting engineers and architects,
Std-företagen, works in the best interests of the member firms
with the aim of strengthening their competitiveness and long-term
profitability. with 750 member firms, and a collective work force
of some 32,000 employees, Std-företagen represents about two
thirds of the industry in Sweden.
Std-företagen strives to promote high quality, sound
development, a high level of profitability and modern working
conditions within the member companies.
Std-företagen is a part of almega, which is the organisation that
represents service companies in Sweden. almega is the largest
federation in the confederation of Swedish enterprises. Std-
företagen is also a member of both the european (eFca) and the
international (Fidic) engineering-consulting organisations.
The Swedish Federation of Consulting Engineers and Architects
visiting address: Sturegatan 11postal address: box 55545 • SE-102 04 Stockholm • SwedenTelephone +46 8 762 67 00 • e-mail: [email protected]
www.std.se
artikel nr: wS0880-1512