Focus december white 0
80
FOCUS No 226 | December 2011 The monthly newsletter of regulated exchanges, with key market figures Alternative financing for SMEs WFE domestic market segmentation study Quick glance at SROs in FEAS region by Alpaslan Budak Alternative capital financing for the 99% (of business) by John Katovich Growing need for innovative SME exchanges in Europe by Carl Johan Högbom and Henrik Wagenius
-
Upload
independent -
Category
Documents
-
view
4 -
download
0
Transcript of Focus december white 0
FOCUSNo 226 | December 2011 The monthly newsletter of regulated exchanges,with key market figures
Alternative financing for SMEs
WFE domestic market segmentation study
Quick glance at SROs in FEAS regionby Alpaslan Budak
Alternative capital financing for the 99% (of business) by John Katovich
Growing need for innovative SME exchanges in Europe by Carl Johan Högbom and Henrik Wagenius
Member exchanges
The WFE is the association of 54 regulated exchanges around the world, which develops and promotes standards in markets. Its membership includes:
Every effort has been made to ensure that the information in this document is accurate at the time of printing, but the Secretariat cannot accept any responsibility for errors or omissions.
WFE commissions articles on capital markets policy and practices for publication in its monthly review, “Focus,” and for website posting. The views of the authors do not necessarily reflect those of this Federation or its member exchanges. For reproduction or citation, please contact the Secretariat.
Amman Stock Exchange
Athens Exchange
Australian Securities Exchange
Bermuda Stock Exchange
BM&FBOVESPA
BME Spanish Exchanges
Bolsa de Comercio de Buenos Aires
Bolsa de Comercio de Santiago
Bolsa de Valores de Colombia
Bolsa de Valores de Lima
Bolsa Mexicana de Valores
Bombay Stock Exchange
Bourse de Casablanca
Bourse de Luxembourg
Bursa Malaysia
Chicago Board Options Exchange
CME Group
Colombo Stock Exchange
Cyprus Stock Exchange
Deutsche Börse
The Egyptian Exchange
Gretai Securities Exchange
Hong Kong Exchanges and Clearing
Indonesia Stock Exchange
IntercontinentalExchange
International Securities Exchange
Irish Stock Exchange
Istanbul Stock Exchange
Johannesburg Stock Exchange
Korea Exchange
London Stock Exchange Group
Malta Stock Exchange
Moscow Interbank Currency Exchange
NASDAQ OMX Group
National Stock Exchange of India
NYSE Euronext
Osaka Securities Exchange
Oslo Børs
Philippine Stock Exchange
RTS Stock Exchange
Saudi Stock Exchange (Tadawul)
Shanghai Stock Exchange
Shenzhen Stock Exchange
Singapore Exchange
SIX Swiss Exchange
Stock Exchange of Mauritius
Stock Exchange of Thailand
Taiwan Futures Exchange
Taiwan Stock Exchange
Tel-Aviv Stock Exchange
TMX Group
Tokyo Stock Exchange Group
Warsaw Stock Exchange
Wiener Börse
Focus | December 2011 1
3 Alternative capital financing for the 99% (of Business) by John Katovich
7 Growing need for innovative SME Exchanges in Europe by Carl Johan Högbom and Henrik Wagenius
10 Quick glance at SROs in FEAS region by Alpaslan Budak
14 Federation news
14 WFE Domestic market segmentation study 18 Query tool for WFE statistics is launched 19 The WFE – MIT Exchange Technology Workshop was held in Cambridge
20 News
20 Corporate news
20 Exchange consolidation news
21 Financial results
21 Indices
22 Inter-market links
23 IT
23 New products
24 New services
26 Post trade
26 Regulation
27 Other
28 WFE Market statistics
76 Calendar of events
Contents

2 Focus | December 2011
The core mission of an exchange is to help financing for companies; this role is especially important for smaller companies.
As John Katovich notes in the article that follows, 99% of the US economy is made up of small and medium-sized enterprises (SMEs), and these firms generate 2/3rds of all new jobs.
While the US marketplaces have a reputation for financing SMEs, a rough estimate is that only 1% are financed through exchanges. With bank lending facing challenges from new rules on capital requirements, and with economic forecasts pointing to a continued climate of risk aversion, the need for alternative sources of financing is likely to grow.
There are models of successful exchanges dedicated to listing SMEs in cities such as Warsaw, Shenzhen, Sao Paulo, London and New York.
Investors are always concerned about the liquidity in smaller stocks. The WFE market segment study included in this month’s issue and, which was released this month, points to some encouraging figures, such as the leap in liquidity in for micro cap stocks. Over the past four years, the number of trades per listed companies of this segment is up by 73% on a global level. (see page 17)
The major points of the study are discussed in the interview with Jeremy Grant of the Financial Times. (http://video.ft.com/ft-trading-room)
One criticism of exchanges is that while mergers have created bigger pools of liquidity, this has focused international investors’ interest on a smaller number of big companies. The data for this period is hard to interpret, for while there was a downturn in listings at the start of the millennium versus the Internet-listing period, the impact of exchange mergers compared to other economic and market structure factors is unclear. Mergers also swept away the boutique banks of the 1990s that were at the forefront of research and underwriting SMEs, and the economic conditions and regulations (ex. Sarbanes Oxley) were different, too, from one decade to the next.
The WFE domestic market cap study also underlined that, during the period overcome under review, the number of micro and small cap companies declined in some regions such as Asia Pacific, and EAME. In order to make the number of listings of micro and small companies grow, several impediments should be neutralized: the costs of going public and the burdens of reporting must not dissuade companies to list; and the rules for SMEs should be adapted to their scale. (see page 14 for the complete study)
This month in Focus, Carl Johan Högbom and Henrik Wagenius discuss Alternativa, another solution to funding companies in Europe. From the US, John Katovich cited above looks to new ways that retail investors can be brought into the financing of firms. While there is no doubt more regulation in the market than before, there are new ways of mobilizing capital and energizing networks of people that have only partly been explored in this context. That prospect makes for good news to start the year with.
Peter Clifford Deputy Secretary General,WFE
Alternative financing for SMEs
Focus | December 2011 3
We stand at a unique moment in history. The capital markets have suffered a severe blow to their reputations from the 2008 financial crisis. The rise of high frequency trading and the “financialization” of economies have called into question whether the markets still deliver on their original purpose of efficiently facilitating the transfer of savings into investments for companies to develop products, services, research and development. Unemployment is now at levels rarely seen before in over a century, with well over 7.5 million “officially” unemployed in the U.S., and likely many more unaccounted for. Add to that the heightened awareness of the stress on the planet combined with the super-charged connectivity of peoples across the globe, we are witnessing an unprecedented demand for change. Economists and politicians are rethinking the status quo, while communities are working to take back their local economies.
Here in the U.S., we are experiencing some interesting dynamics. New listings via the IPO market have significantly dwindled in the last decade due in great part to increased costs and decreased interests by banks to underwrite versus trade for their own accounts. The Occupy and Tea Party movements, while still in their infancy, are signaling that a demand for alternatives is on the rise. And other changes are underway and growing. Local movements are rapidly growing, from the “Buy Local” campaigns to green chambers of commerce to complementary currencies; individuals want to feel connected to something place-based again. The “Move Your Money” campaign may not have caused Bank of America and Citigroup to report significant losses last quarter, but not heeding this signal of a demand for change will only exacerbate their problems in the future. And authors have begun to codify these issues; Journalist Amy Cortese’s Locavesting, and Michael Shuman’s soon-to-be-released Local Dollars – Local Sense, are excellent books covering what is now happening in terms of alternative local investments, and Marjorie Kelly’s upcoming book, Owning Our Future: The Emerging Ownership Revolution, on new generative ownership designs, provides answers to questions she raised previously in her provocative work The Divine Right of Capital.
But for all the talk about “local” movements today, there is still very little that can be done in the U.S. in terms of “local investments” in small to medium sized companies. This is especially true if you are not lucky or smart enough to be one of the 1 to 2 percent who qualifies as an “accredited investor” under U.S. laws. Interestingly, the bar was raised even higher with new laws created out of the financial crisis that eliminated the value of one’s personal residency from this qualification. This is a curious and interesting restriction, given that there is a growing body of work to show that it is quite possible to beat Wall Street’s estimates of 5% long-term performance by investing in local community businesses.
The problem is not the lack of funds available by the non-accredited population. In my county of Alameda, east of San Francisco, California, there are enough investable funds held by individuals in savings, securities and retirement accounts to fund small business needs three times over in a given year. Standing in the way of this potential pool of money are those restrictions that prevent most individuals from investing in private enterprises. As Michael Shuman has pointed out, an individual can fly to Las Vegas and lose his or her entire savings without filling out a single form, but to invest in a private enterprise is more restrictive and difficult today than it has ever been, and for most of the population, extremely difficult unless you know exactly where to look. These restrictions end up costing private companies needed capital to grow and prosper. If national or state governments were to implement simple, zero-cost reforms, the number and variety of local investment opportunities would expand dramatically, and they would be in a position to hire.
Consider this: Small business accounts for 99% of all U.S. companies and the U.S. Department of Commerce reported that it is the fastest growing segment of the U.S. economy. 27.5 million small businesses employ half of all private sector employees and contribute half of private GDP, about $5.5 Trillion annually. They include high growth startups that have the potential to become corporate powerhouses and they produce 16 times more patents than large companies. They are responsible for more than 2 out of every 3 jobs created over the past 30 years, while large corporations have been net job destroyers. There is overwhelming evidence that local small businesses are the untapped resource, and quite likely the only way out of the current economic malaise.
John Katovich President,Cutting Edge Capital
Alternative capital financing for the 99% (of business)
4 Focus | December 2011
Small and medium size businesses are the backbone of the global economy. But today’s capital markets fail the needs of community economies at the risk of snuffing out innovation. The inability to raise capital is the reason half of new businesses don’t last more than five years. The core mission of a bank used to be to support local economies, yet bank loans to small businesses have mostly dried up. No mutual fund specializes in local small businesses, yet most Americans are forced to invest their pensions or choose to direct their long-term savings in mutual funds that have restrictions on where the funds can be invested. We are inundated daily by statistics about the Fortune 500 economy and the performance of the major indices as if they were accurate proxies for the economy, when in fact they represent a wholly different economy from anything remotely close to what individuals see and touch every day. The real economy is in our backyards, but supporting it is quite difficult for most.
Regions that have traditionally been underserved are now discovering advantages by exploring complimentary currencies and new alternative investment vehicles. By supporting this movement we ensure that we will continue to produce a strong stable of listing candidates for the larger exchange markets. Developing and supporting local markets alongside existing markets is neither mutually exclusive nor contrary to the larger market’s competitive advantages. A local exchange could act as an incubator for larger exchanges to tap growing companies, while simultaneously supporting functional economic redundancy, which in turn can help communities to grow, stabilize and invest more in small to large markets. These local systems will continue to be connected to the whole, but they can and will need to become more self-sufficient and self-reliant, especially with regard to necessities such as food, water, and energy systems that will need to work when global infrastructures suffer.
A confluence of climate change, famine, state failure, uncontrolled migration, and disease may likely add unprecedented and unpredictable stresses on all of the world’s resources and systems. Given the likelihood of many if not all of these events in the near future, now is the time to insulate and redesign our social and economic systems to withstand disruption and change, essentially shock-proofing the system for a sustainable 21st century, while at the same time taking advantage of the unique opportunities that these changes create. And these prudent protections can also flow toward greater benefits for the larger capital market system, as mentioned above.
As world exchanges are now advancing their own sustainability practices and agendas, I made the decision to leave my position at NASDAQ to work toward the development of alternative and local investment opportunities, directly, through Cutting Edge Capital, a consulting firm co-founded with my partner, Jenny Kassan, devoted to helping small to medium size businesses find alternative capital financing, and indirectly, by supporting the work of others in this arena.
Examples of some Cutting Edge Capital’s financing alternative work include:
Direct Public Offerings (DPO) that raise capital by selling shares to the public. These work like an IPO in that a company can offer securities or loans directly to the public through a general solicitation, typically relying on an “Intrastate Exemption.” There are dollar limitations depending on the type of DPO, and a company does not receive blanket exemptions from filing in the 50 states. And shares from DPOs are not typically traded on a secondary market, as they would be from listing on a national exchange. With a DPO, the company raising the money handles the marketing of the offering itself, eliminating the middleman. A major advantage is that investors can support a local, place-based company, and also get in on early stage investments typically reserved for angels and accredited investors. Cutting Edge Capital is currently working on DPOs for clients in multiple states including California, Washington and New York where companies either have a ready client base of interested investors, or know that they can spread the word easily to raise their targeted funds.
Local Exchanges that eventually could and should be created to handle all the functions of a stock market for a specific region and provide a way to reinvigorate capital investment in small, innovative firms and regional economies. Until then, the U.S. markets may have to rely on work-around exemptions, such as what CEC is helping companies like Mission Markets plan for, by combining the structures of a broker-dealer with an Alternative Trading System.
Focus | December 2011 5
Investing in Community Development Finance Institutions (CDFI) that assist underserved and low income communities in a specific geographic region. These can be banks, credit unions, venture capital funds or loan funds, and in at least one state, non-accredited investors can own shares in the CDFIs or in funds that support them.
Crowd Funding helps individuals, start ups and even ongoing businesses to raise money by aggregating small sums from many individuals via the Internet. Person to person finance (P2P) was popularized by sites such as Kiva.com, a micro lender, and Kickstarter, which lets people donate to creative projects. And a proposal originally drafted by our nonprofit affiliate Sustainable Economies Law Center, has now resulted in pending legislation in the U.S. Congress that may allow companies to raise as much as $1m from individuals investing up to $10,000 while bypassing the costly federal and state registration processes.
Cutting Edge Capital also works with many Cooperatives - associations that run for the mutual benefit of their member owners. They can be worker owned, consumer owned, producer owned, buyer owned, or a combination, and they can bring in outside investors up to a limit, while still honoring the principles of remaining member-owned and managed.
Naturally, there are risks investing in small businesses that also need to be addressed. Today the U.S. approach requires publicly traded companies to file financial reports, and some form of a lighter, less costly approach must be developed for small companies that offer securities to the public. But there is not, as of yet, an SEC requirement for publicly traded companies to file reports on non-financial risks, even if it is later found to be “material” in nature. Logically, an investor should be just as interested in knowing all material aspects of a business, whether financial or otherwise, and this would be true whether large, medium or small, and whether listed on a large national exchange or locally. Transparency is a strong motivator for good behavior, whether applied to the environment, society, or how you govern, and this would hold true for any size of business.
And as with the reporting of financial information, cost will be a factor when considering how a small company will report on ESG factors. The key here will be the development of clear, concise and practical indicators. Knowing these will be critical in discerning the quality of any local stock or portfolio.
Efforts are underway to provide additional non-financial information that any potential investor can rely on. B-Lab’s GIIRs, for instance, assess the social and environmental impact (but not the financial performance) of companies and funds using a ratings approach analogous to Morningstar investment rankings or S&P credit risk ratings. But even more than ratings are needed before we can be comfortable that investors will have the information they need. In order to confidently rate a company, we must know that a company is transparent in terms of reporting on what it does.
Luckily, a new industry standard is under development by Dr. Jean Rogers that will provide a complete view of risks and opportunities of issuers (publicly listed at first), which will also be able to weight portfolios according to sustainability risks. Investors will finally be able to compare peer performances using key performance indicators on material environmental, social, and governance issues, and understand the relative positioning of companies with respect to future challenges. This Sustainability Accounting Standards Board (SASB) was developed out of Dr. Rogers’ particular expertise in developing metrics for measurement of sustainability performance, having worked with the Global Reporting Initiative on development of the G3 corporate sustainability reporting guidelines, and partnering with the Initiative for Responsible Investment at Harvard University to develop a method for assessing the materiality of sustainability issues by sector, as a basis for identifying opportunities for improved competitiveness.
Industrial civilization has famously raised living standards all over the world, but at the same time compromised much of the adaptability necessary for these changing times. Maintaining the complex structures we have developed to keep the status quo generates growing instability and vulnerability. The transformation of regional markets into a single global system has helped to lower costs and increase productivity, but it may have also ironically and unintentionally led to greater threats to our own security by weakening local community stability and redundancy, and creating outcomes that deplete locally produced goods and services. This is a risky strategy.
6 Focus | December 2011
Diversity is essential to resilience (and employment), and we must together support every effort to maintain and grow this base. The Morris Theorem, coined by Stanford professor of history and archaeology Ian Morris, states that “change is caused by lazy, greedy, frightened people looking for easier, more profitable and safer ways to do things. And they rarely know what they’re doing.” We might be lazy, greedy, frightened people looking only for profit, but this time we will have to know what we’re doing in order to survive and thrive.
About John Katovich
John Katovich was recently Executive Vice President and General Counsel at the Boston Stock Exchange, then Chief Regulatory Officer at BOXR, a subsidiary of NASDAQ. John founded Katovich and Kassan Law Group in 2002, representing corporations, LLCs, non-profits and other entities in areas of general business, financings, licensing, and regulation. Mr. Katovich also recently co-founded Cutting Edge Capital, developing innovative strategies for communities and business. John is also a Professor at Presidio Graduate School, teaching Capital Markets and Law, and consults with emerging countries in the area of markets and regulation. John was Sr. V.P. & General Counsel at the Pacific Stock Exchange, following his role as an Assistant Specialist an enforcement attorney. John was also Sr. VP and General Counsel for two software companies, OptiMark and ePIT, both developers of software for various trading applications. John is a graduate of Southern Illinois University School of Law (1979), and University of Illinois - Urbana-Champaign (1976). He completed the Executive Program on Negotiation at the Harvard Business School and the NASD Series 7. He is licensed to practice law in the state and federal district courts in both California and Illinois.

Focus | December 2011 7
The need for well‐organized and innovative exchange solutions for small and medium sized companies (SMEs) in Europe and the western world is becoming more apparent than ever.
The ongoing global financial crisis has triggered an acute lack of funding that has severe effects on the SME sector. This money draining is induced by banks holding out on traditional loans and is coinciding with the investor community trying to reduce risks by moving towards interest‐bearing financial instruments, such as large cap corporate bonds.
No growth capital for SMEs
This diminishing availability of growth capital is now hitting the SME sector at the same time as the international community is becoming more aware of the need for maintaining and stimulating national production in an almost mercantile sense. How to prevent the growth of trade deficits has become a pressing issue in top-level discussions all over Europe. After the political and financial mills have ground through the outstanding issues, the overall consensus will most likely be that the legislator must stimulate growth in the SME sector by making capital more available.
New legislative initiatives
Already now the European community is working on possible solutions for this pressing issue. By reading through the suggestions for new legislations in the MIFID II, the intention of the legislators becomes clear. There is a need for new thinking in the financial sector, and a lot of focus is put on exchange solutions for SMEs and new financial instruments. The ideas and the political will are there, but as we all know time is of the essence. We need solutions in order to adapt to the current situation.
Solutions are far from simple
How to effectively stimulate growth in the SME sector has always been a hard nut to crack. The best solution we have found so far is to make these companies available for investments through listing them on some kind of marketplace. But stock exchanges targeting this sector have always been struggling with critiques regarding insufficient liquidity and the perception of unscrupulous business owners trying to use the exchange to shift unsuccessful ventures on to new shareholders.
Back to basics
As many large exchanges today naturally focus on the largest companies, high-speed transactions and computer driven algo-trading, the viable solution for the SME markets could be to do the opposite; to go back to basics.
This anachronistic strategy could, for instance, entail the idea that there is a difference between new and old shares, as the money deriving from newly issued shares actually benefits the company. It needs to be clear that it is people making the investments, as opposed to computers, that the investors make investments because they actually believe in the prospects of companies that they invest in (as opposed to short- selling, etc.), that the investors from time to time participate in the company’s annual meeting of shareholders and that the investors, once the company is prosperous, receive dividends on their investment. This may sound like a fairytale to many of us looking back at the last three decades, but the financial markets were, as we all should know, originally designed to accommodate the needs of the companies. The capital strength and innovative force of pure capitalism in the financial community has distorted this original, fundamental economic purpose, and turned the market into a gambling arena on which the companies in many ways have been reduced to gambling chips.
Carl Johan Högbom VD/CEO,Alternativa Aktiemarknaden
Henrik Wagenius Partner/Head of Legal,GXG Global Exchange Group AB
Growing need for innovative SME exchanges in Europe
8 Focus | December 2011
The power of innovation
However, it does not suffice to go back to basics – the initiative needs to be taken back and maybe most importantly the power of innovation. It is hard for the company that lacks sufficient funding to be innovative and change the way that things are done. A company seeking funds will normally be in the hands of a team of consultants that have a problem knowing who their actual customer is: the company or the investor. As we all know, fundraising in the SME sector is the prerogative of corporate finance boutiques and stockbrokers, a fairly conservative and not so innovative sector. If we turn to this sector we will not find any ground-breaking innovations, apart from new and interesting ways of charging companies for the services rendered.
It is evident that there is a need for an external party, preferably driven by economical reasons (as legislative and political initiatives tend to create new problems when attempting to solve old ones), to step in and take the role as the innovator. As we see it, there are a few such innovative forces that can be part of the solution.
“Alternativa” in Sweden and France
My background in this industry consists of almost twenty years at the Stockholm Stock Exchange, the national stock exchange in Sweden. With all the changes that took place during that dramatic period, the closing of the trading floor, demutualization, mergers and listing of the Exchange, I learned to listen and to be open to new ideas. Ever since I left the Exchange in 2001 (since 1998 a part of the OMX Group), I have been looking for new ways to help companies in the SME sector. As a first step in 2003, I founded “Alternativa” (translates as “the Alternative”).
Alternativa is structured as a combination of an exchange and a brokerage firm, with simple application, low formal demand on disclosure but at the same time with a rating given to the company based on the level of information that it discloses to the market. Call auctions are held once per quarter, once per month or weekly, depending on what the company decides. Alternativa offer its customers low listing fees and a full range of services in IR- and issuer-related matters. The investors can choose to trade directly on the market or use traditional brokers. As mentioned above, Alternativa was conceived and started in 2003 before the world ever heard of MTFs and OTFs but the ideas behind Alternativa are similar.
Today Alternativa trades in approximately 30 companies and has more than 5000 connected investors, both institutional and private. In 2007, the Alternativa concept was launched in France but the setup there is a bit different due to the French wealth tax. But the purpose is the same – to help small-and medium-sized companies to get in contact with growth capital.
The idea behind the Alternativa concept is that if you offer a well functioning secondary market designed especially for SMEs, it is easier for a company to raise funds. And if you do this without forcing companies to face a complicated set of exchange regulations every day, management are allowed to focus on running the company instead of dealing with the demands from the financial market. Short and simple.
GXG Markets in Denmark and UK
In 2009, Henrik Wagenius, a former college who recently had left Alternativa (and the co-author of this article), introduced me to a team of people that he was working with. The team had big ideas and was trying to create a new pan-European marketplace for SMEs. The result is GXG Markets, a new marketplace with a three-tier business model containing an OTC market, an MTF and a Regulated Market. GXG is a fully licensed European exchange operator focusing exclusively on the listing of SMEs and new instruments.
The GXG business model is very simple, and one thing was made clear early – GXG has only one customer, the listed company or the company responsible for the listed instrument. The model is based on volume, they have their own electronic exchange system, a front-end for traders and they charge virtually no transaction fees. GXG Markets operate in accordance with the European MiFID legislation under the supervision of the Danish FSA. This means that the license to operate the marketplace is Danish but valid throughout Europe and the EES (European Economic Space). GXG has recently opened up a marketplace in London that could become a hub for SMEs from all over Europe.
GXG is now aiming to establish a global securities exchange for the listing and trading of TIGRcub® Securities (Top-Line Income Generation Rights Certificates) together with the US based financial innovator Entrex. The new marketplace, “Entrex Exchange,” will also target SMEs and TIGRcub® securities to offer issuers a chance to share income instead of profits with Investors. This has great implications for both parties, especially when it comes to investments in private or thinly traded public companies. We believe that a transparent and tradable market for such debt-bases securities could be one way to help SMEs to become far more attractive to the investment community.
Focus | December 2011 9
Summary
Providing capital for SMEs is a key issue today. If we are serious about wanting to solve the financial difficulties that the world is facing today, we need to find a solution to the acute lack of funding that affects this sector. The world today depends on the SMEs for future growth.
Markets focusing on SMEs are not competitors to traditional exchanges; they should rather be seen as feeder markets, supplying the larger exchanges with well-prepared companies for listing. In Sweden, we have seen this in many cases since alternative markets became a fact. But primarily, the purpose of SME exchanges is to create an environment where companies have a better chance to raise capital and also to help them become better prepared for the future, whether they choose to stay on an alternative market or move on to a traditional stock exchange.
All initiatives that help SMEs develop need to be supported. How? By providing honest financial arenas for growing companies, arenas where companies can choose between different levels of regulation and price. Let us tell the politicians-Yes, we can! Let us together show the world that the financial markets can reinvent themselves and that we are innovative, not only when it comes to finding new ways to fill our own pockets.
About Carl Johan Högbom
1981 to 2001 at the Stockholm Stock Exchange (part of OMX since 1998), CEO between 1998-2001. Since 2001 independent consultant in the financial area. Founder and Chairman of “Alternativa” in Sweden and France (member of “Comité Stratégique”), member of the Disciplinary Committee of the NasdaqOMX Stockholm and the Swedish Brokers association. Chairman of GXG Markets in Denmark and member of the board of the Swedish shareholders association.
About Henrik Wagenius
Financial entrepreneur and former corporate finance executive. Has since 1997 been involved in the Private Equity sector with a main focus on companies within the TIME sector (Technology, Internet, Media and Entertainment). Since early 2009 part of the management team at GXG Global Exchange Group and Head of Legal.
10 Focus | December 2011
What does an SRO look like?
An average Self-Regulatory Organization (SRO) looks like a rather unusual animal with elephant’s feet, tiger’s body, giraffe’s neck and rooster’s head. Instead of trying to identify “an average” strange creature, we should, in fact, accept the fact that SROs are so diverse that some are as big as an elephant, while others are as fierce as a tiger, or as farsighted as a giraffe and some even give wake-up calls like a rooster.
To begin with, exchanges, industry associations, central clearing and settlement institutions can all be SROs or can have some sort of a self-regulatory function. Obviously, the focus of these institutions would be different from one another. Second, the level of authority, the range of activities, financial and human resources of the SROs differ quite significantly. In other words, the concept of a “Self-Regulatory Organization” is too broad to address the entire range of activities properly. Therefore, we should create a distinction between Self-Regulatory Associations (SRA) and Self-Regulatory Exchanges (SRE).
This article will summarize the study which was conducted with the members of industry association for the Federation of Euro-Asian Stock Exchanges (FEAS)1. The aim of the study was to identify the common characteristics and discrepancies among the self-regulatory associations (SRAs) both within and outside the FEAS region.
Why study SROs?
Self-regulation is an integral part of the regulatory structure of the securities markets in many countries. The market participants such as broker-dealers, listed firms, futures traders, and others are overseen or regulated, to some degree, by a variety of self-regulatory organizations. It is possible to improve the regulatory system’s efficiency by empowering self-regulatory organizations because of the advantages they offer. In a nutshell, SROs;
• Observe ethical and business standards which go beyond government regulations.
• Have expertise in market operations and practices.
• Respond more quickly and with more flexibility to changing market conditions.
• Build and maintain technological and regulatory infrastructure, funded by regulated persons, not taxpayers.
• Are instrumental in improving the know-how of the public through investor education programs and/or training of market participants.
Previous work
Due to the increasing importance and impact of the SROs, several international bodies conducted studies about their structure and functions.
In 2005, International Council of Securities Associations (ICSA)2
designed a survey to analyze the self-regulatory organizations in different jurisdictions. The survey was done among ICSA members only and the results were compiled in 2006.
In 2007, Self-Regulatory Organizations Consultative Committee (SROCC) of the International Organization of Securities Commissions (IOSCO) developed a similar survey covering stock exchanges, professional associations, clearing, settlement and custody institutions to explore and define the variety of self-regulatory structures.
In 2007, CFA Institute published a report on self-regulation. In 2010, the World Bank published a comprehensive report on self-regulation in the capital markets and in 2011 the report was updated and revised.3 These papers primarily examined organizations with the authority to regulate their members.
Mandate
FEAS amended its Charter in 2009 and allowed the associations to become members. Shortly after four associations became affiliate members, the Dealers’ Associations Task Force (DATF) was established and the Association of Capital Market Intermediary Institutions of Turkey (TSPAKB) was elected as the DATF Leader. In December 2010, the DATF proposed and was mandated by the Executive Committee to conduct a survey on the structure of the FEAS-member associations.
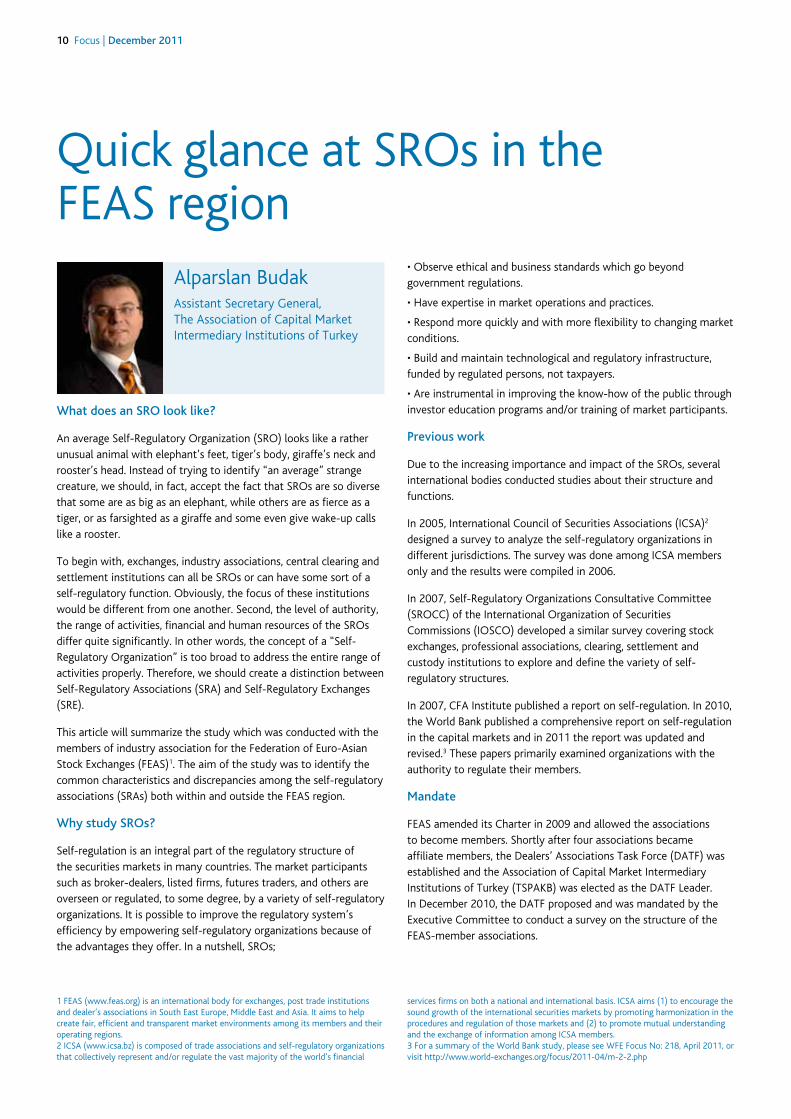
Alparslan Budak Assistant Secretary General,The Association of Capital Market Intermediary Institutions of Turkey
Quick glance at SROs in the FEAS region
1 FEAS (www.feas.org) is an international body for exchanges, post trade institutions and dealer’s associations in South East Europe, Middle East and Asia. It aims to help create fair, efficient and transparent market environments among its members and their operating regions. 2 ICSA (www.icsa.bz) is composed of trade associations and self-regulatory organizations that collectively represent and/or regulate the vast majority of the world’s financial
services firms on both a national and international basis. ICSA aims (1) to encourage the sound growth of the international securities markets by promoting harmonization in the procedures and regulation of those markets and (2) to promote mutual understanding and the exchange of information among ICSA members. 3 For a summary of the World Bank study, please see WFE Focus No: 218, April 2011, or visit http://www.world-exchanges.org/focus/2011-04/m-2-2.php
Focus | December 2011 11
Survey
The survey was based on the IOSCO’s previous study for reasons of consistency. It was sent to FEAS-member associations as well as other associations to provide a basis for comparability. Exchanges are not covered in the study and the results were compiled in April 2011.
Respondents
In addition to all of the FEAS-member associations, 8 other associations who are not FEAS members also replied. We are thankful to these institutions for their valuable contribution.
FEAS members
• Securities and Exchange Brokers Association of Iran
• Association of Certified Capital Market Professionals of Jordan
• Muscat Securities Market Brokers Association of Oman
• The Association of Capital Market Intermediary Institutions of Turkey
Non-FEAS members
• Bulgarian Association of Licensed Investment Intermediaries
• Iraqi Association of Securities Dealers
• Brazilian Financial and Capital Markets Association
• Investment Industry Regulatory Organization of Canada
• Bundesverband der Wertpapierfirmen an den Deutschen Börsen e.V.
• Korea Financial Investment Association
• Swedish Securities Dealers Association
• Association of National Exchanges Members of India
SRO models
The IOSCO SROCC study, conducted in 2007, defined four models for the SROs based on the scope of their authority. The fifth model below is added to this list by the FEAS DATF.
Model 1: Clear delegation from legislative/regulatory authorities granting the power to enact rules to a self-regulatory organization, with those rules becoming a part of the legal framework.
Model 2: The regulatory authority may approve rules enacted by professionals and may embed those rules in the legal framework.
Model 3: Rules enacted by professionals are not embedded in the legal framework but are considered as a relevant reference by legislative authorities or courts.
Model 4: Rules enacted by professionals are used as references by the industry on a voluntary or contractual basis.
Model 5: Organization has no self-regulatory authority; primary focus is on promoting the interests of members.
Although the FEAS DATF observed and attempted to apply these categories in its study the range of activities are so diversified that it is neither easy nor possible to fit an association into any one of these categories. In many cases, the surveyed SRAs are a combination of several of the above models.
Does size matter?
The size of an SRA is also an indicator of its activities and effectiveness. Among the respondents, the smallest association has 2 employees and an annual budget of US$ 42 thousand. On the other hand, the largest SRA employs 440 staff with an annual budget of US$ 72 million.
One overwhelming consistency on all SRAS is that all associations generate revenues from membership fees. Training programs are the second major source of revenue. The third largest revenue source is certification of market professionals.
None of the associations benefits from government grants or subsidies. This verifies that self-regulation is funded by regulated persons, not taxpayers. Eventually, the cost of self-regulation is most probably passed on to investors through intermediation costs. However, this could be seen as fair because in the end, the person benefiting from the financial system is also paying for the cost of his own protection. It is a kind of an insurance premium, implicitly paid by investors, for better functioning of the financial system. On the other hand, the costs of statutory regulators are borne by all taxpayers, regardless of their involvement in the financial system.
Who do they represent?
Out of 12 respondents, 11 have market intermediaries as members, whereas 1 association has only individual members. Among the 11, 3 of them also have individual members in addition to intermediaries. Another 3 have asset management companies as members.
In 5 jurisdictions, membership to the respondent (SRA) is compulsory for intermediaries. In another 4 jurisdictions, it is necessary to be a member of one of the SROs in the country, but it is up to them to decide among several different options, including the respondent (SRA).
12 Focus | December 2011
Raison d’être
The respondent associations share a range of objectives, with almost all reporting that they have a mandate to promote their members’ interest. 9 of the 12 associations are also involved in improving business conduct, investor protection, market integrity and market efficiency.
Basis of authority
In this part of the survey, the respondents were asked how they fit into the previously-mentioned SRO models. Out of 12 associations, 2 of them are so-called trade-associations, fitting into Model 5, with no self-regulatory authority and a focus on promoting the interests of members.
The remaining 10 SRAs made multiple selections. For example, all of the 10 SRAs issue recommendations, market practices, guidelines and industry standards that are voluntarily followed by industry participants (Model 4). In addition to these, 5 respondents’ rules are considered as a relevant legal reference to be used by the courts (Model 3). 6 associations enact rules, such as code of conduct, which are recognized in regulations or in the legal framework (Model 2) of the country. Finally, 5 associations’ authority is based on legislation or entrusted to them by the regulatory authorities of that market (Model 1).
Model 1 represents the strongest form of authority and it is obvious, based on the survey results, that there is much more room to further empower SRAs with proper regulatory authority, which will allow them to relieve some of the burden placed on the market authority.
Regulation
There are three pillars of effective regulation; making of rules, supervising their implementation and enforcement in case of breach. In this section we tried to explore these activities because they are the backbone of an SRA. As mentioned before, the regulatory tools of SRAs span a wide range of possibilities from code of conduct to industry recommendations.
Out of 10 SRAs, 7 of them regulate members’ activities, while 6 of them also regulate members’ employees.
Perhaps an interesting outcome for exchanges is that 6 of the respondents have a say in market trading rules. Some of them are directly setting market trading rules, especially in the OTC market, while some of them have to be consulted before the organized market changes its own rules.
Supervision
Generally, the organizations that are setting the rules also monitor compliance. However, although some associations do not have the authority to make rules, they are expected to supervise compliance with general regulations.
7 organizations supervise compliance of members’ activities, while 5 monitor members’ employees as well.
Enforcement
Generally organizations, which set rules and supervise compliance, also have the power to enforce them. However, some associations do not have the enforcement authority although they can regulate and supervise some activities of intermediaries or market professionals. Instead what they do is act as a watchdog and inform the market authority of any breach of the rules or conduct in their markets.
8 associations can exact fines based on the breach of compliance with standards, codes, guidance or conventions. 3 of these organizations have the authority to enforce market trading rules as well.
Other activities
Associations also contribute to improve the know-how of the industry and the public.
9 of the 12 respondents organize training programs for market professionals. In some jurisdictions, these programs are mandatory. 8 associations also run investor education programs.
How would you like to have your SRO?
Self-regulation is a broad concept, covering regulatory, supervisory and enforcement functions of professional associations, exchanges and market infrastructure providers.
The range of activities and the scope of authority are also different among the SROs. Exchanges generally focus on market trading, market integrity and market efficiency rules. Associations, on the other hand, focus more on code of conduct, best practices and ethical rules for market participants.
Therefore, the concept of Self-Regulatory Organizations can be too broad to address all these range of activities properly. We recommend that further studies should be encouraged to distinguish between Self-Regulatory Associations (SRA) and Self-Regulatory Exchanges (SRE).
Focus | December 2011 13
FEAS DATF survey excluded exchanges and focused on the activities of the SRAs only. With this study, we had the opportunity to compare the size and scope of the SRAs in the FEAS region with that of the SRAs in other jurisdictions.
The size, regulatory authority and scope of activities of SRAs vary considerably. Contrary to the structure of main regulators, there aren’t common models across jurisdictions. There are areas to empower SRAs and enhance the overall efficiency of the regulatory infrastructure. We hope that this study provides a base to discuss and improve the role of self-regulatory organizations.
About Alparslan Budak
Mr. Budak graduated from the Boğaziçi University in Istanbul with a BA degree in Business Administration in 1993. In 1995, he received his MSc degree in Money, Banking & Finance from the University of Birmingham in the UK.
Between 1993 and 2001, Mr. Budak held various positions at the Research, Asset Management, International Business Development and Corporate Finance departments at Demir Investment, a prominent investment bank in Turkey. During his term, he produced research reports on various topics and industries, managed equity mutual funds, established brokerage firms in Romania and Bulgaria and took part in several IPO and M&A projects.
He joined the Association in 2001 and is currently in charge of the Research & Statistics, International Relations, Public Relations and Information Technology departments.
About Federation of Euro-Asian Stock Exchanges (FEAS)
Federation of Euro-Asian Stock Exchanges is an organization composed of 34 stock and commodity exchanges, and 14 affiliate members in 28 countries. FEAS was established on 16 May 1995 with twelve founding members. The mission of FEAS is to create fair, efficient and transparent market environments, with little or no barriers to trade, between the FEAS members and their operating regions. Harmonization of rules and regulations and adoption of new technology, for trading and settlement, by member securities markets, will facilitate the objectives of FEAS by promoting the development of the member markets and providing cross border trading opportunities for securities issued within FEAS member countries. FEAS’ permanent secretariat is located in Istanbul, Turkey. For more information visit www.feas.org or contact [email protected]
14 Focus | December 2011
Large Middle Small Micro
15%
18%
44%
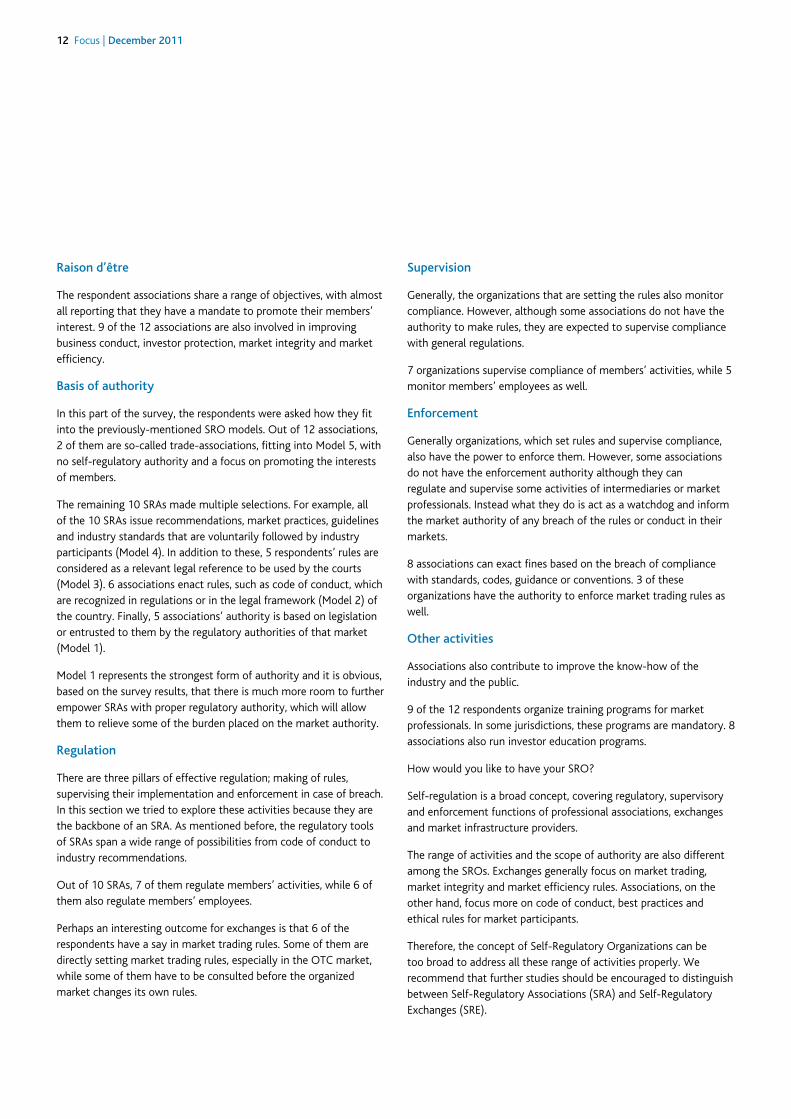
23%Number of companies
Breakdowns in 2010 by sizes of the listed companies for WFE members
Large Middle Small Micro
89%
8%
1%2%
Market capitalization
1) Introduction
The market segmentation survey has been conducted yearly since 2007 by the WFE. The 2010 study was released in November 2011, and available on the Federation’s website (http://world-exchanges.org/reports/studies-and-surveys).
The survey consists in breakdowns, for each member exchange: domestic market capitalization, number of domestic companies, the value of electronic order book share trading and number of trades by size of listed companies. For this purpose, four company sizes were defined:
• Micro cap: market cap < USD 65 m• Small cap: USD 200 m > market cap > USD 65 m• Mid cap: USD 1.3 bn > market cap > USD 200 m • Large cap: market cap > USD 1.3 bn
These thresholds have been kept at the same levels since the inception of the survey to ensure consistency and comparability over time. Data provided by exchanges include their main market and their different alternative segments dedicated to Small-Medium Enterprises (SMEs). As a general rule for the compilation of the data, domestic companies delisted during the year have been excluded from the survey.
As shown on the graphs below, the number of micro cap companies listed on WFE exchanges represented the largest part (44%) of total domestic listings in 2010, making around 1% of the global market capitalization. On the contrary, the smallest group of large cap companies made almost 90% of the total market capitalization.
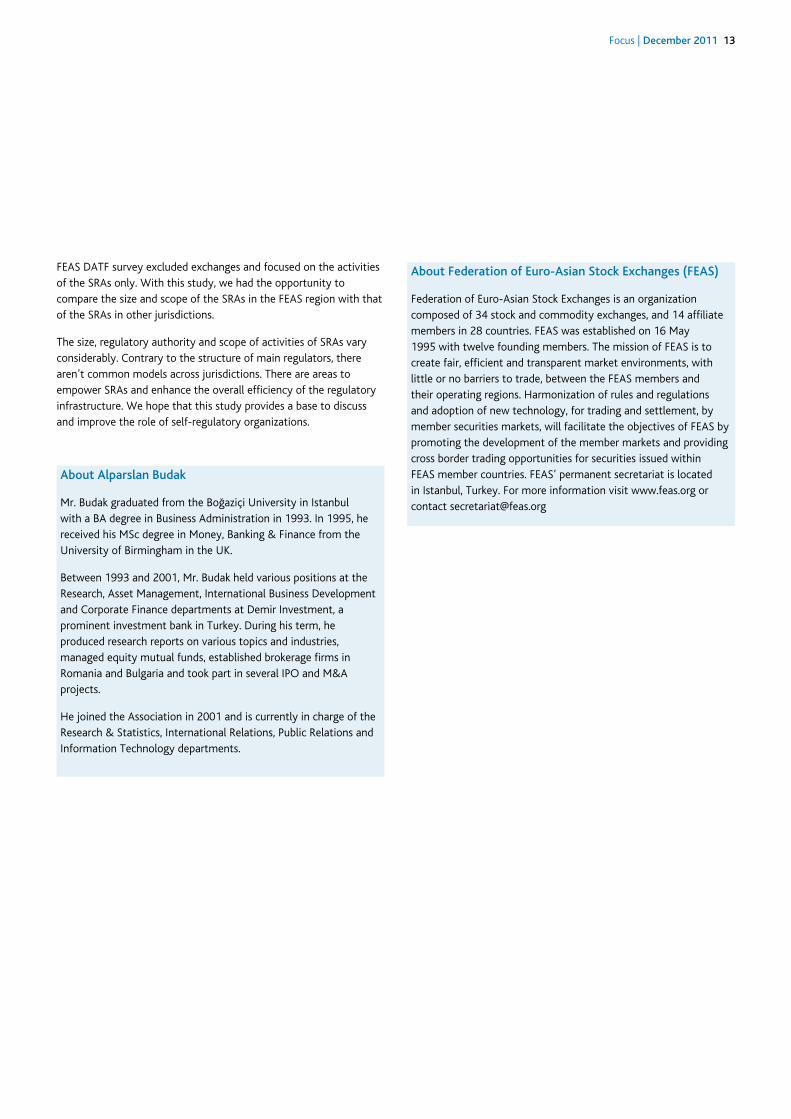
When turning to the Electronic Order Book (EOB) share trading value and number of trades (graphs below), it is interesting to note that, quite logically, turnover is largely dominated by large cap companies; however, in terms of number of trades, it is important to note that micro and small cap companies trading generates a non negligible number of trades, underlying the relatively strong interest of investors in these stocks.
Federation newsWFE 2010 domestic market segmentation surveyby Grégoire Naacke and Lorenzo Gallai
Focus | December 2011 15
Large Middle Small Micro
68%
21%
6%5%
Number of trades
Breakdowns in 2010 by sizes of the listed companies for WFE members
Large Middle Small Micro
87%
10%
1%1%
Value of share trading
The same distribution of domestic market capitalization, listed companies, share trading and number of trades at regional levels, with their particularities, is available in the complete 2010 survey (see WFE website).
2) Micro cap and SMEs
In recent years, exchanges, governments and regulators have made efforts to promote the financing of SMEs by financial markets. In that framework, it is very often stressed that a suitable regulatory environment has to be created for those companies that do not have the same financial and human resources as blue-chip companies. The first necessary step for creating a suitable regulatory environment for SMEs is to define them. The WFE Market Segmentation Survey is a very useful tool for that purpose. Nevertheless, the proportion of Micro, Small, Mid and Large Cap are very different from one exchange to another depending among others on the size of the country and on the level of development. It is therefore difficult to define relevant thresholds at a global level.
There is no harmonized definition of SMEs at a worldwide level but, in the United States, the Securities and Exchange Commission (SEC) uses the thresholds of USD 75 million of public equity float for defining “Small Reporting Companies”: under this threshold, financial disclosure requirements are scaled and streamlined. In Europe, the Prospectus Directive defines SMEs as companies fulfilling at least two out of the three following criteria: an average number of employees during the financial year of less than 250, a balance sheet not exceeding EUR 43 million and an annual net turnover not exceeding EUR 50 million. But in a paper recently written by
Fabrice Demarigny, Director of Capital Markets of Mazars group, for the European Commission1, he explains that “these criteria appear to be disconnected from market and excessively restrictive in Member States with significant exchanges”. In his paper, Fabrice Demarigny also explains that: “Recent negotiations on the proposed modification of the Prospectus Directive show precisely that a criteria based on market capitalization expressed in a fixed amount of Euros is considered as too low by Member States with major Exchanges and too high for Member States with smaller exchanges.” Their new proposal recommends “to create a legal EU definition of “Small and Medium-sized Issuers Listed in Europe” (SMILEs) (…) Small and Medium-sized Issuers Listed in Europe (SMILEs) would be:
- At the initial public offering (IPO), companies for which the transaction value is of less than EUR 75 million. Member States may decide to set a lower threshold for those companies for which they are the Home Member State.
- and, if admitted to trading, companies for which the market capitalization is less than 35% of the average market capitalization on the regulated market(s) of the Home Member State of the issuer.”
WFE’s definition of Micro Cap (inferior to USD 65 million) is not corresponding to the definition of SMEs in all the countries, but it is interesting to look at the number of micro cap in various exchanges with a threshold close to the one used by the SEC for defining SMEs (USD 75 millions), and identical for all the exchanges.
1 AN EU-LISTING SMALL BUSINESS ACT - Establishing a proportionate regulatory and financial environment for Small and Medium-sized Issuers Listed in Europe (SMILEs) -
March 2010 - Report by Fabrice DEMARIGNY, Global Head of Capital Markets Activities of MAZARS Group
16 Focus | December 2011
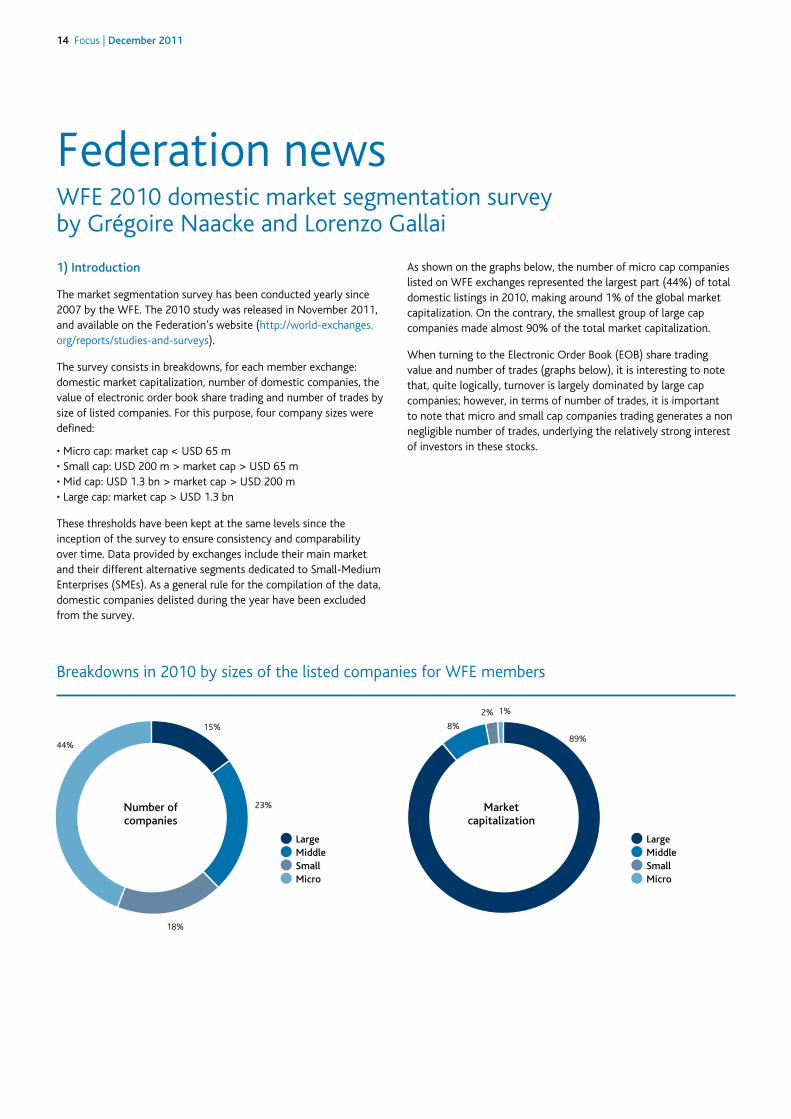
Looking at the share of micro cap in the total number of listed companies at regional levels, differences are not very significant. In all regions, exchanges are playing their role in allowing micro cap to raise capital, indeed those latter are always representing more than one third of the listed companies. Nevertheless, inside the various geographical regions, significant discrepancies can be observed from one exchange to another, related to the sizes of the countries and with the fact that some exchanges more than the others specialized in the financing for smaller companies.
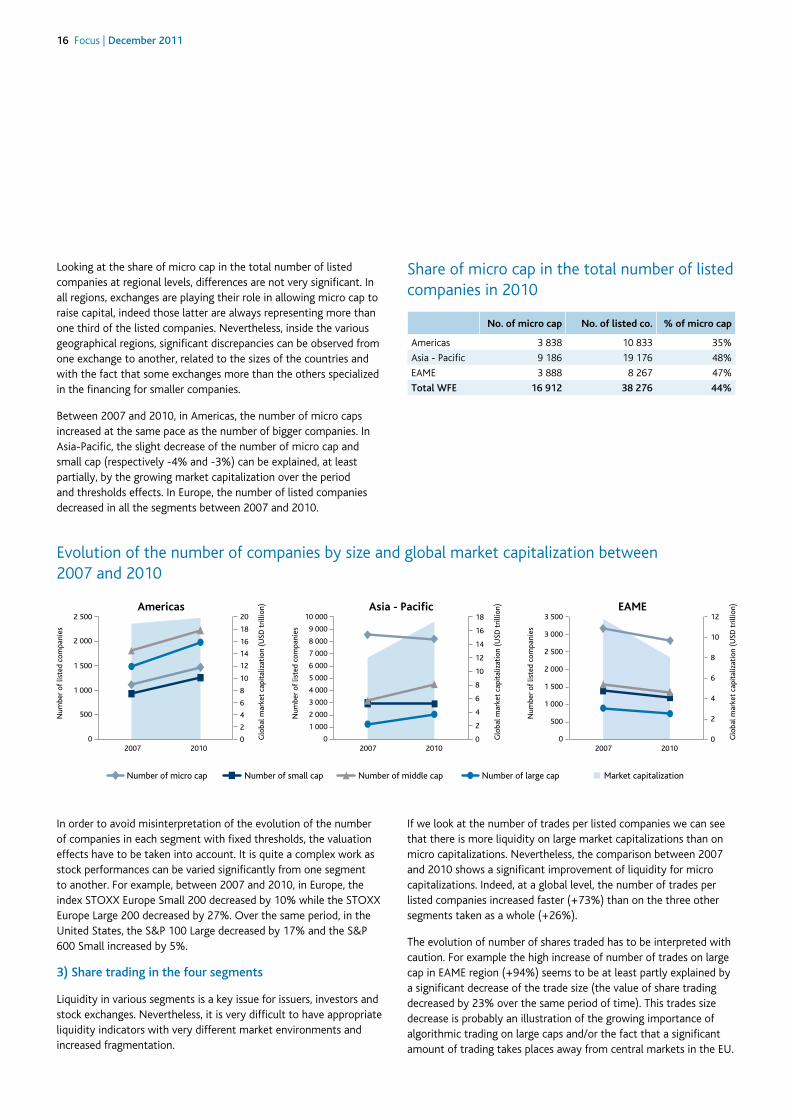
Between 2007 and 2010, in Americas, the number of micro caps increased at the same pace as the number of bigger companies. In Asia-Pacific, the slight decrease of the number of micro cap and small cap (respectively -4% and -3%) can be explained, at least partially, by the growing market capitalization over the period and thresholds effects. In Europe, the number of listed companies decreased in all the segments between 2007 and 2010.
In order to avoid misinterpretation of the evolution of the number of companies in each segment with fixed thresholds, the valuation effects have to be taken into account. It is quite a complex work as stock performances can be varied significantly from one segment to another. For example, between 2007 and 2010, in Europe, the index STOXX Europe Small 200 decreased by 10% while the STOXX Europe Large 200 decreased by 27%. Over the same period, in the United States, the S&P 100 Large decreased by 17% and the S&P 600 Small increased by 5%.
3) Share trading in the four segments
Liquidity in various segments is a key issue for issuers, investors and stock exchanges. Nevertheless, it is very difficult to have appropriate liquidity indicators with very different market environments and increased fragmentation.
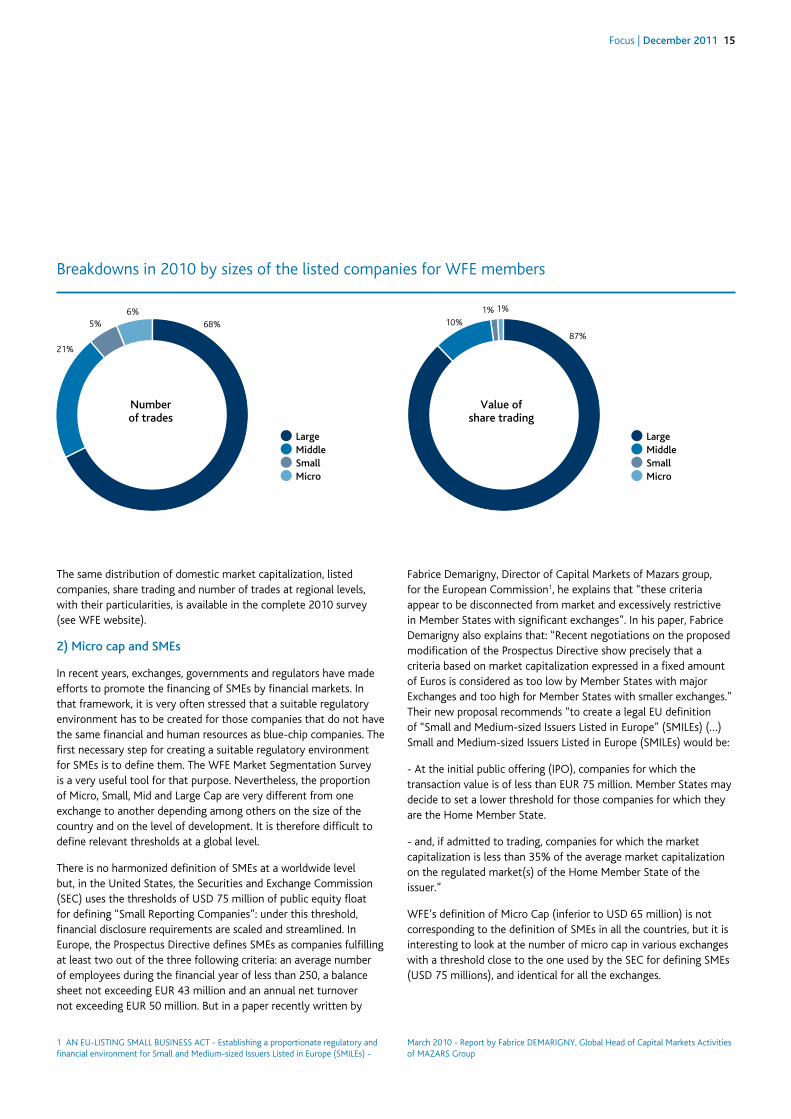
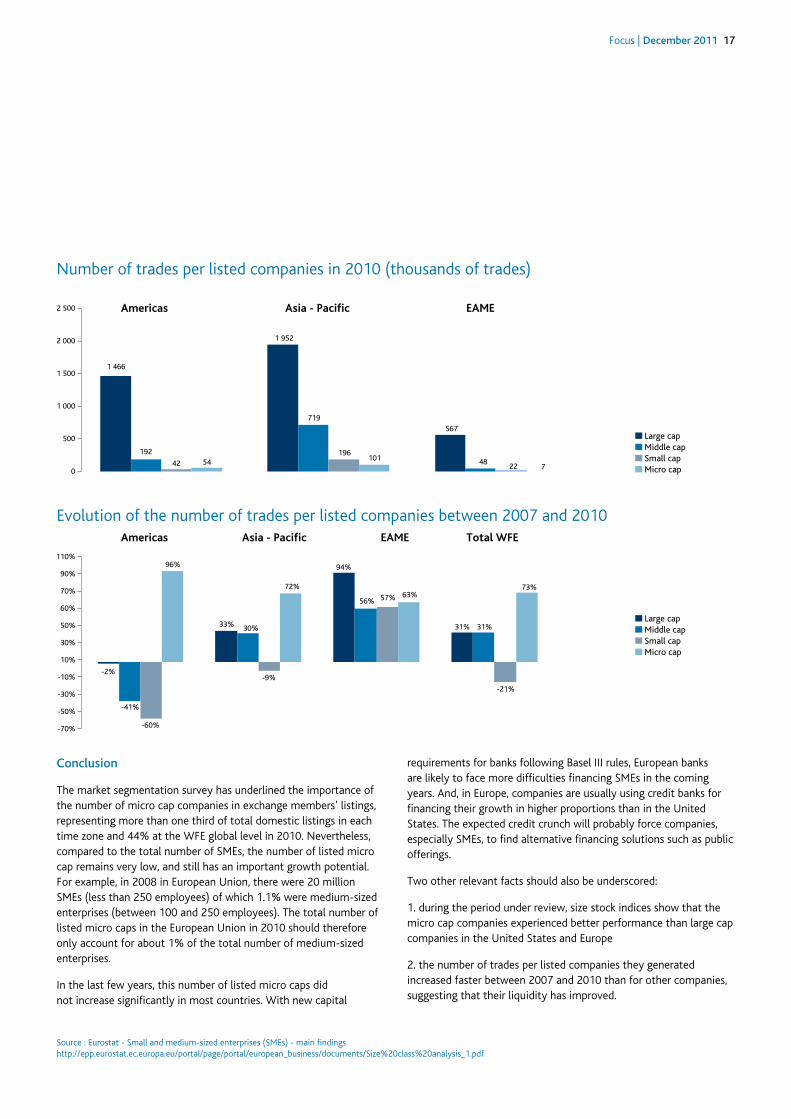
If we look at the number of trades per listed companies we can see that there is more liquidity on large market capitalizations than on micro capitalizations. Nevertheless, the comparison between 2007 and 2010 shows a significant improvement of liquidity for micro capitalizations. Indeed, at a global level, the number of trades per listed companies increased faster (+73%) than on the three other segments taken as a whole (+26%).
The evolution of number of shares traded has to be interpreted with caution. For example the high increase of number of trades on large cap in EAME region (+94%) seems to be at least partly explained by a significant decrease of the trade size (the value of share trading decreased by 23% over the same period of time). This trades size decrease is probably an illustration of the growing importance of algorithmic trading on large caps and/or the fact that a significant amount of trading takes places away from central markets in the EU.
Evolution of the number of companies by size and global market capitalization between 2007 and 2010
Num
ber
of li
sted
com
pani
es
2 500 20
18
16
14
12
10
8
6
4
2
0
Americas
2007 2010
500
0
2 000
1 500
1 000
Glo
bal m
arke
t ca
pita
lizat
ion
(USD
tri
llion
)
Num
ber
of li
sted
com
pani
es
10 000 18
16
14
12
10
8
6
4
2
0
Asia - Pacific
2007 20100
9 000
8 000
7 000
6 000
5 000
4 000
3 000
2 000
1 000
Glo
bal m
arke
t ca
pita
lizat
ion
(USD
tri
llion
)
Num
ber
of li
sted
com
pani
es
3 500 12
10
8
6
4
2
0
EAME
2007 20100
3 000
2 500
2 000
1 500
1 000
500G
loba
l mar
ket
capi
taliz
atio
n (U
SD t
rilli
on)
Number of micro cap Number of small cap Number of middle cap Number of large cap Market capitalization
Share of micro cap in the total number of listed companies in 2010
No. of micro cap No. of listed co. % of micro cap
Americas 3 838 10 833 35%
Asia - Pacific 9 186 19 176 48%
EAME 3 888 8 267 47%
Total WFE 16 912 38 276 44%
Focus | December 2011 17
Conclusion
The market segmentation survey has underlined the importance of the number of micro cap companies in exchange members’ listings, representing more than one third of total domestic listings in each time zone and 44% at the WFE global level in 2010. Nevertheless, compared to the total number of SMEs, the number of listed micro cap remains very low, and still has an important growth potential. For example, in 2008 in European Union, there were 20 million SMEs (less than 250 employees) of which 1.1% were medium-sized enterprises (between 100 and 250 employees). The total number of listed micro caps in the European Union in 2010 should therefore only account for about 1% of the total number of medium-sized enterprises.
In the last few years, this number of listed micro caps did not increase significantly in most countries. With new capital
requirements for banks following Basel III rules, European banks are likely to face more difficulties financing SMEs in the coming years. And, in Europe, companies are usually using credit banks for financing their growth in higher proportions than in the United States. The expected credit crunch will probably force companies, especially SMEs, to find alternative financing solutions such as public offerings.
Two other relevant facts should also be underscored:
1. during the period under review, size stock indices show that the micro cap companies experienced better performance than large cap companies in the United States and Europe
2. the number of trades per listed companies they generated increased faster between 2007 and 2010 than for other companies, suggesting that their liquidity has improved.
Number of trades per listed companies in 2010 (thousands of trades)
Evolution of the number of trades per listed companies between 2007 and 2010
Source : Eurostat - Small and medium-sized enterprises (SMEs) - main findingshttp://epp.eurostat.ec.europa.eu/portal/page/portal/european_business/documents/Size%20class%20analysis_1.pdf
2 500
500
0
2 000
1 500
1 000
Americas
Americas
Asia - Pacific
Asia - Pacific
EAME
EAME Total WFE
1 466
-2%
-41%
-60%
-9%
-21%
96% 94%
56% 57% 63%
33% 31% 31%30%
72% 73%
1 952
567
192
719
4822 742
19654 101
Large cap Middle cap Small cap Micro cap
Large cap Middle cap Small cap Micro cap
110%
30%
50%
-70%
-50%
-30%
-10%
10%
90%
70%
60%
18 Focus | December 2011
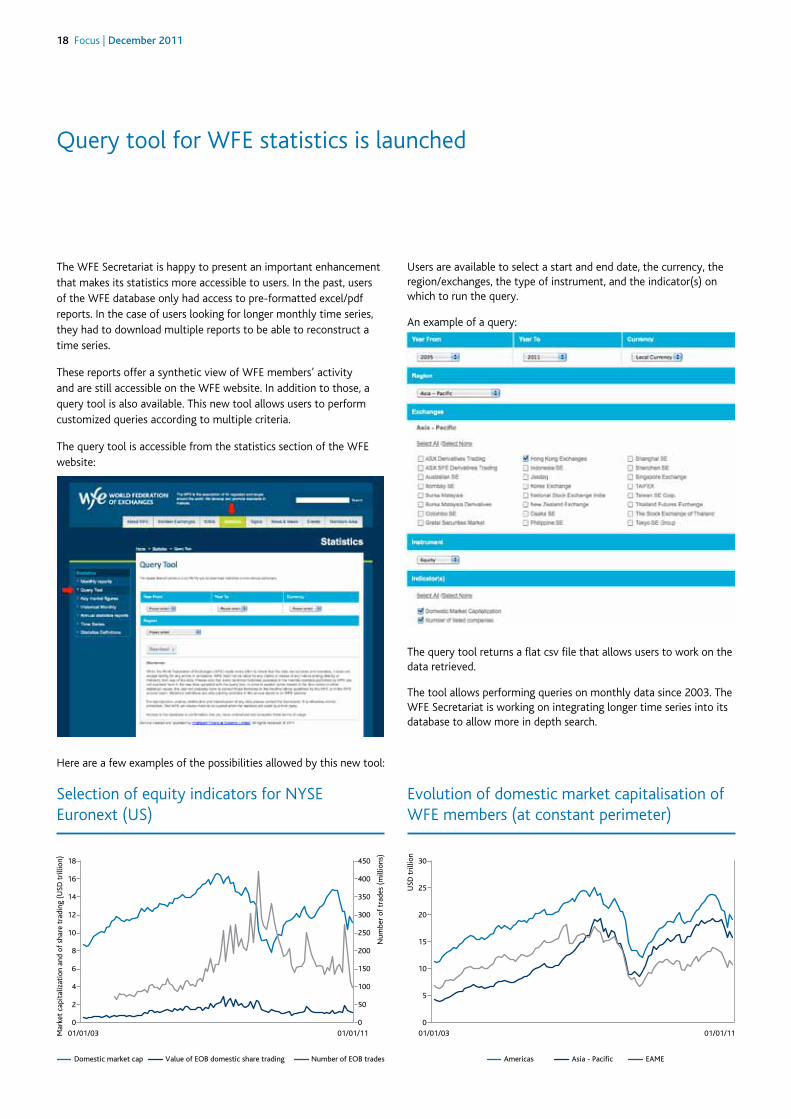
The WFE Secretariat is happy to present an important enhancement that makes its statistics more accessible to users. In the past, users of the WFE database only had access to pre-formatted excel/pdf reports. In the case of users looking for longer monthly time series, they had to download multiple reports to be able to reconstruct a time series.
These reports offer a synthetic view of WFE members’ activity and are still accessible on the WFE website. In addition to those, a query tool is also available. This new tool allows users to perform customized queries according to multiple criteria.
The query tool is accessible from the statistics section of the WFE website:
Users are available to select a start and end date, the currency, the region/exchanges, the type of instrument, and the indicator(s) on which to run the query.
An example of a query:
The query tool returns a flat csv file that allows users to work on the data retrieved.
The tool allows performing queries on monthly data since 2003. The WFE Secretariat is working on integrating longer time series into its database to allow more in depth search.
Query tool for WFE statistics is launched
Selection of equity indicators for NYSE Euronext (US)
Evolution of domestic market capitalisation of WFE members (at constant perimeter)
Mar
ket
capi
taliz
atio
n an
d of
sha
re t
radi
ng (
USD
tri
llion
)
USD
tri
llion
Num
ber
of t
rade
s (m
illio
ns)
01/01/03 01/01/0301/01/11 01/01/11
18 30450
1625
400
14
20
350
12
15
300
10
10
250
8
5
200
6 150
4 100
2 50
0 00
Domestic market cap Value of EOB domestic share trading Number of EOB trades Americas Asia - Pacific EAME
Here are a few examples of the possibilities allowed by this new tool:
Focus | December 2011 19
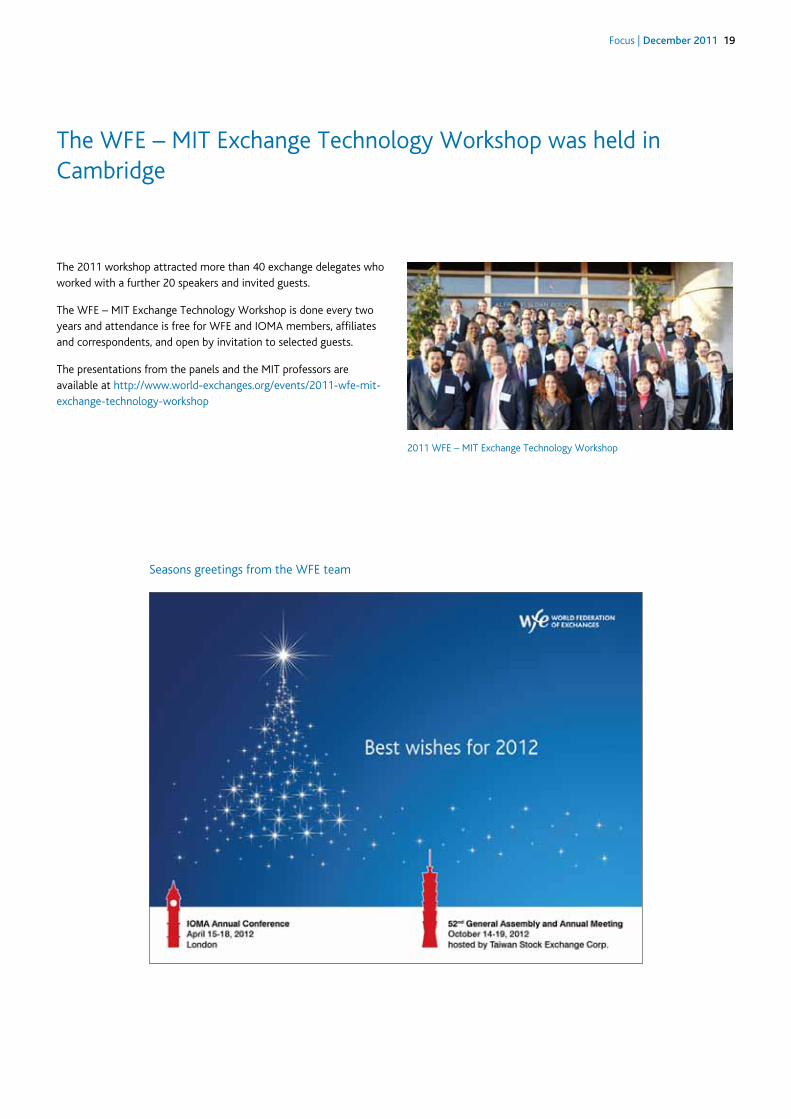
The 2011 workshop attracted more than 40 exchange delegates who worked with a further 20 speakers and invited guests.
The WFE – MIT Exchange Technology Workshop is done every two years and attendance is free for WFE and IOMA members, affiliates and correspondents, and open by invitation to selected guests.
The presentations from the panels and the MIT professors are available at http://www.world-exchanges.org/events/2011-wfe-mit-exchange-technology-workshop
The WFE – MIT Exchange Technology Workshop was held in Cambridge
2011 WFE – MIT Exchange Technology Workshop
Seasons greetings from the WFE team
20 Focus | December 2011
Corporate newsBucharest Stock Exchange names interim CEO
As of 17 November 2011, the Bucharest Stock Exchange named a new CEO, Mr Alin Barbu, on an interim position. Mr. Barbu is replacing Mr. Valentin Ionescu who left the company.
Dubai Financial Market launches new corporate identity
The Dubai Financial Market launched its new corporate identity to reflect the strategic direction and growth of DFM going forward and prepare the Exchange for a new era of sustainable growth. DFM’s new corporate vision and mission are summarized by five key values which govern the exchange’s behavior internally and externally including: transparency, efficiency, confidentiality, innovation and integrity. DFM’s new slogan “Connecting liquidity” underlines the exchange’s commitment to connect liquidity across all its actions, leveraging advanced technology and best practices to drive market growth and trading volume. On this occasion, the Exchange unveiled a new logo:
London Stock Exchange Group to acquire stake in FTSE International
London Stock Exchange Group has signed a definitive agreement to acquire the 50% stake in FTSE International Limited, from Pearson, that LSEG does not already own, for total cash consideration of GBP 450 m. With this acquisition, LSEG significantly diversifies its business into indices, data and analytics and, in particular, creates new growth opportunities for LSEG’s listed derivatives trading business, a key strategic priority for the Group. It will increase access to buy-side firms and services, and will offer an enhanced global footprint, including key emerging and growth markets.
MICEX shareholders approve new corporate charter
The Extraordinary General Meeting of MICEX shareholders, held on 8 December 2011, approved the new version of the MICEX’s corporate charter, providing for, in particular, changing the name of MICEX and transforming MICEX from a Close Joint-Stock Company into an Open Joint-Stock Company which is a necessary measure for the company to make its IPO. According to the new version of the MICEX’s Corporate Charter, the full name of the company will be “Open Joint-Stock Company MICEX-RTS”.
Nairobi Stock Exchange changes name
The Nairobi Stock Exchange has changed its name to the Nairobi Securities Exchange Limited. The new name is a reflection of the 2010/2014 strategic plan to evolve into a full service securities exchange which supports trading, clearing and settlement of equities, debt, derivatives and other associated instruments.
NYSE Liffe opens office in Hong Kong
On 1 December 2011, NYSE Liffe opened an office in Hong Kong. With offices in Singapore, Tokyo and now Hong Kong, the Exchange will further develop its derivatives business in the region.
TMX Group makes offer to acquire Razor Risk Technologies
TMX Group and Razor Risk Technologies have entered into a takeover bid implementation agreement under which TMX Group, or its affiliate, will make a takeover bid for all of the issued shares of Razor. This company, headquartered in Sydney, provides credit risk software to clearing houses, stock exchanges, financial institutions and brokerages around the world. It also develops and integrates economic capital, market, credit and liquidity risk management requirements across multiple asset classes.
TMX Group opens office in Beijing
TMX Group opened a representative office of its indirect wholly owned subsidiaries, Toronto Stock Exchange and TSX Venture Exchange, in Beijing.
Exchange consolidation newsMICEX and RTS to combine securities list for trading
Within the framework of establishing a single listing platform in light of their merger, specialists of MICEX Stock Exchange and RTS are making a combined list of securities admitted to trading. In total, 23 securities of 17 issuers which were admitted to trading only in RTS have already confirmed their quotation level and will continue to trade in the integrated exchange. In addition, RTS will employ prices of the MICEX FX market on FORTS and for the calculation of RTS indices.
News (A-Z)
Focus | December 2011 21
Osaka Securities Exchange and Tokyo Stock Exchange Group sign agreement regarding business combination
The Osaka Securities Exchange and the Tokyo Stock Exchange Group have agreed to conduct a business combination and entered into a Business Combination Agreement. The two exchanges recognize that significant synergies should be created by combining their complementary businesses and by integrating their systems. The combination should generate substantial benefits to market participants and other market users, and should also contribute to the enhanced competitiveness of all the financial and capital markets in Japan. The effective date of the merger is planned for 1 January 2013.
Financial results
Bombay SE (BSE)
Half-year ended 30 September 2011 results - Net profit: INR 10 696 m, up 1.3% compared to the same period of 2010- Revenue: INR 27 903 m, an increase of 9.8%- Total expenditure: INR 11 527 m, up 8.2%
Hong Kong Exchanges
9 months ended 30 September 2011 results - Net profit: HKD 3 821 m, up 10% compared to the same period of 2010- Total income: HKD 5 917 m, an increase of 12%- Operating expenses: HKD 1 383 m, up 17%
London SE Group
6 months ended 30 September 2011 results - Profit before tax: GBP 179.7 m, up 79% compared to the same period of 2010- Total income: GBP 386.5 m, an increase of 20%- Operating expenses: GBP 174.5 m, up 4%
Warsaw SE
Third quarter 2011 results- Net profit: PLN 38.1 m, an increase of PLN 15.9 m year on year
IndicesArab Federation of Exchanges launches regional index
On 4 December 2011, the Arab Federation of Exchanges, in cooperation with S&P Indices, launched the S&P AFE 40, an index designed to measure the performance of 40 leading companies from the Pan-Arab region. The index includes companies from Bahrain, Egypt, Jordan, Kuwait, Lebanon, Morocco, Oman, Palestine, Qatar, Saudi Arabia, Tunisia and the United Arab Emirates.
FEAS introduces blue chips index
The Federation of Euro-Asian Stock Exchanges (FEAS) and Dow Jones Indexes launched a blue chip stocks index, the Dow Jones FEAS Titans 50 Equal Weighted Index to track the 50 largest stocks listed in FEAS exchanges. The new gauge is designed to serve as the basis for financial products such as funds and structured products.
ISE introduces new indices
The International Securities Exchange has created the ISE SPY Bear Option Overlay index and ISE SPY Bull Option Overlay index, two innovative new indexes that track the performance of a diversified portfolio of vertical call or put spread strategies based on the SPDR S&P 500 ETF. The indexes provide leveraged directional exposure to the underlying ETF and give investors the ability to track two popular trading strategies on the most actively traded ETFs.
Mexican Exchange launches sustainability index
The Mexican Exchange launched a sustainability index based on the 70 most liquid shares listed on the Exchange. Companies eligible for inclusion are assessed according to their performance, impact, and responses to emerging environmental, social, and corporate governance issues. The issues include climate change, human rights, policies and systems to counter bribery. In order to be eligible for inclusion, companies will have to score in the top 50% of performers in their industry sectors.
MICEX and RTS unveil new rules for index calculation
Within the framework of the MICEX and RTS integration process, new versions of the rules on calculation of sectoral indices and methodologies for calculating the RTS and MICEX indexes were approved. The rules entered into effect on 16 December and 19 December 2011 respectively.
22 Focus | December 2011
NYSE Euronext launches family of clean energy indices
NYSE Euronext, in partnership with research company Bloomberg New Energy Finance, launched three regionally-focused clean energy stock indices, enabling the most active quoted companies in the world’s shift to low-carbon energy to be tracked in detail. The indices, covering respectively the Americas, EMEA, Asia and Oceania, are the first of a new family of clean energy indices that the partners will start publishing over the next few months. They each presently follow a basket of between 125 and 325 companies with a moderate or greater exposure to renewable energy and energy-smart technologies.
Shanghai Stock Exchange renames its large cap equal weight index
The Shanghai Stock Exchange and China Securities Index announced that the SSE Large-Cap Equal Weight index will be renamed to SSE 50 Equal Weight index on 22 December 2011. The index methodology remains the same.
Shanghai Stock Exchange launches consumer 50 index
On 9 December 2011, the Shanghai Stock Exchange, in cooperation with the China Securities Index, launched the SSE Consumer 50 Index to further enhance its index family as well as to provide new analysis tool and underlying instrument for investors.
Shenzhen Stock Exchange launches new index series
On 15 November 2011, the Shenzhen Stock Exchange, in cooperation with Shenzhen Securities Information, launched four SZSE series theme indexes, including the SZSE equipment index, SZSE real estate index, SZSE environmental protection index and SZSE commodities producer index. On 2 December 2011, it issued the CNINFO 1000 Sector Index series for various economic sectors such as the energy sector index, the raw material sector index, and so on. In addition, the Exchange also issued four composite indexes for the listed funds, including SZSE LEFU Fund Index, SZSE ETF Index, CNINFO Listed Fund Index and CNINFO ETF Index.
Warsaw Stock Exchange introduces new index family
On 1 December 2011, the Warsaw Stock Exchange introduced the WIGPlus index portfolio which tracks the performance of the smallest companies listed on the WSE main market. It includes those companies which do not qualify for the WIG20, mWIG40 or sWIG80 indexes and which belong to the 5PLUS segment. Unlike the WIG20, mWIG40 and sWIG80 indices, the number of companies in the new index portfolio is not fixed: it depends on the number of companies in the latest ranking which fulfill the index portfolio participation criteria.
Inter-market links
Deutsche Börse and Istanbul Stock Exchange to cooperate in various areas
Deutsche Börse and Istanbul Stock Exchange are working together to cooperate in several business areas. Both exchanges support the mutual understanding of developments in each other’s securities markets, carry out joint research projects or seminars on topics of mutual interest and assist each other in marketing activities in Germany and Turkey. It is also their intention to cooperate on the level of joint indices and product development in order to support a closer cooperation between both financial centers, Frankfurt and Istanbul.
Hong Kong Exchanges and Zhengzhou Commodity Exchange sign MoU
On 14 November 2011, Hong Kong Exchanges and Clearing and Zhengzhou Commodity Exchange signed a Memorandum of Understanding on cooperation and the exchange of information.
Tokyo Stock Exchange and NYSE Euronext sign “Master Agreement”
The Tokyo Stock Exchange and NYSE Euronext have signed a “Master Agreement” regarding a mutual connection between TSE’s arrownet trading system and NYSE Euronext’s Secure Financial Transaction Infrastructure (SFTI) system. Both exchanges are set to launch new services in anticipation of the new arrownet system in the coming spring, including access to market operators’ using the existing network environments for trading participants, investors, service providers and other users. Additionally, NYSE Technologies will commence distributing TSE market data using this connection in December 2011.
Wiener Börse and Montenegro Stock Exchange sign data vending cooperation agreement
Wiener Börse has signed a data vending agreement with the Montenegro Stock Exchange. Data vendors of Wiener Börse will be able to subscribe and distribute the price data of the Montenegro Stock Exchange within the Wiener Börse ADH data feed (scheduled for the second quarter of 2012) via their existing lines in the same format than Wiener Börse data.
Focus | December 2011 23
IT
Australian Securities Exchange launches new trading system PureMatch
On 28 November 2011, the Australian Securities Exchange launched its new trading system PureMatch after having received the approval of ASIC, the Australian market regulator. The new system will provide an alternative order book mechanism for trading the most liquid cash market products which are traded on ASX’s TradeMatch. It will operate in parallel to ASX TradeMatch, the primary existing ASX order book through which trading in ASX takes place. It started with a soft launch, trading no more than 10 securities for at least two weeks.
Hong Kong Exchanges upgrades its trading system
On 5 December 2011, Hong Kong Exchanges and Clearing upgraded its securities market trading system AMS/3 from the current AMS/3.5 version to AMS/3.8. The upgrade will increase the trading system’s processing capacity over the current capacity by about 10-fold to 30,000 orders per second, scalable to 150,000 orders per second, and reduce latency to 2 milliseconds on an average trading day, about 70 times faster than present. Market transparency will also be improved as AMS/3.8 will display the 10 best price levels compared to the five best price levels in AMS/3.5.
ISE introduces quoting in its complex order book
On 1 December 2011, the International Securities Exchange enhanced its complex order book to enable market makers to provide two-sided quotes for complex, or multi-legged, instruments. This capability was developed as part of ISE’s implementation of the new Optimise trading architecture. ISE’s complex order book can accommodate multi-legged instruments with up to eight options legs along with a stock component. As a result of this latest enhancement, ISE market makers have more flexibility and control over the liquidity they provide in the complex order book.
Shenzhen Stock Exchange to launch new version of its trading system
The Shenzhen Stock Exchange recently celebrated the 10-year anniversary of the 4th version of its trading system. On this occasion, it launched the construction of the 5th version.
TMX Group improves equity trading performance
TMX Group has completed the second phase of its equity Enterprise Expansion project. This initiative is designed to provide customers with significantly improved trading technology and performance across the TSX Quantum trading system. The second phase of the project accommodates higher throughput and capacity at 40,000 order messages per second, doubling existing capabilities with the introduction of a second trading engine.
TMX Group’s Datalinx to provide Canadian issuer web solutions
TMX Datalinx, TMX Group’s Information Services division, announced that QuoteMedia has been selected as TMX Datalinx’s provider of issuer data solutions for Toronto Stock Exchange and TSX Venture Exchange listed companies. TMX Datalinx and QuoteMedia now offer a comprehensive set of issuer data solutions for corporate websites, ranging from quotes and charting packages to wide-ranging data suites, tailored to meet the needs of every issuer.
Tokyo Stock Exchange launches 3rd generation ToSTNeT system
The Tokyo Stock Exchange has launched the 3rd generation of its ToSTNeT (Tokyo Stock Exchange Trading NeTwork) system. Since its launch in 1998, it has offered investors a means of executing various transactions such as block trading and basket trading during off-auction hours. The main purpose of ToSTNeT has been to complement the auction market by handling orders for which smooth execution is difficult using the auction algorithms. Recent developments in trading technology have spurred the need to a 3rd system generation, enabling for greater diversity of eligible products, in particular.
New products
CME Group to launch new NYMEX brent derivatives contracts and develop new Gulf coast crude oil futures contract
On 12 December 2011, CME Group launched for trading NYMEX Brent 25-day futures and options contracts. They will be listed for electronic trading on CME Globex, open-outcry and OTC clearing on CME ClearPort. In addition, the Exchange will work with oil market participants to discuss developing a new Gulf coast crude oil futures contract at the ECHO Terminal, a storage facility being developed by Enterprise Products Partners, to be listed on the NYMEX exchange.
24 Focus | December 2011
NASDAQ OMX Group lists two new ETFs on NASDAQ indexes
The NASDAQ OMX Group has listed two new ETFs based on two new non-financial NASDAQ indexes: the NASDAQ-400 index which is designed to track the performance of securities that are next-eligible for inclusion into the NASDAQ-100 index, and the NASDAQ-500 index which is designed to track the top 500 non-financial securities listed on NASDAQ.
Osaka Securities Exchange will launch DJIA and Nikkei 225 VI futures
On 27 February 2012, the Osaka Securities Exchange will launch futures products based on the Dow Jones Industrial Average and Nikkei Stock Average Volatility index.
RTS launches futures on Russian Federation government bonds
On 17 November 2011, RTS started trading a futures contract on a basket of six-year Russian Federation government bonds on FORTS. The underlying asset of the contract is Russian Federation government bonds with a period from the contract’s settlement to the maturity date comprising of 5-7 years.
Tokyo Stock Exchange lists new ETF based on TSE Mothers Core index
On 29 November 2011, the Tokyo Stock Exchange approved the listing the TSE Mothers Core ETF whose underlying is represented by the Mothers Core index.
Warsaw Stock Exchange lists futures on foreign company
In November 2011, the Warsaw Stock Exchange listed several single stock futures. Among them, the Exchange listed its first futures on a foreign company, Kernel Holding, a Ukraine-based holding company engaged in the agriculture sector.
New servicesAustralian Securities Exchange to centralize listings resources
The ASX Group will be transferring the listings adviser functions of its Adelaide and Brisbane offices to Sydney from 31 March 2012. The bulk of ASX’s communications with its listed entities are already centralized in Sydney, including the publication of company announcements and the coordination of listing applications.
Australian Securities Exchange sign agreement with Options Industry Council
The Australian Securities Exchange has entered into a content sharing agreement with the Options Industry Council, a US body created to educate investors and financial advisers about the benefits and risks of exchange-traded equity options. The agreement makes the OIC’s research available to local investors. ASX will provide OIC institutional equity options white papers on the ASX website alongside its own Australian-focused research material.
Bombay Stock Exchange launches website for mutual funds
The Bombay Stock Exchange, in collaboration with Morningstar India, launched a dedicated website to empower investors with relevant information and tools on evaluating mutual fund investment opportunities.
Budapest Stock Exchange launched new MTF market
On 15 November 2011, the Budapest Stock Exchange launched its new MTF, called BETa Market, where the largest and most liquid European equities are traded. Trading and settlement on the BETa Market is conducted in local currency targeting mainly Hungarian retail investors; liquidity is ensured by market makers. At the start, ten European shares are traded. The product range, however, is expected to be broadened in the near future to 20-30 further European equities as of January 2012.
Bursa Malaysia launches guide to listing
Bursa Malaysia unveiled a practical guide to listing on Bursa Malaysia to assist aspiring companies, particularly small and medium enterprises (SMEs), on their listing journey and life as a listed company.
Bursa Malaysia Derivatives introduces negotiated large trade facility
Market participants can now transact large-sized orders on futures contracts listed on Bursa Malaysia Derivatives via the Negotiated Large Trade facility. It allows large trades to be transacted at a single price, thereby minimizing slippage and execution uncertainties. This service is available for the KLCI index futures, the crude palm oil futures, the 3-month KLIBOR futures and the 5-Year MGS futures contracts. The new system facilitates direct and private negotiations among customers and enables large orders to be transacted away from the trading system.
Focus | December 2011 25
Deutsche Börse plans new premium segment for corporate bonds
As of 2012, companies will be able to float bonds on the Prime Standard of the Frankfurt Stock Exchange, a Deutsche Börse subsidiary. The new segment will provide cost-effective access to private and institutional investors on the primary market, and liquidity and transparency on the secondary market. The Prime Standard for corporate bonds will be aimed at larger listed and non-listed companies that wish to place an issue volume of over EUR 100 m. In contrast to the Entry Standard for bonds which is aimed at SMEs, the issuers in the premium segment have to meet higher transparency standards and more extensive follow-up requirements.
Egyptian Exchange unveils new trading mechanism on Nilex
On 13 November 2011, Egyptian Exchange’s Nilex market, the EGX market dedicated to SMEs, started operating on a continuous trading basis, as the main market. The new system allows trading from 10:30 to 11:30. Price limits will be allowed to fluctuate 5% up and down during the trading session. The closing price is calculated according to the volume weighted average price, provided a minimum value trading of EGP 20,000 per day is concluded.
ICE to distribute Platts’ information and trading content
IntercontinentalExchange and Platts, an energy, petrochemicals and metals information provider, are combining capabilities to provide the market with an integrated solution for commodities information and trading, with ICE becoming a distributor of Platts’ electronic products and services. Beginning in the second quarter of 2012, some 20,000 ICE participants may subscribe to receive direct access to Platts’ electronic information services through WebICE, ICE’s proprietary frontend trading system. This new agreement expands the relationship between ICE and Platts.
NYSE Technologies expands historical data research products
NYSE Technologies, the commercial technology unit of NYSE Euronext, expanded its historical TAQ product suite to include European cash equities and fixed-income data from Euronext markets as well as derivatives data from the NYSE Liffe US.
Palestine Exchange issues investor relations guide
The Palestine Exchange has issued the “Investor Relations” guide, the first of its kind in Palestine to include comprehensive information on the concept of Investor Relations and its vital role in public shareholding companies.
SIX Swiss Exchange/Deutsche Börse’s Scoach publishes market report express
Scoach Switzerland, the joint venture exchange for structured products of SIX Swiss Exchange and Deutsche Börse, published the Scoach Market Report Express on 2 December 2011 for the first time. It is targeted at investors, market participants and members of the public who wish to gain key trade data as fast as possible. It complements Scoach’s existing information offering and is an additional means of increasing transparency in the structured products market.
TAIFEX introduces block trading
On 19 December 2011, the Taiwan Futures Exchange launched a block trading system for three products: TAIEX futures, mini-TAIEX futures and TAIEX options. Orders for block trades can be single orders or combination orders. In the case of combination orders, prices will be quoted separately for each contract.
Tokyo Stock Exchange expands co-location and proximity services
Until recently, co-location and proximity service users were limited to trading participants, information vendors, and independent software vendors. As of November 2011, co-location and proximity services have also become available for hosting and network service providers.
Tokyo Stock Exchange launches overseas PR magazine
The Tokyo Stock Exchange Group launched “TSE Magazine ‘Evolving Japan’”, TSE’s first PR magazine targeting overseas investors. This magazine was created for the purpose of supporting IR activities of listed companies and allowing international investors to gain insight into the appeal of Japanese companies and market.
26 Focus | December 2011
Post trade CME Clearing to accept offshore Chinese Renminbi as collateral
CME Group will include offshore Chinese Renminbi in the range of instruments to meet performance bond requirements on all exchange futures products cleared through CME Clearing, effective January 2012.
DTCC launches enhanced cost basis reporting service for mutual fund industry
The Depository Trust & Clearing Corporation has launched enhancements to its Cost Basis Reporting Service (CBRS) to help customers comply with federal cost basis reporting regulations for mutual fund assets, which take effect in January 2012.
DTCC launches global OTC interest rate trade repository
On 7 December 2011, the Depository Trust & Clearing Corporation launched its global, OTC interest rates derivatives trade repository. DTCC’s new service will be based in London. This move represents the latest development in DTCC’s drive to bring greater transparency across different OTC derivative asset classes, helping to reduce operational and systemic risk.
Hong Kong Exchanges clearing house and Taiwan Depository & Clearing Corporation sign MoU
The Hong Kong Securities Clearing, a wholly-owned subsidiary of Hong Kong Exchanges and Clearing, and the Taiwan Depository & Clearing Corporation signed a Memorandum of Understanding focused on cooperation and exchange of information.
LCH.Clearnet introduces enhancements to SwapClear service
LCH.Clearnet has introduced significant enhancements to its SwapClear service. Following extensive consultation with the buy side and Futures Commission Merchants, SwapClear now accepts a broader range of collateral for initial margin and offers increased connectivity and variable notional swaps. In addition, the platform offers risk-free compression and flexible trade submission and is now directly accessible via TradeWeb and Bloomberg through SwapClear’s ClearLink API in addition to MarkitSERV.
NASDAQ OMX launches multi-asset risk management platform in Europe
NASDAQ OMX launches Genium Risk, a new risk management platform for its Nordic clearing house, NASDAQ OMX Clearing. Genium Risk, a risk system, provides the clearing house with a real-time risk management solution, including new tools for improved risk monitoring and handling of incidents for derivatives clearing. In addition, capital efficient risk models for fixed income and equities will optimize the use of member collaterals.
RTS Standard and FORTS products settled through unified system
On 14 December 2011, futures and options contracts will be settled through the unified settlement technology implemented on FORTS and RTS Standard.
Singapore Exchange introduces clearing of new OTC coal and naphtha swaps
Singapore Exchange’s AsiaClear service will clear more varieties of OTC coal and naphtha swaps from next month.
SIX Securities Services continues internationalization strategy
SIX Securities Services, the SIX Swiss Exchange global post trade services provider, announced the opening of Vietnam, Qatar and Bosnia- Herzegovina as new markets for its customers.
Regulation
Athens Exchange approves amendments to alternative market
The Board of Directors of the Athens Exchange approved various amendments in the institutional framework of the Alternative Market (EN.A) of ATHEX. They provide pricing incentives for the gradual expansion of the free float of companies listed on EN.A, enable the use of a new service of ATHEX, the Electronic Book of Offers, give the potential to newly established companies willing to acquire the capacity of the Nominated Advisor on EN.A and allow the creation of different distinguished trading categories in EN.A., according to the companies’ main activity, such as environment-friendly activities, in order to reinforce the financing of investments in crucial sectors of the Greek economy. In order to facilitate both investors and listed companies, the Exchange decided to equate the duration of the ATHEX trading session for EN.A. with the one of the main market.

Focus | December 2011 27
FINRA and Ontario Securities Commission sign regulatory cooperation arrangement
On 10 November 2011, the Financial Industry Regulatory Authority (FINRA) and the Ontario Securities Commission entered into a Memorandum of Understanding that will facilitate the exchange of information with respect to regulated entities that operate across the US-Canadian border. The MoU provides a clear mechanism for consultation and cooperation between FINRA and the OSC, and establishes a strong framework to enhance the ability of the OSC and FINRA to oversee securities firms and markets. The arrangement will facilitate the exchange of information on firms and individuals under common supervision, support collaboration on investigations and enforcement matters, and provide a more complete view of market activity.
Shenzhen Stock Exchange amends disclosure of listed companies
In order to strengthen the supervision of information disclosure of listed companies and relevant disclosure parties, and facilitate the successful implementation of information disclosure, the Shenzhen Stock Exchange recently made some amendments to the measures for appraisal on information disclosure of listed companies. The significant features of the amendments include adding indicators of quantitative appraisal and building up a comprehensive quantitative appraisal indicator system.
SIX Swiss Exchange/Deutsche Börse’s Scoach receives licence from Hong Kong regulator
Scoach Switzerland, the joint venture exchange for structured products of SIX Swiss Exchange and Deutsche Börse, has been licensed by the Hong Kong Securities and Futures Commission to connect market participants in Hong Kong directly to the Xetra trading system. In the future, banks and brokers can use the Xetra network to place structured product orders for trading on Scoach.
Other
Bermuda Stock Exchange granted designated exchange status by Canadian Department of Finance
The Bermuda Stock Exchange has been granted the Designated Exchange status by the Department of Finance in Ottawa under the Income Tax Act. Securities listed on BSX will now be eligible for Canadian registered retirement savings plans as well as tax free savings accounts.
Eurex signs training and education partnerships
Eurex has signed cooperation agreements with two well-known and highly respected partners with, the National Taiwan University and the Securities & Futures Institute. The cooperation foresees joint training and education efforts for Taiwanese students and market participants, as well as capital market training courses aimed at contributing to the development of the regional futures markets.
Hong Kong Exchanges and Sichuan Financial Affairs Office sign MoU
Hong Kong Exchanges and Clearing and the Sichuan Province’s Financial Affairs Office in China signed a Memorandum of Understanding on cooperation and the exchange of information.
IASB and IFAC sign MoU on accounting standards
The International Accounting Standards Board and the International Federation of Accountants have recently signed a Memorandum of Understanding to strengthen their cooperation in developing private and public sector accounting standards. The agreement reflects the IASB’s and IFAC’s shared conviction that the transparency provided by high-quality financial reporting standards contributes significantly to the effective functioning of capital markets and sound economic growth. The agreement represents a further commitment to strengthen the cooperation between the two boards, with a view to ensuring greater consistency in their respective standard-setting activities. It also acknowledges the ongoing working relationship between the IASB and the International Auditing and Assurance Standards Board, which is also supported by IFAC.
MICEX-RTS and OECD sign agreement to strengthen corporate governance in Russia
On 12 December 2011, MICEX-RTS and the Organization for Economic Co-operation and Development signed an agreement that will strengthen corporate governance in Russia through a program called the OECD-Russia Corporate Governance roundtable. The program, to last for a period of three years, will tackle remaining corporate governance challenges in Russia through dialogue, research and access to international experts. The program will also improve the understanding of Russian corporate governance practices and ongoing reform efforts among key target audiences.

WFE market statistics
Focus | December 2011 29
Contents
30 Summary of key market indicators - November 2011
32 Equity 32 Domestic market capitalization
34 Number of listed companies
36 Value of share trading
36 Electronic order book value
38 Electronic order book (current month&YTD)
40 Negotiated deals
41 Reported trades
42 Number of trades in shares
42 Electronic order book trades
44 Negotiated deals
46 Reported trades
48 Share turnover velocity
50 Broad stock index performance
52 Blue chip index performance
54 Fixed income 54 Total value of bond trading
56 Value of bond trading
56 Split by sectors
58 Electronic order book trades
59 Negotiated deals
60 Number of trades in bonds
60 Total number of trades in bonds
62 Electronic order book trades
64 Negotiated deals
66 Investment flows - Capital raised by bonds issuance
68 Derivatives 68 Single stock, stock index, bond options and futures
68 Stock options and single stock futures
70 Stock index options and futures
72 Bond options and futures
74 ETFs options and futures
Special Note: As of January 2010, the share trading value and the number of trades in equity shares experienced some changes in their presentation.
Share trading value and equity trades are now presented in three categories (electronic order book, negotiated deals and reported trades).
Following the recommendation of the WFE Statistics Advisory Group, the WFE Working Committee decided that the “total traded value” table, which mixed various kinds of trading activity should be deleted.
Powered by IFS – the LiquidMetrix providerwww.if5.com

30 Focus | December 2011
Summary of key market indicators - November 2011Market capitalization (month-on-month) November 2011 (USD bn) % change / month-on-month
Americas 19 305 -4.5%
Asia-Pacific 14 823 -6.4%
Europe - Africa - Middle East 13 287 -4.9%
Total WFE 47 414 -5.2%
Market capitalization (year-on-year) November 2011 (USD bn) % change / year-on-year
Americas 19 305 -9.1%
Asia-Pacific 14 823 -10.4%
Europe - Africa - Middle East 13 287 -4.4%
Total WFE 47 414 -8.2%
Share turnover value (month-on-month) Electronic Order Book November 2011 (USD bn) % change / month-on-month
Americas 2 502 -13.8%
Asia-Pacific 1 279 10.2%
Europe - Africa - Middle East 837 -7.4%
Total WFE 4 618 -7.0%
Share turnover value (year-on-year) Electronic Order Book Jan-Nov 2011 (USD bn) % change / year-on-year
Americas 31 350 2.3%
Asia-Pacific 16 755 -2.7%
Europe - Africa - Middle East 11 157 6.8%
Total WFE 59 262 1.6%
Number of share trades (month-on-month) Electronic Order Book November 2011 (thousands) % change / month-on-month
Americas 261 943 -16.2%
Asia-Pacific 516 004 17.4%
Europe - Africa - Middle East 95 242 -2.8%
Total WFE 873 189 2.7%
Number of share trades (year-on-year) Electronic Order Book Jan-Nov 2011 (thousands) % change / year-on-year
Americas 3 668 828 -4.3%
Asia-Pacific 5 810 234 -9.0%
Europe - Africa - Middle East 1 022 981 18.1%
Total WFE 10 502 043 -5.2%
Total number of companies listed (year-on-year) November 2011 % change / year-on-year
Americas 10 545 1.9%
Asia-Pacific 21 922 3.0%
Europe - Africa - Middle East 13 349 -0.6%
Total WFE 45 816 1.7%
Derivative markets YTD number of contracts traded Jan-Nov 2011 % change / year-on-year
Single stock options 3 619 965 653 2.5%
Single stock futures 693 744 847 -4.5%
Stock index options 5 378 848 857 14.9%
Stock index futures 1 881 319 607 7.7%
ETF options 1 547 340 889 36.9%
Bond options 624 841 128 2.9%
Bond futures 2 462 828 735 10.9%
Index performance * Nov 2011 /Oct 2011 in local currency Nov 2011 /Oct 2011 in USD
Americas 1.6% 1.3%
Asia-Pacific -5.7% -7.1%
Europe - Africa - Middle East -1.9% -4.9%
Total WFE -1.6% -3.0%
* Regional indexes are weighted by market capitalization
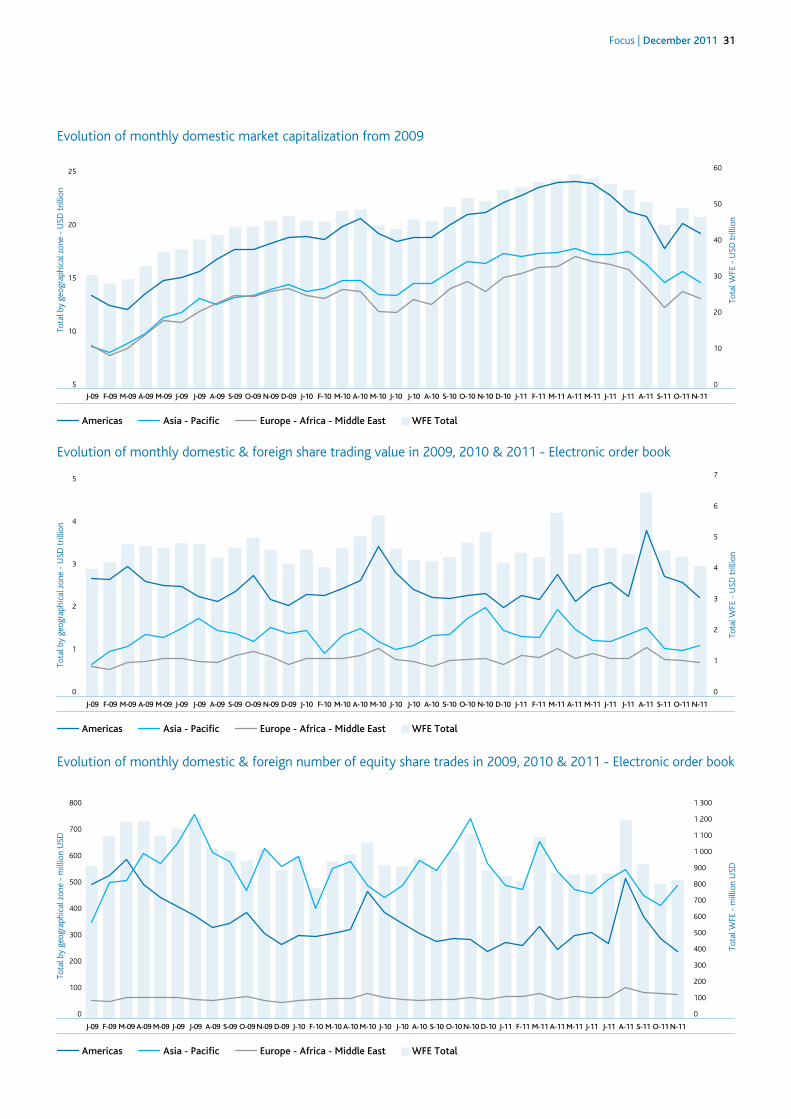
Focus | December 2011 31
1 300
1 200
1 100
1 000
900
800
700
600
500
400
300
200
100
0
Evolution of monthly domestic market capitalization from 2009
Evolution of monthly domestic & foreign share trading value in 2009, 2010 & 2011 - Electronic order book
Americas Asia - Pacific Europe - Africa - Middle East WFE Total
Americas Asia - Pacific Europe - Africa - Middle East WFE Total
60
50
40
30
20
10
0
7
6
5
4
3
2
1
0
25
20
15
10
5
5
4
3
2
1
0
N-11O-11S-11A-11J-11J-11A-11 M-11M-11F-11J-11D-10N-10O-10M-09 J-09 J-09 J-10D-09N-09O-09S-09A-09J-09 F-09 M-10 S-10A-10J-10J-10A-10M-10F-10M-09 A-09
N-11O-11S-11A-11J-11J-11A-11 M-11M-11F-11J-11D-10N-10O-10M-09 J-09 J-09 J-10D-09N-09O-09S-09A-09J-09 F-09 M-10 S-10A-10J-10J-10A-10M-10F-10M-09 A-09
N-11O-11S-11A-11J-11J-11A-11 M-11M-11F-11J-11D-10N-10O-10M-09 J-09 J-09 J-10D-09N-09O-09S-09A-09J-09 F-09 M-10 S-10A-10J-10J-10A-10M-10F-10M-09 A-09
Evolution of monthly domestic & foreign number of equity share trades in 2009, 2010 & 2011 - Electronic order book
Tota
l WFE
- U
SD t
rillio
n
Tota
l by
geog
raph
ical
zon
e -
USD
tril
lion
Tota
l WFE
- U
SD t
rillio
n
Tota
l by
geog
raph
ical
zon
e -
USD
tril
lion
Americas Asia - Pacific Europe - Africa - Middle East WFE Total
Tota
l WFE
- m
illio
n U
SD
Tota
l by
geog
raph
ical
zon
e -
mill
ion
USD
800
700
600
500
400
300
200
100
0
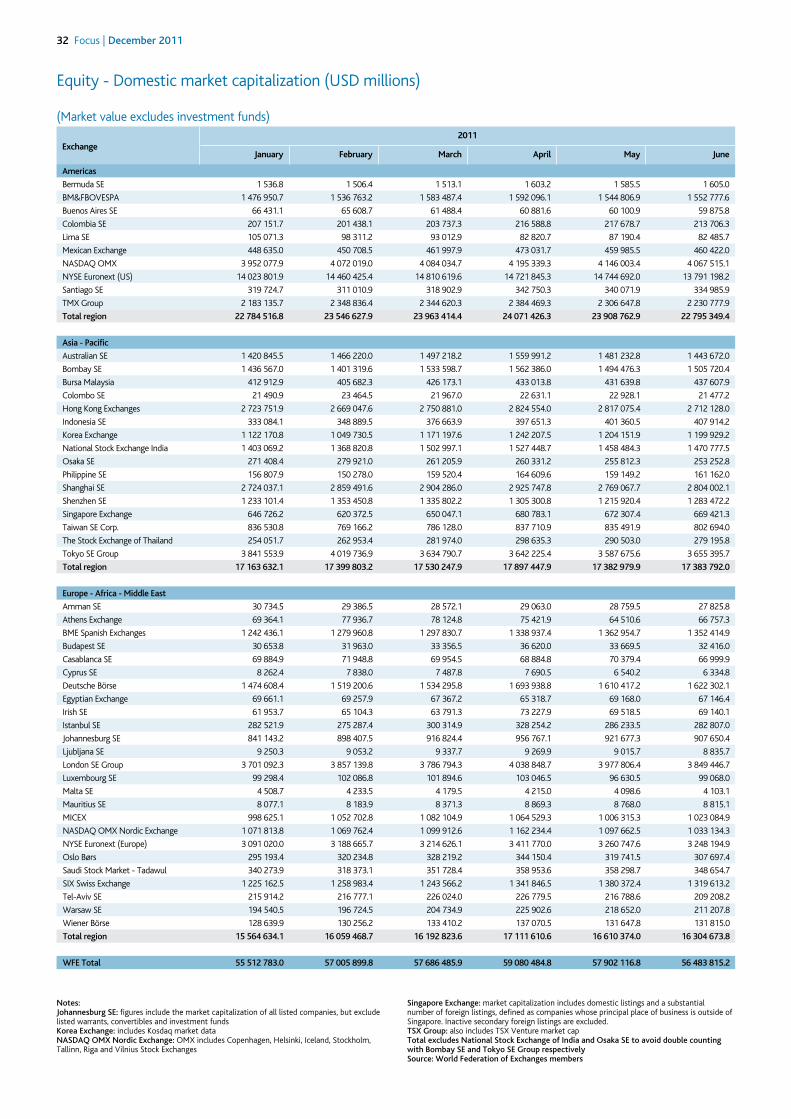
32 Focus | December 2011
Exchange 2011
January February March April May June
Americas
Bermuda SE 1 536.8 1 506.4 1 513.1 1 603.2 1 585.5 1 605.0
BM&FBOVESPA 1 476 950.7 1 536 763.2 1 583 487.4 1 592 096.1 1 544 806.9 1 552 777.6
Buenos Aires SE 66 431.1 65 608.7 61 488.4 60 881.6 60 100.9 59 875.8
Colombia SE 207 151.7 201 438.1 203 737.3 216 588.8 217 678.7 213 706.3
Lima SE 105 071.3 98 311.2 93 012.9 82 820.7 87 190.4 82 485.7
Mexican Exchange 448 635.0 450 708.5 461 997.9 473 031.7 459 985.5 460 422.0
NASDAQ OMX 3 952 077.9 4 072 019.0 4 084 034.7 4 195 339.3 4 146 003.4 4 067 515.1
NYSE Euronext (US) 14 023 801.9 14 460 425.4 14 810 619.6 14 721 845.3 14 744 692.0 13 791 198.2
Santiago SE 319 724.7 311 010.9 318 902.9 342 750.3 340 071.9 334 985.9
TMX Group 2 183 135.7 2 348 836.4 2 344 620.3 2 384 469.3 2 306 647.8 2 230 777.9
Total region 22 784 516.8 23 546 627.9 23 963 414.4 24 071 426.3 23 908 762.9 22 795 349.4
Asia - Pacific
Australian SE 1 420 845.5 1 466 220.0 1 497 218.2 1 559 991.2 1 481 232.8 1 443 672.0
Bombay SE 1 436 567.0 1 401 319.6 1 533 598.7 1 562 386.0 1 494 476.3 1 505 720.4
Bursa Malaysia 412 912.9 405 682.3 426 173.1 433 013.8 431 639.8 437 607.9
Colombo SE 21 490.9 23 464.5 21 967.0 22 631.1 22 928.1 21 477.2
Hong Kong Exchanges 2 723 751.9 2 669 047.6 2 750 881.0 2 824 554.0 2 817 075.4 2 712 128.0
Indonesia SE 333 084.1 348 889.5 376 663.9 397 651.3 401 360.5 407 914.2
Korea Exchange 1 122 170.8 1 049 730.5 1 171 197.6 1 242 207.5 1 204 151.9 1 199 929.2
National Stock Exchange India 1 403 069.2 1 368 820.8 1 502 997.1 1 527 448.7 1 458 484.3 1 470 777.5
Osaka SE 271 408.4 279 921.0 261 205.9 260 331.2 255 812.3 253 252.8
Philippine SE 156 807.9 150 278.0 159 520.4 164 609.6 159 149.2 161 162.0
Shanghai SE 2 724 037.1 2 859 491.6 2 904 286.0 2 925 747.8 2 769 067.7 2 804 002.1
Shenzhen SE 1 233 101.4 1 353 450.8 1 335 802.2 1 305 300.8 1 215 920.4 1 283 472.2
Singapore Exchange 646 726.2 620 372.5 650 047.1 680 783.1 672 307.4 669 421.3
Taiwan SE Corp. 836 530.8 769 166.2 786 128.0 837 710.9 835 491.9 802 694.0
The Stock Exchange of Thailand 254 051.7 262 953.4 281 974.0 298 635.3 290 503.0 279 195.8
Tokyo SE Group 3 841 553.9 4 019 736.9 3 634 790.7 3 642 225.4 3 587 675.6 3 655 395.7
Total region 17 163 632.1 17 399 803.2 17 530 247.9 17 897 447.9 17 382 979.9 17 383 792.0
Europe - Africa - Middle East
Amman SE 30 734.5 29 386.5 28 572.1 29 063.0 28 759.5 27 825.8
Athens Exchange 69 364.1 77 936.7 78 124.8 75 421.9 64 510.6 66 757.3
BME Spanish Exchanges 1 242 436.1 1 279 960.8 1 297 830.7 1 338 937.4 1 362 954.7 1 352 414.9
Budapest SE 30 653.8 31 963.0 33 356.5 36 620.0 33 669.5 32 416.0
Casablanca SE 69 884.9 71 948.8 69 954.5 68 884.8 70 379.4 66 999.9
Cyprus SE 8 262.4 7 838.0 7 487.8 7 690.5 6 540.2 6 334.8
Deutsche Börse 1 474 608.4 1 519 200.6 1 534 295.8 1 693 938.8 1 610 417.2 1 622 302.1
Egyptian Exchange 69 661.1 69 257.9 67 367.2 65 318.7 69 168.0 67 146.4
Irish SE 61 953.7 65 104.3 63 791.3 73 227.9 69 518.5 69 140.1
Istanbul SE 282 521.9 275 287.4 300 314.9 328 254.2 286 233.5 282 807.0
Johannesburg SE 841 143.2 898 407.5 916 824.4 956 767.1 921 677.3 907 650.4
Ljubljana SE 9 250.3 9 053.2 9 337.7 9 269.9 9 015.7 8 835.7
London SE Group 3 701 092.3 3 857 139.8 3 786 794.3 4 038 848.7 3 977 806.4 3 849 446.7
Luxembourg SE 99 298.4 102 086.8 101 894.6 103 046.5 96 630.5 99 068.0
Malta SE 4 508.7 4 233.5 4 179.5 4 215.0 4 098.6 4 103.1
Mauritius SE 8 077.1 8 183.9 8 371.3 8 869.3 8 768.0 8 815.1
MICEX 998 625.1 1 052 702.8 1 082 104.9 1 064 529.3 1 006 315.3 1 023 084.9
NASDAQ OMX Nordic Exchange 1 071 813.8 1 069 762.4 1 099 912.6 1 162 234.4 1 097 662.5 1 033 134.3
NYSE Euronext (Europe) 3 091 020.0 3 188 665.7 3 214 626.1 3 411 770.0 3 260 747.6 3 248 194.9
Oslo Børs 295 193.4 320 234.8 328 219.2 344 150.4 319 741.5 307 697.4
Saudi Stock Market - Tadawul 340 273.9 318 373.1 351 728.4 358 953.6 358 298.7 348 654.7
SIX Swiss Exchange 1 225 162.5 1 258 983.4 1 243 566.2 1 341 846.5 1 380 372.4 1 319 613.2
Tel-Aviv SE 215 914.2 216 777.1 226 024.0 226 779.5 216 788.6 209 208.2
Warsaw SE 194 540.5 196 724.5 204 734.9 225 902.6 218 652.0 211 207.8
Wiener Börse 128 639.9 130 256.2 133 410.2 137 070.5 131 647.8 131 815.0
Total region 15 564 634.1 16 059 468.7 16 192 823.6 17 111 610.6 16 610 374.0 16 304 673.8
WFE Total 55 512 783.0 57 005 899.8 57 686 485.9 59 080 484.8 57 902 116.8 56 483 815.2
Equity - Domestic market capitalization (USD millions)
Notes: Johannesburg SE: figures include the market capitalization of all listed companies, but exclude listed warrants, convertibles and investment fundsKorea Exchange: includes Kosdaq market dataNASDAQ OMX Nordic Exchange: OMX includes Copenhagen, Helsinki, Iceland, Stockholm, Tallinn, Riga and Vilnius Stock Exchanges
Singapore Exchange: market capitalization includes domestic listings and a substantial number of foreign listings, defined as companies whose principal place of business is outside of Singapore. Inactive secondary foreign listings are excluded.TSX Group: also includes TSX Venture market cap Total excludes National Stock Exchange of India and Osaka SE to avoid double counting with Bombay SE and Tokyo SE Group respectivelySource: World Federation of Exchanges members
(Market value excludes investment funds)

Focus | December 2011 33
2011 % change /Nov 10
(in USD)
% change /Nov 10
(in local cur)July August September October November
1 290.0 1 636.8 1 604.0 1 523.3 1 479.6 -6.8% -6.8%
1 486 180.4 1 403 981.8 1 152 005.3 1 350 491.3 1 255 540.1 -13.2% -9.1%
57 874.7 52 902.1 46 228.5 50 121.4 44 289.3 -21.6% -15.7%
207 114.1 206 132.3 190 338.8 200 483.8 195 559.5 -0.4% 0.7%
91 722.1 87 041.9 77 441.8 79 886.2 77 846.2 -16.9% -20.8%
457 865.0 436 924.1 371 498.1 418 978.3 415 185.6 -3.6% 4.8%
4 031 371.9 3 774 853.4 3 558 041.7 3 925 136.6 3 855 420.6 5.7% 5.7%
12 420 524.0 12 464 600.1 10 486 972.1 11 883 665.3 11 232 702.8 -13.9% -13.9%
321 912.7 309 152.5 254 555.4 296 260.3 273 543.4 -16.1% -11.3%
2 210 263.0 2 112 502.9 1 756 014.1 2 004 872.1 1 953 027.0 -2.5% -3.4%
21 286 117.8 20 849 727.8 17 894 699.7 20 211 418.6 19 304 594.2 -9.1%
1 435 677.7 1 352 395.6 1 143 762.3 1 339 205.4 1 244 624.0 -4.9% -11.2%
1 497 459.4 1 316 314.0 1 215 960.5 1 281 477.6 1 086 534.7 -29.5% -19.7%
441 634.5 409 692.3 359 786.3 405 084.8 386 789.0 0.2% 0.5%
22 336.3 22 444.2 22 100.8 20 607.8 19 478.0 1.8% 4.1%
2 731 842.8 2 494 550.0 2 084 194.9 2 375 189.4 2 184 462.8 -19.0% -18.9%
437 805.6 406 458.3 365 280.0 387 963.3 375 887.3 10.8% 11.8%
1 245 198.2 1 091 329.3 929 148.5 1 067 720.8 1 008 235.2 1.7% 0.2%
1 462 375.6 1 285 924.8 1 188 429.6 1 253 083.8 1 062 680.4 -29.3% -19.5%
257 168.2 251 505.4 220 588.4 216 271.3 213 496.4 -15.2% -21.4%
172 583.9 167 824.3 153 142.2 165 443.9 160 793.7 14.1% 13.1%
2 760 074.9 2 661 719.3 2 452 734.1 2 596 660.2 2 451 860.5 -8.5% -12.5%
1 331 847.7 1 330 272.2 1 173 947.6 1 226 891.9 1 180 668.8 -8.0% -12.0%
692 881.7 620 371.3 537 347.5 592 091.9 556 337.7 -8.9% -11.7%
801 844.5 715 972.1 637 548.4 682 725.3 617 032.7 -14.8% -15.3%
313 140.1 294 262.7 243 057.5 261 457.5 263 658.9 -2.8% 0.2%
3 791 140.2 3 518 768.9 3 452 749.4 3 428 076.0 3 286 515.4 -7.2% -14.0%
17 675 467.5 16 402 374.7 14 770 759.9 15 830 595.7 14 822 878.8 -10.4%
28 360.6 27 749.4 26 734.6 27 257.8 26 352.6 -12.0% -11.9%
62 082.0 50 574.2 42 197.6 40 843.4 34 971.4 -46.9% -48.6%
1 296 659.3 1 161 794.4 1 021 099.9 1 141 464.8 1 060 466.3 -1.5% -4.8%
30 239.2 25 802.6 19 107.2 21 399.6 20 967.2 -17.6% -14.2%
64 818.5 67 018.8 63 574.2 65 134.7 61 296.1 - -
5 316.9 4 252.7 3 970.3 3 614.5 2 790.2 -59.4% -60.7%
1 574 959.2 1 315 299.8 1 149 701.7 1 319 585.1 1 261 825.8 -4.4% -7.6%
64 624.5 60 210.1 53 684.3 56 147.4 52 647.0 -36.3% -34.0%
67 555.9 91 622.6 84 498.4 136 068.5 107 194.2 99.4% 92.8%
264 703.2 223 370.3 226 479.0 232 022.9 216 187.8 -27.8% -12.6%
908 323.1 857 844.2 736 218.5 809 285.4 799 723.0 -2.6% 11.2%
8 701.0 8 172.0 6 854.2 7 361.3 6 627.5 -26.9% -29.3%
3 802 276.3 3 447 929.7 3 104 853.3 3 430 049.7 3 301 307.4 -1.6% -4.8%
93 148.6 77 426.4 63 920.7 76 118.0 68 901.0 -19.9% -22.5%
3 941.0 3 760.3 3 554.3 3 744.7 3 575.2 -4.1% -7.3%
8 630.9 8 401.4 7 924.1 7 924.3 7 760.3 4.6% -1.1%
1 061 190.3 914 644.2 729 172.6 854 393.1 846 524.3 3.7% 1.1%
974 671.1 870 242.6 796 766.9 905 805.3 860 262.9 -8.3% -11.3%
3 085 387.3 2 772 123.8 2 395 248.9 2 673 325.4 2 509 386.2 -6.9% -10.0%
259 496.7 241 769.9 204 061.7 238 927.5 226 243.1 -7.9% -14.5%
339 625.0 317 536.9 323 752.4 330 210.2 322 724.5 -4.5% -4.5%
1 319 487.7 1 224 042.4 1 073 361.3 1 162 871.5 1 093 838.7 -2.5% -10.9%
206 462.8 179 187.7 158 470.9 173 084.8 160 679.9 -22.7% -20.9%
208 231.7 180 795.7 144 821.4 162 097.9 147 919.5 -15.0% -8.4%
124 456.9 112 113.7 91 148.2 95 748.2 86 528.5 -20.5% -23.1%
15 863 349.6 14 243 686.1 12 531 176.5 13 974 486.1 13 286 700.8 -4.8%
54 824 934.9 51 495 788.6 45 196 636.1 50 016 500.3 47 414 173.7 -8.3%
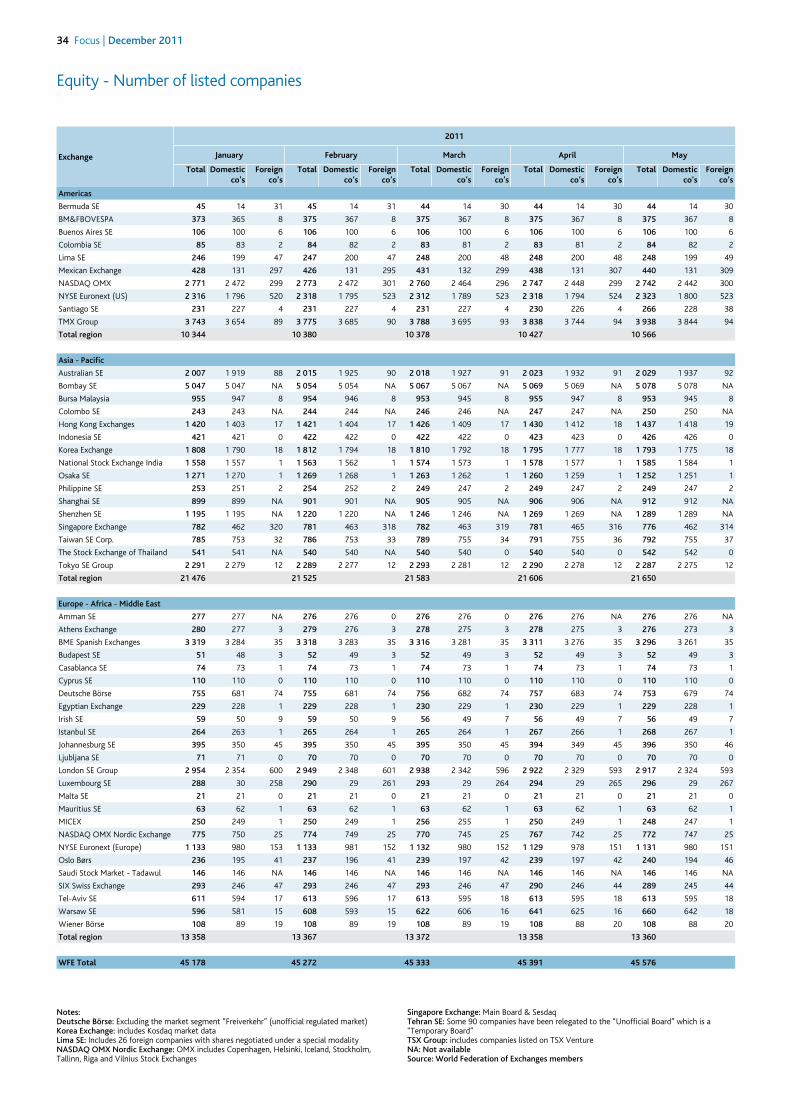
34 Focus | December 2011
Exchange
2011
January February March April May
Total Domestic co’s
Foreign co’s
Total Domestic co’s
Foreign co’s
Total Domestic co’s
Foreign co’s
Total Domestic co’s
Foreign co’s
Total Domestic co’s
Foreign co’s
Americas
Bermuda SE 45 14 31 45 14 31 44 14 30 44 14 30 44 14 30
BM&FBOVESPA 373 365 8 375 367 8 375 367 8 375 367 8 375 367 8
Buenos Aires SE 106 100 6 106 100 6 106 100 6 106 100 6 106 100 6
Colombia SE 85 83 2 84 82 2 83 81 2 83 81 2 84 82 2
Lima SE 246 199 47 247 200 47 248 200 48 248 200 48 248 199 49
Mexican Exchange 428 131 297 426 131 295 431 132 299 438 131 307 440 131 309
NASDAQ OMX 2 771 2 472 299 2 773 2 472 301 2 760 2 464 296 2 747 2 448 299 2 742 2 442 300
NYSE Euronext (US) 2 316 1 796 520 2 318 1 795 523 2 312 1 789 523 2 318 1 794 524 2 323 1 800 523
Santiago SE 231 227 4 231 227 4 231 227 4 230 226 4 266 228 38
TMX Group 3 743 3 654 89 3 775 3 685 90 3 788 3 695 93 3 838 3 744 94 3 938 3 844 94
Total region 10 344 10 380 10 378 10 427 10 566
Asia - Pacific
Australian SE 2 007 1 919 88 2 015 1 925 90 2 018 1 927 91 2 023 1 932 91 2 029 1 937 92
Bombay SE 5 047 5 047 NA 5 054 5 054 NA 5 067 5 067 NA 5 069 5 069 NA 5 078 5 078 NA
Bursa Malaysia 955 947 8 954 946 8 953 945 8 955 947 8 953 945 8
Colombo SE 243 243 NA 244 244 NA 246 246 NA 247 247 NA 250 250 NA
Hong Kong Exchanges 1 420 1 403 17 1 421 1 404 17 1 426 1 409 17 1 430 1 412 18 1 437 1 418 19
Indonesia SE 421 421 0 422 422 0 422 422 0 423 423 0 426 426 0
Korea Exchange 1 808 1 790 18 1 812 1 794 18 1 810 1 792 18 1 795 1 777 18 1 793 1 775 18
National Stock Exchange India 1 558 1 557 1 1 563 1 562 1 1 574 1 573 1 1 578 1 577 1 1 585 1 584 1
Osaka SE 1 271 1 270 1 1 269 1 268 1 1 263 1 262 1 1 260 1 259 1 1 252 1 251 1
Philippine SE 253 251 2 254 252 2 249 247 2 249 247 2 249 247 2
Shanghai SE 899 899 NA 901 901 NA 905 905 NA 906 906 NA 912 912 NA
Shenzhen SE 1 195 1 195 NA 1 220 1 220 NA 1 246 1 246 NA 1 269 1 269 NA 1 289 1 289 NA
Singapore Exchange 782 462 320 781 463 318 782 463 319 781 465 316 776 462 314
Taiwan SE Corp. 785 753 32 786 753 33 789 755 34 791 755 36 792 755 37
The Stock Exchange of Thailand 541 541 NA 540 540 NA 540 540 0 540 540 0 542 542 0
Tokyo SE Group 2 291 2 279 12 2 289 2 277 12 2 293 2 281 12 2 290 2 278 12 2 287 2 275 12
Total region 21 476 21 525 21 583 21 606 21 650
Europe - Africa - Middle East
Amman SE 277 277 NA 276 276 0 276 276 0 276 276 NA 276 276 NA
Athens Exchange 280 277 3 279 276 3 278 275 3 278 275 3 276 273 3
BME Spanish Exchanges 3 319 3 284 35 3 318 3 283 35 3 316 3 281 35 3 311 3 276 35 3 296 3 261 35
Budapest SE 51 48 3 52 49 3 52 49 3 52 49 3 52 49 3
Casablanca SE 74 73 1 74 73 1 74 73 1 74 73 1 74 73 1
Cyprus SE 110 110 0 110 110 0 110 110 0 110 110 0 110 110 0
Deutsche Börse 755 681 74 755 681 74 756 682 74 757 683 74 753 679 74
Egyptian Exchange 229 228 1 229 228 1 230 229 1 230 229 1 229 228 1
Irish SE 59 50 9 59 50 9 56 49 7 56 49 7 56 49 7
Istanbul SE 264 263 1 265 264 1 265 264 1 267 266 1 268 267 1
Johannesburg SE 395 350 45 395 350 45 395 350 45 394 349 45 396 350 46
Ljubljana SE 71 71 0 70 70 0 70 70 0 70 70 0 70 70 0
London SE Group 2 954 2 354 600 2 949 2 348 601 2 938 2 342 596 2 922 2 329 593 2 917 2 324 593
Luxembourg SE 288 30 258 290 29 261 293 29 264 294 29 265 296 29 267
Malta SE 21 21 0 21 21 0 21 21 0 21 21 0 21 21 0
Mauritius SE 63 62 1 63 62 1 63 62 1 63 62 1 63 62 1
MICEX 250 249 1 250 249 1 256 255 1 250 249 1 248 247 1
NASDAQ OMX Nordic Exchange 775 750 25 774 749 25 770 745 25 767 742 25 772 747 25
NYSE Euronext (Europe) 1 133 980 153 1 133 981 152 1 132 980 152 1 129 978 151 1 131 980 151
Oslo Børs 236 195 41 237 196 41 239 197 42 239 197 42 240 194 46
Saudi Stock Market - Tadawul 146 146 NA 146 146 NA 146 146 NA 146 146 NA 146 146 NA
SIX Swiss Exchange 293 246 47 293 246 47 293 246 47 290 246 44 289 245 44
Tel-Aviv SE 611 594 17 613 596 17 613 595 18 613 595 18 613 595 18
Warsaw SE 596 581 15 608 593 15 622 606 16 641 625 16 660 642 18
Wiener Börse 108 89 19 108 89 19 108 89 19 108 88 20 108 88 20
Total region 13 358 13 367 13 372 13 358 13 360
WFE Total 45 178 45 272 45 333 45 391 45 576
Equity - Number of listed companies
Notes: Deutsche Börse: Excluding the market segment “Freiverkehr” (unofficial regulated market)Korea Exchange: includes Kosdaq market dataLima SE: Includes 26 foreign companies with shares negotiated under a special modalityNASDAQ OMX Nordic Exchange: OMX includes Copenhagen, Helsinki, Iceland, Stockholm, Tallinn, Riga and Vilnius Stock Exchanges
Singapore Exchange: Main Board & SesdaqTehran SE: Some 90 companies have been relegated to the “Unofficial Board” which is a “Temporary Board”TSX Group: includes companies listed on TSX VentureNA: Not availableSource: World Federation of Exchanges members
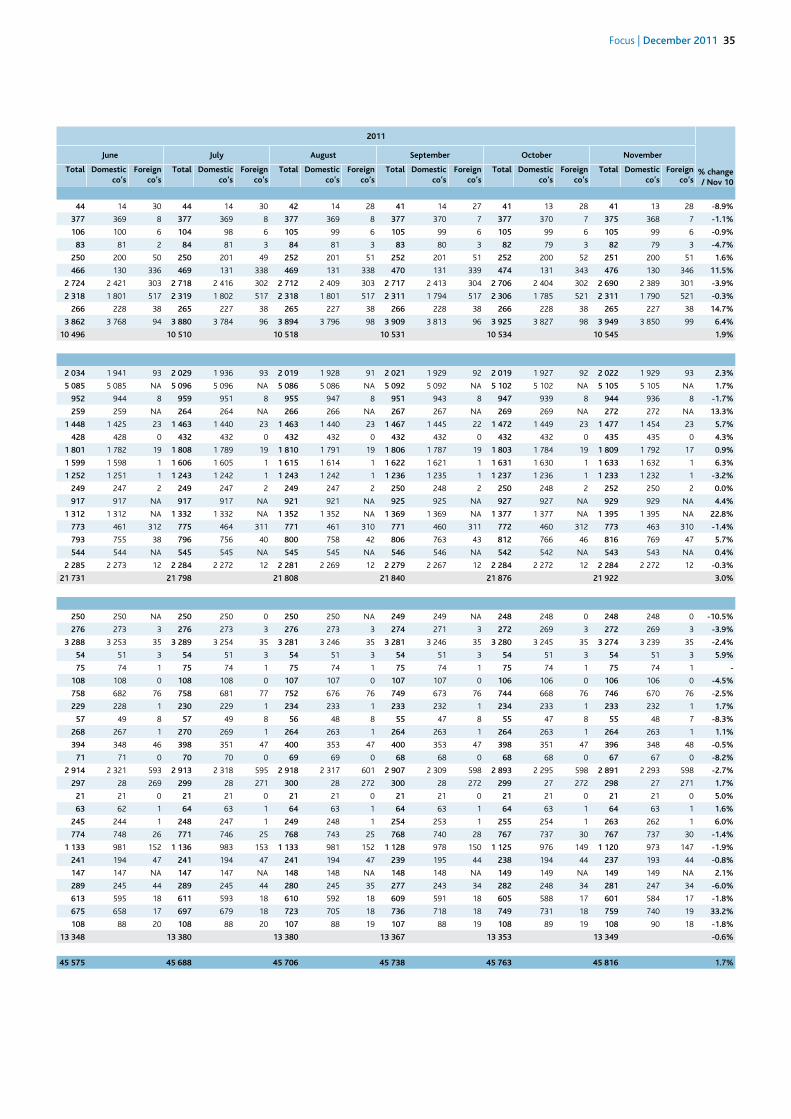
Focus | December 2011 35
2011
% change / Nov 10
June July August September October November
Total Domestic co’s
Foreign co’s
Total Domestic co’s
Foreign co’s
Total Domestic co’s
Foreign co’s
Total Domestic co’s
Foreign co’s
Total Domestic co’s
Foreign co’s
Total Domestic co’s
Foreign co’s
44 14 30 44 14 30 42 14 28 41 14 27 41 13 28 41 13 28 -8.9%
377 369 8 377 369 8 377 369 8 377 370 7 377 370 7 375 368 7 -1.1%
106 100 6 104 98 6 105 99 6 105 99 6 105 99 6 105 99 6 -0.9%
83 81 2 84 81 3 84 81 3 83 80 3 82 79 3 82 79 3 -4.7%
250 200 50 250 201 49 252 201 51 252 201 51 252 200 52 251 200 51 1.6%
466 130 336 469 131 338 469 131 338 470 131 339 474 131 343 476 130 346 11.5%
2 724 2 421 303 2 718 2 416 302 2 712 2 409 303 2 717 2 413 304 2 706 2 404 302 2 690 2 389 301 -3.9%
2 318 1 801 517 2 319 1 802 517 2 318 1 801 517 2 311 1 794 517 2 306 1 785 521 2 311 1 790 521 -0.3%
266 228 38 265 227 38 265 227 38 266 228 38 266 228 38 265 227 38 14.7%
3 862 3 768 94 3 880 3 784 96 3 894 3 796 98 3 909 3 813 96 3 925 3 827 98 3 949 3 850 99 6.4%
10 496 10 510 10 518 10 531 10 534 10 545 1.9%
2 034 1 941 93 2 029 1 936 93 2 019 1 928 91 2 021 1 929 92 2 019 1 927 92 2 022 1 929 93 2.3%
5 085 5 085 NA 5 096 5 096 NA 5 086 5 086 NA 5 092 5 092 NA 5 102 5 102 NA 5 105 5 105 NA 1.7%
952 944 8 959 951 8 955 947 8 951 943 8 947 939 8 944 936 8 -1.7%
259 259 NA 264 264 NA 266 266 NA 267 267 NA 269 269 NA 272 272 NA 13.3%
1 448 1 425 23 1 463 1 440 23 1 463 1 440 23 1 467 1 445 22 1 472 1 449 23 1 477 1 454 23 5.7%
428 428 0 432 432 0 432 432 0 432 432 0 432 432 0 435 435 0 4.3%
1 801 1 782 19 1 808 1 789 19 1 810 1 791 19 1 806 1 787 19 1 803 1 784 19 1 809 1 792 17 0.9%
1 599 1 598 1 1 606 1 605 1 1 615 1 614 1 1 622 1 621 1 1 631 1 630 1 1 633 1 632 1 6.3%
1 252 1 251 1 1 243 1 242 1 1 243 1 242 1 1 236 1 235 1 1 237 1 236 1 1 233 1 232 1 -3.2%
249 247 2 249 247 2 249 247 2 250 248 2 250 248 2 252 250 2 0.0%
917 917 NA 917 917 NA 921 921 NA 925 925 NA 927 927 NA 929 929 NA 4.4%
1 312 1 312 NA 1 332 1 332 NA 1 352 1 352 NA 1 369 1 369 NA 1 377 1 377 NA 1 395 1 395 NA 22.8%
773 461 312 775 464 311 771 461 310 771 460 311 772 460 312 773 463 310 -1.4%
793 755 38 796 756 40 800 758 42 806 763 43 812 766 46 816 769 47 5.7%
544 544 NA 545 545 NA 545 545 NA 546 546 NA 542 542 NA 543 543 NA 0.4%
2 285 2 273 12 2 284 2 272 12 2 281 2 269 12 2 279 2 267 12 2 284 2 272 12 2 284 2 272 12 -0.3%
21 731 21 798 21 808 21 840 21 876 21 922 3.0%
250 250 NA 250 250 0 250 250 NA 249 249 NA 248 248 0 248 248 0 -10.5%
276 273 3 276 273 3 276 273 3 274 271 3 272 269 3 272 269 3 -3.9%
3 288 3 253 35 3 289 3 254 35 3 281 3 246 35 3 281 3 246 35 3 280 3 245 35 3 274 3 239 35 -2.4%
54 51 3 54 51 3 54 51 3 54 51 3 54 51 3 54 51 3 5.9%
75 74 1 75 74 1 75 74 1 75 74 1 75 74 1 75 74 1 -
108 108 0 108 108 0 107 107 0 107 107 0 106 106 0 106 106 0 -4.5%
758 682 76 758 681 77 752 676 76 749 673 76 744 668 76 746 670 76 -2.5%
229 228 1 230 229 1 234 233 1 233 232 1 234 233 1 233 232 1 1.7%
57 49 8 57 49 8 56 48 8 55 47 8 55 47 8 55 48 7 -8.3%
268 267 1 270 269 1 264 263 1 264 263 1 264 263 1 264 263 1 1.1%
394 348 46 398 351 47 400 353 47 400 353 47 398 351 47 396 348 48 -0.5%
71 71 0 70 70 0 69 69 0 68 68 0 68 68 0 67 67 0 -8.2%
2 914 2 321 593 2 913 2 318 595 2 918 2 317 601 2 907 2 309 598 2 893 2 295 598 2 891 2 293 598 -2.7%
297 28 269 299 28 271 300 28 272 300 28 272 299 27 272 298 27 271 1.7%
21 21 0 21 21 0 21 21 0 21 21 0 21 21 0 21 21 0 5.0%
63 62 1 64 63 1 64 63 1 64 63 1 64 63 1 64 63 1 1.6%
245 244 1 248 247 1 249 248 1 254 253 1 255 254 1 263 262 1 6.0%
774 748 26 771 746 25 768 743 25 768 740 28 767 737 30 767 737 30 -1.4%
1 133 981 152 1 136 983 153 1 133 981 152 1 128 978 150 1 125 976 149 1 120 973 147 -1.9%
241 194 47 241 194 47 241 194 47 239 195 44 238 194 44 237 193 44 -0.8%
147 147 NA 147 147 NA 148 148 NA 148 148 NA 149 149 NA 149 149 NA 2.1%
289 245 44 289 245 44 280 245 35 277 243 34 282 248 34 281 247 34 -6.0%
613 595 18 611 593 18 610 592 18 609 591 18 605 588 17 601 584 17 -1.8%
675 658 17 697 679 18 723 705 18 736 718 18 749 731 18 759 740 19 33.2%
108 88 20 108 88 20 107 88 19 107 88 19 108 89 19 108 90 18 -1.8%
13 348 13 380 13 380 13 367 13 353 13 349 -0.6%
45 575 45 688 45 706 45 738 45 763 45 816 1.7%
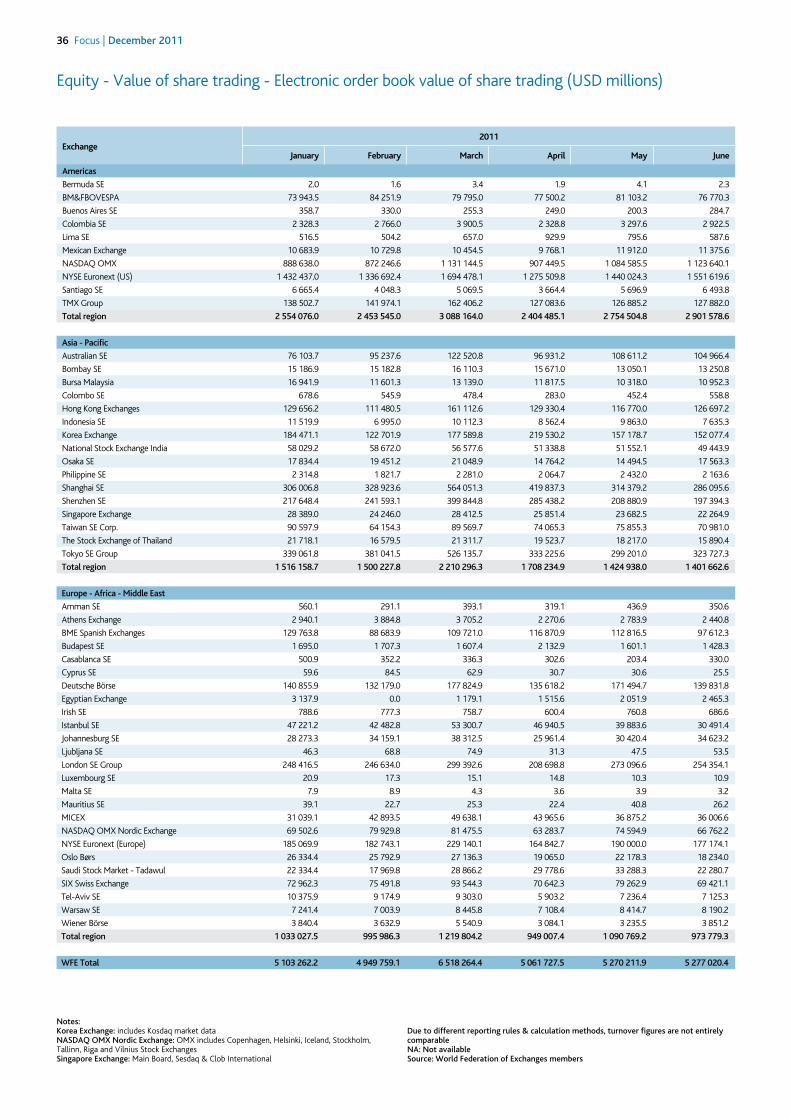
36 Focus | December 2011
Exchange2011
January February March April May June
Americas
Bermuda SE 2.0 1.6 3.4 1.9 4.1 2.3
BM&FBOVESPA 73 943.5 84 251.9 79 795.0 77 500.2 81 103.2 76 770.3
Buenos Aires SE 358.7 330.0 255.3 249.0 200.3 284.7
Colombia SE 2 328.3 2 766.0 3 900.5 2 328.8 3 297.6 2 922.5
Lima SE 516.5 504.2 657.0 929.9 795.6 587.6
Mexican Exchange 10 683.9 10 729.8 10 454.5 9 768.1 11 912.0 11 375.6
NASDAQ OMX 888 638.0 872 246.6 1 131 144.5 907 449.5 1 084 585.5 1 123 640.1
NYSE Euronext (US) 1 432 437.0 1 336 692.4 1 694 478.1 1 275 509.8 1 440 024.3 1 551 619.6
Santiago SE 6 665.4 4 048.3 5 069.5 3 664.4 5 696.9 6 493.8
TMX Group 138 502.7 141 974.1 162 406.2 127 083.6 126 885.2 127 882.0
Total region 2 554 076.0 2 453 545.0 3 088 164.0 2 404 485.1 2 754 504.8 2 901 578.6
Asia - Pacific
Australian SE 76 103.7 95 237.6 122 520.8 96 931.2 108 611.2 104 966.4
Bombay SE 15 186.9 15 182.8 16 110.3 15 671.0 13 050.1 13 250.8
Bursa Malaysia 16 941.9 11 601.3 13 139.0 11 817.5 10 318.0 10 952.3
Colombo SE 678.6 545.9 478.4 283.0 452.4 558.8
Hong Kong Exchanges 129 656.2 111 480.5 161 112.6 129 330.4 116 770.0 126 697.2
Indonesia SE 11 519.9 6 995.0 10 112.3 8 562.4 9 863.0 7 635.3
Korea Exchange 184 471.1 122 701.9 177 589.8 219 530.2 157 178.7 152 077.4
National Stock Exchange India 58 029.2 58 672.0 56 577.6 51 338.8 51 552.1 49 443.9
Osaka SE 17 834.4 19 451.2 21 048.9 14 764.2 14 494.5 17 563.3
Philippine SE 2 314.8 1 821.7 2 281.0 2 064.7 2 432.0 2 163.6
Shanghai SE 306 006.8 328 923.6 564 051.3 419 837.3 314 379.2 286 095.6
Shenzhen SE 217 648.4 241 593.1 399 844.8 285 438.2 208 880.9 197 394.3
Singapore Exchange 28 389.0 24 246.0 28 412.5 25 851.4 23 682.5 22 264.9
Taiwan SE Corp. 90 597.9 64 154.3 89 569.7 74 065.3 75 855.3 70 981.0
The Stock Exchange of Thailand 21 718.1 16 579.5 21 311.7 19 523.7 18 217.0 15 890.4
Tokyo SE Group 339 061.8 381 041.5 526 135.7 333 225.6 299 201.0 323 727.3
Total region 1 516 158.7 1 500 227.8 2 210 296.3 1 708 234.9 1 424 938.0 1 401 662.6
Europe - Africa - Middle East
Amman SE 560.1 291.1 393.1 319.1 436.9 350.6
Athens Exchange 2 940.1 3 884.8 3 705.2 2 270.6 2 783.9 2 440.8
BME Spanish Exchanges 129 763.8 88 683.9 109 721.0 116 870.9 112 816.5 97 612.3
Budapest SE 1 695.0 1 707.3 1 607.4 2 132.9 1 601.1 1 428.3
Casablanca SE 500.9 352.2 336.3 302.6 203.4 330.0
Cyprus SE 59.6 84.5 62.9 30.7 30.6 25.5
Deutsche Börse 140 855.9 132 179.0 177 824.9 135 618.2 171 494.7 139 831.8
Egyptian Exchange 3 137.9 0.0 1 179.1 1 515.6 2 051.9 2 465.3
Irish SE 788.6 777.3 758.7 600.4 760.8 686.6
Istanbul SE 47 221.2 42 482.8 53 300.7 46 940.5 39 883.6 30 491.4
Johannesburg SE 28 273.3 34 159.1 38 312.5 25 961.4 30 420.4 34 623.2
Ljubljana SE 46.3 68.8 74.9 31.3 47.5 53.5
London SE Group 248 416.5 246 634.0 299 392.6 208 698.8 273 096.6 254 354.1
Luxembourg SE 20.9 17.3 15.1 14.8 10.3 10.9
Malta SE 7.9 8.9 4.3 3.6 3.9 3.2
Mauritius SE 39.1 22.7 25.3 22.4 40.8 26.2
MICEX 31 039.1 42 893.5 49 638.1 43 965.6 36 875.2 36 006.6
NASDAQ OMX Nordic Exchange 69 502.6 79 929.8 81 475.5 63 283.7 74 594.9 66 762.2
NYSE Euronext (Europe) 185 069.9 182 743.1 229 140.1 164 842.7 190 000.0 177 174.1
Oslo Børs 26 334.4 25 792.9 27 136.3 19 065.0 22 178.3 18 234.0
Saudi Stock Market - Tadawul 22 334.4 17 969.8 28 866.2 29 778.6 33 288.3 22 280.7
SIX Swiss Exchange 72 962.3 75 491.8 93 544.3 70 642.3 79 262.9 69 421.1
Tel-Aviv SE 10 375.9 9 174.9 9 303.0 5 903.2 7 236.4 7 125.3
Warsaw SE 7 241.4 7 003.9 8 445.8 7 108.4 8 414.7 8 190.2
Wiener Börse 3 840.4 3 632.9 5 540.9 3 084.1 3 235.5 3 851.2
Total region 1 033 027.5 995 986.3 1 219 804.2 949 007.4 1 090 769.2 973 779.3
WFE Total 5 103 262.2 4 949 759.1 6 518 264.4 5 061 727.5 5 270 211.9 5 277 020.4
Equity - Value of share trading - Electronic order book value of share trading (USD millions)
Notes: Korea Exchange: includes Kosdaq market dataNASDAQ OMX Nordic Exchange: OMX includes Copenhagen, Helsinki, Iceland, Stockholm, Tallinn, Riga and Vilnius Stock ExchangesSingapore Exchange: Main Board, Sesdaq & Clob International
Due to different reporting rules & calculation methods, turnover figures are not entirely comparableNA: Not availableSource: World Federation of Exchanges members
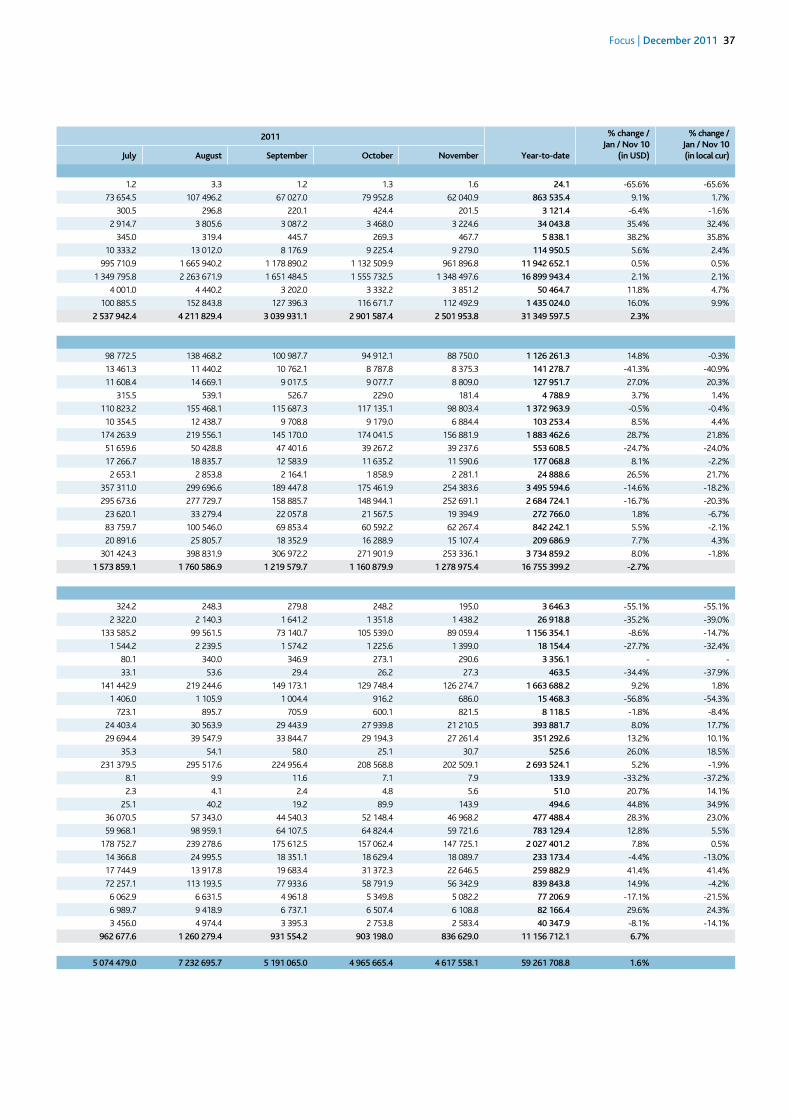
Focus | December 2011 37
2011
Year-to-date
% change / Jan / Nov 10
(in USD)
% change / Jan / Nov 10 (in local cur)July August September October November
1.2 3.3 1.2 1.3 1.6 24.1 -65.6% -65.6%
73 654.5 107 496.2 67 027.0 79 952.8 62 040.9 863 535.4 9.1% 1.7%
300.5 296.8 220.1 424.4 201.5 3 121.4 -6.4% -1.6%
2 914.7 3 805.6 3 087.2 3 468.0 3 224.6 34 043.8 35.4% 32.4%
345.0 319.4 445.7 269.3 467.7 5 838.1 38.2% 35.8%
10 333.2 13 012.0 8 176.9 9 225.4 9 279.0 114 950.5 5.6% 2.4%
995 710.9 1 665 940.2 1 178 890.2 1 132 509.9 961 896.8 11 942 652.1 0.5% 0.5%
1 349 795.8 2 263 671.9 1 651 484.5 1 555 732.5 1 348 497.6 16 899 943.4 2.1% 2.1%
4 001.0 4 440.2 3 202.0 3 332.2 3 851.2 50 464.7 11.8% 4.7%
100 885.5 152 843.8 127 396.3 116 671.7 112 492.9 1 435 024.0 16.0% 9.9%
2 537 942.4 4 211 829.4 3 039 931.1 2 901 587.4 2 501 953.8 31 349 597.5 2.3%
98 772.5 138 468.2 100 987.7 94 912.1 88 750.0 1 126 261.3 14.8% -0.3%
13 461.3 11 440.2 10 762.1 8 787.8 8 375.3 141 278.7 -41.3% -40.9%
11 608.4 14 669.1 9 017.5 9 077.7 8 809.0 127 951.7 27.0% 20.3%
315.5 539.1 526.7 229.0 181.4 4 788.9 3.7% 1.4%
110 823.2 155 468.1 115 687.3 117 135.1 98 803.4 1 372 963.9 -0.5% -0.4%
10 354.5 12 438.7 9 708.8 9 179.0 6 884.4 103 253.4 8.5% 4.4%
174 263.9 219 556.1 145 170.0 174 041.5 156 881.9 1 883 462.6 28.7% 21.8%
51 659.6 50 428.8 47 401.6 39 267.2 39 237.6 553 608.5 -24.7% -24.0%
17 266.7 18 835.7 12 583.9 11 635.2 11 590.6 177 068.8 8.1% -2.2%
2 653.1 2 853.8 2 164.1 1 858.9 2 281.1 24 888.6 26.5% 21.7%
357 311.0 299 696.6 189 447.8 175 461.9 254 383.6 3 495 594.6 -14.6% -18.2%
295 673.6 277 729.7 158 885.7 148 944.1 252 691.1 2 684 724.1 -16.7% -20.3%
23 620.1 33 279.4 22 057.8 21 567.5 19 394.9 272 766.0 1.8% -6.7%
83 759.7 100 546.0 69 853.4 60 592.2 62 267.4 842 242.1 5.5% -2.1%
20 891.6 25 805.7 18 352.9 16 288.9 15 107.4 209 686.9 7.7% 4.3%
301 424.3 398 831.9 306 972.2 271 901.9 253 336.1 3 734 859.2 8.0% -1.8%
1 573 859.1 1 760 586.9 1 219 579.7 1 160 879.9 1 278 975.4 16 755 399.2 -2.7%
324.2 248.3 279.8 248.2 195.0 3 646.3 -55.1% -55.1%
2 322.0 2 140.3 1 641.2 1 351.8 1 438.2 26 918.8 -35.2% -39.0%
133 585.2 99 561.5 73 140.7 105 539.0 89 059.4 1 156 354.1 -8.6% -14.7%
1 544.2 2 239.5 1 574.2 1 225.6 1 399.0 18 154.4 -27.7% -32.4%
80.1 340.0 346.9 273.1 290.6 3 356.1 - -
33.1 53.6 29.4 26.2 27.3 463.5 -34.4% -37.9%
141 442.9 219 244.6 149 173.1 129 748.4 126 274.7 1 663 688.2 9.2% 1.8%
1 406.0 1 105.9 1 004.4 916.2 686.0 15 468.3 -56.8% -54.3%
723.1 895.7 705.9 600.1 821.5 8 118.5 -1.8% -8.4%
24 403.4 30 563.9 29 443.9 27 939.8 21 210.5 393 881.7 8.0% 17.7%
29 694.4 39 547.9 33 844.7 29 194.3 27 261.4 351 292.6 13.2% 10.1%
35.3 54.1 58.0 25.1 30.7 525.6 26.0% 18.5%
231 379.5 295 517.6 224 956.4 208 568.8 202 509.1 2 693 524.1 5.2% -1.9%
8.1 9.9 11.6 7.1 7.9 133.9 -33.2% -37.2%
2.3 4.1 2.4 4.8 5.6 51.0 20.7% 14.1%
25.1 40.2 19.2 89.9 143.9 494.6 44.8% 34.9%
36 070.5 57 343.0 44 540.3 52 148.4 46 968.2 477 488.4 28.3% 23.0%
59 968.1 98 959.1 64 107.5 64 824.4 59 721.6 783 129.4 12.8% 5.5%
178 752.7 239 278.6 175 612.5 157 062.4 147 725.1 2 027 401.2 7.8% 0.5%
14 366.8 24 995.5 18 351.1 18 629.4 18 089.7 233 173.4 -4.4% -13.0%
17 744.9 13 917.8 19 683.4 31 372.3 22 646.5 259 882.9 41.4% 41.4%
72 257.1 113 193.5 77 933.6 58 791.9 56 342.9 839 843.8 14.9% -4.2%
6 062.9 6 631.5 4 961.8 5 349.8 5 082.2 77 206.9 -17.1% -21.5%
6 989.7 9 418.9 6 737.1 6 507.4 6 108.8 82 166.4 29.6% 24.3%
3 456.0 4 974.4 3 395.3 2 753.8 2 583.4 40 347.9 -8.1% -14.1%
962 677.6 1 260 279.4 931 554.2 903 198.0 836 629.0 11 156 712.1 6.7%
5 074 479.0 7 232 695.7 5 191 065.0 4 965 665.4 4 617 558.1 59 261 708.8 1.6%
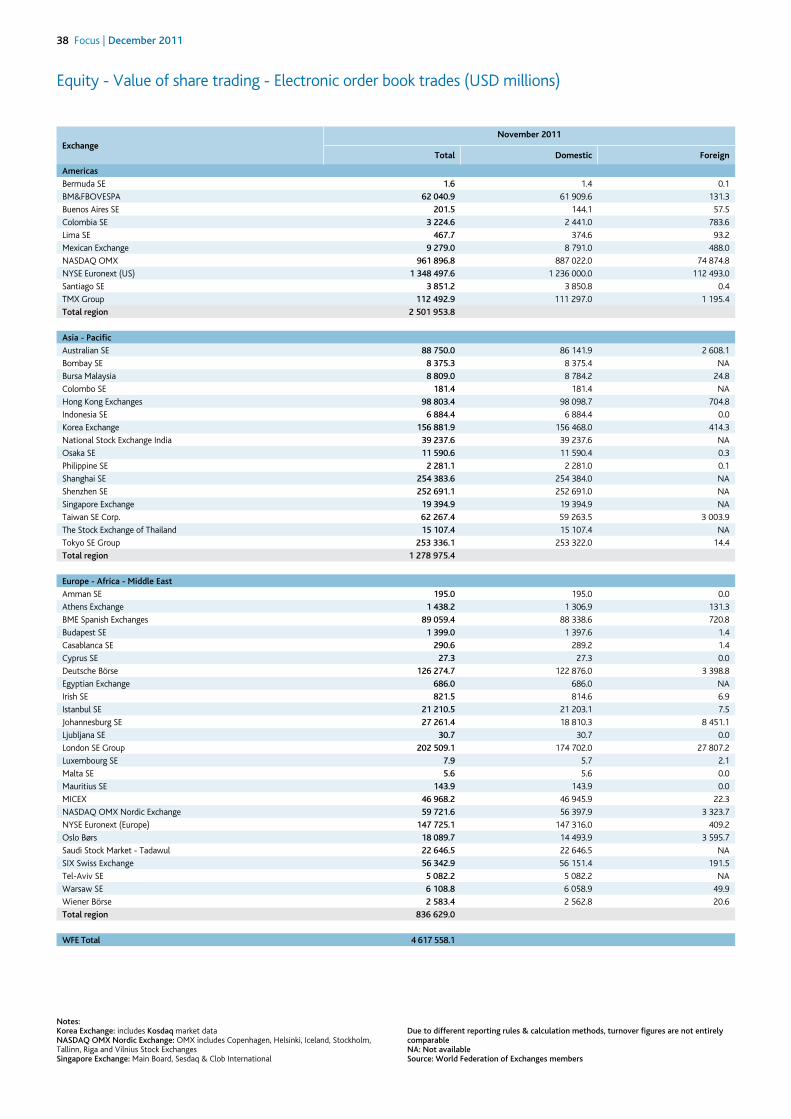
38 Focus | December 2011
Equity - Value of share trading - Electronic order book trades (USD millions)
ExchangeNovember 2011
Total Domestic Foreign
Americas
Bermuda SE 1.6 1.4 0.1
BM&FBOVESPA 62 040.9 61 909.6 131.3
Buenos Aires SE 201.5 144.1 57.5
Colombia SE 3 224.6 2 441.0 783.6
Lima SE 467.7 374.6 93.2
Mexican Exchange 9 279.0 8 791.0 488.0
NASDAQ OMX 961 896.8 887 022.0 74 874.8
NYSE Euronext (US) 1 348 497.6 1 236 000.0 112 493.0
Santiago SE 3 851.2 3 850.8 0.4
TMX Group 112 492.9 111 297.0 1 195.4
Total region 2 501 953.8
Asia - Pacific
Australian SE 88 750.0 86 141.9 2 608.1
Bombay SE 8 375.3 8 375.4 NA
Bursa Malaysia 8 809.0 8 784.2 24.8
Colombo SE 181.4 181.4 NA
Hong Kong Exchanges 98 803.4 98 098.7 704.8
Indonesia SE 6 884.4 6 884.4 0.0
Korea Exchange 156 881.9 156 468.0 414.3
National Stock Exchange India 39 237.6 39 237.6 NA
Osaka SE 11 590.6 11 590.4 0.3
Philippine SE 2 281.1 2 281.0 0.1
Shanghai SE 254 383.6 254 384.0 NA
Shenzhen SE 252 691.1 252 691.0 NA
Singapore Exchange 19 394.9 19 394.9 NA
Taiwan SE Corp. 62 267.4 59 263.5 3 003.9
The Stock Exchange of Thailand 15 107.4 15 107.4 NA
Tokyo SE Group 253 336.1 253 322.0 14.4
Total region 1 278 975.4
Europe - Africa - Middle East
Amman SE 195.0 195.0 0.0
Athens Exchange 1 438.2 1 306.9 131.3
BME Spanish Exchanges 89 059.4 88 338.6 720.8
Budapest SE 1 399.0 1 397.6 1.4
Casablanca SE 290.6 289.2 1.4
Cyprus SE 27.3 27.3 0.0
Deutsche Börse 126 274.7 122 876.0 3 398.8
Egyptian Exchange 686.0 686.0 NA
Irish SE 821.5 814.6 6.9
Istanbul SE 21 210.5 21 203.1 7.5
Johannesburg SE 27 261.4 18 810.3 8 451.1
Ljubljana SE 30.7 30.7 0.0
London SE Group 202 509.1 174 702.0 27 807.2
Luxembourg SE 7.9 5.7 2.1
Malta SE 5.6 5.6 0.0
Mauritius SE 143.9 143.9 0.0
MICEX 46 968.2 46 945.9 22.3
NASDAQ OMX Nordic Exchange 59 721.6 56 397.9 3 323.7
NYSE Euronext (Europe) 147 725.1 147 316.0 409.2
Oslo Børs 18 089.7 14 493.9 3 595.7
Saudi Stock Market - Tadawul 22 646.5 22 646.5 NA
SIX Swiss Exchange 56 342.9 56 151.4 191.5
Tel-Aviv SE 5 082.2 5 082.2 NA
Warsaw SE 6 108.8 6 058.9 49.9
Wiener Börse 2 583.4 2 562.8 20.6
Total region 836 629.0
WFE Total 4 617 558.1
Notes: Korea Exchange: includes Kosdaq market dataNASDAQ OMX Nordic Exchange: OMX includes Copenhagen, Helsinki, Iceland, Stockholm, Tallinn, Riga and Vilnius Stock ExchangesSingapore Exchange: Main Board, Sesdaq & Clob International
Due to different reporting rules & calculation methods, turnover figures are not entirely comparableNA: Not availableSource: World Federation of Exchanges members
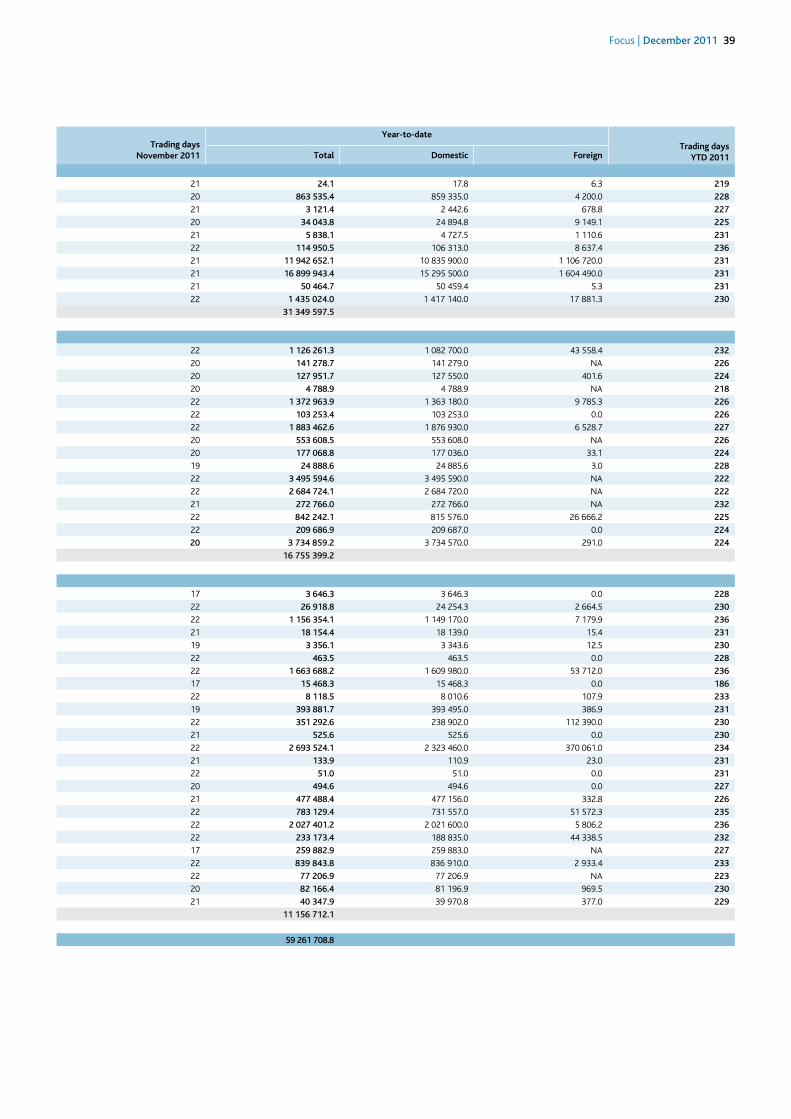
Focus | December 2011 39
Trading days November 2011
Year-to-dateTrading days
YTD 2011Total Domestic Foreign
21 24.1 17.8 6.3 219
20 863 535.4 859 335.0 4 200.0 228
21 3 121.4 2 442.6 678.8 227
20 34 043.8 24 894.8 9 149.1 225
21 5 838.1 4 727.5 1 110.6 231
22 114 950.5 106 313.0 8 637.4 236
21 11 942 652.1 10 835 900.0 1 106 720.0 231
21 16 899 943.4 15 295 500.0 1 604 490.0 231
21 50 464.7 50 459.4 5.3 231
22 1 435 024.0 1 417 140.0 17 881.3 230
31 349 597.5
22 1 126 261.3 1 082 700.0 43 558.4 232
20 141 278.7 141 279.0 NA 226
20 127 951.7 127 550.0 401.6 224
20 4 788.9 4 788.9 NA 218
22 1 372 963.9 1 363 180.0 9 785.3 226
22 103 253.4 103 253.0 0.0 226
22 1 883 462.6 1 876 930.0 6 528.7 227
20 553 608.5 553 608.0 NA 226
20 177 068.8 177 036.0 33.1 224
19 24 888.6 24 885.6 3.0 228
22 3 495 594.6 3 495 590.0 NA 222
22 2 684 724.1 2 684 720.0 NA 222
21 272 766.0 272 766.0 NA 232
22 842 242.1 815 576.0 26 666.2 225
22 209 686.9 209 687.0 0.0 224
20 3 734 859.2 3 734 570.0 291.0 224
16 755 399.2
17 3 646.3 3 646.3 0.0 228
22 26 918.8 24 254.3 2 664.5 230
22 1 156 354.1 1 149 170.0 7 179.9 236
21 18 154.4 18 139.0 15.4 231
19 3 356.1 3 343.6 12.5 230
22 463.5 463.5 0.0 228
22 1 663 688.2 1 609 980.0 53 712.0 236
17 15 468.3 15 468.3 0.0 186
22 8 118.5 8 010.6 107.9 233
19 393 881.7 393 495.0 386.9 231
22 351 292.6 238 902.0 112 390.0 230
21 525.6 525.6 0.0 230
22 2 693 524.1 2 323 460.0 370 061.0 234
21 133.9 110.9 23.0 231
22 51.0 51.0 0.0 231
20 494.6 494.6 0.0 227
21 477 488.4 477 156.0 332.8 226
22 783 129.4 731 557.0 51 572.3 235
22 2 027 401.2 2 021 600.0 5 806.2 236
22 233 173.4 188 835.0 44 338.5 232
17 259 882.9 259 883.0 NA 227
22 839 843.8 836 910.0 2 933.4 233
22 77 206.9 77 206.9 NA 223
20 82 166.4 81 196.9 969.5 230
21 40 347.9 39 970.8 377.0 229
11 156 712.1
59 261 708.8
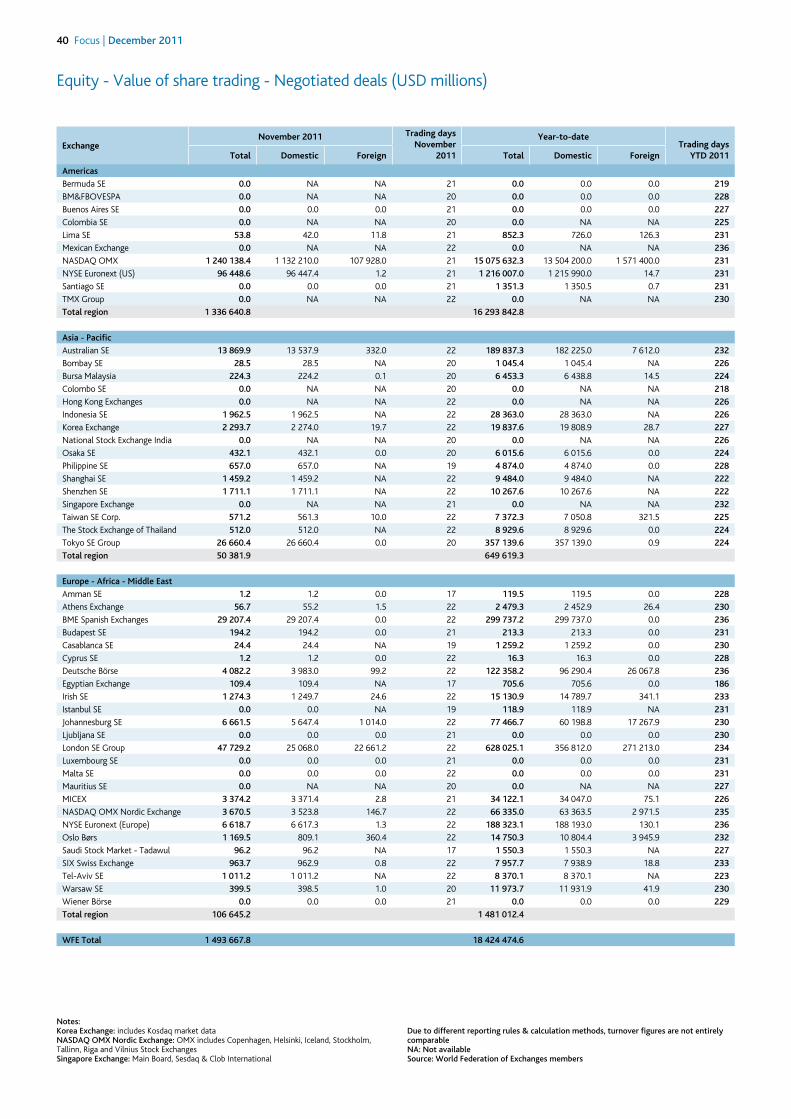
40 Focus | December 2011
ExchangeNovember 2011 Trading days
November 2011
Year-to-dateTrading days
YTD 2011Total Domestic Foreign Total Domestic Foreign
Americas
Bermuda SE 0.0 NA NA 21 0.0 0.0 0.0 219
BM&FBOVESPA 0.0 NA NA 20 0.0 0.0 0.0 228
Buenos Aires SE 0.0 0.0 0.0 21 0.0 0.0 0.0 227
Colombia SE 0.0 NA NA 20 0.0 NA NA 225
Lima SE 53.8 42.0 11.8 21 852.3 726.0 126.3 231
Mexican Exchange 0.0 NA NA 22 0.0 NA NA 236
NASDAQ OMX 1 240 138.4 1 132 210.0 107 928.0 21 15 075 632.3 13 504 200.0 1 571 400.0 231
NYSE Euronext (US) 96 448.6 96 447.4 1.2 21 1 216 007.0 1 215 990.0 14.7 231
Santiago SE 0.0 0.0 0.0 21 1 351.3 1 350.5 0.7 231
TMX Group 0.0 NA NA 22 0.0 NA NA 230
Total region 1 336 640.8 16 293 842.8
Asia - Pacific
Australian SE 13 869.9 13 537.9 332.0 22 189 837.3 182 225.0 7 612.0 232
Bombay SE 28.5 28.5 NA 20 1 045.4 1 045.4 NA 226
Bursa Malaysia 224.3 224.2 0.1 20 6 453.3 6 438.8 14.5 224
Colombo SE 0.0 NA NA 20 0.0 NA NA 218
Hong Kong Exchanges 0.0 NA NA 22 0.0 NA NA 226
Indonesia SE 1 962.5 1 962.5 NA 22 28 363.0 28 363.0 NA 226
Korea Exchange 2 293.7 2 274.0 19.7 22 19 837.6 19 808.9 28.7 227
National Stock Exchange India 0.0 NA NA 20 0.0 NA NA 226
Osaka SE 432.1 432.1 0.0 20 6 015.6 6 015.6 0.0 224
Philippine SE 657.0 657.0 NA 19 4 874.0 4 874.0 0.0 228
Shanghai SE 1 459.2 1 459.2 NA 22 9 484.0 9 484.0 NA 222
Shenzhen SE 1 711.1 1 711.1 NA 22 10 267.6 10 267.6 NA 222
Singapore Exchange 0.0 NA NA 21 0.0 NA NA 232
Taiwan SE Corp. 571.2 561.3 10.0 22 7 372.3 7 050.8 321.5 225
The Stock Exchange of Thailand 512.0 512.0 NA 22 8 929.6 8 929.6 0.0 224
Tokyo SE Group 26 660.4 26 660.4 0.0 20 357 139.6 357 139.0 0.9 224
Total region 50 381.9 649 619.3
Europe - Africa - Middle East
Amman SE 1.2 1.2 0.0 17 119.5 119.5 0.0 228
Athens Exchange 56.7 55.2 1.5 22 2 479.3 2 452.9 26.4 230
BME Spanish Exchanges 29 207.4 29 207.4 0.0 22 299 737.2 299 737.0 0.0 236
Budapest SE 194.2 194.2 0.0 21 213.3 213.3 0.0 231
Casablanca SE 24.4 24.4 NA 19 1 259.2 1 259.2 0.0 230
Cyprus SE 1.2 1.2 0.0 22 16.3 16.3 0.0 228
Deutsche Börse 4 082.2 3 983.0 99.2 22 122 358.2 96 290.4 26 067.8 236
Egyptian Exchange 109.4 109.4 NA 17 705.6 705.6 0.0 186
Irish SE 1 274.3 1 249.7 24.6 22 15 130.9 14 789.7 341.1 233
Istanbul SE 0.0 0.0 NA 19 118.9 118.9 NA 231
Johannesburg SE 6 661.5 5 647.4 1 014.0 22 77 466.7 60 198.8 17 267.9 230
Ljubljana SE 0.0 0.0 0.0 21 0.0 0.0 0.0 230
London SE Group 47 729.2 25 068.0 22 661.2 22 628 025.1 356 812.0 271 213.0 234
Luxembourg SE 0.0 0.0 0.0 21 0.0 0.0 0.0 231
Malta SE 0.0 0.0 0.0 22 0.0 0.0 0.0 231
Mauritius SE 0.0 NA NA 20 0.0 NA NA 227
MICEX 3 374.2 3 371.4 2.8 21 34 122.1 34 047.0 75.1 226
NASDAQ OMX Nordic Exchange 3 670.5 3 523.8 146.7 22 66 335.0 63 363.5 2 971.5 235
NYSE Euronext (Europe) 6 618.7 6 617.3 1.3 22 188 323.1 188 193.0 130.1 236
Oslo Børs 1 169.5 809.1 360.4 22 14 750.3 10 804.4 3 945.9 232
Saudi Stock Market - Tadawul 96.2 96.2 NA 17 1 550.3 1 550.3 NA 227
SIX Swiss Exchange 963.7 962.9 0.8 22 7 957.7 7 938.9 18.8 233
Tel-Aviv SE 1 011.2 1 011.2 NA 22 8 370.1 8 370.1 NA 223
Warsaw SE 399.5 398.5 1.0 20 11 973.7 11 931.9 41.9 230
Wiener Börse 0.0 0.0 0.0 21 0.0 0.0 0.0 229
Total region 106 645.2 1 481 012.4
WFE Total 1 493 667.8 18 424 474.6
Equity - Value of share trading - Negotiated deals (USD millions)
Notes: Korea Exchange: includes Kosdaq market dataNASDAQ OMX Nordic Exchange: OMX includes Copenhagen, Helsinki, Iceland, Stockholm, Tallinn, Riga and Vilnius Stock ExchangesSingapore Exchange: Main Board, Sesdaq & Clob International
Due to different reporting rules & calculation methods, turnover figures are not entirely comparableNA: Not availableSource: World Federation of Exchanges members
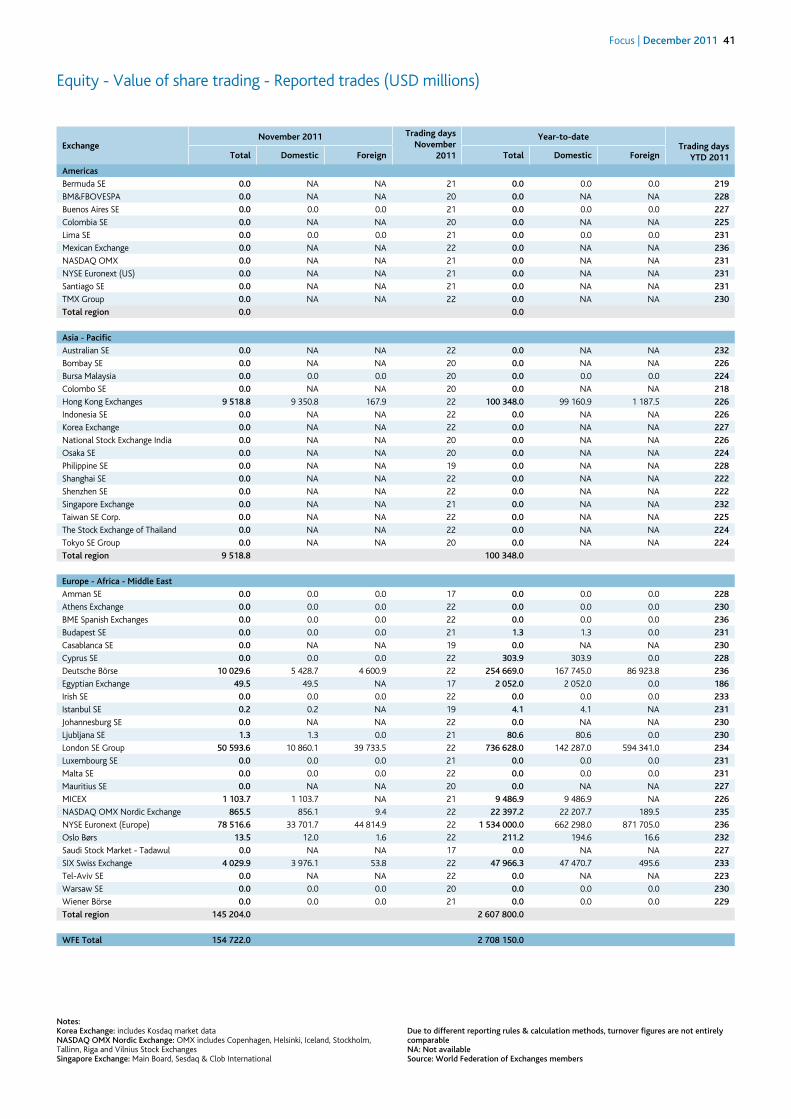
Focus | December 2011 41
Equity - Value of share trading - Reported trades (USD millions)
ExchangeNovember 2011 Trading days
November 2011
Year-to-dateTrading days
YTD 2011Total Domestic Foreign Total Domestic Foreign
Americas
Bermuda SE 0.0 NA NA 21 0.0 0.0 0.0 219
BM&FBOVESPA 0.0 NA NA 20 0.0 NA NA 228
Buenos Aires SE 0.0 0.0 0.0 21 0.0 0.0 0.0 227
Colombia SE 0.0 NA NA 20 0.0 NA NA 225
Lima SE 0.0 0.0 0.0 21 0.0 0.0 0.0 231
Mexican Exchange 0.0 NA NA 22 0.0 NA NA 236
NASDAQ OMX 0.0 NA NA 21 0.0 NA NA 231
NYSE Euronext (US) 0.0 NA NA 21 0.0 NA NA 231
Santiago SE 0.0 NA NA 21 0.0 NA NA 231
TMX Group 0.0 NA NA 22 0.0 NA NA 230
Total region 0.0 0.0
Asia - Pacific
Australian SE 0.0 NA NA 22 0.0 NA NA 232
Bombay SE 0.0 NA NA 20 0.0 NA NA 226
Bursa Malaysia 0.0 0.0 0.0 20 0.0 0.0 0.0 224
Colombo SE 0.0 NA NA 20 0.0 NA NA 218
Hong Kong Exchanges 9 518.8 9 350.8 167.9 22 100 348.0 99 160.9 1 187.5 226
Indonesia SE 0.0 NA NA 22 0.0 NA NA 226
Korea Exchange 0.0 NA NA 22 0.0 NA NA 227
National Stock Exchange India 0.0 NA NA 20 0.0 NA NA 226
Osaka SE 0.0 NA NA 20 0.0 NA NA 224
Philippine SE 0.0 NA NA 19 0.0 NA NA 228
Shanghai SE 0.0 NA NA 22 0.0 NA NA 222
Shenzhen SE 0.0 NA NA 22 0.0 NA NA 222
Singapore Exchange 0.0 NA NA 21 0.0 NA NA 232
Taiwan SE Corp. 0.0 NA NA 22 0.0 NA NA 225
The Stock Exchange of Thailand 0.0 NA NA 22 0.0 NA NA 224
Tokyo SE Group 0.0 NA NA 20 0.0 NA NA 224
Total region 9 518.8 100 348.0
Europe - Africa - Middle East
Amman SE 0.0 0.0 0.0 17 0.0 0.0 0.0 228
Athens Exchange 0.0 0.0 0.0 22 0.0 0.0 0.0 230
BME Spanish Exchanges 0.0 0.0 0.0 22 0.0 0.0 0.0 236
Budapest SE 0.0 0.0 0.0 21 1.3 1.3 0.0 231
Casablanca SE 0.0 NA NA 19 0.0 NA NA 230
Cyprus SE 0.0 0.0 0.0 22 303.9 303.9 0.0 228
Deutsche Börse 10 029.6 5 428.7 4 600.9 22 254 669.0 167 745.0 86 923.8 236
Egyptian Exchange 49.5 49.5 NA 17 2 052.0 2 052.0 0.0 186
Irish SE 0.0 0.0 0.0 22 0.0 0.0 0.0 233
Istanbul SE 0.2 0.2 NA 19 4.1 4.1 NA 231
Johannesburg SE 0.0 NA NA 22 0.0 NA NA 230
Ljubljana SE 1.3 1.3 0.0 21 80.6 80.6 0.0 230
London SE Group 50 593.6 10 860.1 39 733.5 22 736 628.0 142 287.0 594 341.0 234
Luxembourg SE 0.0 0.0 0.0 21 0.0 0.0 0.0 231
Malta SE 0.0 0.0 0.0 22 0.0 0.0 0.0 231
Mauritius SE 0.0 NA NA 20 0.0 NA NA 227
MICEX 1 103.7 1 103.7 NA 21 9 486.9 9 486.9 NA 226
NASDAQ OMX Nordic Exchange 865.5 856.1 9.4 22 22 397.2 22 207.7 189.5 235
NYSE Euronext (Europe) 78 516.6 33 701.7 44 814.9 22 1 534 000.0 662 298.0 871 705.0 236
Oslo Børs 13.5 12.0 1.6 22 211.2 194.6 16.6 232
Saudi Stock Market - Tadawul 0.0 NA NA 17 0.0 NA NA 227
SIX Swiss Exchange 4 029.9 3 976.1 53.8 22 47 966.3 47 470.7 495.6 233
Tel-Aviv SE 0.0 NA NA 22 0.0 NA NA 223
Warsaw SE 0.0 0.0 0.0 20 0.0 0.0 0.0 230
Wiener Börse 0.0 0.0 0.0 21 0.0 0.0 0.0 229
Total region 145 204.0 2 607 800.0
WFE Total 154 722.0 2 708 150.0
Notes: Korea Exchange: includes Kosdaq market dataNASDAQ OMX Nordic Exchange: OMX includes Copenhagen, Helsinki, Iceland, Stockholm, Tallinn, Riga and Vilnius Stock ExchangesSingapore Exchange: Main Board, Sesdaq & Clob International
Due to different reporting rules & calculation methods, turnover figures are not entirely comparableNA: Not availableSource: World Federation of Exchanges members

42 Focus | December 2011
Equity - Number of trades in shares - Electronic order book trades (in thousands)
Notes: NASDAQ OMX Nordic Exchange: OMX includes Copenhagen, Helsinki, Iceland, Stockholm, Tallinn, Riga and Vilnius Stock Exchanges
NA: Not availableSource: World Federation of Exchanges members
(excludes investment fund trades)
Exchange 2011
January February March April May June
Americas
Bermuda SE 0.1 0.1 0.2 0.3 0.1 0.1
BM&FBOVESPA 7 553.8 8 721.1 8 437.1 7 996.0 9 288.7 8 615.6
Buenos Aires SE 104.8 83.3 66.5 56.9 53.9 60.2
Colombia SE 61.1 67.7 93.7 49.0 85.1 65.9
Lima SE 39.6 29.7 39.9 42.6 39.8 33.2
Mexican Exchange 745.9 707.1 660.6 635.7 824.2 766.5
NASDAQ OMX 113 753.3 110 667.9 143 017.2 108 670.3 138 451.0 145 312.3
NYSE Euronext (US) 152 921.7 143 132.2 181 971.3 134 485.9 155 906.3 162 746.7
Santiago SE 199.9 163.1 210.3 154.1 197.3 216.3
TMX Group 18 421.3 17 847.0 21 316.8 16 526.7 17 064.1 17 796.9
Total region 293 801.6 281 419.2 355 813.7 268 617.5 321 910.7 335 613.7
Asia - Pacific
Australian SE 10 075.6 11 069.0 15 150.4 11 115.7 13 602.6 12 753.5
Bombay SE 35 157.8 36 799.9 36 936.4 32 697.0 33 627.5 33 499.9
Bursa Malaysia 2 792.7 1 970.9 2 123.0 2 063.6 1 647.4 1 638.6
Colombo SE 624.7 418.4 335.7 254.4 412.2 485.6
Hong Kong Exchanges 13 189.2 11 391.7 17 148.4 13 896.7 13 207.1 13 822.2
Indonesia SE 2 297.5 1 602.7 2 199.3 2 078.7 2 552.8 1 965.6
Korea Exchange 100 221.0 71 849.6 97 595.4 109 486.7 82 368.6 82 569.7
National Stock Exchange India 118 200.0 127 626.5 122 400.1 107 130.3 114 673.9 115 548.3
Philippine SE 392.6 244.7 303.6 298.9 331.0 285.0
Shanghai SE 104 965.0 110 756.0 188 210.0 140 780.0 112 625.0 101 499.0
Shenzhen SE 76 268.8 80 515.8 136 924.7 99 987.3 79 332.7 75 808.4
Taiwan SE Corp. 20 313.0 14 463.8 20 218.2 16 079.0 16 122.0 14 566.2
The Stock Exchange of Thailand 3 697.7 2 747.6 3 738.4 3 420.6 3 487.7 3 612.9
Tokyo SE Group 27 557.4 28 476.0 43 026.2 29 597.0 25 858.9 28 103.0
Total region 515 752.9 499 932.5 686 309.8 568 886.0 499 849.2 486 157.8
Europe - Africa - Middle East
Amman SE 152.9 91.5 113.5 120.0 151.3 114.8
Athens Exchange 602.8 731.4 568.3 471.2 586.2 544.8
BME Spanish Exchanges 4 548.6 3 807.0 4 549.8 3 499.3 3 407.3 3 484.3
Budapest SE 170.2 168.6 169.4 198.6 148.2 128.8
Casablanca SE 26.9 20.3 16.2 18.0 15.6 15.1
Cyprus SE 17.2 22.0 16.9 8.6 10.0 9.0
Deutsche Börse 9 923.0 9 249.4 12 046.3 8 037.0 9 921.2 8 984.6
Egyptian Exchange 774.8 NA 209.0 560.5 760.9 779.2
Irish SE 82.4 81.6 84.2 75.0 85.7 84.8
Istanbul SE 9 380.0 8 495.4 10 414.7 9 938.5 9 246.2 7 730.4
Johannesburg SE 2 105.0 2 243.6 2 590.9 1 733.1 1 966.2 2 152.2
Ljubljana SE 7.5 9.4 10.1 6.3 7.0 6.8
London SE Group 19 132.4 18 282.2 22 152.8 15 279.4 19 128.4 19 980.4
Luxembourg SE 1.0 1.1 0.9 0.7 0.7 0.7
Malta SE 1.0 0.9 0.6 0.6 0.7 0.5
Mauritius SE 5.7 5.2 4.8 4.2 5.7 4.4
MICEX 7 695.2 10 551.2 9 140.6 8 272.7 8 213.9 7 861.7
NASDAQ OMX Nordic Exchange 6 180.0 6 900.8 7 421.8 5 339.4 6 615.9 6 572.2
NYSE Euronext (Europe) 17 793.8 16 992.5 20 493.8 13 837.2 16 679.7 16 029.4
Oslo Børs 1 768.2 1 738.5 1 881.1 1 334.0 1 748.6 1 619.8
Saudi Stock Market - Tadawul 1 723.0 1 499.6 2 360.1 2 451.6 2 867.1 2 041.3
SIX Swiss Exchange 2 897.7 2 781.2 3 287.0 2 475.4 2 892.1 2 613.1
Tel-Aviv SE 1 936.5 1 627.1 1 535.9 916.2 1 266.8 1 239.3
Warsaw SE 1 222.0 1 298.4 1 374.3 1 212.1 1 238.6 1 129.1
Wiener Börse 409.3 392.3 536.9 324.8 356.0 392.4
Total region 88 557.0 86 991.0 100 979.9 76 114.4 87 320.1 83 519.1
WFE Total 898 111.5 868 342.7 1 143 103.3 913 617.9 909 080.0 905 290.5
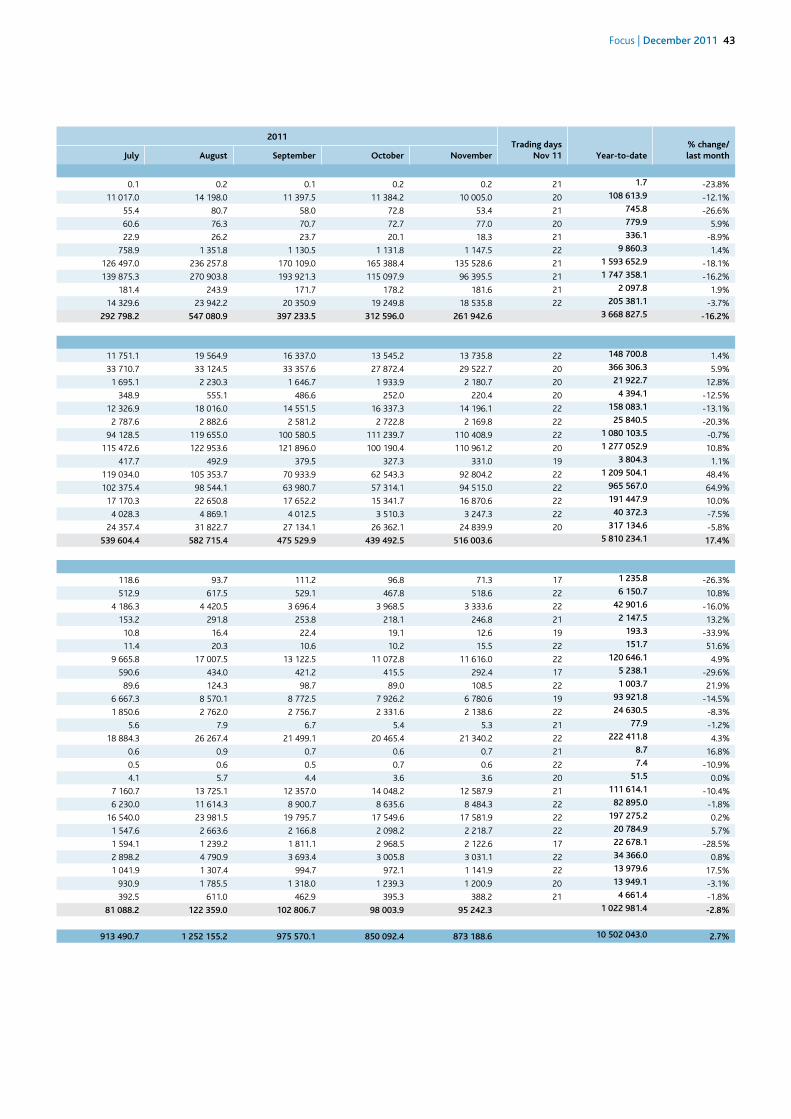
Focus | December 2011 43
2011Trading days
Nov 11 Year-to-date% change/last monthJuly August September October November
0.1 0.2 0.1 0.2 0.2 21 1.7 -23.8%
11 017.0 14 198.0 11 397.5 11 384.2 10 005.0 20 108 613.9 -12.1%
55.4 80.7 58.0 72.8 53.4 21 745.8 -26.6%
60.6 76.3 70.7 72.7 77.0 20 779.9 5.9%
22.9 26.2 23.7 20.1 18.3 21 336.1 -8.9%
758.9 1 351.8 1 130.5 1 131.8 1 147.5 22 9 860.3 1.4%
126 497.0 236 257.8 170 109.0 165 388.4 135 528.6 21 1 593 652.9 -18.1%
139 875.3 270 903.8 193 921.3 115 097.9 96 395.5 21 1 747 358.1 -16.2%
181.4 243.9 171.7 178.2 181.6 21 2 097.8 1.9%
14 329.6 23 942.2 20 350.9 19 249.8 18 535.8 22 205 381.1 -3.7%
292 798.2 547 080.9 397 233.5 312 596.0 261 942.6 3 668 827.5 -16.2%
11 751.1 19 564.9 16 337.0 13 545.2 13 735.8 22 148 700.8 1.4%
33 710.7 33 124.5 33 357.6 27 872.4 29 522.7 20 366 306.3 5.9%
1 695.1 2 230.3 1 646.7 1 933.9 2 180.7 20 21 922.7 12.8%
348.9 555.1 486.6 252.0 220.4 20 4 394.1 -12.5%
12 326.9 18 016.0 14 551.5 16 337.3 14 196.1 22 158 083.1 -13.1%
2 787.6 2 882.6 2 581.2 2 722.8 2 169.8 22 25 840.5 -20.3%
94 128.5 119 655.0 100 580.5 111 239.7 110 408.9 22 1 080 103.5 -0.7%
115 472.6 122 953.6 121 896.0 100 190.4 110 961.2 20 1 277 052.9 10.8%
417.7 492.9 379.5 327.3 331.0 19 3 804.3 1.1%
119 034.0 105 353.7 70 933.9 62 543.3 92 804.2 22 1 209 504.1 48.4%
102 375.4 98 544.1 63 980.7 57 314.1 94 515.0 22 965 567.0 64.9%
17 170.3 22 650.8 17 652.2 15 341.7 16 870.6 22 191 447.9 10.0%
4 028.3 4 869.1 4 012.5 3 510.3 3 247.3 22 40 372.3 -7.5%
24 357.4 31 822.7 27 134.1 26 362.1 24 839.9 20 317 134.6 -5.8%
539 604.4 582 715.4 475 529.9 439 492.5 516 003.6 5 810 234.1 17.4%
118.6 93.7 111.2 96.8 71.3 17 1 235.8 -26.3%
512.9 617.5 529.1 467.8 518.6 22 6 150.7 10.8%
4 186.3 4 420.5 3 696.4 3 968.5 3 333.6 22 42 901.6 -16.0%
153.2 291.8 253.8 218.1 246.8 21 2 147.5 13.2%
10.8 16.4 22.4 19.1 12.6 19 193.3 -33.9%
11.4 20.3 10.6 10.2 15.5 22 151.7 51.6%
9 665.8 17 007.5 13 122.5 11 072.8 11 616.0 22 120 646.1 4.9%
590.6 434.0 421.2 415.5 292.4 17 5 238.1 -29.6%
89.6 124.3 98.7 89.0 108.5 22 1 003.7 21.9%
6 667.3 8 570.1 8 772.5 7 926.2 6 780.6 19 93 921.8 -14.5%
1 850.6 2 762.0 2 756.7 2 331.6 2 138.6 22 24 630.5 -8.3%
5.6 7.9 6.7 5.4 5.3 21 77.9 -1.2%
18 884.3 26 267.4 21 499.1 20 465.4 21 340.2 22 222 411.8 4.3%
0.6 0.9 0.7 0.6 0.7 21 8.7 16.8%
0.5 0.6 0.5 0.7 0.6 22 7.4 -10.9%
4.1 5.7 4.4 3.6 3.6 20 51.5 0.0%
7 160.7 13 725.1 12 357.0 14 048.2 12 587.9 21 111 614.1 -10.4%
6 230.0 11 614.3 8 900.7 8 635.6 8 484.3 22 82 895.0 -1.8%
16 540.0 23 981.5 19 795.7 17 549.6 17 581.9 22 197 275.2 0.2%
1 547.6 2 663.6 2 166.8 2 098.2 2 218.7 22 20 784.9 5.7%
1 594.1 1 239.2 1 811.1 2 968.5 2 122.6 17 22 678.1 -28.5%
2 898.2 4 790.9 3 693.4 3 005.8 3 031.1 22 34 366.0 0.8%
1 041.9 1 307.4 994.7 972.1 1 141.9 22 13 979.6 17.5%
930.9 1 785.5 1 318.0 1 239.3 1 200.9 20 13 949.1 -3.1%
392.5 611.0 462.9 395.3 388.2 21 4 661.4 -1.8%
81 088.2 122 359.0 102 806.7 98 003.9 95 242.3 1 022 981.4 -2.8%
913 490.7 1 252 155.2 975 570.1 850 092.4 873 188.6 10 502 043.0 2.7%

44 Focus | December 2011
Equity - Number of trades in shares - Negotiated deals (in thousands)
Notes: NASDAQ OMX Nordic Exchange: OMX includes Copenhagen, Helsinki, Iceland, Stockholm, Tallinn, Riga and Vilnius Stock Exchanges
NA: Not availableSource: World Federation of Exchanges members
(excludes investment fund trades)
Exchange 2011
January February March April May June
Americas
Lima SE 1.2 1.0 1.1 0.7 0.7 0.7
NASDAQ OMX 98 136.7 90 983.0 109 526.1 93 973.1 97 075.0 102 869.6
NYSE Euronext (US) 13 111.8 12 553.5 16 099.5 13 980.2 15 408.7 16 437.2
Santiago SE 0.0 0.0 0.0 0.0 0.0 0.0
Total region 111 249.7 103 537.5 125 626.7 107 954.0 112 484.4 119 307.5
Asia - Pacific
Australian SE 16.0 18.6 34.6 20.9 26.6 25.8
Bombay SE 0.2 0.1 0.4 0.0 0.3 0.2
Bursa Malaysia 1.0 0.5 0.6 0.8 0.6 0.7
Indonesia SE 11.2 7.7 9.2 8.0 8.4 7.7
Korea Exchange 2.3 1.4 1.6 1.5 1.5 1.5
Philippine SE 0.0 0.0 0.1 0.0 0.0 0.0
Shanghai SE 0.0 0.0 0.0 0.0 0.0 0.0
Shenzhen SE 0.2 0.1 0.3 0.1 0.2 0.3
Taiwan SE Corp. 0.2 0.1 0.2 0.2 0.2 0.3
The Stock Exchange of Thailand 1.4 1.1 1.3 1.1 1.2 1.3
Total region 32.5 29.6 48.2 32.7 39.0 38.0
Europe - Africa - Middle East
Amman SE 0.0 0.0 0.0 0.0 0.0 0.0
Athens Exchange 0.2 0.2 0.2 0.1 0.2 0.1
BME Spanish Exchanges 19.2 15.2 16.8 15.8 15.9 17.1
Budapest SE 0.0 0.0 0.0 0.0 0.0 0.0
Casablanca SE 0.0 0.0 0.0 0.0 0.0 0.0
Cyprus SE 0.0 0.0 0.0 0.0 0.0 0.0
Deutsche Börse 1 759.6 1 567.5 1 921.7 1 172.3 882.5 152.9
Egyptian Exchange 3.3 NA 0.0 1.3 0.1 0.2
Irish SE 9.9 9.0 9.6 8.0 8.5 8.7
Istanbul SE 0.0 0.0 0.0 0.0 0.0 0.0
Johannesburg SE 9.1 10.0 9.2 8.8 11.1 11.0
London SE Group 696.5 643.0 706.9 504.0 506.7 479.9
MICEX 7.0 19.0 27.6 23.3 53.5 4.7
NASDAQ OMX Nordic Exchange 64.9 46.3 53.2 34.6 50.9 43.8
NYSE Euronext (Europe) 107.6 97.4 123.3 74.3 63.9 72.1
Oslo Børs 5.1 4.8 4.8 3.5 4.5 3.0
Saudi Stock Market - Tadawul 0.0 0.0 0.1 0.0 0.1 0.5
SIX Swiss Exchange 0.6 0.6 0.7 1.2 0.9 0.6
Tel-Aviv SE 5.2 4.0 6.2 3.9 4.6 5.8
Warsaw SE 0.4 0.3 0.4 0.3 0.3 0.4
Total region 2 688.4 2 417.2 2 880.6 1 851.3 1 603.7 800.8
WFE Total 113 970.5 105 984.3 128 555.5 109 838.0 114 127.1 120 146.3
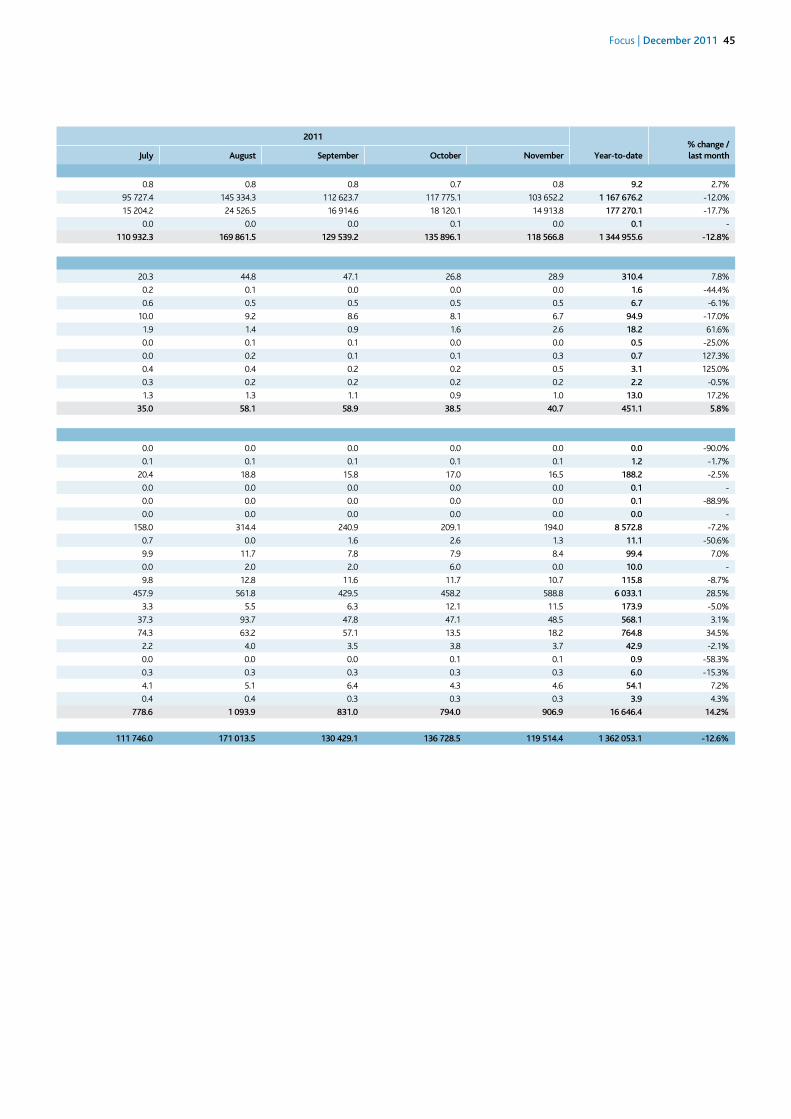
Focus | December 2011 45
2011
Year-to-date% change /last monthJuly August September October November
0.8 0.8 0.8 0.7 0.8 9.2 2.7%
95 727.4 145 334.3 112 623.7 117 775.1 103 652.2 1 167 676.2 -12.0%
15 204.2 24 526.5 16 914.6 18 120.1 14 913.8 177 270.1 -17.7%
0.0 0.0 0.0 0.1 0.0 0.1 -
110 932.3 169 861.5 129 539.2 135 896.1 118 566.8 1 344 955.6 -12.8%
20.3 44.8 47.1 26.8 28.9 310.4 7.8%
0.2 0.1 0.0 0.0 0.0 1.6 -44.4%
0.6 0.5 0.5 0.5 0.5 6.7 -6.1%
10.0 9.2 8.6 8.1 6.7 94.9 -17.0%
1.9 1.4 0.9 1.6 2.6 18.2 61.6%
0.0 0.1 0.1 0.0 0.0 0.5 -25.0%
0.0 0.2 0.1 0.1 0.3 0.7 127.3%
0.4 0.4 0.2 0.2 0.5 3.1 125.0%
0.3 0.2 0.2 0.2 0.2 2.2 -0.5%
1.3 1.3 1.1 0.9 1.0 13.0 17.2%
35.0 58.1 58.9 38.5 40.7 451.1 5.8%
0.0 0.0 0.0 0.0 0.0 0.0 -90.0%
0.1 0.1 0.1 0.1 0.1 1.2 -1.7%
20.4 18.8 15.8 17.0 16.5 188.2 -2.5%
0.0 0.0 0.0 0.0 0.0 0.1 -
0.0 0.0 0.0 0.0 0.0 0.1 -88.9%
0.0 0.0 0.0 0.0 0.0 0.0 -
158.0 314.4 240.9 209.1 194.0 8 572.8 -7.2%
0.7 0.0 1.6 2.6 1.3 11.1 -50.6%
9.9 11.7 7.8 7.9 8.4 99.4 7.0%
0.0 2.0 2.0 6.0 0.0 10.0 -
9.8 12.8 11.6 11.7 10.7 115.8 -8.7%
457.9 561.8 429.5 458.2 588.8 6 033.1 28.5%
3.3 5.5 6.3 12.1 11.5 173.9 -5.0%
37.3 93.7 47.8 47.1 48.5 568.1 3.1%
74.3 63.2 57.1 13.5 18.2 764.8 34.5%
2.2 4.0 3.5 3.8 3.7 42.9 -2.1%
0.0 0.0 0.0 0.1 0.1 0.9 -58.3%
0.3 0.3 0.3 0.3 0.3 6.0 -15.3%
4.1 5.1 6.4 4.3 4.6 54.1 7.2%
0.4 0.4 0.3 0.3 0.3 3.9 4.3%
778.6 1 093.9 831.0 794.0 906.9 16 646.4 14.2%
111 746.0 171 013.5 130 429.1 136 728.5 119 514.4 1 362 053.1 -12.6%
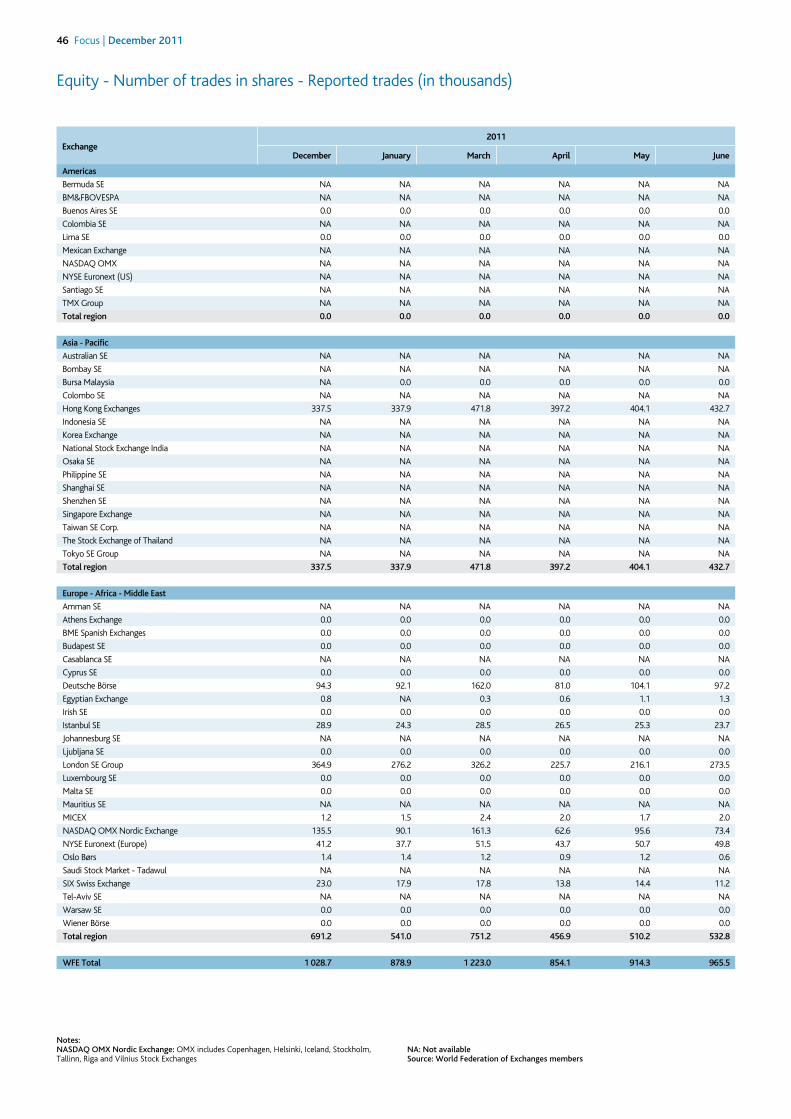
46 Focus | December 2011
Notes: NASDAQ OMX Nordic Exchange: OMX includes Copenhagen, Helsinki, Iceland, Stockholm, Tallinn, Riga and Vilnius Stock Exchanges
NA: Not availableSource: World Federation of Exchanges members
Equity - Number of trades in shares - Reported trades (in thousands)
Exchange 2011
December January March April May June
Americas
Bermuda SE NA NA NA NA NA NA
BM&FBOVESPA NA NA NA NA NA NA
Buenos Aires SE 0.0 0.0 0.0 0.0 0.0 0.0
Colombia SE NA NA NA NA NA NA
Lima SE 0.0 0.0 0.0 0.0 0.0 0.0
Mexican Exchange NA NA NA NA NA NA
NASDAQ OMX NA NA NA NA NA NA
NYSE Euronext (US) NA NA NA NA NA NA
Santiago SE NA NA NA NA NA NA
TMX Group NA NA NA NA NA NA
Total region 0.0 0.0 0.0 0.0 0.0 0.0
Asia - Pacific
Australian SE NA NA NA NA NA NA
Bombay SE NA NA NA NA NA NA
Bursa Malaysia NA 0.0 0.0 0.0 0.0 0.0
Colombo SE NA NA NA NA NA NA
Hong Kong Exchanges 337.5 337.9 471.8 397.2 404.1 432.7
Indonesia SE NA NA NA NA NA NA
Korea Exchange NA NA NA NA NA NA
National Stock Exchange India NA NA NA NA NA NA
Osaka SE NA NA NA NA NA NA
Philippine SE NA NA NA NA NA NA
Shanghai SE NA NA NA NA NA NA
Shenzhen SE NA NA NA NA NA NA
Singapore Exchange NA NA NA NA NA NA
Taiwan SE Corp. NA NA NA NA NA NA
The Stock Exchange of Thailand NA NA NA NA NA NA
Tokyo SE Group NA NA NA NA NA NA
Total region 337.5 337.9 471.8 397.2 404.1 432.7
Europe - Africa - Middle East
Amman SE NA NA NA NA NA NA
Athens Exchange 0.0 0.0 0.0 0.0 0.0 0.0
BME Spanish Exchanges 0.0 0.0 0.0 0.0 0.0 0.0
Budapest SE 0.0 0.0 0.0 0.0 0.0 0.0
Casablanca SE NA NA NA NA NA NA
Cyprus SE 0.0 0.0 0.0 0.0 0.0 0.0
Deutsche Börse 94.3 92.1 162.0 81.0 104.1 97.2
Egyptian Exchange 0.8 NA 0.3 0.6 1.1 1.3
Irish SE 0.0 0.0 0.0 0.0 0.0 0.0
Istanbul SE 28.9 24.3 28.5 26.5 25.3 23.7
Johannesburg SE NA NA NA NA NA NA
Ljubljana SE 0.0 0.0 0.0 0.0 0.0 0.0
London SE Group 364.9 276.2 326.2 225.7 216.1 273.5
Luxembourg SE 0.0 0.0 0.0 0.0 0.0 0.0
Malta SE 0.0 0.0 0.0 0.0 0.0 0.0
Mauritius SE NA NA NA NA NA NA
MICEX 1.2 1.5 2.4 2.0 1.7 2.0
NASDAQ OMX Nordic Exchange 135.5 90.1 161.3 62.6 95.6 73.4
NYSE Euronext (Europe) 41.2 37.7 51.5 43.7 50.7 49.8
Oslo Børs 1.4 1.4 1.2 0.9 1.2 0.6
Saudi Stock Market - Tadawul NA NA NA NA NA NA
SIX Swiss Exchange 23.0 17.9 17.8 13.8 14.4 11.2
Tel-Aviv SE NA NA NA NA NA NA
Warsaw SE 0.0 0.0 0.0 0.0 0.0 0.0
Wiener Börse 0.0 0.0 0.0 0.0 0.0 0.0
Total region 691.2 541.0 751.2 456.9 510.2 532.8
WFE Total 1 028.7 878.9 1 223.0 854.1 914.3 965.5
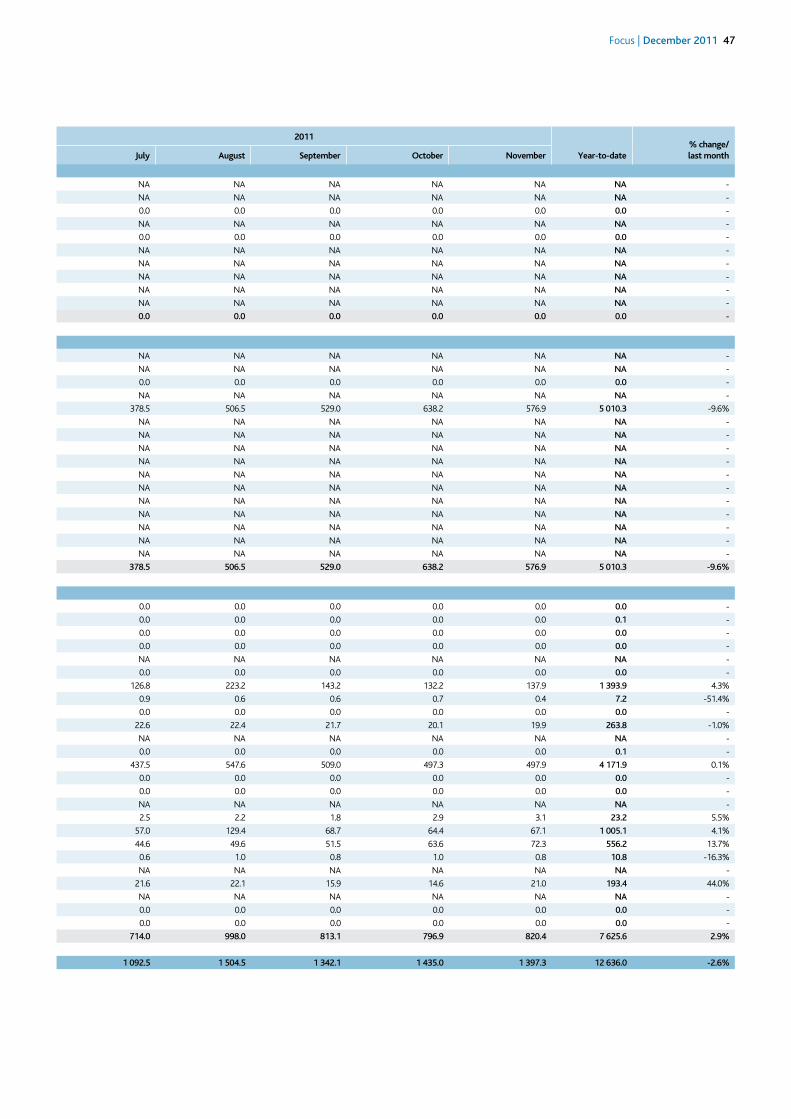
Focus | December 2011 47
2011
Year-to-date% change/last monthJuly August September October November
NA NA NA NA NA NA -
NA NA NA NA NA NA -
0.0 0.0 0.0 0.0 0.0 0.0 -
NA NA NA NA NA NA -
0.0 0.0 0.0 0.0 0.0 0.0 -
NA NA NA NA NA NA -
NA NA NA NA NA NA -
NA NA NA NA NA NA -
NA NA NA NA NA NA -
NA NA NA NA NA NA -
0.0 0.0 0.0 0.0 0.0 0.0 -
NA NA NA NA NA NA -
NA NA NA NA NA NA -
0.0 0.0 0.0 0.0 0.0 0.0 -
NA NA NA NA NA NA -
378.5 506.5 529.0 638.2 576.9 5 010.3 -9.6%
NA NA NA NA NA NA -
NA NA NA NA NA NA -
NA NA NA NA NA NA -
NA NA NA NA NA NA -
NA NA NA NA NA NA -
NA NA NA NA NA NA -
NA NA NA NA NA NA -
NA NA NA NA NA NA -
NA NA NA NA NA NA -
NA NA NA NA NA NA -
NA NA NA NA NA NA -
378.5 506.5 529.0 638.2 576.9 5 010.3 -9.6%
0.0 0.0 0.0 0.0 0.0 0.0 -
0.0 0.0 0.0 0.0 0.0 0.1 -
0.0 0.0 0.0 0.0 0.0 0.0 -
0.0 0.0 0.0 0.0 0.0 0.0 -
NA NA NA NA NA NA -
0.0 0.0 0.0 0.0 0.0 0.0 -
126.8 223.2 143.2 132.2 137.9 1 393.9 4.3%
0.9 0.6 0.6 0.7 0.4 7.2 -51.4%
0.0 0.0 0.0 0.0 0.0 0.0 -
22.6 22.4 21.7 20.1 19.9 263.8 -1.0%
NA NA NA NA NA NA -
0.0 0.0 0.0 0.0 0.0 0.1 -
437.5 547.6 509.0 497.3 497.9 4 171.9 0.1%
0.0 0.0 0.0 0.0 0.0 0.0 -
0.0 0.0 0.0 0.0 0.0 0.0 -
NA NA NA NA NA NA -
2.5 2.2 1.8 2.9 3.1 23.2 5.5%
57.0 129.4 68.7 64.4 67.1 1 005.1 4.1%
44.6 49.6 51.5 63.6 72.3 556.2 13.7%
0.6 1.0 0.8 1.0 0.8 10.8 -16.3%
NA NA NA NA NA NA -
21.6 22.1 15.9 14.6 21.0 193.4 44.0%
NA NA NA NA NA NA -
0.0 0.0 0.0 0.0 0.0 0.0 -
0.0 0.0 0.0 0.0 0.0 0.0 -
714.0 998.0 813.1 796.9 820.4 7 625.6 2.9%
1 092.5 1 504.5 1 342.1 1 435.0 1 397.3 12 636.0 -2.6%
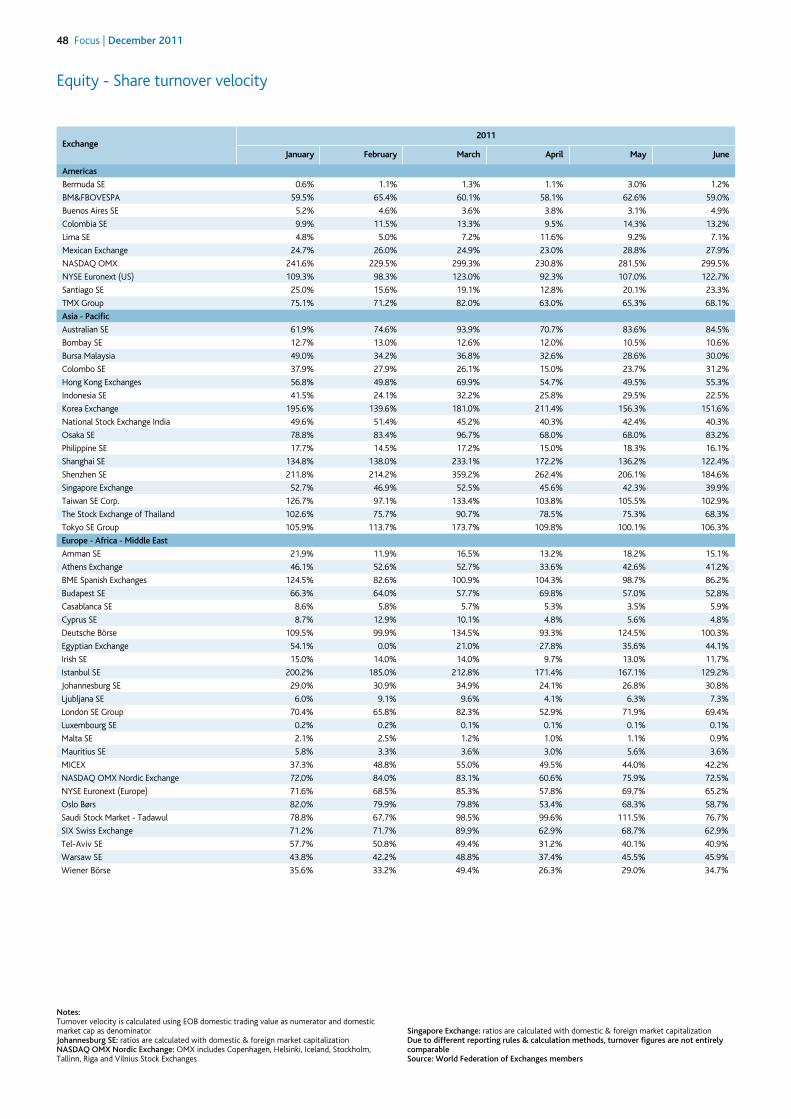
48 Focus | December 2011
Equity - Share turnover velocity
Notes: Turnover velocity is calculated using EOB domestic trading value as numerator and domestic market cap as denominatorJohannesburg SE: ratios are calculated with domestic & foreign market capitalizationNASDAQ OMX Nordic Exchange: OMX includes Copenhagen, Helsinki, Iceland, Stockholm, Tallinn, Riga and Vilnius Stock Exchanges
Singapore Exchange: ratios are calculated with domestic & foreign market capitalizationDue to different reporting rules & calculation methods, turnover figures are not entirely comparableSource: World Federation of Exchanges members
Exchange2011
January February March April May June
Americas
Bermuda SE 0.6% 1.1% 1.3% 1.1% 3.0% 1.2%
BM&FBOVESPA 59.5% 65.4% 60.1% 58.1% 62.6% 59.0%
Buenos Aires SE 5.2% 4.6% 3.6% 3.8% 3.1% 4.9%
Colombia SE 9.9% 11.5% 13.3% 9.5% 14.3% 13.2%
Lima SE 4.8% 5.0% 7.2% 11.6% 9.2% 7.1%
Mexican Exchange 24.7% 26.0% 24.9% 23.0% 28.8% 27.9%
NASDAQ OMX 241.6% 229.5% 299.3% 230.8% 281.5% 299.5%
NYSE Euronext (US) 109.3% 98.3% 123.0% 92.3% 107.0% 122.7%
Santiago SE 25.0% 15.6% 19.1% 12.8% 20.1% 23.3%
TMX Group 75.1% 71.2% 82.0% 63.0% 65.3% 68.1%
Asia - Pacific
Australian SE 61.9% 74.6% 93.9% 70.7% 83.6% 84.5%
Bombay SE 12.7% 13.0% 12.6% 12.0% 10.5% 10.6%
Bursa Malaysia 49.0% 34.2% 36.8% 32.6% 28.6% 30.0%
Colombo SE 37.9% 27.9% 26.1% 15.0% 23.7% 31.2%
Hong Kong Exchanges 56.8% 49.8% 69.9% 54.7% 49.5% 55.3%
Indonesia SE 41.5% 24.1% 32.2% 25.8% 29.5% 22.5%
Korea Exchange 195.6% 139.6% 181.0% 211.4% 156.3% 151.6%
National Stock Exchange India 49.6% 51.4% 45.2% 40.3% 42.4% 40.3%
Osaka SE 78.8% 83.4% 96.7% 68.0% 68.0% 83.2%
Philippine SE 17.7% 14.5% 17.2% 15.0% 18.3% 16.1%
Shanghai SE 134.8% 138.0% 233.1% 172.2% 136.2% 122.4%
Shenzhen SE 211.8% 214.2% 359.2% 262.4% 206.1% 184.6%
Singapore Exchange 52.7% 46.9% 52.5% 45.6% 42.3% 39.9%
Taiwan SE Corp. 126.7% 97.1% 133.4% 103.8% 105.5% 102.9%
The Stock Exchange of Thailand 102.6% 75.7% 90.7% 78.5% 75.3% 68.3%
Tokyo SE Group 105.9% 113.7% 173.7% 109.8% 100.1% 106.3%
Europe - Africa - Middle East
Amman SE 21.9% 11.9% 16.5% 13.2% 18.2% 15.1%
Athens Exchange 46.1% 52.6% 52.7% 33.6% 42.6% 41.2%
BME Spanish Exchanges 124.5% 82.6% 100.9% 104.3% 98.7% 86.2%
Budapest SE 66.3% 64.0% 57.7% 69.8% 57.0% 52.8%
Casablanca SE 8.6% 5.8% 5.7% 5.3% 3.5% 5.9%
Cyprus SE 8.7% 12.9% 10.1% 4.8% 5.6% 4.8%
Deutsche Börse 109.5% 99.9% 134.5% 93.3% 124.5% 100.3%
Egyptian Exchange 54.1% 0.0% 21.0% 27.8% 35.6% 44.1%
Irish SE 15.0% 14.0% 14.0% 9.7% 13.0% 11.7%
Istanbul SE 200.2% 185.0% 212.8% 171.4% 167.1% 129.2%
Johannesburg SE 29.0% 30.9% 34.9% 24.1% 26.8% 30.8%
Ljubljana SE 6.0% 9.1% 9.6% 4.1% 6.3% 7.3%
London SE Group 70.4% 65.8% 82.3% 52.9% 71.9% 69.4%
Luxembourg SE 0.2% 0.2% 0.1% 0.1% 0.1% 0.1%
Malta SE 2.1% 2.5% 1.2% 1.0% 1.1% 0.9%
Mauritius SE 5.8% 3.3% 3.6% 3.0% 5.6% 3.6%
MICEX 37.3% 48.8% 55.0% 49.5% 44.0% 42.2%
NASDAQ OMX Nordic Exchange 72.0% 84.0% 83.1% 60.6% 75.9% 72.5%
NYSE Euronext (Europe) 71.6% 68.5% 85.3% 57.8% 69.7% 65.2%
Oslo Børs 82.0% 79.9% 79.8% 53.4% 68.3% 58.7%
Saudi Stock Market - Tadawul 78.8% 67.7% 98.5% 99.6% 111.5% 76.7%
SIX Swiss Exchange 71.2% 71.7% 89.9% 62.9% 68.7% 62.9%
Tel-Aviv SE 57.7% 50.8% 49.4% 31.2% 40.1% 40.9%
Warsaw SE 43.8% 42.2% 48.8% 37.4% 45.5% 45.9%
Wiener Börse 35.6% 33.2% 49.4% 26.3% 29.0% 34.7%

Focus | December 2011 49
2011
July August September October November
1.1% 1.9% 0.7% 0.6% 1.2%
59.2% 91.7% 69.5% 70.8% 59.2%
5.4% 4.8% 4.1% 8.3% 3.9%
12.9% 16.2% 14.2% 15.6% 15.0%
3.6% 3.1% 5.1% 2.5% 5.8%
25.1% 33.5% 24.7% 24.9% 25.4%
268.8% 487.8% 365.2% 318.2% 276.1%
118.3% 198.8% 172.7% 143.8% 132.0%
14.9% 17.2% 15.1% 13.5% 16.9%
54.2% 85.8% 86.1% 69.1% 68.4%
78.9% 118.8% 102.5% 82.7% 83.1%
10.8% 10.4% 10.6% 8.2% 9.2%
31.4% 42.9% 30.0% 26.8% 27.3%
17.0% 28.8% 28.6% 13.3% 11.2%
48.2% 74.1% 66.1% 58.8% 53.9%
28.4% 36.7% 31.9% 28.4% 22.0%
167.7% 240.9% 187.0% 195.0% 186.2%
42.4% 47.1% 47.9% 37.6% 44.3%
80.5% 89.9% 68.4% 64.6% 65.1%
18.4% 20.4% 17.0% 13.5% 17.0%
155.3% 135.1% 92.7% 81.1% 124.5%
266.4% 250.5% 162.4% 145.7% 256.8%
40.9% 64.4% 49.3% 43.7% 41.8%
122.0% 162.9% 126.8% 101.1% 115.3%
80.1% 105.2% 90.6% 74.8% 68.8%
95.4% 136.0% 106.7% 95.2% 92.5%
13.7% 10.7% 12.6% 10.9% 8.9%
41.6% 44.1% 41.9% 37.2% 44.8%
123.2% 102.1% 85.1% 110.1% 100.0%
61.2% 104.1% 98.8% 68.7% 80.0%
1.5% 6.1% 6.5% 5.0% 5.7%
7.5% 15.1% 8.9% 8.7% 11.7%
104.1% 193.5% 151.5% 114.4% 116.9%
26.1% 22.0% 22.5% 19.6% 15.6%
12.7% 11.5% 9.9% 5.2% 9.1%
110.5% 164.0% 155.9% 144.4% 117.7%
26.4% 34.9% 36.9% 28.5% 28.2%
4.9% 8.0% 10.1% 4.1% 5.6%
63.7% 87.4% 73.7% 62.2% 63.5%
0.1% 0.1% 0.2% 0.1% 0.1%
0.7% 1.3% 0.8% 1.5% 1.9%
3.5% 5.7% 2.9% 13.6% 22.3%
40.8% 75.2% 73.2% 73.2% 66.5%
68.8% 127.3% 90.4% 80.9% 78.7%
69.4% 103.3% 87.7% 70.3% 70.4%
56.2% 100.1% 87.2% 77.0% 76.9%
62.7% 52.6% 73.0% 114.0% 84.2%
65.5% 110.6% 86.9% 60.4% 61.6%
35.2% 44.4% 37.6% 37.1% 38.0%
40.0% 61.9% 55.3% 47.8% 49.2%
33.0% 52.9% 44.5% 34.3% 35.5%
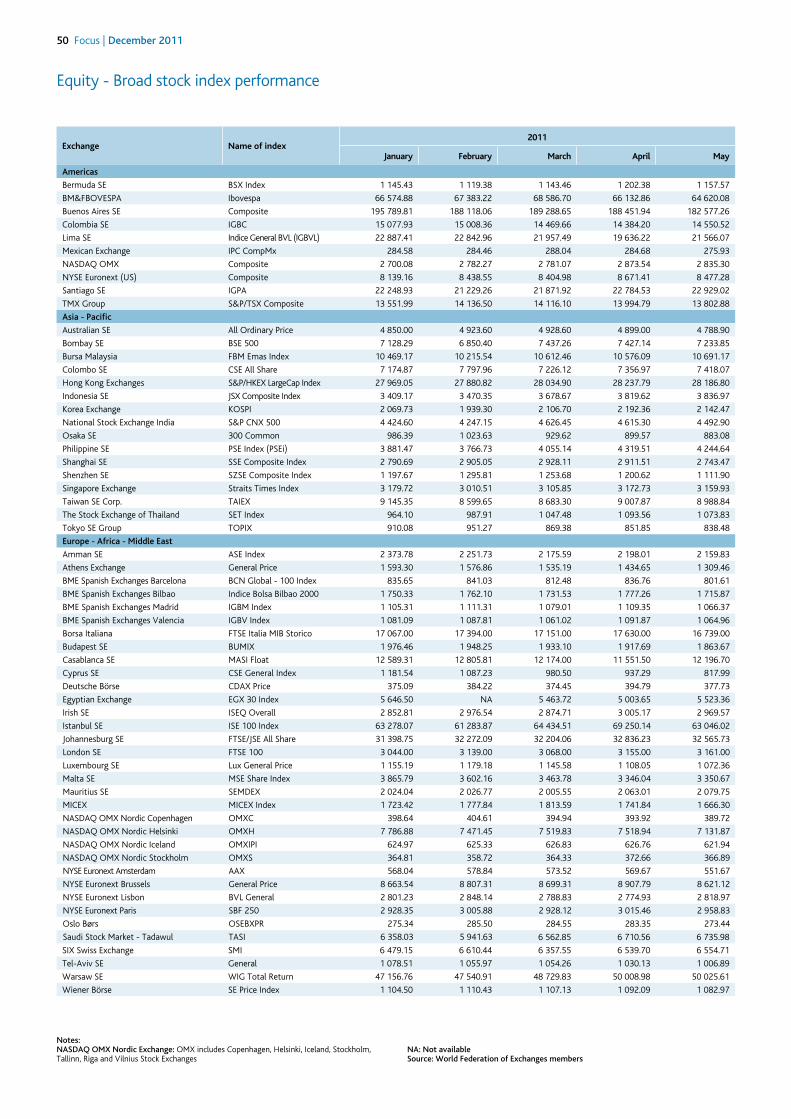
50 Focus | December 2011
Exchange Name of index2011
January February March April May
Americas
Bermuda SE BSX Index 1 145.43 1 119.38 1 143.46 1 202.38 1 157.57
BM&FBOVESPA Ibovespa 66 574.88 67 383.22 68 586.70 66 132.86 64 620.08
Buenos Aires SE Composite 195 789.81 188 118.06 189 288.65 188 451.94 182 577.26
Colombia SE IGBC 15 077.93 15 008.36 14 469.66 14 384.20 14 550.52
Lima SE Indice General BVL (IGBVL) 22 887.41 22 842.96 21 957.49 19 636.22 21 566.07
Mexican Exchange IPC CompMx 284.58 284.46 288.04 284.68 275.93
NASDAQ OMX Composite 2 700.08 2 782.27 2 781.07 2 873.54 2 835.30
NYSE Euronext (US) Composite 8 139.16 8 438.55 8 404.98 8 671.41 8 477.28
Santiago SE IGPA 22 248.93 21 229.26 21 871.92 22 784.53 22 929.02
TMX Group S&P/TSX Composite 13 551.99 14 136.50 14 116.10 13 994.79 13 802.88
Asia - Pacific
Australian SE All Ordinary Price 4 850.00 4 923.60 4 928.60 4 899.00 4 788.90
Bombay SE BSE 500 7 128.29 6 850.40 7 437.26 7 427.14 7 233.85
Bursa Malaysia FBM Emas Index 10 469.17 10 215.54 10 612.46 10 576.09 10 691.17
Colombo SE CSE All Share 7 174.87 7 797.96 7 226.12 7 356.97 7 418.07
Hong Kong Exchanges S&P/HKEX LargeCap Index 27 969.05 27 880.82 28 034.90 28 237.79 28 186.80
Indonesia SE JSX Composite Index 3 409.17 3 470.35 3 678.67 3 819.62 3 836.97
Korea Exchange KOSPI 2 069.73 1 939.30 2 106.70 2 192.36 2 142.47
National Stock Exchange India S&P CNX 500 4 424.60 4 247.15 4 626.45 4 615.30 4 492.90
Osaka SE 300 Common 986.39 1 023.63 929.62 899.57 883.08
Philippine SE PSE Index (PSEi) 3 881.47 3 766.73 4 055.14 4 319.51 4 244.64
Shanghai SE SSE Composite Index 2 790.69 2 905.05 2 928.11 2 911.51 2 743.47
Shenzhen SE SZSE Composite Index 1 197.67 1 295.81 1 253.68 1 200.62 1 111.90
Singapore Exchange Straits Times Index 3 179.72 3 010.51 3 105.85 3 172.73 3 159.93
Taiwan SE Corp. TAIEX 9 145.35 8 599.65 8 683.30 9 007.87 8 988.84
The Stock Exchange of Thailand SET Index 964.10 987.91 1 047.48 1 093.56 1 073.83
Tokyo SE Group TOPIX 910.08 951.27 869.38 851.85 838.48
Europe - Africa - Middle East
Amman SE ASE Index 2 373.78 2 251.73 2 175.59 2 198.01 2 159.83
Athens Exchange General Price 1 593.30 1 576.86 1 535.19 1 434.65 1 309.46
BME Spanish Exchanges Barcelona BCN Global - 100 Index 835.65 841.03 812.48 836.76 801.61
BME Spanish Exchanges Bilbao Indice Bolsa Bilbao 2000 1 750.33 1 762.10 1 731.53 1 777.26 1 715.87
BME Spanish Exchanges Madrid IGBM Index 1 105.31 1 111.31 1 079.01 1 109.35 1 066.37
BME Spanish Exchanges Valencia IGBV Index 1 081.09 1 087.81 1 061.02 1 091.87 1 064.96
Borsa Italiana FTSE Italia MIB Storico 17 067.00 17 394.00 17 151.00 17 630.00 16 739.00
Budapest SE BUMIX 1 976.46 1 948.25 1 933.10 1 917.69 1 863.67
Casablanca SE MASI Float 12 589.31 12 805.81 12 174.00 11 551.50 12 196.70
Cyprus SE CSE General Index 1 181.54 1 087.23 980.50 937.29 817.99
Deutsche Börse CDAX Price 375.09 384.22 374.45 394.79 377.73
Egyptian Exchange EGX 30 Index 5 646.50 NA 5 463.72 5 003.65 5 523.36
Irish SE ISEQ Overall 2 852.81 2 976.54 2 874.71 3 005.17 2 969.57
Istanbul SE ISE 100 Index 63 278.07 61 283.87 64 434.51 69 250.14 63 046.02
Johannesburg SE FTSE/JSE All Share 31 398.75 32 272.09 32 204.06 32 836.23 32 565.73
London SE FTSE 100 3 044.00 3 139.00 3 068.00 3 155.00 3 161.00
Luxembourg SE Lux General Price 1 155.19 1 179.18 1 145.58 1 108.05 1 072.36
Malta SE MSE Share Index 3 865.79 3 602.16 3 463.78 3 346.04 3 350.67
Mauritius SE SEMDEX 2 024.04 2 026.77 2 005.55 2 063.01 2 079.75
MICEX MICEX Index 1 723.42 1 777.84 1 813.59 1 741.84 1 666.30
NASDAQ OMX Nordic Copenhagen OMXC 398.64 404.61 394.94 393.92 389.72
NASDAQ OMX Nordic Helsinki OMXH 7 786.88 7 471.45 7 519.83 7 518.94 7 131.87
NASDAQ OMX Nordic Iceland OMXIPI 624.97 625.33 626.83 626.76 621.94
NASDAQ OMX Nordic Stockholm OMXS 364.81 358.72 364.33 372.66 366.89
NYSE Euronext Amsterdam AAX 568.04 578.84 573.52 569.67 551.67
NYSE Euronext Brussels General Price 8 663.54 8 807.31 8 699.31 8 907.79 8 621.12
NYSE Euronext Lisbon BVL General 2 801.23 2 848.14 2 788.83 2 774.93 2 818.97
NYSE Euronext Paris SBF 250 2 928.35 3 005.88 2 928.12 3 015.46 2 958.83
Oslo Børs OSEBXPR 275.34 285.50 284.55 283.35 273.44
Saudi Stock Market - Tadawul TASI 6 358.03 5 941.63 6 562.85 6 710.56 6 735.98
SIX Swiss Exchange SMI 6 479.15 6 610.44 6 357.55 6 539.70 6 554.71
Tel-Aviv SE General 1 078.51 1 055.97 1 054.26 1 030.13 1 006.89
Warsaw SE WIG Total Return 47 156.76 47 540.91 48 729.83 50 008.98 50 025.61
Wiener Börse SE Price Index 1 104.50 1 110.43 1 107.13 1 092.09 1 082.97
Equity - Broad stock index performance
Notes: NASDAQ OMX Nordic Exchange: OMX includes Copenhagen, Helsinki, Iceland, Stockholm, Tallinn, Riga and Vilnius Stock Exchanges
NA: Not availableSource: World Federation of Exchanges members
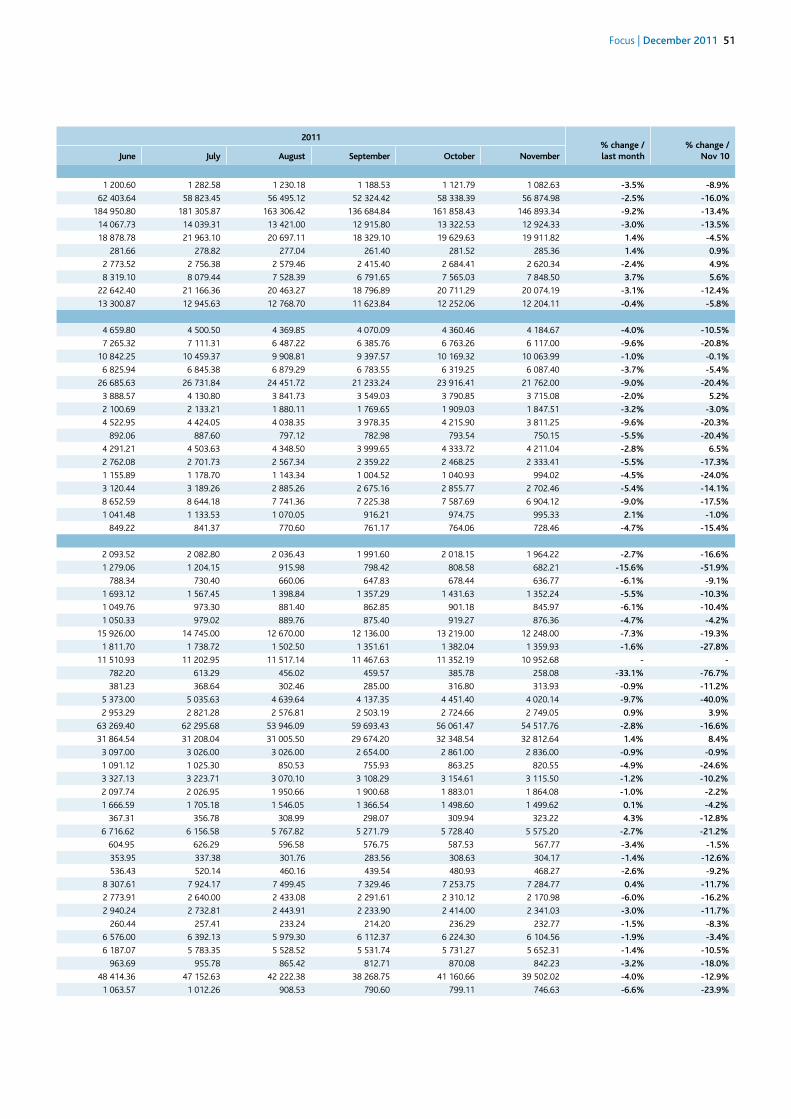
Focus | December 2011 51
2011% change /last month
% change / Nov 10June July August September October November
1 200.60 1 282.58 1 230.18 1 188.53 1 121.79 1 082.63 -3.5% -8.9%
62 403.64 58 823.45 56 495.12 52 324.42 58 338.39 56 874.98 -2.5% -16.0%
184 950.80 181 305.87 163 306.42 136 684.84 161 858.43 146 893.34 -9.2% -13.4%
14 067.73 14 039.31 13 421.00 12 915.80 13 322.53 12 924.33 -3.0% -13.5%
18 878.78 21 963.10 20 697.11 18 329.10 19 629.63 19 911.82 1.4% -4.5%
281.66 278.82 277.04 261.40 281.52 285.36 1.4% 0.9%
2 773.52 2 756.38 2 579.46 2 415.40 2 684.41 2 620.34 -2.4% 4.9%
8 319.10 8 079.44 7 528.39 6 791.65 7 565.03 7 848.50 3.7% 5.6%
22 642.40 21 166.36 20 463.27 18 796.89 20 711.29 20 074.19 -3.1% -12.4%
13 300.87 12 945.63 12 768.70 11 623.84 12 252.06 12 204.11 -0.4% -5.8%
4 659.80 4 500.50 4 369.85 4 070.09 4 360.46 4 184.67 -4.0% -10.5%
7 265.32 7 111.31 6 487.22 6 385.76 6 763.26 6 117.00 -9.6% -20.8%
10 842.25 10 459.37 9 908.81 9 397.57 10 169.32 10 063.99 -1.0% -0.1%
6 825.94 6 845.38 6 879.29 6 783.55 6 319.25 6 087.40 -3.7% -5.4%
26 685.63 26 731.84 24 451.72 21 233.24 23 916.41 21 762.00 -9.0% -20.4%
3 888.57 4 130.80 3 841.73 3 549.03 3 790.85 3 715.08 -2.0% 5.2%
2 100.69 2 133.21 1 880.11 1 769.65 1 909.03 1 847.51 -3.2% -3.0%
4 522.95 4 424.05 4 038.35 3 978.35 4 215.90 3 811.25 -9.6% -20.3%
892.06 887.60 797.12 782.98 793.54 750.15 -5.5% -20.4%
4 291.21 4 503.63 4 348.50 3 999.65 4 333.72 4 211.04 -2.8% 6.5%
2 762.08 2 701.73 2 567.34 2 359.22 2 468.25 2 333.41 -5.5% -17.3%
1 155.89 1 178.70 1 143.34 1 004.52 1 040.93 994.02 -4.5% -24.0%
3 120.44 3 189.26 2 885.26 2 675.16 2 855.77 2 702.46 -5.4% -14.1%
8 652.59 8 644.18 7 741.36 7 225.38 7 587.69 6 904.12 -9.0% -17.5%
1 041.48 1 133.53 1 070.05 916.21 974.75 995.33 2.1% -1.0%
849.22 841.37 770.60 761.17 764.06 728.46 -4.7% -15.4%
2 093.52 2 082.80 2 036.43 1 991.60 2 018.15 1 964.22 -2.7% -16.6%
1 279.06 1 204.15 915.98 798.42 808.58 682.21 -15.6% -51.9%
788.34 730.40 660.06 647.83 678.44 636.77 -6.1% -9.1%
1 693.12 1 567.45 1 398.84 1 357.29 1 431.63 1 352.24 -5.5% -10.3%
1 049.76 973.30 881.40 862.85 901.18 845.97 -6.1% -10.4%
1 050.33 979.02 889.76 875.40 919.27 876.36 -4.7% -4.2%
15 926.00 14 745.00 12 670.00 12 136.00 13 219.00 12 248.00 -7.3% -19.3%
1 811.70 1 738.72 1 502.50 1 351.61 1 382.04 1 359.93 -1.6% -27.8%
11 510.93 11 202.95 11 517.14 11 467.63 11 352.19 10 952.68 - -
782.20 613.29 456.02 459.57 385.78 258.08 -33.1% -76.7%
381.23 368.64 302.46 285.00 316.80 313.93 -0.9% -11.2%
5 373.00 5 035.63 4 639.64 4 137.35 4 451.40 4 020.14 -9.7% -40.0%
2 953.29 2 821.28 2 576.81 2 503.19 2 724.66 2 749.05 0.9% 3.9%
63 269.40 62 295.68 53 946.09 59 693.43 56 061.47 54 517.76 -2.8% -16.6%
31 864.54 31 208.04 31 005.50 29 674.20 32 348.54 32 812.64 1.4% 8.4%
3 097.00 3 026.00 3 026.00 2 654.00 2 861.00 2 836.00 -0.9% -0.9%
1 091.12 1 025.30 850.53 755.93 863.25 820.55 -4.9% -24.6%
3 327.13 3 223.71 3 070.10 3 108.29 3 154.61 3 115.50 -1.2% -10.2%
2 097.74 2 026.95 1 950.66 1 900.68 1 883.01 1 864.08 -1.0% -2.2%
1 666.59 1 705.18 1 546.05 1 366.54 1 498.60 1 499.62 0.1% -4.2%
367.31 356.78 308.99 298.07 309.94 323.22 4.3% -12.8%
6 716.62 6 156.58 5 767.82 5 271.79 5 728.40 5 575.20 -2.7% -21.2%
604.95 626.29 596.58 576.75 587.53 567.77 -3.4% -1.5%
353.95 337.38 301.76 283.56 308.63 304.17 -1.4% -12.6%
536.43 520.14 460.16 439.54 480.93 468.27 -2.6% -9.2%
8 307.61 7 924.17 7 499.45 7 329.46 7 253.75 7 284.77 0.4% -11.7%
2 773.91 2 640.00 2 433.08 2 291.61 2 310.12 2 170.98 -6.0% -16.2%
2 940.24 2 732.81 2 443.91 2 233.90 2 414.00 2 341.03 -3.0% -11.7%
260.44 257.41 233.24 214.20 236.29 232.77 -1.5% -8.3%
6 576.00 6 392.13 5 979.30 6 112.37 6 224.30 6 104.56 -1.9% -3.4%
6 187.07 5 783.35 5 528.52 5 531.74 5 731.27 5 652.31 -1.4% -10.5%
963.69 955.78 865.42 812.71 870.08 842.23 -3.2% -18.0%
48 414.36 47 152.63 42 222.38 38 268.75 41 160.66 39 502.02 -4.0% -12.9%
1 063.57 1 012.26 908.53 790.60 799.11 746.63 -6.6% -23.9%
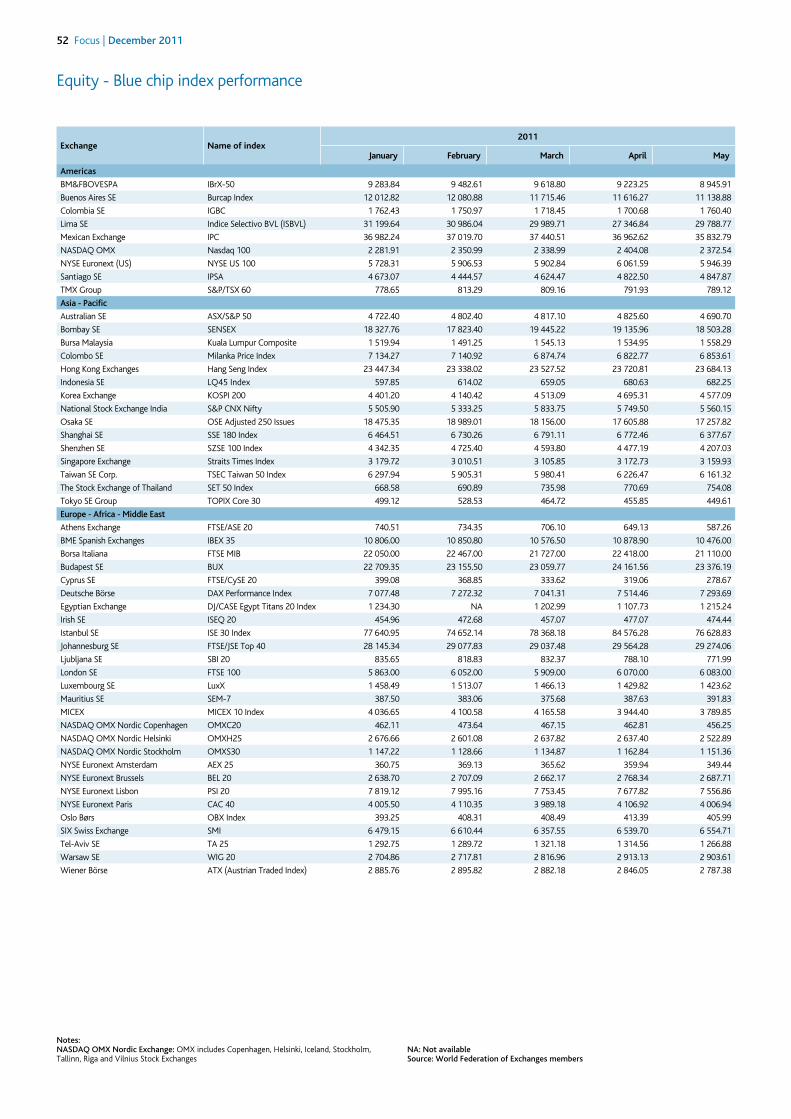
52 Focus | December 2011
Notes: NASDAQ OMX Nordic Exchange: OMX includes Copenhagen, Helsinki, Iceland, Stockholm, Tallinn, Riga and Vilnius Stock Exchanges
NA: Not availableSource: World Federation of Exchanges members
Equity - Blue chip index performance
Exchange Name of index2011
January February March April May
Americas
BM&FBOVESPA IBrX-50 9 283.84 9 482.61 9 618.80 9 223.25 8 945.91
Buenos Aires SE Burcap Index 12 012.82 12 080.88 11 715.46 11 616.27 11 138.88
Colombia SE IGBC 1 762.43 1 750.97 1 718.45 1 700.68 1 760.40
Lima SE Indice Selectivo BVL (ISBVL) 31 199.64 30 986.04 29 989.71 27 346.84 29 788.77
Mexican Exchange IPC 36 982.24 37 019.70 37 440.51 36 962.62 35 832.79
NASDAQ OMX Nasdaq 100 2 281.91 2 350.99 2 338.99 2 404.08 2 372.54
NYSE Euronext (US) NYSE US 100 5 728.31 5 906.53 5 902.84 6 061.59 5 946.39
Santiago SE IPSA 4 673.07 4 444.57 4 624.47 4 822.50 4 847.87
TMX Group S&P/TSX 60 778.65 813.29 809.16 791.93 789.12
Asia - Pacific
Australian SE ASX/S&P 50 4 722.40 4 802.40 4 817.10 4 825.60 4 690.70
Bombay SE SENSEX 18 327.76 17 823.40 19 445.22 19 135.96 18 503.28
Bursa Malaysia Kuala Lumpur Composite 1 519.94 1 491.25 1 545.13 1 534.95 1 558.29
Colombo SE Milanka Price Index 7 134.27 7 140.92 6 874.74 6 822.77 6 853.61
Hong Kong Exchanges Hang Seng Index 23 447.34 23 338.02 23 527.52 23 720.81 23 684.13
Indonesia SE LQ45 Index 597.85 614.02 659.05 680.63 682.25
Korea Exchange KOSPI 200 4 401.20 4 140.42 4 513.09 4 695.31 4 577.09
National Stock Exchange India S&P CNX Nifty 5 505.90 5 333.25 5 833.75 5 749.50 5 560.15
Osaka SE OSE Adjusted 250 Issues 18 475.35 18 989.01 18 156.00 17 605.88 17 257.82
Shanghai SE SSE 180 Index 6 464.51 6 730.26 6 791.11 6 772.46 6 377.67
Shenzhen SE SZSE 100 Index 4 342.35 4 725.40 4 593.80 4 477.19 4 207.03
Singapore Exchange Straits Times Index 3 179.72 3 010.51 3 105.85 3 172.73 3 159.93
Taiwan SE Corp. TSEC Taiwan 50 Index 6 297.94 5 905.31 5 980.41 6 226.47 6 161.32
The Stock Exchange of Thailand SET 50 Index 668.58 690.89 735.98 770.69 754.08
Tokyo SE Group TOPIX Core 30 499.12 528.53 464.72 455.85 449.61
Europe - Africa - Middle East
Athens Exchange FTSE/ASE 20 740.51 734.35 706.10 649.13 587.26
BME Spanish Exchanges IBEX 35 10 806.00 10 850.80 10 576.50 10 878.90 10 476.00
Borsa Italiana FTSE MIB 22 050.00 22 467.00 21 727.00 22 418.00 21 110.00
Budapest SE BUX 22 709.35 23 155.50 23 059.77 24 161.56 23 376.19
Cyprus SE FTSE/CySE 20 399.08 368.85 333.62 319.06 278.67
Deutsche Börse DAX Performance Index 7 077.48 7 272.32 7 041.31 7 514.46 7 293.69
Egyptian Exchange DJ/CASE Egypt Titans 20 Index 1 234.30 NA 1 202.99 1 107.73 1 215.24
Irish SE ISEQ 20 454.96 472.68 457.07 477.07 474.44
Istanbul SE ISE 30 Index 77 640.95 74 652.14 78 368.18 84 576.28 76 628.83
Johannesburg SE FTSE/JSE Top 40 28 145.34 29 077.83 29 037.48 29 564.28 29 274.06
Ljubljana SE SBI 20 835.65 818.83 832.37 788.10 771.99
London SE FTSE 100 5 863.00 6 052.00 5 909.00 6 070.00 6 083.00
Luxembourg SE LuxX 1 458.49 1 513.07 1 466.13 1 429.82 1 423.62
Mauritius SE SEM-7 387.50 383.06 375.68 387.63 391.83
MICEX MICEX 10 Index 4 036.65 4 100.58 4 165.58 3 944.40 3 789.85
NASDAQ OMX Nordic Copenhagen OMXC20 462.11 473.64 467.15 462.81 456.25
NASDAQ OMX Nordic Helsinki OMXH25 2 676.66 2 601.08 2 637.82 2 637.40 2 522.89
NASDAQ OMX Nordic Stockholm OMXS30 1 147.22 1 128.66 1 134.87 1 162.84 1 151.36
NYSE Euronext Amsterdam AEX 25 360.75 369.13 365.62 359.94 349.44
NYSE Euronext Brussels BEL 20 2 638.70 2 707.09 2 662.17 2 768.34 2 687.71
NYSE Euronext Lisbon PSI 20 7 819.12 7 995.16 7 753.45 7 677.82 7 556.86
NYSE Euronext Paris CAC 40 4 005.50 4 110.35 3 989.18 4 106.92 4 006.94
Oslo Børs OBX Index 393.25 408.31 408.49 413.39 405.99
SIX Swiss Exchange SMI 6 479.15 6 610.44 6 357.55 6 539.70 6 554.71
Tel-Aviv SE TA 25 1 292.75 1 289.72 1 321.18 1 314.56 1 266.88
Warsaw SE WIG 20 2 704.86 2 717.81 2 816.96 2 913.13 2 903.61
Wiener Börse ATX (Austrian Traded Index) 2 885.76 2 895.82 2 882.18 2 846.05 2 787.38
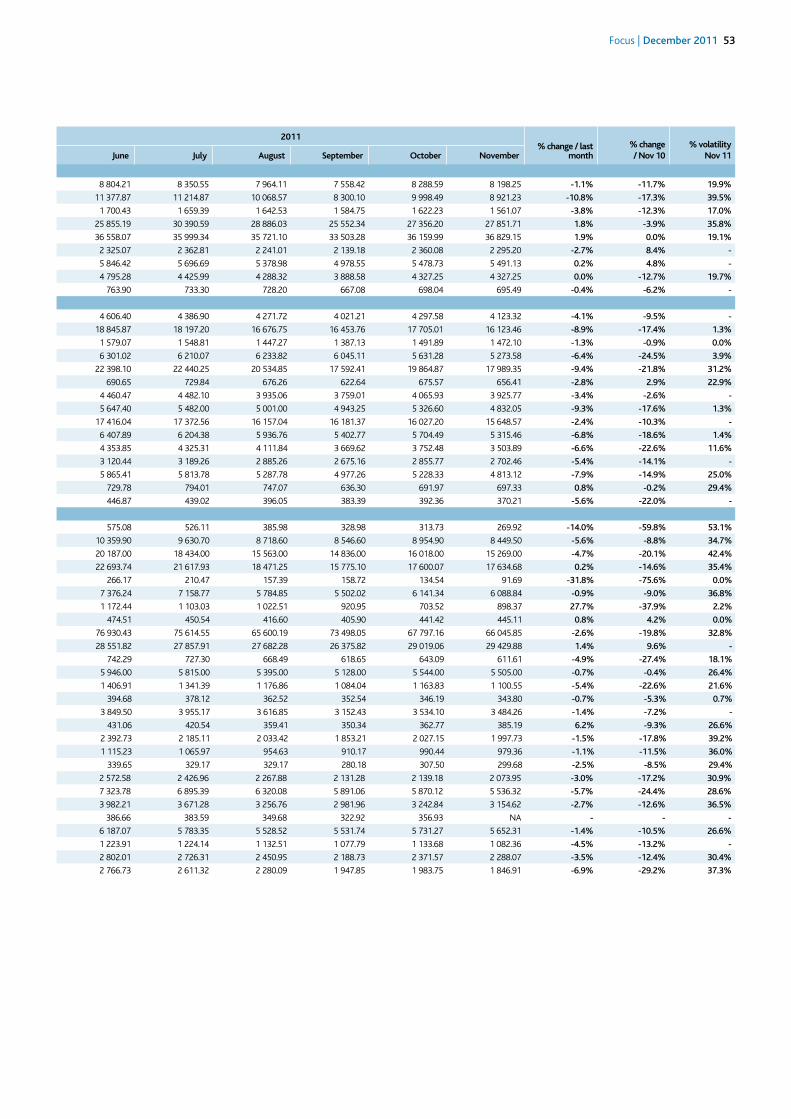
Focus | December 2011 53
2011% change / last
month% change/ Nov 10
% volatilityNov 11June July August September October November
8 804.21 8 350.55 7 964.11 7 558.42 8 288.59 8 198.25 -1.1% -11.7% 19.9%
11 377.87 11 214.87 10 068.57 8 300.10 9 998.49 8 921.23 -10.8% -17.3% 39.5%
1 700.43 1 659.39 1 642.53 1 584.75 1 622.23 1 561.07 -3.8% -12.3% 17.0%
25 855.19 30 390.59 28 886.03 25 552.34 27 356.20 27 851.71 1.8% -3.9% 35.8%
36 558.07 35 999.34 35 721.10 33 503.28 36 159.99 36 829.15 1.9% 0.0% 19.1%
2 325.07 2 362.81 2 241.01 2 139.18 2 360.08 2 295.20 -2.7% 8.4% -
5 846.42 5 696.69 5 378.98 4 978.55 5 478.73 5 491.13 0.2% 4.8% -
4 795.28 4 425.99 4 288.32 3 888.58 4 327.25 4 327.25 0.0% -12.7% 19.7%
763.90 733.30 728.20 667.08 698.04 695.49 -0.4% -6.2% -
4 606.40 4 386.90 4 271.72 4 021.21 4 297.58 4 123.32 -4.1% -9.5% -
18 845.87 18 197.20 16 676.75 16 453.76 17 705.01 16 123.46 -8.9% -17.4% 1.3%
1 579.07 1 548.81 1 447.27 1 387.13 1 491.89 1 472.10 -1.3% -0.9% 0.0%
6 301.02 6 210.07 6 233.82 6 045.11 5 631.28 5 273.58 -6.4% -24.5% 3.9%
22 398.10 22 440.25 20 534.85 17 592.41 19 864.87 17 989.35 -9.4% -21.8% 31.2%
690.65 729.84 676.26 622.64 675.57 656.41 -2.8% 2.9% 22.9%
4 460.47 4 482.10 3 935.06 3 759.01 4 065.93 3 925.77 -3.4% -2.6% -
5 647.40 5 482.00 5 001.00 4 943.25 5 326.60 4 832.05 -9.3% -17.6% 1.3%
17 416.04 17 372.56 16 157.04 16 181.37 16 027.20 15 648.57 -2.4% -10.3% -
6 407.89 6 204.38 5 936.76 5 402.77 5 704.49 5 315.46 -6.8% -18.6% 1.4%
4 353.85 4 325.31 4 111.84 3 669.62 3 752.48 3 503.89 -6.6% -22.6% 11.6%
3 120.44 3 189.26 2 885.26 2 675.16 2 855.77 2 702.46 -5.4% -14.1% -
5 865.41 5 813.78 5 287.78 4 977.26 5 228.33 4 813.12 -7.9% -14.9% 25.0%
729.78 794.01 747.07 636.30 691.97 697.33 0.8% -0.2% 29.4%
446.87 439.02 396.05 383.39 392.36 370.21 -5.6% -22.0% -
575.08 526.11 385.98 328.98 313.73 269.92 -14.0% -59.8% 53.1%
10 359.90 9 630.70 8 718.60 8 546.60 8 954.90 8 449.50 -5.6% -8.8% 34.7%
20 187.00 18 434.00 15 563.00 14 836.00 16 018.00 15 269.00 -4.7% -20.1% 42.4%
22 693.74 21 617.93 18 471.25 15 775.10 17 600.07 17 634.68 0.2% -14.6% 35.4%
266.17 210.47 157.39 158.72 134.54 91.69 -31.8% -75.6% 0.0%
7 376.24 7 158.77 5 784.85 5 502.02 6 141.34 6 088.84 -0.9% -9.0% 36.8%
1 172.44 1 103.03 1 022.51 920.95 703.52 898.37 27.7% -37.9% 2.2%
474.51 450.54 416.60 405.90 441.42 445.11 0.8% 4.2% 0.0%
76 930.43 75 614.55 65 600.19 73 498.05 67 797.16 66 045.85 -2.6% -19.8% 32.8%
28 551.82 27 857.91 27 682.28 26 375.82 29 019.06 29 429.88 1.4% 9.6% -
742.29 727.30 668.49 618.65 643.09 611.61 -4.9% -27.4% 18.1%
5 946.00 5 815.00 5 395.00 5 128.00 5 544.00 5 505.00 -0.7% -0.4% 26.4%
1 406.91 1 341.39 1 176.86 1 084.04 1 163.83 1 100.55 -5.4% -22.6% 21.6%
394.68 378.12 362.52 352.54 346.19 343.80 -0.7% -5.3% 0.7%
3 849.50 3 955.17 3 616.85 3 152.43 3 534.10 3 484.26 -1.4% -7.2% -
431.06 420.54 359.41 350.34 362.77 385.19 6.2% -9.3% 26.6%
2 392.73 2 185.11 2 033.42 1 853.21 2 027.15 1 997.73 -1.5% -17.8% 39.2%
1 115.23 1 065.97 954.63 910.17 990.44 979.36 -1.1% -11.5% 36.0%
339.65 329.17 329.17 280.18 307.50 299.68 -2.5% -8.5% 29.4%
2 572.58 2 426.96 2 267.88 2 131.28 2 139.18 2 073.95 -3.0% -17.2% 30.9%
7 323.78 6 895.39 6 320.08 5 891.06 5 870.12 5 536.32 -5.7% -24.4% 28.6%
3 982.21 3 671.28 3 256.76 2 981.96 3 242.84 3 154.62 -2.7% -12.6% 36.5%
386.66 383.59 349.68 322.92 356.93 NA - - -
6 187.07 5 783.35 5 528.52 5 531.74 5 731.27 5 652.31 -1.4% -10.5% 26.6%
1 223.91 1 224.14 1 132.51 1 077.79 1 133.68 1 082.36 -4.5% -13.2% -
2 802.01 2 726.31 2 450.95 2 188.73 2 371.57 2 288.07 -3.5% -12.4% 30.4%
2 766.73 2 611.32 2 280.09 1 947.85 1 983.75 1 846.91 -6.9% -29.2% 37.3%
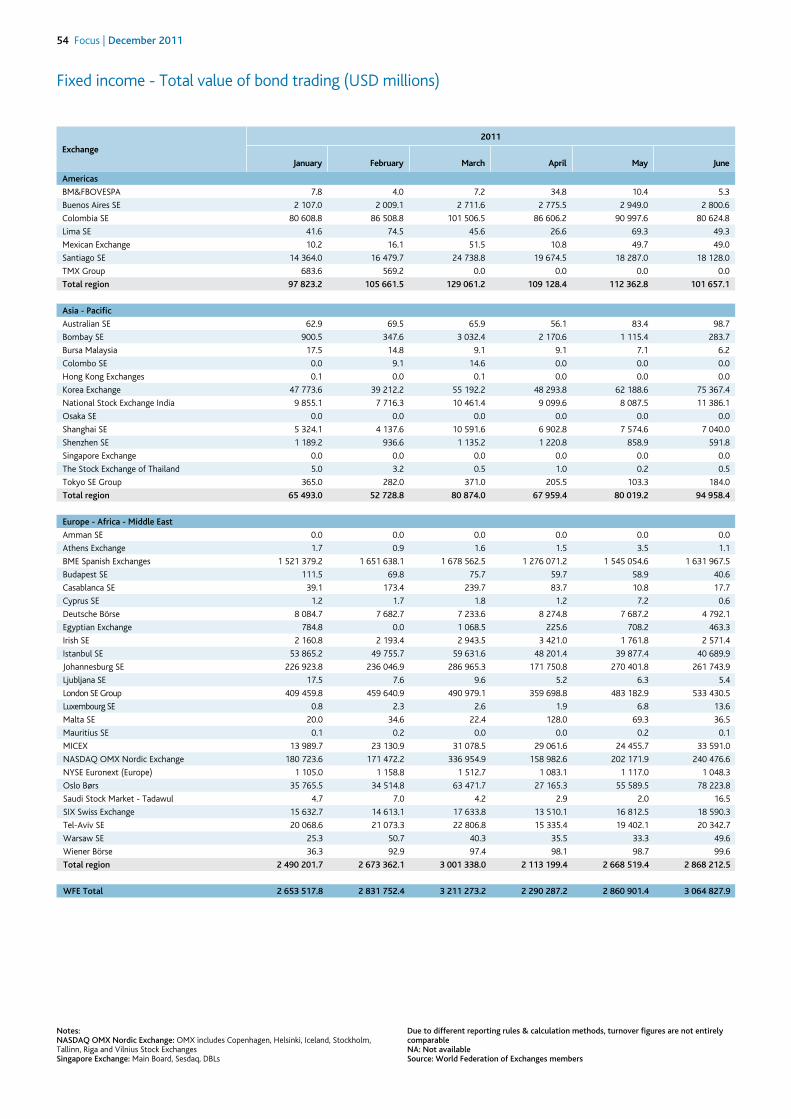
54 Focus | December 2011
Fixed income - Total value of bond trading (USD millions)
Exchange2011
January February March April May June
Americas
BM&FBOVESPA 7.8 4.0 7.2 34.8 10.4 5.3
Buenos Aires SE 2 107.0 2 009.1 2 711.6 2 775.5 2 949.0 2 800.6
Colombia SE 80 608.8 86 508.8 101 506.5 86 606.2 90 997.6 80 624.8
Lima SE 41.6 74.5 45.6 26.6 69.3 49.3
Mexican Exchange 10.2 16.1 51.5 10.8 49.7 49.0
Santiago SE 14 364.0 16 479.7 24 738.8 19 674.5 18 287.0 18 128.0
TMX Group 683.6 569.2 0.0 0.0 0.0 0.0
Total region 97 823.2 105 661.5 129 061.2 109 128.4 112 362.8 101 657.1
Asia - Pacific
Australian SE 62.9 69.5 65.9 56.1 83.4 98.7
Bombay SE 900.5 347.6 3 032.4 2 170.6 1 115.4 283.7
Bursa Malaysia 17.5 14.8 9.1 9.1 7.1 6.2
Colombo SE 0.0 9.1 14.6 0.0 0.0 0.0
Hong Kong Exchanges 0.1 0.0 0.1 0.0 0.0 0.0
Korea Exchange 47 773.6 39 212.2 55 192.2 48 293.8 62 188.6 75 367.4
National Stock Exchange India 9 855.1 7 716.3 10 461.4 9 099.6 8 087.5 11 386.1
Osaka SE 0.0 0.0 0.0 0.0 0.0 0.0
Shanghai SE 5 324.1 4 137.6 10 591.6 6 902.8 7 574.6 7 040.0
Shenzhen SE 1 189.2 936.6 1 135.2 1 220.8 858.9 591.8
Singapore Exchange 0.0 0.0 0.0 0.0 0.0 0.0
The Stock Exchange of Thailand 5.0 3.2 0.5 1.0 0.2 0.5
Tokyo SE Group 365.0 282.0 371.0 205.5 103.3 184.0
Total region 65 493.0 52 728.8 80 874.0 67 959.4 80 019.2 94 958.4
Europe - Africa - Middle East
Amman SE 0.0 0.0 0.0 0.0 0.0 0.0
Athens Exchange 1.7 0.9 1.6 1.5 3.5 1.1
BME Spanish Exchanges 1 521 379.2 1 651 638.1 1 678 562.5 1 276 071.2 1 545 054.6 1 631 967.5
Budapest SE 111.5 69.8 75.7 59.7 58.9 40.6
Casablanca SE 39.1 173.4 239.7 83.7 10.8 17.7
Cyprus SE 1.2 1.7 1.8 1.2 7.2 0.6
Deutsche Börse 8 084.7 7 682.7 7 233.6 8 274.8 7 687.2 4 792.1
Egyptian Exchange 784.8 0.0 1 068.5 225.6 708.2 463.3
Irish SE 2 160.8 2 193.4 2 943.5 3 421.0 1 761.8 2 571.4
Istanbul SE 53 865.2 49 755.7 59 631.6 48 201.4 39 877.4 40 689.9
Johannesburg SE 226 923.8 236 046.9 286 965.3 171 750.8 270 401.8 261 743.9
Ljubljana SE 17.5 7.6 9.6 5.2 6.3 5.4
London SE Group 409 459.8 459 640.9 490 979.1 359 698.8 483 182.9 533 430.5
Luxembourg SE 0.8 2.3 2.6 1.9 6.8 13.6
Malta SE 20.0 34.6 22.4 128.0 69.3 36.5
Mauritius SE 0.1 0.2 0.0 0.0 0.2 0.1
MICEX 13 989.7 23 130.9 31 078.5 29 061.6 24 455.7 33 591.0
NASDAQ OMX Nordic Exchange 180 723.6 171 472.2 336 954.9 158 982.6 202 171.9 240 476.6
NYSE Euronext (Europe) 1 105.0 1 158.8 1 512.7 1 083.1 1 117.0 1 048.3
Oslo Børs 35 765.5 34 514.8 63 471.7 27 165.3 55 589.5 78 223.8
Saudi Stock Market - Tadawul 4.7 7.0 4.2 2.9 2.0 16.5
SIX Swiss Exchange 15 632.7 14 613.1 17 633.8 13 510.1 16 812.5 18 590.3
Tel-Aviv SE 20 068.6 21 073.3 22 806.8 15 335.4 19 402.1 20 342.7
Warsaw SE 25.3 50.7 40.3 35.5 33.3 49.6
Wiener Börse 36.3 92.9 97.4 98.1 98.7 99.6
Total region 2 490 201.7 2 673 362.1 3 001 338.0 2 113 199.4 2 668 519.4 2 868 212.5
WFE Total 2 653 517.8 2 831 752.4 3 211 273.2 2 290 287.2 2 860 901.4 3 064 827.9
Notes: NASDAQ OMX Nordic Exchange: OMX includes Copenhagen, Helsinki, Iceland, Stockholm, Tallinn, Riga and Vilnius Stock ExchangesSingapore Exchange: Main Board, Sesdaq, DBLs
Due to different reporting rules & calculation methods, turnover figures are not entirely comparableNA: Not availableSource: World Federation of Exchanges members
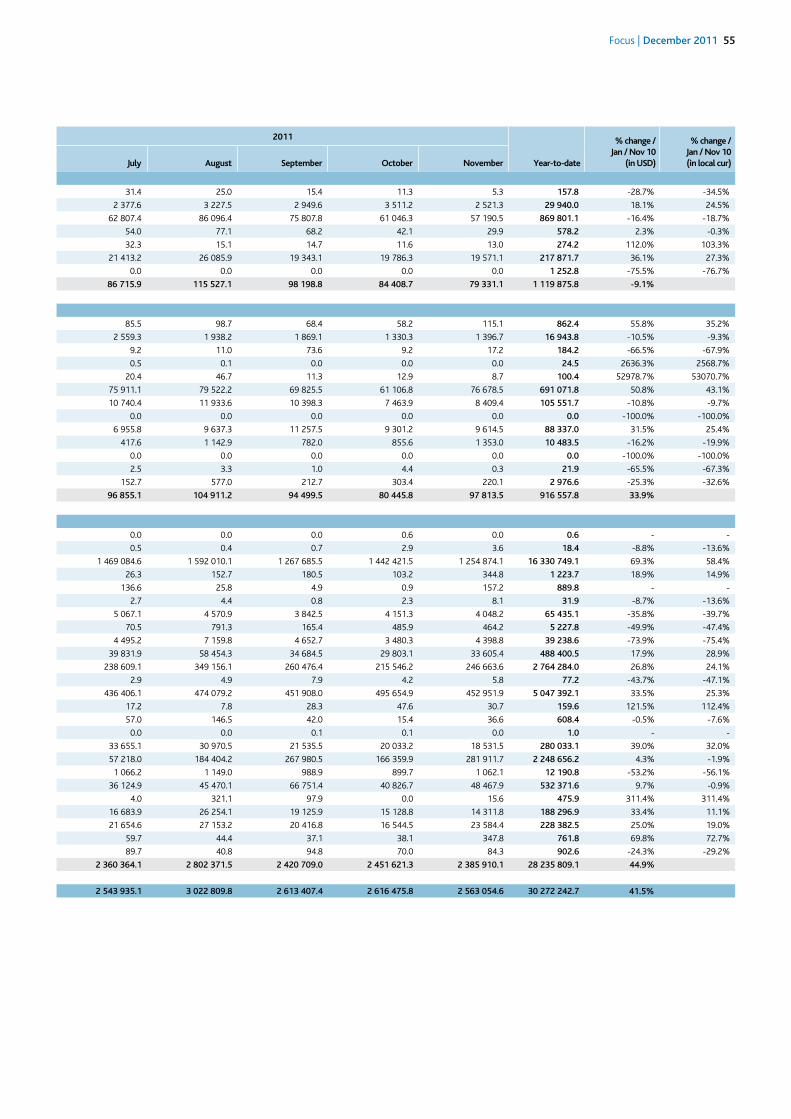
Focus | December 2011 55
2011
Year-to-date
% change /Jan / Nov 10
(in USD)
% change /Jan / Nov 10(in local cur)July August September October November
31.4 25.0 15.4 11.3 5.3 157.8 -28.7% -34.5%
2 377.6 3 227.5 2 949.6 3 511.2 2 521.3 29 940.0 18.1% 24.5%
62 807.4 86 096.4 75 807.8 61 046.3 57 190.5 869 801.1 -16.4% -18.7%
54.0 77.1 68.2 42.1 29.9 578.2 2.3% -0.3%
32.3 15.1 14.7 11.6 13.0 274.2 112.0% 103.3%
21 413.2 26 085.9 19 343.1 19 786.3 19 571.1 217 871.7 36.1% 27.3%
0.0 0.0 0.0 0.0 0.0 1 252.8 -75.5% -76.7%
86 715.9 115 527.1 98 198.8 84 408.7 79 331.1 1 119 875.8 -9.1%
85.5 98.7 68.4 58.2 115.1 862.4 55.8% 35.2%
2 559.3 1 938.2 1 869.1 1 330.3 1 396.7 16 943.8 -10.5% -9.3%
9.2 11.0 73.6 9.2 17.2 184.2 -66.5% -67.9%
0.5 0.1 0.0 0.0 0.0 24.5 2636.3% 2568.7%
20.4 46.7 11.3 12.9 8.7 100.4 52978.7% 53070.7%
75 911.1 79 522.2 69 825.5 61 106.8 76 678.5 691 071.8 50.8% 43.1%
10 740.4 11 933.6 10 398.3 7 463.9 8 409.4 105 551.7 -10.8% -9.7%
0.0 0.0 0.0 0.0 0.0 0.0 -100.0% -100.0%
6 955.8 9 637.3 11 257.5 9 301.2 9 614.5 88 337.0 31.5% 25.4%
417.6 1 142.9 782.0 855.6 1 353.0 10 483.5 -16.2% -19.9%
0.0 0.0 0.0 0.0 0.0 0.0 -100.0% -100.0%
2.5 3.3 1.0 4.4 0.3 21.9 -65.5% -67.3%
152.7 577.0 212.7 303.4 220.1 2 976.6 -25.3% -32.6%
96 855.1 104 911.2 94 499.5 80 445.8 97 813.5 916 557.8 33.9%
0.0 0.0 0.0 0.6 0.0 0.6 - -
0.5 0.4 0.7 2.9 3.6 18.4 -8.8% -13.6%
1 469 084.6 1 592 010.1 1 267 685.5 1 442 421.5 1 254 874.1 16 330 749.1 69.3% 58.4%
26.3 152.7 180.5 103.2 344.8 1 223.7 18.9% 14.9%
136.6 25.8 4.9 0.9 157.2 889.8 - -
2.7 4.4 0.8 2.3 8.1 31.9 -8.7% -13.6%
5 067.1 4 570.9 3 842.5 4 151.3 4 048.2 65 435.1 -35.8% -39.7%
70.5 791.3 165.4 485.9 464.2 5 227.8 -49.9% -47.4%
4 495.2 7 159.8 4 652.7 3 480.3 4 398.8 39 238.6 -73.9% -75.4%
39 831.9 58 454.3 34 684.5 29 803.1 33 605.4 488 400.5 17.9% 28.9%
238 609.1 349 156.1 260 476.4 215 546.2 246 663.6 2 764 284.0 26.8% 24.1%
2.9 4.9 7.9 4.2 5.8 77.2 -43.7% -47.1%
436 406.1 474 079.2 451 908.0 495 654.9 452 951.9 5 047 392.1 33.5% 25.3%
17.2 7.8 28.3 47.6 30.7 159.6 121.5% 112.4%
57.0 146.5 42.0 15.4 36.6 608.4 -0.5% -7.6%
0.0 0.0 0.1 0.1 0.0 1.0 - -
33 655.1 30 970.5 21 535.5 20 033.2 18 531.5 280 033.1 39.0% 32.0%
57 218.0 184 404.2 267 980.5 166 359.9 281 911.7 2 248 656.2 4.3% -1.9%
1 066.2 1 149.0 988.9 899.7 1 062.1 12 190.8 -53.2% -56.1%
36 124.9 45 470.1 66 751.4 40 826.7 48 467.9 532 371.6 9.7% -0.9%
4.0 321.1 97.9 0.0 15.6 475.9 311.4% 311.4%
16 683.9 26 254.1 19 125.9 15 128.8 14 311.8 188 296.9 33.4% 11.1%
21 654.6 27 153.2 20 416.8 16 544.5 23 584.4 228 382.5 25.0% 19.0%
59.7 44.4 37.1 38.1 347.8 761.8 69.8% 72.7%
89.7 40.8 94.8 70.0 84.3 902.6 -24.3% -29.2%
2 360 364.1 2 802 371.5 2 420 709.0 2 451 621.3 2 385 910.1 28 235 809.1 44.9%
2 543 935.1 3 022 809.8 2 613 407.4 2 616 475.8 2 563 054.6 30 272 242.7 41.5%
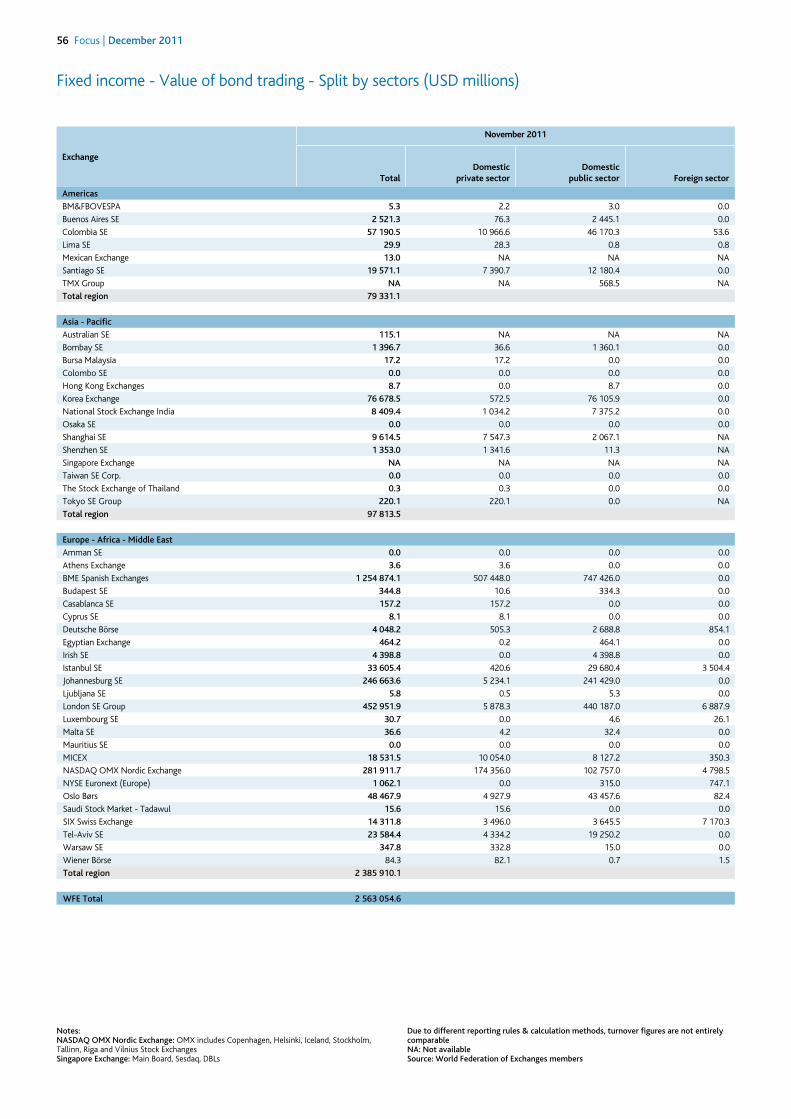
56 Focus | December 2011
Notes: NASDAQ OMX Nordic Exchange: OMX includes Copenhagen, Helsinki, Iceland, Stockholm, Tallinn, Riga and Vilnius Stock ExchangesSingapore Exchange: Main Board, Sesdaq, DBLs
Due to different reporting rules & calculation methods, turnover figures are not entirely comparableNA: Not availableSource: World Federation of Exchanges members
Fixed income - Value of bond trading - Split by sectors (USD millions)
Exchange
November 2011
TotalDomestic
private sector Domestic
public sector Foreign sector
Americas
BM&FBOVESPA 5.3 2.2 3.0 0.0
Buenos Aires SE 2 521.3 76.3 2 445.1 0.0
Colombia SE 57 190.5 10 966.6 46 170.3 53.6
Lima SE 29.9 28.3 0.8 0.8
Mexican Exchange 13.0 NA NA NA
Santiago SE 19 571.1 7 390.7 12 180.4 0.0
TMX Group NA NA 568.5 NA
Total region 79 331.1
Asia - Pacific
Australian SE 115.1 NA NA NA
Bombay SE 1 396.7 36.6 1 360.1 0.0
Bursa Malaysia 17.2 17.2 0.0 0.0
Colombo SE 0.0 0.0 0.0 0.0
Hong Kong Exchanges 8.7 0.0 8.7 0.0
Korea Exchange 76 678.5 572.5 76 105.9 0.0
National Stock Exchange India 8 409.4 1 034.2 7 375.2 0.0
Osaka SE 0.0 0.0 0.0 0.0
Shanghai SE 9 614.5 7 547.3 2 067.1 NA
Shenzhen SE 1 353.0 1 341.6 11.3 NA
Singapore Exchange NA NA NA NA
Taiwan SE Corp. 0.0 0.0 0.0 0.0
The Stock Exchange of Thailand 0.3 0.3 0.0 0.0
Tokyo SE Group 220.1 220.1 0.0 NA
Total region 97 813.5
Europe - Africa - Middle East
Amman SE 0.0 0.0 0.0 0.0
Athens Exchange 3.6 3.6 0.0 0.0
BME Spanish Exchanges 1 254 874.1 507 448.0 747 426.0 0.0
Budapest SE 344.8 10.6 334.3 0.0
Casablanca SE 157.2 157.2 0.0 0.0
Cyprus SE 8.1 8.1 0.0 0.0
Deutsche Börse 4 048.2 505.3 2 688.8 854.1
Egyptian Exchange 464.2 0.2 464.1 0.0
Irish SE 4 398.8 0.0 4 398.8 0.0
Istanbul SE 33 605.4 420.6 29 680.4 3 504.4
Johannesburg SE 246 663.6 5 234.1 241 429.0 0.0
Ljubljana SE 5.8 0.5 5.3 0.0
London SE Group 452 951.9 5 878.3 440 187.0 6 887.9
Luxembourg SE 30.7 0.0 4.6 26.1
Malta SE 36.6 4.2 32.4 0.0
Mauritius SE 0.0 0.0 0.0 0.0
MICEX 18 531.5 10 054.0 8 127.2 350.3
NASDAQ OMX Nordic Exchange 281 911.7 174 356.0 102 757.0 4 798.5
NYSE Euronext (Europe) 1 062.1 0.0 315.0 747.1
Oslo Børs 48 467.9 4 927.9 43 457.6 82.4
Saudi Stock Market - Tadawul 15.6 15.6 0.0 0.0
SIX Swiss Exchange 14 311.8 3 496.0 3 645.5 7 170.3
Tel-Aviv SE 23 584.4 4 334.2 19 250.2 0.0
Warsaw SE 347.8 332.8 15.0 0.0
Wiener Börse 84.3 82.1 0.7 1.5
Total region 2 385 910.1
WFE Total 2 563 054.6

Focus | December 2011 57
Trading days November 2011
Year-to-date
TotalDomestic
private sector Domestic
public sector Foreign sector
20 157.8 111.3 46.4 0.0
21 29 940.0 862.6 29 077.4 0.0
20 869 801.1 167 751.0 701 130.0 919.9
21 578.2 527.1 44.8 6.2
22 274.2 0.0 0.0 0.0
21 217 871.7 88 140.1 129 732.0 0.0
22 1 252.8 0.0 5 946.7 0.0
1 119 875.8
22 862.4 0.0 0.0 0.0
20 16 943.8 927.0 16 016.8 0.0
20 184.2 184.2 0.0 0.0
20 24.5 24.2 0.3 0.0
22 100.4 0.1 100.3 0.0
22 691 071.8 5 360.0 685 712.0 0.0
20 105 551.7 13 758.0 91 793.8 0.0
20 0.0 0.0 0.0 0.0
22 88 337.0 68 184.7 20 152.4 0.0
22 10 483.5 10 330.2 153.2 0.0
21 0.0 0.0 0.0 0.0
22 0.0 0.0 0.0 0.0
22 21.9 21.9 0.0 0.0
20 2 976.6 2 976.7 0.0 0.0
916 557.8
17 0.6 0.6 0.0 0.0
22 18.4 18.4 0.0 0.0
22 16 330 749.1 7 125 390.0 9 205 360.0 0.0
21 1 223.7 30.6 1 193.1 0.0
19 889.8 748.7 29.5 111.6
22 31.9 31.5 0.4 0.0
22 65 435.1 11 779.1 38 501.8 15 154.2
17 5 227.8 146.4 5 081.3 0.0
22 39 238.6 0.0 39 238.6 0.0
19 488 400.5 4 215.2 435 668.0 48 549.8
22 2 764 284.0 69 586.8 2 694 680.0 21.3
21 77.2 26.9 50.3 0.0
22 5 047 392.1 87 680.3 4 736 220.0 223 492.0
21 159.6 0.0 26.2 133.4
22 608.4 44.3 564.0 0.0
20 1.0 1.0 0.0 0.0
21 280 033.1 164 367.0 114 396.0 1 269.9
22 2 248 656.2 1 237 430.0 988 253.0 22 973.2
22 12 190.8 0.0 2 386.8 9 804.1
22 532 371.6 59 400.9 472 528.0 443.0
17 475.9 475.9 0.0 0.0
22 188 296.9 39 508.2 51 444.4 97 344.3
22 228 382.5 45 785.5 182 597.0 0.0
20 761.8 519.1 242.7 0.0
21 902.6 854.5 6.7 41.3
28 235 809.1
30 272 242.7
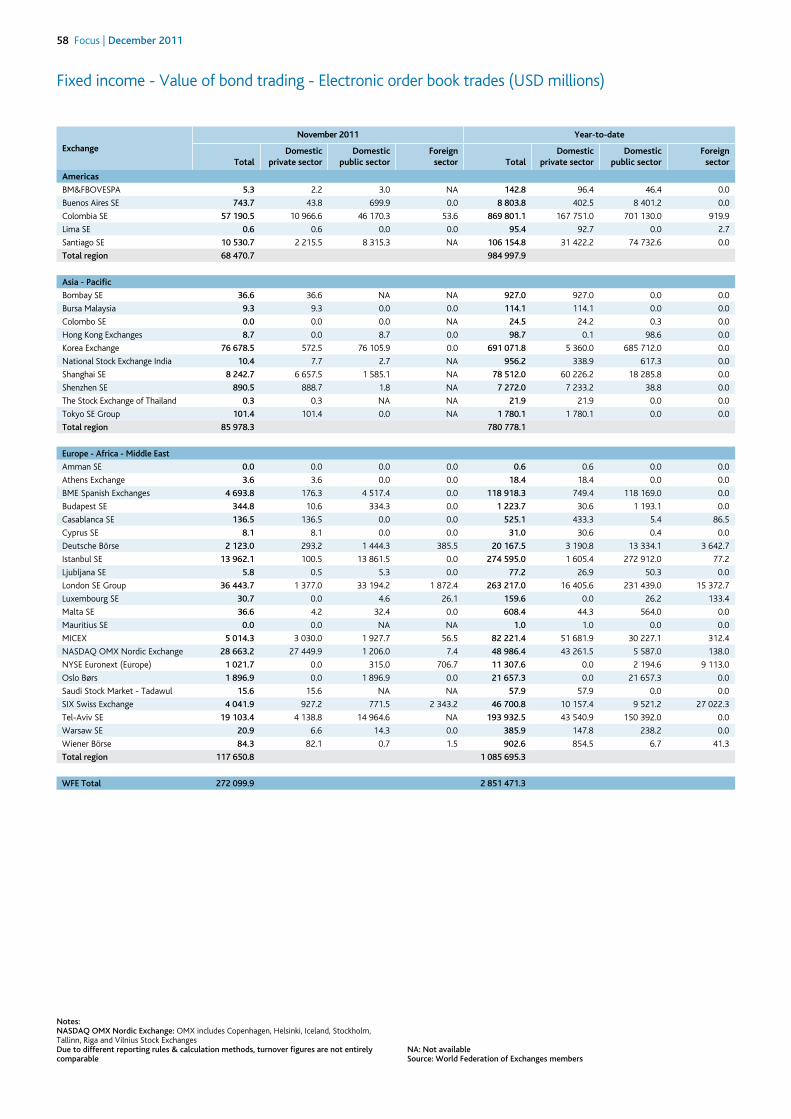
58 Focus | December 2011
Fixed income - Value of bond trading - Electronic order book trades (USD millions)
Exchange
November 2011 Year-to-date
TotalDomestic
private sector Domestic
public sectorForeign
sector TotalDomestic
private sector Domestic
public sectorForeign
sector
Americas
BM&FBOVESPA 5.3 2.2 3.0 NA 142.8 96.4 46.4 0.0
Buenos Aires SE 743.7 43.8 699.9 0.0 8 803.8 402.5 8 401.2 0.0
Colombia SE 57 190.5 10 966.6 46 170.3 53.6 869 801.1 167 751.0 701 130.0 919.9
Lima SE 0.6 0.6 0.0 0.0 95.4 92.7 0.0 2.7
Santiago SE 10 530.7 2 215.5 8 315.3 NA 106 154.8 31 422.2 74 732.6 0.0
Total region 68 470.7 984 997.9
Asia - Pacific
Bombay SE 36.6 36.6 NA NA 927.0 927.0 0.0 0.0
Bursa Malaysia 9.3 9.3 0.0 0.0 114.1 114.1 0.0 0.0
Colombo SE 0.0 0.0 0.0 NA 24.5 24.2 0.3 0.0
Hong Kong Exchanges 8.7 0.0 8.7 0.0 98.7 0.1 98.6 0.0
Korea Exchange 76 678.5 572.5 76 105.9 0.0 691 071.8 5 360.0 685 712.0 0.0
National Stock Exchange India 10.4 7.7 2.7 NA 956.2 338.9 617.3 0.0
Shanghai SE 8 242.7 6 657.5 1 585.1 NA 78 512.0 60 226.2 18 285.8 0.0
Shenzhen SE 890.5 888.7 1.8 NA 7 272.0 7 233.2 38.8 0.0
The Stock Exchange of Thailand 0.3 0.3 NA NA 21.9 21.9 0.0 0.0
Tokyo SE Group 101.4 101.4 0.0 NA 1 780.1 1 780.1 0.0 0.0
Total region 85 978.3 780 778.1
Europe - Africa - Middle East
Amman SE 0.0 0.0 0.0 0.0 0.6 0.6 0.0 0.0
Athens Exchange 3.6 3.6 0.0 0.0 18.4 18.4 0.0 0.0
BME Spanish Exchanges 4 693.8 176.3 4 517.4 0.0 118 918.3 749.4 118 169.0 0.0
Budapest SE 344.8 10.6 334.3 0.0 1 223.7 30.6 1 193.1 0.0
Casablanca SE 136.5 136.5 0.0 0.0 525.1 433.3 5.4 86.5
Cyprus SE 8.1 8.1 0.0 0.0 31.0 30.6 0.4 0.0
Deutsche Börse 2 123.0 293.2 1 444.3 385.5 20 167.5 3 190.8 13 334.1 3 642.7
Istanbul SE 13 962.1 100.5 13 861.5 0.0 274 595.0 1 605.4 272 912.0 77.2
Ljubljana SE 5.8 0.5 5.3 0.0 77.2 26.9 50.3 0.0
London SE Group 36 443.7 1 377.0 33 194.2 1 872.4 263 217.0 16 405.6 231 439.0 15 372.7
Luxembourg SE 30.7 0.0 4.6 26.1 159.6 0.0 26.2 133.4
Malta SE 36.6 4.2 32.4 0.0 608.4 44.3 564.0 0.0
Mauritius SE 0.0 0.0 NA NA 1.0 1.0 0.0 0.0
MICEX 5 014.3 3 030.0 1 927.7 56.5 82 221.4 51 681.9 30 227.1 312.4
NASDAQ OMX Nordic Exchange 28 663.2 27 449.9 1 206.0 7.4 48 986.4 43 261.5 5 587.0 138.0
NYSE Euronext (Europe) 1 021.7 0.0 315.0 706.7 11 307.6 0.0 2 194.6 9 113.0
Oslo Børs 1 896.9 0.0 1 896.9 0.0 21 657.3 0.0 21 657.3 0.0
Saudi Stock Market - Tadawul 15.6 15.6 NA NA 57.9 57.9 0.0 0.0
SIX Swiss Exchange 4 041.9 927.2 771.5 2 343.2 46 700.8 10 157.4 9 521.2 27 022.3
Tel-Aviv SE 19 103.4 4 138.8 14 964.6 NA 193 932.5 43 540.9 150 392.0 0.0
Warsaw SE 20.9 6.6 14.3 0.0 385.9 147.8 238.2 0.0
Wiener Börse 84.3 82.1 0.7 1.5 902.6 854.5 6.7 41.3
Total region 117 650.8 1 085 695.3
WFE Total 272 099.9 2 851 471.3
Notes: NASDAQ OMX Nordic Exchange: OMX includes Copenhagen, Helsinki, Iceland, Stockholm, Tallinn, Riga and Vilnius Stock ExchangesDue to different reporting rules & calculation methods, turnover figures are not entirely comparable
NA: Not availableSource: World Federation of Exchanges members
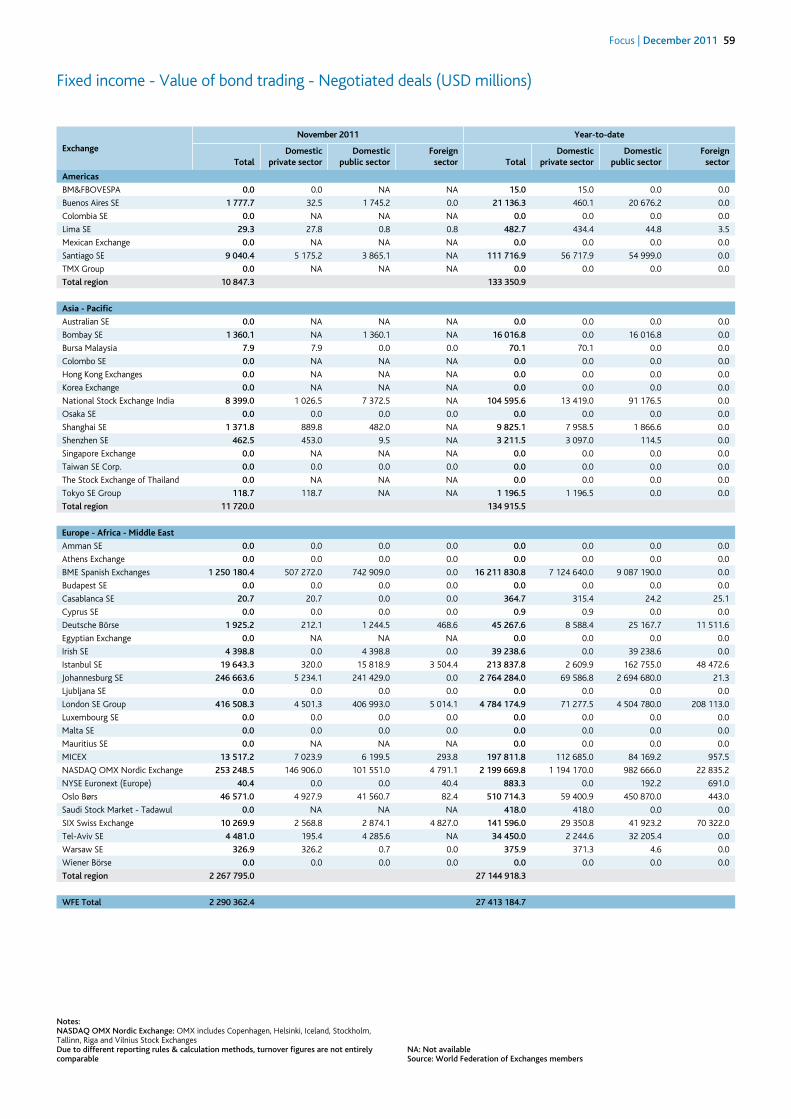
Focus | December 2011 59
Exchange
November 2011 Year-to-date
TotalDomestic
private sector Domestic
public sectorForeign
sector TotalDomestic
private sector Domestic
public sectorForeign
sector
Americas
BM&FBOVESPA 0.0 0.0 NA NA 15.0 15.0 0.0 0.0
Buenos Aires SE 1 777.7 32.5 1 745.2 0.0 21 136.3 460.1 20 676.2 0.0
Colombia SE 0.0 NA NA NA 0.0 0.0 0.0 0.0
Lima SE 29.3 27.8 0.8 0.8 482.7 434.4 44.8 3.5
Mexican Exchange 0.0 NA NA NA 0.0 0.0 0.0 0.0
Santiago SE 9 040.4 5 175.2 3 865.1 NA 111 716.9 56 717.9 54 999.0 0.0
TMX Group 0.0 NA NA NA 0.0 0.0 0.0 0.0
Total region 10 847.3 133 350.9
Asia - Pacific
Australian SE 0.0 NA NA NA 0.0 0.0 0.0 0.0
Bombay SE 1 360.1 NA 1 360.1 NA 16 016.8 0.0 16 016.8 0.0
Bursa Malaysia 7.9 7.9 0.0 0.0 70.1 70.1 0.0 0.0
Colombo SE 0.0 NA NA NA 0.0 0.0 0.0 0.0
Hong Kong Exchanges 0.0 NA NA NA 0.0 0.0 0.0 0.0
Korea Exchange 0.0 NA NA NA 0.0 0.0 0.0 0.0
National Stock Exchange India 8 399.0 1 026.5 7 372.5 NA 104 595.6 13 419.0 91 176.5 0.0
Osaka SE 0.0 0.0 0.0 0.0 0.0 0.0 0.0 0.0
Shanghai SE 1 371.8 889.8 482.0 NA 9 825.1 7 958.5 1 866.6 0.0
Shenzhen SE 462.5 453.0 9.5 NA 3 211.5 3 097.0 114.5 0.0
Singapore Exchange 0.0 NA NA NA 0.0 0.0 0.0 0.0
Taiwan SE Corp. 0.0 0.0 0.0 0.0 0.0 0.0 0.0 0.0
The Stock Exchange of Thailand 0.0 NA NA NA 0.0 0.0 0.0 0.0
Tokyo SE Group 118.7 118.7 NA NA 1 196.5 1 196.5 0.0 0.0
Total region 11 720.0 134 915.5
Europe - Africa - Middle East
Amman SE 0.0 0.0 0.0 0.0 0.0 0.0 0.0 0.0
Athens Exchange 0.0 0.0 0.0 0.0 0.0 0.0 0.0 0.0
BME Spanish Exchanges 1 250 180.4 507 272.0 742 909.0 0.0 16 211 830.8 7 124 640.0 9 087 190.0 0.0
Budapest SE 0.0 0.0 0.0 0.0 0.0 0.0 0.0 0.0
Casablanca SE 20.7 20.7 0.0 0.0 364.7 315.4 24.2 25.1
Cyprus SE 0.0 0.0 0.0 0.0 0.9 0.9 0.0 0.0
Deutsche Börse 1 925.2 212.1 1 244.5 468.6 45 267.6 8 588.4 25 167.7 11 511.6
Egyptian Exchange 0.0 NA NA NA 0.0 0.0 0.0 0.0
Irish SE 4 398.8 0.0 4 398.8 0.0 39 238.6 0.0 39 238.6 0.0
Istanbul SE 19 643.3 320.0 15 818.9 3 504.4 213 837.8 2 609.9 162 755.0 48 472.6
Johannesburg SE 246 663.6 5 234.1 241 429.0 0.0 2 764 284.0 69 586.8 2 694 680.0 21.3
Ljubljana SE 0.0 0.0 0.0 0.0 0.0 0.0 0.0 0.0
London SE Group 416 508.3 4 501.3 406 993.0 5 014.1 4 784 174.9 71 277.5 4 504 780.0 208 113.0
Luxembourg SE 0.0 0.0 0.0 0.0 0.0 0.0 0.0 0.0
Malta SE 0.0 0.0 0.0 0.0 0.0 0.0 0.0 0.0
Mauritius SE 0.0 NA NA NA 0.0 0.0 0.0 0.0
MICEX 13 517.2 7 023.9 6 199.5 293.8 197 811.8 112 685.0 84 169.2 957.5
NASDAQ OMX Nordic Exchange 253 248.5 146 906.0 101 551.0 4 791.1 2 199 669.8 1 194 170.0 982 666.0 22 835.2
NYSE Euronext (Europe) 40.4 0.0 0.0 40.4 883.3 0.0 192.2 691.0
Oslo Børs 46 571.0 4 927.9 41 560.7 82.4 510 714.3 59 400.9 450 870.0 443.0
Saudi Stock Market - Tadawul 0.0 NA NA NA 418.0 418.0 0.0 0.0
SIX Swiss Exchange 10 269.9 2 568.8 2 874.1 4 827.0 141 596.0 29 350.8 41 923.2 70 322.0
Tel-Aviv SE 4 481.0 195.4 4 285.6 NA 34 450.0 2 244.6 32 205.4 0.0
Warsaw SE 326.9 326.2 0.7 0.0 375.9 371.3 4.6 0.0
Wiener Börse 0.0 0.0 0.0 0.0 0.0 0.0 0.0 0.0
Total region 2 267 795.0 27 144 918.3
WFE Total 2 290 362.4 27 413 184.7
Fixed income - Value of bond trading - Negotiated deals (USD millions)
Notes: NASDAQ OMX Nordic Exchange: OMX includes Copenhagen, Helsinki, Iceland, Stockholm, Tallinn, Riga and Vilnius Stock ExchangesDue to different reporting rules & calculation methods, turnover figures are not entirely comparable
NA: Not availableSource: World Federation of Exchanges members
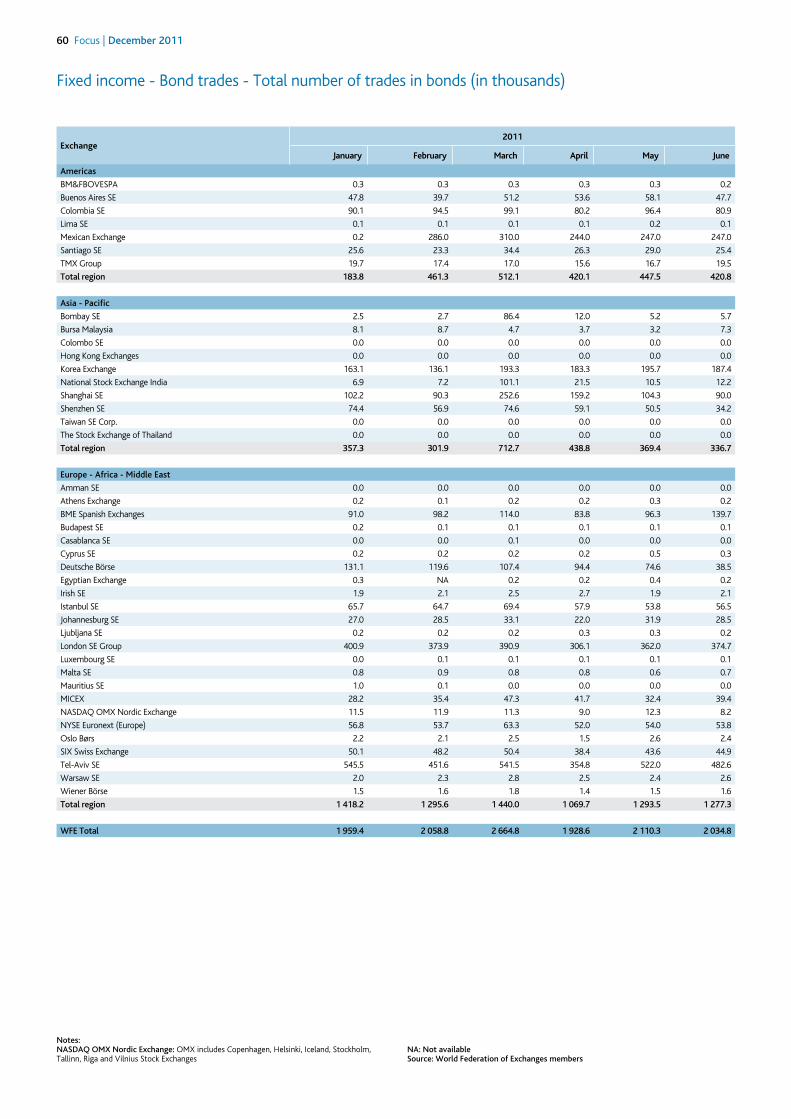
60 Focus | December 2011
Fixed income - Bond trades - Total number of trades in bonds (in thousands)
Notes: NASDAQ OMX Nordic Exchange: OMX includes Copenhagen, Helsinki, Iceland, Stockholm, Tallinn, Riga and Vilnius Stock Exchanges
NA: Not availableSource: World Federation of Exchanges members
Exchange2011
January February March April May June
Americas
BM&FBOVESPA 0.3 0.3 0.3 0.3 0.3 0.2
Buenos Aires SE 47.8 39.7 51.2 53.6 58.1 47.7
Colombia SE 90.1 94.5 99.1 80.2 96.4 80.9
Lima SE 0.1 0.1 0.1 0.1 0.2 0.1
Mexican Exchange 0.2 286.0 310.0 244.0 247.0 247.0
Santiago SE 25.6 23.3 34.4 26.3 29.0 25.4
TMX Group 19.7 17.4 17.0 15.6 16.7 19.5
Total region 183.8 461.3 512.1 420.1 447.5 420.8
Asia - Pacific
Bombay SE 2.5 2.7 86.4 12.0 5.2 5.7
Bursa Malaysia 8.1 8.7 4.7 3.7 3.2 7.3
Colombo SE 0.0 0.0 0.0 0.0 0.0 0.0
Hong Kong Exchanges 0.0 0.0 0.0 0.0 0.0 0.0
Korea Exchange 163.1 136.1 193.3 183.3 195.7 187.4
National Stock Exchange India 6.9 7.2 101.1 21.5 10.5 12.2
Shanghai SE 102.2 90.3 252.6 159.2 104.3 90.0
Shenzhen SE 74.4 56.9 74.6 59.1 50.5 34.2
Taiwan SE Corp. 0.0 0.0 0.0 0.0 0.0 0.0
The Stock Exchange of Thailand 0.0 0.0 0.0 0.0 0.0 0.0
Total region 357.3 301.9 712.7 438.8 369.4 336.7
Europe - Africa - Middle East
Amman SE 0.0 0.0 0.0 0.0 0.0 0.0
Athens Exchange 0.2 0.1 0.2 0.2 0.3 0.2
BME Spanish Exchanges 91.0 98.2 114.0 83.8 96.3 139.7
Budapest SE 0.2 0.1 0.1 0.1 0.1 0.1
Casablanca SE 0.0 0.0 0.1 0.0 0.0 0.0
Cyprus SE 0.2 0.2 0.2 0.2 0.5 0.3
Deutsche Börse 131.1 119.6 107.4 94.4 74.6 38.5
Egyptian Exchange 0.3 NA 0.2 0.2 0.4 0.2
Irish SE 1.9 2.1 2.5 2.7 1.9 2.1
Istanbul SE 65.7 64.7 69.4 57.9 53.8 56.5
Johannesburg SE 27.0 28.5 33.1 22.0 31.9 28.5
Ljubljana SE 0.2 0.2 0.2 0.3 0.3 0.2
London SE Group 400.9 373.9 390.9 306.1 362.0 374.7
Luxembourg SE 0.0 0.1 0.1 0.1 0.1 0.1
Malta SE 0.8 0.9 0.8 0.8 0.6 0.7
Mauritius SE 1.0 0.1 0.0 0.0 0.0 0.0
MICEX 28.2 35.4 47.3 41.7 32.4 39.4
NASDAQ OMX Nordic Exchange 11.5 11.9 11.3 9.0 12.3 8.2
NYSE Euronext (Europe) 56.8 53.7 63.3 52.0 54.0 53.8
Oslo Børs 2.2 2.1 2.5 1.5 2.6 2.4
SIX Swiss Exchange 50.1 48.2 50.4 38.4 43.6 44.9
Tel-Aviv SE 545.5 451.6 541.5 354.8 522.0 482.6
Warsaw SE 2.0 2.3 2.8 2.5 2.4 2.6
Wiener Börse 1.5 1.6 1.8 1.4 1.5 1.6
Total region 1 418.2 1 295.6 1 440.0 1 069.7 1 293.5 1 277.3
WFE Total 1 959.4 2 058.8 2 664.8 1 928.6 2 110.3 2 034.8
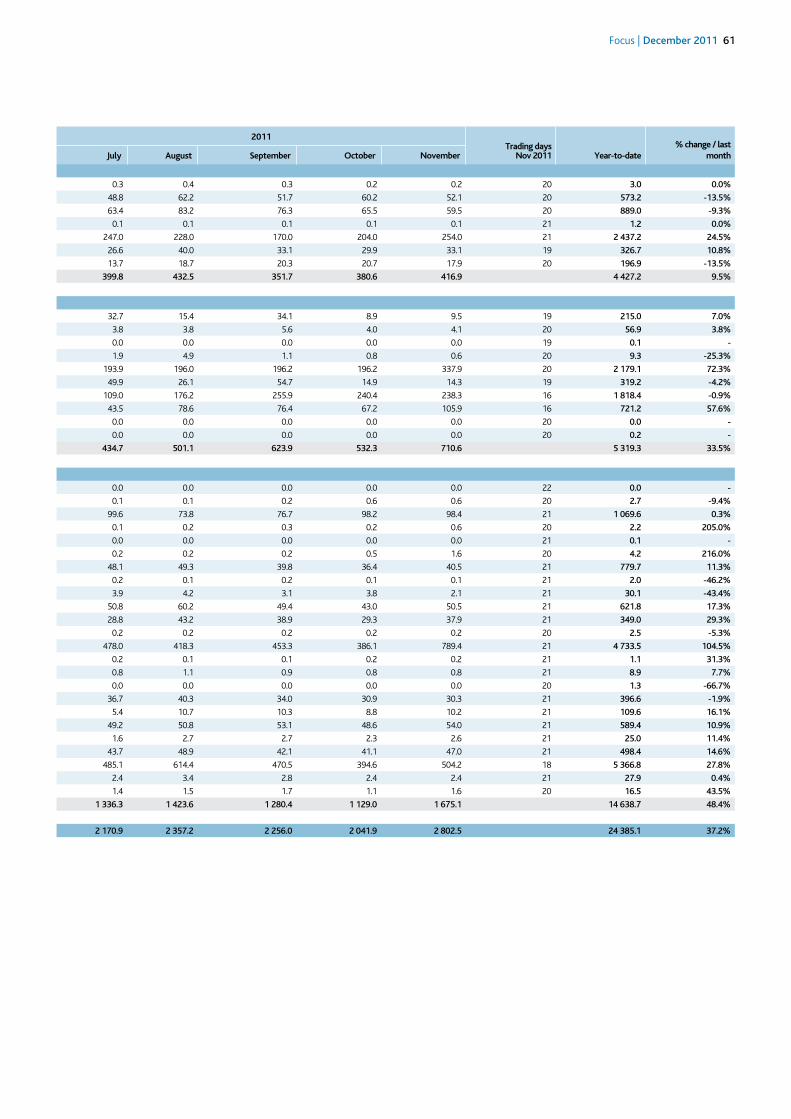
Focus | December 2011 61
2011Trading days
Nov 2011 Year-to-date% change / last
monthJuly August September October November
0.3 0.4 0.3 0.2 0.2 20 3.0 0.0%
48.8 62.2 51.7 60.2 52.1 20 573.2 -13.5%
63.4 83.2 76.3 65.5 59.5 20 889.0 -9.3%
0.1 0.1 0.1 0.1 0.1 21 1.2 0.0%
247.0 228.0 170.0 204.0 254.0 21 2 437.2 24.5%
26.6 40.0 33.1 29.9 33.1 19 326.7 10.8%
13.7 18.7 20.3 20.7 17.9 20 196.9 -13.5%
399.8 432.5 351.7 380.6 416.9 4 427.2 9.5%
32.7 15.4 34.1 8.9 9.5 19 215.0 7.0%
3.8 3.8 5.6 4.0 4.1 20 56.9 3.8%
0.0 0.0 0.0 0.0 0.0 19 0.1 -
1.9 4.9 1.1 0.8 0.6 20 9.3 -25.3%
193.9 196.0 196.2 196.2 337.9 20 2 179.1 72.3%
49.9 26.1 54.7 14.9 14.3 19 319.2 -4.2%
109.0 176.2 255.9 240.4 238.3 16 1 818.4 -0.9%
43.5 78.6 76.4 67.2 105.9 16 721.2 57.6%
0.0 0.0 0.0 0.0 0.0 20 0.0 -
0.0 0.0 0.0 0.0 0.0 20 0.2 -
434.7 501.1 623.9 532.3 710.6 5 319.3 33.5%
0.0 0.0 0.0 0.0 0.0 22 0.0 -
0.1 0.1 0.2 0.6 0.6 20 2.7 -9.4%
99.6 73.8 76.7 98.2 98.4 21 1 069.6 0.3%
0.1 0.2 0.3 0.2 0.6 20 2.2 205.0%
0.0 0.0 0.0 0.0 0.0 21 0.1 -
0.2 0.2 0.2 0.5 1.6 20 4.2 216.0%
48.1 49.3 39.8 36.4 40.5 21 779.7 11.3%
0.2 0.1 0.2 0.1 0.1 21 2.0 -46.2%
3.9 4.2 3.1 3.8 2.1 21 30.1 -43.4%
50.8 60.2 49.4 43.0 50.5 21 621.8 17.3%
28.8 43.2 38.9 29.3 37.9 21 349.0 29.3%
0.2 0.2 0.2 0.2 0.2 20 2.5 -5.3%
478.0 418.3 453.3 386.1 789.4 21 4 733.5 104.5%
0.2 0.1 0.1 0.2 0.2 21 1.1 31.3%
0.8 1.1 0.9 0.8 0.8 21 8.9 7.7%
0.0 0.0 0.0 0.0 0.0 20 1.3 -66.7%
36.7 40.3 34.0 30.9 30.3 21 396.6 -1.9%
5.4 10.7 10.3 8.8 10.2 21 109.6 16.1%
49.2 50.8 53.1 48.6 54.0 21 589.4 10.9%
1.6 2.7 2.7 2.3 2.6 21 25.0 11.4%
43.7 48.9 42.1 41.1 47.0 21 498.4 14.6%
485.1 614.4 470.5 394.6 504.2 18 5 366.8 27.8%
2.4 3.4 2.8 2.4 2.4 21 27.9 0.4%
1.4 1.5 1.7 1.1 1.6 20 16.5 43.5%
1 336.3 1 423.6 1 280.4 1 129.0 1 675.1 14 638.7 48.4%
2 170.9 2 357.2 2 256.0 2 041.9 2 802.5 24 385.1 37.2%
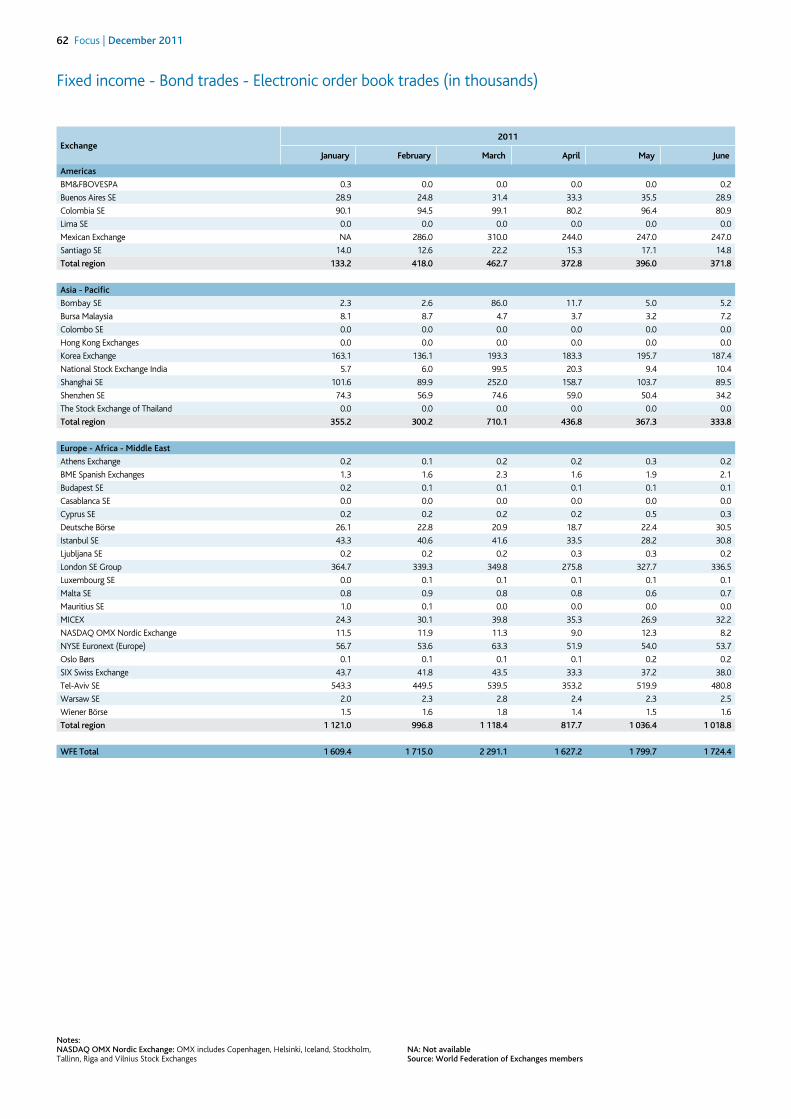
62 Focus | December 2011
Fixed income - Bond trades - Electronic order book trades (in thousands)
Notes: NASDAQ OMX Nordic Exchange: OMX includes Copenhagen, Helsinki, Iceland, Stockholm, Tallinn, Riga and Vilnius Stock Exchanges
NA: Not availableSource: World Federation of Exchanges members
Exchange2011
January February March April May June
Americas
BM&FBOVESPA 0.3 0.0 0.0 0.0 0.0 0.2
Buenos Aires SE 28.9 24.8 31.4 33.3 35.5 28.9
Colombia SE 90.1 94.5 99.1 80.2 96.4 80.9
Lima SE 0.0 0.0 0.0 0.0 0.0 0.0
Mexican Exchange NA 286.0 310.0 244.0 247.0 247.0
Santiago SE 14.0 12.6 22.2 15.3 17.1 14.8
Total region 133.2 418.0 462.7 372.8 396.0 371.8
Asia - Pacific
Bombay SE 2.3 2.6 86.0 11.7 5.0 5.2
Bursa Malaysia 8.1 8.7 4.7 3.7 3.2 7.2
Colombo SE 0.0 0.0 0.0 0.0 0.0 0.0
Hong Kong Exchanges 0.0 0.0 0.0 0.0 0.0 0.0
Korea Exchange 163.1 136.1 193.3 183.3 195.7 187.4
National Stock Exchange India 5.7 6.0 99.5 20.3 9.4 10.4
Shanghai SE 101.6 89.9 252.0 158.7 103.7 89.5
Shenzhen SE 74.3 56.9 74.6 59.0 50.4 34.2
The Stock Exchange of Thailand 0.0 0.0 0.0 0.0 0.0 0.0
Total region 355.2 300.2 710.1 436.8 367.3 333.8
Europe - Africa - Middle East
Athens Exchange 0.2 0.1 0.2 0.2 0.3 0.2
BME Spanish Exchanges 1.3 1.6 2.3 1.6 1.9 2.1
Budapest SE 0.2 0.1 0.1 0.1 0.1 0.1
Casablanca SE 0.0 0.0 0.0 0.0 0.0 0.0
Cyprus SE 0.2 0.2 0.2 0.2 0.5 0.3
Deutsche Börse 26.1 22.8 20.9 18.7 22.4 30.5
Istanbul SE 43.3 40.6 41.6 33.5 28.2 30.8
Ljubljana SE 0.2 0.2 0.2 0.3 0.3 0.2
London SE Group 364.7 339.3 349.8 275.8 327.7 336.5
Luxembourg SE 0.0 0.1 0.1 0.1 0.1 0.1
Malta SE 0.8 0.9 0.8 0.8 0.6 0.7
Mauritius SE 1.0 0.1 0.0 0.0 0.0 0.0
MICEX 24.3 30.1 39.8 35.3 26.9 32.2
NASDAQ OMX Nordic Exchange 11.5 11.9 11.3 9.0 12.3 8.2
NYSE Euronext (Europe) 56.7 53.6 63.3 51.9 54.0 53.7
Oslo Børs 0.1 0.1 0.1 0.1 0.2 0.2
SIX Swiss Exchange 43.7 41.8 43.5 33.3 37.2 38.0
Tel-Aviv SE 543.3 449.5 539.5 353.2 519.9 480.8
Warsaw SE 2.0 2.3 2.8 2.4 2.3 2.5
Wiener Börse 1.5 1.6 1.8 1.4 1.5 1.6
Total region 1 121.0 996.8 1 118.4 817.7 1 036.4 1 018.8
WFE Total 1 609.4 1 715.0 2 291.1 1 627.2 1 799.7 1 724.4
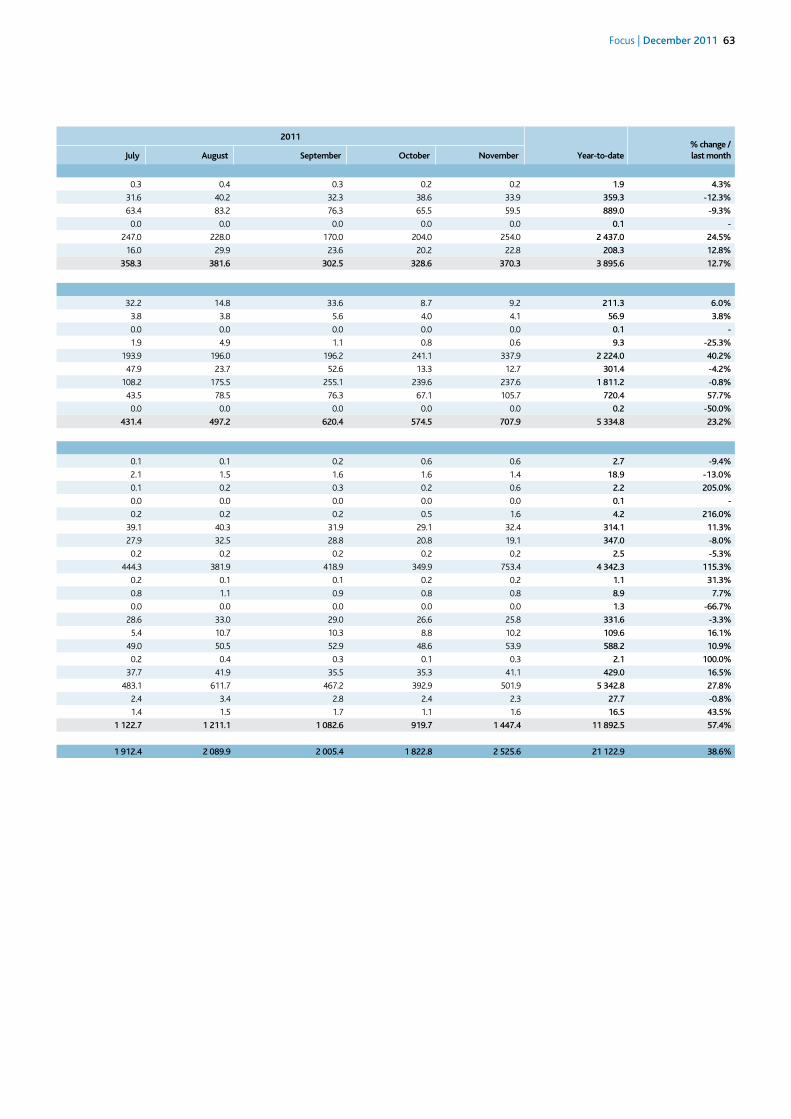
Focus | December 2011 63
2011
Year-to-date% change /last monthJuly August September October November
0.3 0.4 0.3 0.2 0.2 1.9 4.3%
31.6 40.2 32.3 38.6 33.9 359.3 -12.3%
63.4 83.2 76.3 65.5 59.5 889.0 -9.3%
0.0 0.0 0.0 0.0 0.0 0.1 -
247.0 228.0 170.0 204.0 254.0 2 437.0 24.5%
16.0 29.9 23.6 20.2 22.8 208.3 12.8%
358.3 381.6 302.5 328.6 370.3 3 895.6 12.7%
32.2 14.8 33.6 8.7 9.2 211.3 6.0%
3.8 3.8 5.6 4.0 4.1 56.9 3.8%
0.0 0.0 0.0 0.0 0.0 0.1 -
1.9 4.9 1.1 0.8 0.6 9.3 -25.3%
193.9 196.0 196.2 241.1 337.9 2 224.0 40.2%
47.9 23.7 52.6 13.3 12.7 301.4 -4.2%
108.2 175.5 255.1 239.6 237.6 1 811.2 -0.8%
43.5 78.5 76.3 67.1 105.7 720.4 57.7%
0.0 0.0 0.0 0.0 0.0 0.2 -50.0%
431.4 497.2 620.4 574.5 707.9 5 334.8 23.2%
0.1 0.1 0.2 0.6 0.6 2.7 -9.4%
2.1 1.5 1.6 1.6 1.4 18.9 -13.0%
0.1 0.2 0.3 0.2 0.6 2.2 205.0%
0.0 0.0 0.0 0.0 0.0 0.1 -
0.2 0.2 0.2 0.5 1.6 4.2 216.0%
39.1 40.3 31.9 29.1 32.4 314.1 11.3%
27.9 32.5 28.8 20.8 19.1 347.0 -8.0%
0.2 0.2 0.2 0.2 0.2 2.5 -5.3%
444.3 381.9 418.9 349.9 753.4 4 342.3 115.3%
0.2 0.1 0.1 0.2 0.2 1.1 31.3%
0.8 1.1 0.9 0.8 0.8 8.9 7.7%
0.0 0.0 0.0 0.0 0.0 1.3 -66.7%
28.6 33.0 29.0 26.6 25.8 331.6 -3.3%
5.4 10.7 10.3 8.8 10.2 109.6 16.1%
49.0 50.5 52.9 48.6 53.9 588.2 10.9%
0.2 0.4 0.3 0.1 0.3 2.1 100.0%
37.7 41.9 35.5 35.3 41.1 429.0 16.5%
483.1 611.7 467.2 392.9 501.9 5 342.8 27.8%
2.4 3.4 2.8 2.4 2.3 27.7 -0.8%
1.4 1.5 1.7 1.1 1.6 16.5 43.5%
1 122.7 1 211.1 1 082.6 919.7 1 447.4 11 892.5 57.4%
1 912.4 2 089.9 2 005.4 1 822.8 2 525.6 21 122.9 38.6%

64 Focus | December 2011
Fixed income - Bond trades - Negotiated deals (in thousands)
Notes: NASDAQ OMX Nordic Exchange: OMX includes Copenhagen, Helsinki, Iceland, Stockholm, Tallinn, Riga and Vilnius Stock Exchanges
NA: Not availableSource: World Federation of Exchanges members
Exchange2011
January February March April May June
Americas
BM&FBOVESPA 0.0 0.3 0.3 0.3 0.3 0.0
Buenos Aires SE 19.0 14.9 19.8 20.3 22.6 18.8
Lima SE 0.1 0.1 0.1 0.1 0.2 0.1
Santiago SE 11.6 10.7 12.3 11.1 11.9 10.6
Total region 30.7 25.9 32.4 31.8 34.9 29.6
Asia - Pacific
Bombay SE 0.2 0.1 0.4 0.3 0.2 0.5
Bursa Malaysia 0.0 0.0 0.0 0.0 0.0 0.0
National Stock Exchange India 1.2 1.2 1.6 1.2 1.1 1.8
Shanghai SE 0.7 0.4 0.6 0.5 0.7 0.6
Shenzhen SE 0.1 0.1 0.1 0.1 0.1 0.0
Total region 2.1 1.7 2.6 2.1 2.1 2.9
Europe - Africa - Middle East
BME Spanish Exchanges 89.7 96.6 111.7 82.2 94.4 137.6
Casablanca SE 0.0 0.0 0.0 0.0 0.0 0.0
Deutsche Börse 105.0 96.8 86.5 75.7 52.2 7.9
Irish SE 1.9 2.1 2.5 2.7 1.9 2.1
Istanbul SE 22.4 24.1 27.8 24.4 25.6 25.7
Johannesburg SE 27.0 28.5 33.1 22.0 31.9 28.5
London SE Group 36.3 34.6 41.0 30.3 34.3 38.2
MICEX 3.9 5.3 7.5 6.4 5.4 7.3
NYSE Euronext (Europe) 0.1 0.1 0.1 0.0 0.1 0.1
Oslo Børs 2.1 2.0 2.4 1.4 2.4 2.2
SIX Swiss Exchange 6.4 6.4 7.0 5.1 6.4 6.9
Tel-Aviv SE 2.2 2.2 2.0 1.6 2.1 1.8
Warsaw SE 0.0 0.0 0.0 0.0 0.0 0.0
Total region 296.9 298.7 321.4 251.8 256.6 258.3
WFE Total 329.7 326.4 356.5 285.7 293.6 290.7
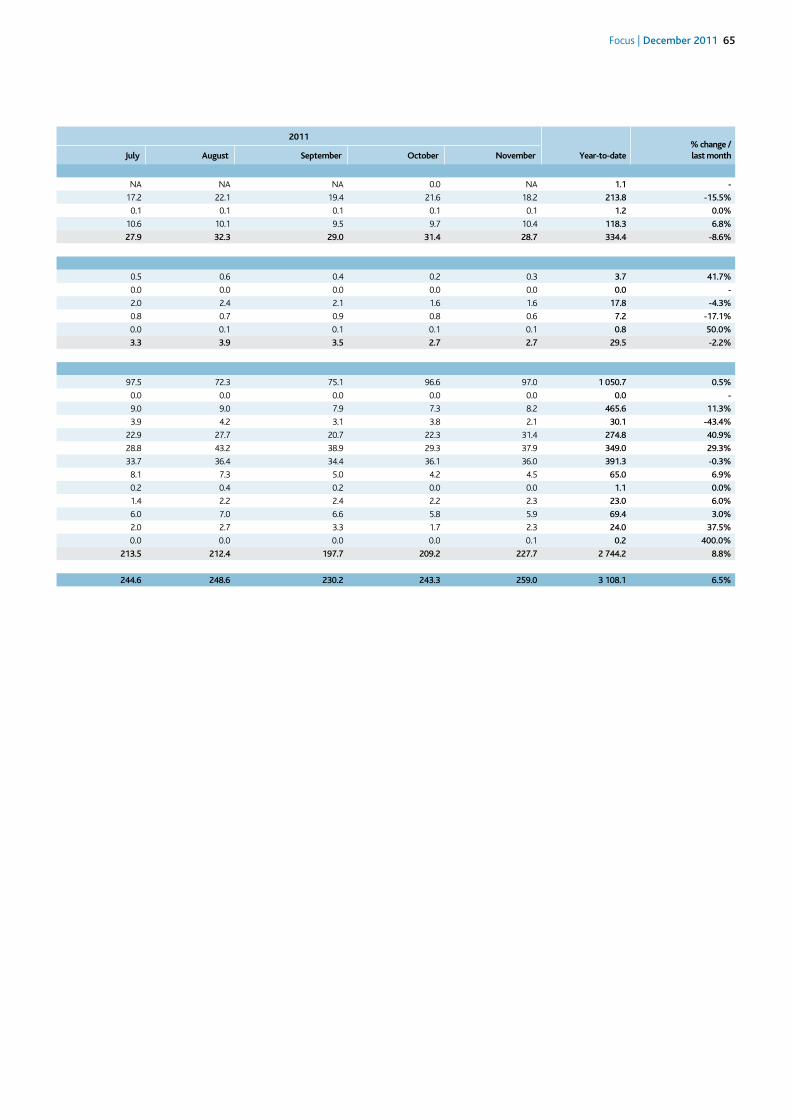
Focus | December 2011 65
2011
Year-to-date% change /last monthJuly August September October November
NA NA NA 0.0 NA 1.1 -
17.2 22.1 19.4 21.6 18.2 213.8 -15.5%
0.1 0.1 0.1 0.1 0.1 1.2 0.0%
10.6 10.1 9.5 9.7 10.4 118.3 6.8%
27.9 32.3 29.0 31.4 28.7 334.4 -8.6%
0.5 0.6 0.4 0.2 0.3 3.7 41.7%
0.0 0.0 0.0 0.0 0.0 0.0 -
2.0 2.4 2.1 1.6 1.6 17.8 -4.3%
0.8 0.7 0.9 0.8 0.6 7.2 -17.1%
0.0 0.1 0.1 0.1 0.1 0.8 50.0%
3.3 3.9 3.5 2.7 2.7 29.5 -2.2%
97.5 72.3 75.1 96.6 97.0 1 050.7 0.5%
0.0 0.0 0.0 0.0 0.0 0.0 -
9.0 9.0 7.9 7.3 8.2 465.6 11.3%
3.9 4.2 3.1 3.8 2.1 30.1 -43.4%
22.9 27.7 20.7 22.3 31.4 274.8 40.9%
28.8 43.2 38.9 29.3 37.9 349.0 29.3%
33.7 36.4 34.4 36.1 36.0 391.3 -0.3%
8.1 7.3 5.0 4.2 4.5 65.0 6.9%
0.2 0.4 0.2 0.0 0.0 1.1 0.0%
1.4 2.2 2.4 2.2 2.3 23.0 6.0%
6.0 7.0 6.6 5.8 5.9 69.4 3.0%
2.0 2.7 3.3 1.7 2.3 24.0 37.5%
0.0 0.0 0.0 0.0 0.1 0.2 400.0%
213.5 212.4 197.7 209.2 227.7 2 744.2 8.8%
244.6 248.6 230.2 243.3 259.0 3 108.1 6.5%
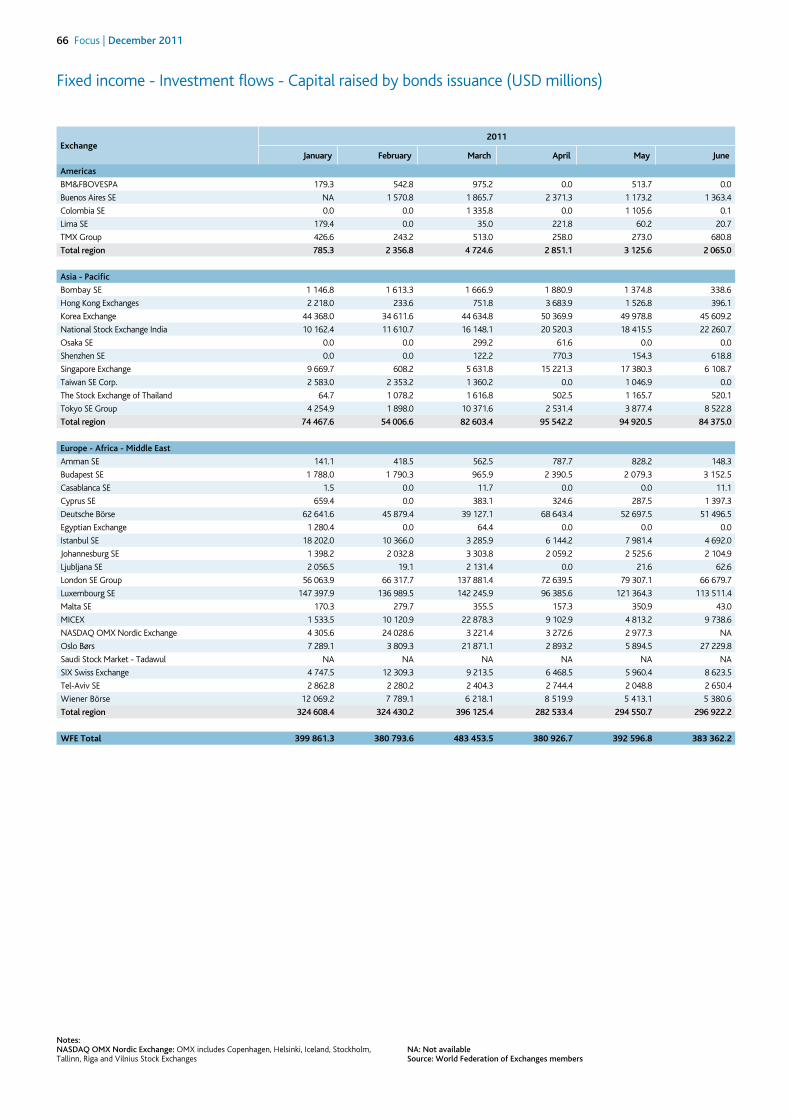
66 Focus | December 2011
Fixed income - Investment flows - Capital raised by bonds issuance (USD millions)
Notes: NASDAQ OMX Nordic Exchange: OMX includes Copenhagen, Helsinki, Iceland, Stockholm, Tallinn, Riga and Vilnius Stock Exchanges
NA: Not availableSource: World Federation of Exchanges members
Exchange2011
January February March April May June
Americas
BM&FBOVESPA 179.3 542.8 975.2 0.0 513.7 0.0
Buenos Aires SE NA 1 570.8 1 865.7 2 371.3 1 173.2 1 363.4
Colombia SE 0.0 0.0 1 335.8 0.0 1 105.6 0.1
Lima SE 179.4 0.0 35.0 221.8 60.2 20.7
TMX Group 426.6 243.2 513.0 258.0 273.0 680.8
Total region 785.3 2 356.8 4 724.6 2 851.1 3 125.6 2 065.0
Asia - Pacific
Bombay SE 1 146.8 1 613.3 1 666.9 1 880.9 1 374.8 338.6
Hong Kong Exchanges 2 218.0 233.6 751.8 3 683.9 1 526.8 396.1
Korea Exchange 44 368.0 34 611.6 44 634.8 50 369.9 49 978.8 45 609.2
National Stock Exchange India 10 162.4 11 610.7 16 148.1 20 520.3 18 415.5 22 260.7
Osaka SE 0.0 0.0 299.2 61.6 0.0 0.0
Shenzhen SE 0.0 0.0 122.2 770.3 154.3 618.8
Singapore Exchange 9 669.7 608.2 5 631.8 15 221.3 17 380.3 6 108.7
Taiwan SE Corp. 2 583.0 2 353.2 1 360.2 0.0 1 046.9 0.0
The Stock Exchange of Thailand 64.7 1 078.2 1 616.8 502.5 1 165.7 520.1
Tokyo SE Group 4 254.9 1 898.0 10 371.6 2 531.4 3 877.4 8 522.8
Total region 74 467.6 54 006.6 82 603.4 95 542.2 94 920.5 84 375.0
Europe - Africa - Middle East
Amman SE 141.1 418.5 562.5 787.7 828.2 148.3
Budapest SE 1 788.0 1 790.3 965.9 2 390.5 2 079.3 3 152.5
Casablanca SE 1.5 0.0 11.7 0.0 0.0 11.1
Cyprus SE 659.4 0.0 383.1 324.6 287.5 1 397.3
Deutsche Börse 62 641.6 45 879.4 39 127.1 68 643.4 52 697.5 51 496.5
Egyptian Exchange 1 280.4 0.0 64.4 0.0 0.0 0.0
Istanbul SE 18 202.0 10 366.0 3 285.9 6 144.2 7 981.4 4 692.0
Johannesburg SE 1 398.2 2 032.8 3 303.8 2 059.2 2 525.6 2 104.9
Ljubljana SE 2 056.5 19.1 2 131.4 0.0 21.6 62.6
London SE Group 56 063.9 66 317.7 137 881.4 72 639.5 79 307.1 66 679.7
Luxembourg SE 147 397.9 136 989.5 142 245.9 96 385.6 121 364.3 113 511.4
Malta SE 170.3 279.7 355.5 157.3 350.9 43.0
MICEX 1 533.5 10 120.9 22 878.3 9 102.9 4 813.2 9 738.6
NASDAQ OMX Nordic Exchange 4 305.6 24 028.6 3 221.4 3 272.6 2 977.3 NA
Oslo Børs 7 289.1 3 809.3 21 871.1 2 893.2 5 894.5 27 229.8
Saudi Stock Market - Tadawul NA NA NA NA NA NA
SIX Swiss Exchange 4 747.5 12 309.3 9 213.5 6 468.5 5 960.4 8 623.5
Tel-Aviv SE 2 862.8 2 280.2 2 404.3 2 744.4 2 048.8 2 650.4
Wiener Börse 12 069.2 7 789.1 6 218.1 8 519.9 5 413.1 5 380.6
Total region 324 608.4 324 430.2 396 125.4 282 533.4 294 550.7 296 922.2
WFE Total 399 861.3 380 793.6 483 453.5 380 926.7 392 596.8 383 362.2
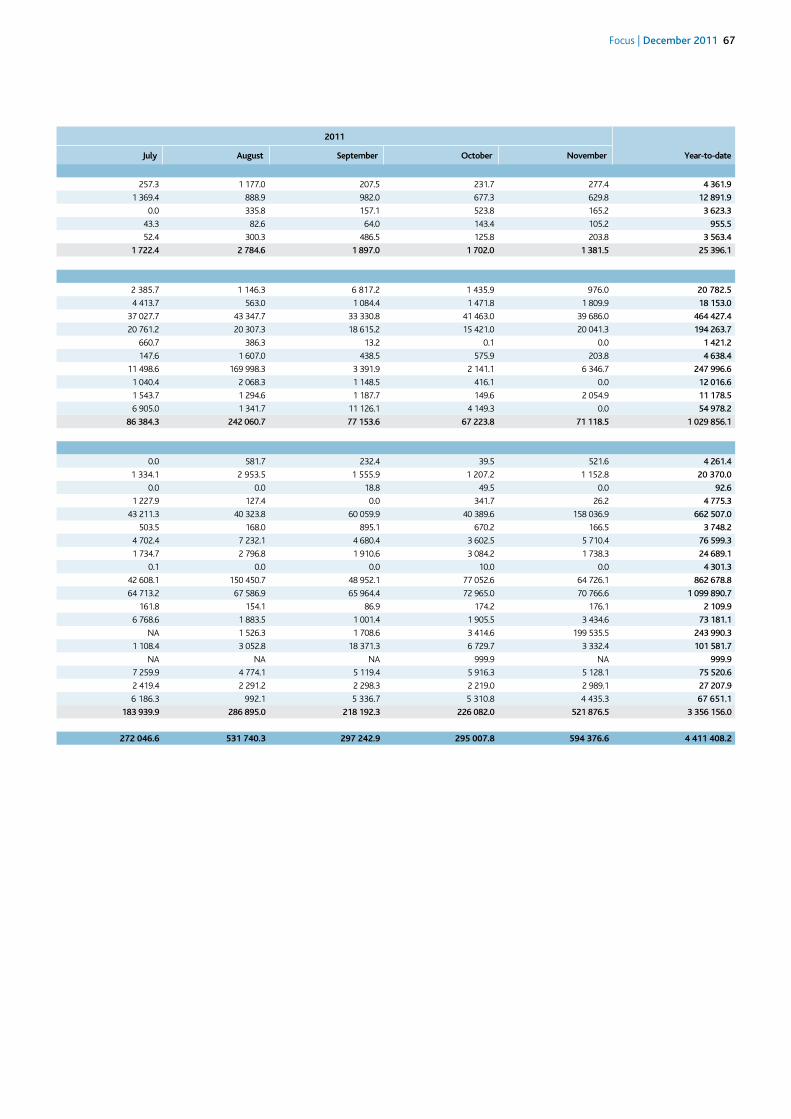
Focus | December 2011 67
2011
Year-to-dateJuly August September October November
257.3 1 177.0 207.5 231.7 277.4 4 361.9
1 369.4 888.9 982.0 677.3 629.8 12 891.9
0.0 335.8 157.1 523.8 165.2 3 623.3
43.3 82.6 64.0 143.4 105.2 955.5
52.4 300.3 486.5 125.8 203.8 3 563.4
1 722.4 2 784.6 1 897.0 1 702.0 1 381.5 25 396.1
2 385.7 1 146.3 6 817.2 1 435.9 976.0 20 782.5
4 413.7 563.0 1 084.4 1 471.8 1 809.9 18 153.0
37 027.7 43 347.7 33 330.8 41 463.0 39 686.0 464 427.4
20 761.2 20 307.3 18 615.2 15 421.0 20 041.3 194 263.7
660.7 386.3 13.2 0.1 0.0 1 421.2
147.6 1 607.0 438.5 575.9 203.8 4 638.4
11 498.6 169 998.3 3 391.9 2 141.1 6 346.7 247 996.6
1 040.4 2 068.3 1 148.5 416.1 0.0 12 016.6
1 543.7 1 294.6 1 187.7 149.6 2 054.9 11 178.5
6 905.0 1 341.7 11 126.1 4 149.3 0.0 54 978.2
86 384.3 242 060.7 77 153.6 67 223.8 71 118.5 1 029 856.1
0.0 581.7 232.4 39.5 521.6 4 261.4
1 334.1 2 953.5 1 555.9 1 207.2 1 152.8 20 370.0
0.0 0.0 18.8 49.5 0.0 92.6
1 227.9 127.4 0.0 341.7 26.2 4 775.3
43 211.3 40 323.8 60 059.9 40 389.6 158 036.9 662 507.0
503.5 168.0 895.1 670.2 166.5 3 748.2
4 702.4 7 232.1 4 680.4 3 602.5 5 710.4 76 599.3
1 734.7 2 796.8 1 910.6 3 084.2 1 738.3 24 689.1
0.1 0.0 0.0 10.0 0.0 4 301.3
42 608.1 150 450.7 48 952.1 77 052.6 64 726.1 862 678.8
64 713.2 67 586.9 65 964.4 72 965.0 70 766.6 1 099 890.7
161.8 154.1 86.9 174.2 176.1 2 109.9
6 768.6 1 883.5 1 001.4 1 905.5 3 434.6 73 181.1
NA 1 526.3 1 708.6 3 414.6 199 535.5 243 990.3
1 108.4 3 052.8 18 371.3 6 729.7 3 332.4 101 581.7
NA NA NA 999.9 NA 999.9
7 259.9 4 774.1 5 119.4 5 916.3 5 128.1 75 520.6
2 419.4 2 291.2 2 298.3 2 219.0 2 989.1 27 207.9
6 186.3 992.1 5 336.7 5 310.8 4 435.3 67 651.1
183 939.9 286 895.0 218 192.3 226 082.0 521 876.5 3 356 156.0
272 046.6 531 740.3 297 242.9 295 007.8 594 376.6 4 411 408.2
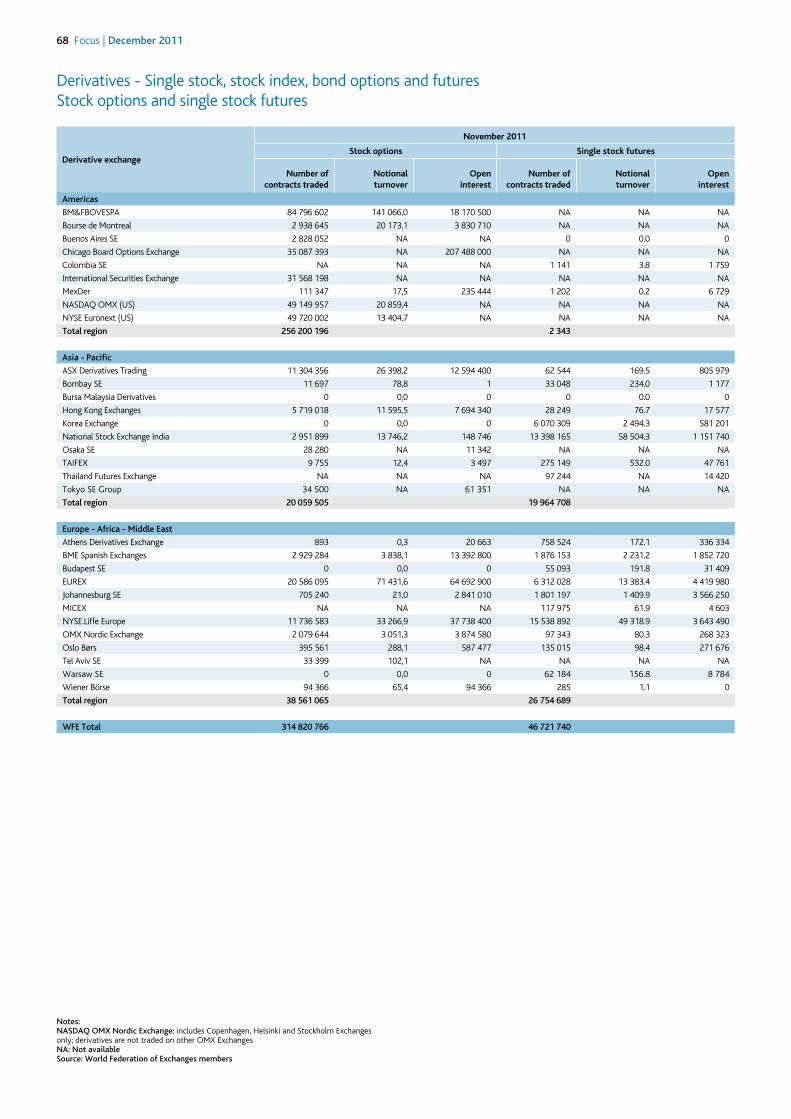
68 Focus | December 2011
Derivatives - Single stock, stock index, bond options and futuresStock options and single stock futures
Derivative exchange
November 2011
Stock options Single stock futures
Number of contracts traded
Notional turnover
Openinterest
Number of contracts traded
Notional turnover
Openinterest
Americas
BM&FBOVESPA 84 796 602 141 066,0 18 170 500 NA NA NA
Bourse de Montreal 2 938 645 20 173,1 3 830 710 NA NA NA
Buenos Aires SE 2 828 052 NA NA 0 0.0 0
Chicago Board Options Exchange 35 087 393 NA 207 488 000 NA NA NA
Colombia SE NA NA NA 1 141 3.8 1 759
International Securities Exchange 31 568 198 NA NA NA NA NA
MexDer 111 347 17,5 235 444 1 202 0.2 6 729
NASDAQ OMX (US) 49 149 957 20 859,4 NA NA NA NA
NYSE Euronext (US) 49 720 002 13 404,7 NA NA NA NA
Total region 256 200 196 2 343
Asia - Pacific
ASX Derivatives Trading 11 304 356 26 398,2 12 594 400 62 544 169.5 805 979
Bombay SE 11 697 78,8 1 33 048 234.0 1 177
Bursa Malaysia Derivatives 0 0,0 0 0 0.0 0
Hong Kong Exchanges 5 719 018 11 595,5 7 694 340 28 249 76.7 17 577
Korea Exchange 0 0,0 0 6 070 309 2 494.3 581 201
National Stock Exchange India 2 951 899 13 746,2 148 746 13 398 165 58 504.3 1 151 740
Osaka SE 28 280 NA 11 342 NA NA NA
TAIFEX 9 755 12,4 3 497 275 149 532.0 47 761
Thailand Futures Exchange NA NA NA 97 244 NA 14 420
Tokyo SE Group 34 500 NA 61 351 NA NA NA
Total region 20 059 505 19 964 708
Europe - Africa - Middle East
Athens Derivatives Exchange 893 0,3 20 663 758 524 172.1 336 334
BME Spanish Exchanges 2 929 284 3 838,1 13 392 800 1 876 153 2 231.2 1 852 720
Budapest SE 0 0,0 0 55 093 191.8 31 409
EUREX 20 586 095 71 431,6 64 692 900 6 312 028 13 383.4 4 419 980
Johannesburg SE 705 240 21,0 2 841 010 1 801 197 1 409.9 3 566 250
MICEX NA NA NA 117 975 61.9 4 603
NYSE.Liffe Europe 11 736 583 33 266,9 37 738 400 15 538 892 49 318.9 3 643 490
OMX Nordic Exchange 2 079 644 3 051,3 3 874 580 97 343 80.3 268 323
Oslo Børs 395 561 288,1 587 477 135 015 98.4 271 676
Tel Aviv SE 33 399 102,1 NA NA NA NA
Warsaw SE 0 0,0 0 62 184 156.8 8 784
Wiener Börse 94 366 65,4 94 366 285 1.1 0
Total region 38 561 065 26 754 689
WFE Total 314 820 766 46 721 740
Notes: NASDAQ OMX Nordic Exchange: includes Copenhagen, Helsinki and Stockholm Exchanges only; derivatives are not traded on other OMX ExchangesNA: Not availableSource: World Federation of Exchanges members

Focus | December 2011 69
Trading days November 2011
Year-to-date
Stock options Single stock futures
Number of contracts traded
Notional turnover
Number of contracts traded
Notional turnover
20 771 142 760 1 552 840.0 NA NA
22 25 764 126 196 363.0 NA NA
21 40 196 434 NA 0 0.0
21 485 226 516 NA NA NA
20 NA NA 29 602 77.6
21 406 417 050 NA NA NA
20 442 199 96.8 44 301 8.7
21 640 384 691 68 829.8 NA NA
21 583 012 177 126 711.0 NA NA
2 952 585 953 73 903
22 99 213 131 366 758.0 2 731 195 5 286.9
20 36 642 244.5 89 908 580.6
20 0 0.0 0 0.0
22 69 023 731 182 292.0 421 538 1 470.1
22 0 0.0 55 642 385 29 700.4
20 29 947 556 174 327.0 148 122 267 820 794.0
20 1 207 580 NA NA NA
22 118 938 226.8 2 128 324 4 911.1
22 NA NA 1 498 177 NA
20 582 858 NA NA NA
200 130 436 210 633 794
22 56 401 65.2 6 788 218 3 030.2
22 25 231 459 41 086.0 24 191 817 37 506.7
21 0 0.0 725 502 3 842.1
22 258 831 252 952 946.0 167 168 551 817 123.0
22 9 658 326 383.5 42 680 492 24 549.4
21 NA NA 7 369 012 4 843.2
22 140 620 971 506 219.0 228 274 082 885 400.0
22 27 888 589 51 709.1 3 675 497 3 954.2
22 3 671 373 3 388.5 1 472 673 1 429.0
22 765 581 3 793.0 NA NA
20 0 0.0 686 876 2 484.2
21 525 312 1 237.7 4 430 47.8
467 249 264 483 037 150
3 619 965 653 693 744 847

70 Focus | December 2011
Derivatives - Single stock, stock index, bond options and futuresStock index options and futures
Derivative exchange
November 2011
Stock index options Stock index futures
Number of contracts traded
Notional turnover
Open interest
Number of contracts traded
Notional turnover
Open interest
Americas
BM&FBOVESPA 71 491 22 580.4 87 881 1 774 340 56 632.1 276 697
Bourse de Montreal 5 371 368.8 16 440 241 124 33 104.8 139 349
Buenos Aires SE 0 0.0 0 0 0.0 0
CBOE Future Exchange NA NA NA 822 891 NA 143 825
Chicago Board Options Exchange 25 749 820 NA 21 785 000 NA NA NA
CME Group 4 944 051 488 827.0 2 103 300 62 032 836 3 816 390.0 4 032 380
Colombia SE NA NA NA 36 0.7 86
International Securities Exchange 737 819 NA NA NA NA NA
MexDer 5 270 140.6 17 306 51 708 1 389.0 96 666
NASDAQ OMX (US) 418 942 578.7 NA NA NA NA
NYSE Euronext (US) 184 014 NA 111 193 NA NA NA
Total region 32 116 778 64 922 935
Asia - Pacific
ASX Derivatives Trading 981 726 42 120.7 526 885 12 200 220.8 13 865
ASX SFE Derivatives Trading 25 189 2 727.4 118 514 808 823 87 203.9 239 636
Bombay SE 81 333 418.8 8 247 772 190 3 687.9 12 128
Bursa Malaysia Derivatives 0 0.0 0 215 173 4 907.7 23 085
Hong Kong Exchanges 1 166 848 109 786.0 649 128 4 758 869 353 518.0 220 850
Korea Exchange 311 145 301 6 603 830.0 4 424 900 7 523 297 798 515.0 135 677
National Stock Exchange India 80 542 787 388 322.0 2 567 700 13 469 578 59 791.0 627 312
Osaka SE 3 236 048 NA 2 396 260 10 496 104 234 558.0 1 051 820
Singapore Exchange 197 915 NA 591 143 5 511 838 NA 794 756
TAIFEX 10 299 600 123 874.0 1 012 270 5 145 727 169 594.0 148 521
Thailand Futures Exchange 3 270 NA 8 329 465 086 NA 37 407
Tokyo SE Group 961 NA 2 217 811 406 70 708.9 489 470
Total region 407 680 978 49 990 291
Europe - Africa - Middle East
Athens Derivatives Exchange 14 251 28.2 5 819 138 445 265.4 20 405
BME Spanish Exchanges 201 951 2 296.9 749 679 550 424 41 770.6 47 331
Budapest SE 0 0.0 0 153 142 113.7 199 256
EUREX 47 098 674 1 434 550.0 54 056 500 38 006 808 1 857 710.0 4 739 040
Johannesburg SE 457 157 499.6 1 050 650 1 174 867 35 852.8 541 633
MICEX NA NA NA 35 935 171.2 229
NYSE.Liffe Europe 4 542 137 265 547.0 5 344 480 7 112 324 463 309.0 1 546 120
OMX Nordic Exchange 1 120 106 15 691.1 873 227 3 739 326 52 376.3 596 117
Oslo Børs 45 632 33.2 27 794 613 793 447.1 134 159
Tel Aviv SE 8 614 309 247 235.0 NA 3 891 106.6 NA
Warsaw SE 49 450 327.9 74 675 1 145 917 8 069.4 116 378
Wiener Börse 1 486 0.7 4 858 13 322 591.7 56 934
Total region 62 145 153 52 688 194
WFE Total 501 942 909 167 601 420
Notes: NASDAQ OMX Nordic Exchange: includes Copenhagen, Helsinki and Stockholm Exchanges only; derivatives are not traded on other OMX ExchangesNA: Not availableSource: World Federation of Exchanges members

Focus | December 2011 71
Trading days November 2011
Year-to-date
Stock index options Stock index futures
Number of contracts traded
Notional turnover
Number of contracts traded
Notional turnover
20 576 918 205 084.0 20 031 985 742 250.0
22 88 463 6 902.8 3 737 048 569 569.0
21 0 0.0 0 0.0
21 64 NA 11 395 966 NA
21 299 813 490 NA NA NA
21 55 216 468 6 056 930.0 680 478 079 45 975 100.0
20 NA NA 481 11.1
21 7 354 267 NA NA NA
20 61 155 1 786.5 1 048 609 30 289.4
21 4 956 932 3 230.2 NA NA
21 1 644 817 NA NA NA
369 712 574 716 692 168
22 9 512 832 447 891.0 227 583 3 773.4
22 392 560 46 025.0 10 852 569 1 259 310.0
20 110 908 580.5 905 313 4 384.0
20 16 0.9 2 321 137 56 346.3
22 14 441 255 1 687 250.0 46 868 563 4 310 750.0
22 3 451 963 899 82 239 700.0 81 533 782 9 597 920.0
20 784 043 285 4 579 750.0 141 827 250 774 102.0
20 42 325 293 NA 127 928 937 3 407 300.0
NA 1 956 982 NA 63 925 128 NA
22 118 348 008 1 677 410.0 49 906 536 1 973 540.0
22 103 664 NA 4 043 214 NA
20 19 236 NA 12 918 698 1 350 760.0
4 423 217 938 543 258 710
22 318 567 1 341.9 2 345 273 9 048.3
22 1 919 658 26 435.5 7 943 565 741 630.0
21 10 0.0 1 757 065 1 871.3
22 437 633 283 16 014 900.0 449 648 985 24 356 200.0
22 4 041 873 4 473.2 15 186 732 468 856.0
21 NA NA 2 004 341 11 753.6
22 48 104 336 3 130 830.0 90 081 401 6 486 370.0
22 11 636 045 185 931.0 34 415 551 548 940.0
22 550 893 503.2 5 051 168 4 602.8
22 80 777 100 2 705 130.0 27 528 930.4
20 909 358 8 018.1 12 619 507 112 048.0
21 27 222 18.4 287 613 18 114.0
585 918 345 621 368 729
5 378 848 857 1 881 319 607
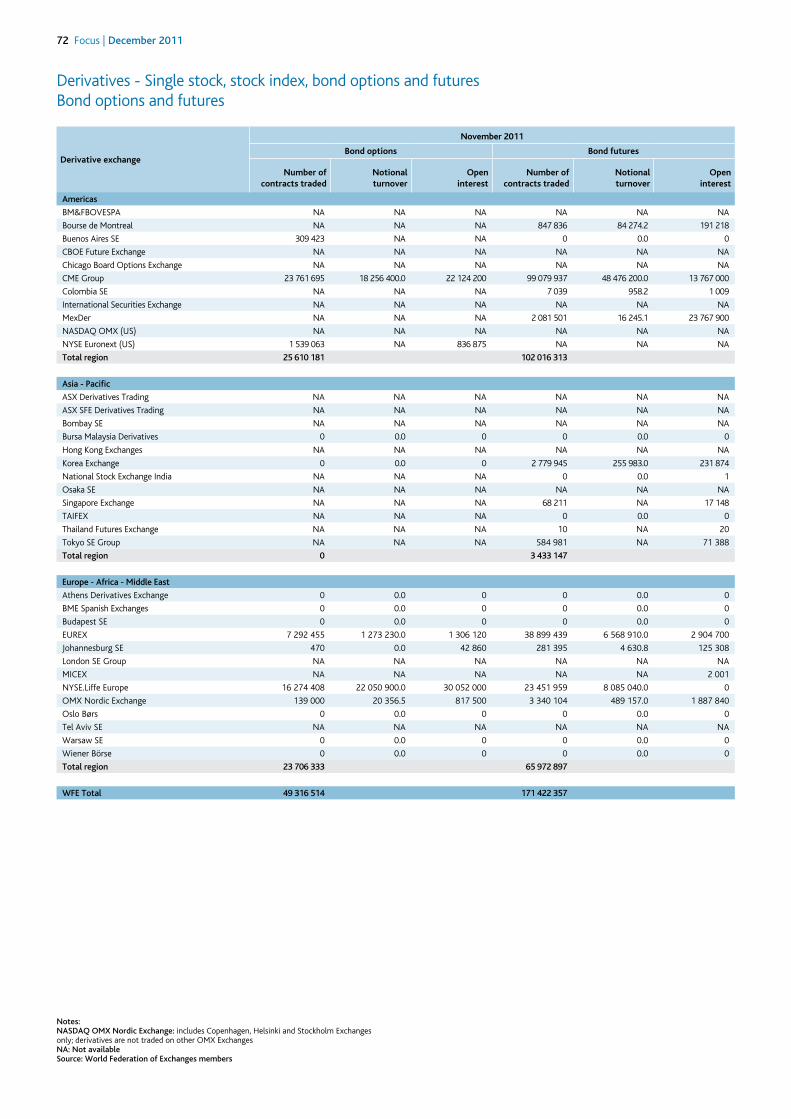
72 Focus | December 2011
Derivatives - Single stock, stock index, bond options and futuresBond options and futures
Derivative exchange
November 2011
Bond options Bond futures
Number of contracts traded
Notional turnover
Openinterest
Number of contracts traded
Notional turnover
Openinterest
Americas
BM&FBOVESPA NA NA NA NA NA NA
Bourse de Montreal NA NA NA 847 836 84 274.2 191 218
Buenos Aires SE 309 423 NA NA 0 0.0 0
CBOE Future Exchange NA NA NA NA NA NA
Chicago Board Options Exchange NA NA NA NA NA NA
CME Group 23 761 695 18 256 400.0 22 124 200 99 079 937 48 476 200.0 13 767 000
Colombia SE NA NA NA 7 039 958.2 1 009
International Securities Exchange NA NA NA NA NA NA
MexDer NA NA NA 2 081 501 16 245.1 23 767 900
NASDAQ OMX (US) NA NA NA NA NA NA
NYSE Euronext (US) 1 539 063 NA 836 875 NA NA NA
Total region 25 610 181 102 016 313
Asia - Pacific
ASX Derivatives Trading NA NA NA NA NA NA
ASX SFE Derivatives Trading NA NA NA NA NA NA
Bombay SE NA NA NA NA NA NA
Bursa Malaysia Derivatives 0 0.0 0 0 0.0 0
Hong Kong Exchanges NA NA NA NA NA NA
Korea Exchange 0 0.0 0 2 779 945 255 983.0 231 874
National Stock Exchange India NA NA NA 0 0.0 1
Osaka SE NA NA NA NA NA NA
Singapore Exchange NA NA NA 68 211 NA 17 148
TAIFEX NA NA NA 0 0.0 0
Thailand Futures Exchange NA NA NA 10 NA 20
Tokyo SE Group NA NA NA 584 981 NA 71 388
Total region 0 3 433 147
Europe - Africa - Middle East
Athens Derivatives Exchange 0 0.0 0 0 0.0 0
BME Spanish Exchanges 0 0.0 0 0 0.0 0
Budapest SE 0 0.0 0 0 0.0 0
EUREX 7 292 455 1 273 230.0 1 306 120 38 899 439 6 568 910.0 2 904 700
Johannesburg SE 470 0.0 42 860 281 395 4 630.8 125 308
London SE Group NA NA NA NA NA NA
MICEX NA NA NA NA NA 2 001
NYSE.Liffe Europe 16 274 408 22 050 900.0 30 052 000 23 451 959 8 085 040.0 0
OMX Nordic Exchange 139 000 20 356.5 817 500 3 340 104 489 157.0 1 887 840
Oslo Børs 0 0.0 0 0 0.0 0
Tel Aviv SE NA NA NA NA NA NA
Warsaw SE 0 0.0 0 0 0.0 0
Wiener Börse 0 0.0 0 0 0.0 0
Total region 23 706 333 65 972 897
WFE Total 49 316 514 171 422 357
Notes: NASDAQ OMX Nordic Exchange: includes Copenhagen, Helsinki and Stockholm Exchanges only; derivatives are not traded on other OMX ExchangesNA: Not availableSource: World Federation of Exchanges members
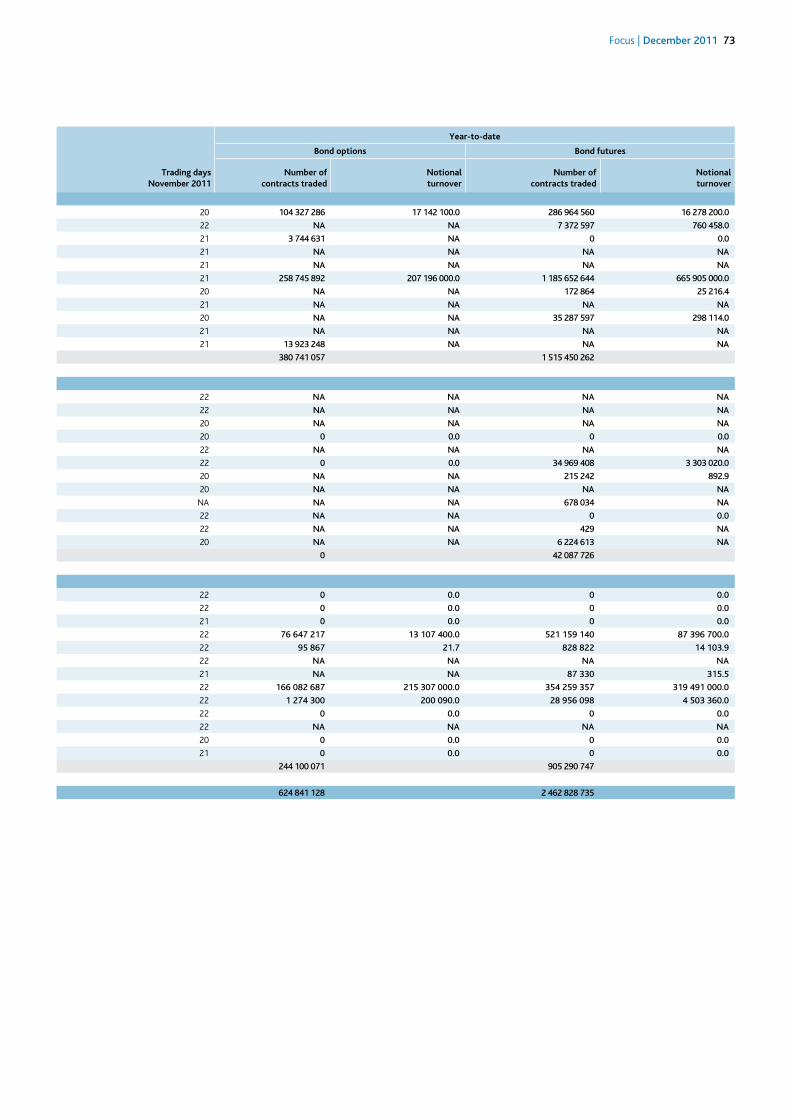
Focus | December 2011 73
Trading days November 2011
Year-to-date
Bond options Bond futures
Number of contracts traded
Notional turnover
Number of contracts traded
Notional turnover
20 104 327 286 17 142 100.0 286 964 560 16 278 200.0
22 NA NA 7 372 597 760 458.0
21 3 744 631 NA 0 0.0
21 NA NA NA NA
21 NA NA NA NA
21 258 745 892 207 196 000.0 1 185 652 644 665 905 000.0
20 NA NA 172 864 25 216.4
21 NA NA NA NA
20 NA NA 35 287 597 298 114.0
21 NA NA NA NA
21 13 923 248 NA NA NA
380 741 057 1 515 450 262
22 NA NA NA NA
22 NA NA NA NA
20 NA NA NA NA
20 0 0.0 0 0.0
22 NA NA NA NA
22 0 0.0 34 969 408 3 303 020.0
20 NA NA 215 242 892.9
20 NA NA NA NA
NA NA NA 678 034 NA
22 NA NA 0 0.0
22 NA NA 429 NA
20 NA NA 6 224 613 NA
0 42 087 726
22 0 0.0 0 0.0
22 0 0.0 0 0.0
21 0 0.0 0 0.0
22 76 647 217 13 107 400.0 521 159 140 87 396 700.0
22 95 867 21.7 828 822 14 103.9
22 NA NA NA NA
21 NA NA 87 330 315.5
22 166 082 687 215 307 000.0 354 259 357 319 491 000.0
22 1 274 300 200 090.0 28 956 098 4 503 360.0
22 0 0.0 0 0.0
22 NA NA NA NA
20 0 0.0 0 0.0
21 0 0.0 0 0.0
244 100 071 905 290 747
624 841 128 2 462 828 735
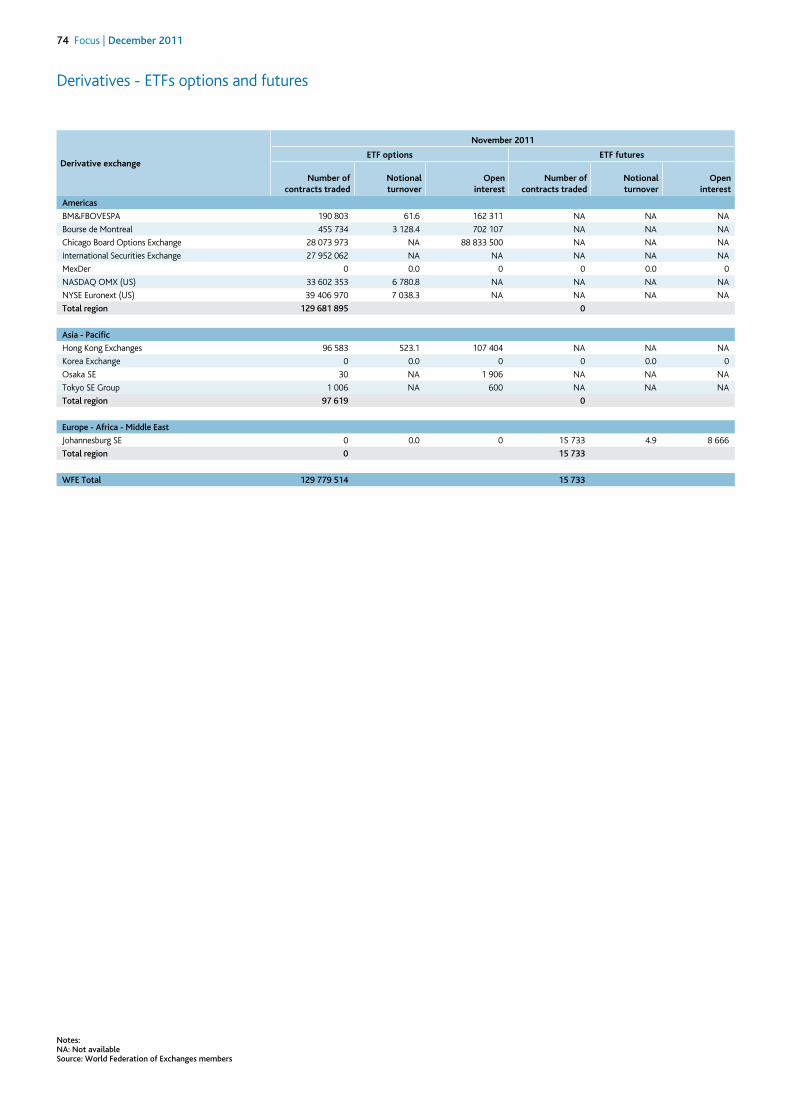
74 Focus | December 2011
Derivatives - ETFs options and futures
Derivative exchange
November 2011
ETF options ETF futures
Number of contracts traded
Notional turnover
Openinterest
Number of contracts traded
Notional turnover
Openinterest
Americas
BM&FBOVESPA 190 803 61.6 162 311 NA NA NA
Bourse de Montreal 455 734 3 128.4 702 107 NA NA NA
Chicago Board Options Exchange 28 073 973 NA 88 833 500 NA NA NA
International Securities Exchange 27 952 062 NA NA NA NA NA
MexDer 0 0.0 0 0 0.0 0
NASDAQ OMX (US) 33 602 353 6 780.8 NA NA NA NA
NYSE Euronext (US) 39 406 970 7 038.3 NA NA NA NA
Total region 129 681 895 0
Asia - Pacific
Hong Kong Exchanges 96 583 523.1 107 404 NA NA NA
Korea Exchange 0 0.0 0 0 0.0 0
Osaka SE 30 NA 1 906 NA NA NA
Tokyo SE Group 1 006 NA 600 NA NA NA
Total region 97 619 0
Europe - Africa - Middle East
Johannesburg SE 0 0.0 0 15 733 4.9 8 666
Total region 0 15 733
WFE Total 129 779 514 15 733
Notes: NA: Not availableSource: World Federation of Exchanges members
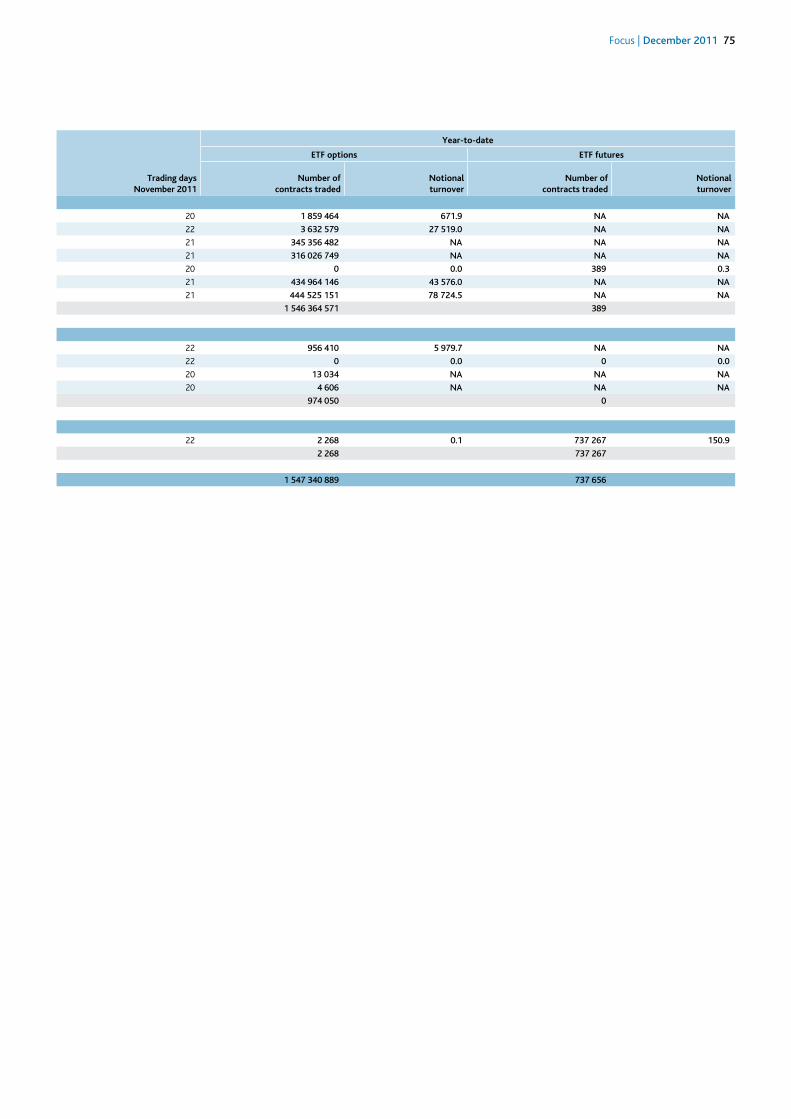
Focus | December 2011 75
Trading days November 2011
Year-to-date
ETF options ETF futures
Number of contracts traded
Notional turnover
Number of contracts traded
Notional turnover
20 1 859 464 671.9 NA NA
22 3 632 579 27 519.0 NA NA
21 345 356 482 NA NA NA
21 316 026 749 NA NA NA
20 0 0.0 389 0.3
21 434 964 146 43 576.0 NA NA
21 444 525 151 78 724.5 NA NA
1 546 364 571 389
22 956 410 5 979.7 NA NA
22 0 0.0 0 0.0
20 13 034 NA NA NA
20 4 606 NA NA NA
974 050 0
22 2 268 0.1 737 267 150.9
2 268 737 267
1 547 340 889 737 656
76 Focus | December 2011
Calendar of events
Meeting Date Place Details
December 2011
Regulation Task Force Meeting 1-2 December Hosted by Singapore Exchange Contact the Secretariat
15th Annual ASEA Conference 11-13 December Marrakeshhttp://www.aseaconference2011.ma/AboutTheConference.aspx
March 2012
FIA Futures Industry Conference 13-16 March Boca Raton http://www.futuresindustry.org
April 2012
IOMA Annual Conference 15-18 April London Contact the Secretariat
Intermarket Surveillance Group Meeting 24-26 April Chicago https://www.isgportal.org/home.html
May 2012
30th Annual Options Industry Conference 3-5 May New Orleanshttp://optionseducation.org/conference2012/video.jsp
IOSCO Annual Conference 13-17 May Beijing www.iosco.org
June 2012
FESE Convention 20-21 June Istanbul www.fese.eu
ICGN Conference 25-27 June Rio de Janerio www.icgn.org
September 2012
FIAB Annual Conference 10-11 September Cartagena de Indias, Colombia http://www.fiabnet.org/en/index.asp
FEAS General Assembly 20-21 September Sofia www.feas.org
October 2012
WFE Board of Directors Meeting 14 October Hosted by Taiwan Stock Exchange Contact the Secretariat
WFE Working Committee Meeting 15 October Hosted by Taiwan Stock Exchange Contact the Secretariat
WFE General Assembly and Annual Meeting 16 October Hosted by Taiwan Stock Exchange Contact the Secretariat


tel. + 33 (0) 1 58 62 54 00 fax. + 33 (0) 1 58 62 50 48 editor. Lorenzo Gallaiwww.world-exchanges.org email. [email protected]
To receive a free copy by email subscribe to www.world-exchanges.org