WEDNESDAY 3 DECEMBER - Focus-Balkans
226
Grant Agreement no. 212579 FOCUS-BALKANS: Food Consumer Sciences in the Balkans: Frameworks, Protocols and Networks for a better knowledge of food behaviours FP7 Cooperation Work Programme: Theme 2 – Food, Agriculture and Fisheries, and Biotechnology Activity 2 Fork to farm FP7 KBBE 2007 2.1-02 DELIVERABLE N°6.1 STUDY REPORT ON CONSUMER MOTIVATIONS AND BEHAVIOURS FOR PRODUCTS WITH HEALTH CLAIMS March 2010 Draft version Ed. Zaklina Stojanovic, Martine Zaouche-Laniau, and Magali Esteve Deliverable lead beneficiary: BEL – Faculty of Economics, University of Belgrade www.focus‐balkans.org FOCUS‐BALKANS, FP7 KBBE 2007 1, GA 212579, is supported by the European Commission, DG Research
-
Upload
khangminh22 -
Category
Documents
-
view
1 -
download
0
Transcript of WEDNESDAY 3 DECEMBER - Focus-Balkans
Grant Agreement no. 212579
FOCUS-BALKANS: Food Consumer Sciences in the Balkans: Frameworks, Protocols and Networks for a better knowledge of food behaviours
FP7 Cooperation Work Programme:
Theme 2 – Food, Agriculture and Fisheries, and Biotechnology
Activity 2 Fork to farm
FP7 KBBE 2007 2.1-02
DELIVERABLE N°6.1
STUDY REPORT ON CONSUMER MOTIVATIONS AND BEHAVIOURS FOR PRODUCTS WITH HEALTH CLAIMS
March 2010
Draft version
Ed. Zaklina Stojanovic, Martine Zaouche-Laniau,
and Magali Esteve
Deliverable lead beneficiary:
BEL – Faculty of Economics, University of Belgrade
www.focus‐balkans.org FOCUS‐BALKANS, FP7 KBBE 2007 1, GA 212579, is supported by the European Commission, DG Research

FP7 KBBE 2007 1 1 GA 212579
TABLE OF CONTENT
TABLE OF CONTENT ................................................................................................................. 1 TABLE OF FIGURES ................................................................................................................... 3 TABLE OF CHARTS.................................................................................................................... 5 TABLE of TABLES ....................................................................................................................... 5 TABLE OF PICTURES ................................................................................................................. 6 SUMMARY ................................................................................................................................ 7 INTRODUCTION ....................................................................................................................... 9
RESEARCH CONCEPT ............................................................................................................................9 METHODOLOGY ................................................................................................................................. 15
A. RESEARCH BACKGROUND ........................................................................................ 21 1. NUTRITIONAL LABELLING AND HEALTH CLAIMS REGULATORY FRAMEWORK (Z.Stojanovic and M.Laniau) ............................................................................................... 21 SUMMARY .............................................................................................................................. 21
1.1. EU REGULATORY FRAMEWORK ............................................................................................. 21 1.2. NUTRITIONAL AND HEALTH LABELLING OF FOOD - WBC APPROACH ............................ 28 1.3. CONCLUSION ......................................................................................................................... 37
2. NUTRITIONAL AND HEALTH CLAIMS PRODUCTS STATISTICS (Z.Stojanovic, R.Dragutinovic-Mitrovic and M.Gligoric) ........................................................................... 39 SUMMARY .............................................................................................................................. 39
2.1. AVAILABLE STATISTICAL DATA BY COUNTRY ....................................................................... 40 2.1.1. Demand .......................................................................................................................... 40 2.1.2. SUPPLY ............................................................................................................................. 52
2.2. WBC N&H PRODUCTS SURVEY ............................................................................................. 61 2.2.1. INTRODUCTION ............................................................................................................... 61 2.2.2. N&H claims ..................................................................................................................... 63 2.2.3. Studied categories overview for WBC ....................................................................... 64 2.2.4. N&H products analysis by country .............................................................................. 77
B/WBC NUTRITIONNAL and Health CLAIMED PRODUCTS MARKET RESEARCH ................. 97 3. WBC N&H CLAIMED PRODUCTS PROCESSORS AND RETAILERS SURVEY - Synthetic report ..................................................................................................................................... 97
SUMMARY ............................................................................................................................................ 97 METHODOLOGY SHORT DESCRIPTION .......................................................................................... 100 3.1. RESEARCH FINDINGS ............................................................................................................ 101
3.1.1. Market structure of the studied categories ............................................................. 101 3.1.2. Margin and price ......................................................................................................... 107 3.1.3. Market structure ........................................................................................................... 108 3.1.4. Estimated market shares for the studied categories ............................................. 110
3.2. Motivations/barriers toward products with N&H claims ................................................ 112 3.2.1. Motivations ................................................................................................................... 112 3.2.2. Barriers ........................................................................................................................... 115
3.3. Perception of demand ....................................................................................................... 116 3.3.1. Processors’ and retailers’ overall attitude toward consumers’ demand ........... 116 3.3.2. Cross-perception of processors supply and retailers’ demand ........................... 126 3.3.3. National policy for nutrition ........................................................................................ 127
3.4. WBC N&H claim products market perspectives and conclusion ................................ 127 3.4.1. Main factors of change and its potential influence on the consumption ......... 127 3.4.2. The trend of consumer’s demand and expected target population ................ 131 3.4.3. Other topics evoked ................................................................................................... 135
FOCUS‐BALKANS DL 6.1 Consumer study implementation for products with health claims

FP7 KBBE 2007 1 2 GA 212579
4. N&H CLAIMS PRODUCTS MARKET - Experts` point of view ...................................... 136 SUMMARY .......................................................................................................................................... 136 METHODOLOGY – short description .............................................................................................. 140
STRUCTURE OF IDIS AND FIELDWORK REPORT .......................................................................... 140 4.1. General presentation of the organization with focus on food and health ................ 143
4.1.1. Main activities of organizations and individual expertise of interviewees ......... 143 4.1.2. Description of activities directly connected with nutrition and public health .. 145 4.1.3. Consumers' demand for products with nutrition and health claims ................... 146 4.1.4. Health benefits as criteria of consumer’s choice of food ..................................... 149
4.2. Perception of consumers’ demand for N&H claims products ..................................... 152 4.3. Perceived consumers’ characteristics ............................................................................. 153 4.4. Commercial offer and health claims ............................................................................... 155
4.4.1. Variety and nutrition quality of the offered product ............................................. 155 4.4.2. N&H claims ................................................................................................................... 156
4.5. Public policy for nutrition .................................................................................................... 160 4.5.1. Regulations and compatibility with EU legislative .................................................. 160 4.5.2. Labelling and national policy for nutrition ............................................................... 164 4.5.3. Public programmes of communication to promote better food habits ............ 165 4.5.4. Trends ............................................................................................................................ 169
4.6. Conclusion ............................................................................................................................ 172 C/ CONSUMERS ATTITUDES TOWARD NUTRITIONNAL AND HEALTH CLAIMS PRODUCTS ............................................................................................................................................. 173 5. CONSUMERS FOCUS GROUPS DISCUSSIONS - SYNTHETIC REPORT .......................... 173
SUMMARY .......................................................................................................................................... 173 METHODOLOGY ............................................................................................................................... 176 5.1. Healthy life style – spontaneous associations .................................................................. 179 5.2. The link between concepts of food and health ............................................................. 180 5.3. Rationale for products choice (regular vs. Products with health claims) ................... 187 5.4. Consumer of products with health claim (image, demographic, personality) ........ 191 5.5. Perception of product claims (commercial, nutritive, health claims) ........................ 193 5.6. Perception and comprehension of nutritional information .......................................... 194 5.7. Products with nutritional and health claims: motives for consumption, trust, expectations ..................................................................................................................................... 196 5.8. Basic demographic information on participants ........................................................... 199 5.9. List of products offered in exercise 2 ................................................................................ 203
6. CONCLUSION .............................................................................................................. 213 7. REFERENCES ................................................................................................................. 219
FOCUS‐BALKANS DL 6.1 Consumer study implementation for products with health claims
FP7 KBBE 2007 1 3 GA 212579
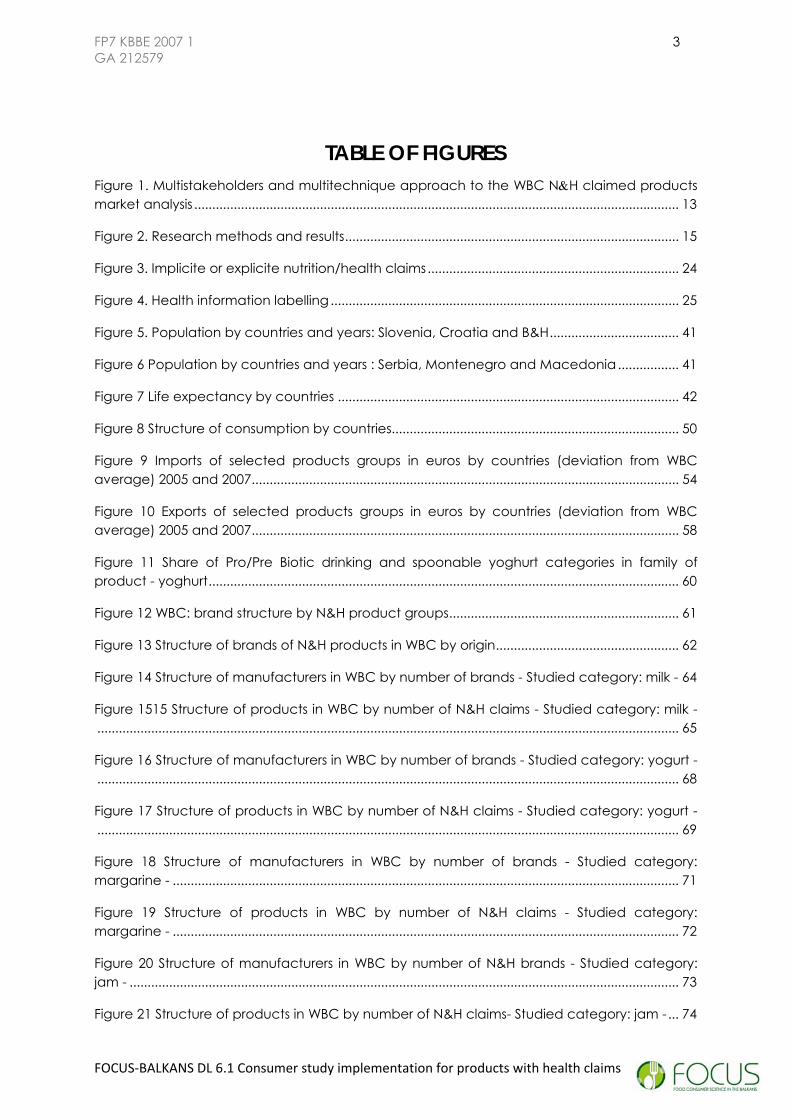
TABLE OF FIGURES Figure 1. Multistakeholders and multitechnique approach to the WBC N&H claimed products market analysis ....................................................................................................................................... 13
Figure 2. Research methods and results ............................................................................................. 15
Figure 3. Implicite or explicite nutrition/health claims ...................................................................... 24
Figure 4. Health information labelling ................................................................................................. 25
Figure 5. Population by countries and years: Slovenia, Croatia and B&H .................................... 41
Figure 6 Population by countries and years : Serbia, Montenegro and Macedonia ................. 41
Figure 7 Life expectancy by countries ............................................................................................... 42
Figure 8 Structure of consumption by countries................................................................................ 50
Figure 9 Imports of selected products groups in euros by countries (deviation from WBC average) 2005 and 2007 ....................................................................................................................... 54
Figure 10 Exports of selected products groups in euros by countries (deviation from WBC average) 2005 and 2007 ....................................................................................................................... 58
Figure 11 Share of Pro/Pre Biotic drinking and spoonable yoghurt categories in family of product - yoghurt ................................................................................................................................... 60
Figure 12 WBC: brand structure by N&H product groups ................................................................ 61
Figure 13 Structure of brands of N&H products in WBC by origin ................................................... 62
Figure 14 Structure of manufacturers in WBC by number of brands - Studied category: milk - 64
Figure 1515 Structure of products in WBC by number of N&H claims - Studied category: milk - .................................................................................................................................................................. 65
Figure 16 Structure of manufacturers in WBC by number of brands - Studied category: yogurt - .................................................................................................................................................................. 68
Figure 17 Structure of products in WBC by number of N&H claims - Studied category: yogurt - .................................................................................................................................................................. 69
Figure 18 Structure of manufacturers in WBC by number of brands - Studied category: margarine - ............................................................................................................................................. 71
Figure 19 Structure of products in WBC by number of N&H claims - Studied category: margarine - ............................................................................................................................................. 72
Figure 20 Structure of manufacturers in WBC by number of N&H brands - Studied category: jam - ......................................................................................................................................................... 73
Figure 21 Structure of products in WBC by number of N&H claims- Studied category: jam - ... 74
FOCUS‐BALKANS DL 6.1 Consumer study implementation for products with health claims

FP7 KBBE 2007 1 4 GA 212579
Figure 22 Structure of manufacturers in WBC by number of N&H brands - Studied category: juice- ........................................................................................................................................................ 75
Figure 23 Structure of products in WBC by number of N&H claims - Studied category: juice - 76
Figure 24 N&H products by origin ........................................................................................................ 78
Figure 25 Manufacturers by N&H product groups and origin ......................................................... 79
Figure 26 Brand structure by N&H product groups ........................................................................... 79
Figure 27 Structure of products by number of N&H claims ............................................................. 80
Figure 28 N&H products by origin ........................................................................................................ 81
Figure 29 Manufacturers by N&H product groups and origin ......................................................... 82
Figure 30 Brand structure by N&H product groups ........................................................................... 82
Figure 31 Structure of products by number of N&H claims ............................................................ 83
Figure 32 N&H products by origin ........................................................................................................ 84
Figure 33 Manufacturers by N&H product groups and origin ......................................................... 85
Figure 34 Brand structure by N&H product groups ........................................................................... 85
Figure 35 Structure of products by number of N&H claims ............................................................. 86
Figure 36 N&H products by origin ........................................................................................................ 87
Figure 37 Manufacturers by N&H product groups and origin ......................................................... 88
Figure 38 Brand structure by N&H product groups ........................................................................... 88
Figure 39 Structure of products by number of N&H claims ............................................................. 89
Figure 40 N&H products by origin ........................................................................................................ 90
Figure 41 Manufacturers by N&H product groups and origin ......................................................... 91
Figure 42 Brand structure by N&H product groups ........................................................................... 91
Figure 43 Structure of products by number of N&H claims ............................................................. 92
Figure 44 N&H products by origin ........................................................................................................ 94
Figure 45 Manufacturers by N&H product groups and origin ......................................................... 94
Figure 46 Brand structure by N&H product groups ........................................................................... 95
Figure 47 Structure of products by number of N&H claims ............................................................ 95
FOCUS‐BALKANS DL 6.1 Consumer study implementation for products with health claims

FP7 KBBE 2007 1 5 GA 212579
TABLE OF CHARTS Chart 1. Motivation to sell nutrition and health claim products-retailers .................................... 113
Chart 2.Motivation to sell nutrition and health claim products-processors ................................ 114
Chart 3. Barriers to sell nutrition and health claim products ......................................................... 115
Chart 4. Barriers to develop nutrition and health claim products-processors ............................ 116
Chart 5. Criteria of consumer’s choice of food: Processors .......................................................... 119
Chart 6. Criteria of consumer’s choice of food: Retailers ............................................................. 120
Chart 7. main restraints for consumers to buy products with H&N claims: Processors .............. 121
Chart 8. The main restraints for consumers to buy products with H&N claims: Processors ...... 122
Chart 9. The main factors of change in consumption of studied categories ............................ 131
TABLE of TABLES Table 1N&H claim market survey structure ........................................................................................ 18
Table 2. Health claims approved by EFSA ......................................................................................... 26
Table 3 Selected claims rejected by EFSA ......................................................................................... 28
Table 4. WBC Nutrition/health labeling regulative ........................................................................... 30
Table 5 The EU and WBC regulative on nutrition claims comparative analysis ........................... 31
Table 6 WBC regulative on dietetic food ........................................................................................... 36
Table 7 Leading non-communicable diseases by countries, 2006. ............................................... 43
Table 8 Structure of death caused by cardiovascular diseases diabetes by gender 2006 (%) 43
Table 9 Life style related to food of adult population...................................................................... 44
Table 10 Available money assets of houdeholds : monthly average ........................................... 48
Table 11 Allocated assets of houdeholds : monthly average ........................................................ 48
Table 12 Selected food and non-alcoholic beverages : monthly average per household ..... 50
Table 13 Share of selected food in all Food and non-alcoholic beverages ............................... 51
Table 14Production in quantities for some selected industrial products ....................................... 52
Table 15 Imports of selected products groups by countries and years ........................................ 53
Table 16 Imports of selected products groups by countries and years: annual average growth rates.......................................................................................................................................................... 54
FOCUS‐BALKANS DL 6.1 Consumer study implementation for products with health claims

FP7 KBBE 2007 1 6 GA 212579
Table 17 Exports of selected products groups by countries and years ......................................... 55
Table 18 Exports of selected products groups by countries and years: annual average growth rates.......................................................................................................................................................... 57
Table 19 Retail/off-trade Value for studied categories ................................................................... 59
Table 20 Development of Pro/Pre biotic yoghurt market (annual growth rate, %) .................... 60
Table 21 Structure of N&H products by origin ................................................................................... 62
Table 22. Characteristics of the consumers of N&H claims products .......................................... 124
Table 23. Structure of in-depth interviews ........................................................................................ 141
Table 24 Characteristics of consumers of N&H claims products .................................................. 153
Table 25. and influence of N&H claims on the food market ........................................................ 158
Table 26. National policy for nutrition ............................................................................................... 165
Table 27. National public programs of communication to promote better food habits ......... 167
Table 28. The frequency of selecting certain products within the groups offered in WBC ..... 188
Table 29. Reasons behind selection of certain products in WBC ................................................. 188
Table 30. : Typical consumer of health claim products ................................................................. 192
TABLE OF PICTURES Picture 1. Lifestyle and non-communicable diseases ...................................................................... 44
Picture 2 Collages from elderly group, Serbia ................................................................................. 183
Picture 3. : Collages from elderly group, BIH ................................................................................... 184
Picture 4. Mother, 24 BIH ..................................................................................................................... 184
Picture 5. Mother, 39 ............................................................................................................................ 184
FOCUS‐BALKANS DL 6.1 Consumer study implementation for products with health claims

FP7 KBBE 2007 1 7 GA 212579
SUMMARY • Although medicine and life sciences started with nutrition and health studies a
long time ago, functional food had been an increasingly salient part of the food market till the end of 20th century. During the 1990-s, government policies, both in developed and developing countries, put more focus on health promotion and preventive measures against illnesses. Thus health has become a life-long project of keeping well and fit, including self-control and continuous work towards better health. Research in the field of economics, marketing, psychology and social sciences with varying perspectives on food with health claims turned to examine consumer points of views at about the same time.
• Qualitative and quantitative consumer studies focus on different aspects of the phenomenon. The first kind of studies focused on the meanings and interpretations of health claim products, while the second category of studies emphasized awareness and valence of attitudes towards specific health claim products, as well as sociodemographic differences. Most interesting for FOCUS-BALKANS project are the following findings: (1) women are generally more focused on healthy eating than men and tend to eat more healthily; (2) concerns about healthy eating increase with age (the elderly were most willing to buy functional foods); (3) the highly educated maintain more healthful eating habits than others; (4) eating so-called health food is related to views on and willingness to use functional foods. On the other hand, some studies found that socio-demographic backgrounds explained attitudes to functional foods only poorly. As functional foods carry a special meaning as health-promoting foods, their acceptability is likely to be connected to peoples’ health concerns and practices.
• In WBC a little attention was paid to the analysis of products with health claims, both from consumer and producer point of view. The analysis of regulatory framework, medical and technological aspects exist. On the other hand, there is no data regarding consumers’ knowledge about functional food and attitudes towards this type of food, confidence in its proposed effects or consumption habits (regular food vs food with health claims). The FOCUS-BALKANS Project addresses topics on consumer motivations and behaviours for products with nutrition and health claims in WBC region.
• This study is composed of three interrelated parts: A-Research background (review of regulative and statistical data), B-WBC N&H claims market current state and perspectives, and C-Expectations and consumer behaviour toward products with N&H claims. Research background refers both to available statistical data analysis and EU-WBC regulative on nutrition and health claim labelling comparison. This case study is linked with the Regulation of the EC on health claims 1924/2006. Market segments targeted by this study are milk and yoghurt, juices, margarine and jam.
• The main purpose of the WP6 in-depth interviews are summarized in the following pre-set research goals: (1) Understanding N&H claimed products situation at WBC market from the key market player’s point of view - both producers and retailers; (2) Understanding the reflections outside of the market itself, based on the expert’s opinion regarding situation on the N&H claimed products market at WBC; (3) Obtaining the data that will be used to explore interesting areas for further investigation during quantitative consumer survey.
FOCUS‐BALKANS DL 6.1 Consumer study implementation for products with health claims

FP7 KBBE 2007 1 8 GA 212579
• WBC N&H claimed products market analysis is based on the multistakeholders and multitechnique approach. The research is based on the different stakeholders’ opinion synthesis about N&H claimed products on WBC market – processors, retailers, experts and consumers. Market players are analyzed by In Depth Interviews, while main consumers’ attitudes toward so-called health food products at WBC market were analyzed by Focus Group Discussions.
• In-depth interviews were conducted with 36 processors (29 from WBC and 7 EU exporters of N&H claimed products at WBC region), 26 retailers and 18 experts. That equals to 80 IDI`s with 120 observations of studied categories in total. Based on all pleaded, the list of interviews included into analysis enabled high rate of market research reliability. Qualitative consumer survey is conducted in order to identify the image and values that are given to health food products by local consumers. Totally 12 focus groups’ discussion were executed (2 per each WBC with groups - «50+» and «mothers with children under 15»).
• Quantitative analysis mainly addresses statistical data information on N&H claimed products market. Statistical analysis is based both on primary (linear and specialized shopcheck) and secondary data (available at national statistical offices and supported by Datamonitor).
FOCUS‐BALKANS DL 6.1 Consumer study implementation for products with health claims

FP7 KBBE 2007 1 9 GA 212579
INTRODUCTION
RESEARCH CONCEPT
Literature review
Although medicine and life sciences started with nutrition and health studies a long time ago, healthy living had been an increasingly salient part of the food market till the end of 20th century. An increasing number of studies about foods with health claims can be seen as part of the rapid development in medicine and life sciences. The interconnection between nutrition and health is the core aspect of these studies. At the same time, technical advances in food engineering and manufacturing have opened up possibilities in developing products with novel technologies and enriching foods with new ingredients (van Kleef et al., 2002).
During the 1990-s, government policies, both in developed and developing countries, put more focus on health promotion and preventive measures against illnesses. Thus health has become a life-long project of keeping well and fit, including self-control and continuous work towards better health. (Burrows et al, 1995, Petersen and Lupton, 1996, Strauss and Tomas 1998). People are generally well aware of the importance of balance, variability and moderation as the cornerstones in eating healthfully (IEFS, 1996a). The public discussion about the future of eating behaviour and the potential adverse effects of health claim products is an important topic in literature, too (Lawrence and Germov, 1999, Roe et. al, 1999, Nestle, 2002, Garde, 2008). A new food category termed ‘functional foods’ (foods marketed as improving health and well-being beyond the health effects of conventional foods) gained in importance on the market during the 1990-s, and started to develop rapidly in market volume during the last decade. (Diplock et al, 1999).
However, health claim foods are not a well-defined category. In most countries there is no legislative definition of this group of foods. A literature review showed that food labeling is an increasingly important field of research (Caswell and Johnson, 1991, Caswell and Padberg, 1992, Caswell and Mojduszka, 1996, Heasman and Mellentin, 2001, May et.al., 2007). Furthermore, the WP6 Literature overview confronts Focus-Balkans project investigation with a novel dilemma – rather than being healthy in an absolute sense, these products might represents only the idea of healthiness (Wansink and Cheney, 2005, Lesch et al., 2005). Criticism towards products with health claim will be considered from different points of view, when having in mind that products with different health claims have not been approved by EFSA.
Within the field of existing health claims, products development and commercialization (supply side of the food market), the literature analysis focuses on conceptualization of the innovation process, identification of market opportunities and regulatory/business environment (Van Kleef et al. 2002, Mark-Herbert, 2003, 2004, Stewart-Knox and Mitchell, 2003, Gray et al, 2003, Maynard and Franklin 2003, Korhonen, 2002, Schaafsma & Kok, 2005, Deepananda et al. 2008). Moreover, innovative process oriented research has been developed in a specific case-study context and largely with a focus on Europe (Hall and Mairesse, 2006, Peng et. al. 2006, Broring et. al, 2006).
FOCUS‐BALKANS DL 6.1 Consumer study implementation for products with health claims

FP7 KBBE 2007 1 10 GA 212579
Research in the field of economics, marketing, psychology and social sciences with varying perspectives on food with health claims turned to examine consumer points of views since the 1990s. Qualitative and quantitative consumer studies focus on different aspects of the phenomenon. The first kind of studies focused on the meanings and interpretations of health claim products, while the second category of studies emphasized attitudes towards specific health claim products.
Qualitative consumer studies mainly include notions about healthy diets, relations between ‘natural’ and ‘technological’ (including bio-technological) food, and the position of health foods products between foods and medicine. (Jonas and Beckmann, 1998, Brannback et al. 2002, Larue et. al, 2004) The contradiction between natural and technological food is particularly evident in health claim foods that are characterized by high technology and novel ingredients (Sorenson and Bogue, 2005).
In contrast to the qualitative approaches, quantitative studies often focus on attitudes towards product types with the aim of finding out what kinds of products, added ingredients, tastes, health claims or combinations of these would most appeal to consumers within different cultural and historical frames (IFIC, 2000; NIN, 2002; Van Kleef et al., 2002; West et al, 2002; Bech-Larsen and Grunert, 2003; Urala et al, 2003, Labrecque et. al, 2006, Kolodinsky,et. al., 2008). These studies indicate that factors such as price, healthiness, convenience, form of processing and promised health effects play a vital role in product with health claim acceptability. From the economic point of view, analysis suggested that the belief in health effects was a strong indicator of willingness to buy health foods (Bech-Larsen et al, 2001; Urala and Lähteenmäki, 2004; Verbeke, 2005). However, studies on health claims have shown that consumers tend to be distrustful towards manufacturers’ claims (Garretson et. al, 2000, Bhaskaran and Hardley, 2002; West et al., 2002). The analysis of food demand at the retail level, influence of health information on food demand and importance of product quality for food demand have been also investigated topics (Herrmann and Roeder, 1998, Kozup et. al., 2003). It was hard to find a complex theoretical study about factors affecting market for products with health claims both from supply and demand side of view. Theoretical background was found in the Handbook of Agricultural Economics (Antle, 2001). Empirical studies trying to emerge issues of health claims products development from supply and demand side of the market are rare, too (Cash et. al., 2006).
Relatively few studies have investigated the role of socio-demographic factors in the acceptability of functional foods. Studies indicated that citizens’ views about food and health as well as their eating patterns are related to age, gender, socio-economic status and phase of life (IEFS, 1996b; Nayga and Capps, 1999, EORG, 2003, Poulsen, 1999). These studies pointed out a few important conclusions. The most interesting for Focus-Balkans project are following findings: (1) women are generally more focused on healthy eating than men and tend to eat more healthily; (2) concerns about healthy eating increase with age (the elderly were most willing to buy functional foods); (3) the highly educated maintain more healthful eating habits than others; (4) eating so-called health food is related to views on and willingness to use functional foods. Other found that socio-demographic backgrounds explained attitudes to functional foods only poorly (Verbeke, 2005). As functional foods carry a
FOCUS‐BALKANS DL 6.1 Consumer study implementation for products with health claims

FP7 KBBE 2007 1 11 GA 212579
FOCUS‐BALKANS DL 6.1 Consumer study implementation for products with health claims
special meaning as health-promoting foods, their acceptability is likely to be connected to peoples’ health concerns and practices (Jong et al., 2003).
In WBC a little attention was paid to the products with health claims analysis, both from consumer and producer point of view. The analysis of regulatory framework, medical and technological aspects are present at elementary level. Vast majority of WBC articles about products with health claims (functional food) are published in medical journals or in agricultural journals by authors that have medical affiliation or medical background (Koch, 1999, Ristevska – Jovanovska, 2000, Sobajic, 2002, Marčeta-Kamenko et. al, 2004, Miletic et. al, 2008). There are several theoretical articles emphasizing health benefits coming from consumption of functional food or analyzing legal environment and regulations regarding this food type, its definition, labelling, good nutrition practice and food safety etc. (Stankovic and Djordjevic, 2002, Grujic, 2005, Raspor, 2008). Several papers analyze possible contribution of marketing and technology to the offer of food with health claims (Rogelj, 2000, Dimitrijević-Branković et. al, 2002, Dimic et. al, 2002, Ristic, 2003, Ljaljević A. et. al., 2006). On the other hand, there is no data regarding consumers’ knowledge about functional food and attitudes towards this type of food, confidence in its proposed effects or consumption habits (regular food vs food with health claims) in the scientific journals.
Research approach and methods
The goal of this study is to identify the image and values that are associated with health food products in WBC. Special attention was paid to health and food in general, social factors, food eating habits, health concerns, prices, products availability, taste, market structure, trends and estimations, etc.
Processors advertise their products with a growing use and stress of a specific property with a healthy added value, either when it refers to a natural property (such as calcium in cheeses) or to an added component (enriched product). This Case study is linked with the EC Regulation on health claims1. Overall, this study takes particular importance for WBC still not aware of the issue of cross compliance between nutritional and public policies.
This material was composed of three interrelated parts:
A: Research background (review of regulative and statistical data), B: WBC N&H claims market current state and perspectives, and C: Expectations and consumer behaviour toward products with N&H claims.
Research background refers to available statistical data analysis and EU-WBC regulative on nutritional and health claim labelling review. A precise and closed list of products to be studied was defined due to linear and specialized shopcheck, with a repartition by family of products. For each product, data are collected about the
1 Regulation (EC) N° 1924/2006, 30.12.2006

FP7 KBBE 2007 1 12 GA 212579
commercial name, the products characteristics, the firm and the product’s origin. Shopcheck resulted in an almost exhaustive firm’s identification and in a good visualization of the different products present on the market.
The overall analysis is supported with in-depth interviews with companies present at this WBC market segment. Market segments targeted by this study are milk and yoghurt, juices, margarine and jam. The market survey is one of the core aspects of this research. The objective is to obtain quantifiable data, namely market shares of the health food products (compared with the conventional products of the same product category, e.g. light margarine compared to classical), and qualitative data on several aspects: consumer demand, firms ability to answer this demand, main problems encountered (regulatory or else…). Additionally, retailers’ survey (both specialized and linear) allowed quantitative analysis with detailed facts and figures. It improved qualitative market analysis as well. The producers and retailers sample size allows extrapolations.
Processors advertise their products with a growing use and stress of a specific property with a healthy added value, either when it refers to a natural property (such as calcium in cheeses) or to an added component (enriched product). A precise and closed list of products to be studied is defined, with a repartition by family of products. For each product, data are collected about the commercial name, the products characteristics, the firm and the product’s origin. Shopcheck resulted in an almost exhaustive firm’s identification and in a good visualization of the different products present on the market.
This Case study is linked with the Regulation of the EC on health claims: Regulation (EC) N° 1924/2006, 30.12.2006 relating to the labelling, presentation and advertising of foodstuffs, especially when dealing with nutritional and health labelling. Overall, this study takes particular importance for WBC still not aware of the issue of cross compliance between nutritional and public policies. The relevant legislation in WBC and EU is analyzed. Qualitative interviews with public administrations and professional organizations representatives were organized with the overall aim to find out and describe the state of the public policy and regulative in the area of N&H claim products.
WBC N&H claim products market analysis is based on the multistakeholders and multitechnique approach (Figure 1).
FOCUS‐BALKANS DL 6.1 Consumer study implementation for products with health claims

FP7 KBBE 2007 1 13 GA 212579
RETAILERS SURVEY
EXPERTS INTERVIEWING
Consumers’ attitudes toward N&H claim products
«50+» and «mothers with children under 15».
International retail chains
Regionally present retail chains
Key domestic retail chains
Public policy makers
Institutes for Public Health
Consumers’ organizations
CONSUMERS
FGD
Key specialized retail chains
EU Exporters
WBC producers
PROCESSORS SURVEY
The research is based on the different stakeholders’ opinion synthesis about N&H claimed products at WBC market – processors, retailers, experts and consumers:
Figure 1. Multistakeholders and multitechnique approach to the WBC N&H claimed products market analysis
Processors - WBC producers and EU exporters, Retailers - international and domestic retailers’ chains, regionally present
retailers’ chains and specialized retailer chains, Experts – representatives of the public policy makers, Institutes of Public Health
and consumers organizations, Consumers - «50+» and «mothers with children younger than 15».
Qualitative analysis is based on in-depth interviews and focus groups technique. Market players are analyzed by IDIs, while main consumers’ attitudes toward so-called health food products at WBC market were analyzed by FGDs. Qualitative
FOCUS‐BALKANS DL 6.1 Consumer study implementation for products with health claims

FP7 KBBE 2007 1 14 GA 212579
consumer survey is conducted in order to identify the image and values that are given to health food products by local consumers. Totally 12 focus groups’ discussion were organized (2 per each WBC with groups «50+» and «mothers with children under 15»). The constructs of dual mediation hypothesis combined with the basic premises of the elaboration likelihood model are serving as the theoretical framework for consumer research of products with N&H claims.
Quantitative methods are equally used in this study. Quantitative analysis is mainly addressed on the statistical data information on N&H claimed products market. Statistical analysis is based both on primary (linear and specialized Shopcheck) and secondary data (available at national statistical offices and supported by Datamonitor).
The study addressed the following research questions:
Do consumers in WBC associate products with N&H with specific benefits - such as nutritional knowledge improvement, better diet, social acceptability etc.?
What are consumers’ perceptions about products with N&H claim in WBC? Does positive or negative perception towards products with additional health benefit exist?
Which factors influence WBC consumers’ perception of studied categories? Does it depend on personal, social or cultural factors?
What is the actual contribution of companies (both processors and retailers) operating in WBC on N&H claim products market development?
Does the form of product health benefit communication influence consumers’ choice of food?
What are companies’ motives for launching and marketing products with N&H claims? Does the health claims made on products creates value added to a company image and market position?
What forms the policy makers’ use to influence on WBC N&H claim products market development? Is it depending only on the regulatory framework? Do they and how they use public programs for healthy eating habits promotion? If the regulatory framework does not exist, does it necessarily mean that N&H claim products market is underdeveloped too, and visa versa?
The final result of this study is illustration of consumer motivations and behaviours towards products with N&H claims seen from the perspective of consumers themselves, as well as producers, retailers, policy makers and consumer organizations point of view. Research results are driven from different stakeholders’ opinion using different techniques as it is previously explained (see Figure 2).
FOCUS‐BALKANS DL 6.1 Consumer study implementation for products with health claims

FP7 KBBE 2007 1 15 GA 212579
FOCUS‐BALKANS DL 6.1 Consumer study implementation for products with health claims
The main purpose of this study report is better understanding of the WBC N&H claimed products market. Research results are presented by analysis of the market players and competitiveness, market structure, economic trends and estimations, and consumers demand and expectations.
METHODOLOGY
Market survey methodology
Due to N&H claimed products insufficient statistical information in WBC, a key method of data collection in this market research is in-depth interview. The official statistics at national level did not support research with important data about N&H
Quantitative methods Qualitative methods
Statistics of N&H claimed products
WBC market
Linear and specialized Shopcheck
Secondary data Primary data
In-depth interviews Focus-groups discussions
Processors
Retailers
Experts
Supply side of the market
Demand side of the market
Consumers
STATISTICAL BACKGROUND
Vital statistics Non-communicable diseases statistics
Household income and consumption
Production/Export/Import Studied categories of products
MARKET STRUCTURE
Market players Competitivness
MARKET TRENDS
Functional food market development
Market estimations
CONSUMER DEMAND AND TRENDS
Figure 2. Research methods and results

FP7 KBBE 2007 1 16 GA 212579
FOCUS‐BALKANS DL 6.1 Consumer study implementation for products with health claims
claims products market size neither from production or consumption side.2 Basically, market research was sentenced to reliance on the collected data by processors’, retailers’ and experts’ interviews. Therefore, in order to obtain reliable data the research is necessarily based on a large sample of producers and retailers.
a.Shopcheck
The market research on WBC N&H claimed products is closely linked to determination of the supply structure - both seen in the form of specific products and the main producers present at these markets. The reliable method for such data obtaining was the linear and specialized shopcheck. N&H claims products database was created by IPSOS Strategic Puls according to data obtained in six WBC shopchecks. The key retailers in each WBC are included into analysis which enabled the complete overview with high rate of reliability in the field of research. In each country the research follows the same structure whenever it was possible. The structure of the revised retail chains includes international retail chains, regionally present retail chains, and key retail chains present only at the domestic market as well as key retail chains of so-called health food (specialized shops).
The main shopcheck objectives can be viewed as following:
1. Identification of products with N&H claims, 2. Differentiation of products according to their characteristics, 3. Classification of claims and 4. Identification of main processors.
Unified methodology for the Shopcheck is based on a questionnaire and unique instructions given to interviewers in all countries (see Appendix 4). Products were divided into five main categories – milk and yogurt, margarine, juices, cereals and dietary products. General products characteristics that were subject to monitoring were: bar code, group, subgroup, brand, product description, specific content, claim, manufacturer, origin, weight and price.
Upon completion of the shopcheck, certain results are merged. Product groups are divided into 7 subgroups, while items are classified into 15 types. All generalizations were done by studied categories, brands, producers and origin. Statistical standardization is done for the prices of the observed product due to different weights per category existence.3
Overall, shopcheck allowed a detailed analysis of available products in the explored categories. Additional benefit was reflected in the detailed structure of manufacturers offering studied categories of product at WBC market. Hence the
2 These data are available only at the level of a family of products, while products selected in the research study are recorded as part of the bigger groups of observation. 3 Comparability of prices was ensured by taking into account the minimum value (product is consisting of different items) for packaging with weight closest to kilogram or liter. If different weights per package in one product category were obtained, statistical calculation of prices was conducted according to median weight in the category.

FP7 KBBE 2007 1 17 GA 212579
FOCUS‐BALKANS DL 6.1 Consumer study implementation for products with health claims
shopcheck served as the basis for the list of producers who have been invited to participate to the interviews in six Western Balkan countries.
b.In-depth interviews
The WBC N&H claimed products market survey is based on the structured interviews (processors, retailers and experts). Questionnaires were carefully worded and arranged for the purpose of minimizing variation in the questions posed to the interviewees in different countries. Training of interviewers was centrally organized by leading beneficiary – Faculty of Economics, University of Belgrade and Ipsos Strategic Puls.
The phases in the process of data collecting and analysis were following: (1) controlling (pre-test of questionnaires); (2) modification and final approval of questionnaires by the methodology group; (3) coding of questionnaires; (4) interviewing; (5) entering the database; (5) data organizing and analysis.
Questionnaires are essentially composed of open open-ended questions emphasizing the qualitative, in-depth aspects of issue. Close-ended questions are used only as a part of already established open issues and only after the spontaneous response of the interviewees. They are asked in different forms - dichotomous (yes or no) question, multiple choice question, rank order scaling and rating scales questions. In accordance with types of questions the following types of data appears in the database: numeric – quantitative data (value, volume, %), qualitative (categorical) data (both nominal and ordinal level) and large amounts of text. Probing and follow-up questions were used whenever it was possible and required, depending on the skills of the interviewers. The processor, retailer and expert questionnaire in English language are given in Appendix 5.4
The main purpose of the WP6 in-depth interviews are summarized in the following pre-set research goals:
1. Understanding N&H claimed products situation at WBC market from the key market player’s point of view - both producers and retailers;
2. Understanding the reflections outside of the market itself, based on the expert’s opinion regarding situation on the N&H claimed products market at WBC;
3. Obtaining the data that will be used to explore interesting areas for further investigation during quantitative consumer survey.
Processors, retailers and experts are asked about overall attitude toward consumers demand, main criteria and restraints for consumer’s choice, perceived consumers’ characteristics and each stakeholder cross-perception. Additionally, processors and retailers are asked to provide insights about studied categories market (general presentation and estimation). Expert’s point of view is more concentrated on
4 The questionnaires in national languages were included as appendix of the national reports.

FP7 KBBE 2007 1 18 GA 212579
nutritional concerns and consumer awareness, variety and nutritional quality of the offered product, regulations and compatibility with EU legislative, public programmes of communication to promote better food habits, as well as to priorities and the main governmental objectives. All stakeholders are asked about N&H claims market trends and perspectives.
Processors and retailers interviews are collected from all WBC. Totally 29 out of 41 identified producers and 26 retailers were interviewed. Additionally, seven EU exporters regionally present at WBC in studied categories of products were interviewed. EU producers’ interviews cover 4 out of 5 studied categories of products (only Milk enriched with vitamins and minerals was not observed as it is not exported in region). If we look at the number of observations per studied categories of products, the analysis was based on the totally 120 observations. It is planned to be a maximum two categories of products surveyed by a questionnaire. Thus the number of observed categories in relation to the interviews done is higher: 62 for processors and 58 for retailers. Based on all pleaded, the list of processors and retailers included into analysis enabled high rate of research reliability.
Table 1N&H claim market survey structure
Criteria Structure No of interviews
Category of products with H&N
claim
Jam for persons sufferingfrom diabetes 15
Yoghurts with probiotics 25 Milk enriched with vitaminsand minerals 17
“Light margarine” withreduced fat content 28
Juice enriched with vitaminsand minerals 21
Other products 14
Stakeholder
Processor 36
Retailer 26
Expert 18
Country
Bosnia and Herzegovina 14
Croatia 9
EU 7
Macedonia 11
Montenegro 11
Serbia 18
Slovenia 10
FOCUS‐BALKANS DL 6.1 Consumer study implementation for products with health claims

FP7 KBBE 2007 1 19 GA 212579
Three respondents were included in each country regarding experts’ interviews. Whenever it was possible the respondents were representatives of consumer organization, the Ministry of Health or the Ministry of Agriculture, as well as The Institute of Public Health. Totally 18 interviews were done. One chapter of this study is dedicated to the integrative report on experts’ opinion about WBC N&H claimed products market.
In general, the N&H claimed products market survey analysis is based on semi-structured interviewees’. Comments on the significant differences according to interviews characteristics were done wherever it was possible. Due to the small number of surveyed companies national, reports are mostly based on the qualitative responses summarizing. However, due to the large number of observations the integrative report was based on the descriptive statistical analysis implied per each studied category of products at WBC market.
c.Focus group discussion
i.Short intro on Focus groups as a technique
A focus group is a form of qualitative research in which a group of people are asked about their attitude towards a product, service, concept, advertisement, idea or packaging. Questions are asked in an interactive group setting where participants are free to talk with other group members. They are similar to group or individual interviews, but the defining feature is group interaction.
“The hallmark of focus groups is their explicit use of group interaction to produce data and insights that would be less accessible without the interaction found in a group” (Morgan, 1997)
Focus groups can be a good method to generate ideas for new products/initiatives. They are also seen as being more efficient than conducting several individual interviews. Focus groups are particularly useful when “gaining access to a sense of participant commonality is the central concern” (Parker & Tritter, 2006).
Group discussion produces data and insights that would be less accessible without interaction found in a group setting—listening to others’ verbalized experiences stimulates memories, ideas, and experiences in participants.
Therefore, a focus group is moderated discussion usually among 6 to 12 persons. A facilitator guides a group through a series of pre-determined questions. A typical focus group lasts about two hours and covers several topics that one decides on beforehand.
Focus groups are an important tool for acquiring feedback regarding various topics, in our case images and values that are given to health food products and some other factors regarding food consumptions.
ii.Recruitment criteria rationale
FOCUS‐BALKANS DL 6.1 Consumer study implementation for products with health claims

FP7 KBBE 2007 1 20 GA 212579
FOCUS‐BALKANS DL 6.1 Consumer study implementation for products with health claims
During WP7 meetings, after a discussion that included consideration of various alternatives, we eventually agreed to choose two groups of people: older citizens (over 50 years old) and mothers who have children under 15. The older citizens usually have more health problems that can be prevented or mitigated by specific diet and healthy nutritional habits. Young children are especially vulnerable group and they often might show problems when they have eaten some inappropriate food. Mothers, always pay more attention than other population on question what their children eat. Therefore, those two groups seemed particularly interested in taking into account importance of food for health.
iii.Fieldwork procedure
Since, focus group as a method needs about 10 people we try to recruit appropriate persons who belongs to planned categories (over 50 and mothers with children under 15). We use snow ball method5 in recruitment.
5 Snowball sampling is a technique for developing a research sample where existing study subjects recruit future subjects from among their acquaintances. Thus the sample group appears to grow like a rolling snowball. As the sample builds up, enough data is gathered to be useful for research.

FP7 KBBE 2007 1 21 GA 212579
A.RESEARCH BACKGROUND
1.NUTRITIONAL LABELLING AND HEALTH CLAIMS REGULATORY FRAMEWORK (Z.Stojanovic and M.Laniau)
SUMMARY
• N&H claim products market functioning depends on the policy makers activities. In that context, this chapter aims to support overall N&H claimed products market analysis with the specific aspects of EU-WBC nutritional/health food labelling.
• General food safety is regulated by so-called Law on Food or Food Safety Low (The Law on Food in Bosnia and Herzegovina, The Food Safety Law in Macedonia, Montenegro and Serbia, as well as The Food Act in Croatia. These legal documents in WBC were adopted during the period 2002-2009 (the first Macedonia and the last Serbia). The purpose of the Law is to ensure high level of protection of life and health of consumers, and interests of consumers while ensuring efficient functioning of food trade. Declaration, labelling, promotion and quality of food, as well as food with traditional name and origin are also important parts of these laws in each WBC. In spite of their importance, these laws usually don’t regulate these nutrition/health claims in details. It is relinquished to the special regulations which results from this basic law framework.
• Differences between EU and WBC food labelling exist. However, differences are rather significant in the case of health claims regulatory framework although difference in nutritional labelling exists, too. The important differences appear in the field of the health claim products labelling: the EU market starts to be under high level of regulatory (EFSA) supervision while WBC market is still mostly unregulated. Majority of WBC (with an exception of Slovenia and Croatia) is still missing EU harmonized regulation on health claims. Using of structure-function claims (statements related to the food component positive effects on certain functions in organism) is not forbidden. However, using of disease-risk reduction claims is strictly forbidden.
• Cost and benefits of health claims regulatory framework is important part of analysis. Health claims cost-benefit analysis could be interpreted by first-order and second-order effects. Uncertainty and regulatory error should be considered equally. Two types of errors might appear. Type I error refers to allowing harmful claims while type II error is based on prohibiting beneficial claims. In both cases consumers and manufacturers will pay a huge price – consumers will be affected by food safety decreasing and manufacturers could be economically seriously injured.
1.1.EU REGULATORY FRAMEWORK
Food may provide a health benefit beyond basic nutrition. Scientifically proven evidence in many epidemiological studies that can be found nutrition abundant in certain foods (e.g. fruits and vegetables) is directly correlated with a decreased risk
FOCUS‐BALKANS DL 6.1 Consumer study implementation for products with health claims

FP7 KBBE 2007 1 22 GA 212579
of degenerative diseases. These results are closely related to nutrition's potentials in preventing chronic diseases. Based on these facts the rigorous scientific investigation has to confirm the positive physiological effects of these compounds upon health.
Nutrition was first mentioned in European texts on dietary products in the 1970s and has become a major issue in community politics, especially since the European Council Resolution of 14 December 2000 on health and nutrition (Official Journal 2001/C 020/01, 23/01/2002). European Council considers “that action on nutritional health must be given an adequate place in the future Community action programme on public health”.
At the EU level listed documents are related on the subject of nutrition policy:
Directive n°2000/13/EC, which is the regulation on the approximation of the laws of the Members States relating to the labelling, presentation and advertising of foodstuffs;
Directive of the European Parliament and of the Council of 10 November 2003 regarding ingredient listing rules (Directive 2003/89/EC), which modified Directive 2000/13 relating to general labelling of foodstuffs;
Directive 89/398/ EEC, is the regulation on the approximation of the laws of the Members States relating to foodstuffs intended for particular nutritional uses;
Directive (EC) 90/496 of 24 September 1990 concerns the nutritional labelling of foodstuffs
Regulation (EC) n° 1924/ 2006 of the European Parliament and of the council of 20 December 2008 is relating to nutrition and health claims made on foods;
Regulation (EC) No 109/2008: Amending Regulation (EC) No 1924/2006 for health claims referring to children’s development and health.
In response to growing consumer awareness, the food-processing industry provides more detailed labelling and often makes claims about the beneficial effects of some foodstuffs. In the context of this study the most important regulation is related to nutrition and health claims made on foods (Regulation EC No 1924/2006 and Regulation EC No 109/2008). This regulation complements the general principles in Directive 2000/13/CE, in order to assure a high level of consumer protection and gives the consumer the necessary information to make choices. Scientific substantiation should be the main aspect to be taken into account for the use of nutrition and health claims: the claims must be justified.
In the current European context, claims are subject to a general obligation of non deception. Therefore, the use of nutrition and health claims shall not be false, encourage excess consumption of a food or exploit fear in the consumer. Claims which suggest that health could be affected by not consuming the food or the claims which make reference to the rate or amount of weight loss are not allowed.
Different labelling claims can be used on foods. Discussion was often made on structure and function claims, as well as on disease-risk reduction claims. Structure and function claims describe effects on normal functioning of the body. They are not referred to the claims such as the food can treat, diagnose, prevent, or cure a disease. Claims such as promotes regularity, helps maintain cardiovascular health
FOCUS‐BALKANS DL 6.1 Consumer study implementation for products with health claims

FP7 KBBE 2007 1 23 GA 212579
FOCUS‐BALKANS DL 6.1 Consumer study implementation for products with health claims
and supports the immune system - fit into this category. Disease-risk reduction claims imply a relationship between dietary components and a disease or health condition (health claims). Structure and function claims require less stringent scientific consensus than disease-risk reduction claims. However, these statements cannot refer to the certain illness or pathological situation.
Within EU regulative health claims means “any claim that states, suggests or implies that a relationship exists between a food category, a food or one of its constituents and health”. Reduction of disease risk claim means any claim that states, suggests or implies that the consumption of a food category, a food or one of its constituents significantly reduces a risk factor of human disease. Health claims others than referring to the reduction of disease risk: Health claims describing or referring to the role of a nutrient or other substance in growth, development and the functions of the body, or psychological or behavioural functions; or slimming or weight - control or a reduction in the sense of hunger. These claims (others than disease risk claims) are often called functional claims.
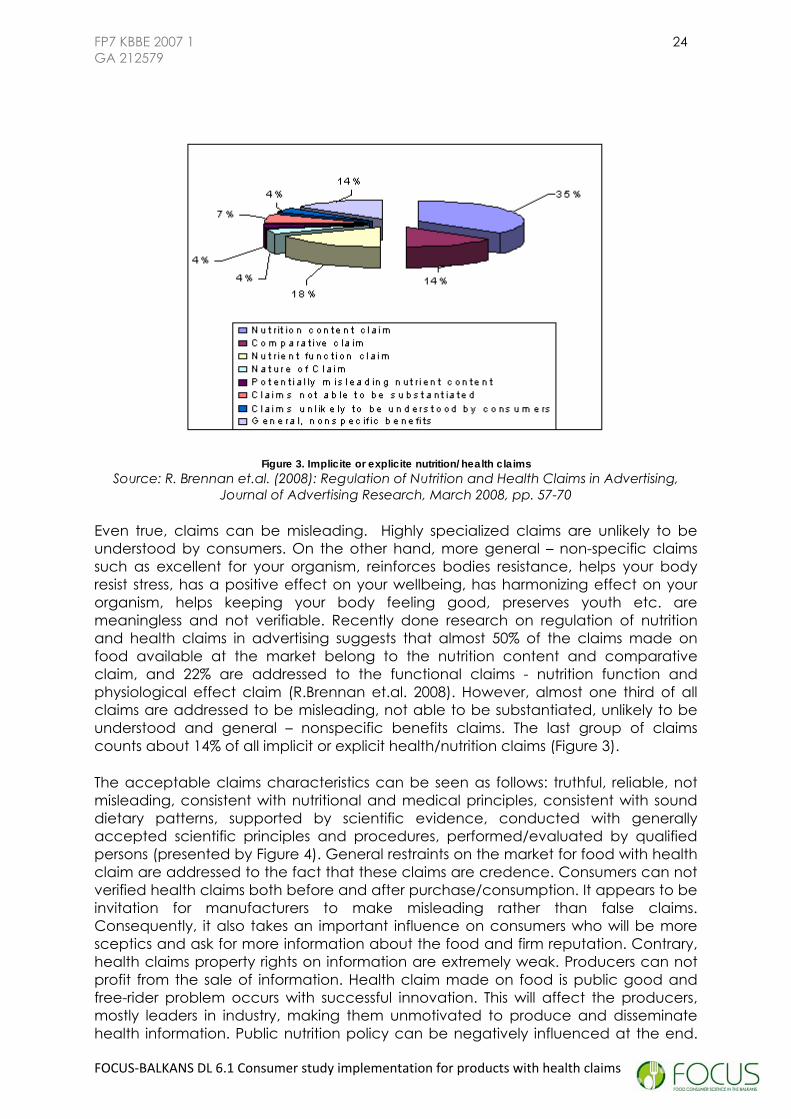
However, health claims structure is deeper in the practice. From the theoretical point of view, health claims could be divided into following categories: (1) nutrition content claim; (2) comparative claim; (3) nutrition function claim; (4) physiological effect claim; (5) claims not be able to be substantiated; (6) claim unlikely to be understood by consumers; (7) general – non-specific benefits claim.6 Nutrition claim can be content, function and comparative oriented. Physiological claims are, for example, devoted to antioxidants and probiotic bacteria in overall body functioning. Nutrition function and physiological claims are most known as functional claims.
6 Modified according to R. Brennan et. al. (2008): Regulation of Nutrition and Health Claims in Advertising, Journal of Advertising Research, March 2008, pp. 57-70.
FP7 KBBE 2007 1 24 GA 212579
Figure 3. Implicite or explicite nutrition/health claims Source: R. Brennan et.al. (2008): Regulation of Nutrition and Health Claims in Advertising,
Journal of Advertising Research, March 2008, pp. 57-70
Even true, claims can be misleading. Highly specialized claims are unlikely to be understood by consumers. On the other hand, more general – non-specific claims such as excellent for your organism, reinforces bodies resistance, helps your body resist stress, has a positive effect on your wellbeing, has harmonizing effect on your organism, helps keeping your body feeling good, preserves youth etc. are meaningless and not verifiable. Recently done research on regulation of nutrition and health claims in advertising suggests that almost 50% of the claims made on food available at the market belong to the nutrition content and comparative claim, and 22% are addressed to the functional claims - nutrition function and physiological effect claim (R.Brennan et.al. 2008). However, almost one third of all claims are addressed to be misleading, not able to be substantiated, unlikely to be understood and general – nonspecific benefits claims. The last group of claims counts about 14% of all implicit or explicit health/nutrition claims (Figure 3).
The acceptable claims characteristics can be seen as follows: truthful, reliable, not misleading, consistent with nutritional and medical principles, consistent with sound dietary patterns, supported by scientific evidence, conducted with generally accepted scientific principles and procedures, performed/evaluated by qualified persons (presented by Figure 4). General restraints on the market for food with health claim are addressed to the fact that these claims are credence. Consumers can not verified health claims both before and after purchase/consumption. It appears to be invitation for manufacturers to make misleading rather than false claims. Consequently, it also takes an important influence on consumers who will be more sceptics and ask for more information about the food and firm reputation. Contrary, health claims property rights on information are extremely weak. Producers can not profit from the sale of information. Health claim made on food is public good and free-rider problem occurs with successful innovation. This will affect the producers, mostly leaders in industry, making them unmotivated to produce and disseminate health information. Public nutrition policy can be negatively influenced at the end.
FOCUS‐BALKANS DL 6.1 Consumer study implementation for products with health claims

FP7 KBBE 2007 1 25 GA 212579
FOCUS‐BALKANS DL 6.1 Consumer study implementation for products with health claims
Therefore strong institutional support has to be addressed to censure the proper functioning of this market.
consistent with nutritional principles
truthful
CLAIM
conducted with generally accepted scientific procedures
performed/evaluated by qualified persons
consistent with medical principles
conducted with generally accepted scientific principles
consistent with sound dietary patternsnot misleading
supported by scientific evidence
reliable
Figure 4. Health information labelling
The list of nutrition claims and conditions applying to them are placed in Annex of the Directive (EC) n° 1924/ 2006. The Commission shall establish and maintain a Community Register of nutrition and health claims. These claims may concern micronutrients, macronutrients, categories of food like fruit and vegetable, substances like lycopene or lutein, plants, etc. The Commission has transmitted to the Authority a list of 2875 “entries” (couple foodstuff-functions, leading to several thousands functional claims) from all the Member States. This list is evaluated by the EFSA in 2008 and 2009. Before 2010, the EFSA has check that these types of claims based on generally accepted scientific data. Functional properties for some vitamins and minerals have already been described. In France, for example claims relating to ω3 and their properties on the cardio vascular function and to cranberries and the reduction of fixation of Escherichia coli, received a favourable opinion. A list of permitted claims and conditions for the uses of these claims will be adopted by the Commission. It seems that the analysis of these claims will have some delay: a first list of 1000 evaluations is published mid 2009.
Authorized health claims can be used by all food business operators. The claim made on food has to comply with the particular conditions of use of the authorized claim and with the principles and requirements of Regulation (EC) No 1924/2006. Health claims are covered by Article 13 and Article 14. Health claims based on newly developed scientific evidence and/or including a request for the protection of proprietary data are regulated by Article 13. The second one covers health claims referring to the reduction of a risk factor in the development of a disease as well as health claims referring to children's development and health.

FP7 KBBE 2007 1 26 GA 212579
FOCUS‐BALKANS DL 6.1 Consumer study implementation for products with health claims
Totally 10 health claims were approved by EFSA till the end of February 2010. Three of them belong to the risk-disease claims. Additionally, only one health claim, based on newly developed scientific evidence and/or including a request for the protection of proprietary data, was approved in the same period. The most of approved claims (totally six) belong to health claims referring to children's development and health (Table 2).
Table 2. Health claims approved by EFSA
Claim
Condition/restriction
EFSA opinion
reference
Commission Regulation
Article 13(5) health claims based on newly developed scientific evidence and/or including a request for the protection of proprietary data
Water-Soluble Tomato Concentrate (WSTC) I and II helps maintain normal platelet aggregation, which contributes to healthy blood flow
Information to the consumer that the beneficial effect is obtained with a daily consumption of 3g WSTC I or 150mg WSTC II in up to 250ml of either fruit juices, flavored drinks or yogurt drinks (unless heavily pasteurized).
Article 14(1)(a) health claims referring to the reduction of a risk factor in the development of a disease Plant sterols have been shown to lower/reduce blood cholesterol. High cholesterol is a risk factor in the development of coronary heart disease.
Information to the consumer that the beneficial effect is obtained with a daily intake of at least 2 g plant sterols.
Q-2008-085
Commission Regulation (EC) No
983/2009 of 21/10/2009
Plant stanol esters have been shown to lower/reduce blood cholesterol. High cholesterol is a risk factor in the development of coronary heart disease.
Information to the consumer that the beneficial effect is obtained with a daily intake of at least 2 g plant stanols.
Q-2008-118
Commission Regulation (EC) No
983/2009 of 21/10/2009
Chewing gum sweetened with 100% xylitol has been shown to reduce dental plaque. High content/level of dental plaque is a risk factor in the development of caries in children
Information to the consumer that the beneficial effect is obtained with a consumption of 2-3g of chewing gum sweetened with 100% xylitol at least 3 times per day after the meals
Q-2008-321
Commission Regulation (EC) No
1024/2009 of 29/10/2009
Article 14(1)(b) health claims referring to children's development and health Essential fatty acids are needed for normal growth and development of children.
Information to the consumer that the beneficial effect is obtained with a daily intake of 1% of total energy for linoleic acid and 0.2% of total energy of α-linolenic acid.
Q-2008-079
Commission Regulation (EC) No
983/2009 of 21/10/2009
Calcium and vitamin D are needed for normal growth and development of bone in children.
The claim can be used only for food which is at least a source of calcium and vitamin D as referred to in the claim SOURCE OF [NAME OF VITAMIN/S] AND/OR [NAME OF MINERAL/S] as listed in the Annex to Regulation 1924/2006.
Q-2008-116
Commission Regulation (EC) No
983/2009 of 21/10/2009

FP7 KBBE 2007 1 27 GA 212579
FOCUS‐BALKANS DL 6.1 Consumer study implementation for products with health claims
Calcium is needed for normal growth and development of bone in children.
The claim can be used only for food which is at least a source of calcium as referred to in the claim SOURCE OF [NAME OF VITAMIN/S] AND/OR [NAME OF MINERAL/S] as listed in the Annex to Regulation 1924/2006.
Q-2008-322
Commission Regulation (EC) No
983/2009 of 21/10/2009
Vitamin D is needed for normal growth and development of bone in children.
The claim can be used only for food which is at least a source of Vitamin D as referred to in the claim SOURCE OF [NAME OF VITAMIN/S] AND/OR [NAME OF MINERAL/S] as listed in the Annex to Regulation 1924/2006.
Q-2008-323
Commission Regulation (EC) No
983/2009 of 21/10/2009
Phosphorus is needed for the normal growth and development of bone in children.
The claim can be used only for food which is at least a source of phosphorus as referred to in the claim SOURCE OF [NAME OF VITAMIN/S] AND/OR [NAME OF MINERAL/S] as listed in the Annex to Regulation 1924/2006
Q-2008-217
Commission Regulation (EC) No
1024/2009 of 29/10/2009
Protein is needed for normal growth and development of bone in children.
The claim can be used only for food which is at least a source of protein as referred to in the claim SOURCE OF PROTEIN as listed in the Annex to Regulation 1924/2006.
Q-2008-326
Commission Regulation (EC) No
983/2009 of 21/10/2009
Source:http://ec.europa.eu/food/food/labellingnutrition/claims/community_register/authorised_health_claims_en.htm
The list of health claims that were not approved by EFSA contains 37 forms of statements made on food.7 These claims are non-compliance with the Regulation regarding one or more following aspects: (1) on the basis of the evidence presented in the dossier; (2) the food for which the claim is made has not been sufficiently characterized; (3) the effect has not been sufficiently defined; (4) a cause and effect relationship between the consumption of the food for which the claim is made and the claimed effect has not been established and five are made based on newly developed scientific evidence and/or including a request for the protection of proprietary data. The largest number of rejected claims (29) belongs to health claims referring to children's development and health. In the context of this study the most important is the list of rejected claims made on studied categories of products (Table 3).
7 The list is commented till the end of February 2010.

FP7 KBBE 2007 1 28 GA 212579
FOCUS‐BALKANS DL 6.1 Consumer study implementation for products with health claims
Table 3 Selected claims rejected by EFSA8
Nutrient, substance, food or food category
Claim
Ocean Spray Cranberry Products®, juice drinks and sweetened dried berries Craisins®
Regular consumption of 2 servings per day of an Ocean Spray product each containing typically 80 mg cranberry proanthocyanidins helps reduce the risk of urinary tract infection in women by inhibiting the adhesion of certain bacteria in the urinary tract
Dairy products (milk, cheese and yoghurt)
Three portions of dairy food everyday, as part of a balanced diet, may help promote a healthy body weight during childhood and adolescence.
Dairy products (milk and cheese) Dairy foods (milk and cheese) promote dental health in children.
Lactobacillus helveticus fermented Evolus® low-fat milk products
Evolus® reduces arterial stiffness.
Dairy product (milk beverage) enriched with milk peptide and magnesium
Helps to moderate signs of anxiety in mildly stress-sensitive adults due to its milk peptide and magnesium content.
Source:http://ec.europa.eu/food/food/labellingnutrition/claims/community_register/rejected_health_claims_en.htm#art135
1.2.NUTRITIONAL AND HEALTH LABELLING OF FOOD - WBC APPROACH
Basic consumer’s right is connected with safety food buying and consumption that prevents diminishing of their health or economic interests. Food claim cannot influence consumer misleading. Food labelling is regulated by several documents in WBC9. These documents can be divided in three groups as follows: (1) general regulative (2) nutritional/health labelling regulative; (3) dietetic products regulative.
General food safety is regulated by so-called Law on Food or Food Safety Law (The Law on Food in Bosnia and Herzegovina10, The Food Safety Law in Macedonia11, Montenegro12 and Serbia13, as well as The Food Act in Croatia)14. It governs all aspects of production, circulation, control and consumption of food, general conditions for ensuring safety of food and feed, rights and responsibilities of persons performing food and feed businesses, early warning system, hygiene and quality of
8 February 2010. 9 In Slovenia, nutritional and health labeling is under the European common practice. 10 http://www.seefsnp.org.yu/documents/bosnia/Law%20on%20food%20BH%20English.pdf
11 http://www.seefsnp.org.yu/documents/macedonia/Macedonian%20Food%20Law.pdf
12 http://www.seefsnp.org.yu/documents/montenegro/FOOD%20SAFETY%20LAW.pdf
13 http://www.http://www.parlament.sr.gov.yu/content/cir/akta/akta_detalji.asp?Id=608&t=Z#
14 http://www.seefsnp.org.yu/documents/croatia/Croatian_Food_Law.pdf

FP7 KBBE 2007 1 29 GA 212579
food and feed. The purpose of the Law is to ensure high level of protection of life and health of consumers, and interests of consumers while ensuring efficient functioning of food trade. The adoption of the Law was necessary for the purpose of harmonization with EU regulations, in particular Directive 178/2002/EC, and compliance with the Agreement on Application of Sanitary and Phytosanitary Measures of the WTO. It is important to notice that declaration, labelling, promotion and quality of food, as well as food with traditional name and origin are also important parts of these laws in each WBC. In spite of their importance, these laws usually don’t regulate these nutrition/health claims in details. It is relinquished to the special regulations which results from this basic law framework.
Ministry of Health is responsible for preparation of all laws and books of rules: General requirements on food hygiene, General requirements of official controls, Food intended for particularly nutritional use, Contaminants, Labelling of food products, Novel technology and GMO, Food produced by means of ionizing radiation, Products and materials in contact with food, and Safety of drinking water, mineral water and other vertical Books of rule. These bylaws definition is based on close cooperation of the Ministry of Health with other ministries, such as the Ministry of Agriculture, the Ministry of Environmental protection and the Ministry of Trade.
Labelling requirements for packed foods designated for the consumer or public food consumption in WBC are regulated by the specific regulation (Table 4). According to regulation, a label must be present in both retail and bulk packaged foods and must indicate the following: expiration date, type and content of food additives, type and content of added vitamins, minerals, and other ingredients added to enrich the product’s nutritional value. All foods are required to have the label in national language.
FOCUS‐BALKANS DL 6.1 Consumer study implementation for products with health claims
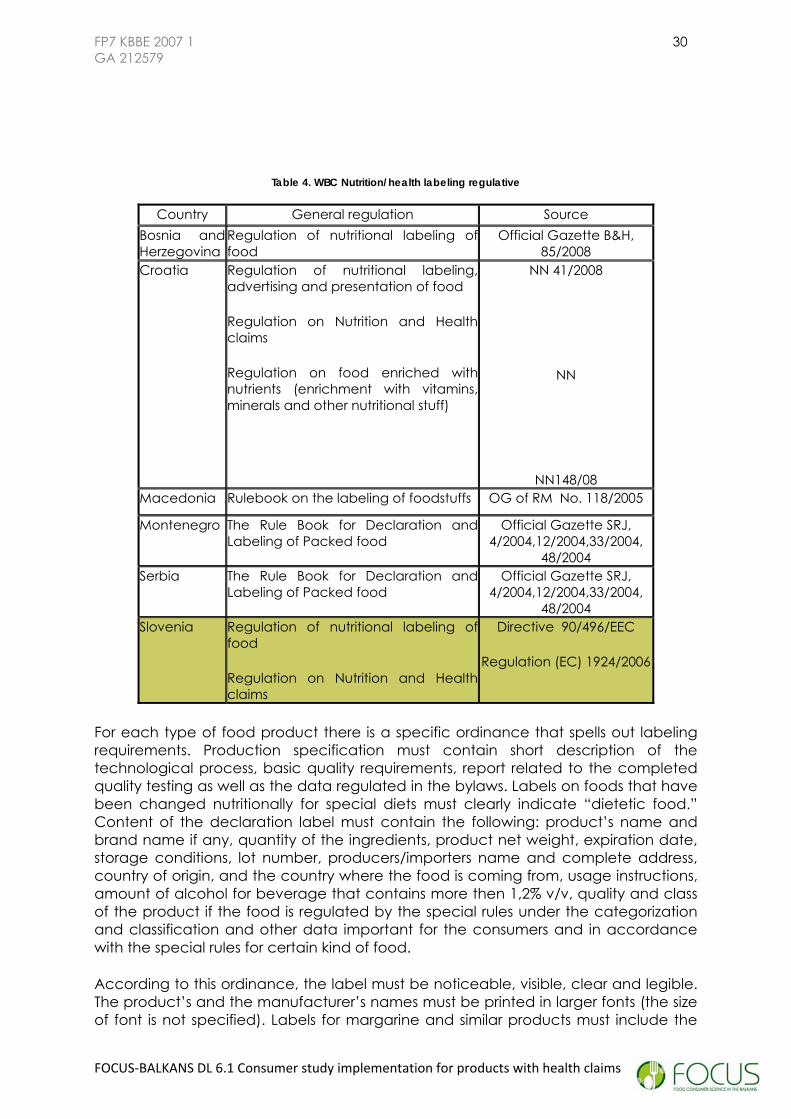
FP7 KBBE 2007 1 30 GA 212579
Table 4. WBC Nutrition/health labeling regulative
Country General regulation Source Bosnia and Herzegovina
Regulation of nutritional labeling offood
Official Gazette B&H, 85/2008
Croatia Regulation of nutritional labeling,advertising and presentation of food
Regulation on Nutrition and Healthclaims
Regulation on food enriched withnutrients (enrichment with vitamins,minerals and other nutritional stuff)
NN 41/2008
NN
NN148/08 Macedonia Rulebook on the labeling of foodstuffs OG of RM No. 118/2005
Montenegro The Rule Book for Declaration andLabeling of Packed food
Official Gazette SRJ, 4/2004,12/2004,33/2004,
48/2004 Serbia The Rule Book for Declaration and
Labeling of Packed food Official Gazette SRJ,
4/2004,12/2004,33/2004, 48/2004
Slovenia Regulation of nutritional labeling offood
Regulation on Nutrition and Healthclaims
Directive 90/496/EEC
Regulation (EC) 1924/2006
For each type of food product there is a specific ordinance that spells out labeling requirements. Production specification must contain short description of the technological process, basic quality requirements, report related to the completed quality testing as well as the data regulated in the bylaws. Labels on foods that have been changed nutritionally for special diets must clearly indicate “dietetic food.” Content of the declaration label must contain the following: product’s name and brand name if any, quantity of the ingredients, product net weight, expiration date, storage conditions, lot number, producers/importers name and complete address, country of origin, and the country where the food is coming from, usage instructions, amount of alcohol for beverage that contains more then 1,2% v/v, quality and class of the product if the food is regulated by the special rules under the categorization and classification and other data important for the consumers and in accordance with the special rules for certain kind of food.
According to this ordinance, the label must be noticeable, visible, clear and legible. The product’s and the manufacturer’s names must be printed in larger fonts (the size of font is not specified). Labels for margarine and similar products must include the
FOCUS‐BALKANS DL 6.1 Consumer study implementation for products with health claims

FP7 KBBE 2007 1 31 GA 212579
FOCUS‐BALKANS DL 6.1 Consumer study implementation for products with health claims
percentage of individual components. If vitamins are added the label must indicate, “Enriched with Vitamins.” If the manufacturing and packaging companies are not the same, the label must indicate the company that did the packaging.
Table 5 The EU15 and WBC16 regulative on nutrition claims comparative analysis
EU (Slovenia) and Croatia B&H, Macedonia, Montenegro and Serbia LOW ENERGY
A claim that a food is low in energy, and any claim likely to have the same meaning for the consumer, may only be made where the product does not contain more than 40 kcal (170 kJ)/100 g for solids or more than 20 kcal (80 kJ)/100 ml for liquids. For table-top sweeteners the limit of 4 kcal (17 kJ)/portion, with equivalent sweetening properties to 6 g of sucrose (approximately 1 teaspoon of sucrose), applies
The energy value less than 170 kJ (40 kcal)/100 g, or less than 80 kJ (20 kcal)/100 ml.
ENERGY-REDUCED A claim that a food is energy-reduced, and any claim likely to have the same meaning for the consumer, may only be made where the energy value is reduced by at least 30 %, with an indication of the characteristic(s) which make(s) the food reduced in its total energy value.
When the energy is decreased at least 30% of energy value of the same or similar product.
ENERGY-FREE A claim that a food is energy-free, and any claim likely to have the same meaning for the consumer, may only be made where the product does not contain more than 4 kcal (17 kJ)/100 ml. For table-top sweeteners the limit of 0,4 kcal (1,7 kJ)/portion, with equivalent sweetening properties to 6 g of sucrose (approximately 1 teaspoon of sucrose), applies.
Energy value is less than 17 kJ (4 kcal)/100 ml. In the case of food with no energy value by nature, for the nutritional claim it is aloud to use prefix “natural”.
LOW FAT A claim that a food is low in fat, and any claim likely to have the same meaning for the consumer, may only be made where the product contains no more than 3 g of fat per 100 g for solids or 1,5 g of fat per 100 ml for liquids (1,8 g of fat per 100 ml for semi-skimmed milk).
When the fat content is less than 3 g/100 g, or less than 1,5 g/100 ml.
FAT-FREE A claim that a food is fat-free, and any claim likely to have the same meaning for the consumer, may only be made where the product contains no more than 0,5 g of fat per 100 g or 100 ml. However, claims expressed as ‘X % fat-free’ shall be prohibited.
When the fat content is less than 0,5 g/100 g or 100 ml.
LOW SATURATED FAT A claim that a food is low in saturated fat, and any claim likely to have the same meaning for the consumer, may only be made if the sum of saturated fatty acids and trans-fatty acids in the product does not exceed 1,5 g per
When the content of saturated fat is less than 1,5 g/100 g or 0,75 g/100 ml, in the both cases saturated fat can not make contribution more than 10% of energy
15 EU regulative is applied in Slovenia and Croatia. 16 In Bosnia and Herzegovina, Macedonia, Montenegro and Serbia nutrition claims regulative is not fully harmonized with EU.

FP7 KBBE 2007 1 32 GA 212579
100 g for solids or 0,75 g/100 ml for liquids and in either case the sum of saturated fatty acids and trans-fatty acids must not provide more than 10 % of energy.
value.
SATURATED FAT-FREE
A claim that a food does not contain saturated fat, and any claim likely to have the same meaning for the consumer, may only be made where the sum of saturated fat and trans-fatty acids does not exceed 0,1 g of saturated fat per 100 g or 100 ml.
When the content of saturated fat is less than 0,1 g/100 g or 100 ml. In the case of food that naturally contents of saturated fats for this nutritional claim it can be used prefix “natural”.
LOW SUGARS A claim that a food is low in sugars, and any claim likely to have the same meaning for the consumer, may only be made where the product contains no more than 5 g of sugars per 100 g for solids or 2,5 g of sugars per 100 ml for liquids.
When sugar content is less than 5 g/100 g or ml. In the case of food with naturally low content of sugar for this claim it can be used prefix “natural”.
SUGARS-FREE A claim that a food is sugars-free, and any claim likely to have the same meaning for the consumer, may only be made where the product contains no more than 0,5 g of sugars per 100 g or 100 ml.
When the content of sugar is less than 0,5g/100 g or 100 ml. In the case of food with no natural content of sugar for this claim it can be used prefix “natural”.
WITH NO ADDED SUGARS A claim stating that sugars have not been added to a food, and any claim likely to have the same meaning for the consumer, may only be made where the product does not contain any added mono- or disaccharides or any other food used for its sweetening properties. If sugars are naturally present in the food, the following indication should also appear on the label: ‘CONTAINS NATURALLY OCCURRING SUGARS’.
When in the food content is not present added mono/disaharid or other foodstuffs with sweet taste in the purpose of sweeteners.
LOW SODIUM/SALT A claim that a food is low in sodium/salt, and any claim likely to have the same meaning for the consumer, may only be made where the product contains no more than 0,12 g of sodium, or the equivalent value for salt, per 100 g or per 100 ml. For waters, other than natural mineral waters falling within the scope of Directive 80/777/EEC, this value should not exceed 2 mg of sodium per 100 ml.
When the content of sodium is less than 0,12g/100 g or 100 ml, e.g. equivalent of value for salt in 100 g or 100 ml. If the food is with naturally low content of salt for this nutrition claim can be used prefix “natural”.
VERY LOW SODIUM/SALT A claim that a food is very low in sodium/salt, and any claim likely to have the same meaning for the consumer, may only be made where the product contains no more than 0,04 g of sodium, or the equivalent value for salt, per 100 g or per 100 ml. This claim shall not be used for natural mineral waters and other waters.
When content of sodium is less than 0,04g/100 g or 100 ml, e.g. equivalent of slat in 100 g or 100 ml. If the food is with naturally natural low content of sodium for this nutrition claim can be used prefix “natural”.
SODIUM-FREE or SALT-FREE A claim that a food is sodium-free or salt-free, and any claim likely to have the same meaning for the consumer, may only be made where the product contains no more than 0,005 g of sodium, or the equivalent value for salt, per 100 g.
When the content of sodium is less than 0,005 g/100 g or 100 ml, e.g. equivalent of sodium in 100 g or 100 ml. In the case with food of zero content of Na/sodium for this nutrition claim can be used prefix “natural”.
SOURCE OF FIBRE A claim that a food is a source of fibre, and any claim When the content of fiber is at least 3 g/100
FOCUS‐BALKANS DL 6.1 Consumer study implementation for products with health claims

FP7 KBBE 2007 1 33 GA 212579
likely to have the same meaning for the consumer, may only be made where the product contains at least 3 g of fibre per 100 g or at least 1,5 g of fibre per 100 kcal.
g or 1,5g/100 kcal. If the food is natural source of fiber for this nutrition claim can be used prefix “natural”.
HIGH FIBRE A claim that a food is high in fibre, and any claim likely to have the same meaning for the consumer, may only be made where the product contains at least 6 g of fibre per 100 g or at least 3 g of fibre per 100 kcal.
When the content of fiber is at least 6 g/100 g or 3 g/100 kcal. In the case of food that is natural source of fiber for this nutrition claim can be used prefix “natural”.
SOURCE OF PROTEIN A claim that a food is a source of protein, and any claim likely to have the same meaning for the consumer, may only be made where at least 12 % of the energy value of the food is provided by protein.
When at least 12% of food energy value is from proteins. In the case of food that is natural source of proteins for this kind of nutrition claim can be used prefix “natural”.
HIGH PROTEIN A claim that a food is high in protein, and any claim likely to have the same meaning for the consumer, may only be made where at least 20 % of the energy value of the food is provided by protein.
When at least 20% of food energy value is from proteins. In the case of food that is natural source of proteins for this kind of nutrition claim can be used prefix “natural”.
SOURCE OF [NAME OF VITAMIN/S] AND/OR [NAME OF MINERAL/S] A claim that a food is a source of vitamins and/or minerals, and any claim likely to have the same meaning for the consumer, may only be made where the product contains at least a significant amount as defined in the Annex to Directive 90/496/EEC or an amount provided for by derogations granted according to Article 6 of Regulation (EC) No 1925/2006 of the European Parliament and of the Council of 20 December 2006 on the addition of vitamins and minerals and of certain other substances to foods .
When content of vitamins and/or minerals is at least 15% of RDA (listed in the Table 2) in 100 g or 100 ml. If the food is natural source of vitamins and/or minerals it can be used prefix “natural”.
RICH/ADDED WITH VITAMINS AND/OR MINERALS
When the content of minerals and/or vitamins is at least 15% of RDA (listed in the Table 2) in 100 g or 100 ml.
HIGH [NAME OF VITAMIN/S] AND/OR [NAME OF MINERAL/S] A claim that a food is high in vitamins and/or minerals, and any claim likely to have the same meaning for the consumer, may only be made where the product contains at least twice the value of ‘source of [NAME OF VITAMIN/S] and/or [NAME OF MINERAL/S]’.
When the contents of vitamins and/or minerals is at least 30% of RDA (listed in the Table 2) in 100 g or 100 ml. In the case of food that is natural source of vitamins and/or minerals it can be used prefix “natural”.
CONTAINS [NAME OF THE NUTRIENT OR OTHER SUBSTANCE] A claim that a food contains a nutrient or another substance, for which specific conditions are not laid down in this Regulation, or any claim likely to have the same meaning for the consumer, may only be made where the product complies with all the applicable provisions of this Regulation, and in particular Article 5. For vitamins and minerals the conditions of the claim ‘source of’ shall apply.
When the content of nutrition is answering on all applicable conditions in the reference defined by this regulation. If the food content is natural for this nutrition claim can be used prefix “natural”.
INCREASED [NAME OF THE NUTRIENT] A claim stating that the content in one or more nutrients, other than vitamins and minerals, has been increased, and any claim likely to have the same meaning for the consumer, may only be made where the product meets
When the nutritional content is defined according to nutritional claim “source of (the name of nutrient) and the increased in content at least for 30% compared to the
FOCUS‐BALKANS DL 6.1 Consumer study implementation for products with health claims

FP7 KBBE 2007 1 34 GA 212579
the conditions for the claim ‘source of’ and the increase in content is at least 30 % compared to a similar product.
same or similar group of food.
REDUCED [NAME OF THE NUTRIENT] A claim stating that the content in one or more nutrients has been reduced, and any claim likely to have the same meaning for the consumer, may only be made where the reduction in content is at least 30 % compared to a similar product, except for micronutrients, where a 10 % difference in the reference values as set in Directive 90/496/EEC shall be acceptable, and for sodium, or the equivalent value for salt, where a 25 % difference shall be acceptable.
When the content of food is at least decreased for 30% compared to the same or similar group of food.
LIGHT/LITE A claim stating that a product is ‘light’ or ‘lite’, and any claim likely to have the same meaning for the consumer, shall follow the same conditions as those set for the term ‘reduced’; the claim shall also be accompanied by an indication of the characteristic(s) which make(s) the food ‘light’ or ‘lite’.
When the nutritional content is answering on conditions of claim “decreased content (the name of nutritional content)”, with obligatory added facts about food content that is giving this kind of characteristic to food.
NATURALLY/NATURAL Where a food naturally meets the condition(s) laid down in this Annex for the use of a nutritional claim, the term ‘naturally/natural’ may be used as a prefix to the claim.
If products were artificially coloured and preserved by preservatives, it must be indicated right below the product’s name, e.g. “artificially coloured” or “preserved by preservative” as well include an indication as to which chemicals were used. Claims such as “light” and “reduced” are permitted. However, generally labels must not contain words, pictures and drawings and health-related information that could mislead consumers regarding product’s origin, quantity and quality. Description of the nutritive values may contain data about the following component: starch, poliol, monounsaturated fatty acids, polyunsaturated fatty acids, cholesterol, minerals and vitamins. Part of the text of the food product name may contain the following statement: “with sweetener” (if product contains one or more sweeteners); “with sugar and sweetener addition” (if one or more different sugars and sweeteners were added into the product); “contain source of phenylalanine” (if the product contain aspartame-E591); “excessive usage may cause laxative effect” (if the product contain more than 10% additional polios). These need to be highlighted.
Food labels in WBC can be presented in the form of table with the following information: energy value and food components - proteins, carbohydrates, fats, fiber, sodium/salt, vitamins or minerals. Nutrition labelling is obligatory if the food declaration states one or more nutrition claims listed in the table above, otherwise is voluntary. Vitamins and minerals have to be clearly stated with their RDA. Quantity of vitamins/minerals which can be claimed has to be at least 15% of RDA (in packed food, or in 100 g / 100 ml). When the quantity of unsaturated fats/cholesterol is declared in the claim, the statement of quantity of saturated fats is obligatory.
The EU and WBC regulative on nutrition claims comparative analysis stressed out a few important conclusions. Although regulative on nutrition claims in most WBC is not fully harmonized with related EU regulative, in both regions significant correlation in permitted claims exist (see Table 4). Totally 24 nutrition claims made on food can be
FOCUS‐BALKANS DL 6.1 Consumer study implementation for products with health claims

FP7 KBBE 2007 1 35 GA 212579
stated under certain circumstances which are strongly regulated. Additionally, regard two specific statements differences apparently exist: RICH/ADDED WITH VITAMINS AND/OR MINERALS and NATURALLY/NATURAL. EU regulative covers rich/added claims in separated regulation more detailed while WBC common regulative stays with narrow definition of this claim covered by nutritional labelling. Nevertheless, claim that product is natural is present in both EU and WBC nutritional labelling. Difference exist according to the fact that this claim is separately regulated as independent in EU regulative, while WBC common regulative use natural as prefix in different already listed claims whenever it is allowed .
Nutrition and health claim regulative in Slovenia and Croatia is fully in the line with the EC Directive number 1924/2006 of the European Parliament and of the council of 20th December 2008. The health and nutritional claims are allowed. The annex of claims will be updated regularly according to the scientific findings but none of the claims outside of this list are eligible for application. Additionally, the Regulation on food enriched with nutrients (enrichment with vitamins, minerals and other nutritional stuff) NN 148/08 in accordance with Directive 1925/2006 EC, sets rules for allowed forms and quantities of chemical vitamins and minerals to be added to the foodstuffs. The products with specific claims that are on the market prior to the implementation of the provisions of this regulation could remain on the market till Croatia becomes EU member.
In other WBC health claims stating risk reduction from the certain illness (for example: sodium and hypertension) cannot be used. It is particularly forbidden to put health claims on food and subjects of public use, as well as propaganda by using pictures, signs or text which put influence on consumer misleading in the context of content, characteristics and purpose of food and subjects of general use.
Parallel, nutrition of people which need a particular controlled use of food is strictly regulated (when the process of changing content of physical, chemical, biological and other characteristics of food was taken in comparison to the food with normal content). This kind of food must be clearly declared as “Dietetic of Dietary”. It includes vulnerable demographic groups such as babies and elderly population. The targeted population and groups of foods are the same than in European regulation. A particular nutritional use must fulfil the particular nutritional requirements: of certain categories of persons whose digestive processes of metabolism are disturbed; or of certain categories of persons who are in a special physiological condition and who are therefore able to obtain special benefit from controlled consumption of certain substances in foodstuffs; or infants or young children.
FOCUS‐BALKANS DL 6.1 Consumer study implementation for products with health claims

FP7 KBBE 2007 1 36 GA 212579
Table 6 WBC regulative on dietetic food
Country General regulation Source Bosnia and Herzegovina
Rulebook of dietetic products healthconditions which can be traded
Official Gazette B&H 7/2004, Official Gazette
SFRJ 4/1985
Croatia Rulebook for food with particulardietary needs
Rulebook on nutritional supplements
Official Gazette 78/ 2008
Official Gazette 148/2008 Macedonia Rulebook on types of food for special
nutritive use and allowed limits of dailyintake of vitamins and minerals
Rulebook on special requirements forinfant formula
OG of RM No. 3/2007
OG of RM No. 118/2005 Montenegro Rulebook on health correctness for
dietetic products which can betraded
Rulebook on Packed Food LabelingFor Infant’s Nutrition
Official Gazette SFRJ 1985/4
Official Gazette SCG 4/05
Serbia Rulebook on health correctness fordietetic products which can betraded
Rulebook on Packed Food LabelingFor Infant’s Nutrition
Official Gazette SFRJ 1985/4
Official Gazette SCG 4/05
Slovenia Directive 89/398/EEC
Dietetic products are classified as follows: baby foods, food stuffs with lower of higher energy value, food stuffs with no lactose, food stuffs with balanced content of proteins, food stuffs with lower content of carbohydrates, dietary food for special medical purposes – diabetes, food low in gluten, food for elderly people, food with vitamins, minerals and other supplements with high energy value, low-sodium food, replacements for sugar, replacements for sodium, artificial sweeteners and other dietetic products. Specific regulations on infants’ nutrition exist. In most WBC regulation on dietetic products is old and not fully harmonized with international standards and EU relevant legislative. In Croatia, this regulation is recently improved towards full harmonization with international standards and EU relevant legislative.
FOCUS‐BALKANS DL 6.1 Consumer study implementation for products with health claims

FP7 KBBE 2007 1 37 GA 212579
At the end, analysis of regulatory framework from the theoretical point of view always stresses out the costs and benefits of health claims regulations as an important part. Health claims cost-benefit analysis could be interpreted by first-order and second-order effects.
The first-order effects of N&H products market development are often discussed in literature. The most beneficial effect for the pubic nutrition policy is connected with dissemination of the health information that consumers might not gain through the regular information system. Information cost components are addressed to the out of pocket of purchasing information (e.g. price of book or magazine) or on the value of time spent on searching information, absorbing information and understand information. The health related marketing messages can be an efficient catalyst for inducing consumers to search more as well as an effective way to communicate with sub-populations not reachable by other information sources. Final effect could be seen in health care costs reducing if better informed consumers choose more healthful food.
The second-order effects refer to the market – e.g. competitors’ reaction. N&H claim products market development significantly increases the demand for health research and consequently improves products quality. Follow-up strategy is often reaction of competitors. Thus, free rider problem occurs which might negatively influence on the R&D activity taken by industry leader. Business companies are exposed to the important budget restraints in product development. Final effects are exposed to the decreasing of innovations efficiency.
On the other hand, the uncertainty and regulatory error should be considered equally. Two types of errors might appear. Type I error refers to allowing harmful claims while type II error is based on prohibiting beneficial claims. In both cases consumers and manufacturers will pay a huge price – consumers will be affected by food safety decreasing and manufacturers could be economically seriously injured. Claim is false or misleading. Type I error means that consumer will pay more for foods incorrectly believed to be health beneficial or even more - consumer can increase her/his health risk by incorrect health problem treatment parasitizing. The most negative effect within type I error is connected with the fact that credibility of all claims can be reduced. Prohibiting beneficial claims as type II error could be interpreted as unqualified, irresponsible and inadequate state governing.
Public health authorities found commercial advertising of health claims to be useful for public health policy. Governments need to work closely with private sector, consumer groups, academics and research community in further N&H claim products market development.
1.3.CONCLUSION
It is important to point out that a particular attention was paid on ensuring a high level of protection of consumer’s interest in relation to food in all WBC. A few important conclusions regarding WBC nutritional/health claims regulative could be emphasized.
FOCUS‐BALKANS DL 6.1 Consumer study implementation for products with health claims

FP7 KBBE 2007 1 38 GA 212579
General food safety is regulated by so-called Law on Food or Food Safety Law (The Law on Food in Bosnia and Herzegovina, The Food Safety Law in Macedonia, Montenegro and Serbia, as well as The Food Act in Croatia. These legal documents in WBC were adopted during the period 2002-2009 (the first Macedonia and the last Serbia). The purpose of the Law is to ensure high level of protection of life and health of consumers, and interests of consumers while ensuring efficient functioning of food trade. Declaration, labelling, promotion and quality of food, as well as food with traditional name and origin are also important parts of these laws in each WBC. In spite of their importance, these laws usually don’t regulate these nutrition/health claims in details. It is relinquished to the special regulations which results from this basic law framework.
Although regulative on nutrition claims in most WBC is not fully harmonized with related EU regulative, regulative significant correlation in permitted claims exist. Nutrition claims are allowed and clearly specified. Totally 24 nutrition claims made on food can be stated under certain circumstances which are strongly regulated.
The regulation on risk reduction disease claims are not yet been harmonized with European countries, except recently in Croatia. In other WBC health claims stating risk reduction from the certain illness (for example: sodium and hypertension) cannot be used. It is particularly forbidden to put health claims on food and subjects of public use, as well as propaganda by using pictures, signs or text which put influence on consumer misleading in the context of content, characteristics and purpose of food and subjects of general use. Structure and function claims at least are not forbidden.
There is, as in Europe, a specific, (although not fully harmonized) regulation for dietetic products, devoted to particular nutritional uses. The targeted population and groups of foods are the same than in European regulation. A particular nutritional use must fulfil the particular nutritional requirements: of certain categories of persons whose digestive processes of metabolism are disturbed; or of certain categories of persons who are in a special physiological condition and who are therefore able to obtain special benefit from controlled consumption of certain substances in foodstuffs; or infants or young children.
It is important to notice that in Europe, only few disease-risk reduction claims are until now allowed, even if the potential of markets will be probably important in the future.
FOCUS‐BALKANS DL 6.1 Consumer study implementation for products with health claims

FP7 KBBE 2007 1 39 GA 212579
2. NUTRITIONAL AND HEALTH CLAIMS PRODUCTS STATISTICS (Z.Stojanovic, R.Dragutinovic-Mitrovic and M.Gligoric)
SUMMARY
• This part of the study is addressed to the main findings related to the available statistics of N&H claimed products at WBC. Official data available by different national statistics offices publications in Bosnia and Herzegovina, Croatia, Macedonia, Montenegro, Serbia and Slovenia are presented.
• Statistical data cover different aspects of demand and supply of N&H products. Demand is analyzed using vital statistics data (population and life expectancy) following by analysis of non-communicable diseases, lifestyle and attitudes toward health in six observed countries, as well as by data registered in the household budget surveys. Research on production in quantities and value, import and export of chosen categories of products allowed the first insight at the supply side of WBC N&H claimed products market. Additionally, the retail/off-trade value for studied categories was given as the important information containing also market shares for the yoghurt with pro/prebiotics as health claimed product included in the study.
• Data presented in this study cover mainly families of products chosen to be studied. As completed data about studied categories (their availability, consumption and production) could not be found neither in national statistic publications nor in official databases, primary data collection was necessarily taken through shopcheck. Collected data strongly supports this study by precise declaration of the N&H claimed products market structure in WBC. Besides, important data about claims were collected.
• The largest number of N&H products is surveyed in Serbia, while their smallest number is covered in Montenegro, mostly in hypermarkets. Almost two third of N&H products are of WBC origin. While Serbia is more concentrated on its own brands and producers, Slovenia and Croatia have the largest number of EU brands, but Macedonia, Montenegro and Bosnia and Herzegovina have other WBC brands as dominant. The largest number of products (more than 70%) has up to two claims with no significant differences by origin. Each fifth product on WBC market is with health claim (mostly general claim type).
• Almost all products in milk category are surveyed in hypermarkets of which more than 90% are of WBC origin. While domestic products are dominant on Serbian, Slovenian and Croatian markets, Macedonia is more concentrated on products from the other WBC (almost 90% of all products). The largest number of products has one claim and the most frequent claim is low fat. Approximately, one third of all products in the studied category has got health claim.
• All products in yogurt category are surveyed in hypermarkets and almost 90% are of WBC origin. The largest number of products has one claim no matter their origin and the most frequent claim is ″contains″.
FOCUS‐BALKANS DL 6.1 Consumer study implementation for products with health claims

FP7 KBBE 2007 1 40 GA 212579
FOCUS‐BALKANS DL 6.1 Consumer study implementation for products with health claims
• All products in margarine category are surveyed in hypermarkets. Slovenia, Bosnia and Herzegovina and Montenegro do not have domestic products in the studied category, while Serbia has only domestic products. A half of margarine brands and producers are of WBC origin with approximately 60% of producers having one brand. Most of WBC products have two claims, whereas the EU products are with one claim. The most frequent claim types are ″low energy″ and ″low fat″. Approximately one fourth of these products are with health claim.
• A half of products in jam category are of WBC origin with more than three fourth surveyed in hypermarkets. Macedonian market is more concentrated on its own products, while the major part of Slovenian and Croatian products refers to the EU origin. WBC producers of jam category have more brands than the EU producers. The largest number of products has one claim with the most frequent claim type: contains nutrient or other substance. About one third of products have health claim, while 45% are dietetic products and 10% are organic products in this category.
• Three fourth of products in juices category are of WBC origin, mostly surveyed in hypermarkets. Apart from domestic and the EU products, WBC import juices from the other countries (Korea, Thailand, and Indonesia). Most of producers are with one brand, but maximal number of brands in this category is two. The largest number of products is with one claim, while the largest number of claims per one product is seven. The most frequent claim type is ″natural″. About 8% of products in this category are with health claim, and 4% and 5% are dietetic and organic products, respectively.
2.1.AVAILABLE STATISTICAL DATA BY COUNTRY 2.1.1.Demand
a.Vital Statistics
At the beginning of the analysis, important information related to each country - such as the number of inhabitants and life expectancy are outlined. The goal is to determine the overall demand potential by number of inhabitants in analyzed countries. Graph 1 and Graph 2 present these data available for each WBC included in this study. Graph 1 shows total population living in Slovenia, Croatia and Bosnia and Herzegovina, while Graph 2 contains the same data for Serbia, Montenegro and Macedonia.17 The last two censuses in most of these countries were carried out at the beginning of 90’s and 2000’s. The recent data are estimates. The exception is B&H, where the last census was in 1991 and after that not even estimate are available (Figure 5).
17 The numbers without stars represent original data from two lasts countries’ ordinary population census, while numbers containing stars are estimates.

FP7 KBBE 2007 1 41 GA 212579
Population - last two census and estimates (*)
4784
41244377
19641913
2019*2009*2001*1997*1997*
4440* 4440* 4440* 4439* 4442* 4440*4437
0
500
1000
1500
2000
2500
3000
3500
4000
4500
5000
1981
1991
2001
2002
2003
2004
2005
2006
2007
in m
illio
ns
Slovenia Croatia BIH
Figure 5. Population by countries and years: Slovenia, Croatia and B&H Source: Health Statistical Yearbook or Statistical Yearbook for selected countries (2002-2009)
Range of data on graphs includes the period from 1981 to 2007. Through these years the changes in the number of inhabitants are not so important. The number of people slightly increased in Macedonia, Montenegro, Slovenia and B&H (only from 1981-1991), while population decreased in Serbia and with occasional variations in Croatia as well.
Population - last two census and estimates (*)
7577
615 620
1946 2023
7481*7498 7481* 7463* 7441* 7412*
626*624*623*622*
2044*2040*2037*2032*2027*
0500
1000150020002500300035004000450050005500600065007000750080008500
1991
1994
2002
2003
2004
2005
2006
2007
in m
illio
ns
Serbia Montenegro Macedonia
Figure 6 Population by countries and years : Serbia, Montenegro and Macedonia Source: Health Statistical Yearbook or Statistical Yearbook for selected countries (2002-2009)
FOCUS‐BALKANS DL 6.1 Consumer study implementation for products with health claims
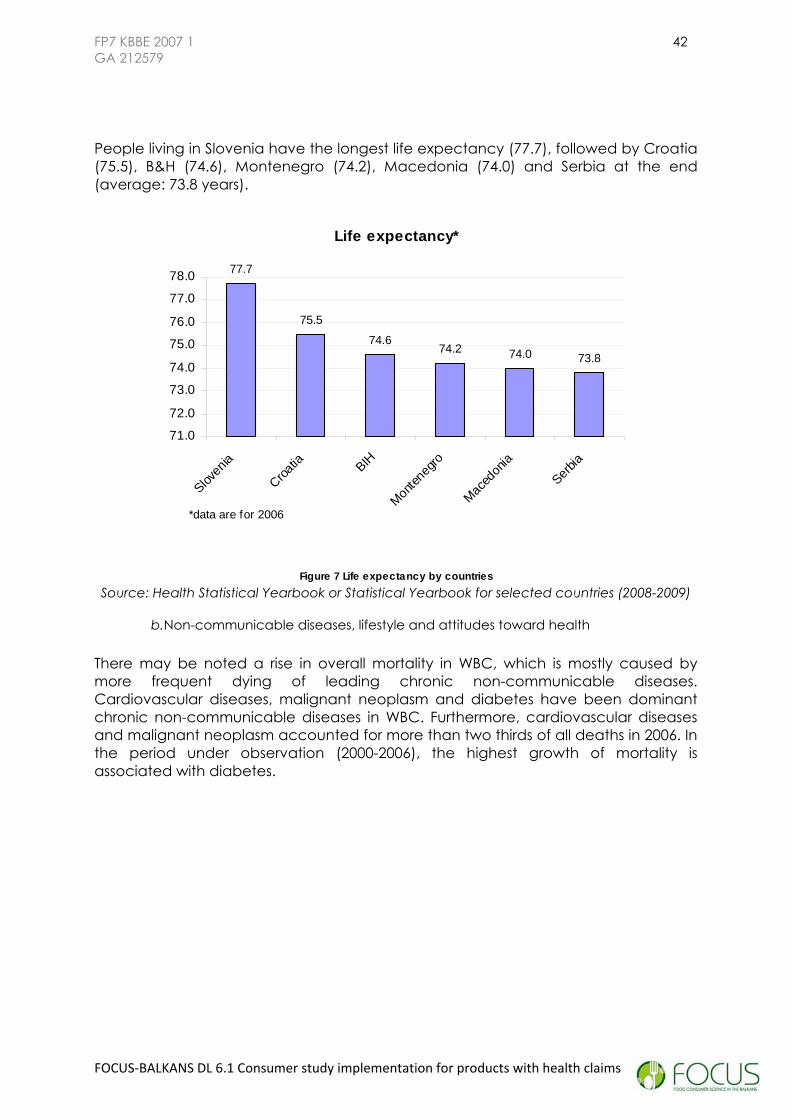
FP7 KBBE 2007 1 42 GA 212579
People living in Slovenia have the longest life expectancy (77.7), followed by Croatia (75.5), B&H (74.6), Montenegro (74.2), Macedonia (74.0) and Serbia at the end (average: 73.8 years).
Life expectancy*
77.7
75.5
74.674.2 74.0 73.8
71.0
72.0
73.0
74.0
75.0
76.0
77.0
78.0
Sloven
ia
Croatia BIH
Monten
egro
Maced
onia
Serbia
*data are for 2006
Figure 7 Life expectancy by countries Source: Health Statistical Yearbook or Statistical Yearbook for selected countries (2008-2009)
b.Non-communicable diseases, lifestyle and attitudes toward health
There may be noted a rise in overall mortality in WBC, which is mostly caused by more frequent dying of leading chronic non-communicable diseases. Cardiovascular diseases, malignant neoplasm and diabetes have been dominant chronic non-communicable diseases in WBC. Furthermore, cardiovascular diseases and malignant neoplasm accounted for more than two thirds of all deaths in 2006. In the period under observation (2000-2006), the highest growth of mortality is associated with diabetes.
FOCUS‐BALKANS DL 6.1 Consumer study implementation for products with health claims

FP7 KBBE 2007 1 43 GA 212579
FOCUS‐BALKANS DL 6.1 Consumer study implementation for products with health claims
Table 7 Leading non-communicable diseases by countries, 2006.
Sloven ia Croatia Federation
BIHRepublic of
Srpska Serbia Mo ntenegro Macedon ia
in % of all causes of deathDiseases of the circulatory system 39.8 50.8 53.7 48.8 57.3 56.8 58.7
Neoplasms 29.5 25.2 19.2 19.3 19.7 16.3 18.4
Injury, poisoning and certain other consequences of external causes 8.2 5.5 4.6 3.7 4.9 3
Diseases of the digestive system 5.7 4.6 2.4 2.3
Diseases of the respiratory system 6.8 5.0 3.2 2.3 4.3 3.7
Endocrine, nutrit ional and metabolic diseases 2.2 4.0 6.0 2.5 2.1 4
Symptoms,s igns and abnormal clinical andlaboratory findings, not elsewhere c lassified 5.7 9.1 9.3 6
Note: data are for 2006
.5
.0
.1
Source: Health Statistical Yearbook for selected countries (2008-2009)
Cardiovascular diseases accounting from 39.8 to 57.3% of all causes of death are a leading cause of death in WBC. Women died of cardiovascular diseases more often than men (table 8). Additionally, the prevalence of diabetes is increasing for a long time assuming epidemic proportion worldwide.18 Although the highest incidence rates are registered in the developed world, the largest increase of number of people with diabetes is expected in the developing countries. Approximately 5% of the population in WBC region suffers from diabetes. The number of persons with diabetes type 2 is much higher. Diabetes is the fifth leading cause of death in the world while in most Western Balkan Countries; it is the fourth leading cause of death and the fifth cause of the burden of disease. For the last six years increasing trend of diabetes mortality has been observed and new cases of diabetes type 1 were recorded among 0-29 year-olds.
Table 8 Structure of death caused by cardiovascular diseases diabetes by gender 2006 (%)
S loven ia C roatia Federation B IH
R epublic ofS rpska Serb ia M on tenegro M acedon ia
in % of to ta l deaths
D iseases o f the circu latory system / C ardiovascular d iseasesM ale 43.0 43 .8 46 .9 46 .5 46 .1 47.8 50.4F em ale 57.0 56 .2 53 .1 53 .5 53 .9 52.2 49.6
Endocrine, nu tritional and m etabolic diseases / D iabetesM ale 39 .2 38 .7 42 .0 43.2 40.9F em ale 60 .8 61 .3 58 .0 56.8 59.1Note: data are for 2006 Source: Health Statistical Yearbook for selected countries (2002-2009)
It would be interesting to compare non-communicable diseases development with life style, knowledge and attitudes toward the health of adult population. These data are available as a part of Health Statistical Yearbook for Serbia, Montenegro and for
18 The World Health Organization – WHO and the International Diabetes Federation – IDF, estimate that in 2007, 246 million people worldwide suffered from diabetes, and that the number of diabetics will increase up to 380 million by the year 2025.

FP7 KBBE 2007 1 44 GA 212579
FOCUS‐BALKANS DL 6.1 Consumer study implementation for products with health claims
B&H only partially – only for the Republic of Srpska. The analysis is more difficult if we take into account the fact that these data are available in four (different) points in time – Serbia and Montenegro: 2000; Serbia: 2006; Montenegro: 2008; and Republic of Srpska 2002. Another problem is that the dynamics of life stile changes can not be observed in Republic of Srpska. For Slovenia, Croatia and Macedonia similar data were collected through Euromonitor report.
Table 9 Life style related to food of adult population
Serbia &Montenegro
Republic ofSrpska Serbia Montenegro
2000 2002 2006 2008in % of total No. of adults
Have breakfast regularly 71.90 87.7 77.57 70.26Urban 68.48 85.10 74.53 70.09Rural 77.10 90.00 81.56 70.58Female 69.51 89.50 75.07 69.04Male 74.55 86.10 79.83 71.58
Have three main meals regularly 52.78 - 56.63 51.19
Urban 48.08 - 53.41 51.43Rural 59.90 - 60.86 50.74Female 47.55 - 51.18 47.11Male 58.57 - 61.55 55.60
Eat fish less than once a week1) 62.68 0.80 48.71 25.09
Urban 61.20 0.90 42.90 21.29Rural 64.91 0.70 56.35 32.19Female 64.38 - 48.34 26.09Male 60.79 - 49.05 24.01
Note: 1) For Republic of Srpska Fish consumption, (average) number of times per week Source: Health Statistical Yearbook for selected countries (2002-2009)
Picture 1. Lifestyle and non-communicable diseases
More than two thirds of the population in observed countries had a regular breakfast.19 Three main meals were regularly consumed by more than one half of adults - in Serbia 57% and in Montenegro 52%. For Serbia it was an improvement in
19 Health Statistical Yearbook for selected countries (2002-2009)

FP7 KBBE 2007 1 45 GA 212579
FOCUS‐BALKANS DL 6.1 Consumer study implementation for products with health claims
comparison with 2000. It is interesting to point out that he oldest, the poorest and those living in rural settlements in Serbia had their meals more regularly than those that were better off and lived in cities. Additionally, with the rise of wealth index, use of animal lard to prepare meals was reduced in observed period. The use of animal fats was most prevalent among the poorest population. Over half of the population used predominantly white bread, and around 15% of adults used whole grain, rye and similar types of bread.20 Significant differences could be noted in fish consumption in observed WBC. For example, in Serbia 49% of the population ate fish less than once a week, while this percentage was significantly lower for Montenegro – only 25%. It is obviously connected with Mediterranean life style practice acceptance in the second observed country. The richest and those living in urban settlements had fish in their diet more frequently. The frequency of daily use of fresh vegetables and fruit consumption increased significantly over the time. The richest people used fresh fruits and vegetables more often. Only for Serbia, data about food health dimension are included in available statistics. In 2006, one out of five adults in Serbia (19.9%) never thought of the health implications when they chose what to eat, which was more than in 2000 (15.4%). When selecting their diet, the elderly (75+) appeared to think less (25.3%), and so did the population of South-eastern Serbia (24.8%) and the poorest part of population (28.7%).21
Leisure, exercise and sports are also important parts of lifestyle. Official statistical data are given in the Health Statistical Yearbook. In 2006, two thirds of the population spent their free time mainly in a sedentary way. In 2006, the percentage of adults, who exercised more than 3 times a week intensively, i.e. sweating and breathing faster, reached 25.5% in Serbia which was significantly more than in 2000 when only 13.7% did so, while for Montenegro this data did not change in observed period. In 2006, one third of the employed population had a sedentary type of work: around one quarter of men and two fifths of women. The percentage of employees with a sedentary type of work was significantly increased in comparison with 2000. The number is the highest among the richest and tends to fall with the wealth index, reaching the lowest value with the poorest.
Around 87% of Slovenians eat breakfast regularly.22 In general, Slovenian meals contain excessive amounts of fat, particularly saturated fats that contribute to increased numbers of heart and vascular diseases and large intestine cancers. However, near the seaside, there light Mediterranean food influence dominated by olive oil, but inhabitants of the eastern of Slovenia eat the highest share of animal fat and, consequently, they have the highest number of cases of heart and vascular diseases and the highest number of overweight individuals. An important factor in eating habits is the level of education and disposable income. Slovenians with higher educational levels are more informed about healthy food and their higher disposable incomes allow them to enjoy healthy food consumption. Healthy foods,
20 Source: Health statistical Yearbook for selected countries (2002-2007) 21 Source: Health statistical Yearbook of Republic of Serbia 2007 22 Soruce: Bulc M. et al. (2001) The countrywide integrated non-communicable disease intervention programme (CINDI) and the effects of healthcare system reform in Slovenia, The European Journal of General Practice, Volume 7, Issue 4 December 2001 , pages 154 - 160

FP7 KBBE 2007 1 46 GA 212579
FOCUS‐BALKANS DL 6.1 Consumer study implementation for products with health claims
containing natural products, are more highly priced and more often available through specialized stores in urban areas, thus there is a higher consumption rate of healthy foods in cities.23 Overall goal of this study was seen in observation of the specific market of chosen families of products. In that context, available data for dairy products consumption in Slovenia seems to be very interesting. These products are very popular in Slovenia, and domestic products are still among the favourites. Slovenians prefer to drink milk with 3.2% fat and eat fruity yoghurts produced by local producer - Ljubljanske mlekarne. Consumption of light products with low fat or 0% fat is increasing, but Slovenians nevertheless still consume more products from 3.2% fat milk. Pasteurized milk dominates over fresh milk. Milk can be found in tetra packaging, not in glass bottles.
Macedonians consider home-cooked meals healthier and cheaper, but changing lifestyles, where people are busier and women are more career oriented, increased the use of ready meals.24 Higher disposable incomes also meant that busy people could afford to eat out more often. Traditional breakfast was changed more towards cereals, which people find handier and healthier than a fried breakfast. Fresh food consumption is very high in Macedonia. Due to the warm and suitable climate convenient for the production, fresh food consumption is constant dependent on the season. Its wide presence and domestic production result in low prices and high demand on food. According to Euromonitor data, packaged and processed foods are consumed less in Macedonia than in other regional countries.
According to the Magazine for Public Health,25 over 70% of Croatians eat three to five meals per day. However 26% have only two meals per day, mostly by skipping breakfast. During the working week, a warm meal is eaten by 87% of those surveyed, while 93% eat it during the weekend. Due to busier lifestyles, breakfast during the week is eaten by 37% of citizens only, while 14% never have breakfast. Skipping meals and eating irregularly is becoming a problem, while eating on the go, primarily fast food, is growing. According to the Institute for Public Health in Croatia, an increase in oil and fats consumption has occurred, resulting in this food category amounting to 38%-39% of all food intakes, while carbohydrate intakes are low, and provide only 49%-50% of energy. This is most likely the consequence of poverty amongst poorer groups and teenagers, who grab unhealthy, fat-laden meals on the go. Around 42% of citizens use animal fats for cooking, while only 9% use olive oil. Worsening diets are causing health problems, such as malnutrition, vitamin and mineral deficiencies, as well as long-term consequences such as cardiovascular diseases. Added to this is the sedentary lifestyle and low levels of physical activity – only 4% of women and 17% of men do some physical activity three days a week. Children are a particularly at-risk group, as their food intake is irregular. Eating in school canteens (where the most common garnish is chips) is less frequent, while half of children do not eat breakfast before school. Despite increases in fish consumption, fish is not eaten often enough as it is recommended. Due to new regulations which have made it mandatory for schools and kindergartens to serve healthier food to children, the sales of fat-free
23 Source: Euromonitor - Consumer Lifestyles – Slovenia 2008. 24 Source: Euromonitor - Consumer Lifestyles – Macedonia 2008. 25 Source Euromonitor - Consumer Lifestyles – Croatia, 2008

FP7 KBBE 2007 1 47 GA 212579
FOCUS‐BALKANS DL 6.1 Consumer study implementation for products with health claims
milk, margarine, cheese spreads and better-quality food such as brown bread, olive oil, fruits and vegetables can be expected to grow.
Increased income resulted in higher expenditure on better-quality food, including fish, fruit and vegetables. This was also stimulated by growing health awareness as people are better informed by doctors, television and media.26 Due to increased health awareness, consumers are expected to continue purchasing more fish, vegetables and fruit, as well as mineral water and juices. For the same reason, products with added minerals and vitamins, such as milk with omega oil, milk with lower amounts of lactose, juices and yoghurt with vitamins, are expected to increase in sales in Croatia.27
c.Household budget survey
It could be observed from the table no. 10 that average annual money assets for different countries are given in different currencies, which negatively influences our analysis. It is clear that different countries apply different methodologies, therefore, in Croatia there is a lack of data for annual money asset per household member. Reference statistical data for Macedonia are available only for year 2007, while there is no statistical evidence on this matter for Bosnia and Herzegovina. Montenegro started to track these statistical indicators from the year 2005.
For all countries included in analysis, it could be concluded that there is a positive nominal trend in average annual assets, i.e. the assets increase, in nominal terms, over the time. With regard to the fact that all countries expressed average incomes in their national currencies, the only comparison can be made for Slovenia and Montenegro – both countries use EUR. In 2005 and 2006 Slovenian average assets per household was three times bigger than Montenegrin, while Slovenian average assets per household member was even four times bigger than corresponding Montenegrin. However, a Montenegrin average annual asset rises faster than Slovenian and the difference between those two is steadily decreasing over the time.
26 For example, growing health awareness in Croatia also led to higher sales of bottled water, which grew by 16% between 2006 and 2007. 27 Soruce: Euromonitor - Consumer Lifestyles – Croatia, 2008

FP7 KBBE 2007 1 48 GA 212579
Table 10 Available money assets of houdeholds : monthly average
per household 970 1,066 1,159 1,241 1,314 1,370 1,427 1,506 N/A
per household member 325 365 405 445 483 512 539 572 N/A
per household N/A N/A N/A 5,168 5,719 5,765 6,006 6,454 6,606per household member N/A N/A N/A N/A N/A N/A N/A N/A N/A
per household N/A N/A N/A 21,875 22,806 26,915 33,012 36,769 41,228per household member N/A N/A N/A 7,079 7,453 8,682 10,480 12,464 13,562per household N/A N/A N/A N/A N/A 459 444 568 607per household member N/A N/A N/A N/A N/A 134 128 165 177per household N/A N/A N/A N/A N/A N/A N/A 24,083 N/A
per household member N/A N/A N/A N/A N/A N/A N/A 6,099 N/AMacedonia(in MKD )
2000Country YearAverage
Slovenia(in EUR )Croatia(in HRK )Serbia(in RSD )Montenegro*(in EUR )
2007 20082001 2002 2003 2004 2005 2006
Note: *average available assets of households; data for BIH is not available Source: National Household budget survey 2008-2009.
In line with our previous observations, it could be noted that all countries except Bosnia and Herzegovina, provided statistics in national currencies and for the same year as in the former case (average annual assets). Furthermore, we can see in table that there are some data for average monthly income for Bosnia and Herzegovina, more precisely, for the year 2004 and 2007. It could be noted that average monthly assets in Federation is slightly higher than the assets in Republic of Srpska. Incomes of both regions rose from 2004 to 2007, whereas growth rate of Federation was higher.
Table 11 Allocated assets of houdeholds : monthly average
per household 1,067 1,133 1,214 1,287 1,389 1,435 1,502 1,567 N/A
per household member 358 388 424 461 510 536 567 595 N/A
per household N/A N/A N/A 6,493 6,896 6,856 7,043 7,486 7,785per household member N/A N/A N/A N/A N/A N/A N/A N/A N/A
per household N/A N/A N/A N/A 1,346 N/A N/A 1,650 N/Aper household member N/A N/A N/A N/A 400 N/A N/A 491 N/A
per household N/A N/A N/A N/A 1,227 N/A N/A 1,364 N/A
per household member N/A N/A N/A N/A 387 N/A N/A 439 N/A
per household N/A N/A N/A 21,707 23,150 27,915 33,910 35,414 40,100per household member N/A N/A N/A 7,025 7,565 9,005 10,765 12,005 13,191per household N/A N/A N/A N/A N/A 469 453 560 638per household member N/A N/A N/A N/A N/A 138 131 162 186per household N/A N/A N/A N/A N/A N/A N/A 32,152 N/A
per household member N/A N/A N/A N/A N/A N/A N/A 8,142 N/A
2000 2001 2006 2007 2008
Slovenia(in EUR )
2002 2003 2004 2005Country YearAverage
Croatia(in HRK )
Serbia(in RSD )Montenegro(in EUR )Macedonia(in MKD )
Federation BIH(in KM )Republic of Srpska(in KM )
Note: Used assets in Croatia. Source: National Household budget survey 2008-2009.
There are several categories of overall consumption that are very interesting from the point of view of consumption of products with H&N claims – food and non-alcoholic beverages, alcoholic beverages and tobacco, healthcare, recreation and education. Restaurants and hotels are given referring to accommodation; therefore they will not be analyzed herein.
Firstly, we can observe that all countries did not change the amount of their spendings for food and non-alcoholic beverages from 2004 to 2007. Slovenia spent the least of all studied countries in this category, approximately 16%, Croatia, Federation of BIH and Republic of Srpska spent a little bit more than 30%, while
FOCUS‐BALKANS DL 6.1 Consumer study implementation for products with health claims

FP7 KBBE 2007 1 49 GA 212579
Serbia, Macedonia and Montenegro spent approximately 40%. It should be stated that statistical offices of BIH include consumption of alcoholic beverages in this group.
The alcoholic beverages and tobacco have the greatest share in consumption of Serbia, comparing to other studied countries, (about 5%), followed by Montenegro, Croatia and Macedonia (about 4%). The spending on these products has a decreasing trend for all countries; except for Slovenia which registered gentle rise (spending is about 2%).
The highest spending for the healthcare is noted in Republic of Srpska (4.5%) and in Serbia (4%). In Federation of BIH people spend approximately 3.5% of their income to healthcare, in Macedonia and Montenegro 3% and in Croatia 2.5%. Slovenians have the lowest expenditures regarding this category – slightly less than 2%. In all countries except in Montenegro the spending for healthcare has increased from 2004 to 2007.
We can see through the category of recreation (in this case it is given jointly with culture) how much people take care of their physical health. From the figure 8, we can observe that Slovenian consumers are most of all other aware of benefits of practicing sports, since they invest about 11% of their income to the recreation and culture. Beside Croatians who spend about 7% for those activities, all other consumers in other studied countries spend 3-4%. It should be stated here that when average real income grows, discretionary income increases too, and people can spend more money on non-existential products, such as recreation and culture. Only in Serbia and Montenegro this category have had positive trend from 2004 to 2007, in all other countries this trend was negative.
FOCUS‐BALKANS DL 6.1 Consumer study implementation for products with health claims

FP7 KBBE 2007 1 50 GA 212579
Figure 8 Structure of consumption by countries
0 %
1 0 %
2 0 %
3 0 %
4 0 %
5 0 %
6 0 %
7 0 %
8 0 %
9 0 %
1 0 0 %
2 0 0 4 2 0 0 7 2 0 0 4 2 0 0 7 2 0 0 4 2 0 0 7 2 0 0 4 2 0 0 7 2 0 0 4 2 0 0 7 2 0 0 5 2 0 0 7 2 0 0 4 2 0 0 7
S lo v e n ia C r o a t ia F e d e r a t io no f B IH *
R e p u b l ic o fS r p s k a *
S e r b ia M o n t e n e g r o M a c e d o n ia
F o o d a n d n o n - a l c o h o l i c b e ve ra g e s A l c o h o l i c b e ve ra g e s a n d t o b a c c o C lo t h e s a n d fo o t w e a r H o u s i n g , w a t e r , e le c t r i c i t y a n d o t h e r fu e l s F u rn i t u re , h o u s e h o l d e q u ip m e n t a n d m a i n t e n a n c e H e a l t h c a r e T ra n s p o r t C o m m u n i c a t i o n sR e c r e a t i o n a n d c u l t u r e E d u c a t i o n R e s t a u ra n t s a n d h o t e l s O t h e r g o o d s a n d s e r vi c e s
All countries except Serbia and Montenegro spend less than 1% of their available income on education. The most extreme is the case of BIH which cut its spending on this category twice from 2004 to 2007. In the view of education on H&N claims we find this trend discouraging and not motivating for all members of the supply chain of this kind of products.
Consumption per household by specific products categories presents very important information. From the data about household consumption of food and non-alcoholic beverages available for all WB countries, interesting categories, e.g. that are the most important for our analysis, have been extracted (Table 11).
Table 12 Selected food and non-alcoholic beverages : monthly average per household
Slovenia1) BIH2) Serbia3) Macedonia4) Croatia4) Montenegro5)
Milk, cheese and eggs 392.0 71.7 1,839.0 358.2 111.3 47.0Oils and fat 83.0 24.0 356.0 89.0 17.7 7.0Sugar, jam, honey, chocolate and sweets 222.0 39.8 662.0 88.4 17.4 10.0Non-alcoholic beverages 256.0 52.3 1,221.0 296.0 68.8 12.0
Note: data are for 2007. 1) in EUR, annual average, 2) in KM, 3) in RSD, 4) in kg or liters, annual average for Croatia per
household member, 5) in EUR Source: National Household budget survey 2008-2009.
Table 12 presents the data for Slovenia, B&H, Serbia, Macedonia, Croatia and Montenegro. The data are for the following selected products categories particularly interesting to the present study: (1) Milk, cheese and eggs; (2) Oils and fat; (3) Sugar, jam, honey, chocolate and sweets; (4) Non-alcoholic beverages. In Slovenia and Montenegro, available data are in Euros, for B&H and Serbia data are given in the
FOCUS‐BALKANS DL 6.1 Consumer study implementation for products with health claims
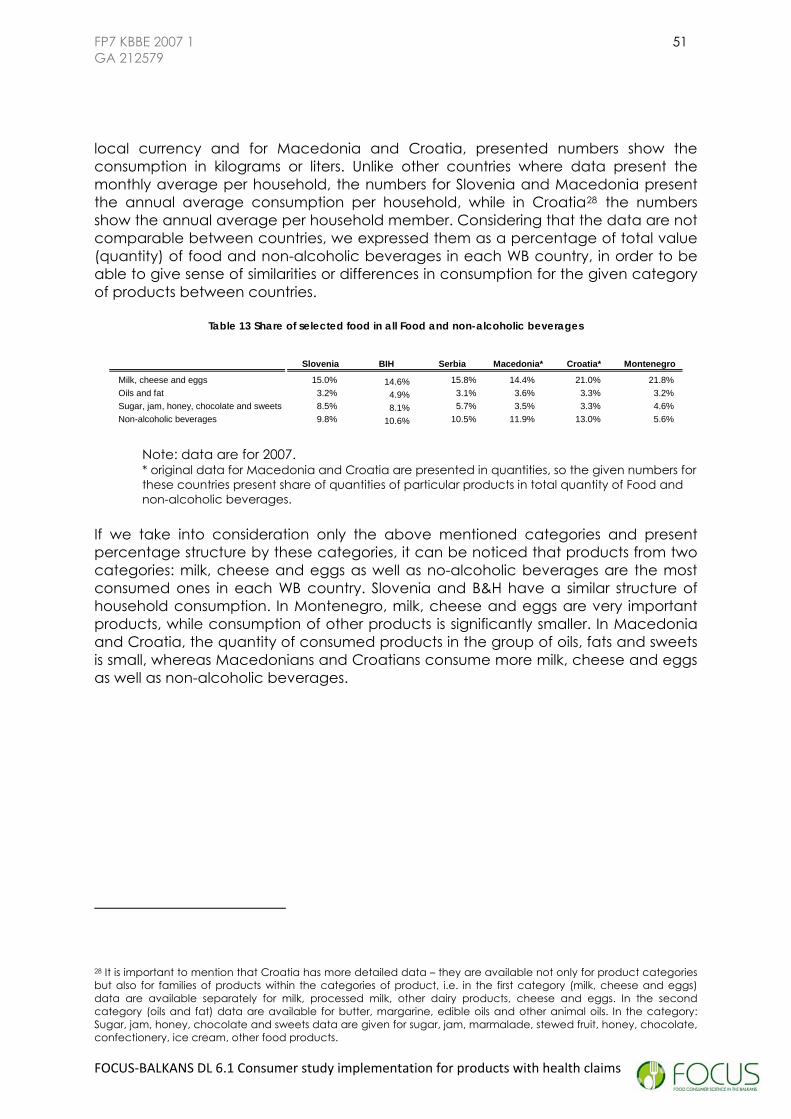
FP7 KBBE 2007 1 51 GA 212579
FOCUS‐BALKANS DL 6.1 Consumer study implementation for products with health claims
local currency and for Macedonia and Croatia, presented numbers show the consumption in kilograms or liters. Unlike other countries where data present the monthly average per household, the numbers for Slovenia and Macedonia present the annual average consumption per household, while in Croatia28 the numbers show the annual average per household member. Considering that the data are not comparable between countries, we expressed them as a percentage of total value (quantity) of food and non-alcoholic beverages in each WB country, in order to be able to give sense of similarities or differences in consumption for the given category of products between countries.
Table 13 Share of selected food in all Food and non-alcoholic beverages
Slovenia BIH Serbia Macedonia* Croatia* Montenegro
Milk, cheese and eggs 15.0% 14.6% 15.8% 14.4% 21.0% 21.8%Oils and fat 3.2% 4.9% 3.1% 3.6% 3.3% 3.2%Sugar, jam, honey, chocolate and sweets 8.5% 8.1% 5.7% 3.5% 3.3% 4.6%Non-alcoholic beverages 9.8% 10.6% 10.5% 11.9% 13.0% 5.6%
Note: data are for 2007. * original data for Macedonia and Croatia are presented in quantities, so the given numbers for these countries present share of quantities of particular products in total quantity of Food and non-alcoholic beverages.
If we take into consideration only the above mentioned categories and present percentage structure by these categories, it can be noticed that products from two categories: milk, cheese and eggs as well as no-alcoholic beverages are the most consumed ones in each WB country. Slovenia and B&H have a similar structure of household consumption. In Montenegro, milk, cheese and eggs are very important products, while consumption of other products is significantly smaller. In Macedonia and Croatia, the quantity of consumed products in the group of oils, fats and sweets is small, whereas Macedonians and Croatians consume more milk, cheese and eggs as well as non-alcoholic beverages.
28 It is important to mention that Croatia has more detailed data – they are available not only for product categories but also for families of products within the categories of product, i.e. in the first category (milk, cheese and eggs) data are available separately for milk, processed milk, other dairy products, cheese and eggs. In the second category (oils and fat) data are available for butter, margarine, edible oils and other animal oils. In the category: Sugar, jam, honey, chocolate and sweets data are given for sugar, jam, marmalade, stewed fruit, honey, chocolate, confectionery, ice cream, other food products.

FP7 KBBE 2007 1 52 GA 212579
FOCUS‐BALKANS DL 6.1 Consumer study implementation for products with health claims
2.1.2.SUPPLY
a. Data for studied families of products
The production in quantities of selected products in WBC from 2000 to 2007 is presented in Table 13. Quantities are given in different units, i.e. in thousands of litres, in tons, in hectolitres as it is available in national statistics publications.
The data for Slovenia cover production of processed liquid milk and cream, yoghurt and other fermented or acidified milk and cream, and Alcoholic and non-alcoholic beverages. In Croatia, the quantity of products is given for Fruit juices and Margarine. The data is available only for the period from 2000 to 2004.
Table 14Production in quantities for some selected industrial products
2000 2001 2002 2003 2004 2005 2006 2007Slovenia
Processed liquid milk and cream * 270,245 286,146 291,694 297,032 287,721 286,805 269,129 276,136Yoghurt and other fermented or acidified milk or cream** 39,433 43,009 n/a n/a 37,655 36,492 37,061 35,177Beverages (alcoholic and nonalcoholic)**** 384,073 402,257 390,543 427,048 367,633 362,627 395,189 396,940
CroatiaFruit juices*** 554,039 586,833 579,937 679,248 676,668 n/a n/a n/aMargarine ** 15,747 16,414 17,869 17,824 18,052 n/a n/a n/a
Federation B&HFruit juice*** 17,407 22,174 37,871 52,952 79,147 86,587 62,011 82,597Jam** 2,573 2,765 3,523 4,096 3,501 2,436 2,330 3,078Milk*** 213,163 218,294 303,754 375,815 411,217 537,118 618,023 636,573
SerbiaFruit and vegetable juices** n/a n/a n/a 103,525 126,022 167,936 179,999 233,641Jams and marmalades** n/a n/a n/a 4,959 3,723 5,369 4,000 3,637Margarine and hydrated vegetable fats** 43,701 41,732 42,459 40,789 42,275 42,290 42,618 43,523Non-alcoholic beverages**** 188,700 242,500 271,200
MontenegroFruit juices** n/a 47 28 31 n/a n/a 641 345Refined oils** n/a 819 185 17 44 n/a 159 n/aPasteurised milk*** n/a 145,979 113,462 72,709 48,746 36,099 28,537 27,002Non-alcoholic beverages*** n/a 10,706 2,243 n/a n/a n/a 412 401
MacedoniaSoft non-alcoholic drinks*** n/a n/a 952,856 n/a n/a 1,421,111 1,305,742 n/a
Note: * 2001-2004 in thous. l; 2005-2007 in t, ** in t, *** in hl, **** in thous. l Source: National Statistical Yearbooks 2002-2009.
Data of Fruit juices, Jam and Milk produced are shown for the Federation of B&H for all observable years.29 For Serbia, fruit and vegetable juices, jams and marmalades, margarine and hydrated vegetable fats and non-alcoholic beverages production data are included into analysis. Data for Serbia in the categories of fruit and vegetable juices, jams and marmalades, margarine and hydrated vegetable fats are given in tons, while data for non-alcoholic beverages are expressed in thousands of litres. In Montenegro, selected product data are fruit juices, refined oils,
29 Data of food production are not available for the Republic of Srpska and were not included into analysis.

FP7 KBBE 2007 1 53 GA 212579
FOCUS‐BALKANS DL 6.1 Consumer study implementation for products with health claims
pasteurized milk and non-alcoholic beverages, but data are not available for each selected year to be studied. Also, the production of soft non-alcoholic drinks for Macedonia is presented, with data available only for three years (2003, 2006 and 2007).
Import of selected products (dairy products and eggs, beverages and vegetable fats and oils) is shown in Table 14. The value of Dairy products and eggs and beverages import is higher than the value of import of products belonging to the vegetable fats and oils group in all analyzed countries in all observable years, except in Slovenia. Generally, the import increases in the observed period.
Table 15 Imports of selected products groups by countries and years
2000 2001 2002 2003 2004 2005 2006 2007 2008
Slovenia in thousands of EURDairy products and eggs 18,243 19,047 20,482 22,425 30,664 51,764 75,833 95,416 N/ABeverages 29,956 27,527 28,940 31,312 42,282 49,484 62,619 80,647 N/AVegetable fats and oils 25,378 29,340 35,266 31,698 29,076 34,447 39,758 44,193 N/A
Croatia in thousands of USDDairy products and eggs N/A N/A N/A N/A N/A N/A N/A N/A N/Beverages 74,853 90,213 116,667 122,992 129,974 138,534 174,183 N/AVegetable fats and oils 20,758 30,606 40,933 51,394 50,366 56,094 63,331 N/A
Federation of B&H in thousands of KMDairy products and eggs N/A N/A N/A N/A N/A 118,270 98,486 116,491 N/ABeverages N/A N/A N/A N/A N/A 134,192 158,127 182,314 N/AVegetable fats and oils N/A N/A N/A N/A N/A 54,341 40,839 45,378 N/A
Serbia in thousands of USDDairy products and eggs N/A N/A N/A N/A N/A 12,381 11,598 24,010 39,595Beverages N/A N/A N/A N/A N/A 29,937 60,885 77,411 90,131Vegetable fats and oils N/A N/A N/A N/A N/A 12,951 31,907 34,030 47,378
Montenegro in thousands of EURDairy products and eggs N/A N/A N/A N/A N/A N/A N/A N/A N/Beverages and tobacco N/A N/A N/A N/A N/A 39,645 34,580 41,201 60,223Animal and vegetable oils and fats N/A N/A N/A N/A N/A 9,892 9,890 9,484 9,698
A
A
Source: National Statistical Yearbooks 2002-2009.
Slovenia experienced a gradual growth of import of dairy products and eggs from 2000 to 2008 (Table 14). The value of import in euros was accelerating until 2005, and then started to slow down. The biggest annual growth of import of these products was recorded in 2005 (68.8%). The import of products in the beverages group was smaller in 2001 compared to 2000, but later on there was a gradual growth in the import of these products (15.2% a year on average). After the annual growth in 2001 and 2002, the import of Vegetable oils and fats products decreased in 2003 and 2004, but it started to grow again after 2004.
The value of import for Croatia is expressed in thousands of dollars. The import of Dairy products and eggs at the beginning of the observed period showed high annual growth. During 2004 and 2005, the import of these products slowed down, but in 2007 it was again high again (25.7%). The import of Vegetable fats and oils in Croatia increased (except in 2005). The higher growth rates at the beginning can be attributed to the lower starting base.

FP7 KBBE 2007 1 54 GA 212579
FOCUS‐BALKANS DL 6.1 Consumer study implementation for products with health claims
The import data for B&H are given in the local currency, and for Serbia in thousands of dollars. Both countries experienced significant changes of import in the observed period. After the dairy products and eggs in both countries, as well as vegetable fats and oils in B&H, fall in 2006, import started to increase. Although slowly, during observed the period the import of beverages in both countries grew.
In Montenegro the import of animal fats and oils expressed stay rather stable in all observed years, while the import of beverages increased (Table 15).
Since the above analyzed values are in different units, calculated trend shows not only the changes in exports but also changes in currency parity. Consequently, the analysis shown above can be used only to give sense of import development for each observed product groups, and it is not comparable between countries. In order to compare the levels of import in observed countries, the original data were converted into the same currency (euro). The average value in WBC was calculated for each products group and finally the absolute deviations from the average were determined. The results are shown in Figure 6.
Table 16 Imports of selected products groups by countries and years: annual average growth rates
2001 2002 2003 2004 2005 2006 2007 2008
Slovenia in %Dairy products and eggs 4.4 7.5 9.5 36.7 68.8 46.5 25.8 -Beverages -8.1 5.1 8.2 35.0 17.0 26.5 28.8 -Vegetable fats and oils 15.6 20.2 -10.1 -8.3 18.5 15.4 11.2 -
CroatiaDairy products and eggs - - - - - - - -Beverages - 20.5 29.3 5.4 5.7 6.6 25.7 -Vegetable fats and oils - 47.4 33.7 25.6 -2.0 11.4 12.9 -
Federation of B&HDairy products and eggs - - - - - -16.7 18.3 -Beverages - - - - - 17.8 15.3 -Vegetable fats and oils - - - - - -24.8 11.1 -
SerbiaDairy products and eggs - - - - - -6.3 107.0 64.9Beverages - - - - - 103.4 27.1 16.4Vegetable fats and oils - - - - - 146.4 6.7 39.2
MontenegroDairy products and eggs - - - - - - - -Beverages and tobacco - - - - - -12.8 19.1 46.2Animal and vegetable oils and fats - - - - - 0.0 -4.1 2.3
Source: National Statistical Yearbooks 2002-2009.
Figure 9 Imports of selected products groups in euros by countries (deviation from WBC average) 2005 and 2007
2 0 0 5
N / A
N / A
- 4 0 , 0 0 0 - 3 0 , 0 0 0 - 2 0 , 0 0 0 - 1 0 , 0 0 0 0 1 0 , 0 0 0 2 0 , 0 0 0 3 0 , 0 0 0 4 0 , 0 0 0 5 0 , 0 0 0 6 0 , 0 0 0
S l o v e n i a
C r o a t i a
F e d e r a t i o n o f B & H
S e r b i a
M o n t e n e g r o
D a i r y p r o d u c t s a n d e g g s B e v e r a g e s V e g e t a b l e fa t s a n d o i l s

FP7 KBBE 2007 1 55 GA 212579
FOCUS‐BALKANS DL 6.1 Consumer study implementation for products with health claims
2007
N/A
N/A
-50,000 -40,000 -30,000 -20,000 -10,000 0 10,000 20,000 30,000 40,000 50,000
Slovenia
Croatia
Federation of B&H
Serbia
Montenegro
Dairy products and eggs Beverages Vegetable fats and oils Analysis made by authors according to data available at national Statistical Yearbooks
2002-2009.
It can be concluded that import in Serbia and Montenegro is below the WBC average, while import in B&H, Croatia and Slovenia was above the average. However, Slovenian import of beverages was below average in 2005, but it was changed in 2007. In 2005, the highest positive deviation from average arises in Croatia and it refers to beverages (51.3 thousand euros), while the highest negative deviation is recorded in Serbia in the case of import of beverages (-33.3 millions of euros) and dairy products and eggs (-30.4 millions of euros). In 2007 in Croatia and Slovenia the import deviated in the greatest extent from the average in the beverages group (41.3 millions of euros) and dairy products and eggs (38.3 millions of euros), respectively, while the lowest import is noted in the case of beverages in Montenegro (-36 millions of euros) and of vegetable fats and oils in Serbia (-40.8 millions of euros) in comparison to the WBC average.
Table 17 Exports of selected products groups by countries and years
2000 2001 2002 2003 2004 2005 2006 2007 2008
Slovenia in thousands of EURDairy products and eggs 42,897 51,903 48,591 50,261 53,302 67,326 88,156 108,289 N/ABeverages 81,542 100,569 125,333 123,139 78,429 63,002 63,663 66,899 N/AVegetable fats and oils 3,153 4,563 7,281 4,044 2,188 3,586 3,005 7,955 N/A
Croatia in thousands of USDDairy products and eggs N/A N/A N/A N/A N/A N/A N/A N/ABeverages 121,439 133,649 162,805 191,016 192,608 195,008 224,218 N/AVegetable fats and oils 8,049 12,309 13,530 13,203 18,747 18,824 22,184 N/A
Federation of B&H in thousands of KMDairy products and eggs N/A N/A N/A N/A N/A 14,888 15,097 20,670 N/ABeverages N/A N/A N/A N/A N/A 12,636 14,352 16,245 N/AVegetable fats and oils N/A N/A N/A N/A N/A 76 1 64 N/A
Serbia in thousands of USDDairy products and eggs N/A N/A N/A N/A N/A 11,669 42,354 54,669 70,423Beverages N/A N/A N/A N/A N/A 51,049 99,913 146,642 204,906Vegetable fats and oils N/A N/A N/A N/A N/A 37,978 25,376 89,997 137,485
Montenegro in thousands of EURDairy products and eggs N/A N/A N/A N/A N/A N/A N/A N/ABeverages and tobacco N/A N/A N/A N/A N/A 46,690 32,264 38,504 54,982Animal and vegetable oils and fats N/A N/A N/A N/A N/A 236 245 376 74
N/A
N/A
Source: National Statistical Yearbooks 2002-2009.

FP7 KBBE 2007 1 56 GA 212579
Export of chosen categories of products expressed in different currencies for WBC is shown in Table 16. Values of export are higher for Dairy products and eggs and Beverages while it is lower for vegetable fats and oils in all WB countries. In Slovenia, the value of export is expressed in euros. The export of this country is characterized by a mild decrease of export of dairy products and eggs in 2002, followed by a period when the export of these products grew all the way up to the high rates recorded at the end of 2007 (Table 16). In the case of export of beverages, the situation is significantly different. The faster growth at the beginning was followed by a period of negative trends. At the end the export of beverages showed a slight increase, so the value of export at the end of the period is smaller than at the beginning. In the case of Vegetable fats and oils the export value varies during this period, with the noticeably higher nominal value in 2007 in comparison with previously recorded data.
Croatian Export is expressed in thousands of dollars. The data show that Croatia recorded the increase of beverage products export each year (Table 16). Although the annual change in the export of products from the vegetable fats and oils group varied, the export of these products in dollars increased in the observed period at the average rate of 18.4% annually, that is, the cumulative export value in dollars was 175.6% bigger in 2007 compared to 2001.
In Federation of B&H the export is expressed in the local currency, whereas the value of Serbian export is shown in dollars. B&H and Serbian export of dairy products and eggs as well as beverages increased over the time. High export growth was recorded in both groups in Serbia in 2006. Export of vegetable fats and oils in the Federation of B&H in 2005 and 2007 were on a similar level, whereas in 2006 it was significantly lower.
In Serbia, despite annual variations in the value of vegetable fats and oils export, in 2008 (the last available data) the export value was 100 million dollars higher than the one from 2005 (first available data for Serbia).
The value of Montenegrin export of beverages and tobacco in euros did not show big oscillations, whereas in 2008 the export of animal and vegetable oils and fats was significantly smaller compared with previous years (Table 16 and Table 17).
FOCUS‐BALKANS DL 6.1 Consumer study implementation for products with health claims

FP7 KBBE 2007 1 57 GA 212579
FOCUS‐BALKANS DL 6.1 Consumer study implementation for products with health claims
Table 18 Exports of selected products groups by countries and years: annual average growth rates
2001 2002 2003 2004 2005 2006 2007 2008
Slovenia in %Dairy products and eggs 21.0 -6.4 3.4 6.1 26.3 30.9 22.8 -Beverages 23.3 24.6 -1.8 -36.3 -19.7 1.0 5.1 -Vegetable fats and oils 44.7 59.6 -44.5 -45.9 63.9 -16.2 164.7 -
CroatiaDairy products and eggs - - - - - - - -Beverages - 10.1 21.8 17.3 0.8 1.2 15.0 -Vegetable fats and oils - 52.9 9.9 -2.4 42.0 0.4 17.8 -
Federation of B&HDairy products and eggs - - - - - 1.4 36.9Bevera
-ges - - - - - 13.6 13.2 -
Vegetable fats and oils - - - - - -98.7 6,300.0 -Serbia
Dairy products and eggs - - - - - 263.0 29.1Bevera
28.8ges - - - - - 95.7 46.8
Ve39.7
getable fats and oils - - - - - -33.2 254.7Montenegro
Dair
52.8
y products and eggs - - - - - - - -Beverages and tobacco - - - - - -30.9 19.3Animal and vegetable oils and fats - - - - - 3.8 53.5 -
42.880.3
Source: National Statistical Yearbooks 2002-2009.
As we mentioned above, currencies have a significant impact on trends. To avoid that problem, it is important and very useful to recalculate given values into the same currency, as it was done in the case of imports. After converting previous export values into euros, we were able to show the deviation from average export for every observed product group. In the Dairy products and eggs group, positive variation in both observed years compared to the average was recorded in Slovenia only, whereas the export of these products in Serbia and the Federation of B&H was below average30.
30 Average for Dairy products and eggs was calculated as a mean value of export for three countries only: Slovenia, Serbia and the Federation of B&H, since the data for other two countries were not available. The average for the remaining two groups of products was calculated as a mean value of export of all five countries.

FP7 KBBE 2007 1 58 GA 212579
FOCUS‐BALKANS DL 6.1 Consumer study implementation for products with health claims
Figure 10 Exports of selected products groups in euros by countries (deviation from WBC average) 2005 and 2007
2005
N/A
N/A
-80,000 -60,000 -40,000 -20,000 0 20,000 40,000 60,000 80,000 100,000 120,000
Slovenia
Croatia
Federation of B&H
Serbia
Montenegro
Dairy products and eggs Beverages Vegetable fats and oils 2007
N/A
N/A
-80,000 -60,000 -40,000 -20,000 0 20,000 40,000 60,000 80,000 100,000
Slovenia
Croatia
Federation of B&H
Serbia
Montenegro
Dairy products and eggs Beverages Vegetable fats and oils
Analysis made by authors according to data available at national Statistical Yearbooks 2002-2009
Beverages export was above average only in Croatia in 2005 (as much as 100 million euros above the average) and in Serbia and Croatia in 2007, while in other countries it was below average. Export of products from the vegetable fats and oils group was above the average only in Serbia and Croatia in 2005, whereas in 2007 Serbia was the only country which had larger than average export of these products (44.1 million euros above the WBCs’ average).
b. Data for studied categories
The insight in the studied categories importance on WBC food market is given by retail/off trade value analysis (Table 18). Data for each country were given in the national currencies. Listed data cover drinking milk products (milk, yoghurt and sour milk drinks with available data of pro/pre biotic drinking and spoon able yoghurt), margarine, jams and preserves, as well as fruit/vegetable juice.

FP7 KBBE 2007 1 59 GA 212579
FOCUS‐BALKANS DL 6.1 Consumer study implementation for products with health claims
Table 19 Retail/off-trade Value for studied categories
2004 2005 2006 2007 2008 2009 2004 2005 2006 2007 2008 2009
Bosnia‐Herzegovina1) Montenegro2)
Drinking milk products 128.6 132.9 141.3 160.8 190.9 189.3 2.9 3.1 3.3 3.8 4.4 4.1
Milk 123.8 127.8 135.8 154.7 182.7 180.8 2.4 2.5 2.7 3.2 3.6 3.3
Yoghurt and sour milk drinks 49.8 56.2 60.4 71.3 80.8 83.1 7.3 7.6 7.9 9 10.1 9.2
Pro/Pre Biotic drinking yoghurt 2.5 3 3.7 3.9 5.3 5.9 0 0 0 0 0 0
Pro/Pre Biotic spoonable yoghurt ‐ ‐ ‐ ‐ ‐ ‐ 0.3 0.3 0.3 0.4 0.5 0.5
Margarine 4.3 4.3 4.6 4.8 5.6 5.5 0.2 0.2 0.2 0.3 0.3 0.3
Jams and preserves 15 15.9 15.9 18.6 21.5 23 0.3 0.3 0.3 0.4 0.4 0.4
Fruit/vegetable juice 90.6 93.4 100.3 110.1 113.1 122.6 0.4 0.4 0.4 0.4 0.4 N/A01
Croatia3) Serbia4)
Drinking milk products 2068.2 2095.2 2113.6 2139.9 2147.7 2066.2 13.3 15.9 18.2 20.2 23.4 23.8
Milk 1969.3 1994.2 2006.8 2032.1 2032 1951.5 12.1 14.4 16.4 18 20.9 21.2
Yoghurt and sour milk drinks 921.9 946.5 955.3 984.1 1005.1 974.7 3.4 4.5 5.2 5.8 6.8 7.1
Pro/Pre Biotic drinking yoghurt 111.2 115.1 116.9 119.2 123.1 120.9 ‐ ‐ ‐ ‐ ‐ ‐
Pro/Pre Biotic spoonable yoghurt 44.5 44.7 47.2 51.5 48.6 46.1 ‐ ‐ ‐ ‐ ‐ ‐
Margarine 152.7 150.9 150.5 152.1 148.7 142.2 0.2 0.3 0.4 0.4 0.4 0.4
Jams and preserves 224.3 242.1 248 252.9 258.4 243.2 1.5 1.7 2 2.3 2.8 3
Fruit/vegetable juice 447.7 513.2 579.5 631 681.4 738.4 2.7 6.7 7.6 11.3 12.6 14.3
Macedonia5) Slovenia6)
Drinking milk products 3.2 3.3 3.4 3.6 4.5 4.7 85.6 82.8 77.7 87.7 96.9 95.2
Milk 3.1 3.2 3.3 3.5 4.4 4.5 79.3 76.2 71.4 81.3 89.8 87.7
Yoghurt and sour milk drinks 1.3 1.4 1.4 1.5 1.9 2.1 50.5 51.4 58.2 71.8 84.2 86.2
Pro/Pre Biotic drinking yoghurt 0 0 0 0 0.1 0.1 2.9 4.4 7.3 12 15.5 1
Pro/Pre Biotic spoonable yoghurt 0 0 0 0.1 0.1 0.1 5.7 5.9 6.5 7.2 8.3 8.3
Margarine 0.1 0.1 0.1 0.1 0.1 0.1 6.6 6.7 6.7 7.1 8.1 8.2
Jams and preserves 0.1 0.1 0.1 0.1 0.1 0.1 6.1 5.8 5.7 5.6 5.8 5.7
Fruit/vegetable juice 1 1 1.1 1.1 1.1 1.2 44.5 46.5 47.9 50.3 60.3 63
6.9
Note: 1) KM mn, 2) HRK mn, 3) MKD bn, 4) $ US mn, 5) RSD bn, 6) EUR mn Source: Datamonitor 2009.
Development of health claims market could be only observed for the yoghurt with pre/pro biotic31 (table 19). Slovenian market is continually growing. However, data for Bosnia and Herzegovina, Macedonia and Montenegro suggest that WBC yoghurt with pre/probiotic market is generally new market with significantly high growth rates.
31 Data for Serbia are not available.

FP7 KBBE 2007 1 60 GA 212579
Table 20 Development of Pro/Pre biotic yoghurt market (annual growth rate, %)
2005 2006 2007 2008Eastern Europe 35.07 33.41 51.71 28.59Western Europe 15.91 11.43 20.46 12.26Bosnia‐Herzegovina 20.00 23.33 5.41 35.90Croatia 2.63 2.69 4.02 0.59Macedonia ... ... ... 100.00Montenegro 0.00 0.00 33.33 25.00Slovenia 19.77 33.98 39.13 23.96 Source: Analysis made by authors according to Datamonitor 2009.
Figure 11 Share of Pro/Pre Biotic drinking and spoonable yoghurt categories in family of product - yoghurt
0
5
10
15
20
25
30
35
1 2 3 4 5 6
%
Eastern Europe Western Europe Bosnia-HerzegovinaCroatia Macedonia MontenegroSlovenia
Source: Analysis made by authors according to Datamonitor 2009.
Previously mentioned conclusion is also confirmed by analysis of share of pro/pre biotic drinking and spoonable yoghurts in the family of products – yoghurt, for observable countries and regions. Similar to Eastern Europe in Montenegro, Bosnia and Herzegovina and Macedonia share of yoghurt with health claim in total family of products is lower (5-10%). The market share of studied category in Croatia is stable (around 16%) during observed period, while Slovenian market starting from 2006 noted even higher share of yoghurt in the total family of products in comparison with the Western Europe average. However, this information is in the line also with findings in this report referring probiotic yoghurt - the most advanced is Slovenian market.
FOCUS‐BALKANS DL 6.1 Consumer study implementation for products with health claims

FP7 KBBE 2007 1 61 GA 212579
2.2.WBC N&H PRODUCTS SURVEY 2.2.1.INTRODUCTION
There are 475 N&H products in all six WBC covered by shopcheck survey, of which the largest number is surveyed in Serbia (166) and in Macedonia (141), while their smallest number is in Montenegro (52). More than three forth of all N&H products are surveyed in hypermarkets and the rest is surveyed in specialized stores. N&H products are classified into five relevant groups: milk and yogurt, margarine, juices, general food and dietetic food (Figure 12).
Figure 12 WBC: brand structure by N&H product groups
25,9%
7,2%
22,4%14,1%
30,4%
Milk and yogurt MargarineFruit juice General foodDietetic food
Source of data: IPSOS Strategic Puls.
Regarding their origin, it seems that WBC market is more concentrated on its own products than the outside that region. Namely, 65.3% of total N&H products come from WBC producers, while 33.9% of them have the EU origin and the rest of 0.8% are from the other countries (Table 20).
FOCUS‐BALKANS DL 6.1 Consumer study implementation for products with health claims

FP7 KBBE 2007 1 62 GA 212579
Table 21 Structure of N&H products by origin
Origin Number of products %
WBC origin 310 65.3 Serbia 114 24.0 Slovenia 44 9.3 Croatia 60 12.6 Macedonia 58 12.2 Montenegro 4 0.8 BIH 30 6.3 EU origin 161 33.9 Other countries 4 0.8 Total 475 100.0
Source of data: IPSOS Strategic Puls.
However, when the origin of brands and manufacturers are observed, significant differences appear among WB countries. While Serbia has the largest share of domestic brands and manufacturers, other WB countries are more concentrated on foreign brands and manufacturers. For instance, Slovenia and Croatia have the largest number of EU brands followed by domestic brands (totally, about 90% of all brands and producers). On the other hand, brands and manufacturers from other WBC are dominant in Macedonia, Montenegro and Bosnia and Herzegovina (see Figure 13).
Figure 13 Structure of brands of N&H products in WBC by origin
Serbia
Domestic56%
Other WBC17%
Other1%
EU & Swiss26%
Slovenia
Domestic44.2%
EU & Swiss48.1%
Other WBC7.8%
FOCUS‐BALKANS DL 6.1 Consumer study implementation for products with health claims

FP7 KBBE 2007 1 63 GA 212579
FOCUS‐BALKANS DL 6.1 Consumer study implementation for products with health claims
Croatia
Domestic33%
EU & Swiss57%
Other WBC8%
Other2%
Macedonia
Domestic19%
Other2%
EU & Swiss34%
Other WBC45%
Montenegro
EU & Swiss28.2%
Domestic7.7%
Other WBC64.1%
Bosnia and Herzegovina
Other WBC44.6%
Domestic21.6%
EU & Swiss32.4%
Source of data: IPSOS Strategic Puls.
2.2.2.N&H claims
The number of nutrition claims on the WBC market varies depending on product origin. While WBC products have up to seven claims, products from the EU market have maximum four claims.32 The largest number of products (more than 70%) has up to two claims no matter their origin is. The most frequent are products with content of nutrient or other substance, low fat, source of vitamins and /or minerals and sugar free. Those four claims make a half of all N&H claims on the WBC market. More precise N&H claim structure is presented in the next part of analysis done by particular studied categories. Approximately 20% of all products on the WBC market have health claim. Most of health claim products are of general type (58%) and functional health claim (38%) while the risk-disease claims are not significant (4%). Additionally, the share of organic products is 10%, while the share of dietetic products is about 5% of all N&H products on the WBC market.
32 Products from Switzerland in group of juices have nine claims.

FP7 KBBE 2007 1 64 GA 212579
2.2.3.Studied categories overview for WBC
a.Studied category I: Milk
i.Product origin, producers and brands
The first studied category is milk covering total number of 52 products in all WBC, of which the largest number is registered in Serbia and its smallest number in Montenegro. Almost all products in this studied category (98%) are surveyed in hypermarkets. This information is also confirmed by interviews with diary producers in all WBC, since specialized retail chains are not supplied with adequate cooling devices/equipment.
With respect to product origin, some differences could be identified across WBC. Apart from domestic products (61%), Serbia imports products in the observed category from: Croatia, Bosnia and Herzegovina (30%) and from the EU (9%). On the opposite side, Slovenia and Croatia are concentrated on their own products and EU products, while products from other WBC countries are not present on their markets. Slovenia is focused on its own products (82%) and the EU products in milk category, while Croatia, beside domestic production (78%), imports products from Slovenia and the EU. Macedonian market of milk mostly consists of products from other WBC (89%) and the rest of the market is covered by domestic products. Similar structure is on the markets of Montenegro and Bosnia and Herzegovina.
Figure 14 Structure of manufacturers in WBC by number of brands - Studied category: milk -
0
2
4
6
8
10
12
1 2 3 4
WBCEU
Number of brands
Number of producers
Source of data: IPSOS Strategic Puls.
The results of survey indicate 29 brands and 21 manufacturers of milk category on the WBC market. Origin of brands is as follows: 82.8% are of the WBC origin and 17.2% refers to the EU brands. Similar to previous is the structure of manufacturers: 76.2% are originated from WBC producers and 23.8% are EU producers. The largest number of brands in Serbia, Slovenia and Croatia are of domestic origin, while other WBC brands are the most present on Macedonian and Montenegrin market. Most of WBC producers have one brand, whereas the maximal number of brands per WBC producer is four. On the other side, EU producers have only one brand (see Figure 14).
FOCUS‐BALKANS DL 6.1 Consumer study implementation for products with health claims

FP7 KBBE 2007 1 65 GA 212579
ii.Prices
This product category is labelled both with nutritional and health claims. This enables us to calculate average price in the category, supported by separate analysis of average price of milk with health claims. As the prices per litre were available in each category dominantly, from the methodological point of view the prices were calculated only for this weight. The average price was calculated for WBC market as the whole and then compared with average price of this category in each country in the region. The lowest price of milk both with nutrition and health claim was recorded in Serbia, while the highest prices are present at Slovenian market. General conclusion is that prices of this category are lower in B&H and Macedonia compared to the WBC average, while they are higher in Croatia.
iii.N&H claims
The number of nutrition claims in milk category depends on the origin of product. In case of WBC products, number of claims varies from one to five, whereas products from the EU market have maximum three claims (Figure 15). The largest number of products has one claim whatever their origin is.
Figure 1515 Structure of products in WBC by number of N&H claims - Studied category: milk -
0
2
4
6
8
10
12
14
16
18
20
1 2 3 4 5
WBC productsEU products
Number of N&H claims
Number of products
Source of data: IPSOS Strategic Puls.
The most of products with nutrition claims in milk category are with low fat, products which contain nutrient or other substance and products with claim source of vitamins and/or minerals. Those claims make more than 70% of all N&H claims. Beside above mentioned claims, producers in this studied category use following claims: enriched with vitamines and minerals, high content of vitamins and/or minerals, increased nutrient, low energy, fat-free and source of fibre.
Among all products of this studied category, 17 of them (around 1/3) have health claim. These products are present in five WBC, except Montenegro. Most of those products are of the WBC origin. More than half of products with health claim present
FOCUS‐BALKANS DL 6.1 Consumer study implementation for products with health claims

FP7 KBBE 2007 1 66 GA 212579
FOCUS‐BALKANS DL 6.1 Consumer study implementation for products with health claims
on the WBC market are of the functional claim type (55%) and no one is with risk-disease claim. In addition to this, there is no any dietetic product in milk category, contrary to organic claim milk products which exist on the same market.
Health claims in milk category:
• Tolerance on lactose is decreasing during the life • Increases the resistance of the organism • Sterilized and homogenized partially skimmed milk with added dietary fiber
which positive effect on strengthening bones • Low fat content, reduce the level of cholesterol • Sterilized, homogenized partially skimmed milk with 1.5% fat, without GMO • Life freshness for children and pregnant women as well as more Ca for your
body • For healthy hart and blood vessels • Digestible for people with health problems • With added coenzyme Q10, increasing immunity. • With natural vegetable fiber, for cholesterol lowering and for people with
disrupted health. • 1.5% fat enriched OMEGA 3 fatty acids 23mg on 100g, Protect heart and
veins, lowering cholesterol and blood pressure.
The product category labels also refers to the additional information such as following ″it is good to know that 55% of people living in the region of Balkans are intolerance on lactose which make problems in digestive process. This milk is easy to digest giving you chance to enjoy in milk without any problems″ or ″Source of vitamins A, E, folic acid, B complex and calcium - for regular growth and development of children and young population, for pregnant and mothers, as well as for active in sports″. Full comment on different food contents function toward health is usually given on the back package label under the question DID YOU KNOW. The form of package might also include some additional association on the healthy lifestyle such as figure of the body on the move, hart or happy woman. Claims also include special statements made for children as target consumer group like ″for proper development of your child, full with vitamins″.
b.Studied category II: Yogurt33
i.Product origin, producers and brands
Studied category yogurt covers 62 products in all WBC. The largest number of observed products is registered in Serbia, while their smallest number is in Croatia. All products of the observed study category are surveyed in hypermarkets since, like in milk category case, specialized retail chains are not supplied with adequate cooling devices/equipment.
33 The studied category contains kefir as a specific item registered in shopcheck.

FP7 KBBE 2007 1 67 GA 212579
Regarding origin of yogurt, differences among WBC are similar to those identified in category milk. Namely, Serbian market of the studied category contains 85% of domestic products, while 15% of the products are imported from foreign countries: Croatia and new EU member states. As in the case of milk category, domestic products are dominant on the Slovenian and Croatian markets and products from other WBC countries are not present on these markets. Beside its own products, Slovenia imports from the EU and Croatia, while Croatia imports only from the EU.
The largest part of Macedonian market of yogurt contains products which come from all five other WBC (76%), while domestic products cover 18% of the whole market and the rest is from the EU. WBC products are dominant on the Montenegrin market, while market of Bosnia and Herzegovina, beside other WBC products contains products from new EU member states.
Survey analysis of the whole WBC market implicates 43 different brands produced by totally 28 manufacturers of yogurt. Approximately 86% of all brands are of the WBC origin and the rest refers to the EU brands. The structure of yogurt manufacturers is as follows: 93% are WBC producers and only 7% are the EU producers. The largest number of brands in Serbia, Slovenia, Bosnia and Herzegovina and Croatia are of domestic origin, while the largest share of other WBC brands appears on Macedonian and Montenegrin market. Most of yogurt producers have one brand (75%), while the average number of brands per producer is two. The WBC producers have up to five brands, whereas the EU producers have one or four brands (see Figure 16).
FOCUS‐BALKANS DL 6.1 Consumer study implementation for products with health claims

FP7 KBBE 2007 1 68 GA 212579
Figure 16
Figure 16 Structure of manufacturers in WBC by number of brands - Studied category: yogurt -
02468
101214161820
1 2 3 4 5
WBCEU
Number of producers
Number of brands
Source of data: IPSOS Strategic Puls. ii.Prices
This product category is also labelled both with nutritional and health claims, so that price in category is calculated, supported by separate analysis of average price of yogurt with health claims. As the different weights per package are present, the prices were recalculated and measured in median weight of the category. The average price for each country is calculated and compared with the average price for whole WBC market. The lowest price in yoghurt with nutrition claim was recorded both in B&H and Macedonia, while the lowest price of products with health claims was present at Serbian market. Prices in Slovenia and Croatia are higher in comparison to the WBC average both for yoghurt with nutritional and yoghurt with health claim.
iii.N&H claims
With exception of two producers with six claims, N&H producers on the WBC market have up to four claims. The average number of claims per producer is two and the most of products from WBC producers have two claims, as well. In case of EU producers present on the WBC market, the largest number of their products has one claim (Figure 17).
FOCUS‐BALKANS DL 6.1 Consumer study implementation for products with health claims

FP7 KBBE 2007 1 69 GA 212579
Figure 17 Structure of products in WBC by number of N&H claims - Studied category: yogurt -
02468
101214161820
1 2 3 4 5 6
WBCEU
Number of products
Number of N&H claims
Source of data: IPSOS Strategic Puls.
Similar to the first studied category, the most of products with nutrition claims in yogurt category have claims: contain nutrient or other substance, with low fat and light products. Those claims make almost 90% of all N&H claims. Apart from mentioned claims, producers in this studied category also use following claims: fat free, with no added sugars, high fibre, source of vitamins and/or minerals and natural.
Health claims in yoghurt category:
• For strong immunity, it recovers intestinal flora, it reduces risk of osteoporosis • Low content of fat, "protect health ", fibrin for strong bones. • Yogurt with BioActiv LGG - Nutritive valuable milk product with probiotic LGG
influence on health by improving your immunity • For better immunology system of younger population/children • Protects health without fat, probiotic yogurt • Natural regulation of metabolism. • Naturally regulates digestion. • For regular and balanced digestion. • Supports digestion and therefore metabolism of whole body. • Activate influence on digestive process, fastening metabolism. • Allows you to feel and look good thanks to the synergy effect and coenzyme Q10
and L-Carnitine, which naturally turns fat into energy. • Strengthen nature power of resistance. • Centenarians’ beverage for good health and long life. • Lowers cholesterol in the natural way. • Healthy food for activity and immunity straitening.
FOCUS‐BALKANS DL 6.1 Consumer study implementation for products with health claims

FP7 KBBE 2007 1 70 GA 212579
There are 32% of products with health claims and they are present in all six WBC. The most of those products are of the WBC origin. Approximately one half of products with health claim present on the WBC market are with general claim type, while only a few products with health claim are of risk-disease claim type. In this study category, there are also several dietetic products both present on the market of Bosnia and Herzegovina. Additionally, some organic products in the studied category are identified on Slovenian and Macedonian markets and are of Slovenian origin.
Health claims in yoghurt category are of general type in most cases. “Improves your immunity” or “Supports digestions” are these kinds of claims. A few claims are functional – for example, with fibrin for strong bones, recovers intestinal flora and reduce risk of osteoporosis. However, there are the claims that suggest that yoghurt (probably kefir) is centenarians’ beverage for good health and long life. Visual presentation of product includes using of an ideal female figure, sign of urgent medical help, arrows around the waist etc.
c.Studied category III: Margarine
i.Product origin, producers and brands
Margarine category contains 29 products on the whole WBC market, with their largest number in Macedonia and the smallest number in Montenegro. All of mentioned products are surveyed only in hypermarkets for the same reason as in the case of milk and yogurt categories.
Observing by origin shows that all Serbian market of margarine consists of domestic products, while on the other side, markets of Bosnia and Herzegovina, Montenegro and Slovenia do not contain domestic products in this category. Bosnia and Herzegovina imports margarine from Serbia, Croatia and the EU. Montenegro imports margarine only from Serbia, whereas Slovenia imports from Croatia as well as from the EU countries. Beside their own products, Croatia imports products only from the EU, but Macedonia imports from Serbia and the EU.
FOCUS‐BALKANS DL 6.1 Consumer study implementation for products with health claims

FP7 KBBE 2007 1 71 GA 212579
Figure 18 Structure of manufacturers in WBC by number of brands - Studied category: margarine -
0
1
2
3
4
5
6
1 2 3
WBCEU
Number of producers
Number of brands
Source of data: IPSOS Strategic Puls.
The whole WBC market of margarine contains 19 brands produced by 12 manufacturers. The origin structures of brands and manufacturers are rather unified: about one half of brands and manufacturers are of WBC origin and the rest are EU brands and producers. Regarding structure of brands by countries, it could be said that, apart from Serbia with only domestic brands, the largest number of brands in Slovenia and Croatia are of the EU origin. Bosnia and Herzegovina have the same number of the EU and other WBC brands in margarine category. Most of margarine producers have one brand (60%), while the average number of brands per producer is two. The WBC producers have up to three brands, while the EU producers present on the WBC market have one or three brands (Figure 18).
ii.Prices
In margarine category also labelled both with low fat (nutritional) and health claim, the average price of the category was calculated. Additionally, the analysis is supported with data about average product with health claim price. Packages were mostly in 500 grams. The average price for each country is calculated and compared with the average price for whole WBC market. Higher prices for both claims categories in margarine was recorded in Slovenia, while other regional markets offer was with lower prices in comparison to WBC average. It might be commented in the context of better quality products presence in EU member state in this category.
iii.N&H claims
N&H producers on the WBC market have up to five claims, and their average number per producer is two. The majority of products from WBC producers are with two claims, whereas the largest number of the EU products present on the WBC market has one claim (Figure 19).
FOCUS‐BALKANS DL 6.1 Consumer study implementation for products with health claims
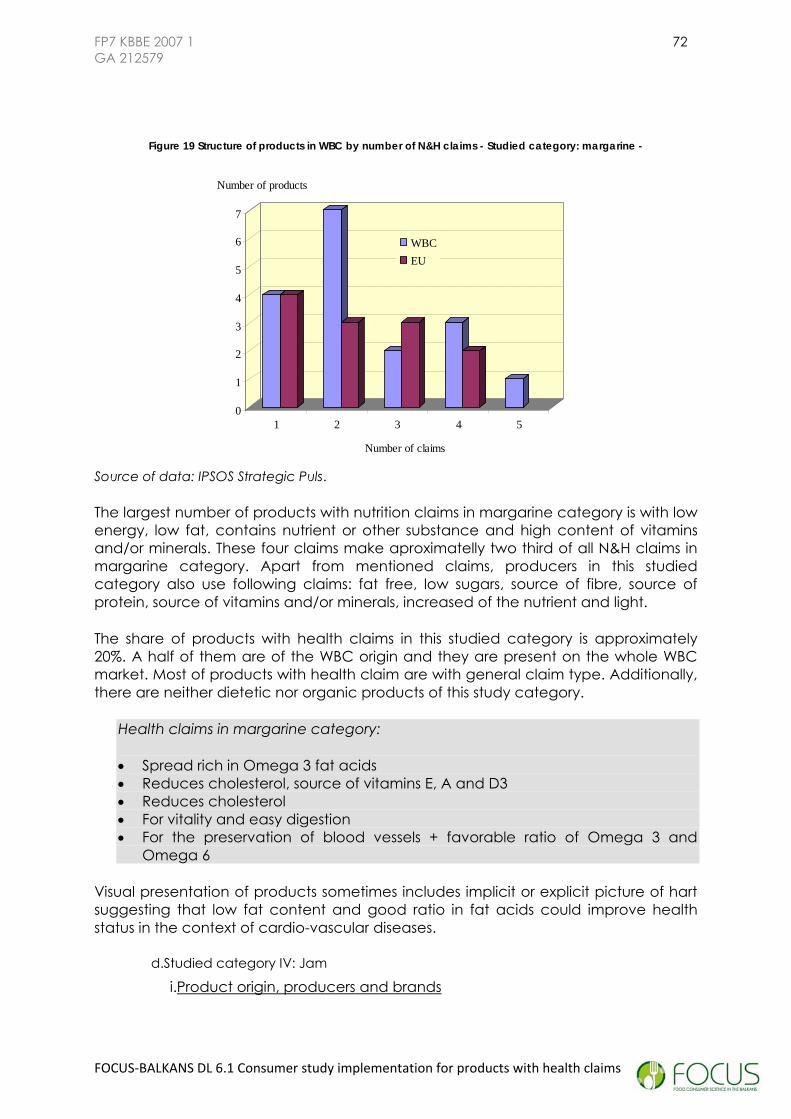
FP7 KBBE 2007 1 72 GA 212579
Figure 19 Structure of products in WBC by number of N&H claims - Studied category: margarine -
0
1
2
3
4
5
6
7
1 2 3 4 5
WBCEU
Number of products
Number of claims
Source of data: IPSOS Strategic Puls.
The largest number of products with nutrition claims in margarine category is with low energy, low fat, contains nutrient or other substance and high content of vitamins and/or minerals. These four claims make aproximatelly two third of all N&H claims in margarine category. Apart from mentioned claims, producers in this studied category also use following claims: fat free, low sugars, source of fibre, source of protein, source of vitamins and/or minerals, increased of the nutrient and light.
The share of products with health claims in this studied category is approximately 20%. A half of them are of the WBC origin and they are present on the whole WBC market. Most of products with health claim are with general claim type. Additionally, there are neither dietetic nor organic products of this study category.
Health claims in margarine category:
• Spread rich in Omega 3 fat acids • Reduces cholesterol, source of vitamins E, A and D3 • Reduces cholesterol • For vitality and easy digestion • For the preservation of blood vessels + favorable ratio of Omega 3 and
Omega 6
Visual presentation of products sometimes includes implicit or explicit picture of hart suggesting that low fat content and good ratio in fat acids could improve health status in the context of cardio-vascular diseases.
d.Studied category IV: Jam
i.Product origin, producers and brands
FOCUS‐BALKANS DL 6.1 Consumer study implementation for products with health claims

FP7 KBBE 2007 1 73 GA 212579
This studied category covers 29 products on the WBC market, mostly surveyed in the hypermarkets (77%). The largest number of jam products is surveyed in Croatia while their smallest number is in Macedonia and Montenegro. As origin is concerned, it could be stated that about one half of products of studied category are produced in WBC. Observing by countries indicates that Serbian market of jam contains equal share of domestic and foreign products, Macedonian market is more concentrated on its own products, while the major part of Slovenian and Croatian products refers to the EU origin. According to the origin of observed product category, Bosnia and Herzegovina and Montenegro import more than they produce their own products.
There are 22 brands on the WBC market produced by 19 producers of jam category. Regarding brand origin, it appears that almost 60% of brands come from WBC producers and the rest comes from foreigners. The conclusion is different as far the origin of producers is concerned. Namely, there are about 40% of WBC producers of jam, which could implicate the WBC producers of jam category intent to have more brands than the EU producers. This could also be confirmed by the analysis of producer structure by number of brands (Figure 20).
Figure 20 Structure of manufacturers in WBC by number of N&H brands - Studied category: jam -
0
2
4
6
8
10
1 2 3
WBC EU
Number of producers
Number of brands
Source of data: IPSOS Strategic Puls.
Although the average number of brands per producer is almost the same in case of WBC and the EU producers, shopcheck data indicate that WBC producers have up to three brands, whereas all EU producers present on WBC market have only one brand. Observing by countries, it could be stated that domestic brands are more important in Serbia, whereas the EU brands are of greater importance in Slovenia and Croatia. While Bosnia and Herzegovina has the same number of the EU and other WBC brands, Macedonia does not have EU brands and Montenegro does not have domestic brands in jam category.
ii.Prices
As the different packages are present, from the methodological point of view the prices were corrected to the median weight in the category. The average price was
FOCUS‐BALKANS DL 6.1 Consumer study implementation for products with health claims

FP7 KBBE 2007 1 74 GA 212579
calculated for the whole WBC market of the studied category. Each country average price of jam is measured relatively as deviation from the WBC average price. The lowest price in this category was recorded in Macedonia. Price level of jam is lower in B&H, while in Slovenia, Serbia, Croatia and Montenegro is higher in comparison to the WBC average price in this category of product.
iii.N&H claims
According to number of N&H claims some difference could be identified between WBC and EU producers of jam: WBC producers have up to five claims, but producers from the EU have maximum two claims. The largest number of products from WBC and the EU producers are with two claims (Figure 21). Regarding claim type, most of products in this studied category are of the following types: low energy, with no added sugars and content of nutrient or other substance. Their total share in jam category is about 60%. Beside mentioned claims, producers in jam category also use following claims: energy-reduced, low sugars, high fibre, source of vitamins and /or minerals, high contents of vitamins and / or minerals and light.
Figure 21 Structure of products in WBC by number of N&H claims- Studied category: jam -
0
1
2
3
4
5
6
7
8
1 2 3 4 5
WBC EU
Number of products
Number of claims
Source of data: IPSOS Strategic Puls.
The share of products with health claims in jam category is about 14% and they are present only on Croatian and Macedonian markets. Most of products with health claim are of general claim type. Among all products of jam category, about 45% are dietetic products, while approximately 10% are organic products.
Health claims in jam category:
• Decrease sugar level in blood • Increase organism resistance • 30% calories, without preservatives, increase organism resistance
FOCUS‐BALKANS DL 6.1 Consumer study implementation for products with health claims

FP7 KBBE 2007 1 75 GA 212579
Majority of claims refer to the nutritional or special – dietary/dietetic claims. If the product is appropriate for special nutrition – diet of people suffering from diabetes, it is clearly stated on the product along with suggestion such as recommended to diabetics or suitable for diabetics in consultation with doctor. Claims that suggest this product suitability for all ages and produced with traditional recipes are present, too.
e.Studied category V: Juice
i.Product origin, producers and brands
Category of juices contains 100 products, of which the largest number is surveyed in Macedonia and Bosnia and Herzegovina and the smallest one in Montenegro. Almost 80% of all products are surveyed in hypermarkets. Analysis of product origin indicates there are about 75% of products produced in WBC. Additionally, there is different origin structure across WBC: domestic products are dominant on Serbian and Croatian markets, while the largest number of other WBC products is present on markets of Bosnia and Herzegovina and Montenegro. Apart from its own products, Slovenian market is concentrated only on the EU countries, whereas other five WBC countries import both from the EU and other WBC. Beside the EU and WBC products, Serbia also imports fruit juices from Korea, while Macedonia and Croatia imports from Thailand, and Bosnia and Herzegovina imports from Indonesia. On the other side, Montenegro does not produce its own products in juice category, but imports from Austria and WBC (Macedonia, Serbia, Slovenia and Croatia).
Figure 22 Structure of manufacturers in WBC by number of N&H brands - Studied category: juice-
0
5
10
15
20
25
30
1 2 3 4
WBC EU
Number of producers
Number of brands
Source of data: IPSOS Strategic Puls.
There are 49 brands and 29 manufacturers on the WBC market of fruit juices. The origin structure of brands and manufacturers is similar: about three fourth of brands and producers come from WBC. Slovenia, Serbia and Croatia have the largest number of domestic brands, while the majority of brands in Bosnia and Herzegovina and Montenegro are of the other WBC origin. Macedonia has the same number of
FOCUS‐BALKANS DL 6.1 Consumer study implementation for products with health claims
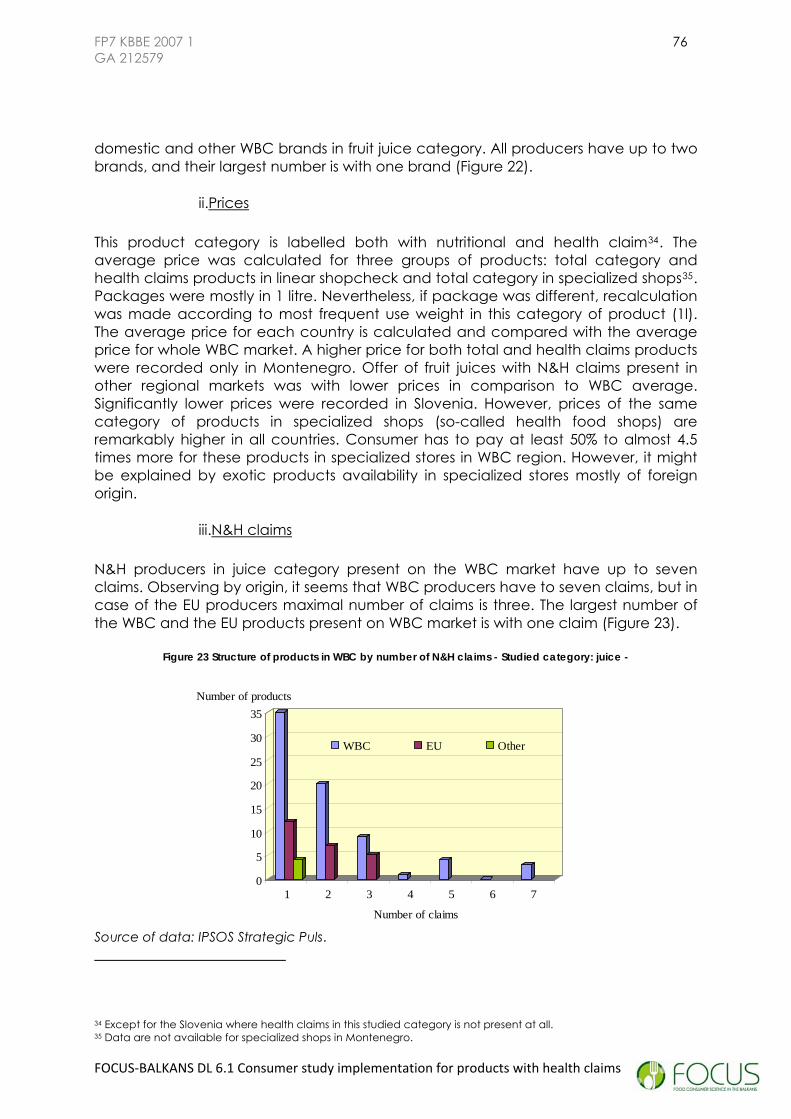
FP7 KBBE 2007 1 76 GA 212579
FOCUS‐BALKANS DL 6.1 Consumer study implementation for products with health claims
domestic and other WBC brands in fruit juice category. All producers have up to two brands, and their largest number is with one brand (Figure 22).
ii.Prices
This product category is labelled both with nutritional and health claim34. The average price was calculated for three groups of products: total category and health claims products in linear shopcheck and total category in specialized shops35. Packages were mostly in 1 litre. Nevertheless, if package was different, recalculation was made according to most frequent use weight in this category of product (1l). The average price for each country is calculated and compared with the average price for whole WBC market. A higher price for both total and health claims products were recorded only in Montenegro. Offer of fruit juices with N&H claims present in other regional markets was with lower prices in comparison to WBC average. Significantly lower prices were recorded in Slovenia. However, prices of the same category of products in specialized shops (so-called health food shops) are remarkably higher in all countries. Consumer has to pay at least 50% to almost 4.5 times more for these products in specialized stores in WBC region. However, it might be explained by exotic products availability in specialized stores mostly of foreign origin.
iii.N&H claims
N&H producers in juice category present on the WBC market have up to seven claims. Observing by origin, it seems that WBC producers have to seven claims, but in case of the EU producers maximal number of claims is three. The largest number of the WBC and the EU products present on WBC market is with one claim (Figure 23).
Figure 23 Structure of products in WBC by number of N&H claims - Studied category: juice -
0
5
10
15
20
25
30
35
1 2 3 4 5 6 7
WBC EU Other
Number of products
Number of claims Source of data: IPSOS Strategic Puls.
34 Except for the Slovenia where health claims in this studied category is not present at all. 35 Data are not available for specialized shops in Montenegro.

FP7 KBBE 2007 1 77 GA 212579
Most of products in juice category are natural, sugars-free, with source of vitamins and/or minerals, with no added sugars, contain nutrient or other substance and with low energy. The share of mentioned claim types in about 83%. Beside them, there also are products with the following claim types: energy-reduced, source of fibre, enriched with vitamins and minerals, high content of vitamins and/or minerals.
Only 8% of products in juices category are with health claims, mostly of general claim type. The origin of those products is Serbian, Croatian and the EU, and they are present in all five WBC, except Montenegro. In this studied category, there are a few of dietetic products present in Slovenia, Bosnia and Herzegovina, and Macedonia (product origin: the EU and Bosnia and Herzegovina). In addition, some organic products are of Serbian, Macedonian, Croatian and Korean origin, and they exist on four WBC markets (except Slovenia and Bosnia and Herzegovina).
Health claims in juices category:
• For healthy skin, good vision and moist mucous membranes • Improves digestion, useful for health, with a natural sugar • For stress relaxation • For urinary system - allowed 2 liters per day • For health of urinary system • Organically produced, contains Aloe Vera, which is rich in natural minerals,
polysaccharides and amino acids necessary for strong immune system and good health.
Majority of claims made on juices are connected with contains or added statements. The role of the specific juices component in the normal body functioning is stressed out. However, the role of cranberries in normal urinary system functioning is strongly emphasized. Aloe Vera, antioxidants, beta-carotene or other added or contained elements in fruit juices are used to point out health dimension of this studied category. Although pictures of fruit are also important part of communication with consumers in this category, the ideal women figure is visually most commonly used to stress out additional benefits of this product consumption.
2.2.4. N&H products analysis by country
a. Bosnia and Herzegovina
The analysis in Bosnia and Herzegovina covered 105 products. The sources of shop check were hypermarkets in 77.8% and specialized shops in 22.2%. According to the structure of N&H products by product groups, 31% of the total number is products in the group of milk and yogurt, 30% belongs to the dietary products group, 16% are fruit juices, 14% is general food, and the rest refers to the group of margarines.
FOCUS‐BALKANS DL 6.1 Consumer study implementation for products with health claims

FP7 KBBE 2007 1 78 GA 212579
FOCUS‐BALKANS DL 6.1 Consumer study implementation for products with health claims
i.Product origin, producers and brands
Products on B&H market come from seventeen different countries (B&H and sixteen others: 11 EU countries36, 4 WBC and 1 other country). Number of foreign countries by product groups ranges from five countries in the group of margarines to fourteen countries (in the group of fruit juices) and fifteen countries in dietetic products group. Structure of N&H products by origin is shown in Figure 24. The largest number of products on B&H market comes from WBC. The share of WBC products in all observed products is 47.6%. Products with EU origin (27.6%) take the second place, followed by domestic products (23.8%), while only 1% originated from one other country.37
Figure 24 N&H products by origin
EU:27.6%
B&H: 23.8%
Other WBC:47.6%
Other countries:1.0%
Source of data: IPSOS Strategic Puls.
There are 59 manufacturers present in B&H, of which the largest number refers to producers from abroad (24 from the EU and 23 from WBC), followed by domestic producers Figure 25 shows the structure of manufacturers by product groups. It is noticeable that the largest number of domestic and other WBC producers is present in the group of fruit juices, while EU producers are present to the highest extent in the general food group. Domestic, EU and WBC producers in the groups of milk and yogurts are present in relatively the same number, while dietetic products group is characterized by large differences in favour of WBC producers. The lowest number of manufacturers is in the group of margarines.
36 Includes Switzerland. 37 From Indonesia. Group of other countries consists of countries that do not belong to the EU or the WBC group. Those are: Indonesia, Korea and Thailand, whose N&H products can be found on WBC market.
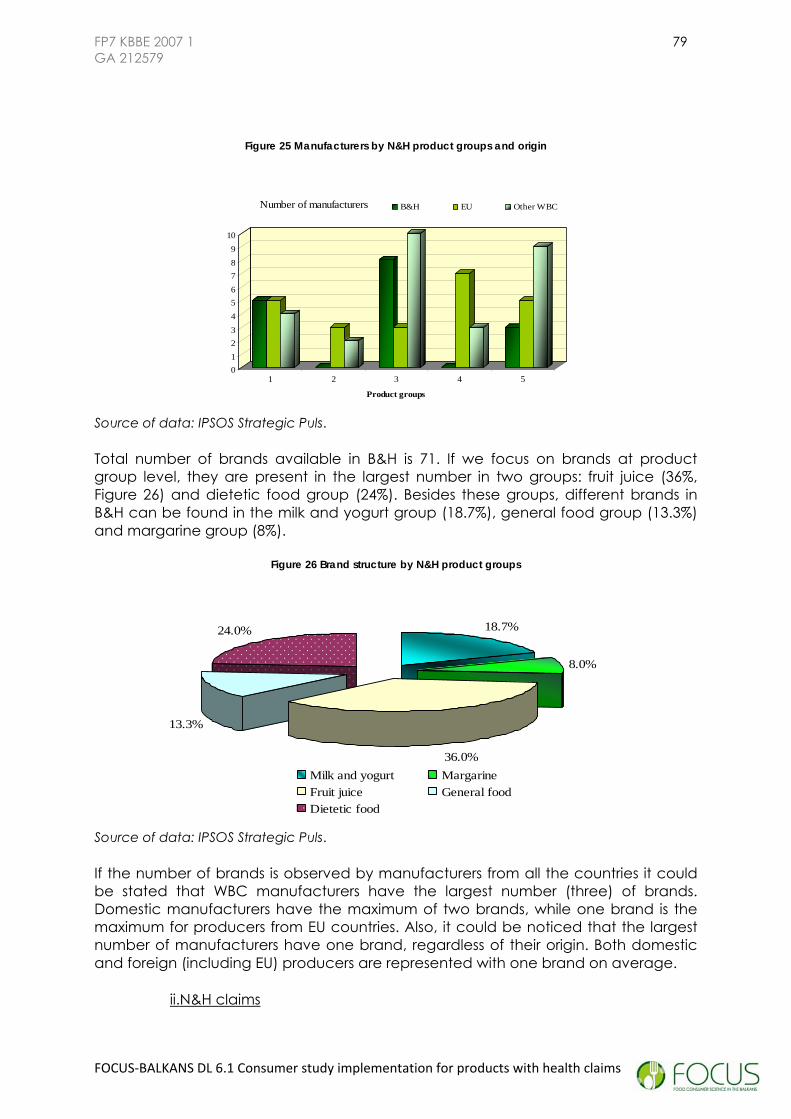
FP7 KBBE 2007 1 79 GA 212579
Figure 25 Manufacturers by N&H product groups and origin
0123456789
10
1 2 3 4 5
Product groups
Number of manufacturers B&H EU Other WBC
Source of data: IPSOS Strategic Puls.
Total number of brands available in B&H is 71. If we focus on brands at product group level, they are present in the largest number in two groups: fruit juice (36%, Figure 26) and dietetic food group (24%). Besides these groups, different brands in B&H can be found in the milk and yogurt group (18.7%), general food group (13.3%) and margarine group (8%).
Figure 26 Brand structure by N&H product groups
18.7%
8.0%
36.0%
13.3%
24.0%
Milk and yogurt MargarineFruit juice General foodDietetic food
Source of data: IPSOS Strategic Puls.
If the number of brands is observed by manufacturers from all the countries it could be stated that WBC manufacturers have the largest number (three) of brands. Domestic manufacturers have the maximum of two brands, while one brand is the maximum for producers from EU countries. Also, it could be noticed that the largest number of manufacturers have one brand, regardless of their origin. Both domestic and foreign (including EU) producers are represented with one brand on average.
ii.N&H claims
FOCUS‐BALKANS DL 6.1 Consumer study implementation for products with health claims

FP7 KBBE 2007 1 80 GA 212579
Figure 27 shows the number of N&H claims on B&H market. Products from EU and WBC have up to four claims, while domestic products have up to three claims. The largest number of the EU products has two claims, while the majority of domestic and other WBC products have one claim.
Figure 27 Structure of products by number of N&H claims
Number of products
0
5
10
15
20
25
30
1 2 3 4Number of claims
B&HEUOther WBC
Source of diiSource of data: IPSOS Strategic Puls.
The largest number of N&H products observed in Bosnia and Herzegovina has following claim types: contain nutrients or other substances (16%), source of vitamins and /or minerals (11%). Only a few products have claim types: energy free, sodium free or salt free, high protein and increased nutrient (0.6%).
Among all 105 products covered by analysis in Bosnia and Herzegovina, only 27 of them (26%) have health claims, of which 14 products have a general health claim type, 12 of them have a functional health claim, while only a few of products are with health claim on risk-disease. The claims of most general type are, for example, following: ″recommended to all having problems with digestion″ or ″for everybody who takes care about health″. The highest number of health claims is in the group of general food and the lowest number is in the group of margarines. In addition, there are 16 products in B&H dietetic claims and the smallest number of them with organic claims.
Claims used by producers in Bosnia and Herzegovina:
• Supportive to digestion and rich in nutritive ingredients. Plant fibers prevent form hemorrhages and colon cancer, excellent influence to the blood cholesterol.
• Effect on and stimulates digestion • Increase organism resistance • Centenarians beverage for good health and long life • 0.5% fat, probiotic, support digestion and therefore metabolism of
whole body
FOCUS‐BALKANS DL 6.1 Consumer study implementation for products with health claims

FP7 KBBE 2007 1 81 GA 212579
FOCUS‐BALKANS DL 6.1 Consumer study implementation for products with health claims
b.Croatia
Analysis in Croatia covers 94 products with N&H claims, of which 68.1% are surveyed in hypermarkets, while the rest is related to specialized shops. Observing by N&H product groups, one could notice that products belonging to the dietetic food group have the highest share (38.3%). Milk and yogurt group and fruit juices group have a share of about one fourth each. Share of general food products is 16%, followed by margarines with the smallest share of only 3.2%.
i.Product origin, producers and brands
Besides domestic products, there are products originating from 16 foreign countries on the Croatian market (3 WBC, 12 EU countries and 1 other country38). The smallest number of different countries is in the group of margarines (three countries) and it goes up to the maximum of eight countries (in general and dietetic food groups). The variety of products’ origin is also present in the group of fruit juices (products from seven different countries).
Figure 28 N&H products by origin
EU:52.6%
Croatia: 37.9%
Other WBC:8.4%
Other Countries:1.1%
Source of data: IPSOS Strategic Puls.
Percentage structure of N&H claim products by origin shows that Croatian market of this product group contains the largest number of products from EU area (more than a half of the total number of products), followed by domestic products (more than one third). On the contrary, availability of WBC products is small (8.7%) and it is particularly the case with products from other countries (Figure 28).
Of all the manufacturers present on the Croatian market, there are 15 domestic producers, 5 WBC producers and 35 producers are from EU countries. Observing manufacturers by product groups, the lowest number of manufacturers, as is the case in B&H, is in the margarine group (see Figure 29). The largest number of EU and domestic manufacturers produce dietetic products. Besides, EU producers are present in a high percentage in general food products, while domestic producers are highly present in fruit juices products on the Croatian market. Dominant number
38 Thailand. See Footnote 17.

FP7 KBBE 2007 1 82 GA 212579
of producers is from EU, while WBC producers are not so prevalent on the Croatian market for products with N&H claim.
Figure 29 Manufacturers by N&H product groups and origin
0123456789
1011121314
1 2 3 4 5
Product groups
Number of manufacturersCroatia EU Other WBC
Source of data: IPSOS Strategic Puls.
There are 60 different brands of N&H claim products on the Croatian market. More brands are registered in the dietetic product group (37.3%) than in the general food group (20.9%), fruit juice group (19.4%) and milk and yogurt group (17.9%). There are not so many brands in margarine group (only 4.5%; see Figure 30).
Figure 30 Brand structure by N&H product groups
17.9%
4.5%
19.4%
20.9%
37.3%
Milk and yogurt MargarineFruit juice General foodDietetic food
Source of data: IPSOS Strategic Puls.
The majority of manufacturers have one brand, which results from the fact that the average number of brands is one (for domestic as well as for foreign manufacturers). WBC manufacturers have only one brand, while EU manufacturers have one or two brands. Domestic manufacturers have one, three or four brands, but it is obvious that a very few of them have three or four brands.
ii.N&H claims
Regarding the number of N&H claims that can be found in analyzed products in Croatia, the characteristics are as follows. While products that come from WB
FOCUS‐BALKANS DL 6.1 Consumer study implementation for products with health claims

FP7 KBBE 2007 1 83 GA 212579
countries have up to two claims, number of domestic product claims goes up to three. In case of EU products even four claims can be found. Figure 31 indicates that the majority of all products have one N&H claim, and they come from the EU, Croatia and other WBC. Numbers of domestic products and products from EU countries that have two claims are the same, and compared to them, the number of WBC products with two claims is relatively low. A significantly lower number of domestic products have three claims.
Figure 31 Structure of products by number of N&H claims
Number of products
0
5
10
15
20
25
30
1 2 3 4Number of claims
CroatiaEUOther WBC products
Source of data: IPSOS Strategic Puls.
Majority of N&H products in Croatia contain the following claims: low fat (10.5% of total number of products), with no sugar added (9.8%), contains nutrients or other substances (9.8%), low energy (8.4%) and sugar free (8.4%), while the lowest number of products have claims such as: energy free, sodium free or salt free, source of protein and increased nutrients (share of product in total for each type of claim of only 0.7%).
Claims used by producers in Croatia:
• For healthy heart and blood vessels • Healthy food for activity and immune system strengthening • Naturally regulates digestion • Helps preserving the vascular system • With natural plant fibers, for cholesterol reduction, and for people
with impaired health • Light, no sugar added, it protects intestinal flora • Probiotic effect - support within regulation of intestinal micro flora • Less calories, without preservatives, increase organism resistance • For the preservation of blood vessels + favourable ratio of Omega 3
and Omega 6 • For urinary system - allowed 2 litres per day • For regular digestion
FOCUS‐BALKANS DL 6.1 Consumer study implementation for products with health claims

FP7 KBBE 2007 1 84 GA 212579
There are 19 products with health claims (20% of total number of N&H products). More than half of all products with health claims are of general health claim type and none of them are with health claim on risk-disease. Of the total of 19 products with a health claim, 42% are in the group of dietetic products, 26% belong to the group of milk and yogurt, 16% are products in the general food group, 11% are in the fruit juice group, while only 5% is in the margarine group. Additionally, among all N&H products, there are 13% of them with dietetic claim and 8% with organic claim.
c. FYR Macedonia
Analysis of N&H products on the FYR Macedonia market covers 140 products, of which 87% refers to hypermarkets and 13% to specialized shops. The percentage structure of N&H product groups is as follows: 37.1% of total belongs to milk and yogurt group, 22.9% refers to fruit juices, 18.6% are dietetic products, 13.6% general food and 7.9% margarines.
i.Product origin, producers and brands
Apart from domestic products, there are products from 15 foreign countries present on Macedonian market. The origin of products refers to 10 EU countries and 4 WB countries. Number of foreign countries by product groups is rather unified and varied from five countries in the group of margarines to seven countries within milk and yogurt and dietetic food.
Figure 32 shows structure of N&H products by origin. The largest part of N&H products on Macedonian market (41.4%) comes from WB countries, mostly from Serbia. The share of domestic products is 30.7%, while 27.1% of N&H products are from the EU market and Switzerland. Only 0.7% comes from other countries.
Figure 32 N&H products by origin
WBC41.4%
Other countries
0.7% Macedonian30.7%
EU & Swiss27.1%
Source of data: IPSOS Strategic Puls.
N&H products analyzed on Macedonian market are produced by 51 manufacturers. Among them, manufacturers from WB countries are of the greatest importance (21 manufacturers), while 11 manufacturers are domestic. However, different structure can be found at product group level (see Figure 33). The largest number of domestic manufacturers is present in the group of fruit juices, while their smallest number is in the group of milk and yogurt and general food. Contrary to this, the largest number
FOCUS‐BALKANS DL 6.1 Consumer study implementation for products with health claims

FP7 KBBE 2007 1 85 GA 212579
of manufacturers from WBC is in the group of milk and yogurt and the smallest number of them is in the group of general food. The EU manufacturers are of the biggest importance in the general food group and in the group of margarines.
Figure 33 Manufacturers by N&H product groups and origin
0
2
4
6
8
10
12
1 2 3 4 5
Macedonian EU WB
Number of manufacturers
Product groups
Source of data: IPSOS Strategic Puls.
Macedonian market of N&H products has 62 different brands. According to the brand structure shown in the Figure 34, the largest number of brands is in the group of milk and yogurt (36%), while the smallest number of brand is in the group of margarines (9%).
Judging to the average number of brands, it seems there is no any significant difference between domestic and foreign manufacturers. Namely, the average number of brands per domestic (and per foreign) manufacturer equals one, approximately. It also appears that the largest number of manufacturers has one brand regardless their origin. In addition to this result, the number of brands on Macedonian market of N&H products varies from one (all domestic manufacturers) to three (manufacturers from other WBC).
Figure 34 Brand structure by N&H product groups
35.9%
9.4%23.4%
10.9%
20.3%
Milk and yogurt MargarineFruite juice General foodDietetic food
Source of data: IPSOS Strategic Puls.
FOCUS‐BALKANS DL 6.1 Consumer study implementation for products with health claims

FP7 KBBE 2007 1 86 GA 212579
ii.N&H claims
According to number of N&H claims, it appears that the structure of domestic and foreign (EU and other WBC) products on Macedonian market are similar: the largest number of products has two N&H claims, followed by products with one and three claims (Figure 35). However, products from the EU market have up to four N&H claims, while domestic products and products from other WBC have maximum seven claims.
Figure 35 Structure of products by number of N&H claims
0
5
10
15
20
25
1 2 3 4 5 6 7
Domestic productsEU productsOther WBC products
Number of claims
Number of products
Source of data: IPSOS Strategic Puls.
Macedonian market of N&H products consists of 140 products with nutrition claims with only 27 health claim products, 13 dietetic claim products and 8 products have organic claims. The largest number of all products (25%) contains vitamins and /or minerals, whereas the smallest number (0.7%) has claim type - increased nutrition. Approximately 22% of all products are with low fat, 15% of them are sugar-free and 13% of products has claim type - source of vitamins and /or minerals.
As it is already stated, 27 products (or 19%) of total number products have health claim. The number of products with health claims varies across product groups, from one in the group of fruit juices, to 17 products in the group of milk and yogurt. However, the structure according to type of health claims is not satisfactory enough and differs from the structure in the EU. The most of products has general type of health claim, while only a few products have the health claim on risk-disease.
Claims used by producers in Macedonia:
• Produced with added organic aloe vera, which is rich in natural minerals, polysaccharides and amino acids necessary for strong immune system and good health.
• High nutrition value and easy digestion. • For better digestion, no sugar.
FOCUS‐BALKANS DL 6.1 Consumer study implementation for products with health claims

FP7 KBBE 2007 1 87 GA 212579
d. Montenegro
N&H products analysis on the market of Montenegro captures 52 products, with 97% of products surveyed in hypermarkets and only 3% in specialized shops. The percentage structure of N&H product groups is very similar to those on Macedonian market: 36.5% of total belongs to milk and yogurt group, 25% refers to fruit juices, 19.2% are dietetic products, 13.5% general food and 5.8% margarines.
i.Product origin, producers and brands
N&H products on Montenegrin market comes from 11 foreign countries (7 EU countries and 5 WBC). Number of foreign countries by product groups varied from one country in the group of margarines to seven countries within dietetic food.
The majority of those products are manufactured in WBC (73.1%), where Serbian products take a half of total number of 52 N&H products. On the other hand, the share of domestic products is only 7.7%, whereas the share of products from West European countries is 19.2% (Figure 36).
Figure 36 N&H products by origin
WBC73.1%
Montenegro7.7% EU & Swiss
19.2%
Source of data: IPSOS Strategic Puls.
There are 31 N&H producers present on Montenegrin market, among which manufacturers from WB countries are the majority (18 manufacturers), 9 manufacturers come from the EU, while only 3 manufacturers are domestic. Structure at product group level indicates that all 3 domestic producers belong to the group of milk and yogurt. The number of WBC manufacturers is dominant in all five groups (Figure 37). In addition, the largest share of manufacturers from WBC is in the group of fruit juices and the EU manufacturers are of the biggest importance in the dietetic products group.
FOCUS‐BALKANS DL 6.1 Consumer study implementation for products with health claims

FP7 KBBE 2007 1 88 GA 212579
Figure 37 Manufacturers by N&H product groups and origin
012
34567
8
1 2 3 4 5
Montenegrian EU Other WBCNumber of manufacturers
Product groups
Source of data: IPSOS Strategic Puls.
Survey of N&H products at the Montenegrin market indicates 30 different brands with the maximum share in the group of milk and yogurt (40%) and fruit juices (33%) and their smallest number in the group of margarines. The percentage structure of brands by N&H product groups is shown in the following Figure.
Figure 38 Brand structure by N&H product groups
30.0%
5.0%
25.0%
17.5%
22.5%
Milk and yogurt MargarineFruite juice General foodDietetic food
Source of data: IPSOS Strategic Puls.
The difference in the average number of brands between domestic and foreign manufacturer is not significant: the average number of brands in both cases is one. The largest number of manufacturers also has one brand. Additionally, there is difference among domestic, EU and WBC manufacturers regarding the number of brand they have: all domestic and EU manufacturers have only one brand, while, on the other hand, some of WBC manufacturers have two and five brands, respectively.
FOCUS‐BALKANS DL 6.1 Consumer study implementation for products with health claims

FP7 KBBE 2007 1 89 GA 212579
ii.N&H claims
Regarding number of N&H claims, products that come from the EU market have up to four N&H claims, domestic products have maximum three claims, while products from other WBC have up to six claims. The largest number of EU products on Montenegrin market has two N&H claims, followed by products with one claim. One half of domestic products have three N&H claims, while other two domestic products have one and two claims (Figure 39). Regarding products from the other WBC present on Montenegrin market, it seems the most of them are with one claim, whereas the smallest number of those products has six claims.
Figure 39 Structure of products by number of N&H claims
0
2
4
6
8
10
12
14
1 2 3 4 5 6
Domestic product EU products Other WBC products
Number of claims
Number of products
Source of data: IPSOS Strategic Puls.
The largest percentage of all products (29%) contains vitamins and /or minerals and the smallest share (1.9%) are energy-reduced products, energy-free, sodium-free or salt-free and enriched with vitamins and minerals. Approximately 19% of all products are with low fat, 17% of them are with no added sugar and 17% of products has nutrition claim type - natural.
All 52 products on Montenegrin market are with nutrition claims, of which 17% have health claim, while a very small number of them are with dietetic and organic claims. The number of health claims varies across product groups from one in the group of margarine, general food and dietetic food to six in the group of milk and yogurt. Most of those products have general type of health claim, while only a few of products has functional health claim.
Claims used by producers in Montenegro:
• Straitening of immunity, 1.6% fat probiotic natural dietetic flavour without preserves
• 100% natural, for active metabolism.
FOCUS‐BALKANS DL 6.1 Consumer study implementation for products with health claims
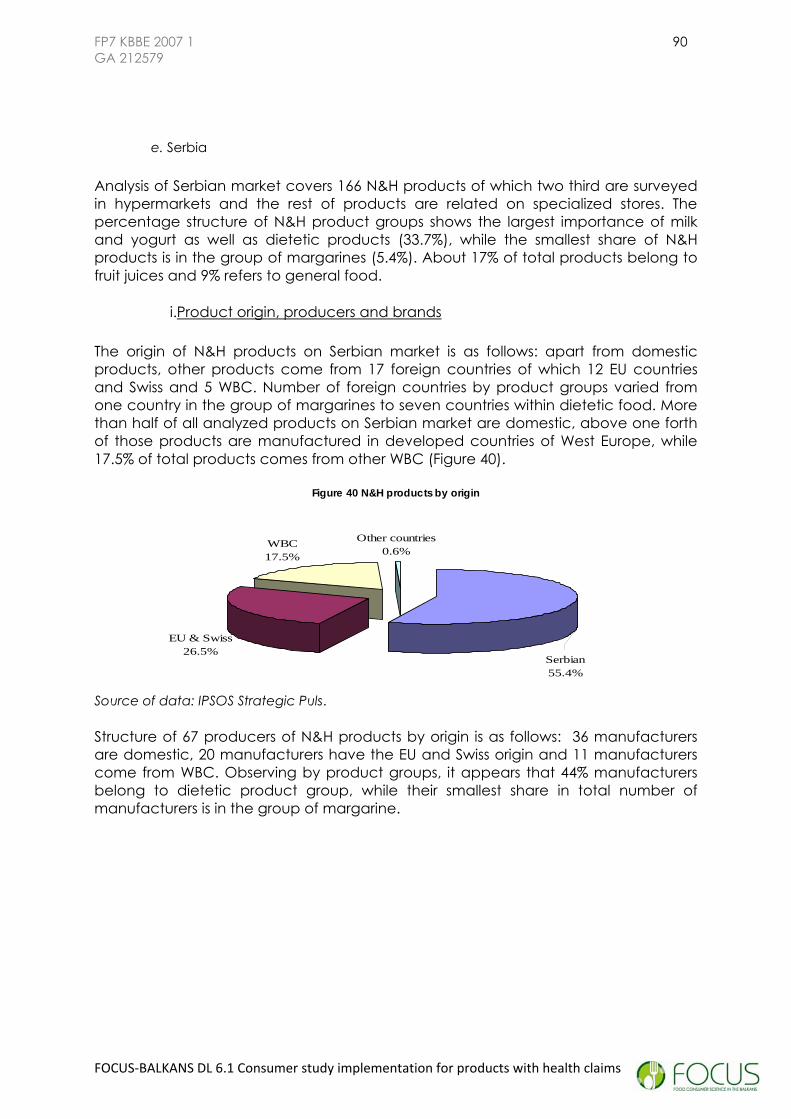
FP7 KBBE 2007 1 90 GA 212579
e. Serbia
Analysis of Serbian market covers 166 N&H products of which two third are surveyed in hypermarkets and the rest of products are related on specialized stores. The percentage structure of N&H product groups shows the largest importance of milk and yogurt as well as dietetic products (33.7%), while the smallest share of N&H products is in the group of margarines (5.4%). About 17% of total products belong to fruit juices and 9% refers to general food.
i.Product origin, producers and brands
The origin of N&H products on Serbian market is as follows: apart from domestic products, other products come from 17 foreign countries of which 12 EU countries and Swiss and 5 WBC. Number of foreign countries by product groups varied from one country in the group of margarines to seven countries within dietetic food. More than half of all analyzed products on Serbian market are domestic, above one forth of those products are manufactured in developed countries of West Europe, while 17.5% of total products comes from other WBC (Figure 40).
Figure 40 N&H products by origin
EU & Swiss26.5%
WBC17.5%
Other countries0.6%
Serbian55.4%
Source of data: IPSOS Strategic Puls.
Structure of 67 producers of N&H products by origin is as follows: 36 manufacturers are domestic, 20 manufacturers have the EU and Swiss origin and 11 manufacturers come from WBC. Observing by product groups, it appears that 44% manufacturers belong to dietetic product group, while their smallest share in total number of manufacturers is in the group of margarine.
FOCUS‐BALKANS DL 6.1 Consumer study implementation for products with health claims

FP7 KBBE 2007 1 91 GA 212579
Figure 41 Manufacturers by N&H product groups and origin
02
46
81012
1416
1 2 3 4 5
Serbian EU Other WBCNumber of manufacturers
Product groups
Source of data: IPSOS Strategic Puls.
Figure 41 shows the structure of manufacturers by origin at N&H product group level. Domestic producers are dominant in all five product groups. The largest number of domestic producers is in the group of dietetic products, followed by EU producers in the same group.
Serbia is the country with the largest number of brands compared with the other five WBC: there are 99 different N&H brands on Serbian market. Regarding brand structure by product groups, it seems there is almost the same share of brands in groups of dietetic products and milk and yogurt, whereas their smallest share is in group of margarines (Figure 42).
Figure 42 Brand structure by N&H product groups
34.7%
5.0%14.9%9.9%
35.6%
Milk and yogurt MargarineFruite juice General foodDietetic food
Source of data: IPSOS Strategic Puls.
The average number of domestic brands is two, but average number of foreign brands equals to one. However, the most of producers has one brand regardless their origin. Domestic and EU producers have up to six and five brands, respectively, while WBC manufacturers have up to three brands.
FOCUS‐BALKANS DL 6.1 Consumer study implementation for products with health claims

FP7 KBBE 2007 1 92 GA 212579
ii.N&H claims
According to number of N&H claims, Swiss products take the first position with nine claims per product (all in dietetic product category), following by products from other WBC that have up to seven claims. Domestic products have up to five claims. The largest numbers of Serbian and EU products present on Serbian market have two N&H claims, while products from other WBC are mostly with one claim (Figure 43).
Figure 43 Structure of products by number of N&H claims
0
5
10
15
20
25
30
35
40
45
50
1 2 3 4 5 6 7 8 9
Domestic products EU and Swiss productsOther WBC products
Number of products
Number of claims Source of data: IPSOS Strategic Puls.
Observing of all 166 products with N&H claims shows that only 14% of them have health claim, 6% of products have dietetic claim and 5% of them are with organic claim. The largest percentage of all products (32%) contain vitamins and /or minerals, followed by 25% of products with low fat and 15% of products with source of fibre. On the other hand, only 0.6% of products are sodium-free or salt-free products and 1.8% of products are with claim type - light.
Claims used by producers in Serbia:
• No added sugar, rich in plant fibers that have a favourable impact on your body
• Nutritive valuable product with probiotic influence on health by improving your immunity
• Naturally regulates metabolism • Naturally regulates digestion • Preventive for cardio vascular diseases, disease of urinary tract,
decrease level of sugar in blood and LDL cholesterol • Activate influence on digestive process, fastening metabolism. • Sterilized and homogenized partially skimmed milk with added
Bengo fiber which positive effect on strengthening bones • Nutritive valuable product with probiotic - influence on health by
improving your immunity • For stress relaxation • FAO recommends full grain nutrition of all family, specially in case
FOCUS‐BALKANS DL 6.1 Consumer study implementation for products with health claims

FP7 KBBE 2007 1 93 GA 212579
of illness - diabetes, cardiovascular diseases, as well as in dietetic nutrition in prevention of cancer diseases
• Includes two probiotic cultures and oligofructoses which favorably affects the digestive tract, stimulates digestion and accelerates metabolism.
• Allows you to feel and look good thanks to the synergic effect of coenzyme Q10 and L Carnitine, which naturally turn fat into energy.
• With fiber, naturally regulates metabolism and digestive.
Regarding structure of health claims by product groups, it could be said the number of products with health claim varies from one in the group of margarine and fruit juices to 12 in the group of milk and yogurt. Like in other WBC, the most of those products has general type of health claim, whereas a very small number of them are health claim on risk-disease.
f. Slovenia
Analysis in Slovenia covered 100 products with N&H claims of which 24% refers to specialized shops while the rest is surveyed in hypermarkets. Divided by product groups, it can be stated that the most spread N&H products on the Slovenian market belong to the group of milk and yogurt and the group of dietetic products. The other three groups: margarines, fruit juices and general food, have a smaller share than the one mentioned above (9%, 16 % and 14%, respectively).
i.Product origin, producers and brands
The analysis of the origin of these products showed that, besides home country, 11 foreign countries are present on the Slovenian market (9 EU countries and 2 WBC). Three groups contain products from five countries: milk and yogurt, margarines and general food. A smaller number of countries are present in the fruit juices group (4 countries). The largest number of countries is present in the dietetic product group. More than a half of total number of covered products in Slovenia originates from EU (54.5%), more than a third of total number of products is domestic, while the rest comes from other WBC (7.9%; see Figure 44).
FOCUS‐BALKANS DL 6.1 Consumer study implementation for products with health claims

FP7 KBBE 2007 1 94 GA 212579
Figure 44 N&H products by origin
Other countries:0%
Other WBC:7.9%
Slovenia:38.6%
EU:54.5%
Source of data: IPSOS Strategic Puls.
N&H products are manufactured by 55 different producers. Among them, manufacturers come from 4 WBC. EU manufacturers have the greatest importance - there are 38 of them present on the market, while 22 manufacturers are domestic. In Figure 45 one can see that domestic producers are uniformly present in all groups except margarines (where domestic producers are not present). EU producers are important in all product groups, but they have the highest importance in the fifth group (dietetic food). Products made in other WBC are present only in three groups: milk and yogurt, margarines and dietetic food, but in a relatively small number compared with domestic and EU products.
Figure 45 Manufacturers by N&H product groups and origin
0
2
4
6
8
10
12
14
16
18
1 2 3 4 5Product groups
Number of manufacturers Slovenia EU Other WBC
Source of data: IPSOS Strategic Puls.
There are 76 different brands in Slovenia. Looking at brands by product groups, it is noticeable that the highest share of brands is present in dietetic product group (29.5%) and milk and yogurt group (28.2%). The share of brands in the fruit juice group is 16.7%, in general food it is 15.4%, and in margarine group 10.3%.
FOCUS‐BALKANS DL 6.1 Consumer study implementation for products with health claims

FP7 KBBE 2007 1 95 GA 212579
Figure 46 Brand structure by N&H product groups
28.2%
10.3%
16.7%15.4%
29.5%
Milk and yogurt MargarineFruit juice General foodDietetic food
Source of data: IPSOS Strategic Puls.
Looking at the manufacturers by the number of brands, the highest number of manufacturers (regardless of their origin) is one, as is the case in previously mentioned countries. Also, because of the highest number of producers with one brand, and not so many with two or more brands, the average number of brands per manufacturer is also one. Domestic manufacturers have two brands on average, while foreign and EU manufacturers have one brand on average. EU manufacturers have one, two or three brands; WB manufacturers have one or three brands, while number of brands of domestic manufacturers varied from one to four.
ii.N&H claims
A lot of products have one N&H claim. When divided into domestic, EU and WBC products, some differences arose concerning the maximum number of N&H claims. WBC products have one or two claims, and there are more products with two claims. Domestic products have up to three claims, with the highest number of products with one claim and the smallest number of products that have three claims. Products that come from EU have up to four claims, but those that contain one claim are dominant.
Figure 47 Structure of products by number of N&H claims
Number of products
0
5
10
15
20
25
30
35
1 2 3 4Number of claims
SloveniaEUOther WBC products
Source of data: IPSOS Strategic Puls.
FOCUS‐BALKANS DL 6.1 Consumer study implementation for products with health claims

FP7 KBBE 2007 1 96 GA 212579
Of all 100 N&H products covered by analysis on the Slovenian market, approximately 20% are with health claim, 16% are with a dietetic claim, while less than 10% of all products in Slovenia have an organic claim. The most present claims are claim types low fat (17%) and content of nutrients or other substances (19%). The less present claims on products are claims like: low sugar, low sodium/salt, sodium free or salt free and source of protein (each of them has 0.7% share).
The highest number of products having health claims belongs to the first group (milk and yogurt group), while the lowest number of them belongs to the general food group. Of mentioned health claim products, one third has a general health claim; more than a half have a functional type claim, while less than 10% have a claim on risk – disease.
Claims used by producers in Slovenia:
• Protect health without fat, probiotic yogurt • Low content of fat, probiotic yogurt "healthy life" • Protect heart and veins, lowering cholesterol and
blood pressure. • Tolerance on lactose is decreasing during the life. • Increasing immunity resistance • Low content of fat, "protect health ", fibrin for strong
bones • Naturally lowering cholesterol • Properly selected food is a source of health
FOCUS‐BALKANS DL 6.1 Consumer study implementation for products with health claims

FP7 KBBE 2007 1 97 GA 212579
B/WBC NUTRITIONNAL AND HEALTH CLAIMED PRODUCTS MARKET RESEARCH
3.WBC N&H CLAIMED PRODUCTS PROCESSORS AND RETAILERS SURVEY - Synthetic report
SUMMARY
Market structure of the studied categories
• Most of the interviewed processors and retailers are important marketers in WBC countries. They have significant market shares in the studied categories. Largest retailers and processors have been included in the interviewing process.
• Some studied categories were introduced ten or more than ten years ago, such as dietetic jam for persons suffering from diabetes in Slovenia and Croatia, light margarine in Slovenia and milk enriched with vitamins in Serbia. However, most of the products in studied categories were introduced to WBC markets after 2000. WBC processors accepted western trends and introduced these products in WBC market. Retailers introduced studied categories mainly after importers or national processors started to import or produce them.
• All of the studied categories have recorded sales increase in the last three years at the WBC markets. More developed markets have lower growth rates since they are more saturated and consumer awareness is higher in these countries. In less developed WBC countries, growth rates have been higher and it will be higher in the future. It is expected that more consumers will accept N&H claim products with the growth of living standard and consumer’s education.
• Distribution channels for studied categories are relatively similar to general food distributions channels at WBC markets. However, there are certain differences across categories and countries. Retail trends in WBC markets are positive for N&H claim products. Larger formats will be more important in the future food retailing and it will allow retailers to carry wider and deeper assortment. In less developed WBC markets, supermarkets and hypermarkets will have much more significant role in retail market. Therefore, the growth of N&H claim products in these countries will be higher due to changing retailing structure.
• Most retailers have similar margins for products from studied categories compared to regular products. In addition, most processors apply the same margin policy but there are more processors than retailers which charge higher margins for N&H products. However, price of the products with claim are higher than the prices of regular products due to more expensive production process according to processors. The only exception is light margarine which is cheaper than regular margarine.
FOCUS‐BALKANS DL 6.1 Consumer study implementation for products with health claims

FP7 KBBE 2007 1 98 GA 212579
• WBC processors (in our sample) dominate the markets of studied categories, except in Slovenia. High import barriers for processors out of WBC and privileged export conditions for WBC companies significantly helped WBC processors dominance.
Motivations/barriers toward products with N&H claims
• Answering consumers demand is the main motive for manufacturing and selling N&H claim products. In addition, profit and following EU trends are the least important motives. However, this does not mean that these criteria are not important.
• Retailers main barriers for N&H claim products in WBC are consumer related. Eating habits are the most important problem for retailers followed by consumer’s awareness and low demand. Processors face regulative barriers as well as insufficient knowledge of consumers’ needs. However, it is positive that barriers for developing N&H claim products are not very high for processors.
Perception of demand for products with N&H claims
• Processors in WBC mostly note an increasing demand for products with H&N claims. The most of them express moderate agreement with the statement that consumers demand related to products with H&N claims is high today. Similarly, the retailers in WBC also perceive not particularly high at the moment, yet an increasing consumers’ demand for products with H&N claims.
• Both processors and retailers in WBC find the price absolutely the most important factor influencing the local consumers’ choice of food. However, they also see health benefits of food as of growing importance. Restraints for consumers to buy products with H&N claims of similar very high importance are economic difficulties, price, lack of nutritional knowledge and eating habits with no explicit differences among product categories. Availability has been the solely restraint not given a great importance either by processors or retailers in almost all WBC.
• According to processors and retailers point of view, consumers in WBC have been showing interest in the information obtained from product packaging as well as through various other sources: word-of-mouth, sales representatives, advertising, media etc. Processors are making efforts to provide such information using different tools and media, while at the same time they seem interested in obtaining information on consumers demand applying various research methods. Retailers seem to be using research to lesser extent than processors.
• Processors and retailers perception of consumers of products with H&N claims in all WBC is quite identical: consumers are generally female belonging to the age groups of 15 to 40 years, or elder (40-64), with higher or middle income, secondary or high education, with or without health problems, living in urban areas. Consumers of products with H&N claims are perceived mostly as practicing a healthy life style, following modern trends and fashion in food consumption, active (sportsmen, businessmen) or mothers who are expected to provide healthy food for their families.
FOCUS‐BALKANS DL 6.1 Consumer study implementation for products with health claims

FP7 KBBE 2007 1 99 GA 212579
• Retailers demand in WBC seems to be not so pronounced. More generally, regarding retail chains, processors mostly complain about the limited shelf space for which “they have to fight”. This is especially true for products with H&N claims since retailers put priority on products with higher turnover which are by definition conventional products. In Slovenia retailers also develop their private labels of healthy food thus giving less space to brand name food supplies. The situation is even worse with specialized chains and independent retailers.
• Processors in WBC are highly dissatisfied with national policy for nutrition. For most of these stakeholders, in most of the countries such policy has not been developed (Serbia, Montenegro, Macedonia, Bosnia and Herzegovina) or implemented (Slovenia). Processors rather strongly disagree (average mark 2.03 on 1 to 5 scale, 1 strongly disagree, 5 strongly agree) with the statement that national nutrition policy today is satisfactory and well suited for the improvement of customer awareness.
Perspectives and Conclusion
• Demand for the products with H&N claims will increase. In less developed N&H WBC markets, consumers’ demand would significantly be changed only in the long run (interviewees agreed that demand will not change in the near future). Increase will be caused by higher average income at the first place. For more developed N&H WBC markets, the main reasons for the change in demand will be driven by the changes in consumers’ education and lifestyles. However, the less developed N&H WBC markets will depend more on the governmental public policy of nutrition.
• All manufacturers agreed on the most important factor of N&H claim products demand change in the region – it is the purchase power. From the retailers’ point of view, it is the least important factor of change. It seems to be connected with revailed retailer format included in interviewing (hypermarkets and supermarkets) and their policy orientation (higher income classes, urban and educated population).
• Target population consists of a few groups of consumers. All interviewed companies suggest that young and more educated people will be target population. The most interesting target group was young people above 15 years. Interviewees also stressed out importance of the “household gate keeper” (the mother) in buying decision process. However, target group will not be changed in the near future (mostly of women, 25-40 years old, with higher than average income and education). In Slovenia and Croatia elderly with high income might be also interesting consumers group for the studied categories of products.
• Other topics evoked during interviewing were connected with the most important associations on health dimension of food not mentioned previously in the questionnaires. The associations refer to two main points – new legislation related to products with health claims in EU and absence of governmental support to the N&H claimed products development. First association mostly occurs in interviews conducted in more developed N&H WBC markets and EU exporters, while the second comes from less developed N&H WBC markets.
FOCUS‐BALKANS DL 6.1 Consumer study implementation for products with health claims

FP7 KBBE 2007 1 100 GA 212579
METHODOLOGY SHORT DESCRIPTION
TYPE OF RESEARCH: Qualitative research, in depth interviews, in face to face
PROCEDURE – TECHNIQUE: In depth interviews are one of the methods of qualitative research. They are facilitated by a trained person and last approximately 1 h. This technique makes possible deeper understanding of behaviour, attitudes, motives, etc; as well as the collection of a big number of information in a relatively short period of time. Taking into consideration that the participants are selected according to previously chosen criteria, opinions expressed in the in depth interviews should be considered typical for that segment of population only.
The aim of IDI is to gain a qualitative understanding of market for products with nutrition and health claim in the WBC. These interviews allow a face to face discussion and yield valuable information towards consumption of these products. The questionnaire includes generally open questions with combination of given list of answers in some cases (ranks or marks of main problems, difficulties, characteristics etc.), so that the discussion may be deepened on the different topics.
Selection of categories to be studied was based on the linear and specialized shop check made in each WBC. Producers were chosen by their importance at the N&H claim products market at national level. The most important representative producers were included in the interviewing whenever it was possible.
The respondents were marketing managers for the studied categories in most cases. The most important representative chains were included in the interviewing whenever it was possible. The respondents were department managers in the stores for the studied categories.
The respondents also had no previous knowledge of the specific issue of study.
FOCUS‐BALKANS DL 6.1 Consumer study implementation for products with health claims

FP7 KBBE 2007 1 101 GA 212579
3.1.RESEARCH FINDINGS 3.1.1.Market structure of the studied categories
a. Introduction - General presentation of the surveyed companies
Most of the interviewed processors are functioning in the diary, fruit processing and oil industry. Their production is important for chosen studied categories at WBC market. Majority of the interviewed processors are medium and large sized companies.
Totally 29 processors have been interviewed in all WBC countries. In addition, 15 companies are leaders in studied categories in their countries. Therefore, interviewed processors are representative for studied categories.
At the retail side, 26 food retailing companies have been interviewed in all WBC. In the most countries, retail market leaders and main followers have been interviewed. In addition, retail market leadership for studied categories correlate with overall food retailing market leadership. Therefore, interviewed retailers are representative for studied categories, too.
b. The market characteristics
Following five categories of N&H claim products were in the focus of the research process:
•Dietetic jam (jam for persons suffering from diabetes); •Milk enriched with vitamins and minerals; •Yogurts with probiotics; •Light margarine; •Juices and nectars enriched with vitamins and minerals.
The introduction period of the studied categories on the market varies per country and per studied category.
Some studied categories were introduced ten or more than ten years ago, such as dietetic jam for persons suffering from diabetes in Slovenia and Croatia, light margarine in Slovenia and milk enriched with vitamins in Serbia. However, most of the products in studied categories were introduced in WBC markets after 2000. WBC processors accepted western trends and introduced these products in WBC market.
Domestic producers in Serbia and Macedonia introduced dietetic jam in 2005; however jam for people suffering from diabetes is much longer on the market. Foreign companies have been present for more than 10 years, especially in Slovenia and Croatia.
Yoghurts with probiotics have been introduced by local processors in 1990s in the WBC markets, mostly in more economically developed WBC countries (e.g.
FOCUS‐BALKANS DL 6.1 Consumer study implementation for products with health claims

FP7 KBBE 2007 1 102 GA 212579
Slovenia). In the other WBC countries, large European processors have entered five years ago. Some local processors have introduced this product as soon as foreign competition started. However, largest WBC diary processors introduced this product in the last two or three years. In addition, they have invested significant efforts in marketing this product. Therefore, it became important category among diary products.
Milk enriched with vitamins and minerals have been present for more than 15 years in WBC market. However, in the last two years it significantly increased its presence especially in less economically developed WBC. Several large processors introduced new brands in this category in 2008 and 2009.
Light margarine has been introduced mainly in the period from 2004-2008 in the WBC market, except in Slovenia where it has been present for a long time. Large European processor introduced this product to Serbian market in 2004 and local processors followed in 2005.
Generally nectars and fruit juices enriched with vitamins have been introduced in the WBC after 2000. However, in the last two or three years significant number of new brands have been added to the existing assortment. Serbian processors have been very active in this category.
Main characteristics of the studied categories included in interviewing are the following:
Category Products Claims Specificity of products
Jam for persons suffering from diabetes.
Jam sweetened with fructose or with fructose and sweeteners.
“suitable for persons suffering from diabetes” , “Diet” 30% less calories,
Less calories (30% or 50 % less), dietetic
Yoghurts with probiotics. Yogurts with specific
“probiotic ferments”. “favourable effect on the digestion; stimulates digestion and metabolism
Specific ferments in addition to regular ferments in yogurts, functional claim.
Milk enriched with vitamins and minerals.
Milk enriched with complex of vitamins and minerals.
Vitamin A,D, 7 vitamins, Ca+.
Both regular and low fat milk, functional claim.
FOCUS‐BALKANS DL 6.1 Consumer study implementation for products with health claims

FP7 KBBE 2007 1 103 GA 212579
FOCUS‐BALKANS DL 6.1 Consumer study implementation for products with health claims
Light margarine.39 Margarine with
significantly reduced fat content .
“Light“ 25% fat content”.
Reduced fat content, functional claim.
Nectars and fruit juices enriched with vitamins.
Nectars and fruit juices enriched with several vitamins or contains specific nutrient.
Multivitamin, 100% fruit juice, added vitamins,
Contains vitamins
Added vitamins or contains, functional claim.
It is important to emphasize that retailers introduced studied categories mainly after national or WBC processors started to produce them. Before WBC processors introduced these products, very small quantities were sold in WBC markets, except in some cases for example prbiotic yoghurts and light magarine in Slovenia. .
It is important to emphasize that retailers were not particularly interested in these categories and processors had the initiative concerning the introduction of these products.
c. Past and future trends
Markets of studied categories in WBC countries have significantly evolved in the last three years, especially in Serbia, Macedonia and Bosnia. However, there are differences among studied categories and countries. Some growth rates are very high because some of the studied categories have been recently introduced to the market.
i.Jam for persons suffering from diabetes
This category has grown in the last three years. However, starting point in less developed WBC markets was low. In addition, the growth was lower in more developed WBC countries. This product has been on the market for long time in Slovenia and Croatia. It mainly targets a specific group (people suffering from diabetes) which is relatively small and saturated target group. Processors and retailers expect some growth in the next period mostly from 2 to 5%. However, some of them think that sales will be steady
a.Yogurts with probiotics
39 Besides light margarines, products with “high content of vitamins” or “good omega 3 –omega 6 ratio” are included in this study as well.

FP7 KBBE 2007 1 104 GA 212579
Some of the largest diary processors introduced this product in the last two or three years. Therefore, it has grown significantly in the last three years since the starting point was low. In addition, processors invested in marketing of these products. Therefore, this category is expected to have significant growth in the future as well. Practically, it is still establishing more important presence in the Serbian, Bosnian, Macedonian and partly Montenegrin markets. Local processors and retailers predict that this category will grow more than 5% in the next few years. Large European exporters agree with these estimates.
b.Milk enriched with vitamins and minerals
Diary producers are more optimistic than retailers concerning the future growth of this category. Sales of milk enriched with vitamins have grown in the last three years. Some of the largest WBC diary processors introduced new products in this category and it resulted in significant growth in certain countries such as Serbia. Both retailers and processors expect growth in the future, except some companies from more developed WBC markets. In the average, the expected growth is between 2 and 5%.
c.Light margarine
Light margarine has been present on the Slovenian market for a long time. Light margarine has been introduced in developing WBC markets in the last five years and it started to gain consumer’s attention. Further growth is expected and the growth rate will be at least 5% according to respondents.
d.Nectars enriched with vitamins and minerals
The market shares of this category have grown as well in the past three years. It is expected to grow in the next period. However, retailers and processors have different growth rate predictions. Retailers are more optimistic and expect that this category will grow more that 5% per year. However, processors opinions are not uniform. One processor from more developed WBC country expects even negative growth. In addition, some processors claim that the growth rate will be between 2 and 5% and some think that it will grow more that 5%.
In general, all of the studied categories have recorded sales increase in the last three years at the WBC markets. More developed markets have lower growth rates since they are more saturated and consumer awareness is higher in these countries. In less developed WBC countries, growth rates have been higher and it will be higher in the future. It is expected that more consumers will accept N&H claim products with the growth of living standard and consumer’s education.
d. Distribution channels
Distribution channels for studied categories are relatively similar to general food distributions channels at WBC markets. However, there are certain differences across categories and countries.
FOCUS‐BALKANS DL 6.1 Consumer study implementation for products with health claims

FP7 KBBE 2007 1 105 GA 212579
WBC countries have different level of development of distribution channels. Slovenia has the most developed distribution channels which are similar to the ones in developed EU countries. Modern retail formats such as hypermarkets and supermarkets are dominant in this market with over 75% of food retailing. In addition, retail chains have more than 80% of the food retail market. Croatia also have more developed food retailing structure than other WBC countries with over 50% market share of modern retail formats and more significant share of retail chains. In addition, Serbia and Bosnia have also significant share of retail chains in food retailing while it is lower in Macedonia and Montenegro. In these countries the role of small, independently owned stores is more significant. However, small stores usually have limited assortment and sell products with highest turnover. N&H claim products often do not fulfill this criterion.
i.Jam for persons suffering from diabetes
Retail chains are main distribution channel for jam for persons suffering from diabetes. In average, more than 70% of sales have been generated through retail chains especially through supermarkets and hypermarkets. In addition, this product has often been offered in the section called “Healthy food”. In less developed countries, the role of smaller stores is more significant in overall food retailing, however these store usually do not carry dietetic products in their assortment or carry very limited number of items. In some countries such as Serbia specialized stores for healthy food also participate in generating sales for this category. In addition, certain percentage of sales has been generated through wholesale channels. Distribution through institutional buyers such as hospitals is significant channel in Slovenia as well as in some other countries. In addition, this product can be bought in pharmacies and drugstores as well.
It's a trend nowadays for the consumers to be oriented towards supermarkets. This is true for every category of products. In general, analytical data on a global level show that the highest turnover is made by the retail chains. Their advantage is that you can get most of the things that you need in one place, in one supermarket. On the other hand, the advantage of the other distribution chains such as specialized shops for dietetic products is that consumers are in position to get direct information and explanation about the product they are interested to buy. But, there is no high turnover here and another point is that these small shops are not able to be competitive with the prices. (Macedonia, producer)
Retail chains and especially large stores such as hypermarkets and supermarkets will dominate the WBC market in this category in the future.
ii.Yogurts with probiotics
Retail chains are the most important channel for selling yoghurts with probiotics. Retail chains generate over 75% of sales in this category for majority of processors. In addition, more than half of interviewed diary processors sell only through retail chains. Supermarkets and hypermarkets are leading format in this category as well.
FOCUS‐BALKANS DL 6.1 Consumer study implementation for products with health claims

FP7 KBBE 2007 1 106 GA 212579
FOCUS‐BALKANS DL 6.1 Consumer study implementation for products with health claims
However, mini markets are important as well especially in less developed Balkan countries. In Montenegro, for example, 75% of sales in this category have been generated through mini-markets. It should point out that small stores lack refrigerators space and have limited assortment of products which need cooling. Processors sell through wholesale especially in less developed WBC markets. It is often cheaper to reach small stores through wholesalers. Small stores have limited assortments and often do not carry N&H claim products. However, due to processors marketing efforts, small retailers are sometimes willing to include yoghurt with probiotics in their assortment, especially in urban areas. This product has been also sold through bakeries. All the respondents claim that retail chains will stay the main distribution channel in the future with increased share of hypermarkets and supermarkets.
iii.Milk enriched with vitamins and minerals
At least 75% of sales of interviewed processors have been generated through retail chains. In the average, this percentage is significantly higher. Hypermarkets and supermarkets are dominant in this category. Wholesalers and small stores are important in less developed countries and regions. However, they carry limited
assortment of diary products. They usually purchase regular milk.
Retail chains will increase its importance in this category. Processors expect that hypermarket will be the fastest growing format for this category in WBC markets.
e. Light margarine
Retail chains dominate in this studied category as well. Interviewed processors have generated about 85% of sales in the retail chains. Supermarkets and hypermarkets generates majority of the sales. However, mini-markets have participated with 30% in retail chains sales. Processors sell about 15% of light margarine through wholesale in Croatia and Serbia. However, this percentage could be even bigger in less developed WB countries. Hotels and restaurants are also interesting channels for selling light margarine especially in countries with strong tourism industry. In addition, margarine requires refrigerators and this selling space is more expensive therefore small stores are very selective concerning the assortment which requires cooling.
In small shops, there are no shelves for such specific products. (Slovenia, producer)Hypermarkets are becoming more and more important for us. (B&H, producer)

FP7 KBBE 2007 1 107 GA 212579
Retail chains will dominate in the future. However, expansion of the tourism industry could influence that hotels and restaurants become significant channel.
f. Juices enriched with vitamins and minerals
Retail chains are the most important distribution channel for this category as well. However, the perce<ntages of sales generated through retail chains have been slightly lower that in other categories. Wholesalers are more important in this category compared to other studied categories. Consequently, small stores have higher importance, especially in the less developed countries and less developed regions of certain countries. In addition, HORECA segment is important for this category. Retail chains still generates at least 50% of sales in this category.
The most important are retail chains ‐ hypermarkets and supermarkets. Small stores are not insisting on constant supply of this product. They are interesting in products without animal fats during Easter or similar fasting days. In small shops people only buy leading brand. But in large stores they are interested in price; quality and they are more willing to by our product. (Serbia, producer)
We don't distribute directly, we have distributors who do it for us. Supermarkets and hypermarkets will become more important in the future. (Serbia, producer)
Supermarkets and hypermarkets are dominant, because of consumer characteristics. (Serbia, producer)
This category of product is distributed in retail chains and small stores, but we have significantly better sale in the retail chains. (Macedonia, producer)
The importance of retail chains will increase in the future. However, it should take into consideration HORECA channel as well. Processors will opt for the most efficient distribution.
Retail trends in WBC markets are positive for N&H claim products. Larger formats will be more important in the future food retailing and it will allow retailers to carry wider and deeper assortment. In less developed WBC markets, supermarkets and hypermarkets will have much more significant role in retail market. Therefore, the growth of N&H claim products in these countries will be higher due to changing retailing structure.
3.1.2. Margin and price
FOCUS‐BALKANS DL 6.1 Consumer study implementation for products with health claims

FP7 KBBE 2007 1 108 GA 212579
Retailers charge the same margin for both N&H claim products and regular products for all studied categories. The only dilemma is jam for people suffering from diabetes where some retailers charge higher margins compared to regular products.
Processors charge higher prices for almost all studied categories (except for light margarine). However, that does not mean that they charge higher margin for all the products. Production process for some N&H products is more expensive than for the regular products. Consequently, the price of the product is higher.
Production of jam for people suffering from diabetes is more expensive than production of regular jam because fructose is used instead of sugar and the content of fruit is higher. In addition, imported brands from large European processors are present in WBC markets.
Yoghurt with probiotics processors claim that they do not charge higher margins however most of them state that the price of this yoghurt is higher compared to the regular yoghurt. Explanation is that production of yoghurt enriched with probiotics is more expensive (includes specific ferments).
Most of the processors agree that the price of milk enriched with vitamins and minerals is higher than the price of regular milk. However, half of the interviewed processors claim that they charge the same level of margin as for the regular milk. Several processors stated that they charge higher margins for this product and one processor claimed that charges lower margin for this type of milk. Therefore, conclusion is that margin policy is the least uniform in this studied category.
Most of the light margarine processors claim that they charge the same margins compared to normal margarines. However, prices differ from the regular margarines. The price of light margarine is usually lower than the price of normal margarine because of the reduced oil content. Regular light margarine has lower price than normal margarine.
Most of WBC processors of nectars enriched with vitamins and minerals claim that they do not charge higher margins. Only, some of them stated that they charge higher margins for these products. However, most of them admit that price of this juices is higher compared to regular juices. Higher prices could be explained by higher margins and some additional costs of enriching juice with vitamins.
Most retailers have similar margins for products from studied categories compared to regular products. In addition, most processors apply the same margin policy. However, price of the products with claim are higher than the prices of regular products due to more expensive production process according to processors. The only exception is light margarine which is cheaper than regular margarine.
3.1.3. Market structure
We present hereafter the main data related to market structure collected through interviews, for the studied categories. In our sample, WBC processors dominate the markets of studied categories.
FOCUS‐BALKANS DL 6.1 Consumer study implementation for products with health claims

FP7 KBBE 2007 1 109 GA 212579
a.Jam for persons suffering from diabetes
There are several strong domestic processors in WBC countries such as Foodland in Serbia, Vitalia in Macedonia or Podravka in Croatia. The market is very competitive with several European processors also present on this market. European companies have higher market share in Slovenia.
b.Yogurts with probiotics
WBC diaries are leaders in this category in WBC markets. Some of the WBC diaries such as Dukat and Imlek are present at several WBC markets. In Serbia, processors with production facilities in Serbia have more than 95% of the market. However, Croatian Dukat has its production in Serbia. In addition, Dukat is also present in Bosnia, Montenegro and Macedonia. Imlek is present in Bosnia and Montenegro as well. French Danone is the main European processor present in WBC in this category. It is significant player in Slovenia, Croatia and Macedonia. Although there is a foreign presence in WBC countries in this category, national companies dominate the market in the most of studied countries (except in Slovenia).
c.Milk enriched with vitamins and minerals
National processors are market leaders in WBC countries. In addition, leading national processors such Imlek, Dukat, Ljubljana diary plant are important exporters to Bosnia and Herzegovina, Macedonia and Montenegro. European processor Meggle is present in some WBC countries. Market share of national companies in Serbia, Croatia and Slovenia is high while national companies in other WBC markets are endangered by foreign (dominantly WBC competition).
d.Light margarine
There are no national margarine processors in Slovenia, Bosnia & Herzegovina, and Montenegro. European companies dominate the market in Slovenia and are important player in Croatia.. In Croatia, national processor Zvijezda is market leader. There are two strong processors in Serbia, market leader Dijamant and the first follower Vital. Serbian manufacturers are also present in Bosnia and Herzegovina and Montenegro.
e. Fruit juices enriched with vitamins
National processors are market leaders in this category in almost all WBC markets. Some of the processors are owned by foreign companies but their production facilities are in WBC countries. In Serbia, almost 100% of products in this category are produced by manufacturers with production facilities in Serbia. WBC processors export in other WBC countries. Market share of the companies out of WBC countries is probably low in this category (except again in Slovenia and in Croatia).
FOCUS‐BALKANS DL 6.1 Consumer study implementation for products with health claims

FP7 KBBE 2007 1 110 GA 212579
One of the reasons for dominance of WBC companies in almost all studied categories is high import barriers for foreign companies in several WBC markets (except of course in Slovenia). In addition, CEFTA allows most of WBC processors to export to other WBC countries under privileged conditions. Therefore, products are much more prices competitive compared to imported products.
3.1.4.Estimated market shares for the studied categories
a.Dietetic jam
The market of dietetic jam is small. At the studied market European companies have probably all together the more important market share, for the whole area. They have important market share in Slovenia and Croatia.
Most of the interviewees said that market size is connected with specific target population group – people suffering from diabetes (see statistical data analysis). It predominately has impact on the market share of the studied category.
Product is oriented to specific target group of customers, and so market share is relatively low. (Serbia, producer)
Globally, according to the collected data, the specific market of jam for persons suffering from diabetes is for all WBC a few hundred tons maximum (and probably around 500 t). It represents significantly small percentage of global consumption of total family of product – jam, in the region.
b.Yoghurt with probiotics
National companies are leaders both for the family of products and probably probiotic yogurts at WBC market (except in Slovenia). The estimate of market share is based on the processors answers as basic source of data, while retailers’ answers are used for required adjustments.
Unfortunately, the market share is not very high. One of the reasons is the higher price. On the other hand, there are still consumers that appreciate the high content of fats in the products, believing that these products are more natural. They are skeptic about the added components and the processing where some of the fat is removed. The level of nutritional knowledge of the consumers is very moderate. (Macedonia, processor)
These types of products are better sold in towns. This is not the case in the other parts of the country, small towns or in the rural area, where the most important thing to the people is the price. They don't mind whether the yoghurt is with probiotcs or wit low fat content. The price is the factor of decision there. (Macedonia, retailer)
More penetrated markets have higher market share of probiotic yoghurt. Slovenian market is more advanced than Serbian and Croatian. Generally, estimated share of
FOCUS‐BALKANS DL 6.1 Consumer study implementation for products with health claims

FP7 KBBE 2007 1 111 GA 212579
probiotic yoghurts is more than 10% in Slovenia, Croatia and also Serbia, but less than 10 % in Macedonia (slighlty less than 10%) and Montenegro and B&H where this share estimats less than 5%. It is more or less in the line with Datamonitor. Our estimation is slightly lower for Slovenia than Datamonitor (see page 45). For information the market share estimated by Datamonitor in Western Europe was, in 2009 of 27 %, as compared with the global family of yogurts and sour milk drinks (for Probiotic/ prebiotic spoonable and drinkable yogurts).
c.Milk enriched with vitamins and minerals
WBC market of milk enriched with vitamins and minerals mostly consists of domestic producers. The market share of this product category in the total family (milk) is estimated from 5% to 10 %. According to interviews, the largest market share is recorded in Croatia, followed by Serbia and Macedonia, while market share of enriched milk in Slovenia is significantly lower than it is expected (from 2 to 4%).
d.Light margarine
Concerning margarine in general, the most important WBC producers are from Serbia and Croatia. Serbian producers are domanant at Montenegrin and Macedonian market. Both Croatian and EU producers are present at Slovenian market. The Serbian market for light margarine could be considered with market share slightly more than 10% (as compared to global market of margarine).
Serbia is very high in fat. Majority of the market is 60-80 % fat content. (EU exporter)
Similar situation is in Slovenia and Croatia. Lower market share is estimated for Macedonia and Montenegro (from 5 to 10%), while the lowest market share estimates for B&H (less than 5%). WBC low fat margarine market could be estimated around 10% of the global market of margarine (at least 6000 t).
It is interesting to point out that the market share for low fat margarine is estimated by Datamonitor to be around 15 % in Western European countries in 2007. Also, we can mention that the margarine with claim related to the good ratio of W3 and W6 could be estimated to be more than 10 % in Croatia (and less than 5 % in Serbia).
e.Nectars enriched with vitamins and minerals
Globally, enriched fruit juices WBC market share is estimated around 5% (20000 t). Retailers` estimates are significantly higher compared to those given by producers probably because of their perception of this category importance at the market according to their policy. Nectars enriched with vitamins and minerals are often used for the promotion purpose by producers and therefore their presence on the shelves is higher than their market share.
In the WB countries where functional products (probiotic) in this category are registered, market share of those functional products is even lower than estimated share of enriched juices. It is estimated on the level less than 1% in volume, and slightly above 1% in value.
FOCUS‐BALKANS DL 6.1 Consumer study implementation for products with health claims

FP7 KBBE 2007 1 112 GA 212579
It is also interesting to mention that the market share of fortified/ functional fruit and vegetable juices are estimated to be 17.5 % of the global family by Datamonitor in Western Europe in 2007.
Although organic juice is not a subject of this study, some producers and retailers consider this type of products also as an important category.
Beside the studied categories some producers found interesting to speak about other functional products as ice-cream, functional water, light mayonnaise, bio light cottage cheese and hall grain cereals. Traditional products are also considered as products with added value and wrongly treated as functional by some producers. Therefore mentioned products are not included in this analysis.
Our aim was, through this quantitative part of the survey to better understand the importance of products with nutrition and functional claims in Western Balkans countries today. The studied categories have to be seen as representative examples of functional food (but they are only examples). All data collected through the different interviews, although sometimes incomplete or unprecise, brought nevertheless interesting information.
First, these kinds of products exist, and begun to have a significant market share, even if this market share is generally much less important than in Western Europe. Very schematically, (except for jam for persons suffering from diabetes, which is specific), estimations for the studied categories vary from 5% to 10 % in average, as compared with the global family of products. Generally, this marketshare is higher (often more than 10%) in Slovenia and also in Croatia than in other Western Balkans countries (rather around 5%) with different positioning of Serbia between these two groups, according to the different products. These data allow a better understanding of the consumers demand and the trends of these markets that are presented hereafter.
3.2.Motivations/barriers toward products with N&H claims 3.2.1. Motivations
Improving company’s image by selling healthy food and answering the consumer’s needs were the most often spontaneously evoked motives by retailers for selling N&H claim products.
FOCUS‐BALKANS DL 6.1 Consumer study implementation for products with health claims

FP7 KBBE 2007 1 113 GA 212579
(Serbia, retailer)
″To improve image of the company is the first motivation. We are selling safety products with health claims and it has influence on our consumers, their trust in our retail chain. Consumers of this category are with higher income status, and we are interested to have them in our supermarkets. To answer on consumers needs and to get their confidence, to educate customers about health importance of products with N&H claim, to made our company regional leader in
sales of these products.″
As shown in Chart 1, retailers ranked answering consumer’s demand as the most important motive followed by improving company’s image. Profit motive is at the last place. This shows that retailers use studied categories as a positioning tool and do not expect high profitability from them. However, it should be careful with these results because putting the profit at the last place is socially desirable answer. In addition, the growth of these categories will increase their contribution to the retailer’s profitability.
4,00
2,00
1,50
3,50 3,50
0,00
0,50
1,00
1,50
2,00
2,50
3,00
3,50
4,00
med
ian
rank
R_Profit_motiv R_Image_motiv R_Cons_motiv R_EU_motiv R_Mposit_motiv
Chart 1. Motivation to sell nutrition and health claim products-retailers
FOCUS‐BALKANS DL 6.1 Consumer study implementation for products with health claims

FP7 KBBE 2007 1 114 GA 212579
Spontaneous answers of the processors varies by categories. However, consumers are mentioned in several contexts. Answering the consumers demand is the main motive for processors in the most of the studied categories. Processors of jam for persons suffering from diabetes, yoghurt with probiotics and light margarines consider answering consumer demand as the main motive for manufacturing N&H claim products. Improving marketing position and company’s image are following motives. Following EU trends and generating profit are the least important motive for processors.
″Generation of profit is not so important because this category is a very small segment of the market. The other motivations are more important. As a dominant leader we have to be trendsetters and fulfill the demands of the consumers that are getting more informed about new
products traveling around Europe.″ (Macedonia, producer)
″The launch of these products enhances market position in several ways ‐ Expanding the target group of consumers, and greater consumption and sale of the product, as well as improving image
of the company, which indirectly influence the consumption of other product categories.″ (Serbia, producer)
″There is a request from consumers. It is also to answer to harmonisation with surrounding
countries.″ (EU exporter)
0
0,5
1
1,5
2
2,5
3
3,5
4
4,5
5
med
ian
rank
Category I Category II Category III Category IV Category V Category VI
P_Profit_motiv P_Image_motiv P_Cons_motiv P_EU_motiv P_Mposit_motiv
Chart 2.Motivation to sell nutrition and health claim products-processors
Note: Categories I – VI: jam, yogurt, milk, margarine, juice, miscellaneous
Comparing retailers and processors answers, it is obvious that answering consumers demand is the main motive for manufacturing and selling N&H claim products. In addition, profit and following EU trends are the least important motives. However, this does not mean that these criteria are not important. Some categories generate modest sales volumes comparing to regular products and therefore they are not as
FOCUS‐BALKANS DL 6.1 Consumer study implementation for products with health claims

FP7 KBBE 2007 1 115 GA 212579
profitable. However, the growth of these categories will influence profit motivation of the companies.
3.2.2. Barriers
Retailers point out that the main barriers for N&H claim products in WBC are consumer related. Eating habits are the most important problem for retailers followed by consumer’s awareness and low demand. Consumers do not include these products in their diets and they are not aware of them. This results in lower demand. Retailers do not perceive relationship with foreign companies, logistic difficulties and availability of products as important problems in WBC markets.
2,391,89
2,96
2,07
3,43 3,57 3,79
2,43
0,00
0,50
1,00
1,50
2,00
2,50
3,00
3,50
4,00
aver
age
mar
k
R_Avail_problem
R_Foreign_problem
R_Price_problem
R_Logistic
R_Low_demand
R_Cons_aware
R_Habit_problem
R_Compet_problem
Chart 3. Barriers to sell nutrition and health claim products
″Prices of the ingredients are the main problem here. The vitamins and the minerals for the fortification of the products are ingredients with usually higher prices. On one hand, we are aiming to offer nutritionally richer product and on the other hand, we have to keep in mind the price of the product to be enough competitive and acceptable to the consumers.″ (Macedonia, producer)
″The main problem is the regulation. It is very difficult to obtain all necessary licenses, some components are imported and some distributors are foreign companies, so it takes a lot of time to get all the permits.″ (Serbia, producer)
FOCUS‐BALKANS DL 6.1 Consumer study implementation for products with health claims

FP7 KBBE 2007 1 116 GA 212579
0,00
0,50
1,00
1,50
2,00
2,50
3,00
3,50
aver
age
mar
k
Category I Category II Category III Category IV Category V Category VI
P_Financ_problem P_Scient_problem P_Regulation P_R&D_problem P_Info_problem
Chart 4. Barriers to develop nutrition and health claim products-processors
Note: Categories I – VI: jam, yogurt, milk, margarine, juice, miscellaneous
As shown on the Chart 3 and 4, Regulations and insufficient knowledge of consumers’ needs have been perceived as the biggest problems in developing N&H claim products. These problems were also point out in spontaneous answers. However, the average grades are not very high-up to 3.5, therefore these are not serious barriers according to processors. The lack of scientific support in the development of innovation and financial problems are next on the list of barriers. The least important barrier is the lack of experts and skills in the field of R&D.
3.3. Perception of demand 3.3.1. Processors’ and retailers’ overall attitude toward consumers’ demand
a. Spontanious associtations
In general, processors in all WBC perceive an increasing consumers’ demand for H&N claim products, especially for diary products (yogurt and milk). With regards to other product categories they also mostly spontaneously mention a growing demand, expected to increase even more in future.
We have noticed growth, slow growth for the moment being. For the future we are expecting bigger growth. (B&H, producer)
In the next 10 years there will be an increase in the consumer demand. This will be induced by producers. People will buy what they see in commercials- on TV and different marketing activities. (Serbia, producer)
I think that lately demand for product with N&H claims is increasing. (Montenegro, producer)
FOCUS‐BALKANS DL 6.1 Consumer study implementation for products with health claims

FP7 KBBE 2007 1 117 GA 212579
The consumers demand for these types of products is higher and higher. They are becoming more aware of the importance of nutrition in maintaining their health. (Macedonia, producer)
However, a few processors perceive the consumers’ demand not to be very high particularly due to price sensitiveness of local population (margarines and juices).
Consumer demand is not high... If you look at the market shares, dominant position at market is hold still by conventional products categories. (Serbia, producer)
There is no high demand for these products. The main factor is the price, which means that consumers are interested in healthy products only if their price is equal with the regular ones. (Macedonia, producer)
Asked for the level of their agreement with the statement Consumer demand related to products with nutrition and health claim is high today (1 strongly disagree - 5 strongly agree) the processors in WBC seem to be moderately in accordance with it (average score 3,17). The most frequent mark was 3 (12 out of 29 processors). As many as six processors have expressed their strong agreement (5) with this statement (Macedonia: jam, Bosnia: juices, Montenegro: yogurt, Croatia: margarines, Bosnia: milk and yogurt, Slovenia: juices), while only 2 have expressed a strong disagreement (1) (Slovenia: milk and yogurt, Bosnia: miscellaneous – biscuits).
In the national reports of all six countries of the Western Balkans, similar results have been obtained. The processors in each country find the demand not to be particularly high at the moment, however expect it to increase in near future. Serbian processors stress the fact that the consumers are highly price sensitive and not ready to pay more for obtaining products with H&N claims. The same may be assumed for other WBC particularly Macedonia, Bosnia and Montenegro, as was implicitly mentioned in the interviews.
On the other hand, foreign exporters to WBC perceive the demand for products with H&N claims not to be very high, while they also perceive the local consumers to be highly price sensitive. General agreement of foreign exporters with the aforementioned statement is 2.5 (vs. 3.17 as expressed by the local processors). However, similarly to how the trend has been perceived by the local processors, foreign exporters also expect the demand to start growing in near future.
“It will take time, but it will gradually increase. People are more educated, more and more travelling…” (EU exporter)
As regards retailers, in general they also expect the consumers demand for products with N&H claims to increase in near future. There are severe differences among the perceptions of retailers in different WBC. Namely, retailers in Slovenia and Croatia find the consumers’ demand relatively high, in Macedonia they perceive it moderate while in Montenegro and Bosnia and Herzegovina they perceive it at very low level. In Serbia, it is perceived not high enough, growing and varying in different regions of the country (higher in Belgrade and Vojvodina than in Central Serbia). On the other hand, the retailers overall agreement with the statement Consumer
FOCUS‐BALKANS DL 6.1 Consumer study implementation for products with health claims

FP7 KBBE 2007 1 118 GA 212579
demand related to products with nutrition and health claim is high today (1 strongly disagree - 5 strongly agree) is somewhat lower than the one expressed by the local processors (2.82). The frequencies of answers show similar pattern with the most frequent mark being 3 (12 out of 28 retailers). However, only two retailers (both Slovenian) have expressed a strong agreement with the statement (5) while three retailers strongly disagree (Serbia, Bosnia and Montenegro).
″The consumers demand for products with nutritional and health claims is growing. Until recently, these types of products were only used by individuals with health problems, but now we have a different situation. A lot of people with developed awareness about healthy diet are buying these products without having any health problems.″ (Macedonia, retailer)
″Consumer’s demand for products with nutrition and health claims is high.″ (Croatia, retailer)
″It is on very low level, partly because of high prices, but more because of knowledge and eating habits.″ (B&H, retailer)
b.Main criteria and restraints for choosing products with N&H claims
Health benefits as a factor influencing consumers’ choice of food is perceived as of a growing importance both by the local processors and retailers in all WBC. While the population in general is seen as very much price sensitive, there is a group of consumers who are aware of functional food and its benefits and ready to pay more to obtain it.
″The main reason to buy any functional products is the functional benefit it offers. Loyalty towards functional products is high, so that in this specific target group, price sensitivity is low (which does not apply to the entire market, where price is an important factor in the choice making).″ (Serbia, producer)
″The awareness of the consumers is growing and this criterion is becoming more important. This is a result of the fact that, nowadays, the food with nutritional and health claims is not so expensive, i.e. it has acceptable prices for most of the consumers. This type of food stopped being exclusive and has comparable prices with the conventional food.″ (Macedonia, producer)
″Health benefit is very important to the consumers. More important than we usually think but they are restricted with the price and can not always afford these products.″ (B&H, producer)
″It becomes more important and it will grow in the future.″ (Serbia, retailer)
″It is becoming more and more important. There are consumers buying a specific product which is essential for their well being regardless its price. Also, some of the consumers which are quite aware of the health benefits of some food are buying products with health and nutritional claims even though they don't have any health problems.″ (Macedonia, retailer)
FOCUS‐BALKANS DL 6.1 Consumer study implementation for products with health claims

FP7 KBBE 2007 1 119 GA 212579
″Health benefit is important criteria for consumer’s choice of food - it is one of more important criteria.″ (Croatia, retailer)
The median ranks of importance of different criteria of consumers’ choice of food are provided in the following charts (3a: perception of processors by food categories and 3b: perception of retailers).
0
1
2
3
4
5
6
med
ian
rank
Category I Category II Category III Category IV Category V Category VI
P_Price_criter P_Taste_criter P_Safety_criter P_Fresh_criter P_Health_dim_criter P_Label_criter
Chart 5. Criteria of consumer’s choice of food: Processors
Note: Categories I – VI: jam, yogurt, milk, margarine, juice, miscellaneous
In general, if applied to the whole population in WBC, price is seen as absolutely the most important criterion for consumers’ choice of food with two exceptions: 1) concerning product category (taste is perceived to be more important than price when buying margarine) and 2) concerning country differences (retailers (unlike processors) in Croatia find price to be the least important criterion in consumers’ choice of food, in Montenegro both processors and retailers and in Macedonia retailers gave a higher rank to safety and health dimensions than to price).
″Main important thing is price. People are buying what is cheaper no matter of the declaration.″ (B&H, producer)
″Consumers take care about food safety and health dimension of food.″ (Montenegro, producer)
FOCUS‐BALKANS DL 6.1 Consumer study implementation for products with health claims
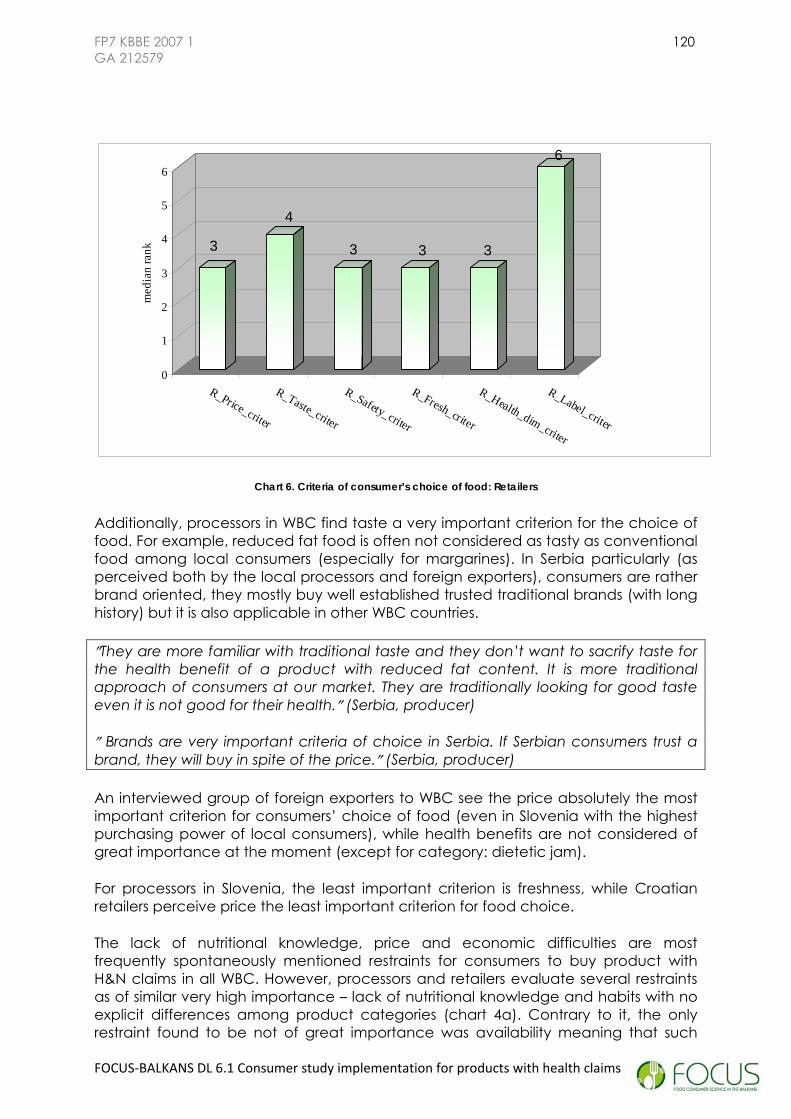
FP7 KBBE 2007 1 120 GA 212579
3
4
3 3 3
6
0
1
2
3
4
5
6
med
ian
rank
R_Price_criter
R_Taste_criter
R_Safety_criter
R_Fresh_criter
R_Health_dim_criter
R_Label_criter
Chart 6. Criteria of consumer’s choice of food: Retailers
Additionally, processors in WBC find taste a very important criterion for the choice of food. For example, reduced fat food is often not considered as tasty as conventional food among local consumers (especially for margarines). In Serbia particularly (as perceived both by the local processors and foreign exporters), consumers are rather brand oriented, they mostly buy well established trusted traditional brands (with long history) but it is also applicable in other WBC countries.
″They are more familiar with traditional taste and they don’t want to sacrify taste for the health benefit of a product with reduced fat content. It is more traditional approach of consumers at our market. They are traditionally looking for good taste even it is not good for their health.″ (Serbia, producer)
″ Brands are very important criteria of choice in Serbia. If Serbian consumers trust a brand, they will buy in spite of the price.″ (Serbia, producer)
An interviewed group of foreign exporters to WBC see the price absolutely the most important criterion for consumers’ choice of food (even in Slovenia with the highest purchasing power of local consumers), while health benefits are not considered of great importance at the moment (except for category: dietetic jam).
For processors in Slovenia, the least important criterion is freshness, while Croatian retailers perceive price the least important criterion for food choice.
The lack of nutritional knowledge, price and economic difficulties are most frequently spontaneously mentioned restraints for consumers to buy product with H&N claims in all WBC. However, processors and retailers evaluate several restraints as of similar very high importance – lack of nutritional knowledge and habits with no explicit differences among product categories (chart 4a). Contrary to it, the only restraint found to be not of great importance was availability meaning that such
FOCUS‐BALKANS DL 6.1 Consumer study implementation for products with health claims

FP7 KBBE 2007 1 121 GA 212579
products were generally available to the local consumers at a satisfactory level (chart 7 and 8).
″Habits, uninformed consumers, higher price of products with nutrition and health declaration.″ (Serbia, producer)
″One of the constraints is the low level of nutritional knowledge of the consumers about a certain ingredients in the food that might have some beneficial effect on their health. The price is not a problem any more.″ (Macedonia, producer)
″People do not know about those products enough. Lack of knowledge exists.″ (B&H, producer)
″Ignorance (people don't know) such products. There is not enough information available.″ (Slovenia, producer)
″The main restraint for consumers to buy products with H&N claim is price (higher price).″ (Croatia, retailer)
″Lack of knowledge, high prices, but the most important is eating habits.″ (Bosnia, retailer)
″Financial situation is the most important problem.″ (Montenegro, retailer)
The average scores of importance of several restraints for consumers’ choice of food with H&N claims are provided on the following charts (4a: perception of processors by food categories and 4b: perception of retailers)
0.00
0.50
1.00
1.50
2.00
2.50
3.00
3.50
4.00
4.50
5.00
aver
age
mar
k
Category I Category II Category III Category IV Category V Category VI
P_Price_restr P_Econ_diffic_restr P_Nutrit_know_restr P_Avail_restr P_Habit_restr
Chart 7. main restraints for consumers to buy products with H&N claims: Processors
Note: Categories I – VI: jam, yogurt, milk, margarine, juice, miscellaneous
Certain differences among WBC countries are present. For example, price and economic difficulties are perceived to be absolutely the most important restraints by
FOCUS‐BALKANS DL 6.1 Consumer study implementation for products with health claims

FP7 KBBE 2007 1 122 GA 212579
processors in Montenegro, Croatia and Serbia, while Macedonian processors find the lack of nutritional knowledge and eating habits the two most important restraints. Bosnian processors also find eating habits to be the most important restraint, followed by price. Finally, Slovenian processors happened to be not very much decisive concerning this issue as they find economic difficulties, eating habits, price and lack of nutritional knowledge to be the restraints of almost equal importance for the local consumers. Retailers in WBC generally share the same opinion as processors: in Montenegro they see nutrition knowledge and price to be the most important restraints for consumers’ choice of functional food, in Serbia these are nutrition knowledge and eating habits, in Slovenia price and lack of nutrition knowledge, in Croatia economic difficulties and price, in Macedonia lack of nutrition knowledge and in Bosnia eating habits, economic difficulties and availability.
3.86 3.714.07
2.50
3.82
0.00
0.50
1.00
1.50
2.00
2.50
3.00
3.50
4.00
4.50
aver
age
mar
k
R_Price_restr
R_Econ_dific_restr
R_Nutrit_know_restr
R_Avail_restr
R_Habit_restr
Chart 8. The main restraints for consumers to buy products with H&N claims: Processors
Interestingly enough, foreign exporters to the WBC markets also see the lack of nutritional knowledge (except in Slovenia) as well as price (i.e. economic conditions) to be the most important restraints. Sometimes the low availability of such products in less developed regions of the countries of the Western Balkans have been mentioned. Availability was perceived to be the least important restraint among the local processors and retailers with only a few exceptions.
″Products are sometimes available, but sometimes they are not available at the market.″ (Montenegro, producer)
″In a local store, the chances to see or bye a specific product are very weak. The local stores are usually supplied with ordinary products and there is not enough choice of different products.″ (Macedonia, retailer)
″Low availability of products, eating habits, economic situation, lack of awareness on nutritional and health value of food.″ (Bosnia, retailer)
FOCUS‐BALKANS DL 6.1 Consumer study implementation for products with health claims

FP7 KBBE 2007 1 123 GA 212579
c. Communication and information
With just a few exceptions (Serbia, Bosnia and Slovenia) processors in WBC generally think that consumers do read nutritional information provided on food packaging prior to making purchases. Similar opinion has been expressed by WBC retailers with only a few exceptions (Serbia, Macedonia and Montenegro). Additionally, processors and retailers in WBC have named other important sources of information for the local consumers: word-of-mouth, advertising, daily papers and magazines, as well as contacting their salespeople and other company representatives in charge of providing information to customers.
″More than before, but still too little, I would give a 2+. Consumers usually read labels before buying something. They want to know what they are giving their money for.″ (Serbia, producer)
″In general those who take care about their consumption, they read before buying.″ (Montenegro, producer)
″They read information on label and on packaging, advertisement on TV, advertisement of retailers, articles in different magazines for healthy life.″ (Slovenia, producer)
″Those consumers who are interested happen to call our Sales department and ask about a certain product. Some of them get the information asking a friend or a relative that is consuming the product of interest.″ (Macedonia, producer)
″Recently this has become very important, they read before they buy and if they are not satisfied what they red they won't buy.″ (Croatia, retailer)
Contrary to it, foreign exporters to WBC countries think that consumers generally don’t pay much attention to the information provided on packaging, except in the case of dietetic jam.
″Consumers’ attention mainly goes to price label and expiry date before list of ingredients and after that to nutritional information.″ (EU exporter)
To communicate health benefits of the products WBC processors use all available marketing communications tools and media – packaging (verbal descriptions and pictograms), sales promotions, TV advertising, billboards, retailers’ leaflets and brochures, media announcements, press releases and other PR tactics, but also well educated personnel in specialized shops who would be ready to provide counseling to consumers. In general, there seem to be no differences among WBC processors as well as among different product categories however the bigger is the company market player on the local market, the more money it invests in advertising and promotions.
The majority of WBC processors use research as a source of information on consumers’ demand (with a few exceptions - smaller companies). Both qualitative and quantitative methods are applied, research conducted both continually and
FOCUS‐BALKANS DL 6.1 Consumer study implementation for products with health claims

FP7 KBBE 2007 1 124 GA 212579
ad hoc, internally as well as by engaging well known marketing research agencies in the regions. Processors claim to be using focus groups, surveys, usage and attitude studies, brand parameters studies, publicly available data and studies of independent consumers associations as well retails audits.
″We use public available information and results of different researches - from Slovenian Consumer Association.″ (Slovenia, producer)
″We use both qualitative and quantitative research. We use focus groups, brand puls, questionnaires during promotion campaigns, interviewing by telephone.″ (Serbia, producer)
″We are oriented to the Usage & Attitude Research, testing product concepts, retail audit research.″ (Serbia, producer)
″We use continuous and ad hoc research internally conducted and externally through marketing research agencies.″ (Croatia, producer)
In comparison to processors, there seem to be more retailers in WBC claiming not to be using any consumer research as a source of information on consumers’ demand (seven out of 28). Also the research methods used by retailers are by far simpler than those used by processors, varying from mystery shopper, loyalty cards, interview with customers on spot and open dialog with customers, customer comments books, customers’ complaints and in only a few cases surveys on brand preferences, market share studies and sales analysis.
″We are hiring companies that are organizing some research activities. We had collaboration with two companies (one domestic and one foreign). One of the researches was "secret consumer" when agents were analyzing the situation in our market. All the activities were previously arranged and afterward the results were analyzed.″ (Macedonia, retailer)
″Loyalty cards.″ (Croatia, retailer)
″Consumer attitudes toward processors brands, market shares etc.″ (Serbia, retailer)
d.Perceived consumers’ characteristics
Consumers’ characteristics are perceived as revealed in the following table:
Table 22. Characteristics of the consumers of N&H claims products
Characteristics Comment
Gender
male Female in general, however several processors and retailers in each of WBC covered by the study have also mentioned male cosumers of products of H&N claims Female
Age less than 15 years old Mostly the age group from 15 to 40, however all other groups were also mentioned. Processors of from 15 to 40 years old
FOCUS‐BALKANS DL 6.1 Consumer study implementation for products with health claims

FP7 KBBE 2007 1 125 GA 212579
from 41 to 64 years old diary products and margarines particularly mentioned age group from 41-64 and elder as consumers of products with H&N claims while young consumers were mentioned by only one processor (diary, Bosnia) and one retailer (Serbia). 65+
Household socioeconomic
status
lower income Mostly with higher but also middle income. Lower income was also mentioned a few times, particularly by retailers.
middle income higher income
Education level primary education
Secondary or higher/high education secondary education higher/high education
Health condition
without health problems
Both with and without health problems with health problems
Geographical situation
urban Both processors and retailers perceive consumers of products with H&N claims as urban population, to substantially lesser extent suburban and in only few cases they have also named rural population
suburban
rural Other
Processors and retailers perception of consumers of products with H&N claims in all WBC is quite identical. Consumers are generally female belonging to the age groups of 15 to 40 years, or elder (40-64), with higher or middle income, secondary or high education, with or without health problems, living in urban areas. Consumers of products with H&N claims are perceived mostly as practicing a healthy life style, following modern trends and fashion in food consumption, active (sportsmen, businessmen) or mothers who are expected to provide healthy food for their families.
However, several processors and retailers in each country separately and for various products categories (with exception of juice and jam) have also noticed male as consumers of products with H&N claim. Additionally, other age groups were also mentioned particularly elderly (from 40 to 64, 65+ to lesser extent) and in just a few cases young population. Processors and retailers generally agree that these are mostly consumers with higher or at least middle income and living in urban, to lesser extent suburban areas. There are no explicit differences concerning this issue either by product categories, countries covered by the study or between processors and retailers. The perception of the foreign exporters to WBC highly mirrors the perception of local processors and retailers.
In addition to that, both processors and retailers perceive consumers of products with H&N claims as those who lead a healthy life style, live quick and active lives, want to stay fit, sportsmen or businessmen, but also mothers who take care of intake of healthy food for the whole family.
″Active life style, mothers.″ (Slovenia, producer)
FOCUS‐BALKANS DL 6.1 Consumer study implementation for products with health claims

FP7 KBBE 2007 1 126 GA 212579
″Light group of people. Lifestyle is very important. Here is a smaller population that takes more care about health, follow trends.″ (Serbia, producer)
″Sportsmen, because of higher needs for proteins, mothers, and fashion in food consumption″. (B&H, retailer)
″Also women with health life stile, they want to be fit, to have a good body line.″ (Montenegro, retailer)
3.3.2. Cross-perception of processors supply and retailers’ demand
In all products categories WBC processors mostly perceive retailers demand for products with H&N claims lower than for the conventional products in their product portfolio. The reasons mostly mentioned are limited shelf space, retailers interest in higher turnovers, their expectancy that consumers’ demand for H&N products won’t grow very fast as well as development of private labels in H&N products category (Slovenia exclusively). On the scale from 1 (very low) to 5 (very high) the demand from retail chains was evaluated 3.17 (average).
″They are not really interested in the sale of this product. The main problem is the high prices of juices with functional claim, so it takes a lot of time to sell some bigger quantity of these products and consequently, retailers don't want them in their shops.″ (Serbia, producer)
″The demand is not so pronounced. We are trying to put these products on the shelves, because the retailers only want to cover their selling area with products that will be sold immediately.″ (Macedonia, producer)
″They don't expect growth of demand, because such products buy very small and limited group of people.″ (Slovenia, producer)
Regarding specialized channels and independent retailers situation is even worse. Many processors in all product categories don’t have an excess to specialized channels. Such channels are either not available or they don’t have cooperation or communication with them (sell only through wholesalers and distributors). Therefore, on the scale from 1 (very low) to 5 (very high) the demand from specialized channels was evaluated 2.52 (average).
″We don't have information. Wholesalers distribute them with juices.″ (Serbia, producer)
″We do not use specialised channels in dietetic products.″ (Macedonia, producer)
″We do not have specialized channels.″ (Montenegro, producer)
The demand of independent retailers is also perceived lower than from retail chains due to even more limited shelf and storage space and the business requiring even higher turnover of stored goods. Interestingly however, demand for some categories of products with H&N claims (particularly margarines) in Serbia seems to have a
FOCUS‐BALKANS DL 6.1 Consumer study implementation for products with health claims

FP7 KBBE 2007 1 127 GA 212579
seasonal character: the demand is growing in the fasting periods (during Christmas and Easter seasons), leaving us with a notion that there is a big enough group of local consumers’ buying such products to satisfy symbolic (folklore, religion) rather than functional (health) needs.
″They are very limited with space and it takes a lot of time to sell these juices so they don't want to have them in stores.″ (Serbia, producer)
″Demand depends on seasonality of product. During the feasts our company products with nutrition claims are more demanded by small independent retailers. They do not have storage space and capacities for large storage keeping. It is a problem.″ (Serbia, producer)
3.3.3. National policy for nutrition
Processors in WBC are highly dissatisfied with national policy for nutrition. For these stakeholders, in most of the countries such policy has not been developed (Serbia, Montenegro, Macedonia, Bosnia and Herzegovina) or implemented (Slovenia). Processors rather strongly disagree (average mark 2.03 on 1 to 5 scale, 1 strongly disagree, 5 strongly agree) with the statement national nutrition policy today is satisfactory and well suited for the improvement of customer awareness.
There seems to be a strong consensus among processors in all WBC regarding this issue, therefore no differences could be mentioned either by product categories or countries.
″We do not know if we have this policy. We did not notice it.″ (Serbia, producer)
″There no enough attention paid to this issue - products with the health and nutrition claims.″ (B&H, producer)
″I don't think that we have any national policy for nutrition.″ (Macedonia, producer)
″We are not aware of this policy. We are very bad informed about it.″ (Montenegro, producer)
3.4. WBC N&H claim products market perspectives and conclusion
3.4.1. Main factors of change and its potential influence on the consumption
Demand for products with H&N claims will increase in the future. It is a common opinion of the economy sector stakeholders in WBC. But in the near future interviewees do not see any significant change in the consumers demand.
″In two or three years there will not be important changes, it is time of economic crisis, it has important influence on the market, and there will not be large changes therefore.″ (Serbia, producer)
FOCUS‐BALKANS DL 6.1 Consumer study implementation for products with health claims
FP7 KBBE 2007 1 128 GA 212579
“In the next 10 years there will not be changes at all. It takes longer time to change some things. Cabbage, potato, meat product and, food with high fat content are present in every household. School lunch program might be implemented in order to improve eating habits. ” (Montenegro, producer)
Increase will be caused by higher average income at the first place. It is also pointed out by EU exporters as an important condition of change. People in a first time will consume and in a second time will ″more intelligently consume″. In actual situation of economic crisis, even in Slovenia as the most developed country in region, people buy what they are able to afford.
“The main factor of change could be the higher living standard of the population. When they have higher incomes they can afford products of higher quality including the one with claims. On the other hand, my opinion is that the consumers in Macedonia are a little bit skeptical when it comes to accepting new products placed on the market”. (Macedonia, producer)
“The increase in purchase power is the factor no 1. Consumer awareness is not sufficient; it needs to be justified with appropriate income”. (Serbia, producer)
″I think that consumers will be more educated in the future and they will earn higher salaries than now.″
(Serbia, producer)
“The prices of food will never again be as low as today.” (Slovenia, producer)
Besides income and overall economic situation, knowledge has got also important role in the perceived N&H claimed products demand change. From the EU exporters point of view nutrition knowledge and health dimension of food received the best scores in average, slightly higher than purchase power. However, in WBC countries producers put nutrition knowledge at the second place, right after consumers’ income. According to interviewed representatives, education has to start in elementary school due to bad eating habits of population.
“Health dimension of food, life style, improvement of income are important factors. Our consumers will opt more for dietetic and probiotic products. Classical products will be replaced with dietetic products. Our offer is dictated by the changes in demand. “(Montenegro, producer)
“Our company’s motto is creating healthy nation by creating healthy youth. We have to create healthy eating habits starting from very early age, starting from schools and introducing subjects as “Food and nutrition” or organizing courses on nutrition, foundation of specialized schools for nutrition, faculties etc.” (Macedonia, producer)
“The knowledge of the consumers is the most important factor. They are aware of this kind of products and if they were better educated they would change their approach to the consumption. “(Montenegro, retailer)
FOCUS‐BALKANS DL 6.1 Consumer study implementation for products with health claims

FP7 KBBE 2007 1 129 GA 212579
The acceptance of changing lifestyles is also important factor of N&H claimed products development. Processors also pointed out importance of following EU trends as a factor that would influence the N&H products consumption. In addition, interviewed companies representatives (mostly retailers) often put products with N&H claims into the group of market trends. It is pointed out that domestic consumers will adopt habits of Western consumers who are perceived to take more care of health aspects of food than WBC consumers. Sometimes changing lyfestile is connected both with fashion and European trands. This could be linked with a better access to EU for some WBC, as it is pointed by EU exporter.
“I expect that consumers will become more educated and informed about the food with claims in future. Moreover, it's very interesting that fashion and lifestyle are factors that influence the consumption of some product and this is the case not only here, in Macedonia, but in the other European countries, as well.” (Macedonia, producer)
“Consumers will have more access to others European countries> we will have more awareness of consumers.” (EU exporter)
However, according interviewees opinion, WBC region is for five or more years behind EU trends. Although interviewed producers (especially leaders) seem to be completely ready for the N&H products market development, they could not put products at the market if consumers in WBC region still were not ready for them. It obviously suggests that the WBC N&H market is producers driven.
“The trend of consumer's demand will be ascending because our company has a plan for a strategic development and plan to invest more efforts in affirmation of the healthy nutrition. Keeping this in mind, we expect increased awareness of the consumers, and according to this fact increased consumption of food with H&N claims, especially if we consider all these diseases of the modern age, epidemics caused by diminished immunity etc. ” (Macedonia, producer)
“It depends on many factors, mainly from investments to the commercial and promotional campains. “ (B&H, producer)
“It will significantly grow but it requires stronger promotion. “ (Serbia, retailer)
Although consumers will be more educated, stakeholders pointed out that promotional activity of the public institutions on healthy diet would be the least important factor of change. In Bosnia and Herzegovina education in area of food consumer science is completely neglected and therefore consumers consciousness and responsibility to the own nutrition is on the lowest level. However, in the underdeveloped WBC N&H claim products markets the public policy is distinguished as an important driver of changes (Montenegro, B&H and Macedonia).
“That is the matter of education and public institutions. They have to influence people. ” (B&H, producer)
FOCUS‐BALKANS DL 6.1 Consumer study implementation for products with health claims

FP7 KBBE 2007 1 130 GA 212579
“Population, social status, education will influence the changes in food consumption. Education from children, from kindergartens is important too. The spreading of fast food restaurants has to be stopped.” (Montenegro, producer)
Additionally, the influence of globalization versus ethnocentrism was also important topic of discussion with interviewees in Slovenia and Croatia. According to respondents this will depend very much on economical situation in the country. Consumers will pay less attention to origin if situation will worsen.
“For the time being Slovenes still prefer the locally produced and processed food. “ (Slovenia, producer)
As country is developing, the important factor will be also the time which people will have or will be willing to use for food preparation and eating. Therefore a type food which is convenient could get larger share on market.
“In this modern age when there is no time for cooking, I think they will look for a product that is easy to prepare and convenient to use but at the same time will contribute in promoting wellbeing and health”. (Macedonia, retailer)
Retailers pointed out importance of cooperation among economy sector stakeholders in N&H products market development. In the countries where N&H trade labels are not developed, retailers still think that processors should lead this process. They also think that domestic companies are not significantly motivated to offer these products at the market. Nevertheless, retailers’ opinion is slightly different regarding the main factors of demand for N&H claim products change. The most important factors of change are connected with nutritional knowledge, education and the public policy activities to promote healthier lifestyles in WBC region. Significantly less importance was given to the fashion and consumers purchase power. It could be argued by the retail format of surveyed companies. The most of them are in hypermarkets and supermarkets present in urban, developed regions of their countries. Their specific target population is both higher educated and income classes population.
FOCUS‐BALKANS DL 6.1 Consumer study implementation for products with health claims

FP7 KBBE 2007 1 131 GA 212579
0.000.501.001.502.002.503.003.504.004.505.00
aver
age
mar
k
Category I Category II Category III Category IV Category V Category VI
P_Nutr_know_factor P_Health_factor P_Public_policy P_Purchase_power P_Lifestyle P_Fashion
Chart 9. The main factors of change in consumption of studied categories
Note: Categories I – VI: jam, yogurt, milk, margarine, juice, miscellaneous
The chart providing revealing average marks for the perceived importance of the main factors of change at the market for studied categories with H&N claims in WBC is listed above.
First, it is interesting to mention that almost all proposed factors received in average high marks. The slightly higher importance of all listed factors was given by the observations in the category 1 – dietetic jam, where two factors have got average mark 5 (Consumer nutritional knowledge and Health dimension of food). Opposite, generally lower marks were given to the factors by the observation of product category IV – margarine. However, the lowest mark was given to the public policy by diary producers. In all studied categories the least important factor that could influence on the change in demand for N&H claims products is “fashion”, except in Macedonia. However, diary processors pointed out that fashion trends will be very important. The spontaneously mentioned factors are promotional campaigns conducted by specific company that might influence on overall demand. That is in the line with previously made conclusion that WBC N&H market is producers driven.
3.4.2. The trend of consumer’s demand and expected target population
All interviewed companies expect that consumers’ demand will increase in the long term. They think that overall economic situation will be improved. It will cause the higher demand for products with H&N claims. However, in medium term they do not expect any changes in consumer`s demand.
EU exporters also suggest that acceleration will be higher than in EU countries. It is also confirmed by producer from less developed WBC N&H claimed products market.
FOCUS‐BALKANS DL 6.1 Consumer study implementation for products with health claims

FP7 KBBE 2007 1 132 GA 212579
“In EU, markets are on the top of the hill. WBC markets are walking up the hill.” (EU exporter)
″Consumers’ knowledge in this area will grow, and sales will expand with about 50% in ten years″. (B&H, retailer)
On the other hand, there are a few exceptions. Some production sector representatives’ ponted out that it is not good time for health claimed products developing at WBC market.
″It is important to determine whether consumer buy more products if there is a health claim on them. It is not always easy to see the health or nutrition claim on the product - consumers do not read everything what is written in small caps. It is not good time for this products development, it is too early.″ (Serbia, producer)
Present leaders predict that they will remain the leaders in their food category. However, producers also pointed out international competitors’ importance in fastering development of WBC N&H claimed products market. It is also suggested from the EU exporters’ point of view. The demand for products could grow faster if there is enough innovation from companies ″to surpass the crisis and respond the demand″. However, just several strongest brands will be able to cope with it. Other brands will either disappear or become niche players. Brand has got an important role in less developed WBC market, particularly in Serbia.
″The demand will constantly grow in the following years. The best brands will dominate the market. The entrance of big foreign companies is expected and it can endanger domestic companies.″ (Serbia, retailer)
It is also important to mention that healthy products are considered often as an “umbrella” for different kind of categories other than health claimed products (for example, natural products – without preservatives or artificial or even organic products). Although interviewees do not consider this products are oriented only to the people with health problems, it is often suggest that health status of population might be important factor of shaping consumer`s demand trend in future.
“Trend will be positive, because of growing awareness of potential health risks and benefits from some kinds of products”. (B&H, retailer)
“Issues like health, (obesity of children…) and also sustainability are coming more and more worldwide concerns. Governments will be focusing on sustainability and health. These issues are political and will come as closest as possible of European trends”. (EU exporter)
However, in the least developed N&H market traditional eating patterns and diet are still important inspite of the fact that obesity and health problems occure. The specific perception of health food is present as well (“food as a medicine”).
FOCUS‐BALKANS DL 6.1 Consumer study implementation for products with health claims

FP7 KBBE 2007 1 133 GA 212579
“It will increase, but structure between dietetic and full fat content will not be changed. Children have to use high fat content milk. Milk products have been used traditionally in this region, which is very good. It is health product, easily available at the market. Our production will be increased with market structure change. ” (Montenegro, producer)
“People are realizing slowly that medicaments are helping them just partly or not at all causing bad effects. All food that can influence people health will get advantage in comparison to the conventional products and pharmaceutical products.” (B&H, producer)
Communication will also play an important role in shaping trend of N&H claimed products consumers demand. It is stressed out both from the WBC producers or retailers and EU exporters’ points of view.
“It depends on many factors, mainly from investments to the commercial and promotional campains.” (B&H, producer)
“You have to inform that cholesterol is more devastating than a plane crash. You have to explain why and give a solution” (EU exporter)
“All is depending on communication, from processors, government or Ministry of health. Somebody shall communicate” (EU exporter)
“The people are going to become more informed about the products enriched with a special ingredient”. (Macedonia, retailer)
Additionally, Slovenian processors argue that a certain number of “classical” products will still remain on market, but the share of products with N&H claims will increase. In certain way the situation is confusing: it is more and more declared how important health and healthy food is but at the same time regulative is so strong and sometimes very restrictive. One of the respondents believes that trend will go into direction of natural, pure, basic and simple.
“Regarding these products the food sector in on “chopping block”; on one side there are needs on the other possibilities.” (Slovenia, producer)
The prevailing life style is the style of instantly enjoyment - people like tasty food. Some processors claimed that target group will not change significantly in the future comparing to present target group. Future target group will consist mostly of women, 25-40 years old, with higher than average income and education.
″Educated, younger, employed, with higher purchase power, healthy life style consumers, women which take care how they look like…″ (Serbia, producer)
″Women up to 40 years, higher educated people with health problems. ″ (Montenegrin retailer)
FOCUS‐BALKANS DL 6.1 Consumer study implementation for products with health claims
FP7 KBBE 2007 1 134 GA 212579
“The target population will be educated people, following the trends, innovative and willing to try products different from the ordinary ones”. (Macedonia, producer)
Target populations will also be mothers as mothers are those one caring on whole families health (household gate keeper). Also level of education will have important role as educated people will be more aware of importance of proper nutrition.
″Females, housewife as they are taking care on whole family health.″ (B&H, producer)
Interviewees also think that target group will include broader public - children and people older than 45 years who take care about their health. At the same time elderly people with health restriction and health problems will always stay as important users of N&H claimed products. Moreover, the most interesting target group is young people (older than 15 years) because the eating habits are learned and accepted at early age and is followed throughout the whole life.
″Target population for N&H claims products are young more educated people or older people with better purchasing power.″ (Croatia, retailer)
″Younger population will use these products for prevention. However, the elderly, who have health problems, will use it more as well. ″ (Serbia, retailer)
“The younger population between 15-40 years will be the target group. If they accept the habit of eating healthy at early age they will continue to practice the healthy diet in the mature age, as well”. (Macedonia, producer)
“Younger generation 15-40 year more informed and interested in this products and programs. “ (Montenegro, retailer)
Producers form the most developed WBC N&H claimed products market argue that in the future targeting will be more precise and at the same time there will be new segments for these products. Youngsters and male are probably going to be new segments targeted since at the moment they are the most careless about what they eat. Also sports and people who want to stay fit and healthy might be interesting target population.
On the other hand, some producers mostly from the less developed WBC N&H claimed products market don’t have a clear vision about target population. It could be anyone – in other words total population is perceived as important for this market segment development. It is also often suggested by retailers no metter of country where they are selling products. Even EU exporters did not suggest clearly N&H claimed products target population.
″Everyone (Everybody) is target population.″ (Serbia, retailer)
″The same as it is today.″ (Serbia, producer)
FOCUS‐BALKANS DL 6.1 Consumer study implementation for products with health claims

FP7 KBBE 2007 1 135 GA 212579
“There won't be any special target population in the future. I think that the whole population without any exclusion will use these products”. (Macedonia, retailer)
3.4.3. Other topics evoked
Other topics evoked during interviewing were connected with the most important associations on health dimension of food not mentioned previously in the questionnaires. The associations refer to two main points – new legislation related to products with health claims in EU and absence of governmental support to the N&H claimed products development in less developed. First association mostly occurs in interviews conducted in more developed WBC and EU exporters, while the second comes from less developed WBC.
Processors suggest that the amount of products with N&H claims will be limited or even reduced by new legislation related to products with health claims. They also argue that consumers trust towards products with health claims is an important factor. The development of these products might be strongly correlated with regulation on nutrition and health claims. The nutrition claims are regulated in all Balkans countries and health claims are regulated only in Slovenia and, recently, in Croatia. When it exists, it has to be properly applied. It is very important that claims are not misleading consumers. It is already mentioned that producers think that there was no national policy for nutrition and that is one of the strongest barriers for future development of this market. They need to improve regulation and explain it clearly to producers.
“Magical benefits of ingredients, over promising ingredients… are misleading consumers”. (EU exporter)
“If they trust products, it could go quickly”. (EU exporter)
″Maybe more regulative, it has to be precise and defined according to common practice.″ (Serbia, producer)
In less developed WBC N&H claimed products market a few processors pointed out that the government must do more in subsidizing important activity connected with the public health. Even in Croatia retailers evoked questions of state subsidies for the local producers and fostering local production.
Respondents important impression is connected also with speed of development and change at this market segment. It is very hard to forecast the development due to the fact that perceptions of healthy food are exposed to the turbulent environment (changing market structure, internationalization and competition, regulation, knowledge etc.).
″It is only 15 years ago when the most appraised hog was the one with a lot of fat. At that time we could not even imagine how fast the situation will change.″ (Slovenia, producer).
FOCUS‐BALKANS DL 6.1 Consumer study implementation for products with health claims

FP7 KBBE 2007 1 136 GA 212579
4.N&H CLAIMS PRODUCTS MARKET - Experts` point of view SUMMARY General presentation of the organization with focus on food and health
• Participants in the survey were experts from 7 Institutes for Health Protection, 7 consumers' associations and 5 Health Ministries from the following countries: Slovenia, Croatia, Bosnia and Herzegovina, Serbia, Montenegro and Macedonia. Participants and experts from different areas are all closely connected through food policy and healthy nutrition.
• Activities which the surveyed organizations conduct are diverse and numerous. Work of the ministries is primarily focused on adoption and implementation of laws and legal rulebooks, as well as coordination of different governmental and nongovernmental institutions involved in food policy. Activities of the Institute for Public Health are mainly related to research, publication and drafting of rulebooks. Besides that, there are also activities of direct education of population through various projects, and advisory activities through the work of advisory offices. Consumers' Associations are focused on education and protection of consumers.
Consumer’s demand for products with nutrition and health claims
• Food-related problems that consumers from western Balkans are faced with can be classified in three categories: quality and safety of food, specification of product ingredients and degree to which the consumers are informed about these issues, as well as nutritional habits.
• Consumers in all countries of Western Balkans call into question the composition of some products and safety of their consumption. On the other hand, majority of experts think that food labelling is not satisfactory and understandable for consumers, particularly because, as they think, majority of consumers still aren't sufficiently educated about nutritional composition of products or proper nutrition and healthy food.
• According to experts, consumers choose food on the basis of price, safety and health benefits, but they focus their attention to labelling, product origin and taste to a lesser extent.
• According to experts, consumers from western Balkans demand products with nutrition and health claims. Although this demand still isn't developed to a high extent, it is nevertheless increasing. The demand for these products is significantly affected by their offer, price and promotional activities of companies.
• Consumers of products with nutrition and health claims are mainly younger women with children, with average or higher income, well informed, who care about preservation of their good health and live a fast-paced life.
Commercial offer and health claims
• Experts agree that offer of products with nutrition and health claims is rather large and diverse, but, according to them, quality of these products is not
FOCUS‐BALKANS DL 6.1 Consumer study implementation for products with health claims

FP7 KBBE 2007 1 137 GA 212579
always satisfactory. They also add that not all nutrition and health claims are always sufficiently verified.
• Majority of experts except those from Slovenia did not react positively to shown nutrition and health claims.
• According to them, certain nutrition claims have the following flaws: they are imprecise; they accentuate only positive aspects, while information about eventual harmful effects are missing; they are not harmonized with rulebooks on food labelling, and their accuracy can not be verified.
• According to majority of experts, health claims should not be allowed to appear on food declarations if they are not experimentally well proven. This particularly applies to claims which indicate a reduction in disease risk. Positively rated are only functional health claims which indicate presence or absence of certain allergens in the product.
• Experts agree that nutrition and health claims help to improve the consumers' habits related to nutrition, but they agree to a lesser extent that such statements affect the promotion of awareness about the importance of food and improvement of public health. The experts mainly do not agree that nutrition and health claims are adapted for prevention of basic health problems, and they agree to an even lesser extent with the statement that nutrition and health claims are true.
• General conclusion of experts is that the nutrition and health claims are simulating on one hand because, by accentuating the product benefits, they attract consumers to buy the product, while the other hand, with their insufficiently precise and verified information, they can mislead the consumers.
• Everyone agrees that, in majority of cases, the consumers do not read labels and declarations. Only a small number of consumers read these messages on point of sale. These are mainly the educated consumers who carefully select the products which they consume.
Public policy for nutrition
• Majority of experts share the opinion that laws, bylaws and rulebooks are being adapted to EU laws at faster or slower pace. However, what the experts find problematic is insufficiently efficient implementation of these laws.
• The experts generally agree that compliance with EU laws is good, and that it brings more order to the market. Standards of production and sale are improving as well as standard of consumers. However, the experts agree that there are also some negative domains, both in EU legislature itself and in implementation of EU laws and harmonization with EU market. According to experts, among other thing the problem are requests which can not easily be harmonized. On one hand they require increased control of products, while, on the other hand, additional liberalization of market resulting from Law on Free Trade causes increasing flow of products. There are experts who claim that even some of previous national laws and regulations were more strict, and due to that better than EU laws, while the others express concern about implementation of certain requests about which there are doubts and disagreement in EU itself, and these requests are imposed as mandatory. The experts also point to potential risk that, while WB countries put into effect
FOCUS‐BALKANS DL 6.1 Consumer study implementation for products with health claims

FP7 KBBE 2007 1 138 GA 212579
certain laws, in the EU countries these laws cease being in force and the new laws are passed.
• Experts' statements show that countries of western Balkans have differently developed nutritional policies. What all of them have in common is that they expect further development and implementation of the designed policies that will be achieved through continuous and systematic education of population which should be organized at state level.
• In majority of countries certain programs are implemented with the aim to raise awareness about healthy nutrition and nutritional habits. The best organized programs are the ones implemented in Slovenia. According to experts, in other countries these programs are realized sporadically and insufficiently, but general conviction is that they are necessary in longer period of time.
Trends and perspectives
• According to experts priorities and main aims of the governments in all countries of western Balkans can be divided into two groups: education of population and control of market – implementation of laws and control of products.
• Spontaneous answers of the experts indicate that expected factors of change in consumption of food are the same for all countries. The main factors which will affect the nutrition are: citizens' knowledge and awareness about healthy nutrition on one hand, and living standard on the other hand.
• When products with nutrition and health claims are concerned, the experts think that their consumption will be influenced by: truthfulness of nutrition and health claims, understanding of these claims and marketing campaigns for the products with nutrition and health claims
• Factors of change which are singled out as more important are the changes in purchasing power, health aspects of food and citizens' knowledge about nutritive values, but also public policies and life style. The only factor which has somewhat lesser impact is fashion.
• Majority of experts agree that demand for products with nutrition and health claims will increase because, on one side, population of the young who will be better informed will mature, while on the other side, the society as a whole will mature and change its nutritional habits. At the same time the market will also change, because, as the experts expect, the products which will remain on the market will be the ones that will truly have high quality ingredients, and accurate nutrition and health claims on their declarations.
• According to experts, the most important activities which can have a positive effect on development of consumption of products with nutrition and health claims, in the context of improvement of public health are:
• Completely transparent state policy regarding nutrition; • Education, promotion and keeping the citizens informed about healthy
nutrition; • Clear-cut policy of labelling and marking of products, training for accurate
reading and interpretation of markings
FOCUS‐BALKANS DL 6.1 Consumer study implementation for products with health claims

FP7 KBBE 2007 1 139 GA 212579
• Control of market in form of control of food safety and verification of accuracy of nutrition and health claims;
• Public policy of stimulating production of food products with nutrition and health claims.
• Institutions in which the experts are employed can give various contributions in these activities. Government bodies should coordinate and link all actors involved in the chain of providing healthy food. Consumers' associations should safeguard the interests of consumers, but, at the same time, they should not obstruct the development of industry. Institutes for public health should participate in the development of strategy for improvement of nutrition, analyses and assessment of product quality and establishment of advisory offices.
FOCUS‐BALKANS DL 6.1 Consumer study implementation for products with health claims

FP7 KBBE 2007 1 140 GA 212579
METHODOLOGY – short description
TYPE OF RESEARCH: Qualitative research, in depth interviews, in face to face
PROCEDURE – TECHNIQUE: In depth interviews are one of the methods of qualitative research. They are facilitated by a trained person (moderator is most often psychologist) and last approximately around 1 h. These techniques makes possible deeper understanding of behavior, attitudes, motives, etc, as well as the collection of a big number of information in a relatively short period of time.
Taking into consideration that the participants are selected according to previously chosen criteria, opinions expressed in the in depth interviews should be considered typical for that segment of population only.
The aim of IDI is to gain a qualitative understanding of market for products with nutrition and health claim in the WBC. These interviews allowed a face to face discussion and yielded valuable information towards consumption of these products.
The questionnaire includes generally open questions with combination of given list of answers in some cases (ranks or marks of main problems, difficulties, characteristics etc.), so that the discussion may be deepened on the different topics.
Two or three respondents were included in each country regarding experts’ interviews. Whenever it was possible the respondents were representatives of consumer organization, the Ministry of Health or the Ministry of Agriculture, as well as The Institute of Public Health. The respondents also had no previous knowledge of the specific issue of study.
These interviews were face to face interviews and last an hour maximum.
STRUCTURE OF IDIS AND FIELDWORK REPORT
During the Project activities realization of 3 interviews per country was performed, which makes a total of 18 interviews for the whole WBC region. Experiences from recruitment and interviews with experts are different.
In Macedonia, the fieldwork was realized very successfully, and the expected deadlines were met without major problems thanks to consultation of local partner for Focus Balkans project - Institute for Public Health, which suggested the names of persons who were competent to respond to the topic of IDIs. The interviews were conducted in the period from 14th to 17th December 2009.
Regarding the interviews themselves, the respondents were motivated and ready to talk about the subject. All respondents welcomed this project and they evaluated the initiative for the same as tremendously essential and useful for their work.
A total of three interviews were conducted in Serbia. The first two interviews were conducted in the first half of December, where both respondents recognized the subject matter of survey as important. There were no difficulties whatsoever with
FOCUS‐BALKANS DL 6.1 Consumer study implementation for products with health claims

FP7 KBBE 2007 1 141 GA 212579
realization of these two interviews since both respondents were motivated to give detailed answers.
The third interview with representative of Health Ministry was conducted at the beginning of February. Namely, this delay was caused by negative response of the Ministry during the first two months. The mentioned reasons for refusal were lack of time, frequent absence and restructuring of the Ministry. With the help of personal contacts the contact was established with Assistant Minister of Health who was willing to participate in the research, since the question of her competence was raised – so finally, the interview was conducted.
Table 23. Structure of in-depth interviews
Different categories IDI number
Country
Bosnia and Herzegovina 4
Croatia 2
Macedonia 3
Montenegro 3
Serbia 3
Slovenia 3
Institution
Ministry of Health 5
Institute for Public Health 7
Consumer organization 6
Interviewee position
Head of department inMinistry 4
Assistant Minister 1
Head of department inInstitute 5
Scientific expert for the areaof nutrition at the Institute 2
Director (president) ofAssociation 6
Nutrition expert in Consumers'Association 1
In Federation of Bosnia and Herzegovina the interviews were conducted in the period from 18th do 23rd December 2009 with representatives of Federal Ministry of Health and Institute for Public Health of B&H Federation. However, scheduling of interviews lasted throughout December. In Republic of Srpska 2 interviews were conducted in the period from 4th to 25th December. Representative of Consumers' Association immediately agreed to participate, without any problems. When scheduling of interviews in Ministry is concerned, the problem was to reach the
FOCUS‐BALKANS DL 6.1 Consumer study implementation for products with health claims

FP7 KBBE 2007 1 142 GA 212579
competent person. Due to the flu epidemic everyone in the Ministry was too busy, however, thanks to the efforts of PR department in Health Ministry and Institute for Health Protection of the Republic of Srpska the interviews were finally scheduled in due term. Scheduling itself lasted for 3 weeks.
There were no difficulties with conducting these two interviews. The respondents were prepared for the interview and furnished all information which was available. Besides that they expressed willingness to participate in future projects, and to be more engaged if possible.
In Slovenia the interviews were conducted in the period from 18th to 23rd December 2009, with representatives of Health Ministry, Health Institute and Consumers' Association. All experts were exceptionally cooperative. Although they are obliged to respond to this kind of surveys, there was a problem with scheduling interview terms because all of them were very busy in December – so the scheduling lasted for 3 weeks. At the end all participants requested to be informed about the results of the survey in order to implement them in their work.
In Croatia we had no problems with interviews in case of representatives of the Institute and Consumers' Association (these interviews were scheduled by partner in project). However, interview with representatives of Ministry couldn't be scheduled. At the beginning of the project we were given the contacts that would help us establish contact with responsible people from the Ministries and institutions of special interest for the project. With the help of our field partners we were able to carry out two in-depth interviews in Croatian Institute for Public Health and Croatian Association for Consumer Protection, while the Ministry of Health remained inaccessible. Respondents who took part in the survey were interested in subject matter and answered all questions. They expressed a high degree of motivation.
In Montenegro all three interviews were conducted. Contact with all respondents was established quickly and easily. Partners in the projects enabled contacts with representatives of Health Ministry and Institute for Public Health, while the representative of Organization for protection of consumers was contacted directly by associate on the project.
All three respondents were highly motivated and willing to be interviewed, so they gave detailed answers to all questions. They recognized the subject matter as important, and of interest for them. Respondents from state institutions were very familiar and well informed about the topic, in contrast to representative of Organization for protection of consumers for whom this topic is relatively new, since this organization has mainly dealt with health aspect of food safety.
FOCUS‐BALKANS DL 6.1 Consumer study implementation for products with health claims

FP7 KBBE 2007 1 143 GA 212579
4.1. General presentation of the organization with focus on food and health
4.1.1. Main activities of organizations and individual expertise of interviewees
a.Main activities of organizations
Participants in the survey were representatives of 7 Institutes for Public Health from: Slovenia, Croatia, Bosnia and Herzegovina (Republic of Srpska and B&H Federation), Serbia, Montenegro and Macedonia. Each Institute has a number of activities which it performs. Some of the main activities of Institutes for Public Health are:
• Prevention programs - the promotion and protection of health, prevention of risks from environment
• Radio-diagnostics of radiation that can be found in the environment and food.
• Diagnostics of electromagnetic radiation and working environment conditions in the radio business - Diagnostics in the area of radio-diagnostic operations
• Programs in the field of hygiene: programs of safety of waters, objects of general use and environment
• Programs in the field of epidemiology – monitoring of infectious diseases, population program for diabetes, immunization
• Social medicine: mortality, birth rate, health card of the institution, health card of medical worker, population register for malignant diseases, hospital and outpatient morbidity, primary health protection, monitoring early detection of physical factors of emergence of mass non-infectious diseases, monitoring quality of work in health institutions, realization of the World Health Survey by standardized methodology of the World Health Organization (WHO) – population study of health, behaviour, knowledge and habits of population (National Health Survey, Serbia, 2005)
• Advisory: dietotherapy and dietoprevention
Representatives of five ministries also took part in this research (Ministry of Health of Slovenia, Ministry of Health of Montenegro, Ministry of Health of Macedonia, B&H -Federal Ministry of Health, Ministry of Health of Serbia). The most important activities associated with food policy that the ministries deal with are:
• Development of strategic plans, monitoring and evaluation • Prevention programs in the area of healthy and normal diet, sports activities,
etc. • Various actions aimed at reduction of drugs and alcohol abuse and risky
behaviour • Organization and coordination of sanitary inspections which act under the
Law on inspection • Protection of consumers and protection of consumers' health
FOCUS‐BALKANS DL 6.1 Consumer study implementation for products with health claims

FP7 KBBE 2007 1 144 GA 212579
Participants in the survey were also 7 experts from Consumers' Associations. Associations are independent, non-governmental, non-profit associations of citizens for the exercise and protection of consumers' rights. They are engaged in numerous activities, such as:
• educating, informing and advising consumers, • representing the interests of consumers when it comes to their rights from
economic and health aspects.
b.Individual expertise of interviewees
Experts from various fields participated in the interviews. Through their work all experts are closely related with the politics of food and healthy diet. Functions that they perform are the following:
Ministries:
• Assistant Minister for Public Health, Monitoring and Evaluation - Tasks: developing strategic plans, monitoring and evaluation.
• Head of Consumer Protection Department in the Ministry - Tasks: consumer protection, implementation of policies that are created for consumer protection.
• Head of Department for Counselling and Healthy Eating - Tasks: all tasks about organization and coordination of the department. Expert for microbiological standards, food quality, food labelling. In charge of food, health claims, the analysis of GMO, metals, metalloids, narrow area of expertise is the area of food additives
Institutes for Public Health:
• National Coordinator for Food and Nutrition Politics - Tasks: contact with the World Health Organization for food and nutrition policy, development of action plan, preparation of research in the area of food policy, preparation of educational materials and implementation of education, coordination with representatives of WHO and the European institutions.
• Head of Department for General Hygiene and Health Ecology in Institute - an expert on nutrition on population level - Tasks: monitoring eating habits, tasks of Head of department, implementation and evaluation of projects and programs in the field of food and nutrition.
• Head of the Department for Physiology and Monitoring of Nutrition - Tasks: proper diet and monitoring of nutrition, management and safety of food, monitoring of nutrition, connection between nutrition and health, the impact of food on human health, particularly in certain population groups.
• Director of Health and Sanitary Inspection - Tasks: coordination of work of Health and Sanitary Inspection.
• Head of Research Department in the field of public health - Tasks: monitoring health status of population, the segments related to social medicine,
FOCUS‐BALKANS DL 6.1 Consumer study implementation for products with health claims

FP7 KBBE 2007 1 145 GA 212579
coordination of all research projects which are realized, preparation of plan for development of the health strategies for public health, drafting laws.
Consumers' Associations:
• President of Consumers' Association / Director for development of Consumers' Association – tasks: tasks of executive director and tasks of PR manager in the association.
4.1.2. Description of activities directly connected with nutrition and public health
Activities conducted by Ministries, institutes for public health and consumers' associations which are directly related to food and public health are diverse and numerous.
Activities of the Ministry are primarily focused on the adoption and implementation of laws and legislation, coordination of various governmental and nongovernmental institutions involved in food policy
Activities of the Institute for Public Health are, for the most part, related to research, publishing and development of rulebooks. In addition, there are also direct activities of population education through various projects, and advisory work. Some of the major projects which were mentioned are the following:
• Establishment of national coordinator for food and nutrition (B&H); • Guide for healthy nutrition designed for medical workers (all countries); • Recommendations for proper nutrition of preschool children, based on the
latest WHO recommendations (Macedonia, Bosnia and Herzegovina);
• Publication for proper nutrition of school children; • Action plan for food and nutrition policy (all countries); • Survey on Health Condition, Needs and Use of Health Services and Health-
related Habits (Serbia, Slovenia, Croatia); • Project for promotion of breastfeeding (FB&H); • Expertise in technical areas such as rulebooks related to control of hygienic
safety of food, control of food in general use (all countries), etc.
Consumers' Associations are focused on education and protection of consumers. The implemented projects include among other things:
• Project for verification of accuracy of food declarations with product ingredients (Slovenia);
• Helping consumers in the area of product quality, instructions related to food, even comparison of prices aimed at making the 'best choice' (all countries);
• Project "With Proper Nutrition and Safer Food Towards Better Health" (Slovenia, Macedonia);
• Education of children from primary and secondary schools about proper nutrition, how to read labels and how to choose products on the market that are most suitable for their health (Macedonia, Slovenia);
• Open debate forums dedicated to different populations (all countries)
FOCUS‐BALKANS DL 6.1 Consumer study implementation for products with health claims

FP7 KBBE 2007 1 146 GA 212579
4.1.3. Consumers' demand for products with nutrition and health claims
a. Nutritional concerns and consumer awareness
Food-related problems that consumers from western Balkans are faced with can be classified in three categories:
- quality and safety of food,
- specification of product ingredients
- degree to which the consumers are informed about these issues, as well as nutritional habits
b.Quality and safety of food
• Consumers in all countries of Western Balkans call into question the ingredients of certain products and safety of consumption of these products.
According to experts, particularly the representatives of Consumers' Associations, citizens often doubt the labelled quality of products, that is, they ask whether the quality fully coincides with the one presented on food declarations. They are particularly concerned about additives, pesticides and other “invisible chemicals and poisons” which cannot be seen when the food is consumed, although they are perceived as extremely harmful, but the citizens suppose that they are not marked on food declarations. When quality of food is concerned, the citizens are worried because of presence of copies and forged products on the market, the quality of which and quality control of which is dubious.
The biggest problem associated with food safety is purchase of food articles with expired shelf life, since there are recorded cases of food poisoning resulting from this. Besides that, the experts mention the problem of unhygienic handling of food products in sales outlets and during transport.
Slovenia: „They are very concerned about chemicals in food, pesticides, additives, toxins because they never know how much of these things are inside. For example, melanin in milk. They fear from such things, forgeries and copies. For example, they fear that water is added to milk. That the oil is mixed ... so that the Declaration on the product does not match the real ingredients. Generally, the citizens fear the most from fraud. "
c.Specification of product ingredients
• Majority of experts think that labelling with specification of product ingredients is not satisfactory, and understandable for consumers.
FOCUS‐BALKANS DL 6.1 Consumer study implementation for products with health claims

FP7 KBBE 2007 1 147 GA 212579
Declarations on products are unsatisfactory because of several reasons:
- They are written in extremely small letter font, which makes it very difficult to read them, particularly for older population.
- In case of imported products translation of declaration to local language often doesn't exist,
- The place where declaration is written often isn't visible enough - Declarations are written too expertly, so wider population can not
understand them (e.g. E markings) - Imprecisely specified ingredients (according to some experts, full
composition of the product is not specified on declaration) - Absence of daily recommended dose for the product - They often contain a marketing message the accuracy of which is brought
into question, and which stimulates the consumers to buy the product
Montenegro: „We still have the situation where labelling is not as good as it should be ...We often have some ingredients specified in declaration although they actually do not exist in the product; we have situations where the specified ingredients are not contained in the product, or there are ingredients in the product which are not specified, the information are not accurate.“
d.Degree to which the consumers are informed about these issues, as well as nutritional habits
• Majority of consumers still aren't sufficiently educated about nutritive composition of food products, about proper and healthy nutrition, which is why they are not able to understand food declarations and choose high quality products.
Besides the already mentioned indistinct labelling, low level of consumers' knowledge and information also represents a problem. Furthermore, disinterest of a part of population in proper nutrition is also obvious. Some experts particularly point to the eating habits of young people which include a lot of fast food. They think that tempo of modern life also contributes to such situation, because it doesn't leave enough time for preparation of food at home.
Macedonia: „The tendency of eating among young population is consumption of fast food, the food rich in energy, with improper fats, which also holds true for consumption and refreshing soft drinks, which contain lots of sugar, as well as other beverages that contain components of high energy value, with no nutritive substances that a young body needs for proper growth.“
Problems which were mentioned in some countries are: poor offer of products in all areas, particularly rural areas, where scant offer affects the quality of available products and their price, absence of information about origin of food products sold on green market, etc.
FOCUS‐BALKANS DL 6.1 Consumer study implementation for products with health claims
FP7 KBBE 2007 1 148 GA 212579
e. Consumers' concerns
Majority of experts share the attitude that consumers are not aware enough of nutrition recommendations. However, they could still be divided into several groups, according to level of being informed and awareness of nutrition recommendations:
- Consumers who pay attention to nutrition recommendations and try to behave in compliance with them;
- Consumers who are aware of the existence of nutrition recommendations, but they do not have enough money to buy such products;
- Consumers who are (not) aware of the existence of nutrition recommendations and do not pay attention to them.
The bulk of consumers belong to the last mentioned group which, according to experts, is upsetting. Consumers' Associations generally think negatively about consumers' education and awareness of nutrition claims provided by official government institutions. Their attitude is based on direct contact with consumers through which they have the „first hand“ information about high level of unawareness about not only nutrition recommendations, but about general safety of food and its permanent impact on quality of health and living. The experts from the Institute agree that consumers start showing interest in nutrition recommendations only when they have certain health needs.
All participants state that continuous education is necessary because population does not have enough information about composition of food, fat content, content of carbohydrates, proteins and other components, about desirable ingredients and those which should be avoided, and about balanced nutrition in general. Besides the fact that citizens are uninformed, inadequate labelling is brought up again. The experts think that part of population is interested in the food they consume, but these information aren't accessible to them, or they are written in indistinct way. Another visible attitude is also that marketing messages on food products are not controlled by competent health institution which controls food, so they can mislead the consumers and stimulate them to buy food which is inappropriate for use or intended for certain age group.
Slovenia: „60% of respondents state that they don't completely understand the content of labels. 18% of these consumers state that they do not understand it at all. We must work a lot more on education of consumers to help them understand the labelling, it is not enough just to tag the product, the consumers should be taught to understand labelling.“1
1 Slovenian Ministry of Health conducted two surveys related to this topic: „Raziskava javnega mnenja o odnosu državljanov do označevanja hranilne vrednosti na prehrambenih izdelkih in do živil iz gensko spremenjenih organizmov“ in 2008, and „Od Vil Do Vilic Potrošniška mnenjska anketa o varnosti hrane“ in 2007.
According to experts, specific problems which exist, but the consumers are not aware of them are:
FOCUS‐BALKANS DL 6.1 Consumer study implementation for products with health claims

FP7 KBBE 2007 1 149 GA 212579
• impact of packaging on product quality:
Certain kinds of packaging, such as plastic materials, change the quality of products.
• shelf life, particularly shelf life after the product is opened:
Shelf life often isn't specified at all, or it is not adequately specified. Namely, it is not indicated how long after opening of the packaging the product is usable
• presence of food with unproven quality on market:
Although official institutions perform quality control, in some countries there are products which, according to respondents, „arrive through dubitable channels„ and are not subjected to control, which is particularly the case with products sold on green markets.
• they are not fully aware of importance of product origin and consequences it can carry
Information about origin, manufacture and distribution of products are often inaccessible to consumers (particularly on green markets). However, the experts accentuate that these information are very important for consumers.
• certification of products
Consumers do not have information about the products which are certified, how the certificate looks, who certifies the products, etc.
Montenegro: “We have the case of red foils in which cheeses are packed that colours the cheese, but what's the use when people don't know that”.
Macedonia: „It is written on cheeses packed in nylon bags that their shelf life is approximately 6 months, however, it is not written what the shelf life is after the cheese is opened. We do not have such labels “.
Montenegro: “People can bring and sell everything on green market, you name it, they sell it. And one prominent officer in the field of health policy says on TV that he can not peep in every plastic bottle that every old woman brings to the market –he should not say something like that, because there shouldn't be anything on green market which is not certified for sale”.
Croatia: „It was announced on TV that one large shipment of squids came to Croatia from Patagonia and they were full of sand. Analysis of Institute for Public Health revealed that they were full of cadmium... Day after that I saw a woman who was buying squid in supermarket. She either didn't hear that information or didn't care.“
4.1.4. Health benefits as criteria of consumer’s choice of food
FOCUS‐BALKANS DL 6.1 Consumer study implementation for products with health claims

FP7 KBBE 2007 1 150 GA 212579
a.Main criteria for choosing food products
Spontaneous answers of the experts indicate that the most important criteria for choice of food products are:
• Price - According to experts, price is one of the most important factors, it dictates the choice of products in consumer basket .
The experts agree that prices of quality food products are rather high for consumers. This is actually one of the key reasons why consumers buy food of lower quality – which ultimately results in lower quality of nutrition.
Although the experts mainly agree that price is one of the main problems that consumers are faced with, the impression is that this problem is the most pronounced in Macedonia and B&H. Experts from Croatia and Serbia point out that prices are problematic, but this is particularly pronounced in households with the lowest income, and in less developed localities. High prices are one of the problems accentuated in Slovenia, but this has particularly been obvious since the outbreak of economic crisis.
• Health benefit – according to majority of experts health benefit is one of the important criteria for choice of food, but not the dominant one. This criterion becomes the leading one in specific situations.
Consumers believe that proper nutrition is important for them or their family members particularly in case of children (newborns) or family members who have some health problems.
Croatia: “All parents want to feed their children with the highest quality food as much as it is possible. But when adult people buy food for themselves high quality article is not so important, price is more important “.
• Closely connected with health benefit as a criterion for choice of food products is being (un)informed. Experts from all countries mainly agree that consumers are not informed about various aspects of health benefits of the food they consume.
• Safety of food is also closely connected with health aspects. Consumers often buy unsafe food out of ignorance.
The experts warn that, even when consumers intend to buy high quality food, it happens that they buy unsafe food. This is primarily the result of incorrectly labelled food products, but also the confusing marketing messages which, according to experts, are often untrue. Although these two aspects are closely connected, the experts think that it would be necessary to make a distinction between safe food (the one which underwent a full scale control) and healthy nutrition. Namely, according to experts, not all safe food is healthy, or at least not healthy for all population categories.
FOCUS‐BALKANS DL 6.1 Consumer study implementation for products with health claims

FP7 KBBE 2007 1 151 GA 212579
Macedonia: “Safe food is guaranteed to consumers, it must be safe in order to be allowed to enter the market, and proper nutrition basically depends on consumers themselves, because they are the ones who choose food, depending on their age, occupation, activities and health condition.“
When experts were asked to rank the criteria (rank 1 = the most important criterion, rank 6 = the least important criterion) on the basis of set of criteria (safety of food, health aspects, price, freshness, taste), somewhat different results were obtained. Based on the obtained data it is obvious that the experts single out from this group as the most important criteria: safety of food (median 2) and health aspects of food (median 2), while price occupies the second place (median 3). These data differ to some extent from data obtained on spontaneous answers because this time health aspect and safety of food are marked as being more important than price. The reason for that lies in tendency of some experts to do the ranking from their own perspective, rather sometimes than from perspective of consumers.
If we observe each country individually, we can see that in B&H, Montenegro, Slovenia and Macedonia safety and health aspects of food are evaluated as the most important criteria, while in Serbia and Croatia price and freshness are singled out as the most important. At the same time we can see that there are differences between experts from various institutions. Namely, while representatives of Health Ministry and Institute for Public Health consider safety of food as the most important criterion for choice of food, representatives of Consumers' Association attribute the biggest importance to price.
Slovenia: “Health aspect is in the first place, because it is important why we eat some food, we do not live in order to eat, but we eat in order to live. Food is a very strong risk factor for life. Because we enjoy throughout our life, several times a day, and that's a life activity. From birth to death.“
The remaining three proposed criteria are evaluated as less important:
Label and designation of origin is less important (median 4) and, according to experts, this criterion is mainly used for negative selection, when the products are excluded as a possible choice based on origin.
Namely, in case of “suspicious” producers the consumers do not trust the accuracy of food declarations. According to Macedonian experts, one of the reasons for consumers' distrust is their perception that, when one product appears on the market, its quality alters in further production, and this creates the distrust among consumers.
Macedonia: „They fear that complete information are not written, some consumers doubt it despite the fact that we have laws according to which the allergens must be specified.”
Consumers are not informed how the product labels should basically look like and which information should include, which leaves space for inadequate labelling.
FOCUS‐BALKANS DL 6.1 Consumer study implementation for products with health claims

FP7 KBBE 2007 1 152 GA 212579
• Freshness and shelf life, plus storage of products are a criterion which was mentioned as less important to consumers (median 4). The experts brought this criterion in connection with safety of food because if the food is safe it means that shelf life is adequate.
This criterion is still accentuated in Macedonia, Montenegro and Bosnia and Herzegovina. According to experts, the products are often stored inadequately.
Montenegro: „Consumers frequently contact us because, when they do their shopping, they frequently come across products with expired shelf life. Sometimes consumers report stomach problems after consumption of certain products.“
Special problem comes from the fact that consumers are not sufficiently educated and they can't recognize the food products which were not stored properly. This problem is the most obvious in case of proper storage of frozen food.
• According to experts, taste is a criterion which, compared with the other five criteria, is the least influential in decision to buy food articles (median 5).
However, just because of the taste which suits those, consumers often buy products which are not healthy or safe. The experts also think that consumers have a perception according to which food which contributes to good health is not tasty, or has unattractive taste. This is often the reason why consumers refrain from buying healthy products.
4.2. Perception of consumers’ demand for N&H claims products
Experts who participated in this survey are not familiar with concrete data about consumption of products with nutrition and health claims; therefore they could not estimate market demand and requirements for this kind of products. They relied on estimates that there were many products with nutrition and health claims currently in the market, and being aware of the market rule that products which are demanded are products manufactured and imported, experts concluded that demand for these products exists among consumers in the Western Balkans, but they were not sure that it is very pronounced. Experts think that this demand is more present among better educated citizens, who are considered to be better informed about nutrition.
Serbia: “There is still not very pronounced demand. Consumers are still getting used to current offer.“
Evaluating their agreement with a set of statements on the scale from one (I don’t agree at all) to five (I agree completely), experts confirmed their spontaneously mentioned moderate estimates of the current demand for products with nutrition and health claims, since average rate for the statement „Consumer demand related to products with nutrition or health claim is high today“ was 2.57.
FOCUS‐BALKANS DL 6.1 Consumer study implementation for products with health claims

FP7 KBBE 2007 1 153 GA 212579
Based on obtained results, the statement “Companies’ promotional activities have significant influence on demand for products with nutrition or health claim” has the highest average grade (4.57). Experts spontaneously mention that advertising campaigns which accompany these products influence demand to a great extent, particularly in case of new products accompanied by intensive campaigns.
statement Min Max Average
Consumer demand related to products with nutrition or health claim is high today 1 3 2.57
Demand for products with nutrition or health claim is increasing 2 5 3.78 Supply of products with nutrition or health claim has significant influence on the demand for these products 3 5 4.28
Companies’ promotional activities have significant influence on demand for products with nutrition or health claim. 4 5 4.57
Price of products with nutrition or health claim has significant influence on the demand for these products. 2 5 4
Besides, the statement “Supply of products with nutrition or health claim has significant influence on the demand for these products” has high average grade as well (4.28). This information complies with the analyzed experts’ spontaneous responses. Additionally, the statement “Price of products with nutrition or health claim has significant influence on the demand for these products” is evaluated with high grades as well (4.00). This information complies with experts’ estimates that price, generally, plays significant role in purchase of food, therefore in purchase of products with nutrition and health claims as well. Somewhat lower average grade is recorded for the statement „Demand for products with nutrition or health claim is increasing“(3.78), but it still implies that increase is expected. Experts relate demand to expected better knowledge of citizens and their more extensive interest in healthy nutrition. There is no significant difference between countries or institutions in terms of level of agreement with the tested set of statements.
4.3. Perceived consumers’ characteristics
According to all descriptions of consumers who choose N&H claims products, they are mainly young women who have a family. They live in their own small families (without parents or relatives) and they usually go shopping either alone or with their husbands. They usually have children, particularly small children. Women are the ones to decide what is going to be bought, and what will be in the basket and on the table. Characteristics of consumers are shown in the table below.
Table 24 Characteristics of consumers of N&H claims products
Characteristics Comment
Gender male At first, all participants say that women usually
go shopping, but in Serbia, Croatia and Slovenia, men are mentioned as well.
female
Age less than 15 years old Experts disagree to some extent. Namely, it is
FOCUS‐BALKANS DL 6.1 Consumer study implementation for products with health claims
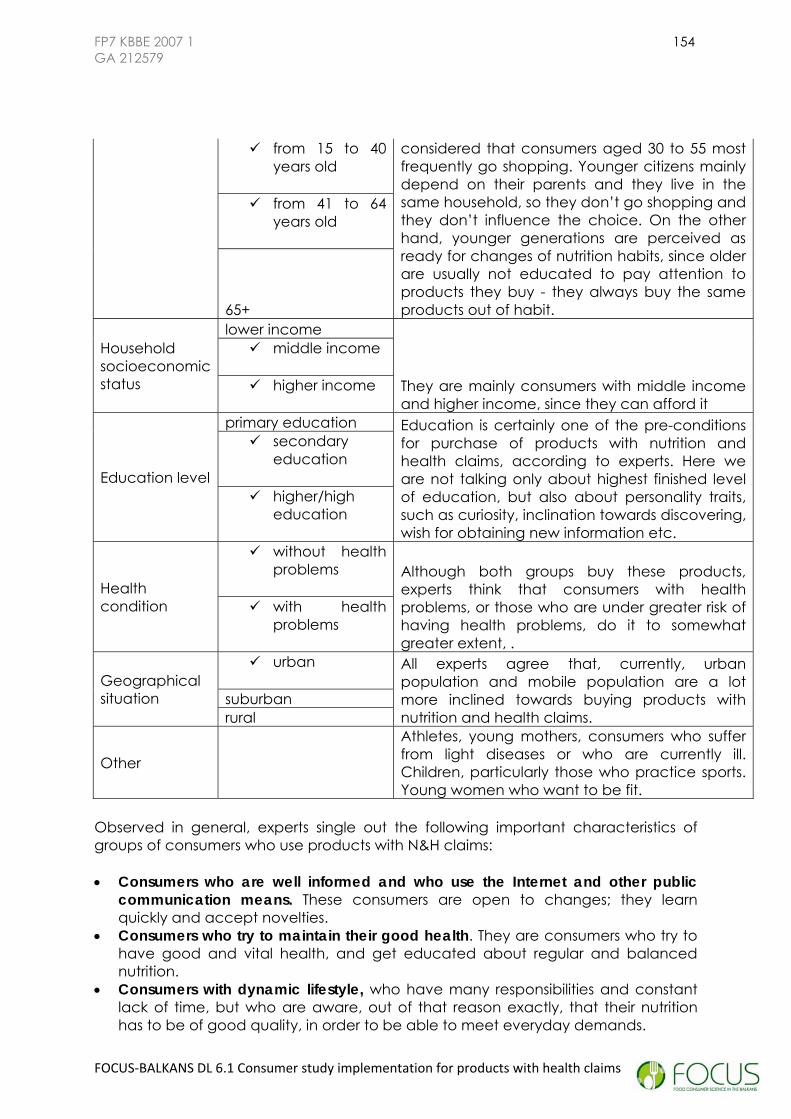
FP7 KBBE 2007 1 154 GA 212579
from 15 to 40 years old
considered that consumers aged 30 to 55 most frequently go shopping. Younger citizens mainly depend on their parents and they live in the same household, so they don’t go shopping and they don’t influence the choice. On the other hand, younger generations are perceived as ready for changes of nutrition habits, since older are usually not educated to pay attention to products they buy - they always buy the same products out of habit.
from 41 to 64 years old
65+
Household socioeconomic status
lower income
They are mainly consumers with middle income and higher income, since they can afford it
middle income
higher income
Education level
primary education Education is certainly one of the pre-conditions for purchase of products with nutrition and health claims, according to experts. Here we are not talking only about highest finished level of education, but also about personality traits, such as curiosity, inclination towards discovering, wish for obtaining new information etc.
secondary education
higher/high education
Health condition
without health problems Although both groups buy these products,
experts think that consumers with health blems, or those who are under greater risk of
having health problems, do it to somewhat greater extent, .
pro with health problems
Geographical situation
urban All experts agree that, currently, urban population and mobile population are a lot more inclined towards buying products with nutrition and health claims.
suburban rural
Other
Athletes, young mothers, consumers who suffer from light diseases or who are currently ill. Children, particularly those who practice sports. Young women who want to be fit.
Observed in general, experts single out the following important characteristics of groups of consumers who use products with N&H claims:
• Consumers who are well informed and who use the Internet and other public communication means. These consumers are open to changes; they learn quickly and accept novelties.
• Consumers who try to maintain their good health. They are consumers who try to have good and vital health, and get educated about regular and balanced nutrition.
• Consumers with dynamic lifestyle, who have many responsibilities and constant lack of time, but who are aware, out of that reason exactly, that their nutrition has to be of good quality, in order to be able to meet everyday demands.
FOCUS‐BALKANS DL 6.1 Consumer study implementation for products with health claims

FP7 KBBE 2007 1 155 GA 212579
• Additionally, they are consumers with varied food at their disposal. Majority of them live in urban areas.
Macedonia: „I think younger population, people who realize importance of nutrition, although they currently have no health problems, they know that investing in their food and nutrition will preserve status of their organism a lot longer than if they just relax completely“.
Serbia: “This consumer is educated, not interested only in price. He/she wants to know which vitamins he/she takes, he/she is interested in his/her health, in safety of products consumed, pays attention to duration of shelf life “.
4.4. Commercial offer and health claims 4.4.1. Variety and nutrition quality of the offered product
Experts agree that offer of products with nutrition and health claims is rather extensive. This is particularly the case in Slovenia and Croatia. In other countries, there is a growing number of such products in a few recent years. Experts highlight that, besides large number of imported products, also domestic producers launch their products with nutrition and health claims.
Experts are also satisfied with offer in terms of variety of products. Some even say that there are too many products, which might confuse consumers who don’t have a lot of time to read all claims, so they choose already known products and brands.
Macedonia:“ It is becoming more and more difficult for consumers to choose, even when they are well informed, not to mention ordinary consumers. This is why consumers get attached to some group of products, to certain brands.“
There is no agreement among experts in terms of quality of products with nutrition and health claims that are present in the market. Some experts think that all these products are well controlled, but majority still stresses that, besides quality products, there are also those that, due to insufficient control, don’t have satisfactory quality (for example they contain too much sugar, fat etc.). We have to say that experts, in majority of cases, are not familiar with official data about quality of all products. Talking about nutrition and health claims, independently of product quality, majority of experts say that there are many claims that are not checked, and that they provide insufficient or incorrect information.
Croatia: „Products are of various quality. I think that variety is most extensive in the category of juices. Some fruit drinks are actually nectars, they contain a lot less fruit.“
FOCUS‐BALKANS DL 6.1 Consumer study implementation for products with health claims

FP7 KBBE 2007 1 156 GA 212579
Croatia: „Let’s say that 20% of claims are fine, while I think that 80% of claims are not functional, that they mislead consumers about the real nature of consumed food and possible expectations.“
4.4.2. N&H claims
a. Pro and con’s concerning the nutrition and health claims
Spontaneous reaction of all experts, except experts from Slovenia, to shown nutrition and health claims was negative.
i.Nutrition claims
Regarding nutrition claims, expressed experts’ opinion points to the following:
• Nutrition claims are imprecise - claims have one part which is correct, but other information is missing, information which would define product precisely is incomplete. Namely, experts say that a product contains some substance, but there is neither information about present quantity of that substance, nor information about the extent to which consumption of that product would satisfy consumer’s daily need for that substance. For example, experts say that each grocery contains some vitamins, so the claim „Contains the following vitamins“ can be put on many products and that it means nothing without precise information about share of those vitamins, thus misleading the consumer.
Macedonia: „These claims are not precise. It is important whether consumer is completely informed from these claims and whether consumer satisfied his or her daily need for some mentioned ingredient after consuming a product.“.
• Some claims stress only positive aspects, while information about possible harmful effects is missing – some products have benefits that are mentioned in claims, but they also may have some other adverse effects, which are not written on the product. For example, a product has reduced content of fat, but it may also have increased quantity of sugar, which is unhealthy.
Macedonia: “They may be healthy from one aspect and unhealthy from another. Perhaps they have too much sugar, and it is not written, it often happens with cereals.”
• Experts say that some nutrition claims which appear in the market are not in accordance with rulebooks on food labelling (for example „rich in“ instead of written present percentage of some ingredient)
FOCUS‐BALKANS DL 6.1 Consumer study implementation for products with health claims

FP7 KBBE 2007 1 157 GA 212579
Croatia: “Such claims are not in accordance with the Rulebook. Claim has to be precise. There can’t be written “rich in”, but exact quantity. “Contains natural antioxidants” – who says that it contains them and how much of them?”.
•Particular problem with nutrition claims is that consumer can’t check truthfulness of these claims. Even the best equipped laboratories would hardly be able to check accuracy and correctness of this information and they are left to producers’ conscience, according to experts. This is the reason why it should be written next to each claim which institution measured or checked it.
ii.Health claims
Health claims, according to majority of experts, must not be a part of declaration. No producer is allowed to publish this information, regardless of product, without previous experimental examination.
Experts think that this is manipulation with undisputable and generally known facts.
Montenegrin experts stress that, by the Law on Safety of Food and by the Rulebook on labelling packed products, no product is allowed to have medicinal characteristics written on it, since it would mean that it is sold as a medicine.
Also experts from Serbia say that it is very dangerous to manipulate statements related to risk and diseases. They say that, according to regulations in majority of Western countries, this type of statements is forbidden, except in Slovenia and, since recently, in Croatia.
Serbia: “By applying our current laws and bylaws in force, primarily Law on Consumer Protection, which is not applied on this, authorities can ban such products, i.e. they can order withdrawal of such products from the market “.
These health claims have to be based on some measurements, research and valid data, or otherwise they might mislead consumers, in the opinion of experts.
Positively evaluated are functional health claims which stress presence or absence of some allergens in a product – such as presence of lactose, gluten, peanuts and other ingredients that some people are allergic to.
Macedonia: „Milk without lactose needs to be labelled properly, since some people are allergic to lactose, or cereals without gluten, food intended for those allergic to gluten. These products should have this nutrition message, ingredients and correct information. Same as baby food... „
Experts from Slovenia did not state their attitude towards this issue and they didn’t give any comments, since the issue of health and nutrition claims in Slovenia is defined with a regulation.
FOCUS‐BALKANS DL 6.1 Consumer study implementation for products with health claims

FP7 KBBE 2007 1 158 GA 212579
Slovenia: “Food claims are defined by regulations. I am not in a position to give any comments. We stated our attitude five years ago. These claims have to be proven and valid till the end of shelf life, and consumer has to be able to understand them”.
Besides giving spontaneous responses to the question about quality of nutrition and health claims, experts stated their degree of agreement with the set of statements (Table 21), using grades from 1 (I don’t agree at all) to 5 (I agree completely). Results show that, in the opinion of experts, nutrition and health claims help in improving consumers’ dietary habits (3.35). However, experts say that this stands only if claims are true and correct. In case they are not, experts think that some consumers, those with some health problems who wish to improve their health through nutrition, can be mislead with such incorrect nutrition and health claims. Representatives of the Ministry of Health, different from their colleagues from the Public Health Institute and members of Consumers’ Association, indicated partial disagreement with this statement (M= 2.50). Experts from Macedonia and B&H, too, gave stricter grades than their colleagues from other countries. (Macedonia M=2.33, B&H M=2.75).
Croatia: „100% fruit juice without added sugar, it’s a claim. What does an average consumer know about that? If I were a diabetic, I would drink it because I would think that it contained minimum or no sugar. This shows that every health claim has to be well examined, not to have harmful effect on some people “.
Table 25. and influence of N&H claims on the food market
Statement Min Max Average Nutrition and health claims improve consumer awareness on the importance of food.
1 5 2.85
Nutrition and health claims help consumers improve consumer dietary habits.
1 5 3.35
Nutrition and health claims are suited to the main health concerns seen by health officials.
1 5 2.5
Nutrition and health claims on food products improve public health.
1 5 2.85
The claims made on food products in our country are truthful.
1 5 2.42
Besides, experts mention to a somewhat lesser extent that nutrition and health claims improve consumer awareness on the importance of food (2.85), as well as that they influence improvement of public health (2.85). We have to bear in mind that experts took into account only correctly and accurately written claims. Representatives of the Ministry of Health agree the least that nutrition and health claims have effect on consumers’ awareness (M=1.75), while, observed by countries, our respondents from Montenegro agree with this statement most (M=3.33). Opinion that these claims influence improvement of public health is present most among experts from Montenegro (M=3.67) and Serbia (M=3.50).
FOCUS‐BALKANS DL 6.1 Consumer study implementation for products with health claims

FP7 KBBE 2007 1 159 GA 212579
Experts mainly disagree that nutrition and health claims are suited to prevention of the basic health problems (2.5), and they agree even less with the statement that claims made on food products in our country are truthful (2.4). Opinion that claims made on food products in our country are truthful is present somewhat among representatives of the Ministry of Health (M=3.75), while, observed by countries, average grade over 3 is recorded in Macedonia only (3.33).
iii. Nutrition and health claims - more stimulating or misleading
General assessment of experts is that nutrition and health messages are, on one hand, stimulating because they attract consumers to buy a product by highlighting its benefits, but, on the other, they might mislead consumers with their insufficiently precise and verified information.
Experts explain that nutrition and health claims have stimulating effect on not well educated consumers who want to take care of their health, although they don’t provide them with sufficient information. There are too many messages in the media which directly connect health and consumption of some product.
Experts think that health and nutrition claims, although attractive, are not sufficient to motivate consumers to buy products in the long run, if consumers realize that product doesn’t have promised characteristics.
Croatia: „They are stimulating at first sight, but people are pragmatic, you will buy a product once, but you’ll consider yourself cheated by the producer if that product doesn’t fulfil what’s promised on its label, and effect will be adverse then, and you will avoid that product in the future“.
All participants agree that consumers, in majority of cases, don’t read labels and declarations.
They particularly don’t read them at POS during shopping. Only small number of consumers read these messages at POS. They are mainly educated consumers who carefully choose products they use. Namely, according to experts, better educated consumers and consumers with higher incomes tend to read labels and compare products to a greater extent.
Serbia: “I don’t think that they read them a lot. I think that educated people read them more frequently than others do. Price is the most important aspect for socio-economically vulnerable groups “.
Declaration is usually read during consumption of product, particularly if consumers are not satisfied with product.
Experts say that there is a trend of reading nutrition and health claims, as well as other characteristics written on a product, particularly if product is new or one is shopping in a new shop.
FOCUS‐BALKANS DL 6.1 Consumer study implementation for products with health claims

FP7 KBBE 2007 1 160 GA 212579
FOCUS‐BALKANS DL 6.1 Consumer study implementation for products with health claims
Serbia: „Growing number of consumers read declaration in detail, if it’s the first purchase. Unfortunately and not rarely, consumers read the declaration after consuming a product, particularly in situations when there is a problem of some kind“.
Additionally, experts from Slovenia, Croatia and Serbia say that some consumers ask for additional information on free info lines of producers or competent institutions. This number is, however, still small, and they are mainly consumers from urban areas.
4.5.Public policy for nutrition 4.5.1. Regulations and compatibility with EU legislative
a.Attitude towards national regulations referring to nutrition and health claims
Majority of experts think that laws, bylaws and regulations are, quickly or slowly, being harmonized with EU standards. However, what experts consider a problem is insufficiently efficient implementation of these laws. Here we have an overview of national regulations referring to nutrition and health claims from the perspective of experts.
i.Bosnia and Herzegovina
Experts from B&H institutions agree that new laws are adjusted with EU laws and recommendations. However, substantial number of bylaws and regulations is still in procedure, which experts consider a problem, since market is active and shortage of legislation disables its regulation.
Federation B&H: „Regulations on food labelling and packing were enacted just recently, so they are harmonized with EU regulations on labelling. However, very large number of regulations, which are very important for safety of food, are unfortunately still being developed, and the Agency for Safety of Food is responsible for that“.
ii.Croatia
Croatian experts think that their Law on Food has certain shortcomings40:
• Regulations are harmonized with EU regulations, but they are not well adjusted to situation in the Croatian market.
• As a consequence of such procedure, there is a problem of interpreting problematic regulations and implementing them.
40 We have to mention here that representatives of the authorities did not participate in the survey, so we are not familiar with their attitude towards this issue.

FP7 KBBE 2007 1 161 GA 212579
• Implementation of laws and monitoring are not conducted in a satisfactory way according to experts from NG sector.
Croatia: “The Agency for Food should be independent, entirely, so agency of the Parliament, which suits the Parliament of the Republic of Croatia. However, a year ago, Croatian Agency for Food was included into the Ministry of Agriculture and I disagree with that“.
• Commenting law regulations in Croatia, experts stated concrete objections to some regulations: regulations about labelling GMO and about dietary supplements. Namely, they think that compulsory labelling of GMO presence is not controlled to a sufficient extent, as well as that there is no sufficient control of products marked as dietary supplements.
Croatia: „This is frequently abused, since it is implicated that these supplements have health effect, and not only health, but even medicinal.“.
iii.Macedonia
Experts from Macedonia stress that there is a Rulebook for food labelling created in 2005, which refers to nutrition and health claims on products with special nutrition value. However, this rulebook doesn’t include conventional food, which leaves space for uncontrolled labelling of conventional products.
Experts mention additional problems related to this issue:
• There are no special regulations which would refer to labelling of some groups of products, since the current Rulebook is too general, it refers to food in general, so it is difficult to interpret and apply in some cases.
• It is necessary to introduce more complex and stricter registering procedure for products with special nutrition values, in order to protect consumers.
Macedonia: „EU regulations describe well the registration procedure of special food, where Minister has to grant a special license, but this process is not as detailed here yet. We have to make this process more complex, in order to be sure that product really deserves the given license. „
iv.Montenegro
Experts from Montenegro think that their Law on Safety of Food is harmonized with EU regulations. This Law also defines in detail responsibilities related to dietary food.
Experts agree that their Law, although it was waited long for, is of very high quality and one of the best in the region, therefore it is very well harmonized and up-to-date with changes regarding nutrition trends on national, European and world level.
What is missing?
FOCUS‐BALKANS DL 6.1 Consumer study implementation for products with health claims
FP7 KBBE 2007 1 162 GA 212579
• Bylaws which treat dietary products as well; • Series of other rulebooks for various kinds of products;
Experts stress that Montenegro is not late with development of laws and that deadlines are respected; that large number of bylaws and rulebooks need to be developed, that it takes time and that they have a list of priorities for development of these bylaws. They hope to have completed Law and rulebooks in a short while.
v.Serbia
Experts from Serbia evaluate national regulations positively, but they give advantage to EU regulations.
They single out the following as very positive regarding EU regulations:
• Regulations which stipulate suppression of drastic abuse of situation in the market;
• Provision about necessary implementation of mechanisms for monitoring and application of legislation.
vi.Slovenia
Experts say that Slovenian laws are completely harmonized with EU laws. Implementation of these laws is monitored by an independent organ – Health Inspectorate. The Law stipulates when, how and what for fines are charged, and control is conducted by the mentioned Health Inspectorate.
The Law allows certain functional health claims, which were not allowed before, but it clearly defined the frame for these claims.
Slovenia: „We prepared a framework, so they know what can and what can’t be done. There are conditions for food claims there. We took maximum care of carriers of activity, and we protected consumers as well, not to mislead them”.
b.Experts’ attitude towards health claims in EU regulations
Talking about EU regulations related to health claims, experts frequently talked in general about advantages and disadvantages of EU regulations related to food.
Their general evaluation is that harmonization with EU laws is good and that it contributes to better order in the market. Standards of production and placement are being improved, as well as consumers’ living standard. However, experts agree that negative domains exist as well, both in EU legislation and in implementation of EU laws and harmonization with EU market.
• According to experts, demands which are difficult to be harmonized with are the problem. On one hand, laws ask for intensified control of products, while on the other, additional liberalization of market enabled by the Law on Free Trade results in growing flow of products. A consequence is inadequate
FOCUS‐BALKANS DL 6.1 Consumer study implementation for products with health claims

FP7 KBBE 2007 1 163 GA 212579
control of such large number of products. Experts think that, due to the Law on Free Trade, laws on quality control can’t be strict enough.
• Some experts say that some previous national laws and regulations were stricter and therefore better than those stipulated by EU. They mention the example of previous Law on Dietary Supplements, which did not allow presence of some of the currently allowed supplements.
B&H: „We have huge problems regarding all regulations, not only B&H, but Serbia and Slovenia as well, since we have a “flood” of dietary supplements that are considered food, supplements or even substitutes... Just for the sake of comparison, our old SFRJ law was a lot stricter about supplements and it allowed none of these currently present supplements. We have to let them in now, since EU allowed it and we mustn’t suppress free trade“.
• Experts are worried about implementation of some regulations, which are ambiguous, or a cause of disputes in EU itself, and which are imposed as compulsory.
Macedonia: „Remember that case with EFSA and health claims which appeared, and producers’ pressure to change the attitude of EFSA, as health institution responsible for that. Nutrition claims are settled, but what about health claims?“.
• There is a problem of potential weakening of regulations. Namely, since implementation of some laws in the Western Balkans requires time, there is a danger that these laws might become invalid and that new laws would be enacted. Every new law brings more complex changes and asks for a lot more time for preparation and implementation, so it is very difficult to harmonize everything, and particularly support everything financially.
Croatia: „Laws keep being changed, amended, growing. I’m afraid that everyone will become confused, both consumers and producers, I don’t know which direction it takes“.
c.Experts’ attitude towards harmonization of laws in tested countries with EU regulations
Harmonization of laws with EU regulations is evaluated positively. Experts agree that every development of law is positive, particularly harmonization with EU regulations, which should, accordingly, enables better flow of goods from tested countries into the European market.
Montenegro: „We have to have same criteria for control and regulations in general in order to be present at that unique market. That way we offer wide range of products to consumers, and they are to decide and choose“.
However, besides positive evaluation, harmonization of laws, according to experts, carries certain negative aspects:
FOCUS‐BALKANS DL 6.1 Consumer study implementation for products with health claims

FP7 KBBE 2007 1 164 GA 212579
• Some laws needn’t be enacted, as well as regulations. It is particularly not necessary to ask for investment of significant financial means, if it can be regulated in a simpler way.
Experts from Slovenia were reserved when evaluating harmonization and they didn’t want to discuss this issue in detail, since they thought that the law was adopted and harmonization conducted. Only during revision there will be some space for evaluation and looking for possible shortcomings.
4.5.2. Labelling and national policy for nutrition
Experts’ statements indicate that countries of the Western Balkans have nutrition policies developed to various extents. What all of them have in common is that they expect further development and implementation of structured policy.
• The highest degree of satisfaction with dietary policy of their country is expressed by experts from Montenegro and Slovenia.
• Experts from Montenegro are satisfied with the foundation provided to nutrition policy by the Law on Safety of Food and they expect further development with adoption of Action plan on Safety of Food, which is in procedure, and which defines everything that not precisely stipulated by the Law.
• Nutritive policy in Slovenia is fully harmonized with EU regulations and it is evaluated as positive and efficient.
• Experts from Macedonia and Croatia, too, are satisfied with their state nutrition policy, but they have objections to its insufficiently efficient implementation.
• Situation in B&H is somewhat specific. Namely, the problem is absence of state policy, while policies of entities are evaluated as well created.
• In Serbia, experts do not express satisfaction, since they are not completely familiar with nutrition policy, therefore impression is created that there is no clearly and precisely defined policy.
Experts perceive continuous and systematic education of citizens organized at state level as the necessary strategy for development and implementation of defined nutrition policies in their countries. Food labelling is perceived as one of the measures for conducting of state policy, which might influence reduction of adverse consequences of food consumption, such as being overweight etc.
Macedonia: „It is well structured, the way it should be developing, we have such plans as well, however its implementation has just started.“
Croatia: „Nutrition policy is conditioned by possibility of the state to educate, to provide continuous education, actions etc, which requires money .“
Experts evaluated success of national nutrition policy and its influence on increasing of consumers’ awareness (Table 22) on the scale from 1 (the worst) to 5 (excellent). Average grade 3.23 for success of nutrition policy confirms participants’ attitude that, although well designed, policies are not sufficiently implemented. Additionally,
FOCUS‐BALKANS DL 6.1 Consumer study implementation for products with health claims

FP7 KBBE 2007 1 165 GA 212579
experts evaluate with average grade (although somewhat higher than 3.53) also influence of nutrition policy on increasing of consumers’ awareness. We have to take into account here that, when answering this question, experts mainly thought of positive influence of well designed nutrition policies. Observing each country separately, the most satisfied with their national nutrition policy are experts from Slovenia and Montenegro, then experts from Croatia and B&H with average grade 3, and from Serbia and Macedonia with average grade 2.5. Representatives of Consumers’ Association have stricter attitude and they give lower average grade (2.75) than experts from other institutions do.
Table 26. National policy for nutrition
Statement Min Max Average The national policy for nutrition is sufficient (well suited).
1 5 3.23
The national policy for nutrition improves consumers’ awareness.
2 5 3.53
4.5.3. Public programmes of communication to promote better food habits
In majority of countries there are certain programs implemented with the aim of raising awareness of healthy nutrition and nutrition habits. Slovenia has the best organized programs. In other countries, they are conducted sporadically and insufficiently, according to experts.
General assessment is that programs of promotion are necessary in the long run, but that there are certain obstacles for realization of such programs:
- shortage of financial means, - shortage of designed projects, - insufficient receptiveness of decision-makers and relevant institutions which
grant funds for projects - no coordination between bodies competent for initiation and
implementation of such programs.
Present in Slovenia:
• Program on national level - CINDI program, which is in accordance with the resolution about the National Program for Food Policy 2005-2010, intended and prepared for various target groups. Health Protection Institute has a separate sector for promotion of healthy lifestyle.
• Besides, there are various types of informing: informative programs, magazines, round tables, seminars, lectures.
• The Ministry of Health also finances projects of Government and NG sector, which refer to informing and communication with the public.
FOCUS‐BALKANS DL 6.1 Consumer study implementation for products with health claims

FP7 KBBE 2007 1 166 GA 212579
Slovenia: „We prepare public competitions that NGOs and other institutions participate in, so we grant financial means to them. “
In Croatia are there certain programs, which are conducted sporadically and in a not well organized way. Participants named no concrete program, but we already mentioned that we had no Ministry representatives there.
Croatia: „These actions are sporadic, what we see on TV, there are warning clips, it’s intensified now, during Near Year holidays, when we all eat heavier food. It’s developing, it’s good “.
In B&H, institutions in each entity have their own activities related to raising of consumers’ awareness and promotion of better nutrition habits. However, in the opinion of experts, it’s insufficient and there is a need for larger number of better organized activities.
In the Republic of Srpska, conducted activities are:
• celebration of the World Day of healthy food. This is conducted since 2005., when the Guide for healthy nutrition was promoted;
• counselling about healthy nutrition, promoted in 2006, which takes place in 4 towns;
• healthy breakfast in schools, with Minister of health and Minister of education as participants;
• in the year 2008, in cooperation with NGO Genesis, a play in schools and kindergartens about healthy nutrition;
• various TV programs - during 2008. the Health Institute and National Coordinator for issues of food and nutrition made a set of programs broadcasted on TV stations
• publishing of Calendar of health, distributed in schools, institutions and companies every year.
In Federation Bosnia and Herzegovina, implemented activities are numerous. Participants mentioned only some, such as:
• Promotion of breastfeeding, supported by the Ministry of Health and UNICEF, the program lasts 10-15 years;
• various programs for education of children and youth.
In Serbia there are many campaigns related to healthy nutrition. However, they are not continuous and they don’t last as long as they should, in the opinion of experts.
Some of the projects are:
• October - Month of Healthy Nutrition organized by the Public Health Institute. Activities during this month are various, emphasizing all aspects of healthy nutrition. The accent is on younger population. Together with Healthcare
FOCUS‐BALKANS DL 6.1 Consumer study implementation for products with health claims

FP7 KBBE 2007 1 167 GA 212579
FOCUS‐BALKANS DL 6.1 Consumer study implementation for products with health claims
centres, health institutions engaged in prevention and NGOs participate in these activities most extensively. This campaign is well covered in the media.
• Consumers say „no to genetically modified food“ organized by the Consumers’ Association
• newspaper articles about healthy nutrition
Table 27. National public programs of communication to promote better food habits
Country Public programmes Bosnia and Herzegovina RS: World Day of Food
promotion of Healthy Nutrition Guide ,
promotion of Healthy Nutrition Advisory
promotion of action: Healthy breakfast for school children.
a play in schools and kindergartens about healthy nutrition
FB&H
program Promotion of breastfeeding
programs of education of children and youth Croatia No concrete programs named41
Macedonia campaign of the Consumers’ Association and the Food Directorate
program of the Public Health Institute
project - Program for Consumer Protection
publications intended for people suffering from malignant diseases about adequate nutrition for them;
Presentation for Albanian - Macedonian children about healthy nutrition
Promotion in the media, public events and workshops conducted by Food Directorate in the Ministry of Health and local Public Health Centres
41 We did not interview any representative of the Ministry of Health in Croatia, therefore this information is missing.

FP7 KBBE 2007 1 168 GA 212579
Montenegro Day of Health, Day of Fight Against Diabetes
brochures and leaflets of the Public Health Institute Serbia Month of healthy food
Campaign against GMO
newspaper articles Slovenia CINDI program
In Montenegro, campaigns for raising awareness of citizens are conducted periodically, not continuously.
• Representative of the Ministry of Health mentions celebrating some days such as the Day of Fight against Diabetes, the Day of Health
• the Public Health Institute publishes brochures and leaflets, which are occasionally distributed.
In Macedonia, according to experts, a lot more engagement in this area is necessary, but institutions responsible for issues related to nutrition and food are well coordinated, and special groups that are to be educated are targeted.
Mentioned programs and activities:
• Campaign of Consumers’ Association and Food Directorate - within the Government Consumer Protection Program;
• Program of the Public Health Institute which includes lots of promotional materials. This institution also includes the Department for education of citizens;
• Project - Consumer Protection Program, including the Regulations on Safe Food;
• Publications intended for citizens with malignant diseases about adequate nutrition for them;
• Presentation for Albanian - Macedonian children about healthy nutrition, with accompanying educational material organized by Consumers’ Association;
• Promotion in the media, public events and workshops conducted by Food Directorate in the Ministry of Health and local Public Health Centres
Even besides everything accomplished, according to experts, lots of things have to be done yet. It has to be worked more on citizens’ awareness and their habits related to nutrition. Educational program about healthy nutrition needs to be started in schools - from the earliest age.
Macedonia: “School curriculum definitely needs to be adapted and expanded – more attention has to be paid to consumption of food, not to let it be just one small part of a school subject, I think it’s called ‘The art of living’ ... and we have to work on the environment of these educational institutions as well - we can’t achieve good results if we teach about healthy food at school, and when
FOCUS‐BALKANS DL 6.1 Consumer study implementation for products with health claims

FP7 KBBE 2007 1 169 GA 212579
children go out for a school break they have the worst junk food you can imagine at their reach“.
4.5.4. Trends
a. Priorities and the main governmental objectives
Priorities and main objectives of Governments of all countries may be divided into two groups:
- education of citizens and - market control - enforcement of laws and control of products.
b.Education of citizens
All participants again stress that education of citizens is necessary. Namely, linking insufficient knowledge of citizens about healthy and balanced nutrition and their wrong nutrition habits with various chronic diseases, experts stress that informing of citizens and expanding their awareness need to be implemented systematically. Majority suggests introduction of preventive and educational programs about healthy nutrition and healthy way of life in general. These programs should primarily be focused on the most vulnerable groups: children, pregnant women and older population. Some experts mention the need for educating sellers, in order to enable them to give good advice to buyers of food products. According to experts, education would require establishing of various organizations and institutions to deal with this issue, such as advisory offices, educational centres etc.
Slovenia: „The main objective is making consumers aware and directing them towards healthy nutrition and healthy lifestyle, in order to reduce number of diseases that might be connected with inappropriate lifestyle and inadequate nutrition.“
c.Market control - enforcement of laws and control of products
Together with education of citizens, strict control of products offered to them should be conducted. In the opinion of experts, this will be accomplished by efficient implementation of current laws and regulations, particularly those which refer to safety of food, as well as by enacting of new laws. Some experts think that it is necessary to enact regulations which would control food sold in the vicinity of schools, or more exactly forbid sale of unhealthy food to children, as well as a law which would limit advertising campaigns for unhealthy products targeted at children.
Macedonia: “We need a law to control shops which are in the vicinity of schools, and to forbid marketing in TV programs intended for children. Ministry of Health, Ministry of Education and Ministry of Justice have to work together and develop a strategy to be implemented at state level.“
FOCUS‐BALKANS DL 6.1 Consumer study implementation for products with health claims

FP7 KBBE 2007 1 170 GA 212579
d. Main factors of change and its potential influence on consumption
Spontaneous experts’ responses show that expected factors of change are same for all countries. Main factors which would influence nutrition are:
- Knowledge and citizens’ awareness of healthy nutrition – Experts expect citizens to get more familiar with principles of healthy nutrition and with health prevention enabled by such nutrition, which would result in changes of nutrition habits.
- Living standard - Even besides developed awareness of healthy nutrition, financial situation would still have very strong effect on possibility of change of nutrition habits.
Besides these key factors, also systematic activities of some institutions might influence citizens’ nutrition: advice provided by doctors during health check-ups, better balanced meals in catering outlets etc.
Croatia: “Entire nutrition policy should be formed in such a way that large number of consumers is educated from early childhood, which would result in a nation with proper nutrition habits.“
Consumption of products with health and nutrition claims, in the opinion of experts, would be influenced by:
- Truthfulness of health and nutrition claims – citizens will build their trust in products based on actually achieved effects promised in these claims. This requires regulations and their strict implementation by state bodies, in order to allow only products with carefully checked claims to appear in the market.
- Understanding of health and nutrition claims – claims would have to be written in understandable language, not too professional, in order to be clear to average consumer.
- Marketing campaigns – Advertising campaigns for products with health and nutrition claims affect consumption of these products.
Montenegro: „ The moment it is regulated what nutrition and health claims are to contain and the moment they can be considered reliable - is the moment crucial for consumers’ attitude towards these products.“
Evaluating importance of six factors which might potentially influence changes of food consumption with grades from 1 (unimportant factor) to five (very important factor), experts evaluated majority of factors as important. Change of purchasing power, health aspect of food and consumers’ knowledge about nutritive values are evaluated as most important, and they are followed by public policy and lifestyle. The only factor with average grade below 4 is fashion.
Estimating influence that these factors might have in the future, experts singled out as factors with positive effect: consumers’ knowledge about nutrition values i.e. increased knowledge, and related factor of health aspects of food. Factors fashion
FOCUS‐BALKANS DL 6.1 Consumer study implementation for products with health claims

FP7 KBBE 2007 1 171 GA 212579
and lifestyle are also expected to have positive effect relying on observation that there is a growing world trend of turning towards healthy nutrition and way of life which includes physical activities, with expectations of launching such a trend in the Balkans, as well.
Change of purchasing power might have both positive and negative effect depending on direction taken by these changes. Experts think that increase of purchasing power would result in growing importance of other factors as well (such as health aspect of food), and price wouldn’t be the only and decisive factor, like in a situation when purchasing power is reduced.
In the opinion of experts, public policy is a factor which influences all other mentioned factors. However, real influence of this factor depends on its implementation, i.e. realization of public policy.
Regarding factors of change, there are significant differences neither between countries, nor between institutions, since all factors were evaluated with high grades and variability of grades was small.
e. The long run trend of consumers’ demand for products with N&H claims
Majority of experts agree that demand for products with nutrition and health claims will grow, since, on one hand, young and better informed population will mature, while, on the other hand, society as a whole will mature and change its nutrition habits.
Population which will use these products increasingly are young people who will travel, get educated and who are inclined to changes and keeping up with trends, and eating healthy and using such products, in the opinion of experts, is a trend in Western countries.
Besides, according to experts, market will change. It may be expected that products with quality ingredients and correct food labelling and nutrition and health claims would remain in the market - which would contribute substantially to consumers’ confidence.
Macedonia: „ I think that it will change, producers have already realized that they need to mark only important and crucial elements, and not everything insignificant“.
FOCUS‐BALKANS DL 6.1 Consumer study implementation for products with health claims

FP7 KBBE 2007 1 172 GA 212579
4.6.Conclusion
The most important activities which might have positive effect on development of consumption of products with nutrition and health claims, in the context of improving public health and in the opinion of experts, are:
• Clear public policy related to nutrition; • Education, promotion and informing of population about healthy nutrition • Clear policy of labelling and marking products, training for accurate reading
and interpretation of markings • Monitoring situation in the market through control of food safety and checking
accuracy of nutrition and health claims
• Public policy of stimulating production of food products with nutrition and health claims
Croatia: „We promote balanced nutrition and variety of food. And we tell citizens to be cautious when consuming fat and concentrated sugar, sweets, snacks ...“
B&H: “Through our control we want to prevent launching of products without adequate nutrition claims and thus protect our consumers’ health”.
In the context of improving public health, experts cited activities which might be contributed by their home institutions.
Public Health Institutes might organize the following activities:
• Participating in development of strategy for improvement of nutrition • Testing and evaluating quality of products • Developing specialized institutions to manage issues related to rights of
consumers • Forming of several Advisory offices to manage issues related to healthy
nutrition
Government bodies, as legislative body, should coordinate and link all participants involved in the healthy nutrition providing chain. On one side are there consumers and on the other - carriers of activities. Consumers need to have their health protected and their right to safety, information and possibility to choose, protected as well.
Consumers’ associations, according to experts, have to take care of consumers’ interests. At the same time, they shouldn’t disable industry development.
Slovenia: „We have to mind both of these aspects. Finally, we can’t forbid consumers to buy such junk food if they want to. We can just provide them with recommendations, eat healthy, you’ll be healthy, exercise. We can’t forbid this food by law.″
FOCUS‐BALKANS DL 6.1 Consumer study implementation for products with health claims
FP7 KBBE 2007 1 173 GA 212579
C/ CONSUMERS ATTITUDES TOWARD NUTRITIONNAL AND HEALTH CLAIMS PRODUCTS
5.CONSUMERS FOCUS GROUPS DISCUSSIONS - SYNTHETIC REPORT
SUMMARY Spontaneous associations to healthy life style
• With no exceptions the consumers in all Western Balkans countries (WBC) spontaneously associate healthy life style with healthy food, practicing physical activity, cleanness, economic and social security. Additionally, healthy life style is defined in terms of practicing daily routines (i.e. sound sleep, regular meals) as well as restraint and moderation: a life without stress, alcohol, drugs and cigarettes. The last is particularly typical for elderly respondents.
The link between concepts of food and health
• In general, respondents in all WBC relate health with concepts of food, sports and recreation, beauty and body, family life and youth. Focusing on the concepts of healthy food in a collage technique revealed rather diverse associations. Starting with fresh vegetables and fruits, fresh milk and water, followed by more abstract categories such as sport and sportsmen, nature, beauty (young women and babies) these associations can be labelled typical.
• For consumers in all WBC healthy food means safe food: grown in healthy environment with exact designation of its origin. To certain extent this issue is related to overall consumers’ ethnocentrism in WBC. For example, our respondents from Croatia explicitly stressed their preference of “domestic” food originating from their own country. In similar manner domestic brands in Slovenia were believed to be healthier due to shorter time between their production and consumption. The subjects in Montenegro also give preference to locally produced food due to their scepticism towards the process of controlling imported food as well as shorter time between production and consumption. For subject in Macedonia it is important to know what region of the country the food comes from.
• On a more symbolic level, in all WBC healthy food was also related with family values (happy families, happy kids), satisfaction and success, joy, love, warmth. Finally, elderly people in all WBC seem to be more concerned about their doctors’ recommendations while mothers are mostly concerned about healthy nutrition of their kids.
Rationale for products choice (regular vs products with health claims)
FOCUS‐BALKANS DL 6.1 Consumer study implementation for products with health claims

FP7 KBBE 2007 1 174 GA 212579
• Related to diary product group consumers in WBC seem to be mostly familiar with benefits of low fat, probiotics and omega acid enriched products.
• Different product groups evoke different motives for consumption: diary products are consumed on every day basis and therefore consumers are more aware of their features. They look for low fat (especially elderly), and products with familiar health claims (e.g. it is well known that probiotics can help digestion). Full fat dairy products are chosen for children (fat is considered to be essential for growth). If choosing between margarine types, than the ones with Omega three acids are chosen (this is also commonly known health benefit). As for juices, they are considered to be healthy by default, so the consumers do not elaborate much on their contents (e.g. they don't know the difference between juice, nectar and drink; they interpret differently labels such as all natural, 100% fruit etc). Cookies are chosen on the basis of taste, but healthy cookies (whole-wheat with less sugar) are often also viewed as tasty. Elderly respondents in all WBC claim to be making their choices based on their health and diet benefits implying that they are paying more attention to nutrition and health claims.
• However, the respondents mostly prefer the products they are familiar with (well established “traditional” brands). Traditional brands are particularly the first choice of mothers who claim not to be ready to experiment with what they would give to their children. However, it is important to notice that while in Serbia traditional means a well established, trustful brand with a good reputation in Croatia and Slovenia it generally means a domestic, locally produced brand present at market for a long time which is in line with overall consumer ethnocentrism already implied in previous exercise.
Consumer of products with health claim (image, demographic, personality)
• Image of a typical consumer of health claim products seems to be heavily influenced by TV commercial stereotype: in all WBC it is seen as a young woman, usually professional with high or above average income. She is well educated and friendly, extroverted. As for physical appearance, she is in a good shape, fit, someone who cares about her appearance a lot. She is usually described as married with children but she has also seen as a single. She lives in a cozy house, designed to fit the family needs. She buys products in large supermarkets, on weekly bases. She follows trends and seeks for novelty in every domain.
• Elderly people usually see her as a young, active female in her twenties. Mothers sometimes see her as an elderly woman with health issues, but trying to stay fit and taking care of herself. It is important to note that each age group perceives functional food to be typical for the other, which might indicate lack of identification with these products.
• There is an astonishing similarity in imaging of a typical consumer of health claim products across all investigated Balkans countries. Age differences (elderly vs mothers) seem to be more important in creating this image then country consumers come from.
Perception of product claims (commercial, nutritive, health claims)
FOCUS‐BALKANS DL 6.1 Consumer study implementation for products with health claims

FP7 KBBE 2007 1 175 GA 212579
• All three types of claims are equally chosen within the groups. Mothers favor commercial statement, while elderly favor health claim. Commercial statement is viewed as catchy, but not “too much”, so it doesn’t provoke suspicion. It is persuasive and calls for consumption. Nutritive claim is perceived as excessively technical, too long and “scary”. Health claim promises health benefits- this is appealing to some, but a “turn-off” for the groups without specific health problems. In Slovenia, consumers expressed highest level of suspicion calling the health claims “fashion” or even “fraud“. Consumers in majority of WBC wanted to know which government agencies check the accuracy of the claims and if this was done or not.
• In general, in order to be persuasive, claims need to be perceived as honest, they need to be short, free of overly scientific terms.
• Consumers state they do not base their choice upon these claims. At best, the claims could be a trigger to try it once.
Perception and comprehension of nutritional information
• Nutrition information is perceived as necessary quality sign of product. It’s very existence, however, seems to be enough for the consumers. They do not have a habit of reading nutrition labels and they claim not to understand its contents, they do not have the required expertise. There is a rellativelly good grasp of calories and fat, followed by carbohydrates, sugar and salt; all the other ingredients are unfamilliar to the average WB consumer. Technically, small letters and too many data are viewed as an intention to discourage buyers from analyzing them in detail. The use on nutritional information is connected to specific situations (loosing one’ weight, certain health problem or special dietary regime, etc).
• If ingredient list is read, it is scrutinized for negative information: dangerous additives, preservatives or allergens. Consumers from all countries do not spontaneously tell apart nutrition information, ingredient lists and nutrition claims. Reading, comprehensing and utilizing of nutrition information is still far from becoming a part of common habits.
• In Montenegro, Macedonia, BIH and Serbia, food safety issue is more often raised: consumers stated they first search for expiration date, always is doubt that the product shelf five might be over. In all WBC consumers check the country of origin: domestic and EU products are more trusted, and the countries the product is exported to (the more, the better).
Products with nutritional health claims: motives for purchase and consumption, trust, expectations
• Motives for choosing products with health claims can be divided into several categories: (a) innovation, scientific background; (b) containing specific ingredient (familiar health claim, e.g. “probiotics improve digestion”); (c) prior personal experience with the product; (d) word of mouth on product effects; (e) appealing effect (e.g. “burns fat”).
• On the other hand, there are still strong barriers when it comes to food with health claims: (a) doubt in added ingredients: vitamins, minerals, Q10 and other enzymes- they are untraceable; (b) some adding is unnatural and unnecessary; (c) health claim doesn’t communicate to consumers (too long,
FOCUS‐BALKANS DL 6.1 Consumer study implementation for products with health claims

FP7 KBBE 2007 1 176 GA 212579
to technical, to complicated); (d) products are perceived as products for specific groups- part of the population doesn’t view themselves as potential consumers; (e) price is expected to be higher than in regular products. It is important to note that taste is rarely mentioned as a barrier for consuming functional food products (it is sometimes stated to be comparative advantage of regular products with traditional brands).
• There can be two main causes to these barriers: first, majority of consumers is still uneducated when it comes to this type of product and express resistance towards interpreting complicated scientific claims; second, there is doubt and refusal to accept novelty (health claims that are longer present on the market are taken to be trustworthy, while the new ones are rejected).
• In Montenegro, Macedonia, BIH and Serbia food with health claims is perceived to be upcoming trend in the food market, while in Croatia and Slovenia it is an actual trend, as stated by consumers.
• Consumers do not have spontaneous expectations regarding health claim products. When prompted, they say they expect: (a) greater availability (in regular supermarkets, not specialized stores); (b) more diversified offer and (c) more consumer awareness (health impact of different ingredients will be grow to be more commonly known).
METHODOLOGY
A focus group is a form of qualitative research in which a group of people is asked about their attitude towards various objects (e.g. product, service, concept, advertisement, idea or packaging). Questions are asked in an interactive group setting where participants are free to talk with other group members. They are similar to group or individual interviews, but their defining feature is group interaction. “The hallmark of focus groups is their explicit use of group interaction to produce data and insights that would be less accessible without the interaction found in a group” (Morgan, 1997). Focus groups can be a good method to generate ideas for new products/initiatives. They are also seen as being more efficient than conducting several individual interviews. Focus groups are particularly useful when “gaining access to a sense of participant commonality is the central concern” (Parker & Tritter, 2006). Group discussion produces data and insights that would be less accessible without interaction found in a group setting—listening to others’ verbalized experiences stimulates memories, ideas, and experiences in participants.
For reasons abovementioned, a focus group is moderated discussion usually among 6 to 12 persons. A facilitator guides a group through a series of pre-determined questions. A typical focus group lasts about two hours and covers several topics that one decides on beforehand.
Focus groups are an important tool for acquiring feedback regarding various topics, in our case images and values that are given to health food products and some basic factors regarding food consumption.
The specific goals of the focus groups discussions were stated to be:
Investigating concepts of healthy life style, healthy diet and their relation;
FOCUS‐BALKANS DL 6.1 Consumer study implementation for products with health claims

FP7 KBBE 2007 1 177 GA 212579
Model of food purchase and food consumption;
Elaborating the purchase process: information that make a difference for buyers;
Perception and understanding of claims: nutritive claims and health claims;
Motives for purchase and consumption of products with health claims;
Barriers for purchase and consumption of products with health claims;
Perception of typical consumer of products with health claims;
Future expectations regarding products with health claims.
Recruitment criteria rationale
Studies show that general “health orientation”, as well as orientation towards healthy food (functional food in particular) varies as a function of age and gender. Women are more health-oriented than men and elderly consumers are more health-oriented than younger consumers. The reason suggested by these studies is that “women feel responsible of the well-being of the members of the families” (they are also the main purchaser of food of the family). “Middle-age and elderly consumers are more concerned by health for they are more likely to be diagnosed with a “life style” disease.
That is the reason we targeted two groups of consumers:
(a)Mothers of children aged fifteen or less, since research show that this is the age range in which mothers are in charge of their children’s nutrition. The group of mothers is also sensitive regarding information about healthy diet and new scientific recommendations on this issue.
(b)Elderly people (older than 50) since this they usually have more health problems that can be prevented or mitigated by specific diet and healthy nutritional habits.
We assumed that these two target groups would probably show specific interest for products with nutrition and function claims. Detailed description of participant’s demographics can be found in Appendix 1.
Recruitment process
Two or three recruiters per country were involved in the recruiting procedure. Recruitment was done face to face or by telephone interview. The recruiters were instructed to over recruit (12 persons), in order to cover persons who don’t eventually show up. Recruitment questionnaire consisted of seven questions collecting basic socio-demographic data of participants and two questions that eliminated (a) marketing or food experts and (b) persons who are not aware of their family food purchase and consumption as potential discussants.
FOCUS‐BALKANS DL 6.1 Consumer study implementation for products with health claims

FP7 KBBE 2007 1 178 GA 212579
We opted for blind recruitment procedure (meaning participants were not informed about the discussion topic) in order to avoid self-selection according to interest in food and healthy food in particular.
Focus group execution: participants, facilities and matherials
Focus group discussions were conducted in capital WBC cities, in appropriate facilities (large, well lit and ventilated, with a round table and a flipchart). Materials used for exercises were: two female weekly magazines per participant for collage technique and different food products for purchase exercise. Complete list of products per country can be found in Appendix 2.
Additional materials (paper, scissors, markers, pencils, glue) were provided by organizer.
The discussions were video-recorded, and there was an assistant to the interviewer taking notes and providing technical support.
The number of participants per group varied from 6 to 11. The groups lasted between two and two and a half hour. The participants were compensated with a voucher in value of 10 euros.
FOCUS‐BALKANS DL 6.1 Consumer study implementation for products with health claims

FP7 KBBE 2007 1 179 GA 212579
5.1.Healthy life style – spontaneous associations
With no exceptions the subjects in all Western Balkans countries (WBC) associate healthy life style with healthy food, practicing physical activity, cleanness, economic and social security. Additionally, healthy life style is defined in terms of practicing daily routines (i.e. sound sleep, regular meals) as well as restraint and moderation: a life without stress, alcohol, drugs and cigarettes.
Healthy food is amongst the first concepts associated with healthy life style for both elderly and mothers with children up to 15 years old in all WBC. It is generally connected with intake of fruits and vegetables as well as cooked (i.e. warm meals) and home-prepared food and diet diversity.
Practicing physical activity is another association of healthy life style equally significant to all subjects in all WBC. By no exceptions the subjects associated healthy life style with practicing sports and recreation in order to stay fit and in good shape. However, in Slovenia, physical activity was especially important to elderly subjects (primary association, before healthy food) who supplemented it with mental activity as another important concept (eg. After retiring people could freeze on sofa, Elderly 63, Slovenia).
Cleanness was mostly related to the environment and environmental issues (clean water, clean and fresh air, etc) contributing to production of healthy food (Montenegro, Macedonia and Serbia). The subjects also related cleanness with personal and overall hygiene in food processing (BIH, Croatia and parental group in Slovenia).
Economic and social security were frequent associations with healthy life style in for being the primary prerequisites for a life without stress. For all WBC subjects healthy life style stands for harmony in family life, interpersonal networks with people who can support a person when he or she needs it, economic and social security. Economic and social security were particularly stressed as an important precondition for a life without stress (It is essential to have economic well being in order to be healthy, Elderly, 58, Macedonia; It is important that you receive a check each month in order to have a healthy life, Parent, 36, Slovenia). In BIH economic and social security was also related to political stability as yet another important contributor to a life without stress, i.e. a healthy life.
Finally, in some countries the respondents related healthy life style to certain more psychological or even spiritual values, such as optimism, voluntary work for others, unselfishness and giving in general (Serbia), religion, meaningful life, meditation, yoga (Slovenia) and positive atmosphere without political misunderstandings (Montenegro, BIH).
Typical associations to concept of healthy life style were (for both groups in all WBC):
• Healthy food: fruit, vegetables, cooked (warm meals), food diversity • Sport activities: walking, running, biking, hiking, swimming, dancing • Environment: clean air and earth, ecology, naturally grown food
FOCUS‐BALKANS DL 6.1 Consumer study implementation for products with health claims
FP7 KBBE 2007 1 180 GA 212579
• Healthy life routines: regular sleeping, frugality and moderation in all activities • Economic and social security: employment, financial safety • Interpersonal networks: friends, neighbours, communication, hobbies • Positive atmosphere, warmth, love, family, loyalty, support. • Absence of cigarettes, drugs, any kind of distress
Food and practicing sports were amongst the first concepts associated with a healthy life style in both groups in all WBC.
As for the food groups mentioned, both groups in all WBC mentioned fruit and vegetables as the most important associations to healthy life.
5.2.The link between concepts of food and health
In general, respondents in all WBC relate health with concepts of food, sports and recreation, beauty and body, family life and youth. Focusing on the concepts of healthy food in a collage technique applied in this exercise, respondents revealed rather diverse associations. However, their associations covering different kinds of food, issues related to food production, preparation and consumption (both food quality and food safety issues), sports and sportsmen, nature, beautiful women, happy families and babies may be labelled as typical.
Healthy food is connected with healthy environment with all WBC respondents strongly valuing the possibility to know the exact designation of its origin. To a certain extent this issue is related to overall consumers’ ethnocentrism in WBC. For example, our respondents from Croatia explicitly stressed their preference of “domestic” food originating from their own country. In similar manner domestic brands in Slovenia were believed to be healthier due to shorter time between their production and consumption. The subjects in Montenegro also give preference to locally produced food due to their scepticism in the process of controlling imported food as well as shorter time between production and consumption. For subjects in Macedonia it is important to know what region of the country the food comes from.
On a more symbolic level, in all WBC healthy food was also related with family values (happy families, happy kids), satisfaction and success, joy, love, warmth. Finally, older people in all WBC seem to be more concerned about their doctors’ recommendations while mothers are mostly concerned about healthy nutrition of their kids.
Methodological note:
We used a modified collage technique for this exercise. The respondents in each of two focus groups in each of WBC were given two magazines (similar types of weekly women's magazine selected separately for every country) with the instruction that he/she should cut out everything he/she relates to concept of healthy food. We insisted on personal associations and pointed out they need not be directly linked to food (e.g. only fruit and vegetables). Each respondent made his/her own collage and explained his/her choice verbally.
FOCUS‐BALKANS DL 6.1 Consumer study implementation for products with health claims

FP7 KBBE 2007 1 181 GA 212579
Cutting the colourful magazines and newspapers they were all presented, our respondents were mostly selecting as follows:
1. pictures of different types of fruits and vegetables (fresh, juices and salads), but also meat, fish, milk, yogurt and diary products, home-made food and dishes (bread, soup, full three course meal), whole grain products, cereals teas, herbs, honey;
2. pictures of sports, recreation and nature, including families on skiing, a couple walking by the river, wellness and spa, sunshine, unpolluted environment;
3. pictures of healthy looking personalities, including sportsmen, celebrities, beautiful women with lush hair and strong nails, good looking men, happy children and sound sleeping babies;
4. pictures depicting more abstract associations, such as for example pictures expressing happiness, success, satisfaction, joy, love, warmth and loyalty (all related to living a healthy life), pictures of money (in order to be healthy one needs to have money to buy healthy food and live a healthy life) or pictures representing simplicity, restraints and moderation (to be healthy means to eat simply food, everything but in small amounts).
Diversity and balance as well as moderate intake of all types of food – healthy food, but also meat, fat milk, “joy food” (i.e. hedonic food – chocolates, sweets), wine and spirits are regarded as healthy. Similarly, organic food was either implicitly or explicitly assumed as yet another healthy food concept however mostly discussed in Slovenia where focus groups subjects mainly questioned its veracity.
Consumers in WBC seem not to be equally well informed about nutritional and health aspects of food. Our respondents in Slovenia for example seem to have been mostly exposed to such information from media, literature and advices from G.P.s. However, the information they obtain are inconsistent and controversial. Especially they express high scepticism and mistrust in the information they are exposed to.
In Serbia, the issue of decision making connected with food purchasing and preparation was also raised. While there are changes towards more fairness in household duties food purchase and preparation still remain primarily female job (this is especially true for households with small children and multigenerational households). Women are in charge for healthy diet of the whole family. Even if men are involved, women are the ones that make decisions. The habit of everyday small grocery shopping is still present, but people tend to buy more on weekly or monthly bases. No place of purchase is a guarantee for the food to be fresh and healthy. Barriers and suspicion occur when it comes to green market (interlopers, food with no safety certificates, with pesticides), but also to supermarkets, hypermarkets (imported, no health certificates, not fresh. However, in focus groups participants in Croatia and BIH were still giving preference to green markets.
Associations covering different kinds of food, issues related to food production, preparation and consumption, sports and sportsmen, nature, beautiful women, happy families and babies may be assumed as typical for all WBC. Discussing about healthy food the subjects mostly focused on food production and processing. While
FOCUS‐BALKANS DL 6.1 Consumer study implementation for products with health claims

FP7 KBBE 2007 1 182 GA 212579
FOCUS‐BALKANS DL 6.1 Consumer study implementation for products with health claims
some were insisting on freshly made dishes and simple preparation (boiling), other stressed the importance of limited use of pesticides, fertilizers and various artificial supplements as well as traditional ways (home-made) of preparing food.
“Healthy food is freshly prepared food.” (Mother, 35, Slovenia)
“Kebab, barbecue…these are all good for a proper feast but they are also the least healthy “ (Elderly, 51, BIH)
“Food have to be well prepared, fruit salad is what I like a lot.” (Elderly, Macedonia)
“All natural- mother’s milk, traditional dishes, traditional customs”” (Elderly, 65, Serbia)
Healthy food is connected with healthy environment with all WBC strongly valuing the possibility to know the exact designation of its origin. Croatian consumers for example find the most important that the food they buy originates from Croatia. Slovenian respondents also prefer domestic brands, however questioning to certain extent whether Slovenian food products could be assumed healthier than imported ones. Similar issue was also raised in Montenegro where our subjects stated preference toward domestic brands, however also mentioning several imported brands as the most preferred ones (Carnex42 and Fructal43). Additionally, both subjects from Slovenia and Montenegro have provided a rational explanation for their preference of domestic food - a shorter time between production and/or processing and consumption and consequently lesser use of artificial additives and preservatives. Judging by the statements of our respondents in Serbia however brand preference seems to be more connected with consumers’ overall belief in brand reputation and the reputation of the processor, no matter whether it is domestic or foreign.
“I prefer brand from Croatia” (Mother, 33, Croatia)
“For me it is important to know in which region of the country that product is grown” (Mother, 47, Macedonia)
“Cokolino, Medolino44 as these products are prepared especially for children and with special care”(Mother, 29, Serbia)
On a more symbolic level our subjects associate health and food with beauty, love, satisfaction and positive feelings. Healthy food influences harmony among family members and vice versa – good interpersonal relations influence positive perception of everything else, including food.
“Good looking men and women are mirror of healthy eating.” (Elderly, Macedonia)
“Allies of health are faith, hope and love.” (Elderly, 55, Serbia)
42 Meat and processed meat, Serbian traditional brand 43 Fruit juices, Slovenian traditional brand 44 Instant meals for babies, Croatian traditional brands produced by “Podravka“.

FP7 KBBE 2007 1 183 GA 212579
FOCUS‐BALKANS DL 6.1 Consumer study implementation for products with health claims
“Socialization and time for relaxation is very important for healthy person. I am always healthy when I have time for friends, music and reading books.”(Mother, Croatia)
“It is not the abundance of food. Atmosphere in the family is more important than what they eat”.(Elderly, 55, Serbia)
According to the pictures they selected from the magazines and newspapers in the collage technique applied45 first associations to healthy food for both groups in all WBC:
• Fresh fruits and vegetables, fresh fruit juices • Clean, fresh water • Unpolluted environment for cultivation, natural, no fertilizers and pesticides
(mention of organic food) • Cleanness and hygiene (in growing, processing, packing and preparation) • Ways of preparation: boiled, cooked (“to be eaten with a spoon”), quickly
prepared, or with no preparation at all: colorful fresh fruit and vegetables, “5 colors concept”
• Positive atmosphere, warmth, love, family, loyalty, support. • Youth, beauty and relaxation, babies • Faith, hope, simplicity, moderation. • Self esteem, life satisfaction, success.
Picture 2 Collages from elderly group, Serbia
All those associations are represented in the pictures selected by our subjects. The respondents from Serbia for example apart from many others have chosen the following pictures depicting fruits, lush hair, family, nature, happy kid with a dog.
The respondents from BIH apart from many other have also chosen fruits and vegetables, young and happy nice looking couple, sound sleeping baby, active young woman, but also traditional meals and sweets.

FP7 KBBE 2007 1 184 GA 212579
Picture 3. : Collages from elderly group, BIH
Mothers seem to be more informed about the trends in healthy nutrition:
Picture 5. Mother, 39 Picture 4. Mother, 24 BIH
A girl in white by the sea is an association to ‘healthy spirit’; sports is relevant for body and a good sleep. Healthy environment (healthy environment and a good sleep) – country. We should eat a lot of fruit, vegetable, and herbal tea. Pumpkin is very healthy and she likes pumpkin pie. She believes that milk is good for children, whereas adults see it only as a habit. Nuts, fish, and yoghurt are
Croatia: the smiley picture is an association to healthy life style conditioned by healthy diet. Healthy hair reflects regular and healthy diet. She stresses out nuts and fruit during the winter period for boosting up our immune system – based on her knowledge of nuts and honey being good for our lungs and breathing system. Long legs – associated with healthy diet, practicing sports (no cellulite and veins). Lemonade
FOCUS‐BALKANS DL 6.1 Consumer study implementation for products with health claims
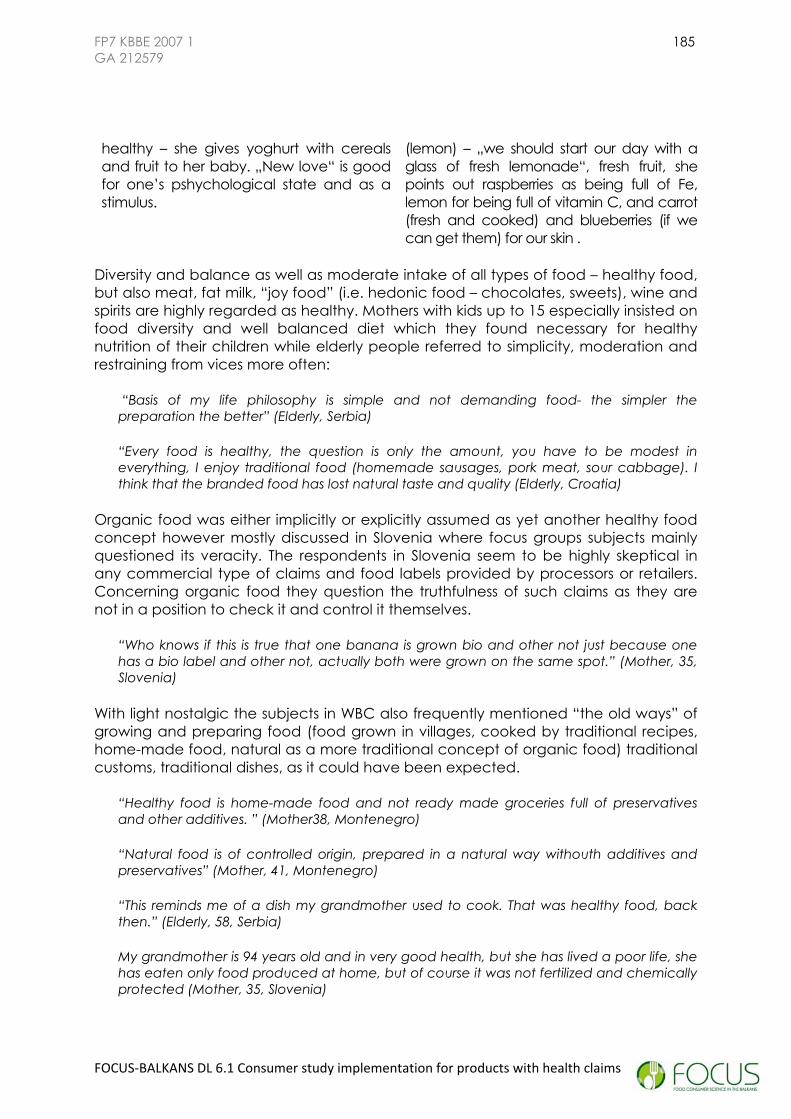
FP7 KBBE 2007 1 185 GA 212579
healthy – she gives yoghurt with cereals and fruit to her baby. „New love“ is good for one’s pshychological state and as a stimulus.
(lemon) – „we should start our day with a glass of fresh lemonade“, fresh fruit, she points out raspberries as being full of Fe, lemon for being full of vitamin C, and carrot (fresh and cooked) and blueberries (if we can get them) for our skin .
Diversity and balance as well as moderate intake of all types of food – healthy food, but also meat, fat milk, “joy food” (i.e. hedonic food – chocolates, sweets), wine and spirits are highly regarded as healthy. Mothers with kids up to 15 especially insisted on food diversity and well balanced diet which they found necessary for healthy nutrition of their children while elderly people referred to simplicity, moderation and restraining from vices more often:
“Basis of my life philosophy is simple and not demanding food- the simpler the preparation the better” (Elderly, Serbia)
“Every food is healthy, the question is only the amount, you have to be modest in everything, I enjoy traditional food (homemade sausages, pork meat, sour cabbage). I think that the branded food has lost natural taste and quality (Elderly, Croatia)
Organic food was either implicitly or explicitly assumed as yet another healthy food concept however mostly discussed in Slovenia where focus groups subjects mainly questioned its veracity. The respondents in Slovenia seem to be highly skeptical in any commercial type of claims and food labels provided by processors or retailers. Concerning organic food they question the truthfulness of such claims as they are not in a position to check it and control it themselves.
“Who knows if this is true that one banana is grown bio and other not just because one has a bio label and other not, actually both were grown on the same spot.” (Mother, 35, Slovenia)
With light nostalgic the subjects in WBC also frequently mentioned “the old ways” of growing and preparing food (food grown in villages, cooked by traditional recipes, home-made food, natural as a more traditional concept of organic food) traditional customs, traditional dishes, as it could have been expected.
“Healthy food is home-made food and not ready made groceries full of preservatives and other additives. ” (Mother38, Montenegro)
“Natural food is of controlled origin, prepared in a natural way withouth additives and preservatives” (Mother, 41, Montenegro)
“This reminds me of a dish my grandmother used to cook. That was healthy food, back then.” (Elderly, 58, Serbia)
My grandmother is 94 years old and in very good health, but she has lived a poor life, she has eaten only food produced at home, but of course it was not fertilized and chemically protected (Mother, 35, Slovenia)
FOCUS‐BALKANS DL 6.1 Consumer study implementation for products with health claims

FP7 KBBE 2007 1 186 GA 212579
“This village house with fireplace reminds me of traditional life which used to be healthier” (Elderly, 57, Serbia)
Consumers in WBC seem not to be equally well informed about nutritional and health aspects of food. Our respondents in Slovenia for example seem to have been mostly exposed to such information from media, literature and advices from G.P.s. However, the information they obtain are inconsistent and controversial. The subjects in other WBC also expressed their strong beliefs about link between health and food. However, our respondents mostly expressed high skepticism and mistrust in the information they are offered through different sources, especially media.
“I don't like the trend of products with health stories. I think that is all big lie.” (Elderly, 60, Croatia)
“When you buy a food item you do not know what you get” (Elderly, 51, Slovenia)
“We don’t know if we eat healthy food. We believe in our eyes (what we see)” (Mother, 28, Macedonia)
In Serbia the issue of family decision making related to purchase of food was also discussed. Although there are changes towards more fairness in household duties, food purchase and preparation remain primarily female job (this is especially true for households with small children and multigenerational households). Women are in charge for healthy diet of the whole family. Even if men are involved, women are the ones that make decisions.
“I go grocery shopping, but I buy only what my wife tells me to- I don’t think at all, I just blindly follow the shopping list” (Engineer, 53, Serbia)
The habit of everyday small grocery shopping is still present, but people tend to buy more on weekly or monthly bases.
No place of purchase is a guarantee for the food to be fresh and healthy. Barriers and suspicion occur when it comes to green market (interlopers, food with no safety certificates, with pesticides), but also to supermarkets, hypermarkets (imported, no health certificates, not fresh). In Croatia and Bosnia however it seems that our subjects still give preference to green markets in their decisions where to go to buy healthy food (A morning ritual of going to green market for buying groceries to cook explained by a mother, 44, BIH)
“I can tell you this- I trust no one!” (Elderly, 65, Serbia)
“I think that the safe and healthy food is only at the green market” (Elderly, 51, Croatia)
In general in all WBC older people more often mentioned their health problems and doctor’s recommendations, mainly as prevention from some diseases, while mothers expressed more consideration of health of their children which they believe to strongly depend on proper intake of healthy food and developing nutrition habits in their early childhood, however some of these believes have sometimes been outdated.
FOCUS‐BALKANS DL 6.1 Consumer study implementation for products with health claims

FP7 KBBE 2007 1 187 GA 212579
“When you get to certain age, you have to take good care of your diet. You cannot eat what you like anymore. At least not when your wife is present.” (Elderly, 57, Serbia)
“Even doctors recommend eggs from time to time.” (Elderly, 65, BIH).
“Nice nutrition habits should be transferred by parents” (Mother, Macedonia)
“My children like to drink freshly squeezed fruit juice, with seven different types of fruits. I think that improves their health. (Mother, Croatia).
“Smiling child and chocolate. Chocolate is very important for children. And other sweets- they need calories” (Mother, 27, Serbia)
5.3.Rationale for products choice (regular vs. Products with health claims)
Different product groups evoke different motives for consumption: diary products are consumed on every day basis and therefore consumers are more aware of their features. Related to diary product group consumers in WBC seem to be mostly familiar with benefits of low fat, probiotics and omega acid enriched products. Elderly respondents in all WBC claim to be making their choices based on their health and diet benefits implying that they are paying more attention to nutrition and health claims. However, the respondents mostly prefer the products they are familiar with (well established “traditional” brands) and/or which taste better. Traditional brands are the first choice particularly in the groups of mothers who claim not to be ready to experiment with what they would give to their children. However, it is important to notice that while in Serbia traditional brand means a well established, trustful brand with a good reputation in Croatia and Slovenia the most important attribute for traditional brand is that it is domestic, locally produced , present at market for a long time. This seems to be in line with somewhat higher overall consumer ethnocentrism already implied in previous exercise.
Methodological note:
Group by group of products was presented to our respondents. Products were in the same packaging size and type so to force the choice by other features (fat content, health claim, and nutrition label). The qualitative scale provided in the table represents the frequency of choices made by our respondents.
In all WBC cookies are chosen on the basis of taste, but healthy cookies (whole-grain with less sugar) are often also viewed as tasty (particularly mothers who regularly buy it both for themselves and their children).
As for juices, they are considered to be healthy by default, so the consumers do not elaborate much on their contents (e.g. in Serbia they don't know the difference between juice, nectar and drink; they interpret differently labels such as all natural, 100% fruit etc while added ingredients (vitamins, Ca etc) are usually seen as unnecessary or unnatural). In Montenegro, Croatia, Macedonia the respondents
FOCUS‐BALKANS DL 6.1 Consumer study implementation for products with health claims

FP7 KBBE 2007 1 188 GA 212579
FOCUS‐BALKANS DL 6.1 Consumer study implementation for products with health claims
give preference to 100% juices and sometimes also to juices with added vitamins. In Slovenia they particularly pay attention to no sugar added juices.
If looking for health claims most of our subjects in all WBC would look for low fat (especially elderly), and products with familiar health claims (e.g. probiotics, omega acid, whole grain and sugar free claims). There seems to be a consensus among both groups of our respondents in all WBC that full fat dairy products should always make a primary choice in their children’s daily diet since fat is considered to be essential for growth. Mothers seem to be more ready to experiment with products with health claims when buying those for themselves and not for their kids. Also, margarine as a generic product is not highly respected since our WBC respondents seem to be giving preference to other spreads (butter) for being more tasty (Serbia) or oil for being less industrial and thus healthier (Slovenia).
Among the information provided on products with no exceptions our respondents mostly look for expiration date (both elderly and mothers). While in most cases this has been the solemn information the elderly group would look for (due to all other information being provided in small letters and thus hardly readable) mothers claim to be paying attention to other nutritional information especially when deciding to buy a new product they have not been familiar with. However, according to what we have heard from our respondents we could assume that most of the consumers in WBC have not been well educated on what they should pay attention to while reading nutritional labels and how they should interpret the information available. Concerning their beliefs in such information there seems not to be a general conclusion. Many of them express doubts in any information regarding it as pure marketing while on the other hand there are also those who are ready to believe at least to those producers they are well familiar with for being present at the market for a long time.
Table 28. The frequency of selecting certain products within the groups offered in WBC46
Products margarine yoghurt cookies juice
Target group
standard light Ω 3,2% fat 0% Lgg classic wholeweat diabetic 50/50% 100% Added Ca and vit. fat
Elderly Many Several Many Several Most Several Most Several Many
Mothers Most Several Several Many Most Several Most
Table 29. Reasons behind selection of certain products in WBC
Group of products
Type of product Reason for the selection
Yoghurt
3,2% fat yoghurt - Fat essential for children - Tastes better by far - Habit - Traditional brand
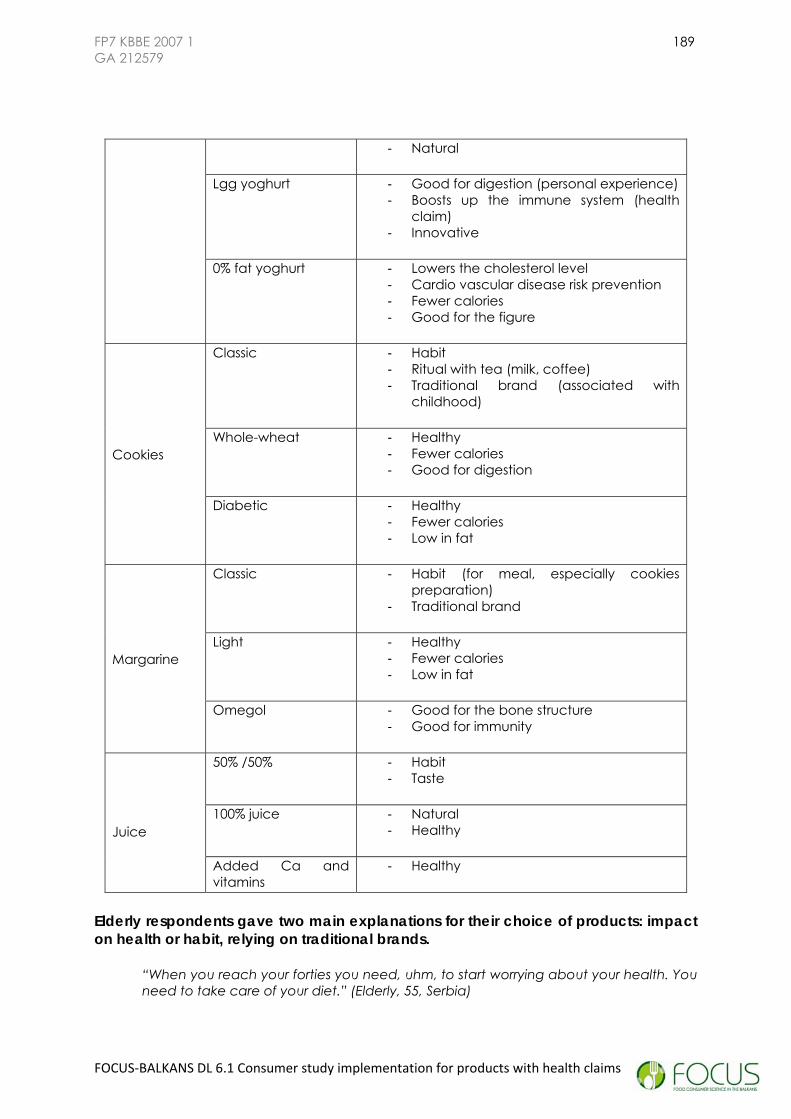
FP7 KBBE 2007 1 189 GA 212579
- Natural
Lgg yoghurt - Good for digestion (personal experience) - Boosts up the immune system (health
claim) - Innovative
0% fat yoghurt - Lowers the cholesterol level - Cardio vascular disease risk prevention - Fewer calories - Good for the figure
Cookies
Classic - Habit - Ritual with tea (milk, coffee) - Traditional brand (associated with
childhood)
Whole-wheat - Healthy - Fewer calories - Good for digestion
Diabetic - Healthy - Fewer calories - Low in fat
Margarine
Classic - Habit (for meal, especially cookies preparation)
- Traditional brand
Light - Healthy - Fewer calories - Low in fat
Omegol - Good for the bone structure - Good for immunity
Juice
50% /50% - Habit - Taste
100% juice - Natural - Healthy
Added Ca and vitamins
- Healthy
Elderly respondents gave two main explanations for their choice of products: impact on health or habit, relying on traditional brands.
“When you reach your forties you need, uhm, to start worrying about your health. You need to take care of your diet.” (Elderly, 55, Serbia)
FOCUS‐BALKANS DL 6.1 Consumer study implementation for products with health claims
FP7 KBBE 2007 1 190 GA 212579
FOCUS‐BALKANS DL 6.1 Consumer study implementation for products with health claims
“I use it because it is on herb basis with no fat and it is easy to digest, I can feel that for sure. I also buy it for my mother, you know, she has a problem with her veins.” (Elderly, 51, BIH)
“My choice is light yoghurt without fat, omegol because it is good for blood vessels, and apple juice because it has great taste” (Elderly, Croatia)
Mothers also stick to the traditional brands, hesitating to experiment when children are “at stake”.
“I buy only what I have tried before for my kids.” (Mother, 27, Serbia)
“3,2 milk fat, I buy products with a lot of fat for my kid, you also know what they say – ‘’an apple in the house chases doctors away”. (Mother, 24, BIH).
“I buy what I like and what my children like.” (Mother, 35, Slovenia)
“I would take bio balans – it is low fat saying it improves digestion, with probiotics – that I would choose for myself. And for my kids I would take classic full fat yogurt.” (Mother, 42, Montenegro)
In Croatia and Slovenia traditional brands refer to local, domestic brands which are strongly preferred over other imported brands. In Macedonia preference of domestic brands is also evident however together with some other foreign traditional and well respected brands. In Serbia respondents refer to familiar brands not explicitly mentioning their country of origin.
“Dukat liquid yogurt because it is Croatian brand, Cappy orange juice again because it is Croatian brand and I think that they have less preservatives and additives than imported juices. Margo light yogurt is my choice because it has less calories.” (Elderly, Croatia)
“Cappy juice, because it is Croatian domestic brand margarine omegol – best Croatian brand, has a fine taste, favourable ratio of omega 3 and omega 6, which is healthy Cookie - digestive, the fine taste of the cake for them ... they are healthy, believe in cereals.” (Mother, Croatia)
“I trust domestic products much more that those imported.” ( Elderly, 51, Slovenia)
“Bimilk balans +, it is probiotic it contains lactobacillus, and 1% fat. I prefer Macedonian products since I think they have higher quality. Fructal 47100%, since it is stated that on the label, I’m not sure if it is like that. I choose Zobelix48 biscuits, since they are the healthiest. If I have to choose by taste I’ll take cookies without doubts” (Mother, 41, Macedonia)
I need to know what I am buying. I feel confident with familiar brands. (Elderly, 65, Serbia)
47 Slovenian brand 48 Croatian brand

FP7 KBBE 2007 1 191 GA 212579
I provide my children with variety of fresh food, I chase them with fruit and vegetables, so they don’t need supplements. I buy them normal products, the old brands. (Mother, 33, Serbia)
5.4.Consumer of products with health claim (image, demographic, personality)
Image of a typical consumer of health claim products seems to be heavily influenced by TV commercial stereotype: in all WBC it is seen as a young woman, usually professional with high or above average income. She is well educated and friendly, extroverted. As for physical appearance, she is in a good shape, fit, someone who cares about her appearance a lot. She is usually described as married with children but she has also seen as a single. She lives in a cozy house, designed to fit the family needs. She buys products in large supermarkets, on weekly bases. She follows trends and seeks for novelty in every domain.
Elderly people usually see her as a young, active female in her twenties. Mothers sometimes see her as an elderly woman with health issues, but trying to stay fit and taking care of herself. It is important to note that each age group perceives functional food to be typical for the other, which might indicate lack of identification with these products.
There is an astonishing similarity in imaging of a typical consumer of health claim products across all investigated Balkans countries. Age differences (elderly vs mothers) seem to be more important in creating this image then country consumers come from.
There are important common characteristics attributed to consumer of functional food: female, educated, hard to please- what one might call “aware consumer”.
She knows what she wants and where to look for it. (Mother, 46, Serbia)
She tries different stuff, she experiments.(Mother, 33, Croatia)
Consumer of products with health claim say that a woman who reads the health claims and labels has a job, with average to very high income. She is positive, friendly and has good physical appearance.
When I watch someone I can tell from a start whether they are healthy-spirited, fresh, and full of positive emotions. (Older examinee, 51, BIH).
It is noticeable that younger group sees her as older (because she takes care of her health), while elderly group sees her as younger (ready to try new things). This might indicate lack of identification with this person.
You know it feels so good to see an older lady who is full of health; you know these women are my idols. (Mother, 27, BIH).
FOCUS‐BALKANS DL 6.1 Consumer study implementation for products with health claims

FP7 KBBE 2007 1 192 GA 212579
FOCUS‐BALKANS DL 6.1 Consumer study implementation for products with health claims
Detailed characteristics of an average consumer of these products are given in the Table 30.
Table 30. : Typical consumer of health claim products
Characteristic
Older examinees Joint characteristics
Mothers
Disagreements within the group
Major opinion
Major
opinion
Disagreements within the group
Sex Female Age 60 20-30 60 60 Appearance Trendy,
attractive In a good shape, well groomed
Employment Retired Working Still working, private company
Retired
Education High Income Average to
high
Household 5 kids 4 members (2 children)
Hobby Skiing, sailing, all that fancy stuff
Taking care of children
House Cozy but not too expensive
Personality Friendly, extroverted
Where they buy
Supermarkets
When they buy
On the weekly bases
Why they buy She wants to try new products, to look good, to loose weight
For health impact
She “needs to believe” something could help their health
When they eat it
On everyday bases
On special occasions - guests

FP7 KBBE 2007 1 193 GA 212579
FOCUS‐BALKANS DL 6.1 Consumer study implementation for products with health claims
5.5.Perception of product claims (commercial, nutritive, health claims)
Consumers across the countries were highly doubtful about the claims presented. It might be a cultural determinant- it is considered to be socially desirable not to trust the commercial promises. However, more elaborate analyses revealed that the claims do have certain impact on consumer’s behavior: they sometimes serve as heuristic cues for food choice.
All three types of claims are equally chosen within the groups. Mothers favor commercial statement, while elderly favor health claim. Commercial statement is viewed as catchy, but not “too much”, so it doesn’t provoke as much suspicion as others. It is persuasive and calls for consumption. Nutritive claim is perceived as excessively technical, too long and “scary”. Health claim promises health benefits - this is appealing to some, but a “turn-off” for the groups without specific health problems.
In general, in order to be persuasive, claims need to be perceived as honest, they need to be short, free of overly scientific terms.
Consumers state they do not base their choice upon these claims. At best, the claims could be a trigger to try it once.
Methodological note:
Participants in this exercise were given three pieces of paper, on which three different statements were written (different in contents across the countries, but from real sources. Examples of those statements are:
o Fruit yoghurt with large selected pieces of fruit – commercial statement; o Sterilized milk with 1,6% milk fat; enriched with 12 vitamins – nutritive
statement; o Partially skimmed milk with the addition of Ca and fibers – helps digestion
and strengthens bones – health statement.
The ranking of claims differed between the groups, but also among countries. Generally speaking, participants from Serbia and Bosnia more often choose nutritive statements, while those from Croatia prefer health claims. It is also shown that majority of participants from all countries did not know how to make difference between different types of claims. Mothers showed relatively higher level of differentiations.
Mothers choose commercial statement more often, claiming that it is believable, it can be easily verified, and it is appealing (calls for consumption).
With large peaces of fruit. You open it and see if it’s true.(Mother, 33, BIH)
I have the urge to try it. Sounds tasty. (Mother, 27, Serbia)

FP7 KBBE 2007 1 194 GA 212579
FOCUS‐BALKANS DL 6.1 Consumer study implementation for products with health claims
It’s the most credible one.(Mother, 29, Macedonia)
Elderly people choose health statement more often, claiming it sounds tempting, it promises health benefits they need:
o Ca which is important for the bones, and they all have bone issues in their age; o Digestion, which is often one of their health issues, o The fact that these products are healthier in general.
Partially skimmed milk because it is good for my bones (Older examinee, 56, Slovenia).
Important addition is that they usually do not read these claims or buy products on the bases of claims. Only when prompted to elaborate the claims, they find them persuasive.
Yes, I need something to fix my bones. (Housewife, 58, Serbia)
These things seem to help my digestion. It might be placebo, but it works for me. (Retired pharmacist, 65, Serbia)
Promises, promises. But they sure sound good. (Bank clerk, 60, BIH)
Because of herbal fibres. (Older examinee, 52, Slovenia).
5.6.Perception and comprehension of nutritional information
Nutrition information is perceived as necessary quality sign of product. It’s very existence, however, seems to be enough for the consumers. They do not have a habit of reading nutrition labels and they claim not to understand its contents. Technically, small letters and too many data are viewed as an intention to discourage buyers from analyzing them in detail.
If nutritional labels are read, they are scrutinized for negative information: dangerous additives, preservatives or allergens.
In Montenegro, Macedonia, BIH and Serbia, food safety issue is more often raised: consumers stated they search for expiration date, always is doubt that the product shelf five might be over. They also doubt that food is properly stored.
Customers do search for expiration date: freshness of products is very important, but there seems to be a margin of optimal shelf life (e.g. for fruit yoghurt it is a month or two). If it is indicated to be longer, consumers doubt its quality (it has supplements, added ingredients, preservatives, it is over processed)
“When I see a product with crazy long shelf life, I know instantly they took its’ heart and soul while producing it.” (Military pilot, 54, Serbia)
Food safety issues are more often raised in Montenegro, Macedonia, BIH and Serbia.

FP7 KBBE 2007 1 195 GA 212579
FOCUS‐BALKANS DL 6.1 Consumer study implementation for products with health claims
“Like those cookies we used to get from America. They were made in 1944. their own war reserves. “ (Retired , 65, BIH).
“People sell products that nobody controlles for quality. Ther is also the thing with storing the food: during the summer they take out fruit, vegetables, greens on the sidewalk near busy crossroads, they store the juices and oil and they don't think about the heat, about the sun... “ (Housewife, 55, Montenegro)
Consumers also check the country of origin: domestic and EU products are more trusted, and the countries the product is exported to (the more, the better).
Nutrition label is an indicator of food safety- it shows that the food was properly analyzed. To be understandable, but also as a proof of it being locally tested, it is important for the labels to be translated in local language.
At the same time, there is no habit of reading and little or no comprehension of nutrition labels. This is a universal finding for all West Balkan consumers:
“I am no expert; it doesn’t mean anything to me” (Mother, 28, Serbia)
“I read nutritional value only when buying for my child, to be honest I do not believe in that“ (Mother, 29, Croatia)
“There is a bulk of things written which we do not understand“, (Father, 40, Slovenia)
“Too long, to small letters, too technical” (Store manager, 55, Serbia)
Even the information of percentage of recommended daily values is perceived to be too complicated; it requires too much cognitive effort. Time restraint is often mentioned as a reason for not reading the labels.
”I carefully read the nutritional information when I’m shopping alone. When I do it with my husband, because of the constant rush, I rarely do that” (Mother, 33, Macedonia)
These labels should be large enough to read. In my own theory, if they want to hide something they write it in small letters so when you go to get more groceries you do not have the time to read it all. (Older examinee, 51, BIH).
Calories are the only information that counts: the lesser the better, but the opposite goes for children.
If nutritional labels are read, they are scrutinized for negative information: dangerous additives, preservatives or allergens.
“I am searching for the ‘E’ signs- if there are too many, no way I will buy the product” (Housewife, 53, Slovenia)
“I had a list somewhere in the kitchen because my son was ill so I tried to avoid them, you know they can cause cancer.“ (Mother, 44, BIH).
Detailed scrutinizing of nutritive labels: only for some products and some populations:

FP7 KBBE 2007 1 196 GA 212579
FOCUS‐BALKANS DL 6.1 Consumer study implementation for products with health claims
• Only for a few products, consumers know what to look for content-wise, they are aware of quality indicators ( e.g. percentage of cocoa in chocolate)
“We understand the part that refers to fat or carbohydrates but there are some facts that not all of us understand. “ (Mother, 24, BIH).
• For some new products, before purchase.
“If I always buy from the same manufacturer, I only read the date, but if it is a new product I read it all. “ (Older examinee, 65, BIH).
• Specific subpopulations (chronically ill, allergy prone, on special dietary regiment) are forced to be informed about nutritive content: percentage of fat, sugar, allergens.
5.7.Products with nutritional and health claims: motives for consumption, trust, expectations
Motives for choosing products with health claims can be divided into several categories: (a) innovation, scientific background; (b) containing specific ingredient (familiar health claim, e.g. “probiotics improve digestion”); (c) prior personal experience with the product; (d) word of mouth on product effects; (e) appealing effect (e.g. “burns fat”).
On the other hand, there are still strong barriers when it comes to food with health claims: (a) doubt in added ingredients: vitamins, minerals, Q10 and other enzymes- they are untraceable; (b) some adding is unnatural and unnecessary (e.g. vitamins in yoghurt; Ca in fruit juice); (c) Health claim doesn’t communicate to consumers (too long, to technical, to complicated); (d) products are perceived as products for specific groups- part of the population doesn’t view themselves as potential consumers.
There can be two main causes to these barriers: first, majority of consumers is still uneducated when it comes to this type of product and express resistance towards interpreting complicated scientific claims; second, there is doubt and refusal to accept novelty (health claims that are longer present on the market are taken to be trustworthy, while the new ones are rejected).
Consumers do not have spontaneous expectations regarding health claim products. When prompted, they say they expect: (a) greater availability (in regular supermarkets, not specialized stores); (b) more diversified offer and (c) more consumer awareness (health impact of different ingredients will be grow to be more commonly known).
In Montenegro, Macedonia, BIH and Serbia food with health claims is perceived to be upcoming trend in the food market, while in Croatia and Slovenia it is an actual trend, as stated by consumers.

FP7 KBBE 2007 1 197 GA 212579
FOCUS‐BALKANS DL 6.1 Consumer study implementation for products with health claims
In sum, motives for choosing products with health claims can be divided into several categories:
5.7.1. Innovation, scientific background
“It is scientifically proven to be beneficial for health. There is research behind it.” (Engineer, 71, Serbia)
“I buy them if I see that the product is controlled in institution of the country that controls those types of products” (Elderly, 56, Macedonia)
5.7.2. Containing specific ingredient (familiar health claim)
“Bioactiv LGG boosts up the immunity and helps the digestion“ (Mother, 44, BIH).
“I look for probiotics.” (Retired, 58, Macedonia)
“It contains magnesium. Magnesium relaxes.” (Housewife, 58, Serbia )
5.7.3. Prior personal experience with the product
“I have tried it before; it seems to improve my digestion.” (Retired elementary school teacher, 65, Serbia)
“I have tried all yoghurts with full fat content before, I like the light one with probiotics because it tastes better” (Mother, 44, Montenegro)
“My son is professional sportsman and he buys these products- he says they give him energy. It’s the right thing for sportsman!” (Retired 54, Montenegro)
5.7.4.Word of mouth on product effects
“I buy Balans with cereals for the kids, everyone says it’s healthy. “ (Mother, 41, Montenegro)
5.7.5. Appealing effect
“Burns fat. Sounds so good. I would certainly give it a try.”(Mother, 28, Croatia)
“I was attracted by Omega 3; it helps reduce cholesterol“ (Older examinee, 65, BIH).
On the other hand, there are still strong barriers when it comes to food with health claims:
5.7.6. Doubt in added ingredients: vitamins, minerals, Q10 and other enzymes- they are untraceable. In some countries (e.g. Croatia) consumers have no information if there is a government agency or body that checks if the health statements are true.
“I don’t know if they added it, I don’t know how much they added. If I am to take supplements, I will buy those in pharmacy, so I can have some control to what I am consuming.” (Engineer, 54, Serbia)

FP7 KBBE 2007 1 198 GA 212579
FOCUS‐BALKANS DL 6.1 Consumer study implementation for products with health claims
“It would be very interesting in Croatia, to see who controls the nutritional and health statement, whether there are bodies that are concerned that the product is what it says it is on the package“ (Business secretary, 33, Croatia)
5.7.7. Some adding is unnatural and unnecessary.
“You tell me what are added vitamins looking for in yoghurt! The yoghurt contains enough vitamins itself.” (Retired teacher, 65, Serbia)
“Why should one add Calcium in the fruit juice- there are natural sources of Calcium.” (Mother, 28, Montenegro)
5.7.8. Health claim doesn’t communicate to consumers
“This claim is too long. Too many scientific terms. Not for me.” (Mother, 29, Slovenia)
5.7.9. Products perceived as products for specific groups. Part of the population doesn’t view themselves as potential consumers.
“For now we are healthy. If there would be some healthy problems in my home then for sure I would check around for such products“ (Mother, 35, Slovenia)
“Why should I try this- I have no problems with my bones yet?”(Mother, 33, Serbia )
5.7.10.The price is higher than the price of regular products
“If the price were the same as in regular products, we would all buy those with claims” (Retired, 65, Slovenia)
There can be two main causes to these barriers: first, majority of consumers is still uneducated when it comes to this type of product and express resistance towards interpreting complicated scientific claims; second, there is doubt and refusal to accept novelty (health claims that are longer present on the market are taken to be trustworthy, while the new ones are rejected).
Claims that appeal to consumers are the ones that are:
• Short and simple • Down to earth, not condescending • Written in everyday language, introducing no more then one scientific term
per claim • Avoiding targeting only specific, narrow populations. • With the image of novelty, trendy, in attractive packaging can draw a wider
range of consumers.
Consumers do not have spontaneous expectations regarding health claim products. When prompted, they say they expect:
5.7.11.Greater availability (in regular supermarkets, not specialized stores)

FP7 KBBE 2007 1 199 GA 212579
FOCUS‐BALKANS DL 6.1 Consumer study implementation for products with health claims
“Maybe shelves for these products, as there are for products for diabetic.” (Engineer, 54, Serbia)
“In shopping malls there should be a special department, something like ‘healthy food’ department. “ (Older examinee, 57, BIH).
5.7.12.More diversified offer
There will be more variety of these products in years to come. Innovations in food industry are happening very fast. (Store manager, 55, Serbia)
5.7.13.More consumer awareness (health impact of different ingredients will be grow to be more commonly known).
“My sisters live in Australia- they put their glasses on, and they read every detail on the label. It is normal there, and it will be normal here too.” (Retired elementary school teacher, 65, Serbia)
In Montenegro, Macedonia, BIH and Serbia food with health claims is perceived to be upcoming trend in the food market, while in Croatia and Slovenia it is an actual trend, as stated by consumers.
“ We are behind, but we follow the trends. It is a trend worldwide and it will be here too.” (Engineer, 54, Serbia)
“Those functional foods are so fashionable right now. We are bombarded with those” (Father, 43, Slovenia)
“I don't like the trend of products with health stories. I think that is all big lie.” (Elderly, 60, Croatia)
5.8.Basic demographic information on participants 5.8.1.Bih
a.Focus group 1: Elderly (50+)
Resp No Age
Gender Household size
Employed
or retired
Profession
Education
Remark
1 56 F 3 unemployed high school les than 500€ 2 63 F 3 retired primary
school les than 500€
3 52 F 3 employed high school between 500–1000€
4 51 M 3 employed high school les than 500€ 5 57 M 2 employed faculty more than
1000€ 6 65 M 3 retired high school more than
1000€

FP7 KBBE 2007 1 200 GA 212579
FOCUS‐BALKANS DL 6.1 Consumer study implementation for products with health claims
7 51 F 3 employed faculty more than 1000€
8 69 M 3 retired faculty between 500–1000€
9 74 F 5 unemployed primary school
between 500–1000€
10 59 F 5 retired high school between 500–1000€
b.Focus group 2: Mothers of children up to 15 years of age
Resp No Age
Number of children
Household
size
Working or staying at home
Profession
Education
Remark
1 27 1 3 working high
school les than 500€
2 32 1 3 staying at home
faculty between 500–1000€
3 39 5 3 staying at home
high school
between 500–1000€
4 24 5 1 staying at home
faculty more than 1000€
5 39 3 1 employed faculty between 500–1000€
6 28 3 1 staying at home
high school
les than 500€
7 29 3 1 employed faculty between 500–1000€
8 29 4 2 employed high school
between 500–1000€
9 41 5 3 staying at home
high school
between 500–1000€
10 44 3 1 employed high school
more than 1000€
5.8.2.Croatia
a.Focus group 1: Elderly (50+)
Resp No Age Gender Household size
Employed or retired
Profession
1 >65 M 2 Retired Teacher 2 >50 F 3 Employed Secretary 3 >60 M 5 Employed Government officials 4 >50 F 3 Employed Secretary 5 56 F 4 Employed Cleaning lady 6 > 50 F 4 Employed Lawyer
b.Focus group 2: Mothers of children up to 15 years of age
Resp No Age Number of
Household size
Working or staying
Profession

FP7 KBBE 2007 1 201 GA 212579
FOCUS‐BALKANS DL 6.1 Consumer study implementation for products with health claims
children at home 1 30-40 1 5 Working Business secretary 2 43 3 5 Working Advisor 3 30-40 3 5 Working Manager of sales 4 >40 3 5 Working Professor 5 30-40 2 4 Working Teaching Assistant 6 30-40 1 2 Working Tourist worker
5.8.3.Macedonia
a.Focus group 1: Elderly (50+)
Resp No
Age Gender Household size
Employed or retired
Profession Remark
1 52 F 4 Employed Social worker 2 53 M 5 Employed Technician 3 51 M 4 Employed Medical doctor 4 61 F 4 Retired Medical doctor 5 56 M 4 Employed Laboratory
worker
6 51 F 4 Employed Lawyer 7 58 M 4 Employed Construction
engineer
8 52 F 4 Employed Cleaning lady
b.Focus group 2: Mothers of children up to 15 years of age
Resp No
Age Number of children
Household size
Working or staying at home
Profession Remark
1 38 2 4 Working Chemical engineer
2 41 2 4 Working Medical doctor 3 40 1 3 Working Technical
secretary
4 47 1 3 Working English teacher 5 34 1 3 Working Laboratory
worker
6 28 2 4 Working Tourist worker 7 33 1 3 Working Pharmacist
5.8.4.Montenegro
a.Focus group 1: Elderly (50+)
Resp No
Age Gender Household size
Employed or retired
Profession Remark
1. 56 F 3 Employed 2. 64 F 3 Retired 3. 69 M 2 Retired 4. 56 M 4 Employed 5. 55 F 4 Employed 6. 65 F 3 / Housewife

FP7 KBBE 2007 1 202 GA 212579
FOCUS‐BALKANS DL 6.1 Consumer study implementation for products with health claims
7. 66 M 3 Retired Retired professor
8. 55 F 3 Retired Teacher
b.Focus group 2: Mothers of children up to 15 years of age
Resp No
Age Number of children
Household size
Working or staying at home
Profession Remark
1. 38 3 5 Employed Restaurant owner 2. 35 2 4 Employed Dentist nurse 3. 37 3 5 Employed Medical worker 4. 46 3 5 Unemployed Housewife 5. 41 1 3 Employed Teacher 6. 42 2 4 Employed Sales manager 7. 31 2 4 Unemployed Waitress 8. 36 1 3 Unemployed Housewife
5.8.5.Serbia
a.Focus group 1: Elderly (50+)
Resp No
Age Gender Household size
Employed or retired
Profession Remark
1 57 M 4 E Driver 2 60 F 4 R Bank clerk 3 55 F 3 E Store manager 4 58 F 4 R State clerk 5 65 F 4 R Elementary school
teacher
6 65 F 3 R Pharmacist 7 55 F 3 E Cleaning lady 8 53 F 2 Housewife 9 54 M 2 E Engineer 10 54 M 1 R Military pilot 11 68 M 2 R Engineer
b.Focus group 2: Mothers of children up to 15 years of age
Resp No
Age Number of children
Household size
Working or staying at home
Profession Remark
1 27 2 4 H Housewife 2 28 1 3 H Housewife 3 29 2 4 H Housewife 4 31 2 4 W Clerk 5 33 2 4 W Clerk 6 34 1 3 W Mid level manager 7 41 2 3 W Private firm owner

FP7 KBBE 2007 1 203 GA 212579
FOCUS‐BALKANS DL 6.1 Consumer study implementation for products with health claims
8 43 3 5 H Teacher 9 46 3 4 W Museum curator
5.8.6.Slovenia
a.Focus group 1: Elderly (50+)
Resp.No Age Gender Household size
Employed or retired
Profession Remark
1 65 F 4 R bookkeeper Tree generation household
2 62 F 2 R security Two generation household
3 61 F 4 R Industrial worker
Tree generation household
4 63 M 2 R bricklayer One generation household
5 54 M 3 E designer Two generation household
6 57 M 3 R industrial worker
Tree generation household
7 51 F 3 E secretary Tree generation household
b.Focus group 2: Mothers of children up to 15 years of age
Resp No.
Age No.of
children
Household size
Working or staying at home
Profession Remark
1 37 3 5 W Civil servant 2 25 1 3 W Student 3 29 1 5 W Sales rep.
leasing Lives in household with parents
4 40 3 5 W Engineer Male* 5 36 5 8 H Farmer Running a farm with
husband 6 35 2 4 W Driver Male* 7 35 4 6 H Farmer Running a farm with
husband 8 36 3 5 W Teacher
5.9.List of products offered in exercise 2 5.9.1.BIH
a.Focus group 1: Elderly (50+)
Product category
(Margarine)
Product group
Brand name Remark
Margarine Standard, milky, domestic 60% fats
„DOBRO JUTRO”
Dijamant a.d. Zrenjanin,
Present on the market for the very long period

FP7 KBBE 2007 1 204 GA 212579
FOCUS‐BALKANS DL 6.1 Consumer study implementation for products with health claims
Serbia Margarine Standard, 3 plant
oils, 48% fats „RAMA”
Unilever, Poland
Relatively new on the market
Margarine Light, 25 % fats „MARGO”
Zvijezda, Zagreb, Croatia
-
Margarine Light, 25 % fats „PRIJATNO”
Vital, Vrbas, Serbia
-
Margarine Margarin with omega 3 and omega 6 fatz y acids
„OMEGOL”
Zvijezda, Zagreb, Croatia
Relatively new on the market
Margarine Margarin with omega 3 and omega 6 fatty acids
„HALTA”
IPSA S.p.A, Italy
Completely new on the market
Product category
(Biscuits)
Product group
(e.g. Biscuits for diabetics)
Brand name
Biscuits Classical “ZLATKA”
Kraš, Zagreb, Croatia
Present on the market for the very long period
Biscuits Classical “DOMAĆICA”
Banini, Serbia
Present on the market for the very long period
Biscuits Biscuits for diabetics “PIKNIK”,
Koestlin, Bjelovar, Craotia
Other products from this company are present on the market for the very long period
Biscuits Biscuits for diabetics “BETIS”
Štark, Beograd, Serbia
-
Biscuits Integrated cookies “SALSA”
Vekić chocolate, Temerin, Serbia
Relatively new on the market
Biscuits Integrated cookies – with cereals
“NATURALIS”
Vekić chocolate, Temerin, Serbia
Relatively new on the market
Product category (Yoghurt)
Product group Brand name
Yoghurt 3.2% m.m – classic "LATEA",
Kozarska Dubica, BiH
Domestic product
Yoghurt 3.2 % m.m – classic “MOJA KRAVICA”
Imlek, Padinska Skela, Srbija
Present on the market for the very long period - as a domestic
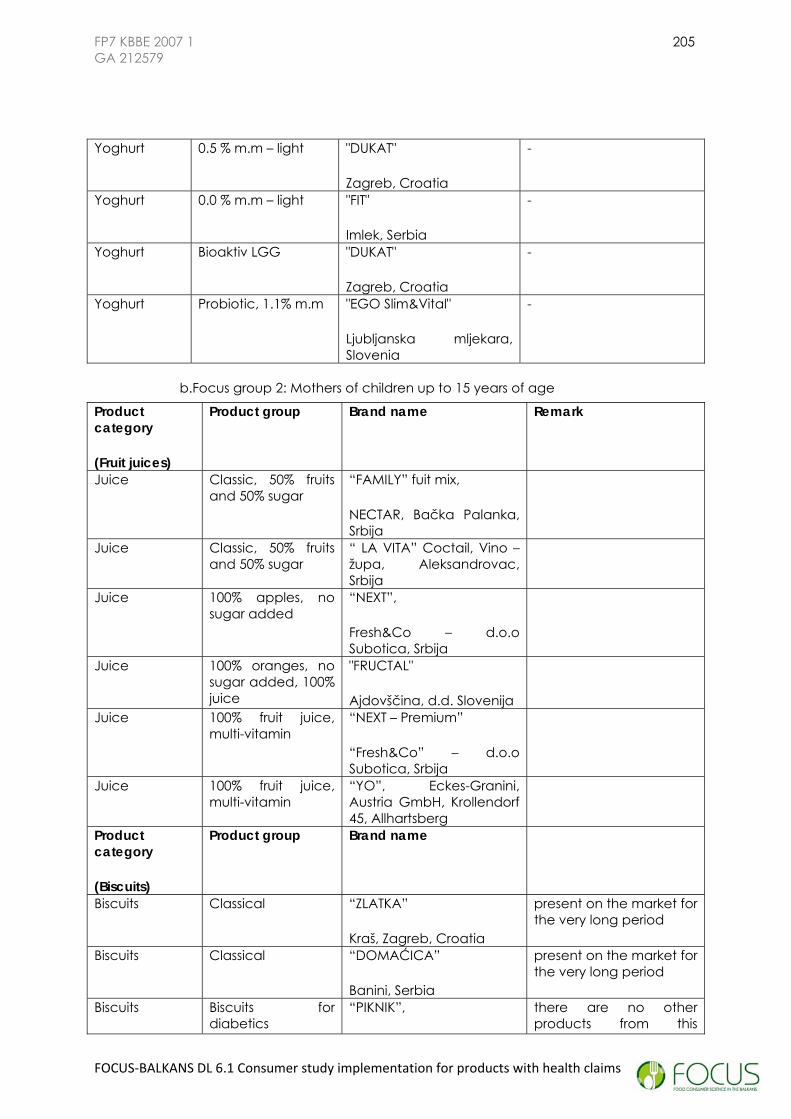
FP7 KBBE 2007 1 205 GA 212579
FOCUS‐BALKANS DL 6.1 Consumer study implementation for products with health claims
Yoghurt 0.5 % m.m – light "DUKAT"
Zagreb, Croatia
-
Yoghurt 0.0 % m.m – light "FIT"
Imlek, Serbia
-
Yoghurt Bioaktiv LGG "DUKAT"
Zagreb, Croatia
-
Yoghurt Probiotic, 1.1% m.m "EGO Slim&Vital"
Ljubljanska mljekara, Slovenia
-
b.Focus group 2: Mothers of children up to 15 years of age
Product category
(Fruit juices)
Product group Brand name Remark
Juice Classic, 50% fruits and 50% sugar
“FAMILY” fuit mix,
NECTAR, Bačka Palanka, Srbija
Juice Classic, 50% fruits and 50% sugar
“ LA VITA” Coctail, Vino – župa, Aleksandrovac, Srbija
Juice 100% apples, no sugar added
“NEXT”,
Fresh&Co – d.o.o Subotica, Srbija
Juice 100% oranges, no sugar added, 100% juice
"FRUCTAL"
Ajdovščina, d.d. Slovenija
Juice 100% fruit juice, multi-vitamin
“NEXT – Premium”
“Fresh&Co” – d.o.o Subotica, Srbija
Juice 100% fruit juice, multi-vitamin
“YO”, Eckes-Granini, Austria GmbH, Krollendorf 45, Allhartsberg
Product category
(Biscuits)
Product group
Brand name
Biscuits Classical “ZLATKA”
Kraš, Zagreb, Croatia
present on the market for the very long period
Biscuits Classical “DOMAĆICA”
Banini, Serbia
present on the market for the very long period
Biscuits Biscuits for diabetics
“PIKNIK”, there are no other products from this

FP7 KBBE 2007 1 206 GA 212579
FOCUS‐BALKANS DL 6.1 Consumer study implementation for products with health claims
Koestlin, Bjelovar, Craotia company on the market Biscuits Biscuits for
diabetics “BETIS”
Štark, Beograd, Serbia
-
Biscuits Integral biscuits “SALSA”
Vekić chocolate, Temerin, Serbia
relatively new on the market
Biscuits Integral biscuits “NATURALIS”
Vekić chocolate, Temerin, Serbia
relatively new on the market
Product category (Yoghurt)
Product group Brand name
Yoghurt 3.2% m.m – classic "LATEA",
Kozarska Dubica, BiH
domestic product
Yoghurt 3.2 % m.m – classic “MOJA KRAVICA”
Imlek, Padinska Skela, Srbija
present on the market for the very long period - as a domestic
Yoghurt 0.5 % m.m – light "DUKAT"
Zagreb, Croatia
-
Yoghurt 0.0 % m.m – light "FIT"
Imlek, Serbia
-
Yoghurt Bioaktiv LGG "DUKAT"
Zagreb, Croatia
-
Yoghurt Probiotic, 1.1% m.m "EGO Slim&Vital"
Ljubljanska mljekara, Slovenia
-
Yoghurt 3.2% m.m – classic "LATEA",
Kozarska Dubica, BiH
domestic product
5.9.2.CROATIA
a.Focus group 1: Elderly (50+)
Product category (Margarine)
Product group Brand name Remark
Margarine Light, 2,5% Margarine Light, diet Margo light Zvijezda, domestic
brand Margarine With omega 3 and
omega 6 fatty acids, for protection of blood vessels
Omegol Zvijezda, domestic brand
Margarine Classic Rama classic Product category Product group (e.g. Brand name

FP7 KBBE 2007 1 207 GA 212579
FOCUS‐BALKANS DL 6.1 Consumer study implementation for products with health claims
(Biscuits) Biscuits for diabetics) Biscuits Cookies Karolina Domestic brand Biscuits No sugar Vitela Kraš, traditional
brand Biscuits Integral cookie with
oat flakes, rich in dietetic fibre
McVities
Product category (Yoghurt)
Product group (e.g. Yoghurt with probiotics)
Brand name
Yoghurt Balans +, with probiotics, 1% fat
Vitaktiv Vindija, traditional brand
Yoghurt 3,2% fat, classic Dukat Traditional brand Yoghurt 0,1% fat Vindija Traditional brand
b.Focus group 2: Mothers of children up to 15 years of age
Product category (Fruit juices)
Product group Brand name Remark
Fruit juice 100% orange Juicy Domestic brand Fruit juice 100% apple Cappy Fruit juice 12 Vitamins Happy day Fruit juice multifruit Product category (Biscuits)
Product group (e.g. Biscuits for diabetics)
Brand name
Biscuits Cookies Karolina Domestic brand Biscuits No sugar Vitela Kraš, traditional
brand Biscuits Integral cookie with
oat flakes, rich in dietetic fibre
McVities
Biscuits Cookies Product category (Yoghurt)
Product group (e.g. Yoghurt with probiotics)
Brand name
Yoghurt Balans +, with probiotics, 1% fat
Vitaktiv Vindija, traditional brand
Yoghurt 3,2% fat, classic Dukat Traditional brand Yoghurt 0,1% fat Vindija Traditional brand
5.9.3.MACEDONIA
a.Focus group 1: Elderly (50+)
Product category (Margarine)
Product group Brand name Remark
Margarine Light, 2,5% Dobro jutro Margarine Light, diet Kristal soft Margarine Slightly salted Bords Eve Margarine With omega 3 and
omega 6 fatty acids, for protection of blood vessels
Omegal
Margarine Classic Rama Margarine Classic Kristal Traditional brand

FP7 KBBE 2007 1 208 GA 212579
FOCUS‐BALKANS DL 6.1 Consumer study implementation for products with health claims
Product category (Biscuits)
Product group (e.g. Biscuits for diabetics)
Brand name
Biscuits Cookies Noblice Biscuits Cookies with chocolate
chips Elbisco
Biscuits No sugar Vitalix Biscuits Integral cookie with oat
flakes, rich in dietetic fibre
Welness
Product category (Yoghurt)
Product group (e.g. Yoghurt with probiotics)
Brand name
Yogurt Balans +, with probiotics, 1% fat
Bimilk
Yogurt Balans +, with probiotics, 1% fat
Imlek
Yogurt 3,2% fat, classic Bitolski Traditional brand Yogurt 0% fat Fit Imlek Yogurt 0,1% fat Jogurt PPM Tuzla Yogurt 3,2% fat, classic Dukat
b.Focus group 2: Mothers of children up to 15 years of age
Product category (Fruit juices)
Product group Brand name Remark
Fruit juice 100% orange Fructal Traditional brand Fruit juice 100% pineapple Jaffa Domestic brand Fruit juice Apricot and apple
nectar Fructal
Fruit juice Peach nectar Bitolski Fruit juice ACE multifruit and
carrot nectar Viva
Fruit juice Red cocktail, A and C vitamins and fibre
Jaffa
Product category (Biscuits)
Product group (e.g. Biscuits for diabetics)
Brand name
Bisquits Cookies Noblice Bisquits Cookies with chocolate
chips Elbisco
Bisquits No sugar Vitalix Bisquits Integral cookie with oat
flakes, rich in dietetic fibre
Welness
Product category (Yoghurt)
Product group (e.g. Yoghurt with probiotics)
Brand name
Yogurt Balans +, with probiotics, 1% fat
Bimilk
Yogurt Balans +, with probiotics, 1% fat
Imlek
Yogurt 3,2% fat, classic Bitolski Traditional brand Yogurt 0% fat Fit Imlek Yogurt 0,1% fat Jogurt PPM Tuzla Yogurt 3,2% fat, classic Dukat
5.9.4.Montenegro

FP7 KBBE 2007 1 209 GA 212579
FOCUS‐BALKANS DL 6.1 Consumer study implementation for products with health claims
a.Focus group 1: Elderly (50+)
Product category (Margarine)
Product group Brand name Remark
Margarine 250g Classical Vital Traditional brand Margarine 250g Diet Dobro jutro-
Dijamant Most avaliable brand
Margarine 250g Light Dobro jutro- Dijamant
Most avaliable brand
Margarine 250g Enriched with ómega 3 acids
Zvijezda d.d. The most famous functional margarine
Product category (Biscuits) Product group (e.g.
Biscuits for diabetics)
Brand name
Tea biscuits Classical “Slap” Čačak Tea biscuits No suger, for
diabetics Swisslion takovo Most available
product for diabetics
Wholeweat biscuit Organic Biotika-Natural food
Most available organic cookie
Product category (Yoghurt)
Product group (e.g. Yoghurt with probiotics)
Brand name
Jogurt3.2% m.m Classical NIKA Most avaliable domestic brand
Dijet jogurt“ - 1,6% m.m Low fat NIKA Most avaliable b=domestic brand
Balans + With probiotics IMLEK Most famous probiotic yoghurt
b.Focus group 2: Mothers of children up to 15 years of age
Product category (Fruit juices)
Product group Brand name Remark
Orange juice 50% nectar Nectar Most available brand
Orange juice 100% fruit , no sugar added
Nectar (life) Most available brand
Orange juice 100% fruit, with added vitamins
Nectar Most available brand
Product category (Biscuits) Product group (e.g.
Biscuits for diabetics) Brand name
Tea biscuits Classical “Slap” Čačak Tea biscuits No suger, for diabetics Swisslion takovo Most available
product for diabetics
Wholeweat biscuit Organic Biotika-Natural food
Most available organic cookie
Product category (Yoghurt)
Product group (e.g. Yoghurt with probiotics)
Brand name

FP7 KBBE 2007 1 210 GA 212579
FOCUS‐BALKANS DL 6.1 Consumer study implementation for products with health claims
Jogurt3.2% m.m Classical NIKA Most avaliable domestic brand
Dijet jogurt“ - 1,6% m.m Low fat NIKA Most avaliable b=domestic brand
Balans + With probiotics IMLEK Most famous probiotic yoghurt
5.9.5.Serbia
a.Focus group 1: Elderly (50+)
Product category (Margarine)
Product group Brand name Remark
Classic Polimark Traditional brand Omega acids Omegol The first enriched with
omega 3 Diet (reduced oil) Polimark Product category (Biscuits)
Product group Brand name
Wholewheat biscuits Wellness Among the first wholewheat cookies
No sugar biscuits for diabetics
Cajni kolutici
Honey cakes Jaffa medenjaci
Product category (Yoghurt)
Product group Brand name
Yoghurt with probiotics Biobalans Most famous functional brand
Yoghurt light Dukat light Full fat yoghurt Kravica,
Imlek Traditional brand
b.Focus group 2: Mothers of children up to 15 years of age
Product category (Fruit juices)
Product group Brand name Remark
100% fruit juice Next premium Domestic, large market
share Juice with added
vitamins Takovo Taditional brand
Juice with added Magnessium (h.c. it works against stress)
Nektar Antistres
Domestic, large market share
Product category (Biscuits)
Product group Brand name
Whole wheat biscuits Wellness No sugar biscuits for
diabetics Cajni kolutici
Honey cakes Jaffa medenjaci
Product category Product group Brand name

FP7 KBBE 2007 1 211 GA 212579
FOCUS‐BALKANS DL 6.1 Consumer study implementation for products with health claims
(Yoghurt) Yoghurt with probiotics
and L carnitine Fit
Yoghurt light Dukat light Full fat yoghurt Kravica, Imlek Traditional brand
5.9.6.SLOVENIA
a.Focus group 1: Elderly (50+)
Category Product group Brand name Remark
Margarine Classical Zvijezda Known brand Rama Popular brand Light version Lätta Marked as Halffat margarine” Remia Marked as “Light” With omega-
3 Omegol Description on package: Less fat, reach
in Ω Omegol activ Description on package: Lowering
cholesterol Biscuits Classical tea
cookies Lilly Kraš - vanilla Traditionally known
Lada Kraš – with butter
Traditionally known
Cookies for diabetics
Medex-Tea cookies Description on package: Low GI, no sugar added, rich in fibers
Mercator –full grain cookies
In shop placed in the shelve for diabetics
Bio cookies Molenaartje from Holland -organic
Wholegrain, sweetened with wheat syrup, BIO labeled
Regina A Bio keksi Bio ingredeentss of high quality, Labeled as Eko by MAFF of SLO
Yoghurt Classical MU 3,2- Ljubljanske mlekarne
Known producer
Yogurt 3,2 m.m.-Mercator
Private label of SLO retailer
Low fat Healthy life- Low fat value
Private label of SLO retailer,
Yogurt light 1,3 by Zelena dolina
Producers brand
Health claim LCA by Zelena dolina Low fat+fiber Beneo for strong bones EGO – Slim - Vital Q10, L-karnitin, Helping to regulate
body weight
b.Focus group 2: Mothers of children up to 15 years of age
Category Product group Brand name Remark
Juices Nectar Peach nectar Private label of SLO retailer Fructal orange Popular SLO brand Classical Fructal premium Popular SLO brand; 100% juice Rauch Happy day 100% grapefruit, without sugar Classical +
suppl. Zmečkanček Presad banana
100% fruit + vitamins C and E
Zmečkanček Presad 100% fruit –veg + fibers

FP7 KBBE 2007 1 212 GA 212579
FOCUS‐BALKANS DL 6.1 Consumer study implementation for products with health claims
banana Biscuits Classical tea
cookies Lilly Kraš - vanilla Traditionally known
Lada Kraš – with butter Traditionally known Cookies for
diabetics Medex-Tea cookies Description on package: Low GI, no
sugar added, rich in fibers Mercator –full grain
cookies In shop placed in the shelve for diabetics
Bio cookies Molenaartje from Holland -organic
Wholegrain, sweetened with wheat syrup, BIO labeled
Regina A Bio keksi Bio ingredeentss of high quality, Labeled as Eko by MAFF of SLO
Yoghurt Classical MU 3,2- Ljubljanske mlekarne
Known producer
Yogurt 3,2 m.m.-Mercator
Private label of SLO retailer
Low fat Healthy life- Low fat value
Private label of SLO retailer,
Yogurt light 1,3 by Zelena dolina
Producers brand
Health claim LCA by Zelena dolina Low fat fiber Beneo for strong bones EGO – Slim - Vital Q10, L-karnitin, Helping to regulate
body weight

FP7 KBBE 2007 1 213 GA 212579
FOCUS‐BALKANS DL 6.1 Consumer study implementation for products with health claims
6.CONCLUSION
• Although regulative on nutrition claims in most WBC is not fully harmonized with related EU regulative, there is a significant corelation in lawfully permitted claims. Nutrition claims are allowed and clearly specified. Totally 24 nutrition claims made on food can be stated under certain circumstances which are strongly regulated at WBC. However, the regulations on risk reduction disease claims have not yet been harmonized with EU, except recently in Croatia. In other WBC health claims stating risk reduction from certain illness (for example: sodium and hypertension) cannot be used. It is particularly forbidden to put health claims on food and subjects of public use, as well as advertising by using pictures, signs or text which may mislead consumers in the context of content, characteristics and purpose of food and subjects of general use. Structure and function claims at least are not forbidden. Additionally, there is, as in Europe, a specific, (although not fully harmonized) regulation for dietetic products, devoted to particular nutritional uses.
• Analysis of share of pro/pre biotic drinking and spoonable yoghurts categories in family of products – yoghurt, for observable countries and regions is available by Datamonitor. Similar to Eastern Europe, share of yoghurt with functional claim in total family of products is lower (5-10%) in Montenegro, Bosnia and Herzegovina and Macedonia. The market share of studied category in Croatia is stable (around 16%) during observed period, while Slovenian market starting from 2006 noted even higher share of yoghurt in the total family of products in comparison with the Western Europe average. However, this information could be steady also with this study report finding, referring to a lesser marketshare than Datamonitor estimates (more than 20 %). As far as other studied categories of products are concerned, data about market share are available only through primary source of information – in-depth interviews.
• The largest number of N&H products is surveyed in Serbia, while their smallest number is covered in Montenegro, mostly in hypermarkets. Almost two third of N&H products are of WBC origin. While Serbia is more concentrated on its own brands and producers, Slovenia and Croatia have the largest number of EU brands, but Macedonia, Montenegro and Bosnia and Herzegovina have other WBC brands as dominant. The largest number of products (more than 70%) has up to two claims with no significant differences by origin. Each fifth surveyed product in studied categories on WBC market is with health claim (mostly general, non specific benefits type).
• Bosnia and Herzegovina has 105 N&H products surveyed by shopcheck. Most of them belong to milk and yogurt group (31%) and dietary products (30%), while the smallest part of products are analyzed in margarine category (9%). Regarding the origin, the largest part of all N&H products comes from WBC (48%) followed by products from EU countries (28%). Manufacturers from WBC as well as domestic producers are dominant in the group of fruit juices, while EU producers are present at the greatest extent in the general food group. Total number of brands available in Bosnia and Herzegovina is 71, with their largest number in two groups: fruit juice (36%) and dietetic food group (24%). The largest number of manufacturers is with one brand, regardless of their origin. Among all N&H products captured by analysis, one forth has health

FP7 KBBE 2007 1 214 GA 212579
FOCUS‐BALKANS DL 6.1 Consumer study implementation for products with health claims
claims (27 products), 16 products have dietetic claims and very small number of them have organic claim. The highest number of products contains nutrients or other substances (16%) or is with source of vitamins and /or minerals (11%).
• Analysis in Croatia covers 94 products with N&H claims, of which the largest share (38.3%) refers to dietetic food group and the smallest share in the margarine category (3.2%). More than a half of N&H products come from EU area and more than one third are domestic products, while availability of WBC products is very small (less than 10%). The largest number of EU and domestic manufacturers are present in dietetic products. Domestic producers are also dominant in fruit juices products. WBC producers are not so prevalent at the Croatian market for N&H products. There are 60 different brands of N&H products present at the Croatian market, with the largest share in dietetic product group (37.3%) and the smallest part in margarine group (4.5%). Most of producers have only one brand. The majority of analyzed products have one N&H claim, regardless their origin. One forth of all N&H products have health claim of which the largest part are of general health claim type. Among all N&H products, about 13% of them are with a dietetic claim and 8% with organic claim. There are three claim types that are the most present and with almost equal share (products with low fat, with no sugar added and with content of nutrients or other substances) – their total share is approximatelly 30%.
• There are 140 N&H products surveyed in Macedonia, of which the largest part belongs to milk and yogurt group (23%), while their smallest part is analyzed in margarine category (8%). According to the origin, the largest part of all N&H products in Macedonia comes from WBC (41%), mostly from Serbia, and then from domestic production (31%). Observed by product categories, manufacturers from WB countries are of the greatest importance in milk and yogurt group, domestic producers are dominant in fruit juices group, while most of the EU producers belong to the general food group and margarines. Macedonian market of N&H products has 62 brands. Their largest number is in the group of milk and yogurt (36%) and the smallest number is in the group of margarines (9%). One fourth of all N&H claims in Macedonia contains vitamines and /or minerals, while the largest N&H number of products has two claims. Each fifth product has health claim, with most of them of general type.
• The largest part of 52 N&H products surveyed in Montenegro belongs to milk and yogurt group (36%) and the smallest part is in margarine category (about 5%). Most of N&H products in Montenegro are of foreign origin (a half of total number comes from Serbia), while the share of domestic products is only 8%. At level of product categories, manufacturers from WB countries are of the greatest importance in all categories. Along with WBC producers, EU producers are also dominant in dietetic product category. There are 30 N&H brands present at Montenegrin market with the maximum number of brands in milk and yogurt category and fruit juices, and the smallest number in margarine category. The largest share of N&H products (29%) contains vitamines and /or minerals. Most of the EU products at Montenegrin market are with two claims, while most of those from WBC are with one claim. About 17% of observed products have health claim mostly of general type. Dietetic and organic products within surveyed categories are less important than in other WBC.

FP7 KBBE 2007 1 215 GA 212579
FOCUS‐BALKANS DL 6.1 Consumer study implementation for products with health claims
• Survey in Serbia captures 166 N&H products with the largest number in milk and yogurt group and dietetic products (34%), and the smallest number in margarine category (5%). Observing by product origin, it appears that more than half of are domestic, above one forth of those products are from developed countries of West Europe, while 17% comes from other WBC. Domestic producers are dominant in all five product groups, with their largest number in dietetic products category, followed by EU producers in the same group. Serbia has the largest number of brands (99) comparing to the other five WBC. According to the brand structure by product groups, it seems there is almost the same percentage of brands in the group of milk and yogurt and dietetic products, whereas their smallest share is in the group of margarines. The largest part of all products (32%) contain vitamines and /or minerals. Most of Serbian and EU products present on Serbian market have two N&H claims, while products from other WBC are mostly with one claim. Only 14% of products have health claim, 6% of them have dietetic claim and 5% of products are with organic claim.
• Analysis in Slovenia covered 100 products with N&H claims with the largest part of them in milk and yogurt group and dietetic products group. More than a half of total number of N&H products in Slovenia originates from EU (55%), more than a third are domestic, while the rest comes from other WBC. Domestic producers are uniformly present in all groups except margarines. EU producers are important in all product groups, but they have the highest importance in the group of dietetic food. There are 76 different brands in Slovenia with the largest share in dietetic product group (29%) and milk and yogurt group (28%), whereas the smallest share is in margarine group (10%). Regardless the origin, the largest number of products is with one N&H claim. About 20% of products have health claim, of which more than half are of functional health claim type. Among all N&H products, 16% of them are with a dietetic claim, while less than 10% of products have an organic claim. The largest part of all N&H products contain nutrients or other substances (19%) and low fat (17%).
• WBC processors dominate the markets of studied categories in our sample. High import barriers for processors out of WBC and privileged export conditions for WBC companies significantly helped WBC processors dominance. Market shares for the more advanced product are estimated at around 10% (for milk enriched with vitamins and minerals, yoghurt with probiotics and light margarine). Nectars and juices enriched with vitamins and minerals market estimate is around 5%. Jam for diabetics is a niche market of few hundred tons, devoted to specific population.
• Some studied categories were introduced ten or more than ten years ago, such as dietetic jam for persons suffering from diabetes in Slovenia and Croatia, light margarine in Slovenia and milk enriched with vitamins in Serbia. However, most of the products in studied categories were introduced on WBC markets after 2000. All of the studied categories have recorded sales increase in the last three years on the WBC markets. More developed markets have lower growth rates since they are more saturated and consumer awareness is higher in these countries. In less developed WBC countries, growth rates have been higher and expected to be even higher in the future.

FP7 KBBE 2007 1 216 GA 212579
FOCUS‐BALKANS DL 6.1 Consumer study implementation for products with health claims
• Distribution channels for studied categories are relatively similar to general food distributions channels at WBC markets. However, there are certain differences across categories and countries. Retail trends in WBC markets are positive for N&H claim products. Larger formats will be more important in the future food retailing and it will allow retailers to carry wider and deeper assortment. In less developed WBC markets, supermarkets and hypermarkets will have much more significant role in retail market. Therefore, the growth of N&H claim products in these countries will be higher due to changing retailing structure.
• Perception of consumers of products with H&N claims in all WBC is surprisingly similar: typical consumer is female aged 15 to 25 or older (over 50), with middle to higher income, well educated, with or without health problems, living in urban areas. Consumers of products with H&N claims are perceived mostly as practicing a healthy life style, following modern trends and fashion in food consumption, active (sportsmen, businessmen) or mothers who are expected to provide healthy food for their families. These findings are in the line with most consumers’ qualitative research done in Europe and worldwide (Poulsen, J.B. 1999; West, G.E et al. 2002; Bech-Larsen, T. et al 2003; Kolodinsky J. et al 2008).
• In general, FGD respondents in all WBC relate health with concepts of food, sports and recreation, beauty and body, family life and youth. However, participants with no exceptions in all WBC spontaneously associate healthy life style with healthy food, practicing physical activity, cleanness, economic and social security. Additionally, healthy life style is defined in terms of practicing daily routines (i.e. sound sleep, regular meals) as well as restraint and moderation: a life without stress, alcohol, drugs and cigarettes. The last is particularly typical for elderly respondents.
• Knowledge about N&H products is growing. It is stated by all participants both in IDI`s and FGD`s. For consumers in all WBC healthy food means safe food: grown in healthy environment with exact designation of its origin. However, different product groups evoke different motives for consumption. Diary products are consumed on every day basis and therefore consumers are more aware of their features. As for juices, they are considered to be healthy by default, so the consumers do not elaborate much on their contents. Elderly respondents in all WBC claim to be making their choices based on their health and diet benefits implying that they are paying more attention to nutrition and health claims. Generally, they are aware of claims types like contains probiotic, omega 3, low fat, calories, sugar etc.
• Consumers’ knowledge is increasing mainly due to N&H products advertising. This market segment is producer driven. Producers’ traditional products benefit from the N&H claimed products innovation as producers improve their image at the market. Additionaly, producers are copying EU and worldwide trends promoting healthy life style by using different N&H products in everyday consumption (Raymond Vernon - Products life cycle theory).
• Producers are more concerned about taste of the N&H products and technology, while consumers think about these products as closest to the conventional category with added health benefit. However, the respondents mostly prefer the products they are familiar with (well established “traditional” brands). Traditional brands are particularly the first choice of mothers who claim not to be ready to experiment with what they would give to their

FP7 KBBE 2007 1 217 GA 212579
FOCUS‐BALKANS DL 6.1 Consumer study implementation for products with health claims
children. However, it is important to notice that while in Serbia traditional means a well established, trustful brand with a good reputation, in Croatia and Slovenia it generally means a domestic, locally produced brand present at market for a long time which is in line with overall consumer ethnocentrism in those two countries (REF: FGD results, other research studies).
• Demand for the products with H&N claims will increase. In less developed N&H WBC markets, consumers` demand would significantly be changed only in the long run (interviewees agreed that demand will not change in the near future). Increase will be caused by higher average income at the first place. For more developed N&H WBC markets, the main reasons for the change in demand will be driven by the changes in consumers’ education and lifestyles. FGD analysis put some emphasise on the fact that consumers still rather think about these products as not for themselves but for somebody else. Consumers are very suspicious about added artificial components in food. This is especially important for mothers when buying food for their children. They generally prefer nutrition claims rather than health claims: functional food is sometimes seen as overprocessed or unnatural.
• Key words concerning N&H claimed products are awareness, knowledge and trust. Consumers have to be aware of these products existence at the market first. They have to be familiar with health dimension of food or importance of so-called functional food. Last but not least, they have to trust that what is promised on the product label is true. This awareness-trust linkage seems to be more important for N&H claimed products then for conventional products category. FGDs show that consumers coming from more developed functional food markets (in WBC those are Slovenia and Croatia) express more doubt in health claims. Slovenian consumers demonstrate highest level of scepticism. This fact might be due to the market being overwhelmed with N&H claims or it might simply be the reluctant way traditional consumers in Slovenia accept novelty. Consumers in Croatia seem to be less sceptical than Slovenians. In line with their high consumer ethnocentrism, Croatian consumers prefer domestic products, whose claims are verified by local health agencies. Serbian consumers accept functional products only when linked to traditional brands and show less awareness when it comes to this product type- this might indicate earlier stage of functional food market development. Montenegrin, Macedonian and B&H consumers seem just to be starting to perceive this specific food category and its’ links to health status.
• In line with the previous conclusion, and as far as products with nutrition and health claims are concerned, the experts think that their consumption will be influenced by: truthfulness of nutrition and health claims, understanding of these claims and marketing campaigns for the products with nutrition and health claims. According to them, certain nutrition claims have the following flaws: they are imprecise; they accentuate only positive aspects, while information about eventual harmful effects are missing; they are not harmonized with rulebooks on food labelling, and their accuracy can not be verified. General conclusion of experts is that the nutrition and health claims are stimulating on one hand because, by accentuating the product benefits, they attract consumers to buy the product, while on the other hand, with their insufficiently precised and verified information, they can mislead the consumers. However, according to FGD consumers believe to the claims approved by very well known institutions. They understand not too long and

FP7 KBBE 2007 1 218 GA 212579
FOCUS‐BALKANS DL 6.1 Consumer study implementation for products with health claims
not too scientific claims. They trust one benefit at the time claims (it sounds trueful).
• Two scenarios about N&H claimed products target population in the future might be constructed. The first scenario predicts that N&H claimed products will go through a fashion product life-cycle stages – introduction, fast growth, short maturity and steep decline. It advocates that N&H claimed products market invention depends on developed market stakeholders’ activities. Current target population covers young, well educated, high income, urban population, mostly females. However, in more developed WBC N&H claimed products market target population is even now expended to the mothers seen as ″household gate keepers″ and children. This market expansion might be also seen as the second scenario of N&H claimed products market development (based on Rogers’s Diffusion of Innovation Theory). Consequently, after the innovators and early adopters (young active female) elderly with high income might be also interesting consumer group for the studied categories of products in the near future, as well as sportsman and businessman (early majority). It can be argued that this market segment is going through multidimensional transition: from children to elderly people, from high income to middle income classes, from women to men. The market development will strongly depend on public policy makers’ activities in promotion of healthy food concept and healthy diet in WBC.
• At the end, it has to be mentioned that it is confirmed by processors, retailers and experts interviews that the most aware consumers belong to urban population. However, knowledge about N&H claimed products might be overestimated in general as FGDs were organized in most urban, capital cities. Additionally, the idea about typical consumer of N&H products might be generated by promotional campaigns and dominant media stereotype. It might influence on the perception of current stage market development, but it cannot significantly influence on the perceived WBC N&H claimed products market perceptive.
• However, it is important to underline that perceptions of healthy food are exposed to turbulent environment in WBC: change in market structure, changes in regulation, internationalization and competition. The development of the “functional food market” remains incertain, mainly linked to changes in consumers purchasing power, increased awareness on the importance of food and nutritional knowledge, as well as public policies. At last, the impact of nutrition and health claims on public health remains controversial, as in European countries.

FP7 KBBE 2007 1 219 GA 212579
FOCUS‐BALKANS DL 6.1 Consumer study implementation for products with health claims
7.REFERENCES
Antle M.J. (2001). Economic Analysis of Food Safety, ed. Gardner B. and Rausser G. Handbook of Agricultural Economics, Vol. 1, Elsevier Science.
Bech-Larsen, T. & Grunert, K.G. (2003) The perceived healthiness of functional foods. A conjoint study of Danish, Finnish and American consumers’ perception of functional foods, Appetite, 40, 9–14.
Bech-Larsen, T., Grunert, K.G. & Poulsen, J.B. (2001) The Acceptance of Functional Foods in Denmark, Finland and the United States. MAPP Working Paper no. 73. Centre for Market Surveillance, Research and Strategy for the Food Sector, Århus.
Bhaskaran, S. & Hardley, F. (2002) Buyer beliefs, attitudes and behaviours: foods with therapeutic claims. Journal of Consumer Marketing, 19, 591–606.
Brannback, Malin, de Heer, Aart Jan and Wiklund, Patricia (2002). The convergence of the pharmaceutical and the food industry through functional food: Strategic change and Business opportunity or an illusion? Pharmaceuticals Policy and Law 5, pp. 63–78
Broring, Stefanie, Cloutier, L. Martin and Leker. Jens (2006). The Front End of Innovation in an Era of Industry Convergence: Evidence from Nutraceuticals and Functional Foods, R&D Management 36, 5, pp. 487-498.
Burrows, R., Nettleton, S. & Bunton, R. (1995) Sociology and health promotion. Health, risk and consumption under late modernism. In The Sociology of Health Promotion (ed. by R. Bunton, S. Nettleton & R.Burrows), pp. 1–9. Routledge, London.
Burton, S, Andrews, C. J, Age, ‘Product Nutrition and Label Format Effects on Consumer Perception and Product Evaluation’, The Journal of Consumer Affairs, Vol. 30 (1), 1996, 68-89
Cash, Sean B, Goddard, Ellen W. and Lerohl, Mel (2006). Canadian Health and Food: The Links between Policy, Consumers, and Industry Canadian Journal of Agricultural Economics 54, pp. 605–629
Caswell, Julie A, and Padberg, I. Daniel (1992). Toward a More Comprehensive Theory of food Labels, American Journal of Agricultural Economics, May 1992, pp. 460-468.
Caswell, Julie A. and Mojduszka, Eliza M. (1996). Using Informational Labeling to Influence the Market for Quality in Food Products, American Journal of Agricultural Economics 78, pp. 1248-1253.
Caswell, Julie A., and Gary V. Johnson (1991) Firm Strategic Response to Food Safety and Nutrition Regulation, Economics of Food Safety, print in ed. Julie A. Caswell 99. 273-297, New York, Elsevier Science Publishing Co.

FP7 KBBE 2007 1 220 GA 212579
FOCUS‐BALKANS DL 6.1 Consumer study implementation for products with health claims
Chan, C, Patch C, Williams, P, ‘Australian Consumers are Skeptical but Influenced by Claims about Fats on Food Labels’, European Journal of Clinical Nutrition, Vol. 59, 2005, pp. 148-151
Datamonitor 2009, Data on selected studied categoires
Deepananda Herath, John Cranfield, Spencer Henson and David Sparling (2008). Market, and Regulatory Factors Influencing Innovation and Commercialization in Canada’s Functional Food and Nutraceutical Sector, Agribusiness, Vol. 24 (2) 207–230
Dimić Etelka B., Vukša Vjera L. and Dimić Vesna (2002). Margarin i masni namazi kao funkcionalna hrana”, Uljarstvo, vol. 33, br. 3-4, str. 3-8.
Dimitrijević-Branković Suzana I., Baras Josip K. and Bojović Jaroslav (2002). Značaj i mogućnosti proizvodnje funkcionalne hrane, Hemijska industrija, vol. 56, br. 3, str. 113-122.
Diplock, A.T., Agget, P.J., Ashwell, M., Bornet, F., Fern, E.B. &Roberfroid, M.B. (1999) Scientific concepts of functional foods in Europe: consensus document. British Journal of Nutrition, 81, S1–S27.
EORG (2003). Health, food and alcohol and safety. Special Euro barometer 186. European Opinion Research Group.for Nutraceuticals and Functional Foods: Legislative and Technical Barriers Facing Agribusiness Marketers, Journal of International Food & Agribusiness Marketing, Vol. 19(1) 2007, pp. 53-79
Euromonitor - Consumer Lifestyles – reports for the selected countries 2009.
Everett Rogers (1962), Diffusion of Innovations, Glencoe: Free Press.
Garde, Amandine (2008). Food Advertising and Obesity Prevention: What Role for the European Union? Journal of Consumer Policy, No 31, pp. 25-44
Garretson, J.A and Burton S, ‘Effects of Nutrition Facts Panel Values, Nutrition Claims and Health Claims on Consumers Attitudes, Perception of Disease Related Risk, and Trust' Journal of Public Policy and Marketing, Vol. 19 (2), 2000, pp 213-227
Gray, J., Armstrong, G. and Farley, H. (2003). Opportunities and constraints in the functional food market. Nutrition and Food Science, 33, 213–218
Grujić, R. (2005). Food Labeling, Proceedings of Final TEMPUS Seminar (Editors: R. Grujić, V.Sanchis), pp. 105-120, Banja Luka.
Hall, Bronwyn & Mairesse, Jacques, 2006. "Empirical studies of innovation in the knowledge driven economy," UNU-MERIT Working Paper Series 028, United Nations University, Maastricht Economic and social Research and training centre on Innovation and Technology

FP7 KBBE 2007 1 221 GA 212579
FOCUS‐BALKANS DL 6.1 Consumer study implementation for products with health claims
Health Statistical Yearbook or Statistical Yearbook for selected countries, 2002-2009
Heasman, M. & Mellentin, J. (2001) The Functional Foods Revolution.Healthy People, Healthy Profits? Earthscan Publications, London.
Herrmann, Roland and Roeder, Claudia (1998). Some Neglected Issues in Food Demand Analysis: Retail-level demand, Health Information and Product Quality, The Australian Journal of Agricultural and Resource Economics, 42:4, pp. 341-367
Hill, Charles W.L (2007), International Business: Competing In The Global Marketplace. New York: McGraw-Hill.
Hooker, N.H, Teratanavat, R, ‘Dissecting Qualified Health Claims: Evidence from experimental studies’, Critical Reviews in Food Science and Nutrition, Vol. 48, 2008, pp. 160-176
IEFS (1996a) A Pan-European Survey of Consumer Attitudes to Food,Nutrition and Health. Report Number Three. Definitions of Healthy Eating, Barriers to Healthy Eating and Benefits of Healthy Eating. Institute of European Food Studies, Dublin.
IEFS (1996b) A Pan-European Survey of Consumer Attitudes to Food, Nutrition and Health. Report Number Four. Dietary Changes. Institute of European Food Studies, Dublin.
IFIC (2000) Functional Foods: Attitudinal Research. International Food Information Council (IFIC) Foundation, Washington DC. [WWW document]. URL http://ific.org/relatives/17260.pdf
Jacob Ostberg.(2003). Functional Foods: A Health Simulacrum, Advances in Consumer Research
Jonas, M.S. & Beckmann, S.C. (1998) Functional Foods: Consumer Perceptions in Denmark and England. MAPP Working Paper no. 55.
Jong, N., Ocké, M.C., Branderhorst, H.A.C. & Friele, R. (2003) Demographic and lifestyle characteristics of functional food consumers and dietary supplement users. British Journal of Nutrition, 89, 273–281.
Kim K, Cheong Y, Zheng L, ‘The Current Practices in Food Advertising: the usage and effectiveness of different advertising claims’, International Journal of Advertising, 28 (3), 2009, pp. 527-553
Koch, V. and Pokorn, D. (1999). Comparison of nutritional habits among various adult age groups in Slovenia, Nutritional Research
Kolodinsky, Jane, JoAnne Labrecque, Maurice Doyon, Travis Reynolds, Frédéric Oble, François Bellavance and Marie Marquis (2008). Sex and Cultural Differences in the Acceptance of Functional Foods: A Comparison of American, Canadian, and French College Students, JOURNAL OF AMERICAN COLLEGE HEALTH, VOL. 57, NO. 2, pp. 143-149

FP7 KBBE 2007 1 222 GA 212579
FOCUS‐BALKANS DL 6.1 Consumer study implementation for products with health claims
Korhonen, H. (2002). Technology options for new nutritional concepts. International Journal of Dairy Technology, 55, 79–88.
Kozup, John C., Creyer, Elizabeth H.and Burton, Scot (2003). Making Healthful Food Choices: The Influence of Health Claims and Nutrition Information on Consumers' Evaluations of Packaged Food Products and Restaurant Menu Items Journat of Martteting Vol. 67 (April 2003), pp. 19-38.
Labrecque, Joanne, Doyon, Maurice, Bellavance, Francois and Kolodinsky, Jane (2006). Acceptance of Functional Foods: A Comparison of French, American, and French Canadian Consumers, Canadian Journal of Agricultural Economics 54, 647–661
Larue Bruno, West, E. Gale, Gendron, Carole and Lambert, Remy (2004). Consumer Response to Functional Foods Produced by Conventional, Organic, or Genetic Manipulation, Agribusiness, Vol. 20 (2) 155-166
Lawrence, M. & Germov, J. (1999) Future food: the politics of functional foods and health claims. In A Sociology of Food and Nutrition. The Social Appetite (ed. by J. Germov & L. Williams), pp. 54–76. Oxford
Lesch, William C., Wachenheim, Cheryl J. and Bård S. Stillerud (2005). Biotechnology: The Healthy Choice?, Health Marketing Quarterly, Vol. 22(3), pp. 59-81.
Ljaljević A. Durišić B.,Mališić N., and Ivanović Lj. (2006). The volume of nutrition elements from milk and eggs in the acerage daily nutrition of the montenegrin population compared to the recommended daily nutrition components volume, Institute for public health of Montenegro.
Lusk Jayson L. and Briggeman Brian C. (2009): Food Values, American Journal of Agricultural Economics. 91(1), pp. 184–196
Marčeta-Kamenko, Nataša, Grujić, R., Grujić, S and Komić, J. (2004). Analysis of Consumers Knowledge related to Nutrition Influence on Obesity in Republica Srpska, Conference proceedings Prvi kongres hiperlipoproteinejama Srbije i Crne Gore, Novi Sad, Serbia.
Mari Niva and Johanna Mäkelä (2005). Finns and functional foods: socio-demographics, health efforts, notions of technology and the acceptability of health-promoting foods, Journal of Consumer Studies, pp. 35-45.
Mark-Herbert, C. (2003). Development and marketing strategies for functional foods. AgBioForum, 6, 75–78.
Mark-Herbert, C. (2004). Innovation of a new product category—Functional foods. Technovation, 24, 713–719.
May T. Yeung, Jill E. Hobbs and William A. Kerr (2007). Accessing US and EU Markets

FP7 KBBE 2007 1 223 GA 212579
FOCUS‐BALKANS DL 6.1 Consumer study implementation for products with health claims
Maynard, Leigh J. and Franklin, Sharon T. (2003). Functional Foods as a Value-Added Strategy: The Commercial Potential of “Cancer-Fighting” Dairy Products, Review of Agricultural Economics—Volume 25, Number 2—Pages 316–331
Mazis, M. B, Raymond, M. A, “Consumer Perceptions of Health Claims in Advertisements and on Food Labels”, The Journal of Consumers Affairs, Vol. 31, No. 1, 1997, pp. 10-26
Miletić Ivanka, Šobajić Slađana and Đorđević Brižita (2008). Funkcionalna hrana - uloga u unapređenju zdravlja, Journal of Medical Biochemistry, vol. 27, br. 3, str. 367-370.
Morgan, D. L. (1997) Focus Groups as Qualitative Research. 2nd Edition. Qualitative Research Methods series, Vol. 16. Sage, London.
National Household budget surveyes for selected countries, 2008-2009
Nayga, R, Lipinski, D, Savur, N (1998), Consumers’ Use of Nutritional Labels while Food Shopping and at Home, The Journal of Consumer Affairs, Vol. 32, No. 1, pp. 106-120
Nayga, R.M.J. & Capps, O.J. (1999) US consumers’ perceptions of the importance of following the US dietary guidelines. Food Policy, 24, 553–564.
Nestle, M. (2002) Food Politics. How the Food Industry Influences Nutrition and Health. University of California Press, Berkeley.
NIN (2002) Consumer Awareness of and Attitudes Toward Functional Foods. June 2002. National Institute of Nutrition, Ottawa.
Parker, A. and Tritter, J.Q. (2006), ‘Focus Group Method and Methodology: reflections on current practice and recent debate’, International Journal of Research and Method in Education, 29 (1): 23-37.
Peng, Yanning, West Gale E. and Wang Cindy (2006). Consumer Attitudes and Acceptance of CLA-Enriched Dairy Products, Canadian Journal of Agricultural Economics 54, 663–684
Petersen, A. & Lupton, D. (1996) The New Public Health. Health and Self in the Age of Risk. SAGE Publications, London.
Poulsen, J.B. (1999) Danish Consumers’ Attitudes Towards Functional Foods. MAPP Working Paper 62. MAPP – Centre for Market Surveillance, Research and Strategy for the Food Sector, Aarhus.
R. Brennan et. al. (2008): Regulation of Nutrition and Health Claims in Advertising, Journal of Advertising Research, March 2008, pp. 57-70.
Raspor, P. and Jevsnik, M. (2008). Good Nutritional Practice from Producer to Consumer, Critical Reviews in Food Science and Nutrition.

FP7 KBBE 2007 1 224 GA 212579
FOCUS‐BALKANS DL 6.1 Consumer study implementation for products with health claims
Ristevska – Jovanovska (2007). Промени во заштитата на потрошувачите во ЕУ согласно со програмата 2007-2013 и состојбите во Република Македонија, Annual of the Faculty of Economics, Volume 42, pp. 39-48
Ristić Gordana N. (2003). Funkcionalna hrana - hrana za XXI vek, Mlekarstvo, vol. 2, br. 14, str. 428-433.
Roe, Brian, Levy, Alan S. and Derby, Brenda M (1999). The Impact of Health Claims on Consumer Search and Product Evaluation Outcomes: Results from FDA Experimental Data, Journal of Public Policy & Marketing, Vol. 18(1) Spring 1999, pp. 89-105
Rogelj, I. (2000). Funkcionalna hrana - hrana bodućnosti, Prehrambena industrija. Mleko i mlečni proizvodi. - ISSN 0354-2068. - Vol. 11, No. 1/2, p. 40-42
Schaafsma, G. and Kok, F. (2005). Nutritional aspects of food innovations: A focus on functional foods. In W. Jongen and M. Meulenberg (Eds.), Innovation in agri-food systems (pp. 207–220). Wageningen, The Netherlands: Wageningen Academic.
Šobajić Slađana S. (2002). Funkcionalna hrana u prevenciji bolesti i terapiji, Arhiv za farmaciju, vol. 52, br. 3, str. 369-375.
Sorenson, Douglas and Bogue, Joe (2005). Market-Oriented New Product Design of Functional Orange Juice Beverages: A Qualitative Approach Journal of Food Products Marketing, Vol. 11(1), pp. 57-73.
Stanković Ivan M., Đorđević Brižita I (2002). Funkcionalna i nekonvencionalna hrana - zakonska regulativa, Hrana i ishrana, vol. 43, br. 1-2, str. 60-62.
Statistical Yearbook for selected countries, 2002-2009
Stewart-Knox, B. and Mitchell, P. (2003) What separates the winner from the losers in new food product development? Food Science and Technology, 14, pp. 58–64.
Strauss John and Dunkan Tomas (1998). Health, Nutrition and Economic Development, Journal of Economic Literature, Vol XXXVI, June 1998, pp. 766-817
Urala, N. & Lähteenmäki, L. (2004) Attitudes behind consumers’ willingness to use functional foods. Food Quality and Preference, 15, pp. 793–803.
Urala, N., Arvola, A. & Lähteenmäki, L. (2003) Strength of health-related claims and their perceived advantage, International Journal of Food Science and Technology, 38, pp. 815–826.
Van Kleef, E., van Trijp, H., & Jongen, W. (2002). Consumer-oriented functional food development: How well do functional disciplines reflect the ‘‘voice of the consumer?’’ Food Science and Technology, 13, pp. 93–101.
Verbeke, W. (2005) Consumer acceptance of functional foods: sociodemographic, cognitive and attitudinal determinants. Food Quality and Preference, 16, 45– 57.

FP7 KBBE 2007 1 225 GA 212579
FOCUS‐BALKANS DL 6.1 Consumer study implementation for products with health claims
Wansink, B (2003), How do front and Back Package Labels influence Beliefs about Health Claims?, The Journal of Consumer Affairs, Vol. 37, no 2, pp. 305-315
Wansink, B, Chandon P (2006), Can “Low Fat” Nutrition Labels lead to Obesity?’ Journal of Marketing Research, Vol. 43, pp. 605-617
Wansink, Brian and Cheney, M. Matthew (2005) Leveraging FDA Health Claims, The Journal of Consumer Affairs, Vol. 39, No. 2, pp. 386-398
West, G.E., Gendron, C., Larue, B. & Lambert, R. (2002) Consumers’ valuation of functional properties of foods: results from a Canada-wide survey. Canadian Journal of Agricultural Economics, 50, pp. 541–558.