Fundamental Analysis - Fidelity Investments
23
BROKERAGE: FUNDAMENTAL ANALYSIS Fundamental Analysis A Fidelity Investments Webinar Series
-
Upload
khangminh22 -
Category
Documents
-
view
1 -
download
0
Transcript of Fundamental Analysis - Fidelity Investments
BROKERAGE: FUNDAMENTAL ANALYSIS
Fundamental Analysis
1145882183
A Fidelity Investments Webinar Series

2
BROKERAGE: FUNDAMENTAL ANALYSIS
Defining Fundamental Analysis
What information is available
Fundamental Reporting
Tools for your research
Agenda

3
BROKERAGE: FUNDAMENTAL ANALYSIS
Watch Videos
Read ArticlesGet more
information
Attend additional Webinars
Additional Resources
Visit Fidelity.comNews and Research – Learning
Center
Fidelity.com/On-Demand
Fidelity.com/Viewpoints
Fidelity.com/Webinars

Defining Fundamental Analysis
5
BROKERAGE: FUNDAMENTAL ANALYSIS
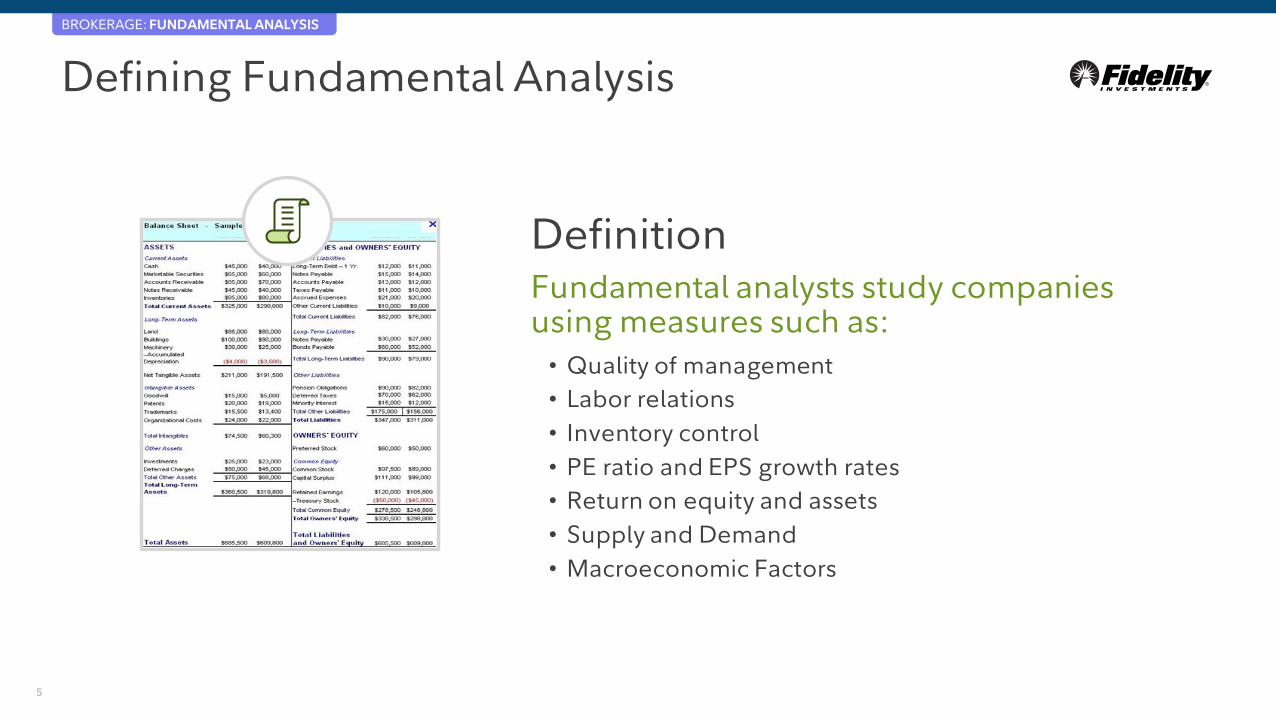
Defining Fundamental Analysis
DefinitionFundamental analysts study companies using measures such as:
• Quality of management
• Labor relations
• Inventory control
• PE ratio and EPS growth rates
• Return on equity and assets
• Supply and Demand
• Macroeconomic Factors

6
BROKERAGE: FUNDAMENTAL ANALYSIS
Defining Fundamental Analysis
LimitsFundamental analysis does not help you with:
• Timing of the investment
• Making the selling decision
• Quantifying the risk vs. reward

Availability of Information

8
BROKERAGE: FUNDAMENTAL ANALYSIS
Availability of InformationReadily available fundamental information
Company reported Financial Statements:
• Balance Sheet
• Income Statements
• Cash Flow
Macroeconomic data includes:
• GDP
• Fiscal/Monetary Policy
• Unemployment
• Other Economic Reports/Surveys
9
BROKERAGE: FUNDAMENTAL ANALYSIS
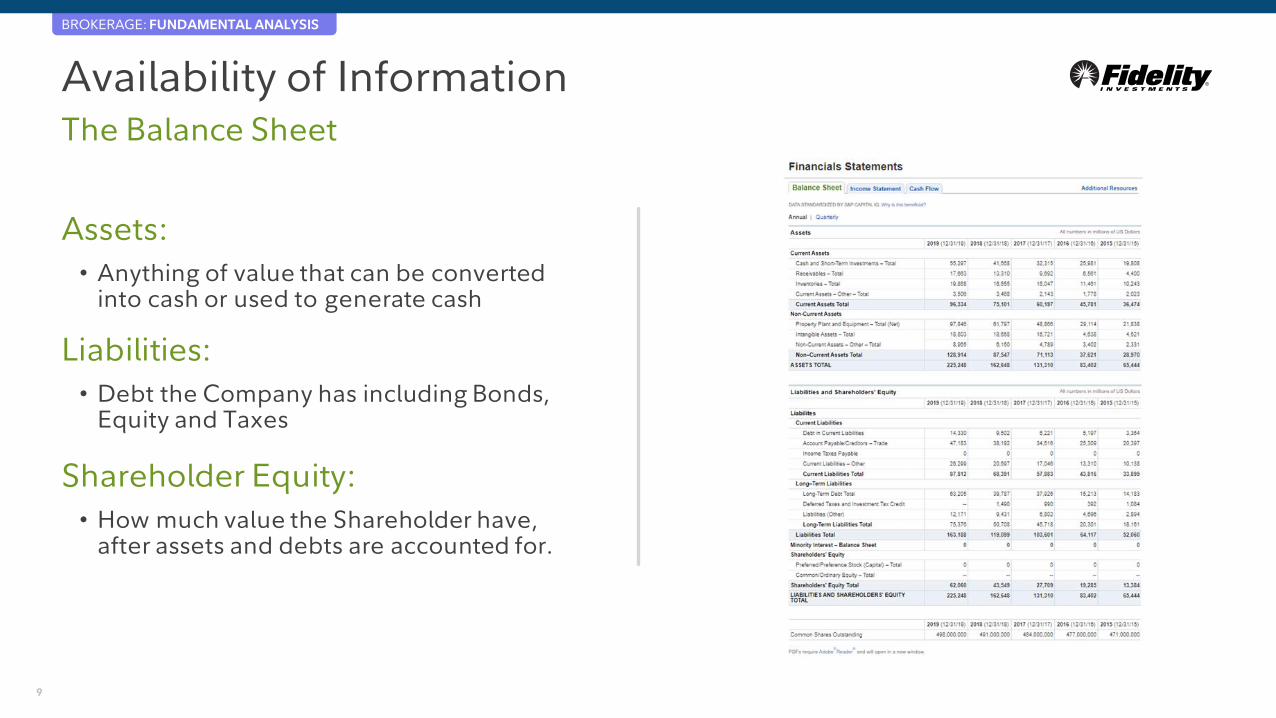
Availability of InformationThe Balance Sheet
Assets:
• Anything of value that can be converted into cash or used to generate cash
Liabilities:
• Debt the Company has including Bonds, Equity and Taxes
Shareholder Equity:
• How much value the Shareholder have, after assets and debts are accounted for.

10
BROKERAGE: FUNDAMENTAL ANALYSIS
Availability of InformationThe Balance Sheet – Common Ratios
Quick Ratio (Acid Test):
• Liquid Assets* / Current Liabilities
Current Ratio:
• Current Assets / Current Liabilities
Debt to Equity:
• Total Liabilities / Share Holder Equity
* Liquid Assets = Cash & Cash Equivalents + Marketable Securities + Accounts Receivable

11
BROKERAGE: FUNDAMENTAL ANALYSIS
Availability of InformationThe Income Statement
Top Line:
• Gross income of the company, before any consideration of cost
Operating Income (OI):
• Gross Income of the company LESS the operating expenses
Bottom Line:
• Net income of the company after ALL cost considerations
12
BROKERAGE: FUNDAMENTAL ANALYSIS
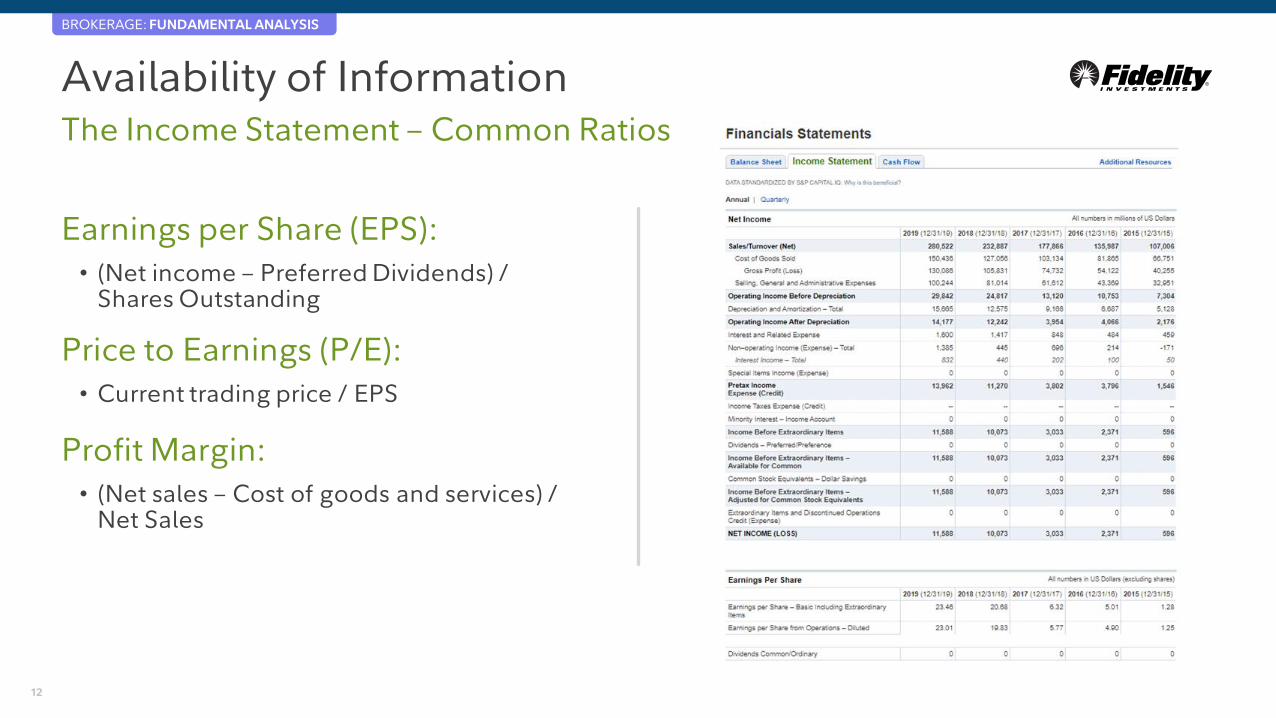
Availability of InformationThe Income Statement – Common Ratios
Earnings per Share (EPS):
• (Net income – Preferred Dividends) / Shares Outstanding
Price to Earnings (P/E):
• Current trading price / EPS
Profit Margin:
• (Net sales – Cost of goods and services) / Net Sales

13
BROKERAGE: FUNDAMENTAL ANALYSIS
Availability of InformationCash Flow
Receivables:
• Amount a company is owed, but not yet paid
Payables:
• Amount a company is required to pay, but not yet fulfilled
Depreciation:
• Accounting for the lower value of an asset to the company
Amortization
• Adjustment to outstanding liabilities accounting for the lower obligation over time

14
BROKERAGE: FUNDAMENTAL ANALYSIS
Availability of InformationCash Flow – Common Ratios
Cash Flow:
• Operating cash flow – Capital expenditures
Asset Efficiency:
• Total sales / Avg. Total Assets
Current Liability Coverage:
• Operating cash flow / Avg. current liabilities

15
BROKERAGE: FUNDAMENTAL ANALYSIS
Availability of InformationCompany Reporting
Timely Reporting:
• The Securities and Exchange Commission (SEC) requires public companies to file quarterly (10-Q) and annual (10-K) financial reports.
G.A.A.P.:
• To ensure standardized accounting principles, the Generally Accepted Accounting Principles ensure you can compare companies side by side.
Company Reported:
• Some companies choose to release additional or revised financial information based on their Non_GAAP accounting standards.
• Common differences are adjusting for one-time expenses like tax write offs or litigation costs that may over or understate a company’s value.

Live Demonstration using Fidelity.com

17
BROKERAGE: FUNDAMENTAL ANALYSIS
Stock Research CenterNews and Research > Stocks > Enter Stock Symbol
Fundamental Break Down:
• S&P Global provides a fast, easy to read report on every company.
• Click ‘More’ in upper right-hand corner for a full breakdown of definitions
S&P Global Market Intelligence and Fidelity Investments are independent entities and are not legally affiliated.

18
BROKERAGE: FUNDAMENTAL ANALYSIS
Financial ReportsNews and Research > Stocks > Enter Stock Symbol
More available research:
• Bottom of stock research page
• Click Financial Statements for a Balance Sheet, Income Statement, and Cash Flow reports.

19
BROKERAGE: FUNDAMENTAL ANALYSIS
Key StatisticsFound in the more research box
How does the company compare?:
• Contains common fundamental ratios and compares the company with its peers.

20
BROKERAGE: FUNDAMENTAL ANALYSIS
Equity Summary ScoreESS found on the Stock Research Page
Access analyst firm’s report by clicking the dated hyperlink
• Contains common fundamental ratios and compares the company with its peers.
• Click ‘More’ in the upper right-hand corner for detailed reports.
The Equity Summary Score is provided for informational purposes only, does not constitute advice or guidance, and is not an endorsement or recommendation for any particular security or trading strategy. The Equity Summary Score is provided by StarMine from Refinitiv, an independent company not affiliated with Fidelity Investments. For more information and details, go to Fidelity.com.

Questions?

22
ThankYou
Please join us for ourupcoming webinars
Fidelity.com/webinars
667913740
Download Active Trader Pro for free at
Fidelity.com/ATP
Questions? Call a trading specialist at
877-907-4429
23
BROKERAGE: FUNDAMENTAL ANALYSIS
Important Information
Any screenshots, charts, or company trading symbols mentioned, are provided for illustrative purposes only and should not be considered an offer to sell, a solicitation of an offer to buy, or a recommendation for the security.
Investing involves risk, including risk of loss.
© 2020 FMR LLC. All rights reserved.
Fidelity Brokerage Services, Member NYSE, SIPC, 900 Salem Street, Smithfield, RI 02917
910805.2.0