Portfolio Holdings Listing Fidelity SAI Emerging Markets Index ...
Upload
khangminh22Category
view
0download
0
Fidelity® MSCI Communication Services Index ETFFidelity® MSCI Consumer Discretionary Index ETFFidelity® MSCI Consumer Staples Index ETFFidelity® MSCI Energy Index ETFFidelity® MSCI Financials Index ETFFidelity® MSCI Health Care Index ETFFidelity® MSCI Industrials Index ETFFidelity® MSCI Information Technology Index ETFFidelity® MSCI Materials Index ETFFidelity® MSCI Real Estate Index ETFFidelity® MSCI Utilities Index ETF
Semi-Annual ReportJanuary 31, 2022
Note to Shareholders 3
Investment Summary 4
Schedule of Investments 15
Financial Statements 64
Notes to Financial Statements 87
Shareholder Expense Example 92
To view a fund’s proxy voting guidelines and proxy voting record for the period ended June, 30, visit http://www.fidelity.com/proxyvotingresults or visit theSecurities and Exchange Commission’s (SEC) web site at http://www.sec.gov. You may also call 1-800-FIDELITY to request a free copy of the proxy votingguidelines.
The funds or securities referred to herein are not sponsored, endorsed, or promoted by MSCI, and MSCI bears no liability with respect to any such funds orsecurities or any index on which such funds or securities are based. The prospectus contains a more detailed description of the limited relationship MSCI haswith Fidelity and any related funds.
Standard & Poor’s, S&P and S&P 500 are registered service marks of The McGraw-Hill Companies, Inc. and have been licensed for use by Fidelity DistributorsCorporation.
Other third party marks appearing herein are the property of their respective owners.
All other marks appearing herein are registered or unregistered trademarks or service marks of FMR LLC or an affiliated company.
© 2022 FMR LLC. All Rights reserved.
This report and the financial statements contained herein are submitted for the general information of the shareholders of the funds. This report is not authorized fordistribution to prospective investors in the funds unless preceded or accompanied by an effective prospectus.
A fund files its complete schedule of portfolio holdings with the SEC for the first and third quarters of each fiscal year on Form N-PORT. Forms N-PORT are available onthe SEC’s web site at http://www.sec.gov. A fund’s Forms N-PORT may be reviewed and copied at the SEC’s Public Reference Room in Washington, DC. Informationregarding the operation of the SEC’s Public Reference Room may be obtained by calling 1-800-SEC-0330. For a complete list of a fund’s portfolio holdings, view the mostrecent holdings listing on Fidelity’s web site at http://www.fidelity.com, http://www.advisor.fidelity.com, or http://www.401k.com, as applicable.
NOT FDIC INSURED • MAY LOSE VALUE • NO BANK GUARANTEE
Neither the funds nor Fidelity Distributors Corporation is a bank.
Contents
Semi-Annual Report 2

Note to Shareholders:
Early in 2020, the outbreak and spread of COVID-19 emerged as a public health emergency that had a major influence on financial markets,primarily based on its impact on the global economy and corporate earnings. On March 11, 2020, the World Health Organization declared theCOVID-19 outbreak a pandemic, citing sustained risk of further global spread. The pandemic prompted a number of measures to limit the spreadof COVID-19, including travel and border restrictions, quarantines, and restrictions on large gatherings. In turn, these resulted in lower consumeractivity, diminished demand for a wide range of products and services, disruption in manufacturing and supply chains, and – given the widevariability in outcomes regarding the outbreak – significant market uncertainty and volatility. To help stem the turmoil, the U.S. government tookunprecedented action – in concert with the U.S. Federal Reserve and central banks around the world – to help support consumers, businesses,and the broader economy, and to limit disruption to the financial system.
In general, the overall impact of the pandemic lessened in 2021, amid a resilient economy and widespread distribution of three COVID-19vaccines granted emergency use authorization from the U.S. Food and Drug Administration (FDA) early in the year. Still, the situation remainsdynamic, and the extent and duration of its influence on financial markets and the economy is highly uncertain, due in part to a recent spike incases based on highly contagious variants of the coronavirus.
Extreme events such as the COVID-19 crisis are exogenous shocks that can have significant adverse effects on mutual funds and theirinvestments. Although multiple asset classes may be affected by market disruption, the duration and impact may not be the same for all types ofassets. Fidelity is committed to helping you stay informed amid news about COVID-19 and during increased market volatility, and we continue totake extra steps to be responsive to customer needs. We encourage you to visit us online, where we offer ongoing updates, commentary, andanalysis on the markets and our funds.
3 Semi-Annual Report

Investment Summary (Unaudited)
Top Ten Stocks as of January 31, 2022
% of fund’snet assets
Facebook, Inc. Class A 17.4Alphabet, Inc. Class A 11.6Alphabet, Inc. Class C 10.9The Walt Disney Co. 5.7Verizon Communications, Inc. 4.9AT&T, Inc. 4.8Comcast Corp. Class A 4.7Netflix, Inc. 3.1Charter Communications, Inc. Class A 2.2T-Mobile US, Inc. 2.0
67.3
Industries as of January 31, 2022
Interactive Media &Services 46.8%Media 19.9%Entertainment 17.5%DiversifiedTelecommunicationServices 13.3%WirelessTelecommunicationServices 2.4%All Others* 0.1%
% of fund’snet assets
* Includes short-term investments and net other assets.
Fidelity® MSCI Communication Services Index ETF
Semi-Annual Report 4

Investment Summary (Unaudited)
Top Ten Stocks as of January 31, 2022
% of fund’snet assets
Amazon.com, Inc. 21.0Tesla, Inc. 13.5The Home Depot, Inc. 7.0McDonald’s Corp. 3.5NIKE, Inc. Class B 3.4Lowe’s Cos., Inc. 3.0Starbucks Corp. 2.1Target Corp. 2.0Booking Holdings, Inc. 1.9The TJX Cos., Inc. 1.6
59.0
Industries as of January 31, 2022
Internet & DirectMarketing Retail 23.7%Specialty Retail 20.5%Hotels, Restaurants &Leisure 17.3%Automobiles 16.6%Textiles, Apparel &Luxury Goods 6.7%All Others* 15.2%
% of fund’snet assets
* Includes short-term investments and net other assets.
Fidelity® MSCI Consumer Discretionary Index ETF
5 Semi-Annual Report

Investment Summary (Unaudited)
Top Ten Stocks as of January 31, 2022
% of fund’snet assets
The Procter & Gamble Co. 13.9The Coca-Cola Co. 8.4PepsiCo, Inc. 8.1Costco Wholesale Corp. 7.5Walmart, Inc. 7.2Philip Morris International, Inc. 4.8Mondelez International, Inc. Class A 3.8Altria Group, Inc. 3.7The Estee Lauder Cos., Inc. Class A 2.9Colgate-Palmolive Co. 2.7
63.0
Industries as of January 31, 2022
Beverages 22.8%Food & StaplesRetailing 22.1%Household Products 21.4%Food Products 20.1%Tobacco 8.9%All Others* 4.7%
% of fund’snet assets
* Includes short-term investments and net other assets.
Fidelity® MSCI Consumer Staples Index ETF
Semi-Annual Report 6

Investment Summary (Unaudited)
Top Ten Stocks as of January 31, 2022
% of fund’snet assets
Exxon Mobil Corp. 21.3Chevron Corp. 16.8ConocoPhillips 7.9EOG Resources, Inc. 4.3Schlumberger N.V. 3.6Pioneer Natural Resources Co. 3.4Marathon Petroleum Corp. 3.0Phillips 66 2.5The Williams Cos., Inc. 2.4Kinder Morgan, Inc. 2.4
67.6
Industries as of January 31, 2022
Oil, Gas &Consumable Fuels 90.1%Energy Equipment &Services 9.6%Short-term Investments 0.2%Other Assets 0.1%
% of fund’snet assets
* Includes short-term investments and net other assets.
Fidelity® MSCI Energy Index ETF
7 Semi-Annual Report

Investment Summary (Unaudited)
Top Ten Stocks as of January 31, 2022
% of fund’snet assets
JPMorgan Chase & Co. 8.4Berkshire Hathaway, Inc. Class B 7.8Bank of America Corp. 6.6Wells Fargo & Co. 4.1Morgan Stanley 2.6Citigroup, Inc. 2.5The Charles Schwab Corp. 2.4BlackRock, Inc. 2.3American Express Co. 2.3Goldman Sachs Group, Inc. 2.3
41.3
Industries as of January 31, 2022
Banks 38.1%Capital Markets 26.8%Insurance 18.0%Diversified FinancialServices 8.7%Consumer Finance 5.8%All Others* 2.6%
% of fund’snet assets
* Includes short-term investments and net other assets.
Fidelity® MSCI Financials Index ETF
Semi-Annual Report 8
Investment Summary (Unaudited)
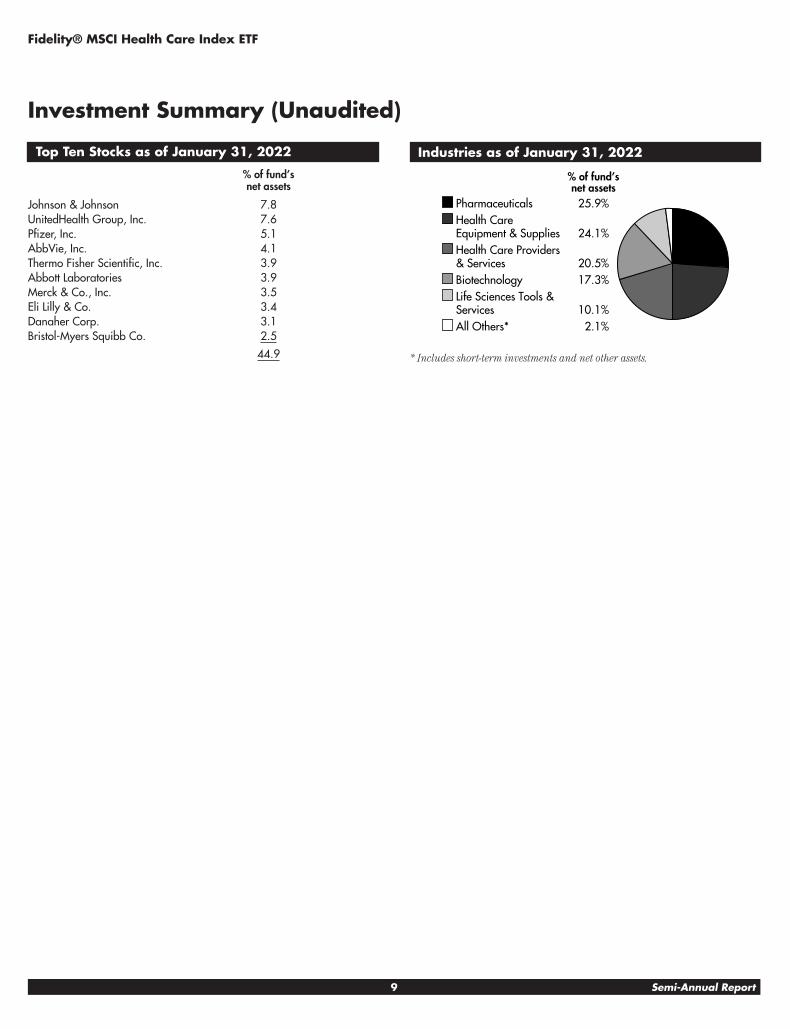
Top Ten Stocks as of January 31, 2022
% of fund’snet assets
Johnson & Johnson 7.8UnitedHealth Group, Inc. 7.6Pfizer, Inc. 5.1AbbVie, Inc. 4.1Thermo Fisher Scientific, Inc. 3.9Abbott Laboratories 3.9Merck & Co., Inc. 3.5Eli Lilly & Co. 3.4Danaher Corp. 3.1Bristol-Myers Squibb Co. 2.5
44.9
Industries as of January 31, 2022
Pharmaceuticals 25.9%Health CareEquipment & Supplies 24.1%Health Care Providers& Services 20.5%Biotechnology 17.3%Life Sciences Tools &Services 10.1%All Others* 2.1%
% of fund’snet assets
* Includes short-term investments and net other assets.
Fidelity® MSCI Health Care Index ETF
9 Semi-Annual Report

Investment Summary (Unaudited)
Top Ten Stocks as of January 31, 2022
% of fund’snet assets
Union Pacific Corp. 4.1United Parcel Service, Inc. Class B 3.8Honeywell International, Inc. 3.6Raytheon Technologies Corp. 3.5The Boeing Co. 2.8Deere & Co. 2.8Caterpillar, Inc. 2.8General Electric Co. 2.6Lockheed Martin Corp. 2.53M Co. 2.4
30.9
Industries as of January 31, 2022
Machinery 20.8%Aerospace & Defense 15.9%Road & Rail 11.8%IndustrialConglomerates 9.8%Electrical Equipment 7.5%All Others* 34.2%
% of fund’snet assets
* Includes short-term investments and net other assets.
Fidelity® MSCI Industrials Index ETF
Semi-Annual Report 10

Investment Summary (Unaudited)
Top Ten Stocks as of January 31, 2022
% of fund’snet assets
Apple, Inc. 23.0Microsoft Corp. 17.6NVIDIA Corp. 4.9Visa, Inc. Class A 3.0Mastercard, Inc. Class A 2.7Adobe, Inc. 2.0Broadcom, Inc. 1.9Cisco Systems, Inc. 1.9Salesforce.com, Inc. 1.8Accenture PLC Class A 1.8
60.6
Industries as of January 31, 2022
Software 33.2%Technology Hardware,Storage & Peripherals 24.2%Semiconductors &SemiconductorEquipment 19.8%IT Services 16.6%Electronic Equipment,Instruments &Components 3.1%All Others* 3.1%
% of fund’snet assets
* Includes short-term investments and net other assets.
Fidelity® MSCI Information Technology Index ETF
11 Semi-Annual Report
Investment Summary (Unaudited)
Top Ten Stocks as of January 31, 2022
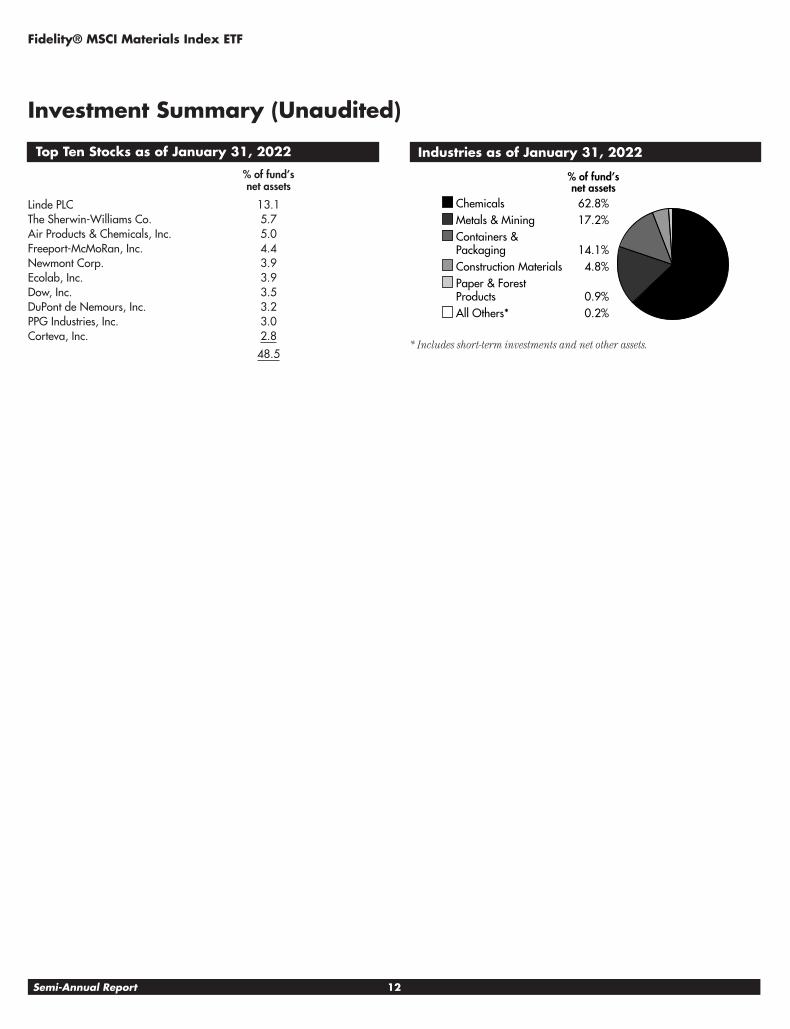
% of fund’snet assets
Linde PLC 13.1The Sherwin-Williams Co. 5.7Air Products & Chemicals, Inc. 5.0Freeport-McMoRan, Inc. 4.4Newmont Corp. 3.9Ecolab, Inc. 3.9Dow, Inc. 3.5DuPont de Nemours, Inc. 3.2PPG Industries, Inc. 3.0Corteva, Inc. 2.8
48.5
Industries as of January 31, 2022
Chemicals 62.8%Metals & Mining 17.2%Containers &Packaging 14.1%Construction Materials 4.8%Paper & ForestProducts 0.9%All Others* 0.2%
% of fund’snet assets
* Includes short-term investments and net other assets.
Fidelity® MSCI Materials Index ETF
Semi-Annual Report 12

Investment Summary (Unaudited)
Top Ten Stocks as of January 31, 2022
% of fund’snet assets
Prologis, Inc. 7.3American Tower Corp. 7.3Crown Castle International Corp. 5.0Equinix, Inc. 4.1Public Storage 3.6Simon Property Group, Inc. 3.1Digital Realty Trust, Inc. 2.7Realty Income Corp. 2.4Welltower, Inc. 2.3SBA Communications Corp. 2.3
40.1
Industries as of January 31, 2022
Equity Real EstateInvestment Trusts (REITs) 94.4%Real EstateManagement &Development 5.4%Short-term Investments 0.1%Other Assets 0.1%
% of fund’snet assets
* Includes short-term investments and net other assets.
Fidelity® MSCI Real Estate Index ETF
13 Semi-Annual Report

Investment Summary (Unaudited)
Top Ten Stocks as of January 31, 2022
% of fund’snet assets
NextEra Energy, Inc. 13.6Duke Energy Corp. 7.2The Southern Co. 6.5Dominion Energy, Inc. 5.8Exelon Corp. 5.0American Electric Power Co., Inc. 4.0Sempra Energy 3.9Xcel Energy, Inc. 3.3Public Service Enterprise Group, Inc. 3.0Eversource Energy 2.7
55.0
Industries as of January 31, 2022
Electric Utilities 59.4%Multi-Utilities 27.8%Water Utilities 4.6%Gas Utilities 4.5%Independent Powerand RenewableElectricity Producers 3.4%All Others* 0.3%
% of fund’snet assets
* Includes short-term investments and net other assets.
Fidelity® MSCI Utilities Index ETF
Semi-Annual Report 14
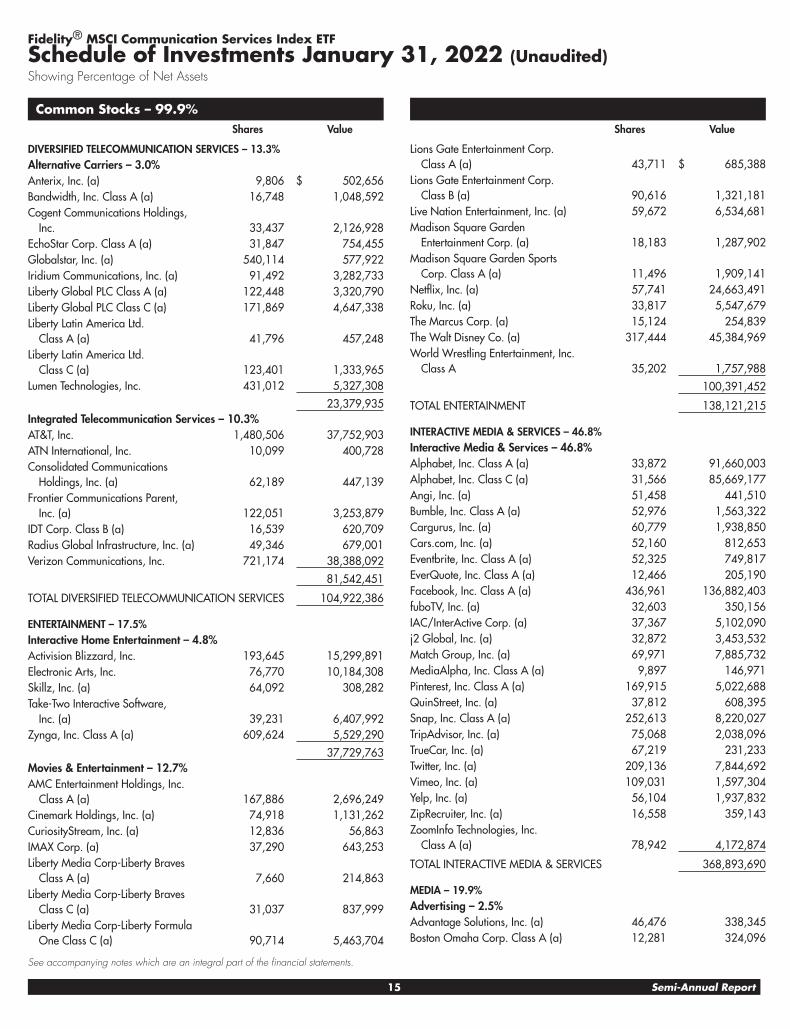
Common Stocks – 99.9%Shares Value
DIVERSIFIED TELECOMMUNICATION SERVICES – 13.3%Alternative Carriers – 3.0%Anterix, Inc. (a) 9,806 $ 502,656Bandwidth, Inc. Class A (a) 16,748 1,048,592Cogent Communications Holdings,
Inc. 33,437 2,126,928EchoStar Corp. Class A (a) 31,847 754,455Globalstar, Inc. (a) 540,114 577,922Iridium Communications, Inc. (a) 91,492 3,282,733Liberty Global PLC Class A (a) 122,448 3,320,790Liberty Global PLC Class C (a) 171,869 4,647,338Liberty Latin America Ltd.
Class A (a) 41,796 457,248Liberty Latin America Ltd.
Class C (a) 123,401 1,333,965Lumen Technologies, Inc. 431,012 5,327,308
23,379,935Integrated Telecommunication Services – 10.3%AT&T, Inc. 1,480,506 37,752,903ATN International, Inc. 10,099 400,728Consolidated Communications
Holdings, Inc. (a) 62,189 447,139Frontier Communications Parent,
Inc. (a) 122,051 3,253,879IDT Corp. Class B (a) 16,539 620,709Radius Global Infrastructure, Inc. (a) 49,346 679,001Verizon Communications, Inc. 721,174 38,388,092
81,542,451
TOTAL DIVERSIFIED TELECOMMUNICATION SERVICES 104,922,386
ENTERTAINMENT – 17.5%Interactive Home Entertainment – 4.8%Activision Blizzard, Inc. 193,645 15,299,891Electronic Arts, Inc. 76,770 10,184,308Skillz, Inc. (a) 64,092 308,282Take-Two Interactive Software,
Inc. (a) 39,231 6,407,992Zynga, Inc. Class A (a) 609,624 5,529,290
37,729,763Movies & Entertainment – 12.7%AMC Entertainment Holdings, Inc.
Class A (a) 167,886 2,696,249Cinemark Holdings, Inc. (a) 74,918 1,131,262CuriosityStream, Inc. (a) 12,836 56,863IMAX Corp. (a) 37,290 643,253Liberty Media Corp-Liberty Braves
Class A (a) 7,660 214,863Liberty Media Corp-Liberty Braves
Class C (a) 31,037 837,999Liberty Media Corp-Liberty Formula
One Class C (a) 90,714 5,463,704
Shares Value
Lions Gate Entertainment Corp.Class A (a) 43,711 $ 685,388
Lions Gate Entertainment Corp.Class B (a) 90,616 1,321,181
Live Nation Entertainment, Inc. (a) 59,672 6,534,681Madison Square Garden
Entertainment Corp. (a) 18,183 1,287,902Madison Square Garden Sports
Corp. Class A (a) 11,496 1,909,141Netflix, Inc. (a) 57,741 24,663,491Roku, Inc. (a) 33,817 5,547,679The Marcus Corp. (a) 15,124 254,839The Walt Disney Co. (a) 317,444 45,384,969World Wrestling Entertainment, Inc.
Class A 35,202 1,757,988
100,391,452
TOTAL ENTERTAINMENT 138,121,215
INTERACTIVE MEDIA & SERVICES – 46.8%Interactive Media & Services – 46.8%Alphabet, Inc. Class A (a) 33,872 91,660,003Alphabet, Inc. Class C (a) 31,566 85,669,177Angi, Inc. (a) 51,458 441,510Bumble, Inc. Class A (a) 52,976 1,563,322Cargurus, Inc. (a) 60,779 1,938,850Cars.com, Inc. (a) 52,160 812,653Eventbrite, Inc. Class A (a) 52,325 749,817EverQuote, Inc. Class A (a) 12,466 205,190Facebook, Inc. Class A (a) 436,961 136,882,403fuboTV, Inc. (a) 32,603 350,156IAC/InterActive Corp. (a) 37,367 5,102,090j2 Global, Inc. (a) 32,872 3,453,532Match Group, Inc. (a) 69,971 7,885,732MediaAlpha, Inc. Class A (a) 9,897 146,971Pinterest, Inc. Class A (a) 169,915 5,022,688QuinStreet, Inc. (a) 37,812 608,395Snap, Inc. Class A (a) 252,613 8,220,027TripAdvisor, Inc. (a) 75,068 2,038,096TrueCar, Inc. (a) 67,219 231,233Twitter, Inc. (a) 209,136 7,844,692Vimeo, Inc. (a) 109,031 1,597,304Yelp, Inc. (a) 56,104 1,937,832ZipRecruiter, Inc. (a) 16,558 359,143ZoomInfo Technologies, Inc.
Class A (a) 78,942 4,172,874
TOTAL INTERACTIVE MEDIA & SERVICES 368,893,690
MEDIA – 19.9%Advertising – 2.5%Advantage Solutions, Inc. (a) 46,476 338,345Boston Omaha Corp. Class A (a) 12,281 324,096
Fidelity® MSCI Communication Services Index ETFSchedule of Investments January 31, 2022 (Unaudited)Showing Percentage of Net Assets
See accompanying notes which are an integral part of the financial statements.
15 Semi-Annual Report
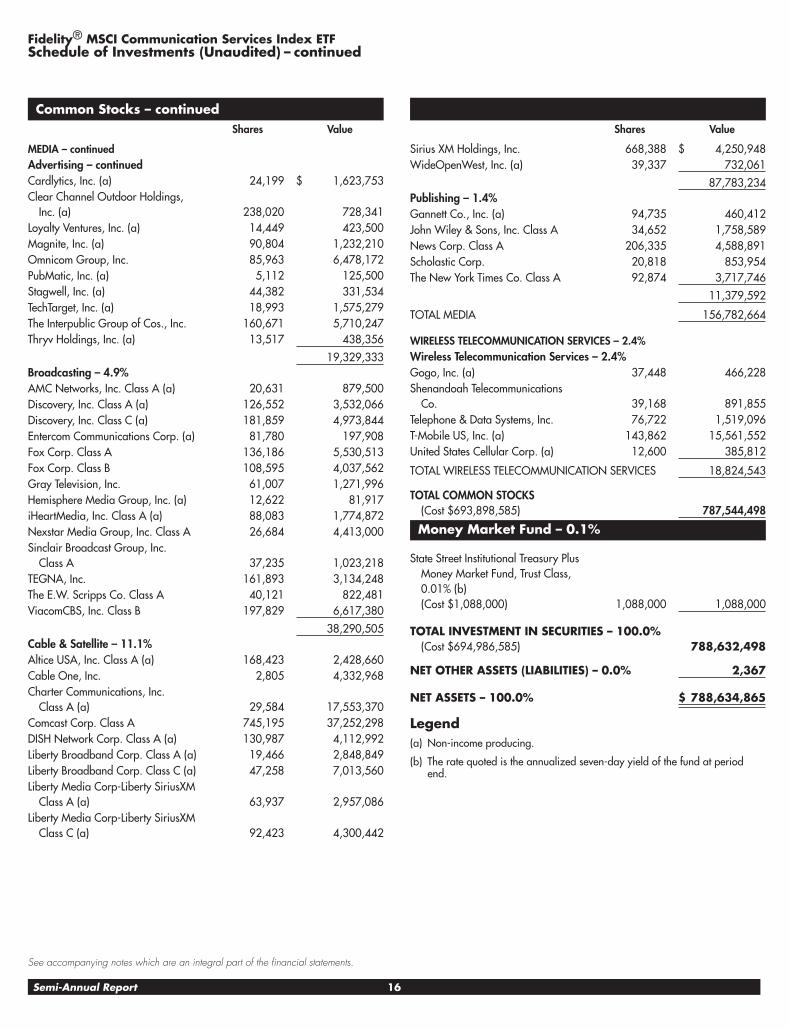
Common Stocks – continuedShares Value
MEDIA – continuedAdvertising – continuedCardlytics, Inc. (a) 24,199 $ 1,623,753Clear Channel Outdoor Holdings,
Inc. (a) 238,020 728,341Loyalty Ventures, Inc. (a) 14,449 423,500Magnite, Inc. (a) 90,804 1,232,210Omnicom Group, Inc. 85,963 6,478,172PubMatic, Inc. (a) 5,112 125,500Stagwell, Inc. (a) 44,382 331,534TechTarget, Inc. (a) 18,993 1,575,279The Interpublic Group of Cos., Inc. 160,671 5,710,247Thryv Holdings, Inc. (a) 13,517 438,356
19,329,333Broadcasting – 4.9%AMC Networks, Inc. Class A (a) 20,631 879,500Discovery, Inc. Class A (a) 126,552 3,532,066Discovery, Inc. Class C (a) 181,859 4,973,844Entercom Communications Corp. (a) 81,780 197,908Fox Corp. Class A 136,186 5,530,513Fox Corp. Class B 108,595 4,037,562Gray Television, Inc. 61,007 1,271,996Hemisphere Media Group, Inc. (a) 12,622 81,917iHeartMedia, Inc. Class A (a) 88,083 1,774,872Nexstar Media Group, Inc. Class A 26,684 4,413,000Sinclair Broadcast Group, Inc.
Class A 37,235 1,023,218TEGNA, Inc. 161,893 3,134,248The E.W. Scripps Co. Class A 40,121 822,481ViacomCBS, Inc. Class B 197,829 6,617,380
38,290,505Cable & Satellite – 11.1%Altice USA, Inc. Class A (a) 168,423 2,428,660Cable One, Inc. 2,805 4,332,968Charter Communications, Inc.
Class A (a) 29,584 17,553,370Comcast Corp. Class A 745,195 37,252,298DISH Network Corp. Class A (a) 130,987 4,112,992Liberty Broadband Corp. Class A (a) 19,466 2,848,849Liberty Broadband Corp. Class C (a) 47,258 7,013,560Liberty Media Corp-Liberty SiriusXM
Class A (a) 63,937 2,957,086Liberty Media Corp-Liberty SiriusXM
Class C (a) 92,423 4,300,442
Shares Value
Sirius XM Holdings, Inc. 668,388 $ 4,250,948WideOpenWest, Inc. (a) 39,337 732,061
87,783,234Publishing – 1.4%Gannett Co., Inc. (a) 94,735 460,412John Wiley & Sons, Inc. Class A 34,652 1,758,589News Corp. Class A 206,335 4,588,891Scholastic Corp. 20,818 853,954The New York Times Co. Class A 92,874 3,717,746
11,379,592
TOTAL MEDIA 156,782,664
WIRELESS TELECOMMUNICATION SERVICES – 2.4%Wireless Telecommunication Services – 2.4%Gogo, Inc. (a) 37,448 466,228Shenandoah Telecommunications
Co. 39,168 891,855Telephone & Data Systems, Inc. 76,722 1,519,096T-Mobile US, Inc. (a) 143,862 15,561,552United States Cellular Corp. (a) 12,600 385,812
TOTAL WIRELESS TELECOMMUNICATION SERVICES 18,824,543
TOTAL COMMON STOCKS(Cost $693,898,585) 787,544,498
Money Market Fund – 0.1%
State Street Institutional Treasury PlusMoney Market Fund, Trust Class,0.01% (b)(Cost $1,088,000) 1,088,000 1,088,000
TOTAL INVESTMENT IN SECURITIES – 100.0%(Cost $694,986,585) 788,632,498
NET OTHER ASSETS (LIABILITIES) – 0.0% 2,367
NET ASSETS – 100.0% $ 788,634,865
Legend(a) Non-income producing.
(b) The rate quoted is the annualized seven-day yield of the fund at periodend.
Fidelity® MSCI Communication Services Index ETFSchedule of Investments (Unaudited) – continued
See accompanying notes which are an integral part of the financial statements.
Semi-Annual Report 16

Futures Contracts
Number ofcontracts
ExpirationDate
NotionalAmount Value
UnrealizedAppreciation/(Depreciation)
Purchased
Equity Index ContractCME E-mini S&P Communication Services Select Sector Index Contracts(United States) 11 March 2022 $1,062,600 $(35,355) $(35,355)
The notional amount of futures purchased as a percentage of Net Assets is 0.1%
Investment ValuationThe following is a summary of the inputs used, as of January 31, 2022, involving the Fund’s assets and liabilities carried at fair value. The inputs or methodologyused for valuing securities may not be an indication of the risk associated with investing in those securities. For more information on valuation inputs, and theiraggregation into the levels used in the table below, please refer to the Investment Valuation section in the accompanying Notes to Financial Statements.
Valuation Inputs at Reporting Date:
Description Total Level 1 Level 2 Level 3Investments in Securities:
Common Stocks $ 787,544,498 $ 787,544,498 $ — $ —Money Market Funds 1,088,000 1,088,000 — —
Total Investments in Securities: $ 788,632,498 $ 788,632,498 $ — $ —
Derivative Instruments:
LiabilitiesFutures Contracts $ (35,355) $ (35,355) $ — $ —
Total Liabilities $ (35,355) $ (35,355) $ — $ —
Total Derivative Instruments: $ (35,355) $ (35,355) $ — $ —
Value of Derivative InstrumentsThe following table is a summary of the Fund’s value of derivative instruments by primary risk exposure as of January 31, 2022. For additional information onderivative instruments, please refer to the Derivative Instruments section in the accompanying Notes to Financial Statements.
Primary Risk/ Derivative Type ValueAsset Liabilities
Equity RiskFutures Contracts(a) $0 $(35,355)
Total Equity Risk 0 (35,355)
Total Value of Derivatives $0 $(35,355)
(a) Reflects gross cumulative appreciation (depreciation) on futures contracts as presented in the Schedule of Investments. In the Statement of Assets and Liabilities,the period end daily variation margin is included in receivable or payable for daily variation margin on futures contracts, and the net cumulative appreciation(depreciation) is included in total accumulated earnings (loss).
See accompanying notes which are an integral part of the financial statements.
17 Semi-Annual Report
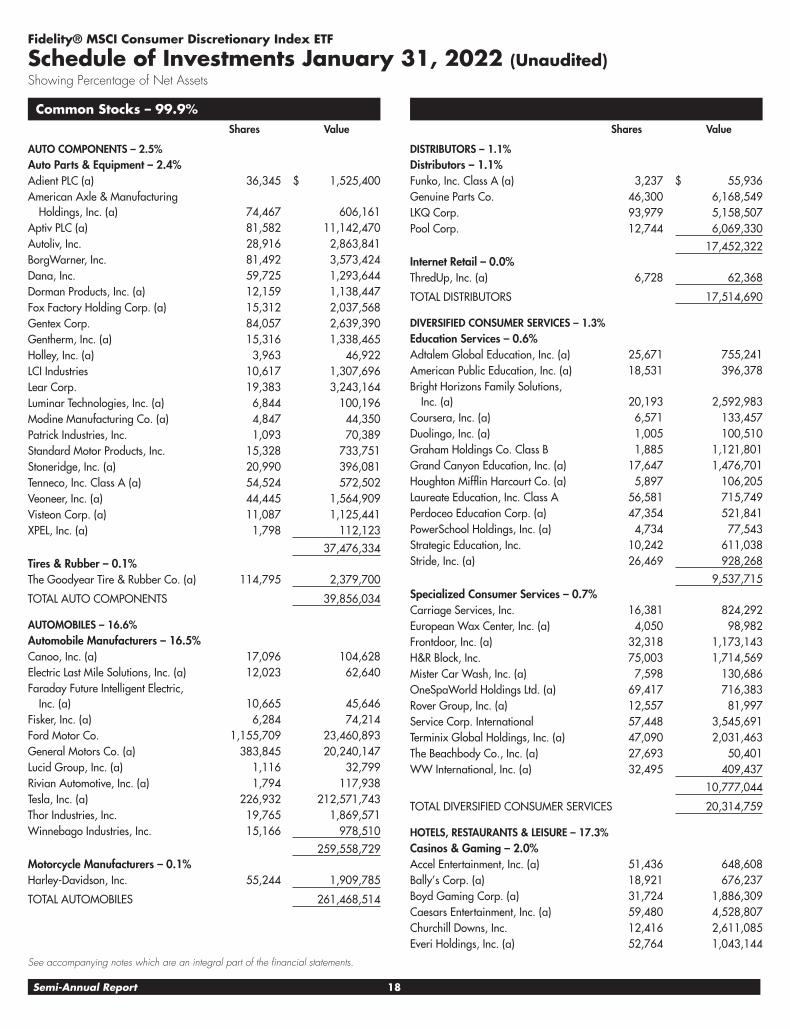
Common Stocks – 99.9%Shares Value
AUTO COMPONENTS – 2.5%Auto Parts & Equipment – 2.4%Adient PLC (a) 36,345 $ 1,525,400American Axle & Manufacturing
Holdings, Inc. (a) 74,467 606,161Aptiv PLC (a) 81,582 11,142,470Autoliv, Inc. 28,916 2,863,841BorgWarner, Inc. 81,492 3,573,424Dana, Inc. 59,725 1,293,644Dorman Products, Inc. (a) 12,159 1,138,447Fox Factory Holding Corp. (a) 15,312 2,037,568Gentex Corp. 84,057 2,639,390Gentherm, Inc. (a) 15,316 1,338,465Holley, Inc. (a) 3,963 46,922LCI Industries 10,617 1,307,696Lear Corp. 19,383 3,243,164Luminar Technologies, Inc. (a) 6,844 100,196Modine Manufacturing Co. (a) 4,847 44,350Patrick Industries, Inc. 1,093 70,389Standard Motor Products, Inc. 15,328 733,751Stoneridge, Inc. (a) 20,990 396,081Tenneco, Inc. Class A (a) 54,524 572,502Veoneer, Inc. (a) 44,445 1,564,909Visteon Corp. (a) 11,087 1,125,441XPEL, Inc. (a) 1,798 112,123
37,476,334Tires & Rubber – 0.1%The Goodyear Tire & Rubber Co. (a) 114,795 2,379,700
TOTAL AUTO COMPONENTS 39,856,034
AUTOMOBILES – 16.6%Automobile Manufacturers – 16.5%Canoo, Inc. (a) 17,096 104,628Electric Last Mile Solutions, Inc. (a) 12,023 62,640Faraday Future Intelligent Electric,
Inc. (a) 10,665 45,646Fisker, Inc. (a) 6,284 74,214Ford Motor Co. 1,155,709 23,460,893General Motors Co. (a) 383,845 20,240,147Lucid Group, Inc. (a) 1,116 32,799Rivian Automotive, Inc. (a) 1,794 117,938Tesla, Inc. (a) 226,932 212,571,743Thor Industries, Inc. 19,765 1,869,571Winnebago Industries, Inc. 15,166 978,510
259,558,729Motorcycle Manufacturers – 0.1%Harley-Davidson, Inc. 55,244 1,909,785
TOTAL AUTOMOBILES 261,468,514
Shares Value
DISTRIBUTORS – 1.1%Distributors – 1.1%Funko, Inc. Class A (a) 3,237 $ 55,936Genuine Parts Co. 46,300 6,168,549LKQ Corp. 93,979 5,158,507Pool Corp. 12,744 6,069,330
17,452,322Internet Retail – 0.0%ThredUp, Inc. (a) 6,728 62,368
TOTAL DISTRIBUTORS 17,514,690
DIVERSIFIED CONSUMER SERVICES – 1.3%Education Services – 0.6%Adtalem Global Education, Inc. (a) 25,671 755,241American Public Education, Inc. (a) 18,531 396,378Bright Horizons Family Solutions,
Inc. (a) 20,193 2,592,983Coursera, Inc. (a) 6,571 133,457Duolingo, Inc. (a) 1,005 100,510Graham Holdings Co. Class B 1,885 1,121,801Grand Canyon Education, Inc. (a) 17,647 1,476,701Houghton Mifflin Harcourt Co. (a) 5,897 106,205Laureate Education, Inc. Class A 56,581 715,749Perdoceo Education Corp. (a) 47,354 521,841PowerSchool Holdings, Inc. (a) 4,734 77,543Strategic Education, Inc. 10,242 611,038Stride, Inc. (a) 26,469 928,268
9,537,715Specialized Consumer Services – 0.7%Carriage Services, Inc. 16,381 824,292European Wax Center, Inc. (a) 4,050 98,982Frontdoor, Inc. (a) 32,318 1,173,143H&R Block, Inc. 75,003 1,714,569Mister Car Wash, Inc. (a) 7,598 130,686OneSpaWorld Holdings Ltd. (a) 69,417 716,383Rover Group, Inc. (a) 12,557 81,997Service Corp. International 57,448 3,545,691Terminix Global Holdings, Inc. (a) 47,090 2,031,463The Beachbody Co., Inc. (a) 27,693 50,401WW International, Inc. (a) 32,495 409,437
10,777,044
TOTAL DIVERSIFIED CONSUMER SERVICES 20,314,759
HOTELS, RESTAURANTS & LEISURE – 17.3%Casinos & Gaming – 2.0%Accel Entertainment, Inc. (a) 51,436 648,608Bally’s Corp. (a) 18,921 676,237Boyd Gaming Corp. (a) 31,724 1,886,309Caesars Entertainment, Inc. (a) 59,480 4,528,807Churchill Downs, Inc. 12,416 2,611,085Everi Holdings, Inc. (a) 52,764 1,043,144
Fidelity® MSCI Consumer Discretionary Index ETF
Schedule of Investments January 31, 2022 (Unaudited)Showing Percentage of Net Assets
See accompanying notes which are an integral part of the financial statements.
Semi-Annual Report 18

Common Stocks – continuedShares Value
HOTELS, RESTAURANTS & LEISURE – continuedCasinos & Gaming – continuedGolden Entertainment, Inc. (a) 1,358 $ 61,083Golden Nugget Online Gaming,
Inc. (a) 11,932 95,933Las Vegas Sands Corp. (a) 108,762 4,763,776MGM Resorts International 128,282 5,480,207Monarch Casino & Resort, Inc. (a) 10,436 645,988Penn National Gaming, Inc. (a) 55,280 2,521,321Red Rock Resorts, Inc. Class A 31,902 1,420,277Rush Street Interactive, Inc. (a) 8,955 90,804Scientific Games Corp. Class A (a) 25,610 1,477,697Wynn Resorts Ltd. (a) 33,829 2,890,688
30,841,964Hotels, Resorts & Cruise Lines – 5.7%Airbnb, Inc. Class A (a) 12,499 1,924,471Booking Holdings, Inc. (a) 11,986 29,439,174Carnival Corp. (a) 224,109 4,439,599Choice Hotels International, Inc. 14,323 2,053,918Expedia Group, Inc. (a) 42,954 7,873,039Hilton Grand Vacations, Inc. (a) 34,311 1,676,436Hilton Worldwide Holdings, Inc. (a) 84,979 12,331,303Hyatt Hotels Corp. Class A (a) 1,323 121,200Lindblad Expeditions Holdings,
Inc. (a) 29,630 499,858Marriott International, Inc.
Class A (a) 84,064 13,544,392Marriott Vacations Worldwide Corp. 14,720 2,390,234Membership Collective Group,
Inc. (a) 5,858 51,960Norwegian Cruise Line
Holdings Ltd. (a) 135,768 2,828,047Playa Hotels & Resorts N.V. (a) 91,307 696,672Royal Caribbean Cruises Ltd. (a) 71,720 5,580,533Travel + Leisure Co. 32,837 1,865,142Wyndham Hotels & Resorts, Inc. 33,745 2,832,893
90,148,871Leisure Facilities – 0.6%F45 Training Holdings, Inc. (a) 5,095 63,739Planet Fitness, Inc. Class A (a) 28,966 2,567,546SeaWorld Entertainment, Inc. (a) 23,440 1,396,555Six Flags Entertainment Corp. (a) 31,974 1,262,653Vail Resorts, Inc. 13,231 3,666,310
8,956,803Restaurants – 9.0%Aramark 78,273 2,683,981BJ’s Restaurants, Inc. (a) 14,809 445,603Bloomin’ Brands, Inc. (a) 37,585 764,103Brinker International, Inc. (a) 21,072 699,801Chipotle Mexican Grill, Inc. (a) 8,066 11,982,688Chuys Holdings, Inc. (a) 1,859 46,865
Shares Value
Cracker Barrel Old Country Store,Inc. 9,276 $ 1,105,143
Darden Restaurants, Inc. 41,677 5,829,362Dave & Buster’s Entertainment,
Inc. (a) 22,576 807,995Denny’s Corp. (a) 43,205 669,677Dine Brands Global, Inc. 9,718 659,366Domino’s Pizza, Inc. 12,204 5,548,548El Pollo Loco Holdings, Inc. (a) 22,496 300,097Jack in the Box, Inc. 10,095 919,150Krispy Kreme, Inc. 3,839 57,547McDonald’s Corp. 214,241 55,584,827Papa John’s International, Inc. 12,667 1,563,741Ruth’s Hospitality Group, Inc. (a) 27,936 559,558Shake Shack, Inc. Class A (a) 15,197 1,004,066Starbucks Corp. 340,847 33,512,077Texas Roadhouse, Inc. 24,212 2,067,463The Cheesecake Factory, Inc. (a) 20,588 734,580The Wendy’s Co. 73,968 1,703,483Wingstop, Inc. 11,191 1,715,021Yum! Brands, Inc. 90,016 11,267,303
142,232,045
TOTAL HOTELS, RESTAURANTS & LEISURE 272,179,683
HOUSEHOLD DURABLES – 4.8%Consumer Electronics – 0.5%Garmin Ltd. 45,488 5,659,617GoPro, Inc. Class A (a) 74,291 658,218Snap One Holdings Corp. (a) 2,323 43,696Sonos, Inc. (a) 38,712 976,317Universal Electronics, Inc. (a) 11,091 393,619
7,731,467Home Furnishings – 0.6%Ethan Allen Interiors, Inc. 22,328 562,889La-Z-Boy, Inc. 23,269 854,205Leggett & Platt, Inc. 48,536 1,934,160Mohawk Industries, Inc. (a) 19,984 3,154,874Tempur Sealy International, Inc. 68,451 2,725,034The Lovesac Co. (a) 3,390 182,552
9,413,714Homebuilding – 3.0%Cavco Industries, Inc. (a) 4,305 1,159,939Century Communities, Inc. 15,373 1,012,312D.R. Horton, Inc. 104,719 9,343,029Dream Finders Homes, Inc. (a) 2,971 55,379Green Brick Partners, Inc. (a) 27,108 641,918Hovnanian Enterprises, Inc. (a) 644 62,391Installed Building Products, Inc. 10,290 1,140,029KB Home 33,437 1,412,713Lennar Corp. Class A 84,897 8,159,451LGI Homes, Inc. (a) 8,978 1,117,851
See accompanying notes which are an integral part of the financial statements.
19 Semi-Annual Report

Common Stocks – continuedShares Value
HOUSEHOLD DURABLES – continuedHomebuilding – continuedM.D.C. Holdings, Inc. 25,008 $ 1,267,656M/I Homes, Inc. (a) 15,988 847,204Meritage Homes Corp. (a) 15,613 1,592,994NVR, Inc. (a) 1,104 5,881,251PulteGroup, Inc. 87,284 4,598,994Skyline Champion Corp. (a) 24,415 1,644,106Taylor Morrison Home Corp. (a) 50,575 1,552,147Toll Brothers, Inc. 42,823 2,525,272TopBuild Corp. (a) 11,680 2,717,352Tri Pointe Homes, Inc. (a) 57,277 1,363,765
48,095,753Household Appliances – 0.5%Cricut, Inc. (a) 2,188 43,279Helen of Troy Ltd. (a) 9,260 1,938,396iRobot Corp. (a) 12,134 795,020Traeger, Inc. (a) 10,037 102,277Weber, Inc. 13,935 151,055Whirlpool Corp. 20,482 4,305,111
7,335,138Housewares & Specialties – 0.2%Newell Brands, Inc. 131,853 3,060,308Tupperware Brands Corp. (a) 4,681 72,181
3,132,489
TOTAL HOUSEHOLD DURABLES 75,708,561
INTERNET & DIRECT MARKETING RETAIL – 23.7%Internet & Direct Marketing Retail – 23.7%1-800-FLOWERS.com, Inc.
Class A (a) 20,324 346,118Amazon.com, Inc. (a) 110,398 330,252,305CarParts.com, Inc. (a) 8,435 77,602Chewy, Inc. Class A (a) 2,864 136,355ContextLogic, Inc. Class A (a) 36,927 97,857DoorDash, Inc. Class A (a) 1,089 123,591Duluth Holdings, Inc. Class B (a) 6,078 91,656eBay, Inc. 196,321 11,793,002Etsy, Inc. (a) 37,765 5,932,126Groupon, Inc. (a) 17,293 528,128Lands’ End, Inc. (a) 15,079 276,398MercadoLibre, Inc. (a) 13,279 15,032,625Overstock.com, Inc. (a) 15,834 759,082PetMed Express, Inc. 16,588 428,468Porch Group, Inc. (a) 9,397 99,138Quotient Technology, Inc. (a) 51,549 366,513Qurate Retail, Inc. Class A 145,394 1,022,120Revolve Group, Inc. (a) 16,896 833,311Shutterstock, Inc. 10,446 1,012,949Stitch Fix, Inc. Class A (a) 23,543 386,812The Original BARK Co. (a) 28,808 108,606
Shares Value
The RealReal, Inc. (a) 24,763 $ 234,010Wayfair, Inc. Class A (a) 21,247 3,312,832
373,251,604Internet Retail – 0.0%Xometry, Inc. (a) 1,477 76,213
TOTAL INTERNET & DIRECT MARKETING RETAIL 373,327,817
INTERNET SOFTWARE & SERVICES – 0.0%Internet Software & Services – 0.0%Liquidity Services, Inc. (a) 1,992 37,908
LEISURE PRODUCTS – 1.2%Leisure Products – 1.2%Acushnet Holdings Corp. 19,805 924,893AMMO, Inc. (a) 13,503 62,654Brunswick Corp. 27,631 2,508,618Callaway Golf Co. (a) 46,110 1,100,185Clarus Corp. 1,689 38,053Hasbro, Inc. 42,907 3,968,039Hayward Holdings, Inc. (a) 1,931 38,021Johnson Outdoors, Inc. Class A 4,740 427,643Latham Group, Inc. (a) 2,398 39,999Malibu Boats, Inc. Class A (a) 11,874 779,647Mattel, Inc. (a) 124,978 2,614,540Polaris, Inc. 20,566 2,315,526Smith & Wesson Brands, Inc. 38,434 656,453Sturm Ruger & Co., Inc. 10,947 735,967Vinco Ventures, Inc. (a) 22,197 73,028Vista Outdoor, Inc. (a) 28,404 1,095,826YETI Holdings, Inc. (a) 29,520 1,935,922
TOTAL LEISURE PRODUCTS 19,315,014
MEDIA – 0.0%Broadcasting – 0.0%Media General, Inc. (a)(b) 7,026 0
MULTILINE RETAIL – 4.2%Department Stores – 0.6%Dillard’s, Inc. Class A 4,383 1,112,055Kohl’s Corp. 54,787 3,271,332Macy’s, Inc. 114,356 2,927,514Nordstrom, Inc. (a) 43,705 983,362
8,294,263General Merchandise Stores – 3.6%Big Lots, Inc. 17,653 739,837Dollar General Corp. 70,153 14,625,498Dollar Tree, Inc. (a) 70,687 9,275,548Franchise Group, Inc. 2,462 123,272Ollie’s Bargain Outlet Holdings,
Inc. (a) 22,219 1,065,179
Fidelity® MSCI Consumer Discretionary Index ETFSchedule of Investments (Unaudited) – continued
See accompanying notes which are an integral part of the financial statements.
Semi-Annual Report 20

Common Stocks – continuedShares Value
MULTILINE RETAIL – continuedGeneral Merchandise Stores – continuedTarget Corp. 141,377 $ 31,163,732
56,993,066
TOTAL MULTILINE RETAIL 65,287,329
SPECIALTY RETAIL – 20.5%Apparel Retail – 3.5%Abercrombie & Fitch Co.
Class A (a) 29,954 1,168,206American Eagle Outfitters, Inc. 59,317 1,354,207Boot Barn Holdings, Inc. (a) 15,091 1,387,919Burlington Stores, Inc. (a) 20,819 4,932,646Caleres, Inc. 2,068 49,591Citi Trends, Inc. (a) 556 27,088Designer Brands, Inc. Class A (a) 44,423 585,051Foot Locker, Inc. 36,242 1,619,293Genesco, Inc. (a) 13,049 839,442Guess?, Inc. 27,212 626,420Ross Stores, Inc. 107,167 10,475,574Shoe Carnival, Inc. 19,992 682,927The Buckle, Inc. 19,108 719,225The Children’s Place, Inc. (a) 9,789 692,572The Gap, Inc. 80,802 1,460,092The TJX Cos., Inc. 352,213 25,348,770Urban Outfitters, Inc. (a) 31,144 894,456Victoria’s Secret & Co. (a) 28,780 1,606,787Zumiez, Inc. (a) 14,651 658,562
55,128,828Automotive Retail – 3.5%Advance Auto Parts, Inc. 21,603 5,001,311America’s Car-Mart, Inc. (a) 4,775 453,243Arko Corp. (a) 8,759 71,999Asbury Automotive Group, Inc. (a) 8,780 1,413,317AutoNation, Inc. (a) 20,138 2,195,042AutoZone, Inc. (a) 6,567 13,044,360Camping World Holdings, Inc.
Class A 21,884 726,549CarMax, Inc. (a) 51,610 5,737,484Carvana Co. (a) 20,486 3,319,961Group 1 Automotive, Inc. 7,762 1,318,065Lithia Motors, Inc. 9,862 2,880,986Monro, Inc. 16,067 799,012Murphy USA, Inc. 11,047 2,172,503O’Reilly Automotive, Inc. (a) 20,952 13,655,466Penske Automotive Group, Inc. 14,623 1,486,135Sonic Automotive, Inc. Class A 15,608 796,164TravelCenters of America, Inc. (a) 927 42,253
55,113,850Computer & Electronics Retail – 0.6%Best Buy Co., Inc. 70,129 6,962,407
Shares Value
GameStop Corp. Class A (a) 19,516 $ 2,125,878Rent-A-Center, Inc. 22,118 932,274
10,020,559Home Improvement Retail – 10.2%Floor & Decor Holdings, Inc.
Class A (a) 28,981 3,150,814GrowGeneration Corp. (a) 11,987 101,170Lowe’s Cos., Inc. 199,017 47,236,685Lumber Liquidators Holdings,
Inc. (a) 3,603 52,027The Home Depot, Inc. 299,669 109,972,530
160,513,226Homefurnishing Retail – 0.6%Bed Bath & Beyond, Inc. (a) 51,637 838,585Haverty Furniture Companies, Inc. 15,799 466,386RH (a) 5,572 2,244,513Sleep Number Corp. (a) 11,671 834,476The Aaron’s Co., Inc. 13,515 286,113Williams-Sonoma, Inc. 25,455 4,086,546
8,756,619Specialty Stores – 2.1%Academy Sports & Outdoors,
Inc. (a) 2,156 83,868Bath & Body Works, Inc. 85,019 4,767,015Dick’s Sporting Goods, Inc. 24,354 2,810,452Five Below, Inc. (a) 18,628 3,054,992Hibbett, Inc. 11,069 682,404Leslie’s, Inc. (a) 4,199 87,465MarineMax, Inc. (a) 15,398 724,630National Vision Holdings, Inc. (a) 34,167 1,396,747Party City Holdings, Inc. (a) 7,691 36,378Petco Health & Wellness Co.,
Inc. (a) 2,181 40,894Sally Beauty Holdings, Inc. (a) 55,771 957,588Signet Jewelers Ltd. 23,236 2,001,317Sportsman’s Warehouse Holdings,
Inc. (a) 5,004 54,844The Container Store Group, Inc. (a) 4,205 42,891The ODP Corp. (a) 24,658 1,090,623Tractor Supply Co. 36,126 7,886,667Ulta Beauty, Inc. (a) 16,573 6,028,263Winmark Corp. 3,032 653,154
32,400,192
TOTAL SPECIALTY RETAIL 321,933,274
TEXTILES, APPAREL & LUXURY GOODS – 6.7%Apparel, Accessories & Luxury Goods – 2.6%Capri Holdings Ltd. (a) 52,164 3,133,491Carter’s, Inc. 17,101 1,592,445Columbia Sportswear Co. 12,780 1,186,879G-III Apparel Group Ltd. (a) 26,501 720,032
See accompanying notes which are an integral part of the financial statements.
21 Semi-Annual Report

Common Stocks – continuedShares Value
TEXTILES, APPAREL & LUXURY GOODS – continuedApparel, Accessories & Luxury Goods – continuedHanesbrands, Inc. 125,100 $ 2,014,110Kontoor Brands, Inc. 21,585 1,063,925Levi Strauss & Co. Class A 33,697 738,975Lululemon Athletica, Inc. (a) 35,848 11,964,629Movado Group, Inc. 1,731 64,168Oxford Industries, Inc. 10,078 830,326PVH Corp. 25,236 2,397,672Ralph Lauren Corp. 17,951 1,989,689Tapestry, Inc. 92,521 3,511,172Under Armour, Inc. Class A (a) 73,555 1,385,041Under Armour, Inc. Class C (a) 83,133 1,329,297VF Corp. 102,756 6,700,719
40,622,570Footwear – 4.1%Crocs, Inc. (a) 23,233 2,384,170Deckers Outdoor Corp. (a) 9,597 3,073,247NIKE, Inc. Class B 365,738 54,154,826Skechers U.S.A., Inc. Class A (a) 50,163 2,106,846Steven Madden Ltd. 34,437 1,416,738Wolverine World Wide, Inc. 35,510 940,660
64,076,487
TOTAL TEXTILES, APPAREL & LUXURY GOODS 104,699,057
TOTAL COMMON STOCKS(Cost $1,316,246,341) 1,571,642,640
Money Market Fund – 0.1%Shares Value
State Street Institutional TreasuryPlus Money Market Fund, TrustClass, 0.01% (c)(Cost $1,810,000) 1,810,000 $ 1,810,000
TOTAL INVESTMENT IN SECURITIES – 100.0%(Cost $1,318,056,341) 1,573,452,640
NET OTHER ASSETS (LIABILITIES) – 0.0% 661,265
NET ASSETS – 100.0% $1,574,113,905
Legend(a) Non-income producing.
(b) Level 3 security.
(c) The rate quoted is the annualized seven-day yield of the fund at periodend.
Futures Contracts
Number ofcontracts
ExpirationDate
NotionalAmount Value
UnrealizedAppreciation/(Depreciation)
Purchased
Equity Index ContractsCME E-mini Russell 2000 Index Contracts (United States) 4 March 2022 $ 404,880 $ (22,414) $ (22,414)CME E-mini S&P Consumer Discretionary Select Sector Index Contracts(United States) 10 March 2022 1,866,400 (114,692) (114,692)
Total Equity Index Contracts $ (137,106)
The notional amount of futures purchased as a percentage of Net Assets is 0.1%
Fidelity® MSCI Consumer Discretionary Index ETFSchedule of Investments (Unaudited) – continued
See accompanying notes which are an integral part of the financial statements.
Semi-Annual Report 22

Investment ValuationThe following is a summary of the inputs used, as of January 31, 2022, involving the Fund’s assets and liabilities carried at fair value. The inputs or methodologyused for valuing securities may not be an indication of the risk associated with investing in those securities. For more information on valuation inputs, and theiraggregation into the levels used in the table below, please refer to the Investment Valuation section in the accompanying Notes to Financial Statements.
Valuation Inputs at Reporting Date:
Description Total Level 1 Level 2 Level 3Investments in Securities:
Common Stocks $ 1,571,642,640 $ 1,571,642,640 $ — $ —Money Market Funds 1,810,000 1,810,000 — —
Total Investments in Securities: $ 1,573,452,640 $ 1,573,452,640 $ — $ —
Derivative Instruments:
LiabilitiesFutures Contracts $ (137,106) $ (137,106) $ — $ —
Total Liabilities $ (137,106) $ (137,106) $ — $ —
Total Derivative Instruments: $ (137,106) $ (137,106) $ — $ —
Value of Derivative InstrumentsThe following table is a summary of the Fund’s value of derivative instruments by primary risk exposure as of January 31, 2022. For additional information onderivative instruments, please refer to the Derivative Instruments section in the accompanying Notes to Financial Statements.
Primary Risk/ Derivative Type ValueAsset Liabilities
Equity RiskFutures Contracts(a) $0 $(137,106)
Total Equity Risk 0 (137,106)
Total Value of Derivatives $0 $(137,106)
(a) Reflects gross cumulative appreciation (depreciation) on futures contracts as presented in the Schedule of Investments. In the Statement of Assets and Liabilities,the period end daily variation margin is included in receivable or payable for daily variation margin on futures contracts, and the net cumulative appreciation(depreciation) is included in total accumulated earnings (loss).
See accompanying notes which are an integral part of the financial statements.
23 Semi-Annual Report
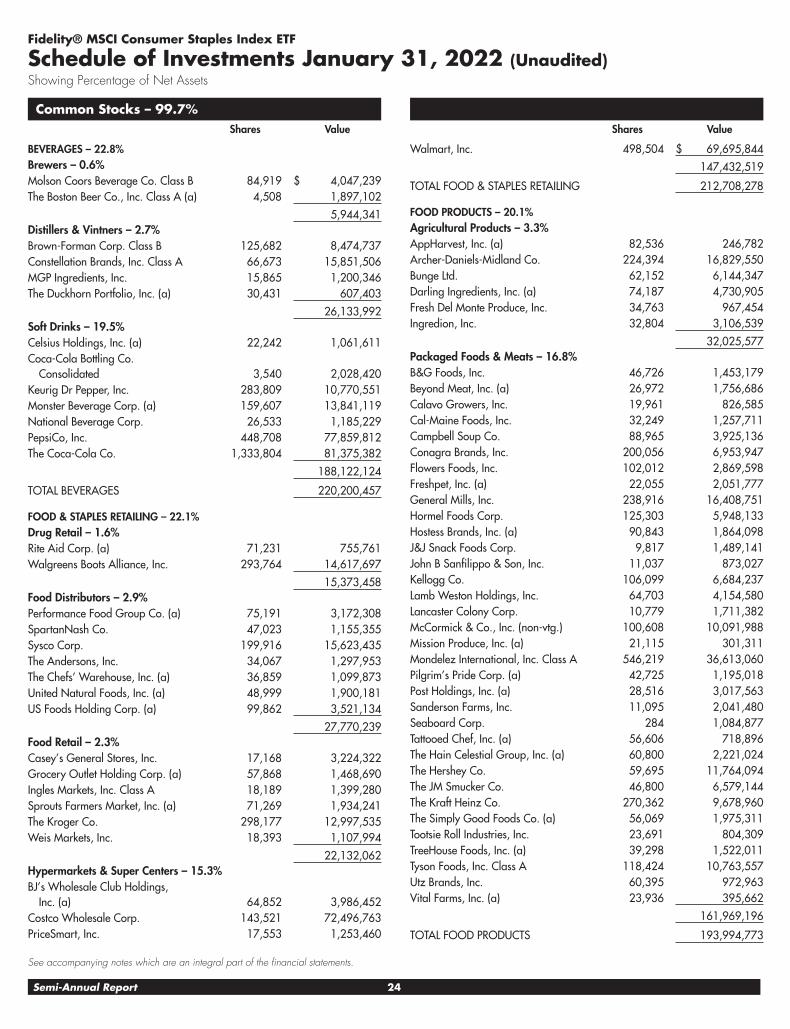
Common Stocks – 99.7%Shares Value
BEVERAGES – 22.8%Brewers – 0.6%Molson Coors Beverage Co. Class B 84,919 $ 4,047,239The Boston Beer Co., Inc. Class A (a) 4,508 1,897,102
5,944,341Distillers & Vintners – 2.7%Brown-Forman Corp. Class B 125,682 8,474,737Constellation Brands, Inc. Class A 66,673 15,851,506MGP Ingredients, Inc. 15,865 1,200,346The Duckhorn Portfolio, Inc. (a) 30,431 607,403
26,133,992Soft Drinks – 19.5%Celsius Holdings, Inc. (a) 22,242 1,061,611Coca-Cola Bottling Co.
Consolidated 3,540 2,028,420Keurig Dr Pepper, Inc. 283,809 10,770,551Monster Beverage Corp. (a) 159,607 13,841,119National Beverage Corp. 26,533 1,185,229PepsiCo, Inc. 448,708 77,859,812The Coca-Cola Co. 1,333,804 81,375,382
188,122,124
TOTAL BEVERAGES 220,200,457
FOOD & STAPLES RETAILING – 22.1%Drug Retail – 1.6%Rite Aid Corp. (a) 71,231 755,761Walgreens Boots Alliance, Inc. 293,764 14,617,697
15,373,458Food Distributors – 2.9%Performance Food Group Co. (a) 75,191 3,172,308SpartanNash Co. 47,023 1,155,355Sysco Corp. 199,916 15,623,435The Andersons, Inc. 34,067 1,297,953The Chefs’ Warehouse, Inc. (a) 36,859 1,099,873United Natural Foods, Inc. (a) 48,999 1,900,181US Foods Holding Corp. (a) 99,862 3,521,134
27,770,239Food Retail – 2.3%Casey’s General Stores, Inc. 17,168 3,224,322Grocery Outlet Holding Corp. (a) 57,868 1,468,690Ingles Markets, Inc. Class A 18,189 1,399,280Sprouts Farmers Market, Inc. (a) 71,269 1,934,241The Kroger Co. 298,177 12,997,535Weis Markets, Inc. 18,393 1,107,994
22,132,062Hypermarkets & Super Centers – 15.3%BJ’s Wholesale Club Holdings,
Inc. (a) 64,852 3,986,452Costco Wholesale Corp. 143,521 72,496,763PriceSmart, Inc. 17,553 1,253,460
Shares Value
Walmart, Inc. 498,504 $ 69,695,844
147,432,519
TOTAL FOOD & STAPLES RETAILING 212,708,278
FOOD PRODUCTS – 20.1%Agricultural Products – 3.3%AppHarvest, Inc. (a) 82,536 246,782Archer-Daniels-Midland Co. 224,394 16,829,550Bunge Ltd. 62,152 6,144,347Darling Ingredients, Inc. (a) 74,187 4,730,905Fresh Del Monte Produce, Inc. 34,763 967,454Ingredion, Inc. 32,804 3,106,539
32,025,577Packaged Foods & Meats – 16.8%B&G Foods, Inc. 46,726 1,453,179Beyond Meat, Inc. (a) 26,972 1,756,686Calavo Growers, Inc. 19,961 826,585Cal-Maine Foods, Inc. 32,249 1,257,711Campbell Soup Co. 88,965 3,925,136Conagra Brands, Inc. 200,056 6,953,947Flowers Foods, Inc. 102,012 2,869,598Freshpet, Inc. (a) 22,055 2,051,777General Mills, Inc. 238,916 16,408,751Hormel Foods Corp. 125,303 5,948,133Hostess Brands, Inc. (a) 90,843 1,864,098J&J Snack Foods Corp. 9,817 1,489,141John B Sanfilippo & Son, Inc. 11,037 873,027Kellogg Co. 106,099 6,684,237Lamb Weston Holdings, Inc. 64,703 4,154,580Lancaster Colony Corp. 10,779 1,711,382McCormick & Co., Inc. (non-vtg.) 100,608 10,091,988Mission Produce, Inc. (a) 21,115 301,311Mondelez International, Inc. Class A 546,219 36,613,060Pilgrim’s Pride Corp. (a) 42,725 1,195,018Post Holdings, Inc. (a) 28,516 3,017,563Sanderson Farms, Inc. 11,095 2,041,480Seaboard Corp. 284 1,084,877Tattooed Chef, Inc. (a) 56,606 718,896The Hain Celestial Group, Inc. (a) 60,800 2,221,024The Hershey Co. 59,695 11,764,094The JM Smucker Co. 46,800 6,579,144The Kraft Heinz Co. 270,362 9,678,960The Simply Good Foods Co. (a) 56,069 1,975,311Tootsie Roll Industries, Inc. 23,691 804,309TreeHouse Foods, Inc. (a) 39,298 1,522,011Tyson Foods, Inc. Class A 118,424 10,763,557Utz Brands, Inc. 60,395 972,963Vital Farms, Inc. (a) 23,936 395,662
161,969,196
TOTAL FOOD PRODUCTS 193,994,773
Fidelity® MSCI Consumer Staples Index ETF
Schedule of Investments January 31, 2022 (Unaudited)Showing Percentage of Net Assets
See accompanying notes which are an integral part of the financial statements.
Semi-Annual Report 24

Common Stocks – continuedShares Value
HOUSEHOLD PRODUCTS – 21.4%Household Products – 21.4%Central Garden and Pet Co. (a) 14,352 $ 665,789Central Garden and Pet Co.
Class A (a) 31,720 1,374,428Church & Dwight Co., Inc. 103,281 10,601,795Colgate-Palmolive Co. 314,641 25,942,150Energizer Holdings, Inc. 40,017 1,505,039Kimberly-Clark Corp. 134,507 18,514,889Reynolds Consumer Products, Inc. 46,348 1,402,954Spectrum Brands Holdings, Inc. 25,924 2,317,087The Clorox Co. 51,767 8,689,609The Procter & Gamble Co. 833,503 133,735,556WD-40 Co. 8,694 1,932,328
TOTAL HOUSEHOLD PRODUCTS 206,681,624
PERSONAL PRODUCTS – 4.4%Personal Products – 4.4%BellRing Brands, Inc. Class A (a) 35,695 869,530Coty, Inc. Class A (a) 188,274 1,596,564Edgewell Personal Care Co. 34,500 1,580,100elf Beauty, Inc. (a) 40,383 1,193,722Herbalife Nutrition Ltd. (a) 56,160 2,387,362Inter Parfums, Inc. 15,732 1,556,996Medifast, Inc. 7,437 1,477,806Nu Skin Enterprises, Inc. Class A 31,791 1,532,008The Beauty Health Co. (a) 46,591 661,592The Estee Lauder Cos., Inc. Class A 88,658 27,642,678The Honest Co., Inc. (a) 40,670 263,948USANA Health Sciences, Inc. (a) 11,561 1,105,000Veru, Inc. (a) 95,397 496,065
TOTAL PERSONAL PRODUCTS 42,363,371
Shares Value
TOBACCO – 8.9%Tobacco – 8.9%Altria Group, Inc. 705,122 $ 35,876,608Philip Morris International, Inc. 455,712 46,869,979Turning Point Brands, Inc. 21,339 751,773Universal Corp. 22,933 1,248,243Vector Group Ltd. 95,408 1,059,983
TOTAL TOBACCO 85,806,586
TOTAL COMMON STOCKS(Cost $817,375,313) 961,755,089
Money Market Fund – 0.2%
State Street Institutional TreasuryPlus Money Market Fund, TrustClass, 0.01% (b)(Cost $1,650,000) 1,650,000 1,650,000
TOTAL INVESTMENT IN SECURITIES – 99.9%(Cost $819,025,313) 963,405,089
NET OTHER ASSETS (LIABILITIES) – 0.1% 1,262,459
NET ASSETS – 100.0% $ 964,667,548
Legend(a) Non-income producing.
(b) The rate quoted is the annualized seven-day yield of the fund at periodend.
Futures Contracts
Number ofcontracts
ExpirationDate
NotionalAmount Value
UnrealizedAppreciation/(Depreciation)
Purchased
Equity Index ContractsCME E-mini Russell 2000 Index Contracts (United States) 1 March 2022 $ 101,220 $ (3,412) $ (3,412)CME E-mini S&P Consumer Staples Select Sector Index Contracts (United States) 35 March 2022 2,673,300 (1,305) (1,305)
Total Equity Index Contracts $ (4,717)
The notional amount of futures purchased as a percentage of Net Assets is 0.3%
See accompanying notes which are an integral part of the financial statements.
25 Semi-Annual Report

Investment ValuationThe following is a summary of the inputs used, as of January 31, 2022, involving the Fund’s assets and liabilities carried at fair value. The inputs or methodologyused for valuing securities may not be an indication of the risk associated with investing in those securities. For more information on valuation inputs, and theiraggregation into the levels used in the table below, please refer to the Investment Valuation section in the accompanying Notes to Financial Statements.
Valuation Inputs at Reporting Date:
Description Total Level 1 Level 2 Level 3Investments in Securities:
Common Stocks $ 961,755,089 $ 961,755,089 $ — $ —Money Market Funds 1,650,000 1,650,000 — —
Total Investments in Securities: $ 963,405,089 $ 963,405,089 $ — $ —
Derivative Instruments:
LiabilitiesFutures Contracts $ (4,717) $ (4,717) $ — $ —
Total Liabilities $ (4,717) $ (4,717) $ — $ —
Total Derivative Instruments: $ (4,717) $ (4,717) $ — $ —
Value of Derivative InstrumentsThe following table is a summary of the Fund’s value of derivative instruments by primary risk exposure as of January 31, 2022. For additional information onderivative instruments, please refer to the Derivative Instruments section in the accompanying Notes to Financial Statements.
Primary Risk/ Derivative Type ValueAsset Liabilities
Equity RiskFutures Contracts(a) $0 $(4,717)
Total Equity Risk 0 (4,717)
Total Value of Derivatives $0 $(4,717)
(a) Reflects gross cumulative appreciation (depreciation) on futures contracts as presented in the Schedule of Investments. In the Statement of Assets and Liabilities,the period end daily variation margin is included in receivable or payable for daily variation margin on futures contracts, and the net cumulative appreciation(depreciation) is included in total accumulated earnings (loss).
Fidelity® MSCI Consumer Staples Index ETFSchedule of Investments (Unaudited) – continued
See accompanying notes which are an integral part of the financial statements.
Semi-Annual Report 26

Common Stocks – 99.7%Shares Value
ENERGY EQUIPMENT & SERVICES – 9.6%Oil & Gas Drilling – 0.7%Helmerich & Payne, Inc. 87,885 $ 2,522,299Nabors Industries Ltd. (a) 6,045 625,718Noble Corp. (a) 36,839 909,555Patterson-UTI Energy, Inc. 152,877 1,522,655Transocean Ltd. (a) 502,513 1,582,916Valaris Ltd. (a) 21,440 889,546
8,052,689Oil & Gas Equipment & Services – 8.9%Archrock, Inc. 102,110 861,808Aspen Aerogels, Inc. (a) 22,081 655,806Baker Hughes Co. 674,304 18,502,902Bristow Group, Inc. (a) 6,089 200,024Cactus, Inc. Class A 47,613 2,307,326ChampionX Corp. (a) 165,418 3,705,363Core Laboratories N.V. 37,810 1,008,393DMC Global, Inc. (a) 15,651 631,361Dril-Quip, Inc. (a) 27,600 698,004Expro Group Holdings N.V. (a) 21,757 340,715Halliburton Co. 724,288 22,264,613Helix Energy Solutions Group,
Inc. (a) 120,154 424,143Liberty Oilfield Services, Inc.
Class A (a) 79,692 964,273NexTier Oilfield Solitions, Inc. (a) 134,949 812,393NOV, Inc. 315,123 5,174,320Oceaneering International, Inc. (a) 82,414 1,073,854ProPetro Holding Corp. (a) 64,490 677,790RPC, Inc. (a) 55,332 327,012Schlumberger N.V. 1,138,898 44,496,745Select Energy Services, Inc.
Class A (a) 54,222 361,661TechnipFMC PLC (a) 345,669 2,243,392US Silica Holdings, Inc. (a) 62,091 592,969Weatherford International PLC (a) 56,556 1,696,680
110,021,547
TOTAL ENERGY EQUIPMENT & SERVICES 118,074,236
OIL, GAS & CONSUMABLE FUELS – 90.1%Coal & Consumable Fuels – 0.3%Arch Resources, Inc. 12,655 1,197,669Centrus Energy Corp. (a) 8,377 363,981CONSOL Energy, Inc. (a) 27,198 591,285Peabody Energy Corp. (a) 70,959 766,357Uranium Energy Corp. (a) 192,922 503,526
3,422,818Integrated Oil & Gas – 40.5%Chevron Corp. 1,577,019 207,109,905Exxon Mobil Corp. 3,452,369 262,241,949
Shares Value
Occidental Petroleum Corp. 761,228 $ 28,675,459
498,027,313Oil & Gas Exploration & Production – 30.2%Antero Resources Corp. (a) 230,548 4,502,603APA Corp. 307,717 10,219,282Berry Corp. 47,211 410,264Brigham Minerals, Inc. Class A 37,581 813,253Cabot Oil & Gas Corp. 628,992 13,774,925California Resources Corp. 33,668 1,434,930Callon Petroleum Co. (a) 38,066 1,881,983Centennial Resource Development,
Inc. Class A (a) 149,935 1,170,992Chesapeake Energy Corp. 61,954 4,223,404Civitas Resources, Inc. 41,506 2,262,077CNX Resources Corp. (a) 177,007 2,625,014Comstock Resources, Inc. (a) 67,737 526,994ConocoPhillips 1,091,966 96,770,027Crescent Energy, Inc. (a) 18,715 248,348Denbury, Inc. (a) 41,138 3,091,109Devon Energy Corp. 524,997 26,549,098Diamondback Energy, Inc. 140,460 17,720,434EOG Resources, Inc. 475,714 53,032,597EQT Corp. (a) 261,408 5,554,920Gulfport Energy Corp. (a) 10,204 667,852Hess Corp. 227,119 20,960,813Kosmos Energy Ltd. (a) 331,925 1,437,235Laredo Petroleum, Inc. (a) 11,137 747,961Magnolia Oil & Gas Corp. Class A 115,355 2,495,129Marathon Oil Corp. 641,941 12,498,591Matador Resources Co. 95,705 4,284,713Murphy Oil Corp. 126,420 3,994,872Northern Oil and Gas, Inc. 49,919 1,174,095Oasis Petroleum, Inc. 16,573 2,244,481Ovintiv, Inc. 213,408 8,280,230PDC Energy, Inc. 80,977 4,799,507Pioneer Natural Resources Co. 189,052 41,381,592Range Resources Corp. (a) 201,519 3,879,241SM Energy Co. 94,358 3,095,886Southwestern Energy Co. (a) 554,751 2,440,904Talos Energy, Inc. (a) 22,833 242,943Tellurian, Inc. (a) 310,528 779,425Texas Pacific Land Corp. 5,070 5,450,250Viper Energy Partners LP 47,736 1,290,781Whiting Petroleum Corp. (a) 31,836 2,363,823
371,322,578Oil & Gas Refining & Marketing – 8.8%Alto Ingredients, Inc. (a) 58,515 303,108Clean Energy Fuels Corp. (a) 135,469 822,297CVR Energy, Inc. 25,274 493,601Delek US Holdings, Inc. (a) 55,088 854,966Gevo, Inc. (a) 162,798 556,769
Fidelity® MSCI Energy Index ETF
Schedule of Investments January 31, 2022 (Unaudited)Showing Percentage of Net Assets
See accompanying notes which are an integral part of the financial statements.
27 Semi-Annual Report

Common Stocks – continuedShares Value
OIL, GAS & CONSUMABLE FUELS – continuedOil & Gas Refining & Marketing – continuedGreen Plains, Inc. (a) 37,085 $ 1,132,576HollyFrontier Corp. 125,469 4,411,490Marathon Petroleum Corp. 520,920 37,376,010Par Pacific Holdings, Inc. (a) 36,973 521,319PBF Energy, Inc. Class A (a) 79,366 1,257,157Phillips 66 357,026 30,272,235Renewable Energy Group, Inc. (a) 41,227 1,659,799REX American Resources Corp. (a) 4,499 433,839Valero Energy Corp. 333,342 27,657,386World Fuel Services Corp. 51,607 1,455,833
109,208,385Oil & Gas Storage & Transportation – 10.3%Antero Midstream Corp. 254,608 2,533,350Cheniere Energy, Inc. 197,537 22,104,390Dorian LPG Ltd. 26,557 315,763DTE Midstream LLC (a) 79,199 4,094,588EnLink Midstream LLC 220,850 1,757,966Equitrans Midstream Corp. 334,458 2,712,454Hess Midstream LP 26,818 787,376International Seaways, Inc. 31,945 466,078Kinder Morgan, Inc. 1,661,422 28,842,286ONEOK, Inc. 364,099 22,093,527Plains GP Holdings LP Class A 151,525 1,747,083
Shares Value
Targa Resources Corp. 168,556 $ 9,958,289The Williams Cos., Inc. 992,498 29,715,390
127,128,540
TOTAL OIL, GAS & CONSUMABLE FUELS 1,109,109,634
TOTAL COMMON STOCKS(Cost $960,170,092) 1,227,183,870
Money Market Fund – 0.2%
State Street Institutional TreasuryPlus Money Market Fund, TrustClass, 0.01% (b)(Cost $1,920,000) 1,920,000 1,920,000
TOTAL INVESTMENT IN SECURITIES – 99.9%(Cost $962,090,092) 1,229,103,870
NET OTHER ASSETS (LIABILITIES) – 0.1% 1,161,701
NET ASSETS – 100.0% $1,230,265,571
Legend(a) Non-income producing.
(b) The rate quoted is the annualized seven-day yield of the fund at periodend.
Futures Contracts
Number ofcontracts
ExpirationDate
NotionalAmount Value
UnrealizedAppreciation/(Depreciation)
Purchased
Equity Index ContractCME E-mini S&P Energy Select Sector Index Contracts (United States) 42 March 2022 $2,883,300 $253,753 $253,753
The notional amount of futures purchased as a percentage of Net Assets is 0.2%
Fidelity® MSCI Energy Index ETFSchedule of Investments (Unaudited) – continued
See accompanying notes which are an integral part of the financial statements.
Semi-Annual Report 28

Investment ValuationThe following is a summary of the inputs used, as of January 31, 2022, involving the Fund’s assets and liabilities carried at fair value. The inputs or methodologyused for valuing securities may not be an indication of the risk associated with investing in those securities. For more information on valuation inputs, and theiraggregation into the levels used in the table below, please refer to the Investment Valuation section in the accompanying Notes to Financial Statements.
Valuation Inputs at Reporting Date:
Description Total Level 1 Level 2 Level 3Investments in Securities:
Common Stocks $ 1,227,183,870 $ 1,227,183,870 $ — $ —Money Market Funds 1,920,000 1,920,000 — —
Total Investments in Securities: $ 1,229,103,870 $ 1,229,103,870 $ — $ —
Derivative Instruments:
AssetsFutures Contracts $ 253,753 $ 253,753 $ — $ —
Total Assets $ 253,753 $ 253,753 $ — $ —
Total Derivative Instruments: $ 253,753 $ 253,753 $ — $ —
Value of Derivative InstrumentsThe following table is a summary of the Fund’s value of derivative instruments by primary risk exposure as of January 31, 2022. For additional information onderivative instruments, please refer to the Derivative Instruments section in the accompanying Notes to Financial Statements.
Primary Risk/ Derivative Type ValueAsset Liabilities
Equity RiskFutures Contracts(a) $253,753 $0
Total Equity Risk 253,753 0
Total Value of Derivatives $253,753 $0
(a) Reflects gross cumulative appreciation (depreciation) on futures contracts as presented in the Schedule of Investments. In the Statement of Assets and Liabilities,the period end daily variation margin is included in receivable or payable for daily variation margin on futures contracts, and the net cumulative appreciation(depreciation) is included in total accumulated earnings (loss).
See accompanying notes which are an integral part of the financial statements.
29 Semi-Annual Report

Common Stocks – 99.7%Shares Value
BANKS – 38.1%Diversified Banks – 23.1%Bank of America Corp. 2,757,006 $ 127,208,257Citigroup, Inc. 737,440 48,022,093JPMorgan Chase & Co. 1,087,617 161,619,886US Bancorp 513,246 29,865,784Wells Fargo & Co. 1,495,106 80,436,703
447,152,723Regional Banks – 15.0%1st Source Corp. 8,186 408,318Allegiance Bancshares, Inc. 6,913 304,379Amalgamated Financial Corp. 5,700 96,957Amerant Bancorp, Inc. 8,173 277,882Ameris Bancorp 25,046 1,235,018Arrow Financial Corp. 7,111 251,587Associated Banc-Corp. 62,708 1,498,721Atlantic Union Bankshares Corp. 30,184 1,229,092Banc of California, Inc. 20,088 388,100Bancfirst Corp. 7,309 547,810Bank First Corp. 2,797 195,762Bank of Hawaii Corp. 16,445 1,415,421Bank of Marin Bancorp 6,507 242,646Bank OZK 45,374 2,125,772BankUnited, Inc. 28,307 1,181,817Banner Corp. 7,992 496,383Bar Harbor Bankshares 6,091 186,019Berkshire Hills Bancorp, Inc. 15,531 459,562BOK Financial Corp. 11,422 1,171,326Brookline Bancorp, Inc. 17,341 296,531Byline Bancorp, Inc. 9,987 259,662Cadence Bank 55,513 1,730,340Camden National Corp. 6,761 335,751Capital City Bank Group, Inc. 6,105 168,864Cathay General Bancorp 29,071 1,312,846CBTX, Inc. 6,810 200,418Central Pacific Financial Corp. 5,914 172,097Citizens Financial Group, Inc. 155,839 8,021,033City Holding Co. 3,499 280,655Columbia Banking System, Inc. 26,291 914,138Comerica, Inc. 49,521 4,594,558Commerce Bancshares, Inc. 41,958 2,891,326Community Bank System, Inc. 17,089 1,220,496Community Trust Bancorp, Inc. 7,906 349,366ConnectOne Bancorp, Inc. 14,047 449,644CrossFirst Bankshares, Inc. (a) 18,388 284,278Cullen/Frost Bankers, Inc. 22,526 3,176,391Customers Bancorp, Inc. (a) 11,010 641,883CVB Financial Corp. 46,312 1,020,253Dime Community Bancshares, Inc. 13,386 467,975Eagle Bancorp, Inc. 8,214 492,594East West Bancorp, Inc. 52,341 4,519,122
Shares Value
Eastern Bankshares, Inc. 62,628 $ 1,333,350Enterprise Financial Services Corp. 14,180 702,477FB Financial Corp. 12,477 555,476Fifth Third Bancorp 252,100 11,251,223First Bancorp 12,741 559,457First BanCorp 62,566 910,335First Busey Corp. 21,851 609,206First Citizens BancShares, Inc.
Class A 4,382 3,413,929First Commonwealth Financial
Corp. 21,144 350,145First Community Bankshares, Inc. 7,685 239,849First Financial Bancorp 23,110 582,603First Financial Bankshares, Inc. 50,064 2,352,507First Financial Corp. 5,498 246,805First Foundation, Inc. 18,254 477,342First Hawaiian, Inc. 50,028 1,418,294First Horizon Corp. 202,779 3,469,549First Interstate Bancsystem, Inc.
Class A 16,760 615,930First Merchants Corp. 22,148 939,740First Mid Bancshares, Inc. 6,547 269,409First Midwest Bancorp, Inc. 36,342 754,823First Republic Bank 64,414 11,181,626Flushing Financial Corp. 10,795 254,870FNB Corp. 128,645 1,662,093Fulton Financial Corp. 69,380 1,245,371German American Bancorp, Inc. 9,871 390,892Glacier Bancorp, Inc. 38,632 2,006,160Great Southern Bancorp, Inc. 5,650 335,271Great Western Bancorp, Inc. 19,345 597,374Hancock Whitney Corp. 32,505 1,713,664Harborone Bancorp, Inc. 22,710 322,482Heartland Financial USA, Inc. 16,268 846,424Heritage Commerce Corp. 26,082 324,982Heritage Financial Corp. 7,803 189,301Hilltop Holdings, Inc. 24,296 802,497Home BancShares, Inc. 58,878 1,387,166HomeStreet, Inc. 4,801 234,049Hope Bancorp, Inc. 32,600 546,050Horizon Bancorp, Inc. 15,013 320,227Huntington Bancshares, Inc. 540,326 8,137,310Independent Bank Corp. 8,920 218,362Independent Bank Corp./MA 15,394 1,298,484Independent Bank Group, Inc. 14,341 1,088,769International Bancshares Corp. 20,616 866,490Investors Bancorp, Inc. 86,033 1,404,059KeyCorp 350,486 8,783,179Lakeland Bancorp, Inc. 26,191 495,796Lakeland Financial Corp. 9,231 737,834Live Oak Bancshares, Inc. 11,868 698,550
Fidelity® MSCI Financials Index ETF
Schedule of Investments January 31, 2022 (Unaudited)Showing Percentage of Net Assets
See accompanying notes which are an integral part of the financial statements.
Semi-Annual Report 30

Common Stocks – continuedShares Value
BANKS – continuedRegional Banks – continuedM&T Bank Corp. 47,377 $ 8,024,716Mercantile Bank Corp. 7,454 286,755Meta Financial Group, Inc. 7,728 459,507Metropolitan Bank Holding
Corp. (a) 3,623 362,300Midland States Bancorp, Inc. 9,906 285,986MidWestOne Financial Group, Inc. 7,013 223,925National Bank Holdings Corp.
Class A 6,487 294,510NBT Bancorp, Inc. 11,425 441,919Nicolet Bankshares, Inc. (a) 4,889 455,117OceanFirst Financial Corp. 23,955 543,779OFG Bancorp 13,558 375,150Old National Bancorp 46,343 849,467Origin Bancorp, Inc. 8,755 374,014Pacific Premier Bancorp, Inc. 29,158 1,115,294PacWest Bancorp 43,214 2,006,426Park National Corp. 5,956 806,800Peapack-Gladstone Financial Corp. 7,939 292,473Peoples Bancorp, Inc. 11,050 366,308People’s United Financial, Inc. 160,454 3,109,599Pinnacle Financial Partners, Inc. 28,024 2,710,201Popular, Inc. 30,247 2,697,125Preferred Bank 2,271 177,274Prosperity Bancshares, Inc. 34,878 2,554,813QCR Holdings, Inc. 6,425 366,482Regions Financial Corp. 348,770 8,000,784Renasant Corp. 15,826 582,080Republic Bancorp, Inc. Class A 4,337 212,600S&T Bancorp, Inc. 8,188 252,272Sandy Spring Bancorp, Inc. 19,187 907,737Seacoast Banking Corp. of Florida 20,017 730,621ServisFirst Bancshares, Inc. 18,186 1,543,446Signature Bank 22,140 6,744,508Silvergate Capital Corp. (a) 10,894 1,173,720Simmons First National Corp.
Class A 37,934 1,084,912Southside Bancshares, Inc. 10,862 455,118SouthState Corp. 25,850 2,181,998Sterling Bancorp 72,788 1,913,597Stock Yards Bancorp, Inc. 9,500 566,010SVB Financial Group (a) 21,367 12,476,191Synovus Financial Corp. 53,756 2,674,899Texas Capital Bancshares, Inc. (a) 18,824 1,180,265The Bancorp, Inc. (a) 18,083 539,235The First Bancshares, Inc. 9,020 325,351The First of Long Island Corp. 10,460 229,179The PNC Financial Services Group,
Inc. 155,198 31,969,236
Shares Value
Tompkins Financial Corp. 6,023 $ 479,190Towne Bank 30,297 950,720Trico Bancshares 12,039 523,335TriState Capital Holdings, Inc. (a) 10,632 335,865Triumph Bancorp, Inc. (a) 8,758 766,150Truist Financial Corp. 486,584 30,567,207Trustmark Corp. 24,184 787,915UMB Financial Corp. 17,053 1,678,868Umpqua Holdings Corp. 83,121 1,685,694United Bankshares, Inc. 50,343 1,778,618United Community Banks, Inc. 29,562 1,046,199Univest Financial Corp. 13,073 393,889Valley National Bancorp 153,496 2,136,664Veritex Holdings, Inc. 16,570 665,286Washington Trust Bancorp, Inc. 8,172 466,458Webster Financial Corp. 33,912 1,926,541WesBanco, Inc. 25,609 908,863Westamerica BanCorp. 7,079 411,148Western Alliance Bancorp 37,954 3,764,657Wintrust Financial Corp. 21,123 2,071,533Zions Bancorp NA 60,163 4,080,255
289,003,328
TOTAL BANKS 736,156,051
CAPITAL MARKETS – 26.8%Asset Management & Custody Banks – 9.5%Affiliated Managers Group, Inc. 15,072 2,203,677Ameriprise Financial, Inc. 41,456 12,615,475Ares Management Corp. Class A 44,744 3,566,992Artisan Partners Asset
Management, Inc. Class A 24,108 1,041,707Assetmark Financial Holdings,
Inc. (a) 6,907 165,699BlackRock, Inc. 55,329 45,532,447Blackstone, Inc. Class A 249,397 32,912,922Blucora, Inc. (a) 18,277 296,453Blue Owl Capital, Inc. 58,371 725,552Brightsphere Investment Group, Inc. 13,332 287,705Cohen & Steers, Inc. 8,881 741,830Diamond Hill Investment Group,
Inc. 1,215 226,901Federated Hermes, Inc. 34,287 1,135,243Focus Financial Partners, Inc.
Class A (a) 19,673 990,732Franklin Resources, Inc. 109,706 3,507,301Hamilton Lane, Inc. Class A 12,757 1,153,998Invesco Ltd. 126,764 2,872,472Janus Henderson Group PLC 56,836 2,097,248KKR & Co., Inc. 190,656 13,567,081Northern Trust Corp. 72,398 8,444,503SEI Investments Co. 44,099 2,584,642
See accompanying notes which are an integral part of the financial statements.
31 Semi-Annual Report

Common Stocks – continuedShares Value
CAPITAL MARKETS – continuedAsset Management & Custody Banks – continuedState Street Corp. 133,292 $ 12,596,094StepStone Group, Inc. 17,451 610,960T Rowe Price Group, Inc. 82,609 12,757,308The Bank of New York Mellon Corp. 298,990 17,718,147The Carlyle Group, Inc. 58,129 2,967,485Victory Capital Holdings, Inc.
Class A 7,471 244,078Virtus Investment Partners, Inc. 2,834 741,601WisdomTree Investments, Inc. 40,105 224,989
184,531,242Financial Exchanges & Data – 8.4%Cboe Global Markets, Inc. 38,762 4,594,460CME Group, Inc. 130,733 30,003,223Coinbase Global, Inc. Class A (a) 13,775 2,619,316Donnelley Financial Solutions,
Inc. (a) 11,005 409,606FactSet Research Systems, Inc. 13,723 5,789,596Intercontinental Exchange, Inc. 204,917 25,954,787MarketAxess Holdings, Inc. 13,808 4,756,580Moody’s Corp. 60,829 20,864,347Morningstar, Inc. 8,571 2,463,391MSCI, Inc. 29,988 16,077,167Nasdaq, Inc. 42,529 7,621,622Open Lending Corp. Class A (a) 32,208 611,630S&P Global, Inc. 87,530 36,344,207Tradeweb Markets, Inc. Class A 38,217 3,239,655
161,349,587Investment Banking & Brokerage – 8.9%B Riley Financial, Inc. 5,462 336,295BGC Partners, Inc. Class A 111,272 469,568Cowen, Inc. Class A 9,627 304,983Evercore, Inc. Class A 14,514 1,811,637Freedom Holding Corp. (a) 6,457 412,344Goldman Sachs Group, Inc. 123,399 43,767,157Houlihan Lokey, Inc. 18,545 1,970,963Interactive Brokers Group, Inc.
Class A 32,009 2,182,694Jefferies Financial Group, Inc. 76,627 2,807,613LPL Financial Holdings, Inc. 29,299 5,048,804Moelis & Co. Class A 22,407 1,265,323Morgan Stanley 497,861 51,050,667Perella Weinberg Partners 12,684 137,748Piper Sandler Cos. 6,712 1,035,125PJT Partners, Inc. Class A 8,795 609,669Raymond James Financial, Inc. 67,782 7,176,080Robinhood Markets, Inc. (a) 65,837 931,594Stifel Financial Corp. 38,292 2,868,071StoneX Group, Inc. (a) 6,193 406,323The Charles Schwab Corp. 527,098 46,226,495
Shares Value
Virtu Financial, Inc. Class A 32,264 $ 997,926
171,817,079
TOTAL CAPITAL MARKETS 517,697,908
CONSUMER FINANCE – 5.8%Consumer Finance – 5.8%Ally Financial, Inc. 131,302 6,265,731American Express Co. 245,923 44,221,874Atlanticus Holdings Corp. (a) 2,672 171,836Capital One Financial Corp. 162,082 23,782,292Credit Acceptance Corp. (a) 3,139 1,693,679Curo Group Holdings Corp. 6,735 96,513Discover Financial Services 108,920 12,607,490Encore Capital Group, Inc. (a) 9,056 584,112Enova International, Inc. (a) 13,606 548,050FirstCash Holdings, Inc. 15,119 1,053,794Green Dot Corp. Class A (a) 17,181 544,810LendingClub Corp. (a) 34,278 643,055LendingTree, Inc. (a) 4,440 540,970Navient Corp. 60,830 1,060,267Nelnet, Inc. Class A 6,331 560,483OneMain Holdings, Inc. 28,675 1,481,351Oportun Financial Corp. (a) 5,934 106,871PRA Group, Inc. (a) 17,098 795,057PROG Holdings, Inc. (a) 20,717 824,744SLM Corp. 101,912 1,869,066SoFi Technologies, Inc. (a) 188,673 2,354,639Synchrony Financial 207,178 8,823,711Upstart Holdings, Inc. (a) 7,107 774,734World Acceptance Corp. (a) 1,427 269,674
TOTAL CONSUMER FINANCE 111,674,803
DIVERSIFIED FINANCIAL SERVICES – 8.7%Multi-Sector Holdings – 7.9%Berkshire Hathaway, Inc.
Class B (a) 482,521 151,038,723Cannae Holdings, Inc. (a) 29,710 887,438
151,926,161Other Diversified Financial Services – 0.8%Apollo Global Management, Inc. 130,774 9,154,180Equitable Holdings, Inc. 134,788 4,534,268Voya Financial, Inc. 40,208 2,732,536
16,420,984Specialized Finance – 0.0%A-Mark Precious Metals, Inc. 3,083 190,838
TOTAL DIVERSIFIED FINANCIAL SERVICES 168,537,983
INSURANCE – 18.0%Insurance Brokers – 4.3%Aon PLC Class A 82,189 22,720,327Arthur J Gallagher & Co. 75,353 11,901,253
Fidelity® MSCI Financials Index ETFSchedule of Investments (Unaudited) – continued
See accompanying notes which are an integral part of the financial statements.
Semi-Annual Report 32

Common Stocks – continuedShares Value
INSURANCE – continuedInsurance Brokers – continuedBrown & Brown, Inc. 88,118 $ 5,840,461BRP Group, Inc. Class A (a) 20,045 611,773eHealth, Inc. (a) 9,034 197,393GoHealth, Inc. Class A (a) 18,510 51,088Goosehead Insurance, Inc. Class A 7,088 698,735Hippo Holdings, Inc. (a) 101,760 213,696Marsh & McLennan Cos., Inc. 184,389 28,329,526Ryan Specialty Group Holdings,
Inc. (a) 25,918 969,592Selectquote, Inc. (a) 21,366 157,895Willis Towers Watson PLC 46,970 10,989,101
82,680,840Life & Health Insurance – 3.8%Aflac, Inc. 231,857 14,565,257American Equity Investment Life
Holding Co. 30,625 1,259,912Brighthouse Financial, Inc. (a) 30,485 1,659,908CNO Financial Group, Inc. 48,009 1,197,344Genworth Financial, Inc.
Class A (a) 173,544 676,822Globe Life, Inc. 35,690 3,651,087Independence Holding Co. 1,757 100,061Lincoln National Corp. 65,073 4,553,808MetLife, Inc. 265,000 17,770,900National Western Life Group, Inc.
Class A 901 192,697Oscar Health, Inc. (a) 15,448 103,502Primerica, Inc. 14,390 2,220,953Principal Financial Group, Inc. 97,143 7,097,268Prudential Financial, Inc. 140,142 15,635,643Trupanion, Inc. (a) 12,488 1,189,482Unum Group 74,650 1,894,617
73,769,261Multi-line Insurance – 1.8%American Financial Group, Inc. 26,229 3,417,114American International Group, Inc. 311,069 17,964,235American National Group, Inc. 2,940 555,043Assurant, Inc. 21,506 3,279,880Horace Mann Educators Corp. 10,908 414,613The Hartford Financial Services
Group, Inc. 126,259 9,074,234
34,705,119Property & Casualty Insurance – 7.4%Ambac Financial Group, Inc. (a) 17,742 251,404AMERISAFE, Inc. 8,228 432,135Arch Capital Group Ltd. (a) 144,790 6,706,673Argo Group International
Holdings Ltd. 13,043 740,582Assured Guaranty Ltd. 26,905 1,433,767
Shares Value
Axis Capital Holdings Ltd. 28,031 $ 1,597,206Chubb Ltd. 159,752 31,515,875Cincinnati Financial Corp. 55,935 6,590,821Donegal Group, Inc. Class A 6,660 95,571Employers Holdings, Inc. 6,239 243,945Erie Indemnity Co. Class A 9,332 1,718,021Fidelity National Financial, Inc. 98,207 4,944,722First American Financial Corp. 39,973 2,978,388HCI Group, Inc. 2,531 171,779James River Group Holdings Ltd. 13,097 370,907Kemper Corp. 23,427 1,405,152Kinsale Capital Group, Inc. 7,878 1,578,121Lemonade, Inc. (a) 13,650 435,845Loews Corp. 80,363 4,794,457Markel Corp. (a) 5,033 6,204,380MBIA, Inc. (a) 18,138 247,946Mercury General Corp. 10,569 577,702MetroMile, Inc. (a) 27,412 45,504Old Republic International Corp. 107,505 2,755,353Palomar Holdings, Inc. (a) 8,866 467,682ProAssurance Corp. 13,572 325,185RLI Corp. 15,046 1,576,520Root, Inc. Class A (a) 20,785 41,778Safety Insurance Group, Inc. 3,083 253,823Selective Insurance Group, Inc. 22,194 1,751,107State Auto Financial Corp. 6,556 338,945Stewart Information Services Corp. 7,616 544,011The Allstate Corp. 107,999 13,032,239The Hanover Insurance Group, Inc. 13,289 1,833,350The Progressive Corp. 213,719 23,222,707The Travelers Cos., Inc. 90,990 15,120,718United Fire Group, Inc. 7,811 194,806Universal Insurance Holdings, Inc. 10,260 176,882White Mountains Insurance
Group Ltd. 1,190 1,238,742WR Berkley Corp. 52,357 4,424,167
142,378,918Reinsurance – 0.7%Alleghany Corp. (a) 5,076 3,370,464Enstar Group Ltd. (a) 3,948 1,046,536Everest Re Group Ltd. 14,505 4,110,717Reinsurance Group of America, Inc. 24,768 2,844,109RenaissanceRe Holdings Ltd. 17,092 2,686,350SiriusPoint Ltd. (a) 33,090 280,272
14,338,448
TOTAL INSURANCE 347,872,586
MORTGAGE REAL ESTATE INVESTMENT TRUSTS (REITS) – 1.2%Mortgage REITs – 1.2%AGNC Investment Corp. 192,355 2,864,166Annaly Capital Management, Inc. 526,107 4,156,245
See accompanying notes which are an integral part of the financial statements.
33 Semi-Annual Report

Common Stocks – continuedShares Value
MORTGAGE REAL ESTATE INVESTMENT TRUSTS (REITS) – continuedMortgage REITs – continuedApollo Commercial Real Estate
Finance, Inc. 51,797 $ 707,029Arbor Realty Trust, Inc. 48,947 857,062Ares Commercial Real Estate Corp. 16,554 243,178ARMOUR Residential REIT, Inc. 30,607 287,094Blackstone Mortgage Trust, Inc.
Class A 51,347 1,613,323BrightSpire Capital, Inc. 30,804 289,250Broadmark Realty Capital, Inc. 48,845 458,166Chimera Investment Corp. 87,446 1,267,967Dynex Capital, Inc. 12,632 203,123Ellington Financial, Inc. 19,128 339,904Franklin BSP Realty Trust, Inc. 11,845 159,552Granite Point Mortgage Trust, Inc. 18,329 221,781Hannon Armstrong Sustainable
Infrastructure Capital, Inc. 28,157 1,167,952Invesco Mortgage Capital, Inc. 101,769 272,741KKR Real Estate Finance Trust, Inc. 12,761 272,320Ladder Capital Corp. 41,710 495,932MFA Financial, Inc. 141,314 654,284New Residential Investment Corp. 169,403 1,804,142New York Mortgage Trust, Inc. 136,792 512,970PennyMac Mortgage Investment
Trust 35,817 638,259Ready Capital Corp. 20,525 292,276Redwood Trust, Inc. 41,301 509,241Starwood Property Trust, Inc. 105,755 2,617,436TPG RE Finance Trust, Inc. 18,135 228,864Two Harbors Investment Corp. 115,763 665,637
TOTAL MORTGAGE REAL ESTATE INVESTMENTTRUSTS (REITS) 23,799,894
THRIFTS & MORTGAGE FINANCE – 1.1%Thrifts & Mortgage Finance – 1.1%Axos Financial, Inc. (a) 19,150 986,225Capitol Federal Financial, Inc. 47,858 532,660Columbia Financial, Inc. (a) 18,623 394,249Essent Group Ltd. 41,330 1,886,301Federal Agricultural Mortgage
Corp. Class C 3,491 425,204Flagstar Bancorp, Inc. 18,547 839,252
Shares Value
Hingham Institution For Savings The 636 $ 246,660Kearny Financial Corp. 30,248 391,409Luther Burbank Corp. 7,032 90,221Merchants Bancorp 6,279 183,033MGIC Investment Corp. 125,471 1,904,650Mr. Cooper Group, Inc. (a) 25,556 1,026,073New York Community Bancorp, Inc. 170,849 1,992,099NMI Holdings, Inc. Class A (a) 30,286 749,276Northfield Bancorp, Inc. 16,797 264,721Northwest Bancshares, Inc. 31,074 438,454PennyMac Financial Services, Inc. 18,115 1,135,810Premier Financial Corp. 14,552 434,377Provident Financial Services, Inc. 27,885 673,980Radian Group, Inc. 69,861 1,564,188Rocket Cos., Inc. Class A 49,935 631,178TFS Financial Corp. 21,762 378,224TrustCo Bank Corp. 4,098 138,922UWM Holdings Corp. 36,609 189,268Walker & Dunlop, Inc. 11,077 1,466,706Washington Federal, Inc. 28,506 998,280Waterstone Financial, Inc. 10,296 210,244WSFS Financial Corp. 21,473 1,124,756
TOTAL THRIFTS & MORTGAGE FINANCE 21,296,420
TOTAL COMMON STOCKS(Cost $1,588,980,035) 1,927,035,645
Money Market Fund – 0.2%
State Street Institutional TreasuryPlus Money Market Fund, TrustClass, 0.01% (b)(Cost $4,259,001) 4,259,001 4,259,001
TOTAL INVESTMENT IN SECURITIES – 99.9%(Cost $1,593,239,036) 1,931,294,646
NET OTHER ASSETS (LIABILITIES) – 0.1% 1,605,478
NET ASSETS – 100.0% $1,932,900,124
Legend(a) Non-income producing.
(b) The rate quoted is the annualized seven-day yield of the fund at periodend.
Fidelity® MSCI Financials Index ETFSchedule of Investments (Unaudited) – continued
See accompanying notes which are an integral part of the financial statements.
Semi-Annual Report 34

Futures Contracts
Number ofcontracts
ExpirationDate
NotionalAmount Value
UnrealizedAppreciation/(Depreciation)
Purchased
Equity Index ContractsCME E-mini Russell 2000 Index Contracts (United States) 6 March 2022 $ 607,320 $ (52,794) $ (52,794)CME E-mini S&P Financial Select Sector Index Contracts (United States) 41 March 2022 4,923,588 (74,431) (74,431)
Total Equity Index Contracts $ (127,225)
The notional amount of futures purchased as a percentage of Net Assets is 0.3%
Investment ValuationThe following is a summary of the inputs used, as of January 31, 2022, involving the Fund’s assets and liabilities carried at fair value. The inputs or methodologyused for valuing securities may not be an indication of the risk associated with investing in those securities. For more information on valuation inputs, and theiraggregation into the levels used in the table below, please refer to the Investment Valuation section in the accompanying Notes to Financial Statements.
Valuation Inputs at Reporting Date:
Description Total Level 1 Level 2 Level 3Investments in Securities:
Common Stocks $ 1,927,035,645 $ 1,927,035,645 $ — $ —Money Market Funds 4,259,001 4,259,001 — —
Total Investments in Securities: $ 1,931,294,646 $ 1,931,294,646 $ — $ —
Derivative Instruments:
LiabilitiesFutures Contracts $ (127,225) $ (127,225) $ — $ —
Total Liabilities $ (127,225) $ (127,225) $ — $ —
Total Derivative Instruments: $ (127,225) $ (127,225) $ — $ —
Value of Derivative InstrumentsThe following table is a summary of the Fund’s value of derivative instruments by primary risk exposure as of January 31, 2022. For additional information onderivative instruments, please refer to the Derivative Instruments section in the accompanying Notes to Financial Statements.
Primary Risk/ Derivative Type ValueAsset Liabilities
Equity RiskFutures Contracts(a) $0 $(127,225)
Total Equity Risk 0 (127,225)
Total Value of Derivatives $0 $(127,225)
(a) Reflects gross cumulative appreciation (depreciation) on futures contracts as presented in the Schedule of Investments. In the Statement of Assets and Liabilities,the period end daily variation margin is included in receivable or payable for daily variation margin on futures contracts, and the net cumulative appreciation(depreciation) is included in total accumulated earnings (loss).
See accompanying notes which are an integral part of the financial statements.
35 Semi-Annual Report

Common Stocks – 99.7%Shares Value
BIOTECHNOLOGY – 17.3%Biotechnology – 17.3%2seventy bio, Inc. (a) 10,892 $ 203,3544D Molecular Therapeutics, Inc. (a) 11,495 181,621AbbVie, Inc. 843,992 115,534,065ACADIA Pharmaceuticals, Inc. (a) 57,543 1,294,142Agenus, Inc. (a) 93,924 259,230Agios Pharmaceuticals, Inc. (a) 25,283 780,992Akebia Therapeutics, Inc. (a) 75,090 149,429Akero Therapeutics, Inc. (a) 7,365 129,035Albireo Pharma, Inc. (a) 8,335 237,464Alder Biopharmaceuticals, Inc. (a)(b) 22,547 19,841Alector, Inc. (a) 24,561 389,537Aligos Therapeutics, Inc. (a) 12,129 38,692Alkermes PLC (a) 77,582 1,978,341Allakos, Inc. (a) 15,341 103,705Allogene Therapeutics, Inc. (a) 36,763 420,936Allovir, Inc. (a) 17,003 138,745Alnylam Pharmaceuticals, Inc. (a) 56,857 7,823,523ALX Oncology Holdings, Inc. (a) 3,550 56,800Amgen, Inc. 271,202 61,600,822Amicus Therapeutics, Inc. (a) 103,009 969,315AnaptysBio, Inc. (a) 8,462 270,530Anavex Life Sciences Corp. (a) 34,274 448,304Anika Therapeutics, Inc. (a) 6,672 212,170Annexon, Inc. (a) 10,961 82,208Apellis Pharmaceuticals, Inc. (a) 36,538 1,471,385Applied Molecular Transport,
Inc. (a) 5,078 47,835Applied Therapeutics, Inc. (a) 8,937 27,526Arcturus Therapeutics Holdings,
Inc. (a) 10,125 264,566Arcus Biosciences, Inc. (a) 18,520 570,416Arcutis Biotherapeutics, Inc. (a) 11,798 178,268Arena Pharmaceuticals, Inc. (a) 27,726 2,550,238Arrowhead Pharmaceuticals, Inc. (a) 47,385 2,500,033Atara Biotherapeutics, Inc. (a) 35,031 538,076Aurinia Pharmaceuticals, Inc. (a) 52,009 866,470Avid Bioservices, Inc. (a) 28,907 545,475Avidity Biosciences, Inc. (a) 16,310 271,072Beam Therapeutics, Inc. (a) 15,810 1,094,210BioAtla, Inc. (a) 9,209 88,038BioCryst Pharmaceuticals, Inc. (a) 86,107 1,330,353Biogen, Inc. (a) 71,199 16,090,974Biohaven Pharmaceutical Holding
Co. Ltd. (a) 28,189 3,745,472BioMarin Pharmaceutical, Inc. (a) 87,441 7,749,896Bioxcel Therapeutics, Inc. (a) 9,134 154,365Bluebird Bio, Inc. (a) 32,676 257,814Blueprint Medicines Corp. (a) 26,499 2,043,073Bolt Biotherapeutics, Inc. (a) 6,046 23,217
Shares Value
Bridgebio Pharma, Inc. (a) 32,344 $ 319,235C4 Therapeutics, Inc. (a) 5,911 144,406CareDx, Inc. (a) 24,973 1,043,871Caribou Biosciences, Inc. (a) 11,432 122,665Catalyst Pharmaceuticals, Inc. (a) 44,864 258,417Celldex Therapeutics, Inc. (a) 18,064 560,165CEL-SCI Corp. (a) 19,261 116,336Cerevel Therapeutics Holdings,
Inc. (a) 21,020 547,361ChemoCentryx, Inc. (a) 23,291 626,295Chimerix, Inc. (a) 33,266 189,949Clovis Oncology, Inc. (a) 56,125 114,495Coherus Biosciences, Inc. (a) 29,281 361,913Cortexyme, Inc. (a) 7,715 46,907Crinetics Pharmaceuticals, Inc. (a) 15,366 290,264CRISPR Therapeutics AG (a) 29,281 1,866,664Cue Biopharma, Inc. (a) 14,562 107,613Cullinan Management, Inc. (a) 7,730 104,200Curis, Inc. (a) 32,463 103,557Cytokinetics, Inc. (a) 35,916 1,192,052Deciphera Pharmaceuticals, Inc. (a) 19,174 161,637Denali Therapeutics, Inc. (a) 37,998 1,300,292DermTech, Inc. (a) 8,187 104,876Dynavax Technologies Corp. (a) 55,633 721,560Dyne Therapeutics, Inc. (a) 10,986 81,516Eagle Pharmaceuticals, Inc. (a) 5,323 244,539Editas Medicine, Inc. (a) 32,449 617,829Emergent BioSolutions, Inc. (a) 23,598 1,104,386Enanta Pharmaceuticals, Inc. (a) 8,907 529,254Epizyme, Inc. (a) 34,447 42,370Erasca, Inc. (a) 11,554 136,915Essa Pharma, Inc. (a) 10,074 93,789Exact Sciences Corp. (a) 82,241 6,279,923Exelixis, Inc. (a) 150,074 2,716,339Fate Therapeutics, Inc. (a) 36,543 1,516,900FibroGen, Inc. (a) 39,150 590,774Forma Therapeutics Holdings,
Inc. (a) 7,916 93,725G1 Therapeutics, Inc. (a) 13,452 135,596Generation Bio Co. (a) 17,189 111,729Geron Corp. (a) 113,476 127,093Gilead Sciences, Inc. 598,812 41,126,408Global Blood Therapeutics, Inc. (a) 26,704 770,410Gossamer Bio, Inc. (a) 24,899 238,781Halozyme Therapeutics, Inc. (a) 64,549 2,234,041Heron Therapeutics, Inc. (a) 46,162 402,071Homology Medicines, Inc. (a) 17,781 66,145Horizon Therapeutics PLC (a) 102,341 9,551,486Humacyte, Inc. (a) 24,543 132,041Humanigen, Inc. (a) 22,648 58,432Icosavax, Inc. (a) 5,632 85,944
Fidelity® MSCI Health Care Index ETF
Schedule of Investments January 31, 2022 (Unaudited)Showing Percentage of Net Assets
See accompanying notes which are an integral part of the financial statements.
Semi-Annual Report 36

Common Stocks – continuedShares Value
BIOTECHNOLOGY – continuedBiotechnology – continuedIdeaya Biosciences, Inc. (a) 12,812 $ 212,295IGM Biosciences, Inc. (a) 3,543 62,711Imago Biosciences, Inc. (a) 5,577 112,767ImmunityBio, Inc. (a) 36,638 213,233ImmunoGen, Inc. (a) 95,201 537,886Immunovant, Inc. (a) 20,372 142,400Incyte Corp. (a) 89,664 6,664,725Inhibrx, Inc. (a) 4,547 120,768Inovio Pharmaceuticals, Inc. (a) 99,523 412,025Insmed, Inc. (a) 55,149 1,250,779Intellia Therapeutics, Inc. (a) 31,527 2,981,508Intercept Pharmaceuticals, Inc. (a) 14,313 234,590Invitae Corp. (a) 93,218 1,047,770Ionis Pharmaceuticals, Inc. (a) 60,689 1,929,910Iovance Biotherapeutics, Inc. (a) 59,899 997,318Ironwood Pharmaceuticals, Inc. (a) 73,383 818,220iTeos Therapeutics, Inc. (a) 6,711 245,757IVERIC bio, Inc. (a) 34,696 483,662Karuna Therapeutics, Inc. (a) 9,839 1,092,719Karyopharm Therapeutics, Inc. (a) 32,380 288,182Keros Therapeutics, Inc. (a) 6,060 281,002Kiniksa Pharmaceuticals Ltd.
Class A (a) 11,440 128,471Kinnate Biopharma, Inc. (a) 5,169 56,756Kodiak Sciences, Inc. (a) 14,768 866,882Kronos Bio, Inc. (a) 7,986 72,673Krystal Biotech, Inc. (a) 8,297 489,523Kura Oncology, Inc. (a) 26,461 372,836Kymera Therapeutics, Inc. (a) 13,492 566,664Lexicon Pharmaceuticals, Inc. (a) 27,429 86,950Ligand Pharmaceuticals, Inc. (a) 8,021 999,657MacroGenics, Inc. (a) 22,920 283,062Madrigal Pharmaceuticals, Inc. (a) 4,923 283,466MannKind Corp. (a) 112,401 419,256MeiraGTx Holdings PLC (a) 10,507 157,500Mersana Therapeutics, Inc. (a) 26,905 128,337Merus N.V. (a) 13,235 325,713MiMedx Group, Inc. (a) 34,891 173,059Mirati Therapeutics, Inc. (a) 17,179 2,049,455Moderna, Inc. (a) 163,862 27,746,752Monte Rosa Therapeutics, Inc. (a) 5,526 69,959Morphic Holding, Inc. (a) 8,551 362,819Myovant Sciences Ltd. (a) 17,552 229,229Myriad Genetics, Inc. (a) 37,882 995,918Natera, Inc. (a) 40,232 2,842,391Neurocrine Biosciences, Inc. (a) 45,120 3,565,382Nkarta, Inc. (a) 5,668 56,170Novavax, Inc. (a) 33,706 3,158,252Nurix Therapeutics, Inc. (a) 9,490 176,704
Shares Value
Ocugen, Inc. (a) 94,594 $ 335,809Olema Pharmaceuticals, Inc. (a) 4,713 30,305Opko Health, Inc. (a) 211,961 663,438Organogenesis Holdings, Inc. (a) 15,193 116,834ORIC Pharmaceuticals, Inc. (a) 13,329 131,824Passage Bio, Inc. (a) 11,367 57,176PMV Pharmaceuticals, Inc. (a) 5,318 85,407Point Biopharma Global, Inc. (a) 17,180 110,811Praxis Precision Medicines, Inc. (a) 10,361 153,964Preciden, Inc. (a) 43,334 111,802Precision BioSciences, Inc. (a) 21,731 103,657Prelude Therapeutics, Inc. (a) 6,475 64,297Prometheus Biosciences, Inc. (a) 5,557 199,663Protagonist Therapeutics, Inc. (a) 20,394 597,340Prothena Corp. PLC (a) 15,402 524,900PTC Therapeutics, Inc. (a) 30,118 1,211,346Radius Health, Inc. (a) 18,921 143,421Rapt Therapeutics, Inc. (a) 8,885 192,094Recursion Pharmaceuticals, Inc. (a) 18,946 224,321Regeneron Pharmaceuticals, Inc. (a) 50,198 30,550,001REGENXBIO, Inc. (a) 15,072 397,901Relay Therapeutics, Inc. (a) 20,114 445,123Repare Therapeutics, Inc. (a) 7,828 120,786Replimune Group, Inc. (a) 9,931 196,932REVOLUTION Medicines, Inc. (a) 23,183 498,898Rhythm Pharmaceuticals, Inc. (a) 16,569 122,776Rigel Pharmaceuticals, Inc. (a) 78,920 202,035Rocket Pharmaceuticals, Inc. (a) 18,185 302,598Rubius Therapeutics, Inc. (a) 19,181 129,472Sage Therapeutics, Inc. (a) 25,641 1,010,768Sana Biotechnology, Inc. (a) 17,909 156,883Sangamo Therapeutics, Inc. (a) 58,722 354,094Sarepta Therapeutics, Inc. (a) 36,270 2,595,844Scholar Rock Holding Corp. (a) 11,311 201,449Seagen, Inc. (a) 65,071 8,752,700Seres Therapeutics, Inc. (a) 32,518 271,200Shattuck Labs, Inc. (a) 6,951 48,031Sorrento Therapeutics, Inc. (a) 135,124 466,178SpringWorks Therapeutics, Inc. (a) 9,398 523,281Stoke Therapeutics, Inc. (a) 6,089 115,387Sutro Biopharma, Inc. (a) 15,252 162,891Syndax Pharmaceuticals, Inc. (a) 17,993 294,006Tango Therapeutics, Inc. (a) 18,759 160,014Taysha Gene Therapies, Inc. (a) 8,068 64,141TG Therapeutics, Inc. (a) 57,509 665,379Travere Therapeutics, Inc. (a) 26,424 726,660Turning Point Therapeutics, Inc. (a) 19,749 735,255Twist Bioscience Corp. (a) 21,064 1,251,623Ultragenyx Pharmaceutical, Inc. (a) 30,926 2,162,655uniQure N.V. (a) 16,808 303,384United Therapeutics Corp. (a) 21,466 4,333,341
See accompanying notes which are an integral part of the financial statements.
37 Semi-Annual Report

Common Stocks – continuedShares Value
BIOTECHNOLOGY – continuedBiotechnology – continuedVanda Pharmaceuticals, Inc. (a) 26,239 $ 397,783Vaxart, Inc. (a) 58,346 288,813Vaxcyte, Inc. (a) 9,683 184,364VBI Vaccines, Inc. (a) 89,549 152,233Veracyte, Inc. (a) 33,766 1,026,824Vericel Corp. (a) 19,347 688,366Vertex Pharmaceuticals, Inc. (a) 123,902 30,114,381Verve Therapeutics, Inc. (a) 8,005 230,704Viking Therapeutics, Inc. (a) 32,605 120,965Vir Biotechnology, Inc. (a) 31,027 1,065,157XBiotech, Inc. 8,688 93,570Xencor, Inc. (a) 24,915 856,329Xenon Pharmaceuticals, Inc. (a) 18,839 510,914Y-mAbs Therapeutics, Inc. (a) 12,348 122,122Zentalis Pharmaceuticals, Inc. (a) 10,735 612,754ZIOPHARM Oncology, Inc. (a) 103,316 111,581Zymeworks, Inc. (a) 17,532 156,035
TOTAL BIOTECHNOLOGY 482,131,792
HEALTH CARE EQUIPMENT & SUPPLIES – 24.1%Health Care Equipment – 22.4%Abbott Laboratories 846,686 107,918,597ABIOMED, Inc. (a) 21,714 6,424,521Accelerate Diagnostics, Inc. (a) 14,915 49,667Alphatec Holdings, Inc. (a) 30,348 313,798AngioDynamics, Inc. (a) 18,834 407,379Aspira Women’s Health, Inc. (a) 23,882 28,897AtriCure, Inc. (a) 20,715 1,359,733AxoGen, Inc. (a) 18,340 159,741Axonics, Inc. (a) 16,770 795,401Baxter International, Inc. 238,754 20,399,142Becton Dickinson and Co. 137,160 34,857,842Boston Scientific Corp. (a) 680,023 29,172,987Butterfly Network, Inc. (a) 51,892 300,974Cardiovascular Systems, Inc. (a) 18,913 332,301CONMED Corp. 13,856 1,906,309CryoLife, Inc. (a) 18,835 335,263CryoPort, Inc. (a) 17,441 728,511Cutera, Inc. (a) 7,268 264,628Danaher Corp. 306,859 87,697,234DexCom, Inc. (a) 46,210 19,892,481Edwards Lifesciences Corp. (a) 297,697 32,508,512Envista Holdings Corp. (a) 76,767 3,319,405Glaukos Corp. (a) 22,086 1,175,859Globus Medical, Inc. Class A (a) 37,501 2,502,442Heska Corp. (a) 4,891 672,904Hologic, Inc. (a) 121,195 8,512,737IDEXX Laboratories, Inc. (a) 40,632 20,612,614Inari Medical, Inc. (a) 9,733 715,959
Shares Value
Inogen, Inc. (a) 9,128 $ 271,375Insulet Corp. (a) 32,955 8,172,840Integer Holdings Corp. (a) 15,902 1,246,876Integra LifeSciences Holdings
Corp. (a) 34,502 2,233,660Intersect ENT, Inc. (a) 14,771 404,725Intuitive Surgical, Inc. (a) 170,488 48,449,280iRhythm Technologies, Inc. (a) 14,181 1,770,214LeMaitre Vascular, Inc. 9,207 389,548LivaNova PLC (a) 25,355 1,904,414Masimo Corp. (a) 24,932 5,481,799Medtronic PLC 642,583 66,500,915Mesa Laboratories, Inc. 2,451 696,893Natus Medical, Inc. (a) 16,691 384,561Nevro Corp. (a) 15,996 1,050,937Novocure Ltd. (a) 44,409 3,048,678NuVasive, Inc. (a) 24,957 1,298,014Ortho Clinical Diagnostics Holdings
PLC (a) 56,028 972,646Orthofix Medical, Inc. (a) 9,861 299,774Outset Medical, Inc. (a) 19,094 710,106Penumbra, Inc. (a) 16,661 3,765,553ResMed, Inc. 69,590 15,908,274Senseonics Holdings, Inc. (a) 172,774 463,034Shockwave Medical, Inc. (a) 15,223 2,206,878SI-BONE, Inc. (a) 12,301 242,330Sight Sciences, Inc. (a) 5,632 82,396Steris PLC 47,698 10,703,431Stryker Corp. 162,089 40,206,176Surmodics, Inc. (a) 6,516 297,651Tactile Systems Technology, Inc. (a) 9,398 148,206Tandem Diabetes Care, Inc. (a) 30,107 3,555,938Teleflex, Inc. 22,385 6,943,603TransMedics Group, Inc. (a) 11,694 185,584Treace Medical Concepts, Inc. (a) 7,545 136,866Vapotherm, Inc. (a) 8,006 129,457Varex Imaging Corp. (a) 18,667 487,209ViewRay, Inc. (a) 57,146 248,585Zimmer Biomet Holdings, Inc. 99,819 12,279,733Zomedica Corp. (a) 427,527 133,089Zynex, Inc. 11,673 92,450
626,869,536Health Care Supplies – 1.7%Align Technology, Inc. (a) 35,866 17,752,235Atrion Corp. 701 424,392Avanos Medical, Inc. (a) 22,819 690,503BioLife Solutions, Inc. (a) 11,564 345,070Cerus Corp. (a) 82,426 441,803DENTSPLY SIRONA, Inc. 104,384 5,576,193Establishment Labs Holdings, Inc. (a) 8,995 470,798Figs, Inc. Class A (a) 14,403 323,779
Fidelity® MSCI Health Care Index ETFSchedule of Investments (Unaudited) – continued
See accompanying notes which are an integral part of the financial statements.
Semi-Annual Report 38

Common Stocks – continuedShares Value
HEALTH CARE EQUIPMENT & SUPPLIES – continuedHealth Care Supplies – continuedHaemonetics Corp. (a) 24,484 $ 1,183,801ICU Medical, Inc. (a) 9,671 2,063,405Lantheus Holdings, Inc. (a) 32,809 833,677Meridian Bioscience, Inc. (a) 19,470 405,950Merit Medical Systems, Inc. (a) 24,166 1,340,005Neogen Corp. (a) 51,200 1,867,264OraSure Technologies, Inc. (a) 33,637 297,688OrthoPediatrics Corp. (a) 6,491 306,959Pulmonx Corp. (a) 9,340 227,429Quidel Corp. (a) 17,857 1,845,700Silk Road Medical, Inc. (a) 15,855 520,203SmileDirectClub, Inc. (a) 48,549 124,285STAAR Surgical Co. (a) 18,196 1,323,213The Cooper Cos., Inc. 23,554 9,381,558
47,745,910
TOTAL HEALTH CARE EQUIPMENT & SUPPLIES 674,615,446
HEALTH CARE PROVIDERS & SERVICES – 20.5%Health Care Distributors – 1.6%AdaptHealth Corp. (a) 36,960 698,544AmerisourceBergen Corp. 74,471 10,142,950Cardinal Health, Inc. 138,450 7,139,866Covetrus, Inc. (a) 49,922 902,091Henry Schein, Inc. (a) 66,557 5,011,742McKesson Corp. 73,877 18,965,703Owens & Minor, Inc. 34,070 1,434,006Patterson Cos., Inc. 42,269 1,212,698PetIQ, Inc. (a) 11,508 235,224
45,742,824Health Care Facilities – 1.8%Acadia Healthcare Co., Inc. (a) 40,640 2,139,696Brookdale Senior Living, Inc. (a) 88,604 468,715Cano Health, Inc. (a) 83,071 480,150Community Health Systems, Inc. (a) 54,701 694,156Encompass Health Corp. 47,617 2,954,159Hanger, Inc. (a) 18,275 331,326HCA Healthcare, Inc. 122,319 29,362,676National HealthCare Corp. 6,303 412,216Select Medical Holdings Corp. 50,980 1,184,265Surgery Partners, Inc. (a) 16,009 683,104Tenet Healthcare Corp. (a) 43,392 3,216,215The Ensign Group, Inc. 24,988 1,884,845The Joint Corp. (a) 6,731 363,743The Pennant Group, Inc. (a) 12,525 208,166Universal Health Services, Inc.
Class B 36,155 4,702,319US Physical Therapy, Inc. 6,252 605,006
49,690,757
Shares ValueHealth Care Services – 5.6%1Life Healthcare, Inc. (a) 39,000 $ 435,240Accolade, Inc. (a) 17,317 330,755Addus HomeCare Corp. (a) 7,493 598,166Agiliti, Inc. (a) 15,533 297,146Amedisys, Inc. (a) 15,545 2,100,130AMN Healthcare Services, Inc. (a) 22,650 2,295,351Apollo Medical Holdings, Inc. (a) 14,528 747,902Apria, Inc. (a) 8,422 315,067Aveanna Healthcare Holdings,
Inc. (a) 21,941 120,456Castle Biosciences, Inc. (a) 9,420 407,415Chemed Corp. 7,497 3,515,418Cigna Corp. 162,432 37,434,079CorVel Corp. (a) 4,652 819,310Cross Country Healthcare, Inc. (a) 17,206 370,101CVS Health Corp. 630,220 67,124,732DaVita, Inc. (a) 32,456 3,517,257Fulgent Genetics, Inc. (a) 9,340 596,546Guardant Health, Inc. (a) 41,071 2,856,488Hims & Hers Health, Inc. (a) 38,925 189,954Laboratory Corp. of America
Holdings (a) 46,076 12,503,183LHC Group, Inc. (a) 14,387 1,785,427MEDNAX, Inc. (a) 37,689 921,496ModivCare, Inc. (a) 6,069 703,579National Research Corp. 6,745 280,592Oak Street Health, Inc. (a) 46,192 802,817Option Care Health, Inc. (a) 60,160 1,405,939Premier, Inc. Class A 58,495 2,235,679Privia Health Group, Inc. (a) 10,079 214,481Quest Diagnostics, Inc. 58,432 7,889,489R1 RCM, Inc. (a) 59,803 1,422,115RadNet, Inc. (a) 21,235 546,801Signify Health, Inc. (a) 12,011 160,107Tivity Health, Inc. (a) 18,614 473,540
155,416,758Managed Health Care – 11.5%Alignment Healthcare, Inc. (a) 17,850 135,660Anthem, Inc. 116,444 51,350,640Centene Corp. (a) 278,458 21,652,894Clover Health Investments Corp. (a) 141,744 365,700HealthEquity, Inc. (a) 39,878 2,131,080Humana, Inc. 61,373 24,088,902Molina Healthcare, Inc. (a) 27,870 8,095,678Progyny, Inc. (a) 25,336 1,026,108Triple-S Management Corp.
Class B (a) 11,651 419,319UnitedHealth Group, Inc. 450,332 212,813,393
322,079,374
TOTAL HEALTH CARE PROVIDERS & SERVICES 572,929,713See accompanying notes which are an integral part of the financial statements.
39 Semi-Annual Report

Common Stocks – continuedShares Value
HEALTH CARE TECHNOLOGY – 1.8%Health Care Technology – 1.8%Allscripts Healthcare Solutions,
Inc. (a) 59,576 $ 1,204,627American Well Corp. Class A (a) 24,492 115,847Cerner Corp. 141,172 12,874,886Certara, Inc. (a) 41,320 1,104,484Change Healthcare, Inc. (a) 111,211 2,188,632Computer Programs & Systems,
Inc. (a) 6,768 191,670Evolent Health, Inc. Class A (a) 41,961 994,895Health Catalyst, Inc. (a) 20,598 614,850HealthStream, Inc. (a) 12,052 293,466Inspire Medical Systems, Inc. (a) 12,981 2,872,565Multiplan Corp. (a) 63,558 256,139NextGen Healthcare, Inc. (a) 27,287 526,912Omnicell, Inc. (a) 20,730 3,112,402OptimizeRx Corp. (a) 7,521 337,919Phreesia, Inc. (a) 21,721 677,478Schrodinger, Inc. (a) 23,415 663,815Sema4 Holdings Corp. (a) 51,509 176,161Simulations Plus, Inc. 7,621 324,045Tabula Rasa HealthCare, Inc. (a) 11,133 120,125Teladoc Health, Inc. (a) 68,291 5,238,603Veeva Systems, Inc. Class A (a) 66,007 15,613,296Vocera Communications, Inc. (a) 16,499 1,303,586
TOTAL HEALTH CARE TECHNOLOGY 50,806,403
LIFE SCIENCES TOOLS & SERVICES – 10.1%Life Sciences Tools & Services – 10.1%10X Genomics, Inc. Class A (a) 36,701 3,533,20523andMe Holding Co. (a) 28,657 133,828Adaptive Biotechnologies Corp. (a) 43,425 757,332Agilent Technologies, Inc. 144,711 20,161,137Avantor, Inc. (a) 250,728 9,359,676Bionano Genomics, Inc. (a) 132,387 293,899Bio-Rad Laboratories, Inc.
Class A (a) 10,641 6,381,727Bio-Techne Corp. 18,677 7,030,210Bruker Corp. 50,613 3,370,826Charles River Laboratories
International, Inc. (a) 24,036 7,926,111Codexis, Inc. (a) 27,984 573,672Fluidigm Corp. (a) 34,487 112,772Illumina, Inc. (a) 70,063 24,439,376IQVIA Holdings, Inc. (a) 91,512 22,411,289Maravai LifeSciences Holdings, Inc.
Class A (a) 53,288 1,541,089MaxCyte, Inc. (a) 31,104 200,932Medpace Holdings, Inc. (a) 13,778 2,445,044Mettler-Toledo International, Inc. (a) 11,048 16,270,169
Shares Value
NanoString Technologies, Inc. (a) 21,715 $ 753,945NeoGenomics, Inc. (a) 55,602 1,253,269Pacific Biosciences of California,
Inc. (a) 89,932 1,005,440PerkinElmer, Inc. 53,471 9,206,102Personalis, Inc. (a) 15,581 177,468Quanterix Corp. (a) 14,101 429,234Quantum-Si, Inc. (a) 38,851 186,096Repligen Corp. (a) 24,891 4,936,881Seer, Inc. (a) 14,864 233,811Sotera Health Co. (a) 40,328 867,455Syneos Health, Inc. (a) 49,514 4,483,988Thermo Fisher Scientific, Inc. 187,894 109,222,782Waters Corp. (a) 29,265 9,368,312West Pharmaceutical Services, Inc. 35,352 13,901,113
TOTAL LIFE SCIENCES TOOLS & SERVICES 282,968,190
PHARMACEUTICALS – 25.9%Pharmaceuticals – 25.9%Aclaris Therapeutics, Inc. (a) 20,975 229,047Aerie Pharmaceuticals, Inc. (a) 21,131 155,524Amneal Pharmaceuticals, Inc. (a) 45,653 202,243Amphastar Pharmaceuticals, Inc. (a) 18,624 430,028ANI Pharmaceuticals, Inc. (a) 5,432 219,561Antares Pharma, Inc. (a) 74,581 251,338Arvinas, Inc. (a) 17,534 1,253,506Atea Pharmaceuticals, Inc. (a) 7,865 56,156Axsome Therapeutics, Inc. (a) 11,530 316,383BioDelivery Sciences International,
Inc. (a) 39,592 144,907Bristol-Myers Squibb Co. 1,061,267 68,865,616Cara Therapeutics, Inc. (a) 18,940 219,325Cassava Sciences, Inc. (a) 18,139 802,651Catalent, Inc. (a) 81,412 8,461,149Collegium Pharmaceutical, Inc. (a) 14,771 263,662Corcept Therapeutics, Inc. (a) 52,872 992,407Elanco Animal Health, Inc. (a) 203,024 5,286,745Eli Lilly & Co. 388,329 95,292,053Endo International PLC (a) 109,285 348,619Fulcrum Therapeutics, Inc. (a) 12,176 148,060Harmony Biosciences Holdings,
Inc. (a) 8,102 290,538Innoviva, Inc. (a) 29,806 477,790Intra-Cellular Therapies, Inc. (a) 38,998 1,852,015Jazz Pharmaceuticals PLC (a) 29,211 4,057,700Johnson & Johnson 1,257,257 216,612,808Merck & Co., Inc. 1,208,968 98,506,713Nektar Therapeutics (a) 87,197 969,631NGM Biopharmaceuticals, Inc. (a) 14,557 230,146Nuvation Bio, Inc. (a) 51,650 315,065Ocular Therapeutix, Inc. (a) 34,671 196,238
Fidelity® MSCI Health Care Index ETFSchedule of Investments (Unaudited) – continued
See accompanying notes which are an integral part of the financial statements.
Semi-Annual Report 40

Common Stocks – continuedShares Value
PHARMACEUTICALS – continuedPharmaceuticals – continuedOmeros Corp. (a) 28,482 $ 170,892Oramed Pharmaceuticals, Inc. (a) 13,944 124,938Organon & Co. 121,580 3,879,618Pacira BioSciences, Inc. (a) 21,128 1,326,205Perrigo Co. PLC 64,057 2,438,650Pfizer, Inc. 2,677,719 141,089,014Phathom Pharmaceuticals, Inc. (a) 6,688 112,358Phibro Animal Health Corp. Class A 10,052 194,004Pliant Therapeutics, Inc. (a) 6,150 72,139Prestige Consumer Healthcare,
Inc. (a) 24,184 1,365,187Provention Bio, Inc. (a) 22,622 121,254Reata Pharmaceuticals, Inc.
Class A (a) 12,813 360,302Relmada Therapeutics, Inc. (a) 11,304 207,881Revance Therapeutics, Inc. (a) 32,198 429,199Royalty Pharma PLC Class A 163,468 6,540,355SIGA Technologies, Inc. (a) 21,874 142,400Supernus Pharmaceuticals, Inc. (a) 25,645 791,148Theravance Biopharma, Inc. (a) 25,575 232,988Tilray, Inc. Class 2 (a) 221,305 1,318,978Viatris, Inc. 576,694 8,633,109
Shares Value
Zoetis, Inc. 226,353 $ 45,223,066Zogenix, Inc. (a) 23,800 619,038
TOTAL PHARMACEUTICALS 722,840,347
TOTAL COMMON STOCKS(Cost $2,164,670,929) 2,786,291,891
Money Market Fund – 0.2%
State Street Institutional TreasuryPlus Money Market Fund, TrustClass, 0.01% (c)(Cost $3,894,000) 3,894,000 3,894,000
TOTAL INVESTMENT IN SECURITIES – 99.9%(Cost $2,168,564,929) 2,790,185,891
NET OTHER ASSETS (LIABILITIES) – 0.1% 4,071,237
NET ASSETS – 100.0% $2,794,257,128
Legend(a) Non-income producing.
(b) Level 3 security.
(c) The rate quoted is the annualized seven-day yield of the fund at periodend.
Futures Contracts
Number ofcontracts
ExpirationDate
NotionalAmount Value
UnrealizedAppreciation/(Depreciation)
Purchased
Equity Index ContractsCME E-mini Russell 2000 Index Contracts (United States) 7 March 2022 $ 708,540 $ (66,892) $ (66,892)CME E-mini S&P Health Care Select Sector Index Contracts (United States) 53 March 2022 7,018,790 (264,156) (264,156)
Total Equity Index Contracts $ (331,048)
The notional amount of futures purchased as a percentage of Net Assets is 0.3%
See accompanying notes which are an integral part of the financial statements.
41 Semi-Annual Report

Investment ValuationThe following is a summary of the inputs used, as of January 31, 2022, involving the Fund’s assets and liabilities carried at fair value. The inputs or methodologyused for valuing securities may not be an indication of the risk associated with investing in those securities. For more information on valuation inputs, and theiraggregation into the levels used in the table below, please refer to the Investment Valuation section in the accompanying Notes to Financial Statements.
Valuation Inputs at Reporting Date:
Description Total Level 1 Level 2 Level 3Investments in Securities:
Common Stocks $ 2,786,291,891 $ 2,786,272,050 $ — $ 19,841Money Market Funds 3,894,000 3,894,000 — —
Total Investments in Securities: $ 2,790,185,891 $ 2,790,166,050 $ — $ 19,841
Derivative Instruments:
LiabilitiesFutures Contracts $ (331,048) $ (331,048) $ — $ —
Total Liabilities $ (331,048) $ (331,048) $ — $ —
Total Derivative Instruments: $ (331,048) $ (331,048) $ — $ —
Value of Derivative InstrumentsThe following table is a summary of the Fund’s value of derivative instruments by primary risk exposure as of January 31, 2022. For additional information onderivative instruments, please refer to the Derivative Instruments section in the accompanying Notes to Financial Statements.
Primary Risk/ Derivative Type ValueAsset Liabilities
Equity RiskFutures Contracts(a) $0 $(331,048)
Total Equity Risk 0 (331,048)
Total Value of Derivatives $0 $(331,048)
(a) Reflects gross cumulative appreciation (depreciation) on futures contracts as presented in the Schedule of Investments. In the Statement of Assets and Liabilities,the period end daily variation margin is included in receivable or payable for daily variation margin on futures contracts, and the net cumulative appreciation(depreciation) is included in total accumulated earnings (loss).
Fidelity® MSCI Health Care Index ETFSchedule of Investments (Unaudited) – continued
See accompanying notes which are an integral part of the financial statements.
Semi-Annual Report 42

Common Stocks – 99.8%Shares Value
AEROSPACE & DEFENSE – 15.9%Aerospace & Defense – 15.9%AAR Corp. (a) 7,331 $ 295,219Aerojet Rocketdyne Holdings, Inc. 14,508 559,864AeroVironment, Inc. (a) 4,993 284,202Astra Space, Inc. (a) 23,479 112,230Axon Enterprise, Inc. (a) 13,995 1,958,320BWX Technologies, Inc. 20,268 902,129Curtiss-Wright Corp. 8,753 1,162,311Ducommun, Inc. (a) 2,319 101,456General Dynamics Corp. 50,725 10,758,772HEICO Corp. 9,300 1,268,427HEICO Corp. Class A 15,631 1,714,721Hexcel Corp. (a) 17,836 930,504Howmet Aerospace, Inc. 82,613 2,568,438Huntington Ingalls Industries, Inc. 8,590 1,608,048Kaman Corp. 5,287 211,321Kratos Defense & Security Solutions,
Inc. (a) 26,420 442,799L3Harris Technologies, Inc. 42,902 8,978,960Lockheed Martin Corp. 53,203 20,702,883Maxar Technologies, Inc. 15,639 406,770Mercury Systems, Inc. (a) 12,416 706,719Momentus, Inc. (a) 9,396 33,826Moog, Inc. Class A 6,214 473,755National Presto Industries, Inc. 1,122 92,284Northrop Grumman Corp. 32,470 12,010,653PAE, Inc. (a) 13,996 140,100Parsons Corp. (a) 5,429 165,313Raytheon Technologies Corp. 321,908 29,032,883Rocket Lab USA, Inc. (a) 33,323 301,240Spirit AeroSystems Holdings, Inc.
Class A 22,561 988,849Textron, Inc. 47,849 3,256,603The Boeing Co. (a) 118,875 23,803,530TransDigm Group, Inc. (a) 11,177 6,887,156Triumph Group, Inc. (a) 13,678 249,213Vectrus, Inc. (a) 2,526 116,221Virgin Galactic Holdings, Inc. (a) 41,510 381,892
TOTAL AEROSPACE & DEFENSE 133,607,611
AIR FREIGHT & LOGISTICS – 6.6%Air Freight & Logistics – 6.6%Air Transport Services Group,
Inc. (a) 3,951 106,084Atlas Air Worldwide Holdings,
Inc. (a) 1,519 122,021CH Robinson Worldwide, Inc. 28,103 2,940,979Expeditors International of
Washington, Inc. 36,266 4,151,732FedEx Corp. 53,988 13,273,490
Shares Value
Forward Air Corp. 5,811 $ 617,709GXO Logistics, Inc. (a) 22,080 1,793,117Hub Group, Inc. Class A (a) 7,145 541,019United Parcel Service, Inc. Class B 155,481 31,439,813
TOTAL AIR FREIGHT & LOGISTICS 54,985,964
AIRLINES – 0.6%Airlines – 0.6%Alaska Air Group, Inc. (a) 6,684 365,882Allegiant Travel Co. (a) 946 169,012American Airlines Group, Inc. (a) 34,743 572,217Delta Air Lines, Inc. (a) 34,055 1,351,643Frontier Group Holdings, Inc. (a) 9,143 119,590Hawaiian Holdings, Inc. (a) 2,893 49,470JetBlue Airways Corp. (a) 17,314 253,304SkyWest, Inc. (a) 2,639 100,678Southwest Airlines Co. (a) 31,531 1,411,328Spirit Airlines, Inc. (a) 5,729 123,002Sun Country Airlines Holdings,
Inc. (a) 4,270 113,497Wheels Up Experience, Inc. (a) 15,629 59,703
TOTAL AIRLINES 4,689,326
BUILDING PRODUCTS – 7.3%Building Products – 7.3%AAON, Inc. 8,978 576,837Advanced Drainage Systems, Inc. 11,324 1,280,631Allegion PLC 19,128 2,347,579American Woodmark Corp. (a) 3,596 215,508AO Smith Corp. 28,508 2,178,581Apogee Enterprises, Inc. 5,429 242,405Armstrong World Industries, Inc. 10,187 1,008,717Builders FirstSource, Inc. (a) 42,013 2,856,464Carlisle Cos., Inc. 11,117 2,483,982Carrier Global Corp. 175,975 8,390,488Cornerstone Building Brands,
Inc. (a) 11,003 162,294CSW Industrials, Inc. 3,188 353,868Fortune Brands Home & Security,
Inc. 29,427 2,771,141Gibraltar Industries, Inc. (a) 6,982 382,614Griffon Corp. 10,483 234,714Insteel Industries, Inc. 4,113 155,595Janus International Group, Inc. (a) 14,677 155,576JELD-WEN Holding, Inc. (a) 19,624 463,126Johnson Controls International PLC 152,040 11,048,747Lennox International, Inc. 7,134 2,023,345Masco Corp. 52,769 3,341,861Masonite International Corp. (a) 4,931 489,352Owens Corning 21,974 1,949,094PGT Innovations, Inc. (a) 12,848 243,984
Fidelity® MSCI Industrials Index ETF
Schedule of Investments January 31, 2022 (Unaudited)Showing Percentage of Net Assets
See accompanying notes which are an integral part of the financial statements.
43 Semi-Annual Report

Common Stocks – continuedShares Value
BUILDING PRODUCTS – continuedBuilding Products – continuedQuanex Building Products Corp. 7,105 $ 154,818Resideo Technologies, Inc. (a) 29,957 742,334Simpson Manufacturing Co., Inc. 9,258 1,044,210The AZEK Co., Inc. (a) 19,839 655,282Trane Technologies PLC 50,725 8,780,498Trex Co., Inc. (a) 24,621 2,252,083UFP Industries, Inc. 13,170 1,051,756View, Inc. (a) 11,511 30,274Zurn Water Solutions Corp. 25,985 793,582
TOTAL BUILDING PRODUCTS 60,861,340
COMMERCIAL SERVICES & SUPPLIES – 6.7%Commercial Printing – 0.1%Brady Corp. Class A 10,400 539,968Cimpress PLC (a) 3,456 232,312Deluxe Corp. 9,262 278,786Ennis, Inc. 5,731 108,488
1,159,554Diversified Support Services – 2.0%ACV Auctions, Inc. Class A (a) 9,135 121,130Cintas Corp. 19,784 7,746,030Copart, Inc. (a) 45,457 5,875,317Driven Brands Holdings, Inc. (a) 10,648 300,806Healthcare Services Group, Inc. 15,996 290,967IAA, Inc. (a) 28,870 1,325,999KAR Auction Services, Inc. (a) 25,833 367,345Matthews International Corp.
Class A 6,698 235,234UniFirst Corp. 3,256 618,933Viad Corp. (a) 4,452 167,707
17,049,468Environmental & Facilities Services – 4.1%ABM Industries, Inc. 14,363 598,794BrightView Holdings, Inc. (a) 8,894 118,023Casella Waste Systems, Inc.
Class A (a) 10,733 815,493Clean Harbors, Inc. (a) 11,013 1,019,253Harsco Corp. (a) 17,017 267,167Heritage-Crystal Clean, Inc. (a) 3,277 93,755Montrose Environmental Group,
Inc. (a) 4,717 215,897Republic Services, Inc. 47,577 6,073,680Rollins, Inc. 47,387 1,461,889SP Plus Corp. (a) 4,999 140,872Stericycle, Inc. (a) 19,691 1,156,649Tetra Tech, Inc. 11,574 1,610,985US Ecology, Inc. (a) 6,663 190,429Waste Connections, Inc. 55,619 6,935,689
Shares Value
Waste Management, Inc. 89,897 $ 13,524,105
34,222,680Office Services & Supplies – 0.3%ACCO Brands Corp. 20,478 166,691Herman Miller, Inc. 16,169 624,447HNI Corp. 9,483 397,717Interface, Inc. 12,433 164,862Kimball International, Inc. Class B 8,058 79,130MSA Safety, Inc. 7,987 1,097,414Pitney Bowes, Inc. 18,240 112,358Steelcase, Inc. Class A 18,519 228,524
2,871,143Security & Alarm Services – 0.2%ADT, Inc. 32,609 247,502CoreCivic, Inc. (a) 26,241 265,297The Brink’s Co. 10,732 748,879
1,261,678
TOTAL COMMERCIAL SERVICES & SUPPLIES 56,564,523
CONSTRUCTION & ENGINEERING – 1.8%Construction & Engineering – 1.8%AECOM 29,175 2,016,868Ameresco, Inc. Class A (a) 5,666 286,756API Group Corp. (a) 30,011 669,245Arcosa, Inc. 10,348 482,838Argan, Inc. 3,407 126,570Comfort Systems USA, Inc. 7,774 697,950Construction Partners, Inc.
Class A (a) 6,728 176,543Dycom Industries, Inc. (a) 6,556 552,605EMCOR Group, Inc. 11,504 1,371,392Fluor Corp. (a) 30,269 636,860Granite Construction, Inc. 9,873 355,230Great Lakes Dredge & Dock
Corp. (a) 14,019 191,920IES Holdings, Inc. (a) 2,044 100,769MasTec, Inc. (a) 12,659 1,090,320MYR Group, Inc. (a) 3,641 342,363NV5 Global, Inc. (a) 2,815 294,421Primoris Services Corp. 11,443 294,314Quanta Services, Inc. 29,703 3,051,092Sterling Construction Co., Inc. (a) 6,057 153,908Tutor Perini Corp. (a) 9,690 115,311Valmont Industries, Inc. 4,525 982,966WillScot Mobile Mini Holdings
Corp. (a) 36,303 1,344,663
TOTAL CONSTRUCTION & ENGINEERING 15,334,904
ELECTRICAL EQUIPMENT – 7.5%Electrical Components & Equipment – 7.4%Acuity Brands, Inc. 7,642 1,463,672
Fidelity® MSCI Industrials Index ETFSchedule of Investments (Unaudited) – continued
See accompanying notes which are an integral part of the financial statements.
Semi-Annual Report 44
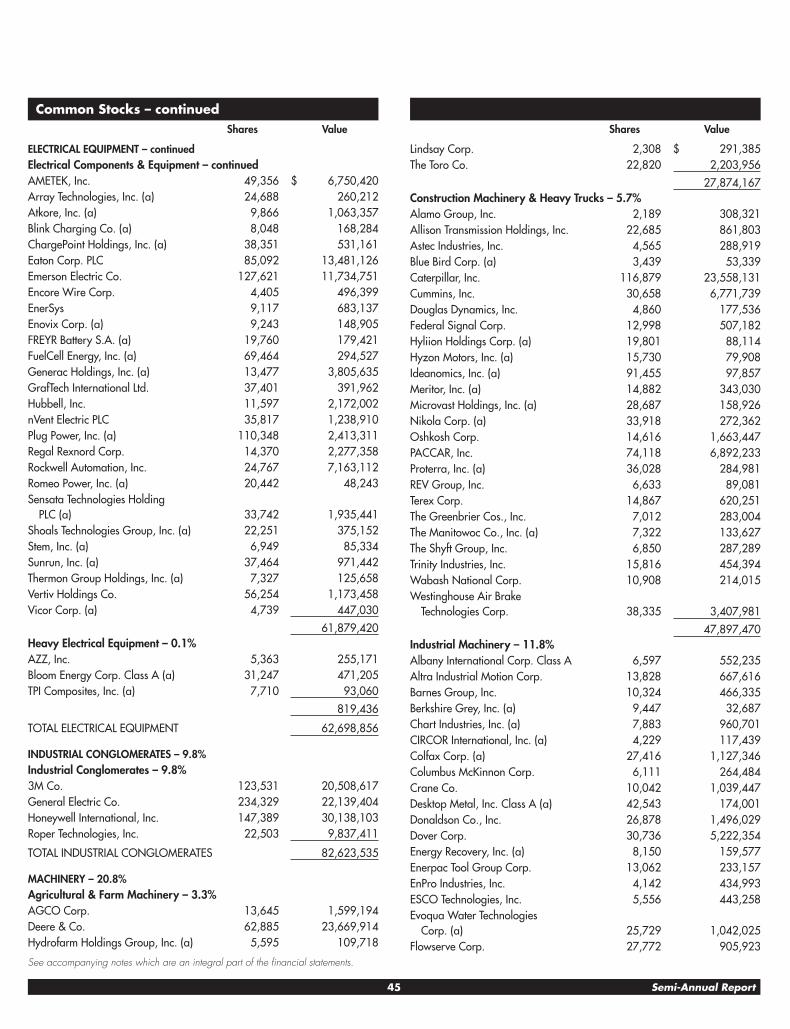
Common Stocks – continuedShares Value
ELECTRICAL EQUIPMENT – continuedElectrical Components & Equipment – continuedAMETEK, Inc. 49,356 $ 6,750,420Array Technologies, Inc. (a) 24,688 260,212Atkore, Inc. (a) 9,866 1,063,357Blink Charging Co. (a) 8,048 168,284ChargePoint Holdings, Inc. (a) 38,351 531,161Eaton Corp. PLC 85,092 13,481,126Emerson Electric Co. 127,621 11,734,751Encore Wire Corp. 4,405 496,399EnerSys 9,117 683,137Enovix Corp. (a) 9,243 148,905FREYR Battery S.A. (a) 19,760 179,421FuelCell Energy, Inc. (a) 69,464 294,527Generac Holdings, Inc. (a) 13,477 3,805,635GrafTech International Ltd. 37,401 391,962Hubbell, Inc. 11,597 2,172,002nVent Electric PLC 35,817 1,238,910Plug Power, Inc. (a) 110,348 2,413,311Regal Rexnord Corp. 14,370 2,277,358Rockwell Automation, Inc. 24,767 7,163,112Romeo Power, Inc. (a) 20,442 48,243Sensata Technologies Holding
PLC (a) 33,742 1,935,441Shoals Technologies Group, Inc. (a) 22,251 375,152Stem, Inc. (a) 6,949 85,334Sunrun, Inc. (a) 37,464 971,442Thermon Group Holdings, Inc. (a) 7,327 125,658Vertiv Holdings Co. 56,254 1,173,458Vicor Corp. (a) 4,739 447,030
61,879,420Heavy Electrical Equipment – 0.1%AZZ, Inc. 5,363 255,171Bloom Energy Corp. Class A (a) 31,247 471,205TPI Composites, Inc. (a) 7,710 93,060
819,436
TOTAL ELECTRICAL EQUIPMENT 62,698,856
INDUSTRIAL CONGLOMERATES – 9.8%Industrial Conglomerates – 9.8%3M Co. 123,531 20,508,617General Electric Co. 234,329 22,139,404Honeywell International, Inc. 147,389 30,138,103Roper Technologies, Inc. 22,503 9,837,411
TOTAL INDUSTRIAL CONGLOMERATES 82,623,535
MACHINERY – 20.8%Agricultural & Farm Machinery – 3.3%AGCO Corp. 13,645 1,599,194Deere & Co. 62,885 23,669,914Hydrofarm Holdings Group, Inc. (a) 5,595 109,718
Shares Value
Lindsay Corp. 2,308 $ 291,385The Toro Co. 22,820 2,203,956
27,874,167Construction Machinery & Heavy Trucks – 5.7%Alamo Group, Inc. 2,189 308,321Allison Transmission Holdings, Inc. 22,685 861,803Astec Industries, Inc. 4,565 288,919Blue Bird Corp. (a) 3,439 53,339Caterpillar, Inc. 116,879 23,558,131Cummins, Inc. 30,658 6,771,739Douglas Dynamics, Inc. 4,860 177,536Federal Signal Corp. 12,998 507,182Hyliion Holdings Corp. (a) 19,801 88,114Hyzon Motors, Inc. (a) 15,730 79,908Ideanomics, Inc. (a) 91,455 97,857Meritor, Inc. (a) 14,882 343,030Microvast Holdings, Inc. (a) 28,687 158,926Nikola Corp. (a) 33,918 272,362Oshkosh Corp. 14,616 1,663,447PACCAR, Inc. 74,118 6,892,233Proterra, Inc. (a) 36,028 284,981REV Group, Inc. 6,633 89,081Terex Corp. 14,867 620,251The Greenbrier Cos., Inc. 7,012 283,004The Manitowoc Co., Inc. (a) 7,322 133,627The Shyft Group, Inc. 6,850 287,289Trinity Industries, Inc. 15,816 454,394Wabash National Corp. 10,908 214,015Westinghouse Air Brake
Technologies Corp. 38,335 3,407,981
47,897,470Industrial Machinery – 11.8%Albany International Corp. Class A 6,597 552,235Altra Industrial Motion Corp. 13,828 667,616Barnes Group, Inc. 10,324 466,335Berkshire Grey, Inc. (a) 9,447 32,687Chart Industries, Inc. (a) 7,883 960,701CIRCOR International, Inc. (a) 4,229 117,439Colfax Corp. (a) 27,416 1,127,346Columbus McKinnon Corp. 6,111 264,484Crane Co. 10,042 1,039,447Desktop Metal, Inc. Class A (a) 42,543 174,001Donaldson Co., Inc. 26,878 1,496,029Dover Corp. 30,736 5,222,354Energy Recovery, Inc. (a) 8,150 159,577Enerpac Tool Group Corp. 13,062 233,157EnPro Industries, Inc. 4,142 434,993ESCO Technologies, Inc. 5,556 443,258Evoqua Water Technologies
Corp. (a) 25,729 1,042,025Flowserve Corp. 27,772 905,923
See accompanying notes which are an integral part of the financial statements.
45 Semi-Annual Report

Common Stocks – continuedShares Value
MACHINERY – continuedIndustrial Machinery – continuedFortive Corp. 72,683 $ 5,127,059Franklin Electric Co., Inc. 8,415 730,422Gates Industrial Corp. PLC (a) 12,757 197,351Graco, Inc. 36,214 2,627,688Helios Technologies, Inc. 6,576 503,919Hillenbrand, Inc. 15,678 728,713Hillman Solutions Corp. (a) 19,891 178,422Hyster-Yale Materials Handling, Inc. 1,507 67,649IDEX Corp. 16,223 3,495,083Illinois Tool Works, Inc. 67,238 15,728,313Ingersoll Rand, Inc. 86,518 4,863,177ITT, Inc. 18,342 1,685,997John Bean Technologies Corp. 6,774 914,490Kadant, Inc. 2,476 517,434Kennametal, Inc. 17,045 589,246Lincoln Electric Holdings, Inc. 12,073 1,543,412Luxfer Holdings PLC 5,963 101,848Markforged Holding Corp. (a) 9,826 46,477Mueller Industries, Inc. 11,021 569,345Mueller Water Products, Inc.
Class A 34,045 437,478Nordson Corp. 11,163 2,595,844Omega Flex, Inc. 663 94,119Otis Worldwide Corp. 86,557 7,394,565Parker Hannifin Corp. 27,565 8,545,426Pentair PLC 35,377 2,253,515Proto Labs, Inc. (a) 5,962 299,173RBC Bearings, Inc. (a) 6,045 1,090,941Snap-on, Inc. 11,510 2,396,958SPX Corp. (a) 9,639 502,963SPX FLOW, Inc. 8,940 770,628Standex International Corp. 2,624 260,694Stanley Black & Decker, Inc. 34,790 6,076,073Tennant Co. 4,032 311,149The Gorman-Rupp Co. 4,417 177,166The Middleby Corp. (a) 11,860 2,196,472The Timken Co. 14,700 981,960Watts Water Technologies, Inc.
Class A 5,868 899,036Welbilt, Inc. (a) 28,772 683,335Woodward, Inc. 12,928 1,425,571Xylem, Inc. 38,458 4,038,859
98,987,577
TOTAL MACHINERY 174,759,214
MARINE – 0.1%Marine – 0.1%Genco Shipping & Trading Ltd. 5,746 89,408Kirby Corp. (a) 3,199 208,511
Shares Value
Matson, Inc. 2,337 $ 228,231
TOTAL MARINE 526,150
PROFESSIONAL SERVICES – 7.2%Human Resource & Employment Services – 1.1%ASGN, Inc. (a) 11,325 1,300,903Barrett Business Services, Inc. 1,619 103,616First Advantage Corp. (a) 6,482 109,675Heidrick & Struggles International,
Inc. 4,153 181,777Insperity, Inc. 7,826 841,530Kelly Services, Inc. Class A 7,343 125,418Kforce, Inc. 4,125 283,264Korn Ferry 11,921 791,316ManpowerGroup, Inc. 11,609 1,217,436Robert Half International, Inc. 23,881 2,704,762Skillsoft Corp. (a) 14,111 104,704TriNet Group, Inc. (a) 8,463 721,048TrueBlue, Inc. (a) 7,552 200,883Upwork, Inc. (a) 24,422 664,278
9,350,610Research & Consulting Services – 6.1%Booz Allen Hamilton Holding Corp. 28,829 2,212,049CACI International, Inc. Class A (a) 5,017 1,241,507CBIZ, Inc. (a) 10,068 388,927Clarivate PLC (a) 74,964 1,233,907CoStar Group, Inc. (a) 84,319 5,915,821CRA International, Inc. 1,567 133,289Dun & Bradstreet Holdings, Inc. (a) 32,485 651,649Equifax, Inc. 26,007 6,235,438Exponent, Inc. 11,101 1,054,373Forrester Research, Inc. (a) 2,538 139,641FTI Consulting, Inc. (a) 7,304 1,064,996Huron Consulting Group, Inc. (a) 4,848 213,894ICF International, Inc. 3,993 376,899IHS Markit Ltd. 80,846 9,442,004Jacobs Engineering Group, Inc. 27,821 3,621,738KBR, Inc. 30,133 1,307,772Leidos Holdings, Inc. 28,680 2,565,426ManTech International Corp.
Class A 5,933 428,600Nielsen Holdings PLC 72,966 1,376,139Resources Connection, Inc. 6,615 115,299Science Applications International
Corp. 12,676 1,039,812Spire Global, Inc. (a) 9,928 24,721TransUnion 40,883 4,215,855Verisk Analytics, Inc. 32,720 6,417,374Willdan Group, Inc. (a) 2,756 86,704
51,503,834
TOTAL PROFESSIONAL SERVICES 60,854,444
Fidelity® MSCI Industrials Index ETFSchedule of Investments (Unaudited) – continued
See accompanying notes which are an integral part of the financial statements.
Semi-Annual Report 46

Common Stocks – continuedShares Value
ROAD & RAIL – 11.8%Railroads – 7.7%CSX Corp. 481,296 $ 16,469,949Norfolk Southern Corp. 52,727 14,341,217Union Pacific Corp. 139,221 34,046,495
64,857,661Trucking – 4.1%AMERCO 2,089 1,272,096ArcBest Corp. 5,451 482,086Avis Budget Group, Inc. (a) 10,684 1,882,307Heartland Express, Inc. 11,033 165,054JB Hunt Transport Services, Inc. 17,968 3,459,559Knight-Swift Transportation
Holdings, Inc. 33,603 1,901,258Landstar System, Inc. 8,189 1,310,240Lyft, Inc. Class A (a) 55,665 2,144,216Marten Transport Ltd. 13,353 222,862Old Dominion Freight Line, Inc. 21,014 6,344,757Ryder System, Inc. 11,474 839,782Saia, Inc. (a) 5,606 1,593,674Schneider National, Inc. Class B 12,299 314,854TuSimple Holdings, Inc. (a) 7,853 147,322Uber Technologies, Inc. (a) 261,477 9,779,240Werner Enterprises, Inc. 13,140 585,913XPO Logistics, Inc. (a) 20,854 1,379,909
33,825,129
TOTAL ROAD & RAIL 98,682,790
TRADING COMPANIES & DISTRIBUTORS – 3.7%Trading Companies & Distributors – 3.7%Air Lease Corp. 23,086 919,054Applied Industrial Technologies, Inc. 8,262 809,511Beacon Roofing Supply, Inc. (a) 11,902 653,063Boise Cascade Co. 8,460 594,061Core & Main, Inc. (a) 14,302 343,963DXP Enterprises, Inc. (a) 3,886 110,945Fastenal Co. 122,695 6,954,353GATX Corp. 7,244 756,636Global Industrial Co. 2,913 101,838
Shares Value
GMS, Inc. (a) 8,293 $ 424,436H&E Equipment Services, Inc. 6,968 290,078Herc Holdings, Inc. 4,411 707,745McGrath RentCorp 5,212 397,206MRC Global, Inc. (a) 16,492 122,206MSC Industrial Direct Co., Inc.
Class A 10,017 817,788NOW, Inc. (a) 23,681 210,524Rush Enterprises, Inc. Class A 9,212 486,578Rush Enterprises, Inc. Class B 1,217 61,750SiteOne Landscape Supply, Inc. (a) 9,494 1,710,059Triton International Ltd. 14,740 890,591United Rentals, Inc. (a) 15,458 4,948,415Univar Solutions, Inc. (a) 36,574 969,211Veritiv Corp. (a) 3,068 285,569Watsco, Inc. 7,028 1,985,832WESCO International, Inc. (a) 9,706 1,183,064WW Grainger, Inc. 9,447 4,677,304
TOTAL TRADING COMPANIES & DISTRIBUTORS 31,411,780
TOTAL COMMON STOCKS(Cost $740,690,342) 837,600,437
Money Market Fund – 0.2%
State Street Institutional TreasuryPlus Money Market Fund, TrustClass, 0.01% (b)(Cost $1,620,000) 1,620,000 1,620,000
TOTAL INVESTMENT IN SECURITIES – 100.0%(Cost $742,310,342) 839,220,437
NET OTHER ASSETS (LIABILITIES) – 0.0% 398,737
NET ASSETS – 100.0% $ 839,619,174
Legend(a) Non-income producing.
(b) The rate quoted is the annualized seven-day yield of the fund at periodend.
Futures Contracts
Number ofcontracts
ExpirationDate
NotionalAmount Value
UnrealizedAppreciation/(Depreciation)
Purchased
Equity Index ContractsCME E-mini Russell 2000 Index Contracts (United States) 3 March 2022 $ 303,660 $ (22,592) $ (22,592)CME E-mini S&P Industrial Select Sector Index Contracts (United States) 16 March 2022 1,620,480 (64,053) (64,053)
Total Equity Index Contracts $ (86,645)
See accompanying notes which are an integral part of the financial statements.
47 Semi-Annual Report

The notional amount of futures purchased as a percentage of Net Assets is 0.2%
Investment ValuationThe following is a summary of the inputs used, as of January 31, 2022, involving the Fund’s assets and liabilities carried at fair value. The inputs or methodologyused for valuing securities may not be an indication of the risk associated with investing in those securities. For more information on valuation inputs, and theiraggregation into the levels used in the table below, please refer to the Investment Valuation section in the accompanying Notes to Financial Statements.
Valuation Inputs at Reporting Date:
Description Total Level 1 Level 2 Level 3Investments in Securities:
Common Stocks $ 837,600,437 $ 837,600,437 $ — $ —Money Market Funds 1,620,000 1,620,000 — —
Total Investments in Securities: $ 839,220,437 $ 839,220,437 $ — $ —
Derivative Instruments:
LiabilitiesFutures Contracts $ (86,645) $ (86,645) $ — $ —
Total Liabilities $ (86,645) $ (86,645) $ — $ —
Total Derivative Instruments: $ (86,645) $ (86,645) $ — $ —
Value of Derivative InstrumentsThe following table is a summary of the Fund’s value of derivative instruments by primary risk exposure as of January 31, 2022. For additional information onderivative instruments, please refer to the Derivative Instruments section in the accompanying Notes to Financial Statements.
Primary Risk/ Derivative Type ValueAsset Liabilities
Equity RiskFutures Contracts(a) $0 $(86,645)
Total Equity Risk 0 (86,645)
Total Value of Derivatives $0 $(86,645)
(a) Reflects gross cumulative appreciation (depreciation) on futures contracts as presented in the Schedule of Investments. In the Statement of Assets and Liabilities,the period end daily variation margin is included in receivable or payable for daily variation margin on futures contracts, and the net cumulative appreciation(depreciation) is included in total accumulated earnings (loss).
Fidelity® MSCI Industrials Index ETFSchedule of Investments (Unaudited) – continued
See accompanying notes which are an integral part of the financial statements.
Semi-Annual Report 48

Common Stocks – 99.8%Shares Value
COMMUNICATIONS EQUIPMENT – 2.9%Communications Equipment – 2.9%ADTRAN, Inc. 25,086 $ 481,902Arista Networks, Inc. (a) 122,554 15,234,688Calix, Inc. (a) 30,851 1,551,188Cambium Networks Corp. (a) 4,887 118,168Casa Systems, Inc. (a) 15,787 69,936Ciena Corp. (a) 81,978 5,435,961Cisco Systems, Inc. 2,240,256 124,715,052Clearfield, Inc. (a) 6,213 400,552CommScope Holding Co., Inc. (a) 106,100 996,279Comtech Telecommunications Corp. 13,988 284,376Digi International, Inc. (a) 17,892 399,707Extreme Networks, Inc. (a) 68,489 869,126F5 Networks, Inc. (a) 32,119 6,668,547Harmonic, Inc. (a) 56,782 610,974Infinera Corp. (a) 95,942 807,832Inseego Corp. (a) 40,940 186,686Juniper Networks, Inc. 173,167 6,029,675Lumentum Holdings, Inc. (a) 38,873 3,944,832Motorola Solutions, Inc. 90,013 20,877,615NETGEAR, Inc. (a) 16,667 461,176Netscout Systems, Inc. (a) 39,505 1,246,383Plantronics, Inc. (a) 20,308 541,208Ribbon Communications, Inc. (a) 50,515 227,318ViaSat, Inc. (a) 29,218 1,286,176Viavi Solutions, Inc. (a) 121,883 2,006,194
TOTAL COMMUNICATIONS EQUIPMENT 195,451,551
ELECTRONIC EQUIPMENT, INSTRUMENTS & COMPONENTS – 3.1%Electronic Components – 0.8%Amphenol Corp. Class A 318,313 25,334,532Belden, Inc. 23,495 1,314,545Corning, Inc. 432,052 18,163,466II-VI, Inc. (a) 55,893 3,543,616Knowles Corp. (a) 49,184 1,043,193Littelfuse, Inc. 13,129 3,544,436Rogers Corp. (a) 10,036 2,739,326Vishay Intertechnology, Inc. 69,434 1,437,978
57,121,092Electronic Equipment & Instruments – 1.2%908 Devices, Inc. (a) 8,264 130,736Advanced Energy Industries, Inc. 20,455 1,762,812Aeva Technologies, Inc. (a) 50,740 265,370AEye, Inc. (a) 53,349 154,179Badger Meter, Inc. 15,803 1,598,790Cognex Corp. 93,953 6,244,116Coherent, Inc. (a) 13,034 3,369,028Evolv Technologies Holdings, Inc. (a) 34,477 110,326FARO Technologies, Inc. (a) 9,378 509,319Itron, Inc. (a) 23,952 1,485,024
Shares Value
Keysight Technologies, Inc. (a) 98,031 $ 16,549,593MicroVision, Inc. (a) 84,023 286,518Napco Security Technologies,
Inc. (a) 16,620 345,530National Instruments Corp. 70,445 2,903,743nLight, Inc. (a) 20,741 429,131Novanta, Inc. (a) 19,027 2,627,629OSI Systems, Inc. (a) 9,124 756,745PAR Technology Corp. (a) 13,095 491,063Teledyne Technologies, Inc. (a) 24,833 10,465,371Trimble, Inc. (a) 134,028 9,671,460Velodyne Lidar, Inc. (a) 50,113 195,942Vishay Precision Group, Inc. (a) 7,488 239,841Vontier Corp. 90,699 2,549,549Zebra Technologies Corp.
Class A (a) 28,447 14,482,937
77,624,752Electronic Manufacturing Services – 0.7%Benchmark Electronics, Inc. 19,499 470,706CTS Corp. 16,474 552,703Fabrinet (a) 19,567 2,214,202Flex Ltd. (a) 260,678 4,217,770IPG Photonics Corp. (a) 20,050 3,097,123Jabil, Inc. 73,782 4,536,855Kimball Electronics, Inc. (a) 14,031 277,673Methode Electronics, Inc. 20,521 903,540Plexus Corp. (a) 14,931 1,157,451Sanmina Corp. (a) 34,940 1,321,431TE Connectivity Ltd. 174,671 24,979,700TTM Technologies, Inc. (a) 56,363 758,646
44,487,800Technology Distributors – 0.4%Arrow Electronics, Inc. (a) 38,255 4,743,620Avnet, Inc. 53,469 2,158,009CDW Corp. 73,218 13,841,863ePlus, Inc. (a) 14,092 647,809Insight Enterprises, Inc. (a) 18,824 1,772,280PC Connection, Inc. 6,226 269,897ScanSource, Inc. (a) 14,423 449,709SYNNEX Corp. 23,712 2,479,564
26,362,751
TOTAL ELECTRONIC EQUIPMENT, INSTRUMENTS &COMPONENTS 205,596,395
IT SERVICES – 16.6%Data Processing & Outsourced Services – 11.1%Affirm Holdings, Inc. (a) 46,388 2,972,079Alliance Data Systems Corp. 24,704 1,705,564Automatic Data Processing, Inc. 224,908 46,369,282Broadridge Financial Solutions, Inc. 61,994 9,870,685Cantaloupe, Inc. (a) 28,339 238,048
Fidelity® MSCI Information Technology Index ETF
Schedule of Investments January 31, 2022 (Unaudited)Showing Percentage of Net Assets
See accompanying notes which are an integral part of the financial statements.
49 Semi-Annual Report

Common Stocks – continuedShares Value
IT SERVICES – continuedData Processing & Outsourced Services – continuedCass Information Systems, Inc. 6,656 $ 270,766Concentrix Corp. 23,712 4,765,875Conduent, Inc. (a) 88,667 419,395CSG Systems International, Inc. 17,568 997,335Euronet Worldwide, Inc. (a) 28,185 3,773,690EVERTEC, Inc. 32,346 1,411,579Evo Payments, Inc. Class A (a) 24,914 600,926ExlService Holdings, Inc. (a) 17,936 2,161,647Fidelity National Information
Services, Inc. 328,355 39,376,332Fiserv, Inc. (a) 316,749 33,480,369FleetCor Technologies, Inc. (a) 41,716 9,939,254Global Payments, Inc. 156,433 23,446,178I3 Verticals, Inc. Class A (a) 11,325 262,061International Money Express,
Inc. (a) 15,659 250,701Jack Henry & Associates, Inc. 39,468 6,623,125Mastercard, Inc. Class A 468,311 180,946,004Maximus, Inc. 33,170 2,564,704MoneyGram International, Inc. (a) 41,350 362,639Paya Holdings, Inc. (a) 37,102 243,018Paychex, Inc. 172,154 20,272,855Paymentus Holdings, Inc.
Class A (a) 6,274 164,881Payoneer Global, Inc. (a) 116,991 610,693PayPal Holdings, Inc. (a) 593,412 102,031,259Repay Holding Corp. (a) 45,823 819,773Sabre Corp. (a) 161,452 1,477,286Shift4 Payments, Inc. (a) 22,631 1,193,106Square, Inc. Class A (a) 268,871 32,880,235TaskUS, Inc. Class A (a) 14,498 463,936The Western Union Co. 217,400 4,111,034TTEC Holdings, Inc. 10,020 802,502Verra Mobility Corp. (a) 73,806 1,169,087Visa, Inc. Class A 897,143 202,906,832WEX, Inc. (a) 23,764 3,825,529
745,780,264Internet Services & Infrastructure – 1.8%Akamai Technologies, Inc. (a) 86,590 9,918,885BigCommerce Holdings, Inc. (a) 20,256 662,169Brightcove, Inc. (a) 18,205 171,673Cloudflare, Inc. Class A (a) 126,257 12,171,175DigitalOcean Holdings, Inc. (a) 14,257 817,496Fastly, Inc. Class A (a) 58,978 1,690,309GoDaddy, Inc. Class A (a) 90,160 6,826,014Limelight Networks, Inc. (a) 66,527 284,070MongoDB, Inc. (a) 30,960 12,542,206Okta, Inc. (a) 66,424 13,144,645Rackspace Technology, Inc. (a) 21,475 268,652
Shares Value
Snowflake, Inc. Class A (a) 111,922 $ 30,879,280SolarWinds Corp. 21,165 287,844Switch, Inc. Class A 54,825 1,405,165Tucows, Inc. Class A (a) 5,090 402,110Twilio, Inc. Class A (a) 88,893 18,322,625VeriSign, Inc. (a) 53,524 11,624,342
121,418,660IT Consulting & Other Services – 3.7%Accenture PLC Class A 337,103 119,192,879Cognizant Technology Solutions
Corp. Class A 279,114 23,841,918DXC Technology Co. (a) 133,183 4,006,145EPAM Systems, Inc. (a) 30,154 14,357,526Gartner, Inc. (a) 44,557 13,094,857Grid Dynamics Holdings, Inc. (a) 22,160 590,564International Business Machines
Corp. 476,480 63,643,434Kyndryl Holdings, Inc. (a) 94,939 1,602,570LiveRamp Holdings, Inc. (a) 36,608 1,634,547Perficient, Inc. (a) 17,397 1,823,553The Hackett Group, Inc. 13,595 260,208Unisys Corp. (a) 33,973 620,007
244,668,208
TOTAL IT SERVICES 1,111,867,132
SEMICONDUCTORS & SEMICONDUCTOR EQUIPMENT – 19.8%Semiconductor Equipment – 3.0%ACM Research, Inc. Class A (a) 6,878 547,833Amkor Technology, Inc. 57,878 1,274,473Applied Materials, Inc. 479,996 66,325,847Axcelis Technologies, Inc. (a) 17,488 1,094,924Brooks Automation, Inc. 39,982 3,372,082CMC Materials, Inc. 15,595 2,820,824Cohu, Inc. (a) 25,273 833,503Enphase Energy, Inc. (a) 68,116 9,568,254Entegris, Inc. 72,208 8,653,407FormFactor, Inc. (a) 41,153 1,758,879Ichor Holdings Ltd. (a) 14,692 623,235KLA Corp. 81,176 31,599,381Kulicke & Soffa Industries, Inc. 32,987 1,804,059Lam Research Corp. 75,467 44,519,493MKS Instruments, Inc. 29,572 4,593,419Onto Innovation, Inc. (a) 26,020 2,381,871PDF Solutions, Inc. (a) 15,285 454,423Photronics, Inc. (a) 31,995 572,071SolarEdge Technologies, Inc. (a) 27,836 6,631,092Teradyne, Inc. 87,698 10,298,376Ultra Clean Holdings, Inc. (a) 23,315 1,175,542Veeco Instruments, Inc. (a) 25,562 702,699
201,605,687
Fidelity® MSCI Information Technology Index ETFSchedule of Investments (Unaudited) – continued
See accompanying notes which are an integral part of the financial statements.
Semi-Annual Report 50

Common Stocks – continuedShares Value
SEMICONDUCTORS & SEMICONDUCTOR EQUIPMENT – continuedSemiconductors – 16.8%Advanced Micro Devices, Inc. (a) 644,809 $ 73,669,428Allegro MicroSystems, Inc. (a) 30,227 857,842Alpha & Omega
Semiconductor Ltd. (a) 10,957 493,394Ambarella, Inc. (a) 19,296 2,704,334Analog Devices, Inc. 285,684 46,843,606Broadcom, Inc. 218,090 127,774,569CEVA, Inc. (a) 12,353 465,338Cirrus Logic, Inc. (a) 30,579 2,734,986Diodes, Inc. (a) 24,151 2,240,971First Solar, Inc. (a) 51,030 3,999,731Impinj, Inc. (a) 9,852 782,150indie Semiconductor, Inc. (a) 20,460 161,839Intel Corp. 2,156,687 105,289,459Lattice Semiconductor Corp. (a) 72,551 4,006,266MACOM Technology Solutions
Holdings, Inc. (a) 25,596 1,566,731MagnaChip Semiconductor
Corp. (a) 22,210 395,116Marvell Technology, Inc. 437,747 31,255,136MaxLinear, Inc. Class A (a) 38,512 2,311,490Meta Materials, Inc. (a) 104,094 173,837Microchip Technology, Inc. 291,426 22,579,687Micron Technology, Inc. 598,445 49,234,070Monolithic Power Systems, Inc. 23,197 9,346,767NeoPhotonics Corp. (a) 29,517 453,381NVIDIA Corp. 1,328,992 325,416,981NXP Semiconductors N.V. 140,898 28,946,085ON Semiconductor Corp. (a) 229,270 13,526,930Power Integrations, Inc. 31,931 2,577,151Qorvo, Inc. (a) 59,183 8,124,642QUALCOMM, Inc. 599,640 105,392,727Rambus, Inc. (a) 57,997 1,464,424Rockley Photonics Holdings Ltd. (a) 43,765 143,112Semtech Corp. (a) 34,424 2,447,546Silicon Laboratories, Inc. (a) 23,777 3,927,723SiTime Corp. (a) 6,473 1,508,792SkyWater Technology, Inc. (a) 5,193 52,086Skyworks Solutions, Inc. 87,702 12,850,097SMART Global Holdings, Inc. (a) 11,601 665,433SunPower Corp. (a) 45,697 766,796Synaptics, Inc. (a) 20,680 4,350,038Texas Instruments, Inc. 490,778 88,089,743Universal Display Corp. 23,927 3,673,034Wolfspeed, Inc. (a) 61,837 5,827,519Xilinx, Inc. 131,425 25,437,309
1,124,528,296
TOTAL SEMICONDUCTORS & SEMICONDUCTOREQUIPMENT 1,326,133,983
Shares Value
SOFTWARE – 33.2%Application Software – 11.6%8x8, Inc. (a) 57,513 $ 882,824ACI Worldwide, Inc. (a) 56,491 1,941,596Adobe, Inc. (a) 253,257 135,315,215Agilysys, Inc. (a) 12,000 456,720Alarm.com Holdings, Inc. (a) 25,233 1,881,625Alkami Technology, Inc. (a) 9,275 142,278Altair Engineering, Inc. Class A (a) 24,541 1,544,120Alteryx, Inc. Class A (a) 31,510 1,798,276American Software, Inc. Class A 15,933 366,300Anaplan, Inc. (a) 69,445 3,352,805ANSYS, Inc. (a) 46,408 15,779,184Appfolio, Inc. Class A (a) 9,292 1,070,996Asana, Inc. (a) 35,461 1,860,993Aspen Technology, Inc. (a) 35,715 5,362,964Autodesk, Inc. (a) 117,104 29,251,408Avalara, Inc. (a) 45,730 5,012,923Avaya Holdings Corp. (a) 44,844 817,058AvePoint, Inc. (a) 43,114 253,941Benefitfocus, Inc. (a) 13,735 153,008Bentley Systems, Inc. 93,474 3,754,851Bill.com Holdings, Inc. (a) 39,765 7,484,171Black Knight, Inc. (a) 83,210 6,207,466Blackbaud, Inc. (a) 23,341 1,590,456Blackline, Inc. (a) 27,828 2,556,558Bottomline Technologies DE, Inc. (a) 23,798 1,341,969Box, Inc. Class A (a) 81,310 2,124,630BTRS Holdings, Inc. (a) 31,773 203,347C3.ai, Inc. (a) 21,223 559,014Cadence Design Systems, Inc. (a) 146,976 22,360,929CDK Global, Inc. 64,108 2,754,721Cerence, Inc. (a) 20,143 1,278,879Ceridian HCM Holding, Inc. (a) 71,616 5,429,925ChannelAdvisor Corp. (a) 15,592 329,615Cipher Mining, Inc. (a) 26,273 79,870Citrix Systems, Inc. 65,781 6,705,715Clear Secure, Inc. (a) 7,904 195,150Consensus Cloud Solutions, Inc. (a) 7,590 430,353Couchbase, Inc. (a) 5,752 134,769Coupa Software, Inc. (a) 39,163 5,258,416Datadog, Inc. Class A (a) 102,123 14,921,191Digital Turbine, Inc. (a) 48,602 2,145,778DocuSign, Inc. (a) 103,606 13,030,527Domo, Inc. Class B (a) 15,083 708,298Dropbox, Inc. Class A (a) 167,400 4,143,150Duck Creek Technologies, Inc. (a) 21,029 537,291Dynatrace, Inc. (a) 98,443 5,400,583E2open Parent Holdings, Inc. (a) 79,815 742,279Ebix, Inc. 13,272 403,336Elastic N.V. (a) 34,209 3,189,989
See accompanying notes which are an integral part of the financial statements.
51 Semi-Annual Report

Common Stocks – continuedShares Value
SOFTWARE – continuedApplication Software – continuedEnvestnet, Inc. (a) 26,978 $ 1,994,753Everbridge, Inc. (a) 20,618 1,053,992Fair Isaac Corp. (a) 15,091 7,469,894Five9, Inc. (a) 36,074 4,534,502Guidewire Software, Inc. (a) 41,965 4,231,751HubSpot, Inc. (a) 23,776 11,621,709Intapp, Inc. (a) 6,469 130,156InterDigital, Inc. 16,559 1,143,068Intuit, Inc. 145,260 80,652,710Jamf Holding Corp. (a) 18,814 621,991Latch, Inc. (a) 18,782 120,393LivePerson, Inc. (a) 35,998 1,075,260Manhattan Associates, Inc. (a) 33,527 4,488,259Marathon Digital Holdings, Inc. (a) 52,572 1,237,545MeridianLink, Inc. (a) 10,689 207,260MicroStrategy, Inc. Class A (a) 4,093 1,506,265Mimecast Ltd. (a) 33,001 2,630,510Mitek Systems, Inc. (a) 22,285 364,805Model N, Inc. (a) 16,882 466,956Momentive Global, Inc. (a) 65,585 1,123,471nCino, Inc. 15,061 690,246NCR Corp. (a) 69,974 2,663,210New Relic, Inc. (a) 31,078 3,267,541Nuance Communications, Inc. (a) 159,116 8,791,159Nutanix, Inc. Class A (a) 108,806 2,974,756Olo, Inc. (a) 13,216 231,941ON24, Inc. (a) 9,291 152,930PagerDuty, Inc. (a) 34,976 1,154,907Palantir Technologies, Inc. (a) 844,617 11,579,699Paycom Software, Inc. (a) 27,158 9,106,077Paylocity Holding Corp. (a) 20,318 4,144,466Pegasystems, Inc. 21,648 2,147,915PROS Holdings, Inc. (a) 22,107 612,585PTC, Inc. (a) 59,062 6,866,548Q2 Holdings, Inc. (a) 28,237 1,842,464Rekor Systems, Inc. (a) 16,275 75,679Rimini Street, Inc. (a) 18,089 93,158RingCentral, Inc. Class A (a) 41,175 7,266,976Riot Blockchain, Inc. (a) 51,090 814,375Salesforce.com, Inc. (a) 520,433 121,068,329ShotSpotter, Inc. (a) 4,309 113,628Smartsheet, Inc. Class A (a) 63,168 3,930,313Splunk, Inc. (a) 87,051 10,787,360Sprinklr, Inc. (a) 15,583 175,309Sprout Social, Inc. Class A (a) 20,652 1,421,890SPS Commerce, Inc. (a) 19,292 2,389,314SS&C Technologies Holdings, Inc. 122,275 9,766,104Synopsys, Inc. (a) 81,039 25,162,609The Trade Desk, Inc. Class A (a) 231,185 16,076,605
Shares Value
Tyler Technologies, Inc. (a) 21,681 $ 10,272,458Unity Software, Inc. (a) 30,088 3,163,753Upland Software, Inc. (a) 13,156 257,858Verint Systems, Inc. (a) 34,391 1,765,290Veritone, Inc. (a) 14,630 230,715Vertex, Inc. (a) 13,537 196,422Vonage Holdings Corp. (a) 125,965 2,625,111Workday, Inc. Class A (a) 101,440 25,665,334Workiva, Inc. (a) 20,611 2,437,869Yext, Inc. (a) 52,318 423,776Zendesk, Inc. (a) 63,921 6,296,858Zoom Video Communications, Inc.
Class A (a) 115,387 17,801,906
776,428,153Systems Software – 21.6%A10 Networks, Inc. 28,647 423,976Appian Corp. (a) 18,800 1,059,756CommVault Systems, Inc. (a) 21,666 1,461,588Crowdstrike Holdings, Inc.
Class A (a) 100,744 18,198,396Dolby Laboratories, Inc. Class A 34,567 3,036,711Fortinet, Inc. (a) 73,731 21,915,802JFrog Ltd. (a) 19,919 532,236KnowBe4, Inc. (a) 17,044 407,693Mandiant, Inc. (a) 127,435 1,922,994McAfee Corp. 37,942 973,212Microsoft Corp. 3,795,145 1,180,214,192N-Able, Inc. (a) 21,165 236,201NortonLifelock, Inc. 308,363 8,020,522OneSpan, Inc. (a) 15,923 255,723Oracle Corp. 890,536 72,275,902Palo Alto Networks, Inc. (a) 51,726 26,763,032Ping Identity Holding Corp. (a) 37,780 747,666Progress Software Corp. 24,061 1,095,016Qualys, Inc. (a) 17,883 2,291,528Rapid7, Inc. (a) 28,369 2,732,786SailPoint Technologies Holding,
Inc. (a) 49,852 1,928,774ServiceNow, Inc. (a) 105,313 61,690,249Telos Corp. (a) 8,752 102,311Tenable Holdings, Inc. (a) 40,320 2,072,448Teradata Corp. (a) 58,800 2,371,992Varonis Systems, Inc. (a) 56,402 2,101,539VMware, Inc. Class A 111,477 14,322,565Xperi Holding Corp. 56,801 958,233Zscaler, Inc. (a) 42,871 11,022,563Zuora, Inc. Class A (a) 59,870 995,638
1,442,131,244
TOTAL SOFTWARE 2,218,559,397
Fidelity® MSCI Information Technology Index ETFSchedule of Investments (Unaudited) – continued
See accompanying notes which are an integral part of the financial statements.
Semi-Annual Report 52

Common Stocks – continuedShares Value
TECHNOLOGY HARDWARE, STORAGE & PERIPHERALS – 24.2%Technology Hardware, Storage & Peripherals – 24.2%3D Systems Corp. (a) 66,760 $ 1,195,004Apple, Inc. 8,787,387 1,535,859,500Avid Technology, Inc. (a) 17,973 563,633Corsair Gaming, Inc. (a) 14,711 287,453DELL Technologies, Inc. Class C (a) 147,314 8,368,908Diebold Nixdorf, Inc. (a) 38,770 362,112Eastman Kodak Co. (a) 22,453 88,240Hewlett Packard Enterprise Co. 693,387 11,323,010HP, Inc. 637,981 23,433,042NetApp, Inc. 119,286 10,319,432Pure Storage, Inc. Class A (a) 142,928 3,786,163Seagate Technology Holdings PLC 108,782 11,655,991Super Micro Computer, Inc. (a) 21,574 874,179Western Digital Corp. (a) 164,427 8,507,453Xerox Holdings Corp. 80,795 1,705,582
TOTAL TECHNOLOGY HARDWARE, STORAGE &PERIPHERALS 1,618,329,702
TOTAL COMMON STOCKS(Cost $3,651,307,681) 6,675,938,160
Money Market Fund – 0.2%Shares Value
State Street Institutional TreasuryPlus Money Market Fund, TrustClass, 0.01% (b)(Cost $11,734,000) 11,734,000 $ 11,734,000
TOTAL INVESTMENT IN SECURITIES – 100.0%(Cost $3,663,041,681) 6,687,672,160
NET OTHER ASSETS (LIABILITIES) – 0.0% 2,638,079
NET ASSETS – 100.0% $6,690,310,239
Legend(a) Non-income producing.
(b) The rate quoted is the annualized seven-day yield of the fund at periodend.
Futures Contracts
Number ofcontracts
ExpirationDate
NotionalAmount Value
UnrealizedAppreciation/(Depreciation)
Purchased
Equity Index ContractsCME E-mini Russell 2000 Index Contracts (United States) 9 March 2022 $ 910,980 $ (64,651) $ (64,651)CME E-mini S&P Information Technology Select Sector Index Contracts(United States) 76 March 2022 12,392,560 (338,884) (338,884)
Total Equity Index Contracts $ (403,535)
The notional amount of futures purchased as a percentage of Net Assets is 0.2%
See accompanying notes which are an integral part of the financial statements.
53 Semi-Annual Report
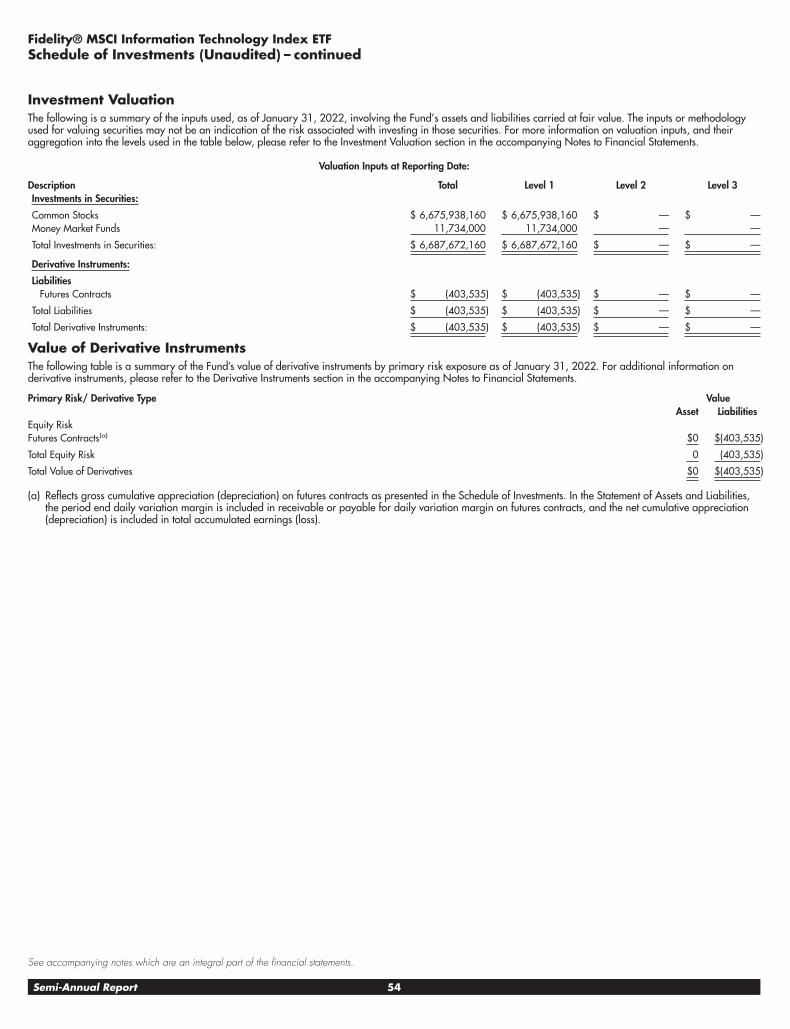
Investment ValuationThe following is a summary of the inputs used, as of January 31, 2022, involving the Fund’s assets and liabilities carried at fair value. The inputs or methodologyused for valuing securities may not be an indication of the risk associated with investing in those securities. For more information on valuation inputs, and theiraggregation into the levels used in the table below, please refer to the Investment Valuation section in the accompanying Notes to Financial Statements.
Valuation Inputs at Reporting Date:
Description Total Level 1 Level 2 Level 3Investments in Securities:
Common Stocks $ 6,675,938,160 $ 6,675,938,160 $ — $ —Money Market Funds 11,734,000 11,734,000 — —
Total Investments in Securities: $ 6,687,672,160 $ 6,687,672,160 $ — $ —
Derivative Instruments:
LiabilitiesFutures Contracts $ (403,535) $ (403,535) $ — $ —
Total Liabilities $ (403,535) $ (403,535) $ — $ —
Total Derivative Instruments: $ (403,535) $ (403,535) $ — $ —
Value of Derivative InstrumentsThe following table is a summary of the Fund’s value of derivative instruments by primary risk exposure as of January 31, 2022. For additional information onderivative instruments, please refer to the Derivative Instruments section in the accompanying Notes to Financial Statements.
Primary Risk/ Derivative Type ValueAsset Liabilities
Equity RiskFutures Contracts(a) $0 $(403,535)
Total Equity Risk 0 (403,535)
Total Value of Derivatives $0 $(403,535)
(a) Reflects gross cumulative appreciation (depreciation) on futures contracts as presented in the Schedule of Investments. In the Statement of Assets and Liabilities,the period end daily variation margin is included in receivable or payable for daily variation margin on futures contracts, and the net cumulative appreciation(depreciation) is included in total accumulated earnings (loss).
Fidelity® MSCI Information Technology Index ETFSchedule of Investments (Unaudited) – continued
See accompanying notes which are an integral part of the financial statements.
Semi-Annual Report 54

Common Stocks – 99.8%Shares Value
CHEMICALS – 62.8%Commodity Chemicals – 8.0%AdvanSix, Inc. 11,636 $ 489,759Cabot Corp. 23,383 1,285,831Dow, Inc. 308,054 18,400,065Hawkins, Inc. 7,926 295,798Koppers Holdings, Inc. (a) 8,788 262,585Kronos Worldwide, Inc. 9,486 136,124LyondellBasell Industries N.V.
Class A 110,542 10,692,728Olin Corp. 59,683 3,024,138Origin Materials, Inc. (a) 43,694 228,957Orion Engineered Carbons S.A. 24,955 426,731PureCycle Technologies, Inc. (a) 29,036 172,764Tredegar Corp. 11,094 130,355Trinseo PLC 12,855 688,257Tronox Holdings PLC Class A 47,525 1,078,817Valvoline, Inc. 74,705 2,460,783Westlake Chemical Corp. 15,888 1,567,351
41,341,043Diversified Chemicals – 2.3%Eastman Chemical Co. 56,088 6,670,546Huntsman Corp. 87,094 3,120,578The Chemours Co. 68,273 2,233,210
12,024,334Fertilizers & Agricultural Chemicals – 6.9%American Vanguard Corp. 11,652 176,761CF Industries Holdings, Inc. 88,851 6,119,168Corteva, Inc. 303,268 14,581,125FMC Corp. 53,162 5,867,490The Mosaic Co. 153,004 6,112,510The Scotts Miracle-Gro Co. 17,295 2,615,004
35,472,058Industrial Gases – 18.1%Air Products & Chemicals, Inc. 91,439 25,796,771Linde PLC (a) 213,312 67,978,268
93,775,039Specialty Chemicals – 27.5%Albemarle Corp. 48,309 10,663,729Amyris, Inc. (a) 67,593 308,224Ashland Global Holdings, Inc. 23,800 2,285,752Avient Corp. 37,753 1,878,967Axalta Coating Systems Ltd. (a) 85,613 2,535,001Balchem Corp. 13,384 1,966,645Celanese Corp. 45,899 7,146,933Chase Corp. 3,110 295,077Danimer Scientific, Inc. (a) 32,247 161,557DuPont de Nemours, Inc. 216,059 16,550,119Ecolab, Inc. 106,356 20,149,144ECOVYST, Inc. 16,915 173,040Element Solutions, Inc. 92,132 2,067,442
Shares Value
Ferro Corp. (a) 30,663 $ 668,453FutureFuel Corp. 11,014 85,909GCP Applied Technologies, Inc. (a) 18,223 581,314HB Fuller Co. 21,667 1,555,041Ingevity Corp. (a) 16,302 1,074,465Innospec, Inc. 10,158 944,288International Flavors & Fragrances,
Inc. 102,882 13,572,193Kraton Corp. (a) 13,327 618,106Livent Corp. (a) 66,829 1,537,735Minerals Technologies, Inc. 13,904 972,863NewMarket Corp. 3,615 1,222,123PPG Industries, Inc. 98,045 15,314,629Quaker Chemical Corp. 5,547 1,160,266RPM International, Inc. 53,606 4,750,028Sensient Technologies Corp. 17,390 1,473,629Stepan Co. 8,804 969,849The Sherwin-Williams Co. 103,325 29,603,646
142,286,167
TOTAL CHEMICALS 324,898,641
CONSTRUCTION MATERIALS – 4.8%Construction Materials – 4.8%Eagle Materials, Inc. 16,443 2,398,212Forterra, Inc. (a) 12,327 289,315Martin Marietta Materials, Inc. 25,767 10,026,455Summit Materials, Inc. Class A (a) 48,673 1,730,812United States Lime & Minerals, Inc. 923 116,750Vulcan Materials Co. 54,805 10,429,939
TOTAL CONSTRUCTION MATERIALS 24,991,483
CONTAINERS & PACKAGING – 14.1%Metal & Glass Containers – 5.9%AptarGroup, Inc. 27,248 3,196,190Ball Corp. 134,911 13,099,858Berry Global Group, Inc. (a) 55,888 3,767,969Crown Holdings, Inc. 54,265 6,207,916Greif, Inc. Class A 10,406 615,619Greif, Inc. Class B 1,787 106,148Myers Industries, Inc. 12,652 228,622O-I Glass, Inc. (a) 65,038 865,656Silgan Holdings, Inc. 36,431 1,631,380Trimas Corp. 17,777 617,928
30,337,286Paper Packaging – 8.2%Amcor PLC 635,430 7,631,514Avery Dennison Corp. 34,236 7,032,759Graphic Packaging Holding Co. 126,637 2,394,706International Paper Co. 153,369 7,400,054Packaging Corp. of America 39,239 5,910,571Pactiv Evergreen, Inc. 18,203 199,323
Fidelity® MSCI Materials Index ETF
Schedule of Investments January 31, 2022 (Unaudited)Showing Percentage of Net Assets
See accompanying notes which are an integral part of the financial statements.
55 Semi-Annual Report

Common Stocks – continuedShares Value
CONTAINERS & PACKAGING – continuedPaper Packaging – continuedRanpak Holdings Corp. (a) 16,210 $ 435,401Sealed Air Corp. 61,916 4,205,335Sonoco Products Co. 40,638 2,301,736Westrock Co. 110,291 5,091,032
42,602,431
TOTAL CONTAINERS & PACKAGING 72,939,717
METALS & MINING – 17.2%Aluminum – 1.3%Alcoa Corp. 77,188 4,377,331Arconic Corp. (a) 42,856 1,325,536Century Aluminum Co. (a) 22,312 342,266Kaiser Aluminum Corp. 6,574 629,461
6,674,594Copper – 4.4%Freeport-McMoRan, Inc. 606,410 22,570,580
Diversified Metals & Mining – 0.5%Compass Minerals International,
Inc. 14,026 748,988Materion Corp. 8,471 701,822MP Materials Corp. (a) 25,657 1,024,741Piedmont Lithium, Inc. (a) 6,549 316,841
2,792,392Gold – 4.5%Coeur Mining, Inc. (a) 106,323 498,655McEwen Mining, Inc. (a) 160,345 136,678Newmont Corp. 330,094 20,191,850Royal Gold, Inc. 27,119 2,753,934
23,581,117Silver – 0.2%Gatos Silver, Inc. (a) 17,069 53,085Hecla Mining Co. 221,466 1,098,471
1,151,556Steel – 6.3%Allegheny Technologies, Inc. (a) 52,679 963,499Alpha Metallurgical Resources,
Inc. (a) 6,831 431,924Carpenter Technology Corp. 19,919 572,074Cleveland-Cliffs, Inc. (a) 196,114 3,361,394Commercial Metals Co. 49,733 1,663,072Nucor Corp. 121,316 12,301,442Reliance Steel & Aluminum Co. 26,224 4,009,125
Shares Value
Ryerson Holding Corp. 7,137 $ 146,309Schnitzer Steel Industries, Inc.
Class A 10,745 420,559Steel Dynamics, Inc. 84,314 4,681,113SunCoke Energy, Inc. 34,539 236,592United States Steel Corp. 111,681 2,314,030Warrior Met Coal, Inc. 21,248 556,698Worthington Industries, Inc. 13,833 749,472
32,407,303
TOTAL METALS & MINING 89,177,542
PAPER & FOREST PRODUCTS – 0.9%Forest Products – 0.5%Louisiana-Pacific Corp. 39,278 2,609,630
Paper Products – 0.4%Clearwater Paper Corp. (a) 6,867 217,135Glatfelter Corp. 18,404 319,494Mercer International, Inc. 17,540 213,111Neenah, Inc. 7,019 323,576Schweitzer-Mauduit International,
Inc. 13,053 395,114Sylvamo Corp. (a) 14,594 434,755
1,903,185
TOTAL PAPER & FOREST PRODUCTS 4,512,815
TOTAL COMMON STOCKS(Cost $495,398,448) 516,520,198
Money Market Fund – 0.3%
State Street Institutional TreasuryPlus Money Market Fund, TrustClass, 0.01% (b)(Cost $1,389,000) 1,389,000 1,389,000
TOTAL INVESTMENT IN SECURITIES – 100.1%(Cost $496,787,448) 517,909,198
NET OTHER ASSETS (LIABILITIES) – (0.1%) (400,693)
NET ASSETS – 100.0% $ 517,508,505
Legend(a) Non-income producing.
(b) The rate quoted is the annualized seven-day yield of the fund at periodend.
Fidelity® MSCI Materials Index ETFSchedule of Investments (Unaudited) – continued
See accompanying notes which are an integral part of the financial statements.
Semi-Annual Report 56

Futures Contracts
Number ofcontracts
ExpirationDate
NotionalAmount Value
UnrealizedAppreciation/(Depreciation)
Purchased
Equity Index ContractsCME E-mini S&P Materials Select Sector Index Contracts (United States) 9 March 2022 $ 801,990 $ (43,186) $ (43,186)CME E-mini Micro Russell 2000 Index Contracts (United States) 9 March 2022 91,098 (8,617) (8,617)
Total Equity Index Contracts $ (51,803)
The notional amount of futures purchased as a percentage of Net Assets is 0.2%
For the period, the average monthly notional amount at value for futures contracts in the aggregate was $1,374,850.
Investment ValuationThe following is a summary of the inputs used, as of January 31, 2022, involving the Fund’s assets and liabilities carried at fair value. The inputs or methodologyused for valuing securities may not be an indication of the risk associated with investing in those securities. For more information on valuation inputs, and theiraggregation into the levels used in the table below, please refer to the Investment Valuation section in the accompanying Notes to Financial Statements.
Valuation Inputs at Reporting Date:
Description Total Level 1 Level 2 Level 3Investments in Securities:
Common Stocks $ 516,520,198 $ 516,520,198 $ — $ —Money Market Funds 1,389,000 1,389,000 — —
Total Investments in Securities: $ 517,909,198 $ 517,909,198 $ — $ —
Derivative Instruments:
LiabilitiesFutures Contracts $ (51,803) $ (51,803) $ — $ —
Total Liabilities $ (51,803) $ (51,803) $ — $ —
Total Derivative Instruments: $ (51,803) $ (51,803) $ — $ —
Value of Derivative InstrumentsThe following table is a summary of the Fund’s value of derivative instruments by primary risk exposure as of January 31, 2022. For additional information onderivative instruments, please refer to the Derivative Instruments section in the accompanying Notes to Financial Statements.
Primary Risk/ Derivative Type ValueAsset Liabilities
Equity RiskFutures Contracts(a) $0 $(51,803)
Total Equity Risk 0 (51,803)
Total Value of Derivatives $0 $(51,803)
(a) Reflects gross cumulative appreciation (depreciation) on futures contracts as presented in the Schedule of Investments. In the Statement of Assets and Liabilities,the period end daily variation margin is included in receivable or payable for daily variation margin on futures contracts, and the net cumulative appreciation(depreciation) is included in total accumulated earnings (loss).
See accompanying notes which are an integral part of the financial statements.
57 Semi-Annual Report

Common Stocks – 99.8%Shares Value
EQUITY REAL ESTATE INVESTMENT TRUSTS (REITS) – 94.4%Diversified REITs – 3.1%Alexander & Baldwin, Inc. 100,843 $ 2,314,347American Assets Trust, Inc. 71,717 2,579,660Armada Hoffler Properties, Inc. 80,970 1,136,009Broadstone Net Lease, Inc. 231,910 5,359,440DigitalBridge Group, Inc. (a) 682,940 4,985,462Empire State Realty Trust, Inc.
Class A 201,408 1,796,559Essential Properties Realty Trust, Inc. 176,461 4,685,040Gladstone Commercial Corp. 49,147 1,139,719Global Net Lease, Inc. 124,393 1,783,796iStar, Inc. 100,870 2,165,679One Liberty Properties, Inc. 27,233 830,606PS Business Parks, Inc. 28,360 4,734,986STORE Capital Corp. 337,073 10,688,585Washington Real Estate Investment
Trust 105,191 2,589,802WP Carey, Inc. 246,353 19,116,993
65,906,683Health Care REITs – 7.9%CareTrust REIT, Inc. 131,491 2,788,924Community Healthcare Trust, Inc. 38,019 1,723,781Diversified Healthcare Trust 322,008 982,124Global Medical REIT, Inc. 101,005 1,707,995Healthcare Realty Trust, Inc. 197,807 6,135,973Healthcare Trust of America, Inc.
Class A 296,913 9,664,518Healthpeak Properties, Inc. 722,058 25,539,192LTC Properties, Inc. 42,155 1,520,531Medical Properties Trust, Inc. 797,232 18,145,000National Health Investors, Inc. 55,599 3,215,290Omega Healthcare Investors, Inc. 320,567 10,091,449Physicians Realty Trust 273,392 4,992,138Sabra Health Care REIT, Inc. 300,457 4,089,220Universal Health Realty Income Trust 16,848 982,238Ventas, Inc. 533,925 28,308,704Welltower, Inc. 573,042 49,642,629
169,529,706Hotel & Resort REITs – 2.6%Apple Hospitality REIT, Inc. 298,256 4,810,869Chatham Lodging Trust (a) 65,975 875,488CorePoint Lodging, Inc. (a) 58,266 915,359DiamondRock Hospitality Co. (a) 284,084 2,656,185Host Hotels & Resorts, Inc. (a) 972,170 16,857,428Park Hotels & Resorts, Inc. (a) 324,809 5,911,524Pebblebrook Hotel Trust 186,077 4,028,567RLJ Lodging Trust 232,192 3,215,859Ryman Hospitality Properties,
Inc. (a) 72,545 6,412,978Service Properties Trust 218,981 1,872,288
Shares Value
Summit Hotel Properties, Inc. (a) 159,213 $ 1,499,787Sunstone Hotel Investors, Inc. (a) 296,980 3,358,844Xenia Hotels & Resorts, Inc. (a) 161,757 2,804,866
55,220,042Industrial REITs – 12.5%Americold Realty Trust 359,647 10,231,957Duke Realty Corp. 514,790 29,744,566EastGroup Properties, Inc. 55,373 11,069,616First Industrial Realty Trust, Inc. 174,994 10,636,135Industrial Logistics Properties Trust 90,090 2,065,764Lexington Realty Trust 380,996 5,673,030Monmouth Real Estate Investment
Corp. Class A 130,483 2,738,838Plymouth Industrial REIT, Inc. 55,958 1,608,793Prologis, Inc. 1,006,242 157,798,870Rexford Industrial Realty, Inc. 192,644 14,095,762SL Green Realty Corp. 92,098 6,678,947STAG Industrial, Inc. 224,676 9,600,406Terreno Realty Corp. 97,819 7,313,927
269,256,611Office REITs – 6.3%Alexandria Real Estate Equities, Inc. 197,841 38,547,340Boston Properties, Inc. 200,806 22,506,337Brandywine Realty Trust 219,241 2,819,439City Office REIT, Inc. 67,683 1,206,788Corporate Office Properties Trust 138,812 3,506,391Cousins Properties, Inc. 204,462 7,884,055Douglas Emmett, Inc. 239,103 7,464,796Easterly Government Properties,
Inc. 114,760 2,406,517Equity Commonwealth (a) 168,636 4,391,281Franklin Street Properties Corp. 124,553 691,269Highwoods Properties, Inc. 142,852 6,159,778Hudson Pacific Properties, Inc. 209,420 4,948,595JBG SMITH Properties 157,787 4,323,364Kilroy Realty Corp. 144,399 9,241,536Mack-Cali Realty Corp. (a) 85,933 1,417,895Office Properties Income Trust 65,463 1,667,997Orion Office REIT, Inc. (a) 98,433 1,637,925Paramount Group, Inc. 226,552 1,968,737Piedmont Office Realty Trust, Inc.
Class A 157,607 2,799,100Vornado Realty Trust 220,128 9,027,449
134,616,589REITs - Shopping Centers – 0.0%Phillips Edison & Co., Inc. 34,350 1,082,712
Residential REITs – 15.1%American Campus Communities,
Inc. 185,602 9,699,560American Homes 4 Rent Class A 390,672 15,286,995Apartment Income REIT Corp. 216,719 11,447,098
Fidelity® MSCI Real Estate Index ETF
Schedule of Investments January 31, 2022 (Unaudited)Showing Percentage of Net Assets
See accompanying notes which are an integral part of the financial statements.
Semi-Annual Report 58

Common Stocks – continuedShares Value
EQUITY REAL ESTATE INVESTMENT TRUSTS (REITS) – continuedResidential REITs – continuedApartment Investment and
Management Co. Class A (a) 191,394 $ 1,345,500AvalonBay Communities, Inc. 188,433 46,020,992Camden Property Trust 137,520 22,015,577Centerspace 19,309 1,841,692Equity Lifestyle Properties, Inc. 239,095 18,718,747Equity Residential 480,401 42,625,981Essex Property Trust, Inc. 88,137 29,305,552Independence Realty Trust, Inc. 160,034 3,679,182Invitation Homes, Inc. 783,663 32,898,173Mid-America Apartment
Communities, Inc. 155,970 32,235,880NexPoint Residential Trust, Inc. 31,976 2,535,697Sun Communities, Inc. 159,577 30,153,670UDR, Inc. 400,621 22,771,298UMH Properties, Inc. 68,169 1,608,788
324,190,382Retail REITs – 10.9%Acadia Realty Trust 119,841 2,371,653Agree Realty Corp. 102,631 6,710,015Alexander’s, Inc. 2,514 661,861American Finance Trust, Inc. 144,967 1,197,427Brixmor Property Group, Inc. 404,895 10,268,137Federal Realty Investment Trust 94,236 12,014,148Getty Realty Corp. 46,615 1,383,067Kimco Realty Corp. 803,742 19,498,781Kite Realty Group Trust 300,157 6,267,278National Retail Properties, Inc. 237,888 10,557,469NETSTREIT Corp. 80,609 1,821,763Realty Income Corp. 755,121 52,412,949Regency Centers Corp. 209,289 15,016,486Retail Opportunity Investments
Corp. 162,928 3,019,056RPT Realty 122,915 1,551,187Saul Centers, Inc. 18,435 910,320Seritage Growth Properties,
Class A (a) 61,509 637,233Simon Property Group, Inc. 447,515 65,874,208SITE Centers Corp. 240,460 3,561,213Spirit Realty Capital, Inc. 161,858 7,681,781Tanger Factory Outlet Centers, Inc. 145,573 2,476,197The Macerich Co. 289,863 4,794,334Urban Edge Properties 162,986 2,972,865Urstadt Biddle Properties, Inc.
Class A 49,434 973,355
234,632,783Specialized REITs – 36.0%American Tower Corp. 619,893 155,903,090
Shares Value
CatchMark Timber Trust, Inc.Class A 67,564 $ 554,025
Crown Castle International Corp. 588,483 107,404,032CubeSmart 279,871 14,200,655CyrusOne, Inc. 168,686 15,156,437Digital Realty Trust, Inc. 384,885 57,436,389EPR Properties 103,080 4,532,428Equinix, Inc. 122,264 88,629,174Extra Space Storage, Inc. 182,060 36,082,471Four Corners Property Trust, Inc. 101,963 2,760,138Gaming and Leisure Properties, Inc. 304,985 13,779,222Gladstone Land Corp. 43,792 1,334,780Iron Mountain, Inc. 396,060 18,187,075Lamar Advertising Co. Class A 118,712 13,148,541Life Storage, Inc. 107,060 14,447,747MGM Growth Properties LLC
Class A 215,252 8,368,998National Storage Affiliates Trust 126,538 7,789,679Outfront Media, Inc. 206,235 5,122,877PotlatchDeltic Corp. 92,440 4,972,348Public Storage 214,061 76,747,290Rayonier, Inc. 194,926 7,122,596Safehold, Inc. 24,160 1,495,504SBA Communications Corp. 149,481 48,647,097Uniti Group, Inc. 322,825 3,893,270VICI Properties, Inc. 856,781 24,521,072Weyerhaeuser Co. 1,018,587 41,181,472
773,418,407
TOTAL EQUITY REAL ESTATE INVESTMENT TRUSTS(REITS) 2,027,853,915
REAL ESTATE MANAGEMENT & DEVELOPMENT – 5.4%Diversified Real Estate Activities – 0.2%Five Point Holdings LLC Class A (a) 105,003 607,968Tejon Ranch Co. (a) 30,222 526,165The RMR Group, Inc. Class A 22,923 733,765The St. Joe Co. 46,904 2,275,313
4,143,211Interactive Media & Services – 0.2%Zillow Group, Inc. Class A (a) 84,719 4,224,089
Real Estate Development – 0.3%Forestar Group, Inc. (a) 37,797 754,050The Howard Hughes Corp. (a) 55,132 5,309,763
6,063,813Real Estate Operating Companies – 0.2%FRP Holdings, Inc. (a) 11,894 671,773Kennedy-Wilson Holdings, Inc. 154,274 3,464,994
4,136,767Real Estate Services – 4.5%CBRE Group, Inc. Class A (a) 456,068 46,217,931Cushman & Wakefield PLC (a) 176,998 3,715,188
See accompanying notes which are an integral part of the financial statements.
59 Semi-Annual Report

Common Stocks – continuedShares Value
REAL ESTATE MANAGEMENT & DEVELOPMENT – continuedReal Estate Services – continuedDoma Holdings, Inc. (a) 213,901 $ 855,604Douglas Elliman, Inc. (a) 113,904 883,895eXp World Holdings, Inc. 94,651 2,568,828Jones Lang LaSalle, Inc. (a) 69,186 17,351,157Marcus & Millichap, Inc. (a) 37,632 1,761,554Newmark Group, Inc. Class A 247,593 3,790,649Opendoor Technologies, Inc. (a) 178,086 1,768,394RE/MAX Holdings, Inc. Class A 25,197 749,863Realogy Holdings Corp. (a) 158,255 2,611,207Redfin Corp. (a) 135,970 4,020,633Zillow Group, Inc. Class C (a) 228,347 11,526,957
97,821,860
TOTAL REAL ESTATE MANAGEMENT &DEVELOPMENT 116,389,740
TOTAL COMMON STOCKS(Cost $1,813,651,672) 2,144,243,655
Money Market Fund – 0.1%Shares Value
State Street Institutional TreasuryPlus Money Market Fund, TrustClass, 0.01% (b)(Cost $2,511,000) 2,511,000 $ 2,511,000
TOTAL INVESTMENT IN SECURITIES – 99.9%(Cost $1,816,162,672) 2,146,754,655
NET OTHER ASSETS (LIABILITIES) – 0.1% 1,749,741
NET ASSETS – 100.0% $2,148,504,396
Legend(a) Non-income producing.
(b) The rate quoted is the annualized seven-day yield of the fund at periodend.
Futures Contracts
Number ofcontracts
ExpirationDate
NotionalAmount Value
UnrealizedAppreciation/(Depreciation)
Purchased
Equity Index ContractCME Dow Jones U.S. Real Estate Index Contracts (United States) 96 March 2022 $3,984,000 $(237,221) $(237,221)
The notional amount of futures purchased as a percentage of Net Assets is 0.2%
Fidelity® MSCI Real Estate Index ETFSchedule of Investments (Unaudited) – continued
See accompanying notes which are an integral part of the financial statements.
Semi-Annual Report 60

Investment ValuationThe following is a summary of the inputs used, as of January 31, 2022, involving the Fund’s assets and liabilities carried at fair value. The inputs or methodologyused for valuing securities may not be an indication of the risk associated with investing in those securities. For more information on valuation inputs, and theiraggregation into the levels used in the table below, please refer to the Investment Valuation section in the accompanying Notes to Financial Statements.
Valuation Inputs at Reporting Date:
Description Total Level 1 Level 2 Level 3Investments in Securities:
Common Stocks $ 2,144,243,655 $ 2,144,243,655 $ — $ —Money Market Funds 2,511,000 2,511,000 — —
Total Investments in Securities: $ 2,146,754,655 $ 2,146,754,655 $ — $ —
Derivative Instruments:
LiabilitiesFutures Contracts $ (237,221) $ (237,221) $ — $ —
Total Liabilities $ (237,221) $ (237,221) $ — $ —
Total Derivative Instruments: $ (237,221) $ (237,221) $ — $ —
Value of Derivative InstrumentsThe following table is a summary of the Fund’s value of derivative instruments by primary risk exposure as of January 31, 2022. For additional information onderivative instruments, please refer to the Derivative Instruments section in the accompanying Notes to Financial Statements.
Primary Risk/ Derivative Type ValueAsset Liabilities
Equity RiskFutures Contracts(a) $0 $(237,221)
Total Equity Risk 0 (237,221)
Total Value of Derivatives $0 $(237,221)
(a) Reflects gross cumulative appreciation (depreciation) on futures contracts as presented in the Schedule of Investments. In the Statement of Assets and Liabilities,the period end daily variation margin is included in receivable or payable for daily variation margin on futures contracts, and the net cumulative appreciation(depreciation) is included in total accumulated earnings (loss).
See accompanying notes which are an integral part of the financial statements.
61 Semi-Annual Report

Common Stocks – 99.7%Shares Value
ELECTRIC UTILITIES – 59.4%Electric Utilities – 59.4%ALLETE, Inc. 56,757 $ 3,622,799Alliant Energy Corp. 271,190 16,233,433American Electric Power Co., Inc. 542,091 49,005,026Duke Energy Corp. 833,662 87,584,530Edison International 411,451 25,835,008Entergy Corp. 217,766 24,339,706Evergy, Inc. 248,457 16,139,767Eversource Energy 372,378 33,324,107Exelon Corp. 1,059,598 61,403,704FirstEnergy Corp. 589,705 24,744,022Hawaiian Electric Industries, Inc. 118,583 5,039,778IDACORP, Inc. 54,768 6,036,529MGE Energy, Inc. 39,365 3,048,032NextEra Energy, Inc. 2,125,797 166,067,262NRG Energy, Inc. 265,250 10,591,432OGE Energy Corp. 216,933 8,226,099Otter Tail Corp. 45,156 2,862,890PG&E Corp. (a) 1,613,471 20,636,294Pinnacle West Capital Corp. 122,208 8,506,899PNM Resources, Inc. 88,513 3,966,268Portland General Electric Co. 96,968 5,094,699PPL Corp. 833,974 24,752,348The Southern Co. 1,147,381 79,731,506Xcel Energy, Inc. 583,469 40,644,451
TOTAL ELECTRIC UTILITIES 727,436,589
GAS UTILITIES – 4.5%Gas Utilities – 4.5%Atmos Energy Corp. 141,719 15,195,111Chesapeake Utilities Corp. 17,976 2,448,511National Fuel Gas Co. 93,935 5,704,673New Jersey Resources Corp. 104,657 4,208,258Northwest Natural Holding Co. 33,601 1,590,671ONE Gas, Inc. 58,044 4,521,047South Jersey Industries, Inc. 122,162 3,056,493Southwest Gas Holdings, Inc. 64,122 4,371,838Spire, Inc. 56,129 3,700,024Star Group LP 39,353 410,845UGI Corp. 226,568 10,274,859
TOTAL GAS UTILITIES 55,482,330
INDEPENDENT POWER AND RENEWABLE ELECTRICITY PRODUCERS – 3.4%Independent Power Producers & Energy Traders – 2.5%Clearway Energy, Inc. Class A 35,787 1,104,029Clearway Energy, Inc. Class C 84,470 2,844,950The AES Corp. 722,079 16,015,712Vistra Corp. 470,572 10,263,175
30,227,866
Shares ValueRenewable Electricity – 0.9%NextEra Energy Partners LP 83,064 $ 6,248,074Ormat Technologies, Inc. 48,634 3,314,894Sunnova Energy International,
Inc. (a) 91,471 1,798,320
11,361,288
TOTAL INDEPENDENT POWER AND RENEWABLEELECTRICITY PRODUCERS 41,589,154
MULTI-UTILITIES – 27.8%Multi-Utilities – 27.8%Ameren Corp. 278,632 24,725,804Avista Corp. 74,139 3,296,220Black Hills Corp. 68,868 4,665,118CenterPoint Energy, Inc. 642,473 18,220,534CMS Energy Corp. 313,878 20,207,466Consolidated Edison, Inc. 382,930 33,104,299Dominion Energy, Inc. 876,105 70,666,629DTE Energy Co. 209,962 25,285,724MDU Resources Group, Inc. 219,444 6,445,070NiSource, Inc. 425,218 12,407,861NorthWestern Corp. 55,874 3,247,397Public Service Enterprise Group,
Inc. 547,864 36,449,392Sempra Energy 346,032 47,807,781Unitil Corp. 17,471 820,089WEC Energy Group, Inc. 341,812 33,169,436
TOTAL MULTI-UTILITIES 340,518,820
WATER UTILITIES – 4.6%Water Utilities – 4.6%American States Water Co. 40,086 3,697,132American Water Works Co., Inc. 196,683 31,626,626California Water Service Group 55,949 3,473,873Essential Utilities, Inc. 253,000 12,331,220Middlesex Water Co. 18,011 1,823,434SJW Group 30,887 2,126,879The York Water Co. 14,348 651,686
TOTAL WATER UTILITIES 55,730,850
TOTAL COMMON STOCKS(Cost $1,135,701,729) 1,220,757,743
Fidelity® MSCI Utilities Index ETF
Schedule of Investments January 31, 2022 (Unaudited)Showing Percentage of Net Assets
See accompanying notes which are an integral part of the financial statements.
Semi-Annual Report 62

Money Market Fund – 0.2%Shares Value
State Street Institutional TreasuryPlus Money Market Fund, TrustClass, 0.01% (b)(Cost $2,214,000) 2,214,000 $ 2,214,000
TOTAL INVESTMENT IN SECURITIES – 99.9%(Cost $1,137,915,729) 1,222,971,743
NET OTHER ASSETS (LIABILITIES) – 0.1% 622,917
NET ASSETS – 100.0% $1,223,594,660
Legend(a) Non-income producing.
(b) The rate quoted is the annualized seven-day yield of the fund at periodend.
Futures Contracts
Number ofcontracts
ExpirationDate
NotionalAmount Value
UnrealizedAppreciation/(Depreciation)
Purchased
Equity Index ContractCME E-mini S&P Utilities Select Sector Index Contracts (United States) 37 March 2022 $2,577,790 $(18,998) $(18,998)
The notional amount of futures purchased as a percentage of Net Assets is 0.2%
Investment ValuationThe following is a summary of the inputs used, as of January 31, 2022, involving the Fund’s assets and liabilities carried at fair value. The inputs or methodologyused for valuing securities may not be an indication of the risk associated with investing in those securities. For more information on valuation inputs, and theiraggregation into the levels used in the table below, please refer to the Investment Valuation section in the accompanying Notes to Financial Statements.
Valuation Inputs at Reporting Date:
Description Total Level 1 Level 2 Level 3Investments in Securities:
Common Stocks $ 1,220,757,743 $ 1,220,757,743 $ — $ —Money Market Funds 2,214,000 2,214,000 — —
Total Investments in Securities: $ 1,222,971,743 $ 1,222,971,743 $ — $ —
Derivative Instruments:
LiabilitiesFutures Contracts $ (18,998) $ (18,998) $ — $ —
Total Liabilities $ (18,998) $ (18,998) $ — $ —
Total Derivative Instruments: $ (18,998) $ (18,998) $ — $ —
Value of Derivative InstrumentsThe following table is a summary of the Fund’s value of derivative instruments by primary risk exposure as of January 31, 2022. For additional information onderivative instruments, please refer to the Derivative Instruments section in the accompanying Notes to Financial Statements.
Primary Risk/ Derivative Type ValueAsset Liabilities
Equity RiskFutures Contracts(a) $0 $(18,998)
Total Equity Risk 0 (18,998)
Total Value of Derivatives $0 $(18,998)
(a) Reflects gross cumulative appreciation (depreciation) on futures contracts as presented in the Schedule of Investments. In the Statement of Assets and Liabilities,the period end daily variation margin is included in receivable or payable for daily variation margin on futures contracts, and the net cumulative appreciation(depreciation) is included in total accumulated earnings (loss).
See accompanying notes which are an integral part of the financial statements.
63 Semi-Annual Report

Fidelity MSCICommunication
ServicesIndex ETF
Fidelity MSCIConsumer
DiscretionaryIndex ETF
Fidelity MSCIConsumer
StaplesIndex ETF
Fidelity MSCIEnergy
Index ETF
AssetsInvestments in securities, at value – See accompanying schedule $788,632,498 $1,573,452,640 $963,405,089 $1,229,103,870Segregated cash with brokers for derivative instruments 55,000 117,000 110,500 168,000Cash 134,762 78,286 41,242 2,901Receivable for investments sold 3,477,839 233,410 — 51,629Receivable for fund shares sold — — 28,265 71,135Dividends receivable 1,280,782 434,965 1,134,709 935,030Interest receivable 5 12 7 6Receivable for daily variation margin on futures contracts 18,592 60,957 12,803 14,153
Total assets 793,599,478 1,574,377,270 964,732,615 1,230,346,724
LiabilitiesPayable for investments purchased 4,907,849 118,851 — —Payable for fund shares redeemed — 23,035 — —Accrued management fees 56,764 121,479 65,067 81,153Payable for daily variation margin on futures contracts — — — —
Total liabilities 4,964,613 263,365 65,067 81,153
Net Assets $788,634,865 $1,574,113,905 $964,667,548 $1,230,265,571
Net Assets consist of:Paid in capital $691,267,733 $1,188,683,799 $840,245,901 $1,135,518,593Total accumulated earnings (loss) 97,367,132 385,430,106 124,421,647 94,746,978
Net Assets $788,634,865 $1,574,113,905 $964,667,548 $1,230,265,571
Shares outstanding 16,350,000 19,750,000 21,100,000 69,050,000
Net Asset Value per share $ 48.23 $ 79.70 $ 45.72 $ 17.82
Investments at cost $694,986,585 $1,318,056,341 $819,025,313 $ 962,090,092
Financial Statements
Statements of Assets and LiabilitiesJanuary 31, 2022 (Unaudited)
See accompanying notes which are an integral part of the financial statements.
Semi-Annual Report 64
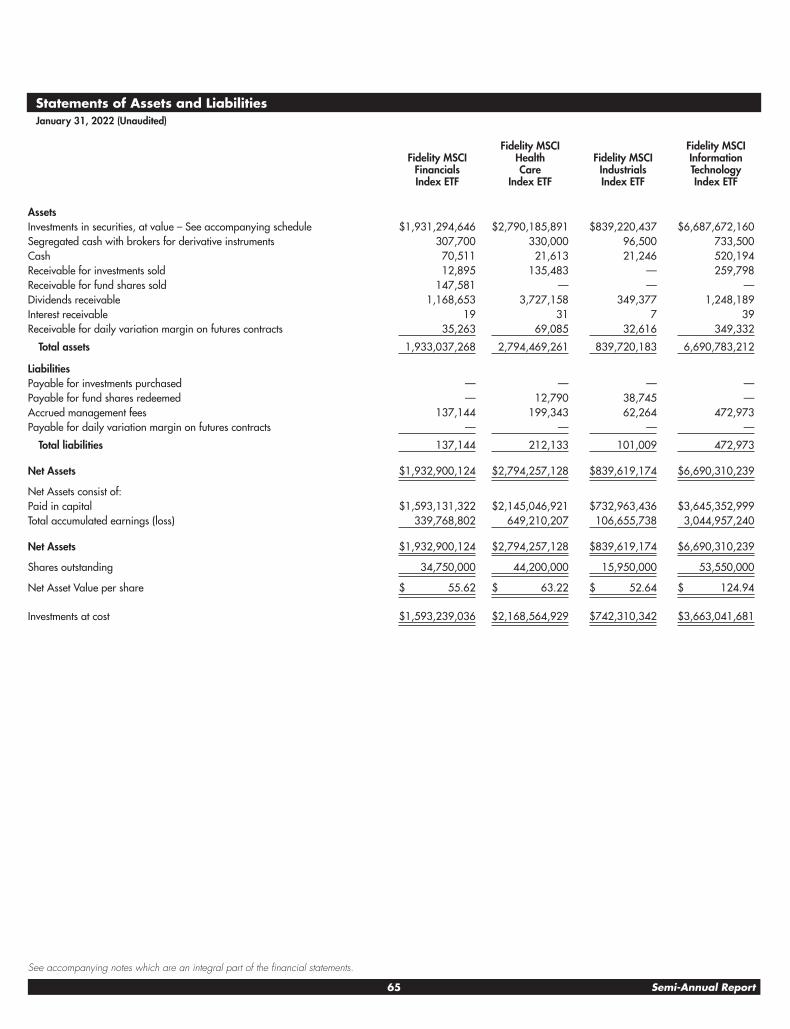
Fidelity MSCIFinancialsIndex ETF
Fidelity MSCIHealthCare
Index ETF
Fidelity MSCIIndustrialsIndex ETF
Fidelity MSCIInformationTechnologyIndex ETF
AssetsInvestments in securities, at value – See accompanying schedule $1,931,294,646 $2,790,185,891 $839,220,437 $6,687,672,160Segregated cash with brokers for derivative instruments 307,700 330,000 96,500 733,500Cash 70,511 21,613 21,246 520,194Receivable for investments sold 12,895 135,483 — 259,798Receivable for fund shares sold 147,581 — — —Dividends receivable 1,168,653 3,727,158 349,377 1,248,189Interest receivable 19 31 7 39Receivable for daily variation margin on futures contracts 35,263 69,085 32,616 349,332
Total assets 1,933,037,268 2,794,469,261 839,720,183 6,690,783,212
LiabilitiesPayable for investments purchased — — — —Payable for fund shares redeemed — 12,790 38,745 —Accrued management fees 137,144 199,343 62,264 472,973Payable for daily variation margin on futures contracts — — — —
Total liabilities 137,144 212,133 101,009 472,973
Net Assets $1,932,900,124 $2,794,257,128 $839,619,174 $6,690,310,239
Net Assets consist of:Paid in capital $1,593,131,322 $2,145,046,921 $732,963,436 $3,645,352,999Total accumulated earnings (loss) 339,768,802 649,210,207 106,655,738 3,044,957,240
Net Assets $1,932,900,124 $2,794,257,128 $839,619,174 $6,690,310,239
Shares outstanding 34,750,000 44,200,000 15,950,000 53,550,000
Net Asset Value per share $ 55.62 $ 63.22 $ 52.64 $ 124.94
Investments at cost $1,593,239,036 $2,168,564,929 $742,310,342 $3,663,041,681
Statements of Assets and LiabilitiesJanuary 31, 2022 (Unaudited)
See accompanying notes which are an integral part of the financial statements.
65 Semi-Annual Report

Fidelity MSCIMaterialsIndex ETF
Fidelity MSCIReal EstateIndex ETF
Fidelity MSCIUtilities
Index ETF
AssetsInvestments in securities, at value – See accompanying schedule $517,909,198 $2,146,754,655 $1,222,971,743Segregated cash with brokers for derivative instruments 40,950 220,800 111,000Cash 39,415 96,336 33,550Receivable for investments sold — 942,561 —Receivable for fund shares sold 20,516 — 94,557Dividends receivable 298,479 666,966 444,315Interest receivable 6 13 10Receivable for daily variation margin on futures contracts 15,639 — 23,976
Total assets 518,324,203 2,148,681,331 1,223,679,151
LiabilitiesPayable for investments purchased 768,502 — —Payable for fund shares redeemed 10,258 — —Accrued management fees 36,938 153,975 84,491Payable for daily variation margin on futures contracts — 22,960 —
Total liabilities 815,698 176,935 84,491
Net Assets $517,508,505 $2,148,504,396 $1,223,594,660
Net Assets consist of:Paid in capital $484,807,248 $1,857,195,053 $1,140,872,625Total accumulated earnings (loss) 32,701,257 291,309,343 82,722,035
Net Assets $517,508,505 $2,148,504,396 $1,223,594,660
Shares outstanding 11,050,000 67,400,000 27,350,000
Net Asset Value per share $ 46.83 $ 31.88 $ 44.74
Investments at cost $496,787,448 $1,816,162,672 $1,137,915,729
Financial Statements – continued
Statements of Assets and LiabilitiesJanuary 31, 2022 (Unaudited)
See accompanying notes which are an integral part of the financial statements.
Semi-Annual Report 66

Fidelity MSCICommunication
ServicesIndex ETF
Fidelity MSCIConsumer
DiscretionaryIndex ETF
Fidelity MSCIConsumer
StaplesIndex ETF
Fidelity MSCIEnergy
Index ETF
Investment IncomeDividends $ 3,726,224 $ 6,715,853 $ 10,050,130 $ 20,530,988Non-Cash dividends 1,381,986 — — —Interest 26 52 30 32
Total income 5,108,236 6,715,905 10,050,160 20,531,020
ExpensesManagement fees 380,805 716,042 355,653 418,109Independent trustees’ fees and expenses 1,592 2,938 1,458 1,674Legal — 33 — —
Total expenses 382,397 719,013 357,111 419,783
Net investment income (loss) 4,725,839 5,996,892 9,693,049 20,111,237
Realized and Unrealized Gain (Loss)Net realized gain (loss) on investment securities 2,178,061 (5,989,711) (64,309) (18,081,175)Net realized gain (loss) on In-kind redemptions 35,830,441 167,948,428 5,308,390 38,070,970Net realized gain (loss) on futures contracts (201,485) 281,586 285,452 (55,734)Net realized gain (loss) on foreign currency transactions — — — —
Total net realized gain (loss) 37,807,017 162,240,303 5,529,533 19,934,061
Change in net unrealized appreciation (depreciation) on investment securities (151,718,321) (203,394,509) 40,782,839 260,122,194Change in net unrealized appreciation (depreciation) on futures contracts (87,835) (220,160) (45,470) 328,765
Total change in net unrealized appreciation (depreciation) (151,806,156) (203,614,669) 40,737,369 260,450,959
Net gain (loss) (113,999,139) (41,374,366) 46,266,902 280,385,020
Net increase (decrease) in net assets resulting from operations $(109,273,300) $ (35,377,474) $ 55,959,951 $300,496,257
Statements of OperationsFor the six months ended January 31, 2022 (Unaudited)
See accompanying notes which are an integral part of the financial statements.
67 Semi-Annual Report

Fidelity MSCIFinancialsIndex ETF
Fidelity MSCIHealthCare
Index ETF
Fidelity MSCIIndustrialsIndex ETF
Fidelity MSCIInformationTechnologyIndex ETF
Investment IncomeDividends $ 18,759,093 $ 18,672,386 $ 5,523,399 $ 24,407,862Non-Cash dividends — — — —Interest 68 123 26 283
Total income 18,759,161 18,672,509 5,523,425 24,408,145
ExpensesManagement fees 789,622 1,217,116 363,950 2,777,781Independent trustees’ fees and expenses 3,209 5,033 1,515 11,273Legal — — — —
Total expenses 792,831 1,222,149 365,465 2,789,054
Net investment income (loss) 17,966,330 17,450,360 5,157,960 21,619,091
Realized and Unrealized Gain (Loss)Net realized gain (loss) on investment securities (3,684,993) (1,562,586) 2,619,951 4,801,621Net realized gain (loss) on In-kind redemptions 37,079,460 68,154,017 21,861,852 54,193,309Net realized gain (loss) on futures contracts 407,593 240,139 (102,466) 2,666,153Net realized gain (loss) on foreign currency transactions — — (3) —
Total net realized gain (loss) 33,802,060 66,831,570 24,379,334 61,661,083
Change in net unrealized appreciation (depreciation) on investment securities 76,265,635 (194,811,270) (56,842,389) 86,709,738Change in net unrealized appreciation (depreciation) on futures contracts (73,838) (546,889) (88,240) (905,459)
Total change in net unrealized appreciation (depreciation) 76,191,797 (195,358,159) (56,930,629) 85,804,279
Net gain (loss) 109,993,857 (128,526,589) (32,551,295) 147,465,362
Net increase (decrease) in net assets resulting from operations $127,960,187 $(111,076,229) $(27,393,335) $169,084,453
Financial Statements – continued
Statements of OperationsFor the six months ended January 31, 2022 (Unaudited)
See accompanying notes which are an integral part of the financial statements.
Semi-Annual Report 68

Fidelity MSCIMaterialsIndex ETF
Fidelity MSCIReal EstateIndex ETF
Fidelity MSCIUtilities
Index ETF
Investment IncomeDividends $ 4,212,172 $ 28,557,856 $ 17,175,778Non-Cash dividends — 1,805,296 —Interest 17 38 25
Total income 4,212,189 30,363,190 17,175,803
ExpensesManagement fees 214,101 859,200 482,678Independent trustees’ fees and expenses 906 3,381 1,965Legal — — —
Total expenses 215,007 862,581 484,643
Net investment income (loss) 3,997,182 29,500,609 16,691,160
Realized and Unrealized Gain (Loss)Net realized gain (loss) on investment securities (559,637) (13,524,622) (1,658,291)Net realized gain (loss) on In-kind redemptions 23,464,049 21,171,594 29,095,367Net realized gain (loss) on futures contracts (61,645) 264,851 236,821Net realized gain (loss) on foreign currency transactions — — —
Total net realized gain (loss) 22,842,767 7,911,823 27,673,897
Change in net unrealized appreciation (depreciation) on investment securities (26,064,642) (10,318,469) 27,391,765Change in net unrealized appreciation (depreciation) on futures contracts (37,481) (321,537) (52,425)
Total change in net unrealized appreciation (depreciation) (26,102,123) (10,640,006) 27,339,340
Net gain (loss) (3,259,356) (2,728,183) 55,013,237
Net increase (decrease) in net assets resulting from operations $ 737,826 $ 26,772,426 $ 71,704,397
Statements of OperationsFor the six months ended January 31, 2022 (Unaudited)
See accompanying notes which are an integral part of the financial statements.
69 Semi-Annual Report
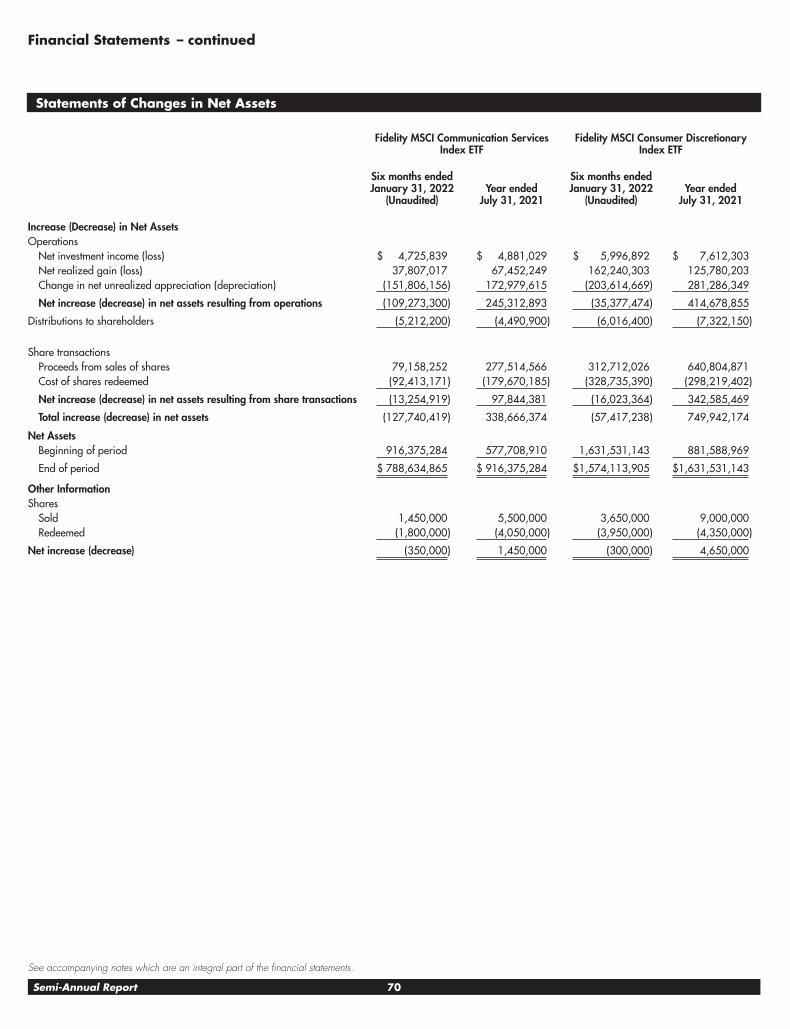
Fidelity MSCI Communication ServicesIndex ETF
Fidelity MSCI Consumer DiscretionaryIndex ETF
Six months endedJanuary 31, 2022
(Unaudited)Year ended
July 31, 2021
Six months endedJanuary 31, 2022
(Unaudited)Year ended
July 31, 2021
Increase (Decrease) in Net AssetsOperations
Net investment income (loss) $ 4,725,839 $ 4,881,029 $ 5,996,892 $ 7,612,303Net realized gain (loss) 37,807,017 67,452,249 162,240,303 125,780,203Change in net unrealized appreciation (depreciation) (151,806,156) 172,979,615 (203,614,669) 281,286,349
Net increase (decrease) in net assets resulting from operations (109,273,300) 245,312,893 (35,377,474) 414,678,855
Distributions to shareholders (5,212,200) (4,490,900) (6,016,400) (7,322,150)
Share transactionsProceeds from sales of shares 79,158,252 277,514,566 312,712,026 640,804,871Cost of shares redeemed (92,413,171) (179,670,185) (328,735,390) (298,219,402)
Net increase (decrease) in net assets resulting from share transactions (13,254,919) 97,844,381 (16,023,364) 342,585,469
Total increase (decrease) in net assets (127,740,419) 338,666,374 (57,417,238) 749,942,174
Net AssetsBeginning of period 916,375,284 577,708,910 1,631,531,143 881,588,969
End of period $ 788,634,865 $ 916,375,284 $1,574,113,905 $1,631,531,143
Other InformationShares
Sold 1,450,000 5,500,000 3,650,000 9,000,000Redeemed (1,800,000) (4,050,000) (3,950,000) (4,350,000)
Net increase (decrease) (350,000) 1,450,000 (300,000) 4,650,000
Financial Statements – continued
Statements of Changes in Net Assets
See accompanying notes which are an integral part of the financial statements.
Semi-Annual Report 70

Fidelity MSCI Consumer Staples Index ETF Fidelity MSCI Energy Index ETF
Six months endedJanuary 31, 2022
(Unaudited)Year ended
July 31, 2021
Six months endedJanuary 31, 2022
(Unaudited)Year ended
July 31, 2021
Increase (Decrease) in Net AssetsOperations
Net investment income (loss) $ 9,693,049 $ 20,968,508 $ 20,111,237 $ 28,490,030Net realized gain (loss) 5,529,533 55,734,389 19,934,061 (6,896,933)Change in net unrealized appreciation (depreciation) 40,737,369 62,687,995 260,450,959 241,972,018
Net increase (decrease) in net assets resulting from operations 55,959,951 139,390,892 300,496,257 263,565,115
Distributions to shareholders (9,715,800) (20,813,400) (18,971,900) (29,586,300)
Share transactionsProceeds from sales of shares 121,801,557 272,522,699 162,720,276 328,207,237Cost of shares redeemed (21,660,848) (251,466,243) (108,037,059) (117,452,719)
Net increase (decrease) in net assets resulting from share transactions 100,140,709 21,056,456 54,683,217 210,754,518
Total increase (decrease) in net assets 146,384,860 139,633,948 336,207,574 444,733,333
Net AssetsBeginning of period 818,282,688 678,648,740 894,057,997 449,324,664
End of period $964,667,548 $ 818,282,688 $1,230,265,571 $ 894,057,997
Other InformationShares
Sold 2,700,000 6,800,000 10,300,000 28,300,000Redeemed (500,000) (6,100,000) (7,600,000) (9,400,000)
Net increase (decrease) 2,200,000 700,000 2,700,000 18,900,000
Statements of Changes in Net Assets
See accompanying notes which are an integral part of the financial statements.
71 Semi-Annual Report

Fidelity MSCI Financials Index ETF Fidelity MSCI Health Care Index ETF
Six months endedJanuary 31, 2022
(Unaudited)Year ended
July 31, 2021
Six months endedJanuary 31, 2022
(Unaudited)Year ended
July 31, 2021
Increase (Decrease) in Net AssetsOperations
Net investment income (loss) $ 17,966,330 $ 24,866,481 $ 17,450,360 $ 31,015,066Net realized gain (loss) 33,802,060 39,534,722 66,831,570 66,838,221Change in net unrealized appreciation (depreciation) 76,191,797 390,693,235 (195,358,159) 504,537,093
Net increase (decrease) in net assets resulting from operations 127,960,187 455,094,438 (111,076,229) 602,390,380
Distributions to shareholders (18,017,150) (23,611,000) (18,462,700) (33,149,950)
Share transactionsProceeds from sales of shares 206,821,504 715,027,877 220,557,260 399,566,161Cost of shares redeemed (100,799,367) (154,635,399) (142,999,766) (137,834,298)
Net increase (decrease) in net assets resulting from share transactions 106,022,137 560,392,478 77,557,494 261,731,863
Total increase (decrease) in net assets 215,965,174 991,875,916 (51,981,435) 830,972,293
Net AssetsBeginning of period 1,716,934,950 725,059,034 2,846,238,563 2,015,266,270
End of period $1,932,900,124 $1,716,934,950 $2,794,257,128 $2,846,238,563
Other InformationShares
Sold 3,650,000 14,900,000 3,300,000 6,950,000Redeemed (1,800,000) (3,250,000) (2,200,000) (2,350,000)
Net increase (decrease) 1,850,000 11,650,000 1,100,000 4,600,000
Financial Statements – continued
Statements of Changes in Net Assets
See accompanying notes which are an integral part of the financial statements.
Semi-Annual Report 72

Fidelity MSCI Industrials Index ETFFidelity MSCI Information Technology
Index ETF
Six months endedJanuary 31, 2022
(Unaudited)Year ended
July 31, 2021
Six months endedJanuary 31, 2022
(Unaudited)Year ended
July 31, 2021
Increase (Decrease) in Net AssetsOperations
Net investment income (loss) $ 5,157,960 $ 7,779,970 $ 21,619,091 $ 39,380,753Net realized gain (loss) 24,379,334 10,549,630 61,661,083 223,319,232Change in net unrealized appreciation (depreciation) (56,930,629) 189,422,820 85,804,279 1,490,020,346
Net increase (decrease) in net assets resulting from operations (27,393,335) 207,752,420 169,084,453 1,752,720,331
Distributions to shareholders (5,147,300) (7,709,800) (23,751,150) (39,319,850)
Share transactionsProceeds from sales of shares 66,309,673 348,123,647 422,255,213 583,974,201Cost of shares redeemed (56,421,016) (33,192,592) (84,167,045) (378,741,782)
Net increase (decrease) in net assets resulting from share transactions 9,888,657 314,931,055 338,088,168 205,232,419
Total increase (decrease) in net assets (22,651,978) 514,973,675 483,421,471 1,918,632,900
Net AssetsBeginning of period 862,271,152 347,297,477 6,206,888,768 4,288,255,868
End of period $839,619,174 $862,271,152 $6,690,310,239 $6,206,888,768
Other InformationShares
Sold 1,200,000 7,200,000 3,250,000 5,600,000Redeemed (1,050,000) (650,000) (700,000) (3,750,000)
Net increase (decrease) 150,000 6,550,000 2,550,000 1,850,000
Statements of Changes in Net Assets
See accompanying notes which are an integral part of the financial statements.
73 Semi-Annual Report
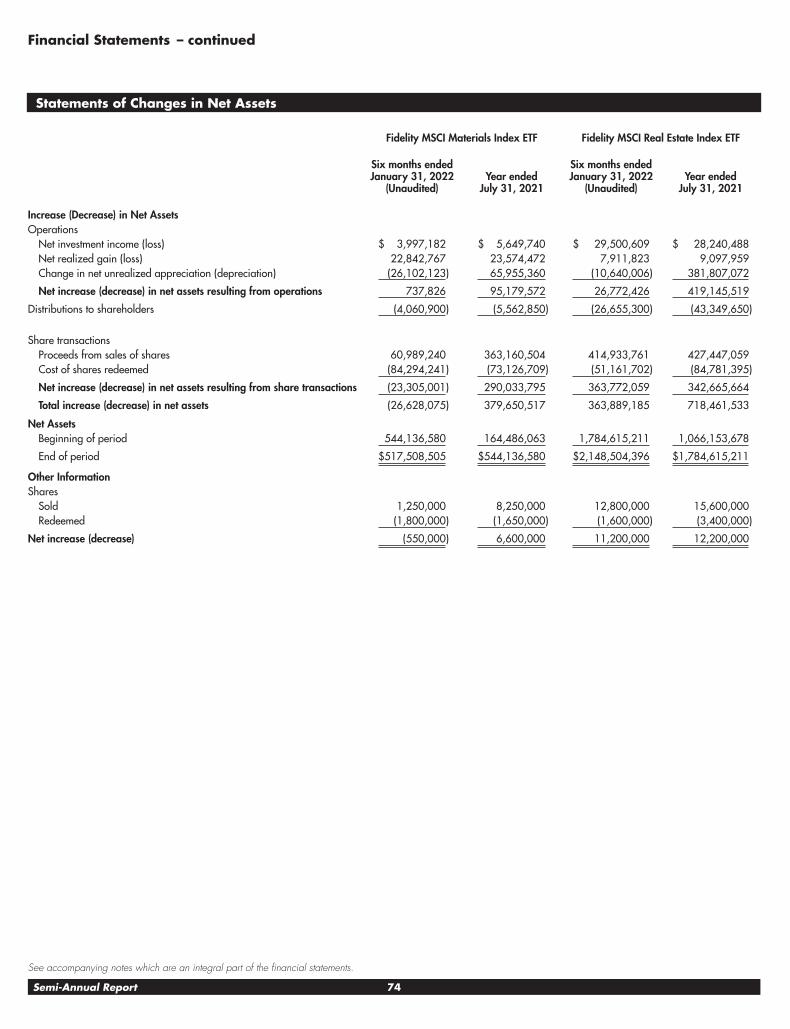
Fidelity MSCI Materials Index ETF Fidelity MSCI Real Estate Index ETF
Six months endedJanuary 31, 2022
(Unaudited)Year ended
July 31, 2021
Six months endedJanuary 31, 2022
(Unaudited)Year ended
July 31, 2021
Increase (Decrease) in Net AssetsOperations
Net investment income (loss) $ 3,997,182 $ 5,649,740 $ 29,500,609 $ 28,240,488Net realized gain (loss) 22,842,767 23,574,472 7,911,823 9,097,959Change in net unrealized appreciation (depreciation) (26,102,123) 65,955,360 (10,640,006) 381,807,072
Net increase (decrease) in net assets resulting from operations 737,826 95,179,572 26,772,426 419,145,519
Distributions to shareholders (4,060,900) (5,562,850) (26,655,300) (43,349,650)
Share transactionsProceeds from sales of shares 60,989,240 363,160,504 414,933,761 427,447,059Cost of shares redeemed (84,294,241) (73,126,709) (51,161,702) (84,781,395)
Net increase (decrease) in net assets resulting from share transactions (23,305,001) 290,033,795 363,772,059 342,665,664
Total increase (decrease) in net assets (26,628,075) 379,650,517 363,889,185 718,461,533
Net AssetsBeginning of period 544,136,580 164,486,063 1,784,615,211 1,066,153,678
End of period $517,508,505 $544,136,580 $2,148,504,396 $1,784,615,211
Other InformationShares
Sold 1,250,000 8,250,000 12,800,000 15,600,000Redeemed (1,800,000) (1,650,000) (1,600,000) (3,400,000)
Net increase (decrease) (550,000) 6,600,000 11,200,000 12,200,000
Financial Statements – continued
Statements of Changes in Net Assets
See accompanying notes which are an integral part of the financial statements.
Semi-Annual Report 74

Fidelity MSCI Utilities Index ETF
Six months endedJanuary 31, 2022
(Unaudited)Year ended
July 31, 2021
Increase (Decrease) in Net AssetsOperations
Net investment income (loss) $ 16,691,160 $ 30,395,742Net realized gain (loss) 27,673,897 37,203,035Change in net unrealized appreciation (depreciation) 27,339,340 48,102,265
Net increase (decrease) in net assets resulting from operations 71,704,397 115,701,042
Distributions to shareholders (16,242,750) (31,181,450)
Share transactionsProceeds from sales of shares 226,414,161 416,979,624Cost of shares redeemed (134,573,391) (270,013,514)
Net increase (decrease) in net assets resulting from share transactions 91,840,770 146,966,110
Total increase (decrease) in net assets 147,302,417 231,485,702
Net AssetsBeginning of period 1,076,292,243 844,806,541
End of period $1,223,594,660 $1,076,292,243
Other InformationShares
Sold 5,100,000 10,350,000Redeemed (3,000,000) (6,700,000)
Net increase (decrease) 2,100,000 3,650,000
Statements of Changes in Net Assets
See accompanying notes which are an integral part of the financial statements.
75 Semi-Annual Report

Fidelity MSCI Communication Services Index ETF
Six months endedJanuary 31, 2022
(Unaudited)Year ended July 31,
2021Year ended July 31,
2020Year ended July 31,
2019Year ended July 31,
2018Year ended July 31,
2017
Selected Per-ShareDataNet asset value,beginning of period $ 54.87 $ 37.88 $ 34.35 $ 28.76 $ 32.62 $ 32.10
Income from InvestmentOperations
Net investmentincome (loss)A,B 0.28 0.34 0.33 0.49 0.85 0.80Net realized andunrealized gain (loss) (6.62) 16.96 3.52 5.59 (2.43) 0.62
Total from investmentoperations (6.34) 17.30 3.85 6.08 (1.58) 1.42
Distributions from netinvestment income (0.30) (0.31) (0.32) (0.49) (1.00) (0.90)Distributions from netrealized gain — — — — (1.28) —
Total distributions (0.30) (0.31) (0.32) (0.49) (2.28) (0.90)
Net asset value, end ofperiod $ 48.23 $ 54.87 $ 37.88 $ 34.35 $ 28.76 $ 32.62
Total ReturnC,D (11.59)% 45.81% 11.40% 21.33% (5.14)% 4.58%Ratios to Average NetAssetsA,E
Expenses beforereductions .08%F .08% .08% .08% .08% .08%Expenses net of feewaivers, if any .08%F .08% .08% .08% .08% .08%Expenses net of allreductions .08%F .08% .08% .08% .08% .08%Net investmentincome (loss) 1.04%F .72% .96% 1.53% 2.81% 2.55%
Supplemental DataNet assets, end ofperiod (000 omitted) $788,635 $916,375 $577,709 $374,389 $125,104 $115,818Portfolio turnoverrateG,H 12%I 13% 23% 82% 38% 27%
A Net investment income (loss) is affected by the timing of the declaration of dividends by any underlying mutual funds or exchange-traded funds (ETFs). Net investment income (loss) of any such underlying funds is not included in the Fund’s netinvestment income (loss) ratio.
B Calculated based on average shares outstanding during the period.C Based on net asset value.D Total returns for periods of less than one year are not annualized.E Expense ratios reflect operating expenses of the class. Expenses before reductions do not reflect amounts reimbursed, waived, or reduced through arrangements with the investment advisor, brokerage services, or other offset arrangements, if
applicable, and do not represent the amount paid by the class during periods when reimbursements, waivers or reductions occur.F Annualized.G Amount does not include the portfolio activity of any underlying mutual funds or exchange-traded funds (ETFs).H Portfolio turnover rate excludes securities received or delivered in-kind.I Amount not annualized.
Financial Statements – continued
Financial Highlights
See accompanying notes which are an integral part of the financial statements.
Semi-Annual Report 76

Fidelity MSCI Consumer Discretionary Index ETF
Six months endedJanuary 31, 2022
(Unaudited)Year ended July 31,
2021Year ended July 31,
2020Year ended July 31,
2019Year ended July 31,
2018Year ended July 31,
2017
Selected Per-ShareDataNet asset value,beginning of period $ 81.37 $ 57.25 $ 46.25 $ 43.32 $ 36.06 $ 31.99
Income from InvestmentOperations
Net investmentincome (loss)A,B 0.30 0.42 0.50 0.51 0.47 0.50Net realized andunrealized gain (loss) (1.67) 24.10 11.01 2.96 7.20 4.07
Total from investmentoperations (1.37) 24.52 11.51 3.47 7.67 4.57
Distributions from netinvestment income (0.30) (0.40) (0.51) (0.54) (0.41) (0.50)
Total distributions (0.30) (0.40) (0.51) (0.54) (0.41) (0.50)
Net asset value, end ofperiod $ 79.70 $ 81.37 $ 57.25 $ 46.25 $ 43.32 $ 36.06
Total ReturnC,D (1.70)% 42.95% 25.26% 8.15% 21.36% 14.41%Ratios to Average NetAssetsA,E
Expenses beforereductions .08%F .08% .08% .08% .08% .08%Expenses net of feewaivers, if any .08%F .08% .08% .08% .08% .08%Expenses net of allreductions .08%F .08% .08% .08% .08% .08%Net investmentincome (loss) .70%F .58% 1.06% 1.18% 1.16% 1.49%
Supplemental DataNet assets, end ofperiod (000 omitted) $1,574,114 $1,631,531 $881,589 $728,457 $628,129 $293,913Portfolio turnoverrateG,H 2%I 48% 60% 25% 5% 7%
A Net investment income (loss) is affected by the timing of the declaration of dividends by any underlying mutual funds or exchange-traded funds (ETFs). Net investment income (loss) of any such underlying funds is not included in the Fund’s netinvestment income (loss) ratio.
B Calculated based on average shares outstanding during the period.C Based on net asset value.D Total returns for periods of less than one year are not annualized.E Expense ratios reflect operating expenses of the class. Expenses before reductions do not reflect amounts reimbursed, waived, or reduced through arrangements with the investment advisor, brokerage services, or other offset arrangements, if
applicable, and do not represent the amount paid by the class during periods when reimbursements, waivers or reductions occur.F Annualized.G Amount does not include the portfolio activity of any underlying mutual funds or exchange-traded funds (ETFs).H Portfolio turnover rate excludes securities received or delivered in-kind.I Amount not annualized.
Financial Highlights
See accompanying notes which are an integral part of the financial statements.
77 Semi-Annual Report

Fidelity MSCI Consumer Staples Index ETF
Six months endedJanuary 31, 2022
(Unaudited)Year ended July 31,
2021Year ended July 31,
2020Year ended July 31,
2019Year ended July 31,
2018Year ended July 31,
2017
Selected Per-ShareDataNet asset value,beginning of period $ 43.30 $ 37.29 $ 35.59 $ 32.33 $ 33.23 $ 32.82
Income from InvestmentOperations
Net investmentincome (loss)A,B 0.50 1.02 0.96 0.94 0.86 0.83Net realized andunrealized gain (loss) 2.43 6.01 1.70 3.23 (0.88) 0.40
Total from investmentoperations 2.93 7.03 2.66 4.17 (0.02) 1.23
Distributions from netinvestment income (0.51) (1.02) (0.96) (0.91) (0.88) (0.82)
Total distributions (0.51) (1.02) (0.96) (0.91) (0.88) (0.82)
Net asset value, end ofperiod $ 45.72 $ 43.30 $ 37.29 $ 35.59 $ 32.33 $ 33.23
Total ReturnC,D 6.82% 19.09% 7.74% 13.16% (0.06)% 3.82%Ratios to Average NetAssetsA,E
Expenses beforereductions .08%F .08% .08% .08% .08% .08%Expenses net of feewaivers, if any .08%F .08% .08% .08% .08% .08%Expenses net of allreductions .08%F .08% .08% .08% .08% .08%Net investmentincome (loss) 2.28%F 2.53% 2.68% 2.83% 2.65% 2.56%
Supplemental DataNet assets, end ofperiod (000 omitted) $964,668 $818,283 $678,649 $548,070 $311,970 $312,349Portfolio turnoverrateG,H 5%I 20% 34% 30% 24% 11%
A Net investment income (loss) is affected by the timing of the declaration of dividends by any underlying mutual funds or exchange-traded funds (ETFs). Net investment income (loss) of any such underlying funds is not included in the Fund’s netinvestment income (loss) ratio.
B Calculated based on average shares outstanding during the period.C Based on net asset value.D Total returns for periods of less than one year are not annualized.E Expense ratios reflect operating expenses of the class. Expenses before reductions do not reflect amounts reimbursed, waived, or reduced through arrangements with the investment advisor, brokerage services, or other offset arrangements, if
applicable, and do not represent the amount paid by the class during periods when reimbursements, waivers or reductions occur.F Annualized.G Amount does not include the portfolio activity of any underlying mutual funds or exchange-traded funds (ETFs).H Portfolio turnover rate excludes securities received or delivered in-kind.I Amount not annualized.
Financial Statements – continued
Financial Highlights
See accompanying notes which are an integral part of the financial statements.
Semi-Annual Report 78

Fidelity MSCI Energy Index ETF
Six months endedJanuary 31, 2022
(Unaudited)Year ended July 31,
2021Year ended July 31,
2020Year ended July 31,
2019Year ended July 31,
2018Year ended July 31,
2017
Selected Per-ShareDataNet asset value,beginning of period $ 13.47 $ 9.47 $ 16.79 $ 21.50 $ 18.39 $ 19.03
Income from InvestmentOperations
Net investmentincome (loss)A,B 0.30 0.49 0.51 0.54 0.47 0.57Net realized andunrealized gain (loss) 4.34 4.02 (6.86) (4.70) 3.22 (0.73)
Total from investmentoperations 4.64 4.51 (6.35) (4.16) 3.69 (0.16)
Distributions from netinvestment income (0.29) (0.51) (0.97) (0.55) (0.58) (0.48)
Total distributions (0.29) (0.51) (0.97) (0.55) (0.58) (0.48)
Net asset value, end ofperiod $ 17.82 $ 13.47 $ 9.47 $ 16.79 $ 21.50 $ 18.39
Total ReturnC,D 34.98% 48.79% (39.28)% (19.42)% 20.52% (0.96)%Ratios to Average NetAssetsA,E
Expenses beforereductions .08%F .08% .08% .08% .08% .08%Expenses net of feewaivers, if any .08%F .08% .08% .08% .08% .08%Expenses net of allreductions .08%F .08% .08% .08% .08% .08%Net investmentincome (loss) 4.03%F 4.11% 4.18% 2.92% 2.40% 2.91%
Supplemental DataNet assets, end ofperiod (000 omitted) $1,230,266 $894,058 $449,325 $467,628 $634,157 $431,311Portfolio turnoverrateG,H 5%I 11% 17% 6% 5% 10%
A Net investment income (loss) is affected by the timing of the declaration of dividends by any underlying mutual funds or exchange-traded funds (ETFs). Net investment income (loss) of any such underlying funds is not included in the Fund’s netinvestment income (loss) ratio.
B Calculated based on average shares outstanding during the period.C Based on net asset value.D Total returns for periods of less than one year are not annualized.E Expense ratios reflect operating expenses of the class. Expenses before reductions do not reflect amounts reimbursed, waived, or reduced through arrangements with the investment advisor, brokerage services, or other offset arrangements, if
applicable, and do not represent the amount paid by the class during periods when reimbursements, waivers or reductions occur.F Annualized.G Amount does not include the portfolio activity of any underlying mutual funds or exchange-traded funds (ETFs).H Portfolio turnover rate excludes securities received or delivered in-kind.I Amount not annualized.
Financial Highlights
See accompanying notes which are an integral part of the financial statements.
79 Semi-Annual Report

Fidelity MSCI Financials Index ETF
Six months endedJanuary 31, 2022
(Unaudited)Year ended July 31,
2021Year ended July 31,
2020Year ended July 31,
2019Year ended July 31,
2018Year ended July 31,
2017
Selected Per-ShareDataNet asset value,beginning of period $ 52.19 $ 34.12 $ 41.22 $ 41.05 $ 36.94 $ 28.61
Income from InvestmentOperations
Net investmentincome (loss)A,B 0.53 0.96 1.00 0.89 0.75 0.61Net realized andunrealized gain (loss) 3.43 18.00 (7.09) 0.18 4.11 8.28
Total from investmentoperations 3.96 18.96 (6.09) 1.07 4.86 8.89
Distributions from netinvestment income (0.53) (0.89) (1.01) (0.90) (0.75) (0.56)
Total distributions (0.53) (0.89) (1.01) (0.90) (0.75) (0.56)
Net asset value, end ofperiod $ 55.62 $ 52.19 $ 34.12 $ 41.22 $ 41.05 $ 36.94
Total ReturnC,D 7.63% 56.15% (14.78)% 2.80% 13.23% 31.31%Ratios to Average NetAssetsA,E
Expenses beforereductions .08%F .08% .08% .08% .08% .08%Expenses net of feewaivers, if any .08%F .08% .08% .08% .08% .08%Expenses net of allreductions .08%F .08% .08% .08% .08% .08%Net investmentincome (loss) 1.91%F 2.10% 2.61% 2.27% 1.88% 1.77%
Supplemental DataNet assets, end ofperiod (000 omitted) $1,932,900 $1,716,935 $725,059 $1,143,858 $1,574,375 $921,679Portfolio turnoverrateG,H 2%I 4% 6% 5% 5% 18%
A Net investment income (loss) is affected by the timing of the declaration of dividends by any underlying mutual funds or exchange-traded funds (ETFs). Net investment income (loss) of any such underlying funds is not included in the Fund’s netinvestment income (loss) ratio.
B Calculated based on average shares outstanding during the period.C Based on net asset value.D Total returns for periods of less than one year are not annualized.E Expense ratios reflect operating expenses of the class. Expenses before reductions do not reflect amounts reimbursed, waived, or reduced through arrangements with the investment advisor, brokerage services, or other offset arrangements, if
applicable, and do not represent the amount paid by the class during periods when reimbursements, waivers or reductions occur.F Annualized.G Amount does not include the portfolio activity of any underlying mutual funds or exchange-traded funds (ETFs).H Portfolio turnover rate excludes securities received or delivered in-kind.I Amount not annualized.
Financial Statements – continued
Financial Highlights
See accompanying notes which are an integral part of the financial statements.
Semi-Annual Report 80

Fidelity MSCI Health Care Index ETF
Six months endedJanuary 31, 2022
(Unaudited)Year ended July 31,
2021Year ended July 31,
2020Year ended July 31,
2019Year ended July 31,
2018Year ended July 31,
2017
Selected Per-ShareDataNet asset value,beginning of period $ 66.04 $ 52.34 $ 44.43 $ 43.72 $ 38.44 $ 35.67
Income from InvestmentOperations
Net investmentincome (loss)A,B 0.40 0.75 0.72 0.63 0.56 0.51Net realized andunrealized gain (loss) (2.81) 13.74 7.88 1.01 5.29 2.76
Total from investmentoperations (2.41) 14.49 8.60 1.64 5.85 3.27
Distributions from netinvestment income (0.41) (0.79) (0.69) (0.93) (0.57) (0.50)
Total distributions (0.41) (0.79) (0.69) (0.93) (0.57) (0.50)
Net asset value, end ofperiod $ 63.22 $ 66.04 $ 52.34 $ 44.43 $ 43.72 $ 38.44
Total ReturnC,D (3.68)% 27.91% 19.69% 3.84% 15.34% 9.30%Ratios to Average NetAssetsA,E
Expenses beforereductions .08%F .08% .08% .08% .08% .08%Expenses net of feewaivers, if any .08%F .08% .08% .08% .08% .08%Expenses net of allreductions .08%F .08% .08% .08% .08% .08%Net investmentincome (loss) 1.20%F 1.28% 1.52% 1.43% 1.39% 1.45%
Supplemental DataNet assets, end ofperiod (000 omitted) $2,794,257 $2,846,239 $2,015,266 $1,557,252 $1,252,626 $818,710Portfolio turnoverrateG,H 2%I 7% 7% 5% 8% 4%
A Net investment income (loss) is affected by the timing of the declaration of dividends by any underlying mutual funds or exchange-traded funds (ETFs). Net investment income (loss) of any such underlying funds is not included in the Fund’s netinvestment income (loss) ratio.
B Calculated based on average shares outstanding during the period.C Based on net asset value.D Total returns for periods of less than one year are not annualized.E Expense ratios reflect operating expenses of the class. Expenses before reductions do not reflect amounts reimbursed, waived, or reduced through arrangements with the investment advisor, brokerage services, or other offset arrangements, if
applicable, and do not represent the amount paid by the class during periods when reimbursements, waivers or reductions occur.F Annualized.G Amount does not include the portfolio activity of any underlying mutual funds or exchange-traded funds (ETFs).H Portfolio turnover rate excludes securities received or delivered in-kind.I Amount not annualized.
Financial Highlights
See accompanying notes which are an integral part of the financial statements.
81 Semi-Annual Report

Fidelity MSCI Industrials Index ETF
Six months endedJanuary 31, 2022
(Unaudited)Year ended July 31,
2021Year ended July 31,
2020Year ended July 31,
2019Year ended July 31,
2018Year ended July 31,
2017
Selected Per-ShareDataNet asset value,beginning of period $ 54.57 $ 37.55 $ 40.04 $ 39.51 $ 34.93 $ 30.10
Income from InvestmentOperations
Net investmentincome (loss)A,B 0.33 0.61 0.69 0.70 0.61 0.61Net realized andunrealized gain (loss) (1.94) 17.00 (2.48) 0.51 4.62 4.79
Total from investmentoperations (1.61) 17.61 (1.79) 1.21 5.23 5.40
Distributions from netinvestment income (0.32) (0.59) (0.70) (0.68) (0.65) (0.57)
Total distributions (0.32) (0.59) (0.70) (0.68) (0.65) (0.57)
Net asset value, end ofperiod $ 52.64 $ 54.57 $ 37.55 $ 40.04 $ 39.51 $ 34.93
Total ReturnC,D (2.97)% 47.17% (4.34)% 3.23% 15.08% 18.08%Ratios to Average NetAssetsA,E
Expenses beforereductions .08%F .08% .08% .08% .08% .08%Expenses net of feewaivers, if any .08%F .08% .08% .08% .08% .08%Expenses net of allreductions .08%F .08% .08% .08% .08% .08%Net investmentincome (loss) 1.19%F 1.24% 1.80% 1.84% 1.61% 1.85%
Supplemental DataNet assets, end ofperiod (000 omitted) $839,619 $862,271 $347,297 $454,471 $499,824 $354,586Portfolio turnoverrateG,H 3%I 5% 4% 5% 5% 5%
A Net investment income (loss) is affected by the timing of the declaration of dividends by any underlying mutual funds or exchange-traded funds (ETFs). Net investment income (loss) of any such underlying funds is not included in the Fund’s netinvestment income (loss) ratio.
B Calculated based on average shares outstanding during the period.C Based on net asset value.D Total returns for periods of less than one year are not annualized.E Expense ratios reflect operating expenses of the class. Expenses before reductions do not reflect amounts reimbursed, waived, or reduced through arrangements with the investment advisor, brokerage services, or other offset arrangements, if
applicable, and do not represent the amount paid by the class during periods when reimbursements, waivers or reductions occur.F Annualized.G Amount does not include the portfolio activity of any underlying mutual funds or exchange-traded funds (ETFs).H Portfolio turnover rate excludes securities received or delivered in-kind.I Amount not annualized.
Financial Statements – continued
Financial Highlights
See accompanying notes which are an integral part of the financial statements.
Semi-Annual Report 82

Fidelity MSCI Information Technology Index ETF
Six months endedJanuary 31, 2022
(Unaudited)Year ended July 31,
2021Year ended July 31,
2020Year ended July 31,
2019Year ended July 31,
2018Year ended July 31,
2017
Selected Per-ShareDataNet asset value,beginning of period $ 121.70 $ 87.25 $ 64.53 $ 56.36 $ 44.50 $ 34.93
Income from InvestmentOperations
Net investmentincome (loss)A,B 0.41 0.79 0.87 0.70 0.53 0.48Net realized andunrealized gain (loss) 3.28 34.45 22.70 8.17 11.85 9.54
Total from investmentoperations 3.69 35.24 23.57 8.87 12.38 10.02
Distributions from netinvestment income (0.45) (0.79) (0.85) (0.70) (0.52) (0.45)
Total distributions (0.45) (0.79) (0.85) (0.70) (0.52) (0.45)
Net asset value, end ofperiod $ 124.94 $ 121.70 $ 87.25 $ 64.53 $ 56.36 $ 44.50
Total ReturnC,D 3.02% 40.57% 36.99% 15.94% 27.92% 28.86%Ratios to Average NetAssetsA,E
Expenses beforereductions .08%F .08% .08% .08% .08% .08%Expenses net of feewaivers, if any .08%F .08% .08% .08% .08% .08%Expenses net of allreductions .08%F .08% .08% .08% .08% .08%Net investmentincome (loss) .65%F .76% 1.21% 1.22% 1.02% 1.19%
Supplemental DataNet assets, end ofperiod (000 omitted) $6,690,310 $6,206,889 $4,288,256 $2,571,364 $2,223,254 $1,010,043Portfolio turnoverrateG,H 2%I 3% 5% 18% 4% 6%
A Net investment income (loss) is affected by the timing of the declaration of dividends by any underlying mutual funds or exchange-traded funds (ETFs). Net investment income (loss) of any such underlying funds is not included in the Fund’s netinvestment income (loss) ratio.
B Calculated based on average shares outstanding during the period.C Based on net asset value.D Total returns for periods of less than one year are not annualized.E Expense ratios reflect operating expenses of the class. Expenses before reductions do not reflect amounts reimbursed, waived, or reduced through arrangements with the investment advisor, brokerage services, or other offset arrangements, if
applicable, and do not represent the amount paid by the class during periods when reimbursements, waivers or reductions occur.F Annualized.G Amount does not include the portfolio activity of any underlying mutual funds or exchange-traded funds (ETFs).H Portfolio turnover rate excludes securities received or delivered in-kind.I Amount not annualized.
Financial Highlights
See accompanying notes which are an integral part of the financial statements.
83 Semi-Annual Report

Fidelity MSCI Materials Index ETF
Six months endedJanuary 31, 2022
(Unaudited)Year ended July 31,
2021Year ended July 31,
2020Year ended July 31,
2019Year ended July 31,
2018Year ended July 31,
2017
Selected Per-ShareDataNet asset value,beginning of period $ 46.91 $ 32.90 $ 32.63 $ 34.70 $ 31.63 $ 27.71
Income from InvestmentOperations
Net investmentincome (loss)A,B 0.37 0.71 0.65 0.65 0.55 0.57Net realized andunrealized gain (loss) (0.07) 13.98 0.30 (2.08) 3.09 3.87
Total from investmentoperations 0.30 14.69 0.95 (1.43) 3.64 4.44
Distributions from netinvestment income (0.38) (0.68) (0.68) (0.64) (0.57) (0.52)
Total distributions (0.38) (0.68) (0.68) (0.64) (0.57) (0.52)
Net asset value, end ofperiod $ 46.83 $ 46.91 $ 32.90 $ 32.63 $ 34.70 $ 31.63
Total ReturnC,D 0.66% 45.01% 3.28% (4.02)% 11.54% 16.17%Ratios to Average NetAssetsA,E
Expenses beforereductions .08%F .08% .08% .08% .08% .08%Expenses net of feewaivers, if any .08%F .08% .08% .08% .08% .08%Expenses net of allreductions .08%F .08% .08% .08% .08% .08%Net investmentincome (loss) 1.56%F 1.66% 2.08% 2.05% 1.60% 1.93%
Supplemental DataNet assets, end ofperiod (000 omitted) $517,509 $544,137 $164,486 $199,043 $265,428 $211,931Portfolio turnoverrateG,H 2%I 4% 3% 12% 10% 7%
A Net investment income (loss) is affected by the timing of the declaration of dividends by any underlying mutual funds or exchange-traded funds (ETFs). Net investment income (loss) of any such underlying funds is not included in the Fund’s netinvestment income (loss) ratio.
B Calculated based on average shares outstanding during the period.C Based on net asset value.D Total returns for periods of less than one year are not annualized.E Expense ratios reflect operating expenses of the class. Expenses before reductions do not reflect amounts reimbursed, waived, or reduced through arrangements with the investment advisor, brokerage services, or other offset arrangements, if
applicable, and do not represent the amount paid by the class during periods when reimbursements, waivers or reductions occur.F Annualized.G Amount does not include the portfolio activity of any underlying mutual funds or exchange-traded funds (ETFs).H Portfolio turnover rate excludes securities received or delivered in-kind.I Amount not annualized.
Financial Statements – continued
Financial Highlights
See accompanying notes which are an integral part of the financial statements.
Semi-Annual Report 84

Fidelity MSCI Real Estate Index ETF
Six months endedJanuary 31, 2022
(Unaudited)Year ended July 31,
2021Year ended July 31,
2020Year ended July 31,
2019Year ended July 31,
2018Year ended July 31,
2017
Selected Per-ShareDataNet asset value,beginning of period $ 31.75 $ 24.23 $ 26.58 $ 24.69 $ 24.53 $ 25.83
Income from InvestmentOperations
Net investmentincome (loss)A,B 0.46 0.58 0.67 1.05 0.76 0.68Net realized andunrealized gain (loss) 0.09C 7.83 (2.13) 2.08 0.32 (1.12)
Total from investmentoperations 0.55 8.41 (1.46) 3.13 1.08 (0.44)
Distributions from netinvestment income (0.42) (0.89) (0.68) (1.24) (0.92) (0.86)Return of capital — — (0.21) — — —
Total distributions (0.42) (0.89) (0.89) (1.24) (0.92) (0.86)
Net asset value, end ofperiod $ 31.88 $ 31.75 $ 24.23 $ 26.58 $ 24.69 $ 24.53
Total ReturnD,E 1.68% 35.58% (5.27)% 13.19% 4.53% (1.53)%Ratios to Average NetAssetsA,F
Expenses beforereductions .08%G .08% .08% .08% .08% .08%Expenses net of feewaivers, if any .08%G .08% .08% .08% .08% .08%Expenses net of allreductions .08%G .08% .08% .08% .08% .08%Net investmentincome (loss) 2.88%G 2.16% 2.62% 4.20% 3.15% 2.85%
Supplemental DataNet assets, end ofperiod (000 omitted) $2,148,504 $1,784,615 $1,066,154 $844,003 $502,347 $392,538Portfolio turnoverrateH,I 6%J 8% 9% 10% 8% 17%
A Net investment income (loss) is affected by the timing of the declaration of dividends by any underlying mutual funds or exchange-traded funds (ETFs). Net investment income (loss) of any such underlying funds is not included in the Fund’s netinvestment income (loss) ratio.
B Calculated based on average shares outstanding during the period.C The amount shown for a share outstanding does not correspond with the aggregate net gain (loss) on investments for the period due to the timing of share transactions in relation to fluctuating market values of the investments of a Fund.D Based on net asset value.E Total returns for periods of less than one year are not annualized.F Expense ratios reflect operating expenses of the class. Expenses before reductions do not reflect amounts reimbursed, waived, or reduced through arrangements with the investment advisor, brokerage services, or other offset arrangements, if
applicable, and do not represent the amount paid by the class during periods when reimbursements, waivers or reductions occur.G Annualized.H Amount does not include the portfolio activity of any underlying mutual funds or exchange-traded funds (ETFs).I Portfolio turnover rate excludes securities received or delivered in-kind.J Amount not annualized.
Financial Highlights
See accompanying notes which are an integral part of the financial statements.
85 Semi-Annual Report

Fidelity MSCI Utilities Index ETF
Six months endedJanuary 31, 2022
(Unaudited)Year ended July 31,
2021Year ended July 31,
2020Year ended July 31,
2019Year ended July 31,
2018Year ended July 31,
2017
Selected Per-ShareDataNet asset value,beginning of period $ 42.63 $ 39.11 $ 39.21 $ 34.85 $ 34.64 $ 33.57
Income from InvestmentOperations
Net investmentincome (loss)A,B 0.63 1.21 1.23 1.16 1.10 1.06Net realized andunrealized gain (loss) 2.09 3.56 (0.09) 4.32 0.20 1.09
Total from investmentoperations 2.72 4.77 1.14 5.48 1.30 2.15
Distributions from netinvestment income (0.61) (1.25) (1.24) (1.12) (1.09) (1.08)
Total distributions (0.61) (1.25) (1.24) (1.12) (1.09) (1.08)
Net asset value, end ofperiod $ 44.74 $ 42.63 $ 39.11 $ 39.21 $ 34.85 $ 34.64
Total ReturnC,D 6.44% 12.46% 3.13% 15.93% 3.83% 6.61%Ratios to Average NetAssetsA,E
Expenses beforereductions .08%F .08% .08% .08% .08% .08%Expenses net of feewaivers, if any .08%F .08% .08% .08% .08% .08%Expenses net of allreductions .08%F .08% .08% .08% .08% .08%Net investmentincome (loss) 2.90%F 2.96% 3.06% 3.11% 3.21% 3.22%
Supplemental DataNet assets, end ofperiod (000 omitted) $1,223,595 $1,076,292 $844,807 $733,190 $336,273 $277,149Portfolio turnoverrateG,H 1%I 5% 5% 7% 6% 6%
A Net investment income (loss) is affected by the timing of the declaration of dividends by any underlying mutual funds or exchange-traded funds (ETFs). Net investment income (loss) of any such underlying funds is not included in the Fund’s netinvestment income (loss) ratio.
B Calculated based on average shares outstanding during the period.C Based on net asset value.D Total returns for periods of less than one year are not annualized.E Expense ratios reflect operating expenses of the class. Expenses before reductions do not reflect amounts reimbursed, waived, or reduced through arrangements with the investment advisor, brokerage services, or other offset arrangements, if
applicable, and do not represent the amount paid by the class during periods when reimbursements, waivers or reductions occur.F Annualized.G Amount does not include the portfolio activity of any underlying mutual funds or exchange-traded funds (ETFs).H Portfolio turnover rate excludes securities received or delivered in-kind.I Amount not annualized.
Financial Statements – continued
Financial Highlights
See accompanying notes which are an integral part of the financial statements.
Semi-Annual Report 86

1. Organization.
Fidelity MSCI Communication Services Index ETF, Fidelity MSCI Consumer Discretionary Index ETF, Fidelity MSCI Consumer StaplesIndex ETF, Fidelity MSCI Energy Index ETF, Fidelity MSCI Financials Index ETF, Fidelity MSCI Health Care Index ETF, Fidelity MSCIIndustrials Index ETF, Fidelity MSCI Information Technology Index ETF, Fidelity MSCI Materials Index ETF, Fidelity MSCI Real EstateIndex ETF and Fidelity MSCI Utilities Index ETF (the Funds) are exchange-traded funds of Fidelity Covington Trust (the Trust) and areauthorized to issue an unlimited number of shares. Each Fund, with the exception of Fidelity MSCI Industrials Index ETF and Fidelity MSCI RealEstate Index ETF, are non-diversified funds. The Trust is registered under the Investment Company Act of 1940, as amended (the 1940 Act), as anopen-end management investment company organized as a Massachusetts business trust.
2. Significant Accounting Policies.
Each Fund is an investment company and applies the accounting and reporting guidance of the Financial Accounting Standards Board (FASB)Accounting Standards Codification Topic 946 Financial Services – Investment Companies. The financial statements have been prepared inconformity with accounting principles generally accepted in the United States of America (GAAP), which require management to make certainestimates and assumptions at the date of the financial statements. Actual results could differ from those estimates. Subsequent events, if any,through the date that the financial statements were issued have been evaluated in the preparation of the financial statements. Each Fund’sSchedule of Investments lists any underlying mutual funds or exchange-traded funds (ETFs) but does not include the underlying holdings ofthese funds. The following summarizes the significant accounting policies of each Fund:
Investment Valuation. Investments are valued as of 4:00 p.m. Eastern time on the last calendar day of the period. The Board of Trustees (theBoard) has delegated the day to day responsibility for the valuation of each Fund’s investments to the FairValue Committee (the Committee)established by each Fund’s investment adviser. In accordance with valuation policies and procedures approved by the Board, each Fundattempts to obtain prices from one or more third party pricing vendors or brokers to value its investments. When current market prices,quotations or currency exchange rates are not readily available or reliable, investments will be fair valued in good faith by the Committee, inaccordance with procedures adopted by the Board. Factors used in determining fair value vary by investment type and may include market orinvestment specific events. The frequency with which these procedures are used cannot be predicted and they may be utilized to a significantextent. The Committee oversees each Fund’s valuation policies and procedures and reports to the Board on the Committee’s activities and fairvalue determinations. The Board monitors the appropriateness of the procedures used in valuing each Fund’s investments and ratifies the fairvalue determinations of the Committee.
Each Fund categorizes the inputs to valuation techniques used to value its investments into a disclosure hierarchy consisting of three levels asshown below:
Level 1 – Unadjusted quoted prices in active markets for identical investments
Level 2 – other significant observable inputs (including quoted prices for similar investments, interest rates, prepayment speeds, etc.)
Level 3 – unobservable inputs (including the Fund’s own assumptions based on the best information available)
Valuation techniques used to value each Fund’s investments by major category are as follows:
Equity securities, including restricted securities, for which market quotations are readily available, are valued at the last reported sale price orofficial closing price as reported by a third party pricing vendor on the primary market or exchange on which they are traded and are categorizedas Level 1 in the hierarchy. In the event there were no sales during the day or closing prices are not available, securities are valued at the lastquoted bid price or may be valued using the last available price and are generally categorized as Level 2 in the hierarchy. For foreign equitysecurities, when market or security specific events arise, comparisons to the valuation of American Depositary Receipts (ADRs), futurescontracts, Exchange-Traded Funds (ETFs) and certain indexes as well as quoted prices for similar securities may be used and would becategorized as Level 2 in the hierarchy. For equity securities, including restricted securities, where observable inputs are limited, assumptionsabout market activity and risk are used and these securities may be categorized as Level 3 in the hierarchy.
Futures contracts are valued at the settlement price established each day by the board of trade or exchange on which they are traded and arecategorized as Level 1 in the hierarchy. Investments in open-end mutual funds are valued at their closing net asset value (NAV) each businessday and are categorized as Level 1 in the hierarchy. If an unaffiliated open-end mutual fund’s NAV is unavailable, shares of that fund may bevalued by another method that the Board believes reflects fair value in accordance with the Board’s fair value pricing policies and is categorizedas Level 2 in the hierarchy.
Changes in valuation techniques may result in transfers in or out of an assigned level within the disclosure hierarchy. The aggregate value ofinvestments by input level as of January 31, 2022 is included at the end of each Fund’s Schedule of Investments.
Foreign Currency. Certain Funds may use foreign currency contracts to facilitate transactions in foreign-denominated securities. Gainsand losses from these transactions may arise from changes in the value of the foreign currency or if the counterparties do not perform under thecontracts’ terms.
Notes to Financial StatementsFor the period ended January 31, 2022 (Unaudited)
87 Semi-Annual Report

2. Significant Accounting Policies – continued
Foreign-denominated assets, including investment securities, and liabilities are translated into U.S. dollars at the exchange rates at period end.Purchases and sales of investment securities, income and dividends received, and expenses denominated in foreign currencies are translatedinto U.S. dollars at the exchange rate in effect on the transaction date.
The effects of exchange rate fluctuations on investments are included with the net realized and unrealized gain (loss) on investment securities.Other foreign currency transactions resulting in realized and unrealized gain (loss) are disclosed separately.
Investment Transactions and Income. For financial reporting purposes, the Funds’ investment holdings and NAV include tradesexecuted through the end of the last business day of the period. The NAV per share for processing shareholder transactions is calculated as of theclose of business (normally 4:00 p.m. Eastern time) of the New York Stock Exchange, Archipelago Exchange (NYSE Arca) and includes tradesexecuted through the end of the prior business day. Gains and losses on securities sold are determined on the basis of identified cost and mayinclude proceeds received from litigation. Commissions paid to certain brokers with whom the investment adviser, or its affiliates, places tradeson behalf of a fund include an amount in addition to trade execution, which may be rebated back to a fund. Any such rebates are included in netrealized gain (loss) on investments in the Statement of Operations. Dividend income is recorded on the ex-dividend date, except for certaindividends from foreign securities where the ex-dividend date may have passed, which are recorded as soon as the Funds are informed of theex-dividend date. Non-cash dividends included in dividend income, if any, are recorded at the fair market value of the securities received.Income and capital gain distributions from any underlying mutual funds or exchange-traded funds (ETFs) are recorded on the ex-dividend date.Certain distributions received by the Funds represent a return of capital or capital gain. The Funds determine the components of thesedistributions subsequent to the ex-dividend date, based upon receipt of tax filings or other correspondence relating to the underlying investment.These distributions are recorded as a reduction of cost of investments and/or as a realized gain. Interest income is accrued as earned andincludes coupon interest and amortization of premium and accretion of discount on debt securities as applicable. Investment income is recordednet of foreign taxes withheld where recovery of such taxes is uncertain. Funds may file withholding tax reclaims in certain jurisdictions torecover a portion of amounts previously withheld. Any withholding tax reclaims income is included in the Statement of Operations in dividends.Any receivables for withholding tax reclaims are included in the Statement of Assets and Liabilities in dividends receivable.
Expenses. Expenses directly attributable to a fund are charged to that fund. Expenses attributable to more than one fund are allocatedamong the respective funds on the basis of relative net assets or other appropriate methods. Expenses included in the accompanying financialstatements reflect the expenses of that Fund and do not include any expenses associated with any underlying mutual funds or exchange-tradedfunds. Although not included in a fund’s expenses, a fund indirectly bears its proportionate share of these expenses through the net asset valueof each underlying mutual fund or exchange-traded fund. Expense estimates are accrued in the period to which they relate and adjustments aremade when actual amounts are known.
Income Tax Information and Distributions to Shareholders. Each year, each Fund intends to qualify as a regulatedinvestment company under Subchapter M of the Internal Revenue Code, including distributing substantially all of its taxable income andrealized gains. As a result, no provision for U.S. Federal income taxes is required. Each Fund files a U.S. federal tax return, in addition to stateand local tax returns as required. Each Fund’s federal income tax returns are subject to examination by the Internal Revenue Service (IRS) for aperiod of three fiscal years after they are filed. State and local tax returns may be subject to examination for an additional fiscal year dependingon the jurisdiction. Realized gain or loss resulting from in-kind redemptions is not taxable to the Fund and is not distributed to shareholders ofthe Fund. Foreign taxes are provided for based on each Fund’s understanding of the tax rules and rates that exist in the foreign markets in whichit invests.
Distributions are declared and recorded on the ex-dividend date. Income and capital gain distributions are determined in accordance withincome tax regulations, which may differ from GAAP.
Capital accounts within the financial statements are adjusted for permanent book-tax differences. These adjustments have no impact on netassets or the results of operations. Capital accounts are not adjusted for temporary book-tax differences which will reverse in a subsequentperiod.
Book-tax differences are primarily due to certain deemed distributions and futures, passive foreign investment companies (PFIC), redemptionsin kind, capital loss carryforwards and losses deferred due to wash sales.
As of period end, the cost and unrealized appreciation (depreciation) in securities, and derivatives if applicable, for federal income tax purposeswere as follows for each Fund:
Tax costGross unrealized
appreciationGross unrealized
depreciation
Net unrealizedappreciation(depreciation)
Fidelity MSCI Communication Services Index ETF $ 699,408,710 $ 140,260,330 $ (51,036,542) $ 89,223,788Fidelity MSCI Consumer Discretionary Index ETF 1,340,231,350 279,672,341 (46,451,051) 233,221,290Fidelity MSCI Consumer Staples Index ETF 834,724,822 159,523,089 (30,842,822) 128,680,267Fidelity MSCI Energy Index ETF 1,031,710,231 273,482,011 (76,088,372) 197,393,639
Notes to Financial Statements – continued
Semi-Annual Report 88

2. Significant Accounting Policies – continued
Tax costGross unrealized
appreciationGross unrealized
depreciation
Net unrealizedappreciation(depreciation)
Fidelity MSCI Financials Index ETF $1,598,827,669 $ 363,988,478 $ (31,521,501) $ 332,466,977Fidelity MSCI Health Care Index ETF 2,182,155,381 738,884,319 (130,853,809) 608,030,510Fidelity MSCI Industrials Index ETF 745,434,982 149,971,285 (56,185,830) 93,785,455Fidelity MSCI Information Technology Index ETF 3,673,066,033 3,106,158,399 (91,552,272) 3,014,606,127Fidelity MSCI Materials Index ETF 497,940,941 42,617,991 (22,649,734) 19,968,257Fidelity MSCI Real Estate Index ETF 1,836,054,980 377,434,511 (66,734,836) 310,699,675Fidelity MSCI Utilities Index ETF 1,144,915,452 98,333,374 (20,277,083) 78,056,291
Capital loss carryforwards are only available to offset future capital gains of the Funds to the extent provided by regulations and may be limited.The capital loss carryforward information presented below, including any applicable limitation, is estimated as of fiscal year end and is subject toadjustment.
No-expirationShort-term
No-expirationLong-term
Total capital losscarryforward
Fidelity MSCI Communication Services Index ETF $ (11,061,146) $ (19,794,881) $ (30,856,027)Fidelity MSCI Consumer Discretionary Index ETF — (4,819,028) (4,819,028)Fidelity MSCI Consumer Staples Index ETF — (10,678,975) (10,678,975)Fidelity MSCI Energy Index ETF (8,042,346) (100,828,687) (108,871,033)Fidelity MSCI Financials Index ETF (9,463,536) (19,878,838) (29,342,374)Fidelity MSCI Health Care Index ETF — (16,536,303) (16,536,303)Fidelity MSCI Industrials Index ETF (2,846,338) (9,667,208) (12,513,546)Fidelity MSCI Information Technology Index ETF (32,507,132) — (32,507,132)Fidelity MSCI Materials Index ETF (3,697,201) (6,550,789) (10,247,990)Fidelity MSCI Real Estate Index ETF (15,726,584) (14,896,815) (30,623,399)Fidelity MSCI Utilities Index ETF (10,426,370) (13,155,761) (23,582,131)
Restricted Securities (including Private Placements). Funds may invest in securities that are subject to legal or contractualrestrictions on resale. These securities generally may be resold in transactions exempt from registration or to the public if the securities areregistered. Disposal of these securities may involve time-consuming negotiations and expense, and prompt sale at an acceptable price may bedifficult. Information regarding restricted securities held at period end is included at the end of the Schedule of Investments, if applicable.
3. Derivative Instruments.
Risk Exposures and the Use of Derivative Instruments. The Funds’ investment objective allows the Funds to enter intovarious types of derivative contracts, including futures contracts. Derivatives are investments whose value is primarily derived from underlyingassets, indices or reference rates and may be transacted on an exchange or over-the-counter (OTC). Derivatives may involve a futurecommitment to buy or sell a specified asset based on specified terms, to exchange future cash flows at periodic intervals based on a notionalprincipal amount, or for one party to make one or more payments upon the occurrence of specified events in exchange for periodic paymentsfrom the other party.
The Funds used derivatives to increase returns and to manage exposure to certain risks as defined below. The success of any strategy involvingderivatives depends on analysis of numerous economic factors, and if the strategies for investment do not work as intended, the Funds may notachieve their objectives.
The Funds’ use of derivatives increased or decreased their exposure to the following risk:
Equity Risk Equity risk relates to the fluctuations in the value of financial instruments as a result of changes in market prices (other thanthose arising from interest rate risk or foreign exchange risk), whether caused by factors specific to an individual investment, itsissuer, or all factors affecting all instruments traded in a market or market segment.
The Funds are also exposed to additional risks from investing in derivatives, such as liquidity risk and counterparty credit risk. Liquidity risk isthe risk that the Funds will be unable to close out the derivative in the open market in a timely manner. Counterparty credit risk is the risk thatthe counterparty will not be able to fulfill its obligation to the Funds. Counterparty credit risk related to exchange-traded futures contracts maybe mitigated by the protection provided by the exchange on which they trade.
89 Semi-Annual Report

3. Derivative Instruments – continued
Investing in derivatives may involve greater risks than investing in the underlying assets directly and, to varying degrees, may involve risk of lossin excess of any initial investment and collateral received and amounts recognized in the Statements of Assets and Liabilities. In addition, theremay be the risk that the change in value of the derivative contract does not correspond to the change in value of the underlying instrument.
Futures Contracts. A futures contract is an agreement between two parties to buy or sell a specified underlying instrument for a fixed priceat a specified future date. The Funds used futures contracts to manage their exposure to the stock market.
Upon entering into a futures contract, a fund is required to deposit either cash or securities (initial margin) with a clearing broker in an amountequal to a certain percentage of the face value of the contract. Futures contracts are marked-to-market daily and subsequent daily payments(variation margin) are made or received by a fund depending on the daily fluctuations in the value of the futures contracts and are recorded asunrealized appreciation or (depreciation). This receivable and/or payable, if any, is included in daily variation margin on futures contracts in theStatements of Assets and Liabilities. Realized gain or (loss) is recorded upon the expiration or closing of a futures contract. The net realized gain(loss) and change in net unrealized appreciation (depreciation) on futures contracts during the period is presented in the Statements ofOperations.
Any open futures contracts at period end are presented in the Schedule of Investments under the caption “Futures Contracts”. The notionalamount at value reflects each contract’s exposure to the underlying instrument or index at period end and is representative of volume of activityduring the period. Cash deposited to meet initial margin requirements is presented as segregated cash with brokers for derivative instruments inthe Statements of Assets and Liabilities.
4. Purchases and Sales of Investments.
Purchases and sales of securities, other than short-term securities and in-kind transactions, as applicable, are noted in the table below.
Purchases ($) Sales ($)Fidelity MSCI Communication Services Index ETF 111,661,346 111,195,791Fidelity MSCI Consumer Discretionary Index ETF 36,774,328 36,066,167Fidelity MSCI Consumer Staples Index ETF 40,091,670 39,739,914Fidelity MSCI Energy Index ETF 49,946,590 48,890,986Fidelity MSCI Financials Index ETF 43,865,612 41,963,415Fidelity MSCI Health Care Index ETF 54,342,146 56,106,228Fidelity MSCI Industrials Index ETF 22,817,982 23,484,630Fidelity MSCI Information Technology Index ETF 117,254,742 115,461,946Fidelity MSCI Materials Index ETF 11,133,154 10,898,381Fidelity MSCI Real Estate Index ETF 134,085,274 128,409,416Fidelity MSCI Utilities Index ETF 16,902,110 16,367,730
Securities received and delivered in-kind through subscriptions and redemptions are noted in the table below.
In-kindSubscriptions ($)
In-kindRedemptions ($)
Fidelity MSCI Communication Services Index ETF 78,964,561 92,107,299Fidelity MSCI Consumer Discretionary Index ETF 311,547,595 327,883,068Fidelity MSCI Consumer Staples Index ETF 121,262,438 215,564,180Fidelity MSCI Energy Index ETF 161,654,485 107,053,486Fidelity MSCI Financials Index ETF 201,059,316 98,136,073Fidelity MSCI Health Care Index ETF 219,579,046 142,371,388Fidelity MSCI Industrials Index ETF 65,890,886 56,068,055Fidelity MSCI Information Technology Index ETF 420,247,684 83,809,469Fidelity MSCI Materials Index ETF 60,733,014 83,786,457Fidelity MSCI Real Estate Index ETF 410,922,843 50,619,469Fidelity MSCI Utilities Index ETF 224,617,765 133,474,055
5. Fees and Other Transactions with Affiliates.
Management Fee. Fidelity Management & Research Company LLC (the investment adviser) provides the Funds with investmentmanagement related services for which the Funds pay a monthly management fee that is based on an annual rate of .084% of each Fund’s averagenet assets. Under the management contract, the investment adviser pays all other expenses, except the compensation of the independentTrustees and certain other expenses such as interest expense. The management fee paid to the investment adviser is reduced by an amountequal to the fees and expenses paid by each fund to the independent Trustees.
Notes to Financial Statements – continued
Semi-Annual Report 90

5. Fees and Other Transactions with Affiliates – continued
Sub-Adviser. BlackRock Fund Advisors (BFA), serves as sub-adviser for the Funds. BFA provides discretionary investment advisory servicesto the Funds and is paid by the investment adviser for providing these services.
Interfund Trades. Funds may purchase from or sell securities to other funds affiliated with each sub-adviser under procedures adopted bythe Board. The procedures have been designed to ensure these interfund trades are executed in accordance with Rule 17a-7 of the 1940 Act. Anyinterfund trades are included within the respective purchases and sales amounts shown in the Purchases and Sales of Investments note. Duringthe period, there were no interfund trades.
6. Share Transactions.
Funds issue and redeem shares at NAV only with certain authorized participants in large increments known as Creation Units. Purchases ofCreation Units are made by tendering a basket of designated securities to a fund and redemption proceeds are paid with a basket of securitiesfrom a fund’s portfolio with a balancing cash component to equate the market value of the basket of securities delivered or redeemed to the NAVper Creation Unit on the transaction date. Cash may be substituted equivalent to the value of certain securities generally when they are notavailable in sufficient quantity for delivery. A fund’s shares are available in smaller increments to investors in the secondary market at marketprices and may be subject to commissions. Authorized participants pay a transaction fee to the shareholder servicing agent when purchasing andredeeming Creation Units of a fund. The transaction fee is used to offset the costs associated with the issuance and redemption of CreationUnits.
7. Other.
A fund’s organizational documents provide former and current trustees and officers with a limited indemnification against liabilities arising inconnection with the performance of their duties to the fund. In the normal course of business, a fund may also enter into contracts that providegeneral indemnifications. A fund’s maximum exposure under these arrangements is unknown as this would be dependent on future claims thatmay be made against a fund. The risk of material loss from such claims is considered remote.
8. Coronavirus (COVID-19) Pandemic.
An outbreak of COVID-19 first detected in China during December 2019 has since spread globally and was declared a pandemic by the WorldHealth Organization during March 2020. Developments that disrupt global economies and financial markets, such as the COVID-19 pandemic,may magnify factors that affect the Funds’ performance.
91 Semi-Annual Report

As a shareholder, you incur two types of costs: (1) transaction costs, which may include sales charges (loads) on purchase payments orredemption proceeds, as applicable and (2) ongoing costs, which generally include management fees, distribution and/or service (12b-1) feesand other Fund expenses. This Example is intended to help you understand your ongoing costs (in dollars) of investing in a fund and to comparethese costs with the ongoing costs of investing in other mutual funds.
The Example is based on an investment of $1,000 invested for the one-half year period (August 1, 2021 to January 31, 2022).
Actual Expenses
The first line of the accompanying table provides information about actual account values and actual expenses. You may use the information inthis line, together with the amount you invested, to estimate the expenses that you paid over the period. Simply divide your account value by$1,000.00 (for example, an $8,600 account value divided by $1,000.00 = 8.6), then multiply the result by the number in the first line for aclass/Fund under the heading entitled “Expenses Paid During Period” to estimate the expenses you paid on your account during this period. Ifany fund is a shareholder of any underlying mutual funds or exchange-traded funds (ETFs) (the Underlying Funds), such fund indirectly bearsits proportional share of the expenses of the Underlying Funds in addition to the direct expenses incurred presented in the table. These fees andexpenses are not included in the annualized expense ratio used to calculate the expense estimate in the table below.
Hypothetical Example for Comparison Purposes
The second line of the accompanying table provides information about hypothetical account values and hypothetical expenses based on theactual expense ratio and an assumed rate of return of 5% per year before expenses, which is not the actual return. The hypothetical accountvalues and expenses may not be used to estimate the actual ending account balance or expenses you paid for the period. You may use thisinformation to compare the ongoing costs of investing in the Fund and other funds. To do so, compare this 5% hypothetical example with the 5%hypothetical examples that appear in the shareholder reports of the other funds. If any fund is a shareholder of any Underlying Funds, such fundindirectly bears its proportional share of the expenses of the Underlying Funds in addition to the direct expenses as presented in the table. Thesefees and expenses are not included in the annualized expense ratio used to calculate the expense estimate in the table below.
Please note that the expenses shown in the table are meant to highlight your ongoing costs only and do not reflect any transaction costs.Therefore, the second line of the table is useful in comparing ongoing costs only, and will not help you determine the relative total costs ofowning different funds.
AnnualizedExpense RatioA
BeginningAccount Value
August 1, 2021Ending
Account ValueJanuary 31, 2022
Expenses PaidDuring PeriodB
August 1, 2021to January 31, 2022
Fidelity MSCI Communication Services Index ETF 0.08%Actual $ 1,000.00 $ 884.10 $ 0.38HypotheticalC $ 1,000.00 $ 1,024.80 $ 0.41
Fidelity MSCI Consumer Discretionary Index ETF 0.08%Actual $ 1,000.00 $ 983.00 $ 0.40HypotheticalC $ 1,000.00 $ 1,024.80 $ 0.41
Fidelity MSCI Consumer Staples Index ETF 0.08%Actual $ 1,000.00 $ 1,068.20 $ 0.42HypotheticalC $ 1,000.00 $ 1,024.80 $ 0.41
Fidelity MSCI Energy Index ETF 0.08%Actual $ 1,000.00 $ 1,349.80 $ 0.47HypotheticalC $ 1,000.00 $ 1,024.80 $ 0.41
Fidelity MSCI Financials Index ETF 0.08%Actual $ 1,000.00 $ 1,076.30 $ 0.42HypotheticalC $ 1,000.00 $ 1,024.80 $ 0.41
Fidelity MSCI Health Care Index ETF 0.08%Actual $ 1,000.00 $ 963.20 $ 0.40HypotheticalC $ 1,000.00 $ 1,024.80 $ 0.41
Fidelity MSCI Industrials Index ETF 0.08%Actual $ 1,000.00 $ 970.30 $ 0.40HypotheticalC $ 1,000.00 $ 1,024.80 $ 0.41
Shareholder Expense Example
Semi-Annual Report 92

AnnualizedExpense RatioA
BeginningAccount Value
August 1, 2021Ending
Account ValueJanuary 31, 2022
Expenses PaidDuring PeriodB
August 1, 2021to January 31, 2022
Fidelity MSCI Information Technology Index ETF 0.08%Actual $ 1,000.00 $ 1,030.20 $ 0.41HypotheticalC $ 1,000.00 $ 1,024.80 $ 0.41
Fidelity MSCI Materials Index ETF 0.08%Actual $ 1,000.00 $ 1,006.60 $ 0.40HypotheticalC $ 1,000.00 $ 1,024.80 $ 0.41
Fidelity MSCI Real Estate Index ETF 0.08%Actual $ 1,000.00 $ 1,016.80 $ 0.41HypotheticalC $ 1,000.00 $ 1,024.80 $ 0.41
Fidelity MSCI Utilities Index ETF 0.08%Actual $ 1,000.00 $ 1,064.40 $ 0.42HypotheticalC $ 1,000.00 $ 1,024.80 $ 0.41A Annualized expense ratio reflects expenses net of applicable fee waivers.B Expenses are equal to the annualized expense ratio, multiplied by the average account value over the period, multiplied by 184/365 (to reflect the one-half year
period). The fees and expenses of any Underlying Funds are not included in each annualized expense ratio.C 5% return per year before expenses.
93 Semi-Annual Report

[THIS PAGE INTENTIONALLY LEFT BLANK]
Semi-Annual Report 94

[THIS PAGE INTENTIONALLY LEFT BLANK]
95 Semi-Annual Report

EXT-SANN-04221.9584798.108
Copyright © 2022 FDOKUMEN