Quarterly Holdings Report for Fidelity® Low-Priced Stock K6 ...
32
Quarterly Holdings Report for Fidelity ® Low-Priced Stock K6 Fund October 31, 2021 LPSK6-NPRT1-1221 1.9883996.104
-
Upload
khangminh22 -
Category
Documents
-
view
0 -
download
0
Transcript of Quarterly Holdings Report for Fidelity® Low-Priced Stock K6 ...

Quarterly Holdings Reportfor
Fidelity® Low-Priced Stock K6 FundOctober 31, 2021
LPSK6-NPRT1-12211.9883996.104

Schedule of Investments October 31, 2021(Unaudited)Showing Percentage of Net Assets
Common Stocks – 87.9%Shares Value ($)
COMMUNICATION SERVICES - 1.2%
Entertainment - 0.0%
GungHo Online Entertainment, Inc. 19,725 370,058
International Games Systems Co. Ltd. 12,000 307,703
677,761
Interactive Media & Services - 0.1%
Cars.com, Inc. (a) 30,000 390,600
Dip Corp. 28,814 1,033,827
QuinStreet, Inc. (a) 11,542 161,588
XLMedia PLC (a) 284,014 174,909
ZIGExN Co. Ltd. 65,372 232,671
1,993,595
Media - 1.1%
AMC Networks, Inc. Class A (a) 38,543 1,533,626
Corus Entertainment, Inc. Class B (non-vtg.) (b) 50,576 229,259
Discovery Communications, Inc.:
Class A (a) 18,800 440,672
Class C (non-vtg.) (a) 473,886 10,690,868
Gray Television, Inc. 17,433 408,630
Hyundai HCN 211,755 848,740
Intage Holdings, Inc. 251,095 4,240,136
Legs Co. Ltd. 1,438 20,562
Meredith Corp. (a) 8,079 470,521
Nexstar Broadcasting Group, Inc. Class A 1,820 272,873
Pico Far East Holdings Ltd. 1,863,039 308,890
RKB Mainichi Broadcasting Corp. 2,966 156,831
Saga Communications, Inc. Class A 35,761 792,464
Sky Network Television Ltd. (a)(b) 203,007 276,402
TechTarget, Inc. (a) 8,606 811,632
Tegna, Inc. 117,751 2,314,985
Thryv Holdings, Inc. (a) 40,100 1,269,967
TOW Co. Ltd. 277,795 846,233
Trenders, Inc. 9,488 81,430
TVA Group, Inc. Class B (non-vtg.) (a) 216,923 499,540
ViacomCBS, Inc. Class B 202,255 7,325,676
WOWOW INC. 16,886 343,836
34,183,773
Wireless Telecommunication Services - 0.0%
Okinawa Cellular Telephone Co. 4,240 191,039
TOTAL COMMUNICATION SERVICES 37,046,168
Quarterly Report 2

Common Stocks – continuedShares Value ($)
CONSUMER DISCRETIONARY - 18.7%
Auto Components - 1.1%
Adient PLC (a) 4,778 198,860
ASTI Corp. 15,113 240,488
Cie Automotive SA 26,894 731,224
Cooper-Standard Holding, Inc. (a) 62,265 1,615,154
DaikyoNishikawa Corp. 20,182 121,280
ElringKlinger AG (a) 127 1,793
G-Tekt Corp. 16,942 211,215
Gentex Corp. 135,795 4,805,785
GUD Holdings Ltd. 19,063 174,950
Hi-Lex Corp. 117,562 1,879,936
Lear Corp. 47,174 8,106,852
Linamar Corp. 20,906 1,149,864
Motonic Corp. 152,681 1,448,674
Murakami Corp. 69,745 1,589,517
Nippon Seiki Co. Ltd. 227,115 2,284,918
Patrick Industries, Inc. 4,834 376,617
Piolax, Inc. 157,271 2,262,408
Plastic Omnium SA 24,163 669,261
SJM Co. Ltd. 50 207
SNT Holdings Co. Ltd. 68,802 1,040,757
Strattec Security Corp. (a) 21,672 751,368
Sungwoo Hitech Co. Ltd. 126,930 653,352
TBK Co. Ltd. 58,408 209,521
Yachiyo Industry Co. Ltd. 79,924 625,454
Yutaka Giken Co. Ltd. 77,826 1,309,539
32,458,994
Automobiles - 0.0%
Harley-Davidson, Inc. 7,000 255,430
Isuzu Motors Ltd. 25,293 340,262
Kabe Husvagnar AB (B Shares) 20,948 539,067
1,134,759
Distributors - 0.1%
Arata Corp. 6,963 246,480
Central Automotive Products Ltd. 4,796 125,005
LKQ Corp. 9,025 497,097
Nakayamafuku Co. Ltd. 41,588 147,952
PALTAC Corp. 2,738 121,238
SPK Corp. 41,801 517,660
1,655,432
3 Quarterly Report

Schedule of Investments (Unaudited) − continued
Common Stocks – continuedShares Value ($)
CONSUMER DISCRETIONARY – continued
Diversified Consumer Services - 0.1%
Adtalem Global Education, Inc. (a) 7,261 268,149
Clip Corp. 16,599 117,882
Cross-Harbour Holdings Ltd. 210,615 311,300
JP-Holdings, Inc. 8,188 18,237
Kukbo Design Co. Ltd. 9,331 197,381
Step Co. Ltd. 67,644 1,054,208
YDUQS Participacoes SA 52,100 192,566
2,159,723
Hotels, Restaurants & Leisure - 0.2%
Ark Restaurants Corp. (a) 1,253 20,048
Betsson AB (B Shares) 264,246 1,839,999
Curves Holdings Co. Ltd. 10,316 80,373
Everi Holdings, Inc. (a) 14,789 354,936
Fairwood Holdings Ltd. 9,100 19,345
Flanigans Enterprises, Inc. (a) 2,441 71,399
Hiday Hidaka Corp. 8,907 127,218
Ibersol SGPS SA (a) 73,143 419,384
Ibersol SGPS SA rights (a) 73,143 25,366
J.D. Weatherspoon PLC (a) 14,659 205,230
Kindred Group PLC (depositary receipt) 96,291 1,345,473
Ruth's Hospitality Group, Inc. (a) 13,318 257,570
Sportscene Group, Inc. Class A (a) 40,681 127,868
The Monogatari Corp. 4,344 270,605
The Restaurant Group PLC (a) 1,312,994 1,586,661
6,751,475
Household Durables - 4.6%
Barratt Developments PLC 4,519,287 41,005,689
Bellway PLC 294,511 13,353,147
Coway Co. Ltd. 3,100 209,118
Cuckoo Holdings Co. Ltd. 23,000 441,792
D.R. Horton, Inc. 78,348 6,994,126
Dorel Industries, Inc. Class B (sub. vtg.) (a) 128,840 2,321,535
Emak SpA 329,735 766,159
First Juken Co. Ltd. 88,703 951,455
FJ Next Co. Ltd. 17,133 152,381
Gree Electric Appliances, Inc. of Zhuhai (A Shares) 1,353,046 7,741,347
Hamilton Beach Brands Holding Co.:
Class A 19,810 297,150
Class B (a) 2,326 34,890
Helen of Troy Ltd. (a) 62,731 14,111,338
Quarterly Report 4

Common Stocks – continuedShares Value ($)
CONSUMER DISCRETIONARY – continued
Household Durables – continued
Henry Boot PLC 161,431 618,594
Lennar Corp. Class A 4,924 492,055
M/I Homes, Inc. (a) 66,310 3,796,911
Mohawk Industries, Inc. (a) 115,425 20,454,464
Newell Brands, Inc. 8,176 187,149
Open House Co. Ltd. 13,915 887,402
Pressance Corp. 116,566 1,931,963
Q.E.P. Co., Inc. 1,557 35,811
Sanei Architecture Planning Co. Ltd. 76,457 1,194,778
Taylor Morrison Home Corp. (a) 310,073 9,466,529
Tempur Sealy International, Inc. 18,869 839,104
Token Corp. 51,800 4,223,805
Toll Brothers, Inc. 4,739 285,146
TopBuild Corp. (a) 1,457 374,405
TRI Pointe Homes, Inc. (a) 84,484 2,043,668
Whirlpool Corp. 982 207,035
ZAGG, Inc. rights (a)(c) 384 35
135,418,981
Internet & Direct Marketing Retail - 0.2%
Aucfan Co. Ltd. (a) 4,350 28,152
Aucnet, Inc. 8,874 183,799
Belluna Co. Ltd. 500,920 3,517,539
Ci Medical Co. Ltd. 5,977 305,252
Dustin Group AB (d) 28,323 346,617
Papyless Co. Ltd. 4,450 53,862
Qurate Retail, Inc. Series A 22,167 231,423
Vipshop Holdings Ltd. ADR (a) 93,903 1,047,957
5,714,601
Leisure Products - 0.0%
Mars Group Holdings Corp. 34,661 503,882
Miroku Corp. 10,652 151,090
Nautilus, Inc. (a)(b) 13,443 137,522
792,494
Multiline Retail - 2.8%
Big Lots, Inc. (b) 93,249 4,126,268
Europris ASA (d) 22,531 166,424
Kohl's Corp. 6,500 315,445
Lifestyle China Group Ltd. (a) 1,521,607 205,345
Lifestyle International Holdings Ltd. (a) 1,627,003 853,181
Macy's, Inc. 8,900 235,583
5 Quarterly Report

Schedule of Investments (Unaudited) − continued
Common Stocks – continuedShares Value ($)
CONSUMER DISCRETIONARY – continued
Multiline Retail – continued
Max Stock Ltd. 2,047 8,358
Next PLC 721,191 78,623,300
Ryohin Keikaku Co. Ltd. 924 18,209
84,552,113
Specialty Retail - 8.2%
Academy Sports & Outdoors, Inc. 10,883 465,575
AT-Group Co. Ltd. 99,858 1,182,433
AutoZone, Inc. (a) 49,573 88,479,873
Bed Bath & Beyond, Inc. (a) 876,863 12,311,157
Best Buy Co., Inc. 144,575 17,672,848
BMTC Group, Inc. 244,668 2,631,328
Bonia Corp. Bhd 54 11
Buffalo Co. Ltd. 6,066 60,586
Burlington Stores, Inc. (a) 1,537 424,658
Delek Automotive Systems Ltd. 29,951 391,573
Dick's Sporting Goods, Inc. 5,916 734,826
Foot Locker, Inc. 263,218 12,547,602
Genesco, Inc. (a) 53,593 3,247,200
Goldlion Holdings Ltd. 1,898,313 409,892
Hour Glass Ltd. 153,818 223,569
IA Group Corp. 7,363 230,677
JD Sports Fashion PLC 518,694 7,723,262
Jumbo SA 622,109 9,233,989
K's Holdings Corp. 84,156 868,719
Kid ASA (d) 2,847 38,082
Ku Holdings Co. Ltd. 68,240 639,953
Leon's Furniture Ltd. 24,819 505,364
Maisons du Monde SA (d) 12,168 275,416
Mr. Bricolage SA (a) 54,517 677,483
Nafco Co. Ltd. 122,718 1,856,289
Nextage Co. Ltd. 28,573 523,651
Ross Stores, Inc. 582,721 65,964,017
Sally Beauty Holdings, Inc. (a) 536,571 8,188,073
T-Gaia Corp. 2,866 51,067
The Buckle, Inc. 131,104 5,456,548
Urban Outfitters, Inc. (a) 8,805 281,144
WH Smith PLC (a) 6,373 136,234
Williams-Sonoma, Inc. 2,481 460,796
243,893,895
Quarterly Report 6

Common Stocks – continuedShares Value ($)
CONSUMER DISCRETIONARY – continued
Textiles, Apparel & Luxury Goods - 1.4%
Best Pacific International Holdings Ltd. 2,173,931 659,402
Capri Holdings Ltd. (a) 218,524 11,634,218
Carter's, Inc. 3,814 375,755
Deckers Outdoor Corp. (a) 2,163 855,056
Embry Holdings Ltd. 153,872 20,370
Fossil Group, Inc. (a) 303,888 3,591,956
G-III Apparel Group Ltd. (a) 69,331 1,987,026
Gildan Activewear, Inc. 450,401 16,544,303
Handsome Co. Ltd. 89,900 3,231,666
JLM Couture, Inc. (a)(c) 10,164 23,377
Movado Group, Inc. (b) 5,123 170,596
Samsonite International SA (a)(d) 160,908 346,612
Sun Hing Vision Group Holdings Ltd. 1,253,947 215,962
Tapestry, Inc. 7,400 288,452
Ted Baker PLC (a) 338,270 624,968
Texwinca Holdings Ltd. 3,714,322 759,048
Victory City International Holdings Ltd. (a)(c) 4,510,307 168,111
Youngone Corp. 21,264 809,710
Youngone Holdings Co. Ltd. 19 761
42,307,349
TOTAL CONSUMER DISCRETIONARY 556,839,816
CONSUMER STAPLES - 10.4%
Beverages - 1.8%
A.G. Barr PLC 177,457 1,205,794
Britvic PLC 505,902 6,148,087
Monster Beverage Corp. (a) 527,859 44,868,015
Olvi PLC (A Shares) 1,647 99,576
Spritzer Bhd 415,500 209,707
Yantai Changyu Pioneer Wine Co. Ltd. (B Shares) 248,255 446,065
52,977,244
Food & Staples Retailing - 6.5%
Alimentation Couche-Tard, Inc. Class A (multi-vtg.) 25,766 980,590
Aoki Super Co. Ltd. 8,095 206,105
Belc Co. Ltd. 137,318 6,778,911
BJ's Wholesale Club Holdings, Inc. (a) 13,221 772,635
Corporativo Fragua S.A.B. de CV 16,924 272,093
Cosmos Pharmaceutical Corp. 135,562 20,716,199
Create SD Holdings Co. Ltd. 333,141 10,241,457
7 Quarterly Report

Schedule of Investments (Unaudited) − continued
Common Stocks – continuedShares Value ($)
CONSUMER STAPLES – continued
Food & Staples Retailing – continued
Daikokutenbussan Co. Ltd. 25,761 1,467,506
G-7 Holdings, Inc. 51,524 942,703
Genky DrugStores Co. Ltd. 65,776 3,172,156
Halows Co. Ltd. 121,848 2,993,376
Kusuri No Aoki Holdings Co. Ltd. 52,973 3,526,174
MARR SpA 1,900 44,719
MARR SpA 9,100 214,179
Metro, Inc. 1,528,912 76,927,400
Naked Wines PLC (a) 21,462 217,939
North West Co., Inc. 7,050 191,574
Olam International Ltd. 4,058 5,116
Qol Holdings Co. Ltd. 190,379 2,828,068
Rami Levi Chain Stores Hashikma Marketing 2006 Ltd. 810 60,922
Sprouts Farmers Market LLC (a) 324,063 7,174,755
Sugi Holdings Co. Ltd. 3,231 231,344
Sundrug Co. Ltd. 236,194 6,912,474
United Natural Foods, Inc. (a) 46,662 2,024,664
Valor Holdings Co. Ltd. 24,780 524,817
Walgreens Boots Alliance, Inc. 845,713 39,765,425
YAKUODO Holdings Co. Ltd. 3,135 66,244
Yaoko Co. Ltd. 58,993 3,511,465
192,771,010
Food Products - 1.5%
Ausnutria Dairy Corp. Ltd. (H Shares) 220,007 275,698
Carr's Group PLC 181,644 365,426
Cranswick PLC 31,569 1,494,850
Darling Ingredients, Inc. (a) 4,778 403,837
Dole PLC 97,602 1,424,989
Food Empire Holdings Ltd. 3,058,953 1,860,097
Fresh Del Monte Produce, Inc. 322,558 10,802,467
Inghams Group Ltd. 76,897 214,608
Ingredion, Inc. 61,480 5,854,740
Kaveri Seed Co. Ltd. 38,300 266,192
Kri Kri Milk Industry SA (a) 12,249 112,996
Lassonde Industries, Inc. Class A (sub. vtg.) 1,169 166,235
Mitsui Sugar Co. Ltd. 28,981 514,997
Origin Enterprises PLC 587,919 2,276,775
Pacific Andes International Holdings Ltd. (a)(c) 3,104,000 29,123
Pacific Andes Resources Development Ltd. (a)(c) 176,886 1,443
Pickles Corp. 17,198 271,115
Quarterly Report 8
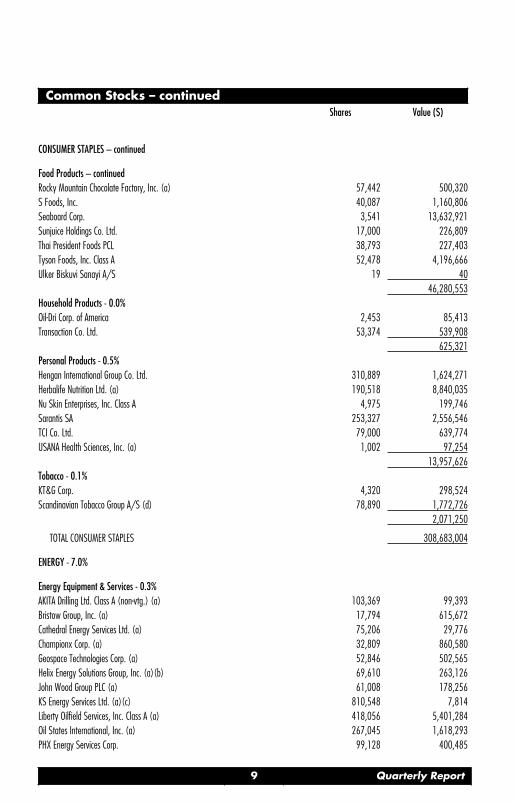
Common Stocks – continuedShares Value ($)
CONSUMER STAPLES – continued
Food Products – continued
Rocky Mountain Chocolate Factory, Inc. (a) 57,442 500,320
S Foods, Inc. 40,087 1,160,806
Seaboard Corp. 3,541 13,632,921
Sunjuice Holdings Co. Ltd. 17,000 226,809
Thai President Foods PCL 38,793 227,403
Tyson Foods, Inc. Class A 52,478 4,196,666
Ulker Biskuvi Sanayi A/S 19 40
46,280,553
Household Products - 0.0%
Oil-Dri Corp. of America 2,453 85,413
Transaction Co. Ltd. 53,374 539,908
625,321
Personal Products - 0.5%
Hengan International Group Co. Ltd. 310,889 1,624,271
Herbalife Nutrition Ltd. (a) 190,518 8,840,035
Nu Skin Enterprises, Inc. Class A 4,975 199,746
Sarantis SA 253,327 2,556,546
TCI Co. Ltd. 79,000 639,774
USANA Health Sciences, Inc. (a) 1,002 97,254
13,957,626
Tobacco - 0.1%
KT&G Corp. 4,320 298,524
Scandinavian Tobacco Group A/S (d) 78,890 1,772,726
2,071,250
TOTAL CONSUMER STAPLES 308,683,004
ENERGY - 7.0%
Energy Equipment & Services - 0.3%
AKITA Drilling Ltd. Class A (non-vtg.) (a) 103,369 99,393
Bristow Group, Inc. (a) 17,794 615,672
Cathedral Energy Services Ltd. (a) 75,206 29,776
Championx Corp. (a) 32,809 860,580
Geospace Technologies Corp. (a) 52,846 502,565
Helix Energy Solutions Group, Inc. (a)(b) 69,610 263,126
John Wood Group PLC (a) 61,008 178,256
KS Energy Services Ltd. (a)(c) 810,548 7,814
Liberty Oilfield Services, Inc. Class A (a) 418,056 5,401,284
Oil States International, Inc. (a) 267,045 1,618,293
PHX Energy Services Corp. 99,128 400,485
9 Quarterly Report

Schedule of Investments (Unaudited) − continued
Common Stocks – continuedShares Value ($)
ENERGY – continued
Energy Equipment & Services – continued
Total Energy Services, Inc. (a) 127,554 517,389
10,494,633
Oil, Gas & Consumable Fuels - 6.7%
Adams Resources & Energy, Inc. 17,208 505,055
Antero Resources Corp. (a) 9,000 178,830
Beach Energy Ltd. 1,162,018 1,219,409
Berry Corp. 236,905 2,276,657
Bonanza Creek Energy, Inc. 118,503 6,652,758
China Petroleum & Chemical Corp.:
(H Shares) 3,886,231 1,893,500
sponsored ADR (H Shares) 7,361 358,333
CNX Resources Corp. (a) 136,154 1,989,210
Delek U.S. Holdings, Inc. (a) 138,346 2,690,830
Denbury, Inc. (a) 11,990 1,015,073
DHT Holdings, Inc. 138,799 903,581
Diamondback Energy, Inc. 58,132 6,231,169
Energy Transfer LP 74,541 708,885
Enterprise Products Partners LP 157,186 3,564,978
EQT Corp. (a) 675,650 13,452,192
Extraction Oil & Gas, Inc. (a) 61,456 4,094,813
Fuji Kosan Co. Ltd. 19,654 181,977
Genesis Energy LP 13,400 146,060
Hankook Shell Oil Co. Ltd. 3,400 808,651
HollyFrontier Corp. 272,734 9,218,409
Iwatani Corp. 9,366 553,207
Kyungdong Invest Co. Ltd. 7,756 245,499
Magellan Midstream Partners LP 8,800 431,200
Marathon Oil Corp. 1,074,410 17,534,371
Marathon Petroleum Corp. 127,924 8,434,029
Murphy Oil Corp. 1,090,510 30,348,893
NACCO Industries, Inc. Class A 44,152 1,370,478
Northern Oil & Gas, Inc. 32,161 744,849
Oasis Petroleum, Inc. (b) 40,504 4,884,782
Oil & Natural Gas Corp. Ltd. 6,260,269 12,448,710
Oil India Ltd. 1,312,400 3,940,439
Ovintiv, Inc. 173,479 6,508,932
PDC Energy, Inc. 16,333 854,379
Petronet LNG Ltd. 1,138,200 3,485,742
Pioneer Natural Resources Co. 1,223 228,677
Range Resources Corp. (a) 27,077 631,436
Quarterly Report 10

Common Stocks – continuedShares Value ($)
ENERGY – continued
Oil, Gas & Consumable Fuels – continued
Reliance Industries Ltd. 6,900 233,475
SilverBow Resources, Inc. (a) 30,211 833,824
Southwestern Energy Co. (a) 3,096,036 15,108,656
Star Petroleum Refining PCL (a) 759,889 240,471
Thai Oil PCL (For. Reg.) 37,267 62,617
Thungela Resources Ltd. (a) 1,918 9,001
Total SA sponsored ADR 145,223 7,277,125
Whiting Petroleum Corp. (a) 342,262 22,291,524
World Fuel Services Corp. 67,547 2,062,210
198,854,896
TOTAL ENERGY 209,349,529
FINANCIALS - 14.3%
Banks - 2.8%
ACNB Corp. 40,658 1,128,260
Arrow Financial Corp. 22,582 809,565
Associated Banc-Corp. 10,097 224,961
Bank Norwegian ASA (b) 72,727 900,489
Bank of America Corp. 6,443 307,847
Bank7 Corp. 3,035 82,249
Bar Harbor Bankshares 38,422 1,141,133
C & F Financial Corp. 2,556 130,791
Camden National Corp. 36,550 1,739,780
Cathay General Bancorp 65,594 2,767,411
Central Pacific Financial Corp. 5,899 162,164
Central Valley Community Bancorp 9,229 196,855
Codorus Valley Bancorp, Inc. 57,894 1,267,300
Comerica, Inc. 3,000 255,270
Community Trust Bancorp, Inc. 5,596 244,433
Dimeco, Inc. 2,384 88,208
Eagle Bancorp, Inc. 75,483 4,271,583
East West Bancorp, Inc. 40,660 3,231,657
Financial Institutions, Inc. 36,922 1,178,550
First Bancorp, Puerto Rico 38,900 530,985
First Foundation, Inc. 10,000 266,100
First of Long Island Corp. 91,100 1,833,843
Five Star Bancorp (b) 12,068 330,905
FNB Corp., Pennsylvania 32,845 382,644
Hanmi Financial Corp. 60,459 1,341,585
11 Quarterly Report

Schedule of Investments (Unaudited) − continued
Common Stocks – continuedShares Value ($)
FINANCIALS – continued
Banks – continued
Hilltop Holdings, Inc. 6,853 242,870
Hope Bancorp, Inc. 125,536 1,831,570
Independent Bank Corp. 10,778 242,828
IndusInd Bank Ltd. 19,300 293,588
LCNB Corp. 9,843 167,823
Meridian Bank/Malvern, PA 12,032 363,366
Oak Valley Bancorp Oakdale California 3,600 62,100
OFG Bancorp 31,000 802,900
Plumas Bancorp (b) 14,081 520,152
Popular, Inc. 4,761 387,736
Preferred Bank, Los Angeles 17,543 1,202,924
Regions Financial Corp. 13,464 318,828
Seven Bank Ltd. 8,600 18,180
Sparebank 1 Sr Bank ASA (primary capital certificate) 88,468 1,355,101
Sparebanken More (primary capital certificate) 15,848 812,295
Sparebanken Nord-Norge 171,738 2,081,697
Synovus Financial Corp. 6,015 280,239
Texas Capital Bancshares, Inc. (a) 96,974 5,876,624
The First Bancorp, Inc. 4,713 139,835
United Community Bank, Inc. 5,500 191,620
Unity Bancorp, Inc. (b) 8,341 211,444
Washington Trust Bancorp, Inc. (b) 54,870 2,999,194
Wells Fargo & Co. 726,281 37,156,536
West Bancorp., Inc. 51,373 1,628,524
Zions Bancorp NA 4,092 257,755
84,260,297
Capital Markets - 1.2%
Azimut Holding SpA 10,420 299,813
Banca Generali SpA 3,572 167,895
CI Financial Corp. 324,545 7,400,339
Daou Data Corp. 2,500 28,923
Diamond Hill Investment Group, Inc. 1,228 266,304
Donnelley Financial Solutions, Inc. (a) 4,547 174,241
Federated Hermes, Inc. 223,944 7,459,575
Goldman Sachs Group, Inc. 708 292,652
Lazard Ltd. Class A 136,714 6,697,619
LPL Financial 2,701 443,018
PJT Partners, Inc. 3,034 248,151
State Street Corp. 118,815 11,709,218
Van Lanschot NV (Bearer) 76,431 2,120,502
Quarterly Report 12

Common Stocks – continuedShares Value ($)
FINANCIALS – continued
37,308,250
Consumer Finance - 3.9%
Aeon Credit Service (Asia) Co. Ltd. 1,028,011 663,276
Cash Converters International Ltd. 1,426,240 311,138
Credit Acceptance Corp. (a)(b) 2,147 1,284,357
Discover Financial Services 197,866 22,422,175
Encore Capital Group, Inc. (a) 4,456 240,713
H&T Group PLC 37,769 140,593
Navient Corp. 107,787 2,123,404
Nicholas Financial, Inc. (a) 594 7,069
OneMain Holdings, Inc. 5,189 274,031
Regional Management Corp. 24,571 1,255,087
Santander Consumer U.S.A. Holdings, Inc. 835,514 34,840,934
Synchrony Financial 1,130,520 52,512,654
116,075,431
Diversified Financial Services - 0.4%
Far East Horizon Ltd. 119,513 114,129
Jackson Financial, Inc. (a) 252,401 6,832,495
Ricoh Leasing Co. Ltd. 60,197 1,908,543
Zenkoku Hosho Co. Ltd. 51,927 2,509,354
11,364,521
Insurance - 5.6%
AEGON NV 3,712,291 18,829,828
AFLAC, Inc. 432,764 23,226,444
Allstate Corp. 3,212 397,228
American Financial Group, Inc. 2,300 312,892
ASR Nederland NV 114,025 5,333,150
Chubb Ltd. 1,500 293,070
Db Insurance Co. Ltd. 78,000 3,943,625
Employers Holdings, Inc. 105,328 4,065,661
FBD Holdings PLC (a) 8,602 82,137
First American Financial Corp. 3,900 285,246
GoHealth, Inc. (a) 732 3,953
Hartford Financial Services Group, Inc. 7,152 521,595
Hiscox Ltd. (a) 21,599 246,229
Hyundai Fire & Marine Insurance Co. Ltd. 49,297 1,102,992
Legal & General Group PLC 606,020 2,396,046
Lincoln National Corp. 307,698 22,200,411
MetLife, Inc. 10,830 680,124
National Western Life Group, Inc. 9,319 2,003,678
NN Group NV 96,767 5,181,478
13 Quarterly Report

Schedule of Investments (Unaudited) − continued
Common Stocks – continuedShares Value ($)
FINANCIALS – continued
Insurance – continued
Old Republic International Corp. 12,000 309,960
Primerica, Inc. 22,607 3,803,402
Principal Financial Group, Inc. 23,023 1,544,613
Prudential Financial, Inc. 114,116 12,558,466
Qualitas Controladora S.A.B. de CV 52,791 244,544
Reinsurance Group of America, Inc. 205,943 24,317,749
RenaissanceRe Holdings Ltd. 32,405 4,595,029
Talanx AG 8,259 397,172
The Travelers Companies, Inc. 2,020 324,978
Unum Group 1,069,011 27,227,710
166,429,410
Thrifts & Mortgage Finance - 0.4%
ASAX Co. Ltd. 33,698 210,590
Axos Financial, Inc. (a) 20,436 1,083,108
Enact Holdings, Inc. 107,200 2,463,456
Equitable Group, Inc. 22,050 1,377,056
Essent Group Ltd. 40,513 1,944,624
Federal Agricultural Mortgage Corp.:
Class A (multi-vtg.) 506 59,934
Class C (non-vtg.) 13,998 1,765,008
Genworth Mortgage Insurance Ltd. 322,192 557,449
Hingham Institution for Savings 937 338,482
Meta Financial Group, Inc. 6,212 344,393
Southern Missouri Bancorp, Inc. 11,843 644,259
Walker & Dunlop, Inc. 819 106,527
10,894,886
TOTAL FINANCIALS 426,332,795
HEALTH CARE - 11.3%
Biotechnology - 1.4%
Amgen, Inc. 141,452 29,276,320
Cell Biotech Co. Ltd. 10,500 159,710
Essex Bio-Technology Ltd. 685,225 466,769
Gilead Sciences, Inc. 1,764 114,448
Regeneron Pharmaceuticals, Inc. (a) 17,913 11,463,245
41,480,492
Health Care Equipment & Supplies - 0.4%
Arts Optical International Holdings Ltd. (a) 1,463,805 129,815
Boston Scientific Corp. (a) 10,214 440,530
Quarterly Report 14

Common Stocks – continuedShares Value ($)
HEALTH CARE – continued
Health Care Equipment & Supplies – continued
Hologic, Inc. (a) 3,104 227,554
Hoshiiryou Sanki Co. Ltd. 16,206 547,644
I-Sens, Inc. 17,900 510,994
InBody Co. Ltd. 40,400 935,582
Meridian Bioscience, Inc. (a) 11,113 209,036
Nakanishi, Inc. 35,464 822,596
Prim SA 90,955 1,477,273
ResMed, Inc. 3,605 947,791
St.Shine Optical Co. Ltd. 228,000 2,411,420
Techno Medica Co. Ltd. 2,154 29,873
Utah Medical Products, Inc. 21,648 2,096,176
Value Added Technology Co. Ltd. 31,600 1,092,005
Vieworks Co. Ltd. 28,800 972,949
12,851,238
Health Care Providers & Services - 9.1%
Anthem, Inc. 155,109 67,492,579
Centene Corp. (a) 129,393 9,217,957
Cigna Corp. 28,825 6,157,308
DVx, Inc. 40,678 412,352
HCA Holdings, Inc. 1,142 286,025
Hi-Clearance, Inc. 120,000 592,566
Humana, Inc. 642 297,349
Laboratory Corp. of America Holdings (a) 1,553 445,742
Medica Sur SA de CV (b) 21,132 45,060
MEDNAX, Inc. (a) 157,621 4,292,020
Quest Diagnostics, Inc. 3,400 499,052
Ship Healthcare Holdings, Inc. 8,292 217,801
Sinopharm Group Co. Ltd. (H Shares) 3,348,365 7,987,360
Triple-S Management Corp. (a) 130,677 4,611,591
UnitedHealth Group, Inc. 303,717 139,852,572
Universal Health Services, Inc. Class B 214,489 26,618,085
WIN-Partners Co. Ltd. 158,797 1,340,874
270,366,293
Pharmaceuticals - 0.4%
Bliss Gvs Pharma Ltd. 247,098 365,265
China Medical System Holdings Ltd. 483,161 823,432
Consun Pharmaceutical Group Ltd. 341,029 147,273
Dai Han Pharmaceutical Co. Ltd. 18,400 474,019
Daito Pharmaceutical Co. Ltd. 39,740 1,120,680
Dawnrays Pharmaceutical Holdings Ltd. 4,092,810 894,258
15 Quarterly Report
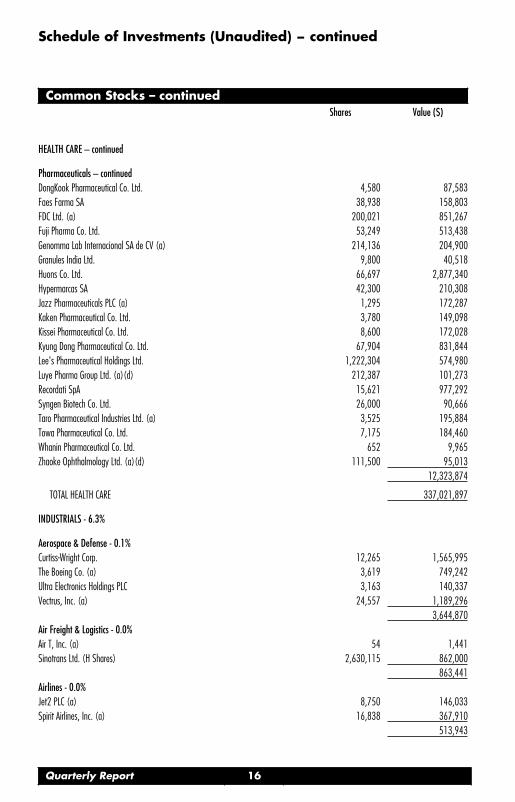
Schedule of Investments (Unaudited) − continued
Common Stocks – continuedShares Value ($)
HEALTH CARE – continued
Pharmaceuticals – continued
DongKook Pharmaceutical Co. Ltd. 4,580 87,583
Faes Farma SA 38,938 158,803
FDC Ltd. (a) 200,021 851,267
Fuji Pharma Co. Ltd. 53,249 513,438
Genomma Lab Internacional SA de CV (a) 214,136 204,900
Granules India Ltd. 9,800 40,518
Huons Co. Ltd. 66,697 2,877,340
Hypermarcas SA 42,300 210,308
Jazz Pharmaceuticals PLC (a) 1,295 172,287
Kaken Pharmaceutical Co. Ltd. 3,780 149,098
Kissei Pharmaceutical Co. Ltd. 8,600 172,028
Kyung Dong Pharmaceutical Co. Ltd. 67,904 831,844
Lee's Pharmaceutical Holdings Ltd. 1,222,304 574,980
Luye Pharma Group Ltd. (a)(d) 212,387 101,273
Recordati SpA 15,621 977,292
Syngen Biotech Co. Ltd. 26,000 90,666
Taro Pharmaceutical Industries Ltd. (a) 3,525 195,884
Towa Pharmaceutical Co. Ltd. 7,175 184,460
Whanin Pharmaceutical Co. Ltd. 652 9,965
Zhaoke Ophthalmology Ltd. (a)(d) 111,500 95,013
12,323,874
TOTAL HEALTH CARE 337,021,897
INDUSTRIALS - 6.3%
Aerospace & Defense - 0.1%
Curtiss-Wright Corp. 12,265 1,565,995
The Boeing Co. (a) 3,619 749,242
Ultra Electronics Holdings PLC 3,163 140,337
Vectrus, Inc. (a) 24,557 1,189,296
3,644,870
Air Freight & Logistics - 0.0%
Air T, Inc. (a) 54 1,441
Sinotrans Ltd. (H Shares) 2,630,115 862,000
863,441
Airlines - 0.0%
Jet2 PLC (a) 8,750 146,033
Spirit Airlines, Inc. (a) 16,838 367,910
513,943
Quarterly Report 16

Common Stocks – continuedShares Value ($)
INDUSTRIALS – continued
Building Products - 0.1%
Builders FirstSource, Inc. (a) 9,032 526,295
Caesarstone Sdot-Yam Ltd. 31,188 389,226
Jeld-Wen Holding, Inc. (a) 50,630 1,387,768
Kondotec, Inc. 128,380 1,101,367
Masonite International Corp. (a) 2,326 279,143
Nihon Flush Co. Ltd. 70,461 668,613
Owens Corning 3,504 327,309
4,679,721
Commercial Services & Supplies - 0.6%
Aeon Delight Co. Ltd. 6,428 197,416
AJIS Co. Ltd. 56,609 1,472,130
Asia File Corp. Bhd 361,200 216,319
Biffa PLC (a)(d) 53,900 293,584
Calian Group Ltd. 7,201 358,421
Civeo Corp. (a) 69,115 1,559,926
CoreCivic, Inc. (a) 404,902 3,486,206
CTS Co. Ltd. 315 2,201
Left Field Printing Group Ltd. 87,222 6,390
Lion Rock Group Ltd. 1,395,558 134,525
Matthews International Corp. Class A 15,934 547,652
Mears Group PLC 77,068 208,833
Mitie Group PLC (a) 3,089,935 2,765,590
NICE Total Cash Management Co., Ltd. 121,311 574,289
Prosegur Compania de Seguridad SA (Reg.) 64,492 182,654
Sunny Friend Environmental Technology Co. Ltd. 13,000 93,141
The Brink's Co. 267 18,391
VSE Corp. 87,724 4,873,068
16,990,736
Construction & Engineering - 0.5%
AECOM (a) 16,601 1,135,010
API Group Corp. (a) 51,493 1,121,518
Argan, Inc. 17,771 733,231
Boustead Projs. Pte Ltd. 113,508 85,015
Boustead Singapore Ltd. 294,990 223,129
Daiichi Kensetsu Corp. 109,178 1,922,705
EMCOR Group, Inc. 5,290 642,682
Fluor Corp. (a) 64,999 1,263,581
Geumhwa PSC Co. Ltd. 28,039 782,169
Granite Construction, Inc. 20,976 778,629
Kyeryong Construction Industrial Co. Ltd. 27,197 830,889
17 Quarterly Report

Schedule of Investments (Unaudited) − continued
Common Stocks – continuedShares Value ($)
INDUSTRIALS – continued
Construction & Engineering – continued
Meisei Industrial Co. Ltd. 92,697 552,394
Mirait Holdings Corp. 32,874 632,257
Nippon Rietec Co. Ltd. 73,506 1,023,303
Per Aarsleff Holding A/S 919 39,631
Primoris Services Corp. 66,002 1,778,754
Raiznext Corp. 120,689 1,304,452
Seikitokyu Kogyo Co. Ltd. 17,127 122,774
Shinnihon Corp. 145,744 1,066,802
Totetsu Kogyo Co. Ltd. 13,502 293,770
United Integrated Services Co. 20,200 133,119
16,465,814
Electrical Equipment - 0.9%
Acuity Brands, Inc. 48,618 9,987,596
Aichi Electric Co. Ltd. 25,678 632,862
AQ Group AB (a) 55,063 1,827,312
Atkore, Inc. (a) 9,129 862,964
AZZ, Inc. 4,549 241,688
Chiyoda Integre Co. Ltd. 24,993 478,002
Generac Holdings, Inc. (a) 808 402,836
GrafTech International Ltd. 639,899 6,846,919
Hammond Power Solutions, Inc. Class A 30,591 281,785
I-Sheng Electric Wire & Cable Co. Ltd. 322,000 491,471
Korea Electric Terminal Co. Ltd. 39,036 2,513,164
Sensata Technologies, Inc. PLC (a) 24,427 1,345,928
Servotronics, Inc. (a)(b) 10,655 120,508
Vitzrocell Co. Ltd. 12,100 168,276
26,201,311
Industrial Conglomerates - 0.4%
DCC PLC (United Kingdom) 124,227 10,380,863
Mytilineos SA 16,671 303,914
Reunert Ltd. 140,013 464,816
Rheinmetall AG 2,286 221,557
11,371,150
Machinery - 1.5%
Aalberts Industries NV 486,016 26,883,781
Allison Transmission Holdings, Inc. 26,916 897,918
ASL Marine Holdings Ltd. (a) 3,429,864 165,325
Clean & Science Co. Ltd. 5,100 87,593
Daiwa Industries Ltd. 16,651 185,578
Estic Corp. 1,031 39,814
Quarterly Report 18

Common Stocks – continuedShares Value ($)
INDUSTRIALS – continued
Machinery – continued
Haitian International Holdings Ltd. 481,743 1,411,701
Hurco Companies, Inc. 10,962 355,717
Hyster-Yale Materials Handling Class A 16,980 815,719
Ihara Science Corp. 74,565 1,377,356
ITT, Inc. 4,932 463,953
JOST Werke AG (d) 7,202 417,108
Kyowakogyosyo Co. Ltd. 2,969 112,610
Luxfer Holdings PLC sponsored 13,645 274,401
Maruzen Co. Ltd. 101,044 1,968,967
Miller Industries, Inc. 6,074 219,514
Mincon Group PLC 154,980 241,862
Mitsui Engineering & Shipbuilding Co. (a) 243,235 1,240,448
Nadex Co. Ltd. 50,528 348,810
Nippon Dry-Chemical Co. Ltd. 7,463 133,748
Nitchitsu Co. Ltd. 3,410 55,876
Park-Ohio Holdings Corp. 56,512 1,317,860
Semperit AG Holding 28,832 971,563
Shinwa Co. Ltd. 1,315 25,556
SIMPAC, Inc. 110,420 742,495
Stabilus SA 3,549 266,672
Takamatsu Machinery Co. Ltd. 32,308 224,539
TK Group Holdings Ltd. 16,200 6,142
Tocalo Co. Ltd. 197,919 2,427,051
Trinity Industrial Corp. 70,428 517,911
44,197,588
Marine - 0.1%
Eagle Bulk Shipping, Inc. (a) 8,420 362,481
Genco Shipping & Trading Ltd. 76,237 1,308,989
Kirby Corp. (a) 16,300 854,283
Tokyo Kisen Co. Ltd. 52,460 277,671
2,803,424
Professional Services - 0.4%
ABIST Co. Ltd. 300 7,560
Alight, Inc. Class A (a) 16,300 177,344
Altech Corp. 8,818 158,848
ASGN, Inc. (a) 1,700 203,422
Barrett Business Services, Inc. 2,337 191,634
Benext-Yumeshin Group Co. 8,600 112,118
Career Design Center Co. Ltd. 6,548 64,515
Careerlink Co. Ltd. 4,094 55,616
19 Quarterly Report

Schedule of Investments (Unaudited) − continued
Common Stocks – continuedShares Value ($)
INDUSTRIALS – continued
Professional Services – continued
Hito Communications Holdings, Inc. 13,141 253,958
Kelly Services, Inc. Class A (non-vtg.) 17,482 315,200
Kforce, Inc. 3,733 241,749
McMillan Shakespeare Ltd. 122,665 1,263,241
Nielsen Holdings PLC 91,101 1,844,795
Outsourcing, Inc. 2,047 39,268
Persol Holdings Co. Ltd. 18,391 494,325
Quick Co. Ltd. 40,384 509,761
SaraminHR Co. Ltd. 9,700 379,764
Science Applications Internati 7,969 715,457
SHL-JAPAN Ltd. 19,114 420,024
Synergie SA 11,539 532,896
TrueBlue, Inc. (a)(b) 52,189 1,453,464
WDB Holdings Co. Ltd. 15,434 486,484
Will Group, Inc. 76,873 868,566
World Holdings Co. Ltd. 35,084 876,353
11,666,362
Road & Rail - 0.7%
Alps Logistics Co. Ltd. 180,632 1,649,265
Chilled & Frozen Logistics Holdings Co. Ltd. 70,860 1,050,136
Daqin Railway Co. Ltd. (A Shares) 3,066,746 3,040,056
Hamakyorex Co. Ltd. 121,126 3,358,143
Knight-Swift Transportation Holdings, Inc. Class A 18,884 1,070,534
Ryder System, Inc. 3,062 260,117
Sakai Moving Service Co. Ltd. 98,281 4,047,091
Stef SA 2,425 303,317
Trancom Co. Ltd. 54,256 3,806,865
Universal Logistics Holdings, Inc. 60,393 1,273,084
19,858,608
Trading Companies & Distributors - 0.9%
AddTech AB (B Shares) 17,824 398,487
AerCap Holdings NV (a) 3,100 183,024
Alconix Corp. 147,687 2,226,361
Chori Co. Ltd. 27,341 435,960
Goodfellow, Inc. 48,186 421,277
Itochu Corp. 334,803 9,548,872
Lumax International Corp. Ltd. 158,000 403,440
Meiwa Corp. 57,840 419,221
Mitani Shoji Co. Ltd. 242,456 3,752,749
MRC Global, Inc. (a) 169,752 1,408,942
Quarterly Report 20

Common Stocks – continuedShares Value ($)
INDUSTRIALS – continued
Trading Companies & Distributors – continued
Nishikawa Keisoku Co. Ltd. 630 25,430
NOW, Inc. (a) 58,687 423,720
Otec Corp. 7,690 161,321
Parker Corp. 140,924 630,148
Richelieu Hardware Ltd. 56,682 2,000,999
Rush Enterprises, Inc. Class A 6,836 356,019
Senshu Electric Co. Ltd. 56,613 2,366,213
Tanaka Co. Ltd. 2,045 11,921
TECHNO ASSOCIE Co. Ltd. 19,378 189,159
Totech Corp. 73,443 1,716,749
Univar, Inc. (a) 10,300 263,474
Yamazen Co. Ltd. 3,567 33,049
27,376,535
Transportation Infrastructure - 0.1%
Anhui Expressway Co. Ltd. (H Shares) 745,508 442,677
Daito Koun Co. Ltd. 1,013 5,358
Isewan Terminal Service Co. Ltd. 98,179 609,456
Meiko Transportation Co. Ltd. 71,882 700,892
Qingdao Port International Co. Ltd. (H Shares) (d) 1,377,370 692,181
2,450,564
TOTAL INDUSTRIALS 189,084,067
INFORMATION TECHNOLOGY - 12.6%
Communications Equipment - 0.0%
Calix, Inc. (a) 14,896 932,341
Casa Systems, Inc. (a) 61,119 386,883
1,319,224
Electronic Equipment & Components - 4.7%
A&D Co. Ltd. 46,566 413,464
Advanced Energy Industries, Inc. 17,859 1,639,813
Alviva Holdings Ltd. 661,881 646,932
Arrow Electronics, Inc. (a) 2,404 278,263
Avnet, Inc. 5,600 213,416
CDW Corp. 7,961 1,485,921
CONEXIO Corp. 2,561 32,822
Daido Signal Co. Ltd. 6,490 34,496
Daiwabo Holdings Co. Ltd. 56,917 1,002,022
Elematec Corp. 188,422 1,880,367
FLEXium Interconnect, Inc. 42,000 144,952
21 Quarterly Report

Schedule of Investments (Unaudited) − continued
Common Stocks – continuedShares Value ($)
INFORMATION TECHNOLOGY – continued
Electronic Equipment & Components – continued
Hon Hai Precision Industry Co. Ltd. (Foxconn) 11,580,900 44,501,932
IDIS Holdings Co. Ltd. 48,087 525,145
Insight Enterprises, Inc. (a) 32,393 3,067,617
Kingboard Chemical Holdings Ltd. 5,964,117 26,100,917
Kitron ASA 176,599 375,445
Methode Electronics, Inc. Class A 81,318 3,421,048
Muramoto Electronic Thailand PCL (For. Reg.) 44,260 366,832
Nippo Ltd. 52,356 311,921
PAX Global Technology Ltd. (c) 1,771,536 1,229,522
Redington (India) Ltd. 4,178,922 8,011,622
Restar Holdings Corp. 3,467 57,948
SAMT Co. Ltd. 8,500 38,019
ScanSource, Inc. (a) 130,845 4,681,634
Shibaura Electronics Co. Ltd. 37,273 2,151,886
Simplo Technology Co. Ltd. 477,000 5,122,033
TD SYNNEX Corp. 207,596 21,797,580
Test Research, Inc. 8,000 16,060
Thinking Electronic Industries Co. Ltd. 36,000 219,788
Tomen Devices Corp. 40,914 2,089,636
Tripod Technology Corp. 103,000 434,638
VSTECS Holdings Ltd. 7,475,282 7,080,885
Wayside Technology Group, Inc. 24,105 640,952
140,015,528
IT Services - 3.9%
ALTEN 8,659 1,393,365
Amdocs Ltd. 347,259 27,030,641
Argo Graphics, Inc. 62,098 1,729,208
CDS Co. Ltd. 27,712 375,542
Concentrix Corp. 206,267 36,649,521
CSE Global Ltd. 2,583,822 986,777
Data Applications Co. Ltd. 2,090 30,661
Densan System Holdings Co. Ltd. 3,662 82,691
Dimerco Data System Corp. 80,299 183,120
DTS Corp. 31,085 689,735
DXC Technology Co. (a) 137,622 4,482,349
E-Credible Co. Ltd. 20,175 344,578
eClerx Services Ltd. (a) 27,121 788,971
EOH Holdings Ltd. (a) 485,245 243,020
EPAM Systems, Inc. (a) 2,589 1,743,018
Estore Corp. 7,968 119,462
Quarterly Report 22

Common Stocks – continuedShares Value ($)
INFORMATION TECHNOLOGY – continued
IT Services – continued
ExlService Holdings, Inc. (a) 17,711 2,171,900
Gabia, Inc. 71,800 784,001
Global Payments, Inc. 6,499 929,292
Indra Sistemas SA (a) 1,032,344 12,470,922
Information Planning Co. Ltd. 5,174 127,053
Know IT AB 53,671 2,156,089
Maximus, Inc. 405 34,251
Nice Information & Telecom, Inc. 29,780 854,924
Poletowin Pitcrew Holdings, Inc. 8,800 79,347
Proact IT Group AB 405 4,079
Societe Pour L'Informatique Industrielle SA 104,819 4,774,128
Softcreate Co. Ltd. 48,690 1,690,403
Sysage Technology Co. Ltd. 162,000 222,535
TDC Soft, Inc. 27,075 311,026
The Western Union Co. 609,937 11,113,052
TravelSky Technology Ltd. (H Shares) 17,463 32,679
Verra Mobility Corp. (a) 87,235 1,298,057
WNS Holdings Ltd. sponsored ADR (a) 5,189 460,835
116,387,232
Semiconductors & Semiconductor Equipment - 0.4%
ASM Pacific Technology Ltd. 22,925 247,651
CMC Materials, Inc. 6,371 817,845
FormFactor, Inc. (a) 16,211 644,874
Japan Material Co. Ltd. 8,644 120,205
Machvision, Inc. 9,000 75,633
Melexis NV 8,865 1,020,695
Miraial Co. Ltd. 12,458 172,755
MKS Instruments, Inc. 8,229 1,234,761
Powertech Technology, Inc. 738,000 2,581,476
Renesas Electronics Corp. (a) 38,205 469,976
Synaptics, Inc. (a) 6,481 1,261,008
Systems Technology, Inc. 21,500 301,055
Topco Scientific Co. Ltd. 407,500 2,019,573
10,967,507
Software - 1.5%
AdaptIT Holdings Ltd. (a) 240,941 110,415
ANSYS, Inc. (a) 79,284 30,094,621
Check Point Software Technologies Ltd. (a) 1,315 157,274
Cresco Ltd. 35,115 642,631
Cyient Ltd. 300,000 4,275,565
23 Quarterly Report

Schedule of Investments (Unaudited) − continued
Common Stocks – continuedShares Value ($)
INFORMATION TECHNOLOGY – continued
Software – continued
Focus Systems Corp. 3,559 31,731
InfoVine Co. Ltd. 2,756 65,201
KSK Co., Ltd. 33,389 656,912
Manhattan Associates, Inc. (a) 11,135 2,021,448
Minwise Co. Ltd. 43,400 692,080
NetGem SA (a) 59,603 94,394
Nippon Systemware Co. Ltd. 13,203 289,568
Open Text Corp. 5,660 285,104
Pegasystems, Inc. 5,147 611,052
Pro-Ship, Inc. 42,347 607,658
Sinosoft Tech Group Ltd. 85,885 11,259
SPS Commerce, Inc. (a) 13,587 2,075,143
System Research Co. Ltd. 4,471 78,962
Telos Corp. 16,806 435,443
43,236,461
Technology Hardware, Storage & Peripherals - 2.1%
Chenbro Micom Co. Ltd. 60,000 162,040
Dell Technologies, Inc. (a) 92,005 10,119,630
Elecom Co. Ltd. 20,200 308,971
HP, Inc. 12,453 377,699
MCJ Co. Ltd. 56,741 638,829
Samsung Electronics Co. Ltd. 3,300 196,569
Seagate Technology Holdings PLC (b) 532,133 47,397,086
Super Micro Computer, Inc. (a) 55,896 1,978,159
TSC Auto ID Technology Corp. 89,000 661,627
61,840,610
TOTAL INFORMATION TECHNOLOGY 373,766,562
MATERIALS - 4.0%
Chemicals - 1.8%
AdvanSix, Inc. 21,850 1,061,910
Axalta Coating Systems Ltd. (a) 24,966 778,690
Birla Carbon Thailand PCL (For. Reg.) 879,028 1,212,041
C. Uyemura & Co. Ltd. 62,617 2,587,423
Chase Corp. 38,840 3,728,640
EcoGreen International Group Ltd. 4,394,838 960,250
Element Solutions, Inc. 14,327 325,366
FMC Corp. 80,973 7,369,353
Fujikura Kasei Co., Ltd. 171,355 790,263
Quarterly Report 24

Common Stocks – continuedShares Value ($)
MATERIALS – continued
Chemicals – continued
Gujarat Narmada Valley Fertilizers Co. 423,142 2,600,216
Gujarat State Fertilizers & Chemicals Ltd. 2,288,187 4,028,101
Huntsman Corp. 12,853 418,751
Innospec, Inc. 10,694 968,983
K+S AG 8,800 151,524
KPX Holdings Corp. 4,873 275,108
Miwon Chemicals Co. Ltd. 3,008 205,952
Miwon Commercial Co. Ltd. 3,600 636,267
Muto Seiko Co. Ltd. 16,237 74,332
Nihon Parkerizing Co. Ltd. 21,887 218,374
Nippon Soda Co. Ltd. 24,037 722,210
Scientex Bhd 9,800 11,028
SK Kaken Co. Ltd. 4,100 1,363,214
Soken Chemical & Engineer Co. Ltd. 42,221 657,190
T&K Toka Co. Ltd. 102,387 727,587
Thai Rayon PCL (For. Reg.) (a) 264,724 408,894
The Chemours Co. LLC 23,249 651,437
The Mosaic Co. 285,480 11,867,404
Trinseo PLC 8,428 472,474
Tronox Holdings PLC 7,400 172,568
Yara International ASA 135,607 7,075,790
Yip's Chemical Holdings Ltd. 2,106,784 1,248,284
53,769,624
Construction Materials - 0.4%
Buzzi Unicem SpA 85,913 2,003,192
Eagle Materials, Inc. 2,953 438,107
Mitani Sekisan Co. Ltd. 112,230 7,121,455
RHI Magnesita NV 8,270 380,055
West China Cement Ltd. 271,458 47,450
Wienerberger AG 5,500 194,682
10,184,941
Containers & Packaging - 0.2%
Berry Global Group, Inc. (a) 4,139 271,270
Chuoh Pack Industry Co. Ltd. 26,559 257,230
International Paper Co. 2,077 103,165
Kohsoku Corp. 110,128 1,561,080
Mayr-Melnhof Karton AG 1,226 241,217
O-I Glass, Inc. (a) 15,019 195,998
Packaging Corp. of America 2,556 351,118
Samhwa Crown & Closure Co. Ltd. 1,620 60,275
25 Quarterly Report

Schedule of Investments (Unaudited) − continued
Common Stocks – continuedShares Value ($)
MATERIALS – continued
Containers & Packaging – continued
Silgan Holdings, Inc. 14,450 580,890
The Pack Corp. 122,394 3,251,651
WestRock Co. 2,864 137,758
7,011,652
Metals & Mining - 1.3%
Anglo American PLC (United Kingdom) 19,177 729,551
Boliden AB 13,150 463,802
Chubu Steel Plate Co. Ltd. 31,428 227,342
Cleveland-Cliffs, Inc. (a)(b) 887,734 21,403,267
Commercial Metals Co. 9,281 298,663
Compania de Minas Buenaventura SA sponsored ADR (a) 176,982 1,394,618
Gatos Silver, Inc. 63,909 773,299
Granges AB 23,536 256,106
Hill & Smith Holdings PLC 64,081 1,608,382
Kirkland Lake Gold Ltd. 34,391 1,449,724
Mount Gibson Iron Ltd. 711,955 224,939
Newmont Corp. 8,610 464,940
Perenti Global Ltd. 1,028,563 789,211
Reliance Steel & Aluminum Co. 1,707 249,495
Sandfire Resources NL 434,212 1,816,096
Teck Resources Ltd. Class B (sub. vtg.) 44,565 1,243,758
Tohoku Steel Co. Ltd. 39,658 603,883
Tokyo Tekko Co. Ltd. 48,194 630,638
Warrior Metropolitan Coal, Inc. 115,769 2,774,983
Webco Industries, Inc. (a) 510 68,850
37,471,547
Paper & Forest Products - 0.3%
Louisiana-Pacific Corp. 19,869 1,170,880
Stella-Jones, Inc. 218,817 7,855,559
Western Forest Products, Inc. 133,719 231,221
9,257,660
TOTAL MATERIALS 117,695,424
REAL ESTATE - 0.3%
Equity Real Estate Investment Trusts (REITs) - 0.0%
CubeSmart 4,660 256,347
The GEO Group, Inc. 39,229 320,893
577,240
Quarterly Report 26

Common Stocks – continuedShares Value ($)
REAL ESTATE – continued
Real Estate Management & Development - 0.3%
Anabuki Kosan, Inc. 15,306 277,845
Century21 Real Estate Japan Ltd. 9,900 90,390
Daito Trust Construction Co. Ltd. 52,802 6,546,609
Jones Lang LaSalle, Inc. (a) 1,966 507,680
LSL Property Services PLC 96,813 585,621
Realogy Holdings Corp. (a) 16,597 287,460
Relo Group, Inc. 16,973 353,036
Selvaag Bolig ASA 48,551 298,275
Servcorp Ltd. 80,248 244,485
Tejon Ranch Co. (a) 32,761 596,578
9,787,979
TOTAL REAL ESTATE 10,365,219
UTILITIES - 1.8%
Electric Utilities - 1.6%
Exelon Corp. 20,574 1,094,331
PG&E Corp. (a) 2,376,227 27,564,233
PPL Corp. 645,785 18,598,608
47,257,172
Gas Utilities - 0.1%
Busan City Gas Co. Ltd. 3,465 249,089
China Resource Gas Group Ltd. 14,792 79,469
GAIL India Ltd. 289,500 574,906
Hokuriku Gas Co. 12,702 348,665
K&O Energy Group, Inc. 17,258 247,300
Keiyo Gas Co. Ltd. 9,381 274,906
Star Gas Partners LP 15,575 176,776
1,951,111
Independent Power and Renewable Electricity Producers - 0.1%
Mega First Corp. Bhd 2,882,200 2,505,656
Multi-Utilities - 0.0%
CMS Energy Corp. 12,916 779,481
Water Utilities - 0.0%
Manila Water Co., Inc. (a) 426,584 223,807
TOTAL UTILITIES 52,717,227
TOTAL COMMON STOCKS (Cost $2,002,896,410) 2,618,901,708
27 Quarterly Report
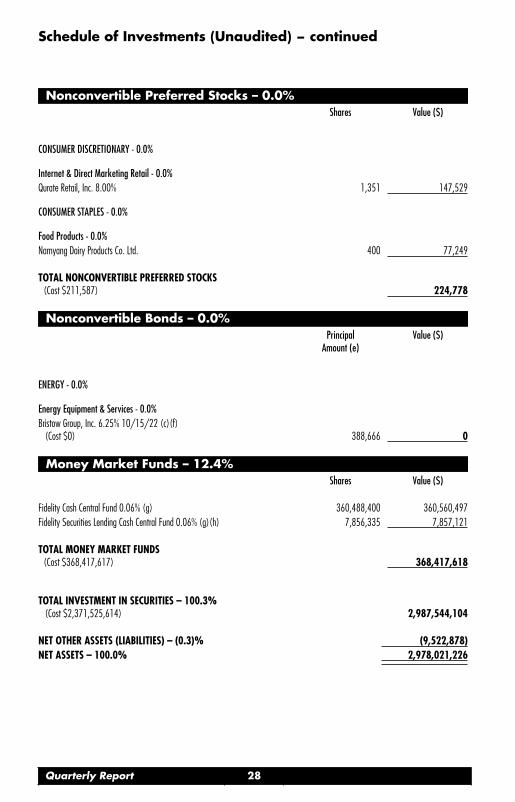
Schedule of Investments (Unaudited) − continued
Nonconvertible Preferred Stocks – 0.0%Shares Value ($)
CONSUMER DISCRETIONARY - 0.0%
Internet & Direct Marketing Retail - 0.0%
Qurate Retail, Inc. 8.00% 1,351 147,529
CONSUMER STAPLES - 0.0%
Food Products - 0.0%
Namyang Dairy Products Co. Ltd. 400 77,249
TOTAL NONCONVERTIBLE PREFERRED STOCKS (Cost $211,587) 224,778
Nonconvertible Bonds – 0.0%Principal
Amount (e)Value ($)
ENERGY - 0.0%
Energy Equipment & Services - 0.0%
Bristow Group, Inc. 6.25% 10/15/22 (c)(f) (Cost $0) 388,666 0
Money Market Funds – 12.4%Shares Value ($)
Fidelity Cash Central Fund 0.06% (g) 360,488,400 360,560,497
Fidelity Securities Lending Cash Central Fund 0.06% (g)(h) 7,856,335 7,857,121
TOTAL MONEY MARKET FUNDS (Cost $368,417,617) 368,417,618
TOTAL INVESTMENT IN SECURITIES – 100.3% (Cost $2,371,525,614) 2,987,544,104
NET OTHER ASSETS (LIABILITIES) – (0.3)% (9,522,878)
NET ASSETS – 100.0% 2,978,021,226
Quarterly Report 28

Legend
(a) Non-income producing
(b) Security or a portion of the security is on loan at periodend.
(c) Level 3 security
(d) Security exempt from registration under Rule 144A of theSecurities Act of 1933. These securities may be resold intransactions exempt from registration, normally to qualifiedinstitutional buyers. At the end of the period, the value ofthese securities amounted to $4,545,036 or 0.2% of netassets.
(e) Amount is stated in United States dollars unless otherwisenoted.
(f) Non-income producing – Security is in default.
(g) Affiliated fund that is generally available only to investmentcompanies and other accounts managed by FidelityInvestments. The rate quoted is the annualized seven-dayyield of the fund at period end. A complete unauditedlisting of the fund’s holdings as of its most recent quarterend is available upon request. In addition, each FidelityCentral Fund’s financial statements are available on theSEC’s website or upon request.
(h) Investment made with cash collateral received fromsecurities on loan.
Affiliated Central FundsFiscal year to date information regarding the Fund’s investments in Fidelity Central Funds, including the ownership percentage, is presentedbelow.
Affiliate
Value,beginning
of period ($) Purchases ($)Sales
Proceeds ($)Dividend
Income ($)
RealizedGain (loss)
($)
Change inUnrealized
appreciation(depreciation)
($)
Value,end
of period ($)
%ownership,end
of period
FidelityCashCentralFund0.06% 379,921,980 110,818,921 130,180,404 53,288 — — 360,560,497 0.6%
FidelitySecuritiesLendingCashCentralFund0.06% 19,768,309 86,832,174 98,743,362 40,931 — — 7,857,121 0.0%
Total 399,690,289 197,651,095 228,923,766 94,219 — — 368,417,618
Amounts in the income column in the above table include any capital gain distributions from underlying funds.
Amount for Fidelity Securities Lending Cash Central Fund represents the income earned on investing cash collateral, less rebates paid toborrowers and any lending agent fees associated with the loan, plus any premium payments received for lending certain types of securities.
Investment ValuationInvestments are valued as of 4:00 p.m. Eastern time on the last calendar day of the period. Security transactions are accounted for as of
29 Quarterly Report

Schedule of Investments (Unaudited) − continued
trade date. The Board of Trustees (the Board) has delegated the day to day responsibility for the valuation of the Fund’s investments to theFair Value Committee (the Committee) established by the Fund’s investment adviser. In accordance with valuation policies and proceduresapproved by the Board, the Fund attempts to obtain prices from one or more third party pricing vendors or brokers to value its investments.When current market prices, quotations or currency exchange rates are not readily available or reliable, investments will be fair valued ingood faith by the Committee, in accordance with procedures adopted by the Board. Factors used in determining fair value vary by investmenttype and may include market or investment specific events, changes in interest rates and credit quality. The frequency with which theseprocedures are used cannot be predicted and they may be utilized to a significant extent. The Committee oversees the Fund’s valuationpolicies and procedures and reports to the Board on the Committee’s activities and fair value determinations. The Board monitors theappropriateness of the procedures used in valuing the Fund’s investments and ratifies the fair value determinations of the Committee.
The inputs to valuation techniques used to value investments are categorized into a disclosure hierarchy consisting of three levels as shownbelow:
Level 1 – quoted prices in active markets for identical investmentsLevel 2 – other significant observable inputs (including quoted prices for similar investments, interest rates, prepayment speeds, etc.)Level 3 – unobservable inputs (including the Fund’s own assumptions based on the best information available)
Valuation techniques used to value investments by major category are as follows:Equity securities, including restricted securities, for which market quotations are readily available, are valued at the last reported sale price orofficial closing price as reported by a third party pricing vendor on the primary market or exchange on which they are traded and arecategorized as Level 1 in the hierarchy. In the event there were no sales during the day or closing prices are not available, securities arevalued at the last quoted bid price or may be valued using the last available price and are generally categorized as Level 2 in the hierarchy.For any foreign equity securities, when market or security specific events arise, comparisons to the valuation of American Depositary Receipts(ADRs), futures contracts, Exchange-Traded Funds (ETFs) and certain indexes as well as quoted prices for similar securities may be used andwould be categorized as Level 2 in the hierarchy. For equity securities, including restricted securities, where observable inputs are limited,assumptions about market activity and risk are used and these securities may be categorized as Level 3 in the hierarchy.
Debt securities, including restricted securities, are valued based on evaluated prices received from third party pricing vendors or from brokerswho make markets in such securities. Nonconvertible Bonds are valued by pricing vendors who utilize matrix pricing which considers yield orprice of bonds of comparable quality, coupon, maturity and type or by broker-supplied prices. When independent prices are unavailable orunreliable, debt securities may be valued utilizing pricing methodologies which consider similar factors that would be used by third partypricing vendors. Debt securities are generally categorized as Level 2 in the hierarchy but may be Level 3 depending on the circumstances.
Investments in any open-end mutual funds are valued at their closing net asset value (NAV) each business day and are categorized as Level1 in the hierarchy.
Changes in valuation techniques may result in transfers in or out of an assigned level within the disclosure hierarchy.
For additional information on the Fund’s significant accounting policies, please refer to the Fund’s most recent semiannual or annualshareholder report.
Quarterly Report 30

The fund’s schedule of investments as of the date on the cover of this report has not been audited. This report isprovided for the general information of the fund’s shareholders. For more information regarding the fund and itsholdings, please see the fund’s most recent prospectus and annual report.
Third party trademarks and service marks are the property of their respective owners. All other trademarks andservice marks are the property of FMR LLC or an affiliate.
31 Quarterly Report

Notes