Exor SpA (EXOR.MI) Priced for failure, run for success - Borsa ...
34
July 28, 2010 Exor SpA (EXOR.MI) Priced for failure, run for success; initiating as Conviction Buy Real sustained change is driven from the top Under Agnelli heir Mr Elkann, together with executives and Fiat CEO Mr Marchionne, there have been several recent positive steps taken to unlock shareholder value. The share price appears to imply that efforts to execute change will fail, but we believe upside potential is high and likely. Exor is a way to play Fiat’s restructuring and execution of the business plan… The next steps in the Fiat story are: (1) demerger of Fiat Industrial, which we believe may unwind the implied current 40% Fiat conglomerate discount; (2) a potential merger between Fiat Auto and Chrysler, which should help execution of the business plan and may in time lead to a re-rating of the auto business to European peer multiples; and (3) transformational deals in Fiat Ind. …at a 44% discount that’s likely to tighten Exor’s NAV discount remains among the widest in our European coverage despite simplification of the structure with the merger of IFI/IFIL into Exor. We believe Exor’s discount will tighten materially. Initiating as Buy; onto Conviction List We initiate on Exor with a Buy rating and add the shares to the Pan-Europe Conviction List. Our 12- month risk-weighted NAV-based price target is €23.7, implying 59% potential upside. Risks Risks to our view and price target include our analysts’ price targets on underlying listed assets, prolonged market volatility and risk aversion. We expect Exor’s wide NAV discount to tighten Source: Company data, Bloomberg, Goldman Sachs Research est. ALMOST 60% OF EXOR’S GAV IS FIAT Source: Company data, Bloomberg, Goldman Sachs Research estimates. RECENT RESEARCH NAV discounts dislocated and close to trough boundaries; Eurazeo and Exor top picks; July 28, 2010 Triple boost for holding companies if market confidence returns; April 27, 2010 Priced at the close of July 26, 2010 (€14.92) Coverage view Neutral See the Financial Advisory Disclosure section of this document for important disclosures about transactions in which The Goldman Sachs Group, Inc. or an affiliate is acting as financial advisor Markus Iwar +44(20)7552-1264 [email protected] Goldman Sachs International The Goldman Sachs Group, Inc. does and seeks to do business with companies covered in its research reports. As a result, investors should be aware that the firm may have a conflict of interest that could affect the objectivity of this report. Investors should consider this report as only a single factor in making their investment decision. For Reg AC certification, see the end of the text. Other important disclosures follow the Reg AC certification, or go to www.gs.com/research/hedge.html. Analysts employed by non-US affiliates are not registered/qualified as research analysts with FINRA in the U.S. Jacqueline Cheung +44(20)7552-5949 [email protected] Goldman Sachs International The Goldman Sachs Group, Inc. Global Investment Research -65% -60% -55% -50% -45% -40% -35% -30% -25% -20% -15% -10% 09/03 01/04 05/04 09/04 01/05 05/05 09/05 01/06 05/06 09/06 01/07 05/07 09/07 01/08 05/08 09/08 01/09 05/09 09/09 01/10 05/10 NAV discount/ premium 12m rolling average +/- 2 standard deviations Target NAV Discount 5yr average 7% 4% 61% 23% 0 1 2 3 4 5 6 0% 10% 20% 30% 40% 50% 60% 70% 80% 90% 100% C&W Other unlisted Fiat SGS Total GAV 2010E Net debt NAV Current mkt cap € bn % of total GAV Asset split (listed mkt value)
-
Upload
khangminh22 -
Category
Documents
-
view
0 -
download
0
Transcript of Exor SpA (EXOR.MI) Priced for failure, run for success - Borsa ...

July 28, 2010
Exor SpA (EXOR.MI)
Priced for failure, run for success; initiating as Conviction Buy
Real sustained change is driven from the top
Under Agnelli heir Mr Elkann, together with
executives and Fiat CEO Mr Marchionne, there
have been several recent positive steps taken to
unlock shareholder value. The share price appears
to imply that efforts to execute change will fail,
but we believe upside potential is high and likely.
Exor is a way to play Fiat’s restructuring and execution of the business plan…
The next steps in the Fiat story are: (1) demerger
of Fiat Industrial, which we believe may unwind
the implied current 40% Fiat conglomerate
discount; (2) a potential merger between Fiat Auto
and Chrysler, which should help execution of the
business plan and may in time lead to a re-rating
of the auto business to European peer multiples;
and (3) transformational deals in Fiat Ind.
…at a 44% discount that’s likely to tighten
Exor’s NAV discount remains among the widest in
our European coverage despite simplification of
the structure with the merger of IFI/IFIL into Exor.
We believe Exor’s discount will tighten materially.
Initiating as Buy; onto Conviction List
We initiate on Exor with a Buy rating and add the
shares to the Pan-Europe Conviction List. Our 12-
month risk-weighted NAV-based price target is
€23.7, implying 59% potential upside.
Risks
Risks to our view and price target include our
analysts’ price targets on underlying listed assets,
prolonged market volatility and risk aversion.
We expect Exor’s wide NAV discount to tighten
Source: Company data, Bloomberg, Goldman Sachs Research est.
ALMOST 60% OF EXOR’S GAV IS FIAT
Source: Company data, Bloomberg, Goldman Sachs
Research estimates.
RECENT RESEARCH
NAV discounts dislocated and close to trough boundaries;
Eurazeo and Exor top picks; July 28, 2010
Triple boost for holding companies if market confidence
returns; April 27, 2010
Priced at the close of July 26, 2010 (€14.92)
Coverage view Neutral
See the Financial Advisory Disclosure section of this document for important disclosures about transactions in which The Goldman Sachs Group, Inc. or an affiliate is acting as financial advisor
Markus Iwar +44(20)7552-1264 [email protected] Goldman Sachs International
The Goldman Sachs Group, Inc. does and seeks to do business with companies covered in its research reports. As a result, investors should be aware that the firm may have a conflict of interest that could affect the objectivity of this report. Investors should consider this report as only a single factor in making their investment decision. For Reg AC certification, see the end of the text. Other important disclosures follow the Reg AC certification, or go to www.gs.com/research/hedge.html. Analysts employed by non-US affiliates are not registered/qualified as research analysts with FINRA in the U.S.
Jacqueline Cheung +44(20)7552-5949 [email protected] Goldman Sachs International
The Goldman Sachs Group, Inc. Global Investment Research
-65%
-60%
-55%
-50%
-45%
-40%
-35%
-30%
-25%
-20%
-15%
-10%
09/0
3
01/0
4
05/0
4
09/0
4
01/0
5
05/0
5
09/0
5
01/0
6
05/0
6
09/0
6
01/0
7
05/0
7
09/0
7
01/0
8
05/0
8
09/0
8
01/0
9
05/0
9
09/0
9
01/1
0
05/1
0
NAV discount/ premium12m rolling average+/- 2 standard deviationsTarget NAV Discount5yr average
7% 4%
61%
23%
0
1
2
3
4
5
6
0%10%20%30%40%50%60%70%80%90%
100%
C&
W
Oth
er u
nlis
ted
Fiat
SGS
Tota
l GA
V
2010
E N
et d
ebt
NA
V
Cur
rent
mkt
cap
€bn
% of total GAVAsset split (listed mkt value)

July 28, 2010 Exor SpA (EXOR.MI)
Goldman Sachs Global Investment Research 2
Contents
Accretive steps have been substantial but yet to fully materialise 3 Exor’s 100-year history and current form 4
Holding co’s context: Potential triple boost from higher GAV + leverage + tighter discounts 5 Exor has one of the widest NAV discounts in our coverage 6 The Italian holding company regime is favourable 7
Fiat roadmap includes several catalysts over the next few years – some imminent 8 First major catalyst: demerger may unwind conglomerate discount 8
Investors get exposure to the Fiat story at a 44% discount via Exor 9 Liquidity seems adequate; in fact financial risk at the Exor level is limited, in our view 11
Our NAV model suggests 59% potential upside; add to Conviction Buy List 12
Cushman & Wakefield looks well placed for market recovery 16
Multiple shares increase complexity but offers different ways to play the situation 19
Exor stub offers 31% ROCE if the NAV discount narrows to the old IFIL average 21
Summary financials 23
Appendix: Refresher on stub trading and European holding company discounts 24
The prices in the body of this report are based on the market close of July 26, 2010.

July 28, 2010 Exor SpA (EXOR.MI)
Goldman Sachs Global Investment Research 3
Accretive steps have been substantial but yet to fully materialise
Under Agnelli heir Mr Elkann, together with other executives and Fiat CEO Mr Marchionne, there have been several accretive steps
taken to unlock value for shareholders. First, in March 2009, IFI and IFIL merged into Exor, removing one of the layers in the holding
structure. In the months after the Exor IPO, the initial discount (IFI + IFIL) narrowed materially, before widening again to above 50%
as market volatility resumed. We believe the current Exor NAV discount (44%) will tighten towards the average European level of
33%. Second, Fiat has announced plans to demerge its industrial and auto businesses. Our analysis suggests Fiat has historically
traded at a material conglomerate discount (35%); we expect the spin-off of Fiat Industrial to reduce (if not full unwind) this discount.
We further believe that a combined Fiat/Chrysler would be well positioned to improve profitability over the next 3-5 years, which
could potentially lead to a considerable re-rating in Fiat’s auto shares. In our view, Exor offers investors an attractive way to gain
exposure to these structural changes. We initiate on Exor as Conviction Buy; our 12-month price target of €23.7 indicates 59% upside.
Exhibit 1: IFI and IFIL became Exor, next step is a simplification on the Fiat level
Source: Company data, Goldman Sachs Research.
Fiat SpA
Inveco
89.8%
Exor
30.45%
CNH
100%
FPT
100%
Auto Components
I&M
Other assets
P&CV
100% 100% 100%
3 share classes
3 share classes
Fiat SpA
Inveco
89.8%
Exor
30.45%
CNH
100%
FPT – I&M
100%
Auto Components Other assets
100% 100% 100%
3 share classes
3 share classes
100%
FPT – P&CV
Fiat Industrial SpA
3 share classes
30.45%
End 2010
March 2009
IFIL
IFI
65%
Fiat SpA30%

July 28, 2010 Exor SpA (EXOR.MI)
Goldman Sachs Global Investment Research 4
Exor’s 100-year history and current form
Exhibit 2: Exor has a long history with several investments and divestments; the recent steps taken are substantial
Source: Company data, Goldman Sachs Research.
Exhibit 3: The Agnelli family are still in the driving seat after 100 years Exhibit 4: Fiat constitute 61% of GAV; less than many believe
Source: Company data, Goldman Sachs Research.
Source: Company data, Bloomberg, Goldman Sachs Research estimates.
Fiat founded
1899
IFI founded to manage Fiat holding
1927
IFI buys Ferrania & increases holding in Cinzano
1935
IFI invests in agriculture
1937
IFI invests further in cement
1942
IFI focuses on post‐war reconstruction
1946
IFI acquires ICLI (financials)
1957
IFI invests in winter tourism
1959
ICLI expands banking ops.
1963
IFI Int. is set up to manage foreign investments
1964
IFIL is created from ICLI
1966
IFI IPOs SAI. Hotel for Club Med is developed
1967
IFI’s pref shares are listed
1968
IFI takes control over Gruppo Editoriale Fabbri
1970
IFI Int is listed in Luxembourg –followed by many investment s in 70’s
1973
IFIL sets up fund mgmt and acquires majority stake in an insurance company
1983
IFIL buys Libyan Arab Foreign Inv’s stake in Fiat
1986
GAeC is set up to bring together the Angelli family’s holdings in IFI
1987
IFIL and BSN takes control over food group Egidio
1989
IFIL buys 7% of Worms
1990
IFI Int acquires Exor SA
1991
IFI participates in Fiat rights issue. IFI Int changes name to Exor. Interest in Auchan is build
1993
Exor buys stakes in Western Industries and Danone
1994
IFI and IFIL buys 5% stake in Gruppo Sanpaolo. IFIL buys out Worms from the French exchange and participates in Telecom Italia’s privatisation.
1997
GAeC takes over Exor and starts disposing its holdings
1999
IFI & IFIL buys c.30% of Fiat pref shares. IFIL gains control in Alpitour
2000
IFI lists a minority of Juventus’ shares
2001
Increase of capital stock at IFIL & IFI as Fiat does the same. Some holdings move from IFI to IFIL.
2003
IFIL and Exordivest their holdings in Club Med.
2004
IFIL acquires Exor’s Fiat shares through a eq. swap
2005
IFIL buys a 10% stake in Banca Leonardo
2006
IFIL buys a majority stake in Cushman & Wakefield
2007
IFIL buys 40% stake in Vision Inv Mgmt and 17% in Banijay
2008
IFIL merged with IFI, which changed its name to Exor
2009
Planned demerger of Fiat
2010
Further efforts to unlock value down to Exor shareholders
2010/11
FiatSequana Other
Juventus
30.45%226.65%
60.00%
Intesa San.
0.08%
Exor
SGS Banca Leonardo
9.71%
1) Giovanni Agnelli c C. S.a.p.az. holds 59.1% of ord, 39.24% of pref, and 11.75% of sav.
2) Exor owns c.30% of ord and pref, and 2.93% of sav.
15.00%
C&W
71.03%
= listed = unlisted
53.2%1
G.A. eC
7% 4%
61%
23%
0
1
2
3
4
5
6
0%10%20%30%40%50%60%70%80%90%
100%
C&
W
Oth
er u
nlis
ted
Fiat
SGS
Tota
l GA
V
2010
E N
et d
ebt
NA
V
Cur
rent
mkt
cap
€bn
% of total GAV Asset split (listed mkt value)

July 28, 2010 Exor SpA (EXOR.MI)
Goldman Sachs Global Investment Research 5
Holding co’s context: Potential triple boost from higher GAV + leverage + tighter discounts
We see potential for holding companies to outperform if market confidence improves. Our European holding company universe has
an average LTV ratio of 16%, which means NAVs would appreciate 24% if GAVs were to appreciate 20% (assuming static net debt),
as detailed in our scenario analysis below. Additionally holding companies’ NAV discounts tend to be wide in times of uncertainty
(market troughs) and tighten significantly when markets regain confidence. As illustrated in Exhibits 6-7, the peak average NAV
discount is 15%, trough 35% and current 33%. In a scenario (Exhibit 5) of regained market confidence (+20%, in line with our
strategists’ forecast for the overall European market over the next 12 months), we estimate average share prices of European
holding companies would increase 39%, outperforming the overall market materially. In a market correction, the effects in Exhibit 5
would work in the other direction, leading to significant potential downside.
Exhibit 5: Potential triple boost to holding companies if market regains confidence
Scenario analysis
Source: Goldman Sachs Research.
Market up 20% from currentlevel
Leverage NAV up 24%
Tighter NAV discounts share prices up 39%
Assuming that the European market is up 20% from the current level (in line with our strategists’ 12‐month forecast), the average GAV in our holding company coverage would likely appreciate about the same percentage. Depending on industrial/company specifics (leverage/performance) exposures, individual GAV performances could differ materially.
Through leverage on the holding company levels, NAVs in our coverage universe would likely outperform the market. The current average loan‐to‐value ratio in our holding company coverage is 16%. Average NAVs would be up 24%. Depending on company‐specific leverage, individual NAV performances could differ materially.
Currently, the average NAV discount is wide at 33%. Our analysis shows that there is a strong correlation between market performance and NAV discounts. As such ,we expect NAV discounts to tighten as stock markets recover. Assuming the average NAV discount narrows to 25%, the average stock price would be up 39% .
GAV up 20%
NAV up 24%
Share prices up 39% The simple maths
Before After ChangeGAV 100 120 20%Net debt 16 16NAV 84 104 24%NAV discount -33% -25%Share price 56 78 39%

July 28, 2010 Exor SpA (EXOR.MI)
Goldman Sachs Global Investment Research 6
We observe there is a strong relationship between overall market performance and NAV discounts (correlation is 0.73 from 2001), as
illustrated in Exhibit 7. The TMT bubble around 2000 caused a lower correlation between market performance and NAV discount
(0.62) when measured from the mid-1990s, since holding companies have had relatively low exposure to TMT (Exhibit 6). See NAV
discounts dislocated and close to trough boundaries; Eurazeo and Exor top picks, July 28, 2010 and Triple boost for holding
companies if market confidence returns: Eurazeo remains top pick, April 27, 2010, for more details on European holding companies.
Exhibit 6: Correlation between market performance and average NAV
discounts since 1996 is significant (0.62) …
Exhibit 7: … and increases to 0.73 starting in 2001 (after TMT bubble period)
Source: Company data, Bloomberg, Goldman Sachs Research estimates.
Source: Company data, Bloomberg, Goldman Sachs Research estimates.
Exor has one of the widest NAV discounts in our coverage
NAV discounts remain wider than historical norms, as seen in Exhibit 8, which highlights current NAV discounts vs. historical
averages. As a result of a reduction in borrowing costs, which have remained high for a considerable amount of time, we believe
mean reversion strategies around NAV discounts will play out quicker than in the past. This would help NAV discounts to gradually
normalise if the economy continues to rebound, in our view. On our estimates, NAV discounts for Eurazeo and Exor currently
appear among the most dislocated.
-50%
-45%
-40%
-35%
-30%
-25%
-20%
-15%
-10%
40
60
80
100
120
140
160
180
01/9
6
01/9
7
01/9
8
01/9
9
01/0
0
01/0
1
01/0
2
01/0
3
01/0
4
01/0
5
01/0
6
01/0
7
01/0
8
01/0
9
01/1
0
SXXP PERF (indexed) - LHSAvg NAV discount (excl. premiums) - RHS12yr avg discount - RHS
IT bubble reduced correlation as hold co’s have had very little exposure to tech
-40%
-35%
-30%
-25%
-20%
-15%
-10%
50.0
70.0
90.0
110.0
130.0
150.0
10/0
1
04/0
2
10/0
2
04/0
3
10/0
3
04/0
4
10/0
4
04/0
5
10/0
5
04/0
6
10/0
6
04/0
7
10/0
7
04/0
8
10/0
8
04/0
9
10/0
9
04/1
0
SXXP PERF (indexed) - LHSAvg NAV discount (excl. premiums) - RHS5yr avg discount - RHS7yr avg discount - RHS
Recent material dislocation

July 28, 2010 Exor SpA (EXOR.MI)
Goldman Sachs Global Investment Research 7
Exhibit 8: NAV discounts remain wider than history; Exor has one of the widest discount in our coverage (as of close 26 July, 2010)
Source: Company Data, Bloomberg, Goldman Sachs Research estimates.
The Italian holding company regime is favourable
Italy has a relatively favourable holding company regime. Since January 1, 2008, only 5% of capital gains on stakes owned for at
least 12 months are taxed at the Italian corporate income tax rate (IRES), currently 27.5%, making the effective tax rate 1.375%. If the
asset is held for less than 12 months, than the full IRES applies, plus a regional tax rate (IRAP), currently at 5%. Only 5% of dividends
are taxed at IRES irrespective of the holding period, making the effective tax rate 1.375%. Under the EU Parent-Subsidiary Directive,
there will be no withholding tax on cross-border distributions of dividends if the parent holds at least 10%. Of note, Exor has almost
€400 mn in tax losses carried forward that may be utilised to minimise tax on future profits.
Company Current -1w -1m -3m -1y 1yr avg 3yr avg 5yr avg Max MinDif. Current vs. 3yr avg
Aker ASA -54% -53% -50% -40% -43% -39% -19% -23% 5% -55% -35%Christian Dior SA -24% -24% -24% -19% -21% -21% -19% -21% -9% -38% -5%CIR SpA -44% -42% -43% -39% -38% -43% -39% -33% -13% -70% -5%Corp Financiera Alba -50% -48% -47% -43% -46% -46% -35% -31% -18% -55% -15%Criteria Caixacorp SA -25% -25% -28% -21% -25% -28% -31% NA -16% -41% NAEurazeo -44% -43% -42% -47% -51% -47% -21% -22% 3% -57% -22%Exor SpA -44% -43% -45% -52% -45% -47% NA NA -41% -53% NAGBL SA -27% -28% -30% -29% -29% -27% -24% -15% 12% -33% -3%Industrivarden AB -24% -25% -26% -21% -16% -14% -14% -14% 3% -28% -10%Investor AB -34% -34% -34% -33% -32% -31% -28% -28% -19% -38% -6%Italmobiliare SpA -54% -56% -55% -48% -57% -51% -26% -29% 0% -59% -28%KBC Ancora -45% -46% -43% -39% 13% 1% -9% -14% NA -46% -36%Kinnevik Investment AB -32% -38% -36% -35% -36% -33% -30% -26% -9% -47% -2%Lundbergforetagen AB -14% -15% -18% -18% -22% -20% -19% -16% -8% -34% 4%Nationale a Portefeuille -28% -29% -30% -26% -15% -13% -10% -5% 17% -32% -18%Orkla ASA -17% -23% -24% -7% 3% 4% -9% NA 22% -29% -8%Pargesa Holding SA 1% 4% 8% 9% 2% 3% 0% -7% 25% -17% 1%Rallye SA -33% -31% -30% -26% 19% -6% -20% -13% 42% -47% -13%Ratos AB -16% -16% -17% -8% -12% -11% -5% -14% 24% -34% -11%Sacyr Vallehermoso SA -26% -29% -21% -22% 2% -4% -19% NA 19% -37% -7%Semapa -31% -31% -32% -20% -11% -14% -20% -17% 25% -34% -10%Societe FFP -46% -45% -44% -39% -39% -42% -30% -28% -15% -49% -16%Sonae SGPS SA -49% -48% -47% -47% -56% -52% -29% -32% 7% -61% -20%Wendel -31% -39% -39% -37% 13% -10% -21% -19% 57% -41% -9%
Average -33% -34% -33% -29% -23% -25% -21% -20% 5% -43% -12%Median -31% -33% -33% -31% -24% -24% -20% -20% 3% -41% -10%Top quartile -25% -25% -25% -21% -8% -11% -16% -14% 20% -34% -6%Bottom quartile -44% -44% -43% -39% -40% -42% -28% -28% -11% -53% -18%

July 28, 2010 Exor SpA (EXOR.MI)
Goldman Sachs Global Investment Research 8
Fiat roadmap includes several catalysts over the next few years – some imminent
Our Fiat analysts have a positive view on Fiat’s shares, which are on the Pan-European Conviction Buy List. For more details on their
thesis and view see: Fiat (FIA.MI): Attractive risk/reward; Conviction Buy, €16 price target, March 8, 2010 and Europe: Automobiles:
Focusing on our core ideas in times of volatility; reiterating Conviction Buys on VW and Fiat, May 20, 2010. The optimistic view on
Fiat’s shares is summarised by a belief that the following events are likely to have a positive outcome and that the optionality these
events offer in terms of delivering a beneficial outcome does not appear to be priced into Fiat’s shares:
Mid 2010: (1) Constructive settlement with unions; and (2) EGM to decide split of debt between Fiat Auto and Fiat Industrial.
Dec 2010/Jan 2011: Demerger of Fiat two listed Fiat entities potentially fully unwind the conglomerate discount over time
Mid-2011: Potential Chrysler IPO
2H 2011/12: Potential merger between Fiat and Chrysler
2011/12: Potential transformational deals in Fiat Industrials
2012 onwards: Fiat + Chrysler = economies of scale best case scenario: F+C profitability = average industry re-rating of
Fiat Auto shares to average sector EV/Sales multiple (10%-20% 45%-60%)
Key risks include a double-dip recession, leading to a broad industrial downturn plus failure to deliver on the new Turin targets.
First major catalyst: demerger may unwind conglomerate discount
Our analysis shows that Fiat’s shares have traded at a substantial conglomerate discount historically. When computing the relative
valuation, we have used: (1) Peugeot EV/Sales multiple for the auto business (10%-30%); (2) its stake in CNH at market value; (3)
average EV/Sales multiple of Volvo, MAN, Navistar and Paccar for the other industrial businesses (avg. 45%-100%); (4) industrial net
debt less CNH’s net debt. We believe the demerger of Fiat Auto and Fiat Industrial will unwind the conglomerate discount over time.
Exhibit 9: Fiat’s conglomerate discount has averaged 35% in the last 5 years Exhibit 10: NAV discount assuming fully re-rated Fiat auto is >65%
Source: Company data, Bloomberg, Goldman Sachs Research estimates.
Source: Company data, Bloomberg, Goldman Sachs Research estimates.
-60%
-55%
-50%
-45%
-40%
-35%
-30%
-25%
-20%
-15%
-10%
10/0
5
02/0
6
06/0
6
10/0
6
02/0
7
06/0
7
10/0
7
02/0
8
06/0
8
10/0
8
02/0
9
06/0
9
10/0
9
02/1
0
06/1
0
NAV discount/ premium
12m rolling average
5yr average
-70%-65%-60%-55%-50%-45%-40%-35%-30%-25%-20%-15%-10%
10/0
5
02/0
6
06/0
6
10/0
6
02/0
7
06/0
7
10/0
7
02/0
8
06/0
8
10/0
8
02/0
9
06/0
9
10/0
9
02/1
0
06/1
0
NAV discount/ premium
12m rolling average
5yr average
July 28, 2010 Exor SpA (EXOR.MI)
Goldman Sachs Global Investment Research 9
Investors get exposure to the Fiat story at a 44% discount via Exor
Exor’s NAV discount is one of the widest in our European coverage universe (see Exhibit 8), on our estimates. Currently, Exor’s NAV
discount is 44% compared with a 5-year average of 34% (Exhibit 11). As illustrated in Exhibit 12, Exor’s NAV discount has varied
between 37%-55% since its IPO in March 2009. We see few reasons why its NAV discount should be substantially wider than
comparable European holding companies; hence, we expect it to narrow.
Exhibit 11: Flow-through discount is near trough levels Exhibit 12: Exor discount has widened over the last year
Source: Company data, Bloomberg, Goldman Sachs Research estimates.
Source: Company data, Bloomberg, Goldman Sachs Research estimates.
One of the main reasons for the merger between IFI and IFIL in 2009 was to eliminate one of the layers in the holding company
chain, and as such increase transparency and reduce complexity (see Exhibit 1). Usually collapsing, or minimizing, a holding
company chain is viewed positively by the market. The “New Co” would as a rule reduce overall overhead costs and increase
overall minority protection (mainly through less complexity and better transparency). As a result, the NAV discount often narrows
materially for the “New Co” which has one NAV vs. several NAVs in the previous set up, each with a discount.
Surprisingly, Exor’s NAV discount is the sum of IFIL’s (c.30%) and IFI’s (c.15%) 5-year average NAV discount (see Exhibit 11-14). We
believe the considerable market turbulence over the last two years may explain this anomaly, especially since the merger into Exor
was made at the peak of market uncertainty. Our analysis shows there is high correlation between NAV discounts and implied
market ERP, which has increased during the spring as concerns towards sovereign debt magnified. As the economic recovery
continues and market volatility is reduced, we believe Exor’s NAV discount will trend towards the European average of 33%.
-65%
-60%
-55%
-50%
-45%
-40%
-35%
-30%
-25%
-20%
-15%
-10%
09/0
3
01/0
4
05/0
4
09/0
4
01/0
5
05/0
5
09/0
5
01/0
6
05/0
6
09/0
6
01/0
7
05/0
7
09/0
7
01/0
8
05/0
8
09/0
8
01/0
9
05/0
9
09/0
9
01/1
0
05/1
0
NAV discount/ premium
12m rolling average
+/- 2 standard deviations
Target NAV Discount
5yr average
-60%
-55%
-50%
-45%
-40%
-35%
03/0
9
04/0
9
05/0
9
06/0
9
07/0
9
08/0
9
09/0
9
10/0
9
11/0
9
12/0
9
01/1
0
02/1
0
03/1
0
04/1
0
05/1
0
06/1
0
07/1
0
NAV discount/ premium
3m rolling average
+/- 2 standard deviations
Target NAV Discount
1yr average

July 28, 2010 Exor SpA (EXOR.MI)
Goldman Sachs Global Investment Research 10
Exhibit 13: IFIL’s NAV discount ranged between 30% and 40% Exhibit 14: IFI’s 5-year average NAV discount was 15%
Source: Company data, Bloomberg, Goldman Sachs Research estimates.
Source: Company data, Bloomberg, Goldman Sachs Research estimates.
Exhibit 15: Exor’s NAV has more than doubled from trough in 2009 Exhibit 16: Exor’s shares have performed well vs. Italian index
Source: Company data, Bloomberg, Goldman Sachs Research estimates.
Source: Company data, Bloomberg, Goldman Sachs Research estimates.
-80%
-70%
-60%
-50%
-40%
-30%
-20%
-10%
01/0
4
04/0
4
07/0
4
10/0
4
01/0
5
04/0
5
07/0
5
10/0
5
01/0
6
04/0
6
07/0
6
10/0
6
01/0
7
04/0
7
07/0
7
10/0
7
01/0
8
04/0
8
07/0
8
10/0
8
01/0
9
NAV discount/ premium52 week rolling average+/- 2 standard deviations5yr average
-40%
-30%
-20%
-10%
0%
10%
08/0
4
11/0
4
02/0
5
05/0
5
08/0
5
11/0
5
02/0
6
05/0
6
08/0
6
11/0
6
02/0
7
05/0
7
08/0
7
11/0
7
02/0
8
05/0
8
08/0
8
11/0
8
02/0
9
NAV discount/ premium52 week rolling average+/- 2 standard deviations5yr average
-60%
-55%
-50%
-45%
-40%
-35%
-30%
500
1,500
2,500
3,500
4,500
5,500
6,500
03/0
9
04/0
9
05/0
9
06/0
9
07/0
9
08/0
9
09/0
9
10/0
9
11/0
9
12/0
9
01/1
0
02/1
0
03/1
0
04/1
0
05/1
0
06/1
0
07/1
0
Net asset value (€ mn, LHS)
Market cap (€ mn, LHS)
NAV discount/ premium (RHS)
Target NAV Discount-20%
0%
20%
40%
60%
80%
100%
4
6
8
10
12
14
16
02/0
9
03/0
9
04/0
9
05/0
9
06/0
9
07/0
9
08/0
9
09/0
9
10/0
9
11/0
9
12/0
9
01/1
0
02/1
0
03/1
0
04/1
0
05/1
0
06/1
0
07/1
0
Exor (LHS)
Exor Relative to IT30 (RHS)
NAV Relative to IT30 (RHS)

July 28, 2010 Exor SpA (EXOR.MI)
Goldman Sachs Global Investment Research 11
Liquidity seems adequate; in fact financial risk at the Exor level is limited, in our view
The Exor holding system currently has a small net cash position. Current liquidity (excluding stakes in liquid listed assets, which
together have a value of over €5 bn) is €1.4 bn. Exor is actively looking to invest excess capital (c.€1.6 bn). The company wants to
retain a minimum of €200 mn in cash and keep its LTV ratio below 20%. The current excess capital is unlikely to be invested in one
new larger asset, but more likely in around three separate investments, according to management. These investments would be
larger and different in nature than the recent committed €100 mn in the partnership with Jardine Matheson and Rothschild
partnership, which will invest in private equity in India and China.
Exhibit 17: The Exor holding system sits on net cash and has almost €1.4 bn in liquid funds
Source: Company Data.
Exhibit 18: Exor sits on net cash; future LTV ratio to stay below 20% Exhibit 19: Expenses vs. NAV is low, coverage ratio is solid
Source: Company data, Bloomberg, Goldman Sachs Research estimates.
Source: Company data, Bloomberg, Goldman Sachs Research estimates.
Net financial position - € mn (parent) 2009 Net financial position - € mn (Exor holding system) 2009 Non currentFinancial assets 353 Financial assets 692 87.2Financial receivables 28 Financial receivables 28Cash and eq. 337 Cash and eq. 463Total financial assets 719 Total financial assets 1,182
Exor bond 2007-17 768 Exor bond 2007-17 768Exor bond 2006-11 200 Exor bond 2006-11 200Bank debt 163 Bank debt 163Total financial liabilities 1,131 Total financial liabilities 1,131
Net debt (Exor SpA) 412 Net debt (Exor holding system) -52
Undrawn credit line 760 Total liquidity 1,365
-60%
-55%
-50%
-45%
-40%
-35%
-30%
-4%
-3%
-3%
-2%
-2%
-1%
-1%
0%
1%
1%
2%
03/0
9
04/0
9
05/0
9
06/0
9
07/0
9
08/0
9
09/0
9
10/0
9
11/0
9
12/0
9
01/1
0
02/1
0
03/1
0
04/1
0
05/1
0
06/1
0
07/1
0
Net debt/ GAV (LHS) NAV discount / permium (RHS)
Exor 2008 2009 2010E 2011E
Operating costs as % of NAV 0.69% 0.39% 0.42% 0.42%
Dividend from listed assets - € mn 206 65 129 125
Net interest expenses - € mn 66 19 19 22
Operting expenses (overheads) € mn
23 22 22 22
Interest/overhead cost coverage from dividends
234% 159% 314% 288%

July 28, 2010 Exor SpA (EXOR.MI)
Goldman Sachs Global Investment Research 12
Our NAV model suggests 59% potential upside; add to Conviction Buy List
Fiat is Exor’s main listed holding and our 12-month price target suggests 51% potential upside for Fiat shares. Fiat is included in our
Conviction Buy List. We further believe Exor’s NAV discount will narrow from the current elevated level of near 44%. We note that
the current average NAV discount in Europe is 33% (which is materially wider than historical levels). In our view, Exor is not more
complex or less transparent vs. European peers, especially after the merger between IFI and IFIL in March 2009. We believe Exor
offers investors an attractive route into Fiat’s restructuring. Our NAV model suggests there is 35% upside to the value of the Exor’s
listed holdings and our Exor price target of €23.7 indicates total potential upside of 59% on a 12-month view. We initiate on Exor
with a Buy rating and add the shares to our Conviction Buy List.
Exhibit 20: We see 59% potential upside to our 12-month price target, current NAV discount wide at 44%
Price targets for Fiat, SGS, and Intesa Sanpaolo are based on a 12-month timeframe. For important disclosures please go to http://www.gs.com/research/hedge.html. For methodology and risks associated with our price targets, please see our previously published research,
Source: Company data, Bloomberg, Goldman Sachs Research estimates.
Listed SEDOL BBG Name % stake Curr. Conv. factorPrice (EUR)
Market value (mn, EUR) % NAV Rating
Tgt / mkt (EUR) Up/down Analyst
Tgt / mkt value (mn, EUR) % NAV
% GAV (mkt)
Holding 1: 5748521 F IM Fiat SpA 26.53% EUR 1.0000 9.9 3,304 55% Buy* 15.0 51% Stefan Burgstaller 4,989 65% 57%Holding 2: 5748554 FP IM Fiat SpA 2.48% EUR 1.0000 5.7 178 3% NC 8.6 49% 267 3% 3%Holding 3: 5748532 FR IM Fiat SpA 0.19% EUR 1.0000 6.2 14 0% NC 9.0 46% 21 0% 0%Holding 4: 4824778 SGSN VX SGS SA 15.00% CHF 0.7339 1,116.3 1,310 22% Neutral 1,089.8 -2% Charles Wilson 1,279 17% 23%Holding 5: 5469242 VOR FP Sequana 26.42% EUR 1.0000 11.2 147 2% NC 11.2 0% 147 2% 3%Holding 6: 7264809 JUVE IM Juventus Football Club 60.00% EUR 1.0000 0.8 99 2% NC 0.8 0% 99 1% 2%Holding 7: 4076836 ISP IM Intesa Sanpaolo SpA 0.08% EUR 1.0000 2.5 25 0% Neutral 3.0 20% Domenico Vinci 30 0% 0%Holding 8: 0% 0%Others: 0 0% NC 0 0% 0%
Value of listed holdings: 5,077 85% Value of listed holdings: 6,831 89% 87%per share 20.6 per share 27.7
Upside / Downside: 34.54%
Unlisted SectorGSSB/ peers Name % stake Valuation method
Target value (mn, EUR) % NAV
2011E (mn, EUR) Multiple
Net debt 2010E (mn, EUR)
Target value (mn, EUR) % NAV
% GAV (mkt)
Holding 1: Financial services CBG Cushman & Wakefield 71.81% 12m forward EV/EBITDA 411 7% EBITDA: 89 8.2x (152) 411 5% 7%Holding 3: Banks EUBANKS_ Banca Leonardo 9.74% 12m forward P/B 117 2% Book value: 870 1.4x na 117 2% 2%Holding 2: Fin. services GSSBBKBR Vision hedge fund 40.00% Book value 58 1% 58 1% 1%Holding 4: Travel GSSBHOLR Alpitour/N.H.T. 100.00% Book value 50 1% 50 1% 1%Others: 91 2% 91 1% 2%
Value of unlisted holdings: 727 12% Value of unlisted holdings: 727 9% 13%per share: 3.0 per share: 3.0
Net debt (parent company level)2010E
(mn, EUR) % NAV2010E
(mn, EUR) % NAVCash & Equiv.: 358 6% 358 5%ST Debt: (25) 0% (25) 0%LT Debt: (1,070) -18% (1,070) -14%Pensions&Other Prov.: (3) 0% (3) 0%Other assets: 789 13% 789 10%Treasury shares: 104 2% 104 1%
Value of net debt: 153 3% 153 2%per share: 0.6 0.6
NAV: 5,957 Target NAV 7,711per share: 24.19 per share: 31.31
Market cap. (mn): 3,363 Market cap. (mn): 3,363NAV discount: -43.6% NAV discount: -56.4%
Assumed NAV discount: -41%Implied per share: 23.7
* = also on the Conviction List, NC = not covered. Upside / Downside to price target: 58.6%** Banca Leonardo 2009A book value LTV: -2.63%

July 28, 2010 Exor SpA (EXOR.MI)
Goldman Sachs Global Investment Research 13
Exor’s exposure to Industrials exceeds 60% in terms of GAV (Exhibit 21), of which Fiat constitutes the vast majority. Correlation
between Fiat and Exor shares is substantial at 0.83 over the past year (Exhibit 23). Of note, Exor’s flow-through exposure to
emerging markets, which we expect to outperform the development world all else equal, is relatively high at 22%.
Exhibit 21: Industrials (mainly Fiat) constitutes over 60% of Exor’s GAV % of current GAV
Exhibit 22: Flow-through emerging market exposure is relatively high % of current GAV
Source: Company data, Bloomberg, Goldman Sachs Research.
Source: Company data, Bloomberg, Goldman Sachs Research.
Fiat’s share price performance has been the major driver of Exor’s NAV over the last 15 months (Exhibit 24). We believe Fiat shares
will continue to outperform the market over the next few years (see page 8 for details on our thesis).
Exhibit 23: Exor’s 1-yr correlation to Fiat is very strong Exhibit 24: Performance of listed assets
Source: Company data, Bloomberg, Goldman Sachs Research.
Source: Company data, Bloomberg, Goldman Sachs Research.
Industrials61%
Financials13%
Business Services23%
Tourism & Entertainment
3%
North America17%
Western Europe61%
Emerging Markets22%
Exor IT30 Fiat SGS SXFPExor 1.00 0.77 0.83 0.28 0.71IT30 0.77 1.00 0.75 0.36 0.87Fiat 0.83 0.75 1.00 0.27 0.70SGS 0.28 0.36 0.27 1.00 0.38SXFP 0.71 0.87 0.70 0.38 1.00
Average 0.65 0.69 0.64 0.32 0.67
80100120140160180200220240260280300320
03/0
9
04/0
9
05/0
9
06/0
9
07/0
9
08/0
9
09/0
9
10/0
9
11/0
9
12/0
9
01/1
0
02/1
0
03/1
0
04/1
0
05/1
0
06/1
0
07/1
0
Fiat Ord. SGS
Sequana Juventus

July 28, 2010 Exor SpA (EXOR.MI)
Goldman Sachs Global Investment Research 14
Exor has less than 15% of its GAV in unlisted assets. Were Exor to invest its €1.6 bn excess liquidity in unlisted assets, scarce assets
would increase to 26% of total GAV. Our analysis suggests attractive scarce assets help narrow NAV discounts for holding
companies, as the only way investors can gain exposure to these assets would be via the holding company, whereas investors can
“free-ride“ any positive influence holding companies have on listed assets.
Exhibit 25: Asset scarcity (unlisted assets) is limited to c.15% of total GAV Exhibit 26: Exor’s dividend yield is lower than the European market average
Source: Company data, Bloomberg, Goldman Sachs Research.
Source: Company data, Bloomberg, Goldman Sachs Research.
Liquidity in Exor shares has increased recently, but we argue that multiple share classes unnecessarily add complexity and reduce
liquidity. The latter is especially true for companies whose shares already have relatively low liquidity; we include Exor here. For a
more comprehensive discussion on share classes and dividend yields, see pages 19-20.
-60%
-55%
-50%
-45%
-40%
-35%
-30%
0%
2%
4%
6%
8%
10%
12%
14%
16%
18%
20%
03/0
9
04/0
9
05/0
9
06/0
9
07/0
9
08/0
9
09/0
9
10/0
9
11/0
9
12/0
9
01/1
0
02/1
0
03/1
0
04/1
0
05/1
0
06/1
0
07/1
0
Unlisted/GAV (LHS) NAV Discount (RHS) 0.20
0.25
0.30
0.35
0.40
0.0%
1.0%
2.0%
3.0%
4.0%
5.0%
6.0%
7.0%
8.0%
9.0%
03/0
9
04/0
9
05/0
9
06/0
9
07/0
9
08/0
9
09/0
9
10/0
9
11/0
9
12/0
9
01/1
0
02/1
0
03/1
0
04/1
0
05/1
0
06/1
0
07/1
0
Exor dividend yield (LHS)SXXP dividend yield (LHS)SX5E dividend yield (LHS)Ordinary DPS (RHS)

July 28, 2010 Exor SpA (EXOR.MI)
Goldman Sachs Global Investment Research 15
Exhibit 27: Exor liquidity has increased, total 3m ADV over €15 mn Exhibit 28: Relative liquidity vs. holdings is relatively low but has increased
Exor pref before Mar-09, thereafter Exor ord
Source: Company data, Bloomberg, Goldman Sachs Research.
Source: Company data, Bloomberg, Goldman Sachs Research.
Exhibit 29: Volatility was near peak at IPO in Mar-2009
Exhibit 30: Volatility on pref showed extreme volatility 18m ago – now back
to norm
Source: Company data, Bloomberg, Goldman Sachs Research.
Source: Company data, Bloomberg, Goldman Sachs Research.
0
2
4
6
8
10
12
0
200,000
400,000
600,000
800,000
1,000,000
1,200,000
01/0
2
07/0
2
01/0
3
07/0
3
01/0
4
07/0
4
01/0
5
07/0
5
01/0
6
07/0
6
01/0
7
07/0
7
01/0
8
07/0
8
01/0
9
07/0
9
01/1
0
07/1
0
Exor pref 3m avg ADV (LHS, shares)
3m avg ADV (LHS, shares)
Exor pref 3m avg ADV (RHS, EUR, mn)
3m avg ADV (RHS, EUR, mn)
0%
5%
10%
15%
20%
01/0
2
07/0
2
01/0
3
07/0
3
01/0
4
07/0
4
01/0
5
07/0
5
01/0
6
07/0
6
01/0
7
07/0
7
01/0
8
07/0
8
01/0
9
07/0
9
01/1
0
07/1
0
Fiat % ADV
SGS % ADV
0
2
4
6
8
10
12
14
16
10%
20%
30%
40%
50%
60%
70%
80%
90%
100%
03/0
9
04/0
9
05/0
9
06/0
9
07/0
9
08/0
9
09/0
9
10/0
9
11/0
9
12/0
9
01/1
0
02/1
0
03/1
0
04/1
0
05/1
0
06/1
0
07/1
0
1 year (LHS) 3 month (LHS) Share price (RHS, EUR)
0
5
10
15
20
25
30
10%
20%
30%
40%
50%
60%
70%
80%
90%
100%
03/0
2
09/0
2
03/0
3
09/0
3
03/0
4
09/0
4
03/0
5
09/0
5
03/0
6
09/0
6
03/0
7
09/0
7
03/0
8
09/0
8
03/0
9
09/0
9
03/1
0
1 year (LHS)
3 month (LHS)
Share price (RHS, EUR)

July 28, 2010 Exor SpA (EXOR.MI)
Goldman Sachs Global Investment Research 16
Cushman & Wakefield looks well placed for market recovery
Cushman & Wakefield (C&W) is the largest unlisted holding of Exor. It is also the largest private real estate service in its field
globally. Exor bought a 71.5% stake in C&W in 2007 for US$625 mn from the Rockefeller Group. C&W management and employees
own the remaining 28.5%. C&W offers several services for the real estate sector including: Transaction Services, Client Solutions,
Capital Markets and Consulting Services. We believe C&W is well placed to benefit from a recovering real estate market place.
Exhibit 31: We expect C&W and its two main listed peers to grow EBITDA and reduce debt levels substantially to 2012
Source: Company data, Bloomberg, Goldman Sachs Research estimates.
Our US Real Estate Research team estimates C&W’s two main public competitors CB Richard Ellis (CBG) and Jones Lang LaSalle
(JLL) will grow EBITDA substantially after a very tough 2008/09; 2009-2012E CAGR of 42.1% and 16.9% respectively. On our forecasts
C&W will deliver EBITDA of US$111 mn in 2011 and US$138 mn in 2012. C&W is executing on its announced cost-cutting
programme that targets operational expense savings of US$300 mn.
Exhibit 32 and 33 illustrate sensitivities around our valuation of C&W depending on cost cutting achieved and the multiple ascribed.
Assuming C&W transfers one-third of the targeted US$300 mn cost savings initiative to the EBIT line, we calculate Exor’s stake
would be worth €874 mn if using the entry multiple. This implies an IRR of only 5.7%, which is not surprising considering the
vintage year was 2007. That said, we believe it is important to note C&W’s main listed peers have recovered significantly since the
trough in early 2009 (Exhibit 34), and we see little evidence why C&W should not have experience a similar re-rating.
CBG (US$ mn) 2006 2007 2008 2009 2010E 2011E 2012E 2009-2012E CAGREBITDA 612 842 455 334 569 792 959 42.1% % change yoy 37.7% -46.0% -26.5% 70.3% 39.2% 21.0%Net debt to EBITDA 2.7x 4.8x 6.0x 3.1x 1.7x 0.9x
Net debt 153 2,250 2,165 2,013 1,744 1,354 828
JLL (US$ mn) 2006 2007 2008 2009 2010E 2011E 2012E 2009-2012E CAGREBITDA 292 404 272 247 304 349 394 16.9% % change yoy 38.4% -32.5% -9.3% 23.0% 14.7% 13.1%Net debt to EBITDA -0.1x 1.7x 0.5x 1.0x 0.6x 0.1x
Net debt 0 -35 463 129 319 207 53
C&W (US$ mn) 2006 2007 2008 2009 2010E 2011E 2012E 2009-2012E CAGREBITDA 118 148 67 56 81 111 138 35.0% % change yoy 25.0% -54.7% -16.4% 44.3% 37.2% 24.4%Net debt to EBITDA 2.2x 3.2x 2.1x 1.2x 0.5x
Net debt 150 179 171 134 69

July 28, 2010 Exor SpA (EXOR.MI)
Goldman Sachs Global Investment Research 17
Exhibit 32: Potential value if cost measures are efficiently executed US$ mn (unless otherwise stated € mn)
Exhibit 33: Sensitivity on C&W valuation US$ mn
Source: Company data, Bloomberg, Goldman Sachs Research estimates.
Source: Goldman Sachs Research estimates.
Exhibit 34: Listed peers’ share prices have recovered substantially from the trough in early 2009
Source: Bloomberg, Goldman Sachs Research.
2008 EBIT 6733% of reduced opex (US$300 mn) drops to EBIT 166
Net debt 189EV/EBIT 7.3xEV/EBITDA 6.9xImplied EV 1,712Implied Equity 1,522Exor's stake 1,093Implied IRR (Exit 2011) 5.7%Exor's stake € mn 874
$1,093.1 $134 $149 $166 $183 $201
8.5x $1,094 $1,185 $1,287 $1,388 $1,5008.1x $1,036 $1,122 $1,219 $1,316 $1,4227.7x $980 $1,063 $1,155 $1,246 $1,3487.3x $927 $1,005 $1,093 $1,181 $1,2777.0x $874 $948 $1,032 $1,115 $1,2066.6x $823 $894 $973 $1,052 $1,1396.3x $775 $843 $918 $993 $1,075
EBIT post cost savings (US$ mn)
EV/EBIT
0
20
40
60
80
100
120
06/0
7
08/0
7
10/0
7
12/0
7
02/0
8
04/0
8
06/0
8
08/0
8
10/0
8
12/0
8
02/0
9
04/0
9
06/0
9
08/0
9
10/0
9
12/0
9
02/1
0
04/1
0
06/1
0
CBG Average JLL DJ600

July 28, 2010 Exor SpA (EXOR.MI)
Goldman Sachs Global Investment Research 18
Our valuation of C&W (Exor’s stake US$514 mn or €411 mn) is based on a risk-weighted sensitivity analysis as per Exhibit 35. It
translates to 8.2x our 2011E EBITDA of US$111 mn (€89 mn).
Exhibit 35: Sensitivity analysis on C&W valuation, earnings and implied multiples US$ mn (unless otherwise stated € mn)
Source: Company data, Bloomberg, Goldman Sachs Research estimates.
C&W 2011E (US$ mn) Historicals
Optimistic scenario Premium scenario Mid multiple on GS est.Revenues (12% CAGR 2009-2011E) 1,507 Revenues (GS forecast) 1,446 Revenues (GS forecast) 1,446 Purchase multiple (2007 EBITDA) 6.9xEBITDA (avg hist. margin) 8.5% EBITDA margin (GS forecast) 7.7% EBITDA margin (GS forecast) 7.7% Purchase multiple (2007 EBIT) 7.3xEBITDA (strong recovery) 128 EBITDA (GS forecast) 111 EBITDA (GS forecast) 111 Initial investment 200710% premium to peer history 8.9x 10% premium to peer history 8.9x EV/EBITDA (10yr avg - disc.) 8.1x Initial equity (US$) 874Implied EV 1,136 Implied EV 983 Implied EV 894 2008 Net Debt (US$) 150Net debt 189 Net debt 189 Net debt 189 Initial EV (US$) 1,024Implied Equity 946 Implied Equity 793 Implied Equity 704Value Exor's stake 679 Value Exor's stake 570 Value Exor's stake 506weighting 15% weighting 25% weighting 25% EBIT
GS EBIT est. Implied EV/EBITDiscount multiple on GS ests. Discount multiple on weak recovery Risk weighted value 148.0 2007A 6.4xRevenues (GS forecast) 1,507 Revenues (GS forecast) 1,446 67.0 2008A 14.2xEBITDA margin (GS forecast) 7.7% EBITDA margin (GS forecast) 6.1% EBITDA (GS forecast) 111 56.0 2009E 17.0xEBITDA (GS forecast) 111 EBITDA (GS forecast) 89 Implied multiple 8.2x 80.8 2010E 11.8x10% discount to peer history 7.3x 10% discount to peer history 7.3x Implied 1yr fwd multiple 8.5x 110.8 2011E 8.6xImplied EV 804 Implied EV 643 Implied EV 952 137.8 2012E 6.9xNet debt 189 Net debt 189 Net debt 189Implied Equity 615 Implied Equity 454 Implied Equity 715Value Exor's stake 441 Value Exor's stake 326 Value Exor's stake (€ mn) 411weighting 25% weighting 10%

July 28, 2010 Exor SpA (EXOR.MI)
Goldman Sachs Global Investment Research 19
Multiple shares increase complexity but offers different ways to play the situation
For both Fiat and Exor, there are three share classes (ordinary, preferred and savings). Non-voting shares act as a control multiplier
and lower the minimum economic ownership while maximizing control and can further restrict the protection of minorities. The
shares with preferential voting rights are mostly held by the controlling family (in this case the Agnelli family through G.A. eC in
Exor and indirectly in Fiat). The voting-disadvantaged shares have some other advantages such as a higher dividend.
Savings and preference shares pay a higher dividend as a percentage of the par value --- this introduces an additional cost. However,
additional dividend payments are usually not adjusted for inflation and as a result the additional benefit is relatively small. Exor
savings shares also have a cumulative feature --- if the dividend is omitted, the minimum amount has to be added to the dividend
which is paid in the following year.
Exhibit 36: Exor ord vs. sav Exhibit 37: Exor ord vs. pref
Source: Goldman Sachs Research, Bloomberg.
Source: Goldman Sachs Research, Bloomberg.
Savings shares often trade at discounts to ordinary shares. This is because they carry no votes, are often less liquid and not part of
benchmarks (and thus mandates), their higher dividends might lead to higher taxation (income or withholding tax) for investors and
there are limits to arbitrage such as restrictions on foreign ownership or borrowability of either share class. Exhibits 39-41 show that
the savings share discounts vary over time, often with investor sentiment (discounts tend to widen in “bear” markets). From 2000 to
2005, most savings share discounts narrowed considerably; since 2007, discounts have widened on average. This has to be
incorporated when deriving price targets and might lead to trading opportunities based on mean reversion. Events such as
takeovers or proposals to convert savings to ordinary shares tend to result in a sharp narrowing of the discount. As earnings and
cash flows appear at risk in the current macroeconomic slowdown, the additional cost of paying higher dividends on savings shares
has been questioned, leading to more speculation over the conversion of dual shares. We note that the conversion of dual shares is
not a current priority at either Fiat or Exor.
0
2
4
6
8
10
12
14
16
18
0%
10%
20%
30%
40%
50%
60%
70%
03/0
9
04/0
9
05/0
9
06/0
9
07/0
9
08/0
9
09/0
9
10/0
9
11/0
9
12/0
9
01/1
0
02/1
0
03/1
0
04/1
0
05/1
0
06/1
0
07/1
0
Ord. shares premium (LHS)52-week rolling avg premium (LHS)Exor savings shares (RHS)Exor ordinary shares (RHS)
0
2
4
6
8
10
12
14
16
30%
45%
60%
75%
90%
105%
03/0
9
04/0
9
05/0
9
06/0
9
07/0
9
08/0
9
09/0
9
10/0
9
11/0
9
12/0
9
01/1
0
02/1
0
03/1
0
04/1
0
05/1
0
06/1
0
07/1
0
Ord. shares premium (LHS)52-week rolling avg premium (LHS)Exor preferred shares (RHS)Exor ordinary shares (RHS)

July 28, 2010 Exor SpA (EXOR.MI)
Goldman Sachs Global Investment Research 20
Exhibit 38: Exor does not offer dividend yield enhancement Exhibit 39: Fiat ord premium vs. pref and sav
Source: Goldman Sachs Research, Bloomberg.
Source: Goldman Sachs Research, Bloomberg.
A strong catalyst for the conversion of dual shares could come from changes in regulation and shareholder rights. The EU started
proceedings with the aim of streamlining corporate governance within the EU, but decided in December 2007 not to take action on
the question of proportionality between capital and control, after much lobbying from the holding companies and the Swedish
government. For further details on the EU study see Proportionality between ownership and control in EU listed companies:
External Study Commissioned by the European Commission, May 18, 2007.
Exhibit 40: Non-voting shares are at less of a discount recently Exhibit 41: Exor saving shares discount over time
Source: Goldman Sachs Research, Bloomberg.
Source: Goldman Sachs Research, Bloomberg.
Div yield 2008 2009 2010 2011EFiat Ord 2.37% 0.00% 1.69% 1.71%Fiat Pref 2.99% 0.00% 5.44% 5.40%Fiat Sav 4.48% 11.47% 5.43% 5.26%
Div yield 2008 2009 2010 2011EExor Ord 0.00% 0.00% 2.03% 1.81%Exor Pref 1.06% 8.42% 4.56% 2.88%Exor Sav 0.00% 0.00% 3.61% 2.81%
Div premium 2008 2009 2010 2011EExor Pref vs. Ord 30% 16% 19% 19%Exor Sav vs. Ord 80% 44% 29% 29%
Fiat Pref vs. Ord 0% na 82% 82%Fiat Sav vs. Ord 39% na 91% 91%
0%
20%
40%
60%
80%
100%
120%
140%
160%
180%
200%
01/9
9
07/9
9
01/0
0
07/0
0
01/0
1
07/0
1
01/0
2
07/0
2
01/0
3
07/0
3
01/0
4
07/0
4
01/0
5
07/0
5
01/0
6
07/0
6
01/0
7
07/0
7
01/0
8
07/0
8
01/0
9
07/0
9
01/1
0
07/1
0
Ord. vs. Pref.1yr rolling avg (Ord. vs. Pref.)Ord. vs. Sav.1yr rolling avg (Ord. vs. Sav.)
-75%
-65%
-55%
-45%
-35%
-25%
-15%
-5%
5%
15%
01/9
0
01/9
1
01/9
2
01/9
3
01/9
4
01/9
5
01/9
6
01/9
7
01/9
8
01/9
9
01/0
0
01/0
1
01/0
2
01/0
3
01/0
4
01/0
5
01/0
6
01/0
7
01/0
8
01/0
9
01/1
0
Fiat Exor Italian Average
-70.0%
-60.0%
-50.0%
-40.0%
-30.0%
-20.0%
-10.0%
0.0%
10.0%
01/9
0
01/9
1
01/9
2
01/9
3
01/9
4
01/9
5
01/9
6
01/9
7
01/9
8
01/9
9
01/0
0
01/0
1
01/0
2
01/0
3
01/0
4
01/0
5
01/0
6
01/0
7
01/0
8
01/0
9
01/1
0
Discount30 day rolling90 day rolling250 day rolling+2 standard deviation-2 standard deviation

July 28, 2010 Exor SpA (EXOR.MI)
Goldman Sachs Global Investment Research 21
Exor stub offers 31% ROCE if the NAV discount narrows to the old IFIL average
An Exor stub can be constructed by purchasing Exor shares and selling short a combination of shares in its listed holdings. Exhibit
42 shows an implementation for Exor where only the more liquid of dual share classes are shorted, given liquidity and borrowing
constraints. A minor risk of this strategy is that the spreads between different share classes may change materially over time and
result in a different return on the trade. Below, the Exor stub isolates exposure to Exor’s €0.7 bn unlisted holdings (major holding is
C&W), less liquid listed assets, net cash of €153 mn and changes in the NAV discount.
Exhibit 42: 31% potential ROCE if Exor NAV discount narrows to 30%
Source: Company data, Bloomberg, Goldman Sachs Research estimates.
Exhibit 43: Stub value, parent company price & value of listed portfolio Exhibit 44: Correlation between parent and the listed portfolio
Source: Goldman Sachs Research estimates, Company data, Bloomberg.
Source: Goldman Sachs Research estimates, Company data, Bloomberg.
Shorts SEDOL BBG Name % stake Curr. Stub ratio3m ADV
(mln, USD)Value per
share (EUR)%
share NAV
discountStub value
(EUR)ROCE 1
(50%, 50%)ROCE 1
(20%, 20%)Short 1: 5748521 F IM Fiat SpA 29.20% EUR 1.5297 335 15.20 102% -40% -6.00 -1% -3%Short 2: 4824778 SGSN VX SGS SA 15.00% CHF 0.0049 27 5.49 37% -35% -4.78 6% 14%Short 3: -30% -3.55 12% 31%Short 4: -25% -2.33 19% 48%Short 5: -20% -1.10 26% 65%Short 6: -15% 0.12 33% 83%Short 7: -10% 1.34 40% 100%Short 8: -5% 2.57 47% 117%Short 9: 0% 3.79 54% 134%Short 10: 5% 5.01 61% 151%
Stub value: -5.76 10% 6.24 67% 169%Stub NAV: 3.79 15% 7.46 74% 186%
31% 20% 8.68 81% 203%1 ROCE = Return on capital employed, with assumed margin requirements on long and short legs respectively.
Up/down to target stub value:
-10.0
-9.0
-8.0
-7.0
-6.0
-5.0
-4.0
-3.0
-2.0
4.0
6.0
8.0
10.0
12.0
14.0
16.0
18.0
20.0
22.0
24.0
03/0
9
04/0
9
05/0
9
06/0
9
07/0
9
08/0
9
09/0
9
10/0
9
11/0
9
12/0
9
01/1
0
02/1
0
03/1
0
04/1
0
05/1
0
06/1
0
07/1
0
Parent (LHS) Holdings (LHS) Stub (RHS)
0.70
0.75
0.80
0.85
0.90
0.95
1.00
03/0
9
04/0
9
05/0
9
06/0
9
07/0
9
08/0
9
09/0
9
10/0
9
11/0
9
12/0
9
01/1
0
02/1
0
03/1
0
04/1
0
05/1
0
06/1
0
07/1
0
Rolling 3 Months Correlation

July 28, 2010 Exor SpA (EXOR.MI)
Goldman Sachs Global Investment Research 22
Risks related to buying or selling stubs
Purchasing a stub involves purchasing a parent company’s shares and simultaneously selling short a combination of shares in
proportion to the parent company’s holdings.
Selling a stub involves the reverse – purchasing the combination of shares of the holdings and selling short the parent company’s
shares. For the long side of the trade, investors can lose the entire gross amount invested. For the short side of the trade, the risk of
loss is potentially unlimited and investors may be required to cover positions at an unfavourable price. We also acknowledge the
risk of regulatory changes which restrict selling short specific stocks given the current market environment.
When undertaking a stub trade, investors should bear in mind both the fundamental risks associated with any directional views that
they are seeking to exploit, as well as the transactional or arbitrage risks that may not be immediately apparent. Holding company
NAV discounts are driven by multiple interrelated factors, including market risk aversion, borrowing stability, minority protection
and regulatory risks.
July 28, 2010 Exor SpA (EXOR.MI)
Goldman Sachs Global Investment Research 23
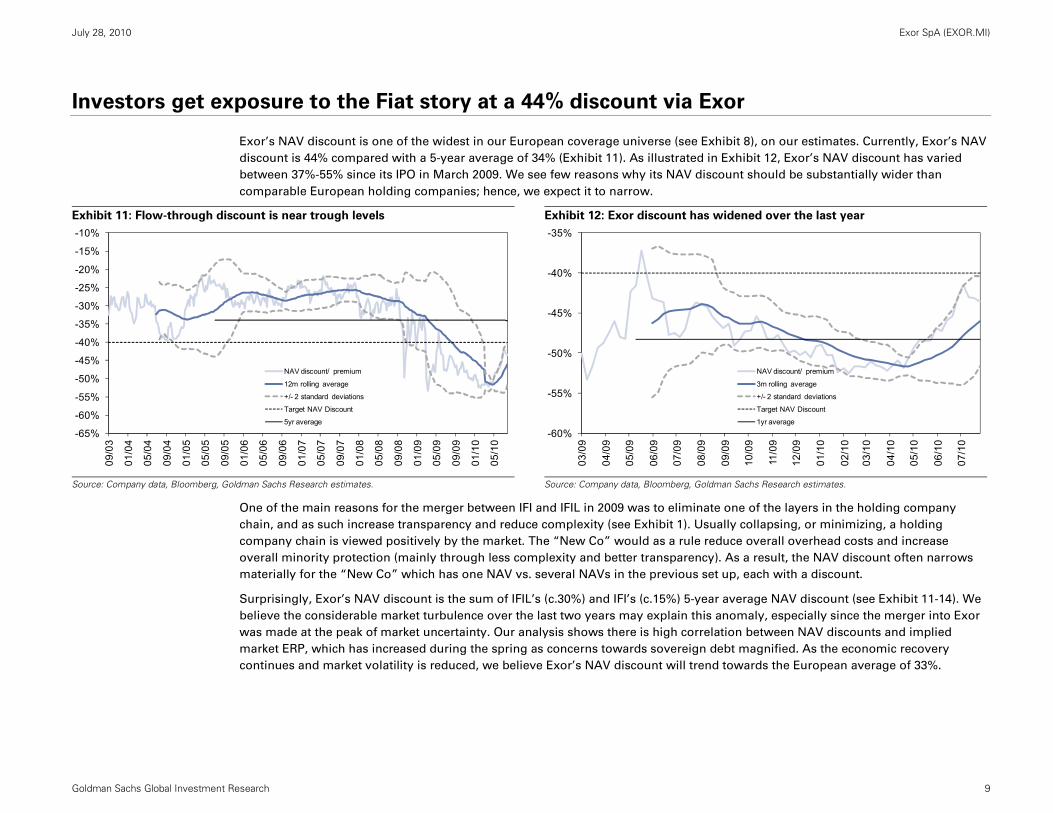
Summary financials
Exhibit 45: Consolidated summary financials
Source: Company Data, Goldman Sachs Research estimates.
Exor (€ mn)Profit model (group, € mn) 2007 2008 2009 2010E 2011E 2012E 2013ERevenue 2,661 2,681 2,427 2,461 2,640 2,829 2,975 Growth NA 1% -9% 1% 7% 7% 5%
EBITDA 158 85 87 268 293 320 345 Margin 6% 3% 4% 11% 11% 11% 12%
EBIT 66 (0) (7) 172 195 220 243 Margin 2% 0% 0% 7% 7% 8% 8%
Net Income (recurring) 480 327 (287) 189 453 831 843 Margin 18% 12% -12% 8% 17% 29% 28%
EPS (€) 3.04 1.39 -1.20 0.77 1.84 3.38 3.42Dividend (€) 157.89 235.29 238.56 246.23 246.23 246.23 246.23Payout ratio 33% 72% -83% 130% 54% 30% 29%
Balance Sheet (group, € mn) 2007 2008 2009 2010E 2011E 2012E 2013ECash 919 975 630 680 739 811 893 Total Current Asset 1,734 1,843 1,698 1,785 1,871 1,971 2,075
Total Assets 9,059 7,749 7,595 7,792 8,211 9,013 9,821 Debt 1,557 1,405 1,355 1,371 1,371 1,371 1,371 Total Liabilities 2,657 2,323 2,205 2,271 2,293 2,317 2,334 Equity 6,402 5,426 5,390 5,521 5,919 6,697 7,487
Total Liabilities & Equity 9,059 7,749 7,595 7,792 8,211 9,013 9,821

July 28, 2010 Exor SpA (EXOR.MI)
Goldman Sachs Global Investment Research 24
Appendix: Refresher on stub trading and European holding company discounts
A stub gives focused exposure to unlisted businesses within a listed company
Stub situations emerge if a listed company owns substantial stakes in other listed companies. If certain liquidity and borrowing
requirements are met, investors are able to trade the stub, which is the collection of unlisted businesses of the parent company, by
going long the parent company and selling short its stakes in listed subsidiaries or cross-holdings. By trading stubs, investors
isolate exposure to the valuation of residual unlisted businesses and/or the valuation of the parent company relative to its holdings.
Stub situations arise mostly in three situations:
• holding companies that have a portfolio of listed shareholdings
• companies that have carried out an equity carve-out (or partial spin-off), potentially with the intention to complete it later
• companies with substantial strategic investments in other listed companies that are usually unrelated to core businesses.
Stub opportunities emerge from intra-group relative value anomalies
Trading opportunities emerge if the market value of the parent company is materially different from its sum-of-the-parts valuation
after adjusting for net debt, also called net asset value (NAV). In the NAV, listed parts are usually marked to market, while unlisted
parts can be valued using common techniques such as DCF or relative valuation. This approach highlights discounts or premiums
assigned by the market to the company’s holdings. These may be anomalies with a clear case for relative value convergence – but,
more often, multiple factors cause such discounts or premiums to persist for longer periods until a catalyst occurs.
The stub ratio indicates how many shares to sell short for each share long of the parent company
The stub ratio indicates how many shares to sell short for each share long of the parent company. It can be calculated by dividing
the number of shares in a company held by the number of shares outstanding of the parent company. The number of shares
outstanding should include all share classes (ordinary and preferred, A, B, C, etc.). When a company buys back shares, they are
usually kept as treasury shares and can become material in the valuation. We decide whether or not to adjust the stub ratio
depending on which case they fall under:
• If the treasury shares are intended to be cancelled, we decrease the number of shares outstanding and therefore increase
the stub ratio (number of shares owned in a listed holding/ number of shares outstanding).
• If they are used to match liabilities/employee stock options or for subsequent sale, the number of shares outstanding is left
unchanged.

July 28, 2010 Exor SpA (EXOR.MI)
Goldman Sachs Global Investment Research 25
For example, Hochtief owns 163,844,626 shares (54.49%) of Leighton. Hochtief has 70,000,000 ordinary shares outstanding and no
other share classes. The stub ratio for Leighton is 150,650,410/ 70,000,000 = 2.3406. Based on company filings, Hochtief currently has
4,312,000 treasury shares. Assuming those are to be deleted, the stub ratio is 150,650,410/ (70,000,000-3,455,685) = 2.4622.
Stub trades can be implemented physically or synthetically
There are different ways to implement stub trades. The optimal implementation will depend on the investor’s desire to leverage and
on trading constraints. We differentiate broadly between physical and synthetic implementation:
• Physical implementation involves buying and selling short shares with different levels of funding. Exhibit 46 shows the
mechanics – investors will usually buy shares partially financed by debt and sell short shares only with the margin requirement as
equity. Minimum margin requirements are usually set by market regulators and stock exchanges.
• Synthetic implementation is a combination of OTC swaps as shown in Exhibit 47. In addition, it is possible to trade stubs
as one swap. A major difference from physical implementation is that margin requirements are set by the broker. Depending on the
credit risk of the investor, this can allow for higher leverage.
• For long-only investors, it may also be possible to buy structured certificates, and on more liquid situations to trade options
on stubs.
Exhibit 46: Implementation with physical long and short positions Exhibit 47: Synthetic implementation with swaps
Source: Goldman Sachs Research.
Source: Goldman Sachs Research.
Main determinants of cost are holding period, margin requirements, ease of execution, and tax
Entry and exit costs such as market-impact-related costs and brokerage fees are usually similar. However, holding period costs such
as financing and borrow costs can vary, as can costs due to differences in dividend income between long and short positions. When
investors physically sell stocks short, they leave collateral which is invested in risk-free bonds and pay borrow cost embedded in the
“rebate” rate, which is usually 25-50 bp lower than the interest on the collateral. Initial margin requirements on the short can be
partially offset by pledging long positions.
Investor BrokerLong:
Investor BrokerCash + Borrow cost + Dividends
Stock + Interest
Stock
Margin
Market
StockCash
Short:
Cash
StockBorrow cost
Market
StockCash
Investor BrokerLong:
Short: Investor BrokerBorrow cost + Dividends
Performance + Interest
Interest + funding cost
Performance + Dividends
Margin
Margin
Market
Hedge
Hedge

July 28, 2010 Exor SpA (EXOR.MI)
Goldman Sachs Global Investment Research 26
For long positions via swaps, investors pay funding costs on top of interest incorporating a balance sheet charge and the cost of
hedging the position. For short positions via swaps, investors receive the interest less the borrow cost. Investors can also trade a
swap directly on the stub. Advantages of synthetic implementations are ease of execution and currency hedging, tax considerations
and potentially lower capital employed. A disadvantage of OTC swaps is that trades have to be closed out with the broker they were
entered with.
Margin requirements and capital employed drive returns on stub trades
Investors should consider capital employed rather than return on the stub when trading stubs. As shown in Exhibit 48, the return on
capital employed can vary considerably for the same expected return. This is because a stub trade is a combination of a long and a
short trade, potentially with different notionals. The capital employed against which changes in the stub value should be compared
will be determined by margin requirements; the return on capital employed will increase with lower margin requirements (and thus
higher leverage).
Exhibit 48: Returns on stub are identical, return on capital differs …
Exhibit 49: … which also is a function of margin requirements
Source: Goldman Sachs Research.
Source: Goldman Sachs Research.
Holding companies tend to trade at discounts to their NAVs
There is strong evidence that the market values holding companies at a persistent discount to their NAV, often called holding
company, conglomerate or diversification discount. NAV discounts tend to vary over time but are mean-reverting and there are
often significant differences between companies. As a result, holding companies tend to attract arbitrageurs such as proprietary
trading desks or hedge funds, but also activist investors who see the opportunity of a collapse eliminating the NAV discount.
We find that factors such as regulatory risk, corporate governance, different approaches to portfolio management and principal-
agent risks play an important role in explaining the variation in discounts over time and between different holding companies.
However, limits to arbitrage can also cause consistently high NAV discounts. Exhibit 50 summarises these factors.
Capital employed example Stub A Stub BParent company price 120 500Value of holding (using stub ratio) 20 400Stub value 100 100Expected change stub value (+10%) 10 10Margin (50% on both legs) 50% 50%Capital employed 50% x (120+20) 50% x (500+400)
= 70 = 450Return on Capital 14.29% 2.22%
Leverage example Stub A Stub BParent company price 120 120Value of holding (using stub ratio) 20 20Stub value 100 100Expected change stub value (+10%) 10 10Margin (different requirements) 20% 50%Capital Employed 20% x (120+20) 50% x (500+400)
= 28 = 70Return on Capital 35.71% 14.29%

July 28, 2010 Exor SpA (EXOR.MI)
Goldman Sachs Global Investment Research 27
Exhibit 50: We identify 21 interrelated factors driving holding company NAV discounts
Source: Goldman Sachs Research.
Discounts to NAV can result from company-specific factors
• Company leverage (and excess cash): If a holding company uses leverage efficiently and has an appropriate capital
structure, it offers investors a leveraged return on its holdings. However, as the leverage increases so does the sensitivity to the
underlying holdings and the risk carried. Thus whether higher leverage increases or decreases the NAV discount will largely depend
on equity market conditions or risk aversion and the sentiment for the holdings.
• Some holding companies have significant non-operating cash balances relative to their market value – for example after the
sale of investments (e.g. Groupe Bruxelles Lambert after it sold Bertelsmann). Excess cash has to be valued by the market
incorporating reinvestment risk. Reinvestment risk can be higher if a controlling shareholder influences investment decisions. As a
result, cash can be valued at a discount by the market, reflecting dilution risk until the investment is made or excess cash is
distributed as dividend. A good investment track record and availability of investments prevents high NAV discounts.
• Contingencies: Contingent assets or liabilities can introduce fundamental risks that result in higher NAV discounts. In the
published accounts, they are usually not disclosed in the balance sheet but discussed separately in the notes to the financial
statements. As a result, they are more difficult to capture. Examples are possible liabilities from pending litigation, loan guarantees
or pensions and possible value appreciation of assets if real estate is accounted for at cost. Also yield enhancement strategies with
Holding company discount/premium
Company leverage
Relative liquidity
Asset scarcity
Diversification
TurnoverTransparency
Org. complexity
Control of holdings
Regulatory risks Yield enhancement
Minority protection
Borrow stability
Synchronization risk
Convergence risk
Risk aversion
Stub volatility
Company-specific factors Limits to arbitragePortfolio management
Arbitrage costs
Track record
Investment style
Contingencies
Operating costs

July 28, 2010 Exor SpA (EXOR.MI)
Goldman Sachs Global Investment Research 28
options bought or sold around listed holdings or convertible bonds can increase uncertainty if they are not properly disclosed. To
account for these in the NAV it is necessary to assess the probability of such cash flows materialising – this increases the overall risk
to the NAV estimate.
• Operating costs: While holding companies can create benefits for their shareholders by effective portfolio management,
there are usually costs involved in running the company (e.g. taxes and management costs). If these costs are substantial and not
outweighed by benefits, the market may incorporate the negative NPV of these future costs in its valuation, which can in part
explain the discount. Taxes on dividends and on realised (and unrealised) gains play an important role. Countries with more
favourable holding company regimes are Sweden, Belgium, Luxembourg, the Netherlands and France – Italy and Germany appear
less favourable. Management costs tend to be low in absolute terms.
• Organisational complexity: Holding companies are often characterised by complex organisational structures for two
reasons: (1) they may be part of pyramidal structures that aim to maximise control while minimising capital employed, and (2)
holding companies often seek to minimise taxation by creating separate entities in countries with favourable holding company
taxation. However, increasing organisational complexity is valued negatively by the market because of higher operating costs and
lower transparency. As a result, restructuring aimed at reducing organisational complexity through demergers or buyouts usually
lowers NAV discounts.
• Transparency: As holding companies are often characterised by complex organisational structures, high portfolio turnover,
contingent assets or liabilities and yield enhancement transactions, they are not easy to analyse. The more layers in the corporate
chain the less visible the group is. If the holding company does not provide detailed and timely disclosure of its current holdings
and voting rights, operating costs and tax situation, the market may assign an uncertainty discount.
• Minority protection: From the perspective of investors, highly concentrated ownership limits accountability to minority
shareholders and is often viewed negatively by the market, leading to a higher discount. The principal-agent problem here is
between the controlling shareholder and its minorities – which arguably is more prevalent in cases of dual share classes (one share
class having preferential voting rights – most common in Italy and Sweden). Dispersed ownership, in contrast, protects the rights of
minority shareholders, prevents abuses of power, and increases free float and liquidity.
• Regulatory risks: Holding companies are often subject to specific regulation, either on taxation, their control of companies
or corporate governance. As a result, changes in regulation can lead to changes in the market’s perception of the value of holdings.
Double taxation of dividends will have an impact from a going-concern perspective and capital gains taxation from a break-up or
exit perspective. Similarly, as holding companies can profit from control premiums resulting from unequal distribution of voting
rights on their holdings, a regulatory change can lead to a loss of control.
Portfolio assets, the investment approach and track record can lead to NAV premiums
• Investment style: There are several dimensions along which the “investment styles” of a holding company can be
compared: active vs. passive, minority stakes vs. controlling stakes, listed vs. unlisted companies, short vs. long investment horizon,
regional vs. global, etc. However, while differences in investment styles can warrant a discount or premium to the NAV, it is often
questionable whether a holding company actually follows a professional approach to portfolio management focused on creating
value for its shareholders. A clearly communicated investment strategy aimed at generating a net operating profit in excess of the
weighted average cost of capital indicates such value creation. If a company is merely a rigid control structure, the market will
assign a higher discount.

July 28, 2010 Exor SpA (EXOR.MI)
Goldman Sachs Global Investment Research 29
• Track record: By investing in a holding company, investors give up discretion they could retain by replicating the portfolio.
Investors may assign a higher discount to NAV to reflect uncertainty about how much value the holding company management will
add relative to long-term costs (i.e. previous president of misused funds or inefficient allocation of resources). Conversely, a good
track record would help to mitigate information asymmetry and agency costs. One indicator is the relative performance of a holding
company versus the market.
• Asset scarcity: If the holding company invests in attractive, undervalued assets that are not accessible to investors (e.g.
Bertelsmann before it was sold by GBL, CIR’s stake in Sorgenia), the market might assign a NAV premium. This is one reason why
some holding companies are increasingly focusing on private equity transactions (e.g. Eurazeo and Ratos). Scarce investments must
be material in the portfolio context – in an optimal case, all other investments are listed so that exposure to the valuation of an
unlisted asset can be isolated with a stub trade. In addition, the value the market assigns to the holding will depend on the
anticipated exit route.
• Diversification (or conglomeration): Provided the portfolio has no sector or country concentrations (e.g. Investor and
Industrivarden focus on Swedish stocks), as well as low correlation across the assets, an investor can get a diversified equity
portfolio through an investment in a holding company at potentially lower transaction and management costs. However, there is
also evidence that diversified firms destroy value by subsidising subsidiaries that are inefficient. Generally, the market tends to view
conglomeration negatively because of the potential agency costs and the additional complexity. However, there are successful
examples of conglomerates that have been able to increase shareholder value (e.g. General Electric).
• Turnover: Usually, holding companies are characterised by a long investment horizon, also because of the size and control
of their holdings. However, if holding companies have too rigid an approach to their holdings, it is questionable whether the holding
company is really aiming at value creation for all its shareholders or if it is merely a control structure for a group of shareholders,
which would warrant a higher discount.
• Control of holdings: A positive influence by the holding company will not only create benefits for the shareholders of the
holding company but in part also for the shareholders of the holdings – as a result, the value of control is questionable. Also, a
holding company can create additional value for its shareholders by granting services to the companies in which it has a stake (e.g.
Pirelli via Pirelli Labs). This will create additional revenues for the holding company but may raise corporate governance concerns.
• Yield enhancement strategies: Many holding companies follow yield enhancement strategies in order to mitigate
operating costs and other frictions caused by the holding company structure. Through option strategies, the holding company
management can express short- to medium-term views around its holdings. Covered call selling is a popular strategy. The holding
company exploits a view that the stock price of one of the holdings has limited short-term upside and receives an up-front premium.
Similarly, if a holding company has a positive long-term view on one of its holdings and would be willing to increase its position at
a lower price, it can sell put options with the respective strike price. A related strategy, which is followed by holding companies with
active portfolio management, is stock lending for which a borrow fee is received.
Limits to arbitrage play a central role in assessing the risk/return trade-off of stub trades
• Convergence risks: The prevalent arbitrage risk of stub trading is convergence risk, i.e. the risk that the relative value
anomaly does not resolve or worsens during the duration of the investor’s trade. For instance, NAV discounts can widen if noise
traders favour investing in a subsidiary because it is a popular stock (e.g. a recent IPO) and/or if institutional investors neglect
holding companies because they prefer a “pure play”. Convergence is mostly idiosyncratic and often depends on corporate

July 28, 2010 Exor SpA (EXOR.MI)
Goldman Sachs Global Investment Research 30
catalysts changing the relationship between parent company and subsidiaries. Examples of corporate catalysts include the
completion of a spin-off, the sale of (unlisted) equity stakes, tax and regulation changes or restructuring.
• Synchronization risks: As single investors are unable to influence prices alone there is synchronisation risk between
arbitrage investors. Lack of communication between investors makes the entry decision difficult and adds to convergence risk
during the trade. There is also synchronisation risk related to the exit of a stub trade. If the convergence is dependent on a corporate
catalyst and several arbitrage investors have positions in the stub before the catalyst occurs, then in order not to lose performance
at convergence, the timing of the exit decision has to incorporate the market impact of the group exiting the trade. Otherwise, if the
parent company is not sufficiently liquid, the exit of the group of arbitrageurs might lead to a new liquidity-related valuation
anomaly.
• Stub volatility: The relationship between parent company and subsidiaries will determine the volatility or holding period
risk of the stub trade. Uncertainty during the duration of the trade can be large and relative value divergence may lead to higher
margin requirements affecting risk-adjusted returns and employing additional capital. We believe three factors determine holding
period risks: the leverage of the stub trade, the co-movement of long and short positions and the respective volatilities.
• Relative liquidity: Differences in liquidity and liquidity risk can lead to a discount on equity stakes held or the holding
company itself. Liquidity risk occurs with non-large cap stocks when a lack of sufficient market depth and liquidity limits the
maximum position that can be taken (long/short) or closed, especially if the parent company owns the majority of a company.
Lack of liquidity limits price discovery and impedes short selling. It increases the market impact of entering or exiting positions and
thus the influence of noise trading. If the holding company has significantly lower liquidity than its holdings, the relative value
anomaly might be liquidity-driven and persist as the holding company valuation does not immediately reflect the value of its
holdings. Similarly, if liquidity of the holdings is low relative to the holding company, the market might assign a discount as
management might not be able to sell its holdings at current market prices.
• Borrow stability: A stub trade is implemented via a combination of long and short positions – thus holdings have to be
borrowable at reasonable cost and are subject to recall risk. Short-selling constraints prevent arbitrageurs from correcting an
anomaly and NAV discounts persist. Risks are particularly prevalent in the event of corporate activity. Short squeeze risk usually
decreases with higher liquidity of the underlying stock, as in the event of a recall it would be possible to close out of the short
position by repurchasing the stock in the market.
• Arbitrage costs: The fixed costs of identifying and evaluating stub opportunities can be high. And there are transaction
costs such as market-impact-related costs and brokerage fees, as well as holding period costs, which are mainly financing, borrow
and dividend-related. The majority of European medium to large cap stocks can be borrowed at reasonable cost. The exceptions are
some special cases where borrow availability is limited, notably recent IPOs, highly popular and volatile stocks, stocks involved in
corporate activity or highly illiquid stocks.
• Risk aversion: In addition to idiosyncratic risks to convergence, worsening market conditions and increasing risk aversion
are notable risks to relative value convergence within holding companies. Holding companies are often out of favour in difficult
market conditions – potentially because they are perceived as more risky and are usually less liquid. As a result, they can exhibit
greater market sensitivity during market corrections than their listed holdings, leading to a widening discount.

July 28, 2010 Exor SpA (EXOR.MI)
Goldman Sachs Global Investment Research 31
Financial Advisory Disclosures
Goldman Sachs is acting as financial advisor to Fiat S.P.A. in an announced strategic transaction

July 28, 2010 Exor SpA (EXOR.MI)
Goldman Sachs Global Investment Research 32
Reg AC
I, Markus Iwar, hereby certify that all of the views expressed in this report accurately reflect my personal views about the subject company or companies and its or their securities. I also certify that no
part of my compensation was, is or will be, directly or indirectly, related to the specific recommendations or views expressed in this report.
Investment Profile
The Goldman Sachs Investment Profile provides investment context for a security by comparing key attributes of that security to its peer group and market. The four key attributes depicted are: growth,
returns, multiple and volatility. Growth, returns and multiple are indexed based on composites of several methodologies to determine the stocks percentile ranking within the region's coverage
universe.
The precise calculation of each metric may vary depending on the fiscal year, industry and region but the standard approach is as follows:
Growth is a composite of next year's estimate over current year's estimate, e.g. EPS, EBITDA, Revenue. Return is a year one prospective aggregate of various return on capital measures, e.g. CROCI,
ROACE, and ROE. Multiple is a composite of one-year forward valuation ratios, e.g. P/E, dividend yield, EV/FCF, EV/EBITDA, EV/DACF, Price/Book. Volatility is measured as trailing twelve-month
volatility adjusted for dividends.
Quantum
Quantum is Goldman Sachs' proprietary database providing access to detailed financial statement histories, forecasts and ratios. It can be used for in-depth analysis of a single company, or to make
comparisons between companies in different sectors and markets.
Disclosures
Coverage group(s) of stocks by primary analyst(s)
Markus Iwar: Europe-Diversified Financials.
Europe-Diversified Financials: Aker ASA, Ashmore Group, Bolsas y Mercados Espanoles, Christian Dior, Compagnie Industriali Riunite Spa, Corporacion Financiera Alba, Criteria CaixaCorp SA,
Deutsche Boerse AG, Eurazeo, Exor SpA, Gottex Fund Management, Groupe Bruxelles Lambert, ICAP plc, Industrivarden AB (A), Investor AB (B), Italmobiliare S.p.A., Italmobiliare S.p.A. (Savings), KBC
Ancora, Kinnevik Investment AB (B), L E Lundbergforetagen AB, London Stock Exchange, Nationale a Portefeuille, Orkla ASA, Pargesa Holding S.A., Rallye, Ratos Ab, Sacyr-Vallehermoso S.A., Semapa,
Societe FFP, Sonae SGPS SA, Tullett Prebon Plc, Wendel.
Company-specific regulatory disclosures
The following disclosures relate to relationships between The Goldman Sachs Group, Inc. (with its affiliates, "Goldman Sachs") and companies covered by the Global Investment Research Division of
Goldman Sachs and referred to in this research.
Goldman Sachs beneficially owned 1% or more of common equity (excluding positions managed by affiliates and business units not required to be aggregated under US securities law) as of the
month end preceding this report: Fiat (€9.81)
Goldman Sachs expects to receive or intends to seek compensation for investment banking services in the next 3 months: Exor SpA (€14.75) and Fiat (€9.81)
Goldman Sachs has received compensation for non-investment banking services during the past 12 months: Exor SpA (€14.75)
Goldman Sachs had an investment banking services client relationship during the past 12 months with: Exor SpA (€14.75) and Fiat (€9.81)
Goldman Sachs had a non-investment banking securities-related services client relationship during the past 12 months with: Exor SpA (€14.75) and Fiat (€9.81)
Goldman Sachs had a non-securities services client relationship during the past 12 months with: Exor SpA (€14.75) and Fiat (€9.81)

July 28, 2010 Exor SpA (EXOR.MI)
Goldman Sachs Global Investment Research 33
Distribution of ratings/investment banking relationships
Goldman Sachs Investment Research global coverage universe
Rating Distribution Investment Banking Relationships
Buy Hold Sell Buy Hold Sell
Global 31% 53% 16% 47% 44% 34%
As of July 1, 2010, Goldman Sachs Global Investment Research had investment ratings on 2,814 equity securities. Goldman Sachs assigns stocks as Buys and Sells on various regional Investment
Lists; stocks not so assigned are deemed Neutral. Such assignments equate to Buy, Hold and Sell for the purposes of the above disclosure required by NASD/NYSE rules. See 'Ratings, Coverage
groups and views and related definitions' below.
Regulatory disclosures
Disclosures required by United States laws and regulations
See company-specific regulatory disclosures above for any of the following disclosures required as to companies referred to in this report: manager or co-manager in a pending transaction; 1% or
other ownership; compensation for certain services; types of client relationships; managed/co-managed public offerings in prior periods; directorships; for equity securities, market making and/or
specialist role. Goldman Sachs usually makes a market in fixed income securities of issuers discussed in this report and usually deals as a principal in these securities.
The following are additional required disclosures: Ownership and material conflicts of interest: Goldman Sachs policy prohibits its analysts, professionals reporting to analysts and members of their
households from owning securities of any company in the analyst's area of coverage. Analyst compensation: Analysts are paid in part based on the profitability of Goldman Sachs, which includes
investment banking revenues. Analyst as officer or director: Goldman Sachs policy prohibits its analysts, persons reporting to analysts or members of their households from serving as an officer,
director, advisory board member or employee of any company in the analyst's area of coverage. Non-U.S. Analysts: Non-U.S. analysts may not be associated persons of Goldman Sachs & Co. and
therefore may not be subject to NASD Rule 2711/NYSE Rules 472 restrictions on communications with subject company, public appearances and trading securities held by the analysts.
Distribution of ratings: See the distribution of ratings disclosure above. Price chart: See the price chart, with changes of ratings and price targets in prior periods, above, or, if electronic format or if
with respect to multiple companies which are the subject of this report, on the Goldman Sachs website at http://www.gs.com/research/hedge.html.
Additional disclosures required under the laws and regulations of jurisdictions other than the United States
The following disclosures are those required by the jurisdiction indicated, except to the extent already made above pursuant to United States laws and regulations. Australia: This research, and any
access to it, is intended only for "wholesale clients" within the meaning of the Australian Corporations Act. Canada: Goldman Sachs & Co. has approved of, and agreed to take responsibility for, this
research in Canada if and to the extent it relates to equity securities of Canadian issuers. Analysts may conduct site visits but are prohibited from accepting payment or reimbursement by the company
of travel expenses for such visits. Hong Kong: Further information on the securities of covered companies referred to in this research may be obtained on request from Goldman Sachs (Asia) L.L.C.
India: Further information on the subject company or companies referred to in this research may be obtained from Goldman Sachs (India) Securities Private Limited; Japan: See below. Korea: Further
information on the subject company or companies referred to in this research may be obtained from Goldman Sachs (Asia) L.L.C., Seoul Branch. Russia: Research reports distributed in the Russian
Federation are not advertising as defined in the Russian legislation, but are information and analysis not having product promotion as their main purpose and do not provide appraisal within the
meaning of the Russian legislation on appraisal activity. Singapore: Further information on the covered companies referred to in this research may be obtained from Goldman Sachs (Singapore) Pte.
(Company Number: 198602165W). Taiwan: This material is for reference only and must not be reprinted without permission. Investors should carefully consider their own investment risk. Investment
results are the responsibility of the individual investor. United Kingdom: Persons who would be categorized as retail clients in the United Kingdom, as such term is defined in the rules of the Financial
Services Authority, should read this research in conjunction with prior Goldman Sachs research on the covered companies referred to herein and should refer to the risk warnings that have been sent
to them by Goldman Sachs International. A copy of these risks warnings, and a glossary of certain financial terms used in this report, are available from Goldman Sachs International on request.
European Union: Disclosure information in relation to Article 4 (1) (d) and Article 6 (2) of the European Commission Directive 2003/126/EC is available at
http://www.gs.com/client_services/global_investment_research/europeanpolicy.html which states the European Policy for Managing Conflicts of Interest in Connection with Investment Research.
Japan: Goldman Sachs Japan Co., Ltd. is a Financial Instrument Dealer under the Financial Instrument and Exchange Law, registered with the Kanto Financial Bureau (Registration No. 69), and is a
member of Japan Securities Dealers Association (JSDA) and Financial Futures Association of Japan (FFAJ). Sales and purchase of equities are subject to commission pre-determined with clients plus
consumption tax. See company-specific disclosures as to any applicable disclosures required by Japanese stock exchanges, the Japanese Securities Dealers Association or the Japanese Securities
Finance Company.
Ratings, coverage groups and views and related definitions
Buy (B), Neutral (N), Sell (S) -Analysts recommend stocks as Buys or Sells for inclusion on various regional Investment Lists. Being assigned a Buy or Sell on an Investment List is determined by a
stock's return potential relative to its coverage group as described below. Any stock not assigned as a Buy or a Sell on an Investment List is deemed Neutral. Each regional Investment Review
Committee manages various regional Investment Lists to a global guideline of 25%-35% of stocks as Buy and 10%-15% of stocks as Sell; however, the distribution of Buys and Sells in any particular
coverage group may vary as determined by the regional Investment Review Committee. Regional Conviction Buy and Sell lists represent investment recommendations focused on either the size of the
potential return or the likelihood of the realization of the return.

July 28, 2010 Exor SpA (EXOR.MI)
Goldman Sachs Global Investment Research 34
Return potential represents the price differential between the current share price and the price target expected during the time horizon associated with the price target. Price targets are required for
all covered stocks. The return potential, price target and associated time horizon are stated in each report adding or reiterating an Investment List membership.
Coverage groups and views: A list of all stocks in each coverage group is available by primary analyst, stock and coverage group at http://www.gs.com/research/hedge.html. The analyst assigns one
of the following coverage views which represents the analyst's investment outlook on the coverage group relative to the group's historical fundamentals and/or valuation. Attractive (A). The
investment outlook over the following 12 months is favorable relative to the coverage group's historical fundamentals and/or valuation. Neutral (N). The investment outlook over the following 12
months is neutral relative to the coverage group's historical fundamentals and/or valuation. Cautious (C). The investment outlook over the following 12 months is unfavorable relative to the coverage
group's historical fundamentals and/or valuation.
Not Rated (NR). The investment rating and target price have been removed pursuant to Goldman Sachs policy when Goldman Sachs is acting in an advisory capacity in a merger or strategic
transaction involving this company and in certain other circumstances. Rating Suspended (RS). Goldman Sachs Research has suspended the investment rating and price target for this stock, because
there is not a sufficient fundamental basis for determining an investment rating or target. The previous investment rating and price target, if any, are no longer in effect for this stock and should not be
relied upon. Coverage Suspended (CS). Goldman Sachs has suspended coverage of this company. Not Covered (NC). Goldman Sachs does not cover this company. Not Available or Not Applicable (NA). The information is not available for display or is not applicable. Not Meaningful (NM). The information is not meaningful and is therefore excluded.
Global product; distributing entities
The Global Investment Research Division of Goldman Sachs produces and distributes research products for clients of Goldman Sachs, and pursuant to certain contractual arrangements, on a global
basis. Analysts based in Goldman Sachs offices around the world produce equity research on industries and companies, and research on macroeconomics, currencies, commodities and portfolio
strategy. This research is disseminated in Australia by Goldman Sachs JBWere Pty Ltd (ABN 21 006 797 897) on behalf of Goldman Sachs; in Canada by Goldman Sachs & Co. regarding Canadian
equities and by Goldman Sachs & Co. (all other research); in Hong Kong by Goldman Sachs (Asia) L.L.C.; in India by Goldman Sachs (India) Securities Private Ltd.; in Japan by Goldman Sachs Japan
Co., Ltd.; in the Republic of Korea by Goldman Sachs (Asia) L.L.C., Seoul Branch; in New Zealand by Goldman Sachs JBWere (NZ) Limited on behalf of Goldman Sachs; in Russia by OOO Goldman
Sachs; in Singapore by Goldman Sachs (Singapore) Pte. (Company Number: 198602165W); and in the United States of America by Goldman Sachs & Co. Goldman Sachs International has approved
this research in connection with its distribution in the United Kingdom and European Union.
European Union: Goldman Sachs International, authorized and regulated by the Financial Services Authority, has approved this research in connection with its distribution in the European Union and
United Kingdom; Goldman Sachs & Co. oHG, regulated by the Bundesanstalt für Finanzdienstleistungsaufsicht, may also distribute research in Germany.
General disclosures
This research is for our clients only. Other than disclosures relating to Goldman Sachs, this research is based on current public information that we consider reliable, but we do not represent it is
accurate or complete, and it should not be relied on as such. We seek to update our research as appropriate, but various regulations may prevent us from doing so. Other than certain industry reports
published on a periodic basis, the large majority of reports are published at irregular intervals as appropriate in the analyst's judgment.
Goldman Sachs conducts a global full-service, integrated investment banking, investment management, and brokerage business. We have investment banking and other business relationships with a
substantial percentage of the companies covered by our Global Investment Research Division. Goldman Sachs & Co., the United States broker dealer, is a member of SIPC (http://www.sipc.org).
Our salespeople, traders, and other professionals may provide oral or written market commentary or trading strategies to our clients and our proprietary trading desks that reflect opinions that are
contrary to the opinions expressed in this research. Our asset management area, our proprietary trading desks and investing businesses may make investment decisions that are inconsistent with the
recommendations or views expressed in this research.
We and our affiliates, officers, directors, and employees, excluding equity and credit analysts, will from time to time have long or short positions in, act as principal in, and buy or sell, the securities or
derivatives, if any, referred to in this research.
This research is not an offer to sell or the solicitation of an offer to buy any security in any jurisdiction where such an offer or solicitation would be illegal. It does not constitute a personal
recommendation or take into account the particular investment objectives, financial situations, or needs of individual clients. Clients should consider whether any advice or recommendation in this
research is suitable for their particular circumstances and, if appropriate, seek professional advice, including tax advice. The price and value of investments referred to in this research and the income
from them may fluctuate. Past performance is not a guide to future performance, future returns are not guaranteed, and a loss of original capital may occur. Fluctuations in exchange rates could have
adverse effects on the value or price of, or income derived from, certain investments.
Certain transactions, including those involving futures, options, and other derivatives, give rise to substantial risk and are not suitable for all investors. Investors should review current options
disclosure documents which are available from Goldman Sachs sales representatives or at http://www.theocc.com/publications/risks/riskchap1.jsp. Transactions cost may be significant in option
strategies calling for multiple purchase and sales of options such as spreads. Supporting documentation will be supplied upon request.
All research reports are disseminated and available to all clients simultaneously through electronic publication to our internal client websites. Not all research content is redistributed to our clients or
available to third-party aggregators, nor is Goldman Sachs responsible for the redistribution of our research by third party aggregators. For all research available on a particular stock, please contact
your sales representative or go to http://360.gs.com.
Disclosure information is also available at http://www.gs.com/research/hedge.html or from Research Compliance, 200 West Street, New York, NY 10282.
Copyright 2010 The Goldman Sachs Group, Inc.
No part of this material may be (i) copied, photocopied or duplicated in any form by any means or (ii) redistributed without the prior written consent of The Goldman Sachs Group, Inc.