zero/near-zero emissions yard tractor testing & demonstration ...
Upload
khangminh22Category
view
3download
0
Quarterly Holdings Reportfor
Fidelity ZERO℠ Total Market Index FundJanuary 31, 2022
TMX-NPRT1-04221.9891458.103

Schedule of Investments January 31, 2022 (Unaudited)Showing Percentage of Net Assets
Common Stocks – 99.8%Shares Value ($)
COMMUNICATION SERVICES - 9.1%
Diversified Telecommunication Services - 1.0%
Anterix, Inc. (a) 4,852 248,714
AT&T, Inc. 2,030,159 51,769,055
ATN International, Inc. 3,151 125,032
Bandwidth, Inc. (a)(b) 6,856 429,254
Cogent Communications Group, Inc. 12,092 769,172
Consolidated Communications Holdings, Inc. (a) 21,557 154,995
EchoStar Holding Corp. Class A (a) 11,187 265,020
Globalstar, Inc. (a)(b) 176,538 188,896
IDT Corp. Class B (a)(b) 4,938 185,323
Iridium Communications, Inc. (a) 37,140 1,332,583
Liberty Global PLC:
Class A (a) 45,776 1,241,445
Class C (a) 97,349 2,632,317
Liberty Latin America Ltd.:
Class A (a) 15,780 172,633
Class C (a) 40,867 441,772
Lumen Technologies, Inc. 259,154 3,203,143
Ooma, Inc. (a) 6,474 116,791
Radius Global Infrastructure, Inc. (a) 17,695 243,483
Verizon Communications, Inc. 1,175,352 62,563,987
126,083,615
Entertainment - 1.4%
Activision Blizzard, Inc. 221,341 17,488,152
AMC Entertainment Holdings, Inc. Class A (a)(b) 145,348 2,334,289
Cinemark Holdings, Inc. (a)(b) 29,022 438,232
Electronic Arts, Inc. 80,460 10,673,824
Lions Gate Entertainment Corp.:
Class A (a)(b) 27,040 423,987
Class B (a) 23,312 339,889
Live Nation Entertainment, Inc. (a) 38,845 4,253,916
LiveOne, Inc. (a) 12,864 12,070
Madison Square Garden Entertainment Corp. (a)(b) 6,885 487,665
Madison Square Garden Sports Corp. (a) 4,849 805,273
Marcus Corp. (a)(b) 5,384 90,720
Netflix, Inc. (a) 125,836 53,749,589
Playtika Holding Corp. 28,955 493,104
Roku, Inc. Class A (a) 33,508 5,496,987
Sciplay Corp. (A Shares) (a) 7,334 91,675
Take-Two Interactive Software, Inc. (a) 32,944 5,381,073
The Walt Disney Co. (a) 516,392 73,828,564
Warner Music Group Corp. Class A 31,185 1,325,363
World Wrestling Entertainment, Inc. Class A (b) 12,844 641,429
Zynga, Inc. (a) 301,938 2,738,578
181,094,379
Interactive Media & Services - 5.5%
Alphabet, Inc.:
Class A (a) 85,427 231,171,442
Class C (a) 79,362 215,386,087
Angi, Inc. (a)(b) 19,456 166,932
Bumble, Inc. (b) 20,991 619,444
CarGurus, Inc. Class A (a) 24,848 792,651
Cars.com, Inc. (a) 17,797 277,277
Eventbrite, Inc. (a)(b) 20,971 300,514
EverQuote, Inc. Class A (a) 6,308 103,830
Common Stocks – continuedShares Value ($)
COMMUNICATION SERVICES – continued
Interactive Media & Services – continued
IAC (a) 23,802 3,249,925
Liberty TripAdvisor Holdings, Inc. (a)(b) 17,647 39,706
Match Group, Inc. (a) 80,927 9,120,473
MediaAlpha, Inc. Class A (a)(b) 6,452 95,812
Meta Platforms, Inc. Class A (a) 672,005 210,512,286
Pinterest, Inc. Class A (a) 160,524 4,745,089
QuinStreet, Inc. (a) 14,222 228,832
Snap, Inc. Class A (a) 305,637 9,945,428
TripAdvisor, Inc. (a) 27,763 753,765
TrueCar, Inc. (a) 21,207 72,952
Twitter, Inc. (a) 227,724 8,541,927
Vimeo, Inc. (a) 42,344 620,340
Yelp, Inc. (a) 19,401 670,111
Ziff Davis, Inc. (a) 13,476 1,415,789
Zoominfo Technologies, Inc. (a) 87,295 4,614,414
703,445,026
Media - 1.1%
Altice U.S.A., Inc. Class A (a) 63,781 919,722
AMC Networks, Inc. Class A (a) 8,717 371,606
Audacy, Inc. Class A (a)(b) 28,618 69,256
Boston Omaha Corp. (a)(b) 4,892 129,100
Cable One, Inc. 1,420 2,193,517
Cardlytics, Inc. (a)(b) 9,116 611,684
Cbdmd, Inc. (a)(b) 6,733 7,002
Charter Communications, Inc. Class A (a) 35,209 20,890,908
Clear Channel Outdoor Holdings, Inc. (a)(b) 124,905 382,209
Comcast Corp. Class A 1,295,379 64,755,996
Discovery Communications, Inc.:
Class A (a) 51,208 1,429,215
Class C (non-vtg.) (a) 83,007 2,270,241
DISH Network Corp. Class A (a) 71,022 2,230,091
E.W. Scripps Co. Class A (a)(b) 16,644 341,202
Fluent, Inc. (a)(b) 8,395 13,432
Fox Corp.:
Class A 94,683 3,845,077
Class B 40,339 1,499,804
Gannett Co., Inc. (a)(b) 38,835 188,738
Gray Television, Inc. 24,743 515,892
iHeartMedia, Inc. (a) 30,632 617,235
Interpublic Group of Companies, Inc. 111,707 3,970,067
John Wiley & Sons, Inc. Class A 11,693 593,420
Liberty Broadband Corp.:
Class A (a) 7,225 1,057,379
Class C (a) 39,787 5,904,789
Liberty Media Corp.:
Liberty Braves Class A (a) 1,595 44,740
Liberty Braves Class C (a) 10,671 288,117
Liberty Formula One Group Series C (a) 53,964 3,250,252
Liberty Media Class A (a) 10,377 568,660
Liberty SiriusXM Series A (a) 24,251 1,121,609
Liberty SiriusXM Series C (a) 43,763 2,036,292
Loyalty Ventures, Inc. (a) 5,213 152,793
Magnite, Inc. (a)(b) 32,795 445,028
National CineMedia, Inc. (b) 17,193 45,390
Quarterly Report 2

Common Stocks – continuedShares Value ($)
COMMUNICATION SERVICES – continued
Media – continued
News Corp.:
Class A 103,192 2,294,990
Class B 43,474 966,862
Nexstar Broadcasting Group, Inc. Class A 11,596 1,917,746
Omnicom Group, Inc. 61,401 4,627,179
PubMatic, Inc. (a)(b) 8,060 197,873
Scholastic Corp. 8,237 337,882
Sinclair Broadcast Group, Inc. Class A (b) 13,453 369,688
Sirius XM Holdings, Inc. (b) 261,858 1,665,417
TechTarget, Inc. (a) 7,389 612,844
Tegna, Inc. 62,213 1,204,444
The New York Times Co. Class A 47,357 1,895,701
ViacomCBS, Inc.:
Class A (b) 8,348 305,370
Class B 166,423 5,566,849
WideOpenWest, Inc. (a)(b) 14,260 265,379
144,988,687
Wireless Telecommunication Services - 0.1%
Gogo, Inc. (a)(b) 19,219 239,277
NII Holdings, Inc. (a)(c) 11,652 3,030
Shenandoah Telecommunications Co. 13,707 312,108
T-Mobile U.S., Inc. (a) 166,478 18,007,925
Telephone & Data Systems, Inc. 28,492 564,142
U.S. Cellular Corp. (a) 4,241 129,859
19,256,341
TOTAL COMMUNICATION SERVICES 1,174,868,048
CONSUMER DISCRETIONARY - 11.9%
Auto Components - 0.3%
Adient PLC (a) 26,388 1,107,504
American Axle & Manufacturing Holdings, Inc. (a) 28,834 234,709
Aptiv PLC (a) 77,645 10,604,754
Autoliv, Inc. 22,428 2,221,269
BorgWarner, Inc. 68,157 2,988,684
Cooper-Standard Holding, Inc. (a) 5,056 104,103
Dana, Inc. 41,674 902,659
Dorman Products, Inc. (a) 7,859 735,838
Fox Factory Holding Corp. (a) 12,061 1,604,957
Gentex Corp. 66,571 2,090,329
Gentherm, Inc. (a) 9,177 801,978
LCI Industries 7,134 878,695
Lear Corp. 16,869 2,822,521
Modine Manufacturing Co. (a) 13,429 122,875
Motorcar Parts of America, Inc. (a)(b) 5,179 85,609
Patrick Industries, Inc. 6,556 422,206
Standard Motor Products, Inc. 4,817 230,590
Stoneridge, Inc. (a) 7,984 150,658
Tenneco, Inc. (a) 21,701 227,861
The Goodyear Tire & Rubber Co. (a) 78,476 1,626,807
Veoneer, Inc. (a)(b) 28,354 998,344
Visteon Corp. (a) 7,854 797,260
XPEL, Inc. (a)(b) 4,620 288,103
32,048,313
Common Stocks – continuedShares Value ($)
CONSUMER DISCRETIONARY – continued
Automobiles - 2.1%
Ford Motor Co. 1,117,154 22,678,226
General Motors Co. (a) 414,199 21,840,713
Harley-Davidson, Inc. 43,028 1,487,478
Rivian Automotive, Inc. (b) 43,561 2,863,700
Tesla, Inc. (a) 231,038 216,417,915
Thor Industries, Inc. (b) 15,531 1,469,077
Winnebago Industries, Inc. (b) 9,624 620,940
Workhorse Group, Inc. (a)(b) 31,700 107,146
267,485,195
Distributors - 0.1%
Funko, Inc. (a)(b) 7,944 137,272
Genuine Parts Co. 40,231 5,359,976
LKQ Corp. 75,723 4,156,435
Pool Corp. 11,450 5,453,063
15,106,746
Diversified Consumer Services - 0.1%
2U, Inc. (a) 20,855 336,600
Adtalem Global Education, Inc. (a) 13,568 399,171
American Public Education, Inc. (a)(b) 4,767 101,966
Aspen Group, Inc. (a)(b) 5,146 11,527
Bright Horizons Family Solutions, Inc. (a) 17,420 2,236,902
Carriage Services, Inc. 4,464 224,628
Chegg, Inc. (a) 40,962 1,084,264
Duolingo, Inc. (a) 1,685 168,517
European Wax Center, Inc. (b) 4,201 102,672
Frontdoor, Inc. (a) 23,912 868,006
Graham Holdings Co. 1,145 681,412
Grand Canyon Education, Inc. (a) 11,490 961,483
H&R Block, Inc. 49,789 1,138,177
Houghton Mifflin Harcourt Co. (a) 36,354 654,736
Laureate Education, Inc. Class A 27,627 349,482
OneSpaWorld Holdings Ltd. (a)(b) 16,244 167,638
Perdoceo Education Corp. (a) 18,121 199,693
PowerSchool Holdings, Inc. (b) 12,159 199,164
Regis Corp. (a)(b) 4,615 6,876
Service Corp. International 46,614 2,877,016
Strategic Education, Inc. 6,305 376,156
Stride, Inc. (a) 11,826 414,738
Terminix Global Holdings, Inc. (a) 34,698 1,496,872
Vivint Smart Home, Inc. Class A (a)(b) 11,942 85,982
WW International, Inc. (a)(b) 14,942 188,269
Xpresspa Group, Inc. (a) 24,220 34,150
15,366,097
Hotels, Restaurants & Leisure - 2.1%
Accel Entertainment, Inc. (a) 14,065 177,360
Airbnb, Inc. Class A (a) 98,451 15,158,500
ARAMARK Holdings Corp. 71,636 2,456,398
Bally's Corp. (a) 8,257 295,105
BJ's Restaurants, Inc. (a)(b) 5,895 177,381
Bloomin' Brands, Inc. (a) 22,875 465,049
Booking Holdings, Inc. (a) 11,686 28,702,335
Boyd Gaming Corp. 22,793 1,355,272
Brinker International, Inc. (a) 13,460 447,007
Caesars Entertainment, Inc. (a) 60,698 4,621,546
3 Quarterly Report

Schedule of Investments (Unaudited) − continued
Common Stocks – continuedShares Value ($)
CONSUMER DISCRETIONARY – continued
Hotels, Restaurants & Leisure – continued
Carnival Corp. (a) 232,870 4,613,155
Carrols Restaurant Group, Inc. (b) 7,427 18,345
Century Casinos, Inc. (a)(b) 6,874 68,396
Chipotle Mexican Grill, Inc. (a) 8,048 11,955,948
Choice Hotels International, Inc. 9,067 1,300,208
Churchill Downs, Inc. 9,614 2,021,824
Chuy's Holdings, Inc. (a)(b) 5,172 130,386
Cracker Barrel Old Country Store, Inc. 6,830 813,726
Darden Restaurants, Inc. 37,620 5,261,909
Dave & Buster's Entertainment, Inc. (a)(b) 10,246 366,704
Del Taco Restaurants, Inc. 7,875 98,201
Denny's Corp. (a)(b) 20,084 311,302
Dine Brands Global, Inc. 4,877 330,904
Domino's Pizza, Inc. 10,290 4,678,349
DraftKings, Inc. Class A (a)(b) 95,479 2,109,131
Drive Shack, Inc. (a)(b) 19,437 27,212
El Pollo Loco Holdings, Inc. (a) 4,411 58,843
Everi Holdings, Inc. (a) 26,896 531,734
Expedia, Inc. (a) 41,552 7,616,066
F45 Training Holdings, Inc. 6,161 77,074
Fiesta Restaurant Group, Inc. (a)(b) 3,604 34,130
GAN Ltd. (a)(b) 11,539 79,504
Golden Entertainment, Inc. (a) 5,336 240,013
Hilton Grand Vacations, Inc. (a) 24,977 1,220,376
Hilton Worldwide Holdings, Inc. (a) 79,605 11,551,482
Hyatt Hotels Corp. Class A (a) 14,289 1,309,015
Jack in the Box, Inc. (b) 5,864 533,917
Las Vegas Sands Corp. (a) 97,953 4,290,341
Lindblad Expeditions Holdings (a) 7,367 124,281
Marriott International, Inc. Class A (a) 78,178 12,596,039
Marriott Vacations Worldwide Corp. 11,991 1,947,099
McDonald's Corp. 211,662 54,915,706
Membership Collective Group, Inc. Class A 9,519 84,434
MGM Resorts International 112,527 4,807,153
Monarch Casino & Resort, Inc. (a) 3,895 241,101
Noodles & Co. (a) 9,091 76,455
Norwegian Cruise Line Holdings Ltd. (a)(b) 106,232 2,212,813
Papa John's International, Inc. 9,167 1,131,666
Penn National Gaming, Inc. (a) 46,916 2,139,839
Planet Fitness, Inc. (a) 24,433 2,165,741
Playa Hotels & Resorts NV (a) 35,943 274,245
PlayAGS, Inc. (a) 8,714 67,882
RCI Hospitality Holdings, Inc. 2,004 140,019
Red Robin Gourmet Burgers, Inc. (a)(b) 3,746 55,254
Red Rock Resorts, Inc. 15,187 676,125
Royal Caribbean Cruises Ltd. (a) 64,746 5,037,886
Ruth's Hospitality Group, Inc. 9,978 199,859
Scientific Games Corp. Class A (a) 27,128 1,565,286
SeaWorld Entertainment, Inc. (a) 14,290 851,398
Shake Shack, Inc. Class A (a) 10,747 710,054
Six Flags Entertainment Corp. (a) 21,565 851,602
Starbucks Corp. 335,405 32,977,020
Texas Roadhouse, Inc. Class A 19,658 1,678,597
The Cheesecake Factory, Inc. (a)(b) 14,160 505,229
Common Stocks – continuedShares Value ($)
CONSUMER DISCRETIONARY – continued
Hotels, Restaurants & Leisure – continued
Travel+Leisure Co. 23,800 1,351,840
Vail Resorts, Inc. 11,558 3,202,722
Wendy's Co. 49,959 1,150,556
Wingstop, Inc. 8,332 1,276,879
Wyndham Hotels & Resorts, Inc. 26,831 2,252,462
Wynn Resorts Ltd. (a) 30,335 2,592,126
Xponential Fitness, Inc. (b) 3,309 57,775
Yum! Brands, Inc. 83,225 10,417,273
265,838,564
Household Durables - 0.5%
Bassett Furniture Industries, Inc. 2,058 38,196
Beazer Homes U.S.A., Inc. (a) 7,857 143,312
Cavco Industries, Inc. (a) 2,351 633,453
Century Communities, Inc. 8,173 538,192
D.R. Horton, Inc. 92,303 8,235,274
Dream Finders Homes, Inc. (b) 5,454 101,663
Ethan Allen Interiors, Inc. 6,876 173,344
Flexsteel Industries, Inc. 1,611 40,130
Garmin Ltd. 42,966 5,345,830
GoPro, Inc. Class A (a) 34,034 301,541
Green Brick Partners, Inc. (a) 12,816 303,483
Helen of Troy Ltd. (a) 7,090 1,484,150
Hooker Furnishings Corp. (b) 3,635 80,115
Hovnanian Enterprises, Inc. Class A (a) 1,441 139,604
Installed Building Products, Inc. 6,442 713,709
iRobot Corp. (a)(b) 7,746 507,518
KB Home 24,198 1,022,366
La-Z-Boy, Inc. 12,722 467,025
Leggett & Platt, Inc. 37,720 1,503,142
Lennar Corp.:
Class A 73,660 7,079,463
Class B 8,805 710,828
LGI Homes, Inc. (a)(b) 6,112 761,005
Lovesac (a)(b) 3,698 199,137
M.D.C. Holdings, Inc. 15,744 798,063
M/I Homes, Inc. (a) 8,676 459,741
Meritage Homes Corp. (a) 10,671 1,088,762
Mohawk Industries, Inc. (a) 15,493 2,445,880
Newell Brands, Inc. 105,651 2,452,160
NVR, Inc. (a) 953 5,076,841
PulteGroup, Inc. 71,225 3,752,845
Purple Innovation, Inc. (a)(b) 16,812 139,876
Skyline Champion Corp. (a) 15,616 1,051,581
Snap One Holdings Corp. (a) 4,187 78,757
Sonos, Inc. (a) 35,825 903,507
Taylor Morrison Home Corp. (a) 35,024 1,074,887
Tempur Sealy International, Inc. 54,482 2,168,928
Toll Brothers, Inc. 32,008 1,887,512
TopBuild Corp. (a) 9,509 2,212,269
Traeger, Inc. (a) 7,305 74,438
TRI Pointe Homes, Inc. (a) 32,585 775,849
Tupperware Brands Corp. (a)(b) 14,787 228,016
Universal Electronics, Inc. (a) 3,491 123,896
VOXX International Corp. (a)(b) 4,376 48,355
Quarterly Report 4

Common Stocks – continuedShares Value ($)
CONSUMER DISCRETIONARY – continued
Household Durables – continued
Vuzix Corp. (a)(b) 17,427 113,798
Weber, Inc. (b) 5,605 60,758
Whirlpool Corp. 17,105 3,595,300
ZAGG, Inc. rights (a)(c) 5,004 450
61,134,949
Internet & Direct Marketing Retail - 3.1%
1-800-FLOWERS.com, Inc. Class A (a)(b) 7,453 126,925
Amazon.com, Inc. (a) 123,849 370,490,568
CarParts.com, Inc. (a)(b) 13,156 121,035
Chewy, Inc. (a)(b) 25,066 1,193,392
Duluth Holdings, Inc. (a)(b) 4,330 65,296
eBay, Inc. 177,402 10,656,538
Etsy, Inc. (a) 36,096 5,669,960
Groupon, Inc. (a)(b) 5,519 168,550
Lands' End, Inc. (a)(b) 4,138 75,850
Liquidity Services, Inc. (a)(b) 6,960 132,449
Overstock.com, Inc. (a)(b) 12,396 594,264
PetMed Express, Inc. 5,512 142,375
Poshmark, Inc. (b) 10,879 171,997
Quotient Technology, Inc. (a) 25,101 178,468
Qurate Retail, Inc. Series A 100,590 707,148
Revolve Group, Inc. (a) 10,869 536,059
Shutterstock, Inc. 6,567 636,802
Stitch Fix, Inc. (a) 23,773 390,590
The RealReal, Inc. (a)(b) 23,604 223,058
Waitr Holdings, Inc. (a)(b) 33,364 18,684
Wayfair LLC Class A (a)(b) 22,481 3,505,238
Xometry, Inc. (b) 2,065 106,554
395,911,800
Leisure Products - 0.1%
Acushnet Holdings Corp. 9,635 449,955
American Outdoor Brands, Inc. (a) 4,211 69,818
AMMO, Inc. (a)(b) 24,995 115,977
Brunswick Corp. 21,654 1,965,967
Callaway Golf Co. (a) 32,163 767,409
Clarus Corp. 6,977 157,192
Hasbro, Inc. 36,886 3,411,217
Johnson Outdoors, Inc. Class A 1,833 165,373
Malibu Boats, Inc. Class A (a) 6,105 400,854
MasterCraft Boat Holdings, Inc. (a) 6,127 155,810
Mattel, Inc. (a) 98,344 2,057,356
Nautilus, Inc. (a)(b) 6,855 34,961
Peloton Interactive, Inc. Class A (a) 83,863 2,291,976
Polaris, Inc. 15,931 1,793,671
Smith & Wesson Brands, Inc. (b) 13,363 228,240
Sturm, Ruger & Co., Inc. 4,943 332,318
Vista Outdoor, Inc. (a) 16,221 625,806
YETI Holdings, Inc. (a) 24,625 1,614,908
16,638,808
Multiline Retail - 0.5%
Big Lots, Inc. (b) 9,539 399,779
Dillard's, Inc. Class A (b) 1,210 307,001
Dollar General Corp. 66,457 13,854,955
Dollar Tree, Inc. (a) 63,705 8,359,370
Common Stocks – continuedShares Value ($)
CONSUMER DISCRETIONARY – continued
Multiline Retail – continued
Franchise Group, Inc. 7,454 373,222
Kohl's Corp. 42,351 2,528,778
Macy's, Inc. 88,136 2,256,282
Nordstrom, Inc. (a)(b) 31,269 703,553
Ollie's Bargain Outlet Holdings, Inc. (a)(b) 17,251 827,013
Target Corp. 138,708 30,575,404
60,185,357
Specialty Retail - 2.3%
Abercrombie & Fitch Co. Class A (a) 16,787 654,693
Academy Sports & Outdoors, Inc. (a) 24,626 957,951
Advance Auto Parts, Inc. 18,286 4,233,392
America's Car Mart, Inc. (a) 1,873 177,785
American Eagle Outfitters, Inc. (b) 42,888 979,133
Asbury Automotive Group, Inc. (a) 6,522 1,049,846
AutoNation, Inc. (a) 11,263 1,227,667
AutoZone, Inc. (a) 5,970 11,858,510
Barnes & Noble Education, Inc. (a)(b) 10,249 61,699
Bath & Body Works, Inc. 74,943 4,202,054
Bed Bath & Beyond, Inc. (a)(b) 28,493 462,726
Best Buy Co., Inc. 62,933 6,247,988
Big 5 Sporting Goods Corp. (b) 5,753 113,277
Boot Barn Holdings, Inc. (a) 8,363 769,145
Burlington Stores, Inc. (a) 19,212 4,551,899
Caleres, Inc. 10,209 244,812
Camping World Holdings, Inc. (b) 12,294 408,161
CarMax, Inc. (a) 46,181 5,133,942
Carvana Co. Class A (a) 24,622 3,990,241
Chico's FAS, Inc. (a) 31,967 150,565
Citi Trends, Inc. (a)(b) 2,626 127,939
Conn's, Inc. (a)(b) 4,801 116,520
Designer Brands, Inc. Class A (a)(b) 18,838 248,096
Dick's Sporting Goods, Inc. 18,303 2,112,166
Five Below, Inc. (a) 15,727 2,579,228
Floor & Decor Holdings, Inc. Class A (a) 30,414 3,306,610
Foot Locker, Inc. 25,824 1,153,816
GameStop Corp. Class A (a)(b) 17,323 1,886,994
Gap, Inc. 61,794 1,116,618
Genesco, Inc. (a) 3,965 255,068
Group 1 Automotive, Inc. 5,207 884,201
GrowGeneration Corp. (a)(b) 14,098 118,987
Guess?, Inc. 11,225 258,400
Haverty Furniture Companies, Inc. (b) 4,330 127,822
Hibbett, Inc. (b) 4,111 253,443
Leslie's, Inc. (a)(b) 38,697 806,059
Lithia Motors, Inc. Class A (sub. vtg.) 8,503 2,483,981
LL Flooring Holdings, Inc. (a)(b) 9,656 139,433
Lowe's Companies, Inc. 196,648 46,674,403
MarineMax, Inc. (a) 5,699 268,195
Monro, Inc. (b) 9,117 453,388
Murphy U.S.A., Inc. 6,624 1,302,676
National Vision Holdings, Inc. (a) 23,884 976,378
O'Reilly Automotive, Inc. (a) 19,180 12,500,565
OneWater Marine, Inc. Class A (b) 2,910 150,476
Party City Holdco, Inc. (a)(b) 29,359 138,868
5 Quarterly Report

Schedule of Investments (Unaudited) − continued
Common Stocks – continuedShares Value ($)
CONSUMER DISCRETIONARY – continued
Specialty Retail – continued
Penske Automotive Group, Inc. 8,785 892,820
Petco Health & Wellness Co., Inc. (b) 23,905 448,219
Rent-A-Center, Inc. 16,911 712,799
RH (a) 4,908 1,977,041
Ross Stores, Inc. 100,664 9,839,906
Sally Beauty Holdings, Inc. (a)(b) 30,521 524,046
Shoe Carnival, Inc. 5,117 174,797
Signet Jewelers Ltd. 14,781 1,273,088
Sleep Number Corp. (a)(b) 6,787 485,271
Sonic Automotive, Inc. Class A (sub. vtg.) 6,162 314,324
Sportsman's Warehouse Holdings, Inc. (a) 12,954 141,976
The Aaron's Co., Inc. 8,165 172,853
The Buckle, Inc. 8,129 305,976
The Cato Corp. Class A (sub. vtg.) 5,869 96,956
The Children's Place, Inc. (a) 4,166 294,745
The Home Depot, Inc. 299,637 109,960,786
The ODP Corp. (a) 12,568 555,883
Tilly's, Inc. 6,975 91,931
TJX Companies, Inc. 342,308 24,635,907
Tractor Supply Co. 32,173 7,023,688
TravelCenters of America LLC (a) 3,661 166,868
Ulta Beauty, Inc. (a) 15,502 5,638,697
Urban Outfitters, Inc. (a) 17,701 508,373
Victoria's Secret & Co. (a) 20,738 1,157,803
Vroom, Inc. (a)(b) 34,625 277,693
Williams-Sonoma, Inc. 20,982 3,368,450
Winmark Corp. 768 165,443
Zumiez, Inc. (a)(b) 6,096 274,015
299,396,170
Textiles, Apparel & Luxury Goods - 0.7%
Capri Holdings Ltd. (a) 42,501 2,553,035
Carter's, Inc. 12,005 1,117,906
Columbia Sportswear Co. 9,617 893,131
Crocs, Inc. (a) 16,608 1,704,313
Deckers Outdoor Corp. (a) 7,738 2,477,940
Fossil Group, Inc. (a) 12,490 138,514
G-III Apparel Group Ltd. (a) 12,008 326,257
Hanesbrands, Inc. 98,891 1,592,145
Kontoor Brands, Inc. 12,902 635,940
Lakeland Industries, Inc. (a)(b) 1,881 39,539
Levi Strauss & Co. Class A 26,462 580,312
lululemon athletica, Inc. (a) 33,772 11,271,743
Movado Group, Inc. (b) 4,961 183,904
NIKE, Inc. Class B 362,990 53,747,929
Oxford Industries, Inc. 4,683 385,832
PVH Corp. 20,528 1,950,365
Ralph Lauren Corp. 13,614 1,508,976
Samsonite International SA (a)(d) 402,000 840,194
Skechers U.S.A., Inc. Class A (sub. vtg.) (a) 37,862 1,590,204
Steven Madden Ltd. 21,963 903,558
Superior Group of Companies, Inc. 2,637 53,874
Tapestry, Inc. 77,666 2,947,425
Under Armour, Inc.:
Class A (sub. vtg.) (a) 57,686 1,086,227
Common Stocks – continuedShares Value ($)
CONSUMER DISCRETIONARY – continued
Textiles, Apparel & Luxury Goods – continued
Under Armour, Inc.: – continued
Class C (non-vtg.) (a) 55,411 886,022
Unifi, Inc. (a) 3,888 73,911
Vera Bradley, Inc. (a) 8,190 67,076
VF Corp. 92,807 6,051,944
Wolverine World Wide, Inc. 22,751 602,674
96,210,890
TOTAL CONSUMER DISCRETIONARY 1,525,322,889
CONSUMER STAPLES - 5.6%
Beverages - 1.3%
Boston Beer Co., Inc. Class A (a) 2,678 1,126,983
Brown-Forman Corp. Class B (non-vtg.) 52,437 3,535,827
Celsius Holdings, Inc. (a) 10,728 512,047
Coca-Cola Bottling Co. Consolidated 1,298 743,754
Constellation Brands, Inc. Class A (sub. vtg.) 46,481 11,050,858
Keurig Dr. Pepper, Inc. 208,438 7,910,222
MGP Ingredients, Inc. (b) 3,388 256,336
Molson Coors Beverage Co. Class B 54,583 2,601,426
Monster Beverage Corp. (a) 106,956 9,275,224
National Beverage Corp. (b) 6,490 289,908
Newage, Inc. (a)(b) 30,286 22,699
PepsiCo, Inc. 392,022 68,023,657
The Coca-Cola Co. 1,103,151 67,303,243
172,652,184
Food & Staples Retailing - 1.3%
Andersons, Inc. 8,900 339,090
BJ's Wholesale Club Holdings, Inc. (a) 38,975 2,395,793
Blue Apron Holdings, Inc.:
warrants 11/4/28 (a) 2,361 935
warrants 11/4/28 (a) 2,361 408
warrants 11/4/28 (a) 2,361 188
Class A (a)(b) 5,664 43,783
Casey's General Stores, Inc. 10,357 1,945,148
Chefs' Warehouse Holdings (a) 9,495 283,331
Costco Wholesale Corp. 125,452 63,369,569
Grocery Outlet Holding Corp. (a)(b) 24,524 622,419
Ingles Markets, Inc. Class A 3,901 300,104
Kroger Co. 193,021 8,413,785
Natural Grocers by Vitamin Cottage, Inc. 3,943 57,568
Performance Food Group Co. (a) 43,188 1,822,102
PriceSmart, Inc. 6,829 487,659
Rite Aid Corp. (a)(b) 14,627 155,192
SpartanNash Co. 8,930 219,410
Sprouts Farmers Market LLC (a) 31,712 860,664
Sysco Corp. 146,203 11,425,764
U.S. Foods Holding Corp. (a) 65,843 2,321,624
United Natural Foods, Inc. (a) 16,422 636,845
Walgreens Boots Alliance, Inc. 204,957 10,198,660
Walmart, Inc. 403,597 56,426,897
Weis Markets, Inc. 4,678 281,803
162,608,741
Food Products - 1.0%
Archer Daniels Midland Co. 158,500 11,887,500
Quarterly Report 6

Common Stocks – continuedShares Value ($)
CONSUMER STAPLES – continued
Food Products – continued
B&G Foods, Inc. Class A (b) 18,642 579,766
Beyond Meat, Inc. (a)(b) 16,819 1,095,421
Bunge Ltd. 40,039 3,958,256
Cal-Maine Foods, Inc. (a)(b) 10,758 419,562
Calavo Growers, Inc. (b) 4,640 192,142
Campbell Soup Co. 56,704 2,501,780
Conagra Brands, Inc. 135,949 4,725,587
Darling Ingredients, Inc. (a) 45,605 2,908,231
Flowers Foods, Inc. 56,889 1,600,288
Fresh Del Monte Produce, Inc. 9,128 254,032
Freshpet, Inc. (a) 12,169 1,132,082
General Mills, Inc. 172,608 11,854,717
Hormel Foods Corp. 79,745 3,785,495
Hostess Brands, Inc. Class A (a) 39,848 817,681
Ingredion, Inc. 19,013 1,800,531
J&J Snack Foods Corp. 4,210 638,615
John B. Sanfilippo & Son, Inc. 2,544 201,230
Kellogg Co. 72,469 4,565,547
Laird Superfood, Inc. (a) 2,109 16,809
Lamb Weston Holdings, Inc. 41,078 2,637,618
Lancaster Colony Corp. 5,428 861,804
Landec Corp. (a) 6,145 66,059
McCormick & Co., Inc. (non-vtg.) 70,836 7,105,559
Mondelez International, Inc. 396,265 26,561,643
Pilgrim's Pride Corp. (a) 13,293 371,805
Post Holdings, Inc. (a) 16,301 1,724,972
Sanderson Farms, Inc. 5,953 1,095,352
Seaboard Corp. 70 267,399
Seneca Foods Corp. Class A (a) 1,775 82,981
The Hain Celestial Group, Inc. (a) 26,376 963,515
The Hershey Co. 41,364 8,151,603
The J.M. Smucker Co. 30,665 4,310,886
The Kraft Heinz Co. 201,543 7,215,239
The Simply Good Foods Co. (a) 23,662 833,612
Tootsie Roll Industries, Inc. (b) 4,992 169,478
TreeHouse Foods, Inc. (a)(b) 15,793 611,663
Tyson Foods, Inc. Class A 84,072 7,641,304
Vital Farms, Inc. (a)(b) 7,549 124,785
Whole Earth Brands, Inc. Class A (a)(b) 12,713 120,519
125,853,068
Household Products - 1.2%
Central Garden & Pet Co. (a) 3,746 173,777
Central Garden & Pet Co. Class A (non-vtg.) (a) 10,950 474,464
Church & Dwight Co., Inc. 69,165 7,099,787
Colgate-Palmolive Co. 239,633 19,757,741
Energizer Holdings, Inc. 17,754 667,728
Kimberly-Clark Corp. 96,056 13,222,108
Procter & Gamble Co. 686,577 110,161,280
Reynolds Consumer Products, Inc. 15,044 455,382
Spectrum Brands Holdings, Inc. 11,868 1,060,762
The Clorox Co. 34,935 5,864,189
WD-40 Co. (b) 3,834 852,145
159,789,363
Common Stocks – continuedShares Value ($)
CONSUMER STAPLES – continued
Personal Products - 0.2%
BellRing Brands, Inc. Class A (a)(b) 10,504 255,877
Coty, Inc. Class A (a) 95,458 809,484
Edgewell Personal Care Co. (b) 15,153 694,007
elf Beauty, Inc. (a) 13,283 392,645
Estee Lauder Companies, Inc. Class A 65,755 20,501,751
Herbalife Nutrition Ltd. (a) 28,267 1,201,630
Inter Parfums, Inc. 5,387 533,151
MediFast, Inc. 3,349 665,480
Nu Skin Enterprises, Inc. Class A 14,124 680,636
The Honest Co., Inc. 7,686 49,882
USANA Health Sciences, Inc. (a) 3,430 327,839
Veru, Inc. (a)(b) 16,169 84,079
26,196,461
Tobacco - 0.6%
22nd Century Group, Inc. (a)(b) 45,916 99,638
Altria Group, Inc. 521,626 26,540,331
Philip Morris International, Inc. 442,071 45,467,002
Turning Point Brands, Inc. 4,219 148,635
Universal Corp. 7,515 409,041
Vector Group Ltd. 35,516 394,583
73,059,230
TOTAL CONSUMER STAPLES 720,159,047
ENERGY - 3.3%
Energy Equipment & Services - 0.3%
Archrock, Inc. 34,643 292,387
Aspen Aerogels, Inc. (a) 6,778 201,307
Baker Hughes Co. Class A 248,707 6,824,520
Bristow Group, Inc. (a) 6,833 224,464
Cactus, Inc. 16,774 812,868
Championx Corp. (a) 57,134 1,279,802
Core Laboratories NV (b) 12,566 335,135
DMC Global, Inc. (a)(b) 5,455 220,055
Dril-Quip, Inc. (a) 10,241 258,995
Expro Group Holdings NV (a)(b) 8,330 130,448
Halliburton Co. 254,736 7,830,585
Helix Energy Solutions Group, Inc. (a)(b) 44,237 156,157
Helmerich & Payne, Inc. 30,516 875,809
Liberty Oilfield Services, Inc. Class A (a) 28,155 340,676
Nabors Industries Ltd. (a) 2,045 211,678
Newpark Resources, Inc. (a) 32,899 116,791
Nextier Oilfield Solutions, Inc. (a) 44,329 266,861
NOV, Inc. 109,266 1,794,148
Oceaneering International, Inc. (a) 30,084 391,995
Oil States International, Inc. (a) 15,609 97,868
Patterson-UTI Energy, Inc. 60,965 607,211
ProPetro Holding Corp. (a) 22,724 238,829
RPC, Inc. (a)(b) 20,977 123,974
Schlumberger Ltd. 400,609 15,651,794
Select Energy Services, Inc. Class A (a) 21,228 141,591
Solaris Oilfield Infrastructure, Inc. Class A 6,688 51,564
TechnipFMC PLC (a) 120,883 784,531
TETRA Technologies, Inc. (a)(b) 32,237 94,454
Tidewater, Inc. (a) 11,790 167,300
7 Quarterly Report

Schedule of Investments (Unaudited) − continued
Common Stocks – continuedShares Value ($)
ENERGY – continued
Energy Equipment & Services – continued
Transocean Ltd. (United States) (a)(b) 175,136 551,678
U.S. Silica Holdings, Inc. (a)(b) 21,903 209,174
Weatherford International PLC (a) 18,431 552,930
41,837,579
Oil, Gas & Consumable Fuels - 3.0%
Alto Ingredients, Inc. (a)(b) 23,768 123,118
Antero Resources Corp. (a) 80,593 1,573,981
APA Corp. 104,350 3,465,464
Arch Resources, Inc. (b) 4,306 407,520
Berry Corp. 17,128 148,842
Brigham Minerals, Inc. Class A 13,726 297,031
Callon Petroleum Co. (a)(b) 13,408 662,892
Centennial Resource Development, Inc. Class A(a)(b) 51,061 398,786
Cheniere Energy, Inc. 67,007 7,498,083
Chevron Corp. 546,645 71,790,888
Civitas Resources, Inc. (b) 20,394 1,111,473
Clean Energy Fuels Corp. (a)(b) 50,161 304,477
CNX Resources Corp. (a)(b) 59,940 888,910
Comstock Resources, Inc. (a)(b) 24,290 188,976
ConocoPhillips Co. 374,555 33,193,064
CONSOL Energy, Inc. (a) 8,413 182,899
Continental Resources, Inc. 16,251 844,077
Coterra Energy, Inc. 231,618 5,072,434
Crescent Energy, Inc. Class A (a)(b) 8,779 116,497
CVR Energy, Inc. 8,781 171,493
Delek U.S. Holdings, Inc. (a) 21,695 336,706
Denbury, Inc. (a) 13,942 1,047,602
Devon Energy Corp. 179,332 9,068,819
Diamondback Energy, Inc. 48,468 6,114,723
DT Midstream, Inc. 26,981 1,394,918
EOG Resources, Inc. 166,326 18,542,022
EQT Corp. 85,162 1,809,693
Equitrans Midstream Corp. 115,317 935,221
Exxon Mobil Corp. 1,201,389 91,257,508
Green Plains, Inc. (a) 14,957 456,787
Hess Corp. 77,911 7,190,406
HollyFrontier Corp. 41,539 1,460,511
International Seaways, Inc. (b) 11,283 164,619
Kinder Morgan, Inc. 552,487 9,591,174
Kosmos Energy Ltd. (a) 127,676 552,837
Laredo Petroleum, Inc. (a)(b) 4,177 280,527
Magnolia Oil & Gas Corp. Class A 42,607 921,589
Marathon Oil Corp. 222,023 4,322,788
Marathon Petroleum Corp. 175,834 12,616,090
Matador Resources Co. 30,734 1,375,961
Murphy Oil Corp. 40,433 1,277,683
National Energy Services Reunited Corp. (a) 9,369 93,034
Northern Oil & Gas, Inc. 18,260 429,475
Occidental Petroleum Corp. 253,360 9,544,071
ONEOK, Inc. 127,230 7,720,316
Ovintiv, Inc. 74,126 2,876,089
Par Pacific Holdings, Inc. (a) 13,508 190,463
PBF Energy, Inc. Class A (a) 26,840 425,146
Common Stocks – continuedShares Value ($)
ENERGY – continued
Oil, Gas & Consumable Fuels – continued
PDC Energy, Inc. 27,332 1,619,968
Peabody Energy Corp. (a) 26,460 285,768
Phillips 66 Co. 125,320 10,625,883
Pioneer Natural Resources Co. 64,589 14,137,886
Range Resources Corp. (a) 70,411 1,355,412
Ranger Oil Corp. (a) 6,062 187,983
Renewable Energy Group, Inc. (a)(b) 13,905 559,815
Rex American Resources Corp. (a) 1,370 132,109
SM Energy Co. 33,807 1,109,208
Southwestern Energy Co. (a) 286,432 1,260,301
Talos Energy, Inc. (a) 11,959 127,244
Targa Resources Corp. 66,151 3,908,201
Teekay Corp. (a) 20,995 65,085
Teekay Tankers Ltd. (a)(b) 6,971 74,381
Tellurian, Inc. (a)(b) 111,678 280,312
The Williams Companies, Inc. 344,431 10,312,264
Uranium Energy Corp. (a)(b) 74,713 195,001
Valero Energy Corp. 116,964 9,704,503
W&T Offshore, Inc. (a) 21,580 92,362
World Fuel Services Corp. 17,468 492,772
376,964,141
TOTAL ENERGY 418,801,720
FINANCIALS - 11.9%
Banks - 4.4%
1st Source Corp. 5,348 266,758
Allegiance Bancshares, Inc. 5,293 233,051
Ameris Bancorp 19,027 938,221
Associated Banc-Corp. 43,762 1,045,912
Atlantic Union Bankshares Corp. 20,870 849,826
Banc of California, Inc. 15,664 302,628
BancFirst Corp. 6,120 458,694
Bancorp, Inc., Delaware (a) 15,805 471,305
Bank of America Corp. 2,045,048 94,358,515
Bank of Hawaii Corp. 11,700 1,007,019
Bank OZK 34,174 1,601,052
BankUnited, Inc. 25,353 1,058,488
Banner Corp. 9,505 590,356
Berkshire Hills Bancorp, Inc. 14,003 414,349
BOK Financial Corp. 8,398 861,215
Brookline Bancorp, Inc., Delaware 23,936 409,306
Cadence Bank 55,194 1,720,397
Camden National Corp. 3,358 166,758
Cathay General Bancorp 20,841 941,180
Central Pacific Financial Corp. 8,642 251,482
Citigroup, Inc. 564,435 36,756,007
Citizens Financial Group, Inc. 120,669 6,210,833
City Holding Co. 4,571 366,640
Columbia Banking Systems, Inc. 21,949 763,167
Comerica, Inc. 37,218 3,453,086
Commerce Bancshares, Inc. 30,809 2,123,048
Community Bank System, Inc. 15,792 1,127,865
Community Trust Bancorp, Inc. 3,056 135,045
ConnectOne Bancorp, Inc. 10,361 331,656
Quarterly Report 8

Common Stocks – continuedShares Value ($)
FINANCIALS – continued
Banks – continued
CrossFirst Bankshares, Inc. (a)(b) 14,822 229,148
Cullen/Frost Bankers, Inc. 15,888 2,240,367
Customers Bancorp, Inc. (a) 8,548 498,348
CVB Financial Corp. 37,344 822,688
Dime Community Bancshares, Inc. 9,573 334,672
Eagle Bancorp, Inc. 9,437 565,937
East West Bancorp, Inc. 40,318 3,481,056
Eastern Bankshares, Inc. 48,335 1,029,052
Enterprise Financial Services Corp. 10,695 529,830
FB Financial Corp. 9,960 443,419
Fifth Third Bancorp 196,332 8,762,297
First Bancorp, North Carolina 9,984 438,397
First Bancorp, Puerto Rico 57,777 840,655
First Bancshares, Inc. (b) 5,811 209,603
First Busey Corp. 13,443 374,791
First Citizens Bancshares, Inc. 3,746 2,918,434
First Commonwealth Financial Corp. 28,076 464,939
First Financial Bancorp, Ohio (b) 26,112 658,284
First Financial Bankshares, Inc. 38,868 1,826,407
First Financial Corp., Indiana 2,595 116,490
First Foundation, Inc. 9,716 254,073
First Hawaiian, Inc. 36,881 1,045,576
First Horizon National Corp. 154,237 2,638,995
First Interstate Bancsystem, Inc. 9,147 336,152
First Merchants Corp. 18,608 789,537
First Midwest Bancorp, Inc., Delaware 33,508 695,961
First Republic Bank 51,544 8,947,523
Five Star Bancorp 2,181 67,611
Flushing Financial Corp. 7,540 178,019
FNB Corp., Pennsylvania 92,492 1,194,997
Fulton Financial Corp. 44,720 802,724
German American Bancorp, Inc. 7,126 282,190
Glacier Bancorp, Inc. 30,755 1,597,107
Great Southern Bancorp, Inc. 2,261 134,168
Hancock Whitney Corp. 23,850 1,257,372
Hanmi Financial Corp. 7,435 199,853
HarborOne Bancorp, Inc. 13,521 191,998
Heartland Financial U.S.A., Inc. 11,144 579,822
Heritage Commerce Corp. 14,178 176,658
Heritage Financial Corp., Washington 10,987 266,545
Hilltop Holdings, Inc. 17,032 562,567
Home Bancshares, Inc. 42,768 1,007,614
HomeStreet, Inc. 5,686 277,193
Hope Bancorp, Inc. 33,335 558,361
Horizon Bancorp, Inc. Indiana (b) 10,704 228,316
Huntington Bancshares, Inc. 409,386 6,165,353
Independent Bank Corp. 4,722 115,595
Independent Bank Corp., Massachusetts 13,541 1,142,183
Independent Bank Group, Inc. 10,673 810,294
International Bancshares Corp. 14,519 610,234
Investors Bancorp, Inc. 63,154 1,030,673
JPMorgan Chase & Co. 839,224 124,708,686
KeyCorp 265,047 6,642,078
Lakeland Bancorp, Inc. 15,245 288,588
Common Stocks – continuedShares Value ($)
FINANCIALS – continued
Banks – continued
Lakeland Financial Corp. 7,224 577,414
Live Oak Bancshares, Inc. 9,181 540,394
M&T Bank Corp. 36,708 6,217,601
Meta Financial Group, Inc. 8,814 524,080
Midland States Bancorp, Inc. 4,640 133,957
National Bank Holdings Corp. 8,441 383,221
NBT Bancorp, Inc. 12,175 470,929
Nicolet Bankshares, Inc. (a) 3,510 326,746
OceanFirst Financial Corp. 16,805 381,474
OFG Bancorp 14,165 391,946
Old National Bancorp, Indiana (b) 48,158 882,736
Origin Bancorp, Inc. 6,508 278,022
Pacific Premier Bancorp, Inc. 27,011 1,033,171
PacWest Bancorp 32,665 1,516,636
Park National Corp. 4,184 566,765
Peoples Bancorp, Inc. 8,186 271,366
Peoples United Financial, Inc. 119,604 2,317,926
Pinnacle Financial Partners, Inc. 21,338 2,063,598
PNC Financial Services Group, Inc. 120,357 24,792,338
Popular, Inc. 22,824 2,035,216
Preferred Bank, Los Angeles 3,880 302,873
Prosperity Bancshares, Inc. 26,150 1,915,488
QCR Holdings, Inc. 4,788 273,108
Regions Financial Corp. 271,843 6,236,078
Renasant Corp. 16,046 590,172
S&T Bancorp, Inc. 10,663 328,527
Sandy Spring Bancorp, Inc. 13,255 627,094
Seacoast Banking Corp., Florida 15,547 567,466
ServisFirst Bancshares, Inc. 14,008 1,188,859
Signature Bank 17,146 5,223,186
Silvergate Capital Corp. (a) 8,418 906,955
Simmons First National Corp. Class A 32,661 934,105
Southside Bancshares, Inc. (b) 9,395 393,651
Southstate Corp. 19,636 1,657,475
Stock Yards Bancorp, Inc. 6,752 402,284
SVB Financial Group (a) 16,787 9,801,929
Synovus Financial Corp. 40,622 2,021,351
Texas Capital Bancshares, Inc. (a) 14,483 908,084
Tompkins Financial Corp. 3,424 272,413
TowneBank 18,139 569,202
Trico Bancshares 7,770 337,762
TriState Capital Holdings, Inc. (a) 8,421 266,019
Triumph Bancorp, Inc. (a) 6,660 582,617
Truist Financial Corp. 380,847 23,924,809
Trustmark Corp. 18,572 605,076
U.S. Bancorp 384,349 22,365,268
UMB Financial Corp. 12,053 1,186,618
Umpqua Holdings Corp. 61,448 1,246,165
United Bankshares, Inc., West Virginia (b) 38,575 1,362,855
United Community Bank, Inc. 29,729 1,052,109
Univest Corp. of Pennsylvania 7,262 218,804
Valley National Bancorp 114,544 1,594,452
Veritex Holdings, Inc. 14,573 585,106
Washington Trust Bancorp, Inc. 4,850 276,838
9 Quarterly Report

Schedule of Investments (Unaudited) − continued
Common Stocks – continuedShares Value ($)
FINANCIALS – continued
Banks – continued
Webster Financial Corp. 25,740 1,462,289
Wells Fargo & Co. 1,132,658 60,937,000
WesBanco, Inc. 17,781 631,048
Westamerica Bancorp. 8,281 480,960
Western Alliance Bancorp. 29,832 2,959,036
Wintrust Financial Corp. 16,268 1,595,403
Zions Bancorp NA 44,024 2,985,708
559,265,067
Capital Markets - 3.1%
Affiliated Managers Group, Inc. 11,428 1,670,888
Ameriprise Financial, Inc. 31,683 9,641,454
Ares Management Corp. 47,609 3,795,389
Artisan Partners Asset Management, Inc. 18,602 803,792
Assetmark Financial Holdings, Inc. (a) 4,688 112,465
B. Riley Financial, Inc. (b) 4,563 280,944
Bank of New York Mellon Corp. 216,210 12,812,605
BGC Partners, Inc. Class A 95,285 402,103
BlackRock, Inc. Class A 40,559 33,377,623
Blackstone, Inc. 195,186 25,758,696
Blucora, Inc. (a) 14,370 233,081
Bridge Investment Group Holdings, Inc. 6,374 137,041
BrightSphere Investment Group, Inc. 10,420 224,864
Carlyle Group LP 40,188 2,051,597
Cboe Global Markets, Inc. 30,143 3,572,850
Charles Schwab Corp. 426,814 37,431,588
CME Group, Inc. 101,884 23,382,378
Cohen & Steers, Inc. 7,413 619,208
Coinbase Global, Inc. (a)(b) 8,319 1,581,858
Cowen Group, Inc. Class A (b) 8,275 262,152
Diamond Hill Investment Group, Inc. 824 153,882
Donnelley Financial Solutions, Inc. (a) 8,112 301,929
Evercore, Inc. Class A 10,867 1,356,419
FactSet Research Systems, Inc. 10,659 4,496,926
Federated Hermes, Inc. 27,220 901,254
Focus Financial Partners, Inc. Class A (a) 14,933 752,026
Franklin Resources, Inc. 79,515 2,542,095
Goldman Sachs Group, Inc. 96,450 34,208,886
Greenhill & Co., Inc. (b) 3,173 52,926
Hamilton Lane, Inc. Class A 9,953 900,348
Houlihan Lokey 14,447 1,535,427
Interactive Brokers Group, Inc. 25,007 1,705,227
Intercontinental Exchange, Inc. 159,673 20,224,182
Invesco Ltd. 95,991 2,175,156
Janus Henderson Group PLC 48,575 1,792,418
Jefferies Financial Group, Inc. 56,682 2,076,828
KKR & Co. LP 166,427 11,842,945
Lazard Ltd. Class A 31,445 1,372,260
LPL Financial 22,650 3,903,048
MarketAxess Holdings, Inc. 10,782 3,714,183
Moelis & Co. Class A 17,761 1,002,964
Moody's Corp. 45,958 15,763,594
Morgan Stanley 407,701 41,805,661
Morningstar, Inc. 6,648 1,910,702
MSCI, Inc. 23,521 12,610,079
Common Stocks – continuedShares Value ($)
FINANCIALS – continued
Capital Markets – continued
NASDAQ, Inc. 33,525 6,008,015
Northern Trust Corp. 59,369 6,924,800
Open Lending Corp. (a) 27,634 524,770
Oppenheimer Holdings, Inc. Class A (non-vtg.) 2,180 92,410
Piper Jaffray Companies 4,100 632,302
PJT Partners, Inc. 7,065 489,746
Raymond James Financial, Inc. 52,309 5,537,954
S&P Global, Inc. 68,407 28,403,955
Sculptor Capital Management, Inc. Class A 5,150 100,940
SEI Investments Co. 30,043 1,760,820
State Street Corp. 103,638 9,793,791
StepStone Group, Inc. Class A 13,922 487,409
Stifel Financial Corp. 29,374 2,200,113
StoneX Group, Inc. (a) 4,973 326,279
T. Rowe Price Group, Inc. 63,961 9,877,497
Tradeweb Markets, Inc. Class A 29,875 2,532,504
Victory Capital Holdings, Inc. 4,788 156,424
Virtu Financial, Inc. Class A 24,366 753,640
Virtus Investment Partners, Inc. 2,109 551,883
WisdomTree Investments, Inc. 33,651 188,782
404,597,975
Consumer Finance - 0.6%
Ally Financial, Inc. 98,623 4,706,290
American Express Co. 178,209 32,045,542
Capital One Financial Corp. 121,183 17,781,182
Credit Acceptance Corp. (a)(b) 2,334 1,259,333
CURO Group Holdings Corp. 6,864 98,361
Discover Financial Services 83,104 9,619,288
Encore Capital Group, Inc. (a)(b) 6,885 444,083
Enova International, Inc. (a)(b) 10,729 432,164
EZCORP, Inc. (non-vtg.) Class A (a)(b) 13,613 81,270
FirstCash Holdings, Inc. 11,114 774,646
Green Dot Corp. Class A (a) 15,334 486,241
LendingClub Corp. (a) 28,707 538,543
LendingTree, Inc. (a)(b) 3,097 377,338
Navient Corp. 46,520 810,844
Nelnet, Inc. Class A 5,599 495,679
OneMain Holdings, Inc. 31,214 1,612,515
PRA Group, Inc. (a) 12,718 591,387
PROG Holdings, Inc. (a) 16,180 644,126
SLM Corp. 82,411 1,511,418
Synchrony Financial 156,875 6,681,306
Upstart Holdings, Inc. (a)(b) 13,852 1,510,007
World Acceptance Corp. (a)(b) 1,149 217,138
82,718,701
Diversified Financial Services - 1.4%
A-Mark Precious Metals, Inc. 2,150 133,085
Apollo Global Management, Inc. 105,286 7,370,020
Berkshire Hathaway, Inc. Class B (a) 519,567 162,634,862
Cannae Holdings, Inc. (a) 24,549 733,279
Equitable Holdings, Inc. 106,101 3,569,238
Voya Financial, Inc. 31,642 2,150,390
176,590,874
Quarterly Report 10

Common Stocks – continuedShares Value ($)
FINANCIALS – continued
Insurance - 2.1%
AFLAC, Inc. 173,178 10,879,042
Alleghany Corp. (a) 3,896 2,586,944
Allstate Corp. 81,606 9,847,396
AMBAC Financial Group, Inc. (a) 11,780 166,923
American Equity Investment Life Holding Co. 23,308 958,891
American Financial Group, Inc. 18,685 2,434,282
American International Group, Inc. 235,259 13,586,207
American National Group, Inc. 3,613 682,098
Amerisafe, Inc. 5,907 310,236
Aon PLC 62,536 17,287,452
Arch Capital Group Ltd. (a) 109,262 5,061,016
Argo Group International Holdings, Ltd. (b) 9,604 545,315
Arthur J. Gallagher & Co. 58,918 9,305,509
Assurant, Inc. 16,327 2,490,031
Assured Guaranty Ltd. 19,710 1,050,346
Axis Capital Holdings Ltd. 21,953 1,250,882
Brighthouse Financial, Inc. (a) 22,494 1,224,798
Brown & Brown, Inc. 67,150 4,450,702
BRP Group, Inc. (a) 15,340 468,177
Chubb Ltd. 122,302 24,127,739
Cincinnati Financial Corp. 42,327 4,987,390
CNO Financial Group, Inc. 34,976 872,301
eHealth, Inc. (a) 6,395 139,731
Employers Holdings, Inc. 8,870 346,817
Enstar Group Ltd. (a) 3,457 916,382
Erie Indemnity Co. Class A 6,969 1,282,993
Everest Re Group Ltd. 11,101 3,146,023
Fidelity National Financial, Inc. 80,436 4,049,953
First American Financial Corp. 31,095 2,316,888
Genworth Financial, Inc. Class A (a) 143,349 559,061
Globe Life, Inc. 26,599 2,721,078
GoHealth, Inc. (a)(b) 19,265 53,171
Goosehead Insurance (b) 5,747 566,539
Greenlight Capital Re, Ltd. (a) 6,458 46,756
Hanover Insurance Group, Inc. 9,975 1,376,151
Hartford Financial Services Group, Inc. 96,365 6,925,753
HCI Group, Inc. 2,402 163,024
Heritage Insurance Holdings, Inc. 5,941 37,012
Horace Mann Educators Corp. 10,799 410,470
James River Group Holdings Ltd. 10,815 306,281
Kemper Corp. 17,505 1,049,950
Kinsale Capital Group, Inc. 6,123 1,226,559
Lemonade, Inc. (a)(b) 11,091 354,136
Lincoln National Corp. 47,815 3,346,094
Loews Corp. 56,494 3,370,432
Markel Corp. (a) 3,950 4,869,323
Marsh & McLennan Companies, Inc. 142,914 21,957,307
MBIA, Inc. (a)(b) 12,552 171,586
Mercury General Corp. 7,529 411,535
MetLife, Inc. 203,690 13,659,451
National Western Life Group, Inc. 664 142,010
Old Republic International Corp. 79,750 2,043,993
Palomar Holdings, Inc. (a) 7,089 373,945
Primerica, Inc. 11,311 1,745,740
Common Stocks – continuedShares Value ($)
FINANCIALS – continued
Insurance – continued
Principal Financial Group, Inc. 69,760 5,096,666
ProAssurance Corp. 15,146 362,898
Progressive Corp. 166,005 18,038,103
Prudential Financial, Inc. 107,082 11,947,139
Reinsurance Group of America, Inc. 18,997 2,181,426
RenaissanceRe Holdings Ltd. 12,967 2,038,023
RLI Corp. 11,408 1,195,330
Root, Inc. (a)(b) 23,853 47,945
Ryan Specialty Group Holdings, Inc. (b) 16,657 623,138
Safety Insurance Group, Inc. 3,639 299,599
Selective Insurance Group, Inc. 16,793 1,324,968
Selectquote, Inc. (a)(b) 33,790 249,708
Siriuspoint Ltd. (a)(b) 25,159 213,097
Stewart Information Services Corp. 7,463 533,082
The Travelers Companies, Inc. 70,131 11,654,370
Trean Insurance Group, Inc. (a) 4,901 39,551
Trupanion, Inc. (a) 9,790 932,498
United Fire Group, Inc. 6,415 159,990
Universal Insurance Holdings, Inc. 8,298 143,058
Unum Group 57,508 1,459,553
W.R. Berkley Corp. 39,853 3,367,579
White Mountains Insurance Group Ltd. 839 873,365
Willis Towers Watson PLC 35,477 8,300,199
265,741,106
Mortgage Real Estate Investment Trusts - 0.2%
AG Mortgage Investment Trust, Inc. 3,260 34,295
AGNC Investment Corp. 151,357 2,253,706
Angel Oak Mortgage, Inc. (b) 2,575 44,007
Annaly Capital Management, Inc. 418,759 3,308,196
Apollo Commercial Real Estate Finance, Inc. 37,587 513,063
Arbor Realty Trust, Inc. 42,581 745,593
Ares Commercial Real Estate Corp. 14,498 212,976
Armour Residential REIT, Inc. 21,650 203,077
Blackstone Mortgage Trust, Inc. 47,030 1,477,683
BrightSpire Capital, Inc. 28,482 267,446
Broadmark Realty Capital, Inc. 40,095 376,091
Cherry Hill Mortgage Investment Corp. 4,889 39,650
Chimera Investment Corp. 66,563 965,164
Dynex Capital, Inc. 10,487 168,631
Ellington Financial LLC 14,132 251,126
Franklin BSP Realty Trust, Inc. 13,043 175,689
Granite Point Mortgage Trust, Inc. 14,174 171,505
Hannon Armstrong Sustainable Infrastructure Capital,Inc. 24,274 1,006,886
Invesco Mortgage Capital, Inc. 91,848 246,153
KKR Real Estate Finance Trust, Inc. (b) 12,388 264,360
Ladder Capital Corp. Class A 31,085 369,601
MFA Financial, Inc. 123,268 570,731
New Residential Investment Corp. 131,304 1,398,388
New York Mortgage Trust, Inc. 96,656 362,460
Orchid Island Capital, Inc. 48,363 194,903
PennyMac Mortgage Investment Trust 30,506 543,617
Ready Capital Corp. 15,800 224,992
Redwood Trust, Inc. 33,616 414,485
11 Quarterly Report
Schedule of Investments (Unaudited) − continued
Common Stocks – continuedShares Value ($)
FINANCIALS – continued
Mortgage Real Estate Investment Trusts –continued
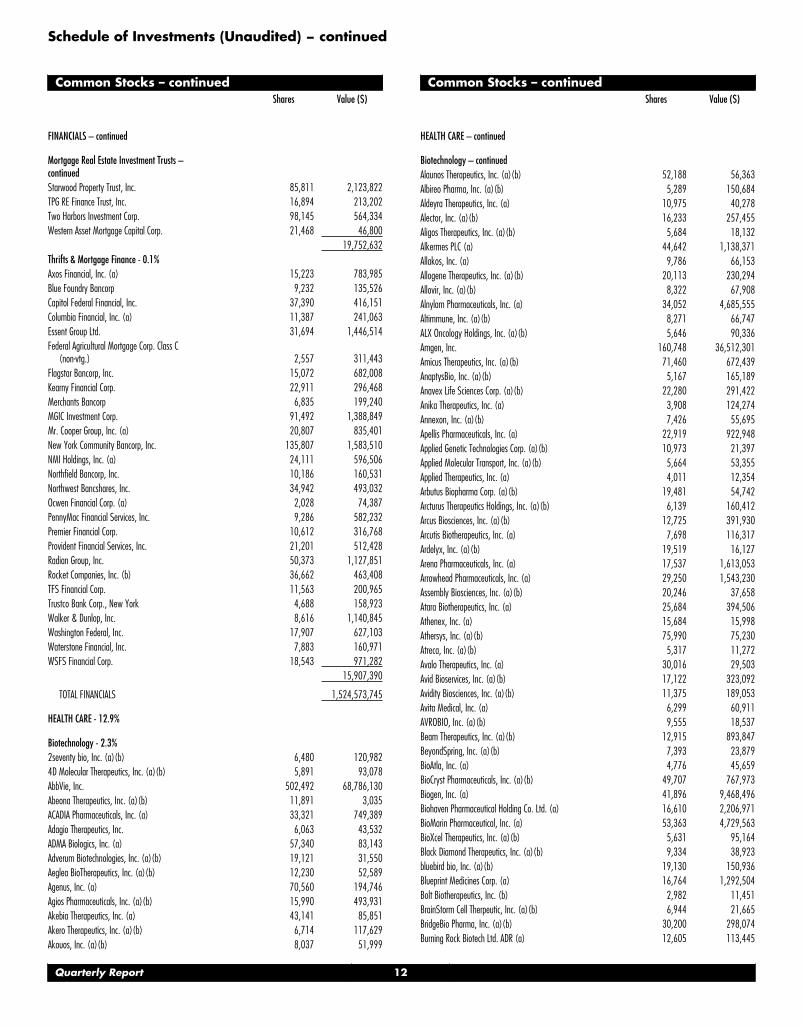
Starwood Property Trust, Inc. 85,811 2,123,822
TPG RE Finance Trust, Inc. 16,894 213,202
Two Harbors Investment Corp. 98,145 564,334
Western Asset Mortgage Capital Corp. 21,468 46,800
19,752,632
Thrifts & Mortgage Finance - 0.1%
Axos Financial, Inc. (a) 15,223 783,985
Blue Foundry Bancorp 9,232 135,526
Capitol Federal Financial, Inc. 37,390 416,151
Columbia Financial, Inc. (a) 11,387 241,063
Essent Group Ltd. 31,694 1,446,514
Federal Agricultural Mortgage Corp. Class C(non-vtg.) 2,557 311,443
Flagstar Bancorp, Inc. 15,072 682,008
Kearny Financial Corp. 22,911 296,468
Merchants Bancorp 6,835 199,240
MGIC Investment Corp. 91,492 1,388,849
Mr. Cooper Group, Inc. (a) 20,807 835,401
New York Community Bancorp, Inc. 135,807 1,583,510
NMI Holdings, Inc. (a) 24,111 596,506
Northfield Bancorp, Inc. 10,186 160,531
Northwest Bancshares, Inc. 34,942 493,032
Ocwen Financial Corp. (a) 2,028 74,387
PennyMac Financial Services, Inc. 9,286 582,232
Premier Financial Corp. 10,612 316,768
Provident Financial Services, Inc. 21,201 512,428
Radian Group, Inc. 50,373 1,127,851
Rocket Companies, Inc. (b) 36,662 463,408
TFS Financial Corp. 11,563 200,965
Trustco Bank Corp., New York 4,688 158,923
Walker & Dunlop, Inc. 8,616 1,140,845
Washington Federal, Inc. 17,907 627,103
Waterstone Financial, Inc. 7,883 160,971
WSFS Financial Corp. 18,543 971,282
15,907,390
TOTAL FINANCIALS 1,524,573,745
HEALTH CARE - 12.9%
Biotechnology - 2.3%
2seventy bio, Inc. (a)(b) 6,480 120,982
4D Molecular Therapeutics, Inc. (a)(b) 5,891 93,078
AbbVie, Inc. 502,492 68,786,130
Abeona Therapeutics, Inc. (a)(b) 11,891 3,035
ACADIA Pharmaceuticals, Inc. (a) 33,321 749,389
Adagio Therapeutics, Inc. 6,063 43,532
ADMA Biologics, Inc. (a) 57,340 83,143
Adverum Biotechnologies, Inc. (a)(b) 19,121 31,550
Aeglea BioTherapeutics, Inc. (a)(b) 12,230 52,589
Agenus, Inc. (a) 70,560 194,746
Agios Pharmaceuticals, Inc. (a)(b) 15,990 493,931
Akebia Therapeutics, Inc. (a) 43,141 85,851
Akero Therapeutics, Inc. (a)(b) 6,714 117,629
Akouos, Inc. (a)(b) 8,037 51,999
Common Stocks – continuedShares Value ($)
HEALTH CARE – continued
Biotechnology – continued
Alaunos Therapeutics, Inc. (a)(b) 52,188 56,363
Albireo Pharma, Inc. (a)(b) 5,289 150,684
Aldeyra Therapeutics, Inc. (a) 10,975 40,278
Alector, Inc. (a)(b) 16,233 257,455
Aligos Therapeutics, Inc. (a)(b) 5,684 18,132
Alkermes PLC (a) 44,642 1,138,371
Allakos, Inc. (a) 9,786 66,153
Allogene Therapeutics, Inc. (a)(b) 20,113 230,294
Allovir, Inc. (a)(b) 8,322 67,908
Alnylam Pharmaceuticals, Inc. (a) 34,052 4,685,555
Altimmune, Inc. (a)(b) 8,271 66,747
ALX Oncology Holdings, Inc. (a)(b) 5,646 90,336
Amgen, Inc. 160,748 36,512,301
Amicus Therapeutics, Inc. (a)(b) 71,460 672,439
AnaptysBio, Inc. (a)(b) 5,167 165,189
Anavex Life Sciences Corp. (a)(b) 22,280 291,422
Anika Therapeutics, Inc. (a) 3,908 124,274
Annexon, Inc. (a)(b) 7,426 55,695
Apellis Pharmaceuticals, Inc. (a) 22,919 922,948
Applied Genetic Technologies Corp. (a)(b) 10,973 21,397
Applied Molecular Transport, Inc. (a)(b) 5,664 53,355
Applied Therapeutics, Inc. (a) 4,011 12,354
Arbutus Biopharma Corp. (a)(b) 19,481 54,742
Arcturus Therapeutics Holdings, Inc. (a)(b) 6,139 160,412
Arcus Biosciences, Inc. (a)(b) 12,725 391,930
Arcutis Biotherapeutics, Inc. (a) 7,698 116,317
Ardelyx, Inc. (a)(b) 19,519 16,127
Arena Pharmaceuticals, Inc. (a) 17,537 1,613,053
Arrowhead Pharmaceuticals, Inc. (a) 29,250 1,543,230
Assembly Biosciences, Inc. (a)(b) 20,246 37,658
Atara Biotherapeutics, Inc. (a) 25,684 394,506
Athenex, Inc. (a) 15,684 15,998
Athersys, Inc. (a)(b) 75,990 75,230
Atreca, Inc. (a)(b) 5,317 11,272
Avalo Therapeutics, Inc. (a) 30,016 29,503
Avid Bioservices, Inc. (a)(b) 17,122 323,092
Avidity Biosciences, Inc. (a)(b) 11,375 189,053
Avita Medical, Inc. (a) 6,299 60,911
AVROBIO, Inc. (a)(b) 9,555 18,537
Beam Therapeutics, Inc. (a)(b) 12,915 893,847
BeyondSpring, Inc. (a)(b) 7,393 23,879
BioAtla, Inc. (a) 4,776 45,659
BioCryst Pharmaceuticals, Inc. (a)(b) 49,707 767,973
Biogen, Inc. (a) 41,896 9,468,496
Biohaven Pharmaceutical Holding Co. Ltd. (a) 16,610 2,206,971
BioMarin Pharmaceutical, Inc. (a) 53,363 4,729,563
BioXcel Therapeutics, Inc. (a)(b) 5,631 95,164
Black Diamond Therapeutics, Inc. (a)(b) 9,334 38,923
bluebird bio, Inc. (a)(b) 19,130 150,936
Blueprint Medicines Corp. (a) 16,764 1,292,504
Bolt Biotherapeutics, Inc. (b) 2,982 11,451
BrainStorm Cell Therpeutic, Inc. (a)(b) 6,944 21,665
BridgeBio Pharma, Inc. (a)(b) 30,200 298,074
Burning Rock Biotech Ltd. ADR (a) 12,605 113,445
Quarterly Report 12

Common Stocks – continuedShares Value ($)
HEALTH CARE – continued
Biotechnology – continued
C4 Therapeutics, Inc. (a)(b) 10,993 268,559
Calithera Biosciences, Inc. (a) 15,184 9,870
Capricor Therapeutics, Inc. (a)(b) 3,520 12,566
CareDx, Inc. (a) 15,498 647,816
Caribou Biosciences, Inc. (b) 6,462 69,337
Catalyst Biosciences, Inc. (a) 5,646 3,275
Catalyst Pharmaceutical Partners, Inc. (a) 27,352 157,548
Cel-Sci Corp. (a)(b) 10,115 61,095
Celldex Therapeutics, Inc. (a) 13,092 405,983
Century Therapeutics, Inc. 3,349 43,637
ChemoCentryx, Inc. (a) 13,176 354,303
Chimerix, Inc. (a) 17,176 98,075
Chinook Therapeutics, Inc. (a)(b) 11,621 149,911
Clene, Inc. (a)(b) 5,037 14,154
Clovis Oncology, Inc. (a)(b) 33,574 68,491
Codiak Biosciences, Inc. (a) 4,986 33,007
Coherus BioSciences, Inc. (a)(b) 18,249 225,558
Concert Pharmaceuticals, Inc. (a) 4,143 12,553
Corbus Pharmaceuticals Holdings, Inc. (a) 69,662 30,651
Cortexyme, Inc. (a)(b) 4,446 27,032
Crinetics Pharmaceuticals, Inc. (a) 11,567 218,501
Cue Biopharma, Inc. (a)(b) 8,332 61,573
Cullinan Oncology, Inc. (b) 6,717 90,545
Cyclerion Therapeutics, Inc. (a) 7,598 10,029
Cytokinetics, Inc. (a)(b) 23,102 766,755
CytomX Therapeutics, Inc. (a) 16,848 77,501
Day One Biopharmaceuticals, Inc. (a) 3,643 53,734
Deciphera Pharmaceuticals, Inc. (a) 10,887 91,777
Denali Therapeutics, Inc. (a)(b) 26,135 894,340
DermTech, Inc. (a)(b) 8,525 109,205
Dynavax Technologies Corp. (a)(b) 31,690 411,019
Dyne Therapeutics, Inc. (a)(b) 7,475 55,465
Eagle Pharmaceuticals, Inc. (a) 2,905 133,456
Editas Medicine, Inc. (a)(b) 18,686 355,781
Eiger Biopharmaceuticals, Inc. (a)(b) 7,379 31,877
Emergent BioSolutions, Inc. (a) 13,974 653,983
Enanta Pharmaceuticals, Inc. (a) 4,875 289,673
Epizyme, Inc. (a) 22,092 27,173
Erasca, Inc. (b) 6,305 74,714
Exact Sciences Corp. (a) 48,637 3,713,921
Exelixis, Inc. (a) 90,332 1,635,009
Fate Therapeutics, Inc. (a)(b) 22,754 944,519
FibroGen, Inc. (a) 25,149 379,498
Foghorn Therapeutics, Inc. (a) 4,943 76,023
Forma Therapeutics Holdings, Inc. (a)(b) 8,975 106,264
Fortress Biotech, Inc. (a) 20,440 42,720
Frequency Therapeutics, Inc. (a)(b) 10,524 56,514
G1 Therapeutics, Inc. (a)(b) 12,182 122,795
Generation Bio Co. (a)(b) 12,136 78,884
Geron Corp. (a)(b) 73,738 82,587
Gilead Sciences, Inc. 355,872 24,441,289
Global Blood Therapeutics, Inc. (a) 15,998 461,542
GlycoMimetics, Inc. (a) 6,172 7,345
Gossamer Bio, Inc. (a) 14,807 141,999
Common Stocks – continuedShares Value ($)
HEALTH CARE – continued
Biotechnology – continued
Graphite Bio, Inc. (b) 5,249 49,026
Gt Biopharma, Inc. (a)(b) 4,518 14,141
Halozyme Therapeutics, Inc. (a)(b) 40,416 1,398,798
Harpoon Therapeutics, Inc. (a)(b) 6,208 32,840
Heat Biologics, Inc. (a)(b) 4,327 12,635
Heron Therapeutics, Inc. (a)(b) 27,991 243,802
Homology Medicines, Inc. (a)(b) 11,181 41,593
Horizon Therapeutics PLC (a) 64,114 5,983,760
iBio, Inc. (a)(b) 52,622 25,185
Icosavax, Inc. (a)(b) 3,894 59,422
Ideaya Biosciences, Inc. (a)(b) 8,906 147,572
IGM Biosciences, Inc. (a)(b) 1,801 31,878
Imago BioSciences, Inc. 2,749 55,585
Immatics NV (a)(b) 8,843 89,226
Immuneering Corp. (b) 2,743 27,430
ImmunityBio, Inc. (a)(b) 18,844 109,672
ImmunoGen, Inc. (a) 52,112 294,433
Immunovant, Inc. (a)(b) 12,341 86,264
Incyte Corp. (a) 53,012 3,940,382
Inhibrx, Inc. (a)(b) 5,398 143,371
Inovio Pharmaceuticals, Inc. (a)(b) 56,267 232,945
Inozyme Pharma, Inc. (a)(b) 1,209 8,076
Insmed, Inc. (a) 32,601 739,391
Intellia Therapeutics, Inc. (a) 19,655 1,858,773
Intercept Pharmaceuticals, Inc. (a)(b) 6,898 113,058
Invitae Corp. (a)(b) 58,225 654,449
Ionis Pharmaceuticals, Inc. (a) 39,363 1,251,743
Iovance Biotherapeutics, Inc. (a) 38,391 639,210
Ironwood Pharmaceuticals, Inc. Class A (a) 48,499 540,764
iTeos Therapeutics, Inc. (a) 5,848 214,154
Iveric Bio, Inc. (a)(b) 28,259 393,930
Janux Therapeutics, Inc. 3,913 59,595
Jounce Therapeutics, Inc. (a) 10,317 77,171
Kalvista Pharmaceuticals, Inc. (a) 8,523 107,560
Karuna Therapeutics, Inc. (a)(b) 6,259 695,125
Karyopharm Therapeutics, Inc. (a)(b) 17,650 157,085
Keros Therapeutics, Inc. (a)(b) 3,650 169,251
Kiniksa Pharmaceuticals Ltd. (a)(b) 6,738 75,668
Kinnate Biopharma, Inc. (a)(b) 3,715 40,791
Kodiak Sciences, Inc. (a)(b) 9,357 549,256
Kronos Bio, Inc. (a)(b) 11,849 107,826
Krystal Biotech, Inc. (a)(b) 5,975 352,525
Kura Oncology, Inc. (a)(b) 19,346 272,585
Kymera Therapeutics, Inc. (a)(b) 9,481 398,202
Ligand Pharmaceuticals, Inc. Class B (a)(b) 4,747 591,619
Lineage Cell Therapeutics, Inc. (a)(b) 35,265 55,719
Macrogenics, Inc. (a) 14,164 174,925
Madrigal Pharmaceuticals, Inc. (a)(b) 3,500 201,530
Magenta Therapeutics, Inc. (a)(b) 10,707 35,012
MannKind Corp. (a)(b) 71,272 265,845
Matinas BioPharma Holdings, Inc. (a) 57,987 43,490
MediciNova, Inc. (a)(b) 13,071 31,632
MEI Pharma, Inc. (a)(b) 36,438 70,325
Mersana Therapeutics, Inc. (a)(b) 20,712 98,796
13 Quarterly Report

Schedule of Investments (Unaudited) − continued
Common Stocks – continuedShares Value ($)
HEALTH CARE – continued
Biotechnology – continued
Mirati Therapeutics, Inc. (a) 14,044 1,675,449
Mirum Pharmaceuticals, Inc. (a)(b) 3,900 74,295
Moderna, Inc. (a) 100,309 16,985,323
Molecular Templates, Inc. (a)(b) 9,589 29,534
Monte Rosa Therapeutics, Inc. 3,844 48,665
Morphic Holding, Inc. (a)(b) 6,992 296,671
Mustang Bio, Inc. (a) 35,365 41,731
Myriad Genetics, Inc. (a) 21,896 575,646
Natera, Inc. (a) 25,100 1,773,315
Neoleukin Therapeutics, Inc. (a) 9,859 35,197
Neubase Therapeutics, Inc. (a) 3,796 5,770
Neurocrine Biosciences, Inc. (a) 27,362 2,162,145
NextCure, Inc. (a)(b) 6,405 35,676
Nkarta, Inc. (a) 4,061 40,245
Novavax, Inc. (a)(b) 21,283 1,994,217
Nurix Therapeutics, Inc. (a) 10,793 200,966
Nuvalent, Inc. Class A (a)(b) 3,175 42,831
Olema Pharmaceuticals, Inc. (a)(b) 7,969 51,241
Oncorus, Inc. (a)(b) 2,117 7,346
Opko Health, Inc. (a)(b) 116,850 365,741
ORIC Pharmaceuticals, Inc. (a)(b) 8,946 88,476
Ovid Therapeutics, Inc. (a)(b) 22,621 62,434
Oyster Point Pharma, Inc. (a)(b) 3,043 36,486
Palatin Technologies, Inc. (a)(b) 38,374 17,134
Passage Bio, Inc. (a)(b) 10,584 53,238
PDL BioPharma, Inc. (a)(c) 20,940 51,722
PMV Pharmaceuticals, Inc. (a)(b) 7,577 121,687
Poseida Therapeutics, Inc. (a)(b) 10,995 52,226
Praxis Precision Medicines, Inc. (a)(b) 9,597 142,611
Precigen, Inc. (a)(b) 28,484 73,489
Precision BioSciences, Inc. (a) 11,660 55,618
Prelude Therapeutics, Inc. (a)(b) 2,911 28,906
Protagonist Therapeutics, Inc. (a) 12,679 371,368
Prothena Corp. PLC (a)(b) 9,851 335,722
PTC Therapeutics, Inc. (a) 19,297 776,125
Puma Biotechnology, Inc. (a)(b) 8,302 20,423
Radius Health, Inc. (a)(b) 13,175 99,867
RAPT Therapeutics, Inc. (a) 5,487 118,629
Recro Pharma, Inc. (a) 2,879 4,434
Regeneron Pharmaceuticals, Inc. (a) 29,979 18,244,920
REGENXBIO, Inc. (a)(b) 10,074 265,954
Relay Therapeutics, Inc. (a)(b) 22,032 487,568
Repligen Corp. (a) 14,547 2,885,252
Replimune Group, Inc. (a) 7,391 146,564
Revolution Medicines, Inc. (a)(b) 16,805 361,644
Rhythm Pharmaceuticals, Inc. (a)(b) 11,573 85,756
Rigel Pharmaceuticals, Inc. (a)(b) 41,490 106,214
Rocket Pharmaceuticals, Inc. (a)(b) 12,137 201,960
Rubius Therapeutics, Inc. (a)(b) 10,823 73,055
Sage Therapeutics, Inc. (a) 14,091 555,467
Sangamo Therapeutics, Inc. (a) 32,464 195,758
Sarepta Therapeutics, Inc. (a) 24,688 1,766,920
Scholar Rock Holding Corp. (a)(b) 7,430 132,328
Seagen, Inc. (a) 38,798 5,218,719
Common Stocks – continuedShares Value ($)
HEALTH CARE – continued
Biotechnology – continued
Selecta Biosciences, Inc. (a)(b) 21,885 54,713
Seres Therapeutics, Inc. (a) 17,842 148,802
Sesen Bio, Inc. (a) 58,324 43,212
Shattuck Labs, Inc. (a) 7,975 55,107
Silverback Therapeutics, Inc. (a) 6,944 33,817
Sorrento Therapeutics, Inc. (a)(b) 90,267 311,421
Spectrum Pharmaceuticals, Inc. (a) 33,214 23,293
Spero Therapeutics, Inc. (a)(b) 8,169 96,966
Springworks Therapeutics, Inc. (a)(b) 7,585 422,333
Spruce Biosciences, Inc. (a)(b) 1,442 3,663
SQZ Biotechnologies Co. (a)(b) 4,437 35,585
Stoke Therapeutics, Inc. (a) 6,061 114,856
Sutro Biopharma, Inc. (a)(b) 12,878 137,537
Syndax Pharmaceuticals, Inc. (a) 12,285 200,737
Syros Pharmaceuticals, Inc. (a)(b) 14,802 29,308
T2 Biosystems, Inc. (a)(b) 28,899 12,138
Talaris Therapeutics, Inc. (a)(b) 2,286 21,557
Taysha Gene Therapies, Inc. (a)(b) 6,954 55,284
TCR2 Therapeutics, Inc. (a) 7,559 25,247
Tenaya Therapeutics, Inc. (a)(b) 4,291 51,149
TG Therapeutics, Inc. (a) 36,759 425,302
Travere Therapeutics, Inc. (a) 14,501 398,778
Trevena, Inc. (a)(b) 35,368 19,223
Turning Point Therapeutics, Inc. (a) 14,635 544,861
Twist Bioscience Corp. (a)(b) 13,679 812,806
Ultragenyx Pharmaceutical, Inc. (a) 19,708 1,378,180
uniQure B.V. (a)(b) 9,796 176,818
United Therapeutics Corp. (a) 13,021 2,628,549
UNITY Biotechnology, Inc. (a) 7,661 9,270
Vanda Pharmaceuticals, Inc. (a) 15,581 236,208
Vaxart, Inc. (a)(b) 34,445 170,503
Vaxcyte, Inc. (a)(b) 8,806 167,666
VBI Vaccines, Inc. (a)(b) 62,875 106,888
Veracyte, Inc. (a) 19,860 603,943
Verastem, Inc. (a) 56,724 86,788
Vericel Corp. (a)(b) 12,512 445,177
Vertex Pharmaceuticals, Inc. (a) 72,092 17,521,961
Verve Therapeutics, Inc. 4,301 123,955
Viking Therapeutics, Inc. (a)(b) 19,944 73,992
Vir Biotechnology, Inc. (a) 20,569 706,134
Vor Biopharma, Inc. (a)(b) 2,585 21,326
Voyager Therapeutics, Inc. (a)(b) 4,677 13,376
Xbiotech, Inc. 2,697 29,047
Xencor, Inc. (a) 16,068 552,257
Y-mAbs Therapeutics, Inc. (a)(b) 9,608 95,023
Zentalis Pharmaceuticals, Inc. (a) 10,196 581,988
294,761,249
Health Care Equipment & Supplies - 2.7%
Abbott Laboratories 501,892 63,971,154
Abiomed, Inc. (a) 12,915 3,821,161
Accelerate Diagnostics, Inc. (a)(b) 10,826 36,051
Accuray, Inc. (a) 31,294 114,223
Acutus Medical, Inc. (a) 6,615 15,016
Align Technology, Inc. (a) 20,965 10,376,836
Quarterly Report 14

Common Stocks – continuedShares Value ($)
HEALTH CARE – continued
Health Care Equipment & Supplies – continued
Alphatec Holdings, Inc. (a)(b) 19,560 202,250
Angiodynamics, Inc. (a)(b) 11,711 253,309
Artivion, Inc. (a)(b) 11,654 207,441
Aspira Women's Health, Inc. (a)(b) 14,536 17,589
Atricure, Inc. (a) 12,905 847,084
Atrion Corp. 412 249,429
Avanos Medical, Inc. (a) 14,338 433,868
AxoGen, Inc. (a) 10,622 92,518
Axonics Modulation Technologies, Inc. (a) 13,219 626,977
Baxter International, Inc. 142,129 12,143,502
Becton, Dickinson & Co. 81,540 20,722,576
BioLife Solutions, Inc. (a) 7,880 235,139
BioSig Technologies, Inc. (a)(b) 4,618 8,220
Bioventus, Inc. (b) 6,431 83,796
Boston Scientific Corp. (a) 405,333 17,388,786
Cardiovascular Systems, Inc. (a) 10,663 187,349
Cerus Corp. (a) 46,943 251,614
Co.-Diagnostics, Inc. (a)(b) 6,703 47,591
CONMED Corp. (b) 8,175 1,124,717
CryoPort, Inc. (a)(b) 13,157 549,568
Cutera, Inc. (a) 4,546 165,520
CytoSorbents Corp. (a)(b) 12,461 46,355
Dentsply Sirona, Inc. 61,602 3,290,779
DexCom, Inc. (a) 27,504 11,839,922
Eargo, Inc. (a)(b) 8,731 41,996
Edwards Lifesciences Corp. (a) 177,823 19,418,272
Envista Holdings Corp. (a) 46,034 1,990,510
Figs, Inc. Class A (a)(b) 10,552 237,209
Glaukos Corp. (a) 13,494 718,421
Globus Medical, Inc. (a) 22,500 1,501,425
Haemonetics Corp. (a) 14,809 716,015
Heska Corp. (a) 2,856 392,928
Hologic, Inc. (a) 71,766 5,040,844
ICU Medical, Inc. (a) 5,748 1,226,393
IDEXX Laboratories, Inc. (a) 24,230 12,291,879
Inari Medical, Inc. (a) 9,513 699,776
Inogen, Inc. (a)(b) 5,573 165,685
Insulet Corp. (a) 19,764 4,901,472
Integer Holdings Corp. (a) 9,492 744,268
Integra LifeSciences Holdings Corp. (a) 20,439 1,323,221
Intersect ENT, Inc. (a) 8,914 244,244
Intuitive Surgical, Inc. (a) 101,574 28,865,299
Invacare Corp. (a) 8,855 19,924
iRhythm Technologies, Inc. (a) 8,213 1,025,229
Lantheus Holdings, Inc. (a) 18,019 457,863
LeMaitre Vascular, Inc. (b) 5,503 232,832
LivaNova PLC (a) 14,876 1,117,336
Masimo Corp. (a) 14,516 3,191,633
Medtronic PLC 382,216 39,555,534
Meridian Bioscience, Inc. (a) 11,539 240,588
Merit Medical Systems, Inc. (a) 14,676 813,784
Mesa Laboratories, Inc. 1,549 440,427
Natus Medical, Inc. (a) 9,527 219,502
Neogen Corp. (a) 29,868 1,089,286
Common Stocks – continuedShares Value ($)
HEALTH CARE – continued
Health Care Equipment & Supplies – continued
Nevro Corp. (a) 9,895 650,102
Novocure Ltd. (a) 25,049 1,719,614
NuVasive, Inc. (a)(b) 14,112 733,965
OraSure Technologies, Inc. (a)(b) 19,233 170,212
Ortho Clinical Diagnostics Holdings PLC 31,454 546,041
Orthofix International NV (a) 5,036 153,094
OrthoPediatrics Corp. (a)(b) 3,923 185,519
Outset Medical, Inc. (a)(b) 11,677 434,268
Penumbra, Inc. (a) 9,983 2,256,258
Pulmonx Corp. (a)(b) 9,477 230,765
Pulse Biosciences, Inc. (a)(b) 3,268 39,739
Quidel Corp. (a) 10,616 1,097,270
Quotient Ltd. (a) 24,935 40,395
Repro Medical Systems, Inc. (a)(b) 14,316 43,091
ResMed, Inc. 41,592 9,507,931
Retractable Technologies, Inc. (a)(b) 4,901 26,759
Seaspine Holdings Corp. (a)(b) 9,689 116,074
Shockwave Medical, Inc. (a) 9,907 1,436,218
SI-BONE, Inc. (a)(b) 7,854 154,724
Sientra, Inc. (a)(b) 13,822 38,840
Sight Sciences, Inc. 3,455 50,547
Silk Road Medical, Inc. (a) 10,049 329,708
SmileDirectClub, Inc. (a)(b) 28,595 73,203
Staar Surgical Co. (a) 13,170 957,722
STERIS PLC 28,416 6,376,550
Stryker Corp. 95,421 23,669,179
Surgalign Holdings, Inc. (a)(b) 26,747 18,455
SurModics, Inc. (a) 3,775 172,442
Tactile Systems Technology, Inc. (a) 5,822 91,813
Talis Biomedical Corp. 3,761 11,095
Tandem Diabetes Care, Inc. (a) 18,021 2,128,460
Teleflex, Inc. 13,520 4,193,769
The Cooper Companies, Inc. 14,022 5,584,963
TransMedics Group, Inc. (a)(b) 7,664 121,628
Vapotherm, Inc. (a)(b) 6,703 108,388
Varex Imaging Corp. (a)(b) 11,090 289,449
ViewRay, Inc. (a) 38,956 169,459
Zimmer Biomet Holdings, Inc. 59,431 7,311,202
Zynex, Inc. 5,748 45,524
349,558,570
Health Care Providers & Services - 2.6%
1Life Healthcare, Inc. (a)(b) 48,712 543,626
Acadia Healthcare Co., Inc. (a) 25,181 1,325,780
Accolade, Inc. (a) 15,390 293,949
AdaptHealth Corp. (a) 28,474 538,159
Addus HomeCare Corp. (a) 4,587 366,180
Amedisys, Inc. (a) 9,146 1,235,625
AmerisourceBergen Corp. 42,303 5,761,669
AMN Healthcare Services, Inc. (a) 13,467 1,364,746
Anthem, Inc. 68,959 30,410,229
Apollo Medical Holdings, Inc. (a)(b) 10,389 534,826
Apria, Inc. 1,841 68,872
Brookdale Senior Living, Inc. (a) 54,977 290,828
Cardinal Health, Inc. 79,313 4,090,171
15 Quarterly Report

Schedule of Investments (Unaudited) − continued
Common Stocks – continuedShares Value ($)
HEALTH CARE – continued
Health Care Providers & Services – continued
Castle Biosciences, Inc. (a)(b) 6,933 299,852
Centene Corp. (a) 165,390 12,860,758
Chemed Corp. 4,364 2,046,323
Cigna Corp. 94,406 21,756,807
Community Health Systems, Inc. (a) 34,864 442,424
Corvel Corp. (a) 2,545 448,225
Covetrus, Inc. (a) 29,352 530,391
Cross Country Healthcare, Inc. (a) 9,780 210,368
CVS Health Corp. 374,690 39,908,232
DaVita HealthCare Partners, Inc. (a) 18,406 1,994,658
Encompass Health Corp. 28,008 1,737,616
Fulgent Genetics, Inc. (a)(b) 5,329 340,363
Guardant Health, Inc. (a) 28,928 2,011,942
Hanger, Inc. (a) 9,811 177,873
HCA Holdings, Inc. 68,113 16,350,526
HealthEquity, Inc. (a) 23,545 1,258,245
Henry Schein, Inc. (a) 40,058 3,016,367
Humana, Inc. 36,588 14,360,790
InfuSystems Holdings, Inc. (a)(b) 4,576 69,098
Laboratory Corp. of America Holdings (a) 27,463 7,452,360
LHC Group, Inc. (a) 9,053 1,123,477
McKesson Corp. 43,544 11,178,616
MEDNAX, Inc. (a)(b) 24,419 597,045
Modivcare, Inc. (a) 3,293 381,757
Molina Healthcare, Inc. (a) 16,531 4,801,925
National Healthcare Corp. 3,866 252,836
National Research Corp. Class A 4,204 174,886
Ontrak, Inc. (a)(b) 1,526 5,280
Option Care Health, Inc. (a) 38,710 904,653
Owens & Minor, Inc. 21,125 889,151
Patterson Companies, Inc. 25,022 717,881
Pennant Group, Inc. (a) 8,815 146,505
PetIQ, Inc. Class A (a)(b) 7,858 160,618
Premier, Inc. 33,965 1,298,142
Progyny, Inc. (a) 19,414 786,267
Quest Diagnostics, Inc. 35,303 4,766,611
R1 RCM, Inc. (a) 37,289 886,732
RadNet, Inc. (a) 12,376 318,682
Select Medical Holdings Corp. 29,445 684,007
Surgery Partners, Inc. (a) 10,136 432,503
Tenet Healthcare Corp. (a) 30,832 2,285,268
The Ensign Group, Inc. 14,676 1,107,011
The Joint Corp. (a) 3,980 215,079
Tivity Health, Inc. (a) 11,917 303,168
Triple-S Management Corp. (a) 6,405 230,516
U.S. Physical Therapy, Inc. 3,599 348,275
UnitedHealth Group, Inc. 267,320 126,327,412
Universal Health Services, Inc. Class B 20,619 2,681,707
338,103,888
Health Care Technology - 0.3%
Allscripts Healthcare Solutions, Inc. (a) 35,623 720,297
American Well Corp. (a)(b) 60,480 286,070
Cerner Corp. 83,893 7,651,042
Certara, Inc. (a)(b) 29,479 787,974
Common Stocks – continuedShares Value ($)
HEALTH CARE – continued
Health Care Technology – continued
Change Healthcare, Inc. (a) 70,309 1,383,681
Computer Programs & Systems, Inc. (a)(b) 5,009 141,855
Doximity, Inc. 13,801 628,912
Evolent Health, Inc. (a) 23,175 549,479
GoodRx Holdings, Inc. (a)(b) 17,695 424,857
Health Catalyst, Inc. (a)(b) 15,813 472,018
HealthStream, Inc. (a) 6,416 156,230
iCAD, Inc. (a) 5,426 30,331
Inspire Medical Systems, Inc. (a) 7,801 1,726,283
Nextgen Healthcare, Inc. (a) 16,318 315,101
Omnicell, Inc. (a) 12,451 1,869,393
OptimizeRx Corp. (a) 5,200 233,636
Phreesia, Inc. (a) 14,605 455,530
Schrodinger, Inc. (a) 14,035 397,892
Simulations Plus, Inc. 4,178 177,649
Tabula Rasa HealthCare, Inc. (a)(b) 5,664 61,115
Teladoc Health, Inc. (a)(b) 45,224 3,469,133
Veeva Systems, Inc. Class A (a) 39,595 9,365,801
Vocera Communications, Inc. (a) 9,690 765,607
32,069,886
Life Sciences Tools & Services - 1.7%
10X Genomics, Inc. (a) 25,852 2,488,772
Adaptive Biotechnologies Corp. (a) 31,196 544,058
Agilent Technologies, Inc. 85,835 11,958,532
Alpha Teknova, Inc. 2,129 33,596
Avantor, Inc. (a) 172,939 6,455,813
Bio-Rad Laboratories, Inc. Class A (a) 6,149 3,687,740
Bio-Techne Corp. 11,112 4,182,668
Bruker Corp. 29,057 1,935,196
Charles River Laboratories International, Inc. (a) 14,352 4,732,716
ChromaDex, Inc. (a)(b) 12,689 35,656
Codexis, Inc. (a) 16,039 328,800
Danaher Corp. 180,663 51,631,679
Fluidigm Corp. (a)(b) 20,426 66,793
Frontage Holdings Corp. (a)(d) 190,000 91,760
Illumina, Inc. (a) 44,511 15,526,327
IQVIA Holdings, Inc. (a) 54,497 13,346,315
Maravai LifeSciences Holdings, Inc. (a) 31,156 901,032
Medpace Holdings, Inc. (a) 8,103 1,437,958
Mettler-Toledo International, Inc. (a) 6,509 9,585,674
Nanostring Technologies, Inc. (a) 12,336 428,306
NeoGenomics, Inc. (a) 35,585 802,086
Pacific Biosciences of California, Inc. (a)(b) 63,142 705,928
PerkinElmer, Inc. 35,961 6,191,405
Personalis, Inc. (a) 10,370 118,114
Quanterix Corp. (a) 9,626 293,015
Seer, Inc. (a)(b) 9,368 147,359
Sotera Health Co. (a) 26,667 573,607
Syneos Health, Inc. (a) 29,308 2,654,132
Thermo Fisher Scientific, Inc. 111,854 65,020,730
Waters Corp. (a) 17,244 5,520,149
West Pharmaceutical Services, Inc. 21,236 8,350,420
219,776,336
Quarterly Report 16

Common Stocks – continuedShares Value ($)
HEALTH CARE – continued
Pharmaceuticals - 3.3%
AcelRx Pharmaceuticals, Inc. (a)(b) 18,538 8,909
Aerie Pharmaceuticals, Inc. (a)(b) 12,944 95,268
Agile Therapeutics, Inc. (a)(b) 14,594 5,093
Amneal Pharmaceuticals, Inc. (a)(b) 31,218 138,296
Amphastar Pharmaceuticals, Inc. (a) 11,558 266,874
Ampio Pharmaceuticals, Inc. (a)(b) 42,328 21,909
ANI Pharmaceuticals, Inc. (a)(b) 2,953 119,360
Antares Pharma, Inc. (a) 44,966 151,535
Aquestive Therapeutics, Inc. (a)(b) 7,179 19,527
Arvinas Holding Co. LLC (a) 12,718 909,210
Athira Pharma, Inc. (a)(b) 10,098 104,009
Axsome Therapeutics, Inc. (a)(b) 8,492 233,020
Aytu BioScience, Inc. (a)(b) 9,771 12,800
Biodelivery Sciences International, Inc. (a) 31,287 114,510
Bristol-Myers Squibb Co. 630,981 40,944,357
Cara Therapeutics, Inc. (a) 11,386 131,850
Catalent, Inc. (a) 49,581 5,152,953
Collegium Pharmaceutical, Inc. (a)(b) 10,399 185,622
Corcept Therapeutics, Inc. (a)(b) 27,122 509,080
CorMedix, Inc. (a)(b) 14,180 59,981
CymaBay Therapeutics, Inc. (a) 21,758 64,839
Durect Corp. (a)(b) 85,861 64,988
Elanco Animal Health, Inc. (a) 134,096 3,491,860
Eli Lilly & Co. 225,516 55,339,371
Endo International PLC (a) 64,956 207,210
Esperion Therapeutics, Inc. (a) 19,401 83,230
Evofem Biosciences, Inc. (a)(b) 15,813 7,146
Evolus, Inc. (a)(b) 10,477 77,739
Fulcrum Therapeutics, Inc. (a) 7,518 91,419
Innoviva, Inc. (a) 17,729 284,196
Intra-Cellular Therapies, Inc. (a) 21,282 1,010,682
Jazz Pharmaceuticals PLC (a) 17,306 2,403,976
Johnson & Johnson 747,424 128,773,681
Kala Pharmaceuticals, Inc. (a)(b) 8,813 7,797
Lannett Co., Inc. (a)(b) 8,822 13,498
Liquidia Technologies, Inc. (a) 13,701 77,548
Marinus Pharmaceuticals, Inc. (a)(b) 8,111 82,732
Merck & Co., Inc. 717,411 58,454,648
Nektar Therapeutics (a) 53,907 599,446
NGM Biopharmaceuticals, Inc. (a)(b) 10,007 158,211
Ocular Therapeutix, Inc. (a)(b) 20,980 118,747
Omeros Corp. (a)(b) 19,278 115,668
OptiNose, Inc. (a)(b) 7,197 16,553
Organon & Co. 72,319 2,307,699
Pacira Biosciences, Inc. (a) 12,628 792,660
Paratek Pharmaceuticals, Inc. (a)(b) 11,958 48,430
Perrigo Co. PLC 37,351 1,421,953
Pfizer, Inc. 1,594,427 84,010,359
Phathom Pharmaceuticals, Inc. (a)(b) 4,790 80,472
Phibro Animal Health Corp. Class A (b) 6,283 121,262
Pliant Therapeutics, Inc. (a) 6,745 79,119
Prestige Brands Holdings, Inc. (a) 13,713 774,099
Provention Bio, Inc. (a)(b) 13,480 72,253
Rani Therapeutics Holdings, Inc. (b) 2,055 42,600
Common Stocks – continuedShares Value ($)
HEALTH CARE – continued
Pharmaceuticals – continued
Reata Pharmaceuticals, Inc. (a)(b) 7,235 203,448
Relmada Therapeutics, Inc. (a)(b) 7,801 143,460
Revance Therapeutics, Inc. (a) 18,911 252,084
Royalty Pharma PLC 100,409 4,017,364
SIGA Technologies, Inc. (a) 9,940 64,709
Supernus Pharmaceuticals, Inc. (a)(b) 14,571 449,515
Tarsus Pharmaceuticals, Inc. (a)(b) 1,353 27,155
TherapeuticsMD, Inc. (a)(b) 85,018 25,803
Theravance Biopharma, Inc. (a) 13,276 120,944
Tricida, Inc. (a)(b) 7,472 75,841
Viatris, Inc. 343,056 5,135,548
Vyne Therapeutics, Inc. (a)(b) 13,159 8,176
WAVE Life Sciences (a) 13,515 29,598
Xeris Biopharma Holdings, Inc. (a)(b) 34,104 71,959
Xeris Biopharma Holdings, Inc. rights (a)(c) 8,992 1,629
Zoetis, Inc. Class A 134,631 26,897,927
Zogenix, Inc. (a) 14,258 370,851
Zynerba Pharmaceuticals, Inc. (a)(b) 23,536 61,429
428,437,694
TOTAL HEALTH CARE 1,662,707,623
INDUSTRIALS - 8.7%
Aerospace & Defense - 1.4%
AAR Corp. (a) 9,674 389,572
Aerojet Rocketdyne Holdings, Inc. 21,316 822,584
AeroVironment, Inc. (a) 6,679 380,169
Astronics Corp. (a) 7,109 85,521
Axon Enterprise, Inc. (a) 18,658 2,610,814
BWX Technologies, Inc. 26,080 1,160,821
Byrna Technologies, Inc. (a)(b) 4,506 49,160
Curtiss-Wright Corp. 11,374 1,510,353
Ducommun, Inc. (a) 3,558 155,663
General Dynamics Corp. 65,647 13,923,729
HEICO Corp. (b) 12,204 1,664,504
HEICO Corp. Class A 20,931 2,296,131
Hexcel Corp. 24,128 1,258,758
Howmet Aerospace, Inc. 109,344 3,399,505
Huntington Ingalls Industries, Inc. 11,219 2,100,197
Kaman Corp. 7,176 286,825
Kratos Defense & Security Solutions, Inc. (a) 37,894 635,103
L3Harris Technologies, Inc. 55,757 11,669,383
Lockheed Martin Corp. 69,599 27,083,059
Maxar Technologies, Inc. (b) 19,646 510,992
Mercury Systems, Inc. (a) 16,021 911,915
Moog, Inc. Class A 8,133 620,060
National Presto Industries, Inc. 1,402 115,315
Northrop Grumman Corp. 42,259 15,631,604
PAE, Inc. (a) 17,155 171,722
Park Aerospace Corp. (b) 4,440 60,073
Parsons Corp. (a) 7,385 224,873
Raytheon Technologies Corp. 425,002 38,330,930
Spirit AeroSystems Holdings, Inc. Class A 29,489 1,292,503
Textron, Inc. 63,770 4,340,186
The Boeing Co. (a) 157,439 31,525,585
17 Quarterly Report
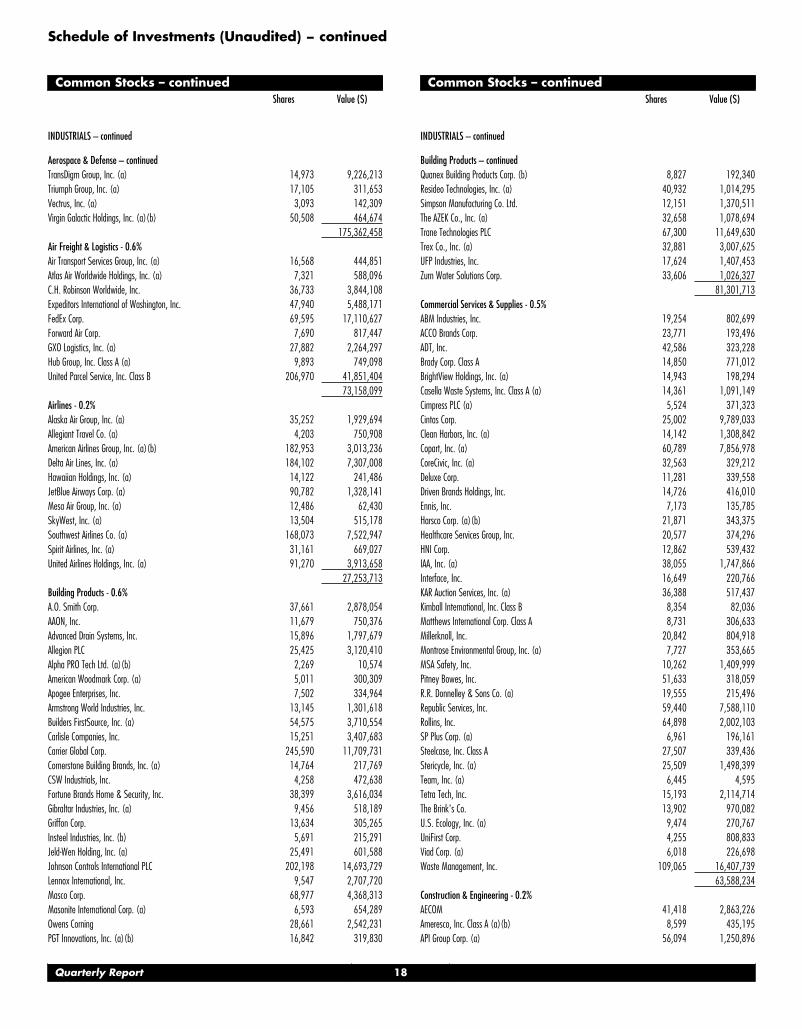
Schedule of Investments (Unaudited) − continued
Common Stocks – continuedShares Value ($)
INDUSTRIALS – continued
Aerospace & Defense – continued
TransDigm Group, Inc. (a) 14,973 9,226,213
Triumph Group, Inc. (a) 17,105 311,653
Vectrus, Inc. (a) 3,093 142,309
Virgin Galactic Holdings, Inc. (a)(b) 50,508 464,674
175,362,458
Air Freight & Logistics - 0.6%
Air Transport Services Group, Inc. (a) 16,568 444,851
Atlas Air Worldwide Holdings, Inc. (a) 7,321 588,096
C.H. Robinson Worldwide, Inc. 36,733 3,844,108
Expeditors International of Washington, Inc. 47,940 5,488,171
FedEx Corp. 69,595 17,110,627
Forward Air Corp. 7,690 817,447
GXO Logistics, Inc. (a) 27,882 2,264,297
Hub Group, Inc. Class A (a) 9,893 749,098
United Parcel Service, Inc. Class B 206,970 41,851,404
73,158,099
Airlines - 0.2%
Alaska Air Group, Inc. (a) 35,252 1,929,694
Allegiant Travel Co. (a) 4,203 750,908
American Airlines Group, Inc. (a)(b) 182,953 3,013,236
Delta Air Lines, Inc. (a) 184,102 7,307,008
Hawaiian Holdings, Inc. (a) 14,122 241,486
JetBlue Airways Corp. (a) 90,782 1,328,141
Mesa Air Group, Inc. (a) 12,486 62,430
SkyWest, Inc. (a) 13,504 515,178
Southwest Airlines Co. (a) 168,073 7,522,947
Spirit Airlines, Inc. (a) 31,161 669,027
United Airlines Holdings, Inc. (a) 91,270 3,913,658
27,253,713
Building Products - 0.6%
A.O. Smith Corp. 37,661 2,878,054
AAON, Inc. 11,679 750,376
Advanced Drain Systems, Inc. 15,896 1,797,679
Allegion PLC 25,425 3,120,410
Alpha PRO Tech Ltd. (a)(b) 2,269 10,574
American Woodmark Corp. (a) 5,011 300,309
Apogee Enterprises, Inc. 7,502 334,964
Armstrong World Industries, Inc. 13,145 1,301,618
Builders FirstSource, Inc. (a) 54,575 3,710,554
Carlisle Companies, Inc. 15,251 3,407,683
Carrier Global Corp. 245,590 11,709,731
Cornerstone Building Brands, Inc. (a) 14,764 217,769
CSW Industrials, Inc. 4,258 472,638
Fortune Brands Home & Security, Inc. 38,399 3,616,034
Gibraltar Industries, Inc. (a) 9,456 518,189
Griffon Corp. 13,634 305,265
Insteel Industries, Inc. (b) 5,691 215,291
Jeld-Wen Holding, Inc. (a) 25,491 601,588
Johnson Controls International PLC 202,198 14,693,729
Lennox International, Inc. 9,547 2,707,720
Masco Corp. 68,977 4,368,313
Masonite International Corp. (a) 6,593 654,289
Owens Corning 28,661 2,542,231
PGT Innovations, Inc. (a)(b) 16,842 319,830
Common Stocks – continuedShares Value ($)
INDUSTRIALS – continued
Building Products – continued
Quanex Building Products Corp. (b) 8,827 192,340
Resideo Technologies, Inc. (a) 40,932 1,014,295
Simpson Manufacturing Co. Ltd. 12,151 1,370,511
The AZEK Co., Inc. (a) 32,658 1,078,694
Trane Technologies PLC 67,300 11,649,630
Trex Co., Inc. (a) 32,881 3,007,625
UFP Industries, Inc. 17,624 1,407,453
Zurn Water Solutions Corp. 33,606 1,026,327
81,301,713
Commercial Services & Supplies - 0.5%
ABM Industries, Inc. 19,254 802,699
ACCO Brands Corp. 23,771 193,496
ADT, Inc. 42,586 323,228
Brady Corp. Class A 14,850 771,012
BrightView Holdings, Inc. (a) 14,943 198,294
Casella Waste Systems, Inc. Class A (a) 14,361 1,091,149
Cimpress PLC (a) 5,524 371,323
Cintas Corp. 25,002 9,789,033
Clean Harbors, Inc. (a) 14,142 1,308,842
Copart, Inc. (a) 60,789 7,856,978
CoreCivic, Inc. (a) 32,563 329,212
Deluxe Corp. 11,281 339,558
Driven Brands Holdings, Inc. 14,726 416,010
Ennis, Inc. 7,173 135,785
Harsco Corp. (a)(b) 21,871 343,375
Healthcare Services Group, Inc. 20,577 374,296
HNI Corp. 12,862 539,432
IAA, Inc. (a) 38,055 1,747,866
Interface, Inc. 16,649 220,766
KAR Auction Services, Inc. (a) 36,388 517,437
Kimball International, Inc. Class B 8,354 82,036
Matthews International Corp. Class A 8,731 306,633
Millerknoll, Inc. 20,842 804,918
Montrose Environmental Group, Inc. (a) 7,727 353,665
MSA Safety, Inc. 10,262 1,409,999
Pitney Bowes, Inc. 51,633 318,059
R.R. Donnelley & Sons Co. (a) 19,555 215,496
Republic Services, Inc. 59,440 7,588,110
Rollins, Inc. 64,898 2,002,103
SP Plus Corp. (a) 6,961 196,161
Steelcase, Inc. Class A 27,507 339,436
Stericycle, Inc. (a) 25,509 1,498,399
Team, Inc. (a) 6,445 4,595
Tetra Tech, Inc. 15,193 2,114,714
The Brink's Co. 13,902 970,082
U.S. Ecology, Inc. (a) 9,474 270,767
UniFirst Corp. 4,255 808,833
Viad Corp. (a) 6,018 226,698
Waste Management, Inc. 109,065 16,407,739
63,588,234
Construction & Engineering - 0.2%
AECOM 41,418 2,863,226
Ameresco, Inc. Class A (a)(b) 8,599 435,195
API Group Corp. (a) 56,094 1,250,896
Quarterly Report 18

Common Stocks – continuedShares Value ($)
INDUSTRIALS – continued
Construction & Engineering – continued
Arcosa, Inc. 13,490 629,443
Argan, Inc. 4,133 153,541
Comfort Systems U.S.A., Inc. 10,240 919,347
Construction Partners, Inc. Class A (a) 10,337 271,243
Dycom Industries, Inc. (a) 8,397 707,783
EMCOR Group, Inc. 14,973 1,784,931
Fluor Corp. (a)(b) 39,533 831,774
Granite Construction, Inc. (b) 12,157 437,409
Great Lakes Dredge & Dock Corp. (a) 17,187 235,290
IES Holdings, Inc. (a) 2,725 134,343
INNOVATE Corp. (a)(b) 15,365 60,384
MasTec, Inc. (a) 16,003 1,378,338
Matrix Service Co. (a) 6,450 46,827
MYR Group, Inc. (a) 5,045 474,381
NV5 Global, Inc. (a)(b) 3,290 344,101
Primoris Services Corp. 15,166 390,070
Quanta Services, Inc. 41,148 4,226,723
Sterling Construction Co., Inc. (a)(b) 7,672 194,946
Tutor Perini Corp. (a) 9,717 115,632
Valmont Industries, Inc. 5,936 1,289,477
Willscot Mobile Mini Holdings (a) 63,344 2,346,262
21,521,562
Electrical Equipment - 0.6%
Acuity Brands, Inc. 9,911 1,898,254
American Superconductor Corp. (a)(b) 9,005 73,841
AMETEK, Inc. 65,638 8,977,309
Array Technologies, Inc. (a) 32,725 344,922
Atkore, Inc. (a) 12,910 1,391,440
AZZ, Inc. 7,002 333,155
Blink Charging Co. (a)(b) 9,992 208,933
Bloom Energy Corp. Class A (a)(b) 42,035 633,888
Eaton Corp. PLC 113,764 18,023,631
Emerson Electric Co. 170,488 15,676,372
Encore Wire Corp. 5,839 657,997
Energous Corp. (a)(b) 41,860 49,395
EnerSys 12,274 919,691
FuelCell Energy, Inc. (a)(b) 104,384 442,588
Generac Holdings, Inc. (a) 17,852 5,041,048
GrafTech International Ltd. 55,199 578,486
Hubbell, Inc. Class B 15,368 2,878,273
nVent Electric PLC 47,086 1,628,705
Orion Energy Systems, Inc. (a) 11,589 37,317
Plug Power, Inc. (a)(b) 147,150 3,218,171
Powell Industries, Inc. 3,022 90,237
Regal Rexnord Corp. 19,056 3,019,995
Rockwell Automation, Inc. 32,876 9,508,397
Sensata Technologies, Inc. PLC (a) 45,075 2,585,502
Shoals Technologies Group, Inc. (b) 29,338 494,639
Sunrun, Inc. (a) 58,447 1,515,531
Thermon Group Holdings, Inc. (a) 8,925 153,064
TPI Composites, Inc. (a) 10,175 122,812
Vertiv Holdings Co. 85,763 1,789,016
Vicor Corp. (a) 5,999 565,886
82,858,495
Common Stocks – continuedShares Value ($)
INDUSTRIALS – continued
Industrial Conglomerates - 0.9%
3M Co. 163,810 27,195,736
General Electric Co. 312,700 29,543,896
Honeywell International, Inc. 195,637 40,003,854
Roper Technologies, Inc. 30,178 13,192,614
109,936,100
Machinery - 1.8%
AGCO Corp. 17,357 2,034,240
Alamo Group, Inc. 2,663 375,084
Albany International Corp. Class A 9,129 764,189
Allison Transmission Holdings, Inc. 28,963 1,100,304
Altra Industrial Motion Corp. 18,326 884,779
Astec Industries, Inc. 6,686 423,157
Barnes Group, Inc. 13,602 614,402
Blue Bird Corp. (a) 3,746 58,100
Caterpillar, Inc. 153,791 30,998,114
Chart Industries, Inc. (a) 10,007 1,219,553
CIRCOR International, Inc. (a) 6,361 176,645
Colfax Corp. (a)(b) 38,642 1,588,959
Columbus McKinnon Corp. (NY Shares) 7,808 337,930
Crane Co. 13,961 1,445,103
Cummins, Inc. 41,050 9,067,124
Deere & Co. 80,162 30,172,977
Donaldson Co., Inc. 35,068 1,951,885
Douglas Dynamics, Inc. 6,296 229,993
Dover Corp. 41,245 7,007,938
Energy Recovery, Inc. (a)(b) 11,033 216,026
Enerpac Tool Group Corp. Class A (b) 17,708 316,088
EnPro Industries, Inc. 5,855 614,892
ESCO Technologies, Inc. 7,498 598,190
Evoqua Water Technologies Corp. (a) 33,497 1,356,629
Federal Signal Corp. 17,751 692,644
Flowserve Corp. 36,367 1,186,292
Fortive Corp. 101,639 7,169,615
Franklin Electric Co., Inc. 10,806 937,961
Gorman-Rupp Co. 6,565 263,322
Graco, Inc. 48,236 3,500,004
Helios Technologies, Inc. 9,040 692,735
Hillenbrand, Inc. 20,593 957,163
Hydrofarm Holdings Group, Inc. (a)(b) 9,803 192,237
Hyster-Yale Materials Handling Class A 2,834 127,218
IDEX Corp. 21,456 4,622,481
Illinois Tool Works, Inc. 80,806 18,902,140
Ingersoll Rand, Inc. 115,889 6,514,121
ITT, Inc. 24,052 2,210,860
John Bean Technologies Corp. 9,092 1,227,420
Kadant, Inc. 3,200 668,736
Kennametal, Inc. 24,389 843,128
Lincoln Electric Holdings, Inc. 16,599 2,122,016
Lindsay Corp. 3,251 410,439
Manitowoc Co., Inc. (a) 9,559 174,452
Meritor, Inc. (a) 18,769 432,625
Middleby Corp. (a) 15,710 2,909,492
Miller Industries, Inc. 3,392 106,746
Mueller Industries, Inc. 16,000 826,560
19 Quarterly Report

Schedule of Investments (Unaudited) − continued
Common Stocks – continuedShares Value ($)
INDUSTRIALS – continued
Machinery – continued
Mueller Water Products, Inc. Class A 45,761 588,029
Nikola Corp. (a)(b) 55,627 446,685
NN, Inc. (a)(b) 12,576 47,915
Nordson Corp. 15,240 3,543,910
Omega Flex, Inc. (b) 816 115,839
Oshkosh Corp. 19,641 2,235,342
Otis Worldwide Corp. 121,038 10,340,276
PACCAR, Inc. 98,308 9,141,661
Parker Hannifin Corp. 36,588 11,342,646
Pentair PLC 46,944 2,990,333
Proto Labs, Inc. (a) 8,345 418,752
RBC Bearings, Inc. (a) 8,187 1,477,508
REV Group, Inc. (b) 9,672 129,895
Snap-On, Inc. 15,200 3,165,400
SPX Corp. (a) 12,293 641,449
SPX Flow, Inc. 11,913 1,026,901
Standex International Corp. 3,196 317,523
Stanley Black & Decker, Inc. 46,326 8,090,836
Tennant Co. 5,079 391,946
Terex Corp. (b) 20,092 838,238
The Greenbrier Companies, Inc. 9,426 380,433
The Shyft Group, Inc. 9,063 380,102
Timken Co. 19,437 1,298,392
Toro Co. 30,068 2,903,967
Trinity Industries, Inc. (b) 23,776 683,084
Wabash National Corp. 14,941 293,142
Watts Water Technologies, Inc. Class A 7,751 1,187,531
Welbilt, Inc. (a) 35,868 851,865
Westinghouse Air Brake Tech Co. 52,931 4,705,566
Woodward, Inc. 17,838 1,966,996
Xylem, Inc. 50,974 5,353,289
228,538,159
Marine - 0.0%
Genco Shipping & Trading Ltd. 10,065 156,611
Kirby Corp. (a) 16,740 1,091,113
Matson, Inc. 11,999 1,171,822
2,419,546
Professional Services - 0.6%
Acacia Research Corp. (a) 13,401 60,305
ASGN, Inc. (a) 14,648 1,682,616
Barrett Business Services, Inc. 2,080 133,120
Booz Allen Hamilton Holding Corp. Class A 37,719 2,894,179
CACI International, Inc. Class A (a) 6,512 1,611,460
CBIZ, Inc. (a) 14,274 551,405
CoStar Group, Inc. (a) 113,040 7,930,886
CRA International, Inc. 2,035 173,097
Dun & Bradstreet Holdings, Inc. (a) 42,438 851,306
Equifax, Inc. 34,708 8,321,590
Exponent, Inc. 14,617 1,388,323
First Advantage Corp. 11,906 201,450
Forrester Research, Inc. (a) 3,280 180,466
Franklin Covey Co. (a) 3,703 173,337
FTI Consulting, Inc. (a) 9,643 1,406,046
Heidrick & Struggles International, Inc. 5,522 241,698
Common Stocks – continuedShares Value ($)
INDUSTRIALS – continued
Professional Services – continued
Huron Consulting Group, Inc. (a) 6,241 275,353
ICF International, Inc. 4,768 450,052
IHS Markit Ltd. 113,738 13,283,461
Insperity, Inc. 9,978 1,072,934
Jacobs Engineering Group, Inc. 36,848 4,796,873
KBR, Inc. 39,805 1,727,537
Kelly Services, Inc. Class A (non-vtg.) 10,915 186,428
Kforce, Inc. 5,520 379,058
Korn Ferry 15,242 1,011,764
Leidos Holdings, Inc. 39,517 3,534,796
Manpower, Inc. 15,205 1,594,548
ManTech International Corp. Class A 7,812 564,339
Nielsen Holdings PLC 100,439 1,894,280
Resources Connection, Inc. 8,286 144,425
Robert Half International, Inc. 31,618 3,581,055
Science Applications International Corp. 15,991 1,311,742
TransUnion Holding Co., Inc. 54,716 5,642,314
TriNet Group, Inc. (a) 11,720 998,544
TrueBlue, Inc. (a) 10,238 272,331
Upwork, Inc. (a) 34,185 929,832
Verisk Analytics, Inc. 46,244 9,069,836
Willdan Group, Inc. (a)(b) 3,139 98,753
80,621,539
Road & Rail - 1.0%
AMERCO 2,778 1,691,663
ArcBest Corp. 7,388 653,395
Avis Budget Group, Inc. (a) 11,272 1,985,901
Covenant Transport Group, Inc. Class A 2,670 57,992
CSX Corp. 630,033 21,559,729
Daseke, Inc. (a) 17,198 192,274
Heartland Express, Inc. 11,794 176,438
J.B. Hunt Transport Services, Inc. 24,115 4,643,102
Knight-Swift Transportation Holdings, Inc. Class A 46,926 2,655,073
Landstar System, Inc. 10,729 1,716,640
Lyft, Inc. (a) 83,275 3,207,753
Marten Transport Ltd. 15,872 264,904
Norfolk Southern Corp. 69,153 18,808,924
Old Dominion Freight Lines, Inc. 26,486 7,996,918
Ryder System, Inc. 15,280 1,118,343
Saia, Inc. (a) 7,555 2,147,735
Schneider National, Inc. Class B 10,003 256,077
U.S. Xpress Enterprises, Inc. (a)(b) 5,641 25,441
Uber Technologies, Inc. (a) 473,302 17,701,495
Union Pacific Corp. 182,282 44,577,063
Werner Enterprises, Inc. 17,447 777,962
XPO Logistics, Inc. (a) 27,893 1,845,680
Yellow Corp. (a) 12,048 125,781
134,186,283
Trading Companies & Distributors - 0.3%
Air Lease Corp. Class A 29,803 1,186,457
Applied Industrial Technologies, Inc. 10,986 1,076,408
Beacon Roofing Supply, Inc. (a) 16,041 880,170
BlueLinx Corp. (a) 2,665 190,921
Boise Cascade Co. 11,305 793,837
Quarterly Report 20

Common Stocks – continuedShares Value ($)
INDUSTRIALS – continued
Trading Companies & Distributors – continued
Core & Main, Inc. (b) 10,641 255,916
DXP Enterprises, Inc. (a) 5,268 150,401
Fastenal Co. 163,142 9,246,889
GATX Corp. 10,348 1,080,849
Global Industrial Co. 4,086 142,847
GMS, Inc. (a) 12,542 641,900
H&E Equipment Services, Inc. 8,754 364,429
Herc Holdings, Inc. 6,944 1,114,165
McGrath RentCorp. 6,555 499,557
MRC Global, Inc. (a) 20,236 149,949
MSC Industrial Direct Co., Inc. Class A 13,226 1,079,771
NOW, Inc. (a) 32,056 284,978
Rush Enterprises, Inc. Class A 11,891 628,083
SiteOne Landscape Supply, Inc. (a) 12,729 2,292,747
Textainer Group Holdings Ltd. 12,899 474,425
Titan Machinery, Inc. (a) 5,672 174,698
Triton International Ltd. 18,686 1,129,008
United Rentals, Inc. (a) 20,581 6,588,390
Univar, Inc. (a) 47,878 1,268,767
Veritiv Corp. (a) 3,903 363,291
W.W. Grainger, Inc. 12,401 6,139,859
Watsco, Inc. 9,396 2,654,934
WESCO International, Inc. (a) 12,407 1,512,289
42,365,935
TOTAL INDUSTRIALS 1,123,111,836
INFORMATION TECHNOLOGY - 27.7%
Communications Equipment - 0.8%
ADTRAN, Inc. 13,394 257,299
Applied Optoelectronics, Inc. (a)(b) 10,595 43,440
Arista Networks, Inc. (a) 63,838 7,935,702
CalAmp Corp. (a) 15,129 89,866
Calix, Inc. (a) 15,372 772,904
Casa Systems, Inc. (a) 7,990 35,396
Ciena Corp. (a) 43,928 2,912,866
Cisco Systems, Inc. 1,197,281 66,652,633
Clearfield, Inc. (a) 3,321 214,105
CommScope Holding Co., Inc. (a) 55,317 519,427
Comtech Telecommunications Corp. 7,652 155,565
Digi International, Inc. (a) 9,950 222,283
Extreme Networks, Inc. (a) 34,921 443,147
F5, Inc. (a) 17,320 3,595,978
Harmonic, Inc. (a) 29,651 319,045
Infinera Corp. (a)(b) 56,809 478,332
Inseego Corp. (a)(b) 23,098 105,327
Juniper Networks, Inc. 91,795 3,196,302
Lumentum Holdings, Inc. (a) 20,494 2,079,731
Motorola Solutions, Inc. 48,136 11,164,664
NETGEAR, Inc. (a)(b) 9,303 257,414
NetScout Systems, Inc. (a) 19,852 626,331
Ondas Holdings, Inc. (a)(b) 7,374 36,796
Plantronics, Inc. (a)(b) 11,424 304,450
Resonant, Inc. (a)(b) 19,607 28,626
Ribbon Communications, Inc. (a) 34,254 154,143
Common Stocks – continuedShares Value ($)
INFORMATION TECHNOLOGY – continued
Communications Equipment – continued
ViaSat, Inc. (a)(b) 20,924 921,074
Viavi Solutions, Inc. (a) 67,872 1,117,173
104,640,019
Electronic Equipment & Components - 0.8%
908 Devices, Inc. (a) 3,841 60,765
Advanced Energy Industries, Inc. 10,736 925,228
Airgain, Inc. (a) 2,184 20,857
Akoustis Technologies, Inc. (a)(b) 12,086 73,120
Amphenol Corp. Class A 170,014 13,531,414
Arlo Technologies, Inc. (a) 21,207 184,289
Arrow Electronics, Inc. (a) 19,927 2,470,948
Avnet, Inc. 27,741 1,119,627
Badger Meter, Inc. 8,097 819,173
Belden, Inc. 13,068 731,155
Benchmark Electronics, Inc. 9,922 239,517
CDW Corp. 38,501 7,278,614
Cognex Corp. 50,152 3,333,102
Coherent, Inc. (a) 6,800 1,757,664
Corning, Inc. 218,492 9,185,404
CTS Corp. 9,548 320,335
ePlus, Inc. (a) 7,482 343,948
Fabrinet (a) 10,373 1,173,809
FARO Technologies, Inc. (a) 5,031 273,234
II-VI, Inc. (a)(b) 30,049 1,905,107
Insight Enterprises, Inc. (a) 10,016 943,006
Intellicheck, Inc. (a)(b) 3,856 15,732
IPG Photonics Corp. (a) 10,017 1,547,326
Itron, Inc. (a)(b) 12,970 804,140
Jabil, Inc. 40,468 2,488,377
Keysight Technologies, Inc. (a) 52,348 8,837,389
Kimball Electronics, Inc. (a) 7,217 142,824
Knowles Corp. (a) 25,783 546,857
Littelfuse, Inc. 7,033 1,898,699
Luna Innovations, Inc. (a)(b) 11,917 86,875
Methode Electronics, Inc. Class A 10,979 483,405
MicroVision, Inc. (a)(b) 49,638 169,266
Napco Security Technologies, Inc. 8,170 169,854
National Instruments Corp. 37,386 1,541,051
nLIGHT, Inc. (a)(b) 11,684 241,742
Novanta, Inc. (a) 10,134 1,399,505
OSI Systems, Inc. (a) 4,407 365,517
Par Technology Corp. (a)(b) 6,632 248,700
PC Connection, Inc. 3,190 138,287
Plexus Corp. (a) 8,219 637,137
Rogers Corp. (a) 5,273 1,439,265
Sanmina Corp. (a) 18,167 687,076
ScanSource, Inc. (a) 7,434 231,792
TD SYNNEX Corp. 11,525 1,205,169
TE Connectivity Ltd. 93,061 13,308,654
Teledyne Technologies, Inc. (a) 13,379 5,638,312
Trimble, Inc. (a) 71,896 5,188,015
TTM Technologies, Inc. (a) 27,165 365,641
Vishay Intertechnology, Inc. 38,268 792,530
Vishay Precision Group, Inc. (a) 3,213 102,912
21 Quarterly Report

Schedule of Investments (Unaudited) − continued
Common Stocks – continuedShares Value ($)
INFORMATION TECHNOLOGY – continued
Electronic Equipment & Components – continued
Vontier Corp. 48,054 1,350,798
Wrap Technologies, Inc. (a)(b) 10,739 28,781
Zebra Technologies Corp. Class A (a) 15,203 7,740,151
106,532,095
IT Services - 4.7%
Accenture PLC Class A 179,301 63,397,248
Affirm Holdings, Inc. 41,149 2,636,416
Akamai Technologies, Inc. (a) 45,891 5,256,814
Alliance Data Systems Corp. 14,376 992,519
Amdocs Ltd. 35,900 2,724,451
Automatic Data Processing, Inc. 119,554 24,648,448
BigCommerce Holdings, Inc. (a) 16,269 531,834
Block, Inc. Class A (a) 114,078 13,950,599
Brightcove, Inc. (a) 10,680 100,712
Broadridge Financial Solutions, Inc. 33,183 5,283,397
Cantaloupe, Inc. (a)(b) 18,248 153,283
Cass Information Systems, Inc. 3,903 158,774
Cloudflare, Inc. (a) 78,119 7,530,672
Cognizant Technology Solutions Corp. Class A 149,166 12,741,760
Concentrix Corp. 12,135 2,439,014
Conduent, Inc. (a) 46,689 220,839
CSG Systems International, Inc. 9,270 526,258
DXC Technology Co. (a) 72,345 2,176,138
EPAM Systems, Inc. (a) 16,193 7,710,135
Euronet Worldwide, Inc. (a) 14,797 1,981,170
EVERTEC, Inc. 16,716 729,486
EVO Payments, Inc. Class A (a)(b) 13,595 327,911
ExlService Holdings, Inc. (a) 9,448 1,138,673
Fastly, Inc. Class A (a)(b) 29,537 846,530
Fidelity National Information Services, Inc. 173,071 20,754,674
Fiserv, Inc. (a) 168,733 17,835,078
FleetCor Technologies, Inc. (a) 23,057 5,493,561
Gartner, Inc. (a) 23,345 6,860,862
Genpact Ltd. 48,841 2,429,840
Global Payments, Inc. 82,202 12,320,436
GoDaddy, Inc. (a) 47,964 3,631,354
Grid Dynamics Holdings, Inc. (a) 13,197 351,700
Hackett Group, Inc. 8,569 164,011
i3 Verticals, Inc. Class A (a)(b) 5,749 133,032
IBM Corp. 254,426 33,983,681
International Money Express, Inc. (a) 10,448 167,272
Jack Henry & Associates, Inc. 20,931 3,512,431
Kyndryl Holdings, Inc. (a) 49,816 840,894
Limelight Networks, Inc. (a)(b) 39,885 170,309
Liveramp Holdings, Inc. (a) 19,331 863,129
Marqeta, Inc. Class A (b) 65,834 776,841
MasterCard, Inc. Class A 246,342 95,181,622
Maximus, Inc. 17,280 1,336,090
MoneyGram International, Inc. (a) 24,485 214,733
MongoDB, Inc. Class A (a) 18,877 7,647,261
Okta, Inc. (a) 42,224 8,355,707
Paychex, Inc. 91,130 10,731,469
Paymentus Holdings, Inc. (a) 4,048 106,381
PayPal Holdings, Inc. (a) 333,925 57,415,065
Common Stocks – continuedShares Value ($)
INFORMATION TECHNOLOGY – continued
IT Services – continued
Paysign, Inc. (a)(b) 4,632 10,283
Perficient, Inc. (a) 9,478 993,484
Rackspace Technology, Inc. (a)(b) 16,648 208,266
Repay Holdings Corp. (a)(b) 19,810 354,401
Sabre Corp. (a)(b) 90,228 825,586
Sezzle, Inc. unit (a)(b) 24,080 42,963
Shift4 Payments, Inc. (a)(b) 12,903 680,246
Snowflake Computing, Inc. (a) 65,957 18,197,536
SolarWinds, Inc. 11,855 161,228
Squarespace, Inc. Class A (a)(b) 8,033 266,214
Switch, Inc. Class A 37,336 956,922
TaskUs, Inc. 7,786 249,152
The Western Union Co. 115,217 2,178,753
Ttec Holdings, Inc. 5,035 403,253
Tucows, Inc. (a)(b) 2,433 192,207
Twilio, Inc. Class A (a) 48,122 9,918,907
Unisys Corp. (a) 18,759 342,352
VeriSign, Inc. (a) 27,404 5,951,601
Verra Mobility Corp. (a) 36,912 584,686
Visa, Inc. Class A 476,157 107,692,429
WEX, Inc. (a) 12,718 2,047,344
601,738,327
Semiconductors & Semiconductor Equipment -5.5%
ACM Research, Inc. (a)(b) 3,582 285,306
Advanced Micro Devices, Inc. (a) 343,208 39,211,514
Allegro MicroSystems LLC (a) 14,724 417,867
Alpha & Omega Semiconductor Ltd. (a) 6,146 276,754
Ambarella, Inc. (a) 10,420 1,460,363
Amkor Technology, Inc. 28,650 630,873
Analog Devices, Inc. 152,460 24,998,866
Applied Materials, Inc. 256,646 35,463,344
Atomera, Inc. (a)(b) 6,032 85,232
Axcelis Technologies, Inc. (a) 9,422 589,911
AXT, Inc. (a) 12,288 92,037
Azenta, Inc. 21,363 1,801,755
Broadcom, Inc. 116,831 68,448,946
CEVA, Inc. (a) 6,795 255,968
Cirrus Logic, Inc. (a) 16,225 1,451,164
CMC Materials, Inc. 7,991 1,445,412
Cohu, Inc. (a) 13,432 442,987
CyberOptics Corp. (a) 1,782 66,932
Diodes, Inc. (a) 12,703 1,178,711
Enphase Energy, Inc. (a) 38,330 5,384,215
Entegris, Inc. 38,302 4,590,112
First Solar, Inc. (a) 28,188 2,209,375
FormFactor, Inc. (a) 22,312 953,615
Ichor Holdings Ltd. (a) 8,402 356,413
Impinj, Inc. (a)(b) 5,017 398,300
Intel Corp. 1,154,457 56,360,591
KLA Corp. 43,155 16,798,947
Kopin Corp. (a)(b) 25,310 74,411
Kulicke & Soffa Industries, Inc. (b) 17,292 945,699
Lam Research Corp. 40,035 23,617,447
Quarterly Report 22

Common Stocks – continuedShares Value ($)
INFORMATION TECHNOLOGY – continued
Semiconductors & Semiconductor Equipment –continued
Lattice Semiconductor Corp. (a) 39,024 2,154,905
MACOM Technology Solutions Holdings, Inc. (a) 13,831 846,596
Marvell Technology, Inc. 234,109 16,715,383
MaxLinear, Inc. Class A (a) 20,073 1,204,781
Microchip Technology, Inc. 158,099 12,249,511
Micron Technology, Inc. 318,142 26,173,542
MKS Instruments, Inc. 16,025 2,489,163
Monolithic Power Systems, Inc. 12,508 5,039,848
NeoPhotonics Corp. (a) 14,857 228,204
NVE Corp. 1,139 70,470
NVIDIA Corp. 709,949 173,838,112
NXP Semiconductors NV 75,519 15,514,623
onsemi (a) 122,944 7,253,696
Onto Innovation, Inc. (a) 13,793 1,262,611
PDF Solutions, Inc. (a) 8,521 253,329
Photronics, Inc. (a) 16,170 289,120
Pixelworks, Inc. (a) 11,824 39,610
Power Integrations, Inc. 16,773 1,353,749
Qorvo, Inc. (a) 31,586 4,336,126
Qualcomm, Inc. 317,983 55,888,692
Rambus, Inc. (a) 31,148 786,487
Semtech Corp. (a) 18,163 1,291,389
Silicon Laboratories, Inc. (a) 11,280 1,863,343
SiTime Corp. (a) 4,235 987,136
Skyworks Solutions, Inc. 47,156 6,909,297
SMART Global Holdings, Inc. (a) 6,177 354,313
SolarEdge Technologies, Inc. (a) 15,121 3,602,125
SunPower Corp. (a)(b) 22,791 382,433
Synaptics, Inc. (a) 11,058 2,326,050
Teradyne, Inc. 46,558 5,467,306
Texas Instruments, Inc. 261,868 47,002,687
Ultra Clean Holdings, Inc. (a) 12,531 631,813
Universal Display Corp. 12,478 1,915,498
Veeco Instruments, Inc. (a)(b) 14,282 392,612
Wolfspeed, Inc. (a) 32,614 3,073,543
Xilinx, Inc. 70,293 13,605,210
708,086,380
Software - 9.5%
8x8, Inc. (a) 32,679 501,623
A10 Networks, Inc. 16,460 243,608
ACI Worldwide, Inc. (a) 33,613 1,155,279
Adobe, Inc. (a) 135,155 72,213,317
Agilysys, Inc. (a) 5,655 215,229
Alarm.com Holdings, Inc. (a) 12,854 958,523
Altair Engineering, Inc. Class A (a) 14,635 920,834
Alteryx, Inc. Class A (a) 16,885 963,627
American Software, Inc. Class A 8,470 194,725
Anaplan, Inc. (a) 41,133 1,985,901
ANSYS, Inc. (a) 24,724 8,406,407
AppFolio, Inc. (a) 5,386 620,790
Appian Corp. Class A (a)(b) 10,893 614,038
Asana, Inc. (a)(b) 22,771 1,195,022
Aspen Technology, Inc. (a) 18,948 2,845,232
Common Stocks – continuedShares Value ($)
INFORMATION TECHNOLOGY – continued
Software – continued
Autodesk, Inc. (a) 62,560 15,626,862
Avalara, Inc. (a) 24,542 2,690,294
Avaya Holdings Corp. (a) 23,572 429,482
Benefitfocus, Inc. (a)(b) 8,004 89,165
Bill.Com Holdings, Inc. (a) 25,992 4,891,954
Black Knight, Inc. (a) 43,718 3,261,363
Blackbaud, Inc. (a) 11,954 814,546
BlackLine, Inc. (a)(b) 15,104 1,387,604
Bottomline Technologies, Inc. (a) 10,903 614,820
Box, Inc. Class A (a) 42,795 1,118,233
C3.Ai, Inc. (a)(b) 19,981 526,300
Cadence Design Systems, Inc. (a) 79,427 12,084,024
CDK Global, Inc. 33,903 1,456,812
Cerence, Inc. (a)(b) 10,711 680,041
Ceridian HCM Holding, Inc. (a) 38,423 2,913,232
ChannelAdvisor Corp. (a) 9,855 208,335
Citrix Systems, Inc. 35,455 3,614,283
Clear Secure, Inc. (b) 4,022 99,303
CommVault Systems, Inc. (a) 12,716 857,821
Confluent, Inc. (b) 17,239 1,127,258
Consensus Cloud Solutions, Inc. (a) 4,560 258,552
CoreCard Corp. (a)(b) 1,650 61,215
Couchbase, Inc. (b) 2,642 61,902
Coupa Software, Inc. (a) 20,845 2,798,858
Crowdstrike Holdings, Inc. (a) 58,739 10,610,613
CS Disco, Inc. (b) 3,718 127,602
Datadog, Inc. Class A (a) 73,348 10,716,876
Digimarc Corp. (a)(b) 3,439 109,016
Digital Turbine, Inc. (a)(b) 25,217 1,113,331
DocuSign, Inc. (a) 55,657 6,999,981
Dolby Laboratories, Inc. Class A 18,511 1,626,191
Domo, Inc. Class B (a) 8,478 398,127
Dropbox, Inc. Class A (a) 80,199 1,984,925
Duck Creek Technologies, Inc. (a) 20,896 533,893
Dynatrace, Inc. (a) 55,426 3,040,670
Ebix, Inc. (b) 7,366 223,853
eGain Communications Corp. (a) 5,073 52,404
Elastic NV (a) 20,477 1,909,480
Envestnet, Inc. (a)(b) 15,146 1,119,895
Everbridge, Inc. (a) 11,036 564,160
Fair Isaac Corp. (a) 7,779 3,850,527
Five9, Inc. (a) 19,127 2,404,264
Fortinet, Inc. (a) 38,473 11,435,715
Guidewire Software, Inc. (a) 23,229 2,342,412
HubSpot, Inc. (a) 12,769 6,241,487
Intapp, Inc. 3,358 67,563
InterDigital, Inc. 8,173 564,182
Intuit, Inc. 80,461 44,674,361
Jamf Holding Corp. (a)(b) 15,892 525,390
LivePerson, Inc. (a) 17,933 535,659
Mandiant, Inc. (a) 68,667 1,036,185
Manhattan Associates, Inc. (a) 18,080 2,420,370
McAfee Corp. 20,573 527,697
MeridianLink, Inc. (b) 4,280 82,989
23 Quarterly Report

Schedule of Investments (Unaudited) − continued
Common Stocks – continuedShares Value ($)
INFORMATION TECHNOLOGY – continued
Software – continued
Microsoft Corp. 2,131,608 662,887,456
MicroStrategy, Inc. Class A (a)(b) 2,369 871,816
Mimecast Ltd. (a) 17,305 1,379,382
Mitek Systems, Inc. (a)(b) 12,054 197,324
Model N, Inc. (a)(b) 9,073 250,959
Momentive Global, Inc. (a) 35,230 603,490
N-able, Inc. (a) 18,651 208,145
nCino, Inc. (a)(b) 15,892 728,330
NCR Corp. (a) 37,035 1,409,552
New Relic, Inc. (a) 16,724 1,758,361
NortonLifeLock, Inc. 163,937 4,264,001
Nuance Communications, Inc. (a) 80,250 4,433,813
Nutanix, Inc. Class A (a) 59,444 1,625,199
ON24, Inc. (a)(b) 2,190 36,047
Onespan, Inc. (a)(b) 10,562 169,626
Oracle Corp. 457,860 37,159,918
Pagerduty, Inc. (a)(b) 20,828 687,741
Palantir Technologies, Inc. (a) 456,396 6,257,189
Palo Alto Networks, Inc. (a) 27,892 14,431,321
Paycom Software, Inc. (a) 13,788 4,623,116
Paycor HCM, Inc. (b) 9,051 234,783
Paylocity Holding Corp. (a) 11,169 2,278,253
Pegasystems, Inc. 11,316 1,122,774
Ping Identity Holding Corp. (a) 17,507 346,464
Progress Software Corp. 12,051 548,441
PROS Holdings, Inc. (a) 11,082 307,082
PTC, Inc. (a) 30,144 3,504,541
Q2 Holdings, Inc. (a)(b) 16,103 1,050,721
Qualtrics International, Inc. 26,880 786,778
Qualys, Inc. (a) 9,383 1,202,338
Rapid7, Inc. (a) 16,634 1,602,353
RingCentral, Inc. (a) 23,378 4,125,983
SailPoint Technologies Holding, Inc. (a)(b) 25,878 1,001,220
Salesforce.com, Inc. (a) 278,067 64,686,726
SecureWorks Corp. (a) 3,430 50,593
SentinelOne, Inc. 11,858 530,646
ServiceNow, Inc. (a) 56,589 33,148,704
ShotSpotter, Inc. (a)(b) 2,852 75,207
Smartsheet, Inc. (a) 36,257 2,255,911
Smith Micro Software, Inc. (a)(b) 17,432 72,866
Splunk, Inc. (a) 45,622 5,653,478
Sprinklr, Inc. (b) 5,174 58,208
Sprout Social, Inc. (a) 12,924 889,817
SPS Commerce, Inc. (a) 10,162 1,258,564
SS&C Technologies Holdings, Inc. 62,455 4,988,281
Synchronoss Technologies, Inc. (a)(b) 27,283 55,657
Synopsys, Inc. (a) 43,627 13,546,184
Telos Corp. (a) 15,883 185,672
Tenable Holdings, Inc. (a) 25,462 1,308,747
Teradata Corp. (a) 30,665 1,237,026
The Trade Desk, Inc. (a) 124,374 8,648,968
Tyler Technologies, Inc. (a) 11,737 5,560,991
Upland Software, Inc. (a) 7,309 143,256
Varonis Systems, Inc. (a) 30,298 1,128,903
Common Stocks – continuedShares Value ($)
INFORMATION TECHNOLOGY – continued
Software – continued
Verint Systems, Inc. (a)(b) 17,788 913,058
Veritone, Inc. (a)(b) 7,771 122,549
Vertex, Inc. Class A (a)(b) 6,693 97,115
Viant Technology, Inc. 2,859 22,843
VirnetX Holding Corp. (a)(b) 13,724 31,016
VMware, Inc. Class A (a) 56,988 7,321,818
Vobile Group Ltd. (a) 265,000 181,578
Vonage Holdings Corp. (a) 71,172 1,483,224
Workday, Inc. Class A (a) 54,164 13,704,034
Workiva, Inc. (a) 12,742 1,507,124
Xperi Holding Corp. (b) 29,103 490,968
Yext, Inc. (a) 30,859 249,958
Zendesk, Inc. (a) 34,389 3,387,660
Zoom Video Communications, Inc. Class A (a) 61,809 9,535,893
Zscaler, Inc. (a) 22,505 5,786,261
Zuora, Inc. (a) 32,176 535,087
1,221,495,340
Technology Hardware, Storage & Peripherals -6.4%
3D Systems Corp. (a)(b) 35,162 629,400
Apple, Inc. 4,425,877 773,554,753
Avid Technology, Inc. (a) 10,463 328,120
Corsair Gaming, Inc. (a)(b) 9,044 176,720
Dell Technologies, Inc. (a) 82,574 4,691,029
Diebold Nixdorf, Inc. (a)(b) 19,642 183,456
Eastman Kodak Co. (a)(b) 16,294 64,035
Hewlett Packard Enterprise Co. 371,386 6,064,733
HP, Inc. 326,577 11,995,173
Immersion Corp. (a)(b) 9,873 51,043
NetApp, Inc. 63,345 5,479,976
Pure Storage, Inc. Class A (a) 76,467 2,025,611
Razer, Inc. (a)(d) 1,177,000 346,699
Seagate Technology Holdings PLC 58,224 6,238,702
Super Micro Computer, Inc. (a) 12,205 494,547
Turtle Beach Corp. (a)(b) 4,485 91,135
Western Digital Corp. (a) 88,967 4,603,153
Xerox Holdings Corp. 38,915 821,496
817,839,781
TOTAL INFORMATION TECHNOLOGY 3,560,331,942
MATERIALS - 2.7%
Chemicals - 1.7%
AdvanSix, Inc. 7,771 327,081
Air Products & Chemicals, Inc. 62,958 17,761,711
Albemarle Corp. U.S. 33,247 7,338,943
American Vanguard Corp. 9,142 138,684
Amyris, Inc. (a)(b) 51,882 236,582
Ashland Global Holdings, Inc. 15,802 1,517,624
Avient Corp. 25,973 1,292,676
Axalta Coating Systems Ltd. (a) 59,928 1,774,468
Balchem Corp. 9,259 1,360,517
Cabot Corp. 16,471 905,740
Celanese Corp. Class A 30,952 4,819,536
CF Industries Holdings, Inc. 60,661 4,177,723
Quarterly Report 24

Common Stocks – continuedShares Value ($)
MATERIALS – continued
Chemicals – continued
Chase Corp. 2,015 191,183
Corteva, Inc. 206,876 9,946,598
Dow, Inc. 209,680 12,524,186
DuPont de Nemours, Inc. 147,980 11,335,268
Eastman Chemical Co. 38,079 4,528,735
Ecolab, Inc. 70,688 13,391,842
Ecovyst, Inc. 14,597 149,327
Element Solutions, Inc. 60,950 1,367,718
Ferro Corp. (a) 22,537 491,307
FMC Corp. 36,066 3,980,604
FutureFuel Corp. 5,729 44,686
GCP Applied Technologies, Inc. (a) 15,248 486,411
H.B. Fuller Co. 15,057 1,080,641
Hawkins, Inc. (b) 5,511 205,671
Huntsman Corp. 58,150 2,083,515
Ingevity Corp. (a) 11,322 746,233
Innospec, Inc. 7,019 652,486
International Flavors & Fragrances, Inc. 72,161 9,519,479
Intrepid Potash, Inc. (a)(b) 2,547 98,773
Koppers Holdings, Inc. (a) 6,240 186,451
Kraton Performance Polymers, Inc. (a) 8,828 409,443
Kronos Worldwide, Inc. 6,969 100,005
Linde PLC 145,384 46,330,973
Livent Corp. (a)(b) 46,303 1,065,432
Loop Industries, Inc. (a)(b) 5,502 44,346
LyondellBasell Industries NV Class A 75,538 7,306,791
Minerals Technologies, Inc. 9,827 687,595
NewMarket Corp. 1,950 659,237
Olin Corp. 40,738 2,064,194
Orion Engineered Carbons SA (a) 15,448 264,161
PPG Industries, Inc. 67,312 10,514,134
Quaker Houghton 3,891 813,880
Rayonier Advanced Materials, Inc. (a) 14,854 92,540
RPM International, Inc. 36,802 3,261,025
Sensient Technologies Corp. 11,947 1,012,389
Sherwin-Williams Co. 68,544 19,638,541
Stepan Co. 5,936 653,910
The Chemours Co. LLC 45,788 1,497,725
The Mosaic Co. 105,428 4,211,849
The Scotts Miracle-Gro Co. Class A 11,395 1,722,924
Tredegar Corp. 6,860 80,605
Trinseo PLC (b) 11,116 595,151
Tronox Holdings PLC 31,648 718,410
Valvoline, Inc. 51,276 1,689,031
Westlake Chemical Corp. 9,512 938,359
221,035,049
Construction Materials - 0.1%
Eagle Materials, Inc. 11,733 1,711,258
Forterra, Inc. (a) 8,162 191,562
Martin Marietta Materials, Inc. 17,645 6,866,022
Summit Materials, Inc. (a) 33,009 1,173,800
Vulcan Materials Co. 37,764 7,186,867
17,129,509
Common Stocks – continuedShares Value ($)
MATERIALS – continued
Containers & Packaging - 0.4%
Amcor PLC 432,250 5,191,323
Aptargroup, Inc. 18,519 2,172,279
Avery Dennison Corp. 23,443 4,815,661
Ball Corp. 91,800 8,913,780
Berry Global Group, Inc. (a) 38,242 2,578,276
Crown Holdings, Inc. 36,335 4,156,724
Graphic Packaging Holding Co. 79,621 1,505,633
Greif, Inc. Class A 7,811 462,099
International Paper Co. 111,376 5,373,892
Myers Industries, Inc. 10,843 195,933
O-I Glass, Inc. (a) 43,088 573,501
Packaging Corp. of America 26,859 4,045,771
Pactiv Evergreen, Inc. 11,892 130,217
Ranpak Holdings Corp. (A Shares) (a)(b) 11,360 305,130
Sealed Air Corp. 41,610 2,826,151
Silgan Holdings, Inc. 23,656 1,059,316
Sonoco Products Co. 27,755 1,572,043
TriMas Corp. 11,850 411,906
WestRock Co. 76,405 3,526,855
49,816,490
Metals & Mining - 0.5%
Alcoa Corp. 53,034 3,007,558
Allegheny Technologies, Inc. (a)(b) 36,390 665,573
Arconic Corp. (a) 30,674 948,747
Carpenter Technology Corp. 12,512 359,345
Century Aluminum Co. (a) 14,815 227,262
Cleveland-Cliffs, Inc. (a) 128,969 2,210,529
Coeur d'Alene Mines Corp. (a) 77,274 362,415
Commercial Metals Co. 33,462 1,118,969
Compass Minerals International, Inc. 9,285 495,819
Coronado Global Resources, Inc. unit (a)(d) 234,576 227,882
Freeport-McMoRan, Inc. 418,620 15,581,036
Gatos Silver, Inc. (a) 12,259 38,125
Gold Resource Corp. 19,233 31,542
Haynes International, Inc. 3,918 147,395
Hecla Mining Co. 154,993 768,765
Kaiser Aluminum Corp. 4,228 404,831
Materion Corp. 5,793 479,950
McEwen Mining, Inc. (a)(b) 111,785 95,286
Newmont Corp. 227,157 13,895,194
Nucor Corp. 81,004 8,213,806
Reliance Steel & Aluminum Co. 17,735 2,711,327
Royal Gold, Inc. 18,351 1,863,544
Ryerson Holding Corp. 4,736 97,088
Schnitzer Steel Industries, Inc. Class A 6,814 266,700
Steel Dynamics, Inc. 53,052 2,945,447
SunCoke Energy, Inc. 25,552 175,031
TimkenSteel Corp. (a)(b) 11,494 161,261
United States Steel Corp. 75,485 1,564,049
Warrior Metropolitan Coal, Inc. 14,039 367,822
Worthington Industries, Inc. (b) 9,340 506,041
59,938,339
Paper & Forest Products - 0.0%
Clearwater Paper Corp. (a)(b) 4,967 157,057
25 Quarterly Report

Schedule of Investments (Unaudited) − continued
Common Stocks – continuedShares Value ($)
MATERIALS – continued
Paper & Forest Products – continued
Glatfelter Corp. 13,046 226,479
Louisiana-Pacific Corp. 24,830 1,649,705
Mercer International, Inc. (SBI) (b) 11,640 141,426
Neenah, Inc. 4,691 216,255
Resolute Forest Products 13,610 185,368
Schweitzer-Mauduit International, Inc. 9,084 274,973
Verso Corp. 7,373 198,186
3,049,449
TOTAL MATERIALS 350,968,836
REAL ESTATE - 3.5%
Equity Real Estate Investment Trusts (REITs) -3.3%
Acadia Realty Trust (SBI) 26,226 519,013
Agree Realty Corp. 20,125 1,315,773
Alexander & Baldwin, Inc. 20,484 470,108
Alexanders, Inc. 649 170,862
Alexandria Real Estate Equities, Inc. 40,063 7,805,875
American Assets Trust, Inc. 15,931 573,038
American Campus Communities, Inc. 40,413 2,111,983
American Finance Trust, Inc. 32,323 266,988
American Homes 4 Rent Class A 80,171 3,137,091
American Tower Corp. 129,493 32,567,490
Americold Realty Trust 75,441 2,146,296
Apartment Income (REIT) Corp. 44,154 2,332,214
Apartment Investment & Management Co. Class A(a) 43,473 305,615
Apple Hospitality (REIT), Inc. 59,253 955,751
Armada Hoffler Properties, Inc. 18,232 255,795
AvalonBay Communities, Inc. 40,138 9,802,904
Bluerock Residential Growth (REIT), Inc. 7,515 199,523
Boston Properties, Inc. 40,600 4,550,448
Brandywine Realty Trust (SBI) 49,034 630,577
Brixmor Property Group, Inc. 83,025 2,105,514
Broadstone Net Lease, Inc. 46,318 1,070,409
Camden Property Trust (SBI) 29,819 4,773,724
CareTrust (REIT), Inc. 28,120 596,425
CatchMark Timber Trust, Inc. 14,638 120,032
Centerspace 3,917 373,603
Chatham Lodging Trust (a) 14,514 192,601
City Office REIT, Inc. 12,052 214,887
Community Healthcare Trust, Inc. 6,896 312,665
CorEnergy Infrastructure Trust, Inc. 2,534 9,300
Corporate Office Properties Trust (SBI) 31,137 786,521
Cousins Properties, Inc. 42,200 1,627,232
Crown Castle International Corp. 123,014 22,451,285
CTO Realty Growth, Inc. 1,691 99,076
CubeSmart 61,276 3,109,144
CyrusOne, Inc. 35,919 3,227,322
DiamondRock Hospitality Co. (a) 59,098 552,566
Digital Realty Trust, Inc. 80,482 12,010,329
Digitalbridge Group, Inc. (a) 145,871 1,064,858
Diversified Healthcare Trust (SBI) 60,579 184,766
Douglas Emmett, Inc. 49,772 1,553,882
Common Stocks – continuedShares Value ($)
REAL ESTATE – continued
Equity Real Estate Investment Trusts (REITs) –continued
Duke Realty Corp. 109,648 6,335,461
Easterly Government Properties, Inc. 24,447 512,654
EastGroup Properties, Inc. 11,543 2,307,561
Empire State Realty Trust, Inc. 40,677 362,839
EPR Properties 21,353 938,891
Equinix, Inc. 25,641 18,587,161
Equity Commonwealth (a) 33,347 868,356
Equity Lifestyle Properties, Inc. 48,267 3,778,823
Equity Residential (SBI) 98,157 8,709,471
Essential Properties Realty Trust, Inc. 35,077 931,294
Essex Property Trust, Inc. 18,568 6,173,860
Extra Space Storage, Inc. 37,947 7,520,716
Farmland Partners, Inc. 10,845 123,525
Federal Realty Investment Trust (SBI) 20,145 2,568,286
First Industrial Realty Trust, Inc. 36,890 2,242,174
Four Corners Property Trust, Inc. 20,922 566,359
Franklin Street Properties Corp. 29,114 161,583
Gaming & Leisure Properties 63,945 2,889,035
Getty Realty Corp. 11,134 330,346
Gladstone Commercial Corp. 11,356 263,346
Gladstone Land Corp. 9,626 293,400
Global Medical REIT, Inc. 18,627 314,983
Global Net Lease, Inc. 28,977 415,530
Healthcare Realty Trust, Inc. 42,381 1,314,659
Healthcare Trust of America, Inc. 62,223 2,025,359
Healthpeak Properties, Inc. 153,717 5,436,970
Hersha Hospitality Trust (a) 8,269 74,586
Highwoods Properties, Inc. (SBI) 29,966 1,292,134
Host Hotels & Resorts, Inc. (a) 200,846 3,482,670
Hudson Pacific Properties, Inc. 46,122 1,089,863
Independence Realty Trust, Inc. 29,071 668,342
Industrial Logistics Properties Trust 18,870 432,689
Invitation Homes, Inc. 169,393 7,111,118
Iron Mountain, Inc. 82,450 3,786,104
iStar Financial, Inc. 19,479 418,214
JBG SMITH Properties 31,173 854,140
Kilroy Realty Corp. 29,816 1,908,224
Kimco Realty Corp. 176,371 4,278,760
Kite Realty Group Trust 62,131 1,297,295
Lamar Advertising Co. Class A 24,570 2,721,373
Life Storage, Inc. 23,156 3,124,902
LTC Properties, Inc. 11,310 407,952
LXP Industrial Trust (REIT) 79,006 1,176,399
Medical Properties Trust, Inc. 169,757 3,863,669
Mid-America Apartment Communities, Inc. 32,643 6,746,655
Monmouth Real Estate Investment Corp. Class A 27,179 570,487
National Health Investors, Inc. 13,629 788,165
National Retail Properties, Inc. 52,240 2,318,411
National Storage Affiliates Trust 23,661 1,456,571
NETSTREIT Corp. 11,975 270,635
NexPoint Residential Trust, Inc. 6,568 520,842
Office Properties Income Trust 14,102 359,319
Omega Healthcare Investors, Inc. 68,294 2,149,895
Quarterly Report 26

Common Stocks – continuedShares Value ($)
REAL ESTATE – continued
Equity Real Estate Investment Trusts (REITs) –continued
One Liberty Properties, Inc. 4,766 145,363
Orion Office (REIT), Inc. (a) 15,670 260,749
Outfront Media, Inc. 41,359 1,027,358
Paramount Group, Inc. 47,279 410,855
Park Hotels & Resorts, Inc. (a) 66,552 1,211,246
Pebblebrook Hotel Trust 37,713 816,486
Phillips Edison & Co., Inc. 5,836 183,951
Physicians Realty Trust 62,509 1,141,414
Piedmont Office Realty Trust, Inc. Class A 34,791 617,888
Plymouth Industrial REIT, Inc. 10,599 304,721
Potlatch Corp. 19,262 1,036,103
Preferred Apartment Communities, Inc. Class A 16,016 267,147
Prologis (REIT), Inc. 209,881 32,913,538
PS Business Parks, Inc. 5,803 968,869
Public Storage 43,367 15,548,371
Rayonier, Inc. 41,492 1,516,118
Realty Income Corp. 160,389 11,132,600
Regency Centers Corp. 43,395 3,113,591
Retail Opportunity Investments Corp. 32,935 610,286
Retail Value, Inc. 3,848 12,121
Rexford Industrial Realty, Inc. 42,897 3,138,773
RLJ Lodging Trust 47,136 652,834
RPT Realty 23,581 297,592
Ryman Hospitality Properties, Inc. (a) 15,436 1,364,542
Sabra Health Care REIT, Inc. 65,034 885,113
Safehold, Inc. 3,776 233,734
Saul Centers, Inc. 4,575 225,914
SBA Communications Corp. Class A 31,035 10,100,030
Seritage Growth Properties (a) 10,667 110,510
Service Properties Trust 46,927 401,226
Simon Property Group, Inc. 93,636 13,783,219
SITE Centers Corp. 51,644 764,848
SL Green Realty Corp. 18,840 1,366,277
Spirit Realty Capital, Inc. 34,782 1,650,754
Stag Industrial, Inc. 49,699 2,123,638
Store Capital Corp. 69,357 2,199,310
Summit Hotel Properties, Inc. (a) 28,466 268,150
Sun Communities, Inc. 32,918 6,220,185
Sunstone Hotel Investors, Inc. (a) 59,619 674,291
Tanger Factory Outlet Centers, Inc. 30,359 516,407
Terreno Realty Corp. 21,526 1,609,499
The GEO Group, Inc. 35,542 239,198
The Macerich Co. 60,317 997,643
UDR, Inc. 83,035 4,719,709
UMH Properties, Inc. 12,877 303,897
Uniti Group, Inc. 64,973 783,574
Universal Health Realty Income Trust (SBI) 3,592 209,414
Urban Edge Properties 29,989 546,999
Urstadt Biddle Properties, Inc. Class A 8,914 175,517
Ventas, Inc. 113,679 6,027,261
Veris Residential, Inc. (a) 23,818 392,997
VICI Properties, Inc. 180,951 5,178,818
Vornado Realty Trust 44,868 1,840,037
Common Stocks – continuedShares Value ($)
REAL ESTATE – continued
Equity Real Estate Investment Trusts (REITs) –continued
Washington REIT (SBI) 22,698 558,825
Welltower, Inc. 123,446 10,694,127
Weyerhaeuser Co. 214,774 8,683,313
Whitestone REIT Class B 11,307 115,444
WP Carey, Inc. 53,450 4,147,720
Xenia Hotels & Resorts, Inc. (a) 32,942 571,214
423,706,869
Real Estate Management & Development - 0.2%
CBRE Group, Inc. 94,877 9,614,835
Cushman & Wakefield PLC (a) 42,603 894,237
Douglas Elliman, Inc. (a)(b) 17,758 137,802
eXp World Holdings, Inc. 18,808 510,449
Forestar Group, Inc. (a) 5,366 107,052
Howard Hughes Corp. (a) 11,478 1,105,446
Jones Lang LaSalle, Inc. (a) 14,373 3,604,605
Kennedy-Wilson Holdings, Inc. 33,930 762,068
Marcus & Millichap, Inc. (a) 6,561 307,120
Newmark Group, Inc. 45,873 702,316
RE/MAX Holdings, Inc. 5,071 150,913
Realogy Holdings Corp. (a) 33,488 552,552
Redfin Corp. (a)(b) 30,085 889,613
Tejon Ranch Co. (a) 6,156 107,176
The RMR Group, Inc. 4,976 159,282
The St. Joe Co. 9,575 464,483
Zillow Group, Inc.:
Class A (a) 14,394 717,685
Class C (a)(b) 44,058 2,224,048
23,011,682
TOTAL REAL ESTATE 446,718,551
UTILITIES - 2.5%
Electric Utilities - 1.5%
Allete, Inc. 14,966 955,280
Alliant Energy Corp. 72,234 4,323,927
American Electric Power Co., Inc. 142,770 12,906,408
Avangrid, Inc. (b) 21,223 991,539
Duke Energy Corp. 217,777 22,879,652
Edison International 108,587 6,818,178
Entergy Corp. 57,458 6,422,081
Evergy, Inc. 64,950 4,219,152
Eversource Energy 98,303 8,797,135
Exelon Corp. 277,747 16,095,439
FirstEnergy Corp. 153,517 6,441,573
Hawaiian Electric Industries, Inc. 30,440 1,293,700
IDACORP, Inc. 14,220 1,567,328
MGE Energy, Inc. 10,513 814,022
NextEra Energy, Inc. 557,617 43,561,040
NRG Energy, Inc. 70,986 2,834,471
OGE Energy Corp. 59,520 2,256,998
Otter Tail Corp. 11,513 729,924
PG&E Corp. (a) 426,657 5,456,943
Pinnacle West Capital Corp. 31,701 2,206,707
PNM Resources, Inc. 24,446 1,095,425
27 Quarterly Report

Schedule of Investments (Unaudited) − continued
Common Stocks – continuedShares Value ($)
UTILITIES – continued
Electric Utilities – continued
Portland General Electric Co. 25,357 1,332,257
PPL Corp. 214,003 6,351,609
Southern Co. 300,138 20,856,590
Via Renewables, Inc. Class A, (b) 2,744 31,391
Xcel Energy, Inc. 152,758 10,641,122
191,879,891
Gas Utilities - 0.1%
Atmos Energy Corp. 38,460 4,123,681
Chesapeake Utilities Corp. 4,804 654,353
National Fuel Gas Co. 25,360 1,540,113
New Jersey Resources Corp. (b) 27,430 1,102,960
Northwest Natural Holding Co. 9,339 442,108
ONE Gas, Inc. 14,730 1,147,320
South Jersey Industries, Inc. 32,391 810,423
Southwest Gas Corp. 16,709 1,139,220
Spire, Inc. (b) 14,413 950,105
UGI Corp. 59,589 2,702,361
14,612,644
Independent Power and Renewable ElectricityProducers - 0.1%
Clearway Energy, Inc.:
Class A 8,156 251,613
Class C 24,704 832,031
Ormat Technologies, Inc. (b) 12,400 845,184
Sunnova Energy International, Inc. (a) 26,830 527,478
The AES Corp. 188,981 4,191,599
Vistra Corp. 135,800 2,961,798
9,609,703
Multi-Utilities - 0.7%
Ameren Corp. 72,878 6,467,194
Avista Corp. 20,858 927,347
Black Hills Corp. 18,248 1,236,120
CenterPoint Energy, Inc. 177,839 5,043,514
CMS Energy Corp. 81,907 5,273,173
Consolidated Edison, Inc. 100,077 8,651,657
Dominion Energy, Inc. 229,389 18,502,517
DTE Energy Co. 54,351 6,545,491
MDU Resources Group, Inc. 57,513 1,689,157
NiSource, Inc. 111,806 3,262,499
NorthWestern Energy Corp. 15,471 899,175
Public Service Enterprise Group, Inc. 142,988 9,512,992
Sempra Energy 90,675 12,527,658
Unitil Corp. 3,927 184,333
WEC Energy Group, Inc. 89,861 8,720,111
89,442,938
Water Utilities - 0.1%
American States Water Co. 10,463 965,002
American Water Works Co., Inc. 51,695 8,312,556
Cadiz, Inc. (a)(b) 7,495 21,061
California Water Service Group 14,662 910,364
Essential Utilities, Inc. 64,942 3,165,273
Middlesex Water Co. 4,975 503,669
SJW Corp. 7,793 536,626
Common Stocks – continuedShares Value ($)
UTILITIES – continued
Water Utilities – continued
York Water Co. 3,869 175,730
14,590,281
TOTAL UTILITIES 320,135,457
TOTAL COMMON STOCKS (Cost $9,803,570,064) 12,827,699,694
Money Market Funds – 1.4%Shares Value ($)
Fidelity Cash Central Fund 0.08% (e) 40,776,691 40,784,846
Fidelity Securities Lending Cash Central Fund 0.08%(e)(f) 140,664,162 140,678,229
TOTAL MONEY MARKET FUNDS (Cost $181,463,075) 181,463,075
TOTAL INVESTMENT IN SECURITIES – 101.2% (Cost $9,985,033,139) 13,009,162,769
NET OTHER ASSETS (LIABILITIES) – (1.2)% (g) (153,526,316)
NET ASSETS – 100.0% 12,855,636,453
Quarterly Report 28

Futures Contracts
Numberof contracts
ExpirationDate
NotionalAmount ($)
Value ($) UnrealizedAppreciation/
(Depreciation) ($)
Purchased
Equity Index Contracts
CME E-mini Russell 2000 Index Contracts (United States) 16 Mar 2022 1,619,520 75,122 75,122
CME E-mini S&P 500 Index Contracts (United States) 99 Mar 2022 22,296,038 1,045,294 1,045,294
CME E-mini S&P MidCap 400 Index Contracts (United States) 5 Mar 2022 1,314,850 30,487 30,487
TOTAL FUTURES CONTRACTS 1,150,903
The notional amount of futures purchased as a percentage of Net Assets is 0.2%
Legend
(a) Non-income producing
(b) Security or a portion of the security is on loan at period end.
(c) Level 3 security
(d) Security exempt from registration under Rule 144A of the Securities Act of 1933. These securitiesmay be resold in transactions exempt from registration, normally to qualified institutional buyers. Atthe end of the period, the value of these securities amounted to $1,506,535 or 0.0% of net assets.
(e) Affiliated fund that is generally available only to investment companies and other accounts managedby Fidelity Investments. The rate quoted is the annualized seven-day yield of the fund at period end. Acomplete unaudited listing of the fund’s holdings as of its most recent quarter end is available uponrequest. In addition, each Fidelity Central Fund’s financial statements are available on the SEC’swebsite or upon request.
(f) Investment made with cash collateral received from securities on loan.
(g) Includes $2,759,900 of cash collateral to cover margin requirements for futures contracts.
Affiliated Central FundsFiscal year to date information regarding the Fund’s investments in Fidelity Central Funds, including the ownership percentage, is presented below.
Affiliate
Value,beginning
of period ($) Purchases ($)Sales
Proceeds ($)Dividend
Income ($)Realized
Gain (loss) ($)
Change inUnrealized
appreciation(depreciation)
($)
Value,end
of period ($)
%ownership,end
of period
Fidelity Cash Central Fund 0.08% 53,399,371 642,631,053 655,245,578 9,173 — — 40,784,846 0.1%
Fidelity Securities Lending Cash Central Fund 0.08% 182,571,856 136,352,245 178,245,872 83,773 — — 140,678,229 0.4%
Total 235,971,227 778,983,298 833,491,450 92,946 — — 181,463,075
Amounts in the income column in the above table include any capital gain distributions from underlying funds.
Amount for Fidelity Securities Lending Cash Central Fund represents the income earned on investing cash collateral, less rebates paid to borrowers and any lending agent fees associated with the loan, plus any premium paymentsreceived for lending certain types of securities.
Investment ValuationInvestments are valued as of 4:00 p.m. Eastern time on the last calendar day of the period. Securities transactions are accounted for as of trade date. The Board of Trustees (the Board) has delegated the day to day responsibility forthe valuation of the Fund’s investments to the Fair Value Committee (the Committee) established by the Fund’s investment adviser. In accordance with valuation policies and procedures approved by the Board, the Fund attempts toobtain prices from one or more third party pricing vendors or brokers to value its investments. When current market prices, quotations or currency exchange rates are not readily available or reliable, investments will be fair valued ingood faith by the Committee, in accordance with procedures adopted by the Board. Factors used in determining fair value vary by investment type and may include market or investment specific events. The frequency with whichthese procedures are used cannot be predicted and they may be utilized to a significant extent. The Committee oversees the Fund’s valuation policies and procedures and reports to the Board on the Committee’s activities and fairvalue determinations. The Board monitors the appropriateness of the procedures used in valuing the Fund’s investments and ratifies the fair value determinations of the Committee.
The inputs to valuation techniques used to value investments are categorized into a disclosure hierarchy consisting of three levels as shown below:
Level 1 – Unadjusted quoted prices in active markets for identical investmentsLevel 2 – other significant observable inputs (including quoted prices for similar investments, interest rates, prepayment speeds, etc.)
29 Quarterly Report

Schedule of Investments (Unaudited) − continued
Level 3 – unobservable inputs (including the Fund’s own assumptions based on the best information available)
Valuation techniques used to value investments by major category are as follows:Equity securities, including restricted securities, for which market quotations are readily available, are valued at the last reported sale price or official closing price as reported by a third party pricing vendor on the primary market orexchange on which they are traded and are categorized as Level 1 in the hierarchy. In the event there were no sales during the day or closing prices are not available, securities are valued at the last quoted bid price or may bevalued using the last available price and are generally categorized as Level 2 in the hierarchy. For any foreign equity securities, when market or security specific events arise, comparisons to the valuation of American DepositaryReceipts (ADRs), futures contracts, Exchange-Traded Funds (ETFs) and certain indexes as well as quoted prices for similar securities may be used and would be categorized as Level 2 in the hierarchy. For equity securities, includingrestricted securities, where observable inputs are limited, assumptions about market activity and risk are used and these securities may be categorized as Level 3 in the hierarchy.
Futures contracts are valued at the settlement price established each day by the board of trade or exchange on which they are traded and are categorized as Level 1 in the hierarchy.
Investments in any open-end mutual funds are valued at their closing net asset value (NAV) each business day and are categorized as Level 1 in the hierarchy.
Changes in valuation techniques may result in transfers in or out of an assigned level within the disclosure hierarchy.
Derivative InstrumentsRisk Exposures and the Use of Derivative Instruments: The Fund’s investment objectives allow the Fund to enter into various types of derivative contracts. Derivatives are investments whose value is primarily derived from underlyingassets, indices or reference rates and may be transacted on an exchange or over-the-counter (OTC). Derivatives may involve a future commitment to buy or sell a specified asset based on specified terms, to exchange future cashflows at periodic intervals based on a notional principal amount, or for one party to make one or more payments upon the occurrence of specified events in exchange for periodic payments from the other party.
The Fund used derivatives to increase returns, to gain exposure to certain types of assets and/or to manage exposure to certain risks as defined below. The success of any strategy involving derivatives depends on analysis ofnumerous economic factors, and if the strategies for investment do not work as intended, the Fund may not achieve its objectives.
The Fund’s use of derivatives increased or decreased its exposure to the following risk(s):
Equity Risk – Equity risk relates to the fluctuations in the value of financial instruments as a result of changes in market prices (other than those arising from interest rate risk or foreign exchange risk), whether caused by factorsspecific to an individual investment, its issuer, or all factors affecting all instruments traded in a market or market segment.
Investing in derivatives may involve greater risks than investing in the underlying assets directly and, to varying degrees, may involve risk of loss in excess of any initial investment and collateral received. In addition, there may bethe risk that the change in value of the derivative contract does not correspond to the change in value of the underlying instrument.
Futures Contracts: A futures contract is an agreement between two parties to buy or sell a specified underlying instrument for a specified price at a specified future date.
The Fund used futures contracts to manage its exposure to the stock market.
Open futures contracts at period end are presented in the Schedule of Investments under the caption “Futures Contracts”. The underlying face amount at value reflects each contract’s exposure to the underlying instrument or index atperiod end. Any securities and/or cash deposited to meet initial margin requirements are identified in the Schedule of Investments.
For additional information on the Fund’s significant accounting policies, please refer to the Fund’s most recent semiannual or annual shareholder report.
Quarterly Report 30

The fund’s schedule of investments as of the date on the cover of this report has not been audited. This report is provided for the general information of the fund’s shareholders. Formore information regarding the fund and its holdings, please see the fund’s most recent prospectus and annual report.
Third party trademarks and service marks are the property of their respective owners. All other trademarks and service marks are the property of FMR LLC or an affiliate.
31 Quarterly Report

Notes
Copyright © 2022 FDOKUMEN