Quarterly Holdings Report for Fidelity® Extended Market Index ...
40
Quarterly Holdings Report for Fidelity ® Extended Market Index Fund November 30, 2021 SEI-NPRT3-0122 1.810690.117
-
Upload
khangminh22 -
Category
Documents
-
view
0 -
download
0
Transcript of Quarterly Holdings Report for Fidelity® Extended Market Index ...

Quarterly Holdings Reportfor
Fidelity® Extended Market Index FundNovember 30, 2021
SEI-NPRT3-01221.810690.117
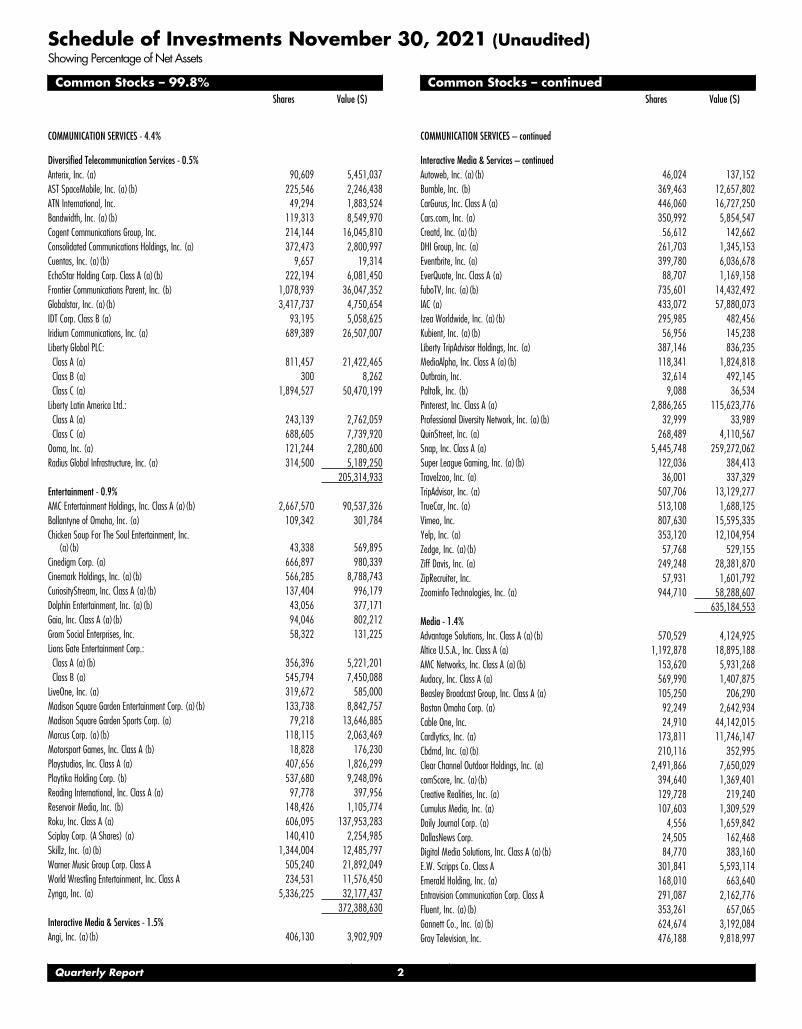
Schedule of Investments November 30, 2021 (Unaudited)Showing Percentage of Net Assets
Common Stocks – 99.8%Shares Value ($)
COMMUNICATION SERVICES - 4.4%
Diversified Telecommunication Services - 0.5%
Anterix, Inc. (a) 90,609 5,451,037
AST SpaceMobile, Inc. (a)(b) 225,546 2,246,438
ATN International, Inc. 49,294 1,883,524
Bandwidth, Inc. (a)(b) 119,313 8,549,970
Cogent Communications Group, Inc. 214,144 16,045,810
Consolidated Communications Holdings, Inc. (a) 372,473 2,800,997
Cuentas, Inc. (a)(b) 9,657 19,314
EchoStar Holding Corp. Class A (a)(b) 222,194 6,081,450
Frontier Communications Parent, Inc. (b) 1,078,939 36,047,352
Globalstar, Inc. (a)(b) 3,417,737 4,750,654
IDT Corp. Class B (a) 93,195 5,058,625
Iridium Communications, Inc. (a) 689,389 26,507,007
Liberty Global PLC:
Class A (a) 811,457 21,422,465
Class B (a) 300 8,262
Class C (a) 1,894,527 50,470,199
Liberty Latin America Ltd.:
Class A (a) 243,139 2,762,059
Class C (a) 688,605 7,739,920
Ooma, Inc. (a) 121,244 2,280,600
Radius Global Infrastructure, Inc. (a) 314,500 5,189,250
205,314,933
Entertainment - 0.9%
AMC Entertainment Holdings, Inc. Class A (a)(b) 2,667,570 90,537,326
Ballantyne of Omaha, Inc. (a) 109,342 301,784
Chicken Soup For The Soul Entertainment, Inc.(a)(b) 43,338 569,895
Cinedigm Corp. (a) 666,897 980,339
Cinemark Holdings, Inc. (a)(b) 566,285 8,788,743
CuriosityStream, Inc. Class A (a)(b) 137,404 996,179
Dolphin Entertainment, Inc. (a)(b) 43,056 377,171
Gaia, Inc. Class A (a)(b) 94,046 802,212
Grom Social Enterprises, Inc. 58,322 131,225
Lions Gate Entertainment Corp.:
Class A (a)(b) 356,396 5,221,201
Class B (a) 545,794 7,450,088
LiveOne, Inc. (a) 319,672 585,000
Madison Square Garden Entertainment Corp. (a)(b) 133,738 8,842,757
Madison Square Garden Sports Corp. (a) 79,218 13,646,885
Marcus Corp. (a)(b) 118,115 2,063,469
Motorsport Games, Inc. Class A (b) 18,828 176,230
Playstudios, Inc. Class A (a) 407,656 1,826,299
Playtika Holding Corp. (b) 537,680 9,248,096
Reading International, Inc. Class A (a) 97,778 397,956
Reservoir Media, Inc. (b) 148,426 1,105,774
Roku, Inc. Class A (a) 606,095 137,953,283
Sciplay Corp. (A Shares) (a) 140,410 2,254,985
Skillz, Inc. (a)(b) 1,344,004 12,485,797
Warner Music Group Corp. Class A 505,240 21,892,049
World Wrestling Entertainment, Inc. Class A 234,531 11,576,450
Zynga, Inc. (a) 5,336,225 32,177,437
372,388,630
Interactive Media & Services - 1.5%
Angi, Inc. (a)(b) 406,130 3,902,909
Common Stocks – continuedShares Value ($)
COMMUNICATION SERVICES – continued
Interactive Media & Services – continued
Autoweb, Inc. (a)(b) 46,024 137,152
Bumble, Inc. (b) 369,463 12,657,802
CarGurus, Inc. Class A (a) 446,060 16,727,250
Cars.com, Inc. (a) 350,992 5,854,547
Creatd, Inc. (a)(b) 56,612 142,662
DHI Group, Inc. (a) 261,703 1,345,153
Eventbrite, Inc. (a) 399,780 6,036,678
EverQuote, Inc. Class A (a) 88,707 1,169,158
fuboTV, Inc. (a)(b) 735,601 14,432,492
IAC (a) 433,072 57,880,073
Izea Worldwide, Inc. (a)(b) 295,985 482,456
Kubient, Inc. (a)(b) 56,956 145,238
Liberty TripAdvisor Holdings, Inc. (a) 387,146 836,235
MediaAlpha, Inc. Class A (a)(b) 118,341 1,824,818
Outbrain, Inc. 32,614 492,145
Paltalk, Inc. (b) 9,088 36,534
Pinterest, Inc. Class A (a) 2,886,265 115,623,776
Professional Diversity Network, Inc. (a)(b) 32,999 33,989
QuinStreet, Inc. (a) 268,489 4,110,567
Snap, Inc. Class A (a) 5,445,748 259,272,062
Super League Gaming, Inc. (a)(b) 122,036 384,413
Travelzoo, Inc. (a) 36,001 337,329
TripAdvisor, Inc. (a) 507,706 13,129,277
TrueCar, Inc. (a) 513,108 1,688,125
Vimeo, Inc. 807,630 15,595,335
Yelp, Inc. (a) 353,120 12,104,954
Zedge, Inc. (a)(b) 57,768 529,155
Ziff Davis, Inc. (a) 249,248 28,381,870
ZipRecruiter, Inc. 57,931 1,601,792
Zoominfo Technologies, Inc. (a) 944,710 58,288,607
635,184,553
Media - 1.4%
Advantage Solutions, Inc. Class A (a)(b) 570,529 4,124,925
Altice U.S.A., Inc. Class A (a) 1,192,878 18,895,188
AMC Networks, Inc. Class A (a)(b) 153,620 5,931,268
Audacy, Inc. Class A (a) 569,990 1,407,875
Beasley Broadcast Group, Inc. Class A (a) 105,250 206,290
Boston Omaha Corp. (a) 92,249 2,642,934
Cable One, Inc. 24,910 44,142,015
Cardlytics, Inc. (a) 173,811 11,746,147
Cbdmd, Inc. (a)(b) 210,116 352,995
Clear Channel Outdoor Holdings, Inc. (a) 2,491,866 7,650,029
comScore, Inc. (a)(b) 394,640 1,369,401
Creative Realities, Inc. (a) 129,728 219,240
Cumulus Media, Inc. (a) 107,603 1,309,529
Daily Journal Corp. (a) 4,556 1,659,842
DallasNews Corp. 24,505 162,468
Digital Media Solutions, Inc. Class A (a)(b) 84,770 383,160
E.W. Scripps Co. Class A 301,841 5,593,114
Emerald Holding, Inc. (a) 168,010 663,640
Entravision Communication Corp. Class A 291,087 2,162,776
Fluent, Inc. (a)(b) 353,261 657,065
Gannett Co., Inc. (a)(b) 624,674 3,192,084
Gray Television, Inc. 476,188 9,818,997
Quarterly Report 2
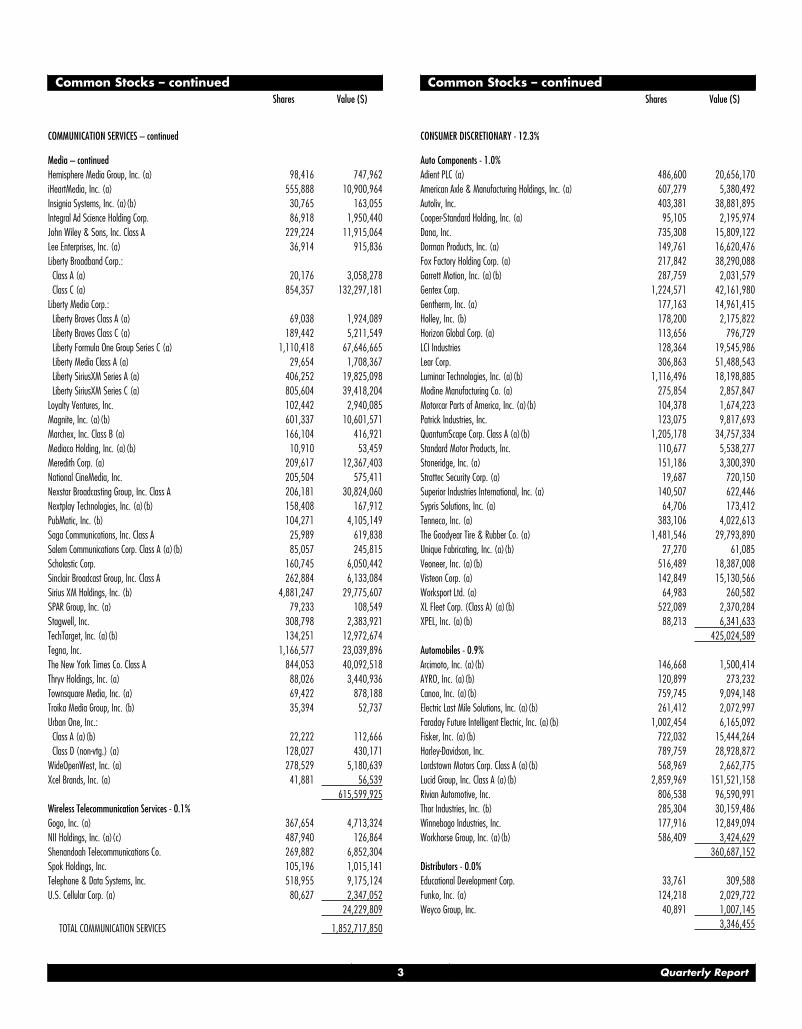
Common Stocks – continuedShares Value ($)
COMMUNICATION SERVICES – continued
Media – continued
Hemisphere Media Group, Inc. (a) 98,416 747,962
iHeartMedia, Inc. (a) 555,888 10,900,964
Insignia Systems, Inc. (a)(b) 30,765 163,055
Integral Ad Science Holding Corp. 86,918 1,950,440
John Wiley & Sons, Inc. Class A 229,224 11,915,064
Lee Enterprises, Inc. (a) 36,914 915,836
Liberty Broadband Corp.:
Class A (a) 20,176 3,058,278
Class C (a) 854,357 132,297,181
Liberty Media Corp.:
Liberty Braves Class A (a) 69,038 1,924,089
Liberty Braves Class C (a) 189,442 5,211,549
Liberty Formula One Group Series C (a) 1,110,418 67,646,665
Liberty Media Class A (a) 29,654 1,708,367
Liberty SiriusXM Series A (a) 406,252 19,825,098
Liberty SiriusXM Series C (a) 805,604 39,418,204
Loyalty Ventures, Inc. 102,442 2,940,085
Magnite, Inc. (a)(b) 601,337 10,601,571
Marchex, Inc. Class B (a) 166,104 416,921
Mediaco Holding, Inc. (a)(b) 10,910 53,459
Meredith Corp. (a) 209,617 12,367,403
National CineMedia, Inc. 205,504 575,411
Nexstar Broadcasting Group, Inc. Class A 206,181 30,824,060
Nextplay Technologies, Inc. (a)(b) 158,408 167,912
PubMatic, Inc. (b) 104,271 4,105,149
Saga Communications, Inc. Class A 25,989 619,838
Salem Communications Corp. Class A (a)(b) 85,057 245,815
Scholastic Corp. 160,745 6,050,442
Sinclair Broadcast Group, Inc. Class A 262,884 6,133,084
Sirius XM Holdings, Inc. (b) 4,881,247 29,775,607
SPAR Group, Inc. (a) 79,233 108,549
Stagwell, Inc. 308,798 2,383,921
TechTarget, Inc. (a)(b) 134,251 12,972,674
Tegna, Inc. 1,166,577 23,039,896
The New York Times Co. Class A 844,053 40,092,518
Thryv Holdings, Inc. (a) 88,026 3,440,936
Townsquare Media, Inc. (a) 69,422 878,188
Troika Media Group, Inc. (b) 35,394 52,737
Urban One, Inc.:
Class A (a)(b) 22,222 112,666
Class D (non-vtg.) (a) 128,027 430,171
WideOpenWest, Inc. (a) 278,529 5,180,639
Xcel Brands, Inc. (a) 41,881 56,539
615,599,925
Wireless Telecommunication Services - 0.1%
Gogo, Inc. (a) 367,654 4,713,324
NII Holdings, Inc. (a)(c) 487,940 126,864
Shenandoah Telecommunications Co. 269,882 6,852,304
Spok Holdings, Inc. 105,196 1,015,141
Telephone & Data Systems, Inc. 518,955 9,175,124
U.S. Cellular Corp. (a) 80,627 2,347,052
24,229,809
TOTAL COMMUNICATION SERVICES 1,852,717,850
Common Stocks – continuedShares Value ($)
CONSUMER DISCRETIONARY - 12.3%
Auto Components - 1.0%
Adient PLC (a) 486,600 20,656,170
American Axle & Manufacturing Holdings, Inc. (a) 607,279 5,380,492
Autoliv, Inc. 403,381 38,881,895
Cooper-Standard Holding, Inc. (a) 95,105 2,195,974
Dana, Inc. 735,308 15,809,122
Dorman Products, Inc. (a) 149,761 16,620,476
Fox Factory Holding Corp. (a) 217,842 38,290,088
Garrett Motion, Inc. (a)(b) 287,759 2,031,579
Gentex Corp. 1,224,571 42,161,980
Gentherm, Inc. (a) 177,163 14,961,415
Holley, Inc. (b) 178,200 2,175,822
Horizon Global Corp. (a) 113,656 796,729
LCI Industries 128,364 19,545,986
Lear Corp. 306,863 51,488,543
Luminar Technologies, Inc. (a)(b) 1,116,496 18,198,885
Modine Manufacturing Co. (a) 275,854 2,857,847
Motorcar Parts of America, Inc. (a)(b) 104,378 1,674,223
Patrick Industries, Inc. 123,075 9,817,693
QuantumScape Corp. Class A (a)(b) 1,205,178 34,757,334
Standard Motor Products, Inc. 110,677 5,538,277
Stoneridge, Inc. (a) 151,186 3,300,390
Strattec Security Corp. (a) 19,687 720,150
Superior Industries International, Inc. (a) 140,507 622,446
Sypris Solutions, Inc. (a) 64,706 173,412
Tenneco, Inc. (a) 383,106 4,022,613
The Goodyear Tire & Rubber Co. (a) 1,481,546 29,793,890
Unique Fabricating, Inc. (a)(b) 27,270 61,085
Veoneer, Inc. (a)(b) 516,489 18,387,008
Visteon Corp. (a) 142,849 15,130,566
Worksport Ltd. (a) 64,983 260,582
XL Fleet Corp. (Class A) (a)(b) 522,089 2,370,284
XPEL, Inc. (a)(b) 88,213 6,341,633
425,024,589
Automobiles - 0.9%
Arcimoto, Inc. (a)(b) 146,668 1,500,414
AYRO, Inc. (a)(b) 120,899 273,232
Canoo, Inc. (a)(b) 759,745 9,094,148
Electric Last Mile Solutions, Inc. (a)(b) 261,412 2,072,997
Faraday Future Intelligent Electric, Inc. (a)(b) 1,002,454 6,165,092
Fisker, Inc. (a)(b) 722,032 15,444,264
Harley-Davidson, Inc. 789,759 28,928,872
Lordstown Motors Corp. Class A (a)(b) 568,969 2,662,775
Lucid Group, Inc. Class A (a)(b) 2,859,969 151,521,158
Rivian Automotive, Inc. 806,538 96,590,991
Thor Industries, Inc. (b) 285,304 30,159,486
Winnebago Industries, Inc. 177,916 12,849,094
Workhorse Group, Inc. (a)(b) 586,409 3,424,629
360,687,152
Distributors - 0.0%
Educational Development Corp. 33,761 309,588
Funko, Inc. (a) 124,218 2,029,722
Weyco Group, Inc. 40,891 1,007,145
3,346,455
3 Quarterly Report

Schedule of Investments (Unaudited) − continued
Common Stocks – continuedShares Value ($)
CONSUMER DISCRETIONARY – continued
Diversified Consumer Services - 0.7%
2U, Inc. (a)(b) 391,946 9,324,395
Adtalem Global Education, Inc. (a) 266,794 7,915,778
American Public Education, Inc. (a) 98,649 1,863,480
Amesite, Inc. (a)(b) 12,972 15,566
Aspen Group, Inc. (a)(b) 111,747 344,181
Bright Horizons Family Solutions, Inc. (a) 314,368 38,651,546
Carriage Services, Inc. 89,253 4,617,950
Chegg, Inc. (a) 735,108 20,472,758
Coursera, Inc. 416,736 12,497,913
Duolingo, Inc. (b) 30,410 3,350,878
European Wax Center, Inc. 52,211 1,408,131
Frontdoor, Inc. (a) 438,469 15,153,489
Graham Holdings Co. 20,966 11,877,658
Grand Canyon Education, Inc. (a) 229,059 16,599,906
H&R Block, Inc. 899,616 21,302,907
Houghton Mifflin Harcourt Co. (a) 669,655 10,419,832
Laureate Education, Inc. Class A 481,683 4,816,830
Lincoln Educational Services Corp. (a) 123,695 872,050
Mister Car Wash, Inc. 206,294 3,313,082
OneSpaWorld Holdings Ltd. (a)(b) 296,227 2,793,421
Perdoceo Education Corp. (a) 377,019 3,713,637
PowerSchool Holdings, Inc. (b) 208,275 4,175,914
Regis Corp. (a)(b) 45,015 122,441
Rover Group, Inc. Class A (b) 391,597 4,041,281
Service Corp. International 867,113 57,368,196
StoneMor, Inc. (a)(b) 613,228 1,508,541
Strategic Education, Inc. 110,246 5,898,161
Stride, Inc. (a) 225,367 7,691,776
Terminix Global Holdings, Inc. (a) 641,056 23,924,210
The Beachbody Co., Inc. (b) 510,147 1,326,382
Universal Technical Institute, Inc. (a) 169,387 1,422,851
Vivint Smart Home, Inc. Class A (a)(b) 236,556 2,493,300
WW International, Inc. (a) 272,968 4,591,322
Xpresspa Group, Inc. (a)(b) 543,601 973,046
Zovio, Inc. (a)(b) 150,466 206,138
307,068,947
Hotels, Restaurants & Leisure - 2.6%
Accel Entertainment, Inc. (a) 308,381 3,925,690
Airbnb, Inc. Class A 1,749,033 301,778,154
Allied Esports Entertainment, Inc. (a)(b) 92,724 171,539
ARAMARK Holdings Corp. 1,320,952 44,119,797
Ark Restaurants Corp. (a)(b) 10,530 173,219
Bally's Corp. (a) 153,669 5,891,669
BBQ Holdings, Inc. (a) 49,493 637,965
Biglari Holdings, Inc. (a) 437 301,967
Biglari Holdings, Inc. (a) 4,721 669,768
BJ's Restaurants, Inc. (a) 122,584 3,660,358
Bloomin' Brands, Inc. (a)(b) 432,556 7,643,265
Bluegreen Vacations Holding Corp. Class A (a) 80,292 2,387,081
Boyd Gaming Corp. (a) 427,676 25,066,090
Brinker International, Inc. (a) 245,698 8,501,151
BurgerFi International, Inc. (a)(b) 61,243 399,917
Canterbury Park Holding Co. (a) 400 7,192
Carrols Restaurant Group, Inc. 207,523 593,516
Common Stocks – continuedShares Value ($)
CONSUMER DISCRETIONARY – continued
Hotels, Restaurants & Leisure – continued
Century Casinos, Inc. (a) 154,192 2,012,206
Choice Hotels International, Inc. 168,705 24,217,603
Churchill Downs, Inc. 180,340 40,435,835
Chuy's Holdings, Inc. (a) 107,435 3,079,087
Cracker Barrel Old Country Store, Inc. 126,159 15,393,921
Dave & Buster's Entertainment, Inc. (a) 230,189 7,476,539
Del Taco Restaurants, Inc. 173,725 1,330,734
Denny's Corp. (a) 347,757 4,816,434
Dine Brands Global, Inc. (a) 92,321 6,630,494
Dover Motorsports, Inc. 22,265 80,154
DraftKings, Inc. Class A (a)(b) 1,720,425 59,440,684
Drive Shack, Inc. (a) 401,246 686,131
El Pollo Loco Holdings, Inc. (a) 107,377 1,355,098
Esports Entertainment Group, Inc. (a)(b) 74,458 376,757
Esports Technologies, Inc. (b) 11,192 323,896
Everi Holdings, Inc. (a) 470,416 9,756,428
F45 Training Holdings, Inc. 103,524 1,101,495
FAT Brands, Inc.:
Class A 8,254 82,375
Class B (b) 825 9,479
Fiesta Restaurant Group, Inc. (a) 95,111 887,386
Flanigans Enterprises, Inc. (a) 5,326 168,302
Full House Resorts, Inc. (a) 191,140 1,712,614
GAN Ltd. (a)(b) 210,345 2,034,036
Golden Entertainment, Inc. (a) 105,864 4,860,216
Golden Nugget Online Gaming, Inc. (a) 230,522 2,874,609
Good Times Restaurants, Inc. (a) 50,196 226,384
Hall of Fame Resort & Entertainment Co. (a)(b) 305,096 567,479
Hilton Grand Vacations, Inc. (a) 455,831 21,651,973
Hyatt Hotels Corp. Class A (a) 242,516 19,102,985
Inspired Entertainment, Inc. (a)(b) 105,768 1,363,350
Jack in the Box, Inc. 106,641 8,808,547
Krispy Kreme, Inc. (b) 154,917 2,254,042
Kura Sushi U.S.A., Inc. Class A (a) 21,902 1,392,967
Lindblad Expeditions Holdings (a) 174,557 2,445,544
Luby's, Inc. (a) 53,797 153,859
Marriott Vacations Worldwide Corp. 222,415 33,951,650
Membership Collective Group, Inc. Class A (b) 157,781 1,959,640
Monarch Casino & Resort, Inc. (a) 72,900 4,911,273
Muscle Maker, Inc. (a)(b) 61,384 65,067
Nathan's Famous, Inc. 15,744 968,886
Noodles & Co. (a) 177,517 1,826,650
Papa John's International, Inc. 166,663 20,319,553
Planet Fitness, Inc. (a) 431,740 35,268,841
Playa Hotels & Resorts NV (a) 649,787 4,626,483
PlayAGS, Inc. (a) 209,366 1,507,435
Potbelly Corp. (a)(b) 129,369 689,537
Rave Restaurant Group, Inc. (a) 99,363 123,210
RCI Hospitality Holdings, Inc. 44,814 2,837,174
Red Robin Gourmet Burgers, Inc. (a) 82,639 1,347,016
Red Rock Resorts, Inc. 313,602 14,908,639
Rush Street Interactive, Inc. (a) 285,800 5,098,672
Ruth's Hospitality Group, Inc. (a) 171,552 2,916,384
Scientific Games Corp. Class A (a) 501,488 32,055,113
Quarterly Report 4
Common Stocks – continuedShares Value ($)
CONSUMER DISCRETIONARY – continued
Hotels, Restaurants & Leisure – continued
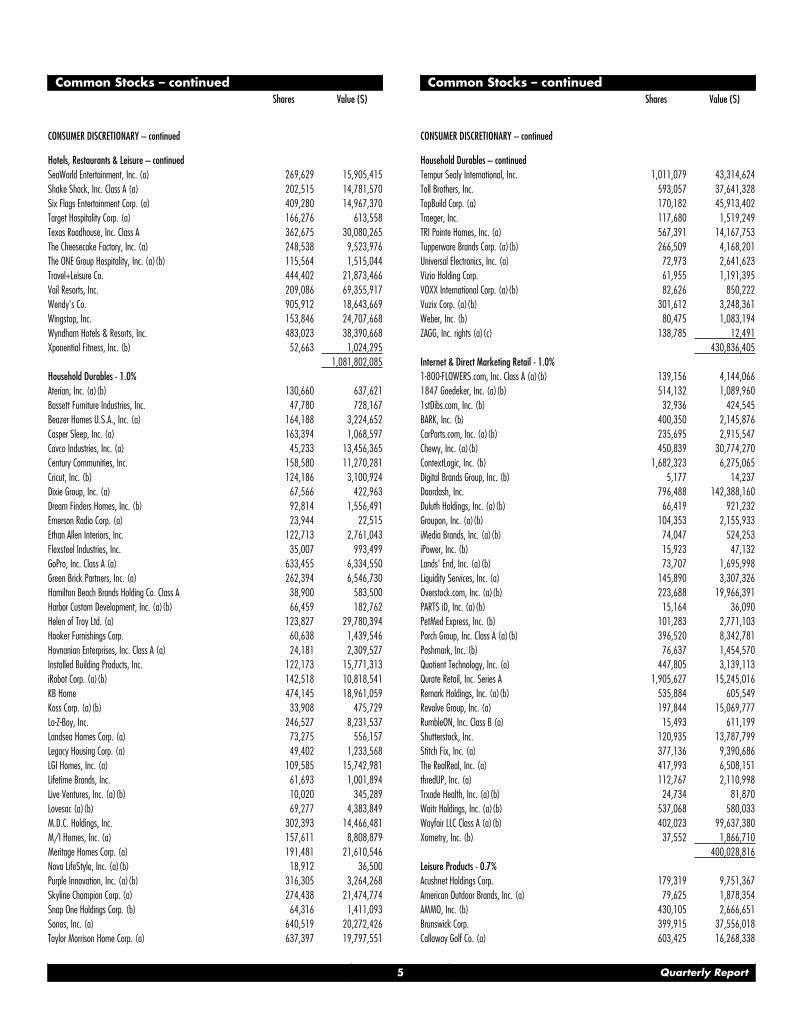
SeaWorld Entertainment, Inc. (a) 269,629 15,905,415
Shake Shack, Inc. Class A (a) 202,515 14,781,570
Six Flags Entertainment Corp. (a) 409,280 14,967,370
Target Hospitality Corp. (a) 166,276 613,558
Texas Roadhouse, Inc. Class A 362,675 30,080,265
The Cheesecake Factory, Inc. (a) 248,538 9,523,976
The ONE Group Hospitality, Inc. (a)(b) 115,564 1,515,044
Travel+Leisure Co. 444,402 21,873,466
Vail Resorts, Inc. 209,086 69,355,917
Wendy's Co. 905,912 18,643,669
Wingstop, Inc. 153,846 24,707,668
Wyndham Hotels & Resorts, Inc. 483,023 38,390,668
Xponential Fitness, Inc. (b) 52,663 1,024,295
1,081,802,085
Household Durables - 1.0%
Aterian, Inc. (a)(b) 130,660 637,621
Bassett Furniture Industries, Inc. 47,780 728,167
Beazer Homes U.S.A., Inc. (a) 164,188 3,224,652
Casper Sleep, Inc. (a) 163,394 1,068,597
Cavco Industries, Inc. (a) 45,233 13,456,365
Century Communities, Inc. 158,580 11,270,281
Cricut, Inc. (b) 124,186 3,100,924
Dixie Group, Inc. (a) 67,566 422,963
Dream Finders Homes, Inc. (b) 92,814 1,556,491
Emerson Radio Corp. (a) 23,944 22,515
Ethan Allen Interiors, Inc. 122,713 2,761,043
Flexsteel Industries, Inc. 35,007 993,499
GoPro, Inc. Class A (a) 633,455 6,334,550
Green Brick Partners, Inc. (a) 262,394 6,546,730
Hamilton Beach Brands Holding Co. Class A 38,900 583,500
Harbor Custom Development, Inc. (a)(b) 66,459 182,762
Helen of Troy Ltd. (a) 123,827 29,780,394
Hooker Furnishings Corp. 60,638 1,439,546
Hovnanian Enterprises, Inc. Class A (a) 24,181 2,309,527
Installed Building Products, Inc. 122,173 15,771,313
iRobot Corp. (a)(b) 142,518 10,818,541
KB Home 474,145 18,961,059
Koss Corp. (a)(b) 33,908 475,729
La-Z-Boy, Inc. 246,527 8,231,537
Landsea Homes Corp. (a) 73,275 556,157
Legacy Housing Corp. (a) 49,402 1,233,568
LGI Homes, Inc. (a) 109,585 15,742,981
Lifetime Brands, Inc. 61,693 1,001,894
Live Ventures, Inc. (a)(b) 10,020 345,289
Lovesac (a)(b) 69,277 4,383,849
M.D.C. Holdings, Inc. 302,393 14,466,481
M/I Homes, Inc. (a) 157,611 8,808,879
Meritage Homes Corp. (a) 191,481 21,610,546
Nova LifeStyle, Inc. (a)(b) 18,912 36,500
Purple Innovation, Inc. (a)(b) 316,305 3,264,268
Skyline Champion Corp. (a) 274,438 21,474,774
Snap One Holdings Corp. (b) 64,316 1,411,093
Sonos, Inc. (a) 640,519 20,272,426
Taylor Morrison Home Corp. (a) 637,397 19,797,551
Common Stocks – continuedShares Value ($)
CONSUMER DISCRETIONARY – continued
Household Durables – continued
Tempur Sealy International, Inc. 1,011,079 43,314,624
Toll Brothers, Inc. 593,057 37,641,328
TopBuild Corp. (a) 170,182 45,913,402
Traeger, Inc. 117,680 1,519,249
TRI Pointe Homes, Inc. (a) 567,391 14,167,753
Tupperware Brands Corp. (a)(b) 266,509 4,168,201
Universal Electronics, Inc. (a) 72,973 2,641,623
Vizio Holding Corp. 61,955 1,191,395
VOXX International Corp. (a)(b) 82,626 850,222
Vuzix Corp. (a)(b) 301,612 3,248,361
Weber, Inc. (b) 80,475 1,083,194
ZAGG, Inc. rights (a)(c) 138,785 12,491
430,836,405
Internet & Direct Marketing Retail - 1.0%
1-800-FLOWERS.com, Inc. Class A (a)(b) 139,156 4,144,066
1847 Goedeker, Inc. (a)(b) 514,132 1,089,960
1stDibs.com, Inc. (b) 32,936 424,545
BARK, Inc. (b) 400,350 2,145,876
CarParts.com, Inc. (a)(b) 235,695 2,915,547
Chewy, Inc. (a)(b) 450,839 30,774,270
ContextLogic, Inc. (b) 1,682,323 6,275,065
Digital Brands Group, Inc. (b) 5,177 14,237
Doordash, Inc. 796,488 142,388,160
Duluth Holdings, Inc. (a)(b) 66,419 921,232
Groupon, Inc. (a)(b) 104,353 2,155,933
iMedia Brands, Inc. (a)(b) 74,047 524,253
iPower, Inc. (b) 15,923 47,132
Lands' End, Inc. (a)(b) 73,707 1,695,998
Liquidity Services, Inc. (a) 145,890 3,307,326
Overstock.com, Inc. (a)(b) 223,688 19,966,391
PARTS iD, Inc. (a)(b) 15,164 36,090
PetMed Express, Inc. (b) 101,283 2,771,103
Porch Group, Inc. Class A (a)(b) 396,520 8,342,781
Poshmark, Inc. (b) 76,637 1,454,570
Quotient Technology, Inc. (a) 447,805 3,139,113
Qurate Retail, Inc. Series A 1,905,627 15,245,016
Remark Holdings, Inc. (a)(b) 535,884 605,549
Revolve Group, Inc. (a) 197,844 15,069,777
RumbleON, Inc. Class B (a) 15,493 611,199
Shutterstock, Inc. 120,935 13,787,799
Stitch Fix, Inc. (a) 377,136 9,390,686
The RealReal, Inc. (a) 417,993 6,508,151
thredUP, Inc. (a) 112,767 2,110,998
Trxade Health, Inc. (a)(b) 24,734 81,870
Waitr Holdings, Inc. (a)(b) 537,068 580,033
Wayfair LLC Class A (a)(b) 402,023 99,637,380
Xometry, Inc. (b) 37,552 1,866,710
400,028,816
Leisure Products - 0.7%
Acushnet Holdings Corp. 179,319 9,751,367
American Outdoor Brands, Inc. (a) 79,625 1,878,354
AMMO, Inc. (b) 430,105 2,666,651
Brunswick Corp. 399,915 37,556,018
Callaway Golf Co. (a) 603,425 16,268,338
5 Quarterly Report
Schedule of Investments (Unaudited) − continued
Common Stocks – continuedShares Value ($)
CONSUMER DISCRETIONARY – continued
Leisure Products – continued
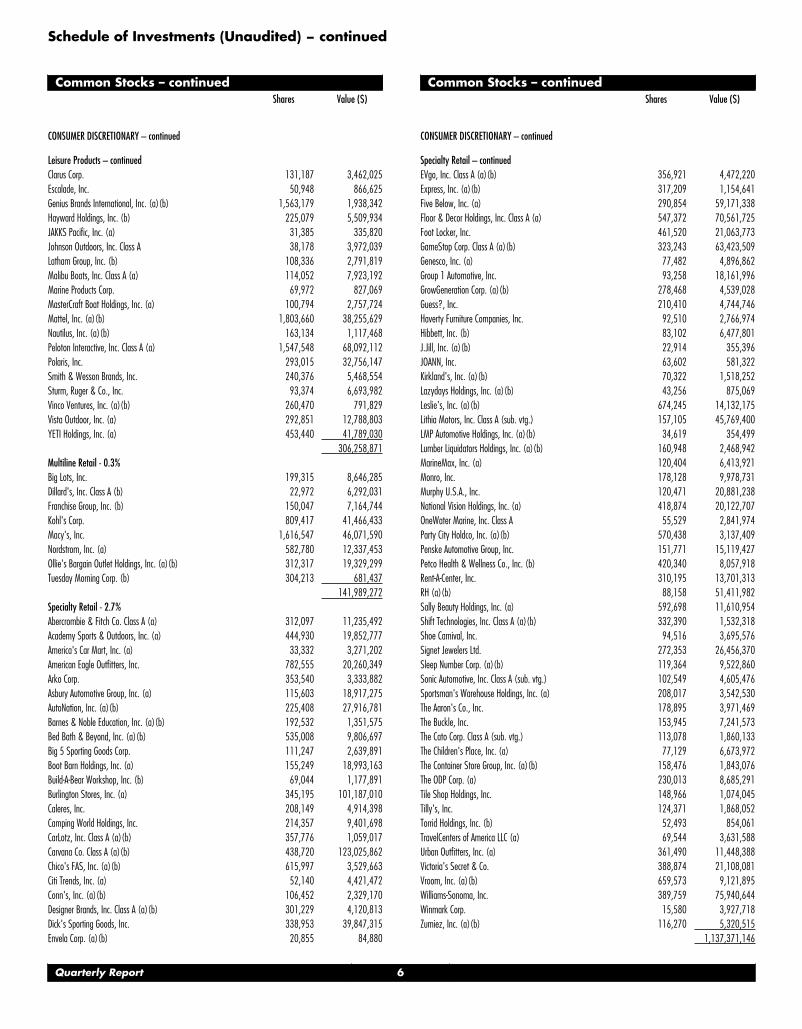
Clarus Corp. 131,187 3,462,025
Escalade, Inc. 50,948 866,625
Genius Brands International, Inc. (a)(b) 1,563,179 1,938,342
Hayward Holdings, Inc. (b) 225,079 5,509,934
JAKKS Pacific, Inc. (a) 31,385 335,820
Johnson Outdoors, Inc. Class A 38,178 3,972,039
Latham Group, Inc. (b) 108,336 2,791,819
Malibu Boats, Inc. Class A (a) 114,052 7,923,192
Marine Products Corp. 69,972 827,069
MasterCraft Boat Holdings, Inc. (a) 100,794 2,757,724
Mattel, Inc. (a)(b) 1,803,660 38,255,629
Nautilus, Inc. (a)(b) 163,134 1,117,468
Peloton Interactive, Inc. Class A (a) 1,547,548 68,092,112
Polaris, Inc. 293,015 32,756,147
Smith & Wesson Brands, Inc. 240,376 5,468,554
Sturm, Ruger & Co., Inc. 93,374 6,693,982
Vinco Ventures, Inc. (a)(b) 260,470 791,829
Vista Outdoor, Inc. (a) 292,851 12,788,803
YETI Holdings, Inc. (a) 453,440 41,789,030
306,258,871
Multiline Retail - 0.3%
Big Lots, Inc. 199,315 8,646,285
Dillard's, Inc. Class A (b) 22,972 6,292,031
Franchise Group, Inc. (b) 150,047 7,164,744
Kohl's Corp. 809,417 41,466,433
Macy's, Inc. 1,616,547 46,071,590
Nordstrom, Inc. (a) 582,780 12,337,453
Ollie's Bargain Outlet Holdings, Inc. (a)(b) 312,317 19,329,299
Tuesday Morning Corp. (b) 304,213 681,437
141,989,272
Specialty Retail - 2.7%
Abercrombie & Fitch Co. Class A (a) 312,097 11,235,492
Academy Sports & Outdoors, Inc. (a) 444,930 19,852,777
America's Car Mart, Inc. (a) 33,332 3,271,202
American Eagle Outfitters, Inc. 782,555 20,260,349
Arko Corp. 353,540 3,333,882
Asbury Automotive Group, Inc. (a) 115,603 18,917,275
AutoNation, Inc. (a)(b) 225,408 27,916,781
Barnes & Noble Education, Inc. (a)(b) 192,532 1,351,575
Bed Bath & Beyond, Inc. (a)(b) 535,008 9,806,697
Big 5 Sporting Goods Corp. 111,247 2,639,891
Boot Barn Holdings, Inc. (a) 155,249 18,993,163
Build-A-Bear Workshop, Inc. (b) 69,044 1,177,891
Burlington Stores, Inc. (a) 345,195 101,187,010
Caleres, Inc. 208,149 4,914,398
Camping World Holdings, Inc. 214,357 9,401,698
CarLotz, Inc. Class A (a)(b) 357,776 1,059,017
Carvana Co. Class A (a)(b) 438,720 123,025,862
Chico's FAS, Inc. (a)(b) 615,997 3,529,663
Citi Trends, Inc. (a) 52,140 4,421,472
Conn's, Inc. (a)(b) 106,452 2,329,170
Designer Brands, Inc. Class A (a)(b) 301,229 4,120,813
Dick's Sporting Goods, Inc. 338,953 39,847,315
Envela Corp. (a)(b) 20,855 84,880
Common Stocks – continuedShares Value ($)
CONSUMER DISCRETIONARY – continued
Specialty Retail – continued
EVgo, Inc. Class A (a)(b) 356,921 4,472,220
Express, Inc. (a)(b) 317,209 1,154,641
Five Below, Inc. (a) 290,854 59,171,338
Floor & Decor Holdings, Inc. Class A (a) 547,372 70,561,725
Foot Locker, Inc. 461,520 21,063,773
GameStop Corp. Class A (a)(b) 323,243 63,423,509
Genesco, Inc. (a) 77,482 4,896,862
Group 1 Automotive, Inc. 93,258 18,161,996
GrowGeneration Corp. (a)(b) 278,468 4,539,028
Guess?, Inc. 210,410 4,744,746
Haverty Furniture Companies, Inc. 92,510 2,766,974
Hibbett, Inc. (b) 83,102 6,477,801
J.Jill, Inc. (a)(b) 22,914 355,396
JOANN, Inc. 63,602 581,322
Kirkland's, Inc. (a)(b) 70,322 1,518,252
Lazydays Holdings, Inc. (a)(b) 43,256 875,069
Leslie's, Inc. (a)(b) 674,245 14,132,175
Lithia Motors, Inc. Class A (sub. vtg.) 157,105 45,769,400
LMP Automotive Holdings, Inc. (a)(b) 34,619 354,499
Lumber Liquidators Holdings, Inc. (a)(b) 160,948 2,468,942
MarineMax, Inc. (a) 120,404 6,413,921
Monro, Inc. 178,128 9,978,731
Murphy U.S.A., Inc. 120,471 20,881,238
National Vision Holdings, Inc. (a) 418,874 20,122,707
OneWater Marine, Inc. Class A 55,529 2,841,974
Party City Holdco, Inc. (a)(b) 570,438 3,137,409
Penske Automotive Group, Inc. 151,771 15,119,427
Petco Health & Wellness Co., Inc. (b) 420,340 8,057,918
Rent-A-Center, Inc. 310,195 13,701,313
RH (a)(b) 88,158 51,411,982
Sally Beauty Holdings, Inc. (a) 592,698 11,610,954
Shift Technologies, Inc. Class A (a)(b) 332,390 1,532,318
Shoe Carnival, Inc. 94,516 3,695,576
Signet Jewelers Ltd. 272,353 26,456,370
Sleep Number Corp. (a)(b) 119,364 9,522,860
Sonic Automotive, Inc. Class A (sub. vtg.) 102,549 4,605,476
Sportsman's Warehouse Holdings, Inc. (a) 208,017 3,542,530
The Aaron's Co., Inc. 178,895 3,971,469
The Buckle, Inc. 153,945 7,241,573
The Cato Corp. Class A (sub. vtg.) 113,078 1,860,133
The Children's Place, Inc. (a) 77,129 6,673,972
The Container Store Group, Inc. (a)(b) 158,476 1,843,076
The ODP Corp. (a) 230,013 8,685,291
Tile Shop Holdings, Inc. 148,966 1,074,045
Tilly's, Inc. 124,371 1,868,052
Torrid Holdings, Inc. (b) 52,493 854,061
TravelCenters of America LLC (a) 69,544 3,631,588
Urban Outfitters, Inc. (a) 361,490 11,448,388
Victoria's Secret & Co. 388,874 21,108,081
Vroom, Inc. (a)(b) 659,573 9,121,895
Williams-Sonoma, Inc. 389,759 75,940,644
Winmark Corp. 15,580 3,927,718
Zumiez, Inc. (a)(b) 116,270 5,320,515
1,137,371,146
Quarterly Report 6
Common Stocks – continuedShares Value ($)
CONSUMER DISCRETIONARY – continued
Textiles, Apparel & Luxury Goods - 1.4%
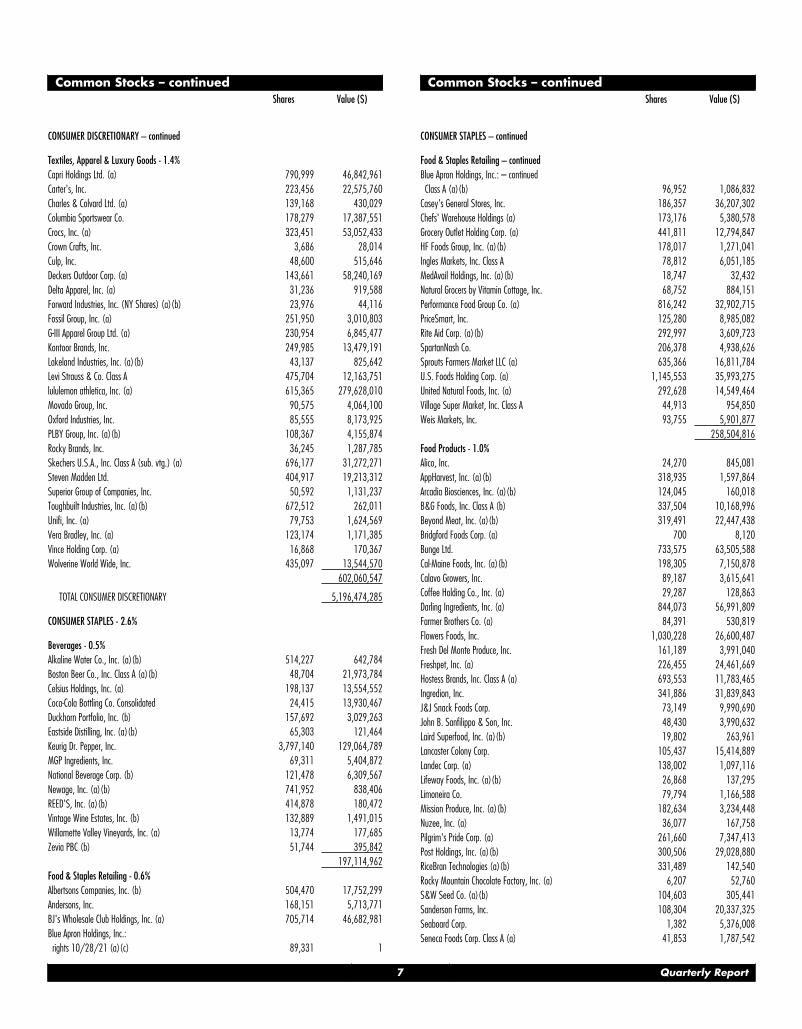
Capri Holdings Ltd. (a) 790,999 46,842,961
Carter's, Inc. 223,456 22,575,760
Charles & Colvard Ltd. (a) 139,168 430,029
Columbia Sportswear Co. 178,279 17,387,551
Crocs, Inc. (a) 323,451 53,052,433
Crown Crafts, Inc. 3,686 28,014
Culp, Inc. 48,600 515,646
Deckers Outdoor Corp. (a) 143,661 58,240,169
Delta Apparel, Inc. (a) 31,236 919,588
Forward Industries, Inc. (NY Shares) (a)(b) 23,976 44,116
Fossil Group, Inc. (a) 251,950 3,010,803
G-III Apparel Group Ltd. (a) 230,954 6,845,477
Kontoor Brands, Inc. 249,985 13,479,191
Lakeland Industries, Inc. (a)(b) 43,137 825,642
Levi Strauss & Co. Class A 475,704 12,163,751
lululemon athletica, Inc. (a) 615,365 279,628,010
Movado Group, Inc. 90,575 4,064,100
Oxford Industries, Inc. 85,555 8,173,925
PLBY Group, Inc. (a)(b) 108,367 4,155,874
Rocky Brands, Inc. 36,245 1,287,785
Skechers U.S.A., Inc. Class A (sub. vtg.) (a) 696,177 31,272,271
Steven Madden Ltd. 404,917 19,213,312
Superior Group of Companies, Inc. 50,592 1,131,237
Toughbuilt Industries, Inc. (a)(b) 672,512 262,011
Unifi, Inc. (a) 79,753 1,624,569
Vera Bradley, Inc. (a) 123,174 1,171,385
Vince Holding Corp. (a) 16,868 170,367
Wolverine World Wide, Inc. 435,097 13,544,570
602,060,547
TOTAL CONSUMER DISCRETIONARY 5,196,474,285
CONSUMER STAPLES - 2.6%
Beverages - 0.5%
Alkaline Water Co., Inc. (a)(b) 514,227 642,784
Boston Beer Co., Inc. Class A (a)(b) 48,704 21,973,784
Celsius Holdings, Inc. (a) 198,137 13,554,552
Coca-Cola Bottling Co. Consolidated 24,415 13,930,467
Duckhorn Portfolio, Inc. (b) 157,692 3,029,263
Eastside Distilling, Inc. (a)(b) 65,303 121,464
Keurig Dr. Pepper, Inc. 3,797,140 129,064,789
MGP Ingredients, Inc. 69,311 5,404,872
National Beverage Corp. (b) 121,478 6,309,567
Newage, Inc. (a)(b) 741,952 838,406
REED'S, Inc. (a)(b) 414,878 180,472
Vintage Wine Estates, Inc. (b) 132,889 1,491,015
Willamette Valley Vineyards, Inc. (a) 13,774 177,685
Zevia PBC (b) 51,744 395,842
197,114,962
Food & Staples Retailing - 0.6%
Albertsons Companies, Inc. (b) 504,470 17,752,299
Andersons, Inc. 168,151 5,713,771
BJ's Wholesale Club Holdings, Inc. (a) 705,714 46,682,981
Blue Apron Holdings, Inc.:
rights 10/28/21 (a)(c) 89,331 1
Common Stocks – continuedShares Value ($)
CONSUMER STAPLES – continued
Food & Staples Retailing – continued
Blue Apron Holdings, Inc.: – continued
Class A (a)(b) 96,952 1,086,832
Casey's General Stores, Inc. 186,357 36,207,302
Chefs' Warehouse Holdings (a) 173,176 5,380,578
Grocery Outlet Holding Corp. (a) 441,811 12,794,847
HF Foods Group, Inc. (a)(b) 178,017 1,271,041
Ingles Markets, Inc. Class A 78,812 6,051,185
MedAvail Holdings, Inc. (a)(b) 18,747 32,432
Natural Grocers by Vitamin Cottage, Inc. 68,752 884,151
Performance Food Group Co. (a) 816,242 32,902,715
PriceSmart, Inc. 125,280 8,985,082
Rite Aid Corp. (a)(b) 292,997 3,609,723
SpartanNash Co. 206,378 4,938,626
Sprouts Farmers Market LLC (a) 635,366 16,811,784
U.S. Foods Holding Corp. (a) 1,145,553 35,993,275
United Natural Foods, Inc. (a) 292,628 14,549,464
Village Super Market, Inc. Class A 44,913 954,850
Weis Markets, Inc. 93,755 5,901,877
258,504,816
Food Products - 1.0%
Alico, Inc. 24,270 845,081
AppHarvest, Inc. (a)(b) 318,935 1,597,864
Arcadia Biosciences, Inc. (a)(b) 124,045 160,018
B&G Foods, Inc. Class A (b) 337,504 10,168,996
Beyond Meat, Inc. (a)(b) 319,491 22,447,438
Bridgford Foods Corp. (a) 700 8,120
Bunge Ltd. 733,575 63,505,588
Cal-Maine Foods, Inc. (a)(b) 198,305 7,150,878
Calavo Growers, Inc. 89,187 3,615,641
Coffee Holding Co., Inc. (a) 29,287 128,863
Darling Ingredients, Inc. (a) 844,073 56,991,809
Farmer Brothers Co. (a) 84,391 530,819
Flowers Foods, Inc. 1,030,228 26,600,487
Fresh Del Monte Produce, Inc. 161,189 3,991,040
Freshpet, Inc. (a) 226,455 24,461,669
Hostess Brands, Inc. Class A (a) 693,553 11,783,465
Ingredion, Inc. 341,886 31,839,843
J&J Snack Foods Corp. 73,149 9,990,690
John B. Sanfilippo & Son, Inc. 48,430 3,990,632
Laird Superfood, Inc. (a)(b) 19,802 263,961
Lancaster Colony Corp. 105,437 15,414,889
Landec Corp. (a) 138,002 1,097,116
Lifeway Foods, Inc. (a)(b) 26,868 137,295
Limoneira Co. 79,794 1,166,588
Mission Produce, Inc. (a)(b) 182,634 3,234,448
Nuzee, Inc. (a) 36,077 167,758
Pilgrim's Pride Corp. (a) 261,660 7,347,413
Post Holdings, Inc. (a)(b) 300,506 29,028,880
RiceBran Technologies (a)(b) 331,489 142,540
Rocky Mountain Chocolate Factory, Inc. (a) 6,207 52,760
S&W Seed Co. (a)(b) 104,603 305,441
Sanderson Farms, Inc. 108,304 20,337,325
Seaboard Corp. 1,382 5,376,008
Seneca Foods Corp. Class A (a) 41,853 1,787,542
7 Quarterly Report
Schedule of Investments (Unaudited) − continued
Common Stocks – continuedShares Value ($)
CONSUMER STAPLES – continued
Food Products – continued
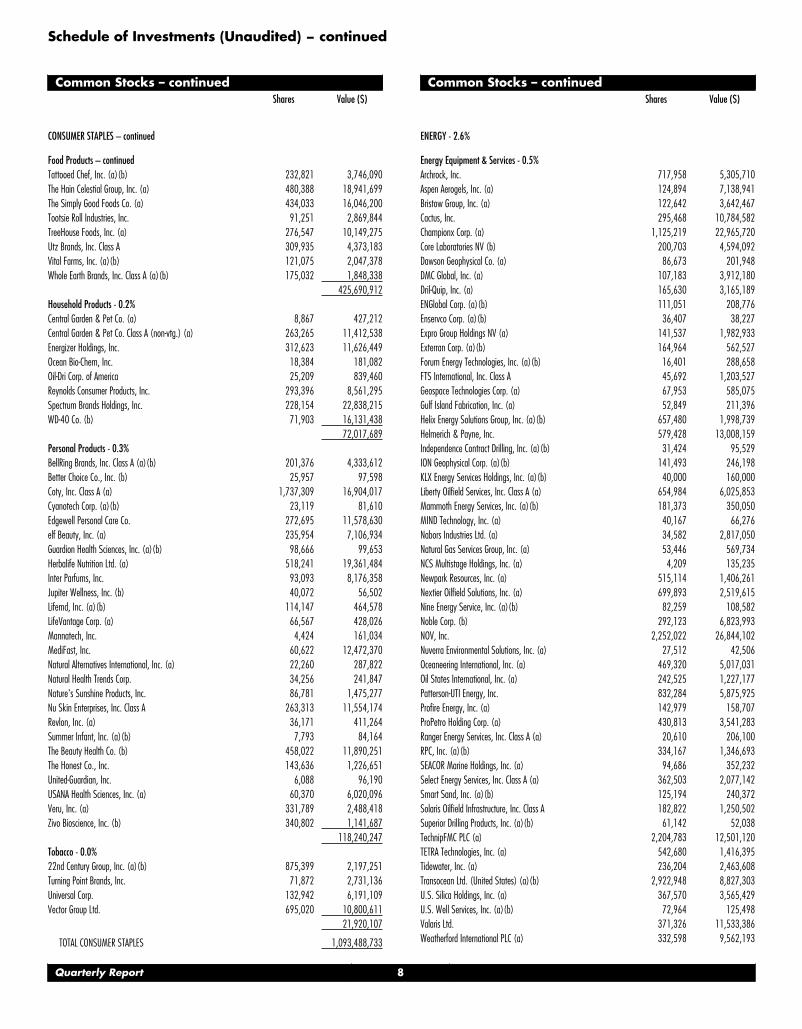
Tattooed Chef, Inc. (a)(b) 232,821 3,746,090
The Hain Celestial Group, Inc. (a) 480,388 18,941,699
The Simply Good Foods Co. (a) 434,033 16,046,200
Tootsie Roll Industries, Inc. 91,251 2,869,844
TreeHouse Foods, Inc. (a) 276,547 10,149,275
Utz Brands, Inc. Class A 309,935 4,373,183
Vital Farms, Inc. (a)(b) 121,075 2,047,378
Whole Earth Brands, Inc. Class A (a)(b) 175,032 1,848,338
425,690,912
Household Products - 0.2%
Central Garden & Pet Co. (a) 8,867 427,212
Central Garden & Pet Co. Class A (non-vtg.) (a) 263,265 11,412,538
Energizer Holdings, Inc. 312,623 11,626,449
Ocean Bio-Chem, Inc. 18,384 181,082
Oil-Dri Corp. of America 25,209 839,460
Reynolds Consumer Products, Inc. 293,396 8,561,295
Spectrum Brands Holdings, Inc. 228,154 22,838,215
WD-40 Co. (b) 71,903 16,131,438
72,017,689
Personal Products - 0.3%
BellRing Brands, Inc. Class A (a)(b) 201,376 4,333,612
Better Choice Co., Inc. (b) 25,957 97,598
Coty, Inc. Class A (a) 1,737,309 16,904,017
Cyanotech Corp. (a)(b) 23,119 81,610
Edgewell Personal Care Co. 272,695 11,578,630
elf Beauty, Inc. (a) 235,954 7,106,934
Guardion Health Sciences, Inc. (a)(b) 98,666 99,653
Herbalife Nutrition Ltd. (a) 518,241 19,361,484
Inter Parfums, Inc. 93,093 8,176,358
Jupiter Wellness, Inc. (b) 40,072 56,502
Lifemd, Inc. (a)(b) 114,147 464,578
LifeVantage Corp. (a) 66,567 428,026
Mannatech, Inc. 4,424 161,034
MediFast, Inc. 60,622 12,472,370
Natural Alternatives International, Inc. (a) 22,260 287,822
Natural Health Trends Corp. 34,256 241,847
Nature's Sunshine Products, Inc. 86,781 1,475,277
Nu Skin Enterprises, Inc. Class A 263,313 11,554,174
Revlon, Inc. (a) 36,171 411,264
Summer Infant, Inc. (a)(b) 7,793 84,164
The Beauty Health Co. (b) 458,022 11,890,251
The Honest Co., Inc. 143,636 1,226,651
United-Guardian, Inc. 6,088 96,190
USANA Health Sciences, Inc. (a) 60,370 6,020,096
Veru, Inc. (a) 331,789 2,488,418
Zivo Bioscience, Inc. (b) 340,802 1,141,687
118,240,247
Tobacco - 0.0%
22nd Century Group, Inc. (a)(b) 875,399 2,197,251
Turning Point Brands, Inc. 71,872 2,731,136
Universal Corp. 132,942 6,191,109
Vector Group Ltd. 695,020 10,800,611
21,920,107
TOTAL CONSUMER STAPLES 1,093,488,733
Common Stocks – continuedShares Value ($)
ENERGY - 2.6%
Energy Equipment & Services - 0.5%
Archrock, Inc. 717,958 5,305,710
Aspen Aerogels, Inc. (a) 124,894 7,138,941
Bristow Group, Inc. (a) 122,642 3,642,467
Cactus, Inc. 295,468 10,784,582
Championx Corp. (a) 1,125,219 22,965,720
Core Laboratories NV (b) 200,703 4,594,092
Dawson Geophysical Co. (a) 86,673 201,948
DMC Global, Inc. (a) 107,183 3,912,180
Dril-Quip, Inc. (a) 165,630 3,165,189
ENGlobal Corp. (a)(b) 111,051 208,776
Enservco Corp. (a)(b) 36,407 38,227
Expro Group Holdings NV (a) 141,537 1,982,933
Exterran Corp. (a)(b) 164,964 562,527
Forum Energy Technologies, Inc. (a)(b) 16,401 288,658
FTS International, Inc. Class A 45,692 1,203,527
Geospace Technologies Corp. (a) 67,953 585,075
Gulf Island Fabrication, Inc. (a) 52,849 211,396
Helix Energy Solutions Group, Inc. (a)(b) 657,480 1,998,739
Helmerich & Payne, Inc. 579,428 13,008,159
Independence Contract Drilling, Inc. (a)(b) 31,424 95,529
ION Geophysical Corp. (a)(b) 141,493 246,198
KLX Energy Services Holdings, Inc. (a)(b) 40,000 160,000
Liberty Oilfield Services, Inc. Class A (a) 654,984 6,025,853
Mammoth Energy Services, Inc. (a)(b) 181,373 350,050
MIND Technology, Inc. (a) 40,167 66,276
Nabors Industries Ltd. (a) 34,582 2,817,050
Natural Gas Services Group, Inc. (a) 53,446 569,734
NCS Multistage Holdings, Inc. (a) 4,209 135,235
Newpark Resources, Inc. (a) 515,114 1,406,261
Nextier Oilfield Solutions, Inc. (a) 699,893 2,519,615
Nine Energy Service, Inc. (a)(b) 82,259 108,582
Noble Corp. (b) 292,123 6,823,993
NOV, Inc. 2,252,022 26,844,102
Nuverra Environmental Solutions, Inc. (a) 27,512 42,506
Oceaneering International, Inc. (a) 469,320 5,017,031
Oil States International, Inc. (a) 242,525 1,227,177
Patterson-UTI Energy, Inc. 832,284 5,875,925
Profire Energy, Inc. (a) 142,979 158,707
ProPetro Holding Corp. (a) 430,813 3,541,283
Ranger Energy Services, Inc. Class A (a) 20,610 206,100
RPC, Inc. (a)(b) 334,167 1,346,693
SEACOR Marine Holdings, Inc. (a) 94,686 352,232
Select Energy Services, Inc. Class A (a) 362,503 2,077,142
Smart Sand, Inc. (a)(b) 125,194 240,372
Solaris Oilfield Infrastructure, Inc. Class A 182,822 1,250,502
Superior Drilling Products, Inc. (a)(b) 61,142 52,038
TechnipFMC PLC (a) 2,204,783 12,501,120
TETRA Technologies, Inc. (a) 542,680 1,416,395
Tidewater, Inc. (a) 236,204 2,463,608
Transocean Ltd. (United States) (a)(b) 2,922,948 8,827,303
U.S. Silica Holdings, Inc. (a) 367,570 3,565,429
U.S. Well Services, Inc. (a)(b) 72,964 125,498
Valaris Ltd. 371,326 11,533,386
Weatherford International PLC (a) 332,598 9,562,193
Quarterly Report 8

Common Stocks – continuedShares Value ($)
ENERGY – continued
201,349,964
Oil, Gas & Consumable Fuels - 2.1%
Adams Resources & Energy, Inc. 11,784 321,114
Aemetis, Inc. (a) 143,903 2,699,620
Alto Ingredients, Inc. (a)(b) 366,771 1,910,877
Altus Midstream Co. 16,680 1,057,178
American Resources Corp. (a)(b) 205,176 385,731
Amplify Energy Corp. (a)(b) 149,254 471,643
Antero Midstream GP LP 1,632,756 15,854,061
Antero Resources Corp. (a) 1,472,090 25,849,900
Arch Resources, Inc. 80,415 6,231,358
Barnwell Industries, Inc. (a)(b) 95,554 239,841
Battalion Oil Corp. (a)(b) 38,008 435,192
Berry Corp. 405,118 3,297,661
Brigham Minerals, Inc. Class A 218,513 4,536,330
California Resources Corp. 422,232 16,496,604
Callon Petroleum Co. (a)(b) 211,050 10,729,782
Camber Energy, Inc. (a)(b) 674,972 803,217
Centennial Resource Development, Inc. Class A(a)(b) 980,389 6,107,823
Centrus Energy Corp. Class A (a)(b) 56,130 3,114,654
Cheniere Energy, Inc. 1,221,268 128,001,099
Chesapeake Energy Corp. 537,141 31,981,375
Civitas Resources, Inc. 271,447 13,873,656
Clean Energy Fuels Corp. (a)(b) 877,613 6,292,485
CNX Resources Corp. (a)(b) 1,096,176 14,951,841
Comstock Resources, Inc. (a) 438,756 3,549,536
CONSOL Energy, Inc. (a) 169,292 3,715,959
Contango Oil & Gas Co. (a)(b) 766,225 2,666,463
Continental Resources, Inc. 303,396 13,452,579
CVR Energy, Inc. 140,772 2,197,451
Delek U.S. Holdings, Inc. (a) 383,350 6,010,928
Denbury, Inc. (a) 255,711 20,359,710
Dorian LPG Ltd. 170,564 2,099,643
DT Midstream, Inc. 494,760 22,694,641
Earthstone Energy, Inc. (a) 148,876 1,521,513
Ecoark Holdings, Inc. (a)(b) 18,655 57,271
Epsilon Energy Ltd. (a) 3,168 17,266
EQT Corp. (a) 1,564,536 30,398,934
Equitrans Midstream Corp. 2,067,630 19,890,601
Evolution Petroleum Corp. 186,509 926,950
Falcon Minerals Corp. 226,197 1,049,554
Gevo, Inc. (a)(b) 1,012,078 5,819,449
Goodrich Petroleum Corp. (a) 66,944 1,539,712
Green Plains, Inc. (a)(b) 273,840 10,583,916
Gulfport Energy Corp. 56,138 4,097,513
Hallador Energy Co. (a)(b) 127,463 313,559
HollyFrontier Corp. 765,610 24,744,515
Houston American Energy Corp. (a)(b) 122,877 201,518
International Seaways, Inc. 228,435 3,335,151
Kosmos Energy Ltd. (a) 2,170,983 7,945,798
Laredo Petroleum, Inc. (a)(b) 67,435 3,971,922
Lightbridge Corp. (a)(b) 32,543 296,792
Magnolia Oil & Gas Corp. Class A 722,308 13,702,183
Matador Resources Co. 565,298 22,199,252
Common Stocks – continuedShares Value ($)
ENERGY – continued
Oil, Gas & Consumable Fuels – continued
Mexco Energy Corp. (a)(b) 8,253 86,574
Murphy Oil Corp. 770,378 20,476,647
NACCO Industries, Inc. Class A 24,311 720,335
New Concept Energy, Inc. (a)(b) 18,365 55,646
New Fortress Energy, Inc. 217,843 5,422,112
Nextdecade Corp. (a)(b) 200,304 636,967
Northern Oil & Gas, Inc. 330,268 6,730,862
Oasis Petroleum, Inc. 93,505 11,211,250
Overseas Shipholding Group, Inc. (a) 480,769 860,577
Ovintiv, Inc. 1,369,311 47,597,250
Par Pacific Holdings, Inc. (a) 252,606 3,420,285
PBF Energy, Inc. Class A (a) 502,731 6,299,219
PDC Energy, Inc. 509,576 25,697,918
Peabody Energy Corp. (a) 452,748 4,509,370
Pedevco Corp. (a)(b) 86,042 93,786
Phx Minerals, Inc. Class A 197,548 491,895
PrimeEnergy Corp. (a) 4,172 263,253
Range Resources Corp. (a) 1,339,185 26,194,459
Ranger Oil Corp. (a) 93,738 2,523,427
Renewable Energy Group, Inc. (a) 257,641 12,310,087
Rex American Resources Corp. (a) 30,524 2,777,684
Riley Exploration Permian, Inc. 10,182 178,898
Ring Energy, Inc. (a)(b) 357,196 825,123
SandRidge Energy, Inc. (a) 160,033 1,701,151
SilverBow Resources, Inc. (a) 49,534 1,167,516
SM Energy Co. 626,055 18,155,595
Southwestern Energy Co. (a) 3,458,327 15,493,305
Talos Energy, Inc. (a) 195,703 1,951,159
Targa Resources Corp. 1,181,982 61,025,731
Tellurian, Inc. (a)(b) 1,959,805 6,388,964
Texas Pacific Land Corp. 32,260 38,994,920
U.S. Energy Corp. (a)(b) 77,059 275,871
Uranium Energy Corp. (a)(b) 1,269,307 4,975,683
VAALCO Energy, Inc. (a) 283,368 867,106
Vertex Energy, Inc. (a)(b) 219,615 1,080,506
W&T Offshore, Inc. (a) 468,996 1,613,346
Whiting Petroleum Corp. (a) 208,348 13,478,032
World Fuel Services Corp. 333,877 8,343,586
879,899,416
TOTAL ENERGY 1,081,249,380
FINANCIALS - 14.5%
Banks - 4.9%
1st Constitution Bancorp 43,797 1,044,120
1st Source Corp. 95,937 4,437,086
ACNB Corp. 46,204 1,341,764
Allegiance Bancshares, Inc. 104,375 4,219,881
Amalgamated Financial Corp. 144,924 2,452,114
Amerant Bancorp, Inc. Class A (a) 121,365 3,416,425
American National Bankshares, Inc. 53,794 1,967,785
Ameris Bancorp 339,202 16,508,961
AmeriServ Financial, Inc. 99,260 382,151
Ames National Corp. 50,203 1,229,974
Arrow Financial Corp. 85,415 2,946,818
9 Quarterly Report
Schedule of Investments (Unaudited) − continued
Common Stocks – continuedShares Value ($)
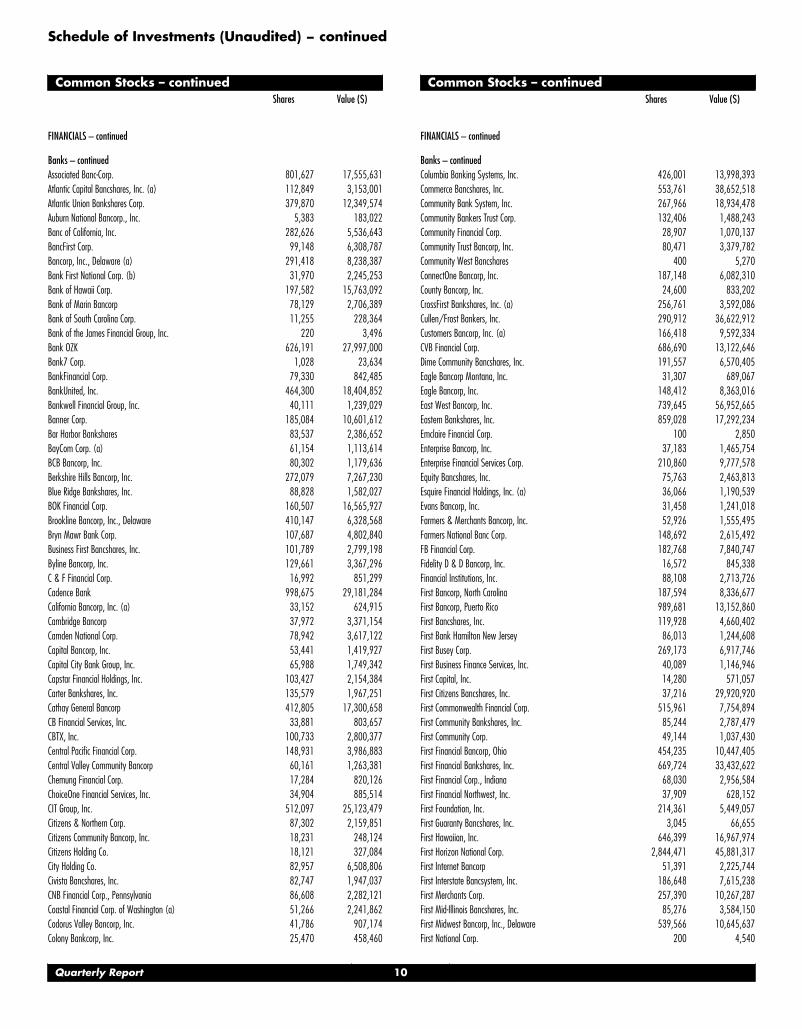
FINANCIALS – continued
Banks – continued
Associated Banc-Corp. 801,627 17,555,631
Atlantic Capital Bancshares, Inc. (a) 112,849 3,153,001
Atlantic Union Bankshares Corp. 379,870 12,349,574
Auburn National Bancorp., Inc. 5,383 183,022
Banc of California, Inc. 282,626 5,536,643
BancFirst Corp. 99,148 6,308,787
Bancorp, Inc., Delaware (a) 291,418 8,238,387
Bank First National Corp. (b) 31,970 2,245,253
Bank of Hawaii Corp. 197,582 15,763,092
Bank of Marin Bancorp 78,129 2,706,389
Bank of South Carolina Corp. 11,255 228,364
Bank of the James Financial Group, Inc. 220 3,496
Bank OZK 626,191 27,997,000
Bank7 Corp. 1,028 23,634
BankFinancial Corp. 79,330 842,485
BankUnited, Inc. 464,300 18,404,852
Bankwell Financial Group, Inc. 40,111 1,239,029
Banner Corp. 185,084 10,601,612
Bar Harbor Bankshares 83,537 2,386,652
BayCom Corp. (a) 61,154 1,113,614
BCB Bancorp, Inc. 80,302 1,179,636
Berkshire Hills Bancorp, Inc. 272,079 7,267,230
Blue Ridge Bankshares, Inc. 88,828 1,582,027
BOK Financial Corp. 160,507 16,565,927
Brookline Bancorp, Inc., Delaware 410,147 6,328,568
Bryn Mawr Bank Corp. 107,687 4,802,840
Business First Bancshares, Inc. 101,789 2,799,198
Byline Bancorp, Inc. 129,661 3,367,296
C & F Financial Corp. 16,992 851,299
Cadence Bank 998,675 29,181,284
California Bancorp, Inc. (a) 33,152 624,915
Cambridge Bancorp 37,972 3,371,154
Camden National Corp. 78,942 3,617,122
Capital Bancorp, Inc. 53,441 1,419,927
Capital City Bank Group, Inc. 65,988 1,749,342
Capstar Financial Holdings, Inc. 103,427 2,154,384
Carter Bankshares, Inc. 135,579 1,967,251
Cathay General Bancorp 412,805 17,300,658
CB Financial Services, Inc. 33,881 803,657
CBTX, Inc. 100,733 2,800,377
Central Pacific Financial Corp. 148,931 3,986,883
Central Valley Community Bancorp 60,161 1,263,381
Chemung Financial Corp. 17,284 820,126
ChoiceOne Financial Services, Inc. 34,904 885,514
CIT Group, Inc. 512,097 25,123,479
Citizens & Northern Corp. 87,302 2,159,851
Citizens Community Bancorp, Inc. 18,231 248,124
Citizens Holding Co. 18,121 327,084
City Holding Co. 82,957 6,508,806
Civista Bancshares, Inc. 82,747 1,947,037
CNB Financial Corp., Pennsylvania 86,608 2,282,121
Coastal Financial Corp. of Washington (a) 51,266 2,241,862
Codorus Valley Bancorp, Inc. 41,786 907,174
Colony Bankcorp, Inc. 25,470 458,460
Common Stocks – continuedShares Value ($)
FINANCIALS – continued
Banks – continued
Columbia Banking Systems, Inc. 426,001 13,998,393
Commerce Bancshares, Inc. 553,761 38,652,518
Community Bank System, Inc. 267,966 18,934,478
Community Bankers Trust Corp. 132,406 1,488,243
Community Financial Corp. 28,907 1,070,137
Community Trust Bancorp, Inc. 80,471 3,379,782
Community West Bancshares 400 5,270
ConnectOne Bancorp, Inc. 187,148 6,082,310
County Bancorp, Inc. 24,600 833,202
CrossFirst Bankshares, Inc. (a) 256,761 3,592,086
Cullen/Frost Bankers, Inc. 290,912 36,622,912
Customers Bancorp, Inc. (a) 166,418 9,592,334
CVB Financial Corp. 686,690 13,122,646
Dime Community Bancshares, Inc. 191,557 6,570,405
Eagle Bancorp Montana, Inc. 31,307 689,067
Eagle Bancorp, Inc. 148,412 8,363,016
East West Bancorp, Inc. 739,645 56,952,665
Eastern Bankshares, Inc. 859,028 17,292,234
Emclaire Financial Corp. 100 2,850
Enterprise Bancorp, Inc. 37,183 1,465,754
Enterprise Financial Services Corp. 210,860 9,777,578
Equity Bancshares, Inc. 75,763 2,463,813
Esquire Financial Holdings, Inc. (a) 36,066 1,190,539
Evans Bancorp, Inc. 31,458 1,241,018
Farmers & Merchants Bancorp, Inc. 52,926 1,555,495
Farmers National Banc Corp. 148,692 2,615,492
FB Financial Corp. 182,768 7,840,747
Fidelity D & D Bancorp, Inc. 16,572 845,338
Financial Institutions, Inc. 88,108 2,713,726
First Bancorp, North Carolina 187,594 8,336,677
First Bancorp, Puerto Rico 989,681 13,152,860
First Bancshares, Inc. 119,928 4,660,402
First Bank Hamilton New Jersey 86,013 1,244,608
First Busey Corp. 269,173 6,917,746
First Business Finance Services, Inc. 40,089 1,146,946
First Capital, Inc. 14,280 571,057
First Citizens Bancshares, Inc. 37,216 29,920,920
First Commonwealth Financial Corp. 515,961 7,754,894
First Community Bankshares, Inc. 85,244 2,787,479
First Community Corp. 49,144 1,037,430
First Financial Bancorp, Ohio 454,235 10,447,405
First Financial Bankshares, Inc. 669,724 33,432,622
First Financial Corp., Indiana 68,030 2,956,584
First Financial Northwest, Inc. 37,909 628,152
First Foundation, Inc. 214,361 5,449,057
First Guaranty Bancshares, Inc. 3,045 66,655
First Hawaiian, Inc. 646,399 16,967,974
First Horizon National Corp. 2,844,471 45,881,317
First Internet Bancorp 51,391 2,225,744
First Interstate Bancsystem, Inc. 186,648 7,615,238
First Merchants Corp. 257,390 10,267,287
First Mid-Illinois Bancshares, Inc. 85,276 3,584,150
First Midwest Bancorp, Inc., Delaware 539,566 10,645,637
First National Corp. 200 4,540
Quarterly Report 10
Common Stocks – continuedShares Value ($)
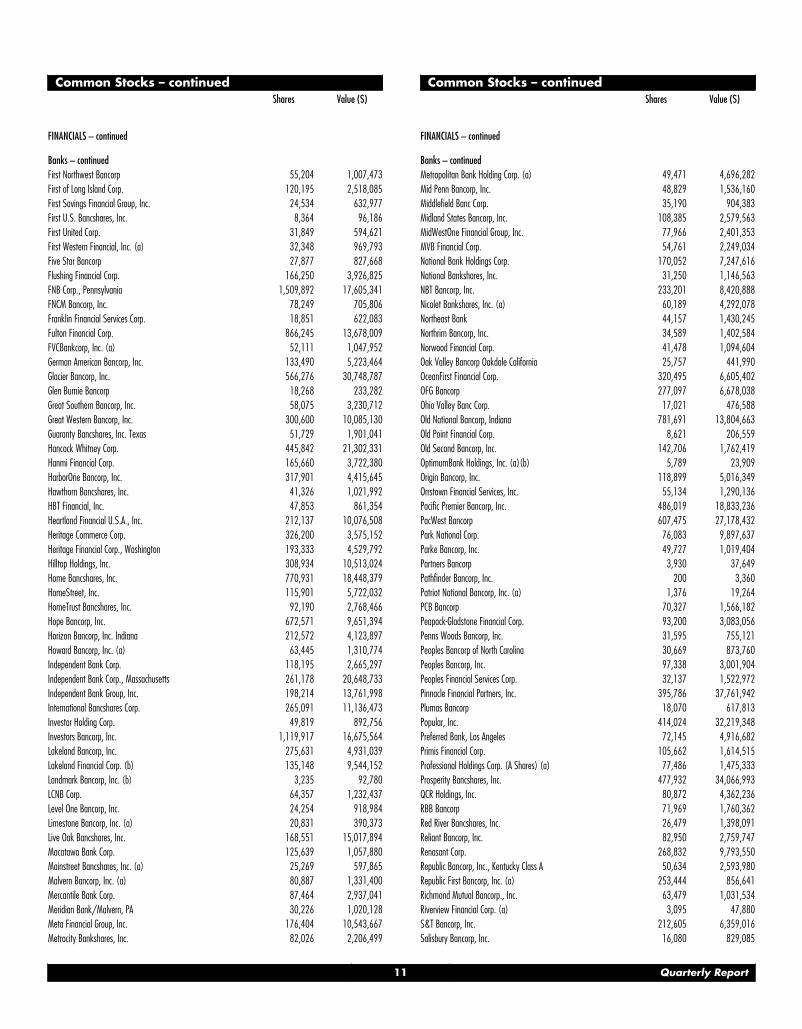
FINANCIALS – continued
Banks – continued
First Northwest Bancorp 55,204 1,007,473
First of Long Island Corp. 120,195 2,518,085
First Savings Financial Group, Inc. 24,534 632,977
First U.S. Bancshares, Inc. 8,364 96,186
First United Corp. 31,849 594,621
First Western Financial, Inc. (a) 32,348 969,793
Five Star Bancorp 27,877 827,668
Flushing Financial Corp. 166,250 3,926,825
FNB Corp., Pennsylvania 1,509,892 17,605,341
FNCM Bancorp, Inc. 78,249 705,806
Franklin Financial Services Corp. 18,851 622,083
Fulton Financial Corp. 866,245 13,678,009
FVCBankcorp, Inc. (a) 52,111 1,047,952
German American Bancorp, Inc. 133,490 5,223,464
Glacier Bancorp, Inc. 566,276 30,748,787
Glen Burnie Bancorp 18,268 233,282
Great Southern Bancorp, Inc. 58,075 3,230,712
Great Western Bancorp, Inc. 300,600 10,085,130
Guaranty Bancshares, Inc. Texas 51,729 1,901,041
Hancock Whitney Corp. 445,842 21,302,331
Hanmi Financial Corp. 165,660 3,722,380
HarborOne Bancorp, Inc. 317,901 4,415,645
Hawthorn Bancshares, Inc. 41,326 1,021,992
HBT Financial, Inc. 47,853 861,354
Heartland Financial U.S.A., Inc. 212,137 10,076,508
Heritage Commerce Corp. 326,200 3,575,152
Heritage Financial Corp., Washington 193,333 4,529,792
Hilltop Holdings, Inc. 308,934 10,513,024
Home Bancshares, Inc. 770,931 18,448,379
HomeStreet, Inc. 115,901 5,722,032
HomeTrust Bancshares, Inc. 92,190 2,768,466
Hope Bancorp, Inc. 672,571 9,651,394
Horizon Bancorp, Inc. Indiana 212,572 4,123,897
Howard Bancorp, Inc. (a) 63,445 1,310,774
Independent Bank Corp. 118,195 2,665,297
Independent Bank Corp., Massachusetts 261,178 20,648,733
Independent Bank Group, Inc. 198,214 13,761,998
International Bancshares Corp. 265,091 11,136,473
Investar Holding Corp. 49,819 892,756
Investors Bancorp, Inc. 1,119,917 16,675,564
Lakeland Bancorp, Inc. 275,631 4,931,039
Lakeland Financial Corp. (b) 135,148 9,544,152
Landmark Bancorp, Inc. (b) 3,235 92,780
LCNB Corp. 64,357 1,232,437
Level One Bancorp, Inc. 24,254 918,984
Limestone Bancorp, Inc. (a) 20,831 390,373
Live Oak Bancshares, Inc. 168,551 15,017,894
Macatawa Bank Corp. 125,639 1,057,880
Mainstreet Bancshares, Inc. (a) 25,269 597,865
Malvern Bancorp, Inc. (a) 80,887 1,331,400
Mercantile Bank Corp. 87,464 2,937,041
Meridian Bank/Malvern, PA 30,226 1,020,128
Meta Financial Group, Inc. 176,404 10,543,667
Metrocity Bankshares, Inc. 82,026 2,206,499
Common Stocks – continuedShares Value ($)
FINANCIALS – continued
Banks – continued
Metropolitan Bank Holding Corp. (a) 49,471 4,696,282
Mid Penn Bancorp, Inc. 48,829 1,536,160
Middlefield Banc Corp. 35,190 904,383
Midland States Bancorp, Inc. 108,385 2,579,563
MidWestOne Financial Group, Inc. 77,966 2,401,353
MVB Financial Corp. 54,761 2,249,034
National Bank Holdings Corp. 170,052 7,247,616
National Bankshares, Inc. 31,250 1,146,563
NBT Bancorp, Inc. 233,201 8,420,888
Nicolet Bankshares, Inc. (a) 60,189 4,292,078
Northeast Bank 44,157 1,430,245
Northrim Bancorp, Inc. 34,589 1,402,584
Norwood Financial Corp. 41,478 1,094,604
Oak Valley Bancorp Oakdale California 25,757 441,990
OceanFirst Financial Corp. 320,495 6,605,402
OFG Bancorp 277,097 6,678,038
Ohio Valley Banc Corp. 17,021 476,588
Old National Bancorp, Indiana 781,691 13,804,663
Old Point Financial Corp. 8,621 206,559
Old Second Bancorp, Inc. 142,706 1,762,419
OptimumBank Holdings, Inc. (a)(b) 5,789 23,909
Origin Bancorp, Inc. 118,899 5,016,349
Orrstown Financial Services, Inc. 55,134 1,290,136
Pacific Premier Bancorp, Inc. 486,019 18,833,236
PacWest Bancorp 607,475 27,178,432
Park National Corp. 76,083 9,897,637
Parke Bancorp, Inc. 49,727 1,019,404
Partners Bancorp 3,930 37,649
Pathfinder Bancorp, Inc. 200 3,360
Patriot National Bancorp, Inc. (a) 1,376 19,264
PCB Bancorp 70,327 1,566,182
Peapack-Gladstone Financial Corp. 93,200 3,083,056
Penns Woods Bancorp, Inc. 31,595 755,121
Peoples Bancorp of North Carolina 30,669 873,760
Peoples Bancorp, Inc. 97,338 3,001,904
Peoples Financial Services Corp. 32,137 1,522,972
Pinnacle Financial Partners, Inc. 395,786 37,761,942
Plumas Bancorp 18,070 617,813
Popular, Inc. 414,024 32,219,348
Preferred Bank, Los Angeles 72,145 4,916,682
Primis Financial Corp. 105,662 1,614,515
Professional Holdings Corp. (A Shares) (a) 77,486 1,475,333
Prosperity Bancshares, Inc. 477,932 34,066,993
QCR Holdings, Inc. 80,872 4,362,236
RBB Bancorp 71,969 1,760,362
Red River Bancshares, Inc. 26,479 1,398,091
Reliant Bancorp, Inc. 82,950 2,759,747
Renasant Corp. 268,832 9,793,550
Republic Bancorp, Inc., Kentucky Class A 50,634 2,593,980
Republic First Bancorp, Inc. (a) 253,444 856,641
Richmond Mutual Bancorp., Inc. 63,479 1,031,534
Riverview Financial Corp. (a) 3,095 47,880
S&T Bancorp, Inc. 212,605 6,359,016
Salisbury Bancorp, Inc. 16,080 829,085
11 Quarterly Report

Schedule of Investments (Unaudited) − continued
Common Stocks – continuedShares Value ($)
FINANCIALS – continued
Banks – continued
Sandy Spring Bancorp, Inc. 256,761 12,049,794
SB Financial Group, Inc. 32,474 612,135
Seacoast Banking Corp., Florida 298,999 10,097,196
ServisFirst Bancshares, Inc. 251,566 20,223,391
Shore Bancshares, Inc. 100,279 1,965,468
Sierra Bancorp 78,716 1,982,069
Signature Bank 314,986 95,220,268
Silvergate Capital Corp. (a) 137,867 28,191,044
Simmons First National Corp. Class A 580,541 16,899,549
SmartFinancial, Inc. 76,603 1,966,399
Sound Financial Bancorp, Inc. (b) 11,669 501,184
South Plains Financial, Inc. 49,911 1,247,775
Southern First Bancshares, Inc. (a) 37,487 2,194,114
Southside Bancshares, Inc. 165,724 6,753,253
Southstate Corp. 364,599 28,489,766
Spirit of Texas Bancshares, Inc. 73,052 2,030,846
Sterling Bancorp 981,022 24,339,156
Stock Yards Bancorp, Inc. 120,125 7,187,079
Summit Financial Group, Inc. 49,707 1,242,675
Summit State Bank 220 3,529
Synovus Financial Corp. 761,442 34,485,708
Texas Capital Bancshares, Inc. (a) 257,838 14,521,436
The Bank of Princeton 28,103 837,750
The First Bancorp, Inc. 55,567 1,682,569
Tompkins Financial Corp. 64,266 5,023,031
TowneBank 354,816 10,853,821
Trico Bancshares 145,798 6,146,844
TriState Capital Holdings, Inc. (a) 151,326 4,526,161
Triumph Bancorp, Inc. (a) 123,594 15,739,696
Trustmark Corp. 340,756 10,430,541
UMB Financial Corp. 216,052 21,730,510
Umpqua Holdings Corp. 1,082,344 20,629,477
Union Bankshares, Inc. 25,687 804,003
United Bancorp, Inc. 40,787 639,132
United Bancshares, Inc. 13,498 371,060
United Bankshares, Inc., West Virginia 651,005 23,260,409
United Community Bank, Inc. 430,944 14,768,451
United Security Bancshares, California 72,516 560,549
Unity Bancorp, Inc. 35,956 934,856
Univest Corp. of Pennsylvania 159,700 4,402,929
Valley National Bancorp 2,093,443 28,135,874
Veritex Holdings, Inc. 275,047 10,900,113
Village Bank & Trust Financial Corp. (b) 8,696 479,150
Virginia National Bank Corp. (b) 4,692 165,252
Washington Trust Bancorp, Inc. 92,049 4,952,236
Webster Financial Corp. 519,466 27,994,023
WesBanco, Inc. 357,744 11,644,567
West Bancorp., Inc. 82,351 2,555,352
Westamerica Bancorp. 142,350 7,655,583
Western Alliance Bancorp. 542,393 59,543,904
Wintrust Financial Corp. 289,509 25,340,723
2,070,556,865
Capital Markets - 4.2%
Affiliated Managers Group, Inc. 215,111 36,596,834
Common Stocks – continuedShares Value ($)
FINANCIALS – continued
Capital Markets – continued
Apollo Global Management LLC Class A 1,087,100 76,944,938
Ares Management Corp. 848,803 68,888,851
Artisan Partners Asset Management, Inc. 337,155 15,080,943
Ashford, Inc. (a)(b) 11,628 226,339
Assetmark Financial Holdings, Inc. (a) 94,909 2,406,892
Associated Capital Group, Inc. 19,292 762,034
B. Riley Financial, Inc. 86,819 6,722,395
BGC Partners, Inc. Class A 1,805,211 8,069,293
Blackstone, Inc. 3,567,316 504,596,783
Blucora, Inc. (a) 254,432 4,119,254
Blue Owl Capital, Inc. Class A (b) 1,398,052 21,166,507
Bridge Investment Group Holdings, Inc. 86,711 1,797,519
BrightSphere Investment Group, Inc. 311,954 9,367,979
Carlyle Group LP 720,324 39,394,520
Cohen & Co., Inc. 10,942 175,665
Cohen & Steers, Inc. 130,393 11,705,380
Coinbase Global, Inc. 149,354 47,046,510
Cowen Group, Inc. Class A 145,660 5,153,451
Diamond Hill Investment Group, Inc. 15,568 2,990,457
Donnelley Financial Solutions, Inc. (a) 155,414 7,260,942
Evercore, Inc. Class A 206,258 28,607,985
FactSet Research Systems, Inc. 195,842 91,765,686
Federated Hermes, Inc. 510,035 17,193,280
Focus Financial Partners, Inc. Class A (a) 263,247 16,200,220
GAMCO Investors, Inc. Class A 21,641 529,772
GCM Grosvenor, Inc. Class A 187,245 2,145,828
Greenhill & Co., Inc. 76,150 1,299,119
Hamilton Lane, Inc. Class A 176,806 18,700,771
Hennessy Advisors, Inc. (b) 9,554 101,941
Heritage Global, Inc. (a) 59,452 90,367
Houlihan Lokey 263,074 28,554,052
Interactive Brokers Group, Inc. 453,932 33,509,260
Janus Henderson Group PLC 895,236 38,253,434
Jefferies Financial Group, Inc. 1,016,547 38,201,836
KKR & Co. LP 3,032,720 225,786,004
Lazard Ltd. Class A 585,927 24,972,209
LPL Financial 417,914 65,867,426
Manning & Napier, Inc. Class A 64,534 573,062
MarketWise, Inc. Class A (a)(b) 136,266 971,577
Moelis & Co. Class A 315,795 19,361,391
Morningstar, Inc. 124,100 38,511,953
National Holdings Corp. warrants 1/18/22 (a)(c) 3,483 0
Open Lending Corp. (a) 536,337 12,464,472
Oppenheimer Holdings, Inc. Class A (non-vtg.) 52,068 2,553,415
Perella Weinberg Partners Class A 145,416 1,733,359
Piper Jaffray Companies 76,287 12,644,570
PJT Partners, Inc. 128,158 9,750,261
Pzena Investment Management, Inc. 87,276 818,649
Safeguard Scientifics, Inc. (a) 119,728 890,776
Sculptor Capital Management, Inc. Class A 113,800 2,062,056
SEI Investments Co. 560,008 33,393,277
Siebert Financial Corp. (a)(b) 58,268 163,733
Silvercrest Asset Management Group Class A 47,307 761,170
StepStone Group, Inc. Class A 229,564 9,497,063
Quarterly Report 12

Common Stocks – continuedShares Value ($)
FINANCIALS – continued
Capital Markets – continued
Stifel Financial Corp. 548,500 38,948,985
StoneX Group, Inc. (a) 86,945 4,884,135
Tradeweb Markets, Inc. Class A 551,107 52,906,272
U.S. Global Investors, Inc. Class A 67,034 348,577
Value Line, Inc. 10,535 426,668
Victory Capital Holdings, Inc. 88,776 3,112,487
Virtu Financial, Inc. Class A 434,418 12,241,899
Virtus Investment Partners, Inc. 38,165 11,349,508
Westwood Holdings Group, Inc. 42,369 686,801
WisdomTree Investments, Inc. 590,199 3,623,822
1,776,932,614
Consumer Finance - 1.0%
Ally Financial, Inc. 1,867,444 85,584,959
Atlanticus Holdings Corp. (a) 33,885 2,013,786
Consumer Portfolio Services, Inc. (a) 69,404 537,881
Credit Acceptance Corp. (a)(b) 46,168 28,850,383
CURO Group Holdings Corp. 98,423 1,632,838
Elevate Credit, Inc. (a)(b) 99,560 317,596
Encore Capital Group, Inc. (a)(b) 158,429 9,242,748
Enova International, Inc. (a) 197,964 7,546,388
EZCORP, Inc. (non-vtg.) Class A (a)(b) 276,099 2,043,133
First Cash Financial Services, Inc. 204,089 13,029,042
Green Dot Corp. Class A (a) 284,059 10,197,718
Katapult Holdings, Inc. (a)(b) 296,193 1,164,038
LendingClub Corp. (a) 509,236 16,662,202
LendingTree, Inc. (a) 57,988 6,574,679
Medallion Financial Corp. (a) 80,536 636,234
Navient Corp. 875,476 17,273,141
Nelnet, Inc. Class A 111,328 9,596,474
Nicholas Financial, Inc. (a) 71,789 850,700
OneMain Holdings, Inc. 564,981 28,130,404
Oportun Financial Corp. (a) 99,176 2,129,309
OppFi, Inc. Class A (a)(b) 31,259 153,169
PRA Group, Inc. (a) 245,400 10,419,684
PROG Holdings, Inc. 344,573 15,547,134
Regional Management Corp. 57,197 3,235,062
SLM Corp. 1,571,269 27,937,163
SoFi Technologies, Inc. (b) 3,356,208 57,726,778
Sunlight Financial Holdings, Inc. Class A (b) 167,341 731,280
Upstart Holdings, Inc. 239,787 49,129,958
World Acceptance Corp. (a)(b) 21,431 4,402,356
413,296,237
Diversified Financial Services - 0.3%
A-Mark Precious Metals, Inc. 44,542 3,084,534
Alerus Financial Corp. 80,521 2,423,682
Cannae Holdings, Inc. (a) 428,657 12,675,387
Equitable Holdings, Inc. 2,059,598 64,794,953
FlexShopper, Inc. (a) 77,793 196,816
LM Funding America, Inc. (a)(b) 53,616 283,092
Marlin Business Services Corp. 63,940 1,467,423
SWK Holdings Corp. (a) 5,523 105,047
Voya Financial, Inc. 579,825 36,030,326
121,061,260
Common Stocks – continuedShares Value ($)
FINANCIALS – continued
Insurance - 2.5%
Alleghany Corp. (a) 71,854 46,480,916
AMBAC Financial Group, Inc. (a) 240,962 3,599,972
American Equity Investment Life Holding Co. 418,132 14,061,779
American Financial Group, Inc. 341,198 45,587,465
American National Group, Inc. 65,413 12,379,410
Amerisafe, Inc. 101,882 5,408,915
Arch Capital Group Ltd. (a) 2,056,713 83,050,071
Argo Group International Holdings, Ltd. 189,041 10,261,145
Assured Guaranty Ltd. 357,425 17,503,102
Athene Holding Ltd. (a) 678,064 55,547,003
Atlantic American Corp. (b) 39,532 152,198
Axis Capital Holdings Ltd. 387,271 19,239,623
Brighthouse Financial, Inc. (a) 423,908 20,606,168
BRP Group, Inc. (a) 270,316 10,012,505
Citizens, Inc. Class A (a)(b) 251,271 1,424,707
CNA Financial Corp. 149,768 6,236,340
CNO Financial Group, Inc. 614,306 13,920,174
Conifer Holdings, Inc. (a) 13,147 31,421
Crawford & Co.:
Class A 84,964 619,388
Class B 51,170 379,170
Donegal Group, Inc. Class A 86,295 1,173,612
eHealth, Inc. (a) 117,144 2,586,540
Employers Holdings, Inc. 150,437 5,808,373
Enstar Group Ltd. (a) 62,634 13,973,645
Erie Indemnity Co. Class A 131,958 24,519,116
Fednat Holding Co. (b) 54,545 83,999
FG Financial Group, Inc. (a)(b) 9,639 33,737
Fidelity National Financial, Inc. 1,483,267 72,546,589
First American Financial Corp. 567,140 42,070,445
Genworth Financial, Inc. Class A (a) 2,636,535 10,071,564
GoHealth, Inc. (a)(b) 315,298 1,116,155
Goosehead Insurance 101,356 13,310,070
Greenlight Capital Re, Ltd. (a) 148,408 1,003,238
Hallmark Financial Services, Inc. (a) 91,665 366,660
Hanover Insurance Group, Inc. 177,887 21,657,742
HCI Group, Inc. 35,010 3,865,104
Heritage Insurance Holdings, Inc. 141,723 943,875
Hippo Holdings, Inc. (b) 1,923,149 7,038,725
Horace Mann Educators Corp. 229,884 8,521,800
Independence Holding Co. 36,899 2,084,794
Investors Title Co. 7,475 1,614,600
James River Group Holdings Ltd. 199,813 5,283,056
Kemper Corp. 303,960 16,815,067
Kingstone Companies, Inc. 38,381 188,835
Kinsale Capital Group, Inc. 111,923 23,279,984
Lemonade, Inc. (a)(b) 199,028 9,841,935
Maiden Holdings Ltd. (a) 374,705 1,124,115
Markel Corp. (a) 71,434 85,350,772
MBIA, Inc. (a)(b) 266,220 3,130,747
Mercury General Corp. 143,954 7,344,533
MetroMile, Inc. (a) 322,972 820,349
Midwest Holding, Inc. 1,340 20,502
National Western Life Group, Inc. 12,503 2,546,236
13 Quarterly Report
Schedule of Investments (Unaudited) − continued
Common Stocks – continuedShares Value ($)
FINANCIALS – continued
Insurance – continued
NI Holdings, Inc. (a) 45,517 843,885
Old Republic International Corp. 1,444,309 34,605,644
Oscar Health, Inc. (b) 212,727 1,914,543
Oxbridge Re Holdings Ltd. (a) 14,895 64,942
Palomar Holdings, Inc. (a) 126,856 9,270,636
Primerica, Inc. 205,625 30,257,719
ProAssurance Corp. 289,849 6,666,527
Reinsurance Group of America, Inc. 350,416 33,257,983
Reliance Global Group, Inc. (a)(b) 43,427 91,197
RenaissanceRe Holdings Ltd. 243,001 37,448,884
RLI Corp. 205,047 21,074,731
Root, Inc. (a)(b) 539,744 2,148,181
Ryan Specialty Group Holdings, Inc. (b) 302,779 11,587,352
Safety Insurance Group, Inc. 74,452 5,752,906
Selective Insurance Group, Inc. 306,319 23,139,337
Selectquote, Inc. (a)(b) 648,334 5,835,006
Siriuspoint Ltd. (a) 413,226 3,181,840
State Auto Financial Corp. 97,580 5,021,467
Stewart Information Services Corp. 143,981 10,254,327
Tiptree, Inc. 103,115 1,343,588
Trean Insurance Group, Inc. (a) 84,449 710,216
Trupanion, Inc. (a) 178,074 21,960,086
United Fire Group, Inc. 116,974 2,447,096
United Insurance Holdings Corp. 117,879 486,840
Universal Insurance Holdings, Inc. 158,867 2,394,126
Unum Group 1,163,308 26,872,415
Vericity, Inc. 18,383 150,189
White Mountains Insurance Group Ltd. 15,836 15,881,924
1,071,301,573
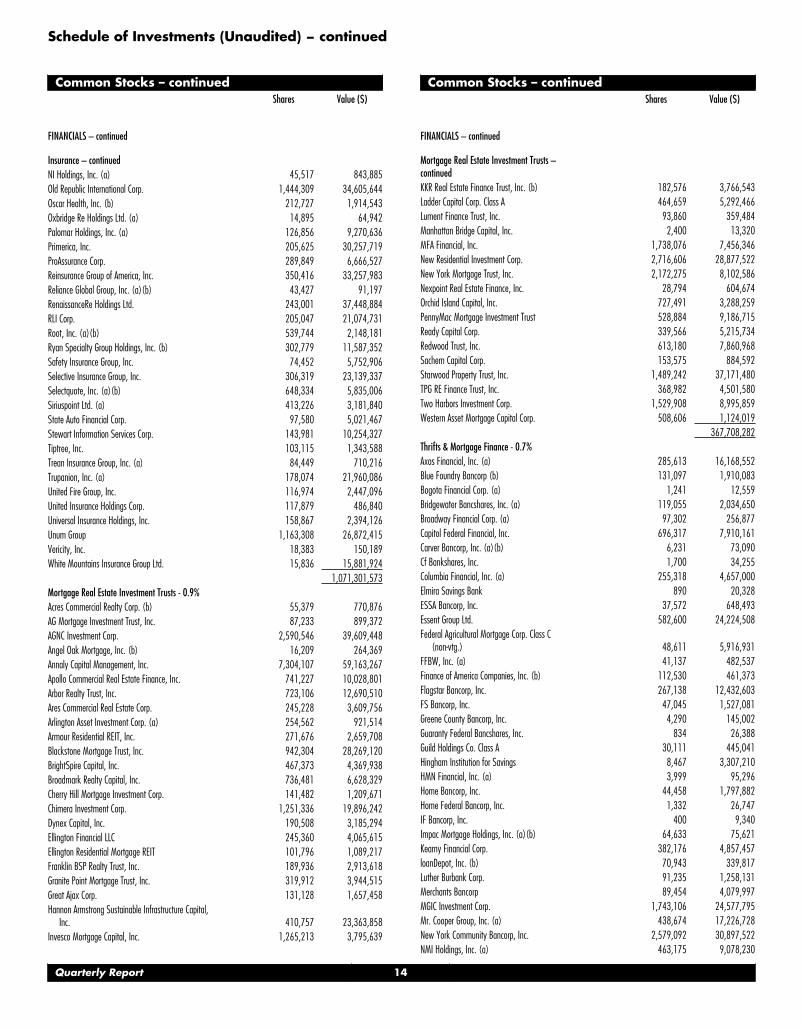
Mortgage Real Estate Investment Trusts - 0.9%
Acres Commercial Realty Corp. (b) 55,379 770,876
AG Mortgage Investment Trust, Inc. 87,233 899,372
AGNC Investment Corp. 2,590,546 39,609,448
Angel Oak Mortgage, Inc. (b) 16,209 264,369
Annaly Capital Management, Inc. 7,304,107 59,163,267
Apollo Commercial Real Estate Finance, Inc. 741,227 10,028,801
Arbor Realty Trust, Inc. 723,106 12,690,510
Ares Commercial Real Estate Corp. 245,228 3,609,756
Arlington Asset Investment Corp. (a) 254,562 921,514
Armour Residential REIT, Inc. 271,676 2,659,708
Blackstone Mortgage Trust, Inc. 942,304 28,269,120
BrightSpire Capital, Inc. 467,373 4,369,938
Broadmark Realty Capital, Inc. 736,481 6,628,329
Cherry Hill Mortgage Investment Corp. 141,482 1,209,671
Chimera Investment Corp. 1,251,336 19,896,242
Dynex Capital, Inc. 190,508 3,185,294
Ellington Financial LLC 245,360 4,065,615
Ellington Residential Mortgage REIT 101,796 1,089,217
Franklin BSP Realty Trust, Inc. 189,936 2,913,618
Granite Point Mortgage Trust, Inc. 319,912 3,944,515
Great Ajax Corp. 131,128 1,657,458
Hannon Armstrong Sustainable Infrastructure Capital,Inc. 410,757 23,363,858
Invesco Mortgage Capital, Inc. 1,265,213 3,795,639
Common Stocks – continuedShares Value ($)
FINANCIALS – continued
Mortgage Real Estate Investment Trusts –continued
KKR Real Estate Finance Trust, Inc. (b) 182,576 3,766,543
Ladder Capital Corp. Class A 464,659 5,292,466
Lument Finance Trust, Inc. 93,860 359,484
Manhattan Bridge Capital, Inc. 2,400 13,320
MFA Financial, Inc. 1,738,076 7,456,346
New Residential Investment Corp. 2,716,606 28,877,522
New York Mortgage Trust, Inc. 2,172,275 8,102,586
Nexpoint Real Estate Finance, Inc. 28,794 604,674
Orchid Island Capital, Inc. 727,491 3,288,259
PennyMac Mortgage Investment Trust 528,884 9,186,715
Ready Capital Corp. 339,566 5,215,734
Redwood Trust, Inc. 613,180 7,860,968
Sachem Capital Corp. 153,575 884,592
Starwood Property Trust, Inc. 1,489,242 37,171,480
TPG RE Finance Trust, Inc. 368,982 4,501,580
Two Harbors Investment Corp. 1,529,908 8,995,859
Western Asset Mortgage Capital Corp. 508,606 1,124,019
367,708,282
Thrifts & Mortgage Finance - 0.7%
Axos Financial, Inc. (a) 285,613 16,168,552
Blue Foundry Bancorp (b) 131,097 1,910,083
Bogota Financial Corp. (a) 1,241 12,559
Bridgewater Bancshares, Inc. (a) 119,055 2,034,650
Broadway Financial Corp. (a) 97,302 256,877
Capitol Federal Financial, Inc. 696,317 7,910,161
Carver Bancorp, Inc. (a)(b) 6,231 73,090
Cf Bankshares, Inc. 1,700 34,255
Columbia Financial, Inc. (a) 255,318 4,657,000
Elmira Savings Bank 890 20,328
ESSA Bancorp, Inc. 37,572 648,493
Essent Group Ltd. 582,600 24,224,508
Federal Agricultural Mortgage Corp. Class C(non-vtg.) 48,611 5,916,931
FFBW, Inc. (a) 41,137 482,537
Finance of America Companies, Inc. (b) 112,530 461,373
Flagstar Bancorp, Inc. 267,138 12,432,603
FS Bancorp, Inc. 47,045 1,527,081
Greene County Bancorp, Inc. 4,290 145,002
Guaranty Federal Bancshares, Inc. 834 26,388
Guild Holdings Co. Class A 30,111 445,041
Hingham Institution for Savings 8,467 3,307,210
HMN Financial, Inc. (a) 3,999 95,296
Home Bancorp, Inc. 44,458 1,797,882
Home Federal Bancorp, Inc. 1,332 26,747
IF Bancorp, Inc. 400 9,340
Impac Mortgage Holdings, Inc. (a)(b) 64,633 75,621
Kearny Financial Corp. 382,176 4,857,457
loanDepot, Inc. (b) 70,943 339,817
Luther Burbank Corp. 91,235 1,258,131
Merchants Bancorp 89,454 4,079,997
MGIC Investment Corp. 1,743,106 24,577,795
Mr. Cooper Group, Inc. (a) 438,674 17,226,728
New York Community Bancorp, Inc. 2,579,092 30,897,522
NMI Holdings, Inc. (a) 463,175 9,078,230
Quarterly Report 14
Common Stocks – continuedShares Value ($)
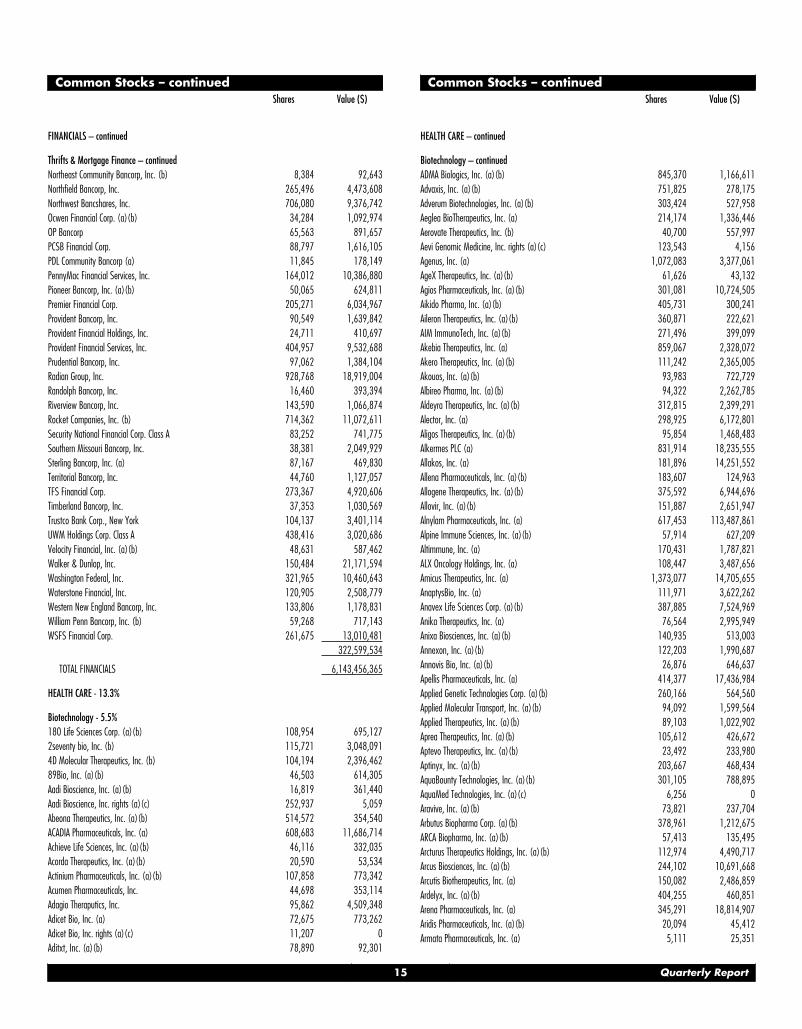
FINANCIALS – continued
Thrifts & Mortgage Finance – continued
Northeast Community Bancorp, Inc. (b) 8,384 92,643
Northfield Bancorp, Inc. 265,496 4,473,608
Northwest Bancshares, Inc. 706,080 9,376,742
Ocwen Financial Corp. (a)(b) 34,284 1,092,974
OP Bancorp 65,563 891,657
PCSB Financial Corp. 88,797 1,616,105
PDL Community Bancorp (a) 11,845 178,149
PennyMac Financial Services, Inc. 164,012 10,386,880
Pioneer Bancorp, Inc. (a)(b) 50,065 624,811
Premier Financial Corp. 205,271 6,034,967
Provident Bancorp, Inc. 90,549 1,639,842
Provident Financial Holdings, Inc. 24,711 410,697
Provident Financial Services, Inc. 404,957 9,532,688
Prudential Bancorp, Inc. 97,062 1,384,104
Radian Group, Inc. 928,768 18,919,004
Randolph Bancorp, Inc. 16,460 393,394
Riverview Bancorp, Inc. 143,590 1,066,874
Rocket Companies, Inc. (b) 714,362 11,072,611
Security National Financial Corp. Class A 83,252 741,775
Southern Missouri Bancorp, Inc. 38,381 2,049,929
Sterling Bancorp, Inc. (a) 87,167 469,830
Territorial Bancorp, Inc. 44,760 1,127,057
TFS Financial Corp. 273,367 4,920,606
Timberland Bancorp, Inc. 37,353 1,030,569
Trustco Bank Corp., New York 104,137 3,401,114
UWM Holdings Corp. Class A 438,416 3,020,686
Velocity Financial, Inc. (a)(b) 48,631 587,462
Walker & Dunlop, Inc. 150,484 21,171,594
Washington Federal, Inc. 321,965 10,460,643
Waterstone Financial, Inc. 120,905 2,508,779
Western New England Bancorp, Inc. 133,806 1,178,831
William Penn Bancorp, Inc. (b) 59,268 717,143
WSFS Financial Corp. 261,675 13,010,481
322,599,534
TOTAL FINANCIALS 6,143,456,365
HEALTH CARE - 13.3%
Biotechnology - 5.5%
180 Life Sciences Corp. (a)(b) 108,954 695,127
2seventy bio, Inc. (b) 115,721 3,048,091
4D Molecular Therapeutics, Inc. (b) 104,194 2,396,462
89Bio, Inc. (a)(b) 46,503 614,305
Aadi Bioscience, Inc. (a)(b) 16,819 361,440
Aadi Bioscience, Inc. rights (a)(c) 252,937 5,059
Abeona Therapeutics, Inc. (a)(b) 514,572 354,540
ACADIA Pharmaceuticals, Inc. (a) 608,683 11,686,714
Achieve Life Sciences, Inc. (a)(b) 46,116 332,035
Acorda Therapeutics, Inc. (a)(b) 20,590 53,534
Actinium Pharmaceuticals, Inc. (a)(b) 107,858 773,342
Acumen Pharmaceuticals, Inc. 44,698 353,114
Adagio Theraputics, Inc. 95,862 4,509,348
Adicet Bio, Inc. (a) 72,675 773,262
Adicet Bio, Inc. rights (a)(c) 11,207 0
Aditxt, Inc. (a)(b) 78,890 92,301
Common Stocks – continuedShares Value ($)
HEALTH CARE – continued
Biotechnology – continued
ADMA Biologics, Inc. (a)(b) 845,370 1,166,611
Advaxis, Inc. (a)(b) 751,825 278,175
Adverum Biotechnologies, Inc. (a)(b) 303,424 527,958
Aeglea BioTherapeutics, Inc. (a) 214,174 1,336,446
Aerovate Therapeutics, Inc. (b) 40,700 557,997
Aevi Genomic Medicine, Inc. rights (a)(c) 123,543 4,156
Agenus, Inc. (a) 1,072,083 3,377,061
AgeX Therapeutics, Inc. (a)(b) 61,626 43,132
Agios Pharmaceuticals, Inc. (a)(b) 301,081 10,724,505
Aikido Pharma, Inc. (a)(b) 405,731 300,241
Aileron Therapeutics, Inc. (a)(b) 360,871 222,621
AIM ImmunoTech, Inc. (a)(b) 271,496 399,099
Akebia Therapeutics, Inc. (a) 859,067 2,328,072
Akero Therapeutics, Inc. (a)(b) 111,242 2,365,005
Akouos, Inc. (a)(b) 93,983 722,729
Albireo Pharma, Inc. (a)(b) 94,322 2,262,785
Aldeyra Therapeutics, Inc. (a)(b) 312,815 2,399,291
Alector, Inc. (a) 298,925 6,172,801
Aligos Therapeutics, Inc. (a)(b) 95,854 1,468,483
Alkermes PLC (a) 831,914 18,235,555
Allakos, Inc. (a) 181,896 14,251,552
Allena Pharmaceuticals, Inc. (a)(b) 183,607 124,963
Allogene Therapeutics, Inc. (a)(b) 375,592 6,944,696
Allovir, Inc. (a)(b) 151,887 2,651,947
Alnylam Pharmaceuticals, Inc. (a) 617,453 113,487,861
Alpine Immune Sciences, Inc. (a)(b) 57,914 627,209
Altimmune, Inc. (a) 170,431 1,787,821
ALX Oncology Holdings, Inc. (a) 108,447 3,487,656
Amicus Therapeutics, Inc. (a) 1,373,077 14,705,655
AnaptysBio, Inc. (a) 111,971 3,622,262
Anavex Life Sciences Corp. (a)(b) 387,885 7,524,969
Anika Therapeutics, Inc. (a) 76,564 2,995,949
Anixa Biosciences, Inc. (a)(b) 140,935 513,003
Annexon, Inc. (a)(b) 122,203 1,990,687
Annovis Bio, Inc. (a)(b) 26,876 646,637
Apellis Pharmaceuticals, Inc. (a) 414,377 17,436,984
Applied Genetic Technologies Corp. (a)(b) 260,166 564,560
Applied Molecular Transport, Inc. (a)(b) 94,092 1,599,564
Applied Therapeutics, Inc. (a)(b) 89,103 1,022,902
Aprea Therapeutics, Inc. (a)(b) 105,612 426,672
Aptevo Therapeutics, Inc. (a)(b) 23,492 233,980
Aptinyx, Inc. (a)(b) 203,667 468,434
AquaBounty Technologies, Inc. (a)(b) 301,105 788,895
AquaMed Technologies, Inc. (a)(c) 6,256 0
Aravive, Inc. (a)(b) 73,821 237,704
Arbutus Biopharma Corp. (a)(b) 378,961 1,212,675
ARCA Biopharma, Inc. (a)(b) 57,413 135,495
Arcturus Therapeutics Holdings, Inc. (a)(b) 112,974 4,490,717
Arcus Biosciences, Inc. (a)(b) 244,102 10,691,668
Arcutis Biotherapeutics, Inc. (a) 150,082 2,486,859
Ardelyx, Inc. (a)(b) 404,255 460,851
Arena Pharmaceuticals, Inc. (a) 345,291 18,814,907
Aridis Pharmaceuticals, Inc. (a)(b) 20,094 45,412
Armata Pharmaceuticals, Inc. (a) 5,111 25,351
15 Quarterly Report

Schedule of Investments (Unaudited) − continued
Common Stocks – continuedShares Value ($)
HEALTH CARE – continued
Biotechnology – continued
Arrowhead Pharmaceuticals, Inc. (a) 543,348 38,061,527
Assembly Biosciences, Inc. (a) 222,867 512,594
Astria Therapeutics, Inc. (a) 23,579 149,962
Atara Biotherapeutics, Inc. (a) 431,086 7,712,129
Athenex, Inc. (a) 307,818 544,838
Athersys, Inc. (a)(b) 1,025,884 1,087,437
Atossa Therapeutics, Inc. (a) 642,311 1,458,046
Atreca, Inc. (a)(b) 177,277 636,424
aTyr Pharma, Inc. (a)(b) 79,622 664,047
Avalo Therapeutics, Inc. (a) 494,950 989,900
AVEO Pharmaceuticals, Inc. (a) 154,456 971,528
Avid Bioservices, Inc. (a) 314,045 9,597,215
Avidity Biosciences, Inc. (a)(b) 219,126 4,893,084
Avita Medical, Inc. (a) 133,907 1,842,560
AVROBIO, Inc. (a) 182,965 702,586
Axcella Health, Inc. (a) 91,601 267,475
Beam Therapeutics, Inc. (a) 228,404 18,078,177
Bellicum Pharmaceuticals, Inc. (a)(b) 37,817 65,802
Benitec Biopharma, Inc. (a)(b) 30,435 93,131
Bio Path Holdings, Inc. (a)(b) 36,941 163,649
BioAtla, Inc. 77,472 1,956,168
BioCardia, Inc. (a)(b) 58,751 120,440
Biocept, Inc. (a)(b) 91,479 361,342
BioCryst Pharmaceuticals, Inc. (a)(b) 922,021 11,119,573
Biohaven Pharmaceutical Holding Co. Ltd. (a) 299,507 33,616,666
BioMarin Pharmaceutical, Inc. (a) 952,477 82,189,240
Biomea Fusion, Inc. (b) 48,283 582,776
BioVie, Inc. (a)(b) 19,167 123,435
BioXcel Therapeutics, Inc. (a)(b) 92,521 2,121,507
Black Diamond Therapeutics, Inc. (a)(b) 106,861 641,166
bluebird bio, Inc. (a)(b) 340,128 3,438,694
Blueprint Medicines Corp. (a) 303,581 29,204,492
Bolt Biotherapeutics, Inc. (b) 62,778 581,952
BrainStorm Cell Therpeutic, Inc. (a)(b) 154,284 586,279
Brickell Biotech, Inc. (a)(b) 320,620 98,751
BridgeBio Pharma, Inc. (a)(b) 609,059 24,666,890
Brooklyn ImmunoTherapeutics, Inc. (a) 138,499 824,069
C4 Therapeutics, Inc. (a) 188,149 6,984,091
Cabaletta Bio, Inc. (a)(b) 73,200 847,656
Calithera Biosciences, Inc. (a)(b) 336,637 278,601
Calyxt, Inc. (a) 80,427 231,630
Candel Therapeutics, Inc. 27,881 288,847
Capricor Therapeutics, Inc. (a)(b) 118,032 397,768
Cardiff Oncology, Inc. (a)(b) 212,750 1,195,655
CareDx, Inc. (a) 273,989 11,819,885
Caribou Biosciences, Inc. 94,745 1,761,310
CASI Pharmaceuticals, Inc. (a)(b) 600,085 537,676
Catalyst Biosciences, Inc. (a) 165,920 199,104
Catalyst Pharmaceutical Partners, Inc. (a)(b) 541,983 3,793,881
Cel-Sci Corp. (a) 216,622 2,224,708
Celcuity, Inc. (a) 45,905 693,166
Celldex Therapeutics, Inc. (a) 238,705 9,094,661
Cellectar Biosciences, Inc. (a) 258,817 178,843
Celsion Corp. (a) 449,817 345,999
Common Stocks – continuedShares Value ($)
HEALTH CARE – continued
Biotechnology – continued
Century Therapeutics, Inc. 54,322 1,038,093
Cerevel Therapeutics Holdings (a)(b) 287,479 8,966,470
Checkmate Pharmaceuticals, Inc. (a)(b) 26,456 96,564
Checkpoint Therapeutics, Inc. (a)(b) 319,185 944,788
ChemoCentryx, Inc. (a) 252,084 9,145,608
Chimerix, Inc. (a) 354,737 2,231,296
Chinook Therapeutics, Inc. (a) 191,620 3,067,836
Chinook Therapeutics, Inc. rights (a)(c) 51,768 2,588
Cidara Therapeutics, Inc. (a) 227,193 338,518
Clene, Inc. (b) 108,937 619,852
Clovis Oncology, Inc. (a)(b) 570,212 1,801,870
Codiak Biosciences, Inc. (a) 63,694 812,099
Cogent Biosciences, Inc. (a) 172,931 1,369,614
Cogent Biosciences, Inc. rights (a)(c) 43,783 0
CohBar, Inc. (a) 239,476 117,224
Coherus BioSciences, Inc. (a)(b) 357,229 6,633,743
Concert Pharmaceuticals, Inc. (a) 154,004 520,534
ContraFect Corp. (a)(b) 167,939 572,672
Corbus Pharmaceuticals Holdings, Inc. (a)(b) 574,488 496,070
Cortexyme, Inc. (a)(b) 85,538 1,112,849
Corvus Pharmaceuticals, Inc. (a)(b) 161,516 550,770
Crinetics Pharmaceuticals, Inc. (a) 189,115 5,166,622
CTI BioPharma Corp. (a)(b) 389,239 875,788
Cue Biopharma, Inc. (a) 161,783 1,983,460
Cullinan Oncology, Inc. 124,086 2,233,548
Curis, Inc. (a) 426,845 2,083,004
Cyclacel Pharmaceuticals, Inc. (a)(b) 39,067 139,860
Cyclerion Therapeutics, Inc. (a)(b) 203,578 443,800
Cyclo Therapeutics, Inc. (a)(b) 28,742 154,919
Cytokinetics, Inc. (a)(b) 432,623 17,019,389
CytomX Therapeutics, Inc. (a) 378,260 2,500,299
Day One Biopharmaceuticals, Inc. (b) 52,590 966,078
Decibel Therapeutics, Inc. 40,457 279,153
Deciphera Pharmaceuticals, Inc. (a) 221,958 1,915,498
Denali Therapeutics, Inc. (a) 483,533 22,368,237
DermTech, Inc. (a)(b) 129,659 2,603,553
Design Therapeutics, Inc. (b) 65,752 1,100,688
DiaMedica Therapeutics, Inc. (a) 85,553 319,968
Dicerna Pharmaceuticals, Inc. (a) 363,391 13,812,492
Diffusion Pharmaceuticals, Inc. (a) 512,505 189,678
Dyadic International, Inc. (a)(b) 103,619 389,607
Dynavax Technologies Corp. (a)(b) 550,460 8,889,929
Dyne Therapeutics, Inc. (a) 119,888 1,703,608
Eagle Pharmaceuticals, Inc. (a)(b) 66,536 3,172,436
Edesa Biotech, Inc. (a)(b) 41,312 261,092
Editas Medicine, Inc. (a)(b) 354,997 11,594,202
Eiger Biopharmaceuticals, Inc. (a)(b) 179,779 1,105,641
Eledon Pharmaceuticals, Inc. (a) 76,769 375,400
Elevation Oncology, Inc. (b) 4,419 28,679
Eliem Therapeutics, Inc. 30,664 441,255
Emergent BioSolutions, Inc. (a) 246,689 10,883,919
Enanta Pharmaceuticals, Inc. (a) 95,924 8,468,171
Enochian Biosciences, Inc. (a)(b) 128,084 1,607,454
Ensysce Biosciences, Inc. (a)(b) 34,965 55,245
Quarterly Report 16

Common Stocks – continuedShares Value ($)
HEALTH CARE – continued
Biotechnology – continued
Entasis Therapeutics Holdings, Inc. (a)(b) 54,620 140,920
Epizyme, Inc. (a)(b) 511,716 1,673,311
Equillium, Inc. (a)(b) 91,304 472,955
Erasca, Inc. (b) 90,836 1,287,146
Evelo Biosciences, Inc. (a)(b) 140,692 1,212,765
Exact Sciences Corp. (a) 894,474 76,361,245
Exagen, Inc. (a) 40,756 418,972
Exelixis, Inc. (a) 1,637,096 27,486,842
Exicure, Inc. (a)(b) 384,807 180,436
F-star Therapeutics, Inc. (a) 86,276 443,459
F-star Therapeutics, Inc.:
rights (a)(c) 13,735 0
rights (a)(c) 13,735 0
Fate Therapeutics, Inc. (a) 422,501 23,241,780
FibroGen, Inc. (a) 438,686 5,487,962
Finch Therapeutics Group, Inc. 44,852 745,440
First Wave BioPharma, Inc. (a)(b) 64,377 131,973
Foghorn Therapeutics, Inc. (a) 56,424 652,826
Forma Therapeutics Holdings, Inc. (a) 152,407 2,208,377
Forte Biosciences, Inc. (a)(b) 62,357 165,870
Fortress Biotech, Inc. (a)(b) 373,542 1,064,595
Frequency Therapeutics, Inc. (a)(b) 191,462 976,456
G1 Therapeutics, Inc. (a)(b) 178,295 2,300,006
Gain Therapeutics, Inc. 1,919 13,894
Galectin Therapeutics, Inc. (a) 311,942 820,407
Galecto, Inc. (a) 62,685 176,772
Galera Therapeutics, Inc. (a)(b) 45,301 59,797
Gemini Therapeutics, Inc. (a)(b) 156,348 431,520
Generation Bio Co. (a)(b) 225,837 3,877,621
Genocea Biosciences, Inc. (a)(b) 119,508 161,336
Genprex, Inc. (a) 220,591 319,857
GeoVax Labs, Inc. (a)(b) 32,008 132,193
Geron Corp. (a) 1,856,595 2,747,761
Global Blood Therapeutics, Inc. (a) 300,765 8,499,619
GlycoMimetics, Inc. (a) 217,773 368,036
Gossamer Bio, Inc. (a)(b) 245,252 2,658,532
Graphite Bio, Inc. (b) 68,029 613,622
Greenwich Lifesciences, Inc. (a)(b) 17,787 559,045
Gritstone Bio, Inc. (a) 197,423 2,605,984
Gt Biopharma, Inc. (a) 95,565 388,950
Halozyme Therapeutics, Inc. (a) 740,630 24,351,914
Harpoon Therapeutics, Inc. (a)(b) 116,720 716,661
HCW Biologics, Inc. 5,881 16,878
Heat Biologics, Inc. (a)(b) 159,438 715,877
Heron Therapeutics, Inc. (a)(b) 511,402 4,832,749
Histogen, Inc. (a)(b) 140,516 67,448
Homology Medicines, Inc. (a)(b) 225,315 1,137,841
Hookipa Pharma, Inc. (a)(b) 111,658 360,655
Horizon Therapeutics PLC (a) 1,172,780 121,687,653
Humanigen, Inc. (a)(b) 259,024 1,569,685
iBio, Inc. (a) 1,211,627 902,662
Icosavax, Inc. 62,742 1,327,621
Ideaya Biosciences, Inc. (a) 166,665 3,666,630
Idera Pharmaceuticals, Inc. (a) 227,943 148,391
Common Stocks – continuedShares Value ($)
HEALTH CARE – continued
Biotechnology – continued
IGM Biosciences, Inc. (a)(b) 41,450 2,069,184
Imago BioSciences, Inc. (b) 45,428 1,016,224
Immucell Corp. (a) 13,082 117,869
Immuneering Corp. (b) 36,327 822,080
Immunic, Inc. (a) 83,517 712,400
ImmunityBio, Inc. (a)(b) 351,378 2,737,235
ImmunoGen, Inc. (a) 928,889 5,731,245
Immunome, Inc. (a)(b) 47,398 898,192
Immunovant, Inc. (a)(b) 215,678 1,660,721
Impel Neuropharma, Inc. (b) 25,203 232,876
In8bio, Inc. (b) 1,413 8,280
Infinity Pharmaceuticals, Inc. (a)(b) 411,900 893,823
Inhibikase Therapeutics, Inc. (b) 24,696 49,392
Inhibrx, Inc. (a)(b) 104,427 4,221,984
Inmune Bio, Inc. (a) 59,884 769,509
Inovio Pharmaceuticals, Inc. (a)(b) 1,101,760 7,976,742
Inozyme Pharma, Inc. (a) 38,383 304,761
Insmed, Inc. (a) 605,396 16,660,498
Instil Bio, Inc. (b) 91,245 2,005,565
Intellia Therapeutics, Inc. (a) 355,474 40,883,065
Intercept Pharmaceuticals, Inc. (a)(b) 152,576 2,625,833
Invitae Corp. (a)(b) 1,035,367 17,601,239
Ionis Pharmaceuticals, Inc. (a) 726,995 19,265,368
Iovance Biotherapeutics, Inc. (a) 723,689 13,547,458
Ironwood Pharmaceuticals, Inc. Class A (a)(b) 866,456 9,608,997
IsoRay, Inc. (a) 730,014 329,236
iTeos Therapeutics, Inc. (a) 103,875 3,666,788
Iveric Bio, Inc. (a) 542,408 7,930,005
Janux Therapeutics, Inc. (b) 61,617 1,095,550
Jounce Therapeutics, Inc. (a) 149,370 1,145,668
Kalvista Pharmaceuticals, Inc. (a) 103,205 1,496,473
Karuna Therapeutics, Inc. (a) 113,290 14,489,791
Karyopharm Therapeutics, Inc. (a)(b) 338,760 2,354,382
Keros Therapeutics, Inc. (a) 73,801 4,117,358
Kezar Life Sciences, Inc. (a) 199,134 2,759,997
Kiniksa Pharmaceuticals Ltd. (a)(b) 135,136 1,570,280
Kinnate Biopharma, Inc. (b) 81,214 1,622,656
Kintara Therapeutics, Inc. (a)(b) 155,912 109,138
Kiromic BioPharma, Inc. (a)(b) 4,300 11,481
Kodiak Sciences, Inc. (a)(b) 175,181 16,088,623
Kronos Bio, Inc. (a)(b) 199,618 2,357,489
Krystal Biotech, Inc. (a) 92,964 7,488,250
Kura Oncology, Inc. (a)(b) 361,520 5,046,819
Kymera Therapeutics, Inc. (a) 184,183 10,225,840
La Jolla Pharmaceutical Co./California (a)(b) 115,205 449,300
Lantern Pharma, Inc. (a)(b) 33,132 279,634
Larimar Therapeutics, Inc. (a)(b) 67,134 616,961
Leap Therapeutics, Inc. (a)(b) 240,107 626,679
Lexicon Pharmaceuticals, Inc. (a)(b) 369,288 1,691,339
Ligand Pharmaceuticals, Inc.:
Class B (a)(b) 87,296 14,134,968
General CVR (a)(c) 26,087 211
Glucagon CVR (a) 26,087 180
rights (a) 26,087 185
17 Quarterly Report
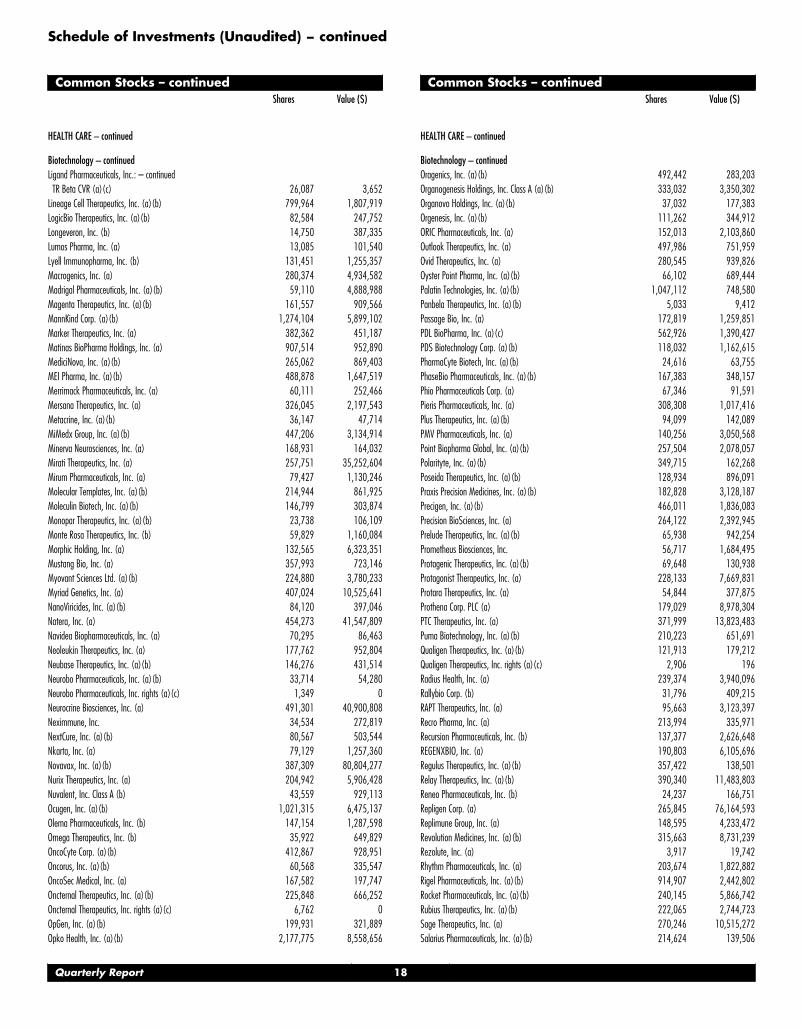
Schedule of Investments (Unaudited) − continued
Common Stocks – continuedShares Value ($)
HEALTH CARE – continued
Biotechnology – continued
Ligand Pharmaceuticals, Inc.: – continued
TR Beta CVR (a)(c) 26,087 3,652
Lineage Cell Therapeutics, Inc. (a)(b) 799,964 1,807,919
LogicBio Therapeutics, Inc. (a)(b) 82,584 247,752
Longeveron, Inc. (b) 14,750 387,335
Lumos Pharma, Inc. (a) 13,085 101,540
Lyell Immunopharma, Inc. (b) 131,451 1,255,357
Macrogenics, Inc. (a) 280,374 4,934,582
Madrigal Pharmaceuticals, Inc. (a)(b) 59,110 4,888,988
Magenta Therapeutics, Inc. (a)(b) 161,557 909,566
MannKind Corp. (a)(b) 1,274,104 5,899,102
Marker Therapeutics, Inc. (a) 382,362 451,187
Matinas BioPharma Holdings, Inc. (a) 907,514 952,890
MediciNova, Inc. (a)(b) 265,062 869,403
MEI Pharma, Inc. (a)(b) 488,878 1,647,519
Merrimack Pharmaceuticals, Inc. (a) 60,111 252,466
Mersana Therapeutics, Inc. (a) 326,045 2,197,543
Metacrine, Inc. (a)(b) 36,147 47,714
MiMedx Group, Inc. (a)(b) 447,206 3,134,914
Minerva Neurosciences, Inc. (a) 168,931 164,032
Mirati Therapeutics, Inc. (a) 257,751 35,252,604
Mirum Pharmaceuticals, Inc. (a) 79,427 1,130,246
Molecular Templates, Inc. (a)(b) 214,944 861,925
Moleculin Biotech, Inc. (a)(b) 146,799 303,874
Monopar Therapeutics, Inc. (a)(b) 23,738 106,109
Monte Rosa Therapeutics, Inc. (b) 59,829 1,160,084
Morphic Holding, Inc. (a) 132,565 6,323,351
Mustang Bio, Inc. (a) 357,993 723,146
Myovant Sciences Ltd. (a)(b) 224,880 3,780,233
Myriad Genetics, Inc. (a) 407,024 10,525,641
NanoViricides, Inc. (a)(b) 84,120 397,046
Natera, Inc. (a) 454,273 41,547,809
Navidea Biopharmaceuticals, Inc. (a) 70,295 86,463
Neoleukin Therapeutics, Inc. (a) 177,762 952,804
Neubase Therapeutics, Inc. (a)(b) 146,276 431,514
Neurobo Pharmaceuticals, Inc. (a)(b) 33,714 54,280
Neurobo Pharmaceuticals, Inc. rights (a)(c) 1,349 0
Neurocrine Biosciences, Inc. (a) 491,301 40,900,808
Neximmune, Inc. 34,534 272,819
NextCure, Inc. (a)(b) 80,567 503,544
Nkarta, Inc. (a) 79,129 1,257,360
Novavax, Inc. (a)(b) 387,309 80,804,277
Nurix Therapeutics, Inc. (a) 204,942 5,906,428
Nuvalent, Inc. Class A (b) 43,559 929,113
Ocugen, Inc. (a)(b) 1,021,315 6,475,137
Olema Pharmaceuticals, Inc. (b) 147,154 1,287,598
Omega Therapeutics, Inc. (b) 35,922 649,829
OncoCyte Corp. (a)(b) 412,867 928,951
Oncorus, Inc. (a)(b) 60,568 335,547
OncoSec Medical, Inc. (a) 167,582 197,747
Oncternal Therapeutics, Inc. (a)(b) 225,848 666,252
Oncternal Therapeutics, Inc. rights (a)(c) 6,762 0
OpGen, Inc. (a)(b) 199,931 321,889
Opko Health, Inc. (a)(b) 2,177,775 8,558,656
Common Stocks – continuedShares Value ($)
HEALTH CARE – continued
Biotechnology – continued
Oragenics, Inc. (a)(b) 492,442 283,203
Organogenesis Holdings, Inc. Class A (a)(b) 333,032 3,350,302
Organovo Holdings, Inc. (a)(b) 37,032 177,383
Orgenesis, Inc. (a)(b) 111,262 344,912
ORIC Pharmaceuticals, Inc. (a) 152,013 2,103,860
Outlook Therapeutics, Inc. (a) 497,986 751,959
Ovid Therapeutics, Inc. (a) 280,545 939,826
Oyster Point Pharma, Inc. (a)(b) 66,102 689,444
Palatin Technologies, Inc. (a)(b) 1,047,112 748,580
Panbela Therapeutics, Inc. (a)(b) 5,033 9,412
Passage Bio, Inc. (a) 172,819 1,259,851
PDL BioPharma, Inc. (a)(c) 562,926 1,390,427
PDS Biotechnology Corp. (a)(b) 118,032 1,162,615
PharmaCyte Biotech, Inc. (a)(b) 24,616 63,755
PhaseBio Pharmaceuticals, Inc. (a)(b) 167,383 348,157
Phio Pharmaceuticals Corp. (a) 67,346 91,591
Pieris Pharmaceuticals, Inc. (a) 308,308 1,017,416
Plus Therapeutics, Inc. (a)(b) 94,099 142,089
PMV Pharmaceuticals, Inc. (a) 140,256 3,050,568
Point Biopharma Global, Inc. (a)(b) 257,504 2,078,057
Polarityte, Inc. (a)(b) 349,715 162,268
Poseida Therapeutics, Inc. (a)(b) 128,934 896,091
Praxis Precision Medicines, Inc. (a)(b) 182,828 3,128,187
Precigen, Inc. (a)(b) 466,011 1,836,083
Precision BioSciences, Inc. (a) 264,122 2,392,945
Prelude Therapeutics, Inc. (a)(b) 65,938 942,254
Prometheus Biosciences, Inc. 56,717 1,684,495
Protagenic Therapeutics, Inc. (a)(b) 69,648 130,938
Protagonist Therapeutics, Inc. (a) 228,133 7,669,831
Protara Therapeutics, Inc. (a) 54,844 377,875
Prothena Corp. PLC (a) 179,029 8,978,304
PTC Therapeutics, Inc. (a) 371,999 13,823,483
Puma Biotechnology, Inc. (a)(b) 210,223 651,691
Qualigen Therapeutics, Inc. (a)(b) 121,913 179,212
Qualigen Therapeutics, Inc. rights (a)(c) 2,906 196
Radius Health, Inc. (a) 239,374 3,940,096
Rallybio Corp. (b) 31,796 409,215
RAPT Therapeutics, Inc. (a) 95,663 3,123,397
Recro Pharma, Inc. (a) 213,994 335,971
Recursion Pharmaceuticals, Inc. (b) 137,377 2,626,648
REGENXBIO, Inc. (a) 190,803 6,105,696
Regulus Therapeutics, Inc. (a)(b) 357,422 138,501
Relay Therapeutics, Inc. (a)(b) 390,340 11,483,803
Reneo Pharmaceuticals, Inc. (b) 24,237 166,751
Repligen Corp. (a) 265,845 76,164,593
Replimune Group, Inc. (a) 148,595 4,233,472
Revolution Medicines, Inc. (a)(b) 315,663 8,731,239
Rezolute, Inc. (a) 3,917 19,742
Rhythm Pharmaceuticals, Inc. (a) 203,674 1,822,882
Rigel Pharmaceuticals, Inc. (a)(b) 914,907 2,442,802
Rocket Pharmaceuticals, Inc. (a)(b) 240,145 5,866,742
Rubius Therapeutics, Inc. (a)(b) 222,065 2,744,723
Sage Therapeutics, Inc. (a) 270,246 10,515,272
Salarius Pharmaceuticals, Inc. (a)(b) 214,624 139,506
Quarterly Report 18
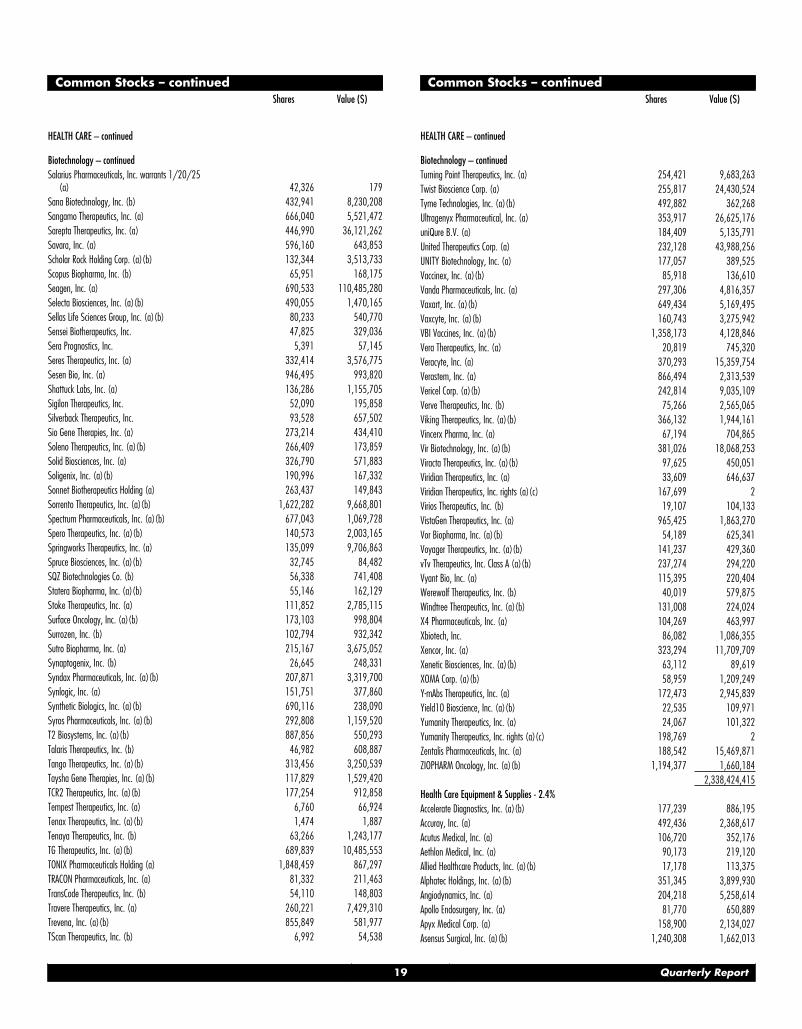
Common Stocks – continuedShares Value ($)
HEALTH CARE – continued
Biotechnology – continued
Salarius Pharmaceuticals, Inc. warrants 1/20/25(a) 42,326 179
Sana Biotechnology, Inc. (b) 432,941 8,230,208
Sangamo Therapeutics, Inc. (a) 666,040 5,521,472
Sarepta Therapeutics, Inc. (a) 446,990 36,121,262
Savara, Inc. (a) 596,160 643,853
Scholar Rock Holding Corp. (a)(b) 132,344 3,513,733
Scopus Biopharma, Inc. (b) 65,951 168,175
Seagen, Inc. (a) 690,533 110,485,280
Selecta Biosciences, Inc. (a)(b) 490,055 1,470,165
Sellas Life Sciences Group, Inc. (a)(b) 80,233 540,770
Sensei Biotherapeutics, Inc. 47,825 329,036
Sera Prognostics, Inc. 5,391 57,145
Seres Therapeutics, Inc. (a) 332,414 3,576,775
Sesen Bio, Inc. (a) 946,495 993,820
Shattuck Labs, Inc. (a) 136,286 1,155,705
Sigilon Therapeutics, Inc. 52,090 195,858
Silverback Therapeutics, Inc. 93,528 657,502
Sio Gene Therapies, Inc. (a) 273,214 434,410
Soleno Therapeutics, Inc. (a)(b) 266,409 173,859
Solid Biosciences, Inc. (a) 326,790 571,883
Soligenix, Inc. (a)(b) 190,996 167,332
Sonnet Biotherapeutics Holding (a) 263,437 149,843
Sorrento Therapeutics, Inc. (a)(b) 1,622,282 9,668,801
Spectrum Pharmaceuticals, Inc. (a)(b) 677,043 1,069,728
Spero Therapeutics, Inc. (a)(b) 140,573 2,003,165
Springworks Therapeutics, Inc. (a) 135,099 9,706,863
Spruce Biosciences, Inc. (a)(b) 32,745 84,482
SQZ Biotechnologies Co. (b) 56,338 741,408
Statera Biopharma, Inc. (a)(b) 55,146 162,129
Stoke Therapeutics, Inc. (a) 111,852 2,785,115
Surface Oncology, Inc. (a)(b) 173,103 998,804
Surrozen, Inc. (b) 102,794 932,342
Sutro Biopharma, Inc. (a) 215,167 3,675,052
Synaptogenix, Inc. (b) 26,645 248,331
Syndax Pharmaceuticals, Inc. (a)(b) 207,871 3,319,700
Synlogic, Inc. (a) 151,751 377,860
Synthetic Biologics, Inc. (a)(b) 690,116 238,090
Syros Pharmaceuticals, Inc. (a)(b) 292,808 1,159,520
T2 Biosystems, Inc. (a)(b) 887,856 550,293
Talaris Therapeutics, Inc. (b) 46,982 608,887
Tango Therapeutics, Inc. (a)(b) 313,456 3,250,539
Taysha Gene Therapies, Inc. (a)(b) 117,829 1,529,420
TCR2 Therapeutics, Inc. (a)(b) 177,254 912,858
Tempest Therapeutics, Inc. (a) 6,760 66,924
Tenax Therapeutics, Inc. (a)(b) 1,474 1,887
Tenaya Therapeutics, Inc. (b) 63,266 1,243,177
TG Therapeutics, Inc. (a)(b) 689,839 10,485,553
TONIX Pharmaceuticals Holding (a) 1,848,459 867,297
TRACON Pharmaceuticals, Inc. (a) 81,332 211,463
TransCode Therapeutics, Inc. (b) 54,110 148,803
Travere Therapeutics, Inc. (a) 260,221 7,429,310
Trevena, Inc. (a)(b) 855,849 581,977
TScan Therapeutics, Inc. (b) 6,992 54,538
Common Stocks – continuedShares Value ($)
HEALTH CARE – continued
Biotechnology – continued
Turning Point Therapeutics, Inc. (a) 254,421 9,683,263
Twist Bioscience Corp. (a) 255,817 24,430,524
Tyme Technologies, Inc. (a)(b) 492,882 362,268
Ultragenyx Pharmaceutical, Inc. (a) 353,917 26,625,176
uniQure B.V. (a) 184,409 5,135,791
United Therapeutics Corp. (a) 232,128 43,988,256
UNITY Biotechnology, Inc. (a) 177,057 389,525
Vaccinex, Inc. (a)(b) 85,918 136,610
Vanda Pharmaceuticals, Inc. (a) 297,306 4,816,357
Vaxart, Inc. (a)(b) 649,434 5,169,495
Vaxcyte, Inc. (a)(b) 160,743 3,275,942
VBI Vaccines, Inc. (a)(b) 1,358,173 4,128,846
Vera Therapeutics, Inc. (a) 20,819 745,320
Veracyte, Inc. (a) 370,293 15,359,754
Verastem, Inc. (a) 866,494 2,313,539
Vericel Corp. (a)(b) 242,814 9,035,109
Verve Therapeutics, Inc. (b) 75,266 2,565,065
Viking Therapeutics, Inc. (a)(b) 366,132 1,944,161
Vincerx Pharma, Inc. (a) 67,194 704,865
Vir Biotechnology, Inc. (a)(b) 381,026 18,068,253
Viracta Therapeutics, Inc. (a)(b) 97,625 450,051
Viridian Therapeutics, Inc. (a) 33,609 646,637
Viridian Therapeutics, Inc. rights (a)(c) 167,699 2
Virios Therapeutics, Inc. (b) 19,107 104,133
VistaGen Therapeutics, Inc. (a) 965,425 1,863,270
Vor Biopharma, Inc. (a)(b) 54,189 625,341
Voyager Therapeutics, Inc. (a)(b) 141,237 429,360
vTv Therapeutics, Inc. Class A (a)(b) 237,274 294,220
Vyant Bio, Inc. (a) 115,395 220,404
Werewolf Therapeutics, Inc. (b) 40,019 579,875
Windtree Therapeutics, Inc. (a)(b) 131,008 224,024
X4 Pharmaceuticals, Inc. (a) 104,269 463,997
Xbiotech, Inc. 86,082 1,086,355
Xencor, Inc. (a) 323,294 11,709,709
Xenetic Biosciences, Inc. (a)(b) 63,112 89,619
XOMA Corp. (a)(b) 58,959 1,209,249
Y-mAbs Therapeutics, Inc. (a) 172,473 2,945,839
Yield10 Bioscience, Inc. (a)(b) 22,535 109,971
Yumanity Therapeutics, Inc. (a) 24,067 101,322
Yumanity Therapeutics, Inc. rights (a)(c) 198,769 2
Zentalis Pharmaceuticals, Inc. (a) 188,542 15,469,871
ZIOPHARM Oncology, Inc. (a)(b) 1,194,377 1,660,184
2,338,424,415
Health Care Equipment & Supplies - 2.4%
Accelerate Diagnostics, Inc. (a)(b) 177,239 886,195
Accuray, Inc. (a) 492,436 2,368,617
Acutus Medical, Inc. (a) 106,720 352,176
Aethlon Medical, Inc. (a) 90,173 219,120
Allied Healthcare Products, Inc. (a)(b) 17,178 113,375
Alphatec Holdings, Inc. (a)(b) 351,345 3,899,930
Angiodynamics, Inc. (a) 204,218 5,258,614
Apollo Endosurgery, Inc. (a) 81,770 650,889
Apyx Medical Corp. (a) 158,900 2,134,027
Asensus Surgical, Inc. (a)(b) 1,240,308 1,662,013
19 Quarterly Report
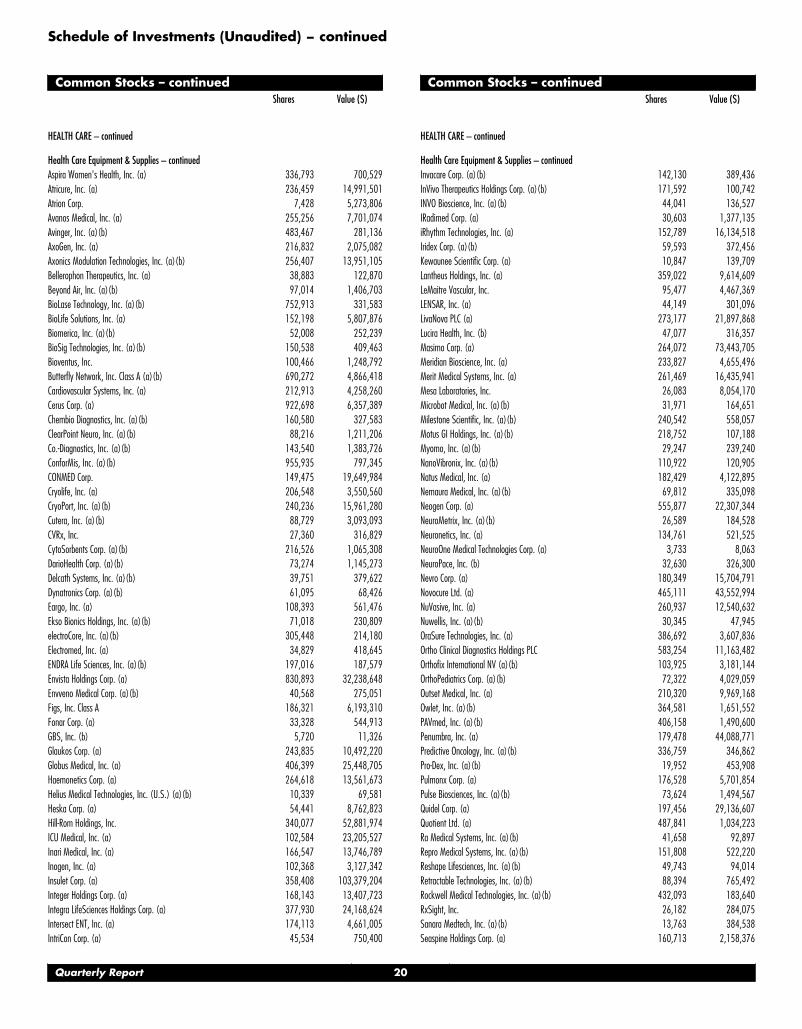
Schedule of Investments (Unaudited) − continued
Common Stocks – continuedShares Value ($)
HEALTH CARE – continued
Health Care Equipment & Supplies – continued
Aspira Women's Health, Inc. (a) 336,793 700,529
Atricure, Inc. (a) 236,459 14,991,501
Atrion Corp. 7,428 5,273,806
Avanos Medical, Inc. (a) 255,256 7,701,074
Avinger, Inc. (a)(b) 483,467 281,136
AxoGen, Inc. (a) 216,832 2,075,082
Axonics Modulation Technologies, Inc. (a)(b) 256,407 13,951,105
Bellerophon Therapeutics, Inc. (a) 38,883 122,870
Beyond Air, Inc. (a)(b) 97,014 1,406,703
BioLase Technology, Inc. (a)(b) 752,913 331,583
BioLife Solutions, Inc. (a) 152,198 5,807,876
Biomerica, Inc. (a)(b) 52,008 252,239
BioSig Technologies, Inc. (a)(b) 150,538 409,463
Bioventus, Inc. 100,466 1,248,792
Butterfly Network, Inc. Class A (a)(b) 690,272 4,866,418
Cardiovascular Systems, Inc. (a) 212,913 4,258,260
Cerus Corp. (a) 922,698 6,357,389
Chembio Diagnostics, Inc. (a)(b) 160,580 327,583
ClearPoint Neuro, Inc. (a)(b) 88,216 1,211,206
Co.-Diagnostics, Inc. (a)(b) 143,540 1,383,726
ConforMis, Inc. (a)(b) 955,935 797,345
CONMED Corp. 149,475 19,649,984
Cryolife, Inc. (a) 206,548 3,550,560
CryoPort, Inc. (a)(b) 240,236 15,961,280
Cutera, Inc. (a)(b) 88,729 3,093,093
CVRx, Inc. 27,360 316,829
CytoSorbents Corp. (a)(b) 216,526 1,065,308
DarioHealth Corp. (a)(b) 73,274 1,145,273
Delcath Systems, Inc. (a)(b) 39,751 379,622
Dynatronics Corp. (a)(b) 61,095 68,426
Eargo, Inc. (a) 108,393 561,476
Ekso Bionics Holdings, Inc. (a)(b) 71,018 230,809
electroCore, Inc. (a)(b) 305,448 214,180
Electromed, Inc. (a) 34,829 418,645
ENDRA Life Sciences, Inc. (a)(b) 197,016 187,579
Envista Holdings Corp. (a) 830,893 32,238,648
Envveno Medical Corp. (a)(b) 40,568 275,051
Figs, Inc. Class A 186,321 6,193,310
Fonar Corp. (a) 33,328 544,913
GBS, Inc. (b) 5,720 11,326
Glaukos Corp. (a) 243,835 10,492,220
Globus Medical, Inc. (a) 406,399 25,448,705
Haemonetics Corp. (a) 264,618 13,561,673
Helius Medical Technologies, Inc. (U.S.) (a)(b) 10,339 69,581
Heska Corp. (a) 54,441 8,762,823
Hill-Rom Holdings, Inc. 340,077 52,881,974
ICU Medical, Inc. (a) 102,584 23,205,527
Inari Medical, Inc. (a) 166,547 13,746,789
Inogen, Inc. (a) 102,368 3,127,342
Insulet Corp. (a) 358,408 103,379,204
Integer Holdings Corp. (a) 168,143 13,407,723
Integra LifeSciences Holdings Corp. (a) 377,930 24,168,624
Intersect ENT, Inc. (a) 174,113 4,661,005
IntriCon Corp. (a) 45,534 750,400
Common Stocks – continuedShares Value ($)
HEALTH CARE – continued
Health Care Equipment & Supplies – continued
Invacare Corp. (a)(b) 142,130 389,436
InVivo Therapeutics Holdings Corp. (a)(b) 171,592 100,742
INVO Bioscience, Inc. (a)(b) 44,041 136,527
IRadimed Corp. (a) 30,603 1,377,135
iRhythm Technologies, Inc. (a) 152,789 16,134,518
Iridex Corp. (a)(b) 59,593 372,456
Kewaunee Scientific Corp. (a) 10,847 139,709
Lantheus Holdings, Inc. (a) 359,022 9,614,609
LeMaitre Vascular, Inc. 95,477 4,467,369
LENSAR, Inc. (a) 44,149 301,096
LivaNova PLC (a) 273,177 21,897,868
Lucira Health, Inc. (b) 47,077 316,357
Masimo Corp. (a) 264,072 73,443,705
Meridian Bioscience, Inc. (a) 233,827 4,655,496
Merit Medical Systems, Inc. (a) 261,469 16,435,941
Mesa Laboratories, Inc. 26,083 8,054,170
Microbot Medical, Inc. (a)(b) 31,971 164,651
Milestone Scientific, Inc. (a)(b) 240,542 558,057
Motus GI Holdings, Inc. (a)(b) 218,752 107,188
Myomo, Inc. (a)(b) 29,247 239,240
NanoVibronix, Inc. (a)(b) 110,922 120,905
Natus Medical, Inc. (a) 182,429 4,122,895
Nemaura Medical, Inc. (a)(b) 69,812 335,098
Neogen Corp. (a) 555,877 22,307,344
NeuroMetrix, Inc. (a)(b) 26,589 184,528
Neuronetics, Inc. (a) 134,761 521,525
NeuroOne Medical Technologies Corp. (a) 3,733 8,063
NeuroPace, Inc. (b) 32,630 326,300
Nevro Corp. (a) 180,349 15,704,791
Novocure Ltd. (a) 465,111 43,552,994
NuVasive, Inc. (a) 260,937 12,540,632
Nuwellis, Inc. (a)(b) 30,345 47,945
OraSure Technologies, Inc. (a) 386,692 3,607,836
Ortho Clinical Diagnostics Holdings PLC 583,254 11,163,482
Orthofix International NV (a)(b) 103,925 3,181,144
OrthoPediatrics Corp. (a)(b) 72,322 4,029,059
Outset Medical, Inc. (a) 210,320 9,969,168
Owlet, Inc. (a)(b) 364,581 1,651,552
PAVmed, Inc. (a)(b) 406,158 1,490,600
Penumbra, Inc. (a) 179,478 44,088,771
Predictive Oncology, Inc. (a)(b) 336,759 346,862
Pro-Dex, Inc. (a)(b) 19,952 453,908
Pulmonx Corp. (a) 176,528 5,701,854
Pulse Biosciences, Inc. (a)(b) 73,624 1,494,567
Quidel Corp. (a) 197,456 29,136,607
Quotient Ltd. (a) 487,841 1,034,223
Ra Medical Systems, Inc. (a)(b) 41,658 92,897
Repro Medical Systems, Inc. (a)(b) 151,808 522,220
Reshape Lifesciences, Inc. (a)(b) 49,743 94,014
Retractable Technologies, Inc. (a)(b) 88,394 765,492
Rockwell Medical Technologies, Inc. (a)(b) 432,093 183,640
RxSight, Inc. 26,182 284,075
Sanara Medtech, Inc. (a)(b) 13,763 384,538
Seaspine Holdings Corp. (a) 160,713 2,158,376
Quarterly Report 20
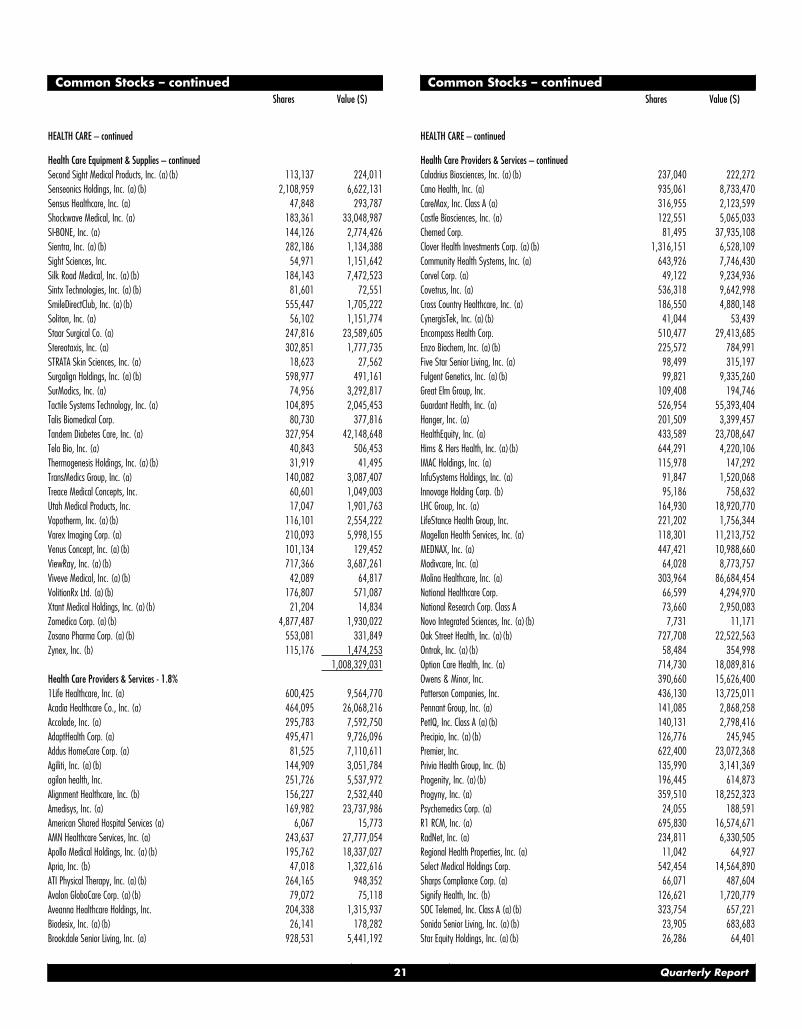
Common Stocks – continuedShares Value ($)
HEALTH CARE – continued
Health Care Equipment & Supplies – continued
Second Sight Medical Products, Inc. (a)(b) 113,137 224,011
Senseonics Holdings, Inc. (a)(b) 2,108,959 6,622,131
Sensus Healthcare, Inc. (a) 47,848 293,787
Shockwave Medical, Inc. (a) 183,361 33,048,987
SI-BONE, Inc. (a) 144,126 2,774,426
Sientra, Inc. (a)(b) 282,186 1,134,388
Sight Sciences, Inc. 54,971 1,151,642
Silk Road Medical, Inc. (a)(b) 184,143 7,472,523
Sintx Technologies, Inc. (a)(b) 81,601 72,551
SmileDirectClub, Inc. (a)(b) 555,447 1,705,222
Soliton, Inc. (a) 56,102 1,151,774
Staar Surgical Co. (a) 247,816 23,589,605
Stereotaxis, Inc. (a) 302,851 1,777,735
STRATA Skin Sciences, Inc. (a) 18,623 27,562
Surgalign Holdings, Inc. (a)(b) 598,977 491,161
SurModics, Inc. (a) 74,956 3,292,817
Tactile Systems Technology, Inc. (a) 104,895 2,045,453
Talis Biomedical Corp. 80,730 377,816
Tandem Diabetes Care, Inc. (a) 327,954 42,148,648
Tela Bio, Inc. (a) 40,843 506,453
Thermogenesis Holdings, Inc. (a)(b) 31,919 41,495
TransMedics Group, Inc. (a) 140,082 3,087,407
Treace Medical Concepts, Inc. 60,601 1,049,003
Utah Medical Products, Inc. 17,047 1,901,763
Vapotherm, Inc. (a)(b) 116,101 2,554,222
Varex Imaging Corp. (a) 210,093 5,998,155
Venus Concept, Inc. (a)(b) 101,134 129,452
ViewRay, Inc. (a)(b) 717,366 3,687,261
Viveve Medical, Inc. (a)(b) 42,089 64,817
VolitionRx Ltd. (a)(b) 176,807 571,087
Xtant Medical Holdings, Inc. (a)(b) 21,204 14,834
Zomedica Corp. (a)(b) 4,877,487 1,930,022
Zosano Pharma Corp. (a)(b) 553,081 331,849
Zynex, Inc. (b) 115,176 1,474,253
1,008,329,031
Health Care Providers & Services - 1.8%
1Life Healthcare, Inc. (a) 600,425 9,564,770
Acadia Healthcare Co., Inc. (a) 464,095 26,068,216
Accolade, Inc. (a) 295,783 7,592,750
AdaptHealth Corp. (a) 495,471 9,726,096
Addus HomeCare Corp. (a) 81,525 7,110,611
Agiliti, Inc. (a)(b) 144,909 3,051,784
agilon health, Inc. 251,726 5,537,972
Alignment Healthcare, Inc. (b) 156,227 2,532,440
Amedisys, Inc. (a) 169,982 23,737,986
American Shared Hospital Services (a) 6,067 15,773
AMN Healthcare Services, Inc. (a) 243,637 27,777,054
Apollo Medical Holdings, Inc. (a)(b) 195,762 18,337,027
Apria, Inc. (b) 47,018 1,322,616
ATI Physical Therapy, Inc. (a)(b) 264,165 948,352
Avalon GloboCare Corp. (a)(b) 79,072 75,118
Aveanna Healthcare Holdings, Inc. 204,338 1,315,937
Biodesix, Inc. (a)(b) 26,141 178,282
Brookdale Senior Living, Inc. (a) 928,531 5,441,192
Common Stocks – continuedShares Value ($)
HEALTH CARE – continued
Health Care Providers & Services – continued
Caladrius Biosciences, Inc. (a)(b) 237,040 222,272
Cano Health, Inc. (a) 935,061 8,733,470
CareMax, Inc. Class A (a) 316,955 2,123,599
Castle Biosciences, Inc. (a) 122,551 5,065,033
Chemed Corp. 81,495 37,935,108
Clover Health Investments Corp. (a)(b) 1,316,151 6,528,109
Community Health Systems, Inc. (a) 643,926 7,746,430
Corvel Corp. (a) 49,122 9,234,936
Covetrus, Inc. (a) 536,318 9,642,998
Cross Country Healthcare, Inc. (a) 186,550 4,880,148
CynergisTek, Inc. (a)(b) 41,044 53,439
Encompass Health Corp. 510,477 29,413,685
Enzo Biochem, Inc. (a)(b) 225,572 784,991
Five Star Senior Living, Inc. (a) 98,499 315,197
Fulgent Genetics, Inc. (a)(b) 99,821 9,335,260
Great Elm Group, Inc. 109,408 194,746
Guardant Health, Inc. (a) 526,954 55,393,404
Hanger, Inc. (a) 201,509 3,399,457
HealthEquity, Inc. (a) 433,589 23,708,647
Hims & Hers Health, Inc. (a)(b) 644,291 4,220,106
IMAC Holdings, Inc. (a) 115,978 147,292
InfuSystems Holdings, Inc. (a) 91,847 1,520,068
Innovage Holding Corp. (b) 95,186 758,632
LHC Group, Inc. (a) 164,930 18,920,770
LifeStance Health Group, Inc. 221,202 1,756,344
Magellan Health Services, Inc. (a) 118,301 11,213,752
MEDNAX, Inc. (a) 447,421 10,988,660
Modivcare, Inc. (a) 64,028 8,773,757
Molina Healthcare, Inc. (a) 303,964 86,684,454
National Healthcare Corp. 66,599 4,294,970
National Research Corp. Class A 73,660 2,950,083
Novo Integrated Sciences, Inc. (a)(b) 7,731 11,171
Oak Street Health, Inc. (a)(b) 727,708 22,522,563
Ontrak, Inc. (a)(b) 58,484 354,998
Option Care Health, Inc. (a) 714,730 18,089,816
Owens & Minor, Inc. 390,660 15,626,400
Patterson Companies, Inc. 436,130 13,725,011
Pennant Group, Inc. (a) 141,085 2,868,258
PetIQ, Inc. Class A (a)(b) 140,131 2,798,416
Precipio, Inc. (a)(b) 126,776 245,945
Premier, Inc. 622,400 23,072,368
Privia Health Group, Inc. (b) 135,990 3,141,369
Progenity, Inc. (a)(b) 196,445 614,873
Progyny, Inc. (a) 359,510 18,252,323
Psychemedics Corp. (a) 24,055 188,591
R1 RCM, Inc. (a) 695,830 16,574,671
RadNet, Inc. (a) 234,811 6,330,505
Regional Health Properties, Inc. (a) 11,042 64,927
Select Medical Holdings Corp. 542,454 14,564,890
Sharps Compliance Corp. (a) 66,071 487,604
Signify Health, Inc. (b) 126,621 1,720,779
SOC Telemed, Inc. Class A (a)(b) 323,754 657,221
Sonida Senior Living, Inc. (a)(b) 23,905 683,683
Star Equity Holdings, Inc. (a)(b) 26,286 64,401
21 Quarterly Report
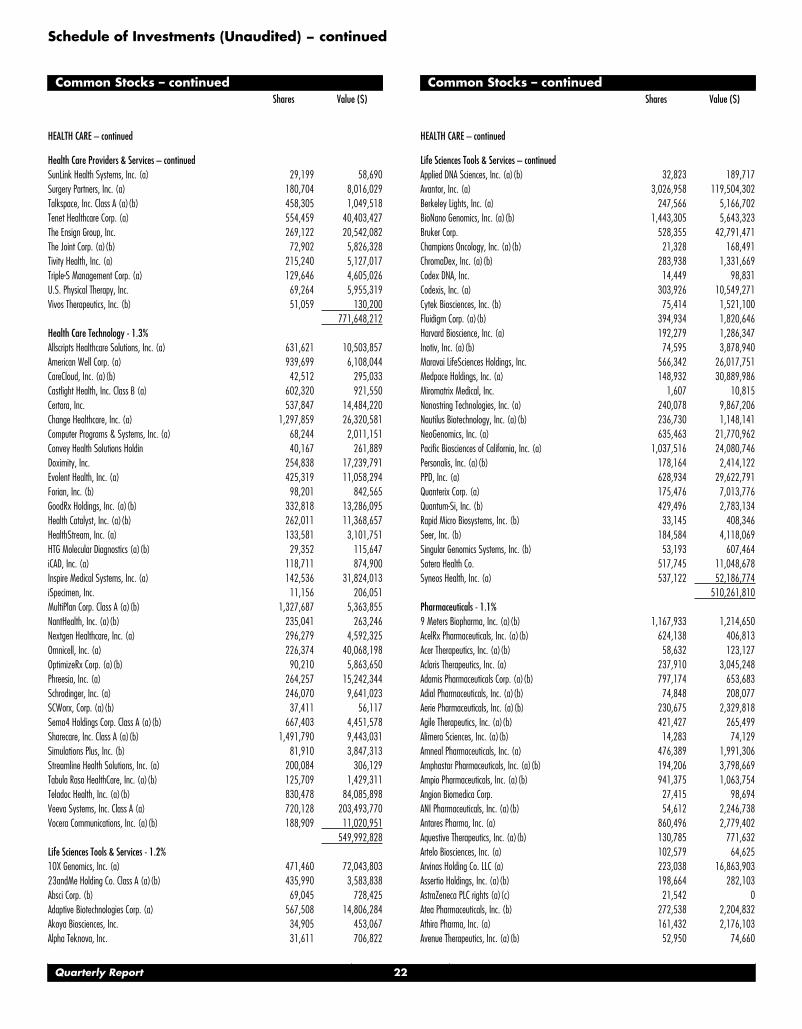
Schedule of Investments (Unaudited) − continued
Common Stocks – continuedShares Value ($)
HEALTH CARE – continued
Health Care Providers & Services – continued
SunLink Health Systems, Inc. (a) 29,199 58,690
Surgery Partners, Inc. (a) 180,704 8,016,029
Talkspace, Inc. Class A (a)(b) 458,305 1,049,518
Tenet Healthcare Corp. (a) 554,459 40,403,427
The Ensign Group, Inc. 269,122 20,542,082
The Joint Corp. (a)(b) 72,902 5,826,328
Tivity Health, Inc. (a) 215,240 5,127,017
Triple-S Management Corp. (a) 129,646 4,605,026
U.S. Physical Therapy, Inc. 69,264 5,955,319
Vivos Therapeutics, Inc. (b) 51,059 130,200
771,648,212
Health Care Technology - 1.3%
Allscripts Healthcare Solutions, Inc. (a) 631,621 10,503,857
American Well Corp. (a) 939,699 6,108,044
CareCloud, Inc. (a)(b) 42,512 295,033
Castlight Health, Inc. Class B (a) 602,320 921,550
Certara, Inc. 537,847 14,484,220
Change Healthcare, Inc. (a) 1,297,859 26,320,581
Computer Programs & Systems, Inc. (a) 68,244 2,011,151
Convey Health Solutions Holdin 40,167 261,889
Doximity, Inc. 254,838 17,239,791
Evolent Health, Inc. (a) 425,319 11,058,294
Forian, Inc. (b) 98,201 842,565
GoodRx Holdings, Inc. (a)(b) 332,818 13,286,095
Health Catalyst, Inc. (a)(b) 262,011 11,368,657
HealthStream, Inc. (a) 133,581 3,101,751
HTG Molecular Diagnostics (a)(b) 29,352 115,647
iCAD, Inc. (a) 118,711 874,900
Inspire Medical Systems, Inc. (a) 142,536 31,824,013
iSpecimen, Inc. 11,156 206,051
MultiPlan Corp. Class A (a)(b) 1,327,687 5,363,855
NantHealth, Inc. (a)(b) 235,041 263,246
Nextgen Healthcare, Inc. (a) 296,279 4,592,325
Omnicell, Inc. (a) 226,374 40,068,198
OptimizeRx Corp. (a)(b) 90,210 5,863,650
Phreesia, Inc. (a) 264,257 15,242,344
Schrodinger, Inc. (a) 246,070 9,641,023
SCWorx, Corp. (a)(b) 37,411 56,117
Sema4 Holdings Corp. Class A (a)(b) 667,403 4,451,578
Sharecare, Inc. Class A (a)(b) 1,491,790 9,443,031
Simulations Plus, Inc. (b) 81,910 3,847,313
Streamline Health Solutions, Inc. (a) 200,084 306,129
Tabula Rasa HealthCare, Inc. (a)(b) 125,709 1,429,311
Teladoc Health, Inc. (a)(b) 830,478 84,085,898
Veeva Systems, Inc. Class A (a) 720,128 203,493,770
Vocera Communications, Inc. (a)(b) 188,909 11,020,951
549,992,828
Life Sciences Tools & Services - 1.2%
10X Genomics, Inc. (a) 471,460 72,043,803
23andMe Holding Co. Class A (a)(b) 435,990 3,583,838
Absci Corp. (b) 69,045 728,425
Adaptive Biotechnologies Corp. (a) 567,508 14,806,284
Akoya Biosciences, Inc. 34,905 453,067
Alpha Teknova, Inc. 31,611 706,822
Common Stocks – continuedShares Value ($)
HEALTH CARE – continued
Life Sciences Tools & Services – continued
Applied DNA Sciences, Inc. (a)(b) 32,823 189,717
Avantor, Inc. (a) 3,026,958 119,504,302
Berkeley Lights, Inc. (a) 247,566 5,166,702
BioNano Genomics, Inc. (a)(b) 1,443,305 5,643,323
Bruker Corp. 528,355 42,791,471
Champions Oncology, Inc. (a)(b) 21,328 168,491
ChromaDex, Inc. (a)(b) 283,938 1,331,669
Codex DNA, Inc. 14,449 98,831
Codexis, Inc. (a) 303,926 10,549,271
Cytek Biosciences, Inc. (b) 75,414 1,521,100
Fluidigm Corp. (a)(b) 394,934 1,820,646
Harvard Bioscience, Inc. (a) 192,279 1,286,347
Inotiv, Inc. (a)(b) 74,595 3,878,940
Maravai LifeSciences Holdings, Inc. 566,342 26,017,751
Medpace Holdings, Inc. (a) 148,932 30,889,986
Miromatrix Medical, Inc. 1,607 10,815
Nanostring Technologies, Inc. (a) 240,078 9,867,206
Nautilus Biotechnology, Inc. (a)(b) 236,730 1,148,141
NeoGenomics, Inc. (a) 635,463 21,770,962
Pacific Biosciences of California, Inc. (a) 1,037,516 24,080,746
Personalis, Inc. (a)(b) 178,164 2,414,122
PPD, Inc. (a) 628,934 29,622,791
Quanterix Corp. (a) 175,476 7,013,776
Quantum-Si, Inc. (b) 429,496 2,783,134
Rapid Micro Biosystems, Inc. (b) 33,145 408,346
Seer, Inc. (b) 184,584 4,118,069
Singular Genomics Systems, Inc. (b) 53,193 607,464
Sotera Health Co. 517,745 11,048,678
Syneos Health, Inc. (a) 537,122 52,186,774
510,261,810
Pharmaceuticals - 1.1%
9 Meters Biopharma, Inc. (a)(b) 1,167,933 1,214,650
AcelRx Pharmaceuticals, Inc. (a)(b) 624,138 406,813
Acer Therapeutics, Inc. (a)(b) 58,632 123,127
Aclaris Therapeutics, Inc. (a) 237,910 3,045,248
Adamis Pharmaceuticals Corp. (a)(b) 797,174 653,683
Adial Pharmaceuticals, Inc. (a)(b) 74,848 208,077
Aerie Pharmaceuticals, Inc. (a)(b) 230,675 2,329,818
Agile Therapeutics, Inc. (a)(b) 421,427 265,499
Alimera Sciences, Inc. (a)(b) 14,283 74,129
Amneal Pharmaceuticals, Inc. (a) 476,389 1,991,306
Amphastar Pharmaceuticals, Inc. (a)(b) 194,206 3,798,669
Ampio Pharmaceuticals, Inc. (a)(b) 941,375 1,063,754
Angion Biomedica Corp. 27,415 98,694
ANI Pharmaceuticals, Inc. (a)(b) 54,612 2,246,738
Antares Pharma, Inc. (a) 860,496 2,779,402
Aquestive Therapeutics, Inc. (a)(b) 130,785 771,632
Artelo Biosciences, Inc. (a) 102,579 64,625
Arvinas Holding Co. LLC (a) 223,038 16,863,903
Assertio Holdings, Inc. (a)(b) 198,664 282,103
AstraZeneca PLC rights (a)(c) 21,542 0
Atea Pharmaceuticals, Inc. (b) 272,538 2,204,832
Athira Pharma, Inc. (a) 161,432 2,176,103
Avenue Therapeutics, Inc. (a)(b) 52,950 74,660
Quarterly Report 22
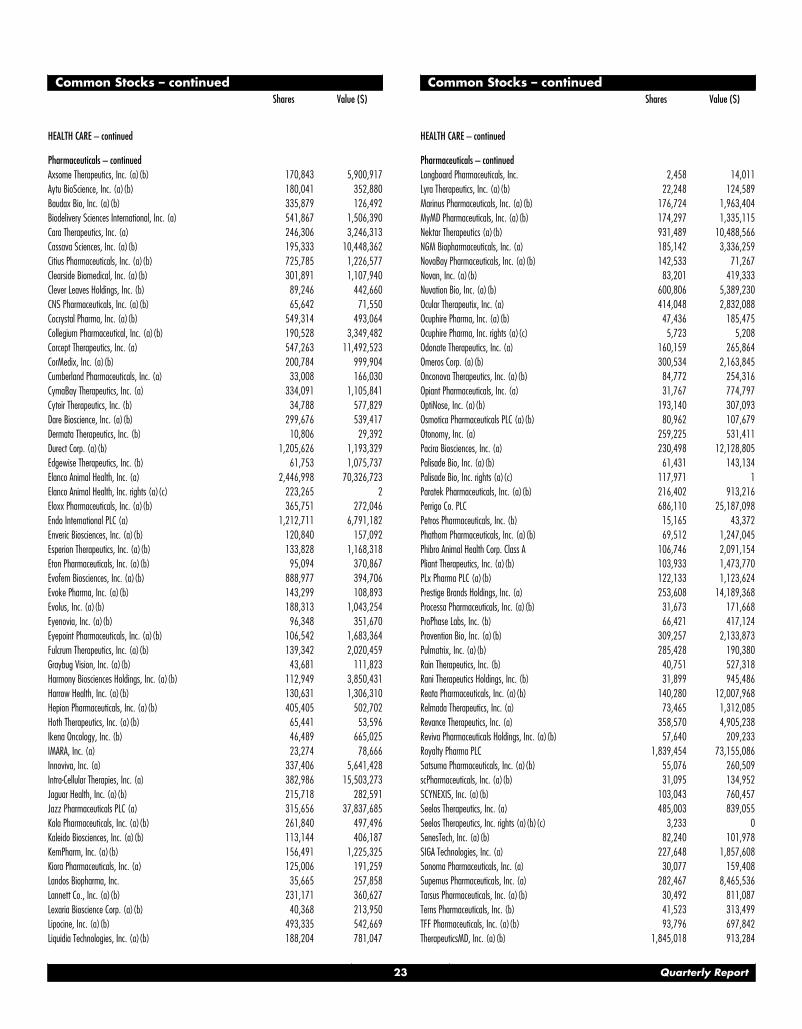
Common Stocks – continuedShares Value ($)
HEALTH CARE – continued
Pharmaceuticals – continued
Axsome Therapeutics, Inc. (a)(b) 170,843 5,900,917
Aytu BioScience, Inc. (a)(b) 180,041 352,880
Baudax Bio, Inc. (a)(b) 335,879 126,492
Biodelivery Sciences International, Inc. (a) 541,867 1,506,390
Cara Therapeutics, Inc. (a) 246,306 3,246,313
Cassava Sciences, Inc. (a)(b) 195,333 10,448,362
Citius Pharmaceuticals, Inc. (a)(b) 725,785 1,226,577
Clearside Biomedical, Inc. (a)(b) 301,891 1,107,940
Clever Leaves Holdings, Inc. (b) 89,246 442,660
CNS Pharmaceuticals, Inc. (a)(b) 65,642 71,550
Cocrystal Pharma, Inc. (a)(b) 549,314 493,064
Collegium Pharmaceutical, Inc. (a)(b) 190,528 3,349,482
Corcept Therapeutics, Inc. (a) 547,263 11,492,523
CorMedix, Inc. (a)(b) 200,784 999,904
Cumberland Pharmaceuticals, Inc. (a) 33,008 166,030
CymaBay Therapeutics, Inc. (a) 334,091 1,105,841
Cyteir Therapeutics, Inc. (b) 34,788 577,829
Dare Bioscience, Inc. (a)(b) 299,676 539,417
Dermata Therapeutics, Inc. (b) 10,806 29,392
Durect Corp. (a)(b) 1,205,626 1,193,329
Edgewise Therapeutics, Inc. (b) 61,753 1,075,737
Elanco Animal Health, Inc. (a) 2,446,998 70,326,723
Elanco Animal Health, Inc. rights (a)(c) 223,265 2
Eloxx Pharmaceuticals, Inc. (a)(b) 365,751 272,046
Endo International PLC (a) 1,212,711 6,791,182
Enveric Biosciences, Inc. (a)(b) 120,840 157,092
Esperion Therapeutics, Inc. (a)(b) 133,828 1,168,318
Eton Pharmaceuticals, Inc. (a)(b) 95,094 370,867
Evofem Biosciences, Inc. (a)(b) 888,977 394,706
Evoke Pharma, Inc. (a)(b) 143,299 108,893
Evolus, Inc. (a)(b) 188,313 1,043,254
Eyenovia, Inc. (a)(b) 96,348 351,670
Eyepoint Pharmaceuticals, Inc. (a)(b) 106,542 1,683,364
Fulcrum Therapeutics, Inc. (a)(b) 139,342 2,020,459
Graybug Vision, Inc. (a)(b) 43,681 111,823
Harmony Biosciences Holdings, Inc. (a)(b) 112,949 3,850,431
Harrow Health, Inc. (a)(b) 130,631 1,306,310
Hepion Pharmaceuticals, Inc. (a)(b) 405,405 502,702
Hoth Therapeutics, Inc. (a)(b) 65,441 53,596
Ikena Oncology, Inc. (b) 46,489 665,025
IMARA, Inc. (a) 23,274 78,666
Innoviva, Inc. (a) 337,406 5,641,428
Intra-Cellular Therapies, Inc. (a) 382,986 15,503,273
Jaguar Health, Inc. (a)(b) 215,718 282,591
Jazz Pharmaceuticals PLC (a) 315,656 37,837,685
Kala Pharmaceuticals, Inc. (a)(b) 261,840 497,496
Kaleido Biosciences, Inc. (a)(b) 113,144 406,187
KemPharm, Inc. (a)(b) 156,491 1,225,325
Kiora Pharmaceuticals, Inc. (a) 125,006 191,259
Landos Biopharma, Inc. 35,665 257,858
Lannett Co., Inc. (a)(b) 231,171 360,627
Lexaria Bioscience Corp. (a)(b) 40,368 213,950
Lipocine, Inc. (a)(b) 493,335 542,669
Liquidia Technologies, Inc. (a)(b) 188,204 781,047
Common Stocks – continuedShares Value ($)
HEALTH CARE – continued
Pharmaceuticals – continued
Longboard Pharmaceuticals, Inc. 2,458 14,011
Lyra Therapeutics, Inc. (a)(b) 22,248 124,589
Marinus Pharmaceuticals, Inc. (a)(b) 176,724 1,963,404
MyMD Pharmaceuticals, Inc. (a)(b) 174,297 1,335,115
Nektar Therapeutics (a)(b) 931,489 10,488,566
NGM Biopharmaceuticals, Inc. (a) 185,142 3,336,259
NovaBay Pharmaceuticals, Inc. (a)(b) 142,533 71,267
Novan, Inc. (a)(b) 83,201 419,333
Nuvation Bio, Inc. (a)(b) 600,806 5,389,230
Ocular Therapeutix, Inc. (a) 414,048 2,832,088
Ocuphire Pharma, Inc. (a)(b) 47,436 185,475
Ocuphire Pharma, Inc. rights (a)(c) 5,723 5,208
Odonate Therapeutics, Inc. (a) 160,159 265,864
Omeros Corp. (a)(b) 300,534 2,163,845
Onconova Therapeutics, Inc. (a)(b) 84,772 254,316
Opiant Pharmaceuticals, Inc. (a) 31,767 774,797
OptiNose, Inc. (a)(b) 193,140 307,093
Osmotica Pharmaceuticals PLC (a)(b) 80,962 107,679
Otonomy, Inc. (a) 259,225 531,411
Pacira Biosciences, Inc. (a) 230,498 12,128,805
Palisade Bio, Inc. (a)(b) 61,431 143,134
Palisade Bio, Inc. rights (a)(c) 117,971 1
Paratek Pharmaceuticals, Inc. (a)(b) 216,402 913,216
Perrigo Co. PLC 686,110 25,187,098
Petros Pharmaceuticals, Inc. (b) 15,165 43,372
Phathom Pharmaceuticals, Inc. (a)(b) 69,512 1,247,045
Phibro Animal Health Corp. Class A 106,746 2,091,154
Pliant Therapeutics, Inc. (a)(b) 103,933 1,473,770
PLx Pharma PLC (a)(b) 122,133 1,123,624
Prestige Brands Holdings, Inc. (a) 253,608 14,189,368
Processa Pharmaceuticals, Inc. (a)(b) 31,673 171,668
ProPhase Labs, Inc. (b) 66,421 417,124
Provention Bio, Inc. (a)(b) 309,257 2,133,873
Pulmatrix, Inc. (a)(b) 285,428 190,380
Rain Therapeutics, Inc. (b) 40,751 527,318
Rani Therapeutics Holdings, Inc. (b) 31,899 945,486
Reata Pharmaceuticals, Inc. (a)(b) 140,280 12,007,968
Relmada Therapeutics, Inc. (a) 73,465 1,312,085
Revance Therapeutics, Inc. (a) 358,570 4,905,238
Reviva Pharmaceuticals Holdings, Inc. (a)(b) 57,640 209,233
Royalty Pharma PLC 1,839,454 73,155,086
Satsuma Pharmaceuticals, Inc. (a)(b) 55,076 260,509
scPharmaceuticals, Inc. (a)(b) 31,095 134,952
SCYNEXIS, Inc. (a)(b) 103,043 760,457
Seelos Therapeutics, Inc. (a) 485,003 839,055
Seelos Therapeutics, Inc. rights (a)(b)(c) 3,233 0
SenesTech, Inc. (a)(b) 82,240 101,978
SIGA Technologies, Inc. (a) 227,648 1,857,608
Sonoma Pharmaceuticals, Inc. (a) 30,077 159,408
Supernus Pharmaceuticals, Inc. (a) 282,467 8,465,536
Tarsus Pharmaceuticals, Inc. (a)(b) 30,492 811,087
Terns Pharmaceuticals, Inc. (b) 41,523 313,499
TFF Pharmaceuticals, Inc. (a)(b) 93,796 697,842
TherapeuticsMD, Inc. (a)(b) 1,845,018 913,284
23 Quarterly Report
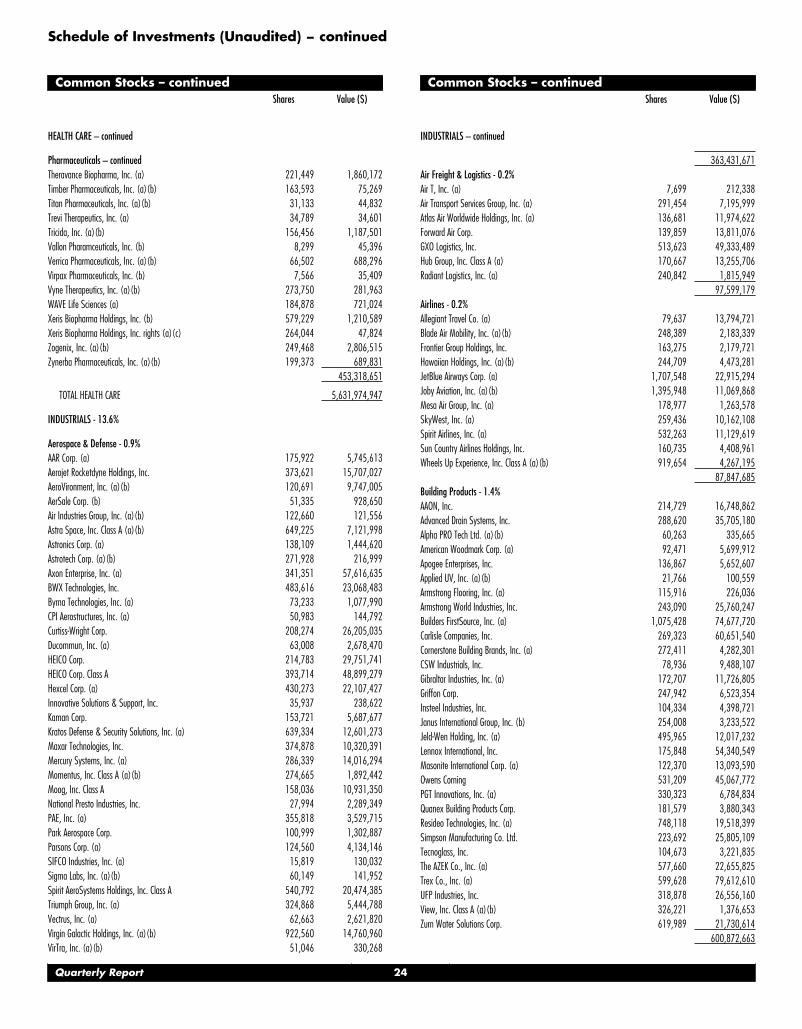
Schedule of Investments (Unaudited) − continued
Common Stocks – continuedShares Value ($)
HEALTH CARE – continued
Pharmaceuticals – continued
Theravance Biopharma, Inc. (a) 221,449 1,860,172
Timber Pharmaceuticals, Inc. (a)(b) 163,593 75,269
Titan Pharmaceuticals, Inc. (a)(b) 31,133 44,832
Trevi Therapeutics, Inc. (a) 34,789 34,601
Tricida, Inc. (a)(b) 156,456 1,187,501
Vallon Pharamceuticals, Inc. (b) 8,299 45,396
Verrica Pharmaceuticals, Inc. (a)(b) 66,502 688,296
Virpax Pharmaceuticals, Inc. (b) 7,566 35,409
Vyne Therapeutics, Inc. (a)(b) 273,750 281,963
WAVE Life Sciences (a) 184,878 721,024
Xeris Biopharma Holdings, Inc. (b) 579,229 1,210,589
Xeris Biopharma Holdings, Inc. rights (a)(c) 264,044 47,824
Zogenix, Inc. (a)(b) 249,468 2,806,515
Zynerba Pharmaceuticals, Inc. (a)(b) 199,373 689,831
453,318,651
TOTAL HEALTH CARE 5,631,974,947
INDUSTRIALS - 13.6%
Aerospace & Defense - 0.9%
AAR Corp. (a) 175,922 5,745,613
Aerojet Rocketdyne Holdings, Inc. 373,621 15,707,027
AeroVironment, Inc. (a)(b) 120,691 9,747,005
AerSale Corp. (b) 51,335 928,650
Air Industries Group, Inc. (a)(b) 122,660 121,556
Astra Space, Inc. Class A (a)(b) 649,225 7,121,998
Astronics Corp. (a) 138,109 1,444,620
Astrotech Corp. (a)(b) 271,928 216,999
Axon Enterprise, Inc. (a) 341,351 57,616,635
BWX Technologies, Inc. 483,616 23,068,483
Byrna Technologies, Inc. (a) 73,233 1,077,990
CPI Aerostructures, Inc. (a) 50,983 144,792
Curtiss-Wright Corp. 208,274 26,205,035
Ducommun, Inc. (a) 63,008 2,678,470
HEICO Corp. 214,783 29,751,741
HEICO Corp. Class A 393,714 48,899,279
Hexcel Corp. (a) 430,273 22,107,427
Innovative Solutions & Support, Inc. 35,937 238,622
Kaman Corp. 153,721 5,687,677
Kratos Defense & Security Solutions, Inc. (a) 639,334 12,601,273
Maxar Technologies, Inc. 374,878 10,320,391
Mercury Systems, Inc. (a) 286,339 14,016,294
Momentus, Inc. Class A (a)(b) 274,665 1,892,442
Moog, Inc. Class A 158,036 10,931,350
National Presto Industries, Inc. 27,994 2,289,349
PAE, Inc. (a) 355,818 3,529,715
Park Aerospace Corp. 100,999 1,302,887
Parsons Corp. (a) 124,560 4,134,146
SIFCO Industries, Inc. (a) 15,819 130,032
Sigma Labs, Inc. (a)(b) 60,149 141,952
Spirit AeroSystems Holdings, Inc. Class A 540,792 20,474,385
Triumph Group, Inc. (a) 324,868 5,444,788
Vectrus, Inc. (a) 62,663 2,621,820
Virgin Galactic Holdings, Inc. (a)(b) 922,560 14,760,960
VirTra, Inc. (a)(b) 51,046 330,268
Common Stocks – continuedShares Value ($)
INDUSTRIALS – continued
363,431,671
Air Freight & Logistics - 0.2%
Air T, Inc. (a) 7,699 212,338
Air Transport Services Group, Inc. (a) 291,454 7,195,999
Atlas Air Worldwide Holdings, Inc. (a) 136,681 11,974,622
Forward Air Corp. 139,859 13,811,076
GXO Logistics, Inc. 513,623 49,333,489
Hub Group, Inc. Class A (a) 170,667 13,255,706
Radiant Logistics, Inc. (a) 240,842 1,815,949
97,599,179
Airlines - 0.2%
Allegiant Travel Co. (a) 79,637 13,794,721
Blade Air Mobility, Inc. (a)(b) 248,389 2,183,339
Frontier Group Holdings, Inc. 163,275 2,179,721
Hawaiian Holdings, Inc. (a)(b) 244,709 4,473,281
JetBlue Airways Corp. (a) 1,707,548 22,915,294
Joby Aviation, Inc. (a)(b) 1,395,948 11,069,868
Mesa Air Group, Inc. (a) 178,977 1,263,578
SkyWest, Inc. (a) 259,436 10,162,108
Spirit Airlines, Inc. (a) 532,263 11,129,619
Sun Country Airlines Holdings, Inc. 160,735 4,408,961
Wheels Up Experience, Inc. Class A (a)(b) 919,654 4,267,195
87,847,685
Building Products - 1.4%
AAON, Inc. 214,729 16,748,862
Advanced Drain Systems, Inc. 288,620 35,705,180
Alpha PRO Tech Ltd. (a)(b) 60,263 335,665
American Woodmark Corp. (a) 92,471 5,699,912
Apogee Enterprises, Inc. 136,867 5,652,607
Applied UV, Inc. (a)(b) 21,766 100,559
Armstrong Flooring, Inc. (a) 115,916 226,036
Armstrong World Industries, Inc. 243,090 25,760,247
Builders FirstSource, Inc. (a) 1,075,428 74,677,720
Carlisle Companies, Inc. 269,323 60,651,540
Cornerstone Building Brands, Inc. (a) 272,411 4,282,301
CSW Industrials, Inc. 78,936 9,488,107
Gibraltar Industries, Inc. (a) 172,707 11,726,805
Griffon Corp. 247,942 6,523,354
Insteel Industries, Inc. 104,334 4,398,721
Janus International Group, Inc. (b) 254,008 3,233,522
Jeld-Wen Holding, Inc. (a) 495,965 12,017,232
Lennox International, Inc. 175,848 54,340,549
Masonite International Corp. (a) 122,370 13,093,590
Owens Corning 531,209 45,067,772
PGT Innovations, Inc. (a) 330,323 6,784,834
Quanex Building Products Corp. 181,579 3,880,343
Resideo Technologies, Inc. (a) 748,118 19,518,399
Simpson Manufacturing Co. Ltd. 223,692 25,805,109
Tecnoglass, Inc. 104,673 3,221,835
The AZEK Co., Inc. (a) 577,660 22,655,825
Trex Co., Inc. (a) 599,628 79,612,610
UFP Industries, Inc. 318,878 26,556,160
View, Inc. Class A (a)(b) 326,221 1,376,653
Zurn Water Solutions Corp. 619,989 21,730,614
600,872,663
Quarterly Report 24
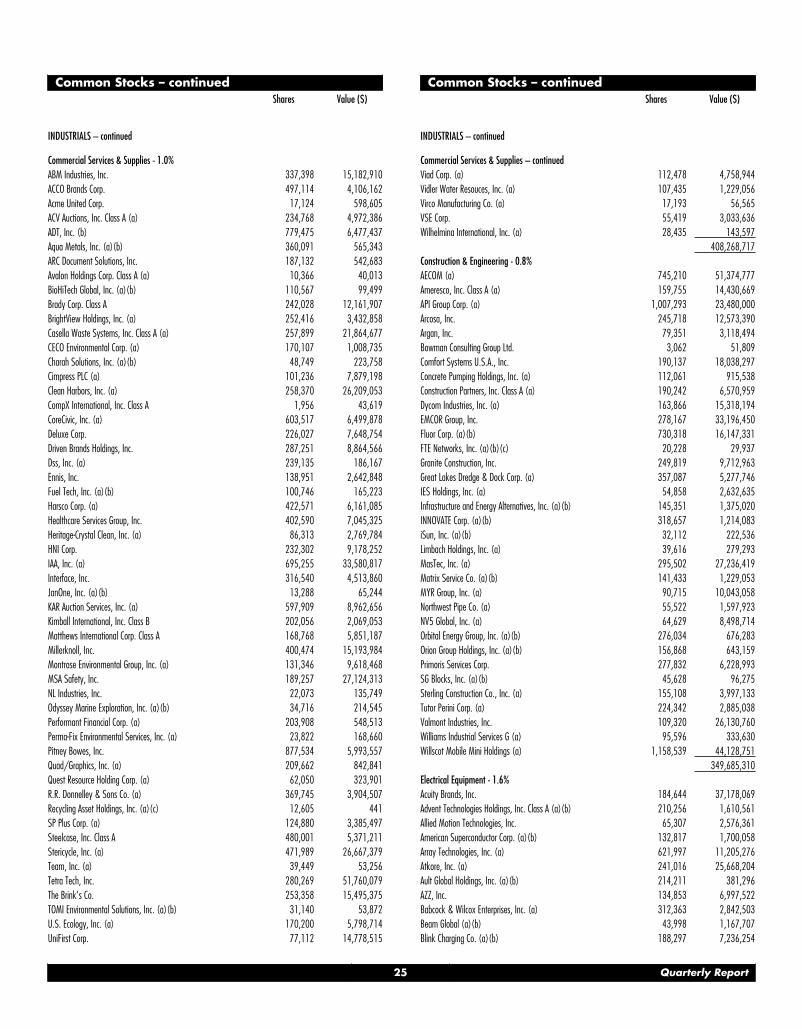
Common Stocks – continuedShares Value ($)
INDUSTRIALS – continued
Commercial Services & Supplies - 1.0%
ABM Industries, Inc. 337,398 15,182,910
ACCO Brands Corp. 497,114 4,106,162
Acme United Corp. 17,124 598,605
ACV Auctions, Inc. Class A (a) 234,768 4,972,386
ADT, Inc. (b) 779,475 6,477,437
Aqua Metals, Inc. (a)(b) 360,091 565,343
ARC Document Solutions, Inc. 187,132 542,683
Avalon Holdings Corp. Class A (a) 10,366 40,013
BioHiTech Global, Inc. (a)(b) 110,567 99,499
Brady Corp. Class A 242,028 12,161,907
BrightView Holdings, Inc. (a) 252,416 3,432,858
Casella Waste Systems, Inc. Class A (a) 257,899 21,864,677
CECO Environmental Corp. (a) 170,107 1,008,735
Charah Solutions, Inc. (a)(b) 48,749 223,758
Cimpress PLC (a) 101,236 7,879,198
Clean Harbors, Inc. (a) 258,370 26,209,053
CompX International, Inc. Class A 1,956 43,619
CoreCivic, Inc. (a) 603,517 6,499,878
Deluxe Corp. 226,027 7,648,754
Driven Brands Holdings, Inc. 287,251 8,864,566
Dss, Inc. (a) 239,135 186,167
Ennis, Inc. 138,951 2,642,848
Fuel Tech, Inc. (a)(b) 100,746 165,223
Harsco Corp. (a) 422,571 6,161,085
Healthcare Services Group, Inc. 402,590 7,045,325
Heritage-Crystal Clean, Inc. (a) 86,313 2,769,784
HNI Corp. 232,302 9,178,252
IAA, Inc. (a) 695,255 33,580,817
Interface, Inc. 316,540 4,513,860
JanOne, Inc. (a)(b) 13,288 65,244
KAR Auction Services, Inc. (a) 597,909 8,962,656
Kimball International, Inc. Class B 202,056 2,069,053
Matthews International Corp. Class A 168,768 5,851,187
Millerknoll, Inc. 400,474 15,193,984
Montrose Environmental Group, Inc. (a) 131,346 9,618,468
MSA Safety, Inc. 189,257 27,124,313
NL Industries, Inc. 22,073 135,749
Odyssey Marine Exploration, Inc. (a)(b) 34,716 214,545
Performant Financial Corp. (a) 203,908 548,513
Perma-Fix Environmental Services, Inc. (a) 23,822 168,660
Pitney Bowes, Inc. 877,534 5,993,557
Quad/Graphics, Inc. (a) 209,662 842,841
Quest Resource Holding Corp. (a) 62,050 323,901
R.R. Donnelley & Sons Co. (a) 369,745 3,904,507
Recycling Asset Holdings, Inc. (a)(c) 12,605 441
SP Plus Corp. (a) 124,880 3,385,497
Steelcase, Inc. Class A 480,001 5,371,211
Stericycle, Inc. (a) 471,989 26,667,379
Team, Inc. (a) 39,449 53,256
Tetra Tech, Inc. 280,269 51,760,079
The Brink's Co. 253,358 15,495,375
TOMI Environmental Solutions, Inc. (a)(b) 31,140 53,872
U.S. Ecology, Inc. (a) 170,200 5,798,714
UniFirst Corp. 77,112 14,778,515
Common Stocks – continuedShares Value ($)
INDUSTRIALS – continued
Commercial Services & Supplies – continued
Viad Corp. (a) 112,478 4,758,944
Vidler Water Resouces, Inc. (a) 107,435 1,229,056
Virco Manufacturing Co. (a) 17,193 56,565
VSE Corp. 55,419 3,033,636
Wilhelmina International, Inc. (a) 28,435 143,597
408,268,717
Construction & Engineering - 0.8%
AECOM (a) 745,210 51,374,777
Ameresco, Inc. Class A (a) 159,755 14,430,669
API Group Corp. (a) 1,007,293 23,480,000
Arcosa, Inc. 245,718 12,573,390
Argan, Inc. 79,351 3,118,494
Bowman Consulting Group Ltd. 3,062 51,809
Comfort Systems U.S.A., Inc. 190,137 18,038,297
Concrete Pumping Holdings, Inc. (a) 112,061 915,538
Construction Partners, Inc. Class A (a) 190,242 6,570,959
Dycom Industries, Inc. (a) 163,866 15,318,194
EMCOR Group, Inc. 278,167 33,196,450
Fluor Corp. (a)(b) 730,318 16,147,331
FTE Networks, Inc. (a)(b)(c) 20,228 29,937
Granite Construction, Inc. 249,819 9,712,963
Great Lakes Dredge & Dock Corp. (a) 357,087 5,277,746
IES Holdings, Inc. (a) 54,858 2,632,635
Infrastructure and Energy Alternatives, Inc. (a)(b) 145,351 1,375,020
INNOVATE Corp. (a)(b) 318,657 1,214,083
iSun, Inc. (a)(b) 32,112 222,536
Limbach Holdings, Inc. (a) 39,616 279,293
MasTec, Inc. (a) 295,502 27,236,419
Matrix Service Co. (a)(b) 141,433 1,229,053
MYR Group, Inc. (a) 90,715 10,043,058
Northwest Pipe Co. (a) 55,522 1,597,923
NV5 Global, Inc. (a) 64,629 8,498,714
Orbital Energy Group, Inc. (a)(b) 276,034 676,283
Orion Group Holdings, Inc. (a)(b) 156,868 643,159
Primoris Services Corp. 277,832 6,228,993
SG Blocks, Inc. (a)(b) 45,628 96,275
Sterling Construction Co., Inc. (a) 155,108 3,997,133
Tutor Perini Corp. (a) 224,342 2,885,038
Valmont Industries, Inc. 109,320 26,130,760
Williams Industrial Services G (a) 95,596 333,630
Willscot Mobile Mini Holdings (a) 1,158,539 44,128,751
349,685,310
Electrical Equipment - 1.6%
Acuity Brands, Inc. 184,644 37,178,069
Advent Technologies Holdings, Inc. Class A (a)(b) 210,256 1,610,561
Allied Motion Technologies, Inc. 65,307 2,576,361
American Superconductor Corp. (a)(b) 132,817 1,700,058
Array Technologies, Inc. (a) 621,997 11,205,276
Atkore, Inc. (a) 241,016 25,668,204
Ault Global Holdings, Inc. (a)(b) 214,211 381,296
AZZ, Inc. 134,853 6,997,522
Babcock & Wilcox Enterprises, Inc. (a) 312,363 2,842,503
Beam Global (a)(b) 43,998 1,167,707
Blink Charging Co. (a)(b) 188,297 7,236,254
25 Quarterly Report
Schedule of Investments (Unaudited) − continued
Common Stocks – continuedShares Value ($)
INDUSTRIALS – continued
Electrical Equipment – continued
Bloom Energy Corp. Class A (a)(b) 769,557 21,147,426
Broadwind, Inc. (a)(b) 85,192 206,165
Capstone Turbine Corp. (a)(b) 64,202 304,317
ChargePoint Holdings, Inc. Class A (a)(b) 901,075 22,995,434
Encore Wire Corp. 109,636 15,399,473
Energous Corp. (a)(b) 380,453 570,680
Energy Focus, Inc. (a)(b) 57,702 128,098
EnerSys 214,675 15,905,271
Enovix Corp. 505,594 17,695,790
Eos Energy Enterprises, Inc. (a)(b) 201,248 2,002,418
Espey Manufacturing & Electronics Corp. 5,259 77,412
Flux Power Holdings, Inc. (a)(b) 53,707 277,128
FTC Solar, Inc. 103,240 883,734
FuelCell Energy, Inc. (a)(b) 1,677,243 14,558,469
GrafTech International Ltd. 1,052,231 12,258,491
Hubbell, Inc. Class B 280,155 54,826,334
Ideal Power, Inc. (a)(b) 25,624 365,911
KULR Technology Group, Inc. (a)(b) 251,352 887,273
LSI Industries, Inc. 139,835 992,829
Nuvve Holding Corp. (b) 72,483 1,144,507
nVent Electric PLC 862,042 30,024,923
Ocean Power Technologies, Inc. (a)(b) 264,774 534,843
Orion Energy Systems, Inc. (a) 148,830 561,089
Pioneer Power Solutions, Inc. (b) 18,679 188,845
Plug Power, Inc. (a)(b) 2,687,492 107,096,556
Polar Power, Inc. (a)(b) 28,861 165,951
Powell Industries, Inc. 48,231 1,177,801
Preformed Line Products Co. 13,367 844,126
Regal Rexnord Corp. 350,624 55,433,654
Romeo Power, Inc. (a)(b) 481,116 1,905,219
Sensata Technologies, Inc. PLC (a) 818,135 45,570,120
Shoals Technologies Group, Inc. 530,507 14,907,247
Stem, Inc. (a)(b) 592,363 12,569,943
Sunrun, Inc. (a) 1,071,541 49,333,748
Sunworks, Inc. (a)(b) 143,950 659,291
Thermon Group Holdings, Inc. (a) 183,061 3,159,633
TPI Composites, Inc. (a) 191,264 3,410,237
Ultralife Corp. (a) 93,481 497,319
Vertiv Holdings Co. 1,564,722 40,119,472
Vicor Corp. (a) 111,512 15,997,512
Westwater Resources, Inc. (a)(b) 144,783 414,079
665,762,579
Industrial Conglomerates - 0.0%
Gaucho Group Holdings, Inc. (a)(b) 99,311 288,002
Raven Industries, Inc. (a) 184,068 10,675,944
10,963,946
Machinery - 2.8%
AGCO Corp. 323,108 35,609,733
AgEagle Aerial Systems, Inc. (a)(b) 342,350 773,711
Agrify Corp. (b) 89,775 1,378,046
Alamo Group, Inc. 52,158 7,417,911
Albany International Corp. Class A 166,658 13,487,632
Allison Transmission Holdings, Inc. 537,458 18,590,672
Altra Industrial Motion Corp. 339,339 17,886,559
Common Stocks – continuedShares Value ($)
INDUSTRIALS – continued
Machinery – continued
Art's-Way Manufacturing Co., Inc. (a) 31,778 111,223
Astec Industries, Inc. 123,505 7,741,293
Barnes Group, Inc. 245,563 10,669,712
Berkshire Grey, Inc. Class A (b) 216,162 1,279,679
Blue Bird Corp. (a) 85,231 1,725,075
Chart Industries, Inc. (a)(b) 185,676 32,409,746
Chicago Rivet & Machine Co. 758 19,496
CIRCOR International, Inc. (a) 109,564 2,952,750
Colfax Corp. (a) 670,671 31,145,961
Columbus McKinnon Corp. (NY Shares) 150,402 6,680,857
Commercial Vehicle Group, Inc. (a) 176,465 1,480,541
Crane Co. 260,505 25,149,153
Desktop Metal, Inc. (a)(b) 962,195 6,273,511
Donaldson Co., Inc. 651,010 36,736,494
Douglas Dynamics, Inc. 119,913 4,766,542
Eastern Co. 28,967 727,217
Energy Recovery, Inc. (a) 221,387 4,704,474
Enerpac Tool Group Corp. Class A 319,354 6,741,563
EnPro Industries, Inc. 110,413 11,262,126
ESCO Technologies, Inc. 139,026 11,363,985
Evoqua Water Technologies Corp. (a) 622,183 27,985,791
Federal Signal Corp. 321,643 13,647,312
Flowserve Corp. 671,110 20,119,878
Franklin Electric Co., Inc. 198,997 17,521,686
FreightCar America, Inc. (a)(b) 61,989 231,839
Gates Industrial Corp. PLC (a) 502,276 8,051,484
Gencor Industries, Inc. (a) 33,897 401,340
Gorman-Rupp Co. 106,673 4,611,474
Graco, Inc. 884,886 64,499,341
Graham Corp. 47,909 611,319
Helios Technologies, Inc. 166,699 16,724,911
Hillenbrand, Inc. 373,525 16,659,215
Hillman Solutions Corp. Class A (a)(b) 496,786 5,255,996
Hurco Companies, Inc. 30,713 925,383
Hydrofarm Holdings Group, Inc. (b) 186,436 6,152,388
Hyliion Holdings Corp. Class A (a)(b) 595,446 3,947,807
Hyster-Yale Materials Handling Class A 52,107 2,045,721
Hyzon Motors, Inc. Class A (b) 468,403 3,555,179
ITT, Inc. 446,862 42,264,208
John Bean Technologies Corp. 164,604 25,969,573
Kadant, Inc. 61,442 14,405,691
Kennametal, Inc. 430,134 15,213,840
L.B. Foster Co. Class A (a) 57,699 874,140
Lightning eMotors, Inc. (a)(b) 151,649 1,102,488
Lincoln Electric Holdings, Inc. 308,627 41,652,300
Lindsay Corp. 60,023 8,734,547
LiqTech International, Inc. (a)(b) 85,087 417,777
Manitex International, Inc. (a) 80,305 525,998
Manitowoc Co., Inc. (a) 189,840 3,618,350
Markforged Holding Corp. (a) 345,690 2,388,718
Mayville Engineering Co., Inc. (a)(b) 34,570 513,365
Meritor, Inc. (a) 386,966 9,786,370
Microvast Holdings, Inc. (a)(b) 1,236,636 10,499,040
Middleby Corp. (a) 288,401 50,377,887
Quarterly Report 26
Common Stocks – continuedShares Value ($)
INDUSTRIALS – continued
Machinery – continued
Miller Industries, Inc. 60,547 1,980,492
Mueller Industries, Inc. 296,624 16,412,206
Mueller Water Products, Inc. Class A 844,247 11,515,529
Nikola Corp. (a)(b) 1,055,619 10,788,426
NN, Inc. (a) 229,592 1,021,684
Nordson Corp. 280,827 71,383,415
Omega Flex, Inc. 15,769 1,860,427
Oshkosh Corp. 356,198 38,326,905
P&F Industries, Inc. Class A (a) 17,959 112,064
Park-Ohio Holdings Corp. 44,173 932,492
Perma-Pipe International Holdings, Inc. (a) 13,145 115,019
Proterra, Inc. Class A (a)(b) 936,428 10,497,358
Proto Labs, Inc. (a)(b) 143,960 7,215,275
RBC Bearings, Inc. (a)(b) 148,278 29,313,078
REV Group, Inc. 173,874 2,729,822
SPX Corp. (a) 233,062 13,552,555
SPX Flow, Inc. 210,985 17,619,357
Standex International Corp. 65,535 6,750,760
Taylor Devices, Inc. (a) 3,749 41,726
Tennant Co. 99,253 7,807,241
Terex Corp. 363,681 15,412,801
The Greenbrier Companies, Inc. 171,264 6,848,847
The L.S. Starrett Co. Class A (a) 20,103 187,963
The Shyft Group, Inc. 174,523 8,483,563
Timken Co. 360,694 23,744,486
Titan International, Inc. (a) 271,164 1,868,320
Toro Co. 557,123 56,024,289
Trinity Industries, Inc. 422,126 11,186,339
Twin Disc, Inc. (a) 41,081 492,150
Urban-Gro, Inc. (a)(b) 47,304 470,675
Wabash National Corp. 293,921 4,908,481
Watts Water Technologies, Inc. Class A 143,098 27,004,024
Welbilt, Inc. (a) 662,686 15,612,882
Woodward, Inc. 331,505 35,073,229
1,197,671,898
Marine - 0.1%
Eagle Bulk Shipping, Inc. 71,218 2,853,705
Genco Shipping & Trading Ltd. 166,036 2,558,615
Kirby Corp. (a) 311,074 16,244,284
Matson, Inc. 225,597 18,392,923
Pangaea Logistics Solutions Ltd. 80,375 307,033
40,356,560
Professional Services - 1.9%
Acacia Research Corp. (a) 207,454 1,016,525
Alight, Inc. Class A (a) 1,256,136 13,063,814
ASGN, Inc. (a) 274,658 33,420,385
Atlas Technical Consultants, Inc. (a)(b) 83,086 761,899
Barrett Business Services, Inc. 40,716 2,874,142
BGSF, Inc. 47,756 668,584
Booz Allen Hamilton Holding Corp. Class A 698,406 58,624,200
CACI International, Inc. Class A (a) 121,745 31,584,305
CBIZ, Inc. (a) 281,097 10,127,925
Clarivate Analytics PLC (a)(b) 1,936,932 45,207,993
CoStar Group, Inc. (a) 2,052,780 159,624,173
Common Stocks – continuedShares Value ($)
INDUSTRIALS – continued
Professional Services – continued
CRA International, Inc. 40,512 3,729,940
DLH Holdings Corp. (a) 7,741 102,181
Dun & Bradstreet Holdings, Inc. (a) 823,704 15,650,376
Exponent, Inc. 270,363 31,497,290
First Advantage Corp. 210,731 3,654,076
Forrester Research, Inc. (a) 61,737 3,484,436
Franklin Covey Co. (a) 60,786 2,673,368
FTI Consulting, Inc. (a) 174,783 25,534,048
Gee Group, Inc. (a)(b) 882,155 391,853
Heidrick & Struggles International, Inc. 104,251 4,500,516
Hill International, Inc. (a)(b) 204,032 414,185
Hirequest, Inc. 25,639 584,569
Hudson Global, Inc. (a) 7,307 210,442
Huron Consulting Group, Inc. (a) 118,885 5,431,856
ICF International, Inc. 89,782 8,685,511
Insperity, Inc. 183,722 21,263,984
KBR, Inc. 726,417 31,962,348
Kelly Services, Inc. Class A (non-vtg.) 176,542 2,976,498
Kforce, Inc. 103,506 7,931,665
Korn Ferry 286,350 20,829,099
LegalZoom.com, Inc. 104,246 1,877,470
Manpower, Inc. 276,631 24,794,437
ManTech International Corp. Class A 143,360 9,741,312
Mastech Digital, Inc. (a) 15,489 273,381
MISTRAS Group, Inc. (a) 94,209 750,846
RCM Technologies, Inc. (a) 43,713 344,021
Red Violet, Inc. (a)(b) 43,664 1,587,623
Resources Connection, Inc. 163,613 2,810,871
Science Applications Internati 296,836 24,901,572
ShiftPixy, Inc. (a)(b) 123,538 96,384
Skillsoft Corp. (a)(b) 314,965 3,697,689
Staffing 360 Solutions, Inc. (a)(b) 25,895 28,743
TransUnion Holding Co., Inc. 991,012 110,190,624
TriNet Group, Inc. (a) 208,859 20,948,558
TrueBlue, Inc. (a) 188,774 4,911,899
Upwork, Inc. (a) 625,566 23,308,589
Volt Information Sciences, Inc. (a)(b) 74,206 218,908
Willdan Group, Inc. (a)(b) 63,169 2,527,392
781,492,505
Road & Rail - 1.8%
AMERCO 51,317 36,155,906
ArcBest Corp. 134,874 13,902,812
Avis Budget Group, Inc. (a)(b) 245,488 67,408,550
Covenant Transport Group, Inc. Class A (a) 59,947 1,502,871
Daseke, Inc. (a) 330,374 3,188,109
Heartland Express, Inc. 263,839 4,416,665
HyreCar, Inc. (a)(b) 92,271 489,036
Knight-Swift Transportation Holdings, Inc. Class A 860,121 49,241,927
Landstar System, Inc. 198,853 33,516,673
Lyft, Inc. (a) 1,512,631 61,427,945
Marten Transport Ltd. 322,256 5,181,876
P.A.M. Transportation Services, Inc. 20,399 1,321,651
Patriot Transportation Holding, Inc. 5,715 55,550
Ryder System, Inc. 274,894 22,838,194
27 Quarterly Report
Schedule of Investments (Unaudited) − continued
Common Stocks – continuedShares Value ($)
INDUSTRIALS – continued
Road & Rail – continued
Saia, Inc. (a) 137,152 45,421,999
Schneider National, Inc. Class B 190,399 4,683,815
TuSimple Holdings, Inc. (b) 175,686 7,025,683
U.S. Xpress Enterprises, Inc. (a)(b) 111,948 879,911
U.S.A. Truck, Inc. (a) 35,416 611,988
Uber Technologies, Inc. (a) 8,428,255 320,273,690
Universal Logistics Holdings, Inc. 41,566 772,712
Werner Enterprises, Inc. 309,178 13,947,020
XPO Logistics, Inc. (a) 513,765 37,217,137
Yellow Corp. (a) 192,332 2,531,089
734,012,809
Trading Companies & Distributors - 0.9%
Air Lease Corp. Class A 547,151 22,208,859
Alta Equipment Group, Inc. (a) 129,497 1,891,951
Applied Industrial Technologies, Inc. 197,555 18,775,627
Beacon Roofing Supply, Inc. (a) 282,498 14,099,475
BlueLinx Corp. (a) 53,346 3,763,027
Boise Cascade Co. 211,809 13,731,577
Core & Main, Inc. (b) 184,028 4,900,666
Custom Truck One Source, Inc. Class A (a)(b) 253,887 1,909,230
DXP Enterprises, Inc. (a) 94,873 2,621,341
EVI Industries, Inc. (a) 28,979 989,053
GATX Corp. 176,902 17,424,847
Global Industrial Co. 86,580 3,468,395
GMS, Inc. (a) 235,533 13,159,229
H&E Equipment Services, Inc. 169,541 7,137,676
Herc Holdings, Inc. 128,232 21,857,144
Hudson Technologies, Inc. (a) 183,402 691,426
Huttig Building Products, Inc. (a)(b) 105,996 921,105
India Globalization Capital, Inc. (a)(b) 182,169 238,641
Karat Packaging, Inc. (a) 17,116 376,381
Lawson Products, Inc. (a) 46,826 2,253,735
McGrath RentCorp. 130,246 10,068,016
MRC Global, Inc. (a) 293,501 2,019,287
MSC Industrial Direct Co., Inc. Class A 233,214 18,353,942
NOW, Inc. (a) 552,992 4,623,013
Rush Enterprises, Inc. Class A 267,799 13,647,037
SiteOne Landscape Supply, Inc. (a) 231,287 55,592,143
Titan Machinery, Inc. (a) 104,030 3,457,957
Transcat, Inc. (a)(b) 38,907 3,461,556
Triton International Ltd. 340,597 19,063,214
Univar, Inc. (a) 876,471 22,709,364
Veritiv Corp. (a)(b) 73,137 9,218,187
Watsco, Inc. 171,073 50,074,778
WESCO International, Inc. (a) 235,179 29,192,769
Willis Lease Finance Corp. (a) 20,262 693,974
394,594,622
TOTAL INDUSTRIALS 5,732,560,144
INFORMATION TECHNOLOGY - 24.3%
Communications Equipment - 0.6%
ADTRAN, Inc. 259,072 5,279,887
Applied Optoelectronics, Inc. (a)(b) 140,669 831,354
Aviat Networks, Inc. (a) 51,719 1,620,873
Common Stocks – continuedShares Value ($)
INFORMATION TECHNOLOGY – continued
Communications Equipment – continued
BK Technologies Corp. 67,932 152,168
CalAmp Corp. (a) 184,519 1,693,884
Calix, Inc. (a) 277,857 18,605,305
Cambium Networks Corp. (a) 58,713 1,597,581
Casa Systems, Inc. (a) 186,784 932,052
Ciena Corp. (a) 798,146 48,072,334
Clearfield, Inc. (a) 59,892 3,877,408
ClearOne, Inc. (a) 68,406 95,084
CommScope Holding Co., Inc. (a) 1,021,110 10,170,256
Communications Systems, Inc. (b) 55,877 169,866
COMSovereign Holding Corp. (b) 206,343 222,850
Comtech Telecommunications Corp. 136,321 3,461,190
Digi International, Inc. (a) 183,676 3,954,544
DZS, Inc. (a) 82,365 1,067,450
EMCORE Corp. (a) 175,391 1,292,632
Extreme Networks, Inc. (a) 678,043 9,153,581
Franklin Wireless Corp. (a) 19,716 76,695
Genasys, Inc. (a)(b) 183,238 765,935
Harmonic, Inc. (a)(b) 535,820 5,760,065
Infinera Corp. (a)(b) 1,050,884 8,543,687
Inseego Corp. (a)(b) 418,038 2,700,525
KVH Industries, Inc. (a) 82,706 826,233
Lantronix, Inc. (a) 82,353 590,471
Lumentum Holdings, Inc. (a) 391,737 33,991,019
NETGEAR, Inc. (a)(b) 160,934 4,303,375
NetScout Systems, Inc. (a) 391,841 11,716,046
Network-1 Security Solutions, Inc. 44,772 125,809
Ondas Holdings, Inc. (b) 137,818 1,048,795
Optical Cable Corp. (a) 11,253 49,963
PC-Tel, Inc. 84,201 477,420
Plantronics, Inc. (a)(b) 219,211 5,594,265
Resonant, Inc. (a)(b) 338,628 707,733
Ribbon Communications, Inc. (a) 641,779 3,497,696
Tessco Technologies, Inc. (a) 29,899 158,465
Ubiquiti, Inc. 33,340 9,978,329
ViaSat, Inc. (a)(b) 376,852 16,690,775
Viavi Solutions, Inc. (a) 1,149,724 17,027,412
Vislink Technologies, Inc. (a)(b) 297,946 440,960
237,321,972
Electronic Equipment & Components - 1.6%
908 Devices, Inc. 71,592 1,718,208
ADDvantage Technologies Group, Inc. (a)(b) 11,707 22,009
Advanced Energy Industries, Inc. 198,708 17,424,705
Aeva Technologies, Inc. (a)(b) 481,524 4,791,164
Airgain, Inc. (a) 51,876 495,416
Akoustis Technologies, Inc. (a)(b) 238,224 1,653,275
AmpliTech Group, Inc. (a)(b) 70,462 257,891
Arlo Technologies, Inc. (a) 426,419 3,304,747
Arrow Electronics, Inc. (a) 372,194 45,277,400
Autoscope Technologies Corp. 31,320 211,723
Avnet, Inc. 497,990 18,062,097
Badger Meter, Inc. 149,678 15,321,040
Bel Fuse, Inc. Class B (non-vtg.) 60,725 731,129
Belden, Inc. 234,217 14,444,162
Quarterly Report 28
Common Stocks – continuedShares Value ($)
INFORMATION TECHNOLOGY – continued
Electronic Equipment & Components – continued
Benchmark Electronics, Inc. 192,992 4,550,751
Cemtrex, Inc. (a)(b) 101,303 103,329
ClearSign Combustion Corp. (a)(b) 158,767 263,553
Coda Octopus Group, Inc. (a)(b) 23,943 184,122
Cognex Corp. 920,854 71,135,972
Coherent, Inc. (a) 126,982 32,879,449
CPS Technologies Corp. (a)(b) 45,803 173,135
CTS Corp. 172,526 6,010,806
Daktronics, Inc. (a) 196,961 961,170
Data I/O Corp. (a) 27,378 128,403
Digital Ally, Inc. (a)(b) 343,088 384,259
Electro-Sensors, Inc. (a) 12,636 79,607
eMagin Corp. (a)(b) 343,570 553,148
ePlus, Inc. (a) 71,124 7,502,871
Evolv Technologies Holdings, Inc. (a)(b) 281,857 1,527,665
Fabrinet (a) 189,675 20,970,468
FARO Technologies, Inc. (a) 96,954 6,734,425
Frequency Electronics, Inc. (a) 20,488 199,963
Identiv, Inc. (a)(b) 114,266 2,626,975
II-VI, Inc. (a)(b) 545,031 34,080,788
Insight Enterprises, Inc. (a) 178,503 17,603,966
Intellicheck, Inc. (a)(b) 89,135 456,371
Iteris, Inc. (a) 209,517 951,207
Itron, Inc. (a) 232,816 14,413,639
Jabil, Inc. 757,382 44,276,552
KEY Tronic Corp. (a) 29,295 178,992
Kimball Electronics, Inc. (a) 133,402 2,830,790
Knowles Corp. (a) 460,274 9,997,151
LGL Group, Inc. (a) 6,067 72,440
LGL Group, Inc. warrants 11/16/25 (a) 6,067 4,853
LightPath Technologies, Inc. Class A (a)(b) 232,269 455,247
Littelfuse, Inc. 127,891 38,172,906
Luna Innovations, Inc. (a)(b) 162,134 1,357,062
Methode Electronics, Inc. Class A 205,283 9,128,935
MicroVision, Inc. (a)(b) 854,807 6,052,034
MICT, Inc. (a)(b) 547,286 552,759
Napco Security Technolgies, Inc. (a) 72,234 3,356,714
National Instruments Corp. 685,152 28,447,511
Neonode, Inc. (a)(b) 24,689 240,965
nLIGHT, Inc. (a) 224,123 5,578,421
Novanta, Inc. (a) 183,670 29,653,522
OSI Systems, Inc. (a) 88,814 8,075,857
Ouster, Inc. (b) 378,759 2,575,561
Par Technology Corp. (a)(b) 128,438 6,726,298
PC Connection, Inc. 60,397 2,647,804
Plexus Corp. (a) 143,384 12,064,330
Powerfleet, Inc. (a)(b) 190,789 1,163,813
Red Cat Holdings, Inc. (b) 144,520 313,608
Research Frontiers, Inc. (a)(b) 118,594 238,374
RF Industries Ltd. (a) 45,673 310,120
Richardson Electronics Ltd. 51,484 565,809
Rogers Corp. (a) 96,324 26,259,849
Sanmina Corp. (a) 328,564 12,005,729
ScanSource, Inc. (a) 136,114 4,253,563
Common Stocks – continuedShares Value ($)
INFORMATION TECHNOLOGY – continued
Electronic Equipment & Components – continued
Sigmatron International, Inc. (a) 11,221 89,768
Soluna Holdings, Inc. (a)(b) 37,164 446,340
Taitron Components, Inc. Class A (sub. vtg.) 12,619 50,981
TD SYNNEX Corp. 216,914 22,441,922
TTM Technologies, Inc. (a) 514,858 7,094,743
Universal Security Instruments, Inc. (a) 12,034 45,850
Velodyne Lidar, Inc. (a)(b) 510,949 2,820,438
VerifyMe, Inc. (a)(b) 32,138 105,413
Vishay Intertechnology, Inc. 664,373 13,533,278
Vishay Precision Group, Inc. (a) 67,486 2,316,794
Vontier Corp. 871,199 27,451,480
Wayside Technology Group, Inc. 15,096 489,110
Wireless Telecom Group, Inc. (a) 115,181 211,795
Wrap Technologies, Inc. (a)(b) 118,491 533,210
683,379,699
IT Services - 5.8%
Affirm Holdings, Inc. 483,412 61,238,632
ALJ Regional Holdings, Inc. (a)(b) 9,675 12,191
Alliance Data Systems Corp. 255,879 17,440,713
American Virtual Cloud Technologies, Inc. (a) 18,978 30,555
BigCommerce Holdings, Inc. (a)(b) 307,357 13,914,051
BM Technologies, Inc. (a)(b) 80,238 966,868
Brightcove, Inc. (a) 213,457 2,055,591
Cantaloupe, Inc. (a)(b) 309,298 2,789,868
Cass Information Systems, Inc. 64,347 2,584,176
Cloudflare, Inc. (a) 1,369,314 257,759,667
Computer Task Group, Inc. (a) 75,181 593,930
Concentrix Corp. 223,130 37,039,580
Conduent, Inc. (a) 864,569 4,357,428
Crexendo, Inc. (a) 7,104 36,230
CSG Systems International, Inc. 168,919 8,903,720
CSP, Inc. (a) 3,689 32,943
Cyxtera Technologies, Inc. Class A (a)(b) 149,886 1,485,370
Data Storage Corp. (a) 56,169 203,893
Digitalocean Holdings, Inc. 90,422 9,115,442
EPAM Systems, Inc. (a) 294,505 179,221,018
Euronet Worldwide, Inc. (a) 274,988 27,875,534
EVERTEC, Inc. 307,042 12,892,694
EVO Payments, Inc. Class A (a) 246,135 5,240,214
Exela Technologies, Inc. (a)(b) 658,388 836,153
ExlService Holdings, Inc. (a) 170,925 22,198,030
Fastly, Inc. Class A (a)(b) 552,986 22,539,709
Flywire Corp. 58,257 2,367,564
Genpact Ltd. 901,725 43,526,266
GoDaddy, Inc. (a) 876,743 61,521,056
GreenBox POS (a) 96,708 503,849
GreenSky, Inc. Class A (a) 351,688 3,988,142
Grid Dynamics Holdings, Inc. (a) 225,742 8,855,859
Hackett Group, Inc. 134,626 2,754,448
i3 Verticals, Inc. Class A (a)(b) 120,834 2,253,554
Information Services Group, Inc. 198,663 1,638,970
Innodata, Inc. (a)(b) 121,582 792,715
Inpixon (a)(b) 680,814 459,481
International Money Express, Inc. (a) 164,892 2,491,518
29 Quarterly Report
Schedule of Investments (Unaudited) − continued
Common Stocks – continuedShares Value ($)
INFORMATION TECHNOLOGY – continued
IT Services – continued
Kyndryl Holdings, Inc. 927,059 14,647,532
Limelight Networks, Inc. (a) 657,683 1,808,628
Liveramp Holdings, Inc. (a) 355,346 16,676,388
Marqeta, Inc. Class A (b) 439,713 8,644,758
Maximus, Inc. 317,698 23,970,314
MoneyGram International, Inc. (a) 474,217 2,812,107
MongoDB, Inc. Class A (a) 335,855 167,289,376
Okta, Inc. (a) 650,368 139,978,705
Paya Holdings, Inc. (a)(b) 420,994 2,711,201
Paymentus Holdings, Inc. (b) 54,414 1,608,478
Payoneer Global, Inc. 1,018,332 7,892,073
Paysign, Inc. (a) 191,197 346,067
Perficient, Inc. (a) 169,466 23,221,926
PFSweb, Inc. (a) 93,038 1,138,785
Priority Technology Holdings, Inc. (a)(b) 33,551 216,739
Rackspace Technology, Inc. (a)(b) 322,130 4,593,574
Repay Holdings Corp. (a)(b) 391,046 6,397,513
Research Solutions, Inc. (a) 32,200 72,772
Sabre Corp. (a)(b) 1,658,102 12,485,508
ServiceSource International, Inc. (a) 431,982 470,860
Shift4 Payments, Inc. (a)(b) 245,076 12,748,854
Snowflake Computing, Inc. (a) 1,185,548 403,264,152
SolarWinds, Inc. (b) 224,729 3,236,098
Square, Inc. (a) 2,066,889 430,594,985
Squarespace, Inc. Class A (a) 148,793 4,889,338
StarTek, Inc. (a) 59,598 239,584
Steel Connect, Inc. (a) 124,142 196,144
Switch, Inc. Class A 655,634 17,931,590
TaskUs, Inc. 142,792 6,361,384
The Glimpse Group, Inc. (b) 5,463 67,468
The OLB Group, Inc. (a)(b) 17,806 76,388
Ttec Holdings, Inc. 95,793 8,083,971
Tucows, Inc. (a)(b) 50,295 4,090,492
Twilio, Inc. Class A (a) 868,044 248,390,791
Unisys Corp. (a) 356,028 6,465,468
Usio, Inc. (a) 89,256 671,205
Verra Mobility Corp. (a) 718,933 10,345,446
WEX, Inc. (a) 233,253 29,487,844
WidePoint Corp. (a)(b) 42,670 190,308
2,446,832,436
Semiconductors & Semiconductor Equipment -3.5%
ACM Research, Inc. (a)(b) 63,806 5,577,921
AEHR Test Systems (a) 110,308 1,921,565
Allegro MicroSystems LLC (a) 290,854 9,083,370
Alpha & Omega Semiconductor Ltd. (a) 112,232 5,512,836
Ambarella, Inc. (a) 188,384 33,818,696
Amkor Technology, Inc. 526,529 11,351,965
Amtech Systems, Inc. (a) 63,669 630,323
Atomera, Inc. (a)(b) 110,797 2,669,100
Axcelis Technologies, Inc. (a) 176,880 10,934,722
AXT, Inc. (a)(b) 219,479 1,804,117
Brooks Automation, Inc. 386,925 43,761,218
CEVA, Inc. (a) 122,281 5,392,592
Common Stocks – continuedShares Value ($)
INFORMATION TECHNOLOGY – continued
Semiconductors & Semiconductor Equipment –continued
Cirrus Logic, Inc. (a) 295,094 23,660,637
CMC Materials, Inc. 151,346 20,098,749
Cohu, Inc. (a) 257,335 8,484,335
CVD Equipment Corp. (a) 12,659 55,826
CyberOptics Corp. (a) 37,837 1,632,667
Diodes, Inc. (a) 231,666 24,637,679
DSP Group, Inc. (a) 116,817 2,568,806
Entegris, Inc. 705,669 103,084,128
Everspin Technologies, Inc. (a) 67,767 819,303
First Solar, Inc. (a) 513,723 53,221,703
FormFactor, Inc. (a) 406,148 17,025,724
GSI Technology, Inc. (a)(b) 80,106 450,196
Ichor Holdings Ltd. (a) 151,444 7,252,653
Impinj, Inc. (a)(b) 96,266 7,217,062
indie Semiconductor, Inc. (b) 261,276 3,587,319
Intest Corp. (a)(b) 49,780 708,369
Kopin Corp. (a) 418,197 2,182,988
Kulicke & Soffa Industries, Inc. (b) 321,656 18,546,685
Lattice Semiconductor Corp. (a) 711,590 54,031,029
MACOM Technology Solutions Holdings, Inc. (a) 249,416 17,935,505
Marvell Technology, Inc. 4,259,389 303,140,715
MaxLinear, Inc. Class A (a) 366,112 24,650,321
Meta Materials, Inc. (a)(b) 1,211,300 4,445,471
MKS Instruments, Inc. 288,192 43,851,295
MoSys, Inc. (a) 31,585 123,182
NeoPhotonics Corp. (a) 266,934 4,102,776
NVE Corp. 25,045 1,684,777
ON Semiconductor Corp. (a) 2,238,153 137,489,739
Onto Innovation, Inc. (a) 256,786 24,178,970
PDF Solutions, Inc. (a) 151,515 4,534,844
Photronics, Inc. (a) 336,626 4,446,829
Pixelworks, Inc. (a) 250,526 1,300,230
Power Integrations, Inc. 314,456 31,455,034
QuickLogic Corp. (a)(b) 58,968 336,707
Rambus, Inc. (a) 555,528 14,943,703
Rubicon Technology, Inc. (a) 8,459 80,783
Semtech Corp. (a) 337,628 28,924,591
Silicon Laboratories, Inc. (a) 209,890 41,195,110
SiTime Corp. (a) 77,177 23,035,791
SkyWater Technology, Inc. (b) 36,097 675,375
SMART Global Holdings, Inc. (a) 115,938 6,610,785
SolarEdge Technologies, Inc. (a) 272,016 89,155,964
Summit Wireless Technologies, Inc. (a)(b) 73,605 133,961
SunPower Corp. (a)(b) 430,654 12,338,237
Synaptics, Inc. (a) 182,634 51,546,620
Trio-Tech International (a)(b) 7,747 67,941
Ultra Clean Holdings, Inc. (a) 236,929 12,986,078
Universal Display Corp. 226,201 32,358,053
Veeco Instruments, Inc. (a)(b) 270,101 7,179,285
Wolfspeed, Inc. (a)(b) 601,213 73,720,738
1,480,353,693
Software - 12.4%
8x8, Inc. (a) 582,137 12,545,052
Quarterly Report 30
Common Stocks – continuedShares Value ($)
INFORMATION TECHNOLOGY – continued
Software – continued
A10 Networks, Inc. 320,979 4,949,496
ACI Worldwide, Inc. (a) 604,475 17,614,402
Agilysys, Inc. (a) 107,154 4,666,557
Alarm.com Holdings, Inc. (a) 240,227 19,167,712
Alfi, Inc. (b) 19,411 73,374
Altair Engineering, Inc. Class A (a) 245,545 18,280,825
Alteryx, Inc. Class A (a) 308,949 20,535,840
American Software, Inc. Class A 161,031 3,671,507
Anaplan, Inc. (a) 753,816 32,270,863
AppFolio, Inc. (a) 98,548 11,874,049
Appian Corp. Class A (a)(b) 206,905 15,383,387
AppLovin Corp. 141,328 12,876,394
Asana, Inc. (a) 405,761 42,178,856
Aspen Technology, Inc. (a) 353,022 51,198,781
Asure Software, Inc. (a) 84,445 724,538
Auddia, Inc. (b) 36,737 78,985
AudioEye, Inc. (a)(b) 29,417 227,982
Avalara, Inc. (a) 450,338 62,903,212
Avaya Holdings Corp. (a) 427,887 8,330,960
AvePoint, Inc. (a)(b) 466,377 3,222,665
Aware, Inc. (a) 24,042 71,164
Benefitfocus, Inc. (a)(b) 155,301 1,562,328
Bentley Systems, Inc. Class B 954,329 45,798,249
Bill.Com Holdings, Inc. (a) 458,750 128,839,938
Bio-Key International, Inc. (a)(b) 63,586 158,329
Black Knight, Inc. (a) 814,302 58,198,164
Blackbaud, Inc. (a)(b) 216,307 16,322,526
BlackLine, Inc. (a) 276,882 30,470,864
Blend Labs, Inc. (b) 112,512 1,287,137
Bottomline Technologies, Inc. (a) 207,693 9,312,954
Box, Inc. Class A (a) 787,764 18,441,555
Bridgeline Digital, Inc. (a)(b) 30,797 81,920
BSQUARE Corp. (a)(b) 60,041 116,480
BTRS Holdings, Inc. (a) 383,969 2,864,409
C3.Ai, Inc. (b) 364,689 13,478,905
CCC Intelligent Solutions Holdings, Inc. Class A (a)(b) 330,815 4,250,973
CDK Global, Inc. 623,786 24,103,091
Cerence, Inc. (a)(b) 198,065 14,890,527
ChannelAdvisor Corp. (a) 161,541 4,040,140
Cleanspark, Inc. (a)(b) 179,102 3,184,434
Clear Secure, Inc. 74,018 2,350,812
CommVault Systems, Inc. (a) 237,145 14,911,678
Confluent, Inc. 143,471 11,193,607
Consensus Cloud Solutions, Inc. 81,558 5,108,793
Couchbase, Inc. (b) 44,108 1,457,769
Coupa Software, Inc. (a) 382,817 75,284,791
Crowdstrike Holdings, Inc. (a) 1,036,112 224,981,360
CS Disco, Inc. (b) 65,578 2,406,713
Datadog, Inc. Class A (a) 1,246,350 222,211,742
DatChat, Inc. (b) 15,813 60,248
Datto Holding Corp. (a)(b) 140,058 3,285,761
Digimarc Corp. (a)(b) 74,007 3,174,900
Digital Turbine, Inc. (a) 456,522 24,223,057
DocuSign, Inc. (a) 1,013,100 249,587,316
Common Stocks – continuedShares Value ($)
INFORMATION TECHNOLOGY – continued
Software – continued
Dolby Laboratories, Inc. Class A 341,069 28,448,565
Domo, Inc. Class B (a) 147,772 10,691,304
Dropbox, Inc. Class A (a) 1,488,572 36,633,757
Duck Creek Technologies, Inc. (a) 392,470 11,220,717
Duos Technologies Group, Inc. (a)(b) 2,422 11,262
Dynatrace, Inc. (a) 1,023,270 64,312,520
E2open Parent Holdings, Inc. (a)(b) 901,722 10,982,974
Ebix, Inc. 130,357 3,983,710
eGain Communications Corp. (a) 119,757 1,257,449
Elastic NV (a) 372,023 57,834,696
Envestnet, Inc. (a) 282,697 21,674,379
Everbridge, Inc. (a) 199,594 22,637,951
EverCommerce, Inc. (b) 106,168 1,728,415
Evolving Systems, Inc. (a) 38,879 92,143
Fair Isaac Corp. (a) 147,232 51,992,036
Five9, Inc. (a) 351,638 50,048,637
Greenidge Generation Holdings, Inc. 5,202 100,815
GSE Systems, Inc. (a)(b) 32,533 42,618
GTY Technology Holdings, Inc. (a)(b) 250,258 1,646,698
Guidewire Software, Inc. (a) 431,696 50,223,513
HubSpot, Inc. (a) 232,113 187,294,301
Intapp, Inc. (b) 57,996 1,588,510
Intelligent Systems Corp. (a)(b) 35,768 1,450,750
InterDigital, Inc. 157,814 10,717,149
Intrusion, Inc. (a)(b) 73,310 260,984
Inuvo, Inc. (a)(b) 483,368 294,903
Issuer Direct Corp. (a)(b) 16,252 496,499
Jamf Holding Corp. (a)(b) 281,472 9,071,843
Kaltura, Inc. 80,573 381,916
Kaspien Holdings, Inc. (a) 3,780 49,140
KnowBe4, Inc. (a) 160,012 3,609,871
Latch, Inc. (b) 476,117 3,942,249
LivePerson, Inc. (a)(b) 332,521 12,855,262
Livevox Holdings, Inc. (a)(b) 61,581 293,126
Mandiant, Inc. (a) 1,229,668 20,867,466
Manhattan Associates, Inc. (a) 330,426 51,599,324
Marathon Digital Holdings, Inc. (a)(b) 517,417 26,424,486
Marin Software, Inc. (a)(b) 72,957 377,188
Matterport, Inc. (b) 956,414 30,968,685
McAfee Corp. 375,894 9,716,860
MeridianLink, Inc. 69,945 1,542,287
MicroStrategy, Inc. Class A (a)(b) 40,424 29,163,086
Mimecast Ltd. (a) 315,990 25,595,190
Mitek Systems, Inc. (a)(b) 232,176 3,977,175
Model N, Inc. (a)(b) 164,573 4,624,501
Momentive Global, Inc. (a) 660,085 13,485,537
Mullen Automotive, Inc. (a)(b) 30,650 242,748
N-able, Inc. (b) 358,099 4,225,568
nCino, Inc. (a)(b) 294,776 18,311,485
NCR Corp. (a) 683,547 26,589,978
NetSol Technologies, Inc. (a) 62,535 250,765
New Relic, Inc. (a) 302,943 33,575,173
Nuance Communications, Inc. (a) 1,485,335 82,421,239
Nutanix, Inc. Class A (a) 1,061,674 35,268,810
31 Quarterly Report
Schedule of Investments (Unaudited) − continued
Common Stocks – continuedShares Value ($)
INFORMATION TECHNOLOGY – continued
Software – continued
NXT-ID, Inc. (a)(b) 23,337 68,377
Oblong, Inc. (a) 73,548 91,200
Olo, Inc. (b) 147,222 3,615,772
ON24, Inc. 42,803 678,000
Onespan, Inc. (a) 179,020 3,059,452
Pagerduty, Inc. (a) 385,723 13,673,880
Palantir Technologies, Inc. (a) 8,148,747 168,271,626
Palo Alto Networks, Inc. (a) 505,771 276,626,391
Park City Group, Inc. (a)(b) 67,939 397,443
Paycor HCM, Inc. 167,670 4,936,205
Paylocity Holding Corp. (a) 205,553 51,869,244
Pegasystems, Inc. 213,362 24,498,225
Phunware, Inc. (a)(b) 328,375 955,571
Ping Identity Holding Corp. (a) 301,772 7,185,191
Progress Software Corp. 226,436 10,970,824
PROS Holdings, Inc. (a) 213,226 7,744,368
Q2 Holdings, Inc. (a) 293,615 23,577,285
Qualtrics International, Inc. 483,605 15,649,458
Qualys, Inc. (a) 172,831 22,518,151
Quantum Computing, Inc. (a)(b) 99,526 527,488
Qumu Corp. (a) 75,054 150,859
Rapid7, Inc. (a) 288,624 35,806,693
RealNetworks, Inc. (a) 166,573 201,553
Rekor Systems, Inc. (a)(b) 174,767 1,174,434
Rimini Street, Inc. (a) 174,538 1,153,696
RingCentral, Inc. (a) 423,087 91,378,330
Riot Blockchain, Inc. (a)(b) 429,078 16,034,645
SailPoint Technologies Holding, Inc. (a)(b) 481,788 25,337,231
SeaChange International, Inc. (a) 356,359 264,133
SecureWorks Corp. (a) 52,150 926,184
Semrush Holdings, Inc. (b) 56,978 1,169,189
SentinelOne, Inc. (b) 188,925 10,196,282
ShotSpotter, Inc. (a)(b) 45,526 1,598,873
SilverSun Technologies, Inc. (A Shares) 17,012 80,467
Smartsheet, Inc. (a) 653,225 41,806,400
Smith Micro Software, Inc. (a)(b) 243,505 1,334,407
Splunk, Inc. (a) 851,319 103,009,599
Sprinklr, Inc. (b) 84,698 1,222,192
Sprout Social, Inc. (a) 235,123 26,258,537
SPS Commerce, Inc. (a) 186,567 26,304,081
SRAX, Inc. (a) 117,088 614,712
SRAX, Inc. rights 12/31/20 (a)(c) 34,667 6,240
SS&C Technologies Holdings, Inc. 1,155,740 88,217,634
Sumo Logic, Inc. (a) 444,360 6,283,250
Synchronoss Technologies, Inc. (a) 205,296 554,299
Telos Corp. 270,472 4,259,934
Tenable Holdings, Inc. (a) 472,277 23,330,484
Teradata Corp. (a) 566,673 24,604,942
The Trade Desk, Inc. (a) 2,257,870 233,508,915
UiPath, Inc. Class A (a)(b) 1,331,314 64,235,901
Unity Software, Inc. (a)(b) 822,996 141,876,280
Upland Software, Inc. (a) 138,577 2,713,338
Varonis Systems, Inc. (a)(b) 558,877 28,955,417
Verb Technology Co., Inc. (a)(b) 352,790 539,769
Common Stocks – continuedShares Value ($)
INFORMATION TECHNOLOGY – continued
Software – continued
Verint Systems, Inc. (a) 335,936 15,987,194
Veritone, Inc. (a)(b) 150,630 3,862,153
Vertex, Inc. Class A (a)(b) 146,405 2,676,283
Viant Technology, Inc. 67,705 663,509
VirnetX Holding Corp. (a)(b) 334,264 1,002,792
VMware, Inc. Class A (a) 1,053,420 122,976,251
Vonage Holdings Corp. (a) 1,297,764 26,759,894
Workday, Inc. Class A (a) 983,138 269,605,934
Workiva, Inc. (a) 223,521 31,174,474
Xperi Holding Corp. 538,574 9,651,246
Yext, Inc. (a) 590,153 5,700,878
Zendesk, Inc. (a) 623,947 63,711,228
Zeta Global Holdings Corp. (b) 115,214 959,733
Zix Corp. (a) 308,136 2,609,912
Zoom Video Communications, Inc. Class A (a) 1,124,171 237,660,991
Zscaler, Inc. (a) 405,603 140,732,073
Zuora, Inc. (a) 571,954 11,330,409
5,226,674,289
Technology Hardware, Storage & Peripherals -0.4%
3D Systems Corp. (a)(b) 651,693 14,845,567
Astro-Med, Inc. (a) 35,848 592,567
Avid Technology, Inc. (a) 184,843 5,926,067
Boxlight Corp. (a)(b) 262,027 408,762
Corsair Gaming, Inc. (a)(b) 170,766 3,825,158
CPI Card Group (a)(b) 18,366 375,952
Dell Technologies, Inc. (a) 1,428,514 80,668,186
Diebold Nixdorf, Inc. (a) 372,332 3,019,613
Eastman Kodak Co. (a)(b) 342,341 2,050,623
Immersion Corp. (a)(b) 131,636 791,132
Intevac, Inc. (a) 144,334 610,533
Moving Image Technologies, Inc. (b) 35,978 73,035
One Stop Systems, Inc. (a)(b) 70,320 358,632
Pure Storage, Inc. Class A (a) 1,385,348 42,904,228
Quantum Corp. (a) 326,653 1,786,792
Socket Mobile, Inc. (a)(b) 29,582 152,347
Sonim Technologies, Inc. (a)(b) 44,987 64,781
Super Micro Computer, Inc. (a) 227,803 9,431,044
Transact Technologies, Inc. (a) 30,061 331,873
Turtle Beach Corp. (a)(b) 85,852 2,300,834
Xerox Holdings Corp. 765,633 14,102,960
184,620,686
TOTAL INFORMATION TECHNOLOGY 10,259,182,775
MATERIALS - 3.5%
Chemicals - 1.5%
Advanced Emissions Solutions, Inc. (a) 96,705 618,912
AdvanSix, Inc. 149,114 6,753,373
AgroFresh Solutions, Inc. (a)(b) 114,670 206,406
American Vanguard Corp. 142,946 2,045,557
Amyris, Inc. (a)(b) 962,154 6,600,376
Ashland Global Holdings, Inc. 290,378 29,348,504
Avient Corp. 465,734 25,620,027
Axalta Coating Systems Ltd. (a) 1,113,195 33,752,072
Quarterly Report 32
Common Stocks – continuedShares Value ($)
MATERIALS – continued
Chemicals – continued
Balchem Corp. 165,434 26,138,572
Cabot Corp. 302,206 15,859,771
Chase Corp. 39,047 3,849,644
Core Molding Technologies, Inc. (a) 33,917 306,949
Crown ElectroKinetics Corp. (a)(b) 73,156 261,167
Danimer Scientific, Inc. (a)(b) 378,353 5,047,229
Diversey Holdings Ltd. 243,799 3,213,271
Ecovyst, Inc. 275,690 2,638,353
Element Solutions, Inc. 1,123,608 25,696,915
Ferro Corp. (a) 410,254 8,664,564
Flotek Industries, Inc. (a)(b) 330,605 247,094
FutureFuel Corp. 143,532 1,082,231
GCP Applied Technologies, Inc. (a) 265,051 6,186,290
H.B. Fuller Co. 264,910 19,380,816
Hawkins, Inc. 103,295 3,427,328
Huntsman Corp. 1,077,386 34,142,362
Ikonics Corp. (a) 5,763 192,311
Ingevity Corp. (a) 199,120 14,318,719
Innospec, Inc. 131,770 10,699,724
Intrepid Potash, Inc. (a) 55,579 2,284,297
Koppers Holdings, Inc. (a)(b) 112,672 3,402,694
Kraton Performance Polymers, Inc. (a) 170,567 7,856,316
Kronos Worldwide, Inc. 121,549 1,701,686
Livent Corp. (a)(b) 853,026 25,838,158
Loop Industries, Inc. (a) 119,036 1,623,651
LSB Industries, Inc. 153,873 1,386,396
Marrone Bio Innovations, Inc. (a) 580,260 409,431
Minerals Technologies, Inc. 180,770 11,871,166
NewMarket Corp. 35,609 11,797,262
Northern Technologies International Corp. 39,977 603,653
Olin Corp. 746,622 40,578,906
Origin Materials, Inc. Class A (a)(b) 600,793 4,079,384
Orion Engineered Carbons SA (a) 318,560 5,590,728
PureCycle Technologies, Inc. 388,622 4,780,051
Quaker Houghton 69,086 15,741,245
Rayonier Advanced Materials, Inc. (a) 296,673 1,625,768
RPM International, Inc. 669,187 60,922,784
Sensient Technologies Corp. 212,785 20,701,853
Stepan Co. 110,708 12,477,899
The Chemours Co. LLC 846,758 25,148,713
The Scotts Miracle-Gro Co. Class A 210,178 30,452,690
Trecora Resources (a) 108,517 929,991
Tredegar Corp. 135,194 1,487,134
Trinseo PLC 207,602 9,805,042
Tronox Holdings PLC 596,538 13,117,871
Valhi, Inc. 13,060 344,523
Valvoline, Inc. 925,237 31,522,825
Westlake Chemical Corp. 169,878 15,785,064
Zymergen, Inc. 76,705 694,947
650,860,665
Construction Materials - 0.1%
Eagle Materials, Inc. 217,419 33,530,358
Forterra, Inc. (a) 156,980 3,734,554
Smith-Midland Corp. (a)(b) 16,883 624,671
Common Stocks – continuedShares Value ($)
MATERIALS – continued
Construction Materials – continued
Summit Materials, Inc. (a) 606,224 22,612,155
United States Lime & Minerals, Inc. 11,610 1,383,332
61,885,070
Containers & Packaging - 0.7%
Aptargroup, Inc. 341,326 40,819,176
Berry Global Group, Inc. (a) 698,726 48,247,030
Crown Holdings, Inc. 679,306 71,870,575
Graphic Packaging Holding Co. 1,449,760 28,618,262
Greif, Inc.:
Class A 129,164 7,837,672
Class B 42,725 2,528,038
Myers Industries, Inc. 189,822 3,697,733
O-I Glass, Inc. (a) 814,640 9,018,065
Pactiv Evergreen, Inc. 219,377 2,722,469
Ranpak Holdings Corp. (A Shares) (a) 213,206 8,449,354
Silgan Holdings, Inc. 420,992 17,458,538
Sonoco Products Co. 498,954 29,004,196
TriMas Corp. 228,736 7,575,736
UFP Technologies, Inc. (a) 37,173 2,485,759
280,332,603
Metals & Mining - 1.0%
Alcoa Corp. 966,716 44,981,295
Allegheny Technologies, Inc. (a) 688,026 9,797,490
Alpha Metallurgical Resources (a) 91,557 4,265,641
Ampco-Pittsburgh Corp. (a)(b) 61,724 309,854
Arconic Corp. (a) 556,666 14,874,116
Carpenter Technology Corp. 258,788 7,111,494
Century Aluminum Co. (a) 276,193 3,654,033
Cleveland-Cliffs, Inc. (a) 2,359,300 48,011,755
Coeur d'Alene Mines Corp. (a)(b) 1,306,109 7,314,210
Commercial Metals Co. 610,202 18,855,242
Compass Minerals International, Inc. 178,568 8,687,333
Comstock Mining, Inc. (a)(b) 196,432 331,970
Friedman Industries 35,132 360,454
Gatos Silver, Inc. (a) 234,766 3,171,689
Gold Resource Corp. 379,229 728,120
Golden Minerals Co. (a)(b) 543,934 223,013
Haynes International, Inc. 67,408 2,701,039
Hecla Mining Co. 2,758,135 15,280,068
Hycroft Mining Holding Corp. (a)(b) 196,162 147,200
Kaiser Aluminum Corp. 84,686 7,556,532
Materion Corp. 106,720 9,034,915
McEwen Mining, Inc. (a) 1,744,556 1,727,110
MP Materials Corp. (a)(b) 387,483 17,026,003
Olympic Steel, Inc. 48,950 996,133
Paramount Gold Nevada Corp. (a) 22,322 16,072
Ramaco Resources, Inc. (a)(b) 55,585 675,914
Reliance Steel & Aluminum Co. 326,644 48,549,098
Royal Gold, Inc. 338,109 33,821,043
Ryerson Holding Corp. 90,246 2,114,464
Schnitzer Steel Industries, Inc. Class A 144,412 6,946,217
Solitario Exploration & Royalty Corp. (a)(b) 221,496 103,572
Steel Dynamics, Inc. 998,184 59,691,403
SunCoke Energy, Inc. 437,241 2,662,798
33 Quarterly Report
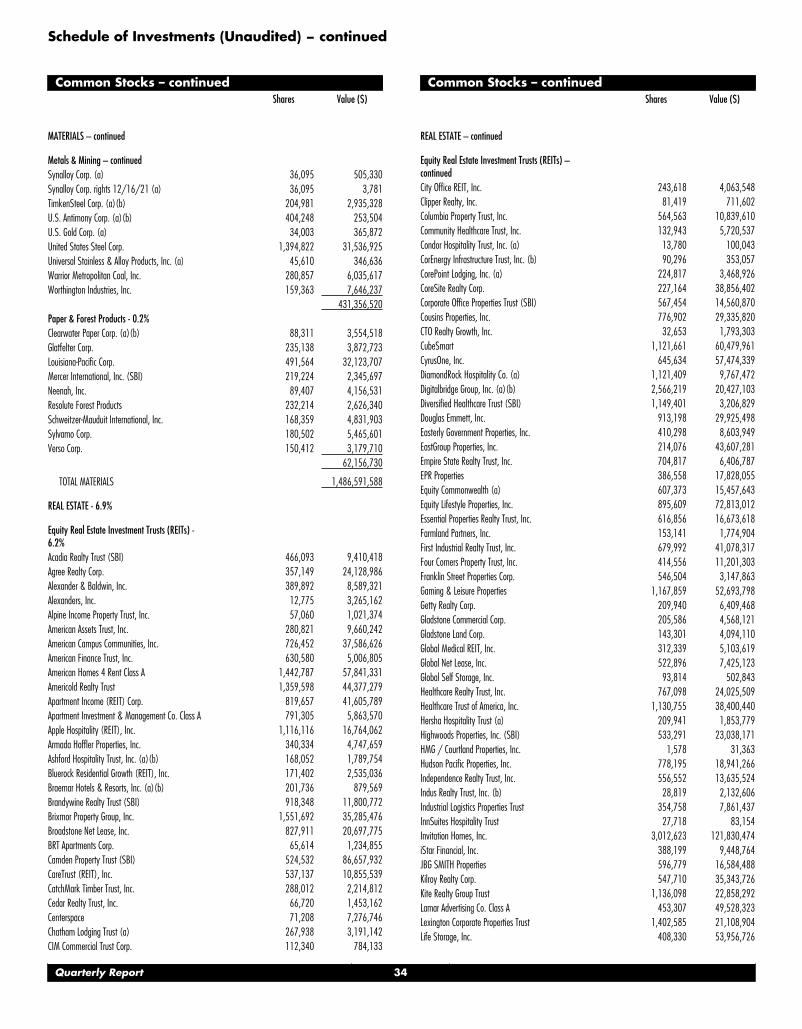
Schedule of Investments (Unaudited) − continued
Common Stocks – continuedShares Value ($)
MATERIALS – continued
Metals & Mining – continued
Synalloy Corp. (a) 36,095 505,330
Synalloy Corp. rights 12/16/21 (a) 36,095 3,781
TimkenSteel Corp. (a)(b) 204,981 2,935,328
U.S. Antimony Corp. (a)(b) 404,248 253,504
U.S. Gold Corp. (a) 34,003 365,872
United States Steel Corp. 1,394,822 31,536,925
Universal Stainless & Alloy Products, Inc. (a) 45,610 346,636
Warrior Metropolitan Coal, Inc. 280,857 6,035,617
Worthington Industries, Inc. 159,363 7,646,237
431,356,520
Paper & Forest Products - 0.2%
Clearwater Paper Corp. (a)(b) 88,311 3,554,518
Glatfelter Corp. 235,138 3,872,723
Louisiana-Pacific Corp. 491,564 32,123,707
Mercer International, Inc. (SBI) 219,224 2,345,697
Neenah, Inc. 89,407 4,156,531
Resolute Forest Products 232,214 2,626,340
Schweitzer-Mauduit International, Inc. 168,359 4,831,903
Sylvamo Corp. 180,502 5,465,601
Verso Corp. 150,412 3,179,710
62,156,730
TOTAL MATERIALS 1,486,591,588
REAL ESTATE - 6.9%
Equity Real Estate Investment Trusts (REITs) -6.2%
Acadia Realty Trust (SBI) 466,093 9,410,418
Agree Realty Corp. 357,149 24,128,986
Alexander & Baldwin, Inc. 389,892 8,589,321
Alexanders, Inc. 12,775 3,265,162
Alpine Income Property Trust, Inc. 57,060 1,021,374
American Assets Trust, Inc. 280,821 9,660,242
American Campus Communities, Inc. 726,452 37,586,626
American Finance Trust, Inc. 630,580 5,006,805
American Homes 4 Rent Class A 1,442,787 57,841,331
Americold Realty Trust 1,359,598 44,377,279
Apartment Income (REIT) Corp. 819,657 41,605,789
Apartment Investment & Management Co. Class A 791,305 5,863,570
Apple Hospitality (REIT), Inc. 1,116,116 16,764,062
Armada Hoffler Properties, Inc. 340,334 4,747,659
Ashford Hospitality Trust, Inc. (a)(b) 168,052 1,789,754
Bluerock Residential Growth (REIT), Inc. 171,402 2,535,036
Braemar Hotels & Resorts, Inc. (a)(b) 201,736 879,569
Brandywine Realty Trust (SBI) 918,348 11,800,772
Brixmor Property Group, Inc. 1,551,692 35,285,476
Broadstone Net Lease, Inc. 827,911 20,697,775
BRT Apartments Corp. 65,614 1,234,855
Camden Property Trust (SBI) 524,532 86,657,932
CareTrust (REIT), Inc. 537,137 10,855,539
CatchMark Timber Trust, Inc. 288,012 2,214,812
Cedar Realty Trust, Inc. 66,720 1,453,162
Centerspace 71,208 7,276,746
Chatham Lodging Trust (a) 267,938 3,191,142
CIM Commercial Trust Corp. 112,340 784,133
Common Stocks – continuedShares Value ($)
REAL ESTATE – continued
Equity Real Estate Investment Trusts (REITs) –continued
City Office REIT, Inc. 243,618 4,063,548
Clipper Realty, Inc. 81,419 711,602
Columbia Property Trust, Inc. 564,563 10,839,610
Community Healthcare Trust, Inc. 132,943 5,720,537
Condor Hospitality Trust, Inc. (a) 13,780 100,043
CorEnergy Infrastructure Trust, Inc. (b) 90,296 353,057
CorePoint Lodging, Inc. (a) 224,817 3,468,926
CoreSite Realty Corp. 227,164 38,856,402
Corporate Office Properties Trust (SBI) 567,454 14,560,870
Cousins Properties, Inc. 776,902 29,335,820
CTO Realty Growth, Inc. 32,653 1,793,303
CubeSmart 1,121,661 60,479,961
CyrusOne, Inc. 645,634 57,474,339
DiamondRock Hospitality Co. (a) 1,121,409 9,767,472
Digitalbridge Group, Inc. (a)(b) 2,566,219 20,427,103
Diversified Healthcare Trust (SBI) 1,149,401 3,206,829
Douglas Emmett, Inc. 913,198 29,925,498
Easterly Government Properties, Inc. 410,298 8,603,949
EastGroup Properties, Inc. 214,076 43,607,281
Empire State Realty Trust, Inc. 704,817 6,406,787
EPR Properties 386,558 17,828,055
Equity Commonwealth (a) 607,373 15,457,643
Equity Lifestyle Properties, Inc. 895,609 72,813,012
Essential Properties Realty Trust, Inc. 616,856 16,673,618
Farmland Partners, Inc. 153,141 1,774,904
First Industrial Realty Trust, Inc. 679,992 41,078,317
Four Corners Property Trust, Inc. 414,556 11,201,303
Franklin Street Properties Corp. 546,504 3,147,863
Gaming & Leisure Properties 1,167,859 52,693,798
Getty Realty Corp. 209,940 6,409,468
Gladstone Commercial Corp. 205,586 4,568,121
Gladstone Land Corp. 143,301 4,094,110
Global Medical REIT, Inc. 312,339 5,103,619
Global Net Lease, Inc. 522,896 7,425,123
Global Self Storage, Inc. 93,814 502,843
Healthcare Realty Trust, Inc. 767,098 24,025,509
Healthcare Trust of America, Inc. 1,130,755 38,400,440
Hersha Hospitality Trust (a) 209,941 1,853,779
Highwoods Properties, Inc. (SBI) 533,291 23,038,171
HMG / Courtland Properties, Inc. 1,578 31,363
Hudson Pacific Properties, Inc. 778,195 18,941,266
Independence Realty Trust, Inc. 556,552 13,635,524
Indus Realty Trust, Inc. (b) 28,819 2,132,606
Industrial Logistics Properties Trust 354,758 7,861,437
InnSuites Hospitality Trust 27,718 83,154
Invitation Homes, Inc. 3,012,623 121,830,474
iStar Financial, Inc. 388,199 9,448,764
JBG SMITH Properties 596,779 16,584,488
Kilroy Realty Corp. 547,710 35,343,726
Kite Realty Group Trust 1,136,098 22,858,292
Lamar Advertising Co. Class A 453,307 49,528,323
Lexington Corporate Properties Trust 1,402,585 21,108,904
Life Storage, Inc. 408,330 53,956,726
Quarterly Report 34

Common Stocks – continuedShares Value ($)
REAL ESTATE – continued
Equity Real Estate Investment Trusts (REITs) –continued
LTC Properties, Inc. 212,868 6,760,688
Mack-Cali Realty Corp. (a) 392,625 6,560,764
Medalist Diversified (REIT), Inc. 214,119 235,531
Medical Properties Trust, Inc. 3,223,041 68,618,543
Monmouth Real Estate Investment Corp. Class A 512,009 10,634,427
National Health Investors, Inc. 231,462 12,091,575
National Retail Properties, Inc. 914,837 40,344,312
National Storage Affiliates Trust 429,044 26,334,721
NETSTREIT Corp. 204,083 4,355,131
New York City REIT, Inc. 56,900 381,230
NexPoint Residential Trust, Inc. 124,788 9,306,689
Office Properties Income Trust 244,775 5,808,511
Omega Healthcare Investors, Inc. 1,376,484 38,458,963
One Liberty Properties, Inc. 93,803 3,051,412
Orion Office (REIT), Inc. 281,261 4,998,008
Outfront Media, Inc. 757,428 18,928,126
Paramount Group, Inc. 796,001 6,336,168
Park Hotels & Resorts, Inc. (a) 1,243,103 20,685,234
Pebblebrook Hotel Trust 698,216 14,627,625
Pennsylvania Real Estate Investment Trust (SBI)(a)(b) 325,372 390,446
Phillips Edison & Co., Inc. 99,370 3,117,237
Physicians Realty Trust 1,084,239 19,331,981
Piedmont Office Realty Trust, Inc. Class A 682,821 11,867,429
Plymouth Industrial REIT, Inc. 168,077 5,000,291
Postal Realty Trust, Inc. 75,685 1,313,135
Potlatch Corp. 351,448 19,027,395
Preferred Apartment Communities, Inc. Class A 295,673 3,896,970
PS Business Parks, Inc. 105,621 18,504,799
Rayonier, Inc. 741,806 28,018,013
Retail Opportunity Investments Corp. 661,475 11,615,501
Retail Value, Inc. 100,540 611,283
Rexford Industrial Realty, Inc. 730,616 51,201,569
RLJ Lodging Trust 885,104 11,143,459
RPT Realty 455,682 5,796,275
Ryman Hospitality Properties, Inc. (a) 304,837 23,594,384
Sabra Health Care REIT, Inc. 1,110,188 14,354,731
Safehold, Inc. 74,036 5,296,535
Saul Centers, Inc. 78,435 3,861,355
Seritage Growth Properties (a) 207,841 2,990,832
Service Properties Trust 849,234 7,226,981
SITE Centers Corp. 924,460 13,922,368
SL Green Realty Corp. 383,004 26,591,968
Sotherly Hotels, Inc. (a) 67,520 151,245
Spirit Realty Capital, Inc. 618,070 27,541,199
Stag Industrial, Inc. 848,204 36,964,730
Store Capital Corp. 1,288,421 42,440,588
Summit Hotel Properties, Inc. (a) 574,008 5,137,372
Sun Communities, Inc. 604,299 113,958,705
Sunstone Hotel Investors, Inc. (a) 1,153,192 12,535,197
Tanger Factory Outlet Centers, Inc. (b) 538,010 10,657,978
Terreno Realty Corp. 369,907 28,168,418
The GEO Group, Inc. (b) 627,475 5,270,790
The Macerich Co. 1,102,480 20,792,773
Common Stocks – continuedShares Value ($)
REAL ESTATE – continued
Equity Real Estate Investment Trusts (REITs) –continued
UMH Properties, Inc. 238,405 5,502,387
Uniti Group, Inc. 1,202,162 15,952,690
Universal Health Realty Income Trust (SBI) 75,428 4,199,077
Urban Edge Properties 599,330 10,326,456
Urstadt Biddle Properties, Inc. Class A 181,100 3,419,168
VICI Properties, Inc. (b) 3,203,184 87,126,605
Washington REIT (SBI) 454,771 11,460,229
Wheeler REIT, Inc. (a) 41,732 87,220
Whitestone REIT Class B 243,703 2,256,690
WP Carey, Inc. 961,291 73,394,568
Xenia Hotels & Resorts, Inc. (a) 613,689 9,616,507
2,641,816,194
Real Estate Management & Development - 0.7%
Alset Ehome International, Inc. (b) 56,198 76,991
Altisource Asset Management Corp. (a) 2,426 46,773
Altisource Portfolio Solutions SA (a) 70,562 745,840
American Realty Investments, Inc. (a) 22,049 253,564
Amrep Corp. (a) 3,721 46,513
Comstock Holding Companies, Inc. (a) 13,924 66,557
Cushman & Wakefield PLC (a) 764,707 13,520,020
Doma Holdings, Inc. Class A (b) 903,397 5,700,435
eXp World Holdings, Inc. (b) 348,307 12,786,350
Fathom Holdings, Inc. (a)(b) 26,733 630,631
Forestar Group, Inc. (a) 112,400 2,227,768
FRP Holdings, Inc. (a) 34,185 2,004,608
Howard Hughes Corp. (a) 210,267 17,239,791
InterGroup Corp. (a) 1,743 82,531
J.W. Mays, Inc. (a) 15 575
Jones Lang LaSalle, Inc. (a) 262,582 61,683,138
Kennedy-Wilson Holdings, Inc. 584,953 12,687,631
Marcus & Millichap, Inc. (a) 133,337 5,713,490
Maui Land & Pineapple, Inc. (a) 29,790 295,564
Newmark Group, Inc. 860,055 13,812,483
Opendoor Technologies, Inc. (a)(b) 1,983,422 31,417,404
Rafael Holdings, Inc. (a)(b) 55,256 303,355
RE/MAX Holdings, Inc. 108,147 2,972,961
Realogy Holdings Corp. (a) 596,202 9,056,308
Redfin Corp. (a)(b) 566,121 23,035,463
Stratus Properties, Inc. (a) 41,910 1,477,747
Tejon Ranch Co. (a) 126,930 2,322,819
The RMR Group, Inc. 90,805 2,966,599
The St. Joe Co. 174,133 8,360,125
Transcontinental Realty Investors, Inc. (a) 2,197 88,319
Trinity Place Holdings, Inc. (a)(b) 39,666 75,762
Trinity Place Holdings, Inc. rights (a) 2,979 30
Zillow Group, Inc.:
Class A (a) 344,584 18,645,440
Class C (a)(b) 727,141 39,461,942
289,805,527
TOTAL REAL ESTATE 2,931,621,721
35 Quarterly Report
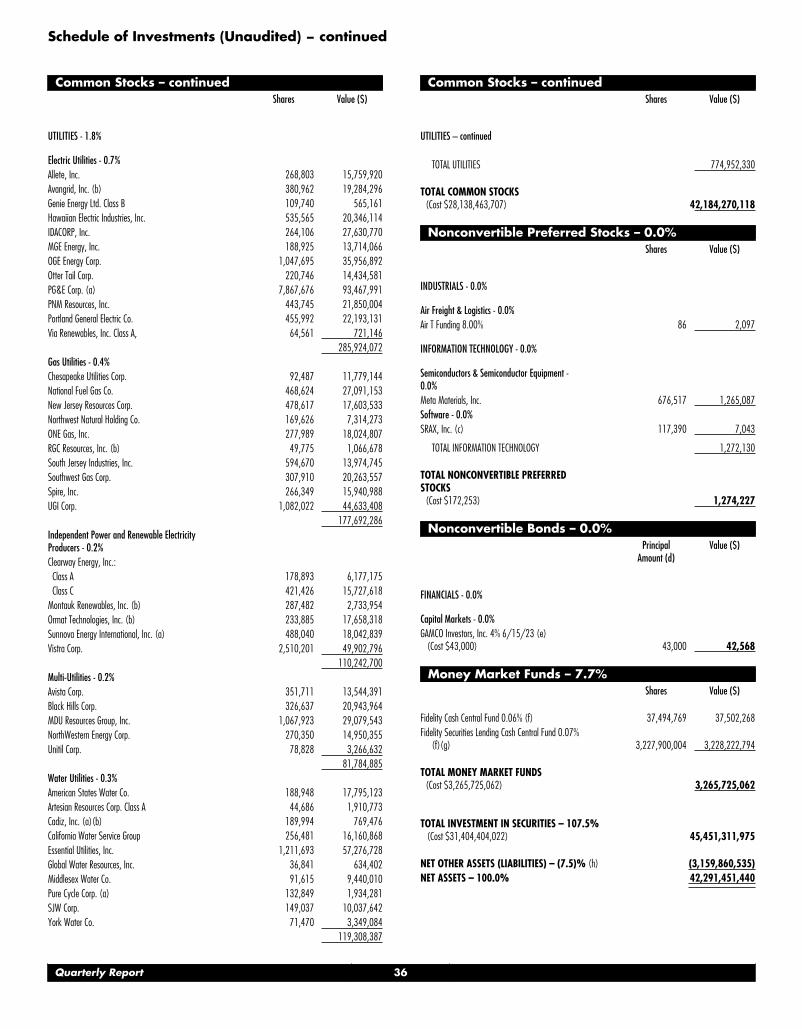
Schedule of Investments (Unaudited) − continued
Common Stocks – continuedShares Value ($)
UTILITIES - 1.8%
Electric Utilities - 0.7%
Allete, Inc. 268,803 15,759,920
Avangrid, Inc. (b) 380,962 19,284,296
Genie Energy Ltd. Class B 109,740 565,161
Hawaiian Electric Industries, Inc. 535,565 20,346,114
IDACORP, Inc. 264,106 27,630,770
MGE Energy, Inc. 188,925 13,714,066
OGE Energy Corp. 1,047,695 35,956,892
Otter Tail Corp. 220,746 14,434,581
PG&E Corp. (a) 7,867,676 93,467,991
PNM Resources, Inc. 443,745 21,850,004
Portland General Electric Co. 455,992 22,193,131
Via Renewables, Inc. Class A, 64,561 721,146
285,924,072
Gas Utilities - 0.4%
Chesapeake Utilities Corp. 92,487 11,779,144
National Fuel Gas Co. 468,624 27,091,153
New Jersey Resources Corp. 478,617 17,603,533
Northwest Natural Holding Co. 169,626 7,314,273
ONE Gas, Inc. 277,989 18,024,807
RGC Resources, Inc. (b) 49,775 1,066,678
South Jersey Industries, Inc. 594,670 13,974,745
Southwest Gas Corp. 307,910 20,263,557
Spire, Inc. 266,349 15,940,988
UGI Corp. 1,082,022 44,633,408
177,692,286
Independent Power and Renewable ElectricityProducers - 0.2%
Clearway Energy, Inc.:
Class A 178,893 6,177,175
Class C 421,426 15,727,618
Montauk Renewables, Inc. (b) 287,482 2,733,954
Ormat Technologies, Inc. (b) 233,885 17,658,318
Sunnova Energy International, Inc. (a) 488,040 18,042,839
Vistra Corp. 2,510,201 49,902,796
110,242,700
Multi-Utilities - 0.2%
Avista Corp. 351,711 13,544,391
Black Hills Corp. 326,637 20,943,964
MDU Resources Group, Inc. 1,067,923 29,079,543
NorthWestern Energy Corp. 270,350 14,950,355
Unitil Corp. 78,828 3,266,632
81,784,885
Water Utilities - 0.3%
American States Water Co. 188,948 17,795,123
Artesian Resources Corp. Class A 44,686 1,910,773
Cadiz, Inc. (a)(b) 189,994 769,476
California Water Service Group 256,481 16,160,868
Essential Utilities, Inc. 1,211,693 57,276,728
Global Water Resources, Inc. 36,841 634,402
Middlesex Water Co. 91,615 9,440,010
Pure Cycle Corp. (a) 132,849 1,934,281
SJW Corp. 149,037 10,037,642
York Water Co. 71,470 3,349,084
119,308,387
Common Stocks – continuedShares Value ($)
UTILITIES – continued
TOTAL UTILITIES 774,952,330
TOTAL COMMON STOCKS (Cost $28,138,463,707) 42,184,270,118
Nonconvertible Preferred Stocks – 0.0%Shares Value ($)
INDUSTRIALS - 0.0%
Air Freight & Logistics - 0.0%
Air T Funding 8.00% 86 2,097
INFORMATION TECHNOLOGY - 0.0%
Semiconductors & Semiconductor Equipment -0.0%
Meta Materials, Inc. 676,517 1,265,087
Software - 0.0%
SRAX, Inc. (c) 117,390 7,043
TOTAL INFORMATION TECHNOLOGY 1,272,130
TOTAL NONCONVERTIBLE PREFERREDSTOCKS (Cost $172,253) 1,274,227
Nonconvertible Bonds – 0.0%Principal
Amount (d)Value ($)
FINANCIALS - 0.0%
Capital Markets - 0.0%
GAMCO Investors, Inc. 4% 6/15/23 (e) (Cost $43,000) 43,000 42,568
Money Market Funds – 7.7%Shares Value ($)
Fidelity Cash Central Fund 0.06% (f) 37,494,769 37,502,268
Fidelity Securities Lending Cash Central Fund 0.07%(f)(g) 3,227,900,004 3,228,222,794
TOTAL MONEY MARKET FUNDS (Cost $3,265,725,062) 3,265,725,062
TOTAL INVESTMENT IN SECURITIES – 107.5% (Cost $31,404,404,022) 45,451,311,975
NET OTHER ASSETS (LIABILITIES) – (7.5)% (h) (3,159,860,535)
NET ASSETS – 100.0% 42,291,451,440
Quarterly Report 36
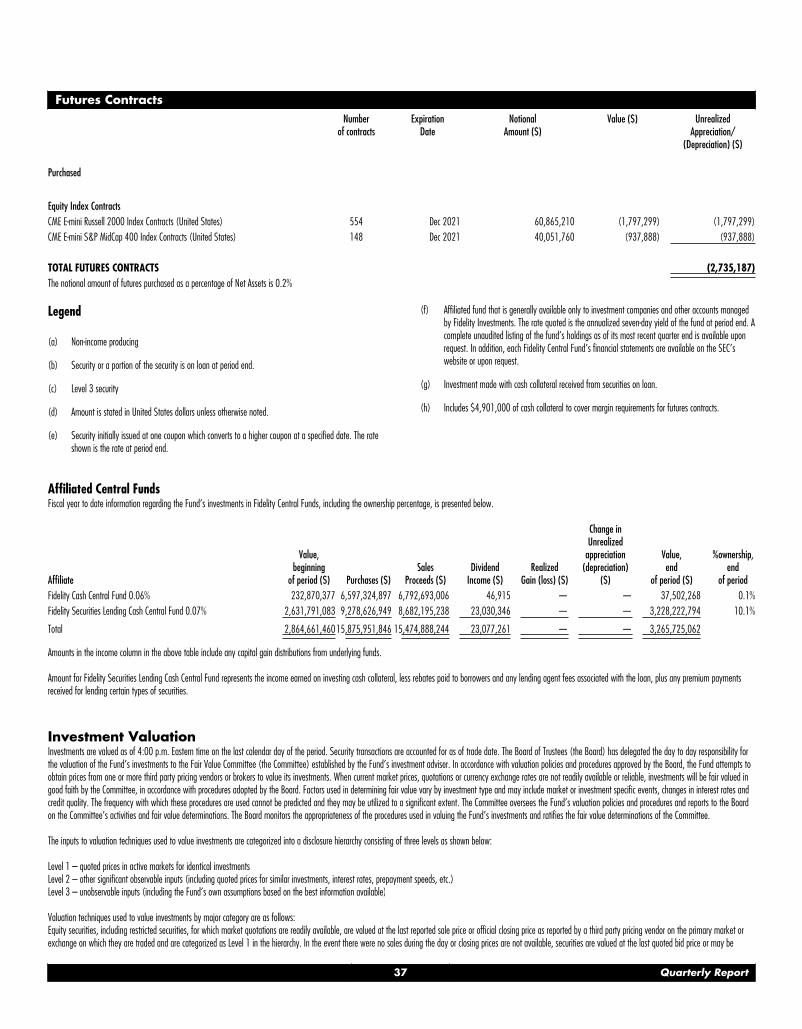
Futures Contracts
Numberof contracts
ExpirationDate
NotionalAmount ($)
Value ($) UnrealizedAppreciation/
(Depreciation) ($)
Purchased
Equity Index Contracts
CME E-mini Russell 2000 Index Contracts (United States) 554 Dec 2021 60,865,210 (1,797,299) (1,797,299)
CME E-mini S&P MidCap 400 Index Contracts (United States) 148 Dec 2021 40,051,760 (937,888) (937,888)
TOTAL FUTURES CONTRACTS (2,735,187)
The notional amount of futures purchased as a percentage of Net Assets is 0.2%
Legend
(a) Non-income producing
(b) Security or a portion of the security is on loan at period end.
(c) Level 3 security
(d) Amount is stated in United States dollars unless otherwise noted.
(e) Security initially issued at one coupon which converts to a higher coupon at a specified date. The rateshown is the rate at period end.
(f) Affiliated fund that is generally available only to investment companies and other accounts managedby Fidelity Investments. The rate quoted is the annualized seven-day yield of the fund at period end. Acomplete unaudited listing of the fund’s holdings as of its most recent quarter end is available uponrequest. In addition, each Fidelity Central Fund’s financial statements are available on the SEC’swebsite or upon request.
(g) Investment made with cash collateral received from securities on loan.
(h) Includes $4,901,000 of cash collateral to cover margin requirements for futures contracts.
Affiliated Central FundsFiscal year to date information regarding the Fund’s investments in Fidelity Central Funds, including the ownership percentage, is presented below.
Affiliate
Value,beginning
of period ($) Purchases ($)Sales
Proceeds ($)Dividend
Income ($)Realized
Gain (loss) ($)
Change inUnrealized
appreciation(depreciation)
($)
Value,end
of period ($)
%ownership,end
of period
Fidelity Cash Central Fund 0.06% 232,870,377 6,597,324,897 6,792,693,006 46,915 — — 37,502,268 0.1%
Fidelity Securities Lending Cash Central Fund 0.07% 2,631,791,083 9,278,626,949 8,682,195,238 23,030,346 — — 3,228,222,794 10.1%
Total 2,864,661,46015,875,951,846 15,474,888,244 23,077,261 — — 3,265,725,062
Amounts in the income column in the above table include any capital gain distributions from underlying funds.
Amount for Fidelity Securities Lending Cash Central Fund represents the income earned on investing cash collateral, less rebates paid to borrowers and any lending agent fees associated with the loan, plus any premium paymentsreceived for lending certain types of securities.
Investment ValuationInvestments are valued as of 4:00 p.m. Eastern time on the last calendar day of the period. Security transactions are accounted for as of trade date. The Board of Trustees (the Board) has delegated the day to day responsibility forthe valuation of the Fund’s investments to the Fair Value Committee (the Committee) established by the Fund’s investment adviser. In accordance with valuation policies and procedures approved by the Board, the Fund attempts toobtain prices from one or more third party pricing vendors or brokers to value its investments. When current market prices, quotations or currency exchange rates are not readily available or reliable, investments will be fair valued ingood faith by the Committee, in accordance with procedures adopted by the Board. Factors used in determining fair value vary by investment type and may include market or investment specific events, changes in interest rates andcredit quality. The frequency with which these procedures are used cannot be predicted and they may be utilized to a significant extent. The Committee oversees the Fund’s valuation policies and procedures and reports to the Boardon the Committee’s activities and fair value determinations. The Board monitors the appropriateness of the procedures used in valuing the Fund’s investments and ratifies the fair value determinations of the Committee.
The inputs to valuation techniques used to value investments are categorized into a disclosure hierarchy consisting of three levels as shown below:
Level 1 – quoted prices in active markets for identical investmentsLevel 2 – other significant observable inputs (including quoted prices for similar investments, interest rates, prepayment speeds, etc.)Level 3 – unobservable inputs (including the Fund’s own assumptions based on the best information available)
Valuation techniques used to value investments by major category are as follows:Equity securities, including restricted securities, for which market quotations are readily available, are valued at the last reported sale price or official closing price as reported by a third party pricing vendor on the primary market orexchange on which they are traded and are categorized as Level 1 in the hierarchy. In the event there were no sales during the day or closing prices are not available, securities are valued at the last quoted bid price or may be
37 Quarterly Report
Schedule of Investments (Unaudited) − continued
valued using the last available price and are generally categorized as Level 2 in the hierarchy. For any foreign equity securities, when market or security specific events arise, comparisons to the valuation of American DepositaryReceipts (ADRs), futures contracts, Exchange-Traded Funds (ETFs) and certain indexes as well as quoted prices for similar securities may be used and would be categorized as Level 2 in the hierarchy. For equity securities, includingrestricted securities, where observable inputs are limited, assumptions about market activity and risk are used and these securities may be categorized as Level 3 in the hierarchy.
Debt securities, including restricted securities, are valued based on evaluated prices received from third party pricing vendors or from brokers who make markets in such securities. Nonconvertible Bonds are valued by pricing vendorswho utilize matrix pricing which considers yield or price of bonds of comparable quality, coupon, maturity and type or by broker-supplied prices. When independent prices are unavailable or unreliable, debt securities may be valuedutilizing pricing methodologies which consider similar factors that would be used by third party pricing vendors. Debt securities are generally categorized as Level 2 in the hierarchy but may be Level 3 depending on the circumstances.
Futures contracts are valued at the settlement price established each day by the board of trade or exchange on which they are traded and are categorized as Level 1 in the hierarchy.
Investments in any open-end mutual funds are valued at their closing net asset value (NAV) each business day and are categorized as Level 1 in the hierarchy.
Changes in valuation techniques may result in transfers in or out of an assigned level within the disclosure hierarchy.
Derivative InstrumentsRisk Exposures and the Use of Derivative Instruments: The Fund’s investment objectives allow the Fund to enter into various types of derivative contracts. Derivatives are investments whose value is primarily derived from underlyingassets, indices or reference rates and may be transacted on an exchange or over-the-counter (OTC). Derivatives may involve a future commitment to buy or sell a specified asset based on specified terms, to exchange future cashflows at periodic intervals based on a notional principal amount, or for one party to make one or more payments upon the occurrence of specified events in exchange for periodic payments from the other party.
The Fund used derivatives to increase returns, to gain exposure to certain types of assets and/or to manage exposure to certain risks as defined below. The success of any strategy involving derivatives depends on analysis ofnumerous economic factors, and if the strategies for investment do not work as intended, the Fund may not achieve its objectives.
The Fund’s use of derivatives increased or decreased its exposure to the following risk(s):
Equity Risk – Equity risk relates to the fluctuations in the value of financial instruments as a result of changes in market prices (other than those arising from interest rate risk or foreign exchange risk), whether caused by factorsspecific to an individual investment, its issuer, or all factors affecting all instruments traded in a market or market segment.
Investing in derivatives may involve greater risks than investing in the underlying assets directly and, to varying degrees, may involve risk of loss in excess of any initial investment and collateral received. In addition, there may bethe risk that the change in value of the derivative contract does not correspond to the change in value of the underlying instrument.
Futures Contracts: A futures contract is an agreement between two parties to buy or sell a specified underlying instrument for a specified price at a specified future date.
The Fund used futures contracts to manage its exposure to the stock market.
Open futures contracts at period end are presented in the Schedule of Investments under the caption “Futures Contracts”. The underlying face amount at value reflects each contract’s exposure to the underlying instrument or index atperiod end. Any securities and/or cash deposited to meet initial margin requirements are identified in the Schedule of Investments.
For additional information on the Fund’s significant accounting policies, please refer to the Fund’s most recent semiannual or annual shareholder report.
Quarterly Report 38

The fund’s schedule of investments as of the date on the cover of this report has not been audited. This report is provided for the general information of the fund’s shareholders. Formore information regarding the fund and its holdings, please see the fund’s most recent prospectus and annual report.
Third party trademarks and service marks are the property of their respective owners. All other trademarks and service marks are the property of FMR LLC or an affiliate.
39 Quarterly Report

Notes