Quarterly Performance Review - June 2008 - State Bank of ...
Upload
khangminh22Category
view
1download
0
Visit the Investments Thought Leadership Site (https://insights-north-america.aon.com/investment); sharing our best thinking.
Nebraska Investment Council | Third Quarter 2020
Quarterly Investment Review

(This Page Left Blank Intentionally)

1 Market Environment 5
2 Nebraska Investment Council 23
3 Total Defined Benefit Plan 27
4 Defined Contribution Option and Deferred Compensation Plan 113
5 Total Cash Balance Benefit 117
6 Total Hartford Options 125
7 Total CSP of Nebraska 129
8 Enable Savings Plan 159
9 Total State Farm College Savings Plan 165
10 Total Endowment 169
11 Total In-House Plans 175
12 OSERS 177
13 Appendix 237
Table of Contents

(This Page Left Blank Intentionally)

Market Environment
5
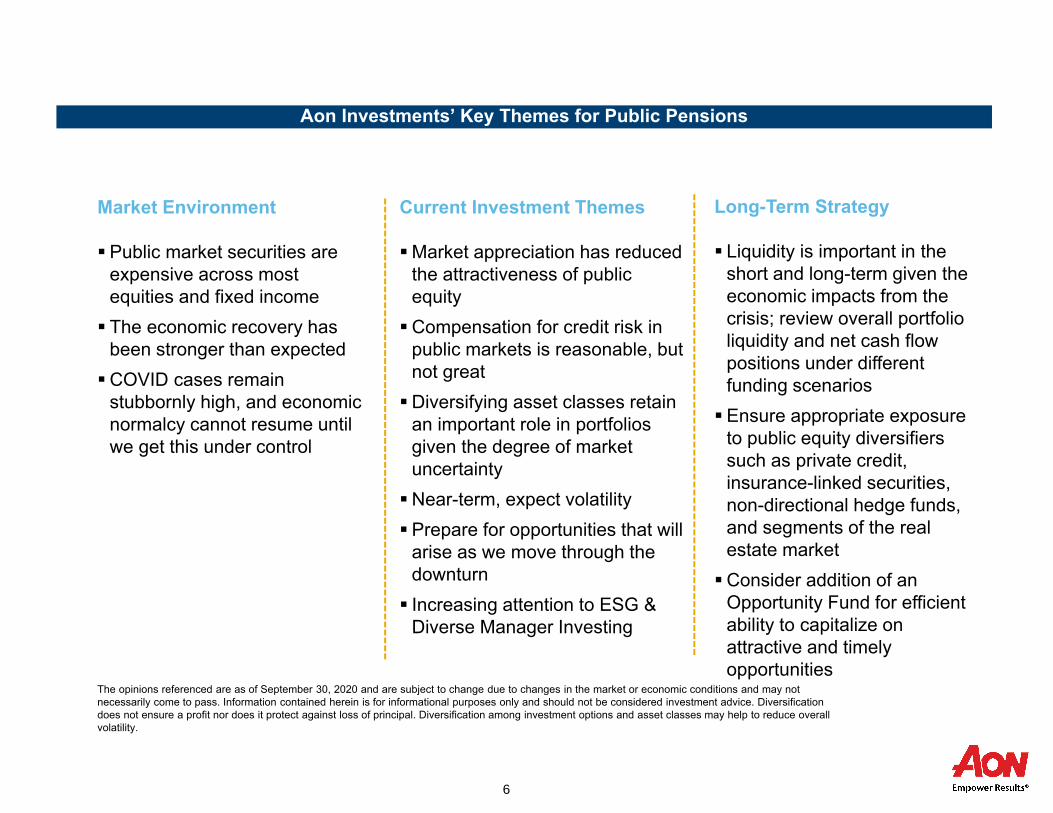
Aon Investments’ Key Themes for Public Pensions
Market Environment
Public market securities are expensive across most equities and fixed income
The economic recovery has been stronger than expected
COVID cases remain stubbornly high, and economic normalcy cannot resume until we get this under control
Current Investment Themes
Market appreciation has reduced the attractiveness of public equity
Compensation for credit risk in public markets is reasonable, but not great
Diversifying asset classes retain an important role in portfolios given the degree of market uncertainty
Near-term, expect volatility
Prepare for opportunities that will arise as we move through the downturn
Increasing attention to ESG & Diverse Manager Investing
Long-Term Strategy
Liquidity is important in the short and long-term given the economic impacts from the crisis; review overall portfolio liquidity and net cash flow positions under different funding scenarios
Ensure appropriate exposure to public equity diversifiers such as private credit, insurance-linked securities, non-directional hedge funds, and segments of the real estate market
Consider addition of an Opportunity Fund for efficient ability to capitalize on attractive and timely opportunities
The opinions referenced are as of September 30, 2020 and are subject to change due to changes in the market or economic conditions and may not necessarily come to pass. Information contained herein is for informational purposes only and should not be considered investment advice. Diversification does not ensure a profit nor does it protect against loss of principal. Diversification among investment options and asset classes may help to reduce overall volatility.
6
Opinions, estimates, forecasts, and statements on financial market trends that are based on currentmarket conditions constitute our judgment and are subject to change without notice. The views andstrategies described may not be suitable for all investors. References to specific securities, asset classes,and financial markets are for illustrative purposes only and are not intended to be, and should not beinterpreted as, recommendations.
Thought Leadership Hub Find Additional Research at https://insights-north-america.aon.com
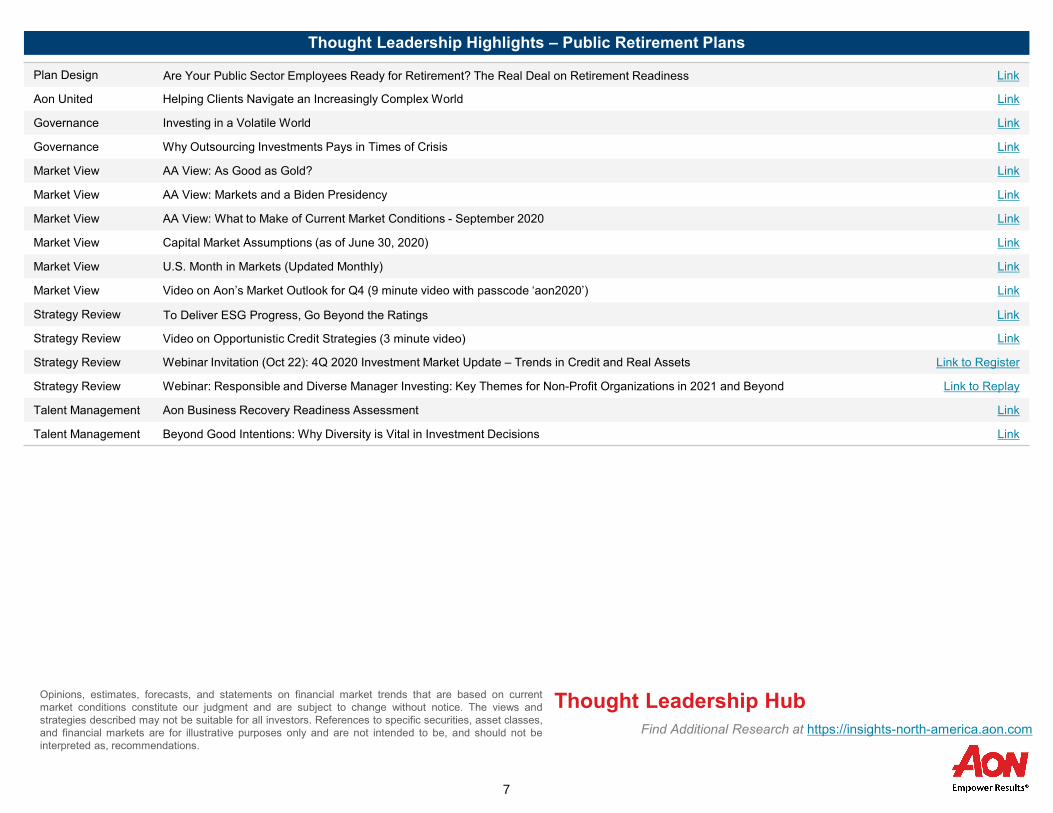
Thought Leadership Highlights – Public Retirement Plans
Plan Design Are Your Public Sector Employees Ready for Retirement? The Real Deal on Retirement Readiness Link
Aon United Helping Clients Navigate an Increasingly Complex World Link
Governance Investing in a Volatile World Link
Governance Why Outsourcing Investments Pays in Times of Crisis Link
Market View AA View: As Good as Gold? Link
Market View AA View: Markets and a Biden Presidency Link
Market View AA View: What to Make of Current Market Conditions - September 2020 Link
Market View Capital Market Assumptions (as of June 30, 2020) Link
Market View U.S. Month in Markets (Updated Monthly) Link
Market View Video on Aon’s Market Outlook for Q4 (9 minute video with passcode ‘aon2020’) Link
Strategy Review To Deliver ESG Progress, Go Beyond the Ratings Link
Strategy Review Video on Opportunistic Credit Strategies (3 minute video) Link
Strategy Review Webinar Invitation (Oct 22): 4Q 2020 Investment Market Update – Trends in Credit and Real Assets Link to Register
Strategy Review Webinar: Responsible and Diverse Manager Investing: Key Themes for Non-Profit Organizations in 2021 and Beyond Link to Replay
Talent Management Aon Business Recovery Readiness Assessment Link
Talent Management Beyond Good Intentions: Why Diversity is Vital in Investment Decisions Link
7

Aon Proprietary & Confidential Investment advice and consulting services provided by Aon Investments USA Inc.
Market Highlights
14.1%
8.0%
5.3%
9.0%
4.2%
8.2% 8.8%6.8%
-3.1%
13.7%
9.9%
4.6%2.5%
3.6%
7.2% 7.3% 6.5%
-6.0%-10.0%
-5.0%
0.0%
5.0%
10.0%
15.0%
20.0%
S&P 500 Russell 2000 MSCI EAFE MSCI EmergingMarkets
BloombergBarclays U.S.
Aggregate
BloombergBarclays U.S.
Long Gov't
BloombergBarclays U.S.Long Credit
BloombergBarclays U.S.
High Yield
BloombergCommodity Index
LONG TERM ANNUALIZED RETURNSAS OF 09/30/2020
Five-Year Ten-Year
Source: Russell, MSCI, Bloomberg Barclays, Bloomberg
8.9%
4.9% 4.8%
9.6%
0.6% 0.1%2.0%
4.6%
9.1%5.6%
-8.7%-7.1%
-1.2%
6.8%
21.1%
8.0%
0.6%
-12.1%-15.0%
-10.0%
-5.0%
0.0%
5.0%
10.0%
15.0%
20.0%
25.0%
S&P 500 Russell 2000 MSCI EAFE MSCI EmergingMarkets
BloombergBarclays U.S.
Aggregate
BloombergBarclays U.S.
Long Gov't
BloombergBarclays U.S.Long Credit
BloombergBarclays U.S.
High Yield
BloombergCommodity Index
SHORT TERM RETURNSAS OF 09/30/2020
Third Quarter 2020 YTD
Source: Russell, MSCI, Bloomberg Barclays, BloombergMSCI Indices show net total returns throughout this report. All other indices show gross total returns..
8
Aon Proprietary & Confidential Investment advice and consulting services provided by Aon Investments USA Inc.
Market Highlights
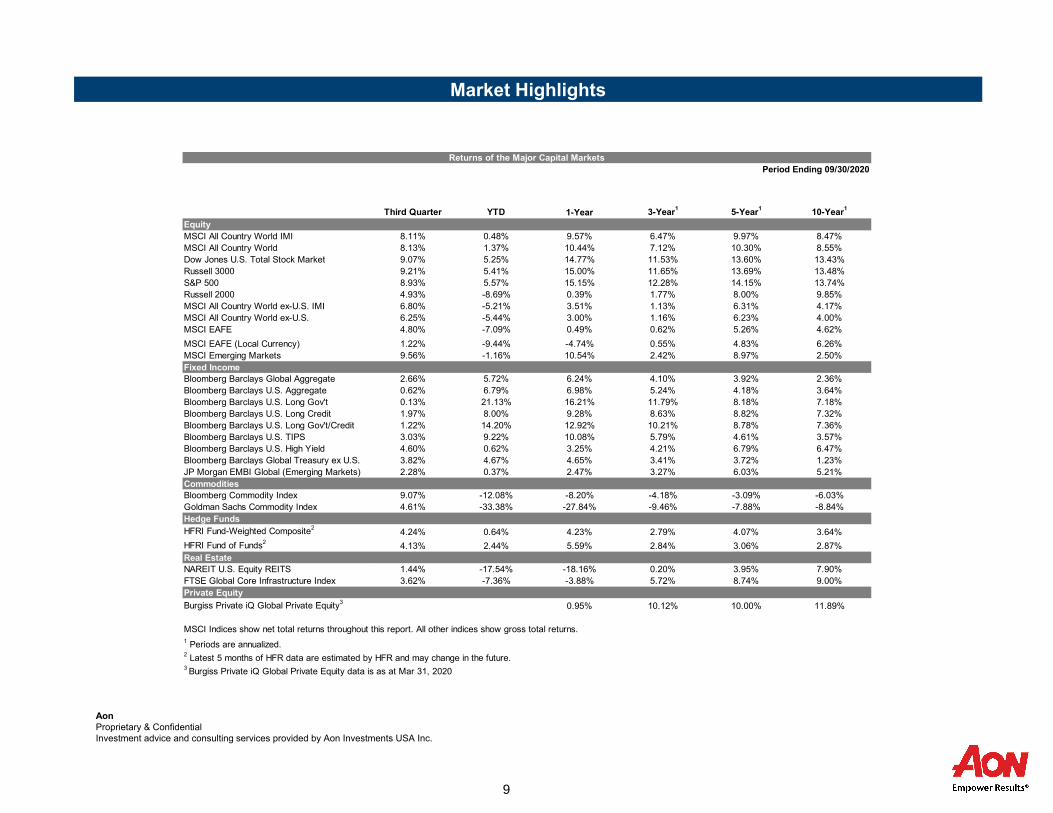
Third Quarter YTD 1-Year 3-Year1
5-Year1
10-Year1
Equity
MSCI All Country World IMI 8.11% 0.48% 9.57% 6.47% 9.97% 8.47%
MSCI All Country World 8.13% 1.37% 10.44% 7.12% 10.30% 8.55%
Dow Jones U.S. Total Stock Market 9.07% 5.25% 14.77% 11.53% 13.60% 13.43%
Russell 3000 9.21% 5.41% 15.00% 11.65% 13.69% 13.48%
S&P 500 8.93% 5.57% 15.15% 12.28% 14.15% 13.74%
Russell 2000 4.93% -8.69% 0.39% 1.77% 8.00% 9.85%
MSCI All Country World ex-U.S. IMI 6.80% -5.21% 3.51% 1.13% 6.31% 4.17%
MSCI All Country World ex-U.S. 6.25% -5.44% 3.00% 1.16% 6.23% 4.00%
MSCI EAFE 4.80% -7.09% 0.49% 0.62% 5.26% 4.62%
MSCI EAFE (Local Currency) 1.22% -9.44% -4.74% 0.55% 4.83% 6.26%
MSCI Emerging Markets 9.56% -1.16% 10.54% 2.42% 8.97% 2.50%
Fixed Income
Bloomberg Barclays Global Aggregate 2.66% 5.72% 6.24% 4.10% 3.92% 2.36%
Bloomberg Barclays U.S. Aggregate 0.62% 6.79% 6.98% 5.24% 4.18% 3.64%
Bloomberg Barclays U.S. Long Gov't 0.13% 21.13% 16.21% 11.79% 8.18% 7.18%
Bloomberg Barclays U.S. Long Credit 1.97% 8.00% 9.28% 8.63% 8.82% 7.32%
Bloomberg Barclays U.S. Long Gov't/Credit 1.22% 14.20% 12.92% 10.21% 8.78% 7.36%
Bloomberg Barclays U.S. TIPS 3.03% 9.22% 10.08% 5.79% 4.61% 3.57%
Bloomberg Barclays U.S. High Yield 4.60% 0.62% 3.25% 4.21% 6.79% 6.47%
Bloomberg Barclays Global Treasury ex U.S. 3.82% 4.67% 4.65% 3.41% 3.72% 1.23%
JP Morgan EMBI Global (Emerging Markets) 2.28% 0.37% 2.47% 3.27% 6.03% 5.21%
Commodities
Bloomberg Commodity Index 9.07% -12.08% -8.20% -4.18% -3.09% -6.03%
Goldman Sachs Commodity Index 4.61% -33.38% -27.84% -9.46% -7.88% -8.84%
Hedge Funds
HFRI Fund-Weighted Composite2
4.24% 0.64% 4.23% 2.79% 4.07% 3.64%
HFRI Fund of Funds24.13% 2.44% 5.59% 2.84% 3.06% 2.87%
Real Estate
NAREIT U.S. Equity REITS 1.44% -17.54% -18.16% 0.20% 3.95% 7.90%
FTSE Global Core Infrastructure Index 3.62% -7.36% -3.88% 5.72% 8.74% 9.00%
Private Equity
Burgiss Private iQ Global Private Equity3
0.95% 10.12% 10.00% 11.89%
MSCI Indices show net total returns throughout this report. All other indices show gross total returns.1 Periods are annualized.2 Latest 5 months of HFR data are estimated by HFR and may change in the future.
3 Burgiss Private iQ Global Private Equity data is as at Mar 31, 2020
Returns of the Major Capital Markets
Period Ending 09/30/2020
9
Aon Proprietary & Confidential Investment advice and consulting services provided by Aon Investments USA Inc..
Global Equity Markets
8.1% 6.8%9.1%
0.8%
7.4% 6.5%
2.1%
6.7%3.2%
9.8%9.6%
3.5%
14.5%
-14.5%
6.8%
-1.7% -0.4%
5.6%
-4.4%
10.1%
-20%
-10%
0%
10%
20%
ACWI IMI 42.6%ACWI ex-U.S.
IMI
57.4%USA IMI
3.8%UK IMI
7.4%Japan IMI
2.8%Canada IMI
0.2%Israel IMI
13.1%Europe ex-UK
IMI
3.2%Pacific ex-Japan
IMI
12.2%Emerging
Markets IMI
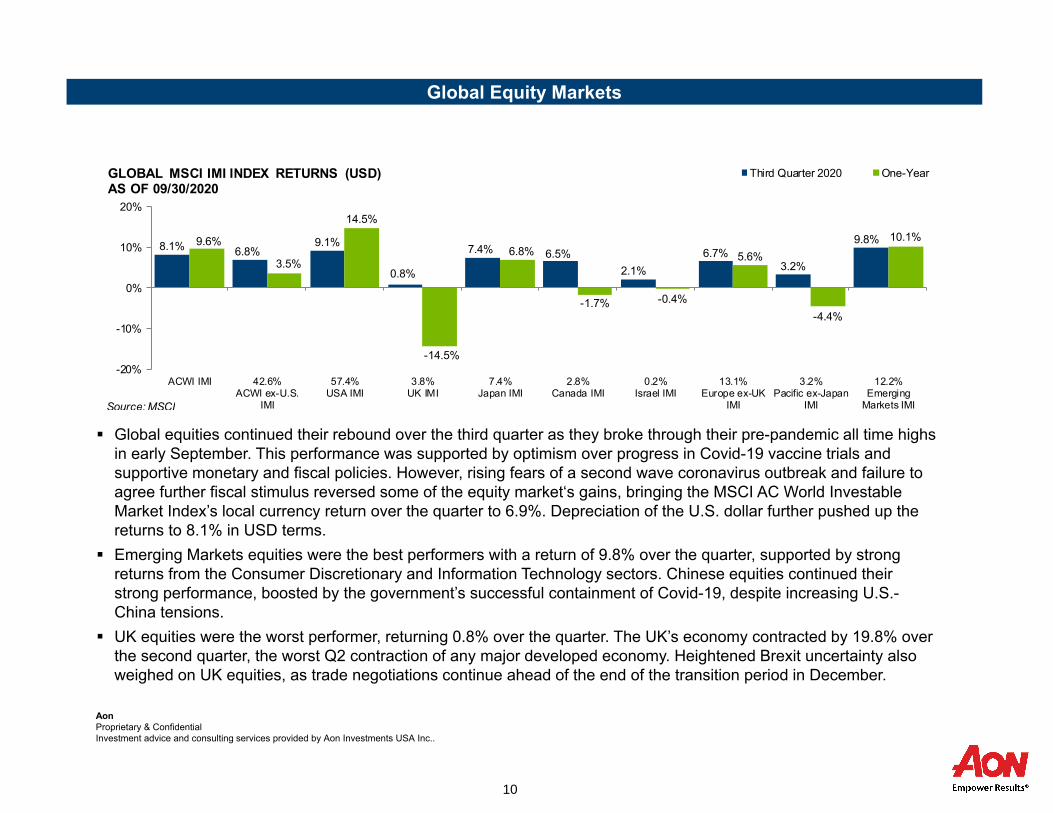
GLOBAL MSCI IMI INDEX RETURNS (USD)AS OF 09/30/2020
Third Quarter 2020 One-Year
Source: MSCI
Global equities continued their rebound over the third quarter as they broke through their pre-pandemic all time highs in early September. This performance was supported by optimism over progress in Covid-19 vaccine trials and supportive monetary and fiscal policies. However, rising fears of a second wave coronavirus outbreak and failure to agree further fiscal stimulus reversed some of the equity market‘s gains, bringing the MSCI AC World Investable Market Index’s local currency return over the quarter to 6.9%. Depreciation of the U.S. dollar further pushed up the returns to 8.1% in USD terms.
Emerging Markets equities were the best performers with a return of 9.8% over the quarter, supported by strong returns from the Consumer Discretionary and Information Technology sectors. Chinese equities continued their strong performance, boosted by the government’s successful containment of Covid-19, despite increasing U.S.-China tensions.
UK equities were the worst performer, returning 0.8% over the quarter. The UK’s economy contracted by 19.8% over the second quarter, the worst Q2 contraction of any major developed economy. Heightened Brexit uncertainty also weighed on UK equities, as trade negotiations continue ahead of the end of the transition period in December.
10

Aon Proprietary & Confidential Investment advice and consulting services provided by Aon Investments USA Inc..
Global Equity Markets
The two exhibits on this slide illustrate the percentage that each country/region represents of the global and international equity markets as measured by the MSCI All Country World IMI Index and the MSCI All Country World ex-U.S. IMI Index, respectively.
11
Aon Proprietary & Confidential Investment advice and consulting services provided by Aon Investments USA Inc..
U.S. Equity Markets
9.2%5.2%
14.0%
6.4% 9.4%
2.6%7.2%
15.0%
-3.9%
41.2%
-7.3%
23.2%
-14.9%
15.7%
-20.0%
-10.0%
0.0%
10.0%
20.0%
30.0%
40.0%
50.0%
Russell3000
29.6%LargeValue
41.2%Large
Growth
15.0%MediumValue
8.5%MediumGrowth
2.7%SmallValue
3.0%Small
Growth
RUSSELL STYLE RETURNS AS OF 09/30/2020
Third Quarter 2020
One-Year
Source: Russell Indexes
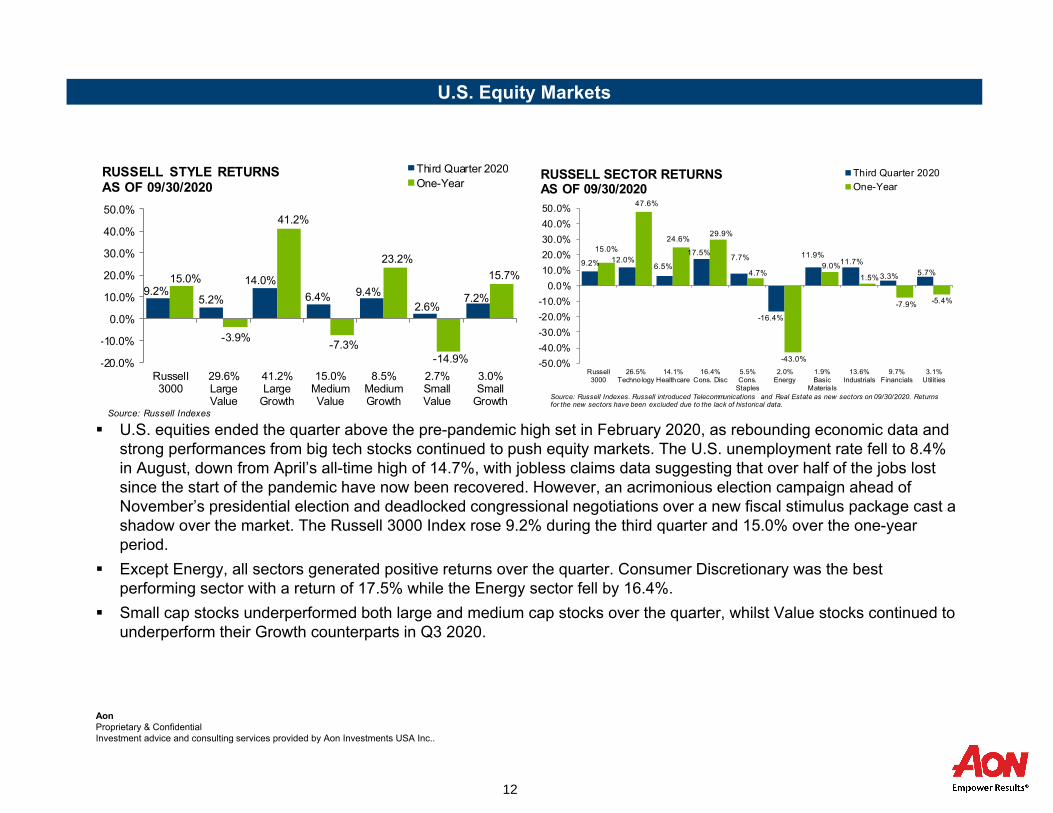
U.S. equities ended the quarter above the pre-pandemic high set in February 2020, as rebounding economic data and strong performances from big tech stocks continued to push equity markets. The U.S. unemployment rate fell to 8.4% in August, down from April’s all-time high of 14.7%, with jobless claims data suggesting that over half of the jobs lost since the start of the pandemic have now been recovered. However, an acrimonious election campaign ahead of November’s presidential election and deadlocked congressional negotiations over a new fiscal stimulus package cast a shadow over the market. The Russell 3000 Index rose 9.2% during the third quarter and 15.0% over the one-year period.
Except Energy, all sectors generated positive returns over the quarter. Consumer Discretionary was the best performing sector with a return of 17.5% while the Energy sector fell by 16.4%.
Small cap stocks underperformed both large and medium cap stocks over the quarter, whilst Value stocks continued to underperform their Growth counterparts in Q3 2020.
9.2% 12.0%6.5%
17.5%7.7%
-16.4%
11.9%11.7%
3.3% 5.7%
15.0%
47.6%
24.6%29.9%
4.7%
-43.0%
9.0%
1.5%
-7.9% -5.4%
-50.0%
-40.0%
-30.0%
-20.0%
-10.0%
0.0%
10.0%
20.0%
30.0%
40.0%
50.0%
Russell3000
26.5%Technology
14.1%Healthcare
16.4%Cons. Disc
5.5%Cons.
Staples
2.0%Energy
1.9%Basic
Materia ls
13.6%Industrials
9.7%Financials
3.1%Utilities
RUSSELL SECTOR RETURNS AS OF 09/30/2020
Third Quarter 2020
One-Year
Source: Russell Indexes. Russell introduced Telecommunications and Real Estate as new sectors on 09/30/2020. Returns for the new sectors have been excluded due to the lack of historical data.
12
Aon Proprietary & Confidential Investment advice and consulting services provided by Aon Investments USA Inc..
U.S. Fixed Income Markets
0.6% 0.2%
1.5%
0.1%0.8%
1.7%
7.0%
8.0% 7.9%
4.4% 4.5%
6.6%
0.0%
1.0%
2.0%
3.0%
4.0%
5.0%
6.0%
7.0%
8.0%
9.0%
Barclays Agg.Bond
40.6%Govt
28.6%Corp.
28.1%MBS
0.4%ABS
2.3%CMBS
BLOOMBERG BARCLAYS AGGREGATE RETURNS BY SECTOR AS OF 09/30/2020
Third Quarter 2020 One-YearSource: FactSet
0.2% 0.4% 0.8%1.3% 1.2%
3.4%
5.6%
7.8%
9.3%
12.9%
0.0%
2.0%
4.0%
6.0%
8.0%
10.0%
12.0%
14.0%
1-3 Yr. 3-5 Yr. 5-7 Yr. 7-10 Yr. >10 Yr.
BLOOMBERG BARCLAYS AGGREGATE RETURNS BY MATURITY AS OF 09/30/2020
Third Quarter 2020 One-YearSource: FactSet
0.2%0.9% 1.2%
2.1%
4.6%
6.6%6.9%
8.4%
7.0%
3.3%
0.0%
1.0%
2.0%
3.0%
4.0%
5.0%
6.0%
7.0%
8.0%
9.0%
Aaa Aa A Baa High Yield
BLOOMBERG BARCLAYS AGGREGATE RETURNS BY QUALITY AND HIGH YIELD RETURNS AS OF 09/30/2020
Third Quarter 2020 One-YearSource: FactSet
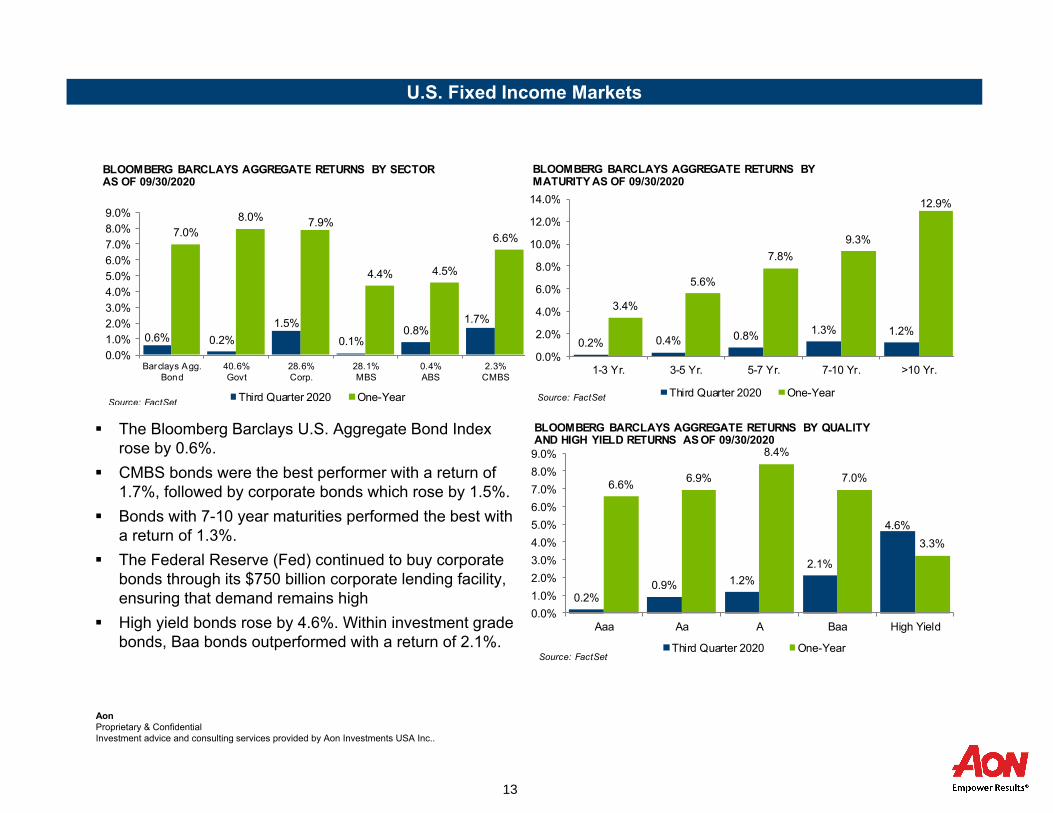
The Bloomberg Barclays U.S. Aggregate Bond Index rose by 0.6%.
CMBS bonds were the best performer with a return of 1.7%, followed by corporate bonds which rose by 1.5%.
Bonds with 7-10 year maturities performed the best with a return of 1.3%.
The Federal Reserve (Fed) continued to buy corporate bonds through its $750 billion corporate lending facility, ensuring that demand remains high
High yield bonds rose by 4.6%. Within investment grade bonds, Baa bonds outperformed with a return of 2.1%.
13

Aon Proprietary & Confidential Investment advice and consulting services provided by Aon Investments USA Inc..
U.S. Fixed Income Markets
-2.0%
-1.0%
0.0%
1.0%
2.0%
3.0%
4.0%
Sep 10 Sep 12 Sep 14 Sep 16 Sep 18 Sep 20
U.S. 10-YEAR TREASURY AND TIPS YIELDS10Y TIPS Yield
10Y Treasury Yield
Source: U.S. Department of Treasury
-0.5%
0.0%
0.5%
1.0%
1.5%
2.0%
2.5%
0 5 10 15 20 25 30
Maturity (Years)
U.S. TREASURY YIELD CURVE
9/30/2019
6/30/2020
9/30/2020
Source: U.S. Department of Treasury
The U.S. nominal yield curve slightly steepened over the quarter, but overall yields were broadly unchanged. The Fed projected that it would keep interest rates near zero until at least 2023. During the quarter, the Fed also announced a major policy shift by adopting an “average inflation targeting” approach. Under this new approach the Fed will seek an average of 2.0% inflation over time by allowing inflation to run above the target to make up for periods where inflation ran below the target. Since inflation has recently run below the target, a period of higher inflation could be tolerated under the approach without the Fed having to tighten monetary policy.
The 10-year U.S. treasury yield ended the quarter 3bps higher at 0.69% and the 30-year yield increased by 5bps to 1.46%.
The 10-year TIPS yield fell by 26bps over the quarter to -0.94%. Breakeven inflation rose across the curve, with the short end rising by a greater extent. The Fed’s new “average inflation targeting” approach, the continued relaxation of lockdown measures and the anticipation of further fiscal stimulus raised inflationary expectations over the quarter.
14

Aon Proprietary & Confidential Investment advice and consulting services provided by Aon Investments USA Inc..
European Fixed Income Markets
0%
2%
4%
6%
8%
10%
12%
14%
16%
2014 2015 2016 2017 2018 2019 2020
EUROZONE PERIPHERAL BOND SPREADS(10-YEAR SPREADS OVER GERMAN BUNDS)
Spain ItalyPortugal GreeceIreland
Source: FactSet
European government bond spreads over 10-year German bunds continued to narrow across the Euro Area. European Union leaders struck a deal on a €750bn coronavirus recovery package, which the European Commission will fund by borrowing in the capital markets for the first time. Elsewhere, the Eurozone witnessed a second consecutive month of deflation, putting pressure on the European Central Bank to allow inflation to overshoot its target in the future.
German bund yields fell by 5bps to -0.53% over the quarter. In Q2 2020 the Eurozone economy suffered the sharpest drop in growth since its inception, with GDP contracting by 12.1% on a quarter-on-quarter basis. Spain, which is one of the worst hit countries by the Covid-19 pandemic, was the worst performing major Eurozone economy over the quarter as it contracted by 18.5%.
Italian government bond yields fell the most at 37bps to 0.87%, whereas, Spanish and Portuguese government bond yields fell by 22bps and 21bps to 0.25% and 0.26% respectively.
15

Aon Proprietary & Confidential Investment advice and consulting services provided by Aon Investments USA Inc..
Credit Spreads
Spread (bps) 09/30/2020 06/30/2020 09/30/2019 Quarterly Change (bps)One-Year Change
(bps)
U.S. Aggregate 60 68 46 -8 14
Long Gov't 0 1 1 -1 -1
Long Credit 188 202 167 -14 21
Long Gov't/Credit 111 120 95 -9 16
MBS 61 70 46 -9 15
CMBS 106 132 70 -26 36
ABS 41 68 37 -27 4
Corporate 136 150 115 -14 21
High Yield 517 626 373 -109 144
Global Emerging Markets 334 393 312 -59 22
Source: FactSet, B loomberg Barclays
Credit markets generally performed well as spreads continued to fall, especially in the riskier credit areas. However, similar to equity markets, growing concerns over rising COVID cases and uncertainty with regards to the next round of fiscal stimulus caused spreads to widen in September. Overall, credit spreads over U.S. treasuries narrowed over the quarter.
Riskier areas of credit, such as U.S. high yield bonds and emerging market debt performed well. High yield credit spreads narrowed significantly in Q3 2020, decreasing by 109bps, whilst Global Emerging Markets spreads narrowed by 59bps over the quarter.
16
Aon Proprietary & Confidential Investment advice and consulting services provided by Aon Investments USA Inc..
Currency
80
90
100
110
120
130
140
Sep 14 Sep 15 Sep 16 Sep 17 Sep 18 Sep 19 Sep 20
U.S. DOLLAR RELATIVE TO EUR, GBP AND JPY REBASED TO 100 AT 09/30/2014
EUR/USD GBP/USD
JPY/USD
Source: FactSet
Stronger Dollar
Weaker Dollar
90
95
100
105
110
115
120
125
Sep 14 Sep 15 Sep 16 Sep 17 Sep 18 Sep 19 Sep 20
TRADE WEIGHTED U.S. DOLLAR INDEX(1973 = 100)
Source: Federal Reserve
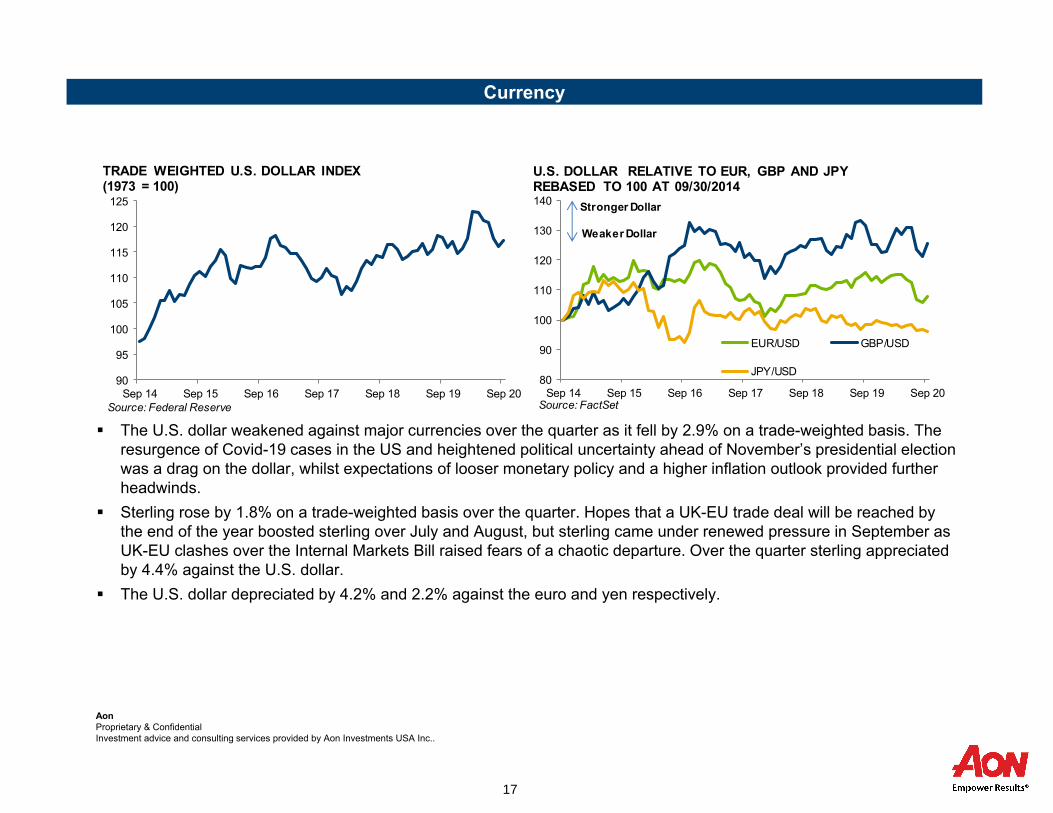
The U.S. dollar weakened against major currencies over the quarter as it fell by 2.9% on a trade-weighted basis. The resurgence of Covid-19 cases in the US and heightened political uncertainty ahead of November’s presidential election was a drag on the dollar, whilst expectations of looser monetary policy and a higher inflation outlook provided further headwinds.
Sterling rose by 1.8% on a trade-weighted basis over the quarter. Hopes that a UK-EU trade deal will be reached by the end of the year boosted sterling over July and August, but sterling came under renewed pressure in September as UK-EU clashes over the Internal Markets Bill raised fears of a chaotic departure. Over the quarter sterling appreciated by 4.4% against the U.S. dollar.
The U.S. dollar depreciated by 4.2% and 2.2% against the euro and yen respectively.
17

Aon Proprietary & Confidential Investment advice and consulting services provided by Aon Investments USA Inc..
Commodities
9.1%
10.7%
4.3%11.2%
7.8%
11.9%
7.7%
12.3%
13.8%
-8.2%
5.9%
-40.7%
1.6%
27.2%
2.8%
2.6%
1.2%
-25.1%
-50.0% -40.0% -30.0% -20.0% -10.0% 0.0% 10.0% 20.0% 30.0% 40.0%
Bloomberg Commodity Index
Ex-Energy
Energy
Industrial Metals
Prec. Metals
Agric.
Softs
Grains
Livestock
COMMODITY RETURNS AS OF 09/30/2020
Third Quarter 2020
One-Year
Source: BloombergNote: Softs and Grains are part of the wider Agriculture sector
Commodities started the quarter off strong before falling back in tandem with equity markets in September. Despite the poor performance in September, the Bloomberg Commodity Index returned 9.1%.
The Energy sector rose by 4.3% over the quarter. Oil had another turbulent quarter with prices seeming to stabilize in July and August as OPEC+ agreed to scale back its production cuts from 9.7 million barrels per day to 7.7 million barrels per day until the end of the year. However, WTI crude prices fell by 5.6% in September as OPEC reduced its demand expectations for the rest of 2020 to 90.2 million barrels per day as global coronavirus cases continued to grow.
The price of Brent crude oil fell by 0.5% to $40.9/bbl. whilst WTI crude oil spot prices rose by 2.4% to $40.2/bbl. On a one-year basis, the Energy sector is down by 40.7%.
Livestock was the best performing sector, rising by 13.8% in Q3 2020.
18

Aon Proprietary & Confidential Investment advice and consulting services provided by Aon Investments USA Inc..
Hedge Fund Markets Overview
Hedge fund performance was positive across all strategies in the third quarter.
Over the quarter, Fixed Income/Convertible Arbitrage and Equity Hedge strategies were the best performers, returning 6.6% and 6.0% respectively.
HFRI Fund-Weighted Composite Index and the HFRI Fund of Funds Composite Index produced returns of 4.2% and 4.1% respectively.
19

Aon Proprietary & Confidential Investment advice and consulting services provided by Aon Investments USA Inc..
Private Equity Market Overview – Q2 2020 Slide 1 of 2
Sources: 1 Preqin 2 Standard & Poor’s 3 PwC/CB Insights MoneyTree Report 4 PitchBook/NVCA Venture Monitor 5 Fitch Ratings 6 Thomson Reuters 7 UBS
Notes: FY=Fiscal year ended 12/31; YTD=Year to date; LTM=Last 12 months (aka trailing 12 months); PPM=Purchase Price Multiples: Total Purchase Price ÷ EBITDA.
Fundraising: In 2Q 2020, $162.3 billion was raised by 349 funds, which was a decrease of 17.7% on a capital basis and 15.9% by number of funds over the prior quarter. Dry powder stood at nearly $2.2 trillion at the end of the quarter, a modest increase compared to the previous quarter.1
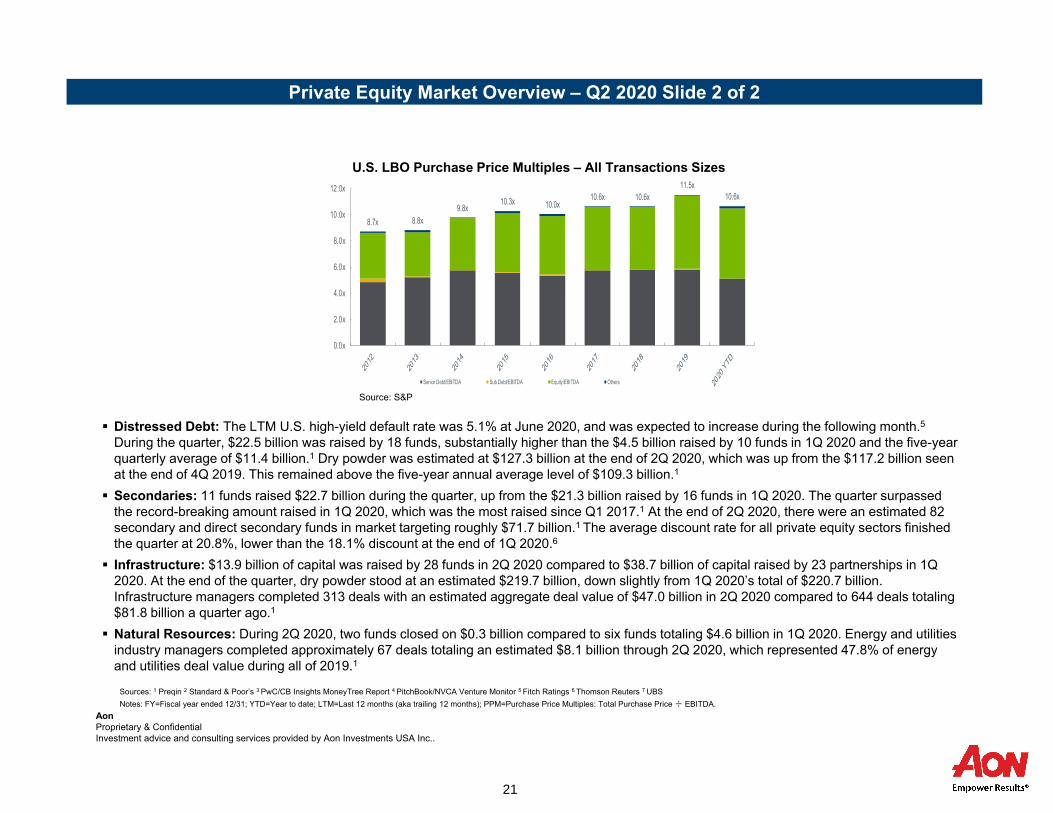
Buyout: Global private equity-backed buyout deals totaled $61.9 billion in 2Q 2020, which was down 40.1% on a capital basis and down 30.0% by number of deals from 1Q 2020.1 In 2Q 2020, the average purchase price multiple for all U.S. LBOs was 9.2x EBITDA, a decrease of 2.0x over 1Q 2020 and lower than the five-year average (10.6x).2 Large cap purchase price multiples stood at 9.2x in 2Q 2020, down compared to 1Q 2020’s level of 10.9x.2 The weighted average purchase price multiple across all European transaction sizes averaged 12.6x EBITDA for 2Q 2020, up from the 12.2x multiple seen at the end of 1Q 2020. Purchase prices for transactions of greater than €1.0 billion increased to 12.7x at the end of 2Q 2020, a jump from the 12.1x seen at the previous quarter end. Globally, exit value totaled $36.4 billion from 296 deals during the second quarter, meaningfully down from the $70.0 billion in exits from 453 deals during 1Q 2020.1
Venture: During the second quarter, 1,374 venture-backed transactions totaling $26.9 billion were completed in the U.S., which was a decrease on a capital basis over the prior quarter’s total of $27.0 billion across 1,336 deals. This was 16.3% higher than the five-year quarterly average of $23.1 billion.3 Total U.S. venture-backed exit activity totaled approximately $21,2 billion across 147 completed transactions in 2Q 2020, down on a capital basis from the $24.1 billion across 229 exits in 1Q 2020. Through 2Q 2020, U.S. exit activity represented only 17.3% of 2019’s total.4
Mezzanine: Six funds closed on $2.6 billion during the second quarter. This was up from the prior quarter’s total of $2.3 billion raised by six funds and represented 53.0% of the five-year quarterly average of $4.9 billion. Estimated dry powder was $48.6 billion at the end of 2Q 2020, up from the $48.5 billion seen at the end of 1Q 2020.1
Source: Preqin
LTM Global Private Equity-Backed Buyout Deal Volume
0
1,000
2,000
3,000
4,000
5,000
6,000
7,000
8,000
$0
$100
$200
$300
$400
$500
$600
1Q12 4Q12 3Q13 2Q14 1Q15 4Q15 3Q16 2Q17 1Q18 4Q18 3Q19 2Q20
# of D
ea
lsV
alu
e ($
Bil
lio
ns)
Deal Value ($ Billions)
Number of Deals
20
Aon Proprietary & Confidential Investment advice and consulting services provided by Aon Investments USA Inc..
Private Equity Market Overview – Q2 2020 Slide 2 of 2
Distressed Debt: The LTM U.S. high-yield default rate was 5.1% at June 2020, and was expected to increase during the following month.5
During the quarter, $22.5 billion was raised by 18 funds, substantially higher than the $4.5 billion raised by 10 funds in 1Q 2020 and the five-year quarterly average of $11.4 billion.1 Dry powder was estimated at $127.3 billion at the end of 2Q 2020, which was up from the $117.2 billion seen at the end of 4Q 2019. This remained above the five-year annual average level of $109.3 billion.1
Secondaries: 11 funds raised $22.7 billion during the quarter, up from the $21.3 billion raised by 16 funds in 1Q 2020. The quarter surpassed the record-breaking amount raised in 1Q 2020, which was the most raised since Q1 2017.1 At the end of 2Q 2020, there were an estimated 82 secondary and direct secondary funds in market targeting roughly $71.7 billion.1 The average discount rate for all private equity sectors finished the quarter at 20.8%, lower than the 18.1% discount at the end of 1Q 2020.6
Infrastructure: $13.9 billion of capital was raised by 28 funds in 2Q 2020 compared to $38.7 billion of capital raised by 23 partnerships in 1Q 2020. At the end of the quarter, dry powder stood at an estimated $219.7 billion, down slightly from 1Q 2020’s total of $220.7 billion. Infrastructure managers completed 313 deals with an estimated aggregate deal value of $47.0 billion in 2Q 2020 compared to 644 deals totaling $81.8 billion a quarter ago.1
Natural Resources: During 2Q 2020, two funds closed on $0.3 billion compared to six funds totaling $4.6 billion in 1Q 2020. Energy and utilitiesindustry managers completed approximately 67 deals totaling an estimated $8.1 billion through 2Q 2020, which represented 47.8% of energy and utilities deal value during all of 2019.1
Source: S&P
Sources: 1 Preqin 2 Standard & Poor’s 3 PwC/CB Insights MoneyTree Report 4 PitchBook/NVCA Venture Monitor 5 Fitch Ratings 6 Thomson Reuters 7 UBS
Notes: FY=Fiscal year ended 12/31; YTD=Year to date; LTM=Last 12 months (aka trailing 12 months); PPM=Purchase Price Multiples: Total Purchase Price ÷ EBITDA.
U.S. LBO Purchase Price Multiples – All Transactions Sizes
8.7x 8.8x
9.8x10.3x 10.0x
10.6x 10.6x
11.5x10.6x
0.0x
2.0x
4.0x
6.0x
8.0x
10.0x
12.0x
Senior Debt/EBITDA Sub Debt/EBITDA Equity/EBITDA Others
21

Aon Proprietary & Confidential Investment advice and consulting services provided by Aon Investments USA Inc..
U.S. Commercial Real Estate Markets
*Indicates preliminary NFI-ODCE data gross of fees
CAP RATES BY SECTORSOURCE: RCA, AON 6/30/2020
U.S. Core Real Estate returned 0.48%* over the third quarter, equating to a 1.4% total gross return year-over-year, including a 4.0% income return. Shelterin place orders and social distancing practices have most severely impacted the retail and hotel property sectors. Property valuations have begun to pricein the loss of cash flow as a result of COVID-19. Transaction volume has contracted -57% YoY through Q3 2020, and price discovery continues to belimited.
Global property markets, as measured by the FTSE EPRA/NAREIT Developed Real Estate Index, returned 2.3% (USD) in aggregate during the thirdquarter and experienced a cumulative decline of -19.1% YTD. REIT market performance was driven by Asia Pacific (2.0% USD), North America (0.9%USD) and Europe (3.1% USD). The U.S. REIT markets (FTSE NAREIT Equity REITs Index) returned 1.4% in the third quarter. The U.S. 10-year treasurybond yields rose by 3bps to 0.69% during the quarter.
The coronavirus fueled market volatility in the stock and bond markets has created a situation of uncertainty for private real estate pricing. Public marketsare searching for the right pricing level in light of the global pandemic, and how it will affect the regional and global economies. Implied volatility continuesto signal elevated levels of uncertainty concerning public market implied valuations. Considering this situation, we are recommending that investments withpre-specified assets be postponed. Private market transactions based on appraisal valuations lag the most current information, and they do not fully reflectthe current market conditions.
We are proactively evolving our investment strategy. In the post-coronavirus world, supply chains may move back to North America which will requirecorresponding real estate infrastructure. Demand for last mile logistics, already a key investment theme, will accelerate. Live and work preference changeswill create opportunities. Interest rates are likely to remain lower for even longer, making real estate a very compelling alternative to fixed incomeinvestments.
Blind pool funds offer a potential to have capital available when the new opportunity set presents itself. Those strategies need careful review in light of thechanging market dynamics. Strategies that worked previously in a growth-oriented market may not be appropriate for what may be more opportunistic styleinvesting. Regions, countries and property types all need to be reevaluated.
4.0%
5.0%
6.0%
7.0%
8.0%
9.0%
10.0%
'08 '09 '10 '11 '12 '13 '14 '15 '16 '17 '18 '19 '20
Office Industrial Retail Apartment
0.5% 1.4%5.2% 6.6%
10.3%
1.4%
-18.2%
0.2%3.9%
7.9%
-20.0%
-15.0%
-10.0%
-5.0%
0.0%
5.0%
10.0%
15.0%
Q3 2020 1-Year 3-Years 5-Years 10-Years
PRIVATE VS. PUBLIC REAL ESTATE RETURNSAS OF 09/30/2020
Private (NFI-ODCEGross)*Public (NAREITGross)
*Third quarter returns are preliminarySources: NCREIF, FactSet
22

Nebraska Investment Council
23
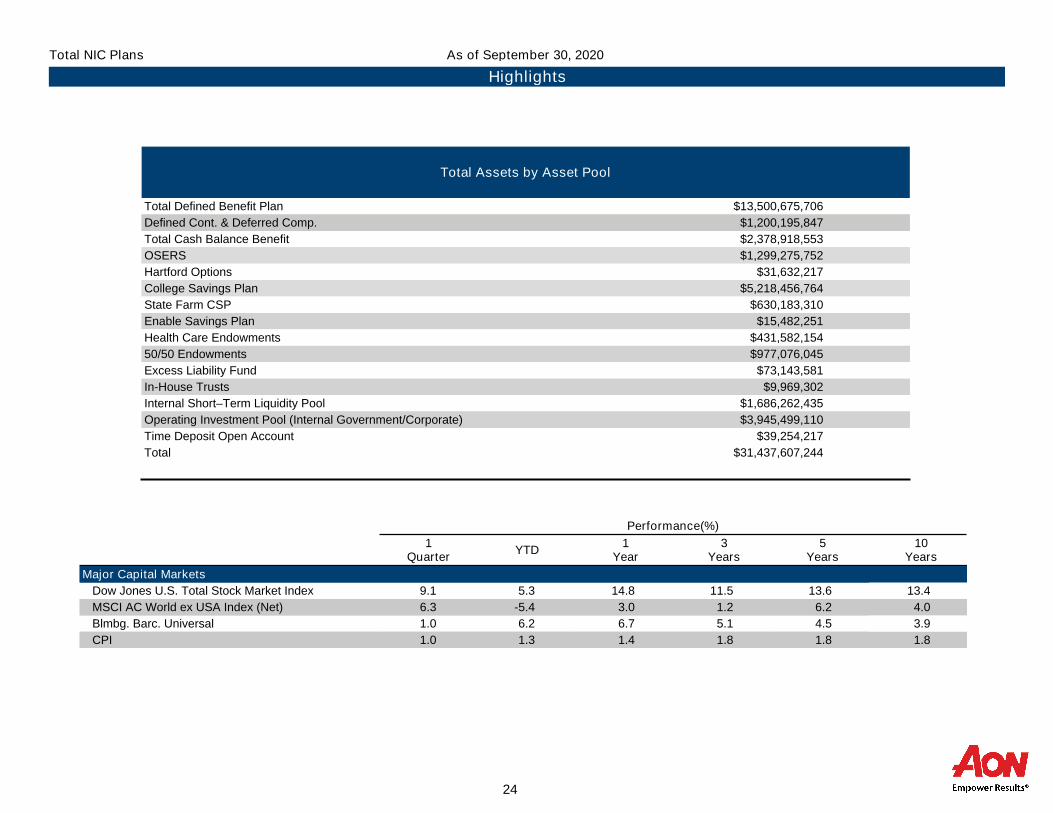
Total Assets by Asset Pool
Total Defined Benefit Plan $13,500,675,706
Defined Cont. & Deferred Comp. $1,200,195,847
Total Cash Balance Benefit $2,378,918,553
OSERS $1,299,275,752
Hartford Options $31,632,217
College Savings Plan $5,218,456,764
State Farm CSP $630,183,310
Enable Savings Plan $15,482,251
Health Care Endowments $431,582,154
50/50 Endowments $977,076,045
Excess Liability Fund $73,143,581
In-House Trusts $9,969,302
Internal Short–Term Liquidity Pool $1,686,262,435
Operating Investment Pool (Internal Government/Corporate) $3,945,499,110
Time Deposit Open Account $39,254,217
Total $31,437,607,244
Performance(%)
1Quarter
YTD1
Year3
Years5
Years10
Years
Major Capital Markets
Dow Jones U.S. Total Stock Market Index 9.1 5.3 14.8 11.5 13.6 13.4
MSCI AC World ex USA Index (Net) 6.3 -5.4 3.0 1.2 6.2 4.0
Blmbg. Barc. Universal 1.0 6.2 6.7 5.1 4.5 3.9
CPI 1.0 1.3 1.4 1.8 1.8 1.8
Total NIC Plans
Highlights
As of September 30, 2020
24

Total Assets by Asset Pool
As of September 30, 2020
Total Defined Benefit Plan42.9%
College Savings Plan16.6%
Operating Investment Pool (Internal Government/Corporate)
12.6%
Total Cash Balance Benefit7.6%
Internal Short–Term Liquidity Pool5.4%
OSERS4.1%
Defined Cont. & Deferred Comp.3.8%
50/50 Endowments3.1%
State Farm CSP2.0%
Health Care Endowments1.4%
Excess Liability Fund0.2%
Time Deposit Open Account0.1%
Hartford Options0.1%
Enable Savings Plan0.0%
In-House Trusts0.0%
25

(This Page Left Blank Intentionally)
26

Total Defined Benefit Plan
27
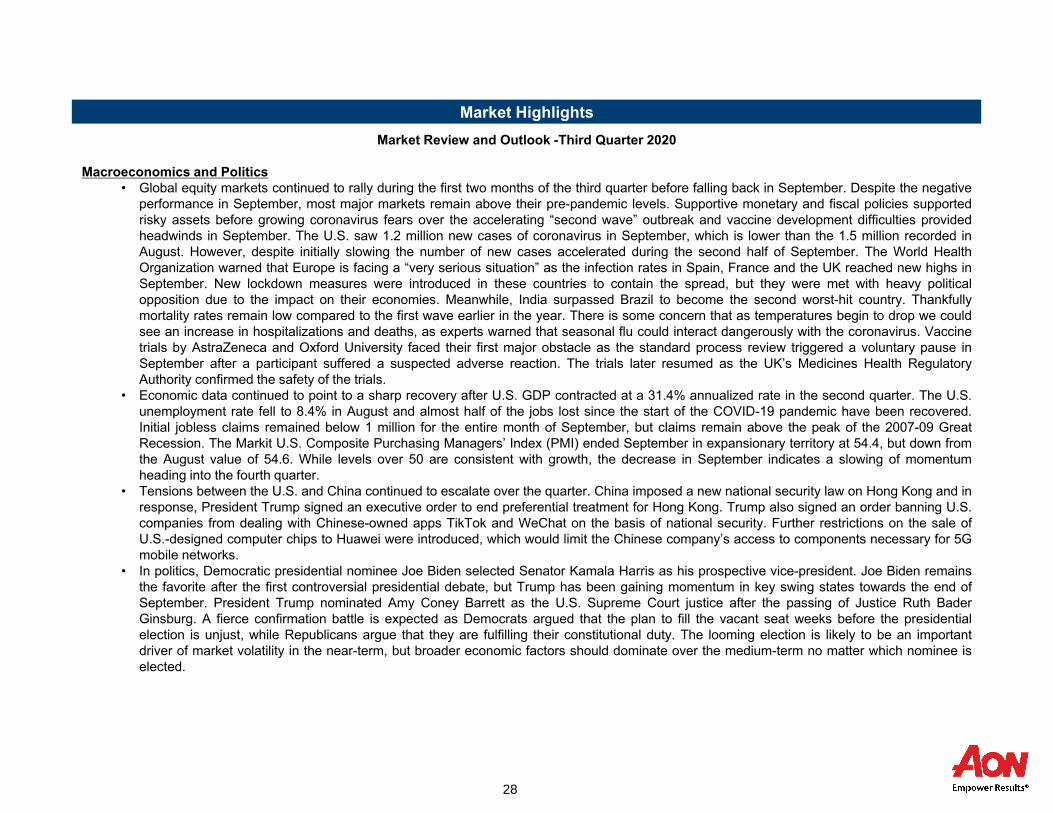
Market Highlights
Market Review and Outlook -Third Quarter 2020
Macroeconomics and Politics• Global equity markets continued to rally during the first two months of the third quarter before falling back in September. Despite the negative
performance in September, most major markets remain above their pre-pandemic levels. Supportive monetary and fiscal policies supportedrisky assets before growing coronavirus fears over the accelerating “second wave” outbreak and vaccine development difficulties providedheadwinds in September. The U.S. saw 1.2 million new cases of coronavirus in September, which is lower than the 1.5 million recorded inAugust. However, despite initially slowing the number of new cases accelerated during the second half of September. The World HealthOrganization warned that Europe is facing a “very serious situation” as the infection rates in Spain, France and the UK reached new highs inSeptember. New lockdown measures were introduced in these countries to contain the spread, but they were met with heavy politicalopposition due to the impact on their economies. Meanwhile, India surpassed Brazil to become the second worst-hit country. Thankfullymortality rates remain low compared to the first wave earlier in the year. There is some concern that as temperatures begin to drop we couldsee an increase in hospitalizations and deaths, as experts warned that seasonal flu could interact dangerously with the coronavirus. Vaccinetrials by AstraZeneca and Oxford University faced their first major obstacle as the standard process review triggered a voluntary pause inSeptember after a participant suffered a suspected adverse reaction. The trials later resumed as the UK’s Medicines Health RegulatoryAuthority confirmed the safety of the trials.
• Economic data continued to point to a sharp recovery after U.S. GDP contracted at a 31.4% annualized rate in the second quarter. The U.S.unemployment rate fell to 8.4% in August and almost half of the jobs lost since the start of the COVID-19 pandemic have been recovered.Initial jobless claims remained below 1 million for the entire month of September, but claims remain above the peak of the 2007-09 GreatRecession. The Markit U.S. Composite Purchasing Managers’ Index (PMI) ended September in expansionary territory at 54.4, but down fromthe August value of 54.6. While levels over 50 are consistent with growth, the decrease in September indicates a slowing of momentumheading into the fourth quarter.
• Tensions between the U.S. and China continued to escalate over the quarter. China imposed a new national security law on Hong Kong and inresponse, President Trump signed an executive order to end preferential treatment for Hong Kong. Trump also signed an order banning U.S.companies from dealing with Chinese-owned apps TikTok and WeChat on the basis of national security. Further restrictions on the sale ofU.S.-designed computer chips to Huawei were introduced, which would limit the Chinese company’s access to components necessary for 5Gmobile networks.
• In politics, Democratic presidential nominee Joe Biden selected Senator Kamala Harris as his prospective vice-president. Joe Biden remainsthe favorite after the first controversial presidential debate, but Trump has been gaining momentum in key swing states towards the end ofSeptember. President Trump nominated Amy Coney Barrett as the U.S. Supreme Court justice after the passing of Justice Ruth BaderGinsburg. A fierce confirmation battle is expected as Democrats argued that the plan to fill the vacant seat weeks before the presidentialelection is unjust, while Republicans argue that they are fulfilling their constitutional duty. The looming election is likely to be an importantdriver of market volatility in the near-term, but broader economic factors should dominate over the medium-term no matter which nominee iselected.
28

Market Highlights
Market Review and Outlook - Third Quarter 2020
Monetary Policy• Major central banks signaled their plans to keep interest rates low for an extended period to support the recovery from the ongoing pandemic.
The U.S. Federal Reserve (Fed) projected that it will keep interest rates near zero until at least 2023. During the quarter the Fed alsoannounced a major policy shift by adopting a new “average inflation targeting” approach. Under this approach the Fed will seek an average of2.0% inflation over time by allowing inflation to run above the target for some time to make up for periods where inflation ran below the target.Since inflation has run below the target recently, a period of higher inflation could be tolerated by the Fed without tightening monetary policy.Outside of the U.S., the Bank of England reported in its meeting minutes that it is examining how negative interest rates could be implementedeffectively should this be required.
Equities• Global equity markets continued to surge for the first two months of the quarter before falling back in September as the uncertainty over the
course of the pandemic, future size of ongoing fiscal support, and upcoming U.S. elections continued to grow. Despite falling back inSeptember, most major indices recouped all their losses from the first quarter and ended the quarter above the levels seen pre-pandemic.Tech stocks, which had driven a large part of the market rally, suffered their largest sell-off since March as investors began to fear thatvaluations had become too high. U.S. equities still managed to outperform global equities as the Dow Jones U.S. Total Stock Market Indexreturned 9.1% for the quarter while the MSCI All Country World Index (net) returned 8.1%. With valuations continuing to look stretched and theinitial sharp recovery beginning to slow, it seems unlikely that sustainable gains will be supported in the near term. Value continued to laggrowth during the quarter with the MSCI All Country World Growth Index and the MSCI All Country World Value Index returning 12.0% and4.0% respectively (all returns in net terms). While the tech fallback did allow value to outperform growth in September, the current ultra-lowinterest rate environment makes it unlikely that value will be able to produce consistent outperformance in the near term.
Credit• Credit markets generally had a solid quarter as spreads continued to fall, especially in the riskier credit areas. However, similar to equity
markets, growing concerns over rising COVID cases and uncertainty with regards to the next round of fiscal stimulus caused spreads to widenin September. Overall, the Barclays Global High Yield Index returned 4.3% for the quarter but year-to-date returns still remain slightlynegative. The Barclays Global Credit Index returned 3.2% for the quarter and returns are positive since the beginning of the year. U.S.corporate bond issuance surpassed previous calendar year records in the first nine months of 2020 as interest rates remained near zero andthe Federal Reserve continued to buy individual bonds in the corporate market, ensuring that demand remains high.
29

Market Highlights
Market Review and Outlook - Third Quarter 2020
Government Bond Yields• We saw a slight steepening of the yield curve over the quarter, but overall yields were broadly unchanged from the end of the second quarter.
Yields for 30-year treasury bills rose by 4 basis points, ending the quarter at 1.45%, while yields on the short end of the curve decreased by asimilar amount. The Merrill Lynch Option Volatility (MOVE) Index, a well-known measure of expected interest rate volatility, hit all-time lows inSeptember as the Fed announced its intention to keep rates unchanged until 2023. Breakeven inflation rose across the curve, with the shortend rising to a greater extent, after the Fed announced their “average inflation targeting” approach which could see inflation rise above 2% fora period of time. With returns remaining low for government bonds we continue to recommend that portfolios use gains from governmentbonds allocation to fund asset purchases in other markets or as a source of liquidity.
Commodities• Commodities started the quarter off strong before tumbling in tandem with equity markets in September. Despite poor performance in
September the S&P GSCI Index still managed to end the quarter up 4.6%. Oil had another turbulent quarter with prices seeming to stabilize inJuly and August as OPEC+ agreed to scale back its production from 9.7 million barrels per day to 7.7 million barrels per day from August untilthe end of the year. However, WTI crude prices fell by 5.6% in September. OPEC reduced its demand expectations for the rest of 2020 to 90.2million barrels per day as global coronavirus cases continued to grow. The S&P GSCI Gold Index produced a 6.7% return over the quarter, buta strengthening U.S. Dollar and investors profit taking after a strong rally caused gold prices to fall in September. With high inflationuncertainty, interest rates locked in by central banks well below inflation, and the dollar likely to weaken further it is likely the demand for goldwill remain strong. We see gold as an “uncertainty hedge” that should fit well in most portfolios given today’s risky environment.
30
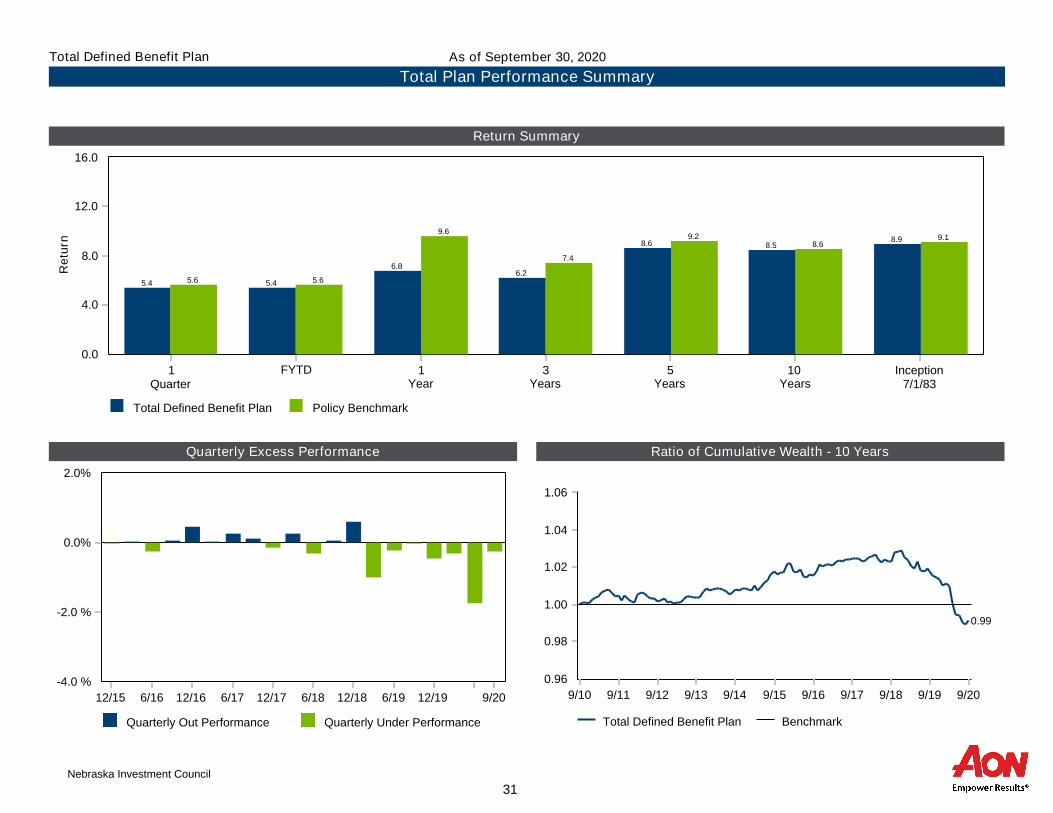
Return Summary
Quarterly Excess Performance Ratio of Cumulative Wealth - 10 Years
Total Defined Benefit Plan Policy Benchmark
0.0
4.0
8.0
12.0
16.0
Re
turn
1Quarter
FYTD 1Year
3Years
5Years
10Years
Inception7/1/83
5.6 5.6
9.6
7.4
9.28.6
9.1
5.4 5.4
6.86.2
8.6 8.58.9
Total Defined Benefit Plan Benchmark
0.96
0.98
1.00
1.02
1.04
1.06
9/10 9/11 9/12 9/13 9/14 9/15 9/16 9/17 9/18 9/19 9/20
0.99
Quarterly Out Performance Quarterly Under Performance
0.0%
2.0%
-2.0 %
-4.0 %
12/15 6/16 12/16 6/17 12/17 6/18 12/18 6/19 12/19 9/20
Total Plan Performance Summary
As of September 30, 2020Total Defined Benefit Plan
Nebraska Investment Council
31

Allocation
MarketValue
$% Policy(%)
Performance(%)
1Quarter
YTD1
Year3
Years5
Years10
YearsSince
InceptionInception
Date
Total Defined Benefit Plan $13,500,675,706 100.0 100.0 5.4 (33) 1.2 (50) 6.8 (43) 6.2 (31) 8.6 (16) 8.5 (10) 8.9 (-) 07/01/1983
Policy Benchmark 5.6 (18) 3.4 (15) 9.6 (3) 7.4 (10) 9.2 (7) 8.6 (9) 9.1 (-)
Total U.S. Equity $3,877,328,777 28.7 27.5 9.0 (17) 4.5 (25) 13.9 (23) 11.0 (27) 13.3 (24) 13.4 (21) 9.9 (-) 07/01/1983
Dow Jones U.S. Total Stock Market 9.1 (16) 5.3 (21) 14.8 (21) 11.5 (16) 13.6 (22) 13.4 (20) 10.7 (-)
DFA $308,383,704 2.3 3.9 (66) -13.7 (72) -6.7 (73) -1.5 (72) 5.7 (74) 9.6 (63) 10.5 (26) 10/01/1996
Russell 2000 Index* 4.9 (51) -8.7 (46) 0.4 (42) 1.8 (46) 8.0 (42) 9.5 (64) 8.9 (79)
BlackRock Russell 1000 Index $3,568,945,073 26.4 9.4 (23) 6.4 (28) 16.0 (27) 12.4 (25) 14.1 (16) 13.8 (17) 8.7 (33) 10/01/2007
Russell 1000 Index 9.5 (23) 6.4 (28) 16.0 (27) 12.4 (25) 14.1 (17) 13.8 (18) 8.6 (34)
Total Non-U.S. Equity $1,477,796,059 10.9 11.5 6.8 (71) -5.1 (70) 3.7 (69) 1.6 (73) 7.0 (60) 4.7 (74) 5.5 (-) 10/01/1991
MSCI All Country World ex-U.S. IMI* 6.8 (71) -5.2 (71) 3.5 (70) 1.1 (81) 6.3 (82) 4.2 (98) 5.7 (-)
BlackRock ACWI ex-U.S. IMI Index $1,477,796,059 10.9 6.8 (63) -5.1 (59) 3.7 (61) - - - 0.6 (50) 12/01/2017
MSCI AC World ex USA IMI (Net) 6.8 (63) -5.2 (60) 3.5 (62) - - - 0.2 (53)
Total Global Equity $2,587,176,590 19.2 19.0 6.5 (66) -4.2 (68) 4.1 (64) 4.4 (63) 8.8 (55) 8.6 (60) 7.2 (39) 09/01/2005
MSCI All Country World IMI* 8.1 (49) 0.5 (55) 9.6 (52) 6.5 (50) 10.0 (44) 8.5 (60) 6.6 (51)
MFS $869,238,821 6.4 8.5 (45) -0.5 (57) 6.9 (59) 7.4 (44) 10.6 (40) 10.7 (30) 9.0 (15) 10/01/2005
MSCI All Country World IMI* 8.1 (49) 0.5 (55) 9.6 (52) 6.5 (50) 10.0 (44) 8.4 (60) 6.4 (52)
Arrowstreet $818,213,679 6.1 7.4 (58) 2.2 (51) 11.2 (46) 7.3 (45) - - 11.4 (33) 09/01/2016
MSCI AC World IMI (Net) 8.1 (49) 0.5 (55) 9.6 (52) 6.5 (50) - - 9.4 (49)
Wellington Equity $261,484,208 1.9 6.5 (76) -12.3 (93) -5.0 (95) -0.8 (73) - - 5.1 (67) 09/01/2016
MSCI AC World Small Cap (Net) 7.9 (57) -5.9 (55) 3.2 (60) 2.0 (64) - - 6.3 (64)
Dodge & Cox $638,239,882 4.7 2.9 (78) -14.6 (84) -5.4 (76) -1.5 (81) - - 0.4 (80) 07/01/2017
MSCI AC World IMI (Net) 8.1 (36) 0.5 (43) 9.6 (43) 6.5 (40) - - 7.7 (39)
Total Defined Benefit Plan
Asset Allocation & Performance
As of September 30, 2020
Performance for individual private equity accounts are provided separately in the private equity performance report. Nebraska Investment Council
32

Total Defined Benefit Plan
Asset Allocation & Performance
As of September 30, 2020
Allocation
MarketValue
$% Policy(%)
Performance(%)
1Quarter
YTD1
Year3
Years5
Years10
YearsSince
InceptionInception
Date
Total Fixed Income $3,972,350,437 29.4 30.0 1.8 (42) 4.8 (79) 5.3 (83) 4.6 (85) 4.5 (87) 4.0 (86) 7.8 (-) 07/01/1983
Blmbg. Barc. Universal Bond Index* 1.0 (84) 6.2 (64) 6.7 (67) 5.1 (65) 4.5 (87) 3.9 (87) 7.7 (-)
BlackRock Core Plus Universal $567,770,419 4.2 1.4 (67) 6.8 (48) 7.5 (41) 5.4 (48) 4.7 (57) 4.4 (48) 5.8 (33) 04/01/1998
Blmbg. Barc. Universal Bond Index* 1.0 (90) 6.2 (62) 6.7 (64) 5.1 (65) 4.5 (67) 3.9 (73) 5.4 (54)
PIMCO $732,181,476 5.4 1.8 (39) 7.5 (30) 7.8 (32) 5.9 (16) 5.6 (17) 4.2 (60) 6.0 (19) 04/01/1998
Blmbg. Barc. Univeral Bond Index* 1.0 (90) 6.2 (62) 6.7 (64) 5.1 (65) 4.5 (67) 3.9 (73) 5.4 (54)
BlackRock Aggregate Bond Index $623,531,825 4.6 0.7 (88) 6.9 (56) 7.1 (53) 5.3 (60) 4.2 (70) 3.7 (69) 4.6 (63) 02/01/2006
Blmbg. Barc. Aggregate Bond Index 0.6 (89) 6.8 (61) 7.0 (62) 5.2 (64) 4.2 (78) 3.6 (75) 4.5 (69)
Loomis Sayles $242,283,864 1.8 2.8 (10) 8.7 (9) 9.9 (5) 6.2 (9) 6.9 (1) 7.1 (1) 7.3 (1) 07/01/2006
Blmbg. Barc. Universal Bond Index* 1.0 (90) 6.2 (62) 6.7 (64) 5.1 (65) 4.5 (67) 3.9 (73) 5.3 (50)
Wellington Global $484,117,455 3.6 2.3 (74) 4.6 (34) 4.7 (45) 3.8 (44) 3.6 (80) - 2.0 (74) 09/01/2014
Blmbg. Barc. Global Aggregate 2.7 (66) 5.7 (26) 6.2 (30) 4.1 (40) 3.9 (71) - 2.2 (70)
Loomis Sayles Bank Loans $329,012,450 2.4 3.4 (68) -1.6 (60) -0.5 (67) 2.0 (81) 2.8 (92) - 2.6 (81) 06/01/2014
S&P/LSTA Leveraged Loan Index 4.1 (13) -0.7 (25) 1.1 (30) 3.1 (27) 4.0 (15) - 3.3 (20)
Franklin Templeton $331,591,199 2.5 2.8 (92) -4.3 (95) -3.6 (95) 0.5 (97) 2.3 (97) - 2.1 (95) 07/01/2014
Credit Suisse Leveraged Loan (Split BB) 3.0 (91) -1.9 (64) -0.5 (65) 2.5 (52) 3.3 (59) - 3.2 (35)
Neuberger Berman Core Plus $629,218,314 4.7 1.3 (75) 6.7 (49) 7.5 (42) 5.7 (32) 5.1 (29) - 4.8 (35) 07/01/2015
Blmbg. Barc. Universal Bond Index 1.0 (90) 6.2 (62) 6.7 (64) 5.1 (65) 4.5 (67) - 4.4 (59)
Opportunistic Fixed Income - PIMCO Bravo II $26,565,129 0.2
Opportunistic Fixed Income - Oaktree $5,040,679 0.0
Opportunistic Cash and Int Rec $1,002,978 0.0
Contributions and Withdrawals $34,648 0.0
Total Real Estate $818,023,960 6.1 7.0 -1.5 -0.3 0.9 4.3 6.5 9.1 6.4 12/01/2004
Performance Benchmark 0.3 -0.7 0.5 4.2 5.6 9.1 8.2
CB Richard Ellis Strategic $4,144,122 0.0
Prudential PRISA I $166,350,494 1.2
UBS Real Estate $126,870,984 0.9
Rockwood Capital Real Estate Fund IX $3,113,362 0.0
Prudential PRISA II $75,545,436 0.6
Five Arrows Realty $56,456 0.0
RockPoint Fund III $954,355 0.0
Landmark Real Estate VI $1,860,675 0.0
Landmark Real Estate VII $14,965,806 0.1
AG Realty Fund VIII $5,426,494 0.0
UBS Trumbull Property Income $115,152,111 0.9
Almanac Realty Securities VII $16,371,226 0.1
Performance for individual private equity accounts are provided separately in the private equity performance report. Nebraska Investment Council
33

Total Defined Benefit Plan
Asset Allocation & Performance
As of September 30, 2020
Allocation
MarketValue
$% Policy(%)
Performance(%)
1Quarter
YTD1
Year3
Years5
Years10
YearsSince
InceptionInception
Date
Torchlight IV $2,667,831 0.0
Torchlight V $9,375,131 0.1
Rockwood Capital Real Estate Fund X $24,611,654 0.2
Landmark Real Estate VIII $10,290,251 0.1
Torchlight VI $33,657,698 0.2
Almanac Realty Securities VIII $4,709,328 0.0
Clarion Lion Properties Fund $194,444,114 1.4
Rockwood Capital Real Estate Fund XI $224,672 0.0
Torchlight Debt Opportunity $4,258,362 0.0
Real Estate Cash $2,973,399 0.0
Total Private Equity $764,254,462 5.7 5.0 7.9 1.9 4.3 11.1 11.8 12.4 5.1 09/01/2005
Dow Jones U.S. Total Stock Market + 3% 9.9 7.6 18.2 14.9 17.0 16.8 12.5
Abbott Capital $6,910,949 0.1
Pathway $12,588,918 0.1
Sun Capital $2,850,767 0.0
Dover Street VIII $7,196,455 0.1
CMEA Ventures VII $4,424,358 0.0
New Mountain Partners III $11,942,278 0.1
New Mountain Partners IV $21,076,675 0.2
Citigroup Venture Capital International $2,400,126 0.0
Wayzata Opportunities Fund II $217,915 0.0
Resolute Fund II $7,376,079 0.1
Resolute Fund III $21,706,975 0.2
Accel KKR Capital Partners III $39,913 0.0
BridgePoint Europe IV $3,724,942 0.0
Quantum Energy Partners V $5,648,085 0.0
Quantum Energy Partners VI $22,023,141 0.2
CVC European Equity Partners VI $15,064,575 0.1
CVC European Equity Partners V $2,953,806 0.0
Fulcrum Growth Partners IV $7,370,384 0.1
Ares Corporate Opp Fund III $832,578 0.0
Ares Corporate Opp Fund IV $11,482,782 0.1
New Enterprise Associates 13 $10,120,061 0.1
New Enterprise Associates 14 $19,624,264 0.1
Lincolnshire Equity Partners IV $6,759,554 0.1
Longroad Capital Partners LP $57,716 0.0
Performance for individual private equity accounts are provided separately in the private equity performance report. Nebraska Investment Council
34

Total Defined Benefit Plan
Asset Allocation & Performance
As of September 30, 2020
Allocation
MarketValue
$% Policy(%)
Performance(%)
1Quarter
YTD1
Year3
Years5
Years10
YearsSince
InceptionInception
Date
Merit Mezzanine Fund V $5,437,139 0.0
Ares Mezzanine Fund Partners $53,113 0.0
Lightyear Fund III $1,347,227 0.0
EIF U.S. Power Fund IV $12,863,304 0.1
McCarthy Capital Fund V $6,477,250 0.0
Green Equity Investors VI $17,845,106 0.1
Wayzata Opp Fund III $3,640,349 0.0
Accel KKR Capital Partners IV $10,089,853 0.1
Beeker Petty O'Keefe & Co. IV $13,718,558 0.1
Pine Brook Capital Partners II $21,123,489 0.2
EMG III LP $14,281,800 0.1
Francisco Partners IV $23,997,527 0.2
Wynnchurch Capital Partners IV $17,986,312 0.1
BridgePoint Europe V $18,439,632 0.1
McCarthy Capital Fund VI $46,059,096 0.3
Dover Street IX $33,187,455 0.2
Green Equity Investors VII $44,401,600 0.3
Quantum Energy Investors VII $19,982,573 0.1
Ares Corporate Opp Fund V $29,466,644 0.2
Genstar Cap Ptr VIII L.P. $54,694,462 0.4
New Mountain Partners V $38,921,532 0.3
Francisco Partners V $33,138,893 0.2
Resolute Fund IV $30,752,161 0.2
BridgePoint Europe VI $15,214,622 0.1
Genstar Cap Ptr IX LP $16,462,314 0.1
New Enterprise Associates 17 $11,998,285 0.1
Dover Street X $6,146,205 0.0
Private Equity Cash $12,134,664 0.1
Total Cash $3,745,421 0.0 0.0
STIF $3,745,421 0.0
The Inception-to-Date IRR for Real Estate is 6.5% as of 6/30/2020. The Inception-to-Date IRR for Private Equity is 11.3% as of 6/30/2020.
* Denotes a performance benchmark that is a splice of more than one index. Descriptions can be found in the appendix of this report.
The Private Equity asset class returns are time-weighted.
Performance for individual private equity accounts are provided separately in the private equity performance report. Nebraska Investment Council
35
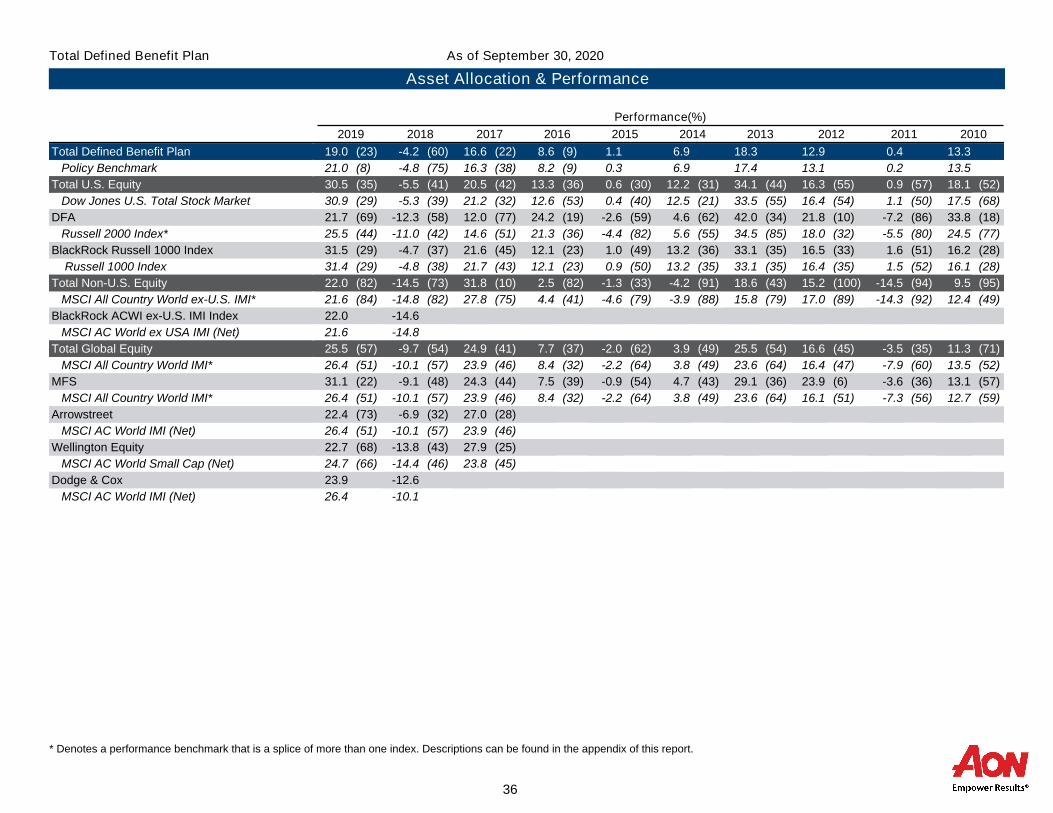
Performance(%)
2019 2018 2017 2016 2015 2014 2013 2012 2011 2010
Total Defined Benefit Plan 19.0 (23) -4.2 (60) 16.6 (22) 8.6 (9) 1.1 6.9 18.3 12.9 0.4 13.3
Policy Benchmark 21.0 (8) -4.8 (75) 16.3 (38) 8.2 (9) 0.3 6.9 17.4 13.1 0.2 13.5
Total U.S. Equity 30.5 (35) -5.5 (41) 20.5 (42) 13.3 (36) 0.6 (30) 12.2 (31) 34.1 (44) 16.3 (55) 0.9 (57) 18.1 (52)
Dow Jones U.S. Total Stock Market 30.9 (29) -5.3 (39) 21.2 (32) 12.6 (53) 0.4 (40) 12.5 (21) 33.5 (55) 16.4 (54) 1.1 (50) 17.5 (68)
DFA 21.7 (69) -12.3 (58) 12.0 (77) 24.2 (19) -2.6 (59) 4.6 (62) 42.0 (34) 21.8 (10) -7.2 (86) 33.8 (18)
Russell 2000 Index* 25.5 (44) -11.0 (42) 14.6 (51) 21.3 (36) -4.4 (82) 5.6 (55) 34.5 (85) 18.0 (32) -5.5 (80) 24.5 (77)
BlackRock Russell 1000 Index 31.5 (29) -4.7 (37) 21.6 (45) 12.1 (23) 1.0 (49) 13.2 (36) 33.1 (35) 16.5 (33) 1.6 (51) 16.2 (28)
Russell 1000 Index 31.4 (29) -4.8 (38) 21.7 (43) 12.1 (23) 0.9 (50) 13.2 (35) 33.1 (35) 16.4 (35) 1.5 (52) 16.1 (28)
Total Non-U.S. Equity 22.0 (82) -14.5 (73) 31.8 (10) 2.5 (82) -1.3 (33) -4.2 (91) 18.6 (43) 15.2 (100) -14.5 (94) 9.5 (95)
MSCI All Country World ex-U.S. IMI* 21.6 (84) -14.8 (82) 27.8 (75) 4.4 (41) -4.6 (79) -3.9 (88) 15.8 (79) 17.0 (89) -14.3 (92) 12.4 (49)
BlackRock ACWI ex-U.S. IMI Index 22.0 -14.6
MSCI AC World ex USA IMI (Net) 21.6 -14.8
Total Global Equity 25.5 (57) -9.7 (54) 24.9 (41) 7.7 (37) -2.0 (62) 3.9 (49) 25.5 (54) 16.6 (45) -3.5 (35) 11.3 (71)
MSCI All Country World IMI* 26.4 (51) -10.1 (57) 23.9 (46) 8.4 (32) -2.2 (64) 3.8 (49) 23.6 (64) 16.4 (47) -7.9 (60) 13.5 (52)
MFS 31.1 (22) -9.1 (48) 24.3 (44) 7.5 (39) -0.9 (54) 4.7 (43) 29.1 (36) 23.9 (6) -3.6 (36) 13.1 (57)
MSCI All Country World IMI* 26.4 (51) -10.1 (57) 23.9 (46) 8.4 (32) -2.2 (64) 3.8 (49) 23.6 (64) 16.1 (51) -7.3 (56) 12.7 (59)
Arrowstreet 22.4 (73) -6.9 (32) 27.0 (28)
MSCI AC World IMI (Net) 26.4 (51) -10.1 (57) 23.9 (46)
Wellington Equity 22.7 (68) -13.8 (43) 27.9 (25)
MSCI AC World Small Cap (Net) 24.7 (66) -14.4 (46) 23.8 (45)
Dodge & Cox 23.9 -12.6
MSCI AC World IMI (Net) 26.4 -10.1
Total Defined Benefit Plan
Asset Allocation & Performance
As of September 30, 2020
* Denotes a performance benchmark that is a splice of more than one index. Descriptions can be found in the appendix of this report.
36
Total Defined Benefit Plan
Asset Allocation & Performance
As of September 30, 2020
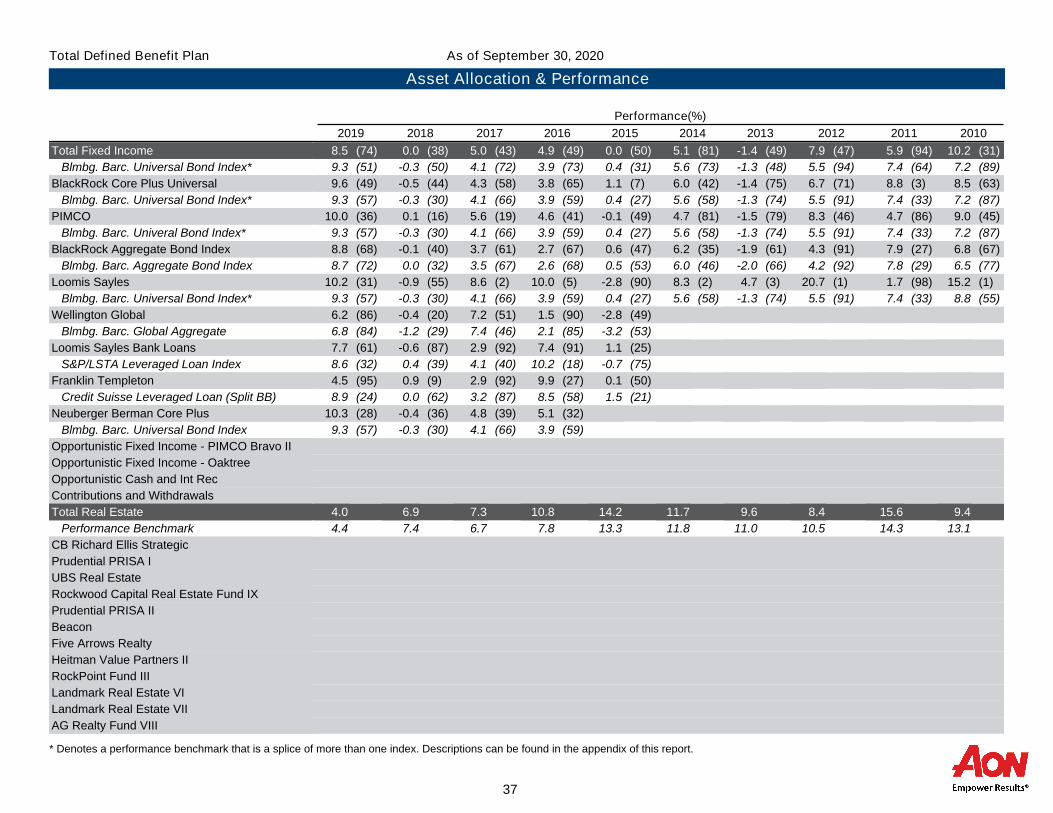
Performance(%)
2019 2018 2017 2016 2015 2014 2013 2012 2011 2010
Total Fixed Income 8.5 (74) 0.0 (38) 5.0 (43) 4.9 (49) 0.0 (50) 5.1 (81) -1.4 (49) 7.9 (47) 5.9 (94) 10.2 (31)
Blmbg. Barc. Universal Bond Index* 9.3 (51) -0.3 (50) 4.1 (72) 3.9 (73) 0.4 (31) 5.6 (73) -1.3 (48) 5.5 (94) 7.4 (64) 7.2 (89)
BlackRock Core Plus Universal 9.6 (49) -0.5 (44) 4.3 (58) 3.8 (65) 1.1 (7) 6.0 (42) -1.4 (75) 6.7 (71) 8.8 (3) 8.5 (63)
Blmbg. Barc. Universal Bond Index* 9.3 (57) -0.3 (30) 4.1 (66) 3.9 (59) 0.4 (27) 5.6 (58) -1.3 (74) 5.5 (91) 7.4 (33) 7.2 (87)
PIMCO 10.0 (36) 0.1 (16) 5.6 (19) 4.6 (41) -0.1 (49) 4.7 (81) -1.5 (79) 8.3 (46) 4.7 (86) 9.0 (45)
Blmbg. Barc. Univeral Bond Index* 9.3 (57) -0.3 (30) 4.1 (66) 3.9 (59) 0.4 (27) 5.6 (58) -1.3 (74) 5.5 (91) 7.4 (33) 7.2 (87)
BlackRock Aggregate Bond Index 8.8 (68) -0.1 (40) 3.7 (61) 2.7 (67) 0.6 (47) 6.2 (35) -1.9 (61) 4.3 (91) 7.9 (27) 6.8 (67)
Blmbg. Barc. Aggregate Bond Index 8.7 (72) 0.0 (32) 3.5 (67) 2.6 (68) 0.5 (53) 6.0 (46) -2.0 (66) 4.2 (92) 7.8 (29) 6.5 (77)
Loomis Sayles 10.2 (31) -0.9 (55) 8.6 (2) 10.0 (5) -2.8 (90) 8.3 (2) 4.7 (3) 20.7 (1) 1.7 (98) 15.2 (1)
Blmbg. Barc. Universal Bond Index* 9.3 (57) -0.3 (30) 4.1 (66) 3.9 (59) 0.4 (27) 5.6 (58) -1.3 (74) 5.5 (91) 7.4 (33) 8.8 (55)
Wellington Global 6.2 (86) -0.4 (20) 7.2 (51) 1.5 (90) -2.8 (49)
Blmbg. Barc. Global Aggregate 6.8 (84) -1.2 (29) 7.4 (46) 2.1 (85) -3.2 (53)
Loomis Sayles Bank Loans 7.7 (61) -0.6 (87) 2.9 (92) 7.4 (91) 1.1 (25)
S&P/LSTA Leveraged Loan Index 8.6 (32) 0.4 (39) 4.1 (40) 10.2 (18) -0.7 (75)
Franklin Templeton 4.5 (95) 0.9 (9) 2.9 (92) 9.9 (27) 0.1 (50)
Credit Suisse Leveraged Loan (Split BB) 8.9 (24) 0.0 (62) 3.2 (87) 8.5 (58) 1.5 (21)
Neuberger Berman Core Plus 10.3 (28) -0.4 (36) 4.8 (39) 5.1 (32)
Blmbg. Barc. Universal Bond Index 9.3 (57) -0.3 (30) 4.1 (66) 3.9 (59)
Opportunistic Fixed Income - PIMCO Bravo II
Opportunistic Fixed Income - Oaktree
Opportunistic Cash and Int Rec
Contributions and Withdrawals
Total Real Estate 4.0 6.9 7.3 10.8 14.2 11.7 9.6 8.4 15.6 9.4
Performance Benchmark 4.4 7.4 6.7 7.8 13.3 11.8 11.0 10.5 14.3 13.1
CB Richard Ellis Strategic
Prudential PRISA I
UBS Real Estate
Rockwood Capital Real Estate Fund IX
Prudential PRISA II
Beacon
Five Arrows Realty
Heitman Value Partners II
RockPoint Fund III
Landmark Real Estate VI
Landmark Real Estate VII
AG Realty Fund VIII
* Denotes a performance benchmark that is a splice of more than one index. Descriptions can be found in the appendix of this report.
37

Total Defined Benefit Plan
Asset Allocation & Performance
As of September 30, 2020
Performance(%)
2019 2018 2017 2016 2015 2014 2013 2012 2011 2010
UBS Trumbull Property Income
Almanac Realty Securities VII
Francisco Partners IV
Torchlight IV
Torchlight V
Rockwood Capital Real Estate Fund X
Landmark Real Estate VIII
Torchlight VI
Almanac Realty Securities VIII
Clarion Lion Properties Fund
Torchlight Debt Opportunity
Real Estate Cash
Total Private Equity 14.9 14.2 18.7 9.2 14.4 11.9 13.0 9.6 10.9 25.0
Dow Jones U.S. Total Stock Market + 3% 34.7 -2.4 24.7 16.0 3.5 15.8 37.4 19.8 4.1 21.0
Abbott Capital
Pathway
Sun Capital
Dover Street VIII
CMEA Ventures VII
New Mountain Partners III
New Mountain Partners IV
Citigroup Venture Capital International
Wayzata Opportunities Fund II
Resolute Fund II
Resolute Fund III
Accel KKR Capital Partners III
BridgePoint Europe IV
Quantum Energy Partners V
Quantum Energy Partners VI
CVC European Equity Partners VI
CVC European Equity Partners V
Fulcrum Growth Partners IV
Ares Corporate Opp Fund III
Ares Corporate Opp Fund IV
New Enterprise Associates 13
New Enterprise Associates 14
* Denotes a performance benchmark that is a splice of more than one index. Descriptions can be found in the appendix of this report.
38

Total Defined Benefit Plan
Asset Allocation & Performance
As of September 30, 2020
Performance(%)
2019 2018 2017 2016 2015 2014 2013 2012 2011 2010
Lincolnshire Equity Partners IV
Longroad Capital Partners LP
Merit Mezzanine Fund V
Ares Mezzanine Fund Partners
Lightyear Fund III
EIF U.S. Power Fund IV
McCarthy Capital Fund V
Green Equity Investors VI
Wayzata Opp Fund III
Accel KKR Capital Partners IV
Beeker Petty O'Keefe & Co. IV
Pine Brook Capital Partners II
EMG III LP
Francisco Partners IV
Wynnchurch Capital Partners IV
BridgePoint Europe V
McCarthy Capital Fund VI
Dover Street IX
Ares Corporate Opp Fund V
Genstar Cap Ptr VIII L.P.
Green Equity Investors VII
Quantum Energy Investors VII
New Mountain Mountain Partners V, LP
Francisco Partners V
Resolute Fund IV
BridgePoint Europe VI
Genstar Cap Ptr IX LP
New Enterprise Associates 17
Dover Street X
Private Equity Cash
Total Cash
STIF
The Private Equity asset class returns are time-weighted. Performance for individual Private Equity accounts are provided separately in the PrivateEquity performance report.
* Denotes a performance benchmark that is a splice of more than one index. Descriptions can be found in the appendix of this report.
39

-22.0
-16.0
-10.0
-4.0
2.0
8.0
14.0
20.0
26.0
32.0
Re
turn
1Quarter
YTD FYTD1
Year3
Years5
Years10
Years2019 2018 2017
Total Defined Benefit Plan 5.4 (33) 1.2 (50) 5.4 (33) 6.8 (43) 6.2 (31) 8.6 (16) 8.5 (10) 19.0 (23) -4.2 (60) 16.6 (22)¢
Policy Benchmark 5.6 (18) 3.4 (15) 5.6 (18) 9.6 (3) 7.4 (10) 9.2 (7) 8.6 (9) 21.0 (8) -4.8 (75) 16.3 (38)�
5th Percentile 6.2 4.5 6.2 9.3 7.7 9.3 9.0 21.2 0.6 17.7
1st Quartile 5.6 2.7 5.6 7.8 6.5 8.3 8.0 18.7 -2.4 16.4
Median 5.0 1.1 5.0 5.9 5.5 7.4 7.4 17.1 -3.7 16.2
3rd Quartile 4.1 -0.5 4.1 4.1 4.7 6.8 6.8 15.6 -4.8 14.5
95th Percentile 0.5 -3.3 0.5 1.6 3.0 3.9 3.3 11.7 -6.6 12.7
Population 72 72 72 72 72 71 63 81 55 13
Total Defined Benefit Plan
Plan Sponsor Peer Group Analysis
As of September 30, 2020
All Public Plans > $1B-Total Fund
Parentheses contain percentile rankings.
40

Annualized Return vs. Annualized Standard Deviation5 Years
Rolling 5 Years Standard Deviation
5 Years Historical Statistics
Total Defined Benefit Plan Policy Benchmark
FTSE 3 Month T-Bill
-2.0
0.0
2.0
4.0
6.0
8.0
10.0
12.0
14.0
Re
turn
(%)
0.0 2.0 4.0 6.0 8.0 10.0 12.0 14.0Risk (Standard Deviation %)
Total Defined Benefit Plan Policy Benchmark
0.0
3.0
6.0
9.0
12.0
15.0
18.0
21.0
12/05 6/07 12/08 6/10 12/11 6/13 12/14 6/16 12/17 6/19 9/20
ActiveReturn
TrackingError
InformationRatio
R-SquaredSharpeRatio
Alpha Beta ReturnStandardDeviation
ActualCorrelation
Total Defined Benefit Plan -0.57 0.88 -0.65 0.99 0.82 -0.07 0.95 8.62 9.21 1.00
Policy Benchmark 0.00 0.00 N/A 1.00 0.83 0.00 1.00 9.18 9.71 1.00
FTSE 3 Month T-Bill -8.13 9.74 -0.83 0.02 N/A 1.19 0.00 1.16 0.24 -0.13
Total Defined Benefit Plan Risk Profile
As of September 30, 2020Total Defined Benefit Plan
41

Total Fund Performance
0.00% 4.00% 8.00% 12.00%-4.00 %
Total Fund
Total Fund Benchmark
Total Value Added
5.38%
5.65%
-0.27 %
Total Value Added:-0.27 %
0.00% 0.20%-0.20 %-0.40 %-0.60 %
Other
Manager Value Added
Asset Allocation
0.00%
-0.29 %
0.02%
Total Asset Allocation:0.02%
Average Active Weight
0.00% 2.00% 4.00%-2.00 %
Total Cash
Total Private Equity
Total Real Estate
Total Fixed Income
Total Global Equity
Total Non-U.S. Equity
Total U.S. Equity
We
igh
t
(%)
0.05%
0.37%
-0.86 %
-0.33 %
0.16%
-0.63 %
1.23%
Asset Allocation Value Added
0.00% 0.04% 0.08%-0.04 %-0.08 %
-0.01 %
0.02%
0.03%
-0.03 %
0.00%
-0.01 %
0.01%
Total Manager Value Added:-0.29 %
Manager Value Added
0.00% 0.40% 0.80%-0.40 %-0.80 %
0.00%
-0.11 %
-0.11 %
0.25%
-0.30 %
0.00%
-0.02 %
Total Defined Benefit Plan
Total Fund Attribution
1 Quarter Ending September 30, 2020
42

Total Fund Performance
0.00% 8.00% 16.00%-8.00 %
Total Fund
Total Fund Benchmark
Total Value Added
6.78%
9.61%
-2.82 %
Total Value Added:-2.82 %
-4.00 % -2.00 % 0.00%
Other
Manager Value Added
Asset Allocation
-0.13 %
-2.59 %
-0.10 %
Total Asset Allocation:-0.10 %
Average Active Weight
0.00% 0.71% 1.42%-0.71 %-1.42 %
Total Cash
Total Private Equity
Total Real Estate
Total Fixed Income
Total Global Equity
Total Non-U.S. Equity
Total U.S. Equity
We
igh
t
(%)
0.06%
0.60%
-0.22 %
0.07%
0.20%
-0.64 %
-0.06 %
Asset Allocation Value Added
0.00% 0.20% 0.40%-0.20 %-0.40 %
0.00%
0.11%
0.09%
-0.19 %
-0.07 %
-0.01 %
-0.02 %
Total Manager Value Added:-2.59 %
Manager Value Added
0.00% 0.80%-0.80 %-1.60 %
0.00%
-0.86 %
0.02%
-0.50 %
-1.04 %
0.02%
-0.24 %
Total Defined Benefit Plan
Total Fund Attribution
1 Year Ending September 30, 2020
43
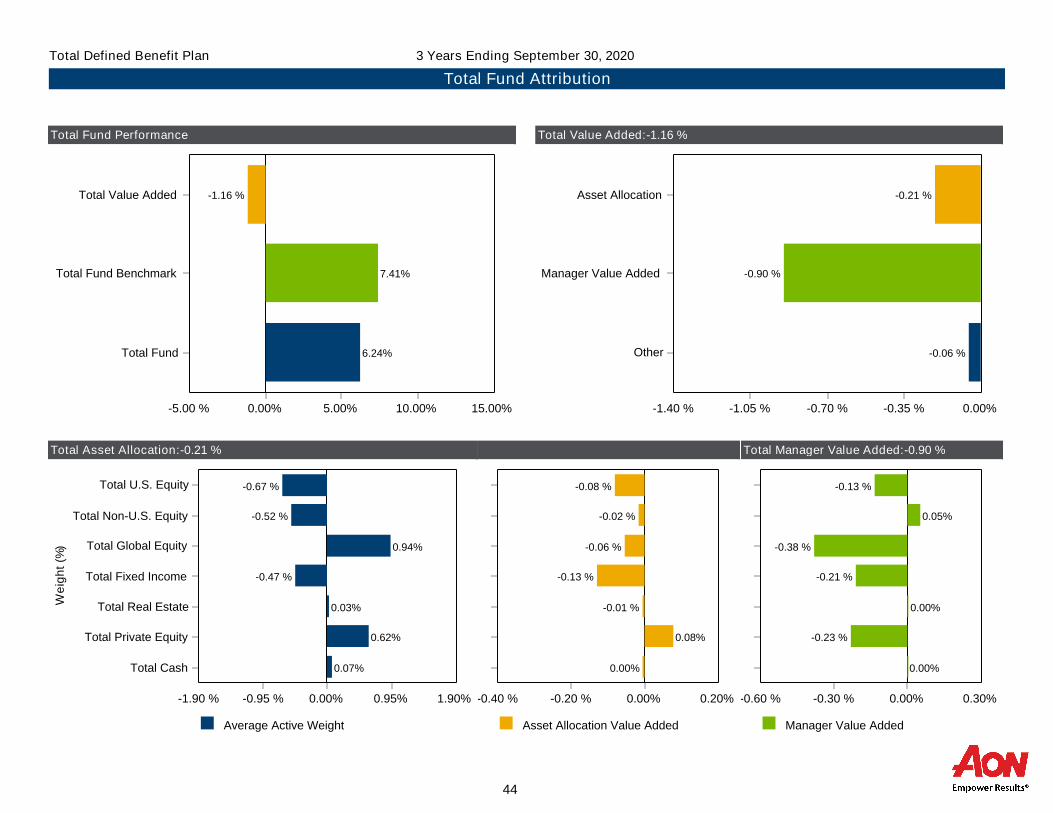
Total Fund Performance
0.00% 5.00% 10.00% 15.00%-5.00 %
Total Fund
Total Fund Benchmark
Total Value Added
6.24%
7.41%
-1.16 %
Total Value Added:-1.16 %
-1.40 % -1.05 % -0.70 % -0.35 % 0.00%
Other
Manager Value Added
Asset Allocation
-0.06 %
-0.90 %
-0.21 %
Total Asset Allocation:-0.21 %
Average Active Weight
0.00% 0.95% 1.90%-0.95 %-1.90 %
Total Cash
Total Private Equity
Total Real Estate
Total Fixed Income
Total Global Equity
Total Non-U.S. Equity
Total U.S. Equity
We
igh
t
(%)
0.07%
0.62%
0.03%
-0.47 %
0.94%
-0.52 %
-0.67 %
Asset Allocation Value Added
0.00% 0.20%-0.20 %-0.40 %
0.00%
0.08%
-0.01 %
-0.13 %
-0.06 %
-0.02 %
-0.08 %
Total Manager Value Added:-0.90 %
Manager Value Added
0.00% 0.30%-0.30 %-0.60 %
0.00%
-0.23 %
0.00%
-0.21 %
-0.38 %
0.05%
-0.13 %
Total Defined Benefit Plan
Total Fund Attribution
3 Years Ending September 30, 2020
44
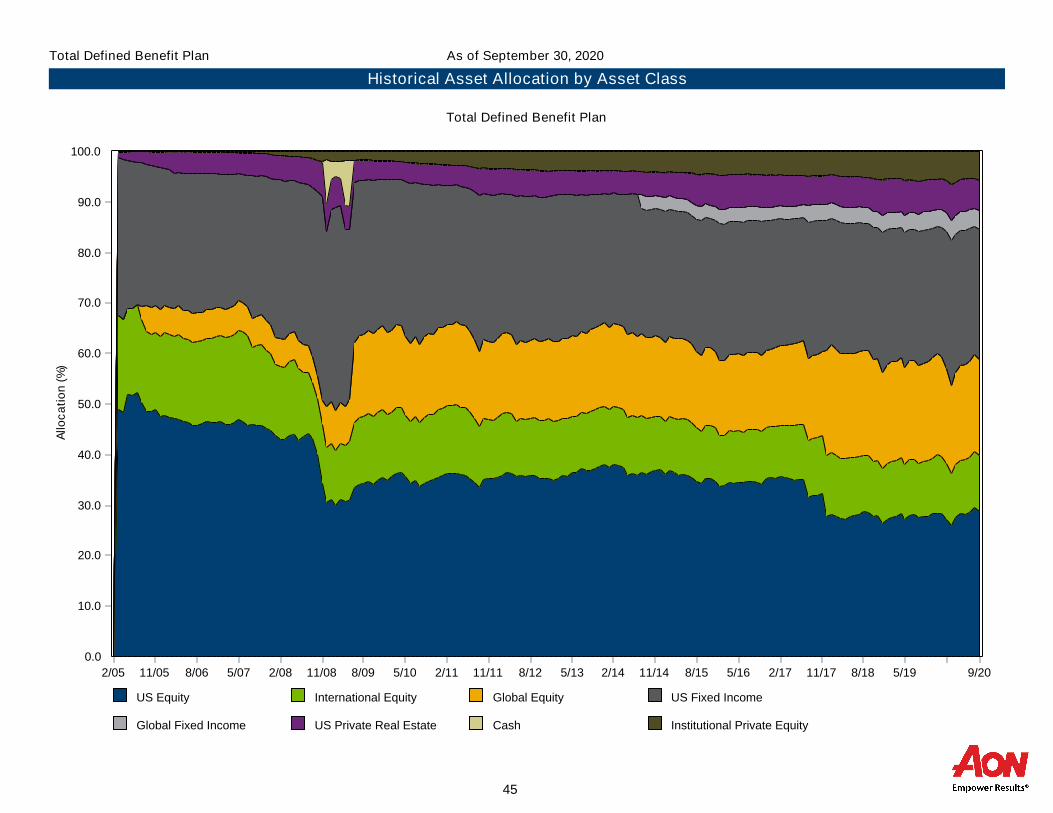
US Equity International Equity Global Equity US Fixed Income
Global Fixed Income US Private Real Estate Cash Institutional Private Equity
0.0
10.0
20.0
30.0
40.0
50.0
60.0
70.0
80.0
90.0
100.0
Allo
ca
tio
n (%
)
2/05 11/05 8/06 5/07 2/08 11/08 8/09 5/10 2/11 11/11 8/12 5/13 2/14 11/14 8/15 5/16 2/17 11/17 8/18 5/19 9/20
Total Defined Benefit Plan
Historical Asset Allocation by Asset Class
As of September 30, 2020
Total Defined Benefit Plan
45

Total U.S. Equity
46
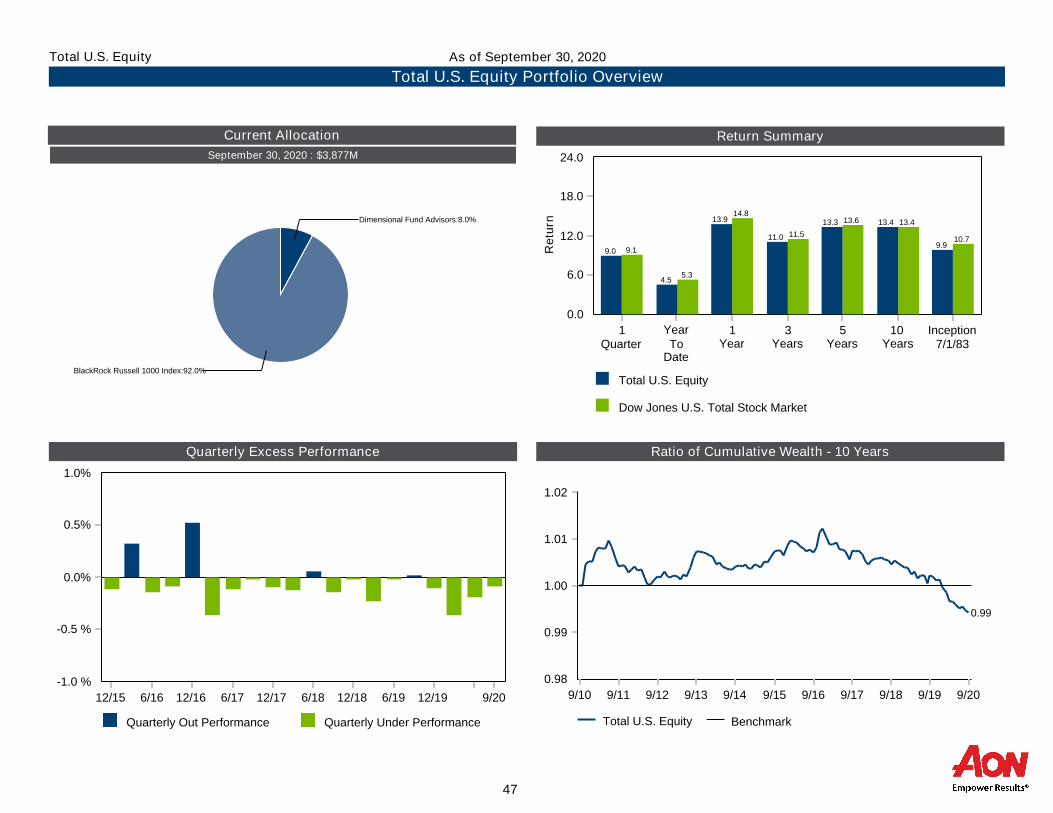
Return Summary
Quarterly Excess Performance Ratio of Cumulative Wealth - 10 Years
Current Allocation
Total U.S. Equity
Dow Jones U.S. Total Stock Market
0.0
6.0
12.0
18.0
24.0
Re
turn
1Quarter
YearTo
Date
1Year
3Years
5Years
10Years
Inception7/1/83
9.1
5.3
14.8
11.5
13.6 13.4
10.7
9.0
4.5
13.9
11.0
13.3 13.4
9.9
September 30, 2020 : $3,877M
Dimensional Fund Advisors:8.0%
BlackRock Russell 1000 Index:92.0%
Total U.S. Equity Benchmark
0.98
0.99
1.00
1.01
1.02
9/10 9/11 9/12 9/13 9/14 9/15 9/16 9/17 9/18 9/19 9/20
0.99
Quarterly Out Performance Quarterly Under Performance
0.0%
0.5%
1.0%
-0.5 %
-1.0 %
12/15 6/16 12/16 6/17 12/17 6/18 12/18 6/19 12/19 9/20
Total U.S. Equity Portfolio Overview
As of September 30, 2020Total U.S. Equity
47

-30.0
-20.0
-10.0
0.0
10.0
20.0
30.0
40.0
50.0
Re
turn
1Quarter
YearTo
Date
1Year
3Years
5Years
10Years
2019 2018 2017
Total U.S. Equity 9.0 (17) 4.5 (25) 13.9 (23) 11.0 (27) 13.3 (24) 13.4 (21) 30.5 (35) -5.5 (41) 20.5 (42)¢
Dow Jones U.S. Total Stock Market 9.1 (16) 5.3 (21) 14.8 (21) 11.5 (16) 13.6 (22) 13.4 (20) 30.9 (29) -5.3 (39) 21.2 (32)�
5th Percentile 9.8 7.5 17.2 12.6 14.5 14.0 32.2 -3.1 23.5
1st Quartile 8.8 4.5 13.7 11.2 13.2 13.2 31.2 -5.0 21.4
Median 8.1 2.6 10.9 9.7 12.1 12.7 30.1 -5.9 20.2
3rd Quartile 7.5 0.2 8.5 8.6 11.1 12.1 27.7 -6.9 18.6
95th Percentile 6.3 -6.1 1.2 4.8 7.8 9.9 25.0 -9.2 16.6
Population 56 53 52 48 46 31 52 53 58
Total U.S. Equity
Plan Sponsor Peer Group Analysis
As of September 30, 2020
All Public Plans > $1B-US Equity Segment
Parentheses contain percentile rankings.
48
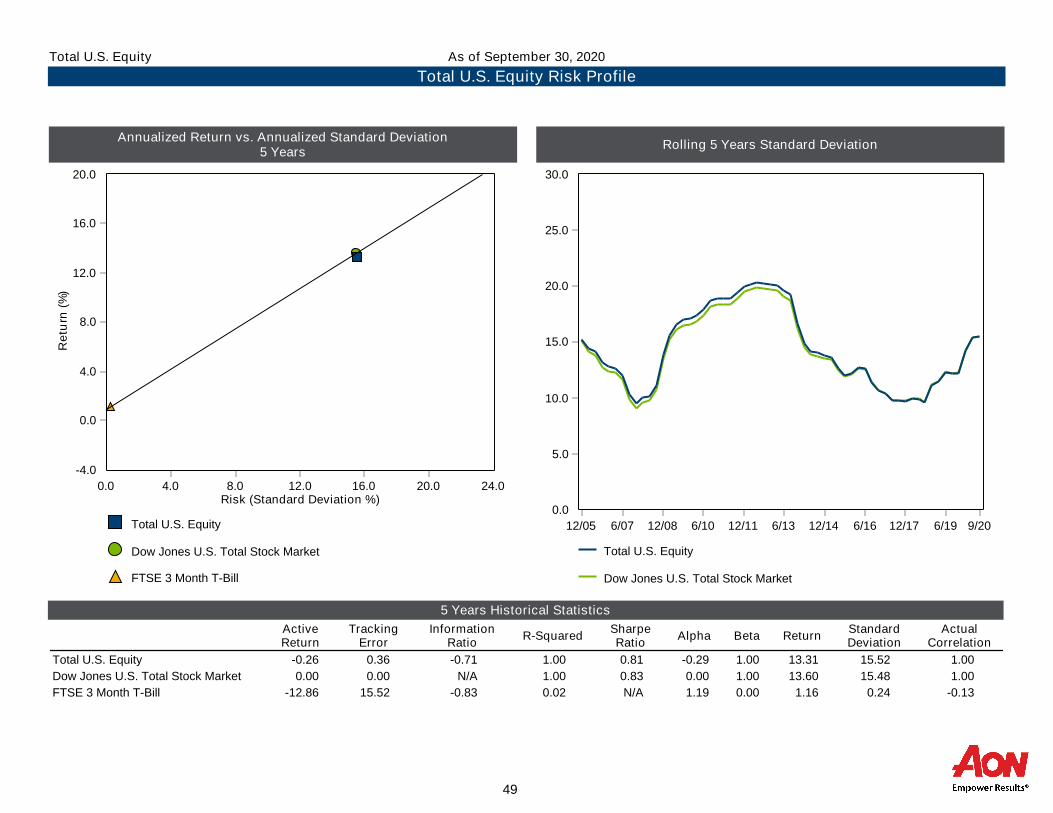
Annualized Return vs. Annualized Standard Deviation5 Years
Rolling 5 Years Standard Deviation
5 Years Historical Statistics
Total U.S. Equity
Dow Jones U.S. Total Stock Market
FTSE 3 Month T-Bill
-4.0
0.0
4.0
8.0
12.0
16.0
20.0
Re
turn
(%)
0.0 4.0 8.0 12.0 16.0 20.0 24.0Risk (Standard Deviation %)
Total U.S. Equity
Dow Jones U.S. Total Stock Market
0.0
5.0
10.0
15.0
20.0
25.0
30.0
12/05 6/07 12/08 6/10 12/11 6/13 12/14 6/16 12/17 6/19 9/20
ActiveReturn
TrackingError
InformationRatio
R-SquaredSharpeRatio
Alpha Beta ReturnStandardDeviation
ActualCorrelation
Total U.S. Equity -0.26 0.36 -0.71 1.00 0.81 -0.29 1.00 13.31 15.52 1.00
Dow Jones U.S. Total Stock Market 0.00 0.00 N/A 1.00 0.83 0.00 1.00 13.60 15.48 1.00
FTSE 3 Month T-Bill -12.86 15.52 -0.83 0.02 N/A 1.19 0.00 1.16 0.24 -0.13
Total U.S. Equity Risk Profile
As of September 30, 2020Total U.S. Equity
49

1 Quarter
0 2 4 6 8-2-4-6-8-10-12-14
BlackRock Russell 1000 Index
Dimensional Fund Advisors
Benchmark Effect
Cash Flow Effect
Total Excess Return
-2
-8
2
0
-8
1 Year
0 15 30 45-15-30-45-60-75-90-105-120-135
BlackRock Russell 1000 Index
Dimensional Fund Advisors
Benchmark Effect
Cash Flow Effect
Total Excess Return
1
-73
-18
0
-90
Total U.S. Equity
Asset Class Attribution
As of September 30, 2020
50

3 Years
0 8 16 24-8-16-24-32-40-48-56-64-72
BlackRock Russell 1000 Index
Turner
Dimensional Fund Advisors
Benchmark Effect
Cash Flow Effect
Total Excess Return
3
0
-33
-18
-1
-49
Total U.S. Equity
Asset Class Attribution
3 Years Ending September 30, 2020
51
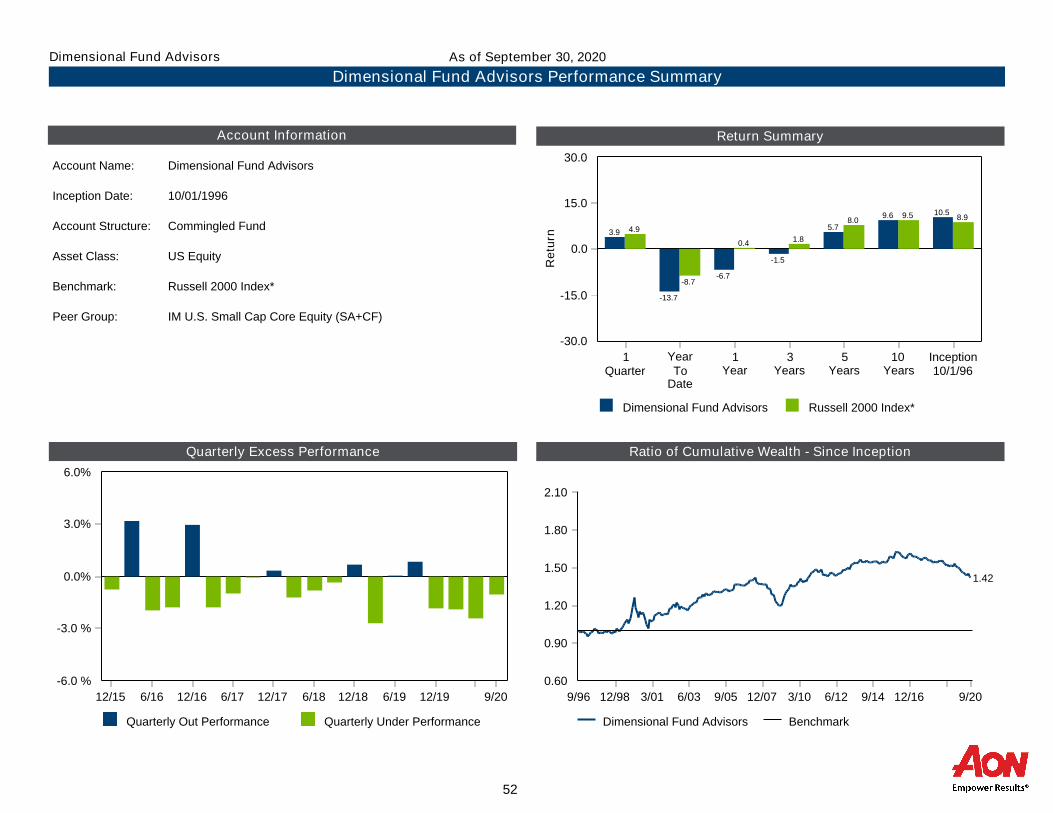
Return Summary
Quarterly Excess Performance Ratio of Cumulative Wealth - Since Inception
Account Information
Dimensional Fund Advisors Russell 2000 Index*
0.0
15.0
30.0
-15.0
-30.0
Re
turn
1Quarter
YearTo
Date
1Year
3Years
5Years
10Years
Inception10/1/96
4.9
-8.7
0.4 1.8
8.09.5 8.9
3.9
-13.7
-6.7
-1.5
5.7
9.6 10.5
Account Name: Dimensional Fund Advisors
Inception Date: 10/01/1996
Account Structure: Commingled Fund
Asset Class: US Equity
Benchmark: Russell 2000 Index*
Peer Group: IM U.S. Small Cap Core Equity (SA+CF)
Quarterly Out Performance Quarterly Under Performance
0.0%
3.0%
6.0%
-3.0 %
-6.0 %
12/15 6/16 12/16 6/17 12/17 6/18 12/18 6/19 12/19 9/20
Dimensional Fund Advisors Benchmark
0.60
0.90
1.20
1.50
1.80
2.10
9/96 12/98 3/01 6/03 9/05 12/07 3/10 6/12 9/14 12/16 9/20
1.42
Dimensional Fund Advisors Performance Summary
As of September 30, 2020Dimensional Fund Advisors
52

-40.0
-25.0
-10.0
5.0
20.0
35.0
50.0
65.0
Re
turn
1Quarter
YearTo
Date
1Year
3Years
5Years
10Years
2019 2018 2017
Dimensional Fund Advisors 3.9 (66) -13.7 (72) -6.7 (73) -1.5 (72) 5.7 (74) 9.6 (63) 21.7 (69) -12.3 (58) 12.0 (77)¢
Russell 2000 Index* 4.9 (51) -8.7 (46) 0.4 (42) 1.8 (46) 8.0 (42) 9.5 (64) 25.5 (44) -11.0 (42) 14.6 (51)�
5th Percentile 11.2 5.1 14.7 10.4 13.9 13.3 33.3 -1.7 22.7
1st Quartile 6.6 -2.9 5.1 4.3 9.3 11.4 27.2 -7.9 17.5
Median 4.9 -9.5 -2.4 1.3 7.5 10.0 24.5 -11.7 15.0
3rd Quartile 3.1 -14.4 -6.9 -1.7 5.5 9.2 20.2 -14.0 12.2
95th Percentile 1.5 -18.6 -10.0 -2.9 3.8 8.3 16.2 -18.0 7.7
Population 81 81 81 75 74 65 88 94 95
Dimensional Fund Advisors
Peer Group Analysis
As of September 30, 2020
IM U.S. Small Cap Core Equity (SA+CF)
Parentheses contain percentile rankings.
53

Annualized Return vs. Annualized Standard Deviation5 Years
Rolling 5 Years Standard Deviation
5 Years Historical Statistics
Dimensional Fund Advisors Russell 2000 Index*
FTSE 3 Month T-Bill
-2.0
0.0
2.0
4.0
6.0
8.0
10.0
12.0
Re
turn
(%)
0.0 5.0 10.0 15.0 20.0 25.0 30.0Risk (Standard Deviation %)
Dimensional Fund Advisors Russell 2000 Index*
0.0
5.0
10.0
15.0
20.0
25.0
30.0
35.0
40.0
9/01 6/03 3/05 12/06 9/08 6/10 3/12 12/13 9/15 6/17 3/19 9/20
ActiveReturn
TrackingError
InformationRatio
R-SquaredSharpeRatio
Alpha Beta ReturnStandardDeviation
ActualCorrelation
Dimensional Fund Advisors -2.23 2.78 -0.80 0.98 0.32 -2.07 0.99 5.65 19.98 0.99
Russell 2000 Index* 0.00 0.00 N/A 1.00 0.43 0.00 1.00 8.00 20.08 1.00
FTSE 3 Month T-Bill -8.64 20.11 -0.43 0.02 N/A 1.18 0.00 1.16 0.24 -0.16
Dimensional Fund Advisors Risk Profile
As of September 30, 2020Dimensional Fund Advisors
54

Return Summary
Quarterly Excess Performance Ratio of Cumulative Wealth - Since Inception
Account Information
BlackRock Russell 1000 Index
Russell 1000 Index
0.0
6.0
12.0
18.0
24.0
Re
turn
1Quarter
YearTo
Date
1Year
3Years
5Years
10Years
Inception10/1/07
9.5
6.4
16.0
12.4
14.1 13.8
8.69.4
6.4
16.0
12.4
14.1 13.8
8.7
Account Name: BlackRock Russell 1000 Index
Inception Date: 10/01/2007
Account Structure: Commingled Fund
Asset Class: US Equity
Benchmark: Russell 1000 Index
Peer Group: IM U.S. Large Cap Core Equity (SA+CF)
Quarterly Out Performance Quarterly Under Performance
0.0%
0.1%
-0.1 %
-0.2 %
12/15 6/16 12/16 6/17 12/17 6/18 12/18 6/19 12/19 9/20 BlackRock Russell 1000 Index
Benchmark
0.99
1.00
1.01
9/07 12/08 3/10 6/11 9/12 12/13 3/15 6/16 9/17 12/18 9/20
1.00
BlackRock Russell 1000 Index Performance Summary
As of September 30, 2020BlackRock Russell 1000 Index
55

-40.0
-25.0
-10.0
5.0
20.0
35.0
50.0
65.0
Re
turn
1Quarter
YearTo
Date
1Year
3Years
5Years
10Years
2019 2018 2017
BlackRock Russell 1000 Index 9.4 (23) 6.4 (28) 16.0 (27) 12.4 (25) 14.1 (16) 13.8 (17) 31.5 (29) -4.7 (37) 21.6 (45)¢
Russell 1000 Index 9.5 (23) 6.4 (28) 16.0 (27) 12.4 (25) 14.1 (17) 13.8 (18) 31.4 (29) -4.8 (38) 21.7 (43)�
5th Percentile 11.8 16.9 26.4 17.5 17.1 14.7 35.5 0.6 27.4
1st Quartile 9.3 7.2 16.3 12.3 13.5 13.4 31.7 -4.0 23.5
Median 7.9 2.4 11.3 9.9 12.2 12.7 29.0 -5.7 21.2
3rd Quartile 6.1 -2.5 4.6 7.6 10.4 11.5 26.0 -7.6 18.6
95th Percentile 3.4 -9.6 -4.0 2.4 5.8 7.8 17.7 -11.9 12.1
Population 149 149 149 136 128 104 167 169 185
BlackRock Russell 1000 Index
Peer Group Analysis
As of September 30, 2020
IM U.S. Large Cap Core Equity (SA+CF)
Parentheses contain percentile rankings.
56

Annualized Return vs. Annualized Standard Deviation5 Years
Rolling 5 Years Standard Deviation
5 Years Historical Statistics
BlackRock Russell 1000 Index
Russell 1000 Index
FTSE 3 Month T-Bill
-8.0
-4.0
0.0
4.0
8.0
12.0
16.0
20.0
Re
turn
(%)
0.0 4.0 8.0 12.0 16.0 20.0 24.0Risk (Standard Deviation %)
BlackRock Russell 1000 Index Russell 1000 Index
0.0
4.0
8.0
12.0
16.0
20.0
24.0
28.0
9/12 6/13 3/14 12/14 9/15 6/16 3/17 12/17 9/18 6/19 9/20
ActiveReturn
TrackingError
InformationRatio
R-SquaredSharpeRatio
Alpha Beta ReturnStandardDeviation
ActualCorrelation
BlackRock Russell 1000 Index 0.02 0.05 0.37 1.00 0.87 0.03 1.00 14.12 15.22 1.00
Russell 1000 Index 0.00 0.00 N/A 1.00 0.87 0.00 1.00 14.09 15.24 1.00
FTSE 3 Month T-Bill -13.26 15.27 -0.87 0.02 N/A 1.19 0.00 1.16 0.24 -0.13
BlackRock Russell 1000 Index Risk Profile
As of September 30, 2020BlackRock Russell 1000 Index
57

Total Non-U.S. Equity
58

Return Summary
Quarterly Excess Performance Ratio of Cumulative Wealth - 10 Years
Current Allocation
Total Non-U.S. Equity
MSCI All Country World ex-U.S. IMI*
0.0
6.0
12.0
18.0
-6.0
-12.0
Re
turn
1Quarter
YearTo
Date
1Year
3Years
5Years
10Years
Inception10/1/91
6.8
-5.2
3.5
1.1
6.3
4.25.7
6.8
-5.1
3.7
1.6
7.0
4.7 5.5
September 30, 2020 : $1,478M
BlackRock ACWI ex-U.S. IMI Index:100.0%
Total Non-U.S. Equity Benchmark
0.96
1.00
1.04
1.08
1.12
9/10 9/11 9/12 9/13 9/14 9/15 9/16 9/17 9/18 9/19 9/20
1.05
Quarterly Out Performance Quarterly Under Performance
0.0%
2.0%
4.0%
-2.0 %
-4.0 %
12/15 6/16 12/16 6/17 12/17 6/18 12/18 6/19 12/19 9/20
Total Non-U.S. Equity Portfolio Overview
As of September 30, 2020Total Non-U.S. Equity
59

-40.0
-25.0
-10.0
5.0
20.0
35.0
50.0
65.0
Re
turn
1Quarter
YearTo
Date
1Year
3Years
5Years
10Years
2019 2018 2017
Total Non-U.S. Equity 6.8 (71) -5.1 (70) 3.7 (69) 1.6 (73) 7.0 (60) 4.7 (74) 22.0 (82) -14.5 (73) 31.8 (10)¢
MSCI All Country World ex-U.S. IMI* 6.8 (71) -5.2 (71) 3.5 (70) 1.1 (81) 6.3 (82) 4.2 (98) 21.6 (84) -14.8 (82) 27.8 (75)�
5th Percentile 10.5 7.8 19.2 6.5 9.9 7.3 27.9 -10.8 33.4
1st Quartile 8.5 -0.5 9.1 4.1 8.4 6.1 25.5 -13.0 30.4
Median 7.6 -3.4 5.9 2.4 7.5 5.5 23.7 -13.6 29.3
3rd Quartile 6.5 -5.5 3.0 1.4 6.4 4.6 22.4 -14.6 27.8
95th Percentile 4.8 -8.1 0.3 0.2 5.6 4.2 20.0 -15.5 25.1
Population 57 55 55 52 50 32 53 55 59
Total Non-U.S. Equity
Plan Sponsor Peer Group Analysis
As of September 30, 2020
All Public Plans > $1B-Intl. Equity Segment
Parentheses contain percentile rankings.
60
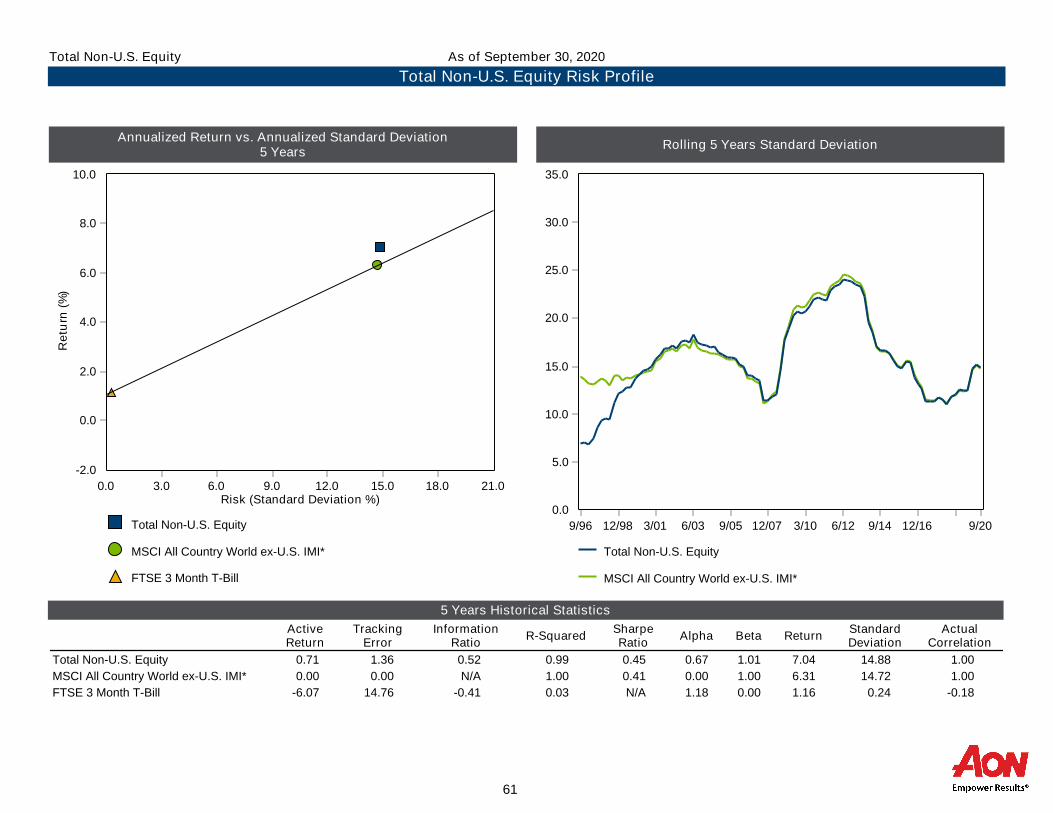
Annualized Return vs. Annualized Standard Deviation5 Years
Rolling 5 Years Standard Deviation
5 Years Historical Statistics
Total Non-U.S. Equity
MSCI All Country World ex-U.S. IMI*
FTSE 3 Month T-Bill
-2.0
0.0
2.0
4.0
6.0
8.0
10.0
Re
turn
(%)
0.0 3.0 6.0 9.0 12.0 15.0 18.0 21.0Risk (Standard Deviation %)
Total Non-U.S. Equity
MSCI All Country World ex-U.S. IMI*
0.0
5.0
10.0
15.0
20.0
25.0
30.0
35.0
9/96 12/98 3/01 6/03 9/05 12/07 3/10 6/12 9/14 12/16 9/20
ActiveReturn
TrackingError
InformationRatio
R-SquaredSharpeRatio
Alpha Beta ReturnStandardDeviation
ActualCorrelation
Total Non-U.S. Equity 0.71 1.36 0.52 0.99 0.45 0.67 1.01 7.04 14.88 1.00
MSCI All Country World ex-U.S. IMI* 0.00 0.00 N/A 1.00 0.41 0.00 1.00 6.31 14.72 1.00
FTSE 3 Month T-Bill -6.07 14.76 -0.41 0.03 N/A 1.18 0.00 1.16 0.24 -0.18
Total Non-U.S. Equity Risk Profile
As of September 30, 2020Total Non-U.S. Equity
61

1 Quarter
-4 -3 -2 -1 0
BlackRock ACWI ex-U.S. IMI Index
Benchmark Effect
Cash Flow Effect
Total Excess Return
-2
0
0
-2
1 Year
0 3 6 9 12 15 18 21 24 27-3-6-9
McKinley
BlackRock ACWI ex-U.S. IMI Index
Gryphon
Benchmark Effect
Cash Flow Effect
Total Excess Return
0
17
0
0
0
17
Total Non-U.S. Equity
Asset Class Attribution
As of September 30, 2020
62

3 Years
0 20 40 60 80 100 120-20-40-60-80-100
McKinley
BlackRock ACWI ex-U.S. IMI Index
Gryphon
Baillie Gifford
BlackRock World ex-U.S. IMI
Benchmark Effect
Cash Flow Effect
Total Excess Return
0
24
21
-15
-46
-2
64
46
Total Non-U.S. Equity
Asset Class Attribution
3 Years Ending September 30, 2020
63
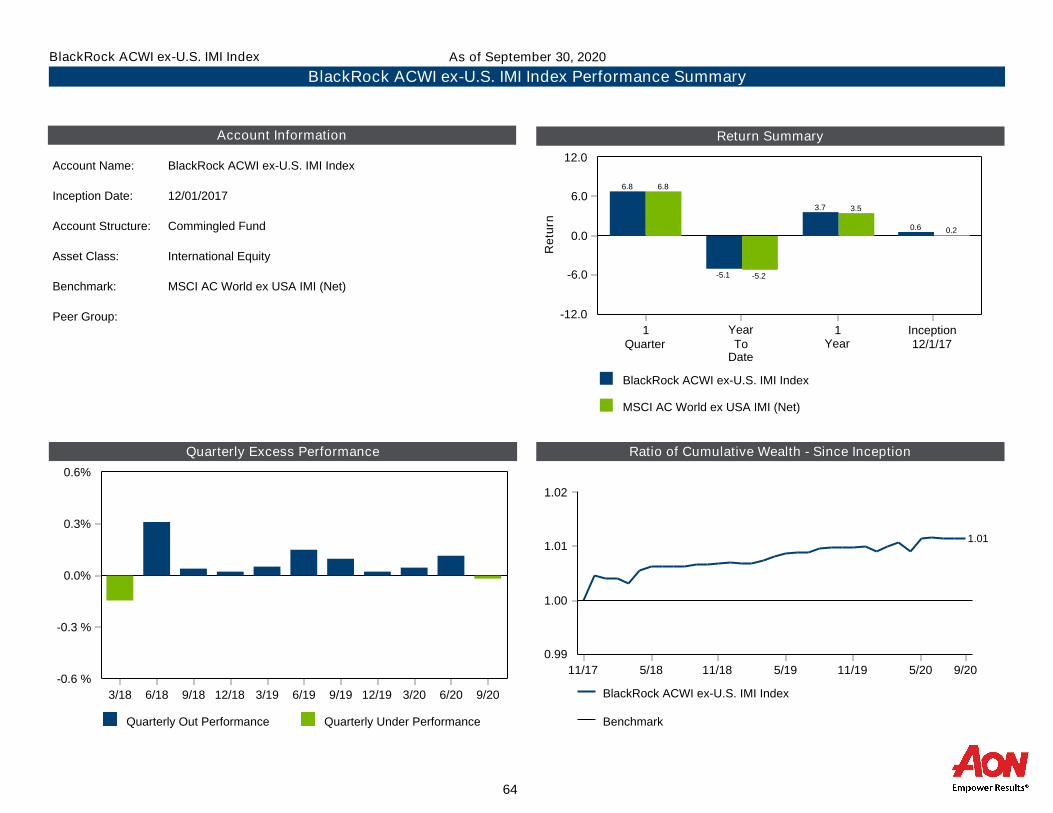
Return Summary
Quarterly Excess Performance Ratio of Cumulative Wealth - Since Inception
Account Information
BlackRock ACWI ex-U.S. IMI Index
MSCI AC World ex USA IMI (Net)
0.0
6.0
12.0
-6.0
-12.0
Re
turn
1Quarter
YearTo
Date
1Year
Inception12/1/17
6.8
-5.2
3.5
0.2
6.8
-5.1
3.7
0.6
Account Name: BlackRock ACWI ex-U.S. IMI Index
Inception Date: 12/01/2017
Account Structure: Commingled Fund
Asset Class: International Equity
Benchmark: MSCI AC World ex USA IMI (Net)
Peer Group:
Quarterly Out Performance Quarterly Under Performance
0.0%
0.3%
0.6%
-0.3 %
-0.6 %
3/18 6/18 9/18 12/18 3/19 6/19 9/19 12/19 3/20 6/20 9/20 BlackRock ACWI ex-U.S. IMI Index
Benchmark
0.99
1.00
1.01
1.02
11/17 5/18 11/18 5/19 11/19 5/20 9/20
1.01
BlackRock ACWI ex-U.S. IMI Index Performance Summary
As of September 30, 2020BlackRock ACWI ex-U.S. IMI Index
64

Total Global Equity
65

Return Summary
Quarterly Excess Performance Ratio of Cumulative Wealth - Since Inception
Current Allocation
Total Global Equity MSCI All Country World IMI*
0.0
8.0
16.0
-8.0
-16.0
Re
turn
1Quarter
YearTo
Date
1Year
3Years
5Years
10Years
Inception9/1/05
8.1
0.5
9.6
6.5
10.08.5
6.66.5
-4.2
4.1 4.4
8.8 8.67.2
September 30, 2020 : $2,587M
Wellington Equity:10.1%
MFS:33.6%
Arrowstreet:31.6%
Dodge & Cox:24.7%
Total Global Equity Benchmark
0.96
1.04
1.12
1.20
1.28
8/05 2/07 8/08 2/10 8/11 2/13 8/14 2/16 8/17 2/19 9/20
1.10
Quarterly Out Performance Quarterly Under Performance
0.0%
2.0%
4.0%
-2.0 %
-4.0 %
-6.0 %
12/15 6/16 12/16 6/17 12/17 6/18 12/18 6/19 12/19 9/20
Total Global Equity Portfolio Overview
As of September 30, 2020Total Global Equity
66

-55.0
-40.0
-25.0
-10.0
5.0
20.0
35.0
50.0
65.0
80.0
Re
turn
1Quarter
YearTo
Date
1Year
3Years
5Years
10Years
2019 2018 2017
Total Global Equity 6.5 (66) -4.2 (68) 4.1 (65) 4.4 (63) 8.8 (55) 8.6 (60) 25.5 (58) -9.7 (53) 24.9 (41)¢
MSCI All Country World IMI* 8.1 (50) 0.5 (55) 9.6 (52) 6.5 (49) 10.0 (44) 8.5 (60) 26.4 (52) -10.1 (57) 23.9 (47)�
5th Percentile 15.2 30.5 44.6 19.3 19.0 15.1 36.3 -0.3 38.0
1st Quartile 10.5 9.5 19.5 12.2 13.3 11.5 30.6 -6.0 27.9
Median 8.0 2.2 10.0 6.3 9.3 9.1 26.6 -9.5 23.4
3rd Quartile 5.3 -7.7 -2.1 2.4 6.9 7.4 21.8 -13.1 19.0
95th Percentile 0.8 -19.9 -12.4 -4.5 2.4 3.4 13.2 -19.0 11.0
Population 346 344 341 327 296 185 374 391 399
Total Global Equity
Peer Group Analysis
As of September 30, 2020
IM Global Equity (SA+CF)
Parentheses contain percentile rankings.
67

Annualized Return vs. Annualized Standard Deviation5 Years
Rolling 5 Years Standard Deviation
5 Years Historical Statistics
Total Global Equity MSCI All Country World IMI*
FTSE 3 Month T-Bill
-3.0
0.0
3.0
6.0
9.0
12.0
15.0
Re
turn
(%)
0.0 4.0 8.0 12.0 16.0 20.0 24.0Risk (Standard Deviation %)
Total Global Equity MSCI All Country World IMI*
0.0
4.0
8.0
12.0
16.0
20.0
24.0
28.0
32.0
9/10 9/11 9/12 9/13 9/14 9/15 9/16 9/17 9/18 9/19 9/20
ActiveReturn
TrackingError
InformationRatio
R-SquaredSharpeRatio
Alpha Beta ReturnStandardDeviation
ActualCorrelation
Total Global Equity -1.00 1.58 -0.63 0.99 0.56 -1.13 1.01 8.84 15.01 0.99
MSCI All Country World IMI* 0.00 0.00 N/A 1.00 0.64 0.00 1.00 9.97 14.74 1.00
FTSE 3 Month T-Bill -9.48 14.78 -0.64 0.02 N/A 1.18 0.00 1.16 0.24 -0.16
Total Global Equity Risk Profile
As of September 30, 2020Total Global Equity
68
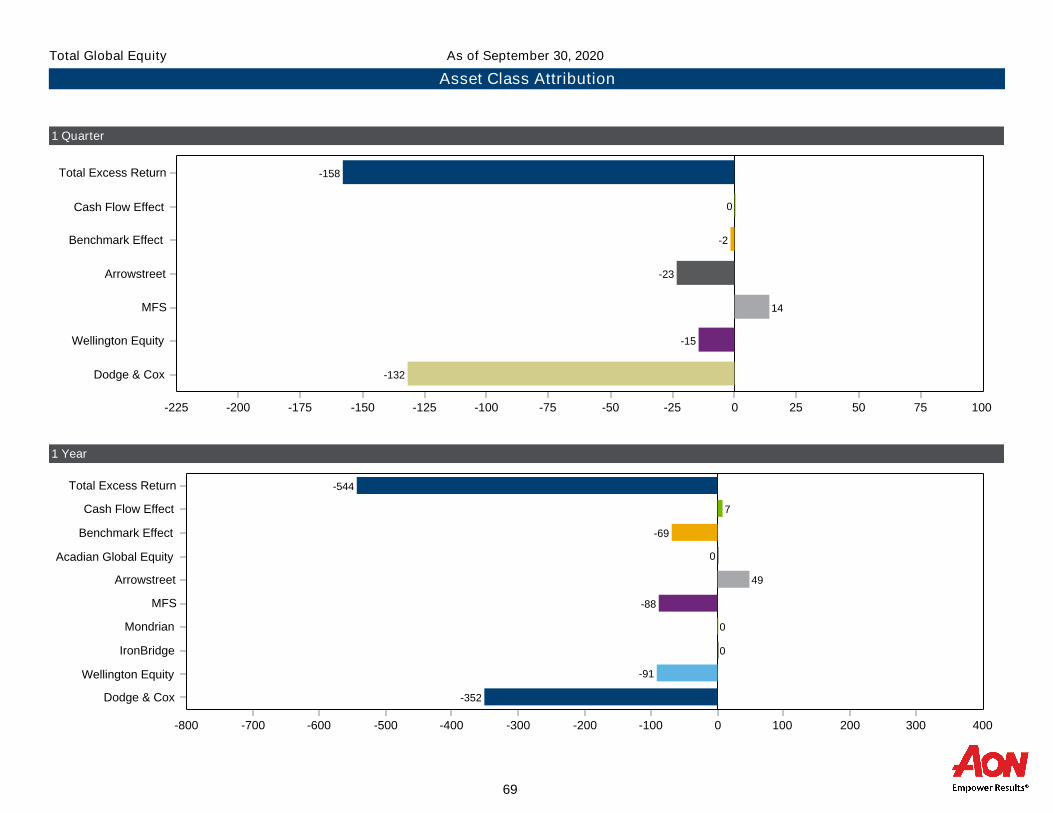
1 Quarter
0 25 50 75 100-25-50-75-100-125-150-175-200-225
Dodge & Cox
Wellington Equity
MFS
Arrowstreet
Benchmark Effect
Cash Flow Effect
Total Excess Return
-132
-15
14
-23
-2
0
-158
1 Year
0 100 200 300 400-100-200-300-400-500-600-700-800
Dodge & Cox
Wellington Equity
IronBridge
Mondrian
MFS
Arrowstreet
Acadian Global Equity
Benchmark Effect
Cash Flow Effect
Total Excess Return
-352
-91
0
0
-88
49
0
-69
7
-544
Total Global Equity
Asset Class Attribution
As of September 30, 2020
69
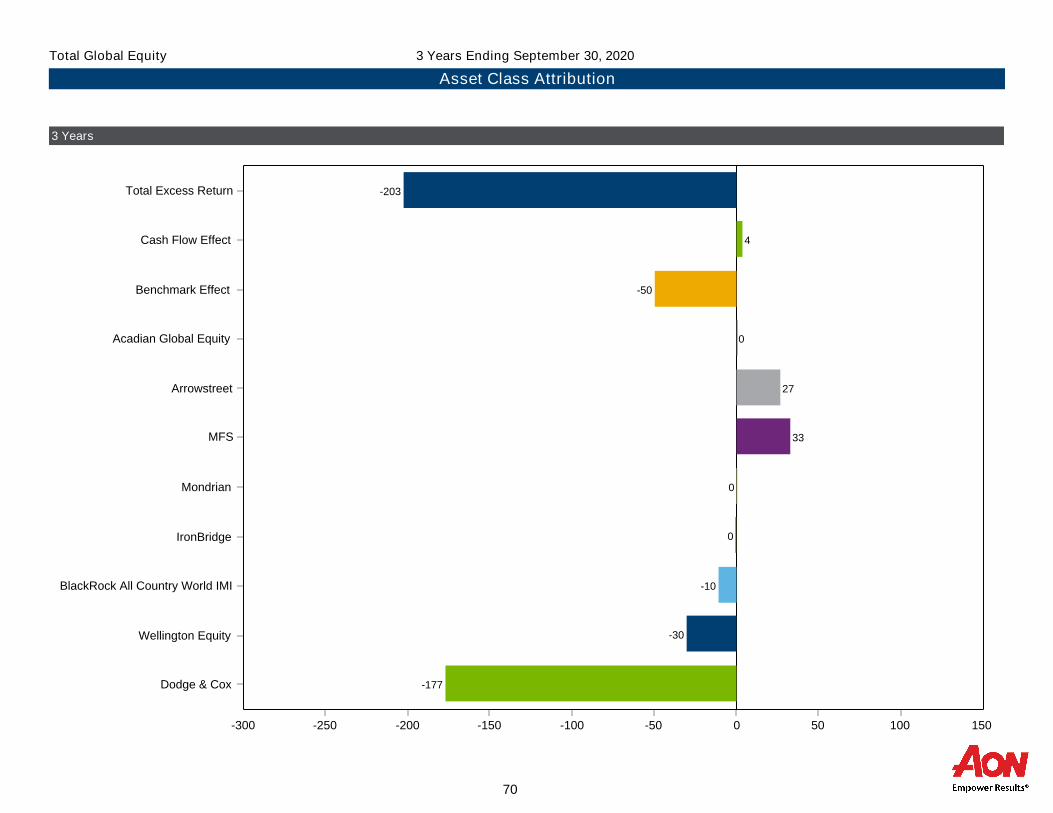
3 Years
0 50 100 150-50-100-150-200-250-300
Dodge & Cox
Wellington Equity
BlackRock All Country World IMI
IronBridge
Mondrian
MFS
Arrowstreet
Acadian Global Equity
Benchmark Effect
Cash Flow Effect
Total Excess Return
-177
-30
-10
0
0
33
27
0
-50
4
-203
Total Global Equity
Asset Class Attribution
3 Years Ending September 30, 2020
70
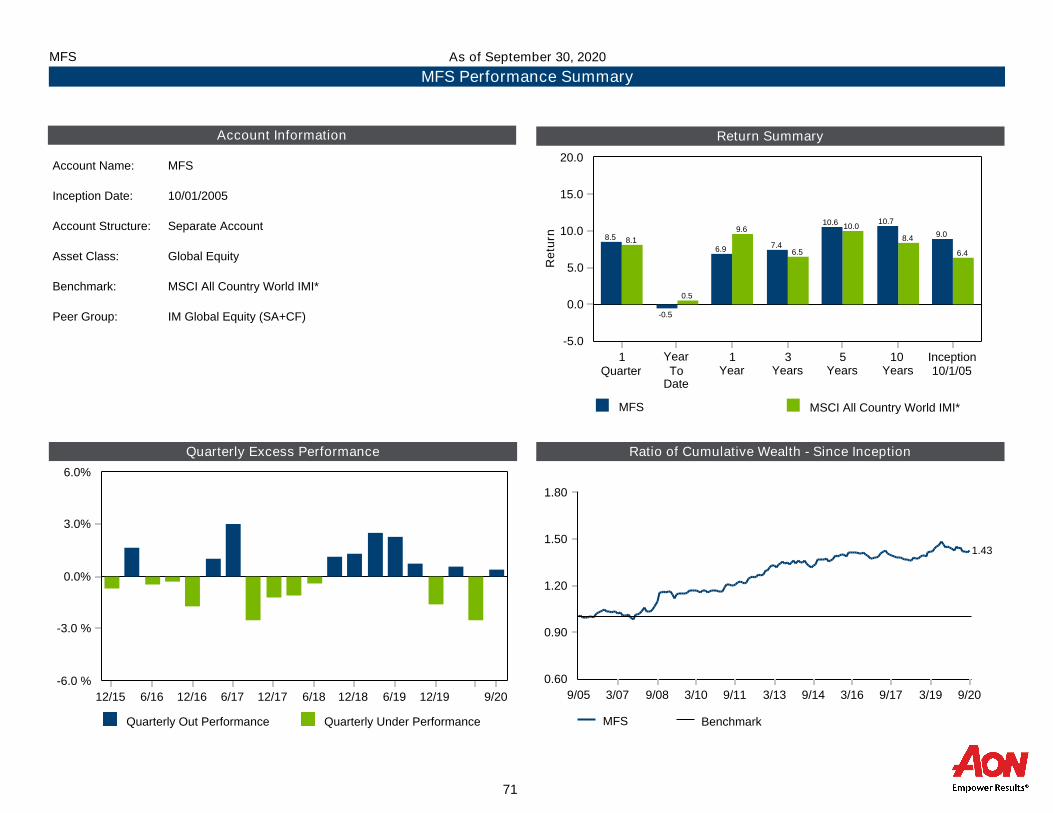
Return Summary
Quarterly Excess Performance Ratio of Cumulative Wealth - Since Inception
Account Information
MFS MSCI All Country World IMI*
0.0
5.0
10.0
15.0
20.0
-5.0
Re
turn
1Quarter
YearTo
Date
1Year
3Years
5Years
10Years
Inception10/1/05
8.1
0.5
9.6
6.5
10.0
8.4
6.4
8.5
-0.5
6.9 7.4
10.6 10.7
9.0
Account Name: MFS
Inception Date: 10/01/2005
Account Structure: Separate Account
Asset Class: Global Equity
Benchmark: MSCI All Country World IMI*
Peer Group: IM Global Equity (SA+CF)
Quarterly Out Performance Quarterly Under Performance
0.0%
3.0%
6.0%
-3.0 %
-6.0 %
12/15 6/16 12/16 6/17 12/17 6/18 12/18 6/19 12/19 9/20
MFS Benchmark
0.60
0.90
1.20
1.50
1.80
9/05 3/07 9/08 3/10 9/11 3/13 9/14 3/16 9/17 3/19 9/20
1.43
MFS Performance Summary
As of September 30, 2020MFS
71
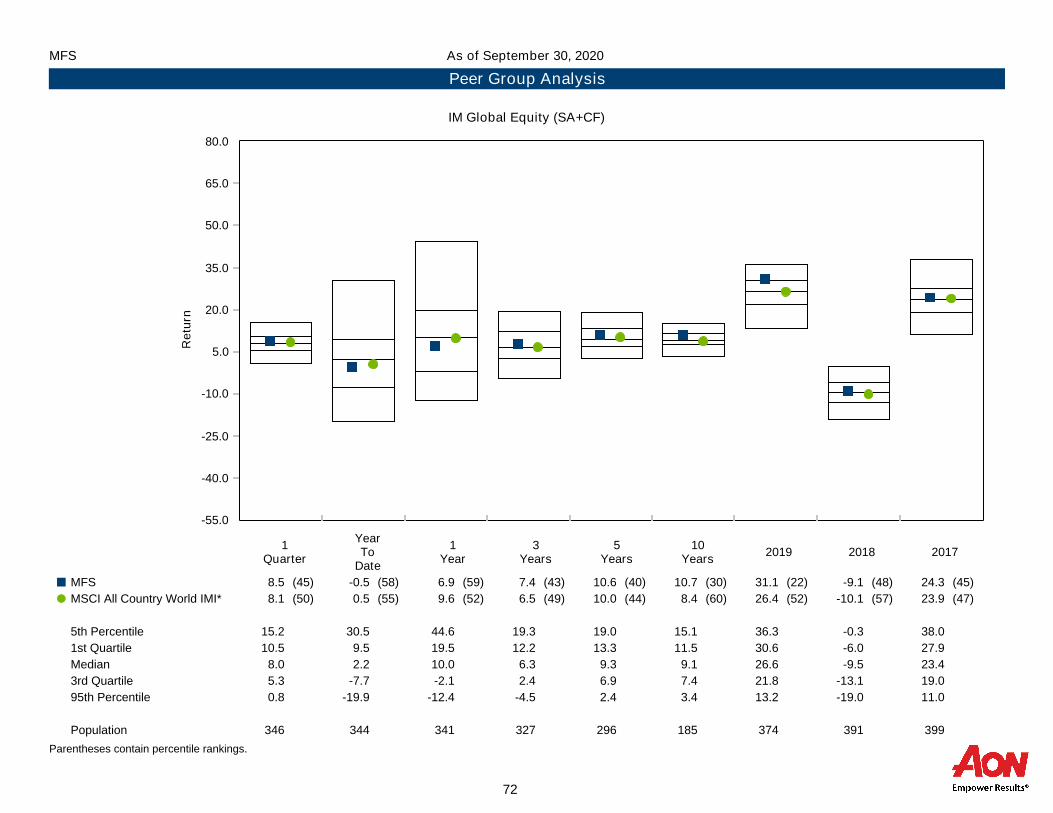
-55.0
-40.0
-25.0
-10.0
5.0
20.0
35.0
50.0
65.0
80.0
Re
turn
1Quarter
YearTo
Date
1Year
3Years
5Years
10Years
2019 2018 2017
MFS 8.5 (45) -0.5 (58) 6.9 (59) 7.4 (43) 10.6 (40) 10.7 (30) 31.1 (22) -9.1 (48) 24.3 (45)¢
MSCI All Country World IMI* 8.1 (50) 0.5 (55) 9.6 (52) 6.5 (49) 10.0 (44) 8.4 (60) 26.4 (52) -10.1 (57) 23.9 (47)�
5th Percentile 15.2 30.5 44.6 19.3 19.0 15.1 36.3 -0.3 38.0
1st Quartile 10.5 9.5 19.5 12.2 13.3 11.5 30.6 -6.0 27.9
Median 8.0 2.2 10.0 6.3 9.3 9.1 26.6 -9.5 23.4
3rd Quartile 5.3 -7.7 -2.1 2.4 6.9 7.4 21.8 -13.1 19.0
95th Percentile 0.8 -19.9 -12.4 -4.5 2.4 3.4 13.2 -19.0 11.0
Population 346 344 341 327 296 185 374 391 399
MFS
Peer Group Analysis
As of September 30, 2020
IM Global Equity (SA+CF)
Parentheses contain percentile rankings.
72

Annualized Return vs. Annualized Standard Deviation5 Years
Rolling 5 Years Standard Deviation
5 Years Historical Statistics
MFS MSCI All Country World IMI*
FTSE 3 Month T-Bill
-3.0
0.0
3.0
6.0
9.0
12.0
15.0
Re
turn
(%)
0.0 3.0 6.0 9.0 12.0 15.0 18.0 21.0Risk (Standard Deviation %)
MFS MSCI All Country World IMI*
0.0
4.0
8.0
12.0
16.0
20.0
24.0
28.0
32.0
9/10 9/11 9/12 9/13 9/14 9/15 9/16 9/17 9/18 9/19 9/20
ActiveReturn
TrackingError
InformationRatio
R-SquaredSharpeRatio
Alpha Beta ReturnStandardDeviation
ActualCorrelation
MFS 0.44 3.03 0.14 0.96 0.70 1.09 0.94 10.55 14.13 0.98
MSCI All Country World IMI* 0.00 0.00 N/A 1.00 0.64 0.00 1.00 9.97 14.74 1.00
FTSE 3 Month T-Bill -9.48 14.78 -0.64 0.02 N/A 1.18 0.00 1.16 0.24 -0.16
MFS Risk Profile
As of September 30, 2020MFS
73

Return Summary
Quarterly Excess Performance Ratio of Cumulative Wealth - Since Inception
Account Information
Arrowstreet MSCI AC World IMI (Net)
0.0
5.0
10.0
15.0
20.0
Re
turn
1Quarter
YearTo
Date
1Year
3Years
Inception9/1/16
8.1
0.5
9.6
6.5
9.4
7.4
2.2
11.2
7.3
11.4
Account Name: Arrowstreet
Inception Date: 09/01/2016
Account Structure: Separate Account
Asset Class: Global Equity
Benchmark: MSCI AC World IMI (Net)
Peer Group: IM Global Equity (SA+CF)
Quarterly Out Performance Quarterly Under Performance
0.0%
2.0%
4.0%
6.0%
-2.0 %
-4.0 %
12/16 6/17 12/17 6/18 12/18 6/19 12/19 9/20
Arrowstreet Benchmark
0.95
1.00
1.05
1.10
1.15
8/16 2/17 8/17 2/18 8/18 2/19 8/19 2/20 9/20
1.08
Arrowstreet Performance Summary
As of September 30, 2020Arrowstreet
74
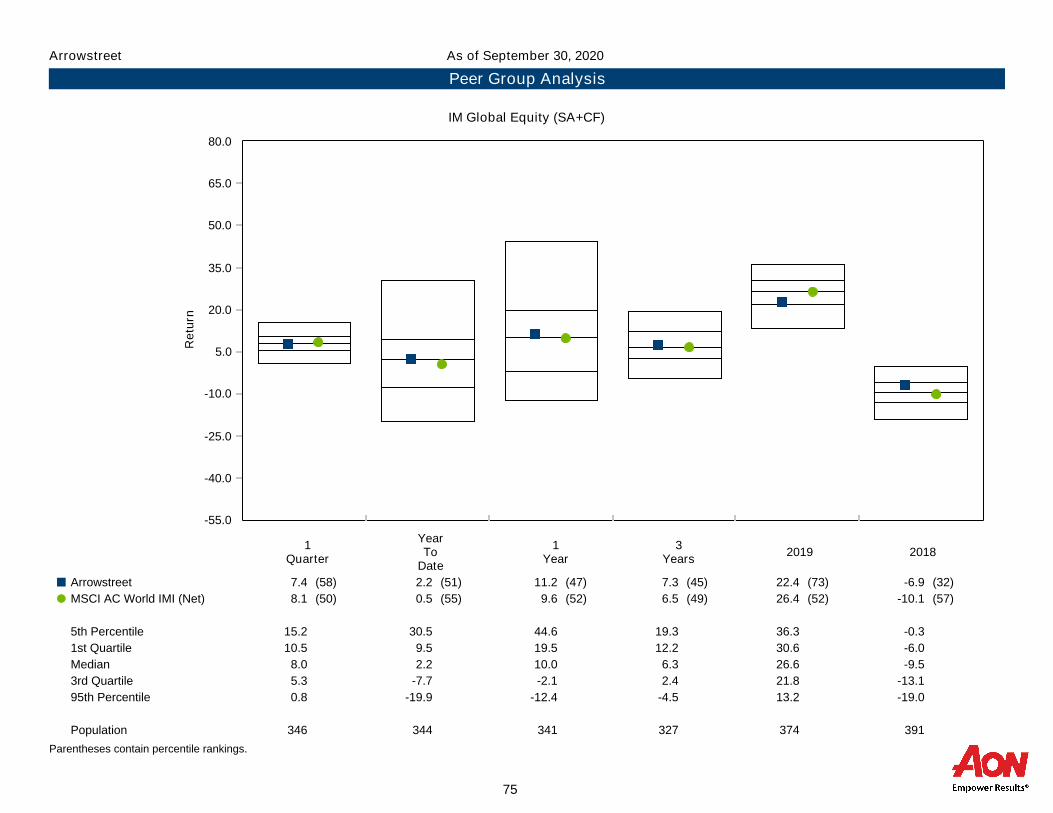
-55.0
-40.0
-25.0
-10.0
5.0
20.0
35.0
50.0
65.0
80.0
Re
turn
1Quarter
YearTo
Date
1Year
3Years
2019 2018
Arrowstreet 7.4 (58) 2.2 (51) 11.2 (47) 7.3 (45) 22.4 (73) -6.9 (32)¢
MSCI AC World IMI (Net) 8.1 (50) 0.5 (55) 9.6 (52) 6.5 (49) 26.4 (52) -10.1 (57)�
5th Percentile 15.2 30.5 44.6 19.3 36.3 -0.3
1st Quartile 10.5 9.5 19.5 12.2 30.6 -6.0
Median 8.0 2.2 10.0 6.3 26.6 -9.5
3rd Quartile 5.3 -7.7 -2.1 2.4 21.8 -13.1
95th Percentile 0.8 -19.9 -12.4 -4.5 13.2 -19.0
Population 346 344 341 327 374 391
Arrowstreet
Peer Group Analysis
As of September 30, 2020
IM Global Equity (SA+CF)
Parentheses contain percentile rankings.
75
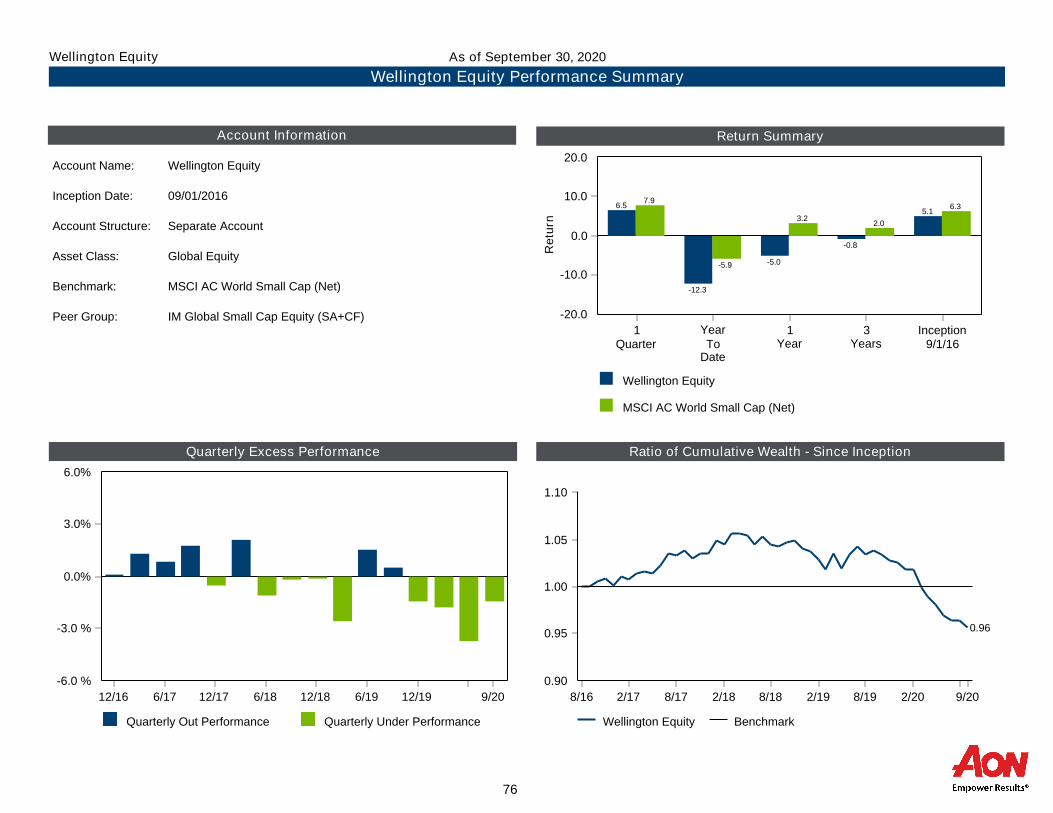
Return Summary
Quarterly Excess Performance Ratio of Cumulative Wealth - Since Inception
Account Information
Wellington Equity
MSCI AC World Small Cap (Net)
0.0
10.0
20.0
-10.0
-20.0
Re
turn
1Quarter
YearTo
Date
1Year
3Years
Inception9/1/16
7.9
-5.9
3.22.0
6.36.5
-12.3
-5.0
-0.8
5.1
Account Name: Wellington Equity
Inception Date: 09/01/2016
Account Structure: Separate Account
Asset Class: Global Equity
Benchmark: MSCI AC World Small Cap (Net)
Peer Group: IM Global Small Cap Equity (SA+CF)
Quarterly Out Performance Quarterly Under Performance
0.0%
3.0%
6.0%
-3.0 %
-6.0 %
12/16 6/17 12/17 6/18 12/18 6/19 12/19 9/20
Wellington Equity Benchmark
0.90
0.95
1.00
1.05
1.10
8/16 2/17 8/17 2/18 8/18 2/19 8/19 2/20 9/20
0.96
Wellington Equity Performance Summary
As of September 30, 2020Wellington Equity
76

-55.0
-40.0
-25.0
-10.0
5.0
20.0
35.0
50.0
65.0
Re
turn
1Quarter
YearTo
Date
1Year
3Years
2019 2018
Wellington Equity 6.5 (76) -12.3 (93) -5.0 (95) -0.8 (73) 22.7 (67) -13.8 (43)¢
MSCI AC World Small Cap (Net) 7.9 (57) -5.9 (55) 3.2 (60) 2.0 (64) 24.7 (61) -14.4 (53)�
5th Percentile 15.5 17.7 31.0 15.0 35.6 -6.9
1st Quartile 12.3 6.3 19.7 9.2 32.0 -11.0
Median 9.1 -5.7 5.2 3.5 26.0 -14.1
3rd Quartile 6.6 -8.5 -0.8 -2.7 20.0 -16.8
95th Percentile 4.4 -13.9 -5.0 -7.5 5.2 -21.0
Population 23 23 23 23 28 33
Wellington Equity
Peer Group Analysis
As of September 30, 2020
IM Global Small Cap Equity (SA+CF)
Parentheses contain percentile rankings.
77

Return Summary
Quarterly Excess Performance Ratio of Cumulative Wealth - Since Inception
Account Information
Dodge & Cox MSCI AC World IMI (Net)
0.0
15.0
30.0
-15.0
-30.0
Re
turn
1Quarter
YearTo
Date
1Year
Inception7/1/17
8.1
0.5
9.67.7
2.9
-14.6
-5.4
0.4
Account Name: Dodge & Cox
Inception Date: 07/01/2017
Account Structure: Mutual Fund
Asset Class: Global Equity
Benchmark: MSCI AC World IMI (Net)
Peer Group: IM Global Equity (MF)
Quarterly Out Performance Quarterly Under Performance
0.0%
5.0%
10.0%
-5.0 %
-10.0 %
-15.0 %
9/17 3/18 9/18 3/19 9/19 3/20 9/20
Dodge & Cox Benchmark
0.70
0.80
0.90
1.00
1.10
6/17 12/17 6/18 12/18 6/19 12/19 6/20 9/20
0.80
Dodge & Cox Performance Summary
As of September 30, 2020Dodge & Cox
78

-60.0
-40.0
-20.0
0.0
20.0
40.0
60.0
80.0
Re
turn
1Quarter
YearTo
Date
1Year
2019
Dodge & Cox 2.9 (78) -14.6 (84) -5.4 (76) 23.9 (61)¢
MSCI AC World IMI (Net) 8.1 (36) 0.5 (43) 9.6 (43) 26.4 (46)�
5th Percentile 15.1 38.9 53.0 36.5
1st Quartile 9.3 7.3 18.4 29.4
Median 6.8 -2.3 5.7 25.6
3rd Quartile 3.3 -10.7 -5.3 20.4
95th Percentile -1.0 -23.8 -18.7 10.1
Population 306 306 306 324
Dodge & Cox
Peer Group Analysis
As of September 30, 2020
IM Global Equity (MF)
Parentheses contain percentile rankings.
79

Total Fixed Income
80

Return Summary
Quarterly Excess Performance Ratio of Cumulative Wealth - 15 Years
Current Allocation
Total Fixed Income
Blmbg. Barc. Universal Bond Index
0.0
3.0
6.0
9.0
12.0
Re
turn
1Quarter
YearTo
Date
1Year
3Years
5Years
10Years
Inception7/1/83
1.0
6.26.7
5.14.5
3.9
7.7
1.8
4.85.3
4.6 4.54.0
7.8
September 30, 2020 : $3,972M
Contributions and Withdrawals:0.0%Opportunistic Cash and Int Rec:0.0%Opportunistic Fixed Income - Oaktree:0.1%Opportunistic Fixed Income - PIMCO Bravo II:0.7%Loomis Sayles:6.1%Loomis Sayles Bank Loans:8.3%Franklin Templeton:8.3%
Wellington Global:12.2%
PIMCO:18.4%
Neuberger Berman Core Plus:15.8%
BlackRock Aggregate Bond Index:15.7% BlackRock Core Plus Universal:14.3%
Total Fixed Income Benchmark
0.96
1.02
1.08
1.14
9/05 3/07 9/08 3/10 9/11 3/13 9/14 3/16 9/17 3/19 9/20
1.03
Quarterly Out Performance Quarterly Under Performance
0.0%
3.0%
6.0%
-3.0 %
-6.0 %
12/05 6/07 12/08 6/10 12/11 6/13 12/14 6/16 12/17 6/19 9/20
Total Fixed Income Portfolio Overview
As of September 30, 2020Total Fixed Income
81

-12.0
-8.0
-4.0
0.0
4.0
8.0
12.0
16.0
20.0
Re
turn
1Quarter
YearTo
Date
1Year
3Years
5Years
10Years
2019 2018 2017
Total Fixed Income 1.8 (42) 4.8 (79) 5.3 (83) 4.6 (85) 4.5 (87) 4.0 (86) 8.5 (74) 0.0 (38) 5.0 (43)¢
Blmbg. Barc. Universal Bond Index 1.0 (84) 6.2 (64) 6.7 (67) 5.1 (65) 4.5 (87) 3.9 (87) 9.3 (51) -0.3 (50) 4.1 (72)�
5th Percentile 2.8 12.4 10.8 6.5 6.1 6.3 11.4 2.0 7.6
1st Quartile 2.1 8.4 8.3 6.0 5.5 5.0 10.3 0.3 5.8
Median 1.7 6.8 7.2 5.4 5.1 4.5 9.3 -0.3 4.8
3rd Quartile 1.3 5.4 6.0 4.9 4.7 4.1 8.4 -0.9 3.9
95th Percentile 0.2 2.2 3.6 3.7 3.8 2.8 6.5 -3.4 2.3
Population 58 55 54 51 49 33 53 56 61
Total Fixed Income
Plan Sponsor Peer Group Analysis
As of September 30, 2020
All Public Plans > $1B-US Fixed Income Segment
Parentheses contain percentile rankings.
82

Annualized Return vs. Annualized Standard Deviation5 Years
Rolling 5 Years Standard Deviation
5 Years Historical Statistics
Total Fixed Income Blmbg. Barc. Universal Bond
FTSE 3 Month T-Bill
-1.0
0.0
1.0
2.0
3.0
4.0
5.0
6.0
Re
turn
(%)
0.0 0.7 1.4 2.1 2.8 3.5 4.2 4.9Risk (Standard Deviation %)
Total Fixed Income Blmbg. Barc. Universal Bond
0.0
2.0
4.0
6.0
8.0
10.0
12.0
14.0
6/88 6/91 6/94 6/97 6/00 6/03 6/06 6/09 6/12 6/15 9/20
ActiveReturn
TrackingError
InformationRatio
R-SquaredSharpeRatio
Alpha Beta ReturnStandardDeviation
ActualCorrelation
Total Fixed Income 0.02 1.56 0.01 0.80 0.96 0.13 0.98 4.49 3.44 0.89
Blmbg. Barc. Universal Bond 0.00 0.00 N/A 1.00 1.05 0.00 1.00 4.49 3.15 1.00
FTSE 3 Month T-Bill -3.30 3.12 -1.05 0.02 N/A 1.11 0.01 1.16 0.24 0.13
Total Fixed Income Risk Profile
As of September 30, 2020Total Fixed Income
83

1 Quarter
0 20 40 60 80 100 120 140-20-40-60
Contributions and Withdrawals
Opportunistic Cash and Int Rec
Opportunistic Fixed Income - Oaktree
Opportunistic Fixed Income - PIMCO Bravo II
Neuberger Berman Core Plus
Wellington Global
Franklin Templeton
Loomis Sayles Bank Loans
Loomis Sayles
BlackRock Aggregate Bond Index
PIMCO
BlackRock Core Plus Universal
Benchmark Effect
Cash Flow Effect
Total Excess Return
0
0
0
0
5
-4
-1
-6
11
1
15
6
57
0
83
1 Year
0 50 100-50-100-150-200
Contributions and Withdrawals
Opportunistic Cash and Int Rec
Opportunistic Fixed Income - Oaktree
Opportunistic Fixed Income - PIMCO Bravo II
Neuberger Berman Core Plus
Wellington Global
Franklin Templeton
Loomis Sayles Bank Loans
Loomis Sayles
BlackRock Aggregate Bond Index
PIMCO
BlackRock Core Plus Universal
Benchmark Effect
Cash Flow Effect
Total Excess Return
0
0
2
-25
14
-19
-27
-15
20
2
20
12
-112
-5
-134
Total Fixed Income
Asset Class Attribution
As of September 30, 2020
84

3 Years
0 15 30 45 60-15-30-45-60-75-90
Contributions and WithdrawalsOpportunistic Cash and Int Rec
Opportunistic Fixed Income - OaktreeOpportunistic Fixed Income - PIMCO Bravo II
Neuberger Berman Core PlusBlackRock Mortgage Investors
Wellington GlobalRogge Global
Franklin TempletonLoomis Sayles Bank Loans
Loomis SaylesBlackRock Aggregate Bond Index
PIMCOBlackRock Core Plus Universal
Benchmark EffectCash Flow Effect
Total Excess Return
0
0
3
-6
90
-3
0
-19
-10
6
0
133
-50
-2
-56
5 Years
0 8 16 24 32 40-8-16-24-32-40-48
BlackRock Mortgage InvestorsContributions and WithdrawalsOpportunistic Cash and Int Rec
Opportunistic Fixed Income - OaktreeOpportunistic Fixed Income - PIMCO Bravo II
Neuberger Berman Core PlusWellington Global
Rogge GlobalFranklin Templeton
Loomis Sayles Bank LoansLoomis Sayles
BlackRock Aggregate Bond IndexPIMCO
BlackRock Core Plus UniversalBenchmark EffectCash Flow Effect
Total Excess Return
0
0
0
4
410
-3
0
-9
-10
12
1
203
-28
-3
1
Total Fixed Income
Asset Class Attribution
As of September 30, 2020
85
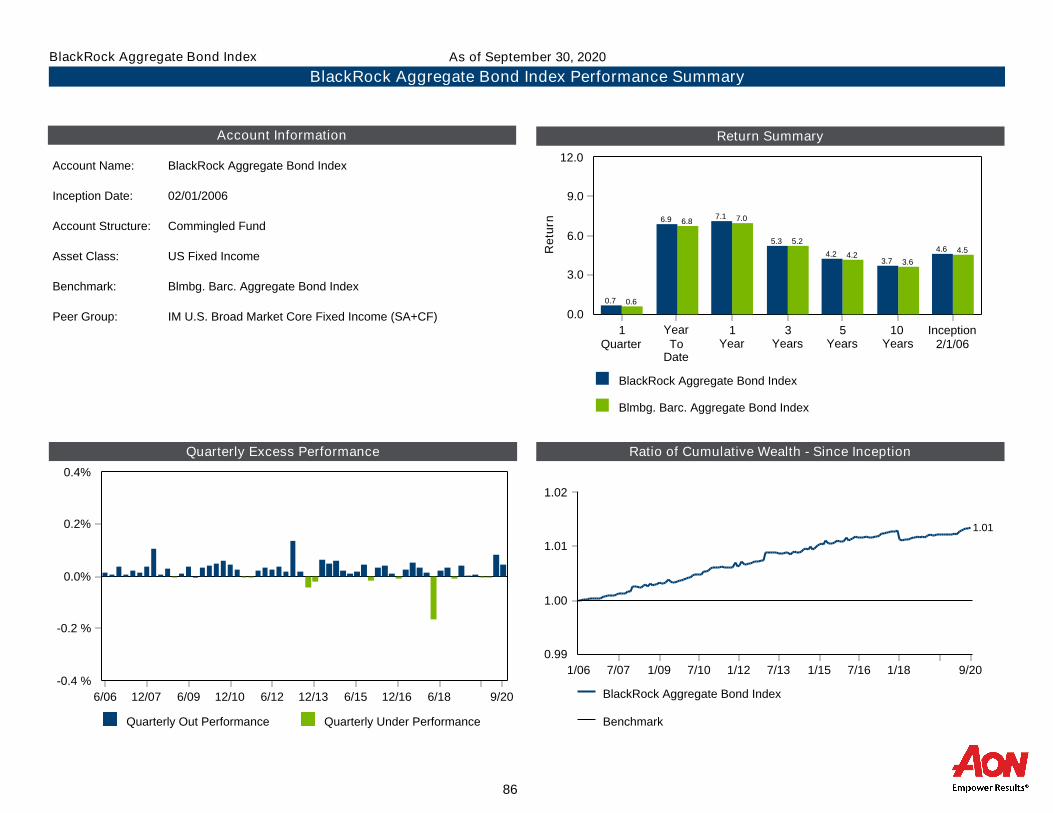
Return Summary
Quarterly Excess Performance Ratio of Cumulative Wealth - Since Inception
Account Information
BlackRock Aggregate Bond Index
Blmbg. Barc. Aggregate Bond Index
0.0
3.0
6.0
9.0
12.0
Re
turn
1Quarter
YearTo
Date
1Year
3Years
5Years
10Years
Inception2/1/06
0.6
6.8 7.0
5.2
4.23.6
4.5
0.7
6.9 7.1
5.3
4.23.7
4.6
Account Name: BlackRock Aggregate Bond Index
Inception Date: 02/01/2006
Account Structure: Commingled Fund
Asset Class: US Fixed Income
Benchmark: Blmbg. Barc. Aggregate Bond Index
Peer Group: IM U.S. Broad Market Core Fixed Income (SA+CF)
Quarterly Out Performance Quarterly Under Performance
0.0%
0.2%
0.4%
-0.2 %
-0.4 %
6/06 12/07 6/09 12/10 6/12 12/13 6/15 12/16 6/18 9/20 BlackRock Aggregate Bond Index
Benchmark
0.99
1.00
1.01
1.02
1/06 7/07 1/09 7/10 1/12 7/13 1/15 7/16 1/18 9/20
1.01
BlackRock Aggregate Bond Index Performance Summary
As of September 30, 2020BlackRock Aggregate Bond Index
86

-7.0
-4.0
-1.0
2.0
5.0
8.0
11.0
14.0
17.0
Re
turn
1Quarter
YearTo
Date
1Year
3Years
5Years
10Years
2019 2018 2017
BlackRock Aggregate Bond Index 0.7 (88) 6.9 (56) 7.1 (53) 5.3 (60) 4.2 (70) 3.7 (69) 8.8 (68) -0.1 (40) 3.7 (61)¢
Blmbg. Barc. Aggregate Bond Index 0.6 (89) 6.8 (61) 7.0 (62) 5.2 (64) 4.2 (78) 3.6 (75) 8.7 (72) 0.0 (32) 3.5 (67)�
5th Percentile 2.7 8.7 8.8 6.0 5.3 4.6 11.2 1.1 5.2
1st Quartile 1.5 7.7 7.8 5.7 4.7 4.3 9.4 0.1 4.2
Median 1.1 7.1 7.2 5.3 4.5 3.9 9.1 -0.2 3.8
3rd Quartile 0.8 6.1 6.3 5.1 4.2 3.6 8.6 -0.5 3.5
95th Percentile 0.5 3.9 4.2 4.8 3.7 3.2 7.0 -1.4 2.6
Population 82 82 82 76 74 66 91 92 96
BlackRock Aggregate Bond Index
Peer Group Analysis
As of September 30, 2020
IM U.S. Broad Market Core Fixed Income (SA+CF)
Parentheses contain percentile rankings.
87

Annualized Return vs. Annualized Standard Deviation5 Years
Rolling 5 Years Standard Deviation
5 Years Historical Statistics
BlackRock Aggregate Bond Index
Blmbg. Barc. Aggregate Bond Index
FTSE 3 Month T-Bill
-1.0
0.0
1.0
2.0
3.0
4.0
5.0
6.0
Re
turn
(%)
0.0 0.6 1.2 1.8 2.4 3.0 3.6 4.2 4.8Risk (Standard Deviation %)
BlackRock Aggregate Bond Index
Blmbg. Barc. Aggregate Bond Index
0.0
0.8
1.6
2.4
3.2
4.0
4.8
5.6
3/11 3/12 3/13 3/14 3/15 3/16 3/17 3/18 3/19 9/20
ActiveReturn
TrackingError
InformationRatio
R-SquaredSharpeRatio
Alpha Beta ReturnStandardDeviation
ActualCorrelation
BlackRock Aggregate Bond Index 0.05 0.10 0.52 1.00 0.97 0.01 1.01 4.23 3.18 1.00
Blmbg. Barc. Aggregate Bond Index 0.00 0.00 N/A 1.00 0.96 0.00 1.00 4.18 3.15 1.00
FTSE 3 Month T-Bill -3.00 3.12 -0.96 0.04 N/A 1.09 0.02 1.16 0.24 0.20
BlackRock Aggregate Bond Index Risk Profile
As of September 30, 2020BlackRock Aggregate Bond Index
88

Return Summary
Quarterly Excess Performance Ratio of Cumulative Wealth - Since Inception
Account Information
BlackRock Core Plus Universal
Blmbg. Barc. Universal Bond Index*
0.0
3.0
6.0
9.0
12.0
Re
turn
1Quarter
YearTo
Date
1Year
3Years
5Years
10Years
Inception4/1/98
1.0
6.26.7
5.14.5
3.9
5.4
1.4
6.87.5
5.44.7
4.4
5.8
Account Name: BlackRock Core Plus Universal
Inception Date: 04/01/1998
Account Structure: Separate Account
Asset Class: US Fixed Income
Benchmark: Blmbg. Barc. Universal Bond Index*
Peer Group: IM U.S. Broad Market Core+ Fixed Income (SA+CF)
Quarterly Out Performance Quarterly Under Performance
0.0%
2.0%
4.0%
-2.0 %
-4.0 %
12/05 6/07 12/08 6/10 12/11 6/13 12/14 6/16 12/17 6/19 9/20 BlackRock Core Plus Universal
Benchmark
0.90
0.95
1.00
1.05
1.10
1.15
3/98 6/00 9/02 12/04 3/07 6/09 9/11 12/13 3/16 6/18 9/20
1.09
BlackRock Core Plus Universal Performance Summary
As of September 30, 2020BlackRock Core Plus Universal
89

-12.0
-8.0
-4.0
0.0
4.0
8.0
12.0
16.0
20.0
Re
turn
1Quarter
YearTo
Date
1Year
3Years
5Years
10Years
2019 2018 2017
BlackRock Core Plus Universal 1.4 (67) 6.8 (48) 7.5 (41) 5.4 (48) 4.7 (57) 4.4 (48) 9.6 (49) -0.5 (44) 4.3 (58)¢
Blmbg. Barc. Universal Bond Index* 1.0 (90) 6.2 (62) 6.7 (64) 5.1 (65) 4.5 (67) 3.9 (73) 9.3 (57) -0.3 (30) 4.1 (66)�
5th Percentile 3.3 9.2 9.9 6.4 6.4 5.8 13.4 1.0 7.5
1st Quartile 2.0 7.7 8.1 5.8 5.2 4.8 10.6 -0.2 5.1
Median 1.7 6.7 7.1 5.3 4.8 4.3 9.5 -0.8 4.5
3rd Quartile 1.3 5.3 5.9 4.8 4.3 3.9 8.7 -1.5 3.8
95th Percentile 0.8 0.7 1.4 1.7 2.5 2.3 6.7 -3.6 2.9
Population 109 108 107 104 101 91 118 117 128
BlackRock Core Plus Universal
Peer Group Analysis
As of September 30, 2020
IM U.S. Broad Market Core+ Fixed Income (SA+CF)
Parentheses contain percentile rankings.
90

Annualized Return vs. Annualized Standard Deviation5 Years
Rolling 5 Years Standard Deviation
5 Years Historical Statistics
BlackRock Core Plus Universal
Blmbg. Barc. Universal Bond Index*
FTSE 3 Month T-Bill
-1.5
0.0
1.5
3.0
4.5
6.0
Re
turn
(%)
0.0 0.6 1.2 1.8 2.4 3.0 3.6 4.2 4.8Risk (Standard Deviation %)
BlackRock Core Plus Universal
Blmbg. Barc. Universal Bond Index*
0.0
2.0
4.0
6.0
8.0
10.0
3/03 12/04 9/06 6/08 3/10 12/11 9/13 6/15 3/17 12/18 9/20
ActiveReturn
TrackingError
InformationRatio
R-SquaredSharpeRatio
Alpha Beta ReturnStandardDeviation
ActualCorrelation
BlackRock Core Plus Universal 0.19 0.64 0.30 0.96 1.05 0.02 1.04 4.68 3.33 0.98
Blmbg. Barc. Universal Bond Index* 0.00 0.00 N/A 1.00 1.05 0.00 1.00 4.49 3.15 1.00
FTSE 3 Month T-Bill -3.30 3.12 -1.05 0.02 N/A 1.11 0.01 1.16 0.24 0.13
BlackRock Core Plus Universal Risk Profile
As of September 30, 2020BlackRock Core Plus Universal
91
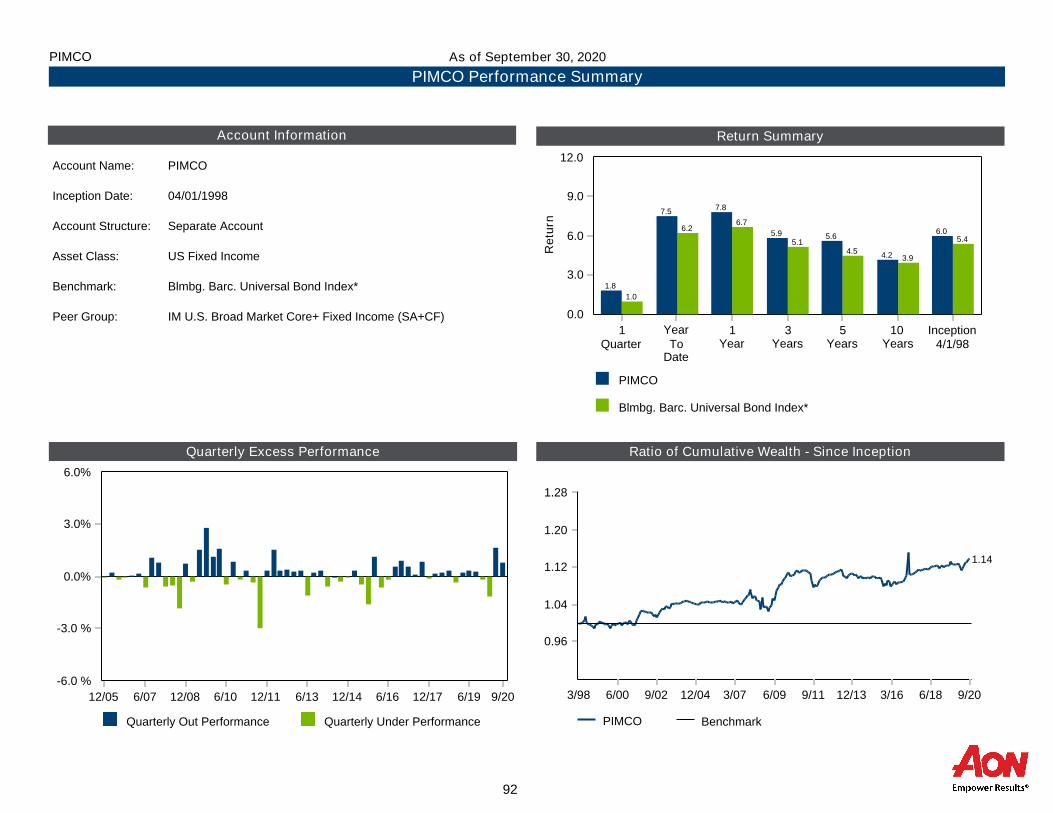
Return Summary
Quarterly Excess Performance Ratio of Cumulative Wealth - Since Inception
Account Information
PIMCO
Blmbg. Barc. Universal Bond Index*
0.0
3.0
6.0
9.0
12.0
Re
turn
1Quarter
YearTo
Date
1Year
3Years
5Years
10Years
Inception4/1/98
1.0
6.26.7
5.14.5
3.9
5.4
1.8
7.5 7.8
5.9 5.6
4.2
6.0
Account Name: PIMCO
Inception Date: 04/01/1998
Account Structure: Separate Account
Asset Class: US Fixed Income
Benchmark: Blmbg. Barc. Universal Bond Index*
Peer Group: IM U.S. Broad Market Core+ Fixed Income (SA+CF)
Quarterly Out Performance Quarterly Under Performance
0.0%
3.0%
6.0%
-3.0 %
-6.0 %
12/05 6/07 12/08 6/10 12/11 6/13 12/14 6/16 12/17 6/19 9/20
PIMCO Benchmark
0.96
1.04
1.12
1.20
1.28
3/98 6/00 9/02 12/04 3/07 6/09 9/11 12/13 3/16 6/18 9/20
1.14
PIMCO Performance Summary
As of September 30, 2020PIMCO
92

-12.0
-8.0
-4.0
0.0
4.0
8.0
12.0
16.0
20.0
Re
turn
1Quarter
YearTo
Date
1Year
3Years
5Years
10Years
2019 2018 2017
PIMCO 1.8 (39) 7.5 (30) 7.8 (32) 5.9 (16) 5.6 (17) 4.2 (60) 10.0 (36) 0.1 (16) 5.6 (19)¢
Blmbg. Barc. Universal Bond Index* 1.0 (90) 6.2 (62) 6.7 (64) 5.1 (65) 4.5 (67) 3.9 (73) 9.3 (57) -0.3 (30) 4.1 (66)�
5th Percentile 3.3 9.2 9.9 6.4 6.4 5.8 13.4 1.0 7.5
1st Quartile 2.0 7.7 8.1 5.8 5.2 4.8 10.6 -0.2 5.1
Median 1.7 6.7 7.1 5.3 4.8 4.3 9.5 -0.8 4.5
3rd Quartile 1.3 5.3 5.9 4.8 4.3 3.9 8.7 -1.5 3.8
95th Percentile 0.8 0.7 1.4 1.7 2.5 2.3 6.7 -3.6 2.9
Population 109 108 107 104 101 91 118 117 128
PIMCO
Peer Group Analysis
As of September 30, 2020
IM U.S. Broad Market Core+ Fixed Income (SA+CF)
Parentheses contain percentile rankings.
93

Annualized Return vs. Annualized Standard Deviation5 Years
Rolling 5 Years Standard Deviation
5 Years Historical Statistics
PIMCO
Blmbg. Barc. Universal Bond Index*
FTSE 3 Month T-Bill
-1.5
0.0
1.5
3.0
4.5
6.0
7.5
Re
turn
(%)
0.0 0.9 1.8 2.7 3.6 4.5 5.4 6.3 7.2Risk (Standard Deviation %)
PIMCO
Blmbg. Barc. Universal Bond Index*
0.0
2.0
4.0
6.0
8.0
10.0
3/03 12/04 9/06 6/08 3/10 12/11 9/13 6/15 3/17 12/18 9/20
ActiveReturn
TrackingError
InformationRatio
R-SquaredSharpeRatio
Alpha Beta ReturnStandardDeviation
ActualCorrelation
PIMCO 1.14 3.01 0.38 0.59 0.96 0.57 1.13 5.62 4.64 0.77
Blmbg. Barc. Universal Bond Index* 0.00 0.00 N/A 1.00 1.05 0.00 1.00 4.49 3.15 1.00
FTSE 3 Month T-Bill -3.30 3.12 -1.05 0.02 N/A 1.11 0.01 1.16 0.24 0.13
PIMCO Risk Profile
As of September 30, 2020PIMCO
94
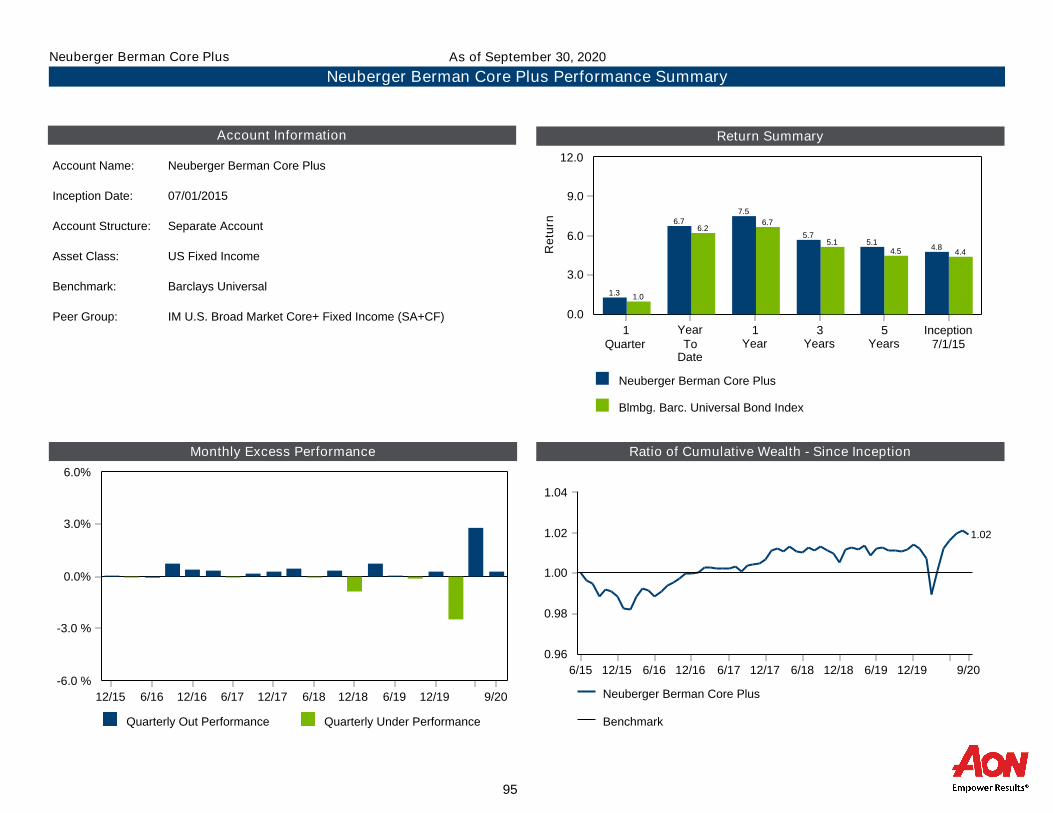
Return Summary
Monthly Excess Performance Ratio of Cumulative Wealth - Since Inception
Account Information
Neuberger Berman Core Plus
Blmbg. Barc. Universal Bond Index
0.0
3.0
6.0
9.0
12.0
Re
turn
1Quarter
YearTo
Date
1Year
3Years
5Years
Inception7/1/15
1.0
6.26.7
5.14.5 4.4
1.3
6.77.5
5.75.1
4.8
Account Name: Neuberger Berman Core Plus
Inception Date: 07/01/2015
Account Structure: Separate Account
Asset Class: US Fixed Income
Benchmark: Barclays Universal
Peer Group: IM U.S. Broad Market Core+ Fixed Income (SA+CF)
Quarterly Out Performance Quarterly Under Performance
0.0%
3.0%
6.0%
-3.0 %
-6.0 %
12/15 6/16 12/16 6/17 12/17 6/18 12/18 6/19 12/19 9/20 Neuberger Berman Core Plus
Benchmark
0.96
0.98
1.00
1.02
1.04
6/15 12/15 6/16 12/16 6/17 12/17 6/18 12/18 6/19 12/19 9/20
1.02
Neuberger Berman Core Plus Performance Summary
As of September 30, 2020Neuberger Berman Core Plus
95
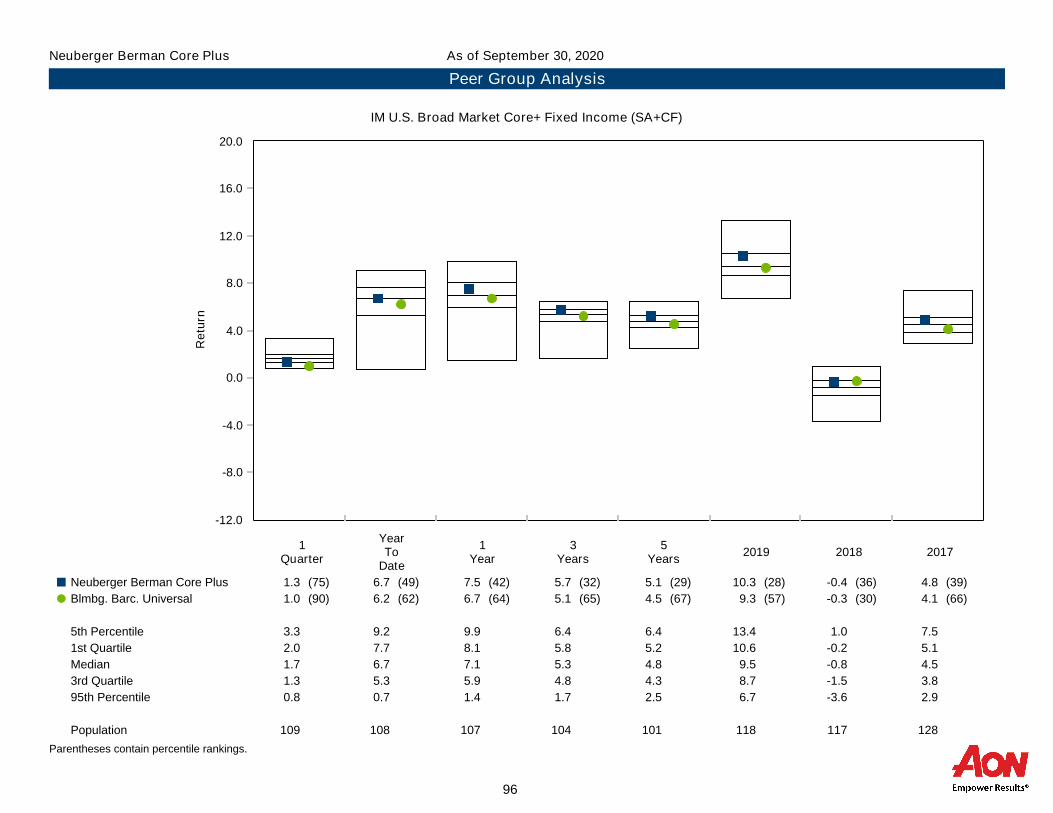
-12.0
-8.0
-4.0
0.0
4.0
8.0
12.0
16.0
20.0
Re
turn
1Quarter
YearTo
Date
1Year
3Years
5Years
2019 2018 2017
Neuberger Berman Core Plus 1.3 (75) 6.7 (49) 7.5 (42) 5.7 (32) 5.1 (29) 10.3 (28) -0.4 (36) 4.8 (39)¢
Blmbg. Barc. Universal 1.0 (90) 6.2 (62) 6.7 (64) 5.1 (65) 4.5 (67) 9.3 (57) -0.3 (30) 4.1 (66)�
5th Percentile 3.3 9.2 9.9 6.4 6.4 13.4 1.0 7.5
1st Quartile 2.0 7.7 8.1 5.8 5.2 10.6 -0.2 5.1
Median 1.7 6.7 7.1 5.3 4.8 9.5 -0.8 4.5
3rd Quartile 1.3 5.3 5.9 4.8 4.3 8.7 -1.5 3.8
95th Percentile 0.8 0.7 1.4 1.7 2.5 6.7 -3.6 2.9
Population 109 108 107 104 101 118 117 128
Neuberger Berman Core Plus
Peer Group Analysis
As of September 30, 2020
IM U.S. Broad Market Core+ Fixed Income (SA+CF)
Parentheses contain percentile rankings.
96

Annualized Return vs. Annualized Standard DeviationSince Inception
Rolling 5 Years Standard Deviation
Since Inception Historical Statistics
Neuberger Berman Core Plus
Blmbg. Barc Universal
FTSE 3 Month T-Bill
-1.0
0.0
1.0
2.0
3.0
4.0
5.0
6.0
7.0
Re
turn
(%)
0.0 0.7 1.4 2.1 2.8 3.5 4.2 4.9 5.6Risk (Standard Deviation %)
Neuberger Berman Core Plus Blmbg. Barc Universal
0.0
0.7
1.4
2.1
2.8
3.5
4.2
4.9
5.6
6/20 9/20
ActiveReturn
TrackingError
InformationRatio
R-SquaredSharpeRatio
Alpha Beta ReturnStandardDeviation
ActualCorrelation
InceptionDate
Neuberger Berman Core Plus 0.39 1.42 0.27 0.85 1.02 0.07 1.07 4.79 3.60 0.92 07/01/2015
Blmbg. Barc Universal 0.00 0.00 N/A 1.00 0.95 0.00 1.00 6.17 3.56 1.00 01/01/1990
FTSE 3 Month T-Bill -3.27 3.06 -1.07 0.02 N/A 1.05 0.01 1.10 0.25 0.14 07/01/2015
Neuberger Berman Core Plus Risk Profile
As of September 30, 2020Neuberger Berman Core Plus
97
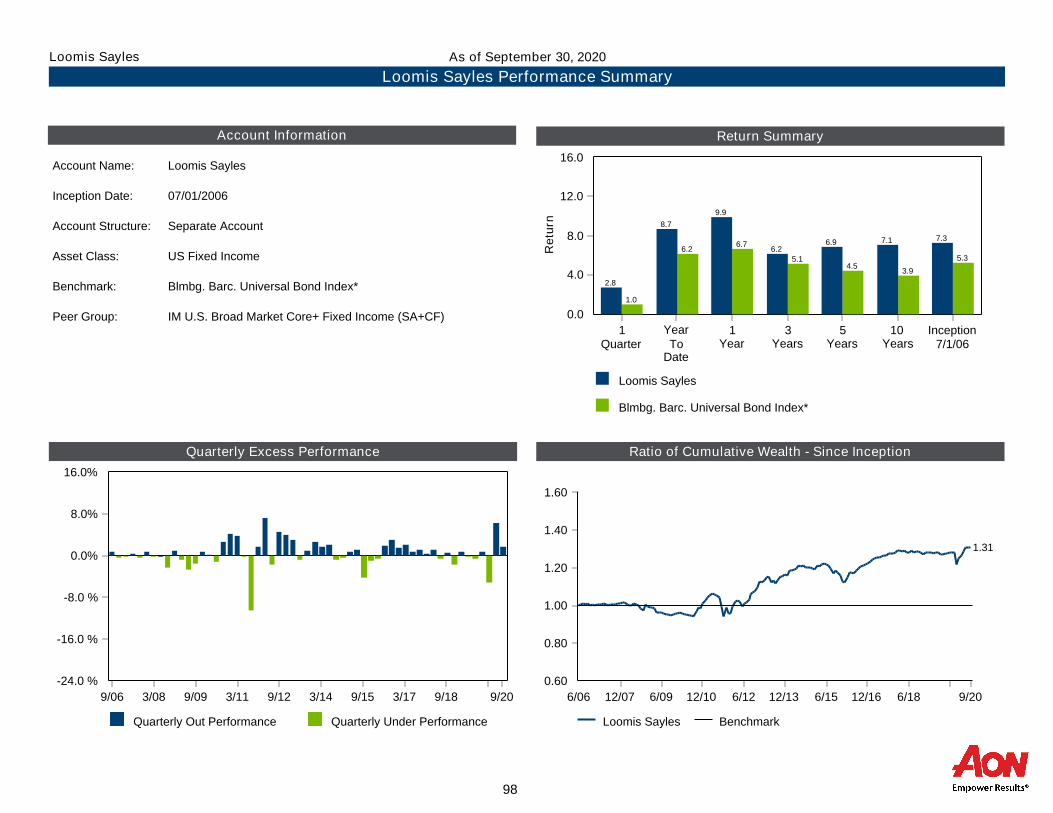
Return Summary
Quarterly Excess Performance Ratio of Cumulative Wealth - Since Inception
Account Information
Loomis Sayles
Blmbg. Barc. Universal Bond Index*
0.0
4.0
8.0
12.0
16.0
Re
turn
1Quarter
YearTo
Date
1Year
3Years
5Years
10Years
Inception7/1/06
1.0
6.26.7
5.14.5
3.9
5.3
2.8
8.7
9.9
6.26.9 7.1 7.3
Account Name: Loomis Sayles
Inception Date: 07/01/2006
Account Structure: Separate Account
Asset Class: US Fixed Income
Benchmark: Blmbg. Barc. Universal Bond Index*
Peer Group: IM U.S. Broad Market Core+ Fixed Income (SA+CF)
Quarterly Out Performance Quarterly Under Performance
0.0%
8.0%
16.0%
-8.0 %
-16.0 %
-24.0 %
9/06 3/08 9/09 3/11 9/12 3/14 9/15 3/17 9/18 9/20
Loomis Sayles Benchmark
0.60
0.80
1.00
1.20
1.40
1.60
6/06 12/07 6/09 12/10 6/12 12/13 6/15 12/16 6/18 9/20
1.31
Loomis Sayles Performance Summary
As of September 30, 2020Loomis Sayles
98

-12.0
-8.0
-4.0
0.0
4.0
8.0
12.0
16.0
20.0
Re
turn
1Quarter
YearTo
Date
1Year
3Years
5Years
10Years
2019 2018 2017
Loomis Sayles 2.8 (10) 8.7 (9) 9.9 (5) 6.2 (9) 6.9 (1) 7.1 (1) 10.2 (31) -0.9 (55) 8.6 (2)¢
Blmbg. Barc. Universal Bond Index* 1.0 (90) 6.2 (62) 6.7 (64) 5.1 (65) 4.5 (67) 3.9 (73) 9.3 (57) -0.3 (30) 4.1 (66)�
5th Percentile 3.3 9.2 9.9 6.4 6.4 5.8 13.4 1.0 7.5
1st Quartile 2.0 7.7 8.1 5.8 5.2 4.8 10.6 -0.2 5.1
Median 1.7 6.7 7.1 5.3 4.8 4.3 9.5 -0.8 4.5
3rd Quartile 1.3 5.3 5.9 4.8 4.3 3.9 8.7 -1.5 3.8
95th Percentile 0.8 0.7 1.4 1.7 2.5 2.3 6.7 -3.6 2.9
Population 109 108 107 104 101 91 118 117 128
Loomis Sayles
Peer Group Analysis
As of September 30, 2020
IM U.S. Broad Market Core+ Fixed Income (SA+CF)
Parentheses contain percentile rankings.
99

Annualized Return vs. Annualized Standard Deviation5 Years
Rolling 5 Years Standard Deviation
5 Years Historical Statistics
Loomis Sayles
Blmbg. Barc. Universal Bond Index*
FTSE 3 Month T-Bill
-2.0
0.0
2.0
4.0
6.0
8.0
10.0
Re
turn
(%)
0.0 1.0 2.0 3.0 4.0 5.0 6.0 7.0 8.0Risk (Standard Deviation %)
Loomis Sayles
Blmbg. Barc. Universal Bond Index*
0.0
3.0
6.0
9.0
12.0
15.0
18.0
21.0
6/11 6/12 6/13 6/14 6/15 6/16 6/17 6/18 6/19 9/20
ActiveReturn
TrackingError
InformationRatio
R-SquaredSharpeRatio
Alpha Beta ReturnStandardDeviation
ActualCorrelation
Loomis Sayles 2.43 4.00 0.61 0.51 1.02 1.26 1.26 6.93 5.58 0.71
Blmbg. Barc. Universal Bond Index* 0.00 0.00 N/A 1.00 1.05 0.00 1.00 4.49 3.15 1.00
FTSE 3 Month T-Bill -3.30 3.12 -1.05 0.02 N/A 1.11 0.01 1.16 0.24 0.13
Loomis Sayles Risk Profile
As of September 30, 2020Loomis Sayles
100
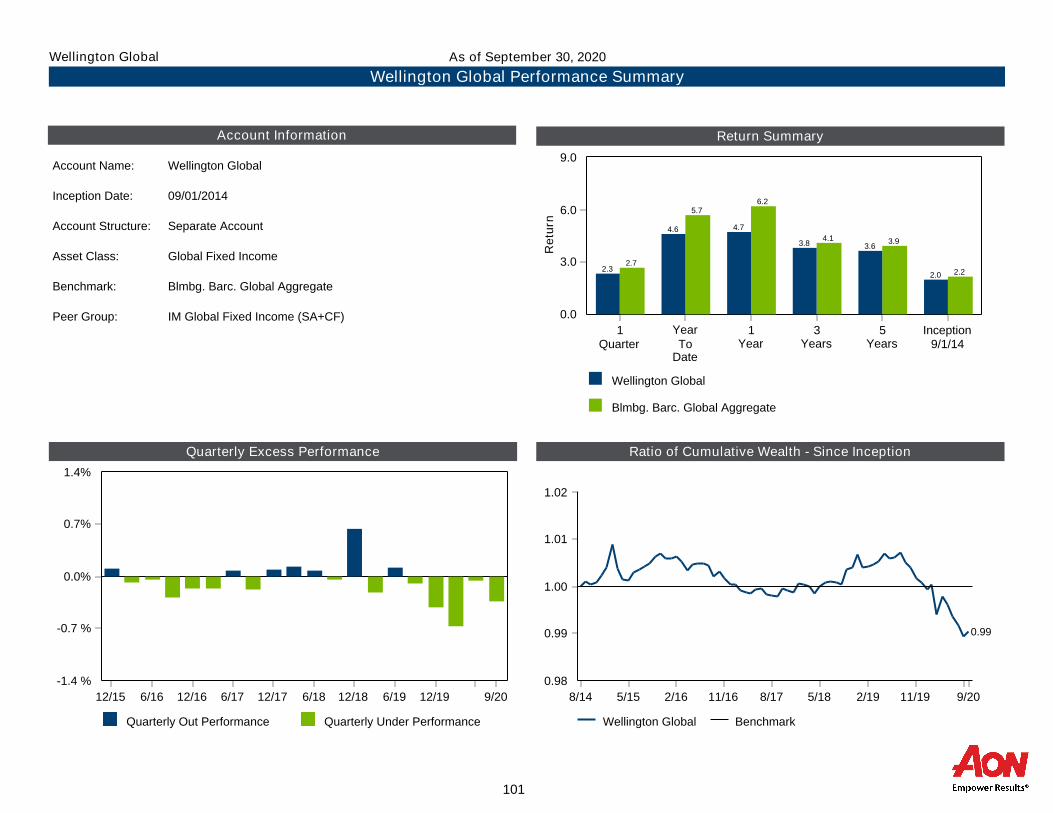
Return Summary
Quarterly Excess Performance Ratio of Cumulative Wealth - Since Inception
Account Information
Wellington Global
Blmbg. Barc. Global Aggregate
0.0
3.0
6.0
9.0
Re
turn
1Quarter
YearTo
Date
1Year
3Years
5Years
Inception9/1/14
2.7
5.76.2
4.1 3.9
2.22.3
4.6 4.7
3.8 3.6
2.0
Account Name: Wellington Global
Inception Date: 09/01/2014
Account Structure: Separate Account
Asset Class: Global Fixed Income
Benchmark: Blmbg. Barc. Global Aggregate
Peer Group: IM Global Fixed Income (SA+CF)
Quarterly Out Performance Quarterly Under Performance
0.0%
0.7%
1.4%
-0.7 %
-1.4 %
12/15 6/16 12/16 6/17 12/17 6/18 12/18 6/19 12/19 9/20
Wellington Global Benchmark
0.98
0.99
1.00
1.01
1.02
8/14 5/15 2/16 11/16 8/17 5/18 2/19 11/19 9/20
0.99
Wellington Global Performance Summary
As of September 30, 2020Wellington Global
101

-15.0
-10.0
-5.0
0.0
5.0
10.0
15.0
20.0
25.0
Re
turn
1Quarter
YearTo
Date
1Year
3Years
5Years
2019 2018 2017
Wellington Global 2.3 (75) 4.6 (34) 4.7 (45) 3.8 (43) 3.6 (80) 6.2 (86) -0.4 (20) 7.2 (52)¢
Blmbg. Barc. Global Aggregate 2.7 (67) 5.7 (27) 6.2 (31) 4.1 (39) 3.9 (72) 6.8 (84) -1.2 (29) 7.4 (48)�
5th Percentile 6.8 9.0 11.0 6.4 7.0 15.1 1.5 11.8
1st Quartile 4.2 5.8 6.8 4.6 5.9 12.9 -1.1 9.0
Median 3.5 2.5 4.3 3.6 4.7 9.0 -2.4 7.3
3rd Quartile 2.3 -1.2 1.5 2.3 3.8 7.8 -4.0 5.2
95th Percentile 1.1 -5.4 -3.1 -1.0 1.7 4.0 -7.1 2.4
Population 151 151 150 145 142 159 174 186
Wellington Global
Peer Group Analysis
As of September 30, 2020
IM Global Fixed Income (SA+CF)
Parentheses contain percentile rankings.
102

Annualized Return vs. Annualized Standard DeviationSince Inception
Rolling 1 Year Standard Deviation
Since Inception Historical Statistics
Wellington Global
Blmbg. Barc. Global Aggregate
FTSE 3 Month T-Bill
0.4
0.8
1.2
1.6
2.0
2.4
2.8
Re
turn
(%)
0.0 0.9 1.8 2.7 3.6 4.5 5.4 6.3 7.2Risk (Standard Deviation %)
Wellington Global
Blmbg. Barc. Global Aggregate
0.0
2.0
4.0
6.0
8.0
10.0
9/15 3/16 9/16 3/17 9/17 3/18 9/18 3/19 9/19 3/20 9/20
ActiveReturn
TrackingError
InformationRatio
R-SquaredSharpeRatio
Alpha Beta ReturnStandardDeviation
ActualCorrelation
InceptionDate
Wellington Global -0.15 0.61 -0.25 0.98 0.25 -0.16 1.00 2.02 4.70 0.99 09/01/2014
Blmbg. Barc. Global Aggregate 0.00 0.00 N/A 1.00 0.55 0.00 1.00 5.64 5.30 1.00 01/01/1990
FTSE 3 Month T-Bill -1.31 4.62 -0.28 0.01 N/A 0.94 0.01 0.95 0.25 0.11 09/01/2014
Wellington Global Risk Profile
As of September 30, 2020Wellington Global
103
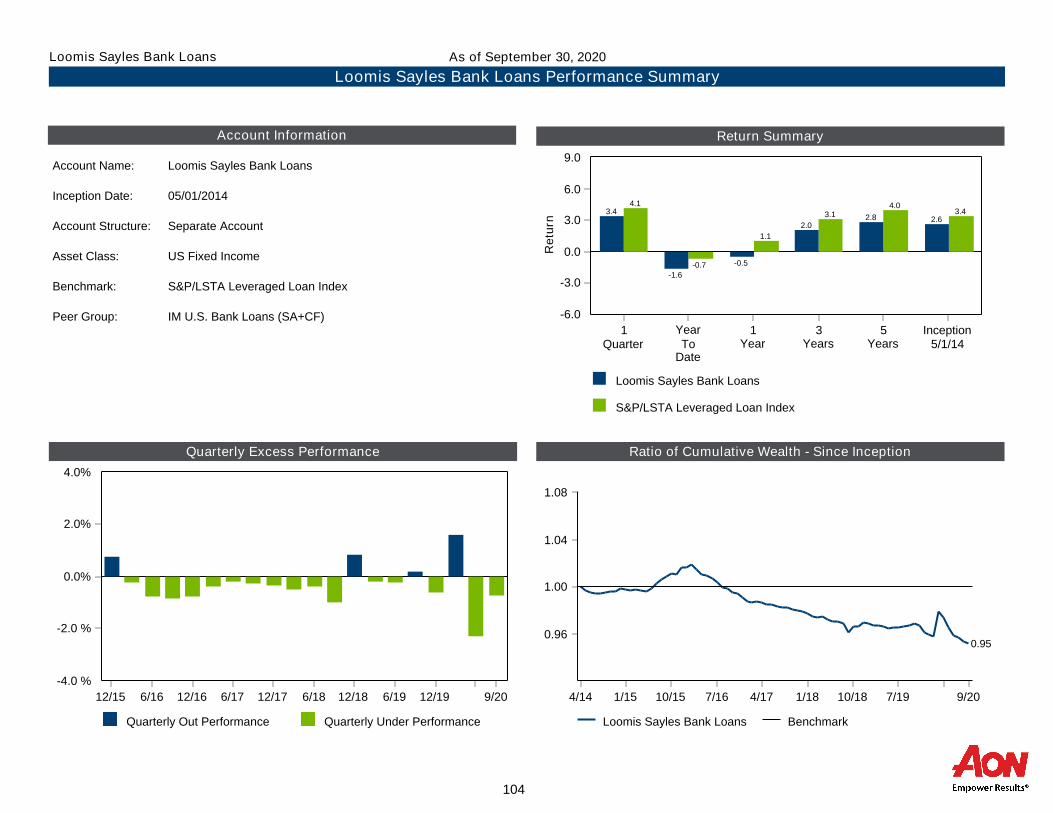
Return Summary
Quarterly Excess Performance Ratio of Cumulative Wealth - Since Inception
Account Information
Loomis Sayles Bank Loans
S&P/LSTA Leveraged Loan Index
0.0
3.0
6.0
9.0
-3.0
-6.0
Re
turn
1Quarter
YearTo
Date
1Year
3Years
5Years
Inception5/1/14
4.1
-0.7
1.1
3.14.0
3.43.4
-1.6
-0.5
2.02.8 2.6
Account Name: Loomis Sayles Bank Loans
Inception Date: 05/01/2014
Account Structure: Separate Account
Asset Class: US Fixed Income
Benchmark: S&P/LSTA Leveraged Loan Index
Peer Group: IM U.S. Bank Loans (SA+CF)
Quarterly Out Performance Quarterly Under Performance
0.0%
2.0%
4.0%
-2.0 %
-4.0 %
12/15 6/16 12/16 6/17 12/17 6/18 12/18 6/19 12/19 9/20
Loomis Sayles Bank Loans Benchmark
0.96
1.00
1.04
1.08
4/14 1/15 10/15 7/16 4/17 1/18 10/18 7/19 9/20
0.95
Loomis Sayles Bank Loans Performance Summary
As of September 30, 2020Loomis Sayles Bank Loans
104
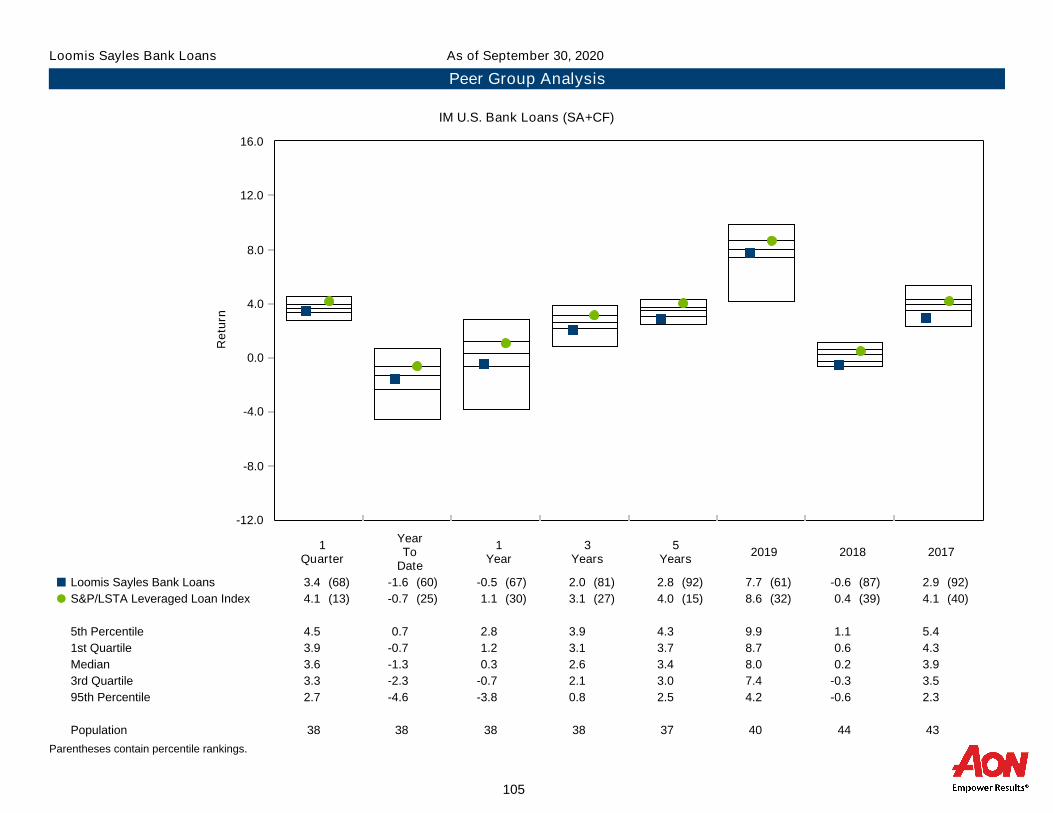
-12.0
-8.0
-4.0
0.0
4.0
8.0
12.0
16.0
Re
turn
1Quarter
YearTo
Date
1Year
3Years
5Years
2019 2018 2017
Loomis Sayles Bank Loans 3.4 (68) -1.6 (60) -0.5 (67) 2.0 (81) 2.8 (92) 7.7 (61) -0.6 (87) 2.9 (92)¢
S&P/LSTA Leveraged Loan Index 4.1 (13) -0.7 (25) 1.1 (30) 3.1 (27) 4.0 (15) 8.6 (32) 0.4 (39) 4.1 (40)�
5th Percentile 4.5 0.7 2.8 3.9 4.3 9.9 1.1 5.4
1st Quartile 3.9 -0.7 1.2 3.1 3.7 8.7 0.6 4.3
Median 3.6 -1.3 0.3 2.6 3.4 8.0 0.2 3.9
3rd Quartile 3.3 -2.3 -0.7 2.1 3.0 7.4 -0.3 3.5
95th Percentile 2.7 -4.6 -3.8 0.8 2.5 4.2 -0.6 2.3
Population 38 38 38 38 37 40 44 43
Loomis Sayles Bank Loans
Peer Group Analysis
As of September 30, 2020
IM U.S. Bank Loans (SA+CF)
Parentheses contain percentile rankings.
105

Annualized Return vs. Annualized Standard Deviation5 Years
Rolling 1 Year Standard Deviation
5 Years Historical Statistics
Loomis Sayles Bank Loans
S&P/LSTA Leveraged Loan Index
FTSE 3 Month T-Bill
0.0
0.9
1.8
2.7
3.6
4.5
5.4
Re
turn
(%)
0.0 2.0 4.0 6.0 8.0 10.0Risk (Standard Deviation %)
Loomis Sayles Bank Loans
S&P/LSTA Leveraged Loan Index
0.0
4.0
8.0
12.0
16.0
20.0
24.0
28.0
6/15 12/15 6/16 12/16 6/17 12/17 6/18 12/18 6/19 12/19 9/20
ActiveReturn
TrackingError
InformationRatio
R-SquaredSharpeRatio
Alpha Beta ReturnStandardDeviation
ActualCorrelation
Loomis Sayles Bank Loans -1.23 1.32 -0.93 0.98 0.30 -0.57 0.84 2.82 5.92 0.99
S&P/LSTA Leveraged Loan Index 0.00 0.00 N/A 1.00 0.43 0.00 1.00 4.01 6.96 1.00
FTSE 3 Month T-Bill -3.04 7.00 -0.43 0.02 N/A 1.18 0.00 1.16 0.24 -0.14
Loomis Sayles Bank Loans Risk Profile
As of September 30, 2020Loomis Sayles Bank Loans
106
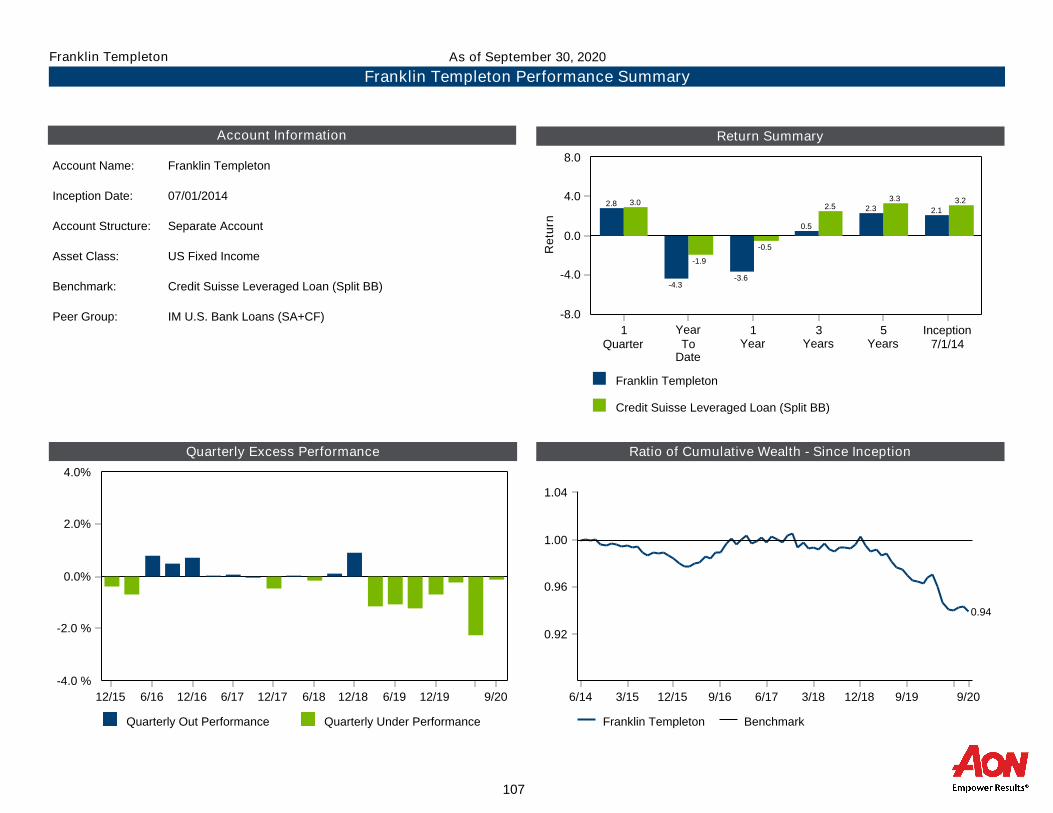
Return Summary
Quarterly Excess Performance Ratio of Cumulative Wealth - Since Inception
Account Information
Franklin Templeton
Credit Suisse Leveraged Loan (Split BB)
0.0
4.0
8.0
-4.0
-8.0
Re
turn
1Quarter
YearTo
Date
1Year
3Years
5Years
Inception7/1/14
3.0
-1.9
-0.5
2.53.3 3.22.8
-4.3-3.6
0.5
2.3 2.1
Account Name: Franklin Templeton
Inception Date: 07/01/2014
Account Structure: Separate Account
Asset Class: US Fixed Income
Benchmark: Credit Suisse Leveraged Loan (Split BB)
Peer Group: IM U.S. Bank Loans (SA+CF)
Quarterly Out Performance Quarterly Under Performance
0.0%
2.0%
4.0%
-2.0 %
-4.0 %
12/15 6/16 12/16 6/17 12/17 6/18 12/18 6/19 12/19 9/20
Franklin Templeton Benchmark
0.92
0.96
1.00
1.04
6/14 3/15 12/15 9/16 6/17 3/18 12/18 9/19 9/20
0.94
Franklin Templeton Performance Summary
As of September 30, 2020Franklin Templeton
107

-12.0
-8.0
-4.0
0.0
4.0
8.0
12.0
16.0
Re
turn
1Quarter
YearTo
Date
1Year
3Years
5Years
2019 2018 2017
Franklin Templeton 2.8 (92) -4.3 (95) -3.6 (95) 0.5 (97) 2.3 (97) 4.5 (95) 0.9 (9) 2.9 (92)¢
Credit Suisse Leveraged Loan (Split BB) 3.0 (91) -1.9 (64) -0.5 (65) 2.5 (52) 3.3 (59) 8.9 (24) 0.0 (62) 3.2 (87)�
5th Percentile 4.5 0.7 2.8 3.9 4.3 9.9 1.1 5.4
1st Quartile 3.9 -0.7 1.2 3.1 3.7 8.7 0.6 4.3
Median 3.6 -1.3 0.3 2.6 3.4 8.0 0.2 3.9
3rd Quartile 3.3 -2.3 -0.7 2.1 3.0 7.4 -0.3 3.5
95th Percentile 2.7 -4.6 -3.8 0.8 2.5 4.2 -0.6 2.3
Population 38 38 38 38 37 40 44 43
Franklin Templeton
Peer Group Analysis
As of September 30, 2020
IM U.S. Bank Loans (SA+CF)
Parentheses contain percentile rankings.
108
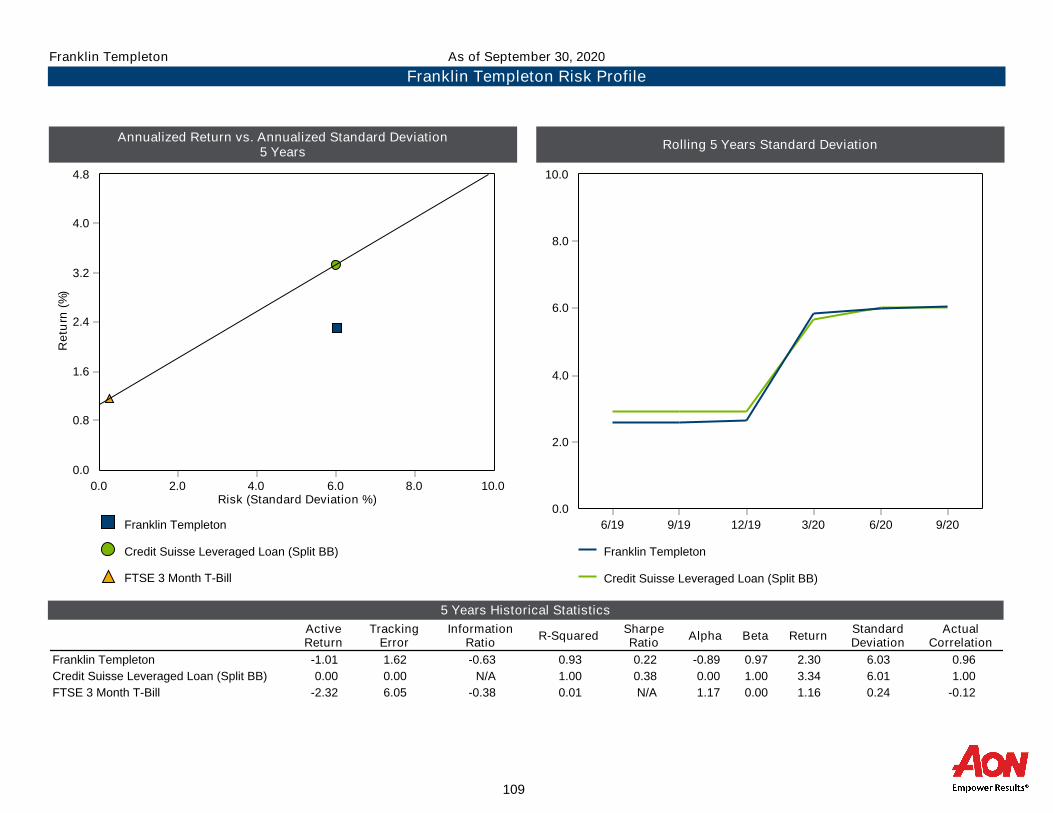
Annualized Return vs. Annualized Standard Deviation5 Years
Rolling 5 Years Standard Deviation
5 Years Historical Statistics
Franklin Templeton
Credit Suisse Leveraged Loan (Split BB)
FTSE 3 Month T-Bill
0.0
0.8
1.6
2.4
3.2
4.0
4.8
Re
turn
(%)
0.0 2.0 4.0 6.0 8.0 10.0Risk (Standard Deviation %)
Franklin Templeton
Credit Suisse Leveraged Loan (Split BB)
0.0
2.0
4.0
6.0
8.0
10.0
6/19 9/19 12/19 3/20 6/20 9/20
ActiveReturn
TrackingError
InformationRatio
R-SquaredSharpeRatio
Alpha Beta ReturnStandardDeviation
ActualCorrelation
Franklin Templeton -1.01 1.62 -0.63 0.93 0.22 -0.89 0.97 2.30 6.03 0.96
Credit Suisse Leveraged Loan (Split BB) 0.00 0.00 N/A 1.00 0.38 0.00 1.00 3.34 6.01 1.00
FTSE 3 Month T-Bill -2.32 6.05 -0.38 0.01 N/A 1.17 0.00 1.16 0.24 -0.12
Franklin Templeton Risk Profile
As of September 30, 2020Franklin Templeton
109
Total Real Estate
110

September 30, 2020 : $813,765,598
Clarion Lion Properties Fund 23.9%
Prudential PRISA I 20.4%
AG Realty Fund VIII 0.7%
Almanac Realty Securities VIII 0.6%
Torchlight V 1.2%
CB Richard Ellis Strategic 0.5%
Landmark Real Estate VIII 1.3%
Rockwood Capital Real Estate Fund IX 0.4%
Landmark Real Estate VII 1.8%
Real Estate Cash 0.4%
Almanac Realty Securities VII 2.0%
Torchlight IV 0.3%
Rockwood Capital Real Estate Fund X 3.0%
Landmark Real Estate VI 0.2%
Torchlight VI 4.1%
RockPoint Fund III 0.1%
Prudential PRISA II 9.3%
Rockwood Capital Real Estate Fund XI 0.0%
UBS Trumbull Property Income 14.2%
Five Arrows Realty 0.0%
UBS Real Estate 15.6%
Total Real Estate
Asset Allocation by Plan
As of September 30, 2020
111

Investment Watchlist Summary
Defined Benefit Plan
• The table below provides a “Suggested Action” based on the number of affirmative responses received to the questions noted above.
• Changes in Watch List designations from the previous quarter are highlighted in red.
Status Number of Criteria Met Suggested Action
Less than 2 Active – No action required
2 to 3 Active – On “closely monitored” list
4 Closed – all allocations to the fund must be stopped, but accumulated balances may remain Invested
Greater than 4 Closed Out – All invested balances must be moved to another active option
DB Plan
Investment Watchlist Summary
1 2 3 4 5 6 Watch List StatusUnderperformed During Trailing
5 Years
Underperformed in 3 of 4
Trailing Calendar Quarters
Diverged from Strategy and/or
Portfolio Characteristics
Adverse Change in Portfolio Manager
Weak Manager Research
Rating
Significant Organizational
Change
3rdQuarter
2020
2ndQuarter
2020
DFA Yes Yes No No No No 2 2
BlackRock Russell 1000 Index* No No No No No No 0 0
BlackRock ACWI ex-U.S. IMI Index N/A No No No No No
Arrowstreet N/A Yes No No No No 1 1
MFS No No No No No No 0 0
Wellingtion Equity N/A Yes No No No No 1 1
Dodge & Cox N/A No No No No No 0 0
BlackRock Core Plus Universal No No No No No No 0 0
PIMCO No No No No No No 0 0
BlackRock Aggregate Bond Index* No No No No No No 0 0
Loomis Sayles No No No No No No 0 0
Loomis Sayles Bank Loans Yes Yes No No No No 2 0
Neuberger Berman No No No No No No 0 0
Franklin Templeton Yes Yes No No No Yes 3 2
Wellington Global Yes Yes No No No No 2 2
112
Defined Contribution Option and Deferred Compensation
113

Allocation
MarketValue
($)%
Performance(%)
1Quarter
YearTo
Date
1Year
3Years
5Years
10Years
SinceInception
InceptionDate
Total Defined Cont. & Deferred Comp. 1,200,195,847 100.0
DFA Small Cap 46,191,758 3.8 3.9 -13.6 -6.3 -1.8 5.3 9.3 8.0 01/01/2001
Russell 2000 Index 4.9 -8.7 0.4 1.8 8.0 9.9 7.4
Russell 1000 Growth Index Fund 96,326,175 8.0 13.2 24.3 37.5 21.6 20.0 17.2 7.2 10/01/1999
Russell 1000 Growth Index 13.2 24.3 37.5 21.7 20.1 17.3 7.2
Russell 1000 Value Index Fund 39,280,229 3.3 5.6 -11.5 -5.0 2.7 7.7 10.0 6.4 10/01/1999
Russell 1000 Value Index 5.6 -11.6 -5.0 2.6 7.7 9.9 6.3
U.S. Equity Index Fund 215,911,935 18.0 8.9 5.6 15.2 12.3 14.2 13.8 7.7 01/01/1998
S&P 500 Index 8.9 5.6 15.1 12.3 14.1 13.7 7.6
BlackRock All-Country World ex-U.S. Index Fund 30,604,877 2.5 6.2 -5.4 3.0 1.3 6.4 4.1 4.9 07/01/2005
MSCI AC World ex USA Index (Net) 6.3 -5.4 3.0 1.2 6.2 4.0 4.8
U.S. Debt Index Fund 23,082,493 1.9 0.7 6.8 7.0 5.2 4.2 3.7 5.1 01/01/1998
Blmbg. Barc. U.S. Aggregate 0.6 6.8 7.0 5.2 4.2 3.6 5.1
T. Rowe Stable Value 136,214,866 11.3 0.5 1.4 2.0 2.0 1.9 2.0 4.0 01/01/1997
Performance Benchmark 0.6 1.7 2.4 2.3 2.1 2.1 3.3
SSgA STIF 14,434,560 1.2 0.0 0.6 1.0 1.7 1.3 0.7 2.1 01/01/1998
Blmbg. Barc. 90-Day T-Bill Index 0.0 0.6 1.1 1.7 1.2 0.7 2.1
Conservative Premixed 61,155,006 5.1 2.8 5.1 7.7 5.8 5.9 5.4 5.1 10/01/1999
Conservative Policy 2.3 4.9 7.4 5.8 5.8 5.2 4.9
Moderate Premixed 418,296,467 34.9 4.1 5.0 9.8 7.2 8.2 7.7 6.1 10/01/1999
Moderate Policy 4.2 4.6 9.4 7.2 8.2 7.6 6.0
Aggressive Premixed 97,727,617 8.1 6.3 3.4 10.4 7.9 9.9 9.6 6.4 10/01/1999
Aggressive Policy 6.0 3.0 10.0 7.9 10.0 9.5 6.4
Investor Select Fund 20,969,865 1.7 6.0 2.3 7.4 6.8 8.6 8.6 7.1 10/01/2005
Performance Benchmark 5.6 2.1 7.9 7.0 8.9 8.4 6.8
Total Defined Cont. & Deferred Comp.
Asset Allocation & Performance
As of September 30, 2020
114

Premixed Funds
Employee Conservative
Premixed
Employee ModeratePremixed
Employee AggressivePremixed
Investor Select Fund
Allocation to Underlying Funds
DFA Small-Cap Portfolio 4.0% 8.0% 12.0% 3.2%
BlackRock Russell 1000 Index Fund -- -- -- 28.8
BlackRock U.S. Equity Market Index 16.0 32.0 48.0 --
BlackRock All Country World Ex-U.S. Index 5.0 10.0 15.0 11.5
MFS Global Equity Fund -- -- -- 19.0
PIMCO Total Return Fund -- -- -- 12.2
BlackRock Core Plus -- -- -- 10.0
BlackRock U.S. Debt Index 60.0 50.0 25.0 7.8
SSgA Money Market 15.0 -- -- --
Goldman Sachs Real Estate -- -- -- 7.5
Total Fund Assets 100.0% 100.0% 100.0% 100.0%
The Premixed Funds' Target allocations to the underlying mutual funds are shown in the table above. As illustrated, the Conservative Fund allocates 25% of assets to stocks, 60% to bonds, and 15% to cash; the Moderate Fund allocates 50% of assets to stocks and 50% to bonds, while the Aggressive Fund allocates 75% to stocks and 25% to bonds. The Investor Select Fund allocates 62.5% to stocks, 30% to bonds, and 7.5% to real estate.
115

Investment Watchlist Summary
Defined Cont. and Deferred Comp. Plan
*Tracking error of 10 to 20 basis points is typical for index funds
• The table below provides a “Suggested Action” based on the number of affirmative responses received to the questions noted above.
• Changes in Watch List designations from the previous quarter are highlighted in red.
Status Number of Criteria Met Suggested Action
Less than 2 Active – No action required
2 to 3 Active – On “closely monitored” list
4 Closed – all allocations to the fund must be stopped, but accumulated balances may remain invested
Greater than 4 Closed Out – All invested balances must be moved to another active option
DC Plan
Investment Watchlist Summary
1 2 3 4 5 6Watch List Status
Underperformed During Trailing
5 Years
Underperformed in 3 of 4
Trailing Calendar Quarters
Diverged from Strategy and/or
Portfolio Characteristics
Adverse Change in Portfolio Manager
Weak Manager Research
Rating
Significant Organizational
Change
3rdQuarter
2020
2ndQuarter
2020
DFA Small Cap Value Yes Yes No No No No 2 2
Russell 1000 Growth Index Fund* No No No No No No 0 0
Russell 1000 Value Index Fund* No No No No No No 0 0
U.S. Equity Index Fund* No No No No No No 0 0
BlackRock All-Country World ex-US Index Fund* No No No No No No 0 0
U.S. Debt Index Fund* No No No No No No 0 0
T.Rowe Stable Value No No No No No No 0 0
SSgA STIF No No No No No No 0 0
116

Total Cash Balance Benefit
117
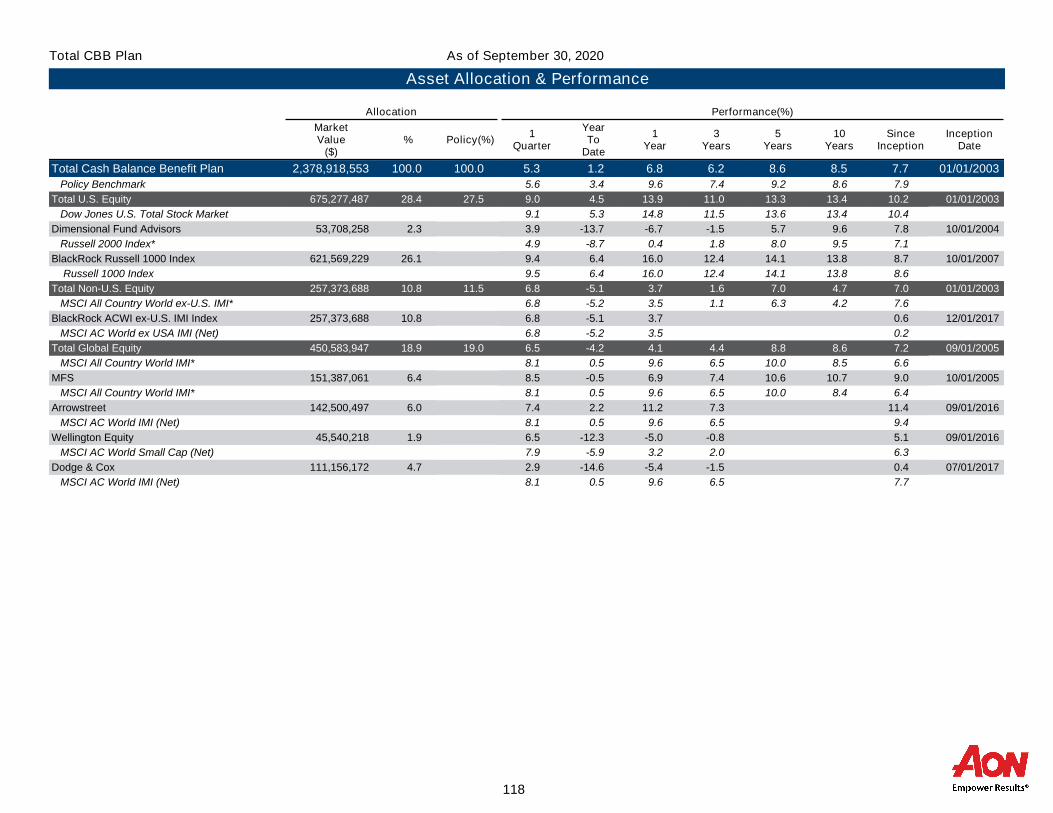
Allocation
MarketValue
($)% Policy(%)
Performance(%)
1Quarter
YearTo
Date
1Year
3Years
5Years
10Years
SinceInception
InceptionDate
Total Cash Balance Benefit Plan 2,378,918,553 100.0 100.0 5.3 1.2 6.8 6.2 8.6 8.5 7.7 01/01/2003
Policy Benchmark 5.6 3.4 9.6 7.4 9.2 8.6 7.9
Total U.S. Equity 675,277,487 28.4 27.5 9.0 4.5 13.9 11.0 13.3 13.4 10.2 01/01/2003
Dow Jones U.S. Total Stock Market 9.1 5.3 14.8 11.5 13.6 13.4 10.4
Dimensional Fund Advisors 53,708,258 2.3 3.9 -13.7 -6.7 -1.5 5.7 9.6 7.8 10/01/2004
Russell 2000 Index* 4.9 -8.7 0.4 1.8 8.0 9.5 7.1
BlackRock Russell 1000 Index 621,569,229 26.1 9.4 6.4 16.0 12.4 14.1 13.8 8.7 10/01/2007
Russell 1000 Index 9.5 6.4 16.0 12.4 14.1 13.8 8.6
Total Non-U.S. Equity 257,373,688 10.8 11.5 6.8 -5.1 3.7 1.6 7.0 4.7 7.0 01/01/2003
MSCI All Country World ex-U.S. IMI* 6.8 -5.2 3.5 1.1 6.3 4.2 7.6
BlackRock ACWI ex-U.S. IMI Index 257,373,688 10.8 6.8 -5.1 3.7 0.6 12/01/2017
MSCI AC World ex USA IMI (Net) 6.8 -5.2 3.5 0.2
Total Global Equity 450,583,947 18.9 19.0 6.5 -4.2 4.1 4.4 8.8 8.6 7.2 09/01/2005
MSCI All Country World IMI* 8.1 0.5 9.6 6.5 10.0 8.5 6.6
MFS 151,387,061 6.4 8.5 -0.5 6.9 7.4 10.6 10.7 9.0 10/01/2005
MSCI All Country World IMI* 8.1 0.5 9.6 6.5 10.0 8.4 6.4
Arrowstreet 142,500,497 6.0 7.4 2.2 11.2 7.3 11.4 09/01/2016
MSCI AC World IMI (Net) 8.1 0.5 9.6 6.5 9.4
Wellington Equity 45,540,218 1.9 6.5 -12.3 -5.0 -0.8 5.1 09/01/2016
MSCI AC World Small Cap (Net) 7.9 -5.9 3.2 2.0 6.3
Dodge & Cox 111,156,172 4.7 2.9 -14.6 -5.4 -1.5 0.4 07/01/2017
MSCI AC World IMI (Net) 8.1 0.5 9.6 6.5 7.7
Total CBB Plan
Asset Allocation & Performance
As of September 30, 2020
118

Total CBB Plan
Asset Allocation & Performance
As of September 30, 2020
Allocation
MarketValue
($)% Policy(%)
Performance(%)
1Quarter
YearTo
Date
1Year
3Years
5Years
10Years
SinceInception
InceptionDate
Total Fixed Income 720,113,043 30.3 30.0 1.8 4.7 5.3 4.5 4.4 3.9 4.8 01/01/2003
Blmbg. Barc. Universal Bond Index* 1.0 6.2 6.7 5.1 4.5 3.9 4.7
BlackRock Core Plus Universal 98,883,175 4.2 1.4 6.8 7.5 5.4 4.7 4.4 5.1 01/01/2003
Blmbg. Barc. Universal Bond Index* 1.0 6.2 6.7 5.1 4.5 3.9 4.7
PIMCO 127,517,086 5.4 1.8 7.5 7.8 5.9 5.6 4.2 5.3 03/01/2005
Blmbg. Barc. Universal Bond Index* 1.0 6.2 6.7 5.1 4.5 3.9 4.6
BlackRock Aggregate Bond Index 108,594,609 4.6 0.7 6.9 7.1 5.3 4.2 3.7 4.8 07/01/2006
Blmbg. Barc. Aggregate Bond Index 0.6 6.8 7.0 5.2 4.2 3.6 4.7
Loomis Sayles 42,196,277 1.8 2.8 8.7 9.9 6.2 6.9 7.1 7.3 07/01/2006
Blmbg. Barc. Universal Bond Index* 1.0 6.2 6.7 5.1 4.5 3.9 5.3
Wellington Global 84,314,134 3.5 2.3 4.6 4.7 3.8 3.6 2.0 09/01/2014
Blmbg. Barc. Global Aggregate 2.7 5.7 6.2 4.1 3.9 2.2
Loomis Sayles Bank Loans 57,300,970 2.4 3.4 -1.6 -0.5 2.0 2.8 2.6 06/01/2014
S&P/LSTA Leveraged Loan Index 4.1 -0.7 1.1 3.1 4.0 3.3
Franklin Templeton 57,750,086 2.4 2.8 -4.3 -3.6 0.5 2.3 2.1 07/01/2014
Credit Suisse Leveraged Loan (Split BB) 3.0 -1.9 -0.5 2.5 3.3 3.2
Neuberger Berman Core Plus 109,584,971 4.6 1.3 6.7 7.5 5.7 5.1 4.8 07/01/2015
Blmbg. Barc. Universal Bond Index 1.0 6.2 6.7 5.1 4.5 4.4
Opportunistic Fixed Income - PIMCO Bravo II 4,626,596 0.2
Opportunistic Fixed Income - Oaktree 877,887 0.0
Opportunistic Cash and Int Rec 174,679 0.0
CBB GICS and Money Market 28,292,571 1.2
Total Real Estate 142,467,455 6.0 7.0 -1.5 -0.3 0.9 4.3 6.5 9.1 6.5 12/01/2004
Performance Benchmark* 0.3 -0.7 0.5 4.2 5.6 9.0 7.8
CB Richard Ellis Strategic 721,742 0.0
Prudential PRISA I 28,971,684 1.2
UBS Real Estate 22,095,913 0.9
Rockwood Capital Real Estate Fund IX 542,225 0.0
Prudential PRISA II 13,157,030 0.6
Five Arrows Realty 9,832 0.0
RockPoint Fund III 166,211 0.0
Landmark Real Estate VI 324,056 0.0
Landmark Real Estate VII 2,606,452 0.1
AG Realty Fund VIII 945,081 0.0
UBS Trumbull Property Income 20,054,948 0.8
Almanac Realty Securities VII 2,851,221 0.1
Torchlight IV 464,631 0.0
Torchlight V 1,632,777 0.1
Rockwood Capital Real Estate Fund X 4,286,378 0.2
119

Total CBB Plan
Asset Allocation & Performance
As of September 30, 2020
Allocation
MarketValue
($)% Policy(%)
Performance(%)
1Quarter
YearTo
Date
1Year
3Years
5Years
10Years
SinceInception
InceptionDate
Landmark Real Estate VIII 1,792,155 0.1
Torchlight VI 5,861,841 0.2
Almanac Realty Securities VIII 820,179 0.0
Clarion Lion Properties Fund 33,864,483 1.4
Torchlight Debt Opportunity 4,258,362 0.2
Real Estate Cash 517,849 0.0
Total Private Equity 133,102,933 5.6 5.0 7.9 1.9 4.3 11.1 11.8 12.4 5.1 09/01/2005
Dow Jones U.S. Total Stock Market + 3% 9.9 7.6 18.2 14.9 17.0 16.8 12.5
Abbott Capital 1,203,614 0.1
Pathway 2,192,492 0.1
Sun Capital 496,491 0.0
Dover Street VIII 1,253,338 0.1
CMEA Ventures VII 770,548 0.0
New Mountain Partners III 2,079,873 0.1
New Mountain Partners IV 3,670,724 0.2
New Mountain Partners, V 6,778,593 0.3
Citigroup Venture Capital International 418,007 0.0
Wayzata Opportunities Fund II 37,952 0.0
Resolute Fund II 1,284,622 0.1
Resolute Fund III 3,780,497 0.2
Accell KKR Capital Partners III 6,951 0.0
BridgePoint Europe IV 648,738 0.0
Quantum Energy Partners V 983,673 0.0
Quantum Energy Partners VI 3,835,561 0.2
CVC European Equity Partners 2,623,654 0.1
CVC European Equity Partners V 514,436 0.0
Fulcrum Growth Partners IV 1,283,630 0.1
Ares Corporate Opp Fund III 145,002 0.0
Ares Corporate Opportunities Fund IV 1,999,847 0.1
New Enterprise Associates 13 1,762,515 0.1
New Enterprise Associates 14 3,417,771 0.1
Lincolnshire Equity Partners IV 1,177,247 0.0
Merit Mezzanine Fund V 946,935 0.0
Ares Mezzanine Fund Partners 9,250 0.0
Lightyear Fund III 234,634 0.0
EIF U.S. Power Fund IV 2,240,279 0.1
McCarthy Capital Fund V 1,128,081 0.0
Green Equity Investors VI 3,107,912 0.1
Wayzata Opp Fund III 634,005 0.0
120

Total CBB Plan
Asset Allocation & Performance
As of September 30, 2020
Allocation
MarketValue
($)% Policy(%)
Performance(%)
1Quarter
YearTo
Date
1Year
3Years
5Years
10Years
SinceInception
InceptionDate
Accell KKR Capital Partners IV 1,757,254 0.1
Beecken Petty O'Keefe & Co. IV 2,389,231 0.1
Pine Brook Capital Partners II 3,678,877 0.2
EMG III LP 2,487,325 0.1
Francisco Partners IV 4,179,421 0.2
Wynnchurch Capital Partners IV 3,132,505 0.1
BridgePoint Europe V 3,211,455 0.1
McCarthy Capital Fund VI 8,021,675 0.3
Dover Street IX 5,779,943 0.2
Green Equity Investors VII 7,733,004 0.3
Quantum Energy Partners VII 3,480,175 0.1
Ares Corporate Opp Fund V 5,131,925 0.2
Genstar Cap Ptr VIII L.P. 9,525,614 0.4
Francisco Partners V 5,771,486 0.2
Resolute Fund IV 5,355,811 0.2
BridgePoint Europe VI 2,649,786 0.1
Genstar Cap Ptr IX LP 2,867,085 0.1
New Enterprise Associates 17 2,089,627 0.1
Dover Street X 6,146,205 0.3
Private Equity Cash 2,113,379 0.1
121

Total Fund Performance
0.00% 4.00% 8.00% 12.00%-4.00 %
Total Fund
Total Fund Benchmark
Total Value Added
5.33%
5.65%
-0.32 %
Total Value Added:-0.32 %
0.00% 0.20%-0.20 %-0.40 %-0.60 %
Other
Manager Value Added
Asset Allocation
0.00%
-0.30 %
-0.02 %
Total Asset Allocation:-0.02 %
Average Active Weight
0.00% 1.00% 2.00%-1.00 %-2.00 %
Private Equity
Real Estate
Fixed Income
Global Equity
Non-U.S. Equity
U.S. Equity
We
igh
t
(%)
0.31%
-0.92 %
0.45%
-0.04 %
-0.74 %
0.93%
Asset Allocation Value Added
0.00% 0.08%-0.08 %-0.16 %
0.01%
0.03%
-0.06 %
-0.01 %
-0.01 %
0.01%
Total Manager Value Added:-0.30 %
Manager Value Added
0.00% 0.40% 0.80%-0.40 %-0.80 %
-0.10 %
-0.11 %
0.24%
-0.30 %
0.00%
-0.02 %
Total CBB Plan
Total Fund Attribution
1 Quarter Ending September 30, 2020
122

Total Fund Performance
0.00% 8.00% 16.00%-8.00 %
Total Fund
Total Fund Benchmark
Total Value Added
6.75%
9.61%
-2.85 %
Total Value Added:-2.85 %
-4.00 % -2.00 % 0.00%
Other
Manager Value Added
Asset Allocation
-0.11 %
-2.61 %
-0.13 %
Total Asset Allocation:-0.13 %
Average Active Weight
0.00% 0.74% 1.48%-0.74 %-1.48 %
Private Equity
Real Estate
Fixed Income
Global Equity
Non-U.S. Equity
U.S. Equity
We
igh
t
(%)
0.56%
-0.26 %
0.63%
0.06%
-0.72 %
-0.26 %
Asset Allocation Value Added
0.00% 0.20% 0.40%-0.20 %-0.40 %
0.10%
0.10%
-0.21 %
-0.08 %
-0.01 %
-0.03 %
Total Manager Value Added:-2.61 %
Manager Value Added
0.00% 0.80%-0.80 %-1.60 %
-0.86 %
0.02%
-0.53 %
-1.03 %
0.02%
-0.23 %
Total CBB Plan
Total Fund Attribution
1 Year Ending September 30, 2020
123

Total Fund Performance
0.00% 5.00% 10.00% 15.00%-5.00 %
Total Fund
Total Fund Benchmark
Total Value Added
6.23%
7.41%
-1.18 %
Total Value Added:-1.18 %
-1.44 % -1.08 % -0.72 % -0.36 % 0.00%
Other
Manager Value Added
Asset Allocation
-0.04 %
-0.91 %
-0.22 %
Total Asset Allocation:-0.22 %
Average Active Weight
0.00% 0.90% 1.80%-0.90 %-1.80 %
Private Equity
Real Estate
Fixed Income
Global Equity
Non-U.S. Equity
U.S. Equity
We
igh
t
(%)
0.58%
0.01%
0.00%
0.83%
-0.59 %
-0.83 %
Asset Allocation Value Added
0.00% 0.20%-0.20 %-0.40 %
0.07%
0.00%
-0.14 %
-0.05 %
-0.01 %
-0.09 %
Total Manager Value Added:-0.91 %
Manager Value Added
0.00% 0.30%-0.30 %-0.60 %
-0.23 %
0.00%
-0.23 %
-0.38 %
0.05%
-0.13 %
Total CBB Plan
Total Fund Attribution
3 Years Ending September 30, 2020
124

Total Hartford Options
125

Allocation
MarketValue
($)%
Performance(%)
1Quarter
YearTo
Date
1Year
3Years
5Years
10Years
Total Hartford Options 31,632,217 100.0
American Century Value 135,658 0.4 2.5 -16.9 -8.8 1.1 6.2 8.7
DJ U.S. Large-Cap Value Total Stock Market Index 5.4 -10.6 -4.2 3.5 8.8 10.4
American Funds Growth Fund of America 907,766 2.9 10.9 18.5 31.7 17.2 17.1 14.7
Russell 3000 Growth Index 12.9 23.0 36.1 20.7 19.5 16.9
Hartford Capital Appreciation HLS 14,695,968 46.5 9.9 5.9 14.3 11.1 12.3 11.5
Dow Jones U.S. Total Stock Market Index 9.1 5.3 14.8 11.5 13.6 13.4
Harford Dividend & Growth HLS 280,490 0.9 5.9 -6.2 0.8 7.3 10.8 11.3
DJ U.S. Large-Cap Value Total Stock Market Index 5.4 -10.6 -4.2 3.5 8.8 10.4
SSgA S&P 500 Flagship 525,970 1.7 8.7 5.0 14.3 12.5 14.0 13.4
S&P 500 Index 8.9 5.6 15.1 12.3 14.1 13.7
T. Rowe Price Growth Stock 1,625,237 5.1 12.0 21.7 33.7 19.1 18.3 16.5
Russell 1000 Growth Index 13.2 24.3 37.5 21.7 20.1 17.3
Goldman Sachs Mid-Cap Value 114,908 0.4 7.0 -10.6 -5.6 3.3 5.7 8.1
Russell Midcap Value Index 6.4 -12.8 -7.3 0.8 6.4 9.7
Munder Mid-Cap Core Growth 63,662 0.2 8.8 1.3 5.7 5.5 8.2 10.2
Russell Midcap Growth Index 9.4 13.9 23.2 16.2 15.5 14.6
SSgA S&P MidCap Index 124,138 0.4 4.5 -9.2 -2.9 3.6 8.3 10.0
Russell Midcap Index 7.5 -2.3 4.6 7.1 10.1 11.8
Hartford Small Company HLS 533,007 1.7 14.5 19.7 34.0 19.5 16.1 14.2
Russell 2000 Index 4.9 -8.7 0.4 1.8 8.0 9.9
Skyline Special Equities Portfolio 243,715 0.8 5.7 -19.0 -11.2 -4.4 2.6 8.6
DJ U.S. Small-Cap Value Total Stock Market Index -0.9 -29.9 -25.4 -8.8 0.9 6.1
SSgA Russell 2000 Index 44,053 0.1 4.8 -9.2 -0.4 2.8 8.4 9.6
Russell 2000 Index 4.9 -8.7 0.4 1.8 8.0 9.9
American Funds EuroPacific Growth 161,221 0.5 9.5 3.9 14.2 5.9 8.9 6.5
MSCI EAFE Index (Net) 4.8 -7.1 0.5 0.6 5.3 4.6
Hartford International Opportunities HLS 632,882 2.0 9.0 2.4 11.7 3.6 6.8 5.9
MSCI EAFE Index (Net) 4.8 -7.1 0.5 0.6 5.3 4.6
Mutual Discovery 103,716 0.3 1.9 -20.4 -14.6 -3.3 2.6 4.8
MSCI AC World Index (Net) 8.1 1.4 10.4 7.1 10.3 8.5
Hartford Total Return Bond HLS 856,149 2.7 1.5 6.8 7.6 4.8 4.2 3.8
Blmbg. Barc. U.S. Aggregate 0.6 6.8 7.0 5.2 4.2 3.6
Total Hartford Options
Asset Allocation & Performance
As of September 30, 2020
126
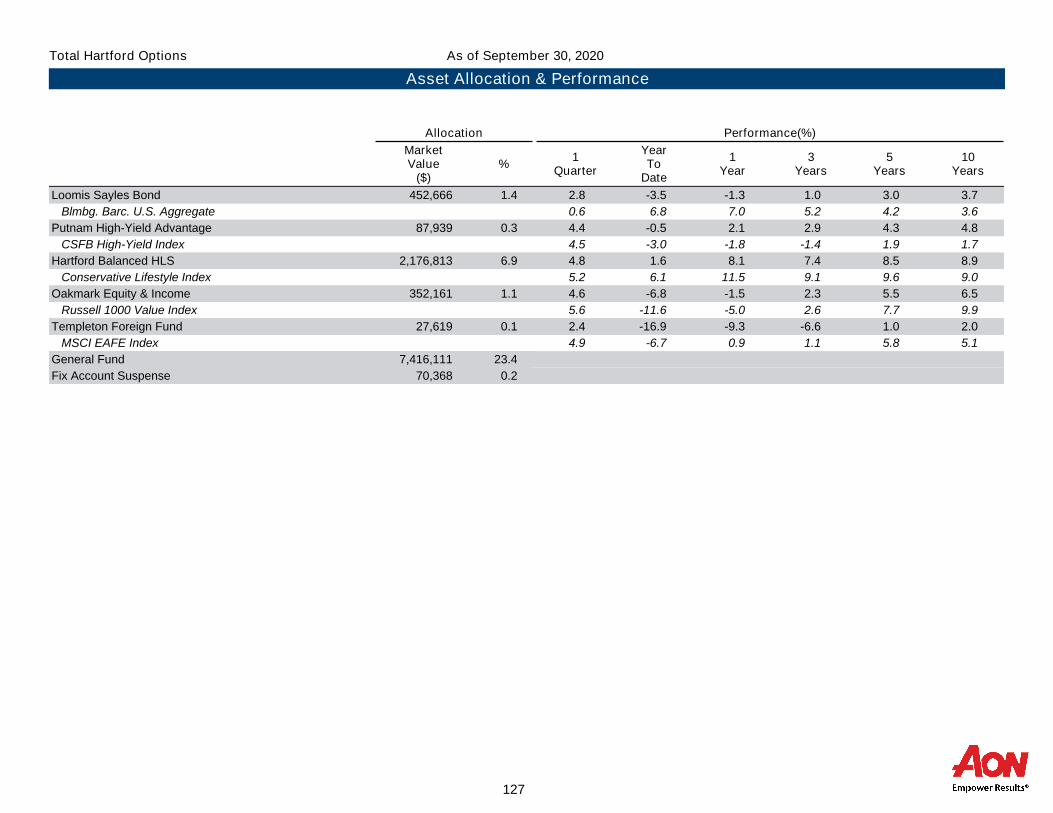
Total Hartford Options
Asset Allocation & Performance
As of September 30, 2020
Allocation
MarketValue
($)%
Performance(%)
1Quarter
YearTo
Date
1Year
3Years
5Years
10Years
Loomis Sayles Bond 452,666 1.4 2.8 -3.5 -1.3 1.0 3.0 3.7
Blmbg. Barc. U.S. Aggregate 0.6 6.8 7.0 5.2 4.2 3.6
Putnam High-Yield Advantage 87,939 0.3 4.4 -0.5 2.1 2.9 4.3 4.8
CSFB High-Yield Index 4.5 -3.0 -1.8 -1.4 1.9 1.7
Hartford Balanced HLS 2,176,813 6.9 4.8 1.6 8.1 7.4 8.5 8.9
Conservative Lifestyle Index 5.2 6.1 11.5 9.1 9.6 9.0
Oakmark Equity & Income 352,161 1.1 4.6 -6.8 -1.5 2.3 5.5 6.5
Russell 1000 Value Index 5.6 -11.6 -5.0 2.6 7.7 9.9
Templeton Foreign Fund 27,619 0.1 2.4 -16.9 -9.3 -6.6 1.0 2.0
MSCI EAFE Index 4.9 -6.7 0.9 1.1 5.8 5.1
General Fund 7,416,111 23.4
Fix Account Suspense 70,368 0.2
127

Investment Watchlist Summary
Hartford Options Plan
*Tracking error of 10 to 20 basis points is typical for index funds
• The table below provides a “Suggested Action” based on the number of affirmative responses received to the questions noted above.
• Changes in Watch List designations from the previous quarter are highlighted in red.
• Hartford fees include a Guaranteed Death Benefit for members.
Status Number of Criteria Met Suggested Action
Less than 2 Active – No action required
2 to 3 Active – On “closely monitored” list
4 Closed – all allocations to the fund must be stopped, but accumulated balances may remain invested
4 Closed Out – All invested balances must be moved to another active option
Hartford Options Plan
Investment Watchlist Summary
1 2 3 4 5 6 Watch List StatusUnderperformed During Trailing
5 Years
Underperformed in 3 of 4
Trailing Calendar Quarters
Diverged from Strategy and/or
Portfolio Characteristics
Adverse Change in Portfolio Manager
Weak Manager Research
Rating
Significant Organizational
Change
3rdQuarter
2020
2ndQuarter
2020
American Century Value Yes No No No No No 1
American Funds Growth Fund of America Yes Yes No No No No 2 2
Hartford Capital Appreciation HLS Yes No No No No No 1 2
Hartford Dividend & Growth HLS No No No No No No 0
SSgA S&P 500 Flagship* No No No No No No 0
T.Rowe Price Growth Stock Yes Yes No No No No 2 2
Goldman Sachs Mid-Cap Value Yes No No Yes Yes No 3 2
Munder Mid-Cap Core Growth Yes Yes No No No No 2 2
SSgA S&P MidCap Index* No No No No No No 0
Hartford Small Company HLS No No No No No No 0
Skyline Special Equities Portfolio No No No No No No 0
SSgA Russell 2000 Index* No No No No No No 0
American Funds EuroPacific Growth No No No No No No 0
Hartford International Opportunities HLS No No No No No No 0
Mutual Discovery Yes Yes No No Yes No 3 2
Hartford Total Return Bond HLS No No No No No No 0
Loomis Sayles Bond Yes No No No No No 1 1
Putnam High-Yield Advantage No No No No Yes No 1
Hartford Balanced HLS Yes No No No No No 1
Oakmark Equity & Income Yes No No No Yes No 2 2
Templeton Foreign Fund Yes Yes No No No No 2 2
128

Total CSP of Nebraska
129

Total Fund
$ %
First National 5,218,456,764 100.0
Direct 2,319,660,575 44.5
TD 1,646,766,695 31.6
Advisor 1,252,029,495 24.0
A 1,117,462,403 21.4
C 134,567,092 2.6
Allocation
MarketValue
($)%
Performance(%)
1Quarter
YearTo
Date
1Year
3Years
5Years
SinceInception
InceptionDate
Direct 2,319,660,575 100.0
Age-Based Aggressive 0-2 8,907,445 0.4 7.4 0.6 9.0 6.1 08/01/2018
NEST Benchmark 0-2 yr Aggressive 7.8 1.3 10.1 6.7
Age-Based Agressive 3-5 28,564,047 1.2 7.1 1.1 9.0 6.9 10.2 8.9 01/01/2011
NEST Benchmark 3-5 yr Aggressive 7.4 1.6 10.0 8.3 11.1 9.7
Age-Based Aggressive 6-8 46,272,726 2.0 6.4 1.9 9.0 7.8 10.3 8.9 01/01/2011
NEST Benchmark 6-8 yr Aggressive 6.7 2.2 9.7 8.1 10.4 9.2
Age-Based Aggressive 9-10 42,484,988 1.8 5.8 2.5 8.8 6.7 08/01/2018
NEST Benchmark 9-10 yr Aggressive 6.0 3.1 9.7 7.2
Age-Based Aggressive 11-12 64,367,430 2.8 5.0 3.0 8.4 7.1 8.7 7.5 01/01/2011
NEST Benchmark 11-12 yr Aggressive 5.3 3.1 8.9 7.3 8.6 7.7
Age-Based Aggressive 13-14 85,696,749 3.7 4.4 3.3 7.9 6.6 08/01/2018
NEST Benchmark 13-14 yr Aggressive 4.6 3.8 8.7 6.9
Age-Based Aggressive 15-16 98,329,768 4.2 3.6 3.6 7.3 6.1 7.0 6.0 01/01/2011
NEST Benchmark 15-16 yr Aggressive 3.8 3.6 7.6 6.3 7.0 6.2
Age-Based Aggressive 17-18 99,320,056 4.3 3.0 3.8 6.8 6.1 08/01/2018
NEST Benchmark 17-18 yr Aggressive 3.1 4.1 7.3 6.4
Age-Based Aggressive 19+ 111,150,671 4.8 2.3 3.9 6.1 5.0 5.1 4.4 01/01/2011
NEST Benchmark 19+ yr Aggressive 2.4 3.9 6.2 5.2 5.3 4.6
Age-Based Growth 0-2 8,038,479 0.3 6.5 2.0 9.0 7.8 10.3 8.9 01/01/2011
NEST Benchmark 0-2 yr Growth 6.7 2.2 9.7 8.1 10.4 9.2
Age-Based Growth 3-5 17,914,115 0.8 5.8 2.5 8.8 6.7 08/01/2018
NEST Benchmark 3-5 yr Growth 6.0 3.1 9.7 7.2
Age-Based Growth 6-8 32,089,260 1.4 5.0 3.0 8.4 7.1 8.7 7.5 01/01/2011
NEST Benchmark 6-8 yr Growth 5.3 3.1 8.9 7.3 8.6 7.7
Total CSP of Nebraska
Asset Allocation & Performance
As of September 30, 2020
130
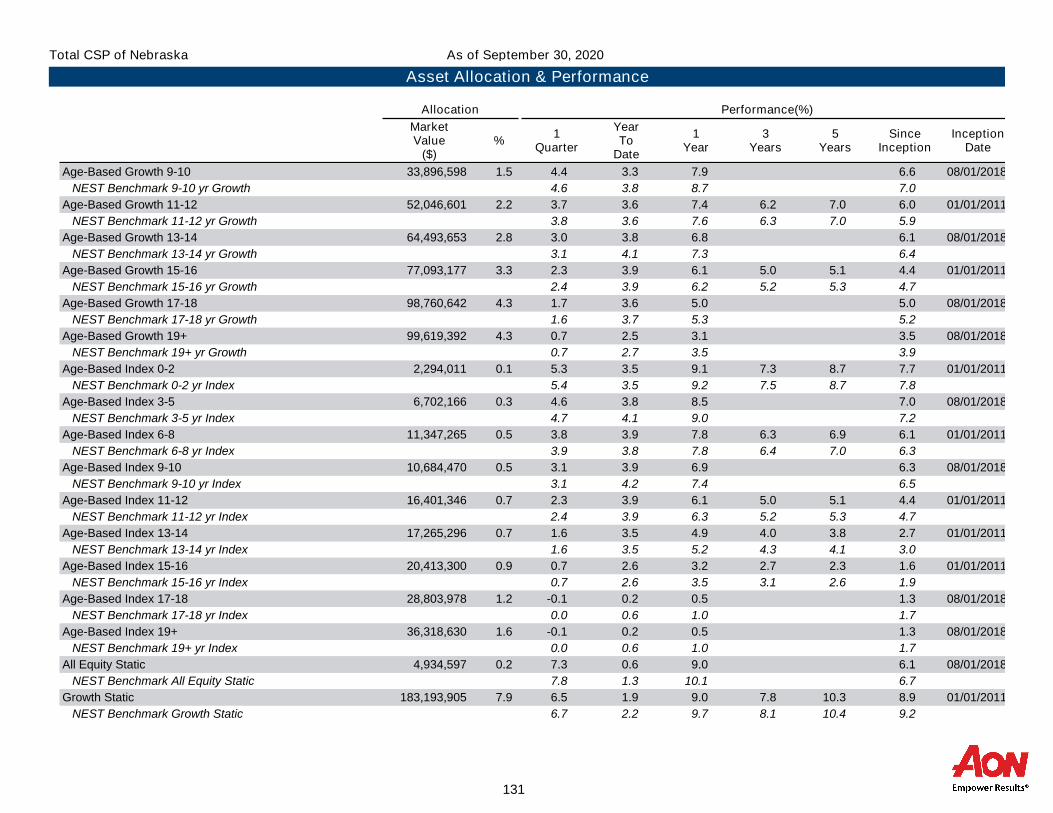
Total CSP of Nebraska
Asset Allocation & Performance
As of September 30, 2020
Allocation
MarketValue
($)%
Performance(%)
1Quarter
YearTo
Date
1Year
3Years
5Years
SinceInception
InceptionDate
Age-Based Growth 9-10 33,896,598 1.5 4.4 3.3 7.9 6.6 08/01/2018
NEST Benchmark 9-10 yr Growth 4.6 3.8 8.7 7.0
Age-Based Growth 11-12 52,046,601 2.2 3.7 3.6 7.4 6.2 7.0 6.0 01/01/2011
NEST Benchmark 11-12 yr Growth 3.8 3.6 7.6 6.3 7.0 5.9
Age-Based Growth 13-14 64,493,653 2.8 3.0 3.8 6.8 6.1 08/01/2018
NEST Benchmark 13-14 yr Growth 3.1 4.1 7.3 6.4
Age-Based Growth 15-16 77,093,177 3.3 2.3 3.9 6.1 5.0 5.1 4.4 01/01/2011
NEST Benchmark 15-16 yr Growth 2.4 3.9 6.2 5.2 5.3 4.7
Age-Based Growth 17-18 98,760,642 4.3 1.7 3.6 5.0 5.0 08/01/2018
NEST Benchmark 17-18 yr Growth 1.6 3.7 5.3 5.2
Age-Based Growth 19+ 99,619,392 4.3 0.7 2.5 3.1 3.5 08/01/2018
NEST Benchmark 19+ yr Growth 0.7 2.7 3.5 3.9
Age-Based Index 0-2 2,294,011 0.1 5.3 3.5 9.1 7.3 8.7 7.7 01/01/2011
NEST Benchmark 0-2 yr Index 5.4 3.5 9.2 7.5 8.7 7.8
Age-Based Index 3-5 6,702,166 0.3 4.6 3.8 8.5 7.0 08/01/2018
NEST Benchmark 3-5 yr Index 4.7 4.1 9.0 7.2
Age-Based Index 6-8 11,347,265 0.5 3.8 3.9 7.8 6.3 6.9 6.1 01/01/2011
NEST Benchmark 6-8 yr Index 3.9 3.8 7.8 6.4 7.0 6.3
Age-Based Index 9-10 10,684,470 0.5 3.1 3.9 6.9 6.3 08/01/2018
NEST Benchmark 9-10 yr Index 3.1 4.2 7.4 6.5
Age-Based Index 11-12 16,401,346 0.7 2.3 3.9 6.1 5.0 5.1 4.4 01/01/2011
NEST Benchmark 11-12 yr Index 2.4 3.9 6.3 5.2 5.3 4.7
Age-Based Index 13-14 17,265,296 0.7 1.6 3.5 4.9 4.0 3.8 2.7 01/01/2011
NEST Benchmark 13-14 yr Index 1.6 3.5 5.2 4.3 4.1 3.0
Age-Based Index 15-16 20,413,300 0.9 0.7 2.6 3.2 2.7 2.3 1.6 01/01/2011
NEST Benchmark 15-16 yr Index 0.7 2.6 3.5 3.1 2.6 1.9
Age-Based Index 17-18 28,803,978 1.2 -0.1 0.2 0.5 1.3 08/01/2018
NEST Benchmark 17-18 yr Index 0.0 0.6 1.0 1.7
Age-Based Index 19+ 36,318,630 1.6 -0.1 0.2 0.5 1.3 08/01/2018
NEST Benchmark 19+ yr Index 0.0 0.6 1.0 1.7
All Equity Static 4,934,597 0.2 7.3 0.6 9.0 6.1 08/01/2018
NEST Benchmark All Equity Static 7.8 1.3 10.1 6.7
Growth Static 183,193,905 7.9 6.5 1.9 9.0 7.8 10.3 8.9 01/01/2011
NEST Benchmark Growth Static 6.7 2.2 9.7 8.1 10.4 9.2
131

Total CSP of Nebraska
Asset Allocation & Performance
As of September 30, 2020
Allocation
MarketValue
($)%
Performance(%)
1Quarter
YearTo
Date
1Year
3Years
5Years
SinceInception
InceptionDate
Moderate Growth Static 5,991,089 0.3 5.1 3.0 8.5 6.7 08/01/2018
NEST Benchmark Moderate Growth Static 5.3 3.5 9.4 7.2
Balanced Static 67,891,226 2.9 4.4 3.3 7.9 6.6 08/01/2018
NEST Benchmark Balanced Static 4.6 3.8 8.7 7.0
Conservative Static 38,497,039 1.7 2.3 3.9 6.1 5.0 5.1 4.4 01/01/2011
NEST Benchmark Conservative Static 2.4 3.9 6.2 5.2 5.3 4.7
Bank Savings Static 73,883,636 3.2 0.2 0.7 1.0 1.1 0.9 0.7 10/01/2011
FTSE 3 Month T-Bill 0.0 0.6 1.0 1.6 1.2 0.7
State Street S&P 500 Index 107,047,600 4.6 8.9 5.4 14.9 12.0 13.8 12.6 01/01/2011
S&P 500 Index 8.9 5.6 15.1 12.3 14.1 12.9
Vanguard Total Stock Market Index 113,098,814 4.9 9.2 5.3 14.7 11.4 13.4 12.3 01/01/2011
Dow Jones U.S. Total Stock Market Index 9.1 5.3 14.8 11.5 13.6 12.5
Vanguard Equity Income 46,615,554 2.0 5.1 -9.0 -3.0 4.4 9.2 10.2 07/01/2012
Russell 1000 Value Index 5.6 -11.6 -5.0 2.6 7.7 9.7
T. Rowe Price Large Cap Growth 112,810,852 4.9 11.4 23.2 35.4 20.8 20.3 16.9 01/01/2011
Russell 1000 Growth Index 13.2 24.3 37.5 21.7 20.1 16.4
Vanguard Extended Market Index 53,352,198 2.3 9.8 3.6 12.7 7.8 11.0 10.3 01/01/2011
Dow Jones U.S. Completion Total Stock Market Index 9.9 3.7 12.9 8.0 11.1 10.6
Tributary Small Company 15,192,941 0.7 2.8 -22.0 -17.7 -4.4 3.9 6.3 01/01/2011
Russell 2000 Value Index 2.6 -21.5 -14.9 -5.1 4.1 5.7
iShares Russell 2000 Growth Index ETF 38,155,776 1.6 7.1 4.1 15.7 7.8 11.0 11.8 07/01/2012
Russell 2000 Growth Index 7.2 3.9 15.7 8.2 11.4 12.2
Vanguard REIT Index 19,593,705 0.8 1.3 -12.9 -12.4 2.1 4.9 7.6 01/01/2011
Vanguard Real Estate Spliced Index 1.3 -12.7 -12.1 2.5 5.3 8.0
State Street MSCI ACWI Ex-Us Index 49,550,366 2.1 6.2 -5.8 2.6 0.7 5.7 2.9 01/01/2011
MSCI AC World ex USA Index (Net) 6.3 -5.4 3.0 1.2 6.2 3.4
DFA World ex-US Government Fixed Income 2,725,475 0.1 1.2 5.4 2.4 6.1 4.7 04/01/2016
Citigroup World Government Bond Index ex-U.S. 1.0 3.8 1.8 5.5 4.0
MetWest Total Return 28,938,612 1.2 1.2 7.6 7.8 5.5 4.2 3.7 03/01/2015
Blmbg. Barc. U.S. Aggregate 0.6 6.8 7.0 5.2 4.2 3.7
Vanguard Total Bond Market Index 33,577,451 1.4 0.6 6.8 6.7 5.0 3.9 3.6 01/01/2011
Blmbg. Barc. U.S. Aggregate 0.6 6.8 7.0 5.2 4.2 3.9
Vanguard Short-Term Bond Index 29,763,137 1.3 0.3 4.3 4.5 3.2 2.3 1.9 01/01/2011
Barclays Capital 1-5 Yr Gov/Credit Bond Index 0.4 4.4 4.9 3.5 2.6 2.2
132

Total CSP of Nebraska
Asset Allocation & Performance
As of September 30, 2020
Allocation
MarketValue
($)%
Performance(%)
1Quarter
YearTo
Date
1Year
3Years
5Years
SinceInception
InceptionDate
Vanguard Short-Term Inflation-Protected Index 14,055,638 0.6 1.7 3.4 4.5 2.8 1.9 04/01/2016
Barclays U.S. 0-5 Year TIPS 1.8 3.7 4.9 3.1 2.4
Goldman Sachs Financial Square Gov't Money Market 61,514,705 2.7 0.0 0.2 0.6 1.3 0.9 04/01/2016
FTSE 3 Month T-Bill 0.0 0.6 1.0 1.6 1.3
133

Allocation
MarketValue
($)%
Performance(%)
1Quarter
YearTo
Date
1Year
3Years
5Years
SinceInception
InceptionDate
TD 1,646,766,695 100.0
Age-Based Core 0-2 Years 22,497,504 1.4 8.0 2.9 2.9 01/01/2020
NEST Benchmark Core 0-2 yr 8.1 3.3 3.3
Age-Based Core 3-5 Years 57,148,554 3.5 7.3 3.3 3.3 01/01/2020
NEST Benchmark Core 3-5 yr 7.3 3.9 3.9
Age-Based Core 6-8 Years 92,400,991 5.6 6.5 3.6 3.6 01/01/2020
NEST Benchmark Core 6-8 yr 6.5 4.4 4.4
Age-Based Core 9-10 Years 76,608,052 4.7 5.6 3.9 3.9 01/01/2020
NEST Benchmark Core 9-10 yr 5.7 4.8 4.8
Age-Based Core 11-12 Years 92,890,530 5.6 4.8 4.0 4.0 01/01/2020
NEST Benchmark Core 11-12 yr 4.9 5.0 5.0
Age-Based Core 13-14 Years 109,030,433 6.6 4.0 4.0 4.0 01/01/2020
NEST Benchmark Core 13-14 yr 4.1 5.0 5.0
Age-Based Core 15-16 Years 113,704,658 6.9 3.1 4.0 4.0 01/01/2020
NEST Benchmark Core 15-16 yr 3.3 5.0 5.0
Age-Based Core 17-18 Years 116,100,416 7.1 2.3 4.0 4.0 01/01/2020
NEST Benchmark Core 17-18 yr 2.5 4.9 4.9
Age-Based Core 19+ Years 101,430,024 6.2 1.5 3.4 3.4 01/01/2020
NEST Benchmark Core 19+ yr 1.6 4.1 4.1
Age-Based Socially Aware 0-2 Years 505,199 0.0 7.8 3.9 3.9 01/01/2020
NEST Benchmark Socially Aware 0-2 yr 8.1 4.4 4.4
Age-Based Socially Aware 3-5 Years 401,308 0.0 7.0 4.2 4.2 01/01/2020
NEST Benchmark Socially Aware 3-5 yr 7.3 4.9 4.9
Age-Based Socially Aware 6-8 Years 531,329 0.0 6.2 4.4 4.4 01/01/2020
NEST Benchmark Socially Aware 6-8 yr 6.5 5.3 5.3
Age-Based Socially Aware 9-10 Years 353,850 0.0 5.4 4.7 4.7 01/01/2020
NEST Benchmark Socially Aware 9-10 yr 5.7 5.6 5.6
Age-Based Socially Aware 11-12 Years 277,545 0.0 4.7 4.6 4.6 01/01/2020
NEST Benchmark Socially Aware 11-12 yr 4.9 5.6 5.6
Age-Based Socially Aware 13-14 Years 454,195 0.0 3.8 4.5 4.5 01/01/2020
NEST Benchmark Socially Aware 13-14 yr 4.1 5.5 5.5
Age-Based Socially Aware 15-16 Years 636,641 0.0 3.1 4.5 4.5 01/01/2020
NEST Benchmark Socially Aware 15-16 yr 3.3 5.4 5.4
Total CSP of Nebraska
Asset Allocation & Performance
As of September 30, 2020
134

Total CSP of Nebraska
Asset Allocation & Performance
As of September 30, 2020
Allocation
MarketValue
($)%
Performance(%)
1Quarter
YearTo
Date
1Year
3Years
5Years
SinceInception
InceptionDate
Age-Based Socially Aware 17-18 Years 1,060,519 0.1 2.2 4.3 4.3 01/01/2020
NEST Benchmark Socially Aware 17-18 yr 2.5 5.2 5.2
Age-Based Socially Aware 19+ Years 324,742 0.0 1.4 3.5 3.5 01/01/2020
NEST Benchmark Socially Aware 19+ yr 1.6 4.3 4.3
Core Aggressive Static 79,397,333 4.8 7.0 1.9 1.9 01/01/2020
NEST Benchmark Core Aggressive Static 7.0 2.4 2.4
Core Growth Static 6,157,642 0.4 5.7 2.6 2.6 01/01/2020
NEST Benchmark Core Growth Static 5.7 3.5 3.5
Core Moderate Growth Static 38,388,089 2.3 4.0 3.6 3.6 01/01/2020
NEST Benchmark Core Moderate Growth Static 4.1 4.6 4.6
Core Moderate Static 1,989,206 0.1 3.2 3.9 3.9 01/01/2020
NEST Benchmark Core Moderate Static 3.3 4.9 4.9
Core Conservative Static 22,573,506 1.4 1.9 4.8 4.8 01/01/2020
NEST Benchmark Core Conservative Static 2.1 5.6 5.6
Socially Aware Aggressive Static 407,712 0.0 6.7 2.6 2.6 01/01/2020
NEST Benchmark Socially Aware Aggressive Static 7.0 3.1 3.1
Socially Aware Growth Static 535,513 0.0 5.5 3.1 3.1 01/01/2020
NEST Benchmark Socially Aware Growth Static 5.7 3.9 3.9
Socially Aware Moderate Growth Static 167,273 0.0 3.8 4.1 4.1 01/01/2020
NEST Benchmark Socially Aware Moderate Growth 4.1 4.9 4.9
Socially Aware Moderate Static 92,642 0.0 3.1 4.4 4.4 01/01/2020
NEST Benchmark Socially Aware Moderate Static 3.3 5.1 5.1
Socially Aware Conservative Static 524,091 0.0 1.9 5.0 5.0 01/01/2020
NEST Benchmark Socially Aware Conservative 2.1 5.7 5.7
DFA World ex-US Government Fixed Income 4,523,839 0.3 1.2 5.3 10.1 8.5 5.6 06/01/2016
Citigroup World Gov't Bond Index ex USA 1.0 3.8 1.8 5.5 4.2
Goldman Sachs Financial Square Gov't Money Market 70,075,241 4.3 0.0 0.2 0.5 1.1 0.8 04/01/2016
FTSE 3 Month T-Bill 0.0 0.6 1.0 1.6 1.3
iShares Core S&P Small-Cap ETF 13,623,453 0.8 3.1 -15.0 -15.0 01/01/2020
S&P SmallCap 600 3.2 -15.2 -15.2
MetWest Total Return 20,571,423 1.2 1.2 7.4 7.7 5.4 4.0 3.5 03/01/2015
Blmbg. Barc. U.S. Aggregate 0.6 6.8 7.0 5.2 4.2 3.7
State Street MSCI ACWI Ex-US Index 38,487,145 2.3 6.2 -5.8 2.6 0.5 5.6 4.9 07/01/2012
MSCI AC World ex USA Index (Net) 6.3 -5.4 3.0 1.2 6.2 5.5
135

Total CSP of Nebraska
Asset Allocation & Performance
As of September 30, 2020
Allocation
MarketValue
($)%
Performance(%)
1Quarter
YearTo
Date
1Year
3Years
5Years
SinceInception
InceptionDate
State Street S&P 500 Index 119,988,212 7.3 8.9 5.4 14.8 11.8 13.6 13.4 07/01/2012
S&P 500 Index 8.9 5.6 15.1 12.3 14.1 13.9
T. Rowe Price Large Cap Growth 105,340,661 6.4 11.4 23.2 35.4 20.6 20.1 11.5 11/01/2001
Russell 1000 Growth Index 13.2 24.3 37.5 21.7 20.1 10.0
Vanguard Emerging Markets Stock Index 20,909,791 1.3 8.9 -1.6 -1.6 01/01/2020
FTSE Emerging Mkts All Cap China A Inclusion Index 9.1 -1.4 -1.4
Vanguard Equity Income 22,231,774 1.4 5.0 -9.1 -3.1 4.2 9.0 9.9 07/01/2012
FTSE High Dividend Yield Index 3.6 -11.3 -5.5 3.3 8.7 10.0
Vanguard Extended Market Index 37,021,863 2.2 9.8 3.6 12.6 7.6 10.8 11.7 07/01/2012
Dow Jones U.S. Completion Total Stock Market Index 9.9 3.7 12.9 8.0 11.1 12.0
Vanguard Real Estate Index 21,299,631 1.3 1.3 -12.9 -12.5 2.0 4.8 9.1 06/01/1996
Vanguard Real Estate Spliced Index 1.3 -12.7 -12.1 2.5 5.3 9.4
Vanguard Russell 1000 Value Index 29,393,468 1.8 5.5 -11.8 -5.4 2.1 7.1 9.1 07/01/2012
Russell 1000 Value Index 5.6 -11.6 -5.0 2.6 7.7 9.7
Vanguard Russell 2000 Growth Index 36,535,433 2.2 7.2 3.7 3.7 01/01/2020
Russell 2000 Growth Index 7.2 3.9 3.9
Vanguard Short-Term Bond Index 23,010,992 1.4 0.3 4.2 4.4 3.0 2.1 1.7 01/01/2011
Blmbg. Barc. Capital 1-5 Yr Gov/Credit Bond Index 0.4 4.4 4.9 3.5 2.6 2.2
Vanguard Short-Term Inflation-Protected Index 10,415,566 0.6 0.3 2.1 3.0 2.2 1.8 07/01/2016
Blmbg. Barc. Global Inflation-Linked: U.S. TIPS 3.0 9.2 10.1 5.8 4.1
Vanguard Total Bond Market Index 38,345,168 2.3 0.6 6.8 6.8 4.9 3.8 2.8 07/01/2012
Blmbg. Barc. U.S. Aggregate 0.6 6.8 7.0 5.2 4.2 3.3
Vanguard Total Stock Market Index 98,403,536 6.0 9.1 5.3 14.6 11.2 13.2 12.1 01/01/2011
CRSP US Total Market Index 9.2 5.5 15.0 11.7 13.7 12.6
136

Allocation
MarketValue
($)%
Performance(%)
1Quarter
YearTo
Date
1Year
3Years
5Years
SinceInception
InceptionDate
A 1,117,462,403 100.0
Age-Based Aggressive 0-2 A 8,282,224 0.7 7.2 0.2 8.8 5.4 08/01/2018
NEST Benchmark 0-2 yr Aggressive 7.8 1.3 10.1 6.7
Age-Based Aggressive 3-5 A 19,894,836 1.8 6.9 0.6 8.9 7.4 10.6 9.0 01/01/2011
NEST Benchmark 3-5 yr Aggressive 7.4 1.6 10.0 8.3 11.1 9.7
Age-Based Aggressive 6-8 A 32,431,127 2.9 6.4 1.5 8.9 7.4 10.0 8.6 01/01/2011
NEST Benchmark 6-8 yr Aggressive 6.7 2.2 9.7 8.1 10.4 9.2
Age-Based Aggressive 9-10 A 26,984,425 2.4 5.8 2.1 8.7 6.1 08/01/2018
NEST Benchmark 9-10 yr Aggressive 6.0 3.1 9.7 7.2
Age-Based Aggressive 11-12 A 34,818,630 3.1 5.0 2.6 8.3 6.7 8.5 7.3 01/01/2011
NEST Benchmark 11-12 yr Aggressive 5.3 3.1 8.9 7.3 8.6 7.7
Age-Based Aggressive 13-14 A 45,064,471 4.0 4.3 2.9 7.9 6.0 08/01/2018
NEST Benchmark 13-14 yr Aggressive 4.6 3.8 8.7 6.9
Age-Based Aggressive 15-16 A 58,477,214 5.2 3.6 3.3 7.3 5.8 6.8 5.7 01/01/2011
NEST Benchmark 15-16 yr Aggressive 3.8 3.6 7.6 6.3 7.0 6.2
Age-Based Aggressive 17-18 A 70,376,742 6.3 3.0 3.5 6.7 5.7 08/01/2018
NEST Benchmark 17-18 yr Aggressive 3.1 4.1 7.3 6.4
Age-Based Aggressive 19+ A 66,131,192 5.9 2.4 3.7 6.0 4.7 5.0 4.1 01/01/2011
NEST Benchmark 19+ yr Aggressive 2.4 3.9 6.2 5.2 5.3 4.6
Age-Based Growth 0-2 A 4,702,986 0.4 6.3 1.5 8.9 7.3 10.0 8.6 01/01/2011
NEST Benchmark 0-2 yr Growth 6.7 2.2 9.7 8.1 10.4 9.2
Age-Based Growth 3-5 A 15,626,262 1.4 5.8 2.1 8.7 6.1 08/01/2018
NEST Benchmark 3-5 yr Growth 6.0 3.1 9.7 7.2
Age-Based Growth 6-8 A 31,888,300 2.9 5.0 2.6 8.3 6.7 8.5 7.3 01/01/2011
NEST Benchmark 6-8 yr Growth 5.3 3.1 8.9 7.3 8.6 7.7
Age-Based Growth 9-10 A 29,269,993 2.6 4.3 2.9 7.9 6.0 08/01/2018
NEST Benchmark 9-10 yr Growth 4.6 3.8 8.7 7.0
Age-Based Growth 11-12 A 33,928,930 3.0 3.7 3.3 7.3 5.8 6.9 5.7 01/01/2011
NEST Benchmark 11-12 yr Growth 3.8 3.6 7.6 6.3 7.0 5.9
Age-Based Growth 13-14 A 38,587,408 3.5 3.0 3.5 6.7 5.7 08/01/2018
NEST Benchmark 13-14 yr Growth 3.1 4.1 7.3 6.4
Age-Based Growth 15-16 A 47,836,482 4.3 2.4 3.7 6.0 4.7 5.0 4.1 01/01/2011
NEST Benchmark 15-16 yr Growth 2.4 3.9 6.2 5.2 5.3 4.7
Total CSP of Nebraska
Asset Allocation & Performance
As of September 30, 2020
137

Total CSP of Nebraska
Asset Allocation & Performance
As of September 30, 2020
Allocation
MarketValue
($)%
Performance(%)
1Quarter
YearTo
Date
1Year
3Years
5Years
SinceInception
InceptionDate
Age-Based Growth 17-18 A 51,124,136 4.6 1.8 3.4 4.9 4.6 08/01/2018
NEST Benchmark 17-18 yr Growth 1.6 3.7 5.3 5.2
Age-Based Growth 19+ A 49,330,376 4.4 0.8 2.3 3.1 3.2 08/01/2018
NEST Benchmark 19+ yr Growth 0.7 2.7 3.5 3.9
Age-Based Index 0-2 A 916,882 0.1 5.2 3.3 8.9 7.0 8.4 7.3 01/01/2011
NEST Benchmark 0-2 yr Index 5.4 3.5 9.2 7.5 8.7 7.8
Age-Based Index 3-5 A 3,071,300 0.3 4.5 3.5 8.1 6.6 08/01/2018
NEST Benchmark 3-5 yr Index 4.7 4.1 9.0 7.2
Age-Based Index 6-8 A 5,661,454 0.5 3.7 3.6 7.4 5.9 6.6 5.7 01/01/2011
NEST Benchmark 6-8 yr Index 3.9 3.8 7.8 6.4 7.0 6.3
Age-Based Index 9-10 A 6,755,508 0.6 2.9 3.7 6.6 5.9 08/01/2018
NEST Benchmark 9-10 yr Index 3.1 4.2 7.4 6.5
Age-Based Index 11-12 A 6,947,023 0.6 2.1 3.6 5.8 4.6 4.7 4.1 01/01/2011
NEST Benchmark 11-12 yr Index 2.4 3.9 6.3 5.2 5.3 4.7
Age-Based Index 13-14 A 6,548,968 0.6 1.5 3.2 4.6 3.5 3.4 2.3 01/01/2011
NEST Benchmark 13-14 yr Index 1.6 3.5 5.2 4.3 4.1 3.0
Age-Based Index 15-16 A 8,238,845 0.7 0.5 2.2 2.8 2.4 2.0 1.2 01/01/2011
NEST Benchmark 15-16 yr Index 0.7 2.6 3.5 3.1 2.6 1.9
Age-Based Index 17-18 A 10,056,934 0.9 -0.1 0.2 0.5 1.2 08/01/2018
NEST Benchmark 17-18 yr Index 0.0 0.6 1.0 1.7
Age-Based Index 19+ A 12,864,110 1.2 -0.1 0.2 0.5 1.2 08/01/2018
NEST Benchmark 19+ yr Index 0.0 0.6 1.0 1.7
All Equity Static A 4,471,604 0.4 7.3 0.2 8.8 5.5 08/01/2018
NEST Benchmark All Equity Static 7.8 1.3 10.1 6.7
Growth A 153,110,777 13.7 6.3 1.5 8.8 7.4 10.0 8.6 01/01/2011
NEST Benchmark Growth Static 6.7 2.2 9.7 8.1 10.4 9.2
Moderate Growth Static A 2,951,250 0.3 5.1 2.6 8.4 6.2 08/01/2018
NEST Benchmark Moderate Growth Static 5.3 3.5 9.4 7.2
Balanced Static A 41,675,083 3.7 4.3 2.9 7.8 6.0 08/01/2018
NEST Benchmark Balanced Static 4.6 3.8 8.7 7.0
Conservative Static A 10,700,686 1.0 2.4 3.7 6.0 4.7 5.0 4.1 01/01/2011
NEST Benchmark Conservative Static 2.4 3.9 6.2 5.2 5.3 4.7
Bank Savings Static A 16,472,723 1.5 0.2 0.7 1.0 1.1 0.9 0.7 11/01/2011
FTSE 3 Month T-Bill 0.0 0.6 1.0 1.6 1.2 0.7
138

Total CSP of Nebraska
Asset Allocation & Performance
As of September 30, 2020
Allocation
MarketValue
($)%
Performance(%)
1Quarter
YearTo
Date
1Year
3Years
5Years
SinceInception
InceptionDate
State Street S&P 500 Index A 21,328,124 1.9 8.8 5.2 14.6 11.7 13.5 12.3 01/01/2011
S&P 500 Index 8.9 5.6 15.1 12.3 14.1 12.9
Vanguard Total Stock Market Index ETF A 21,329,207 1.9 8.9 5.0 14.0 10.8 12.8 11.7 01/01/2011
CRSP US Total Market Index 9.2 5.5 15.0 11.7 13.7 12.6
Dodge & Cox Stock A 9,997,948 0.9 4.1 -11.7 -2.9 2.3 8.5 7.7 10/01/2013
Russell 1000 Value Index 5.6 -11.6 -5.0 2.6 7.7 7.4
T. Rowe Price Large Cap Growth A 30,921,414 2.8 11.3 23.0 35.1 20.5 20.0 16.6 01/01/2011
Russell 1000 Growth Index 13.2 24.3 37.5 21.7 20.1 16.4
SPDR S&P Dividend ETF A 6,484,006 0.6 1.9 -12.0 -7.3 3.5 8.6 9.9 07/01/2012
S&P High Yield Dividend Aristocrats Index 2.1 -11.9 -6.8 4.4 9.7 11.0
Vanguard Extended Market ETF A 1,522,107 0.1 9.8 3.6 12.5 7.5 10.5 11.4 07/01/2012
Dow Jones U.S. Completion Total Stock Market Index 9.9 3.7 12.9 8.0 11.1 12.0
Tributary Small Company A 4,586,242 0.4 2.7 -22.1 -17.9 -4.6 3.6 6.0 01/01/2011
Russell 2000 Value Index 2.6 -21.5 -14.9 -5.1 4.1 5.7
iShares Russell 2000 Growth Index ETF A 10,165,211 0.9 7.0 3.7 15.3 7.6 9.6 10.8 07/01/2012
Russell 2000 Growth Index 7.2 3.9 15.7 8.2 11.4 12.2
Vanguard REIT Index ETF A 3,528,385 0.3 1.1 -12.3 -11.9 2.1 6.5 8.1 01/01/2011
Vanguard Real Estate Spliced Index 1.3 -12.7 -12.1 2.5 5.3 8.0
State Street MSCI ACWI Ex-US Index A 11,908,920 1.1 6.1 -6.0 2.3 0.4 3.9 1.9 01/01/2011
MSCI AC World ex USA Index (Net) 6.3 -5.4 3.0 1.2 6.2 3.4
Vanguard FTSE Emerging Markets ETF A 3,693,783 0.3 9.9 -1.5 9.8 1.9 7.6 3.3 07/01/2012
FTSE Emerging Market Index 9.2 -2.1 9.4 2.9 8.8 4.3
American Funds The Income Fund of America A 2,599,154 0.2 4.9 -3.6 1.6 3.8 5.7 07/01/2016
S&P 500 Index 8.9 5.6 15.1 12.3 14.0
DFA World ex-US Government Fixed Income A 495,241 0.0 1.1 5.2 2.2 5.8 3.8 07/01/2016
Citigroup World Gov't Bond Index ex USA 1.0 3.8 1.8 5.5 3.5
MetWest Total Return A 8,462,477 0.8 1.2 7.4 7.6 5.3 4.0 3.4 03/01/2015
Blmbg. Barc. U.S. Aggregate 0.6 6.8 7.0 5.2 4.2 3.7
Federated Total Return Bond A 2,493,569 0.2 1.5 6.8 7.5 4.9 4.4 3.8 01/01/2011
Blmbg. Barc. U.S. Aggregate 0.6 6.8 7.0 5.2 4.2 3.9
iShares Core US Aggregate ETF A 3,575,921 0.3 0.2 6.1 6.1 8.1 5.6 07/01/2016
Blmbg. Barc. U.S. Aggregate 0.6 6.8 7.0 5.2 3.8
Vanguard Short-Term Bond ETF A 4,338,470 0.4 0.2 3.8 4.2 2.8 1.9 1.4 07/01/2012
Blmbg. Barc. Capital 1-5 Yr Gov/Credit Bond Index 0.4 4.4 4.9 3.5 2.6 2.1
139

Total CSP of Nebraska
Asset Allocation & Performance
As of September 30, 2020
Allocation
MarketValue
($)%
Performance(%)
1Quarter
YearTo
Date
1Year
3Years
5Years
SinceInception
InceptionDate
Vanguard Short-Term Inflation-Protected ETF A 1,607,659 0.1 1.5 3.0 4.1 2.5 2.1 07/01/2016
Blmbg. Barc. Global Inflation-Linked: U.S. TIPS 3.0 9.2 10.1 5.8 4.1
Goldman Sachs Financial Square Gov't Money Market A 13,225,687 1.2 0.0 0.2 0.6 1.3 1.0 07/01/2016
FTSE 3 Month T-Bill 0.0 0.6 1.0 1.6 1.3
140

Allocation
MarketValue
($)%
Performance(%)
1Quarter
YearTo
Date
1Year
3Years
5Years
SinceInception
InceptionDate
C 134,567,092 100.0
Age-Based Aggressive 0-2 C 772,862 0.6 7.0 -0.4 7.9 4.6 08/01/2018
NEST Benchmark 0-2 yr Aggressive 7.8 1.3 10.1 6.7
Age-Based Aggressive 3-5 C 3,257,455 2.4 6.8 0.1 8.0 6.7 9.8 8.2 01/01/2011
NEST Benchmark 3-5 yr Aggressive 7.4 1.6 10.0 8.3 11.1 9.7
Age-Based Aggressive 6-8 C 3,528,648 2.6 6.1 0.9 8.0 6.6 9.2 7.8 01/01/2011
NEST Benchmark 6-8 yr Aggressive 6.7 2.2 9.7 8.1 10.4 9.2
Age-Based Aggressive 9-10 C 1,918,509 1.4 5.6 1.5 7.8 5.3 08/01/2018
NEST Benchmark 9-10 yr Aggressive 6.0 3.1 9.7 7.2
Age-Based Aggressive 11-12 C 3,225,272 2.4 4.9 2.0 7.5 6.0 7.8 6.5 01/01/2011
NEST Benchmark 11-12 yr Aggressive 5.3 3.1 8.9 7.3 8.6 7.7
Age-Based Aggressive 13-14 C 4,061,504 3.0 4.2 2.4 7.1 5.2 08/01/2018
NEST Benchmark 13-14 yr Aggressive 4.6 3.8 8.7 6.9
Age-Based Aggressive 15-16 C 5,142,368 3.8 3.5 2.7 6.5 6.1 6.7 5.3 01/01/2011
NEST Benchmark 15-16 yr Aggressive 3.8 3.6 7.6 6.3 7.0 6.2
Age-Based Aggressive 17-18 C 5,746,337 4.3 2.9 3.0 5.9 4.9 08/01/2018
NEST Benchmark 17-18 yr Aggressive 3.1 4.1 7.3 6.4
Age-Based Aggressive 19+ C 4,497,326 3.3 2.2 3.1 5.2 4.0 4.3 3.4 01/01/2011
NEST Benchmark 19+ yr Aggressive 2.4 3.9 6.2 5.2 5.3 4.6
Age-Based Growth 0-2 C 882,671 0.7 6.1 0.9 8.0 6.6 9.2 7.8 01/01/2011
NEST Benchmark 0-2 yr Growth 6.7 2.2 9.7 8.1 10.4 9.2
Age-Based Growth 3-5 2,801,601 2.1 5.6 1.4 7.8 5.3 08/01/2018
NEST Benchmark 3-5 yr Growth 6.0 3.1 9.7 7.2
Age-Based Growth 6-8 C 3,932,370 2.9 4.8 2.0 7.5 6.0 7.8 6.5 01/01/2011
NEST Benchmark 6-8 yr Growth 5.3 3.1 8.9 7.3 8.6 7.7
Age-Based Growth 9-10 C 3,190,781 2.4 4.2 2.4 7.1 5.2 08/01/2018
NEST Benchmark 9-10 yr Growth 4.6 3.8 8.7 7.0
Age-Based Growth 11-12 C 3,704,645 2.8 3.5 2.7 6.5 5.0 6.1 5.0 01/01/2011
NEST Benchmark 11-12 yr Growth 3.8 3.6 7.6 6.3 7.0 5.9
Age-Based Growth 13-14 C 4,854,847 3.6 2.9 3.0 5.9 4.9 08/01/2018
NEST Benchmark 13-14 yr Growth 3.1 4.1 7.3 6.4
Age-Based Growth 15-16 C 5,262,384 3.9 2.2 3.0 5.2 4.0 4.3 3.4 01/01/2011
NEST Benchmark 15-16 yr Growth 2.4 3.9 6.2 5.2 5.3 4.7
Total CSP of Nebraska
Asset Allocation & Performance
As of September 30, 2020
141

Total CSP of Nebraska
Asset Allocation & Performance
As of September 30, 2020
Allocation
MarketValue
($)%
Performance(%)
1Quarter
YearTo
Date
1Year
3Years
5Years
SinceInception
InceptionDate
Age-Based Growth 17-18 C 6,941,493 5.2 1.6 2.7 4.2 3.9 08/01/2018
NEST Benchmark 17-18 yr Growth 1.6 3.7 5.3 5.2
Age-Based Growth 19+ C 5,458,606 4.1 0.6 1.7 2.3 2.4 08/01/2018
NEST Benchmark 19+ yr Growth 0.7 2.7 3.5 3.9
Age-Based Index 0-2 C 268,592 0.2 5.0 2.8 8.1 6.3 7.6 6.6 01/01/2011
NEST Benchmark 0-2 yr Index 5.4 3.5 9.2 7.5 8.7 7.8
Age-Based Index 3-5 C 771,482 0.6 4.2 2.9 7.3 5.8 08/01/2018
NEST Benchmark 3-5 yr Index 4.7 4.1 9.0 7.2
Age-Based Index 6-8 C 794,674 0.6 3.5 3.0 6.6 5.1 5.8 5.0 01/01/2011
NEST Benchmark 6-8 yr Index 3.9 3.8 7.8 6.4 7.0 6.3
Age-Based Index 9-10 C 790,445 0.6 2.8 3.1 5.9 5.1 08/01/2018
NEST Benchmark 9-10 yr Index 3.1 4.2 7.4 6.5
Age-Based Index 11-12 C 650,297 0.5 2.0 3.1 5.0 3.9 4.0 3.3 01/01/2011
NEST Benchmark 11-12 yr Index 2.4 3.9 6.3 5.2 5.3 4.7
Age-Based Index 13-14 C 974,914 0.7 1.2 2.6 3.8 2.9 2.7 1.6 01/01/2011
NEST Benchmark 13-14 yr Index 1.6 3.5 5.2 4.3 4.1 3.0
Age-Based Index 15-16 C 1,525,557 1.1 0.4 1.6 2.1 1.7 1.3 0.5 01/01/2011
NEST Benchmark 15-16 yr Index 0.7 2.6 3.5 3.1 2.6 1.9
Age-Based Index 17-18 C 1,699,344 1.3 0.0 0.2 0.6 1.2 08/01/2018
NEST Benchmark 17-18 yr Index 0.0 0.6 1.0 1.7
Age-Based Index 19+ C 1,915,108 1.4 -0.1 0.2 0.5 1.2 08/01/2018
NEST Benchmark 19+ yr Index 0.0 0.6 1.0 1.7
All Equity Static C 331,359 0.2 7.1 -0.5 7.9 4.7 08/01/2018
NEST Benchmark All Equity Static 7.8 1.3 10.1 6.7
Growth C 12,934,012 9.6 6.1 0.9 8.0 6.6 9.2 7.8 01/01/2011
NEST Benchmark Growth Static 6.7 2.2 9.7 8.1 10.4 9.2
Moderate Growth Static C 563,219 0.4 4.9 2.1 7.6 5.4 08/01/2018
NEST Benchmark Moderate Growth Static 5.3 3.5 9.4 7.2
Balanced Static C 4,732,888 3.5 4.2 2.4 7.1 5.1 08/01/2018
NEST Benchmark Balanced Static 4.6 3.8 8.7 7.0
Conservative Static C 1,670,669 1.2 2.2 3.1 5.2 3.9 4.2 3.4 01/01/2011
NEST Benchmark Conservative Static 2.4 3.9 6.2 5.2 5.3 4.7
Bank Savings Static C 2,716,757 2.0 0.1 0.7 1.0 1.1 0.9 0.7 10/01/2011
FTSE 3 Month T-Bill 0.0 0.6 1.0 1.6 1.2 0.7
142

Total CSP of Nebraska
Asset Allocation & Performance
As of September 30, 2020
Allocation
MarketValue
($)%
Performance(%)
1Quarter
YearTo
Date
1Year
3Years
5Years
SinceInception
InceptionDate
State Street S&P 500 Index C 2,831,754 2.1 8.6 4.6 13.7 10.9 12.7 11.5 01/01/2011
S&P 500 Index 8.9 5.6 15.1 12.3 14.1 12.9
Vanguard Total Stock Market Index ETF C 2,730,682 2.0 8.8 4.4 13.2 10.0 12.0 10.8 01/01/2011
CRSP US Total Market Index 9.2 5.5 15.0 11.7 13.7 12.6
Dodge & Cox Stock C 1,178,587 0.9 4.0 -12.2 -3.7 1.5 7.7 6.9 10/01/2013
Russell 1000 Value Index 5.6 -11.6 -5.0 2.6 7.7 7.4
T. Rowe Price Large Cap Growth C 4,017,073 3.0 11.1 22.3 34.1 19.6 19.1 15.7 01/01/2011
Russell 1000 Growth Index 13.2 24.3 37.5 21.7 20.1 16.4
SPDR S&P Dividend ETF C 1,277,863 0.9 1.7 -12.5 -8.0 2.7 7.8 9.1 07/01/2012
S&P High Yield Dividend Aristocrats Index 2.1 -11.9 -6.8 4.4 9.7 11.0
Vanguard Extended Market ETF C 11,066,163 8.2 9.6 3.0 11.6 6.6 9.7 10.6 07/01/2012
Dow Jones U.S. Completion Total Stock Market Index 9.9 3.7 12.9 8.0 11.1 12.0
Tributary Small Company C 728,010 0.5 2.6 -22.6 -18.6 -5.4 1.8 4.7 01/01/2011
Russell 2000 Value Index 2.6 -21.5 -14.9 -5.1 4.1 5.7
iShares Russell 2000 Growth Index ETF C 1,229,411 0.9 6.8 3.1 14.4 6.7 8.8 10.0 07/01/2012
Russell 2000 Growth Index 7.2 3.9 15.7 8.2 11.4 12.2
Vanguard REIT Index ETF C 543,089 0.4 1.0 -12.7 -12.5 1.3 5.7 7.3 01/01/2011
Vanguard Real Estate Spliced Index 1.3 -12.7 -12.1 2.5 5.3 8.0
State Street MSCI ACWI Ex-US Index C 1,922,363 1.4 6.0 -6.5 1.6 -0.3 3.2 1.1 01/01/2011
MSCI AC World ex USA Index (Net) 6.3 -5.4 3.0 1.2 6.2 3.4
Vanguard FTSE Emerging Markets ETF C 826,149 0.6 9.6 -2.1 8.9 1.2 6.7 2.5 07/01/2012
FTSE Emerging Market Index 9.2 -2.1 9.4 2.9 8.8 4.3
American Funds The Income Fund of America C 300,183 0.2 4.7 -4.3 0.8 3.0 4.9 07/01/2016
S&P 500 Index 8.9 5.6 15.1 12.3 14.0
DFA World ex-US Government Fixed Income C 45,934 0.0 0.9 4.5 1.4 5.0 3.1 07/01/2016
Citigroup World Gov't Bond Index ex USA 1.0 3.8 1.8 5.5 3.5
MetWest Total Return C 1,115,261 0.8 1.0 6.7 6.7 4.5 3.2 2.7 03/01/2015
Blmbg. Barc. U.S. Aggregate 0.6 6.8 7.0 5.2 4.2 3.7
Federated Total Return Bond C 437,222 0.3 1.3 6.2 6.7 4.1 3.6 3.0 01/01/2011
Blmbg. Barc. U.S. Aggregate 0.6 6.8 7.0 5.2 4.2 3.9
iShares Core US Aggregate ETF C 420,737 0.3 0.1 5.5 5.3 7.3 4.8 07/01/2016
Blmbg. Barc. U.S. Aggregate 0.6 6.8 7.0 5.2 3.8
Vanguard Short-Term Bond ETF C 494,242 0.4 0.0 3.3 3.5 2.1 1.2 0.7 07/01/2012
Blmbg. Barc. Capital 1-5 Yr Gov/Credit Bond Index 0.4 4.4 4.9 3.5 2.6 2.1
143

Total CSP of Nebraska
Asset Allocation & Performance
As of September 30, 2020
Allocation
MarketValue
($)%
Performance(%)
1Quarter
YearTo
Date
1Year
3Years
5Years
SinceInception
InceptionDate
Vanguard Short-Term Inflation-Protected ETF C 365,378 0.3 1.4 2.6 3.5 1.7 1.4 07/01/2016
Blmbg. Barc. Global Inflation-Linked: U.S. TIPS 3.0 9.2 10.1 5.8 4.1
Goldman Sachs Financial Square Gov't Money Market C 1,517,994 1.1 -0.1 0.2 0.5 1.2 0.9 07/01/2016
FTSE 3 Month T-Bill 0.0 0.6 1.0 1.6 1.3
144

College Savings Plans of Nebraska - Direct Aggressive
Allocation to Underlying Funds
Direct - Aggressive 19+ Years 17-18 Years 15-16 Years 13-14 Years 11-12 Years 9-10 Years 6-8 Years 3-5 Years 0-2 Years
State Street S&P 500 Index 12.00% 13.00% 14.00% 18.00% 22.00% 27.00% 32.00% 36.00% 38.00%
Vanguard Equity Income 2.00% 4.50% 7.00% 8.00% 9.00% 9.50% 10.00% 11.00% 11.50%
T. Rowe Price Large Cap Growth 2.00% 4.50% 7.00% 8.00% 9.00% 9.50% 10.00% 11.00% 11.50%
Vanguard Extended Market Index 1.00% 1.00% 1.00% 1.00% 1.00% 1.50% 2.00% 2.00% 2.00%
Tributary Small Company 0.50% 1.00% 1.50% 2.00% 2.50% 2.80% 3.00% 4.00% 4.25%
iShares Russell 2000 Growth ETF 0.50% 1.00% 1.50% 2.00% 2.50% 2.80% 3.00% 4.00% 4.25%
Vanguard REIT Index 2.00% 2.50% 3.00% 3.50% 4.00% 4.50% 5.00% 5.00% 5.25%
State Street MSCI ACWI ex USA Index 5.00% 7.50% 10.00% 12.50% 15.00% 17.50% 20.00% 22.00% 23.25%
DFA World ex-US Government Fixed Income 4.00% 4.00% 4.00% 3.50% 3.00% 2.50% 2.00% -- --
MetWest Total Return Bond 10.00% 10.00% 10.00% 9.50% 9.00% 7.00% 5.00% -- --
Vanguard Total Bond Market Index 18.00% 16.50% 15.00% 14.00% 13.00% 10.50% 8.00% 5.00% --
Vanguard Short-Term Bond Index 17.00% 15.00% 13.00% 9.50% 6.00% 3.00% -- -- --
Vanguard Short-Term Inflation-Protected Index 5.00% 2.50% -- -- -- -- -- -- --
Bank Savings 10.00% 8.00% 6.00% 3.00% -- -- -- -- --
Goldman Sachs Fin Sq Government Money Market 11.00% 9.00% 7.00% 5.50% 4.00% 2.00% -- -- --
145
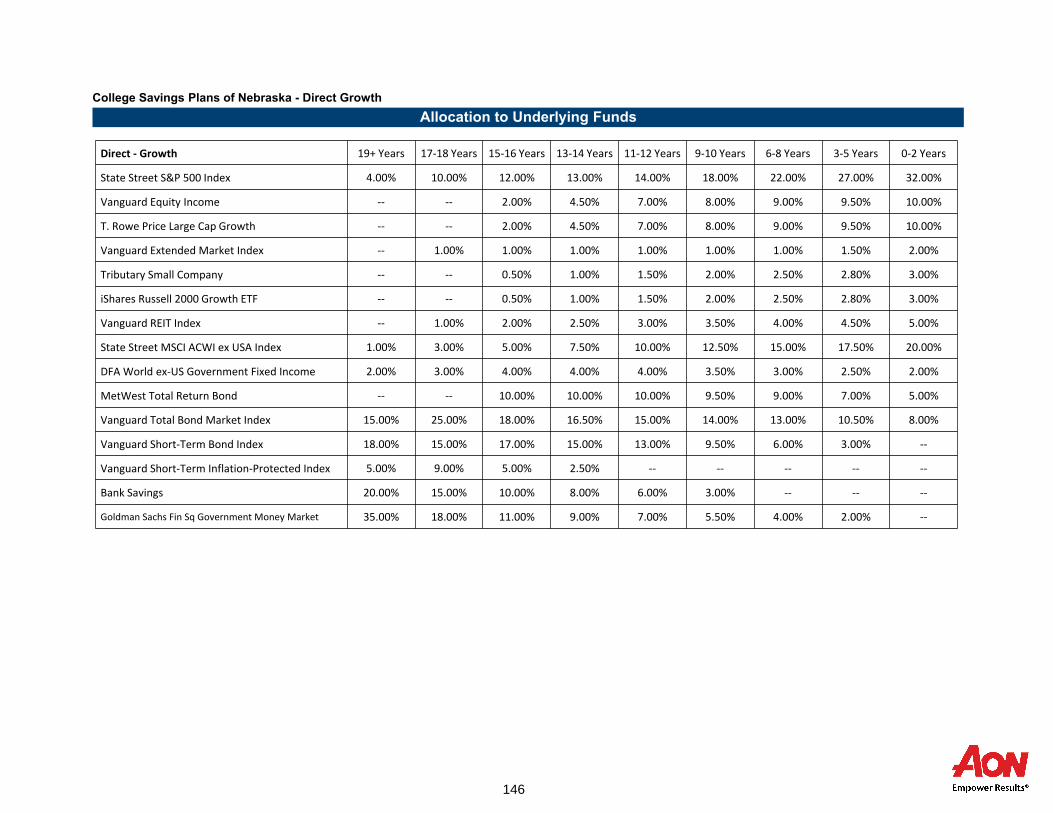
College Savings Plans of Nebraska - Direct Growth
Allocation to Underlying Funds
Direct - Growth 19+ Years 17-18 Years 15-16 Years 13-14 Years 11-12 Years 9-10 Years 6-8 Years 3-5 Years 0-2 Years
State Street S&P 500 Index 4.00% 10.00% 12.00% 13.00% 14.00% 18.00% 22.00% 27.00% 32.00%
Vanguard Equity Income -- -- 2.00% 4.50% 7.00% 8.00% 9.00% 9.50% 10.00%
T. Rowe Price Large Cap Growth -- -- 2.00% 4.50% 7.00% 8.00% 9.00% 9.50% 10.00%
Vanguard Extended Market Index -- 1.00% 1.00% 1.00% 1.00% 1.00% 1.00% 1.50% 2.00%
Tributary Small Company -- -- 0.50% 1.00% 1.50% 2.00% 2.50% 2.80% 3.00%
iShares Russell 2000 Growth ETF -- -- 0.50% 1.00% 1.50% 2.00% 2.50% 2.80% 3.00%
Vanguard REIT Index -- 1.00% 2.00% 2.50% 3.00% 3.50% 4.00% 4.50% 5.00%
State Street MSCI ACWI ex USA Index 1.00% 3.00% 5.00% 7.50% 10.00% 12.50% 15.00% 17.50% 20.00%
DFA World ex-US Government Fixed Income 2.00% 3.00% 4.00% 4.00% 4.00% 3.50% 3.00% 2.50% 2.00%
MetWest Total Return Bond -- -- 10.00% 10.00% 10.00% 9.50% 9.00% 7.00% 5.00%
Vanguard Total Bond Market Index 15.00% 25.00% 18.00% 16.50% 15.00% 14.00% 13.00% 10.50% 8.00%
Vanguard Short-Term Bond Index 18.00% 15.00% 17.00% 15.00% 13.00% 9.50% 6.00% 3.00% --
Vanguard Short-Term Inflation-Protected Index 5.00% 9.00% 5.00% 2.50% -- -- -- -- --
Bank Savings 20.00% 15.00% 10.00% 8.00% 6.00% 3.00% -- -- --
Goldman Sachs Fin Sq Government Money Market 35.00% 18.00% 11.00% 9.00% 7.00% 5.50% 4.00% 2.00% --
146
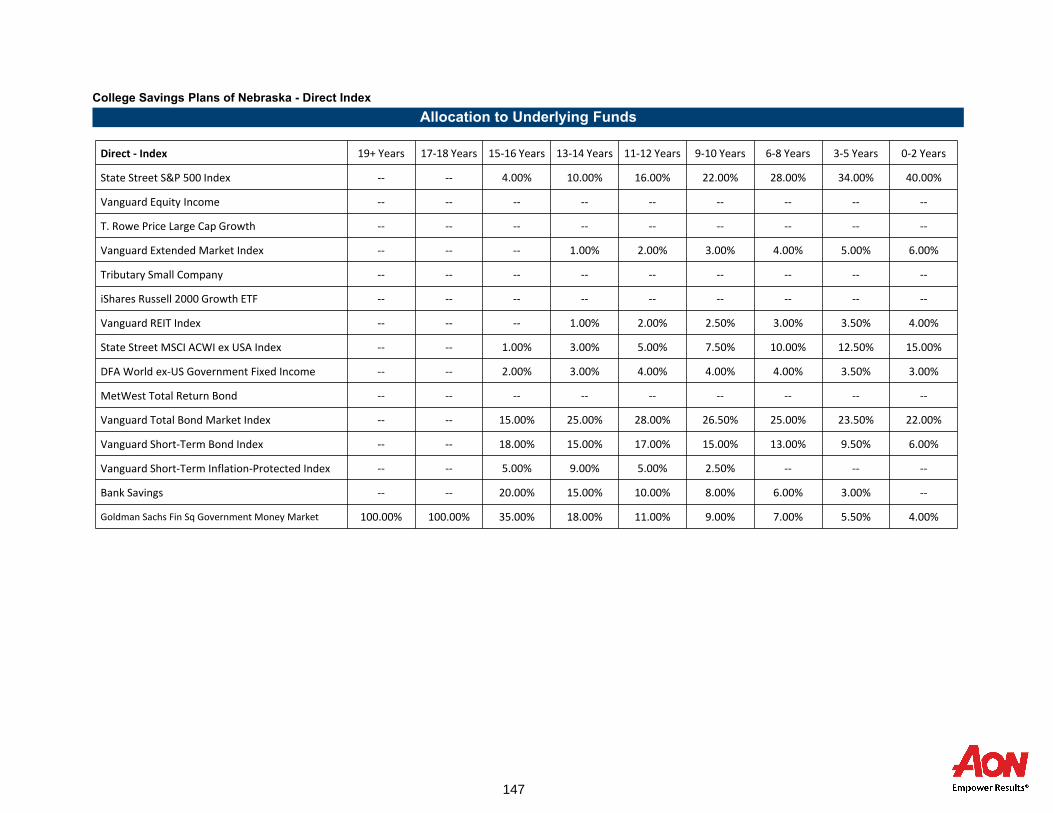
College Savings Plans of Nebraska - Direct Index
Allocation to Underlying Funds
Direct - Index 19+ Years 17-18 Years 15-16 Years 13-14 Years 11-12 Years 9-10 Years 6-8 Years 3-5 Years 0-2 Years
State Street S&P 500 Index -- -- 4.00% 10.00% 16.00% 22.00% 28.00% 34.00% 40.00%
Vanguard Equity Income -- -- -- -- -- -- -- -- --
T. Rowe Price Large Cap Growth -- -- -- -- -- -- -- -- --
Vanguard Extended Market Index -- -- -- 1.00% 2.00% 3.00% 4.00% 5.00% 6.00%
Tributary Small Company -- -- -- -- -- -- -- -- --
iShares Russell 2000 Growth ETF -- -- -- -- -- -- -- -- --
Vanguard REIT Index -- -- -- 1.00% 2.00% 2.50% 3.00% 3.50% 4.00%
State Street MSCI ACWI ex USA Index -- -- 1.00% 3.00% 5.00% 7.50% 10.00% 12.50% 15.00%
DFA World ex-US Government Fixed Income -- -- 2.00% 3.00% 4.00% 4.00% 4.00% 3.50% 3.00%
MetWest Total Return Bond -- -- -- -- -- -- -- -- --
Vanguard Total Bond Market Index -- -- 15.00% 25.00% 28.00% 26.50% 25.00% 23.50% 22.00%
Vanguard Short-Term Bond Index -- -- 18.00% 15.00% 17.00% 15.00% 13.00% 9.50% 6.00%
Vanguard Short-Term Inflation-Protected Index -- -- 5.00% 9.00% 5.00% 2.50% -- -- --
Bank Savings -- -- 20.00% 15.00% 10.00% 8.00% 6.00% 3.00% --
Goldman Sachs Fin Sq Government Money Market 100.00% 100.00% 35.00% 18.00% 11.00% 9.00% 7.00% 5.50% 4.00%
147
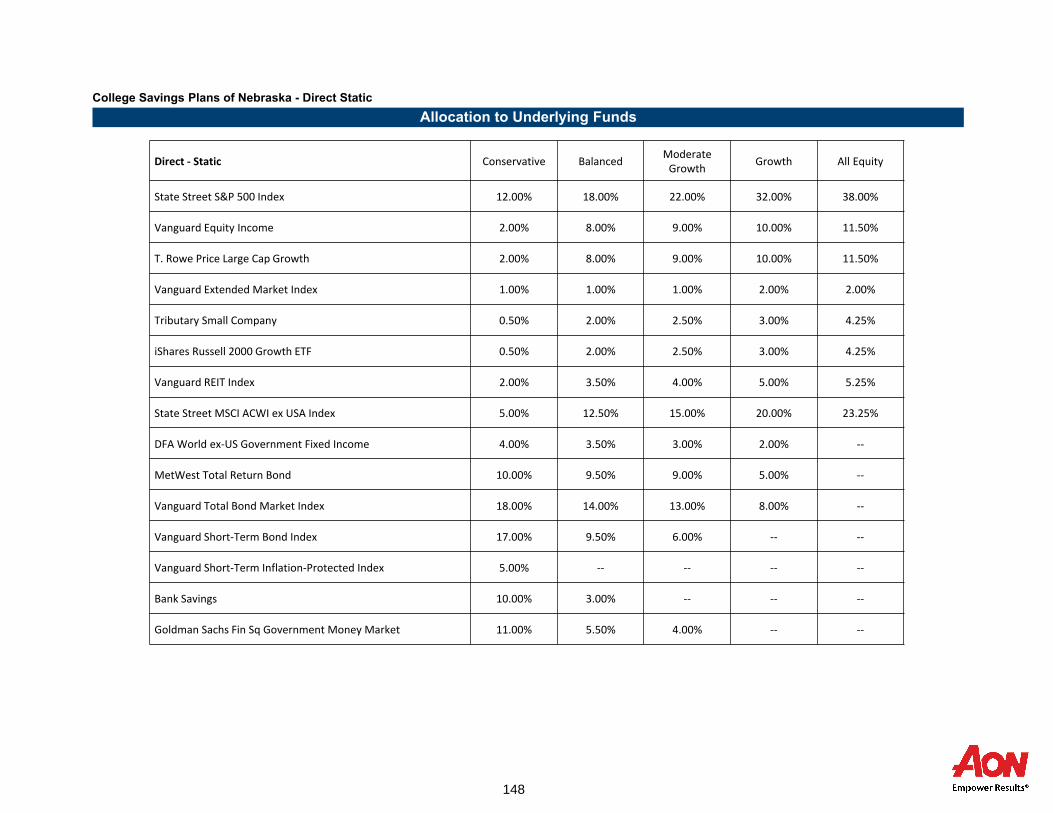
College Savings Plans of Nebraska - Direct Static
Allocation to Underlying Funds
Direct - Static Conservative BalancedModerate
GrowthGrowth All Equity
State Street S&P 500 Index 12.00% 18.00% 22.00% 32.00% 38.00%
Vanguard Equity Income 2.00% 8.00% 9.00% 10.00% 11.50%
T. Rowe Price Large Cap Growth 2.00% 8.00% 9.00% 10.00% 11.50%
Vanguard Extended Market Index 1.00% 1.00% 1.00% 2.00% 2.00%
Tributary Small Company 0.50% 2.00% 2.50% 3.00% 4.25%
iShares Russell 2000 Growth ETF 0.50% 2.00% 2.50% 3.00% 4.25%
Vanguard REIT Index 2.00% 3.50% 4.00% 5.00% 5.25%
State Street MSCI ACWI ex USA Index 5.00% 12.50% 15.00% 20.00% 23.25%
DFA World ex-US Government Fixed Income 4.00% 3.50% 3.00% 2.00% --
MetWest Total Return Bond 10.00% 9.50% 9.00% 5.00% --
Vanguard Total Bond Market Index 18.00% 14.00% 13.00% 8.00% --
Vanguard Short-Term Bond Index 17.00% 9.50% 6.00% -- --
Vanguard Short-Term Inflation-Protected Index 5.00% -- -- -- --
Bank Savings 10.00% 3.00% -- -- --
Goldman Sachs Fin Sq Government Money Market 11.00% 5.50% 4.00% -- --
148
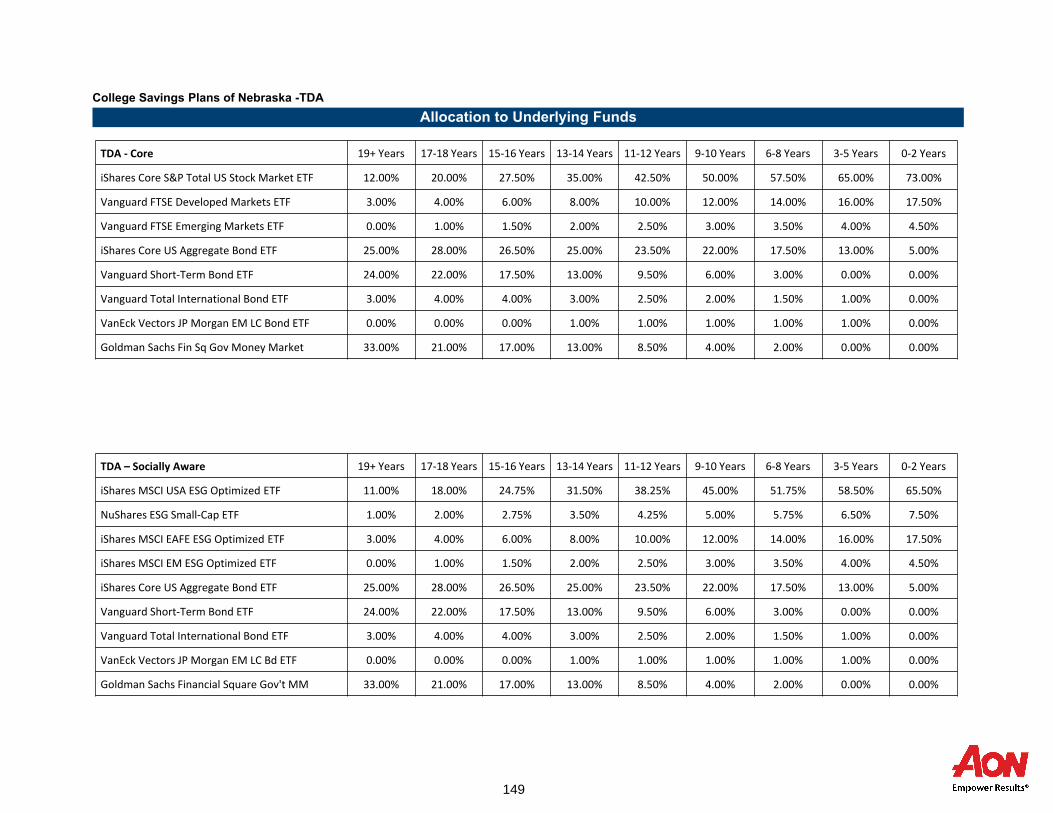
College Savings Plans of Nebraska -TDA
Allocation to Underlying Funds
TDA - Core 19+ Years 17-18 Years 15-16 Years 13-14 Years 11-12 Years 9-10 Years 6-8 Years 3-5 Years 0-2 Years
iShares Core S&P Total US Stock Market ETF 12.00% 20.00% 27.50% 35.00% 42.50% 50.00% 57.50% 65.00% 73.00%
Vanguard FTSE Developed Markets ETF 3.00% 4.00% 6.00% 8.00% 10.00% 12.00% 14.00% 16.00% 17.50%
Vanguard FTSE Emerging Markets ETF 0.00% 1.00% 1.50% 2.00% 2.50% 3.00% 3.50% 4.00% 4.50%
iShares Core US Aggregate Bond ETF 25.00% 28.00% 26.50% 25.00% 23.50% 22.00% 17.50% 13.00% 5.00%
Vanguard Short-Term Bond ETF 24.00% 22.00% 17.50% 13.00% 9.50% 6.00% 3.00% 0.00% 0.00%
Vanguard Total International Bond ETF 3.00% 4.00% 4.00% 3.00% 2.50% 2.00% 1.50% 1.00% 0.00%
VanEck Vectors JP Morgan EM LC Bond ETF 0.00% 0.00% 0.00% 1.00% 1.00% 1.00% 1.00% 1.00% 0.00%
Goldman Sachs Fin Sq Gov Money Market 33.00% 21.00% 17.00% 13.00% 8.50% 4.00% 2.00% 0.00% 0.00%
TDA – Socially Aware 19+ Years 17-18 Years 15-16 Years 13-14 Years 11-12 Years 9-10 Years 6-8 Years 3-5 Years 0-2 Years
iShares MSCI USA ESG Optimized ETF 11.00% 18.00% 24.75% 31.50% 38.25% 45.00% 51.75% 58.50% 65.50%
NuShares ESG Small-Cap ETF 1.00% 2.00% 2.75% 3.50% 4.25% 5.00% 5.75% 6.50% 7.50%
iShares MSCI EAFE ESG Optimized ETF 3.00% 4.00% 6.00% 8.00% 10.00% 12.00% 14.00% 16.00% 17.50%
iShares MSCI EM ESG Optimized ETF 0.00% 1.00% 1.50% 2.00% 2.50% 3.00% 3.50% 4.00% 4.50%
iShares Core US Aggregate Bond ETF 25.00% 28.00% 26.50% 25.00% 23.50% 22.00% 17.50% 13.00% 5.00%
Vanguard Short-Term Bond ETF 24.00% 22.00% 17.50% 13.00% 9.50% 6.00% 3.00% 0.00% 0.00%
Vanguard Total International Bond ETF 3.00% 4.00% 4.00% 3.00% 2.50% 2.00% 1.50% 1.00% 0.00%
VanEck Vectors JP Morgan EM LC Bd ETF 0.00% 0.00% 0.00% 1.00% 1.00% 1.00% 1.00% 1.00% 0.00%
Goldman Sachs Financial Square Gov't MM 33.00% 21.00% 17.00% 13.00% 8.50% 4.00% 2.00% 0.00% 0.00%
149
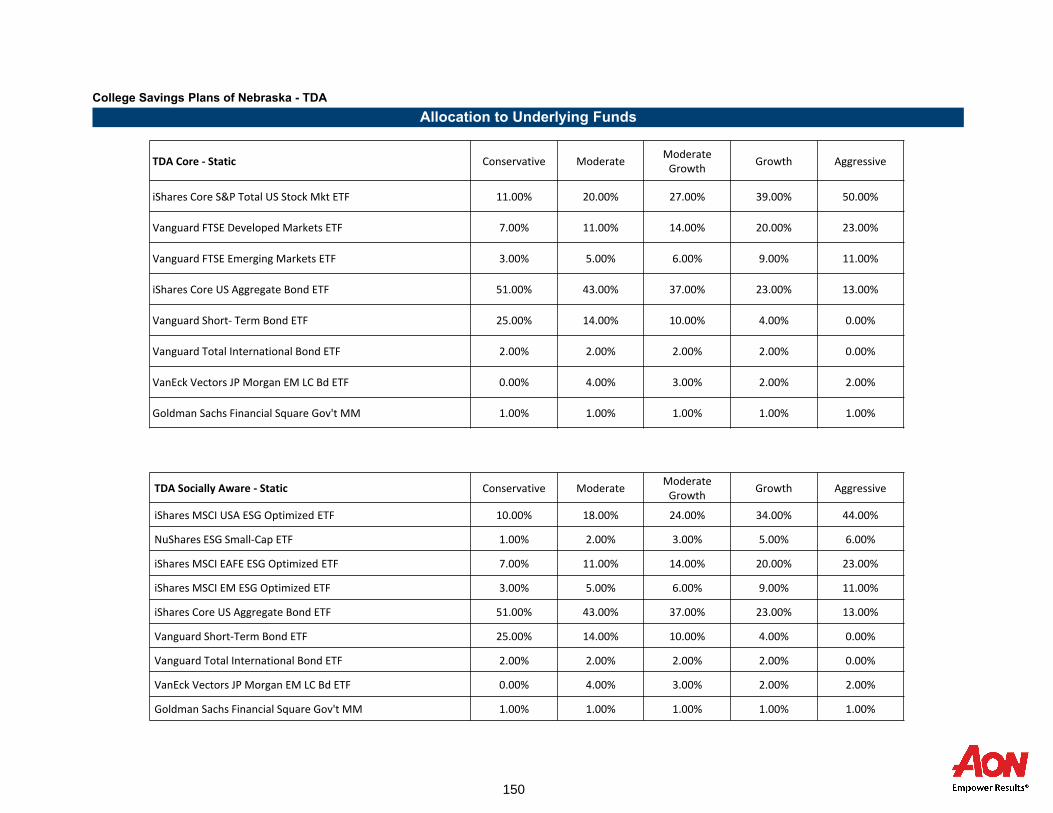
College Savings Plans of Nebraska - TDA
Allocation to Underlying Funds
TDA Core - Static Conservative ModerateModerate
GrowthGrowth Aggressive
iShares Core S&P Total US Stock Mkt ETF 11.00% 20.00% 27.00% 39.00% 50.00%
Vanguard FTSE Developed Markets ETF 7.00% 11.00% 14.00% 20.00% 23.00%
Vanguard FTSE Emerging Markets ETF 3.00% 5.00% 6.00% 9.00% 11.00%
iShares Core US Aggregate Bond ETF 51.00% 43.00% 37.00% 23.00% 13.00%
Vanguard Short- Term Bond ETF 25.00% 14.00% 10.00% 4.00% 0.00%
Vanguard Total International Bond ETF 2.00% 2.00% 2.00% 2.00% 0.00%
VanEck Vectors JP Morgan EM LC Bd ETF 0.00% 4.00% 3.00% 2.00% 2.00%
Goldman Sachs Financial Square Gov't MM 1.00% 1.00% 1.00% 1.00% 1.00%
TDA Socially Aware - Static Conservative ModerateModerate
GrowthGrowth Aggressive
iShares MSCI USA ESG Optimized ETF 10.00% 18.00% 24.00% 34.00% 44.00%
NuShares ESG Small-Cap ETF 1.00% 2.00% 3.00% 5.00% 6.00%
iShares MSCI EAFE ESG Optimized ETF 7.00% 11.00% 14.00% 20.00% 23.00%
iShares MSCI EM ESG Optimized ETF 3.00% 5.00% 6.00% 9.00% 11.00%
iShares Core US Aggregate Bond ETF 51.00% 43.00% 37.00% 23.00% 13.00%
Vanguard Short-Term Bond ETF 25.00% 14.00% 10.00% 4.00% 0.00%
Vanguard Total International Bond ETF 2.00% 2.00% 2.00% 2.00% 0.00%
VanEck Vectors JP Morgan EM LC Bd ETF 0.00% 4.00% 3.00% 2.00% 2.00%
Goldman Sachs Financial Square Gov't MM 1.00% 1.00% 1.00% 1.00% 1.00%
150

College Savings Plans of Nebraska - Advisor Aggressive
Allocation to Underlying Funds
Advisor - Aggressive 19+ Years 17-18 Years 15-16 Years 13-14 Years 11-12 Years 9-10 Years 6-8 Years 3-5 Years 0-2 Years
State Street S&P 500 Index 12.00% 13.00% 14.00% 18.00% 22.00% 27.00% 32.00% 36.00% 38.00%
Dodge & Cox Stock 2.00% 4.50% 7.00% 8.00% 9.00% 9.50% 10.00% 11.00% 11.50%
T. Rowe Price Large Cap Growth 2.00% 4.50% 7.00% 8.00% 9.00% 9.50% 10.00% 11.00% 11.50%
Vanguard Extended Market ETF 1.00% 1.00% 1.00% 1.00% 1.00% 1.50% 2.00% 2.00% 2.00%
Tributary Small Company 0.50% 1.00% 1.50% 2.00% 2.50% 2.80% 3.00% 4.00% 4.25%
iShares Russell 2000 Growth ETF 0.50% 1.00% 1.50% 2.00% 2.50% 2.80% 3.00% 4.00% 4.25%
Vanguard REIT ETF 2.00% 2.50% 3.00% 3.50% 4.00% 4.50% 5.00% 5.00% 5.25%
State Street MSCI ACWI ex USA Index 5.00% 7.50% 10.00% 12.50% 15.00% 17.50% 20.00% 22.00% 23.25%
DFA World ex-US Government Fixed Income 4.00% 4.00% 4.00% 3.50% 3.00% 2.50% 2.00% -- --
MetWest Total Return Bond 10.00% 10.00% 10.00% 9.50% 9.00% 7.00% 5.00% -- --
Federated Total Return Bond 18.00% 16.50% 15.00% 14.00% 13.00% 10.50% 8.00% 5.00% --
iShares Core US Aggregate ETF -- -- -- -- -- -- -- -- --
Vanguard Short-Term Bond ETF 17.00% 15.00% 13.00% 9.50% 6.00% 3.00% -- -- --
Vanguard Short-Term Inflation-Protected ETF 5.00% 2.50% -- -- -- -- -- -- --
Bank Savings 10.00% 8.00% 6.00% 3.00% -- -- -- -- --
Goldman Sachs Fin Sq Government Money Market 11.00% 9.00% 7.00% 5.50% 4.00% 2.00% -- -- --
151

College Savings Plans of Nebraska - Advisor Growth
Allocation to Underlying Funds
Advisor - Growth 19+ Years 17-18 Years 15-16 Years 13-14 Years 11-12 Years 9-10 Years 6-8 Years 3-5 Years 0-2 Years
State Street S&P 500 Index 4.00% 10.00% 12.00% 13.00% 14.00% 18.00% 22.00% 27.00% 32.00%
Dodge & Cox Stock -- -- 2.00% 4.50% 7.00% 8.00% 9.00% 9.50% 10.00%
T. Rowe Price Large Cap Growth -- -- 2.00% 4.50% 7.00% 8.00% 9.00% 9.50% 10.00%
Vanguard Extended Market ETF -- 1.00% 1.00% 1.00% 1.00% 1.00% 1.00% 1.50% 2.00%
Tributary Small Company -- -- 0.50% 1.00% 1.50% 2.00% 2.50% 2.80% 3.00%
iShares Russell 2000 Growth ETF -- -- 0.50% 1.00% 1.50% 2.00% 2.50% 2.80% 3.00%
Vanguard REIT ETF -- 1.00% 2.00% 2.50% 3.00% 3.50% 4.00% 4.50% 5.00%
State Street MSCI ACWI ex USA Index 1.00% 3.00% 5.00% 7.50% 10.00% 12.50% 15.00% 17.50% 20.00%
DFA World ex-US Government Fixed Income 2.00% 3.00% 4.00% 4.00% 4.00% 3.50% 3.00% 2.50% 2.00%
MetWest Total Return Bond -- -- 10.00% 10.00% 10.00% 9.50% 9.00% 7.00% 5.00%
Federated Total Return Bond 15.00% 25.00% 18.00% 16.50% 15.00% 14.00% 13.00% 10.50% 8.00%
iShares Core US Aggregate ETF -- -- -- -- -- -- -- -- --
Vanguard Short-Term Bond ETF 18.00% 15.00% 17.00% 15.00% 13.00% 9.50% 6.00% 3.00% --
Vanguard Short-Term Inflation-Protected ETF 5.00% 9.00% 5.00% 2.50% -- -- -- -- --
Bank Savings 20.00% 15.00% 10.00% 8.00% 6.00% 3.00% -- -- --
Goldman Sachs Fin Sq Government Money Market 35.00% 18.00% 11.00% 9.00% 7.00% 5.50% 4.00% 2.00% --
152

College Savings Plans of Nebraska - Advisor Index
Allocation to Underlying Funds
Advisor - Index 19+ Years 17-18 Years 15-16 Years 13-14 Years 11-12 Years 9-10 Years 6-8 Years 3-5 Years 0-2 Years
State Street S&P 500 Index -- -- 4.00% 10.00% 16.00% 22.00% 28.00% 34.00% 40.00%
Dodge & Cox Stock -- -- -- -- -- -- -- -- --
T. Rowe Price Large Cap Growth -- -- -- -- -- -- -- -- --
Vanguard Extended Market ETF -- -- -- 1.00% 2.00% 3.00% 4.00% 5.00% 6.00%
Tributary Small Company -- -- -- -- -- -- -- -- --
iShares Russell 2000 Growth ETF -- -- -- -- -- -- -- -- --
Vanguard REIT ETF -- -- -- 1.00% 2.00% 2.50% 3.00% 3.50% 4.00%
State Street MSCI ACWI ex USA Index -- -- 1.00% 3.00% 5.00% 7.50% 10.00% 12.50% 15.00%
DFA World ex-US Government Fixed Income -- -- 2.00% 3.00% 4.00% 4.00% 4.00% 3.50% 3.00%
MetWest Total Return Bond -- -- -- -- -- -- -- -- --
Federated Total Return Bond -- -- -- -- -- -- -- -- --
iShares Core US Aggregate ETF -- -- 15.00% 25.00% 28.00% 26.50% 25.00% 23.50% 22.00%
Vanguard Short-Term Bond ETF -- -- 18.00% 15.00% 17.00% 15.00% 13.00% 9.50% 6.00%
Vanguard Short-Term Inflation-Protected ETF -- -- 5.00% 9.00% 5.00% 2.50% -- -- --
Bank Savings -- -- 20.00% 15.00% 10.00% 8.00% 6.00% 3.00% --
Goldman Sachs Fin Sq Government Money Market 100.00% 100.00% 35.00% 18.00% 11.00% 9.00% 7.00% 5.50% 4.00%
153
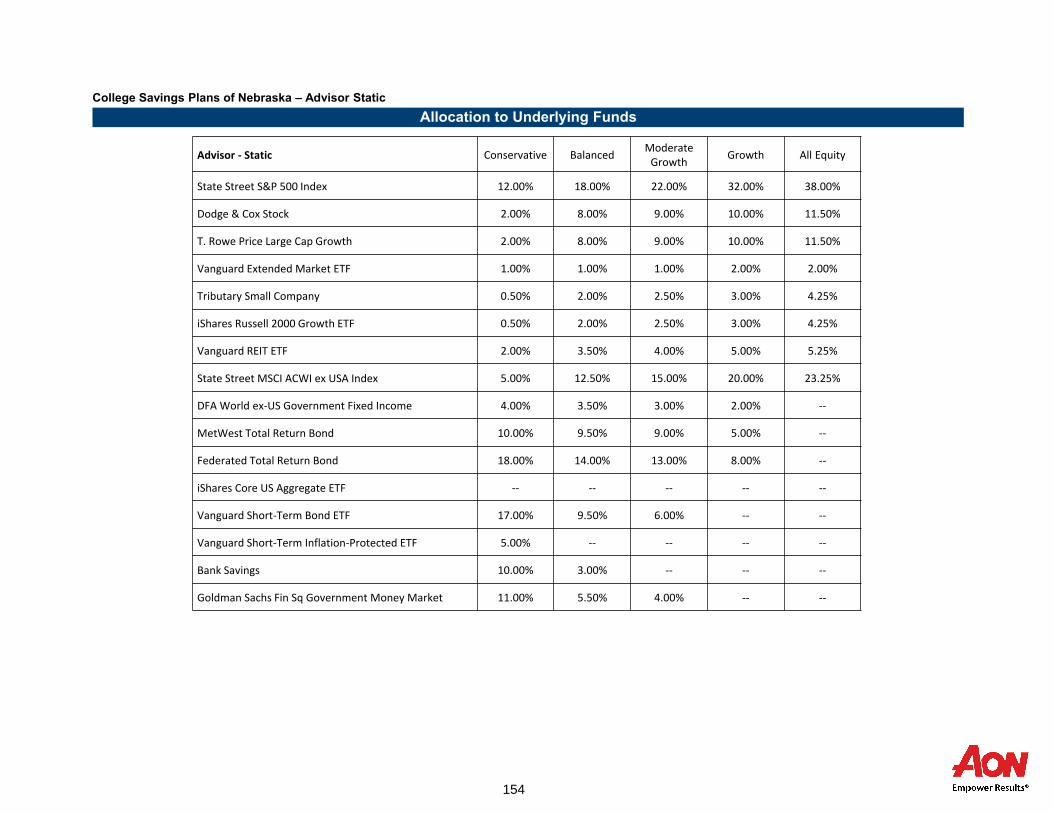
College Savings Plans of Nebraska – Advisor Static
Allocation to Underlying Funds
Advisor - Static Conservative BalancedModerate
GrowthGrowth All Equity
State Street S&P 500 Index 12.00% 18.00% 22.00% 32.00% 38.00%
Dodge & Cox Stock 2.00% 8.00% 9.00% 10.00% 11.50%
T. Rowe Price Large Cap Growth 2.00% 8.00% 9.00% 10.00% 11.50%
Vanguard Extended Market ETF 1.00% 1.00% 1.00% 2.00% 2.00%
Tributary Small Company 0.50% 2.00% 2.50% 3.00% 4.25%
iShares Russell 2000 Growth ETF 0.50% 2.00% 2.50% 3.00% 4.25%
Vanguard REIT ETF 2.00% 3.50% 4.00% 5.00% 5.25%
State Street MSCI ACWI ex USA Index 5.00% 12.50% 15.00% 20.00% 23.25%
DFA World ex-US Government Fixed Income 4.00% 3.50% 3.00% 2.00% --
MetWest Total Return Bond 10.00% 9.50% 9.00% 5.00% --
Federated Total Return Bond 18.00% 14.00% 13.00% 8.00% --
iShares Core US Aggregate ETF -- -- -- -- --
Vanguard Short-Term Bond ETF 17.00% 9.50% 6.00% -- --
Vanguard Short-Term Inflation-Protected ETF 5.00% -- -- -- --
Bank Savings 10.00% 3.00% -- -- --
Goldman Sachs Fin Sq Government Money Market 11.00% 5.50% 4.00% -- --
154
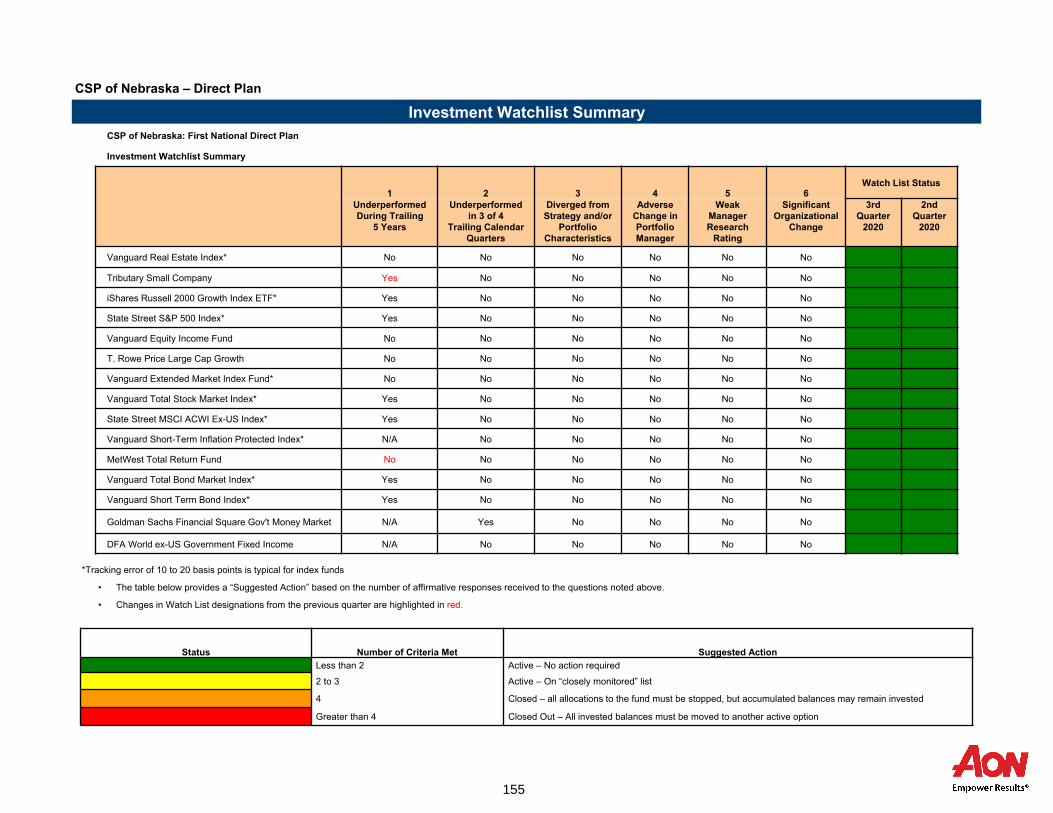
Investment Watchlist Summary
CSP of Nebraska – Direct Plan
*Tracking error of 10 to 20 basis points is typical for index funds
• The table below provides a “Suggested Action” based on the number of affirmative responses received to the questions noted above.
• Changes in Watch List designations from the previous quarter are highlighted in red.
Status Number of Criteria Met Suggested Action
Less than 2 Active – No action required
2 to 3 Active – On “closely monitored” list
4 Closed – all allocations to the fund must be stopped, but accumulated balances may remain invested
Greater than 4 Closed Out – All invested balances must be moved to another active option
CSP of Nebraska: First National Direct Plan
Investment Watchlist Summary
1 2 3 4 5 6Watch List Status
Underperformed During Trailing
5 Years
Underperformed in 3 of 4
Trailing Calendar Quarters
Diverged from Strategy and/or
Portfolio Characteristics
Adverse Change in Portfolio Manager
Weak Manager Research
Rating
Significant Organizational
Change
3rdQuarter
2020
2ndQuarter
2020
Vanguard Real Estate Index* No No No No No No 0
Tributary Small Company Yes No No No No No 1
iShares Russell 2000 Growth Index ETF* Yes No No No No No 1
State Street S&P 500 Index* Yes No No No No No 1
Vanguard Equity Income Fund No No No No No No 0
T. Rowe Price Large Cap Growth No No No No No No 0
Vanguard Extended Market Index Fund* No No No No No No 0
Vanguard Total Stock Market Index* Yes No No No No No 1
State Street MSCI ACWI Ex-US Index* Yes No No No No No 1
Vanguard Short-Term Inflation Protected Index* N/A No No No No No 0
MetWest Total Return Fund No No No No No No 0
Vanguard Total Bond Market Index* Yes No No No No No 1
Vanguard Short Term Bond Index* Yes No No No No No 1
Goldman Sachs Financial Square Gov't Money Market N/A Yes No No No No
DFA World ex-US Government Fixed Income N/A No No No No No 0
155

Investment Watchlist Summary
CSP of Nebraska – TDA
*Tracking error of 10 to 20 basis points is typical for index funds
• The table below provides a “Suggested Action” based on the number of affirmative responses received to the questions noted above.
• Changes in Watch List designations from the previous quarter are highlighted in red.
Status Number of Criteria Met Suggested Action
Less than 2 Active – No action required
2 to 3 Active – On “closely monitored” list
4 Closed – all allocations to the fund must be stopped, but accumulated balances may remain invested
Greater than 4 Closed Out – All invested balances must be moved to another active option
CSP of Nebraska: First National TD Ameritrade Plan
Investment Watchlist Summary
1 2 3 4 5 6Watch List Status
Underperformed During Trailing
5 Years
Underperformed in 3 of 4 Trailing
Calendar Quarters
Diverged from Strategy and/or
Portfolio Characteristics
Adverse Change in Portfolio Manager
Weak Manager Research Rating
Significant Organizational
Change
3rdQuarter
2020
2ndQuarter
2020
Vanguard Real Estate Index* No No No No No No 0 0
Vanguard Russell 2000 Growth Index* N/A No No No No No 0 0
iShares Core S&P Small-Cap ETF* N/A No No No No No 0 0
State Street S&P 500 Index* Yes No No No No No 1 0
Vanguard Equity Income Fund No No No No No No 0 0
T. Rowe Price Large Cap Growth No No No No No No 0 0
Vanguard Russell 1000 Value Index* Yes No No No No No 1 0
Vanguard Extended Market Index* Yes No No No No No 1 0
Vanguard Total Stock Market Index* Yes No No No No No 1 0
State Street MSCI ACWI Ex-US Index* Yes No No No No No 1 0
Vanguard Emerging Markets Stock Index* N/A No No No No No 0 0
DFA World ex-US Government Fixed Income N/A No No No No No 0 0
MetWest Total Return Fund Yes No No No No No 1 1
Vanguard Total Bond Market Index* Yes No No No No No 1 0
Goldman Sachs Financial Square Gov't Money Market N/A Yes No No No No
Vanguard Short Term Bond Index* Yes No No No No No 1 0
Vanguard Short-Term Inflation-Protected Index* N/A No No No No No 0 0
156
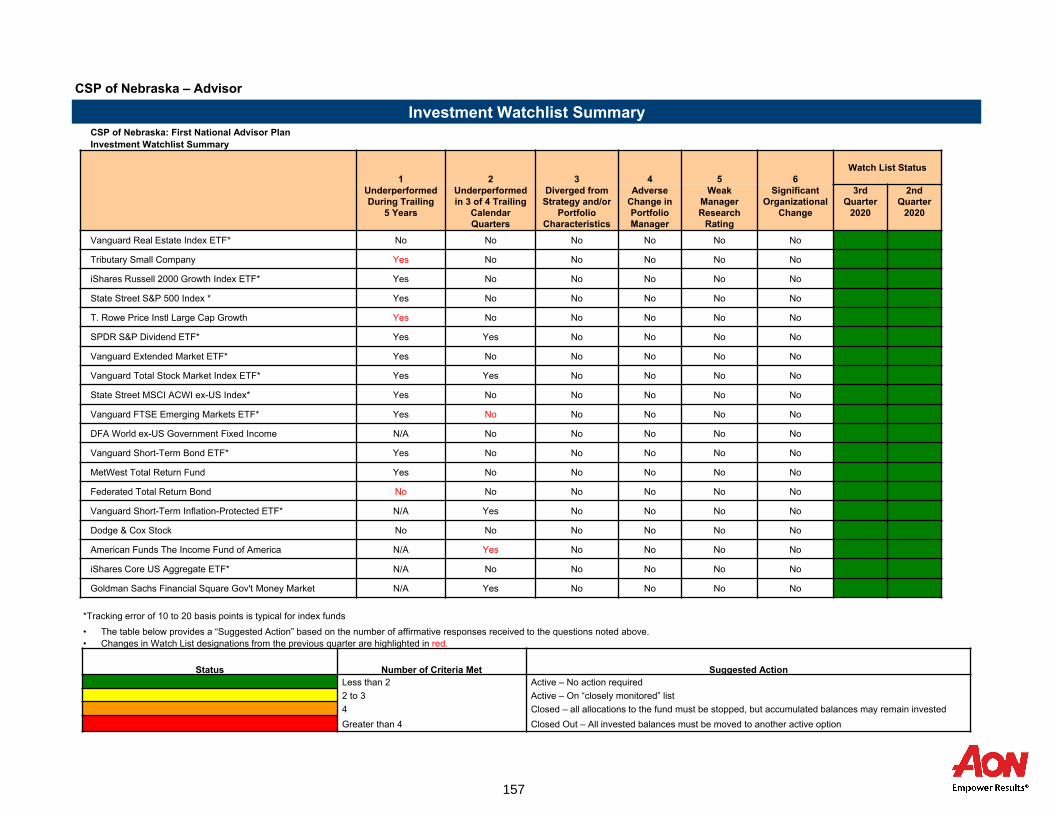
Investment Watchlist Summary
CSP of Nebraska – Advisor
*Tracking error of 10 to 20 basis points is typical for index funds
• The table below provides a “Suggested Action” based on the number of affirmative responses received to the questions noted above.
• Changes in Watch List designations from the previous quarter are highlighted in red.
Status Number of Criteria Met Suggested Action
Less than 2 Active – No action required
2 to 3 Active – On “closely monitored” list
4 Closed – all allocations to the fund must be stopped, but accumulated balances may remain invested
Greater than 4 Closed Out – All invested balances must be moved to another active option
CSP of Nebraska: First National Advisor Plan
Investment Watchlist Summary
1 2 3 4 5 6Watch List Status
Underperformed During Trailing
5 Years
Underperformed in 3 of 4 Trailing
Calendar Quarters
Diverged from Strategy and/or
Portfolio Characteristics
Adverse Change in Portfolio Manager
Weak Manager Research
Rating
Significant Organizational
Change
3rdQuarter
2020
2ndQuarter
2020
Vanguard Real Estate Index ETF* No No No No No No
Tributary Small Company Yes No No No No No 1 0
iShares Russell 2000 Growth Index ETF* Yes No No No No No
State Street S&P 500 Index * Yes No No No No No
T. Rowe Price Instl Large Cap Growth Yes No No No No No 1 0
SPDR S&P Dividend ETF* Yes Yes No No No No 1
Vanguard Extended Market ETF* Yes No No No No No
Vanguard Total Stock Market Index ETF* Yes Yes No No No No 1
State Street MSCI ACWI ex-US Index* Yes No No No No No
Vanguard FTSE Emerging Markets ETF* Yes No No No No No 1
DFA World ex-US Government Fixed Income N/A No No No No No 0 0
Vanguard Short-Term Bond ETF* Yes No No No No No
MetWest Total Return Fund Yes No No No No No 1 0
Federated Total Return Bond No No No No No No 0 1
Vanguard Short-Term Inflation-Protected ETF* N/A Yes No No No No
Dodge & Cox Stock No No No No No No 0 0
American Funds The Income Fund of America N/A Yes No No No No 1 1
iShares Core US Aggregate ETF* N/A No No No No No
Goldman Sachs Financial Square Gov't Money Market N/A Yes No No No No
157

(This Page Left Blank Intentionally)
158

Enable Savings Plan
159

Allocation
MarketValue
($)
Performance(%)
1Quarter
YTD1
Year3
YearsSince
InceptionInception
Date
Enable Savings Plan 15,482,251
Growth Option 3,472,772 6.7 3.8 11.0 7.8 9.8 07/01/2016
Enable Benchmark Growth Option 6.9 3.3 10.7 7.9 10.1
Moderate Option 2,181,756 5.1 4.6 10.2 7.1 8.2 07/01/2016
Enable Benchmark Moderate Option 5.4 3.9 9.6 7.1 8.4
Conservative Option 1,474,997 2.8 4.4 7.4 5.1 5.2 07/01/2016
Enable Benchmark Conservative Option 3.1 3.9 7.0 5.2 5.5
Bank Savings Option 6,276,532 0.1 0.4 0.8 0.8 0.7 07/01/2016
FTSE 3 Month T-Bill 0.0 0.6 1.0 1.6 1.3
Checking Option 2,076,194
.Inception
DateAllocation
Enable Savings Plan: Nebraska 13,319,204
Growth Option Nebraska 2,790,336 07/01/2016
Moderate Option Nebraska 1,960,664 07/01/2016
Conservative Option Nebraska 1,224,231 07/01/2016
Bank Savings Option Nebraska 5,743,567 07/01/2016
Checking Option Nebraska 1,600,406 07/01/2016
SinceInception
InceptionDate
Allocation
Enable Savings Plan: Alabama 2,163,048
Growth Option Alabama 682,436
Moderate Option Alabama 221,092
Conservative Option Alabama 250,766
Bank Savings Option Alabama 532,966
Checking Option Alabama 475,788
Enable Savings Plan
Asset Allocation & Performance
As of September 30, 2020
160
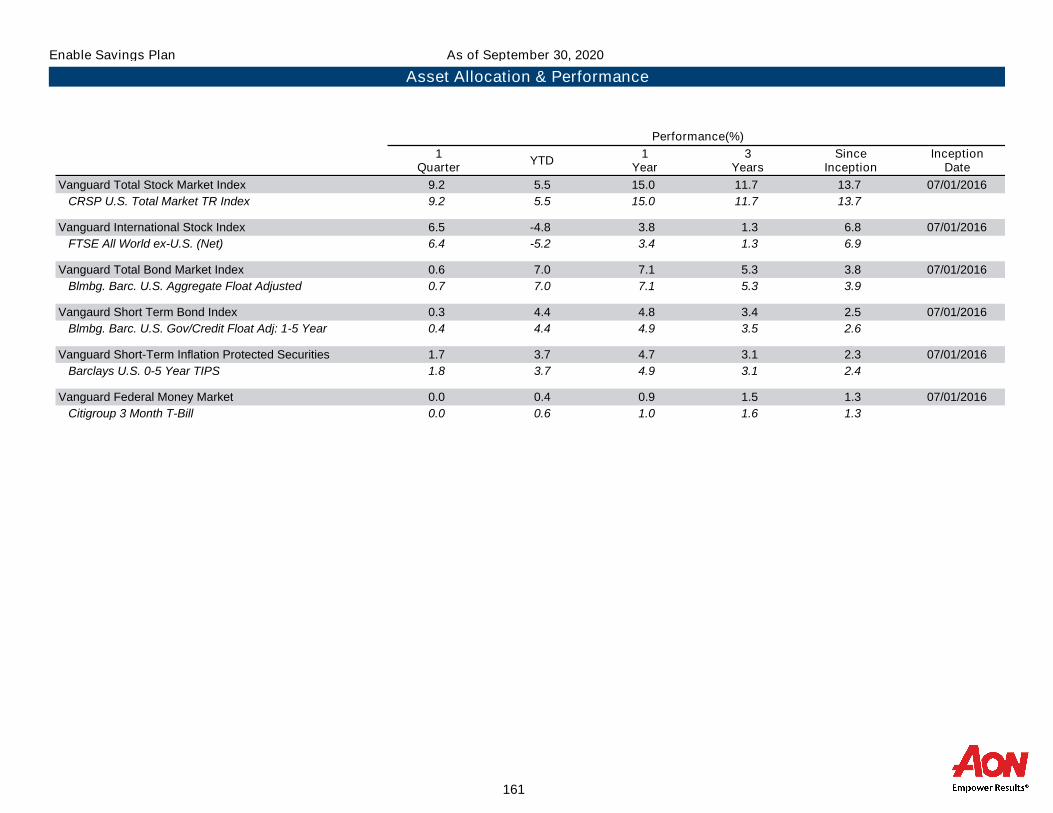
Performance(%)
1Quarter
YTD1
Year3
YearsSince
InceptionInception
Date
Vanguard Total Stock Market Index 9.2 5.5 15.0 11.7 13.7 07/01/2016
CRSP U.S. Total Market TR Index 9.2 5.5 15.0 11.7 13.7
Vanguard International Stock Index 6.5 -4.8 3.8 1.3 6.8 07/01/2016
FTSE All World ex-U.S. (Net) 6.4 -5.2 3.4 1.3 6.9
Vanguard Total Bond Market Index 0.6 7.0 7.1 5.3 3.8 07/01/2016
Blmbg. Barc. U.S. Aggregate Float Adjusted 0.7 7.0 7.1 5.3 3.9
Vangaurd Short Term Bond Index 0.3 4.4 4.8 3.4 2.5 07/01/2016
Blmbg. Barc. U.S. Gov/Credit Float Adj: 1-5 Year 0.4 4.4 4.9 3.5 2.6
Vanguard Short-Term Inflation Protected Securities 1.7 3.7 4.7 3.1 2.3 07/01/2016
Barclays U.S. 0-5 Year TIPS 1.8 3.7 4.9 3.1 2.4
Vanguard Federal Money Market 0.0 0.4 0.9 1.5 1.3 07/01/2016
Citigroup 3 Month T-Bill 0.0 0.6 1.0 1.6 1.3
Enable Savings Plan
Asset Allocation & Performance
As of September 30, 2020
161

Enable Savings Plan Underlying Funds
Allocation to Underlying Funds
Growth Option Moderate Option Conservative Option
Equity
Vanguard Total Stock Market Index 56% 42% 21%
Vanguard International Stock Index 24 18 9
Fixed Income
Vanguard Total Bond Market Index 20 30 25
Vanguard Short-Term Bond Index -- 5 15
Vanguard Short-Term Inflation Protect Securities -- -- 15
Cash
Vanguard Federal Money Market -- 5 15
Total Fund Assets 100% 100% 100%
162

Investment Watchlist Summary
Enable Savings Plan
*Tracking error of 10 to 20 basis points is typical for index funds
• The table below provides a “Suggested Action” based on the number of affirmative responses received to the questions noted above.
• Changes in Watch List designations from the previous quarter are highlighted in red.
Status Number of Criteria Met Suggested Action
Less than 2 Active – No action required
2 to 3 Active – On “closely monitored” list
4 Closed – all allocations to the fund must be stopped, but accumulated balances may remain invested
Greater than 4 Closed Out – All invested balances must be moved to another active option
1 2 3 4 5 6 Watch List StatusUnderperformed During Trailing
5 Years
Underperformed in 3 of 4
Trailing Calendar Quarters
Diverged from Strategy and/or
Portfolio Characteristics
Adverse Change in Portfolio Manager
Weak Manager Research
Rating
Significant Organizational
Change
3rdQuarter
2020
2ndQuarter
2020
Vanguard Total Stock Market Index* N/A No No No No No 0 0
Vanguard International Stock Index* N/A No No No No No 0
Vanguard Total Bond Market Index* N/A No No No No No 0 0
Vangaurd Short Term Bond Index* N/A No No No No No 0 0
Vanguard Short-Term Inflation Protected Securities N/A No No No No No 0 0
Vanguard Federal Money Market N/A No No No No No 0 0
163

(This Page Left Blank Intentionally)
164

Total State Farm College Savings Plan
165

Allocation
MarketValue
($)%
Performance(%)
1Quarter
YearTo
Date
1Year
3Years
5Years
SinceInception
InceptionDate
Total State Farm College Savings Plan 630,183,310 100.0
State Farm Age-Based Investment Options 473,581,671 75.1
Age-Based 0-2 3,775,338 0.6 7.9 1.6 10.1 6.0 09/01/2018
Age-Based Benchmark 0-2 yr 8.0 1.8 10.5 6.4
Age-Based 3-5 18,660,791 3.0 7.6 1.9 10.1 6.1 09/01/2018
Age-Based Benchmark 3-5 yr 7.7 2.2 10.5 6.6
Age-Based 6-8 50,232,650 8.0 6.7 2.5 9.7 6.4 09/01/2018
Age-Based Benchmark 6-8 yr 6.9 2.7 10.1 6.8
Age-Based 9-10 47,091,367 7.5 6.0 2.9 9.3 6.5 09/01/2018
Age-Based Benchmark 9-10 yr 6.2 3.2 9.7 6.9
Age-Based 11-12 56,998,470 9.0 5.2 3.3 8.8 6.4 09/01/2018
Age-Based Benchmark 11-12 yr 5.4 3.6 9.3 6.9
Age-Based 13-14 64,682,730 10.3 4.4 3.4 8.1 6.2 09/01/2018
Age-Based Benchmark 13-14 yr 4.7 3.7 8.6 6.7
Age-Based 15-16 82,141,708 13.0 3.6 3.5 7.4 6.0 09/01/2018
Age-Based Benchmark 15-16 yr 3.9 3.9 7.9 6.4
Age-Based 17-18 82,452,588 13.1 2.9 3.7 6.6 5.7 09/01/2018
Age-Based Benchmark 17-18 yr 3.2 3.9 7.1 6.1
Age-Based 19+ 67,546,028 10.7 2.2 3.7 5.9 5.3 09/01/2018
Age-Based Benchmark 19+ yr 2.4 4.0 6.4 5.8
State Farm Static Investment Options 156,601,638 24.9
All Equity Static 81,276,920 12.9 7.9 1.6 10.1 6.0 09/01/2018
All Equity Static Benchmark 8.0 1.8 10.5 6.4
Growth Static 39,655,654 6.3 6.7 2.5 9.7 6.4 09/01/2018
Growth Static Benchmark 6.9 2.7 10.1 6.8
Total State Farm College Savings Plan
Asset Allocation & Performance
As of September 30, 2020
166

Total State Farm College Savings Plan
Asset Allocation & Performance
As of September 30, 2020
Allocation
MarketValue
($)%
Performance(%)
1Quarter
YearTo
Date
1Year
3Years
5Years
SinceInception
InceptionDate
Moderate Growth Static 16,850,130 2.7 5.2 3.3 8.8 6.4 09/01/2018
Moderate Growth State Benchmark 5.4 3.6 9.3 6.9
Balanced Static 2,551,535 0.4 4.5 3.5 8.1 6.3 09/01/2018
Balanced Static Benchmark 4.7 3.7 8.6 6.7
Conservative Static 2,809,258 0.4 2.2 3.7 5.9 5.3 09/01/2018
Conservative Static Benchmark 2.4 4.0 6.4 5.8
Money Market Static 9,502,522 1.5 0.0 0.2 0.6 1.3 09/01/2018
FTSE 3 Month T-Bill 0.0 0.6 1.0 1.7
Bank Savings Static 3,955,619 0.6 0.1 0.5 0.8 1.0 09/01/2018
FTSE 3 Month T-Bill 0.0 0.6 1.0 1.7
167
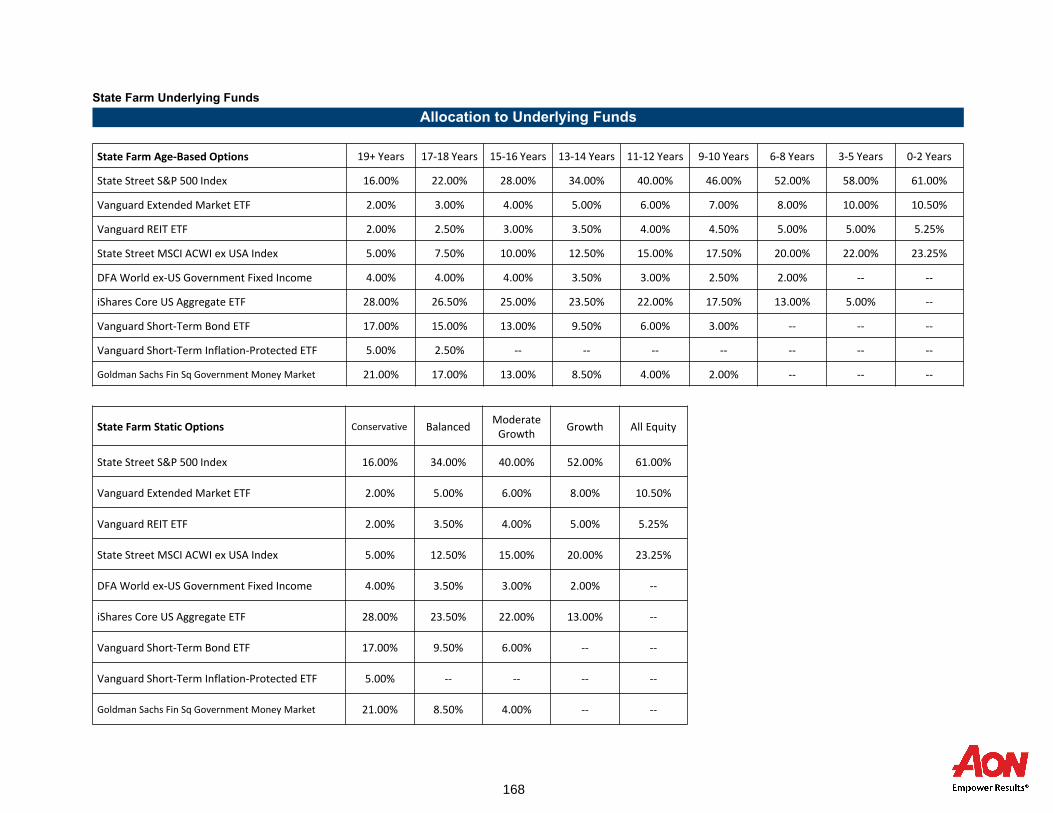
State Farm Underlying Funds
Allocation to Underlying Funds
State Farm Age-Based Options 19+ Years 17-18 Years 15-16 Years 13-14 Years 11-12 Years 9-10 Years 6-8 Years 3-5 Years 0-2 Years
State Street S&P 500 Index 16.00% 22.00% 28.00% 34.00% 40.00% 46.00% 52.00% 58.00% 61.00%
Vanguard Extended Market ETF 2.00% 3.00% 4.00% 5.00% 6.00% 7.00% 8.00% 10.00% 10.50%
Vanguard REIT ETF 2.00% 2.50% 3.00% 3.50% 4.00% 4.50% 5.00% 5.00% 5.25%
State Street MSCI ACWI ex USA Index 5.00% 7.50% 10.00% 12.50% 15.00% 17.50% 20.00% 22.00% 23.25%
DFA World ex-US Government Fixed Income 4.00% 4.00% 4.00% 3.50% 3.00% 2.50% 2.00% -- --
iShares Core US Aggregate ETF 28.00% 26.50% 25.00% 23.50% 22.00% 17.50% 13.00% 5.00% --
Vanguard Short-Term Bond ETF 17.00% 15.00% 13.00% 9.50% 6.00% 3.00% -- -- --
Vanguard Short-Term Inflation-Protected ETF 5.00% 2.50% -- -- -- -- -- -- --
Goldman Sachs Fin Sq Government Money Market 21.00% 17.00% 13.00% 8.50% 4.00% 2.00% -- -- --
State Farm Static Options Conservative BalancedModerate
GrowthGrowth All Equity
State Street S&P 500 Index 16.00% 34.00% 40.00% 52.00% 61.00%
Vanguard Extended Market ETF 2.00% 5.00% 6.00% 8.00% 10.50%
Vanguard REIT ETF 2.00% 3.50% 4.00% 5.00% 5.25%
State Street MSCI ACWI ex USA Index 5.00% 12.50% 15.00% 20.00% 23.25%
DFA World ex-US Government Fixed Income 4.00% 3.50% 3.00% 2.00% --
iShares Core US Aggregate ETF 28.00% 23.50% 22.00% 13.00% --
Vanguard Short-Term Bond ETF 17.00% 9.50% 6.00% -- --
Vanguard Short-Term Inflation-Protected ETF 5.00% -- -- -- --
Goldman Sachs Fin Sq Government Money Market 21.00% 8.50% 4.00% -- --
168

Total Endowment
169

Allocation
MarketValue
($)%
Performance(%)
1Quarter
YearTo
Date
1Year
3Years
5Years
10Years
SinceInception
InceptionDate
Total Endowment Plans 1,481,801,780 100.0
Health Care Endowment 431,582,154 29.1 5.7 -0.1 6.0 6.2 8.4 8.6 6.7 01/01/2001
Health Care Policy 6.1 3.4 10.1 7.6 9.4 8.9 6.1
50/50 Endowments 977,076,045 65.9 3.3 0.0 3.6 5.0 6.8 6.9 7.2 01/01/1996
50/50 Endowment Policy 4.3 4.6 9.2 7.1 8.1 7.6 7.0
Excess Liability Fund 73,143,581 4.9 1.1 7.0 7.4 5.5 4.9 4.1 5.7 07/01/1997
Performance Benchmark 1.0 6.2 6.7 5.1 4.5 3.9 5.4
Health Care Endowment Fixed 107,046,326 7.2 0.2 5.1 5.1 3.7 2.6 2.0 3.3 12/01/2000
Performance Benchmark 0.2 5.4 5.5 3.8 2.6 2.1 3.4
Total Endowment Plans
Asset Allocation & Performance
As of September 30, 2020
The table above details the allocation and performance of the various Endowment Funds. The line-item labeled "50/50 Endowments" represents theAgricultural College, Bessey, Permanent School, Permanent University, State College, Veterans Aid, Cultural Endowments, and the EnvironmentalEndowment Fund.
170

Allocation
MarketValue
($)%
Performance(%)
1Quarter
YTD1
Year3
Years5
Years10
YearsSince
InceptionInception
Date
Total Health Care Endowment 431,582,154 100.0 5.7 -0.1 6.0 6.2 8.4 8.6 6.7 01/01/2001
Health Care Policy 6.1 3.4 10.1 7.6 9.4 8.9 6.1
Total US Equity 125,203,212 29.0 9.0 4.5 13.9 11.1 13.2 13.3 8.0 01/01/2002
Dow Jones U.S. Total Stock Market Index 9.1 5.3 14.8 11.5 13.6 13.4 8.4
Total Non-US Equity 54,948,283 12.7 6.7 -5.2 3.5 1.0 6.6 4.1 4.2 01/01/2001
MSCI All Country World ex-U.S. IMI* 6.8 -5.2 3.5 1.1 6.3 4.2 4.6
Total Global Equity 98,856,323 22.9 5.9 -8.1 0.0 2.8 7.4 7.9 7.6 09/01/2005
MSCI All Country World IMI* 8.1 0.5 9.6 6.5 10.0 8.4 6.6
Total Fixed Income 107,046,326 24.8 0.2 5.1 5.1 3.7 2.6 2.0 3.3 12/01/2000
Performance Benchmark 0.2 5.4 5.5 3.8 2.6 2.1 3.4
Total Real Estate 15,737,430 3.6
Total Private Equity 29,790,580 6.9
Allocation
MarketValue
($)%
Performance(%)
1Quarter
YTD1
Year3
Years5
Years10
YearsSince
InceptionInception
Date
Total 50/50 Endowment 977,076,044 100.0 3.3 0.0 3.6 5.0 6.8 6.9 7.2 01/01/1996
50/50 Endowment Policy 4.3 4.6 9.2 7.1 8.1 7.6 7.0
Total US Equity 177,411,730 18.2 5.4 -11.7 -5.1 2.3 7.5 10.0 6.3 01/01/2002
Dow Jones U.S. Total Stock Market Index 9.1 5.3 14.8 11.5 13.6 13.4 8.4
Total Non-US Equity 76,256,303 7.8 6.7 -5.2 3.5 1.0 6.6 4.1 4.2 01/01/2001
MSCI All Country World ex-U.S. IMI* 6.8 -5.2 3.5 1.1 6.3 4.2 4.6
Total Global Equity 113,762,877 11.6 5.9 -8.1 0.0 2.8 7.4 7.9 7.6 09/01/2005
MSCI All Country World IMI* 8.1 0.5 9.6 6.5 10.0 8.4 6.6
Total Fixed Income 500,571,159 51.2 1.2 7.0 7.4 5.4 4.8 4.0 5.7 07/01/1997
Blmbg. Barc. Universal Bond Index* 1.0 6.2 6.7 5.1 4.5 3.9 5.4
Total Real Estate 43,668,856 4.5
Total Private Equity 65,405,119 6.7
Endowment Breakout
Asset Class Performance
As of September 30, 2020
-Beginning December 2012, performance was calculated by Aon. Prior to December 2012, performance was calculated by State Street.*Denotes a performance benchmark that is a splice of more than one index. Descriptions can be found in the appendix of this report. Nebraska Investment Council
171

Allocation
MarketValue
($)%
Performance(%)
1Quarter
YTD1
Year3
Years5
Years10
YearsSince
InceptionInception
Date
Total Endowment 1,375,148,234 100.0
Total U.S. Equity 302,614,942 22.0 7.0 -5.0 2.6 5.8 9.8 11.4 6.9 01/01/2002
Dow Jones U.S. Total Stock Market Index 9.1 5.3 14.8 11.5 13.6 13.4 8.4
DFA 26,670,611 1.9 3.9 -13.6 -6.3 -1.8 5.3 9.5 8.8 01/01/2002
Russell 2000 Index* 4.9 -8.7 0.4 1.8 8.0 9.5 8.0
BlackRock Russell 1000 (Healthcare Endowment) 113,959,364 8.3 9.5 6.4 16.0 12.4 14.1 - 13.4 02/01/2013
Russell 1000 Index 9.5 6.4 16.0 12.4 14.1 - 13.4
BlackRock Russell 1000 Value Index 161,965,523 11.8 5.6 -11.4 -4.9 2.7 7.7 - 9.3 12/01/2012
Russell 1000 Value Index 5.6 -11.6 -5.0 2.6 7.7 - 9.4
BlackRock Russell 1000 Index 19,445 0.0
Total Non-U.S. Equity 131,204,586 9.5 6.7 -5.2 3.5 1.0 6.6 4.1 4.2 01/01/2001
MSCI All Country World ex-U.S. IMI* 6.8 -5.2 3.5 1.1 6.3 4.2 4.6
BlackRock All Country World ex-U.S. IMI 131,204,586 9.5 6.7 -5.2 3.5 1.1 6.3 4.2 3.8 01/01/2001
MSCI All Country World ex-U.S. IMI* 6.8 -5.2 3.5 1.1 6.3 4.2 3.8
Total Global Equity 212,619,200 15.5 5.9 -8.1 0.0 2.8 7.4 7.9 7.6 09/01/2005
MSCI All Country World IMI* 8.1 0.5 9.6 6.5 10.0 8.5 6.6
MFS 94,879,494 6.9 8.5 -0.7 6.7 7.4 10.6 10.6 8.8 10/01/2005
MSCI All Country World IMI* 8.1 0.5 9.6 6.5 10.0 8.4 6.4
Wellington Equity 29,457,509 2.1 6.6 -12.0 -5.1 -1.5 - - 4.7 12/01/2016
MSCI AC World Small Cap (Net) 7.9 -5.9 3.2 2.0 - - 6.4
Dodge & Cox 88,279,906 6.4 2.9 -14.6 -5.3 -1.5 - - 0.4 07/01/2017
MSCI AC World IMI (Net) 8.1 0.5 9.6 6.5 - - 7.7
Mondrian 2,291 0.0
Total Endowment
Asset Allocation & Performance
As of September 30, 2020
*Denotes a performance benchmark that is a splice of more than one index. Descriptions can be found in the appendix of this report. Nebraska Investment Council
172

Total Endowment
Asset Allocation & Performance
As of September 30, 2020
Allocation
MarketValue
($)%
Performance(%)
1Quarter
YTD1
Year3
Years5
Years10
YearsSince
InceptionInception
Date
Total Fixed Income 574,107,521 41.7 1.2 7.0 7.4 5.4 4.8 4.0 5.7 07/01/1997
Blmbg. Barc. Universal Bond Index* 1.0 6.2 6.7 5.1 4.5 3.9 5.4
PIMCO 132,240,714 9.6 1.6 6.8 6.9 5.3 5.2 3.9 5.7 04/01/1998
Blmbg. Barc. Universal Bond Index* 1.0 6.2 6.7 5.1 4.5 3.9 5.2
Loomis Sayles 36,304,485 2.6 2.8 10.3 11.8 6.6 7.1 6.6 6.9 07/01/2006
Blmbg. Barc. Universal Bond Index* 1.0 6.2 6.7 5.1 4.5 3.9 5.3
BlackRock Aggregate Bond Index 272,812,254 19.8 0.6 6.9 7.1 5.3 4.2 3.7 4.5 12/01/2006
Blmbg. Barc. U.S. Aggregate 0.6 6.8 7.0 5.2 4.2 3.6 4.5
Neuberger Berman Core Plus 132,750,068 9.7 1.3 6.5 7.2 5.5 5.0 - 4.7 07/01/2015
Blmbg. Barc. Universal Bond Index 1.0 6.2 6.7 5.1 4.5 - 4.4
Total Real Estate 59,406,286 4.3
Metropolitan Real Estate Partners (Combined) 2,599,710 0.2
Prudential PRISA 9,414,042 0.7
UBS Trumbull 11,096,987 0.8
Landmark VII 2,635,838 0.2
UBS Trumbull Property Income 6,440,274 0.5
MREP SCIF 4,618,773 0.3
Torchlight Debt Opportunity 400,000 0.0
Real Estate Cash 4,556,872 0.3
Total Private Equity 95,195,699 6.9
Abbott Capital VI 25,147,373 1.8
Abbott Capital VII 22,607,362 1.6
RCP Fund VII 10,973,925 0.8
RCP Fund VIII 8,705,518 0.6
Dover Street VIII L.P. 5,069,879 0.4
Ironside Partnership Fund V 17,045,087 1.2
Dover Street X L.P. 2,309,326 0.2
Private Equity Cash 3,337,230 0.2
Inception-to-date IRR for Real Estate 8.8% as of 6/30/2020. The Inception-to-Date IRR for Private Equity is 14.6% as of 6/30/2020.
*Denotes a performance benchmark that is a splice of more than one index. Descriptions can be found in the appendix of this report. Nebraska Investment Council
173

(This Page Left Blank Intentionally)
174

Total In-House Plans
175

Allocation
MarketValue
($)%
Performance(%)
1Quarter
YTD1
Year3
Years5
Years10
YearsSince
InceptionInception
Date
Total In-House Plans 9,969,302 100.0
Aeronautics 7,150,910 71.7 0.1 9.1 8.4 5.6 3.7 3.3 6.1 01/01/1990
Blmbg. Barc. U.S. Treasury 0.2 8.9 8.0 5.5 3.7 3.1 5.7
Agricultural Development 2,818,391 28.3 0.2 9.4 8.7 5.7 3.8 3.4 6.3 01/01/1989
Blmbg. Barc. U.S. Treasury 0.2 8.9 8.0 5.5 3.7 3.1 6.0
Allocation
MarketValue
($)%
Performance(%)
1Quarter
YTD1
Year3
Years5
Years10
YearsSince
InceptionInception
Date
Total OIP 5,635,506,966 100.0 0.4 4.8 5.1 3.9 3.0 2.4 3.9 01/01/1997
Performance Benchmark 0.4 5.3 5.6 4.0 3.0 2.6 3.9
Internal Short–Term Liquidity Pool 1,690,007,856 30.0 0.0 0.3 0.7 1.4 1.0 0.7 3.0 01/01/1997
Performance Benchmark 0.0 0.6 1.1 1.4 0.9 0.5 2.9
Operating Investment Pool (Internal G/C) 3,945,499,110 70.0 0.5 6.2 6.3 4.4 3.4 2.8 11/01/2011
Performance Benchmark 0.4 6.0 6.3 4.3 3.3 2.8
Total Fund
$ %
Time Deposit Open Account 39,254,217 100.0
Total In House Trusts & OIP
Asset Allocation & Performance
As of September 30, 2020
The Internal Short-Term Liquidity Pool includes the DB STIF amount of $3,745,421. When summing the assets of all NIC plans, the DB STIF has beencounted in the DB Plan and removed from the In-House Plan to avoid double counting.
176

OSERS
177

Change in Market ValueFrom July 1, 2020 to September 30, 2020
Summary of Cash Flow
$0.0
$400.0
$800.0
$1,200.0
$1,600.0
$2,000.0
Mill
ion
s ($
)
Beginning Market Value Net Additions / Withdrawals Investment Earnings Ending Market Value
$1,237.0
$9.8 $52.5
$1,299.3
1Quarter
FYTD1
Year
Total Fund Composite
Beginning Market Value 1,237,012,455 1,324,122,168 1,289,788,452
+ Additions / Withdrawals 9,770,862 -9,044,998 -42,433,127
+ Investment Earnings 52,492,435 -15,801,417 51,920,427
= Ending Market Value 1,299,275,752 1,299,275,752 1,299,275,752
Total Fund Composite
Total Plan Asset Summary
As of September 30, 2020
178
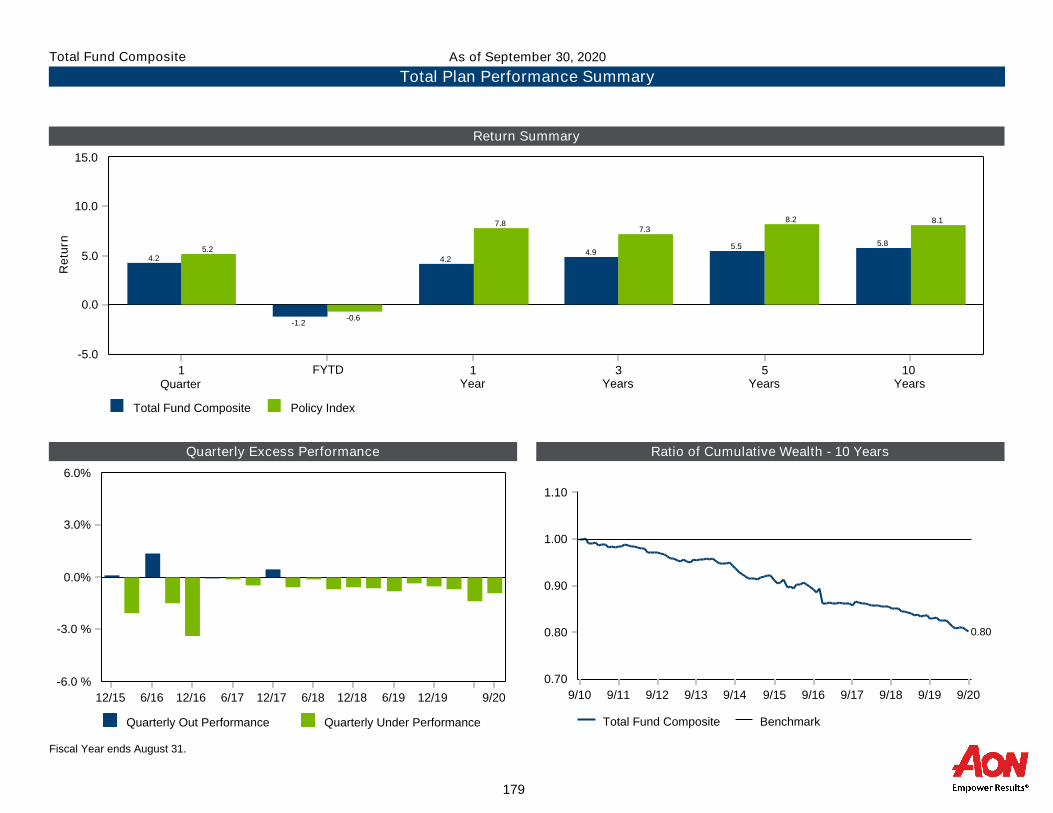
Return Summary
Quarterly Excess Performance Ratio of Cumulative Wealth - 10 Years
Total Fund Composite Policy Index
0.0
5.0
10.0
15.0
-5.0
Re
turn
1Quarter
FYTD 1Year
3Years
5Years
10Years
5.2
-0.6
7.87.3
8.2 8.1
4.2
-1.2
4.24.9
5.5 5.8
Total Fund Composite Benchmark
0.70
0.80
0.90
1.00
1.10
9/10 9/11 9/12 9/13 9/14 9/15 9/16 9/17 9/18 9/19 9/20
0.80
Quarterly Out Performance Quarterly Under Performance
0.0%
3.0%
6.0%
-3.0 %
-6.0 %
12/15 6/16 12/16 6/17 12/17 6/18 12/18 6/19 12/19 9/20
Total Plan Performance Summary
As of September 30, 2020Total Fund Composite
Fiscal Year ends August 31.
179

Allocation
MarketValue
($)%
Performance(%)
1Quarter
YTD FYTD1
Year3
Years5
Years10
Years
OSERS 1,299,275,752 100.0 4.2 (73) 0.1 (67) -1.2 (40) 4.2 (74) 4.9 (67) 5.5 (92) 5.8 (91)
Policy Index 5.2 (42) 3.1 (22) -0.6 (16) 7.8 (25) 7.3 (12) 8.2 (27) 8.1 (23)
U.S. Equity Composite 292,040,327 22.5 9.0 (20) 4.6 (25) -3.7 (69) 13.9 (22) 11.0 (27) 11.0 (79) 11.9 (78)
Custom U.S. Equity Index 9.1 (16) 5.3 (21) -3.7 (64) 14.8 (21) 11.5 (16) 13.5 (23) 12.8 (40)
BlackRock Russell 1000 Index 265,867,390 20.5 9.4 (35) 6.4 (37) -3.7 (63) 16.0 (37) 12.4 (37) - -
Russell 1000 Index 9.5 (35) 6.4 (37) -3.7 (63) 16.0 (37) 12.4 (37) - -
Dimensional Fund Advisors 26,172,936 2.0 3.9 (66) -13.7 (72) -4.1 (62) -6.7 (73) - - -
Russell 2000 Index 4.9 (51) -8.7 (46) -3.3 (43) 0.4 (42) - - -
Global Equity Composite 211,220,369 16.3 6.6 (65) -4.3 (68) -2.8 (54) 4.0 (64) 4.3 (64) 8.5 (59) 8.6 (60)
Custom Global Equity Index 8.1 (49) 0.5 (55) -3.1 (62) 9.6 (52) 6.5 (50) 9.9 (44) 8.5 (60)
Arrowstreet 71,618,665 5.5 7.4 (57) 2.2 (51) -2.6 (46) 11.2 (46) 7.3 (46) - -
MSCI AC World IMI (Net) 8.1 (49) 0.5 (55) -3.1 (62) 9.6 (52) 6.5 (50) - -
MFS 66,735,356 5.1 8.5 (44) -0.5 (57) -1.8 (24) 6.9 (59) 7.3 (45) - -
MSCI AC World IMI (Net) 8.1 (49) 0.5 (55) -3.1 (62) 9.6 (52) 6.5 (50) - -
Wellington Equity 23,806,887 1.8 6.5 (76) -12.3 (93) -2.9 (94) -5.0 (96) -0.8 (73) - -
MSCI AC World Small Cap (Net) 7.9 (57) -5.9 (55) -2.1 (79) 3.2 (60) 2.0 (64) - -
Dodge & Cox 49,059,461 3.8 2.9 (78) -14.6 (84) -4.4 (89) -5.4 (76) -1.7 (83) - -
MSCI AC World IMI (Net) 8.1 (36) 0.5 (43) -3.1 (66) 9.6 (43) 6.5 (40) - -
International Equity Composite 125,549,882 9.7 6.8 (63) -5.1 (59) -2.3 (69) 3.7 (61) 1.2 (52) - -
MSCI AC World ex USA IMI (Net) 6.8 (63) -5.2 (60) -2.3 (69) 3.5 (62) 1.1 (53) - -
BlackRock ACWI ex-U.S. IMI Index 125,549,882 9.7 6.8 (63) -5.1 (59) -2.3 (69) 3.7 (61) - - -
MSCI AC World ex USA IMI (Net) 6.8 (63) -5.2 (60) -2.3 (69) 3.5 (62) - - -
OSERS
Asset Allocation & Performance
As of September 30, 2020
Fiscal Year ends August 31.
180

OSERS
Asset Allocation & Performance
As of September 30, 2020
Allocation
MarketValue
($)%
Performance(%)
1Quarter
YTD FYTD1
Year3
Years5
Years10
Years
Total Fixed Income 374,214,116 28.8 1.2 (80) 6.9 (46) -0.1 (64) 7.3 (46) 5.5 (46) 0.5 (100) -
Custom Fixed Income Index 1.0 (84) 6.2 (64) -0.2 (79) 6.7 (67) 5.1 (65) 4.2 (90) -
BlackRock Aggregate Bond Index 159,365,487 12.3 0.7 (88) 6.9 (56) 0.0 (52) 7.1 (53) 5.3 (50) - -
Blmbg. Barc. U.S. Aggregate 0.6 (89) 6.8 (61) -0.1 (56) 7.0 (62) 5.2 (64) - -
BlackRock Core Plus Universal 57,557,792 4.4 1.4 (67) 6.8 (49) -0.2 (55) 7.5 (42) 5.3 (52) - -
Blmbg. Barc. Universal Bond Index 1.0 (90) 6.2 (62) -0.2 (59) 6.7 (64) 5.1 (65) - -
PIMCO 79,820,732 6.1 1.8 (39) 7.5 (30) 0.0 (39) 7.8 (32) 5.7 (32) - -
Blmbg. Barc. Universal Bond Index 1.0 (90) 6.2 (62) -0.2 (59) 6.7 (64) 5.1 (65) - -
Neuberger Berman Core Plus 76,294,876 5.9 1.3 (75) 6.7 (49) -0.4 (80) 7.5 (42) 5.8 (19) - -
Blmbg. Barc. Universal Bond Index 1.0 (90) 6.2 (62) -0.2 (59) 6.7 (64) 5.1 (65) - -
OSERS Contributions & Withdrawals 1,175,230 0.1
Hedge Fund Composite 7,065,500 0.5 0.0 1.3 0.0 1.3 -4.6 -3.5 -
HFRI RV: Multi-Strategy Index 3.2 2.4 0.5 4.2 2.9 3.6 -
Vaquero EMD 7,053,630 0.5 0.0 1.3 0.0 1.3 -6.9 -3.3 -6.0
Blmbg. Barc. Emerging Markets USD Aggregate Index 2.4 1.9 -1.3 4.1 4.2 6.2 5.4
Hedge Fund Cash 11,870 0.0
Real Asset Composite 13,082,507 1.0 -10.2 -19.5 0.0 -20.8 -10.9 -3.8 -
Custom Real Asset Benchmark 2.9 1.6 2.9 2.0 5.6 7.8 -
BTG 1,311,659 0.1
JP Morgan Global Maritime 11,725,332 0.9
Real Asset Cash 45,516 0.0
Private Equity Composite 143,717,608 11.1 3.1 -2.9 1.9 -3.9 7.9 7.1 -
Burgiss All US PE (1-Qtr Lag) 8.0 3.6 8.0 4.8 11.8 10.8 -
AAVIN Mezzanine Credit Funds 29,917,721 2.3
FCP Capital 12,072,552 0.9
SPC Capital* 69,357,616 5.3
Stonetree Capital 30,826,649 2.4
Private Equity Cash 1,543,069 0.1
*SPC is currently being wound down by Hamilton Lane
Fiscal Year ends August 31.
181

OSERS
Asset Allocation & Performance
As of September 30, 2020
Allocation
MarketValue
($)%
Performance(%)
1Quarter
YTD FYTD1
Year3
Years5
Years10
Years
Real Estate Composite 132,385,444 10.2 1.2 -9.0 1.6 -8.5 -2.0 1.5 -
NCREIF Property Index 0.7 0.5 0.7 2.0 5.1 6.3 -
25 Capital Residential Mortgage Opp. Fund 11,133,226 0.9
Mariner IV 54,377,838 4.2
Almanac Realty Securities VI 3,167,231 0.2
Almanac Realty Securities VII 14,416,844 1.1
JPM Strategic 14,920,275 1.1
JP Morgan India Property Fund II 9,502,012 0.7
Mariner III 10,988,800 0.8
UBS Trumbull 13,415,351 1.0
Real Estate Cash 463,867 0.0
Fiscal Year ends August 31.
182

OSERS Private Markets Manager IRR Summary (Through 6/30/2020)
*Total Commitments include commitments to Real Estate funds that have already wound down.1 SPC is currently being wound down by Hamilton Lane
Private Equity Portfolio
InvestmentVintage
YearTotal
Commitments Quarter Inception
SPC I-IV1
2001 $163,958,323 8.14% 4.99%
FCP Fund II 2011 30,000,000 3.25% 8.28%
Stonetree IV 2012 53,152,755 -0.37% 4.43%
AAVIN Mezzanine Fund, LP 2014 5,000,000 6.59% 12.79%
AAVIN Equity Partners II, LP 2015 25,000,000 4.15% 11.34%
Total Private Equity Portfolio $277,111,078 5.08% 5.48%
Real Assets Portfolio
InvestmentVintage
YearTotal
Commitments Quarter Inception
BTG Pactual Timberland 2004 $25,000,000 -0.32% 1.20%
JP Morgan Maritime Global 2010 25,000,000 -12.66% -10.84%
Total Real Assets Portfolio $50,000,000 -10.49% -1.82%
Real Estate Portfolio
InvestmentVintage
YearTotal
Commitments Quarter Inception
UBS Trumbull Property Fund 1995 $33,615,067 -2.59% 10.41%JPMorgan Strategic Property Fund 1998 48,165,726 -2.26% 9.66%Almanac Realty Securities Fund VI, L.P. 2011 25,000,000 0.57% 9.42%Mariner Real Estate Partners III, L.P. 2011 50,000,000 -33.90% 7.76%25 Capital Residential Mortgage Opportunities Fund 2012 50,000,000 87.92% -0.30%JP Morgan India Property Fund II 2012 25,000,000 -1.27% -18.64%Mariner Real Estate Partners IV, L.P. 2014 60,000,000 3.81% 14.12%Almanac Realty Securities Fund VII, L.P. 2015 30,000,000 5.92% 13.33%Total Real Estate Portfolio $361,338,022 -0.33% 8.19%
183

Performance(%)
2019 2018 2017 2016 2015 2014 2013 2012 2011
OSERS 13.8 (89) -2.4 (25) 13.5 (85) 1.3 (100) -2.5 (-) 3.0 (-) 14.5 (-) 9.4 (-) 4.0 (-)
Policy Index 16.3 (63) -0.5 (11) 13.7 (83) 7.1 (61) -1.7 (-) 7.1 (-) 15.1 (-) 12.4 (-) 4.2 (-)
U.S. Equity Composite 30.3 (-) -5.5 (-) 20.5 (-) 7.2 (-) -3.2 (-) 5.7 (-) 36.2 (-) 13.7 (-) -1.8 (-)
Custom U.S. Equity Benchmark 30.9 (-) -5.3 (-) 18.0 (-) 18.5 (-) -3.5 (-) 7.2 (-) 36.3 (-) 16.7 (-) -2.5 (-)
BlackRock Russell 1000 Index 31.3 (35) -4.7 (42) - - - - - - -
Russell 1000 Index 31.4 (34) -4.8 (43) - - - - - - -
Dimensional Fund Advisors 21.6 (69) -12.3 (58) - - - - - - -
Russell 2000 Index* 25.5 (44) -11.0 (42) - - - - - - -
Global Equity Composite 25.5 (57) -9.9 (55) 23.1 (51) 7.0 (44) 1.9 (32) 3.6 (52) 21.7 (70) 18.1 (31) -1.8 (24)
Custom Global Equity Benchmark 26.4 (51) -10.1 (57) 24.1 (45) 7.9 (35) -2.4 (66) 4.2 (46) 22.8 (66) 15.0 (62) -4.7 (41)
Arrowstreet 22.4 (73) -6.9 (32) - - - - - - -
MSCI AC World IMI (Net) 26.4 (51) -10.1 (57) - - - - - - -
MFS 31.2 (22) -9.3 (49) - - - - - - -
MSCI All Country World IMI* 26.4 (51) -10.1 (57) - - - - - - -
Wellington Equity 22.8 (68) -13.9 (43) - - - - - - -
MSCI AC World Small Cap (Net) 24.7 (66) -14.4 (46) - - - - - - -
Dodge & Cox 23.9 -12.8 - - - - - - -
MSCI AC World IMI (Net) 26.4 -10.1 - - - - - - -
International Equity Composite 21.2 (56) -14.5 (39) - - - - - - -
MSCI AC World ex USA IMI (Net) 21.6 (52) -14.8 (41) - - - - - - -
BlackRock ACWI ex-U.S. IMI 21.9 -14.5 - - - - - - -
MSCI AC World ex USA IMI (Net) 21.6 -14.8 - - - - - - -
OSERS
Asset Allocation & Performance
As of September 30, 2020
Fiscal Year ends August 31.184
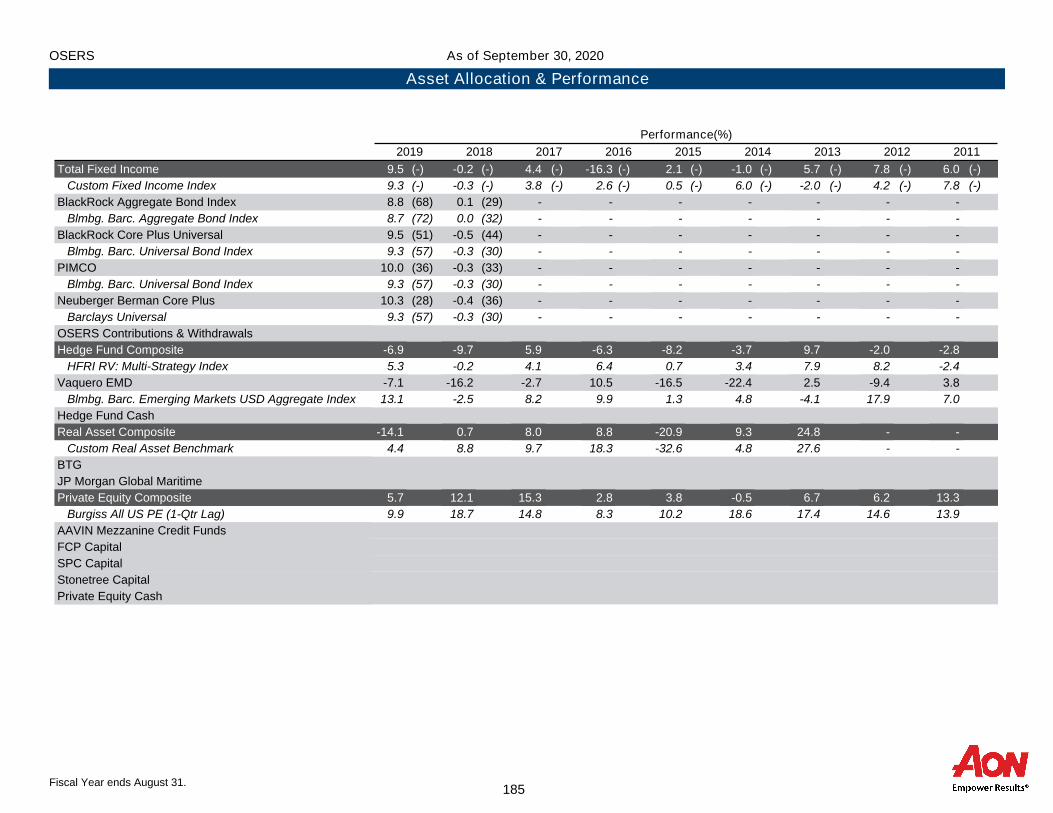
OSERS
Asset Allocation & Performance
As of September 30, 2020
Performance(%)
2019 2018 2017 2016 2015 2014 2013 2012 2011
Total Fixed Income 9.5 (-) -0.2 (-) 4.4 (-) -16.3 (-) 2.1 (-) -1.0 (-) 5.7 (-) 7.8 (-) 6.0 (-)
Custom Fixed Income Index 9.3 (-) -0.3 (-) 3.8 (-) 2.6 (-) 0.5 (-) 6.0 (-) -2.0 (-) 4.2 (-) 7.8 (-)
BlackRock Aggregate Bond Index 8.8 (68) 0.1 (29) - - - - - - -
Blmbg. Barc. Aggregate Bond Index 8.7 (72) 0.0 (32) - - - - - - -
BlackRock Core Plus Universal 9.5 (51) -0.5 (44) - - - - - - -
Blmbg. Barc. Universal Bond Index 9.3 (57) -0.3 (30) - - - - - - -
PIMCO 10.0 (36) -0.3 (33) - - - - - - -
Blmbg. Barc. Universal Bond Index 9.3 (57) -0.3 (30) - - - - - - -
Neuberger Berman Core Plus 10.3 (28) -0.4 (36) - - - - - - -
Barclays Universal 9.3 (57) -0.3 (30) - - - - - - -
OSERS Contributions & Withdrawals
Hedge Fund Composite -6.9 -9.7 5.9 -6.3 -8.2 -3.7 9.7 -2.0 -2.8
HFRI RV: Multi-Strategy Index 5.3 -0.2 4.1 6.4 0.7 3.4 7.9 8.2 -2.4
Vaquero EMD -7.1 -16.2 -2.7 10.5 -16.5 -22.4 2.5 -9.4 3.8
Blmbg. Barc. Emerging Markets USD Aggregate Index 13.1 -2.5 8.2 9.9 1.3 4.8 -4.1 17.9 7.0
Hedge Fund Cash
Real Asset Composite -14.1 0.7 8.0 8.8 -20.9 9.3 24.8 - -
Custom Real Asset Benchmark 4.4 8.8 9.7 18.3 -32.6 4.8 27.6 - -
BTG
JP Morgan Global Maritime
Private Equity Composite 5.7 12.1 15.3 2.8 3.8 -0.5 6.7 6.2 13.3
Burgiss All US PE (1-Qtr Lag) 9.9 18.7 14.8 8.3 10.2 18.6 17.4 14.6 13.9
AAVIN Mezzanine Credit Funds
FCP Capital
SPC Capital
Stonetree Capital
Private Equity Cash
Fiscal Year ends August 31.185
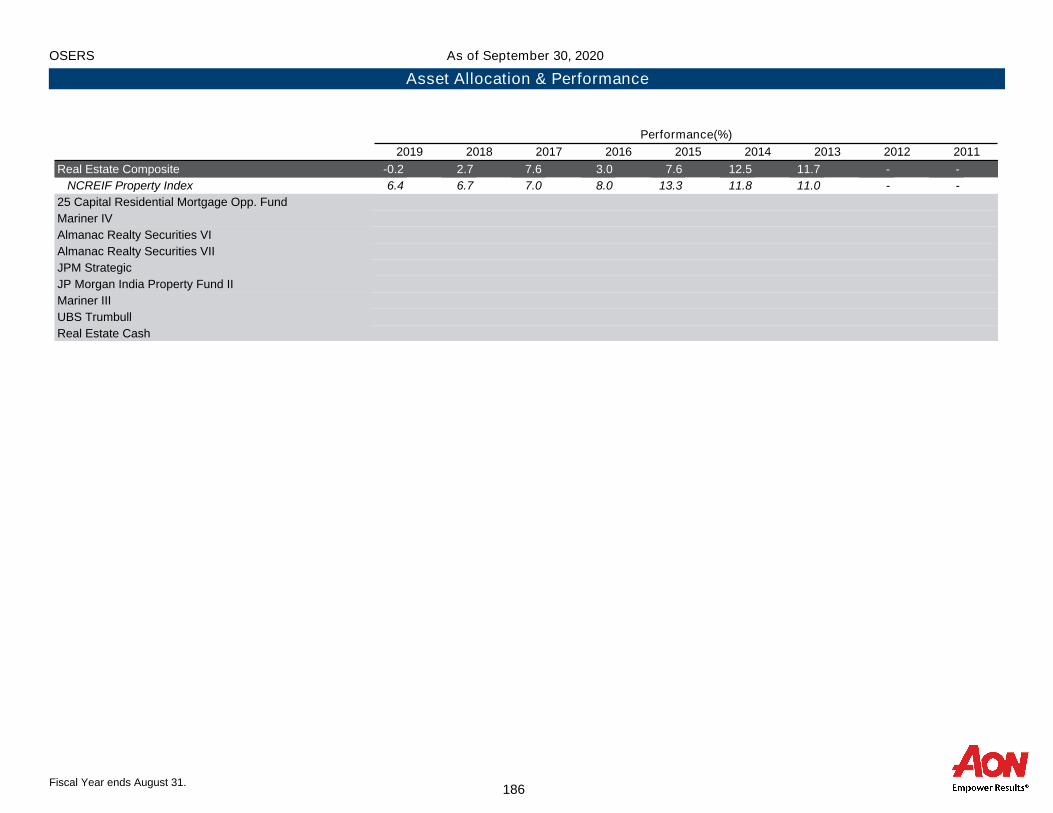
OSERS
Asset Allocation & Performance
As of September 30, 2020
Performance(%)
2019 2018 2017 2016 2015 2014 2013 2012 2011
Real Estate Composite -0.2 2.7 7.6 3.0 7.6 12.5 11.7 - -
NCREIF Property Index 6.4 6.7 7.0 8.0 13.3 11.8 11.0 - -
25 Capital Residential Mortgage Opp. Fund
Mariner IV
Almanac Realty Securities VI
Almanac Realty Securities VII
JPM Strategic
JP Morgan India Property Fund II
Mariner III
UBS Trumbull
Real Estate Cash
Fiscal Year ends August 31.186
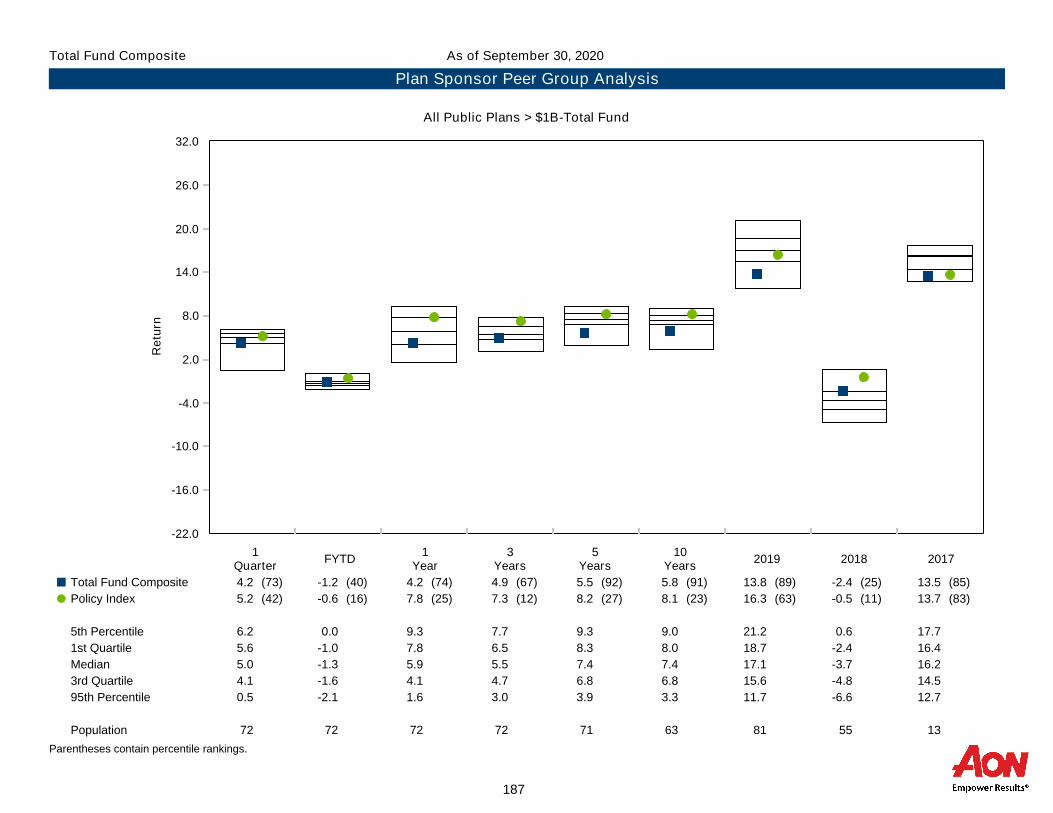
-22.0
-16.0
-10.0
-4.0
2.0
8.0
14.0
20.0
26.0
32.0R
etu
rn
1Quarter
FYTD1
Year3
Years5
Years10
Years2019 2018 2017
Total Fund Composite 4.2 (73) -1.2 (40) 4.2 (74) 4.9 (67) 5.5 (92) 5.8 (91) 13.8 (89) -2.4 (25) 13.5 (85)¢
Policy Index 5.2 (42) -0.6 (16) 7.8 (25) 7.3 (12) 8.2 (27) 8.1 (23) 16.3 (63) -0.5 (11) 13.7 (83)�
5th Percentile 6.2 0.0 9.3 7.7 9.3 9.0 21.2 0.6 17.7
1st Quartile 5.6 -1.0 7.8 6.5 8.3 8.0 18.7 -2.4 16.4
Median 5.0 -1.3 5.9 5.5 7.4 7.4 17.1 -3.7 16.2
3rd Quartile 4.1 -1.6 4.1 4.7 6.8 6.8 15.6 -4.8 14.5
95th Percentile 0.5 -2.1 1.6 3.0 3.9 3.3 11.7 -6.6 12.7
Population 72 72 72 72 71 63 81 55 13
Total Fund Composite
Plan Sponsor Peer Group Analysis
As of September 30, 2020
All Public Plans > $1B-Total Fund
Parentheses contain percentile rankings.
187
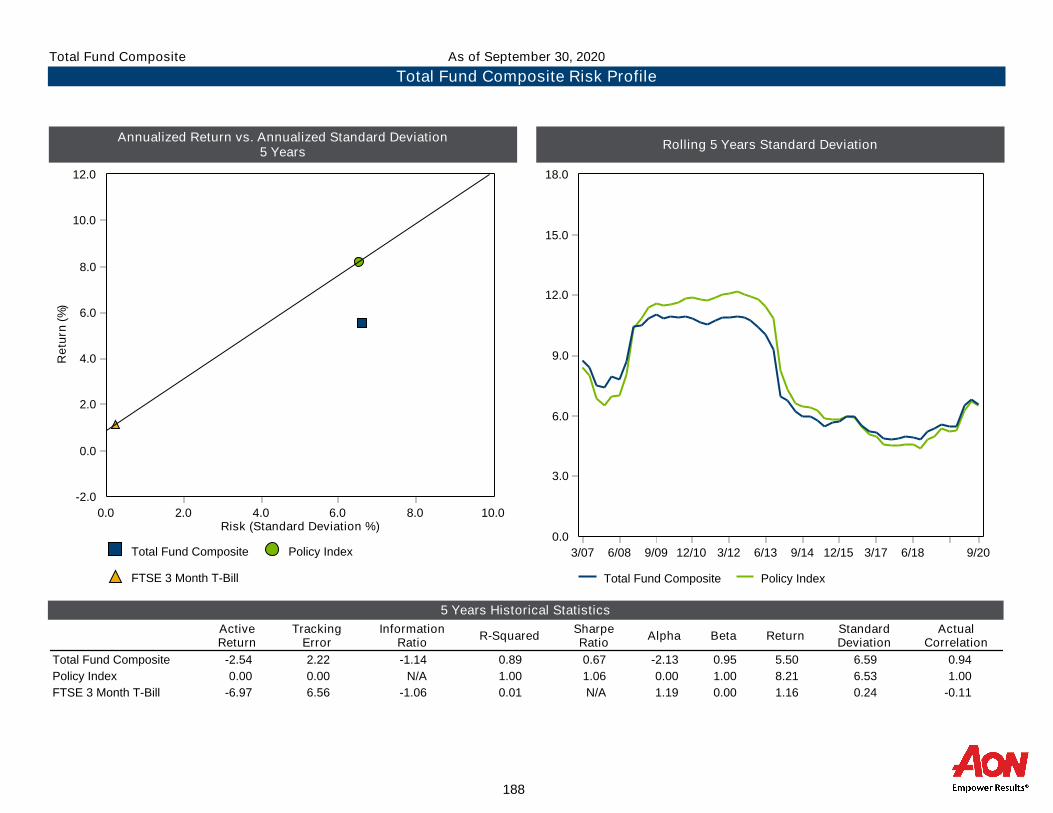
Annualized Return vs. Annualized Standard Deviation5 Years
Rolling 5 Years Standard Deviation
5 Years Historical Statistics
Total Fund Composite Policy Index
FTSE 3 Month T-Bill
-2.0
0.0
2.0
4.0
6.0
8.0
10.0
12.0
Re
turn
(%)
0.0 2.0 4.0 6.0 8.0 10.0Risk (Standard Deviation %)
Total Fund Composite Policy Index
0.0
3.0
6.0
9.0
12.0
15.0
18.0
3/07 6/08 9/09 12/10 3/12 6/13 9/14 12/15 3/17 6/18 9/20
ActiveReturn
TrackingError
InformationRatio
R-SquaredSharpeRatio
Alpha Beta ReturnStandardDeviation
ActualCorrelation
Total Fund Composite -2.54 2.22 -1.14 0.89 0.67 -2.13 0.95 5.50 6.59 0.94
Policy Index 0.00 0.00 N/A 1.00 1.06 0.00 1.00 8.21 6.53 1.00
FTSE 3 Month T-Bill -6.97 6.56 -1.06 0.01 N/A 1.19 0.00 1.16 0.24 -0.11
Total Fund Composite Risk Profile
As of September 30, 2020Total Fund Composite
188

Asset Class Performance
189

(This Page Left Blank Intentionally)
190

U.S. Equity Performance
191

Return Summary
Quarterly Excess Performance Ratio of Cumulative Wealth - 10 Years
Current Allocation
U.S. Equity Composite Custom U.S. Equity Index
0.0
8.0
16.0
24.0
-8.0
-16.0
Re
turn
1Quarter
YearTo
Date
FYTD 1Year
3Years
5Years
10Years
9.1
5.3
-3.7
14.8
11.513.5 12.8
9.0
4.6
-3.7
13.9
11.0 11.0 11.9
September 30, 2020 : $292M
Dimensional Fund Advisors:9.0%
BlackRock Russell 1000 Index:91.0%
U.S. Equity Composite Benchmark
0.84
0.91
0.98
1.05
1.12
1.19
9/10 9/11 9/12 9/13 9/14 9/15 9/16 9/17 9/18 9/19 9/20
0.92
Quarterly Out Performance Quarterly Under Performance
0.0%
4.0%
8.0%
-4.0 %
-8.0 %
-12.0 %
12/15 6/16 12/16 6/17 12/17 6/18 12/18 6/19 12/19 9/20
U.S. Equity Composite Portfolio Overview
As of September 30, 2020U.S. Equity Composite
192

-30.0
-20.0
-10.0
0.0
10.0
20.0
30.0
40.0
50.0
Re
turn
1Quarter
YearTo
DateFYTD
1Year
3Years
5Years
10Years
2019 2018 2017
U.S. Equity Composite 9.0 (20) 4.6 (25) -3.7 (69) 13.9 (22) 11.0 (27) 11.0 (79) 11.9 (78) 30.3 (40) -5.5 (41) 20.5 (42)¢
Custom U.S. Equity Index 9.1 (16) 5.3 (21) -3.7 (64) 14.8 (21) 11.5 (16) 13.5 (23) 12.8 (40) 30.9 (29) -5.3 (39) 18.0 (86)�
5th Percentile 9.8 7.5 -2.8 17.2 12.6 14.5 14.0 32.2 -3.1 23.5
1st Quartile 8.8 4.5 -3.3 13.7 11.2 13.2 13.2 31.2 -5.0 21.4
Median 8.1 2.6 -3.6 10.9 9.7 12.1 12.7 30.1 -5.9 20.2
3rd Quartile 7.5 0.2 -3.8 8.5 8.6 11.1 12.1 27.7 -6.9 18.6
95th Percentile 6.3 -6.1 -4.8 1.2 4.8 7.8 9.9 25.0 -9.2 16.6
Population 56 53 56 52 48 46 31 52 53 58
U.S. Equity Composite
Plan Sponsor Peer Group Analysis
As of September 30, 2020
All Public Plans > $1B-US Equity Segment
Parentheses contain percentile rankings.
193

Annualized Return vs. Annualized Standard Deviation5 Years
Rolling 5 Years Standard Deviation
5 Years Historical Statistics
U.S. Equity Composite Custom U.S. Equity Index
FTSE 3 Month T-Bill
-4.0
0.0
4.0
8.0
12.0
16.0
20.0
Re
turn
(%)
0.0 4.0 8.0 12.0 16.0 20.0 24.0Risk (Standard Deviation %)
U.S. Equity Composite Custom U.S. Equity Index
0.0
5.0
10.0
15.0
20.0
25.0
30.0
35.0
12/05 6/07 12/08 6/10 12/11 6/13 12/14 6/16 12/17 6/19 9/20
ActiveReturn
TrackingError
InformationRatio
R-SquaredSharpeRatio
Alpha Beta ReturnStandardDeviation
ActualCorrelation
U.S. Equity Composite -2.40 2.49 -0.97 0.98 0.67 -1.79 0.96 10.96 15.62 0.99
Custom U.S. Equity Index 0.00 0.00 N/A 1.00 0.80 0.00 1.00 13.55 16.13 1.00
FTSE 3 Month T-Bill -12.91 16.16 -0.80 0.02 N/A 1.18 0.00 1.16 0.24 -0.12
U.S. Equity Composite Risk Profile
As of September 30, 2020U.S. Equity Composite
194
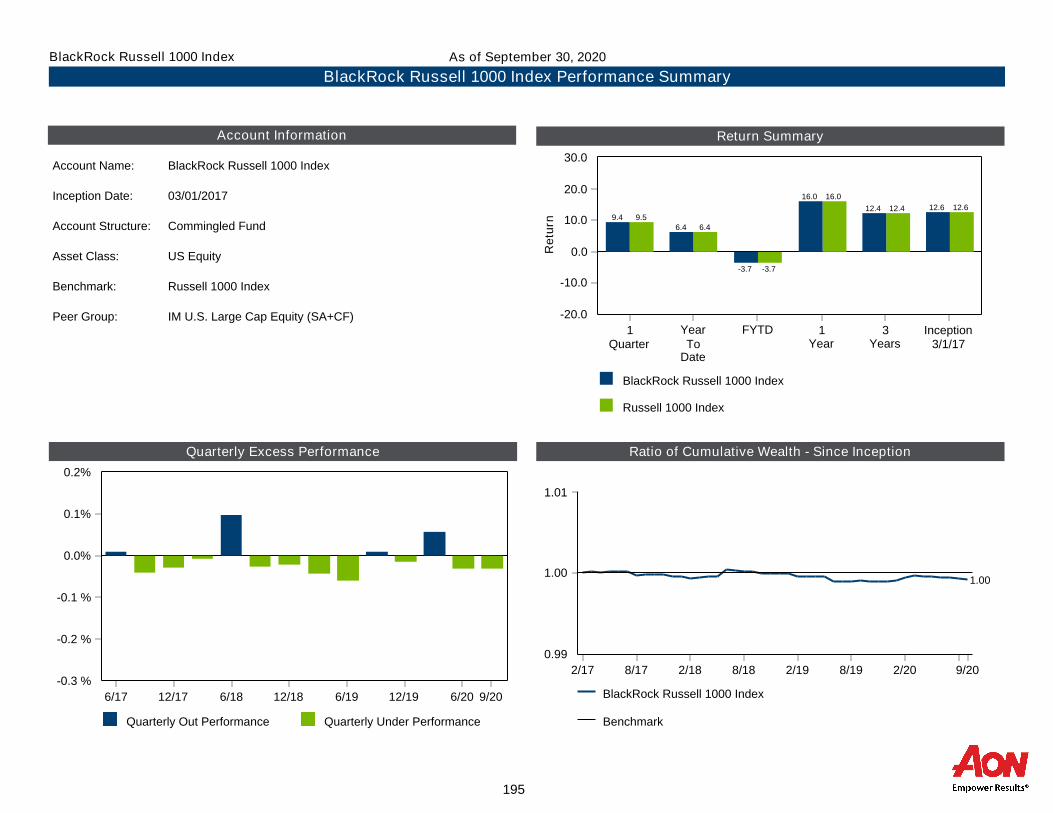
Return Summary
Quarterly Excess Performance Ratio of Cumulative Wealth - Since Inception
Account Information
BlackRock Russell 1000 Index
Russell 1000 Index
0.0
10.0
20.0
30.0
-10.0
-20.0
Re
turn
1Quarter
YearTo
Date
FYTD 1Year
3Years
Inception3/1/17
9.56.4
-3.7
16.0
12.4 12.69.4
6.4
-3.7
16.0
12.4 12.6
Account Name: BlackRock Russell 1000 Index
Inception Date: 03/01/2017
Account Structure: Commingled Fund
Asset Class: US Equity
Benchmark: Russell 1000 Index
Peer Group: IM U.S. Large Cap Equity (SA+CF)
Quarterly Out Performance Quarterly Under Performance
0.0%
0.1%
0.2%
-0.1 %
-0.2 %
-0.3 %
6/17 12/17 6/18 12/18 6/19 12/19 6/20 9/20 BlackRock Russell 1000 Index
Benchmark
0.99
1.00
1.01
2/17 8/17 2/18 8/18 2/19 8/19 2/20 9/20
1.00
BlackRock Russell 1000 Index Performance Summary
As of September 30, 2020BlackRock Russell 1000 Index
195
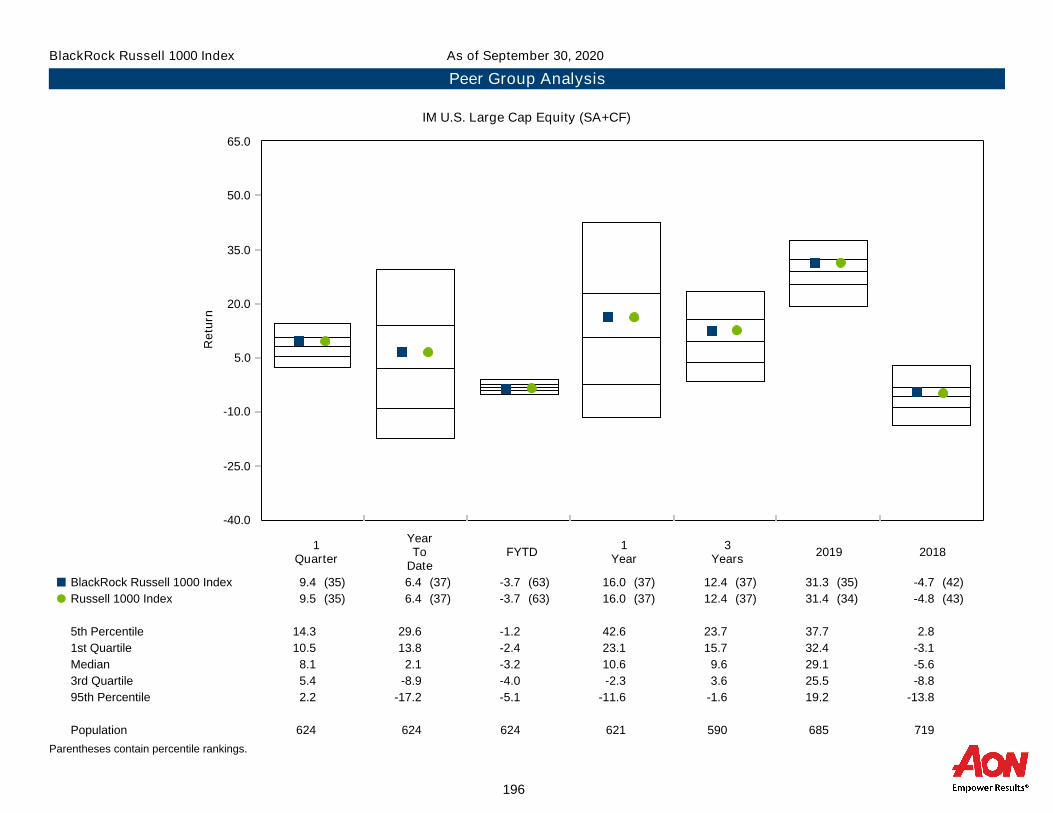
-40.0
-25.0
-10.0
5.0
20.0
35.0
50.0
65.0
Re
turn
1Quarter
YearTo
DateFYTD
1Year
3Years
2019 2018
BlackRock Russell 1000 Index 9.4 (35) 6.4 (37) -3.7 (63) 16.0 (37) 12.4 (37) 31.3 (35) -4.7 (42)¢
Russell 1000 Index 9.5 (35) 6.4 (37) -3.7 (63) 16.0 (37) 12.4 (37) 31.4 (34) -4.8 (43)�
5th Percentile 14.3 29.6 -1.2 42.6 23.7 37.7 2.8
1st Quartile 10.5 13.8 -2.4 23.1 15.7 32.4 -3.1
Median 8.1 2.1 -3.2 10.6 9.6 29.1 -5.6
3rd Quartile 5.4 -8.9 -4.0 -2.3 3.6 25.5 -8.8
95th Percentile 2.2 -17.2 -5.1 -11.6 -1.6 19.2 -13.8
Population 624 624 624 621 590 685 719
BlackRock Russell 1000 Index
Peer Group Analysis
As of September 30, 2020
IM U.S. Large Cap Equity (SA+CF)
Parentheses contain percentile rankings.
196
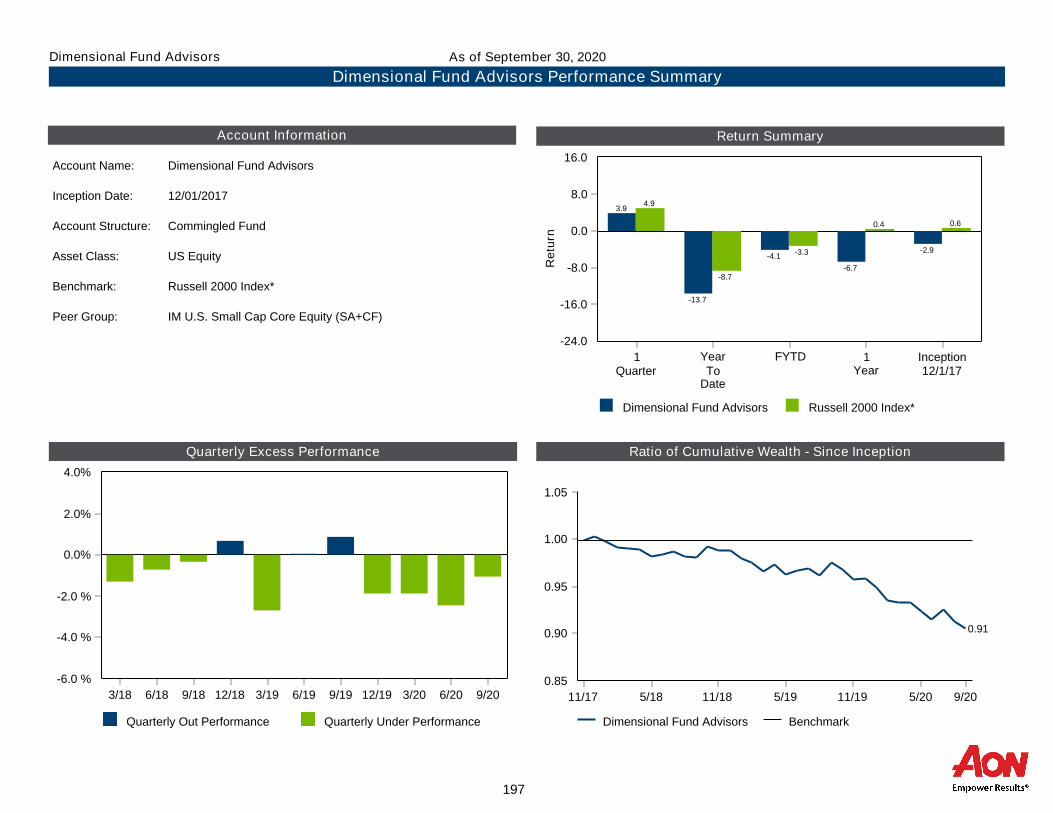
Return Summary
Quarterly Excess Performance Ratio of Cumulative Wealth - Since Inception
Account Information
Dimensional Fund Advisors Russell 2000 Index*
0.0
8.0
16.0
-8.0
-16.0
-24.0
Re
turn
1Quarter
YearTo
Date
FYTD 1Year
Inception12/1/17
4.9
-8.7
-3.3
0.4 0.6
3.9
-13.7
-4.1
-6.7
-2.9
Account Name: Dimensional Fund Advisors
Inception Date: 12/01/2017
Account Structure: Commingled Fund
Asset Class: US Equity
Benchmark: Russell 2000 Index*
Peer Group: IM U.S. Small Cap Core Equity (SA+CF)
Quarterly Out Performance Quarterly Under Performance
0.0%
2.0%
4.0%
-2.0 %
-4.0 %
-6.0 %
3/18 6/18 9/18 12/18 3/19 6/19 9/19 12/19 3/20 6/20 9/20
Dimensional Fund Advisors Benchmark
0.85
0.90
0.95
1.00
1.05
11/17 5/18 11/18 5/19 11/19 5/20 9/20
0.91
Dimensional Fund Advisors Performance Summary
As of September 30, 2020Dimensional Fund Advisors
197

-40.0
-25.0
-10.0
5.0
20.0
35.0
50.0
65.0
Re
turn
1Quarter
YearTo
DateFYTD
1Year
2019 2018
Dimensional Fund Advisors 3.9 (66) -13.7 (72) -4.1 (62) -6.7 (73) 21.6 (69) -12.3 (58)¢
Russell 2000 Index* 4.9 (51) -8.7 (46) -3.3 (43) 0.4 (42) 25.5 (44) -11.0 (42)�
5th Percentile 11.2 5.1 -0.7 14.7 33.3 -1.7
1st Quartile 6.6 -2.9 -2.5 5.1 27.2 -7.9
Median 4.9 -9.5 -3.5 -2.4 24.5 -11.7
3rd Quartile 3.1 -14.4 -4.4 -6.9 20.2 -14.0
95th Percentile 1.5 -18.6 -5.1 -10.0 16.2 -18.0
Population 81 81 81 81 88 94
Dimensional Fund Advisors
Peer Group Analysis
As of September 30, 2020
IM U.S. Small Cap Core Equity (SA+CF)
Parentheses contain percentile rankings.
198

(This Page Left Blank Intentionally)
199

Global Equity Performance
200

Return Summary
Quarterly Excess Performance Ratio of Cumulative Wealth - 10 Years
Current Allocation
Global Equity Composite Custom Global Equity Index
0.0
8.0
16.0
-8.0
-16.0
Re
turn
1Quarter
YearTo
Date
FYTD 1Year
3Years
5Years
10Years
8.1
0.5
-3.1
9.6
6.5
9.98.5
6.6
-4.3-2.8
4.0 4.3
8.5 8.6
September 30, 2020 : $211M
Wellington Equity:11.3%
Arrowstreet:33.9%
MFS:31.6%
Dodge & Cox:23.2%
Global Equity Composite Benchmark
0.96
1.04
1.12
1.20
9/10 9/11 9/12 9/13 9/14 9/15 9/16 9/17 9/18 9/19 9/20
1.01
Quarterly Out Performance Quarterly Under Performance
0.0%
3.0%
6.0%
-3.0 %
-6.0 %
12/15 6/16 12/16 6/17 12/17 6/18 12/18 6/19 12/19 9/20
Global Equity Composite Portfolio Overview
As of September 30, 2020Global Equity Composite
201
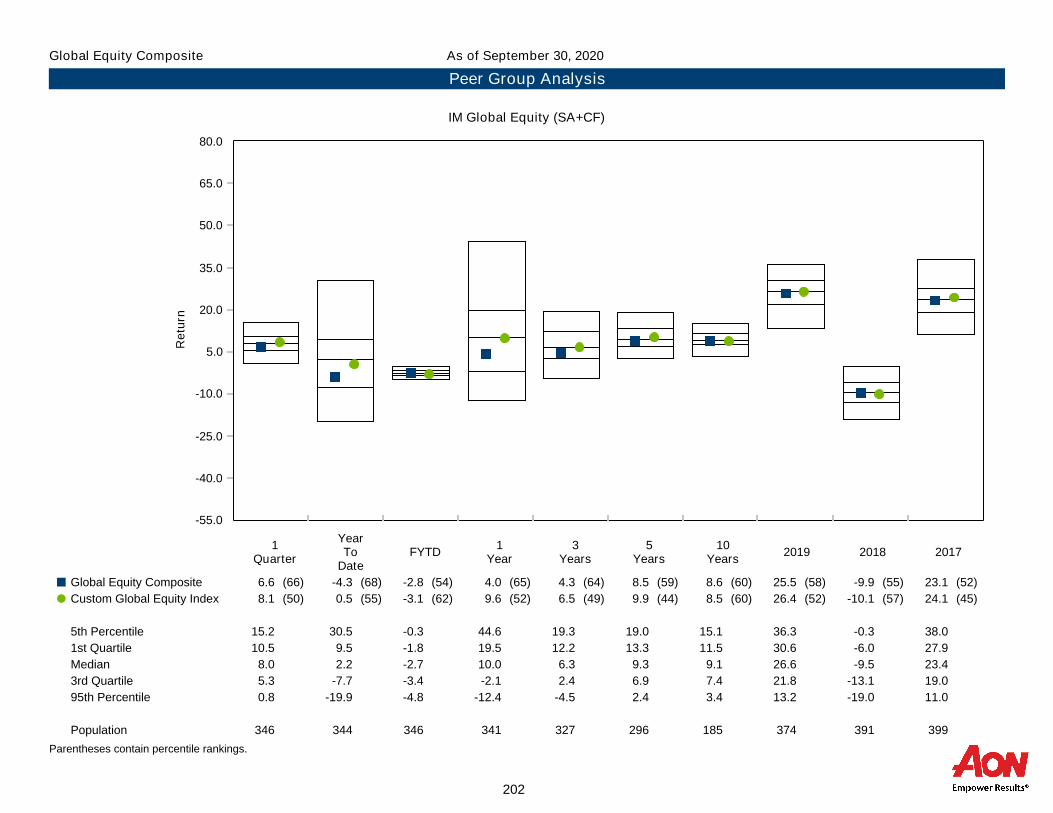
-55.0
-40.0
-25.0
-10.0
5.0
20.0
35.0
50.0
65.0
80.0
Re
turn
1Quarter
YearTo
DateFYTD
1Year
3Years
5Years
10Years
2019 2018 2017
Global Equity Composite 6.6 (66) -4.3 (68) -2.8 (54) 4.0 (65) 4.3 (64) 8.5 (59) 8.6 (60) 25.5 (58) -9.9 (55) 23.1 (52)¢
Custom Global Equity Index 8.1 (50) 0.5 (55) -3.1 (62) 9.6 (52) 6.5 (49) 9.9 (44) 8.5 (60) 26.4 (52) -10.1 (57) 24.1 (45)�
5th Percentile 15.2 30.5 -0.3 44.6 19.3 19.0 15.1 36.3 -0.3 38.0
1st Quartile 10.5 9.5 -1.8 19.5 12.2 13.3 11.5 30.6 -6.0 27.9
Median 8.0 2.2 -2.7 10.0 6.3 9.3 9.1 26.6 -9.5 23.4
3rd Quartile 5.3 -7.7 -3.4 -2.1 2.4 6.9 7.4 21.8 -13.1 19.0
95th Percentile 0.8 -19.9 -4.8 -12.4 -4.5 2.4 3.4 13.2 -19.0 11.0
Population 346 344 346 341 327 296 185 374 391 399
Global Equity Composite
Peer Group Analysis
As of September 30, 2020
IM Global Equity (SA+CF)
Parentheses contain percentile rankings.
202
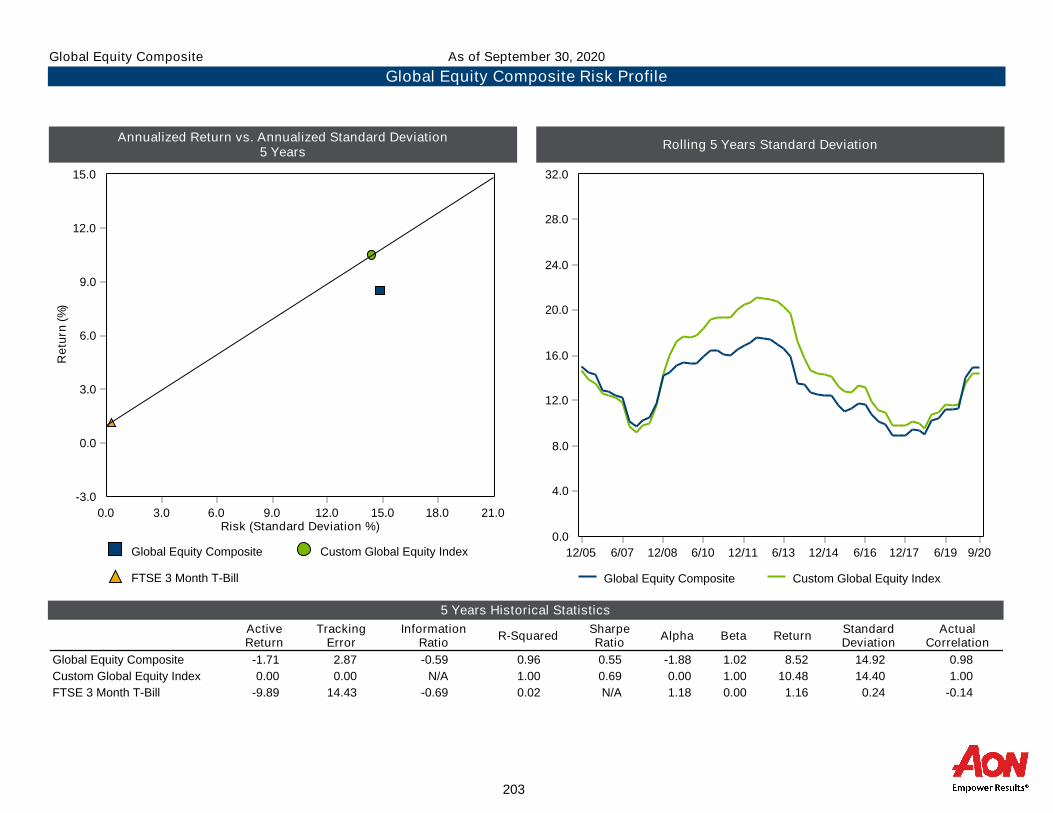
Annualized Return vs. Annualized Standard Deviation5 Years
Rolling 5 Years Standard Deviation
5 Years Historical Statistics
Global Equity Composite Custom Global Equity Index
FTSE 3 Month T-Bill
-3.0
0.0
3.0
6.0
9.0
12.0
15.0
Re
turn
(%)
0.0 3.0 6.0 9.0 12.0 15.0 18.0 21.0Risk (Standard Deviation %)
Global Equity Composite Custom Global Equity Index
0.0
4.0
8.0
12.0
16.0
20.0
24.0
28.0
32.0
12/05 6/07 12/08 6/10 12/11 6/13 12/14 6/16 12/17 6/19 9/20
ActiveReturn
TrackingError
InformationRatio
R-SquaredSharpeRatio
Alpha Beta ReturnStandardDeviation
ActualCorrelation
Global Equity Composite -1.71 2.87 -0.59 0.96 0.55 -1.88 1.02 8.52 14.92 0.98
Custom Global Equity Index 0.00 0.00 N/A 1.00 0.69 0.00 1.00 10.48 14.40 1.00
FTSE 3 Month T-Bill -9.89 14.43 -0.69 0.02 N/A 1.18 0.00 1.16 0.24 -0.14
Global Equity Composite Risk Profile
As of September 30, 2020Global Equity Composite
203

Return Summary
Quarterly Excess Performance Ratio of Cumulative Wealth - Since Inception
Account Information
Arrowstreet MSCI AC World IMI (Net)
0.0
8.0
16.0
24.0
-8.0
-16.0
Re
turn
1Quarter
YearTo
Date
FYTD 1Year
3Years
Inception4/1/17
8.1
0.5
-3.1
9.6
6.58.4
7.4
2.2
-2.6
11.2
7.39.3
Account Name: Arrowstreet
Inception Date: 04/01/2017
Account Structure: Separate Account
Asset Class: Global Equity
Benchmark: MSCI AC World IMI (Net)
Peer Group: IM Global Equity (SA+CF)
Quarterly Out Performance Quarterly Under Performance
0.0%
2.0%
4.0%
6.0%
-2.0 %
-4.0 %
6/17 12/17 6/18 12/18 6/19 12/19 6/20 9/20
Arrowstreet Benchmark
0.96
0.99
1.02
1.05
1.08
3/17 9/17 3/18 9/18 3/19 9/19 3/20 9/20
1.03
Arrowstreet Performance Summary
As of September 30, 2020Arrowstreet
204
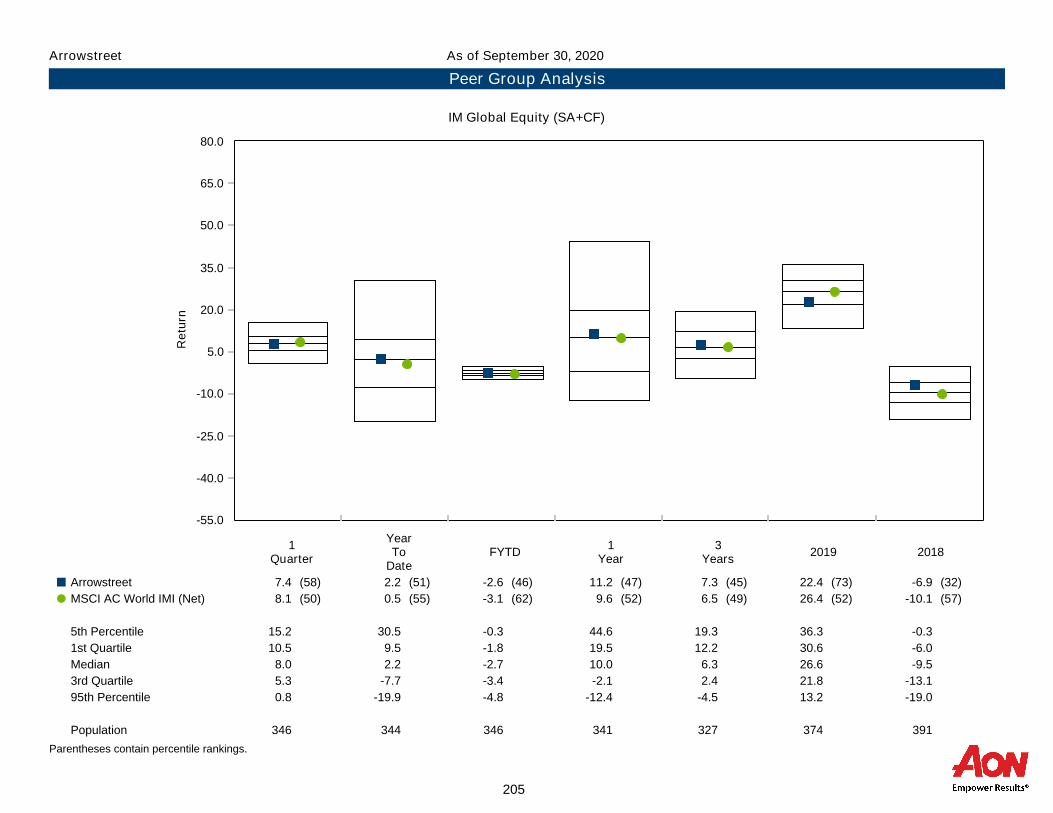
-55.0
-40.0
-25.0
-10.0
5.0
20.0
35.0
50.0
65.0
80.0
Re
turn
1Quarter
YearTo
DateFYTD
1Year
3Years
2019 2018
Arrowstreet 7.4 (58) 2.2 (51) -2.6 (46) 11.2 (47) 7.3 (45) 22.4 (73) -6.9 (32)¢
MSCI AC World IMI (Net) 8.1 (50) 0.5 (55) -3.1 (62) 9.6 (52) 6.5 (49) 26.4 (52) -10.1 (57)�
5th Percentile 15.2 30.5 -0.3 44.6 19.3 36.3 -0.3
1st Quartile 10.5 9.5 -1.8 19.5 12.2 30.6 -6.0
Median 8.0 2.2 -2.7 10.0 6.3 26.6 -9.5
3rd Quartile 5.3 -7.7 -3.4 -2.1 2.4 21.8 -13.1
95th Percentile 0.8 -19.9 -4.8 -12.4 -4.5 13.2 -19.0
Population 346 344 346 341 327 374 391
Arrowstreet
Peer Group Analysis
As of September 30, 2020
IM Global Equity (SA+CF)
Parentheses contain percentile rankings.
205

Return Summary
Quarterly Excess Performance Ratio of Cumulative Wealth - Since Inception
Account Information
MFS MSCI All Country World IMI*
0.0
6.0
12.0
18.0
-6.0
-12.0
Re
turn
1Quarter
YearTo
Date
FYTD 1Year
3Years
Inception4/1/17
8.1
0.5
-3.1
9.6
6.5
8.48.5
-0.5-1.8
6.9 7.3
9.3
Account Name: MFS
Inception Date: 04/01/2017
Account Structure: Separate Account
Asset Class: Global Equity
Benchmark: MSCI All Country World IMI*
Peer Group: IM Global Equity (SA+CF)
Quarterly Out Performance Quarterly Under Performance
0.0%
3.0%
6.0%
-3.0 %
-6.0 %
6/17 12/17 6/18 12/18 6/19 12/19 6/20 9/20
MFS Benchmark
0.90
0.95
1.00
1.05
1.10
1.15
3/17 9/17 3/18 9/18 3/19 9/19 3/20 9/20
1.03
MFS Performance Summary
As of September 30, 2020MFS
206

-55.0
-40.0
-25.0
-10.0
5.0
20.0
35.0
50.0
65.0
80.0
Re
turn
1Quarter
YearTo
DateFYTD
1Year
3Years
2019 2018
MFS 8.5 (45) -0.5 (58) -1.8 (24) 6.9 (59) 7.3 (44) 31.2 (22) -9.3 (49)¢
MSCI All Country World IMI* 8.1 (50) 0.5 (55) -3.1 (62) 9.6 (52) 6.5 (49) 26.4 (52) -10.1 (57)�
5th Percentile 15.2 30.5 -0.3 44.6 19.3 36.3 -0.3
1st Quartile 10.5 9.5 -1.8 19.5 12.2 30.6 -6.0
Median 8.0 2.2 -2.7 10.0 6.3 26.6 -9.5
3rd Quartile 5.3 -7.7 -3.4 -2.1 2.4 21.8 -13.1
95th Percentile 0.8 -19.9 -4.8 -12.4 -4.5 13.2 -19.0
Population 346 344 346 341 327 374 391
MFS
Peer Group Analysis
As of September 30, 2020
IM Global Equity (SA+CF)
Parentheses contain percentile rankings.
207
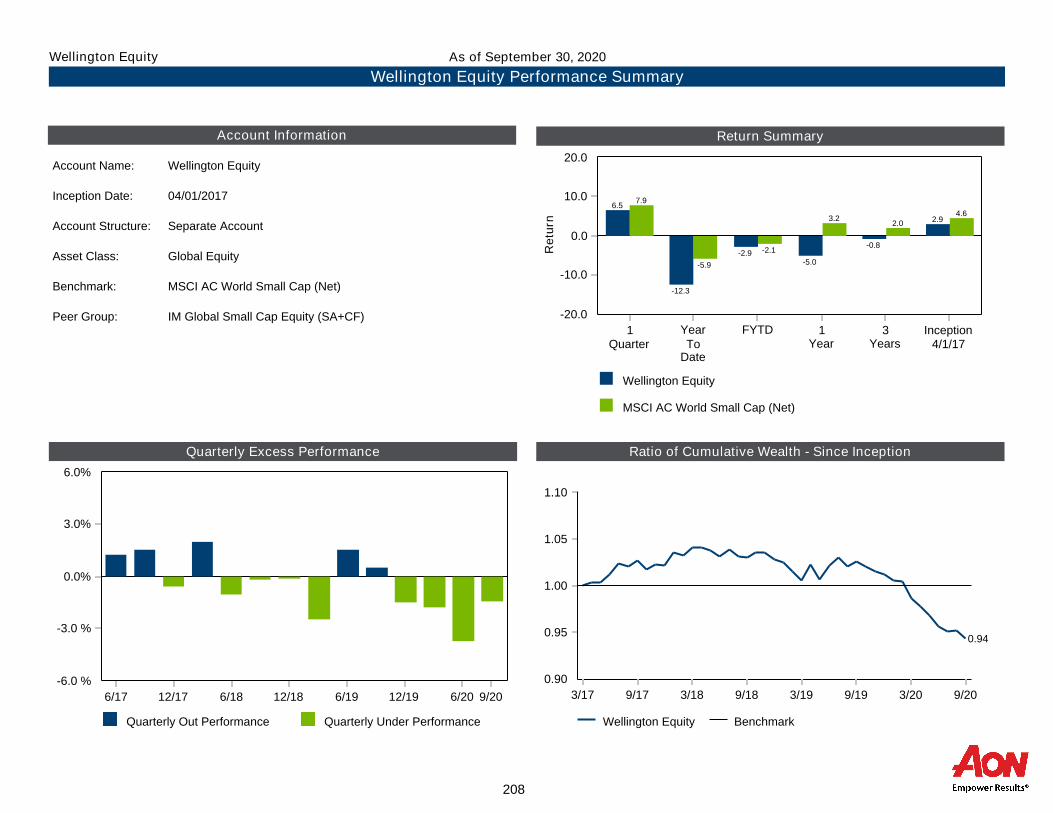
Return Summary
Quarterly Excess Performance Ratio of Cumulative Wealth - Since Inception
Account Information
Wellington Equity
MSCI AC World Small Cap (Net)
0.0
10.0
20.0
-10.0
-20.0
Re
turn
1Quarter
YearTo
Date
FYTD 1Year
3Years
Inception4/1/17
7.9
-5.9
-2.1
3.22.0
4.66.5
-12.3
-2.9-5.0
-0.8
2.9
Account Name: Wellington Equity
Inception Date: 04/01/2017
Account Structure: Separate Account
Asset Class: Global Equity
Benchmark: MSCI AC World Small Cap (Net)
Peer Group: IM Global Small Cap Equity (SA+CF)
Quarterly Out Performance Quarterly Under Performance
0.0%
3.0%
6.0%
-3.0 %
-6.0 %
6/17 12/17 6/18 12/18 6/19 12/19 6/20 9/20
Wellington Equity Benchmark
0.90
0.95
1.00
1.05
1.10
3/17 9/17 3/18 9/18 3/19 9/19 3/20 9/20
0.94
Wellington Equity Performance Summary
As of September 30, 2020Wellington Equity
208
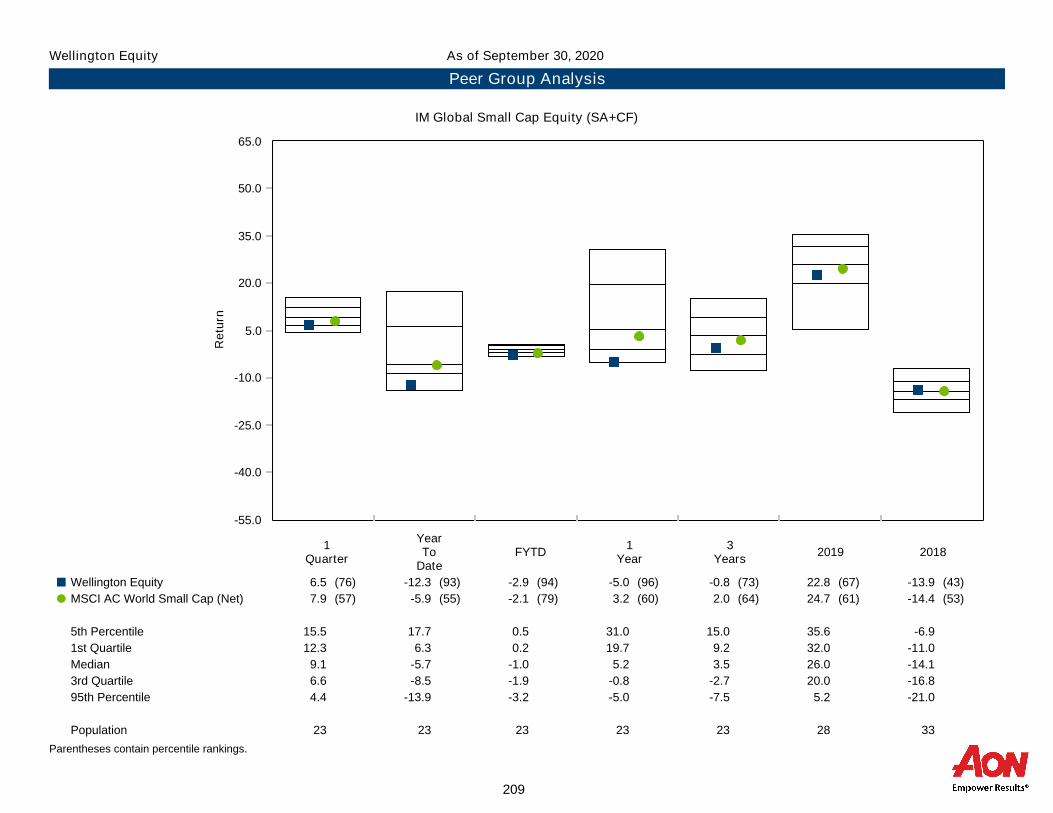
-55.0
-40.0
-25.0
-10.0
5.0
20.0
35.0
50.0
65.0
Re
turn
1Quarter
YearTo
DateFYTD
1Year
3Years
2019 2018
Wellington Equity 6.5 (76) -12.3 (93) -2.9 (94) -5.0 (96) -0.8 (73) 22.8 (67) -13.9 (43)¢
MSCI AC World Small Cap (Net) 7.9 (57) -5.9 (55) -2.1 (79) 3.2 (60) 2.0 (64) 24.7 (61) -14.4 (53)�
5th Percentile 15.5 17.7 0.5 31.0 15.0 35.6 -6.9
1st Quartile 12.3 6.3 0.2 19.7 9.2 32.0 -11.0
Median 9.1 -5.7 -1.0 5.2 3.5 26.0 -14.1
3rd Quartile 6.6 -8.5 -1.9 -0.8 -2.7 20.0 -16.8
95th Percentile 4.4 -13.9 -3.2 -5.0 -7.5 5.2 -21.0
Population 23 23 23 23 23 28 33
Wellington Equity
Peer Group Analysis
As of September 30, 2020
IM Global Small Cap Equity (SA+CF)
Parentheses contain percentile rankings.
209

Return Summary
Quarterly Excess Performance Ratio of Cumulative Wealth - Since Inception
Account Information
Dodge & Cox MSCI AC World IMI (Net)
0.0
15.0
30.0
-15.0
-30.0
Re
turn
1Quarter
YearTo
Date
FYTD 1Year
3Years
Inception7/1/17
8.1
0.5
-3.1
9.66.5 7.7
2.9
-14.6
-4.4 -5.4
-1.5
0.4
Account Name: Dodge & Cox
Inception Date: 07/01/2017
Account Structure: Mutual Fund
Asset Class: Global Equity
Benchmark: MSCI AC World IMI (Net)
Peer Group: IM Global Equity (MF)
Quarterly Out Performance Quarterly Under Performance
0.0%
5.0%
10.0%
-5.0 %
-10.0 %
-15.0 %
9/17 3/18 9/18 3/19 9/19 3/20 9/20
Dodge & Cox Benchmark
0.70
0.80
0.90
1.00
1.10
6/17 12/17 6/18 12/18 6/19 12/19 6/20 9/20
0.80
Dodge & Cox Performance Summary
As of September 30, 2020Dodge & Cox
210

-60.0
-40.0
-20.0
0.0
20.0
40.0
60.0
80.0
Re
turn
1Quarter
YearTo
DateFYTD
1Year
3Years
2019 2018
Dodge & Cox 2.9 (78) -14.6 (84) -4.4 (89) -5.4 (76) -1.7 (83) 23.9 (61) -12.8 (69)¢
MSCI AC World IMI (Net) 8.1 (36) 0.5 (43) -3.1 (66) 9.6 (43) 6.5 (40) 26.4 (46) -10.1 (53)�
5th Percentile 15.1 38.9 0.2 53.0 20.3 36.5 -0.8
1st Quartile 9.3 7.3 -1.7 18.4 10.0 29.4 -6.6
Median 6.8 -2.3 -2.6 5.7 4.4 25.6 -9.7
3rd Quartile 3.3 -10.7 -3.5 -5.3 0.1 20.4 -13.7
95th Percentile -1.0 -23.8 -6.2 -18.7 -9.8 10.1 -23.4
Population 306 306 306 306 306 324 349
Dodge & Cox
Peer Group Analysis
As of September 30, 2020
IM Global Equity (MF)
Parentheses contain percentile rankings.
211

International Equity Performance
212
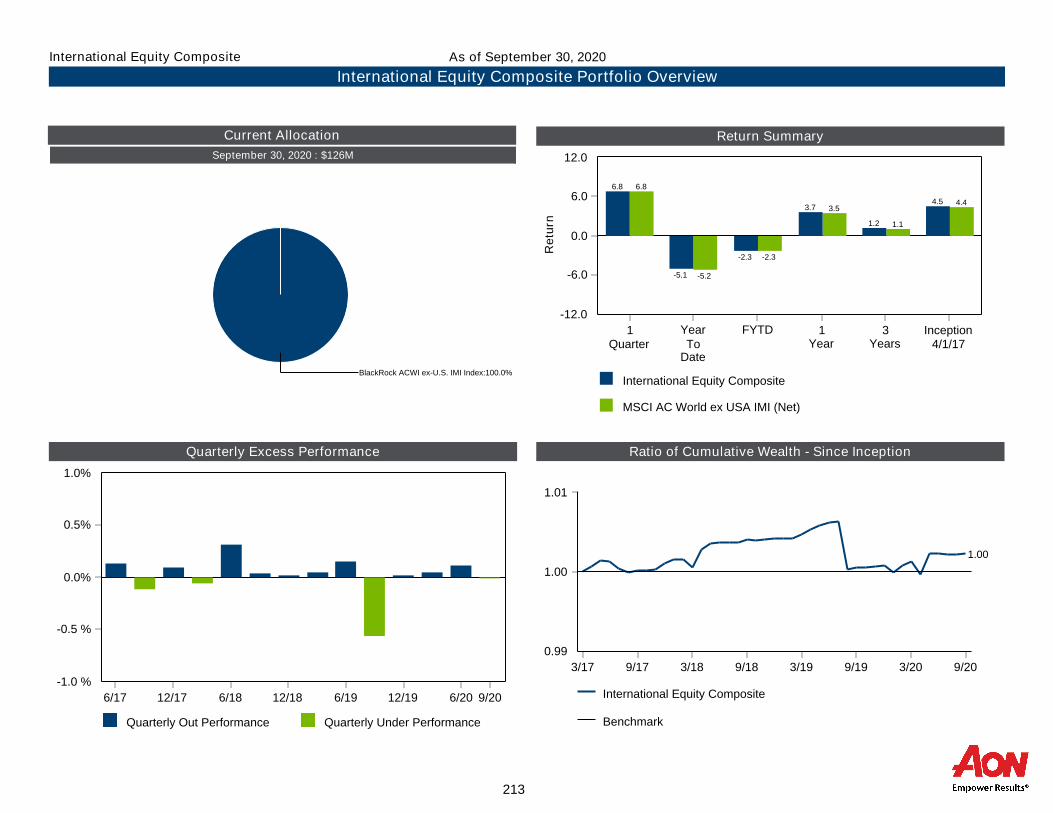
Return Summary
Quarterly Excess Performance Ratio of Cumulative Wealth - Since Inception
Current Allocation
International Equity Composite
MSCI AC World ex USA IMI (Net)
0.0
6.0
12.0
-6.0
-12.0
Re
turn
1Quarter
YearTo
Date
FYTD 1Year
3Years
Inception4/1/17
6.8
-5.2
-2.3
3.5
1.1
4.4
6.8
-5.1
-2.3
3.7
1.2
4.5
September 30, 2020 : $126M
BlackRock ACWI ex-U.S. IMI Index:100.0%
International Equity Composite
Benchmark
0.99
1.00
1.01
3/17 9/17 3/18 9/18 3/19 9/19 3/20 9/20
1.00
Quarterly Out Performance Quarterly Under Performance
0.0%
0.5%
1.0%
-0.5 %
-1.0 %
6/17 12/17 6/18 12/18 6/19 12/19 6/20 9/20
International Equity Composite Portfolio Overview
As of September 30, 2020International Equity Composite
213

Return Summary
Quarterly Excess Performance Ratio of Cumulative Wealth - Since Inception
Account Information
BlackRock ACWI ex-U.S. IMI Index
MSCI AC World ex USA IMI (Net)
0.0
6.0
12.0
-6.0
-12.0
Re
turn
1Quarter
YearTo
Date
FYTD 1Year
Inception12/1/17
6.8
-5.2
-2.3
3.5
0.2
6.8
-5.1
-2.3
3.7
0.7
Account Name: BlackRock ACWI ex-U.S. IMI Index
Inception Date: 12/01/2017
Account Structure: Commingled Fund
Asset Class: International Equity
Benchmark: MSCI AC World ex USA IMI (Net)
Peer Group:
Quarterly Out Performance Quarterly Under Performance
0.0%
0.1%
0.2%
-0.1 %
-0.2 %
12/19 3/20 6/20 9/20 BlackRock ACWI ex-U.S. IMI Index
Benchmark
0.99
1.00
1.01
1.02
11/17 5/18 11/18 5/19 11/19 5/20 9/20
1.01
BlackRock ACWI ex-U.S. IMI Index Performance Summary
As of September 30, 2020BlackRock ACWI ex-U.S. IMI Index
214

Fixed Income Performance
215

Return Summary
Quarterly Excess Performance Ratio of Cumulative Wealth - 5 Years
Current Allocation
Total Fixed Income Custom Fixed Income Index
0.0
4.0
8.0
12.0
-4.0
Re
turn
1Quarter
YearTo
Date
FYTD 1Year
3Years
5Years
Inception12/1/10
1.0
6.2
-0.2
6.7
5.1
4.23.7
1.2
6.9
-0.1
7.3
5.5
0.5
2.3
September 30, 2020 : $374M
OSERS Cont/Withdr:0.3%
BlackRock Aggregate Bond Index:42.6%
Neuberger Berman Core Plus:20.4%
PIMCO:21.3%
BlackRock Core Plus Universal:15.4%
Total Fixed Income Benchmark
0.72
0.81
0.90
0.99
1.08
1.17
9/15 3/16 9/16 3/17 9/17 3/18 9/18 3/19 9/19 3/20 9/20
0.83
Quarterly Out Performance Quarterly Under Performance
0.0%
8.0%
-8.0 %
-16.0 %
-24.0 %
12/15 6/16 12/16 6/17 12/17 6/18 12/18 6/19 12/19 9/20
Total Fixed Income Portfolio Overview
As of September 30, 2020Total Fixed Income
216
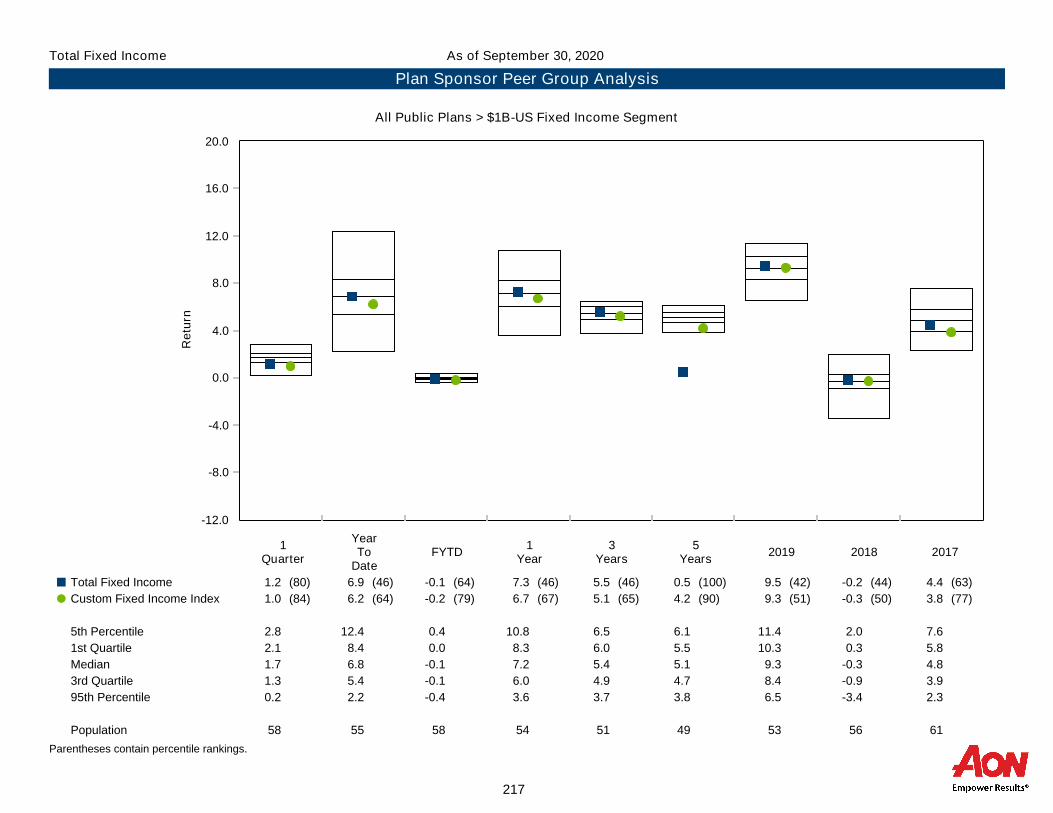
-12.0
-8.0
-4.0
0.0
4.0
8.0
12.0
16.0
20.0
Re
turn
1Quarter
YearTo
DateFYTD
1Year
3Years
5Years
2019 2018 2017
Total Fixed Income 1.2 (80) 6.9 (46) -0.1 (64) 7.3 (46) 5.5 (46) 0.5 (100) 9.5 (42) -0.2 (44) 4.4 (63)¢
Custom Fixed Income Index 1.0 (84) 6.2 (64) -0.2 (79) 6.7 (67) 5.1 (65) 4.2 (90) 9.3 (51) -0.3 (50) 3.8 (77)�
5th Percentile 2.8 12.4 0.4 10.8 6.5 6.1 11.4 2.0 7.6
1st Quartile 2.1 8.4 0.0 8.3 6.0 5.5 10.3 0.3 5.8
Median 1.7 6.8 -0.1 7.2 5.4 5.1 9.3 -0.3 4.8
3rd Quartile 1.3 5.4 -0.1 6.0 4.9 4.7 8.4 -0.9 3.9
95th Percentile 0.2 2.2 -0.4 3.6 3.7 3.8 6.5 -3.4 2.3
Population 58 55 58 54 51 49 53 56 61
Total Fixed Income
Plan Sponsor Peer Group Analysis
As of September 30, 2020
All Public Plans > $1B-US Fixed Income Segment
Parentheses contain percentile rankings.
217

Annualized Return vs. Annualized Standard Deviation3 Years
Rolling 3 Years Standard Deviation
3 Years Historical Statistics
Total Fixed Income Custom Fixed Income Index
FTSE 3 Month T-Bill
0.0
1.0
2.0
3.0
4.0
5.0
6.0
7.0
Re
turn
(%)
0.0 0.7 1.4 2.1 2.8 3.5 4.2 4.9 5.6Risk (Standard Deviation %)
Total Fixed Income Custom Fixed Income Index
0.0
2.0
4.0
6.0
8.0
10.0
12.0
14.0
16.0
11/13 8/14 5/15 2/16 11/16 8/17 5/18 2/19 11/19 9/20
ActiveReturn
TrackingError
InformationRatio
R-SquaredSharpeRatio
Alpha Beta ReturnStandardDeviation
ActualCorrelation
Total Fixed Income 0.32 0.38 0.84 0.99 1.06 0.10 1.04 5.48 3.57 1.00
Custom Fixed Income Index 0.00 0.00 N/A 1.00 1.02 0.00 1.00 5.15 3.40 1.00
FTSE 3 Month T-Bill -3.45 3.38 -1.02 0.02 N/A 1.61 0.01 1.65 0.21 0.13
Total Fixed Income Risk Profile
As of September 30, 2020Total Fixed Income
218

Return Summary
Quarterly Excess Performance Ratio of Cumulative Wealth - Since Inception
Account Information
BlackRock Aggregate Bond Index
Blmbg. Barc. Aggregate Bond Index
0.0
4.0
8.0
12.0
-4.0
Re
turn
1Quarter
YearTo
Date
FYTD 1Year
3Years
Inception4/1/17
0.6
6.8
-0.1
7.0
5.2 5.2
0.7
6.9
0.0
7.1
5.3 5.3
Account Name: BlackRock Aggregate Bond Index
Inception Date: 04/01/2017
Account Structure: Commingled Fund
Asset Class: US Fixed Income
Benchmark: Blmbg. Barc. Aggregate Bond Index
Peer Group: IM U.S. Broad Market Core Fixed Income (SA+CF)
Quarterly Out Performance Quarterly Under Performance
0.0%
0.1%
0.2%
-0.1 %
-0.2 %
6/17 12/17 6/18 12/18 6/19 12/19 6/20 9/20 BlackRock Aggregate Bond Index
Benchmark
0.99
1.00
1.01
3/17 9/17 3/18 9/18 3/19 9/19 3/20 9/20
1.00
BlackRock Aggregate Bond Index Performance Summary
As of September 30, 2020BlackRock Aggregate Bond Index
219

-7.0
-4.0
-1.0
2.0
5.0
8.0
11.0
14.0
17.0
Re
turn
1Quarter
YearTo
DateFYTD
1Year
3Years
2019 2018
BlackRock Aggregate Bond Index 0.7 (88) 6.9 (56) 0.0 (52) 7.1 (53) 5.3 (50) 8.8 (68) 0.1 (29)¢
Blmbg. Barc. Aggregate Bond Index 0.6 (89) 6.8 (61) -0.1 (56) 7.0 (62) 5.2 (64) 8.7 (72) 0.0 (32)�
5th Percentile 2.7 8.7 0.2 8.8 6.0 11.2 1.1
1st Quartile 1.5 7.7 0.1 7.8 5.7 9.4 0.1
Median 1.1 7.1 0.0 7.2 5.3 9.1 -0.2
3rd Quartile 0.8 6.1 -0.1 6.3 5.1 8.6 -0.5
95th Percentile 0.5 3.9 -0.3 4.2 4.8 7.0 -1.4
Population 82 82 82 82 76 91 92
BlackRock Aggregate Bond Index
Peer Group Analysis
As of September 30, 2020
IM U.S. Broad Market Core Fixed Income (SA+CF)
Parentheses contain percentile rankings.
220

Return Summary
Quarterly Excess Performance Ratio of Cumulative Wealth - Since Inception
Account Information
BlackRock Core Plus Universal
Blmbg. Barc. Universal Bond Index
0.0
4.0
8.0
12.0
-4.0
Re
turn
1Quarter
YearTo
Date
FYTD 1Year
3Years
Inception4/1/17
1.0
6.2
-0.2
6.7
5.1 5.1
1.4
6.8
-0.2
7.5
5.3 5.3
Account Name: BlackRock Core Plus Universal
Inception Date: 04/01/2017
Account Structure: Separate Account
Asset Class: US Fixed Income
Benchmark: Blmbg. Barc. Universal Bond Index
Peer Group: IM U.S. Broad Market Core+ Fixed Income (SA+CF)
Quarterly Out Performance Quarterly Under Performance
0.0%
2.0%
4.0%
-2.0 %
-4.0 %
6/17 12/17 6/18 12/18 6/19 12/19 6/20 9/20 BlackRock Core Plus Universal
Benchmark
0.98
0.99
1.00
1.01
1.02
3/17 9/17 3/18 9/18 3/19 9/19 3/20 9/20
1.01
BlackRock Core Plus Universal Performance Summary
As of September 30, 2020BlackRock Core Plus Universal
221
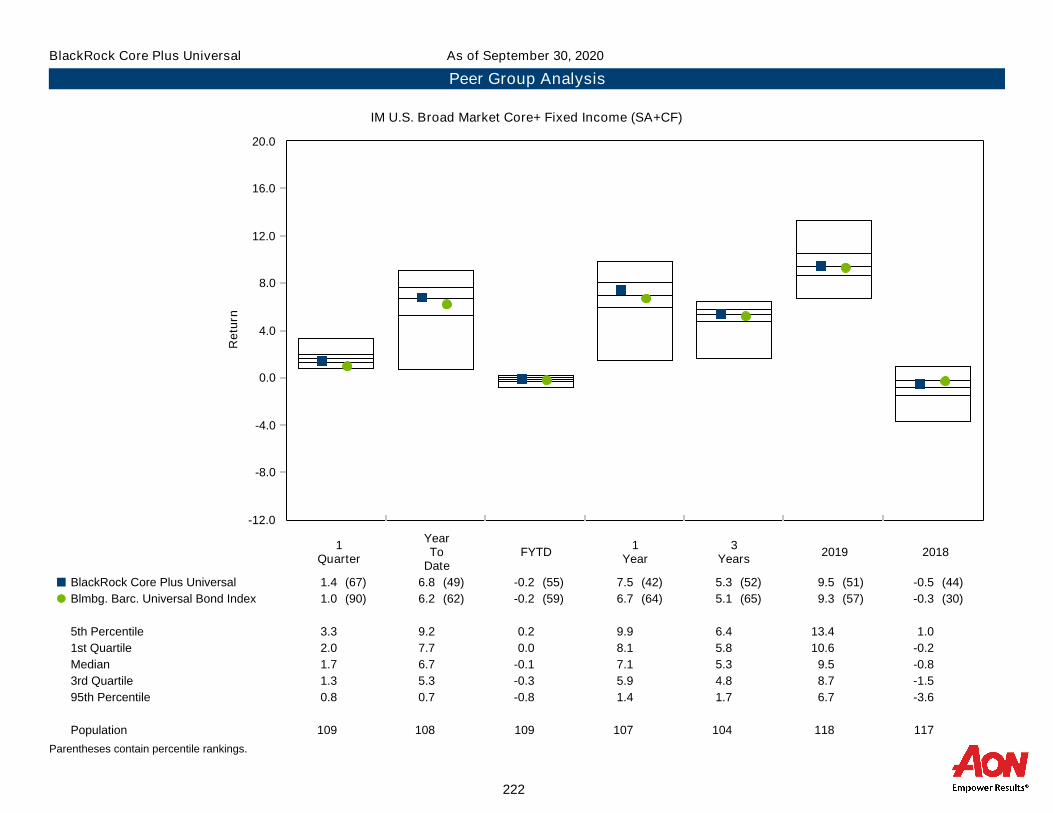
-12.0
-8.0
-4.0
0.0
4.0
8.0
12.0
16.0
20.0
Re
turn
1Quarter
YearTo
DateFYTD
1Year
3Years
2019 2018
BlackRock Core Plus Universal 1.4 (67) 6.8 (49) -0.2 (55) 7.5 (42) 5.3 (52) 9.5 (51) -0.5 (44)¢
Blmbg. Barc. Universal Bond Index 1.0 (90) 6.2 (62) -0.2 (59) 6.7 (64) 5.1 (65) 9.3 (57) -0.3 (30)�
5th Percentile 3.3 9.2 0.2 9.9 6.4 13.4 1.0
1st Quartile 2.0 7.7 0.0 8.1 5.8 10.6 -0.2
Median 1.7 6.7 -0.1 7.1 5.3 9.5 -0.8
3rd Quartile 1.3 5.3 -0.3 5.9 4.8 8.7 -1.5
95th Percentile 0.8 0.7 -0.8 1.4 1.7 6.7 -3.6
Population 109 108 109 107 104 118 117
BlackRock Core Plus Universal
Peer Group Analysis
As of September 30, 2020
IM U.S. Broad Market Core+ Fixed Income (SA+CF)
Parentheses contain percentile rankings.
222

Return Summary
Quarterly Excess Performance Ratio of Cumulative Wealth - Since Inception
Account Information
PIMCO
Blmbg. Barc. Universal Bond Index
0.0
4.0
8.0
12.0
-4.0
Re
turn
1Quarter
YearTo
Date
FYTD 1Year
3Years
Inception4/1/17
1.0
6.2
-0.2
6.7
5.1 5.1
1.8
7.5
0.0
7.8
5.7 5.9
Account Name: PIMCO
Inception Date: 04/01/2017
Account Structure: Separate Account
Asset Class: US Fixed Income
Benchmark: Blmbg. Barc. Universal Bond Index*
Peer Group: IM U.S. Broad Market Core+ Fixed Income (SA+CF)
Quarterly Out Performance Quarterly Under Performance
0.0%
2.0%
4.0%
-2.0 %
-4.0 %
6/17 12/17 6/18 12/18 6/19 12/19 6/20 9/20
PIMCO Benchmark
0.98
1.00
1.02
1.04
3/17 9/17 3/18 9/18 3/19 9/19 3/20 9/20
1.03
PIMCO Performance Summary
As of September 30, 2020PIMCO
223

-12.0
-8.0
-4.0
0.0
4.0
8.0
12.0
16.0
20.0
Re
turn
1Quarter
YearTo
DateFYTD
1Year
3Years
2019 2018
PIMCO 1.8 (39) 7.5 (30) 0.0 (39) 7.8 (32) 5.7 (32) 10.0 (36) -0.3 (33)¢
Blmbg. Barc. Universal Bond Index* 1.0 (90) 6.2 (62) -0.2 (59) 6.7 (64) 5.1 (65) 9.3 (57) -0.3 (30)�
5th Percentile 3.3 9.2 0.2 9.9 6.4 13.4 1.0
1st Quartile 2.0 7.7 0.0 8.1 5.8 10.6 -0.2
Median 1.7 6.7 -0.1 7.1 5.3 9.5 -0.8
3rd Quartile 1.3 5.3 -0.3 5.9 4.8 8.7 -1.5
95th Percentile 0.8 0.7 -0.8 1.4 1.7 6.7 -3.6
Population 109 108 109 107 104 118 117
PIMCO
Peer Group Analysis
As of September 30, 2020
IM U.S. Broad Market Core+ Fixed Income (SA+CF)
Parentheses contain percentile rankings.
224
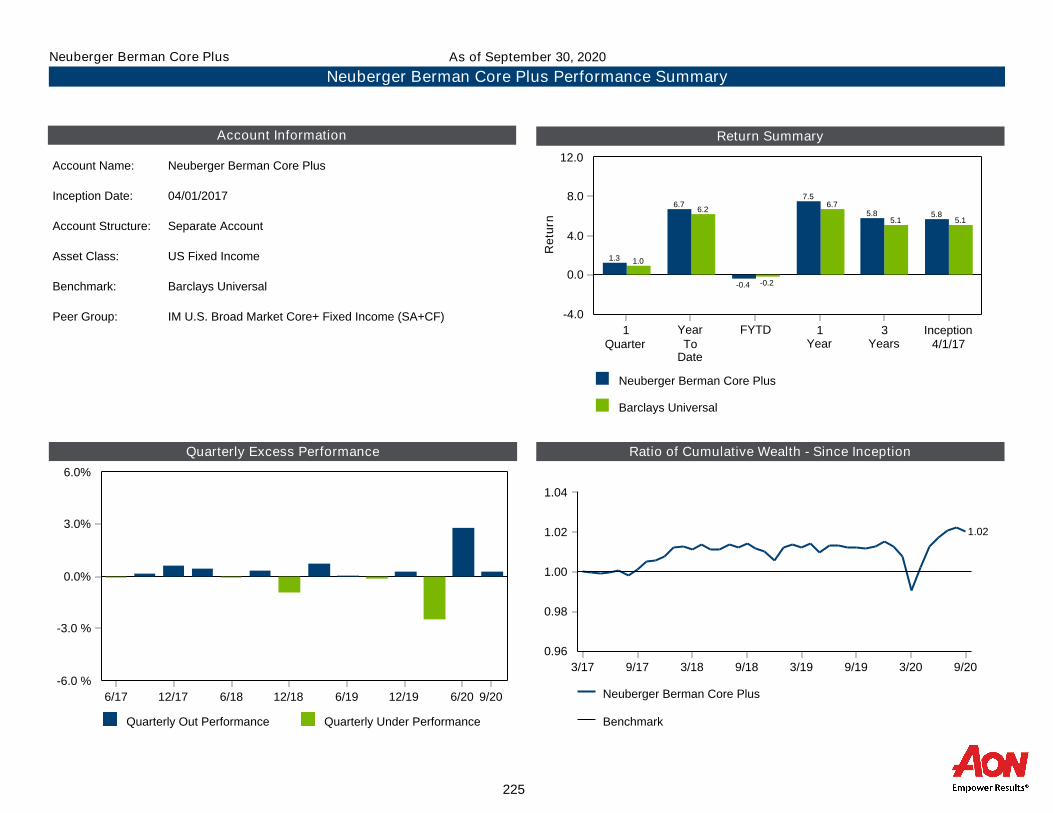
Return Summary
Quarterly Excess Performance Ratio of Cumulative Wealth - Since Inception
Account Information
Neuberger Berman Core Plus
Barclays Universal
0.0
4.0
8.0
12.0
-4.0
Re
turn
1Quarter
YearTo
Date
FYTD 1Year
3Years
Inception4/1/17
1.0
6.2
-0.2
6.7
5.1 5.1
1.3
6.7
-0.4
7.5
5.8 5.8
Account Name: Neuberger Berman Core Plus
Inception Date: 04/01/2017
Account Structure: Separate Account
Asset Class: US Fixed Income
Benchmark: Barclays Universal
Peer Group: IM U.S. Broad Market Core+ Fixed Income (SA+CF)
Quarterly Out Performance Quarterly Under Performance
0.0%
3.0%
6.0%
-3.0 %
-6.0 %
6/17 12/17 6/18 12/18 6/19 12/19 6/20 9/20 Neuberger Berman Core Plus
Benchmark
0.96
0.98
1.00
1.02
1.04
3/17 9/17 3/18 9/18 3/19 9/19 3/20 9/20
1.02
Neuberger Berman Core Plus Performance Summary
As of September 30, 2020Neuberger Berman Core Plus
225

-12.0
-8.0
-4.0
0.0
4.0
8.0
12.0
16.0
20.0
Re
turn
1Quarter
YearTo
DateFYTD FYTD
1Year
3Years
2019 2018
Neuberger Berman Core Plus 1.3 (75) 6.7 (49) 6.5 (36) -0.4 (80) 7.5 (42) 5.8 (19) 10.3 (28) -0.4 (36)¢
Barclays Universal 1.0 (90) 6.2 (62) 5.7 (63) -0.2 (59) 6.7 (64) 5.1 (65) 9.3 (57) -0.3 (30)�
5th Percentile 3.3 9.2 8.8 0.2 9.9 6.4 13.4 1.0
1st Quartile 2.0 7.7 7.0 0.0 8.1 5.8 10.6 -0.2
Median 1.7 6.7 6.0 -0.1 7.1 5.3 9.5 -0.8
3rd Quartile 1.3 5.3 5.0 -0.3 5.9 4.8 8.7 -1.5
95th Percentile 0.8 0.7 1.5 -0.8 1.4 1.7 6.7 -3.6
Population 109 108 107 109 107 104 118 117
Neuberger Berman Core Plus
Peer Group Analysis
As of September 30, 2020
IM U.S. Broad Market Core+ Fixed Income (SA+CF)
Parentheses contain percentile rankings.
226

Hedge Fund Performance
227
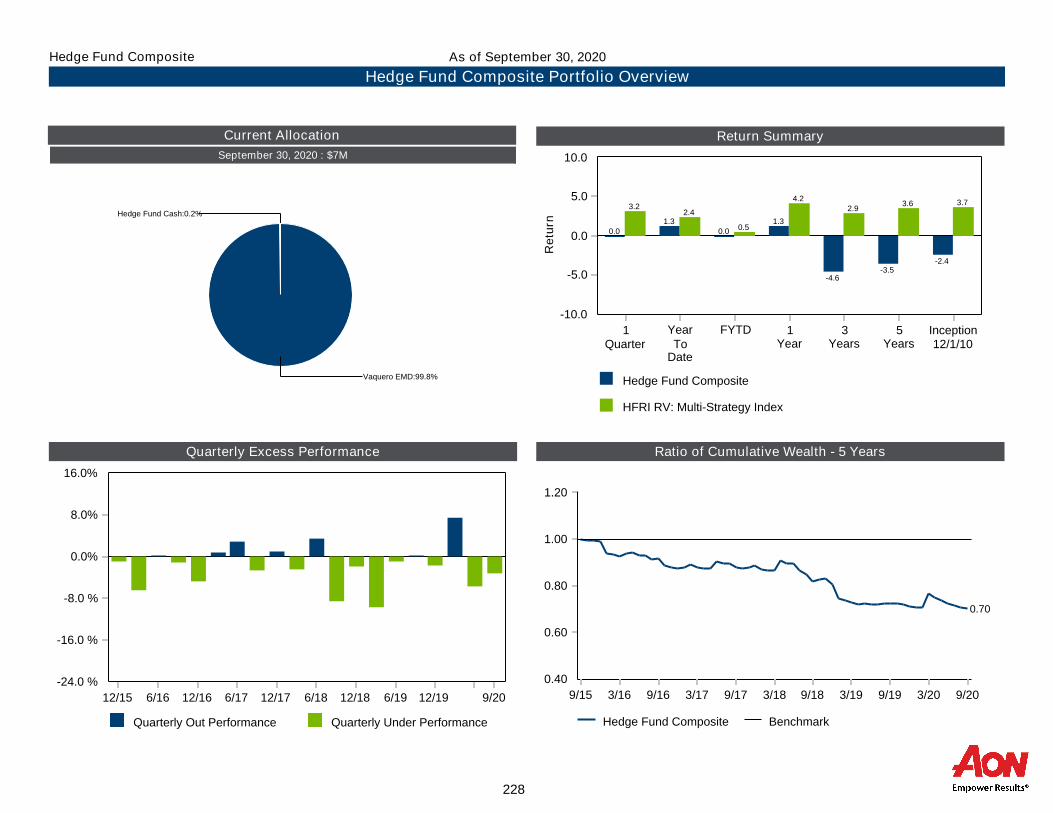
Return Summary
Quarterly Excess Performance Ratio of Cumulative Wealth - 5 Years
Current Allocation
Hedge Fund Composite
HFRI RV: Multi-Strategy Index
0.0
5.0
10.0
-5.0
-10.0
Re
turn
1Quarter
YearTo
Date
FYTD 1Year
3Years
5Years
Inception12/1/10
3.22.4
0.5
4.22.9
3.6 3.7
0.01.3
0.01.3
-4.6-3.5
-2.4
September 30, 2020 : $7M
Hedge Fund Cash:0.2%
Vaquero EMD:99.8%
Hedge Fund Composite Benchmark
0.40
0.60
0.80
1.00
1.20
9/15 3/16 9/16 3/17 9/17 3/18 9/18 3/19 9/19 3/20 9/20
0.70
Quarterly Out Performance Quarterly Under Performance
0.0%
8.0%
16.0%
-8.0 %
-16.0 %
-24.0 %
12/15 6/16 12/16 6/17 12/17 6/18 12/18 6/19 12/19 9/20
Hedge Fund Composite Portfolio Overview
As of September 30, 2020Hedge Fund Composite
228

(This Page Left Blank Intentionally)
229

Real Asset Performance
230

Return Summary
Quarterly Excess Performance Ratio of Cumulative Wealth - 5 Years
Current Allocation
Real Asset Composite
Custom Real Asset Benchmark
0.0
15.0
30.0
-15.0
-30.0
-45.0
Re
turn
1Quarter
YearTo
Date
FYTD 1Year
3Years
5Years
Inception9/1/12
2.9 1.6 2.9 2.05.6 7.8
3.6
-10.2
-19.5
0.0
-20.8
-10.9
-3.8-1.3
September 30, 2020 : $13M
BTG:10.0%Real Asset Cash:0.3%
JP Morgan Global Maritime:89.6%
Real Asset Composite Benchmark
0.30
0.60
0.90
1.20
1.50
9/15 3/16 9/16 3/17 9/17 3/18 9/18 3/19 9/19 3/20 9/20
0.57
Quarterly Out Performance Quarterly Under Performance
0.0%
8.0%
16.0%
-8.0 %
-16.0 %
-24.0 %
12/15 6/16 12/16 6/17 12/17 6/18 12/18 6/19 12/19 9/20
Real Asset Composite Portfolio Overview
As of September 30, 2020Real Asset Composite
231

Private Equity Performance
232
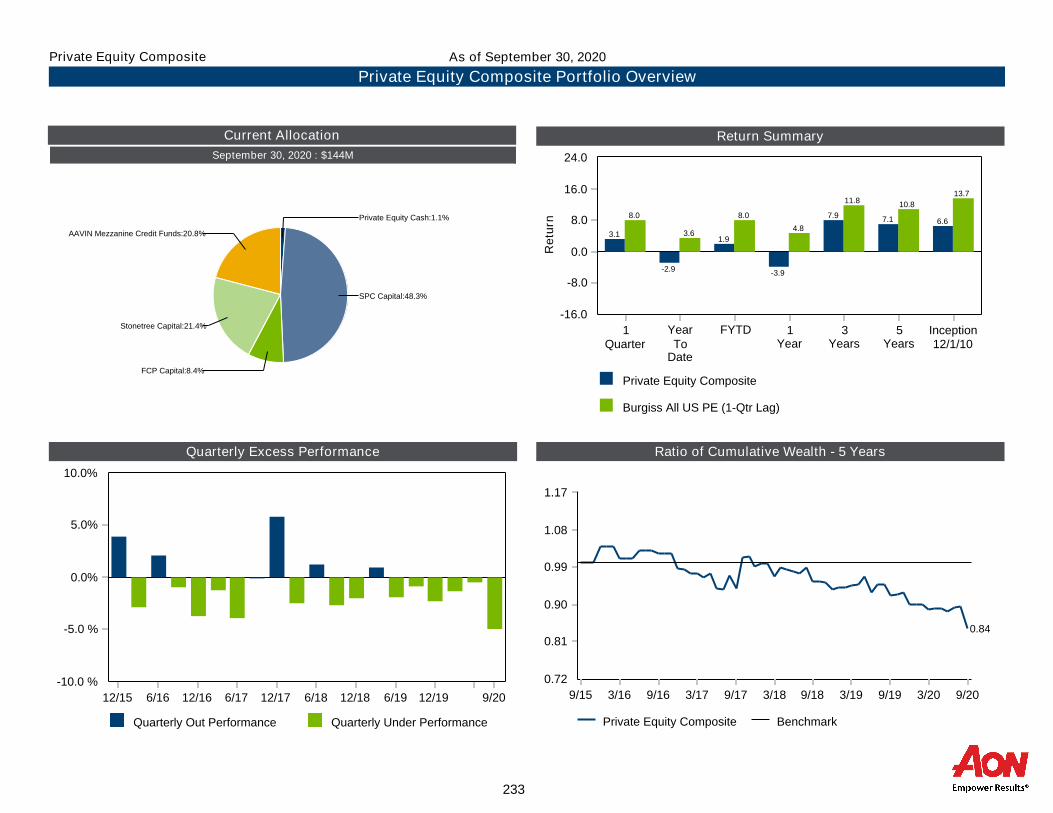
Return Summary
Quarterly Excess Performance Ratio of Cumulative Wealth - 5 Years
Current Allocation
Private Equity Composite
Burgiss All US PE (1-Qtr Lag)
0.0
8.0
16.0
24.0
-8.0
-16.0
Re
turn
1Quarter
YearTo
Date
FYTD 1Year
3Years
5Years
Inception12/1/10
8.0
3.6
8.0
4.8
11.8 10.8
13.7
3.1
-2.9
1.9
-3.9
7.9 7.1 6.6
September 30, 2020 : $144M
Private Equity Cash:1.1%
SPC Capital:48.3%
AAVIN Mezzanine Credit Funds:20.8%
Stonetree Capital:21.4%
FCP Capital:8.4%
Private Equity Composite Benchmark
0.72
0.81
0.90
0.99
1.08
1.17
9/15 3/16 9/16 3/17 9/17 3/18 9/18 3/19 9/19 3/20 9/20
0.84
Quarterly Out Performance Quarterly Under Performance
0.0%
5.0%
10.0%
-5.0 %
-10.0 %
12/15 6/16 12/16 6/17 12/17 6/18 12/18 6/19 12/19 9/20
Private Equity Composite Portfolio Overview
As of September 30, 2020Private Equity Composite
233

Real Estate Performance
234

Return Summary
Quarterly Excess Performance Ratio of Cumulative Wealth - Since Inception
Current Allocation
Real Estate Composite NCREIF Property Index
0.0
8.0
16.0
-8.0
-16.0
Re
turn
1Quarter
YearTo
Date
FYTD 1Year
3Years
5Years
0.7 0.5 0.72.0
5.16.3
1.2
-9.0
1.6
-8.5
-2.0
1.5
September 30, 2020 : $132M
Real Estate Cash:0.4%
Mariner IV:41.1%
Almanac Realty Securities VI:2.4%
25 Capital Residential Mortgage Opp. Fund:8.4%
UBS Trumbull:10.1%
Mariner III:8.3%
Almanac Realty Securities VII:10.9%
JP Morgan India Property Fund II:7.2%
JPM Strategic:11.3%
Real Estate Composite Benchmark
0.60
0.80
1.00
1.20
8/12 5/13 2/14 11/14 8/15 5/16 2/17 11/17 8/18 5/19 9/20
0.74
Quarterly Out Performance Quarterly Under Performance
0.0%
8.0%
16.0%
-8.0 %
-16.0 %
12/15 6/16 12/16 6/17 12/17 6/18 12/18 6/19 12/19 9/20
Real Estate Composite Portfolio Overview
As of September 30, 2020Real Estate Composite
235

(This Page Left Blank Intentionally)
236

Appendix
237

Benchmark Descriptions
Bloomberg Barclays Corporate High Yield Bond Index - An index that covers the U.S.D-dominated, non- investment grade, fixed rate, taxable corporate bond market. Debt issues from emerging market countries are excluded. Securities are classified as high-yield if the middle rating is Ba1/BB+ or below.
Bloomberg Barclays Emerging Markets Index - An unmanaged index that tracks total returns for external-currency-denominated debt instruments of the emerging markets.
Bloomberg Barclays Global Aggregate - Provides a broad-based measure of the global investment-grade fixed income markets. The three major components of this index are the U.S. Aggregate, the Pan-European Aggregate, and the Asian-Pacific Aggregate Indices. The index also includes Eurodollar and Euro-Yen corporate bonds, Canadian government, agency and corporate securities, and U.S.D investment grade 144A securities.
Bloomberg Barclays Global Treasury Ex-U.S. - The Barclays Global Treasury ex U.S. Index is a subset of the flagship Global Treasury Index that does not have any exposure to U.S. debt. This multi-currency benchmark includes investment grade, fixed-rate bonds issued by governments in their native currencies.
Bloomberg Barclays Inflation Index - Measures the performance of the U.S. Treasury Inflation Protected Securities ("TIPS") market.
Bloomberg Barclays Universal Index - A market value-weighted index which is the union of the U.S. Aggregate Index, U.S. High Yield Corporate Index, Eurodollar Index, U.S. Emerging Markets Index and the CMBS High Yield Index. The Index is appropriate for core plus fixed income mandates.
Bloomberg Barclays U.S. Aggregate Bond Index - A market value-weighted index consisting of government bonds, SEC-registered corporate bonds and mortgage-related and asset-backed securities with at least one year to maturity and an outstanding par value of $250 M or greater. This index is a broad measure of the performance of the investment grade U.S. fixed income market.
Bloomberg Barclays U.S. Government/Credit Index - A subcomponent of the Barclays Capital Aggregate Index, this benchmark includes treasury securities, government related issues, and high quality corporate bonds with an outstanding par value of $250 M or greater and at least one year of maturity remaining.
Bloomberg Barclays U.S. Government Index - A market value weighted index of U.S. government and government agency securities (other than mortgage securities) with maturities of one year or more.
Bloomberg Barclays U.S. High Yield Index - An index composed of non-investment grade corporate debt denominated in U.S. dollars. The issues have to have an outstanding par value of $150 M or greater and at least one year of maturity remaining.
Bloomberg Barclays U.S. Intermediate Aggregate Bond Index - A market value-weighted index consisting of U.S. Treasury securities, corporate bonds and mortgage-related and asset-backed securities with one to ten years to maturity and an outstanding par value of $250 M or greater.
Bloomberg Barclays U.S. Intermediate Government Bond Index - An unmanaged index considered representative of intermediate- term fixed-income obligations issued by the U.S. Treasury, government agencies and quasi-federal corporations.
Bloomberg Barclays U.S. Intermediate Government/Credit Index - A market-value weighted index consisting of U.S. government bonds and SEC-registered corporate bonds with one to ten years to maturity and an outstanding par value of $150 M or greater.
Bloomberg Barclays U.S. Intermediate Treasury - An unmanaged index considered representative of intermediate-term fixed- income obligations issued by the U.S. Treasury.
Bloomberg Barclays U.S. Long Credit Bond Index - An unmanaged index considered representative of long-term fixed-income obligations issued by U.S. corporate, specified foreign debentures, and secured notes that meet the specified maturity, liquidity, and quality requirements. To qualify, bonds must be SEC-registered.
238

Benchmark Descriptions
Bloomberg Barclays U.S. Long Gov’t/Credit Index - The Barclays Capital U.S. Government/ Credit Bond Index measures performance of U.S. dollar denominated U.S. treasuries, government-related, and investment grade U.S. corporate securities that have a remaining maturity of greater than or equal to 1 year. In addition, the securities have $250 M or more of outstanding face value, and must be fixed rate and non-convertible.
Bloomberg Barclays U.S. Long Government Bond Index - An unmanaged index considered representative of long-term fixed- income obligations issued by the U.S. Treasury, government agencies and quasi-federal corporations.
Bloomberg Barclays U.S. TIPS - A market value-weighted index consisting of U.S. Treasury Inflation Protected Securities with one or more years remaining until maturity with total outstanding issue size of $500m or more.
Bloomberg Barclays U.S. Treasury 20-30 Year STRIPS Index - A subcomponent of the Barclays Aggregate Index, this benchmark includes long-term treasury STRIPS.
Bloomberg Commodity Index - Consists of 22 exchange-traded futures on physical commodities, which are weighted to account for economic significance and market liquidity. Performance is calculated on an excess return basis and reflects commodity future price movements.
BofA Merrill Lynch 3 Month Treasury Bill - An index that measures the average return of the last three-month U.S. Treasury Bill issues.
BofA Merrill Lynch High Yield Master - A market-capitalization weighted index that tracks the performance of U.S. dollar- denominated, below investment grade corporate debt publicly issued in the U.S. domestic market.
Citigroup 90-Day T-Bill Index - An index that measures the average return of the last three-month U.S. Treasury Bill issues.
Credit Suisse Leveraged Loan Index - Designed to mirror the investable universe of the U.S. dollar denominated leveraged loan market.
CRSP U.S. Large Cap Index - an index comprised of nearly 640 U.S. large cap companies and includes securities traded on NYSE, NYSE Market, NASDAQ, or ARCA, representing nearly 85% of the U.S. investable equity market. The index is reconstituted quarterly after the market close on the third Fridays of March, June, September, and December.
CRSP U.S. Total Market Index - an index comprised of nearly 4,000 constituents across mega, large, small, and micro capitalizations and includes securities traded on NYSE, NYSE Market, NASDAQ, or ARCA, representing nearly 100% of the U.S. investable equity market. The index is reconstituted quarterly after the market close on the third Fridays of March, June, September, and December.
DJ U.S. Completion Total Stock Market Index - A capitalization-weighted index that consists of the stocks in the Dow Jones U.S. Total Stock Market Index less the stocks in the S&P 500 Stock Index.
DJ U.S. Total Stock Market Index - A capitalization-weighted stock index representing all domestic common stocks traded regularly on the organized exchanges. The index is the broadest measure of the aggregate domestic stock market and includes approximately 5,000 stocks.
FTSE 4Good U.S. Select Index - a socially responsible investment (SRI) index of U.S. stocks that excludes companies with certain business activities such as weapons, tobacco, gambling, alcohol, nuclear power, and adult entertainment.
FTSE All-World ex-U.S. Index - A capitalization-weighted stock index representing 46 developed market countries and emerging market countries excluding the U.S.
239
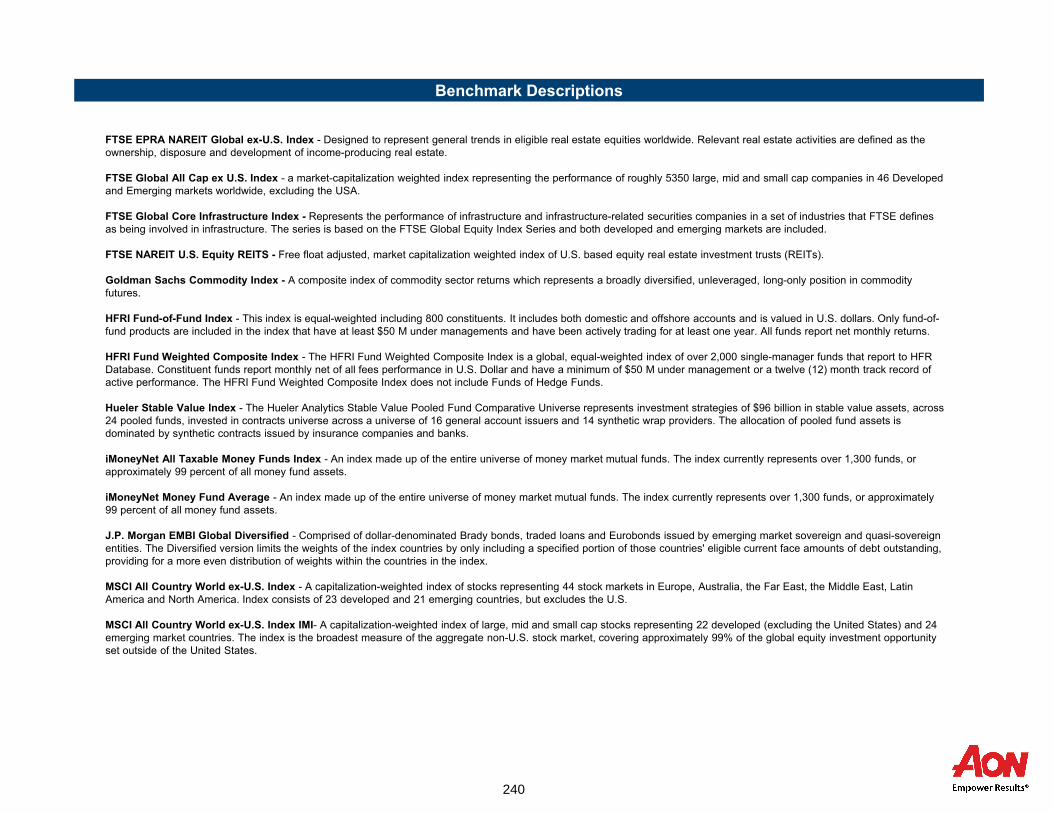
Benchmark Descriptions
FTSE EPRA NAREIT Global ex-U.S. Index - Designed to represent general trends in eligible real estate equities worldwide. Relevant real estate activities are defined as the ownership, disposure and development of income-producing real estate.
FTSE Global All Cap ex U.S. Index - a market-capitalization weighted index representing the performance of roughly 5350 large, mid and small cap companies in 46 Developed and Emerging markets worldwide, excluding the USA.
FTSE Global Core Infrastructure Index - Represents the performance of infrastructure and infrastructure-related securities companies in a set of industries that FTSE defines as being involved in infrastructure. The series is based on the FTSE Global Equity Index Series and both developed and emerging markets are included.
FTSE NAREIT U.S. Equity REITS - Free float adjusted, market capitalization weighted index of U.S. based equity real estate investment trusts (REITs).
Goldman Sachs Commodity Index - A composite index of commodity sector returns which represents a broadly diversified, unleveraged, long-only position in commodity futures.
HFRI Fund-of-Fund Index - This index is equal-weighted including 800 constituents. It includes both domestic and offshore accounts and is valued in U.S. dollars. Only fund-of-fund products are included in the index that have at least $50 M under managements and have been actively trading for at least one year. All funds report net monthly returns.
HFRI Fund Weighted Composite Index - The HFRI Fund Weighted Composite Index is a global, equal-weighted index of over 2,000 single-manager funds that report to HFRDatabase. Constituent funds report monthly net of all fees performance in U.S. Dollar and have a minimum of $50 M under management or a twelve (12) month track record of active performance. The HFRI Fund Weighted Composite Index does not include Funds of Hedge Funds.
Hueler Stable Value Index - The Hueler Analytics Stable Value Pooled Fund Comparative Universe represents investment strategies of $96 billion in stable value assets, across 24 pooled funds, invested in contracts universe across a universe of 16 general account issuers and 14 synthetic wrap providers. The allocation of pooled fund assets is dominated by synthetic contracts issued by insurance companies and banks.
iMoneyNet All Taxable Money Funds Index - An index made up of the entire universe of money market mutual funds. The index currently represents over 1,300 funds, or approximately 99 percent of all money fund assets.
iMoneyNet Money Fund Average - An index made up of the entire universe of money market mutual funds. The index currently represents over 1,300 funds, or approximately 99 percent of all money fund assets.
J.P. Morgan EMBI Global Diversified - Comprised of dollar-denominated Brady bonds, traded loans and Eurobonds issued by emerging market sovereign and quasi-sovereign entities. The Diversified version limits the weights of the index countries by only including a specified portion of those countries' eligible current face amounts of debt outstanding, providing for a more even distribution of weights within the countries in the index.
MSCI All Country World ex-U.S. Index - A capitalization-weighted index of stocks representing 44 stock markets in Europe, Australia, the Far East, the Middle East, Latin America and North America. Index consists of 23 developed and 21 emerging countries, but excludes the U.S.
MSCI All Country World ex-U.S. Index IMI- A capitalization-weighted index of large, mid and small cap stocks representing 22 developed (excluding the United States) and 24 emerging market countries. The index is the broadest measure of the aggregate non-U.S. stock market, covering approximately 99% of the global equity investment opportunity set outside of the United States.
240

Benchmark Descriptions
MSCI All Country World ex-U.S. Small Cap Index - Covers all investable small cap securities with a market capitalization below that of the companies in the MSCI Standard Indices (excluding U.S.), and target approximately 14% of each market’s free-float adjusted market capitalization.
MSCI All Country World Index - A capitalization-weighted index of stocks representing 46 stock markets in Europe, Australia, the Far East, the Middle East, Latin America and North America.
MSCI All Country World Index IMI - A capitalization-weighted index of large, mid and small cap stocks representing 23 developed and 24 emerging market countries. The index is the broadest measure of the aggregate global stock market, covering approximately 99% of the global equity investment opportunity set.
MSCI EAFE Growth Index - A capitalization-weighted index of 21 stock markets in Europe, Australia, Asia and the Far East designed to capture the growth-oriented companies.
MSCI EAFE Index - A capitalization-weighted index of stocks representing 22 developed countries in Europe, Australia, Asia, and the Far East.
MSCI EAFE Small Cap Index - A capitalization-weighted index of small cap stocks representing 23 developed country markets in Europe, Australia, Asia, and the Far East.
MSCI EAFE Value Index - A capitalization-weighted index of 21 stock markets in Europe, Australia, Asia and the Far East designed to capture the value-oriented companies.
MSCI Emerging Markets Index - A capitalization-weighted index of stocks representing 22 emerging country markets.
MSCI Emerging Markets Value Index - A capitalization-weighted index considered representative of value stocks across 46 stock markets in Europe, Australia, the Far East, the Middle East, Latin America and North America.
MSCI U.S. Broad Market Index - A capitalization-weighted stock index that aggregates the MSCI U.S. Large Cap 300, Mid Cap 450, Small Cap 1,750 and Micro Cap Indices. This index represents approximately 99.5% of the capitalization of the U.S. Equity market and includes approximately 3,562 companies.
MSCI U.S. REIT Index - A broad index that fairly represents the equity REIT opportunity set with proper investability screens to ensure that the index is investable and replicable. The index represents approximately 85% of the U.S. REIT universe.
MSCI World Index - A free float-adjusted market capitalization weighted index that is designed to measure the equity market performance of developed markets, representing 24 developed market country indices.
NCREIF Property Index - A capitalization-weighted index of privately owned investment grade income-producing properties representing approximately $269 billion in assets.
NFI ODCE Index - A capitalization weighted index comprised of open-end, Core funds investing in commercial real estate properties. The funds that constitute the index are subject to certain geographic and property type diversification requirements as well as leverage restrictions. The index reflects the impact of leverage on investment results. The returns shown in this report are net of management fees of the respective funds included in the index.
Rolling 3-year Constant Maturity Treasury Index - An index published by the Federal Reserve Board based on the monthly average yield of a range of Treasury securities, all adjusted to the equivalent of a three-year maturity.
Russell 1000 Growth Index - An index that measures the performance of those Russell 1000 companies with higher price-to- book ratios and higher I/B/E/S growth forecasts.
Russell 1000 Index - A capitalization-weighted index of the 1,000 largest publicly traded U.S. stocks by capitalization.
241

Benchmark Descriptions
Russell 1000 Value Index - An index that measures the performance of those stocks included in the Russell 1000 Index with lower price-to-book ratios and lower I/B/E/S earnings growth forecasts.
Russell 2000 Growth Index - A capitalization-weighted index of those stocks in the Russell 2000 Index with higher price-to-book ratios and higher I/B/E/S earnings growth forecasts.
Russell 2000 Index - A capitalization-weighted index of the smallest 2,000 stocks in the Russell 3000 Index. The index excludes the largest- and smallest-capitalization issues in the domestic stock market.
Russell 2000 Value Index - An index that measures the performance of those stocks included in the Russell 2000 Index with lower price-to-book ratios and lower I/B/E/S earnings growth forecasts.
Russell 2500 Growth Index - A capitalization-weighted index representing those companies within the Russell 2500 Index with higher price-to-book ratios and higher I/B/E/S earnings growth forecasts.
Russell 2500 Index - The Index is constructed by first identifying the 3,000 largest-capitalization U.S. stocks and ranking them by market capitalizations, choosing the bottom 2,500 names on the list.
Russell 2500 Value Index - An index that measures the performance of those stocks included in the Russell 2500 Index with lower price-to-book ratios and lower I/B/E/S earnings growth forecasts.
Russell 3000 Growth Index - A capitalization-weighted index consisting of those Russell 3000 Index stocks that have higher price-to-book ratios and higher I/B/E/S earnings growth forecasts.
Russell 3000 Index - A capitalization-weighted index consisting of the 3,000 largest publicly traded U.S. stocks by capitalization. This index is a broad measure of the performance of the aggregate domestic equity market.
Russell 3000 Value Index - A capitalization-weighted index consisting of those Russell 3000 Index stocks that have lower price-to-book ratios and lower I/B/E/S earnings growth forecasts.
Russell Mid Cap Growth Index - A capitalization-weighted index representing those stocks in the Russell MidCap Index with higher price-to-book ratios and higher I/B/E/S earnings growth forecasts.
Russell Mid Cap Index - A capitalization-weighted index of the 800 smallest stocks in the Russell 1000 Index. This index is a broad measure of mid-capitalization stocks.
Russell Mid Cap Value Index - A capitalization-weighted index consisting of those Russell MidCap Index stocks that have lower price-to-book ratios and lower I/B/E/S earnings growth forecasts.
S&P 500 Index - A capitalization-weighted index representing stocks chosen by Standard & Poor's, Inc. for their size, liquidity, stability and industry group representation. The companies in the S&P 500 Index are generally among the largest in their industries.
242

Benchmark Descriptions
S&P Completion Index -The S&P Completion Index is a sub-index of the S&P Total Market Index, including all stocks eligible for the S&P TMI and excluding all current constituents of the S&P 500. The index covers approximately 4,000 constituents, offering investors broad exposure to mid, small, and micro cap companies.
S&P Leverage Loan Index - A daily total return index that uses LSTA/LPC Mark-to-Market Pricing to calculate market value change.
S&P MidCap 400 Index - A market-capitalization-weighted index of stocks in all major industries in the mid-range of the U.S. stock market.
Wilshire REIT - A measure of the types of U.S. real estate securities that represent the ownership and operation of commercial or residential real estate. To be included in the index, a company must have a market capitalization of $200 M and have at least 75% of the total revenue derived from the ownership and operation of the real estate assets.
Indices cannot be invested in directly. Unmanaged index returns assume reinvestment of any and all distributions and do not reflect our fees or expenses.
Past performance is no guarantee of future results.
Please feel free to contact us at [email protected] for more index information.
243

Total FundBenchmark: As of April 2020, 27.5% of the DJ U.S.Total Stock Market Index,19% of the MSCI All Country World IMI, 11.5% of the MSCI All Country World ex-U.S. IMI, 30% of thefixed income component, 7% of the real estate component, and 5% of the private equity component. As of October 2018, 28.5% of the DJ U.S.Total Stock Market Index,19% of theMSCI All Country World IMI, 11.5% of the MSCI All Country World ex-U.S. IMI, 30% of the fixed income component, 6% of the real estate component, and 5% of the private equitycomponent. As of January 2018, 29.5% of the DJ U.S.Total Stock Market Index,19% of the MSCI All Country World IMI, 11.5% of the MSCI All Country World ex-U.S. IMI, 30% ofthe fixed income component, 6% of the real estate component, and 4% of the private equity component. As of October 2014, 32.5% of the DJ U.S.Total Stock Market Index ,15% ofthe MSCI All Country World IMI, 13.5% of the MSCI All Country World ex-U.S. IMI, 30% of the fixed income component, 6% of the real estate component, and 5% of the privateequity component. As of January 2018, 29.5% of the DJ U.S.Total Stock Market Index,19% of the MSCI All Country World IMI, 11.5% of the MSCI All Country World ex-U.S. IMI,30% of the fixed income component, 6% of the real estate component, and 4% of the private equity component. As of October 2014, 32.5% of the DJ U.S.Total Stock MarketIndex ,15% of the MSCI All Country World IMI, 13.5% of the MSCI All Country World ex-U.S. IMI, 30% of the fixed income component, 5% of the real estate component, and 4% ofthe private equity component. As of October 2015, 31.5% of the DJ U.S.Total Stock Market Index,15% of the MSCI All Country World IMI, 13.5% of the MSCI All Country World ex-U.S. IMI, 30% of the fixed income component, 6% of the real estate component, and 4% of the private equity component. As of October 2014, 32.5% of the DJ U.S.Total StockMarket Index ,15% of the MSCI All Country World IMI, 13.5% of the MSCI All Country World ex-U.S. IMI, 30% of the fixed income component, 5% of the real estate component, and4% of the private equity component. As of July 2012, 33.5% of the DJ U.S.Total Stock Market Index ,15% of the MSCI All Country World IMI, 13.5% of the MSCI All Country Worldex-U.S. IMI, 30% of the fixed income component, 5% of the real estate component, and 3% of the private equity component. As of August 2010, 36.5% of the DJ U.S.Total StockMarket Index ,15% of the MSCI All Country World IMI, 13.5% of the MSCI All Country World ex-U.S. IMI, 30% of the fixed income component, and 5% of the real estate component.As of June 2009, 36.5% of the DJU.S.Total Stock Market Index ,15% of the MSCI All Country World Index, 13.5% of the MSCI All Country World ex-U.S. Index GD, 30% of thefixed income component, and 5% of the real estate component. As of December 2008, 42.5% of the DJ U.S.Total Stock Market Index ,10% of the MSCI All Country World Index,12.5% of the MSCI All Country World ex-U.S. Index GD, and the fixed income component allocation is comprised of 35% minus the actual allocation of real estate until real estatereaches its 5% target policy. As of September 2005, 47.5% of the DJ U.S.Total Stock Market Index, 5% of the MSCI All Country World Index, 12.5% of the MSCI All Country Worldex-U.S. Index GD, and the fixed income component allocation is comprised of 35% minus the actual allocation of real estate until real estate reaches its 5% target policy. As ofDecember 2004, the policy benchmark consisted of 50% of the DJ U.S.Total Stock Market Index, 15% of the MSCI All Country World ex-U.S. Index GD, the actual allocation of realestate, and the fixed income allocation was 35% minus the actual allocation of real estate. Beginning September 1, 2004, the fixed income component of the benchmark wastransitioned to the Bloomberg Barclays Universal Index over a five month period. As of April 2004, the Policy Benchmark consisted of 50% of the DJ U.S.Total Stock Market Index,35% of the Citigroup Large Public Fund Index and 15% of the MSCI All Country World ex-U.S. Index GD. Prior to April 2003, the Policy Benchmark consisted of 50% of the DJU.S.Total Stock Market Index, 35% of the Citigroup LPF Index and 15% of the MSCI All Country World ex-U.S. Index GD. Prior to October 2000, the Policy Benchmark consisted of45% of the DJ U.S.Total Stock Market Index, 45% of the Bloomberg Barclays Aggregate Bond Index and 10% of the MSCI EAFE Index ND. Prior to October 1995, the PolicyBenchmark consisted of 50% of the DJ U.S.Total Stock Market Index, 45% of the Bloomberg Barclays Aggregate Bond Index and 5% of the MSCI EAFE Index ND. Prior to October1991, the Policy Benchmark Consisted of 50% of the DJ U.S.Total Stock Market Index and 50% of the Bloomberg Barclays Aggregate Bond Index.
Universe A universe of Public Plans with total assets in excess of $1 billion as comprised by Investment Metrics and BNY Mellon Performance & Risk Analytics. The universeconsisted of 171 accounts as of 9/30/2020.
U.S. Equity ComponentBenchmark: The DJ U.S.Total Stock Market Index
Universe: A universe of U.S. Equity portfolios within Public Plans with total assets in excess of $1 billion as comprised by Investment Metrics and BNY Mellon Performance & RiskAnalytics. The universe consisted of 55 accounts as of 9/30/2020.
DFABenchmark: Russell 2000 Index. Prior to April 2014, the Russell 2000 Value Index. Prior to August 2006, the Wilshire Small-Cap Value Style Index.
BlackRock Russell 1000 Index FundBenchmark: Russell 1000 Index
Appendix
Defined Benefit Plan – Benchmarks and Universes
244
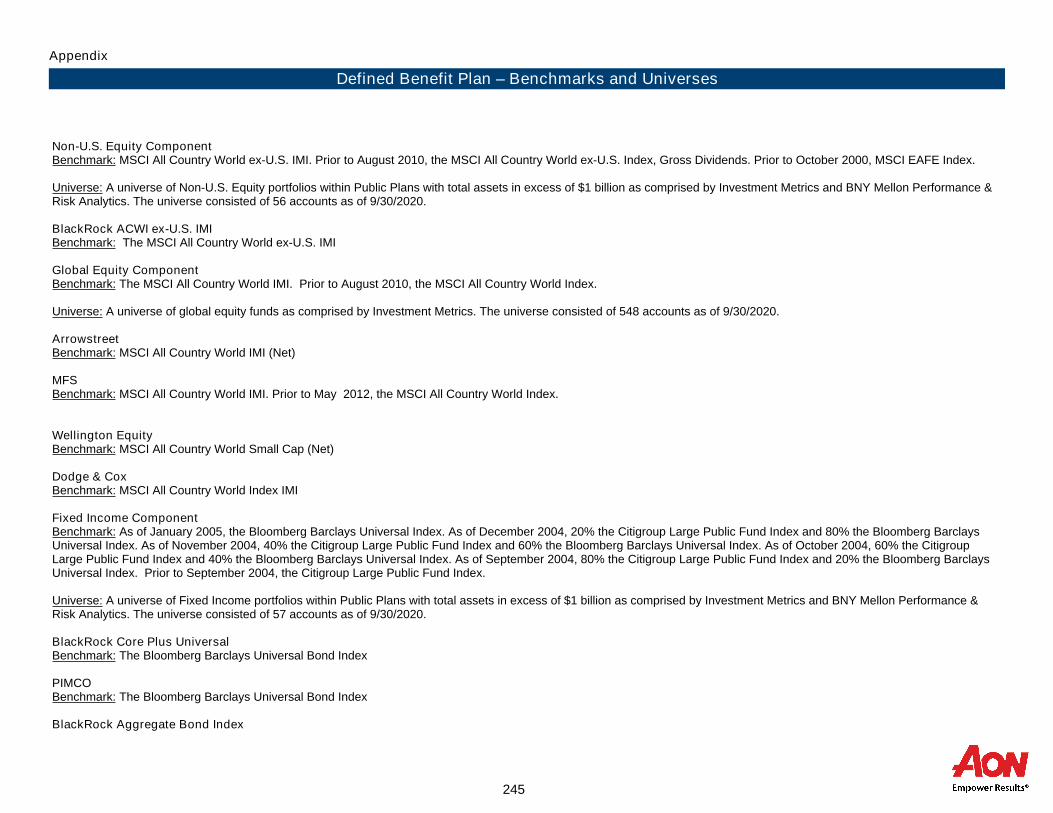
Appendix
Defined Benefit Plan – Benchmarks and Universes
Non-U.S. Equity ComponentBenchmark: MSCI All Country World ex-U.S. IMI. Prior to August 2010, the MSCI All Country World ex-U.S. Index, Gross Dividends. Prior to October 2000, MSCI EAFE Index.
Universe: A universe of Non-U.S. Equity portfolios within Public Plans with total assets in excess of $1 billion as comprised by Investment Metrics and BNY Mellon Performance &Risk Analytics. The universe consisted of 56 accounts as of 9/30/2020.
BlackRock ACWI ex-U.S. IMIBenchmark: The MSCI All Country World ex-U.S. IMI
Global Equity ComponentBenchmark: The MSCI All Country World IMI. Prior to August 2010, the MSCI All Country World Index.
Universe: A universe of global equity funds as comprised by Investment Metrics. The universe consisted of 548 accounts as of 9/30/2020.
ArrowstreetBenchmark: MSCI All Country World IMI (Net)
MFSBenchmark: MSCI All Country World IMI. Prior to May 2012, the MSCI All Country World Index.
Wellington EquityBenchmark: MSCI All Country World Small Cap (Net)
Dodge & CoxBenchmark: MSCI All Country World Index IMI
Fixed Income ComponentBenchmark: As of January 2005, the Bloomberg Barclays Universal Index. As of December 2004, 20% the Citigroup Large Public Fund Index and 80% the Bloomberg BarclaysUniversal Index. As of November 2004, 40% the Citigroup Large Public Fund Index and 60% the Bloomberg Barclays Universal Index. As of October 2004, 60% the CitigroupLarge Public Fund Index and 40% the Bloomberg Barclays Universal Index. As of September 2004, 80% the Citigroup Large Public Fund Index and 20% the Bloomberg BarclaysUniversal Index. Prior to September 2004, the Citigroup Large Public Fund Index.
Universe: A universe of Fixed Income portfolios within Public Plans with total assets in excess of $1 billion as comprised by Investment Metrics and BNY Mellon Performance &Risk Analytics. The universe consisted of 57 accounts as of 9/30/2020.
BlackRock Core Plus UniversalBenchmark: The Bloomberg Barclays Universal Bond Index
PIMCOBenchmark: The Bloomberg Barclays Universal Bond Index
BlackRock Aggregate Bond Index
245
Appendix
Defined Benefit Plan – Benchmarks and Universes
Benchmark: The Bloomberg Barclays Aggregate Bond Index
Loomis SaylesBenchmark: As of August 1, 2010 the benchmark is the Bloomberg Barclays Universal Bond Index. Prior to July 31, 2010 the benchmark was the Bloomberg Barclays High YieldIndex.
Wellington GlobalBenchmark: The Bloomberg Barclays Global Aggregate Index
Loomis Sayles Bank LoansBenchmark: The S&P/LSTA Leveraged Loan Index
Franklin TempletonBenchmark: The Credit Suisse Leveraged Loan (Split BB) Index
Neuberger Berman Core PlusBenchmark: The Bloomberg Barclays Universal Bond Index
Real Estate ComponentBenchmark: The NCREIF ODCE Index. Prior to January 2016, the NCREIF Property Index. Prior to April 2009, 20% DJ US Select Real Estate Securities Total Return - Float, 80%NCREIF Property Index. Prior to April 2006, 25% DJ US Select Real Estate Securities Total Return- Float, 75% NCREIF Property Index. Prior to December 2004, the DJ US SelectReal Estate Securities Total Return
Private Equity ComponentBenchmark: Dow Jones U.S. Total Stock Market Index + 3%
246

DFABenchmark: Russell 2000 Index
Russell 1000 Growth IndexBenchmark: Russell 1000 Growth Index
Russell 1000 Value IndexBenchmark: Russell 1000 Value Index
U.S. Equity Index FundBenchmark: S&P 500 Index
BlackRock All Country World ex-U.S. Index FundBenchmark: MSCI All Country World ex-U.S. Index
U.S. Debt Index FundBenchmark: Bloomberg Barclays Aggregate Bond Index
T.Rowe Price Stable ValueBenchmark: The Hueler Index as of June 1, 2004. Prior to that, the 90-Day Treasury Bill.
SSgA STIFBenchmark: 90-Day Treasury Bill
Conservative PremixedBenchmark: A composite of 16% of the S&P 500 Index, 4% of the Russell 2000 Index, 60% of the Bloomberg Barclays Aggregate Bond Index, 5% of the MSCI All Country Worldex-U.S. Index and 15% of the 90-Day T-Bill.
Moderate PremixedBenchmark: A composite of 32% of the S&P 500 Index, 8% of the Russell 2000 Index, 50% of the Bloomberg Barclays Aggregate Bond Index, and 10% of the MSCI All CountryWorld ex-U.S. Index.
Aggressive PremixedBenchmark: A composite of 48% of the S&P 500 Index, 12% of the Russell 2000 Index, 25% of the Bloomberg Barclays Aggregate Bond Index, and 15% of the MSCI All CountryWorld ex-U.S. Index.
Investor SelectBenchmark: A composite of 32% of the DJ U.S. Total Stock Market Index, 30% of the Bloomberg Barclays Universal Bond Index, 11.5% of the MSCI All Country World ex-U.S. IMI,19% of the MSCI All Country World IMI, and 7.5% of the DJ Wilshire Real Estate Securities Index.
Appendix
DC Plan Benchmarks
247

Total FundBenchmark: As of April 2020, 27.5% of the DJ U.S.Total Stock Market Index,19% of the MSCI All Country World IMI, 11.5% of the MSCI All Country World ex-U.S. IMI, 30% of thefixed income component, 7% of the real estate component, and 5% of the private equity component. As of October 2018, 28.5% of the DJ U.S.Total Stock Market Index,19% of theMSCI All Country World IMI, 11.5% of the MSCI All Country World ex-U.S. IMI, 30% of the fixed income component, 6% of the real estate component, and 5% of the private equitycomponent. As of January 2018, 29.5% of the DJ U.S.Total Stock Market Index,19% of the MSCI All Country World IMI, 11.5% of the MSCI All Country World ex-U.S. IMI, 30% ofthe fixed income component, 6% of the real estate component, and 4% of the private equity component. As of October 2014, 32.5% of the DJ U.S.Total Stock Market Index ,15% ofthe MSCI All Country World IMI, 13.5% of the MSCI All Country World ex-U.S. IMI, 30% of the fixed income component, 5% of the real estate component, and 4% of the privateequity component. As of October 2015, 31.5% of the DJ U.S.Total Stock Market Index,15% of the MSCI All Country World IMI, 13.5% of the MSCI All Country World ex-U.S. IMI,30% of the fixed income component, 6% of the real estate component, and 4% of the private equity component. As of October 2014, 32.5% of the DJ U.S.Total Stock MarketIndex ,15% of the MSCI All Country World IMI, 13.5% of the MSCI All Country World ex-U.S. IMI, 30% of the fixed income component, 5% of the real estate component, and 4% ofthe private equity component. As of July 2012, 33.5% of the DJ U.S.Total Stock Market Index ,15% of the MSCI All Country World IMI, 13.5% of the MSCI All Country World ex-U.S. IMI, 30% of the fixed income component, 5% of the real estate component, and 3% of the private equity component. As of August 2010, 36.5% of the DJ U.S.Total StockMarket Index ,15% of the MSCI All Country World IMI, 13.5% of the MSCI All Country World ex-U.S. IMI, 30% of the fixed income component, and 5% of the real estate component.As of June 2009, 36.5% of the DJ U.S.Total Stock Market Index ,15% of the MSCI All Country World Index, 13.5% of the MSCI All Country World ex-U.S. Index GD, 30% of thefixed income component, and 5% of the real estate component. As of December 2008, 42.5% of the DJ U.S.Total Stock Market Index ,10% of the MSCI All Country World Index,12.5% of the MSCI All Country World ex-U.S. Index GD, and the fixed income component allocation is comprised of 35% minus the actual allocation of real estate until real estatereaches its 5% target policy. As of September 2005, 47.5% of the DJ U.S.Total Stock Market Index, 5% of the MSCI All Country World Index, 12.5% of the MSCI All Country Worldex-U.S. Index GD, and the fixed income component allocation is comprised of 35% minus the actual allocation of real estate until real estate reaches its 5% target policy. As ofDecember 2004, the policy benchmark consisted of 50% of the DJ U.S.Total Stock Market Index, 15% of the MSCI All Country World ex-U.S. Index GD, the actual allocation of realestate, and the fixed income allocation was 35% minus the actual allocation of real estate. Beginning September 1, 2004, the fixed income component of the benchmark wastransitioned to the Bloomberg Barclays Universal Index over a five month period. As of April 2004, the Policy Benchmark consisted of 50% of the DJ U.S.Total Stock Market Index,35% of the Citigroup Large Public Fund Index and 15% of the MSCI All Country World ex-U.S. Index GD. Prior to April 2003, the Policy Benchmark consisted of 50% of the DJU.S.Total Stock Market Index, 35% of the Citigroup LPF Index and 15% of the MSCI All Country World ex-U.S. Index GD. Prior to October 2000, the Policy Benchmark consisted of45% of the DJ U.S.Total Stock Market Index, 45% of the Bloomberg Barclays Aggregate Bond Index and 10% of the MSCI EAFE Index ND. Prior to October 1995, the PolicyBenchmark consisted of 50% of the DJ U.S.Total Stock Market Index, 45% of the Bloomberg Barclays Aggregate Bond Index and 5% of the MSCI EAFE Index ND. Prior to October1991, the Policy Benchmark Consisted of 50% of the DJ U.S.Total Stock Market Index and 50% of the Bloomberg Barclays Aggregate Bond Index.
U.S. Equity ComponentBenchmark: The DJ U.S. Total Stock Market Index
Universe: A universe of U.S. Equity portfolios within Public Plans with total assets in excess of $1 billion as comprised by Investment Metrics and BNY Mellon Performance & RiskAnalytics. The universe consisted of 55 accounts as of 9/30/2020.
DFABenchmark: Russell 2000 Index. Prior to April 2014, the Russell 2000 Value Index. Prior to August 2006, the Wilshire Small-Cap Value Style Index.
BlackRock Russell 1000 Growth Index FundBenchmark: Russell 1000 Growth Index
Non-U.S. Equity ComponentBenchmark: MSCI All Country World ex-U.S. IMI. Prior to August 2010, the MSCI All Country World ex-U.S. Index, Gross Dividends. Prior to October 2000, MSCI EAFE Index.
Universe: A universe of Non-U.S. Equity portfolios within Public Plans with total assets in excess of $1 billion as comprised by Investment Metrics and BNY Mellon Performance &Risk Analytics. The universe consisted of 56 accounts as of 9/30/2020.
Appendix
Cash Balance Plan
248

Appendix
Cash Balance Plan
BlackRock ACWI ex-U.S. IMIBenchmark: The MSCI All Country World ex-U.S. IMI
Global Equity ComponentBenchmark: The MSCI All Country World IMI. Prior to August 2010, the MSCI All Country World Index.
Universe: A universe of global equity funds as comprised by Investment Metrics. The universe consisted of 548 accounts as of 9/30/2020.
ArrowstreetBenchmark: MSCI All Country World IMI (Net)
MFSBenchmark: MSCI All Country World IMI. Prior to May 2012, the MSCI All Country World Index.
Wellington EquityBenchmark: MSCI All Country World Small Cap (Net)
BlackRock All Country World IMIBenchmark: MSCI All Country World Index IMI
Dodge & CoxBenchmark: MSCI All Country World Index IMI
Fixed Income ComponentBenchmark: As of January 2005, the Bloomberg Barclays Universal Index. As of December 2004, 20% the Citigroup Large Public Fund Index and 80% the Bloomberg BarclaysUniversal Index. As of November 2004, 40% the Citigroup Large Public Fund Index and 60% the Bloomberg Barclays Universal Index. As of October 2004, 60% the CitigroupLarge Public Fund Index and 40% the Bloomberg Barclays Universal Index. As of September 2004, 80% the Citigroup Large Public Fund Index and 20% the Bloomberg BarclaysUniversal Index. Prior to September 2004, the Citigroup Large Public Fund Index.
Universe: A universe of Fixed Income portfolios within Public Plans with total assets in excess of $1 billion as comprised by Investment Metrics and BNY Mellon Performance &Risk Analytics. The universe consisted of 57 accounts as of 9/30/2020.
BlackRock Core Plus UniversalBenchmark: The Bloomberg Barclays Universal Bond Index
PIMCOBenchmark: The Bloomberg Barclays Universal Bond Index
BlackRock Aggregate Bond IndexBenchmark: The Bloomberg Barclays Aggregate Bond Index
249

Appendix
Cash Balance Plan
Loomis SaylesBenchmark: As of August 1, 2010 the benchmark is the Bloomberg Barclays U.S. Universal Bond Index. Prior to July 31,2010 the benchmark was the Bloomberg Barclays HighYield Index.
Wellington GlobalBenchmark: The Bloomberg Barlcays Global Aggregate Index
Loomis Sayles Bank LoansBenchmark: The S&P/LSTA Leveraged Loan Index
Franklin TempletonBenchmark: The Credit Suisse Leveraged Loan (Split BB) Index
Neuberger Berman Core PlusBenchmark: The Bloomberg Barclays Universal Bond Index
Real Estate ComponentBenchmark: The NCREIF ODCE Index. Prior to January 2016, the NCREIF Property Index. Prior to April 2009, 20% DJ US Select Real Estate Securities Total Return - Float, 80%NCREIF Property Index. Prior to April 2006, 25% DJ US Select Real Estate Securities Total Return- Float, 75% NCREIF Property Index. Prior to December 2004, the DJ US SelectReal Estate Securities Total Return
Private Equity ComponentBenchmark: Dow Jones U.S. Total Stock Market Index + 3%
250

Direct Aggressive 19+ MixBenchmark: A composite of 12.0% of the S&P 500 Index, 2.0% of the FTSE High Dividend Yield Index, 2.0% of the Russell 1000 Growth Index, 1.0% of the S&P CompletionIndex, 0.5% of the Russell 2000 Index, 0.5% of the Russell 2000 Growth Index, 5.0% of the MSCI ACWI ex USA (Net) Index, 4.0% Citigroup World Gov’t Bond Index ex-USA,28.0% of the Bloomberg Barclays Capital U.S. Aggregate Index, 17.0% of the Bloomberg Barclays Capital U.S. Govt/Credit 1-5 Float Index, 5.0% of the Bloomberg BarclaysCapital U.S. Treasury: U.S. TIPS 0-5 Year Index, 2.0% of the MSCI US REIT Index, 10.0% 1 Month US Bank Deposit Index, and 11.0% of the Citigroup 3-Month T-Bill Index.
Direct Aggressive 17-18 MixBenchmark: A composite of 13.0% of the S&P 500 Index, 4.5% of the FTSE High Dividend Yield Index, 4.5% of the Russell 1000 Growth Index, 1.0% of the S&P CompletionIndex, 1.0% of the Russell 2000 Index, 1.0% of the Russell 2000 Growth Index, 7.5% of the MSCI ACWI ex USA (Net) Index, 4.0% Citigroup World Gov’t Bond Index ex-USA,26.5% of the Bloomberg Barclays Capital U.S. Aggregate Index, 15.0% of the Bloomberg Barclays Capital U.S. Govt/Credit 1-5 Float Index, 2.5% of the Bloomberg BarclaysCapital U.S. Treasury: U.S. TIPS 0-5 Year Index, 2.5% of the MSCI US REIT Index, 8.0% 1 Month US Bank Deposit Index, and 9.0% of the Citigroup 3-Month T-Bill Index.
Direct Aggressive 15-16 MixBenchmark: A composite of 14.0% of the S&P 500 Index, 7.0% of the FTSE High Dividend Yield Index, 7.0% of the Russell 1000 Growth Index, 1.0% of the S&P CompletionIndex, 1.5% of the Russell 2000 Index, 1.5% of the Russell 2000 Growth Index, 10.0% of the MSCI ACWI ex USA (Net) Index, 4.0% Citigroup World Gov’t Bond Index ex-USA,25.0% of the Bloomberg Barclays Capital U.S. Aggregate Index, 13.0% of the Bloomberg Barclays Capital U.S. Govt/Credit 1-5 Float Index, 3.0% of the MSCI US REIT Index,6.0% 1 Month US Bank Deposit Index, and 7.0% of the Citigroup 3-Month T-Bill Index.
Direct Aggressive 13-14 MixBenchmark: A composite of 18.0% of the S&P 500 Index, 8.0% of the FTSE High Dividend Yield Index, 8.0% of the Russell 1000 Growth Index, 1.0% of the S&P CompletionIndex, 2.0% of the Russell 2000 Index, 2.0% of the Russell 2000 Growth Index, 12.5% of the MSCI ACWI ex USA (Net) Index, 3.5% Citigroup World Gov’t Bond Index ex-USA,23.5% of the Bloomberg Barclays Capital U.S. Aggregate Index, 9.5% of the Bloomberg Barclays Capital U.S. Govt/Credit 1-5 Float Index, 3.5% of the MSCI US REIT Index, 3.0%1 Month US Bank Deposit Index, and 5.5% of the Citigroup 3-Month T-Bill Index.
Direct Aggressive 11-12 MixBenchmark: A composite of 22.0% of the S&P 500 Index, 9.0% of the FTSE High Dividend Yield Index, 9.0% of the Russell 1000 Growth Index, 1.0% of the S&P CompletionIndex, 2.5% of the Russell 2000 Index, 2.5% of the Russell 2000 Growth Index, 15.0% of the MSCI ACWI ex USA (Net) Index, 3.0% Citigroup World Gov’t Bond Index ex-USA,22.0% of the Bloomberg Barclays Capital U.S. Aggregate Index, 6.0% of the Bloomberg Barclays Capital U.S. Govt/Credit 1-5 Float Index, 4.0% of the MSCI US REIT Index, and4.0% of the Citigroup 3-Month T-Bill Index.
Direct Aggressive 9-10 MixBenchmark: A composite of 27.0% of the S&P 500 Index, 9.5% of the FTSE High Dividend Yield Index, 9.5% of the Russell 1000 Growth Index, 1.5% of the S&P CompletionIndex, 2.8% of the Russell 2000 Index, 2.8% of the Russell 2000 Growth Index, 17.5% of the MSCI ACWI ex USA (Net) Index, 2.5% Citigroup World Gov’t Bond Index ex-USA,17.5% of the Bloomberg Barclays Capital U.S. Aggregate Index, 3.0% of the Bloomberg Barclays Capital U.S. Govt/Credit 1-5 Float Index, 4.5% of the MSCI US REIT Index, and2.0% of the Citigroup 3-Month T-Bill Index.
Direct Aggressive 6-8 MixBenchmark: A composite of 32.0% of the S&P 500 Index, 10.0% of the FTSE High Dividend Yield Index, 10.0% of the Russell 1000 Growth Index, 2.0% of the S&P CompletionIndex, 3.0% of the Russell 2000 Index, 3.0% of the Russell 2000 Growth Index, 20.0% of the MSCI ACWI ex USA (Net) Index, 2.0% Citigroup World Gov’t Bond Index ex-USA,13.0% of the Bloomberg Barclays Capital U.S. Aggregate Index, and 5.0% of the MSCI US REIT Index.
Appendix
College Savings Plans of Nebraska
251
Appendix
College Savings Plans of Nebraska
Direct Aggressive 3-5 MixBenchmark: A composite of 36.0% of the S&P 500 Index, 11.0% of the FTSE High Dividend Yield Index, 11.0% of the Russell 1000 Growth Index, 2.0% of the S&P CompletionIndex, 4.0% of the Russell 2000 Index, 4.0% of the Russell 2000 Growth Index, 22.0% of the MSCI ACWI ex USA (Net) Index, 5.0% of the Bloomberg Barclays Capital U.S.Aggregate Index, and 5.0% of the MSCI US REIT Index.
Direct Aggressive 0-2 MixBenchmark: A composite of 38.0% of the S&P 500 Index, 11.5% of the FTSE High Dividend Yield Index, 11.5% of the Russell 1000 Growth Index, 2.0% of the S&P CompletionIndex, 4.25% of the Russell 2000 Index, 4.25% of the Russell 2000 Growth Index, 23.25% of the MSCI ACWI ex USA (Net) Index, and 5.25% of the MSCI US REIT Index.
Direct Growth 19+ MixBenchmark: A composite of 4.0% of the S&P 500 Index, 1.0% of the MSCI ACWI ex USA (Net) Index, 2.0% Citigroup World Gov’t Bond Index ex-USA, 15.0% of the BloombergBarclays Capital U.S. Aggregate Index, 18.0% of the Bloomberg Barclays Capital U.S. Govt/Credit 1-5 Float Index, 5.0% of the Bloomberg Barclays Capital U.S. Treasury: U.S.TIPS 0-5 Year Index, 20.0% 1 Month US Bank Deposit Index, and 35.0% of the Citigroup 3-Month T-Bill Index.
Direct Growth 17-18 MixBenchmark: A composite of 10.0% of the S&P 500 Index, 1.0% of the S&P Completion Index, 3.0% of the MSCI ACWI ex USA (Net) Index, 3.0% Citigroup World Gov’t Bond Indexex-USA, 25.0% of the Bloomberg Barclays Capital U.S. Aggregate Index, 15.0% of the Bloomberg Barclays Capital U.S. Govt/Credit 1-5 Float Index, 9.0% of the BloombergBarclays Capital U.S. Treasury: U.S. TIPS 0-5 Year Index, 1.0% of the MSCI US REIT Index, 15.0% 1 Month US Bank Deposit Index, and 18.0% of the Citigroup 3-Month T-BillIndex.
Direct Growth 15-16 MixBenchmark: A composite of 12.0% of the S&P 500 Index, 2.0% of the FTSE High Dividend Yield Index, 2.0% of the Russell 1000 Growth Index, 1.0% of the S&P CompletionIndex, 0.5% of the Russell 2000 Index, 0.5% of the Russell 2000 Growth Index, 5.0% of the MSCI ACWI ex USA (Net) Index, 4.0% Citigroup World Gov’t Bond Index ex-USA,28.0% of the Bloomberg Barclays Capital U.S. Aggregate Index, 17.0% of the Bloomberg Barclays Capital U.S. Govt/Credit 1-5 Float Index, 5.0% of the Bloomberg BarclaysCapital U.S. Treasury: U.S. TIPS 0-5 Year Index, 2.0% of the MSCI US REIT Index, 10.0% 1 Month US Bank Deposit Index, and 11.0% of the Citigroup 3-Month T-Bill Index.
Direct Growth 13-14 MixBenchmark: A composite of 13.0% of the S&P 500 Index, 4.5% of the FTSE High Dividend Yield Index, 4.5% of the Russell 1000 Growth Index, 1.0% of the S&P CompletionIndex, 1.0% of the Russell 2000 Index, 1.0% of the Russell 2000 Growth Index, 7.5% of the MSCI ACWI ex USA (Net) Index, 4.0% Citigroup World Gov’t Bond Index ex-USA,26.5% of the Bloomberg Barclays Capital U.S. Aggregate Index, 15.0% of the Bloomberg Barclays Capital U.S. Govt/Credit 1-5 Float Index, 2.5% of the Bloomberg BarclaysCapital U.S. Treasury: U.S. TIPS 0-5 Year Index, 2.5% of the MSCI US REIT Index, 8.0% 1 Month US Bank Deposit Index, and 9.0% of the Citigroup 3-Month T-Bill Index.
Direct Growth 11-12 MixBenchmark: A composite of 14.0% of the S&P 500 Index, 7.0% of the FTSE High Dividend Yield Index, 7.0% of the Russell 1000 Growth Index, 1.0% of the S&P CompletionIndex, 1.5% of the Russell 2000 Index, 1.5% of the Russell 2000 Growth Index, 10.0% of the MSCI ACWI ex USA (Net) Index, 4.0% Citigroup World Gov’t Bond Index ex-USA,25.0% of the Bloomberg Barclays Capital U.S. Aggregate Index, 13.0% of the Bloomberg Barclays Capital U.S. Govt/Credit 1-5 Float Index, 3.0% of the MSCI US REIT Index,6.0% 1 Month US Bank Deposit Index, and 7.0% of the Citigroup 3-Month T-Bill Index.
Direct Growth 9-10 MixBenchmark: A composite of 18.0% of the S&P 500 Index, 8.0% of the FTSE High Dividend Yield Index, 8.0% of the Russell 1000 Growth Index, 1.0% of the S&P CompletionIndex, 2.0% of the Russell 2000 Index, 2.0% of the Russell 2000 Growth Index, 12.5% of the MSCI ACWI ex USA (Net) Index, 3.5% Citigroup World Gov’t Bond Index ex-USA,23.5% of the Bloomberg Barclays Capital U.S. Aggregate Index, 9.5% of the Bloomberg Barclays Capital U.S. Govt/Credit 1-5 Float Index, 3.5% of the MSCI US REIT Index, 3.0%1 Month US Bank Deposit Index, and 5.5% of the Citigroup 3-Month T-Bill Index.
252

Appendix
College Savings Plans of Nebraska
Direct Growth 6-8 MixBenchmark: A composite of 22.0% of the S&P 500 Index, 9.0% of the FTSE High Dividend Yield Index, 9.0% of the Russell 1000 Growth Index, 1.0% of the S&P CompletionIndex, 2.5% of the Russell 2000 Index, 2.5% of the Russell 2000 Growth Index, 15.0% of the MSCI ACWI ex USA (Net) Index, 3.0% Citigroup World Gov’t Bond Index ex-USA,22.0% of the Bloomberg Barclays Capital U.S. Aggregate Index, 6.0% of the Bloomberg Barclays Capital U.S. Govt/Credit 1-5 Float Index, 4.0% of the MSCI US REIT Index, and4.0% of the Citigroup 3-Month T-Bill Index.
Direct Growth 3-5 MixBenchmark: A composite of 27.0% of the S&P 500 Index, 9.5% of the FTSE High Dividend Yield Index, 9.5% of the Russell 1000 Growth Index, 1.5% of the S&P CompletionIndex, 2.8% of the Russell 2000 Index, 2.8% of the Russell 2000 Growth Index, 17.5% of the MSCI ACWI ex USA (Net) Index, 2.5% Citigroup World Gov’t Bond Index ex-USA,17.5% of the Bloomberg Barclays Capital U.S. Aggregate Index, 3.0% of the Bloomberg Barclays Capital U.S. Govt/Credit 1-5 Float Index, 4.5% of the MSCI US REIT Index, and2.0% of the Citigroup 3-Month T-Bill Index.
Direct Growth 0-2 MixBenchmark: A composite of 32.0% of the S&P 500 Index, 10.0% of the FTSE High Dividend Yield Index, 10.0% of the Russell 1000 Growth Index, 2.0% of the S&P CompletionIndex, 3.0% of the Russell 2000 Index, 3.0% of the Russell 2000 Growth Index, 20.0% of the MSCI ACWI ex USA (Net) Index, 2.0% Citigroup World Gov’t Bond Index ex-USA,13.0% of the Bloomberg Barclays Capital U.S. Aggregate Index, and 5.0% of the MSCI US REIT Index.
Direct Index 19+ MixBenchmark: 100.0% of the Citigroup 3-Month T-Bill Index.
Direct Index 17-18 MixBenchmark: 100.0% of the Citigroup 3-Month T-Bill Index.
Direct Index 15-16 MixBenchmark: A composite of 4.0% of the S&P 500 Index, 1.0% of the MSCI ACWI ex USA (Net) Index, 2.0% of the Citigroup World Gov’t Bond Index ex-USA, 15.0% of theBloomberg Barclays Capital U.S. Aggregate Index, 18.0% of the Bloomberg Barclays Capital U.S. Govt/Credit 1-5 Float Index, 5.0% of the Bloomberg Barclays US Treasury: U.S.TIPS 0-5 Year Index, 20.0% of the 1 Month US Bank Deposit Index and 35.0% of the Citigroup 3-Month T-Bill Index.
Direct Index 13-14 MixBenchmark: A composite of 10.0% of the S&P 500 Index, 1.0% of the S&P Completion Index, 3.0% of the MSCI ACWI ex USA (Net) Index, 3.0% of the Citigroup World Gov’t BondIndex ex-USA, 25.0% of the Bloomberg Barclays Capital U.S. Aggregate Index, 15.0% of the Bloomberg Barclays Capital U.S. Govt/Credit 1-5 Float Index, 9.0% of the BloombergBarclays US Treasury: U.S. TIPS 0-5 Year Index, 1.0% of the MSCI US REIT Index, 15.0% of the 1 Month US Bank Deposit Index and 18.0 % of the Citigroup 3-Month T-Bill Index.
Direct Index 11-12 MixBenchmark: A composite of 16.0% of the S&P 500 Index, 2.0% of the S&P Completion Index, 5.0% of the MSCI ACWI ex USA (Net) Index, 4.0% of the Citigroup World Gov’t BondIndex ex-USA, 28.0% of the Bloomberg Barclays Capital U.S. Aggregate Index, 17.0% of the Bloomberg Barclays Capital U.S. Govt/Credit 1-5 Float Index, 5.0% of the BloombergBarclays US Treasury: U.S. TIPS 0-5 Year Index, 2.0% of the MSCI US REIT Index, 10.0% of the 1 Month US Bank Deposit Index and 11.0 % of the Citigroup 3-Month T-Bill Index.
Direct Index 9-10 MixBenchmark: A composite of 22.0% of the S&P 500 Index, 3.0% of the S&P Completion Index, 7.5% of the MSCI ACWI ex USA (Net) Index, 4.0% of the Citigroup World Gov’t BondIndex ex-USA, 26.5% of the Bloomberg Barclays Capital U.S. Aggregate Index, 15.0% of the Bloomberg Barclays Capital U.S. Govt/Credit 1-5 Float Index, 2.5% of the BloombergBarclays US Treasury: U.S. TIPS 0-5 Year Index, 2.5% of the MSCI US REIT Index, 8.0% of the 1 Month US Bank Deposit Index and 9.0% of the Citigroup 3-Month T-Bill Index.
253

Appendix
College Savings Plans of Nebraska
Direct Index 6-8 MixBenchmark: A composite of 28.0% of the S&P 500 Index, 4.0% of the S&P Completion Index, 10.0% of the MSCI ACWI ex USA (Net) Index, 4.0% of the Citigroup World Gov’tBond Index ex-USA, 25.0% of the Bloomberg Barclays Capital U.S. Aggregate Index, 13.0% of the Bloomberg Barclays Capital U.S. Govt/Credit 1-5 Float Index, 3.0% of the MSCIUS REIT Index, 6.0% of the 1 Month US Bank Deposit Index and 7.0% of the Citigroup 3-Month T-Bill Index.
Direct Index 3-5 MixBenchmark: A composite of 34.0% of the S&P 500 Index, 5.0% of the S&P Completion Index, 12.5% of the MSCI ACWI ex USA (Net) Index, 3.5% of the Citigroup World Gov’tBond Index ex-USA, 23.5% of the Bloomberg Barclays Capital U.S. Aggregate Index, 9.5% of the Bloomberg Barclays Capital U.S. Govt/Credit 1-5 Float Index, 3.5% the MSCI USREIT Index, 3.0% of the 1 Month US Bank Deposit Index and 5.5% of the Citigroup 3-Month T-Bill Index.
Direct Index 0-2 MixBenchmark: A composite of 40.0% of the S&P 500 Index, 6.0% of the S&P Completion Index, 15.0% of the MSCI ACWI ex USA (Net) Index, 3.0% of the Citigroup World Gov’tBond Index ex-USA, 22.0% of the Bloomberg Barclays Capital U.S. Aggregate Index, 6.0% of the Bloomberg Barclays Capital U.S. Govt/Credit 1-5 Float Index, 4.0% of the MSCIUS REIT Index, and 4.0% of the Citigroup 3-Month T-Bill Index.
Direct Conservative Static MixBenchmark: A composite of 12.0% of the S&P 500 Index, 2.0% of the FTSE High Dividend Yield Index, 2.0% of the Russell 1000 Growth Index, 1.0% of the S&P CompletionIndex, 0.5% of the Russell 2000 Index, 0.5% of the Russell 2000 Growth Index, 5.0% of the MSCI ACWI ex USA (Net) Index, 4.0% Citigroup World Gov’t Bond Index ex-USA,28.0% of the Bloomberg Barclays Capital U.S. Aggregate Index, 17.0% of the Bloomberg Barclays Capital U.S. Govt/Credit 1-5 Float Index, 5.0% of the Bloomberg BarclaysCapital U.S. Treasury: U.S. TIPS 0-5 Year Index, 2.0% of the MSCI US REIT Index, and 10.0% of the Citigroup 3-Month T-Bill Index.
Direct Balanced Static MixBenchmark: A composite of 18.0% of the S&P 500 Index, 8.0% of the FTSE High Dividend Yield Index, 8.0% of the Russell 1000 Growth Index, 1.0% of the S&P CompletionIndex, 2.0% of the Russell 2000 Index, 2.0% of the Russell 2000 Growth Index, 12.5% of the MSCI ACWI ex USA (Net) Index, 3.5% Citigroup World Gov’t Bond Index ex-USA,23.5% of the Bloomberg Barclays Capital U.S. Aggregate Index, 9.5% of the Bloomberg Barclays Capital U.S. Govt/Credit 1-5 Float Index, 3.5% of the MSCI US REIT Index, and3.0% of the Citigroup 3-Month T-Bill Index.
Direct Moderate Growth Static MixBenchmark: A composite of 22.0% of the S&P 500 Index, 9.0% of the FTSE High Dividend Yield Index, 9.0% of the Russell 1000 Growth Index, 1.0% of the S&P CompletionIndex, 2.5% of the Russell 2000 Index, 2.5% of the Russell 2000 Growth Index, 15.0% of the MSCI ACWI ex USA (Net) Index, 3.0% Citigroup World Gov’t Bond Index ex-USA,22.0% of the Bloomberg Barclays Capital U.S. Aggregate Index, 6.0% of the Bloomberg Barclays Capital U.S. Govt/Credit 1-5 Float Index, and 4.0% of the MSCI US REIT Index.
Growth Static MixBenchmark: A composite of 32.0% of the S&P 500 Index, 10.0% of the FTSE High Dividend Yield Index, 10.0% of the Russell 1000 Growth Index, 2.0% of the S&P CompletionIndex, 3.0% of the Russell 2000 Index, 3.0% of the Russell 2000 Growth Index, 20.0% of the MSCI ACWI ex USA (Net) Index, 2.0% Citigroup Gov’t World Bond Index ex USA,13.0% of the Bloomberg Barclays Capital U.S. Aggregate Index, and 5.0% of the MSCI US REIT Index.
Direct All Equity Static MixBenchmark: A composite of 38.0% of the S&P 500 Index, 11.5% of the FTSE High Dividend Yield Index, 11.5% of the Russell 1000 Growth Index, 2.0% of the S&P CompletionIndex, 4.25% of the Russell 2000 Index, 4.25% of the Russell 2000 Growth Index, 23.25% of the MSCI ACWI ex USA (Net) Index, and 5.25% of the MSCI US REIT Index.
254

Appendix
College Savings Plans of Nebraska
TDA Core 19+ MixBenchmark: A composite of 12.0% of the S&P 500 Index, 3.0% of the FTSE Developed All Cap ex US Index, 25.0% of the Bloomberg Barclays US Aggregated Bond Index, 24.0%of the Bloomberg Barclays U.S. 1-5 Year Government/Credit Float Adjusted Index, 3.0% of the Bloomberg Barclays Global Aggregate ex-USD Float Adjusted RIC Capped Index(USD Hedged), 33.0% of the FTSE 3-Month T-Bill.
TDA Core 17-18 MixBenchmark: A composite of 20.0% of the S&P 500 Index, 4.0% of the FTSE Developed All Cap ex US Index, 1.0% of the FTSE Emerging Markets All Cap China A Inclusion Index,28.0% of the Bloomberg Barclays US Aggregated Bond Index, 22.0% of the Bloomberg Barclays U.S. 1-5 Year Government/Credit Float Adjusted Index, 4.0% of the BloombergBarclays Global Aggregate ex-USD Float Adjusted RIC Capped Index (USD Hedged), 21.0% of the FTSE 3-Month T-Bill.
TDA Core 15-16 MixBenchmark: A composite of 27.5% of the S&P 500 Index, 6.0% of the FTSE Developed All Cap ex US Index, 1.5% of the FTSE Emerging Markets All Cap China A Inclusion Index,26.5% of the Bloomberg Barclays US Aggregated Bond Index, 17.5% of the Bloomberg Barclays U.S. 1-5 Year Government/Credit Float Adjusted Index, 4.0% of the BloombergBarclays Global Aggregate ex-USD Float Adjusted RIC Capped Index (USD Hedged), 17.0% of the FTSE 3-Month T-Bill.
TDA Core 13-14 MixBenchmark: A composite of 35.0% of the S&P 500 Index, 8.0% of the FTSE Developed All Cap ex US Index, 2.0% of the FTSE Emerging Markets All Cap China A Inclusion Index,25.0% of the Bloomberg Barclays US Aggregated Bond Index, 13.0% of the Bloomberg Barclays U.S. 1-5 Year Government/Credit Float Adjusted Index, 3.0% of the BloombergBarclays Global Aggregate ex-USD Float Adjusted RIC Capped Index (USD Hedged), 1.0% of the J.P. Morgan GBI-EM Global Core Index, 13.0% of the FTSE 3-Month T-Bill.
TDA Core 11-12 MixBenchmark: A composite of 42.5% of the S&P 500 Index, 10.0% of the FTSE Developed All Cap ex US Index, 2.5% of the FTSE Emerging Markets All Cap China A InclusionIndex, 23.5% of the Bloomberg Barclays US Aggregated Bond Index, 9.5% of the Bloomberg Barclays U.S. 1-5 Year Government/Credit Float Adjusted Index, 2.5% of theBloomberg Barclays Global Aggregate ex-USD Float Adjusted RIC Capped Index (USD Hedged), 1.0% of the J.P. Morgan GBI-EM Global Core Index, 8.5% of the FTSE 3-Month T-Bill.
TDA Core 9-10 MixBenchmark: A composite of 50.0% of the S&P 500 Index, 12.0% of the FTSE Developed All Cap ex US Index, 3.0% of the FTSE Emerging Markets All Cap China A InclusionIndex, 22.0% of the Bloomberg Barclays US Aggregated Bond Index, 6.0% of the Bloomberg Barclays U.S. 1-5 Year Government/Credit Float Adjusted Index, 2.0% of theBloomberg Barclays Global Aggregate ex-USD Float Adjusted RIC Capped Index (USD Hedged), 1.0% of the J.P. Morgan GBI-EM Global Core Index, 4.0% of the FTSE 3-Month T-Bill.
TDA Core 6-8 MixBenchmark: A composite of 57.5% of the S&P 500 Index, 14.0% of the FTSE Developed All Cap ex US Index, 3.5% of the FTSE Emerging Markets All Cap China A InclusionIndex, 17.5% of the Bloomberg Barclays US Aggregated Bond Index, 3.0% of the Bloomberg Barclays U.S. 1-5 Year Government/Credit Float Adjusted Index, 1.5% of theBloomberg Barclays Global Aggregate ex-USD Float Adjusted RIC Capped Index (USD Hedged), 1.0% of the J.P. Morgan GBI-EM Global Core Index, 2.0% of the FTSE 3-Month T-Bill.
TDA Core 3-5 MixBenchmark: A composite of 65.0% of the S&P 500 Index, 16.0% of the FTSE Developed All Cap ex US Index, 4.0% of the FTSE Emerging Markets All Cap China A InclusionIndex, 13.0% of the Bloomberg Barclays US Aggregated Bond Index, 1.0% of the Bloomberg Barclays Global Aggregate ex-USD Float Adjusted RIC Capped Index (USD Hedged),1.0% of the J.P. Morgan GBI-EM Global Core Index.
255

Appendix
College Savings Plans of Nebraska
TDA Core 0-2 MixBenchmark: A composite of 73.0% of the S&P 500 Index, 17.5% of the FTSE Developed All Cap ex US Index, 4.5% of the FTSE Emerging Markets All Cap China A InclusionIndex, 5.0% of the Bloomberg Barclays US Aggregated Bond Index.
TDA Socially Aware 19+ MixBenchmark: A composite of 11.0% of the MSCI USA Extended ESG Focus Index, 1.0% of the TIAA ESG USA Small-Cap Index, 3.0% of the MSCI EAFE Extended ESG FocusIndex, 25.0% of the Bloomberg Barclays US Aggregate Bond Index, 24.0% of the Bloomberg Barclays U.S. 1-5 Year Government/Credit Float Adjusted Index, 3.0% of theBloomberg Barclays Global Aggregate ex-USD Float Adjusted RIC Capped Index (USD Hedged), 33.0% FTSE 3-Month T-Bill Index.
TDA Socially Aware 17-18 MixBenchmark: A composite of 18.0% of the MSCI USA Extended ESG Focus Index, 2.0% of the TIAA ESG USA Small-Cap Index, 4.0% of the MSCI EAFE Extended ESG FocusIndex, 1.0% of the MSCI Emerging Markets Extended ESG Focus Index, 28.0% of the Bloomberg Barclays US Aggregate Bond Index, 22.0% of the Bloomberg Barclays U.S. 1-5Year Government/Credit Float Adjusted Index, 4.0% of the Bloomberg Barclays Global Aggregate ex-USD Float Adjusted RIC Capped Index (USD Hedged), 21.0% FTSE 3-MonthT-Bill Index.
TDA Socially Aware 15-16 MixBenchmark: A composite of 24.75% of the MSCI USA Extended ESG Focus Index, 2.75% of the TIAA ESG USA Small-Cap Index, 6.0% of the MSCI EAFE Extended ESG FocusIndex, 1.5% of the MSCI Emerging Markets Extended ESG Focus Index, 26.5% of the Bloomberg Barclays US Aggregate Bond Index, 17.5% of the Bloomberg Barclays U.S. 1-5Year Government/Credit Float Adjusted Index, 4.0% of the Bloomberg Barclays Global Aggregate ex-USD Float Adjusted RIC Capped Index (USD Hedged), 17.0% FTSE 3-MonthT-Bill Index.
TDA Socially Aware 13-14 MixBenchmark: A composite of 31.5% of the MSCI USA Extended ESG Focus Index, 3.5% of the TIAA ESG USA Small-Cap Index, 8.0% of the MSCI EAFE Extended ESG FocusIndex, 2.0% of the MSCI Emerging Markets Extended ESG Focus Index, 25.0% of the Bloomberg Barclays US Aggregate Bond Index, 13.0% of the Bloomberg Barclays U.S. 1-5Year Government/Credit Float Adjusted Index, 3.0% of the Bloomberg Barclays Global Aggregate ex-USD Float Adjusted RIC Capped Index (USD Hedged), 1.0 % J.P. MorganGBI-EM Global Core Index, 13.0% FTSE 3-Month T-Bill Index.
TDA Socially Aware 11-12 MixBenchmark: A composite of 38.25% of the MSCI USA Extended ESG Focus Index, 4.25% of the TIAA ESG USA Small-Cap Index, 10.0% of the MSCI EAFE Extended ESG FocusIndex, 2.5% of the MSCI Emerging Markets Extended ESG Focus Index, 23.5% of the Bloomberg Barclays US Aggregate Bond Index, 9.5% of the Bloomberg Barclays U.S. 1-5Year Government/Credit Float Adjusted Index, 2.5% of the Bloomberg Barclays Global Aggregate ex-USD Float Adjusted RIC Capped Index (USD Hedged), 1.0 % J.P. MorganGBI-EM Global Core Index, 8.5% FTSE 3-Month T-Bill Index.
TDA Socially Aware 9-10 MixBenchmark: A composite of 45.0% of the MSCI USA Extended ESG Focus Index, 5.0% of the TIAA ESG USA Small-Cap Index, 12.0% of the MSCI EAFE Extended ESG FocusIndex, 3.0% of the MSCI Emerging Markets Extended ESG Focus Index, 22.0% of the Bloomberg Barclays US Aggregate Bond Index, 6.0% of the Bloomberg Barclays U.S. 1-5Year Government/Credit Float Adjusted Index, 2.0% of the Bloomberg Barclays Global Aggregate ex-USD Float Adjusted RIC Capped Index (USD Hedged), 1.0 % J.P. MorganGBI-EM Global Core Index, 4.0% FTSE 3-Month T-Bill Index.
TDA Socially Aware 6-8 MixBenchmark: A composite of 51.75% of the MSCI USA Extended ESG Focus Index, 5.75% of the TIAA ESG USA Small-Cap Index, 14.0% of the MSCI EAFE Extended ESG FocusIndex, 3.5% of the MSCI Emerging Markets Extended ESG Focus Index, 17.5% of the Bloomberg Barclays US Aggregate Bond Index, 3.0% of the Bloomberg Barclays U.S. 1-5Year Government/Credit Float Adjusted Index, 1.5% of the Bloomberg Barclays Global Aggregate ex-USD Float Adjusted RIC Capped Index (USD Hedged), 1.0 % J.P. MorganGBI-EM Global Core Index, 2.0% FTSE 3-Month T-Bill Index.
256

Appendix
College Savings Plans of Nebraska
TDA Socially Aware 3-5 MixBenchmark: A composite of 58.5% of the MSCI USA Extended ESG Focus Index, 6.5% of the TIAA ESG USA Small-Cap Index, 16.0% of the MSCI EAFE Extended ESG FocusIndex, 4.0% of the MSCI Emerging Markets Extended ESG Focus Index, 13.0% of the Bloomberg Barclays US Aggregate Bond Index, 1.0% of the Bloomberg Barclays GlobalAggregate ex-USD Float Adjusted RIC Capped Index (USD Hedged), 1.0 % J.P. Morgan GBI-EM Global Core Index.
TDA Socially Aware 0-2 MixBenchmark: A composite of 65.5% of the MSCI USA Extended ESG Focus Index, 7.5% of the TIAA ESG USA Small-Cap Index, 17.5% of the MSCI EAFE Extended ESG FocusIndex, 4.5% of the MSCI Emerging Markets Extended ESG Focus Index, 5.0% of the Bloomberg Barclays US Aggregate Bond Index.
TDA Core Aggressive Static MixBenchmark: A composite of 50.0% of the S&P 500 Index, 23.0% of the FTSE Developed All Cap ex US Index, 11.0% of the FTSE Emerging Markets All Cap China A InclusionIndex, 13.0% of the Bloomberg Barclays US Aggregated Bond Index, 2.0% of the J.P. Morgan GBI-EM Global Core Index, 1.0% of the FTSE 3-Month T-Bill.
TDA Core Growth Static MixBenchmark: A composite of 39.0% of the S&P 500 Index, 20.0% of the FTSE Developed All Cap ex US Index, 9.0% of the FTSE Emerging Markets All Cap China A InclusionIndex, 23.0% of the Bloomberg Barclays US Aggregated Bond Index, 4.0% of the Bloomberg Barclays U.S. 1-5 Year Government/Credit Float Adjusted Index, 2.0% of theBloomberg Barclays Global Aggregate ex-USD Float Adjusted RIC Capped Index (USD Hedged), 2.0% of the J.P. Morgan GBI-EM Global Core Index, 1.0% of the FTSE 3-Month T-Bill.
TDA Core Moderate Growth Static MixBenchmark: A composite of 27.0% of the S&P 500 Index, 14.0% of the FTSE Developed All Cap ex US Index, 6.0% of the FTSE Emerging Markets All Cap China A InclusionIndex, 37.0% of the Bloomberg Barclays US Aggregated Bond Index, 10.0% of the Bloomberg Barclays U.S. 1-5 Year Government/Credit Float Adjusted Index, 2.0% of theBloomberg Barclays Global Aggregate ex-USD Float Adjusted RIC Capped Index (USD Hedged), 3.0% of the J.P. Morgan GBI-EM Global Core Index, 1.0% of the FTSE 3-Month T-Bill.
TDA Core Moderate Static MixBenchmark: A composite of 20.0% of the S&P 500 Index, 11.0% of the FTSE Developed All Cap ex US Index, 5.0% of the FTSE Emerging Markets All Cap China A InclusionIndex, 43.0% of the Bloomberg Barclays US Aggregated Bond Index, 14.0% of the Bloomberg Barclays U.S. 1-5 Year Government/Credit Float Adjusted Index, 2.0% of theBloomberg Barclays Global Aggregate ex-USD Float Adjusted RIC Capped Index (USD Hedged), 4.0% of the J.P. Morgan GBI-EM Global Core Index, 1.0% of the FTSE 3-Month T-Bill.
TDA Core Conservative Static MixBenchmark: A composite of 11.0% of the S&P 500 Index, 7.0% of the FTSE Developed All Cap ex US Index, 3.0% of the FTSE Emerging Markets All Cap China A Inclusion Index,51.0% of the Bloomberg Barclays US Aggregated Bond Index, 25.0% of the Bloomberg Barclays U.S. 1-5 Year Government/Credit Float Adjusted Index, 2.0% of the BloombergBarclays Global Aggregate ex-USD Float Adjusted RIC Capped Index (USD Hedged), 1.0% of the FTSE 3-Month T-Bill.
TDA Socially Aware Aggressive Static MixBenchmark: A composite of 44.0% of the MSCI USA Extended ESG Focus Index, 6.0% of the TIAA ESG USA Small-Cap Index, 23.0% of the MSCI EAFE Extended ESG FocusIndex, 11.0% of the MSCI Emerging Markets Extended ESG Focus Index, 13.0% of the Bloomberg Barclays US Aggregate Bond Index, 2.0 % J.P. Morgan GBI-EM Global CoreIndex, 1.0% FTSE 3-Month T-Bill Index.
257

Appendix
College Savings Plans of Nebraska
TDA Socially Aware Growth Static MixBenchmark: A composite of 34.0% of the MSCI USA Extended ESG Focus Index, 5.0% of the TIAA ESG USA Small-Cap Index, 20.0% of the MSCI EAFE Extended ESG FocusIndex, 9.0% of the MSCI Emerging Markets Extended ESG Focus Index, 23.0% of the Bloomberg Barclays US Aggregate Bond Index, 4.0% of the Bloomberg Barclays U.S. 1-5Year Government/Credit Float Adjusted Index, 2.0% of the Bloomberg Barclays Global Aggregate ex-USD Float Adjusted RIC Capped Index (USD Hedged), 2.0 % J.P. MorganGBI-EM Global Core Index, 1.0% FTSE 3-Month T-Bill Index.
TDA Socially Aware Moderate Growth Static MixBenchmark: A composite of 24.0% of the MSCI USA Extended ESG Focus Index, 3.0% of the TIAA ESG USA Small-Cap Index, 14.0% of the MSCI EAFE Extended ESG FocusIndex, 6.0% of the MSCI Emerging Markets Extended ESG Focus Index, 37.0% of the Bloomberg Barclays US Aggregate Bond Index, 10.0% of the Bloomberg Barclays U.S. 1-5Year Government/Credit Float Adjusted Index, 2.0% of the Bloomberg Barclays Global Aggregate ex-USD Float Adjusted RIC Capped Index (USD Hedged), 3.0 % J.P. MorganGBI-EM Global Core Index, 1.0% FTSE 3-Month T-Bill Index.
TDA Socially Aware Moderate Static MixBenchmark: A composite of 18.0% of the MSCI USA Extended ESG Focus Index, 2.0% of the TIAA ESG USA Small-Cap Index, 11.0% of the MSCI EAFE Extended ESG FocusIndex, 5.0% of the MSCI Emerging Markets Extended ESG Focus Index, 43.0% of the Bloomberg Barclays US Aggregate Bond Index, 14.0% of the Bloomberg Barclays U.S. 1-5Year Government/Credit Float Adjusted Index, 2.0% of the Bloomberg Barclays Global Aggregate ex-USD Float Adjusted RIC Capped Index (USD Hedged), 4.0 % J.P. MorganGBI-EM Global Core Index, 1.0% FTSE 3-Month T-Bill Index.
TDA Socially Aware Conservative Static MixBenchmark: A composite of 10.0% of the MSCI USA Extended ESG Focus Index, 1.0% of the TIAA ESG USA Small-Cap Index, 7.0% of the MSCI EAFE Extended ESG FocusIndex, 3.0% of the MSCI Emerging Markets Extended ESG Focus Index, 51.0% of the Bloomberg Barclays US Aggregate Bond Index, 25.0% of the Bloomberg Barclays U.S. 1-5Year Government/Credit Float Adjusted Index, 2.0% of the Bloomberg Barclays Global Aggregate ex-USD Float Adjusted RIC Capped Index (USD Hedged), 1.0% FTSE 3-Month T-Bill Index.
Advisor Aggressive 19+ MixBenchmark: A composite of 12.0% of the S&P 500 Index, 2.0% of the Russell 1000 Value Index, 2.0% of the Russell 1000 Growth Index, 1.0% of the S&P Completion Index, 0.5%of the Russell 2000 Index, 0.5% of the Russell 2000 Growth Index, 5.0% of the MSCI ACWI ex USA (Net) Index, 4.0% of the Citigroup World Gov’t Bond Index ex USA, 28.0% ofthe Bloomberg Barclays Capital U.S. Aggregate Index, 17.0% of the Bloomberg Barclays Capital U.S. Govt/Credit 1-5 Float Index, 5.0% of the Bloomberg Barclays Capital U.S.Treasury: U.S. TIPS 0-5 Year Index, 2.0% of the MSCI US REIT Index, 10.0% of the 1 Month U.S. Bank Deposit Index, and 11.0% of the Citigroup 3-Month T-Bill Index.
Advisor Aggressive 17-18 MixBenchmark: A composite of 13.0% of the S&P 500 Index, 4.5% of the Russell 1000 Value Index, 4.5% of the Russell 1000 Growth Index, 1.0% of the S&P Completion Index, 1.0%of the Russell 2000 Index, 1.0% of the Russell 2000 Growth Index, 7.5% of the MSCI ACWI ex USA (Net) Index, 4.0% of the Citigroup World Gov’t Bond Index ex USA, 26.5% ofthe Bloomberg Barclays Capital U.S. Aggregate Index, 15.0% of the Bloomberg Barclays Capital U.S. Govt/Credit 1-5 Float Index, 2.5% of the Bloomberg Barclays Capital U.S.Treasury: U.S. TIPS 0-5 Year Index, 2.5% of the MSCI US REIT Index, 8.0% of the 1 Month U.S. Bank Deposit Index, and 9.0% of the Citigroup 3-Month T-Bill Index.
Advisor Aggressive 15-16 MixBenchmark: A composite of 14.0% of the S&P 500 Index, 7.0% of the Russell 1000 Value Index, 7.0% of the Russell 1000 Growth Index, 1.0% of the S&P Completion Index, 1.5%of the Russell 2000 Index, 1.5% of the Russell 2000 Growth Index, 10.0% of the MSCI ACWI ex USA (Net) Index, 4.0% of the Citigroup World Gov’t Bond Index ex USA, 25.0% ofthe Bloomberg Barclays Capital U.S. Aggregate Index, 13.0% of the Bloomberg Barclays Capital U.S. Govt/Credit 1-5 Float Index, 3.0% of the MSCI US REIT Index, 6.0% of the 1Month U.S. Bank Deposit Index and 7.0% of the Citigroup 3-Month T-Bill Index.
258
Appendix
College Savings Plans of Nebraska
Advisor Aggressive 13-14 MixBenchmark: A composite of 18.0% of the S&P 500 Index, 8.0% of the Russell 1000 Value Index, 8.0% of the Russell 1000 Growth Index, 1.0% of the S&P Completion Index, 2.0%of the Russell 2000 Index, 2.0% of the Russell 2000 Growth Index, 12.5% of the MSCI ACWI ex USA (Net) Index, 3.5% of the Citigroup World Gov’t Bond Index ex USA, 23.5% ofthe Bloomberg Barclays Capital U.S. Aggregate Index, 9.5% of the Bloomberg Barclays Capital U.S. Govt/Credit 1-5 Float Index, 3.5% of the MSCI US REIT Index, 3.0% of the 1Month U.S. Bank Deposit Index and 5.5% of the Citigroup 3-Month T-Bill Index.
Advisor Aggressive 11-12 MixBenchmark: A composite of 22.0% of the S&P 500 Index, 9.0% of the Russell 1000 Value Index, 9.0% of the Russell 1000 Growth Index, 1.0% of the S&P Completion Index, 2.5%of the Russell 2000 Index, 2.5% of the Russell 2000 Growth Index, 15.0% of the MSCI ACWI ex USA (Net) Index, 3.0% of the Citigroup World Gov’t Bond Index ex USA, 22.0% ofthe Bloomberg Barclays Capital U.S. Aggregate Index, 6.0% of the Bloomberg Barclays Capital U.S. Govt/Credit 1-5 Float Index, 4.0% of the MSCI US REIT Index, and 4.0% of theCitigroup 3-Month T-Bill Index.
Advisor Aggressive 9-10 MixBenchmark: A composite of 27.0% of the S&P 500 Index, 9.5% of the Russell 1000 Value Index, 9.5% of the Russell 1000 Growth Index, 1.5% of the S&P Completion Index, 2.8%of the Russell 2000 Index, 2.8% of the Russell 2000 Growth Index, 17.5% of the MSCI ACWI ex USA (Net) Index, 2.5% of the Citigroup World Gov’t Bond Index ex USA, 17.5% ofthe Bloomberg Barclays Capital U.S. Aggregate Index, 3.0% of the Bloomberg Barclays Capital U.S. Govt/Credit 1-5 Float Index, 4.5% of the MSCI US REIT Index, and 2.0% of theCitigroup 3-Month T-Bill Index.
Advisor Aggressive 6-8 MixBenchmark: A composite of 32.0% of the S&P 500 Index, 10.0% of the Russell 1000 Value Index, 10.0% of the Russell 1000 Growth Index, 2.0% of the S&P Completion Index,3.0% of the Russell 2000 Index, 3.0% of the Russell 2000 Growth Index, 20.0% of the MSCI ACWI ex USA (Net) Index, 2.0% of the Citigroup World Gov’t Bond Index ex USA,13.0% of the Bloomberg Barclays Capital U.S. Aggregate Index, and 5.0% of the MSCI US REIT Index.
Advisor Aggressive 3-5 MixBenchmark: A composite of 36.0% of the S&P 500 Index, 11.0% of the Russell 1000 Value Index, 11.0% of the Russell 1000 Growth Index, 2.0% of the S&P Completion Index,4.0% of the Russell 2000 Index, 4.0% of the Russell 2000 Growth Index, 22.0% of the MSCI ACWI ex USA (Net) Index, 5.0% of the Bloomberg Barclays Capital U.S. AggregateIndex, and 5.0% of the MSCI US REIT Index.
Advisor Aggressive 0-2 MixBenchmark: A composite of 38.0% of the S&P 500 Index, 11.5% of the Russell 1000 Value Index, 11.5% of the Russell 1000 Growth Index, 2.0% of the S&P Completion Index,4.25% of the Russell 2000 Index, 4.25% of the Russell 2000 Growth Index, 23.25% of the MSCI ACWI ex USA (Net) Index, and 5.25% of the MSCI US REIT Index.
Advisor Growth 19+ MixBenchmark: A composite of 4.0% of the S&P 500 Index, 1.0% of the MSCI ACWI ex USA (Net) Index, 2.0% of the Citigroup World Gov’t Bond Index ex USA, 15.0% of theBloomberg Barclays Capital U.S. Aggregate Index, 18.0% of the Bloomberg Barclays Capital U.S. Govt/Credit 1-5 Float Index, 5.0% of the Bloomberg Barclays Capital U.S.Treasury: U.S. TIPS 0-5 Year Index, 20.0% of the 1 Month US Bank Deposit Index and 35.0% of the Citigroup 3-Month T-Bill Index.
Advisor Growth 17-18 MixBenchmark: A composite of 10.0% of the S&P 500 Index, 1.0% of the S&P Completion Index, 3.0% of the MSCI ACWI ex USA (Net) Index, 3.0% of the Citigroup World Gov’t BondIndex ex USA, 25.0% of the Bloomberg Barclays Capital U.S. Aggregate Index, 15.0% of the Bloomberg Barclays Capital U.S. Govt/Credit 1-5 Float Index, 9.0% of the BloombergBarclays Capital U.S. Treasury: U.S. TIPS 0-5 Year Index, 1.0% of the MSCI US REIT Index, 15.0% of the 1 Month US Bank Deposit Index and 18.0% of the Citigroup 3-Month T-Bill Index.
259

Appendix
College Savings Plans of Nebraska
Advisor Growth 15-16 MixBenchmark: A composite of 12.0% of the S&P 500 Index, 2.0% of the Russell 1000 Value Index, 2.0% of the Russell 1000 Growth Index, 1.0% of the S&P Completion Index, 0.5%of the Russell 2000 Index, 0.5% of the Russell 2000 Growth Index, 5.0% of the MSCI ACWI ex USA (Net) Index, 4.0% of the Citigroup World Gov’t Bond Index ex USA, 28.0% ofthe Bloomberg Barclays Capital U.S. Aggregate Index, 17.0% of the Bloomberg Barclays Capital U.S. Govt/Credit 1-5 Float Index, 5.0% of the Bloomberg Barclays Capital U.S.Treasury: U.S. TIPS 0-5 Year Index, 2.0% of the MSCI US REIT Index, 10.0% of the 1 Month US Bank Deposit Index and 11.0% of the Citigroup 3-Month T-Bill Index.
Advisor Growth 13-14 MixBenchmark: A composite of 13.0% of the S&P 500 Index, 4.5% of the Russell 1000 Value Index, 4.5% of the Russell 1000 Growth Index, 1.0% of the S&P Completion Index, 1.0%of the Russell 2000 Index, 1.0% of the Russell 2000 Growth Index, 7.5% of the MSCI ACWI ex USA (Net) Index, 4.0% of the Citigroup World Gov’t Bond Index ex USA, 26.5% ofthe Bloomberg Barclays Capital U.S. Aggregate Index, 15.0% of the Bloomberg Barclays Capital U.S. Govt/Credit 1-5 Float Index, 2.5% of the Bloomberg Barclays Capital U.S.Treasury: U.S. TIPS 0-5 Year Index, 2.5% of the MSCI US REIT Index, 8.0% of the 1 Month US Bank Deposit Index and 9.0% of the Citigroup 3-Month T-Bill Index.
Advisor Growth 11-12 MixBenchmark: A composite of 14.0% of the S&P 500 Index, 7.0% of the Russell 1000 Value Index, 7.0% of the Russell 1000 Growth Index, 1.0% of the S&P Completion Index, 1.5%of the Russell 2000 Index, 1.5% of the Russell 2000 Growth Index, 10.0% of the MSCI ACWI ex USA (Net) Index, 4.0% of the Citigroup World Gov’t Bond Index ex USA, 25.0% ofthe Bloomberg Barclays Capital U.S. Aggregate Index, 13.0% of the Bloomberg Barclays Capital U.S. Govt/Credit 1-5 Float Index, 3.0% of the MSCI US REIT Index, 6.0% of the 1Month US Bank Deposit Index, and 7.0% of the Citigroup 3-Month T-Bill Index.
Advisor Growth 9-10 MixBenchmark: A composite of 18.0% of the S&P 500 Index, 8.0% of the Russell 1000 Value Index, 8.0% of the Russell 1000 Growth Index, 1.0% of the S&P Completion Index, 2.0%of the Russell 2000 Index, 2.0% of the Russell 2000 Growth Index, 12.5% of the MSCI ACWI ex USA (Net) Index, 3.5% of the Citigroup World Gov’t Bond Index ex USA, 23.5% ofthe Bloomberg Barclays Capital U.S. Aggregate Index, 9.5% of the Bloomberg Barclays Capital U.S. Govt/Credit 1-5 Float Index, 3.5% of the MSCI US REIT Index, 3.0% of the 1Month US Bank Deposit Index, and 5.5% of the Citigroup 3-Month T-Bill Index.
Advisor Growth 6-8 MixBenchmark: A composite of 22.0% of the S&P 500 Index, 9.0% of the Russell 1000 Value Index, 9.0% of the Russell 1000 Growth Index, 1.0% of the S&P Completion Index, 2.5%of the Russell 2000 Index, 2.5% of the Russell 2000 Growth Index, 15.0% of the MSCI ACWI ex USA (Net) Index, 3.0% of the Citigroup World Gov’t Bond Index ex USA, 22.0% ofthe Bloomberg Barclays Capital U.S. Aggregate Index, 6.0% of the Bloomberg Barclays Capital U.S. Govt/Credit 1-5 Float Index, 4.0% of the MSCI US REIT Index, and 4.0% of theCitigroup 3-Month T-Bill Index.
Advisor Growth 3-5 MixBenchmark: A composite of 27.0% of the S&P 500 Index, 9.5% of the Russell 1000 Value Index, 9.5% of the Russell 1000 Growth Index, 1.5% of the S&P Completion Index, 2.8%of the Russell 2000 Index, 2.8% of the Russell 2000 Growth Index, 17.5% of the MSCI ACWI ex USA (Net) Index, 2.5% of the Citigroup World Gov’t Bond Index ex USA, 17.5% ofthe Bloomberg Barclays Capital U.S. Aggregate Index, 3.0% of the Bloomberg Barclays Capital U.S. Govt/Credit 1-5 Float Index, 4.5% of the MSCI US REIT Index, and 2.0% of theCitigroup 3-Month T-Bill Index.
Advisor Growth 0-2 MixBenchmark: A composite of 32.0% of the S&P 500 Index, 10.0% of the Russell 1000 Value Index, 10.0% of the Russell 1000 Growth Index, 2.0% of the S&P Completion Index,3.0% of the Russell 2000 Index, 3.0% of the Russell 2000 Growth Index, 20.0% of the MSCI ACWI ex USA (Net) Index, 13.0% of the Bloomberg Barclays Capital U.S. AggregateIndex, 5.0% of the MSCI US REIT Index.
Advisor Index 19+ MixBenchmark: 100.0% of the Citigroup 3-Month T-Bill Index.
260

Appendix
College Savings Plans of Nebraska
Advisor Index 17-18 MixBenchmark: 100.0% of the Citigroup 3-Month T-Bill Index.
Advisor Index 15-16 MixBenchmark: A composite of 4.0% of the S&P 500 Index, 1.0% of the MSCI ACWI ex USA (Net) Index, 2.0% of the Citigroup World Gov’t Bond Index ex USA, 15.0% of theBloomberg Barclays Capital U.S. Aggregate Index, 18.0% of the Bloomberg Barclays Capital U.S. Govt/Credit 1-5 Float Index, 5.0% of the Bloomberg Barclays U.S. Treasury: U.S.TIPS 0-5 Year Index, 20.0% of the 1 Month U.S. Bank Deposit Index, and 35.0% of the Citigroup 3-Month T-Bill Index.
Advisor Index 13-14 MixBenchmark: A composite of 10.0% of the S&P 500 Index, 1.0% of the S&P Completion Index, 3.0% of the MSCI ACWI ex USA (Net) Index, 3.0% of the Citigroup World Gov’t BondIndex ex USA, 25.0% of the Bloomberg Barclays Capital U.S. Aggregate Index, 15.0% of the Bloomberg Barclays Capital U.S. Govt/Credit 1-5 Float Index, 9.0% of the BloombergBarclays U.S. Treasury TIPS 0-5 Year Index, 1.0% of the MSCI US REIT Index, 15.0% of the 1 Month U.S. Bank Deposit Index, and 18.0% of the Citigroup 3-Month T-Bill Index.
Advisor Index 11-12 MixBenchmark: A composite of 16.0% of the S&P 500 Index, 2.0% of the S&P Completion Index, 5.0% of the MSCI ACWI ex USA (Net) Index, 4.0% of the Citigroup World Gov’t BondIndex ex USA, 28.0% of the Bloomberg Barclays Capital U.S. Aggregate Index, 17.0% of the Bloomberg Barclays Capital U.S. Govt/Credit 1-5 Float Index, 5.0% of the BloombergBarclays U.S. Treasury TIPS 0-5 Year Index, 2.0% of the MSCI US REIT Index, 10.0% of the 1 Month U.S. Bank Deposit Index, and 11.0% of the Citigroup 3-Month T-Bill Index.
Advisor Index 9-10 MixBenchmark: A composite of 22.0% of the S&P 500 Index, 3.0% of the S&P Completion Index, 7.5% of the MSCI ACWI ex USA (Net) Index, 4.0% of the Citigroup World Gov’t BondIndex ex USA, 26.5% of the Bloomberg Barclays Capital U.S. Aggregate Index, 15.0% of the Bloomberg Barclays Capital U.S. Govt/Credit 1-5 Float Index, 2.5% of the BloombergBarclays U.S. Treasury TIPS 0-5 Year Index, 2.5% of the MSCI US REIT Index, 8.0% of the 1 Month U.S. Bank Deposit Index, and 9.0% of the Citigroup 3-Month T-Bill Index.
Advisor Index 6-8 MixBenchmark: A composite of 28.0% of the S&P 500 Index, 4.0% of the S&P Completion Index, 10.0% of the MSCI ACWI ex USA (Net) Index, 4.0% of the Citigroup World Gov’tBond Index ex USA, 25.0% of the Bloomberg Barclays Capital U.S. Aggregate Index, 13.0% of the Bloomberg Barclays Capital U.S. Govt/Credit 1-5 Float Index, 3.0% of the MSCIUS REIT Index, 6.0% of the 1 Month U.S. Bank Deposit Index, and 7.0% of the Citigroup 3-Month T-Bill Index.
Advisor Index 3-5 MixBenchmark: A composite of 34.0% of the S&P 500 Index, 5.0% of the S&P Completion Index, 12.5% of the MSCI ACWI ex USA (Net) Index, 3.5% of the Citigroup World Gov’tBond Index ex USA, 23.5% of the Bloomberg Barclays Capital U.S. Aggregate Index, 9.5% of the Bloomberg Barclays Capital U.S. Govt/Credit 1-5 Float Index, 3.5% of the MSCIUS REIT Index, 3.0% of the 1 Month U.S. Bank Deposit Index, and 5.5% of the Citigroup 3-Month T-Bill Index.
Advisor Index 0-2 MixBenchmark: A composite of 40.0% of the S&P 500 Index, 6.0% of the S&P Completion Index, 15.0% of the MSCI ACWI ex USA (Net) Index, 3.0% of the Citigroup World Gov’tBond Index ex USA, 22.0% of the Bloomberg Barclays Capital U.S. Aggregate Index, 6.0% of the Bloomberg Barclays Capital U.S. Govt/Credit 1-5 Float Index, 4.0% of the MSCIUS REIT Index, and 4.0% of the Citigroup 3-Month T-Bill Index.
Advisor Conservative Static MixBenchmark: A composite of 12.0% of the S&P 500 Index, 2.0% of the Russell 1000 Value Index, 2.0% of the Russell 1000 Growth Index, 1.0% of the S&P Completion Index, 0.5%of the Russell 2000 Index, 0.5% of the Russell 2000 Growth Index, 5.0% of the MSCI ACWI ex USA (Net) Index, 4.0% of the Citigroup World Gov’t Bond Index ex USA, 28.0% ofthe Bloomberg Barclays Capital U.S. Aggregate Index, 17.0% of the Bloomberg Barclays Capital U.S. Govt/Credit 1-5 Float Index, 5.0% of the Bloomberg Barclays Capital U.S.Treasury: U.S. TIPS 0-5 Year Index, 2.0% of the MSCI US REIT Index, 10.0% of the 1 Month U.S. Bank Deposit Index, and 11.0% of the Citigroup 3-Month T-Bill Index.
261
Appendix
College Savings Plans of Nebraska
Advisor Balanced Static MixBenchmark: A composite of 18.0% of the S&P 500 Index, 8.0% of the Russell 1000 Value Index, 8.0% of the Russell 1000 Growth Index, 1.0% of the S&P Completion Index, 2.0%of the Russell 2000 Index, 2.0% of the Russell 2000 Growth Index, 12.5% of the MSCI ACWI ex USA (Net) Index, 3.5% of the Citigroup World Gov’t Bond Index ex USA, 23.5% ofthe Bloomberg Barclays Capital U.S. Aggregate Index, 9.5% of the Bloomberg Barclays Capital U.S. Govt/Credit 1-5 Float Index, 3.5% of the MSCI US REIT Index, 3.0% of the 1Month U.S. Bank Deposit Index, and 5.5% of the Citigroup 3-Month T-Bill Index.
Advisor Moderate Growth Static MixBenchmark: A composite of 22.0% of the S&P 500 Index, 9.0% of the Russell 1000 Value Index, 9.0% of the Russell 1000 Growth Index, 1.0% of the S&P Completion Index, 2.5%of the Russell 2000 Index, 2.5% of the Russell 2000 Growth Index, 15.0% of the MSCI ACWI ex USA (Net) Index, 3.0% of the Citigroup World Gov’t Bond Index ex USA, 22.0% ofthe Bloomberg Barclays Capital U.S. Aggregate Index, 6.0% of the Bloomberg Barclays Capital U.S. Govt/Credit 1-5 Float Index, 4.0% of the MSCI US REIT Index, and 4.0% of theCitigroup 3-Month T-Bill Index.
Advisor Growth Static MixBenchmark: A composite of 32.0% of the S&P 500 Index, 10.0% of the Russell 1000 Value Index, 10.0% of the Russell 1000 Growth Index, 2.0% of the S&P Completion Index,3.0% of the Russell 2000 Index, 3.0% of the Russell 2000 Growth Index, 20.0% of the MSCI ACWI ex USA (Net) Index, 2.0% of the Citigroup World Gov’t Bond Index ex USA,13.0% of the Bloomberg Barclays Capital U.S. Aggregate Index, and 5.0% of the MSCI US REIT Index.
Advisor All Equity Static MixBenchmark: A composite of 38.0% of the S&P 500 Index, 11.5% of the Russell 1000 Value Index, 11.5% of the Russell 1000 Growth Index, 2.0% of the S&P Completion Index,4.25% of the Russell 2000 Index, 4.25% of the Russell 2000 Growth Index, 23.25% of the MSCI ACWI ex USA (Net) Index, and 5.25% of the MSCI US REIT Index.
262
Growth MixBenchmark: A composite of 56.0% of the CRSP U.S. Total Market TR Index, 24.0% of the MSCI All Country World ex-U.S. (Net), 20.0% of the Blmbg. Barc. U.S.Aggregate
ModerateBenchmark: A composite of 42.0% of the CRSP U.S. Total Market TR Index, 18.0% of the MSCI All Country World ex-U.S. (Net), 30.0% of the Blmbg. Barc. U.S.Aggregate Float Adjusted, 5.0% of the Blmbg. Barc. U.S. Gov/Credit Float Adj: 1-5 Year, 5.0% of the Barclays U.S. 0-5 Year TIPS
Conservative MixBenchmark: A composite of 21.0% of the CRSP U.S. Total Market TR Index, 9.0% of the MSCI All Country World ex-U.S. (Net), 25.0% of the Blmbg. Barc. U.S.Aggregate, 15.0% of the Blmbg. Barc. U.S. Gov/Credit: 1-5 Year, 15.0% of the Blmbg Barclays U.S. 0-5 Year TIPS, 15.0% Citigroup 3 Month T-Bill
Appendix
Enable Savings Plan
263

Age-Based 0-2Benchmark: A composite of 61.0% of the S&P 500 Index, 10.5% of the S&P Completion Index, 23.25% of the MSCI ACWI ex USA (Net) Index, and 5.25% of the MSCI US REITIndex.
Age-Based 3-5Benchmark: A composite of 58.0% of the S&P 500 Index, 10.0% of the S&P Completion Index, 22.0% of the MSCI ACWI ex USA (Net) Index, 5.0% of the Bloomberg BarclaysCapital U.S. Aggregate Index, and 5.0% of the MSCI US REIT Index.
Age-Based 6-8Benchmark: A composite of 52.0% of the S&P 500 Index, 8.0% of the S&P Completion Index, 20.0% of the MSCI ACWI ex USA (Net) Index, 2.0% Citigroup World Gov’t BondIndex ex-USA, 13.0% of the Bloomberg Barclays Capital U.S. Aggregate Index, and 5.0% of the MSCI US REIT Index.
Age-Based 9-10Benchmark: A composite of 46.0% of the S&P 500 Index, 7.0% of the S&P Completion Index, 17.5% of the MSCI ACWI ex USA (Net) Index, 2.5% Citigroup World Gov’t BondIndex ex-USA, 17.5% of the Bloomberg Barclays Capital U.S. Aggregate Index, 3.0% of the Bloomberg Barclays Capital U.S. Govt/Credit 1-5 Float Index, 4.5% of the MSCI USREIT Index, and 2.0% of the Citigroup 3-Month T-Bill Index.
Age-Based 11-12Benchmark: A composite of 40.0% of the S&P 500 Index, 6.0% of the S&P Completion Index, 15.0% of the MSCI ACWI ex USA (Net) Index, 3.0% Citigroup World Gov’t BondIndex ex-USA, 22.0% of the Bloomberg Barclays Capital U.S. Aggregate Index, 6.0% of the Bloomberg Barclays Capital U.S. Govt/Credit 1-5 Float Index, 4.0% of the MSCI USREIT Index, and 4.0% of the Citigroup 3-Month T-Bill Index.
Age-Based 13-14Benchmark: A composite of 34.0% of the S&P 500 Index, 5.0% of the S&P Completion Index, 12.5% of the MSCI ACWI ex USA (Net) Index, 3.5% Citigroup World Gov’t BondIndex ex-USA, 23.5% of the Bloomberg Barclays Capital U.S. Aggregate Index, 9.5% of the Bloomberg Barclays Capital U.S. Govt/Credit 1-5 Float Index, 3.5% of the MSCI USREIT Index, and 8.5% of the Citigroup 3-Month T-Bill Index.
Age-Based 15-16Benchmark: A composite of 28.0% of the S&P 500 Index, 4.0% of the S&P Completion Index, 10.0% of the MSCI ACWI ex USA (Net) Index, 4.0% Citigroup World Gov’t BondIndex ex-USA, 25.0% of the Bloomberg Barclays Capital U.S. Aggregate Index, 13.0% of the Bloomberg Barclays Capital U.S. Govt/Credit 1-5 Float Index, 3.0% of the MSCI USREIT Index, and 13.0% of the Citigroup 3-Month T-Bill Index.
Age-Based 17-18Benchmark: A composite of 22.0% of the S&P 500 Index, 3.0% of the S&P Completion Index, 7.5% of the MSCI ACWI ex USA (Net) Index, 4.0% Citigroup World Gov’t Bond Indexex-USA, 26.5% of the Bloomberg Barclays Capital U.S. Aggregate Index, 15.0% of the Bloomberg Barclays Capital U.S. Govt/Credit 1-5 Float Index, 2.5% of the BloombergBarclays Capital U.S. Treasury: U.S. TIPS 0-5 Year Index, 2.5% of the MSCI US REIT Index, and 17.0% of the Citigroup 3-Month T-Bill Index.
Age-Based 19+Benchmark: A composite of 16.0% of the S&P 500 Index, 2.0% of the S&P Completion Index, 5.0% of the MSCI ACWI ex USA (Net) Index, 4.0% Citigroup World Gov’t Bond Indexex-USA, 28.0% of the Bloomberg Barclays Capital U.S. Aggregate Index, 17.0% of the Bloomberg Barclays Capital U.S. Govt/Credit 1-5 Float Index, 5.0% of the BloombergBarclays Capital U.S. Treasury: U.S. TIPS 0-5 Year Index, 2.0% of the MSCI US REIT Index, and 21.0% of the Citigroup 3-Month T-Bill Index.
Appendix
State Farm College Savings Plan
As of September 30, 2020
264
Appendix
State Farm College Savings Plan
As of September 30, 2020
All Equity StaticBenchmark: A composite of 61.0% of the S&P 500 Index, 10.5% of the S&P Completion Index, 23.25% of the MSCI ACWI ex USA (Net) Index, and 5.25% of the MSCI US REITIndex.
Growth StaticBenchmark: A composite of 52.0% of the S&P 500 Index, 8.0% of the S&P Completion Index, 20.0% of the MSCI ACWI ex USA (Net) Index, 2.0% Citigroup World Gov’t BondIndex ex-USA, 13.0% of the Bloomberg Barclays Capital U.S. Aggregate Index, and 5.0% of the MSCI US REIT Index.
Moderate Growth StaticBenchmark: A composite of 40.0% of the S&P 500 Index, 6.0% of the S&P Completion Index, 15.0% of the MSCI ACWI ex USA (Net) Index, 3.0% Citigroup World Gov’t BondIndex ex-USA, 22.0% of the Bloomberg Barclays Capital U.S. Aggregate Index, 6.0% of the Bloomberg Barclays Capital U.S. Govt/Credit 1-5 Float Index, 4.0% of the MSCI USREIT Index, and 4.0% of the Citigroup 3-Month T-Bill Index.
Balanced StaticBenchmark: A composite of 34.0% of the S&P 500 Index, 5.0% of the S&P Completion Index, 12.5% of the MSCI ACWI ex USA (Net) Index, 3.5% Citigroup World Gov’t BondIndex ex-USA, 23.5% of the Bloomberg Barclays Capital U.S. Aggregate Index, 9.5% of the Bloomberg Barclays Capital U.S. Govt/Credit 1-5 Float Index, 3.5% of the MSCI USREIT Index, and 8.5% of the Citigroup 3-Month T-Bill Index.
Conservative StaticBenchmark: A composite of 16.0% of the S&P 500 Index, 2.0% of the S&P Completion Index, 5.0% of the MSCI ACWI ex USA (Net) Index, 4.0% Citigroup World Gov’t Bond Indexex-USA, 28.0% of the Bloomberg Barclays Capital U.S. Aggregate Index, 17.0% of the Bloomberg Barclays Capital U.S. Govt/Credit 1-5 Float Index, 5.0% of the BloombergBarclays Capital U.S. Treasury: U.S. TIPS 0-5 Year Index, 2.0% of the MSCI US REIT Index, and 21.0% of the Citigroup 3-Month T-Bill Index.
265

Aeronautics and Agricultural Development FundsBenchmark: The Bloomberg Barclays U.S. Treasury Index.
Internal Short-Term Liquidity PoolBenchmark: As of June 2018, ICE BofAML 3 Month T-Bill. As of June 2009, FTSE 1 Month CD. As of October 1997, 90-Day T-Bill + 15 basis points. Prior to October 1997, 90-Day T-Bill + 90 basis points
Operating Investment Pool (Internal Government/Corporate)Benchmark: As of March 2014, BofA Merrill Lynch Custom Index*. Prior to March 2014, the Bloomberg Barclays Capital Intermediate Government/Corporate Index.
Total Operating Investment PoolBenchmark As of June 2018, 15% ICE BofAML 3 Month T-Bill and 85% BofA Merrill Lynch Custom Index*. As of March 2014, 15% FTSE 1-month CD and 85% BofA Merrill LynchCustom Index*. As of November 2011, 15% FTSE 1-month CD and 85% Bloomberg Barclays Capital Intermediate Government/Corporate Index. As of June 2009, 90% of theBloomberg Barclays Intermediate Government/Credit Index and 10% of the FTSE 1-month CD. Prior to July 2003, the benchmark consisted of 85% of the ML 1-3 YearGovernment/Credit Index and 15% of the 90-Day T-Bill + 15 basis points. Prior to October 1997, the benchmark consisted of 50% of the ML 1-3 Year Government/Credit Index and50% of the 90-Day T-Bill + 90 basis points.
*BofA Merrill Lynch Custom Index is composed of 60% BofA Merrill Lynch US Treasury/Agency 1-10 Year Index and 40% BofA Merrill Lynch US Corporate A-AAA 1-10 Year Index
In-House Trusts & Operating Investment Pool
As of September 30, 2020
266

Health Care EndowmentBenchmark: As of September 2018, a composite of 30.5% of the DJ U.S. Total Stock Market Index, 13.0% of the MSCI All Country World ex-U.S. IMI, 21.5% of the MSCI All
Country World IMI, 25.0% of the Bloomberg Barclays Intermediate Government/Credit Index, 5.0% of the NCREIF ODCE Index, and 5.0% of the Dow U.S. Total Stock Market
Index + 3%. As of January 2016, a composite of 40.0% of the DJ U.S. Total Stock Market Index, 15.0% of the MSCI All Country World ex-U.S. IMI, 10.0% of the MSCI All Country
World IMI, 22.5% of the Bloomberg Barclays Intermediate Government/Credit Index, 2.5% of the Citigroup 30-Day CD, 5.0% of the NCREIF ODCE Index, and 5.0% of the Dow
U.S. Total Stock Market Index + 3%. As of October 2015, a composite of 40.0% of the DJ U.S. Total Stock Market Index, 15.0% of the MSCI All Country World ex-U.S. IMI, 10.0%
of the MSCI All Country World IMI, 22.5% of the Bloomberg Barclays Intermediate Government/Credit Index, 2.5% of the Citigroup 30-Day CD, 5.0% of the NCREIF Property Index,
and 5.0% of the Dow U.S. Total Stock Market Index + 3%. As of October 2014, a composite of 41.0% of the DJ U.S. Total Stock Market Index, 15.0% of the MSCI All Country
World ex-U.S. IMI, 10.0% of the MSCI All Country World IMI, 22.5% of the Bloomberg Barclays Intermediate Government/Credit Index, 2.5% of the Citigroup 30-Day CD, 5.0% of
the real estate component benchmark, and 4.0% of the Dow U.S. Total Stock Market Index + 3%. As of July 2014, a composite of 42.0% of the DJ U.S. Total Stock Market Index,
15.0% of the MSCI All Country World ex-U.S. IMI, 10.0% of the MSCI All Country World IMI, 22.5% of the Bloomberg Barclays Intermediate Government/Credit Index, 2.5% of the
Citigroup 30-Day CD, 5.0% of the real estate component benchmark, and 3.0% of the Dow U.S. Total Stock Market Index + 3%. As of October 2012, a composite of 43.0% of the
DJ U.S. Total Stock Market Index, 15.0% of the MSCI All Country World ex-U.S. IMI, 10.0% of the MSCI All Country World IMI, 22.5% of the Bloomberg Barclays Intermediate
Government/Credit Index, 2.5% of the Citigroup 30-Day CD, 5.0% of the real estate component benchmark, and 2.0% of the Dow U.S. Total Stock Market Index + 3%. As of
January 2012, a composite of 45.0% of the DJ U.S. Total Stock Market Index, 15.0% of the MSCI All Country World ex-U.S. IMI, 10.0% of the MSCI All Country World IMI, 22.5% of
the Bloomberg Barclays Intermediate Government/Credit Index, 2.5% of the Citigroup 30-Day CD, 4.0% of the real estate component benchmark, and 1.0% of the Dow U.S. Total
Stock Market Index + 3%. As of October 2011, a composite of 46.0% of the DJ U.S. Total Stock Market Index, 15.0% of the MSCI All Country World ex-U.S. IMI, 10.0% of the
MSCI All Country World IMI, 22.5% of the Bloomberg Barclays Intermediate Government/Credit Index, 2.5% of the Citigroup 30-Day CD, 3.0% of the real estate component
benchmark, and 1.0% of the Dow U.S. Total Stock Market Index + 3%. As of October 2010, a composite of 48.0% of the DJ U.S. Total Stock Market Index, 15.0% of the MSCI All
Country World ex-U.S. IMI, 10.0% of the MSCI All Country World IMI, 22.5% of the Bloomberg Barclays Intermediate Government/Credit Index, 2.5% of the Citigroup 30-Day CD,
and 2.0% of the real estate component benchmark. As of August 2010, a composite of 50.0% of the DJ U.S. Total Stock Market Index, 15.0% of the MSCI All Country World ex-
U.S. IMI, 10.0% of the MSCI All Country World IMI, 22.5% of the Bloomberg Barclays Intermediate Government/Credit Index and 2.5% of the Citigroup 30-Day CD. As of January
2009, a composite of 50.0% of the DJ U.S. Total Stock Market Index, 15.0% of the MSCI All Country World ex-U.S. Index, 10.0% of the MSCI All Country World Index, 22.5% of the
Bloomberg Barclays Intermediate Government/Credit Index and 2.5% of the Citigroup 30-Day CD. As of September 2005, a composite of 55.75% of the DJ U.S. Total Stock Market
Index, 15.75% of the MSCI All Country World ex-U.S. Index, 3.5% of the MSCI All Country World Index, 22.5% of the Bloomberg Barclays Intermediate Government/Credit Index
and 2.5% of the Citigroup 30-Day CD. Prior to September 2005, a composite of 56.25% of the DJ U.S. Total Stock Market Index, 18.75% of the MSCI All Country World ex-U.S.
Index, 22.5% of the Bloomberg Barclays Intermediate Government/Credit Index and 2.5% of the Citigroup 30-Day CD. Prior to June 2004, the benchmark was a composite of
56.25% of the DJ U.S. Total Stock Market Index, 18.75% of the MSCI EAFE + Canada Index, 22.5% of the Bloomberg Barclays Intermediate Government/Credit Index and 2.5% of
the Citigroup 30-Day CD. Prior to April 2004, the benchmark was a composite of 56.25% of the DJ U.S. Total Stock Market Index, 18.75% of the MSCI EAFE Index, 22.5% of the
Bloomberg Barclays Intermediate Government/Credit Index and 2.5% of the Citigroup 30-Day CD.
Appendix
Endowment Pool
267

Appendix
Endowment Pool
50/50 EndowmentsBenchmark: As of September 2018, a composite of 19.0% of the DJ U.S. Total Stock Market Index, 8.0% of the MSCI All Country World ex-U.S. IMI, 13.0% of the MSCI AllCountry World IMI, 50.0% of the fixed income component benchmark, 5.0% of the NCREIF ODCE Index, and 5.0% of the DJ U.S. Total Stock Market Index + 3%. As of April 2016,a composite of 25.0% of the DJ U.S. Total Stock Market Index, 10.0% of the MSCI All Country World ex-U.S. IMI, 5.0% of the MSCI All Country World IMI, 50.0% of the fixedincome component benchmark, 5.0% of the NCREIF ODCE Index, and 5.0% of the DJ U.S. Total Stock Market Index + 3%. As of January 2016, a composite of 26.0% of the DJU.S. Total Stock Market Index, 10.0% of the MSCI All Country World ex-U.S. IMI, 5.0% of the MSCI All Country World IMI, 50.0% of the fixed income component benchmark, 4.0%of the NCREIF ODCE Index, and 5.0% of the DJ U.S. Total Stock Market Index + 3%. As of July 2015, a composite of 26.0% of the DJ U.S. Total Stock Market Index, 10.0% of theMSCI All Country World ex-U.S. IMI, 5.0% of the MSCI All Country World IMI, 50.0% of the fixed income component benchmark, 4.0% of the NCREIF Property Index, and 5.0% ofthe DJ U.S. Total Stock Market Index + 3%. As of October 2014, a composite of 27.0% of the DJ U.S. Total Stock Market Index, 10.0% of the MSCI All Country World ex-U.S. IMI,5.0% of the MSCI All Country World IMI, 50.0% of the fixed income component benchmark, 4.0% of the real estate component benchmark, and 4.0% of the DJ U.S. Total StockMarket Index + 3%. As of April 2014, a composite of 28.0% of the DJ U.S. Total Stock Market Index, 10.0% of the MSCI All Country World ex-U.S. IMI, 5.0% of the MSCI AllCountry World IMI, 50.0% of the fixed income component benchmark, 4.0% of the real estate component benchmark, and 3.0% of the DJ U.S. Total Stock Market Index + 3%. Asof January 2013, a composite of 29.0% of the DJ U.S. Total Stock Market Index, 10.0% of the MSCI All Country World ex-U.S. IMI, 5.0% of the MSCI All Country World IMI, 50.0%of the fixed income component benchmark, 4.0% of the real estate component benchmark, and 2.0% of the DJ U.S. Total Stock Market Index + 3%. As of January 2012, acomposite of 30.0% of the DJ U.S. Total Stock Market Index, 10.0% of the MSCI All Country World ex-U.S. IMI, 5.0% of the MSCI All Country World IMI, 50.0% of the fixed incomecomponent benchmark, 4.0% of the real estate component benchmark, and 1.0% of the DJ U.S. Total Stock Market Index + 3%. As of July 2011, a composite of 32.0% of the DJU.S. Total Stock Market Index, 10.0% of the MSCI All Country World ex-U.S. IMI, 5.0% of the MSCI All Country World IMI, 50.0% of the fixed income component benchmark, and3.0% of the real estate component benchmark. As of January 2011, a composite of 33.0% of the DJ U.S. Total Stock Market Index, 10.0% of the MSCI All Country World ex-U.S.IMI, 5.0% of the MSCI All Country World IMI, 50.0% of the fixed income component benchmark, and 2.0% of the real estate component benchmark. As of August 2010, acomposite of 34.0% of the DJ U.S. Total Stock Market Index, 10.0% of the MSCI All Country World ex-U.S. IMI, 5.0% of the MSCI All Country World IMI, 50.0% of the fixed incomecomponent benchmark, and 1.0% of the real estate component benchmark. As of April 2009, a composite of 34.0% of the DJ U.S. Total Stock Market Index, 10.0% of the MSCI AllCountry World ex-U.S. Index, 5.0% of the MSCI All Country World Index, 50.0% of the fixed income component benchmark, and 1.0% of the real estate component benchmark. Asof January 2009, a composite of 35.0% of the DJ U.S. Total Stock Market Index, 10.0% of the MSCI All Country World ex-U.S. Index, 5.0% of the MSCI All Country World Indexand 50.0% of the fixed income component benchmark. As of September 2005, a composite of 37.625% of the DJ U.S. Total Stock Market Index, 10.125% of the MSCI All CountryWorld ex-U.S. Index, 2.25% of the MSCI All Country World Index and 50% of the fixed income component benchmark. Prior to September 2005, a composite of 37.5% of the DJU.S. Total Stock Market Index, 12.5% of the MSCI All Country World ex-U.S Index, and 50% of the fixed income component benchmark. Prior to April 2005, the benchmark was acomposite of 37.5% of the DJ U.S. Total Stock Market Index, 12.5% of the MSCI All Country World ex-U.S Index and 50% of the Bloomberg Barclays Aggregate Bond Index. Priorto June 2004, the benchmark was a composite of 37.5% of the DJ U.S. Total Stock Market Index, 12.5% of the MSCI EAFE + Canada Index and 50% of the Bloomberg BarclaysAggregate Bond Index. Prior to April 2004, the benchmark was a composite of 37.5% of the DJ U.S. Total Stock Market Index, 12.5% of the MSCI EAFE Index and 50% of theBloomberg Barclays Aggregate Bond Index.
Excess Liability FundBenchmark: Bloomberg Barclays Aggregate Bond Index until March 31, 2005, the Bloomberg Barclays Universal Bond Index thereafter
Fixed Income ComponentBenchmark: Bloomberg Barclays Aggregate Bond Index until March 31, 2005, the Bloomberg Barclays Universal Bond Index thereafter
DFABenchmark: The Russell 2000 Index. Prior to April 2014, the Russell 2000 Value Index. Prior to August 2006, the Wilshire Small-Cap Value Style Index.
Blackrock Russell 1000 (Healthcare Endowment)Benchmark: The Russell 1000 Index.
268
Appendix
Endowment Pool
Blackrock Russell 1000 Value IndexBenchmark: The Russell 1000 Value Index.
Non-U.S. Equity ComponentBenchmark: The MSCI All Country World ex-U.S. IMI. Prior to August 2010, the MSCI All Country World ex-U.S. Index.
BlackRock All Country World ex-U.S. IMIBenchmark: The MSCI All Country World ex-U.S. IMI. Prior to June 2011, the MSCI EAFE + Canada Index.
Baillie GiffordBenchmark: The MSCI Emerging Markets Index.
Global Equity ComponentBenchmark: The MSCI All Country World IMI. Prior to August 2010, the MSCI All Country World Index.
MFSBenchmark: The MSCI All Country World IMI. Prior to May 2012, the MSCI All Country World Index.
Blackrock ACWI IMIBenchmark: The MSCI All Country World IMI.
Wellington EquityBenchmark: MSCI All Country World Small Cap (Net).
Dodge & CoxBenchmark: MSCI All Country World Index IMI
Fixed Income Component, PIMCOBenchmark: The Bloomberg Barclays Universal Index. Prior to April 2005, the Bloomberg Barclays Aggregate Bond Index.
Loomis SaylesBenchmark: The Bloomberg Barclays Universal Index. Prior to August 2010, the benchmark was the Bloomberg Barclays High Yield Index.
Neuberger Berman Core PlusBenchmark: The Bloomberg Barclays Universal Bond Index
Blackrock Aggregate Bond IndexBenchmark: The Bloomberg Barclays Aggregate Index.
269
OSERS
Policy Index: Beginning April 1, 2017, the Policy Index will be calculated monthly based on weightings of each underlying benchmark for the respective composites from previousmonth close. Prior to April 1, 2017, 7.0% Russell 1000 Index, 3.0% U.S Equity Allocation Index, 5.5% MSCI World ex USA Index (net), 2.5% MSCI Emerging Markets Index,2.5% MSCI Emerging Markets Small Cap Index, 10.0% MSCI AC World Index (Net), 10.0% NCREIF Property Index, 21.0% Burgiss All US PE (1 Qtr-Lag), 10.0% HFRI RV: Multi-Strategy Index, 7.0% Bloomberg Barclays U.S. Aggregate Index, 2.5% Bloomberg Barclays U.S. TIPS Index, 9.0% Bloomberg Barclays Global Aggregate index, 5.0% 60/40 MSCIWorld/JPM GBI Index, 5.0% 60/40 MSCI ACWI/Blmbg. Barc. U.S. Agg Index. Prior to October 1, 2016, performance history was calculated by NEPC.
U.S. Equity Composite
Benchmark: Beginning April 1, 2017, the Custom U.S. Equity Benchmark is composed of the Dow Jones U.S. Total Stock Market. Prior to April 1, 2017, the benchmark wascalculated monthly based on the weightings of each underlying benchmark for the respective managers in the composite from previous month close.
Global Equity Composite
Benchmark: Beginning April 1, 2017, the Custom Global Equity Benchmark is composed of the MSCI ACWI IMI Net. Prior to April 1, 2017, the benchmark was calculated monthlybased on the weightings of each underlying benchmark for the respective managers in the composite from previous month close.
International Equity Composite
Benchmark: The MSCI ACWI ex U.S. IMI Net
Fixed Income Composite
Benchmark: Beginning April 1, 2017, the Custom Fixed Income Benchmark is composed of the Bloomberg Barclays Universal Index. Prior to April 1, 2017, Bloomberg BarclaysAggregate Index
Private Equity Composite
Benchmark: The Burgiss All US PE (1-Qtr Lag) Index.
Real Asset Composite
Benchmark: Beginning April 1, 2017, the Custom Real Asset Benchmark is composed of the Burgiss All US PE (1-Qrt Lag) Index and NCREIF Timberland Index. Prior to April 1,2017, The Alerian MLP Index and the NCREIF Timberland Index.
Hedge Fund Composite
Benchmark: The HFRI RV: Multi-Strategy Index.
Real Estate Composite
Benchmark: The NCREIF Property Index.
OSERS
Appendix
270
RankA representation of the percentile position of the performance of a given portfolio, relative to a universe of similar funds. For example, a rank of 25 for a given manager indicatesoutperformance, by that manager, of 75% of other Funds in that universe.
UniverseA distribution of the returns achieved by a group of funds with similar investment objectives.
Ratio of Cumulative WealthAn illustration of a portfolio's cumulative, unannualized performance relative to that of its benchmark. An upward sloping line indicates fund outperformance. Conversely, adownward sloping line indicates underperformance by the fund. A flat line is indicative of benchmark-like performance.
Risk-ReturnThe horizontal axis, annualized standard deviation, is a statistical measure of risk, or the volatility of returns. The vertical axis is the annualized rate of return. As most investorsgenerally prefer less risk to more risk and always prefer greater returns, the upper left corner of the graph is the most attractive place to be. The line on this exhibit represents therisk and return trade-offs associated with market portfolios, or index funds.
Appendix
Other Terms & Descriptions
271

DFAThe objective of the DFA Small Cap Trust is to capture the returns of the small company asset class while reducing transaction costs. The portfolio holds capitalization-weightedpositions of all eligible securities. Industry diversification is a residual of the process. In an attempt to minimize the costs of a pure indexing strategy that demands immediateexecution in illiquid small-cap markets, DFA's trading strategy focuses on controlling transaction costs. DFA establishes buy, hold, and sell ranges aimed at moderating turnoverand limiting transaction costs. Price sensitivity takes precedence over time of execution and block trading is utilized whenever possible.
BlackRock Russell 1000 IndexBlackRock Russell 1000 Index Fund provides a passive investment in the large cap segment of the stock market, and holds issues in their appropriate weights with those of theIndex.
BlackRock ACWI ex-U.S. IMIThe BlackRock ACWI ex-U.S. IMI Fund is a composite fund, comprised of individual country funds weighted proportionately to the weights of those countries that constitute theIndex. The object of the Fund is to track the return of the MSCI AC World ex-U.S. IMI.
Appendix
Manager Descriptions
272

Appendix
Manager Descriptions
ArrowstreetArrowstreet uses an active, quantitative investment approach. It looks to consistently outperform the benchmark through varying market conditions. Arrowstreet's quantitativemodels examine both information and behaviour to identify attractive stocks from around the world. Arrowstreet then uses forecasting models and the judgment of its investmentteam to combine its rigorous quantitative research with investment intuition.
MFSThe MFS Global Equity portfolio is a relatively concentrated, actively managed product that seeks to measure each company's ability to generate above-average, sustainableearnings growth while considering the attractiveness of their valuation. MFS focuses on a fundamental bottom-up company analysis by research analysts organized along globalsector lines. Using quantitative screens, the investment professionals narrow the investable universe from 5,000 names to about 450 names, rated ''buy''. From there the analystsperform proprietary fundamental analysis on each buy-rated company to determine if it should be included in the portfolio. Analysts are given the discretion to use whatever modelsthey deem appropriate for the given stock's sector and country. From there, the investment team will include 90-110 names in the portfolio.
Wellington EquityThe philosophy of the Global Equities approaches is based on four key tenets. The first principle is that high active share strategies outperform. Active share is a metric whichcalculates the magnitude of the active bets in a portfolio. An increasing body of academic evidence and proprietary research conducted by the Team supports this. Nonetheless,high active share investing entails a much greater level of risk than many can tolerate. In fact, the majority of the strategies utilized in the Global Equities approach are customportfolios not broadly utilized or marketed outside of this team managed approach due to their high level of concentration and/or volatility. However, by combining independent andcomplementary high active share strategies, the team strives to retain the high level of alpha these styles can generate while minimizing the significant drawdowns that often occurwith aggressive investment styles such as these.
Dodge & CoxDodge & Cox employs a fundamental, bottom-up investment approach and seeks to invest in companies with long-term earnings and cash flow growth prospects that are selling atattractive prices. The Fund is managed by a team of experienced and talented investors that form the Global Stock Investment Committee (“GSIC”), which in turn is supported bywell-resourced, high-quality industry research teams. Analysts construct detailed financial models and conduct extensive company management visits across the value chain.
BlackRock Core Plus UniversalBlackRock's fixed income management approach revolves around the following fundamental principle: The firm does not believe significant value can be added through interestrate forecasting, and therefore manages portfolio durations within a narrow band around the index. BlackRock utilizes sophisticated proprietary quantitative tools to evaluate thecash flows of complex fixed income securities. In making sector and security decisions, BlackRock considers both fundamental and technical factors, including macroeconomictrends, supply and demand analysis, yield curve structure, and volatility and convexity analysis. The firm believes that it can add value by utilizing a broader range of eligible assets,including a wide range of mortgage securities, medium-term notes, floating-rate notes, and Treasury STRIPS.
PIMCOPIMCO employs a top-down, core approach that combines active sector rotation and moderate duration positions. The firm's objective is to add value without increasing risk byusing innovative portfolio management techniques and by identifying superior sector and issue opportunities. Although PIMCO generally keeps portfolio duration within 30% of thatof the benchmark, the manager shifts other dimensions of the portfolio (sector weightings, coupon, yield curve exposure, etc.) more liberally, depending on where they find value.PIMCO uses fixed income derivative instruments both for hedging purposes and as synthetic investments.
273
Appendix
Manager Descriptions
BlackRock Aggregate Bond IndexBlackRock employs a modular structure in capturing the U.S. bond market. The Fund's structure can be thought of as a ''superfund,'' or a fund constructed by holding units of thefollowing seven modular funds that each track its own particular segment of the Barclays Universe - Intermediate Government, Long Government, Intermediate Credit, Long Credit,Mortgage-Backed, Asset-Backed, and Commercial Mortgage-Backed. Each individual modular fund is constructed to accurately represent the overall risk and return characteristicsof its relevant benchmark universe. BlackRock uses a combination of a cellular stratified sampling approach and a risk factor model.
Loomis SaylesLoomis Sayles employs an opportunistic buy-and-hold approach of purchasing long-dated, call-protected, lower-quality corporate paper generally at a deep discount. For its HighYield strategy, the manager will opportunistically invest in foreign local government debt as well as make extensive use of busted convertibles and preferred issues. Loomis Sayles'strong fundamental credit research supports the manager's credit-driven process. The manager employs over 20 senior fixed income analysts who are supported by researchassociates. These senior analysts, who perform fundamental sector, industry, and company analysis across the global credit ratings spectrum, work in concert with fixed incometraders/specialists who monitor the market and provide relative value inputs. Loomis Sayles' portfolio managers synthesize the credit fundamentals and relative value analysis tomake buy/sell decisions. The portfolio may look significantly different than the benchmark.
Wellington GlobalThe Global Aggregate approach seeks to generate consistent excess returns through the combination of lowly correlated investment strategies developed by five highly specializedinvestment teams. Each team has a unique area of focus which is sector, region, or investment style based. This unique team structure ensures that Global Aggregate portfoliosare highly diversified which leads to more consistent risk-adjusted returns in a wide variety of market environments. The Global Aggregate approach seeks to generate 1% - 1.5%of excess relative return over the Barclays Global Aggregate Bond Index. Global Aggregate portfolios invest in debt securities of government, corporate, and securitized debtissuers from around the world.
Loomis Sayles Bank LoansLoomis Sayles structures bank loan portfolios in a conservative and benchmark-aware framework. Initial screening criteria include likelihood of default and size of loan relative tosize of company. Analysts focus on understanding collateral, level of debt and equity subordination, cash flow generation ability, strength of covenants, and equity valuation.Loomis Sayles’ bank loan strategy favors high quality loans with a focus on the risk-return trade-off between BB and B loans, and seeks to avoid CCC & below and second lienloans.
Franklin TempletonFranklin Templeton applies a bottom-up approach to portfolio construction that is supplemented with industry top-down views. Franklin Templeton believes that constructingdiversified portfolios of predominantly senior-secured floating rate debt instruments can provide the potential for high income. Franklin Templeton seeks to reduce levels of overallcredit risk and principal value volatility through independent fundamental credit research and active portfolio management. The manager’s bank loan strategy aims to minimizedefault risk and, as a result, places a low priority on price appreciation.
Neuberger BermanNeuberger Berman employs a process in managing its fixed income strategies that combines top-down and bottom-up sources of active management, while complementing itsapproach with quantitative models to calibrate the manger’s views. The process is predicated on the manager’s philosophy that asset prices reflect consensus expectations acrossan array of factors, such as the path of interest rates, the shape of the yield curve, credit risk, cash flow patterns, and volatility; and leads to opportunities. Neuberger Bermanbelieves it is able to add value over time from its interest rate framework, productive sector decisions, and fundamentally-driven issue selection.
274

· The rates of return contained in this report are shown on an after-fees basis unless otherwise noted. They are geometric and time-weighted.Returns for periods longer than one year are annualized.
· Universe percentiles are based upon an ordering system in which 1 is the best ranking and 100 is the worst ranking.
· Due to rounding throughout the report, percentage totals displayed may not sum to 100%. Additionally, individual fund totals in dollar termsmay not sum to the plan total.
<ReportMemberName>
Notes
As of September 30, 2020
275

Past performance is not necessarily indicative of future results.
Unless otherwise noted, performance returns presented reflect the respective fund’s performance as indicated. Returns may be presented on a before-fees basis (gross) or after-fees basis (net). After-fee performance is net of each respective sub-advisors’ investment management fees and include the reinvestment of dividends and interest as indicated onthe notes page within this report or on the asset allocation and performance summary pages. Actual returns may be reduced by Aon Investments’ investment advisory fees or othertrust payable expenses you may incur as a client. Aon Investments’ advisory fees are described in Form ADV Part 2A. Portfolio performance, characteristics and volatility also maydiffer from the benchmark(s) shown.
The information contained herein is confidential and proprietary and provided for informational purposes only. It is not complete and does not contain certain material informationabout making investments in securities including important disclosures and risk factors. All securities transactions involve substantial risk of loss. Under no circumstances does theinformation in this report represent a recommendation to buy or sell stocks, limited partnership interests, or other investment instruments.
The data contained in these reports is compiled from statements provided by custodian(s), record-keeper(s), and/or other third-party data provider(s). This document is not intendedto provide, and shall not be relied upon for, accounting and legal or tax advice. Aon Investments has not conducted additional audits and cannot warrant its accuracy orcompleteness. We urge you to carefully review all custodial statements and notify Aon Investments with any issues or questions you may have with respect to investmentperformance or any other matter set forth herein.
The mutual fund information found in this report is provided by Thomson Reuters Lipper and Aon Investments cannot warrant its accuracy or timeliness. Thomson Reuters LipperGlobal Data Feed provides comprehensive coverage of mutual fund information directly to Investment Metrics, Aon Investments’ performance reporting vendor, via the PARisperformance reporting platform. Thomson Reuters Lipper is the data provider chosen by Investment Metrics, and as such, Aon Investments has no direct relationship with ThomsonReuters Lipper.
Refer to Hedge Fund Research, Inc. www.hedgefundresearch.com for information on HFR indices.
FTSE International Limited (“FTSE”) © FTSE 2017. “FTSE®” and “FTSE4Good®” are trademarks of the London Stock Exchange Group companies and are used by FTSEInternational Limited under license. The FTSE indices are calculated by FTSE International Limited in conjunction with Indonesia Stock Exchange, Bursa Malaysia Berhad, ThePhilippine Stock Exchange, Inc., Singapore Exchange Securities Trading Limited and the Stock Exchange of Thailand (the "Exchanges"). All intellectual property rights in theFTSE/ASEAN Index vest in FTSE and the Exchanges. Neither FTSE nor its licensors accept any liability for any errors or omissions in the FTSE indices and / or FTSE ratings orunderlying data. No further distribution of FTSE Data is permitted without FTSE’s express written consent.
Aon Investments USA Inc. (“Aon Investments”) is a federally registered investment advisor with the U.S. Securities and Exchange Commission (“SEC”). Aon Investments is alsoregistered with the Commodity Futures Trade Commission as a commodity pool operator and a commodity trading advisor, and is a member of the National Futures Association.The Aon Investments ADV Form Part 2A disclosure statement is available upon written request to:
Aon Investments USA Inc.200 East Randolph StreetSuite 700Chicago, IL 60601ATTN: Aon Investments Compliance Officer
Disclaimer
276
Copyright © 2022 FDOKUMEN