Annual Report and Accounts - Fidelity International
45
Fidelity Active STrategy Société d’investissement à capital variable Established in Luxembourg RCS Luxembourg B 102 944 Annual Report and Accounts For the year ended 30 September 2021 Audited
-
Upload
khangminh22 -
Category
Documents
-
view
5 -
download
0
Transcript of Annual Report and Accounts - Fidelity International

Fidelity Active STrategy
Société d’investissement à capital variable Established in Luxembourg
RCS Luxembourg B 102 944
Annual Report and Accounts
For the year ended
30 September 2021 Audited

This audited Annual Report of the Company does not constitute an offer of Shares. Shares are offered on the basis of the information contained in the current Prospectus (and the documents referred to within it) supplemented by the last available audited Annual Report of the Company and any subsequently published unaudited Semi-Annual Report. Copies of the current Prospectus, latest audited Annual and unaudited Semi-Annual Reports and Portfolio Changes for the Company are available free of charge from the registered office of the Company or from any of the companies registered as distributors of Fidelity Active STrategy.

Fidelity
Active
STrategy Contents
1
Directors' Report 2 Directors and Conducting Officers 5 Investment Manager’s Report 6 Footnotes 7 Fund Reviews 8
. .
Schedule of Investments
Equity Funds
Asia Fund 1 14 Emerging Markets Fund 1 15 Europe Fund 1 18 Global Fund 19 UK Fund 20 US Fund 21 . .
Statement of Net Assets 24 Statement of Net Asset Value per Share 26 Statement of Operations and Changes in Net Assets 28 Statement of Share Statistics 30 Notes to the Financial Statements 31 Audit Report 37 Unaudited Supplementary Information 39 Directory 42

Fidelity
Active
STrategy Directors' Report
2
.
I Introduction
Fidelity Active STrategy (the "Company") is an open-ended investment company established in Luxembourg as a société d'investissement à capital variable (SICAV). Its assets are held in different sub-funds. Each sub-fund holds a separate portfolio of securities and other assets managed in accordance with specific investment objectives. Separate classes of Shares are or may be issued in relation to the sub-funds. .
II Financial Statements The Board of Directors of the Company (the "Board") submits its Report and the audited Financial Statements for the year ended 30 September 2021. The audited Financial Statements are set out on pages 14 to 36 of this Annual Report, with results for the year appearing in the Statement of Operations and Changes in Net Assets on pages 28 to 29. A copy of the Annual Report may be obtained upon request from the offices of companies registered as share distributors or from the Registered Office of the Company. Comparative figures for the previous year can be found in the Annual Report of the Company for the year ended 30 September 2020. .
III Activities during the year During the year the Company followed the normal activities of an open-ended investment company. The Investment Manager's Report that follows gives an overview of performance. Assets under management as at 30 September 2021 exceeded USD 1,968 million (2020:USD 2,513 million).
COVID- 19 Pandemic From January 2020, due to the COVID-19 pandemic situation, global financial markets have experienced significant volatility. This has resulted in severe disruptions in the supply chain, travel and border restrictions, a fall in consumer demand and general market uncertainty. The FIL Limited Group ("FIL", "FIL International" or "Fidelity") business contingency plans have been activated gradually across all FIL International locations since the beginning of 2020. This has included the implementation of remote access to enable FIL Group employees to work from home. Despite these exceptional circumstances, all Fund-related controls have remained unchanged and continue to run. No significant operational problems or performance issues or system outage have been identified to date. Fidelity International (including FIL Investment Management (Luxembourg) S.A. ("FIMLUX") has been in a heightened phase of liquidity and counterparty monitoring across the Fund's portfolios. Market and transaction data relevant to any and each sub-fund of the company have been considered and analysed on a more frequent basis during this period in order to ensure the calculation of accurate NAVs that are fully representative of prevailing market conditions and to consider potential areas of concern and whether it could be in the best interests of Shareholders of the Fund to invoke additional liquidity management measures. In accordance with the update to the Swing Pricing FAQs of the CSSF, which were issued on 20 March 2020, certain changes to the swing pricing policy were approved in response to the market situation, as notified to Shareholders via publication on Fidelity's website. A copy of this publication can be found at www.fidelity.lu. The Board of Directors of the Company (the "Board") has been kept duly and appropriately informed of matters relating to the impact of COVID-19 on the Company and the steps being taken to ensure that the interests of shareholders remain a priority. .
IV Board of Directors The Directors of the Company are listed on page 5. There are no service contracts proposed or in existence between any of the Directors and the Company. There has been the following change to the Board of Fidelity Active STrategy during the year to 30 September 2021: At the Annual General Meeting of the Company held on 11 March 2021, Ms Corinna Valentine was duly appointed as a Director of the Company. Mr Nishith Gandhi has replaced her as the permanent representative of FIL (Luxembourg) S.A., Corporate Director of the Company. The Directors of the Management Company as at 30 September 2021 are also listed on page 5.
Board’s Responsibilities The Board is responsible for the overall strategy of the Company. .
V Management of the Company FIL Investment Management (Luxembourg) S.A. ("FIMLUX") as the Management Company, is responsible for the investment management, administration and distribution functions of the Company. FIMLUX may delegate part or all of such functions to third parties, subject to overall control and supervision. With the consent of the Company, FIMLUX has delegated the investment management function to FIL Fund Management Limited ("FFML") and the distribution function to FIL Distributors ("FID"). FIMLUX provides services to the Company in connection with keeping the Company's accounts, determination of the Net Asset Value of Shares in each sub-fund on each Valuation Date and despatch of dividend payments. FIMLUX is formally responsible for the Annual Report and Accounts of the Company for each financial year, which are required under general principles to give a true and fair view of the state of affairs of the Company. In accordance with those same principles, FIMLUX is responsible for:
• selecting suitable accounting policies and applying them consistently;
• preparing the Annual Report and Accounts on a going concern basis;
• maintaining proper accounting records which disclose at any time the financial position of the Company; and

Fidelity
Active
STrategy Directors' Report
3
• complying with both the amended Luxembourg Law of 10 August 1915 on commercial companies and the amended Luxembourg Law of 17 December 2010, on undertakings for collective investment.
Conducting Officers As at 30 September 2021 the Conducting Officers (COs) appointed by FIMLUX were as listed on page 5.
Conducting Officers’ Responsibilities The COs have a duty to ensure that the tasks delegated to FFML and to FID as well as the administrative functions carried out by the Management Company are performed in compliance with Luxembourg Law, the Company's Articles of Incorporation and the current Prospectus. Amongst other things, the COs ensure compliance with the investment restrictions of the Company and oversee the implementation of the investment policy of each sub-fund by the appointed Investment Manager. The Management Company and/or the COs report to the Board on a quarterly basis and the COs inform the Management Company and the Board without delay of any materially adverse matters resulting from the actions of the Investment Manager, the General Distributor or of the Management Company in relation to the administrative functions. .
VI Role of the Investment Manager and other services FFML provides day-to-day investment management of the Company, under the supervision and subject to the control of the Board and FIMLUX. FFML is authorised to act on behalf of the Company and to select agents, brokers and dealers through whom to execute transactions and is required to provide the Board and FIMLUX with any reports it may require. FFML may receive investment advice from, and act upon the advice of, any company within the holding company FIL Limited ("FIL"), including affiliate companies of FFML, and may execute, transact and otherwise carry out its functions, duties and obligations with or through any of these Fidelity companies. FFML remains responsible for the proper performance by such companies of those responsibilities. The duties of the Investment Manager include the design, implementation and maintenance of controls and procedures to administer the assets of the Company and to manage its affairs properly. The process extends to operational and compliance controls and risk management. In addition, the Company and FIMLUX have appointed FIL to provide services in relation to the investments of the sub-funds including valuation, statistical, technical, reporting and other assistance. .
VII Corporate Governance
The Board applies a clear and transparent corporate governance framework for the management of the Company's affairs. 1. The Board has adopted the principles of good governance as set out in the ALFI (Association of the Luxembourg Fund Industry) Code of
Conduct issued in June 2013 and considers that the Company has been in compliance in all material respects throughout the financial year ended 30 September 2021.
2. There are contractual arrangements in place governing the relationships with FIMLUX, FFML, FID and FIL as well as other third party suppliers to the Company.
3. The Directors take decisions in the interests of the Company and its Shareholders and refrain from taking part in any deliberation or decision which creates conflict between their personal interests and those of the Company and its Shareholders.
4. The Board meets at least four times a year. The Board requests and receives reports from relevant Committees, COs, FIMLUX, FFML and FID on the various activities including compliance controls and risk management undertaken by the relevant FIL companies.
5. As part of the control framework within FIL, all FIL group employees are subject to the FIL Code of Conduct and its associated policies, which, amongst other things, set out procedures for personal account dealing in securities. The Board receives regular reports from the FIL Ethics Office on Employee Personal Trading to ensure that any conflicts of interest between personal accounts dealing by FIL group staff and the interests of the Company are properly managed.
6. The Board reviews the Annual Report, the external audit process, corporate governance issues, sub-custodian arrangements and the relationship with the external Auditor, including the recommendation to Shareholders of its appointment and level of fees.
7. The nomination of new Directors is considered by the Board and is subject to the approval of the CSSF and ultimately the approval of Shareholders at the Annual General Meeting. Directors, all of whom are affiliated with FFML or its holding company or its subsidiaries, have waived their fees for the year ended 30 September 2021.
8. The Directors are committed to ensuring that Shareholders are kept informed of matters relevant to their investment and that all Shareholders are treated fairly. The maintenance and integrity of information concerning the Company on the Fidelity website is the responsibility of FIL. FIMLUX is responsible for the accuracy of translations of documents which may be available to investors in languages other than English. The Directors consider and, if thought fit, approve the English form of the financial statements presented to them at the relevant Audit and Risk Committee and Board meetings.

Fidelity
Active
STrategy Directors' Report
4
.
VIII Other Information
Proxy Voting FFML has a policy of voting on equity securities where it is possible to do so, unless the loss of liquidity as a result of attendant share blocking is deemed to outweigh the expected benefits to be gained. Such voting is undertaken in accordance with written proxy voting guidelines employed by the FIL group, of which FFML is a part, and takes account of prevailing local market best practices. The Board reviews and approves the proxy voting policy, activity and guidelines annually. FIL's Principles of Ownership, which summarises how FIL engages with companies in which the Company's sub-funds have invested, can be accessed from the Corporate Governance section of FIL's website (https://www.fidelityinternational.com).
Swiss investors Swiss investors are advised that all the present sub-funds of the Company have been authorised by the Swiss Financial Market Supervisory Authority for distribution in Switzerland.
.
IX Business of the Annual General Meeting
The Board of Directors is proposing the following resolutions be put to Shareholders at the Annual General Meeting of the Company to be held on 10 March 2022 at noon at 2a rue Albert Borschette, L-1021 Luxembourg, Grand Duchy of Luxembourg:
• the presentation of the Report of the Board of Directors;
• the presentation of the Audit Report;
• the approval of the Statement of Net Assets and Statement of Operations and Changes in Net Assets for the year ended 30 September 2021;
• the discharge of the Board of Directors;
• the election/re-election of the Directors;
• the election of the external Auditor;
• approval of the payment of dividends; and
• consideration of such other business that may properly come before the Annual General Meeting under the Articles of Association. Board of Directors Fidelity Active STrategy 15 December 2021
.

Fidelity
Active
STrategy Directors and Conducting Officers
5
Board of Directors of Fidelity Active STrategy
as at 30 September 2021
Florence Alexandre Chairman of the Board
Grand Duchy of Luxembourg
Rani Jandu Corinna Valentine FIL (Luxembourg) S.A. Director
United Kingdom
Director Germany
Corporate Director Grand Duchy of Luxembourg
Represented by Nishith Gandhi
Board of Directors of FIL Investment Management (Luxembourg) S.A. (the "Management Company")
Christopher Brealey Chairman of the Board
Grand Duchy of Luxembourg
Eliza Dungworth Dominic Rossi^ Jon Skillman^ Director
United Kingdom
Director United Kingdom
Director Grand Duchy of Luxembourg
Conducting Officers of the Management Company
Florence Alexandre Stephan von Bismarck Philip Hanssens Conducting Officer
Grand Duchy of Luxembourg
Conducting Officer United Kingdom
Conducting Officer Grand Duchy of Luxembourg
Corinne Lamesch Paul Witham Karin Winklbauer Conducting Officer
Grand Duchy of Luxembourg
Conducting Officer Grand Duchy of Luxembourg
Conducting Officer Grand Duchy of Luxembourg
^Non-executive Director

Fidelity
Active
STrategy Investment Manager’s Report*
*The information stated in this report is historical and not necessarily indicative of future performance. 6
Market Environment Global equity markets, as measured by the MSCI All Country World (Net Total Return) Index, returned 27.4% in US dollar terms over the 12-month period. The rebound in global economic activity, easing of mobility restrictions in major economies and an accommodative policy backdrop supported investor sentiment. Additionally, encouraging COVID-19 vaccine trial results and the subsequent roll-out of vaccination programmes to combat the virus globally fuelled optimism towards the economic recovery. However, rising infections and the re-imposition of targeted restrictions in many regions; concerns over new, more infectious COVID-19 strains; and a rise in government bond yields amid inflationary concerns held back gains. Towards the end of the period, major central banks indicated that they would tighten their policy stance, which further weighed on markets. Against this global backdrop, key regional equity markets ended higher. Emerging markets gained but lagged developed markets, largely due to weakness in China amid policy changes and property market risks in the country. From a sector perspective, energy and financials were among the leading performers. Overall, returns in US dollar terms were supported by its depreciation against sterling, but undermined by its appreciation against the euro and yen.
Regional Developments European equities, as measured by the MSCI Europe (Net Total Return) Index, returned 28.8% in euro terms (27.3% in US dollar terms) over the review period. Markets declined slightly in October 2020 due to a resurgence in COVID-19 cases in Europe and the US, coupled with uncertainty around US elections. However, markets subsequently received a strong boost on Joe Biden's victory in the US presidential election and the signing of a long-awaited Brexit deal. The uptrend continued in 2021, as increasing hopes for a global economic recovery led by vaccine rollouts, additional fiscal stimulus in the US, strong corporate earnings and improving economic data supported equities. Later in the period, with the global recovery picking up steam, increasing concerns around inflation, higher bond yields and the prospect of tighter monetary policy tempered optimism. European Central Bank (ECB) President Christine Lagarde set a cautious tone, sticking to the rhetoric of transitory inflation and attributing the current pressure to a rebound in energy prices. Her comments set the ECB apart from other major central banks, as both the US Federal Reserve (Fed) and the Bank of England adopted a more aggressive tone. Renewed weakness in Chinese markets along with uncertainty over the outcome of German national elections added to investor caution towards the end of the period. Against this backdrop, all sectors posted positive returns, with energy and financials rising the most. Defensives, including utilities, health care and consumer staples, lagged the broader market. From a market-cap perspective, small-cap and mid-cap companies outperformed their larger peers. In the risk-on environment amid rising yields, value stocks outpaced growth and quality peers. UK equities, as measured by the FTSE All Share (Total Return) Index, recovered strongly from the downturn caused by the COVID-19 outbreak, returning 27.9% in sterling terms (33.4% in US dollar terms) over the review period. Unprecedented policy responses from authorities around the world and a swift domestic vaccine rollout gave the UK market a significant boost. Investors were also relieved as the UK and the European Union finally agreed on a post-Brexit trade deal. As economies began to reopen, a sharp pick-up in corporate earnings and robust economic data, alongside a spate of merger and acquisition activity, added to the upbeat mood. While the number of COVID-19 cases picked up in August, hospitalisations remained relatively low, as vaccines continue to prove effective in reducing the number of individuals needing treatment. In this environment, all sectors posted positive returns, with cyclical/recovery areas such as energy, basic materials, industrials and financials among the largest gainers. Meanwhile, sectors such as health care and consumer staples, which had proved more resilient in the earlier selloff, underperformed in the recovery. US equities, as measured by the S&P 500 Index (Net Total Return) Index, returned 29.4% in US dollar terms over the review period. US markets continued to recover, fuelled by record levels of stimulus, economic recovery and progress in the rollout of COVID-19 vaccines. A victory for Joe Biden in the US presidential election and major breakthroughs announced by COVID-19 vaccine manufacturers buoyed investor sentiment as the stock market continued to recover from the fallout of the pandemic. On the monetary policy front, US Fed Chairman Jerome Powell helped markets to keep calm in September, by providing clearer timelines on asset tapering and interest rate increases by de-linking the two. Financials, utilities and health care were the among the best performing sectors over the period. Asia ex Japan equities, as measured by the MSCI All Country Asia ex Japan (Net Total Return) Index, returned 14.4% in US dollar terms over the review period. The period started on a positive note on prospects of a balanced approach to international relations under newly elected US President Joe Biden and the passage of a fresh US stimulus package. Stock markets were further supported by encouraging global economic data, strong corporate earnings and ample liquidity. However, a resurgence in COVID-19 cases in key regional markets, coupled with a slow vaccine roll-out, hurt sentiment. Performance was also impacted by Chinese regulatory scrutiny, which continued through the period and widened its scope in terms of the number of industries and sectors impacted. More recently, news flows around liquidity issues at Chinese property developer China Evergrande and a potential wider contagion effect on China and the global economy triggered a sell-off. Against this backdrop, Chinese equities ended the period lower. Meanwhile, Indian equities were among the best performers given its swift revival from the massive second wave of COVID-19 infections in the country. Equities in export-oriented regions of Korea and Taiwan gained strength amid an acceleration in the re-opening of global economies (especially developed countries). At a sector level in the region, materials, industrials and information technology led gains, while consumer discretionary, communication services and real estate lagged. Emerging market equities, as measured by the MSCI Emerging Markets (Net Total Return) Index, rose by 18.2% in US dollar terms over the review period. Risk assets were bolstered by reassuring commentary from the US Fed, which said that it plans to maintain an accommodative monetary policy stance for now, despite considering tapering bond purchases this year. However, as the period drew to a close, markets were badly hurt by the sell-off in the property and banking sectors, after beleaguered property developer China Evergrande warned that its cash position was worsening. The series of events in China hampered investor sentiment and weighed on the region's performance. In emerging Asia, Indian equities were among the top performers, reaching a new all-time high, supported by the highest annual inflows since 2013. Performance was further supported as the country kicked-off an expansion of its COVID-19 vaccine campaign. On a regional basis, Emerging Asia and Emerging Europe, Middle East and Africa (EMEA) were the best performers, followed by Latin America. Markets were supported by rising crude oil and gas prices. Crude oil prices surpassed the US$80 per barrel mark for the first time since October 2018. The easing of lockdown measures in China and supply disruption due to hurricane Ida bolstered equities in the EMEA region. At the sector level, energy and materials were the best performers.

Fidelity
Active
STrategy Footnotes
7
1. These sub-funds are defined as Article 8 sub-funds as per Sustainable Finance Disclosure Regulation ("SFDR"). SFDR refers to the regulation (EU) 2019/2088 of the European Parliament and of the Council of 27 November 2019 on sustainability-related disclosures in the financial services sector. Article 8 sub-funds seek to achieve their investment objectives while promoting, among other characteristics, environmental or social characteristics, or a combination of those characteristics. A copy of the Fund Factsheet report disclosing the Sector/Industry Exposure, Country Exposure and Top Net Long Positions including derivatives exposures may be obtained upon request from either the offices of the companies registered as distributors or from the Registered Office of the Company. The market value disclosed in the largest holdings consists of the market value as per local GAAP and does not include derivatives exposures. This is also the basis by which the geographical/sector split was calculated. Alternatively, please go to https://www.fidelity.lu/funds/pricing-and-performance. Cumulative Returns are calculated from published Net Asset Value price to published Net Asset Value price with income reinvested on exdividend dates. For
Performance notes on Fund Reviews
Cumulative Returns are calculated from published Net Asset Value price to published Net Asset Value price with income reinvested on exdividend dates. For sub-funds where the price adjustment policy has been applied as per note 2 on page 32, the Cumulative Returns are calculated to or from the adjusted Net Asset Value price. This calculation does not include any initial charge, and represents the true investment performance of the sub-fund. The performance figures reported under the column "Since Launch" in the tables are calculated from the commencement of operations until 30 September 2021. Annualised performance is an alternative way of expressing a sub-fund's total return. It assumes a steady compound rate of growth during the period in question and is not the sub-fund's year by year performance, which fluctuated over the periods shown. Please note that the Manager's Overviews are based on the first Share class disclosed for each sub-fund. Performance data is expressed in the Share class currency of denomination, indicated by the ISO code shown.

Fidelity
Active
STrategy Asia Fund 1
*Please note that the market value disclosed in the largest holdings consists of the market value as per local GAAP and does not include exposure to derivatives. This is also the basis by which the geographical/sector split was calculated. *The largest holdings do not include holdings in Equity Linked Notes **Comparative index: MSCI All Country Asia ex Japan (Net Total Return) Index Comparative index Hedged EUR/USD: MSCI All Country Asia ex Japan (Net Total Return) Hedged to EUR/USD Please refer to performance notes on page 7.
8
FUND SIZE AS AT 30.09.2021 : USD 189 MILLION Manager's Overview
Anthony Srom became the Lead Portfolio Manager of the FAST - Asia Fund effective 1 July 2021. The A-ACC-USD class of the fund returned 9.5% in net US dollar terms, underperforming the MSCI All Country Asia ex Japan (Net Total Return) Index, which returned 14.4% over the period. The fund's short positions detracted from relative returns, while the long book added value. In the fund's short book, the position in an Indian government owned engineering and manufacturing enterprise undermined performance. Its share price surged as retail investors focused on public sector unit (PSU) privatisation candidates. Another short position in an Indian technology major held back gains. The stock advanced following an announcement of modest results. However, its execution has remained inconsistent and revenue growth was weak. A short position in a Korean pharmaceuticals company detracted from performance as its shares rose amid continued optimism around its COVID-19 antibody programme. A position in a medical device company weighed on performance as its shares gained following accretive acquisitions. All of these positions were sold. In the fund's long book, power equipment company Techtronic Industries gained on the back of robust earnings, with all its product lines reporting strong performance. Dutch semiconductor equipment maker ASML rose along with the broader semiconductor industry as brokers remain positive on semiconductor demand. The company could see a further boost as chip supply shortages ease. Sentiment towards India's private lender HDFC Bank improved as the central bank allowed it to resume issuing credit cards as well as given the capital expenditure up-cycle in light of increased expectations of economic strength in India. At the end of the period, the fund's net equity exposure was 103.6%, which is in line with the typical 90-110% range. The long exposure was 106.0% and the short book stood at -2.4%. Over the last 12 months, the index has rallied strongly, and market valuations have elevated. Lofty valuations typically contribute to lower future returns. The market is currently focusing on the debate over just how transitory higher inflation will be. Policy settings are increasingly being driven by governments, not central banks. As a result, companies with pricing power and capital-light business models are preferred.
Total Return as at 30.09.2021 One Year Five Years Since Launch
Share Class Launch Date
Performance From
Share Class Cumulative
Index** Cumulative
Share Class Cumulative
Index** Cumulative
Share Class Annualised
Share Class Cumulative
Index** Cumulative
Share Class Annualised
A-ACC Shares (USD) 31.01.2013 31.01.2013 9.5% 14.4% 40.0% 62.0% 7.0% 86.3% 76.0% 7.4%
A-ACC Shares (EUR) 02.04.2014 02.04.2014 10.8% 15.8% 36.0% 57.1% 6.3% 107.1% 104.9% 10.2%
A-ACC Shares (SGD) 16.05.2016 16.05.2016 9.0% 13.8% 39.7% 61.3% 6.9% 63.9% 87.4% 9.6%
A-DIST Shares (EUR) (Euro/USD hedged) 14.12.2016 14.12.2016 8.4% 12.9% - - - 35.1% 49.7% 6.5%
I-ACC Shares (USD) 31.01.2013 31.01.2013 10.5% 14.4% 47.0% 62.0% 8.0% 101.0% 76.0% 8.4%
Y-ACC Shares (USD) 31.01.2013 31.01.2013 10.2% 14.4% 44.7% 62.0% 7.7% 96.4% 76.0% 8.1%
Y-ACC Shares (EUR) 16.03.2017 16.03.2017 11.5% 15.8% - - - 31.7% 41.7% 6.3%
Y-ACC Shares (GBP) 31.01.2013 31.01.2013 5.6% 9.7% 39.4% 56.1% 6.9% 130.7% 107.0% 10.1%
LARGEST HOLDINGS AS AT 30.09.2021*
Market Value (USD)
Net Assets (%)
Taiwan Semiconductor Manufacturing 18,133,379 9.60
Alibaba Group Holding 14,045,803 7.43
HDFC Bank 9,143,259 4.84
SK Hynix 9,021,945 4.77
Franco-Nevada 9,005,510 4.77
Hon Hai Precision Industry 8,688,738 4.60
Kweichow Moutai (A) 8,048,536 4.26
ASML Holding 7,998,715 4.23
MediaTek 6,937,215 3.67
Midea Group (A) 6,319,642 3.34
GEOGRAPHICAL BREAKDOWN AS AT 30.09.2021*
Net Assets (%)
China 41.78
Taiwan Area 22.15
India 4.84
Korea 4.77
Canada 4.77
Hong Kong SAR China 4.46
Netherlands 4.23
Singapore 3.32
USA 2.42

Fidelity
Active
STrategy Emerging Markets Fund 1
*Please note that the market value disclosed in the largest holdings consists of the market value as per local GAAP and does not include exposure to derivatives. This is also the basis by which the geographical/sector split was calculated. *The largest holdings do not include holdings in Equity Linked Notes **Comparative index: MSCI Emerging Markets (Net Total Return) Index Comparative index Hedged EUR : MSCI Emerging Markets (Net Total Return) Hedged to EUR Please refer to performance notes on page 7.
9
FUND SIZE AS AT 30.09.2021 : USD 463 MILLION Manager's Overview
The A-ACC-USD class of the fund returned 26.8% in net dollar terms, outperforming the MSCI Emerging Markets Index, which returned 18.2% over the period. The long book contributed to performance, but short positions weighed on returns. Holdings in Russia, China and Kazakhstan added notable value, though the fund's positioning in Saudi Arabia offset some of these gains. At the sector level, stock picking in financials and the positioning in information technology (IT) were the top contributors to returns. However, certain holdings in the materials sector declined. Energy prices soared during the period. Crude oil prices surpassed the US$80 per barrel mark for the first time since October 2018. The easing of lockdown measures in China and supply disruptions due to hurricane Ida bolstered equities in Russia. As a result, Russian holdings, including TCS Group and Sberbank, enhanced gains. In financials, India's HDFC Bank and Bajaj Finance featured among the key contributors to returns. Indian markets enjoyed a strong run, and HDFC Bank received an additional boost as the Reserve Bank of India lifted a previously enforced ban on the issuance of new credit cards. Conversely, the exposure to Chinese e-commerce company Alibaba Group was the key detector from performance. Chinese internet stocks came under pressure as regulatory fears resurfaced. At period end, the fund's net equity exposure was 100.0%, which is in line with the typical 90-110% range. The long exposure was 145.7% and the short book stood at -45.7%. Emerging markets continue to offer many opportunities, supported by structural growth drivers such as urbanisation and lifestyle changes. This will drive demand for different goods and services in underpenetrated markets. China has been and will remain in the spotlight ----- our exposure to the country is measured and considers the risks with which we have been presented. Beyond China, the pandemic has resulted in unprecedented monetary policy. Although interest rates are starting to rise in some emerging markets, which can lift net interest margins, we believe that interest rates will remain low in the developed world. Emerging markets offer an abundance of quality characteristics such as high returns, prudent balance sheets and valuation multiples, with the scope to deliver attractive total shareholder returns.
Total Return as at 30.09.2021 One Year Five Years Since Launch
Share Class Launch Date
Performance From
Share Class Cumulative
Index** Cumulative
Share Class Cumulative
Index** Cumulative
Share Class Annualised
Share Class Cumulative
Index** Cumulative
Share Class Annualised
A-ACC Shares (USD) 31.10.2011 31.10.2011 26.8% 18.2% 59.2% 55.5% 9.8% 108.0% 59.4% 7.7%
A-ACC Shares (EUR) 01.04.2015 01.04.2015 27.9% 19.6% 53.9% 50.8% 9.0% 32.8% 38.2% 4.5%
A-ACC Shares (EUR) (hedged) 31.10.2011 31.10.2011 23.0% 14.6% 44.6% 40.6% 7.7% 100.5% 52.9% 7.3%
E-ACC Shares (EUR) 07.05.2013 07.05.2013 27.5% 19.6% 48.9% 50.8% 8.3% 74.5% 64.4% 6.8%
I-ACC Shares (USD) 31.10.2011 31.10.2011 28.1% 18.2% 67.1% 55.5% 10.8% 128.6% 59.4% 8.7%
I-DIST Shares (USD) 14.11.2018 14.11.2018 28.0% 18.2% - - - 62.2% 38.4% 18.3%
Y-ACC Shares (USD) 31.10.2011 31.10.2011 27.7% 18.2% 64.5% 55.5% 10.5% 122.4% 59.4% 8.4%
Y-ACC Shares (EUR) 25.01.2016 25.01.2016 29.3% 19.6% 59.5% 50.8% 9.8% 78.9% 87.0% 10.8%
Y-ACC Shares (GBP) 31.10.2011 31.10.2011 22.6% 13.3% 58.9% 49.8% 9.7% 165.0% 90.8% 10.3%
Y-DIST Shares (USD) 05.10.2015 05.10.2015 27.6% 18.2% 64.5% 55.5% 10.5% 74.3% 75.1% 9.7%
LARGEST HOLDINGS AS AT 30.09.2021*
Market Value (USD)
Net Assets (%)
TCS Group Holding Reg S 31,342,081 6.77
HDFC Bank 28,239,703 6.10
Kaspi.KZ Reg S 25,171,205 5.44
Sberbank of Russia Perpetual (Pref'd) 17,345,781 3.75
Gazprom 16,711,166 3.61
Infosys 16,028,058 3.46
SK Hynix 14,715,239 3.18
First Quantum Minerals 14,224,611 3.07
Bajaj Finance 11,870,839 2.56
Armac Locacao Logistica E Servicos 11,739,577 2.54
GEOGRAPHICAL BREAKDOWN AS AT 30.09.2021*
Net Assets (%)
Russia 19.51
India 16.07
China 13.39
South Africa 7.86
Cyprus 6.77
Brazil 6.43
Kazakhstan 5.44
Taiwan Area 5.01
Korea 3.18
Canada 3.07
UK 2.69
Netherlands 1.49

Fidelity
Active
STrategy Europe Fund 1
*Please note that the market value disclosed in the largest holdings consists of the market value as per local GAAP and does not include exposure to derivatives. This is also the basis by which the geographical/sector split was calculated. **Comparative index: MSCI Europe (Net Total Return) Index Please refer to performance notes on page 7.
10
FUND SIZE AS AT 30.09.2021 : EUR 1,021 MILLION Manager's Overview
The A-ACC-EUR class of the fund returned 14.9% in net euro terms, underperforming the MSCI Europe (Net Total Return) index, which returned 28.8% over the period. While security selection in some sectors proved weak, sector allocation was the dominant driver of returns, with the fund's quality/growth bias proving a headwind for much of the year. The overweight stance in the more defensive sectors such as information technology (IT) and health care weighed on relative returns. The underweight position in financials and lack of long exposure to energy also proved unfavourable as these sectors benefited the most from the optimism around an economic reopening. At a stock level, consumer internet company Prosus was the dominant detractor from performance, while SAP and Just Eat Takeaway also weighed on relative returns. However, there were some areas of strong performance over the year. For instance, solid stock picking in health care, such as holdings in Novo Nordisk, Straumann and Sonova, added value. Elsewhere, airplane manufacturer Airbus and semi-conductor firm Infineon Technologies were among the top three contributors to performance. The managers take a long-term approach when making investment decisions and look for companies in industries with long-term structural growth drivers. The fund is overweight in stock-picking sectors such as IT, health care and industrials as a result of this bottom-up process. The key themes within the portfolio are supported by wider structural shifts, including areas such as payments, cloud/digital transition, healthier foods, electric vehicles and demographics (health care). The team avoids macroeconomic sensitive sectors such as financials and energy due to their dependence on exogenous factors. At period end, the fund's equity exposure was 100.2% (net), 114.9% (long) and -14.8% (short). The managers continue to believe that the pandemic has created a supercharged cyclical environment that is favouring cyclical and high beta names. A lot of this is now annualised and priced in by the market. The managers believe that expectations are quite high and that future stock market performance is likely to be driven by earnings rather than by multiples/sentiment. Holdings in companies that are significantly higher quality versus the average of the market (higher returns/barriers to entry), with significantly better growth prospects, were retained.
Total Return as at 30.09.2021 One Year Five Years Since Launch
Share Class Launch Date
Performance From
Share Class Cumulative
Index** Cumulative
Share Class Cumulative
Index** Cumulative
Share Class Annualised
Share Class Cumulative
Index** Cumulative
Share Class Annualised
A-ACC Shares (EUR) 01.10.2004 04.10.2004 14.9% 28.8% 87.4% 48.2% 13.4% 456.3% 181.4% 10.6%
A-DIST Shares (EUR) 08.02.2016 08.02.2016 14.9% 28.8% 81.3% 48.2% 12.6% 83.7% 65.9% 11.4%
A-DIST Shares (GBP) 22.02.2008 22.02.2008 8.9% 22.0% 86.9% 47.2% 13.3% 248.3% 128.8% 9.6%
E-ACC Shares (EUR) 22.02.2008 22.02.2008 14.1% 28.8% 80.5% 48.2% 12.5% 170.1% 100.5% 7.6%
I-ACC Shares (EUR) 22.02.2008 22.02.2008 16.1% 28.8% 93.6% 48.2% 14.1% 232.3% 100.5% 9.2%
I-DIST Shares (GBP) 29.01.2021 29.01.2021 - - - - - 11.6% 13.7% -
W-ACC Shares (GBP) 11.03.2014 11.03.2014 9.6% 22.0% 92.2% 47.2% 14.0% 104.3% 69.0% 9.9%
Y-ACC Shares (EUR) 22.02.2008 22.02.2008 15.7% 28.8% 93.5% 48.2% 14.1% 225.5% 100.5% 9.1%
LARGEST HOLDINGS AS AT 30.09.2021*
Market Value (EUR)
Net Assets (%)
Novo Nordisk (B) 62,411,789 6.11
SAP 59,667,708 5.84
Infineon Technologies 58,198,050 5.70
Merck KGaA 39,269,516 3.85
Experian 38,209,981 3.74
Sonova Holding 34,566,496 3.39
Worldline 33,969,208 3.33
Edenred 29,110,736 2.85
Swedish Match 27,148,773 2.66
Nexi 26,703,398 2.61
GEOGRAPHICAL BREAKDOWN AS AT 30.09.2021*
Net Assets (%)
UK 22.33
Germany 20.39
France 13.14
Netherlands 8.58
Switzerland 7.73
Sweden 7.11
Denmark 6.11
Ireland 5.61
Spain 5.43
Italy 2.61

Fidelity
Active
STrategy Global Fund
*Please note that the market value disclosed in the largest holdings consists of the market value as per local GAAP and does not include exposure to derivatives. This is also the basis by which the geographical/sector split was calculated. **Comparative index: MSCI All Country World (Net Total Return) Index Please refer to performance notes on page 7.
11
FUND SIZE AS AT 30.09.2021 : USD 43 MILLION Manager's Overview
The A-ACC-USD class of the fund returned 68.2% in net US dollar terms, outperforming the MSCI All Country World (Net Total Return) index, which returned 27.4% over the period. Both aggregate long and short positions contributed to performance. At a sector level, strong stock selection in industrials, consumer discretionary and consumer staples added value. Conversely, stock selection in the materials sector detracted from returns. Within industrials, aerospace & defence major Rolls-Royce supported performance. The company sold its Spanish business for €1.7 billion and won a multibillion-dollar contract from the US air force, as investors cheered signs of the jet engine maker's post-pandemic recovery. General Electric was another notable contributor to performance, as investors grew more positive about its turnaround strategy, particularly its efforts to bolster its balance sheet and improve free cash flow generation. The holding in Bunge, the US agricultural commodities trader, added value after it raised its full-year profit outlook amid increased demand for vegetable oils from food service companies and the renewable diesel sector. The position in home-goods retailer Bed Bath & Beyond rose as investors welcomed its renewed focus on its core businesses after having shed most of its other operations. Baker Hughes, one of the world's largest oil field services companies, added notable value as economic reopenings and higher oil prices drove a share price rally. On the downside, the position in gold producers Barrick Gold and Agnico Eagle Mines fell on the back of a decline in gold prices. Weakness in the gold price was driven by the gradual lifting of lockdowns, which led to expectations of faster economic recovery. Additionally, successful COVID-19 vaccination rollouts led to overall positive sentiment in the market, in turn affecting prices of precious metals, which are considered safe havens. At the end of the period, the fund's net equity exposure was 96.0%, comprising long exposure of 124.1%, and short exposure of -28.1%. The manager continues to stay true to his contrarian-value investment style and runs a very high active money portfolio. The focus remains on bottom up stock selection, ensuring that stock picking is the key driver of risk and return.
Total Return as at 30.09.2021 One Year Five Years Since Launch
Share Class Launch Date
Performance From
Share Class Cumulative
Index** Cumulative
Share Class Cumulative
Index** Cumulative
Share Class Annualised
Share Class Cumulative
Index** Cumulative
Share Class Annualised
A-ACC Shares (USD) 30.09.2013 30.09.2013 68.2% 27.4% 82.6% 85.8% 12.8% 104.4% 116.2% 9.3%
A-ACC Shares (EUR) 02.04.2014 02.04.2014 71.2% 28.9% 77.4% 80.2% 12.1% 127.7% 134.8% 11.6%
E-ACC Shares (EUR) 30.09.2013 30.09.2013 69.3% 28.9% 70.7% 80.2% 11.3% 125.0% 152.5% 10.7%
I-ACC Shares (USD) 30.09.2013 30.09.2013 69.9% 27.4% 91.8% 85.8% 13.9% 121.2% 116.2% 10.4%
Y-ACC Shares (USD) 30.09.2013 30.09.2013 69.3% 27.4% 88.5% 85.8% 13.5% 115.2% 116.2% 10.1%
Y-ACC Shares (EUR) 30.09.2013 30.09.2013 70.3% 28.9% 81.9% 80.2% 12.7% 149.9% 152.5% 12.1%
Y-ACC Shares (GBP) 30.09.2013 30.09.2013 61.9% 22.2% 80.8% 79.0% 12.6% 156.6% 159.7% 12.5%
LARGEST HOLDINGS AS AT 30.09.2021*
Market Value (USD)
Net Assets (%)
General Electric 2,172,337 5.05
Bunge 2,009,611 4.67
Cigna 1,782,643 4.15
Telefonaktiebolaget LM Ericsson (B) 1,707,954 3.97
Babcock International Group 1,632,119 3.80
Serco Group 1,616,541 3.76
Agnico Eagle Mines 1,595,033 3.71
Danone 1,534,932 3.57
ConvaTec Group 1,440,428 3.35
Golar LNG 1,363,464 3.17
GEOGRAPHICAL BREAKDOWN AS AT 30.09.2021*
Net Assets (%)
USA 24.83
UK 16.00
China 12.55
France 7.78
Hong Kong SAR China 5.01
Sweden 3.97
Switzerland 3.93
Canada 3.71
Bermuda 3.17
Germany 2.92
Italy 2.86
Spain 2.39

Fidelity
Active
STrategy UK Fund
*Please note that the market value disclosed in the largest holdings consists of the market value as per local GAAP and does not include exposure to derivatives. This is also the basis by which the geographical/sector split was calculated. *The largest holdings do not include holdings in cash or currency funds, such as Fidelity ILF - The Sterling Fund - A-ACC-GBP. **Comparative index: FTSE All Share (Total Return) Index Please refer to performance notes on page 7.
12
FUND SIZE AS AT 30.09.2021 : GBP 27 MILLION Manager's Overview
The A-ACC-GBP class of the fund returned 20.9% in net sterling terms but underperformed the FTSE All Share (Total Return) index, which returned 27.9% over the period. Given its quality focus, the fund tends to lag the market during the recovery phase, as we have seen since the announcement of vaccines, with the lack of exposure to riskier/lower quality businesses proving especially detrimental. However, experience shows that when the recovery broadens, quality characteristics come back into focus and good quality companies tend to outperform over the long run. Meanwhile, our preferred holdings in the financials and health care sectors performed strongly, as they continued to beat consensus expectations. Overall, the long book contributed to returns, while the short book suffered in a rising market and declined in absolute terms. Portfolio changes have primarily involved rotating out of older ideas into opportunities with more favourable risk-reward scenarios. Holdings in British American Tobacco and L'Oreal, as well as in engineering group Renishaw were sold given their reduced upside. Some of the proceeds were used to purchase new positions in housing-related companies such as Forterra and Redrow in light of particularly strong industry trends. Holdings were also purchased in Lloyds Banking Group and Legal & General following encouraging company meetings. Meanwhile, the managers repositioned the fund's exposure to recovery beneficiaries by selling positions in Meggitt, Whitbread and Flutter Entertainment as their valuations rose. The proceeds were used to purchase a holding in Hollywood Bowl, an operator of bowling centres. Elsewhere, Norwegian energy company Equinor was sold, while the allocation to low-cost Permian producer Pioneer Resources was increased. The managers also repurchased a position in Royal Dutch Shell. At the end of the period, the fund's net equity exposure stood at 94.1%. The short book stood at -13.0% and the long book at 107.1%, both lower on a year-on-year basis. Given the strong market recovery, the managers believe it is important to remain disciplined from a valuations perspective. While they continue to find quality businesses trading at reasonable valuations, the managers are having to look further down the market spectrum and are considering lower growth franchises while continuing to take advantage of near-term headwinds affecting industry leaders.
Total Return as at 30.09.2021 One Year Five Years Since Launch
Share Class Launch Date
Performance From
Share Class Cumulative
Index** Cumulative
Share Class Cumulative
Index** Cumulative
Share Class Annualised
Share Class Cumulative
Index** Cumulative
Share Class Annualised
A-ACC Shares (GBP) 14.03.2011 14.03.2011 20.9% 27.9% 42.1% 29.8% 7.3% 142.1% 98.0% 8.7%
Y-ACC Shares (GBP) 14.03.2011 14.03.2011 21.7% 27.9% 45.7% 29.8% 7.8% 155.3% 98.0% 9.3%
LARGEST HOLDINGS AS AT 30.09.2021*
Market Value (GBP)
Net Assets (%)
Diageo 1,345,976 4.99
Novo Nordisk (B) 1,285,416 4.76
NatWest Group 1,233,017 4.57
Experian 1,226,314 4.55
RELX 1,198,541 4.44
Lloyds Banking Group 990,663 3.67
Roche Holding 966,098 3.58
Next 959,162 3.56
Ashtead Group 951,633 3.53
Headlam Group 930,820 3.45
SECTOR BREAKDOWN AS AT 30.09.2021*
Net Assets (%)
Industrials 26.37
Consumer Discretionary 19.95
Financials 10.81
Open Ended Fund 8.49
Healthcare 8.35
Information Technology 8.01
Consumer Staples 6.64
Energy 5.41
Materials 4.49

Fidelity
Active
STrategy US Fund
*Please note that the market value disclosed in the largest holdings consists of the market value as per local GAAP and does not include exposure to derivatives. This is also the basis by which the geographical/sector split was calculated. The largest holdings do not include holdings in cash or currency funds, such as Fidelity ILF - The US Dollar Fund - A-ACC-USD. **Comparative index: S&P 500 (Net Total Return) Index Comparative index Hedged EUR: S&P 500 (Net Total Return) Hedged to EUR Please refer to performance notes on page 7.
13
FUND SIZE AS AT 30.09.2021 : USD 54 MILLION Manager's Overview
During the year, the A-ACC-USD class of the FAST US Fund returned 32.8% in net US dollar terms, outperforming the S&P 500 (Net Total Return) index, which delivered 29.4%. The aggregate long position contributed to returns, while the short position detracted from performance. Both stock selection and sector allocation were positive. Holdings in the health care and consumer staples sectors were notably strong, while the allocation to information technology and consume discretionary stocks detracted from performance. At a stock level, shares in payments solutions provider Wise contributed to performance. The company announced better-than-expected quarterly earnings and management reiterated its optimistic guidance for the full year. The holding in energy company Pioneer Natural Resources rallied as oil prices reached a multi-year high in 2021. Additionally, increasing demand for gasoline and low inventory levels in the US lifted its share price. At a stock level, the position in Alphabet rose as its quarterly revenue and profit surged to record highs, powered by a rise in advertising spending as more consumers shopped online. Meanwhile, the position in Fidelity National Information Services (FIS) declined as the payment processor announced underwhelming earnings. The company faced further headwinds as its peers reported better quarterly growth and revenues. FIS also said that its third quarter guidance would be below expectations. The holding in payments processor Fiserv fell as its operating earnings were below expectations, driven by higher expenses. However, it is expected to meet its 2021 financial target as consumer spending increases and the economy continues to open up. The allocation to Harmonic Drive Systems declined after it announced a conservative earnings guidance. The company also faces headwinds with new competitors in the industrial robotics market. At the end of the period, the fund's net equity exposure stood at 85.9%, which is outside the typical 90-110% range. The short book was held at -29.4% and the long book at 115.3. Investors are optimistic due to the resilience, fundamentals and strong fiscal support that the economy has received. Threats remain on the horizon as we head into the fourth quarter. Against this backdrop, bottom-up stock selection, backed by detailed fundamental research on companies that can produce resilient long-term growth, should benefit long-term investors.
Total Return as at 30.09.2021 One Year Five Years Since Launch
Share Class Launch Date
Performance From
Share Class Cumulative
Index** Cumulative
Share Class Cumulative
Index** Cumulative
Share Class Annualised
Share Class Cumulative
Index** Cumulative
Share Class Annualised
A-ACC Shares (USD) 25.06.2013 25.06.2013 32.8% 29.4% 76.1% 112.2% 12.0% 163.2% 204.0% 12.4%
A-ACC Shares (EUR) 25.06.2013 25.06.2013 34.1% 31.0% 70.1% 105.8% 11.2% 195.2% 243.0% 14.0%
A-ACC Shares (EUR) (hedged) 25.06.2013 25.06.2013 31.2% 27.9% 58.2% 89.3% 9.6% 132.6% 165.5% 10.7%
E-ACC Shares (EUR) 25.06.2013 25.06.2013 33.6% 31.0% 64.3% 105.8% 10.4% 179.0% 243.0% 13.2%
I-ACC Shares (USD) 25.06.2013 25.06.2013 34.1% 29.4% 85.0% 112.2% 13.1% 183.9% 204.0% 13.4%
Y-ACC Shares (USD) 25.06.2013 25.06.2013 33.7% 29.4% 81.9% 112.2% 12.7% 177.5% 204.0% 13.1%
Y-ACC Shares (GBP) 25.06.2013 25.06.2013 29.4% 24.1% 75.6% 104.4% 11.9% 217.0% 247.3% 15.0%
LARGEST HOLDINGS AS AT 30.09.2021*
Market Value (USD)
Net Assets (%)
Horizon Therapeutics 2,398,334 4.45
salesforce.com 2,383,706 4.43
Pioneer Natural Resources 2,031,028 3.77
Fiserv 2,030,379 3.77
Bank OZK 1,625,297 3.02
XPO Logistics 1,582,957 2.94
Microsoft 1,556,923 2.89
Oshkosh 1,378,745 2.56
Tradeweb Markets (A) 1,257,603 2.34
Fidelity National Information Services 1,250,840 2.32
SECTOR BREAKDOWN AS AT 30.09.2021*
Net Assets (%)
Information Technology 31.16
Healthcare 14.34
Industrials 11.69
Financials 11.60
Energy 8.93
Consumer Discretionary 6.64
Consumer Staples 3.14
Materials 2.90
Open Ended Fund 2.33
Communication Services 0.82

Fidelity
Active
STrategy Asia Fund 1 Schedule of Investments as at 30 September 2021 1
* Security with price determined by the Directors. The accompanying notes to the financial statements form an integral part of these financial statements. The percentage of net assets in the schedule of investments and in the geographical split is subject to rounding.
14
Country Code Ccy
Shares or Nominal
Market Value USD
% Net Assets
Securities Admitted to or Dealt on an Official Stock Exchange Securities Admitted to or Dealt on an Official Stock Exchange Energy China Merchants Energy Shipping (A) CN CNY 1,295,100 1,107,797 0.59
1,107,797 0.59
Materials Franco-Nevada CA USD 69,188 9,005,510 4.77Beijing Oriental Yuhong Waterproof Technology CN CNY 126,000 864,372 0.46
9,869,882 5.22
Industrials BOC Aviation SG HKD 747,900 6,270,714 3.32Full Truck Alliance ADR CN USD 105,870 1,624,046 0.86
7,894,760 4.18
Information Technology Taiwan Semiconductor Manufacturing TW TWD 869,000 18,133,379 9.60SK Hynix KR KRW 104,098 9,021,945 4.77Hon Hai Precision Industry TW TWD 2,311,000 8,688,738 4.60ASML Holding NL EUR 10,696 7,998,715 4.23MediaTek TW TWD 214,000 6,937,215 3.67Zhen Ding Technology Holding TW TWD 1,367,000 4,838,512 2.56Tencent Holdings CN HKD 71,500 4,264,910 2.26VisEra Technologies TW TWD 206,074 3,249,307 1.72Linklogis CN HKD 911,000 936,236 0.50
64,068,957 33.91
Consumer Discretionary Alibaba Group Holding CN HKD 757,836 14,045,803 7.43Midea Group (A) CN CNY 586,200 6,319,642 3.34Yum China Holdings CN USD 77,669 4,576,257 2.42Bafang Electric Suzhou (A) CN CNY 82,867 3,356,341 1.78Trip.com Group ADR CN USD 28,395 869,739 0.46Bafang Electric Suzhou CN CNY 11,800 477,932 0.25Yum China Holdings (A) CN HKD 3,850 227,746 0.12
29,873,460 15.81
Consumer Staples Kweichow Moutai (A) CN CNY 28,400 8,048,536 4.26
8,048,536 4.26
Financials HDFC Bank IN INR 425,540 9,143,259 4.84Dah Sing Banking Group HK HKD 2,537,200 2,326,712 1.23
11,469,971 6.07
Real Estate Sun Hung Kai Properties HK HKD 487,500 6,093,469 3.22
6,093,469 3.22
Equity Linked Notes BNP (Kweichow Moutai (A)) ELN 12/10/2022 CN USD 18,008 5,103,444 2.70UBS (Focus Media Inf. Tech (A)) ELN 24/02/2023 CN USD 678,900 769,558 0.41Macquarie (Beijing Ori. Yuhong (A)) ELN 03/08/2023 CN USD 38,896 266,830 0.14
6,139,832 3.25
Securities Admitted to or Dealt on Other Regulated Markets Securities Admitted to or Dealt on Other Regulated Markets Consumer Discretionary Trip.com Group CN HKD 108,700 3,332,559 1.76
3,332,559 1.76
Equity Linked Notes JP.Morgan (Beijing Ori. Yuhong (A)) ELN 13/06/2022 CN USD 1,248,100 8,562,069 4.53CITI (Focus Media Inf. Tech (A)) ELN 18/02/2022 CN USD 5,428,800 6,153,740 3.26UBS (Beijing Oriental Yuhong(A)) ELN 16/06/2023 CN USD 402,200 2,759,125 1.46UBS (China Merchants Energy(A)) ELN 25/01/2023 CN USD 2,322,444 1,986,558 1.05HSBC (Skshu Paint (A)) ELN 29/07/2022 CN USD 82,198 1,271,224 0.67CITI (Kweichow Moutai (A)) ELN 18/02/2022 CN USD 4,100 1,161,935 0.61UBS (Skshu Paint (A)) ELN 03/03/2022 CN USD 50,835 786,183 0.42UBS (Bafang Electric Suzhou(A)) ELN 22/02/2023 CN USD 1,900 76,955 0.04
22,757,789 12.04
Unlisted Unlisted Healthcare Grail* US USD 384,000 4,569,600 2.42
4,569,600 2.42
Fractions (1) (0.00)
Total Investments (Cost USD 172,353,638) 175,226,611 92.74 175,226,611.00 1
Ccy
Underlying exposure
Unrealised gain/(loss)
USD
% Net Assets
Contracts For Difference Contracts For Difference Bluescope Steel (JPLS) AUD (2,290,500) 215,377 0.11 AIA Group (HSBC) HKD 63,797,299 169,140 0.09 Kuaishou Technology Class (HSBC) HKD (9,131,395) 99,918 0.05 Alibaba Group Holding (HSBC) HKD 3,419,689 (21,947) (0.01) Qantas Airways (JPLS) AUD (2,272,276) (79,998) (0.04) Beijing Oriental Yuhong (JPLS) USD 2,835,958 (316,502) (0.17) Techtronic Industries (HSBC) HKD 99,291,000 (553,779) (0.29)
(487,791) (0.26)
Underlying exposure USD
Unrealised gain/(loss)
USD
% Net Assets
Forward Foreign Exchange Contracts Forward Foreign Exchange Contracts A-DIST Shares (EUR) (Euro/USD hedged) Bought USD Sold EUR at 1.177450 21/10/2021 60,805 1,012 0.00 Bought USD Sold EUR at 1.174125 21/10/2021 55,361 762 0.00 Bought EUR Sold USD at 0.845476 21/10/2021 1,616,486 (33,598) (0.02)
(31,824) (0.02)
Ccy Contracts Market Value
USD% Net Assets
Options Options Written Call ASML Holding 760 15/10/2021 EUR (6) (243) (0.00) Written Call AIA Group 110 29/11/2021 HKD (43) (400) (0.00) Written Call ASML Holding 800 19/11/2021 EUR (6) (1,125) (0.00) Written Put Tencent Holdings 400 28/10/2021 HKD (381) (9,393) (0.00) Written Put ASML Holding 600 19/11/2021 EUR (8) (14,533) (0.01) Written Put Tencent Holdings 420 28/10/2021 HKD (381) (24,192) (0.01)
(49,886) (0.03)
Other Assets and Liabilities 14,289,147 7.56
Net Assets 188,946,257 100.00 188,946,257.00
GEOGRAPHICAL SPLIT
Country Country Code % Net Assets China CN 41.78 Taiwan Area TW 22.15 India IN 4.84 Korea KR 4.77 Canada CA 4.77 Hong Kong SAR China HK 4.46 Netherlands NL 4.23 Singapore SG 3.32 USA US 2.42 Cash and other net assets 7.26

Fidelity
Active
STrategy Emerging Markets Fund 1 Schedule of Investments as at 30 September 2021 2
The accompanying notes to the financial statements form an integral part of these financial statements. The percentage of net assets in the schedule of investments and in the geographical split is subject to rounding.
15
Country Code Ccy
Shares or Nominal
Market Value USD
% Net Assets
Securities Admitted to or Dealt on an Official Stock Exchange Securities Admitted to or Dealt on an Official Stock Exchange Energy Gazprom RU USD 3,360,391 16,711,166 3.61
16,711,166 3.61
Materials First Quantum Minerals CA CAD 768,226 14,224,611 3.07Endeavour Mining GB CAD 290,831 6,617,725 1.43Jubilee Metals Group GB GBP 27,189,150 5,822,749 1.26Beijing Oriental Yuhong Waterproof Technology (A) CN CNY 773,600 5,306,969 1.15Sibanye Stillwater ZA ZAR 1,538,431 4,754,941 1.03DRDGOLD ZA ZAR 3,444,783 2,746,443 0.59Beijing Oriental Yuhong Waterproof Technology CN CNY 393,958 2,702,589 0.58Alphamin Resources MU CAD 4,223,260 2,633,288 0.57
44,809,315 9.68
Industrials Zhejiang Sanhua Intelligent Controls (A) CN CNY 3,172,900 11,188,936 2.42HeadHunter Group ADR RU USD 131,336 6,386,870 1.38Wizz Air Holdings CH GBP 60,683 4,098,139 0.88Copa Holdings PA USD 30,477 2,507,952 0.54
24,181,897 5.22
Information Technology Infosys IN INR 711,799 16,028,058 3.46SK Hynix KR KRW 169,789 14,715,239 3.18MediaTek TW TWD 278,000 9,011,896 1.95Yandex (A) RU USD 106,976 8,543,103 1.84Daqo New Energy ADR CN USD 97,416 5,426,071 1.17Silergy CN TWD 34,000 4,996,334 1.08TravelSky Technology (H) CN HKD 2,546,000 4,915,512 1.06Infosys ADR IN USD 100 2,238 0.00
63,638,451 13.74
Consumer Discretionary Midea Group (A) CN CNY 853,521 9,201,548 1.99Prosus NL EUR 86,442 6,904,695 1.49Detsky Mir RU USD 3,837,700 6,884,554 1.49Pepkor Holdings ZA ZAR 3,985,140 5,711,118 1.23Ozon Holdings ADR RU USD 101,456 5,067,727 1.09Eicher Motors IN INR 123,273 4,631,301 1.00Naspers ZA ZAR 23,549 3,899,891 0.84MercadoLibre AR USD 1,875 3,145,819 0.68MakeMyTrip IN USD 110,450 2,875,566 0.62momo.com TW TWD 48,000 2,791,822 0.60Galaxy Entertainment Group HK HKD 311,000 1,602,446 0.35New Oriental Education & Technology Group ADR CN USD 251,688 508,661 0.11Alibaba Group Holding ADR CN USD 2,948 434,830 0.09
53,659,978 11.59
Consumer Staples Bid Corp ZA ZAR 198,959 4,264,507 0.92
4,264,507 0.92
Healthcare Aspen Pharmacare Holdings ZA ZAR 165,764 2,983,835 0.64Innovent Biologics CN HKD 259,500 2,517,261 0.54Life Healthcare Group Holdings ZA ZAR 1,626,091 2,462,162 0.53Remegen (H) CN HKD 89,500 1,132,798 0.24
9,096,056 1.96
Financials HDFC Bank IN INR 1,314,315 28,239,703 6.10Sberbank of Russia Perpetual (Pref'd) RU USD 3,960,966 17,345,781 3.75Bajaj Finance IN INR 114,894 11,870,839 2.56Chailease Holding TW TWD 1,289,941 11,374,445 2.46Bank Central Asia ID IDR 2,160,300 5,275,893 1.14HDFC Life Insurance IN INR 500,912 4,875,630 1.05ICICI Lombard General Insurance (A) IN INR 193,565 4,143,834 0.89Vinci Partners Investments BR USD 269,012 3,534,818 0.76Noah Holdings ADR CN USD 75,942 2,825,042 0.61East Money Information (A) CN CNY 335,400 1,783,330 0.39
91,269,315 19.71
Open Ended Fund Fidelity ILF - The US Dollar Fund - A-ACC-USD IE USD 1 6,724 0.00
6,724 0.00
Equity Linked Notes HSBC (Kweichow Moutai (A)) ELN 04/12/2024 CN USD 27,111 7,683,222 1.66Macquarie (Weichai Power (A)) ELN 20/01/2023 CN USD 520,316 1,381,415 0.30
9,064,637 1.96
Communication Services MTN Group ZA ZAR 1,019,745 9,577,354 2.07Bharti Airtel IN INR 186,813 1,732,262 0.37
11,309,616 2.44
Country Code Ccy
Shares or Nominal
Market Value USD
% Net Assets
Securities Admitted to or Dealt on Other Regulated Markets Securities Admitted to or Dealt on Other Regulated Markets Energy Gazprom ADR RU USD 687,320 6,863,578 1.48
6,863,578 1.48
Materials PhosAgro Reg S RU USD 515,402 11,483,157 2.48 Novolipetsk Steel RU USD 136,339 4,054,722 0.88
15,537,879 3.36
Industrials Armac Locacao Logistica E Servicos BR BRL 3,371,369 11,739,577 2.54 Vamos Locacao de Caminhoes Maquinas e Equipa. BR BRL 1,885,200 5,204,561 1.12 Localiza Rent a Car BR BRL 348,060 3,465,394 0.75
20,409,532 4.41
Consumer Discretionary Pet Center Comercio e Participacoes BR BRL 1,341,425 5,816,010 1.26
5,816,010 1.26
Financials TCS Group Holding Reg S CY USD 341,417 31,342,081 6.77 Kaspi.KZ Reg S KZ USD 237,017 25,171,205 5.44 Sberbank of Russia ADR RU USD 371,875 6,998,688 1.51
63,511,974 13.72
Communication Services Bharti Airtel Rts 31/12/2049 IN INR 13,343 27,555 0.01
27,555 0.01
Total Investments (Cost USD 314,952,268) 440,178,190 95.05 440,178,190.00 1
Ccy
Underlying exposure
Unrealised gain/(loss)
USD
% Net Assets
Contracts For Difference Contracts For Difference China Mengniu Dairy (HSBC) HKD 209,708,901 1,084,359 0.23 AIA Group (GS) HKD 132,515,950 673,002 0.15 Jinkosolar Holding ADR (MS) USD (3,312,326) 509,361 0.11 Zhongsheng Group Holdings (HSBC) HKD 93,728,220 425,293 0.09 UP Fintech Holdings (JPLS) USD (1,092,838) 343,791 0.07 First Majestic Silver (JPLS) USD (3,347,084) 310,924 0.07 China Everbright (UBS) HKD (21,586,852) 301,910 0.07 NIO ADR (JPLS) USD (2,264,544) 189,191 0.04 Allegro.Eu (JPLS) PLN (7,040,576) 171,285 0.04 Berli Jucker (MS) USD (242,761) 155,839 0.03 Emaar The Economic City (GS) USD (6,379,014) 142,687 0.03 Gome Retail Holdings (MS) HKD (4,443,873) 133,103 0.03 Via Varejo (UBS) USD (989,851) 129,054 0.03 Seven Bank (GS) JPY (366,603,680) 105,382 0.02 Celltrion (UBS) USD (967,996) 105,344 0.02 El Puerto De Liverpool-C1 (MS) MXN (37,672,000) 93,110 0.02 Doosan Heavy Industries & Construction (GS) USD (3,664,242) 90,297 0.02 Natura &Co Holding ADR (HSBC) USD (1,216,445) 78,597 0.02 Beijing Enterprises Water (MS) HKD (6,184,657) 76,523 0.02 Genting Singapore (MS) SGD (968,869) 60,679 0.01 Orion Corp/Republic Of Korea (GS) USD (2,076,493) 58,811 0.01 Turkiye Halk Bankasi (MS) USD (256,718) 47,954 0.01 B2W Companhia Global (JPLS) USD (125,905) 47,818 0.01 Inpost (HSBC) EUR (448,034) 43,778 0.01 Samsung Heavy Industries (JPLS) USD (757,047) 40,951 0.01 Inpost (JPLS) EUR (437,174) 38,608 0.01 Jinkosolar Holding ADR (JPLS) USD (493,393) 38,157 0.01 Jumia Technologies ADR (HSBC) USD (667,147) 37,708 0.01 Iqiyi ADR (JPLS) USD (787,129) 37,684 0.01 Gigabyte Technology (UBS) USD (431,757) 33,837 0.01 Samsung Heavy Industries (MS) USD (876,181) 33,674 0.01 JD Logistics (JPLS) HKD (4,461,560) 31,834 0.01 WEG (GS) USD (933,808) 28,211 0.01 Allegro.EU (HSBC) PLN (1,746,781) 26,860 0.01 Hyundai Wia (JPLS) USD (294,361) 26,576 0.01 China Evergrande Group (JPLS) HKD (1,256,127) 23,056 0.00 El Puerto De Liverpool-C1 (GS) MXN (19,788,000) 22,982 0.00 Jumia Technologies ADR (JPLS) USD (328,900) 22,523 0.00 Skshu Paint (UBS) USD 1,503,283 22,432 0.00 Heineken (Br) (GS) EUR 2,370,456 20,690 0.00 Unilever Indonesia (JPLS) USD (483,715) 18,941 0.00 Gigabyte Technology (JPLS) USD (394,483) 18,790 0.00 Tencent Holdings (UBS) HKD 57,071,950 18,583 0.00 Shin Kong Financial Holdings (MS) USD (1,179,453) 18,270 0.00 Hyundai Wia (GS) USD (2,248,085) 16,523 0.00 Berli Jucker (UBS) USD (594,715) 16,220 0.00 Shin Kong Financial Holdings (GS) USD (1,074,997) 15,074 0.00 Yieh Phui Enterprise (JPLS) USD (267,769) 14,944 0.00 Berli Jucker (GS) USD (658,671) 13,916 0.00 Highwealth Construction (UBS) USD (320,226) 13,188 0.00 Antofagasta Holdings (GS) GBP (1,659,079) 13,125 0.00 Shanghai Comm & Saving Bank (UBS) USD (1,781,737) 12,137 0.00 First Majestic Silver (UBS) USD (290,180) 11,891 0.00

Fidelity
Active
STrategy Emerging Markets Fund 1 - continued Schedule of Investments as at 30 September 2021
16
Ccy
Underlying exposure
Unrealised gain/(loss)
USD
% Net Assets
Jumia Technologies ADR (GS) USD (466,054) 10,638 0.00Samsung Heavy Industries (HSBC) USD (501,199) 10,126 0.00Gulf Energy (UBS) USD (1,723,984) 9,690 0.00Taiwan Mobile (JPLS) USD (940,805) 9,588 0.00IQiyi ADR (GS) USD (637,512) 8,854 0.00National Bank of Kuwait (UBS) USD (4,092,723) 8,159 0.00Celltrion (JPLS) USD (359,479) 7,477 0.00Golden Eagle Retail Group (JPLS) HKD (5,069,130) 7,179 0.00Alinma Bank (HSBC) USD (3,612,421) 6,806 0.00Sharp (MS) JPY (121,559,994) 5,289 0.00B2W Companhia Global (GS) USD (1,025,639) 4,036 0.00Xinyi Solar Holdings (GS) HKD (8,206,088) 2,368 0.00Samsung Heavy Industries (UBS) USD (209,341) 2,184 0.00Ta Chen Stainless Pipe (UBS) USD (865,732) 359 0.00Singapore Exchange (GS) SGD (1,919,830) 237 0.00Gome Retail Holdings (UBS) HKD (463,436) 15 0.00Paradise (UBS) USD (1,237,795) (205) (0.00)Natura & Co Holding (GS) USD (16,153) (244) (0.00)Arcelik (GS) USD (254,167) (661) (0.00)Aerospace Index Development (HSBC) USD (330,382) (1,977) (0.00)Aerospace Index Development (UBS) USD (581,759) (2,802) (0.00)BYD (H) (GS) HKD (22,667,684) (2,824) (0.00)Alinma Bank (UBS) USD (440,403) (2,964) (0.00)Pegatron (UBS) USD (478,182) (4,414) (0.00)Paradise (GS) USD (608,653) (4,651) (0.00)Natura & Co Holding ADR (GS) USD (455,085) (4,856) (0.00)Pegatron (GS) USD (2,676,856) (5,439) (0.00)Rabigh Refining & Petro (GS) USD (470,400) (5,965) (0.00)Li Auto ADR (GS) USD (1,870,063) (6,419) (0.00)Tatneft ADR (GS) USD (3,067,312) (7,000) (0.00)JD Logistics (UBS) HKD (2,346,137) (11,546) (0.00)China Gas Holdings (GS) HKD (1,922,698) (11,799) (0.00)Samsung Heavy Industries (UBS) USD (11,816) (11,816) (0.00)Rabigh Refining & Petro (UBS) USD (335,361) (14,393) (0.00)Luye Pharma Group (HSBC) HKD (8,190,238) (14,913) (0.00)Komercni Banka (JPLS) USD (311,794) (16,283) (0.00)Banque Saudi Fransi (UBS) USD (390,749) (17,359) (0.00)Grupo Mexico (GS) MXN 232,015,668 (18,296) (0.00)Jinkosolar Holdings ADR (GS) USD (470,710) (18,727) (0.00)Aerospace Index Development (JPLS) USD (611,514) (22,791) (0.00)Hysan Development (GS) HKD (10,745,888) (26,909) (0.01)Samsung Heavy Industries (HSBC) USD (28,289) (28,289) (0.01)Guangzhou R&F Property (GS) HKD (2,309,809) (39,404) (0.01)Samsung Heavy Industries (JPLS) USD (42,730) (42,730) (0.01)Compal Electronics (JPLS) USD (1,954,022) (43,490) (0.01)Bank Of Communications (GS) HKD (13,502,131) (44,204) (0.01)Gome Retail Holdings (HSBC) HKD (11,058,961) (44,859) (0.01)China Water Affairs Group (MS) HKD (5,880,920) (45,117) (0.01)Samsung Heavy Industries (MS) USD (49,454) (49,454) (0.01)China Evergrande Group (UBS) HKD (4,396,443) (53,367) (0.01)Komercni Banka (HSBC) USD (2,755,844) (63,131) (0.01)Yieh Phui Enterprise (UBS) USD (1,135,559) (72,777) (0.02)Banque Saudi Fransi (HSBC) USD (2,846,657) (74,490) (0.02)Porsche Auto Holding (JPLS) EUR 7,927,621 (83,306) (0.02)Tata Motors ADR (HSBC) USD (1,517,580) (93,134) (0.02)Want Want China Holdings (UBS) HKD (15,066,841) (94,596) (0.02)Guangzhou R&F Property (HSBC) HKD (8,015,973) (188,263) (0.04)Adidas (JPLS) EUR 1,767,787 (193,153) (0.04)Flatex (JPLS) EUR 2,318,214 (226,346) (0.05)GSX Techedu ADR (HSBC) USD (1,658,271) (289,107) (0.06)Techtronic Industries (HSBC) HKD 58,351,843 (325,447) (0.07)Anta Sports Products (HSBC) HKD 99,359,731 (396,687) (0.09)Alibaba Group Holding ADR (GS) USD 20,007,195 (663,289) (0.14)Taiwan Semiconductor Manufacturing (GS) USD 45,594,144 (1,208,709) (0.26)ASML Holding (JPLS) EUR 10,267,872 (1,639,934) (0.35)Samsung Electronics (UBS) USD 39,581,168 (2,195,425) (0.47)
(2,275,479) (0.49)
Underlying exposure USD
Unrealised gain/(loss)
USD
% Net Assets
Forward Foreign Exchange Contracts Forward Foreign Exchange Contracts Bought USD Sold TRY at 0.113646 03/12/2021 8,797,435 373,076 0.08Bought USD Sold PHP at 0.019846 08/11/2021 3,482,299 61,042 0.01Bought USD Sold TRY at 0.116497 08/11/2021 1,089,376 59,787 0.01Bought MYR Sold USD at 4.246100 08/11/2021 4,280,493 56,269 0.01Bought USD Sold BRL at 0.188359 08/11/2021 1,727,654 55,224 0.01Bought USD Sold ZAR at 0.067900 08/11/2021 1,803,063 48,627 0.01Bought USD Sold PLN at 0.260607 08/11/2021 1,287,965 47,696 0.01Bought USD Sold MXN at 0.049960 08/11/2021 1,386,743 45,626 0.01Bought USD Sold THB at 0.030370 08/11/2021 1,532,123 42,622 0.01Bought USD Sold HUF at 0.003382 08/11/2021 731,751 37,068 0.01Bought USD Sold KRW at 0.000870 08/11/2021 1,145,090 34,511 0.01Bought USD Sold PLN at 0.253878 08/11/2021 3,017,465 30,949 0.01Bought INR Sold USD at 75.243000 08/11/2021 3,017,033 29,473 0.01Bought RUB Sold USD at 74.025000 08/11/2021 2,444,151 28,526 0.01Bought USD Sold PEN at 0.244808 08/11/2021 1,982,574 27,323 0.01Bought USD Sold PLN at 0.255955 08/11/2021 1,333,802 24,705 0.01Bought USD Sold CLP at 0.001280 08/11/2021 555,606 21,995 0.00Bought RUB Sold USD at 74.044500 08/11/2021 1,737,927 20,747 0.00Bought USD Sold INR at 0.013539 08/11/2021 2,124,945 18,817 0.00Bought USD Sold TWD at 0.036212 08/11/2021 3,183,192 18,772 0.00Bought USD Sold BRL at 0.193226 08/11/2021 318,050 18,646 0.00Bought USD Sold ZAR at 0.068184 08/11/2021 538,344 16,833 0.00Bought USD Sold MXN at 0.049708 08/11/2021 591,829 16,388 0.00
Underlying exposure USD
Unrealised gain/(loss)
USD
% Net Assets
Bought USD Sold THB at 0.030198 08/11/2021 737,755 16,230 0.00 Bought USD Sold MXN at 0.049625 08/11/2021 615,549 15,988 0.00 Bought USD Sold MXN at 0.049298 08/11/2021 780,815 15,003 0.00 Bought COP Sold USD at 3871.406986 08/11/2021 976,362 12,111 0.00 Bought USD Sold KRW at 0.000850 08/11/2021 1,666,904 11,764 0.00 Bought COP Sold USD at 3925.299958 08/11/2021 425,985 11,287 0.00 Bought USD Sold INR at 0.013491 08/11/2021 2,060,935 10,929 0.00 Bought COP Sold USD at 3852.779986 08/11/2021 1,256,503 9,465 0.00 Bought USD Sold MXN at 0.049422 08/11/2021 426,568 9,292 0.00 Bought USD Sold ILS at 0.311677 08/11/2021 1,486,451 9,162 0.00 Bought INR Sold USD at 74.927000 08/11/2021 1,583,456 8,754 0.00 Bought USD Sold KRW at 0.000868 08/11/2021 281,154 7,720 0.00 Bought USD Sold TWD at 0.036286 08/11/2021 799,459 6,357 0.00 Bought USD Sold BRL at 0.183834 08/11/2021 832,369 5,968 0.00 Bought IDR Sold USD at 14547.000122 08/11/2021 490,708 5,927 0.00 Bought USD Sold INR at 0.013509 08/11/2021 825,163 5,440 0.00 Bought ZAR Sold USD at 15.195000 08/11/2021 814,867 3,787 0.00 Bought USD Sold ZAR at 0.066730 03/12/2021 210,029 2,726 0.00 Bought USD Sold CLP at 0.001274 08/11/2021 75,732 2,601 0.00 Bought USD Sold CLP at 0.001273 08/11/2021 70,710 2,392 0.00 Bought USD Sold ZAR at 0.068763 08/11/2021 48,173 1,928 0.00 Bought USD Sold MXN at 0.049683 08/11/2021 68,983 1,875 0.00 Bought USD Sold TRY at 0.113054 08/11/2021 74,158 1,758 0.00 Bought USD Sold THB at 0.030329 08/11/2021 48,931 1,293 0.00 Bought USD Sold INR at 0.013448 08/11/2021 578,270 1,206 0.00 Bought USD Sold MXN at 0.049740 08/11/2021 37,950 1,076 0.00 Bought USD Sold THB at 0.029804 08/11/2021 76,945 666 0.00 Bought USD Sold ILS at 0.311005 08/11/2021 162,597 650 0.00 Bought USD Sold PEN at 0.242101 08/11/2021 234,356 603 0.00 Bought USD Sold MXN at 0.048635 08/11/2021 63,856 352 0.00 Bought USD Sold PEN at 0.243481 08/11/2021 30,257 251 0.00 Bought USD Sold ILS at 0.309829 08/11/2021 1,138,303 227 0.00 Bought USD Sold IDR at 0.000070 08/11/2021 41,457 204 0.00 Bought USD Sold MYR at 0.238658 08/11/2021 221,426 48 0.00 Bought USD Sold THB at 0.029549 08/11/2021 710,571 21 0.00 Bought USD Sold RUB at 0.013667 08/11/2021 133,280 2 0.00 Bought KRW Sold USD at 1184.190037 08/11/2021 41,614 (6) (0.00) Bought USD Sold RUB at 0.013665 08/11/2021 554,929 (68) (0.00) Bought USD Sold TWD at 0.035984 08/11/2021 415,013 (177) (0.00) Bought USD Sold COP at 0.000258 08/11/2021 26,680 (333) (0.00) Bought PEN Sold USD at 4.112100 08/11/2021 51,263 (359) (0.00) Bought ILS Sold USD at 3.202210 08/11/2021 53,088 (428) (0.00) Bought TWD Sold USD at 27.730000 08/11/2021 255,110 (442) (0.00) Bought ZAR Sold USD at 14.987185 08/11/2021 55,421 (504) (0.00) Bought USD Sold MYR at 0.237812 08/11/2021 162,777 (542) (0.00) Bought CLP Sold USD at 798.508060 08/11/2021 33,610 (555) (0.00) Bought MXN Sold USD at 20.331660 08/11/2021 42,117 (699) (0.00) Bought TWD Sold USD at 27.715000 08/11/2021 448,930 (1,021) (0.00) Bought HUF Sold USD at 308.191599 08/11/2021 130,212 (1,028) (0.00) Bought MYR Sold USD at 4.166600 08/11/2021 186,531 (1,086) (0.00) Bought PHP Sold USD at 49.948004 08/11/2021 45,888 (1,184) (0.00) Bought USD Sold COP at 0.000261 08/11/2021 580,379 (1,231) (0.00) Bought THB Sold USD at 33.412600 08/11/2021 115,588 (1,472) (0.00) Bought IDR Sold USD at 14339.500002 08/11/2021 685,706 (1,617) (0.00) Bought USD Sold KRW at 0.000842 08/11/2021 670,063 (1,890) (0.00) Bought USD Sold TWD at 0.035851 08/11/2021 461,849 (1,902) (0.00) Bought USD Sold INR at 0.013313 08/11/2021 239,028 (1,909) (0.00) Bought TRY Sold USD at 9.030600 08/11/2021 749,098 (2,019) (0.00) Bought ILS Sold USD at 3.222050 08/11/2021 1,140,485 (2,182) (0.00) Bought USD Sold INR at 0.013374 08/11/2021 668,513 (2,279) (0.00) Bought USD Sold TRY at 0.110011 08/11/2021 596,256 (2,296) (0.00) Bought USD Sold MYR at 0.235960 08/11/2021 215,366 (2,388) (0.00) Bought PEN Sold USD at 4.042700 08/11/2021 137,408 (3,266) (0.00) Bought ZAR Sold USD at 14.467080 08/11/2021 76,982 (3,347) (0.00) Bought USD Sold TWD at 0.035923 08/11/2021 1,635,588 (3,458) (0.00) Bought HUF Sold USD at 293.791703 08/11/2021 95,496 (5,181) (0.00) Bought USD Sold RUB at 0.013535 08/11/2021 542,745 (5,208) (0.00) Bought ILS Sold USD at 3.214500 08/11/2021 1,292,549 (5,495) (0.00) Bought USD Sold COP at 0.000259 08/11/2021 745,128 (6,827) (0.00) Bought PEN Sold USD at 4.110200 08/11/2021 947,496 (7,077) (0.00) Bought PHP Sold USD at 50.805000 08/11/2021 821,577 (7,472) (0.00) Bought USD Sold IDR at 0.000069 08/11/2021 496,635 (7,574) (0.00) Bought ILS Sold USD at 3.209550 08/11/2021 1,411,974 (8,168) (0.00) Bought PHP Sold USD at 50.430000 08/11/2021 499,229 (8,191) (0.00) Bought ILS Sold USD at 3.204400 08/11/2021 1,114,124 (8,223) (0.00) Bought MXN Sold USD at 20.286000 08/11/2021 544,203 (10,228) (0.00) Bought USD Sold MYR at 0.237643 08/11/2021 2,648,934 (10,697) (0.00) Bought TWD Sold USD at 27.695000 08/11/2021 4,033,761 (12,075) (0.00) Bought BRL Sold USD at 5.396300 08/11/2021 807,757 (12,149) (0.00) Bought USD Sold RUB at 0.013490 08/11/2021 1,070,498 (13,827) (0.00) Bought KRW Sold USD at 1171.049997 08/11/2021 1,277,406 (14,345) (0.00) Bought PHP Sold USD at 50.692500 08/11/2021 1,304,313 (14,723) (0.00) Bought USD Sold RUB at 0.013376 08/11/2021 714,398 (15,203) (0.00) Bought USD Sold ZAR at 0.065381 08/11/2021 1,410,493 (15,704) (0.00) Bought IDR Sold USD at 14302.000015 08/11/2021 3,367,399 (16,726) (0.00) Bought HUF Sold USD at 302.046402 08/11/2021 626,027 (17,328) (0.00) Bought BRL Sold USD at 5.308000 08/11/2021 564,977 (17,603) (0.00) Bought CLP Sold USD at 792.380001 08/11/2021 742,144 (17,850) (0.00) Bought TRY Sold USD at 8.839173 08/11/2021 754,686 (17,988) (0.00) Bought TWD Sold USD at 27.490000 08/11/2021 1,789,400 (18,562) (0.00) Bought PLN Sold USD at 3.828970 08/11/2021 559,263 (21,128) (0.00) Bought PEN Sold USD at 4.038600 08/11/2021 909,895 (22,529) (0.00) Bought ZAR Sold USD at 15.107830 03/12/2021 4,749,981 (22,664) (0.00) Bought PLN Sold USD at 3.833266 08/11/2021 740,283 (27,167) (0.01) Bought USD Sold INR at 0.013326 08/11/2021 4,015,980 (28,253) (0.01) Bought CLP Sold USD at 763.020006 08/11/2021 490,917 (29,560) (0.01) Bought KRW Sold USD at 1151.379999 08/11/2021 1,177,880 (32,790) (0.01) Bought HUF Sold USD at 301.400000 08/11/2021 1,123,033 (33,421) (0.01) Bought CLP Sold USD at 772.299998 08/11/2021 767,076 (37,421) (0.01)

Fidelity
Active
STrategy Emerging Markets Fund 1 - continued Schedule of Investments as at 30 September 2021
17
Underlying exposure USD
Unrealised gain/(loss)
USD
% Net Assets
Bought USD Sold COP at 0.000249 08/11/2021 818,686 (39,145) (0.01)Bought HUF Sold USD at 299.055000 08/11/2021 1,089,808 (40,659) (0.01)Bought BRL Sold USD at 5.218000 08/11/2021 1,078,651 (51,327) (0.01)Bought PLN Sold USD at 3.876440 08/11/2021 2,138,921 (55,288) (0.01)Bought PLN Sold USD at 3.806148 08/11/2021 1,309,434 (56,978) (0.01)Bought HUF Sold USD at 301.127600 08/11/2021 1,872,053 (57,353) (0.01)Bought INR Sold USD at 73.463000 08/11/2021 4,534,710 (64,025) (0.01)Bought ZAR Sold USD at 14.320800 08/11/2021 2,077,363 (110,416) (0.02)Bought BRL Sold USD at 5.334200 03/12/2021 4,730,288 (145,806) (0.03)
109,743 0.02
A-ACC Shares (EUR) (hedged) Bought USD Sold BRL at 0.190498 21/10/2021 239,874 9,735 0.00Bought USD Sold KRW at 0.000856 21/10/2021 643,680 8,415 0.00Bought USD Sold ZAR at 0.069496 21/10/2021 154,588 7,491 0.00Bought USD Sold INR at 0.013555 21/10/2021 581,094 4,696 0.00Bought USD Sold TWD at 0.036093 21/10/2021 745,611 3,036 0.00Bought USD Sold THB at 0.030505 21/10/2021 83,713 2,701 0.00Bought USD Sold MXN at 0.049812 21/10/2021 96,575 2,604 0.00Bought USD Sold EUR at 1.177450 21/10/2021 115,008 1,913 0.00Bought USD Sold PLN at 0.261778 21/10/2021 37,797 1,574 0.00Bought USD Sold HKD at 0.128602 21/10/2021 1,114,952 1,265 0.00Bought USD Sold HUF at 0.003383 21/10/2021 12,348 620 0.00Bought USD Sold CLP at 0.001267 21/10/2021 21,873 579 0.00Bought USD Sold TRY at 0.115806 21/10/2021 13,424 519 0.00Bought USD Sold PHP at 0.019866 21/10/2021 31,334 502 0.00Bought USD Sold MYR at 0.240385 21/10/2021 67,541 463 0.00Bought USD Sold IDR at 0.000070 21/10/2021 61,865 53 0.00Bought KRW Sold USD at 1185.859909 21/10/2021 23,137 34 0.00Bought RUB Sold USD at 73.076849 21/10/2021 14,000 28 0.00Bought CNY Sold USD at 6.473549 21/10/2021 20,761 23 0.00Bought INR Sold USD at 74.428999 21/10/2021 21,219 17 0.00Bought HKD Sold USD at 7.788310 21/10/2021 21,635 10 0.00Bought HKD Sold USD at 7.785846 21/10/2021 27,743 4 0.00Bought USD Sold COP at 0.000262 21/10/2021 8,164 (1) (0.00)Bought HKD Sold USD at 7.782719 21/10/2021 22,306 (6) (0.00)Bought HKD Sold USD at 7.778162 21/10/2021 14,284 (12) (0.00)Bought CNY Sold USD at 6.461300 21/10/2021 20,692 (16) (0.00)Bought USD Sold EUR at 1.157911 21/10/2021 140,835 (33) (0.00)Bought BRL Sold USD at 5.439613 21/10/2021 8,383 (35) (0.00)Bought TWD Sold USD at 27.784998 21/10/2021 29,239 (36) (0.00)Bought TWD Sold USD at 27.687999 21/10/2021 23,617 (111) (0.00)Bought KRW Sold USD at 1174.110241 21/10/2021 14,380 (122) (0.00)Bought INR Sold USD at 73.789008 21/10/2021 16,799 (131) (0.00)Bought USD Sold CNY at 0.154370 21/10/2021 552,803 (994) (0.00)Bought USD Sold RUB at 0.013533 21/10/2021 172,201 (2,247) (0.00)Bought EUR Sold USD at 0.845476 21/10/2021 4,919,006 (102,240) (0.02)
(59,702) (0.01)
Ccy
Underlying exposure
Unrealised gain/(loss)
USD
% Net Assets
Futures Futures MSCI Emerging Market Future 17/12/2021 USD (91,856,280) 3,711,923 0.80Hero Motocorp Future 28/10/2021 INR (133,353,206) 28,677 0.01JSW Steel Ltd Future 28/10/2021 INR (67,187,401) 5,017 0.00Vodafone Idea Ltd Future 28/10/2021 INR (103,411,728) (76,632) (0.02)
3,668,985 0.79
Ccy Contracts Market Value
USD % Net Assets
Options Options Purchased Call Galaxy Entertainment 57.5 30/12/2021 HKD 566,979 44,579 0.01Purchased Call SK Hynix 140000 09/12/2021 KRW 115,362 10,276 0.00Written Put Tata Motors ADR 15 15/10/2021 USD (485) (1,213) (0.00)Written Call Adidas 350 19/11/2021 EUR (70) (1,297) (0.00)Written Put Want Want China Holdings 4.7 30/12/2021 HKD (1,420) (1,623) (0.00)Written Put Nio ADR 25 15/10/2021 USD (310) (1,860) (0.00)Written Put Tencent Holdings 370 28/10/2021 HKD (591) (1,938) (0.00)Written Call Techtronic Industries 195 28/10/2021 HKD (114,024) (2,019) (0.00)Written Call ASML Holding 840 19/11/2021 EUR (33) (3,439) (0.00)Written Call TCS Group Holding GDR 106 15/10/2021 USD (26,780) (3,474) (0.00)Written Put Jinkosolar Holding ADR 30 15/10/2021 USD (270) (3,510) (0.00)Written Call Daqo New Energy ADR 75 15/10/2021 USD (165) (4,620) (0.00)Written Call Infosy Technologies ADR 24 15/10/2021 USD (475) (6,650) (0.00)Written Call Infosy Technologies ADR 28 21/01/2022 USD (693) (6,930) (0.00)Written Put Jumia Technologies ADR 14 15/10/2021 USD (625) (7,188) (0.00)Written Put Antofagasta Holdings 1100 15/10/2021 GBP (108) (8,729) (0.00)Written Put First Majestic Silver 10 15/10/2021 USD (1,525) (12,200) (0.00)Written Put Heineken 75 17/12/2021 EUR (218) (13,377) (0.00)Written Put JD.Com ADR 60 15/10/2021 USD (630) (14,490) (0.00)Written Call Flatex 22 19/11/2021 EUR (412) (15,503) (0.00)Written Call China Mengniu Dairy 55 28/10/2021 HKD (339) (16,967) (0.00)Written Call HDFC Bank ADR 85 21/01/2022 USD (256) (17,920) (0.00)Written Put Antofagasta Holdings 1040 17/12/2021 GBP (121) (19,150) (0.00)Written Put First Majestic Silver 9 19/11/2021 USD (1,375) (24,063) (0.01)Written Call China Mengniu Dairy 60 29/11/2021 HKD (595) (25,823) (0.01)Written Put UP Fintech Holdings 7.5 19/11/2021 USD (600) (27,000) (0.01)Written Put Iqiyi ADR 7.5 15/10/2021 USD (1,025) (30,750) (0.01)Written Call China Mengniu Dairy 57.5 29/11/2021 HKD (418) (32,065) (0.01)Written Call China Mengniu Dairy 62.5 30/12/2021 HKD (553,000) (32,478) (0.01)
Ccy
Contracts Market Value USD
% Net Assets
Written Put Alibaba Group Holding 130 28/10/2021 HKD (441) (80,205) (0.02) Written Call Yandex 80 19/11/2021 USD (205) (82,000) (0.02) Written Put Alibaba Group Hldgs ADR 140 19/11/2021 USD (140) (110,180) (0.02) Written Put Ternium ADR 43 19/11/2021 USD (720) (201,600) (0.04) Written Put Ternium ADR 45 19/11/2021 USD (720) (264,240) (0.06) Written Put Galaxy Entertainment 40 30/12/2021 HKD (1,133,958) (635,833) (0.14)
(1,655,479) (0.36)
Other Assets and Liabilities 23,112,355 4.99
Net Assets 463,078,613 100.00 463,078,613.00
GEOGRAPHICAL SPLIT
Country Country Code % Net Assets Russia RU 19.51 India IN 16.07 China CN 13.39 South Africa ZA 7.86 Cyprus CY 6.77 Brazil BR 6.43 Kazakhstan KZ 5.44 Taiwan Area TW 5.01 Korea KR 3.18 Canada CA 3.07 UK GB 2.69 Netherlands NL 1.49 Indonesia ID 1.14 Switzerland CH 0.88 Argentina AR 0.68 Mauritius MU 0.57 Panama PA 0.54 Hong Kong SAR China HK 0.35 Ireland IE 0.00 Cash and other net assets 4.95

Fidelity
Active
STrategy Europe Fund 1 Schedule of Investments as at 30 September 2021 3
The accompanying notes to the financial statements form an integral part of these financial statements. The percentage of net assets in the schedule of investments and in the geographical split is subject to rounding.
18
Country Code Ccy
Shares or Nominal
Market Value EUR
% Net Assets
Securities Admitted to or Dealt on an Official Stock Exchange Securities Admitted to or Dealt on an Official Stock Exchange Materials Koninklijke DSM NL EUR 101,394 17,515,814 1.72
17,515,814 1.72
Industrials Experian IE GBP 1,056,463 38,209,981 3.74Assa Abloy (B) SE SEK 1,057,667 26,667,767 2.61Bunzl GB GBP 857,434 24,488,039 2.40Brenntag DE EUR 247,271 19,925,097 1.95RELX GB GBP 775,942 19,380,417 1.90Sandvik SE SEK 947,044 18,789,062 1.84HomeServe GB GBP 1,780,568 18,735,658 1.83Ferguson GB GBP 149,271 17,946,829 1.76DKSH Holding CH CHF 233,733 15,833,265 1.55Airbus FR EUR 101,752 11,711,655 1.15
211,687,770 20.73
Information Technology SAP DE EUR 510,504 59,667,708 5.84Infineon Technologies DE EUR 1,638,228 58,198,050 5.70Worldline FR EUR 514,607 33,969,208 3.33Edenred FR EUR 624,292 29,110,736 2.85Nexi IT EUR 1,652,438 26,703,398 2.61Sage Group GB GBP 2,939,244 24,263,366 2.38Alten FR EUR 181,124 23,020,860 2.25AVEVA Group GB GBP 390,959 16,373,274 1.60Scout24 DE EUR 209,603 12,567,796 1.23
283,874,396 27.80
Consumer Discretionary Prosus NL EUR 380,077 26,221,512 2.57Informa GB GBP 3,674,221 23,483,117 2.30Burberry Group GB GBP 967,117 20,420,081 2.00LVMH Moet Hennessy Louis Vuitton FR EUR 30,452 18,883,285 1.85Kering FR EUR 28,436 17,516,576 1.72Just Eat Takeaway NL EUR 246,045 15,510,677 1.52
122,035,248 11.95
Consumer Staples Swedish Match SE SEK 3,591,488 27,148,773 2.66British American Tobacco GB GBP 437,577 13,255,535 1.30JDE Peet's NL EUR 479,347 12,367,153 1.21Imperial Brands GB GBP 512,371 9,289,517 0.91
62,060,978 6.08
Healthcare Novo Nordisk (B) DK DKK 746,925 62,411,789 6.11Merck KGaA DE EUR 209,270 39,269,516 3.85Sonova Holding CH CHF 105,230 34,566,496 3.39QIAGEN NL EUR 358,016 16,035,537 1.57Roche Holding CH CHF 49,471 15,644,300 1.53Straumann Holding CH CHF 8,276 12,884,763 1.26AstraZeneca GB GBP 110,579 11,523,530 1.13
192,335,931 18.83
Financials Prudential GB GBP 1,416,184 23,970,908 2.35Deutsche Boerse DE EUR 132,463 18,611,052 1.82Allfunds Group GB EUR 291,037 4,883,601 0.48
47,465,561 4.65
Open Ended Fund Fidelity ILF - The Euro Fund - A-ACC-EUR IE EUR 1,395 19,106,754 1.87Fidelity ILF - The US Dollar Fund - A-ACC-USD IE USD 1 8,475 0.00Fidelity ILF - The Sterling Fund - A-ACC-GBP IE GBP 1 3,175 0.00
19,118,404 1.87
Securities Admitted to or Dealt on Other Regulated Markets Securities Admitted to or Dealt on Other Regulated Markets Information Technology Amadeus IT Group ES EUR 297,324 16,911,789 1.66
16,911,789 1.66
Consumer Discretionary Industria de Diseno Textil ES EUR 685,383 21,808,887 2.14
21,808,887 2.14
Healthcare Grifols ES EUR 793,612 16,729,341 1.64
16,729,341 1.64
Fractions (3) (0.00)
Total Investments (Cost EUR 816,701,921) 1,011,544,116 99.06 1,011,544,116.0
1
Ccy
Underlying exposure
Unrealised gain/(loss)
EUR
% Net Assets
Contracts For Difference Contracts For Difference Clariant (MS) CHF (11,393,805) 1,088,063 0.11 THG (JPLS) GBP (3,484,844) 977,513 0.10 Colruyt (JPLS) EUR (10,927,972) 834,500 0.08 Skanska (JPLS) SEK (84,398,108) 791,875 0.08 Marshalls (JPLS) GBP (6,314,219) 679,410 0.07 Telia Sweden (MS) SEK (189,853,276) 479,357 0.05 Oesterreichische Post (HSBC) EUR (6,854,668) 468,215 0.05 Astrazeneca (UBS) GBP 12,008,289 452,241 0.04 Kuehne & Nagel Intl (MS) CHF (6,949,505) 412,492 0.04 Ambu (MS) DKK (29,494,906) 333,208 0.03 Nokia (JPLS) EUR (6,569,286) 261,584 0.03 Telefonica (MS) EUR (6,620,168) 239,648 0.02 Electrolux Service (JPLS) SEK (74,829,354) 189,665 0.02 Fevertree Drinks (GS) GBP (8,139,226) 187,014 0.02 BT Group (GS) GBP (7,534,714) 134,387 0.01 Siemens Gamesa Renewable (HSBC) EUR (4,794,723) 100,162 0.01 Bae Systems (GS) GBP (6,162,257) 17,757 0.00 Roche Holdings Genusscheine (JPLS) CHF 19,796,853 16,062 0.00 Sage Group (GS) GBP 4,422,192 13,050 0.00 Airbus (JPLS) EUR 16,606,053 2,886 0.00 Swisscom (MS) CHF (10,296,584) (63,788) (0.01) Saipem (JPLS) EUR (3,618,333) (101,973) (0.01) Standard Life Aberdeen (GS) GBP (4,434,410) (106,968) (0.01) Saipem (UBS) EUR (4,510,235) (137,701) (0.01) Deutsche Boerse (JPLS) EUR 13,253,927 (160,368) (0.02) Rentokil Initial (JPLS) GBP 28,253,961 (371,715) (0.04) GVC Holdings (UBS) GBP 9,981,989 (719,637) (0.07) Relx (UBS) GBP 25,589,749 (942,855) (0.09) Prosus (JPLS) EUR 26,221,512 (1,045,212) (0.10) Beiersdorf (JPLS) EUR 13,353,471 (1,720,263) (0.17)
2,308,609 0.23
Other Assets and Liabilities 7,310,322 0.72
Net Assets 1,021,163,047 100.00 1,021,163,047.0
GEOGRAPHICAL SPLIT
Country Country Code % Net Assets UK GB 22.33 Germany DE 20.39 France FR 13.14 Netherlands NL 8.58 Switzerland CH 7.73 Sweden SE 7.11 Denmark DK 6.11 Ireland IE 5.61 Spain ES 5.43 Italy IT 2.61 Cash and other net assets 0.95
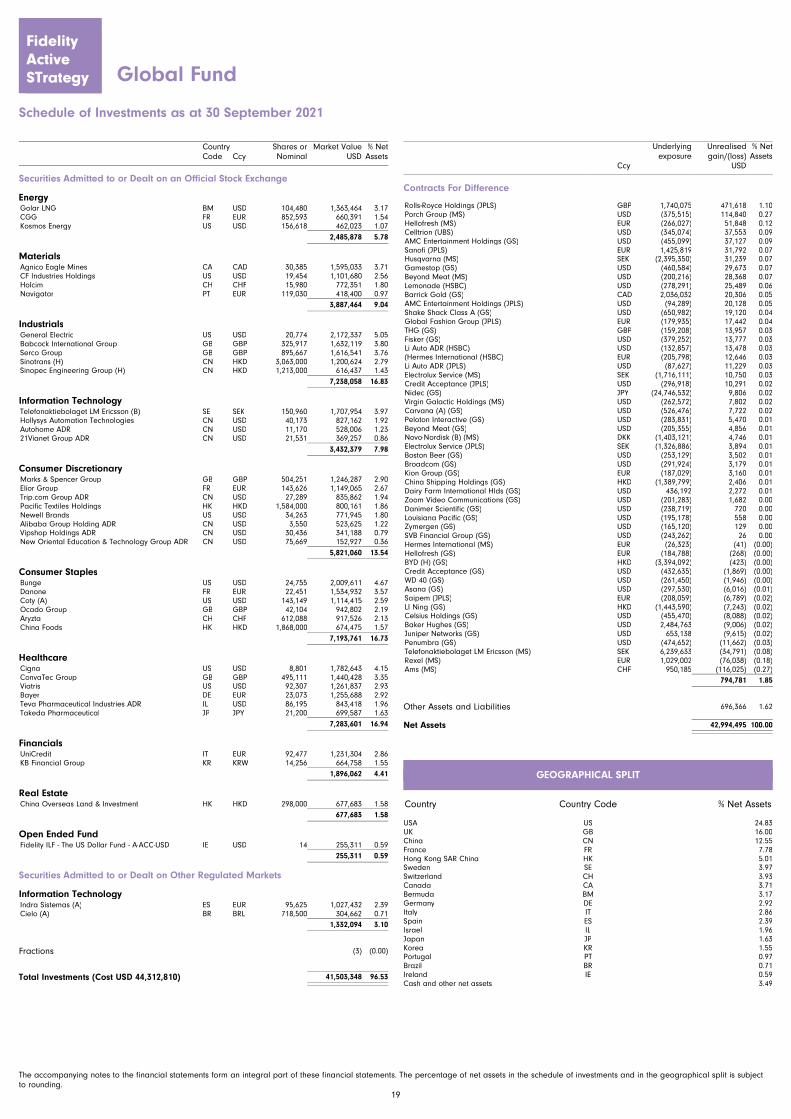
Fidelity
Active
STrategy Global Fund Schedule of Investments as at 30 September 2021 5
The accompanying notes to the financial statements form an integral part of these financial statements. The percentage of net assets in the schedule of investments and in the geographical split is subject to rounding.
19
Country Code Ccy
Shares or Nominal
Market Value USD
% Net Assets
Securities Admitted to or Dealt on an Official Stock Exchange Securities Admitted to or Dealt on an Official Stock Exchange Energy Golar LNG BM USD 104,480 1,363,464 3.17CGG FR EUR 852,593 660,391 1.54Kosmos Energy US USD 156,618 462,023 1.07
2,485,878 5.78
Materials Agnico Eagle Mines CA CAD 30,385 1,595,033 3.71CF Industries Holdings US USD 19,454 1,101,680 2.56Holcim CH CHF 15,980 772,351 1.80Navigator PT EUR 119,030 418,400 0.97
3,887,464 9.04
Industrials General Electric US USD 20,774 2,172,337 5.05Babcock International Group GB GBP 325,917 1,632,119 3.80Serco Group GB GBP 895,667 1,616,541 3.76Sinotrans (H) CN HKD 3,063,000 1,200,624 2.79Sinopec Engineering Group (H) CN HKD 1,213,000 616,437 1.43
7,238,058 16.83
Information Technology Telefonaktiebolaget LM Ericsson (B) SE SEK 150,960 1,707,954 3.97Hollysys Automation Technologies CN USD 40,173 827,162 1.92Autohome ADR CN USD 11,170 528,006 1.2321Vianet Group ADR CN USD 21,531 369,257 0.86
3,432,379 7.98
Consumer Discretionary Marks & Spencer Group GB GBP 504,251 1,246,287 2.90Elior Group FR EUR 143,626 1,149,065 2.67Trip.com Group ADR CN USD 27,289 835,862 1.94Pacific Textiles Holdings HK HKD 1,584,000 800,161 1.86Newell Brands US USD 34,263 771,945 1.80Alibaba Group Holding ADR CN USD 3,550 523,625 1.22Vipshop Holdings ADR CN USD 30,436 341,188 0.79New Oriental Education & Technology Group ADR CN USD 75,669 152,927 0.36
5,821,060 13.54
Consumer Staples Bunge US USD 24,755 2,009,611 4.67Danone FR EUR 22,451 1,534,932 3.57Coty (A) US USD 143,149 1,114,415 2.59Ocado Group GB GBP 42,104 942,802 2.19Aryzta CH CHF 612,088 917,526 2.13China Foods HK HKD 1,868,000 674,475 1.57
7,193,761 16.73
Healthcare Cigna US USD 8,801 1,782,643 4.15ConvaTec Group GB GBP 495,111 1,440,428 3.35Viatris US USD 92,307 1,261,837 2.93Bayer DE EUR 23,073 1,255,688 2.92Teva Pharmaceutical Industries ADR IL USD 86,195 843,418 1.96Takeda Pharmaceutical JP JPY 21,200 699,587 1.63
7,283,601 16.94
Financials UniCredit IT EUR 92,477 1,231,304 2.86KB Financial Group KR KRW 14,256 664,758 1.55
1,896,062 4.41
Real Estate China Overseas Land & Investment HK HKD 298,000 677,683 1.58
677,683 1.58
Open Ended Fund Fidelity ILF - The US Dollar Fund - A-ACC-USD IE USD 14 255,311 0.59
255,311 0.59
Securities Admitted to or Dealt on Other Regulated Markets Securities Admitted to or Dealt on Other Regulated Markets Information Technology Indra Sistemas (A) ES EUR 95,625 1,027,432 2.39Cielo (A) BR BRL 718,500 304,662 0.71
1,332,094 3.10
Fractions (3) (0.00)
Total Investments (Cost USD 44,312,810) 41,503,348 96.53 41,503,348.00 1
Ccy
Underlying exposure
Unrealised gain/(loss)
USD
% Net Assets
Contracts For Difference Contracts For Difference Rolls-Royce Holdings (JPLS) GBP 1,740,075 471,618 1.10 Porch Group (MS) USD (375,515) 114,840 0.27 Hellofresh (MS) EUR (266,027) 51,848 0.12 Celltrion (UBS) USD (345,074) 37,553 0.09 AMC Entertainment Holdings (GS) USD (455,099) 37,127 0.09 Sanofi (JPLS) EUR 1,425,819 31,792 0.07 Husqvarna (MS) SEK (2,395,350) 31,239 0.07 Gamestop (GS) USD (460,584) 29,673 0.07 Beyond Meat (MS) USD (200,216) 28,368 0.07 Lemonade (HSBC) USD (278,291) 25,489 0.06 Barrick Gold (GS) CAD 2,036,032 20,306 0.05 AMC Entertainment Holdings (JPLS) USD (94,289) 20,128 0.05 Shake Shack Class A (GS) USD (650,982) 19,120 0.04 Global Fashion Group (JPLS) EUR (179,935) 17,442 0.04 THG (GS) GBP (159,208) 13,957 0.03 Fisker (GS) USD (379,252) 13,777 0.03 Li Auto ADR (HSBC) USD (132,857) 13,478 0.03 (Hermes International (HSBC) EUR (205,798) 12,646 0.03 Li Auto ADR (JPLS) USD (87,627) 11,229 0.03 Electrolux Service (MS) SEK (1,716,111) 10,750 0.03 Credit Acceptance (JPLS) USD (296,918) 10,291 0.02 Nidec (GS) JPY (24,746,532) 9,806 0.02 Virgin Galactic Holdings (MS) USD (262,572) 7,802 0.02 Carvana (A) (GS) USD (526,476) 7,722 0.02 Peloton Interactive (GS) USD (283,831) 5,470 0.01 Beyond Meat (GS) USD (205,355) 4,856 0.01 Novo-Nordisk (B) (MS) DKK (1,403,121) 4,746 0.01 Electrolux Service (JPLS) SEK (1,326,886) 3,894 0.01 Boston Beer (GS) USD (253,129) 3,502 0.01 Broadcom (GS) USD (291,924) 3,179 0.01 Kion Group (GS) EUR (187,029) 3,160 0.01 China Shipping Holdings (GS) HKD (1,389,799) 2,406 0.01 Dairy Farm International Hlds (GS) USD 436,192 2,272 0.01 Zoom Video Communications (GS) USD (201,283) 1,682 0.00 Danimer Scientific (GS) USD (238,719) 720 0.00 Louisiana Pacific (GS) USD (195,178) 558 0.00 Zymergen (GS) USD (165,120) 129 0.00 SVB Financial Group (GS) USD (243,262) 26 0.00 Hermes International (MS) EUR (26,323) (41) (0.00) Hellofresh (GS) EUR (184,788) (268) (0.00) BYD (H) (GS) HKD (3,394,092) (423) (0.00) Credit Acceptance (GS) USD (432,635) (1,869) (0.00) WD 40 (GS) USD (261,450) (1,946) (0.00) Asana (GS) USD (297,530) (6,016) (0.01) Saipem (JPLS) EUR (208,059) (6,789) (0.02) LI Ning (GS) HKD (1,443,590) (7,243) (0.02) Celsius Holdings (GS) USD (455,470) (8,088) (0.02) Baker Hughes (GS) USD 2,484,763 (9,006) (0.02) Juniper Networks (GS) USD 653,138 (9,615) (0.02) Penumbra (GS) USD (474,652) (11,662) (0.03) Telefonaktiebolaget LM Ericsson (MS) SEK 6,239,633 (34,791) (0.08) Rexel (MS) EUR 1,029,002 (76,038) (0.18) Ams (MS) CHF 950,185 (116,025) (0.27)
794,781 1.85
Other Assets and Liabilities 696,366 1.62
Net Assets 42,994,495 100.00 42,994,495.00
GEOGRAPHICAL SPLIT
Country Country Code % Net Assets USA US 24.83 UK GB 16.00 China CN 12.55 France FR 7.78 Hong Kong SAR China HK 5.01 Sweden SE 3.97 Switzerland CH 3.93 Canada CA 3.71 Bermuda BM 3.17 Germany DE 2.92 Italy IT 2.86 Spain ES 2.39 Israel IL 1.96 Japan JP 1.63 Korea KR 1.55 Portugal PT 0.97 Brazil BR 0.71 Ireland IE 0.59 Cash and other net assets 3.49

Fidelity
Active
STrategy UK Fund Schedule of Investments as at 30 September 2021 7
The accompanying notes to the financial statements form an integral part of these financial statements. The percentage of net assets in the schedule of investments and in the geographical split is subject to rounding.
20
Country Code Ccy
Shares or Nominal
Market Value GBP
% Net Assets
Securities Admitted to or Dealt on an Official Stock Exchange Securities Admitted to or Dealt on an Official Stock Exchange Energy Pioneer Natural Resources US USD 5,802 726,359 2.69Royal Dutch Shell NL GBP 43,456 719,197 2.67Thungela Resources ZA GBP 2,871 13,227 0.05
1,458,783 5.41
Materials Anglo American GB GBP 21,866 573,436 2.13Essentra GB GBP 122,014 326,387 1.21Forterra GB GBP 112,023 310,864 1.15
1,210,687 4.49
Industrials Experian IE GBP 39,444 1,226,314 4.55RELX GB GBP 55,824 1,198,541 4.44Ashtead Group GB GBP 16,855 951,633 3.53Ferguson GB GBP 8,373 865,350 3.21Weir Group GB GBP 46,955 794,244 2.94Ryanair Holdings IE EUR 52,261 738,097 2.74Howden Joinery Group GB GBP 63,248 566,576 2.10Genuit Group GB GBP 73,115 508,880 1.89Diploma GB GBP 9,319 264,846 0.98
7,114,481 26.37
Information Technology Auto Trader Group GB GBP 140,619 827,965 3.07Rightmove GB GBP 84,421 576,933 2.14Spectris GB GBP 9,739 376,997 1.40Trustpilot GB GBP 48,511 187,058 0.69Bytes Technology Group GB GBP 29,472 149,423 0.55Midwich Group GB GBP 6,642 41,446 0.15
2,159,822 8.01
Consumer Discretionary Next GB GBP 11,680 959,162 3.56Headlam Group GB GBP 189,191 930,820 3.45Burberry Group GB GBP 44,712 811,523 3.01Persimmon GB GBP 24,119 643,495 2.39Redrow GB GBP 73,021 487,488 1.81Hollywood Bowl Group GB GBP 196,781 477,194 1.77Inchcape GB GBP 52,431 425,215 1.58JD Wetherspoon GB GBP 31,906 332,780 1.23Domino's Pizza Group GB GBP 78,949 312,796 1.16
5,380,473 19.95
Consumer Staples Diageo GB GBP 37,326 1,345,976 4.99Reckitt Benckiser Group GB GBP 7,657 446,403 1.65
1,792,379 6.64
Healthcare Novo Nordisk (B) DK DKK 17,896 1,285,416 4.76Roche Holding CH CHF 3,554 966,098 3.58
2,251,514 8.35
Financials NatWest Group GB GBP 548,251 1,233,017 4.57Lloyds Banking Group GB GBP 2,127,256 990,663 3.67Legal & General Group GB GBP 166,662 468,487 1.74Bridgepoint Group GB GBP 44,530 224,431 0.83
2,916,598 10.81
Open Ended Fund Fidelity ILF - The Sterling Fund - A-ACC-GBP IE GBP 109 2,287,451 8.48Fidelity ILF - The US Dollar Fund - A-ACC-USD IE USD 1 2,024 0.01
2,289,475 8.49
Fractions (2) (0.00)
Total Investments (Cost GBP 21,559,059) 26,574,210 98.51 26,574,210.00 1
Ccy
Underlying exposure
Unrealised gain/(loss)
GBP
% Net Assets
Contracts For Difference Contracts For Difference THG (GS) GBP (331,406) 21,571 0.08ITV (JPLS) GBP (352,510) 16,865 0.06Colruyt (JPLS) EUR (233,376) 15,319 0.06Husqvarna (MS) SEK (1,507,678) 14,598 0.05Michael Page International (UBS) GBP (199,652) 9,645 0.04Oesterreichische Post (JPLS) EUR (155,623) 7,858 0.03Telia Sweden (MS) SEK (2,656,235) 5,765 0.02Embracer Group (JPLS) SEK (551,153) 5,376 0.02Electrolux Service (JPLS) SEK (2,459,766) 5,359 0.02Unilever (UBS) GBP 1,209,029 4,226 0.02
Ccy
Underlying exposure
Unrealised gain/(loss)
GBP
% Net Assets
Embracer Group (UBS) SEK (542,386) 3,981 0.01 Gamestop (GS) USD (75,002) 3,588 0.01 Dunelm Group (GS) GBP (272,100) 2,870 0.01 Prosieben Sat.1 Media (GS) EUR (140,298) 1,065 0.00 Oesterreichische Post (GS) EUR (275,195) 0 0.00 BT Group (JPLS) GBP (325,257) (102) (0.00) ITM Power (JPLS) GBP (80,017) (154) (0.00) Bae Systems (UBS) GBP (287,274) (2,440) (0.01) Breedon Group (UBS) GBP 541,779 (3,842) (0.01) Securitas (UBS) SEK (3,083,712) (7,049) (0.03) Hargreaves Lansdown (JPLS) GBP 640,310 (9,617) (0.04) Bovis Homes Group (UBS) GBP 391,517 (12,655) (0.05) Victrex (HSBC) GBP 594,690 (34,952) (0.13) St James Place (HSBC) GBP 1,239,417 (104,861) (0.39)
(57,586) (0.21)
Other Assets and Liabilities 459,818 1.70
Net Assets 26,976,442 100.00 26,976,442.00
GEOGRAPHICAL SPLIT
Country Country Code % Net Assets UK GB 68.99 Ireland IE 15.77 Denmark DK 4.76 Switzerland CH 3.58 USA US 2.69 Netherlands NL 2.67 South Africa ZA 0.05 Cash and other net assets 1.47

Fidelity
Active
STrategy US Fund Schedule of Investments as at 30 September 2021 9
* Security with price determined by the Directors. The accompanying notes to the financial statements form an integral part of these financial statements. The percentage of net assets in the schedule of investments and in the geographical split is subject to rounding.
21
Country Code Ccy
Shares or Nominal
Market Value USD
% Net Assets
Securities Admitted to or Dealt on an Official Stock Exchange Securities Admitted to or Dealt on an Official Stock Exchange Energy Pioneer Natural Resources US USD 12,045 2,031,028 3.77Marathon Petroleum US USD 18,758 1,174,438 2.18Diamondback Energy US USD 9,681 935,185 1.74ChampionX US USD 29,728 667,988 1.24
4,808,639 8.93
Materials FMC US USD 5,159 479,529 0.89
479,529 0.89
Industrials XPO Logistics US USD 19,702 1,582,957 2.94Oshkosh US USD 13,347 1,378,745 2.56GXO Logistics US USD 13,859 1,086,961 2.02Fortive US USD 14,430 1,029,869 1.91Schneider National (B) US USD 25,635 590,118 1.10Harmonic Drive Systems JP JPY 6,400 309,188 0.57First Advantage US USD 9,629 179,003 0.33
6,156,841 11.43
Information Technology salesforce.com US USD 8,783 2,383,706 4.43Fiserv US USD 18,653 2,030,379 3.77Microsoft US USD 5,480 1,556,923 2.89Fidelity National Information Services US USD 10,273 1,250,840 2.32Concentrix US USD 6,948 1,222,570 2.27ON Semiconductor US USD 24,731 1,134,164 2.11CDW US USD 6,153 1,128,583 2.10SS&C Technologies Holdings US USD 16,031 1,122,170 2.08Wise GB GBP 60,637 887,774 1.65Alphabet (A) US USD 305 821,097 1.52Advanced Energy Industries US USD 6,503 584,945 1.09Nutanix (A) US USD 14,115 532,418 0.99Akamai Technologies US USD 5,023 527,716 0.98Lumentum Holdings US USD 3,291 276,641 0.51Littelfuse US USD 994 276,084 0.51Ciena US USD 5,213 266,332 0.49Descartes Systems Group CA USD 2,901 235,677 0.44Innoviz Technologies IL USD 32,319 185,834 0.35Global Payments US USD 503 79,967 0.15
16,503,820 30.64
Consumer Discretionary Deckers Outdoor US USD 1,949 714,153 1.33Burlington Stores US USD 2,128 621,461 1.15Petco Health & Wellness US USD 25,343 537,525 1.00F45 Training Holdings US USD 36,972 533,876 0.99Service Corp International US USD 6,611 400,627 0.74Churchill Downs US USD 1,346 326,270 0.61Altice (A) US USD 8,929 184,830 0.34NEOGAMES (A) IL USD 4,163 153,989 0.29Cricut (A) US USD 3,529 100,929 0.19
3,573,660 6.64
Consumer Staples Tyson Foods (A) US USD 14,509 1,157,093 2.15Sprouts Farmers Market US USD 22,852 533,366 0.99
1,690,459 3.14
Healthcare Horizon Therapeutics US USD 21,807 2,398,334 4.45McKesson US USD 5,897 1,194,025 2.22Stryker US USD 4,120 1,099,175 2.04UnitedHealth Group US USD 2,600 1,020,838 1.90Humana US USD 2,363 924,122 1.72Encompass Health US USD 8,215 627,955 1.17Maravai LifeSciences Holdings US USD 4,737 230,739 0.43TG Therapeutics US USD 6,665 226,677 0.42
7,721,865 14.34
Financials Bank OZK US USD 37,286 1,625,297 3.02Tradeweb Markets (A) US USD 15,482 1,257,603 2.34Houlihan Lokey US USD 12,718 1,173,236 2.18American Express US USD 6,519 1,103,927 2.05Texas Capital Bancshares US USD 13,395 820,310 1.52Hamilton Lane (A) US USD 3,070 264,972 0.49
6,245,345 11.60
Open Ended Fund Fidelity ILF - The US Dollar Fund - A-ACC-USD IE USD 69 1,252,206 2.33
1,252,206 2.33
Communication Services Walt Disney US USD 2,600 443,352 0.82
443,352 0.82
Country Code Ccy
Shares or Nominal
Market Value USD
% Net Assets
Unlisted Unlisted Materials Farmers Bus (E) Perpetual (Pref'd)* US USD 10,300 640,225 1.19 Farmers Bus (F) Perpetual (Pref'd)* US USD 7,100 441,320 0.82
1,081,545 2.01
Industrials Tradeshift Holdings* US USD 23,219 139,314 0.26
139,314 0.26
Information Technology Graphcore Service (E) Perpetual (Pref'd)* GB USD 49,582 279,999 0.52
279,999 0.52
Fractions 1 0.00
Total Investments (Cost USD 38,866,330) 50,376,575 93.54 50,376,575.00 1
Ccy
Underlying exposure
Unrealised gain/(loss)
USD
% Net Assets
Contracts For Difference Contracts For Difference Valero Energy (JPLS) USD 1,475,814 96,887 0.18 Cree (JPLS) USD (608,364) 62,112 0.12 Square (MS) USD (496,944) 58,339 0.11 Resmed (HSBC) USD (627,955) 44,955 0.08 Methanex US (UBS) USD 1,177,389 44,010 0.08 Cadence Design Systems (JPLS) USD (467,678) 38,394 0.07 Zoom Video Communications (HSBC) USD (565,670) 37,495 0.07 Wayfair (MS) USD (552,057) 37,139 0.07 Docusign (HSBC) USD (501,341) 36,510 0.07 Chegg (JPLS) USD (286,455) 32,228 0.06 Logitech International (MS) CHF (422,711) 30,730 0.06 Shopify (GS) CAD (630,603) 27,368 0.05 Microstrategy (JPLS) USD (215,753) 23,332 0.04 Coupa Software (MS) USD (133,754) 22,705 0.04 Novavax (MS) USD (526,608) 21,931 0.04 Moderna (MS) USD (580,195) 19,079 0.04 MKS Instruments (MS) USD 797,528 18,776 0.03 Gamestop (GS) USD (253,531) 16,334 0.03 US Foods Holding (JPLS) USD 941,466 16,041 0.03 Dr Horton (MS) USD (545,339) 15,471 0.03 Peloton Interactive (GS) USD (696,528) 13,423 0.02 Palantir Technologies (JPLS) USD (174,364) 12,439 0.02 Twilio Class A (GS) USD (432,354) 12,213 0.02 Boston Scientific (GS) USD 1,600,998 11,104 0.02 Zillow Group (GS) USD (693,393) 9,751 0.02 Okta (MS) USD (49,847) 7,493 0.01 CME Group (GS) USD (442,037) 6,183 0.01 Lowes (GS) USD (679,706) 5,403 0.01 Insulet (MS) USD (55,082) 4,051 0.01 Etsy (JPLS) USD (172,413) 3,407 0.01 Overstock.Com (UBS) USD (160,985) 3,153 0.01 West Pharmaceutical (HSBC) USD (57,174) 2,816 0.01 Boston Beer (GS) USD (191,378) 2,648 0.00 T-Mobile (GS) USD 298,220 2,528 0.00 Paycom Software (UBS) USD (54,307) 1,420 0.00 Univar (MS) USD 952,379 806 0.00 Trade Desk (GS) USD (82,408) 24 0.00 Veeva Systems (GS) USD (344,166) (1,167) (0.00) Marketaxess Holdings (GS) USD (421,488) (3,047) (0.01) Dexcom (GS) USD (227,102) (3,198) (0.01) Workday (GS) USD 349,524 (3,794) (0.01) Charter Communications (UBS) USD 272,125 (3,880) (0.01) Alphabet (GS) USD 443,814 (5,594) (0.01) Amazon.Com (GS) USD 1,120,504 (6,922) (0.01) Cable One (GS) USD (621,210) (8,379) (0.02) Manpower Group (UBS) USD 1,122,484 (13,140) (0.02) Celanese (MS) USD 1,229,378 (26,642) (0.05) HEICO (MS) USD (580,265) (28,103) (0.05) New Relic (MS) USD 290,042 (34,523) (0.06) Electronic Arts (GS) USD (562,855) (37,139) (0.07) Tesla (MS) USD (614,031) (38,373) (0.07) Fisker (JPLS) USD (588,400) (39,926) (0.07) Digital Turbine (MS) USD (602,458) (44,724) (0.08) Terex (MS) USD 828,007 (152,206) (0.28)
347,941 0.65
Underlying exposure USD
Unrealised gain/(loss)
USD
% Net Assets
Forward Foreign Exchange Contracts Forward Foreign Exchange Contracts A-ACC Shares (EUR) (hedged) Bought USD Sold EUR at 1.174079 21/10/2021 333,441 4,577 0.01

Fidelity
Active
STrategy US Fund - continued Schedule of Investments as at 30 September 2021
22
Underlying exposure USD
Unrealised gain/(loss)
USD
% Net Assets
Bought EUR Sold USD at 0.854362 21/10/2021 252,586 (2,650) (0.00)Bought EUR Sold USD at 0.845476 21/10/2021 7,510,564 (156,105) (0.29)
(154,178) (0.29)
Other Assets and Liabilities 3,287,203 6.10
Net Assets 53,857,541 100.00 53,857,541.00
GEOGRAPHICAL SPLIT
Country Country Code % Net Assets USA US 87.40Ireland IE 2.33UK GB 2.17Israel IL 0.63Japan JP 0.57Canada CA 0.44Cash and other net assets 6.46

23
This page has been left blank intentionally

24
Fidelity
Active
STrategy Statement of Net Assets as at 30 September 2021
Equity Funds:
NAME
Combined
Asia Fund1
Emerging Markets Fund1
Europe Fund1
Global Fund
CURRENCY
USD
USD
USD
EUR
USD
ASSETS
Investments in securities at market value 1,914,243,306 175,226,611 440,178,190 1,011,544,116 41,503,348 Cash at banks and Brokers 52,679,406 12,954,935 26,929,867 8,059,415 786,667 Receivables on investments sold 12,570,065 3,455,357 4,746,969 354,375 404,352 Receivables on fund Shares issued 2,351,349 3,423 166,336 1,603,269 73,973 Dividends and interest receivable 2,162,588 219,810 522,030 1,037,284 129,222 Unrealised gain on contracts for difference 17,576,115 484,435 6,158,482 7,679,089 1,084,601 Unrealised gain on forward foreign exchange contracts 1,372,418 1,774 1,366,067 - - Unrealised gain on futures 3,745,617 - 3,745,617 - - Purchased options at market value 54,855 - 54,855 - - Total Assets 2,006,755,719 192,346,345 483,868,413 1,030,277,548 43,982,163
LIABILITIES
Payables on investments purchased 9,854,350 1,543,029 3,421,191 2,363,925 371,502 Payables on fund Shares redeemed 1,855,047 446,968 239,384 141,971 249,081 Expenses payable 2,440,942 273,397 528,477 1,238,125 77,265 Unrealised loss on contracts for difference 16,601,318 972,226 8,433,961 5,370,480 289,820 Unrealised loss on forward foreign exchange contracts 1,508,379 33,598 1,316,026 - - Unrealised loss on futures 76,632 - 76,632 - - Written options at market value 1,760,220 49,886 1,710,334 - - Capital gains tax payable 3,104,925 80,984 3,023,941 - - Bank overdrafts 2,039,854 - 2,039,854 - - Total Liabilities 39,241,667 3,400,088 20,789,800 9,114,501 987,668 NET ASSETS as at 30.09.21 1,967,514,052* 188,946,257 463,078,613 1,021,163,047 42,994,495 NET ASSETS as at 30.09.20 2,513,360,185 479,528,589 463,591,309 1,252,387,160 24,445,263 NET ASSETS as at 30.09.19 1,947,190,508 615,638,550 566,695,900 581,966,843 46,441,488
COST OF INVESTMENTS 1,545,100,427 172,353,638 314,952,268 816,701,921 44,312,810
* For comparison purposes, the combined net assets total as at 30 September 2021, translated in EUR at the foreign exchange rate as of 30 September 2021, is EUR 1,699,355,718. The accompanying notes to the financial statements form an integral part of these financial statements.

25
UK Fund
US Fund
GBP USD
26,574,210 50,376,575
364,867 2,185,307
98,317 3,420,668
141,284 61,057
46,238 28,281
118,086 798,698
- 4,577
- -
- -
27,343,002 56,875,163
143,852 1,587,921
10,968 740,467
36,068 79,722
175,672 450,757
- 158,755
- -
- -
- -
- -
366,560 3,017,622
26,976,442 53,857,541
21,439,963 49,866,011
21,787,738 56,943,009
21,559,059 38,866,330

Fidelity
Active
STrategy Statement of Net Asset Value per Share as at 30 September 2021
26
Name - Currency Shares outstanding
as at 30.09.21:
Net Asset Value per share
as at 30.09.21:
Net Asset Valueper share
as at 30.09.20:
Net Asset Value per share
as at 30.09.19:
Equity Funds
Asia Fund 1 - USD
- A-ACC Shares (USD) 274,177 186.31 170.22 154.63
- A-ACC Shares (EUR) 101,777 207.08 186.90 182.69
- A-ACC Shares (SGD) 11,144 163.89 150.40 138.41
- A-DIST Shares (EUR) (Euro/USD hedged) 9,563 135.06 124.61 115.88
- I-ACC Shares (USD) 12,858 201.02 181.87 163.62
- Y-ACC Shares (USD) 262,184 196.39 178.26 160.90
- Y-ACC Shares (EUR) 300,335 131.74 118.14 114.69
- Y-ACC Shares (GBP) 34,554 230.72 218.42 207.57
Emerging Markets Fund 1 - USD
- A-ACC Shares (USD) 215,090 207.97 163.98 145.83
- A-ACC Shares (EUR) 5,918 132.77 103.83 99.27
- A-ACC Shares (EUR) (hedged) 20,207 200.54 162.99 146.03
- E-ACC Shares (EUR) 452 174.47 136.88 131.97
- I-ACC Shares (USD) 359,667 228.60 178.50 157.21
- I-DIST Shares (USD) 164,794 159.38 124.55 111.54
- Y-ACC Shares (USD) 1,203,795 222.38 174.21 153.93
- Y-ACC Shares (EUR) 84,383 178.90 138.41 131.41
- Y-ACC Shares (GBP) 47,914 265.04 216.25 200.59
- Y-DIST Shares (USD) 10,918 171.57 134.42 120.40
Europe Fund 1 - EUR
- A-ACC Shares (EUR) 555,218 556.04 483.77 431.15
- A-DIST Shares (EUR) 66,546 180.05 156.65 144.06
- A-DIST Shares (GBP) 878 332.95 305.77 265.67
- E-ACC Shares (EUR) 82,080 270.10 236.76 212.59
- I-ACC Shares (EUR) 983,610 332.30 286.34 256.73
- I-DIST Shares (GBP) 16,619 111.61 - -
- W-ACC Shares (GBP) 8,740 204.27 186.40 161.11
- Y-ACC Shares (EUR) 1,065,480 325.54 281.40 249.16
Global Fund - USD
- A-ACC Shares (USD) 86,156 204.40 121.49 132.98
- A-ACC Shares (EUR) 44,882 227.72 132.98 156.64
- E-ACC Shares (EUR) 19,812 225.01 132.94 157.59
- I-ACC Shares (USD) 1,440 221.19 130.19 141.10
- Y-ACC Shares (USD) 3,590 215.21 127.10 138.25
- Y-ACC Shares (EUR) 9,695 249.86 146.75 171.48
- Y-ACC Shares (GBP) 12,822 256.61 158.46 181.30
UK Fund - GBP
- A-ACC Shares (GBP) 74,232 242.08 200.18 213.31
- Y-ACC Shares (GBP) 35,283 255.27 209.74 223.71
US Fund - USD
- A-ACC Shares (USD) 94,943 263.39* 198.15 201.64
- A-ACC Shares (EUR) 11,280 295.44* 220.08 240.84
- A-ACC Shares (EUR) (hedged) 26,644 232.82* 177.29 183.86
- E-ACC Shares (EUR) 4,432 279.24* 208.87 230.92
- I-ACC Shares (USD) 27,843 284.14* 211.66 213.27
- Y-ACC Shares (USD) 27,883 277.71* 207.57 209.87
- Y-ACC Shares (GBP) 1,689 317.25* 245.06 259.77
The accompanying notes to the financial statements form an integral part of these financial statements. * Please refer to the price adjustment policy in note 2.

27
This page has been left blank intentionally

28
Fidelity
Active
STrategy Statement of Operations and Changes in Net Assets
for the year ended 30 September 2021
Equity Funds:
NAME
Combined
Asia Fund1
Emerging Markets Fund1
Europe Fund1
CURRENCY
USD
USD
USD
EUR
INVESTMENT INCOME
Net dividend and interest income 37,443,221 5,964,526 10,659,639 16,244,317
Derivative income 13,282,233 2,480,196 5,710,196 3,873,401
Net income 50,725,454 8,444,722 16,369,835 20,117,718
EXPENSES
Investment management fee 25,449,650 4,665,384 5,258,781 11,915,812
Administration expenses 4,686,280 878,515 950,561 2,133,147
Government taxes 879,519 171,225 201,034 387,995
Custody fees 701,778 312,868 198,335 109,665
Distribution fees 233,050 - 747 160,929
Performance fees 9 - - -
Other expenses 654,689 113,283 145,505 310,519
Total expenses 32,604,975 6,141,275 6,754,963 15,018,067
Derivative expenses 14,339,725 2,526,976 4,364,995 6,021,048
Finance costs on contracts for difference 4,200,643 985,205 2,141,496 763,660
Net expenses 51,145,343 9,653,456 13,261,454 21,802,775
NET INVESTMENT INCOME / (LOSS) (419,889) (1,208,734) 3,108,381 (1,685,057)
Net realised gain / (loss) on securities 337,424,099 132,133,977 84,164,174 87,498,276
Net realised gain / (loss) on foreign currencies (595,206) (279,271) (43,191) 35,608
Net realised gain / (loss) on contracts for difference 59,415,241 10,044,867 59,407,542 (5,841,537)
Net realised gain / (loss) on forward foreign exchange contracts (1,932,032) (41,914) (1,782,862) -
Net realised gain / (loss) on options 6,482,171 730,510 5,751,661 -
Net realised gain / (loss) on futures (25,012,987) (7,109,079) (17,903,908) -
Net change in unrealised appreciation / (depreciation) on securities 91,849,694 (50,412,852) 53,011,098 64,709,825
Net change in unrealised appreciation / (depreciation) on foreign currencies (2,566,765) (72,685) (2,448,903) (1,265)
Net change in unrealised appreciation / (depreciation) on contracts for difference (60,706,854) (17,398,562) (58,315,447) 8,817,840
Net change in unrealised appreciation / (depreciation) on forward foreign exchange contracts 515,562 7,341 586,713 -
Net change in unrealised appreciation / (depreciation) on options (1,696,045) (39,412) (1,656,633) -
Net change in unrealised appreciation / (depreciation) on futures 3,542,096 306,178 3,235,918 -
RESULTS OF OPERATIONS 406,299,085 66,660,364 127,114,543 153,533,690
DIVIDENDS TO SHAREHOLDERS (28,300) - (28,300) -
CAPITAL SHARE TRANSACTIONS
Proceeds from fund Shares issued 438,071,896 55,262,080 101,504,350 182,723,497
Payment for fund Shares redeemed (1,373,655,924) (412,897,778) (229,025,621) (567,646,167)
Equalisation 504,782 393,002 (77,668) 164,867
Increase / (decrease) derived from capital share transactions (935,079,246) (357,242,696) (127,598,939) (384,757,803)
NET INCREASE / (DECREASE) (528,808,461) (290,582,332) (512,696) (231,224,113)
NET ASSETS
Beginning of year 2,496,322,513* 479,528,589 463,591,309 1,252,387,160
End of year 1,967,514,052** 188,946,257 463,078,613 1,021,163,047
* The combined net assets total at the beginning of the period has been translated at the foreign exchange rates as of 30 September 2021, recalculated from an original amount of USD 2,513,360,185 using the foreign exchange rates as of 30 September 2020. ** For comparison purposes, the combined net assets total as at 30 September 2021, translated in EUR at the foreign exchange rate as of 30 September 2021, is EUR 1,699,355,718. The accompanying notes to the financial statements form an integral part of these financial statements.

29
Global Fund
UK Fund
US Fund
USD GBP
USD
783,027 621,773 390,893
273,936 187,597 80,607
1,056,963 809,370 471,500
565,355 325,074 726,161
129,109 73,423 159,444
19,358 11,629 23,018
32,336 9,335 18,696
36,036 - 9,943
- 7 -
11,513 6,928 15,538
793,707 426,396 952,800
134,331 150,994 138,880
64,705 56,393 49,116
992,743 633,783 1,140,796
64,220 175,587 (669,296)
7,378,215 1,821,930 9,988,271
(352,039) (1,144) 39,611
(3,038,292) (647,042) 635,956
- - (107,256)
- - -
- - -
3,668,101 3,418,986 6,057,279
(318) (254) (43,052)
6,044,558 (261,874) (893,980)
- - (78,492)
- - -
- - -
13,764,445 4,506,189 14,929,041
- - -
50,868,947 7,762,816 8,423,517
(46,023,933) (6,737,389) (19,413,270)
(60,227) 4,863 52,242
4,784,787 1,030,290 (10,937,511)
18,549,232 5,536,479 3,991,530
24,445,263 21,439,963 49,866,011
42,994,495 26,976,442 53,857,541

Fidelity
Active
STrategy Statement of Share Statistics as at 30 September 2021
30
Name - Currency Shares outstanding -beginning of year
SharesIssued
SharesRedeemed
Net increase / (decrease) in
Shares
Shares outstanding - end of year
Equity Funds
Asia Fund 1 - USD
- A-ACC Shares (USD) 378,085 46,934 (150,842) (103,908) 274,177
- A-ACC Shares (EUR) 187,703 16,847 (102,773) (85,926) 101,777
- A-ACC Shares (SGD) 20,190 2,265 (11,311) (9,046) 11,144
- A-DIST Shares (EUR) (Euro/USD hedged) 21,908 231 (12,576) (12,345) 9,563
- I-ACC Shares (USD) 641,107 54,739 (682,988) (628,249) 12,858
- Y-ACC Shares (USD) 1,090,625 107,022 (935,463) (828,441) 262,184
- Y-ACC Shares (EUR) 335,823 22,741 (58,229) (35,488) 300,335
- Y-ACC Shares (GBP) 39,311 5,761 (10,518) (4,757) 34,554
Emerging Markets Fund 1 - USD
- A-ACC Shares (USD) 328,809 12,475 (126,194) (113,719) 215,090
- A-ACC Shares (EUR) 19,083 2,598 (15,763) (13,165) 5,918
- A-ACC Shares (EUR) (hedged) 51,071 2,927 (33,791) (30,864) 20,207
- E-ACC Shares (EUR) 465 99 (112) (13) 452
- I-ACC Shares (USD) 384,748 211,123 (236,204) (25,081) 359,667
- I-DIST Shares (USD) 352,906 52,164 (240,276) (188,112) 164,794
- Y-ACC Shares (USD) 1,396,973 159,650 (352,828) (193,178) 1,203,795
- Y-ACC Shares (EUR) 68,808 23,043 (7,468) 15,575 84,383
- Y-ACC Shares (GBP) 78,317 5,269 (35,672) (30,403) 47,914
- Y-DIST Shares (USD) 63,107 1,457 (53,646) (52,189) 10,918
Europe Fund 1 - EUR
- A-ACC Shares (EUR) 579,874 72,792 (97,448) (24,656) 555,218
- A-DIST Shares (EUR) 58,396 19,404 (11,254) 8,150 66,546
- A-DIST Shares (GBP) 800 97 (19) 78 878
- E-ACC Shares (EUR) 91,444 15,457 (24,821) (9,364) 82,080
- I-ACC Shares (EUR) 1,649,091 198,653 (864,134) (665,481) 983,610
- I-DIST Shares (GBP) - 17,147 (528) 16,619 16,619
- W-ACC Shares (GBP) 9,310 3,889 (4,459) (570) 8,740
- Y-ACC Shares (EUR) 1,658,432 238,944 (831,896) (592,952) 1,065,480
Global Fund - USD
- A-ACC Shares (USD) 120,526 30,557 (64,927) (34,370) 86,156
- A-ACC Shares (EUR) 17,365 93,322 (65,805) 27,517 44,882
- E-ACC Shares (EUR) 21,423 17,481 (19,092) (1,611) 19,812
- I-ACC Shares (USD) 1,000 440 - 440 1,440
- Y-ACC Shares (USD) 2,831 1,014 (255) 759 3,590
- Y-ACC Shares (EUR) 2,400 38,259 (30,964) 7,295 9,695
- Y-ACC Shares (GBP) 13,941 12,746 (13,865) (1,119) 12,822
UK Fund - GBP
- A-ACC Shares (GBP) 82,824 1,629 (10,221) (8,592) 74,232
- I-ACC Shares (GBP) 40 - (40) (40) -
- Y-ACC Shares (GBP) 23,155 31,153 (19,025) 12,128 35,283
US Fund - USD
- A-ACC Shares (USD) 122,961 3,682 (31,700) (28,018) 94,943
- A-ACC Shares (EUR) 12,749 7,423 (8,892) (1,469) 11,280
- A-ACC Shares (EUR) (hedged) 28,804 1,926 (4,086) (2,160) 26,644
- E-ACC Shares (EUR) 4,035 2,547 (2,150) 397 4,432
- I-ACC Shares (USD) 48,189 - (20,346) (20,346) 27,843
- Y-ACC Shares (USD) 22,351 11,835 (6,303) 5,532 27,883
- Y-ACC Shares (GBP) 1,258 1,194 (763) 431 1,689

Fidelity
Active
STrategy Notes to the Financial Statements
31
1. General The Company is an open-ended investment company incorporated in Luxembourg as a SICAV on 14 September 2004.
The Company is governed under part I of the Luxembourg Law of 17 December 2010, as amended, relating to undertakings for collective investment, which implements Directive 2014/91/EU ("UCITS V Directive"). As at 30 September 2021, the Company consisted of 6 active sub-funds. The Directors may from time to time close sub-funds and classes of Shares as well as add further sub-funds and classes of Shares with different investment objectives, subject to the approval of the CSSF.
The following class of Shares was launched during the year:
Sub-fund name Class of Shares Date of launch
Europe Fund I-DIST Shares (GBP) 29/01/2021
.
The following class of Shares was closed during the year: Sub-fund name Class of Shares Date of closure
UK Fund I-ACC Shares (GBP) 06/10/2020 2. Significant Accounting Policies The Financial Statements are prepared in accordance with the Luxembourg legal and regulatory requirements relating to undertakings for collective investments. Calculation of the Net Asset Value.Calculation of the Net Asset Value.Calculation of the Net Asset Value.Calculation of the Net Asset Value. The Net Asset Value per Share of each class of Shares, is calculated by determining first the proportion of the net assets of the relevant sub-fund attributable to each class of Shares. Each such amount will be divided by the number of Shares of the relevant class outstanding as at close of business to the extent feasible. The Net Asset Value of each class is determined in the principal dealing currency of the respective class. Security ValuationSecurity ValuationSecurity ValuationSecurity Valuation. Investments in financial instruments traded on any stock exchange are valued at the last available price at the time when the valuation is carried out on the principal stock exchange on which such security is traded. Financial instruments dealt on any over the counter market, short-dated debt transferable securities and money market instruments not traded on a regulated exchange or market are valued at the last available price at the time when the valuation is carried out. All other assets are valued with prudence and in good faith by the Directors of the Company on the basis of their reasonably foreseeable sales price. All holdings owned by the Company are quoted on a regulated market, except where otherwise distinguished in a sub-fund's Schedule of Investments. Fair Value Adjustments PolicyFair Value Adjustments PolicyFair Value Adjustments PolicyFair Value Adjustments Policy. Fair value adjustments may be implemented to protect the interests of Shareholders against market timing practices. Accordingly if a sub-fund invests in markets that are closed for business at the time the sub-fund is valued, the Directors may, by derogation from the provisions above under security valuation, allow for the securities included in a particular portfolio to be adjusted to reflect more accurately the fair value of the sub-fund's investments at the point of valuation. Bank Deposits and Cash at Banks and Brokers. Bank Deposits and Cash at Banks and Brokers. Bank Deposits and Cash at Banks and Brokers. Bank Deposits and Cash at Banks and Brokers. All bank deposits and cash at bank and brokers amounts are carried at face value. Investment Security TransactionsInvestment Security TransactionsInvestment Security TransactionsInvestment Security Transactions. Investment security transactions are accounted for on the date securities are purchased or sold. The computation of the cost of sales of securities is made on the basis of average cost. FuturesFuturesFuturesFutures. Futures are accounted for on the date of opening or closing of the contract. Subsequent payments are made or received by the portfolio each day, dependent on the daily fluctuations in the value of the underlying index or security which are recorded for financial reporting purposes as unrealised gains or losses by the portfolio. The unrealised gains or losses resulting from futures are included in the Statement of Net Assets and in the Schedule of Investments. The realised gain and loss is based on the First In --- First Out method. All gains and losses on futures are disclosed in the Statement of Operations and Changes in Net Assets. ForwaForwaForwaForward Foreign Exchange Contractsrd Foreign Exchange Contractsrd Foreign Exchange Contractsrd Foreign Exchange Contracts. Forward foreign exchange contracts are valued on the basis of forward exchange rates prevailing at the closing date and applicable to the remaining period until the expiration date. The unrealised gains or losses resulting from forward foreign exchange contracts are included in the Statement of Net Assets and in the Schedule of Investments. All forwards, including those used for the hedging of share classes, are included in the Schedule of Investments. All gains and losses on forwards are disclosed in the Statement of Operations and Changes in Net Assets. Option ContractsOption ContractsOption ContractsOption Contracts. Options purchased are recorded as investments at their realisable market value; options written or sold are recorded as liabilities based on the cost to close the position. Purchased and written options are included in the Statement of Net Assets and in the Schedule of Investments. When the exercise of an option results in a cash settlement, the difference between the premium and the settlement proceeds is accounted for as a realised gain or loss. When an option expires, the premium is accounted for as a realised gain for options written or as a realised loss for options purchased. All gains and losses on options are disclosed in the Statement of Operations and Changes in Net Assets. Contracts for DifferenceContracts for DifferenceContracts for DifferenceContracts for Difference. Contracts for difference are contracts entered into between a broker and the Company under which the parties agree to make payments to each other so as to replicate the economic consequences of holding a long or short position in the underlying security. Contracts for difference also mirror any corporate actions that take place. Dividends received or paid on contracts for difference are disclosed net in the Statement of Operations and Changes in Net Assets under the caption Derivative Income or Derivative Expenses. When a contract is closed, the Company records a realised gain or loss equal to the difference between the value of the contract at the time it was opened and the value at the time it was closed. The valuation of contracts for difference is based on the underlying security and they are disclosed in the Statement of Net Assets and the Schedule of Investments. The finance costs paid to the broker for holding the underlying security are included under the caption Finance costs on contracts for difference in the Statement of Operations and Changes in Net Assets. All gains and losses on contracts for difference are disclosed in the Statement of Operations and Changes in Net Assets.

Fidelity
Active
STrategy Notes to the Financial Statements - continued
32
Foreign ExchangeForeign ExchangeForeign ExchangeForeign Exchange. The Directors determine the designated currency of each sub-fund. All transactions denominated in foreign currencies during the year are translated into the sub-fund's designated currency at the exchange rate prevailing on the day of transaction. Assets and liabilities as at 30 September 2021 have been translated at the prevailing exchange rates on that date. Securities in EscrowSecurities in EscrowSecurities in EscrowSecurities in Escrow. Securities included in the Schedule of Investments can be used as collateral against open derivative exposures. Where this is the case, securities will be escrowed to prevent them from being traded. As at 30 September 2021, no securities in escrow were held by the sub-funds. Fund Share TransactionsFund Share TransactionsFund Share TransactionsFund Share Transactions. The issue and redemption price per Share of each sub-fund is the Net Asset Value per Share on the date of trade, subject to the price adjustment policy. Price Adjustment PolicyPrice Adjustment PolicyPrice Adjustment PolicyPrice Adjustment Policy. A price adjustment policy has been adopted and implemented to protect the interests of the Company's shareholders. The purpose of the price adjustment policy is to allocate the costs associated with large inflows and outflows to investors transacting that day, thereby protecting the long-term Shareholder from the worst effects of dilution. It achieves this purpose by adjusting the share class price at which deals in a sub-fund are transacted. As such, share class prices may be adjusted up or down depending on the level and type of investor transactions on a particular day within a sub-fund. In this way the existing and remaining Shareholders do not suffer an inappropriate level of dilution. The Company will only trigger an adjustment in the price when there are significant net flows likely to have a material impact on the remaining Shareholders. The adjustment will be based on the normal dealing costs for the particular assets in which a sub-fund is invested but will not exceed 2% of the price. The Board may decide to increase this adjustment limit in exceptional circumstances to protect Shareholders' interests. With effect from 20 March 2020, the Board decided to temporarily revise the current Swing Pricing policy of the Company in line with the provisions of the Company's prospectus and lift the price adjustment limit of 2% on a temporary basis. This decision was taken in light of the exceptional circumstances presented by the COVID-19 pandemic and the decision remains under constant review. Once an adjustment is made to a share class price, that price is the official price for that share class for all deals that day. The price adjustment policy applies to all sub-funds during the year. As at 30 September 2021, price adjustments were made on the following sub-fund: Sub-fund name Class of Shares Un-adjusted NAV per Share Adjusted NAV per Share
US Fund A-ACC Shares (USD) 263.39 263.18US Fund A-ACC Shares (EUR) 295.44 295.21US Fund A-ACC Shares (EUR) (hedged) 232.82 232.63US Fund E-ACC Shares (EUR) 279.24 279.01US Fund I-ACC Shares (USD) 284.14 283.91US Fund Y-ACC Shares (USD) 277.71 277.49US Fund Y-ACC Shares (GBP) 317.25 316.99
Formation CostsFormation CostsFormation CostsFormation Costs. All formation costs related to the launch of the Company have been amortised. Costs incurred in launching new sub-funds will be charged to current operating expenses. IncomeIncomeIncomeIncome. Dividends on equities are recognised when the security is quoted ex-dividend. Interest is accounted for on an accrual basis. Combined AccountsCombined AccountsCombined AccountsCombined Accounts. The combined Financial Statements have been presented in USD and represent the total Financial Statements of the different sub-funds. Sub-funds stated in currencies other than USD have been converted at exchange rates ruling at the year end. NAV Error.NAV Error.NAV Error.NAV Error. A material NAV error at year-end has been identified for two classes of Shares. The re-calculated Net Assets Values are disclosed in the Annual Report and differ from the published NAV per Share as at year-end: Class of SharesClass of SharesClass of SharesClass of Shares Published NAVPublished NAVPublished NAVPublished NAV ReReReRe----calculated NAVcalculated NAVcalculated NAVcalculated NAV per Shareper Shareper Shareper Share per Shareper Shareper Shareper Share
Emerging Markets Fund - A-ACC Shares (EUR) 135.34 132.77
Global Fund - Y-ACC Shares (EUR) 255.24 249.86
3. Investment Management Fees and Other Transactions with the Investment Manager or its Affiliates HEADER WITH BACKGROUND FIL Fund Management Limited ("FFML") earns a monthly investment management fee, calculated separately in respect of each sub-fund and accrued daily in the reference currency of the sub-fund, at annual rates disclosed in the table below:
Sub fund name / Class of Shares Maximum annual investment
management fee
HEADER WITH BACKGROUND HEADER WITH HEADER WITH Equity Funds A, E Shares 1.50%I Shares 0.80%W,Y Shares 1.00%
During the year ended 30 September 2021, some sub-funds invested in the following fund shares: Fidelity ILF - The Sterling Fund - A-ACC-GBP, Fidelity ILF - The US Dollar Fund - A-ACC-USD and Fidelity ILF - The Euro Fund - A-ACC-EUR which have their management fees capped at 0.25% per annum. These fund shares are included in the Schedule of Investments. Performance FeesPerformance FeesPerformance FeesPerformance Fees In addition, FFML is entitled to receive an annual performance fee equivalent to the given performance fee rate multiplied by the increase in the Net Asset Value per Share of each class of Shares outstanding in respect of the Company's financial year subject to a hurdle rate over the relevant equity comparative index. The basis for calculation of performance fees is fully explained in the Prospectus that all investors should read before investing. The relevant performance fee rates, hurdle rates and comparative indices for each sub-fund are as follows:
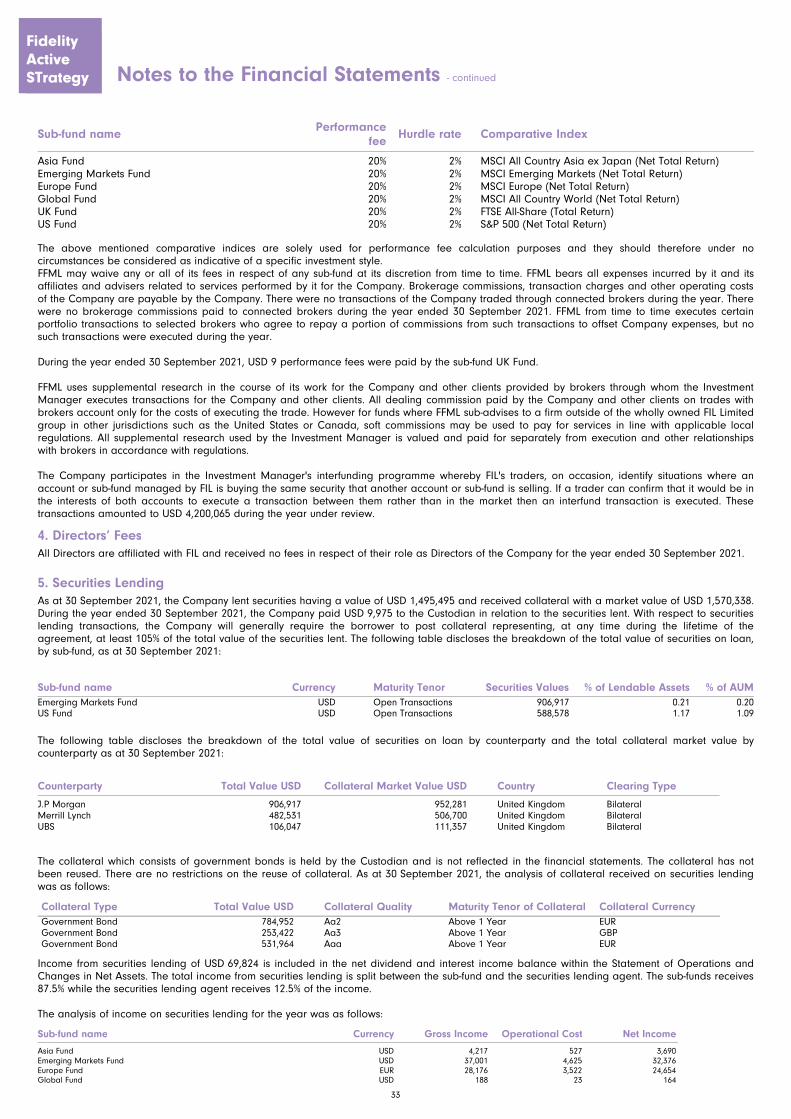
Fidelity
Active
STrategy Notes to the Financial Statements - continued
33
Sub-fund name Performance
fee Hurdle rate Comparative Index
Asia Fund 20% 2% MSCI All Country Asia ex Japan (Net Total Return) Emerging Markets Fund 20% 2% MSCI Emerging Markets (Net Total Return) Europe Fund 20% 2% MSCI Europe (Net Total Return) Global Fund 20% 2% MSCI All Country World (Net Total Return) UK Fund 20% 2% FTSE All-Share (Total Return) US Fund 20% 2% S&P 500 (Net Total Return)
HEADER WITH BACKGROUND The above mentioned comparative indices are solely used for performance fee calculation purposes and they should therefore under no circumstances be considered as indicative of a specific investment style. FFML may waive any or all of its fees in respect of any sub-fund at its discretion from time to time. FFML bears all expenses incurred by it and its affiliates and advisers related to services performed by it for the Company. Brokerage commissions, transaction charges and other operating costs of the Company are payable by the Company. There were no transactions of the Company traded through connected brokers during the year. There were no brokerage commissions paid to connected brokers during the year ended 30 September 2021. FFML from time to time executes certain portfolio transactions to selected brokers who agree to repay a portion of commissions from such transactions to offset Company expenses, but no such transactions were executed during the year. During the year ended 30 September 2021, USD 9 performance fees were paid by the sub-fund UK Fund. FFML uses supplemental research in the course of its work for the Company and other clients provided by brokers through whom the Investment Manager executes transactions for the Company and other clients. All dealing commission paid by the Company and other clients on trades with brokers account only for the costs of executing the trade. However for funds where FFML sub-advises to a firm outside of the wholly owned FIL Limited group in other jurisdictions such as the United States or Canada, soft commissions may be used to pay for services in line with applicable local regulations. All supplemental research used by the Investment Manager is valued and paid for separately from execution and other relationships with brokers in accordance with regulations. The Company participates in the Investment Manager's interfunding programme whereby FIL's traders, on occasion, identify situations where an account or sub-fund managed by FIL is buying the same security that another account or sub-fund is selling. If a trader can confirm that it would be in the interests of both accounts to execute a transaction between them rather than in the market then an interfund transaction is executed. These transactions amounted to USD 4,200,065 during the year under review.
4. Directors’ Fees HEADER WITH BACKGROUND All Directors are affiliated with FIL and received no fees in respect of their role as Directors of the Company for the year ended 30 September 2021.
5. Securities Lending As at 30 September 2021, the Company lent securities having a value of USD 1,495,495 and received collateral with a market value of USD 1,570,338. During the year ended 30 September 2021, the Company paid USD 9,975 to the Custodian in relation to the securities lent. With respect to securities lending transactions, the Company will generally require the borrower to post collateral representing, at any time during the lifetime of the agreement, at least 105% of the total value of the securities lent. The following table discloses the breakdown of the total value of securities on loan, by sub-fund, as at 30 September 2021:
Sub-fund name Currency Maturity Tenor Securities Values % of Lendable Assets % of AUM
Emerging Markets Fund USD Open Transactions 906,917 0.21 0.20 US Fund USD Open Transactions 588,578 1.17 1.09
The following table discloses the breakdown of the total value of securities on loan by counterparty and the total collateral market value by counterparty as at 30 September 2021: Counterparty Total Value USD Collateral Market Value USD Country Clearing Type
J.P Morgan 906,917 952,281 United Kingdom Bilateral Merrill Lynch 482,531 506,700 United Kingdom Bilateral UBS 106,047 111,357 United Kingdom Bilateral
The collateral which consists of government bonds is held by the Custodian and is not reflected in the financial statements. The collateral has not been reused. There are no restrictions on the reuse of collateral. As at 30 September 2021, the analysis of collateral received on securities lending was as follows: Collateral Type Total Value USD Collateral Quality Maturity Tenor of Collateral Collateral Currency
Government Bond 784,952 Aa2 Above 1 Year EUR Government Bond 253,422 Aa3 Above 1 Year GBP Government Bond 531,964 Aaa Above 1 Year EUR
Income from securities lending of USD 69,824 is included in the net dividend and interest income balance within the Statement of Operations and Changes in Net Assets. The total income from securities lending is split between the sub-fund and the securities lending agent. The sub-funds receives 87.5% while the securities lending agent receives 12.5% of the income. The analysis of income on securities lending for the year was as follows: Sub-fund name Currency Gross Income Operational Cost Net Income
Asia Fund USD 4,217 527 3,690 1Emerging Markets Fund USD 37,001 4,625 32,376 1Europe Fund EUR 28,176 3,522 24,654 1Global Fund USD 188 23 164 1

Fidelity
Active
STrategy Notes to the Financial Statements - continued
34
Sub-fund name Currency Gross Income Operational Cost Net Income
US Fund USD 4,595 574 4,021 1
6. Taxation The Company is not liable to any Luxembourg taxes on income or on realised or unrealised capital gains, nor to any Luxembourg withholding tax. The sub-funds are subject to an annual subscription tax of 0.05%, calculated and payable quarterly on the net assets of the sub-funds on the last day of each calendar quarter. The reduced tax rate of 0.01% per annum of the net assets will be applicable to classes of Shares which are only sold or held by institutional investors within the meaning of Article 174 of the amended Law of 17 December 2010. Capital gains, dividends and interest on securities may be subject to capital gains and withholding taxes or other taxes imposed by the country of origin concerned and such taxes may not be recoverable by the Company or its Shareholders.
7. Transaction Fees Transaction fees are fees paid to brokers when buying and selling equities, CFD's, futures, options and exchange traded funds. Transaction fees are included in the costs of investments that are part of the realised and unrealised gain/(loss) in the Statement of Operations and Changes in Net Assets. For the year ended 30 September 2021, these transaction fees amounted to:
Sub-fund name Currency Transaction Fees
Asia Fund USD 1,858,198
Emerging Markets Fund USD 1,352,308
Europe Fund EUR 460,389
Global Fund USD 64,009
UK Fund GBP 13,970
US Fund USD 28,426
8. Equalisation Income equalisation arrangements are applied to all Share classes across all sub-funds. These arrangements are intended to ensure that the income per Share which is distributed in respect of a distribution year is not affected by changes in the number of Shares in issue during that year. The calculation of equalisation is based on net investment income.
9. Dividend Payments The following dividend payments were made during the year ended 30 September 2021: Sub-fund name Div per Share Ex-div date
Emerging Markets Fund I-DIST Shares (USD) 0.0863
01-Dec-2020
10. Cash Balances held at Brokers As at 30 September 2021, there were outstanding margin deposits and cash collateral amounts in the form of cash balances held at brokers which have been included in the Cash at banks and brokers shown in the Statement of Net Assets. The following table discloses the breakdown of such cash amounts held at brokers, by sub-fund, as at 30 September 2021:
Sub-fund name CurrencyCash atbrokers
Asia Fund USD 2,612,138
Emerging Markets Fund USD 19,533,884
Europe Fund EUR 3,215,000
Global Fund USD 40,000
UK Fund GBP 140,000
US Fund USD 160,000
11. Commitments on Derivatives The total commitments by category of financial derivative instruments as at 30 September 2021 amounted to:
Sub-fund name Currency Contracts for Difference
Forward Foreign Exchange Contracts Futures
Asia Fund USD 28,694,983 1,732,652 -1Emerging Markets Fund USD 346,973,214 152,571,436 95,951,1551Europe Fund EUR 331,836,996 - -1Global Fund USD 24,174,054 - -1UK Fund GBP 8,127,703 - -1US Fund USD 28,715,586 8,096,591 -1 Sub-fund name Currency Options
Asia Fund USD 907,636 1Emerging Markets Fund USD 13,423,191 1Europe Fund EUR - 1Global Fund USD - 1UK Fund GBP - 1US Fund USD - 1

Fidelity
Active
STrategy Notes to the Financial Statements - continued
35
Commitments are calculated in accordance with the European Securities and Markets Authority ("ESMA") guidelines 10/788.
12. Exposure of Futures by Clearing Brokers As at 30 September 2021, the total exposure by counterparty to futures, calculated as the aggregation of the unrealised, was as follows: Sub-fund name Currency UBS
Emerging Markets Fund USD 3,668,985
13. Counterparty Exposure of Options As at 30 September 2021, the total exposure by clearing brokers to options, calculated as the aggregation of the unrealised, was as follows: Sub-fund name Currency Citibank Exchange Traded Goldman Sachs Morgan Stanley
Asia Fund USD - (49,886) - - Emerging Markets Fund USD (2,019) (1,036,528) (35,951) (580,978)
14. Counterparty Exposure of Forward Foreign Exchange Contracts As at 30 September 2021, the total exposure by counterparty to forward foreign exchange contracts, calculated as the aggregation of the unrealised, was as follows:
Sub-fund name Currency BBH BNPBank of America Barclays CIBC Citibank
Goldman Sachs
Emerging Markets Fund USD (1,018) (47,262) (35,251) 71,598 (94,273) (77,089) 13,6571
US Fund USD - (2,650) - - - - -1
Sub-fund name Currency HSBC JP.Morgan Morgan Stanley NAB RBC
Standard Chartered State Street
HSBC Asia Fund USD 762 - - (32,586) - - -
1 Emerging Markets Fund USD 100,308 47,568 (33,114) (99,746) (192,988) (11,546) 7,043
1 US Fund USD - - - (156,105) 4,577 - -
1 Sub-fund name Currency UBS UBS
Emerging Markets Fund USD 402,1541
15. Exposure of Contracts For Difference by Clearing Brokers As at 30 September 2021, the total exposure by counterparty to contracts for difference, calculated as the aggregation of the unrealised, was as follows: Sub-fund name Currency Goldman Sachs HSBC JP.Morgan Morgan Stanley UBS
Asia Fund USD - (306,668) (181,122) - - Emerging Markets Fund USD (842,562) 193,230 (868,718) 1,039,231 (1,796,662) Europe Fund EUR 245,240 568,377 353,963 2,488,979 (1,347,951) Global Fund USD 123,310 51,613 559,604 22,697 37,553 UK Fund GBP 29,093 (139,814) 40,905 20,363 (8,134) US Fund USD 37,739 121,776 244,916 (88,051) 31,563
16. For UK Investors The Company applied for entry into the new UK 'reporting fund' regime in respect of all sub-funds and Share classes which are registered in the United Kingdom. All those sub-funds and Share classes have been certified as "UK reporting funds" by HM Revenue & Customs for the accounting period commencing 1 October 2010 or, if later, the date on which the sub-fund or Share class was first registered for distribution to UK Shareholders. Reporting fund status will apply to all future accounting periods subject to compliance with the annual reporting requirements set out in UK tax legislation. Reportable income figures are generally available six months after the year end date.

Fidelity
Active
STrategy Notes to the Financial Statements - continued
36
17. COVID-19 Pandemic As referenced in the Directors' report, due to the COVID-19 outbreak, the FIL Group business contingency plans have been activated gradually across all FIL Group locations from January 2020. All controls remain unchanged and continue to run. The Fund has continued to operate as required and in accordance with its investment policies and the Prospectus. No significant operational or performance issues or systems outage have been identified to the date of the approval of these accounts. Pro-active steps are being and continue to be taken to ensure continuity of service despite this exceptional period of market and operational stress. Fidelity International (including FIMLUX) has been in a heightened phase of liquidity and counterparty monitoring across the Fund's portfolios. Market and transaction data relevant to any and each sub-fund of Fidelity Active STrategy have been considered and analysed on a more frequent basis during this period in order to ensure the calculation of accurate NAVs that are fully representative of prevailing market conditions and to consider potential areas of concern and whether it would be in the best interests of Shareholders of the Fund to invoke additional liquidity management measures. It has not been necessary to suspend the calculation of the NAV of any of the sub-funds and there has been no instance of late publication of the NAV during the financial year. The published unaudited NAVs and other financial information are available on Fundsquare, at www.fidelity.lu or upon request at the registered office of the Fund. There were no limitations to redemptions during the year, and no redemptions were put on hold. As disclosed under note 2, Significant Accounting Policies, changes to the price adjustment policy were approved in response to the exceptional market situation, as notified to Shareholders via publication on Fidelity's website. It was resolved to adjust the swing pricing threshold on a temporary basis for all sub-funds with effect from 10 March 2020. On 20 March 2020, it was resolved that the swing price adjustment cap (or swing factor) applied to the Fund be lifted, also on a temporary basis. These changes to the swing pricing policy remain under ongoing review and will remain in place until such time as market conditions stabilise and as approved by the Board. A copy of the Shareholder publication can be found at www.fidelity.lu.
18. Statement of Changes in Investments A list for each sub-fund, specifying for each investment the total purchases and sales which occurred during the year under review, may be obtained free of charge upon request from the Registered Office of the Company or from any of the companies registered as Distributors of the Company. It is possible to receive information about the full holdings of the sub-funds in which you invest, at any point in time during the year. This is available upon request by contacting your usual Fidelity Representative.
19. Rates of Exchange
The USD exchange rates at 30 September 2021 are noted below.
Currency Exchange rate
Australian dollar (AUD) 1.38341288 Brazilian real (BRL) 5.4478 Canadian dollar (CAD) 1.267 Chilean peso (CLP) 809.025 Chinese renminbi (CNY) 6.4521 Colombian peso (COP) 3,813.9 Danish krone (DKK) 6.42315 Euro (EUR) 0.86370703 Hong Kong dollar (HKD) 7.78515 Hungarian forint (HUF) 310.2479 Indian rupee (INR) 74.2275 Indonesian rupiah (IDR) 14,312.5 Israeli shekel (ILS) 3.22905 Japanese yen (JPY) 111.515 Korean won (KRW) 1,184
Currency Exchange rate
Malaysian ringgit (MYR) 4.1865 Mexican peso (MXN) 20.563 Peruvian nuevo sol (PEN) 4.1378 Philippine peso (PHP) 51.01 Polish zloty (PLN) 3.979 Pound sterling (GBP) 0.74244562 Russian ruble (RUB) 72.7 Singapore dollar (SGD) 1.3582 South African rand (ZAR) 15.05125 Swedish krona (SEK) 8.7591 Swiss franc (CHF) 0.93395 Taiwan new dollar (TWD) 27.8605 Thailand baht (THB) 33.835 Turkish lira (TRY) 8.8875
20. Subsequent Events On 1 October 2021, an amended performance fee calculation mechanism was implemented to reflect changes required in accordance with the ESMA guidelines on performance fees. The updated version of the section "Investment Management Fee and Performance Fee" of the Prospectus will describe in detail the performance fee calculation method, including the reference indicator used to measure the relevant performance of each Fund, the crystallisation frequency, the performance reference period and the performance fee rate applicable to each relevant Share Class. On 6 December 2021 Fidelity Active STrategy - UK Fund and Fidelity Active STrategy - US Fund were respectively merged into Fidelity Funds - UK Special Situations Fund and Fidelity Funds - Sustainable US Equity Fund.

Société à responsabilité limitée au capital de 360.000 € RCS Luxembourg B 67.895 Autorisation d'établissement 10022179 © Deloitte Audit, SARL
37
Deloitte Audit
Société à responsabilité limitée
20 Boulevard de Kockelscheuer
L-1821 Luxembourg
BP 1173
L-1011 Luxembourg
Tel: +352 451 451
www.deloitte.lu
To the Shareholders of
Fidelity Active STrategy
2a, rue Albert Borschette
B.P. 2174
L-1246 Luxembourg
REPORT OF THE REVISEUR D'ENTREPRISES AGREEREPORT OF THE REVISEUR D'ENTREPRISES AGREEREPORT OF THE REVISEUR D'ENTREPRISES AGREEREPORT OF THE REVISEUR D'ENTREPRISES AGREE
OpinionOpinionOpinionOpinion
We have audited the financial statements of Fidelity Active STrategy (the "Fund") and of each of its sub-funds, which comprise the statement of net assets and the schedule of investments as at September 30, 2021 and the statement of operations and changes in net assets for the year then ended, and notes to the financial statements, including a summary of significant accounting policies.
In our opinion, the accompanying financial statements give a true and fair view of the financial position of the Fund and of each of its sub-funds as at September 30, 2021, and of the results of their operations and changes in their net assets for the year then ended in accordance with Luxembourg legal and regulatory requirements relating to the preparation and presentation of the financial statements.
Basis for OpinionBasis for OpinionBasis for OpinionBasis for Opinion
We conducted our audit in accordance with the Law of 23 July 2016 on the audit profession (Law of 23 July 2016) and with International Standards on Auditing (ISAs) as adopted for Luxembourg by the "Commission de Surveillance du Secteur Financier" (CSSF). Our responsibilities under the Law of 23 July 2016 and ISAs as adopted for Luxembourg by the CSSF are further described in the "Responsibilities of the "réviseur d'entreprises agréé" for the Audit of the Financial Statements" section of our report. We are also independent of the Fund in accordance with the International Code of Ethics for Professional Accountants, including International Independence Standards, issued by the International Ethics Standards Board for Accountants (IESBA Code) as adopted for Luxembourg by the CSSF together with the ethical requirements that are relevant to our audit of the financial statements, and have fulfilled our other ethical responsibilities under those ethical requirements. We believe that the audit evidence we have obtained is sufficient and appropriate to provide a basis for our opinion.
Other informationOther informationOther informationOther information
The Board of Directors of the Fund is responsible for the other information. The other information comprises the information stated in the annual report but does not include the financial statements and our report of the "réviseur d'entreprises agréé" thereon.
Our opinion on the financial statements does not cover the other information and we do not express any form of assurance conclusion thereon.
In connection with our audit of the financial statements, our responsibility is to read the other information and, in doing so, consider whether the other information is materially inconsistent with the financial statements or our knowledge obtained in the audit or otherwise appears to be materially misstated. If, based on the work we have performed, we conclude that there is a material misstatement of this other information, we are required to report this fact. We have nothing to report in this regard.

38
Responsibilities of the Board of Directors of the Fund for the Financial StatementsResponsibilities of the Board of Directors of the Fund for the Financial StatementsResponsibilities of the Board of Directors of the Fund for the Financial StatementsResponsibilities of the Board of Directors of the Fund for the Financial Statements
The Board of Directors of the Fund is responsible for the preparation and fair presentation of the financial statements in accordance with Luxembourg legal and regulatory requirements relating to the preparation and presentation of the financial statements, and for such internal control as the Board of Directors of the Fund determines is necessary to enable the preparation of financial statements that are free from material misstatement, whether due to fraud or error.
In preparing the financial statements, the Board of Directors of the Fund is responsible for assessing the Fund's ability to continue as a going concern, disclosing, as applicable, matters related to going concern and using the going concern basis of accounting unless the Board of Directors of the Fund either intends to liquidate the Fund or to cease operations, or has no realistic alternative but to do so.
Responsibilities of the Responsibilities of the Responsibilities of the Responsibilities of the "réviseur d'entreprises agréé""réviseur d'entreprises agréé""réviseur d'entreprises agréé""réviseur d'entreprises agréé" for the Audit of the Financial Statementsfor the Audit of the Financial Statementsfor the Audit of the Financial Statementsfor the Audit of the Financial Statements
The objectives of our audit are to obtain reasonable assurance about whether the financial statements as a whole are free from material misstatement, whether due to fraud or error, and to issue a report of the "réviseur d'entreprises agréé" that includes our opinion. Reasonable assurance is a high level of assurance, but is not a guarantee that an audit conducted in accordance with the Law dated 23 July 2016 and with ISAs as adopted for Luxembourg by the CSSF will always detect a material misstatement when it exists. Misstatements can arise from fraud or error and are considered material if, individually or in the aggregate, they could reasonably be expected to influence the economic decisions of users taken on the basis of these financial statements.
As part of an audit in accordance with the Law dated 23 July 2016 and with ISAs as adopted for Luxembourg by the CSSF, we exercise professional judgment and maintain professional skepticism throughout the audit. We also:
• Identify and assess the risks of material misstatement of the financial statements, whether due to fraud or error, design and perform audit procedures responsive to those risks, and obtain audit evidence that is sufficient and appropriate to provide a basis for our opinion. The risk of not detecting a material misstatement resulting from fraud is higher than for one resulting from error, as fraud may involve collusion, forgery, intentional omissions, misrepresentations, or the override of internal control.
• Obtain an understanding of internal control relevant to the audit in order to design audit procedures that are appropriate in the circumstances, but not for the purpose of expressing an opinion on the effectiveness of the Fund's internal control.
• Evaluate the appropriateness of accounting policies used and the reasonableness of accounting estimates and related disclosures made by the Board of Directors of the Fund.
• Conclude on the appropriateness of the Board of Directors of the Fund use of the going concern basis of accounting and, based on the audit evidence obtained, whether a material uncertainty exists related to events or conditions that may cast significant doubt on the Fund's ability to continue as a going concern. If we conclude that a material uncertainty exists, we are required to draw attention in our report of the "réviseur d'entreprises agréé" to the related disclosures in the financial statements or, if such disclosures are inadequate, to modify our opinion. Our conclusions are based on the audit evidence obtained up to the date of our report of the "réviseur d'entreprises agréé". However, future events or conditions may cause the Fund to cease to continue as a going concern.
• Evaluate the overall presentation, structure and content of the financial statements, including the disclosures, and whether the financial statements represent the underlying transactions and events in a manner that achieves fair presentation.
We communicate with those charged with governance regarding, among other matters, the planned scope and timing of the audit and significant audit findings, including any significant deficiencies in internal control that we identify during our audit.
For Deloitte Audit, Cabinet de révision agréé
Laurent Fedrigo, Réviseur d'entreprises agréé Partner
15 December 2021

Fidelity
Active
STrategy Unaudited Supplementary Information
39
Global Market Risk Exposure
The global market risk exposure information for the year ending 30 September 2021 is as follows:
Sub-Fund
Global Risk calculation Method
VaR model
Reference Portfolio
VaR limit
Lowest utilisation of VaR limit
Highest utilisation of VaR limit
Average utilisation of VaR limit
Average level of leverage reached during the year
Asia Fund Relative VaR Monte Carlo Simulation
MSCI All Country Asia ex Japan
200% 43.87% 54.38% 50.02% 57.49%
Emerging Markets Fund Relative VaR Monte Carlo Simulation
MSCI Emerging Markets 200% 53.25% 60.01% 56.08% 195.02%
Europe Fund Relative VaR Monte Carlo Simulation
MSCI Europe 200% 45.61% 53.86% 49.09% 29.83%
Global Fund Relative VaR Monte Carlo Simulation
MSCI All Country World 200% 52.98% 71.64% 62.89% 54.75%
UK Fund Relative VaR Monte Carlo Simulation
FTSE All Share 200% 44.50% 56.32% 50.21% 34.39%
US Fund Relative VaR Monte Carlo Simulation
S&P 500 200% 43.29% 58.37% 53.00% 56.13%
For the above mentioned sub-funds, the global exposure is calculated and monitored daily by using the Value at Risk (VaR) calculation methodology. The observation period is at least 250 days. The VaR methodology provides an estimate of the maximum potential loss over a specific holding period and at a given interval of confidence, i.e. probability level. The holding period is one month (20 business days) and the interval of confidence is 99%. For example, taking into account the assumptions and limitations of the selected model, a VaR estimate of 3% on 20-days holding period with a 99% interval of confidence means that, with 99% certainty, the percentage of the sub-fund can expect to lose over the next 20-days period should be maximum 3%.
Leverage is determined using the sum of the notionals of all financial derivatives instruments used.
EU Securities Financing Transactions Regulation
The Securities Financing Transactions Regulation (SFTR), which came into effect on the 13 January 2017, requires further transparency regarding the use of securities financing transactions. The Company may use Total Return Swaps or other financial derivative instruments with similar characteristics to meet the investment objective of the Company. The Company used Contracts for Difference (CFD) and securities lending for the year ended 30 September 2021. The top 10 counterparties for CFD is disclosed in note 15.
Assets engaged in securities financing transactions as at 30 September 2021 The assets engaged, expressed in absolute value and as a proportion of the net assets, by category of securities financing transactions as at 30 September 2021 amounted to:
Sub-fund name Currency Contracts for Difference
% Net Assets
Total Return Swaps
% Net Assets
Asia Fund USD 1,456,661 0.77 - - Emerging Markets Fund USD 14,592,443 3.15 - - Europe Fund EUR 13,049,569 1.28 - - Global Fund USD 1,374,420 3.20 - - UK Fund GBP 293,758 1.09 - - US Fund USD 1,249,455 2.32 - -
Top 10 Collateral issuers As at 30 September 2021, the total value, in base currency, of collateral received from the ten largest collateral issuers (governments and international institutions) across all derivatives and securities lending is as follows:
Sub-fund name Currency Ranking Issuer Name Market Value
Emerging Markets Fund USD 1 France 476,132 2 Germany 474,977 3 Netherlands 1,172US Fund USD 1 France 308,820 2 UK 253,422 3 Germany 55,605 4 Netherlands 210
Collateral received for derivatives The collateral which consists of cash is held by the Custodian and is not reflected in the financial statements. As at 30 September 2021, collateral had been received from the following counterparties:
Sub-fund name Currency Goldman Sachs HSBC JP.Morgan
Morgan Stanley
Emerging Markets Fund USD - - - 530,0001
Europe Fund EUR - 545,000 - 2,170,0001
Global Fund USD 610,000 - 730,000 -1
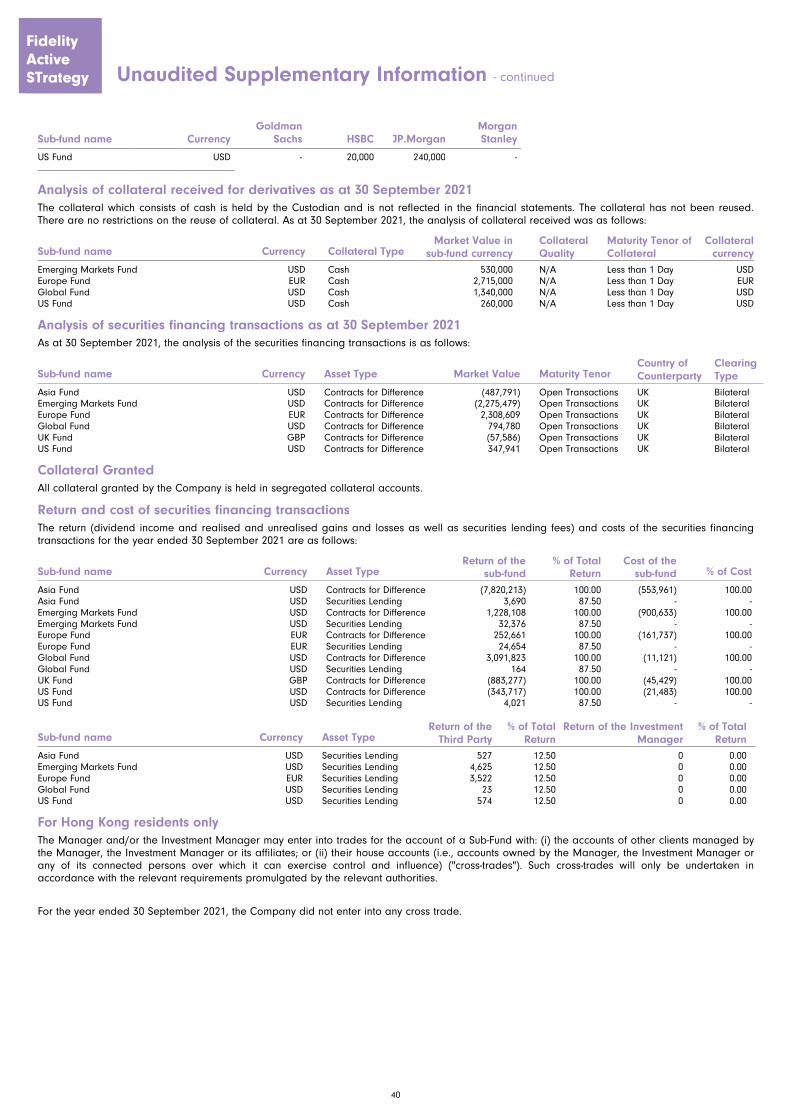
Fidelity
Active
STrategy Unaudited Supplementary Information - continued
40
Sub-fund name Currency Goldman Sachs HSBC JP.Morgan
Morgan Stanley
US Fund USD - 20,000 240,000 -1
1
Analysis of collateral received for derivatives as at 30 September 2021 The collateral which consists of cash is held by the Custodian and is not reflected in the financial statements. The collateral has not been reused. There are no restrictions on the reuse of collateral. As at 30 September 2021, the analysis of collateral received was as follows:
Sub-fund name Currency Collateral Type Market Value in sub-fund currency
Collateral Quality
Maturity Tenor of Collateral
Collateral currency
Emerging Markets Fund USD Cash 530,000 N/A Less than 1 Day USD Europe Fund EUR Cash 2,715,000 N/A Less than 1 Day EUR Global Fund USD Cash 1,340,000 N/A Less than 1 Day USD US Fund USD Cash 260,000 N/A Less than 1 Day USD
Analysis of securities financing transactions as at 30 September 2021 As at 30 September 2021, the analysis of the securities financing transactions is as follows:
Sub-fund name Currency Asset Type Market Value Maturity Tenor Country of Counterparty
Clearing Type
Asia Fund USD Contracts for Difference (487,791) Open Transactions UK Bilateral Emerging Markets Fund USD Contracts for Difference (2,275,479) Open Transactions UK Bilateral Europe Fund EUR Contracts for Difference 2,308,609 Open Transactions UK Bilateral Global Fund USD Contracts for Difference 794,780 Open Transactions UK Bilateral UK Fund GBP Contracts for Difference (57,586) Open Transactions UK Bilateral US Fund USD Contracts for Difference 347,941 Open Transactions UK Bilateral
Collateral Granted
All collateral granted by the Company is held in segregated collateral accounts.
Return and cost of securities financing transactions The return (dividend income and realised and unrealised gains and losses as well as securities lending fees) and costs of the securities financing transactions for the year ended 30 September 2021 are as follows:
Sub-fund name Currency Asset Type Return of the
sub-fund% of Total Return
Cost of the sub-fund % of Cost
Asia Fund USD Contracts for Difference (7,820,213) 100.00 (553,961) 100.00Asia Fund USD Securities Lending 3,690 87.50 - -Emerging Markets Fund USD Contracts for Difference 1,228,108 100.00 (900,633) 100.00Emerging Markets Fund USD Securities Lending 32,376 87.50 - -Europe Fund EUR Contracts for Difference 252,661 100.00 (161,737) 100.00Europe Fund EUR Securities Lending 24,654 87.50 - -Global Fund USD Contracts for Difference 3,091,823 100.00 (11,121) 100.00Global Fund USD Securities Lending 164 87.50 - -UK Fund GBP Contracts for Difference (883,277) 100.00 (45,429) 100.00US Fund USD Contracts for Difference (343,717) 100.00 (21,483) 100.00US Fund USD Securities Lending 4,021 87.50 - -
Sub-fund name Currency Asset Type Return of the Third Party
% of Total Return
Return of the Investment Manager
% of Total Return
Asia Fund USD Securities Lending 527 12.50 0 0.001
Emerging Markets Fund USD Securities Lending 4,625 12.50 0 0.001
Europe Fund EUR Securities Lending 3,522 12.50 0 0.001
Global Fund USD Securities Lending 23 12.50 0 0.001
US Fund USD Securities Lending 574 12.50 0 0.001
For Hong Kong residents only
The Manager and/or the Investment Manager may enter into trades for the account of a Sub-Fund with: (i) the accounts of other clients managed by the Manager, the Investment Manager or its affiliates; or (ii) their house accounts (i.e., accounts owned by the Manager, the Investment Manager or any of its connected persons over which it can exercise control and influence) ("cross-trades"). Such cross-trades will only be undertaken in accordance with the relevant requirements promulgated by the relevant authorities.
For the year ended 30 September 2021, the Company did not enter into any cross trade.

Fidelity
Active
STrategy Unaudited Supplementary Information - continued
41
Remuneration
Remuneration DisclosureRemuneration DisclosureRemuneration DisclosureRemuneration Disclosure
FIL investment Management (Luxembourg) S.A. ('FIMLUX') is a UCITS licensed Management Company and wholly-owned subsidiary of FIL Limited ('FIL'). The FIL Group, consisting of FIL and its subsidiaries, has approved a remuneration policy which is applicable to all constituent parts of the group. In addition FIMLUX has its own remuneration policy which closely reflects the FIL group policy. In the implementation of its policy, FIMLUX will ensure good corporate governance and promote sound and effective risk management. Remuneration PolicyRemuneration PolicyRemuneration PolicyRemuneration Policy The remuneration policy does not encourage any risk taking which would be inconsistent with the risk appetite of the Company, the Articles of Association or Prospectus. FIMLUX will ensure that any decisions are consistent with the overall business strategy, objectives and the remuneration policy and try to avoid any conflicts of interest which may arise. Fixed remuneration is defined as base salary plus other benefits. Base salaries are set competitive to local market, based on an individual's specific role and responsibilities as well as their relevant experience, qualifications, performance and overall contribution to FIL. These levels are reviewed on a regular basis. Variable remuneration is defined as annual bonuses and long term incentive awards. These discretionary pay elements are determined by individual performance and overall company affordability (set taking into consideration the financial and non-financial performance and associated business and operational risks). A summary of the Remuneration Policy is available at https://www.fidelityinternational.com. FIMLUX will ensure that the remuneration policy is reviewed internally and independently annually. The Remuneration Policy applies to all employees of FIMLUX, including individuals whose professional activities have a material impact on the risk profile of the Management Company or the UCITS Funds it manages ('UCITS Identified Staff'). The UCITS identified staff include members of the Board of the Management Company, senior management, heads of relevant control functions and heads of other key functions. Individuals are notified of their identification and the implications of this status on at least an annual basis.
Total Remuneration paid to staff of the Management Company and to its delegates for the past financial year EUR 4,759,617
Of which, fixed remuneration EUR 3,879,451
Of which, variable remuneration EUR 880,166
Total number of employees of the Management Company and its delegates (as at 30/06/2020) 67
Portion of remuneration that is attributable to the Fund (as at 30/06/2020) 1.68%
Shareholders Rights Directive ll On 20 August 2019, the Grand Ducal Law of 1 August 2019 amended the Law of 24 May 2011 on the exercise of certain shareholder rights. This law transposes, for Luxembourg, the Directive (EU) 2017/828 (the Shareholders' Rights Directive II). It entered into force on 24 August 2019. The information on the Portfolio turnover ratio (PTR) and the Portfolio turnover cost (PTC) are disclosed in the fund factsheet. SRDII does not define a methodology for these values; ours is as follows: PTR = (purchases of securities + sales of securities) minus (subscriptions of units + redemptions of units), divided by average fund value over the prior 12 months multiplied by 100. Any funds' trading in Fidelity Institutional Liquidity Funds is excluded from the PTR calculation. PTC = PTR (capped at 100%) x transaction cost, where transaction cost is calculated as ex-post (i.e. prior 12 months) MiFID disclosure of portfolio transaction costs minus implicit costs. The risks factors are available in the section 1.2 Risk Factor of the prospectus.

Fidelity
Active
STrategy
Directory as at 30 September 2021
42
Registered Office
Fidelity Active STrategy 2a, rue Albert Borschette
B.P. 2174
L-1021 Luxembourg
Grand Duchy of Luxembourg
Management Company FIL Investment Management (Luxembourg) S.A. 2a, rue Albert Borschette
B.P. 2174
L-1021 Luxembourg
Grand Duchy of Luxembourg
Investment Manager FIL Fund Management Limited
Pembroke Hall 42 Crow Lane
Pembroke HM19
Bermuda
Custodian & Depositary Brown Brothers Harriman (Luxembourg) S.C.A. 80, route D'Esch
L-1470 Luxembourg
Grand Duchy of Luxembourg
General Distributor FIL Distributors Pembroke Hall 42 Crow Lane
Pembroke HM19
Bermuda
Telephone: (1) 441 297 7267
Fax: (1) 441 295 4493
Share Distributors FIL Distributors International Limited
PO Box HM670
Hamilton HMCX
Bermuda
Telephone: (1) 441 297 7267
Fax: (1) 441 295 4493
FIL Investments International Beech Gate Millfield Lane
Lower Kingswood
Tadworth Surrey KT20 6RP
United Kingdom
(Authorised and regulated in the UK by the Financial Conduct Authority) Telephone: (44) 1732 777377
Fax: (44) 1732 777262
FIL Pensions Management Beech Gate Millfield Lane
Lower Kingswood
Tadworth Surrey KT20 6RP
United Kingdom
Telephone: (44) 1732 777377
Fax: (44) 1732 777262
FIL (Luxembourg) S.A. 2a, rue Albert Borschette
B.P. 2174
L-1021 Luxembourg
Grand Duchy of Luxembourg
Telephone: (352) 250 404 1
Fax: (352) 26 38 39 38
FIL Investment Services GmbH
Kastanienhöhe 1
D-61476 Kronberg im Taunus Germany Telephone: (49) 6173 509 0
Fax: (49) 6173 509 4199
FIL Gestion 21 avenue Kléber 75784 Paris Cedex 16 France
Telephone: (33) 1 7304 3000
FIL Investment Management (Hong Kong) Limited
Level 21
Two Pacific Place
88 Queensway Admiralty Hong Kong
Telephone: (852) 26 29 2629
Fax: (852) 2629 6088
FIL Investment Management (Singapore) Limited
8 Marina View No. 35-06 Asia Square Tower 1
Singapore 018960
Telephone: (65) 6511 2200 (general) Fax: (65) 6536 1960
Registrar, Transfer Agent, Administrative Service Agent and Domiciliary Agent FIL Investment Management (Luxembourg) S.A. 2a, rue Albert Borschette
B.P. 2174
L-1021 Luxembourg
Grand Duchy of Luxembourg
Representative & Paying Agent for Austria
UniCredit Bank Austria AG
Schottengasse 6-8
A-1010 Wien
Austria
Representative for Denmark P/F BankNordik DK-2300 Copenhagen S CVR no. 32049664 Denmark Representative for Ireland
FIL Fund Management (Ireland) Limited
George's Quay House
43 Townsend Street Dublin 2
D02 VK65
Ireland
Representative for Norway FIL (Luxembourg) S.A. 2a, rue Albert Borschette
B.P. 2174
L-1021 Luxembourg
Grand Duchy of Luxembourg
Telephone: (352) 250 404 1
Fax: (352) 26 38 39 38
Representative for Singapore
FIL Investment Management (Singapore) Limited
8 Marina View No. 35-06 Asia Square Tower 1
Singapore 018960
Representative for Sweden
Skandinaviska Enskilda Banken AB (publ), SE-106 40 Stockholm, Sweden
Representative & Paying Agent for Switzerland
BNP Paribas Securities Services Paris, Succursale de Zürich Selnaustrasse 16
CH-8002 Zürich
Switzerland
Representative for the United Kingdom
FIL Pensions Management Beech Gate Millfield Lane
Lower Kingswood
Tadworth Surrey KT20 6RP
United Kingdom
Telephone: (44) 1732 777377
Fax: (44) 1732 777262
Auditor Deloitte Audit S.à r.l. Société à responsabilité limitée 20 Boulevard de Kockelscheuer L-1821 Luxembourg
Grand Duchy of Luxembourg

Fidelity, Fidelity International, the Fidelity International logo and symbol are trademarks of FIL Limited